UNITED STATES
SECURITIES AND EXCHANGE COMMISSION
Washington, D.C. 20549
_______________________________
FORM 10‑K
_______________________________
þ | ANNUAL REPORT PURSUANT TO SECTION 13 OR 15(d) OF THE SECURITIES EXCHANGE ACT OF 1934 |
For the fiscal year ended December 31, 2018
or
o | TRANSITION REPORT PURSUANT TO SECTION 13 OR 15(d) OF THE SECURITIES EXCHANGE ACT OF 1934 |
For the transition period from _______________ to _______________
Commission file number 1-4347
_______________________________
ROGERS CORPORATION
(Exact Name of Registrant as Specified in its Charter)
_______________________________
Massachusetts | 06-0513860 |
(State or Other Jurisdiction of Incorporation or Organization) | (I. R. S. Employer Identification No.) |
2225 W. Chandler Blvd., Chandler, Arizona | 85224-6155 |
(Address of Principal Executive Offices) | (Zip Code) |
Registrant’s telephone number, including area code: (480) 917-6000
Securities registered pursuant to Section 12(b) of the Act: | ||
Title of Each Class | Name of Each Exchange on Which Registered | |
Common Stock, $1 Par Value | New York Stock Exchange | |
Securities registered pursuant to Section 12(g) of the Act: None | ||
Indicate by check mark if the registrant is a well-known seasoned issuer, as defined in Rule 405 of the Securities Act. Yes ý No ¨
Indicate by check mark if the registrant is not required to file reports pursuant to Section 13 or Section 15(d) of the Act. Yes ¨ No ý
Indicate by check mark whether the registrant (1) has filed all reports required to be filed by Section 13 or 15(d) of the Securities Exchange Act of 1934 during the preceding 12 months (or for such shorter period that the registrant was required to file such reports), and (2) has been subject to such filing requirements for the past 90 days. Yes ý No ¨
Indicate by check mark whether the registrant has submitted electronically every Interactive Data File required to be submitted pursuant to Rule 405 of Regulation S-T (§ 232.405 of this chapter) during the preceding 12 months (or for such shorter period that the registrant was required to submit such files). Yes ý No ¨
Indicate by check mark if disclosure of delinquent filers pursuant to Item 405 of Regulation S-K (§ 229.405 of this chapter) is not contained herein, and will not be contained, to the best of registrant’s knowledge, in definitive proxy or information statements incorporated by reference in Part III of this Form 10-K or any amendment to this Form 10-K. ý
Indicate by check mark whether the registrant is a large accelerated filer, an accelerated filer, a non-accelerated filer, smaller reporting company, or an emerging growth company. See the definitions of “large accelerated filer”, “accelerated filer”, “smaller reporting company”, and “emerging growth company” in Rule 12b-2 of the Exchange Act.
If an emerging growth company, indicate by check mark if the registrant has elected not to use the extended transition period for complying with any new or revised financial accounting standards provided pursuant to Section 13(a) of the Exchange Act. o
Large accelerated filer ý | Accelerated filer o | Non-accelerated filer o |
Smaller reporting company o | Emerging growth company o | |
Indicate by check mark whether the registrant is a shell company (as defined in Rule 12b-2 of the Act) Yes ¨ No ý
The aggregate market value of the voting common equity held by non-affiliates as of June 30, 2018, the last business day of the registrant’s most recently completed second fiscal quarter, was approximately $2,026,896,605. Rogers has no non-voting common equity. The number of shares outstanding of common stock as of February 15, 2019 was 18,438,502.
Documents Incorporated by Reference:
Portions of Rogers’ Definitive Proxy Statement for its 2019 Annual Meeting of Shareholders, currently scheduled for May 9, 2019, are incorporated by reference into Part III of this Form 10-K.
2
ROGERS CORPORATION
FORM 10-K
December 31, 2018
TABLE OF CONTENTS | ||
Part I | ||
Item 1. | Business | |
Item 1A. | Risk Factors | |
Item 1B. | Unresolved Staff Comments | |
Item 2. | Properties | |
Item 3. | Legal Proceedings | |
Item 4. | Mine Safety Disclosures | |
Part II | ||
Item 5. | Market for Registrant’s Common Equity, Related Stockholder Matters and Issuer Purchases of Equity Securities | |
Item 6. | Selected Financial Data | |
Item 7. | Management’s Discussion and Analysis of Results of Operations and Financial Position | |
Item 7A. | Quantitative and Qualitative Disclosures About Market Risk | |
Item 8. | Financial Statements and Supplementary Data | |
Item 9. | Changes in and Disagreements with Accountants on Accounting and Financial Disclosure | |
Item 9A. | Controls and Procedures | |
Item 9B. | Other Information | |
Part III | ||
Item 10. | Directors, Executive Officers and Corporate Governance | |
Item 11. | Executive Compensation | |
Item 12. | Security Ownership of Certain Beneficial Owners and Management and Related Stockholder Matters | |
Item 13. | Certain Relationships and Related Transactions, and Director Independence | |
Item 14. | Principal Accountant Fees and Services | |
Part IV | ||
Item 15. | Exhibits, Financial Statement Schedules | |
Item 16. | Form 10-K Summary | |
Signatures | ||
3
Part I
Item 1. Business
As used herein, the “Company,” “Rogers,” “we,” “us,” “our” and similar terms include Rogers Corporation and its subsidiaries, unless the context indicates otherwise.
Forward-Looking Statements
This Annual Report on Form 10-K includes “forward-looking statements” within the meaning of Section 27A of the Securities Act of 1933, as amended, and Section 21E of the Securities Exchange Act of 1934, as amended. Such statements are generally accompanied by words such as “anticipate,” “assume,” “believe,” “could,” “estimate,” “expect,” “foresee,” “goal,” “intend,” “may,” “might,” “plan,” “potential,” “predict,” “project,” “should,” “seek,” “target” or similar expressions that convey uncertainty as to future events or outcomes. Forward-looking statements are based on assumptions and beliefs that we believe to be reasonable; however, assumed facts almost always vary from actual results, and the differences between assumed facts and actual results could be material depending upon the circumstances. Where we express an expectation or belief as to future results, that expectation or belief is expressed in good faith and based on assumptions believed to have a reasonable basis. We cannot assure you, however, that the stated expectation or belief will occur or be achieved or accomplished. Among the factors that could cause our results to differ materially from those indicated by forward-looking statements are risks and uncertainties inherent in our business including, without limitation:
• | failure to capitalize on, volatility within, or other adverse changes with respect to the Company’s growth drivers, including advanced mobility and advanced connectivity, such as delays in adoption or implementation of new technologies; |
• | uncertain business, economic and political conditions in the United States and abroad, particularly in China, South Korea, Germany, Hungary and Belgium, where we maintain significant manufacturing, sales or administrative operations; |
• | the ongoing trade policy dispute between the United States and China, as well as adverse changes in trade policy, tariff regulation or other trade restrictions; |
• | fluctuations in foreign currency exchange rates; |
• | our ability to develop innovative products and have them incorporated into end-user products and systems; |
• | the extent to which end-user products and systems incorporating our products achieve commercial success; |
• | the ability of our sole or limited source suppliers to deliver certain key raw materials, including commodities, to us in a timely manner; |
• | intense global competition affecting both our existing products and products currently under development; |
• | failure to realize, or delays in the realization of, anticipated benefits of acquisitions and divestitures due to, among other things, the existence of unknown liabilities or difficulty integrating acquired businesses; |
• | our ability to attract and retain management and skilled technical personnel; |
• | our ability to protect our proprietary technology from infringement by third parties and/or allegations that our technology infringes third party rights; |
• | changes in effective tax rates or tax laws and regulations in the jurisdictions in which we operate; |
• | failure to comply with financial and restrictive covenants in our credit agreement or restrictions on our operational and financial flexibility due to such covenants; |
• | the outcome of ongoing and future litigation, including our asbestos-related product liability litigation; |
• | changes in environmental laws and regulations applicable to our business; and |
• | disruptions in, or breaches of, our information technology systems. |
Our forward-looking statements are expressly qualified by these cautionary statements, which you should consider carefully, along with the risks discussed under the headings “Item 1A. Risk Factors” and “Item 7. Management’s Discussion and Analysis of Results of Operations and Financial Position” and elsewhere in this report, any of which could cause actual results to differ materially from historical results or anticipated results. We undertake no obligation to update or revise any forward-looking statements, whether as a result of new information, future events or otherwise, unless required by law.
Overview
Rogers Corporation designs, develops, manufactures and sells high-quality and high-reliability engineered materials and components for mission critical applications. We operate three strategic operating segments: Advanced Connectivity Solutions (ACS), Elastomeric Material Solutions (EMS) and Power Electronics Solutions (PES). The remaining operations, which represent our non-core businesses, are reported in the Other operating segment. We have a history of innovation and have established Innovation Centers for our research and development activities in Chandler, Arizona; Burlington, Massachusetts; Eschenbach, Germany; and Suzhou, China. We are headquartered in Chandler, Arizona.
4
Growth Strategy and Recent Acquisitions
Our growth strategy is based upon the following principles: (1) market-driven organization, (2) innovation leadership, (3) synergistic mergers and acquisitions, and (4) operational excellence. As a market-driven organization, we are focused on growth drivers, including advanced mobility and advanced connectivity. More specifically, the key trends currently affecting our business include the increasing use of advanced driver assistance systems and adoption of electric and hybrid electric vehicles in the automotive industry and new technology adoption in the telecommunications industry, including next generation wireless infrastructure. In addition to our focus on advanced mobility and advanced connectivity in the automotive and telecommunications industries, we sell into a variety of other end markets including renewable energy, consumer electronics, aerospace and defense and diverse general industrial applications.
Our sales and marketing approach is based on addressing these trends, while our strategy focuses on factors for success as a manufacturer of engineered materials and components: quality, service, cost, efficiency, innovation and technology. We have expanded our capabilities through organic investment and acquisitions, and we strive to ensure high quality solutions for our customers. We continue to review and re-align our manufacturing and engineering footprint in an effort to attain a leading competitive position globally. We have established or expanded our capabilities in various locations in support of our customers’ growth initiatives.
We seek to enhance our operational and financial performance by investing in research and development, manufacturing and materials efficiencies, and new product initiatives that respond to the needs of our customers. We strive to evaluate operational and strategic alternatives to improve our business structure and align our business with the changing needs of our customers and major industry trends affecting our business.
In executing on our growth strategy, we have completed three strategic acquisitions in the last three fiscal years: (1) in July 2018, we acquired Griswold LLC (Griswold), a manufacturer of a wide range of high-performance engineered cellular elastomer and microcellular polyurethane products and solutions, (2) in January 2017, we acquired the principal operating assets of Diversified Silicone Products, Inc. (DSP), a custom silicone product development and manufacturing business serving a wide range of high reliability applications, and (3) in November 2016, we acquired DeWAL Industries LLC (DeWAL), a manufacturer of polytetrafluoroethylene and ultra-high molecular weight polyethylene films, pressure sensitive tapes and specialty products for the industrial, aerospace, automotive and electronics markets. Additionally, in August 2018, we acquired a production facility and related machinery and equipment located in Chandler, Arizona from Isola USA Corp (Isola).
Operating Segments
Advanced Connectivity Solutions
Our ACS operating segment designs, develops, manufactures and sells circuit materials and solutions enabling high-performance and high-reliability connectivity for applications in wireless infrastructure (e.g., power amplifiers, antennas, small cells and distributed antenna systems), automotive (e.g., active safety, advanced driver assistance systems, telematics and thermal management), aerospace and defense, connected devices (e.g., mobile internet devices and Internet of Things), wired infrastructure (e.g., computing and IP infrastructure) and consumer electronics. We believe these products have characteristics that offer performance and other functional advantages in many market applications that serve to differentiate our products from other commonly available materials. These products are sold principally to independent and captive printed circuit board fabricators that convert our laminates to custom printed circuits. Trade names for our ACS products include: RO3000®, RO4000®, RT/duroid®, TMM®, AD SeriesTM and CLTE SeriesTM. As of December 31, 2018, our ACS operating segment had manufacturing and administrative facilities in Chandler, Arizona; Rogers, Connecticut; Bear, Delaware; Evergem, Belgium; and Suzhou, China.
Elastomeric Material Solutions
Our EMS operating segment designs, develops, manufactures and sells engineered material solutions for a wide variety of applications and end markets. These include polyurethane and silicone materials used in critical cushioning, sealing and vibration management applications for portable electronics (e.g., smart phones), automotive, aerospace, rail, footwear and printing end markets; customized silicones used in flex heater and semiconductor thermal applications; polytetrafluoroethylene and ultra-high molecular weight polyethylene materials used in wire and cable, pressure-sensitive tapes and automotive applications. We believe these materials have characteristics that offer functional advantages in many market applications which serve to differentiate Rogers’ products from other commonly available materials. EMS products are sold globally to converters, fabricators, distributors and original equipment manufacturers (OEMs). Trade names for our EMS products include: PORON®, BISCO®, DeWAL®, ARLON®, DSP®, Griswold®, eSORBA®, XRD®, HeatSORB™ and R/bak®.
As of December 31, 2018, our EMS operating segment had administrative and manufacturing facilities in Moosup, Connecticut; Rogers, Connecticut; Woodstock, Connecticut; Bear, Delaware; Carol Stream, Illinois; Narragansett, Rhode Island; Santa Fe Springs, California; Ansan, South Korea; and Suzhou, China. We also own 50% of: (1) Rogers Inoac Corporation (RIC), a joint venture established in Japan to design, develop, manufacture and sell PORON products predominantly for the Japanese market and (2) Rogers INOAC Suzhou Corporation (RIS), a joint venture established in China to design, develop, manufacture and sell PORON products primarily for RIC customers in various Asian countries. INOAC Corporation owns the remaining 50% of both
5
RIC and RIS. RIC has manufacturing facilities at the INOAC facilities in Nagoya and Mie, Japan, and RIS has manufacturing facilities at Rogers’ facilities in Suzhou, China.
Power Electronics Solutions
Our PES operating segment designs, develops, manufactures and sells ceramic substrate materials for power module applications (e.g., variable frequency drives, vehicle electrification and renewable energy), laminated busbars for power inverter and high power interconnect applications (e.g., mass transit, hybrid-electric and electric vehicles, renewable energy and variable frequency drives) and micro-channel coolers (e.g., laser cutting equipment). We sell our ceramic substrate materials and micro-channel coolers under the curamik® trade name, and our busbars under the ROLINX® trade name. As of December 31, 2018, our PES operating segment had manufacturing and administrative facilities in Evergem, Belgium; Eschenbach, Germany; Budapest, Hungary; and Suzhou, China.
Other
Our Other operating segment consists of elastomer components for applications in ground transportation, office equipment, consumer and other markets; elastomer floats for level sensing in fuel tanks, motors, and storage tanks; and inverters for portable communications and automotive markets. Trade names for our elastomer components include: NITROPHYL® floats for level sensing in fuel tanks, motors, and storage tanks and ENDUR® elastomer rollers.
Sales and Competition
We sell our materials and components primarily through direct sales channels positioned near major concentrations of our customers in North America, Europe and Asia. We sold to over 5,000 customers worldwide in 2018, primarily OEMs and component suppliers. No individual customer represented more than 10% of our total net sales for 2018; however, there are concentrations of OEM customers in our ACS (Chinese telecommunications equipment manufacturers) and PES (semiconductor and automotive manufacturers) operating segments. Although the loss of any one of our larger customers would require a period of adjustment, during which the results of operations could be materially adversely impacted, we believe that such events could be successfully mitigated over a period of time due to the diversity of our customer base.
We employ a technical sales and marketing approach pursuant to which we work collaboratively to provide design engineering, testing, product development and other technical support services to OEMs that incorporate our engineered materials and components in their products. Component suppliers convert, modify or otherwise incorporate our engineered materials and components into their components for these OEMs in accordance with their specifications. Accordingly, we provide similar technical support services to component suppliers.
We compete primarily with manufacturers of high-end materials, some of which are large, multi-national companies, principally on the basis of innovation, historical customer relationships, product quality, reliability, performance and price, technical and engineering service and support, breadth of product line, and manufacturing capabilities. We also compete with manufacturers of commodity materials, including smaller regional producers with lower overhead costs and profit requirements located in Asia that attempt to upsell their products based principally upon price, particularly for products that have matured in their life cycle. We believe that we have a competitive advantage because of our reputation for innovation, the quality and reliability of our materials and components, and our commitment to technical support and customer service.
Research and Development
We have a history of innovation, and innovation leadership is a key component of our overall business strategy. The markets we serve are typically characterized by rapid technological changes and advances. Accordingly, the success of our strategy is in part dependent on our ability to develop market-leading products, which is primarily driven by efforts in research and development. We are focused on identifying technologies and innovations related to both our current product portfolio as well as initiatives targeted at further diversifying and growing our business. As part of this technology commitment, we have Rogers Innovation Centers at Northeastern University in Burlington, Massachusetts, as well as at our facilities in Chandler, Arizona, Eschenbach, Germany and Suzhou, China. Our Innovation Centers focus on early stages of technical and commercial development of new high-tech materials solutions in an effort to align with market direction and needs.
Patents and Other Intellectual Property
We have many domestic and foreign patents, licenses and have additional patent applications pending related to technology in each of our operating segments. These patents and licenses vary in duration and provide some protection from competition. We also own a number of registered and unregistered trademarks and have acquired and developed certain confidential and proprietary technology, including trade secrets that we believe to be of some importance to our business.
While we believe our patents and other intellectual property provide a competitive advantage to our operating segments, we believe that a significant part of our competitive position and future success will be determined by factors such as the innovative skills, systems and process knowledge, and technological expertise of our personnel; the range of new products we develop; and our customer service and support.
6
Manufacturing and Raw Materials
The key raw materials used in our business are as follows: for our ACS operating segment, copper, polymer and polytetraflouroethylene materials; for our EMS operating segment, polyurethane, polytetraflouroethylene, polyethylene, silicone and natural rubber materials; and for our PES operating segment, copper, ceramic and brazing paste materials.
Some of the raw materials used in our business are available through sole or limited-source suppliers. While we have undertaken strategies to mitigate the risks associated with sole or limited source suppliers, these strategies may not be effective in all cases, and price increases or disruptions in our supply of raw materials could have a material adverse impact on our business. For additional information, refer to “Item 1A. Risk Factors.”
Seasonality
Except for some minor seasonality for consumer products, which often aligns with year-end holidays and product launch cycles, the operations of our segments have not been seasonal.
Our Employees
As of December 31, 2018, we employed approximately 3,700 people.
Backlog
Our backlog of firm orders was $152.8 million as of December 31, 2018, compared to $122.8 million as of December 31, 2017. The year-over-year increase in backlog was mainly comprised of a $24.1 million increase in the backlog for our PES operating segment, primarily due to overall sales growth in 2018 compared to 2017 and favorable foreign currency fluctuations, in addition to $4.2 million of backlog related to Griswold. The backlog of firm orders is expected to be filled within the next 12 months.
Executive Officers
Our executive officers as of February 20, 2019 were as follows:
Name | Age | Present Position | Year Appointed to Present Position | Other Relevant Positions Held |
Bruce D. Hoechner | 59 | President and Chief Executive Officer, Director, Principal Executive Officer | 2011 | |
Michael M. Ludwig | 57 | Senior Vice President, Chief Financial Officer and Treasurer, Principal Financial Officer | 2018 | Senior Vice President and Chief Financial Officer, FormFactor, Inc., from May 2011 to March 2018. |
Marc J. Beulque | 54 | Vice President, Global Operations | 2016 | Vice President, Power Electronics Solutions Operations and Research and Development, Rogers, from June 2013 to April 2016; General Manager, Power Distribution Systems from December 2011 to May 2013. Mr. Beulque was promoted to Vice President, Global Operations in April 2016 and was appointed as an executive officer in February 2018 as a result of an expansion of his responsibility to oversee all global operations of the Company. |
Benjamin M. Buckley | 46 | Vice President and Chief Human Resources Officer | 2019 | Associate General Counsel and Director of Global Compliance and Integrity, Rogers, from October 2014 to January 2019. President and Chief Executive Officer, Verge America Ltd., from May 2013 to October 2014. |
Robert C. Daigle | 55 | Senior Vice President and Chief Technology Officer | 2009 | |
Jeffrey M. Grudzien | 57 | Senior Vice President and General Manager, Advanced Connectivity Solutions | 2017 | Vice President, Advanced Connectivity Solutions, Rogers, from February 2012 to February 2017. |
Jay B. Knoll | 55 | Senior Vice President, Corporate Development, General Counsel and Secretary | 2017 | Vice President and General Counsel, Rogers, from November 2014 to February 2017; Senior Vice President, General Counsel PKC Group Oyj - North America from June 2012 to November 2014. |
Helen Zhang | 55 | Senior Vice President and General Manager, Power Electronics Solutions and President, Rogers Asia | 2017 | Vice President, Power Electronics Solutions and President, Rogers Asia, Rogers, from May 2012 to February 2017. |
7
Available Information
We make available on our website (http://www.rogerscorp.com), or through a link posted on our website, free of charge, our annual reports on Form 10-K, quarterly reports on Form 10-Q, current reports on Form 8-K, reports filed by our executive officers and directors pursuant to Section 16 of the Securities Exchange Act of 1934, as amended (the Exchange Act), and amendments to those reports filed pursuant to Section 13(a) or 15(d) of the Exchange Act as soon as reasonably practicable after we electronically file such material with, or furnish it to, the Securities and Exchange Commission (SEC). In addition, the SEC maintains an internet site that contains these reports, proxy and information statements, and other information regarding issuers that file electronically with the SEC (http://www.sec.gov).
We also make available on our website, in a printable format, the charters for our Audit Committee, Compensation and Organization Committee, and Nominating and Governance Committee, in addition to our Corporate Governance Guidelines, Bylaws, Code of Business Ethics, Related Party Transactions Policy and Compensation Recovery Policy. Our website is not incorporated into or a part of this Form 10-K.
8
Item 1A. Risk Factors
Our business, results of operations and financial position are subject to various risks, including those discussed below, which may affect the value of our capital stock. The risks discussed below are those that we believe are currently the most significant, although additional risks not presently known to us or that we currently deem less significant may also impact our business, results of operations and financial position, perhaps materially.
Failure to capitalize on, volatility within, or other adverse changes with respect to the Company’s growth drivers, including advanced connectivity and advanced mobility, may adversely affect our business.
We derived approximately 25% and 27% of our net sales for the year ended December 31, 2018 from sales relating to the key market growth drivers of advanced connectivity and advanced mobility, respectively. These growth drivers are served by our direct and indirect customers in a variety of end markets, including transportation (specifically including the advanced driver assistance systems and electric and hybrid electric vehicles markets), communications, wireless infrastructure and portable electronics. These growth drivers, as well as specific market and industry trends within them, may be volatile, cyclical and sensitive to a variety of factors, including general economic conditions, technology disruptions, consumer preferences and political priorities. Adverse or cyclical changes to and within these growth drivers, such as delays in adoption or implementation of new technologies, has resulted in, and may continue to result in, reduced demand for certain of our products, production overcapacity, increased inventory levels and related risks of obsolescence, as well as price erosion, ultimately leading to a decline in our operating results. Acceleration within these growth drivers and corresponding rapid increases in demand for certain products may also require us to make significant capital investments or acquisitions in order to increase production levels and to maintain customer relationships and market positions. However, we may not be able to increase our production levels with sufficient speed or efficiency to capitalize on such increases in demand.
We have extensive international operations, and events and circumstances that have general international consequence or specific impact in the countries in which we operate may materially adversely affect our business.
For the year ended December 31, 2018, approximately 72% of our net sales resulted from sales in foreign markets, with approximately 47% and 22% of such net sales occurring in Asia and Europe, respectively. We expect our net sales in foreign markets to continue to represent a substantial majority of our consolidated net sales. We maintain significant manufacturing and administrative operations in China, South Korea, Germany, Hungary and Belgium, and approximately 62% of our employees are located outside the United States. Risks related to our extensive international operations include the following:
• | foreign currency fluctuations, particularly in the value of the Euro, the Hungarian forint, the Japanese yen, the Chinese yuan and the South Korean won against the U.S. dollar; |
• | economic and political instability, due to regional or country-specific events or changes in relations between the United States and the countries in which we operate; |
• | accounts receivable practices across countries, including longer payment cycles; |
• | export control or customs matters, the ongoing trade policy dispute between the United States and China and adverse changes in trade policy, tariff regulations or other trade restrictions; |
• | complications in complying, and failure to comply, with a variety of foreign laws, including due to unexpected changes in the laws or regulations of the countries in which we operate; |
• | failure to comply with the Foreign Corrupt Practices Act or other applicable anti-corruption laws; |
• | greater difficulty protecting our intellectual property; |
• | compliance with foreign employment regulations, as well as work stoppages and labor and union disputes. |
The foregoing risks may be particularly acute in emerging markets such as China and India, where our operations are subject to greater uncertainty due to increased volatility associated with the developing nature of the economic, legal and governmental systems of these countries, changes in bilateral and multilateral arrangements with the United States and other governments, and challenges that some multinational customers that are headquartered in emerging markets may have complying fully with United States and other developed market extraterritorial regulations. In addition, our business has been, and may continue to be, adversely affected by the lack of development, or disruptions, of transportation or other critical infrastructure in emerging markets. If we are unable to successfully manage the risks associated with expanding our global business, or to adequately manage operational fluctuations, it may materially adversely affect our business, results of operations and financial position.
Our business is dependent upon our development of innovative products and our customers’ incorporation of those products into end user products and systems that achieve commercial success.
As a manufacturer and supplier of engineered materials and components, our business depends upon our ability to innovate and sell our materials and components for inclusion in other products that are developed, manufactured and sold by our customers. We strive to differentiate our products and secure long-term demand through our engagement with our customers to design in our materials and components as part of their product development processes. The value of any design-in largely depends upon the decision of our customers to manufacture their products or systems in sufficient production quantities, the commercial success of the end product and the extent to which the design of our customers’ products or systems could accommodate substitution of
9
competitor products. A consistent failure to introduce new products in a timely manner, achieve design-ins or achieve market acceptance on commercially reasonable terms could materially adversely affect our business, results of operations and financial position. The introduction of new products presents particularly significant business challenges in our business because product development commitments and expenditures must be made well in advance of product sales.
Our dependence on sole or limited source suppliers for certain of our raw materials could materially adversely affect our ability to manufacture products and materially increase our costs.
We rely on sole and limited source suppliers for certain of the raw materials that are critical to the manufacturing of our products. This reliance subjects us to risks related to our potential inability to obtain an adequate supply of required raw materials, particularly given our use of lean manufacturing and just-in-time inventory techniques, and our reduced control over pricing and timing of delivery of raw materials. Our operating results could be materially adversely affected if we were unable to obtain adequate supplies of these materials in a timely manner or if their cost increased significantly.
While we believe we could obtain and qualify alternative sources for most sole and limited source supplier materials if necessary, the transition time could be long, particularly if the change requires us to redesign our systems. Ultimately, we may be unable to redesign our systems, which could further increase delays or prevent us from manufacturing our products at all. Even if a system redesign is feasible, increased costs associated with such a redesign would decrease our profit margins, perhaps materially, if we could not effectively pass such costs along to our customers. Further, it would likely result in production and delivery delays, which could lead to lost sales and damage to our relationships with current and potential customers.
We face intense global competition, which could reduce demand for our products or create additional pricing pressure on our products.
We operate in a highly competitive global environment and compete with domestic and international companies principally on the basis of the following:
• | innovation; |
• | historical customer relationships; |
• | product quality, reliability, performance and price; |
• | technical and engineering service and support; |
• | breadth of product line; and |
• | manufacturing capabilities. |
Our competitors include commodity materials suppliers, which offer product substitutions based mostly on price, and suppliers of alternate solutions, which offer product substitutions or eliminations based mostly on disruptive technology. Furthermore, our customers may engage in internal manufacturing of products that may result in reduced demand for our products. Certain of these competitors have greater financial and other resources than we have and, in some cases, these competitors are well established in specific product niches. We expect that our competitors will continue to improve the design and performance of their products, which could result in the development of products that offer price or performance features superior to our products. If we are unable to maintain our competitive advantage for any reason, demand for our products may be materially reduced, which may adversely affect our business, results of operations and financial position.
We may acquire or dispose of businesses, or engage in other transactions, which expose us to a variety of risks that could materially adversely affect our business operating results and financial position.
From time to time, we have explored and pursued transaction opportunities that we believe complement our core businesses, and we expect to do so again in the future. We have divested and may again consider divesting businesses or assets that we do not regard as part of our core businesses. These transaction opportunities may come in the form of acquisitions, joint ventures, investments, divestitures or other structures. There are risks associated with such transactions, including, without limitation, general business risk, technology risk, market acceptance risk, litigation risk, environmental risk, regulatory approval risk and risks associated with the failure to complete announced transactions. In addition, if we are unsuccessful in integrating any acquired company or business into our operations or if integration is more difficult than anticipated, we may experience disruptions that could harm our business and result in our failure to realize the anticipated benefits of the acquisitions. In the case of acquisitions, we may not be able to discover, during the due diligence process or otherwise, all known and unknown risks associated with the business we are acquiring, including the existence of liabilities. We may spend a significant portion of available cash, incur substantial debt or issue equity securities, which would dilute current shareholders’ equity ownership, to pay for the acquisitions. In the case of divestitures, we may agree to indemnify acquiring parties for known or unknown liabilities arising from the businesses we are divesting. We have incurred, and may in the future incur, significant costs in the pursuit and evaluation of transactions that we do not consummate for a variety of reasons.
As a result, these transactions may not ultimately create value for us or our shareholders and may harm our reputation and materially adversely affect our business, results of operations and financial position.
10
Our business may be materially adversely affected if we cannot protect our proprietary technology or if we infringe the proprietary rights of others.
Our proprietary technology supports our ability to compete effectively with other companies, and we seek to protect our intellectual property rights by obtaining domestic and foreign patents, trademarks and copyrights, and maintaining trade secrets for our manufacturing processes. It is possible, however, that our efforts to obtain such protection in the United States and abroad will be unsuccessful or that the protection afforded will not be sufficiently broad to protect our technology.
Even if domestic and foreign laws do grant initial protection to our technology, our competitors or other third parties may subsequently obtain and unlawfully copy, use or disclose our technologies, products, and processes. We believe that the risk of piracy of our technology is particularly acute in the foreign countries in which we operate. In circumstances in which we conclude that our proprietary technology has been infringed, we have pursued, and may again pursue, litigation to enforce our rights. The defense and prosecution of intellectual property infringement suits are both costly and time consuming, even if the outcome is favorable to us. If we are not successful in protecting our proprietary technology or if the protection afforded to us is not sufficiently broad, our competitors may be able to manufacture and offer products substantially similar to our own, thereby reducing demand for our products and adversely affecting our results of operations and financial position. We may also be adversely affected by, and subject to increased competition as a result of, the normal expiration of our issued patents.
Our competitors or other third parties may also assert infringement or invalidity claims against us in the future. In addition to the significant costs associated with such suits, as noted above, an adverse outcome could subject us to significant liabilities to third parties and require us to license rights from third parties or cease selling our products. Any of these events may have a material adverse effect on our business, results of operations and financial position.
The failure to attract and retain specialized technical and management personnel could impair our expected growth and future success.
We depend upon the continued services and performance of key executives, senior management and skilled technical personnel, particularly our sales engineers and other professionals with significant experience in the key industries we serve. Competition for these personnel from other companies, academic institutions and government entities is intense, and our expected growth and future success will depend, in large part, upon our ability to attract and retain these individuals.
As a multinational corporation doing business in the United States and various foreign jurisdictions, changes in tax laws or exposures to additional tax liability could negatively impact our operating results.
As a result of the variability and uncertainty in global taxation, we are subject to a wide variety of tax-related risks, any of which could provoke changes in our global structure, international operations or intercompany agreements, which could materially reduce our net income in future periods or result in restructuring costs, increased effective tax rates and other expenses. Given the global nature of our business, a number of factors may increase our effective tax rates, including:
• | decisions to redeploy foreign earnings outside of their country of origin for which we have not previously provided for income taxes; |
• | increased scrutiny of our transactions by taxing authorities; |
• | changes in the geographic mix of our profits among jurisdictions with differing statutory income tax rates; |
• | ability to utilize, or changes in the valuation of, deferred tax assets; and |
• | changes in tax laws and regulations or issuance of new interpretations of the law applicable to us. |
For instance, on December 22, 2017, the Tax Cuts and Jobs Act of 2017 (U.S. Tax Reform) was signed into law, making significant changes to the Internal Revenue Code. As a result, we recognized an income tax expense in 2017 and made adjustments to the original estimate in 2018. This tax expense is related to the transition tax on our previously untaxed foreign earnings and the remeasurement of deferred income taxes. For additional information regarding U.S. Tax Reform, refer to “Note 14 – Income Taxes” to “Item 8. Financial Statements and Supplementary Data.”
The terms of our credit agreement subject us to risks, including potential acceleration of our outstanding indebtedness if we fail to satisfy financial ratios and comply with numerous covenants.
Our credit agreement contains, and any future debt agreements into which we enter may contain, certain financial ratios and certain restrictive covenants that, among other things, limit our ability to incur indebtedness or liens, acquire other businesses, dispose of assets, or make investments. Our ability to make scheduled payments on these borrowings and to satisfy financial ratios may be adversely affected by changes in economic or business conditions beyond our control, while the restrictive covenants to which we are subject may limit our ability to take advantage of potential business opportunities as they arise. Failure to satisfy these financial ratios or to comply with the covenants in our credit agreement would constitute a default. An uncured default with respect to one or more of our covenants could result in outstanding borrowings thereunder being declared immediately due and payable, which may also trigger an obligation to repay other outstanding indebtedness. Any such acceleration of our indebtedness would have a material adverse effect on our cash flows, financial position and results of operations.
11
Our credit agreement currently permits us to borrow euro-currency loans that bear interest based on the London interbank offered rate (LIBOR), plus a specified spread. In July 2017, the United Kingdom’s Financial Conduct Authority, which regulates LIBOR, announced that it intends to phase out LIBOR by the end of 2021. LIBOR borrowings may become unavailable before that date, and it is unclear what reference rate might replace it. If LIBOR becomes unavailable, the credit agreement presently provides for the interest rate on our loans to convert to a higher base reference rate plus a spread. Even if we agree with our lenders to amend the credit agreement to identify a new reference rate for borrowings thereunder, this rate may be higher than our present interest rate, thereby causing the cost of our borrowings to increase.
We may be adversely affected by litigation stemming from product liability and other claims.
Our products may contain defects that we do not detect before sale, which may lead to warranty or damage claims against us or product recalls. We are involved in various unresolved legal matters that arise in the ordinary course of our operations, including asbestos-related product liability claims related to our operations before the 1990s. For additional information, refer to “Item 3. Legal Proceedings” and “Note 13 – Commitments and Contingencies” to “Item 8. Financial Statements and Supplementary Data.” We maintain insurance coverage with respect to certain claims, but the policy coverage limits may not be adequate or cover a particular loss. Costs associated with, among other things, the defense of, or settlements or judgments relating to, claims against us that are not covered by insurance or that result in recoveries in excess of insurance coverage may adversely affect our business, results of operations and financial position. Irrespective of insurance coverage, claims against us could divert the attention of our senior management and/or result in reputational damage, thereby adversely affecting our business.
Our projections on the potential exposure and expected insurance coverage relating to our asbestos-related product liability claims are based on a number of assumptions, including the number of new claims to be filed each year, the average cost of disposing of such claims, the length of time it takes to dispose of such claims, coverage issues among insurers and the continuing solvency of various insurance companies, as well as the numerous uncertainties surrounding asbestos litigation in the United States. To the extent such assumptions are inaccurate, the net liabilities that we have recorded in our financial statements may fail to approximate the losses we could suffer in connection with such claims.
We are subject to many environmental laws and regulations as well as potential environmental liabilities that could adversely affect our business.
We are subject to a variety of federal, state, local and foreign laws, rules and regulations related to the use, storage, handling, discharge or disposal of certain toxic, volatile or otherwise hazardous chemicals, gases and other substances used in manufacturing our products. Some of these laws in the United States include the Federal Clean Water Act, Clean Air Act, Resource Conservation and Recovery Act, Comprehensive Environmental Response, Compensation, and Liability Act, Toxic Substances Control Act, and similar state statutes and regulations. In the European Union (EU) we are subject to the EU regulation on Registration, Evaluation, Authorization and Restriction of Chemicals. Compliance with these laws and regulations could require us to incur substantial expenses, including in connection with the acquisition of new equipment. Any failure to comply with present or future environmental laws, rules and regulations could result in criminal and civil liabilities, fines, suspension of production or cessation of certain operations, any of which could have a material adverse effect on our business, results of operations and financial position.
In addition, some environmental laws impose liability, sometimes without fault, for investigating and/or cleaning up contamination on, or emanating from, properties currently or formerly owned, leased or operated by us, as well as for damages to property or natural resources and for personal injury arising out of such contamination. Such liability may be joint and several, meaning that we could be held responsible for more than our share of the liability involved, or even the entire liability. For additional information, refer to “Note 13 – Commitments and Contingencies” to “Item 8. Financial Statements and Supplementary Data.”
A significant disruption in, or breach in security of, our information technology systems or violations of data protection laws could materially adversely affect our business and reputation.
In the ordinary course of business, we collect and store confidential information, including proprietary business information belonging to us, our customers, suppliers, business partners and other third parties and personally identifiable information of our employees. We rely on information technology systems to protect this information and to keep financial records, process orders, manage inventory, coordinate shipments to customers, and operate other critical functions. Our information technology systems may be susceptible to damage, disruptions or shutdowns due to power outages, hardware failures, telecommunication failures and user errors. If we experience a disruption in our information technology systems, it could result in the loss of sales and customers and significant incremental costs, which could materially adversely affect our business.
We may also be subject to security breaches caused by computer viruses, illegal break-ins or hacking, sabotage, or acts of vandalism by disgruntled employees or third parties. The risk of a security breach or disruption, particularly through cyberattack or cyber intrusion, including by computer hackers, foreign governments and cyber terrorists, has increased as the number, intensity and sophistication of attempted attacks and intrusions from around the world have increased. Our information technology network and systems have been and, we believe, continue to be under constant attack. Accordingly, despite our security measures or those of our third party service providers, a security breach may occur, including breaches that we may not be able to detect. Security breaches of our information technology systems could result in the misappropriation or unauthorized disclosure of confidential
12
information belonging to us or to our customers, suppliers, business partners, employees or other third parties, which could result in our suffering significant financial and reputational damage. If we are unable to protect sensitive information, our customers or governmental authorities could question the adequacy of our security processes and procedures and our compliance with evolving government cyber security requirements for government contractors.
In addition, the processing and storage of certain information is increasingly subject to privacy and data security regulations, and many such regulations are country-specific. The interpretation and application of data protection laws in the United States, Europe, and elsewhere, including the EU General Data Protection Regulation and the California Consumer Privacy Act, are uncertain, evolving and may be inconsistent among jurisdictions. Compliance with these various laws may be onerous and require us to incur substantial costs or to change our business practices in a manner that adversely affects our business, while failure to comply with such laws may subject us to substantial penalties.
Employee benefit cost increases and costs associated with the proposed termination of certain of our pension plans could reduce our profitability.
Our profitability is affected by employee benefit costs, particularly medical, pension and other employee benefits. In recent years, employee medical costs have increased due to factors such as the increase in health care costs in the United States. These factors will continue to put pressure on our business and financial performance, as employee benefit costs continue to escalate. We may not succeed in limiting future cost increases. Continued employee benefit cost increases could have an adverse effect on our results of operations, cash flows and financial position.
We also sponsor various defined benefit pension plans that cover certain employees. Our costs of providing defined benefit pension plans have risen dramatically in recent years, and are dependent upon a number of factors and assumptions that drive our projected liabilities and annual expenses, such as discount rates, the actual and projected rates of return on the plans’ assets, governmental regulation, global equity prices, portfolio composition, mortality rates and required or voluntary contributions to the plans. Changes in assumptions, the inability to grow our pension investments over time to increase the value of the plans’ assets, and other factors relating to worldwide and domestic economic trends and financial market conditions, could all have a negative impact on our pension plans, which could result in an increase in our pension liabilities, a reduction in the funded status of our plan, increases in annual expense recognized related to the plans, and requirements to increase funding for some or all of our defined benefit pension plans, among other factors, all of which could negatively impact our results of operations and financial position.
In October 2017, the Company merged two of its qualified noncontributory defined benefit pension plans (the Merged Plan). The Company currently intends to terminate the Merged Plan and has requested a determination letter from the IRS. The termination of the Merged Plan remains subject to final approval by both management and the IRS. We expect the settlement process to be completed in 2019, but the process for finalizing the termination of the Merged Plan includes compliance with a regulatory review by the IRS and the timing of the resolution of the compliance process may be delayed. Following receipt of approval from the IRS and upon the effectiveness of the termination of the Merged Plan, we plan to distribute the benefits remaining in the Merged Plan. This distribution could have an adverse effect on our results of operations, cash flows and financial position.
Item 1B. Unresolved Staff Comments
None.
13
Item 2. Properties
We operate various general offices and manufacturing facilities throughout the United States, Europe and Asia. The following table provides certain information about the principal general offices and manufacturing facilities used by our operating segments:
Location | Floor Space (Square Feet) | Type of Facility | Leased / Owned | Operating Segment | ||||
United States | ||||||||
Chandler, Arizona | 147,000 | Manufacturing | Owned | ACS | ||||
Chandler, Arizona | 105,100 | Manufacturing | Owned | ACS | ||||
Chandler, Arizona | 100,000 | Manufacturing | Owned | ACS | ||||
Chandler, Arizona | 75,000 | Administrative Offices | Owned | All | ||||
Chandler, Arizona | 17,000 | Warehouse / Administrative Offices | Leased through 3/2020 | ACS | ||||
Rogers, Connecticut | 388,100 | Manufacturing / Administrative Offices | Owned | All | ||||
Moosup, Connecticut | 185,500 | Manufacturing | Owned | EMS | ||||
Woodstock, Connecticut | 150,600 | Manufacturing | Owned | EMS | ||||
Carol Stream, Illinois | 216,600 | Manufacturing | Owned | EMS | ||||
Bear, Delaware | 125,000 | Manufacturing / Administrative Offices | Owned | ACS & EMS | ||||
Burlington, Massachusetts | 6,000 | R&D Lab / Administrative Offices | Leased through 2/2021 | All | ||||
Narragansett, Rhode Island | 84,600 | Manufacturing | Owned | EMS | ||||
North Kingston, Rhode Island | 10,000 | Warehouse | Leased through 3/2020 | EMS | ||||
Santa Fe Springs, California | 42,000 | Manufacturing / Administrative Offices | Leased through 3/2019 | EMS | ||||
Europe | ||||||||
Eschenbach, Germany | 149,000 | Manufacturing / Administrative Offices | Leased through 6/2021 | PES | ||||
Eschenbach, Germany | 24,100 | Warehouse / Administrative Offices | Leased through 3/2020 | PES | ||||
Eschenbach, Germany | 1,050 | Warehouse | Leased through 3/2020 | PES | ||||
Evergem, Belgium | 122,000 | Manufacturing / Administrative Offices | Owned | ACS & PES | ||||
Evergem, Belgium | 55,700 | Warehouse / Administrative Offices | Leased through 5/2021 | ACS & PES | ||||
Ghent, Belgium | 45,000 | Warehouse | Leased through 3/2020 | ACS & EMS | ||||
Budapest, Hungary | 64,000 | Manufacturing | Leased through 2/2023 | PES | ||||
Asia | ||||||||
Suzhou, China | 821,000 | Manufacturing / Administrative Offices | Owned | All | ||||
Ansan, South Korea | 40,000 | Manufacturing | Leased through 10/2021 | EMS | ||||
14
Item 3. Legal Proceedings
Asbestos Products Litigation
We, like many other industrial companies, have been named as a defendant in a number of lawsuits filed in courts across the country by persons alleging personal injury from exposure to products containing asbestos. We were a defendant in 745 asbestos-related product liability cases as of December 31, 2018, compared to 687 cases as of December 31, 2017, with the change reflecting new cases, dismissals, settlements and other dispositions. We have never mined, milled, manufactured or marketed asbestos; rather, we made and provided to industrial users a limited number of products that contained encapsulated asbestos, but we stopped manufacturing these products in the late 1980s. In virtually all of the cases against us, the plaintiffs are seeking unspecified damages above a jurisdictional minimum against multiple defendants who may have manufactured, sold or used asbestos-containing products to which the plaintiffs were allegedly exposed and from which they purportedly suffered injury. Most of these cases are being litigated in Illinois, Maryland, Missouri and New York; however, we are also defending cases in other states. We intend to vigorously defend these cases, primarily on the basis of the plaintiffs’ inability to establish compensable loss as a result of exposure to our products. As of December 31, 2018, the estimated liability and estimated insurance recovery for all current and future claims projected through 2058 was $70.3 million and $63.8 million, respectively.
The defense and settlement costs of our asbestos-related product liability litigation to date have been substantially covered by insurance. As of December 31, 2018, our consolidated statements of financial position include approximately $6.5 million of estimated asbestos-related expenses that exceed asbestos-related insurance coverage for all current and future claims projected through 2058. For additional information regarding our asbestos-related product liability litigation, refer to “Note 13 – Commitments and Contingencies” to “Item 8. Financial Statements and Supplementary Data.”
Other Matters
We are currently involved in a variety of other legal proceedings that we view as ordinary routine litigation incidental to our business, including commercial disputes, intellectual property matters, personal injury claims, tax claims and employment matters. Although the outcome of no legal matter can be predicted with certainty, we do not believe that the outcome of any of these legal proceedings, either individually or in the aggregate, will have a material adverse effect on our business, results of operations, cash flows or financial position. In addition, we are involved in certain environmental matters, principally investigations, which we do not view as material legal proceedings, either pending or known to be contemplated. For additional information regarding these matters, refer to “Note 13 – Commitments and Contingencies” to “Item 8. Financial Statements and Supplementary Data.”
15
Item 4. Mine Safety Disclosures
Not applicable.
16
Part II
Item 5. Market for Registrant’s Common Equity, Related Stockholder Matters and Issuer Purchases of Equity Securities
Capital Stock Market Prices and Dividend Policy
Our capital stock is traded on the New York Stock Exchange under the symbol “ROG”. As of the end of business on February 15, 2019, we had 312 shareholders of record. On the same date, the trading price of our capital stock closed at $136.05 per share.
We expect to maintain a policy of emphasizing longer-term growth of capital rather than immediate dividend income and do not anticipate paying cash dividends in the foreseeable future.
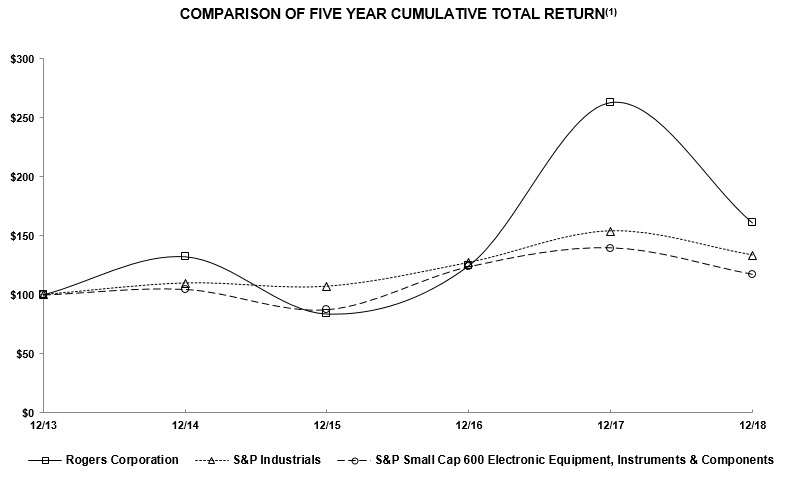
Performance Graph
The following graph compares the cumulative total return on Rogers’ capital stock over the past five fiscal years with the cumulative total return on the Standard & Poor’s Industrials Index (S&P Industrials) and the S&P Small Cap 600 Electronic Equipment, Instruments & Components Index. The graph tracks the performance of a $100 investment in the Company’s common stock and in each of the indexes (with the reinvestment of all dividends) on the date specified.
Issuer Purchases of Equity Securities
In 2015, we initiated a share repurchase program (the Program) of up to $100.0 million of the Company’s capital stock. We initiated the Program to mitigate dilutive effects of stock option exercises and vesting of restricted stock units granted by the Company, in addition to enhancing shareholder value. The Program has no expiration date, and may be suspended or discontinued at any time without notice.
During the year ended December 31, 2018, we made $3.0 million of repurchases using cash from operations and cash on hand. As of December 31, 2018, $49.0 million remained available to purchase under the Program. For additional information regarding share repurchases, refer to “Note 21 – Share Repurchases” to “Item 8. Financial Statements and Supplementary Data.”
17
Item 6. Selected Financial Data
(Dollars in thousands, except per share amounts) | 2018 | 2017 | 2016 | 2015 | 2014 | ||||||||||||||
Financial Results | |||||||||||||||||||
Net sales | $ | 879,091 | $ | 821,043 | $ | 656,314 | $ | 641,443 | $ | 610,911 | |||||||||
Income before income tax expense | $ | 110,589 | $ | 132,925 | $ | 82,280 | $ | 66,173 | $ | 81,224 | |||||||||
Net income | $ | 87,651 | $ | 80,459 | $ | 48,283 | $ | 46,320 | $ | 53,412 | |||||||||
Per Share Data | |||||||||||||||||||
Basic earnings per share | $ | 4.77 | $ | 4.43 | $ | 2.68 | $ | 2.52 | $ | 2.94 | |||||||||
Diluted earnings per share | $ | 4.70 | $ | 4.34 | $ | 2.65 | $ | 2.48 | $ | 2.86 | |||||||||
Book value | $ | 46.12 | $ | 41.99 | $ | 35.28 | $ | 32.55 | $ | 31.91 | |||||||||
Financial Position | |||||||||||||||||||
Current assets | $ | 485,786 | $ | 454,523 | $ | 458,401 | $ | 428,665 | $ | 438,174 | |||||||||
Current liabilities | $ | 107,180 | $ | 113,808 | $ | 101,185 | $ | 78,648 | $ | 120,445 | |||||||||
Ratio of current assets to current liabilities | 4.5 to 1 | 4.0 to 1 | 4.5 to 1 | 5.5 to 1 | 3.6 to 1 | ||||||||||||||
Cash and cash equivalents | $ | 167,738 | $ | 181,159 | $ | 227,767 | $ | 204,586 | $ | 237,375 | |||||||||
Net working capital | $ | 378,606 | $ | 340,715 | $ | 357,216 | $ | 350,017 | $ | 317,729 | |||||||||
Property, plant and equipment, net | $ | 242,759 | $ | 179,611 | $ | 176,916 | $ | 178,661 | $ | 150,420 | |||||||||
Total assets | $ | 1,279,344 | $ | 1,125,134 | $ | 1,056,500 | $ | 930,355 | $ | 840,435 | |||||||||
Borrowings under revolving credit facility | $ | 228,482 | $ | 130,982 | $ | 235,877 | $ | 173,557 | $ | 25,000 | |||||||||
Shareholders’ equity | $ | 848,324 | $ | 766,573 | $ | 635,786 | $ | 584,582 | $ | 587,281 | |||||||||
Borrowings under revolving credit facility as a percentage of shareholders’ equity | 26.9 | % | 17.1 | % | 37.1 | % | 29.7 | % | 4.3 | % | |||||||||
Other Data | |||||||||||||||||||
Depreciation and amortization | $ | 50,073 | $ | 44,099 | $ | 37,847 | $ | 34,054 | $ | 26,268 | |||||||||
Research and development expenses | $ | 33,075 | $ | 29,547 | $ | 28,582 | $ | 27,644 | $ | 22,878 | |||||||||
Capital expenditures | $ | 90,549 | $ | 27,215 | $ | 18,136 | $ | 24,837 | $ | 28,755 | |||||||||
Number of employees (approximate) | 3,700 | 3,400 | 3,100 | 2,800 | 2,800 | ||||||||||||||
Net sales per employee | $ | 238 | $ | 241 | $ | 212 | $ | 229 | $ | 218 | |||||||||
Number of shares outstanding at year end | 18,395 | 18,255 | 18,021 | 17,957 | 18,403 | ||||||||||||||
Amounts disclosed above for 2014 have been adjusted for our 2015 change in accounting principle from the last in, first out (LIFO) cost method to the first in, first out (FIFO) cost method for valuing inventory for all operations that were using the LIFO cost method. The financial data included within the preceding table should be read in conjunction with our Management’s Discussion and Analysis of Results of Operations and Financial Position as well as the Financial Statements and Supplementary Data included in Items 7 and 8, respectively, of this Form 10-K, and with our previously filed Forms 10-K.
18
Item 7. Management’s Discussion and Analysis of Results of Operations and Financial Position
The following discussion and analysis of our results of operations and financial position should be read together with the Selected Financial Data and our Consolidated Financial Statements and the related notes that appear elsewhere in this Form 10-K.
Business Overview
Rogers Corporation designs, develops, manufactures and sells high-quality and high-reliability engineered materials and components for mission critical applications. We operate three strategic operating segments: Advanced Connectivity Solutions (ACS), Elastomeric Material Solutions (EMS) and Power Electronics Solutions (PES). The remaining operations, which represent our non-core businesses, are reported in the Other operating segment. We have a history of innovation and have established Innovation Centers for our research and development activities in Chandler, Arizona; Burlington, Massachusetts; Eschenbach, Germany and Suzhou, China. We are headquartered in Chandler, Arizona.
Growth Strategy and Recent Acquisitions
Our growth strategy is based upon the following principles: (1) market-driven organization, (2) innovation leadership, (3) synergistic mergers and acquisitions, and (4) operational excellence. As a market-driven organization, we are focused on growth drivers, including advanced mobility and advanced connectivity. More specifically, the key trends currently affecting our business include the increasing use of advanced driver assistance systems and adoption of electric and hybrid electric vehicles in the automotive industry and new technology adoption in the telecommunications industry, including next generation wireless infrastructure. In addition to our focus on advanced mobility and advanced connectivity in the automotive and telecommunications industries, we sell into a variety of other end markets including renewable energy, consumer electronics, aerospace and defense and diverse general industrial applications.
Our sales and marketing approach is based on addressing these trends, while our strategy focuses on factors for success as a manufacturer of engineered materials and components: quality, service, cost, efficiency, innovation and technology. We have expanded our capabilities through organic investment and acquisitions, and we strive to ensure high quality solutions for our customers. We continue to review and re-align our manufacturing and engineering footprint in an effort to attain a leading competitive position globally. We have established or expanded our capabilities in various locations in support of our customers’ growth initiatives.
We seek to enhance our operational and financial performance by investing in research and development, manufacturing and materials efficiencies, and new product initiatives that respond to the needs of our customers. We strive to evaluate operational and strategic alternatives to improve our business structure and align our business with the changing needs of our customers and major industry trends affecting our business.
In executing on our growth strategy, we have completed three strategic acquisitions in the last three fiscal years: (1) in July 2018, we acquired Griswold LLC (Griswold), a manufacturer of a wide range of high-performance engineered cellular elastomer and microcellular polyurethane products and solutions, (2) in January 2017, we acquired the principal operating assets of Diversified Silicone Products, Inc. (DSP), a custom silicone product development and manufacturing business serving a wide range of high reliability applications, and (3) in November 2016, we acquired DeWAL Industries LLC (DeWAL), a manufacturer of polytetrafluoroethylene and ultra-high molecular weight polyethylene films, pressure sensitive tapes and specialty products for the industrial, aerospace, automotive and electronics markets. Additionally, in August 2018, we acquired a production facility and related machinery and equipment located in Chandler Arizona from Isola USA Corp (Isola).
2018 Executive Summary
In 2018 as compared to 2017, our net sales increased 7.1% to $879.1 million, gross margin decreased approximately 340 basis points to 35.4%, and operating income as a percentage of net sales decreased approximately 290 basis points to 12.8%. The following key factors should be considered when reviewing our results of operations, financial position and liquidity for the periods discussed:
• | Our net sales increase in 2018 was attributable to increases in net sales in our EMS and PES strategic operating segments. Net sales were favorably impacted by higher net sales in electric and hybrid electric vehicle and micro-channel cooler applications in our PES operating segment and higher net sales in portable electronics and automotive applications in our EMS operating segment, partially offset by lower net sales in wireless 4G LTE and portable electronics applications in our ACS operating segment. The increase in net sales was also driven in part by net sales of $13.7 million, or 1.7%, related to our acquisition of Griswold, as well as $15.5 million, or 1.9%, of favorable impacts from appreciation in value of the Euro and Renminbi relative to the U.S. dollar. The adoption of new accounting guidance for revenue recognition favorably impacted net sales in 2018 by $4.6 million, or 0.6%. |
• | Our gross margin decreased approximately 340 basis points to 35.4% in 2018 from 38.8% in 2017. Gross margin was unfavorably impacted as a result of strategic investments in capacity optimization and infrastructure to support future growth initiatives, increased costs for raw materials, facility consolidation and new product launch, as well as unfavorable |
19
absorption of fixed costs. The adoption of new accounting guidance for revenue recognition favorably impacted gross margin in 2018 by $1.5 million, or 0.5%.
• | Our operating income decreased 12.7% to $112.7 million in 2018, as compared to $129.1 million in 2017. The decrease was primarily due to a decrease in gross margin, as well as a $2.4 million increase in selling, general & administrative (SG&A) expenses and a $3.5 million increase in research and development (R&D) expenses, furthered by a decrease in other operating income of $2.2 million. The increase in SG&A expenses was driven by increases in acquisition expenses as well as other intangible assets amortization related to Griswold. SG&A expenses decreased as a percentage of net sales from 19.7% in 2017 to 18.7% in 2018. The decrease in other operating income was primarily due to the $3.5 million of depreciation expense on leased assets netted against the $0.9 million of imputed income related to the Isola asset acquisition. |
• | We are an innovation company, and in 2018 we continued our investment in R&D, with R&D expenses comprising 3.8% of net sales, an increase of approximately 20 basis points from 2017. R&D expenses were $33.1 million in 2018, as compared to $29.5 million in 2017. We have made concerted efforts to realign our R&D organization to better fit the expected future direction of our Company, including dedicating resources to focus on current product extensions and enhancements to meet our expected short-term and long-term technology needs. |
• | We acquired Griswold in July 2018, as we continue to execute on our synergistic acquisition strategy. Acquisitions are a core part of our growth strategy, and the Griswold acquisition extends the product portfolio and technology capabilities of our EMS operating segment. We financed our acquisition of Griswold with $82.5 million in borrowings under our revolving credit facility. As a result, borrowings under our revolving credit facility increased in 2018. |
• | In preparation for expected demand in advanced connectivity and advanced mobility, we acquired a production facility and related machinery and equipment from Isola in August 2018. We intend to use the purchased assets for capacity expansion within our ACS operating segment in contemplation of expected future demand from our 5G customers. We financed the asset acquisition with $43.4 million in cash on hand. |
20
Results of Operations
The following table sets forth, for the periods indicated, selected operations data expressed as a percentage of net sales.
2018 | 2017 | 2016 | ||||||
Net sales | 100.0 | % | 100.0 | % | 100.0 | % | ||
Gross margin | 35.4 | % | 38.8 | % | 38.0 | % | ||
Selling, general and administrative expenses | 18.7 | % | 19.7 | % | 21.2 | % | ||
Research and development expenses | 3.8 | % | 3.6 | % | 4.4 | % | ||
Restructuring and impairment charges | 0.5 | % | 0.4 | % | 0.1 | % | ||
Other operating (income) expense, net | (0.4 | )% | (0.6 | )% | — | % | ||
Operating income | 12.8 | % | 15.7 | % | 12.3 | % | ||
Equity income in unconsolidated joint ventures | 0.6 | % | 0.6 | % | 0.6 | % | ||
Other income (expense), net | (0.1 | )% | 0.6 | % | 0.2 | % | ||
Interest expense, net | (0.7 | )% | (0.7 | )% | (0.6 | )% | ||
Income before income tax expense | 12.6 | % | 16.2 | % | 12.5 | % | ||
Income tax expense | 2.6 | % | 6.4 | % | 5.1 | % | ||
Net income | 10.0 | % | 9.8 | % | 7.4 | % | ||
2018 vs. 2017
Net Sales | ||||||||||
(Dollars in thousands) | 2018 | 2017 | Percent Change | |||||||
Net sales | $ | 879,091 | $ | 821,043 | 7.1% | |||||
Net sales increased by 7.1% in 2018 compared to 2017. Our EMS and PES operating segments had net sales increases of 9.2% and 20.8%, respectively, while our ACS operating segment had a net sales decrease of 2.3%. The increase in net sales was favorably impacted by higher net sales in electric and hybrid electric vehicles and micro-channel cooler applications in our PES operating segment and higher net sales in portable electronics and automotive applications in our EMS operating segment, partially offset by lower net sales in wireless 4G LTE and portable electronics applications in our ACS operating segment. The increase in net sales was also driven in part by net sales of $13.7 million, or 1.7%, related to our acquisition of Griswold, as well as $15.5 million, or 1.9%, of favorable currency fluctuations due to the appreciation in value of the Euro and Renminbi relative to the U.S. dollar. The adoption of new accounting guidance for revenue recognition favorably impacted net sales in 2018 by $4.6 million, or 0.6%. For additional information regarding the impacts of adoption of new accounting guidance for revenue recognition, refer to “Note 16 – Revenue from Contracts with Customers,” as well as “Note 15 – Operating Segment and Geographic Information” to “Item 8. Financial Statements and Supplementary Data.”
Gross Margin | ||||||||||
(Dollars in thousands) | 2018 | 2017 | Percent Change | |||||||
Gross margin | $ | 310,783 | $ | 318,575 | (2.4)% | |||||
Percentage of net sales | 35.4 | % | 38.8 | % | ||||||
Gross margin as a percentage of net sales decreased approximately 340 basis points to 35.4% in 2018 compared to 38.8% in 2017. Gross margin in 2018 was unfavorably impacted by strategic investments in capacity optimization and infrastructure to support future growth initiatives, increased costs for raw materials, facility consolidation and new product launch, as well as unfavorable absorption of fixed costs. The adoption of new accounting guidance for revenue recognition favorably impacted gross margin in 2018 by $1.5 million, or 0.5%.
Selling, General and Administrative Expenses | ||||||||||
(Dollars in thousands) | 2018 | 2017 | Percent Change | |||||||
Selling, general and administrative expenses | $ | 164,046 | $ | 161,651 | 1.5% | |||||
Percentage of net sales | 18.7 | % | 19.7 | % | ||||||
21
SG&A expenses increased 1.5% in 2018 from 2017, due to a $2.0 million increase in other intangible assets amortization and a $0.5 million increase in acquisition expenses year-over-year. SG&A expenses were also unfavorably impacted by increases in sales and marketing investments to support future growth initiatives and other SG&A expenses, which were almost completely offset by decreases in total compensation and benefits. The total year-over-year increase in other SG&A expenses was favorably impacted by cost control initiatives executed in the fourth quarter. SG&A expenses decreased as a percentage of net sales to 18.7% in 2018 from 19.7% from 2017.
Research and Development Expenses | ||||||||||
(Dollars in thousands) | 2018 | 2017 | Percent Change | |||||||
Research and development expenses | $ | 33,075 | $ | 29,547 | 11.9% | |||||
Percentage of net sales | 3.8 | % | 3.6 | % | ||||||
R&D expenses increased 11.9% in 2018 from 2017 due to concerted efforts to realign our R&D organization to better fit the expected future direction of our Company, including dedicating resources to focus on current product extensions and enhancements to meet our expected short-term and long-term technology needs. R&D expenses increased as a percentage of net sales to 3.8% in 2018 from 3.6% from 2017.
Restructuring and Impairment Charges and Other Operating (Income) Expense, Net | ||||||||||
(Dollars in thousands) | 2018 | 2017 | Percent Change | |||||||
Restructuring and impairment charges | $ | 4,038 | $ | 3,567 | 13.2% | |||||
Other operating (income) expense, net | $ | (3,087 | ) | $ | (5,329 | ) | (42.1)% | |||
We incurred restructuring charges associated with the relocation of our global headquarters from Rogers, Connecticut to Chandler, Arizona and the consolidation of our Santa Fe Springs, California operations into the Company’s facilities in Carol Stream, Illinois and Bear, Delaware. We recognized $2.0 million and $0.6 million of restructuring charges associated with the facility consolidation and our global headquarters relocation, respectively, in 2018, and $2.8 million of restructuring charges related to the global headquarters relocation in 2017. We did not recognize any restructuring charges related to the facility consolidation in 2017. We estimate that approximately $0.5 million of additional costs related to the facility consolidation will be incurred in 2019.
In 2018, we recognized $1.5 million in impairment charges on certain assets in connection with the Isola asset acquisition, which was allocated to our ACS operating segment. In 2017, we recognized a $0.3 million impairment charge related to our remaining investment in BrightVolt, Inc. and recognized a $0.5 million impairment charge related to the remaining net book value of an other intangible asset within our ROLINX® product line in our PES operating segment. The impairment of our remaining investment in BrightVolt, Inc. was allocated ratably among the three operating segments, while the impairment of the ROLINX® related other intangible asset was allocated to our PES operating segment.
In 2018, we recognized lease income of approximately $0.9 million and related depreciation expense on leased assets of approximately $3.5 million in connection with the transitional leaseback of a portion of the facility and certain machinery and equipment acquired from Isola in August 2018. We recorded a gain from the settlement of antitrust litigation in the amount of $4.2 million, a gain of $0.7 million for the settlement of indemnity claims related to the DSP acquisition, income of $0.6 million from economic incentive grants related to the physical relocation of our global headquarters from Rogers, Connecticut to Chandler, Arizona and a gain on sale of property, plant and equipment of $0.2 million. In 2017, we recognized other operating income of $5.3 million as a result of the sales of a facility and a parcel of land located in Belgium. For additional information related to the year-over-year changes in other operating income (expense), refer to “Note 18 – Supplemental Financial Information” to “Item 8. Financial Statements and Supplementary Data.”
Equity Income in Unconsolidated Joint Ventures | ||||||||||
(Dollars in thousands) | 2018 | 2017 | Percent Change | |||||||
Equity income in unconsolidated joint ventures | $ | 5,501 | $ | 4,898 | 12.3% | |||||
Equity income in unconsolidated joint ventures increased 12.3% in 2018 from 2017 due to higher demand, primarily in portable electronics applications.
Other Income (Expense), Net | ||||||||||
(Dollars in thousands) | 2018 | 2017 | Percent Change | |||||||
Other income (expense), net | $ | (994 | ) | $ | 5,019 | (119.8)% | ||||
22
Other income (expense), net decreased 119.8% in 2018 from 2017 due to declines in the value of our copper derivatives and foreign exchange contracts, as well as unfavorable changes in foreign currency transaction costs.
Interest Expense, Net | ||||||||||
(Dollars in thousands) | 2018 | 2017 | Percent Change | |||||||
Interest expense, net | $ | (6,629 | ) | $ | (6,131 | ) | 8.1% | |||
Interest expense, net, increased by 8.1% in 2018 from 2017 due to higher interest rates, partially offset by a lower average outstanding balance on our revolving credit facility in 2018 compared to 2017. The lower average outstanding balance was a result of discretionary payments of $50.0 million and $60.0 million during the second and third quarters of 2017, respectively, to reduce our outstanding borrowings under our revolving credit facility, largely offset by new borrowings under our revolving credit facility during the third quarter of 2018 to fund our acquisition of Griswold and our voluntary pension contribution in connection with the proposed plan termination process.
Income Tax Expense | ||||||||||
(Dollars in thousands) | 2018 | 2017 | Percent Change | |||||||
Income tax expense | $ | 22,938 | $ | 52,466 | (56.3)% | |||||
Effective tax rate | 20.7 | % | 39.5 | % | ||||||
Our effective income tax rate for 2018 was 20.7% compared to 39.5% for 2017. The 2018 rate decrease was primarily due to a lower U.S. statutory tax rate in 2018 and the absence of the one-time impact from the enactment of the Tax Cuts and Jobs Act of 2017 (U.S. Tax Reform) in 2017, an increase in reversal of reserves associated with uncertain tax positions and lower foreign tax impact on remitted and unremitted foreign earnings and profits.
On December 22, 2017, Staff Accounting Bulletin No. 118 (SAB 118) was issued to address the application of U.S. GAAP in situations when a registrant does not have the necessary information available, prepared, or analyzed (including computations) in reasonable detail to complete the accounting for certain income tax effects of the U.S. Tax Reform. December 22, 2018 marked the end of the measurement period for purposes of SAB 118. As such, we completed our analysis based on currently available legislative updates relating to the U.S. Tax Reform, as well as a more detailed analysis of the post-1986 undistributed earnings and profits that required further adjustment, resulting in a tax expense of $0.2 million in the fourth quarter of 2018 and a total tax expense of $0.2 million for the year ended December 31, 2018. The total tax expense included a $7.5 million benefit related to adjustments to the transition tax and a $7.7 million expense related to the establishment of a valuation allowance against deferred tax assets associated with carried over research and developments credits. There were no significant adjustments recorded with respect to finalization of the impact of the U.S. Tax Reform on state taxes and the remeasurement of certain deferred tax assets and liabilities. For additional information regarding U.S. Tax Reform, refer to “Note 14 – Income Taxes” to “Item 8. Financial Statements and Supplementary Data.”
2017 vs. 2016
Net Sales | ||||||||||
(Dollars in thousands) | 2017 | 2016 | Percent Change | |||||||
Net sales | $ | 821,043 | $ | 656,314 | 25.1% | |||||
Net sales increased by 25.1% in 2017 compared to 2016. This increase was driven by the net sales from our acquisitions of DeWAL and DSP, as well as higher organic net sales in our three strategic operating segments (ACS, EMS and PES). The ACS operating segment had an increase in net sales of 8.4% due to higher end-market demand in automotive radar, consumer electronics, and aerospace and defense applications, partially offset by lower demand in wireless infrastructure applications and satellite TV dish applications. EMS net sales increased 53.9% primarily due to the acquisitions of DeWAL and DSP, and from higher end-market product demand from core markets, including automotive, mass transit, portable electronics, general industrial and consumer products applications. PES had increased net sales of 21.4% due to higher end-market demand in laser diode cooler applications, renewable energy, mass transit, electric and hybrid electric vehicles and variable frequency motor drives. Net sales were unfavorably impacted by 0.1% due to currency fluctuations primarily as a result of the depreciation in value of the Renminbi relative to the U.S. dollar, offset in part by appreciation in value of the Euro relative to the U.S. dollar.
23
Gross Margin | ||||||||||
(Dollars in thousands) | 2017 | 2016 | Percent Change | |||||||
Gross Margin | $ | 318,575 | $ | 249,485 | 27.7% | |||||
Percentage of sales | 38.8 | % | 38.0 | % | ||||||
Gross margin as a percentage of net sales increased by 79 basis points to 38.8% in 2017 compared to 38.0% in 2016. In 2017, gross margin was favorably impacted by an increase in net sales combined with operational excellence initiatives across our operating segments, including increased capacity utilization, operational process enhancements and automation, conversion of fixed cost structure to variable, benefits from low cost country manufacturing expansion, and synergies from the acquisitions of DeWAL and DSP.
Selling, General and Administrative Expenses | ||||||||||
(Dollars in thousands) | 2017 | 2016 | Percent Change | |||||||
Selling, general and administrative expenses | $ | 161,651 | $ | 139,272 | 16.1% | |||||
Percentage of net sales | 19.7 | % | 21.2 | % | ||||||
SG&A expenses increased by 16.1% in 2017 compared to 2016, due principally to $6.1 million of additional equity and incentive compensation expense, $4.8 million of additional other intangible assets amortization and depreciation related to the acquisitions, $4.7 million of additional SG&A expenses from the operations of the acquired businesses, $3.6 million of additional sales and marketing costs, $1.3 million of corporate development activity costs, and $3.4 million for additional asbestos liability accruals. Our 2017 results also included $3.2 million of acquisition and integration costs related to DeWAL and DSP. SG&A decreased as a percent of net sales to 19.7% in 2017 compared to 21.2% in 2016 as a result of administrative cost containment activities.
Research and Development Expenses | ||||||||||
(Dollars in thousands) | 2017 | 2016 | Percent Change | |||||||
Research and development expenses | $ | 29,547 | $ | 28,582 | 3.4% | |||||
Percentage of net sales | 3.6 | % | 4.4 | % | ||||||
R&D expenses increased by 3.4% in 2017 compared to 2016. The increase was due to continued investments that are targeted at developing new platforms and technologies focused on long-term growth initiatives at our Innovation Centers in the United States, Europe and Asia. As a percentage of sales, R&D costs decreased from 4.4% in 2016 to 3.6% in 2017 primarily due to sales growth increasing at a higher rate than the increase in R&D spend.
Restructuring and Impairment Charges and Other Operating (Income) Expense, Net | ||||||||||
(Dollars in thousands) | 2017 | 2016 | Percent Change | |||||||
Restructuring and impairment charges | $ | 3,567 | $ | 734 | 386.0% | |||||
Other operating (income) expense, net | $ | (5,329 | ) | $ | — | N/A | ||||
In the second quarter of 2017, we completed the physical relocation of our global headquarters from Rogers, Connecticut to Chandler, Arizona. We recorded $2.8 million of expense related to this project in 2017 compared to $0.7 million recorded in 2016.
In the third quarter of 2017, we recognized a $0.3 million impairment charge related to our remaining investment in BrightVolt, Inc. As this investment did not relate to a specific operating segment, we allocated it ratably among the three operating segments.
In the fourth quarter of 2017, we recognized a $0.5 million impairment charge related to the remaining net book value of an other intangible asset within our ROLINX® product line in our PES operating segment.
In the first quarter of 2017, we completed the planned sale of a parcel of land in Belgium that had been classified as held for sale as of December 31, 2016 and recognized a gain on sale of approximately $0.9 million in operating income.
Also in the third quarter of 2017, we completed the sale of a facility located in Belgium and recognized a gain on sale of approximately $4.4 million in operating income.
Equity Income in Unconsolidated Joint Ventures | ||||||||||
(Dollars in thousands) | 2017 | 2016 | Percent Change | |||||||
Equity income in unconsolidated joint ventures | $ | 4,898 | $ | 4,146 | 18.1% | |||||
24
Equity income in unconsolidated joint ventures increased 18.1% in 2017 from 2016. The increase was due to higher demand, primarily in the portable electronics market.
Other Income (Expense), Net | ||||||||||
(Dollars in thousands) | 2017 | 2016 | Percent Change | |||||||
Other income (expense), net | $ | 5,019 | $ | 1,167 | (330.1)% | |||||
In 2017, the increase in other income (expense), net was attributable to gains in copper derivative transactions of approximately $1.9 million compared to gains of $0.5 million in 2016, as well as gains from foreign currency fluctuations of $0.8 million compared to losses of $1.8 million in 2016. In 2016, we also recorded an additional loss related to the sale of the Arlon polyimide and thermoset laminate business of $0.2 million, and $0.8 million of expense for tax indemnity receivables that were reversed due to the release of uncertain tax positions.
Interest Expense, Net | ||||||||||
(Dollars in thousands) | 2017 | 2016 | Percent Change | |||||||
Interest expense, net | $ | (6,131 | ) | $ | (3,930 | ) | 56.0% | |||
Interest expense, net, increased by 56.0% in 2017 from 2016. This increase was primarily due to higher outstanding borrowings on our credit facility in 2017 compared to 2016 due to borrowings to fund the acquisitions of DeWAL and DSP. As explained in “Liquidity, Capital Resources and Financial Position” below, we made discretionary principal payments of $110.2 million in 2017 to reduce our outstanding borrowings under our credit facility to $131.0 million as of December 31, 2017.
Income Tax Expense | ||||||||||
(Dollars in thousands) | 2017 | 2016 | Percent Change | |||||||
Income tax expense | $ | 52,466 | $ | 33,997 | 54.3% | |||||
Effective tax rate | 39.5 | % | 41.3 | % | ||||||
Our effective tax rate for 2017 was 39.5%, including our provisional estimate of the impact of the U.S. Tax Reform, compared to 41.3% in 2016. The 2017 rate decrease was primarily due to lower foreign tax impact on remitted and unremitted foreign earnings and profits, equity compensation excess tax deductions recognized in 2017 and increased international tax rate benefits due to earnings mix. This was substantially offset by our provisional estimate of the impact of U.S. Tax Reform, a decrease in reversal of reserves associated with uncertain tax positions and a change in valuation allowance associated with deferred tax assets that are capital in nature. For additional information regarding U.S. Tax Reform, refer to “Note 14 – Income Taxes” to “Item 8. Financial Statements and Supplementary Data.”
On December 22, 2017, Staff Accounting Bulletin No. 118 (SAB 118) was issued to address the application of U.S. GAAP in situations when a registrant does not have the necessary information available, prepared, or analyzed (including computations) in reasonable detail to complete the accounting for certain income tax effects of the U.S. Tax Reform. In accordance with SAB 118, we determined that the $1.7 million of the deferred tax expense recorded in connection with the remeasurement of certain deferred tax assets and liabilities and the $12.0 million of tax expense recorded in connection with the transition tax on the mandatory deemed repatriation of foreign earnings was a provisional amount and a reasonable estimate at December 31, 2017. Under SAB 118, we completed our analysis based on currently available legislative updates relating to the U.S. Tax Reform, as well as a more detailed analysis of the post-1986 undistributed earnings and profits that required further adjustment, resulting in a tax expense of $0.2 million in the fourth quarter of 2018 and a total tax expense of $0.2 million for the year ended December 31, 2018. The total tax expense included a $7.5 million benefit related to adjustments to the transition tax and a $7.7 million expense related to the establishment of a valuation allowance against deferred tax assets associated with carried over research and developments credits. There were no significant adjustments recorded with respect to finalization of the impact of the U.S. Tax Reform on state taxes and the remeasurement of certain deferred tax assets and liabilities. For additional information regarding U.S. Tax Reform, refer to “Note 14 – Income Taxes” to “Item 8. Financial Statements and Supplementary Data.”
25
Operating Segment Net Sales and Operating Income
Advanced Connectivity Solutions
(Dollars in thousands) | 2018 | 2017 | 2016 | ||||||||
Net sales | $ | 294,154 | $ | 301,092 | $ | 277,787 | |||||
Operating income | $ | 33,827 | $ | 55,410 | $ | 42,455 | |||||
2018 vs. 2017
ACS net sales decreased by 2.3% in 2018 compared to 2017. The decrease in net sales was primarily driven by lower demand in wireless 4G LTE and portable electronics applications, partially offset by favorable currency fluctuations of $2.8 million, or 0.9%, due to the appreciation in value of the Euro and Renminbi relative to the U.S. dollar, as well as higher demand in automotive radar and aerospace and defense applications. The adoption of new accounting guidance for revenue recognition did not impact ACS net sales in 2018.
Operating income decreased by 39.0% in 2018 compared to 2017. The decrease in operating income was due to lower net sales, increased costs for copper commodities and multi-site product qualification, including freight, lower capacity utilization due to process issues and machine downtime, as well as strategic investments in capacity optimization, infrastructure and sales and marketing to support future growth initiatives. Additionally, we recognized $1.5 million in impairment charges on certain assets in connection with the Isola asset acquisition. The adoption of new accounting guidance for revenue recognition did not impact ACS operating income in 2018. As a percentage of net sales, the 2018 operating income was 11.5%, an approximately 690 basis point decrease as compared to the 18.4% reported in 2017.
2017 vs. 2016
Net sales in this segment increased by 8.4% in 2017 compared to 2016. The increase in net sales was primarily driven by end market demand in automotive radar, consumer electronics and aerospace and defense applications, partially offset by lower demand in wireless infrastructure and satellite TV dish applications. Net sales were unfavorably impacted by 0.4% due to currency fluctuations, primarily as a result of the depreciation in value of the Renminbi relative to the U.S. dollar.
Operating income improved by 30.5% in 2017 compared to 2016. As a percentage of net sales in 2017, operating income was 18.4%, a 310 basis point increase, compared to 15.3% in 2016. This increase was primarily due to higher net sales as well as lower costs from continued operational efficiencies and cost reduction initiatives.
Elastomeric Material Solutions
(Dollars in thousands) | 2018 | 2017 | 2016 | ||||||||
Net sales | $ | 341,364 | $ | 312,661 | $ | 203,181 | |||||
Operating income | $ | 52,502 | $ | 50,908 | $ | 25,884 | |||||
2018 vs. 2017
EMS net sales increased by 9.2% in 2018 compared to 2017. The increase in net sales was primarily driven by net sales related to our acquisition of Griswold of $13.7 million, or 4.4%, higher demand in portable electronics and automotive applications, as well as favorable currency fluctuations of $3.5 million, or 1.1%, due to the appreciation in value of the Euro and Renminbi relative to the U.S. dollar. The adoption of new accounting guidance for revenue recognition favorably impacted EMS net sales in 2018 by $0.7 million, or 0.2%.
Operating income increased by 3.1% in 2018 compared to 2017. The increase in operating income was primarily due to increased net sales related to our acquisition of Griswold and organic growth, a gain from the settlement of antitrust litigation of $4.2 million, discussed in “Note 18 – Supplemental Financial Information” to “Item 8. Financial Statements and Supplementary Data,” a gain of $0.7 million for the settlement of indemnity claims related to the DSP acquisition, as well as discretionary cost control. These increases in operating income were partially offset by increased costs for raw materials and facility consolidation, unfavorable absorption of fixed costs, strategic investments in sales and marketing to support future growth initiatives, as well as increases in other intangible assets amortization. The adoption of new accounting guidance for revenue recognition favorably impacted EMS operating income in 2018 by $0.2 million, or 0.4%. As a percentage of net sales, the 2018 operating income was 15.4%, an approximately 90 basis point decrease as compared to the 16.3% reported in 2017.
2017 vs. 2016
Net sales in this segment increased 53.9% in 2017 compared to 2016. The increase in net sales was primarily driven by the acquisitions of DeWAL and DSP, 38.8%, as well as an increase in organic net sales 15.1%. EMS experienced higher end-market demand in core markets including automotive, mass transit, portable electronics, general industrial and consumer products
26
applications. Net sales were unfavorably impacted by 0.4% due to currency fluctuations, primarily as a result of the depreciation in value of the Renminbi relative to the U.S. dollar, partially offset by the appreciation in value of the Korean Won and Euro relative to the U.S. dollar.
Operating income improved 96.7% in 2017 as compared to 2016. As a percentage of net sales, 2017 operating income was 16.3%, a 360 basis point increase compared to 12.7% in 2016. This increase was primarily due to higher net sales attributable to both acquisitions and organic growth, as well as lower costs from continued operational efficiencies. Operating income in 2017 included a $1.6 million charge to reflect a purchase accounting fair value adjustment for inventory related to the DeWAL and DSP acquisitions and $3.2 million of acquisition and integration costs. Operating income in 2017 also included increased other intangible assets amortization and depreciation expense of $4.9 million related to the DeWAL and DSP acquisitions.
Power Electronics Solutions
(Dollars in thousands) | 2018 | 2017 | 2016 | ||||||||
Net sales | $ | 223,338 | $ | 184,954 | $ | 152,367 | |||||
Operating income | $ | 19,648 | $ | 15,668 | $ | 5,229 | |||||
2018 vs. 2017
PES net sales increased by 20.8% in 2018 compared to 2017. Net sales increased in electric and hybrid electric vehicles and micro-channel coolers applications, primarily due to higher demand. Net sales were also impacted by favorable currency fluctuations of $8.9 million, or 4.8%, due to the appreciation in value of the Euro and Renminbi relative to the U.S. dollar. The adoption of new accounting guidance for revenue recognition favorably impacted PES net sales in 2018 by $6.3 million, or 3.4%.
Operating income increased 25.4% in 2018 compared to 2017. The adoption of new accounting guidance for revenue recognition favorably impacted PES operating income in 2018 by $2.0 million, or 12.8%. The increase in operating income was also due to increases in net sales from higher demand, partially offset by strategic investments in capacity optimization and sales and marketing to support future growth initiatives, a commercial settlement, increased costs for facility consolidation and new product launch, as well as process issues. As a percentage of net sales, the 2018 operating income was 8.8%, an approximately 30 basis point increase as compared to the 8.5% reported in 2017.
2017 vs. 2016
Net sales in this segment increased 21.4% in 2017 compared to 2016. The increase in net sales was driven by higher demand for laser diode coolers, renewable energy, mass transit, electric and hybrid electric vehicles and variable frequency motor drives applications. Net sales were favorably impacted by 0.8% due to currency fluctuations primarily as a result of the appreciation in value of the Euro relative to the U.S. dollar, partially offset by the depreciation in value of the Renminbi relative to the U.S. dollar.
Operating income increased 199.6% in 2017 compared to 2016. As a percentage of net sales, 2017 operating income was 8.5%, a 510 basis point increase as compared to 3.4% in 2016. This increase was primarily due to higher net sales and increased equipment utilization, supply chain volume discounts, and improved productivity from operational excellence initiatives, partially offset by a $0.5 million impairment charge related to the remaining net book value of an other intangible asset within our ROLINX® product line in our PES operating segment.
Other
(Dollars in thousands) | 2018 | 2017 | 2016 | ||||||||
Net sales | $ | 20,235 | $ | 22,336 | $ | 22,979 | |||||
Operating income | $ | 6,734 | $ | 7,153 | $ | 7,329 | |||||
2018 vs 2017
Net sales in this segment decreased by 9.4% in 2018 compared to 2017. The decrease in net sales was primarily driven by the adoption of new accounting guidance for revenue recognition, which resulted in a $2.4 million unfavorable impact, or 10.5%. Currency fluctuations had a $0.3 million favorable impact on net sales during 2018 due to the appreciation in value of the Euro and Renminbi relative to the U.S. dollar.
Operating income decreased by 5.9% in 2018 compared to 2017. This decrease in operating income was primarily driven by lower net sales, partially offset by operational improvements and efficiency initiatives. Operating income in 2018 was unfavorably impacted by $0.7 million, or 10.5%, from the adoption of new accounting guidance for revenue recognition. As a percentage of net sales, the 2018 operating income was 33.3%, an approximately 130 basis point increase as compared to the 32.0% reported in the 2017.
27
2017 vs. 2016
Net sales decreased 2.8% in 2017 compared to 2016, primarily due to lower demand in global light vehicles, as well as a negative impact from currency fluctuations of 0.7% resulting from a depreciation in the value of the Renminbi relative to the U.S. dollar.
Operating income in 2017 decreased by 2.4% compared to 2016 primarily due to lower net sales, partially offset by the impact of continuing operating efficiencies.
Product and Market Development
Our research and development team is dedicated to growing our business by developing cost effective solutions that improve the performance of customers’ products and by identifying business and technology acquisition or development opportunities to expand our market presence.
Liquidity, Capital Resources and Financial Position
We believe that our existing sources of liquidity and cash flows that are expected to be generated from our operations, together with our available credit facilities, will be sufficient to fund our operations, currently planned capital expenditures, research and development efforts and our debt service commitments, for at least the next 12 months. We regularly review and evaluate the adequacy of our cash flows, borrowing facilities and banking relationships seeking to ensure that we have the appropriate access to cash to fund both our near-term operating needs and our long-term strategic initiatives.
(Dollars in thousands) | As of December 31, | ||||||
Key Financial Position Accounts: | 2018 | 2017 | |||||
Cash and cash equivalents | $ | 167,738 | $ | 181,159 | |||
Accounts receivable, less allowance for doubtful accounts | 144,623 | 140,562 | |||||
Contract assets | 22,728 | — | |||||
Inventories | 132,637 | 112,557 | |||||
Borrowings under revolving credit facility | 228,482 | 130,982 | |||||
The following table illustrates the location of our cash and cash equivalents by our three major geographic areas:
As of December 31, | |||||||||||
(Dollars in thousands) | 2018 | 2017 | 2016 | ||||||||
United States | $ | 41,833 | $ | 35,653 | $ | 95,481 | |||||
Europe | 31,244 | 41,307 | 37,791 | ||||||||
Asia | 94,661 | 104,199 | 94,495 | ||||||||
Total cash and cash equivalents | $ | 167,738 | $ | 181,159 | $ | 227,767 | |||||
Approximately $125.9 million of cash and cash equivalents were held by non-U.S. subsidiaries as of December 31, 2018. The Company did not make any changes in 2018 to its position on the permanent reinvestment of its earnings from foreign operations. With the exception of certain of our Chinese subsidiaries, we continue to assert that historical foreign earnings are indefinitely reinvested.
Net working capital was $378.6 million, $340.7 million and $357.2 million as of December 31, 2018, 2017 and 2016, respectively.
Significant changes in our statement of financial position accounts from December 31, 2017 to December 31, 2018 were as follows:
• | Accounts receivable, less allowance for doubtful accounts increased 2.9% to $144.6 million as of December 31, 2018, from $140.6 million as of December 31, 2017. The increase was primarily due to higher net sales at the end of 2018 compared to at the end of the 2017. |
• | We recorded contract assets of $22.7 million as of December 31, 2018 related to the adoption of ASU 2014-09. For additional information, refer to “Note 16 – Revenue from Contracts with Customers” to “Item 8. Financial Statements and Supplementary Data.” |
• | Inventories increased 17.8% to $132.6 million as of December 31, 2018, from $112.6 million as of December 31, 2017, as a result of our acquisition of Griswold, additional purchases as a result of changes in vendor allocations, supplier transition, safety stock replenishment and raw material cost increases, partially offset by the impact from the adoption of new accounting guidance for revenue recognition. For additional information regarding the impact of the new revenue recognition adoption, refer to “Note 16 – Revenue from Contracts with Customers” to “Item 8. Financial Statements and Supplementary Data.” |
28
• | Accrued employee benefits and compensation decreased to $30.5 million as of December 31, 2018, from $39.4 million as of December 31, 2017. This decrease is primarily due to incentive compensation payouts of $18.2 million that occurred during 2018, partially offset by $5.8 million of accruals for projected incentive compensation payouts for the 2018 performance year. |
• | Goodwill increased 11.7% to $264.9 million as of December 31, 2018, from $237.1 million as of December 31, 2017, primarily due to the acquisition of Griswold in July 2018. |
• | Other intangible assets, net of amortization, increased 10.4% to $177.0 million as of December 31, 2018, from $160.3 million as of December 31, 2017, primarily due to the acquisition of Griswold in July 2018. |
(Dollars in thousands) | For the year ended December 31, | ||||||||||
Key Cash Flow Measures: | 2018 | 2017 | 2016 | ||||||||
Net cash provided by operating activities | $ | 66,820 | $ | 138,982 | $ | 116,967 | |||||
Net cash used in investing activities | (167,437 | ) | (78,270 | ) | (151,804 | ) | |||||
Net cash provided by (used in) financing activities | 88,682 | (113,187 | ) | 57,869 | |||||||
As of December 31, 2018, cash and cash equivalents were $167.7 million as compared to $181.2 million as of December 31, 2017, a decrease of $13.4 million, or 7.4%. This decrease was primarily due to $78.0 million paid for the Griswold acquisition, net of cash acquired, $47.1 million in capital expenditures, $43.4 million paid for the Isola asset acquisition, and $25.4 million in pension and other postretirement benefits contributions, along with $6.6 million in tax payments related to net share settlement of equity awards, $5.0 million of principal payments made on our outstanding borrowings on our revolving credit facility and $3.0 million in repurchases of capital stock. This activity was partially offset by proceeds of $102.5 million from additional borrowings under our revolving credit facility, of which $82.5 million and $20.0 million were used to fund the Griswold acquisition and the voluntary pension plan contribution, respectively, and by cash flows generated by operations.
In 2017, cash and cash equivalents decreased $46.6 million, primarily due to $110.2 million of principal payments made on our outstanding borrowings on our revolving credit facility, $60.2 million cash paid for the DSP acquisition, net of cash acquired and $27.2 million in capital expenditures, partially offset by cash flows generated by operations.
In 2016, cash and cash equivalents increased $23.2 million, primarily due to proceeds of $166.0 million from borrowings under our revolving credit facility and cash flows generated by operations, partially offset by $133.9 million of cash paid for the DeWAL acquisition, net of cash acquired, $100.0 million of principal payments made on our outstanding borrowings under our revolving credit facility and $18.1 million in capital expenditures.
Revolving Credit Facility
On February 17, 2017, we entered into a secured five year credit agreement with JPMorgan Chase Bank, N.A., as administrative agent, and the lenders party thereto (the Third Amended Credit Agreement), which amended and restated the Second Amended Credit Agreement. The Third Amended Credit Agreement refinanced the Second Amended Credit Agreement, eliminated the term loan under the Second Amended Credit Agreement, increased the principal amount of our revolving credit facility to up to $450.0 million of borrowing capacity, with sublimits for multicurrency borrowings, letters of credit and swing-line notes, and provided an additional $175.0 million accordion feature.
All revolving loans under the Third Amended Credit Agreement are due on the maturity date, February 17, 2022. We are not required to make any quarterly principal payments under the Third Amended Credit Agreement. During 2018, 2017 and 2016, we made discretionary principal payments of $5.0 million, $110.2 million and $100.0 million, respectively on the outstanding borrowings under our revolving credit facility. As of December 31, 2018, we had $228.5 million in outstanding borrowings under our revolving credit facility. For additional information regarding the Third Amended Credit Agreement, refer to “Note 11 – Debt and Capital Leases” to “Item 8. Financial Statements and Supplementary Data.”
Restriction on Payment of Dividends
Our Third Amended Credit Agreement generally permits us to pay cash dividends to our shareholders, provided that (i) no default or event of default has occurred and is continuing or would result from the dividend payment and (ii) our leverage ratio does not exceed 2.75 to 1.00. If our leverage ratio exceeds 2.75 to 1.00, we may nonetheless make up to $20.0 million in restricted payments, including cash dividends, during the fiscal year, provided that no default or event of default has occurred and is continuing or would result from the payments. Our leverage ratio did not exceed 2.75 to 1.00 as of December 31, 2018.
29
Contractual Obligations
The following table summarizes our significant contractual obligations as of December 31, 2018.
Payments Due by Period | |||||||||||||||||||
(Dollars in thousands) | Total | Less than 1 Year | 1-3 Years | 3-5 Years | More than 5 Years | ||||||||||||||
Operating leases | $ | 11,217 | $ | 3,951 | $ | 5,268 | $ | 1,998 | $ | — | |||||||||
Capital leases | 5,344 | 543 | 4,801 | — | — | ||||||||||||||
Interest payments on capital lease | 295 | 125 | 170 | — | — | ||||||||||||||
Inventory purchase obligations | 344 | 344 | — | — | — | ||||||||||||||
Capital commitments(1) | 17,606 | 17,606 | — | — | — | ||||||||||||||
Borrowings under revolving credit facility(2) | 228,482 | — | — | 228,482 | — | ||||||||||||||
Interest payments on outstanding borrowings(3) | 28,000 | 8,955 | 17,851 | 1,194 | — | ||||||||||||||
Retiree health and life insurance benefits | 1,880 | 334 | 436 | 285 | 825 | ||||||||||||||
Total | $ | 293,168 | $ | 31,858 | $ | 28,526 | $ | 231,959 | $ | 825 | |||||||||
(1) | This amount represents non-cancelable vendor purchase commitments. |
(2) | All outstanding borrowings under our revolving credit facility are due on February 17, 2022. |
(3) | Estimated future interest payments are based on a leverage ratio based spread that ranges from 1.375% to 1.75%, plus projected forward 1-month LIBOR rates, and have been adjusted for the impact of the floating to fixed rate interest rate swap on $75.0 million of the outstanding borrowings under our revolving credit facility. For additional information, refer to “Note 3 – Hedging Transactions and Derivative Financial Instruments” to “Item 8. Financial Statements and Supplementary Data.” |
Unfunded pension benefit obligations, which amount to $0.2 million as of December 31, 2018, are expected to be paid from operating cash flows and the timing of payments is not definitive. Retiree health and life insurance benefits, which amount to $1.9 million, are expected to be paid from operating cash flows.
Other long-term liabilities, such as deferred taxes, unrecognized tax benefits and asbestos-related product liability reserves, have been excluded from the table due to the uncertainty of the timing of payments combined with the absence of historical trends to be used as a predictor for such payments.
Effects of Inflation
We do not believe that inflation had a material impact on our business, net sales, or operating results during the periods presented.
Off-Balance Sheet Arrangements
We do not have any off-balance sheet arrangements that have, or are, in the opinion of management, reasonably likely to have, a current or future material effect on our results of operations or financial position.
Critical Accounting Estimates
Our consolidated financial statements are prepared in accordance with U.S. generally accepted accounting principles, which require management to make estimates, judgments and assumptions that affect the amounts reported in the financial statements and accompanying notes. We base our estimates on historical experience and on various other assumptions that are believed to be reasonable under the circumstances and believe that appropriate reserves have been established based on reasonable methodologies and appropriate assumptions based on facts and circumstances that are known; however, actual results may differ from these estimates under different assumptions or conditions. An accounting policy is deemed to be critical if it requires an accounting estimate to be made based on assumptions that are highly judgmental and uncertain at the time the estimate is made, if different estimates could reasonably have been used, or if changes to those estimates are reasonably likely to periodically occur that could affect the amounts carried in the financial statements. A summary of our critical accounting estimates is presented below:
Inventory Valuation
Inventories are stated at the lower of cost or net realizable value with costs determined primarily on a first-in first-out basis. We also maintain a reserve for excess, obsolete and slow-moving inventory that is primarily developed by utilizing both specific product identification and historical product demand as the basis for our analysis. Products and materials that are specifically identified as obsolete are fully reserved. In general, most products that have been held in inventory greater than one year are fully reserved unless there are mitigating circumstances, including forecasted sales or current orders for the product. The remainder of the allowance is based on our estimates and fluctuates with market conditions, design cycles and other economic factors. Risks associated with this allowance include unforeseen changes in business cycles that could affect the marketability of certain products and an unexpected decline in current production. We closely monitor the marketplace and related inventory levels and have historically maintained reasonably accurate allowance levels. Our obsolescence reserve has ranged from 9% to 14% of gross inventory over the last three years.
30
Goodwill and Other Intangible Assets
We have made acquisitions over the years that included the recognition of intangible assets. Intangible assets are classified into three categories: (1) goodwill; (2) other intangible assets with definite lives subject to amortization; and (3) other intangible assets with indefinite lives not subject to amortization. Other intangible assets can include items such as trademarks and trade names, licensed technology, customer relationships and covenants not to compete, among other things. Each definite-lived other intangible asset is amortized over its respective economic useful life using the economic attribution method.
Goodwill is tested for impairment annually and between annual impairment tests if events or changes in circumstances indicate the carrying value may be impaired. If it is more likely than not that our goodwill is impaired, then we compare the estimated fair value of each of our reporting units to their respective carrying value. If a reporting unit’s carrying value is greater than its fair value, then an impairment is recognized for the excess and charged to operations. We currently have four reporting units with goodwill: ACS, EMS, curamik® and Elastomer Components Division (ECD). Consistent with historical practice, the annual impairment test on these reporting units was performed as of November 30, 2018.
The application of the annual goodwill impairment test requires significant judgment, including the identification of reporting units, assignment of assets and liabilities to reporting units and determination of the fair value of each reporting unit. Determining the fair value is subjective and requires the use of significant estimates and assumptions, including financial projections for net sales, gross margin and operating margin, discount rates, terminal year growth rates and future market conditions, among others. We estimated the fair value of our reporting units using an income approach based on the present value of future cash flows through a five year discounted cash flow analysis. The discounted cash flow analysis utilized the discount rates for each of the reporting units ranging from 11.3% for EMS to 12.9% for ECD, and terminal year growth rates ranging from 4.9% for curamik® to 5.9% for ACS. We believe this approach yields the most appropriate evidence of fair value as our reporting units are not easily compared to other corporations involved in similar businesses. We further believe that the assumptions and rates used in our annual goodwill impairment test are reasonable, but inherently uncertain. There were no impairment charges resulting from our goodwill impairment analysis for the year ended December 31, 2018. Our ACS, EMS, curamik® and ECD reporting units had allocated goodwill of approximately $51.7 million, $142.6 million, $68.4 million and $2.2 million respectively, as of December 31, 2018.
Indefinite-lived other intangible assets are tested for impairment annually and between annual impairment tests if events or changes in circumstances indicate the carrying value may be impaired. If it is more likely than not that an indefinite-lived other intangible asset is impaired, then we compare the estimated fair value of that indefinite-lived other intangible asset to its respective carrying value. If an indefinite-lived other intangible asset’s carrying value is greater than its fair value, then an impairment charge is recognized for the excess and charged to operations. The application of the annual indefinite-lived other intangible asset impairment test requires significant judgment, including the determination of fair value of each indefinite-lived other intangible asset. Fair value is primarily based on income approaches using discounted cash flow models, which have significant assumptions. Such assumptions are subject to variability from year to year and are directly impacted by global market conditions. There were no impairment charges resulting from our indefinite-lived other intangible assets impairment analysis for the year ended December 31, 2018. Our curamik® reporting unit had an indefinite-lived other intangible asset of approximately $4.5 million as of December 31, 2018.
Definite-lived other intangible assets are tested for recoverability whenever events or changes in circumstances indicate the carrying value may not be recoverable. The recoverability test involves comparing the estimated sum of the undiscounted cash flows for each definite-lived other intangible asset to its respective carrying value. If a definite-lived other intangible asset’s carrying value is greater than the sum of its undiscounted cash flows, then the definite-lived other intangible asset’s carrying value is compared to its estimated fair value and an impairment charge is recognized for the excess and charged to operations. The application of the recoverability test requires significant judgment, including the identification of the asset group and determination of undiscounted cash flows and fair value of the underlying definite-lived other intangible asset. Determination of undiscounted cash flows requires the use of significant estimates and assumptions, including certain financial projections. Fair value is primarily based on income approaches using discounted cash flow models, which have significant assumptions. Such assumptions are subject to variability from year to year and are directly impacted by global market conditions. There were no impairment charges resulting from our definite-lived other intangible assets impairment analysis for the year ended December 31, 2018. Our ACS, EMS and curamik® reporting units had definite-lived other intangible assets of approximately $7.9 million, $152.2 million and $12.4 million, respectively, as of December 31, 2018.
Product Liabilities
We endeavor to maintain insurance coverage with reasonable deductible levels to protect us from potential exposures to product liability claims. Any liability associated with such claims is based on management’s best estimate of the potential claim value, while insurance receivables associated with related claims are not recorded until verified by the insurance carrier.
For asbestos-related claims, we recognize projected asbestos liabilities and related insurance receivables, with any difference between the liability and related insurance receivable recognized as an expense in the consolidated statements of operations. Our estimates of asbestos-related contingent liabilities and related insurance receivables are based on an independent actuarial analysis and an independent insurance usage analysis prepared annually by third parties. The actuarial analysis contains numerous
31
assumptions, including number of claims that might be received, the type and severity of the disease alleged by each claimant, the long latency period associated with asbestos exposure, dismissal rates, average settlement costs, average defense costs, costs of medical treatment, the financial resources of other companies that are co-defendants in claims, uncertainties surrounding the litigation process from jurisdiction to jurisdiction and from case to case, and the impact of potential changes in legislative or judicial standards, including potential tort reform. Furthermore, any predictions with respect to these assumptions are subject to even greater uncertainty as the projection period lengthens. The insurance usage analysis considers, among other things, applicable deductibles, retentions and policy limits, the solvency and historical payment experience of various insurance carriers, the likelihood of recovery as estimated by external legal counsel and existing insurance settlements.
The liability projection period covers all current and future claims through 2058, which represents the expected end of our asbestos liability exposure with no further ongoing claims expected beyond that date. This conclusion was based on our history and experience with the claims data, the diminished volatility and consistency of observable claims data, the period of time that has elapsed since we stopped manufacturing products that contained encapsulated asbestos and an expected downward trend in claims due to the average age of our claimants, which is approaching the average life expectancy.
There can be no assurance that our accrued asbestos liabilities will approximate our actual asbestos-related settlement and defense costs, or that our accrued insurance recoveries will be realized. We believe that it is reasonably possible that we may incur additional charges for our asbestos liabilities and defense costs in the future, that could exceed existing reserves and insurance recovery. We plan to continue to vigorously defend ourselves and believe we have substantial unutilized insurance coverage to mitigate future costs related to this matter.
We review our asbestos-related projections annually in the fourth quarter of each year unless facts and circumstances materially change during the year, at which time we would analyze these projections. We believe the assumptions made on the potential exposure and expected insurance coverage are reasonable at the present time, but are subject to uncertainty based on the actual future outcome of our asbestos litigation.
As of December 31, 2018, the estimated liability and estimated insurance recovery for all current and future claims projected through 2058 was $70.3 million and $63.8 million, respectively.
Revenue Recognition
Recognition of revenue occurs when a customer obtains control of promised goods or services in an amount that reflects the consideration to which the providing entity expects to be entitled in exchange for those goods or services. We recognize revenue when all of the following criteria are met: (1) we have entered into a binding agreement, (2) the performance obligations have been identified, (3) the transaction price to the customer has been determined, (4) the transaction price has been allocated to the performance obligations in the contract, and (5) the performance obligations have been satisfied. The majority of our shipping terms permit us to recognize revenue at point of shipment. Some shipping terms require the goods to be through customs or be received by the customer before title passes. In those instances, revenue is not recognized until either the customer has received the goods or they have passed through customs, depending on the circumstances. Shipping and handling costs are treated as fulfillment costs. Sales tax or value added tax (VAT) are excluded from the measurement of the transaction price.
The Company manufactures some products to customer specifications which are customized to such a degree that it is unlikely that another entity would purchase these products or that we could modify these products for another customer. These products are deemed to have no alternative use to the Company whereby we have an enforceable right to payment evidenced by contractual termination clauses. In accordance with ASC 606, for those circumstances we recognize revenue on an over-time basis. Revenue recognition does not occur until the product meets the definition of “no alternative use” and therefore, items that have not yet reached that point in the production process are not included in the population of items with over-time revenue recognition.
As appropriate, we record estimated reductions to revenue for customer returns, allowances, and warranty claims. Provisions for such reductions are made at the time of sale and are typically derived from historical trends and other relevant information.
Pension and Other Postretirement Benefits
We provide various defined benefit pension plans for our U.S. employees and sponsor three defined benefit health care plans and a life insurance plan. The costs and obligations associated with these plans are dependent upon various actuarial assumptions used in calculating such amounts. These assumptions include discount rates, long-term rates of return on plan assets, mortality rates, and other factors. The assumptions used were determined as follows: (i) the discount rate used is based on the PruCurve high quality corporate bond index, with comparisons against other similar indices; and (ii) the long-term rate of return on plan assets is determined based on historical portfolio results, market conditions and our expectations of future returns. We determine these assumptions based on consultation with outside actuaries and investment advisors. Any changes in these assumptions could have a significant impact on future recognized pension costs, assets and liabilities.
The rates used to determine our costs and obligations under our pension and postretirement plans are disclosed in “Note 12 – Pension, Other Postretirement Benefits and Employee Savings and Investment Plans” to “Item 8. Financial Statements and Supplementary Data.” Each assumption has different sensitivity characteristics. For the year ended December 31, 2018, a 25 basis
32
point decrease in the discount rate would have increased our pension expense for Rogers Corporation Employees’ Pension Plan (the Union Plan), the Rogers Corporation Defined Benefit Pension Plan (following its merger with the Hourly Employees Pension Plan of Arlon LLC, Microwave Material and Silicone Technologies Divisions, Bear, Delaware (the Merged Plan)), and the Rogers Corporation Amended and Restated Pension Restoration Plan and the Rogers Corporation Amended and Restated Pension Restoration Plan (the Nonqualified Plans) by a de minimis amount. A 25 basis point decrease in the discount rate would have decreased the other post-employment benefits (OPEB) expense by a de minimis amount. A 25 basis point decrease in the expected return on assets would have increased the total 2018 pension expense for the Union Plan and the Merged Plan by approximately $0.4 million. Since the OPEB and Nonqualified Plans are unfunded, those plans would not be impacted by this assumption change.
Equity Compensation
Determining the amount of equity compensation expense to be recorded requires us to develop estimates to be used in calculating the grant-date fair value of performance-based restricted stock units.
Performance-Based Restricted Stock Units
As of December 31, 2018, we had performance-based restricted stock units from 2018, 2017 and 2016 outstanding. These awards generally cliff vest at the end of a three year measurement period. However, employees whose employment terminates during the measurement period due to death, disability, or, in certain cases, retirement may receive a pro-rata payout based on the number of days they were employed during the measurement period. Participants are eligible to be awarded shares ranging from 0% to 200% of the original award amount, based on certain defined performance measures.
The 2018, 2017 and 2016 awards have one measurement criteria: the three year total shareholder return (TSR) on the performance of our capital stock as compared to that of a specified group of peer companies. The TSR measurement criteria of the awards is considered a market condition. As such, the fair value of this measurement criteria was determined on the grant date using a Monte Carlo simulation valuation model. We recognize compensation expense on all of these awards on a straight-line basis over the vesting period with no changes for final projected payout of the awards. We account for forfeitures as they occur.
Below were the assumptions used in the Monte Carlo calculation on the respective grant dates for awards granted in 2018 and 2017:
September 17, 2018 | February 8, 2018 | February 9, 2017 | |||
Expected volatility | 36.6% | 34.8% | 33.6% | ||
Expected term (in years) | 3.0 | 3.0 | 3.0 | ||
Risk-free interest rate | 2.85% | 2.28% | 1.38% | ||
Expected volatility – In determining expected volatility, we have considered a number of factors, including historical volatility.
Expected term – We use the measurement period of the award to determine the expected term assumption for the Monte Carlo simulation valuation model.
Risk-free interest rate – We use an implied “spot rate” yield on U.S. Treasury Constant Maturity rates as of the grant date for our assumption of the risk-free interest rate.
Expected dividend yield – We do not currently pay dividends on our capital stock; therefore, a dividend yield of 0% was used in the Monte Carlo simulation valuation model.
33
Item 7A. Quantitative and Qualitative Disclosures About Market Risk
Market Risk
• | Foreign Currency Risk |
Our financial results are affected by changes in foreign exchange rates and economic conditions in foreign countries in which we operate. Our primary overseas markets are in Europe and Asia, thus exposing us to exchange rate risk from fluctuations in the Euro and the various currencies used in Asia. Exposure to variability in currency exchange rates is mitigated, when possible, through the use of natural hedges, whereby purchases and sales in the same foreign currency and with similar maturity dates offset one another. We further mitigate this exposure through hedging activities by entering into foreign exchange forward contracts with third parties when the use of natural hedges is not possible or desirable. We currently do not use derivative instruments for trading or speculative purposes. We monitor foreign exchange risks and at times manage such risks on specific transactions. Our risk management process primarily uses analytical techniques and sensitivity analysis. In 2018, a 10% strengthening of the U.S dollar relative to other currencies would have resulted in a decrease to net sales and net income of approximately $37 million and $5 million, respectively, while a 10% weakening of the U.S. dollar relative to other currencies would have resulted in an increase to net sales and net income of approximately $45 million and $6 million, respectively.
• | Interest Rate Risk |
As of December 31, 2018, we had $228.5 million in borrowings outstanding under our revolving credit facility. The interest charged on these borrowings fluctuates with movements in the benchmark LIBOR. As of December 31, 2018, the effective all-in rate of interest on our revolving credit facility was 3.77%, net of the impact of our interest rate swap, and a 100 basis point increase in LIBOR would have increased the amount of interest expense by approximately $1.8 million for the year ended December 31, 2018.
• | Commodity Risk |
We are subject to fluctuations in the cost of raw materials used to manufacture our materials and products. In particular, we are exposed to market fluctuations in commodity pricing as we utilize certain materials, such as copper and ceramic, that are key materials in certain of our products. In order to minimize the risk of market driven price changes in these commodities, we utilize hedging strategies to insulate us against price fluctuations of copper, the most frequently used commodity in our manufacturing processes. We currently do not use hedging strategies to minimize the risk of price fluctuations on other commodity-based raw materials; however, we regularly review such strategies to hedge market risk on an ongoing basis.
For additional discussion, refer to “Note 2 – Fair Value Measurements” and “Note 3 – Hedging Transactions and Derivative Financial Instruments” to “Item 8. Financial Statements and Supplementary Data.”
34
Item 8. Financial Statements and Supplementary Data
REPORT OF INDEPENDENT REGISTERED PUBLIC ACCOUNTING FIRM
To the Board of Directors and Shareholders of Rogers Corporation
Opinions on the Financial Statements and Internal Control over Financial Reporting
We have audited the accompanying consolidated statements of financial position of Rogers Corporation and its subsidiaries (the “Company”) as of December 31, 2018 and 2017, and the related consolidated statements of operations, comprehensive income, shareholders’ equity and cash flows for each of the three years in the period ended December 31, 2018, including the related notes and financial statement schedule listed in the index appearing under Item 15(2) (collectively referred to as the “consolidated financial statements”). We also have audited the Company’s internal control over financial reporting as of December 31, 2018, based on criteria established in Internal Control - Integrated Framework (2013) issued by the Committee of Sponsoring Organizations of the Treadway Commission (COSO).
In our opinion, the consolidated financial statements referred to above present fairly, in all material respects, the financial position of the Company as of December 31, 2018 and 2017, and the results of its operations and its cash flows for each of the three years in the period ended December 31, 2018 in conformity with accounting principles generally accepted in the United States of America. Also in our opinion, the Company maintained, in all material respects, effective internal control over financial reporting as of December 31, 2018, based on criteria established in Internal Control - Integrated Framework (2013) issued by the COSO.
Change in Accounting Principle
As discussed in Note 16 to the consolidated financial statements, the Company changed the manner in which it accounts for revenues from contracts with customers in 2018.
Basis for Opinions
The Company’s management is responsible for these consolidated financial statements, for maintaining effective internal control over financial reporting, and for its assessment of the effectiveness of internal control over financial reporting, included in Management’s Report on Internal Control over Financial Reporting appearing under Item 9A. Our responsibility is to express opinions on the Company’s consolidated financial statements and on the Company’s internal control over financial reporting based on our audits. We are a public accounting firm registered with the Public Company Accounting Oversight Board (United States) (PCAOB) and are required to be independent with respect to the Company in accordance with the U.S. federal securities laws and the applicable rules and regulations of the Securities and Exchange Commission and the PCAOB.
We conducted our audits in accordance with the standards of the PCAOB. Those standards require that we plan and perform the audits to obtain reasonable assurance about whether the consolidated financial statements are free of material misstatement, whether due to error or fraud, and whether effective internal control over financial reporting was maintained in all material respects.
Our audits of the consolidated financial statements included performing procedures to assess the risks of material misstatement of the consolidated financial statements, whether due to error or fraud, and performing procedures that respond to those risks. Such procedures included examining, on a test basis, evidence regarding the amounts and disclosures in the consolidated financial statements. Our audits also included evaluating the accounting principles used and significant estimates made by management, as well as evaluating the overall presentation of the consolidated financial statements. Our audit of internal control over financial reporting included obtaining an understanding of internal control over financial reporting, assessing the risk that a material weakness exists, and testing and evaluating the design and operating effectiveness of internal control based on the assessed risk. Our audits also included performing such other procedures as we considered necessary in the circumstances. We believe that our audits provide a reasonable basis for our opinions.
As described in Management’s Report on Internal Control over Financial Reporting, management has excluded Griswold LLC (Griswold) from its assessment of internal control over financial reporting as of December 31, 2018, because it was acquired by the Company in a purchase business combination during 2018. We have also excluded Griswold from our audit of internal control over financial reporting. Griswold is a wholly-owned subsidiary whose total assets and total revenues excluded from management’s assessment and our audit of internal control over financial reporting represent 1.3% and 1.6%, respectively, of the related consolidated financial statement amounts as of and for the year ended December 31, 2018.
35
Definition and Limitations of Internal Control over Financial Reporting
A company’s internal control over financial reporting is a process designed to provide reasonable assurance regarding the reliability of financial reporting and the preparation of financial statements for external purposes in accordance with generally accepted accounting principles. A company’s internal control over financial reporting includes those policies and procedures that (i) pertain to the maintenance of records that, in reasonable detail, accurately and fairly reflect the transactions and dispositions of the assets of the company; (ii) provide reasonable assurance that transactions are recorded as necessary to permit preparation of financial statements in accordance with generally accepted accounting principles, and that receipts and expenditures of the company are being made only in accordance with authorizations of management and directors of the company; and (iii) provide reasonable assurance regarding prevention or timely detection of unauthorized acquisition, use, or disposition of the company’s assets that could have a material effect on the financial statements.
Because of its inherent limitations, internal control over financial reporting may not prevent or detect misstatements. Also, projections of any evaluation of effectiveness to future periods are subject to the risk that controls may become inadequate because of changes in conditions, or that the degree of compliance with the policies or procedures may deteriorate.
/s/ PricewaterhouseCoopers LLP |
Hartford, Connecticut |
February 20, 2019 |
We have served as the Company’s auditor since 2015. |
36
ROGERS CORPORATION
CONSOLIDATED STATEMENTS OF OPERATIONS
For each of the fiscal years in the three-year period ended December 31, 2018
(Dollars and shares in thousands, except per share amounts) | 2018 | 2017 | 2016 | ||||||||
Net sales | $ | 879,091 | $ | 821,043 | $ | 656,314 | |||||
Cost of sales | 568,308 | 502,468 | 406,829 | ||||||||
Gross margin | 310,783 | 318,575 | 249,485 | ||||||||
Selling, general and administrative expenses | 164,046 | 161,651 | 139,272 | ||||||||
Research and development expenses | 33,075 | 29,547 | 28,582 | ||||||||
Restructuring and impairment charges | 4,038 | 3,567 | 734 | ||||||||
Other operating (income) expense, net | (3,087 | ) | (5,329 | ) | — | ||||||
Operating income | 112,711 | 129,139 | 80,897 | ||||||||
Equity income in unconsolidated joint ventures | 5,501 | 4,898 | 4,146 | ||||||||
Other income (expense), net | (994 | ) | 5,019 | 1,167 | |||||||
Interest expense, net | (6,629 | ) | (6,131 | ) | (3,930 | ) | |||||
Income before income tax expense | 110,589 | 132,925 | 82,280 | ||||||||
Income tax expense | 22,938 | 52,466 | 33,997 | ||||||||
Net income | $ | 87,651 | $ | 80,459 | $ | 48,283 | |||||
Basic earnings per share | $ | 4.77 | $ | 4.43 | $ | 2.68 | |||||
Diluted earnings per share | $ | 4.70 | $ | 4.34 | $ | 2.65 | |||||
Shares used in computing: | |||||||||||
Basic earnings per share | 18,374 | 18,154 | 17,991 | ||||||||
Diluted earnings per share | 18,659 | 18,547 | 18,223 | ||||||||
The accompanying notes are an integral part of the consolidated financial statements.
37
ROGERS CORPORATION
CONSOLIDATED STATEMENTS OF COMPREHENSIVE INCOME
For each of the fiscal years in the three-year period ended December 31, 2018
(Dollars in thousands) | 2018 | 2017 | 2016 | ||||||||
Net income | $ | 87,651 | $ | 80,459 | $ | 48,283 | |||||
Foreign currency translation adjustment | (12,505 | ) | 28,463 | (5,081 | ) | ||||||
Derivative instrument designated as cash flow hedge: | |||||||||||
Change in unrealized gain (loss) before reclassifications, net of tax (Note 4) | 519 | (6 | ) | — | |||||||
Unrealized (gain) loss reclassified into earnings, net of tax (Note 4) | (191 | ) | 32 | 11 | |||||||
Pension and other postretirement benefits: | |||||||||||
Actuarial net gain (loss) incurred, net of tax (Note 4) | (1,678 | ) | (1,481 | ) | 1,106 | ||||||
Amortization of gain, net of tax (Note 4) | 176 | 99 | 160 | ||||||||
Other comprehensive income (loss) | (13,679 | ) | 27,107 | (3,804 | ) | ||||||
Comprehensive income | $ | 73,972 | $ | 107,566 | $ | 44,479 | |||||
The accompanying notes are an integral part of the consolidated financial statements.
38
ROGERS CORPORATION
CONSOLIDATED STATEMENTS OF FINANCIAL POSITION
(Dollars and share amounts in thousands, except par value of capital stock) | As of December 31, | ||||||
2018 | 2017 | ||||||
Assets | |||||||
Current assets | |||||||
Cash and cash equivalents | $ | 167,738 | $ | 181,159 | |||
Accounts receivable, less allowance for doubtful accounts of $1,354 and $1,525 | 144,623 | 140,562 | |||||
Contract assets | 22,728 | — | |||||
Inventories | 132,637 | 112,557 | |||||
Prepaid income taxes | 3,093 | 3,087 | |||||
Asbestos-related insurance receivables, current portion | 4,138 | 5,682 | |||||
Assets held for sale | — | 896 | |||||
Other current assets | 10,829 | 10,580 | |||||
Total current assets | 485,786 | 454,523 | |||||
Property, plant and equipment, net of accumulated depreciation of $317,414 and $289,909 | 242,759 | 179,611 | |||||
Investments in unconsolidated joint ventures | 18,667 | 18,324 | |||||
Deferred income taxes | 8,236 | 6,008 | |||||
Goodwill | 264,885 | 237,107 | |||||
Other intangible assets, net of amortization | 177,008 | 160,278 | |||||
Asbestos-related insurance receivables, non-current portion | 59,685 | 63,511 | |||||
Other long-term assets | 22,318 | 5,772 | |||||
Total assets | $ | 1,279,344 | $ | 1,125,134 | |||
Liabilities and Shareholders’ Equity | |||||||
Current liabilities | |||||||
Accounts payable | $ | 40,321 | $ | 36,116 | |||
Accrued employee benefits and compensation | 30,491 | 39,394 | |||||
Accrued income taxes payable | 7,032 | 6,408 | |||||
Capital lease obligations, current portion | 420 | 579 | |||||
Asbestos-related liabilities, current portion | 5,547 | 5,682 | |||||
Other accrued liabilities | 23,369 | 25,629 | |||||
Total current liabilities | 107,180 | 113,808 | |||||
Borrowings under revolving credit facility | 228,482 | 130,982 | |||||
Capital lease obligations, non-current portion | 4,629 | 5,873 | |||||
Pension liability | 270 | 8,720 | |||||
Retiree health care and life insurance benefits | 1,469 | 1,685 | |||||
Asbestos-related liabilities, non-current portion | 64,799 | 70,500 | |||||
Non-current income tax | 8,418 | 12,823 | |||||
Deferred income taxes | 10,806 | 10,706 | |||||
Other long-term liabilities | 4,967 | 3,464 | |||||
Commitments and contingencies (Note 13) | |||||||
Shareholders’ equity | |||||||
Capital stock - $1 par value; 50,000 authorized shares; 18,395 and 18,255 shares issued and outstanding | 18,395 | 18,255 | |||||
Additional paid-in capital | 132,360 | 128,933 | |||||
Retained earnings | 776,403 | 684,540 | |||||
Accumulated other comprehensive loss | (78,834 | ) | (65,155 | ) | |||
Total shareholders' equity | 848,324 | 766,573 | |||||
Total liabilities and shareholders' equity | $ | 1,279,344 | $ | 1,125,134 | |||
The accompanying notes are an integral part of the consolidated financial statements.
39
ROGERS CORPORATION
CONSOLIDATED STATEMENTS OF SHAREHOLDERS’ EQUITY
For each of the fiscal years in the three-year period ended December 31, 2018
(Dollars in thousands) | Capital Stock | Additional Paid-In Capital | Retained Earnings | Accumulated Other Comprehensive Loss | Total Shareholders’ Equity | ||||||||||||||
Balance as of December 31, 2015 | $ | 17,957 | $ | 112,017 | $ | 543,066 | $ | (88,458 | ) | $ | 584,582 | ||||||||
Net income | — | — | 48,283 | — | 48,283 | ||||||||||||||
Other comprehensive income (loss) | — | — | — | (3,804 | ) | (3,804 | ) | ||||||||||||
Shares issued for vested restricted stock units, net of cancellations for tax withholding | 63 | (1,440 | ) | — | — | (1,377 | ) | ||||||||||||
Stock options exercised | 95 | 4,048 | — | — | 4,143 | ||||||||||||||
Shares issued for employee stock purchase plan | 23 | 835 | — | — | 858 | ||||||||||||||
Shares issued to directors | 24 | (24 | ) | — | — | — | |||||||||||||
Equity compensation expense | — | 11,275 | — | — | 11,275 | ||||||||||||||
Tax adjustments on share-based compensation | — | (179 | ) | — | — | (179 | ) | ||||||||||||
Shares repurchased | (141 | ) | (7,854 | ) | — | — | (7,995 | ) | |||||||||||
Balance as of December 31, 2016 | 18,021 | 118,678 | 591,349 | (92,262 | ) | 635,786 | |||||||||||||
Net income | — | — | 80,459 | — | 80,459 | ||||||||||||||
Other comprehensive income (loss) | — | — | — | 27,107 | 27,107 | ||||||||||||||
Shares issued for vested restricted stock units, net of cancellations for tax withholding | 121 | (5,430 | ) | — | — | (5,309 | ) | ||||||||||||
Stock options exercised | 83 | 3,002 | — | 3,085 | |||||||||||||||
Shares issued for employee stock purchase plan | 15 | 880 | — | 895 | |||||||||||||||
Shares issued to directors | 15 | (15 | ) | — | — | ||||||||||||||
Equity compensation expense | — | 11,818 | — | 11,818 | |||||||||||||||
Cumulative-effect adjustment of change in accounting for share-based compensation | — | — | 12,732 | — | 12,732 | ||||||||||||||
Shares repurchased | — | — | — | — | — | ||||||||||||||
Balance as of December 31, 2017 | 18,255 | 128,933 | 684,540 | (65,155 | ) | 766,573 | |||||||||||||
Net income | — | — | 87,651 | — | 87,651 | ||||||||||||||
Other comprehensive income (loss) | — | — | — | (13,679 | ) | (13,679 | ) | ||||||||||||
Shares issued for vested restricted stock units, net of cancellations for tax withholding | 117 | (6,717 | ) | — | — | (6,600 | ) | ||||||||||||
Stock options exercised | 22 | 839 | — | — | 861 | ||||||||||||||
Shares issued for employee stock purchase plan | 12 | 1,070 | — | — | 1,082 | ||||||||||||||
Shares issued to directors | 12 | (12 | ) | — | — | — | |||||||||||||
Equity compensation expense | — | 11,223 | — | — | 11,223 | ||||||||||||||
Cumulative-effect adjustment of revenue recognition | — | — | 4,212 | — | 4,212 | ||||||||||||||
Shares repurchased | (23 | ) | (2,976 | ) | — | — | (2,999 | ) | |||||||||||
Balance as of December 31, 2018 | $ | 18,395 | $ | 132,360 | $ | 776,403 | $ | (78,834 | ) | $ | 848,324 | ||||||||
The accompanying notes are an integral part of the consolidated financial statements.
40
ROGERS CORPORATION
CONSOLIDATED STATEMENTS OF CASH FLOWS
For each of the fiscal years in the three-year period ended December 31, 2018
(Dollars in thousands) | 2018 | 2017 | 2016 | ||||||||
Operating Activities: | |||||||||||
Net income | $ | 87,651 | $ | 80,459 | $ | 48,283 | |||||
Adjustments to reconcile net income to cash provided by operating activities: | |||||||||||
Depreciation and amortization | 50,073 | 44,099 | 37,847 | ||||||||
Equity compensation expense | 11,223 | 11,818 | 11,275 | ||||||||
Deferred income taxes | (3,325 | ) | 17,513 | 7,382 | |||||||
Equity in undistributed income of unconsolidated joint ventures | (5,501 | ) | (4,898 | ) | (4,146 | ) | |||||
Dividends received from unconsolidated joint ventures | 4,431 | 3,529 | 2,757 | ||||||||
Pension and other postretirement benefits | (1,552 | ) | (1,561 | ) | (2,822 | ) | |||||
Asbestos-related charges | 704 | 3,400 | 313 | ||||||||
(Gain) loss on sale or disposal of property, plant and equipment | (164 | ) | (5,154 | ) | 225 | ||||||
Impairment charges | 1,506 | 807 | — | ||||||||
Provision (benefit) for doubtful accounts | 236 | (439 | ) | 1,321 | |||||||
Proceeds from insurance related to operations | — | 932 | — | ||||||||
Changes in assets and liabilities: | |||||||||||
Accounts receivable | (3,824 | ) | (14,059 | ) | (13,005 | ) | |||||
Contract assets | (22,728 | ) | — | — | |||||||
Inventories | (19,013 | ) | (14,208 | ) | 9,689 | ||||||
Pension and postretirement benefit contributions | (25,354 | ) | (906 | ) | (842 | ) | |||||
Other current assets | (648 | ) | (576 | ) | 1,933 | ||||||
Accounts payable and other accrued expenses | (7,886 | ) | 12,341 | 21,472 | |||||||
Other, net | 991 | 5,885 | (4,715 | ) | |||||||
Net cash provided by operating activities | 66,820 | 138,982 | 116,967 | ||||||||
Investing Activities: | |||||||||||
Acquisition of business, net of cash received | (77,969 | ) | (60,191 | ) | (133,943 | ) | |||||
Isola asset acquisition | (43,434 | ) | — | — | |||||||
Capital expenditures | (47,115 | ) | (27,215 | ) | (18,136 | ) | |||||
Proceeds from the sale of property, plant and equipment, net | 1,081 | 8,095 | — | ||||||||
Proceeds from insurance claims | — | 1,041 | 275 | ||||||||
Net cash used in investing activities | (167,437 | ) | (78,270 | ) | (151,804 | ) | |||||
Financing Activities: | |||||||||||
Proceeds from borrowings under revolving credit facility | 102,500 | — | 166,000 | ||||||||
Line of credit issuance costs | — | (1,169 | ) | — | |||||||
Repayment of debt principal and capital lease obligations | (6,162 | ) | (110,689 | ) | (103,760 | ) | |||||
Payments of taxes related to net share settlement of equity awards | (6,600 | ) | (5,309 | ) | (1,377 | ) | |||||
Proceeds from the exercise of stock options, net | 861 | 895 | 858 | ||||||||
Proceeds from issuance of shares to employee stock purchase plan | 1,082 | 3,085 | 4,143 | ||||||||
Share repurchases | (2,999 | ) | — | (7,995 | ) | ||||||
Net cash provided by (used in) financing activities | 88,682 | (113,187 | ) | 57,869 | |||||||
Effect of exchange rate fluctuations on cash | (1,486 | ) | 5,867 | 149 | |||||||
Net increase (decrease) in cash and cash equivalents | (13,421 | ) | (46,608 | ) | 23,181 | ||||||
Cash and cash equivalents at beginning of period | 181,159 | 227,767 | 204,586 | ||||||||
Cash and cash equivalents at end of period | $ | 167,738 | $ | 181,159 | $ | 227,767 | |||||
Supplemental Disclosures: | |||||||||||
Accrued capital additions | $ | 2,744 | $ | 2,376 | $ | 1,081 | |||||
Assets obtained under leasing arrangements | $ | — | $ | 883 | $ | — | |||||
Cash paid during the year for: | |||||||||||
Interest, net of amounts capitalized | $ | 7,040 | $ | 5,787 | $ | 3,924 | |||||
Income taxes | $ | 29,161 | $ | 36,918 | $ | 23,952 | |||||
The accompanying notes are an integral part of the consolidated financial statements.
41
ROGERS CORPORATION
NOTES TO CONSOLIDATED FINANCIAL STATEMENTS
Note 1 – Basis of Presentation, Organization and Summary of Significant Accounting Policies
As used herein, the terms “Company,” “Rogers,” “we,” “us,” “our” and similar terms mean Rogers Corporation and its subsidiaries, unless the context indicates otherwise.
Principles of Consolidation
The consolidated financial statements include the accounts of the Company and our wholly-owned subsidiaries, after elimination of inter-company accounts and transactions. The preparation of financial statements, in conformity with accounting principles generally accepted in the United States (U.S. GAAP), requires management to make estimates and assumptions that affect the amounts reported in the financial statements and accompanying notes. Actual results could differ from those estimates.
Reclassification
On January 1, 2018, the Company adopted ASU 2017-07, Compensation - Retirement Benefits (Topic 715): Improving the Presentation of Net Periodic Pension Cost and Net Periodic Post-Retirement Benefit Cost. Upon adoption, the Company reclassified $1.6 million and $3.0 million in net periodic pension benefits from “Selling, general and administrative expenses” to “Other income (expense), net” for the years ended December 31, 2017 and 2016, respectively. Refer to “Note 19 – Recent Accounting Standards” for further information.
Organization
Our reporting structure is comprised of three strategic operating segments: Advanced Connectivity Solutions (ACS), Elastomeric Material Solutions (EMS) and Power Electronics Solutions (PES). The remaining operations are accumulated and reported as our Other operating segment.
Advanced Connectivity Solutions
Our ACS operating segment designs, develops, manufactures and sells circuit materials and solutions enabling high-performance and high-reliability connectivity for applications in wireless infrastructure (e.g., power amplifiers, antennas, small cells and distributed antenna systems), automotive (e.g., active safety, advanced driver assistance systems, telematics and thermal management), aerospace and defense, connected devices (e.g., mobile internet devices and Internet of Things), wired infrastructure (e.g., computing and IP infrastructure) and consumer electronics. We believe these products have characteristics that offer performance and other functional advantages in many market applications that serve to differentiate our products from other commonly available materials. These products are sold principally to independent and captive printed circuit board fabricators that convert our laminates to custom printed circuits. Trade names for our ACS products include: RO3000®, RO4000®, RT/duroid®, TMM®, AD SeriesTM and CLTE SeriesTM. As of December 31, 2018, our ACS operating segment had manufacturing and administrative facilities in Chandler, Arizona; Rogers, Connecticut; Bear, Delaware; Evergem, Belgium; and Suzhou, China.
Elastomeric Material Solutions
Our EMS operating segment designs, develops, manufactures and sells engineered material solutions for a wide variety of applications and end markets. These include polyurethane and silicone materials used in critical cushioning, sealing and vibration management applications for portable electronics (e.g., smart phones), automotive, aerospace, rail, footwear and printing end markets; customized silicones used in flex heater and semiconductor thermal applications; polytetrafluoroethylene and ultra-high molecular weight polyethylene materials used in wire and cable, pressure-sensitive tapes and automotive applications. We believe these materials have characteristics that offer functional advantages in many market applications which serve to differentiate Rogers’ products from other commonly available materials. EMS products are sold globally to converters, fabricators, distributors and original equipment manufacturers (OEMs). Trade names for our EMS products include: PORON®, BISCO®, DeWAL®, ARLON®, DSP®, Griswold®, eSORBA®, XRD®, HeatSORB™ and R/bak®.
In July 2018, we acquired Griswold LLC (Griswold), a manufacturer of a wide range of high-performance engineered cellular elastomer and microcellular polyurethane products and solutions. In January 2017, we acquired the principal operating assets of Diversified Silicone Products, Inc. (DSP), a custom silicone product development and manufacturing business, serving a wide range of high reliability applications, and in November 2016, we acquired DeWAL Industries LLC (DeWAL), a manufacturer of polytetrafluoroethylene and ultra-high molecular weight polyethylene films, pressure sensitive tapes and specialty products for the industrial, aerospace, automotive, and electronics markets. The acquisitions of Griswold, DSP and DeWAL, and their subsequent integration into our EMS operating segment, have enabled us to increase scale and complement our existing product offerings, thus enhancing our ability to support our customers.
As of December 31, 2018, our EMS operating segment had administrative and manufacturing facilities in Moosup, Connecticut; Rogers, Connecticut; Woodstock, Connecticut; Bear, Delaware; Carol Stream, Illinois; Narragansett, Rhode Island; Santa Fe
42
Springs, California; Ansan, South Korea; and Suzhou, China. We also own 50% of: (1) Rogers Inoac Corporation (RIC), a joint venture established in Japan to design, develop, manufacture and sell PORON products predominantly for the Japanese market and (2) Rogers INOAC Suzhou Corporation (RIS), a joint venture established in China to design, develop, manufacture and sell PORON products primarily for RIC customers in various Asian countries. INOAC Corporation owns the remaining 50% of both RIC and RIS. RIC has manufacturing facilities at the INOAC facilities in Nagoya and Mie, Japan, and RIS has manufacturing facilities at Rogers’ facilities in Suzhou, China.
Power Electronics Solutions
Our PES operating segment designs, develops, manufactures and sells ceramic substrate materials for power module applications (e.g., variable frequency drives, vehicle electrification and renewable energy), laminated busbars for power inverter and high power interconnect applications (e.g., mass transit, hybrid-electric and electric vehicles, renewable energy and variable frequency drives) and micro-channel coolers (e.g., laser cutting equipment). We sell our ceramic substrate materials and micro channel coolers under the curamik® trade name, and our busbars under the ROLINX® trade name. As of December 31, 2018, our PES operating segment had manufacturing and administrative facilities in Evergem, Belgium; Eschenbach, Germany; Budapest, Hungary; and Suzhou, China.
Other
Our Other operating segment consists of elastomer components for applications in ground transportation, office equipment, consumer and other markets; elastomer floats for level sensing in fuel tanks, motors, and storage tanks; and inverters for portable communications and automotive markets. Trade names for our elastomer components include: NITROPHYL® floats for level sensing in fuel tanks, motors, and storage tanks and ENDUR® elastomer rollers.
Summary of Significant Accounting Policies
Cash Equivalents
Highly liquid investments with original maturities of three months or less are considered cash equivalents. These investments are stated at cost, which approximates fair value.
Investments in Unconsolidated Joint Ventures
We account for our investments in and advances to unconsolidated joint ventures, both of which are 50% owned, using the equity method of accounting.
Foreign Currency
All balance sheet accounts of foreign subsidiaries are translated or remeasured at exchange rates in effect at each year end, and income statement items are translated using the average exchange rates for the year. Translation adjustments for those entities that operate under a local currency are recorded directly to a separate component of shareholders’ equity, while remeasurement adjustments for those entities that operate under the parent’s functional currency are recorded to the income statement as a component of “Other income (expense), net.” Currency transaction gains and losses are reported as income or expense, respectively, in the consolidated statements of operations as a component of “Other income (expense), net.” Such adjustments resulted in losses of $0.7 million in 2018, gains of $0.9 million in 2017 and losses of $2.7 million in 2016.
Allowance for Doubtful Accounts
The allowance for doubtful accounts is determined based on a variety of factors that affect the potential collectability of the related receivables, including the length of time receivables are past due, customer credit ratings, financial stability of customers, specific one-time events and past customer history. In addition, in circumstances where we are made aware of a specific customer’s inability to meet its financial obligations, a specific allowance is established. The majority of accounts are individually evaluated on a regular basis and appropriate reserves are established as deemed appropriate based on the criteria previously mentioned. The remainder of the reserve is based on our estimates and takes into consideration historical trends, market conditions and the composition of our customer base.
Inventories
Inventories are stated at the lower of cost or net realizable value. The cost of inventories is determined using the first in, first out (FIFO) method. An allowance is made for estimated losses due to obsolescence. The allowance is determined for groups of products based on purchases in the recent past and/or expected future demand and market conditions. Abnormal amounts of idle facility expense and waste are not capitalized in inventory. The allocation of fixed production overheads to the inventory cost is based on the normal capacity of the production facilities.
43
Inventories consisted of the following:
As of December 31, | |||||||
(Dollars in thousands) | 2018 | 2017 | |||||
Raw materials | $ | 59,321 | $ | 43,092 | |||
Work-in-process | 30,086 | 28,133 | |||||
Finished goods | 43,230 | 41,332 | |||||
Total inventories | $ | 132,637 | $ | 112,557 | |||
Property, Plant and Equipment
Property, plant and equipment are stated on the basis of cost. For financial reporting purposes, provisions for depreciation are calculated on a straight-line basis over the following estimated useful lives of the underlying assets:
Property, Plant and Equipment Classification | Estimated Useful Lives |
Buildings and improvements | 30-40 years |
Machinery and equipment | 5-15 years |
Office equipment | 3-10 years |
Software Costs
We capitalize certain computer software and software development costs incurred in connection with developing or obtaining computer software for internal use when both the preliminary project stage is completed and it is probable that the software will be used as intended. Capitalized software costs include only (i) external direct costs of materials and services utilized in developing or obtaining computer software, and (ii) compensation and related benefits for employees who are directly associated with the software project. Capitalized software costs are amortized on a straight-line basis when placed into service over the estimated useful lives of the software, which approximates three to five years. Net capitalized software and development costs were $1.7 million and $4.7 million for the years ended December 31, 2018 and 2017, respectively. Capitalized software is included within “Property, plant and equipment, net of accumulated depreciation” in the consolidated statements of financial position.
Goodwill and Other Intangible Assets
We have made acquisitions over the years that included the recognition of intangible assets. Intangible assets are classified into three categories: (1) goodwill; (2) other intangible assets with definite lives subject to amortization; and (3) other intangible assets with indefinite lives not subject to amortization. Other intangible assets can include items such as trademarks and trade names, licensed technology, customer relationships and covenants not to compete, among other things. Each definite-lived other intangible asset is amortized over its respective economic useful life using the economic attribution method.
Goodwill is tested for impairment annually and between annual impairment tests if events or changes in circumstances indicate the carrying value may be impaired. If it is more likely than not that our goodwill is impaired, then we compare the estimated fair value of each of our reporting units to their respective carrying value. If a reporting unit’s carrying value is greater than its fair value, then an impairment is recognized for the excess and charged to operations. We currently have four reporting units with goodwill: ACS, EMS, curamik® and Elastomer Components Division (ECD). Consistent with historical practice, the annual impairment test on these reporting units was performed as of November 30, 2018.
The application of the annual goodwill impairment test requires significant judgment, including the identification of reporting units, assignment of assets and liabilities to reporting units and determination of the fair value of each reporting unit. Determining the fair value is subjective and requires the use of significant estimates and assumptions, including financial projections for net sales, gross margin and operating margin, discount rates, terminal year growth rates and future market conditions, among others. We estimated the fair value of our reporting units using an income approach based on the present value of future cash flows through a five year discounted cash flow analysis. The discounted cash flow analysis utilized the discount rates for each of the reporting units ranging from 11.25% for EMS to 12.90% for ECD, and terminal year growth rates ranging from 4.9% for curamik® to 5.9% for ACS. We believe this approach yields the most appropriate evidence of fair value as our reporting units are not easily compared to other corporations involved in similar businesses. We further believe that the assumptions and rates used in our annual goodwill impairment test are reasonable, but inherently uncertain. There were no impairment charges resulting from our goodwill impairment analysis for the year ended December 31, 2018. Our ACS, EMS, curamik® and ECD reporting units had allocated goodwill of approximately $51.7 million, $142.6 million, $68.4 million and $2.2 million respectively, as of December 31, 2018.
Indefinite-lived other intangible assets are tested for impairment annually and between annual impairment tests if events or changes in circumstances indicate the carrying value may be impaired. If it is more likely than not that an indefinite-lived other intangible
44
asset is impaired, then we compare the estimated fair value of that indefinite-lived other intangible asset to its respective carrying value. If an indefinite-lived other intangible asset’s carrying value is greater than its fair value, then an impairment charge is recognized for the excess and charged to operations. Consistent with historical practice, the annual impairment test on these reporting units was performed as of November 30, 2018. The application of the annual indefinite-lived other intangible asset impairment test requires significant judgment, including the determination of fair value of each indefinite-lived other intangible asset. Fair value is primarily based on income approaches using discounted cash flow models, which have significant assumptions. Such assumptions are subject to variability from year to year and are directly impacted by global market conditions. There were no impairment charges resulting from our indefinite-lived other intangible assets impairment analysis for the year ended December 31, 2018. The curamik® reporting unit had an indefinite-lived other intangible asset of approximately $4.5 million as of December 31, 2018.
Definite-lived other intangible assets are tested for recoverability whenever events or changes in circumstances indicate the carrying value may not be recoverable. The recoverability test involves comparing the estimated sum of the undiscounted cash flows for each definite-lived other intangible asset to its respective carrying value. If a definite-lived other intangible asset’s carrying value is greater than the sum of its undiscounted cash flows, then the definite-lived other intangible asset’s carrying value is compared to its estimated fair value and an impairment charge is recognized for the excess and charged to operations. The application of the recoverability test requires significant judgment, including the identification of the asset group and determination of undiscounted cash flows and fair value of the underlying definite-lived other intangible asset. Determination of undiscounted cash flows requires the use of significant estimates and assumptions, including certain financial projections. Fair value is primarily based on income approaches using discounted cash flow models, which have significant assumptions. Such assumptions are subject to variability from year to year and are directly impacted by global market conditions. There were no impairment charges resulting from our definite-lived other intangible assets impairment analysis for the year ended December 31, 2018. Our ACS, EMS and curamik® reporting units had definite-lived other intangible assets of approximately $7.9 million, $152.2 million and $12.4 million, respectively, as of December 31, 2018.
Environmental and Product Liabilities
We accrue for our environmental investigation, remediation, operating and maintenance costs when it is probable that a liability has been incurred and the amount can be reasonably estimated. For environmental matters, the most likely cost to be incurred is accrued based on an evaluation of currently available facts with respect to each individual site, including existing technology, current laws and regulations and prior remediation experience. For sites with multiple potential responsible parties (PRPs), we consider our likely proportionate share of the anticipated remediation costs and the ability of the other parties to fulfill their obligations in establishing a provision for those costs. When no amount within a range of estimates is more likely to occur than another, we accrue to the low end of the range and disclose the range. When future liabilities are determined to be reimbursable by insurance coverage, an accrual is recorded for the potential liability and a receivable is recorded for the estimated insurance reimbursement amount. We are exposed to the uncertain nature inherent in such remediation and the possibility that initial estimates will not reflect the final outcome of a matter.
We review our asbestos-related projections annually in the fourth quarter of each year unless facts and circumstances materially change during the year, at which time we would analyze these projections. We believe the assumptions made on the potential exposure and expected insurance coverage are reasonable at the present time, but are subject to uncertainty based on the actual future outcome of our asbestos litigation. Our estimates of asbestos-related contingent liabilities and related insurance receivables are based on an independent actuarial analysis and an independent insurance usage analysis prepared annually by third parties. The actuarial analysis contains numerous assumptions, including number of claims that might be received, the type and severity of the disease alleged by each claimant, the long latency period associated with asbestos exposure, dismissal rates, average settlement costs, average defense costs, costs of medical treatment, the financial resources of other companies that are co-defendants in claims, uncertainties surrounding the litigation process from jurisdiction to jurisdiction and from case to case, and the impact of potential changes in legislative or judicial standards, including potential tort reform. Furthermore, any predictions with respect to these assumptions are subject to even greater uncertainty as the projection period lengthens. The insurance usage analysis considers, among other things, applicable deductibles, retentions and policy limits, the solvency and historical payment experience of various insurance carriers, the likelihood of recovery as estimated by external legal counsel and existing insurance settlements.
We believe the assumptions used in our models for determining our potential exposure and related insurance coverage are reasonable at the present time, but such assumptions are inherently uncertain. Given the inherent uncertainty in making projections, we plan to re-examine periodically the assumptions used in the projections of current and future asbestos claims, and we will update them if needed based on our experience, changes in the assumptions underlying our models, and other relevant factors, such as changes in the tort system. There can be no assurance that our accrued asbestos liabilities will approximate our actual asbestos-related settlement and defense costs, or that our accrued insurance recoveries will be realized. We believe that it is reasonably possible that we may incur additional charges for our asbestos liabilities and defense costs in the future, that could exceed existing reserves and insurance recovery. We plan to continue to vigorously defend ourselves and believe we have unutilized insurance coverage to mitigate future costs related to this matter.
45
Fair Value of Financial Instruments
Management believes that the carrying values of financial instruments, including cash and cash equivalents, short-term investments, accounts receivable, accounts payable and accrued liabilities approximate fair value based on the maturities of these instruments. The fair value of our borrowings under credit facility are determined using discounted cash flows based upon our estimated current interest cost for similar type borrowings or current market value, which falls under Level 2 of the fair value hierarchy. Based on our credit characteristics as of December 31, 2018, borrowings would generally bear interest at LIBOR plus 150.0 basis points. As the current borrowings under our Third Amended Credit Agreement bear interest at adjusted 1-month LIBOR plus 150.0 basis points, we believe the carrying value of our borrowings approximates fair value. For additional information on the calculation of fair value measurements, refer to “Note 2 – Fair Value Measurements.”
Hedging Transactions and Derivative Financial Instruments
From time to time, we use derivative instruments to manage commodity, interest rate and foreign currency exposures. Derivative instruments are viewed as risk management tools and are not used for trading or speculative purposes. To qualify for hedge accounting treatment, derivatives used for hedging purposes must be designated and deemed effective as a hedge of the identified underlying risk exposure at the inception of the contract. Accordingly, changes in fair value of the derivative contract must be highly correlated with changes in the fair value of the underlying hedged item at inception of the hedge and over the life of the hedge contract.
Derivatives used to hedge forecasted cash flows associated with interest rates, foreign currency commitments, or forecasted commodity purchases are accounted for as cash flow hedges. For those derivative instruments that qualify for hedge accounting treatment, if the hedge is highly effective, all changes in the fair value of the derivative hedging instrument are recorded in other comprehensive income (loss). The derivative hedging instrument will be reclassified to earnings when the hedged item impacts earnings. For those derivative instruments that do not qualify for hedge accounting treatment, any related gains and losses are recognized in the consolidated statements of operations as a component of “Other income (expense), net.” For additional information, refer to “Note 3 – Hedging Transactions and Derivative Financial Instruments.”
Concentration of Credit and Investment Risk
We extend credit on an uncollateralized basis to almost all customers. Concentration of credit and geographic risk with respect to accounts receivable is limited due to the large number and general dispersion of accounts that constitute our customer base. We routinely perform credit evaluations on our customers. As of December 31, 2018 and 2017, there were no customers that individually accounted for more than 10% of total accounts receivable. We have purchased credit insurance coverage for certain accounts receivable. We did not experience significant credit losses on customers’ accounts in 2018, 2017 or 2016.
We are subject to credit and market risk by using derivative instruments. If a counterparty fails to fulfill its performance obligations under a derivative contract, our credit risk will equal the fair value of the derivative instrument. We seek to minimize counterparty credit (or repayment) risk by entering into derivative transactions with major financial institutions with investment grade credit ratings.
We invest excess cash principally in investment grade government securities and time deposits. We have established guidelines relative to diversification and maturities in order to maintain safety and liquidity. These guidelines are periodically reviewed and modified to reflect changes in market conditions.
Income Taxes
We are subject to income taxes in the United States and in numerous foreign jurisdictions. The Company accounts for income taxes following Accounting Standards Codification (ASC) 740, Income Taxes, recognizing deferred tax assets and liabilities using enacted tax rates for the effect of temporary differences between book and tax basis of recorded assets and liabilities. Deferred tax assets are reduced by a valuation allowance if it is more likely than not that some or all of a deferred tax asset will not be realized.
As a result of the Tax Cuts and Jobs Act of 2017 (U.S. Tax Reform), all post-1986 undistributed foreign subsidiary earnings and profits as of December 31, 2018 have been subjected to U.S. tax through the transition tax. Our unremitted foreign earnings could be subject to additional income taxes if they are redeployed outside of their country of origin. The Company did not make any changes in 2018 to its position on the permanent reinvestment of its historical earnings from foreign operations. With the exception of certain Chinese subsidiaries, the Company continues to assert that historical foreign earnings are indefinitely reinvested. As of December 31, 2018 and 2017, the Company had recorded a deferred tax liability of $1.8 million and $3.1 million, respectively, for Chinese withholding tax on undistributed earnings that are not indefinitely reinvested. The other remaining foreign subsidiaries have both the intent and ability to indefinitely reinvest their undistributed earnings and the Company does not expect that these undistributed earnings should give rise to significant additional tax liabilities as a result of such earnings. For additional information regarding U.S. Tax Reform, refer to “Note 14 – Income Taxes.”
On December 22, 2017, Staff Accounting Bulletin No. 118 (SAB 118) was issued to address the application of U.S. GAAP in situations when a registrant does not have the necessary information available, prepared, or analyzed (including computations) in
46
reasonable detail to complete the accounting for certain income tax effects of the U.S. Tax Reform. December 22, 2018 marked the end of the measurement period for purposes of SAB 118. As such, we have completed our analysis based on currently available legislative updates relating to the U.S. Tax Reform, as well as a more detailed analysis of the post-1986 undistributed earnings and profits that required further adjustment, resulting in a tax expense of $0.2 million in the fourth quarter of 2018 and a total tax expense of $0.2 million for the year ended December 31, 2018. The total tax expense included a $7.5 million benefit related to adjustments to the transition tax and a $7.7 million expense related to the establishment of a valuation allowance against deferred tax assets associated with carried over research and development credits. There were no significant adjustments recorded with respect to finalization of the impact of the U.S. Tax Reform on state taxes and the remeasurement of certain deferred tax assets and liabilities.
U.S. Tax Reform includes two new U.S. tax base erosion provisions, the Global Intangible Low-Taxed Income (GILTI) provisions and the Base Erosion and Anti-Abuse Tax (BEAT) provisions. The GILTI provisions require the Company to include in its U.S. income tax return foreign subsidiary earnings in excess of an allowable return on the foreign subsidiary's tangible assets. The Company has elected to account for GILTI tax in the period in which it is incurred, and therefore has not provided any deferred tax impacts of GILTI in its consolidated financial statements for the year ended December 31, 2018. The BEAT provisions eliminate the deduction of certain base-erosion payments made to related foreign corporations, and impose a minimum tax if greater than regular tax. Starting January 1, 2018, the Company has accounted for BEAT in the period in which it is incurred to the extent the Company is subject to it. We have determined that our base erosion payments do not exceed the threshold for applicability for the year ended December 31, 2018 and we do not currently anticipate any significant long-term impact from the BEAT on our effective tax rate in future periods.
We record benefits for uncertain tax positions based on an assessment of whether it is more likely than not that the tax positions will be sustained by the taxing authorities. If this threshold is not met, no tax benefit of the uncertain position is recognized. If the threshold is met, we recognize the largest amount of the tax benefit that is greater than fifty percent likely to be realized upon ultimate settlement.
We recognize interest and penalties within the “Income tax expense” line item in the consolidated statements of operations. Accrued interest and penalties are included within the related tax liability line item in the consolidated statements of financial position.
Revenue Recognition
Recognition of revenue occurs when a customer obtains control of promised goods or services in an amount that reflects the consideration to which the providing entity expects to be entitled in exchange for those goods or services. We recognize revenue when all of the following criteria are met: (1) we have entered into a binding agreement, (2) the performance obligations have been identified, (3) the transaction price to the customer has been determined, (4) the transaction price has been allocated to the performance obligations in the contract, and (5) the performance obligations have been satisfied. The majority of our shipping terms permit us to recognize revenue at point of shipment. Some shipping terms require the goods to be through customs or be received by the customer before title passes. In those instances, revenue is not recognized until either the customer has received the goods or they have passed through customs, depending on the circumstances. Shipping and handling costs are treated as fulfillment costs. Sales tax or VAT are excluded from the measurement of the transaction price.
Pension and Other Postretirement Benefits
We provide various defined benefit pension plans for our U.S. employees and we sponsor multiple fully insured or self-funded medical plans and fully insured life insurance plans for retirees. In 2013, the defined benefit pension plans were frozen, so that future benefits no longer accrue. The costs and obligations associated with these plans are dependent upon various actuarial assumptions used in calculating such amounts. These assumptions include discount rates, long-term rate of return on plan assets, mortality rates, and other factors. The assumptions used in these models are determined as follows: (i) the discount rate used is based on the PruCurve index; (ii) the long-term rate of return on plan assets is determined based on historical portfolio results, market results and our expectations of future returns, as well as current market assumptions related to long-term return rates; and (iii) the mortality rate is based on a mortality projection that estimates current longevity rates and their impact on the long-term plan obligations. We review these assumptions periodically throughout the year and update as necessary.
In October 2017, the Company merged two of its defined benefit pension plans: the Rogers Corporation Defined Benefit Pension Plan and the Hourly Employees Pension Plan of Arlon LLC, Microwave Material and Silicone Technologies Divisions, Bear, Delaware (collectively, the Merged Plan). The Company currently intends to terminate the Merged Plan and has requested a determination letter from the Internal Revenue Service (IRS). The termination of the Merged Plan remains subject to final approval by both management and the IRS. The Company plans to provide for lump sum distributions or annuity payments in connection with the termination of the Merged Plan and we expect the settlement process to be completed in 2019. The Company lacks sufficient information as of December 31, 2018 to determine the financial impact of the proposed plan termination. At this time, there are no plans to terminate the Rogers Corporation Employees’ Pension Plan (the Union Plan). For additional information, refer to “Note 12 – Pension, Other Postretirement Benefits and Employee Savings and Investment Plans.”
47
Advertising Costs
Advertising costs are expensed as incurred and amounted to $3.8 million, $4.4 million and $3.0 million for 2018, 2017 and 2016, respectively.
Earnings Per Share
Basic earnings per share is based on the weighted average number of common shares outstanding. Diluted earnings per share is based on the weighted average number of common shares outstanding and all dilutive potential common shares outstanding.
Equity Compensation
Equity compensation mainly consists of expense related to restricted stock units and deferred stock units.
Performance-based restricted stock unit compensation expense is based on achievement of both market and service conditions. The fair value of these awards is determined based on a Monte Carlo simulation valuation model on the grant date. We recognize compensation expense on all of these awards on a straight-line basis over the vesting period with no changes for final projected payout of the awards.
Time-based restricted stock units compensation expense is based on the achievement of only service conditions. The fair value of these awards is determined based on the market value of the underlying stock price on the grant date. We recognize compensation expense on all of these awards on a straight-line basis over the vesting period.
Deferred stock units, which are granted to non-management directors, are fully vested on the date of grant and the related shares are generally issued on the 13-month anniversary of the grant date unless the individual elects to defer the receipt of those shares. The fair value of these awards is determined based on the market value of the underlying stock price on the grant date. The compensation related to these grants is expensed immediately on the date of grant.
Note 2 – Fair Value Measurements
The accounting guidance for fair value measurements establishes a three-tier fair value hierarchy, which prioritizes the inputs used in measuring fair value.
• | Level 1 – Quoted prices in active markets for identical assets or liabilities. |
• | Level 2 – Inputs other than Level 1 that are observable, either directly or indirectly, such as quoted prices for similar assets or liabilities; quoted prices in markets that are not active; or other inputs that are observable or can be corroborated by observable market data for substantially the full term of the assets or liabilities. |
• | Level 3 – Unobservable inputs that are supported by little or no market activity and that are significant to the fair value of the assets or liabilities. |
From time to time we enter into various instruments that require fair value measurement, including foreign currency contracts, copper derivative contracts and interest rate swaps. Derivative instruments measured at fair value on a recurring basis, categorized by the level of inputs used in the valuation, include:
Derivative Instruments at Fair Value as of December 31, 2018 | |||||||||||||||
(Dollars in thousands) | Level 1 | Level 2 | Level 3 | Total | |||||||||||
Foreign currency contracts | $ | — | $ | 522 | $ | — | $ | 522 | |||||||
Copper derivative contracts | $ | — | $ | 583 | $ | — | $ | 583 | |||||||
Interest rate swap | $ | — | $ | 461 | $ | — | $ | 461 | |||||||
Derivative Instruments at Fair Value as of December 31, 2017 | |||||||||||||||
(Dollars in thousands) | Level 1 | Level 2 | Level 3 | Total | |||||||||||
Foreign currency contracts | $ | — | $ | (396 | ) | $ | — | $ | (396 | ) | |||||
Copper derivative contracts | $ | — | $ | 2,016 | $ | — | $ | 2,016 | |||||||
Interest rate swap | $ | — | $ | 41 | $ | — | $ | 41 | |||||||
For further discussion on our derivative contracts, refer to “Note 3 – Hedging Transactions and Derivative Financial Instruments.”
Note 3 – Hedging Transactions and Derivative Financial Instruments
We are exposed to certain risks related to our ongoing business operations. The primary risks being managed through our use of derivative instruments are foreign currency exchange rate risk and commodity pricing risk (primarily related to copper). During
48
2017, we entered into an interest rate swap to hedge interest rate risk. We do not use derivative financial instruments for trading or speculative purposes. The valuation of derivative contracts used to manage each of these risks is described below:
• | Foreign Currency - The fair value of any foreign currency option derivative is based upon valuation models applied to current market information such as strike price, spot rate, maturity date and volatility, and by reference to market values resulting from an over-the-counter market or obtaining market data for similar instruments with similar characteristics. |
• | Commodity - The fair value of copper derivatives is computed using a combination of intrinsic and time value valuation models, which are collectively a function of five primary variables: price of the underlying instrument, time to expiration, strike price, interest rate and volatility. The intrinsic valuation model reflects the difference between the strike price of the underlying copper derivative instrument and the current prevailing copper prices in an over-the-counter market at period end. The time value valuation model incorporates changes in the price of the underlying copper derivative instrument, the time value of money, the underlying copper derivative instrument’s strike price and the remaining time to the underlying copper derivative instrument’s expiration date from the period end date. |
• | Interest Rates - The fair value of interest rate swap instruments is derived by comparing the present value of the interest rate forward curve against the present value of the swap rate, relative to the notional amount of the swap. The net value represents the estimated amount we would receive or pay to terminate the agreements. Settlement amounts for an “in the money” swap would be adjusted down to compensate the counterparty for cost of funds, and the adjustment is directly related to the counterparties’ credit ratings. |
The guidance for the accounting and disclosure of derivatives and hedging transactions requires companies to recognize all of their derivative instruments as either assets or liabilities at fair value in the statements of financial position. The accounting for changes in the fair value (i.e., gains or losses) of a derivative instrument depends on whether it has been designated and qualifies for hedge accounting treatment as defined under the applicable accounting guidance. For derivative instruments that are designated and qualify for hedge accounting treatment as cash flow hedges (i.e., hedging the exposure to variability in expected future cash flows that is attributable to a particular risk), the effective portion of the gain or loss on the derivative instrument is reported as a component of other comprehensive income (loss). This gain or loss is reclassified into earnings in the same line item of the consolidated statements of operations associated with the forecasted transaction and in the same period or periods during which the hedged transaction affects earnings. As of December 31, 2018 and 2017, only our interest rate swap qualified for hedge accounting treatment as a cash flow hedge, and the hedge was highly effective.
Foreign Currency
During 2018, we entered into Korean Won, Japanese Yen, Euro, Hungarian Forint and Chinese Renminbi forward contracts. We entered into these foreign currency forward contracts to mitigate certain global transactional exposures. These contracts do not qualify for hedge accounting treatment. As a result, any fair value adjustments required on these contracts are recorded in “Other income (expense), net” in our consolidated statements of operations in the period in which the adjustment occurred.
As of December 31, 2018 the notional values of these foreign currency forward contracts were as follows:
Notional Values of Foreign Currency Derivatives | |||
KRW/USD | ₩ | 1,325,760,000 | |
JPY/EUR | ¥ | 675,000,000 | |
EUR/USD | € | 10,449,335 | |
USD/CNY | $ | 23,655,942 | |
Commodity
As of December 31, 2018, we had 26 outstanding contracts to hedge exposure related to the purchase of copper in our PES and ACS operating segments. These contracts are held with financial institutions and are intended to offset rising copper prices and do not qualify for hedge accounting treatment. As a result, any fair value adjustments required on these contracts are recorded in “Other income (expense), net” in our consolidated statements of operations in the period in which the adjustment occurred.
49
As of December 31, 2018, the volume of our copper contracts outstanding were as follows:
Volume of Copper Derivatives | |
January 2019 - March 2019 | 189 metric tons per month |
April 2019 - June 2019 | 188 metric tons per month |
July 2019 - September 2019 | 191 metric tons per month |
October 2019 - December 2019 | 195 metric tons per month |
January 2020 - March 2020 | 202 metric tons per month |
Interest Rates
In March 2017, we entered into an interest rate swap to hedge the variable interest rate on $75.0 million of our $450.0 million revolving credit facility. This transaction has been designated as a cash flow hedge and qualifies for hedge accounting treatment. For additional information regarding our revolving credit facility, refer to “Note 11 – Debt and Capital Leases.”
Effects on Financial Statements
The Effect of Current Derivative Instruments on the Financial Statements for the period ended December 31, 2018 | Fair Values of Derivative Instruments as of December 31, 2018 | |||||||||
(Dollars in thousands) | Location | Gain (Loss) | Other Assets/ (Other Liabilities)(1) | |||||||
Foreign Exchange Contracts | ||||||||||
Contracts not designated as hedging instruments | Other income (expense), net | $ | (333 | ) | $ | 522 | ||||
Copper Derivatives | ||||||||||
Contracts not designated as hedging instruments | Other income (expense), net | $ | (2,101 | ) | $ | 583 | ||||
Interest Rate Swap | ||||||||||
Contract designated as hedging instrument | Other comprehensive income (loss) | $ | 420 | $ | 461 | |||||
The Effect of Current Derivative Instruments on the Financial Statements for the period ended December 31, 2017 | Fair Values of Derivative Instruments as of December 31, 2017 | |||||||||
(Dollars in thousands) | Location | Gain (Loss) | Other Assets/ (Other Liabilities)(1) | |||||||
Foreign Exchange Contracts | ||||||||||
Contracts not designated as hedging instruments | Other income (expense), net | $ | (7 | ) | $ | (396 | ) | |||
Copper Derivatives | ||||||||||
Contracts not designated as hedging instruments | Other income (expense), net | $ | 1,928 | $ | 2,016 | |||||
Interest Rate Swap | ||||||||||
Contract designated as hedging instrument | Other comprehensive income (loss) | $ | 41 | $ | 41 | |||||
(1) All balances were recorded in the “Other current assets” or “Other accrued liabilities” line items in the consolidated statements of financial position, except the 2018 interest rate swap balance, which was recorded in the “Other long-term assets” line item in the consolidated statements of financial position.
50
Note 4 – Accumulated Other Comprehensive Loss
The changes in accumulated other comprehensive loss by component for the years ended December 31, 2018 and 2017 were as follows:
(Dollars and accompanying footnotes in thousands) | Foreign Currency Translation Adjustments | Pension and Other Postretirement Benefits(1) | Derivative Instrument Designated as Cash Flow Hedge(2) | Total | |||||||||||
Balance as of December 31, 2016 | $ | (46,446 | ) | $ | (45,816 | ) | $ | — | $ | (92,262 | ) | ||||
Other comprehensive income (loss) before reclassifications | 28,463 | — | (6 | ) | 28,457 | ||||||||||
Actuarial net loss incurred in the fiscal year | — | (1,481 | ) | — | (1,481 | ) | |||||||||
Amounts reclassified from accumulated other comprehensive loss | — | 99 | 32 | 131 | |||||||||||
Net current-period other comprehensive income (loss) | 28,463 | (1,382 | ) | 26 | 27,107 | ||||||||||
Balance as of December 31, 2017 | (17,983 | ) | (47,198 | ) | 26 | (65,155 | ) | ||||||||
Other comprehensive income (loss) before reclassifications | (12,505 | ) | — | 519 | (11,986 | ) | |||||||||
Actuarial net loss incurred in the fiscal year | — | (1,678 | ) | — | (1,678 | ) | |||||||||
Amounts reclassified from accumulated other comprehensive loss | — | 176 | (191 | ) | (15 | ) | |||||||||
Net current-period other comprehensive income (loss) | (12,505 | ) | (1,502 | ) | 328 | (13,679 | ) | ||||||||
Balance as of December 31, 2018 | $ | (30,488 | ) | $ | (48,700 | ) | $ | 354 | $ | (78,834 | ) | ||||
(1) Net of taxes of $9,984, $9,563 and $9,160 for the years ended December 31, 2018, 2017 and 2016, respectively.
(2) Net of taxes of $106, $15 and $0 for the years ended December 31, 2018, 2017 and 2016, respectively.
The impacts to the statements of operations related to reclassifications from accumulated other comprehensive loss for the years ended December 31, 2018 and 2017 were as follows:
(Dollars in thousands) | December 31, 2018 | December 31, 2017 | Financial Statement Line Item | ||||
Amortization of pension and other postretirement benefits | |||||||
$ | (227 | ) | $ | (154 | ) | Other income (expense), net(1) | |
51 | 55 | Income tax expense | |||||
$ | (176 | ) | $ | (99 | ) | Net income | |
Unrealized gains (losses) on derivative instruments held at year end | |||||||
$ | 247 | $ | (51 | ) | Other income (expense), net | ||
(56 | ) | 19 | Income tax expense | ||||
$ | 191 | $ | (32 | ) | Net income | ||
(1) These accumulated other comprehensive loss components are included in the computation of net periodic pension cost. For additional details, refer to “Note 12 – Pension, Other Postretirement Benefits and Employee Savings and Investment Plans.”
Note 5 – Acquisitions
Griswold
On July 6, 2018, we acquired 100% of the membership interests in Griswold for an aggregate purchase price of $78.0 million, net of cash acquired, pursuant to the terms of the Membership Interest Purchase Agreement, dated July 6, 2018 by and among the Company and the owners of Griswold (the MIPA). We used borrowings of $82.5 million under our revolving credit facility to fund the acquisition. There was a possible earn-out capped at $3.0 million based on certain of Griswold’s 2018 product sales. At the time of acquisition, we determined that the probability of the earn-out was extremely low, and as a result, assigned no fair value to the contingent consideration as of the valuation date. No earn-out was actually paid based on the related sales results.
51
Griswold is a manufacturer of a wide range of high-performance engineered cellular elastomer and microcellular polyurethane products and solutions across the automotive, transportation, medical, office products, printing and electronics industries. The acquisition built on our existing EMS platform of engineered materials and added new products and capabilities to the portfolio of our EMS operating segment.
The acquisition has been accounted for in accordance with applicable purchase accounting guidance. We recorded goodwill primarily related to the expected synergies from combining operations and the value of Griswold’s existing workforce, which is expected to be deductible for tax purposes. We also recorded other intangible assets related to acquired customer relationships, developed technology, trademarks and trade names, and a covenant not to compete.
The following table represents the fair values assigned to the acquired assets and liabilities assumed in the transaction. As of the filing date of this Form 10-K, the purchase accounting and purchase price allocation for the Griswold acquisition are substantially complete, as we continue to refine our valuation of certain acquired assets and assumed liabilities.
(Dollars in thousands) | July 6, 2018 | ||
Assets: | |||
Accounts receivable, less allowance for doubtful accounts | $ | 2,553 | |
Inventories | 2,951 | ||
Other current assets | 155 | ||
Property, plant & equipment | 7,554 | ||
Other intangible assets | 34,120 | ||
Goodwill | 31,738 | ||
Total assets | 79,071 | ||
Liabilities: | |||
Accounts payable | 711 | ||
Accrued employee benefits and compensation | 299 | ||
Other accrued liabilities | 92 | ||
Total liabilities | 1,102 | ||
Fair value of net assets acquired | $ | 77,969 | |
The other intangible assets consist of customer relationships valued at $22.1 million, developed technology valued at $9.6 million, trademarks and trade names valued at $1.8 million, and a covenant not to compete valued at $0.6 million. The fair value of acquired identified other intangible assets was determined by applying the income approach, using several significant unobservable inputs for projected cash flows and a discount rate. These inputs are considered Level 3 under the fair value measurements and disclosure guidance.
At the acquisition date, the weighted average amortization period for the other intangible asset classes was 9.5 years for customer relationships, 3.5 years for developed technology, 10.4 years for trademarks and trade names, and 3.2 years for the covenant not to compete, resulting in amortization expenses ranging from $0.7 million to $3.0 million annually. The estimated annual future amortization expense is $2.8 million for 2019, $3.0 million for 2020, $2.8 million for 2021, $2.7 million for 2022, and $2.5 million for 2023.
During 2018, we incurred transaction costs of $1.1 million related to the Griswold acquisition, which were recorded within selling, general and administrative (SG&A) expenses in the consolidated statements of operations.
The results of Griswold have been included in our consolidated financial statements for the period subsequent to the completion of the acquisition on July 6, 2018, through December 31, 2018. Griswold’s net sales for that period totaled $13.7 million.
DSP
On January 6, 2017, we acquired the principal operating assets of DSP, pursuant to the terms of the Asset Purchase Agreement by and among the Company, DSP and the principal shareholders of DSP (the Purchase Agreement). Pursuant to the terms of the Purchase Agreement, we acquired certain assets and assumed certain liabilities of DSP for a total purchase price of approximately $60.2 million. We used borrowings of $30.0 million under our revolving credit facility in addition to cash on hand to fund the acquisition.
The acquisition was accounted for in accordance with applicable purchase accounting guidance. We recorded goodwill primarily related to the expected synergies from combining operations and the value of the existing workforce. We also recorded other intangible assets related to customer relationships, developed technology, trade names and a covenant not to compete.
52
The following table represents the fair values assigned to the acquired assets and liabilities in the transaction:
(Dollars in thousands) | January 6, 2017 | ||
Assets: | |||
Accounts receivable | $ | 2,724 | |
Prepaid expenses | 21 | ||
Inventory | 2,433 | ||
Property, plant & equipment | 1,589 | ||
Other intangible assets | 35,860 | ||
Goodwill | 17,793 | ||
Total assets | 60,420 | ||
Liabilities: | |||
Accounts payable | 179 | ||
Accrued expenses | 50 | ||
Total liabilities | 229 | ||
Fair value of net assets acquired | $ | 60,191 | |
The other intangible assets consist of customer relationships valued at $30.5 million, developed technology valued at $1.8 million, trademarks valued at $3.3 million, and a covenant not to compete valued at $0.3 million. The fair value of acquired identified other intangible assets was determined by applying the income approach, using several significant unobservable inputs for projected cash flows and a discount rate. These inputs are considered Level 3 under the fair value measurements and disclosure guidance.
At the acquisition date, the weighted average amortization period for the other intangible asset classes was 11.8 years for customer relationships, 4.3 years for developed technology, 11.7 years for trademarks, and 4.1 years for the covenant not to compete, resulting in amortization expenses ranging from $1.1 million to $2.0 million annually. The estimated annual future amortization expense is $1.8 million for each of 2019, 2020 and 2021, and $1.7 million for each of 2022 and 2023.
During 2017, we incurred transaction costs of $0.5 million related to the DSP acquisition, which were recorded within SG&A expenses in the consolidated statements of operations. DSP’s net sales totaled $22.3 million for the year ended December 31, 2017.
DeWAL
On November 23, 2016, we acquired all of the membership interests in DeWAL pursuant to the terms of the Membership Interest Purchase Agreement, dated November 23, 2016, by and among the Company and the owners of DeWAL for an aggregate purchase price of $135.5 million. We used borrowings of $136.0 million under our revolving credit facility to fund the acquisition.
The acquisition was accounted for in accordance with applicable purchase accounting guidance. We recorded goodwill, primarily related to the expected synergies from combining operations and the value of the existing workforce. We also recorded other intangible assets related to customer relationships, developed technology, trade names and covenants not to compete.
53
The following table represents the fair values assigned to the acquired assets and liabilities in the transaction:
(Dollars in thousands) | November 23, 2016 | ||
Assets: | |||
Cash and cash equivalents | $ | 1,539 | |
Accounts receivable | 7,513 | ||
Other current assets | 691 | ||
Inventory | 9,915 | ||
Property, plant & equipment | 9,932 | ||
Other intangible assets | 73,500 | ||
Goodwill | 35,985 | ||
Other long-term assets | 101 | ||
Total assets | 139,176 | ||
Liabilities: | |||
Accounts payable | 2,402 | ||
Other current liabilities | 1,292 | ||
Total liabilities | 3,694 | ||
Fair value of net assets acquired | $ | 135,482 | |
The other intangible assets consist of customer relationships valued at $46.7 million, developed technology valued at $22.0 million, trademarks valued at $4.3 million, and covenants not to compete valued at $0.5 million. The fair value of acquired identified other intangible assets was determined by applying the income approach, using several significant unobservable inputs for projected cash flows and a discount rate. These inputs are considered Level 3 under the fair value measurements and disclosure guidance.
At the acquisition date, the weighted average amortization period for the other intangible asset classes was 13.5 years for customer relationships, 8.6 years for developed technology, 5.2 years for trademarks, and 3.8 years for the covenants not to compete, resulting in amortization expenses ranging from $2.4 million to $4.3 million, annually. The future estimated annual amortization expense is $4.1 million for 2019, $4.3 million for each of 2020, 2021, 2022 and 2023.
During 2016, we incurred transaction costs of $2.1 million related to the DeWAL acquisition, which were recorded within SG&A expenses in the consolidated statements of operations. DeWAL’s net sales totaled $5.4 million for the year ended December 31, 2016.
Pro Forma Financial Information
The following unaudited pro forma financial information presents the combined results of operations of Rogers, Griswold, DSP, and DeWAL as if the Griswold acquisition had occurred on January 1, 2017, the DSP acquisition had occurred on January 1, 2016 and the DeWAL acquisition had occurred on January 1, 2015. The unaudited pro forma financial information is not intended to represent or be indicative of our consolidated results of operations that would have been reported had the Griswold, DSP, and DeWAL acquisitions been completed as of January 1, 2017, January 1, 2016 and January 1, 2015, respectively, and should not be taken as indicative of our future consolidated results of operations.
For the Years Ended December 31, | |||||||||
(Dollars in thousands) | 2018 | 2017 | 2016 | ||||||
Net sales | $ | 893,878 | $ | 851,122 | $ | 724,877 | |||
Net income | 87,584 | 80,283 | 50,349 | ||||||
Isola Asset Acquisition
On August 28, 2018, the Company entered into an Asset Purchase Agreement (APA) with Isola USA Corp. (Isola) to acquire a production facility and related machinery and equipment located in Chandler, Arizona for cash consideration of $43.4 million. In connection with the APA, the Company also entered into a Transition Services Agreement and a Lease Agreement with Isola whereby Isola leases back a portion of the facility and related machinery and equipment from the Company during the transition period through December 31, 2019. We used cash on hand to fund the asset purchase. This transaction was evaluated under ASC 805, Business Combinations and was determined to be an asset acquisition as the transaction did not meet the definition of a business.
54
The assets acquired in connection with the acquisition were recorded by the Company at their estimated relative fair values as follows:
(Dollars in thousands) | August 28, 2018 | ||
Land | $ | 6,104 | |
Buildings | 8,401 | ||
Machinery and equipment | 18,616 | ||
Equipment in process | 12,633 | ||
Total property, plant and equipment | $ | 45,754 | |
The $45.8 million of capitalized cost summarized above includes both lease consideration valued at $2.0 million and transaction costs incurred of $0.4 million.
Note 6 – Property, Plant and Equipment
As of December 31, | |||||||
(Dollars in thousands) | 2018 | 2017 | |||||
Land | $ | 21,525 | $ | 14,620 | |||
Buildings and improvements | 175,279 | 135,191 | |||||
Machinery and equipment | 256,301 | 238,000 | |||||
Office equipment | 64,886 | 56,554 | |||||
Property plant and equipment, gross | 517,991 | 444,365 | |||||
Accumulated depreciation | (317,414 | ) | (289,909 | ) | |||
Property, plant and equipment, net | 200,577 | 154,456 | |||||
Equipment in process | 42,182 | 25,155 | |||||
Total property, plant and equipment, net | $ | 242,759 | $ | 179,611 | |||
Depreciation expense was $33.5 million in 2018, $29.3 million in 2017 and $26.6 million in 2016. Additionally, we recognized $1.5 million in impairment charges on certain assets in connection with the Isola asset acquisition.
In the second quarter of 2017, we began actively marketing for sale unutilized property in Chandler, Arizona, consisting of a building and two adjacent parcels of land with an aggregate net book value of $0.9 million. In the second quarter of 2018, we completed the sale of the building and one parcel of land and recognized a gain on sale of approximately $0.4 million in operating income. The remaining parcel of land, which was previously classified as held for sale, had a net book value of $0.4 million and was reclassified in the third quarter of 2018 to held and used as the initial held for sale classification had surpassed one year.
In the third quarter of 2017, we completed the sale of a facility located in Belgium that had been classified as held for sale as of June 30, 2017 and recognized a gain on sale of approximately $4.4 million in operating income.
In the first quarter of 2017, we completed the planned sale of a parcel of land in Belgium that had been classified as held for sale as of December 31, 2016 and recognized a gain on sale of approximately $0.9 million in operating income.
55
Note 7 – Goodwill and Other Intangible Assets
On July 6, 2018, we acquired Griswold. For further detail on the goodwill and other intangible assets recorded in connection with the acquisition, refer to “Note 5 – Acquisitions.”
Goodwill
The changes in the carrying amount of goodwill for the period ending December 31, 2018, by operating segment, were as follows:
(Dollars in thousands) | Advanced Connectivity Solutions | Elastomeric Material Solutions | Power Electronics Solutions | Other | Total | ||||||||||||||
December 31, 2017 | $ | 51,693 | $ | 111,575 | $ | 71,615 | $ | 2,224 | $ | 237,107 | |||||||||
Acquisition | — | 32,305 | — | — | 32,305 | ||||||||||||||
Purchase accounting adjustment | — | (567 | ) | — | — | (567 | ) | ||||||||||||
Foreign currency translation adjustment | — | (724 | ) | (3,236 | ) | — | (3,960 | ) | |||||||||||
December 31, 2018 | $ | 51,693 | $ | 142,589 | $ | 68,379 | $ | 2,224 | $ | 264,885 | |||||||||
Other Intangible Assets
The changes in the carrying amount of other intangible assets for the two-year period ending December 31, 2018, were as follows:
December 31, 2018 | December 31, 2017 | ||||||||||||||||||||||
(Dollars in thousands) | Gross Carrying Amount | Accumulated Amortization | Net Carrying Amount | Gross Carrying Amount | Accumulated Amortization | Net Carrying Amount | |||||||||||||||||
Customer relationships | $ | 149,753 | $ | 30,078 | $ | 119,675 | $ | 128,907 | $ | 22,514 | $ | 106,393 | |||||||||||
Technology | 81,535 | 38,624 | 42,911 | 73,891 | 33,491 | 40,400 | |||||||||||||||||
Trademarks and trade names | 12,019 | 3,213 | 8,806 | 10,213 | 2,157 | 8,056 | |||||||||||||||||
Covenants not to compete | 1,340 | 249 | 1,091 | 1,799 | 1,108 | 691 | |||||||||||||||||
Total definite-lived other intangible assets | 244,647 | 72,164 | 172,483 | 214,810 | 59,270 | 155,540 | |||||||||||||||||
Indefinite-lived other intangible asset | 4,525 | — | 4,525 | 4,738 | — | 4,738 | |||||||||||||||||
Total other intangible assets | $ | 249,172 | $ | 72,164 | $ | 177,008 | $ | 219,548 | $ | 59,270 | $ | 160,278 | |||||||||||
In the table above, gross carrying amounts and accumulated amortization may differ from prior periods due to foreign exchange rate fluctuations.
Amortization expense was approximately $16.5 million, $14.8 million and $11.2 million in 2018, 2017 and 2016, respectively. The estimated annual future amortization expense is $17.7 million, $14.6 million, $13.8 million, $13.3 million and $12.7 million in 2019, 2020, 2021, 2022 and 2023, respectively. These amounts could vary based on changes in foreign currency exchange rates.
The weighted average amortization period as of December 31, 2018, by definite-lived other intangible asset class, is presented in the table below:
Definite-Lived Other Intangible Asset Class | Weighted Average Remaining Amortization Period |
Customer relationships | 7.6 |
Technology | 4.4 |
Trademarks and trade names | 5.0 |
Covenants not to compete | 2.1 |
Total definite-lived other intangible assets | 6.6 |
Note 8 – Earnings Per Share
Basic earnings per share is based on the weighted average number of common shares outstanding. Diluted earnings per share is based on the weighted average number of common shares outstanding and all dilutive potential common shares outstanding.
56
The following table sets forth the computation of basic and diluted earnings per share:
Years Ended December 31, | |||||||||||
(In thousands, except per share amounts) | 2018 | 2017 | 2016 | ||||||||
Numerator: | |||||||||||
Net income | $ | 87,651 | $ | 80,459 | $ | 48,283 | |||||
Denominator: | |||||||||||
Weighted-average shares outstanding - basic | 18,374 | 18,154 | 17,991 | ||||||||
Effect of dilutive shares | 285 | 393 | 232 | ||||||||
Weighted-average shares outstanding - diluted | 18,659 | 18,547 | 18,223 | ||||||||
Basic earnings per share: | $ | 4.77 | $ | 4.43 | $ | 2.68 | |||||
Diluted earnings per share: | $ | 4.70 | $ | 4.34 | $ | 2.65 | |||||
Certain options to purchase shares were excluded from the calculation of diluted weighted-average shares outstanding because the exercise price was greater than the average market price of our capital stock during the year. For 2018, 36,642 shares were excluded. No shares were excluded in 2017 and 2016.
Note 9 – Capital Stock and Equity Compensation
Capital Stock
Our 2009 Long-Term Equity Compensation Plan, which expired in early February 2019, permitted the granting of restricted stock units and certain other forms of equity awards to officers and other key employees. Under this plan, we also awarded each non-management director deferred stock units, which permitted non-management directors to receive, at a later date, one share of Rogers capital stock for each deferred stock unit, with no payment of any consideration by the director at the time the shares were received.
Shares of capital stock reserved for possible future issuance were as follows:
As of December 31, | |||||
2018 | 2017 | ||||
Shares reserved for issuance under the stock acquisition program(1) | — | 120,883 | |||
Shares reserved for issuance under the Rogers Employee Savings and Investment Plan(2) | — | 169,044 | |||
Shares reserved for issuance under outstanding stock options and restricted stock unit awards | 413,294 | 545,018 | |||
Deferred compensation to be paid in stock, including deferred stock units | 13,498 | 17,100 | |||
Additional shares reserved for issuance under Rogers Corporation 2009 Long-Term Equity Compensation Plan(3) | 777,385 | 793,603 | |||
Shares reserved for issuance under the Rogers Corporation Global Stock Ownership Plan for Employees | 106,344 | 117,987 | |||
Total | 1,310,521 | 1,763,635 | |||
(1) | The Company ceased offering capital stock under the stock acquisition program prior to the periods covered by this table. |
(2) | The Company ceased offering its capital stock as an investment option under the Rogers Employee Savings and Investment Plan prior to the periods covered by this table. |
(3) This plan expired in early February 2019, and these shares are no longer available for issuance thereunder.
Equity Compensation
Performance-Based Restricted Stock Units
As of December 31, 2018, we had performance-based restricted stock units from 2018, 2017 and 2016 outstanding. These awards generally cliff vest at the end of a three year measurement period. However, employees whose employment terminates during the measurement period due to death, disability, or, in certain cases, retirement may receive a pro-rata payout based on the number of days they were employed during the measurement period. Participants are eligible to be awarded shares ranging from 0% to 200% of the original award amount, based on certain defined performance measures.
The outstanding awards have one measurement criteria: the three year total shareholder return (TSR) on our capital stock as compared to that of a specified group of peer companies. The TSR measurement criteria of the awards is considered a market condition. As such, the fair value of this measurement criteria is determined on the grant date using a Monte Carlo simulation valuation model. We recognize compensation expense on all of these awards on a straight-line basis over the vesting period with no changes for final projected payout of the awards. We account for forfeitures as they occur.
57
Below were the assumptions used in the Monte Carlo calculation on the respective grant dates for awards granted in 2018 and 2017:
September 17, 2018 | February 8, 2018 | February 9, 2017 | |||
Expected volatility | 36.6% | 34.8% | 33.6% | ||
Expected term (in years) | 3.0 | 3.0 | 3.0 | ||
Risk-free interest rate | 2.85% | 2.28% | 1.38% | ||
Expected volatility – In determining expected volatility, we have considered a number of factors, including historical volatility.
Expected term – We use the vesting period of the award to determine the expected term assumption for the Monte Carlo simulation valuation model.
Risk-free interest rate – We use an implied “spot rate” yield on U.S. Treasury Constant Maturity rates as of the grant date for our assumption of the risk-free interest rate.
Expected dividend yield – We do not currently pay dividends on our capital stock; therefore, a dividend yield of 0% was used in the Monte Carlo simulation valuation model.
A summary of activity of the outstanding performance-based restricted stock units for 2018, 2017 and 2016 is presented below:
2018 | 2017 | 2016 | ||||||||||||||||||
Awards Outstanding | Weighted- Average Grant Date Fair Value | Awards Outstanding | Weighted- Average Grant Date Fair Value | Awards Outstanding | Weighted- Average Grant Date Fair Value | |||||||||||||||
Awards outstanding as of January 1 | 169,202 | $ | 97.16 | 151,769 | $ | 89.72 | 107,229 | $ | 66.13 | |||||||||||
Awards granted | 75,760 | 163.55 | 56,147 | 110.77 | 84,443 | 69.01 | ||||||||||||||
Stock issued | (81,230 | ) | 131.72 | (34,442 | ) | 86.59 | (25,397 | ) | 72.68 | |||||||||||
Awards forfeited | (21,298 | ) | 114.40 | (4,272 | ) | 99.35 | (14,506 | ) | 104.83 | |||||||||||
Awards outstanding as of December 31 | 142,434 | $ | 110.19 | 169,202 | $ | 97.16 | 151,769 | $ | 89.72 | |||||||||||
We recognized $4.4 million, $4.7 million and $4.6 million of compensation expense related to performance-based restricted stock units for the years ended December 31, 2018, 2017 and 2016, respectively. As of December 31, 2018, there was $6.0 million of total unrecognized compensation cost related to unvested performance-based restricted stock units. That cost is expected to be recognized over a weighted-average period of 0.9 years.
Time-Based Restricted Stock Units
As of December 31, 2018, we had time-based restricted stock unit awards from 2018, 2017 and 2016 outstanding. The outstanding awards all ratably vest on the first, second and third anniversaries of the original grant date. However, employees whose employment terminates during the measurement period due to death, disability, or, in certain cases, retirement may receive a pro-rata payout based on the number of days they were employed subsequent to the last grant anniversary date. Each time-based restricted stock unit represents a right to receive one share of the Rogers’ capital stock at the end of the vesting period. The fair value of the award is determined by the market value of the underlying stock price at the grant date. We recognize compensation expense on all of these awards on a straight-line basis over the vesting period. We account for forfeitures as they occur.
A summary of activity of the outstanding time-based restricted stock units for 2018, 2017 and 2016 is presented below:
2018 | 2017 | 2016 | ||||||||||||||||||
Awards Outstanding | Weighted- Average Grant Date Fair Value | Awards Outstanding | Weighted- Average Grant Date Fair Value | Awards Outstanding | Weighted- Average Grant Date Fair Value | |||||||||||||||
Awards outstanding as of January 1 | 173,331 | $ | 69.10 | 239,189 | $ | 57.71 | 208,318 | $ | 64.27 | |||||||||||
Awards granted | 46,810 | 143.93 | 80,535 | 83.17 | 118,660 | 51.70 | ||||||||||||||
Stock issued | (82,921 | ) | 84.92 | (140,208 | ) | 58.18 | (60,326 | ) | 64.03 | |||||||||||
Awards forfeited | (19,744 | ) | 112.06 | (6,185 | ) | 60.70 | (27,463 | ) | 64.60 | |||||||||||
Awards outstanding as of December 31 | 117,476 | $ | 116.10 | 173,331 | $ | 69.10 | 239,189 | $ | 57.71 | |||||||||||
58
We recognized $5.6 million, $5.7 million and $5.6 million of compensation expense related to time-based restricted stock units for the years ended December 31, 2018, 2017 and 2016, respectively. As of December 31, 2018, there was $6.7 million of total unrecognized compensation cost related to unvested time-based restricted stock units. That cost is expected to be recognized over a weighted-average period of 0.9 years.
Deferred Stock Units
We grant deferred stock units to non-management directors. These awards are fully vested on the date of grant and the related shares are generally issued on the 13-month anniversary of the grant date unless the individual elects to defer the receipt of those shares. Each deferred stock unit results in the issuance of one share of Rogers’ capital stock. The grant of deferred stock units is typically done annually during the second quarter of each year. The fair value of the award is determined by the market value of the underlying stock price at the grant date.
A summary of activity of the outstanding deferred stock units for 2018, 2017 and 2016 is presented below:
2018 | 2017 | 2016 | ||||||||||||||||||
Awards Outstanding | Weighted- Average Grant Date Fair Value | Awards Outstanding | Weighted- Average Grant Date Fair Value | Awards Outstanding | Weighted- Average Grant Date Fair Value | |||||||||||||||
Awards outstanding as of January 1 | 9,250 | $ | 109.48 | 11,900 | $ | 58.82 | 23,950 | $ | 27.22 | |||||||||||
Awards granted | 8,400 | 108.86 | 9,250 | 109.48 | 11,900 | 58.82 | ||||||||||||||
Stock issued | (9,250 | ) | 109.48 | (11,900 | ) | 58.82 | (23,950 | ) | 52.69 | |||||||||||
Awards outstanding as of December 31 | 8,400 | $ | 108.86 | 9,250 | $ | 109.48 | 11,900 | $ | 58.82 | |||||||||||
We recognized compensation expense related to deferred stock units of $0.9 million, $1.0 million and $0.7 million, for the years ended December 31, 2018, 2017 and 2016, respectively.
Stock Options
Stock options have been granted under various equity compensation plans. The maximum contractual term for all options is normally 10 years. We have not granted any stock options since the first quarter of 2012. As of February 2016, all outstanding stock option awards were fully vested and the related compensation cost had been expensed. The total grant-date fair value of stock options that vested during 2016 and the equity compensation expense related to stock options that we recognized in 2016 were both de minimis.
During the years ended December 31, 2018 and 2017, the total intrinsic value of options exercised (i.e., the difference between the market price at time of exercise and the price paid by the individual to exercise the options) was $2.4 million and $6.0 million, respectively. The total amount of cash received from the exercise of these options was $0.9 million and $3.1 million, during the years ended December 31, 2018 and 2017, respectively.
A summary of the activity under our stock option plans for 2018, 2017 and 2016, is presented below:
2018 | 2017 | 2016 | ||||||||||||||||||
Options Outstanding | Weighted- Average Exercise Price Per Share | Options Outstanding | Weighted- Average Exercise Price Per Share | Options Outstanding | Weighted- Average Exercise Price Per Share | |||||||||||||||
Options outstanding, vested and exercisable as of January 1 | 33,283 | $ | 36.40 | 116,575 | $ | 37.76 | 212,038 | $ | 40.47 | |||||||||||
Options exercised | (22,333 | ) | 38.57 | (83,292 | ) | 37.04 | (95,113 | ) | 43.56 | |||||||||||
Options forfeited | — | — | — | — | (350 | ) | 44.32 | |||||||||||||
Options outstanding, vested and exercisable as of December 31 | 10,950 | $ | 31.99 | 33,283 | $ | 36.40 | 116,575 | $ | 37.76 | |||||||||||
As of December 31, 2018 and 2017, our outstanding stock options had a weighted-average remaining contractual life of 2.0 years and 2.2 years, respectively, and an aggregate intrinsic value of $0.7 million and $4.2 million, respectively.
Employee Stock Purchase Plan
We have an ESPP that allows eligible employees to purchase, through payroll deductions, shares of our capital stock at a discount to fair market value. The ESPP has two six-month offering periods each year, the first beginning in January and ending in June and the second beginning in July and ending in December. The ESPP contains a look-back feature that allows the employee to
59
acquire stock at a 15% discount from the underlying market price at the beginning or end of the applicable period, whichever is lower. We recognize compensation expense on this plan ratably over the offering period based on the fair value of the anticipated number of shares that will be issued at the end of each offering period. Compensation expense is adjusted at the end of each offering period for the actual number of shares issued. Fair value is determined based on two factors: (i) the 15% discount on the underlying stock’s market value on the first day of the applicable offering period, and (ii) the fair value of the look-back feature determined by using the Black-Scholes model. We recognized approximately $0.3 million of compensation expense associated with the plan for the year ended December 31, 2018, and $0.5 million for each of the years ended December 31, 2017 and 2016, respectively.
Note 10 – Joint Ventures
As of December 31, 2018, we had two joint ventures, each 50% owned, which are accounted for under the equity method of accounting.
Joint Venture | Location | Operating Segment | Fiscal Year-End |
Rogers INOAC Corporation (RIC) | Japan | Elastomeric Material Solutions | October 31 |
Rogers INOAC Suzhou Corporation (RIS) | China | Elastomeric Material Solutions | December 31 |
We recognized equity income related to the joint ventures of $5.5 million, $4.9 million and $4.1 million for the years ended December 31, 2018, 2017 and 2016, respectively. These amounts are presented in “Equity income in unconsolidated joint ventures” on our consolidated statements of operations.
The summarized financial information for the joint ventures for the periods indicated was as follows:
As of December 31, | |||||||
(Dollars in thousands) | 2018 | 2017 | |||||
Current assets | $ | 38,730 | $ | 40,934 | |||
Non-current assets | $ | 4,839 | $ | 4,947 | |||
Current liabilities | $ | 6,376 | $ | 9,519 | |||
Shareholders' equity | $ | 37,193 | $ | 36,362 | |||
For the Years Ended December 31, | |||||||||||
(Dollars in thousands) | 2018 | 2017 | 2016 | ||||||||
Net sales | $ | 55,465 | $ | 54,597 | $ | 47,321 | |||||
Gross profit | $ | 21,229 | $ | 21,462 | $ | 16,829 | |||||
Net income | $ | 11,002 | $ | 9,796 | $ | 8,292 | |||||
Receivables from and payables to joint ventures arise during the normal course of business from transactions between us and the joint ventures. As of December 31, 2018 and 2017, we had receivables of $1.5 million and $3.7 million, respectively, due from RIC, RIS, our affiliated partner in the joint ventures, as well as its subsidiaries. These receivables are included in “Accounts receivable, less allowance for doubtful accounts” on our consolidated statements of financial position. As of December 31, 2018 and 2017, we owed payables of $2.3 million and $2.1 million, respectively, to RIC and RIS. These payables are included in “Accounts payable” on our consolidated statements of financial position.
Note 11 – Debt and Capital Leases
Debt
On February 17, 2017, we entered into a secured five year credit agreement with JPMorgan Chase Bank, N.A., as administrative agent, and the lenders party thereto (the Third Amended Credit Agreement), which increased the principal amount of our revolving credit facility to up to $450.0 million borrowing capacity, with sublimits for multicurrency borrowings, letters of credit and swing-line notes, and provided an additional $175.0 million accordion feature. Borrowings may be used to finance working capital needs, for letters of credit and for general corporate purposes in the ordinary course of business, including the financing of permitted acquisitions (as defined in the Third Amended Credit Agreement).
In 2018, we borrowed $82.5 million under our revolving credit facility to fund the acquisition of Griswold and an additional $20.0 million to fund the Merged Plan as part of the proposed plan termination process.
Borrowings under the Third Amended Credit Agreement can be made as alternate base rate loans or euro-currency loans. Alternate base rate loans bear interest that includes a base reference rate plus a spread of 37.5 to 75.0 basis points, depending on our leverage ratio. The base reference rate is the greater of the prime rate; federal funds effective rate (or the overnight bank funding rate, if
60
greater) plus 50 basis points. Euro-currency loans bear interest based on adjusted LIBOR plus a spread of 137.5 to 175.0 basis points, depending on our leverage ratio. Based on our leverage ratio as of December 31, 2018, the spread was 150.0 basis points.
We incurred interest expense on our outstanding debt of $6.1 million, $5.2 million, and $3.1 million for the years ended December 31, 2018, 2017 and 2016, respectively.
In addition to interest payable on the principal amount of indebtedness outstanding from time to time under the Third Amended Credit Agreement, we are required to pay a quarterly fee of 20 to 30 basis points (based upon our leverage ratio) of the unused amount of the lenders’ commitments under the Third Amended Credit Agreement. We incurred an unused commitment fee of $0.6 million, $0.6 million and $0.4 million for the years ended December 31, 2018, 2017 and 2016, respectively.
The Third Amended Credit Agreement contains customary representations, warranties, covenants, mandatory prepayments and events of default under which our payment obligations may be accelerated. If an event of default occurs, the lenders may, among other things, terminate their commitments and declare all outstanding borrowings to be immediately due and payable together with accrued interest and fees. The financial covenants include requirements to maintain (1) a leverage ratio of no more than 3.25 to 1.00, subject to an election to increase the maximum leverage ratio to 3.50 to 1.00 for one fiscal year in connection with a permitted acquisition, and (2) an interest coverage ratio of no less than 3.00 to 1.00.
All obligations under the Third Amended Credit Agreement are guaranteed by each of our existing and future material domestic subsidiaries, as defined in the Third Amended Credit Agreement (the Guarantors). The obligations are also secured by a Third Amended and Restated Pledge and Security Agreement, dated as of February 17, 2017, entered into by us and the Guarantors which grants to the administrative agent, for the benefit of the lenders, a security interest, subject to certain exceptions, in substantially all of the non-real estate assets of the Guarantors. These assets include, but are not limited to, receivables, equipment, intellectual property, inventory, and stock in certain subsidiaries.
All revolving loans are due on the maturity date, February 17, 2022. We are not required to make any quarterly principal payments under the Third Amended Credit Agreement and as of December 31, 2018, we had $228.5 million in outstanding borrowings under our revolving credit facility. However, we made discretionary principal payments totaling $5.0 million and $110.2 million on our revolving credit facility in 2018 and 2017, respectively.
As of December 31, 2018, we had $1.7 million of outstanding line of credit issuance costs that will be amortized over the life of the Third Amended Credit Agreement, which will terminate in February 2022. We recorded amortization expense of $0.6 million and $0.5 million for the years ended December 31, 2018 and 2017, respectively, related to these deferred costs.
In March 2017, we entered into an interest rate swap to hedge the variable interest rate on $75.0 million of our $450.0 million revolving credit facility. For further information regarding the interest rate swap, refer to “Note 3 – Hedging Transactions and Derivative Financial Instruments.”
Restriction on Payment of Dividends
Our Third Amended Credit Agreement generally permits us to pay cash dividends to our shareholders, provided that (i) no default or event of default has occurred and is continuing or would result from the dividend payment and (ii) our leverage ratio does not exceed 2.75 to 1.00. If our leverage ratio exceeds 2.75 to 1.00, we may nonetheless make up to $20.0 million in restricted payments, including cash dividends, during the fiscal year, provided that no default or event of default has occurred and is continuing or would result from the payments. Our leverage ratio did not exceed 2.75 to 1.00 as of December 31, 2018.
Capital Leases
We have a capital lease obligation related to our manufacturing facility in Eschenbach, Germany. Under the terms of the leasing agreement, we have an option to purchase the property upon the expiration of the lease in 2021 at a price which is the greater of (i) the then-current market value or (ii) the residual book value of the land including the buildings and installations thereon. The total obligation recorded for this lease as of December 31, 2018 and 2017 was $5.0 million and $5.7 million, respectively. Depreciation expense related to this capital lease was $0.3 million for each of the years ending December 31, 2018, 2017 and 2016. The depreciation expense related to this capital lease was recorded in “Cost of sales” on our consolidated statements of operations. Accumulated depreciation as of December 31, 2018 and 2017 was $3.5 million and $3.3 million, respectively.
We also incurred an immaterial amount of interest expense on this capital lease for the years ended December 31, 2018, 2017 and 2016, respectively. The interest expense related to this capital lease was recorded in “Interest expense, net” on our consolidated statements of operations.
Note 12 – Pension, Other Postretirement Benefits and Employee Savings and Investment Plans
Pension and Other Postretirement Benefits
As of December 31, 2018, we had two qualified noncontributory defined benefit pension plans: 1) the Union Plan and 2) the Merged Plan. All qualified noncontributory defined benefit pension plans have been frozen and have ceased accruing benefits.
61
The Company also maintains the Rogers Corporation Amended and Restated Pension Restoration Plan effective as of January 1, 2004 and the Rogers Corporation Amended and Restated Pension Restoration Plan effective as of January 1, 2005 (collectively, the Nonqualified Plans). The Nonqualified Plans serve to restore certain retirement benefits that might otherwise be lost due to limitations imposed by federal law on qualified pension plans, as well as to provide supplemental retirement benefits, for certain senior executives of the Company. In addition, we sponsor multiple fully insured or self-funded medical plans and life insurance plans for certain retirees. The measurement date for all plans is December 31st for each respective plan year.
We are required, as an employer, to: (a) recognize in our consolidated statements of financial position an asset for a plan’s overfunded status or a liability for a plan’s underfunded status; (b) measure a plan’s assets and our obligations that determine our funded status as of the end of the year; and (c) recognize changes in the funded status of a defined benefit postretirement plan in the year in which the changes occur and report these changes in accumulated other comprehensive loss. In addition, actuarial gains and losses that are not immediately recognized as net periodic pension cost are recognized as a component of accumulated other comprehensive loss and amortized into net periodic pension cost in future periods.
Pension Plan Merger and Proposed Termination
The Company currently intends to terminate the Merged Plan and has requested a determination letter from the IRS. The termination of the Merged Plan remains subject to final approval by both management and the IRS. The Company plans to provide for lump sum distributions or annuity payments in connection with the termination of the Merged Plan and we expect the settlement process to be completed in 2019. The Company lacked sufficient information as of December 31, 2018 to determine the financial impact of the proposed plan termination. At this time, there are no plans to terminate the Union Plan.
(Dollars in thousands) | Pension Benefits | Retirement Health and Life Insurance Benefits | |||||||||||
Change in benefit obligation: | 2018 | 2017 | 2018 | 2017 | |||||||||
Benefit obligation at beginning of year | $ | 185,760 | $ | 177,696 | $ | 2,037 | $ | 2,504 | |||||
Service cost | — | — | 73 | 80 | |||||||||
Interest cost | 6,758 | 7,356 | 62 | 71 | |||||||||
Actuarial (gain) loss | (10,805 | ) | 9,601 | (5 | ) | 460 | |||||||
Benefit payments | (9,105 | ) | (8,893 | ) | (364 | ) | (533 | ) | |||||
Plan amendment | — | — | — | (545 | ) | ||||||||
Benefit obligation at end of year | $ | 172,608 | $ | 185,760 | $ | 1,803 | $ | 2,037 | |||||
Change in plan assets: | 2018 | 2017 | 2018 | 2017 | |||||||||
Fair value of plan assets at the beginning of the year | $ | 180,056 | $ | 171,778 | $ | — | $ | — | |||||
Actual return on plan assets | (4,299 | ) | 16,799 | — | — | ||||||||
Employer contributions | 25,000 | 372 | 364 | 533 | |||||||||
Benefit payments | (9,105 | ) | (8,893 | ) | (364 | ) | (533 | ) | |||||
Fair value of plan assets at the end of the year | 191,652 | 180,056 | — | — | |||||||||
Funding status | $ | 19,044 | $ | (5,704 | ) | $ | (1,803 | ) | $ | (2,037 | ) | ||
Amounts included in the consolidated statements of financial position consist of:
(Dollars in thousands) | Pension Benefits | Retirement Health and Life Insurance Benefits | |||||||||||
2018 | 2017 | 2018 | 2017 | ||||||||||
Noncurrent assets | $ | 19,273 | $ | 3,021 | $ | — | $ | — | |||||
Current liabilities | (4 | ) | (5 | ) | (334 | ) | (352 | ) | |||||
Noncurrent liabilities | (225 | ) | (8,720 | ) | (1,469 | ) | (1,685 | ) | |||||
Net amount recognized at end of year | $ | 19,044 | $ | (5,704 | ) | $ | (1,803 | ) | $ | (2,037 | ) | ||
62
(Dollars in thousands) | Pension Benefits | Retirement Health and Life Insurance Benefits | |||||||||||
2018 | 2017 | 2018 | 2017 | ||||||||||
Net actuarial (loss) gain | $ | (59,972 | ) | $ | (59,645 | ) | $ | 68 | $ | 63 | |||
Prior service benefit | — | — | 1,220 | 2,821 | |||||||||
Net amount recognized at end of year | $ | (59,972 | ) | $ | (59,645 | ) | $ | 1,288 | $ | 2,884 | |||
The projected benefit obligation, accumulated benefit obligation, and fair value of plan assets for the pension plans with an accumulated benefit obligation in excess of plan assets were $0.2 million, $0.2 million and $0.0 million, respectively, as of December 31, 2018 and $155.8 million, $155.8 million and $147.1 million, respectively, as of December 31, 2017.
The projected benefit obligation, accumulated benefit obligation, and fair value of plan assets for the pension plans with plan assets in excess of an accumulated benefit obligation were $172.4 million, $172.4 million and $191.7 million, respectively, as of December 31, 2018. For 2017, the projected benefit obligation, accumulated benefit obligation, and fair value of plan assets for the pension plans with plan assets in excess of an accumulated benefit obligation were $30.0 million, $30.0 million and $33.0 million, respectively.
Components of Net Periodic (Benefit) Cost
(Dollars in thousands) | Pension Benefits | Retirement Health and Life Insurance Benefits | |||||||||||||||||||||
2018 | 2017 | 2016 | 2018 | 2017 | 2016 | ||||||||||||||||||
Service cost | $ | — | $ | — | — | $ | 73 | $ | 80 | $ | 133 | ||||||||||||
Interest cost | 6,758 | 7,356 | 7,530 | 62 | 71 | 75 | |||||||||||||||||
Expected return of plan assets | (8,662 | ) | (9,221 | ) | (10,808 | ) | — | — | — | ||||||||||||||
Amortization of prior service cost (credit) | — | — | — | (1,602 | ) | (1,602 | ) | (1,489 | ) | ||||||||||||||
Amortization of net loss | 1,828 | 1,755 | 1,784 | — | — | (47 | ) | ||||||||||||||||
Settlement charge | — | — | — | — | — | — | |||||||||||||||||
Net periodic benefit cost (benefit) | $ | (76 | ) | $ | (110 | ) | $ | (1,494 | ) | $ | (1,467 | ) | $ | (1,451 | ) | $ | (1,328 | ) | |||||
The estimated net loss for the defined benefit pension plans that will be amortized from accumulated other comprehensive loss into net periodic benefit cost over the next fiscal year is $1.8 million. The estimated net benefit for the defined benefit postretirement plans that will be amortized from accumulated other comprehensive loss into net periodic benefit cost over the next fiscal year is $1.0 million.
Weighted-average assumptions used to determine benefit obligations at December 31:
Pension Benefits | Retirement Health and Life Insurance Benefits | ||||||||
2018 | 2017 | 2018 | 2017 | ||||||
Discount rate | 4.25 | % | 3.70 | % | 3.75 | % | 3.25 | % | |
Weighted-average assumptions used to determine net benefit cost for the years ended December 31:
Pension Benefits | Retirement Health and Life Insurance Benefits | ||||||||
2018 | 2017 | 2018 | 2017 | ||||||
Discount rate | 3.70 | % | 4.25 | % | 3.25 | % | 3.25 | % | |
Expected long-term rate of return on plan assets | 4.94 | % | 5.51 | % | — | % | — | % | |
Rate of compensation increase - An expected rate of compensation increase was not included in the weighted average assumptions as there would be no impact to the net benefit cost, as the plans have been previously frozen.
Discount rate - To determine the discount rate, we review current market indices of high quality corporate bonds, particularly the PruCurve index, to ensure that the rate used in our calculations is consistent and within an acceptable range based on these indices, which reflect current market conditions. The market-based rates are modified to be Rogers-specific, which is done by applying our pension benefit cash flow projections to the generic index rate.
63
Long-term rate of return on assets - To determine the expected long-term rate of return on plan assets, we review historical and projected portfolio performance, the historical long-term rate of return, and we consider how any change in the allocation of the assets could affect the anticipated returns. Adjustments are made to the projected rate of return if it is deemed necessary based on those factors and other current market trends.
Health care cost trend rates - For measurement purposes as of December 31, 2018, we assumed an annual health care cost trend rates of 7.00% and 7.00% for covered health care benefits for retirees pre-age 65 and post-age 65, respectively. The rates were assumed to decrease gradually by 0.25% annually until reaching 4.50% and 4.50%, respectively, and remain at those levels thereafter. For measurement purposes as of December 31, 2017, we assumed annual health care cost trend rates of 7.25% and 7.25% for covered health care benefits for retirees pre-age 65 and post-age 65, respectively. Assumed health care cost trend rates may have a significant effect on the amounts reported for the health care plans. A one-percentage point change in assumed health care cost trend rates would have been expected to have the following effects as of December 31, 2018:
(Dollars in thousands) | Increase | Decrease | |||||
Effect on total service and interest cost | $ | 8 | $ | (8 | ) | ||
Effect on other postretirement benefit obligations | $ | 65 | (60 | ) | |||
Pension Plan Assets
Our defined benefit pension assets are invested with the objective of achieving a total rate of return over the long-term that is sufficient to fund future pension obligations. In managing these assets and our investment strategy, we take into consideration future cash contributions to the plans, as well as the potential of the portfolio underperforming the market, which is partially mitigated by maintaining a diversified portfolio of assets.
In order to meet our investment objectives, we set asset allocation target ranges based on current funding status and future projections in order to mitigate the risk in the plan while maintaining its funded status. In November 2014, we implemented a pension risk reduction strategy related to our investments, which included a change in our asset mix to hold a larger amount of fixed income securities. As of December 31, 2018, we held approximately 1% equity securities and 99% fixed income and short-term cash securities in our portfolio, compared to December 31, 2017 when we held approximately 4% equity securities and 96% fixed income securities.
In determining our investment strategy and calculating the net benefit cost, we utilized an expected long-term rate of return on plan assets. This rate is developed based on several factors, including the plans’ asset allocation targets, the historical and projected performance on those asset classes, and the plans’ current asset composition. To justify our assumptions, we analyze certain data points related to portfolio performance. For example, we analyze the actual historical performance of our total plan assets, which has generated a return of approximately 7.05% over the past 20 year period. Based on the historical returns and the projected future returns, we determined that a target return of 4.69% is appropriate for the current portfolio. Investments were stated at fair value as of the dates reported.
Securities traded on a national securities exchange are valued at the last reported sales price on the last business day of the plan year. The fair value of the guaranteed deposit account was determined through discounting expected future investment cash flow from both investment income and repayment of principal for each investment purchased.
The estimated fair values of the participation units owned by the plan in pooled separate accounts were based on quoted redemption values and adjusted for management fees and asset charges, as determined by the recordkeeper, on the last business day of the relevant plan year. Pooled separate accounts are accounts established solely for the purpose of investing the assets of one or more plans. Funds in a separate account are not commingled with other Company assets for investment purposes.
64
The following table presents the fair value of the pension plan net assets by asset category and level, within the fair value hierarchy, as of December 31, 2018 and 2017.
Assets at Fair Value as of December 31, 2018 | |||||||||||||||
(Dollars in thousands) | Level 1 | Level 2 | Level 3 | Total | |||||||||||
Pooled separate accounts | $ | — | $ | 1,216 | $ | — | $ | 1,216 | |||||||
Fixed income bonds | — | 186,385 | — | 186,385 | |||||||||||
Mutual funds | 2,691 | — | — | 2,691 | |||||||||||
Guaranteed deposit account | — | — | 1,360 | 1,360 | |||||||||||
Total assets at fair value | $ | 2,691 | $ | 187,601 | $ | 1,360 | $ | 191,652 | |||||||
Assets at Fair Value as of December 31, 2017 | |||||||||||||||
(Dollars in thousands) | Level 1 | Level 2 | Level 3 | Total | |||||||||||
Pooled separate accounts | $ | — | $ | 4,610 | $ | — | $ | 4,610 | |||||||
Fixed income bonds | — | 162,934 | — | 162,934 | |||||||||||
Mutual funds | 6,223 | — | — | 6,223 | |||||||||||
Guaranteed deposit account | — | — | 6,289 | 6,289 | |||||||||||
Total assets at fair value | $ | 6,223 | $ | 167,544 | $ | 6,289 | $ | 180,056 | |||||||
The table below sets forth a summary of changes in the fair value of the guaranteed deposit account’s Level 3 assets for the year ended December 31, 2018:
(Dollars in thousands) | Guaranteed Deposit Account | ||
Balance at beginning of year | $ | 6,289 | |
Change in unrealized gain (loss) | (194 | ) | |
Purchases, sales, issuances and settlements (net) | (4,735 | ) | |
Balance at end of year | $ | 1,360 | |
Cash Flows
Contributions
We made a voluntary contribution of $25.0 million to the Merged Plan during the third quarter of 2018 as part of the proposed plan termination process. We made required contributions of $0.4 million to our qualified defined benefit pension plans in 2017. As there is no funding requirement for the Nonqualified Plans or the Retiree Health and Life Insurance benefit plans, we fund the amount of benefit payments made during the year.
Estimated Future Payments
The following pension benefit payments are expected to be paid through the utilization of plan assets for the funded plans and from the Company’s operating cash flows for the unfunded plans. The Retiree Health and Life Insurance benefits, for which no funding has been made, are expected to be paid from the Company’s operating cash flows. The benefit payments are based on the same assumptions used to measure our benefit obligation at the end of fiscal 2018.
(Dollars in thousands) | Pension Benefits | Retiree Health and Life Insurance Benefits | |||||
2019 | $ | 9,500 | $ | 334 | |||
2020 | $ | 9,597 | $ | 265 | |||
2021 | $ | 9,818 | $ | 171 | |||
2022 | $ | 10,038 | $ | 134 | |||
2023 | $ | 10,228 | $ | 151 | |||
2024-2028 | $ | 53,901 | $ | 825 | |||
Employee Savings and Investment Plans
We sponsor the Rogers Employee Savings and Investment Plan (RESIP), a 401(k) plan for domestic employees. Employees can defer an amount they choose, up to the annual IRS limit of $18,500. Certain eligible participants are also allowed to contribute
65
the maximum catch-up contribution per IRS regulations. Our matching contribution is 6% of an eligible employee’s annual pre-tax contribution at a rate of 100% for the first 1% and 50% for the next 5% for a total match of 3.5%. Unless otherwise indicated by the participant, the matching dollars are invested in the same funds as the participant’s contributions. RESIP related expense amounted to $5.6 million in 2018, $4.0 million in 2017 and $3.0 million in 2016, which related solely to our matching contributions.
We acquired Griswold in July 2018 and eligible Griswold employees were included in the Griswold LLC 401K Plan. As of January 2019, eligible Griswold employees are being included in the RESIP. Compensation expense related to the additional Griswold employees was de minimis in 2018. We acquired DSP in January 2017 and DeWAL in November 2016. Eligible DSP and DeWAL employees were included in the RESIP as of the third quarter of 2017 and the first quarter of 2018, respectively. Compensation expense related to the additional DSP and DeWAL employees was de minimis in 2017. DeWAL employees were initially included under the DeWAL Industries, Inc. 401k Profit Sharing Plan (DeWAL Plan) from the acquisition date through the end of 2017. The DeWAL Plan matching contribution was 100% of the first 3% of employee pre-tax contributions.
66
Note 13 – Commitments and Contingencies
Leases
Our principal non-cancelable operating lease obligations are for building space and vehicles. The leases generally provide that we pay maintenance costs. The lease periods typically range from one to five years and include purchase or renewal provisions. We have leases that are cancelable with minimal notice. Additionally, we have capital leases for our manufacturing facility in Eschenbach, Germany as well as office related equipment in various worldwide locations.
The following table includes future minimum lease payments under capital leases together with the present value of the net future minimum lease payments as of December 31, 2018:
(Dollars in thousands) | ||||
Year Ending December 31, | ||||
2019 | $ | 543 | ||
2020 | 525 | |||
2021 | 4,276 | |||
2022 | — | |||
2023 | — | |||
Thereafter | — | |||
Total | 5,344 | |||
Less: Interest | (295 | ) | ||
Present Value of Net Future Minimum Lease Payments | $ | 5,049 | ||
The following table includes future minimum lease payments required under operating leases that have initial or remaining non-cancelable lease terms in excess of one year as of December 31, 2018:
(Dollars in thousands) | ||||
Year Ending December 31, | ||||
2019 | $ | 3,951 | ||
2020 | 3,052 | |||
2021 | 2,216 | |||
2022 | 1,507 | |||
2023 | 491 | |||
Thereafter | — | |||
Total | $ | 11,217 | ||
The following table includes lease expense for each of the three years ended December 31, 2018:
For the Year Ended December 31, | |||||||||||
(Dollars in thousands) | 2018 | 2017 | 2016 | ||||||||
Operating Leases | $ | 3,850 | $ | 3,819 | $ | 3,567 | |||||
Capital Leases | $ | 472 | $ | 608 | $ | 564 | |||||
Environmental & Legal
We are currently engaged in the following environmental and legal proceedings:
Voluntary Corrective Action Program
Our location in Rogers, Connecticut is part of the Connecticut Voluntary Corrective Action Program (VCAP). As part of this program, we partnered with the Connecticut Department of Energy and Environmental Protection (CT DEEP) to determine the corrective actions to be taken at the site related to contamination issues. We evaluated this matter and completed internal due diligence work related to the site in the fourth quarter of 2015. Remediation activities on the site are ongoing and are recorded as reductions to the accrual as they are incurred. We have incurred aggregate remediation costs of $0.7 million through December 31, 2018, and the accrual for future remediation efforts is $1.7 million.
67
Asbestos
Overview
We, like many other industrial companies, have been named as a defendant in a number of lawsuits filed in courts across the country by persons alleging personal injury from exposure to products containing asbestos. We have never mined, milled, manufactured or marketed asbestos; rather, we made and provided to industrial users a limited number of products that contained encapsulated asbestos, but we stopped manufacturing these products in the late 1980s. Most of the claims filed against us involve numerous defendants, sometimes as many as several hundred.
The following table summarizes the change in number of asbestos claims outstanding during 2018 and 2017:
2018 | 2017 | ||||
Claims outstanding at beginning of year | 687 | 605 | |||
New claims filed | 275 | 362 | |||
Pending claims concluded* | (217 | ) | (280 | ) | |
Claims outstanding at end of year | 745 | 687 | |||
* For the year ended December 31, 2018, 192 claims were dismissed and 25 claims were settled. For the year ended December 31, 2017, 258 claims were dismissed and 22 claims were settled. Settlements totaled approximately $7.1 million for the year ended December 31, 2018, compared to $5.0 million for the year ended December 31, 2017.
Impacts on Financial Statements
We recognize a liability for asbestos-related contingencies that are probable of occurrence and reasonably estimable. In connection with the recognition of liabilities for asbestos-related matters, we record asbestos-related insurance receivables that are deemed probable.
The liability projection period covers all current and future claims through 2058, which represents the expected end of our asbestos liability exposure with no further ongoing claims expected beyond that date. This conclusion was based on our history and experience with the claims data, the diminished volatility and consistency of observable claims data, the period of time that has elapsed since we stopped manufacturing products that contained encapsulated asbestos and an expected downward trend in claims due to the average age of our claimants, which is approaching the average life expectancy.
To date, the defense and settlement costs of our asbestos-related product liability litigation have been substantially covered by insurance. We have identified continuous coverage for primary, excess and umbrella insurance from the 1950s through the mid-1980s, except for a period in the early 1960s, with respect to which we have entered into an agreement for primary, but not excess or umbrella, coverage. In addition, we have entered into a cost sharing agreement with most of our primary, excess and umbrella insurance carriers to facilitate the ongoing administration and payment of claims by the carriers. The cost sharing agreement may be terminated by any party, but will continue until a party elects to terminate it. As of the filing date for this report, the agreement has not been terminated, and no carrier had informed us it intended to terminate the agreement. During 2018, we received notices that primary coverage for a period of eight years and excess coverage for a period of three years had been exhausted. In 2018, we incurred indemnity and defense costs of $1.2 million for the year ended December 31, 2018, primarily related to the periods referenced above. We expect to exhaust individual primary, excess and umbrella coverages over time, and there is no assurance that such exhaustion will not accelerate due to additional claims, damages and settlements or that coverage will be available as expected.
The amounts recorded for the asbestos-related liability and the related insurance receivables are based on facts known at the time and a number of assumptions. However, projecting future events, such as the number of new claims to be filed each year, the average cost of disposing of such claims, the length of time it takes to dispose of such claims, coverage issues among insurers and the continuing solvency of various insurance companies, as well as the numerous uncertainties surrounding asbestos litigation in the United States, could cause the actual liability and insurance recoveries for us to be higher or lower than those projected or recorded.
Changes recorded in the estimated liability and estimated insurance recovery based on the projections of asbestos litigation and corresponding insurance coverage, result in the recognition of expense or income. For the years ended December 31, 2018, 2017 and 2016, we recognized expense of $0.7 million, $3.4 million and $0.3 million, respectively. The increase in expense recognized in 2017 compared to 2016 was primarily attributable to the change in the forecast period from 10 years to 40 years.
68
For the years ended December 31, 2018 and 2017, our projected asbestos-related claims and insurance receivables were as follows:
(Dollars in millions) | 2018 | 2017 | |||||
Asbestos-related claims | $ | 70.3 | $ | 76.2 | |||
Asbestos-related insurance receivables | $ | 63.8 | $ | 69.2 | |||
General
In addition to the above issues, the nature and scope of our business brings us in regular contact with the general public and a variety of businesses and government agencies. Such activities inherently subject us to the possibility of litigation, including environmental and product liability matters that are defended and handled in the ordinary course of business. We have established accruals for matters for which management considers a loss to be probable and reasonably estimable. It is the opinion of management that facts known at the present time do not indicate that such litigation will have a material adverse impact on our results of operations, financial position or cash flows.
Note 14 – Income Taxes
The “Income before income tax expense” line item in the consolidated statements of operations consisted of:
(Dollars in thousands) | 2018 | 2017 | 2016 | ||||||||
Domestic | $ | 14,381 | $ | 39,751 | $ | 10,888 | |||||
International | 96,208 | 93,174 | 71,392 | ||||||||
Total | $ | 110,589 | $ | 132,925 | $ | 82,280 | |||||
The “Income tax expense” line item in the consolidated statements of operations consisted of:
(Dollars in thousands) | Current | Deferred | Total | ||||||||
2018 | |||||||||||
Domestic | $ | (341 | ) | $ | (3,007 | ) | $ | (3,348 | ) | ||
International | 26,604 | (318 | ) | 26,286 | |||||||
Total | $ | 26,263 | $ | (3,325 | ) | $ | 22,938 | ||||
2017 | |||||||||||
Domestic | $ | 7,535 | $ | 21,936 | $ | 29,471 | |||||
International | 27,418 | (4,423 | ) | 22,995 | |||||||
Total | $ | 34,953 | $ | 17,513 | $ | 52,466 | |||||
2016 | |||||||||||
Domestic | $ | 2,078 | $ | 3,376 | $ | 5,454 | |||||
International | 24,537 | 4,006 | 28,543 | ||||||||
Total | $ | 26,615 | $ | 7,382 | $ | 33,997 | |||||
69
Deferred tax assets and liabilities as of December 31, 2018 and 2017, were comprised of the following:
(Dollars in thousands) | 2018 | 2017 | |||||
Deferred tax assets | |||||||
Accrued employee benefits and compensation | $ | 4,269 | $ | 8,410 | |||
Tax loss and credit carryforwards | 18,604 | 7,905 | |||||
Reserves and accruals | 4,935 | 4,699 | |||||
Other | 1,953 | 2,977 | |||||
Total deferred tax assets | 29,761 | 23,991 | |||||
Less deferred tax asset valuation allowance | (16,889 | ) | (8,754 | ) | |||
Total deferred tax assets, net of valuation allowance | 12,872 | 15,237 | |||||
Deferred tax liabilities | |||||||
Depreciation and amortization | 8,335 | 14,300 | |||||
Postretirement benefit obligations | 3,234 | 2,311 | |||||
Unremitted earnings | 1,778 | 3,100 | |||||
Other | 2,094 | 224 | |||||
Total deferred tax liabilities | 15,441 | 19,935 | |||||
Net deferred tax asset (liability) | $ | (2,569 | ) | $ | (4,698 | ) | |
As of December 31, 2018, the Company had state net operating loss carryforwards ranging from $3.7 million to $6.1 million in various state taxing jurisdictions, which expire between 2021 and 2038 and approximately $8.4 million of credit carryforwards in Arizona, which will expire between 2019 and 2033. The Company also had $8.3 million of federal research and development credit carryforwards that begin to expire in 2026. We believe that it is more likely than not that the benefit from certain of the state net operating loss, state credits and federal research and development credits carryforwards will not be realized. In recognition of this risk, we have provided a valuation allowance of $16.9 million relating to these carryforwards.
We currently have approximately $3.7 million of foreign tax credits that begin to expire in 2027 and $0.5 million of minimum tax credits that can be utilized or refunded by tax year 2021.
We had a valuation allowance of $16.9 million as of December 31, 2018 and $8.8 million as of December 31, 2017, against certain of our deferred tax assets, primarily carryforwards expected to expire unused and deferred tax assets that are capital in nature. No valuation allowance has been provided on our other deferred tax assets, as we believe it is more likely than not that all such assets will be realized in the applicable jurisdictions. We reached this conclusion after considering the availability of taxable income in prior carryback years, tax planning strategies, and the likelihood of future taxable income exclusive of reversing temporary differences and carryforwards in the respective jurisdictions or entities. Differences between forecasted and actual future operating results or changes in carryforward periods could adversely impact the amount of deferred tax asset considered realizable.
Income tax expense differs from the amount computed by applying the United States federal statutory income tax rate to income before income taxes. The reasons for this difference were as follows:
(Dollars in thousands) | 2018 | 2017 | 2016 | ||||||||
Tax expense at Federal statutory income tax rate | $ | 23,224 | $ | 46,529 | $ | 28,798 | |||||
International tax rate differential | 826 | (9,603 | ) | (2,260 | ) | ||||||
Foreign source income, net of tax credits (excluding U.S. Tax Reform) | (197 | ) | 1,087 | 1,215 | |||||||
State tax, net of federal | 121 | 279 | (200 | ) | |||||||
Unrecognized tax benefits | (869 | ) | 2,874 | (5,555 | ) | ||||||
U.S. Tax Reform | 209 | 13,683 | — | ||||||||
Equity compensation excess tax deductions | (2,238 | ) | (3,867 | ) | — | ||||||
General business credits | (2,172 | ) | (1,080 | ) | (1,125 | ) | |||||
Distribution related foreign taxes | 1,916 | 2,173 | 12,433 | ||||||||
Valuation allowance change (excluding U.S. Tax Reform) | 602 | 1,393 | 171 | ||||||||
Other | 1,516 | (1,002 | ) | 520 | |||||||
Income tax expense (benefit) | $ | 22,938 | $ | 52,466 | $ | 33,997 | |||||
Our effective income tax rate for 2018 was 20.7% compared to 39.5% for 2017. The 2018 rate decrease was primarily due to a lower U.S. statutory tax rate in 2018 and the absence of the one-time impact from the enactment of the Tax Cuts and Jobs Act of
70
2017 (U.S. Tax Reform) in 2017, an increase in reversal of reserves associated with uncertain tax positions and lower foreign tax impact on remitted and unremitted foreign earnings and profits.
The Company did not make any changes in 2018 to its position on the permanent reinvestment of its earnings from foreign operations. With the exception of certain Chinese subsidiaries, the Company continues to assert that historical foreign earnings are indefinitely reinvested. As of December 31, 2018 and 2017, the Company had recorded a deferred tax liability of $1.8 million and $3.1 million, respectively, for Chinese withholding tax on undistributed earnings that are not indefinitely reinvested. The other remaining foreign subsidiaries have both the intent and ability to indefinitely reinvest their undistributed earnings and the Company does not expect that these undistributed earnings should give rise to significant additional tax liabilities as a result of distribution of such earnings.
On December 22, 2017, Staff Accounting Bulletin No. 118 (SAB 118) was issued to address the application of U.S. GAAP in situations when a registrant does not have the necessary information available, prepared, or analyzed (including computations) in reasonable detail to complete the accounting for certain income tax effects of the U.S. Tax Reform. December 22, 2018 marked the end of the measurement period for purposes of SAB 118. As such, we completed our analysis based on currently available legislative updates relating to the U.S. Tax Reform, as well as a more detailed analysis of the post-1986 undistributed earnings and profits that required further adjustment, resulting in a tax expense of $0.2 million in the fourth quarter of 2018 and a total tax expense of $0.2 million for the year ended December 31, 2018. The total tax expense included a $7.5 million benefit related to adjustments to the transition tax and a $7.7 million expense related to the establishment of a valuation allowance against deferred tax assets associated with carried over research and development credits. There were no significant adjustments recorded with respect to finalization of the impact of the U.S. Tax Reform on state taxes and the remeasurement of certain deferred tax assets and liabilities.
Unrecognized tax benefits, excluding potential interest and penalties, for the years ended December 31, 2018 and December 31, 2017, were as follows:
(Dollars in thousands) | 2018 | 2017 | |||||
Beginning balance | $ | 14,565 | $ | 5,883 | |||
Gross increases - current period tax positions | 2,583 | 7,056 | |||||
Gross increases - tax positions in prior periods | 505 | 3,243 | |||||
Gross decreases - tax positions in prior periods | — | (375 | ) | ||||
Foreign currency exchange | (142 | ) | 467 | ||||
Lapse of statute of limitations | (7,710 | ) | (1,709 | ) | |||
Ending balance | $ | 9,801 | $ | 14,565 | |||
Included in the balance of unrecognized tax benefits as of December 31, 2018 were $9.6 million of tax benefits that, if recognized, would impact the effective tax rate. Also included in the balance of unrecognized tax benefit as of December 31, 2018 were $0.2 million of tax benefits that, if recognized, would result in adjustments to other tax accounts, primarily deferred taxes.
We recognize interest accrued related to unrecognized tax benefit as income tax expense. Related to the unrecognized tax benefits noted above, at December 31, 2018 and 2017, we had accrued potential interest and penalties of approximately $0.5 million and $0.6 million, respectively. We have recorded a net income tax benefit of $0.1 million during 2018, net income tax expense of $0.2 million during 2017 and $0.9 million net income tax benefit during 2016. It is possible that up to $1.8 million of our currently unrecognized tax benefits could be recognized within 12 months as a result of projected resolutions of worldwide tax disputes or the expiration of the statute of limitations.
We are subject to taxation in the United States and various state and foreign jurisdictions. Our tax years from 2014 through 2018 are subject to examination by the tax authorities. With few exceptions, we are no longer subject to United States federal, state, local and foreign examinations by tax authorities for the years before 2014.
Note 15 – Operating Segment and Geographic Information
Our reporting structure is comprised of the following strategic operating segments: ACS, EMS and PES. The remaining operations, which represent our non-core businesses, are reported in the Other operating segment. We believe this structure aligns our external reporting presentation with how we currently manage and view our business internally.
On January 1, 2018, we adopted ASU 2014-09, Revenue from Contracts with Customers. For additional information regarding the impacts of adoption of new accounting guidance for revenue recognition, refer to “Note 16 – Revenue from Contracts with Customers.” We sell products to fabricators and distributors who then sell directly into various end markets. End markets within our ACS operating segment include wireless infrastructure, aerospace and defense, automotive, connected devices, wired infrastructure and consumer electronics. End markets within our EMS operating segment include portable electronics, mass transit,
71
automotive and consumer. End markets within our PES operating segment include e-mobility, industrial, renewable energy, mass transit and micro channel coolers. End markets in our Other operating segment include automotive and industrial.
The following table presents a disaggregation of revenue from contracts with customers and other pertinent financial information, for the periods indicated; inter-segment sales have been eliminated from the net sales data:
(Dollars in thousands) | Advanced Connectivity Solutions | Elastomeric Material Solutions | Power Electronics Solutions | Other | Total | ||||||||||||||
2018 | |||||||||||||||||||
Net sales - recognized over time | $ | — | $ | 5,788 | $ | 221,896 | $ | 16,973 | $ | 244,657 | |||||||||
Net sales - recognized at a point in time | $ | 294,154 | $ | 335,576 | $ | 1,442 | $ | 3,262 | $ | 634,434 | |||||||||
Total net sales | $ | 294,154 | $ | 341,364 | $ | 223,338 | $ | 20,235 | $ | 879,091 | |||||||||
Operating income | $ | 33,827 | $ | 52,502 | $ | 19,648 | $ | 6,734 | $ | 112,711 | |||||||||
Total assets | $ | 396,075 | $ | 588,841 | $ | 273,212 | $ | 21,216 | $ | 1,279,344 | |||||||||
Capital expenditures | $ | 61,425 | $ | 10,917 | $ | 18,051 | $ | 156 | $ | 90,549 | |||||||||
Depreciation & amortization | $ | 20,121 | $ | 18,501 | $ | 10,640 | $ | 811 | $ | 50,073 | |||||||||
Investment in unconsolidated joint ventures | $ | — | $ | 18,667 | $ | — | $ | — | $ | 18,667 | |||||||||
Equity income in unconsolidated joint ventures | $ | — | $ | 5,501 | $ | — | $ | — | $ | 5,501 | |||||||||
2017 | |||||||||||||||||||
Total net sales | $ | 301,092 | $ | 312,661 | $ | 184,954 | $ | 22,336 | $ | 821,043 | |||||||||
Operating income | $ | 55,410 | $ | 50,908 | $ | 15,668 | $ | 7,153 | $ | 129,139 | |||||||||
Total assets | $ | 353,786 | $ | 489,456 | $ | 261,034 | $ | 20,858 | $ | 1,125,134 | |||||||||
Capital expenditures | $ | 9,900 | $ | 7,563 | $ | 9,238 | $ | 514 | $ | 27,215 | |||||||||
Depreciation & amortization | $ | 16,351 | $ | 16,270 | $ | 10,572 | $ | 906 | $ | 44,099 | |||||||||
Investment in unconsolidated joint ventures | $ | — | $ | 18,324 | $ | — | $ | — | $ | 18,324 | |||||||||
Equity income in unconsolidated joint ventures | $ | — | $ | 4,898 | $ | — | $ | — | $ | 4,898 | |||||||||
2016 | |||||||||||||||||||
Total net sales | $ | 277,787 | $ | 203,181 | $ | 152,367 | $ | 22,979 | $ | 656,314 | |||||||||
Operating income | $ | 42,455 | $ | 25,884 | $ | 5,229 | $ | 7,329 | $ | 80,897 | |||||||||
Total assets | $ | 361,746 | $ | 421,011 | $ | 247,187 | $ | 26,556 | $ | 1,056,500 | |||||||||
Capital expenditures | $ | 7,569 | $ | 4,051 | $ | 6,009 | $ | 507 | $ | 18,136 | |||||||||
Depreciation & amortization | $ | 15,654 | $ | 10,141 | $ | 11,208 | $ | 844 | $ | 37,847 | |||||||||
Investment in unconsolidated joint ventures | $ | — | $ | 16,183 | $ | — | $ | — | $ | 16,183 | |||||||||
Equity income in unconsolidated joint ventures | $ | — | $ | 4,146 | $ | — | $ | — | $ | 4,146 | |||||||||
72
The following table presents net sales by our operating segment operations by geographic area for the years indicated:
(Dollars in thousands) | Net Sales(1) | |||||||||||||||||||
Region/Country | Advanced Connectivity Solutions | Elastomeric Material Solutions | Power Electronics Solutions | Other | Total | |||||||||||||||
December 31, 2018 | ||||||||||||||||||||
United States | $ | 52,661 | $ | 152,284 | $ | 37,325 | $ | 4,527 | $ | 246,797 | ||||||||||
Other Americas | 3,104 | 14,453 | 931 | 773 | 19,261 | |||||||||||||||
Total Americas | 55,765 | 166,737 | 38,256 | 5,300 | 266,058 | |||||||||||||||
China | 136,315 | 101,036 | 39,781 | 4,959 | 282,091 | |||||||||||||||
Other APAC | 63,318 | 40,788 | 28,414 | 2,892 | 135,412 | |||||||||||||||
Total APAC | 199,633 | 141,824 | 68,195 | 7,851 | 417,503 | |||||||||||||||
Germany | 18,165 | 9,907 | 62,359 | 584 | 91,015 | |||||||||||||||
Other EMEA | 20,591 | 22,896 | 54,528 | 6,500 | 104,515 | |||||||||||||||
Total EMEA | 38,756 | 32,803 | 116,887 | 7,084 | 195,530 | |||||||||||||||
Total net sales | $ | 294,154 | $ | 341,364 | $ | 223,338 | $ | 20,235 | $ | 879,091 | ||||||||||
December 31, 2017 | ||||||||||||||||||||
United States | $ | 48,277 | $ | 141,508 | $ | 30,403 | $ | 5,210 | $ | 225,398 | ||||||||||
Other Americas | 2,946 | 9,709 | 1,153 | 699 | 14,507 | |||||||||||||||
Total Americas | 51,223 | 151,217 | 31,556 | 5,909 | 239,905 | |||||||||||||||
China | 143,065 | 93,039 | 32,164 | 5,123 | 273,391 | |||||||||||||||
Other APAC | 64,077 | 36,233 | 21,845 | 3,421 | 125,576 | |||||||||||||||
Total APAC | 207,142 | 129,272 | 54,009 | 8,544 | 398,967 | |||||||||||||||
Germany | 23,925 | 9,211 | 54,813 | 657 | 88,606 | |||||||||||||||
Other EMEA | 18,802 | 22,961 | 44,576 | 7,226 | 93,565 | |||||||||||||||
Total EMEA | 42,727 | 32,172 | 99,389 | 7,883 | 182,171 | |||||||||||||||
Total net sales | $ | 301,092 | $ | 312,661 | $ | 184,954 | $ | 22,336 | $ | 821,043 | ||||||||||
December 31, 2016 | ||||||||||||||||||||
United States | $ | 46,951 | $ | 61,188 | $ | 25,599 | $ | 5,499 | $ | 139,237 | ||||||||||
Other Americas | 2,035 | 7,722 | 313 | 855 | 10,925 | |||||||||||||||
Total Americas | 48,986 | 68,910 | 25,912 | 6,354 | 150,162 | |||||||||||||||
China | 137,695 | 77,033 | 20,964 | 5,511 | 241,203 | |||||||||||||||
Other APAC | 53,082 | 29,109 | 17,751 | 3,898 | 103,840 | |||||||||||||||
Total APAC | 190,777 | 106,142 | 38,715 | 9,409 | 345,043 | |||||||||||||||
Germany | 19,842 | 7,621 | 53,426 | 849 | 81,738 | |||||||||||||||
Other EMEA | 18,182 | 20,508 | 34,314 | 6,367 | 79,371 | |||||||||||||||
Total EMEA | 38,024 | 28,129 | 87,740 | 7,216 | 161,109 | |||||||||||||||
Total net sales | $ | 277,787 | $ | 203,181 | $ | 152,367 | $ | 22,979 | $ | 656,314 | ||||||||||
(1) Net sales are allocated to countries based on the location of the customer. The table above lists individual countries with 10% or more of net sales for the periods indicated.
Information relating to our long-lived assets by geographic area was as follows as of December 31 for the year indicated:
Long-Lived Assets(1) | |||||||||||
(Dollars in thousands) | 2018 | 2017 | 2016 | ||||||||
United States | $ | 476,560 | $ | 370,964 | $ | 326,199 | |||||
China | 58,205 | 57,404 | 62,728 | ||||||||
Germany | 113,412 | 114,497 | 101,725 | ||||||||
Other | 36,475 | 34,131 | 32,242 | ||||||||
Total | $ | 684,652 | $ | 576,996 | $ | 522,894 | |||||
(1) Long-lived assets are based on the location of the asset and are comprised of goodwill, other intangible assets and property, plant and equipment. Countries with 10% of more of long-lived assets have been disclosed.
73
Note 16 – Revenue from Contracts with Customers
Revenue Recognition
In May 2014, the FASB issued ASU 2014-09, Revenue from Contracts with Customers, to achieve a consistent application of revenue recognition, resulting in a single revenue model to be applied by reporting companies under U.S. generally accepted accounting principles. Under the new model, recognition of revenue occurs when a customer obtains control of promised goods or services in an amount that reflects the consideration to which the providing entity expects to be entitled in exchange for those goods or services. In addition, the new standard requires that reporting companies disclose the nature, amount, timing, and uncertainty of revenue and cash flows arising from contracts with customers.
The Company manufactures some products to customer specifications which are customized to such a degree that it is unlikely that another entity would purchase these products or that we could modify these products for another customer. These products are deemed to have no alternative use to the Company whereby we have an enforceable right to payment evidenced by contractual termination clauses. In accordance with ASC 606, for those circumstances we recognize revenue on an over-time basis. Revenue recognition does not occur until the product meets the definition of “no alternative use” and therefore, items that have not yet reached that point in the production process are not included in the population of items with over-time revenue recognition.
As appropriate, we record estimated reductions to revenue for customer returns, allowances, and warranty claims. Provisions for such reductions are made at the time of sale and are typically derived from historical trends and other relevant information.
Performance Obligations
Manufactured goods are our primary performance obligations. Revenue related to our performance obligations is predominantly recognized at a point in time consistent with our shipping terms. For certain products that meet the criteria of no alternative use whereby the Company has the right to payment, we recognize revenue on an over-time basis.
The selection of a method to measure progress toward completion of a contract requires judgment and is based on the nature of the products or services to be provided. We use the cost incurred method to measure the progress of our contracts with no alternative use products whereby the Company has the right to payment as we believe it is the best depiction of the transferring of value to the customer. Under the cost incurred method, the extent of progress toward completion is measured based on the ratio of costs incurred to date to the total estimated costs at completion of the contract. Contract costs include labor, materials and subcontractors costs, as well as an allocation of indirect costs. Net sales, including estimated fees or profits, are recorded as costs are incurred.
Performance obligations are typically satisfied within three months of receipt of a customer order; therefore, a change in cost estimates will not have a material impact on the percentage of completion noted at the prior quarter end. Our typical payment terms with customers range from 30 days to 105 days. Product pricing is determined and negotiated on a standalone basis. Product pricing is determined without consideration for the pricing, margin, or other information specific to other products that the same customer or other parties related to that customer may also purchase, whether in the same or a different contract. Management allocates the transaction price to its performance obligations primarily based on stand-alone selling prices that may have been developed via specific customer quote for no alternative use products and non-standard products or standard price lists for standard products. The accounting for the estimate of variable consideration is consistent with our current practice.
Contract modifications occur when there is a change to the products, price, or both. Contract modifications are treated as a separate contract if there are additions to promised goods and services that are distinct and if the price for that separate performance obligation reflects the stand-alone selling price for those goods or services. However, if the obligations in the contract modification are not distinct and are part of a single performance obligation that is only partially satisfied, the contract is not determined to be a separate contract and is accounted for as a revision to an existing contract. These modifications are accounted for prospectively when remaining promises are distinct from those previously transferred, or through a cumulative catch-up adjustment.
Contract Balances
The Company has contract assets primarily related to unbilled revenue for revenue recognized related to products that are deemed to have no alternative use whereby we have the right to payment. Revenue is recognized in advance of billing to the customer in these circumstances as billing is typically performed at the time of shipment to the customer. The unbilled revenue is included in the contract assets on the consolidated statements of financial position.
The Company did not have any contract liabilities as of December 31, 2018.
The following table presents contract assets by operating segment as of December 31, 2018:
December 31, 2018 | ||||||||||||||
(Dollars in thousands) | Advanced Connectivity Solutions | Elastomeric Material Solutions | Power Electronics Solutions | Other | Total | |||||||||
Contract Assets | — | 943 | 19,738 | 2,047 | 22,728 | |||||||||
74
No impairment losses were recognized during the year ended December 31, 2018 on any receivables or contract assets arising from our contracts with customers.
Transition
We adopted ASU 2014-09 in the first quarter of 2018 retrospectively with the cumulative effect of applying the standard recognized at the date of implementation and without restatement of comparative periods. This application of the new standard resulted in an increase to the January 1, 2018 balance of retained earnings of approximately $4.2 million, net of tax.
The guidance was applied to all contracts that were not completed at the date of implementation. The primary reason for the impact of adoption is due to over-time revenue recognition.
If the criteria for over-time recognition are not met, revenue is recognized at a point in time. In considering at what point in time control of the product or service has transferred to the customer, we consider qualitative factors such as: 1) present right to payment; 2) legal title to the asset; 3) physical possession; 4) risks and rewards of ownership; and, 5) customer acceptance.
The impact of adoption using the modified retrospective method on the Company’s consolidated financial statements is as follows:
As of | |||||||||||
Consolidated Statements of Financial Position: | December 31, 2017 | January 1, 2018 | |||||||||
(Dollars in thousands) | Under ASC 605 | Impact of Adoption | Under ASC 606 | ||||||||
Contract assets | $ | — | $ | 18,099 | $ | 18,099 | |||||
Inventories | 112,557 | (12,307 | ) | 100,250 | |||||||
Deferred income taxes | 10,706 | 1,580 | 12,286 | ||||||||
Retained earnings | 684,540 | 4,212 | 688,752 | ||||||||
The following tables set forth the amount by which each financial statement line item is affected in the current reporting period by the application of ASC 606, as compared to the guidance that was in effect before its adoption. The impact of adoption on the consolidated financial statements as of and for the year ended December 31, 2018 is as follows:
Consolidated Statements of Operations: | Year Ended | ||||||||||
December 31, 2018 | December 31, 2018 | ||||||||||
(Dollars in thousands, except per share amounts) | Under ASC 605 | Impact of Adoption | Under ASC 606 | ||||||||
Net sales | $ | 874,462 | $ | 4,629 | $ | 879,091 | |||||
Cost of sales | 565,160 | 3,148 | 568,308 | ||||||||
Income tax expense | 22,558 | 380 | 22,938 | ||||||||
Net income | 86,550 | 1,101 | 87,651 | ||||||||
Basic earnings per share | $ | 4.71 | $ | 0.06 | $ | 4.77 | |||||
Diluted earnings per share | $ | 4.64 | $ | 0.06 | $ | 4.70 | |||||
As of | |||||||||||
Consolidated Statements of Financial Position: | December 31, 2018 | December 31, 2018 | |||||||||
(Dollars in thousands) | Under ASC 605 | Impact of Adoption | Under ASC 606 | ||||||||
Contract assets | $ | — | $ | 22,728 | $ | 22,728 | |||||
Inventories | 148,092 | (15,455 | ) | 132,637 | |||||||
Deferred income taxes | 8,846 | 1,960 | 10,806 | ||||||||
Retained earnings | 771,090 | 5,313 | 776,403 | ||||||||
75
Year Ended | |||||||||||
Consolidated Statements of Cash Flows: | December 31, 2018 | December 31, 2018 | |||||||||
(Dollars in thousands) | Under ASC 605 | Impact of Adoption | Under ASC 606 | ||||||||
Cash provided by operating activities: | |||||||||||
Net income | $ | 86,550 | $ | 1,101 | $ | 87,651 | |||||
Deferred income taxes | (3,705 | ) | 380 | (3,325 | ) | ||||||
Contract assets | — | (22,728 | ) | (22,728 | ) | ||||||
Inventories | (34,468 | ) | 15,455 | (19,013 | ) | ||||||
Other, net | (4,801 | ) | 5,792 | 991 | |||||||
Net cash provided by operating activities | 66,820 | — | 66,820 | ||||||||
Practical Expedients
The Company recognizes the incremental costs of obtaining a contract as an expense when incurred as the amortization period of the asset is expected to be one year or less. The Company does not adjust the promised amount of consideration for the effects of a significant financing component as we expect, at contract inception, that the period between when the transfer of goods to our customer occurs and when the customer fully pays for the goods will be one year or less. We do not disclose the Company’s unsatisfied performance obligations as they are part of contracts that have an original expected duration of one year or less.
Note 17 – Restructuring and Impairment Charges
Restructuring Charges
Global Headquarters Relocation
In 2017, we completed the physical relocation of our global headquarters from Rogers, Connecticut to Chandler, Arizona. We recorded $0.6 million, $2.8 million and $0.7 million of expense for the years ended December 31, 2018, 2017 and 2016, respectively, related to the headquarters relocation, including $0.1 million, $0.4 million and $0.6 million of severance benefits expense for the years ended December 31, 2018, 2017 and 2016, respectively. The fair value of the total severance benefits to be paid (including payments already made) in connection with the headquarter relocation was $1.1 million. The total severance costs were expensed ratably over the required service period for the affected employees.
The following table presents severance activity related to the headquarters relocation for the year ended December 31, 2018:
(Dollars in thousands) | Severance Related to Headquarters Relocation | ||
Balance as of December 31, 2017 | $ | 183 | |
Provisions | 186 | ||
Payments | (264 | ) | |
Balance as of December 31, 2018 | $ | 105 | |
Facility Consolidation
On April 24, 2018, we made the decision to consolidate our Santa Fe Springs, California operations into the Company’s facilities in Carol Stream, Illinois and Bear, Delaware. We recorded $2.0 million of expense for the year ended December 31, 2018 related to the facility consolidation, including $0.5 million of severance benefits expense for the year ended December 31, 2018. The fair value of the total severance benefits to be paid (including payments already made) in connection with the facility consolidation is $0.5 million. The total severance costs are being expensed ratably over the required service period for the affected employees. Additionally, we incurred $1.6 million in capital expenditures for the year ended December 31, 2018 related to the facility consolidation.
The following table presents severance activity related to the facility consolidation for the year ended December 31, 2018:
(Dollars in thousands) | Severance Related to Facility Consolidation | ||
Balance as of December 31, 2017 | $ | — | |
Provisions | 546 | ||
Payments | (23 | ) | |
Balance as of December 31, 2018 | $ | 523 | |
76
Impairment Charges
In 2018, we recognized $1.5 million in impairment charges on certain assets in connection with the Isola asset acquisition, which was allocated specifically to the ACS operating segment. In 2017, we recognized a $0.3 million charge related to the impairment of our remaining investment in BrightVolt, Inc. As this investment did not relate to a specific operating segment, we allocated it ratably among ACS, EMS and PES. Also in 2017, we recognized a $0.5 million impairment charge related to the remaining net book value of an other intangible asset within the ROLINX® product line in our PES operating segment.
Allocation of Charges to Operating Segments
The following table summarizes the restructuring and impairment charges recorded in our operating results in 2018, 2017 and 2016:
(Dollars in thousands) | 2018 | 2017 | 2016 | ||||||||
Advanced Connectivity Solutions | |||||||||||
Severance and other related costs | $ | 244 | $ | 1,305 | $ | 375 | |||||
Allocated impairment charges | 1,506 | 161 | — | ||||||||
Elastomeric Material Solutions | |||||||||||
Severance and other related costs | 2,152 | 834 | 176 | ||||||||
Allocated impairment charges | — | 103 | — | ||||||||
Power Electronics Solutions | |||||||||||
Severance and other related costs | 136 | 621 | 183 | ||||||||
Allocated impairment charges | — | 543 | — | ||||||||
Total Restructuring and Impairment Charges | $ | 4,038 | $ | 3,567 | $ | 734 | |||||
Note 18 – Supplemental Financial Information
The components of Other operating (income) expense, net are as follows:
Year Ended December 31, | |||||||||||
(Dollars in thousands) | 2018 | 2017 | 2016 | ||||||||
Gain from antitrust litigation settlement | $ | (4,231 | ) | $ | — | $ | — | ||||
Gain on sale of property, plant and equipment | (164 | ) | (5,329 | ) | — | ||||||
Lease income | (948 | ) | — | — | |||||||
Depreciation on leased assets | 3,512 | — | — | ||||||||
Indemnity claim settlement from acquisitions | (700 | ) | — | — | |||||||
Economic incentive grants | (556 | ) | — | — | |||||||
$ | (3,087 | ) | $ | (5,329 | ) | $ | — | ||||
In 2018, we recorded a gain from the settlement of antitrust litigation in the amount of $4.2 million as a result of the settlement of a class action lawsuit, filed in 2005, which alleged that Dow Chemical Company and other urethane raw material suppliers unlawfully agreed to fix, raise, maintain or stabilize the prices of Polyether Polyol Products sold in the United States from January 1, 1999 through December 31, 2004 in violation of the federal antitrust laws. We also recorded a gain of $0.7 million for the settlement of indemnity claims related to the DSP acquisition, income of $0.6 million from economic incentive grants related to the physical relocation of our global headquarters from Rogers, Connecticut to Chandler, Arizona and a gain on sale of property, plant and equipment of $0.2 million.
In 2018, we recognized lease income of approximately $0.9 million and related depreciation expense on leased assets of approximately $3.5 million in connection with the transitional leaseback of a portion of the facility and certain machinery and equipment acquired from Isola in August 2018.
In 2017, we recognized other operating income of $5.3 million as a result of the sales of a facility and a parcel of land located in Belgium.
Note 19 – Recent Accounting Standards
Recently Issued Standards
In October 2018, the Financial Accounting Standards Board (FASB) issued Accounting Standards Update (ASU) No. 2018-16, Derivatives and Hedging (Topic 815): Inclusion of the Secured Overnight Financing Rate (SOFR) Overnight Index Swap (OIS) Rate as a Benchmark Interest Rate for Hedge Accounting Purposes, which permits the use of the OIS rate based on the SOFR as a U.S. benchmark interest rate for hedge accounting purposes. This ASU is effective for our fiscal year ending December 31, 2019 and the interim periods within that year. The amendments in this update will be adopted on a prospective basis and the Company does not expect this guidance to have a significant impact on our results of operations or statements of cash flows.
77
In August 2018, the FASB issued Accounting Standards Update ASU No. 2018-15, Intangibles - Goodwill and Other - Internal-Use Software (Subtopic 350-40): Customer’s Accounting for Implementation Costs Incurred in a Cloud computing Arrangement that is a Service Contract, which aligns the requirements for capitalizing costs incurred in the implementation of a hosting arrangement that is a service contract with the requirements for capitalizing costs incurred to develop or obtain internal use software. This ASU is effective for our fiscal year ending December 31, 2020 and for the interim periods within that year, with early adoption permitted. The amendments in this update may be applied either retrospectively or prospectively to all implementation costs incurred after the date of adoption. The Company is currently evaluating the potential impact of adopting this guidance on our consolidated financial statements.
In August 2018, the FASB issued ASU No. 2018-14, Compensation - Retirement Benefits - Defined Benefit Plans - General (Subtopic 715-20): Disclosure Framework - Changes to the Disclosure Requirements for Defined Benefit Plans, which modifies the disclosure requirements for employers that sponsor defined benefit plans or other postretirement plans. This ASU is effective for our fiscal year ending December 31, 2020, with early adoption permitted. ASU 2018-14 is required to be applied on a retrospective basis to all periods presented. The Company is currently evaluating the potential impact of adopting this guidance on our consolidated financial statements.
In August 2018, the FASB issued ASU No. 2018-13, Fair Value Measurement (Topic 820): Disclosure Framework—Changes to the Disclosure Requirements for Fair Value Measurement. This ASU modifies the disclosure requirements for fair value measurements by removing the requirement to disclose the amount and reasons for transfers between Level 1 and Level 2 of the fair value hierarchy and the policy for timing of such transfers. This ASU expands the disclosure requirements for Level 3 fair value measurements, primarily focused on changes in unrealized gains and losses included in other comprehensive income (loss). This ASU is effective for our fiscal year ending December 31, 2020 and for the interim periods within that year. Early adoption is permitted. ASU 2018-13 is generally required to be applied retrospectively to all periods presented upon their effective date with the exception of certain amendments, which should be applied prospectively to the most recent interim or annual period presented in the year of adoption. The Company is currently evaluating the potential impact of adopting this guidance on our consolidated financial statements.
In February 2018, the FASB issued ASU No. 2018-02, Income Statement - Reporting Comprehensive Income (Topic 220): Reclassification of Certain Tax Effects from Accumulated Other Comprehensive Income. This ASU allows for reclassification of stranded tax effects resulting from U.S. Tax Reform from accumulated other comprehensive loss to retained earnings but it does not require this reclassification. This ASU is effective for our fiscal year ending December 31, 2019 and the interim periods within that year. The Company will adopt this ASU in the first quarter of 2019 and will not elect to reclassify the stranded tax effects resulting from U.S. Tax Reform. As a result of that election, the adoption of ASU 2018-02 will not have an impact on the Company’s consolidated financial statements and disclosures.
In February 2016, the FASB issued ASU No. 2016-02, Leases, which sets out the principles for the recognition, measurement, presentation and disclosure of leases for both parties to a contract (i.e., lessees and lessors). The new standard requires lessees to classify leases as either finance or operating leases and record a right-of-use asset and a lease liability for all leases with a term of greater than 12 months regardless of their classification. An accounting policy election may be made to account for leases with a term of 12 months or less similar to existing guidance for operating leases today. ASU No. 2016-02 supersedes the existing guidance on accounting for leases. In July 2018, the FASB issued ASU No. 2018-11, Leases (Topic 842): Targeted Improvements, which allows for an optional transition method for the adoption of Topic 842. The two permitted transition methods are now the modified retrospective approach, which applies the new lease requirements at the beginning of the earliest period presented, and the optional transition method, which applies the new lease requirements through a cumulative-effect adjustment to the opening balance of retained earnings in the period of adoption. ASU 2016-02 is effective for our fiscal year ending December 31, 2019 and the interim periods within that year. The Company will adopt this standard in the first quarter of 2019 using the optional transition method. The Company also intends to elect the practical expedients that allows us to carry forward the historical lease classification. The Company has established an inventory of existing leases and implemented a new process of evaluating the classification of each lease. The financial impact of the adoption of the new standard is estimated to increase total assets and total liabilities by approximately $9.0 million to $11.0 million, as of January 1, 2019. The financial impact of the adoption primarily relates to the capitalization of right-of-use assets related to operating leases. The Company has implemented changes to its processes and internal controls, as necessary, to meet the reporting and disclosure requirements of the new standard.
Recently Adopted Standards Reflected in Our 2018 Financial Statements
In March 2018, the FASB issued ASU No. 2018-05, Income Taxes (Topic 740): Amendments to SEC Paragraphs Pursuant to SEC Staff Accounting Bulletin No. 118. This ASU adds guidance that answers questions regarding how certain income tax effects from the U.S. Tax Reform should be applied to companies’ financial statements. The guidance also lists which financial statement disclosures are required under a measurement period approach.
In January 2018, the FASB released guidance on the accounting for tax on the Global Intangible Low Tax Income (GILTI) provisions of U.S. Tax Reform. The GILTI provisions impose a tax on foreign income in excess of a deemed return on tangible assets of foreign corporations. The guidance indicates that accounting for deferred taxes related to GILTI inclusions or treating any taxes
78
on GILTI inclusions as period costs are both acceptable methods subject to an accounting policy election. This guidance was effective for our first quarter of 2018 and the Company elected to treat any potential GILTI inclusions as a period cost.
In December 2017, SAB 118 was issued to address the application of U.S. GAAP in situations when a registrant does not have the necessary information available, prepared, or analyzed (including computations) in reasonable detail to complete the accounting for certain income tax effects of U.S. Tax Reform. In accordance with SAB 118, the company recorded provisional estimates for the deferred tax expense recorded in connection with the remeasurement of certain deferred tax assets and tax expense associated with the mandatory deemed repatriation of foreign earnings at December 31, 2017. The Company completed the analysis of the impact of U.S. Tax Reform during 2018 and recorded an additional tax expense of $0.2 million for the year ended December 31, 2018.
In May 2017, the FASB issued ASU No. 2017-09, Compensation - Stock Compensation (Topic 718): Scope of Modification Accounting. This ASU clarifies which changes to the terms or conditions of a share-based payment award require an entity to apply modification accounting. The Company adopted this standard on January 1, 2018, which did not have a material effect on the consolidated financial statements. Adoption of this standard was applied prospectively to awards modified on or after the adoption date.
In March 2017, the FASB issued ASU No. 2017-07, Compensation - Retirement Benefits (Topic 715): Improving the Presentation of Net Periodic Pension Cost and Net Periodic Post-Retirement Benefit Cost. The changes to the standard require employers to report the service cost component in the same line item as other compensation costs arising from services rendered by employees during the reporting period. The other components of net periodic pension benefit costs are now being presented in the statement of operations separately from the service cost and outside of a subtotal of operating income from operations. In addition, only the service cost component may be eligible for capitalization, where applicable. The Company adopted this standard on January 1, 2018. In conjunction with the adoption of this guidance, the Company reclassified $1.6 million and $3.0 million in net periodic pension benefits from “Selling, general and administrative expenses” to “Other income (expense), net” for the years ended December 31, 2017 and 2016.
79
Note 20 – Quarterly Results of Operations (Unaudited)
2018 | |||||||||||||||
(Dollars in thousands, except per share amounts) | First Quarter | Second Quarter | Third Quarter | Fourth Quarter | |||||||||||
Net sales | $ | 214,611 | $ | 214,675 | $ | 226,863 | $ | 222,942 | |||||||
Gross margin | $ | 76,606 | $ | 76,672 | $ | 79,130 | $ | 78,375 | |||||||
Net income | $ | 26,136 | $ | 17,329 | $ | 19,734 | $ | 24,452 | |||||||
Net income per share: | |||||||||||||||
Basic | $ | 1.43 | $ | 0.94 | $ | 1.07 | $ | 1.33 | |||||||
Diluted | $ | 1.40 | $ | 0.93 | $ | 1.06 | $ | 1.31 | |||||||
(Dollars in thousands, except per share amounts) | 2017 | ||||||||||||||
First Quarter | Second Quarter | Third Quarter | Fourth Quarter | ||||||||||||
Net sales | $ | 203,828 | $ | 201,424 | $ | 206,783 | $ | 209,008 | |||||||
Gross margin | $ | 80,350 | $ | 80,546 | $ | 82,188 | $ | 75,491 | |||||||
Net income | $ | 27,032 | $ | 20,896 | $ | 25,532 | $ | 6,999 | |||||||
Net income per share: | |||||||||||||||
Basic | $ | 1.50 | $ | 1.15 | $ | 1.40 | $ | 0.38 | |||||||
Diluted | $ | 1.47 | $ | 1.13 | $ | 1.37 | $ | 0.37 | |||||||
Note 21 – Share Repurchases
In 2015, we initiated a share repurchase program (the Program) of up to $100.0 million of the Company’s capital stock. We initiated the Program to mitigate potentially dilutive effects of stock options and shares of restricted stock granted by the Company, in addition to enhancing shareholder value. The share repurchase program has no expiration date, and may be suspended or discontinued at any time without notice. As of December 31, 2018, $49.0 million remained of our $100.0 million share repurchase program.
We repurchased the following shares of capital stock through the Program, using cash from operations and cash on hand, during the years presented below:
For the Years Ended December 31, | |||||||
(Dollars in thousands) | 2018 | 2017 | |||||
Shares of capital stock repurchased | 23,138 | — | |||||
Value of capital stock repurchased | $ | 2,999 | $ | — | |||
80
SCHEDULE II
Valuation and Qualifying Accounts
(Dollars in thousands) | Balance at Beginning of Period | Charged to (Reduction of) Costs and Expenses | Taken Against Allowance | Other (Deductions) Recoveries | Balance at End of Period | |||||||||||||||
Allowance for Doubtful Accounts | ||||||||||||||||||||
December 31, 2018 | $ | 1,525 | $ | 189 | $ | (360 | ) | $ | — | $ | 1,354 | |||||||||
December 31, 2017 | $ | 1,952 | $ | (275 | ) | $ | (152 | ) | $ | — | $ | 1,525 | ||||||||
December 31, 2016 | $ | 695 | $ | 1,321 | $ | (64 | ) | $ | — | $ | 1,952 | |||||||||
(Dollars in thousands) | Balance at Beginning of Period | Charged to (Reduction of) Costs and Expenses | Taken Against Allowance | Other (Deductions) Recoveries | Balance at End of Period | |||||||||||||||
Valuation on Allowance for Deferred Tax Assets | ||||||||||||||||||||
December 31, 2018 | $ | 8,754 | $ | 8,135 | $ | — | $ | — | $ | 16,889 | ||||||||||
December 31, 2017 | $ | 6,388 | $ | 2,366 | $ | — | $ | — | $ | 8,754 | ||||||||||
December 31, 2016 | $ | 6,202 | $ | 186 | $ | — | $ | — | $ | 6,388 | ||||||||||
81
Item 9. Changes in and Disagreements with Accountants on Accounting and Financial Disclosure
None.
Item 9A. Controls and Procedures
EVALUATION OF DISCLOSURE CONTROLS AND PROCEDURES
The Company, with the participation of our Chief Executive Officer and Chief Financial Officer, conducted an evaluation of the design and operation of our disclosure controls and procedures, as defined in Rules 13a-15(e) and 15d- 15(e) under the Securities Exchange Act of 1934, as amended (the “Exchange Act”), as of December 31, 2018. The Company’s disclosure controls and procedures are designed (i) to ensure that information required to be disclosed by it in the reports that it files or submits under the Exchange Act is recorded, processed, summarized and reported within the time periods specified in the SEC’s rules and forms and (ii) to ensure that information required to be disclosed in the reports the Company files or submits under the Exchange Act is accumulated and communicated to its management, including its Chief Executive Officer and Chief Financial Officer, as appropriate to allow timely decisions regarding required disclosure. Based on their evaluation, our Chief Executive Officer and Chief Financial Officer have concluded that the Company’s disclosure controls and procedures were effective as of December 31, 2018.
CHANGES IN INTERNAL CONTROL OVER FINANCIAL REPORTING
There were no changes in the Company’s internal control over financial reporting during the fourth quarter of the fiscal year ended December 31, 2018 that have materially affected or are reasonably likely to materially affect its internal control over financial reporting, as defined in Rules 13a-15(f) and 15d-15(f) under the Exchange Act. This evaluation excluded the operations of Griswold LLC (Griswold), which we acquired on July 6, 2018. As part of the ongoing integration activities, we will complete an assessment of Griswold’s existing controls and incorporate our controls and procedures into the acquired operations, as appropriate.
MANAGEMENT’S REPORT ON INTERNAL CONTROL OVER FINANCIAL REPORTING
The management of the Company is responsible for establishing and maintaining adequate internal control over financial reporting as defined in Exchange Act Rules 13a-15(f) and 15d-15(f). The Company’s internal control over financial reporting was designed to provide reasonable assurance regarding the reliability of financial reporting and the preparation of the Company’s financial statements for external purposes in accordance with accounting principles generally accepted in the United States. Our internal control over financial reporting includes those policies and procedures that:
• | pertain to the maintenance of records that, in reasonable detail, accurately and fairly reflect the transactions and dispositions of our assets; |
• | provide reasonable assurance that transactions are recorded as necessary to permit preparation of financial statements in accordance with accounting principles generally accepted in the United States, and that receipts and expenditures are being made only in accordance with authorizations of our management and directors; and |
• | provide reasonable assurance regarding prevention or timely detection of unauthorized acquisition, use or disposition of our assets that could have a material effect on the financial statements. |
Because of its inherent limitations, internal control over financial reporting may not prevent or detect misstatements. Also, projections of any evaluation of effectiveness to future periods are subject to the risk that controls may become inadequate because of changes in conditions, or that the degree of compliance with the policies or procedures may deteriorate.
Management assessed the effectiveness of the Company’s internal control over financial reporting as of December 31, 2018. In making its assessment of internal control over financial reporting, management used the criteria issued by the Committee of Sponsoring Organizations of the Treadway Commission (COSO) in Internal Control-Integrated Framework (2013). Based on the results of this assessment, management, including our Chief Executive Officer and our Chief Financial Officer, has concluded that, as of December 31, 2018, our internal control over financial reporting was effective.
The Company’s independent registered public accounting firm, PricewaterhouseCoopers, LLP, has audited the effectiveness of the Company’s internal control over financial reporting as of December 31, 2018.
On July 6, 2018, the Company acquired 100% of the membership interests in Griswold. As a result, management has excluded Griswold from its assessment of internal control over financial reporting. The Griswold assets are held in a wholly-owned subsidiary whose total assets and total net sales represent 1.3% and 1.6%, respectively, of the Company’s total assets and net sales as of and for the year ended December 31, 2018.
Item 9B. Other Information
None.
82
Part III
Item 10. Directors, Executive Officers and Corporate Governance
We are incorporating by reference the information with respect to the Directors, Executive Officers and Corporate Governance set forth under the captions “Nominees for Director, Director Qualifications and Experience”, “Section 16(a) Beneficial Ownership Reporting Compliance” and “Board of Directors - Meetings of the Board and Committees” in our Definitive Proxy Statement for our 2019 Annual Meeting of Shareholders, which we intend to file within 120 days after the end of our fiscal year pursuant to Section 14(a) of the Exchange Act. Information with respect to our executive officers is presented in Part I, Item 1 of this report and is hereby incorporated into this Item 10 by reference.
Code of Ethics
We have adopted a code of business conduct and ethics policy, which applies to all employees, officers and directors of Rogers Corporation. The Rogers Corporation Code of Business Conduct and Ethics Policy is posted on our website at http://www.rogerscorp.com. We intend to satisfy the disclosure requirements regarding any amendment to, or waiver of, a provision of the Code of Business Conduct and Ethics Policy for our principal executive officer, principal financial officer or principal accounting officer (or others performing similar functions) by posting such information on our website. Our website is not incorporated into or a part of this Form 10-K.
Item 11. Executive Compensation
We are incorporating by reference the information with respect to Executive Compensation set forth under the captions “Board of Directors - Directors’ Compensation”, “Board of Directors - Meetings of the Board and Committees”, “Compensation Discussion and Analysis”, “Compensation and Organization Committee Report” and “2018 Compensation” in our Definitive Proxy Statement for our 2019 Annual Meeting of Shareholders, which we intend to file within 120 days after the end of our fiscal year pursuant to Section 14(a) of the Exchange Act.
Item 12. Security Ownership of Certain Beneficial Owners and Management and Related Stockholder Matters
We are incorporating by reference the information with respect to Security Ownership of Certain Beneficial Owners and Management and Related Stockholder Matters set forth under the captions “Stock Ownership of Management and Directors” and “Beneficial Ownership of More Than Five Percent of Rogers Stock” in our Definitive Proxy Statement for our 2019 Annual Meeting of Shareholders, which we intend to file within 120 days after the end of our fiscal year pursuant to Section 14(a) of the Exchange Act.
Item 13. Certain Relationships and Related Transactions, and Director Independence
We are incorporating by reference the information with respect to Certain Relationships and Related Transactions and Director Independence as set forth under the captions “Related Party Transactions” and “Board of Directors-Director Independence” in our Definitive Proxy Statement for our 2019 Annual Meeting of Shareholders, which we intend to file within 120 days after the end of our fiscal year pursuant to Section 14(a) of the Exchange Act.
Item 14. Principal Accountant Fees and Services
We are incorporating by reference the information with respect to Accountant Fees and Services set forth under the caption “Fees of Independent Registered Public Accounting Firm” in our Definitive Proxy Statement for our 2019 Annual Meeting of Shareholders, which we intend to file within 120 days after the end of our fiscal year pursuant to Section 14(a) of the Exchange Act.
Part IV
Item 15. Exhibits, Financial Statement Schedules
(1) Financial Statements and Schedules.
The following consolidated financial statements of the Company are included in Item 8 of this Form 10-K:
Report of Independent Registered Public Accounting Firm
Consolidated Statements of Operations
Consolidated Statements of Comprehensive Income
Consolidated Statements of Financial Position
Consolidated Statements of Shareholders’ Equity
Consolidated Statements of Cash Flows
83
Notes to Consolidated Financial Statements
(2) Financial Statement Schedules.
Schedule II - Valuation and Qualifying Accounts
Other than as set forth above, schedules are omitted because they are not applicable, or are not required, or because the information is included in the consolidated financial statements and notes thereto.
(3) Exhibits.
The following list of exhibits includes exhibits submitted with this Form 10-K as filed with the SEC and those incorporated by reference to other filings.
3.1 |
3.2 |
10.1 |
10.1.1 |
10.1.2 |
10.2 |
10.2.1 |
10.2.2 |
10.2.3 |
10.2.4 |
10.3 |
10.3.1 |
10.3.2 |
10.4 |
10.5 |
10.6 |
84
10.7 |
10.8 |
10.9 |
10.10 |
10.11 |
10.12 |
10.13 |
21 |
23.1 |
31.1 |
31.2 |
32 |
101 | The following materials from Rogers Corporation’s Annual Report on Form 10-K for the fiscal year ended December 31, 2018, formatted in XBRL (eXtensible Business Reporting Language): (i) Consolidated Statements of Financial Position for the fiscal years ended December 31, 2018 and 2017; (ii) Consolidated Statements of Operations for the fiscal years ended December 31, 2018, 2017 and 2016; (iii) Consolidated Statements of Shareholders’ Equity for the fiscal years ended December 31, 2018, 2017 and 2016; and (iv) Consolidated Statements of Cash Flows for the fiscal years ended December 31, 2018, 2017 and 2016; and (v) Notes to Consolidated Financial Statements. |
** | Management contract or compensatory plan or arrangement. |
Item 16. Form 10-K Summary
Not Applicable.
85
Signatures
Pursuant to the requirements of Section 13 or 15(d) of the Securities Exchange Act of 1934, the Registrant has duly caused this report to be signed on its behalf by the undersigned, thereunto duly authorized.
ROGERS CORPORATION (Registrant) |
/s/ Bruce D. Hoechner |
Bruce D. Hoechner |
President and Chief Executive Officer Principal Executive Officer |
Dated: February 20, 2019 |
Pursuant to the requirements of the Securities Exchange Act of 1934, this report has been signed below on February 20, 2019, by the following persons on behalf of the Registrant and in the capacities indicated.
/s/ Bruce D. Hoechner | /s/ Keith L. Barnes | |
Bruce D. Hoechner President and Chief Executive Officer Director Principal Executive Officer | Keith L. Barnes Director | |
/s/ Michael M. Ludwig | /s/ Carol R. Jensen | |
Michael M. Ludwig Senior Vice President, Chief Financial Officer and Treasurer Principal Financial Officer | Carol R. Jensen Director | |
/s/ Mark D. Weaver | ||
Mark D. Weaver Chief Accounting Officer and Corporate Controller Principal Accounting Officer | Jeffrey J. Owens Director | |
/s/ Michael F. Barry | /s/ Ganesh Moorthy | |
Michael F. Barry Director | Ganesh Moorthy Director | |
/s/ Helene Simonet | /s/ Peter C. Wallace | |
Helene Simonet Director | Peter C. Wallace Director | |
86