UNITED STATES
SECURITIES AND EXCHANGE COMMISSION
Washington, D.C. 20549
FORM N-CSR
CERTIFIED SHAREHOLDER REPORT OF REGISTERED MANAGEMENT
INVESTMENT COMPANIES
|
Investment Company Act file number |
811-05719 | |||||
|
|
| |||||
|
|
Dreyfus Stock Index Fund, Inc. |
| ||||
|
|
(Exact name of Registrant as specified in charter) |
| ||||
|
|
|
| ||||
|
|
c/o The Dreyfus Corporation 200 Park Avenue New York, New York 10166 |
| ||||
|
|
(Address of principal executive offices) (Zip code) |
| ||||
|
|
|
| ||||
|
|
Bennett A. MacDougall, Esq. 200 Park Avenue New York, New York 10166 |
| ||||
|
|
(Name and address of agent for service) |
| ||||
|
| ||||||
|
Registrant's telephone number, including area code: |
(212) 922-6400 | |||||
|
|
| |||||
|
Date of fiscal year end:
|
12/31 |
| ||||
|
Date of reporting period: |
12/31/16
|
| ||||
Dreyfus Stock Index Fund, Inc.
|
|
ANNUAL REPORT December 31, 2016 |

|
|

|
The views expressed in this report reflect those of the portfolio manager(s) only through the end of the period covered and do not necessarily represent the views of Dreyfus or any other person in the Dreyfus organization. Any such views are subject to change at any time based upon market or other conditions and Dreyfus disclaims any responsibility to update such views. These views may not be relied on as investment advice and, because investment decisions for a Dreyfus fund are based on numerous factors, may not be relied on as an indication of trading intent on behalf of any Dreyfus fund. |
|
Not FDIC-Insured • Not Bank-Guaranteed • May Lose Value |
Contents
T H E F U N D
|
Chief Executive Officer |
|
|
With Those of Other Funds |
|
|
Public Accounting Firm |
|
F O R M O R E I N F O R M AT I O N
Back Cover
|
|
The Fund |
A LETTER FROM THE CHIEF EXECUTIVE OFFICER
Dear Shareholder:
We are pleased to present this annual report for Dreyfus Stock Index Fund, Inc. covering the 12-month period from January 1, 2016 through December 31, 2016. For information about how the fund performed during the reporting period, as well as general market perspectives, we provide a Discussion of Fund Performance on the pages that follow.
Stocks and bonds advanced over 2016 despite bouts of market volatility stemming from various economic and political developments. In January, stocks declined sharply and long-term interest rates fell in response to sluggish global economic growth, falling commodity prices, and worries following the first increase in short-term U.S. interest rates in nearly a decade. However, equities began a sustained rebound in February when U.S. monetary policymakers refrained from additional rate hikes, other central banks eased their monetary policies, and commodity prices recovered. After a bout of volatility in June stemming from the United Kingdom’s referendum to leave the European Union, stocks generally continued to climb over the summer. Stock prices moderated in advance of U.S. elections, but markets subsequently rallied to new highs in anticipation of changes in U.S. fiscal and tax policies. In the bond market, yields of high-quality government bonds moved lower over much of the reporting period amid robust investor demand for current income, but yields surged higher after the election due to expectations of rising interest rates. Corporate-backed bonds fared especially well in this environment.
The transition to a new U.S. president and ongoing global economic headwinds suggest that volatility may persist in the financial markets. Some asset classes and industry groups seem likely to benefit from a changing economic and geopolitical landscape, while others probably will face challenges. Consequently, selectivity seems likely to be an important determinant of investment success in 2017. As always, we encourage you to discuss the implications of our observations with your financial advisor.
Thank you for your continued confidence and support.
Sincerely,

Mark D. Santero
Chief Executive Officer
The Dreyfus Corporation
January 17, 2017
2
DISCUSSION OF FUND PERFORMANCE
For the period of January 1, 2016 through December 31, 2016, as provided by Thomas J. Durante, CFA, Karen Q. Wong, CFA, and Richard A. Brown, CFA, Portfolio Managers of Mellon Capital Management Corporation, Sub-Investment Adviser
Market and Fund Performance Overview
For the 12-month period ended December 31, 2016, Dreyfus Stock Index Fund’s Initial shares produced a total return of 11.71%, and its Service shares produced a total return of 11.44%.1 In comparison, the S&P 500 Index (the “Index”), the fund’s benchmark, provided a total return of 11.94% for the same period.2
U.S. stocks achieved solid returns in 2016 on the strength of positive economic growth and expectations of changing fiscal, tax, and regulatory policies under a new presidential administration. The differences in returns between the fund and the Index were primarily the result of transaction costs and operating expenses that are not reflected in the Index’s results.
The Fund’s Investment Approach
The fund seeks to match the total return of the Index by generally investing in all 500 stocks in the Index in proportion to their respective weighting. Often considered a proxy for the stock market in general, the Index is made up of 500 common stocks chosen to reflect the industries of the U.S. economy.
Each company’s stock is weighted by the number of available float shares (i.e., those shares available to investors) divided by the total shares outstanding, which means larger companies with more available float shares have greater representation in the Index than smaller ones. The fund attempts to have a correlation between its performance and that of the Index of at least .95 before fees and expenses. A correlation of 1.00 would mean that the fund and the Index were perfectly correlated.
Economic and Political Developments Drove Equity Markets
U.S. stocks moved sharply lower over the opening weeks of 2016 due to weakening commodity prices, disappointing global economic data, and higher short-term U.S. interest rates. However, equities began a dramatic recovery in February and rallied through the spring in response to rebounding commodity prices, global monetary easing, and indications that additional U.S. rate increases would be delayed.
The market’s advance faltered in June over concerns regarding the United Kingdom’s referendum to leave the European Union, but the decline proved short lived. By early July, the market had regained most of its lost ground, and encouraging U.S. economic data helped the Index advance further over the summer. Stocks gave back some of their previous gains in October when investors became more cautious ahead of the presidential election. After the election, stocks again rallied strongly, and the Index achieved record highs as investors anticipated higher government spending, lower corporate taxes, and a less stringent regulatory environment.
Energy and Financial Stocks Led the 2016 Market
After suffering particularly steep declines early in 2016 in response to plummeting oil prices, the energy sector came roaring back to end the year as the top performing sector within the Index. The energy sector’s rebound was propelled by recovering commodity prices, which enhanced the earnings of oil-and-gas producers that had cut costs and become more efficient during the downturn. Energy infrastructure companies, such as pipeline operators, fared especially well,
3
DISCUSSION OF FUND PERFORMANCE (continued)
while oil refiners generally lagged sector averages. The financials sector languished for much of 2016, in part due to the dampening effect of low interest rates on profit margins. However, banks, capital markets companies, and other financial institutions gained considerable ground in the weeks after the presidential election as investors looked forward to higher interest rates stemming from new pro-growth fiscal policies, an easing of costly banking regulations, lower corporate tax rates, and higher trading volumes.
The industrials sector also fared better than broader market averages, largely due to post-election expectations of rising government spending on infrastructure development and repair. This development especially benefited large equipment producers and railroads. Meanwhile, airlines gained value when reduced industry capacity led to higher ticket prices, and aerospace-and-defense companies rallied in anticipation of higher military spending.
In contrast, only one of the Index’s market segments produced negative absolute returns in 2016: the health care sector. Biotechnology firms and pharmaceutical developers contended throughout the year with industrywide pricing pressures and the derailment of some high-profile mergers. Toward the end of the year, service providers and health care insurers struggled with uncertainty surrounding the future of the Affordable Care Act. In the real estate sector, real estate investment trusts (REITs) gave back previous gains amid waning investor demand for dividend-paying stocks. In addition, REITs that focus on malls and other retail properties were hurt by a generally sluggish retail environment as more consumers made purchases over the internet.
Replicating the Performance of the Index
Although we do not actively manage the fund’s investments in response to macroeconomic trends, we have been encouraged by the stock market’s resilience in the face of political change and persistent global economic headwinds. As always, we have continued to monitor the factors considered by the fund’s investment model in light of current market conditions.
January 17, 2017
Equities are subject generally to market, market sector, market liquidity, issuer, and investment style risks, among other factors, to varying degrees, all of which are more fully described in the fund’s prospectus.
The fund is only available as a funding vehicle under variable life insurance policies or variable annuity contracts issued by insurance companies. Individuals may not purchase shares of the fund directly. A variable annuity is an insurance contract issued by an insurance company that enables investors to accumulate assets on a tax-deferred basis for retirement or other long-term goals. The investment objective and policies of Dreyfus Stock Index Fund, made available through insurance products may be similar to other funds managed by Dreyfus. However, the investment results of the fund may be higher or lower than, and may not be comparable to, those of any other Dreyfus fund.
1 Total return includes reinvestment of dividends and any capital gains paid. Past performance is no guarantee of future results. Share price and investment return fluctuate such that upon redemption, fund shares may be worth more or less than their original cost. The fund’s performance does not reflect the deduction of additional charges and expenses imposed in connection with investing in variable insurance contracts, which will reduce returns.
2 Source: Lipper Inc. — The S&P 500 Index is an unmanaged index of 500 common stocks chosen to reflect the industries of the U.S. economy and is often considered a proxy for the stock market in general. Investors cannot invest directly in any index
3 “Standard & Poor’sÒ,” “S&PÒ,” “Standard & Poor’s 500Ô,”and “S&P 500Ò” are trademarks of Standard & Poor’s Financial Services LLC (“Standard & Poor’s”) and have been licensed for use by the fund. The fund is not sponsored, endorsed, sold, or promoted by Standard & Poor’s, and Standard & Poor’s does not make any representation regarding the advisability of investing in the fund.
4
FUND PERFORMANCE
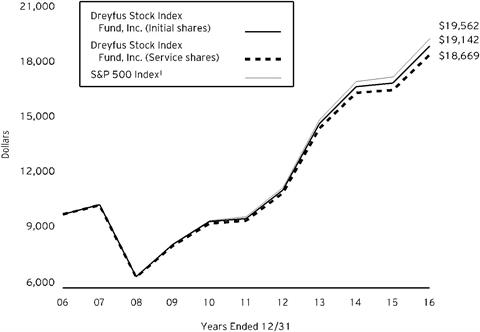
Comparison of change in value of $10,000 investment in Dreyfus Stock Index Fund, Inc. Initial shares and Service shares and the S&P 500 Index (the “Index”)
|
Average Annual Total Returns as of 12/31/16 | |||
|
|
1 Year |
5 Years |
10 Years |
|
Initial shares |
11.71% |
14.38% |
6.71% |
|
Service shares |
11.44% |
14.10% |
6.44% |
|
S&P 500 Index |
11.94% |
14.65% |
6.94% |
† Source: Lipper Inc.
Past performance is not predictive of future performance. The fund’s performance shown in the graph and table does not reflect the deduction of taxes that a shareholder would pay on fund distributions or the redemption of fund shares.
The fund’s performance does not reflect the deduction of additional charges and expenses imposed in connection with investing in variable insurance contracts which will reduce returns.
The above graph compares a $10,000 investment made in Initial and Service shares of Dreyfus Stock Index Fund, Inc. on 12/31/06 to a $10,000 investment made in the Index on that date.
The fund’s Initial shares are not subject to a Rule 12b-1 fee. The fund’s Service shares are subject to a 0.25% annual Rule 12b-1 fee. All dividends and capital gain distributions are reinvested.
The fund’s performance shown in the line graph above takes into account all applicable fund fees and expenses for Initial and Service shares. The Index is an unmanaged index of 500 common stocks chosen to reflect the industries of the U.S. economy and is often considered a proxy for the stock market in general. Unlike a mutual fund, the Index is not subject to charges, fees and other expenses. Investors cannot invest directly in any index. Further information relating to fund performance, including expense reimbursements, if applicable, is contained in the Financial Highlights section of the prospectus and elsewhere in this report.
5
UNDERSTANDING YOUR FUND’S EXPENSES (Unaudited)
As a mutual fund investor, you pay ongoing expenses, such as management fees and other expenses. Using the information below, you can estimate how these expenses affect your investment and compare them with the expenses of other funds. You also may pay one-time transaction expenses, including sales charges (loads), redemption fees and expenses associated with variable annuity or insurance contracts, which are not shown in this section and would have resulted in higher total expenses. For more information, see your fund’s prospectus or talk to your financial adviser.
Review your fund’s expenses
The table below shows the expenses you would have paid on a $1,000 investment in Dreyfus Stock Index Fund, Inc. from July 1, 2016 to December 31, 2016. It also shows how much a $1,000 investment would be worth at the close of the period, assuming actual returns and expenses.
|
Expenses and Value of a $1,000 Investment | ||||||||
|
assuming actual returns for the six months ended December 31, 2016 | ||||||||
|
Initial Shares |
Service Shares | |||||||
|
Expenses paid per $1,000† |
|
$1.46 |
|
$2.77 | ||||
|
Ending value (after expenses) |
|
$1,077.10 |
|
$1,075.90 | ||||
COMPARING YOUR FUND’S EXPENSES
WITH THOSE OF OTHER FUNDS (Unaudited)
Using the SEC’s method to compare expenses
The Securities and Exchange Commission (SEC) has established guidelines to help investors assess fund expenses. Per these guidelines, the table below shows your fund’s expenses based on a $1,000 investment, assuming a hypothetical 5% annualized return. You can use this information to compare the ongoing expenses (but not transaction expenses or total cost) of investing in the fund with those of other funds. All mutual fund shareholder reports will provide this information to help you make this comparison. Please note that you cannot use this information to estimate your actual ending account balance and expenses paid during the period.
|
Expenses and Value of a $1,000 Investment | ||||||||
|
assuming a hypothetical 5% annualized return for the six months ended December 31, 2016 | ||||||||
|
Initial Shares |
Service Shares | |||||||
|
Expenses paid per $1,000† |
|
$1.42 |
|
$2.69 | ||||
|
Ending value (after expenses) |
|
$1,023.73 |
|
$1,022.47 | ||||
† Expenses are equal to the fund’s annualized expense ratio of .28% for Initial shares and .53% for Service shares, multiplied by the average account value over the period, multiplied by 184/366 (to reflect the one-half year period).
6
STATEMENT OF INVESTMENTS
December 31, 2016
|
Common Stocks - 98.8% |
Shares |
Value ($) |
|||
|
Automobiles & Components - .7% |
|||||
|
BorgWarner |
22,800 |
899,232 |
|||
|
Delphi Automotive |
31,469 |
2,119,437 |
|||
|
Ford Motor |
437,732 |
5,309,689 |
|||
|
General Motors |
156,844 |
5,464,445 |
|||
|
Goodyear Tire & Rubber |
30,967 |
955,951 |
|||
|
Harley-Davidson |
20,079 |
a |
1,171,409 |
||
|
15,920,163 |
|||||
|
Banks - 6.7% |
|||||
|
Bank of America |
1,141,772 |
25,233,161 |
|||
|
BB&T |
91,974 |
4,324,617 |
|||
|
Citigroup |
322,242 |
19,150,842 |
|||
|
Citizens Financial Group |
58,601 |
2,087,954 |
|||
|
Comerica |
19,956 |
1,359,203 |
|||
|
Fifth Third Bancorp |
85,622 |
2,309,225 |
|||
|
Huntington Bancshares |
121,666 |
1,608,425 |
|||
|
JPMorgan Chase & Co. |
404,297 |
34,886,788 |
|||
|
KeyCorp |
121,390 |
2,217,795 |
|||
|
M&T Bank |
17,691 |
2,767,403 |
|||
|
People's United Financial |
34,845 |
a |
674,599 |
||
|
PNC Financial Services Group |
55,399 |
6,479,467 |
|||
|
Regions Financial |
142,658 |
2,048,569 |
|||
|
SunTrust Banks |
55,560 |
3,047,466 |
|||
|
U.S. Bancorp |
181,278 |
9,312,251 |
|||
|
Wells Fargo & Co. |
511,718 |
28,200,779 |
|||
|
Zions Bancorporation |
22,974 |
988,801 |
|||
|
146,697,345 |
|||||
|
Capital Goods - 7.3% |
|||||
|
3M |
68,047 |
12,151,153 |
|||
|
Acuity Brands |
4,892 |
1,129,367 |
|||
|
Allegion |
10,234 |
654,976 |
|||
|
AMETEK |
27,023 |
1,313,318 |
|||
|
Arconic |
48,128 |
892,293 |
|||
|
Boeing |
64,864 |
10,098,028 |
|||
|
Caterpillar |
65,745 |
6,097,191 |
|||
|
Cummins |
17,836 |
2,437,646 |
|||
|
Deere & Co. |
32,735 |
a |
3,373,014 |
||
|
Dover |
18,078 |
1,354,585 |
|||
7
STATEMENT OF INVESTMENTS (continued)
|
Common Stocks - 98.8% (continued) |
Shares |
Value ($) |
|||
|
Capital Goods - 7.3% (continued) |
|||||
|
Eaton |
51,565 |
3,459,496 |
|||
|
Emerson Electric |
71,981 |
4,012,941 |
|||
|
Fastenal |
32,172 |
1,511,441 |
|||
|
Flowserve |
15,568 |
a |
748,042 |
||
|
Fluor |
16,549 |
869,153 |
|||
|
Fortive |
33,382 |
1,790,277 |
|||
|
Fortune Brands Home & Security |
17,234 |
921,330 |
|||
|
General Dynamics |
32,750 |
5,654,615 |
|||
|
General Electric |
999,875 |
31,596,050 |
|||
|
Honeywell International |
85,802 |
9,940,162 |
|||
|
Illinois Tool Works |
35,735 |
4,376,108 |
|||
|
Ingersoll-Rand |
28,715 |
2,154,774 |
|||
|
Jacobs Engineering Group |
14,513 |
b |
827,241 |
||
|
Johnson Controls International |
105,135 |
4,330,511 |
|||
|
L-3 Communications Holdings |
8,743 |
1,329,898 |
|||
|
Lockheed Martin |
28,477 |
7,117,541 |
|||
|
Masco |
37,770 |
1,194,287 |
|||
|
Northrop Grumman |
19,937 |
4,636,947 |
|||
|
PACCAR |
39,531 |
2,526,031 |
|||
|
Parker-Hannifin |
15,317 |
2,144,380 |
|||
|
Pentair |
19,784 |
1,109,289 |
|||
|
Quanta Services |
18,065 |
b |
629,565 |
||
|
Raytheon |
33,530 |
4,761,260 |
|||
|
Rockwell Automation |
14,665 |
1,970,976 |
|||
|
Rockwell Collins |
14,853 |
1,377,764 |
|||
|
Roper Technologies |
11,265 |
a |
2,062,396 |
||
|
Snap-on |
6,232 |
1,067,355 |
|||
|
Stanley Black & Decker |
17,036 |
1,953,859 |
|||
|
Textron |
30,968 |
1,503,806 |
|||
|
TransDigm Group |
5,656 |
1,408,118 |
|||
|
United Rentals |
9,586 |
b |
1,012,090 |
||
|
United Technologies |
86,541 |
9,486,624 |
|||
|
W.W. Grainger |
6,218 |
1,444,131 |
|||
|
Xylem |
21,061 |
1,042,941 |
|||
|
161,472,970 |
|||||
|
Commercial & Professional Services - .6% |
|||||
|
Cintas |
9,665 |
1,116,887 |
|||
|
Dun & Bradstreet |
3,746 |
454,465 |
|||
|
Equifax |
13,371 |
1,580,853 |
|||
8
|
Common Stocks - 98.8% (continued) |
Shares |
Value ($) |
|||
|
Commercial & Professional Services - .6% (continued) |
|||||
|
Nielsen Holdings |
37,978 |
1,593,177 |
|||
|
Pitney Bowes |
22,074 |
335,304 |
|||
|
Republic Services |
27,494 |
1,568,533 |
|||
|
Robert Half International |
14,327 |
698,871 |
|||
|
Stericycle |
9,110 |
a,b |
701,834 |
||
|
Verisk Analytics |
17,125 |
b |
1,390,036 |
||
|
Waste Management |
46,938 |
3,328,374 |
|||
|
12,768,334 |
|||||
|
Consumer Durables & Apparel - 1.2% |
|||||
|
Coach |
31,265 |
1,094,900 |
|||
|
D.R. Horton |
37,152 |
1,015,364 |
|||
|
Garmin |
13,643 |
a |
661,549 |
||
|
Hanesbrands |
44,747 |
a |
965,193 |
||
|
Harman International Industries |
7,553 |
839,591 |
|||
|
Hasbro |
12,054 |
a |
937,681 |
||
|
Leggett & Platt |
15,616 |
763,310 |
|||
|
Lennar, Cl. A |
22,082 |
947,980 |
|||
|
Mattel |
38,873 |
1,070,951 |
|||
|
Michael Kors Holdings |
20,145 |
b |
865,832 |
||
|
Mohawk Industries |
6,920 |
b |
1,381,786 |
||
|
Newell Brands |
54,146 |
2,417,619 |
|||
|
NIKE, Cl. B |
151,746 |
7,713,249 |
|||
|
PulteGroup |
37,434 |
688,037 |
|||
|
PVH |
8,909 |
803,948 |
|||
|
Ralph Lauren |
6,872 |
620,679 |
|||
|
Under Armour, Cl. A |
19,832 |
a,b |
576,120 |
||
|
Under Armour, Cl. C |
19,973 |
b |
502,720 |
||
|
VF |
38,116 |
2,033,489 |
|||
|
Whirlpool |
8,605 |
1,564,131 |
|||
|
27,464,129 |
|||||
|
Consumer Services - 1.6% |
|||||
|
Carnival |
47,509 |
2,473,319 |
|||
|
Chipotle Mexican Grill |
3,403 |
a,b |
1,284,020 |
||
|
Darden Restaurants |
14,133 |
1,027,752 |
|||
|
H&R Block |
26,428 |
607,580 |
|||
|
Marriott International, Cl. A |
36,264 |
2,998,308 |
|||
|
McDonald's |
93,973 |
11,438,394 |
|||
|
Royal Caribbean Cruises |
18,715 |
1,535,379 |
|||
|
Starbucks |
164,338 |
9,124,046 |
|||
9
STATEMENT OF INVESTMENTS (continued)
|
Common Stocks - 98.8% (continued) |
Shares |
Value ($) |
|||
|
Consumer Services - 1.6% (continued) |
|||||
|
Wyndham Worldwide |
13,088 |
999,531 |
|||
|
Wynn Resorts |
8,918 |
a |
771,496 |
||
|
Yum! Brands |
39,520 |
2,502,802 |
|||
|
34,762,627 |
|||||
|
Diversified Financials - 5.3% |
|||||
|
Affiliated Managers Group |
6,206 |
b |
901,732 |
||
|
American Express |
87,600 |
6,489,408 |
|||
|
Ameriprise Financial |
17,934 |
1,989,598 |
|||
|
Bank of New York Mellon |
120,372 |
5,703,225 |
|||
|
Berkshire Hathaway, Cl. B |
214,387 |
b |
34,940,793 |
||
|
BlackRock |
13,760 |
5,236,230 |
|||
|
Capital One Financial |
54,712 |
4,773,075 |
|||
|
Charles Schwab |
134,898 |
5,324,424 |
|||
|
CME Group |
37,983 |
4,381,339 |
|||
|
Discover Financial Services |
44,688 |
3,221,558 |
|||
|
E*TRADE Financial |
32,190 |
b |
1,115,384 |
||
|
Franklin Resources |
39,758 |
1,573,622 |
|||
|
Goldman Sachs Group |
41,821 |
10,014,038 |
|||
|
Intercontinental Exchange |
67,203 |
3,791,593 |
|||
|
Invesco |
46,902 |
1,423,007 |
|||
|
Leucadia National |
36,418 |
846,719 |
|||
|
Moody's |
19,282 |
1,817,714 |
|||
|
Morgan Stanley |
163,090 |
6,890,552 |
|||
|
Nasdaq |
13,061 |
876,654 |
|||
|
Navient |
38,690 |
635,677 |
|||
|
Northern Trust |
23,950 |
2,132,748 |
|||
|
S&P Global |
29,342 |
3,155,439 |
|||
|
State Street |
41,470 |
3,223,048 |
|||
|
Synchrony Financial |
88,830 |
3,221,864 |
|||
|
T. Rowe Price Group |
28,009 |
2,107,957 |
|||
|
115,787,398 |
|||||
|
Energy - 7.4% |
|||||
|
Anadarko Petroleum |
62,992 |
4,392,432 |
|||
|
Apache |
42,662 |
2,707,757 |
|||
|
Baker Hughes |
48,414 |
3,145,458 |
|||
|
Cabot Oil & Gas |
50,852 |
1,187,903 |
|||
|
Chesapeake Energy |
83,595 |
a,b |
586,837 |
||
|
Chevron |
213,135 |
25,085,989 |
|||
|
Cimarex Energy |
10,282 |
1,397,324 |
|||
10
|
Common Stocks - 98.8% (continued) |
Shares |
Value ($) |
|||
|
Energy - 7.4% (continued) |
|||||
|
Concho Resources |
16,464 |
b |
2,183,126 |
||
|
ConocoPhillips |
138,919 |
6,965,399 |
|||
|
Devon Energy |
58,745 |
2,682,884 |
|||
|
EOG Resources |
64,912 |
6,562,603 |
|||
|
EQT |
19,349 |
1,265,425 |
|||
|
Exxon Mobil |
468,192 |
42,259,010 |
|||
|
FMC Technologies |
26,101 |
b |
927,369 |
||
|
Halliburton |
97,527 |
5,275,235 |
|||
|
Helmerich & Payne |
11,716 |
906,818 |
|||
|
Hess |
29,481 |
1,836,371 |
|||
|
Kinder Morgan |
215,542 |
4,463,875 |
|||
|
Marathon Oil |
93,228 |
1,613,777 |
|||
|
Marathon Petroleum |
59,509 |
2,996,278 |
|||
|
Murphy Oil |
17,960 |
a |
559,095 |
||
|
National Oilwell Varco |
42,858 |
1,604,604 |
|||
|
Newfield Exploration |
21,907 |
b |
887,234 |
||
|
Noble Energy |
46,865 |
1,783,682 |
|||
|
Occidental Petroleum |
86,247 |
6,143,374 |
|||
|
ONEOK |
23,366 |
a |
1,341,442 |
||
|
Phillips 66 |
50,198 |
4,337,609 |
|||
|
Pioneer Natural Resources |
19,052 |
3,430,694 |
|||
|
Range Resources |
21,056 |
723,484 |
|||
|
Schlumberger |
156,536 |
13,141,197 |
|||
|
Southwestern Energy |
54,891 |
b |
593,921 |
||
|
Spectra Energy |
78,839 |
3,239,495 |
|||
|
Tesoro |
13,539 |
1,183,986 |
|||
|
Transocean |
43,624 |
a,b |
643,018 |
||
|
Valero Energy |
52,038 |
3,555,236 |
|||
|
Williams Cos. |
76,768 |
2,390,556 |
|||
|
164,000,497 |
|||||
|
Food & Staples Retailing - 2.1% |
|||||
|
Costco Wholesale |
49,111 |
7,863,162 |
|||
|
CVS Health |
120,677 |
9,522,622 |
|||
|
Kroger |
108,916 |
3,758,691 |
|||
|
Sysco |
56,959 |
3,153,820 |
|||
|
Walgreens Boots Alliance |
96,543 |
7,989,899 |
|||
|
Wal-Mart Stores |
170,172 |
11,762,289 |
|||
|
Whole Foods Market |
36,455 |
1,121,356 |
|||
|
45,171,839 |
|||||
11
STATEMENT OF INVESTMENTS (continued)
|
Common Stocks - 98.8% (continued) |
Shares |
Value ($) |
|||
|
Food, Beverage & Tobacco - 5.3% |
|||||
|
Altria Group |
219,491 |
14,841,981 |
|||
|
Archer-Daniels-Midland |
65,168 |
2,974,919 |
|||
|
Brown-Forman, Cl. B |
20,697 |
929,709 |
|||
|
Campbell Soup |
21,784 |
1,317,278 |
|||
|
Coca-Cola |
436,849 |
18,111,760 |
|||
|
Conagra Brands |
47,952 |
1,896,502 |
|||
|
Constellation Brands, Cl. A |
20,047 |
3,073,406 |
|||
|
Dr. Pepper Snapple Group |
21,059 |
1,909,420 |
|||
|
General Mills |
66,724 |
4,121,541 |
|||
|
Hershey |
15,825 |
1,636,780 |
|||
|
Hormel Foods |
30,855 |
1,074,063 |
|||
|
J.M. Smucker |
13,216 |
1,692,441 |
|||
|
Kellogg |
28,520 |
2,102,209 |
|||
|
Kraft Heinz |
66,832 |
5,835,770 |
|||
|
McCormick & Co. |
12,842 |
1,198,544 |
|||
|
Mead Johnson Nutrition |
20,928 |
1,480,865 |
|||
|
Molson Coors Brewing, Cl. B |
20,165 |
1,962,256 |
|||
|
Mondelez International, Cl. A |
174,322 |
7,727,694 |
|||
|
Monster Beverage |
45,756 |
b |
2,028,821 |
||
|
PepsiCo |
161,626 |
16,910,928 |
|||
|
Philip Morris International |
175,127 |
16,022,369 |
|||
|
Reynolds American |
93,317 |
5,229,485 |
|||
|
Tyson Foods, Cl. A |
32,807 |
2,023,536 |
|||
|
116,102,277 |
|||||
|
Health Care Equipment & Services - 5.1% |
|||||
|
Abbott Laboratories |
165,863 |
6,370,798 |
|||
|
Aetna |
39,472 |
4,894,923 |
|||
|
AmerisourceBergen |
19,031 |
1,488,034 |
|||
|
Anthem |
29,493 |
4,240,209 |
|||
|
Baxter International |
55,464 |
2,459,274 |
|||
|
Becton Dickinson & Co. |
23,802 |
3,940,421 |
|||
|
Boston Scientific |
152,189 |
b |
3,291,848 |
||
|
C.R. Bard |
8,185 |
1,838,842 |
|||
|
Cardinal Health |
36,264 |
2,609,920 |
|||
|
Centene |
19,000 |
b |
1,073,690 |
||
|
Cerner |
34,052 |
b |
1,613,043 |
||
|
Cigna |
28,770 |
3,837,630 |
|||
|
Cooper |
5,475 |
957,742 |
|||
|
Danaher |
68,348 |
5,320,208 |
|||
12
|
Common Stocks - 98.8% (continued) |
Shares |
Value ($) |
|||
|
Health Care Equipment & Services - 5.1% (continued) |
|||||
|
DaVita |
18,721 |
b |
1,201,888 |
||
|
DENTSPLY SIRONA |
26,832 |
1,549,011 |
|||
|
Edwards Lifesciences |
23,958 |
b |
2,244,865 |
||
|
Envision Healthcare |
13,166 |
b |
833,276 |
||
|
Express Scripts Holding |
69,793 |
b |
4,801,060 |
||
|
HCA Holdings |
33,101 |
b |
2,450,136 |
||
|
Henry Schein |
9,183 |
b |
1,393,153 |
||
|
Hologic |
31,059 |
b |
1,246,087 |
||
|
Humana |
16,816 |
3,430,968 |
|||
|
Intuitive Surgical |
4,370 |
b |
2,771,323 |
||
|
Laboratory Corporation of America Holdings |
11,603 |
b |
1,489,593 |
||
|
McKesson |
25,275 |
3,549,874 |
|||
|
Medtronic |
155,697 |
11,090,297 |
|||
|
Patterson |
9,008 |
a |
369,598 |
||
|
Quest Diagnostics |
15,804 |
1,452,388 |
|||
|
St. Jude Medical |
31,874 |
2,555,976 |
|||
|
Stryker |
34,907 |
4,182,208 |
|||
|
UnitedHealth Group |
107,221 |
17,159,649 |
|||
|
Universal Health Services, Cl. B |
10,032 |
1,067,204 |
|||
|
Varian Medical Systems |
11,368 |
a,b |
1,020,619 |
||
|
Zimmer Biomet Holdings |
22,480 |
2,319,936 |
|||
|
112,115,691 |
|||||
|
Household & Personal Products - 1.9% |
|||||
|
Church & Dwight |
29,176 |
1,289,287 |
|||
|
Clorox |
14,394 |
1,727,568 |
|||
|
Colgate-Palmolive |
100,185 |
6,556,106 |
|||
|
Coty |
53,112 |
972,481 |
|||
|
Estee Lauder, Cl. A |
24,379 |
1,864,750 |
|||
|
Kimberly-Clark |
40,244 |
4,592,645 |
|||
|
Procter & Gamble |
302,095 |
25,400,148 |
|||
|
42,402,985 |
|||||
|
Insurance - 2.8% |
|||||
|
Aflac |
46,537 |
3,238,975 |
|||
|
Allstate |
42,078 |
3,118,821 |
|||
|
American International Group |
110,582 |
7,222,110 |
|||
|
Aon |
29,774 |
3,320,694 |
|||
|
Arthur J. Gallagher & Co. |
19,742 |
1,025,794 |
|||
|
Assurant |
6,829 |
634,141 |
|||
|
Chubb |
52,105 |
6,884,113 |
|||
13
STATEMENT OF INVESTMENTS (continued)
|
Common Stocks - 98.8% (continued) |
Shares |
Value ($) |
|||
|
Insurance - 2.8% (continued) |
|||||
|
Cincinnati Financial |
16,738 |
1,267,904 |
|||
|
Hartford Financial Services Group |
42,802 |
2,039,515 |
|||
|
Lincoln National |
26,329 |
1,744,823 |
|||
|
Loews |
30,064 |
1,407,897 |
|||
|
Marsh & McLennan Cos. |
58,112 |
3,927,790 |
|||
|
MetLife |
123,246 |
6,641,727 |
|||
|
Principal Financial Group |
29,776 |
1,722,839 |
|||
|
Progressive |
64,601 |
2,293,336 |
|||
|
Prudential Financial |
48,639 |
5,061,374 |
|||
|
Torchmark |
12,557 |
926,204 |
|||
|
Travelers |
32,155 |
3,936,415 |
|||
|
Unum Group |
27,151 |
1,192,743 |
|||
|
Willis Towers Watson |
14,576 |
1,782,353 |
|||
|
XL Group |
31,094 |
1,158,562 |
|||
|
60,548,130 |
|||||
|
Materials - 2.8% |
|||||
|
Air Products & Chemicals |
24,250 |
3,487,635 |
|||
|
Albemarle |
12,596 |
1,084,264 |
|||
|
Avery Dennison |
9,516 |
668,214 |
|||
|
Ball |
19,568 |
1,468,970 |
|||
|
CF Industries Holdings |
26,859 |
845,521 |
|||
|
Dow Chemical |
126,810 |
7,256,068 |
|||
|
E.I. du Pont de Nemours & Co. |
97,569 |
7,161,565 |
|||
|
Eastman Chemical |
15,962 |
1,200,502 |
|||
|
Ecolab |
29,358 |
3,441,345 |
|||
|
FMC |
14,705 |
831,715 |
|||
|
Freeport-McMoRan |
139,284 |
a,b |
1,837,156 |
||
|
International Flavors & Fragrances |
8,842 |
1,041,853 |
|||
|
International Paper |
46,473 |
2,465,857 |
|||
|
LyondellBasell Industries, Cl. A |
37,816 |
3,243,857 |
|||
|
Martin Marietta Materials |
7,404 |
1,640,208 |
|||
|
Monsanto |
49,243 |
5,180,856 |
|||
|
Mosaic |
39,295 |
1,152,522 |
|||
|
Newmont Mining |
58,102 |
1,979,535 |
|||
|
Nucor |
35,477 |
2,111,591 |
|||
|
PPG Industries |
29,912 |
2,834,461 |
|||
|
Praxair |
32,089 |
3,760,510 |
|||
|
Sealed Air |
22,022 |
998,477 |
|||
|
Sherwin-Williams |
9,027 |
2,425,916 |
|||
14
|
Common Stocks - 98.8% (continued) |
Shares |
Value ($) |
|||
|
Materials - 2.8% (continued) |
|||||
|
Vulcan Materials |
14,776 |
1,849,216 |
|||
|
WestRock |
29,036 |
1,474,133 |
|||
|
61,441,947 |
|||||
|
Media - 3.0% |
|||||
|
CBS, Cl. B |
44,459 |
2,828,482 |
|||
|
Charter Communications, Cl. A |
24,259 |
b |
6,984,651 |
||
|
Comcast, Cl. A |
269,351 |
18,598,687 |
|||
|
Discovery Communications, Cl. A |
16,778 |
a,b |
459,885 |
||
|
Discovery Communications, Cl. C |
26,806 |
b |
717,865 |
||
|
Interpublic Group of Companies |
45,800 |
1,072,178 |
|||
|
News Corp., Cl. A |
42,339 |
485,205 |
|||
|
News Corp., Cl. B |
11,662 |
137,612 |
|||
|
Omnicom Group |
27,006 |
2,298,481 |
|||
|
Scripps Networks Interactive, Cl. A |
10,903 |
778,147 |
|||
|
TEGNA |
24,620 |
526,622 |
|||
|
Time Warner |
87,665 |
8,462,302 |
|||
|
Twenty-First Century Fox, Cl. A |
120,101 |
3,367,632 |
|||
|
Twenty-First Century Fox, Cl. B |
54,492 |
1,484,907 |
|||
|
Viacom, Cl. B |
39,470 |
1,385,397 |
|||
|
Walt Disney |
165,436 |
17,241,740 |
|||
|
66,829,793 |
|||||
|
Pharmaceuticals, Biotechnology & Life Sciences - 8.4% |
|||||
|
AbbVie |
183,295 |
11,477,933 |
|||
|
Agilent Technologies |
37,187 |
1,694,240 |
|||
|
Alexion Pharmaceuticals |
24,810 |
b |
3,035,504 |
||
|
Allergan |
42,251 |
8,873,133 |
|||
|
Amgen |
84,282 |
12,322,871 |
|||
|
Biogen |
24,642 |
b |
6,987,978 |
||
|
Bristol-Myers Squibb |
188,077 |
10,991,220 |
|||
|
Celgene |
87,527 |
b |
10,131,250 |
||
|
Eli Lilly & Co. |
109,343 |
8,042,178 |
|||
|
Endo International |
22,198 |
b |
365,601 |
||
|
Gilead Sciences |
149,643 |
10,715,935 |
|||
|
Illumina |
16,407 |
b |
2,100,752 |
||
|
Johnson & Johnson |
307,309 |
35,405,070 |
|||
|
Mallinckrodt |
12,698 |
b |
632,614 |
||
|
Merck & Co. |
310,302 |
18,267,479 |
|||
|
Mettler-Toledo International |
3,001 |
b |
1,256,099 |
||
|
Mylan |
51,607 |
b |
1,968,807 |
||
15
STATEMENT OF INVESTMENTS (continued)
|
Common Stocks - 98.8% (continued) |
Shares |
Value ($) |
|||
|
Pharmaceuticals, Biotechnology & Life Sciences - 8.4% (continued) |
|||||
|
PerkinElmer |
12,123 |
632,214 |
|||
|
Perrigo |
16,097 |
1,339,753 |
|||
|
Pfizer |
685,145 |
22,253,510 |
|||
|
Regeneron Pharmaceuticals |
8,510 |
b |
3,123,936 |
||
|
Thermo Fisher Scientific |
44,579 |
6,290,097 |
|||
|
Vertex Pharmaceuticals |
27,284 |
b |
2,010,012 |
||
|
Waters |
8,990 |
b |
1,208,166 |
||
|
Zoetis |
55,501 |
2,970,969 |
|||
|
184,097,321 |
|||||
|
Real Estate - 2.8% |
|||||
|
American Tower |
48,034 |
c |
5,076,233 |
||
|
Apartment Investment & Management, Cl. A |
17,129 |
c |
778,513 |
||
|
AvalonBay Communities |
15,192 |
c |
2,691,263 |
||
|
Boston Properties |
16,862 |
c |
2,120,902 |
||
|
CBRE Group, Cl. A |
33,493 |
b,c |
1,054,695 |
||
|
Crown Castle International |
40,427 |
c |
3,507,851 |
||
|
Digital Realty Trust |
17,868 |
a,c |
1,755,710 |
||
|
Equinix |
7,993 |
c |
2,856,778 |
||
|
Equity Residential |
40,529 |
c |
2,608,446 |
||
|
Essex Property Trust |
7,209 |
c |
1,676,093 |
||
|
Extra Space Storage |
13,718 |
c |
1,059,578 |
||
|
Federal Realty Investment Trust |
7,716 |
c |
1,096,521 |
||
|
General Growth Properties |
64,692 |
c |
1,616,006 |
||
|
HCP |
52,374 |
a,c |
1,556,555 |
||
|
Host Hotels & Resorts |
83,282 |
c |
1,569,033 |
||
|
Iron Mountain |
26,946 |
c |
875,206 |
||
|
Kimco Realty |
47,152 |
c |
1,186,344 |
||
|
Macerich |
14,237 |
c |
1,008,549 |
||
|
Mid-America Apartment Communities |
12,761 |
c |
1,249,557 |
||
|
Prologis |
59,617 |
c |
3,147,181 |
||
|
Public Storage |
16,827 |
c |
3,760,835 |
||
|
Realty Income |
28,881 |
c |
1,660,080 |
||
|
Simon Property Group |
35,337 |
c |
6,278,325 |
||
|
SL Green Realty |
10,988 |
c |
1,181,759 |
||
|
UDR |
29,091 |
c |
1,061,240 |
||
|
Ventas |
39,462 |
c |
2,467,164 |
||
|
Vornado Realty Trust |
19,624 |
c |
2,048,157 |
||
|
Welltower |
40,873 |
c |
2,735,630 |
||
16
|
Common Stocks - 98.8% (continued) |
Shares |
Value ($) |
|||
|
Real Estate - 2.8% (continued) |
|||||
|
Weyerhaeuser |
84,114 |
c |
2,530,990 |
||
|
62,215,194 |
|||||
|
Retailing - 5.3% |
|||||
|
Advance Auto Parts |
8,069 |
a |
1,364,629 |
||
|
Amazon.com |
44,522 |
b |
33,385,712 |
||
|
AutoNation |
7,413 |
b |
360,642 |
||
|
AutoZone |
3,270 |
b |
2,582,613 |
||
|
Bed Bath & Beyond |
17,332 |
a |
704,372 |
||
|
Best Buy |
30,994 |
a |
1,322,514 |
||
|
CarMax |
21,971 |
a,b |
1,414,713 |
||
|
Dollar General |
29,325 |
2,172,103 |
|||
|
Dollar Tree |
26,188 |
b |
2,021,190 |
||
|
Expedia |
13,536 |
1,533,358 |
|||
|
Foot Locker |
15,344 |
a |
1,087,736 |
||
|
Gap |
26,364 |
a |
591,608 |
||
|
Genuine Parts |
17,058 |
1,629,721 |
|||
|
Home Depot |
137,732 |
18,467,107 |
|||
|
Kohl's |
20,100 |
a |
992,538 |
||
|
L Brands |
27,116 |
1,785,317 |
|||
|
LKQ |
34,220 |
b |
1,048,843 |
||
|
Lowe's |
98,334 |
6,993,514 |
|||
|
Macy's |
34,787 |
1,245,722 |
|||
|
Netflix |
48,239 |
b |
5,971,988 |
||
|
Nordstrom |
13,213 |
a |
633,299 |
||
|
O'Reilly Automotive |
10,880 |
a,b |
3,029,101 |
||
|
Priceline Group |
5,588 |
b |
8,192,343 |
||
|
Ross Stores |
45,361 |
2,975,682 |
|||
|
Signet Jewelers |
7,936 |
748,047 |
|||
|
Staples |
68,569 |
620,549 |
|||
|
Target |
63,539 |
4,589,422 |
|||
|
The TJX Companies |
74,660 |
5,609,206 |
|||
|
Tiffany & Co. |
12,708 |
a |
983,980 |
||
|
Tractor Supply |
14,814 |
1,123,049 |
|||
|
TripAdvisor |
12,112 |
b |
561,633 |
||
|
Ulta Salon Cosmetics & Fragrance |
6,632 |
b |
1,690,762 |
||
|
Urban Outfitters |
10,351 |
b |
294,796 |
||
|
117,727,809 |
|||||
|
Semiconductors & Semiconductor Equipment - 3.3% |
|||||
|
Analog Devices |
34,867 |
2,532,042 |
|||
17
STATEMENT OF INVESTMENTS (continued)
|
Common Stocks - 98.8% (continued) |
Shares |
Value ($) |
|||
|
Semiconductors & Semiconductor Equipment - 3.3% (continued) |
|||||
|
Applied Materials |
122,571 |
3,955,366 |
|||
|
Broadcom |
44,844 |
7,927,074 |
|||
|
First Solar |
7,929 |
a,b |
254,442 |
||
|
Intel |
535,020 |
19,405,175 |
|||
|
KLA-Tencor |
17,400 |
1,369,032 |
|||
|
Lam Research |
18,335 |
1,938,560 |
|||
|
Linear Technology |
26,310 |
1,640,429 |
|||
|
Microchip Technology |
24,065 |
1,543,770 |
|||
|
Micron Technology |
120,214 |
b |
2,635,091 |
||
|
NVIDIA |
60,133 |
6,418,596 |
|||
|
Qorvo |
14,534 |
a,b |
766,378 |
||
|
QUALCOMM |
166,687 |
10,867,992 |
|||
|
Skyworks Solutions |
21,180 |
a |
1,581,299 |
||
|
Texas Instruments |
113,503 |
8,282,314 |
|||
|
Xilinx |
28,382 |
1,713,421 |
|||
|
72,830,981 |
|||||
|
Software & Services - 12.1% |
|||||
|
Accenture, Cl. A |
70,161 |
8,217,958 |
|||
|
Activision Blizzard |
75,833 |
2,738,330 |
|||
|
Adobe Systems |
55,658 |
b |
5,729,991 |
||
|
Akamai Technologies |
19,815 |
b |
1,321,264 |
||
|
Alliance Data Systems |
6,883 |
1,572,766 |
|||
|
Alphabet, Cl. A |
33,423 |
b |
26,486,056 |
||
|
Alphabet, Cl. C |
33,498 |
b |
25,854,426 |
||
|
Autodesk |
22,174 |
b |
1,641,098 |
||
|
Automatic Data Processing |
51,029 |
5,244,761 |
|||
|
CA |
35,277 |
1,120,750 |
|||
|
Citrix Systems |
17,304 |
b |
1,545,420 |
||
|
Cognizant Technology Solutions, Cl. A |
68,285 |
b |
3,826,009 |
||
|
CSRA |
15,162 |
482,758 |
|||
|
eBay |
118,405 |
b |
3,515,444 |
||
|
Electronic Arts |
34,042 |
a,b |
2,681,148 |
||
|
Facebook, Cl. A |
264,192 |
b |
30,395,290 |
||
|
Fidelity National Information Services |
36,625 |
2,770,315 |
|||
|
Fiserv |
24,974 |
b |
2,654,237 |
||
|
Global Payments |
17,220 |
1,195,240 |
|||
|
International Business Machines |
97,996 |
16,266,356 |
|||
|
Intuit |
27,652 |
3,169,196 |
|||
|
Mastercard, Cl. A |
108,038 |
11,154,923 |
|||
18
|
Common Stocks - 98.8% (continued) |
Shares |
Value ($) |
|||
|
Software & Services - 12.1% (continued) |
|||||
|
Microsoft |
877,758 |
54,543,882 |
|||
|
Oracle |
339,441 |
13,051,506 |
|||
|
Paychex |
35,741 |
2,175,912 |
|||
|
PayPal Holdings |
126,255 |
b |
4,983,285 |
||
|
Red Hat |
19,963 |
b |
1,391,421 |
||
|
salesforce.com |
72,456 |
b |
4,960,338 |
||
|
Symantec |
69,197 |
1,653,116 |
|||
|
Teradata |
16,481 |
b |
447,789 |
||
|
Total System Services |
18,754 |
919,509 |
|||
|
VeriSign |
10,951 |
a,b |
833,043 |
||
|
Visa, Cl. A |
211,026 |
16,464,249 |
|||
|
Western Union |
56,534 |
a |
1,227,918 |
||
|
Xerox |
96,376 |
841,362 |
|||
|
Yahoo! |
99,030 |
b |
3,829,490 |
||
|
266,906,556 |
|||||
|
Technology Hardware & Equipment - 5.1% |
|||||
|
Amphenol, Cl. A |
34,783 |
2,337,418 |
|||
|
Apple |
602,550 |
69,787,341 |
|||
|
Cisco Systems |
566,727 |
17,126,490 |
|||
|
Corning |
107,125 |
2,599,924 |
|||
|
F5 Networks |
7,782 |
b |
1,126,211 |
||
|
FLIR Systems |
15,166 |
548,858 |
|||
|
Harris |
13,494 |
1,382,730 |
|||
|
Hewlett Packard Enterprise |
186,815 |
4,322,899 |
|||
|
HP |
193,428 |
2,870,472 |
|||
|
Juniper Networks |
42,907 |
1,212,552 |
|||
|
Motorola Solutions |
18,713 |
1,551,121 |
|||
|
NetApp |
31,516 |
1,111,569 |
|||
|
Seagate Technology |
33,426 |
a |
1,275,870 |
||
|
TE Connectivity |
40,200 |
2,785,056 |
|||
|
Western Digital |
32,165 |
2,185,612 |
|||
|
112,224,123 |
|||||
|
Telecommunication Services - 2.6% |
|||||
|
AT&T |
692,680 |
29,459,680 |
|||
|
CenturyLink |
61,508 |
1,462,660 |
|||
|
Frontier Communications |
126,110 |
a |
426,252 |
||
|
Level 3 Communications |
32,503 |
b |
1,831,869 |
||
|
Verizon Communications |
460,279 |
24,569,693 |
|||
|
57,750,154 |
|||||
19
STATEMENT OF INVESTMENTS (continued)
|
Common Stocks - 98.8% (continued) |
Shares |
Value ($) |
|||
|
Transportation - 2.3% |
|||||
|
Alaska Air Group |
13,736 |
a |
1,218,795 |
||
|
American Airlines Group |
59,942 |
2,798,692 |
|||
|
CH Robinson Worldwide |
16,089 |
a |
1,178,680 |
||
|
CSX |
107,426 |
3,859,816 |
|||
|
Delta Air Lines |
84,518 |
4,157,440 |
|||
|
Expeditors International of Washington |
20,436 |
1,082,291 |
|||
|
FedEx |
27,538 |
5,127,576 |
|||
|
J.B. Hunt Transport Services |
10,158 |
986,037 |
|||
|
Kansas City Southern |
12,245 |
1,038,988 |
|||
|
Norfolk Southern |
33,539 |
3,624,560 |
|||
|
Ryder System |
5,594 |
416,417 |
|||
|
Southwest Airlines |
70,001 |
3,488,850 |
|||
|
Union Pacific |
93,841 |
9,729,435 |
|||
|
United Continental Holdings |
33,278 |
b |
2,425,301 |
||
|
United Parcel Service, Cl. B |
77,811 |
8,920,253 |
|||
|
50,053,131 |
|||||
|
Utilities - 3.1% |
|||||
|
AES |
71,053 |
825,636 |
|||
|
Alliant Energy |
25,476 |
965,286 |
|||
|
Ameren |
27,309 |
1,432,630 |
|||
|
American Electric Power |
54,807 |
3,450,649 |
|||
|
American Water Works |
19,959 |
1,444,233 |
|||
|
CenterPoint Energy |
49,503 |
1,219,754 |
|||
|
CMS Energy |
30,145 |
1,254,635 |
|||
|
Consolidated Edison |
34,098 |
2,512,341 |
|||
|
Dominion Resources |
70,399 |
5,391,859 |
|||
|
DTE Energy |
19,966 |
1,966,851 |
|||
|
Duke Energy |
77,279 |
5,998,396 |
|||
|
Edison International |
36,276 |
2,611,509 |
|||
|
Entergy |
20,377 |
1,497,098 |
|||
|
Eversource Energy |
34,641 |
1,913,222 |
|||
|
Exelon |
103,820 |
3,684,572 |
|||
|
FirstEnergy |
46,108 |
1,427,965 |
|||
|
NextEra Energy |
52,540 |
6,276,428 |
|||
|
NiSource |
34,042 |
753,690 |
|||
|
NRG Energy |
37,334 |
457,715 |
|||
|
PG&E |
57,029 |
3,465,652 |
|||
|
Pinnacle West Capital |
12,470 |
973,034 |
|||
|
PPL |
76,632 |
2,609,320 |
|||
20
|
Common Stocks - 98.8% (continued) |
Shares |
Value ($) |
|||
|
Utilities - 3.1% (continued) |
|||||
|
Public Service Enterprise Group |
56,373 |
2,473,647 |
|||
|
SCANA |
16,090 |
1,179,075 |
|||
|
Sempra Energy |
28,053 |
2,823,254 |
|||
|
Southern |
109,964 |
5,409,129 |
|||
|
WEC Energy Group |
35,907 |
2,105,946 |
|||
|
Xcel Energy |
57,273 |
2,331,011 |
|||
|
68,454,537 |
|||||
|
Total Common Stocks (cost $908,413,957) |
2,175,745,931 |
||||
|
Short-Term Investments - .1% |
Principal Amount ($) |
Value ($) |
|||
|
U.S. Treasury Bills |
|||||
|
0.52%, 3/16/17 |
1,325,000 |
d |
1,323,688 |
||
|
Other Investment - 1.1% |
Shares |
Value ($) |
|||
|
Registered Investment Company; |
|||||
|
Dreyfus Institutional Preferred Government Plus Money Market Fund |
25,283,384 |
e |
25,283,384 |
||
|
Investment of Cash Collateral for Securities Loaned - .5% |
|||||
|
Registered Investment Company; |
|||||
|
Dreyfus Institutional Preferred Money Market Fund, Hamilton Shares |
9,945,073 |
e |
9,945,073 |
||
|
Total Investments (cost $944,966,009) |
100.5% |
2,212,298,076 |
|||
|
Liabilities, Less Cash and Receivables |
(.5%) |
(10,160,406) |
|||
|
Net Assets |
100.0% |
2,202,137,670 |
|||
aSecurity, or portion thereof, on loan. At December 31, 2016, the value of the fund’s securities on loan was $42,261,603 and the value of the collateral held by the fund was $43,475,171, consisting of cash collateral of $9,945,073 and U.S. Government & Agency securities valued at $33,530,098.
b Non-income producing security.
c Investment in real estate investment trust.
d Held by or on behalf of a counterparty for open futures contracts.
e Investment in affiliated money market mutual fund.
21
STATEMENT OF INVESTMENTS (continued)
|
Portfolio Summary (Unaudited) † |
Value (%) |
|
Software & Services |
12.1 |
|
Pharmaceuticals, Biotechnology & Life Sciences |
8.4 |
|
Energy |
7.4 |
|
Capital Goods |
7.3 |
|
Banks |
6.7 |
|
Diversified Financials |
5.3 |
|
Food, Beverage & Tobacco |
5.3 |
|
Retailing |
5.3 |
|
Health Care Equipment & Services |
5.1 |
|
Technology Hardware & Equipment |
5.1 |
|
Semiconductors & Semiconductor Equipment |
3.3 |
|
Utilities |
3.1 |
|
Media |
3.0 |
|
Insurance |
2.8 |
|
Materials |
2.8 |
|
Real Estate |
2.8 |
|
Telecommunication Services |
2.6 |
|
Transportation |
2.3 |
|
Food & Staples Retailing |
2.1 |
|
Household & Personal Products |
1.9 |
|
Short-Term/Money Market Investments |
1.7 |
|
Consumer Services |
1.6 |
|
Consumer Durables & Apparel |
1.2 |
|
Automobiles & Components |
.7 |
|
Commercial & Professional Services |
.6 |
|
100.5 |
† Based on net assets.
See notes to financial statements.
22
STATEMENT OF FUTURES
December 31, 2016
|
Contracts |
Market Value Covered by Contracts ($) |
Expiration |
Unrealized (Depreciation) ($) |
||||
|
Futures Long |
|||||||
|
Standard & Poor's 500 E-mini |
259 |
28,958,790 |
March 2017 |
(242,979) |
|||
|
Gross Unrealized Depreciation |
(242,979) |
||||||
See notes to financial statements.
23
STATEMENT OF ASSETS AND LIABILITIES
December 31, 2016
|
|
|
|
|
|
|
|
|
|
|
|
Cost |
|
Value |
|
|
Assets ($): |
|
|
|
| ||
|
Investments in securities—See Statement of Investments |
|
|
|
| ||
|
Unaffiliated issuers |
|
909,737,552 |
|
2,177,069,619 |
| |
|
Affiliated issuers |
|
35,228,457 |
|
35,228,457 |
| |
|
Cash |
|
|
|
|
710,911 |
|
|
Dividends and securities lending income receivable |
|
|
|
|
2,779,000 |
|
|
Prepaid expenses |
|
|
|
|
8,876 |
|
|
|
|
|
|
|
2,215,796,863 |
|
|
Liabilities ($): |
|
|
|
| ||
|
Due to The Dreyfus Corporation and affiliates—Note 3(c) |
|
|
|
|
509,386 |
|
|
Liability for securities on loan—Note 1(b) |
|
|
|
|
9,945,073 |
|
|
Payable for shares of Common Stock redeemed |
|
|
|
|
2,888,037 |
|
|
Payable for futures variation margin—Note 4 |
|
|
|
|
115,705 |
|
|
Accrued expenses |
|
|
|
|
200,992 |
|
|
|
|
|
|
|
13,659,193 |
|
|
Net Assets ($) |
|
|
2,202,137,670 |
| ||
|
Composition of Net Assets ($): |
|
|
|
| ||
|
Paid-in capital |
|
|
|
|
916,135,707 |
|
|
Accumulated undistributed investment income—net |
|
|
|
|
733,550 |
|
|
Accumulated net realized gain (loss) on investments |
|
|
|
|
18,179,325 |
|
|
Accumulated net unrealized appreciation (depreciation) |
|
|
|
1,267,089,088 |
| |
|
Net Assets ($) |
|
|
2,202,137,670 |
| ||
|
Net Asset Value Per Share |
Initial Shares |
Service Shares |
|
|
Net Assets ($) |
2,001,467,653 |
200,670,017 |
|
|
Shares Outstanding |
43,643,544 |
4,370,483 |
|
|
Net Asset Value Per Share ($) |
45.86 |
45.91 |
|
|
See notes to financial statements. |
24
STATEMENT OF OPERATIONS
Year Ended December 31, 2016
|
|
|
|
|
|
|
|
|
|
|
|
|
|
|
|
|
Investment Income ($): |
|
|
|
| ||
|
Income: |
|
|
|
| ||
|
Cash dividends (net of $5,257 foreign taxes withheld at source): |
|
|
|
| ||
|
Unaffiliated issuers |
|
|
45,510,426 |
| ||
|
Affiliated issuers |
|
|
72,157 |
| ||
|
Income from securities lending—Note 1(b) |
|
|
169,834 |
| ||
|
Interest |
|
|
3,852 |
| ||
|
Total Income |
|
|
45,756,269 |
| ||
|
Expenses: |
|
|
|
| ||
|
Management fee—Note 3(a) |
|
|
5,133,533 |
| ||
|
Distribution fees—Note 3(b) |
|
|
490,582 |
| ||
|
Directors’ fees and expenses—Note 3(d) |
|
|
172,213 |
| ||
|
Prospectus and shareholders’ reports |
|
|
132,448 |
| ||
|
Professional fees |
|
|
109,834 |
| ||
|
Loan commitment fees—Note 2 |
|
|
42,549 |
| ||
|
Shareholder servicing costs—Note 3(c) |
|
|
4,084 |
| ||
|
Registration fees |
|
|
352 |
| ||
|
Miscellaneous |
|
|
165,923 |
| ||
|
Total Expenses |
|
|
6,251,518 |
| ||
|
Less—reduction in fees due to earnings credits—Note 3(c) |
|
|
(62) |
| ||
|
Net Expenses |
|
|
6,251,456 |
| ||
|
Investment Income—Net |
|
|
39,504,813 |
| ||
|
Realized and Unrealized Gain (Loss) on Investments—Note 4 ($): |
|
| ||||
|
Net realized gain (loss) on investments |
56,161,462 |
| ||||
|
Net realized gain (loss) on futures |
2,493,086 |
| ||||
|
Net Realized Gain (Loss) |
|
|
58,654,548 |
| ||
|
Net unrealized appreciation (depreciation) on investments |
|
|
136,615,302 |
| ||
|
Net unrealized appreciation (depreciation) on futures |
|
|
(207,858) |
| ||
|
Net Unrealized Appreciation (Depreciation) |
|
|
136,407,444 |
| ||
|
Net Realized and Unrealized Gain (Loss) on Investments |
|
|
195,061,992 |
| ||
|
Net Increase in Net Assets Resulting from Operations |
|
234,566,805 |
| |||
|
See notes to financial statements. |
||||||
25
STATEMENT OF CHANGES IN NET ASSETS
|
|
|
|
|
Year Ended December 31, | |||||
|
|
|
|
|
2016 |
|
|
|
2015 |
|
|
Operations ($): |
|
|
|
|
|
|
|
| |
|
Investment income—net |
|
|
39,504,813 |
|
|
|
38,033,215 |
| |
|
Net realized gain (loss) on investments |
|
58,654,548 |
|
|
|
78,121,420 |
| ||
|
Net unrealized appreciation (depreciation) |
|
136,407,444 |
|
|
|
(91,936,305) |
| ||
|
Net Increase (Decrease) in Net Assets |
234,566,805 |
|
|
|
24,218,330 |
| |||
|
Distributions to Shareholders from ($): |
|
|
|
|
|
|
|
| |
|
Investment income—net: |
|
|
|
|
|
|
|
| |
|
Initial Shares |
|
|
(38,523,757) |
|
|
|
(34,900,712) |
| |
|
Service Shares |
|
|
(3,459,777) |
|
|
|
(3,321,783) |
| |
|
Net realized gain on investments: |
|
|
|
|
|
|
|
| |
|
Initial Shares |
|
|
(66,770,473) |
|
|
|
(53,808,935) |
| |
|
Service Shares |
|
|
(6,995,648) |
|
|
|
(6,088,629) |
| |
|
Total Distributions |
|
|
(115,749,655) |
|
|
|
(98,120,059) |
| |
|
Capital Stock Transactions ($): |
|
|
|
|
|
|
|
| |
|
Net proceeds from shares sold: |
|
|
|
|
|
|
|
| |
|
Initial Shares |
|
|
175,074,006 |
|
|
|
213,837,562 |
| |
|
Service Shares |
|
|
14,779,629 |
|
|
|
12,117,429 |
| |
|
Distributions reinvested: |
|
|
|
|
|
|
|
| |
|
Initial Shares |
|
|
105,294,230 |
|
|
|
88,709,647 |
| |
|
Service Shares |
|
|
10,455,425 |
|
|
|
9,410,412 |
| |
|
Cost of shares redeemed: |
|
|
|
|
|
|
|
| |
|
Initial Shares |
|
|
(267,602,472) |
|
|
|
(310,357,317) |
| |
|
Service Shares |
|
|
(38,417,929) |
|
|
|
(45,945,352) |
| |
|
Increase (Decrease) in Net Assets |
(417,111) |
|
|
|
(32,227,619) |
| |||
|
Total Increase (Decrease) in Net Assets |
118,400,039 |
|
|
|
(106,129,348) |
| |||
|
Net Assets ($): |
|
|
|
|
|
|
|
| |
|
Beginning of Period |
|
|
2,083,737,631 |
|
|
|
2,189,866,979 |
| |
|
End of Period |
|
|
2,202,137,670 |
|
|
|
2,083,737,631 |
| |
|
Undistributed investment income—net |
733,550 |
|
|
|
2,397,015 |
| |||
|
Capital Share Transactions (Shares): |
|
|
|
|
|
|
|
| |
|
Initial Shares |
|
|
|
|
|
|
|
| |
|
Shares sold |
|
|
4,042,774 |
|
|
|
4,841,013 |
| |
|
Shares issued for distributions reinvested |
|
|
2,462,148 |
|
|
|
2,036,868 |
| |
|
Shares redeemed |
|
|
(6,171,082) |
|
|
|
(7,033,064) |
| |
|
Net Increase (Decrease) in Shares Outstanding |
333,840 |
|
|
|
(155,183) |
| |||
|
Service Shares |
|
|
|
|
|
|
|
| |
|
Shares sold |
|
|
347,728 |
|
|
|
277,303 |
| |
|
Shares issued for distributions reinvested |
|
|
244,569 |
|
|
|
215,621 |
| |
|
Shares redeemed |
|
|
(892,184) |
|
|
|
(1,030,819) |
| |
|
Net Increase (Decrease) in Shares Outstanding |
(299,887) |
|
|
|
(537,895) |
| |||
|
See notes to financial statements. |
|||||||||
26
FINANCIAL HIGHLIGHTS
The following tables describe the performance for each share class for the fiscal periods indicated. All information (except portfolio turnover rate) reflects financial results for a single fund share. Total return shows how much your investment in the fund would have increased (or decreased) during each period, assuming you had reinvested all dividends and distributions. The fund’s total returns do not reflect expenses associated with variable annuity or insurance contracts. These figures have been derived from the fund’s financial statements.
|
Year Ended December 31, | ||||||
|
Initial Shares |
2016 |
2015 |
2014 |
2013 |
2012 | |
|
Per Share Data ($): |
||||||
|
Net asset value, beginning of period |
43.42 |
44.99 |
40.84 |
31.86 |
29.48 | |
|
Investment Operations: |
||||||
|
Investment income—neta |
.83 |
.80 |
.74 |
.66 |
.63 | |
|
Net realized and unrealized |
4.04 |
(.32) |
4.65 |
9.39 |
3.95 | |
|
Total from Investment Operations |
4.87 |
.48 |
5.39 |
10.05 |
4.58 | |
|
Distributions: |
||||||
|
Dividends from investment income—net |
(.88) |
(.81) |
(.75) |
(.68) |
(.64) | |
|
Dividends from net realized gain on investments |
(1.55) |
(1.24) |
(.49) |
(.39) |
(1.56) | |
|
Total Distributions |
(2.43) |
(2.05) |
(1.24) |
(1.07) |
(2.20) | |
|
Net asset value, end of period |
45.86 |
43.42 |
44.99 |
40.84 |
31.86 | |
|
Total Return (%) |
11.71 |
1.11 |
13.42 |
32.02 |
15.74 | |
|
Ratios/Supplemental Data (%): |
||||||
|
Ratio of total expenses to average net assets |
.27 |
.27 |
.27 |
.29 |
.28 | |
|
Ratio of net expenses to average net assets |
.27 |
.27 |
.27 |
.29 |
.28 | |
|
Ratio of net investment income |
1.91 |
1.81 |
1.76 |
1.82 |
2.02 | |
|
Portfolio Turnover Rate |
3.87 |
3.74 |
1.59 |
3.76 |
3.13 | |
|
Net Assets, end of period ($ x 1,000) |
2,001,468 |
1,880,694 |
1,955,325 |
1,798,538 |
1,541,577 | |
a Based on average shares outstanding.
See notes to financial statements.
27
FINANCIAL HIGHLIGHTS (continued)
|
Year Ended December 31, | ||||||
|
Service Shares |
2016 |
2015 |
2014 |
2013 |
2012 | |
|
Per Share Data ($): |
||||||
|
Net asset value, beginning of period |
43.47 |
45.03 |
40.89 |
31.90 |
29.51 | |
|
Investment Operations: |
||||||
|
Investment income—neta |
.72 |
.69 |
.64 |
.57 |
.56 | |
|
Net realized and unrealized |
4.04 |
(.31) |
4.63 |
9.40 |
3.96 | |
|
Total from Investment Operations |
4.76 |
.38 |
5.27 |
9.97 |
4.52 | |
|
Distributions: |
||||||
|
Dividends from investment income—net |
(.77) |
(.70) |
(.64) |
(.59) |
(.57) | |
|
Dividends from net realized gain on investments |
(1.55) |
(1.24) |
(.49) |
(.39) |
(1.56) | |
|
Total Distributions |
(2.32) |
(1.94) |
(1.13) |
(.98) |
(2.13) | |
|
Net asset value, end of period |
45.91 |
43.47 |
45.03 |
40.89 |
31.90 | |
|
Total Return (%) |
11.44 |
.86 |
13.10 |
31.71 |
15.47 | |
|
Ratios/Supplemental Data (%): |
||||||
|
Ratio of total expenses to average net assets |
.52 |
.52 |
.52 |
.54 |
.53 | |
|
Ratio of net expenses to average net assets |
.52 |
.52 |
.52 |
.54 |
.53 | |
|
Ratio of net investment income |
1.66 |
1.56 |
1.50 |
1.57 |
1.78 | |
|
Portfolio Turnover Rate |
3.87 |
3.74 |
1.59 |
3.76 |
3.13 | |
|
Net Assets, end of period ($ x 1,000) |
200,670 |
203,044 |
234,542 |
239,742 |
185,127 | |
a Based on average shares outstanding.
See notes to financial statements.
28
NOTES TO FINANCIAL STATEMENTS
NOTE 1—Significant Accounting Policies:
Dreyfus Stock Index Fund, Inc. (the “fund”) is registered under the Investment Company Act of 1940, as amended (the “Act”), as a non-diversified open-end management investment company. The fund is only offered to separate accounts established by insurance companies to fund variable annuity contracts and variable life insurance policies. The fund’s investment objective is to seek to match the total return of the S&P 500® Index. The Dreyfus Corporation (the “Manager” or “Dreyfus”), a wholly-owned subsidiary of The Bank of New York Mellon Corporation (“BNY Mellon”), serves as the fund’s investment adviser. Mellon Capital Management Corporation (“Mellon Capital”), an indirect wholly-owned subsidiary of BNY Mellon, serves as the fund’s index manager.
MBSC Securities Corporation (the “Distributor”), a wholly-owned subsidiary of Dreyfus, is the distributor of the fund’s shares, which are sold without a sales charge. The fund is authorized to issue 400 million shares of $.001 par value Common Stock in each of the following classes of shares: Initial shares (250 million shares authorized) and Service shares (150 million shares authorized). Initial shares are subject to a Shareholder Services Plan fee and Service shares are subject to a Distribution Plan fee. Each class of shares has identical rights and privileges, except with respect to the Distribution Plan, Shareholder Services Plan and the expenses borne by each class, the allocation of certain transfer agency costs, and certain voting rights. Income, expenses (other than expenses attributable to a specific class), and realized and unrealized gains or losses on investments are allocated to each class of shares based on its relative net assets.
The Financial Accounting Standards Board (“FASB”) Accounting Standards Codification is the exclusive reference of authoritative U.S. generally accepted accounting principles (“GAAP”) recognized by the FASB to be applied by nongovernmental entities. Rules and interpretive releases of the Securities and Exchange Commission (“SEC”) under authority of federal laws are also sources of authoritative GAAP for SEC registrants. The fund’s financial statements are prepared in accordance with GAAP, which may require the use of management estimates and assumptions. Actual results could differ from those estimates.
The fund enters into contracts that contain a variety of indemnifications. The fund’s maximum exposure under these arrangements is unknown. The fund does not anticipate recognizing any loss related to these arrangements.
(a) Portfolio valuation: The fair value of a financial instrument is the amount that would be received to sell an asset or paid to transfer a liability
29
NOTES TO FINANCIAL STATEMENTS (continued)
in an orderly transaction between market participants at the measurement date (i.e., the exit price). GAAP establishes a fair value hierarchy that prioritizes the inputs of valuation techniques used to measure fair value. This hierarchy gives the highest priority to unadjusted quoted prices in active markets for identical assets or liabilities (Level 1 measurements) and the lowest priority to unobservable inputs (Level 3 measurements).
Additionally, GAAP provides guidance on determining whether the volume and activity in a market has decreased significantly and whether such a decrease in activity results in transactions that are not orderly. GAAP requires enhanced disclosures around valuation inputs and techniques used during annual and interim periods.
Various inputs are used in determining the value of the fund’s investments relating to fair value measurements. These inputs are summarized in the three broad levels listed below:
Level 1—unadjusted quoted prices in active markets for identical investments.
Level 2—other significant observable inputs (including quoted prices for similar investments, interest rates, prepayment speeds, credit risk, etc.).
Level 3—significant unobservable inputs (including the fund’s own assumptions in determining the fair value of investments).
The inputs or methodology used for valuing securities are not necessarily an indication of the risk associated with investing in those securities.
Changes in valuation techniques may result in transfers in or out of an assigned level within the disclosure hierarchy. Valuation techniques used to value the fund’s investments are as follows:
Investments in securities are valued at the last sales price on the securities exchange or national securities market on which such securities are primarily traded. Securities listed on the National Market System for which market quotations are available are valued at the official closing price or, if there is no official closing price that day, at the last sales price. For open short positions, asked prices are used for valuation purposes. Bid price is used when no asked price is available. Registered investment companies that are not traded on an exchange are valued at their net asset value. All of the preceding securities are generally categorized within Level 1 of the fair value hierarchy.
Securities not listed on an exchange or the national securities market, or securities for which there were no transactions, are valued at the average of
30
the most recent bid and asked prices. U.S. Treasury Bills are valued at the mean price between quoted bid prices and asked prices by an independent pricing service (the “Service”) approved by the fund’s Board of Directors (the “Board”). These securities are generally categorized within Level 2 of the fair value hierarchy.
The Service is engaged under the general supervision of the Board.
Fair valuing of securities may be determined with the assistance of a pricing service using calculations based on indices of domestic securities and other appropriate indicators, such as prices of relevant American Depository Receipts and futures. Utilizing these techniques may result in transfers between Level 1 and Level 2 of the fair value hierarchy.
When market quotations or official closing prices are not readily available, or are determined not to reflect accurately fair value, such as when the value of a security has been significantly affected by events after the close of the exchange or market on which the security is principally traded (for example, a foreign exchange or market), but before the fund calculates its net asset value, the fund may value these investments at fair value as determined in accordance with the procedures approved by the Board. Certain factors may be considered when fair valuing investments such as: fundamental analytical data, the nature and duration of restrictions on disposition, an evaluation of the forces that influence the market in which the securities are purchased and sold, and public trading in similar securities of the issuer or comparable issuers. These securities are either categorized within Level 2 or 3 of the fair value hierarchy depending on the relevant inputs used.
For restricted securities where observable inputs are limited, assumptions about market activity and risk are used and are generally categorized within Level 3 of the fair value hierarchy.
Futures, which are traded on an exchange, are valued at the last sales price on the securities exchange on which such securities are primarily traded or at the last sales price on the national securities market on each business day and are generally categorized within Level 1 of the fair value hierarchy.
The following is a summary of the inputs used as of December 31, 2016 in valuing the fund’s investments:
31
NOTES TO FINANCIAL STATEMENTS (continued)
|
|
Level 1 - |
Level 2 – Other |
Level 3 - |
Total |
|
Assets ($) |
||||
|
Investment in Securities: | ||||
|
Equity Securities- |
2,163,779,607 |
- |
- |
2,163,779,607 |
|
Equity Securities- |
11,966,324 |
- |
- |
11,966,324 |
|
Registered Investment Companies |
35,228,457 |
- |
- |
35,228,457 |
|
U.S. Treasury |
- |
1,323,688 |
- |
1,323,688 |
|
Liabilities ($) |
||||
|
Other Financial Instruments: | ||||
|
Futures†† |
(242,979) |
- |
- |
(242,979) |
† See Statement of Investments for additional detailed categorizations.
†† Amount shown represents unrealized (depreciation) at period end.
At December 31, 2016, there were no transfers between levels of the fair value hierarchy.
(b) Securities transactions and investment income: Securities transactions are recorded on a trade date basis. Realized gains and losses from securities transactions are recorded on the identified cost basis. Dividend income is recognized on the ex-dividend date and interest income, including, where applicable, accretion of discount and amortization of premium on investments, is recognized on the accrual basis.
Pursuant to a securities lending agreement with The Bank of New York Mellon, a subsidiary of BNY Mellon and an affiliate of Dreyfus, the fund may lend securities to qualified institutions. It is the fund’s policy that, at origination, all loans are secured by collateral of at least 102% of the value of U.S. securities loaned and 105% of the value of foreign securities loaned. Collateral equivalent to at least 100% of the market value of securities on loan is maintained at all times. Collateral is either in the form of cash, which can be invested in certain money market mutual funds managed by Dreyfus, or U.S. Government and Agency securities. The fund is entitled to receive all dividends, interest and distributions on securities loaned, in addition to income earned as a result of the lending transaction. Should a borrower fail to return the securities in a timely manner, The Bank of New York Mellon is required to replace the securities for the benefit of the fund or credit the fund with the market value of the unreturned securities and is subrogated to the fund’s rights against the borrower and the collateral. Additionally, the contractual maturity of
32
security lending transactions are on an overnight and continuous basis. During the period ended December 31, 2016, The Bank of New York Mellon earned $38,866 from lending portfolio securities, pursuant to the securities lending agreement.
(c) Affiliated issuers: Investments in other investment companies advised by Dreyfus are defined as “affiliated” under the Act. Investments in affiliated investment companies during the period ended December 31, 2016 were as follows:
|
Affiliated Investment Company |
Value |
Purchases ($) |
Sales ($) |
Value 12/31/2016 ($) |
Net |
|
Dreyfus Institutional Cash Advantage Fund, Institutional Shares† |
6,753,514 |
154,490,022 |
161,243,536 |
- |
- |
|
Dreyfus Institutional Preferred Government Plus Money Market Fund†† |
12,670,872 |
176,972,230 |
164,359,718 |
25,283,384 |
1.1 |
|
Dreyfus Institutional Preferred Money Market Fund, Hamilton Shares† |
- |
68,328,606 |
58,383,533 |
9,945,073 |
.5 |
|
Total |
19,424,386 |
399,790,858 |
383,986,787 |
35,228,457 |
1.6 |
† During the period ended December 31, 2016, Dreyfus Institutional Cash Advantage Fund was acquired by Dreyfus Institutional Preferred Money Market Fund.
†† Formerly Dreyfus Institutional Preferred Plus Money Market Fund.
(d) Dividends and distributions to shareholders: Dividends and distributions are recorded on the ex-dividend date. Dividends from investment income-net are normally declared and paid quarterly. Dividends from net realized capital gains, if any, are normally declared and paid annually, but the fund may make distributions on a more frequent basis to comply with the distribution requirements of the Internal Revenue Code of 1986, as amended (the “Code”). To the extent that net realized capital gains can be offset by capital loss carryovers, it is the policy of the fund not to distribute such gains. Income and capital gain distributions are determined in accordance with income tax regulations, which may differ from GAAP.
33
NOTES TO FINANCIAL STATEMENTS (continued)
(e) Federal income taxes: It is the policy of the fund to continue to qualify as a regulated investment company, if such qualification is in the best interests of its shareholders, by complying with the applicable provisions of the Code, and to make distributions of taxable income sufficient to relieve it from substantially all federal income and excise taxes.
As of and during the period ended December 31, 2016, the fund did not have any liabilities for any uncertain tax positions. The fund recognizes interest and penalties, if any, related to uncertain tax positions as income tax expense in the Statement of Operations. During the period ended December 31, 2016, the fund did not incur any interest or penalties.
Each tax year in the four-year period ended December 31, 2016 remains subject to examination by the Internal Revenue Service and state taxing authorities.
At December 31, 2016, the components of accumulated earnings on a tax basis were as follows: undistributed ordinary income $2,592,892, undistributed capital gains $53,202,654 and unrealized appreciation $1,230,149,301.
The tax character of distributions paid to shareholders during the fiscal periods ended December 31, 2016 and December 31, 2015 were as follows: ordinary income $42,944,377 and $39,952,720, and long-term capital gains $72,805,278 and $58,167,339, respectively.
During the period ended December 31, 2016, as a result of permanent book to tax differences, primarily due to tax basis deemed dividends, the fund increased accumulated undistributed investment income-net by $815,256 and decreased accumulated net realized gain (loss) on investments by the same amount. Net assets and net asset value per share were not affected by this reclassification.
NOTE 2—Bank Lines of Credit:
The fund participates with other Dreyfus-managed funds in an $810 million unsecured credit facility led by Citibank, N.A. and a $300 million unsecured credit facility provided by The Bank of New York Mellon (each, a “Facility”), each to be utilized primarily for temporary or emergency purposes, including the financing of redemptions. Prior to October 5, 2016, the unsecured credit facility with Citibank, N.A. was $555 million and prior to January 11, 2016, the unsecured credit facility with Citibank, N.A. was $480 million. In connection therewith, the fund has agreed to pay its pro rata portion of commitment fees for each Facility. Interest is charged to the fund based on rates determined pursuant to the terms of
34
the respective Facility at the time of borrowing. During the period ended December 31, 2016, the fund did not borrow under the Facilities.
NOTE 3—Management Fee, Index-Management Fee and Other Transactions with Affiliates:
(a) Pursuant to a management agreement (the “Agreement”) with Dreyfus, the management fee is computed at the annual rate of .245% of the value of the fund’s average daily net assets and is payable monthly.
Pursuant to an index-management agreement (the “Index Agreement”), Dreyfus has agreed to pay Mellon Capital a monthly index-management fee at the annual rate of .095% of the value of the fund’s average daily net assets. Pursuant to the Index Agreement, Mellon Capital pays the Custodian for its services to the fund.
(b) Under the Distribution Plan adopted pursuant to Rule 12b-1 under the Act, Service shares pay the Distributor for distributing its shares, for servicing and/or maintaining Service shares’ shareholder accounts and for advertising and marketing for Service shares. The Distribution Plan provides for payments to be made at an annual rate of .25% of the value of the Service shares’ average daily net assets. The Distributor may make payments to Participating Insurance Companies and to brokers and dealers acting as principal underwriter for their variable insurance products. The fees payable under the Distribution Plan are payable without regard to actual expenses incurred. During the period ended December 31, 2016, Service shares were charged $490,582 pursuant to the Distribution Plan.
(c) Under the Shareholder Services Plan, Initial shares reimburse the Distributor at an amount not to exceed an annual rate of .25% of the value of its average daily net assets for certain allocated expenses with respect to servicing and/or maintaining Initial shares’ shareholder accounts. During the period ended December 31, 2016, Initial shares were charged $2,350 pursuant to the Shareholder Services Plan.
The fund has arrangements with the transfer agent and the custodian whereby the fund may receive earnings credits when positive cash balances are maintained, which are used to offset transfer agency and custody fees. For financial reporting purposes, the fund includes net earnings credits as an expense offset in the Statement of Operations.
The fund compensates Dreyfus Transfer, Inc., a wholly-owned subsidiary of Dreyfus, under a transfer agency agreement for providing transfer agency and cash management services for the fund. The majority of transfer agency fees are comprised of amounts paid on a per account basis, while cash management fees are related to fund subscriptions and
35
NOTES TO FINANCIAL STATEMENTS (continued)
redemptions. During the period ended December 31, 2016, the fund was charged $1,453 for transfer agency services and $132 for cash management services. These fees are included in Shareholder servicing costs in the Statement of Operations. Cash management fees were partially offset by earnings credits of $62.
During the period ended December 31, 2016, the fund was charged $9,640 for services performed by the Chief Compliance Officer and his staff.
The components of “Due to The Dreyfus Corporation and affiliates” in the Statement of Assets and Liabilities consist of: management fees $459,028, Distribution Plan fees $42,782, Chief Compliance Officer fees $7,314 and transfer agency fees $262.
(d) Each Board member also serves as a Board member of other funds within the Dreyfus complex. Annual retainer fees and attendance fees are allocated to each fund based on net assets.
NOTE 4—Securities Transactions:
The aggregate amount of purchases and sales of investment securities, excluding short-term securities and futures, during the period ended December 31, 2016, amounted to $80,246,534 and $151,853,033, respectively.
Derivatives: A derivative is a financial instrument whose performance is derived from the performance of another asset. Each type of derivative instrument that was held by the fund during the period ended December 31, 2016 is discussed below.
Futures: In the normal course of pursuing its investment objective, the fund is exposed to market risk, including equity price risk, as a result of changes in value of underlying financial instruments. The fund invests in futures in order to manage its exposure to or protect against changes in the market. A futures contract represents a commitment for the future purchase or a sale of an asset at a specified date. Upon entering into such contracts, these investments require initial margin deposits with a counterparty, which consist of cash or cash equivalents. The amount of these deposits is determined by the exchange or Board of Trade on which the contract is traded and is subject to change. Accordingly, variation margin payments are received or made to reflect daily unrealized gains or losses which are recorded in the Statement of Operations. When the contracts are closed, the fund recognizes a realized gain or loss which is reflected in the Statement of Operations. There is minimal counterparty credit risk to the fund with futures since they are exchange traded, and the
36
exchange guarantees the futures against default. Futures open at December 31, 2016 are set forth in the Statement of Futures.
The following summarizes the average market value of derivatives outstanding during the period ended December 31, 2016:
|
|
|
Average Market Value ($) |
|
Equity futures |
27,969,643 | |
At December 31, 2016, the cost of investments for federal income tax purposes was $982,148,775; accordingly, accumulated net unrealized appreciation on investments was $1,230,149,301, consisting of $1,297,591,402 gross unrealized appreciation and $67,442,101 gross unrealized depreciation.
NOTE 5—Pending Legal Matters:
The fund and many other entities have been named as defendants in numerous pending litigations as a result of their participation in the leveraged buyout transaction (“LBO”) of the Tribune Company (“Tribune”). The cases allege that Tribune took on billions of dollars of debt in the LBO to purchase its own stock from shareholders at $34 per share. The LBO was executed in a two-step transaction: shares were repurchased by Tribune in a tender offer in June 2007 and then in a go-private merger in December 2007. In 2008, approximately one year after the LBO was concluded, Tribune filed for bankruptcy protection under Chapter 11. Thereafter, in approximately June 2011, certain Tribune creditors filed dozens of complaints in various courts throughout the country alleging that the payments made to shareholders in the LBO were “fraudulent conveyances” under state and/or federal law, and that the shareholders must return the payments they received for their shares to satisfy the plaintiffs’ unpaid claims. These cases were consolidated for coordinated pre-trial proceedings in a multi-district litigation in the United States District Court for the Southern District of New York titled In re Tribune Company Fraudulent Conveyance Litigation (S.D.N.Y. Nos. 11-md-2296 and 12-mc-2296 (RJS) (“Tribune MDL”)).
In addition, there was a case pending in United States Bankruptcy Court for the District of Delaware brought by the Unsecured Creditors Committee of the Tribune Company that has since been transferred to the Tribune MDL (formerly The Official Committee of Unsecured Creditors of Tribune Co. v. FitzSimons, et al., Bankr. D. Del. Adv. Pro. No. 10-54010 (KJC)) (“FitzSimons case”). The case was originally filed on November 1, 2010. In a Fourth Amended Complaint filed in November 2012, among other claims, the Creditors Committee sought recovery under the Bankruptcy
37
NOTES TO FINANCIAL STATEMENTS (continued)
Code for alleged “fraudulent conveyances” from more than 5,000 Tribune shareholders (“Shareholder Defendants”), including the fund, and a defendants’ class of all shareholders who tendered their Tribune stock in the LBO and received cash in exchange. There were 35 other counts in the Fourth Amended Complaint that did not relate to claims against Shareholder Defendants, but instead were brought against parties directly involved in approval or execution of the leveraged buyout. On January 10, 2013, pursuant to the Tribune bankruptcy plan, Mark S. Kirchner, as Litigation Trustee for the Tribune Litigation Trust, became the successor plaintiff to the Creditors Committee in this case. The case is now proceeding as: Mark S. Kirchner, as Litigation Trustee for the Tribune Litigation Trust v. FitzSimons, et al., S.D.N.Y. No. 12-cv-2652 (RJS). On August 1, 2013, the plaintiff filed a Fifth Amended Complaint with the Court. The Fifth Amended Complaint contains more detailed allegations regarding the steps Tribune took in consideration and execution of the LBO, but did not change the legal basis for the claim previously alleged against the Shareholder Defendants.
On November 6, 2012, a motion to dismiss was filed in the Tribune MDL that applied to most, but not all, of the cases in the Tribune MDL. On September 23, 2013 Judge Sullivan granted the motion to dismiss on standing grounds, after rejecting defendants’ preemption arguments. By granting the motion, Judge Sullivan dismissed nearly 50 cases in the Tribune MDL. The fund was a defendant in at least one of the dismissed cases. The motion had no effect on the FitzSimons case, which had been stayed.
On September 30, 2013, plaintiffs appealed the motion to dismiss decision to the U.S. Court of Appeals for the Second Circuit. On October 28, 2013, certain defendants cross-appealed from Judge Sullivan’s decision, seeking review of the arguments that Judge Sullivan rejected in his decision. On March 29, 2016, the Second Circuit issued its decision on the appeal and cross-appeal. A panel of three judges unanimously affirmed the dismissal on the grounds that the plaintiffs’ claims were preempted by section 546(e) of the Bankruptcy Code. On April 12, 2016, the plaintiffs/appellants filed a petition with the Second Circuit requesting rehearing of the appeal by the same panel of judges and/or rehearing en banc by all judges on the Second Circuit. On July 22, 2016, the Second Circuit denied both requests for rehearing. On September 9, 2016, Plaintiffs filed a petition for certiorari with the U.S. Supreme Court. A brief in opposition to the petition was filed on behalf of defendants on October 24, 2016. Plaintiffs filed a reply brief on November 4, 2016. As of February 2, 2017, the Supreme Court has not ruled on the petition.
38
In the FitzSimons case, a “global” motion to dismiss the fraudulent transfer claim asserted against the Shareholder Defendants, which applies equally to all Shareholder Defendants including the fund, was filed on May 23, 2014 and briefing was completed in July 2014. On January 9, 2017, Judge Sullivan entered an order granting the “global” motion and dismissing the claim against all the Shareholder Defendants. On February 2, 2017, the plaintiff filed a request to seek leave to appeal with the court. As of February 2, 2017, the Court had not ruled on the request.
At this stage in the proceedings, it is not possible to assess with any reasonable certainty the probable outcomes of the pending litigations. Consequently, at this time, management is unable to estimate the possible loss that may result.
39
REPORT OF INDEPENDENT REGISTERED
PUBLIC ACCOUNTING FIRM
Shareholders and Board of Directors
Dreyfus Stock Index Fund, Inc.
We have audited the accompanying statement of assets and liabilities of Dreyfus Stock Index Fund, Inc., including the statements of investments and futures, as of December 31, 2016, and the related statement of operations for the year then ended, the statement of changes in net assets for each of the two years in the period then ended, and the financial highlights for each of the five years in the period then ended. These financial statements and financial highlights are the responsibility of the Fund’s management. Our responsibility is to express an opinion on these financial statements and financial highlights based on our audits.
We conducted our audits in accordance with the standards of the Public Company Accounting Oversight Board (United States). Those standards require that we plan and perform the audit to obtain reasonable assurance about whether the financial statements and financial highlights are free of material misstatement. We were not engaged to perform an audit of the Fund’s internal control over financial reporting. Our audits included consideration of internal control over financial reporting as a basis for designing audit procedures that are appropriate in the circumstances, but not for the purpose of expressing an opinion on the effectiveness of the Fund’s internal control over financial reporting. Accordingly, we express no such opinion. An audit also includes examining, on a test basis, evidence supporting the amounts and disclosures in the financial statements and financial highlights, assessing the accounting principles used and significant estimates made by management, and evaluating the overall financial statement presentation. Our procedures included confirmation of securities owned as of December 31, 2016 by correspondence with the custodian and others. We believe that our audits provide a reasonable basis for our opinion.
In our opinion, the financial statements and financial highlights referred to above present fairly, in all material respects, the financial position of Dreyfus Stock Index Fund, Inc., at December 31, 2016, the results of its operations for the year then ended, the changes in its net assets for each of the two years in the period then ended, and the financial highlights for each of the five years in the period then ended, in conformity with U.S. generally accepted accounting principles.

New York, New York
February 10, 2017
40
IMPORTANT TAX INFORMATION (Unaudited)
For federal tax purposes, the fund hereby reports 100% of the ordinary dividends paid during the fiscal year ended December 31, 2016 as qualifying for the corporate dividends received deduction. Shareholders will receive notification in early 2017 of the percentage applicable to the preparation of their 2016 income tax returns. Also, the fund hereby reports $.0202 per share as a short-term capital gain distribution and $1.5306 per share as a long-term capital gain distribution paid on March 31, 2016.
41
BOARD MEMBERS INFORMATION (Unaudited)
INDEPENDENT BOARD MEMBERS
Chairman of the Board (1995)
Principal Occupation During Past 5 Years:
· Corporate Director and Trustee (1995-present)
Other Public Company Board Memberships During Past 5 Years:
· CBIZ (formerly, Century Business Services, Inc.), a provider of outsourcing functions for small and medium size companies, Director (1997-present)
No. of Portfolios for which Board Member Serves: 135
———————
Peggy C. Davis (73)
Board Member (2006)
Principal Occupation During Past 5 Years:
· Shad Professor of Law, New York University School of Law (1983-present)
No. of Portfolios for which Board Member Serves: 49
———————
David P. Feldman (77)
Board Member (1996)
Principal Occupation During Past 5 Years:
· Corporate Director and Trustee (1985-present)
Other Public Company Board Memberships During Past 5 Years:
· BBH Mutual Funds Group (5 registered mutual funds), Director (1992-2014)
No. of Portfolios for which Board Member Serves: 35
———————
Ehud Houminer (76)
Board Member (1993)
Principal Occupation During Past 5 Years:
· Executive-in-Residence at the Columbia Business School, Columbia
University (1992-present)
Other Public Company Board Memberships During Past 5 Years:
· Avnet, Inc., an electronics distributor, Director (1993-2012)
No. of Portfolios for which Board Member Serves: 59
———————
42
Lynn Martin (77)
Board Member (2012)
Principal Occupation During Past 5 Years:
· President of The Martin Hall Group LLC, a human resources consulting firm (2005-2012)
Other Public Company Board Memberships During Past 5 Years:
· AT&T, Inc., a telecommunications company, Director (1999-2012)
· Ryder System, Inc., a supply chain and transportation management company, Director (1993-2012)
No. of Portfolios for which Board Member Serves: 35
———————
Robin A. Melvin (53)
Board Member (2012)
Principal Occupation During Past 5 Years:
· Co-chairman, Illinois Mentoring Partnership, non-profit organization dedicated to increasing the quantity and quality of mentoring services in Illinois; (2014-present; board member since 2013)
· Director, Boisi Family Foundation, a private family foundation that supports youth-serving organizations that promote the self sufficiency of youth from disadvantaged circumstances (1995-2012)
No. of Portfolios for which Board Member Serves: 107
———————
Dr. Martin Peretz (77)
Board Member (2006)
Principal Occupation During Past 5 Years:
· Editor-in-Chief Emeritus of The New Republic Magazine (2011-2012) (previously,
Editor-in-Chief, 1974-2011)
· Director of TheStreet.com, a financial information service on the web (1996-2010)
· Lecturer at Harvard University (1969-2012)
No. of Portfolios for which Board Member Serves: 35
———————
Once elected all Board Members serve for an indefinite term, but achieve Emeritus status upon reaching age 80. The address of the Board Members and Officers is c/o The Dreyfus Corporation, 200 Park Avenue, New York, New York 10166. Additional information about the Board Members is available in the fund’s Statement of Additional Information which can be obtained from Dreyfus free of charge by calling this toll free number: 1-800-DREYFUS.
James F. Henry, Emeritus Board Member
Philip L. Toia, Emeritus Board Member
43
OFFICERS OF THE FUND (Unaudited)
BRADLEY J. SKAPYAK, President since January 2010.
Chief Operating Officer and a director of the Manager since June 2009, Chairman of Dreyfus Transfer, Inc., an affiliate of the Manager and the transfer agent of the funds, since May 2011 and Executive Vice President of MBSC Securities Corporation since June 2007. He is an officer of 64 investment companies (comprised of 135 portfolios) managed by the Manager. He is 58 years old and has been an employee of the Manager since February 1988.
BENNETT A. MACDOUGALL, Chief Legal Officer since October 2015.
Chief Legal Officer of the Manager and Associate General Counsel and Managing Director of BNY Mellon since June 2015; from June 2005 to June 2015, he served in various capacities with Deutsche Bank – Asset & Wealth Management Division, including as Director and Associate General Counsel, and Chief Legal Officer of Deutsche Investment Management Americas Inc. from June 2012 to May 2015. He is an officer of 65 investment companies (comprised of 160 portfolios) managed by the Manager. He is 45 years old and has been an employee of the Manager since June 2015.
JANETTE E. FARRAGHER, Vice President and Secretary since December 2011.
Associate General Counsel of BNY Mellon, and an officer of 65 investment companies (comprised of 160 portfolios) managed by the Manager. She is 54 years old and has been an employee of the Manager since February 1984.
JAMES BITETTO, Vice President and Assistant Secretary since August 2005.
Managing Counsel of BNY Mellon and Secretary of the Manager, and an officer of 65 investment companies (comprised of 160 portfolios) managed by the Manager. He is 50 years old and has been an employee of the Manager since December 1996.
JONI LACKS CHARATAN, Vice President and Assistant Secretary since August 2005.
Managing Counsel of BNY Mellon, and an officer of 65 investment companies (comprised of 160 portfolios) managed by the Manager. She is 61 years old and has been an employee of the Manager since October 1988.
JOSEPH M. CHIOFFI, Vice President and Assistant Secretary since August 2005.
Managing Counsel of BNY Mellon, and an officer of 65 investment companies (comprised of 160 portfolios) managed by the Manager. He is 55 years old and has been an employee of the Manager since June 2000.
MAUREEN E. KANE, Vice President and Assistant Secretary since April 2015.
Managing Counsel of BNY Mellon since July 2014; from October 2004 until July 2014, General Counsel, and from May 2009 until July 2014, Chief Compliance Officer of Century Capital Management. She is an officer of 65 investment companies (comprised of 160 portfolios) managed by the Manager. She is 54 years old and has been an employee of the Manager since July 2014.
SARAH S. KELLEHER, Vice President and Assistant Secretary since April 2014.
Senior Counsel of BNY Mellon since March 2013, from August 2005 to March 2013, Associate General Counsel of Third Avenue Management. She is an officer of 65 investment companies (comprised of 160 portfolios) managed by the Manager. She is 41 years old and has been an employee of the Manager since March 2013.
JEFF PRUSNOFSKY, Vice President and Assistant Secretary since September 2003.
Senior Managing Counsel of BNY Mellon, and an officer of 65 investment companies (comprised of 160 portfolios) managed by the Manager. He is 51 years old and has been an employee of the Manager since October 1990.
JAMES WINDELS, Treasurer since September 2003.
Director – Mutual Fund Accounting of the Manager, and an officer of 65 investment companies (comprised of 160 portfolios) managed by the Manager. He is 58 years old and has been an employee of the Manager since April 1985.
RICHARD CASSARO, Assistant Treasurer since January 2007.
Senior Accounting Manager – Money Market, Municipal Bond and Equity Funds of the Manager, and an officer of 65 investment companies (comprised of 160 portfolios) managed by the Manager. He is 57 years old and has been an employee of the Manager since September 1982.
44
GAVIN C. REILLY, Assistant Treasurer since December 2005.
Tax Manager of the Investment Accounting and Support Department of the Manager, and an officer of 65 investment companies (comprised of 160 portfolios) managed by the Manager. He is 48 years old and has been an employee of the Manager since April 1991.
ROBERT S. ROBOL, Assistant Treasurer since August 2005.
Senior Accounting Manager of the Manager, and an officer of 65 investment companies (comprised of 160 portfolios) managed by the Manager. He is 52 years old and has been an employee of the Manager since October 1988.
ROBERT SALVIOLO, Assistant Treasurer since July 2007.
Senior Accounting Manager – Equity Funds of the Manager, and an officer of 65 investment companies (comprised of 160 portfolios) managed by the Manager. He is 49 years old and has been an employee of the Manager since June 1989.
ROBERT SVAGNA, Assistant Treasurer since September 2003.
Senior Accounting Manager – Fixed Income and Equity Funds of the Manager, and an officer of 65 investment companies (comprised of 160 portfolios) managed by the Manager. He is 49 years old and has been an employee of the Manager since November 1990.
JOSEPH W. CONNOLLY, Chief Compliance Officer since October 2004.
Chief Compliance Officer of the Manager and The Dreyfus Family of Funds (65 investment companies, comprised of 160 portfolios). He is 59 years old and has served in various capacities with the Manager since 1980, including manager of the firm’s Fund Accounting Department from 1997 through October 2001.
CARIDAD M. CAROSELLA, Anti-Money Laundering Compliance Officer since January 2016.
Anti-Money Laundering Compliance Officer of the Dreyfus Family of Funds and BNY Mellon Funds Trust since January 2016; from May 2015 to December 2015, Interim Anti-Money Laundering Compliance Officer of the Dreyfus Family of Funds and BNY Mellon Funds Trust and the Distributor; from January 2012 to May 2015, AML Surveillance Officer of the Distributor and from 2007 to December 2011, Financial Processing Manager of the Distributor. She is an officer of 60 investment companies (comprised of 155 portfolios) managed by the Manager. She is 48 years old and has been an employee of the Distributor since 1997.
45
Dreyfus Stock Index Fund, Inc.
200 Park Avenue
New York, NY 10166
Manager
The Dreyfus Corporation
200 Park Avenue
New York, NY 10166
Index Fund Manager
Mellon Capital Management Corporation
500 Grant Street
Pittsburgh, PA 15258
Custodian
The Bank of New York Mellon
225 Liberty Street
New York, NY 10286
Transfer Agent &
Dividend Disbursing Agent
Dreyfus Transfer, Inc.
200 Park Avenue
New York, NY 10166
Distributor
MBSC Securities Corporation
200 Park Avenue
New York, NY 10166
Telephone 1-800-258-4260 or 1-800-258-4261
Mail The Dreyfus Family of Funds, 144 Glenn Curtiss Boulevard, Uniondale, NY 11556-0144 Attn: Institutional Services Department
E-mail Send your request to info@dreyfus.com
Internet Information can be viewed online or downloaded at www.dreyfus.com
The fund files its complete schedule of portfolio holdings with the Securities and Exchange Commission (“SEC”) for the first and third quarters of each fiscal year on Form N-Q. The fund’s Forms N-Q are available on the SEC’s website at http://www.sec.gov and may be reviewed and copied at the SEC’s Public Reference Room in Washington, DC. Information on the operation of the Public Reference Room may be obtained by calling 1-800-SEC-0330.
A description of the policies and procedures that the fund uses to determine how to vote proxies relating to portfolio securities, and information regarding how the fund voted these proxies for the most recent 12-month period ended June 30 is available at http://www.dreyfus.com and on the SEC’s website at http://www.sec.gov. The description of the policies and procedures is also available without charge, upon request, by calling 1-800-DREYFUS.
|
© 2017 MBSC Securities Corporation |
|

Item 2. Code of Ethics.
The Registrant has adopted a code of ethics that applies to the Registrant's principal executive officer, principal financial officer, principal accounting officer or controller, or persons performing similar functions. There have been no amendments to, or waivers in connection with, the Code of Ethics during the period covered by this Report.
Item 3. Audit Committee Financial Expert.
The Registrant's Board has determined that David P. Feldman, a member of the Audit Committee of the Board, is an audit committee financial expert as defined by the Securities and Exchange Commission (the "SEC"). Mr. Feldman is "independent" as defined by the SEC for purposes of audit committee financial expert determinations.
Item 4. Principal Accountant Fees and Services.
(a) Audit Fees. The aggregate fees billed for each of the last two fiscal years (the "Reporting Periods") for professional services rendered by the Registrant's principal accountant (the "Auditor") for the audit of the Registrant's annual financial statements or services that are normally provided by the Auditor in connection with the statutory and regulatory filings or engagements for the Reporting Periods, were $33,031 in 2015 and $33,856 in 2016.
(b) Audit-Related Fees. The aggregate fees billed in the Reporting Periods for assurance and related services by the Auditor that are reasonably related to the performance of the audit of the Registrant's financial statements and are not reported under paragraph (a) of this Item 4 were $9,350 in 2015 and $9,507 in 2016. These services consisted of one or more of the following: (i) agreed upon procedures related to compliance with Internal Revenue Code section 817(h), (ii) security counts required by Rule 17f-2 under the Investment Company Act of 1940, as amended, (iii) advisory services as to the accounting or disclosure treatment of Registrant transactions or events and (iv) advisory services to the accounting or disclosure treatment of the actual or potential impact to the Registrant of final or proposed rules, standards or interpretations by the Securities and Exchange Commission, the Financial Accounting Standards Boards or other regulatory or standard-setting bodies.
The aggregate fees billed in the Reporting Periods for non-audit assurance and related services by the Auditor to the Registrant's investment adviser (not including any sub-investment adviser whose role is primarily portfolio management and is subcontracted with or overseen by another investment adviser), and any entity controlling, controlled by or under common control with the investment adviser that provides ongoing services to the Registrant ("Service Affiliates"), that were reasonably related to the performance of the annual audit of the Service Affiliate, which required pre-approval by the Audit Committee were $0 in 2015 and $0 in 2016.
(c) Tax Fees. The aggregate fees billed in the Reporting Periods for professional services rendered by the Auditor for tax compliance, tax advice, and tax planning ("Tax Services") were $3,479 in 2015 and $3,766 in 2016. These services consisted of: (i) review or preparation of U.S. federal, state, local and excise tax returns; (ii) U.S. federal, state and local tax planning, advice and assistance regarding statutory, regulatory or administrative developments; (iii) tax advice regarding tax qualification matters and/or treatment of various financial instruments held or proposed to be acquired or held, and (iv) determination of Passive Foreign Investment Companies. The aggregate fees billed in the Reporting Periods for Tax Services by the Auditor to Service Affiliates, which required pre-approval by the Audit Committee were $0 in 2015 and $0 in 2016.
(d) All Other Fees. The aggregate fees billed in the Reporting Periods for products and services provided by the Auditor, other than the services reported in paragraphs (a) through (c) of this Item, were $16 in 2015 and $21 in 2016. These services consisted of a review of the Registrant’s anti-money laundering program.
The aggregate fees billed in the Reporting Periods for Non-Audit Services by the Auditor to Service Affiliates, other than the services reported in paragraphs (b) through (c) of this Item, which required pre-approval by the Audit Committee, were $0 in 2015 and $0 in 2016.
(e)(1) Audit Committee Pre-Approval Policies and Procedures. The Registrant's Audit Committee has established policies and procedures (the "Policy") for pre-approval (within specified fee limits) of the Auditor's engagements for non-audit services to the Registrant and Service Affiliates without specific case-by-case consideration. The pre-approved services in the Policy can include pre-approved audit services, pre-approved audit-related services, pre-approved tax services and pre-approved all other services. Pre-approval considerations include whether the proposed services are compatible with maintaining the Auditor's independence. Pre-approvals pursuant to the Policy are considered annually.
(e)(2) Note. None of the services described in paragraphs (b) through (d) of this Item 4 were approved by the Audit Committee pursuant to paragraph (c)(7)(i)(C) of Rule 2-01 of Regulation S-X.
(f) None of the hours expended on the principal accountant's engagement to audit the registrant's financial statements for the most recent fiscal year were attributed to work performed by persons other than the principal account's full-time, permanent employees.
Non-Audit Fees. The aggregate non-audit fees billed by the Auditor for services rendered to the Registrant, and rendered to Service Affiliates, for the Reporting Periods were $20,055,582 in 2015 and $19,533,050 in 2016.
Auditor Independence. The Registrant's Audit Committee has considered whether the provision of non-audit services that were rendered to Service Affiliates, which were not pre-approved (not requiring pre-approval), is compatible with maintaining the Auditor's independence.
Item 5. Audit Committee of Listed Registrants.
Not applicable.
Item 6. Investments.
(a) Not applicable.
Item 7. Disclosure of Proxy Voting Policies and Procedures for Closed-End Management Investment Companies.
Not applicable.
Item 8. Portfolio Managers of Closed-End Management Investment Companies.
Not applicable.
Item 9. Purchases of Equity Securities by Closed-End Management Investment Companies and Affiliated Purchasers.
Not applicable.
Item 10. Submission of Matters to a Vote of Security Holders.
There have been no material changes to the procedures applicable to Item 10.
Item 11. Controls and Procedures.
(a) The Registrant's principal executive and principal financial officers have concluded, based on their evaluation of the Registrant's disclosure controls and procedures as of a date within 90 days of the filing date of this report, that the Registrant's disclosure controls and procedures are reasonably designed to ensure that information required to be disclosed by the Registrant on Form N-CSR is recorded, processed, summarized and reported within the required time periods and that information required to be disclosed by the Registrant in the reports that it files or submits on Form N-CSR is accumulated and communicated to the Registrant's management, including its principal executive and principal financial officers, as appropriate to allow timely decisions regarding required disclosure.
(b) There were no changes to the Registrant's internal control over financial reporting that occurred during the second fiscal quarter of the period covered by this report that have materially affected, or are reasonably likely to materially affect, the Registrant's internal control over financial reporting.
Item 12. Exhibits.
(a)(1) Code of ethics referred to in Item 2.
(a)(2) Certifications of principal executive and principal financial officers as required by Rule 30a-2(a) under the Investment Company Act of 1940.
(a)(3) Not applicable.
(b) Certification of principal executive and principal financial officers as required by Rule 30a-2(b) under the Investment Company Act of 1940.
SIGNATURES
Pursuant to the requirements of the Securities Exchange Act of 1934 and the Investment Company Act of 1940, the Registrant has duly caused this Report to be signed on its behalf by the undersigned, thereunto duly authorized.
Dreyfus Stock Index Fund, Inc.
By: /s/ Bradley J. Skapyak
Bradley J. Skapyak
President
Date: February 14, 2017
Pursuant to the requirements of the Securities Exchange Act of 1934 and the Investment Company Act of 1940, this Report has been signed below by the following persons on behalf of the Registrant and in the capacities and on the dates indicated.
By: /s/ Bradley J. Skapyak
Bradley J. Skapyak
President
Date: February 14, 2017
By: /s/ James Windels
James Windels
Treasurer
Date: February 14, 2017
EXHIBIT INDEX
(a)(1) Code of ethics referred to in Item 2.
(a)(2) Certifications of principal executive and principal financial officers as required by Rule 30a-2(a) under the Investment Company Act of 1940. (EX-99.CERT)
(b) Certification of principal executive and principal financial officers as required by Rule 30a-2(b) under the Investment Company Act of 1940. (EX-99.906CERT)