| ITEM 1. | REPORTS TO STOCKHOLDERS. |

Annual Report to Shareholders |
February 29, 2024 |
Performance summary | ||
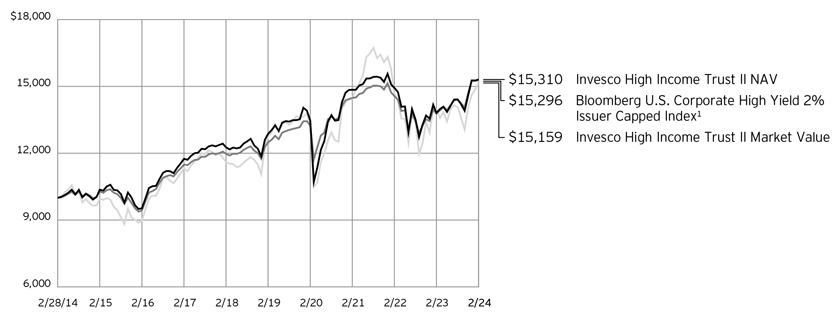
For the fiscal year ended February 29, 2024, Invesco High Income Trust II (the Trust), at net asset value (NAV), underperformed its style-specific benchmark, the Bloomberg U.S. Corporate High Yield 2% Issuer Capped Index. The Trust’s return can be calculated based on either the market price or the NAV of its shares. NAV per share is determined by dividing the value of the Trust’s portfolio securities, cash and other assets, less all liabilities, by the total number of shares outstanding. Market price reflects the supply and demand for Trust shares. As a result, the two returns can differ, as they did during the fiscal year. | ||
Performance |
||
Total returns, 2/28/23 to 2/29/24 |
||
Trust at NAV |
10.82% | |
Trust at Market Value |
8.51 | |
Bloomberg U.S. Corporate High Yield 2% Issuer Capped Index q |
11.01 | |
Market Price Discount to NAV as of 2/29/24 |
-7.84 | |
Source(s): q |
||
The performance data quoted represent past performance and cannot guarantee comparable future results; current performance may be lower or higher. Investment return, NAV and market price will fluctuate so that you may have a gain or loss when you sell shares. Please visit invesco.com/us for the most recent month-end performance. Performance figures reflect Trust expenses, the reinvestment of distributions (if any) and changes in NAV for performance based on NAV and changes in market price for performance based on market price. Since the Trust is a closed-end management investment company, shares of the Trust may trade at a discount or premium from the NAV. This characteristic is separate and distinct from the risk that NAV could decrease as a result of investment activities and may be a greater risk to investors expecting to sell their shares after a short time. The Trust cannot predict whether shares will trade at, above or below NAV. The Trust should not be viewed as a vehicle for trading purposes. It is designed primarily for risk-tolerant long-term investors. | ||
| 1 | Source: Federal Reserve of Economic Data |
| 2 | Source: Fitch Ratings |
| 3 | Source: US Department of the Treasury |
| 4 | Source: JP Morgan Markets |
| 1 | Source: RIMES Technologies Corp. |
Average Annual Total Returns |
||||||||
As of 2/29/24 |
||||||||
NAV |
Market |
|||||||
10 Years |
4.35 | % | 4.25 | % | ||||
5 Years |
3.53 | 3.51 | ||||||
1 Year |
10.82 | 8.51 | ||||||
∎ |
Unless otherwise stated, information presented in this report is as of February 29, 2024, and is based on total net assets. |
∎ |
Unless otherwise noted, all data is provided by Invesco. |
∎ |
To access your Trust’s reports, visit invesco.com/fundreports. |
∎ |
The Bloomberg U.S. Corporate High Yield 2% Issuer Capped Index |
∎ |
The Trust is not managed to track the performance of any particular index, including the index(es) described here, and consequently, the performance of the Trust may deviate significantly from the performance of the index(es). |
∎ |
A direct investment cannot be made in an index. Unless otherwise indicated, index results include reinvested dividends, and they do not reflect sales charges. Performance of the peer group, if applicable, reflects fund expenses; performance of a market index does not. |
∎ |
Add to your account: |
∎ |
Low transaction costs: |
∎ |
Convenience: |
∎ |
Safekeeping: |
| 1. | Premium: If the Trust is trading at a premium – a market price that is higher than its NAV – you’ll pay either the NAV or 95 percent of |
the market price, whichever is greater. When the Trust trades at a premium, you may pay less for your reinvested shares than an investor purchasing shares on the stock exchange. Keep in mind, a portion of your price reduction may be taxable because you are receiving shares at less than market price. |
| 2. | Discount: If the Trust is trading at a discount – a market price that is lower than its NAV –you’ll pay the market price for your reinvested shares. |
| 1. | If you opt to continue to hold your non-certificated whole shares (Investment Plan Book Shares), they will be held by the Agent electronically as Direct Registration Book Shares (Book-Entry Shares) and fractional shares will be sold at the then-current market price. Proceeds will be sent via check to your address of record after deducting applicable fees, including per share fees such as any applicable brokerage commissions the Agent is required to pay. |
| 2. | If you opt to sell your shares through the Agent, we will sell all full and fractional shares and send the proceeds via check to your address of record after deducting $2.50 per account and a brokerage charge. |
| 3. | You may sell your shares through your financial adviser through the Direct Registration System (DRS). DRS is a service within the securities industry that allows Trust shares to be held in your name in electronic format. You retain full ownership of your shares, without having to hold a share certificate. You should contact your financial adviser to learn more about any restrictions or fees that may apply. |
By credit quality |
% of total investments | ||||
A |
0.06 | % | |||
BBB |
3.93 | ||||
BB |
32.02 | ||||
B |
49.4 | ||||
CCC |
11.7 | ||||
CC |
0.28 | ||||
C |
0.87 | ||||
D |
0.15 | ||||
Non-Rated |
1.04 | ||||
Cash |
0.55 | ||||
| * | Source: Standard & Poor’s. A credit rating is an assessment provided by a nationally recognized statistical rating organization (NRSRO) of the creditworthiness of an issuer with respect to debt obligations, including specific securities, money market instruments or other debts. Ratings are measured on a scale that generally ranges from AAA (highest) to D (lowest); ratings are subject to change without notice. “Non-Rated” indicates the debtor was not rated, and should not be interpreted as indicating low quality. For more information on Standard & Poor’s rating methodology, please visit standardandpoors.com and select “Understanding Ratings” under Rating Resources on the homepage. |
% of total net assets | |||||
1. Service Properties Trust |
3.15 | % | |||
2. TransDigm, Inc. |
2.31 | ||||
3. Transocean, Inc. |
2.27 | ||||
4. LCM Investments Holdings II LLC |
2.20 | ||||
5. Mativ Holdings, Inc. |
2.18 | ||||
| * | Excluding money market fund holdings, if any. |
Principal Amount |
Value | |||||||
U.S. Dollar Denominated Bonds & Notes–121.55% (b) | ||||||||
Advertising–0.81% |
||||||||
Clear Channel Outdoor Holdings, Inc., |
||||||||
7.75%, 04/15/2028 (c) |
$ | 58,000 | $ 50,206 | |||||
7.50%, 06/01/2029 (c) |
62,000 | 51,371 | ||||||
Lamar Media Corp., |
||||||||
4.00%, 02/15/2030 |
23,000 | 20,545 | ||||||
3.63%, 01/15/2031 |
558,000 | 482,246 | ||||||
| 604,368 | ||||||||
Aerospace & Defense–2.31% |
||||||||
TransDigm, Inc., |
||||||||
6.75%, 08/15/2028 (c) |
727,000 | 736,601 | ||||||
7.13%, 12/01/2031 (c) |
961,000 | 987,014 | ||||||
| 1,723,615 | ||||||||
Alternative Carriers–0.16% |
||||||||
Lumen Technologies, Inc., 4.00%, 02/15/2027 (c) |
100,000 | 60,603 | ||||||
Zayo Group Holdings, Inc., 4.00%, 03/01/2027 (c) |
71,000 | 59,191 | ||||||
| 119,794 | ||||||||
Aluminum–0.70% |
||||||||
Novelis Corp., 4.75%, 01/30/2030 (c) |
570,000 | 521,070 | ||||||
Apparel Retail–0.76% |
||||||||
Victoria’s Secret & Co., 4.63%, 07/15/2029 (c) |
673,000 | 568,498 | ||||||
Apparel, Accessories & Luxury Goods–0.07% |
||||||||
Hanesbrands, Inc., 9.00%, 02/15/2031 (c) |
49,000 | 49,160 | ||||||
Application Software–1.02% |
||||||||
Cloud Software Group, Inc., 9.00%, 09/30/2029 (c) |
261,000 | 243,904 | ||||||
SS&C Technologies, Inc., 5.50%, 09/30/2027 (c) |
527,000 | 513,691 | ||||||
| 757,595 | ||||||||
Automobile Manufacturers–2.11% | ||||||||
Allison Transmission, Inc., 3.75%, 01/30/2031 (c) |
1,816,000 | 1,570,722 | ||||||
Automotive Parts & Equipment–2.76% |
||||||||
Clarios Global L.P./Clarios US Finance Co., 8.50%, 05/15/2027 (c) |
496,000 | 499,500 | ||||||
NESCO Holdings II, Inc., 5.50%, 04/15/2029 (c) |
550,000 | 513,763 | ||||||
ZF North America Capital, Inc. (Germany), |
||||||||
6.88%, 04/14/2028 (c) |
868,000 | 886,907 | ||||||
7.13%, 04/14/2030 (c) |
151,000 | 157,444 | ||||||
| 2,057,614 | ||||||||
Automotive Retail–5.47% |
||||||||
Carvana Co., 14.00% PIK Rate, 9.00% Cash Rate, 06/01/2031 (c)(d) |
183,480 | 178,740 | ||||||
Group 1 Automotive, Inc., 4.00%, 08/15/2028 (c) |
1,370,000 | 1,251,807 | ||||||
Principal Amount |
Value | |||||
Automotive Retail–(continued) |
||||||
LCM Investments Holdings II LLC, |
||||||
4.88%, 05/01/2029 (c) |
$ | 565,000 | $ 507,937 | |||
8.25%, 08/01/2031 (c) |
1,109,000 | 1,132,828 | ||||
Lithia Motors, Inc., |
||||||
3.88%, 06/01/2029 (c) |
562,000 | 502,102 | ||||
4.38%, 01/15/2031 (c) |
571,000 | 507,094 | ||||
| 4,080,508 | ||||||
Broadcasting–0.25% |
||||||
Gray Television, Inc., |
||||||
7.00%, 05/15/2027 (c) |
104,000 | 94,109 | ||||
5.38%, 11/15/2031 (c) |
65,000 | 42,120 | ||||
Sinclair Television Group, Inc., 4.13%, 12/01/2030 (c) |
71,000 | 51,945 | ||||
| 188,174 | ||||||
Broadline Retail–1.90% |
||||||
B2W Digital Lux S.a.r.l. (Brazil), 4.38%, 12/20/2030 (c)(e) |
309,000 | 67,208 | ||||
Kohl’s Corp., 4.63%, 05/01/2031 |
338,000 | 266,577 | ||||
Macy’s Retail Holdings LLC, |
||||||
5.88%, 04/01/2029 (c) |
258,000 | 248,721 | ||||
5.88%, 03/15/2030 (c) |
541,000 | 507,753 | ||||
QVC, Inc., 4.75%, 02/15/2027 |
123,000 | 110,979 | ||||
Rakuten Group, Inc. (Japan), 11.25%, 02/15/2027 (c) |
200,000 | 212,985 | ||||
| 1,414,223 | ||||||
Building Products–0.07% |
||||||
New Enterprise Stone & Lime Co., Inc., 9.75%, 07/15/2028 (c) |
49,000 | 49,661 | ||||
Cable & Satellite–5.15% |
||||||
Altice Financing S.A. (Luxembourg), 5.75%, 08/15/2029 (c) |
200,000 | 172,469 | ||||
CCO Holdings LLC/CCO Holdings Capital Corp., 5.13%, 05/01/2027 (c) |
488,000 | 461,829 | ||||
5.00%, 02/01/2028 (c) |
117,000 | 108,078 | ||||
5.38%, 06/01/2029 (c) |
261,000 | 236,300 | ||||
4.50%, 08/15/2030 (c) |
185,000 | 153,626 | ||||
7.38%, 03/01/2031 (c) |
517,000 | 501,259 | ||||
CSC Holdings LLC, |
||||||
5.50%, 04/15/2027 (c) |
338,000 | 303,591 | ||||
5.38%, 02/01/2028 (c) |
870,000 | 759,219 | ||||
5.75%, 01/15/2030 (c) |
257,000 | 151,373 | ||||
4.63%, 12/01/2030 (c) |
216,000 | 120,334 | ||||
DIRECTV Financing LLC/DIRECTV Financing Co-Obligor, Inc., 5.88%,08/15/2027 (c) |
95,000 | 89,734 | ||||
DISH DBS Corp., |
||||||
7.75%, 07/01/2026 |
89,000 | 56,827 | ||||
5.75%, 12/01/2028 (c) |
147,000 | 102,073 | ||||
5.13%, 06/01/2029 |
131,000 | 56,002 | ||||
Scripps Escrow, Inc., 5.88%, 07/15/2027 (c) |
57,000 | 46,324 | ||||
Ziggo B.V. (Netherlands), 4.88%, 01/15/2030 (c) |
582,000 | 519,025 | ||||
| 3,838,063 | ||||||
Principal Amount |
Value | |||||
Casinos & Gaming–4.91% |
||||||
Codere Finance 2 (Luxembourg) S.A. (Spain), 11.63% PIK Rate, 2.00% Cash Rate, 11/30/2027 (c)(d) |
$ | 64,573 | $ 4,520 | |||
International Game Technology PLC, 5.25%, 01/15/2029 (c) |
537,000 | 519,499 | ||||
Melco Resorts Finance Ltd. (Hong Kong), 5.38%, 12/04/2029 (c) |
925,000 | 833,108 | ||||
Mohegan Tribal Gaming Authority, 8.00%, 02/01/2026 (c) |
54,000 | 50,963 | ||||
Premier Entertainment Sub LLC/ Premier Entertainment Finance Corp., 5.63%, 09/01/2029 (c) |
68,000 | 49,030 | ||||
Sabre GLBL, Inc., 8.63%, 06/01/2027 (c) |
53,000 | 46,717 | ||||
Studio City Finance Ltd. (Macau), 5.00%, 01/15/2029 (c) |
1,295,000 | 1,130,490 | ||||
Wynn Macau Ltd. (Macau), Conv., |
||||||
4.50%, 03/07/2027 (c)(f) |
250,000 | 260,719 | ||||
5.63%, 08/26/2028 (c) |
815,000 | 766,769 | ||||
| 3,661,815 | ||||||
Commercial & Residential Mortgage Finance–0.67% | ||||||
Nationstar Mortgage Holdings, Inc., 7.13%, 02/01/2032 (c) |
508,000 | 500,044 | ||||
Commodity Chemicals–2.18% |
||||||
Mativ Holdings, Inc., 6.88%, 10/01/2026 (c) |
1,680,000 | 1,628,785 | ||||
Communications Equipment–0.06% |
||||||
Viasat, Inc., 7.50%, 05/30/2031 (c) |
67,000 | 47,151 | ||||
Construction & Engineering–0.74% |
||||||
Howard Midstream Energy Partners LLC, |
||||||
6.75%, 01/15/2027 (c) |
161,000 | 160,532 | ||||
8.88%, 07/15/2028 (c) |
370,000 | 390,259 | ||||
| 550,791 | ||||||
Consumer Finance–2.44% |
||||||
FirstCash, Inc., |
||||||
5.63%, 01/01/2030 (c) |
559,000 | 530,218 | ||||
6.88%, 03/01/2032 (c) |
267,000 | 264,695 | ||||
Navient Corp., |
||||||
5.00%, 03/15/2027 |
366,000 | 347,414 | ||||
9.38%, 07/25/2030 |
163,000 | 170,530 | ||||
OneMain Finance Corp., |
||||||
3.50%, 01/15/2027 |
316,000 | 291,271 | ||||
5.38%, 11/15/2029 |
233,000 | 216,496 | ||||
| 1,820,624 | ||||||
Diversified Banks–2.21% |
||||||
Citigroup, Inc., |
||||||
3.88% (g)(h) |
448,000 | 421,962 | ||||
7.38% (g)(h) |
107,000 | 109,689 | ||||
Freedom Mortgage Corp., 6.63%, 01/15/2027 (c) |
110,000 | 104,955 | ||||
JPMorgan Chase & Co., Series FF, 5.00% (g)(h) |
1,020,000 | 1,014,880 | ||||
| 1,651,486 | ||||||
Diversified Capital Markets–0.71% |
||||||
UBS Group AG (Switzerland), 7.75% (c)(g)(h) |
530,000 | 531,472 | ||||
Principal Amount |
Value | |||||
Diversified Chemicals–0.13% |
||||||
SCIH Salt Holdings, Inc., 6.63%, 05/01/2029 (c) |
$ | 109,000 | $ 99,236 | |||
Diversified Financial Services–0.90% |
||||||
Jefferies Finance LLC/JFIN Co-Issuer Corp., 5.00%, 08/15/2028(c) |
622,000 | 560,243 | ||||
LD Holdings Group LLC, 6.50%, 11/01/2025 (c) |
55,000 | 50,958 | ||||
VistaJet Malta Finance PLC/Vista Management Holding, Inc. (Switzerland), 6.38%, 02/01/2030 (c) |
80,000 | 58,525 | ||||
| 669,726 | ||||||
Diversified Metals & Mining–1.00% |
||||||
Hudbay Minerals, Inc. (Canada), 6.13%, 04/01/2029 (c) |
759,000 | 745,563 | ||||
Diversified REITs–0.38% |
||||||
Uniti Group L.P./Uniti Group Finance, Inc./CSL Capital LLC, |
||||||
10.50%, 02/15/2028 (c) |
121,000 | 125,372 | ||||
6.50%, 02/15/2029 (c) |
209,000 | 161,130 | ||||
| 286,502 | ||||||
Diversified Support Services–1.04% |
||||||
Ritchie Bros. Holdings, Inc. (Canada), 6.75%, 03/15/2028 (c) |
754,000 | 772,624 | ||||
Electric Utilities–3.13% |
||||||
Electricite de France S.A. (France), 9.13% (c)(g)(h) |
526,000 | 584,944 | ||||
Talen Energy Supply LLC, 8.63%, 06/01/2030 (c) |
494,000 | 521,635 | ||||
Vistra Operations Co. LLC, 7.75%, 10/15/2031 (c) |
1,189,000 | 1,230,920 | ||||
| 2,337,499 | ||||||
Electrical Components & Equipment–0.91% |
||||||
EnerSys, |
||||||
4.38%, 12/15/2027 (c) |
286,000 | 269,491 | ||||
6.63%, 01/15/2032 (c) |
227,000 | 228,222 | ||||
Sensata Technologies B.V., 4.00%, 04/15/2029 (c) |
200,000 | 181,573 | ||||
| 679,286 | ||||||
Electronic Components–0.46% |
||||||
Sensata Technologies, Inc., |
||||||
4.38%, 02/15/2030 (c) |
170,000 | 155,051 | ||||
3.75%, 02/15/2031 (c) |
221,000 | 189,189 | ||||
| 344,240 | ||||||
Electronic Manufacturing Services–1.33% |
||||||
EMRLD Borrower L.P./Emerald Co-Issuer, Inc., 6.63%, 12/15/2030(c) |
987,000 | 991,688 | ||||
Environmental & Facilities Services–0.77% |
||||||
GFL Environmental, Inc. (Canada), 6.75%, 01/15/2031 (c) |
513,000 | 525,369 | ||||
Madison IAQ LLC, 5.88%, 06/30/2029 (c) |
58,000 | 51,839 | ||||
| 577,208 | ||||||
Principal Amount |
Value | |||||
Gold–0.66% |
||||||
New Gold, Inc. (Canada), 7.50%, 07/15/2027 (c) |
$ | 497,000 | $ 492,709 | |||
Health Care Facilities–1.37% |
||||||
Encompass Health Corp., 4.50%, 02/01/2028 |
582,000 | 551,255 | ||||
LifePoint Health, Inc., 5.38%, 01/15/2029 (c) |
259,000 | 206,817 | ||||
Tenet Healthcare Corp., 4.88%, 01/01/2026 |
262,000 | 261,893 | ||||
| 1,019,965 | ||||||
Health Care REITs–1.03% |
||||||
Diversified Healthcare Trust, 0.00%, 01/15/2026 (c)(i) |
778,000 | 661,300 | ||||
MPT Operating Partnership L.P./MPT Finance Corp., 3.50%, 03/15/2031 |
161,000 | 107,940 | ||||
| 769,240 | ||||||
Health Care Services–3.00% |
||||||
Catalent Pharma Solutions, Inc., 3.50%, 04/01/2030 (c) |
585,000 | 563,920 | ||||
Community Health Systems, Inc., |
||||||
8.00%, 03/15/2026 (c) |
275,000 | 272,518 | ||||
5.25%, 05/15/2030 (c) |
477,000 | 381,053 | ||||
4.75%, 02/15/2031 (c) |
318,000 | 242,276 | ||||
DaVita, Inc., 3.75%, 02/15/2031 (c) |
349,000 | 286,800 | ||||
Select Medical Corp., 6.25%, 08/15/2026 (c) |
493,000 | 492,208 | ||||
| 2,238,775 | ||||||
Health Care Supplies–0.68% |
||||||
Medline Borrower L.P., |
||||||
3.88%, 04/01/2029 (c) |
287,000 | 257,582 | ||||
5.25%, 10/01/2029 (c) |
267,000 | 247,224 | ||||
| 504,806 | ||||||
Health Care Technology–0.19% |
||||||
athenahealth Group, Inc., 6.50%, 02/15/2030 (c) |
162,000 | 145,194 | ||||
Hotel & Resort REITs–3.81% |
||||||
RLJ Lodging Trust L.P., 4.00%, 09/15/2029 (c) |
568,000 | 496,313 | ||||
Service Properties Trust, |
||||||
5.50%, 12/15/2027 |
809,000 | 762,535 | ||||
8.63%, 11/15/2031 (c) |
1,501,000 | 1,586,567 | ||||
| 2,845,415 | ||||||
Hotels, Resorts & Cruise Lines–1.44% |
||||||
Carnival Corp., 6.00%, 05/01/2029 (c) |
266,000 | 260,105 | ||||
Royal Caribbean Cruises Ltd., 6.25%, 03/15/2032 (c) |
815,000 | 817,686 | ||||
| 1,077,791 | ||||||
Household Products–0.66% |
||||||
Prestige Brands, Inc., 3.75%, 04/01/2031 (c) |
572,000 | 494,666 | ||||
Principal Amount |
Value | |||||
Independent Power Producers & Energy Traders–1.40% | ||||||
Clearway Energy Operating LLC, |
||||||
4.75%, 03/15/2028 (c) |
$ | 561,000 | $ 525,185 | |||
3.75%, 02/15/2031 (c) |
288,000 | 243,174 | ||||
Vistra Corp., Series C, 8.88% (c)(g)(h) |
272,000 | 277,365 | ||||
| 1,045,724 | ||||||
Industrial Machinery & Supplies & Components–1.71% | ||||||
Enpro, Inc., 5.75%, 10/15/2026 |
764,000 | 753,857 | ||||
Roller Bearing Co. of America, Inc., 4.38%, 10/15/2029 (c) |
571,000 | 520,914 | ||||
| 1,274,771 | ||||||
Insurance Brokers–1.99% |
||||||
Alliant Holdings Intermediate LLC/ Alliant Holdings Co-Issuer, 7.00%, 01/15/2031(c) |
492,000 | 490,423 | ||||
HUB International Ltd., |
||||||
7.25%, 06/15/2030 (c) |
252,000 | 257,234 | ||||
7.38%, 01/31/2032 (c) |
249,000 | 249,944 | ||||
USI, Inc., 7.50%, 01/15/2032 (c) |
488,000 | 486,780 | ||||
| 1,484,381 | ||||||
Integrated Telecommunication Services–2.93% |
||||||
Altice France Holding S.A. (Luxembourg), 10.50%, 05/15/2027 (c) |
255,000 | 166,844 | ||||
Altice France S.A. (France), 8.13%, 02/01/2027 (c) |
576,000 | 529,900 | ||||
CommScope, Inc., 4.75%, 09/01/2029 (c) |
71,000 | 48,708 | ||||
Frontier Communications Holdings LLC, |
||||||
6.75%, 05/01/2029 (c) |
280,000 | 251,715 | ||||
6.00%, 01/15/2030 (c) |
60,000 | 51,368 | ||||
Iliad Holding S.A.S.U. (France), 6.50%, 10/15/2026 (c) |
530,000 | 524,380 | ||||
Level 3 Financing, Inc., 4.63%, 09/15/2027 (c) |
90,000 | 55,800 | ||||
Telecom Italia Capital S.A. (Italy), 7.72%, 06/04/2038 |
489,000 | 501,398 | ||||
Windstream Escrow LLC/Windstream Escrow Finance Corp., 7.75%, 08/15/2028 (c) |
56,000 | 52,343 | ||||
| 2,182,456 | ||||||
Internet Services & Infrastructure–0.07% |
||||||
Arches Buyer, Inc., 6.13%, 12/01/2028 (c) |
58,000 | 49,195 | ||||
Leisure Facilities–3.01% |
||||||
Carnival Holdings Bermuda Ltd., 10.38%, 05/01/2028 (c) |
1,080,000 | 1,178,954 | ||||
NCL Finance Ltd., 6.13%, 03/15/2028 (c) |
512,000 | 499,734 | ||||
Viking Ocean Cruises Ship VII Ltd., 5.63%, 02/15/2029 (c) |
585,000 | 565,046 | ||||
| 2,243,734 | ||||||
Leisure Products–0.70% |
||||||
Amer Sports Co. (Finland), 6.75%, 02/16/2031 (c) |
527,000 | 524,866 | ||||
Principal Amount |
Value |
|||||||
Marine Transportation–4.09% |
||||||||
NCL Corp. Ltd., |
||||||||
5.88%, 03/15/2026 (c) |
$ | 1,028,000 | $ | 1,004,870 | ||||
8.13%, 01/15/2029 (c) |
239,000 | 251,640 | ||||||
Stena International S.A. (Sweden), |
||||||||
7.25%, 01/15/2031 (c) |
520,000 | 517,499 | ||||||
7.63%, 02/15/2031 (c) |
290,000 | 291,831 | ||||||
Viking Cruises Ltd., |
||||||||
5.88%, 09/15/2027 (c) |
309,000 | 302,301 | ||||||
7.00%, 02/15/2029 (c) |
685,000 | 685,344 | ||||||
| 3,053,485 | ||||||||
Metal, Glass & Plastic Containers–1.06% |
||||||||
Ardagh Packaging Finance PLC/Ardagh Holdings USA, Inc., 5.25%, 08/15/2027 (c) |
200,000 | 145,289 | ||||||
Mauser Packaging Solutions Holding Co., 9.25%, 04/15/2027 (c) |
152,000 | 147,989 | ||||||
OI European Group B.V., 4.75%, 02/15/2030 (c) |
536,000 | 493,951 | ||||||
| 787,229 | ||||||||
Multi-line Insurance–0.20% |
||||||||
Acrisure LLC/Acrisure Finance, Inc., 6.00%, 08/01/2029 (c) |
166,000 | 149,584 | ||||||
Office REITs–1.70% |
||||||||
Office Properties Income Trust, |
||||||||
4.25%, 05/15/2024 |
724,000 | 720,790 | ||||||
9.00%, 03/31/2029 (c) |
586,000 | 547,204 | ||||||
| 1,267,994 | ||||||||
Oil & Gas Drilling–5.41% |
||||||||
Delek Logistics Partners L.P./Delek Logistics Finance Corp., |
||||||||
7.13%, 06/01/2028 (c) |
794,000 | 760,950 | ||||||
8.63%, 03/15/2029 (c) |
261,000 | 261,604 | ||||||
Nabors Industries Ltd., |
||||||||
7.25%, 01/15/2026 (c) |
102,000 | 100,549 | ||||||
Rockies Express Pipeline LLC, 4.95%, 07/15/2029 (c) |
522,000 | 488,633 | ||||||
Transocean, Inc., |
||||||||
7.25%, 11/01/2025 (c) |
268,000 | 264,266 | ||||||
7.50%, 01/15/2026 (c) |
802,000 | 793,490 | ||||||
8.75%, 02/15/2030 (c) |
605,700 | 622,395 | ||||||
Valaris Ltd., 8.38%, 04/30/2030 (c) |
725,000 | 744,022 | ||||||
| 4,035,909 | ||||||||
Oil & Gas Equipment & Services–0.71% |
||||||||
Oceaneering International, Inc., 6.00%, 02/01/2028 |
538,000 | 529,500 | ||||||
Oil & Gas Exploration & Production–5.79% |
||||||||
Aethon United BR L.P./Aethon United Finance Corp., 8.25%, 02/15/2026 (c) |
1,441,000 | 1,448,275 | ||||||
Ascent Resources Utica Holdings LLC/ARU Finance Corp., 7.00%, 11/01/2026 (c) |
500,000 | 500,054 | ||||||
Hilcorp Energy I L.P./Hilcorp Finance Co., |
||||||||
6.00%, 04/15/2030 (c) |
401,000 | 389,702 | ||||||
6.25%, 04/15/2032 (c) |
151,000 | 146,209 | ||||||
Moss Creek Resources Holdings, Inc., 10.50%, 05/15/2027 (c) |
485,000 | 497,375 | ||||||
Principal Amount |
Value |
|||||||
Oil & Gas Exploration & Production–(continued) |
||||||||
Sitio Royalties Operating Partnership L.P./Sitio Finance Corp., 7.88%, 11/01/2028 (c) |
$ | 481,000 | $ | 492,094 | ||||
SM Energy Co., 6.50%, 07/15/2028 |
336,000 | 336,692 | ||||||
Southwestern Energy Co., 4.75%, 02/01/2032 |
563,000 | 511,804 | ||||||
| 4,322,205 | ||||||||
Oil & Gas Refining & Marketing–1.36% |
||||||||
CVR Energy, Inc., 8.50%, 01/15/2029 (c) |
493,000 | 496,478 | ||||||
PBF Holding Co. LLC/PBF Finance Corp., 7.88%, 09/15/2030 (c) |
505,000 | 517,865 | ||||||
| 1,014,343 | ||||||||
Oil & Gas Storage & Transportation–8.37% |
||||||||
Genesis Energy L.P./Genesis Energy Finance Corp., |
||||||||
7.75%, 02/01/2028 |
579,000 | 579,520 | ||||||
8.88%, 04/15/2030 |
448,000 | 464,924 | ||||||
Martin Midstream Partners L.P./Martin Midstream Finance Corp., 11.50%, 02/15/2028 (c) |
515,000 | 541,296 | ||||||
New Fortress Energy, Inc., 6.50%, 09/30/2026 (c) |
643,000 | 621,532 | ||||||
NGL Energy Operating LLC/NGL Energy Finance Corp., |
||||||||
8.13%, 02/15/2029 (c) |
245,000 | 247,518 | ||||||
8.38%, 02/15/2032 (c) |
514,000 | 522,528 | ||||||
Prairie Acquiror L.P., 9.00%, 08/01/2029 (c) |
265,000 | 267,182 | ||||||
Summit Midstream Holdings LLC/ Summit Midstream Finance Corp., 9.00%, 10/15/2026 (c)(j) |
491,000 | 486,265 | ||||||
Tallgrass Energy Partners L.P./Tallgrass Energy Finance Corp., 7.38%, 02/15/2029 (c) |
755,000 | 753,891 | ||||||
Venture Global Calcasieu Pass LLC, 6.25%, 01/15/2030 (c) |
500,000 | 499,579 | ||||||
Venture Global LNG, Inc., |
||||||||
8.13%, 06/01/2028 (c) |
500,000 | 508,356 | ||||||
9.50%, 02/01/2029 (c) |
517,000 | 551,556 | ||||||
9.88%, 02/01/2032 (c) |
188,000 | 198,059 | ||||||
| 6,242,206 | ||||||||
Other Specialty Retail–1.13% |
||||||||
Bath & Body Works, Inc., 6.88%, 11/01/2035 |
148,000 | 148,213 | ||||||
Michaels Cos., Inc. (The), 5.25%, 05/01/2028 (c) |
66,000 | 51,325 | ||||||
PetSmart, Inc./PetSmart Finance Corp., 7.75%, 02/15/2029 (c) |
546,000 | 539,978 | ||||||
Staples, Inc., 7.50%, 04/15/2026 (c) |
110,000 | 105,866 | ||||||
| 845,382 | ||||||||
Paper & Plastic Packaging Products & Materials–2.18% |
||||||||
Clydesdale Acquisition Holdings, Inc., |
||||||||
6.63%, 04/15/2029 (c) |
509,000 | 506,509 | ||||||
8.75%, 04/15/2030 (c) |
272,000 | 259,184 | ||||||
LABL, Inc., |
||||||||
10.50%, 07/15/2027 (c) |
104,000 | 101,088 | ||||||
8.25%, 11/01/2029 (c) |
59,000 | 49,966 | ||||||
Principal Amount |
Value |
|||||||
Paper & Plastic Packaging Products & Materials–(continued) |
||||||||
Sealed Air Corp., |
||||||||
7.25%, 02/15/2031 (c) |
$ | 501,000 | $ | 517,850 | ||||
6.88%, 07/15/2033 (c) |
186,000 | 192,670 | ||||||
| 1,627,267 | ||||||||
Passenger Airlines–1.41% |
||||||||
American Airlines, Inc./AAdvantage Loyalty IP Ltd., 5.75%, 04/20/2029 (c) |
1,019,000 | 997,478 | ||||||
Hawaiian Brand Intellectual Property Ltd./HawaiianMiles Loyalty Ltd., 5.75%, 01/20/2026 (c) |
55,000 | 51,974 | ||||||
| 1,049,452 | ||||||||
Pharmaceuticals–0.89% |
||||||||
Bausch Health Cos., Inc., |
||||||||
5.50%, 11/01/2025 (c) |
271,000 | 252,452 | ||||||
4.88%, 06/01/2028 (c) |
329,000 | 187,839 | ||||||
5.25%, 01/30/2030 (c) |
263,000 | 113,741 | ||||||
Par Pharmaceutical, Inc., 7.50%, 04/01/2027 (c) |
174,000 | 110,479 | ||||||
| 664,511 | ||||||||
Real Estate Services–0.06% |
||||||||
Realogy Group LLC/Realogy Co-Issuer Corp., 5.75%, 01/15/2029(c) |
62,000 | 46,190 | ||||||
Regional Banks–0.07% |
||||||||
Verde Purchaser LLC, 10.50%, 11/30/2030 (c) |
50,000 | 52,312 | ||||||
Research & Consulting Services–1.01% |
||||||||
Clarivate Science Holdings Corp., 4.88%, 07/01/2029 (c) |
828,000 | 751,925 | ||||||
Restaurants–1.51% |
||||||||
1011778 BC ULC/New Red Finance, Inc. (Canada), 4.00%, 10/15/2030 (c) |
549,000 | 482,700 | ||||||
Fertitta Entertainment LLC/Fertitta Entertainment Finance Co., Inc., 6.75%, 01/15/2030 (c) |
172,000 | 152,081 | ||||||
Yum! Brands, Inc., 5.38%, 04/01/2032 |
508,000 | 488,259 | ||||||
| 1,123,040 | ||||||||
Retail REITs–1.02% |
||||||||
NMG Holding Co., Inc./Neiman Marcus Group LLC, 7.13%, 04/01/2026 (c) |
777,000 | 762,819 | ||||||
Security & Alarm Services–0.48% |
||||||||
Allied Universal Holdco LLC/Allied Universal Finance Corp., |
||||||||
9.75%, 07/15/2027 (c) |
30,000 | 29,928 | ||||||
6.00%, 06/01/2029 (c) |
270,000 | 223,846 | ||||||
Garda World Security Corp. (Canada), 9.50%, 11/01/2027 (c) |
100,000 | 100,475 | ||||||
| 354,249 | ||||||||
Single-Family Residential REITs–0.27% |
||||||||
Ashton Woods USA LLC/Ashton Woods Finance Co., 6.63%, 01/15/2028 (c) |
202,000 | 200,969 | ||||||
Principal Amount |
Value |
|||||||
Specialized Consumer Services–2.72% |
||||||||
Allwyn Entertainment Financing (UK) PLC (Czech Republic), 7.88%, 04/30/2029 (c) |
$ | 502,000 | $ | 517,688 | ||||
Carriage Services, Inc., 4.25%, 05/15/2029 (c) |
1,732,000 | 1,507,539 | ||||||
| 2,025,227 | ||||||||
Specialized Finance–0.34% |
||||||||
Jefferson Capital Holdings LLC, 9.50%, 02/15/2029 (c) |
252,000 | 254,849 | ||||||
Specialty Chemicals–0.24% |
||||||||
Olympus Water US Holding Corp., 6.25%, 10/01/2029 (c) |
200,000 | 177,599 | ||||||
Steel–1.32% |
||||||||
Cleveland-Cliffs, Inc., |
||||||||
6.75%, 04/15/2030 (c) |
726,000 | 721,595 | ||||||
6.25%, 10/01/2040 |
298,000 | 261,100 | ||||||
| 982,695 | ||||||||
Systems Software–1.91% |
||||||||
Camelot Finance S.A., 4.50%, 11/01/2026 (c) |
814,000 | 778,417 | ||||||
CrowdStrike Holdings, Inc., 3.00%, 02/15/2029 |
569,000 | 502,624 | ||||||
McAfee Corp., 7.38%, 02/15/2030 (c) |
162,000 | 143,167 | ||||||
| 1,424,208 | ||||||||
Telecom Tower REITs–0.67% |
||||||||
SBA Communications Corp., 3.13%, 02/01/2029 |
567,000 | 502,183 | ||||||
Trading Companies & Distributors–2.02% |
||||||||
Fortress Transportation and Infrastructure Investors LLC, |
||||||||
5.50%, 05/01/2028 (c) |
787,000 | 754,624 | ||||||
7.88%, 12/01/2030 (c) |
717,000 | 752,385 | ||||||
| 1,507,009 | ||||||||
Wireless Telecommunication Services–1.45% |
||||||||
Vodafone Group PLC (United Kingdom), 4.13%, 06/04/2081 (g) |
1,260,000 | 1,078,970 | ||||||
Total U.S. Dollar Denominated Bonds & Notes (Cost $91,127,693) |
90,665,804 | |||||||
Variable Rate Senior Loan Interests–14.95% (k)(l) |
||||||||
Advertising–0.76% |
||||||||
Clear Channel Worldwide Holdings, Inc., Term Loan B, 9.07% (3 mo. Term SOFR + 3.76%), 08/21/2026 |
569,083 | 568,055 | ||||||
Apparel Retail–0.33% |
||||||||
Victoria’s Secret & Co., First Lien Term Loan, 0.00%, 08/02/2028 |
245,000 | 244,898 | ||||||
Casinos & Gaming–0.71% |
||||||||
Bally’s Corp., Term Loan B, 8.83%, 10/02/2028 |
555,000 | 528,465 | ||||||
Commodity Chemicals–0.28% |
||||||||
Schweitzer-Mauduit International, Inc. (SWM International), Term Loan B, 9.19% (1 mo. Term SOFR + 3.86%), 04/20/2028 |
212,353 | 212,442 | ||||||
Principal Amount |
Value |
|||||||
Distributors–1.41% |
||||||||
IRB Holding Corp., Term Loan B, 8.18% (1 mo. SOFR + 2.75%), 12/15/2027 |
$ | 1,051,580 | $ | 1,051,617 | ||||
Diversified Financial Services–2.12% |
||||||||
Boost Newco Borrower LLC (WorldPay), Term Loan, 8.33% (1 mo. SOFR + 3.00%), 01/31/2031 |
525,000 | 527,625 | ||||||
Scientific Games Lottery, First Lien Term Loan, 8.58%, 04/04/2029 |
1,054,100 | 1,053,067 | ||||||
| 1,580,692 | ||||||||
Health Care Supplies–0.70% |
||||||||
Mozart Debt Merger Sub, Inc. (Medline Industries), Term Loan, 8.44% (1 mo. SOFR + 3.11%), 10/23/2028 |
523,337 | 523,991 | ||||||
Hotels, Resorts & Cruise Lines–0.77% |
||||||||
Carnival Corp., Incremental Term Loan B, 8.69% (1 mo. Term SOFR + 3.36%), 10/18/2028 |
571,531 | 573,140 | ||||||
Industrial REITs–0.49% |
||||||||
Greystar Real Estate Partners LLC, Term Loan, 8.58% (1 mo. Term SOFR + 3.75%), 08/21/2030 (m) |
367,479 | 367,938 | ||||||
Investment Banking & Brokerage–0.70% |
||||||||
Jane Street Group LLC, Term Loan, 7.94% (1 mo. SOFR + 2.61%), 01/26/2028 |
520,000 | 519,444 | ||||||
Life Sciences Tools & Services–0.71% |
||||||||
Syneos Health, Inc., Term Loan, 9.35% (1 mo. SOFR + 4.00%), 09/27/2030 |
535,000 | 528,984 | ||||||
Oil & Gas Exploration & Production–0.47% |
||||||||
Prairie ECI Acquiror L.P., Term Loan B, 0.00%, 03/11/2026 |
350,000 | 347,923 | ||||||
Oil & Gas Storage & Transportation–0.97% |
||||||||
NFE Atlantic Holdings LLC, Term Loan B, 10.32%, 10/30/2028 |
720,000 | 722,250 | ||||||
Passenger Ground Transportation–0.42% |
||||||||
Uber Technologies, Inc., Term Loan B, 0.00% (3 mo. SOFR + 2.75%), 03/03/2030 |
315,000 | 316,158 | ||||||
Pharmaceuticals–0.55% |
||||||||
Endo Luxembourg Finance Co. I S.a.r.l., Term Loan, 14.50% (1 mo. PRIME + 6.00%), 03/27/2028 |
627,062 | 413,861 | ||||||
Real Estate Services–0.72% |
||||||||
DTZ U.S. Borrower LLC, Term loan B, 9.33% (1 mo. Term SOFR + 4.00%), 01/31/2030 (m) |
537,000 | 537,000 | ||||||
Research & Consulting Services–1.42% |
||||||||
Dun & Bradstreet Corp. (The), Incremental Term Loan B-2, 8.07% (1 mo. SOFR + 2.75%), 01/18/2029 |
1,056,969 | 1,055,780 | ||||||
Principal Amount |
Value |
|||||||||
Restaurants–0.72% |
||||||||||
New Red Finance, Inc., Term Loan B-5, 7.58% (1 mo. SOFR + 2.25%), 09/23/2030 |
$ | 536,000 | $ | 534,422 | ||||||
Systems Software–0.70% |
||||||||||
Camelot US Acquisition LLC, Term Loan, 8.08%, 01/31/2031 |
525,000 | 524,016 | ||||||||
Total Variable Rate Senior Loan Interests (Cost $11,250,038) |
11,151,076 | |||||||||
Non-U.S. Dollar Denominated Bonds & Notes–4.18%(n) |
||||||||||
Casinos & Gaming–0.11% |
||||||||||
Codere Finance 2 (Luxembourg) S.A. (Spain), 3.00% PIK Rate, 8.00% Cash Rate, 09/30/2026 (c)(d) |
EUR | 138,521 | 79,348 | |||||||
Diversified Banks–1.72% |
||||||||||
Banco Bilbao Vizcaya Argentaria S.A. (Spain), 6.00% (c)(g)(h) |
EUR | 200,000 | 214,730 | |||||||
BNP Paribas S.A. (France), 6.88% (c)(g)(h) |
EUR | 200,000 | 222,058 | |||||||
Cooperatieve Rabobank U.A. (Netherlands), 4.38% (c)(g)(h) |
EUR | 200,000 | 202,477 | |||||||
Credit Agricole S.A. (France), 7.25% (c)(g)(h) |
EUR | 200,000 | 225,817 | |||||||
Lloyds Banking Group PLC (United Kingdom), 4.95% (c)(g)(h) |
EUR | 400,000 | 420,963 | |||||||
| 1,286,045 | ||||||||||
Diversified Capital Markets–0.30% |
||||||||||
Deutsche Bank AG (Germany), 10.00% (c)(g)(h) |
EUR | 200,000 | 226,192 | |||||||
Food Retail–0.02% |
||||||||||
Casino Guichard Perrachon S.A. (France), |
||||||||||
6.63%, 01/15/2026 (c)(e) |
EUR | 451,000 | 6,215 | |||||||
3.99% (c)(g)(h) |
EUR | 1,200,000 | 5,097 | |||||||
| 11,312 | ||||||||||
Pharmaceuticals–0.87% |
||||||||||
Nidda Healthcare Holding GmbH (Germany), 7.50%, 08/21/2026 (c) |
EUR | 582,000 | 651,853 | |||||||
Wireless Telecommunication Services–1.16% |
||||||||||
VMED O2 UK Financing I PLC (United Kingdom), 3.25%, 01/31/2031 (c) |
EUR | 900,000 | 866,790 | |||||||
Total Non-U.S. Dollar Denominated Bonds & Notes(Cost $3,085,313) |
3,121,540 | |||||||||
Shares |
||||||||||
Preferred Stocks–0.66% |
||||||||||
Diversified Banks–0.66% |
||||||||||
Bank of America Corp., 6.50%, Series Z, Pfd. (Cost $487,779) (g) |
489,000 | 489,578 | ||||||||
Principal Amount |
||||||||||
U.S. Treasury Securities–0.08% |
||||||||||
U.S. Treasury Bills–0.08% |
||||||||||
5.38%, 04/18/2024 (Cost $59,583) (o)(p) |
$ | 60,000 | 59,583 | |||||||
Shares |
Value |
|||||||
Money Market Funds–1.80% |
||||||||
Invesco Government & Agency Portfolio, Institutional Class, 5.24% (q)(r) |
470,059 | $ | 470,059 | |||||
Invesco Liquid Assets Portfolio, Institutional Class, 5.41% (q)(r) |
335,558 | 335,726 | ||||||
Invesco Treasury Portfolio, Institutional Class, 5.23% (q)(r) |
537,210 | 537,210 | ||||||
Total Money Market Funds (Cost $1,342,998) |
1,342,995 | |||||||
TOTAL INVESTMENTS IN SECURITIES–143.22% (Cost $107,353,404) |
106,830,576 | |||||||
BORROWINGS–(40.95)% |
(30,550,000 | ) | ||||||
OTHER ASSETS LESS LIABILITIES–(2.27)% |
(1,686,167 | ) | ||||||
NET ASSETS–100.00% |
$ | 74,594,409 | ||||||
| Investment Abbreviations: | ||
| Conv. | – Convertible | |
| EUR | – Euro | |
| Pfd. | – Preferred | |
| PIK | – Pay-in-Kind | |
| REIT | – Real Estate Investment Trust | |
| SOFR | – Secured Overnight Financing Rate | |
(a) |
Industry and/or sector classifications used in this report are generally according to the Global Industry Classification Standard, which was developed by and is the exclusive property and a service mark of MSCI Inc. and Standard & Poor’s. |
(b) |
Calculated as a percentage of net assets. Amounts in excess of 100% are due to the Trust’s use of leverage. |
(c) |
Security purchased or received in a transaction exempt from registration under the Securities Act of 1933, as amended (the “1933 Act”). The security may be resold pursuant to an exemption from registration under the 1933 Act, typically to qualified institutional buyers. The aggregate value of these securities at February 29, 2024 was $81,158,469, which represented 108.80% of the Trust’s Net Assets. |
(d) |
All or a portion of this security is Pay-in-Kind. Pay-in-Kind |
(e) |
Defaulted security. Currently, the issuer is in default with respect to principal and/or interest payments. The aggregate value of these securities at February 29, 2024 was $73,423, which represented less than 1% of the Trust’s Net Assets. |
(f) |
Security has an irrevocable call by the issuer or mandatory put by the holder. Maturity date reflects such call or put. |
(g) |
Security issued at a fixed rate for a specific period of time, after which it will convert to a variable rate. |
(h) |
Perpetual bond with no specified maturity date. |
(i) |
Zero coupon bond issued at a discount. |
(j) |
Step coupon bond. The interest rate represents the coupon rate at which the bond will accrue at a specified future date. |
(k) |
Variable rate senior loan interests often require prepayments from excess cash flow or permit the borrower to repay at its election. The degree to which borrowers repay, whether as a contractual requirement or at their election, cannot be predicted with any accuracy. As a result, the actual remaining maturity may be substantially less than the stated maturities shown. However, it is anticipated that the variable rate senior loan interests will have an expected average life of three to five years. |
(l) |
Variable rate senior loan interests are, at present, not readily marketable, not registered under the 1933 Act and may be subject to contractual and legal restrictions on sale. Variable rate senior loan interests in the Trust’s portfolio generally have variable rates which adjust to a base, such as the Secured Overnight Financing Rate (“SOFR”), on set dates, typically every 30 days, but not greater than one year, and/or have interest rates that float at margin above a widely recognized base lending rate such as the Prime Rate of a designated U.S. bank. |
(m) |
Security valued using significant unobservable inputs (Level 3). See Note 3. |
(n) |
Foreign denominated security. Principal amount is denominated in the currency indicated. |
(o) |
All or a portion of the value was pledged as collateral to cover margin requirements for open futures contracts. See Note 1M. |
(p) |
Security traded on a discount basis. The interest rate shown represents the discount rate at the time of purchase by the Fund. |
(q) |
Affiliated holding. Affiliated holdings are investments in entities which are under common ownership or control of Invesco Ltd. or are investments in entities in which the Trust owns 5% or more of the outstanding voting securities. The table below shows the Trust’s transactions in, and earnings from, its investments in affiliates for the fiscal year ended February 29, 2024. |
Value February 28, 2023 |
Purchases at Cost |
Proceeds from Sales |
Change in Unrealized Appreciation |
Realized Gain |
Value February 29, 2024 |
Dividend Income | ||||||||||||||||||
Invesco At1 Capital Bond Ucits |
$ - | $ 1,549,363 | $ | (1,597,531 | ) | $ - | $48,168 | $ - | $ - | |||||||||||||||
Invesco Senior Loan ETF |
- | 1,045,000 | (1,050,992 | ) | - | 5,992 | - | - | ||||||||||||||||
Investments in Affiliated Money Market Funds: |
||||||||||||||||||||||||
Invesco Government & Agency Portfolio, Institutional Class |
575,999 | 19,003,952 | (19,109,892 | ) | - | - | 470,059 | 26,146 | ||||||||||||||||
Invesco Liquid Assets Portfolio, Institutional Class |
412,760 | 13,574,252 | (13,651,443 | ) | 25 | 132 | 335,726 | 17,715 | ||||||||||||||||
Invesco Treasury Portfolio, Institutional Class |
658,284 | 21,718,803 | (21,839,877 | ) | - | - | 537,210 | 27,531 | ||||||||||||||||
Total |
$1,647,043 | $56,891,370 | $ | (57,249,735 | ) | $25 | $54,292 | $1,342,995 | $71,392 | |||||||||||||||
(r) |
The rate shown is the 7-day SEC standardized yield as of February 29, 2024. |
Open Forward Foreign Currency Contracts | ||||||||||||||||
Settlement Date |
Unrealized Appreciation (Depreciation) | |||||||||||||||
Contract to |
||||||||||||||||
Counterparty |
Deliver |
Receive |
||||||||||||||
Currency Risk |
||||||||||||||||
05/15/2024 |
Canadian Imperial Bank of Commerce | USD 93,272 | GBP 74,000 | $ 176 | ||||||||||||
Currency Risk |
||||||||||||||||
05/15/2024 |
Goldman Sachs International | EUR 3,315,000 | USD 3,578,065 | (15,308) | ||||||||||||
Total Forward Foreign Currency Contracts |
$(15,132) | |||||||||||||||
Open Centrally Cleared Credit Default Swap Agreements (a) |
||||||||||||||||||||||||||||||||||||
Reference Entity |
Buy/Sell Protection |
(Pay)/ Receive Fixed Rate |
Payment Frequency |
Maturity Date |
Implied Credit Spread (b) |
Notional Value |
Upfront Payments Paid (Received) |
Value |
Unrealized Appreciation |
|||||||||||||||||||||||||||
Credit Risk |
||||||||||||||||||||||||||||||||||||
Markit CDX North America High Yield Index, Series 41, Version 2 |
Sell | 5.00% | Quarterly | 12/20/2028 | 3.391% | USD 5,940,000 | $217,605 | $375,782 | $158,177 | |||||||||||||||||||||||||||
(a) |
Centrally cleared swap agreements collateralized by $472,343 cash held with Merrill Lynch International. |
(b) |
Implied credit spreads represent the current level, as of February 29, 2024, at which protection could be bought or sold given the terms of the existing credit default swap agreement and serve as an indicator of the current status of the payment/performance risk of the credit default swap agreement. An implied credit spread that has widened or increased since entry into the initial agreement may indicate a deteriorating credit profile and increased risk of default for the reference entity. A declining or narrowing spread may indicate an improving credit profile or decreased risk of default for the reference entity. Alternatively, credit spreads may increase or decrease reflecting the general tolerance for risk in the credit markets generally. |
Assets: |
||||
Investments in unaffiliated securities, at value (Cost $106,010,406) |
$ | 105,487,581 | ||
Investments in affiliated money market funds, at value (Cost $1,342,998) |
1,342,995 | |||
Other investments: |
||||
Variation margin receivable–centrally cleared swap agreements |
76,563 | |||
Unrealized appreciation on forward foreign currency contracts outstanding |
176 | |||
Deposits with brokers: |
||||
Cash collateral – centrally cleared swap agreements |
472,343 | |||
Cash |
392,144 | |||
Foreign currencies, at value (Cost $511,634) |
512,985 | |||
Receivable for: |
||||
Investments sold |
14,404 | |||
Dividends |
6,585 | |||
Interest |
1,514,487 | |||
Investment for trustee deferred compensation and retirement plans |
21,173 | |||
Total assets |
109,841,436 | |||
Liabilities: |
||||
Other investments: |
||||
Unrealized depreciation on forward foreign currency contracts outstanding |
15,308 | |||
Payable for: |
||||
Borrowings |
30,550,000 | |||
Investments purchased |
4,393,423 | |||
Dividends |
35,753 | |||
Accrued fees to affiliates |
15,087 | |||
Accrued interest expense |
157,142 | |||
Accrued other operating expenses |
58,037 | |||
Trustee deferred compensation and retirement plans |
22,277 | |||
Total liabilities |
35,247,027 | |||
Net assets applicable to common shares |
$ | 74,594,409 | ||
Net assets applicable to common shares consist of: |
||||
Shares of beneficial interest – common shares |
$ | 105,254,094 | ||
Distributable earnings (loss) |
(30,659,685 | ) | ||
| $ | 74,594,409 | |||
Common shares outstanding, no par value, with an unlimited number of common shares authorized: |
||||
Common shares outstanding |
6,498,037 | |||
Net asset value per common share |
$ | 11.48 | ||
Market value per common share |
$ | 10.58 | ||
Investment income: |
||||
Interest |
$ | 7,501,572 | ||
Dividends |
32,527 | |||
Dividends from affiliated money market funds |
71,392 | |||
Total investment income |
7,605,491 | |||
Expenses: |
||||
Advisory fees |
731,508 | |||
Administrative services fees |
10,552 | |||
Custodian fees |
7,667 | |||
Interest, facilities and maintenance fees |
1,982,971 | |||
Transfer agent fees |
35,864 | |||
Trustees’ and officers’ fees and benefits |
17,928 | |||
Registration and filing fees |
24,220 | |||
Reports to shareholders |
23,059 | |||
Professional services fees |
117,149 | |||
Other |
1,409 | |||
Total expenses |
2,952,327 | |||
Less: Fees waived |
(1,492 | ) | ||
Net expenses |
2,950,835 | |||
Net investment income |
4,654,656 | |||
Realized and unrealized gain (loss) from: |
||||
Net realized gain (loss) from: |
||||
Unaffiliated investment securities |
(6,422,269 | ) | ||
Affiliated investment securities |
54,292 | |||
Foreign currencies |
49,084 | |||
Forward foreign currency contracts |
82,957 | |||
Futures contracts |
(21,664 | ) | ||
Swap agreements |
(30,684 | ) | ||
| (6,288,284 | ) | |||
Change in net unrealized appreciation (depreciation) of: |
||||
Unaffiliated investment securities |
8,394,144 | |||
Affiliated investment securities |
25 | |||
Foreign currencies |
2,679 | |||
Forward foreign currency contracts |
(47,021 | ) | ||
Swap agreements |
155,297 | |||
| 8,505,124 | ||||
Net realized and unrealized gain |
2,216,840 | |||
Net increase in net assets resulting from operations applicable to common shares |
$ | 6,871,496 | ||
2024 |
2023 |
|||||||
Operations: |
||||||||
Net investment income |
$ | 4,654,656 | $ | 4,463,580 | ||||
Net realized gain (loss) |
(6,288,284 | ) | (6,239,388 | ) | ||||
Change in net unrealized appreciation (depreciation) |
8,505,124 | (5,850,016 | ) | |||||
Net increase (decrease) in net assets resulting from operations applicable to common shares |
6,871,496 | (7,625,824 | ) | |||||
Distributions to common shareholders from distributable earnings |
(4,956,936 | ) | (4,934,108 | ) | ||||
Return of capital applicable to common shares |
(2,559,993 | ) | (2,582,821 | ) | ||||
Total distributions |
(7,516,929 | ) | (7,516,929 | ) | ||||
Net increase (decrease) in net assets applicable to common shares |
(645,433 | ) | (15,142,753 | ) | ||||
Net assets applicable to common shares: |
||||||||
Beginning of year |
75,239,842 | 90,382,595 | ||||||
End of year |
$ | 74,594,409 | $ | 75,239,842 | ||||
Cash provided by operating activities: |
||||
Net increase in net assets resulting from operations applicable to common shares |
$ | 6,871,496 | ||
Adjustments to reconcile the change in net assets applicable to common shares from operations to net cash provided by operating activities: |
||||
Purchases of investments |
(143,645,443 | ) | ||
Proceeds from sales of investments |
148,440,904 | |||
Purchases of short-term investments, net |
(654,431 | ) | ||
Amortization of premium on investment securities |
210,692 | |||
Accretion of discount on investment securities |
(1,144,940 | ) | ||
Net realized loss from investment securities |
6,368,109 | |||
Net change in unrealized appreciation on investment securities |
(8,394,144 | ) | ||
Net change in unrealized depreciation of forward foreign currency contracts |
47,021 | |||
Change in operating assets and liabilities: |
||||
Decrease in receivables and other assets |
130,242 | |||
Decrease in accrued expenses and other payables |
(110,436 | ) | ||
Net change in transactions in swap agreements |
37,179 | |||
Net cash provided by operating activities |
8,156,249 | |||
Cash provided by (used in) financing activities: |
||||
Dividends paid to common shareholders from distributable earnings |
(4,943,543 | ) | ||
Return of capital |
(2,559,993 | ) | ||
Net cash provided by (used in) financing activities |
(7,503,536 | ) | ||
Net increase in cash and cash equivalents |
652,713 | |||
Cash and cash equivalents at beginning of period |
2,067,754 | |||
Cash and cash equivalents at end of period |
$ | 2,720,467 | ||
Supplemental disclosure of cash flow information: |
||||
Cash paid during the period for taxes |
$ | 1,429 | ||
Cash paid during the period for interest, facilities and maintenance fees |
$ | 2,054,769 | ||
Year Ended February 29, |
Years Ended February 28, |
Year Ended February 29, |
||||||||||||||||||
2024 |
2023 |
2022 |
2021 |
2020 |
||||||||||||||||
Net asset value per common share, beginning of period |
$ 11.58 | $ | 13.91 | $ | 14.99 | $ | 14.94 | $ | 15.46 | |||||||||||
Net investment income (a) |
0.72 | 0.69 | 0.73 | 0.93 | 0.92 | |||||||||||||||
Net gains (losses) on securities (both realized and unrealized) |
0.34 | (1.86 | ) | (0.65 | ) | 0.28 | (0.28) | |||||||||||||
Total from investment operations |
1.06 | (1.17 | ) | 0.08 | 1.21 | 0.64 | ||||||||||||||
Less: |
||||||||||||||||||||
Dividends paid to common shareholders from net investment income |
(0.76 | ) | (0.76 | ) | (0.89 | ) | (1.00 | ) | (1.03) | |||||||||||
Return of capital |
(0.40 | ) | (0.40 | ) | (0.27 | ) | (0.16 | ) | (0.13) | |||||||||||
Total distributions |
(1.16 | ) | (1.16 | ) | (1.16 | ) | (1.16 | ) | (1.16) | |||||||||||
Net asset value per common share, end of period |
$ 11.48 | $ | 11.58 | $ | 13.91 | $ | 14.99 | $ | 14.94 | |||||||||||
Market value per common share, end of period |
$ 10.58 | $ | 10.90 | $ | 12.70 | $ | 13.56 | $ | 13.53 | |||||||||||
Total return at net asset value (b) |
10.82 | % | (7.50 | )% | 0.58 | % | 10.16 | % | 4.72% | |||||||||||
Total return at market value (c) |
8.51 | % | (4.64 | )% | 1.52 | % | 10.04 | % | 2.81% | |||||||||||
Net assets applicable to common shares, end of period (000’s omitted) |
$74,594 | $ | 75,240 | $ | 90,383 | $ | 97,369 | $ | 97,007 | |||||||||||
Portfolio turnover rate (d) |
142 | % | 86 | % | 89 | % | 101 | % | 41% | |||||||||||
Ratios/supplemental data based on average net assets: |
||||||||||||||||||||
Ratio of expenses: |
||||||||||||||||||||
With fee waivers and/or expense reimbursements |
4.00 | % | 2.63 | % | 1.55 | % | 1.63 | % | 2.41% | |||||||||||
With fee waivers and/or expense reimbursements excluding interest, facilities and maintenance fees |
1.31 | % | 1.23 | % | 1.12 | % | 1.20 | % | 1.24% | |||||||||||
Without fee waivers and/or expense reimbursements |
4.00 | % | 2.63 | % | 1.55 | % | 1.63 | % | 2.42% | |||||||||||
Ratio of net investment income to average net assets |
6.29 | % | 5.63 | % | 4.92 | % | 6.68 | % | 5.93% | |||||||||||
Senior securities: |
||||||||||||||||||||
Asset coverage per $1,000 unit of senior indebtedness (e) |
$ 3,442 | $ | 3,463 | $ | 3,959 | $ | 4,187 | $ | 3,280 | |||||||||||
Total borrowings (000’s omitted) |
$30,550 | $ | 30,550 | $ | 30,550 | $ | 30,550 | $ | 42,550 | |||||||||||
(a) |
Calculated using average shares outstanding. |
(b) |
Includes adjustments in accordance with accounting principles generally accepted in the United States of America and as such, the net asset value for financial reporting purposes and the returns based upon those net asset values may differ from the net asset value and returns for shareholder transactions. Not annualized for periods less than one year, if applicable. |
(c) |
Total return assumes an investment at the common share market price at the beginning of the period indicated, reinvestment of all distributions for the period in accordance with the Trust’s dividend reinvestment plan, and sale of all shares at the closing common share market price at the end of the period indicated. Not annualized for periods less than one year, if applicable. |
(d) |
Portfolio turnover is calculated at the fund level and is not annualized for periods less than one year, if applicable. |
(e) |
Calculated by subtracting the Trust’s total liabilities (not including the Borrowings) from the Trust’s total assets and dividing by the total number of senior indebtedness units, where one unit equals $1,000 of senior indebtedness. |
A. |
Security Valuations |
unobservable inputs and assumptions, to determine a methodology that will result in a valuation that the Adviser believes approximates market value. Trust securities that are fair valued may be subject to greater fluctuation in their value from one day to the next than would be the case if market quotations were used. Because of the inherent uncertainties of valuation, and the degree of subjectivity in such decisions, the Trust could realize a greater or lesser than expected gain or loss upon the sale of the investment. |
B. |
Securities Transactions and Investment Income Pay-in-kind non-cash dividend income received in the form of securities in lieu of cash are recorded at the fair value of the securities received. Dividend income (net of withholding tax, if any) is recorded on the ex-dividend date. |
C. |
Country Determination |
D. |
Distributions ex-dividend date. The Plan may be amended or terminated at any time by the Board. |
E. |
Federal Income Taxes |
F. |
Interest, Facilities and Maintenance Fees |
G. |
Accounting Estimates period-end date and before the date the financial statements are released to print. |
H. |
Indemnifications |
I. |
Cash and Cash Equivalents |
J. |
Securities Purchased on a When-Issued and Delayed Delivery Basis |
K. |
Foreign Currency Translations |
foreign currency gains and losses arise from changes in the fair values of assets and liabilities, other than investments in securities at fiscal period end, resulting from changes in exchange rates. |
L. |
Forward Foreign Currency Contracts |
M. |
Futures Contracts |
N. |
Swap Agreements over-the-counter pre-determined level of net assets, and/ or provide limits regarding the decline of the Trust’s net asset value (“NAV”) per share over specific periods of time. If the Trust were to trigger such provisions and have open derivative positions at that time, the Counterparty may be able to terminate such agreement and request immediate payment in an amount equal to the net liability positions, if any. |
assets of value and recourse in the event of default under the swap agreement or bankruptcy/insolvency of a party to the swap agreement. If a Counterparty becomes bankrupt or otherwise fails to perform its obligations due to financial difficulties, the Trust may experience significant delays in obtaining any recovery in a bankruptcy or other reorganization proceeding. The Trust may obtain only limited recovery or may obtain no recovery in such circumstances. The Trust’s maximum risk of loss from Counterparty risk, either as the protection seller or as the protection buyer, is the value of the contract. The risk may be mitigated by having a master netting arrangement between the Trust and the Counterparty and by the designation of collateral by the Counterparty to cover the Trust’s exposure to the Counterparty. |
O. |
Bank Loan Risk |
P. |
Leverage Risk |
Q. |
Collateral |
R. |
Other Risks |
| Level 1 - | Prices are determined using quoted prices in an active market for identical assets. | |
| Level 2 - | Prices are determined using other significant observable inputs. Observable inputs are inputs that other market participants may use in pricing a security. These may include quoted prices for similar securities, interest rates, prepayment speeds, credit risk, yield curves, loss severities, default rates, discount rates, volatilities and others. | |
| Level 3 - | Prices are determined using significant unobservable inputs. In situations where quoted prices or observable inputs are unavailable (for example, when there is little or no market activity for an investment at the end of the period), unobservable inputs may be used. Unobservable inputs reflect the Adviser’s assumptions about the factors market participants would use in determining fair value of the securities or instruments and would be based on the best available information. |
Level 1 |
Level 2 |
Level 3 |
Total |
|||||||||||||||||||||||||
Investments in Securities |
||||||||||||||||||||||||||||
U.S. Dollar Denominated Bonds & Notes |
$ | – | $ | 90,665,804 | $ | – | $ | 90,665,804 | ||||||||||||||||||||
Variable Rate Senior Loan Interests |
– | 10,246,138 | 904,938 | 11,151,076 | ||||||||||||||||||||||||
Non-U.S. Dollar Denominated Bonds & Notes |
– | 3,121,540 | – | 3,121,540 | ||||||||||||||||||||||||
Preferred Stocks |
– | 489,578 | – | 489,578 | ||||||||||||||||||||||||
U.S. Treasury Securities |
– | 59,583 | – | 59,583 | ||||||||||||||||||||||||
Money Market Funds |
1,342,995 | – | – | 1,342,995 | ||||||||||||||||||||||||
Total Investments in Securities |
1,342,995 | 104,582,643 | 904,938 | 106,830,576 | ||||||||||||||||||||||||
Other Investments - Assets* |
||||||||||||||||||||||||||||
Forward Foreign Currency Contracts |
– | 176 | – | 176 | ||||||||||||||||||||||||
Swap Agreements |
– | 158,177 | – | 158,177 | ||||||||||||||||||||||||
| – | 158,353 | – | 158,353 | |||||||||||||||||||||||||
Other Investments - Liabilities* |
||||||||||||||||||||||||||||
Forward Foreign Currency Contracts |
– | (15,308 | ) | – | (15,308 | ) | ||||||||||||||||||||||
Total Other Investments |
– | 143,045 | – | 143,045 | ||||||||||||||||||||||||
Total Investments |
$ | 1,342,995 | $ | 104,725,688 | $ | 904,938 | $ | 106,973,621 | ||||||||||||||||||||
| * | Unrealized appreciation (depreciation). |
Value |
||||||||||||||||||||
Derivative Assets |
Credit Risk |
Currency Risk |
Total |
|||||||||||||||||
Unrealized appreciation on swap agreements – Centrally Cleared |
$ | 158,177 | $ | – | $ | 158,177 | ||||||||||||||
Unrealized appreciation on forward foreign currency contracts outstanding |
– | 176 | 176 | |||||||||||||||||
Total Derivative Assets |
158,177 | 176 | 158,353 | |||||||||||||||||
Derivatives not subject to master netting agreements |
(158,177 | ) | – | (158,177 | ) | |||||||||||||||
Total Derivative Assets subject to master netting agreements |
$ | – | $ | 176 | $ | 176 | ||||||||||||||
Value |
||||
Derivative Liabilities |
Currency Risk |
|||
Unrealized depreciation on forward foreign currency contracts outstanding |
$ | (15,308 | ) | |
Derivatives not subject to master netting agreements |
– | |||
Total Derivative Liabilities subject to master netting agreements |
$ | (15,308 | ) | |
Financial Derivative Assets |
Financial Derivative Liabilities |
Collateral (Received)/Pledged |
||||||||||||||||||||||
Counterparty |
Forward Foreign Currency Contracts |
Forward Foreign Currency Contracts |
Net Value of Derivatives |
Non-Cash |
Cash |
Net Amount |
||||||||||||||||||
Canadian Imperial Bank of Commerce |
$176 | $ – | $ 176 | $– | $– | $ | 176 | |||||||||||||||||
Goldman Sachs International |
– | (15,308) | (15,308) | – | – | (15,308 | ) | |||||||||||||||||
Total |
$176 | $(15,308) | $(15,132) | $– | $– | $ | (15,132 | ) | ||||||||||||||||
Location of Gain (Loss) on Statement of Operations |
||||||||||||||||||||||||||||
Credit Risk |
Currency Risk |
Interest Rate Risk |
Total |
|||||||||||||||||||||||||
Realized Gain (Loss): |
||||||||||||||||||||||||||||
Forward foreign currency contracts |
$ | - | $ | 82,957 | $ | - | $ | 82,957 | ||||||||||||||||||||
Futures contracts |
- | - | (21,664 | ) | (21,664 | ) | ||||||||||||||||||||||
Swap agreements |
(30,684 | ) | - | - | (30,684 | ) | ||||||||||||||||||||||
Change in Net Unrealized Appreciation (Depreciation): |
||||||||||||||||||||||||||||
Forward foreign currency contracts |
- | (47,021 | ) | - | (47,021 | ) | ||||||||||||||||||||||
Swap agreements |
155,297 | - | - | 155,297 | ||||||||||||||||||||||||
Total |
$ | 124,613 | $ | 35,936 | $ | (21,664 | ) | $ | 138,885 | |||||||||||||||||||
Forward Foreign Currency Contracts |
Futures Contracts |
Swap Agreements |
||||||||||
Average notional value |
$6,612,938 | $2,671,289 | $ | 4,035,000 | ||||||||
2024 |
2023 |
|||||||
Ordinary income* |
$ | 4,956,936 | $ | 4,934,108 | ||||
Return of capital |
2,559,993 | 2,582,821 | ||||||
Total distributions |
$ | 7,516,929 | $ | 7,516,929 | ||||
| * | Includes short-term capital gain distributions, if any. |
2024 |
||||
Net unrealized appreciation (depreciation) – investments |
$ | (724,302 | ) | |
Net unrealized appreciation – foreign currencies |
2,860 | |||
Temporary book/tax differences |
(16,826 | ) | ||
Capital loss carryforward |
(29,921,417 | ) | ||
Shares of beneficial interest |
105,254,094 | |||
Total net assets |
$ | 74,594,409 | ||
Capital Loss Carryforward* | ||||||||||||
Expiration |
Short-Term |
Long-Term |
Total | |||||||||
Not subject to expiration |
$6,184,096 | $23,737,321 | $29,921,417 | |||||||||
| * | Capital loss carryforward is reduced for limitations, if any, to the extent required by the Internal Revenue Code and may be further limited depending upon a variety of factors, including the realization of net unrealized gains or losses as of the date of any reorganization. |
Unrealized Appreciation (Depreciation) of Investments on a Tax Basis |
||||
Aggregate unrealized appreciation of investments |
$ | 2,439,666 | ||
Aggregate unrealized (depreciation) of investments |
(3,163,968 | ) | ||
Net unrealized appreciation (depreciation) of investments |
$ | (724,302 | ) | |
Year Ended February 29, |
Year Ended February 28, |
|||||||||||
2024 |
2023 |
|||||||||||
Beginning shares |
6,498,037 | 6,498,037 | ||||||||||
Shares issued through dividend reinvestment |
– | – | ||||||||||
Ending shares |
6,498,037 | 6,498,037 | ||||||||||
Declaration Date |
Amount per Share |
Record Date |
Payable Date | |||||||||
March 1, 2024 |
$0.0964 | March 15, 2024 | March 28, 2024 | |||||||||
April 1, 2024 |
$0.0964 | April 16, 2024 | April 30, 2024 | |||||||||
/s/PricewaterhouseCoopers LLP |
| Houston, Texas |
| April 25, 2024 |
Fund |
March 2024 | |||||||||||||||||
Net Investment Income |
Net Realized Capital Gains |
Return of Principal (or Other Capital Source) |
Total Current Distribution (common share) | |||||||||||||||
Per Share Amount |
% of Current Distribution |
Per Share Amount |
% of Current Distribution |
Per Share Amount |
% of Current Distribution | |||||||||||||
Invesco High Income Trust II |
$0.0573 | 59.44% | $ | 0.0000 | 0.00% | $0.0391 | 40.56% | $0.0964 | ||||||||||
Invesco Senior Income Trust |
$0.0330 | 76.74% | $ | 0.0000 | 0.00% | $0.0100 | 23.26% | $0.0430 | ||||||||||
Fund |
CUMULATIVE FISCAL YEAR-TO-DATE (YTD) February 29, 2024* | |||||||||||||||||
Net Investment Income |
Net Realized Capital Gains |
Return of Principal (or Other Capital Source) |
Total FYTD Distribution (common share) | |||||||||||||||
Per Share Amount |
% of 2023 Distribution |
Per Share Amount |
% of 2023 Distribution |
Per Share Amount |
% of 2023 Distribution | |||||||||||||
Invesco High Income Trust II |
$0.7215 | 62.37% | $ | 0.0000 | 0.00% | $0.4353 | 37.63% | $1.1568 | ||||||||||
Invesco Senior Income Trust |
$0.4321 | 88.55% | $ | 0.0000 | 0.00% | $0.0559 | 11.45% | $0.4880 | ||||||||||
* |
Form 1099-DIV for the calendar year will report distributions for federal income tax purposes. Each Fund’s annual report to shareholders will include information regarding the tax character of Fund distributions for the fiscal year. The final determination of the source and tax characteristics of all distributions in 2024 will be made after the end of the year. |
Fiscal Year-to-date March 1, 2023 to February 29, 2024 |
Five-year period ending February 29, 2024 | |||||||
Fund |
FYTD Cumulative Total Return 1 |
Cumulative Distribution Rate 2 |
Current Annualized Distribution Rate 3 |
Average Annual Total Return 4 | ||||
Invesco High Income Trust II |
10.82% | 10.08% | 10.08% | 3.53% | ||||
Invesco Senior Income Trust |
12.65% | 11.92% | 11.93% | 6.06% | ||||
1 |
Fiscal year-to-date year-to-date |
2 |
Cumulative Distribution Rate for the Fund’s current fiscal period (March 1, 2023 through February 29, 2024) is calculated as the dollar value of distributions in the fiscal year-to-date |
3 |
The Current Annualized Distribution Rate is the current fiscal period’s distribution rate annualized as a percentage of the Fund’s NAV as of February 29, 2024. |
4 |
Average Annual Total Return represents the compound average of the annual NAV Total Returns of the Fund for the five year period ending February 29, 2024. Annual NAV Total Return is the percentage change in the Fund’s NAV over a year including distributions paid and reinvested. |
Federal and State Income Tax |
||||||
| Qualified Dividend Income* | 2.58 | % | ||||
| Corporate Dividends Received Deduction* | 2.16 | % | ||||
| U.S. Treasury Obligations* | 0.03 | % | ||||
| Qualified Business Income* | 0.00 | % | ||||
| Business Interest Income* | 86.39 | % | ||||
| * | The above percentages are based on ordinary income dividends paid to shareholders during the Trust’s fiscal year. |
Non-Resident Alien Shareholders |
||||||
| Qualified Interest Income** | 68.88 | % | ||||
| † | Standard & Poor’s, Fitch Ratings, Moody’s. A credit rating is an assessment provided by a nationally recognized statistical rating organization (NRSRO) of the creditworthiness of an issuer with respect to debt obligations, including specific securities, money market instruments or other debts. Ratings are measured on a scale that generally ranges from AAA (highest) to D (lowest); ratings are subject to change without notice. “Non-Rated” indicates the debtor was not rated and should not be interpreted as indicating low quality. For more information on rating methodology, please visit spglobal.com, fitchratings.com and ratings.moodys.com. |
Name, Year of Birth and Position(s) Held with the Trust |
Trustee and/or Officer Since |
Principal Occupation(s) During Past 5 Years |
Number of Funds in Fund Complex Overseen by Trustee |
Other Directorship(s) Held by Trustee During Past 5 Years | ||||
Interested Trustees |
||||||||
Jeffrey H. Kupor 1 – 1968Trustee |
2024 | Senior Managing Director and General Counsel, Invesco Ltd.; Trustee, Invesco Foundation, Inc.; Director, Invesco Advisers, Inc.; Executive Vice President, Invesco Asset Management (Bermuda), Ltd., Invesco Investments (Bermuda) Ltd.; and Vice President, Invesco Group Services, Inc. Formerly: Head of Legal of the Americas, Invesco Ltd.; Senior Vice President and Secretary, Invesco Advisers, Inc. (formerly known as Invesco Institutional (N.A.), Inc.) (registered investment adviser); Secretary, Invesco Distributors, Inc. (formerly known as Invesco AIM Distributors, Inc.); Vice President and Secretary, Invesco Investment Services, Inc. (formerly known as Invesco AIM Investment Services, Inc.); Senior Vice President, Chief Legal Officer and Secretary, The Invesco Funds; Secretary and General Counsel, Invesco Investment Advisers LLC (formerly known as Van Kampen Asset Management); Secretary and General Counsel, Invesco Capital Markets, Inc. (formerly known as Van Kampen Funds Inc.) and Chief Legal Officer, Invesco Exchange-Traded Fund Trust, Invesco Exchange-Traded Fund Trust II, Invesco India Exchange-Traded Fund Trust, Invesco Actively Managed Exchange-Traded Fund Trust, Invesco Actively Managed Exchange-Traded Commodity Fund Trust and Invesco Exchange-Traded Self-Indexed Fund Trust; Secretary and Vice President, Harbourview Asset Management Corporation; Secretary and Vice President, OppenheimerFunds, Inc. and Invesco Managed Accounts, LLC; Secretary and Senior Vice President, OFI Global Institutional, Inc.; Secretary and Vice President, OFI SteelPath, Inc.; Secretary and Vice President, Oppenheimer Acquisition Corp.; Secretary and Vice President, Shareholder Services, Inc.; Secretary and Vice President, Trinity Investment Management Corporation, Senior Vice President, Invesco Distributors, Inc.; Secretary and Vice President, Jemstep, Inc.; Head of Legal, Worldwide Institutional, Invesco Ltd.; Secretary and General Counsel, INVESCO Private Capital Investments, Inc.; Senior Vice President, Secretary and General Counsel, Invesco Management Group, Inc. (formerly known as Invesco AIM Management Group, Inc.); Assistant Secretary, INVESCO Asset Management (Bermuda) Ltd.; Secretary and General Counsel, Invesco Private Capital, Inc.; Assistant Secretary and General Counsel, INVESCO Realty, Inc.; Secretary and General Counsel, Invesco Senior Secured Management, Inc.; Secretary, Sovereign G./P. Holdings Inc.; Secretary, Invesco Indexing LLC; and Secretary, W.L. Ross & Co., LLC |
165 | None | ||||
Douglas Sharp 1 – 1974Trustee |
2024 | Senior Managing Director and Head of Americas & EMEA, Invesco Ltd. Formerly: Director and Chairman Invesco UK Limited; Director, Chairman and Chief Executive, Invesco Fund Managers Limited |
165 | None |
1 |
Mr. Kupor and Mr. Sharp are considered interested persons (within the meaning of Section 2(a)(19) of the 1940 Act) of the Trust because they are officers of the Adviser to the Trust, and officers of Invesco Ltd., ultimate parent of the Adviser. |
Name, Year of Birth and Position(s) Held with the Trust |
Trustee and/or Officer Since |
Principal Occupation(s) During Past 5 Years |
Number of Funds in Fund Complex Overseen by Trustee |
Other Directorship(s) Held by Trustee During Past 5 Years | ||||
Independent Trustees |
||||||||
Beth Ann Brown – 1968 Trustee (2019) and Chair (2022) |
2019 | Independent Consultant Formerly: Head of Intermediary Distribution, Managing Director, Strategic Relations, Managing Director, Head of National Accounts, Senior Vice President, National Account Manager and Senior Vice President, Key Account Manager, Columbia Management Investment Advisers LLC; Vice President, Key Account Manager, Liberty Funds Distributor, Inc.; and Trustee of certain Oppenheimer Funds |
165 | Director, Board of Directors of Caron Engineering Inc.; Formerly: Advisor, Board of Advisors of Caron Engineering Inc.; President and Director, Acton Shapleigh Youth Conservation Corps (non-profit) President and Director Director of Grahamtastic Connection (non-profit) | ||||
Carol Deckbar – 1962 Trustee |
2024 | Formerly: Executive Vice President and Chief Product Officer, TIAA Financial Services; Executive Vice President and Principal, College Retirement Equities Fund at TIAA; Executive Vice President and Head of Institutional Investments and Endowment Services, TIAA |
165 | Formerly: Board Member, TIAA Asset Management, Inc.; and Board Member, TH Real Estate Group Holdings Company | ||||
Cynthia Hostetler –1962 Trustee |
2017 | Non-Executive Director and Trustee of a number of public and private business corporationsFormerly: Director, Aberdeen Investment Funds (4 portfolios); Director, Artio Global Investment LLC (mutual fund complex); Director, Edgen Group, Inc. (specialized energy and infrastructure products distributor); Director, Genesee & Wyoming, Inc. (railroads); Head of Investment Funds and Private Equity, Overseas Private Investment Corporation; President, First Manhattan Bancorporation, Inc.; and Attorney, Simpson Thacher & Bartlett LLP |
165 | Resideo Technologies, Inc. (smart home technology); Vulcan Materials Company (construction materials company); Trilinc Global Impact Fund; Textainer Group Holdings, (shipping container leasing company); Investment Company Institute (professional organization); and Independent Directors Council (professional organization) | ||||
Eli Jones – 1961 Trustee |
2016 | Professor and Dean Emeritus, Mays Business School - Texas A&M University Formerly: Dean of Mays Business School-Texas A&M University; Professor and Dean, Walton College of Business, University of Arkansas and E.J. Ourso College of Business, Louisiana State University; and Director, Arvest Bank |
165 | Insperity, Inc. (formerly known as Administaff) (human resources provider); Board Member of the regional board, First Financial Bank Texas; and Boad Member, First Financial Bankshares, Inc. Texas | ||||
Elizabeth Krentzman – 1959 Trustee |
2019 | Formerly: Principal and Chief Regulatory Advisor for Asset Management Services and U.S. Mutual Fund Leader of Deloitte & Touche LLP; General Counsel of the Investment Company Institute (trade association); National Director of the Investment Management Regulatory Consulting Practice, Principal, Director and Senior Manager of Deloitte & Touche LLP; Assistant Director of the Division of Investment Management - Office of Disclosure and Investment Adviser Regulation of the U.S. Securities and Exchange Commission and various positions with the Division of Investment Management - Office of Regulatory Policy of the U.S. Securities and Exchange Commission; Associate at Ropes & Gray LLP; and Trustee of certain Oppenheimer Funds |
165 | Formerly: Member of the Cartica Funds Board of Directors (private investment fund); Trustee of the University of Florida National Board Foundation; and Member of the University of Florida Law Center Association, Inc. Board of Trustees, Audit Committee and Membership Committee | ||||
Anthony J. LaCava, Jr. – 1956 Trustee |
2019 | Formerly: Director and Member of the Audit Committee, Blue Hills Bank (publicly traded financial institution) and Managing Partner, KPMG LLP |
165 | Member and Chairman, of the Bentley University, Business School Advisory Council; and Board Member and Chair of the Audit and Finance Committee and Nominating Committee, KPMG LLP | ||||
James “Jim” Liddy – 1959 Trustee |
2024 | Formerly: Chairman, Global Financial Services, Americas and Retired Partner, KPMG LLP |
165 | Director and Treasurer, Gulfside Place Condominium Association, Inc. and Non-Executive Director, Kellenberg Memorial High School | ||||
Prema Mathai-Davis – 1950 Trustee |
2014 | Formerly: Co-Founder & Partner of Quantalytics Research, LLC, (a FinTech Investment Research Platform for the Self-Directed Investor); Trustee of YWCA Retirement Fund; CEO of YWCA of the USA; Board member of the NY Metropolitan Transportation Authority; Commissioner of the NYC Department of Aging; and Board member of Johns Hopkins Bioethics Institute |
165 | Member of Board of Positive Planet US (non-profit) and HealthCare Chaplaincy Network (non-profit) |
Name, Year of Birth and Position(s) Held with the Trust |
Trustee and/or Officer Since |
Principal Occupation(s) During Past 5 Years |
Number of Funds in Fund Complex Overseen by Trustee |
Other Directorship(s) Held by Trustee During Past 5 Years | ||||
Independent Trustees–(continued) |
||||||||
Joel W. Motley – 1952 Trustee |
2019 | Director of Office of Finance, Federal Home Loan Bank System; Managing Director of Carmona Motley Inc. (privately held financial advisor); Member of the Council on Foreign Relations and its Finance and Budget Committee; Chairman Emeritus of Board of Human Rights Watch and Member of its Investment Committee; and Member of Investment Committee Board of Historic Hudson Valley (non-profit cultural organization); Member of the Board, Blue Ocean Acquisition Corp.; and Member of the Vestry and the Investment Committee of Trinity Church Wall Street.Formerly: Managing Director of Public Capital Advisors, LLC (privately held financial advisor); Managing Director of Carmona Motley Hoffman, Inc. (privately held financial advisor); Trustee of certain Oppenheimer Funds; and Director of Columbia Equity Financial Corp. (privately held financial advisor) |
165 | Member of Board of Trust for Mutual Understanding (non-profit promoting the arts and environment); Member of Board of Greenwall Foundation (bioethics research foundation) and its Investment Committee; Member of Board of Friends of the LRC (non- profit legal advocacy); and Board Member and Investment Committee Member of Pulitzer Center for Crisis Reporting (non-profit journalism) | ||||
| Teresa M. Ressel – 1962 Trustee | 2017 | Non-executive director and trustee of a number of public and private business corporationsFormerly: Chief Executive Officer, UBS Securities LLC (investment banking); Group Chief Operating Officer, UBS AG Americas (investment banking); Sr. Management Team Olayan America, The Olayan Group (international investor/commercial/industrial); and Assistant Secretary for Management & Budget and Designated Chief Financial Officer, U.S. Department of Treasury |
165 | None | ||||
| Robert C. Troccoli – 1949 Trustee | 2016 | Formerly: Adjunct Professor, University of Denver - Daniels College of Business; and Managing Partner, KPMG LLP |
165 | None | ||||
| Daniel S. Vandivort – 1954 Trustee | 2019 | President, Flyway Advisory Services LLC (consulting and property management) and Member, Investment Committee of Historic Charleston Foundation Formerly: President and Chief Investment Officer, previously Head of Fixed Income, Weiss Peck and Greer/Robeco Investment Management; Trustee and Chair, Weiss Peck and Greer Funds Board; and various capacities at CS First Boston including Head of Fixed Income at First Boston Asset Management. |
165 | Formerly: Trustee and Governance Chair, Oppenheimer Funds; Treasurer, Chairman of the Audit and Finance Committee, Huntington Disease Foundation of America | ||||
Name, Year of Birth and Position(s) Held with the Trust |
Trustee and/or Officer Since |
Principal Occupation(s) During Past 5 Years |
Number of Funds in Fund Complex Overseen by Trustee |
Other Directorship(s) Held by Trustee During Past 5 Years | ||||
Officers |
||||||||
Glenn Brightman – 1972 President and Principal Executive Officer |
2023 | Chief Operating Officer, Americas, Invesco Ltd.; Senior Vice President, Invesco Advisers, Inc.; President and Principal Executive Officer, The Invesco Funds; Manager, Invesco Investment Advisers LLC. Formerly: Global Head of Finance, Invesco Ltd; Executive Vice President and Chief Financial Officer, Nuveen |
N/A | N/A | ||||
Melanie Ringold – 1975 Senior Vice President, Chief Legal Officer and Secretary |
2023 | Head of Legal of the Americas, Invesco Ltd.; Senior Vice President and Secretary, Invesco Advisers, Inc. (formerly known as Invesco Institutional (N.A.), Inc.) (registered investment adviser); Secretary, Invesco Distributors, Inc. (formerly known as Invesco AIM Distributors, Inc.); Secretary, Invesco Investment Services, Inc. (formerly known as Invesco AIM Investment Services, Inc.); Senior Vice President, Chief Legal Officer and Secretary, The Invesco Funds; Secretary, Invesco Investment Advisers LLC, Invesco Capital Markets, Inc.; Chief Legal Officer, Invesco Exchange-Traded Fund Trust, Invesco Exchange-Traded Fund Trust II, Invesco India Exchange-Traded Fund Trust, Invesco Actively Managed Exchange-Traded Fund Trust, Invesco Actively Secretary and Vice President, Harbourview Asset Management Corporation; Secretary and Senior Vice President, OppenheimerFunds, Inc. and Invesco Managed Accounts, LLC; Secretary and Senior Vice President, Oppenheimer Acquisition Corp.; Secretary, SteelPath Funds Remediation LLC; and Secretary and Senior Vice President, Trinity Investment Management Corporation Formerly: Secretary and Senior Vice President, OFI SteelPath, Inc., Assistant Secretary, Invesco Distributors, Inc., Invesco Advisers, Inc., Invesco Investment Services, Inc., Invesco Capital Markets, Inc., Invesco Capital Management LLC and Invesco Investment Advisers LLC; and Assistant Secretary and Investment Vice President, Invesco Funds |
N/A | N/A | ||||
Andrew R. Schlossberg – 1974 Senior Vice President |
2019 | Chief Executive Officer, President and Executive Director, Invesco Ltd.; Senior Vice President, The Invesco Funds; and Trustee, Invesco Foundation, Inc. Formerly: Senior Vice President, Invesco Group Services, Inc.;. Director and Senior Vice President, Invesco Advisers, Inc. (formerly known as Invesco Institutional (N.A.), Inc.) (registered investment adviser); Director and Chairman, Invesco Investment Services, Inc. (formerly known as Invesco AIM Investment Services, Inc.) (registered transfer agent); Head of the Americas and Senior Managing Director, Invesco Ltd.; Director, Invesco Investment Advisers LLC (formerly known as Van Kampen Asset Management); Director, President and Chairman, Invesco Insurance Agency, Inc.; Director, Invesco UK Limited; Director and Chief Executive, Invesco Asset Management Limited and Invesco Fund Managers Limited; Assistant Vice President, The Invesco Funds; Senior Vice President, Invesco Advisers, Inc. (formerly known as Invesco Institutional (N.A.), Inc.) (registered investment adviser); Director and Chief Executive, Invesco Administration Services Limited and Invesco Global Investment Funds Limited; Director, Invesco Distributors, Inc.; Head of EMEA, Invesco Ltd.; President, Invesco Actively Managed Exchange-Traded Commodity Fund Trust, Invesco Actively Managed Exchange-Traded Fund Trust, Invesco Exchange-Traded Fund Trust, Invesco Exchange-Traded Fund Trust II and Invesco India Exchange-Traded Fund Trust; and Managing Director and Principal Executive Officer, Invesco Capital Management LLC |
N/A | N/A | ||||
Name, Year of Birth and Position(s) Held with the Trust |
Trustee and/or Officer Since |
Principal Occupation(s) During Past 5 Years |
Number of Funds in Fund Complex Overseen by Trustee |
Other Directorship(s) Held by Trustee During Past 5 Years | ||||
Officers–(continued) |
||||||||
John M. Zerr – 1962 Senior Vice President |
2010 | Chief Operating Officer of the Americas; Senior Vice President, Invesco Advisers, Inc. (formerly known as Invesco Institutional (N.A.), Inc.) (registered investment adviser); Senior Vice President, Invesco Distributors, Inc. (formerly known as Invesco AIM Distributors, Inc.); Director and Vice President, Invesco Investment Services, Inc. (formerly known as Invesco AIM Investment Services, Inc.) Senior Vice President, The Invesco Funds; Managing Director, Invesco Capital Management LLC; Senior Vice President, Invesco Capital Markets, Inc. (formerly known as Van Kampen Funds Inc.); Manager, Invesco Specialized Products, LLC; Member, Invesco Canada Funds Advisory Board; Director, President and Chief Executive Officer, Invesco Corporate Class Inc. (corporate mutual fund company); Director, Chairman, President and Chief Executive Officer, Invesco Canada Ltd. (formerly known as Invesco Trimark Ltd./Invesco Trimark Ltèe) (registered investment adviser and registered transfer agent); President, Invesco, Inc.; President, Invesco Global Direct Real Estate Feeder GP Ltd.; President, Invesco IP Holdings (Canada) Ltd; President, Invesco Global Direct Real Estate GP Ltd.; President, Invesco Financial Services Ltd. / Services Financiers Invesco Ltée; and Director and Chairman, Invesco Trust Company Formerly: Manager, Invesco Indexing LLC; Director, Invesco Investment Advisers LLC (formerly known as Van Kampen Asset Management); President, Trimark Investments Ltd/Services Financiers Invesco Ltee; Director and Senior Vice President, Invesco Insurance Agency, Inc.; Director and Senior Vice President, Invesco Management Group, Inc. (formerly known as Invesco AIM Management Group, Inc.); Secretary and General Counsel, Invesco Management Group, Inc. (formerly known as Invesco AIM Management Group, Inc.); Secretary, Invesco Investment Services, Inc. (formerly known as Invesco AIM Investment Services, Inc.); Chief Legal Officer and Secretary, The Invesco Funds; Secretary and General Counsel, Invesco Investment Advisers LLC (formerly known as Van Kampen Asset Management); Secretary and General Counsel, Invesco Capital Markets, Inc. (formerly known as Van Kampen Funds Inc.); Chief Legal Officer, Invesco Exchange-Traded Fund Trust, Invesco Exchange-Traded Fund Trust II, Invesco India Exchange-Traded Fund Trust, Invesco Actively Managed Exchange-Traded Fund Trust, Invesco Actively Managed Exchange-Traded Commodity Fund Trust and Invesco Exchange-Traded Self-Indexed Fund Trust; Secretary, Invesco Indexing LLC; Director, Secretary, General Counsel and Senior Vice President, Van Kampen Exchange Corp.; Director, Vice President and Secretary, IVZ Distributors, Inc. (formerly known as INVESCO Distributors, Inc.); Director and Vice President, INVESCO Funds Group, Inc.; Director and Vice President, Van Kampen Advisors Inc.; Director, Vice President, Secretary and General Counsel, Van Kampen Investor Services Inc.;Director and Secretary, Invesco Distributors, Inc. (formerly known as Invesco AIM Distributors, Inc.); Director, Senior Vice President, General Counsel and Secretary, Invesco AIM Advisers, Inc. and Van Kampen Investments Inc.; Director, Vice President and Secretary, Fund Management Company; Director, Senior Vice President, Secretary, General Counsel and Vice President, Invesco AIM Capital Management, Inc.; and Chief Operating Officer and General Counsel, Liberty Ridge Capital, Inc. (an investment adviser) |
N/A | N/A | ||||
Tony Wong – 1973 Senior Vice President |
2023 | Senior Managing Director, Invesco Ltd.; Director, Chairman, Chief Executive Officer and President, Invesco Advisers, Inc.; Director and Chairman, Invesco Private Capital, Inc., INVESCO Private Capital Investments, Inc. and INVESCO Realty, Inc.; Director, Invesco Senior Secured Management, Inc.; President, Invesco Managed Accounts, LLC and SNW Asset Management Corporation; and Senior Vice President, The Invesco Funds Formerly: Assistant Vice President, The Invesco Funds; and Vice President, Invesco Advisers, Inc. |
N/A | N/A | ||||
Stephanie C. Butcher – 1971 Senior Vice President |
2023 | Senior Managing Director, Invesco Ltd.; Senior Vice President, The Invesco Funds; Director and Chief Executive Officer, Invesco Asset Management Limited |
N/A | N/A | ||||
Adrien Deberghes – 1967 Principal Financial Officer, Treasurer and Senior Vice President |
2020 | Head of the Fund Office of the CFO and Fund Administration; Vice President, Invesco Advisers, Inc.; Director, Invesco Trust Company; Principal Financial Officer, Treasurer and Senior Vice President, The Invesco Funds; Vice President, Invesco Exchange-Traded Fund Trust, Invesco Exchange-Traded Fund Trust II, Invesco India Exchange-Traded Fund Trust, Invesco Actively Managed Exchange-Traded Fund Trust, Invesco Actively Managed Exchange-Traded Commodity Fund Trust and Invesco Exchange-Traded Self-Indexed Fund Trust Formerly: Vice President, The Invesco Funds; Senior Vice President and Treasurer, Fidelity Investments |
N/A | N/A | ||||
Crissie M. Wisdom – 1969 Anti-Money Laundering Compliance Officer |
2013 | Anti-Money Laundering and OFAC Compliance Officer for Invesco U.S. entities including: Invesco Advisers, Inc. and its affiliates, Invesco Capital Markets, Inc., Invesco Distributors, Inc., Invesco Investment Services, Inc., The Invesco Funds, Invesco Capital Management, LLC, Invesco Trust Company; and Fraud Prevention Manager for Invesco Investment Services, Inc. |
N/A | N/A | ||||
Name, Year of Birth and Position(s) Held with the Trust |
Trustee and/or Officer Since |
Principal Occupation(s) During Past 5 Years |
Number of Funds in Fund Complex Overseen by Trustee |
Other Directorship(s) Held by Trustee During Past 5 Years | ||||
Officers–(continued) |
||||||||
Todd F. Kuehl – 1969 Chief Compliance Officer and Senior Vice President |
2020 | Chief Compliance Officer, Invesco Advisers, Inc. (registered investment adviser); and Chief Compliance Officer and Senior Vice President, The Invesco Funds Formerly: Managing Director and Chief Compliance Officer, Legg Mason (Mutual Funds); Chief Compliance Officer, Legg Mason Private Portfolio Group (registered investment adviser) |
N/A | N/A | ||||
James Bordewick, Jr. – 1959 Senior Vice President and Senior Officer |
2022 | Senior Vice President and Senior Officer, The Invesco Funds Formerly: Chief Legal Officer, KingsCrowd, Inc. (research and analytical platform for investment in private capital markets); Chief Operating Officer and Head of Legal and Regulatory, Netcapital (private capital investment platform); Managing Director, General Counsel of asset management and Chief Compliance Officer for asset management and private banking, Bank of America Corporation; Chief Legal Officer, Columbia Funds and BofA Funds; Senior Vice President and Associate General Counsel, MFS Investment Management; Chief Legal Officer, MFS Funds; Associate, Ropes & Gray; and Associate, Gaston Snow & Ely Bartlett |
N/A | N/A | ||||
Office of the Fund |
Investment Adviser |
Auditors |
Custodian | |||
1331 Spring Street NW, Suite 2500 Atlanta, GA 30309 |
Invesco Advisers, Inc. 1331 Spring Street NW, Suite 2500 Atlanta, GA 30309 |
PricewaterhouseCoopers LLP 1000 Louisiana Street, Suite 5800 Houston, TX 77002-5021 |
State Street Bank and Trust Company 225 Franklin Street Boston, MA 02110-2801 | |||
Counsel to the Fund |
Counsel to the Independent Trustees |
Transfer Agent |
||||
Stradley Ronon Stevens & Young, LLP 2005 Market Street, Suite 2600 Philadelphia, PA 19103-7018 |
Sidley Austin LLP 787 Seventh Avenue New York, NY 10019 |
Computershare Trust Company, N.A 250 Royall Street Canton, MA 02021 |
||||
| SEC file number(s): 811-05769 |
VK-CE-HINC2-AR-1 |
(b) Not applicable.
| ITEM 2. | CODE OF ETHICS. |
There were no amendments to the Code of Ethics (the “Code”) that applies to the Registrant’s Principal Executive Officer (“PEO”) and Principal Financial Officer (“PFO”) during the period covered by the report. The Registrant did not grant any waivers, including implicit waivers, from any provisions of the Code to the PEO or PFO during the period covered by this report.
| ITEM 3. | AUDIT COMMITTEE FINANCIAL EXPERT. |
The Board of Trustees has determined that the Registrant has at least one audit committee financial expert serving on its Audit Committee. The Audit Committee financial experts are Cynthia Hostetler, Anthony J. LaCava, Jr., Robert C. Troccoli and James Liddy. Cynthia Hostetler, Anthony J. LaCava, Jr., Robert C. Troccoli and James Liddy are “independent” within the meaning of that term as used in Form N-CSR.
| ITEM 4. | PRINCIPAL ACCOUNTANT FEES AND SERVICES. |
(a) to (d)
Fees Billed by PwC Related to the Registrant
PricewaterhouseCoopers LLP (“PwC”), the Registrant’s independent registered public accounting firm, billed the Registrant aggregate fees for services rendered to the Registrant for the last two fiscal years as shown in the following table. The Audit Committee pre-approved all audit and non-audit services provided to the Registrant.
| Fees Billed for Services Rendered to the Registrant for fiscal year end 2024 |
Fees Billed for Services Rendered to the Registrant for fiscal year end 2023 |
|||||||
| Audit Fees |
$ | 40,663 | $ | 38,942 | ||||
| Audit-Related Fees |
$ | 0 | $ | 0 | ||||
| Tax Fees(1) |
$ | 16,098 | $ | 15,053 | ||||
| All Other Fees |
$ | 0 | $ | 0 | ||||
|
|
|
|
|
|||||
| Total Fees |
$ | 56,761 | $ | 53,995 | ||||
|
|
|
|
|
|||||
| (1) | Tax Fees for the fiscal years ended 2024 and 2023 includes fees billed for preparation of U.S. Tax Returns and Taxable Income calculations, including excise tax and year-to-date estimates for various book-to-tax differences. |
Fees Billed by PwC Related to Invesco and Affiliates
PwC billed Invesco Advisers, Inc. (“Invesco”), the Registrant’s investment adviser, and any entity controlling, controlled by or under common control with Invesco that provides ongoing services to the Registrant (“Affiliates”) aggregate fees for pre-approved non-audit services rendered to Invesco and Affiliates for the last two fiscal years as shown in the following table. The Audit Committee pre-approved all non-audit services provided to Invesco and Affiliates that were required to be pre-approved.
| Fees Billed for Non- Audit Services Rendered to Invesco and Invesco Affiliates for fiscal year end 2024 That Were Required to be Pre-Approved by the Registrant’s Audit Committee |
Fees Billed for Non-Audit Services Rendered to Invesco and Invesco Affiliates for fiscal year end 2023 That Were Required to be Pre-Approved by the Registrant’s Audit Committee |
|||||||
| Audit-Related Fees(1) |
$ | 1,094,000 | $ | 874,000 | ||||
| Tax Fees |
$ | 0 | $ | 0 | ||||
| All Other Fees |
$ | 0 | $ | 0 | ||||
|
|
|
|
|
|||||
| Total Fees |
$ | 1,094,000 | $ | 874,000 | ||||
|
|
|
|
|
|||||
| (1) | Audit-Related Fees for the fiscal years ended 2024 and 2023 include fees billed related to reviewing controls at a service organization. |
(e)(1)
PRE-APPROVAL OF AUDIT AND NON-AUDIT SERVICES
POLICIES AND PROCEDURES
As adopted by the Audit Committees
of the Invesco Funds (the “Funds”)
Last Amended March 29, 2017
| I. | Statement of Principles |
The Audit Committees (the “Audit Committee”) of the Boards of Trustees of the Funds (the “Board”) have adopted these policies and procedures (the “Procedures”) with respect to the pre-approval of audit and non-audit services to be provided by the Funds’ independent auditor (the “Auditor”) to the Funds, and to the Funds’ investment adviser(s) and any entity controlling, controlled by, or under common control with the investment adviser(s) that provides ongoing services to the Funds (collectively, “Service Affiliates”).
Under Section 202 of the Sarbanes-Oxley Act of 2002, all audit and non-audit services provided to the Funds by the Auditor must be preapproved by the Audit Committee. Rule 2-01 of Regulation S-X requires that the Audit Committee also pre-approve a Service Affiliate’s engagement of the Auditor for non-audit services if the engagement relates directly to the operations and financial reporting of the Funds (a “Service Affiliate’s Covered Engagement”).
These Procedures set forth the procedures and the conditions pursuant to which the Audit Committee may pre-approve audit and non-audit services for the Funds and a Service Affiliate’s Covered Engagement pursuant to rules and regulations of the Securities and Exchange Commission (“SEC”) and other organizations and regulatory bodies applicable to the Funds (“Applicable Rules”).1 They address both general pre-approvals without consideration of specific case-by-case services (“general pre-approvals”) and pre-approvals on a case-by-case basis (“specific pre-approvals”). Any services requiring pre-approval that are not within the scope of general pre-approvals hereunder are subject to specific pre-approval. These Procedures also address the delegation by the Audit Committee of pre-approval authority to the Audit Committee Chair or Vice Chair.
| II. | Pre-Approval of Fund Audit Services |
The annual Fund audit services engagement, including terms and fees, is subject to specific pre-approval by the Audit Committee. Audit services include the annual financial statement audit and other procedures required to be performed by an independent auditor to be able to form an opinion on the Funds’ financial statements. The Audit Committee will receive, review and consider sufficient information concerning a proposed Fund audit engagement to make a reasonable evaluation of the Auditor’s qualifications and independence. The Audit Committee will oversee the Fund audit services engagement as necessary, including approving any changes in terms, audit scope, conditions and fees.
In addition to approving the Fund audit services engagement at least annually and specifically approving any changes, the Audit Committee may generally or specifically pre-approve engagements for other audit services, which are those services that only an independent auditor reasonably can provide. Other audit services may include services associated with SEC registration statements, periodic reports and other documents filed with the SEC.
| III. | General and Specific Pre-Approval of Non-Audit Fund Services |
The Audit Committee will consider, at least annually, the list of General Pre-Approved Non-Audit Services which list may be terminated or modified at any time by the Audit Committee. To inform the Audit Committee’s review and approval of General Pre-Approved Non-Audit Services, the Funds’ Treasurer (or his or her designee) and Auditor shall provide such information regarding independence or other matters as the Audit Committee may request.
Any services or fee ranges that are not within the scope of General Pre-Approved Non-Audit Services have not received general pre-approval and require specific pre-approval. Each request for specific pre-approval by the Audit Committee for services to be provided by the Auditor to the Funds must be submitted to the Audit Committee by the Funds’ Treasurer (or his or her designee) and must include detailed information about the services to be provided, the fees or fee ranges to be charged, and other relevant information sufficient to allow the Audit Committee to consider whether to pre-approve such engagement, including evaluating whether the provision of such services will impair the independence of the Auditor and is otherwise consistent with Applicable Rules.
| IV. | Non-Audit Service Types |
The Audit Committee may provide either general or specific pre-approval of audit-related, tax or other services, each as described in more detail below.
| 1 | Applicable Rules include, for example, New York Stock Exchange (“NYSE”) rules applicable to closed-end funds managed by Invesco and listed on NYSE. |
| a. | Audit-Related Services |
“Audit-related services” are assurance and related services that are reasonably related to the performance of the audit or review of the Fund’s financial statements or that are traditionally performed by an independent auditor. Audit-related services include, among others, accounting consultations related to accounting, financial reporting or disclosure matters not classified as “Audit services”; assistance with understanding and implementing new accounting and financial reporting guidance from rulemaking authorities; services related to mergers, acquisitions or dispositions; compliance with ratings agency requirements and interfund lending activities; and assistance with internal control reporting requirements.
| b. | Tax Services |
“Tax services” include, but are not limited to, the review and signing of the Funds’ federal tax returns, the review of required distributions by the Funds and consultations regarding tax matters such as the tax treatment of new investments or the impact of new regulations. The Audit Committee will not approve proposed services of the Auditor which the Audit Committee believes are to be provided in connection with a service or transaction initially recommended by the Auditor, the sole business purpose of which may be tax avoidance and the tax treatment of which may not be supported in the Internal Revenue Code and related regulations. The Audit Committee will consult with the Funds’ Treasurer (or his or her designee) and may consult with outside counsel or advisers as necessary to ensure the consistency of tax services rendered by the Auditor with the foregoing policy. The Auditor shall not represent any Fund or any Service Affiliate before a tax court, district court or federal court of claims.
Each request to provide tax services under either the general or specific pre-approval of the Audit Committee will include a description from the Auditor in writing of (i) the scope of the service, the fee structure for the engagement, and any side letter or other amendment to the engagement letter, or any other agreement (whether oral, written, or otherwise) between the Auditor and the Funds, relating to the service; and (ii) any compensation arrangement or other agreement, such as a referral agreement, a referral fee or fee-sharing arrangement, between the Auditor (or an affiliate of the Auditor) and any person (other than the Funds or Service Affiliates receiving the services) with respect to the promoting, marketing, or recommending of a transaction covered by the service. The Auditor will also discuss with the Audit Committee the potential effects of the services on the independence of the Auditor, and document the substance of its discussion with the Audit Committee.
| c. | Other Services |
The Audit Committee may pre-approve other non-audit services so long as the Audit Committee believes that the service will not impair the independence of the Auditor. Appendix I includes a list of services that the Auditor is prohibited from performing by the SEC rules. Appendix I also includes a list of services that would impair the Auditor’s independence unless the Audit Committee reasonably concludes that the results of the services will not be subject to audit procedures during an audit of the Funds’ financial statements.
| V. | Pre-Approval of Service Affiliate’s Covered Engagements |
Rule 2-01 of Regulation S-X requires that the Audit Committee pre-approve a Service Affiliate’s engagement of the Auditor for non-audit services if the engagement relates directly to the operations and financial reporting of the Funds, defined above as a “Service Affiliate’s Covered Engagement”.
The Audit Committee may provide either general or specific pre-approval of any Service Affiliate’s Covered Engagement, including for audit-related, tax or other services, as described above, if the Audit Committee believes that the provision of the services to a Service Affiliate will not impair the independence
of the Auditor with respect to the Funds. Any Service Affiliate’s Covered Engagements that are not within the scope of General Pre-Approved Non-Audit Services have not received general pre-approval and require specific pre-approval.
Each request for specific pre-approval by the Audit Committee of a Service Affiliate’s Covered Engagement must be submitted to the Audit Committee by the Funds’ Treasurer (or his or her designee) and must include detailed information about the services to be provided, the fees or fee ranges to be charged, a description of the current status of the pre-approval process involving other audit committees in the Invesco investment company complex (as defined in Rule 2-201 of Regulation S-X) with respect to the proposed engagement, and other relevant information sufficient to allow the Audit Committee to consider whether the provision of such services will impair the independence of the Auditor from the Funds. Additionally, the Funds’ Treasurer (or his or her designee) and the Auditor will provide the Audit Committee with a statement that the proposed engagement requires pre-approval by the Audit Committee, the proposed engagement, in their view, will not impair the independence of the Auditor and is consistent with Applicable Rules, and the description of the proposed engagement provided to the Audit Committee is consistent with that presented to or approved by the Invesco audit committee.
Information about all Service Affiliate engagements of the Auditor for non-audit services, whether or not subject to pre-approval by the Audit Committee, shall be provided to the Audit Committee at least quarterly, to allow the Audit Committee to consider whether the provision of such services is compatible with maintaining the Auditor’s independence from the Funds. The Funds’ Treasurer and Auditor shall provide the Audit Committee with sufficiently detailed information about the scope of services provided and the fees for such services, to ensure that the Audit Committee can adequately consider whether the provision of such services is compatible with maintaining the Auditor’s independence from the Fund.
| VI. | Pre-Approved Fee Levels or Established Amounts |
Pre-approved fee levels or ranges for audit and non-audit services to be provided by the Auditor to the Funds, and for a Service Affiliate’s Covered Engagement, under general pre-approval or specific pre-approval will be set periodically by the Audit Committee. Any proposed fees exceeding 110% of the maximum pre-approved fee levels or ranges for such services or engagements will be promptly presented to the Audit Committee and will require specific pre-approval by the Audit Committee before payment of any additional fees is made.
| VII. | Delegation |
The Audit Committee hereby delegates, subject to the dollar limitations set forth below, specific authority to its Chair, or in his or her absence, Vice Chair, to pre-approve audit and non-audit services proposed to be provided by the Auditor to the Funds and/or a Service Affiliate’s Covered Engagement, between Audit Committee meetings. Such delegation does not preclude the Chair or Vice Chair from declining, on a case-by-case basis, to exercise his or her delegated authority and instead convening the Audit Committee to consider and pre-approve any proposed services or engagements.
Notwithstanding the foregoing, the Audit Committee must pre-approve: (a) any non-audit services to be provided to the Funds for which the fees are estimated to exceed $500,000; (b) any Service Affiliate’s Covered Engagement for which the fees are estimated to exceed $500,000; or (c) any cost increase to any previously approved service or engagement that exceeds the greater of $250,000 or 50% of the previously approved fees up to a maximum increase of $500,000.
| VIII. | Compliance with Procedures |
Notwithstanding anything herein to the contrary, failure to pre-approve any services or engagements that are not required to be pre-approved pursuant to the de minimis exception provided for in Rule 2-01(c)(7)(i)(C) of Regulation S-X shall not constitute a violation of these Procedures. The Audit Committee has designated the Funds’ Treasurer to ensure services and engagements are pre-approved in compliance with these Procedures. The Funds’ Treasurer will immediately report to the Chair of the Audit Committee, or the Vice Chair in his or her absence, any breach of these Procedures that comes to the attention of the Funds’ Treasurer or any services or engagements that are not required to be pre-approved pursuant to the de minimis exception provided for in Rule 2-01(c)(7)(i)(C) of Regulation S-X.
On at least an annual basis, the Auditor will provide the Audit Committee with a summary of all non-audit services provided to any entity in the investment company complex (as defined in section 2-01(f)(14) of Regulation S-X, including the Funds and Service Affiliates) that were not pre-approved, including the nature of services provided and the associated fees.
| IX. | Amendments to Procedures |
All material amendments to these Procedures must be approved in advance by the Audit Committee. Non-material amendments to these Procedures may be made by the Legal and Compliance Departments and will be reported to the Audit Committee at the next regularly scheduled meeting of the Audit Committee.
Appendix I
Non-Audit Services That May Impair the Auditor’s Independence
The Auditor is not independent if, at any point during the audit and professional engagement, the Auditor provides the following non-audit services:
| • | Management functions; |
| • | Human resources; |
| • | Broker-dealer, investment adviser, or investment banking services; |
| • | Legal services; |
| • | Expert services unrelated to the audit; |
| • | Any service or product provided for a contingent fee or a commission; |
| • | Services related to marketing, planning, or opining in favor of the tax treatment of confidential transactions or aggressive tax position transactions, a significant purpose of which is tax avoidance; |
| • | Tax services for persons in financial reporting oversight roles at the Fund; and |
| • | Any other service that the Public Company Oversight Board determines by regulation is impermissible. |
An Auditor is not independent if, at any point during the audit and professional engagement, the Auditor provides the following non-audit services unless it is reasonable to conclude that the results of the services will not be subject to audit procedures during an audit of the Funds’ financial statements:
| • | Bookkeeping or other services related to the accounting records or financial statements of the audit client; |
| • | Financial information systems design and implementation; |
| • | Appraisal or valuation services, fairness opinions, or contribution-in-kind reports; |
| • | Actuarial services; and |
| • | Internal audit outsourcing services. |
(e)(2) There were no amounts that were pre-approved by the Audit Committee pursuant to the de minimis exception under Rule 2-01 of Regulation S-X.
(f) Not applicable.
(g) In addition to the amounts shown in the tables above, PwC billed Invesco and Invesco Affiliates aggregate fees of $6,510,000 for the fiscal year ended February 29, 2024 and $7,376,000 for the fiscal year ended February 28, 2023. In total, PwC billed the Registrant, Invesco and Invesco Affiliates aggregate non-audit fees of $7,620,098 for the fiscal year ended February 29, 2024 and $8,265,053 for the fiscal year ended February 28, 2023.
PwC provided audit services to the Investment Company complex of approximately $33 million.
(h) The Audit Committee also has considered whether the provision of non-audit services that were rendered to Invesco and Invesco Affiliates that were not required to be pre-approved pursuant to SEC regulations, if any, is compatible with maintaining PwC’s independence.
(i) Not Applicable.
(j) Not Applicable.
| ITEM 5. | AUDIT COMMITTEE OF LISTED REGISTRANTS. |
Not applicable.
| ITEM 6. | SCHEDULE OF INVESTMENTS. |
Investments in securities of unaffiliated issuers is included as part of the reports to stockholders filed under Item 1 of this Form.
| ITEM 7. | DISCLOSURE OF PROXY VOTING POLICIES AND PROCEDURES FOR CLOSED-END MANAGEMENT INVESTMENT COMPANIES. |

| |
|
|
| I. |
Introduction |
3 |
| |
A. Our Approach to Proxy Voting |
3 |
| |
B. Applicability of Policy |
3 |
| |
|
|
| II. |
Global Proxy Voting Operational Procedures |
4 |
| |
A. Oversight and Governance |
4 |
| |
B. The Proxy Voting Process |
4 |
| |
C. Retention and Oversight of Proxy Service Providers |
5 |
| |
D. Disclosures and Recordkeeping |
5 |
| |
E. Market and Operational Limitations |
6 |
| |
F. Securities Lending |
7 |
| |
G. Conflicts of Interest |
7 |
| |
H. Review of Policy |
8 |
| |
|
|
| III. |
Our Good Governance Principles |
9 |
| |
A. Transparency |
9 |
| |
B. Accountability |
10 |
| |
C. Board Composition and Effectiveness |
12 |
| |
D. Long-Term Stewardship of Capital |
13 |
| |
E. Environmental, Social and Governance Risk Oversight |
14 |
| |
F. Executive Compensation and Alignment |
15 |
| |
|
|
| |
Exhibit A |
17 |
| ITEM 8. | PORTFOLIO MANAGERS OF CLOSED-END MANAGEMENT INVESTMENT COMPANIES. |
| Fund |
Portfolio Managers |
Dollar Range of Investments in the Fund |
| Invesco High Income Trust II | ||
| |
Niklas Nordenfelt |
None |
| |
Rahim Shad |
None |
| |
Philip Susser |
None |
| |
|
|
| Portfolio Manager(s) |
Other Registered Investment Companies Managed |
Other Pooled Investment Vehicles Managed |
Other Accounts Managed | |||
| |
Number of Accounts |
Assets (in millions) |
Number of Accounts |
Assets (in millions) |
Number of Accounts |
Assets (in millions) |
| Invesco High Income Trust II | ||||||
| Niklas Nordenfelt |
5 |
$4,277.8 |
7 |
$400.8 |
None |
None |
| Rahim Shad |
4 |
$1,216.1 |
2 |
$178.9 |
None |
None |
| Philip Susser |
4 |
$1,216.1 |
2 |
$178.9 |
None |
None |
| |
|
|
|
|
|
|
| Sub-Adviser |
Performance time period1 |
| Invesco2 |
One-, Three- and Five-year performance against Fund peer group |
| Invesco Canada2 | |
| Invesco Deutschland2 | |
| Invesco Hong Kong2 | |
| Invesco Asset Management2 | |
| Invesco India2 | |
| Invesco Listed Real Assets Division2 | |
| |
|
| Invesco Senior Secured2, 3 |
Not applicable |
| Invesco Capital2, 4 | |
| |
|
| Invesco Japan |
One-, Three- and Five-year performance |
| | |
| 1 Rolling time periods based on calendar year-end. | |
| 2 Portfolio Managers may be granted an annual deferral award that vests on a pro-rata basis over a four-year period. | |
| 3 Invesco Senior Secured’s bonus is based on annual measures of equity return and standard tests of collateralization performance. | |
| 4 Portfolio Managers for Invesco Capital base their bonus on Invesco results as well as overall performance of Invesco Capital. | |
| ITEM 9. | PURCHASES OF EQUITY SECURITIES BY CLOSED-END MANAGEMENT INVESTMENT COMPANY AND AFFILIATED PURCHASERS. |
Not applicable.
| ITEM 10. | SUBMISSION OF MATTERS TO A VOTE OF SECURITY HOLDERS. |
None.
| ITEM 11. | CONTROLS AND PROCEDURES. |
| (a) | As of April 16, 2024, an evaluation was performed under the supervision and with the participation of the officers of the Registrant, including the PEO and PFO, to assess the effectiveness of the Registrant’s disclosure controls and procedures, as that term is defined in Rule 30a-3(c) under the Investment Company Act of 1940 (the “Act”), as amended. Based on that evaluation, the Registrant’s officers, including the PEO and PFO, concluded that, as of April 16, 2024, the Registrant’s disclosure controls and procedures were reasonably designed to ensure: (1) that information required to be disclosed by the Registrant on Form N-CSR is recorded, processed, summarized and reported within the time periods specified by the rules and forms of the Securities and Exchange Commission; and (2) that material information relating to the Registrant is made known to the PEO and PFO as appropriate to allow timely decisions regarding required disclosure. |
| (b) | There have been no changes in the Registrant’s internal control over financial reporting (as defined in Rule 30a-3(d) under the Act) that occurred during the period covered by this report that have materially affected, or are reasonably likely to materially affect, the Registrant’s internal control over financial reporting. |
| ITEM 12. | DISCLOSURE OF SECURITIES LENDING ACTIVITIES FOR CLOSED-END MANAGEMENT INVESTMENT COMPANIES. |
Not applicable.
| ITEM 13. | RECOVERY OF ERRONEOUSLY AWARDED COMPENSATION. |
Not applicable.
| ITEM 14. | EXHIBITS. |
| 14(a) (1) |
| 14(a) (2) |
| 14(a) (3) | Not applicable. |
| 14(a) (4) | Not applicable. |
| 14(b) |
| 14(c) |
SIGNATURES
Pursuant to the requirements of the Securities Exchange Act of 1934 and the Investment Company Act of 1940, the Registrant has duly caused this report to be signed on its behalf by the undersigned, thereunto duly authorized.
Registrant: Invesco High Income Trust II
| By: | /s/ Glenn Brightman | |
| Glenn Brightman | ||
| Principal Executive Officer | ||
| Date: | May 2, 2024 | |
Pursuant to the requirements of the Securities and Exchange Act of 1934 and the Investment Company Act of 1940, this report has been signed below by the following persons on behalf of the Registrant and in the capacities and on the dates indicated.
| By: | /s/ Glenn Brightman | |
| Glenn Brightman | ||
| Principal Executive Officer | ||
| Date: | May 2, 2024 | |
| By: | /s/ Adrien Deberghes | |
| Adrien Deberghes | ||
| Principal Financial Officer | ||
| Date: | May 2, 2024 | |
