Table of Contents
UNITED STATES
SECURITIES AND EXCHANGE COMMISSION
Washington, D.C. 20549
FORM N-CSR
CERTIFIED SHAREHOLDER REPORT OF REGISTERED
MANAGEMENT INVESTMENT COMPANIES
Investment Company Act file number: 811-05749
THE CHINA FUND, INC.
(Exact name of registrant as specified in charter)
C/O STATE STREET BANK & TRUST COMPANY
ONE LINCOLN STREET
P.O. BOX 5049
BOSTON, MA 02206-5049
(Address of principal executive offices)(Zip code)
| Copy to: | ||
| Brian F. Link Assistant Secretary The China Fund, Inc. 4 Copley Place, 5th Floor CPH-0326 Boston, MA 02116 |
Leonard B. Mackey, Jr., Esq. Clifford Chance US LLP 31 West 52nd Street New York, New York 10019-6131 | |
| (Name and Address of Agent for Service) | ||
Registrant’s telephone number, including area code: (888) 246-2255
Date of fiscal year end: October 31
Date of reporting period: April 30, 2014
Table of Contents
Item 1. Report to Stockholders.
Table of Contents
|
THE CHINA FUND, INC.
|
SEMI ANNUAL REPORT
April 30, 2014 (Unaudited)
| The China Fund, Inc. | ||||
| Table of Contents | ||||
| Page | ||||
| 1 | ||||
| 2 | ||||
| 3 | ||||
| 4 | ||||
| 5 | ||||
| 7 | ||||
| 8 | ||||
| 13 | ||||
| 17 | ||||
| 27 | ||||
| Dividends and Distributions; Dividend Reinvestment and Cash Purchase Plan |
29 | |||
Table of Contents
THE CHINA FUND, INC.
| FUND DATA | ||
| NYSE Stock Symbol | CHN | |
| Listing Date | July 10, 1992 | |
| Shares Outstanding | 15,682,029 | |
| Total Net Assets (04/30/14) | $351,979,312 | |
| Net Asset Value Per Share (04/30/14) | $22.44 | |
| Market Price Per Share (04/30/14) | $19.86 | |
| TOTAL RETURN(1) | ||||
| Performance as of 04/30/14: |
Net Asset Value | Market Price | ||
| 6-Months |
0.97% | 1.62% | ||
| 3-Year Cumulative |
(2.06)% | (4.87)% | ||
| 3-Year Annualized |
(0.69)% | (1.65)% | ||
| 5-Year Cumulative |
94.75% | 87.40% | ||
| 5-Year Annualized |
14.26% | 13.38% | ||
| 10-Year Cumulative |
277.82% | 218.37% | ||
| 10-Year Annualized |
14.22% | 12.28% | ||
| DIVIDEND HISTORY | ||||
| Record Date | Income | Capital Gains | ||
| 12/23/13 |
$0.4387 | $2.8753 | ||
| 12/24/12 |
$0.3473 | $2.9044 | ||
| 12/23/11 |
$0.1742 | $2.8222 | ||
| 12/24/10 |
$0.3746 | $1.8996 | ||
| 12/24/09 |
$0.2557 | — | ||
| 12/24/08 |
$0.4813 | $5.3361 | ||
| 12/21/07 |
$0.2800 | $11.8400 | ||
| 12/21/06 |
$0.2996 | $3.7121 | ||
| 12/21/05 |
$0.2172 | $2.2947 | ||
| 12/22/04 |
$0.1963 | $3.3738 | ||
| 12/31/03 |
$0.0700 | $1.7100 | ||
(1) Total investment returns reflect changes in net asset value or market price, as the case may be, during each period and assumes that dividends and capital gains distributions, if any, were reinvested in accordance with the dividend reinvestment plan. The net asset value returns are not an indication of the performance of a stockholder’s investment in the Fund, which is based on market price. Total investment returns do not reflect the deduction of taxes that a stockholder would pay on Fund distributions or the sale of Fund shares. Total investment returns are historical and do not guarantee future results. Market price returns do not reflect broker commissions in connection with the purchase or sale of Fund shares.
1
Table of Contents
THE CHINA FUND, INC.
ASSET ALLOCATION AS OF April 30, 2014 (Unaudited)
| Ten Largest Listed Equity Investments * | ||
| 1. Beijing Enterprises Holdings, Ltd. |
4.1% | |
| 2. China Minsheng Banking Corp., Ltd. |
3.9% | |
| 3. Hutchison Whampoa, Ltd. |
3.8% | |
| 4. Li & Fung, Ltd. |
3.5% | |
| 5. Taiwan Semiconductor Manufacturing Co., Ltd. |
3.5% | |
| 6. Hermes Microvision, Inc. |
3.2% | |
| 7. Tong Hsing Electronic Industries, Ltd. |
3.2% | |
| 8. PetroChina Co., Ltd. |
3.1% | |
| 9. Delta Electronics, Inc. |
3.0% | |
| 10. Hong Kong Exchanges and Clearing, Ltd. |
3.0% | |
| Direct Investments * | ||
| 1. Zong Su Foods |
0.0% | |
| * | Percentages based on net assets at April 30, 2014. |
2
Table of Contents
INDUSTRY ALLOCATION (Unaudited)
Industry Allocation (as a percentage of net assets)
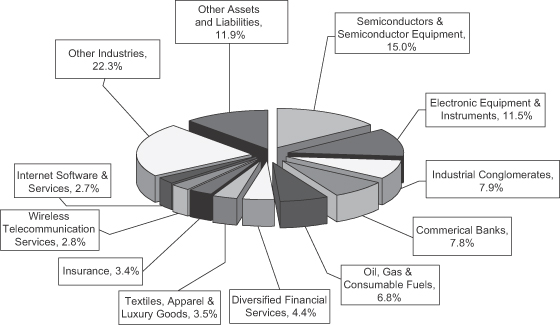
Fund holdings are subject to change and percentages shown above are based on net assets at April 30,
2014. A complete list of holdings at April 30, 2014 is contained in the Schedule of Investments included in this report. The most current available data regarding portfolio holdings can be found on our website, www.chinafundinc.com. You may
also obtain holdings by calling
1-888-246-2255.
3
Table of Contents
THE CHINA FUND, INC.
CHAIRMAN’S STATEMENT (Unaudited)
Dear Stockholders,
The Greater China equity markets have continued to perform in a lackluster manner over the last six months. This is consistent with the negative fund flows seen across the broader Asian equity markets and global investors’ generally cautious view of emerging markets as a whole.
Despite this relatively negative sentiment, we believe that there are positive developments in China that still make it an attractive investment and the current depressed valuations represent a good buying opportunity.
In my previous letter I discussed some of the reforms being introduced by the Chinese government aimed at implementing structural changes to the economy and society. Since then, measures have been taken to speed up the pace of liberalization of China’s capital markets. These include the widening of the trading band of the Chinese currency in early April and the joint announcement by the China Securities Regulatory Commission and Hong Kong’s Securities and Futures Commission of a new “through train” cross-border trading scheme.
This “through train” initiative will allow mainland investors to trade Hong Kong listed stocks through domestic brokers and overseas investors to trade Shanghai listed stocks through Hong Kong brokers. While our Investment Manager does not expect the scheme to result in any major short term impact on markets, this represents a small but significant step towards full liberalization. Over time, we expect to see further efforts towards opening up China’s capital markets which should result in a gradual revaluation of Chinese equities from their current depressed levels.
Our Investment Manager has completed the sale of our holdings in Hand Enterprises, our most successful direct investment. That process had resulted in significant cash holdings which were held in a Chinese bank account. Those funds are now being repatriated and reinvested.
The Board thanks you for your support and looks forward to further strong performance through the remainder of 2014.
Sincerely,

Joe O. Rogers
Chairman
4
Table of Contents
THE CHINA FUND, INC.
INVESTMENT MANAGER’S STATEMENT (Unaudited)
Market Review
China/Hong Kong
Concerns over the deceleration of China’s economic growth and the fear of potential systematic risk in the Chinese banking system undermined the market sentiment in the China and Hong Kong equity markets over the past six months. The Shanghai Composite Index was down 6.5% in renminbi terms for the period, while the Hang Seng China Enterprise Index ended the period down 2.3% in Hong Kong dollar terms.
In November 2013, the Chinese government unveiled a comprehensive economic and social reform blueprint. The blueprint pledged a “decisive” role for markets in the economy. However, the equity market was disappointed by the initial communiqué which neither held any positive surprises nor a detailed reform plan, but reacted positively on the follow-up reform blueprint which tried to address most of the structural problems in the Chinese economy. Also, liquidity remained a key market driver, as the People’s Bank of China undertook a hawkish stance by halting reverse repo operations, and seven-day repo rates surged to about 7% in December.
Progressing into 2014, Chinese macroeconomic data suggested a moderation in economic activity and the equity markets pulled back in the first quarter. Concerns over the potential default of maturing trust loans amidst the risk of a credit squeeze and a spike in interbank interest rates dampened market sentiment. The rebound in equity markets starting from late March was bumpy, due to renminbi volatility, continued lackluster macro-economic data and tighter lending policies impacting the property sector. The share prices of “new” economy stocks have finally pulled back since mid-March after the announcement of lackluster company earnings results in general.
Taiwan
The Taiwan market performed relatively well in the six month period and the TAIEX Index was up 8.3% in local terms. Growth in exports remained the key driver, as the U.S. and European economies recovered. The official GDP growth rate for the fourth quarter of 2013 surprised the market on the upside and retail sales and consumer confidence indicators continued to show improvement.
The equity market was mainly led by the technology sector while the financial sector reported a moderate gain due to concerns over the potential lift in the business tax rate from current 2% to 5%. Non-technology sectors excluding financials were relatively stable.
Performance
The Fund outperformed its benchmark, the MSCI Golden Dragon index for the six months ending April 30, 2014. During this period the Fund increased 0.97% based on net asset value per share compared with a 2.57% decline for the index.
5
Table of Contents
THE CHINA FUND, INC.
INVESTMENT MANAGER’S STATEMENT (continued) (Unaudited)
Review of Listed and Direct Investments
In December 2013, the Fund received the final installment from the sale of its direct investment in China Bright back to its parent.
With respect to listed assets, the top contributor was China Everbright International, an environmental protection company. The share price was supported by positive sentiment across the environmental protection-related names, particularly in the first quarter of 2014. The company also delivered earnings in line with expectations in contrast to many others in the sector. Hermes Microvision was another top contributor. We believe the company should benefit from the increasing demand for semiconductor wafer inspection tools. The company was re-rated by the market on the promising outlook.
Conversely, one of the main detractors was Digital China. The company reported results in line with market expectations in the fourth quarter of 2013 but issued a profit warning in January 2014 that was mainly the result of a change in its accounting year end. The market also had concerns over PC demand; however, the company’s valuation remains at historical lows. It is a key beneficiary of the smart city projects rollout in China, and we expect IT expenditure to recover in the second half of the year. Our holdings in Semiconductor Manufacturing International Corporation (SMIC) also detracted from performance. The company posted a worse-than-expected fourth quarter earnings result. However, we remain positive on the company, riding on the strong growth of the IT sector in China in the medium term.
Outlook
We believe Hong Kong/China equities should continue to consolidate in the short term given slow economic growth in China coupled with concerns over the corporate earnings outlook and companies’ cash flow positions. With the Chinese government focusing on economic and structural reforms, it is unlikely to adopt significant policy easing measures in the short term despite some selective areas of economic support. Hence, in the absence of signs of economic recovery in China, we believe Hong Kong and China equities will continue to range trade. Against this backdrop, we will continue to focus on stock selection particularly in the technology sector and companies with global exposure to drive portfolio performance.
In Taiwan, we believe the technology sector will continue to benefit from strong demand recovery particularly for key players in the smartphone supply chain.
6
Table of Contents
THE CHINA FUND, INC.
ABOUT THE PORTFOLIO MANAGER (Unaudited)
Listed and Direct Investment Managers
The Fund’s Investment Manager is Allianz Global Investors U.S. LLC (AllianzGI U.S.), an indirect, wholly-owned subsidiary of Allianz Asset Management of America L.P. (“AAM”).
Allianz Global Investors is a diversified active Investment Manager with a strong parent company and a culture of risk management. With 23 offices in 18 countries, it provides global investment and research capabilities with consultative local delivery. It has $475 billion in assets under management for individuals, families and institutions worldwide, and employs over 500 investment professionals.1
Ms. Christina Chung serves as the portfolio manager for the Fund’s portfolio of listed and direct securities. She joined AllianzGI U.S. in 1998 and has been a managing director since January 2010. She heads the Greater China Team and is the lead manager of Hong Kong, China, China A-shares and Greater China equity mandates. The Hong Kong and China Funds that she manages have won industry recognition and awards for consistent, strong performance. She has 25 years’ experience in managing Asian regional and single country portfolios for both institutional and retail accounts.
Before joining the AllianzGI U.S., she was a senior portfolio manager with Royal Bank of Canada Investment Management. Prior to that, she was a portfolio manager with Search International and an economist with HSBC Asset Management. Christina was educated in Canada. She attained a Bachelor of Administration from Brock University, followed by an M.A. in Economics from the University of Alberta. She became a Certified Management Accountant in 1992 and qualified as a chartered financial analyst, AIMR, in 1995.
| 1 | Combined worldwide AUM as of December 31, 2013 |
7
Table of Contents
THE CHINA FUND, INC.
April 30, 2014 (Unaudited)
| Name of Issuer and Title of Issue |
Shares |
Value (Note A) | ||||||||||
| COMMON STOCK AND OTHER EQUITY INTERESTS |
||||||||||||
| HONG KONG |
||||||||||||
| Commercial Services & Supplies — (1.4%) |
||||||||||||
| China Everbright International, Ltd.(2) |
4,002,000 | $ | 5,001,823 | |||||||||
|
|
|
|||||||||||
| Communications Equipment — (0.8%) |
||||||||||||
| Comba Telecom Systems Holdings, Ltd.*(2) |
11,150,000 | 2,833,143 | ||||||||||
|
|
|
|||||||||||
| Diversified Financial Services — (3.0%) |
||||||||||||
| Hong Kong Exchanges and Clearing, Ltd. |
576,300 | 10,384,186 | ||||||||||
|
|
|
|||||||||||
| Electronic Equipment & Instruments — (2.3%) |
||||||||||||
| Digital China Holdings, Ltd.†(2) |
8,865,000 | 8,198,328 | ||||||||||
|
|
|
|||||||||||
| Industrial Conglomerates — (7.9%) |
||||||||||||
| Beijing Enterprises Holdings, Ltd.(2) |
1,683,500 | 14,570,117 | ||||||||||
| Hutchison Whampoa, Ltd. |
975,000 | 13,330,238 | ||||||||||
|
|
|
|||||||||||
| 27,900,355 | ||||||||||||
|
|
|
|||||||||||
| Internet Software & Services — (2.7%) |
||||||||||||
| Tencent Holdings, Ltd. |
148,700 | 9,271,394 | ||||||||||
|
|
|
|||||||||||
| Metals & Mining — (0.9%) |
||||||||||||
| Tiangong International Co., Ltd.(2) |
18,480,000 | 3,217,830 | ||||||||||
|
|
|
|||||||||||
| Oil, Gas & Consumable Fuels — (2.4%) |
||||||||||||
| CNOOC, Ltd. |
5,160,000 | 8,492,348 | ||||||||||
|
|
|
|||||||||||
| Personal Products — (0.7%) |
||||||||||||
| Natural Beauty Bio-Technology, Ltd. |
47,710,000 | 2,461,483 | ||||||||||
|
|
|
|||||||||||
| Real Estate Management & Development — (1.0%) |
||||||||||||
| Shui On Land, Ltd.(2) |
13,172,500 | 3,499,958 | ||||||||||
|
|
|
|||||||||||
| Semiconductors & Semiconductor Equipment — (2.9%) |
||||||||||||
| ASM Pacific Technology, Ltd. |
335,400 | 3,724,720 | ||||||||||
| Semiconductor Manufacturing International Corp.*(2) |
79,698,000 | 6,476,128 | ||||||||||
|
|
|
|||||||||||
| 10,200,848 | ||||||||||||
|
|
|
|||||||||||
| Specialty Retail — (1.0%) |
||||||||||||
| Zhongsheng Group Holdings, Ltd.(2) |
2,996,500 | 3,613,710 | ||||||||||
|
|
|
|||||||||||
| Textiles, Apparel & Luxury Goods — (3.5%) |
||||||||||||
| Li & Fung, Ltd.(2) |
8,538,000 | 12,400,008 | ||||||||||
|
|
|
|||||||||||
| Wireless Telecommunication Services — (2.8%) |
||||||||||||
| China Mobile, Ltd.(2) |
1,015,500 | 9,653,278 | ||||||||||
|
|
|
|||||||||||
| TOTAL HONG KONG — (Cost $125,229,810) |
33.3 | % | 117,128,692 | |||||||||
|
|
|
|
|
|||||||||
See notes to financial statements and notes to schedule of investments.
8
Table of Contents
THE CHINA FUND, INC.
SCHEDULE OF INVESTMENTS (continued)
April 30, 2014 (Unaudited)
| Name of Issuer and Title of Issue |
Shares |
Value (Note A) | ||||||||||
| COMMON STOCK AND OTHER EQUITY INTERESTS (continued) |
||||||||||||
| HONG KONG — “H” SHARES |
||||||||||||
| Automobiles — (2.5%) |
||||||||||||
| Qingling Motors Co., Ltd.† |
28,960,000 | $ | 8,890,024 | |||||||||
|
|
|
|||||||||||
| Commercial Banks — (7.8%) |
||||||||||||
| China Merchants Bank Co., Ltd.(2) |
4,312,000 | 7,675,121 | ||||||||||
| China Minsheng Banking Corp., Ltd.(2) |
13,723,500 | 13,806,605 | ||||||||||
| Industrial & Commercial Bank of China, Ltd. |
9,925,000 | 5,901,452 | ||||||||||
|
|
|
|||||||||||
| 27,383,178 | ||||||||||||
|
|
|
|||||||||||
| Construction Materials — (0.9%) |
||||||||||||
| China National Building Material Co., Ltd.(2) |
3,538,000 | 3,331,257 | ||||||||||
|
|
|
|||||||||||
| Independent Power Producers & Energy Traders — (0.7%) |
||||||||||||
| Beijing Jingneng Clean Energy Co., Ltd.† |
6,244,000 | 2,689,904 | ||||||||||
|
|
|
|||||||||||
| Insurance — (2.4%) |
||||||||||||
| Ping An Insurance (Group) Company of China, Ltd. |
1,153,500 | 8,517,664 | ||||||||||
|
|
|
|||||||||||
| Machinery — (2.1%) |
||||||||||||
| CSR Corp., Ltd.(2) |
9,930,000 | 7,287,674 | ||||||||||
|
|
|
|||||||||||
| Oil, Gas & Consumable Fuels — (4.4%) |
||||||||||||
| China Suntien Green Energy Corp., Ltd.† |
12,785,000 | 4,320,455 | ||||||||||
| PetroChina Co., Ltd. |
9,564,000 | 11,052,868 | ||||||||||
|
|
|
|||||||||||
| 15,373,323 | ||||||||||||
|
|
|
|||||||||||
| TOTAL HONG KONG — “H” SHARES — (Cost $78,342,002) |
20.8 | % | 73,473,024 | |||||||||
|
|
|
|
|
|||||||||
| TOTAL HONG KONG (INCLUDING “H” SHARES) — (Cost $203,571,812) |
54.1 | % | 190,601,716 | |||||||||
|
|
|
|
|
|||||||||
| TAIWAN |
||||||||||||
| Computers & Peripherals — (1.2%) |
||||||||||||
| Advantech Co., Ltd. |
632,000 | 4,081,065 | ||||||||||
|
|
|
|||||||||||
| Diversified Financial Services — (1.4%) |
||||||||||||
| Chailease Holding Co., Ltd. |
2,132,000 | 5,062,070 | ||||||||||
|
|
|
|||||||||||
| Electronic Equipment & Instruments — (8.2%) |
||||||||||||
| Delta Electronics, Inc. |
1,723,000 | 10,555,500 | ||||||||||
| Largan Precision Co., Ltd. |
118,000 | 7,365,720 | ||||||||||
| Tong Hsing Electronic Industries, Ltd.† |
2,067,000 | 11,088,615 | ||||||||||
|
|
|
|||||||||||
| 29,009,835 | ||||||||||||
|
|
|
|||||||||||
See notes to financial statements and notes to schedule of investments.
9
Table of Contents
THE CHINA FUND, INC.
SCHEDULE OF INVESTMENTS (continued)
April 30, 2014 (Unaudited)
| Name of Issuer and Title of Issue |
Shares |
Value (Note A) | ||||||||||
| COMMON STOCK AND OTHER EQUITY INTERESTS (continued) |
||||||||||||
| TAIWAN (continued) |
||||||||||||
| Leisure Equipment & Products — (2.4%) |
||||||||||||
| Merida Industry Co., Ltd. |
1,260,000 | $ | 8,428,373 | |||||||||
|
|
|
|||||||||||
| Real Estate Management & Development — (1.2%) |
||||||||||||
| Ruentex Development Co., Ltd. |
2,298,904 | 4,065,219 | ||||||||||
|
|
|
|||||||||||
| Semiconductors & Semiconductor Equipment — (11.1%) |
||||||||||||
| Epistar Corp. |
1,812,000 | 3,954,262 | ||||||||||
| Hermes Microvision, Inc. |
269,000 | 11,134,843 | ||||||||||
| Hermes Microvision, Inc. GDR* |
46,900 | 1,942,129 | ||||||||||
| MediaTek, Inc. |
627,000 | 9,800,119 | ||||||||||
| Taiwan Semiconductor Manufacturing Co., Ltd. |
3,115,000 | 12,223,575 | ||||||||||
|
|
|
|||||||||||
| 39,054,928 | ||||||||||||
|
|
|
|||||||||||
| TOTAL TAIWAN — (Cost $64,903,575) |
25.5 | % | 89,701,490 | |||||||||
|
|
|
|
|
|||||||||
| TOTAL COMMON STOCK AND OTHER EQUITY INTERESTS — (Cost $268,475,387) |
79.6 | % | 280,303,206 | |||||||||
|
|
|
|
|
|||||||||
| EQUITY-LINKED SECURITIES |
||||||||||||
| Electronic Equipment & Instruments — (1.0%) |
||||||||||||
| Dongxu Optoelectronic Technology Co., Ltd. Access Product (expiration 06/30/15) 144A*(3) |
962,760 | 3,714,328 | ||||||||||
|
|
|
|||||||||||
| Hotels, Restaurants & Leisure — (0.9%) |
||||||||||||
| China International Travel Service Corp., Ltd. Access Product (expiration 08/25/15) 144A*(3) |
626,632 | 3,324,471 | ||||||||||
|
|
|
|||||||||||
| Household Durables — (2.5%) |
||||||||||||
| Gree Electric Appliances, Inc. Access Product (expiration 01/16/15) 144A*(4) |
1,838,546 | 8,990,490 | ||||||||||
|
|
|
|||||||||||
| Insurance — (1.0%) |
||||||||||||
| Ping An Insurance (Group) Company of China, Ltd. Access Product (expiration 06/30/15) 144A*(3) |
541,933 | 3,444,526 | ||||||||||
|
|
|
|||||||||||
| Personal Products — (1.1%) |
||||||||||||
| Shanghai Jahwa United Co., Ltd. Access Product (expiration 01/16/15) 144A*(4) |
193,700 | 1,110,676 | ||||||||||
| Shanghai Jahwa United Co., Ltd. Access Product (expiration 06/12/17) 144A*(3) |
460,100 | 2,638,213 | ||||||||||
|
|
|
|||||||||||
| 3,748,889 | ||||||||||||
|
|
|
|||||||||||
See notes to financial statements and notes to schedule of investments.
10
Table of Contents
THE CHINA FUND, INC.
SCHEDULE OF INVESTMENTS (continued)
April 30, 2014 (Unaudited)
| Name of Issuer and Title of Issue |
Shares |
Value (Note A) | ||||||||||
| COMMON STOCK AND OTHER EQUITY INTERESTS (continued) |
|
|||||||||||
| EQUITY-LINKED SECURITIES (continued) |
||||||||||||
| Pharmaceuticals — (1.0%) |
||||||||||||
| Jiangsu Hengrui Medicine Co., Ltd. Access Product (expiration 01/16/15) 144A*(4) |
633,046 | $ | 3,428,577 | |||||||||
|
|
|
|||||||||||
| Semiconductors & Semiconductor Equipment — (1.0%) |
||||||||||||
| Sanan Optoelectronics Co., Ltd. Access Product (expiration date 02/15/16)*(3) |
871,809 | 3,394,825 | ||||||||||
|
|
|
|||||||||||
| TOTAL EQUITY-LINKED SECURITIES — (Cost $27,566,075) |
8.5 | % | 30,046,106 | |||||||||
|
|
|
|
|
|||||||||
| DIRECT INVESTMENT(5) |
||||||||||||
| Food Products — (0.0%) |
||||||||||||
| Zong Su Foods (acquired 09/21/10)*^(1) (Cost $15,000,035) |
2,677 | — | ||||||||||
|
|
|
|||||||||||
| COLLATERAL FOR SECURITIES ON LOAN — (10.3%) |
||||||||||||
| State Street Navigator Securities Lending Prime Portfolio (Cost $36,142,500) |
36,142,500 | 36,142,500 | ||||||||||
|
|
|
|||||||||||
| Face |
||||||||||||
| SHORT TERM INVESTMENT — (0.5%) |
||||||||||||
| Repurchase Agreement with State Street Bank and Trust, dated 04/30/14, 0.00%, due 05/1/14, proceeds $1,765,000; collateralized by U.S. Treasury Notes, 1.50%-2.125%, due 08/31/18-08/15/21, valued at $1,803,681. (Cost $1,765,000) |
$ | 1,765,000 | 1,765,000 | |||||||||
|
|
|
|||||||||||
| TOTAL INVESTMENTS — (Cost $348,948,997) |
98.9 | % | $ | 348,256,812 | ||||||||
|
|
|
|
|
|||||||||
| OTHER ASSETS AND LIABILITIES |
1.1 | % | 3,722,500 | |||||||||
|
|
|
|
|
|||||||||
| NET ASSETS |
100.0 | % | $ | 351,979,312 | ||||||||
|
|
|
|
|
|||||||||
Notes to Schedule of Investments
| * | Denotes non-income producing security. |
| ^ | Security is deemed worthless under fair value procedures established by the Board of Directors. |
| † | Affiliated issuer (see Note G). |
| (1) | Security valued at fair value using methods determined in good faith by or at the direction of the Board of Directors. |
| (2) | A portion or all of the security is on loan. As of April 30, 2014, the market value of the securities loaned was $46,225,315. |
| (3) | Equity linked securities issued by Credit Lyonnais (CLSA). |
| (4) | Equity linked securities issued by Citigroup Global Markets Holdings. |
See notes to financial statements and notes to schedule of investments.
11
Table of Contents
THE CHINA FUND, INC.
SCHEDULE OF INVESTMENTS (continued)
April 30, 2014 (Unaudited)
| (5) | Direct investments are generally restricted as to resale and do not have a readily available resale market. On the date of acquisition of the direct investment, there were no market quotations on similar securities, and the investment was therefore valued in good faith by the Board of Directors at fair market value. |
144A Securities restricted for resale to Qualified Institutional Buyers in the United States or to non-US persons. At April 30, 2014, these restricted securities amounted to $26,651,281, which represented 7.57% of total net assets.
GDR Global Depositary Receipt
See notes to financial statements and notes to schedule of investments.
12
Table of Contents
THE CHINA FUND, INC.
STATEMENT OF ASSETS AND LIABILITIES
April 30, 2014 (Unaudited)
| ASSETS |
||||
| Investments in securities, at value (cost $307,717,332) (including securities on loan, at value, $46,225,315) (Note A) |
$ | 313,069,486 | ||
| Investments in non-controlled affiliated investments, at value (cost $41,231,665) (Notes A and G) |
35,187,326 | |||
|
|
|
|||
| Total Investments |
348,256,812 | |||
| Cash |
771 | |||
| Foreign currency, at value (cost $40,929,783) |
40,349,840 | |||
| Receivable for securities lending income |
27,759 | |||
| Dividends and interest receivable |
127,851 | |||
| Prepaid expenses |
113,204 | |||
|
|
|
|||
| TOTAL ASSETS |
388,876,237 | |||
|
|
|
|||
| LIABILITIES |
||||
| Payable upon return of collateral for securities on loan |
36,142,500 | |||
| Investment management fee payable (Note B) |
402,816 | |||
| Administration and custodian fees payable (Note B) |
226,085 | |||
| Chief Compliance Officer fees payable |
4,754 | |||
| Accrued expenses and other liabilities |
120,770 | |||
|
|
|
|||
| TOTAL LIABILITIES |
36,896,925 | |||
|
|
|
|||
| TOTAL NET ASSETS |
$ | 351,979,312 | ||
|
|
|
|||
| COMPOSITION OF NET ASSETS: |
||||
| Par value, 100,000,000 shares authorized, 15,682,029 shares outstanding (Note C) |
156,820 | |||
| Paid in capital in excess of par |
291,728,538 | |||
| Accumulated net investment loss |
(1,133,362 | ) | ||
| Accumulated net realized gain on investments and foreign currency transactions |
62,499,461 | |||
| Net unrealized depreciation on investments and foreign currency |
(1,272,145 | ) | ||
|
|
|
|||
| TOTAL NET ASSETS |
$ | 351,979,312 | ||
|
|
|
|||
| NET ASSET VALUE PER SHARE |
||||
| ($351,979,312/15,682,029 shares of common stock outstanding) |
$22.44 | |||
|
|
|
|||
See notes to financial statements.
13
Table of Contents
THE CHINA FUND, INC.
STATEMENT OF OPERATIONS
Six Months Ended April 30, 2014 (Unaudited)
| INVESTMENT INCOME: |
||||
| Interest income |
$ | 791,608 | ||
| Dividend income |
584,481 | |||
| Securities lending income |
183,883 | |||
|
|
|
|||
| TOTAL INVESTMENT INCOME |
1,559,972 | |||
|
|
|
|||
| EXPENSES |
||||
| Investment Management fees (Note B) |
1,239,598 | |||
| Directors’ fees and expenses (Note B) |
350,938 | |||
| Custodian fees (Note B) |
264,623 | |||
| Administration fees (Note B) |
248,529 | |||
| Audit and tax service fees |
43,886 | |||
| Insurance |
42,939 | |||
| Shareholder service fees |
30,027 | |||
| Chief Compliance Officer fee |
29,754 | |||
| Legal fees |
27,353 | |||
| Printing and postage |
26,713 | |||
| Transfer agent fees |
13,089 | |||
| Stock exchange listing fee |
11,258 | |||
| Miscellaneous expenses |
51,608 | |||
|
|
|
|||
| TOTAL EXPENSES |
2,380,315 | |||
|
|
|
|||
| NET INVESTMENT LOSS |
(820,343 | ) | ||
|
|
|
|||
| NET REALIZED AND UNREALIZED GAIN/(LOSS) ON INVESTMENTS AND FOREIGN CURRENCY TRANSACTIONS |
||||
| Net realized gain on investments |
45,334,829 | |||
| Net realized gain on non-controlled affiliate transactions (Note G) |
17,356,376 | |||
| Net realized loss on foreign currency transactions |
(170,909 | ) | ||
|
|
|
|||
| 62,520,296 | ||||
|
|
|
|||
| Net change in unrealized appreciation/depreciation on investments |
(60,768,968 | ) | ||
| Net change in unrealized appreciation/depreciation on foreign currency |
(1,144,300 | ) | ||
|
|
|
|||
| (61,913,268 | ) | |||
|
|
|
|||
| NET REALIZED AND UNREALIZED GAIN ON INVESTMENTS AND FOREIGN CURRENCY TRANSACTIONS |
607,028 | |||
|
|
|
|||
| NET DECREASE IN NET ASSETS FROM OPERATIONS |
$ | (213,315 | ) | |
|
|
|
|||
See notes to financial statements.
14
Table of Contents
THE CHINA FUND, INC.
STATEMENTS OF CHANGES IN NET ASSETS
| Six Months Ended April 30, 2014 |
Year Ended October 31, 2013 |
|||||||
| (Unaudited) | ||||||||
| INCREASE (DECREASE) IN NET ASSETS FROM OPERATIONS |
||||||||
| Net investment income (loss) |
$ | (820,343 | ) | $ | 6,535,386 | |||
| Net realized gain on investments and foreign currency transactions |
62,520,296 | 45,102,803 | ||||||
| Net change in unrealized appreciation/depreciation on investments and foreign currency transactions |
(61,913,268 | ) | 18,958,129 | |||||
|
|
|
|
|
|||||
| Net increase/(decrease) in net assets from operations |
(213,315 | ) | 70,596,318 | |||||
|
|
|
|
|
|||||
| DIVIDENDS AND DISTRIBUTIONS TO SHAREHOLDERS FROM: |
||||||||
| Net investment income |
(6,879,707 | ) | (5,533,326 | ) | ||||
| Net realized gains |
(45,090,537 | ) | (46,274,085 | ) | ||||
|
|
|
|
|
|||||
| Total dividends and distributions to shareholders |
(51,970,244 | ) | (51,807,411 | ) | ||||
|
|
|
|
|
|||||
| CAPITAL SHARE TRANSACTIONS: |
||||||||
| Cost of shares repurchased (Note D) |
— | (10,719,839 | ) | |||||
|
|
|
|
|
|||||
| NET INCREASE (DECREASE) IN NET ASSETS |
(52,183,559 | ) | 8,069,068 | |||||
|
|
|
|
|
|||||
| NET ASSETS: |
||||||||
| Beginning of Period |
404,162,871 | 396,093,803 | ||||||
|
|
|
|
|
|||||
| End of Period |
$ | 351,979,312 | $ | 404,162,871 | ||||
|
|
|
|
|
|||||
| (Accumulated net investment loss) undistributed net investment income, end of period |
$ | (1,133,362 | ) | $ | 6,566,688 | |||
|
|
|
|
|
|||||
See notes to financial statements.
15
Table of Contents
THE CHINA FUND, INC.
FINANCIAL HIGHLIGHTS
Selected data for a share of common stock outstanding for the period(s) indicated
| Six Months Ended April 30, 2014(1) |
Year Ended October 31, | |||||||||||||||||||||||
| 2013(1) | 2012(1)(2) | 2011(1) | 2010(1) | 2009(1) | ||||||||||||||||||||
| (Unaudited) | ||||||||||||||||||||||||
| Per Share Operation Performance |
||||||||||||||||||||||||
| Net asset value, beginning of period |
$ | 25.77 | $ | 24.50 | $ | 28.99 | $ | 34.46 | $ | 27.24 | $ | 21.72 | ||||||||||||
|
|
|
|
|
|
|
|
|
|
|
|
|
|||||||||||||
| Net investment income/(loss)* |
(0.05 | ) | 0.41 | 0.28 | 0.27 | 0.21 | 0.29 | |||||||||||||||||
| Net realized and unrealized gain (loss) on investments and foreign currency transactions |
0.04 | 4.05 | (1.95 | ) | (3.83 | ) | 7.27 | 11.24 | ||||||||||||||||
|
|
|
|
|
|
|
|
|
|
|
|
|
|||||||||||||
| Total from investment operations |
(0.01 | ) | 4.46 | (1.67 | ) | (3.56 | ) | 7.48 | 11.53 | |||||||||||||||
|
|
|
|
|
|
|
|
|
|
|
|
|
|||||||||||||
| Less dividends and distributions: |
||||||||||||||||||||||||
| Dividends from net investment income |
(0.44 | ) | (0.35 | ) | (0.17 | ) | (0.37 | ) | (0.26 | ) | (0.48 | ) | ||||||||||||
| Distributions from net realized gains |
(2.88 | ) | (2.90 | ) | (2.82 | ) | (1.90 | ) | — | (5.34 | ) | |||||||||||||
|
|
|
|
|
|
|
|
|
|
|
|
|
|||||||||||||
| Total dividends and distributions |
(3.32 | ) | (3.25 | ) | (2.99 | ) | (2.27 | ) | (0.26 | ) | (5.82 | ) | ||||||||||||
|
|
|
|
|
|
|
|
|
|
|
|
|
|||||||||||||
| Net increase from payment by affiliate |
— | — | — | 0.36 | — | — | ||||||||||||||||||
| Capital Share Transactions: |
||||||||||||||||||||||||
| Accretion (Dilution) to net asset value, resulting from share repurchase program, tender offer or issuance of shares in stock dividend |
— | 0.06 | 0.17 | — | — | (0.19 | ) | |||||||||||||||||
|
|
|
|
|
|
|
|
|
|
|
|
|
|||||||||||||
| Net asset value, end of period |
$ | 22.44 | $ | 25.77 | $ | 24.50 | $ | 28.99 | $ | 34.46 | $ | 27.24 | ||||||||||||
|
|
|
|
|
|
|
|
|
|
|
|
|
|||||||||||||
| Market price, end of period |
$ | 19.86 | $ | 22.66 | $ | 21.85 | $ | 25.88 | $ | 33.45 | $ | 25.25 | ||||||||||||
|
|
|
|
|
|
|
|
|
|
|
|
|
|||||||||||||
| Total Investment Return (Based on Market Price) |
1.62 | %(3) | 19.67 | % | (3.02 | )% | (16.96 | )%(5) | 33.70 | % | 73.37 | % | ||||||||||||
|
|
|
|
|
|
|
|
|
|
|
|
|
|||||||||||||
| Total Investment Return (Based on Net Asset Value) |
0.97 | %(3) | 21.38 | % | (2.93 | )% | (9.71 | )%(5)(6) | 27.67 | %(6) | 71.10 | %(6) | ||||||||||||
|
|
|
|
|
|
|
|
|
|
|
|
|
|||||||||||||
| Ratios and Supplemental Data |
||||||||||||||||||||||||
| Net assets, end of period (000’s) |
$ | 351,979 | $ | 404,163 | $ | 396,094 | $ | 660,444 | $ | 785,002 | $ | 620,467 | ||||||||||||
| Ratio of net expenses to average net assets |
1.30 | %(4) | 1.34 | % | 1.41 | % | 1.01 | %(7) | 1.14 | % | 1.44 | % | ||||||||||||
| Ratio of gross expenses to average net assets |
1.30 | %(4) | 1.34 | % | 1.41 | % | 1.11 | % | 1.14 | % | 1.44 | % | ||||||||||||
| Ratio of net investment income/(loss) to average net assets |
(0.45 | )%(4) | 1.73 | % | 1.12 | % | 0.82 | % | 0.67 | % | 1.36 | % | ||||||||||||
| Portfolio turnover rate |
43 | %(3) | 45 | % | 78 | % | 20 | % | 29 | % | 34 | % | ||||||||||||
| * | Per share amounts have been calculated using the average share method. |
| (1) | The Fund was audited by Tait, Weller & Baker, LLP for the years ending October 31, 2013 and 2012, and by other auditors for the years ended October 31, 2011, 2010 and 2009. |
| (2) | The Fund’s investment management arrangements changed in November 2011, and February 2012. |
| (3) | Not Annualized |
| (4) | Annualized |
| (5) | Without the indemnity payment the Fund received, the Fund’s total return on net asset value would have been (10.83)%. |
| (6) | Unaudited. |
| (7) | Net of management fee reimbursements. |
See notes to financial statements.
16
Table of Contents
NOTES TO FINANCIAL STATEMENTS
APRIL 30, 2014 (Unaudited)
NOTE A — SUMMARY OF SIGNIFICANT ACCOUNTING POLICIES
The China Fund, Inc. (the “Fund”) was incorporated under the laws of the State of Maryland on April 28, 1992, and is a non-diversified, closed-end management investment company registered under the Investment Company Act of 1940, as amended (the “1940 Act”). The Fund’s investment objective is long-term capital appreciation which it seeks to achieve by investing primarily in equity securities (i) of companies for which the principal securities trading market is the People’s Republic of China (“China”), (ii) of companies for which the principal securities trading market is outside of China, or constituting direct equity investments in companies organized outside of China, that in both cases derive at least 50% of their revenues from goods and services sold or produced, or have at least 50% of their assets, in China and (iii) constituting direct equity investments in companies organized in China. The following is a summary of significant accounting policies followed by the Fund in the preparation of its financial statements.
Use of estimates: The preparation of financial statements requires management to make estimates and assumptions that affect the reported amounts of assets and liabilities at the date of the financial statements and the reported amounts of income and expenses for the period. Actual results could differ from these estimates. The significant estimates made as of, and for the six months ended April 30, 2014, relate to Direct Investments and other Level 3 securities.
Security Valuation: Portfolio securities listed on recognized United States or foreign security exchanges are valued at the last quoted sales price in the principal market where they are traded. Listed securities with no such sales price and unlisted securities are valued at the mean between the current bid and asked prices, if any, from brokers. Short-term investments having maturities of sixty days or less are valued at amortized cost (original purchase cost as adjusted for amortization of premium or accretion of discount) which when combined with accrued interest approximates market value. Securities for which market quotations are not readily available or are deemed unreliable are valued at fair value in good faith by or at the direction of the Board of Directors considering relevant factors, data and information including, if relevant, the market value of freely tradable securities of the same class in the principal market on which such securities are normally traded. Direct Investments are valued at fair value as determined by or at the direction of the Board of Directors based on financial and other information supplied by the Direct Investment Manager regarding each Direct Investment. Forward currency contracts are valued at the current cost of offsetting the contract. Equity linked securities are valued at fair value primarily based on the value(s) of the underlying security (or securities), which normally follows the same methodology as the valuation of securities listed on recognized exchanges.
Factors used in determining fair value may include, but are not limited to, the type of security, the size of the holding, the initial cost of the security, the existence of any contractual restrictions on the security’s disposition, the price and extent of public trading in similar securities of the issuer or of comparable companies, the availability of quotations from broker-dealers, the availability of values of third parties other than the Investment Manager or Direct Investment Manager, information obtained from the issuer, analysts, and/or the appropriate stock exchange (if available), an analysis of the company’s financial statements, an evaluation of the forces that influence the issuer and the market(s) in which the security is purchased and sold and with respect to debt securities, the maturity, coupon, creditworthiness, currency denomination, and the movement of the market in which they trade.
17
Table of Contents
NOTES TO FINANCIAL STATEMENTS (continued) (Unaudited)
Repurchase Agreements: In connection with transactions in repurchase agreements, it is the Fund’s policy that its custodian take possession of the underlying collateral securities, the fair value of which exceeds the principal amount of the repurchase transaction, including accrued interest, at all times. If the seller defaults, and the fair value of the collateral declines, realization of the collateral by the Fund may be delayed or limited.
Securities Lending: The Fund may lend up to 33 1/3% of the Fund’s total assets held by State Street Bank and Trust Company (“State Street”) as custodian to certain qualified brokers, except those securities which the Fund or the Investment Manager specifically identifies as not being available. By lending its investment securities, the Fund attempts to increase its net investment income through the receipt of interest on the loan. Any gain or loss in the market price of the securities loaned that might occur and any interest or dividends declared during the term of the loan would accrue to the account of the Fund. Risks of delay in recovery of the securities or even loss of rights in the collateral may occur should the borrower of the securities fail financially. Risks may also arise to the extent that the value of the collateral decreases below the value of the securities loaned. Upon entering into a securities lending transaction, the Fund receives cash or other securities as collateral in an amount equal to or exceeding 100% of the current market value of the loaned securities with respect to securities of the U.S. government or its agencies, 102% of the current market value of the loaned securities with respect to U.S. securities and 105% of the current market value of the loaned securities with respect to foreign securities. Any cash received as collateral is generally invested by State Street, acting in its capacity as securities lending agent (the “Agent”), in the State Street Navigator Securities Lending Prime Portfolio. Non-cash collateral is not disclosed in the Fund’s Statement of Assets and Liabilities as it is held by the lending agent on behalf of the Fund and the Fund does not have the ability to re-hypothecate those securities. A portion of the dividends received on the collateral is rebated to the borrower of the securities and the remainder is split between the Agent and the Fund.
As of April 30, 2014, the Fund had loaned securities which were collateralized by cash, short term investments, long term bonds and equities. The value of the securities on loan and the value of the related collateral were as follows:
| Value of Securities |
Value of Cash Collateral |
Value of Non-Cash Collateral* |
Total Collateral |
|||||||||||
| $46,225,315 | $ | 36,142,500 | $ | 14,523,064 | $ | 50,665,564 | ||||||||
| * | Fund cannot repledge or dispose of this collateral, nor does the Fund earn any income or receive dividends with respect to this collateral. |
The following table presents financial instruments that are subject to enforceable netting arrangements as of April 30, 2014.
| Gross Amounts Not Offset in the Statement of Assets and Liabilities | ||||||||||||||
| Gross Asset Amounts Presented in Statement of Assets and Liabilities(a) |
Financial Instrument |
Collateral Received(b) |
Net Amount (not less than 0) |
|||||||||||
| $46,225,315 | — | ($ | 46,225,315 | ) | $ | 0 | ||||||||
| (a) | Represents market value of loaned securities at period end. |
| (b) | The actual collateral received is greater than the amount shown here due to overcollateralization. |
18
Table of Contents
NOTES TO FINANCIAL STATEMENTS (continued) (Unaudited)
Foreign currency translations: The records of the Fund are maintained in U.S. dollars. Foreign currencies, investments and other assets and liabilities are translated into U.S. dollars at the current exchange rates. Purchases and sales of investment securities and income and expenses are translated on the respective dates of such transactions. Net realized gains and losses on foreign currency transactions represent net gains and losses from the disposition of foreign currencies, currency gains and losses realized between the trade dates and settlement dates of security transactions, and the difference between the amount of net investment income accrued and the U.S. dollar amount actually received. The effects of changes in foreign currency exchange rates on investments in securities are not segregated in the Statement of Operations from the effects of changes in market prices of those securities, but are included in realized and unrealized gain or loss on investments. Net unrealized foreign currency gains and losses arise from changes in the value of assets and liabilities, other than investments in securities, as a result of changes in exchange rates.
Forward Foreign Currency Contracts: The Fund may enter into forward foreign currency contracts to hedge against foreign currency exchange rate risks. A forward currency contract is an agreement between two parties to buy or sell currency at a set price on a future date. Upon entering into these contracts, risks may arise from the potential inability of counterparties to meet the terms of their contracts and from unanticipated movements in the value of the foreign currency relative to the U.S. dollar. The U.S. dollar value of forward currency contracts is determined using forward exchange rates provided by quotation services. Daily fluctuations in the value of such contracts are recorded as unrealized gain or loss on the Statement of Assets and Liabilities. When the contract is closed, the Fund records a realized gain or loss equal to the difference between the value at the time it was opened and the value at the time it was closed. Such gain or loss is disclosed in the realized and unrealized gain or loss on foreign currency in the Fund’s accompanying Statement of Operations. At April 30, 2014, the Fund did not hold forward foreign currency contracts.
Option Contracts: The Fund may purchase and write (sell) call options and put options provided the transactions are for hedging purposes and the initial margin and premiums do not exceed 5% of total assets. Option contracts are valued daily and unrealized gains or losses are recorded on the Statement of Assets and Liabilities based upon the last sales price on the principal exchange on which the options are traded. The Fund will realize a gain or loss upon the expiration or closing of the option contract. Such gain or loss is disclosed in the realized and unrealized gain or loss on options in the Fund’s accompanying Statement of Operations. When an option is exercised, the proceeds on sales of the underlying security for a written call option, the purchase cost of the security for a written put option, or the cost of the security for a purchased put or call option is adjusted by the amount of premium received or paid.
The risk in writing a call option is that the Fund gives up the opportunity for profit if the market price of the security increases and the option is exercised. The risk in writing a put option is that the Fund may incur a loss if the market price of the security decreases and the option is exercised. The risk in buying an option is that the Fund pays a premium whether or not the option is exercised. Risks may also arise from an illiquid secondary market or from the inability of counter parties to meet the terms of the contract. At the end of the period, the Fund did not hold any option contracts.
Equity-Linked Securities: The Fund may invest in equity-linked securities such as linked participation notes, equity swaps and zero-strike options and securities warrants. Equity-linked securities currently held by the Fund are
19
Table of Contents
NOTES TO FINANCIAL STATEMENTS (continued) (Unaudited)
privately issued securities whose investment results are designed to correspond generally to the performance of a specified stock index or “basket” of stocks, or a single stock. Equity-linked securities may be used by the Fund to gain exposure to countries that place restrictions on investments by foreigners. To the extent that the Fund invests in equity-linked securities whose return corresponds to the performance of a foreign securities index or one or more foreign stocks, investing in equity-linked securities will involve risks similar to the risks of investing in foreign securities. In addition, the Fund bears the risk that the issuer of any equity-linked securities may default on its obligation under the terms of the arrangement with the counterparty. Equity-linked securities are often used for many of the same purposes as, and share many of the same risks with, derivative instruments. In addition, equity-linked securities may be considered illiquid.
At April 30, 2014, the Fund held equity-linked securities, in the form of warrants issued by Credit Lyonnais and Citigroup Global Markets Holdings, (the “Issuers”). Under the terms of the agreements, each warrant entitles the Fund to receive from the corresponding Issuer an amount in U.S. dollars linked to the performance of specific equity shares. Under these agreements, the Fund has agreed to pay or provide reimbursement for any taxes imposed on the China A Share investments underlying the equity-linked securities. Non-resident corporate investors in China, such as the Issuers of the equity-linked securities, are subject to a statutory 10% withholding tax on both dividend and interest income sourced from China, absent an applicable tax treaty; however to date China has not implemented procedures to collect the tax. There can be no assurance that in the future China will not implement such procedures and also subject capital gains to taxation. If China does implement such procedures the Fund may be required to pay or reimburse for any taxes that the Issuers of the equity-linked securities became subject to under those procedures.
Direct Investments: The Fund may invest up to 25% of the net proceeds from its offering of its outstanding common stock in direct investments; however, the Board of Directors of the Fund has suspended additional investments in direct investments. Direct investments are generally restricted and do not have a readily available resale market. Because of the absence of any public trading market for these investments, the Fund may take longer to liquidate these positions than would be the case for publicly traded securities. Although these securities may be resold in privately negotiated transactions, the prices on these sales could be less than those originally paid by the Fund. Issuers whose securities are not publicly traded may not be subject to public disclosure and other investor protections requirements applicable to publicly traded securities. The value of these securities at April 30, 2014 was $0 or 0.0% of the Fund’s net assets. The table below details the acquisition date, cost, and value of the Fund’s direct investments as determined by the Board of Directors of the Fund. The Fund does not have the right to demand that such securities be registered.
| Security |
Acquisition Date(s) | Cost | Value | |||||||
| Zong Su Foods |
09/21/2010 | $ | 15,000,035 | $ | — | |||||
Indemnification Obligations: Under the Fund’s organizational documents, its Officers and Directors are indemnified against certain liabilities arising out of the performance of their duties to the Fund. In addition, in the normal course of business the Fund enters into contracts that provide general indemnifications to other parties. The Fund’s maximum exposure under these arrangements is unknown as this would involve future claims that may be made against the Fund that have not yet occurred.
20
Table of Contents
NOTES TO FINANCIAL STATEMENTS (continued) (Unaudited)
Security transactions and investment income: Security transactions are recorded as of the trade date. Realized gains and losses from securities sold are recorded on the identified cost basis. Dividend income is recorded on the ex-dividend date, or, in the case of dividend income on foreign securities, on the ex-dividend date or when the Fund becomes aware of its declaration. Interest income is recorded on the accrual basis. All premiums and discounts are amortized/accreted for both financial reporting and federal income tax purposes.
Dividend and interest income generated in Taiwan is subject to a 20% withholding tax. Stock dividends received are taxable at 20% of the par value of the stock dividends received. The Fund records the taxes paid on stock dividends, if any, as an operating expense.
Dividends and distributions: The Fund intends to distribute to its stockholders, at least annually, substantially all of its net investment income and any net realized capital gains. Distributions to stockholders are recorded on the ex-dividend date. Income and capital gains distributions are determined in accordance with federal income tax regulations, which may differ from U.S. generally accepted accounting principles. Certain capital accounts in the financial statements are periodically adjusted for permanent differences in order to reflect their tax character. These adjustments have no impact on net assets or net asset value per share. Temporary differences which arise from recognizing certain items of income, expense, gain or loss in different periods for financial statement and tax purposes will reverse at some time in the future. The Board of Directors has determined that if the Fund makes any distributions of capital gains realized during the fiscal year ended October 31, 2014, that distribution will be paid in cash, except with respect to stockholders that have elected to participate in the Fund’s dividend reinvestment program.
Federal Taxes: It is the Fund’s policy to qualify each year as a regulated investment company under Subchapter M of the Internal Revenue Code, as amended (“Code”) and to distribute to stockholders each year substantially all of its income. Accordingly, no provision for federal income tax is necessary. As of and during the period ended April 30, 2014, the Fund did not have a liability for any uncertain tax positions. The Fund recognizes interest and penalties, if any, related to tax liabilities as income tax expense in the Statement of Operations. For the previous three years the Fund remains subject to examination by the Fund’s major tax jurisdictions, which include the United States of America and the State of Maryland. The Fund may be subject to taxes imposed by governments of countries in which it invests. Such taxes are generally based on either income or gains earned or repatriated. The Fund accrues and applies such taxes to net investment income, net realized gains and net unrealized gains as income and/or gains are earned.
At April 30, 2014, the cost of investments for federal income tax purposes was $348,948,997. Gross unrealized appreciation of investments was $43,422,193 while gross unrealized depreciation of investments was $44,114,378, resulting in net unrealized depreciation of investments of $692,185.
NOTE B — ADVISORY FEE AND OTHER TRANSACTIONS
Allianz Global Investors U.S. LLC (“AllianzGI U.S.”) is the Investment Manager for the Fund’s listed assets (the “Listed Assets”). AllianzGI U.S. receives a fee, computed weekly and payable monthly, at the following annual rates: 0.70% of the first US$315 million of the Fund’s average weekly net assets invested in Listed Assets; and
21
Table of Contents
NOTES TO FINANCIAL STATEMENTS (continued) (Unaudited)
0.50% of the Fund’s average weekly net assets invested in Listed Assets in excess of US$315 million. AllianzGI U.S. is the Investment Manager for the Fund’s direct investments. AllianzGI U.S. receives a fee computed weekly and payable monthly, at an annual rate of 1.50% of the average weekly value of the Fund’s assets invested in direct investments.
No director, officer or employee of the Investment Manager or Direct Investment Manager or any affiliates of those entities will receive any compensation from the Fund for serving as an officer or director of the Fund. The Fund pays the Chairman of the Board and each of the directors (who is not a director, officer or employee of the Investment Manager or Direct Investment Manager or any affiliate thereof) an annual fee of $35,000 and $20,000 respectively, plus $3,000 for each Board of Directors’ meeting or Audit and Nominating Committee meeting attended, $3,000 for each telephonic meeting attended. In addition, the Fund will reimburse each of the directors for travel and out-of-pocket expenses incurred in connection with attending Board of Directors’ meetings.
State Street provides, or arranges for the provision of certain administrative services for the Fund, including preparing certain reports and other documents required by federal and/or state laws and regulations. The Fund pays State Street a fee that is calculated daily and paid monthly at an annual rate based on aggregate average daily assets of the Fund. The Fund also pays State Street an annual fee for certain legal administration services, including corporate secretarial services and preparing regulatory filings.
The Fund has also contracted with State Street to provide custody and fund accounting services to the Fund. For these services, the Fund pays State Street asset-based fees that vary according to the number of positions and transactions plus out-of-pocket expenses.
NOTE C — FUND SHARES
At April 30, 2014, there were 100,000,000 shares of $0.01 par value capital stock authorized, of which 15,682,029 were issued and outstanding.
NOTE D — DISCOUNT MANAGEMENT PROGRAM
On March 15, 2013, the Fund announced that the Board had voted to discontinue the operation of the Fund’s Discount Management Program (the “Program”) effective at the close of business on March 15, 2013. Prior to March 16, 2013, under the Program, the Fund repurchased its common shares in the open market on any day that the Fund’s shares were trading at a discount of 8% or more from net asset value the prior day and there was a daily average discount of 8% or more from net asset value over the five-day period ending the prior day. On each day that shares were repurchased, the Fund repurchased its shares to the maximum extent permitted by law. On each day that shares were repurchased, in addition to the limits set forth above, the Fund repurchased shares only at such times that the market price represented a discount of 8% or more from the Fund’s closing net asset value on the prior day. Under the program, the Fund was authorized to repurchase in each twelve month period ended October 31 up to 10% of its common shares outstanding as of October 31 of the prior year.
22
Table of Contents
NOTES TO FINANCIAL STATEMENTS (continued) (Unaudited)
NOTE E — INVESTMENT TRANSACTIONS
For the six months ended April 30, 2014, the Fund’s cost of purchases and proceeds from sales of investment securities, other than short-term securities, were $144,541,689 and $209,855,153, respectively.
NOTE F — INVESTMENTS IN CHINA
The Fund’s investments in Chinese companies involve certain risks not typically associated with investments in securities of U.S. companies or the U.S. Government, including risks relating to (1) social, economic and political uncertainty; (2) price volatility, lesser liquidity and smaller market capitalization of securities markets in which securities of Chinese companies trade; (3) currency exchange fluctuations, currency blockage and higher rates of inflation; (4) controls on foreign investment and limitations on repatriation of invested capital and on the Fund’s ability to exchange local currencies for U.S. dollars; (5) governmental involvement in and control over the economy; (6) risk of nationalization or expropriation of assets; (7) the nature of the smaller, less seasoned and newly organized Chinese companies, particularly in China; and (8) the absence of uniform accounting, auditing and financial reporting standards, practices and disclosure requirements and less government supervision and regulation.
NOTE G — INVESTMENTS IN NON-CONTROLLED AFFILIATES*:
| Name of Issuer |
Balance of Shares/Par Held October 31, 2013 |
Gross Purchases and Additions |
Gross Sales and Reductions |
Balance of Shares/Par Held April 30, 2014 |
Value April 30, 2014 |
Income From Non-Controlled Affiliates |
Gain Realized on Sale of Shares as of April 30, 2014 |
|||||||||||||||||||||
| Beijing Jingneng Clean Energy Co., Ltd. |
— | 6,244,000 | — | 6,244,000 | $ | 2,689,904 | $ | — | $ | — | ||||||||||||||||||
| China Everbright International, Ltd.(1) |
24,687,000 | — | 20,685,000 | 4,002,000 | 5,001,823 | — | 17,356,376 | |||||||||||||||||||||
| China Suntien Green Energy Corp., Ltd. |
3,731,000 | 9,054,000 | — | 12,785,000 | 4,320,455 | — | — | |||||||||||||||||||||
| Digital China Holdings, Ltd. |
7,256,000 | 1,609,000 | — | 8,865,000 | 8,198,328 | — | — | |||||||||||||||||||||
| Qingling Motors Co., Ltd. |
28,960,000 | — | — | 28,960,000 | 8,890,024 | — | — | |||||||||||||||||||||
| Tong Hsing Electronic Industries, Ltd. |
1,203,000 | 864,000 | — | 2,067,000 | 11,088,615 | — | — | |||||||||||||||||||||
|
|
|
|
|
|
|
|
|
|
|
|
|
|
|
|||||||||||||||
| 65,837,000 | 17,771,000 | 20,685,000 | 62,923,000 | $ | 40,189,149 | $ | — | $ | 17,356,376 | |||||||||||||||||||
|
|
|
|
|
|
|
|
|
|
|
|
|
|
|
|||||||||||||||
| * | Affiliated issuers, as defined in the 1940 Act as amended, include issuers in which the Fund held 5% or more of the outstanding voting securities. |
| (1) | Not affiliated as of April 30, 2014. |
23
Table of Contents
NOTES TO FINANCIAL STATEMENTS (continued) (Unaudited)
NOTE H — FAIR VALUE MEASUREMENT
The Fund has adopted fair valuation accounting standards which establish a definition of fair value and set out a hierarchy for measuring fair value. These standards require additional disclosures about the various inputs and valuation techniques used to develop the measurements of fair value and a discussion of changes in valuation techniques and related inputs during the period. These inputs are summarized in the three broad levels listed below:
| • | Level 1 — Inputs that reflect unadjusted quoted prices in active markets for identical assets or liabilities that the Fund has the ability to access at the measurement date; |
| • | Level 2 — Inputs other than quoted prices that are observable for the asset or liability either directly or indirectly, including inputs in markets that are not considered to be active; |
| • | Level 3 — Inputs that are unobservable. |
The following is a summary of the inputs used as of April 30, 2014 in valuing the Fund’s investments carried at value:
ASSETS VALUATION INPUT
| Description |
Level 1 | Level 2 | Level 3 | Total | ||||||||||||
| COMMON STOCK AND OTHER EQUITY |
||||||||||||||||
| Automobiles |
$ | 8,890,024 | $ | — | $ | — | $ | 8,890,024 | ||||||||
| Commercial Banks |
27,383,178 | — | — | 27,383,178 | ||||||||||||
| Commercial Services & Supplies |
5,001,823 | — | — | 5,001,823 | ||||||||||||
| Communications Equipment |
2,833,143 | — | — | 2,833,143 | ||||||||||||
| Computers & Peripherals |
4,081,065 | — | — | 4,081,065 | ||||||||||||
| Construction Materials |
3,331,257 | — | — | 3,331,257 | ||||||||||||
| Diversified Financial Services |
15,446,256 | — | — | 15,446,256 | ||||||||||||
| Electronic Equipment & Instruments |
37,208,163 | — | — | 37,208,163 | ||||||||||||
| Independent Power Producers & Energy Traders |
2,689,904 | — | — | 2,689,904 | ||||||||||||
| Industrial Conglomerates |
27,900,355 | — | — | 27,900,355 | ||||||||||||
| Insurance |
8,517,664 | — | — | 8,517,664 | ||||||||||||
| Internet Software & Services |
9,271,394 | — | — | 9,271,394 | ||||||||||||
| Leisure Equipment & Products |
8,428,373 | — | — | 8,428,373 | ||||||||||||
| Machinery |
7,287,674 | — | — | 7,287,674 | ||||||||||||
| Metals & Mining |
3,217,830 | — | — | 3,217,830 | ||||||||||||
| Oil, Gas & Consumable Fuels |
23,865,671 | — | — | 23,865,671 | ||||||||||||
| Personal Products |
2,461,483 | — | — | 2,461,483 | ||||||||||||
| Real Estate Management & Development |
7,565,177 | — | — | 7,565,177 | ||||||||||||
| Semiconductors & Semiconductor Equipment |
49,255,776 | — | — | 49,255,776 | ||||||||||||
| Specialty Retail |
3,613,710 | — | — | 3,613,710 | ||||||||||||
| Textiles, Apparel & Luxury Goods |
12,400,008 | — | — | 12,400,008 | ||||||||||||
| Wireless Telecommunication Services |
9,653,278 | — | — | 9,653,278 | ||||||||||||
|
|
|
|
|
|
|
|
|
|||||||||
| TOTAL COMMON STOCK AND OTHER EQUITY INTERESTS |
280,303,206 | — | — | 280,303,206 | ||||||||||||
24
Table of Contents
NOTES TO FINANCIAL STATEMENTS (continued) (Unaudited)
| Description |
Level 1 | Level 2 | Level 3 | Total | ||||||||||||
| EQUITY-LINKED SECURITIES |
||||||||||||||||
| Electronic Equipment & Instruments |
— | 3,714,328 | — | 3,714,328 | ||||||||||||
| Hotels, Restaurants & Leisure |
— | 3,324,471 | — | 3,324,471 | ||||||||||||
| Household Durables |
— | 8,990,490 | — | 8,990,490 | ||||||||||||
| Insurance |
— | 3,444,526 | — | 3,444,526 | ||||||||||||
| Personal Products |
— | 3,748,889 | — | 3,748,889 | ||||||||||||
| Pharmaceuticals |
— | 3,428,577 | — | 3,428,577 | ||||||||||||
| Semiconductors & Semiconductor Equipment |
— | 3,394,825 | — | 3,394,825 | ||||||||||||
|
|
|
|
|
|
|
|
|
|||||||||
| TOTAL EQUITY-LINKED SECURITIES |
— | 30,046,106 | — | 30,046,106 | ||||||||||||
| DIRECT INVESTMENTS |
||||||||||||||||
| Food Products |
— | — | —^ | — | ||||||||||||
|
|
|
|
|
|
|
|
|
|||||||||
| TOTAL DIRECT INVESTMENTS |
— | — | — | — | ||||||||||||
| COLLATERAL FOR SECURITIES ON LOAN |
36,142,500 | — | — | 36,142,500 | ||||||||||||
|
|
|
|
|
|
|
|
|
|||||||||
| SHORT TERM INVESTMENTS |
— | 1,765,000 | — | 1,765,000 | ||||||||||||
|
|
|
|
|
|
|
|
|
|||||||||
| TOTAL INVESTMENTS |
$ | 316,445,706 | $ | 31,811,106 | $ | — | $ | 348,256,812 | ||||||||
|
|
|
|
|
|
|
|
|
|||||||||
| ^ | Security is deemed worthless under fair value procedures established by the Board of Directors. |
The Fund’s policy is to disclose transfers between levels based on valuations at the end of the reporting period. As of April 30, 2014, there were no transfers between Level 1, 2 or 3.
The following is a reconciliation of the fair valuations using significant unobservable inputs (Level 3) for the Fund during the six months ended April 30, 2014:
| Investments in Securities |
Balance as of October 31, 2013 |
Purchases | Sales | Realized Gain/ (Loss) |
Change in Unrealized Appreciation (Depreciation) |
Transfers in to Level 3 |
Transfers out of Level 3 |
Balance as of April 30, 2014 |
Change in Unrealized Appreciation (Depreciation) from Investments Held at April 30, 2014 |
|||||||||||||||||||||||||||
| COMMON STOCK AND OTHER EQUITY INTERESTS |
|
|||||||||||||||||||||||||||||||||||
| Commercial Services & Supplies |
$ | 1,119,908 | $ | — | ($ | 1,727,606 | ) | ($ | 6,246,477 | ) | $ | 6,854,175 | $ | — | $ | — | $ | — | $ | — | ||||||||||||||||
|
|
|
|
|
|
|
|
|
|
|
|
|
|
|
|
|
|
|
|||||||||||||||||||
| DIRECT INVESTMENTS |
|
|||||||||||||||||||||||||||||||||||
| Food Products |
—^ | — | — | — | — | — | — | —^ | — | |||||||||||||||||||||||||||
| Health Care Providers & Services |
6,007,700 | — | (7,509,916 | ) | (1,162 | ) | 1,503,378 | — | — | — | — | |||||||||||||||||||||||||
|
|
|
|
|
|
|
|
|
|
|
|
|
|
|
|
|
|
|
|||||||||||||||||||
| $ | 7,127,608 | $ | — | ($ | 9,237,522 | ) | ($ | 6,247,639 | ) | $ | 8,357,553 | $ | — | $ | — | $ | — | $ | — | |||||||||||||||||
|
|
|
|
|
|
|
|
|
|
|
|
|
|
|
|
|
|
|
|||||||||||||||||||
| ^ | Security is deemed worthless under fair value procedures established by the Board of Directors. |
25
Table of Contents
NOTES TO FINANCIAL STATEMENTS (continued) (Unaudited)
NOTE I — DERIVATIVE INSTRUMENTS AND HEDGING ACTIVITIES
The Fund did not enter into any derivatives transactions or hedging activities for the six months ended April 30, 2014.
26
Table of Contents
THE CHINA FUND, INC.
Results of Annual Stockholder Meeting held on March 13, 2014
1. Election of Directors — The stockholders of the Fund elected William Kirby and Nigel Tulloch as Class III directors each to serve for a term expiring on the date on which the annual meeting of stockholders is held in 2017 and Gary French as Class II director to serve for a term expiring on the date on which the annual meeting of stockholders is held in 2016.
| For | Withheld | |||||
| William Kirby |
11,558,828.253 | 691,768.401 | ||||
| Nigel S. Tulloch |
11,101,046.491 | 1,149,550.163 | ||||
| Gary L. French |
11,534,993.491 | 715,603.163 | ||||
PRIVACY POLICY
| Privacy Notice
The China Fund, Inc. collects nonpublic personal information about its stockholders from the following sources:
¨ Information it receives from stockholders on applications or other forms; and
¨ Information about stockholder transactions with the Fund.
The Fund’s policy is to not disclose nonpublic personal information about its stockholders to nonaffiliated third parties (other than disclosures permitted by law).
The Fund restricts access to nonpublic personal information about its stockholders to those agents of the Fund who need to know that information to provide products or services to stockholders. The Fund maintains physical, electronic and procedural safeguards that comply with federal standards to guard its stockholders’ nonpublic personal information. |
PROXY VOTING POLICIES AND PROCEDURES
A description of the policies and procedures that are used by the Fund’s investment advisers to vote proxies relating to the Fund’s portfolio securities is available (1) without charge, upon request, by calling 1-888-CHN-CALL (246-2255); and (2) as an exhibit to the Fund’s annual report on Form N-CSR which is available on the website of the Securities and Exchange Commission (the “Commission”) at http://www.sec.gov. Information regarding how the investment advisers vote these proxies is now available by calling the same number and on the Commission’s website. The Fund has filed its report on Form N-PX covering the Fund’s proxy voting record for the 12 month period ending June 30, 2013.
QUARTERLY PORTFOLIO OF INVESTMENTS
A Portfolio of Investments will be filed as of the end of the first and third quarter of each fiscal year on Form N-Q and will be available on the Securities and Exchange Commission’s website at http://www.sec.gov. Form N-Q has
27
Table of Contents
THE CHINA FUND, INC.
Other Information (continued) (Unaudited)
been filed as of January 31, 2014 for the first quarter of this fiscal year and is available on the Securities and Exchange Commission’s website at http://www.sec.gov. Additionally, the Portfolio of Investments may be reviewed and copied at the Commission’s Public Reference Room in Washington, DC. Information on the operation of the Public Reference Room may be obtained by calling 1-800-SEC-0330. The quarterly Portfolio of Investments will be made available with out charge, upon request, by calling 1-888-246-2255.
CERTIFICATIONS
The Fund’s chief executive officer has certified to the New York Stock Exchange that, as of April 12, 2013, he was not aware of any violation by the Fund of applicable New York Stock Exchange corporate governance listing standards. The Fund also has included the certifications of the Fund’s chief executive officer and chief financial officer required by Section 302 and Section 906 of the Sarbanes-Oxley Act of 2002 in the Fund’s Form N-CSR filed with the Securities and Exchange Commission, for the period of this report.
28
Table of Contents
SUMMARY OF DIVIDEND REINVESTMENT AND CASH PURCHASE PLAN (Unaudited)
The Fund will distribute to stockholders, at least annually, substantially all of its net investment income from dividends and interest earnings and expects to distribute any net realized capital gains annually. Pursuant to the Dividend Reinvestment and Cash Purchase Plan (the “Plan”), adopted by the Fund, each stockholder will automatically be a participant (a “Participant”) in the Plan unless Computershare Trust Company, N.A., the Plan Agent, is otherwise instructed by the stockholder in writing, to have all distributions, net of any applicable U.S. withholding tax, paid in cash. Stockholders who do not participate in the Plan will receive all distributions in cash paid by check in U.S. dollars mailed directly to the stockholder by Computershare Trust Company, N.A., as paying agent. Stockholders who do not wish to have distributions automatically reinvested should notify the Fund by contacting Computershare Trust Company, N.A. c/o The China Fund, Inc. at P.O. Box 43078, Providence, Rhode Island 02940-3078, by telephone at 1-800-426-5523 or via the Internet at www.computershare.com/investor.
The Plan will operate whenever a dividend or distribution is declared payable only in cash or in cash or shares of the Fund’s common stock, but it will not operate with respect to a dividend or distribution declared payable only in shares of the Fund’s common stock (including such a declaration that provides an option to receive cash).
Computershare Trust Company, N.A (“Computershare” or the “Plan Agent”) act as Plan Agent. If the Directors of the Fund declare an income dividend or a capital gains distribution payable either in the Fund’s Common Stock or in cash, non-participants in the Plan will receive cash and participants in the Plan will receive Common Stock. The shares of common stock issued by the Fund will be valued at net asset value or, if the net asset value is less than 95% of the market price on the valuation date, then shares will be valued at 95% of the market price. If the net asset value per share of the common stock on the valuation date exceeds the market price, participants will be issued shares at market price. The valuation date will be the dividend or distribution payment date or, if that date is not a trading day on the exchange on which the Fund’s shares are then listed, the next preceding trading day. If the Fund should declare a dividend or capital gains distribution payable only in cash, the Plan Agent will, as purchasing agent for the participants, buy shares of common stock in the open market, on the New York Stock Exchange or elsewhere, with the cash in respect of such dividend or distribution, for the participant’s accounts on, or shortly after, the payment date.
Participants in the Plan have the option of making additional payments to the Plan Agent annually, in any amount from $100 to $3,000 for investment in the Fund’s Common Stock. The Plan Agent will use all funds received from participants (as well as any dividends and capital gains distributions received in cash) to purchase Fund shares in the open market on January 15 of each year or the next trading day if January 15th is not a trading day. Participants may make voluntary cash payments by sending a check (in U.S. dollars and drawn on a U.S. Bank) made payable to “Computershare” along with a completed transaction form which is attached to each statement a Participant receives. The Plan Agent will not accept cash, traveler’s checks, money orders or third party checks. Any voluntary cash payments received more than thirty-five days prior to such date will be returned by the Plan Agent, and interest will not be paid on any such amounts. To avoid unnecessary cash accumulations, and also to allow ample time for receipt and processing by the Plan Agent, participants should send in voluntary cash payments to be received by the Plan Agent approximately two days before January 15. A participant may withdraw a voluntary cash payment by written notice, if the notice is received by the Plan Agent not less than 48 hours before such payment is to be
29
Table of Contents
DIVIDENDS AND DISTRIBUTIONS:
SUMMARY OF DIVIDEND REINVESTMENT AND CASH PURCHASE PLAN (continued) (Unaudited)
invested. In the event that a Participant’s check for a voluntary cash payment is returned unpaid for any reason, the Plan Agent will consider the request for investment of such funds null and void, and shall immediately remove from the Participant’s account those shares, if any, purchased upon the prior credit of such funds. The Plan Agent shall be entitled to sell shares to satisfy any uncollected amount plus any applicable fees. If the net proceeds of the sale of such shares are insufficient to satisfy the balance of such uncollected amounts, the Plan Agent shall be entitled to sell such additional shares from the Participant’s account as may be necessary to satisfy the uncollected balance.
The Plan Agent will confirm in writing, each trade for a Participant’s account and each share deposit or share transfer promptly after the account activity occurs. The statement will show the number of shares held, the number of shares for which dividends are being reinvested, any cash received for purchase of shares, the price per share for any purchases or sales, and any applicable fees for each transaction charged the Participant. In the event the only activity in a Participant’s account is the reinvestment of dividends, this activity will be confirmed in a statement on at least a quarterly basis. If the Fund pays an annual dividend and the only activity in a Participant’s account for the calendar year is the reinvestment of such dividend, the Participant will receive an annual statement. These statements are a Participant’s continuing record of the cost basis of purchases and should be retained for income tax purposes.
The Plan Agent will hold shares of common stock acquired pursuant to the Plan in non-certificated form in the name of the Participant for whom such shares are being held and each Participant’s proxy will include those shares of common stock held pursuant to the Plan. The Plan Agent will forward to each Participant any proxy solicitation material received by it. In the case of stockholders, such as banks, brokers or nominees, which hold shares for others who are the beneficial owners, the Plan Agent will administer the Plan on the basis of the number of shares certified from time to time by the stockholder as representing the total amount registered in the name of such Participants and held for the account of beneficial owners who participate in the Plan. Upon a Participant’s Internet, telephone or written request, the Plan Agent will deliver to her or him, without charge, a certificate or certificates representing all full shares of common stock held by the Plan Agent pursuant to the Plan for the benefit of such Participant.
Participants will not be charged a fee in connection with the reinvestment of dividends or capital gains distributions. The Plan Agent’s transaction fees for the handling of the reinvestment of dividends and distributions will be paid by the Fund. However, Participants will be charged a per share fee (currently $0.05) incurred with respect to the Plan Agent’s open market purchases in connection with the reinvestment of dividends or capital gains distributions and with purchases from voluntary cash payments made by the Participant. A $2.50 transaction fee and a per share fee of $0.15 will also be charged by the Plan Agent upon any request for sale. Per share fees include any brokerage commissions the Plan Agent is required to pay.
The automatic reinvestment of dividends and distributions will not relieve participants of any income tax which may be payable on such dividends and distributions. Participants will receive tax information annually for their personal records and to help them prepare their federal income tax return. For further information as to tax consequences of participation in the Plan, Participants should consult with their own tax advisors.
These terms and conditions may be amended or supplemented by the Plan Agent or the Fund at any time or times but, except when necessary or appropriate to comply with applicable law or the rules or policies of the Securities
30
Table of Contents
DIVIDENDS AND DISTRIBUTIONS:
SUMMARY OF DIVIDEND REINVESTMENT AND CASH PURCHASE PLAN (continued) (Unaudited)
and Exchange Commission or any other regulatory authority, only by mailing to the Stockholders appropriate written notice at least 30 days prior to the effective date thereof. The amendment or supplement shall de deemed to be accepted by the Participants unless, prior to the effective date thereof, the Plan Agent receives written notice of the termination of a Participant’s account under the Plan. Any such amendment may include an appointment by the Plan Agent in its place and stead of a successor Plan Agent under these terms and conditions, with full power and authority to perform all or any of the acts to be performed by the Plan Agent under these terms and conditions. Upon any such appointment of a successor Plan Agent for the purposes of receiving dividends and distributions, the Fund will be authorized to pay to such successor Plan Agent, for the Participants’ accounts, all dividends and distributions payable on the shares of common stock held in the Participants’ name or under the Plan for retention or application by such successor Plan Agent as provided in these terms and conditions.
Requests for copies of the Plan, which sets forth all of the terms of the Plan, and all correspondence concerning the Plan should be directed to Computershare Trust Company, N.A., the Plan Agent for The China Fund, Inc., in writing at P.O. Box 43078, Providence, Rhode Island, 02940-3078, by telephone at 1-800-426-5523 or via the Internet at www.computershare.com/investor.
31
Table of Contents
THE CHINA FUND, INC.
United States Address
The China Fund, Inc.
c/o State Street Bank and Trust Company
1 Lincoln St.
P.O. Box 5049
Boston, MA 02206-5049
1-888-CHN-CALL (246-2255)
Directors and Officers
Joe O. Rogers, Chairman of the Board and Director
James J. Lightburn, Director
Michael F. Holland, Director
William Kirby, Director
Li Jin, Director
Nigel S. Tulloch, Director
Gary L. French, Director
Joseph Quirk, President
Patrick Keniston, Chief Compliance Officer of the Fund
Laura F. Dell, Treasurer
Caroline M. Connolly, Assistant Treasurer
Chad C. Hallett, Assistant Treasurer
Francine S. Hayes, Assistant Secretary
Investment Manager
Allianz Global Investors U.S. LLC
Shareholder Servicing Agent
AST Fund Solutions
Administrator, Accounting Agent and Custodian
State Street Bank and Trust Company
Transfer Agent, Dividend Paying Agent and Registrar
Computershare Trust Company, N.A.
Independent Registered Public Accounting Firm
Tait, Weller & Baker, LLP
Legal Counsel
Clifford Chance US LLP
Notice is hereby given in accordance with Section 23(c) of the Investment Company Act of 1940 that from time to time the Fund may purchase shares of its common stock in the open market at prevailing market prices.
Table of Contents
Item 2. Code of Ethics.
Not required for this filing.
Item 3. Audit Committee Financial Expert.
Not required for this filing.
Item 4. Principal Accountant Fees and Services.
Not required for this filing.
Item 5. Audit Committee of Listed Registrants.
Not required for this filing.
Item 6. Investments.
| a. | Schedule of Investments is included as part of Item 1. |
| b. | Not applicable. |
Item 7. Disclosure of Proxy Voting Policies and Procedures for Closed-End Investment Companies.
Not required for this filing.
Item 8. Portfolio Managers of Closed-End Management Investment Companies.
| a. | Not required for this filing. |
| b. | Not applicable. |
Item 10. Submission of Matters to a Vote of Security Holders.
There have been no material changes to the procedures by which shareholders may recommend nominees to the registrant’s Board of Directors during the period covered by this Form N-CSR filing.
Item 11. Controls and Procedures.
| (a) | The registrant’s principal executive and principal financial officers have concluded that the registrant’s disclosure controls and procedures (as defined in Rule 30a-3(c) under the Investment Company Act of 1940, as amended (the “1940 Act”) (17 CFR 270.30a-3(c))) are effective, as of a date within 90 days of the filing date of this Form N-CSR based on their evaluation of these controls and procedures required by Rule 30a-3(b) under the 1940 Act (17 CFR 270.30a-3(b)) and Rules 13a-15(b) or 15d-15(b) under the 1934 Act (17 CFR 240.13a-15(b) or 240.15d-15(b)). |
| (b) | There were no changes in the registrant’s internal control over financial reporting (as defined in Rule 30a-3(d) under the 1940 Act (17 CFR 270.30a-3(d))) that occurred during the registrant’s second fiscal quarter that has materially affected, or is reasonably likely to materially affect, the registrant’s internal control over financial reporting. |
Table of Contents
Item 12. Exhibits.
| (a)(1) | Not required for this filing. |
| (a)(2) | The certifications required by Rule 30a-2 of the 1940 Act are attached hereto. |
| (a)(3) | Not applicable. |
| (b) | The certifications required by Rule 30a-2(b) of the 1940 Act and Section 906 of the Sarbanes-Oxley Act of 2002 are attached hereto. |
Table of Contents
SIGNATURES
Pursuant to the requirements of the Securities Exchange Act of 1934 and the Investment Company Act of 1940, the registrant has duly caused this report to be signed on its behalf by the undersigned, thereunto duly authorized.
| THE CHINA FUND, INC. | ||
| By: | /s/ Joseph S. Quirk | |
| Joseph S. Quirk | ||
| President of The China Fund, Inc. | ||
Date: June 17, 2014
Pursuant to the requirements of the Securities Exchange Act of 1934 and the Investment Company Act of 1940, this report has been signed below by the following persons on behalf of the registrant and in the capacities and on the dates indicated.
| By: | /s/ Joseph S. Quirk | |
| Joseph S. Quirk | ||
| President of The China Fund, Inc. |
Date: June 17, 2014
| By: | /s/ Laura F. Dell | |
| Laura F. Dell | ||
| Treasurer of The China Fund, Inc. |
Date: June 17, 2014