Table of Contents
falseFY0000844551Not for trading, but only in connection with the registration of American Depositary Shares, pursuant to the requirements of the Securities and Exchange Commission.Investments accounted for using the equity method, which was previously included within other assets (non-current), is separately presented in the consolidated statement of financial position. The 2021 amounts have been reclassified to be presented on the same basis.Oil and gas properties includes other plant and equipment which is no longer separately presented in the consolidated statement of financial position. The 2021 amounts have been reclassified to be presented on the same basis.Additions exclude acquisitions through business combinations.Borrowing costs capitalised were at a weighted average interest rate of 3.8%.Projects in development include the fair value ascribed to future phases of certain projects acquired through business combinations.The 2021 amounts have been restated to reflect the changes in operating segments. Refer to ‘Operating segment information’ in Note A.1 for details. In addition, oil and gas properties includes other plant and equipment which is no longer separately presented in the consolidated statement of financial position. The 2021 amounts have been reclassified to be presented on the same basis.Acquisitions through business combination have been recognised on a provisional basis. Adjustments will be made to the provisional amounts if new information is obtained within 12 months from the acquisition date. Refer to Note B.5 for details.Relates to changes in restoration provision assumptions.Borrowing costs capitalised were at a weighted average interest rate of 3.6%.Oceania and Asia have been presented within Asia Pacific for the year ended 31 December 2022. The 2021 amounts have been reclassified to be presented on the same basis.$125 million (2021: $56 million) relates to costs of unsuccessful wells. For the year ended 31 December 2021, $209 million relates to capitalised costs written off due to the Group’s decision to withdraw its interests in Myanmar.The sensitivities represent reasonable possible changes to the discount rate, oil price and FX assumptions.The relationship between the discount rate and carrying amount is non-linear and as such, the sensitivities are unlikely to result in a symmetrical impact. Due to the non-linear relationship, the impact of changing the discount rate is likely to be greater at a lower discount rate than at a higher discount rate. A change of 1% represents 100 basis points.FX sensitivity of +12%/-12% was determined based on historical 5-year standard deviation of AU$/US$.2022 change in provision is due to a revision of discount rates of $978 million (primarily due to an increase in risk free rates) and provisions used of $262 million, offset by changes in estimates of $858 million. Changes in estimates are due to new activities, increase in scope of removal and cost and rate escalations supported by the most recent estimates and benchmarks.2022 change in provision is due to changes in estimates of $245 million offset by provisions used of $29 million.Acquisitions through business combination have been recognised on a provisional basis. Adjustments will be made to the provisional amounts if new information is obtained within 12 months from the acquisition date. Refer to Note B.5 for details. Projects in development include the fair value ascribed to future phases of certain projects acquired through business combinations.Includes $3,904 million of capital additions and $294 million of capitalised borrowing costs offset by $374 million following changes in restoration provision assumptions.Refer to Note B.4 for details on impairment losses and impairment reversals.Refer to Note B.7 for details on non-current assets held for sale. 0000844551 2022-01-01 2022-12-31 0000844551 2021-12-31 0000844551 2020-01-01 2020-12-31 0000844551 2021-01-01 2021-12-31 0000844551 2022-12-31 0000844551 2020-12-31 0000844551 2022-03-23 2022-03-23 0000844551 2021-03-24 2021-03-24 0000844551 2020-03-20 2020-03-20 0000844551 2022-10-06 2022-10-06 0000844551 2021-09-24 2021-09-24 0000844551 2020-09-18 2020-09-18 0000844551 2023-04-05 2023-04-05 0000844551 2019-12-31 0000844551 wds:PetroleumResourceRentTaxMember 2020-01-01 2020-12-31 0000844551 country:AU 2020-01-01 2020-12-31 0000844551 wds:InternationalMember 2020-01-01 2020-12-31 0000844551 ifrs-full:ExplorationAndEvaluationAssetsMember 2020-01-01 2020-12-31 0000844551 ifrs-full:ExplorationAndEvaluationAssetsMember wds:CapitalisedAfterOneYearMember 2020-01-01 2020-12-31 0000844551 ifrs-full:RetainedEarningsMember 2020-01-01 2020-12-31 0000844551 ifrs-full:EquityAttributableToOwnersOfParentMember 2020-01-01 2020-12-31 0000844551 ifrs-full:NoncontrollingInterestsMember 2020-01-01 2020-12-31 0000844551 wds:EmployeeBenefitsReserveMember 2020-01-01 2020-12-31 0000844551 ifrs-full:ReserveOfCashFlowHedgesMember 2020-01-01 2020-12-31 0000844551 wds:DistributableProfitsReserveMember 2020-01-01 2020-12-31 0000844551 ifrs-full:IssuedCapitalMember 2020-01-01 2020-12-31 0000844551 ifrs-full:ReserveOfSharebasedPaymentsMember 2020-01-01 2020-12-31 0000844551 wds:WoodsideEquityPlanMember 2020-01-01 2020-12-31 0000844551 wds:EmployeeSharePlansMember 2020-01-01 2020-12-31 0000844551 ifrs-full:SubsidiariesWithMaterialNoncontrollingInterestsMember wds:BurrupFacilitiesCompanyPtyLtdMember 2020-01-01 2020-12-31 0000844551 ifrs-full:SubsidiariesWithMaterialNoncontrollingInterestsMember wds:BurrupTrain1PtyLtdMember 2020-01-01 2020-12-31 0000844551 srt:EuropeMember 2020-01-01 2020-12-31 0000844551 srt:AsiaPacificMember 2020-01-01 2020-12-31 0000844551 wds:AustraliaOperatingSegmentMember ifrs-full:OperatingSegmentsMember 2020-01-01 2020-12-31 0000844551 wds:MajorCustomerOneMember ifrs-full:OperatingSegmentsMember wds:AustraliaOperatingSegmentMember 2020-01-01 2020-12-31 0000844551 wds:MajorCustomerTwoMember ifrs-full:OperatingSegmentsMember wds:AustraliaOperatingSegmentMember 2020-01-01 2020-12-31 0000844551 ifrs-full:OperatingSegmentsMember wds:AustraliaSegmentMember wds:LiquefiedNaturalGasMember 2020-01-01 2020-12-31 0000844551 ifrs-full:OperatingSegmentsMember wds:MarketingSegmentMember wds:LiquefiedNaturalGasMember 2020-01-01 2020-12-31 0000844551 ifrs-full:OperatingSegmentsMember wds:AustraliaSegmentMember wds:PipelineGasMember 2020-01-01 2020-12-31 0000844551 ifrs-full:OperatingSegmentsMember wds:PipelineGasMember 2020-01-01 2020-12-31 0000844551 ifrs-full:OperatingSegmentsMember wds:LiquefiedNaturalGasMember 2020-01-01 2020-12-31 0000844551 ifrs-full:OperatingSegmentsMember wds:AustraliaSegmentMember wds:CrudeOilAndCondensateMember 2020-01-01 2020-12-31 0000844551 ifrs-full:OperatingSegmentsMember wds:CrudeOilAndCondensateMember 2020-01-01 2020-12-31 0000844551 ifrs-full:OperatingSegmentsMember wds:AustraliaSegmentMember srt:NaturalGasLiquidsReservesMember 2020-01-01 2020-12-31 0000844551 ifrs-full:OperatingSegmentsMember srt:NaturalGasLiquidsReservesMember 2020-01-01 2020-12-31 0000844551 ifrs-full:OperatingSegmentsMember wds:AustraliaSegmentMember wds:RevenueFromSaleOfHydrocarbonsMember 2020-01-01 2020-12-31 0000844551 ifrs-full:OperatingSegmentsMember wds:RevenueFromSaleOfHydrocarbonsMember 2020-01-01 2020-12-31 0000844551 ifrs-full:OperatingSegmentsMember wds:MarketingSegmentMember wds:RevenueFromSaleOfHydrocarbonsMember 2020-01-01 2020-12-31 0000844551 ifrs-full:OperatingSegmentsMember wds:AustraliaSegmentMember wds:ProcessingAndServicesRevenueMember 2020-01-01 2020-12-31 0000844551 ifrs-full:OperatingSegmentsMember wds:ProcessingAndServicesRevenueMember 2020-01-01 2020-12-31 0000844551 ifrs-full:OperatingSegmentsMember wds:AustraliaSegmentMember wds:ShippingAndOtherRevenueMember 2020-01-01 2020-12-31 0000844551 ifrs-full:OperatingSegmentsMember wds:MarketingSegmentMember wds:ShippingAndOtherRevenueMember 2020-01-01 2020-12-31 0000844551 ifrs-full:OperatingSegmentsMember wds:ShippingAndOtherRevenueMember 2020-01-01 2020-12-31 0000844551 ifrs-full:OperatingSegmentsMember wds:AustraliaSegmentMember 2020-01-01 2020-12-31 0000844551 ifrs-full:OperatingSegmentsMember wds:MarketingSegmentMember 2020-01-01 2020-12-31 0000844551 ifrs-full:OperatingSegmentsMember 2020-01-01 2020-12-31 0000844551 ifrs-full:OperatingSegmentsMember wds:AustraliaSegmentMember wds:ExternalCustomersMember 2020-01-01 2020-12-31 0000844551 ifrs-full:OperatingSegmentsMember wds:MarketingSegmentMember wds:ExternalCustomersMember 2020-01-01 2020-12-31 0000844551 wds:CorporateOrOtherSegmentMember ifrs-full:OperatingSegmentsMember 2020-01-01 2020-12-31 0000844551 ifrs-full:LandAndBuildingsMember wds:AustraliaSegmentMember ifrs-full:OperatingSegmentsMember 2020-01-01 2020-12-31 0000844551 ifrs-full:LandAndBuildingsMember ifrs-full:OperatingSegmentsMember 2020-01-01 2020-12-31 0000844551 ifrs-full:ExplorationAndEvaluationAssetsMember wds:AustraliaSegmentMember ifrs-full:OperatingSegmentsMember 2020-01-01 2020-12-31 0000844551 ifrs-full:ExplorationAndEvaluationAssetsMember ifrs-full:OperatingSegmentsMember 2020-01-01 2020-12-31 0000844551 ifrs-full:OperatingSegmentsMember ifrs-full:OtherPropertyPlantAndEquipmentMember 2020-01-01 2020-12-31 0000844551 wds:OilAndGasPropertiesMember wds:AustraliaSegmentMember ifrs-full:OperatingSegmentsMember 2020-01-01 2020-12-31 0000844551 wds:OilAndGasPropertiesMember ifrs-full:OperatingSegmentsMember 2020-01-01 2020-12-31 0000844551 wds:AustraliaSegmentMember ifrs-full:OperatingSegmentsMember ifrs-full:OtherPropertyPlantAndEquipmentMember 2020-01-01 2020-12-31 0000844551 wds:IncomeTaxMember 2020-01-01 2020-12-31 0000844551 wds:TemporaryDifferenceAraisesDueToDerivativesMember 2020-01-01 2020-12-31 0000844551 ifrs-full:OtherTemporaryDifferencesMember 2020-01-01 2020-12-31 0000844551 country:AU wds:IncomeTaxMember 2020-01-01 2020-12-31 0000844551 wds:GlobalMember wds:IncomeTaxMember 2020-01-01 2020-12-31 0000844551 ifrs-full:OperatingSegmentsMember wds:InventoryMovementMember wds:AustraliaSegmentMember 2020-01-01 2020-12-31 0000844551 ifrs-full:OperatingSegmentsMember wds:CostsOfProductionMember 2020-01-01 2020-12-31 0000844551 ifrs-full:OperatingSegmentsMember wds:CostsOfProductionMember wds:CorporateOrOtherSegmentMember 2020-01-01 2020-12-31 0000844551 ifrs-full:OperatingSegmentsMember wds:CostsOfProductionMember wds:AustraliaSegmentMember 2020-01-01 2020-12-31 0000844551 ifrs-full:OperatingSegmentsMember wds:InventoryMovementMember 2020-01-01 2020-12-31 0000844551 ifrs-full:OperatingSegmentsMember wds:TotalOtherCostOfSalesMember 2020-01-01 2020-12-31 0000844551 ifrs-full:OperatingSegmentsMember wds:MarketingSegmentMember wds:MovementInOnerousContractProvisionMember 2020-01-01 2020-12-31 0000844551 ifrs-full:OperatingSegmentsMember wds:TotalOtherCostOfSalesMember wds:CorporateOrOtherSegmentMember 2020-01-01 2020-12-31 0000844551 ifrs-full:OperatingSegmentsMember wds:TotalOtherCostOfSalesMember wds:MarketingSegmentMember 2020-01-01 2020-12-31 0000844551 ifrs-full:OperatingSegmentsMember wds:TotalOtherCostOfSalesMember wds:AustraliaSegmentMember 2020-01-01 2020-12-31 0000844551 ifrs-full:OperatingSegmentsMember wds:MovementInOnerousContractProvisionMember 2020-01-01 2020-12-31 0000844551 ifrs-full:OperatingSegmentsMember wds:OtherHydrocarbonCostsMember 2020-01-01 2020-12-31 0000844551 ifrs-full:OperatingSegmentsMember wds:AustraliaSegmentMember wds:OtherHydrocarbonCostsMember 2020-01-01 2020-12-31 0000844551 ifrs-full:OperatingSegmentsMember wds:TradingCostsMember 2020-01-01 2020-12-31 0000844551 ifrs-full:OperatingSegmentsMember wds:MarketingSegmentMember wds:TradingCostsMember 2020-01-01 2020-12-31 0000844551 ifrs-full:OperatingSegmentsMember wds:AustraliaSegmentMember wds:TradingCostsMember 2020-01-01 2020-12-31 0000844551 ifrs-full:OperatingSegmentsMember wds:ShippingAndDirectSalesCostsMember 2020-01-01 2020-12-31 0000844551 ifrs-full:OperatingSegmentsMember wds:CorporateOrOtherSegmentMember wds:ShippingAndDirectSalesCostsMember 2020-01-01 2020-12-31 0000844551 ifrs-full:OperatingSegmentsMember wds:MarketingSegmentMember wds:ShippingAndDirectSalesCostsMember 2020-01-01 2020-12-31 0000844551 ifrs-full:OperatingSegmentsMember wds:AustraliaSegmentMember wds:ShippingAndDirectSalesCostsMember 2020-01-01 2020-12-31 0000844551 ifrs-full:OperatingSegmentsMember wds:RoyaltiesExciseAndLeviesMember 2020-01-01 2020-12-31 0000844551 ifrs-full:OperatingSegmentsMember wds:AustraliaSegmentMember wds:RoyaltiesExciseAndLeviesMember 2020-01-01 2020-12-31 0000844551 ifrs-full:OperatingSegmentsMember wds:ProductionCostsMember 2020-01-01 2020-12-31 0000844551 ifrs-full:OperatingSegmentsMember wds:CorporateOrOtherSegmentMember wds:ProductionCostsMember 2020-01-01 2020-12-31 0000844551 ifrs-full:OperatingSegmentsMember wds:AustraliaSegmentMember wds:ProductionCostsMember 2020-01-01 2020-12-31 0000844551 wds:InternationalSegmentMember ifrs-full:OperatingSegmentsMember 2020-01-01 2020-12-31 0000844551 wds:AustraliaSegmentMember srt:RestatementAdjustmentMember ifrs-full:OperatingSegmentsMember 2020-01-01 2020-12-31 0000844551 ifrs-full:OperatingSegmentsMember ifrs-full:OilAndGasAssetsMember 2020-01-01 2020-12-31 0000844551 ifrs-full:OperatingSegmentsMember ifrs-full:ExplorationAndEvaluationAssetsMember 2020-01-01 2020-12-31 0000844551 wds:TwoThousandAndNineteenDividendReinvestmentPlanMember ifrs-full:OrdinarySharesMember 2020-01-01 2020-12-31 0000844551 wds:TwoThousandTwentyDividendReinvestmentPlanMember ifrs-full:OrdinarySharesMember 2020-01-01 2020-12-31 0000844551 wds:TwoThousandSeventeenWoodsideEquityPlanMember ifrs-full:OrdinarySharesMember 2020-01-01 2020-12-31 0000844551 wds:FarSenegalRssdSaSangomarExploitationAreaMember 2020-01-01 2020-12-31 0000844551 wds:FarSenegalRssdSaRssdEvaluationAreaMember 2020-01-01 2020-12-31 0000844551 wds:TemporaryDifferenceAraisesDueToProductionAndGrowthAssetsMember wds:PetroleumResourceRentTaxMember 2020-01-01 2020-12-31 0000844551 wds:TemporaryDifferenceAraisesDueToAugmentationForCurrentYearMember wds:PetroleumResourceRentTaxMember 2020-01-01 2020-12-31 0000844551 wds:TemporaryDifferenceAraisesDueToProvisionsMember wds:PetroleumResourceRentTaxMember 2020-01-01 2020-12-31 0000844551 ifrs-full:OtherTemporaryDifferencesMember wds:PetroleumResourceRentTaxMember 2020-01-01 2020-12-31 0000844551 wds:TemporaryDifferenceAraisesDueToOilAndGasPropertiesMember wds:IncomeTaxMember 2020-01-01 2020-12-31 0000844551 wds:TemporaryDifferenceAraisesDueToExplorationAndEvaluationAssetsMember wds:IncomeTaxMember 2020-01-01 2020-12-31 0000844551 wds:TemporaryDifferenceAraisesDueToLeaseAssetsAndLiabilitiesMember wds:IncomeTaxMember 2020-01-01 2020-12-31 0000844551 wds:TemporaryDifferenceAraisesDueToProvisionsMember wds:IncomeTaxMember 2020-01-01 2020-12-31 0000844551 wds:TemporaryDifferenceAraisesDueToPetroleumResourceRentTaxAssetsAndLiabilitiesMember wds:IncomeTaxMember 2020-01-01 2020-12-31 0000844551 wds:TemporaryDifferenceAraisesDueToUnusedTaxLossesAndTaxCreditsMember wds:IncomeTaxMember 2020-01-01 2020-12-31 0000844551 wds:TemporaryDifferenceAraisesDueToDerivativesMember wds:IncomeTaxMember 2020-01-01 2020-12-31 0000844551 ifrs-full:OtherTemporaryDifferencesMember wds:IncomeTaxMember 2020-01-01 2020-12-31 0000844551 ifrs-full:BottomOfRangeMember 2021-01-01 2021-12-31 0000844551 ifrs-full:TopOfRangeMember 2021-01-01 2021-12-31 0000844551 wds:PetroleumResourceRentTaxMember 2021-01-01 2021-12-31 0000844551 country:AU 2021-01-01 2021-12-31 0000844551 wds:InternationalMember 2021-01-01 2021-12-31 0000844551 ifrs-full:ExplorationAndEvaluationAssetsMember 2021-01-01 2021-12-31 0000844551 ifrs-full:ExplorationAndEvaluationAssetsMember wds:CapitalisedAfterOneYearMember 2021-01-01 2021-12-31 0000844551 ifrs-full:NoncontrollingInterestsMember 2021-01-01 2021-12-31 0000844551 ifrs-full:RetainedEarningsMember 2021-01-01 2021-12-31 0000844551 ifrs-full:EquityAttributableToOwnersOfParentMember 2021-01-01 2021-12-31 0000844551 wds:EmployeeBenefitsReserveMember 2021-01-01 2021-12-31 0000844551 ifrs-full:ReserveOfCashFlowHedgesMember 2021-01-01 2021-12-31 0000844551 ifrs-full:IssuedCapitalMember 2021-01-01 2021-12-31 0000844551 ifrs-full:ReserveOfSharebasedPaymentsMember 2021-01-01 2021-12-31 0000844551 wds:DistributableProfitsReserveMember 2021-01-01 2021-12-31 0000844551 wds:EmployeePlansMember wds:WoodsideEquityPlanMember 2021-01-01 2021-12-31 0000844551 wds:ExecutivePlansMember wds:LongTermAwardsMember 2021-01-01 2021-12-31 0000844551 wds:ShortTermAwardsMember wds:ExecutivePlansMember 2021-01-01 2021-12-31 0000844551 wds:WoodsideEquityPlanMember 2021-01-01 2021-12-31 0000844551 wds:SupplementaryWoodsideEquityPlanMember 2021-01-01 2021-12-31 0000844551 wds:RestrictedSharesMember 2021-01-01 2021-12-31 0000844551 wds:PerformanceRightsMember ifrs-full:BottomOfRangeMember 2021-01-01 2021-12-31 0000844551 wds:PerformanceRightsMember ifrs-full:TopOfRangeMember 2021-01-01 2021-12-31 0000844551 wds:EmployeeSharePlansMember 2021-01-01 2021-12-31 0000844551 wds:WoodsideEmployeeSharePlanMember 2021-01-01 2021-12-31 0000844551 wds:NorthWestShelfLiftingCoordinatorPtyLtdMember 2021-01-01 2021-12-31 0000844551 wds:NorthWestShelfShippingServiceCompanyPtyLtdMember 2021-01-01 2021-12-31 0000844551 wds:ChinaAdministrationCompanyPtyLtdMember 2021-01-01 2021-12-31 0000844551 wds:NorthWestShelfLiaisonCompanyPtyLtdMember 2021-01-01 2021-12-31 0000844551 wds:NorthWestShelfGasPtyLtdMember 2021-01-01 2021-12-31 0000844551 ifrs-full:SubsidiariesWithMaterialNoncontrollingInterestsMember wds:BurrupFacilitiesCompanyPtyLtdMember 2021-01-01 2021-12-31 0000844551 ifrs-full:SubsidiariesWithMaterialNoncontrollingInterestsMember wds:BurrupTrain1PtyLtdMember 2021-01-01 2021-12-31 0000844551 wds:JBICFacilityMember 2021-01-01 2021-12-31 0000844551 wds:UsBondsMember 2021-01-01 2021-12-31 0000844551 wds:MediumTermNotesMember 2021-01-01 2021-12-31 0000844551 wds:SyndicateFacilitiesMember 2021-01-01 2021-12-31 0000844551 country:AU wds:ExplorationMember 2021-01-01 2021-12-31 0000844551 wds:ExplorationMember wds:InternationalMember 2021-01-01 2021-12-31 0000844551 wds:ExplorationMember ifrs-full:ConsolidatedMember 2021-01-01 2021-12-31 0000844551 wds:EvaluationMember country:AU 2021-01-01 2021-12-31 0000844551 wds:EvaluationMember wds:InternationalMember 2021-01-01 2021-12-31 0000844551 wds:EvaluationMember ifrs-full:ConsolidatedMember 2021-01-01 2021-12-31 0000844551 country:AU wds:RestorationMember 2021-01-01 2021-12-31 0000844551 wds:RestorationMember ifrs-full:ConsolidatedMember 2021-01-01 2021-12-31 0000844551 country:AU 2021-01-01 2021-12-31 0000844551 wds:InternationalMember 2021-01-01 2021-12-31 0000844551 ifrs-full:ConsolidatedMember 2021-01-01 2021-12-31 0000844551 wds:CorporatesOrOthersMember 2021-01-01 2021-12-31 0000844551 wds:CapitalisedBorrowingCostsMember ifrs-full:ConsolidatedMember 2021-01-01 2021-12-31 0000844551 wds:OilAndGasPropertiesMember country:AU 2021-01-01 2021-12-31 0000844551 wds:OilAndGasPropertiesMember wds:InternationalMember 2021-01-01 2021-12-31 0000844551 wds:OilAndGasPropertiesMember wds:CorporatesOrOthersMember 2021-01-01 2021-12-31 0000844551 wds:OilAndGasPropertiesMember ifrs-full:ConsolidatedMember 2021-01-01 2021-12-31 0000844551 wds:CapitalisedBorrowingCostsMember country:AU 2021-01-01 2021-12-31 0000844551 wds:CapitalisedBorrowingCostsMember wds:InternationalMember 2021-01-01 2021-12-31 0000844551 wds:RestorationMember wds:InternationalMember 2021-01-01 2021-12-31 0000844551 ifrs-full:LandAndBuildingsMember wds:InternationalMember 2021-01-01 2021-12-31 0000844551 ifrs-full:LandAndBuildingsMember ifrs-full:ConsolidatedMember 2021-01-01 2021-12-31 0000844551 wds:PlantAndEquipmentMember wds:InternationalMember 2021-01-01 2021-12-31 0000844551 ifrs-full:ConsolidatedMember wds:PlantAndEquipmentMember 2021-01-01 2021-12-31 0000844551 wds:PlutoMember country:AU wds:ProducingAndDevelopingAssetsMember 2021-01-01 2021-12-31 0000844551 wds:SangomarMember wds:InternationalMember wds:ProducingAndDevelopingAssetsMember 2021-01-01 2021-12-31 0000844551 wds:SenegalMember srt:AfricaMember ifrs-full:ExplorationAndEvaluationAssetsMember 2021-01-01 2021-12-31 0000844551 wds:RepublicOfKoreaMember srt:AsiaMember ifrs-full:ExplorationAndEvaluationAssetsMember 2021-01-01 2021-12-31 0000844551 ifrs-full:BottomOfRangeMember country:AU wds:NorthWestShelfMember wds:ProducingAndDevelopingAssetsMember 2021-01-01 2021-12-31 0000844551 ifrs-full:TopOfRangeMember country:AU wds:NorthWestShelfMember wds:ProducingAndDevelopingAssetsMember 2021-01-01 2021-12-31 0000844551 wds:GreaterEnfieldAndVincentMember wds:ProducingAndDevelopingAssetsMember country:AU 2021-01-01 2021-12-31 0000844551 country:AU wds:ProducingAndDevelopingAssetsMember wds:StybarrowMember 2021-01-01 2021-12-31 0000844551 wds:ProducingAndDevelopingAssetsMember wds:BalnavesMember country:AU 2021-01-01 2021-12-31 0000844551 ifrs-full:BottomOfRangeMember country:AU wds:ProducingAndDevelopingAssetsMember wds:WheatstoneMember 2021-01-01 2021-12-31 0000844551 ifrs-full:TopOfRangeMember country:AU wds:ProducingAndDevelopingAssetsMember wds:WheatstoneMember 2021-01-01 2021-12-31 0000844551 country:AU wds:ScarboroughMember wds:ProducingAndDevelopingAssetsMember 2021-01-01 2021-12-31 0000844551 wds:BrowseBasinMember wds:OceaniaMember ifrs-full:ExplorationAndEvaluationAssetsMember 2021-01-01 2021-12-31 0000844551 wds:CarnarvonBasinMember ifrs-full:ExplorationAndEvaluationAssetsMember wds:OceaniaMember ifrs-full:BottomOfRangeMember 2021-01-01 2021-12-31 0000844551 wds:CarnarvonBasinMember ifrs-full:ExplorationAndEvaluationAssetsMember wds:OceaniaMember ifrs-full:TopOfRangeMember 2021-01-01 2021-12-31 0000844551 wds:OceaniaMember wds:ScarboroughMember ifrs-full:ExplorationAndEvaluationAssetsMember 2021-01-01 2021-12-31 0000844551 ifrs-full:ExplorationAndEvaluationAssetsMember wds:OceaniaMember wds:BonaparteBasinMember ifrs-full:BottomOfRangeMember 2021-01-01 2021-12-31 0000844551 ifrs-full:ExplorationAndEvaluationAssetsMember wds:OceaniaMember wds:BonaparteBasinMember ifrs-full:TopOfRangeMember 2021-01-01 2021-12-31 0000844551 srt:AfricaMember wds:CongoMember ifrs-full:ExplorationAndEvaluationAssetsMember 2021-01-01 2021-12-31 0000844551 wds:KitimatMember ifrs-full:ExplorationAndEvaluationAssetsMember srt:AmericasMember 2021-01-01 2021-12-31 0000844551 srt:AsiaMember ifrs-full:ExplorationAndEvaluationAssetsMember wds:MyanmarMember ifrs-full:BottomOfRangeMember 2021-01-01 2021-12-31 0000844551 srt:AsiaMember ifrs-full:ExplorationAndEvaluationAssetsMember wds:MyanmarMember ifrs-full:TopOfRangeMember 2021-01-01 2021-12-31 0000844551 srt:AsiaPacificMember ifrs-full:ExplorationAndEvaluationAssetsMember wds:CarryingAmountsMember 2021-01-01 2021-12-31 0000844551 srt:AfricaMember ifrs-full:ExplorationAndEvaluationAssetsMember wds:CarryingAmountsMember 2021-01-01 2021-12-31 0000844551 wds:CarryingAmountsMember wds:OtherMember ifrs-full:ExplorationAndEvaluationAssetsMember 2021-01-01 2021-12-31 0000844551 srt:EuropeMember 2021-01-01 2021-12-31 0000844551 srt:AsiaPacificMember 2021-01-01 2021-12-31 0000844551 wds:AustraliaOperatingSegmentMember ifrs-full:OperatingSegmentsMember 2021-01-01 2021-12-31 0000844551 wds:MajorCustomerOneMember ifrs-full:OperatingSegmentsMember wds:AustraliaOperatingSegmentMember 2021-01-01 2021-12-31 0000844551 wds:MajorCustomerTwoMember ifrs-full:OperatingSegmentsMember wds:AustraliaOperatingSegmentMember 2021-01-01 2021-12-31 0000844551 wds:CorporatesOrOthers2022Member 2021-01-01 2021-12-31 0000844551 ifrs-full:OperatingSegmentsMember wds:AustraliaSegmentMember wds:LiquefiedNaturalGasMember 2021-01-01 2021-12-31 0000844551 ifrs-full:OperatingSegmentsMember wds:MarketingSegmentMember wds:LiquefiedNaturalGasMember 2021-01-01 2021-12-31 0000844551 ifrs-full:OperatingSegmentsMember wds:AustraliaSegmentMember wds:PipelineGasMember 2021-01-01 2021-12-31 0000844551 ifrs-full:OperatingSegmentsMember wds:PipelineGasMember 2021-01-01 2021-12-31 0000844551 ifrs-full:OperatingSegmentsMember wds:LiquefiedNaturalGasMember 2021-01-01 2021-12-31 0000844551 ifrs-full:OperatingSegmentsMember wds:AustraliaSegmentMember wds:CrudeOilAndCondensateMember 2021-01-01 2021-12-31 0000844551 ifrs-full:OperatingSegmentsMember srt:NaturalGasLiquidsReservesMember 2021-01-01 2021-12-31 0000844551 ifrs-full:OperatingSegmentsMember wds:RevenueFromSaleOfHydrocarbonsMember 2021-01-01 2021-12-31 0000844551 ifrs-full:OperatingSegmentsMember wds:CrudeOilAndCondensateMember 2021-01-01 2021-12-31 0000844551 ifrs-full:OperatingSegmentsMember wds:AustraliaSegmentMember srt:NaturalGasLiquidsReservesMember 2021-01-01 2021-12-31 0000844551 ifrs-full:OperatingSegmentsMember wds:MarketingSegmentMember wds:RevenueFromSaleOfHydrocarbonsMember 2021-01-01 2021-12-31 0000844551 ifrs-full:OperatingSegmentsMember wds:AustraliaSegmentMember wds:RevenueFromSaleOfHydrocarbonsMember 2021-01-01 2021-12-31 0000844551 ifrs-full:OperatingSegmentsMember wds:AustraliaSegmentMember wds:ProcessingAndServicesRevenueMember 2021-01-01 2021-12-31 0000844551 ifrs-full:OperatingSegmentsMember wds:ProcessingAndServicesRevenueMember 2021-01-01 2021-12-31 0000844551 ifrs-full:OperatingSegmentsMember wds:AustraliaSegmentMember wds:ShippingAndOtherRevenueMember 2021-01-01 2021-12-31 0000844551 ifrs-full:OperatingSegmentsMember wds:MarketingSegmentMember wds:ShippingAndOtherRevenueMember 2021-01-01 2021-12-31 0000844551 ifrs-full:OperatingSegmentsMember wds:ShippingAndOtherRevenueMember 2021-01-01 2021-12-31 0000844551 ifrs-full:OperatingSegmentsMember wds:AustraliaSegmentMember 2021-01-01 2021-12-31 0000844551 ifrs-full:OperatingSegmentsMember wds:MarketingSegmentMember 2021-01-01 2021-12-31 0000844551 ifrs-full:OperatingSegmentsMember 2021-01-01 2021-12-31 0000844551 ifrs-full:OperatingSegmentsMember wds:AustraliaSegmentMember wds:ExternalCustomersMember 2021-01-01 2021-12-31 0000844551 ifrs-full:OperatingSegmentsMember wds:MarketingSegmentMember wds:ExternalCustomersMember 2021-01-01 2021-12-31 0000844551 wds:CorporateOrOtherSegmentMember ifrs-full:OperatingSegmentsMember 2021-01-01 2021-12-31 0000844551 ifrs-full:LandAndBuildingsMember wds:AustraliaSegmentMember ifrs-full:OperatingSegmentsMember 2021-01-01 2021-12-31 0000844551 ifrs-full:LandAndBuildingsMember ifrs-full:OperatingSegmentsMember 2021-01-01 2021-12-31 0000844551 ifrs-full:ExplorationAndEvaluationAssetsMember wds:AustraliaSegmentMember ifrs-full:OperatingSegmentsMember 2021-01-01 2021-12-31 0000844551 ifrs-full:ExplorationAndEvaluationAssetsMember ifrs-full:OperatingSegmentsMember 2021-01-01 2021-12-31 0000844551 wds:CorporateOrOtherSegmentMember ifrs-full:OperatingSegmentsMember ifrs-full:OtherPropertyPlantAndEquipmentMember 2021-01-01 2021-12-31 0000844551 ifrs-full:OperatingSegmentsMember ifrs-full:OtherPropertyPlantAndEquipmentMember 2021-01-01 2021-12-31 0000844551 wds:AustraliaSegmentMember ifrs-full:OperatingSegmentsMember wds:OilAndGasPropertiesMember 2021-01-01 2021-12-31 0000844551 wds:CorporateOrOtherSegmentMember ifrs-full:OperatingSegmentsMember wds:OilAndGasPropertiesMember 2021-01-01 2021-12-31 0000844551 ifrs-full:OperatingSegmentsMember wds:OilAndGasPropertiesMember 2021-01-01 2021-12-31 0000844551 wds:AustraliaSegmentMember ifrs-full:OperatingSegmentsMember ifrs-full:OtherPropertyPlantAndEquipmentMember 2021-01-01 2021-12-31 0000844551 wds:PlantAndEquipmentMember ifrs-full:OilAndGasAssetsMember ifrs-full:GrossCarryingAmountMember 2021-01-01 2021-12-31 0000844551 wds:ProjectsInDevelopmentMember ifrs-full:OilAndGasAssetsMember ifrs-full:GrossCarryingAmountMember 2021-01-01 2021-12-31 0000844551 ifrs-full:OilAndGasAssetsMember ifrs-full:GrossCarryingAmountMember 2021-01-01 2021-12-31 0000844551 ifrs-full:LandAndBuildingsMember ifrs-full:OilAndGasAssetsMember ifrs-full:GrossCarryingAmountMember 2021-01-01 2021-12-31 0000844551 wds:TransferredExplorationAndEvaluationMember ifrs-full:OilAndGasAssetsMember ifrs-full:GrossCarryingAmountMember 2021-01-01 2021-12-31 0000844551 wds:PlantAndEquipmentMember 2021-01-01 2021-12-31 0000844551 ifrs-full:LandAndBuildingsMember 2021-01-01 2021-12-31 0000844551 wds:LeaseCommitmentsMember 2021-01-01 2021-12-31 0000844551 ifrs-full:FairValueHedgesMember 2021-01-01 2021-12-31 0000844551 ifrs-full:LaterThanTenYearsMember 2021-01-01 2021-12-31 0000844551 ifrs-full:OnerousContractsProvisionMember 2021-01-01 2021-12-31 0000844551 wds:IncomeTaxMember 2021-01-01 2021-12-31 0000844551 wds:TemporaryDifferenceAraisesDueToDerivativesMember 2021-01-01 2021-12-31 0000844551 ifrs-full:OtherTemporaryDifferencesMember 2021-01-01 2021-12-31 0000844551 country:AU wds:IncomeTaxMember 2021-01-01 2021-12-31 0000844551 wds:GlobalMember wds:IncomeTaxMember 2021-01-01 2021-12-31 0000844551 wds:CashFlowAndFairValueHedgesMember wds:CrossCurrencyInterestRateSwapMember 2021-01-01 2021-12-31 0000844551 ifrs-full:InterestRateSwapContractMember ifrs-full:CashFlowHedgesMember 2021-01-01 2021-12-31 0000844551 ifrs-full:CashFlowHedgesMember wds:TtfCommoditySwapsMember 2021-01-01 2021-12-31 0000844551 ifrs-full:BottomOfRangeMember ifrs-full:CashFlowHedgesMember wds:OilSwapsMember 2021-01-01 2021-12-31 0000844551 ifrs-full:TopOfRangeMember ifrs-full:CashFlowHedgesMember wds:OilSwapsMember 2021-01-01 2021-12-31 0000844551 ifrs-full:CashFlowHedgesMember wds:HhCorpusChristiCommoditySwapsMember ifrs-full:TopOfRangeMember 2021-01-01 2021-12-31 0000844551 ifrs-full:CashFlowHedgesMember wds:HhCorpusChristiCommoditySwapsMember ifrs-full:BottomOfRangeMember 2021-01-01 2021-12-31 0000844551 ifrs-full:CashFlowHedgesMember wds:TtfCorpusChristiCommoditySwapsMember ifrs-full:TopOfRangeMember 2021-01-01 2021-12-31 0000844551 ifrs-full:CashFlowHedgesMember wds:TtfCorpusChristiCommoditySwapsMember ifrs-full:BottomOfRangeMember 2021-01-01 2021-12-31 0000844551 wds:FxForwardsMember ifrs-full:CashFlowHedgesMember ifrs-full:TopOfRangeMember 2021-01-01 2021-12-31 0000844551 wds:FxForwardsMember ifrs-full:CashFlowHedgesMember ifrs-full:BottomOfRangeMember 2021-01-01 2021-12-31 0000844551 wds:OilAndGasPropertiesMember ifrs-full:LandAndBuildingsMember 2021-01-01 2021-12-31 0000844551 ifrs-full:LandAndBuildingsMember wds:OilAndGasPropertiesMember wds:ProducingMember wds:NorthWestShelfMember 2021-01-01 2021-12-31 0000844551 wds:NorthWestShelfMember wds:ProducingMember wds:OilAndGasPropertiesMember wds:TransferredExplorationAndEvaluationMember 2021-01-01 2021-12-31 0000844551 wds:NorthWestShelfMember wds:ProducingMember wds:OilAndGasPropertiesMember wds:PlantAndEquipmentMember 2021-01-01 2021-12-31 0000844551 wds:NorthWestShelfMember wds:ProducingMember wds:OilAndGasPropertiesMember wds:ProjectsInDevelopmentMember 2021-01-01 2021-12-31 0000844551 wds:PlutoScarboroughMember wds:ProducingAndDevelopmentMember wds:OilAndGasPropertiesMember ifrs-full:LandAndBuildingsMember 2021-01-01 2021-12-31 0000844551 wds:PlutoScarboroughMember wds:ProducingAndDevelopmentMember wds:OilAndGasPropertiesMember wds:TransferredExplorationAndEvaluationMember 2021-01-01 2021-12-31 0000844551 wds:PlutoScarboroughMember wds:ProducingAndDevelopmentMember wds:OilAndGasPropertiesMember wds:ProjectsInDevelopmentMember 2021-01-01 2021-12-31 0000844551 wds:PlutoScarboroughMember wds:ProducingAndDevelopmentMember wds:OilAndGasPropertiesMember 2021-01-01 2021-12-31 0000844551 wds:PlutoScarboroughMember wds:ProducingAndDevelopmentMember wds:OilAndGasPropertiesMember wds:PlantAndEquipmentMember 2021-01-01 2021-12-31 0000844551 wds:NorthWestShelfMember wds:ProducingMember wds:OilAndGasPropertiesMember 2021-01-01 2021-12-31 0000844551 wds:OilAndGasPropertiesMember wds:TransferredExplorationAndEvaluationMember 2021-01-01 2021-12-31 0000844551 wds:OilAndGasPropertiesMember wds:PlantAndEquipmentMember 2021-01-01 2021-12-31 0000844551 wds:OilAndGasPropertiesMember wds:ProjectsInDevelopmentMember 2021-01-01 2021-12-31 0000844551 wds:OilAndGasPropertiesMember 2021-01-01 2021-12-31 0000844551 ifrs-full:DiscountRateMeasurementInputMember wds:OilAndGasPropertiesMember wds:ProducingMember wds:WheatstoneMember 2021-01-01 2021-12-31 0000844551 wds:BrentPriceMeasurementInputMember wds:OilAndGasPropertiesMember wds:ProducingMember wds:WheatstoneMember 2021-01-01 2021-12-31 0000844551 wds:FxMeasurementInputMember wds:OilAndGasPropertiesMember wds:ProducingMember wds:WheatstoneMember 2021-01-01 2021-12-31 0000844551 wds:BrentPriceMeasurementInputMember wds:OilAndGasPropertiesMember wds:ProducingMember wds:NWSOilOkhaMember 2021-01-01 2021-12-31 0000844551 wds:FxMeasurementInputMember wds:OilAndGasPropertiesMember wds:ProducingMember wds:NWSOilOkhaMember 2021-01-01 2021-12-31 0000844551 ifrs-full:DiscountRateMeasurementInputMember wds:OilAndGasPropertiesMember wds:ProducingMember wds:NWSOilOkhaMember 2021-01-01 2021-12-31 0000844551 wds:BrentPriceMeasurementInputMember wds:OilAndGasPropertiesMember wds:ProducingMember wds:NorthWestShelfMember 2021-01-01 2021-12-31 0000844551 wds:TwoThousandAndTwentyTwoMember 2021-01-01 2021-12-31 0000844551 wds:TwoThousandAndTwentyThreeMember 2021-01-01 2021-12-31 0000844551 wds:TwoThousandAndTwentyFourMember 2021-01-01 2021-12-31 0000844551 wds:TwoThousandAndTwentySixMember 2021-01-01 2021-12-31 0000844551 wds:TwoThousandAndTwentySevenMember 2021-01-01 2021-12-31 0000844551 wds:TwoThousandAndTwentyFiveMember 2021-01-01 2021-12-31 0000844551 wds:TwoThousandAndTwentyEightMember 2021-01-01 2021-12-31 0000844551 wds:TwoThousandAndTwentyTwoRealTermsMember wds:TwoThousandAndTwentyFourMember 2021-01-01 2021-12-31 0000844551 ifrs-full:Level3OfFairValueHierarchyMember ifrs-full:NoncurrentAssetsHeldForSaleMember 2021-01-01 2021-12-31 0000844551 ifrs-full:NoncurrentAssetsHeldForSaleMember wds:AustralianOperatingSegmentMember 2021-01-01 2021-12-31 0000844551 wds:MarketingSegmentMember ifrs-full:OperatingSegmentsMember wds:TotalOtherCostOfSalesMember 2021-01-01 2021-12-31 0000844551 ifrs-full:OperatingSegmentsMember wds:TotalOtherCostOfSalesMember 2021-01-01 2021-12-31 0000844551 wds:CorporateOrOtherSegmentMember ifrs-full:OperatingSegmentsMember wds:TotalOtherCostOfSalesMember 2021-01-01 2021-12-31 0000844551 wds:AustraliaSegmentMember ifrs-full:OperatingSegmentsMember wds:TotalOtherCostOfSalesMember 2021-01-01 2021-12-31 0000844551 ifrs-full:OperatingSegmentsMember wds:CostsOfProductionMember 2021-01-01 2021-12-31 0000844551 wds:CorporateOrOtherSegmentMember ifrs-full:OperatingSegmentsMember wds:CostsOfProductionMember 2021-01-01 2021-12-31 0000844551 wds:AustraliaSegmentMember ifrs-full:OperatingSegmentsMember wds:CostsOfProductionMember 2021-01-01 2021-12-31 0000844551 wds:AustraliaSegmentMember ifrs-full:OperatingSegmentsMember wds:InventoryMovementMember 2021-01-01 2021-12-31 0000844551 ifrs-full:OperatingSegmentsMember wds:InventoryMovementMember 2021-01-01 2021-12-31 0000844551 ifrs-full:OperatingSegmentsMember wds:AustraliaSegmentMember wds:OtherHydrocarbonCostsMember 2021-01-01 2021-12-31 0000844551 ifrs-full:OperatingSegmentsMember wds:MovementInOnerousContractProvisionMember 2021-01-01 2021-12-31 0000844551 ifrs-full:OperatingSegmentsMember wds:MarketingSegmentMember wds:MovementInOnerousContractProvisionMember 2021-01-01 2021-12-31 0000844551 ifrs-full:OperatingSegmentsMember wds:OtherCostOfSalesMember 2021-01-01 2021-12-31 0000844551 ifrs-full:OperatingSegmentsMember wds:CorporateOrOtherSegmentMember wds:OtherCostOfSalesMember 2021-01-01 2021-12-31 0000844551 ifrs-full:OperatingSegmentsMember wds:AustraliaSegmentMember wds:OtherCostOfSalesMember 2021-01-01 2021-12-31 0000844551 ifrs-full:OperatingSegmentsMember wds:OtherHydrocarbonCostsMember 2021-01-01 2021-12-31 0000844551 ifrs-full:OperatingSegmentsMember wds:TradingCostsMember 2021-01-01 2021-12-31 0000844551 ifrs-full:OperatingSegmentsMember wds:MarketingSegmentMember wds:TradingCostsMember 2021-01-01 2021-12-31 0000844551 ifrs-full:OperatingSegmentsMember wds:AustraliaSegmentMember wds:TradingCostsMember 2021-01-01 2021-12-31 0000844551 ifrs-full:OperatingSegmentsMember wds:ShippingAndDirectSalesCostsMember 2021-01-01 2021-12-31 0000844551 ifrs-full:OperatingSegmentsMember wds:CorporateOrOtherSegmentMember wds:ShippingAndDirectSalesCostsMember 2021-01-01 2021-12-31 0000844551 ifrs-full:OperatingSegmentsMember wds:MarketingSegmentMember wds:ShippingAndDirectSalesCostsMember 2021-01-01 2021-12-31 0000844551 ifrs-full:OperatingSegmentsMember wds:AustraliaSegmentMember wds:ShippingAndDirectSalesCostsMember 2021-01-01 2021-12-31 0000844551 ifrs-full:OperatingSegmentsMember wds:RoyaltiesExciseAndLeviesMember 2021-01-01 2021-12-31 0000844551 ifrs-full:OperatingSegmentsMember wds:AustraliaSegmentMember wds:RoyaltiesExciseAndLeviesMember 2021-01-01 2021-12-31 0000844551 ifrs-full:OperatingSegmentsMember wds:ProductionCostsMember 2021-01-01 2021-12-31 0000844551 ifrs-full:OperatingSegmentsMember wds:CorporateOrOtherSegmentMember wds:ProductionCostsMember 2021-01-01 2021-12-31 0000844551 ifrs-full:OperatingSegmentsMember wds:AustraliaSegmentMember wds:ProductionCostsMember 2021-01-01 2021-12-31 0000844551 wds:InternationalSegmentMember ifrs-full:OperatingSegmentsMember 2021-01-01 2021-12-31 0000844551 wds:FxForwardsMember ifrs-full:CashFlowHedgesMember 2021-01-01 2021-12-31 0000844551 wds:TtfCorpusChristiCommoditySwapsMember ifrs-full:CashFlowHedgesMember 2021-01-01 2021-12-31 0000844551 wds:HhCorpusChristiCommoditySwapsMember ifrs-full:CashFlowHedgesMember 2021-01-01 2021-12-31 0000844551 wds:OilSwapsMember ifrs-full:CashFlowHedgesMember 2021-01-01 2021-12-31 0000844551 wds:TwoThousandTwentyDividendReinvestmentPlanMember ifrs-full:OrdinarySharesMember 2021-01-01 2021-12-31 0000844551 wds:TwoThousandTwentyOneDividendReinvestmentPlanMember ifrs-full:OrdinarySharesMember 2021-01-01 2021-12-31 0000844551 wds:FarSenegalRssdSaSangomarExploitationAreaMember 2021-01-01 2021-12-31 0000844551 wds:FarSenegalRssdSaRssdEvaluationAreaMember 2021-01-01 2021-12-31 0000844551 wds:TemporaryDifferenceAraisesDueToProductionAndGrowthAssetsMember wds:PetroleumResourceRentTaxMember 2021-01-01 2021-12-31 0000844551 wds:TemporaryDifferenceAraisesDueToAugmentationForCurrentYearMember wds:PetroleumResourceRentTaxMember 2021-01-01 2021-12-31 0000844551 wds:TemporaryDifferenceAraisesDueToProvisionsMember wds:PetroleumResourceRentTaxMember 2021-01-01 2021-12-31 0000844551 ifrs-full:OtherTemporaryDifferencesMember wds:PetroleumResourceRentTaxMember 2021-01-01 2021-12-31 0000844551 wds:TemporaryDifferenceAraisesDueToOilAndGasPropertiesMember wds:IncomeTaxMember 2021-01-01 2021-12-31 0000844551 wds:TemporaryDifferenceAraisesDueToExplorationAndEvaluationAssetsMember wds:IncomeTaxMember 2021-01-01 2021-12-31 0000844551 wds:TemporaryDifferenceAraisesDueToLeaseAssetsAndLiabilitiesMember wds:IncomeTaxMember 2021-01-01 2021-12-31 0000844551 wds:TemporaryDifferenceAraisesDueToProvisionsMember wds:IncomeTaxMember 2021-01-01 2021-12-31 0000844551 wds:TemporaryDifferenceAraisesDueToPetroleumResourceRentTaxAssetsAndLiabilitiesMember wds:IncomeTaxMember 2021-01-01 2021-12-31 0000844551 wds:TemporaryDifferenceAraisesDueToUnusedTaxLossesAndTaxCreditsMember wds:IncomeTaxMember 2021-01-01 2021-12-31 0000844551 wds:TemporaryDifferenceAraisesDueToAssetsheldForSaleMember wds:IncomeTaxMember 2021-01-01 2021-12-31 0000844551 wds:TemporaryDifferenceAraisesDueToDerivativesMember wds:IncomeTaxMember 2021-01-01 2021-12-31 0000844551 ifrs-full:OtherTemporaryDifferencesMember wds:IncomeTaxMember 2021-01-01 2021-12-31 0000844551 ifrs-full:ProvisionForDecommissioningRestorationAndRehabilitationCostsMember 2021-01-01 2021-12-31 0000844551 wds:EmployeesBenefitsProvisionsMember 2021-01-01 2021-12-31 0000844551 ifrs-full:MiscellaneousOtherProvisionsMember 2021-01-01 2021-12-31 0000844551 ifrs-full:TradeReceivablesMember ifrs-full:CreditRiskMember 2021-01-01 2021-12-31 0000844551 ifrs-full:CreditRiskMember ifrs-full:TradeReceivablesMember wds:SubsequentPeriodMember 2021-01-01 2021-12-31 0000844551 wds:PlutoPRRTDeferredTaxAssetMember 2022-01-01 2022-12-31 0000844551 ifrs-full:AssociatesMember 2022-01-01 2022-12-31 0000844551 wds:FxMeasurementInputMember wds:WheatstoneMember wds:WdsaustraliaSegmentMember 2022-01-01 2022-12-31 0000844551 wds:BrentPriceMeasurementInputMember wds:WheatstoneMember wds:WdsaustraliaSegmentMember 2022-01-01 2022-12-31 0000844551 wds:ProducingMember wds:WheatstoneMember 2022-01-01 2022-12-31 0000844551 wds:WheatstoneMember wds:WdsaustraliaSegmentMember 2022-01-01 2022-12-31 0000844551 ifrs-full:GoodwillMember wds:OilAndGsPropertiesMember wds:ShenziAndAtlantisMember 2022-01-01 2022-12-31 0000844551 wds:PetroleumResourceRentTaxMember 2022-01-01 2022-12-31 0000844551 country:AU 2022-01-01 2022-12-31 0000844551 wds:InternationalMember 2022-01-01 2022-12-31 0000844551 ifrs-full:ExplorationAndEvaluationAssetsMember 2022-01-01 2022-12-31 0000844551 wds:CapitalisedAfterOneYearMember ifrs-full:ExplorationAndEvaluationAssetsMember 2022-01-01 2022-12-31 0000844551 dei:BusinessContactMember 2022-01-01 2022-12-31 0000844551 dei:AdrMember 2022-01-01 2022-12-31 0000844551 ifrs-full:OrdinarySharesMember 2022-01-01 2022-12-31 0000844551 ifrs-full:TopOfRangeMember 2022-01-01 2022-12-31 0000844551 ifrs-full:BottomOfRangeMember 2022-01-01 2022-12-31 0000844551 ifrs-full:RetainedEarningsMember 2022-01-01 2022-12-31 0000844551 ifrs-full:EquityAttributableToOwnersOfParentMember 2022-01-01 2022-12-31 0000844551 ifrs-full:NoncontrollingInterestsMember 2022-01-01 2022-12-31 0000844551 ifrs-full:ReserveOfExchangeDifferencesOnTranslationMember 2022-01-01 2022-12-31 0000844551 ifrs-full:MiscellaneousOtherReservesMember 2022-01-01 2022-12-31 0000844551 ifrs-full:ReserveOfCashFlowHedgesMember 2022-01-01 2022-12-31 0000844551 wds:DistributableProfitsReserveMember 2022-01-01 2022-12-31 0000844551 ifrs-full:ReserveOfSharebasedPaymentsMember 2022-01-01 2022-12-31 0000844551 ifrs-full:IssuedCapitalMember 2022-01-01 2022-12-31 0000844551 wds:EmployeeBenefitsReserveMember 2022-01-01 2022-12-31 0000844551 wds:ExecutivePlansMember wds:ShortTermAwardsMember 2022-01-01 2022-12-31 0000844551 wds:ExecutivePlansMember wds:LongTermAwardsMember 2022-01-01 2022-12-31 0000844551 wds:SupplementaryWoodsideEquityPlanMember wds:EmployeePlansMember 2022-01-01 2022-12-31 0000844551 wds:EmployeePlansMember wds:WoodsideEquityPlanMember 2022-01-01 2022-12-31 0000844551 wds:WoodsideEquityPlanMember 2022-01-01 2022-12-31 0000844551 wds:SupplementaryWoodsideEquityPlanMember 2022-01-01 2022-12-31 0000844551 ifrs-full:BottomOfRangeMember wds:RestrictedSharesMember 2022-01-01 2022-12-31 0000844551 ifrs-full:TopOfRangeMember wds:RestrictedSharesMember 2022-01-01 2022-12-31 0000844551 wds:PerformanceRightsMember ifrs-full:BottomOfRangeMember 2022-01-01 2022-12-31 0000844551 wds:PerformanceRightsMember ifrs-full:TopOfRangeMember 2022-01-01 2022-12-31 0000844551 wds:LongTermAwardsMember 2022-01-01 2022-12-31 0000844551 wds:SupplementaryWoodsideEquityPlanMember wds:WoodsideShareOrAmericanDepositaryShareMember 2022-01-01 2022-12-31 0000844551 ifrs-full:OrdinarySharesMember wds:TwoThousandTwentyOneDividendReinvestmentPlanMember 2022-01-01 2022-12-31 0000844551 ifrs-full:OrdinarySharesMember wds:BhpPetroleumInternationalPtyLtdMember 2022-01-01 2022-12-31 0000844551 wds:TwoThousandTwentyDividendReinvestmentPlanMember ifrs-full:OrdinarySharesMember 2022-01-01 2022-12-31 0000844551 wds:TwoThousandTwentyOneInterimDividendMember ifrs-full:OrdinarySharesMember 2022-01-01 2022-12-31 0000844551 wds:TwoThousandAndNineteenDividendReinvestmentPlanMember ifrs-full:OrdinarySharesMember 2022-01-01 2022-12-31 0000844551 wds:TwoThousandTwentyInterimDividendMember ifrs-full:OrdinarySharesMember 2022-01-01 2022-12-31 0000844551 wds:TwoThousandSeventeenWoodsideEquityPlanMember ifrs-full:OrdinarySharesMember 2022-01-01 2022-12-31 0000844551 wds:EmployeeSharePlansMember 2022-01-01 2022-12-31 0000844551 wds:DividendReinvestmentPlanMember 2022-01-01 2022-12-31 0000844551 wds:WoodsideEmployeeSharePlanMember 2022-01-01 2022-12-31 0000844551 wds:BhpPetroleumInternationalPtyLtdMember 2022-01-01 2022-12-31 0000844551 wds:BhpPetroleumInternationalPtyLtdMember wds:CashFlowsAsFinancingActivitiesMember 2022-01-01 2022-12-31 0000844551 wds:NorthWestShelfGasPtyLtdMember 2022-01-01 2022-12-31 0000844551 wds:NorthWestShelfLiaisonCompanyPtyLtdMember 2022-01-01 2022-12-31 0000844551 wds:NorthWestShelfLiftingCoordinatorPtyLtdMember 2022-01-01 2022-12-31 0000844551 wds:ChinaAdministrationCompanyPtyLtdMember 2022-01-01 2022-12-31 0000844551 wds:NorthWestShelfShippingServiceCompanyPtyLtdMember 2022-01-01 2022-12-31 0000844551 wds:FARSenegalRSSDSAMember 2022-01-01 2022-12-31 0000844551 wds:CapricornSenegalLimitedMember 2022-01-01 2022-12-31 0000844551 wds:WoodsideEnergyUsaOperationsIncMember wds:WoodsideEnergyGlobalHoldingsPtyLtdMember 2022-01-01 2022-12-31 0000844551 wds:KansaiElectricPowerAustraliaPtyLtdMember 2022-01-01 2022-12-31 0000844551 wds:TokyoGasPlutoPtyLtdMember 2022-01-01 2022-12-31 0000844551 wds:PtWoodsideEnergyIndonesiaMember wds:WoodsideEnergyHoldingsPtyLtdMember 2022-01-01 2022-12-31 0000844551 wds:PtWoodsideEnergyIndonesiaMember wds:WoodsideEnergyLtdMember 2022-01-01 2022-12-31 0000844551 wds:WoodsideEnergyTanzaniaLimitedMember wds:WoodsideEnergyHoldingsPtyLtdMember 2022-01-01 2022-12-31 0000844551 wds:WoodsideEnergiaBrasilApoioAdministrativoLtdaMember wds:WoodsideEnergyHoldingsSouthAmericaPtyLtdMember 2022-01-01 2022-12-31 0000844551 wds:WoodsideEnergyInternationalCanadaLimitedMember 2022-01-01 2022-12-31 0000844551 wds:WoodsideEnergyCanadaLngLimitedMember 2022-01-01 2022-12-31 0000844551 wds:PerdidoMexicoPipelineHoldingsS.a.DeC.vMember wds:WoodsideEnergyHoldingsPtyLtdMember 2022-01-01 2022-12-31 0000844551 wds:PerdidoMexicoPipelineS.DeR.l.DeC.vMember wds:WoodsideEnergyGlobalHoldingsPtyLtdMember 2022-01-01 2022-12-31 0000844551 wds:WoodsideEnergyInvestmentsPtyLtdMember 2022-01-01 2022-12-31 0000844551 wds:WoodsideEnergiaBrasilInvestimentosLtdaMember wds:WoodsideEnergyInvestmentsPtyLtdMember 2022-01-01 2022-12-31 0000844551 wds:WoodsideEnergiaBrasilInvestimentosLtdaMember wds:WoodsideEnergyGlobalHoldingsPtyLtdMember 2022-01-01 2022-12-31 0000844551 wds:WoodsideEnergyGlobalHoldingsPtyLtdMember 2022-01-01 2022-12-31 0000844551 wds:WoodsideEnergaServiciosAdministrativosS.DeR.l.DeC.vMember wds:WoodsideEnergyMexicoLimitedMember 2022-01-01 2022-12-31 0000844551 wds:WoodsideEnergaServiciosDeMxicoS.DeR.l.DeC.vMember wds:WoodsideEnergyMexicoLimitedMember 2022-01-01 2022-12-31 0000844551 wds:OperacionesConjuntasS.DeR.l.DeC.vMember wds:WoodsideEnergyMexicoLimitedMember 2022-01-01 2022-12-31 0000844551 wds:WoodsidePetrleoOperacionesDeMxicoS.DeR.l.DeC.vMember wds:WoodsideEnergyMexicoLimitedMember 2022-01-01 2022-12-31 0000844551 wds:WoodsideEnergaHoldingsDeMxicoS.DeR.l.DeC.vMember wds:WoodsideEnergyMexicoLimitedMember 2022-01-01 2022-12-31 0000844551 wds:WoodsideEnergyMexicoHoldingsLlcMember ifrs-full:BottomOfRangeMember 2022-01-01 2022-12-31 0000844551 wds:WoodsideEnergyMexicoHoldingsLlcMember ifrs-full:TopOfRangeMember 2022-01-01 2022-12-31 0000844551 wds:WoodsideEnergyUsaOperationsIncMember wds:WoodsideEnergyHoldingsLlcMember 2022-01-01 2022-12-31 0000844551 wds:WoodsideEnergyTechnologiesPtyLtdMember wds:BlueOceanSeismicServicesLimitedMember 2022-01-01 2022-12-31 0000844551 wds:WoodsidePetroleumHoldingsPtyLtdMember wds:InternationalGasTransportationCompanyLimitedMember 2022-01-01 2022-12-31 0000844551 wds:WoodsideEnergyNorthWestShelfPtyLtdMember wds:InternationalGasTransportationCompanyLimitedMember 2022-01-01 2022-12-31 0000844551 wds:IwileiDistrictParticipatingPartiesLlcMember wds:WoodsideEnergyHawaiiIncMember 2022-01-01 2022-12-31 0000844551 wds:CaesarOilPipelineCompanyLlcMember wds:WoodsideEnergyDeepwaterIncMember 2022-01-01 2022-12-31 0000844551 wds:CleopatraGasGatheringCompanyLlcMember wds:WoodsideEnergyDeepwaterIncMember 2022-01-01 2022-12-31 0000844551 wds:MarineWellContainmentCompanyLlcMember wds:WoodsideEnergyDeepwaterIncMember 2022-01-01 2022-12-31 0000844551 wds:BurrupFacilitiesCompanyPtyLtdMember country:AU ifrs-full:SubsidiariesWithMaterialNoncontrollingInterestsMember 2022-01-01 2022-12-31 0000844551 wds:BurrupTrain1PtyLtdMember country:AU ifrs-full:SubsidiariesWithMaterialNoncontrollingInterestsMember 2022-01-01 2022-12-31 0000844551 ifrs-full:SubsidiariesWithMaterialNoncontrollingInterestsMember wds:BurrupFacilitiesCompanyPtyLtdMember 2022-01-01 2022-12-31 0000844551 ifrs-full:SubsidiariesWithMaterialNoncontrollingInterestsMember wds:BurrupTrain1PtyLtdMember 2022-01-01 2022-12-31 0000844551 wds:WoodsideEnergyMyanmarPteMember 2022-01-01 2022-12-31 0000844551 wds:BilateralFacilitiesMember 2022-01-01 2022-12-31 0000844551 wds:MediumTermNotesMember 2022-01-01 2022-12-31 0000844551 wds:UsBondsMember 2022-01-01 2022-12-31 0000844551 wds:JBICFacilityMember 2022-01-01 2022-12-31 0000844551 wds:SyndicateFacilitiesMember 2022-01-01 2022-12-31 0000844551 wds:TrancheOneMember ifrs-full:BottomOfRangeMember wds:BilateralFacilitiesMember 2022-01-01 2022-12-31 0000844551 wds:TrancheOneMember ifrs-full:TopOfRangeMember wds:BilateralFacilitiesMember 2022-01-01 2022-12-31 0000844551 wds:TrancheTwoMember ifrs-full:BottomOfRangeMember wds:BilateralFacilitiesMember 2022-01-01 2022-12-31 0000844551 wds:TrancheTwoMember ifrs-full:TopOfRangeMember wds:BilateralFacilitiesMember 2022-01-01 2022-12-31 0000844551 wds:TrancheThreeMember ifrs-full:BottomOfRangeMember wds:BilateralFacilitiesMember 2022-01-01 2022-12-31 0000844551 wds:TrancheThreeMember ifrs-full:TopOfRangeMember wds:BilateralFacilitiesMember 2022-01-01 2022-12-31 0000844551 wds:TrancheFourMember wds:BilateralFacilitiesMember 2022-01-01 2022-12-31 0000844551 wds:TrancheOneMember wds:BilateralFacilitiesMember 2022-01-01 2022-12-31 0000844551 wds:TrancheTwoMember wds:BilateralFacilitiesMember 2022-01-01 2022-12-31 0000844551 wds:TrancheThreeMember wds:BilateralFacilitiesMember 2022-01-01 2022-12-31 0000844551 wds:MaturingOnEleventhOfDecemberTwoThousandAndTwentyThreeMember wds:MediumTermNotesMember 2022-01-01 2022-12-31 0000844551 wds:MaturingOnTwentyNineOfJanuaryTwoThousandAndTwentySevenMember wds:MediumTermNotesMember 2022-01-01 2022-12-31 0000844551 wds:UsBondsMember wds:FifthOfMarchTwoThousandAndTwoThousandAndTwentyFiveMember 2022-01-01 2022-12-31 0000844551 wds:UsBondsMember wds:FifteenthOfSeptemberTwoThousandAndTwentySixMember 2022-01-01 2022-12-31 0000844551 wds:UsBondsMember wds:FifteenthOfMarchTwoThousandAndTwentyEightMember 2022-01-01 2022-12-31 0000844551 wds:UsBondsMember wds:FourthOfMarchTwoThouandAndTwentyNineMember 2022-01-01 2022-12-31 0000844551 wds:ExplorationMember country:AU 2022-01-01 2022-12-31 0000844551 wds:ExplorationMember wds:InternationalMember 2022-01-01 2022-12-31 0000844551 wds:ExplorationMember ifrs-full:ConsolidatedMember 2022-01-01 2022-12-31 0000844551 wds:EvaluationMember country:AU 2022-01-01 2022-12-31 0000844551 wds:EvaluationMember wds:InternationalMember 2022-01-01 2022-12-31 0000844551 wds:EvaluationMember ifrs-full:ConsolidatedMember 2022-01-01 2022-12-31 0000844551 country:AU 2022-01-01 2022-12-31 0000844551 wds:InternationalMember 2022-01-01 2022-12-31 0000844551 ifrs-full:ConsolidatedMember 2022-01-01 2022-12-31 0000844551 wds:RestorationMember country:AU 2022-01-01 2022-12-31 0000844551 ifrs-full:ConsolidatedMember wds:RestorationMember 2022-01-01 2022-12-31 0000844551 wds:InternationalMember wds:RestorationMember 2022-01-01 2022-12-31 0000844551 wds:OilAndGasPropertiesMember ifrs-full:ConsolidatedMember 2022-01-01 2022-12-31 0000844551 wds:CorporatesOrOthersMember 2022-01-01 2022-12-31 0000844551 wds:OilAndGasPropertiesMember country:AU 2022-01-01 2022-12-31 0000844551 wds:OilAndGasPropertiesMember wds:InternationalMember 2022-01-01 2022-12-31 0000844551 wds:OilAndGasPropertiesMember wds:CorporatesOrOthersMember 2022-01-01 2022-12-31 0000844551 wds:CapitalisedBorrowingCostsMember country:AU 2022-01-01 2022-12-31 0000844551 wds:CapitalisedBorrowingCostsMember wds:InternationalMember 2022-01-01 2022-12-31 0000844551 wds:CapitalisedBorrowingCostsMember ifrs-full:ConsolidatedMember 2022-01-01 2022-12-31 0000844551 ifrs-full:LandAndBuildingsMember ifrs-full:ConsolidatedMember 2022-01-01 2022-12-31 0000844551 wds:PlantAndEquipmentMember wds:InternationalMember 2022-01-01 2022-12-31 0000844551 wds:PlantAndEquipmentMember wds:CorporatesOrOthersMember 2022-01-01 2022-12-31 0000844551 wds:PlantAndEquipmentMember ifrs-full:ConsolidatedMember 2022-01-01 2022-12-31 0000844551 ifrs-full:LandAndBuildingsMember country:AU 2022-01-01 2022-12-31 0000844551 wds:PlantAndEquipmentMember country:AU 2022-01-01 2022-12-31 0000844551 wds:PlutoMember country:AU wds:ProducingAndDevelopingAssetsMember 2022-01-01 2022-12-31 0000844551 wds:MacedonMember country:AU wds:ProducingAndDevelopingAssetsMember 2022-01-01 2022-12-31 0000844551 wds:SangomarMember wds:InternationalMember wds:ProducingAndDevelopingAssetsMember 2022-01-01 2022-12-31 0000844551 wds:AtlantisMember wds:InternationalMember wds:ProducingAndDevelopingAssetsMember 2022-01-01 2022-12-31 0000844551 wds:MadDogMember wds:InternationalMember wds:ProducingAndDevelopingAssetsMember 2022-01-01 2022-12-31 0000844551 wds:ShenziMember wds:InternationalMember wds:ProducingAndDevelopingAssetsMember 2022-01-01 2022-12-31 0000844551 wds:ProducingAndDevelopingAssetsMember wds:InternationalMember wds:TrionMember 2022-01-01 2022-12-31 0000844551 wds:CalypsoMember wds:InternationalMember wds:ProducingAndDevelopingAssetsMember 2022-01-01 2022-12-31 0000844551 wds:SenegalMember srt:AfricaMember ifrs-full:ExplorationAndEvaluationAssetsMember 2022-01-01 2022-12-31 0000844551 wds:RepublicOfKoreaMember srt:AsiaMember ifrs-full:ExplorationAndEvaluationAssetsMember 2022-01-01 2022-12-31 0000844551 wds:BarbadosMember wds:CaribbeanMember ifrs-full:ExplorationAndEvaluationAssetsMember 2022-01-01 2022-12-31 0000844551 ifrs-full:BottomOfRangeMember country:AU wds:ProducingAndDevelopingAssetsMember wds:NorthWestShelfMember 2022-01-01 2022-12-31 0000844551 ifrs-full:TopOfRangeMember country:AU wds:ProducingAndDevelopingAssetsMember wds:NorthWestShelfMember 2022-01-01 2022-12-31 0000844551 wds:GreaterEnfieldAndVincentMember wds:ProducingAndDevelopingAssetsMember country:AU 2022-01-01 2022-12-31 0000844551 wds:ProducingAndDevelopingAssetsMember wds:BalnavesMember country:AU 2022-01-01 2022-12-31 0000844551 wds:WheatstoneMember wds:ProducingAndDevelopingAssetsMember country:AU ifrs-full:BottomOfRangeMember 2022-01-01 2022-12-31 0000844551 wds:WheatstoneMember wds:ProducingAndDevelopingAssetsMember country:AU ifrs-full:TopOfRangeMember 2022-01-01 2022-12-31 0000844551 ifrs-full:BottomOfRangeMember country:AU wds:ProducingAndDevelopingAssetsMember wds:PyreneesMember 2022-01-01 2022-12-31 0000844551 ifrs-full:TopOfRangeMember country:AU wds:ProducingAndDevelopingAssetsMember wds:PyreneesMember 2022-01-01 2022-12-31 0000844551 ifrs-full:BottomOfRangeMember country:AU wds:ProducingAndDevelopingAssetsMember wds:GriffinMember 2022-01-01 2022-12-31 0000844551 ifrs-full:TopOfRangeMember country:AU wds:ProducingAndDevelopingAssetsMember wds:GriffinMember 2022-01-01 2022-12-31 0000844551 country:AU wds:ProducingAndDevelopingAssetsMember wds:MinervaMember 2022-01-01 2022-12-31 0000844551 ifrs-full:BottomOfRangeMember wds:InternationalMember wds:GreaterAngosturaMember wds:ProducingAndDevelopingAssetsMember 2022-01-01 2022-12-31 0000844551 ifrs-full:TopOfRangeMember wds:InternationalMember wds:GreaterAngosturaMember wds:ProducingAndDevelopingAssetsMember 2022-01-01 2022-12-31 0000844551 wds:BrowseBasinMember wds:OceaniaMember ifrs-full:ExplorationAndEvaluationAssetsMember 2022-01-01 2022-12-31 0000844551 wds:CarnarvonBasinMember ifrs-full:ExplorationAndEvaluationAssetsMember wds:OceaniaMember ifrs-full:BottomOfRangeMember 2022-01-01 2022-12-31 0000844551 wds:CarnarvonBasinMember ifrs-full:ExplorationAndEvaluationAssetsMember wds:OceaniaMember ifrs-full:TopOfRangeMember 2022-01-01 2022-12-31 0000844551 ifrs-full:ExplorationAndEvaluationAssetsMember wds:OceaniaMember wds:BonaparteBasinMember ifrs-full:BottomOfRangeMember 2022-01-01 2022-12-31 0000844551 ifrs-full:ExplorationAndEvaluationAssetsMember wds:OceaniaMember wds:BonaparteBasinMember ifrs-full:TopOfRangeMember 2022-01-01 2022-12-31 0000844551 srt:AfricaMember wds:CongoMember ifrs-full:ExplorationAndEvaluationAssetsMember 2022-01-01 2022-12-31 0000844551 srt:AfricaMember ifrs-full:ExplorationAndEvaluationAssetsMember wds:EgyptMember ifrs-full:BottomOfRangeMember 2022-01-01 2022-12-31 0000844551 srt:AfricaMember ifrs-full:ExplorationAndEvaluationAssetsMember wds:EgyptMember ifrs-full:TopOfRangeMember 2022-01-01 2022-12-31 0000844551 wds:UsGulfOfMexicoMember ifrs-full:ExplorationAndEvaluationAssetsMember srt:AmericasMember ifrs-full:BottomOfRangeMember 2022-01-01 2022-12-31 0000844551 wds:UsGulfOfMexicoMember ifrs-full:ExplorationAndEvaluationAssetsMember srt:AmericasMember ifrs-full:TopOfRangeMember 2022-01-01 2022-12-31 0000844551 wds:KitimatMember ifrs-full:ExplorationAndEvaluationAssetsMember srt:AmericasMember 2022-01-01 2022-12-31 0000844551 srt:AsiaMember ifrs-full:ExplorationAndEvaluationAssetsMember wds:MyanmarMember ifrs-full:BottomOfRangeMember 2022-01-01 2022-12-31 0000844551 srt:AsiaMember ifrs-full:ExplorationAndEvaluationAssetsMember wds:MyanmarMember ifrs-full:TopOfRangeMember 2022-01-01 2022-12-31 0000844551 wds:CaribbeanMember ifrs-full:ExplorationAndEvaluationAssetsMember wds:TrinidadAndTobagoMember ifrs-full:BottomOfRangeMember 2022-01-01 2022-12-31 0000844551 wds:CaribbeanMember ifrs-full:ExplorationAndEvaluationAssetsMember wds:TrinidadAndTobagoMember ifrs-full:TopOfRangeMember 2022-01-01 2022-12-31 0000844551 wds:OtherJointOperationsMember wds:AngelMember 2022-01-01 2022-12-31 0000844551 wds:OtherJointOperationsMember wds:BonaparteBasinMember 2022-01-01 2022-12-31 0000844551 wds:ProducingAndDevelopingAssetsMember country:AU wds:BassStraitMember ifrs-full:BottomOfRangeMember 2022-01-01 2022-12-31 0000844551 wds:ProducingAndDevelopingAssetsMember country:AU wds:BassStraitMember ifrs-full:TopOfRangeMember 2022-01-01 2022-12-31 0000844551 wds:OtherMember ifrs-full:ExplorationAndEvaluationAssetsMember wds:CarryingAmountsMember 2022-01-01 2022-12-31 0000844551 srt:AmericasMember ifrs-full:ExplorationAndEvaluationAssetsMember wds:CarryingAmountsMember 2022-01-01 2022-12-31 0000844551 srt:AsiaPacificMember ifrs-full:ExplorationAndEvaluationAssetsMember wds:CarryingAmountsMember 2022-01-01 2022-12-31 0000844551 srt:AfricaMember ifrs-full:ExplorationAndEvaluationAssetsMember wds:CarryingAmountsMember 2022-01-01 2022-12-31 0000844551 srt:EuropeMember 2022-01-01 2022-12-31 0000844551 srt:AsiaPacificMember 2022-01-01 2022-12-31 0000844551 srt:AmericasMember 2022-01-01 2022-12-31 0000844551 wds:MajorCustomerOneMember 2022-01-01 2022-12-31 0000844551 wds:MajorCustomerTwoMember 2022-01-01 2022-12-31 0000844551 ifrs-full:OperatingSegmentsMember wds:AustraliaSegmentMember wds:LiquefiedNaturalGasMember 2022-01-01 2022-12-31 0000844551 ifrs-full:OperatingSegmentsMember wds:MarketingSegmentMember wds:LiquefiedNaturalGasMember 2022-01-01 2022-12-31 0000844551 ifrs-full:OperatingSegmentsMember wds:AustraliaSegmentMember wds:PipelineGasMember 2022-01-01 2022-12-31 0000844551 ifrs-full:OperatingSegmentsMember wds:InternationalSegmentMember wds:PipelineGasMember 2022-01-01 2022-12-31 0000844551 ifrs-full:OperatingSegmentsMember wds:LiquefiedNaturalGasMember 2022-01-01 2022-12-31 0000844551 ifrs-full:OperatingSegmentsMember wds:PipelineGasMember 2022-01-01 2022-12-31 0000844551 ifrs-full:OperatingSegmentsMember wds:AustraliaSegmentMember wds:CrudeOilAndCondensateMember 2022-01-01 2022-12-31 0000844551 ifrs-full:OperatingSegmentsMember wds:InternationalSegmentMember wds:CrudeOilAndCondensateMember 2022-01-01 2022-12-31 0000844551 ifrs-full:OperatingSegmentsMember wds:MarketingSegmentMember wds:CrudeOilAndCondensateMember 2022-01-01 2022-12-31 0000844551 ifrs-full:OperatingSegmentsMember wds:CrudeOilAndCondensateMember 2022-01-01 2022-12-31 0000844551 ifrs-full:OperatingSegmentsMember wds:InternationalSegmentMember srt:NaturalGasLiquidsReservesMember 2022-01-01 2022-12-31 0000844551 ifrs-full:OperatingSegmentsMember wds:AustraliaSegmentMember srt:NaturalGasLiquidsReservesMember 2022-01-01 2022-12-31 0000844551 ifrs-full:OperatingSegmentsMember wds:MarketingSegmentMember srt:NaturalGasLiquidsReservesMember 2022-01-01 2022-12-31 0000844551 ifrs-full:OperatingSegmentsMember srt:NaturalGasLiquidsReservesMember 2022-01-01 2022-12-31 0000844551 ifrs-full:OperatingSegmentsMember wds:AustraliaSegmentMember wds:RevenueFromSaleOfHydrocarbonsMember 2022-01-01 2022-12-31 0000844551 ifrs-full:OperatingSegmentsMember wds:InternationalSegmentMember wds:RevenueFromSaleOfHydrocarbonsMember 2022-01-01 2022-12-31 0000844551 ifrs-full:OperatingSegmentsMember wds:MarketingSegmentMember wds:RevenueFromSaleOfHydrocarbonsMember 2022-01-01 2022-12-31 0000844551 ifrs-full:OperatingSegmentsMember wds:RevenueFromSaleOfHydrocarbonsMember 2022-01-01 2022-12-31 0000844551 ifrs-full:OperatingSegmentsMember wds:AustraliaSegmentMember wds:ProcessingAndServicesRevenueMember 2022-01-01 2022-12-31 0000844551 ifrs-full:OperatingSegmentsMember wds:ProcessingAndServicesRevenueMember 2022-01-01 2022-12-31 0000844551 ifrs-full:OperatingSegmentsMember wds:ShippingAndOtherRevenueMember 2022-01-01 2022-12-31 0000844551 ifrs-full:OperatingSegmentsMember wds:AustraliaSegmentMember 2022-01-01 2022-12-31 0000844551 ifrs-full:OperatingSegmentsMember wds:InternationalSegmentMember 2022-01-01 2022-12-31 0000844551 ifrs-full:OperatingSegmentsMember wds:MarketingSegmentMember 2022-01-01 2022-12-31 0000844551 ifrs-full:OperatingSegmentsMember 2022-01-01 2022-12-31 0000844551 ifrs-full:OperatingSegmentsMember wds:MarketingSegmentMember wds:ShippingAndOtherRevenueMember 2022-01-01 2022-12-31 0000844551 ifrs-full:OperatingSegmentsMember wds:AustraliaSegmentMember wds:ExternalCustomersMember 2022-01-01 2022-12-31 0000844551 ifrs-full:OperatingSegmentsMember wds:InternationalSegmentMember wds:ExternalCustomersMember 2022-01-01 2022-12-31 0000844551 ifrs-full:OperatingSegmentsMember wds:MarketingSegmentMember wds:ExternalCustomersMember 2022-01-01 2022-12-31 0000844551 wds:CorporateOrOtherSegmentMember ifrs-full:OperatingSegmentsMember 2022-01-01 2022-12-31 0000844551 ifrs-full:LandAndBuildingsMember wds:AustraliaSegmentMember ifrs-full:OperatingSegmentsMember 2022-01-01 2022-12-31 0000844551 ifrs-full:LandAndBuildingsMember ifrs-full:OperatingSegmentsMember 2022-01-01 2022-12-31 0000844551 ifrs-full:ExplorationAndEvaluationAssetsMember wds:AustraliaSegmentMember ifrs-full:OperatingSegmentsMember 2022-01-01 2022-12-31 0000844551 ifrs-full:ExplorationAndEvaluationAssetsMember wds:InternationalSegmentMember ifrs-full:OperatingSegmentsMember 2022-01-01 2022-12-31 0000844551 ifrs-full:ExplorationAndEvaluationAssetsMember ifrs-full:OperatingSegmentsMember 2022-01-01 2022-12-31 0000844551 wds:AustraliaSegmentMember ifrs-full:OtherPropertyPlantAndEquipmentMember ifrs-full:OperatingSegmentsMember 2022-01-01 2022-12-31 0000844551 wds:InternationalSegmentMember ifrs-full:OtherPropertyPlantAndEquipmentMember ifrs-full:OperatingSegmentsMember 2022-01-01 2022-12-31 0000844551 ifrs-full:LandAndBuildingsMember wds:InternationalSegmentMember ifrs-full:OperatingSegmentsMember 2022-01-01 2022-12-31 0000844551 wds:CorporateOrOtherSegmentMember ifrs-full:OtherPropertyPlantAndEquipmentMember ifrs-full:OperatingSegmentsMember 2022-01-01 2022-12-31 0000844551 ifrs-full:OtherPropertyPlantAndEquipmentMember ifrs-full:OperatingSegmentsMember 2022-01-01 2022-12-31 0000844551 wds:OilAndGasPropertiesMember wds:AustraliaSegmentMember ifrs-full:OperatingSegmentsMember 2022-01-01 2022-12-31 0000844551 ifrs-full:OperatingSegmentsMember wds:InternationalSegmentMember wds:OilAndGasPropertiesMember 2022-01-01 2022-12-31 0000844551 wds:OilAndGasPropertiesMember ifrs-full:OperatingSegmentsMember 2022-01-01 2022-12-31 0000844551 wds:OilAndGasPropertiesMember wds:CorporateOrOtherSegmentMember ifrs-full:OperatingSegmentsMember 2022-01-01 2022-12-31 0000844551 ifrs-full:LandAndBuildingsMember ifrs-full:OilAndGasAssetsMember ifrs-full:GrossCarryingAmountMember 2022-01-01 2022-12-31 0000844551 wds:PlantAndEquipmentMember ifrs-full:OilAndGasAssetsMember ifrs-full:GrossCarryingAmountMember 2022-01-01 2022-12-31 0000844551 wds:ProjectsInDevelopmentMember ifrs-full:OilAndGasAssetsMember ifrs-full:GrossCarryingAmountMember 2022-01-01 2022-12-31 0000844551 ifrs-full:OilAndGasAssetsMember ifrs-full:GrossCarryingAmountMember 2022-01-01 2022-12-31 0000844551 wds:TransferredExplorationAndEvaluationMember ifrs-full:OilAndGasAssetsMember ifrs-full:GrossCarryingAmountMember 2022-01-01 2022-12-31 0000844551 ifrs-full:BuildingsMember ifrs-full:BottomOfRangeMember 2022-01-01 2022-12-31 0000844551 ifrs-full:BuildingsMember ifrs-full:TopOfRangeMember 2022-01-01 2022-12-31 0000844551 ifrs-full:OtherPropertyPlantAndEquipmentMember ifrs-full:BottomOfRangeMember 2022-01-01 2022-12-31 0000844551 ifrs-full:OtherPropertyPlantAndEquipmentMember ifrs-full:TopOfRangeMember 2022-01-01 2022-12-31 0000844551 ifrs-full:LandAndBuildingsMember 2022-01-01 2022-12-31 0000844551 wds:PlantAndEquipmentMember 2022-01-01 2022-12-31 0000844551 wds:LeaseCommitmentsMember 2022-01-01 2022-12-31 0000844551 ifrs-full:FairValueHedgesMember 2022-01-01 2022-12-31 0000844551 wds:TrancheThreeMember wds:SyndicatedFacilityMember 2022-01-01 2022-12-31 0000844551 wds:TrancheTwoMember wds:SyndicatedFacilityMember 2022-01-01 2022-12-31 0000844551 wds:SyndicatedFacilityMember wds:TrancheOneMember 2022-01-01 2022-12-31 0000844551 wds:LaterThanTwoThousandTwentyFiveMember 2022-01-01 2022-12-31 0000844551 ifrs-full:OnerousContractsProvisionMember 2022-01-01 2022-12-31 0000844551 ifrs-full:ProvisionForDecommissioningRestorationAndRehabilitationCostsMember 2022-01-01 2022-12-31 0000844551 ifrs-full:ProvisionForDecommissioningRestorationAndRehabilitationCostsMember ifrs-full:DiscountRateMeasurementInputMember 2022-01-01 2022-12-31 0000844551 ifrs-full:LaterThanTenYearsMember 2022-01-01 2022-12-31 0000844551 wds:IncomeTaxMember 2022-01-01 2022-12-31 0000844551 wds:TemporaryDifferenceAraisesDueToDerivativesMember 2022-01-01 2022-12-31 0000844551 ifrs-full:OtherTemporaryDifferencesMember 2022-01-01 2022-12-31 0000844551 country:AU wds:IncomeTaxMember 2022-01-01 2022-12-31 0000844551 wds:GlobalMember wds:IncomeTaxMember 2022-01-01 2022-12-31 0000844551 ifrs-full:CashFlowHedgesMember wds:HhCorpusChristiCommoditySwapsMember ifrs-full:TopOfRangeMember 2022-01-01 2022-12-31 0000844551 ifrs-full:CashFlowHedgesMember wds:HhCorpusChristiCommoditySwapsMember ifrs-full:BottomOfRangeMember 2022-01-01 2022-12-31 0000844551 ifrs-full:CashFlowHedgesMember wds:TtfCorpusChristiCommoditySwapsMember ifrs-full:TopOfRangeMember 2022-01-01 2022-12-31 0000844551 ifrs-full:CashFlowHedgesMember wds:TtfCorpusChristiCommoditySwapsMember ifrs-full:BottomOfRangeMember 2022-01-01 2022-12-31 0000844551 wds:FxForwardsMember ifrs-full:CashFlowHedgesMember ifrs-full:TopOfRangeMember 2022-01-01 2022-12-31 0000844551 wds:FxForwardsMember ifrs-full:CashFlowHedgesMember ifrs-full:BottomOfRangeMember 2022-01-01 2022-12-31 0000844551 ifrs-full:InterestRateSwapContractMember ifrs-full:CashFlowHedgesMember 2022-01-01 2022-12-31 0000844551 wds:CrossCurrencyInterestRateSwapMember wds:CashFlowAndFairValueHedgesMember 2022-01-01 2022-12-31 0000844551 wds:OilSwapsMember ifrs-full:CashFlowHedgesMember 2022-01-01 2022-12-31 0000844551 ifrs-full:LandAndBuildingsMember wds:OilAndGasPropertiesMember 2022-01-01 2022-12-31 0000844551 wds:TransferredExplorationAndEvaluationMember wds:OilAndGasPropertiesMember 2022-01-01 2022-12-31 0000844551 wds:PlantAndEquipmentMember wds:OilAndGasPropertiesMember 2022-01-01 2022-12-31 0000844551 wds:OilAndGasPropertiesMember 2022-01-01 2022-12-31 0000844551 wds:TwoThousandTwentyTwoMember 2022-01-01 2022-12-31 0000844551 wds:TwoThousandTwentyThreeMember 2022-01-01 2022-12-31 0000844551 wds:TwoThousandTwentyFourMember 2022-01-01 2022-12-31 0000844551 ifrs-full:InterestRateSwapContractMember wds:SyndicatedFacilityMember ifrs-full:CashFlowHedgesMember 2022-01-01 2022-12-31 0000844551 wds:TwoThousandAndTwentyThreeMember 2022-01-01 2022-12-31 0000844551 wds:TwoThousandAndTwentyFourMember 2022-01-01 2022-12-31 0000844551 wds:TwoThousandAndTwentyFiveMember 2022-01-01 2022-12-31 0000844551 wds:TwoThousandAndTwentySixMember 2022-01-01 2022-12-31 0000844551 wds:TwoThousandAndTwentySevenMember 2022-01-01 2022-12-31 0000844551 wds:TwoThousandAndTwentyEightMember 2022-01-01 2022-12-31 0000844551 wds:TwoThousandAndTwentyTwoRealTermsMember wds:TwoThousandAndTwentyFiveMember 2022-01-01 2022-12-31 0000844551 wds:TwoThousandAndTwentyRealTermsMember wds:TwoThousandAndTwentyFourMember 2022-01-01 2022-12-31 0000844551 wds:AustraliaSegmentMember ifrs-full:OperatingSegmentsMember wds:InventoryMovementMember 2022-01-01 2022-12-31 0000844551 wds:InternationalSegmentMember ifrs-full:OperatingSegmentsMember wds:InventoryMovementMember 2022-01-01 2022-12-31 0000844551 ifrs-full:OperatingSegmentsMember wds:InventoryMovementMember 2022-01-01 2022-12-31 0000844551 wds:AustraliaSegmentMember ifrs-full:OperatingSegmentsMember wds:CostsOfProductionMember 2022-01-01 2022-12-31 0000844551 wds:CorporateOrOtherSegmentMember ifrs-full:OperatingSegmentsMember wds:CostsOfProductionMember 2022-01-01 2022-12-31 0000844551 ifrs-full:OperatingSegmentsMember wds:CostsOfProductionMember 2022-01-01 2022-12-31 0000844551 ifrs-full:OperatingSegmentsMember wds:AustraliaSegmentMember wds:ProductionCostsMember 2022-01-01 2022-12-31 0000844551 ifrs-full:OperatingSegmentsMember wds:InternationalSegmentMember wds:ProductionCostsMember 2022-01-01 2022-12-31 0000844551 ifrs-full:OperatingSegmentsMember wds:CorporateOrOtherSegmentMember wds:ProductionCostsMember 2022-01-01 2022-12-31 0000844551 ifrs-full:OperatingSegmentsMember wds:ProductionCostsMember 2022-01-01 2022-12-31 0000844551 wds:InternationalSegmentMember ifrs-full:OperatingSegmentsMember wds:CostsOfProductionMember 2022-01-01 2022-12-31 0000844551 ifrs-full:OperatingSegmentsMember wds:AustraliaSegmentMember wds:RoyaltiesExciseAndLeviesMember 2022-01-01 2022-12-31 0000844551 ifrs-full:OperatingSegmentsMember wds:InternationalSegmentMember wds:RoyaltiesExciseAndLeviesMember 2022-01-01 2022-12-31 0000844551 ifrs-full:OperatingSegmentsMember wds:CorporateOrOtherSegmentMember wds:RoyaltiesExciseAndLeviesMember 2022-01-01 2022-12-31 0000844551 ifrs-full:OperatingSegmentsMember wds:RoyaltiesExciseAndLeviesMember 2022-01-01 2022-12-31 0000844551 wds:AustraliaSegmentMember ifrs-full:OperatingSegmentsMember wds:ShippingAndDirectSalesCostsMember 2022-01-01 2022-12-31 0000844551 wds:InternationalSegmentMember ifrs-full:OperatingSegmentsMember wds:ShippingAndDirectSalesCostsMember 2022-01-01 2022-12-31 0000844551 wds:MarketingSegmentMember ifrs-full:OperatingSegmentsMember wds:ShippingAndDirectSalesCostsMember 2022-01-01 2022-12-31 0000844551 wds:CorporateOrOtherSegmentMember ifrs-full:OperatingSegmentsMember wds:ShippingAndDirectSalesCostsMember 2022-01-01 2022-12-31 0000844551 ifrs-full:OperatingSegmentsMember wds:ShippingAndDirectSalesCostsMember 2022-01-01 2022-12-31 0000844551 wds:AustraliaSegmentMember ifrs-full:OperatingSegmentsMember wds:TradingCostsMember 2022-01-01 2022-12-31 0000844551 wds:MarketingSegmentMember ifrs-full:OperatingSegmentsMember wds:TradingCostsMember 2022-01-01 2022-12-31 0000844551 ifrs-full:OperatingSegmentsMember wds:TradingCostsMember 2022-01-01 2022-12-31 0000844551 wds:AustraliaSegmentMember ifrs-full:OperatingSegmentsMember wds:OtherHydrocarbonCostsMember 2022-01-01 2022-12-31 0000844551 ifrs-full:OperatingSegmentsMember wds:OtherHydrocarbonCostsMember 2022-01-01 2022-12-31 0000844551 wds:AustraliaSegmentMember ifrs-full:OperatingSegmentsMember wds:OtherCostOfSalesMember 2022-01-01 2022-12-31 0000844551 wds:MarketingSegmentMember ifrs-full:OperatingSegmentsMember wds:MovementInOnerousContractProvisionMember 2022-01-01 2022-12-31 0000844551 ifrs-full:OperatingSegmentsMember wds:MovementInOnerousContractProvisionMember 2022-01-01 2022-12-31 0000844551 wds:AustraliaSegmentMember ifrs-full:OperatingSegmentsMember wds:TotalOtherCostOfSalesMember 2022-01-01 2022-12-31 0000844551 wds:InternationalSegmentMember ifrs-full:OperatingSegmentsMember wds:TotalOtherCostOfSalesMember 2022-01-01 2022-12-31 0000844551 wds:MarketingSegmentMember ifrs-full:OperatingSegmentsMember wds:TotalOtherCostOfSalesMember 2022-01-01 2022-12-31 0000844551 wds:CorporateOrOtherSegmentMember ifrs-full:OperatingSegmentsMember wds:TotalOtherCostOfSalesMember 2022-01-01 2022-12-31 0000844551 ifrs-full:OperatingSegmentsMember wds:OtherCostOfSalesMember 2022-01-01 2022-12-31 0000844551 ifrs-full:OperatingSegmentsMember wds:TotalOtherCostOfSalesMember 2022-01-01 2022-12-31 0000844551 ifrs-full:CashFlowHedgesMember wds:TtfCommoditySwapsMember 2022-01-01 2022-12-31 0000844551 wds:FxForwardsMember ifrs-full:CashFlowHedgesMember 2022-01-01 2022-12-31 0000844551 wds:TtfCorpusChristiCommoditySwapsMember ifrs-full:CashFlowHedgesMember 2022-01-01 2022-12-31 0000844551 wds:HhCorpusChristiCommoditySwapsMember ifrs-full:CashFlowHedgesMember 2022-01-01 2022-12-31 0000844551 wds:CorporatesOrOthers2022Member 2022-01-01 2022-12-31 0000844551 wds:TitleTransferFacilityPriceMember wds:TwoThousandTwentyThreeMember 2022-01-01 2022-12-31 0000844551 wds:TitleTransferFacilityPriceMember wds:TwoThousandTwentyTwoMember 2022-01-01 2022-12-31 0000844551 wds:TitleTransferFacilityPriceMember wds:TwoThousandTwentyFourMember 2022-01-01 2022-12-31 0000844551 wds:TitleTransferFacilityPriceMember wds:TwoThousandTwentyFiveMember 2022-01-01 2022-12-31 0000844551 wds:BrentSalePriceMember wds:TwoThousandTwentyTwoMember 2022-01-01 2022-12-31 0000844551 wds:TitleTransferFacilityPriceMember wds:TwoThousandTwentySixMember 2022-01-01 2022-12-31 0000844551 wds:BrentSalePriceMember wds:TwoThousandTwentyThreeMember 2022-01-01 2022-12-31 0000844551 wds:BrentSalePriceMember wds:TwoThousandTwentyFourMember 2022-01-01 2022-12-31 0000844551 wds:BrentSalePriceMember wds:TwoThousandTwentySixMember 2022-01-01 2022-12-31 0000844551 wds:BrentSalePriceMember wds:TwoThousandTwentyFiveMember 2022-01-01 2022-12-31 0000844551 wds:HenryHubPriceMember wds:TwoThousandTwentyTwoMember 2022-01-01 2022-12-31 0000844551 wds:HenryHubPriceMember wds:TwoThousandTwentyThreeMember 2022-01-01 2022-12-31 0000844551 wds:HenryHubPriceMember wds:TwoThousandTwentyFourMember 2022-01-01 2022-12-31 0000844551 wds:HenryHubPriceMember wds:TwoThousandTwentyFiveMember 2022-01-01 2022-12-31 0000844551 wds:TwoThousandTwentySixMember wds:HenryHubPriceMember 2022-01-01 2022-12-31 0000844551 wds:TemporaryDifferenceAraisesDueToProductionAndGrowthAssetsMember wds:PetroleumResourceRentTaxMember 2022-01-01 2022-12-31 0000844551 wds:TemporaryDifferenceAraisesDueToAugmentationForCurrentYearMember wds:PetroleumResourceRentTaxMember 2022-01-01 2022-12-31 0000844551 wds:TemporaryDifferenceAraisesDueToProvisionsMember wds:PetroleumResourceRentTaxMember 2022-01-01 2022-12-31 0000844551 ifrs-full:OtherTemporaryDifferencesMember wds:PetroleumResourceRentTaxMember 2022-01-01 2022-12-31 0000844551 wds:TemporaryDifferenceAraisesDueToOilAndGasPropertiesMember wds:IncomeTaxMember 2022-01-01 2022-12-31 0000844551 wds:TemporaryDifferenceAraisesDueToExplorationAndEvaluationAssetsMember wds:IncomeTaxMember 2022-01-01 2022-12-31 0000844551 wds:TemporaryDifferenceAraisesDueToLeaseAssetsAndLiabilitiesMember wds:IncomeTaxMember 2022-01-01 2022-12-31 0000844551 wds:TemporaryDifferenceAraisesDueToProvisionsMember wds:IncomeTaxMember 2022-01-01 2022-12-31 0000844551 wds:TemporaryDifferenceAraisesDueToPetroleumResourceRentTaxAssetsAndLiabilitiesMember wds:IncomeTaxMember 2022-01-01 2022-12-31 0000844551 wds:TemporaryDifferenceAraisesDueToUnusedTaxLossesAndTaxCreditsMember wds:IncomeTaxMember 2022-01-01 2022-12-31 0000844551 wds:TemporaryDifferenceAraisesDueToAssetsheldForSaleMember wds:IncomeTaxMember 2022-01-01 2022-12-31 0000844551 wds:TemporaryDifferenceAraisesDueToDerivativesMember wds:IncomeTaxMember 2022-01-01 2022-12-31 0000844551 ifrs-full:OtherTemporaryDifferencesMember wds:IncomeTaxMember 2022-01-01 2022-12-31 0000844551 wds:EmployeesBenefitsProvisionsMember 2022-01-01 2022-12-31 0000844551 ifrs-full:MiscellaneousOtherProvisionsMember 2022-01-01 2022-12-31 0000844551 ifrs-full:CreditRiskMember wds:DebtorMember 2022-01-01 2022-12-31 0000844551 ifrs-full:CreditRiskMember wds:OtherFinancialAssetsMember 2022-01-01 2022-12-31 0000844551 ifrs-full:CreditRiskMember ifrs-full:TradeReceivablesMember ifrs-full:TopOfRangeMember 2022-01-01 2022-12-31 0000844551 ifrs-full:CreditRiskMember ifrs-full:BottomOfRangeMember ifrs-full:TradeReceivablesMember 2022-01-01 2022-12-31 0000844551 ifrs-full:TradeReceivablesMember ifrs-full:CreditRiskMember 2022-01-01 2022-12-31 0000844551 ifrs-full:CreditRiskMember ifrs-full:TradeReceivablesMember wds:SubsequentPeriodMember 2022-01-01 2022-12-31 0000844551 wds:WoodsideEnergyBassStraitPtyLtdMember 2022-01-01 2022-12-31 0000844551 wds:WoodsideEnergyVictoriaPtyLtdMember 2022-01-01 2022-12-31 0000844551 wds:WoodsideEnergyHoldingsLlcMember 2022-01-01 2022-12-31 0000844551 wds:WoodsideEnergyTrinidad2cltdMember 2022-01-01 2022-12-31 0000844551 wds:WoodsideEnergyCanadaCorporationMember 2022-01-01 2022-12-31 0000844551 wds:WoodsideEnergyLtdMember 2022-01-01 2022-12-31 0000844551 wds:WoodsideBrowsePtyLtdMember 2022-01-01 2022-12-31 0000844551 wds:WoodsideBurrupPtyLtdMember 2022-01-01 2022-12-31 0000844551 wds:BurrupFacilitiesCompanyPtyLtdMember 2022-01-01 2022-12-31 0000844551 wds:BurrupTrain1PtyLtdMember 2022-01-01 2022-12-31 0000844551 wds:PlutoLngPtyLtdMember 2022-01-01 2022-12-31 0000844551 wds:WoodsideBurrupTrain2APtyLtdMember 2022-01-01 2022-12-31 0000844551 wds:WoodsideBurrupTrain2BPtyLtdMember 2022-01-01 2022-12-31 0000844551 wds:WoodsideEnergyLngFuelsAndPowerPtyLtdMember 2022-01-01 2022-12-31 0000844551 wds:WoodsideEnergyDomesticGasPtyLtdMember 2022-01-01 2022-12-31 0000844551 wds:WoodsideEnergyAlgeriaPtyLtdMember 2022-01-01 2022-12-31 0000844551 wds:WoodsideEnergyAustraliaAsiaHoldingsPteLtdMember 2022-01-01 2022-12-31 0000844551 wds:WoodsideEnergyHoldingsInternationalPtyLtdMember 2022-01-01 2022-12-31 0000844551 wds:WoodsideEnergyCanadaPtpLimitedMember 2022-01-01 2022-12-31 0000844551 wds:KMLNGOperatingGeneralPartnershipMember 2022-01-01 2022-12-31 0000844551 wds:KMLNGOperatingLtdMember 2022-01-01 2022-12-31 0000844551 wds:WoodsideEnergyHoldingsPtyLtdMember 2022-01-01 2022-12-31 0000844551 wds:WoodsideEnergyHoldingsUsaIncMember 2022-01-01 2022-12-31 0000844551 wds:WoodsideEnergyUsaIncMember 2022-01-01 2022-12-31 0000844551 wds:GryphonExplorationCompanyMember 2022-01-01 2022-12-31 0000844551 wds:PtWoodsideEnergyIndonesiaMember 2022-01-01 2022-12-31 0000844551 wds:WoodsideEnergyCameroonSarlMember 2022-01-01 2022-12-31 0000844551 wds:WoodsideEnergyGabonPtyLtdMember 2022-01-01 2022-12-31 0000844551 wds:WoodsideEnergyIndonesiaPtyLtdMember 2022-01-01 2022-12-31 0000844551 wds:WoodsideEnergyIndonesiaIiPtyLtdMember 2022-01-01 2022-12-31 0000844551 wds:WoodsideEnergyMalaysiaPtyLtdMember 2022-01-01 2022-12-31 0000844551 wds:WoodsideEnergyIrelandPtyLtdMember 2022-01-01 2022-12-31 0000844551 wds:WoodsideEnergyKoreaPteLtdMember 2022-01-01 2022-12-31 0000844551 wds:WoodsideEnergyKoreaIiPteLtdMember 2022-01-01 2022-12-31 0000844551 wds:WoodsideEnergyMoroccoPtyLtdMember 2022-01-01 2022-12-31 0000844551 wds:WoodsideEnergyNewZealandLimitedMember 2022-01-01 2022-12-31 0000844551 wds:WoodsideEnergyNewZealand55794LimitedMember 2022-01-01 2022-12-31 0000844551 wds:WoodsideEnergyPeruPtyLtdMember 2022-01-01 2022-12-31 0000844551 wds:WoodsideEnergySenegalPtyLtdMember 2022-01-01 2022-12-31 0000844551 wds:WoodsideEnergyTanzaniaLimitedMember 2022-01-01 2022-12-31 0000844551 wds:WoodsideEnergyHoldingsIiPtyLtdMember 2022-01-01 2022-12-31 0000844551 wds:WoodsidePowerPtyLtdMember 2022-01-01 2022-12-31 0000844551 wds:WoodsidePowerGenerationPtyLtdMember 2022-01-01 2022-12-31 0000844551 wds:WoodsideEnergyHoldingsSouthAmericaPtyLtdMember 2022-01-01 2022-12-31 0000844551 wds:WoodsideEnergiaBrasilApoioAdministrativoLtdaMember 2022-01-01 2022-12-31 0000844551 wds:WoodsideEnergyHoldingsUkPtyLtdMember 2022-01-01 2022-12-31 0000844551 wds:WoodsideEnergyUkLimitedMember 2022-01-01 2022-12-31 0000844551 wds:WoodsideEnergyFinanceUkLimitedMember 2022-01-01 2022-12-31 0000844551 wds:WoodsideEnergyCongoLimitedMember 2022-01-01 2022-12-31 0000844551 wds:WoodsideEnergyBulgariaLimitedMember 2022-01-01 2022-12-31 0000844551 wds:WoodsideEnergyHoldingsSenegalLimitedMember 2022-01-01 2022-12-31 0000844551 wds:WoodsideEnergySenegalB.v.Member 2022-01-01 2022-12-31 0000844551 wds:WoodsideEnergyFranceSasMember 2022-01-01 2022-12-31 0000844551 wds:WoodsideEnergyIberiaS.a.Member 2022-01-01 2022-12-31 0000844551 wds:WoodsideEnergyN.a.LtdMember 2022-01-01 2022-12-31 0000844551 wds:WoodsideEnergyServicesQingdaoCoLtdMember 2022-01-01 2022-12-31 0000844551 wds:WoodsideEnergyJulimarPtyLtdMember 2022-01-01 2022-12-31 0000844551 wds:WoodsideEnergyNorwayPtyLtdMember 2022-01-01 2022-12-31 0000844551 wds:WoodsideEnergyTechnologiesPtyLtdMember 2022-01-01 2022-12-31 0000844551 wds:WoodsideTechnologySolutionsPtyLtdMember 2022-01-01 2022-12-31 0000844551 wds:WoodsideEnergyScarboroughPtyLtdMember 2022-01-01 2022-12-31 0000844551 wds:WoodsideEnergyCarbonHoldingsPtyLtdMember 2022-01-01 2022-12-31 0000844551 wds:WoodsideEnergyCarbonAssetsPtyLtdMember 2022-01-01 2022-12-31 0000844551 wds:WoodsideEnergyCarbonServicesPtyLtdMember 2022-01-01 2022-12-31 0000844551 wds:WoodsideEnergyFinancialAdvisoryServicesPtyLtdMember 2022-01-01 2022-12-31 0000844551 wds:WoodsideEnergyTradingSingaporePteLtdMember 2022-01-01 2022-12-31 0000844551 wds:WelcapInsurancePteLtdMember 2022-01-01 2022-12-31 0000844551 wds:WoodsideEnergyShippingSingaporePteLtdMember 2022-01-01 2022-12-31 0000844551 wds:MetasourcePtyLtdMember 2022-01-01 2022-12-31 0000844551 wds:MermaidSoundPortAndMarineServicesPtyLtdMember 2022-01-01 2022-12-31 0000844551 wds:WoodsideFinanceLimitedMember 2022-01-01 2022-12-31 0000844551 wds:WoodsidePetroleumTimorSea19PtyLtdMember 2022-01-01 2022-12-31 0000844551 wds:WoodsidePetroleumTimorSea20PtyLtdMember 2022-01-01 2022-12-31 0000844551 wds:WoodsidePetroleumHoldingsPtyLtdMember 2022-01-01 2022-12-31 0000844551 wds:WoodsideEnergyGlobalHoldingsPtyLtdMember 2022-01-01 2022-12-31 0000844551 wds:WoodsideEnergyGlobalPtyLtdMember 2022-01-01 2022-12-31 0000844551 wds:PerdidoMexicoPipelineHoldingsS.a.DeC.v.Member 2022-01-01 2022-12-31 0000844551 wds:PerdidoMexicoPipelineS.DeR.l.DeC.v.Member 2022-01-01 2022-12-31 0000844551 wds:WoodsideEnergyInvestmentsPtyLtdMember 2022-01-01 2022-12-31 0000844551 wds:WoodsideEnergiaBrasilInvestimentosLtda.Member 2022-01-01 2022-12-31 0000844551 wds:WoodsideEnergiaBrasilExploraoEProduoLtda.Member 2022-01-01 2022-12-31 0000844551 wds:WoodsideEnergyGreatBritainLimitedMember 2022-01-01 2022-12-31 0000844551 wds:WoodsideEnergyNorthWestShelfPtyLtdMember 2022-01-01 2022-12-31 0000844551 wds:WoodsideEnergyTrinidadHoldingsLtdMember 2022-01-01 2022-12-31 0000844551 wds:WoodsideEnergyTrinidad3aLtdMember 2022-01-01 2022-12-31 0000844551 wds:WoodsideEnergyUsaOperationsIncMember 2022-01-01 2022-12-31 0000844551 wds:HamiltonBrothersPetroleumCorporationMember 2022-01-01 2022-12-31 0000844551 wds:HamiltonOilCompanyLlcMember 2022-01-01 2022-12-31 0000844551 wds:WoodsideEnergyBolivianaInc.Member 2022-01-01 2022-12-31 0000844551 wds:WoodsideEnergyNorthAmericaLlcMember 2022-01-01 2022-12-31 0000844551 wds:WoodsideEnergyAmericasInc.Member 2022-01-01 2022-12-31 0000844551 wds:WoodsideEnergyGomInc.Member 2022-01-01 2022-12-31 0000844551 wds:WoodsideEnergyHawaiiInc.Member 2022-01-01 2022-12-31 0000844551 wds:WoodsideEnergyResourcesInc.Member 2022-01-01 2022-12-31 0000844551 wds:WoodsideEnergyHoldingsResourcesInc.Member 2022-01-01 2022-12-31 0000844551 wds:WoodsideEnergyUsaServicesInc.Member 2022-01-01 2022-12-31 0000844551 wds:WoodsideEnergyMarketingInc.Member 2022-01-01 2022-12-31 0000844551 wds:WoodsideEnergyDeepwaterInc.Member 2022-01-01 2022-12-31 0000844551 wds:WoodsideEnergyForeignExplorationHoldingsLlcMember 2022-01-01 2022-12-31 0000844551 wds:OodsideEnergyTrinidadBlock3LimitedMember 2022-01-01 2022-12-31 0000844551 wds:WoodsideEnergyTrinidadBlock6LimitedMember 2022-01-01 2022-12-31 0000844551 wds:WoodsideEnergyTrinidadBlock5LimitedMember 2022-01-01 2022-12-31 0000844551 wds:WoodsideEnergyTrinidadBlock7LimitedMember 2022-01-01 2022-12-31 0000844551 wds:WoodsideEnergyTrinidadBlock14LimitedMember 2022-01-01 2022-12-31 0000844551 wds:WoodsideEnergyTrinidadBlock23aLimitedMember 2022-01-01 2022-12-31 0000844551 wds:WoodsideEnergyTrinidadBlock23bLimitedMember 2022-01-01 2022-12-31 0000844551 wds:WoodsideEnergyTrinidadBlock28LimitedMember 2022-01-01 2022-12-31 0000844551 wds:WoodsideEnergyTrinidadBlock29LimitedMember 2022-01-01 2022-12-31 0000844551 wds:WoodsideEnergyBimshireLimitedMember 2022-01-01 2022-12-31 0000844551 wds:WoodsideEnergySouthAfrica3b4bLimitedMember 2022-01-01 2022-12-31 0000844551 wds:WoodsideEnergyEgyptLimitedMember 2022-01-01 2022-12-31 0000844551 wds:WoodsideEnergyCarlisleBayLimitedMember 2022-01-01 2022-12-31 0000844551 wds:WoodsideEnergyMexicoLimitedMember 2022-01-01 2022-12-31 0000844551 wds:WoodsideEnergaServiciosAdministrativosS.DeR.l.DeC.v.Member 2022-01-01 2022-12-31 0000844551 wds:WoodsideEnergaServiciosDeMxicoS.DeR.l.DeC.v.Member 2022-01-01 2022-12-31 0000844551 wds:WoodsideEnergyMexicoHoldingsLlcMember 2022-01-01 2022-12-31 0000844551 wds:OperacionesConjuntasS.DeR.l.DeC.v.Member 2022-01-01 2022-12-31 0000844551 wds:WoodsideEnergaHoldingsDeMxicoS.DeR.l.DeC.v.Member 2022-01-01 2022-12-31 0000844551 wds:WoodsidePetrleoOperacionesDeMxicoS.DeR.l.DeC.v.Member 2022-01-01 2022-12-31 0000844551 wds:WoodsideEnergyAustraliaPtyLtdMember 2022-01-01 2022-12-31 0000844551 wds:WoodsideEnergyInternationalExplorationPtyLtdMember 2022-01-01 2022-12-31 0000844551 wds:OilSwapsMember 2022-01-01 2022-12-31 0000844551 wds:DirectorsMember 2022-01-01 2022-12-31 0000844551 wds:WdsinternationalSegmentMember wds:OtherMember 2021-12-31 0000844551 country:AU 2021-12-31 0000844551 wds:InternationalMember 2021-12-31 0000844551 ifrs-full:ExplorationAndEvaluationAssetsMember 2021-12-31 0000844551 wds:InternationalMember ifrs-full:ExplorationAndEvaluationAssetsMember 2021-12-31 0000844551 country:AU ifrs-full:ExplorationAndEvaluationAssetsMember 2021-12-31 0000844551 wds:CapitalisedAfterOneYearMember ifrs-full:ExplorationAndEvaluationAssetsMember 2021-12-31 0000844551 wds:CapitalisedWithinOneYearMember ifrs-full:ExplorationAndEvaluationAssetsMember 2021-12-31 0000844551 ifrs-full:CurrencyRiskMember 2021-12-31 0000844551 ifrs-full:ContingentLiabilityForGuaranteesMember 2021-12-31 0000844551 ifrs-full:OtherContingentLiabilitiesMember 2021-12-31 0000844551 wds:EmployeePlansMember wds:WoodsideEquityPlanMember 2021-12-31 0000844551 wds:ExecutivePlansMember wds:ShortTermAwardsMember 2021-12-31 0000844551 wds:ExecutivePlansMember wds:LongTermAwardsMember 2021-12-31 0000844551 wds:AustraliaSegmentMember 2021-12-31 0000844551 wds:MarketingSegmentsMember 2021-12-31 0000844551 wds:InternationalSegmentsMember 2021-12-31 0000844551 wds:CorporateAndOtherSegmentsMember 2021-12-31 0000844551 wds:TwoThousandTwentyDividendReinvestmentPlanMember ifrs-full:OrdinarySharesMember 2021-12-31 0000844551 wds:TwoThousandTwentyOneDividendReinvestmentPlanMember ifrs-full:OrdinarySharesMember 2021-12-31 0000844551 ifrs-full:SubsidiariesWithMaterialNoncontrollingInterestsMember wds:BurrupFacilitiesCompanyPtyLtdMember 2021-12-31 0000844551 ifrs-full:SubsidiariesWithMaterialNoncontrollingInterestsMember wds:BurrupTrain1PtyLtdMember 2021-12-31 0000844551 wds:BilateralFacilitiesMember 2021-12-31 0000844551 wds:SyndicateFacilitiesMember 2021-12-31 0000844551 wds:JBICFacilityMember 2021-12-31 0000844551 wds:UsBondsMember 2021-12-31 0000844551 wds:MediumTermNotesMember 2021-12-31 0000844551 srt:AsiaPacificMember country:AU 2021-12-31 0000844551 ifrs-full:ConsolidatedMember srt:AsiaPacificMember 2021-12-31 0000844551 srt:AfricaMember wds:InternationalMember 2021-12-31 0000844551 country:AU 2021-12-31 0000844551 wds:InternationalMember 2021-12-31 0000844551 srt:AfricaMember ifrs-full:ConsolidatedMember 2021-12-31 0000844551 ifrs-full:ConsolidatedMember 2021-12-31 0000844551 wds:PlantAndEquipmentMember wds:CorporatesOrOthersMember 2021-12-31 0000844551 ifrs-full:ConsolidatedMember wds:PlantAndEquipmentMember 2021-12-31 0000844551 wds:ProjectsInDevelopmentMember country:AU 2021-12-31 0000844551 wds:ProjectsInDevelopmentMember wds:InternationalMember 2021-12-31 0000844551 wds:ProjectsInDevelopmentMember wds:CorporatesOrOthersMember 2021-12-31 0000844551 wds:ProjectsInDevelopmentMember ifrs-full:ConsolidatedMember 2021-12-31 0000844551 wds:CorporatesOrOthersMember 2021-12-31 0000844551 wds:PlantAndEquipmentMember wds:InternationalMember 2021-12-31 0000844551 ifrs-full:LandAndBuildingsMember country:AU 2021-12-31 0000844551 ifrs-full:LandAndBuildingsMember wds:CorporatesOrOthersMember 2021-12-31 0000844551 ifrs-full:LandAndBuildingsMember ifrs-full:ConsolidatedMember 2021-12-31 0000844551 wds:TransferredExplorationAndEvaluationMember country:AU 2021-12-31 0000844551 wds:TransferredExplorationAndEvaluationMember ifrs-full:ConsolidatedMember 2021-12-31 0000844551 wds:PlantAndEquipmentMember country:AU 2021-12-31 0000844551 wds:MarketingMember 2021-12-31 0000844551 ifrs-full:LandAndBuildingsMember wds:InternationalMember 2021-12-31 0000844551 ifrs-full:LandAndBuildingsMember wds:MarketingMember 2021-12-31 0000844551 srt:AsiaPacificMember 2021-12-31 0000844551 srt:AmericasMember 2021-12-31 0000844551 srt:AfricaMember 2021-12-31 0000844551 wds:CorporatesOrOthers2022Member 2021-12-31 0000844551 ifrs-full:LandAndBuildingsMember 2021-12-31 0000844551 wds:PlantAndEquipmentMember 2021-12-31 0000844551 ifrs-full:NotLaterThanOneYearMember 2021-12-31 0000844551 ifrs-full:LaterThanTwoYearsAndNotLaterThanThreeYearsMember 2021-12-31 0000844551 ifrs-full:LaterThanOneYearAndNotLaterThanTwoYearsMember 2021-12-31 0000844551 ifrs-full:LaterThanThreeYearsAndNotLaterThanFourYearsMember 2021-12-31 0000844551 ifrs-full:LaterThanFourYearsAndNotLaterThanFiveYearsMember 2021-12-31 0000844551 ifrs-full:LaterThanFiveYearsMember 2021-12-31 0000844551 ifrs-full:LaterThanOneYearAndNotLaterThanFiveYearsMember 2021-12-31 0000844551 wds:ForeignExchangeRiskMember 2021-12-31 0000844551 wds:UnsecuredBondsMember 2021-12-31 0000844551 wds:PlutoTrain2JointVentureMember 2021-12-31 0000844551 wds:OilSwapsMember ifrs-full:CashFlowHedgesMember 2021-12-31 0000844551 wds:HhCorpusChristiCommoditySwapsMember ifrs-full:CashFlowHedgesMember 2021-12-31 0000844551 wds:TtfCorpusChristiCommoditySwapsMember ifrs-full:CashFlowHedgesMember 2021-12-31 0000844551 ifrs-full:CashFlowHedgesMember wds:TtfCommoditySwapsMember 2021-12-31 0000844551 wds:CashFlowAndFairValueHedgesMember wds:CrossCurrencyInterestRateSwapMember 2021-12-31 0000844551 ifrs-full:InterestRateSwapContractMember ifrs-full:CashFlowHedgesMember 2021-12-31 0000844551 wds:FxForwardsMember ifrs-full:CashFlowHedgesMember 2021-12-31 0000844551 wds:UnusedTaxLossesAndCreditsMember wds:UsaTaxConsolidationGroupMember 2021-12-31 0000844551 wds:UnusedTaxLossesAndCreditsMember wds:OtherThanAustraliaAndTheUSAMember 2021-12-31 0000844551 wds:TemporaryDifferenceWheatstoneMember 2021-12-31 0000844551 wds:TemporaryDifferencePlutoQuarantinedExplorationExpenditureMember 2021-12-31 0000844551 wds:TemporaryDifferenceNorthWestShelfProjectMember 2021-12-31 0000844551 wds:NorthWestShelfMember wds:ProducingMember 2021-12-31 0000844551 wds:PlutoScarboroughMember wds:ProducingAndDevelopmentMember 2021-12-31 0000844551 wds:LondonInterbankOfferedRateLiborMember ifrs-full:SignificantInterestRateBenchmarksSubjectToInterestRateBenchmarkReformMember 2021-12-31 0000844551 wds:OilAndGasPropertiesMember wds:FxMeasurementInputMember 2021-12-31 0000844551 wds:OilAndGasPropertiesMember wds:BrentPriceMeasurementInputMember 2021-12-31 0000844551 wds:OilAndGasPropertiesMember ifrs-full:DiscountRateMeasurementInputMember 2021-12-31 0000844551 ifrs-full:TopOfRangeMember 2021-12-31 0000844551 ifrs-full:BottomOfRangeMember 2021-12-31 0000844551 ifrs-full:BottomOfRangeMember ifrs-full:ProvisionForDecommissioningRestorationAndRehabilitationCostsMember ifrs-full:DiscountRateMeasurementInputMember 2021-12-31 0000844551 ifrs-full:TopOfRangeMember ifrs-full:ProvisionForDecommissioningRestorationAndRehabilitationCostsMember ifrs-full:DiscountRateMeasurementInputMember 2021-12-31 0000844551 wds:TemporaryDifferenceAraisesDueToProductionAndGrowthAssetsMember wds:PetroleumResourceRentTaxMember 2021-12-31 0000844551 wds:TemporaryDifferenceAraisesDueToAugmentationForCurrentYearMember wds:PetroleumResourceRentTaxMember 2021-12-31 0000844551 wds:TemporaryDifferenceAraisesDueToProvisionsMember wds:PetroleumResourceRentTaxMember 2021-12-31 0000844551 ifrs-full:OtherTemporaryDifferencesMember wds:PetroleumResourceRentTaxMember 2021-12-31 0000844551 wds:PetroleumResourceRentTaxMember 2021-12-31 0000844551 wds:IncomeTaxMember 2021-12-31 0000844551 wds:TemporaryDifferenceAraisesDueToOilAndGasPropertiesMember wds:IncomeTaxMember 2021-12-31 0000844551 wds:TemporaryDifferenceAraisesDueToExplorationAndEvaluationAssetsMember wds:IncomeTaxMember 2021-12-31 0000844551 wds:TemporaryDifferenceAraisesDueToLeaseAssetsAndLiabilitiesMember wds:IncomeTaxMember 2021-12-31 0000844551 wds:TemporaryDifferenceAraisesDueToProvisionsMember wds:IncomeTaxMember 2021-12-31 0000844551 wds:TemporaryDifferenceAraisesDueToDerivativesMember wds:IncomeTaxMember 2021-12-31 0000844551 ifrs-full:OtherTemporaryDifferencesMember wds:IncomeTaxMember 2021-12-31 0000844551 wds:TemporaryDifferenceAraisesDueToIncomeTaxMember wds:IncomeTaxMember 2021-12-31 0000844551 wds:TemporaryDifferenceAraisesDueToPetroleumResourceRentTaxAssetsAndLiabilitiesMember wds:IncomeTaxMember 2021-12-31 0000844551 wds:TemporaryDifferenceAraisesDueToAssetsheldForSaleMember wds:IncomeTaxMember 2021-12-31 0000844551 ifrs-full:ProvisionForDecommissioningRestorationAndRehabilitationCostsMember 2021-12-31 0000844551 wds:EmployeesBenefitsProvisionsMember 2021-12-31 0000844551 ifrs-full:MiscellaneousOtherProvisionsMember 2021-12-31 0000844551 ifrs-full:OnerousContractsProvisionMember 2021-12-31 0000844551 wds:InterestRateBenchmarkRatesNotExposedToCashFlowHedgeMember ifrs-full:InterestRateRiskMember 2021-12-31 0000844551 ifrs-full:CurrencySwapContractMember wds:InterestRateBenchmarkRatesNotExposedToCashFlowHedgeMember 2021-12-31 0000844551 ifrs-full:CommodityPriceRiskMember 2021-12-31 0000844551 ifrs-full:CurrencyRiskMember country:AU 2021-12-31 0000844551 ifrs-full:CreditRiskMember ifrs-full:TradeReceivablesMember 2021-12-31 0000844551 currency:USD ifrs-full:CurrencyRiskMember 2021-12-31 0000844551 wds:OthersMember ifrs-full:CurrencyRiskMember 2021-12-31 0000844551 currency:AUD ifrs-full:CurrencyRiskMember 2021-12-31 0000844551 wds:OtherMember ifrs-full:ExplorationAndEvaluationAssetsMember 2021-12-31 0000844551 srt:AsiaPacificMember ifrs-full:ExplorationAndEvaluationAssetsMember 2021-12-31 0000844551 srt:AmericasMember ifrs-full:ExplorationAndEvaluationAssetsMember 2021-12-31 0000844551 srt:AfricaMember ifrs-full:ExplorationAndEvaluationAssetsMember 2021-12-31 0000844551 wds:UsaTaxConsolidationGroupMember wds:UnusedTaxLossesAndCreditsMember 2022-12-31 0000844551 wds:OutsideOfTheUSATCGMember wds:UnusedTaxLossesAndCreditsMember 2022-12-31 0000844551 wds:OtherThanAustraliaAndTheUSAMember wds:UnusedTaxLossesAndCreditsMember 2022-12-31 0000844551 wds:WdsinternationalSegmentMember wds:OtherMember 2022-12-31 0000844551 wds:ShenziMember wds:OilAndGsPropertiesMember ifrs-full:GoodwillMember 2022-12-31 0000844551 wds:AtlantisMember wds:OilAndGsPropertiesMember ifrs-full:GoodwillMember 2022-12-31 0000844551 wds:RelatingToSettledHedgesMember 2022-12-31 0000844551 wds:WdsplutoScarboroughMember wds:WdsaustraliaSegmentMember 2022-12-31 0000844551 wds:NwsGasMember wds:WdsaustraliaSegmentMember 2022-12-31 0000844551 wds:WdsShenziMember wds:WdsinternationalSegmentMember 2022-12-31 0000844551 wds:WdsAtlantisMember wds:WdsinternationalSegmentMember 2022-12-31 0000844551 wds:OtherMember wds:WdsinternationalSegmentMember 2022-12-31 0000844551 country:AU 2022-12-31 0000844551 wds:InternationalMember 2022-12-31 0000844551 ifrs-full:ExplorationAndEvaluationAssetsMember 2022-12-31 0000844551 ifrs-full:ExplorationAndEvaluationAssetsMember wds:InternationalMember 2022-12-31 0000844551 country:AU ifrs-full:ExplorationAndEvaluationAssetsMember 2022-12-31 0000844551 wds:CapitalisedAfterOneYearMember ifrs-full:ExplorationAndEvaluationAssetsMember 2022-12-31 0000844551 wds:CapitalisedWithinOneYearMember ifrs-full:ExplorationAndEvaluationAssetsMember 2022-12-31 0000844551 wds:BhpPetroleumInternationalPtyLtdMember 2022-12-31 0000844551 ifrs-full:CurrencyRiskMember 2022-12-31 0000844551 ifrs-full:ContingentLiabilityForGuaranteesMember 2022-12-31 0000844551 ifrs-full:OtherContingentLiabilitiesMember 2022-12-31 0000844551 wds:EmployeePlansMember wds:WoodsideEquityPlanMember 2022-12-31 0000844551 wds:EmployeePlansMember wds:SupplementaryWoodsideEquityPlanMember 2022-12-31 0000844551 wds:ExecutivePlansMember wds:ShortTermAwardsMember 2022-12-31 0000844551 wds:ExecutivePlansMember wds:LongTermAwardsMember 2022-12-31 0000844551 ifrs-full:AssociatesMember 2022-12-31 0000844551 wds:AustraliaSegmentMember 2022-12-31 0000844551 wds:InternationalSegmentsMember 2022-12-31 0000844551 wds:MarketingSegmentsMember 2022-12-31 0000844551 wds:CorporateAndOtherSegmentsMember 2022-12-31 0000844551 wds:TwoThousandTwentyOneDividendReinvestmentPlanMember ifrs-full:OrdinarySharesMember 2022-12-31 0000844551 ifrs-full:OrdinarySharesMember wds:BhpPetroleumInternationalPtyLtdMember 2022-12-31 0000844551 wds:CapricornSenegalLimitedMember 2022-12-31 0000844551 wds:FARSenegalRSSDSAMember 2022-12-31 0000844551 ifrs-full:SubsidiariesWithMaterialNoncontrollingInterestsMember wds:BurrupFacilitiesCompanyPtyLtdMember 2022-12-31 0000844551 ifrs-full:SubsidiariesWithMaterialNoncontrollingInterestsMember wds:BurrupTrain1PtyLtdMember 2022-12-31 0000844551 wds:BilateralFacilitiesMember 2022-12-31 0000844551 wds:SyndicateFacilitiesMember 2022-12-31 0000844551 wds:JBICFacilityMember 2022-12-31 0000844551 wds:UsBondsMember 2022-12-31 0000844551 wds:MediumTermNotesMember 2022-12-31 0000844551 wds:TrancheOneMember wds:BilateralFacilitiesMember 2022-12-31 0000844551 wds:TrancheTwoMember wds:BilateralFacilitiesMember 2022-12-31 0000844551 wds:TrancheThreeMember wds:BilateralFacilitiesMember 2022-12-31 0000844551 wds:TrancheFourMember wds:BilateralFacilitiesMember 2022-12-31 0000844551 wds:MediumTermNotesMember ifrs-full:GrossCarryingAmountMember wds:MaturingOnEleventhOfDecemberTwoThousandAndTwentyThreeMember 2022-12-31 0000844551 wds:UsBondsMember ifrs-full:GrossCarryingAmountMember wds:FifthOfMarchTwoThousandAndTwoThousandAndTwentyFiveMember 2022-12-31 0000844551 wds:MediumTermNotesMember ifrs-full:GrossCarryingAmountMember wds:MaturingOnTwentyNineOfJanuaryTwoThousandAndTwentySevenMember 2022-12-31 0000844551 wds:UsBondsMember ifrs-full:GrossCarryingAmountMember wds:FifteenthOfSeptemberTwoThousandAndTwentySixMember 2022-12-31 0000844551 wds:UsBondsMember ifrs-full:GrossCarryingAmountMember wds:FifteenthOfMarchTwoThousandAndTwentyEightMember 2022-12-31 0000844551 wds:UsBondsMember ifrs-full:GrossCarryingAmountMember wds:FourthOfMarchTwoThouandAndTwentyNineMember 2022-12-31 0000844551 wds:UsBondsMember wds:FourthOfMarchTwoThouandAndTwentyNineMember 2022-12-31 0000844551 wds:UsBondsMember wds:FifteenthOfMarchTwoThousandAndTwentyEightMember 2022-12-31 0000844551 wds:UsBondsMember wds:FifteenthOfSeptemberTwoThousandAndTwentySixMember 2022-12-31 0000844551 wds:MediumTermNotesMember wds:MaturingOnTwentyNineOfJanuaryTwoThousandAndTwentySevenMember 2022-12-31 0000844551 wds:UsBondsMember wds:FifthOfMarchTwoThousandAndTwoThousandAndTwentyFiveMember 2022-12-31 0000844551 wds:MediumTermNotesMember wds:MaturingOnEleventhOfDecemberTwoThousandAndTwentyThreeMember 2022-12-31 0000844551 ifrs-full:ConsolidatedMember 2022-12-31 0000844551 wds:InternationalMember 2022-12-31 0000844551 country:AU 2022-12-31 0000844551 srt:AfricaMember ifrs-full:ConsolidatedMember 2022-12-31 0000844551 srt:AmericasMember wds:InternationalMember 2022-12-31 0000844551 srt:AfricaMember wds:InternationalMember 2022-12-31 0000844551 srt:AmericasMember ifrs-full:ConsolidatedMember 2022-12-31 0000844551 srt:AsiaPacificMember ifrs-full:ConsolidatedMember 2022-12-31 0000844551 srt:AsiaPacificMember country:AU 2022-12-31 0000844551 wds:CorporatesOrOthersMember 2022-12-31 0000844551 wds:ProjectsInDevelopmentMember ifrs-full:ConsolidatedMember 2022-12-31 0000844551 wds:ProjectsInDevelopmentMember wds:CorporatesOrOthersMember 2022-12-31 0000844551 wds:ProjectsInDevelopmentMember wds:InternationalMember 2022-12-31 0000844551 wds:ProjectsInDevelopmentMember country:AU 2022-12-31 0000844551 ifrs-full:LandAndBuildingsMember ifrs-full:ConsolidatedMember 2022-12-31 0000844551 wds:PlantAndEquipmentMember ifrs-full:ConsolidatedMember 2022-12-31 0000844551 wds:PlantAndEquipmentMember wds:CorporatesOrOthersMember 2022-12-31 0000844551 wds:PlantAndEquipmentMember wds:InternationalMember 2022-12-31 0000844551 wds:PlantAndEquipmentMember country:AU 2022-12-31 0000844551 wds:TransferredExplorationAndEvaluationMember ifrs-full:ConsolidatedMember 2022-12-31 0000844551 wds:TransferredExplorationAndEvaluationMember country:AU 2022-12-31 0000844551 ifrs-full:LandAndBuildingsMember wds:CorporatesOrOthersMember 2022-12-31 0000844551 ifrs-full:LandAndBuildingsMember wds:InternationalMember 2022-12-31 0000844551 ifrs-full:LandAndBuildingsMember country:AU 2022-12-31 0000844551 srt:AsiaPacificMember 2022-12-31 0000844551 srt:AfricaMember 2022-12-31 0000844551 srt:AmericasMember 2022-12-31 0000844551 wds:CorporatesOrOthers2022Member 2022-12-31 0000844551 ifrs-full:LandAndBuildingsMember 2022-12-31 0000844551 wds:PlantAndEquipmentMember 2022-12-31 0000844551 ifrs-full:NotLaterThanOneYearMember 2022-12-31 0000844551 ifrs-full:LaterThanOneYearAndNotLaterThanTwoYearsMember 2022-12-31 0000844551 ifrs-full:LaterThanTwoYearsAndNotLaterThanThreeYearsMember 2022-12-31 0000844551 ifrs-full:LaterThanFourYearsAndNotLaterThanFiveYearsMember 2022-12-31 0000844551 ifrs-full:LaterThanFiveYearsMember 2022-12-31 0000844551 ifrs-full:LaterThanThreeYearsAndNotLaterThanFourYearsMember 2022-12-31 0000844551 ifrs-full:LaterThanOneYearAndNotLaterThanFiveYearsMember 2022-12-31 0000844551 wds:ForeignExchangeRiskMember 2022-12-31 0000844551 wds:UnsecuredBondsMember 2022-12-31 0000844551 wds:BorrowingsMember wds:SyndicatedFacilityMember 2022-12-31 0000844551 wds:TrancheOneMember wds:SyndicatedFacilityMember 2022-12-31 0000844551 wds:TrancheTwoMember wds:SyndicatedFacilityMember 2022-12-31 0000844551 wds:TrancheThreeMember wds:SyndicatedFacilityMember 2022-12-31 0000844551 wds:LaterThanTwoThousandTwentyFiveMember 2022-12-31 0000844551 ifrs-full:DiscountRateMeasurementInputMember ifrs-full:ProvisionForDecommissioningRestorationAndRehabilitationCostsMember 2022-12-31 0000844551 wds:OilSwapsMember ifrs-full:CashFlowHedgesMember 2022-12-31 0000844551 wds:TtfCorpusChristiCommoditySwapsMember ifrs-full:CashFlowHedgesMember 2022-12-31 0000844551 ifrs-full:CashFlowHedgesMember wds:TtfCommoditySwapsMember 2022-12-31 0000844551 wds:HhCorpusChristiCommoditySwapsMember ifrs-full:CashFlowHedgesMember 2022-12-31 0000844551 ifrs-full:InterestRateSwapContractMember ifrs-full:CashFlowHedgesMember 2022-12-31 0000844551 wds:CashFlowAndFairValueHedgesMember wds:CrossCurrencyInterestRateSwapMember 2022-12-31 0000844551 wds:FxForwardsMember ifrs-full:CashFlowHedgesMember 2022-12-31 0000844551 wds:TemporaryDifferenceWheatstoneMember 2022-12-31 0000844551 wds:TemporaryDifferencePlutoQuarantinedExplorationExpenditureMember 2022-12-31 0000844551 wds:TemporaryDifferenceNorthWestShelfProjectMember 2022-12-31 0000844551 wds:WdsaustraliaSegmentMember wds:OilAndGasPropertiesMember 2022-12-31 0000844551 wds:LondonInterbankOfferedRateLiborMember ifrs-full:SignificantInterestRateBenchmarksSubjectToInterestRateBenchmarkReformMember 2022-12-31 0000844551 ifrs-full:InterestRateSwapContractMember wds:SyndicatedFacilityMember ifrs-full:CashFlowHedgesMember 2022-12-31 0000844551 ifrs-full:CurrencySwapContractMember wds:CashFlowAndFairValueHedgesMember 2022-12-31 0000844551 wds:OilSwapsMember 2022-12-31 0000844551 ifrs-full:BottomOfRangeMember 2022-12-31 0000844551 ifrs-full:TopOfRangeMember 2022-12-31 0000844551 wds:OilAndGsPropertiesMember wds:ValuationOfRecoverableAmountOfCashGeneratingUnitMember ifrs-full:DiscountRateMeasurementInputMember 2022-12-31 0000844551 wds:OilAndGsPropertiesMember wds:ValuationOfRecoverableAmountOfCashGeneratingUnitMember wds:BrentPriceMeasurementInputMember 2022-12-31 0000844551 wds:OilAndGsPropertiesMember wds:ValuationOfRecoverableAmountOfCashGeneratingUnitMember wds:FxMeasurementInputMember 2022-12-31 0000844551 wds:OilAndGsPropertiesMember wds:ValuationOfRecoverableAmountOfCashGeneratingUnitMember wds:VolumeOfProductionOfBrentOilMember 2022-12-31 0000844551 ifrs-full:ProvisionForDecommissioningRestorationAndRehabilitationCostsMember ifrs-full:BottomOfRangeMember ifrs-full:DiscountRateMeasurementInputMember 2022-12-31 0000844551 ifrs-full:TopOfRangeMember ifrs-full:ProvisionForDecommissioningRestorationAndRehabilitationCostsMember ifrs-full:DiscountRateMeasurementInputMember 2022-12-31 0000844551 wds:TemporaryDifferenceAraisesDueToProductionAndGrowthAssetsMember wds:PetroleumResourceRentTaxMember 2022-12-31 0000844551 wds:TemporaryDifferenceAraisesDueToAugmentationForCurrentYearMember wds:PetroleumResourceRentTaxMember 2022-12-31 0000844551 wds:TemporaryDifferenceAraisesDueToProvisionsMember wds:PetroleumResourceRentTaxMember 2022-12-31 0000844551 ifrs-full:OtherTemporaryDifferencesMember wds:PetroleumResourceRentTaxMember 2022-12-31 0000844551 wds:PetroleumResourceRentTaxMember 2022-12-31 0000844551 wds:TemporaryDifferenceAraisesDueToOilAndGasPropertiesMember wds:IncomeTaxMember 2022-12-31 0000844551 wds:TemporaryDifferenceAraisesDueToExplorationAndEvaluationAssetsMember wds:IncomeTaxMember 2022-12-31 0000844551 wds:TemporaryDifferenceAraisesDueToLeaseAssetsAndLiabilitiesMember wds:IncomeTaxMember 2022-12-31 0000844551 wds:TemporaryDifferenceAraisesDueToUnusedTaxLossesAndTaxCreditsMember wds:IncomeTaxMember 2022-12-31 0000844551 wds:TemporaryDifferenceAraisesDueToDerivativesMember wds:IncomeTaxMember 2022-12-31 0000844551 wds:IncomeTaxMember wds:TemporaryDifferenceAraisesDueToProvisionsMember 2022-12-31 0000844551 ifrs-full:OtherTemporaryDifferencesMember wds:IncomeTaxMember 2022-12-31 0000844551 wds:TemporaryDifferenceAraisesDueToIncomeTaxMember wds:IncomeTaxMember 2022-12-31 0000844551 wds:IncomeTaxMember 2022-12-31 0000844551 wds:TemporaryDifferenceAraisesDueToPetroleumResourceRentTaxAssetsAndLiabilitiesMember wds:IncomeTaxMember 2022-12-31 0000844551 ifrs-full:ProvisionForDecommissioningRestorationAndRehabilitationCostsMember 2022-12-31 0000844551 wds:EmployeesBenefitsProvisionsMember 2022-12-31 0000844551 ifrs-full:OnerousContractsProvisionMember 2022-12-31 0000844551 ifrs-full:MiscellaneousOtherProvisionsMember 2022-12-31 0000844551 wds:InterestRateBenchmarkRatesNotExposedToCashFlowHedgeMember ifrs-full:InterestRateRiskMember 2022-12-31 0000844551 ifrs-full:CurrencySwapContractMember wds:InterestRateBenchmarkRatesNotExposedToCashFlowHedgeMember 2022-12-31 0000844551 ifrs-full:CommodityPriceRiskMember 2022-12-31 0000844551 ifrs-full:CurrencyRiskMember country:AU 2022-12-31 0000844551 ifrs-full:CreditRiskMember ifrs-full:TradeReceivablesMember 2022-12-31 0000844551 currency:USD ifrs-full:CurrencyRiskMember 2022-12-31 0000844551 currency:AUD ifrs-full:CurrencyRiskMember 2022-12-31 0000844551 wds:OthersMember ifrs-full:CurrencyRiskMember 2022-12-31 0000844551 srt:AmericasMember ifrs-full:ExplorationAndEvaluationAssetsMember 2022-12-31 0000844551 srt:AfricaMember ifrs-full:ExplorationAndEvaluationAssetsMember 2022-12-31 0000844551 wds:OtherMember ifrs-full:ExplorationAndEvaluationAssetsMember 2022-12-31 0000844551 srt:AsiaPacificMember ifrs-full:ExplorationAndEvaluationAssetsMember 2022-12-31 0000844551 wds:PlutoTrain2JointVentureMember 2022-12-31 0000844551 wds:TwoThousandAndTwentyThreeMember 2020-06-30 2020-06-30 0000844551 wds:TwoThousandAndTwentyFourMember 2020-06-30 2020-06-30 0000844551 wds:TwoThousandAndTwentyFiveMember 2020-06-30 2020-06-30 0000844551 wds:TwoThousandAndTwentySixMember 2020-06-30 2020-06-30 0000844551 wds:TwoThousandAndTwentySevenMember 2020-06-30 2020-06-30 0000844551 wds:TwoThousandAndTwentyTwoMember 2020-06-30 2020-06-30 0000844551 wds:TwoThousandAndTwentyRealTermsMember wds:TwoThousandAndTwentyFiveMember 2020-06-30 2020-06-30 0000844551 wds:BhpPetroleumInternationalPtyLtdMember 2022-05-19 0000844551 wds:BhpPetroleumInternationalPtyLtdMember 2022-06-01 0000844551 wds:BhpPetroleumInternationalPtyLtdMember 2022-06-01 2022-12-31 0000844551 wds:FarSenegalRssdSaRssdEvaluationAreaMember 2021-07-07 0000844551 wds:FarSenegalRssdSaSangomarExploitationAreaMember 2021-07-07 0000844551 wds:FARSenegalRSSDSAMember wds:RSSDJointVentureMember 2021-07-07 0000844551 wds:CapricornSenegalLimitedSangomarExploitationAreaMember 2020-12-22 0000844551 wds:CapricornSenegalLimitedRssdEvaluationAreaMember 2020-12-22 0000844551 wds:CapricornSenegalLimitedMember 2020-12-22 0000844551 wds:PlutoTrain2JointVentureMember 2021-11-15 2021-11-15 0000844551 wds:PlutoTrain2JointVentureMember 2021-11-15 0000844551 wds:GlobalInfrastructurePartnersMember wds:PlutoTrain2JointVentureMember 2021-11-15 0000844551 wds:PlutoTrain2JointVentureMember 2022-01-18 2022-01-18 0000844551 wds:PlutoTrain2JointVentureMember wds:GlobalInfrastructurePartnersMember 2022-01-18 2022-01-18 0000844551 wds:NewSyndicatedFacilityMember 2020-01-17 0000844551 ifrs-full:LoanCommitmentsMember wds:JBICFacilityMember wds:TrancheOneMember 2008-06-24 2008-06-24 0000844551 wds:JBICFacilityMember 2008-06-24 2008-06-24 0000844551 ifrs-full:LoanCommitmentsMember wds:JBICFacilityMember wds:TrancheOneMember 2008-06-24 0000844551 ifrs-full:LoanCommitmentsMember wds:TrancheTwoMember wds:JBICFacilityMember 2008-06-24 0000844551 wds:JBICFacilityMember 2008-06-24 0000844551 ifrs-full:LoanCommitmentsMember wds:JBICFacilityMember wds:TrancheTwoMember 2013-01-01 2013-12-31 0000844551 wds:GlobalMediumTermNotesMember 2015-08-28 0000844551 wds:UsBondsMember 2015-08-28 2015-08-28 0000844551 wds:YuchoTwoThousandTwentyTwoMedianTermNoteMember wds:UsBondsMember 2015-08-28 2015-08-28 0000844551 wds:JBICFacilityMember wds:UsBondsMember 2015-08-28 2015-08-28 0000844551 wds:GlobalMediumTermNotesMember 2015-08-28 2015-08-28 0000844551 country:AU 2020-12-31 0000844551 wds:InternationalMember 2020-12-31 0000844551 ifrs-full:ExplorationAndEvaluationAssetsMember 2020-12-31 0000844551 country:AU ifrs-full:ExplorationAndEvaluationAssetsMember 2020-12-31 0000844551 wds:CapitalisedAfterOneYearMember ifrs-full:ExplorationAndEvaluationAssetsMember 2020-12-31 0000844551 wds:CapitalisedWithinOneYearMember ifrs-full:ExplorationAndEvaluationAssetsMember 2020-12-31 0000844551 wds:TwoThousandAndNineteenDividendReinvestmentPlanMember ifrs-full:OrdinarySharesMember 2020-12-31 0000844551 wds:TwoThousandTwentyDividendReinvestmentPlanMember ifrs-full:OrdinarySharesMember 2020-12-31 0000844551 wds:TwoThousandSeventeenWoodsideEquityPlanMember ifrs-full:OrdinarySharesMember 2020-12-31 0000844551 ifrs-full:SubsidiariesWithMaterialNoncontrollingInterestsMember wds:BurrupFacilitiesCompanyPtyLtdMember 2020-12-31 0000844551 ifrs-full:SubsidiariesWithMaterialNoncontrollingInterestsMember wds:BurrupTrain1PtyLtdMember 2020-12-31 0000844551 wds:SecuredLoanAgreementMember wds:PetrosenMember 2020-01-09 2020-01-09 0000844551 wds:SecuredLoanAgreementMember wds:PetrosenMember 2020-01-09 0000844551 wds:PaymentOfInterimDividendMember 2022-10-06 2022-10-06 0000844551 wds:BhpPetroleumInternationalPtyLtdMember 2022-06-01 2022-06-01 0000844551 wds:MergerwithBHPPMember wds:StybarrowAndScarboroughMember 2022-06-01 2022-06-01 0000844551 wds:CongoMember wds:FarmdownOfInterestMember 2022-06-01 2022-06-30 0000844551 wds:NewSyndicatedFacilityMember 2020-01-17 2020-01-17 0000844551 wds:SubsequentPeriodMember 2023-01-01 2023-12-31 0000844551 ifrs-full:ExplorationAndEvaluationAssetsMember 2019-12-31 0000844551 ifrs-full:RetainedEarningsMember 2019-12-31 0000844551 ifrs-full:IssuedCapitalMember 2019-12-31 0000844551 ifrs-full:ReserveOfSharebasedPaymentsMember 2019-12-31 0000844551 wds:EmployeeBenefitsReserveMember 2019-12-31 0000844551 ifrs-full:ReserveOfExchangeDifferencesOnTranslationMember 2019-12-31 0000844551 ifrs-full:ReserveOfCashFlowHedgesMember 2019-12-31 0000844551 ifrs-full:EquityAttributableToOwnersOfParentMember 2019-12-31 0000844551 ifrs-full:NoncontrollingInterestsMember 2019-12-31 0000844551 ifrs-full:OrdinarySharesMember 2019-12-31 0000844551 wds:EmployeeSharePlansMember 2019-12-31 0000844551 ifrs-full:OrdinarySharesMember 2020-12-31 0000844551 wds:EmployeeSharePlansMember 2020-12-31 0000844551 ifrs-full:EquityAttributableToOwnersOfParentMember 2020-12-31 0000844551 ifrs-full:NoncontrollingInterestsMember 2020-12-31 0000844551 ifrs-full:IssuedCapitalMember 2020-12-31 0000844551 ifrs-full:ReserveOfSharebasedPaymentsMember 2020-12-31 0000844551 wds:EmployeeBenefitsReserveMember 2020-12-31 0000844551 ifrs-full:ReserveOfExchangeDifferencesOnTranslationMember 2020-12-31 0000844551 ifrs-full:ReserveOfCashFlowHedgesMember 2020-12-31 0000844551 wds:DistributableProfitsReserveMember 2020-12-31 0000844551 ifrs-full:RetainedEarningsMember 2020-12-31 0000844551 wds:LongTermAwardsMember wds:ExecutivePlansMember 2020-12-31 0000844551 wds:ExecutivePlansMember wds:ShortTermAwardsMember 2020-12-31 0000844551 wds:EmployeePlansMember wds:WoodsideEquityPlanMember 2020-12-31 0000844551 wds:BilateralFacilitiesMember 2020-12-31 0000844551 wds:SyndicateFacilitiesMember 2020-12-31 0000844551 wds:JBICFacilityMember 2020-12-31 0000844551 wds:UsBondsMember 2020-12-31 0000844551 wds:MediumTermNotesMember 2020-12-31 0000844551 wds:CarryingAmountsMember wds:OtherMember ifrs-full:ExplorationAndEvaluationAssetsMember 2020-12-31 0000844551 srt:AsiaPacificMember ifrs-full:ExplorationAndEvaluationAssetsMember wds:CarryingAmountsMember 2020-12-31 0000844551 srt:AfricaMember ifrs-full:ExplorationAndEvaluationAssetsMember wds:CarryingAmountsMember 2020-12-31 0000844551 srt:AsiaPacificMember ifrs-full:ExplorationAndEvaluationAssetsMember wds:CarryingAmountsMember 2021-12-31 0000844551 srt:AfricaMember ifrs-full:ExplorationAndEvaluationAssetsMember wds:CarryingAmountsMember 2021-12-31 0000844551 wds:CarryingAmountsMember wds:OtherMember ifrs-full:ExplorationAndEvaluationAssetsMember 2021-12-31 0000844551 ifrs-full:LandAndBuildingsMember ifrs-full:OilAndGasAssetsMember ifrs-full:GrossCarryingAmountMember 2020-12-31 0000844551 wds:TransferredExplorationAndEvaluationMember ifrs-full:OilAndGasAssetsMember ifrs-full:GrossCarryingAmountMember 2020-12-31 0000844551 wds:PlantAndEquipmentMember ifrs-full:OilAndGasAssetsMember ifrs-full:GrossCarryingAmountMember 2020-12-31 0000844551 wds:ProjectsInDevelopmentMember ifrs-full:OilAndGasAssetsMember ifrs-full:GrossCarryingAmountMember 2020-12-31 0000844551 ifrs-full:OilAndGasAssetsMember ifrs-full:GrossCarryingAmountMember 2020-12-31 0000844551 ifrs-full:LandAndBuildingsMember ifrs-full:OilAndGasAssetsMember ifrs-full:GrossCarryingAmountMember 2021-12-31 0000844551 wds:TransferredExplorationAndEvaluationMember ifrs-full:OilAndGasAssetsMember ifrs-full:GrossCarryingAmountMember 2021-12-31 0000844551 wds:PlantAndEquipmentMember ifrs-full:OilAndGasAssetsMember ifrs-full:GrossCarryingAmountMember 2021-12-31 0000844551 wds:ProjectsInDevelopmentMember ifrs-full:OilAndGasAssetsMember ifrs-full:GrossCarryingAmountMember 2021-12-31 0000844551 ifrs-full:OilAndGasAssetsMember ifrs-full:GrossCarryingAmountMember 2021-12-31 0000844551 ifrs-full:LandAndBuildingsMember ifrs-full:OilAndGasAssetsMember wds:HistoricalCostMember 2021-12-31 0000844551 wds:TransferredExplorationAndEvaluationMember ifrs-full:OilAndGasAssetsMember wds:HistoricalCostMember 2021-12-31 0000844551 wds:PlantAndEquipmentMember ifrs-full:OilAndGasAssetsMember wds:HistoricalCostMember 2021-12-31 0000844551 wds:ProjectsInDevelopmentMember ifrs-full:OilAndGasAssetsMember wds:HistoricalCostMember 2021-12-31 0000844551 ifrs-full:OilAndGasAssetsMember wds:HistoricalCostMember 2021-12-31 0000844551 ifrs-full:LandAndBuildingsMember ifrs-full:OilAndGasAssetsMember ifrs-full:AccumulatedDepreciationAmortisationAndImpairmentMember 2021-12-31 0000844551 wds:TransferredExplorationAndEvaluationMember ifrs-full:OilAndGasAssetsMember ifrs-full:AccumulatedDepreciationAmortisationAndImpairmentMember 2021-12-31 0000844551 wds:PlantAndEquipmentMember ifrs-full:OilAndGasAssetsMember ifrs-full:AccumulatedDepreciationAmortisationAndImpairmentMember 2021-12-31 0000844551 wds:ProjectsInDevelopmentMember ifrs-full:OilAndGasAssetsMember ifrs-full:AccumulatedDepreciationAmortisationAndImpairmentMember 2021-12-31 0000844551 ifrs-full:OilAndGasAssetsMember ifrs-full:AccumulatedDepreciationAmortisationAndImpairmentMember 2021-12-31 0000844551 ifrs-full:LandAndBuildingsMember ifrs-full:OilAndGasAssetsMember 2021-12-31 0000844551 wds:TransferredExplorationAndEvaluationMember ifrs-full:OilAndGasAssetsMember 2021-12-31 0000844551 wds:PlantAndEquipmentMember ifrs-full:OilAndGasAssetsMember 2021-12-31 0000844551 wds:ProjectsInDevelopmentMember ifrs-full:OilAndGasAssetsMember 2021-12-31 0000844551 ifrs-full:OilAndGasAssetsMember 2021-12-31 0000844551 wds:PlantAndEquipmentMember 2020-12-31 0000844551 ifrs-full:LandAndBuildingsMember 2020-12-31 0000844551 ifrs-full:ProvisionForDecommissioningRestorationAndRehabilitationCostsMember 2020-12-31 0000844551 wds:EmployeesBenefitsProvisionsMember 2020-12-31 0000844551 ifrs-full:OnerousContractsProvisionMember 2020-12-31 0000844551 ifrs-full:MiscellaneousOtherProvisionsMember 2020-12-31 0000844551 ifrs-full:OrdinarySharesMember 2021-12-31 0000844551 wds:EmployeeSharePlansMember 2021-12-31 0000844551 ifrs-full:IssuedCapitalMember 2021-12-31 0000844551 ifrs-full:ReserveOfSharebasedPaymentsMember 2021-12-31 0000844551 wds:EmployeeBenefitsReserveMember 2021-12-31 0000844551 ifrs-full:ReserveOfExchangeDifferencesOnTranslationMember 2021-12-31 0000844551 wds:DistributableProfitsReserveMember 2021-12-31 0000844551 ifrs-full:RetainedEarningsMember 2021-12-31 0000844551 ifrs-full:EquityAttributableToOwnersOfParentMember 2021-12-31 0000844551 ifrs-full:NoncontrollingInterestsMember 2021-12-31 0000844551 ifrs-full:ReserveOfCashFlowHedgesMember 2021-12-31 0000844551 wds:EmployeePlansMember wds:SupplementaryWoodsideEquityPlanMember 2021-12-31 0000844551 wds:DividendReinvestmentPlanMember 2021-12-31 0000844551 srt:AsiaPacificMember ifrs-full:ExplorationAndEvaluationAssetsMember wds:CarryingAmountsMember 2022-12-31 0000844551 srt:AmericasMember ifrs-full:ExplorationAndEvaluationAssetsMember wds:CarryingAmountsMember 2022-12-31 0000844551 srt:AfricaMember ifrs-full:ExplorationAndEvaluationAssetsMember wds:CarryingAmountsMember 2022-12-31 0000844551 wds:OtherMember ifrs-full:ExplorationAndEvaluationAssetsMember wds:CarryingAmountsMember 2022-12-31 0000844551 ifrs-full:LandAndBuildingsMember ifrs-full:OilAndGasAssetsMember ifrs-full:GrossCarryingAmountMember 2022-12-31 0000844551 wds:TransferredExplorationAndEvaluationMember ifrs-full:OilAndGasAssetsMember ifrs-full:GrossCarryingAmountMember 2022-12-31 0000844551 wds:PlantAndEquipmentMember ifrs-full:OilAndGasAssetsMember ifrs-full:GrossCarryingAmountMember 2022-12-31 0000844551 wds:ProjectsInDevelopmentMember ifrs-full:OilAndGasAssetsMember ifrs-full:GrossCarryingAmountMember 2022-12-31 0000844551 ifrs-full:OilAndGasAssetsMember ifrs-full:GrossCarryingAmountMember 2022-12-31 0000844551 ifrs-full:LandAndBuildingsMember ifrs-full:OilAndGasAssetsMember wds:HistoricalCostMember 2022-12-31 0000844551 wds:TransferredExplorationAndEvaluationMember ifrs-full:OilAndGasAssetsMember wds:HistoricalCostMember 2022-12-31 0000844551 wds:PlantAndEquipmentMember ifrs-full:OilAndGasAssetsMember wds:HistoricalCostMember 2022-12-31 0000844551 wds:ProjectsInDevelopmentMember ifrs-full:OilAndGasAssetsMember wds:HistoricalCostMember 2022-12-31 0000844551 ifrs-full:OilAndGasAssetsMember wds:HistoricalCostMember 2022-12-31 0000844551 ifrs-full:LandAndBuildingsMember ifrs-full:OilAndGasAssetsMember ifrs-full:AccumulatedDepreciationAmortisationAndImpairmentMember 2022-12-31 0000844551 wds:TransferredExplorationAndEvaluationMember ifrs-full:OilAndGasAssetsMember ifrs-full:AccumulatedDepreciationAmortisationAndImpairmentMember 2022-12-31 0000844551 wds:PlantAndEquipmentMember ifrs-full:OilAndGasAssetsMember ifrs-full:AccumulatedDepreciationAmortisationAndImpairmentMember 2022-12-31 0000844551 wds:ProjectsInDevelopmentMember ifrs-full:OilAndGasAssetsMember ifrs-full:AccumulatedDepreciationAmortisationAndImpairmentMember 2022-12-31 0000844551 ifrs-full:OilAndGasAssetsMember ifrs-full:AccumulatedDepreciationAmortisationAndImpairmentMember 2022-12-31 0000844551 ifrs-full:LandAndBuildingsMember ifrs-full:OilAndGasAssetsMember 2022-12-31 0000844551 wds:TransferredExplorationAndEvaluationMember ifrs-full:OilAndGasAssetsMember 2022-12-31 0000844551 wds:PlantAndEquipmentMember ifrs-full:OilAndGasAssetsMember 2022-12-31 0000844551 wds:ProjectsInDevelopmentMember ifrs-full:OilAndGasAssetsMember 2022-12-31 0000844551 ifrs-full:OilAndGasAssetsMember 2022-12-31 0000844551 ifrs-full:OrdinarySharesMember 2022-12-31 0000844551 wds:EmployeeSharePlansMember 2022-12-31 0000844551 wds:DividendReinvestmentPlanMember 2022-12-31 0000844551 ifrs-full:IssuedCapitalMember 2022-12-31 0000844551 ifrs-full:ReserveOfSharebasedPaymentsMember 2022-12-31 0000844551 ifrs-full:ReserveOfExchangeDifferencesOnTranslationMember 2022-12-31 0000844551 ifrs-full:ReserveOfCashFlowHedgesMember 2022-12-31 0000844551 wds:DistributableProfitsReserveMember 2022-12-31 0000844551 ifrs-full:MiscellaneousOtherReservesMember 2022-12-31 0000844551 ifrs-full:RetainedEarningsMember 2022-12-31 0000844551 ifrs-full:EquityAttributableToOwnersOfParentMember 2022-12-31 0000844551 ifrs-full:NoncontrollingInterestsMember 2022-12-31 0000844551 wds:EmployeeBenefitsReserveMember 2022-12-31 iso4217:USD xbrli:pure xbrli:shares utr:Day utr:Year iso4217:CHF iso4217:USD utr:bbl utr:t wds:Projects iso4217:USD xbrli:shares iso4217:AUD xbrli:shares wds:Loan utr:bbl utr:MMBTU wds:TBTU iso4217:AUD wds:SwissFrance utr:MMBbls wds:us-au iso4217:USD utr:MMBTU wds:customer wds:Note
 
 
UNITED STATES
SECURITIES AND EXCHANGE COMMISSION
Washington, D.C. 20549
Form
20-F
(Mark one)
REGISTRATION STATEMENT PURSUANT TO SECTION 12(b) OR (g) OF THE SECURITIES EXCHANGE ACT OF 1934
OR
ANNUAL REPORT PURSUANT TO SECTION 13 OR 15(d) OF THE SECURITIES EXCHANGE ACT OF 1934
For the fiscal year ended December 31, 2022
OR
TRANSITION REPORT PURSUANT TO SECTION 13 OR 15(d) OF THE SECURITIES EXCHANGE ACT OF 1934
For the transition period from                  to                 
OR
SHELL COMPANY REPORT PURSUANT TO SECTION 13 OR 15(d) OF THE SECURITIES EXCHANGE ACT OF 1934
Date of event requiring this shell company report
For the transition period from                to                
Commission File Number:
001-41404
Woodside Energy Group Ltd
(Exact name of registrant as specified in its charter)
Australia
(Jurisdiction of incorporation or organization)
Woodside Energy Group Ltd
Mia Yellagonga, 11 Mount Street
Perth, Western Australia 6000
Australia
(Address of principal executive offices)
Matthew Turnbull
Woodside Energy Group Ltd
Mia Yellagonga, 11 Mount Street
Perth, Western Australia 6000
Australia
Tel: +61 8 9348 4000
        +61 410 471 079
E-mail:
investor@woodside.com
(Name, telephone,
e-mail
and/or facsimile number and address of company contact person)
 
 
Securities registered or to be registered pursuant to Section 12(b) of the Act.
 
Title of Each Class
 
Trading Symbol(s)
 
Name of each exchange on which registered
American Depositary Shares
 
WDS
 
New York Stock Exchange
Ordinary Shares, no par value per share*
     
New York Stock Exchange
* Not for trading, but only in connection with the registration of American Depositary Shares, pursuant to the requirements of the Securities and Exchange Commission.
Securities registered pursuant to Section 12(g) of the Act.
None.
(Title of Class)
Securities for which there is a reporting obligation pursuant to Section 15(d) of the Act.
None.
(Title of Class)
Indicate the number of outstanding shares of each of the issuer’s classes of capital or common stock as of the close of the period covered by the annual report.
Ordinary Shares:
1,898,749,771
 
 
Indicate by check mark if the registrant is a well-known seasoned issuer, as defined in Rule 405 of the Securities Act. ☐ Yes ☒ No
If this report is an annual or transition report, indicate by check mark if the registrant is not required to file reports pursuant to Section 13 or 15(d) of the Securities Exchange Act of 1934. ☐ Yes ☒ No
Indicate by check mark whether the registrant: (1) has filed all reports required to be filed by Section 13 or 15(d) of the Securities Exchange Act of 1934 during the preceding 12 months (or for such shorter period that the registrant was required to file such reports), and (2) has been subject to such filing requirements for the past 90 days. ☒ 
Yes
 ☐ No 
Indicate by check mark whether the registrant has submitted electronically every Interactive Data File required to be submitted pursuant to Rule 405 of Regulation
S-T
during the preceding 12 months (or for such shorter period that the registrant was required to submit such files). ☒ Yes ☐ No
Indicate by check mark whether the registrant is a large accelerated filer, an accelerated filer, a
non-accelerated
filer, or an emerging growth company. See definition of “large accelerated filer,” “accelerated filer,” and “emerging growth company” in Rule
12b-2
of the Exchange Act:
 
Large accelerated filer ☐    Accelerated filer ☐   
Non-accelerated
filer
 ☒
   Emerging growth company 
If an emerging growth company that prepares its financial statements in accordance with U.S. GAAP, indicate by check mark if the registrant has elected not to use the extended transition period for complying with any new or revised financial accounting standard† provided pursuant to Section 13(a) of the Exchange Act. ☐
† The term “new or revised financial accounting standard” refers to any update issued by the Financial Accounting Standards Board to its Accounting Standards Codification after April 5, 2012.
Indicate by check mark whether the registrant has filed a report on and attestation to its management’s assessment of the effectiveness of its internal control over financial reporting under Section 404(b) of the Sarbanes-Oxley Act (15 U.S.C. 7262(b)) by the registered public accounting firm that prepared or issued its audit report.
If securities are registered pursuant to Section 12(b) of the Act, indicate by check mark whether the financial statements of the registrant included in the filing reflect the correction of an error to previously issued financial statements. ☐
Indicate by check mark whether any of those error corrections are restatements that required a recovery analysis of incentive-based compensation received by any of the registrant’s executive officers during the relevant recovery period pursuant to §240.10D-1(b). ☐
Indicate by check mark which basis of accounting the registrant has used to prepare the financial statements included in this filing:
 
U.S. GAAP    ☐    International Financial Reporting Standards as issued
by the International Accounting Standards Board    ☒
   Other    ☐
If “Other” has been checked in response to the previous question, indicate by check mark which financial statement item the registrant has elected to follow:
☐ Item 17  ☐ Item 18
If this is an annual report, indicate by check mark whether the registrant is a shell company (as defined in Rule
12b-2
of the Exchange Act). ☐ Yes  No
(APPLICABLE ONLY TO ISSUERS INVOLVED IN BANKRUPTCY PROCEEDINGS DURING THE PAST FIVE YEARS)
Indicate by check mark whether the registrant has filed all documents and reports required to be filed by Sections 12, 13 or 15(d) of the Securities Exchange Act of 1934 subsequent to the distribution of securities under a plan confirmed by a court. ☐ Yes ☐ No


Table of Contents

Annual Report 2022

This Annual Report 2022 is a summary of Woodside’s operations and activities for the 12-month period ended 31 December 2022 and financial position as at 31 December 2022. Woodside Energy Group Ltd (ABN 55 004 898 962) is the ultimate holding company of the Woodside group of companies. In this report, unless otherwise stated, references to ‘Woodside’, the ‘Group’, the ‘company’, ‘we’, ‘us’ and ‘our’ refer to Woodside Energy Group Ltd and its controlled entities, as a whole. The text does not distinguish between the activities of the ultimate holding company and those of its controlled entities. In this report, references to a year are to the calendar and financial year ended 31 December 2022 unless otherwise stated.

All dollar figures are expressed in US currency, Woodside share, unless otherwise stated.

Forward-looking statements

This report contains forward-looking statements, greenhouse gas emissions data, industry, market and competitive position data and Woodside’s Financial Statements. Please refer to section 6.9 - Information about this report for important cautionary information relating to these matters.

Non-IFRS measures

Certain parts of this report contain financial measures that have not been prepared in accordance with International Financial Reporting Standards (IFRS) and are also ‘non-GAAP financial measures’ (as defined in Item 10(e) of Regulation S-K under the US Securities Act of 1933, as amended). Refer to section 6.7 - Alternative performance measures for a reconciliation of these measures to Woodside’s Financial Statements. These non-IFRS financial measures are defined in section 6.8 - Glossary, units of measure and conversion factors of this report.

Sustainable Development Report 2022 and Climate Report 2022

No material on Woodside’s website forms any part of this Annual Report. References in this Annual Report to documents on Woodside’s website are included as an aid to the location of such documents and such documents are not incorporated by reference. References to websites and our Sustainable Development Report 2022 and our Climate Report 2022 contained in this Annual Report (including all exhibits hereto) are provided for reference only; the information contained on the referenced websites or in the Sustainable Development Report 2022 and our Climate Report 2022 are not incorporated by reference in this Annual Report.

Acknowledging Country

Woodside recognises Aboriginal and Torres Strait Islander peoples as Australia’s first peoples. We acknowledge the unique connection that First Nations people have to land, waters and the environment. We extend this recognition and respect to First Nations peoples and communities around the world.


1


Table of Contents

CROSS-REFERENCE TO FORM 20-F


  Item      Form 20-F Description    Reference in this report
     
  1      Identity of Directors, Senior Management and Advisors    Not applicable
     
  2      Offer Statistics and Expected Timetable    Not applicable
     
  3      Key Information     
     
  A      [Reserved]    Not applicable
     
  B      Capitalisation and indebtedness    Not applicable
     
  C      Reasons for the offer and use of proceeds    Not applicable
     
  D      Risk Factors    Section 3.8, 5.1, 6.3
     
  4      Information on the Company     
     
  A      History and development of the company    Section 1, 6.2, 6.3, 6.4
     
  B      Business overview    Section 1, 2, 3
     
  C      Organisational structure    Section 5.1, Exhibit 8.1
     
  D      Property, plants and equipment    Section 1.6, 3, 5.1, 6.6
     
  4A      Unresolved Staff Comments    None
     
  5      Operating and Financial Review Prospects     
     
  A      Operating results    Section 1, 2, 3, 5.1, 6.2, 6.3
     
  B      Liquidity and capital resources    Section 2.1, 2.2
     
  C      Research and development, patents and licenses, etc.    Not applicable
     
  D      Trend information    Section 6.2
     
  E      Critical Accounting estimates    IFRS is applied in the Financial Statements
     
  6      Directors, Senior Management and Employees     
     
  A      Directors and senior management    Section 4.1
     
  B      Compensation    Section 4.3
     
  C      Board practices    Section 4.1
     
  D      Employees    Section 6.3
     
  E      Share Ownership    Section 4.3
     
  7      Major Shareholders and Related Party Transactions     
     
  A      Major shareholders    Section 6.4
     
  B      Related party transactions    Section 4.3, 5.1 (Note E.3)
     
  C      Interests of experts and counsel    Not applicable
     
  8      Financial Information     
     
  A      Consolidated Statements and Other Financial Information    Section 2.1, 5.1, 6.1, 6.2
     
  B      Significant Changes    Section 5.1 (Note E.5)
     
  9      The Offer and Listing     
     
  A      Offer and listing details    Section 6.4, Exhibit 2.1
     
  B      Plan of distribution    Not applicable
     
  C      Markets    Section 6.4
     
  D      Selling shareholders    Not applicable
     
  E      Dilution    Not applicable
     
  F      Expenses of the issue    Not applicable
     
  10      Additional Information     
     
  A      Share Capital    Not applicable
     
  B      Memorandum and articles of association    Exhibit 2.1
     
  C      Material contracts    Not applicable
     
  D      Exchange controls    Section 6.3, 6.4
     
  E      Taxation    Section 6.4
     
  F      Dividends and paying agents    Not applicable
     
  G      Statement by experts    Not applicable
     
  H      Documents on display    Section 6.4
     
  I      Subsidiary Information    Section 5.1 (Note E.8), Exhibit 8.1


2


Table of Contents
     
  11      Quantitative and Qualitative Disclosures About Market Risk    Section 2.2, 3.8, 5.1 (Note A, C), 6.2, 6.3
     
  12      Description of Securities Other than Equity Securities     
     
  A      Debt Securities    Not applicable
     
  B      Warrants and Rights    Not applicable
     
  C      Other Securities    Not applicable
     
  D      American Depositary Shares    Section 6.4, Exhibit 2.1
     
  13      Defaults, Dividend Arrearages and Delinquencies    None
     
  14      Material Modifications to the Rights of Security Holders and Use of Proceeds    None
     
  15      Controls and Procedures    Section 3.8, 4.1.6, 4.1.8, 4.1.9, 6.4
     
  16      [Reserved]    Not applicable
     
  16A      Audit committee financial expert    Section 4.1.3
     
  16B      Code of Ethics    Section 4.1.5, 4.1.8, Exhibit 11.1
     
  16C      Principal Accountant Fees and Services    Section 4.1.6
     
  16D      Exemptions from the Listing Standards for Audit Committees    Section 4.1.8
     
  16E      Purchases of Equity Securities by the Issuer and Affiliated Purchasers    Section 6.4
     
  16F      Change in Registrant’s Certifying Accountant    Not applicable
     
  16G      Corporate Governance    Section 4.1, 4.1.8
     
  16H      Mine Safety Disclosure    Not applicable
     
  16I      Disclosure Regarding Foreign Jurisdictions that Prevent Inspections    Not applicable
     
  17      Financial Statements    Not applicable
     
  18      Financial Statements    Section 5.1, 6.1, 6.2
     
  19      Exhibits    Exhibits


3


Table of Contents

  Contents

1.


Overview


1.1


About Woodside

     5  

1.2


2022 achievements

     6  

1.3


2022 summary

     7  

1.4


Chair’s report

     9  

1.5


Chief Executive Officer’s report

     10  

1.6


Focus areas

     12  

1.7


Merger with BHP Petroleum

     14  

2.


Financial performance and strategy


2.1


Financial overview

     15  

2.2


Strategy and capital management

     18  

2.3


Energy markets

     21  

2.4


Business model and value chain

     22  

3.


Our business


3.1


Australian operations

     23  

3.2


International operations

     25  

3.3


Marketing and trading

     26  

3.4


Projects

     27  

3.5


Exploration and development

     29  

3.6


New energy and carbon solutions

     31  

3.7


Climate and sustainability

     34  

3.8


Risk factors

     35  

3.9


Reserves Statement

     43  

4.


Governance


4.1


Corporate Governance Statement

     51  
 

Corporate governance at Woodside

     51  
 

Board of directors

     52  
 

Board committees

     63  
 

Executive Leadership Team

     66  
 

Promoting responsible and ethical behaviour

     70  
 

Risk management and internal control

     72  
 

Inclusion and diversity

     73  
 

Other governance disclosures

     76  
 

Shareholders

     78  

4.2


Directors’ report

     79  

4.3


Remuneration Report

     83  
 

Committee Chair’s letter

     84  
 

Remuneration Report (audited)

     86  
 

Glossary

     106  

5.


Financial Statements


5.1


Financial Statements

     F-1  

6.


Additional Information


6.1


Supplementary information on oil and gas - unaudited

     A-1  

6.2


Three-year financial analysis

     A-7  

6.3


Additional disclosures

     A-12  

6.4


Shareholder statistics

     A-19  

6.5


Business directory

     A-31  

6.6


Asset facts

     A-32  

6.7


Alternative performance measures

     A-37  

6.8


Glossary, units of measure and conversion factors

     A-40  

6.9


Information about this report

     A-43  

Exhibits

     A-45  


4


Table of Contents


  SECTION 1:    OVERVIEW


SECTION 1.1

About Woodside

We are a global energy company, founded in Australia with a spirit of innovation and determination.

The world needs energy that is affordable, reliable and lower carbon to support a successful energy transition. We provide energy to heat and cool homes, keep lights on and support industry.

We aim to thrive through the global energy transition with a low cost, lower carbon, profitable, resilient and diversified portfolio.1

The merger with BHP’s petroleum business has increased the scale and diversification of our global portfolio, which includes oil and gas assets and interests in Australia, the Gulf of Mexico, the Caribbean, Senegal and Timor-Leste. We also have a focused exploration program.

Our focus in operations remains on safety, reliability, efficiency and environmental performance, leveraging more than 35 years of operating experience.

We have growth opportunities across gas, oil and new energy.

Woodside has several projects currently in execution phase. The Scarborough and Pluto Train 2 projects in Australia achieved a positive final investment decision (FID) in November 2021 and are targeting first LNG cargo in 2026. In Senegal, the Sangomar Field Development Phase 1 is targeting first oil in late 2023. In the US Gulf of Mexico, Shenzi North, a brownfield expansion of the Shenzi oil project, is targeting first oil in 2024 and Mad Dog Phase 2, a development of the southern flank of the Mad Dog field, is targeting start up in 2023. Woodside completed front-end engineering design (FEED) for the Trion oil project in 2022 and is aiming to be FID-ready in 2023.

Our marketing, trading and shipping activities enable us to supply a diverse range of customers from our recently expanded global portfolio.

Our climate strategy has two key elements: reducing our net equity Scope 1 and 2 greenhouse gas emissions; and investing in the products and services to help our customers secure their energy needs and reduce their emissions. We have targets to reduce our net equity Scope 1 and 2 greenhouse gas emissions by 15% by 2025 and 30% by 2030, towards our aspiration to achieve net zero by 2050 or sooner.2,3

We also have a target to invest $5 billion in new energy products and lower carbon services by 2030.4

Our new energy opportunities include the proposed hydrogen and ammonia projects H2Perth and H2TAS in Australia, and the proposed hydrogen projects H2OK in the US and Southern Green Hydrogen in New Zealand.

We take a disciplined and prudent approach to investment through our capital allocation framework, with the goal to manage financial risks and maintain a resilient financial position to allow us to optimise the value delivered from our portfolio of opportunities.

Integrity, accountability and transparency drive our environmental, social and governance (ESG) aspirations and guide decision making at all levels of our business.

We strive to operate responsibly across our business activities. Enduring and meaningful relationships with communities are fundamental to our social performance.

We recognise that our success is driven by our people and our culture. We value diversity and we strive to keep each other safe.


1.

For Woodside, a lower carbon portfolio is one from which the net equity scope 1 and 2 greenhouse gas emissions, which includes the use of offsets, are being reduced towards targets, and into which new energy products and lower carbon services are planned to be introduced as a complement to existing and new investments in oil and gas.

2.

Target is for net equity Scope 1 and 2 greenhouse gas emissions, relative to a starting base representative of the gross annual average equity Scope 1 and 2 greenhouse gas emissions over 2016-2020 and may be adjusted (up or down) for potential equity changes in producing or sanctioned assets with an FID prior to 2021.

3.

Net equity greenhouse gas emissions are equal to Woodside’s equity share of gross greenhouse gas emissions reduced by the number of retired carbon credits.

4.

Individual investment decisions are subject to Woodside’s investment targets. Not guidance. Potentially includes both organic and inorganic investment.


5


Table of Contents

SECTION 1.2

2022 achievements


                                    NET PROFIT AFTER TAX


OPERATING REVENUE


LOGO

228%


LOGO

142%

  
  $6.5            $16.8      
  billion              billion        


UNDERLYING NET PROFIT AFTER TAX1


FULL-YEAR DIVIDEND


LOGO

223%


LOGO

87%

  
  $5.2            253      
  billion              US cps        


                                    PRODUCTION VOLUME2


FREE CASH FLOW1,3


LOGO

73%


LOGO

669%

  
  157.7            $6.5      
  MMboe              billion        

DELIVERING ON OUR COMMITMENTS


LOGO


1.

This is an alternative performance measure (APM) which is a non-IFRS measure that is unaudited. Woodside believes this non-IFRS measure provides useful performance information, however it should not be considered as an indication of, or as a substitute for, statutory measures as an indicator of actual operating performance (such as net profit after tax or net cash from operating activities) or any other measure of financial performance or position presented in accordance with IFRS. For more information on non-IFRS measures, including reconciliations to Woodside’s Financial Statements, refer to section 6.7 - Alternative performance measures.

2.

Includes production of 156.8 MMboe from Woodside reserves and 0.9 MMboe primarily from feed gas purchased from Pluto non-operating participants processed through the Pluto-KGP Interconnector.

3.

Free cash flow of $6.5 billion includes the impact of collateral payments of $506 million against hedging activities. Without the collateral payments operating cash flow would be $9.3 billion and cash flow would be $7.1 billion.


6


Table of Contents

SECTION 1.3

2022 summary

Completed the transformational merger with BHP’s petroleum business, delivered record profit and production, and further strengthened the balance sheet.


Creating value


We delivered a record reported NPAT of $6,498 million. underpinned by the merger with BHP’s petroleum business, increased market oil and gas prices and strong operational performance.


Earnings per share increased by 109% to 430 US cents per share (cps) and our full-year fully franked total dividend increased by 87% to 253 US cps.


LOGO             


Financial strength


Our low level of net debt of $583 million and gearing of 1.6%, below our target gearing range of 10-20%, positions our balance sheet for our expected future capital expenditure.2 Had the 2022 final dividend been paid on 31 December 2022, our gearing would increase to 9.0%.


We maintained our investment grade credit rating and ended the period with more than $10 billion of liquidity.


LOGO             


Consistent operations

Our operations maintained strong LNG reliability. Total recordable injury rate (TRIR) increased to 1.80 per million work hours.


Our production cost and unit production cost (UPC) increased following the merger and start-up of the KGP-Pluto lnterconnector.


LOGO


1.

Includes production of 156.8 MMboe from Woodside reserves and 0.9 MMboe primarily from feed gas purchased from Pluto non-operating participants processed through the Pluto-KGP Interconnector.

2.

This is an alternative performance measure (APM) which is a non-IFRS measure that is unaudited. Woodside believes this non-IFRS measure provides useful performance information, however it should not be considered as an indication of, or as a substitute for, statutory measures as an indicator of actual operating performance (such as net profit after tax or net cash from operating activities) or any other measure of financial performance or position presented in accordance with IFRS. For more information on non-IFRS measures, including reconciliations to Woodside’s Financial Statements, refer to the section 6.7 - Alternative performance measures.


7


Table of Contents
    SHAREHOLDER OUTCOMES


            FULL YEAR DIVIDEND

LOGO     253
    US cps
    LOGO 87%


EARNINGS PER SHARE

    430
    US cps
    LOGO 109%


            RETURN ON EQUITY

    17.9%
    LOGO 3%


            RETURN ON AVERAGE

CAPITAL EMPLOYED

    25%
    LOGO 9%


All footnotes related to this page are displayed on the previous page.


8


Table of Contents

SECTION 1.4

Chair’s report

On behalf of the Board, I am pleased to report that 2022 was an historic year for Woodside. We successfully completed the merger with BHP’s petroleum business, delivered record profit and became an even more significant supplier of energy to a world that needs it.

The combination of sustained high oil and gas prices coupled with strong operational performance from our enlarged portfolio contributed to a record reported annual net profit after tax of $6,498 million. We are well positioned for major capital investment through 2023 and 2024 and to return value to shareholders. The Board has determined a fully-franked final dividend of 144 US cents per share, resulting in a total full-year dividend of 253 US cents per share.

Our merger with BHP’s petroleum business was completed in June 2022, after gaining the approval of 98.7% of the shareholders who voted on the transaction. The merger was a momentous point in Woodside’s history. It brought together the best of both organisations to create the largest energy company listed on the Australian Securities Exchange and we subsequently commenced trading with secondary listings on the London Stock Exchange and the New York Stock Exchange. As a global independent energy company, we have the scale, diversity and resilience to provide value to shareholders and thrive through the energy transition.

The past year was marked by turmoil in global energy markets, with the impact of Russia’s invasion of Ukraine highlighting the importance of energy security and affordability as the world transitions to a lower carbon energy mix. An orderly energy transition requires solutions that balance these three elements.

Forecasts indicate that the energy transition is unlikely to be smooth and linear. An enormous amount of investment is required in the coming decades to meet growing global demand, particularly in developing economies with populations who are aspiring for an improved quality of life and access to reliable energy. The global energy transition could take a range of different pathways, and many pathways modelled include strong demand for natural gas. In order to embed new forms of energy into the mix, the world will need to build almost entirely new supply chains, whilst striving to maintain uninterrupted supply.

Woodside’s strategy in response to this challenge is unchanged. We are focused on delivering reliable, affordable and lower carbon energy today and into the future.

We intend to do this from our low cost, resilient, diversified and profitable portfolio that enables us to adapt to the choices our customers make as they also navigate the energy transition.

We will continue to work cooperatively with governments and regulators as we deliver this energy, noting the importance of stable policy settings to encourage investment in new supply and reduce market volatility during this transition.

Delivering energy safely remains Woodside’s top priority. Our personal safety outcomes in 2022 failed to improve against the disappointing result in 2021. It is imperative we improve this in late 2023.

We maintained high operational and process safety performance both in Australia and globally as we integrated new assets and personnel following the merger.

Good progress has also been made on our key growth projects in 2022. Our Scarborough project in Australia is on track for first LNG cargo in 2026 and the Sangomar development offshore Senegal is expected to deliver first oil late in 2023.

The completion of the merger also brought an expanded development opportunity portfolio across oil, gas and new energy. We have never had so many opportunities competing for capital, and we are focused on high grading those opportunities that will deliver the most value in accordance with our capital allocation framework.

Opportunities in the oil portfolio that we are looking to unlock include Trion, one of Mexico’s first deepwater developments, and infill and tieback opportunities to Atlantis, Shenzi and Mad Dog in the US Gulf of Mexico.

In gas, our opportunities include Calypso in Trinidad and Tobago, Browse off the west coast of Australia, and Greater Sunrise in the Timor Sea between Australia and Timor-Leste.

Woodside is also progressing opportunities in new energy products, such as hydrogen and ammonia, and technologies our customers need as they reduce their own emissions. We are leveraging nearly four decades of experience as a safe and reliable producer as we pursue these new energy opportunities.

To date, Woodside has spent US$100 million towards our target to invest US$5 billion in new energy products and lower carbon services by 2030, including ordering key equipment for the proposed H2OK hydrogen project in Oklahoma in the United States. We are targeting our first new energy final investment decision at H2OK in 2023.1

We continue to make progress towards our 2025 and 2030 net equity Scope 1 and 2 greenhouse gas emissions reduction targets. 2,3

On behalf of the Board, I would like to thank the entire Woodside team for an excellent performance in 2022 and CEO Meg O’Neill for her outstanding leadership. In a year of significant change, our people have delivered impressive operational results and strong progress on our growth projects and new energy opportunities.

My thanks also go to my Board colleagues, who have been tireless in their support of Woodside’s purpose and strategic objectives. As a Board, we value the ongoing support of our shareholders and are pleased to be able to reward that trust by delivering increased returns to you in 2022.


Richard Goyder, AO

Chair of the Board

27 February 2023


1.

Individual investment decisions are subject to Woodside’s investment targets. Not guidance. Potentially includes both organic and inorganic investment.

2.

Target is for net equity Scope 1 and 2 greenhouse gas emissions, relative to a starting base representative of the gross annual average equity Scope 1 and 2 greenhouse gas emissions over 2016-2020 and may be adjusted (up or down) for potential equity changes in producing or sanctioned assets with an FID prior to 2021.

3.

Net equity greenhouse gas emissions are equal to Woodside’s equity share of gross greenhouse gas emissions reduced by the number of retired carbon credits.


9


Table of Contents

SECTION 1.5

Chief Executive Officer’s report

The past year has been truly transformative for Woodside. The merged company has delivered record profit driven by our larger, geographically diverse portfolio of high-quality assets, and made significant progress on our growth projects.

In 2022 Woodside reported net profit after tax of $6,498 million, driven by higher oil and gas prices and strong operational performance from our global assets. Operating cash flow increased by 132% to $8,811 million, strengthening Woodside’s ability to fund our growth projects over the coming years and supporting returns to shareholders.

We completed the merger with BHP’s petroleum business in June 2022, increasing Woodside’s scale, diversity and financial resilience and positioning us to implement our strategy to thrive through the energy transition.

Woodside’s subsequent secondary listings on the London and New York stock exchanges provided a greater global presence and improved access to deep capital markets.

Woodside has implemented initiatives to deliver greater than US$400 million annual synergies ahead of target.1

The global energy security and affordability crises that unfolded in 2022 resulted in unprecedented market volatility and shone a spotlight on the challenge we all face as we strive to maintain and improve global standards of living while reducing our emissions. But what we can be confident of is that global energy demand will continue to grow as the more than one billion people who don’t currently have access to reliable and affordable energy pursue aspirations for the same quality of life that we enjoy.

That demand, and the role gas can play as a lower carbon source of the energy the world needs, underpins our confidence in the strategy we have set out and are pursuing. Liquefied natural gas (LNG) is making a significant contribution to both global energy security and decarbonisation. LNG is an important enabler for increased renewables build-out, providing the baseload and firming capacity required to address the intermittency of solar and wind power.

The world’s demand for oil is also forecast to remain strong for the next two decades in applications such as power generation, transportation, manufacturing and other hard-to-abate sectors. Post-merger, Woodside’s increased exposure to oil, which now contributes approximately 30% of our production, is expected to generate significant cash flow that will help fund our investments in both conventional and new energy.

Delivering energy safely remains Woodside’s top priority and in 2022 we disappointingly recognised a total recordable injury rate (TRIR) higher than target. Improving the safety performance of our workforce will be a key focus area in 2023.

We continued to achieve high reliability across Woodside’s operated assets in 2022.

When a supply crunch hit the eastern Australian energy market in mid-year due to coal-fired power outages and a drop off in renewables, Woodside played its part by delivering as many molecules of its Bass Strait gas as possible to customers who needed it.

In Western Australia, the successful start-up of the Pluto-Karratha Gas Plant (KGP) Interconnector pipeline enabled the accelerated production of 9.4 MMboe of Pluto gas using emerging spare capacity at KGP.

Our international portfolio across the US Gulf of Mexico and the Caribbean now includes interests in Shenzi, Atlantis, Mad Dog, Angostura and Ruby. These low cost producing assets have significant expansion potential in close proximity to infrastructure and attractive markets.

We are investing in projects that will deliver production and revenue for decades to come, providing a bright future for Woodside.

At the Sangomar field in Senegal, the subsea installation campaign got underway and development drilling progressed, with seven of the planned 23 wells now complete. Work to complete and commission Sangomar’s floating production storage and offloading facility is currently underway in Singapore ahead of targeted first oil towards the end of 2023.

Our Scarborough and Pluto Train 2 projects combined were 25% complete at year-end and remain on track for targeted first LNG cargo in 2026. In 2022, fabrication of the floating production unit topsides commenced, subsea trees were delivered, pipeline manufacturing commenced, and we also completed the first stage of the Pluto Train 2 construction accommodation village in Karratha.


1.

Pre-tax 100% basis. Excluding transition and separation costs. Net of any expected ongoing cost increases as a result of the merger.


10


Table of Contents

Meanwhile, Woodside’s pipeline of unsanctioned conventional energy developments continued to be matured. These include the Trion field offshore Mexico, where we have completed front-end engineering design activities, issued tender packages for competitive bids and are working on regulatory approval submissions. We are aiming to be ready for a final investment decision on Trion in 2023.

There has also been progress on the proposed Browse project with the publication of the final Environmental Impact Statement. At Sunrise in the Timor Sea, the joint venture has agreed to undertake concept select studies while negotiations continue between the governments of Timor-Leste and Australia and the project proponents to agree a new production sharing contract. At Calypso in the Caribbean, we are focused on identifying the development concept and required commercial alignment.

Woodside is managing our net equity Scope 1 and 2 greenhouse gas emissions and investing in the products and services our customers need to decarbonise.

In 2022, we achieved an 11% reduction in net equity Scope 1 and 2 emissions against our 2016-2020 starting base.2 Our heritage Woodside-operated assets developed decarbonisation plans to identify and implement opportunities to reduce emissions, and similar plans are expected to be developed this year for the heritage BHP operated assets.3

We have made progress on our hydrogen and ammonia opportunities. At our most advanced, H2OK in Oklahoma in the United States, we are aiming to be ready for a final investment decision in 2023.

Woodside is developing a suite of carbon initiatives that could be used as services to customers or to reduce and offset our own emissions. In 2022 we were awarded multiple offshore greenhouse gas assessment permits for future carbon capture and storage opportunities. We also developed multiple relationships to collaborate on technologies which convert carbon to useful products.

Our record profit in 2022 also means we are delivering strong returns through our payments to governments in Australia. Our total Australian tax and royalty payments of A$2.7 billion in 2022 demonstrates that when Woodside and our industry performs well, our contribution to government revenue is significant.

I am proud to reflect on an incredible year for Woodside, in which our people achieved outstanding results while adapting to significant change.

Woodside’s roots remain in Australia, but in 2022 we have become a truly global business. I look forward in 2023 to the new Woodside continuing to deliver what we have promised for our shareholders, employees, partners and communities as we execute our strategy to thrive through the energy transition.


Meg O’Neill

Chief Executive Officer and Managing Director

27 February 2023


2.

Woodside’s net emissions reduction targets are for net equity Scope 1 and 2 greenhouse gas emissions, with a targeted reduction of 15% by 2025, 30% by 2030, with an aspiration of net zero by 2050. Target is for net equity Scope 1 and 2 greenhouse gas emissions, relative to a starting base representative of the gross annual average equity Scope 1 and 2 greenhouse gas emissions over 2016-2020 and may be adjusted (up or down) for potential equity changes in producing or sanctioned assets with an FID prior to 2021.

3.

Heritage Woodside refers to Woodside’s assets prior to the merger with BHP’s petroleum business. Heritage BHP refers to the assets acquired through the merger with BHP’s petroleum business.


11


Table of Contents

SECTION 1.6

Focus areas


LOGO


12


Table of Contents

LOGO


13


Table of Contents

SECTION 1.7

Merger with BHP Petroleum

The merger of Woodside and BHP’s petroleum business completed on 1 June 2022.

The merger completed following Woodside shareholder approval on 19 May 2022, creating the largest energy company listed on the Australian Securities Exchange (ASX).1

On completion, Woodside acquired the entire share capital of BHP Petroleum International Pty Ltd (BHPP) and issued 914,768,948 new Woodside shares to BHP, which BHP distributed to its eligible shareholders. Woodside received net cash of approximately $1.1 billion, which included the cash remaining in BHPP bank accounts of $399 million immediately prior to completion.

Trading of the new Woodside shares on the ASX and Woodside’s American Depository Shares (ADS) on the New York Stock Exchange (NYSE) commenced on 2 June 2022 under the ticker WDS. On 6 June 2022, trading of Woodside shares commenced on the Main Market for listed securities of the London Stock Exchange (LSE).

Woodside has implemented initiatives to deliver greater than US$400 million annual synergies ahead of target.2

Strategic rationale for the merger


LOGO


1.

Based on market capitalisation and production, as of the date of this report.

2.

Pre-tax 100% basis. Excluding transition and separation costs. Net of any expected ongoing cost increases as a result of the merger.


14


Table of Contents


  SECTION 2: FINANCIAL PERFORMANCE AND STRATEGY


SECTION 2.1

Financial overview

In 2022 we achieved a reported net profit after tax of $6,498 million and an underlying net profit after tax of $5,230 million. The additional revenue generated by a more diverse portfolio of assets following the merger with BHP’s petroleum business, along with increased market pricing across all products and strong operational performance, were key contributors to the result.

Key metrics

The financial summary below includes both IFRS and non-IFRS measures. Woodside uses various alternative performance measures (APM) which are non-IFRS measures to reflect our underlying performance. These measures are identified below and are reconciled to Woodside’s Financial Statements in section 6.7 - Alternative performance measures.


           2022                         2021                         2020                      

Operating revenue


$ million

    16,817       6,962       3,600  

EBITDA excluding impairment1


$ million

    11,234       4,135       1,922  

EBIT1


$ million

    9,186       3,493       (5,171)  

Net profit after tax (NPAT)2,3


$ million

    6,498       1,983       (4,028)  

Underlying NPAT1


$ million

    5,230       1,620       447  

Net cash from operating activities


$ million

    8,811       3,792       1,849  

Investment expenditure1,4,5


$ million

    4,441       2,727       2,013  

Capital expenditure1,4


$ million

    4,023       2,631       1,901  

Exploration expenditure1,5


$ million

    418       96       112  

Free cash flow1,6


$ million

    6,546       851       (263)  

Dividends distributed


$ million

    3,088       404       766  

Final dividend determined


US cps

    144       105       12  

Key ratios


Earnings


US cps

    430.0       206.0       (423.5)  

Gearing1


%

    1.6       21.9       24.4  
        

Production7


Gas


MMboe

    113.8       73.3       80.3  

Liquids


MMboe

    43.9       17.8       20.0  

Total


MMboe

    157.7       91.1       100.3  

Sales volumes


Gas


MMboe

    125.0       93.7       86.5  

Liquids


MMboe

    43.9       17.9       20.3  

Total


MMboe

    168.9       111.6       106.8  


1.

These are alternative performance measures (APM) which are non-IFRS measures that are unaudited. Woodside believes these non-IFRS measures provide useful performance information, however they should not be considered as an indication of, or as a substitute for, statutory measures as an indicator of actual operating performances (such as net profit after tax or net cash from operating activities) or any other measure of financial performance or position presented in accordance with IFRS. For more information on non-IFRS measures, including reconciliations to Woodside’s Financial Statements, refer to section 6.7 - Alternative performance measures.

2.

Net profit after tax attributable to equity holders of the parent.

3.

The global operations effective income tax rate (EITR) is ~31%. The EITR is calculated as Woodside’s income tax expense or benefit divided by profit or loss before income tax. EITR was ~32% for 2021 and ~21% for 2020.

4.

Excludes exploration capitalised and the effect of Global Infrastructure Partners’ (GIP) additional contribution to Pluto Train 2.

5.

Excludes prior period expenditure written off and permit amortisation and includes evaluation expense.

6.

Cash flow from operating activities less cash flow from investing activities. Free cash flow of $6,546 million includes the impact of collateral payments of $506 million against hedging activities. Without the collateral free cash flow would be $7,052 million.

7.

Includes production of 156.8 MMboe from Woodside reserves and 0.9 MMboe primarily from feed gas purchased from Pluto non-operating participants processed through the Pluto-KGP Interconnector.


15


Table of Contents

NPAT reconciliation

The following table summarises the variance between the 2021 and 2022 results for the contribution of each line item to NPAT.


      million      Primary reasons for variance

  2021 reported NPAT

     $1,983       

    Revenue from sale of hydrocarbons


        Price

     $4,830      Higher market pricing across all products was also experienced in 2022. A 51% increase in sales volumes due to the contribution of the BHP Petroleum assets, start-up of the Pluto-KGP Interconnector and higher plant reliability resulted in higher operating revenue.

        Volume

     $5,007  

    Other operating revenue

     $18      Primarily driven by additional processing and services revenue, offset by a decrease in shipping and other revenue.

    Costs of sales

     ($2,695)      primarily driven by the additional volumes as a result of the merger with BHP’s petroleum business and the start-up of the Pluto-KGP interconnector, as well as higher royalties and excise costs as a result of higher pricing and associated revenue.

    Other income

     $596      Primarily due to the sale of 49% of the Pluto Train 2 joint venture to GIP.

    General administrative costs

     ($633)      Primarily due to trannsaction and integration costs as a result of the merger with BHP’s petroleum business.

    Other

     ($1,115)      Other includes higher losses on hedging activities and repurchase agreements, higher movement on restoration due to an increase in the number of assets following the merger with BHP Petroleum and increased exploration activity.

    Income tax and PRRT

     ($1,345)      Increased taxes due to higher revenue offset by an increase in the Pluto PRRT deferred tax asset (DTA) as a result of higher 2022 income, improved future price assumptions and additional volumes processed through the Pluto-KGP Interconnector.

    Impairment and impairment reversals

     ($148)      Due to lower pre-tax impairment reversal recognised in 2022 compared to 2021.
     

  2022 reported NPAT

     $6,498       

    2022 NPAT adjustments

     ($1,268)      Adjustment for merger transaction costs ($419 million) and Orphan Basin exit costs ($142 million) offset by Pluto PRRT DTA ($954 million), derecognition of the Corpus Christi onerous contract provision ($245 million) and Wheatstone impairment reversal, net of tax ($630 million).
     

  2022 underlying NPAT

     $5,230       

Capital management

Final dividend and dividend reinvestment plan

A 2022 fully franked final dividend of 144 US cps has been determined. The value of the final dividend payment is $2,734 million which represents approximately 80% of underlying NPAT for the second half of 2022, reflecting Woodside’s strong operational performance and the contribution of BHP’s petroleum business following completion of the merger on 1 June 2022.1

The dividend reinvestment plan (DRP) has been suspended.

Liquidity and debt service

During the year, Woodside generated $8,811 million of cash flow from operating activities and delivered positive free cash flow of $6,546 million.2,3

Woodside increased its standby debt facilities from $3,100 million to $4,050 million and repaid $283 million of maturing debt. At the end of the period, drawn debt was $5,138 million and liquidity was $10,239 million.

Woodside’s primary sources of liquidity are cash and cash equivalents, net cash provided by operating activities, unused borrowing capacity under its bilateral facilities and syndicated facilities, issuances of debt or equity securities, and other sources, such as sales of non-strategic assets. Details of Woodside’s credit facilities, including total commitments, maturity and interest, and amount outstanding at 31 December 2022, can be found in section 5 - Financial Statements.

Woodside’s principal ongoing uses of cash are to meet working capital requirements, fund debt obligations and to finance Woodside’s capital expenditure and acquisitions. In our opinion, working capital is sufficient for our present requirements.

Woodside’s capital expenditure for 2023 is expected to be between $6,000 million and $6,500 million primarily due to Sangomar and Scarborough project expenditure. This excludes the impact of any subsequent asset sell-downs or other changes in equity. We expect the execution of Sangomar and Scarborough to continue safely, targeting first oil in late 2023 and first LNG cargo in 2026 respectively.


1.

Underlying NPAT is a non-IFRS measures. Refer to section 6.7 - Alternative performance measures for a reconciliation of these measures to Woodside’s Financial Statements.

2.

Free cash flow is a non-IFRS measure. Refer to section 6.7 - Alternative performance measures for a reconciliation of these measures to Woodside’s Financial Statements.

3.

Cash flow from operating activities less cash flow from investing activities. Free cash flow of $6,546 million includes the impact of collateral payments of $506 million against hedging activities. Without the collateral free cash flow would be $7,052 million.


16


Table of Contents

Woodside has no off-balance sheet arrangements that have, or are reasonably likely to have, a current or future material effect on the Woodside’s financial condition, revenues or expenses, results of operations, liquidity, capital expenditures or capital resources.


Liquidity


Debt maturity profile


LOGO


LOGO


Balance sheet

Woodside’s commitment to an investment grade credit rating remains unchanged and supports Woodside’s aims of providing sustainable returns to shareholders and investing in future growth opportunities, in accordance with our capital allocation framework. Woodside’s credit ratings of BBB+ and Baa1 were both reaffirmed in 2022 by S&P Global and Moody’s respectively.1

Woodside’s gearing at the end of 2022 was 1.6%, below our target range of 10% to 20%. Had the 2022 final dividend been paid on 31 December 2022, our gearing would increase to 9.0%. A low level of net debt positions Woodside’s balance sheet for its expected future capital expenditure. As a result, Woodside’s gearing may at times fall outside the target range of 10% to 20% as the balance sheet is managed through the investment cycle.2

Commodity price risk management

Woodside hedges to protect the balance sheet against downside commodity price risk, particularly during periods of high capital expenditure.

Woodside hedged approximately 17 MMboe of 2022 volumes. The realised value of these oil price hedges was a pre-tax expense of approximately $475 million.

As at 31 December 2022, Woodside has placed oil price hedges for approximately 22 MMboe of 2023 production at an average price of $75 per barrel.

Woodside has also placed hedges for Corpus Christi LNG volumes to protect against downside pricing risk. These hedges are Henry Hub and Title Transfer Facility (TTF) commodity swaps. Approximately 49% of Corpus Christi volumes included in stock in transit for 2022, approximately 82% of 2023 volumes and approximately 29% of 2024 volumes have reduced pricing risk as a result of hedging activities.


1.

Credit ratings are forward-looking opinions on credit risk. S&P Global’s and Moody’s credit ratings express the opinion of each agency on the ability and willingness of Woodside to meet its financial obligations in full and on time. A credit rating is not a recommendation to buy, sell or hold securities and may be subject to suspension, reduction or withdrawal at any time by an assigning rating agency. Any rating should be evaluated independently of any other information.

2.

Gearing and net debt are non-IFRS measures. Refer to section 6.7 - Alternative performance measures for a reconciliation of these measures to Woodside’s Financial Statements.


17


Table of Contents

SECTION 2.2

Strategy and capital management

Woodside’s strategy is to thrive through the energy transition by building a low cost, lower carbon, profitable, resilient and diversified portfolio.1

Woodside’s strategy is underpinned by our focus on safe, reliable and efficient operations, and disciplined capital allocation, providing the foundation to progress key development projects and to navigate the energy transition.

Woodside’s high cash generating portfolio is made up of quality assets which have the scale, diversification and resilience to deliver ongoing value. Our capital management framework seeks to optimise value and shareholder returns and we are positioning ourselves to be agile, flexible and adaptable as the world’s energy mix evolves. We are navigating the energy transition by building on our traditional energy capabilities and maturing opportunities to produce lower carbon energy and provide integrated carbon solutions which are customer-led and scalable.

The energy challenge faced by the world today is complex. The world needs energy that is affordable, secure, reliable and lower carbon to support a successful energy transition.

Woodside has a history of delivering strong margins from our operations and we believe our conventional asset base which is weighted to LNG will become increasingly attractive through the energy transition.


Woodside’s strategy


Elements for a stable energy transition


LOGO

      LOGO


1.

Please see section 6.8 – Glossary, units of measure and conversion factors for a definition of how Woodside uses the term lower carbon portfolio.


18


Table of Contents

Capital allocation

Woodside’s disciplined capital allocation approach includes robust assessment of opportunities, portfolio outcomes and shareholder returns while maintaining focus on safe, reliable and efficient operations.

Our investment decisions are informed by energy market analysis including supply, demand and price outlooks. We test the robustness of potential investments against a wide range of scenarios to support our investment decisions with the goal of remaining profitable and resilient through various commodity cycles and climate outcomes.

A high performing culture, that includes an engaged, accountable and diverse workforce with a responsible ESG mindset, is critical to enabling us to deliver our vision and strategy. Our strategic framework is underpinned by our focus on safe and reliable operations, a strong balance sheet and technology to enhance efficiency and improve decision making across the value chain.

Our capital allocation framework sets target investment criteria for oil, gas and new energy opportunities. We use this capital allocation framework to create a diversified and flexible portfolio, which allows us to respond to changes in demand and supply for our products.


LOGO

When assessing opportunities, we consider a broad range of portfolio evaluation and opportunity evaluation factors relevant to the opportunity. These assessments can apply to acquisitions or divestments, and for evaluating the impact of a new project on the portfolio.


LOGO


1.

CCUS refers to carbon capture utilisation and storage.

2.

Payback refers to RFSU + X years.

3.

Target is for net equity Scope 1 and 2 greenhouse gas emissions, relative to a starting base representative of the gross annual average equity Scope 1 and 2 greenhouse gas emissions over 2016-2020 and may be adjusted (up or down) for potential equity changes in producing or sanctioned assets with an FID prior to 2021.

4.

Illustrative of the considerations. Not an exhaustive list.


19


Table of Contents

Capital management

Our capital management framework provides us with the flexibility to optimise value and shareholder returns delivered from our portfolio of opportunities.

We consider a range of scenarios to inform our decision making as we strive to balance a resilient financial position with strong shareholder returns.

Our capital investment requirements are primarily funded by our operating cash flows, which we augment or distribute with a number of capital management levers:


debt management, enabling continued access to premium debt markets at a competitive cost to support our growth activities and managing the debt maturity profile of our debt portfolio. Our gearing target is 10-20% and we continue to target maintaining an investment grade credit rating


shareholder returns, to reward our shareholders appropriately. Our dividend policy aims to pay a minimum of 50% of NPAT excluding non-recurring items (underlying NPAT), with a target payout ratio between 50% and 80%. Our dividend reinvestment plan (DRP) has been suspended.


hedging, to protect the balance sheet against the commodity cycle


focused expenditure management, enabling prudent and efficient deployment of capital to support delivery of our operating asset and growth opportunities


participating interest management, enabling us to balance capital investment requirements, project execution risk and long-term value. In January 2022 we completed the sale of a 49% non-operating participating interest in the Pluto Train 2 Joint Venture. In 2023 we continue to assess opportunities to balance our participating interest in ventures, including the sell-down of Scarborough.

Capital management framework


LOGO


20


Table of Contents

SECTION 2.3

Energy markets

The world is grappling with a global energy crisis as surging energy prices impact economic conditions and disrupt customers’ expectations for reliable and affordable energy. Heightened geopolitical tension, rerouting of energy flows and an uncertain energy transition are contributing to a period of volatile energy prices.

Macroeconomic

The global economic rebound from the COVID-19 induced lows of 2020 is facing a weakened outlook as central banks in advanced economies tighten monetary conditions in response to elevated inflation levels. A broad-based global economic slowdown is widely expected to continue through 2023. The International Monetary Fund estimates in its World Economic Outlook report released in January 2023 that global gross domestic product (GDP) growth will slow from 3.4% in 2022 to 2.9% in 2023.1

Oil

Oil markets oscillated through 2022 as the rebound in post COVID-19 demand and sanctioned Russian supply put upward pressure on prices, whilst weakening global macroeconomic conditions and China’s ongoing management of COVID-19 weighed against demand. The Dated Brent price averaged $101/bbl in 2022, a 43% increase from 2021.2 Geopolitical tensions have highlighted the importance of energy security and further investment in low cost, lower emission developments to meet medium-term global demand.

Liquefied natural gas

Global gas markets remain tight, as available LNG capacity is unable to meet immediate demand requirements from the unprecedented supply shock of reduced Russian supplies to Europe. In 2022, North Asian LNG prices averaged $34/MMBtu, more than doubling from 2021.2

Woodside expects natural gas to play a critical role in the energy transition across a range of sectors. Currently, less than half of global natural gas supply is used in power generation. On a lifecycle basis, natural gas emits approximately half the carbon dioxide of coal to generate power. It also has the potential to provide grid stability where needed, and may contribute to improved local air quality.

According to Wood Mackenzie, global LNG demand is expected to grow by more than 60% in volume between 2021 and 2040.3 This growth is driven across Asian and European nations, phasing out Russian natural gas supply. Woodside expects more LNG projects will be required to ensure adequate supply from the late-2020s, requiring a sufficient price to bring new liquefaction capacity to the market.

Woodside’s competitive cost of supply, experienced operatorship, balance sheet strength, and geographical proximity to major buyers makes us well placed to meet customers’ demand for reliable and secure LNG supply.

New energy products

Action to address climate change continues to strengthen against the backdrop of ensuring reliable, secure and affordable energy. Targets to accelerate a hydrogen economy are building, for example the European Commission’s REPowerEU plan and the pivotal United States’ Inflation Reduction Act incentivises the production of lower carbon intensity energy. While the pace in growth of new energy products demand is uncertain, Woodside expects these to become a larger part of the future energy mix.

Australian domestic gas market

Supply and price challenges experienced during 2022 highlighted the central role of gas in Australia’s energy mix and reinforced the importance of stable policy settings to support new investment in gas supply and infrastructure.

In mid-2022, the east coast Australian gas market experienced a price spike which was driven primarily by the market being unable to respond to a sharp increase in gas demand caused by a colder than average winter, intermittent renewables generation and increased unreliability of coal generation. This price spike led to the Australian Government passing legislation imposing a 12 month price cap of A$12 per gigajoule in 2023 on new contract sales of gas sold by east coast and Northern Territory gas producers to customers and their affiliates to wholesale customers in Australia.

The Western Australian gas market, with different infrastructure constraints, demand profiles and regulatory frameworks has not experienced the same supply and pricing issues. However, the Australian Energy Market Operator (AEMO) has forecast a small supply deficit for several years from 2023, until Woodside’s Scarborough project is brought online.

As Australia rapidly reduces its reliance on coal for power generation and develops large-scale renewable generation and transmission infrastructure, Woodside expects gas to play a critical role in ensuring reliable and affordable energy. With further supply challenges forecast in coming years, any longer-term solution to current pricing issues will require investment in new gas infrastructure and supply.


1.

Source: World Economic Outlook update (January 2023) - Inflation Peaking amid Low Growth.

2.

Source: S&P Global

3.

Source: Wood Mackenzie


21


Table of Contents

SECTION 2.4

Business model and value chain

Woodside’s business model seeks to optimise returns across the value chain by prioritising competitive growth opportunities; utilising our operational, development and technological capabilities; and deepening relationships in energy markets with strong demand growth.


2022 examples


Acquire, explore and develop

We grow our portfolio through acquisitions and exploration, based on a disciplined approach to optimising shareholder value and appropriately managing risk. We look for material positions in world-class assets and basins that are aligned with our capabilities and existing portfolio. We are focused on value and look to generate low cost, lower carbon development opportunities. During the development phase, we aim to maximise value by selecting the most competitive concept for extracting, processing and delivering energy to our customers.


       Completed merger with BHP’s petroleum business on 1 June 2022 and targeting FID readiness for Trion and H2OK in 2023.


Project execution

We are building on more than 35 years of project execution expertise, investing in opportunities in Australia and internationally. We have combined the extensive projects experience of Woodside and BHP Petroleum across oil and gas. Woodside is benefitting from the increased scope and scale of the new projects portfolio through knowledge sharing across projects and our relationships with suppliers and contractors. We design and execute projects with a focus on safety, cost and sustainability.


Continued project execution

of Scarborough and Sangomar

Field Development Phase 1.


Operate

Our operations are characterised by strong safety, reliability and environmental performance in remote and challenging locations. In Australia, our operated assets include the NWS Project and Pluto LNG. We also operate Macedon and three floating production storage and offloading (FPSO) facilities, and have non- operated interests in Bass Strait and Wheatstone. Internationally, we operate Shenzi in the Gulf of Mexico and Angostura and Ruby in Trinidad and Tobago, and have non-operated interests in Atlantis and Mad Dog in the Gulf of Mexico. We endeavour to adopt technology and a continuous improvement mindset to support operational performance and optimise the value of our assets.


Increased production by accelerating Pluto gas through the Pluto-KGP Interconnector for processing at NWS’s KGP.


Achieved reliability above 98% at Pluto LNG and KGP.


Market

Our relationships with customers have been maintained through a track record of reliable delivery since the NWS Project’s first LNG cargo was delivered to Japan in 1989. We are building scale and flexibility in our portfolio by expanding our global marketing presence and enabling further optimisation and short-term trading activities. We manage our LNG portfolio by balancing contract term and price mix exposure; and timing of when we place contracts to capture opportunities through the price cycle. We continue to look for opportunities to collaborate with our customers on lower carbon energy solutions.


Entered into a long-term sale and purchase agreement to supply LNG to Europe. Also entered into an offtake agreement to access low cost and flexible LNG supply in the Atlantic basin.


Decommission

Decommissioning is integrated into project planning, from the earliest stages of development through to the end of field life. We work with global contractors to safely remove facilities and plug and abandon wells that are no longer required for our operations. We work with regulators to deliver our decommissioning commitments.


Completed permanent plug and abandonment (P&A) of four wells in the Balnaves field. The Enfield P&A campaign continued with five wells permanently plugged and 13 xmas trees removed.


22


Table of Contents


  SECTION 3: OUR BUSINESS


SECTION 3.1

Australian operations

Woodside’s Australian portfolio consists of operated and non-operated oil and gas projects across Australia. On completion of the merger with BHP’s petroleum business, Woodside doubled its interest in the North West Shelf Project and acquired interests in Bass Strait, Pyrenees and Macedon. Woodside’s share of production from Australian operations was 136.6 MMboe in 2022, a 50% increase compared to 2021.1

Pluto LNG

Pluto LNG is a gas processing facility in the Pilbara region of Western Australia, comprising an offshore platform and one onshore LNG processing train.

Woodside’s share of Pluto production was 52.4 MMboe in 2022, an 18% increase compared to 2021. This increase was driven by sustained high reliability of 98.3% for 2022, the start up of the Pluto-KGP Interconnector ahead of schedule and the commencement of operations on the first phase of the Pyxis Hub.

Processing of Pluto gas at KGP commenced in March 2022, resulting in the production of 13 additional LNG cargoes in 2022.

The Pyxis and Pluto North subsea tiebacks achieved steady state operations in January 2022, followed by the successful completion of the Xena-2 tieback in November 2022.

We continued to undertake safe and reliable operations at Pluto LNG with no Tier 1 or 2 process safety events in 2022, and strong safety performance while completing a high level of maintenance work.

Woodside is pursuing the opportunity to reduce Scope 1 emissions at Pluto LNG by utilising solar energy from the proposed Woodside Solar project.

Woodside celebrated in May 2022, the tenth anniversary of the first LNG produced at Pluto and in November 2022, the delivery of the asset’s 700th LNG cargo. In December 2022, Pluto achieved the milestone of 50 million tonnes of LNG produced since start up in 2012. In 2023, a major turnaround is planned for Pluto LNG.

Woodside is operator and holds a 90% participating interest.

North West Shelf Project

The NWS Project consists of three offshore platforms and the Onshore Karratha Gas Plant (KGP) which includes five onshore LNG processing trains. It produces LNG, condensate, pipeline gas and natural gas liquids (NGLs).

Woodside’s share of NWS Project production was 36.7 MMboe in 2022, a 49% increase compared to 2021. This was driven by the increase of Woodside’s equity share from 16.67% to 33.33% following completion of the merger. In 2022, NWS also sustained high LNG reliability of 98.5% and successfully completed a major turnaround on KGP LNG Train 3 in May 2022.

The Greater Western Flank Phase 3 and Lambert Deep infill projects started up ahead of schedule and under budget. The successful delivery of the projects contributed to KGP continuing to operate at near full production rates in 2022.

In September 2022, the NWS Project celebrated the delivery of the 6,000th LNG cargo from KGP.

The NWS Project commenced tolling operations in March 2022 with the processing of gas delivered from Pluto through the Pluto-KGP Interconnector. During the year, 9.4 MMboe of production was delivered through the Interconnector. This is the first example of KGP processing third-party gas by utilising spare capacity.


1.

Includes production of 0.9 MMboe primarily from feed gas purchased from Pluto non-operating participants processed through the Pluto-KGP Interconnector.


23


Table of Contents

Woodside and NWS Project participants signed non-binding agreements with Western Gas for processing 2-3 Mtpa of Equus gas from 2027, initially through KGP and then later through Pluto LNG. Discussions continue with other resource owners for processing of additional third-party gas.

The NWS Project remains on track to accept Waitsia gas for processing at KGP in the second half of 2023.

State and Commonwealth regulatory approval processes continue for the North West Shelf Project Extension, which supports long-term operations and processing of future third-party gas resources at KGP.

Woodside is operator and holds a 33.33% participating interest.

Wheatstone and Julimar-Brunello

Wheatstone is an LNG processing facility near Onslow, Western Australia, comprising an offshore production platform and two onshore LNG processing trains. It processes gas from several offshore gas fields including Julimar and Brunello.

Woodside’s share of Wheatstone production was 12.2 MMboe in 2022, a decrease from 13.5 MMboe in 2021 primarily due to the major facility turnaround in 2022.

The Julimar-Brunello Phase 2 project, which included the tieback of the Julimar field to the Wheatstone platform, achieved steady- state operations in Q1 2022.

Wheatstone safely completed the second phase of the multi-year, major turnaround in May 2022. High-rate production trials commenced in September 2022 to assess the feasibility of increased domestic gas production capacity. Trials are expected to conclude in Q2 2023.

Woodside completed concept select for Julimar-Brunello Phase 3 and is maturing the project. The third phase of the Julimar- Brunello project will involve the tieback of additional production wells to the Wheatstone platform.

In 2023, Woodside is targeting FID readiness for Julimar-Brunello Phase 3.

Woodside is operator and holds a 65% participating interest in the Julimar-Brunello fields. Woodside holds a 13% non-operated interest in the Wheatstone project.

Bass Strait

The Bass Strait is located in the south-east of Australia and produces oil and gas through a network of offshore platforms, pipelines and onshore processing facilities.

The Bass Strait assets include the Gippsland Basin Joint Venture (GBJV) and Kipper Unit Joint Venture (KUJV), which were added to Woodside’s portfolio on 1 June 2022.

Woodside’s share of production from the Bass Strait was 19.6 MMboe in 2022, driven by strong plant reliability and gas demand.

The Bass Strait remains an important source of gas supply to the Australian east coast. The GBJV continues to invest in gas supply for the domestic market including taking a FID to develop additional gas from the Gippsland Basin Kipper field in March 2022.

The GBJV is progressing carbon dioxide (CO2) emissions reduction opportunities which include executing long-term carbon dioxide supply contracts and progressing early front-end engineering design (pre-FEED) studies to determine the potential for carbon capture and storage in the Gippsland Basin.

The focus in 2023 is progressing execution of the Kipper Compression project, facility optimisation with reducing production rates and ongoing offshore decommissioning obligations.

Woodside holds a 50% non-operating interest in the GBJV and a 32.5% non-operating interest in the KUJV.

Other oil and gas assets

Woodside operates three floating production storage and offloading (FPSO) facilities off the north-west coast of Western Australia. These are the Okha FPSO (Woodside interest: 50%), Ngujima-Yin FPSO (Woodside interest: 60%) and Pyrenees FPSO (Woodside interest: 40% in WA-43-L and 71.4% in WA-42-L).

Macedon (Woodside interest: 71.4%), also operated by Woodside, is a gas project located near Onslow, Western Australia which produces pipeline gas for the Western Australian domestic gas market.

The Pyrenees FPSO and Macedon were added to Woodside’s portfolio on 1 June 2022.

Woodside’s share of production from the FPSO assets was 10.6 MMboe, up from 8.6 MMboe in 2021.

Woodside’s share of production from Macedon was 5.1 MMboe since 1 June 2022. The Macedon facility delivered approximately 18% of the Western Australian domestic gas market supply in 2022.

Permanent plugging and abandonment of four wells in the Balnaves field was successfully completed in November 2022. The well decommissioning activity was undertaken in preparation for the removal of remaining subsea infrastructure.

Bumi Armada’s application to the High Court for special leave to appeal a judgement of the Court of Appeal of Western Australia in respect to its claim against Woodside following termination of FPSO services in 2016 was dismissed in November 2022.

In 2023, a major dry-dock turnaround is planned on the Ngujima-Yin FPSO.


24


Table of Contents

SECTION 3.2

International operations

Woodside’s international portfolio includes assets in the US Gulf of Mexico and the Caribbean with embedded growth options. Woodside is focused on safe, low cost, reliable operations and production optimisation.

Shenzi

Shenzi is a conventional oil and gas field developed through a tension leg platform (TLP) located in the US Gulf of Mexico.

Woodside’s share of production from Shenzi was 6.2 MMboe from 1 June 2022. A side track development well was brought online in July 2022, increasing field production rates. A subsea multi-phase pump was installed in April-May 2022 to improve recovery from existing producing wells and future infill wells. The B102 well was returned to service after an extended workover.

Shenzi North is a two-well subsea tieback to the Shenzi TLP and is targeting first oil in 2024. The second development well was drilled in 2022 and completion operations were ongoing at year end. Completion operations will be followed by subsea equipment installation and hook up.

In 2023, focus areas include infill maturation based on seismic acquired in 2022 tying in the Shenzi North project.

Woodside is operator and holds a 72% participating interest.

Atlantis

Atlantis is a conventional oil and gas development and is one of the largest producing fields in the US Gulf of Mexico. The Atlantis development includes a semi-submersible facility with 26 active producer wells and two water injector wells.

Woodside’s share of production from Atlantis was 6.3 MMboe from 1 June 2022. Ocean bottom node (OBN) seismic acquisition was completed in June 2022, supporting optimisation of future development opportunities.

A planned turnaround was completed in August 2022 with the executed scopes expected to deliver increased facility reliability.

In 2023, the focus areas include maturing the scope of facilities and water injection expansions and a horizontal well trial to improve infill productivity.

Woodside holds a 44% non-operating interest.

Mad Dog

Mad Dog is a conventional oil and gas development located in the US Gulf of Mexico. The Phase 1 development includes a spar facility with drilling capability and 10 active producer wells.

Mad Dog Phase 2 is a development of the southern flank of the Mad Dog field. It includes the installation of a new floating production facility, Argos, with production capacity of up to 140,000 gross barrels of oil equivalent per day (100% project). Start up is expected in 2023.

Woodside’s share of production from Mad Dog was 2.6 MMboe from 1 June 2022. OBN seismic acquisition and analysis is in progress to inform subsequent development phases.

In 2023, the focus areas include Mad Dog Phase 2 start up and A-spar debottlenecking.

Woodside holds a 23.9% non-operating interest.

Angostura and Ruby

Greater Angostura includes the Angostura and Ruby conventional oil and gas fields, located offshore Trinidad and Tobago. The development includes an offshore central processing facility and five wellhead platforms.

Woodside’s share of production from Greater Angostura was 5.8 MMboe from 1 June 2022. Woodside continues to pursue opportunities to maximise value, and safely optimise production and operating costs.

In 2023, focus areas include prioritisation of production enhancement activities.

Woodside is operator and holds a 45% participating interest in the Angostura field and a 68.5% participating interest in the Ruby field.


25


Table of Contents

SECTION 3.3

Marketing and trading

Woodside’s global portfolio has expanded following the merger with BHP’s petroleum business, increasing our positions in the Asia-Pacific and Atlantic basins.

Woodside has a proven track record in our integrated shipping, operations, marketing and trading activities across LNG, condensate, crude and NGL cargoes.

Woodside’s LNG portfolio is managed through a mix of short, mid and long-term contracts, supplied with cargoes sourced from producing assets or purchased from third parties.

In the Asia-Pacific, the LNG portfolio has been supplemented by Pluto gas transported through the Pluto-KGP Interconnector, which has resulted in additional sales of uncontracted LNG cargoes in a high-priced market. In 2022, Woodside’s exposure of produced LNG to gas hub indices was 23%.

Woodside’s LNG trading activities seek to maximise value of our LNG portfolio. Third-party cargoes are purchased from Corpus Christi LNG through a long-term offtake agreement and from the prompt market through our relationships with other producers and traders.

The marketing of crude, condensate and natural gas liquids is predominately based on short-term sales and supplemented by term arrangements.

Natural gas is sold domestically in both Western Australia and the east coast of Australia. In Western Australia, Woodside’s domestic gas obligations are met from multiple producing assets. All production from Bass Strait is sold into the east coast domestic market. From June to December 2022, Woodside supplied approximately 86 petajoules (PJ) of natural gas from the project, representing approximately 15% of all gas supplied to the east coast market.1 In 2023, almost 90% of Woodside’s equity production from the Bass Strait has been sold under term sales and any excess capacity is expected to be sold into domestic spot markets. In the Western Australian market, Woodside volumes accounted for approximately 14% of domestic gas supplied in 2022.

In the Gulf of Mexico, crude oil is sold to refiners and traders on the US Gulf Coast. In Trinidad and Tobago, crude oil is sold to international markets and natural gas is sold into the domestic market.

In 2022, Woodside entered into a long-term sale and purchase agreement (SPA) with Uniper Global Commodities to supply LNG from our global portfolio to Europe. Woodside also entered into an offtake agreement with Commonwealth LNG, to provide low cost and flexible LNG for Woodside’s Atlantic position.2

Woodside’s LNG shipping fleet includes six vessels under long-term contracts and multiple vessels on short-term charter. Woodside chartered an additional five new build LNG ships in 2022 to support the delivery of Scarborough LNG cargoes and growth in trading activities. The new-build vessels are expected to be delivered between 2024 and 2027.


1.

Approximately 24% on an annualised basis.

2.

This will become fully effective upon the satisfaction of customary conditions including an affirmative FID on the project.


26


Table of Contents

SECTION 3.4

Projects

Woodside’s projects portfolio has increased scale and is underpinned by strong project delivery capability.

Scarborough

The Scarborough gas field is located in the Carnarvon Basin, approximately 375 km off the coast of Western Australia. The field is being developed through new offshore facilities connected by an approximately 430 km pipeline to a second LNG train at the existing Pluto LNG onshore facility.

Development of Scarborough includes the installation of a floating production unit (FPU) with eight wells drilled in the initial phase and 13 wells drilled over the life of the Scarborough field.

Expansion of Pluto LNG includes the construction of a second LNG train (Pluto Train 2), installation of additional domestic gas processing facilities and supporting infrastructure and modifications to the existing Pluto Train 1 to allow it to process Scarborough gas.

Scarborough gas is expected to produce approximately 5 million tonnes per annum (Mtpa) of LNG from Pluto Train 2, and up to 3 Mtpa of LNG from the existing Pluto Train 1. The Scarborough reservoir contains less than 0.1% CO2. The lean Scarborough gas composition is well suited to the design of Pluto LNG.

The sale of a 49% non-operating participating interest in the Pluto Train 2 Joint Venture to Global Infrastructure Partners (GIP) was completed in January 2022.

Fabrication of the FPU topsides commenced in June 2022 and FPU hull fabrication commenced in October 2022.

All phase 1 subsea production trees were delivered ahead of the planned commencement of drilling operations in 2023. Pipeline manufacturing commenced in February 2022 and three shipments of linepipe were delivered to Indonesia for application of insulation coating. Subsea flowline fabrication also commenced in August 2022.

Pluto Train 2 site works commenced in June 2022, the construction accommodation village became operational in August 2022 and the Train 2 module fabrication activities commenced in November 2022.

Front-end engineering design (FEED) activities for Pluto Train 1 modifications were completed in Q4 2022 and execution activities are planned to commence in Q2 2023.

Woodside continues to work with Traditional Custodians to identify, manage and protect heritage located near the project footprint on the Burrup Peninsula.1,2 The Scarborough Cultural Heritage Management Plan was approved by the Western Australian Department of Water and Environmental Regulation in January 2023.

Woodside received the final primary approvals for Scarborough in early 2022 from the Commonwealth-Western Australian Joint Authority. This included the pipeline licence to construct and operate the Scarborough pipeline in Commonwealth waters and approval for the Scarborough Field Development Plan, enabling Woodside to commence petroleum recovery operations.

Regulator assessment of secondary environmental approvals for offshore project execution activities is ongoing.

The sell-down process for equity in the Scarborough Joint Venture is progressing.

Woodside is targeting first LNG cargo in 2026.

Woodside is operator and holds a 100% participating interest in Scarborough, 51% participating interest in Pluto Train 2 and 90% participating interest in Pluto LNG.


1.

The Traditional Custodians are members of the local Aboriginal groups with traditional rights and responsibilities in relation to the land and water in which we operate.

2.

Heritage is the places, objects, landscapes, traditions or other matters that have cultural significance to a community. Cultural significance is defined in the Burra Charter as ‘aesthetic, historic, scientific, social or spiritual value for past, present or future generations. Cultural significance is embodied in the place itself, its fabric, setting, use, associations, meanings, records, related places and related objects.’


27


Table of Contents

Sangomar

Development of the offshore Sangomar field, containing both oil and gas, is Senegal’s first offshore oil project.

The Sangomar Field Development Phase 1 is developing the less complex reservoirs in the Sangomar field and testing other reservoirs to support potential future phases.

Oil will be produced through a stand-alone FPSO facility with supporting subsea infrastructure. It is designed to allow the tie-in of subsequent phases.

The FPSO Léopold Sédar Senghor is a converted oil tanker with new topsides, turret and mooring systems.

The construction phase for the FPSO facility was completed in China. The FPSO facility was successfully relocated in December 2022 to Singapore to complete topsides integration and pre-commissioning.

The drilling and completions campaign involves the drilling of 23 production, gas and water injection wells. The reinjection of gas and water will help maximise the recovery of the oil and enable gas to be stored for future use. At the end of 2022, seven wells were complete, ten further wells partially complete and six wells were still to spud.

A first drillship, the Ocean BlackRhino, commenced the drilling campaign in July 2021 and was joined by a second drillship, the Ocean BlackHawk, commencing operations in July 2022 using a batch drilling approach to enable operational efficiencies.

Subsea equipment fabrication is complete, and the subsea installation campaign commenced in September 2022.

Woodside is committed to supporting the development of local capabilities, supporting training initiatives, offering local employment and business opportunities and supporting capacity building within Senegal.

To date, over 4,400 local Senegalese people have worked on the project and approximately 1,000 local businesses have been engaged across the supply chain.

The Sangomar Field Development Phase 1 is targeting first oil in late 2023.

Woodside is operator and holds an 82% participating interest in the Sangomar exploitation area and a 90% participating interest of the remaining Rufisque Offshore, Sangomar Offshore and Sangomar Deep Offshore (RSSD) evaluation area.

Trion

The Trion project is an oil opportunity in Mexico and is located in the Gulf of Mexico, approximately 180 km off the Mexican coastline and 30 km south of the US/Mexico maritime border at a water depth of approximately 2,500 metres. Trion will be one of Mexico’s first deepwater oil developments and is targeting FID readiness in 2023.

The selected concept for Trion is a subsea development connected to a semi-submersible FPU capable of producing and transferring 100,000 barrels of oil per day to a floating storage and offloading (FSO) vessel. Oil from the FSO is expected to be exported to the market, with excess gas transferred back via a pipeline to existing offshore gas export infrastructure.

The main components of the reservoir development plan include crestal gas injection, peripheral water injection, and phased development drilling with 24 total wells. The field was appraised with a total of six well penetrations.

A number of activities were completed during the year including FPU FEED, offshore seabed surveys and OBN seismic data interpretation while subsea hardware vendor engineering commenced. Key tender packages were also issued for competitive bids.

In 2023, the project is expected to progress the necessary technical, commercial and regulatory work streams to support FID readiness and commence execution activities if sanctioned.

Woodside is operator and holds a 60% participating interest.


28


Table of Contents

SECTION 3.5

Exploration and development

Woodside’s portfolio of developments and targeted exploration program is focused on identifying and addressing key technical and commercial elements to allow resources to compete for capital.

Calypso

Calypso is located approximately 220 km off the coast of Trinidad and comprises several gas discoveries in Block 23(a) and Block TTDAA 14. Two appraisal wells were drilled in 2021 to delineate the resource and provide information for development studies. Appraisal results are being assessed in conjunction with conceptual engineering studies.

Woodside is operator and holds a 70% participating interest.

Browse

The Browse development comprises the Calliance, Brecknock and Torosa gas and condensate fields located approximately 425 km north of Broome, Western Australia.

The Browse Joint Venture (BJV) is evaluating the development of these fields through the NWS Project’s KGP. Commercial discussions continue between the Browse and NWS joint ventures. The final Commonwealth Environmental Impact Statement was published in September 2022 and regulatory approvals processes are ongoing.

In 2022, the BJV determined that a carbon capture and storage (CCS) solution to abate Browse reservoir CO2 was feasible and the CCS infrastructure has subsequently been incorporated into the development concept. Woodside was awarded a greenhouse gas assessment permit over the Calliance field in August 2022.

Woodside is operator and holds a 30.6% participating interest.

Liard

The Liard basin is located in British Columbia, western Canada. Woodside is assessing development concepts for the resource.

Woodside is operator and holds a 100% participating interest in 28 leases, and a 50% non-operated interest in 11 leases.1

Sunrise

The Sunrise development comprises the Sunrise and Troubadour gas and condensate fields which are located approximately 450 km north-west of Darwin and 150 km south of Timor-Leste.

During 2022, the Sunrise Joint Venture (SJV) and Australian and Timor-Leste Governments held two further Greater Sunrise trilateral meetings to progress a new production sharing contract (PSC). Subsequent to the quarter, retention lease renewals were granted for Australian titles NT/RL2 and NT/RL4.

Woodside is operator and holds a 33.44% participating interest.

Myanmar

On 27 January 2022, Woodside decided to withdraw from its interests in Myanmar. Some formal exit activities continue in order to complete Woodside’s country exit.

Wildling

Wildling was a two-well tieback opportunity to the Shenzi TLP in the central Gulf of Mexico. Drilling of an appraisal well was completed in July 2022 and sub-commercial quantities of hydrocarbons were encountered. The well was plugged and abandoned, and Woodside does not plan to pursue any further Wildling development activities in Blocks GC564 or GC520.


1

Includes 9 titles acquired from Chevron Canada (via split-transfer) in 2021 awaiting execution by the British Columbia Ministry of Energy.


29


Table of Contents

Exploration

Woodside is focused on accessing, testing and developing low cost, lower carbon, value-adding opportunities with the characteristics and project pace to be resilient through the energy transition.

In the US Gulf of Mexico, Woodside completed a number of cross assignments and farm outs with Shell, Oxy and Equinor separately, which expanded the portfolio while managing capital and risk. Woodside drilled the Hoodoo-1 well which did not find hydrocarbons and participated in the non-operated Starman-1 well which found hydrocarbons below Woodside’s threshold for a standalone development and is subject to ongoing analysis.

In Senegal, Woodside drilled a well to appraise a nearfield tieback opportunity near the Sangomar field. The well encountered gas at the appraisal target depth and was plugged and abandoned as planned.

In the Caribbean, Woodside acquired exploration 3D seismic over our Barbados acreage and completed a farm down agreement with Shell. In Australia, 2D seismic was acquired offshore northern Australia.

Additionally, Woodside has established acreage positions in key areas viewed to be competitive and fast to market including Egypt and Congo. In the Egyptian Red Sea, Woodside participated in a 3D seismic acquisition over Blocks 3 and 4. In Congo, Woodside completed a joint agreement with operator Total Energies to farm down a joint 30% interest to Petronas.

Following completion of the merger with BHP’s petroleum business, Woodside took decisive action to exit our exploration positions in offshore Canada and the Republic of Korea.


30


Table of Contents

SECTION 3.6

New energy and carbon solutions

Woodside’s new energy strategy is centred on building relationships across the value chain and developing profitable solutions to meet customer requirements that have the ability to scale to match the pace of the energy transition.

We target locations that have advantaged access to lower cost renewables, enabling infrastructure or access to market. Our competitive advantage is our experience as a safe and reliable producer and supplier of bulk energy to customers across the globe. Woodside has set a target to invest $5 billion in new energy products and lower carbon services by 2030.1

H2OK

H2OK is a proposed liquid hydrogen project to be located in Ardmore, Oklahoma with a maximum design capacity of 90 tonnes per day (tpd) of liquid hydrogen through electropysis, initially targeting the heavy transport sector.

Woodside completed FEED activities in 2022 which have matured the facility design, cost and schedule. In October 2022, Woodside awarded a contract to supply 160MW of alkaline electrolyser equipment and in December 2022 awarded a contract for liquefaction units with a capacity of 60 tpd.

Woodside is operator and holds a 100% participating interest.

H2Perth

H2Perth is a proposed hydrogen and ammonia production facility to be located in Perth, Western Australia. Phase 1 of the project is targeting up to 2,700 tpd of ammonia produced through gas reforming and electrolysis. It is targeting supply to local industry and international users. Subsequent phases have the potential to expand to 8,900 tpd by increasing the electrolysis component. Pre-FEED commenced in May 2022.

Woodside is operator and holds a 100% participating interest.

Hydrogen Refueller @H2Perth

In 2022, Woodside announced plans for a proposed self-contained hydrogen production, storage and refuelling station located adjacent to H2Perth, named the Hydrogen Refueller @H2Perth. Initially, Woodside is targeting production of 0.2 tpd of hydrogen, with the potential to scale up to a targeted 0.8 tpd. Woodside is targeting the supply of hydrogen to industrial customers and the public.

Woodside is operator and holds a 100% participating interest.

Southern Green Hydrogen

Woodside has been selected as the preferred partner for the Southern Green Hydrogen project, a proposed hydrogen and ammonia facility to be located in Southland, New Zealand. The proposal is targeting up to 1,400 tpd of ammonia. Southern Green Hydrogen is expected to utilise renewable power to produce hydrogen and ammonia for export and domestic supply.

H2TAS

Woodside has a proposed renewable ammonia and hydrogen production facility in the Bell Bay area of Tasmania. H2TAS is planned to be a phased development, targeting an initial capacity of up to 550 tpd of ammonia. Ammonia would be produced through electrolysis, utilising a combination of wind and hydroelectric power. Woodside continues to evaluate the cost and schedule impacts of the renewable power solutions that would enable the project to progress.

Woodside is operator and holds a 100% participating interest.


1.

Individual investment decisions are subject to Woodside’s investment targets. Not guidance. Potentially includes both organic and inorganic investment.


31


Table of Contents

Heliogen

Woodside and Heliogen entered into a project agreement in 2022 to deploy a 5 MW module of Heliogen’s artificial intelligence- enabled concentrated solar energy technology in California. In addition, Heliogen and Woodside have signed a collaboration agreement to jointly market Heliogen’s renewable energy technology in Australia.

Woodside Solar

Woodside is progressing the proposed Woodside Solar project, a facility which would initially generate electricity from a solar photovoltaic farm approximately 15 km south-west of Karratha in Western Australia, complemented by a battery energy storage system. The facility is expected to supply up to 100 MW of solar energy with potential expansion to a maximum of 500 MW. It could supply Pluto LNG (potentially reducing Woodside’s Scope 1 emissions) as well as other customers located near Karratha that are connected to the North West Interconnected System (NWIS).

In 2022, Woodside entered a bilateral Indigenous Land Use Agreement and a modern benefit sharing agreement with the Ngarluma Aboriginal Corporation, which holds the native title rights on behalf of the Ngarluma people, for the land where Woodside Solar is proposed. Woodside also executed options to lease associated land within the Maitland Industrial Estate with Development WA and has been progressing NWIS connection and transmission access arrangements.

Woodside is operator and holds a 100% participating interest.

Carbon solutions

Some technologies can abate emissions from conventional processes by capturing greenhouse gases and durably storing them out of the atmosphere.

Offsets

Woodside is developing a portfolio of carbon credits to contribute to the achievement of its net equity Scope 1 and 2 greenhouse gas emissions targets. These carbon credits also have the potential to be bundled with product sales to assist customers with their carbon abatement.

Carbon capture and storage

Woodside, as a participant in various joint ventures, was awarded three greenhouse gas assessment permits in 2022. These permits enable carbon capture and storage assessments in the Browse Basin (operated), Northern Carnarvon Basin (operated) and Bonaparte Basin (non-operated).

One of these permits covers the depleted Angel gas field, which could provide a storage reservoir for a multi-user carbon capture and storage (CCS) project near Karratha in Western Australia. This could be ideally located to aggregate emissions from various existing industrial emissions sources on the Burrup Peninsula. It could also have the potential to facilitate the development of new industries, such as the production of hydrogen and ammonia, by providing a local solution for emissions. The size of the potential CCS facility is subject to the completion of additional technical, regulatory and commercial studies, but could have a processing capacity of up to 5 million tonnes of carbon dioxide per annum.

Woodside is also a participant in the Gippsland Basin Joint Venture, which is progressing a feasibility study into the development of a south-east Australian carbon capture and storage hub. This aims to utilise existing infrastructure to capture and store CO2 in the depleted Bream reservoir located offshore Victoria.

Carbon to products

In 2022, Woodside launched a carbon capture and utilisation (CCU) collaboration with US based technology developers ReCarbon and LanzaTech to assess the viability of a proposed CCU pilot facility in Perth, Western Australia. The proposed pilot CCU facility would convert greenhouse gases into ethanol.

Woodside and LanzaTech also entered into a strategic framework agreement, under which Woodside will collaborate with LanzaTech to design, construct, own, maintain and operate pilot facilities utilising LanzaTech’s CCU technologies. LanzaTech’s skillset is in the fields of synthetic biology, bioinformatics, artificial intelligence, and machine learning coupled with engineering.

Woodside also announced plans to invest US$9.9 million in String Bio Private Limited (String Bio), the developer of a patented process for recycling greenhouse gases into products such as livestock feed. Woodside and String Bio entered a strategic development agreement to explore opportunities for the potential commercial scale up of String Bio’s technology.


32


Table of Contents
     OFFSETS      

CARBON CAPTURE
AND STORAGE

(CCS)2


CARBON TO

PRODUCTS

     
FOCUS   

Originate carbon credits and

purchase from select third

parties


Secure and accelerate CCS in

Australia and beyond


Invest in technology

advancement to convert

carbon into useful products

     
BENEFITS    Available at scale now      

Potential for large scale CO2

storage

       Future conversion of carbon at
source of generation
     
PROGRESS   

Executing plan to secure

offsets to meet Woodside’s

2030 net emissions reduction

targets1


Awarded three permits to

advance studies on carbon

capture and storage in

Australia

       Collaborations with String Bio,
ReCarbon and LanzaTech


1.

Woodside equity emissions abatement demand is based on current and sanctioned projects at current equity share as well as near and medium term net equity Scope 1 and 2 greenhouse gas emissions targets. Refer to section 3.7 - Climate and sustainability for further information on Woodside’s net emissions reduction targets.

2.

The greenhouse gas assessment permits are subject to commercial agreements and regulatory approvals.


33


Table of Contents

SECTION 3.7

Climate and sustainability

Woodside aims to thrive through the energy transition by building a low cost, lower carbon, profitable, resilient and diversified portfolio.1 Climate and sustainability considerations are integral to our success.

Climate

Our climate strategy is an integral part of our company strategy. It has two key elements: reducing our net equity Scope 1 and 2 greenhouse gas emissions and investing in the products and services that our customers need as they secure their energy needs and reduce their emissions.

Woodside has targets to reduce our net equity Scope 1 and 2 greenhouse gas emissions by 15% by 2025 and 30% by 2030, towards our aspiration to achieve net zero by 2050 or sooner.2,3 In 2022, Woodside’s net equity Scope 1 and 2 greenhouse gas emissions totalled 4,615 kt CO2-e in 2022, which was 11% below the starting base. To achieve this, 754 kt CO2-e of carbon credits were retired.

Woodside plans to achieve these targets by avoiding greenhouse gas emissions through the way we design our assets; reducing greenhouse gas emissions through the way we operate our assets; and originating and acquiring carbon credits to use as offsets for the remainder.

How we operate our facilities has a direct impact on our progress towards our emission reduction targets. In 2022, asset decarbonisation plans were developed for the heritage Woodside assets, with the intention to extend these to the heritage BHP operated assets.4 These plans identify opportunities to reduce emissions, such as energy efficiency projects, equipment modifications and lower carbon power.

In 2022, Woodside signed the Aiming for Zero Methane Emissions Initiative, becoming the first Australasian company to do so. The signatories to the Initiative state that they believe virtually all methane emissions from the industry can and should be avoided.

Woodside has a target to invest $5 billion in new energy products and lower carbon services by 2030, as part of our Scope 3 emissions plan.5 At the end of 2022, Woodside has spent more than $100 million towards its $5 billion target. This spend includes electrolysers and liquefaction equipment for the proposed H2OK hydrogen project, the Heliogen pilot project, as well as the investment in String Bio.

Sustainability

We apply an ESG mindset to guide decision making at all levels of the business. Our activities and reporting continue to evolve in response to the increasing focus on sustainability priorities.

We conduct a broad-based materiality assessment process each year to inform our understanding of which sustainability topics are relevant to our business activities and stakeholders. This includes consideration of potential risks, opportunities and impacts.

Woodside is an active member of the Voluntary Principles on Security and Human Rights Initiative. It is underpinned by risk assessments, training, management of arrangements with private security providers and where applicable arrangements with public security.

Woodside has been a member of Extractive Industries Transparency Initiative (EITI) since 2005 and became an EITI Supporting Company in 2008. We are also an active member in Senegal, Timor-Leste and Trinidad and Tobago multi- stakeholder groups.


1.

Please see section 6.8 – Glossary, units of measure and conversion factors for a definition of how Woodside uses the term lower carbon portfolio.

2.

Target is for net equity Scope 1 and 2 greenhouse gas emissions, relative to a starting base representative of the gross annual average equity Scope 1 and 2 greenhouse gas emissions over 2016-2020 and may be adjusted (up or down) for potential equity changes in producing or sanctioned assets with an FID prior to 2021.

3.

Net equity greenhouse gas emissions are equal to Woodside’s equity share of gross greenhouse gas emissions reduced by the number of retired carbon credits.

4.

Heritage Woodside refers to Woodside’s assets prior to the merger with BHP’s petroleum business. Heritage BHP refers to the assets acquired through the merger with BHP’s petroleum business.

5.

Individual investment decisions are subject to Woodside’s investment targets. Not guidance. Potentially includes both organic and inorganic investment.


34


Table of Contents

SECTION 3.8

Risk factors

Woodside recognises that risk is inherent in our business and the effective management of risk is vital to deliver our strategic objectives, continued growth and success.

We are committed to managing risks in a proactive and effective manner as a source of competitive advantage.

Our approach is intended to protect us against potential negative impacts and improve our resilience against emerging risks. The objective of our risk management framework is to provide a single consolidated view of risks across the company to understand our full risk exposure and prioritise risk management and governance.


LOGO   For more information on our risk management process, refer to our Risk Management Policy, which can be found on our website at woodside.com

Woodside’s risk management process is presented as a set of iterative steps that we undertake in a coordinated manner. The process helps us implement risk management to effectively identify, assess, and control risks, thereby enhancing the likelihood of achieving our business objectives. The process involves:


communication and consultation with key stakeholders


define risk scope, context and criteria


risk assessment


risk treatment


monitor and review risk management process


record and report risks.

The process is defined in our risk management procedure which is designed to provide a consistent process for the recognition and management of risks that have the potential to materially impact the achievement of Woodside’s business objectives.

The Audit & Risk Committee plays a crucial role in assisting the Board meet its oversight responsibility in relation to Woodside’s risk management procedures. Refer to section 4.1.3 - Board committees for more information on the Audit & Risk Committee.

We categorise risks into three categories:

Strategic risks - Risks that could affect our organisation’s ability to achieve its strategic objectives.

Entity risks - Risks that could affect our organisation’s ability to achieve our business objectives. They can be positive, negative, or both and can address, create, or result in opportunities and threats.

Emerging risks - Risks defined as an external threat or opportunity that has a high degree of uncertainty due to rapid or non-linear evolution. They have the potential to materially impact the achievement of strategic objectives.

Woodside’s risk appetite statement is a vital element of our risk framework. The statement communicates the type and amount of risk we are willing to take and accept in pursuit of our strategic objectives. The statement is designed to enable our organisation to make risk informed decisions.


35


Table of Contents

Overview of our strategic and material risk factors

Climate change


The global response to climate change is changing the way the world produces and consumes energy. The complex and pervasive nature of climate change means transition risks are interconnected with and may amplify other risks. Additionally, the inherent uncertainty of potential societal responses to climate change may create a systemic risk to the global economy. Climate change may also create significant physical risks, such as increased frequency and severity of storms, wildfires, floods and other climatic events, as well as chronic shifts in temperature and precipitation patterns.


How is this factor relevant to Woodside?


Woodside’s risks associated with climate change and the transition to a lower carbon economy include possible impacts to demand (and pricing) for oil, gas and its substitutes, the policy and legal environment for its production, and Woodside’s reputation and the operating environment. We may also face risks related to climate change’s potential to cause physical damage or disruptions to our assets or our supply chains.

Woodside is an energy company and in order for us to meet the needs of our current and future customers and the communities in which we operate, we must forecast and manage several critical risks to evolve and prosper through this transition.

These elements include:


the demand and pricing of oil and gas


the regulation of oil and gas production and consumption


the timing and rate of the global transition to a lower carbon economy


public perception of Woodside and the broader oil and gas industry


access to carbon credits or emission allowances


uncertainties associated with changing weather patterns.


Examples of how this factor may impact Woodside


    Physical impacts on our assets or those of our suppliers or customers caused by increased frequency or intensity of severe weather events.


    Over or under investing in oil and gas reserves leading to an imbalance between our supply and global demand.


    Failure to transition to new energy at a pace that serves the global demand.


    Climate-driven changes to legislation or climate-related litigation resulting in additional costs and adversely impacting Woodside’s reputation.


    Low availability and high cost of emission allowances or carbon credits impacting Woodside’s ability to meet its 2025 and 2030 net emissions reduction targets.1
  Reputational risks with respect to Woodside or the oil and gas industry in general.


  Financial risks, including limits on availability of funding or changes in financing terms for oil and gas projects.

These impacts may lead to a loss in shareholder value, loss of market share to competitors, delays or stoppages in our operations, reduced capacity to fund capital projects, delayed or suspended regulatory approvals, legal liabilities and adverse impacts on Woodside’s reputation, social licence to operate and on the delivery of our strategy.


How is Woodside managing these risks?


Woodside is actively engaged in reducing our emissions and improving our energy efficiency, while providing opportunities for our customers and value chain participants to decarbonise, by supplying LNG and developing innovative lower carbon solutions and markets with a goal of growing a longer-term resilient portfolio.

We have near and mid-term emissions reduction targets with plans to meet them.1 We engage and advocate with key industry and governance stakeholders. Our Climate Report includes further information on Woodside’s approach to managing climate change risks.


LOGO   For more information on this topic, refer to Woodside’s website for the Climate Report 2022 at woodside.com


1.

Target is for net equity Scope 1 and 2 greenhouse gas emissions, relative to a starting base representative of the gross annual average equity Scope 1 and 2 greenhouse gas emissions over 2016-2020 and may be adjusted (up or down) for potential equity changes in producing or sanctioned assets with an FID prior to 2021.


36


Table of Contents

Social licence to operate


Risks associated with actual or alleged deviation from social or business expectations of ethical behaviour (including breaches of laws or regulations) and social responsibility (including environmental impact and community contribution), particularly as these expectations evolve.


How is this factor relevant to Woodside?


Woodside relies on maintaining healthy relationships with our numerous stakeholders in order for us to achieve our objectives. Our employees, host communities, Traditional Owners, government authorities, investors and other groups form significant relationships with our organisation. These relationships are built on the trust that Woodside will meet our stakeholders’ expectations. We must also consider the role our commercial agreements play in relation to human rights around the world, we have a responsibility to ensure the rights of all humans aren’t negatively affected by our organisation.

Some of the most significant risks to our relationships with stakeholders include:


engaging in activities that have real or perceived adverse impacts on the environment, biodiversity, human rights or cultural heritage


failing to meet our climate reduction targets or investment targets in new energy


inadequately responding to quickly evolving expectations of Woodside (including expectations that may significantly differ in the various jurisdictions in which we operate).

Additionally, third-party risks that are outside of our control could negatively impact our reputation and licence to operate, such as oil spills or other disasters or scandals that cause collateral damage to Woodside’s licence to operate via reputational damage to the oil and gas industry at large.

Failure to maintain healthy relationships with our various stakeholders may result in violation of local or national laws or regulations, significant reputational damage, delayed approvals, civil suits and ultimately the deterioration of our licence to operate.


Examples of how this factor may impact Woodside


    Limited, delayed or failed approvals from local and national government bodies.


    Lost or limited stakeholder support for our current business and future opportunities.


    Risks related to class action lawsuits, litigation and activism, including allegations of greenwashing.


    Reductions in the availability, or less favourable terms, of financing.


    Decreased ability to attract and retain a talented workforce, and other operational concerns.

These impacts may lead to a loss in shareholder value, loss of market share to competitors, delays or stoppages in our operations, reduced capacity to fund capital projects, delayed or suspended regulatory approvals, legal liabilities and adverse impacts on Woodside’s reputation, social licence to operate and on the delivery of our strategy.

Our business conduct informed by the United Nations Guiding Principles on Business and Human Rights (UNGPs), which set a global standard of conduct for all businesses wherever they operate. These principles exist over and above compliance with national laws and regulations protecting human rights.


How is Woodside managing these risks?


Woodside proactively maintains and builds our social licence to operate through the application of our values, effective stakeholder engagement strategies, our regulatory compliance framework and our anti-fraud and corruption program.

Our regulatory compliance framework assists Woodside to proactively maintain relationships with governments and regulators within countries that support base business and future growth opportunities.

Woodside maintains meaningful relationships with stakeholders, seeking proactive engagement to inform decisions and gain support for changes.

Our fraud and corruption framework aims to prevent, detect and respond to unethical behaviour. It incorporates policies, standards, guidelines and training, which will enable us to conduct our activities ethically and to a high standard.


37


Table of Contents

Growth


Risks associated with delivery of both major and complex multi-year execution project activities across multiple global locations, including a reliance on third parties for materials, products and services.


How is this factor relevant to Woodside?


Traditional energy: In order to maintain our production levels and deliver shareholder value, Woodside must continue to identify growth opportunities and commercialise them. In order to maintain a stable pipeline of future projects and realise the full value of growth opportunities, Woodside will need to compete with major oil companies, national oil companies (NOCs), independent oil and gas companies, individual producers and new energy companies. Failure to effectively compete with these companies may result in the inability to continue to expand Woodside’s current operations and deliver shareholder value.

Woodside must continue to effectively manage relationships with industry partners, for example, at times we enter joint ventures with organisations which may also be a competing oil and gas supplier. It is essential that our voice is heard both within our industry and more broadly. In order for us to effectively communicate, we may at times align with industry bodies to advocate what we believe is right.

In addition, our current and planned projects involve many unknown uncertainties and operating risks that could prevent us from realising profits or result in the total or partial loss of our investment. For example our Scarborough project is more than 12 months in to execution phase, however, we may face third-party opposition to environmental approvals, potentially impacting our project delivery schedule.

New energy: We have targeted to invest $5 billion in new energy products and lower carbon services by 2030.1 However, there is uncertainty around the pace of required technological innovation and the reliability of technologies that will be needed to transition to a lower carbon environment. In addition, new sources of energy, such as hydrogen or ammonia, may be more difficult to commercialise than expected or may not be able to be commercialised safely or as efficiently as expected at scale. Woodside may also face unforeseen obstacles in the commercialisation of a future carbon capture business and in the implementation of other lower carbon services and emission reduction efforts.


Examples of how this factor may impact Woodside


    An unbalanced portfolio of traditional and new energy which may not meet the market’s needs.


    Limited or reduced market share resulting in a loss of shareholder value.


    Our competitors may be able to pay more for exploratory prospects and productive oil and natural gas properties and may be able to define, evaluate, bid for and purchase a greater number of properties and prospects, including operatorships and licences, than our financial or human resources permit.


    Our projects could experience project implementation schedule slippage, permitting delays, shortages of or delays in the delivery of equipment or purpose-built components from suppliers, escalation in capital cost estimates, possible shortages of construction or other personnel, other labour shortages, environmental occurrences during construction that result in a failure to comply with environmental regulations or conditions on development, or delays and higher-than-expected costs due to the remote location of the projects, the impact of COVID-19 on the relevant workforce or supply chain, other unanticipated natural disasters, accidents, miscalculations, political or other opposition, litigation, acts of terrorism, operational difficulties, climate change related risks or other events associated with that construction that may result in the delay, suspension or termination of our projects.
  An inability to obtain financing at acceptable costs, or at all, for the development of new energy projects.


  Failure to implement our new energy plans within our anticipated time frame, or at all.


  Higher than expected competition in the markets for new energy products and lower carbon services in which Woodside expects to participate.

These impacts may lead to a loss in shareholder value, loss of market share to competitors, delays or stoppages in our operations, reduced capacity to fund capital projects, delayed or suspended regulatory approvals, legal liabilities and adverse impacts on Woodside’s reputation, social licence to operate and on the delivery of our strategy.


How is Woodside managing these risks?


Our opportunity management framework is flexible and adaptable with the primary objective to realise the value of an opportunity while mitigating the risk of a suboptimal outcome.

We aim to identify and progress a suite of commercially attractive and sustainable opportunities that complement our existing assets, enable portfolio diversity and optimise our commercial position.


1.

Individual investment decisions are subject to Woodside’s investment targets. Not guidance. Potentially includes both organic and inorganic investment.


38


Table of Contents

Operations


Due to the nature of our operations, Woodside and our communities are potentially exposed to a broad range of risks. This is a result of factors such as the geographical range, operational diversity and technical complexity of our assets.

Health and safety: Our operations are subject to risks related to safety or major hazard events in connection with our activities or facilities, and may also include unanticipated or unforeseeable adverse events which impact our ability to respond, manage and recover from such events.

Commercial: We manage commercial risks within our operations, including third-party relationships such as joint venture partners, contract counterparties and our supply chain.

Regulation: Woodside is subject to extensive governmental oversight and regulation in the jurisdictions in which we operate, and such regulations may change in ways that adversely affect our business, results of operations and financial condition. In addition, we are required to comply with securities regulations in Australia, the US and the UK.

Reserves and resources estimates: We manage the estimation of proved oil and gas reserves by using judgment and the application of complex rules, and subsequent downward adjustments of Woodside’s reported reserves estimates are possible.


How is this factor relevant to Woodside?


General operational risks: Our operating assets are subject to a range of operating risks associated with process safety incidents, breaches of cybersecurity, extreme weather events and supply chain disruptions. Disruptions to our supply chain, or failure of our contractual counterparties to fulfill their obligations, could adversely impact our production, operations and our financial performance, result in litigation or class actions and cause long-term damage to our reputation.

Health and safety: At Woodside, one of our competitive advantages is our record of operating safely. Failure to continue to do so could result in sustained production interruptions leading to an inability to meet production forecasts, as well as potential reputational damage with customers, employees, commercial partners and other stakeholders.

Commercial: The majority of our major projects and operations are conducted in joint ventures, which may limit our control over, and our ability to effectively manage risks associated with, such projects. Joint venture participants may have economic or business interests or objectives that are inconsistent with or opposed to our interests and objectives. For projects in which we are not the operator, we may be unable to control the behaviour, performance and cost of operations of joint ventures in which we participate. In these cases, we will be dependent on joint venture participants acting as operators and their ability to direct operations or manage the timing and performance of any activity or the costs or risks involved may be reduced.

Regulation: We are subject, in each of the countries in which we operate, to various national and local laws, regulations and approvals relating to the exploration, development, production, marketing, pricing, transportation and storage of our products, as well as the management, decommissioning, clean up and restoration of our properties, and management and disclosure of our operations and impacts. The exploration, production, and transportation of oil and gas involves risk that releases to the environment may occur, which could cause substantial harm to the environment, natural resources, or human health and safety.

These laws and regulations could change, and any such changes could have a material adverse effect on our business and financial condition. Because such laws and regulations are subject to amendment and reinterpretation over time, we are unable to predict the future cost or impact of complying with such laws. Moreover, we cannot predict whether new legislation to regulate the oil and gas industries might be proposed, what proposals, if any, might actually be enacted and what effect, if any, the proposals might have on our operations. The adoption and implementation of new or more stringent legislation, regulations or other regulatory initiatives that result in the imposition of more stringent standards for greenhouse gas emissions from the oil and gas industry could restrict the areas in which this sector may operate, and could result in increased compliance costs and changes in product pricing, which could impact consumer demand for our products.

Additionally, the conduct of Woodside, our employees and our third-party partners could result in actual or alleged breaches of laws, regulations and approvals, including fraud, corruption, anti-competitive behaviour, money laundering, breaching trade or financial sanctions, market manipulation, privacy breaches, ethical misconduct and wider organisational cultural failings. We have incurred and will continue to incur operating and capital expenditures, some of which may be material, to comply with applicable laws, regulations and approvals.

Reserves and resources estimates: Estimating proved oil and gas reserves involves subjective judgements and determinations based on available geological, technical, contractual and economic information. New information from production or drilling activities, changes in economic factors, such as oil and gas prices, alterations in the regulatory policies of host governments in the jurisdictions in which we operate, or other events may cause estimates to change over time. Additionally, estimates may change to reflect acquisitions, divestments, new discoveries, extensions of existing fields and improved recovery techniques.


39


Table of Contents
 Operations   (Cont.)


  Examples of how this factor may impact Woodside


    A loss of containment event or other operational incident on or related to our property or operations could occur, which could have significant impacts including to human health and safety, the environment, natural resources or cultural resources, as well as financial, legal and reputational impacts.


    An aviation incident could result in multiple fatalities.


    Supply chain disruptions such as long wait times for critical spares may cause extended outages at our operations.


    Natural disasters, earthquakes, social unrest, pandemic diseases (such as COVID-19) and criminal actions by external parties could result in injuries, loss of life, disruption of our operations or the loss or suspension of permits or other approvals.


    Our joint venture partners may have the ability to exercise veto rights to block certain key decisions or actions that we believe are in our or the joint venture’s best interests or approve those matters without our support.


    Joint participants or contractual counterparties may be primarily responsible for the adequacy of the human or technical competencies and capabilities which they bring to bear on the joint project, which may not be adequate.


    Our partners and contractual counterparties may not be able to meet their financial or other obligations to the projects.


    Applicable laws and regulations may obligate Woodside to identify, avoid, mitigate and disclose environmental risks in various operational practices, which in turn could materially adversely affect our business, financial condition or results of operations. We may also be required to maintain financial assurance through bonds or insurance.


    A failure to comply with applicable laws, regulations and approvals may result in the assessment of sanctions, including administrative, civil, and criminal penalties, the imposition of investigatory, remedial, and corrective action obligations or the incurrence of capital expenditures, the occurrence of restrictions, delays or cancellations in the permitting, development or expansion of current or proposed projects, and issuance of injunctions restricting or prohibiting some or all of our activities in a particular area.
    The suspension, revocation, failure to renew or alteration of, or challenges to, the terms of the licences, permits, government contracts or approvals required for our operations.


    Sanctions for non-compliance with laws and regulations may include administrative, civil and criminal penalties, demand for reimbursement for government or regulatory actions, government orders, suspension or revocation of licences, permits, government contracts or approvals, and corrective action orders.


    Government policy objectives in the countries in which we do business, now or in the future, could take the form of increased governmental regulations (including in respect of restoration, protection of the environment, greenhouse gas emissions, natural resources, and worker health and safety), redirection of product distribution (such as domestic gas reservation policies), changes in taxation regulation or enforcement (including, for example, changes in tax rates or increased focus on audits), taxation subsidies or royalties, nationalisation of resource assets or restrictions or moratoriums on our operations on government leases, limitations on periods of lease retention, interference with the confidentiality and availability of information, forced renegotiation of contracts, changes in laws and policies governing operations of foreign-based companies, trade sanctions, currency restrictions and exchange rate fluctuations and other governmental steps.


    Actual or alleged violations of the securities laws that we are subject to could result in private or governmental litigation, civil penalties and regulatory action.


    Downward adjustments of our reported reserves estimates could indicate lower future production volumes or the impairment of assets.

These impacts may lead to a loss in shareholder value, loss of market share to competitors, delays or stoppages in our operations, reduced capacity to fund capital projects, delayed or suspended regulatory approvals, legal liabilities and adverse impacts on Woodside’s reputation, social licence to operate and on the delivery of our strategy.


  How is Woodside managing these risks?


    Safe operation is fundamentally embedded through an extensive framework of controls that deliver strong operational performance in our base business. We have a track record of operating discipline and excellence.


    The framework includes production processes, drilling and completions and well integrity management processes, inspection and maintenance procedures and performance standards. The framework is supported and inspected on an ongoing basis by our regulators.
    Decommissioning is integrated into project planning. We work with our partners and technical experts to identify sustainable and beneficial post-closure options that minimise financial, social and environmental impacts.


    The framework is adaptable to enable us to maintain and improve our operating model and performance, target reliability, cost discipline, emissions reductions and strong safety and environmental performance for both our existing business and future growth opportunities.


40


Table of Contents

Finance and market


Risks associated with the ability to capture value whether markets are stable or volatile, and manage the risks associated with interest rate, commodity price and foreign exchange fluctuations and inflation, as well as risks associated with the ongoing integration of the business activities and operations of BHP’s petroleum business.


  How is this factor relevant to Woodside?


Woodside must be financially well positioned in order to pursue our strategic objectives and remain resilient during times of economic challenge. Several factors can affect our position, including:


Market and commodity price: Woodside’s revenues are primarily derived from the sale of hydrocarbons. The prices Woodside receives for these products are variable and are impacted by global economic factors beyond Woodside’s control. We seek to forecast changes in the economic factors to enable us to maintain a strong market position during challenging economic times. Refer to section 6.3 - Additional disclosures and section A in the Notes to the Financial Statements for further information.


Capital management: For Woodside to continue to operate sustainably we must make risk informed decisions related to allocation of capital. We seek to apply a disciplined and balanced approach to capital management through the commodity price cycle. Refer to section 2.2 - Strategy and capital management for further information.


Foreign exchange risk: Woodside is exposed to foreign currency risk from future commitments, financial assets and financial liabilities that are not denominated in US dollars. Refer to section A in the Notes to the Financial Statements for further information.


Interest rate risk: This is the risk that Woodside’s financial position will fluctuate due to changes in market interest rates. Woodside’s risk relates primarily to financial instruments with floating interest rates including long-term debt obligations, cash and short-term deposits. Refer to section C in the Notes to the Financial Statements for further information.


Integration of BHP Petroleum: While Woodside continues to integrate BHP’s petroleum business with its own, there is a risk that integration may take longer than expected or that integration may cost more than anticipated. If integration is not achieved in a timely and effective manner, the full benefits of the combination of the two businesses, including the anticipated cost savings, synergies and other benefits that Woodside expects to achieve from the merger, may be delayed or achieved only in part or not at all. This could adversely impact the merged group’s business, results of operations and financial condition and the prospects of the merged group. Woodside’s financial results could also be adversely affected by impairments of goodwill or other intangible assets, the application of future accounting policies or interpretations of existing accounting policies including by regulatory direction, and changes in estimates of decommissioning costs.


  Examples of how this factor may impact Woodside


    A reduced ability to fund our strategy including our projects.


    An imbalance in supply and demand can impact commodity prices and our ability to forecast market conditions determines whether we are impacted positively or negatively.


    Woodside may become a less attractive joint venture partner.


    Reduced shareholder returns due to lower commodity prices.


    If we inaccurately forecast the global demand for our LNG products we may face difficulties obtaining longer term sales contracts with desirable commercial terms.


    If counterparties to our derivative instruments are unable to fulfill their obligations, a larger percentage of our future oil and gas production could be subject to price changes.


    Inability to achieve anticipated synergies and cost savings on expected timeline or at all.
    Unforeseen costs relating to the integration of development, extraction and production operational systems, IT systems and financial and accounting systems of both businesses.


    Higher than anticipated costs and liabilities for P&A and decommissioning requirements for assets following the merger.


    Impairments of assets, goodwill or other intangible assets could have a significant negative effect on our reported net income and our ability to pay dividends in one or more accounting periods if the level of impairment were to exceed profits available for distribution.

These impacts may lead to a loss in shareholder value, loss of market share to competitors, delays or stoppages in our operations, reduced capacity to fund capital projects, delayed or suspended regulatory approvals, legal liabilities and adverse impacts on Woodside’s reputation, social licence to operate and on the delivery of our strategy.


  How is Woodside managing these risks?


The delivery of our strategic portfolio objectives requires significant capital expenditure, supported by strong underlying cashflows.

Uncertainty associated with product demand is mitigated by selling LNG in a portfolio manner and under long-term take or pay sale agreements, in addition to the spot market. Our low cost of production and prudent approach to balance sheet risk management further mitigates this exposure. Refer to section 6.3 - Additional disclosures and section A in the Notes to the Financial Statements for further information.


    A flexible approach to capital management enables this overall level of investment in the different areas of our business and the mix to be adjusted to reflect the external environment. Our capital management strategy focuses on capital allocation, capital discipline and efficiency, and active balance sheet management including commodity and foreign exchange hedging.
    We maintain insurance in line with industry practice and sufficient to cover normal operational risks. However, Woodside is not insured against all potential risks because not all risks can be insured and because of constraints on the availability of commercial insurance in global markets. Insurance coverage is determined by the availability of commercial options and cost/benefit analysis, taking into account Woodside’s risk management program. Losses that are not insured could impact Woodside’s financial performance. For example, Woodside does not purchase insurance for the loss of revenue arising from an operational interruption. Our extensive framework of financial controls, including monitoring of counterparties, enables the management of these risks.


    The US dollar reflects the majority of Woodside’s underlying cashflows and is used in our financial reporting, reducing our exposure to currency fluctuations. Refer to section A in the Notes to the Financial Statements for further information.


    Refer to section C in the Notes to the Financial Statements for further information on interest rate risk management.


    Woodside has commenced implementing controls and procedures to satisfy the requirements of Sarbanes Oxley (SOX) in 2023.


41


Table of Contents

People and culture


Risks associated with the ability to attract, retain, develop, and motivate key employees to succeed and safeguard both current or future performance and growth.


  How is this factor relevant to Woodside?


People are key to the success of Woodside. We must build and maintain a capable workforce if we are to achieve our strategic objectives. An effective operating model with a balanced organisation structure will allow us to conduct our operations and pursue new energy opportunities. For Woodside to remain an employer of choice, our culture must support our current employees and attract the best new candidates.


  Examples of how this factor may impact Woodside


    During periods of high demand for skilled resources, Woodside may be unable to fill critical roles at acceptable costs or at all, leading to operational impacts.


    A limited ability to operate due to our people leaving critical roles.


    An inability to pursue innovation opportunities due to a skills shortage.


    Loss of key personnel or expert knowledge.


    Inability to integrate or retain new employees in connection with mergers and acquisitions.
    An inability to reach timely agreements with employee bodies may result in industrial action.

These impacts may lead to a loss in shareholder value, loss of market share to competitors, delays or stoppages in our operations, reduced capacity to fund capital projects, delayed or suspended regulatory approvals, legal liabilities and adverse impacts on Woodside’s reputation, social licence to operate and on the delivery of our strategy.


  How is Woodside managing these risks?


Woodside has a set of resourcing frameworks to attract, retain and develop our workforce to support both base business and growth opportunities. We recognise and value the benefits of creating an inclusive and diverse working environment.

We employ a direct engagement model to maintain effective employee and industrial relations. We proactively engage our major contractors and suppliers to strengthen alignment with expectations, securing capability and pricing to meet future business needs.


Digital and cybersecurity


Risks associated with adopting and implementing new technologies, whilst safeguarding our digital information and landscape (including from cyber threats) across our value chain.


  How is this factor relevant to Woodside?


Woodside must relentlessly protect the confidentiality, integrity and availability of digital data, sensitive information and operational technologies. Woodside’s technology systems may be targeted by an internal or external malicious act and our systems may be disrupted unintentionally. Additionally, the cost of implementing and maintaining effective technology systems may be higher than anticipated. While our technology controls are designed to protect against all causes of disruption, we cannot be certain that they will protect our systems in all cases.


  Examples of how this factor may impact Woodside


    In the event of a cyber attack, Woodside’s confidential or sensitive information may be made public or held for ransom.


    Our operations may be disrupted if an attack gains access to our control systems.


    Litigation and governmental proceedings arising from the occurrence of a cyber attack.
    Potential adverse impacts on our reputation and the safety of our employees and the communities in which we operate.

These impacts may lead to a loss in shareholder value, loss of market share to competitors, delays or stoppages in our operations, loss of revenue, increased expenses, reduced capacity to fund capital projects, delayed or suspended regulatory approvals, legal liabilities and adverse impacts on Woodside’s reputation, social licence to operate and on the delivery of our strategy.


  How is Woodside managing these risks?


We are committed to the protection of our people, assets, reputation and brand through securely enabled digital technologies.

Digital risks are identified, assessed and managed based on the business criticality of our people and systems, and may be required to be segregated and isolated. Digital risks include third parties, including suppliers and service providers, within our supply chain.

Our operating model aims to continuously assess and determine access permissions to critical information or data, while consolidating, simplifying and automating security controls.

Our exposure to cyber risk is managed by a control framework that ensures cyber events are identified, contained and recovered in a timely manner, and embeds a cyber-safe culture across the company, with our joint venture participants and in our supply chain. However, there can be no assurance that such procedures and controls will be sufficient to prevent security breaches.


42


Table of Contents

SECTION 3.9

Reserves Statement

Woodside produced 156.8 MMboe for sale in 2022, including 61.4 MMboe produced since 1 June 2022 from interests acquired as part of the merger with the BHP Petroleum business on 1 June 2022 (Acquired Assets). An additional 14.9 MMboe of production was consumed primarily as fuel in operations in the year ended 31 December 2022 (FY2022) resulting in a total production of 171.7 MMboe for 2022.1 At 31 December 2022, Woodside’s remaining Proved (1P) Reserves are 2,385.2 MMboe (Table 1).

Woodside is an Australian company listed on the Australian Securities Exchange, the New York Stock Exchange, and the London Stock Exchange. Woodside reports its Proved (1P) Reserves in accordance with United States Securities and Exchange Commission (SEC) regulations. These guidelines are also compliant with 2018 Society of Petroleum Engineers/ World Petroleum Council/American Association of Petroleum Geologists/Society of Petroleum Evaluation Engineers Petroleum Resources Management System (SPE-PRMS).

The acquisition of the Acquired Assets on 1 June 2022 increased Woodside’s Proved (1P) Reserves as at 1 June 2022 by 922.8 MMboe to 2,339.6 MMboe. These changes are further described below.

Unless stated otherwise, the following apply to this Reserves Statement: The effective date for Reserves estimates is 31 December 2022. Proved Reserves are calculated using SEC-compliant economic assumptions and pricing. Production is reported for the period from 1 January 2022 to 31 December 2022. Reserves and Production stated are Woodside’s net share and inclusive of fuel consumed in operations.

FY2022 included revisions of previous estimates of 202.5 MMboe for 1P Reserves. Key drivers for the revisions include:


completion of an Atlantis full field integrated subsurface study that resulted in a 46.3 MMboe increase in 1P Reserves


inclusion of offshore fuel gas reserves and favourable commodity prices resulting in a net increase of 51.7 MMboe to Proved Undeveloped Reserves at Scarborough


inclusion of fuel gas reserves and incorporation of drilling results at Sangomar resulting in a Proved Undeveloped Reserves increase of 24.7 MMboe


improved overall field performance at Pluto, North West Shelf, and Julimar-Brunello led to 1P Reserves increases of 31.7 MMboe, 17.6 MMboe, and 25.7 MMboe, respectively.

Proved Undeveloped to Proved Developed reclassifications are further discussed in the Proved Undeveloped Reserves section of this Reserves Statement.


43


Table of Contents

Table 1: Woodside’s Reserves2,3,4 overview (net Woodside share, as at 31 December 2022)


Natural gas5

Bcf7


NGLs6

MMbbl8


Oil &

condensate

MMbbl


Total

MMboe9


Fuel included

in total

MMboe


Proved10 Developed11 and Undeveloped12

     10,783.6        26.3        467.0        2,385.2        251.6  

Proved Developed

     2,925.1        22.5        234.3        770.0        81.1  

Proved Undeveloped

     7,858.5        3.8        232.8        1,615.2        170.5  

  Small differences are due to rounding

Methodology

Reserves estimates have not been adjusted for risk. Proved (1P) Reserves are estimated and reported on a net interest basis, excluding royalties owned by others, in accordance with the SEC regulations and have been determined in accordance with SEC Rule 4-10(a) of Regulation S-X. As defined by the SEC, Proved (1P) Reserves are those quantities of crude oil, natural gas, and natural gas liquids that, by analysis of geoscience and engineering data, can be estimated with reasonable certainty to be economically producible from a given date forward from known reservoirs and under existing economic conditions, operating methods, operating contracts, and government regulations. Unless evidence indicates that renewal of existing operating contracts is reasonably certain, estimates of economically producible Reserves reflect only the period before the contracts expire. The project to extract the hydrocarbons must have commenced or the operator must be reasonably certain that it will commence within a reasonable time.

Proved Reserves are estimated by reference to available well and reservoir information, including but not limited to well logs, well test data, core data, production and pressure data, geologic data, seismic data and, in some cases, similar data from analogous, producing reservoirs. A wide range of engineering and geoscience methods, including performance analysis, numerical simulation, well analogues and geologic studies, (Reliable Technologies), have been used to develop high confidence in estimated quantities.

Changes in the estimates of Reserves from those reported by Woodside in the reserves statement in Woodside’s 2021 Annual Report released in February 2022 include changes due to the matters noted below, including changes in the basis used to define the volumes reported and the inclusion of volumes added as a result of the merger with the BHP Petroleum business.

Specifically:


Prior to the merger with BHP Petroleum, Woodside reported Proved Reserves based on the SPE-PRMS guidelines. Woodside now reports its Proved Reserves in accordance with SEC regulations. The use of SEC-compliant methods for estimating and reporting Proved Reserves resulted in reductions in the estimates of Proved Reserves for some assets. SEC-compliant Proved Reserves estimates use a more restrictive rules-based approach and are generally lower than estimates prepared solely in accordance with SPE-PRMS guidelines due to certain differences, including because the SEC-compliant Proved Reserves use specified commodity price assumptions, exclude probabilistic aggregation, and use a narrower interpretation around unpenetrated sand bodies and fault blocks.


Woodside’s Reserves are now reported inclusive of all fuel consumed in operations. Prior to the merger with BHP Petroleum, Woodside’s Reserves were reported net of the fuel consumed in operations up to the outlet of the floating production storage and offloading facility (FPSO) or platform (for offshore oil projects) or the inlet to the downstream (onshore) processing facility (for onshore gas projects).


To achieve consistency between Woodside’s reporting of production and reserves volumes, Woodside now uses ‘natural gas’, ‘natural gas liquids’, and ‘oil/condensate’ volumes categories, effective 1 June 2022, which are defined based on products. Prior to the merger with BHP Petroleum Woodside used ‘dry gas’ and ‘condensate’ volumes categories, which were defined based on composition.


The barrel of oil equivalent (boe) conversion factor for natural gas remains unchanged at 5.7 Bcf per MMboe, the same conversion factor used previously for dry gas. The Acquired Assets are now reported on this basis. Historically, the BHP Petroleum business used a boe conversion factor of 6.0 Bcf per MMboe.

Governance and Assurance

Woodside has several processes to provide assurance for Reserves reporting, including the Woodside Reserves Policy, the Woodside Petroleum Resources Management Procedure, the Woodside Petroleum Resource Management Guideline, staff training, and minimum competency levels. The Reserves reported for the Acquired Assets were assured by Woodside in accordance with the processes previously applied by the BHP Petroleum business. Reserves assessments are reviewed to ensure technical quality and compliance with SEC reporting requirements. Unless otherwise stated, all petroleum reserves estimates are quoted at standard oilfield conditions of 14.696 pounds per square inch (psi) (101.325 kPa) and 60 degrees Fahrenheit (15.56 degrees Celsius).


44


Table of Contents

Qualified petroleum reserves evaluator statement

The estimates of petroleum reserves are based on and fairly represent information and supporting documentation prepared by, or under the supervision of Mr. Ben Stephens, Woodside’s Vice President Reserves and Subsurface, who is a full-time employee of the company and a member of the Society of Petroleum Engineers. The reserves statement as a whole has been approved by Mr. Stephens. Mr. Stephen’s qualifications include a Bachelor of Engineering (Petroleum Engineering) from the University of New South Wales, Australia, and 19 years of relevant experience.

Table 2: Proved (1P) Developed and Undeveloped Reserves Reconciliation (net Woodside share, as at 31 December 2022)


      Australia       International       Total  
       
    LOGO       LOGO       LOGO       LOGO       LOGO       LOGO       LOGO       LOGO       LOGO       LOGO       LOGO       LOGO  
                         

 Proved Reserves

    Bcf       MMbbl       MMbbl       MMboe       Bcf       MMbbl       MMbbl       MMboe       Bcf       MMbbl       MMbbl       MMboe  
       

 Reserves as at 31 December 2019

    2,865.3       0.0       83.4       586.1       0.0       0.0       0.0       0.0       2,865.3       0.0       83.4       586.1  
       

 Acquisitions and Divestments14

    0.0       0.0       0.0       0.0       0.0       0.0       0.0       0.0       0.0       0.0       0.0       0.0  
       

 Extensions and Discoveries15

    9.6       0.0       0.1       1.8       0.0       0.0       0.0       0.0       9.6       0.0       0.1       1.8  
       

 Revision of Previous Estimates16

    89.1       0.0       -2.6       13.0       0.0       0.0       0.0       0.0       89.1       0.0       -2.6       13.0  
       

 Production1

    -461.5       0.0       -19.9       -100.8       0.0       0.0       0.0       0.0       -461.5       0.0       -19.9       -100.8  
                         

 Reserves as at 31 December 2020

    2,502.5       0.0       61.1       500.1       0.0       0.0       0.0       0.0       2,502.5       0.0       61.1       500.1  
       

 Acquisitions and Divestments

    0.0       0.0       0.0       0.0       0.0       0.0       0.0       0.0       0.0       0.0       0.0       0.0  
       

 Extensions and Discoveries

    5,146.4       0.0       0.2       903.0       0.0       0.0       81.2       81.2       5,146.4       0.0       81.3       984.2  
       

 Revision of Previous Estimates

    151.2       0.0       12.9       39.5       0.0       0.0       0.0       0.0       151.2       0.0       12.9       39.5  
       

 Production

    -430.1       0.0       -16.7       -92.1       0.0       0.0       0.0       0.0       -430.1       0.0       -16.7       -92.1  
                         

 Reserves as at 31 December 2021

    7,370.0       0.0       57.5       1,350.5       0.0       0.0       81.2       81.2       7,370.0       0.0       138.7       1,431.6  
       

 Acquisitions and Divestments

    3,096.1       18.3       34.0       595.4       251.2       7.7       275.6       327.4       3,347.4       26.0       309.6       922.8  
       

 Extensions and Discoveries

    0.0       0.0       0.0       0.0       0.0       0.0       0.0       0.0       0.0       0.0       0.0       0.0  
       

 Revision of Previous Estimates

    682.3       3.6       12.3       135.6       112.0       2.1       45.2       66.9       794.3       5.7       57.5       202.5  
       

 Production

    -692.5       -4.5       -24.0       -150.0       -35.4       -0.8       -14.7       -21.7       -728.0       -5.3       -38.7       -171.7  
                         

 Reserves as at 31 December 2022

    10,455.8       17.3       79.7       1,931.4       327.8       9.0       387.3       453.8       10,783.6       26.3       467.0       2,385.2  
       
 Fuel included in 31 December 2022 Reserves     1,266.3       0.5       0.0       222.7       164.7       0.0       0.0       28.9       1,431.0       0.5       0.0       251.6  
       

 Proved Developed and Undeveloped Reserves


 Proved Developed Reserves                        
       

 as at 31 December 2019

    2,151.0       0.0       73.7       451.1       0.0       0.0       0.0       0.0       2,151.0       0.0       73.7       451.1  
       

 as at 31 December 2020

    1,778.5       0.0       51.2       363.3       0.0       0.0       0.0       0.0       1,778.5       0.0       51.2       363.3  
       

 as at 31 December 2021

    1,744.5       0.0       50.2       356.3       0.0       0.0       0.0       0.0       1,744.5       0.0       50.2       356.3  
       

 as at 31 December 2022

    2,722.6       16.7       73.3       567.6       202.5       5.9       161.0       202.4       2,925.1       22.5       234.3       770.0  


 Proved Undeveloped Reserves


 as at 31 December 2019

    714.4       0.0       9.7       135.0       0.0       0.0       0.0       0.0       714.4       0.0       9.7       135.0  
       

 as at 31 December 2020

    724.0       0.0       9.8       136.8       0.0       0.0       0.0       0.0       724.0       0.0       9.8       136.8  
       

 as at 31 December 2021

    5,625.5       0.0       7.2       994.2       0.0       0.0       81.2       81.2       5,625.5       0.0       88.4       1,075.3  
       

 as at 31 December 2022

    7,733.2       0.7       6.4       1,363.8       125.2       3.1       226.3       251.4       7,858.5       3.8       232.8       1,615.2  

Small differences are due to rounding


45


Table of Contents

Proved Undeveloped Reserves

At 31 December 2022, Woodside’s remaining Proved Undeveloped Reserves were 1,615.2 MMboe, which is roughly 68% of the total remaining Proved Reserves of 2,385.2 MMboe. This represents an increase in Proved Undeveloped Reserves of 539.9 MMboe from the 1,075.3 MMboe as at 31 December 2021. The largest element of this increase was a 529.7 MMboe increase as a result of the acquisition of the Acquired Assets.

During FY2022, a total of 54.0 MMboe Proved Undeveloped Reserves were converted to Proved Developed Reserves through development activities primarily in the following projects: Greater Western Flank Phase 3 and Lambert Deep developments at North West Shelf in Australia (20.5 MMboe), infill well (XNA02) to support ongoing production from the Pluto LNG Project in Australia (15.8 MMboe), and multiple development opportunities at Shenzi in the US Gulf of Mexico including installation and commissioning of subsea multiphase pumping and well completions (17.1 MMboe).

Development plan changes in Sangomar and Julimar-Brunello Phase 3 resulted in 24.7 MMboe and 4.1 MMboe increases to Proved Undeveloped Reserves. Favourable commodity prices resulted in an increase of 15.5 MMboe in Proved Undeveloped Reserves. Additionally, a net increase of 19.9 MMboe in Proved Undeveloped Reserves occurred due to positive revisions in Scarborough and Bass Strait partially offset by negative revisions due to technical studies and performance at Pluto and Julimar-Brunello.

Material concentrations of Undeveloped Reserves in the North West Shelf, Greater Pluto, and Julimar Brunello regions have remained undeveloped for longer than five years from the dates they were initially reported as the incremental reserves are expected to be recovered through future developments to meet long-term contractual commitments. The incremental projects are included in the company business plan, demonstrating the intent to proceed with the developments. Material concentrations of Undeveloped Reserves in the US Gulf of Mexico are under active development and are converted to Developed Reserves as wells are drilled and completed. The Mad Dog Phase 2 development is expected to come online in 2023.

The changes in Proved Undeveloped Reserves in FY2022 are summarised by category in Table 3.

Table 3: Proved Undeveloped Reserves Reconciliation (net Woodside share, as at 31 December 2022)


Total

MMboe


 Reserves as at 31 December 2021

          1,075.3  
   

 Acquisitions and Divestments

          529.7  
   

 Revision of Previous Estimates

          10.2  


   Reclassifications to Developed          -54.0  


   Performance, Technical Studies, and Other          19.9  


   Development Plan Changes          28.8  


   Price          15.5  
   

 Extensions and Discoveries

          -  
   

 Reserves as at 31 December 2022

                                      1,615.217  

Small differences are due to rounding

During FY2022, Woodside spent $3.8 billion on development activities worldwide. Of this amount:


$3.5 billion was spent progressing the conversion of Proved Undeveloped Reserves for projects where development status was achieved in FY2022 or will be achieved when development is completed in the future; and


$0.3 billion represented other development expenditures, including compliance and infrastructure improvement.

Notes to the Reserves Statement


1.

‘Production’ is the volume of natural gas, NGLs, condensate and oil produced during the period from 1 January 2022 to 31 December 2022 and converted to ‘MMboe’ for the specific purpose of reserves reconciliation. The production volume figures in this Reserves Statement differ from the production volume figures reported in Woodside’s annual and quarterly reports, because the production volume figures reported in this Reserves Statement include all fuel consumed in operations but exclude 0.9 MMboe in excess of Reserves working interest percentage primarily from Pluto non-operating participants processed via the Pluto-KGP Interconnector.


2.

For offshore oil projects, the reference point is defined as the outlet of the floating production storage and offloading facility (FPSO) or platform, while for the onshore gas projects the reference point is defined as the outlet of the downstream (onshore) gas processing facility.


46


Table of Contents
3.

‘Reserves’ are estimated quantities of petroleum that have been demonstrated to be producible from known accumulations in which the company has a material interest from a given date forward, at commercial rates, under presently anticipated production methods, operating conditions, prices, and costs. Woodside reports Reserves inclusive of all fuel consumed in operations. Proved (1P) Reserves are estimated and reported in accordance with SEC regulations which are also compliant with SPE-PRMS guidelines. SEC-compliant Proved (1P) Reserves estimates use a more restrictive, rules-based approach and are generally lower than estimates prepared solely in accordance with SPE-PRMS guidelines due to, among other things, the requirement to use commodity prices based on the average of first of month prices during the 12-month period in the reporting company’s fiscal year.


4.

All Proved (1P) Reserves estimates have been estimated using deterministic methodology and reported on a net interest basis in accordance with the SEC regulations, and have been determined in accordance with SEC Rule 4-10(a) of Regulation S-X. Unless otherwise stated, all petroleum estimates reported at the company or region level are aggregated by arithmetic summation by category. The aggregated Proved (1P) Reserves may be a conservative estimate due to the portfolio effects of arithmetic summation.


5.

‘Natural gas’ is defined as the gas product associated with liquefied natural gas (LNG) and pipeline gas. Liquid volumes of crude oil, condensate, and NGLs are reported separately.


6.

‘Natural gas liquids’ or ‘NGL’ is defined as the product associated with liquified petroleum gas (LPG) and consists of propane, butane, and ethane - individually or as a mixture.


7.

‘Bcf’ means Billions (109) of cubic feet of gas at standard oilfield conditions of 14.696 psi (101.325 kPa) and 60 degrees Fahrenheit (15.56 degrees Celsius).


8.

‘MMbbl’ means millions (106) of barrels of NGL, oil and condensate at standard oilfield conditions of 14.696 psi (101.325 kPa) and 60 degrees Fahrenheit (15.56 degrees Celsius).


9.

‘MMboe’ means millions (106) of barrels of oil equivalent. Natural Gas volumes are converted to oil equivalent volumes via a constant conversion factor, which for Woodside is 5.7 Bcf of dry gas per 1 MMboe. Volumes of NGL, oil and condensate are converted from MMbbl to MMboe on a 1:1 ratio.


10.

‘Proved Reserves’ are those quantities of crude oil, condensate, natural gas and NGLs that, by analysis of geoscience and engineering data, can be estimated with reasonable certainty to be economically producible from a given date forward from known reservoirs and under existing economic conditions, operating methods, operating contracts, and government regulations. Proved Reserves are estimated and reported on a net interest basis in accordance with the SEC regulations and have been determined in accordance with SEC Rule 4-10(a) of Regulation S-X.


11.

‘Developed Reserves’ are those Reserves that are producible through currently existing completions and installed facilities for treatment, compression, transportation, and delivery, using existing operating methods and standards.


12.

‘Undeveloped Reserves’ are those Reserves for which wells and facilities have not been installed or executed but are expected to be recovered through future significant investments.


13.

‘International’ consists of Trinidad and Tobago, Senegal, and the United States Gulf of Mexico


14.

‘Acquisitions and Divestments’ are revisions that represent changes (either upward or downward) in previous estimates of Reserves which result from either purchase or sale of interests and/or execution of contracts conveying entitlement, and, in this Reserves Statement includes volumes added as a result of the merger with the BHP petroleum business.


15.

‘Extensions and Discoveries’ represent additions to Reserves that result from increased areal extensions of previously discovered fields demonstrated to exist subsequent to the original discovery and/or discovery of Reserves in new fields or new reservoirs in old fields.


16.

‘Revision of Previous Estimates’ are changes (either upward or downward) in previous estimates of Reserves which, for the purposes of this Reserves Statement, includes: adjustments (i) to include all fuel consumed in operations; and (ii) to revise reporting categories to achieve consistency between Woodside’s reporting of production and reserves volumes.


17.

Scarborough Proved (1P) Undeveloped Reserves as at 31 December 2022 are 7,336.0 Bcf (1,287.0 MMboe). Development activities are underway.


47


Table of Contents

Drilling and other exploratory and development activities

The number of crude oil and natural gas wells drilled and completed for each of the last three years was as follows:


     Net exploratory wells    Net development wells      
     
          Productive            Dry            Total              Productive            Dry            Total                Total      
     

Year ended 31 December 20221


Australia

   -    -    -    0.9    -    0.9    0.9
     

International2

   0.9    2.0    2.9    1.2    -    1.2    4.0
               

Total

   0.9    2.0    2.9    2.1    -    2.1    4.9
     

Year ended 31 December 2021


Australia

   -    -    -    0.6    -    0.6    0.6
     

International3

   -    1.5    1.5    -    -    -    1.5
               

Total

   -    1.5    1.5    0.6    -    0.6    2.1
     

Year ended 31 December 2020


Australia

   -    -    -    4.4    0.7    5.0    5.0
     

International

   -    -    -    -    -    -    -
               

Total

   -    -    -    4.4    0.7    5.0    5.0

Small differences are due to rounding


  1.

Includes BHP Petroleum from 1 June 2022 to 31 December 2022.

  2.

International is primarily US.

  3.

International is primarily Myanmar.

As set out in this section, the number of wells drilled refers to the number of wells completed at any time during the respective year, regardless of when drilling was initiated. Completion refers to the installation of permanent equipment for production of oil or gas, or, in the case of a dry well, to reporting to the appropriate authority that the well has been abandoned.

An exploratory well is a well drilled to find oil or gas in a new field or to find a new reservoir in a field previously found to be productive of oil or gas in another reservoir. A development well is a well drilled within the limits of a known oil or gas reservoir to the depth of a stratigraphic horizon known to be productive.

A productive well is an exploratory, development or extension well that is not a dry well. Productive wells include wells in which hydrocarbons were encountered and the drilling or completion of which, in the case of exploratory wells, has been suspended pending further drilling or evaluation. A dry well is an exploratory, development, or extension well that proves to be incapable of producing either oil or gas in sufficient quantities to justify completion as an oil or gas well.

During 2022, productive development wells included the XNA02 Xena well in Australia and wells at Shenzi and Atlantis in the US GoM. Dry exploratory wells included the Hoodoo test in Western GoM, Wildling, which was a potential Shenzi tie back, and the non-operated Starman test in the central GoM. In Senegal, Woodside drilled a productive exploratory well to appraise a nearfield tieback opportunity near to the under construction Sangomar FPSO facility.

Present development activities continuing as of 31 December 2022

The number of wells in the process of drilling and/or completion as of 31 December 2022 was as follows:


     Exploratory wells    Development wells    Total
 
              Gross                    Net                    Gross                    Net                    Gross                    Net        
 

Australia

   -    -    -    -    -    -
 

International1

   -    -    30    13.0    30    13.0
             

Total

   -    -    30    13.0    30    13.0


  1.

International is primarily US and Senegal

Development wells in progress include Sangomar wells in Senegal, Mad Dog Phase 2 wells, Atlantis wells, Shenzi North wells and a Mad Dog A spar well in the US GoM. The Sangomar development is installing a waterflood recovery scheme as part of the ongoing project, and in the Gulf of Mexico a waterflood recovery scheme is included in the Mad Dog Phase 2 project.

Oil and gas properties, wells, operations and acreage

The following tables show the number of gross and net productive crude oil and natural gas wells and total gross and net developed and undeveloped oil and natural gas acreage as at 31 December 2022. A gross well or acre is one in which a working interest is owned, while a net well or acre exists when the sum of fractional working interests owned in gross wells or acres equals one.

Productive wells are producing wells and wells mechanically capable of production. Developed acreage is comprised of leased acres that are within an area by or assignable to a productive well. Undeveloped acreage is comprised of leased acres on which wells have not been drilled or completed to a point that would permit the production of economic quantities of oil and gas, regardless of whether such acres contain proved reserves.


48


Table of Contents

The number of productive crude oil and natural gas wells in which Woodside held an interest at 31 December 2022 was as follows:


     Crude oil wells    Natural gas wells    Total
 
              Gross                    Net                    Gross                    Net                    Gross                    Net        
 

Australia

   323    167.8    183    94.1    506    262.0
 

International1

     77      38.3      10      4.7      87      43.1
 

Total

   400    206.2    193    98.9    593    305.0

Small differences are due to rounding


  1.

International is primarily US and Trinidad and Tobago.

Of the productive crude oil and natural gas wells, 140 (net: 66) wells had multiple completions. The number of wells with multiple completions refers to wells that have downhole equipment installed that allows zonal isolation or controlled commingling of production as permitted and approved by the applicable regulator.

Developed and undeveloped acreage (including both leases and concessions) held at 31 December 2022 was as follows:


      Developed acreage    Undeveloped acreage
Thousands of acres            Gross                      Net                      Gross                      Net          

Australia

   2,417    1,212      3,406      3,116

International1,2

      147         74    23,736    11,466

Total

   2,564    1,286    27,142    14,582


  1.

Developed acreage in International primarily comprises US and Trinidad and Tobago.

  2.

Undeveloped acreage in International primarily comprises Barbados, Canada, Congo, Egypt, Ireland, Korea, Mexico, Myanmar, Peru, Senegal, Timor-Leste and Trinidad and Tobago.

Woodside has initiated exists from our Myanmar, Republic of Korea, Peru, Ireland and offshore Canada positions, totalling approximately 13,545 thousand acres gross (7,149 thousand acres net). Approximately 744 thousand acres gross (476 thousand acres net), 57 thousand acress gross (26 thousand acres net) and 963 thousand acres gross, (277 thousand acres net) of undeveloped acreage will expire in the years ending 31 December 2023, 2024 and 2025 respectively if Woodside does not establish production or take any other action to extend the terms of the licenses and concessions.

Delivery commitments

Woodside has contracts that require delivery of fixed volumes of crude oil, condensate, natural gas and NGL. Woodside intends to fulfill its short-term and long-term obligations with its production or from purposes of third-party volumes.

As at 31 December 2022, delivery commitments were as follows:


      Natural gas (MMboe)    Crude oil (MMbbl)    Condensate (MMbbl)    NGLs (MMbbl)        

Year ending 31 December


2023 to 2027

   362.6    6.3    1.1    3.8

Thereafter

   232.6    -    -    -

Total oil and gas delivery commitments

   595.2    6.3    1.1    3.8


49


Table of Contents

Production

The following table details production by product and geographic location for each of the three years ended 31 December 2022, 2021 and 2020. The volumes are marketable production after deduction of applicable royalties, fuel and flare. Average production costs per unit of production and average sales prices per unit of production has also been included for each of these periods.


     20221    20212    20202

Production volumes (MMboe)


LNG


Australia

  84.4     70.8     75.1 

International


Total LNG

  84.4     70.8     75.1 

Pipeline gas


Australia

  22.9     2.5     5.3 

International

  5.6       
       

Total pipeline gas

  28.5     2.5     5.3 

Crude oil and condensate


Australia

  24.0     17.3     19.5 

International

  14.7       
       

Total crude oil and condensate

  38.7     17.3     19.5 

Natural gas liquids (NGLs)


Australia

  4.4     0.5     0.5 

International

  0.8       
       

Total NGLs

  5.2     0.5     0.5 

Total petroleum products


Australia

  135.7     91.1     100.3 

International

  21.1       
       

Total production

  156.8     91.1     100.3 


Average sales price per produced boe (US$/boe)


LNG


Australia

  104.0     55.4     32.1 

International


Total LNG

  104.0     55.4     32.1 

Pipeline gas


Australia

  47.3     18.0     13.9 

International

  48.9       
       

Total pipeline gas

  47.6     18.0     13.9 

Crude oil and condensate


Australia

  103.3     75.8     43.3 

International

  86.7        
       

Total crude oil and condensate

  97.0     75.8      43.3 

Natural gas liquids (NGLs)


Australia

  40.6     121.2     31.1 

International

  34.5       
       

Total NGLs

  39.7     121.2     31.1 


Total average production cost per produced boe (US$/boe)


Australia

  10.4     7.9     6.3 

International

  16.9       
       

Total average production cost per produced boe

  11.2     7.9     6.3 


  1.

Includes production of 156.8 MMboe from Woodside reserves, and excludes 0.9 MMboe primarily from feed gas purchased from Pluto non-operating participants processed through the Pluto-KGP Interconnector.

  2.

Production volumes for 2021 and 2020 have been restated to present marketable production after deduction of applicable royalties, fuel and flare.

  3.

Average production costs per produced boe includes direct and indirect costs relating to production of total hydrocarbons and the foreign exchange effect of translating local currency denominated costs into US dollars but excludes cost to transport produced hydrocarbons to the point of sale, ad valorem and severange taxes.


50


Table of Contents


  SECTION 4: GOVERNANCE


SECTION 4.1

Corporate Governance Statement

4.1.1 Corporate governance at Woodside

Woodside is committed to a high level of corporate governance and fostering a culture that values ethical behaviour, integrity and respect. The Board is responsible for the overall corporate governance of Woodside.

Woodside’s corporate governance model is illustrated in the diagram below. The Woodside Management System (WMS) describes the Woodside way of working, enabling Woodside to understand and manage its business to achieve its objectives. It defines the boundaries within which Woodside employees and contractors are expected to work. The WMS establishes a common approach to how we operate, wherever the location.

Woodside continues to review and, where necessary, enhance our corporate governance policies and practices. We frequently consider developments arising in the markets where Woodside securities are listed, including the Australian Securities Exchange (ASX), London Stock Exchange (LSE) and New York Stock Exchange (NYSE). Our practices will evolve as we continually look to strengthen our governance framework in the context of our multi-jurisdictional business.


LOGO

The company must comply with the Corporations Act 2001 (Cth), the ASX Listing Rules, UK Listing Rules, UK Disclosure Guidance and Transparency Rules, UK Market Abuse Regulation, relevant provisions of the NYSE Listing Manual and US securities laws applicable to Woodside as a foreign private issuer and other applicable Australian and international laws. This Corporate Governance Statement (Statement) reports on Woodside’s key governance principles and practices.

The ASX Listing Rules require the company to report on the extent to which it has followed the Corporate Governance Recommendations contained in the fourth edition of the ASX Corporate Governance Council’s Principles and Recommendations (ASXCGC Recommendations). The UK Disclosure Guidance and Transparency Rules, the NYSE listing rules and US securities laws also require the company to report on its governance arrangements and the governance code that it applies.

The ASXCGC recommendations are publicly available at https://www.asx.com.au/documents/asx-compliance/cgc-principles-and-recommendations-fourth-edn.pdf. The ASXCGC Recommendations are not incorporated by reference to this Statement. As shown in this Statement, throughout the year, Woodside complied with all the ASXCGC Recommendations. Following our listing on the NYSE and LSE, we are also subject to certain governance requirements of the LSE, the NYSE and the SEC. Refer to the section ‘Differences from NYSE corporate governance requirements’ for further information.

The Statement was approved by the Board and is current as at 27 February 2023.

All Board and committee charters and copies of the policies and documents referred to in this Statement are available on the Corporate Governance section of Woodside’s website.


51


Table of Contents

4.1.2 Board of directors

Board role and responsibilities

The Constitution provides that the business and affairs of the company are to be managed by or under the direction of the Board. The central role of the Board is to set the company’s strategic direction, to select and appoint a Chief Executive Officer (CEO) and to oversee the company’s management and business activities.

The Board’s role, powers, duties and functions are formalised in a Board Charter. The Charter sets out the matters and functions that are specifically reserved to the Board and the powers that are delegated to the CEO and management.

The Board Charter and the delegation of Board authority to the CEO and management are reviewed regularly.

Key activities of the Board undertaken during the year:


completing the merger with BHP’s petroleum business


monitoring the Scarborough and Pluto Expansion Projects


overseeing the Sangomar Field Development


participating with management in frequent strategic engagements to review Woodside’s corporate strategy and providing input and guidance


monitoring management’s execution of strategy


monitoring the global energy market and the war in Ukraine


appointing Graham Tiver as Woodside’s Chief Financial Officer (CFO) effective February 2022


overseeing financial performance and key metrics


setting clear near and medium-term emissions reduction targets that put Woodside on the pathway towards our aspiration of net zero by 2050 or sooner1


satisfying itself that management has developed and implemented a sound system of risk management and internal control


reviewing key corporate governance policies and practices to ensure a robust corporate governance system


engaging in the Board and director performance evaluations


attending director professional development sessions, including seminars and engaging in educational presentations on industry related matters and new and emerging developments with the potential to affect Woodside.

Board composition

The Constitution provides that the company is not to have more than 12, nor less than three directors. The Board is currently comprised of ten independent non-executive directors and the CEO. The following page shows each of the current directors and the date of their appointment as a director.


1.

Target is for net equity Scope 1 and 2 greenhouse gas emissions, relative to a starting base representative of the gross annual average equity Scope 1 and 2 greenhouse gas emissions over 2016-2020 and may be adjusted (up or down) for potential equity changes in producing or sanctioned assets with an FID prior to 2021.


52


Table of Contents

LOGO

Richard Goyder, AO

BCom, FAICD


Chair: Chair since April 2018

Term of office: Director since August 2017,

re-election required at AGM in 2024.

Independent: Yes

Experience: Mr Goyder spent 24 years with Wesfarmers Limited, where he served as Managing Director and Chief Executive Officer from 2005 to late 2017. Mr Goyder also served as Chair of the Australian B20 (the key business advisory body to the international economic forum which includes business leaders from all G20 economies) from February 2013 to December 2014.

Committee membership: Chair of the Nominations & Governance Committee. Attends other Board committee meetings.

Current directorships/other interests:

Chair: Qantas Airways Limited (since 2018), Channel 7 Telethon Trust (since 2018) and West Australian Symphony Orchestra (WASO) (since 2018) and Australian Football League Commission (since 2017).

Member: Evans and Partners Investment Committee.

Directorships of other listed entities within the past three years: Nil


LOGO

Meg O’Neill

BSc (Ocean Engineering), BSc (Chemical Engineering), MSc (Ocean Systems Management)


CEO and Managing Director

Term of office: Director since August 2021.

Independent: No

Experience: Ms O’Neill joined Woodside in 2018 and has performed a number of senior executive positions including Chief Operations Officer, Executive Vice President Development and Executive Vice President Development and Marketing. From April 2021 to August 2021, Ms O’Neill was acting Chief Executive Officer (CEO) until she was formally appointed to the position.

Prior to joining Woodside, Ms O’Neill spent 23 years with ExxonMobil in a variety of technical, operational and senior leadership roles.

Committee membership: Attends Board committee meetings.

Current directorships/other interests:

Chair: Australian Petroleum Production & Exploration Association (APPEA) (since 2022).

Director: American Petroleum Institute (API) (since 2022), Reconciliation WA (since 2022), WA Venues & Events Pty Ltd (WAVE) (since 2019) and West Australian Symphony Orchestra (WASO) (since 2019).

Member: Chief Executive Women, National Petroleum Council and American Petroleum Institute in the US and UWA Business School Advisory Board.

Other: Honorary Governor of the American Chamber of Commerce (AmCham).

Directorship of other listed entities within the past three years: Nil


53


Table of Contents

LOGO

Larry Archibald

BSc (Geosciences), BA (Geology), MBA


Term of office: Director since February 2017, re-election required at AGM in 2023.

Independent: Yes

Experience: Mr Archibald previously worked at ConocoPhillips, where he spent eight years in senior executive positions including Senior Vice President, Business Development and Exploration and Senior Vice President, Exploration. Prior to joining ConocoPhillips, Mr Archibald spent 29 years at Amoco from 1980 to 1998 and BP from 1998 to 2008 in various positions including leading exploration programs covering many world regions.

Committee membership: Audit & Risk, Sustainability and Nominations & Governance Committees.

Current directorships/other interests:

Chair: University of Arizona Geosciences Advisory Board (since 2019).

Directorship of other listed entities within the past three years: Nil


LOGO

Frank Cooper, AO

BCom, FCA, FAICD


Term of office: Director since February 2013, re-election required at AGM in 2025.

Independent: Yes

Experience: Mr Cooper was a Partner at PricewaterhouseCoopers from 2006 until his retirement in 2012, and a director of the Insurance Commission of Western Australia until September 2022. Prior to joining PricewaterhouseCoopers, Mr Cooper was a partner of Ernst & Young from 2002 to 2005 and managing partner of Arthur Andersen from 1991 to 2002.

Committee membership: Chair of the Audit & Risk Committee. Member of the Human Resources & Compensation and Nominations & Governance Committees.

Current directorships/other interests:

Director: Wright Prospecting Pty Ltd (since 2022), St John of God Australia Limited (since 2015) and South32 Limited (since 2015).

Trustee: St John of God Health Care (since 2015).

Directorship of other listed entities within the past three years: Nil


54


Table of Contents

LOGO

Swee Chen Goh

BSc (Information Science), MBA


Term of office: Director since January 2020, re-election required at AGM in 2023.

Independent: Yes

Experience: Ms Goh joined Shell in 2003 and was the Chair of Shell Companies in Singapore from 2014 until her retirement in 2019.

During her tenure at Shell, Ms Goh served on the boards of a number of Shell joint ventures in China, Korea and Saudi Arabia. Prior to joining Shell, Ms Goh worked at Procter & Gamble and IBM.

Committee membership: Member of the Human Resources & Compensation, Sustainability and Nominations & Governance Committees.

Current directorships/other interests:

Chair: Nanyang Technological University (since 2021), National Arts Council (since 2019) and Singapore Institute for Human Resource Professionals (since 2016).

Director: Carbon Solutions Holdings Pte Ltd (since 2022), Carbon Solutions Platform Pte Ltd (since 2022), Carbon Solutions Investments Pte Ltd (since 2022), Carbon Solutions Services Pte Ltd (since 2022), JTC Corporation (since 2022), Resilience Collective Ltd (since 2020), Singapore Airlines Ltd (since 2019) and Singapore Power Ltd (since 2019).

President: Global Compact Network Singapore.

Member: Singapore Legal Services Commission, Centre for Liveable Cities Advisory Panel and Singapore Research, Innovation and Enterprise Council.

Directorship of other listed entities within the past three years: Nil


LOGO

Christopher Haynes, OBE

BSc, DPhil, FREng, CEng, FIMechE, FIEAust


Term of office: Director since June 2011, re-election required at AGM in 2024.

Independent: Yes

Experience: Dr Haynes had a 38-year career with Shell where he served as Executive Vice President, Upstream Major Projects within Shell’s Projects and Technology Business, General Manager of Shell’s operations in Syria, and a secondment as Managing Director of Nigeria LNG Ltd.

From 1999 to 2002, Dr Haynes was seconded to Woodside as General Manager of the North West Shelf Venture. Dr Haynes retired from Shell in August 2011.

Committee membership: Member of the Audit & Risk, Sustainability and Nominations & Governance Committees.

Current directorships/other interests:

Director: Worley Limited (since 2012).

Directorship of other listed entities within the past three years: Nil


55


Table of Contents

LOGO

Ian Macfarlane

Former Australian Federal Minister (Resources; Energy; Industry and Innovation), FAICD


Term of office: Director since November 2016, re-election required at AGM in 2023.

Independent: Yes

Experience: Mr Macfarlane served as director of METS Ignited Ltd and was Australia’s longest serving Federal Resources and Energy Minister, and the Coalition’s longest serving Federal Industry and Innovation Minister, with over 14 years of experience in both Cabinet and shadow ministerial positions. Prior to entering politics, Mr Macfarlane was the President of the Queensland Graingrowers Association from 1991 to 1998 and the President of the Grains Council of Australia from 1994 to 1996.

Committee membership: Member of the Human Resources & Compensation, Sustainability and Nominations & Governance Committees.

Current directorships/other interests:

Chief Executive: Queensland Resources Council (since 2016).

Chair: Innovation Manufacturing Co-operative Research Centre (since 2016).

Director: Sovereign Manufacturing Automation for Composites Cooperative Research Centre (since 2023), CSIRO (since 2021) and Toowomba and Surat Basin Enterprise Board (since 2018).

Member: Fellow of the Australian Institute of Company Directors, Toowoomba Community Advisory Committee of the University of Queensland Rural Clinical School and Mooloolaba and the Spit Association.

Directorship of other listed entities within the past three years: Nil


LOGO

Ann Pickard

BA, MA


Term of office: Director since February 2016, re-election required at AGM in 2025.

Independent: Yes

Experience: Ms Pickard joined Shell in 2000 and served in a number of senior executive positions including as the Director, Global Business and Strategy and as a member of the Shell Gas & Power Executive Committee. Ms Pickard retired from Shell in 2016. Prior to joining Shell, Ms Pickard spent 11 years with Mobil before its merger with Exxon in 1998.

Committee membership: Chair of the Sustainability Committee, member of the Human Resources & Compensation and Nominations & Governance Committees.

Current directorships/other interests:

Director: Noble Corporation Plc. (since 2021) and KBR Inc (since 2015).

Member: Chief Executive Women and University of Wyoming Foundation Board.

Directorship of other listed entities within the past three years: Nil


56


Table of Contents

LOGO

Sarah Ryan

BSc (Geology), BSc (Geophysics) (Hons 1), PhD (Petroleum and Gephysics), FTSE


Term of office: Director since December 2012, re-election required at AGM in 2025.

Independent: Yes

Experience: Dr Ryan has more than 30 years’ experience in the oil and gas industry in various technical, operational and senior management positions. Dr Ryan worked at Schlumberger Ltd for 15 years. Dr Ryan was also an equity analyst, portfolio manager and energy advisor for Earnest Partners from 2007 to 2017.

Committee membership: Member of the Audit & Risk, Sustainability and Nominations & Governance Committees.

Current directorships/other interests:

Director: OZ Minerals Limited (since 2021), Future Battery Industries Cooperative Research Centre (since 2020), Aurizon Holdings (since 2019) and Viva Energy Group Ltd (since 2018).

Chair: Australian Academy of Technology and Engineering’s Energy Forum.

Member: Australian Commonwealth Government Strategic Shipping Taskforce, Chief Executive Women, Australian Securities & Investments Commission (ASIC), Corporate Governance Consultative Panel and Australian Institute of Company Directors.

Other: Judging Committee for the Prime Minister’s Prizes for Science (2022).

Directorship of other listed entities within the past three years: Nil


LOGO

Gene Tilbrook

BSc, MBA, FAICD


Term of office: Director since December 2014, re-election required at AGM in 2024.

Independent: Yes

Experience: Mr Tilbrook served as a senior executive of Wesfarmers Limited between 1985 and 2009, including as Executive Director Finance and Executive Director Business Development.

Committee membership: Chair of the Human Resources & Compensation Committee, Member of the Audit & Risk and Nominations & Governance Committees.

Current directorships/other interests:

Director: Orica Limited (since 2013).

Member: Life Fellow of the Australian Institute of Company Directors.

Directorship of other listed entities within the past three years: GPT Group Limited (2010 – 2021).


57


Table of Contents

LOGO

Ben Wyatt

LLB, MSc


Term of office: Director since June 2021, re-election required at AGM in 2025.

Independent: Yes

Experience: Mr Wyatt served in the Western Australian Legislative Assembly for 15 years, including as the Western Australian Treasurer and Minister for Finance, Energy, Aboriginal Affairs and Lands. Additionally, Mr Wyatt held various shadow cabinet portfolios including responsibility for Native Title and the Pilbara.

Prior to entering Parliament, Mr Wyatt practised as a lawyer in both private practice and with the Western Australian Office of the Director of Public Prosecutions.

Committee membership: Member of the Human Resources & Compensation, Sustainability and Nominations & Governance Committees.

Current directorships/other interests:

Director: APM Group (since 2022), Wyatt Martin Pty Ltd (since 2021), West Coast Eagles (since 2021), Perth International Arts Festival (since 2021), Telethon Kids Institute (since 2021) and Rio Tinto Ltd (since 2021).

Member: UWA Business School Advisory Board, Australian Institute of Company Directors and Australian Capital Equity Pty Ltd Advisory Board.

Directorship of other listed entities within the past three years: Nil

Director appointment, induction training and continuing education

All new non-executive directors are required to sign a letter of appointment which sets out the key terms and conditions of their appointment, including duties, rights and responsibilities, the time commitment envisaged and the Board’s expectations regarding their involvement with committee work.

Executive Directors and other Senior Executives enter into employment agreements which govern the terms of their employment. Woodside undertakes extensive background and screening checks prior to appointing Senior Executives. Details of Woodside’s Senior Executives are set out in section 4.1.4 - Executive Leadership Team.

Woodside also undertakes extensive background and screening checks prior to nominating a director for election by shareholders, including checks as to character, experience, education, criminal record and bankruptcy history. Woodside provides to shareholders all material information in its possession concerning the director standing for election or re-election in the explanatory notes accompanying the notice of meeting.

Induction training is provided to all new directors. It includes a comprehensive induction manual, discussions with the CEO and Senior Executives and the option to visit Woodside’s principal operations either upon appointment or with the Board during its next site tour.

Questionnaires are completed annually to assess each director’s skills and knowledge required to discharge their obligations to the company. Woodside considers at least annually the need for new and existing directors to undertake professional development to develop and maintain the skills and knowledge needed to perform their role as directors effectively, and provides directors who require professional development the opportunity to develop and maintain the required skills and knowledge. Directors attend continuing professional education sessions, including industry seminars and approved education courses, which are paid for by the company, where appropriate.

Director remuneration

Details of remuneration paid to directors (executive and non-executive) are set out in the 2022 Remuneration Report in section 4.3 - Remuneration Report. The Remuneration Report also contains information on the company’s policy for determining the nature and amount of remuneration for directors and Senior Executives and the relationship between the policy and company performance.


58


Table of Contents

Board access to information and independent advice

Subject to the Directors’ Conflict of Interest Policy, directors have direct access to members of company management and to company information in the possession of management. Directors are entitled to obtain independent legal, accounting or other professional advice at the company’s expense where a request for such advice is approved by the Chair. In the case of a request made by the Chair, approval is required by a majority of the non-executive directors.

Director attendance at meetings

Directors in office, committee membership and directors’ attendance at meetings during 2022


                                   Human Resources                   Nominations
Director    Board    Audit & Risk    & Compensation    Sustainability    & Governance
                                            
      Held1          Attended2    Held1          Attended2    Held1          Attended2    Held1          Attended2    Held1          Attended2    

Executive Director


Meg O’Neill

       14                   14                              7                              8                              4                              4

Non-Executive Director


Larry Archibald

       14                   14        7                   7                              7        4                   4        4                   4

Frank Cooper

       14                   13        7                   6        8                   7                              4        4                   3

Swee Chen Goh

       14                   13                              6        8                   7        4                   3        4                   4

Richard Goyder

       14                   14                              7                              8                              4        4                   4

Chris Haynes

       14                   14        7                   7                              8        4                   4        4                   4

Ian Macfarlane

       14                   14                              7        8                   8        4                   4        4                   4

Ann Pickard

       14                   14                              5        8                   8        4                   4        4                   4

Sarah Ryan

       14                   14        7                   7                              6        4                   4        4                   4

Gene Tilbrook

       14                   13        7                   7        8                   8                              4        4                   4

Ben Wyatt

       14                   14                              7        8                   8        4                   4        4                   4
                                                        
            Current Chair                Current Member                                        


1.

‘Held’ indicates the number of meetings held during the period of each director’s tenure. Where a director is not a member but attended meetings during the period, then only the number of meetings attended rather than held is shown.

2.

‘Attended’ indicates the number of meetings attended by each director. All directors are entitled to and generally attend meetings of the standing committees.

Board performance evaluation

Board performance evaluations are conducted annually.

The reports on Board and committee performance are provided to all directors and discussed by the Board. The report on the Chair’s performance is provided to the Chair and two committee chairs for discussion.

The report on each individual director is provided to the individual and to the Chair. The Chair meets individually with each director to discuss the findings of their report.

As disclosed in the 2021 Corporate Governance Statement, in 2021 an external consultant was engaged to conduct a comprehensive review of the effectiveness of the Board and Board committees. The evaluation followed the process outlined above and involved interviews with directors and senior management and observation of Board and committee meetings. The review also focused on the Board’s composition and succession planning including diversity, skills and experience.

The review was finalised in 2022. It highlighted the directors’ views on the top priorities for the Board.

The Board, through the Nominations & Governance Committee, considered and discussed the final report in detail.

The external review also informed the Board’s review of succession priorities and upcoming appointments will be made with regard to the key opportunities identified.

The Human Resources & Compensation Committee reviews and makes recommendations to the Board on the criteria for the evaluation of the performance of the CEO. The Board conducts the evaluation of the performance of the CEO.

Review of the 2022 performance of the CEO and executive succession planning was conducted by the Board.


59


Table of Contents

Directors’ retirement and re-election

The Woodside Constitution sets out the requirements for the retirement and re-election of directors. With the exception of the CEO/Managing Director, directors must retire at the third AGM following their election or most recent re-election. At least one director must stand for election at each AGM.

Board support for a director’s re-election is not automatic and is subject to satisfactory director performance.

Director independence

In accordance with the Policy on Independence of Directors, the Board assesses independence with reference to whether a director is non-executive, not a member of management and is free of any business or other relationship that could materially interfere with, or could reasonably be perceived to materially interfere with, the independent exercise of their judgement.

In making this assessment, the Board considers all relevant facts and circumstances. In particular, the Board focuses on the factors relevant to assessing the independence of a director set out in Box 2.3 of the ASXCGC Recommendations.

The Board has reviewed the independence of each of the non-executive directors in office at the date of this Statement and determined that they are all independent. The CEO, Ms Meg O’Neill, is not considered independent as she is an Executive Director and a member of management.

Two of the non-executive directors have been employed by Woodside in the past. Dr Haynes was seconded to Woodside as General Manager of the North West Shelf Venture from 1999 to 2002. Dr Ryan was employed by Woodside as a member of the North West Shelf petroleum production team from 1993 to 1996. A significant period of time has elapsed since they ceased employment with Woodside and the Board is comfortable that they bring an independent judgement to bear on issues before the Board.

Dr Haynes was re-elected at the 2021 AGM and has served eleven years on the Board in June 2022. The Board reviewed the independence of Dr Haynes and determined that he remained independent, notwithstanding his length of tenure on the Board.

For more information regarding our Constitution, please refer to the full text of the Woodside Constitution, attached as Exhibit 1.1 to this Annual Report. For information regarding the rights attaching to Woodside’s ordinary shares and American Depositary Shares, please refer to Exhibit 2.1 to this Annual Report.

Conflicts of interest

The Board has approved a Directors’ Conflict of Interest Policy which applies if there is, or may be, a conflict between the personal interests of a director, or the duties a director owes to another company, and the duties the director owes to Woodside. Directors are required to disclose circumstances that may affect, or be perceived to affect, their ability to exercise independent judgement so that the Board can assess independence on a regular basis.

Under Woodside’s Constitution, directors must comply with the Corporations Act in relation to disclosure and voting on matters involving material personal interests. Subject to the Corporations Act:


a director may be counted in a quorum at a Board meeting that considers, and may vote on, any matter in which that director has an interest


the company may proceed with any transaction that relates to the interest and the director may participate in the execution of any relevant document by or on behalf of the company


the director may retain benefits under the transaction even though the director has an interest


the company cannot avoid the transaction merely because of the existence of the interest.

Under Woodside’s Constitution, a director may be a director of or hold any other office or position in any corporation promoted by the company or in which the company may be interested. The Board may exercise the voting power conferred by the shares in any corporation held or owned by the company, and a director may vote in favour of exercising those voting rights despite the fact that the director is, or may be about to be appointed, a director of that other corporation and may be interested in the exercise of those voting rights. An interested director is to be counted in a quorum despite the interest.

Under Woodside’s Constitution, the Board may exercise all the powers of the company to raise or borrow money, guarantee the debts or obligations of any person or enter into any other financing arrangements on the terms it thinks fit. If any director or officer of the company is personally liable for the payment of any sum which is or may become primarily due from the company, the Board may charge the whole or any part of the assets of the company by way of indemnity to secure the director or officer from any loss in respect of the liability.

About this statement

For more information regarding our Constitution, please refer to the full text of the Woodside Constitution, attached as Exhibit 1.1 to this Annual Report. For information regarding the rights attaching to Woodside’s ordinary shares and American Depositary Shares, please refer to Exhibit 2.1 to this Annual Report.

Areas of competence and skills of the Board of Directors

The directors on the Board collectively have a combination of skills and experience which are necessary to direct the company in accordance with high standards of corporate governance and to oversee Woodside’s management and business activities.


60


Table of Contents

The competences and skills are set out in the skills matrix below. The Board uses this skills matrix to assess the skills and experience of each director and the combined capabilities of the Board, to identify potential areas of focus for director recruitment and to identify any professional development opportunities that may benefit directors.


Leadership and culture


•   Business leadership


•   Public listed company Experience

•   Values and behaviours


Finance


•   Accounting & audit


•   Financial acumen

Business strategy


•   Corporate financing & treasury


•   Capital investments & projects

•   Business strategy


Commercial


•   Gas/LNG marketing


•   US regulatory compliance

•   Mergers & acquisitions


•   Risk management

•   Business development


•   Insurance

•   Legal & regulatory compliance


•   Taxation

Sustainability & stakeholder management


•   Community relations


•   Public & regulatory policy

•   Corporate governance


•   Health & safety

•   Environment


Climate change


•   Policy & legal risks


•   Technology

•   Market


•   Reputation

People & capability


•   People & culture


•   Remuneration

•   Industrial relations


Industry


•   New energy & renewables


•   Digital cybersecurity

•   Technology & innovation


International


•   International oil and gas exploration, development and production


•   International experience

Ordinarily, the skills matrix is reviewed annually and updated regularly to ensure it remains appropriate for Woodside’s strategy, operations and risk profile and any other emerging issues. In 2022, this review also involved benchmarking against Woodside’s international oil and gas peers.

This review confirmed that the Board collectively have the necessary skills and competencies. As discussed in the Board performance evaluation section, the review also informed and supported the Board’s review of succession priorities.

The Board supplements its expertise with internal and external subject matter experts as appropriate (for example, regular attendance at Board meetings by relevant executives and other independent advisers). The Sustainability Committee received regular briefings and education on climate change from Woodside’s Senior Executive responsible for climate change, to ensure decisions are informed by climate change science and expert advice.

Chair

The Chair of the Board, Mr Richard Goyder, is an independent, non-executive director and an Australian resident and citizen.

The Chair is responsible for leadership and effective performance of the Board and for the maintenance of relations between directors and management that are open, cordial and conducive to productive cooperation. The Chair’s responsibilities are set out in more detail in the Board Charter.


61


Table of Contents

Company Secretaries

Details of the Company Secretaries are set out in section 4.2 - Directors’ report - Company Secretaries. All directors have direct access to the Company Secretaries who are accountable directly to the Board, through the Chair, on all matters to do with the proper functioning of the Board.

Board succession planning

The Board manages its succession planning with the assistance of the Nominations & Governance Committee which annually reviews the size, composition and diversity of the Board. In conducting the review, the Board skills matrix and the tenure of each director is considered.

The Nominations & Governance Committee is also responsible for evaluating Board candidates and recommending individuals for appointment to the Board. The Committee evaluates prospective candidates against a range of criteria including the skills, experience, expertise and diversity that will best complement Board effectiveness at the time. The Board may engage an independent recruitment firm to undertake a search for suitable candidates.

Refer to the ‘Board composition’ section for information about recent changes to the Board’s composition.


62


Table of Contents

4.1.3 Board committees

The Board has four standing committees to assist in the discharge of its responsibilities. The committees operate principally in a review or advisory capacity, except in cases where powers are specifically conferred on a committee by the Board.

Each committee has a charter, detailing its role, duties and membership requirements. The committee charters are reviewed regularly and updated as required.

Membership of the committees is based on directors’ qualifications, skills and experience. Each standing committee is comprised of:


only non-executive directors


at least three members, the majority of whom are independent


a chair appointed by the Board who is one of the independent non-executive directors.

The Audit & Risk Committee and the Human Resources & Compensation Committee have additional membership requirements as set out in their respective charters.

Each committee is entitled to seek information from any employee of the company and to obtain any professional advice it requires in order to perform its duties. All directors are entitled to and generally attend meetings of the standing committees.

Audit & Risk Committee

Assists with overseeing the company’s financial reporting, compliance with legal and regulatory requirements, risk management and the internal and external audit functions.

Members:


Frank Cooper (Committee Chair)


Larry Archibald


Christopher Haynes


Sarah Ryan


Gene Tilbrook

FY22 key activities:


overseeing the integration activities required after completion of the merger


monitoring developments in accounting, financial reporting and taxation relevant to Woodside


reviewing significant accounting policies and practices


reviewing and making recommendations to the Board for the adoption of the Group’s half-year and annual Financial Statements


approving the fees and reviewing the external auditor’s scope and plan for the 2022 external audit


considering and approving non-audit services provided by the external auditor


reviewing the independence and performance of the external auditor


reviewing Internal Audit reports and material post-investment reviews and approval of the 2023/2024 Internal Audit program


reviewing the Group’s key risks and risk management framework, confirming that the framework was sound and that the company is operating with due regard to the risk appetite set by the Board


reviewing reports from management on the effectiveness of the Group’s management of its material business risks including contemporary and emerging risks such as cybersecurity, conduct risk, technology and innovation, privacy and data breaches, sustainability and climate change


reviewing the company’s annual insurance plan and maintaining oversight of the company’s insurance activities


overseeing the company’s tax matters, including reviewing the company’s policies and practices for managing compliance with tax laws


assessing processes to ensure compliance with legal and regulatory requirements


monitoring material litigation


monitoring matters and informing the Board of any material concerns raised under the Code of Conduct, the Anti-Bribery and Corruption and Whistleblower Policies that call into question the culture of the organisation


63


Table of Contents
 

informing the Board of the company’s compliance with material legal and regulatory requirements and any conduct that is materially inconsistent with the company’s values or Code of Conduct


reviewing and making recommendations to the Board on amendments to company policies.

Audit committee financial expert

Woodside’s Board has determined that Frank Cooper, who serves on the Audit & Risk Committee, meets the audit committee financial expert requirements under SEC Rules. The Board has also determined that he is independent under applicable NYSE rules.

Nominations & Governance Committee

Assists the Board with reviewing Board composition, performance and succession planning, including identifying, evaluating and recommending candidates for the Board.

Members:


Richard Goyder (Committee Chair)


Larry Archibald


Frank Cooper


Swee Chen Goh


Christopher Haynes


Ian Macfarlane


Ann Pickard


Sarah Ryan


Gene Tilbrook


Ben Wyatt

FY22 key activities:


reviewing the size and composition of the Board


reviewing the director skills matrix


Board succession planning


recommending to the Board directors for re-election at the 2023 AGM


approving the process for the annual Board performance evaluation.

Human Resources & Compensation Committee

Assists with establishing human resources and compensation policies and practices.

Members:


Gene Tilbrook (Committee Chair)


Frank Cooper


Swee Chen Goh


Ian Macfarlane


Ann Pickard


Ben Wyatt

FY22 key activities:


considering changes to the leadership structure in consultation with the Board; including the CFO transition


approving changes to the leadership structure in connection with the merger, including the appointment and remuneration packages of executives reporting directly to the CEO


64


Table of Contents
 

considering the integration requirements, including organisation design, harmonisation and policy changes, arising in relation to the merger


monitoring legislative and corporate governance developments in relation to employment and remuneration matters relevant to Woodside


monitoring Woodside’s response to the WA Parliamentary Inquiry into sexual harassment against women in the FIFO mining industry


reviewing the company’s remuneration policies and practices and considering advice on the remuneration of Woodside’s key management personnel


reviewing the company’s recruitment and retention strategies


considering activities to assess and monitor culture, including across all areas of our Integrated Culture Framework (values, safety, risk and compliance)


monitoring learning and organisational development strategies and activities across Woodside


reviewing progress against the 2021-2025 Inclusion and Diversity strategy


monitoring progress against measurable objectives in respect of gender diversity and endorsing for Board approval the 2023 measurable objectives


reviewing and making recommendations to the Board on:


remuneration for non-executive directors


the remuneration of the CEO


the criteria for the evaluation of the CEO’s performance


incentives payable to the CEO


employee equity-based plans


the annual Remuneration Report.

Sustainability Committee

Assists the Board in meeting its oversight responsibilities in relation to the company’s sustainability policies and practices.

Members:


Ann Pickard (Committee Chair)


Larry Archibald


Swee Chen Goh


Christopher Haynes


Ian Macfarlane


Sarah Ryan


Ben Wyatt

FY22 key activities:


reviewing Woodside’s environmental performance, including major incident prevention


monitoring the Group’s health and personal safety performance


monitoring Woodside’s process safety performance including major incident prevention


reviewing Woodside’s quality management


endorsing the creation of new Environment and Biodiversity and Health and Safety policies, replacing the previous Health, Safety and Environment policy


considering security and emergency management performance, including major incident prevention and response and business continuity


considering Woodside’s management of climate change risk and opportunities


overseeing and reviewing the proposed content for Woodside’s Climate Report 2022, and approach to climate-related disclosures


considering First Nations affairs, including cultural heritage and land access matters, and endorsement of changes to the First Nations Communities Policy


reviewing Woodside’s activities supporting local content in our supply chain


monitoring Woodside’s social performance and social contribution in our host communities


reviewing Woodside’s reputational performance and issues of significance to our communities and stakeholders


overseeing and reviewing the proposed content for Woodside’s Climate Report 2021


overseeing publication of the Reconciliation Action Plan Report 2021


endorsing Board approval of Woodside’s Modern Slavery Statement 2021 and reviewing related human rights issues.


65


Table of Contents

4.1.4 Executive Leadership Team


LOGO

Graham Tiver1

Executive Vice President and Chief Financial Officer

BBus, FCPA


Joined Woodside: 2022

Experience: Graham is responsible for Finance; Treasury; Tax; Investor Relations; Governance, Risk and Compliance; Audit; and Mergers and Acquisitions. Prior to joining Woodside, Graham spent 28 years with BHP and WMC Resources where he held significant financial, commercial and leadership roles across multiple business sectors. He has extensive international experience, having worked in North and South America as well as in a variety of roles around Australia.

Directorship: Nil


LOGO

Shiva McMahon1

Executive Vice President International Operations

MA, BA


Joined Woodside: 2022

Experience: Shiva is responsible for Woodside’s International operations portfolio. Shiva has 30 years of industry experience and prior to joining Woodside held senior leaderships roles at both BHP and BP. Shiva spent a large part of her career at BP in roles including CFO Global Lubricants, Chief of Staff Upstream Executive Office and CFO Trinidad and Tobago.

Directorship: Greater Houston Partnership (since 2022).


LOGO

Mike Price

Acting Executive Vice President Australian Operations

BEng (Hons) (MechEng)


Joined Woodside: 1994

Experience: Mike is the Acting Executive Vice President Australian Operations, following the resignation of Fiona Hick in November 2022. Mike is responsible for Woodside’s Australian operations portfolio. Mike has over 29 years of industry experience in operations and project roles. He has had multiple leadership roles and most recently held the role Vice President Pluto/Scarborough.


1.

Identified as key management personnel (KMP).


66


Table of Contents

LOGO

Julie Fallon

Executive Vice President Corporate Services

BEng (Hons) (ChemEng)


Joined Woodside: 1998

Experience: Julie is responsible for Legal; Health, Safety & Environment; Security & Emergency Management; Supply Chain; and Human Resources. Julie has 30 years of industry experience and has held a number of senior leadership roles at Woodside including Senior Vice President Pluto and Senior Vice President Engineering.


LOGO

Shaun Gregory

Executive Vice President New Energy

BSc (Hons), MBT


Joined Woodside: 1995

Experience: Shaun is responsible for new energy and carbon solutions. Shaun has over 30 years of industry experience and has had senior leadership roles across Woodside’s value chain from Exploration acreage capture and evaluation, through Development concept selection and technology development.


LOGO

Daniel Kalms

Executive Vice President Technical Services

BEng (Hons) (ChemEng), MBA


Joined Woodside: 2001

Experience: Daniel is responsible for Digital; Technology; Surface Engineering; Subsurface and Reserves; and merger integration. Daniel has over 25 years of industry experience and has held senior leadership roles across development, projects, operations and corporate.


67


Table of Contents

LOGO

Mark Abbotsford

Executive Vice President Marketing and Trading

BEc (Hons), MPhil, MBA


Joined Woodside: 2002

Experience: Mark is responsible for Woodside’s global commodity marketing, trading and shipping portfolio. Mark has over 20 years industry experience and has held a number of senior leadership positions across commercial, finance and marketing in various global locations. Prior to joining Woodside, Mark had roles at Treasury (Western Australia) and BHP Iron Ore.


LOGO

Tony Cudmore

Executive Vice President Strategy and Climate

BA, GCIR


Joined Woodside: 2022

Experience: Tony is responsible for Corporate Strategy, Climate and Sustainability, External Environment and Corporate Affairs. Tony has over 20 years industry experience and prior to joining Woodside, Tony worked for BHP and ExxonMobil where he held senior leadership positions including Chief Public Affairs Officer and Group Sustainability and Public Policy Officer at BHP.


LOGO

Andy Drummond

Executive Vice President Exploration & Development

BEng (Hons) (ChemEng)


Joined Woodside: 2022

Experience: Andy is responsible for exploration and development activities at Woodside. Andy has over 25 years industry experience. Prior to joining Woodside, Andy held senior leadership positions at BHP and Marathon Oil Corporation, including Vice President of Sustainability and Innovation for BHP’s petroleum business.


68


Table of Contents

LOGO

Matthew Ridolfi

Executive Vice President Projects

BEng (Hons) (MechEng)


Joined Woodside: 2022

Experience: Matthew is responsible for Woodside’s project execution activities globally. Matthew has more than 30 years of industry experience and prior to joining Woodside held a number of senior leadership positions at BHP including Vice President of Major Developments for BHP’s petroleum business and Vice President of Health, Safety, Environment and Community.

Performance evaluation of Executive Leadership Team

With respect to executives, their performance is reviewed annually, which considers and assesses the executive’s performance against a list of key performance indicators.

All executives had a performance evaluation in FY2022 and further details are set out in section 4.3 - Remuneration Report. Details of the CEO’s performance evaluation (process and outcomes) are set out in section 4.3 - Remuneration Report.


69


Table of Contents

4.1.5 Promoting responsible and ethical behaviour

Our Values

Everything we do is guided by Our Values and inspired by our common purpose. We are one team, we care, we innovate every day, our results matter and we build and maintain trust.


LOGO

Code of Conduct and Anti-Bribery and Corruption Policy

The Code of Conduct and the Anti-Bribery and Corruption Policy (ABC Policy) cover matters such as compliance with laws and regulations, responsibilities to shareholders and the community, sound employment practices, confidentiality, privacy, conflicts of interest, giving and accepting business courtesies and the protection and proper use of Woodside’s assets.

All directors, officers and employees are required to comply with the Code of Conduct and the ABC Policy and managers are expected to take reasonable steps to ensure that employees, contractors, consultants, agents and partners under their supervision are aware of both policies.

All breaches of the Code of Conduct and ABC Policy are required to be recorded. Substantiated allegations of breaches of the Code of Conduct and material breaches of the ABC Policy are reported to the Audit & Risk Committee.

Whistleblower Policy

Woodside’s Whistleblower Policy documents our commitment to maintaining an open working environment in which Woodside personnel and other stakeholders can report instances of unethical, unlawful or undesirable conduct without fear of intimidation or reprisal.

Any material incidents reported under Woodside’s Whistleblower Policy are reported to the Audit & Risk Committee and in line with applicable whistleblower protection laws.

Securities Dealing Policy

Woodside’s Securities Dealing Policy applies to all directors, employees, contractors, consultants and advisers. It prohibits directors and employees from dealing in the company’s securities when they are in possession of price-sensitive information that is not generally available to the market. It also prohibits dealings by directors and certain restricted employees during ‘black-out’ periods, such as during the period between the end of the financial half and full-year and the day following the announcement of the results.

The Securities Dealing Policy also sets out our approach to transactions which limit the economic risk of participating in equity-based remuneration schemes.


70


Table of Contents

Working Respectfully

Woodside is committed to a safe, inclusive and respectful working environment. Our culture is underpinned by our Values and Code of Conduct. Sexual and other unlawful discrimination, bullying and harassment are serious violations of those principles and will not be tolerated. The Woodside Working Respectfully Policy sets out our expectation for everyone working for and with our employees, contractors and customers to treat others with respect, in line with our values, Code of Conduct, and the Working Respectfully Policy.

Human rights

We conduct business in a way that respects the human rights of all people, including our employees, the communities where we are active and those working throughout our supply chains.

Woodside’s approach to human rights is set out in our Human Rights Policy and overseen by the Board. The Board’s Sustainability Committee is responsible for reviewing and making recommendations and endorsements to the Board on Woodside’s Human Rights Policy and performance.

Payments to political entities for business engagement

Woodside does not donate to campaign funds for any political party, politician or candidate for public office in any country. In Australia, Woodside makes payments to attend ad hoc business engagement events arranged by political stakeholders. Decisions to attend these events are subject to strict governance processes. Our Board considers and approves our approach to political contributions annually.

As reported to the Australian Electoral Commission in compliance with our reporting requirements, our payments for the financial year 2021/22 totalled A$109,930, down from A$232,350 in 2020/21. In 2021/22 Woodside did not renew any of its business forum memberships and only attended State and Federal ad hoc business engagement, policy and networks events.

Our contributions for the year ending 30 June 2022 (being the relevant reporting period) are as follows:

  
     Value (A$)  


Australian Labor Party

     43,400  

Australian Labor Party (Western Australia Branch)

     24,750  

Liberal Party of Australia

     8,500  

Liberal Party (WA Division) Inc

     11,580  

National Party of Australia

     14,700  

National Party of Australia (WA) Inc

     7,000  


Total:

     109,930  


71


Table of Contents

4.1.6 Risk management and internal control

Risk management

Approach to risk management

Woodside is committed to managing risks in a proactive and effective manner as a source of competitive advantage. Our approach is intended to protect us against potential negative impacts and improve our resilience against emerging risks. These include conduct risk, technology and innovation, cybersecurity, privacy and data breaches, sustainability and climate change.

Woodside’s Risk Management Policy describes the manner in which Woodside:


provides a consolidated view of risks across the company to understand risk exposure and prioritise risk management and governance


confers responsibility on Woodside staff at all levels to pro-actively identify, assess and treat risks relating to the objectives they are accountable for delivering.

Board, Audit & Risk Committee and management

The Board is responsible for reviewing and approving Woodside’s risk management framework, policy and performance. The Board is also responsible for satisfying itself that management has developed and implemented a sound system of risk management and internal control.

The Board has delegated oversight of the Risk Management Policy, including review (at least annually) of the effectiveness of Woodside’s internal control system and risk management framework, to the Audit & Risk Committee. The Audit & Risk Committee also regularly reviews Woodside’s Risk Appetite Statement and oversees Internal Audit’s activities and reviews Internal Audit’s performance.

Management is responsible for promoting and applying the Risk Management Policy.

In 2022, the Audit & Risk Committee reviewed and confirmed the company’s risk management framework was sound, and that the company was operating with due regard to the risk appetite endorsed by the Board.

Internal Audit function

Internal Audit provides independent assurance that the design and operation of the Group’s risk management and internal control system is effective. A risk-based audit approach is used to ensure that higher risk activities are prioritised in the audit program.

Internal Audit is independent of both business management and of the activities it reviews and has all necessary access to management and information to fulfill its role. Internal Audit is staffed by industry professionals including qualified accountants and engineers. The head of Internal Audit is jointly accountable to the Audit & Risk Committee and the Senior Vice President Corporate Services.

Governance, Risk and Compliance function

The Governance, Risk and Compliance Function is responsible for Woodside’s risk management framework, development of risk management capability, and providing risk management oversight to senior levels of management and the Audit & Risk Committee on the strategic risk profile and the Group’s risk management performance.

Material risks

Our material risks (including environmental and social risks) and how they are managed are disclosed in section 3.8 – Risk factors.

External audit and reporting

External Auditor independence

In accordance with Woodside’s External Auditor Policy, the Audit & Risk Committee oversees the engagement of Woodside’s external auditor, governed by the External Auditor Guidance Policy (guidance policy). Internal audit and external audit are separate and independent of each other.

The guidance policy includes provisions directed at maintaining the independence of the external auditor and assessing whether the proposed provision of any non-audit services by the external auditor is appropriate. The guidance policy classifies a range of non-audit services which could potentially be provided by the external auditor as acceptable within limits, requiring Audit & Risk Committee pre-approval or not acceptable. The Audit & Risk Committee reviews the auditor independence annually.

The Audit & Risk Committee did not waive the pre-approval requirement under paragraph (c)(7)(i) of Rule 2-01 of SEC Regulation S-X in 2022.

With effect from 2022, PricewaterhouseCoopers (PwC) was appointed as auditor of the Group replacing Ernst & Young (EY). Under SEC regulations, the remuneration of the auditors (PwC) of $5.4 million (2021: $4.6 million (EY)) is required to be presented as follows: audit fees represent 76% (2021: 38%); audit-related fees 18% (2021: 58%); tax fees 5% (2021: 3%); and all other fees 1% (2021: 1%).

Verification of periodic corporate reports

A statement setting out the processes undertaken by Woodside to verify the integrity of the periodic corporate reports it releases to the market that are not audited by an external auditor is available in the Corporate Governance section of Woodside’s website.

CEO and CFO assurance

Before approving the Financial Statements for a financial period, the Board receives from the CEO and CFO a declaration stating that:


in their opinion Woodside’s financial records have been properly maintained, comply with the appropriate accounting standards and give a true and fair view of Woodside’s financial position and performance


the opinion has been formed on the basis of a sound system of risk management and internal control which is operating effectively.


72


Table of Contents

4.1.7 Inclusion and diversity

Inclusion and Diversity Policy

Our Inclusion and Diversity (I&D) Policy outlines our commitment to an inclusive workplace culture that values diversity and promotes equal opportunities. Our I&D Policy applies throughout Woodside, including the Board. The Human Resources & Compensation Committee is responsible for monitoring the company’s I&D Policy and setting measurable objectives for achieving diversity in the composition of the Board, Senior Executives and Woodside’s workforce generally.

Our diversity encompasses differences in age, nationality, race, ethnicity, national origin, religious beliefs, sex, sexual orientation, intersex status, gender identity or expression, relationship status, disability, neurodiversity, cultural background, thinking styles, experience, family background, including caregiving commitments and education.


   LOGO


For more information, refer to our I&D policy on our website.

Initiatives to promote inclusion and diversity

Woodside aims to drive I&D and implement the objectives set out in the I&D Policy, among other things:


respecting the unique attributes that each individual brings to the workplace and fostering a values-based and leader-led inclusive culture


providing I&D education and training as well as undertaking diversity initiatives and measuring their effectiveness


amplifying the voices of employees to inform our activities to achieve inclusion by enabling the Employee Impact Groups and conducting employee surveys


the Board annually reviewing the aspirational goals it has set for achieving improvement in Woodside’s I&D indicators and the progress in achieving those objectives


reporting gender equality indicators in accordance with the Workplace Gender Equality Act 2012 (Cth). For further information, refer to our FY22 submission available on our website.


73


Table of Contents

2022 measurable objectives

Our 2022 measurable objectives include objectives set out in our I&D policy


2022 measurable objective

   Progress

Deliver a comprehensive Inclusive Leadership program via company-wide leadership program.


•   Inclusive Leadership embedded into Navigator Leadership Program. During 2022, through Navigator, 924 people commenced the leadership program; 56 senior leaders completed Inclusive Leadership Assessments; and 48 people participated in an additional two half-day Inclusive Leadership courses.


•   Employee Impact Groups delivered three Inclusive Leadership Series events with 315 people attending.

Continue to track perceived level of inclusion and use inclusion survey insights to inform initiatives to continually improve.


•   Our Voice survey was completed, with belonging, inclusive culture and inclusive leadership measured. Survey feedback used to inform 2023 priorities.

Embed Respectful Behaviours at Woodside via increasing a ‘speak up’ culture and proactive employee engagement on this topic.


•   653 people completed the Working Better Together – Respectful Behaviours program.


•   Employee perceptions in relation to respect, harassment and discrimination at work improved during 2022 (measured via the employee survey).


•   Multi-disciplinary team established in 2021 maintained during 2022 to identify and embed improvements related to respect at work. Examples include improving site induction and online training, strong regular messaging and participation in industry bodies to share learnings.

Ensure diversity of the Board with consideration for gender and cultural diversity.


•   The I&D Policy was enhanced in 2022 to include a public commitment to improving diversity on the Board, with a key focus on gender equality reaching 40% male, 40% female and 20% any gender.


•   As of 31 December 2022, Board diversity included:


-   36% female representation

-   9% LGBTIQ+ representation

-   country based cultural diversity included - Indigenous and non-Indigenous Australian, American, Singaporean Chinese and English

-   racial diversity included 9% Asian, 9% Indigenous Australian, 82% white/Caucasian.

Increase the percentage of Indigenous Australian people employed in leadership roles, mid-career and senior roles and overall.


•   The percentage of Indigenous Australian people employed by Woodside in:


-   mid-career and senior roles increased to 0.7% (from 0.6%)


-   leadership roles increased to 0.9% (from 0.8%).


•   Overall participation (including third-party pathway program participants) increased to 5.4% (from 5.2%)

Increase the percentage of females employed in leadership roles, trade and technician roles and overall.


•   The percentage of females employed by Woodside in:


-   trade and technician roles increased to 9.8% (from 9%)


-   leadership roles increased to 26.8% (from 25.2%).


•   There was an overall increase to 33.4% (from 32.7%).

Maintain gender balance1 and meet recruitment goals for Indigenous Australian peoples through all forms of entry to Woodside including pathway programs and experienced hires.


•   Recruitment results for gender were:


-   non-tertiary pathways2: 63.6% female

-   summer vacation and graduates: 50.9% female for summer vacation 2022/2023 and 54% female for graduates

-   experienced hires: 40.6% female.


•   Recruitment results for Indigenous Australian people, against goals, were:


-   non-tertiary pathways2: 59.1% (goal of 50%)

-   summer vacation and graduates: 3.8% for summer vacation 2022/2023 and 4.8% for graduates (goal of 10%)

-   experienced hires: 6.2% (goal of 2%).

Make progress towards building greater inclusion of people who are differently abled and/or neurodiverse.


•   Progress made in relation to introduction of a low-sensory room to support people with light sensitivity, recruitment processes enhanced, awareness raising via education and information sessions.

Support LGBTIQ+ individuals to feel safe to be out at work.


•   Authentic Leaders Program for LGBTIQ+ employees was completed


•   Introduction of strong visible signs of support ie. Progress Pride flags at Karratha sites


•   193 people completed LGBTIQ+ related training in 2022


•   Gender Affirmation Guide, including access to four weeks paid leave, introduced.


  1.

Gender balance in the US is defined as representative and reflective of the available talent pool.

  2.

Non-tertiary pathway data is based on third-party program recruitment information.


74


Table of Contents

Woodside workforce gender profile


LOGO


75


Table of Contents

4.1.8 Other governance disclosures

Evaluation of disclosure controls and procedures

Woodside’s management, with the participation of its CEO and CFO, have evaluated, as required by Rule 13a-15(b) under the US Securities Exchange Act of 1934 (Exchange Act), the effectiveness of Woodside’s disclosure controls and procedures (as defined in Exchange Act Rule 13a-15(e)) as at 31 December 2022. Based on that evaluation, the CEO and CFO concluded that Woodside’s disclosure controls and procedures were effective, as at 31 December 2022, in ensuring that information required to be disclosed by Woodside in the reports that it files or submits under the Exchange Act is recorded, processed, summarised and reported within the time periods specified in the SEC’s rules and forms, including that such information is accumulated and communicated to Woodside’s management, including the CEO and CFO, to allow timely decisions regarding required disclosure.

Management’s annual report on internal control over financial reporting

This annual report does not include a report of management’s assessment regarding internal control over financial reporting or an attestation report of Woodside’s registered public accounting firm due to a transition period established by rules of the SEC for newly public companies.

Attestation report of the registered public accounting firm

Not applicable.

Changes in internal control over financial reporting

The Group’s accounting records and financial reporting processes rely on the effectiveness of the Enterprise Resource Planning (ERP) systems used. Following the merger, the ERP system of BHP Petroleum was separated from BHP and exists independently of Woodside’s ERP system. There are various risks associated with maintaining two independent ERP systems, including reliability and integrity of the systems and accuracy of financial information.

This change occurred during the year ended December 31, 2022, and in Woodside’s view it has materially affected, or is reasonably likely to materially affect, Woodside’s internal control over financial reporting. To address this, Woodside performed the following procedures:


reconciled opening balances for BHP Petroleum to ensure data migration from the BHP system was complete and accurate


implemented additional internal controls over the model to consolidate financial information from both ERP systems to ensure the data was complete and accurate


assessed the accounting policies of BHP Petroleum and the impact on the Group’s financial position and results of operation


reformed additional governance procedures to incorporate and identify impacts of the BHP Petroleum business on the Group’s financial records and disclosures.

Exemptions from the NYSE listing standards for audit committee

As required by NYSE listing standards, Woodside maintains an Audit & Risk Committee for the purpose of assisting the Board’s oversight of its financial statements, its internal audit function and its independent auditors. Woodside’s Audit & Risk Committee is in full compliance with Exchange Act Rule 10A-3 and Section 303A.06 of the NYSE Listed Company Manual.

While Woodside’s Audit & Risk Committee is directly responsible for remuneration and oversight of the external auditor, ultimate responsibility for the appointment of the external auditor rests with Woodside shareholders, in accordance with Australian law and the Woodside Constitution. However, in accordance with the limited exemptions set forth in Rule 10A-3, the Audit & Risk Committee is responsible for the annual auditor engagement and if there is any proposal to change auditors, the committee does make recommendations to the Woodside Board on any change of auditor, which are then considered by Woodside shareholders at the annual meeting of Woodside shareholders.

Differences from NYSE corporate governance requirements

Woodside’s ADSs are listed on the New York Stock Exchange (NYSE) and, accordingly, Woodside is subject to the listing rules of the NYSE (NYSE Listing Rules). The NYSE Listing Rules include certain accommodations in the corporate governance requirements that allow foreign private issuers, such as Woodside, to follow ‘home country’ corporate governance practices in lieu of the otherwise applicable corporate governance standards of the NYSE. Woodside has elected to comply with certain home country rules in lieu of the applicable NYSE requirements, as more fully described below.


76


Table of Contents

Woodside may in the future decide to use other foreign private issuer exemptions with respect to some of the other NYSE Listing Rules. Following Woodside’s home country governance practices, as opposed to the requirements that would otherwise apply to a company listed on the NYSE, may provide less protection than is accorded to investors under the NYSE Listing Rules applicable to US domestic issuers. If, at any time, Woodside ceases to be a foreign private issuer, it will take all action necessary to comply with the SEC and NYSE Listing Rules.

Quorum

The NYSE Listing Rules generally require that a listed company’s by-laws provide for a quorum for any meeting of the holders of such company’s voting shares that is sufficiently high to ensure a representative vote. Pursuant to the NYSE Listing Rules, Woodside, as a foreign private issuer, has elected to comply with practices that are permitted under Australian securities laws in lieu of the provisions of the NYSE Listing Rules. The Woodside Constitution provides that a quorum for a meeting of Woodside Shareholders is three eligible Woodside Shareholders entitled to vote.

Audit committee and audit committee additional requirements

Under Section 303A.06 of the NYSE Listing Rules and the requirements of Rule 10A-3 under the Exchange Act (Rule 10A- 3), a US listed company is required to have an audit committee of such company’s board of directors consisting entirely of independent members that comply with the requirements of Rule 10A-3. In addition, (i) the audit committee must have a written charter which is compliant with the requirements of Section 303A.07(b) of the NYSE Listing Rules, (ii) the listed company must have an internal audit function and (iii) the listed company must fulfill all other requirements of the NYSE Listing Rules and Rule 10A-3. Foreign private issuers must comply with the audit committee standard set forth in Rule 10A-3, subject to limited exemptions, but may elect to follow ‘home country’ practices in lieu of the additional audit committee requirements in the NYSE Listing Rules. Rule 10A-3 requires NYSE-listed companies to ensure their audit committees are directly responsible for the appointment, compensation, retention and oversight of the work of the external auditor unless the company’s governing law or documents or other home country legal requirements require or permit shareholders to ultimately vote on or approve these matters. Refer to section 4.1.3 - Board committees - Audit & Risk Committee for information on Audit and Risk Committee requirements under the ASX Recommendations.

Code of Ethics

The Woodside Board has adopted the Code of Conduct, which applies to the Woodside Board and Woodside’s CEO and CFO, along with all other Woodside employees.

During 2022, we refreshed our Code of Conduct to align it with global best practices and in connection with our new listings on the NYSE and LSE.


   LOGO

  The Code of Conduct can be found on Woodside’s website at woodside.com/who-we-are/corporate-governance


77


Table of Contents

4.1.9 Shareholders


Shareholder communications


Shareholders are encouraged to receive electronic communications from the company and can elect to receive email notification when key materials are posted to the website. Shareholders can also receive an email notification of Woodside’s announcements and media releases.


Shareholders can communicate directly with Woodside by submitting questions or comments on the Contact Us section of the website. The Shareholder Services section of the website also sets out the email address for Woodside’s share registry, Computershare.

Investor relations program


Woodside has an investor relations program to facilitate effective two-way communication with investors. Our Continuous Disclosure and Market Communications Policy facilitates this by requiring:


•   the full and timely disclosure of information about Woodside’s material activities to the ASX and other relevant exchanges and our website (where they are retained for at least three years)


•   that all disclosures, including notices of meetings and other shareholder communications, are drafted clearly and concisely


•   the conduct of briefings for investors from time to time (such as the annual and half year results, and Investor Briefing Days).


Investor briefings are webcast and presentation material for briefings or speeches containing new and substantive information are first disclosed to the market and other relevant exchanges and posted to Woodside’s website.

Shareholder meetings

   The company recognises the importance of shareholder participation in general meetings and supports and encourages that participation. The company has direct voting arrangements in place, allowing shareholders unable to attend the AGM to vote on resolutions without having to appoint someone else as a proxy. Voting on any substantial resolution at an AGM is conducted by poll.

Continuous disclosure and market communications


Woodside’s Continuous Disclosure and Market Communications Policy and associated guidelines reinforce Woodside’s commitment to continuous disclosure and outline management’s accountabilities and the processes to be followed for ensuring compliance.


A Disclosure Committee manages compliance with market disclosure obligations and is responsible for implementing and monitoring reporting processes and controls and setting guidelines for the release of information. The Disclosure Committee is comprised of senior leaders. Employees considered to hold higher risk roles are required to participate in annual continuous disclosure training.


The Board and Senior Executives are provided with copies of all information disclosed pursuant to the stock exchange rules.


78


Table of Contents

SECTION 4.2

Directors’ report

The directors of Woodside Energy Group Ltd present their report (including the Remuneration Report) together with the Financial Statements of the consolidated entity, being Woodside Energy Group Ltd and its controlled entities, for the year ended 31 December 2022.

Directors

The directors of Woodside Energy Group Ltd in office at any time during or since the end of the 2022 financial year and information on the directors (including qualifications and experience and directorships of listed companies held by the directors at any time in the last three years) are set out in section 4.1.2 - Board of directors.

The number of directors’ meetings held (including meetings of committees of the Board) and the number of meetings attended by each of the directors of Woodside Energy Group Ltd during the financial year are shown in section 4.1.2 - Board of directors - Director attendance at meetings.

Details of director and Senior Executive remuneration are set out in section 4.3 - Remuneration Report.

The particulars of directors’ interests in shares of Woodside as at the date of this report are set out at the end of this section.

Principal activities

The principal activities and operations of Woodside during the financial year were hydrocarbon exploration, evaluation, development, production and marketing.

Other than as previously referred to in the operating and financial review section, including the merger with BHP’s petroleum business, there were no other significant changes in the nature of the activities of the consolidated entity during the year.

Consolidated results

The consolidated operating profit attributable to Woodside’s shareholders after provision for income tax was $6,498 million ($1,983 million in 2021).

Operating and financial review

A review of the operations of Woodside during the financial year and the results of those operations are set out in section 1 - Overview, section 2 - Financial performance and strategy, section 3 - Our business and section 6.6 - Asset facts.

Significant changes in the state of affairs

The review of operations sets out a number of matters that have had a significant effect on the state of affairs of the consolidated entity.

Other than those matters, there were no significant changes in the state of affairs of the consolidated entity during the financial year.

Events subsequent to end of financial year

Since the reporting date, the directors have resolved to pay a fully franked dividend. More information is available in the Dividend section below. No provision has been made for this dividend in the financial report as the dividend was not determined by the directors on or before the end of the financial year.

Other than those disclosed in Note E.5 of section 5 – Financial Statements, there are no other material subsequent events.

Dividend

The directors have resolved to pay a final dividend in respect of the year ended 31 December 2022 of 144 US cents per ordinary share (fully franked) payable on 5 April 2023.


79


Table of Contents
Type   2022 final      2022 interim      2021 final

Payment date

  5 April 2023      6 October 2022      23 March 2022

Period ends

  31 December 2022      30 June 2022      31 December 2021

Cents per share

  144      109      105

Value $ million

  2,734      2,070      1,018

Fully franked


Likely developments and expected results

In general terms, the review of operations of Woodside gives an indication of likely developments and the expected results of the operations. In the opinion of the directors, disclosure of any further information would be likely to result in unreasonable prejudice to Woodside. Section 6.9 - Information about this report includes further details regarding Woodside’s reliance on the unreasonable prejudice exemption.

Environmental compliance

Woodside is subject to a range of environmental legislation in Australia and other countries in which it operates. In 2022, there three environmental incidents (two hazardous non-hydrocarbon and one hydrocarbon) involving spills of greater than 1 bbl released to the environment. The incidents did not result in significant negative impacts to the surrounding environment, were localized and temporary in nature.

Through its Health, Safety and Environment Policy and Quality Policy, Woodside plans and performs activities so that adverse effects on the environment are avoided or kept as low as reasonably practicable.

Research and development

Technology has the potential to support safe, low cost and lower carbon operations. Woodside has a number of technology collaborations and pursues opportunities through technology across operations including for emissions reduction.

For further information on examples of the Group’s activities in the field of research and development see section 3.8 - New energy and carbon solution.

Company Secretaries

The following individuals have acted as Company Secretary during 2022:

Andrew Cox BA (Hons), LLB, MA

Vice President Legal and General Counsel, and Joint Company Secretary

Mr Cox joined Woodside in 2004 and was appointed to the role of Vice President Legal in January 2015. He was appointed Vice President Legal and General Counsel and Joint Company Secretary on 1 June 2017 and ceased to be an additional Company Secretary effective 20 October 2022.

Warren Baillie LLB, BCom, Grad. Dip. CSP

Group Company Secretary

Mr Baillie joined Woodside in 2005 and was appointed Group Company Secretary effective 1 February 2012. Mr Baillie is a solicitor and chartered secretary. He is a former President of the board of the Governance Institute of Australia.

Lucy Bowman MA (Oxon), Jurisprudence

Joint Company Secretary

Ms Bowman joined Woodside in 2021 as Senior Legal Counsel and was appointed Joint Company Secretary effective 20 October 2022. She is a graduate member of the Australian Institute of Company Directors.

Branches

Woodside Energy Group Ltd, through various subsidiaries, has established branches in a number of countries.

Indemnification and insurance of directors and officers

Woodside Energy Group Ltd’s constitution requires Woodside Energy Group Ltd to indemnify each director, secretary, executive officer or employee of Woodside Energy Group Ltd or its wholly owned subsidiaries against liabilities (to the extent Woodside Energy Group Ltd is not precluded by law from doing so) incurred in or arising out of the conduct of the business of Woodside Energy Group Ltd or the discharge of the duties of any such person. Woodside Energy Group Ltd enters into deeds of indemnity with directors, secretaries, certain Senior Executives and employees serving as officers on wholly owned or partly owned companies of Woodside in terms consistent with the indemnity provided under Woodside Energy Group Ltd’s constitution.

From time to time, Woodside engages its external auditor, PricewaterhouseCoopers, to conduct non-statutory audit work and provide other services in accordance with Woodside’s External Auditor Guidance Policy. The terms of engagement include an indemnity in favour of PricewaterhouseCoopers:


against all losses, claims, costs, expenses, actions, demands, damages, liabilities or any proceedings (liabilities) incurred by PricewaterhouseCoopers in respect of third-party claims arising from a breach by Woodside under the engagement terms


80


Table of Contents
 

for all liabilities PricewaterhouseCoopers has to Woodside or any third-party as a result of reliance on information provided by Woodside that is false, misleading or incomplete.

Woodside Energy Group Ltd has paid a premium under a contract insuring each director, officer, secretary and employee who is concerned with the management of Woodside Energy Group Ltd or its subsidiaries against liability incurred in that capacity. Disclosure of the nature of the liability covered by and the amount of the premium payable for such insurance is subject to a confidentiality clause under the contract of insurance. Woodside Energy Group Ltd has not provided any insurance for the external auditor of Woodside Energy Group Ltd or a body corporate related to the external auditor.

During the financial year ended 31 December 2022 and as at the date of this Directors’ Report, no indemnity in favour of a current or former director, officer or external auditor of Woodside has been called on.

Non-audit services and auditor independence declaration

Based on advice provided by the Audit & Risk Committee, the directors are satisfied that the provision of non-audit services by the external auditors during the financial year is compatible with the general standard of independence for auditors imposed by the Corporations Act 2001 for the following reasons:


all non-audit services were provided in accordance with Woodside’s External Auditor Policy and External Auditor Guidance Policy


all non-audit services were subject to the corporate governance processes adopted by the company and have been reviewed by the Audit & Risk Committee to ensure that they do not affect the integrity or objectivity of the auditor.

Financial instruments

For further information on Woodside’s financial risk management objectives and policies, hedging and exposure to price risk, credit risk, liquidity risk and cash flow risk, refer to sections A, C and D in section 5 - Financial Statements and Quantitative and qualitative disclosures about market risk in section 6.3 - Additional disclosures.

Proceedings on behalf of the company

No proceedings have been brought on behalf of the company, nor has any application been made in respect of the company, under section 237 of the Corporations Act 2001.

Rounding of amounts

Woodside Energy Group Limited is an entity to which the Australian Securities and Investments Commission (ASIC) Corporations (Rounding in Financial/Directors’ Reports) Instrument 2016/191 (ASIC Instrument 2016/191) applies. Amounts in this report have been rounded in accordance with ASIC Instrument 2016/191. This means that amounts contained in this report have been rounded to the nearest million dollars unless otherwise stated.

Information in other parts of the Annual Report

Where this Directors’ Report refers to other parts of the Annual Report, those pages form part of this report.

Directors’ relevant interests in Woodside Energy Group Ltd shares as at the date of this report


Director    Relevant interest in shares  

Larry Archibald

     13,524  


Frank Cooper

     14,895  


Swee Chen Goh

     13,949  


Richard Goyder

     26,163  


Chris Haynes

     16,009  


Ian Macfarlane

     10,891  


Meg O’Neill1

     327,635  


Ann Pickard

     15,870  


Sarah Ryan

     13,168  


Gene Tilbrook

     9,947  


Ben Wyatt

     1,639  


1.

Meg O’Neill is the only Woodside Energy Group Ltd director who has rights on issue and her rights holdings are set out in Section 4.3 - Remuneration Report. Woodside Energy Group Ltd does not have any options on issue.


81


Table of Contents

Auditor’s independence declaration to the Directors of Woodside Energy Group Ltd

Not required for US reporting.


82


Table of Contents

SECTION 4.3

Remuneration Report


Contents


4.3.1 Committee Chair’s letter

   84

4.3.2 Remuneration Report (audited)

   86

KMP and summary of Woodside’s five-year performance

   86

Executive KMP

   87

Remuneration policy

   87

Executive Incentive Scheme

   87

2022 Corporate Scorecard

   88

Remuneration changes

   88

Executive KMP remuneration structure

   89

Corporate Scorecard measures and outcomes for 2022

   92

Executive KMP KPIs and outcomes for 2022

   93

Other equity plans

   98

Contracts for Executive KMP

   99

Non-executive directors (NEDs)

   99

Human Resources & Compensation Committee

   100

Loans and transactions

   100

Use of remuneration consultants

   100

Reporting notes

   101

Statutory tables

   101

4.3.3 Glossary

   106


83


Table of Contents

4.3.1 Committee Chair’s letter


27 February 2023    LOGO

Dear Shareholders

On behalf of the Board, I am pleased to present the Remuneration Report for the year ended 31 December 2022.

2022 was an historic year for Woodside with the successful completion of the merger with BHP’s petroleum business, bringing together the best of both organisations to create the largest energy company currently listed on the Australian Securities Exchange and a greater global presence.

The merger saw the Committee’s activity focused on our total reward framework to ensure it continues to motivate and retain our people, attract the best talent and keep Woodside globally competitive. This work considered the transition requirements arising from the merger, including organisation design and alignment of remuneration policies and practices. The Committee (and in the case of the CEO the Board) reviewed and approved changes to the leadership structure in connection with the merger, including the remuneration packages of the CEO and Senior Executives and changes to the structure of the Executive Incentive Scheme (EIS).

Culture continued to be a priority for the Committee throughout 2022. The Committee considered activities to assess and monitor culture, across all areas of our Integrated Culture Framework (values, safety, risk and compliance); and oversaw implementation of the 2021-2025 Inclusion and Diversity strategy. More detail on the Committee’s activities in 2022 is available in the Corporate Governance Statement 2022.

The Board is proud of the excellent results achieved by the Woodside team in 2022 through the merger process and in the combined business. These results are reflected in our 2022 Executive key management personnel (KMP) remuneration outcomes outlined below and in further detail in this report.

Business performance

In 2022, the Corporate Scorecard was based on five equally weighted measures chosen for their impact on short-term and long-term shareholder value. These measures are earnings before interest, taxes, depreciation and amortisation excluding impairment (EBITDA excluding impairment), operating expenditure, production, material sustainability issues and delivery against business priorities.

The merged company delivered EBITDA excluding impairment significantly above target at US$11,234 million and Operating Expenditure in line with target at A$2,063 million. Production for 2022 was above the revised target at 157.7 MMboe. Process safety performance was on target with zero Tier 1 loss of primary containment process safety events and one low risk Tier 2 event. Personal safety has remained a priority during 2022 but disappointingly our total recordable injury rate of 1.80 was higher than our target of 1.0. Gross equity scope 1 and 2 emissions were higher than target primarily due to increased production. Gross equity emissions are calculated prior to retirement of carbon credits as offsets, focusing the organisational priorities on avoiding and reducing emissions.

Good progress has been made on key growth projects in 2022. Our Scarborough project in Australia is on track for first LNG cargo in 2026 and the Sangomar development offshore Senegal is expected to deliver first oil late in 2023.

The company’s performance across the five Corporate Scorecard measures gave an overall corporate performance outcome of 7 (out of a maximum of 10). The Board considered the significant achievements of our team in 2022 and exercised its discretion by raising the outcome to 8 for the purposes of the EIS. This outcome recognises the sustained efforts of the team to successfully complete the merger while delivering strong operational results and progressing our growth projects and new energy opportunities. Overall the CEO’s award increased by approximately 5.6% as a result of this decision.

These results are reflected in our 2022 Executive KMP KPIs and outcomes for 2022 section of this report.

Executive KMP changes

In 2022 the Committee approved changes to the leadership structure for the merged company, including appointment to roles reporting directly to the CEO, aiming to bring together the capabilities, experiences and diverse perspectives from both organisations to deliver long-term success for the merged company. Leadership positions are based in Perth and Houston, reflecting the geographic spread of the combined portfolio.

As a result, effective 1 June 2022 Graham Tiver continued as Woodside’s Executive Vice President and Chief Financial Officer having commenced with Woodside on 1 February 2022, based in Perth. On 1 June 2022, Shiva McMahon commenced as Executive Vice President International Operations transitioning from BHP’s petroleum business, to be based in Houston.

Effective 1 June 2022 Shaun Gregory’s role changed from Executive Vice President Sustainability and Chief Technology Officer to Executive Vice President New Energy. Mr Gregory ceased to be Executive KMP given the adjustment to the responsibilities of his role. Fiona Hick resigned as Executive Vice President Australian Operations and ceased to be Executive KMP on 28 November 2022. Sherry Duhe resigned as Executive Vice President and Chief Financial Officer and ceased to be Executive KMP on 4 February 2022.


84


Table of Contents

Executive remuneration changes

Following the merger with BHP’s petroleum business, the Board reviewed remuneration for the CEO and Senior Executives, based on benchmarking against a defined peer group and with consideration of organisation size and structure.

As a result of the Board’s review, the Board approved an increase to Meg O’Neill’s fixed and variable remuneration components. Effective 1 June 2022, Ms O’Neill’s fixed annual remuneration (FAR) increased by A$200,000 to A$2,400,000 with a target value for variable annual reward (VAR) set at A$6,720,000. Remuneration changes approved for the CEO and Senior Executives are outlined in further detail in the Executive KMP KPIs and outcomes for 2022 section of this report.

The Board also approved changes within the structure of the EIS to ensure it remains competitive in the broader markets in which we now operate. As a result, the cash component of the EIS award for Executive KMP will increase from 12.5% to 20%, positioning the cash opportunity more closely to the defined peer group while maintaining the intent for most of the award to be delivered as equity. These changes are described in further detail in the Remuneration changes section of this report.

As a part of the review, the 2023 Corporate Scorecard has been updated to comprise of four equally weighted measures which between them cover the same scope as the prior five measures with appropriate emphasis on key performance metrics including material sustainability issues. These changes are outlined in the Remuneration changes section of this report.

Conclusion

Following the merger with BHP’s petroleum business, we have worked to ensure our integrated remuneration policies and practices align with the new markets in which we operate, to keep Woodside globally competitive. The Board reviewed remuneration for the CEO and Senior Executives based on benchmarking against a defined peer group together with organisation size and structure. As a result, increases were approved that reflect performance and changes to role scope and accountabilities. The VAR outcome for 2022 is above target and recognises the efforts of the team to successfully complete the merger while delivering strong operational results and progressing our growth projects and new energy opportunities.

The Board is proud of the sustained efforts of the entire Woodside team throughout 2022. We look forward to our ongoing engagement with Woodside shareholders and sharing in Woodside’s future success.

Yours sincerely,

/s/ Gene Tilbrook

Gene Tilbrook

Chair of Human Resources & Compensation Committee


85


Table of Contents

4.3.2 Remuneration Report (audited)

KMP and summary of Woodside’s five-year performance

This report outlines the remuneration arrangements and outcomes achieved for Woodside’s key management personnel (KMP) during 2022.

Woodside’s KMP are the people who have the authority to shape and influence the Group’s strategic direction and performance through their actions, either collectively (in the case of the Board) or as individuals acting under delegated authorities (in the case of the CEO and Senior Executives).

The names and positions of the individuals who were KMP during 2022 are set out in Tables 1A and 1B.

Table 1A – Executive KMP


Executive Director


Meg O’Neill (Chief Executive Officer and Managing Director (CEO))


Senior Executives


Graham Tiver (Executive Vice President and Chief Financial Officer)1


Shiva McMahon (Executive Vice President International Operations)2


Shaun Gregory (former Executive Vice President Sustainability and Chief Technology Officer)3


Fiona Hick (former Executive Vice President Australian Operations)4


Sherry Duhe (former Executive Vice President and Chief Financial Officer)5


1.

Mr G Tiver commenced with Woodside on 1 February 2022.

2.

Ms S McMahon commenced with Woodside on 1 June 2022.

3.

Mr S Gregory ceased to be Executive Vice President Sustainability and Chief Technology Officer and an Executive KMP on 31 May 2022. Mr Gregory’s title changed to Executive Vice President New Energy on 1 June 2022.

4.

Ms F Hick’s title changed from Executive Vice President Operations to Executive Vice President Australian Operations on 1 June 2022. Ms Hick ceased to be Executive Vice President Australian Operations and an Executive KMP on 28 November 2022.

5.

Ms S Duhe ceased to be Executive Vice President and Chief Financial Officer and Executive KMP on 4 February 2022.

Table 1B – Non-Executive Directors KMP


Richard Goyder, AO (Chair)


Larry Archibald


Frank Cooper, AO


Swee Chen Goh


Christopher Haynes, OBE


Ian Macfarlane


Ann Pickard


Sarah Ryan


Gene Tilbrook


Ben Wyatt


Table 2 – Five-year performance


            2022      2021      2020      2019      2018  

EBITDA excluding impairment1

   (US$million)        11,234        4,135        1,922        3,531        3,814  

Operating Expenditure2

   (A$million)        2,063        1,030                             

Net profit after tax (NPAT)3

   (US$million)        6,498        1,983        (4,028)        343        1,364  

Basic earnings per share4

   (US cents)        430        206        (424)        37        148  

Dividends per share

   (US cents)        253        135        38        91        144  

Share closing price (last trading day of the year)7

   (A$)        35.44        21.93        22.74        34.38        31.325  

Production6,7

   (MMboe)        157.7        91.1        100.3        89.6        91.4  

Average annual Dated Brent7

   ($/boe)        101        71        42        64        71  


1.

This is a non-IFRS measure that is unaudited but derived from audited Financial Statements. This measure is presented to provide further insight into Woodside’s performance and has been calculated as defined in the Alternative performance measures section of the 2022 Annual Report.

2.

Operating expenditure is a non-IFRS measure that is unaudited. This measure includes operating and general, administrative and other expenses incurred in generating revenue from the sale of hydrocarbons from Woodside’s operating assets. Operating expenditure was not disclosed prior to 2021.

3.

Represents profit after tax attributable to equity holders of the parent. This measure is presented to provide further insight into Woodside’s performance.

4.

Basic earnings per share from total operations.

5.

Share closing price (last trading day) for 2017 was $33.08.

6.

Production volumes for 2022 have been calculated using updated conversion factors as defined in the Glossary, units of measure and conversion factors section of the Annual Report.

7.

These measures are non-IFRS financial performance measures and therefore are unaudited.


86


Table of Contents

Executive KMP

Remuneration policy

Woodside’s strategy is to thrive through the energy transition by building a low cost, lower carbon, profitable, resilient and diversified portfolio. This is underpinned by our focus on safe, reliable and efficient operations, and disciplined capital allocation, providing the foundation to progress key development projects and to navigate the energy transition. As the world’s energy mix evolves we are positioning ourselves to be agile, flexible and adaptable; building on our traditional energy capabilities and maturing opportunities to produce lower carbon energy and provide integrated carbon solutions which are customer-led and scalable.

To do so, the company must be able to attract and retain executive capability in a globally competitive market. The Board structures remuneration so that it rewards those who perform, is valued by Executives, and is aligned with the company’s values, strategic direction and the creation of enduring value to shareholders, and other stakeholders.

Fixed Annual Reward (FAR) is determined having regard to the scope of each Executive’s role and their level of knowledge, skills and experience.

Variable Annual Reward (VAR) is calculated annually, based on performance measures set by the Board aimed at aligning executive remuneration with short and long-term returns. VAR aligns shareholder and executive remuneration outcomes by making a significant portion of executive remuneration at risk, while rewarding performance.

Executive remuneration is reviewed annually, having regard to the accountabilities, experience and performance of each individual. FAR and VAR are compared against domestic and international competitors at target, to maintain Woodside’s capacity to attract and retain talent and to ensure appropriate motivation is provided to Executives to deliver on the company’s strategic objectives.

Executive Incentive Scheme

VAR is delivered under the Woodside Executive Incentive Scheme (EIS). The EIS is structured having regard to the key objectives of executive engagement, alignment with the shareholder experience and strategic fit.


LOGO

The EIS delivers a single variable reward linked to challenging individual and company annual targets set by the Board.

Each Executive’s award is based on their individual performance against key performance indicators (KPIs) and the company’s performance through the Corporate Scorecard. The award is subject to performance in each 12-month period and is determined at the conclusion of each performance year.

The Corporate Scorecard targets and individual KPIs are designed to promote short-term and long-term shareholder value. Exceeding targets results in an increased award with a linear calculation up to the maximum, while under-performance will result in a reduced award. The minimum award that an Executive can receive is zero if the performance conditions are not achieved on either company or individual performance.

Individual performance is assessed by the Board in the case of the CEO, and by the CEO and the Human Resources & Compensation Committee in the case of Senior Executives.

The Board has strong oversight and governance and seeks to ensure that targets are set to create a clear link between performance and reward. The Board has an overriding discretion which it can and does exercise to adjust outcomes in line with shareholder experience and company or management performance.


87


Table of Contents

2022 Corporate Scorecard

The 2022 Corporate Scorecard for Executives was based on five equally weighted measures that were chosen because they impact short-term and long-term shareholder value, with a score of 5 for an outcome at target and a maximum score of 10 for each measure.


LOGO

Remuneration changes

In 2022 the Board reviewed remuneration for the CEO and Senior Executives based on benchmarking against a defined peer group and with consideration of organisation size and structure following the merger with BHP’s petroleum business.

As a result of the review the Board approved an increase to FAR for the CEO and an increase to FAR for Senior Executives, effective 1 June 2022. These increases reflect performance and changes to role scope and accountabilities and are outlined in the Executive KMP FAR and VAR outcomes section of this report.

The review also resulted in changes within the structure of the EIS to ensure it remains competitive in the broader markets in which we now operate. As a result a change was approved to the cash component of the award for the CEO and Senior Executives, increasing the cash opportunity from 12.5% to 20%. This change maintains the intent for most of the award to be delivered in deferred equity while positioning the cash opportunity more closely with our competitors. A combination of Restricted Shares and Performance Rights will continue to deliver the equity component of the EIS (80%) over a three-to-five-year period. The Board remains confident the EIS is structured to reflect Woodside’s strategic time horizons, align with shareholder interests and attract and retain the executive talent required to deliver our strategic objectives.

The previous EIS structure has been applied to the assessment of the CEO’s performance from 1 January to 31 May 2022, with the new structure applied in respect of the period from 1 June to 31 December 2022. The new structure will be applied to Senior Executives from 1 January 2023. The diagrams below show the EIS as it is applied to the CEO from 1 June 2022 and as it applied to Senior Executives from 1 January 2023.

2023 Corporate Scorecard

As part of the review of Executive KMP VAR the Corporate Scorecard for 2023 has been updated to four equally weighted measures. These four measures cover the same scope as the five which previously applied with appropriate emphasis on key performance objectives including material sustainability issues.

The 2023 measures are:


Financial


Base business


Material sustainability issues


Strategy and growth


88


Table of Contents
                                   CEO EIS structure (Effective 1 June 2022)                   Senior Executives EIS structure (Effective 1 January 2023)
LOGO


1.

Allocated using a face value methodology.

2.

Award allocated after completion of performance year.

Executive KMP remuneration structure

Woodside’s remuneration structure for the CEO and Senior Executives is comprised of two components: FAR and VAR.

FAR


Based upon the scope of the Executive’s role and their individual level of knowledge, skill and experience.


Benchmarked for competitiveness against domestic and international peers to enable the company to attract and retain superior executive capability.

VAR


Executives are eligible to receive a single variable reward linked to individual and company annual targets set by the Board.


The VAR is subject to performance against individual and corporate performance in the initial 12-month period and is determined at the conclusion of each performance year.

For 2022, VAR will be structured for CEO and Senior Executives as outlined below.


CEO

1 January to 31 May 2022


CEO

1 June to 31 December 2022


Senior Executives

1 January to 31 December 2022


Performance Rights1

Subject to a five-year performance period with a RTSR test five years after the date of allocation

     30%        30%        30%  

Restricted Shares1

Subject to a five-year deferral period

     30%        30%        30%  

Restricted Shares1

Subject to a four-year deferral period

     0%        10%        0%  

Restricted Shares1

Subject to a three-year deferral period

     27.5%        10%        27.5%  

Cash

Payable following the end of the performance year

     12.5%        20%        12.5%  


1.

Allocated using a face value methodology.


89


Table of Contents

Cash

The cash component is payable following the end of the 12-month performance year, in the March pay-cycle.

Restricted Shares

For the CEO’s VAR award from 1 January 2022 to 31 May 2022 and for Senior Executive VAR awards for 2022, the Restricted Shares are divided into tranches with three-year and five-year deferral periods. From 1 June 2022 for the CEO the Restricted Share component of VAR is divided into tranches with three, four and five-year deferral periods. There are no further performance conditions attached to these awards. This element creates a strong retention proposition for Executives as vesting is subject to employment not being terminated with cause or by resignation during the deferral period. The deferral mechanism means that the value of awards reflects fluctuations in share price across the deferral periods, which is intended to reflect the sustainability of performance over the medium-term and long-term and support increased alignment between Executives and shareholders.

Performance Rights

The Performance Rights are divided into two portions with each portion subject to a separate RTSR performance hurdle tested over a five-year period. Performance is tested after five years as Woodside operates in a capital intensive industry with long investment timelines. It is imperative that Executives take decisions in the long-term interest of shareholders, focused on value creation across the commodity price cycles of the oil and gas industry. Our view is that RTSR is the best measure of long-term value creation across the commodity price cycle of our industry.

One-third of the Performance Rights are tested against a comparator group that comprises the entities within the ASX 50 index at 1 December 2022. The remaining two-thirds are tested against an international group of oil and gas companies, set out in Table 11. The international peer group used to measure RTSR for the 2022 EIS award was reviewed and updated to maintain alignment with Woodside’s expanded global business activities.

RTSR outcomes are calculated by an external adviser after the conclusion of the performance year. The outcome of the test is measured against the schedule below. For EIS awards, any Performance Rights that do not vest will lapse and are not retested.

RTSR performance hurdle vesting


Woodside RTSR percentile position within peer group

   Vesting of Performance Rights

Less than 50th percentile

   No vesting

Equal to 50th percentile

   50% vest

Between the 50th and 75th percentile

   Vesting on a pro-rata basis

Equal to or greater than 75th percentile

   100% vest

Table 3 – Key EIS features


Allocation methodology

  Restricted Shares and Performance Rights are allocated using a face value allocation methodology. The number of Restricted Shares and Performance Rights is calculated by dividing the value by the volume weighted average price (VWAP) across December of the performance year.

Dividends and voting


Executives are entitled to receive dividends on Restricted Shares. No dividends are paid on Performance Rights prior to vesting. For Performance Rights that do vest, a dividend equivalent payment will be paid by Woodside for dividends paid during the period between allocation and vesting.

Restricted Shares have voting rights in the same way as other Woodside shareholders. Performance Rights do not have voting rights until shares are allocated following vesting.

Clawback provisions


The Board has the discretion to reduce unvested entitlements including where an Executive has acted fraudulently or dishonestly or is found to be in material breach of their obligations; there is a material misstatement or omission in the financial statements; or the Board determines that circumstances have occurred that have resulted in an unfair benefit to the Executive.

The US Securities Exchange Commission (SEC) has adopted a new rule that directs US exchanges (including the NYSE) to establish listing standards that require US-listed companies to adopt a “clawback” policy providing for the recovery of excess incentive-based compensation received by current or former executive officers due to a material misstatement of financial information that requires an accounting restatement.

Woodside will continue to review its clawback policy to ensure it remains appropriate and meets requirements in relevant jurisdictions including the SEC rules, which are expected to take effect in 2024.

Control event


The Board has the discretion to determine the treatment of any EIS award on a change of control event. If a change of control occurs during the performance year, an Executive will receive at least a pro-rata cash payment in respect of the unallocated cash and Restricted Share components of the EIS award for that performance year, assessed at target.

If a change of control occurs during the vesting period for equity awards, Restricted Shares will vest in full whilst Performance Rights may, at the discretion of the Board, vest on an at least pro-rata basis.

Cessation of employment


During a performance year, should an Executive resign or be terminated for cause, no EIS award will be provided (unless the Board determines otherwise). In any other case, Woodside will have regard to performance against target and the portion of the performance year elapsed in determining any EIS award.

During a deferral period, should an Executive resign or be terminated for cause, any EIS award will be forfeited or lapse (unless the Board determines otherwise). In any other case, any Restricted Shares will vest in full from a date determined by the Board while any Performance Rights will remain on foot and vest in the ordinary course subject to the satisfaction of applicable conditions, unless the Board determines otherwise. The Board will have discretion to accelerate the vesting of unvested equity awards, subject to termination benefits laws.

No retesting

  There will be no retest applied to EIS awards. Performance Rights will lapse if the required RTSR performance is not achieved at the conclusion of the five-year period.


90


Table of Contents

Calculation of award for 2022

Each Executive KMP’s award is based upon two components: individual performance against KPIs (30% weighting) and the company’s performance against the Corporate Scorecard (70% weighting). Individual performance is rated on a scale between 0 and 5 and company performance on a scale between 0 and 10. The sum of these two components determines the award.

The decision to pay or allocate an EIS award is subject to the overriding discretion of the Board, which may adjust outcomes, both upwards and downwards, to better reflect shareholder outcomes and company or management performance.

See Table 4 for details of the CEO’s and each Senior Executives’ individual performance assessment.


LOGO

Target variable reward opportunity for 2022

Each Executive is given a target VAR opportunity and a maximum VAR opportunity which is a percentage of the Executive’s FAR. The opportunities for 2022 are outlined below.


    Position

   Minimum opportunity    

(% of FAR)

   Target opportunity    

(% of FAR)

   Maximum opportunity    

(% of FAR)


    CEO

    1 January to 31 May 2022

   Zero    200    300

    CEO1

    1 June to 31 December 2022

   Zero    280    420

    Senior Executives

    1 January to 31 December 2022

   Zero    160    256


  1.

1 June 2022 changes to CEO target and maximum opportunity are noted in the remuneration changes section of this report.


CEO remuneration at target

(1 January to 31 May 2022)


CEO remuneration at target

(1 June to 31 December 2022)


Senior Executives remuneration at target

(1 January to 31 December 2022)

LOGO    LOGO    LOGO


91


Table of Contents

Corporate Scorecard measures and outcomes for 2022

The company’s performance across the five Corporate Scorecard measures gave an overall corporate performance outcome of 7 (out of a maximum of 10). The Board considered the significant achievements of our team in 2022 and exercised its discretion by raising the outcome to 8 for the purposes of the EIS. This outcome recognises the sustained efforts of the team to successfully complete the merger while delivering strong operational results and progressing our growth projects and new energy opportunities.


EBITDA excluding impairment (20%)


Outcome    10


EBITDA is a key contributor to annual profitability and is influenced by both management performance and commodity prices. EBITDA is closely aligned with short-term shareholder value creation. EBITDA is underpinned by efficient operational performance and outcomes are exposed to the upside and downside of oil and gas price and foreign exchange fluctuations, as are returns to shareholders.


2022 performance: EBITDA excluding impairment for 2022 was US$11,234 million, significantly above the target of US$6,919 million due to higher realised pricing across all price markers, and higher production.


Operating Expenditure (20%)


Outcome    5


Controlling Operating Expenditure brings a focus on efficient operations; cost competitiveness; and shareholder returns.


2022 performance: Operating Expenditure for 2022 was A$2,063 million, in line with the target of A$2,072 million excluding costs related to the Wildling well and foreign exchange impacts associated with a stronger US dollar.


Production (20%)


Outcome    10


Revenue is maximised and value generated from Woodside’s assets when they are fully utilised in production. Production must be carefully managed throughout the year to optimise value from the assets. The production target for Corporate Scorecard purposes is set relative to the company’s annual budget and market guidance.


2022 performance: Total production for 2022 was 157.7 MMboe, above the revised market guidance of 153 to 157 MMboe.1 Performance was higher due to early Interconnector start up and sustained production above committed volumes (+4.9 MMboe), Greater Western Flank Phase 3 acceleration and high reliability at North West Shelf (2.2 MMboe), and higher Bass Strait sales (1.5 MMboe).


Material sustainability issues (20%)


Outcome    3


The Board considers performance across material sustainability issues including personal and process safety, climate change and greenhouse gas emissions, and our social licence to operate. Strong performance in this area creates and protects value in four ways: it reduces the likelihood of major accident events and catastrophic losses; it maintains Woodside’s licence to operate which enables the development of its growth portfolio; it reflects efficient, optimised and controlled business processes that generate value; and it supports the company’s position as a partner of choice.


2022 performance: Safety performance was below target, with a TRIR of 1.80 compared to a target TRIR of 1.0. Process safety performance was on target with zero Tier 1 and one low risk Tier 2 process safety event recorded. Gross equity scope 1 and 2 emissions performance in 2022 was 294kT CO2-e higher than the target primarily due to increased production.


Delivery against business priorities (20%)


Outcome    6


In 2022, we focused on progressing Scarborough and Sangomar, finalising the strategic direction to Trion and maturing opportunities in new energy and carbon, combined with completing the merger with BHP’s petroleum business.


Merger with BHP’s petroleum business


•   It was an historic year for Woodside with the successful completion of the merger with BHP’s petroleum business according to plan.


•   Woodside has implemented initiatives to deliver greater than US$400 million annual synergies ahead of target.2


Scarborough and Pluto Train 2 execution


•   Scarborough and Pluto Train 2 25% complete, targeting first LNG cargo in 2026.


•   Project remains on schedule and budget.


Sangomar


•   Phase 1 77% complete, targeting first oil late 2023.


•   Drilling on schedule with the first seven development wells delivered.


•   FPSO conversion topsides and turret fabrication complete and successfully relocated to Singapore.


Trion


•   Progressing towards final investment decision (FID) readiness in 2023.


•   Front-end engineering design (FEED) and key technical studies completed.


•   Competitive tenders for major scopes of work issued.


Maturing key future new energy opportunities


•   H2OK progressing towards FID readiness, with FEED scope completed in Q4 2022 and contracts awarded for alkaline electrolyser and liquefaction packages.


•   Concept definition work for H2Perth is progressing to plan.


•   H2TAS concept definition studies and social impact assessment completed.


•   Selected as preferred project partner for Southern Green Hydrogen, non-binding MOU executed with Mitsui.


Overall corporate performance outcome


Outcome    7


1.

The 157.7 MMboe includes production of 156.8 MMboe from Woodside reserves and 0.9 MMboe primarily from feed gas purchased from Pluto non-operating participants processed through the Pluto-KGP Interconnector.

2.

Pre-tax 100% basis. Excluding transition and separation costs. Net of any expected ongoing cost increases as a result of the merger.


92


Table of Contents

Executive KMP KPIs and outcomes for 2022

CEO FAR

As a result of the Board’s review of CEO remuneration, Ms O’Neill’s FAR was increased from A$2,200,000 to A$2,400,000 effective 1 June 2022.

CEO VAR and other incentives

Ms O’Neill’s incentive arrangements are governed under the EIS.

For 2022, the individual performance of the CEO was reviewed by the Board against five equally weighted measures. These metrics, outlined in Table 4, were chosen because successful performance in each area is a key driver of superior shareholder returns.

The same metrics were cascaded to the Senior Executives to measure individual performance.

At the end of the year, the Board reviewed the CEO’s performance for 2022. The CEO is given an individual performance score between 0 and 5, which together with the Corporate Scorecard determines the VAR. This resulted in an award of 88.1% of maximum opportunity.

Information on the individual performance of the CEO is shown in Table 4.

The 2022 EIS award for the CEO is detailed in Table 7.

The Board approved a one-off cash bonus payment to the CEO of A$400,000 in recognition of Ms O’Neill’s significant contribution towards the merger of Woodside and BHP’s petroleum business, to be paid in two stages. The first A$200,000 was paid on merger completion and the second $A200,000 will be paid twelve months following merger completion. The second payment is subject to satisfactory individual performance and continued service. This payment is detailed in Table 5 and Table 10.

Senior Executive FAR

As a result of the Board’s review of Senior Executive Remuneration, Mr Tiver’s FAR was increased to A$1,100,300 and Ms Hick’s FAR to A$920,000 effective 1 June 2022. Ms McMahon’s FAR on appointment was US$550,000.

Management will continue to monitor market developments to ensure FAR for Senior Executives remains competitive and benchmarks appropriately against peer companies.

Senior Executive VAR and other incentives

For 2022, the individual performance of each Senior Executive was evaluated against the same performance measures as the CEO, with individual KPIs set relevant to each Executive’s area of responsibility. These metrics aim to align individual performance with the achievement of Woodside’s corporate strategy while fostering collaboration between Executives.

The Board approved EIS awards to Senior Executives based on the Corporate Scorecard result and their individual performance assessment.

Information on the individual performance of Senior Executives who were KMP as at 31 December 2022 is shown in Table 4. Details of the EIS award for each Senior Executive are set out in Table 7.

Ms Hick and Ms Duhe were not eligible for a 2022 EIS award as they resigned during the period. No individual performance assessment has been included for Ms Hick or Ms Duhe.

Other incentives paid to Senior Executives in 2022 include:


Sign-on benefit granted to Mr Tiver to compensate for benefits forgone on leaving the BHP Group. These included a cash payment (A$500,000) and equity rights, subject to a holding lock, under the Supplementary Woodside Equity Plan (SWEP).


An offer of equity rights under the SWEP to Ms McMahon to compensate for employee equity rights foregone with BHP Group. The offer facilitates the transition from BHP Group incentive arrangements to Woodside incentive arrangements following merger completion.


One-off cash bonus payments to three Senior Executives, Mr Tiver (A$50,000), Mr Gregory (A$90,000), and Ms Hick (A$60,000) in recognition of their significant contribution and leadership related to the merger with BHP’s petroleum business.

As each of the above payments were awarded in recognition of benefits forgone upon leaving the BHP Group or significant executive contribution, they are not subject to performance conditions. These payments are detailed in Table 5 and Table 10.


93


Table of Contents

Table 4 – CEO and Senior Executive individual performance for 2022 EIS


  Meg O’Neill - CEO and Managing Director
     
  KPI    Performance    Outcome

  Growth agenda


Assesses the alignment of growth opportunities to shareholder return; portfolio balance; the achievement of challenging business objectives.


•   Merger with BHP’s petroleum business successfully completed with strong shareholder and market support.


•   Matured Woodside’s corporate strategy post-merger with sharper articulation of the strategy for thriving through energy transition.


•   Matured projects to underpin future financial resilience consistent with this strategy, including Trion FEED, H2OK FEED and progressing Woodside Power towards FID readiness in 2023.


•   Progressed early-stage opportunities consistent with long-term corporate strategy, matured three-pronged carbon strategy, advanced the Browse to NWS Project and achieved selection of Woodside in a competitive process as preferred partner for Southern Green Hydrogen project in New Zealand.


Above target

  Effective execution


Assesses the maintenance, operation and profitability of existing assets; project delivery to achieve budget, schedule and stated performance; cost reduction; achievement of health, safety and community expectations.


•   Strong base business delivery.


•   Personal safety performance failed to meet target, although process safety was on target.


•   Production was above target, supported by Interconnector volumes and NWS performance.


•   Emissions abatement was above target; met Scope 1 and 2 commitments via increased offsets.


•   EBITDA excluding impairment well above target, supported by strong market conditions.


•   Progressed US$17 billion of operated major projects (100%); Sangomar, Scarborough & Pluto Train 2 on schedule and budget.


On target

  Enterprise capability


Assesses leadership development; workforce planning; executive succession; Indigenous participation and diversity; effective risk identification and management.


•   Successful establishment of Executive Leadership Team and implementation of new organisational structure.


•   Increased female and Indigenous representation across the organisation.


•   Delivered the 2022 Reconciliation Action Plan, meeting or exceeding all metrics.


Above target

  Culture and reputation


Assesses performance culture and emphasis on values; engagement and enablement; improved employee climate; Woodside’s brand as a partner of choice.


•   Developed Our Values specifically for the new merged entity.


•   Leveraged merger to shift culture focus on commercial capability, innovation and becoming a partner of choice.


•   Continued implementation of 2021-2025 Inclusion and Diversity Strategy, focusing on building an inclusive culture with diverse representation throughout Woodside.


Above target

  Shareholder focus


Assesses whether decisions are made with a long-term shareholder return focus; efficient and timely communication to shareholders, market analysts and fund managers; the focus on shareholder return throughout the organisation.


•   Delivered shareholder value via strong dividends and share price growth, top stock in the ASX 50 in 2022.


•   Share price re-rated to greater alignment with US peer companies.


•   Financially well positioned with strong balance sheet, low gearing, high liquidity and appropriate hedging to protect against low price environment.


•   Led implementation of initiatives to deliver greater than US$400 million annual synergies ahead of target.1


Above target

EIS earned as percentage of maximum opportunity2,3

   88.1%     


  1.

Pre-tax 100% basis. Excluding transition and separation costs. Net of any expected ongoing cost increases as a result of the merger.

  2.

The award of Restricted Shares and Performance Rights is subject to shareholder approval at the 2023 Woodside Annual General Meeting.

  3.

Ms O’Neill’s EIS structure changed effective 1 June 2022, including the target and maximum award opportunity. Ms O’Neill’s 2022 EIS award was calculated on a pro-rata basis including target and maximum opportunity.


94


Table of Contents
  Graham Tiver - Executive Vice President and Chief Financial Officer
     
  KPI    Performance    Outcome

  Growth agenda


Assesses the alignment of growth opportunities to shareholder return; portfolio balance; the achievement of challenging business objectives.


•   Merger completed and implementation of secondary listings in the US (NYSE) and UK (LSE).


•   Disciplined balance sheet management; well positioned with high liquidity and appropriate hedging to protect against low price environment.


•   Identified and led the evaluation of a number of potential material acquisitions for Board review.


   Above target

  Effective execution


Assesses the maintenance, operation and profitability of existing assets; project delivery to achieve budget, schedule and stated performance; cost reduction; achievement of health, safety and community expectations.


•   Delivered half-year and full-year reporting to the market as a merged company, including the new secondary listings.


•   Managed the change of the external auditor and as part of the merger, the internal audit organisation.


•   Designed an internal control framework to be Sarbanes-Oxley compliant.


•   Increased the level of standby facilities and executed various re-financing.


   Above target

  Enterprise capability


Assesses leadership development; workforce planning; executive succession; Indigenous participation and diversity; effective risk identification and management.


•   Embedded the delivery of synergies for the business, bringing together the strengths of the respective Woodside and BHP’s petroleum teams to produce strong results.

   On target

  Culture and reputation


Assesses performance culture and emphasis on values; engagement and enablement; improved employee climate; Woodside’s brand as a partner of choice.


•   Embedded the new Woodside mission and vision, focus areas and values in the new organisation upon merger completion.


•   Established a new Finance leadership team, with a values focus, demonstrated through new ways of working.


   Above target

  Shareholder focus


Assesses whether decisions are made with a long-term shareholder return focus; efficient and timely communication to shareholders, market analysts and fund managers; the focus on shareholder return throughout the organisation.


•   Improved communication of the merged entity narrative, with targeted information improving the external markets’ understanding of the combined business value.


•   Delivered shareholder value through strong dividends and share price growth, top stock in the ASX 50 in 2022.


   Above target
     

EIS earned as percentage of maximum opportunity

   86.8%     


95


Table of Contents
  Shiva McMahon - Executive Vice President International Operations
     
  KPI    Performance    Outcome

  Growth agenda


Assesses the alignment of growth opportunities to shareholder return; portfolio balance; the achievement of challenging business objectives.


•   Supported progress of pipeline of value-adding opportunities.


•   Advanced integrated Caribbean strategy to improve value optimisation.


•   Successful completion and first production of Shenzi sidetrack.


On target

  Effective execution


Assesses the maintenance, operation and profitability of existing assets; project delivery to achieve budget, schedule and stated performance; cost reduction; achievement of health, safety and community expectations.


•   Strong safety performance.


•   Production slightly above target.


•   Operating Costs above target, driven by Shenzi B201 extended workover activity.


•   Successful startup of subsea multi-phase pump and operational optimisation.


On target

  Enterprise capability


Assesses leadership development; workforce planning; executive succession; Indigenous participation and diversity; effective risk identification and management.


•   Safe and on schedule delivery of the Shenzi turnaround and fabric maintenance campaign.


•   Focused on asset integrity and value delivery enabled by; above target delivery of Field Leadership activities; efficient organisation model enabled by resource sharing across teams and geographies.


On target

  Culture and reputation


Assesses performance culture and emphasis on values; engagement and enablement; improved employee climate; Woodside’s brand as a partner of choice.


•   Led roll out and role modelling of Woodside values across International organisation.


•   Integration of operating models across Australia and International Operations groups to balance sizing and premise of self-reliance by region.


   Above target

  Shareholder focus


Assesses whether decisions are made with a long-term shareholder return focus; efficient and timely communication to shareholders, market analysts and fund managers; the focus on shareholder return throughout the organisation.


•   On track to exceed synergies and value capture target, including cost saving, revenue expansion and production efficiency opportunities.

   Above target
     

EIS earned as percentage of maximum opportunity


78.3%


CEO actual remuneration


   Senior Executives actual remuneration1
LOGO    LOGO


1.

This represents an average of all Senior Executives actual and variable remuneration for 2022. It does not include Ms Hick or Ms Duhe who were not eligible for a 2022 EIS award.


96


Table of Contents

The following table provides greater transparency to shareholders of the take home pay received or receivable by the CEO and Senior Executives, in 2021 and 2022. This includes FAR, EIS cash awards earned in respect of performance for the year and the value of shares and rights which vested during the year calculated using the five-day VWAP leading up to but not including the vesting, forfeiture or lapsing date. Termination benefits are not included in the table below; these amounts are disclosed in Table 10. Amounts are shown in the currency in which the remuneration is paid, either AUD or USD, whereas Table 10 is expressed in USD which is Woodside’s reporting currency.

Take home pay differs from statutory remuneration reported in Table 10 that is prepared in accordance with the Corporations Act 2001 (Cth) and Accounting Standards which require share-based payments to be reported as remuneration from the time of grant, even though actual value may ultimately not be realised from these share-based payments.

Table 5 – CEO and Senior Executive take home pay table (non-IFRS information)1


  Name

   Year     

Salary,  
allowances and  
superannuation2    

A$  


EIS cash  
and other  
cash  
incentives3,4    

A$  


Restricted Shares  
vested5    

A$  

     RTSR tested  
VPRs vested5    
A$  
    

Equity  

Rights vested5    
A$  


Total  
remuneration  
received  

A$  


Previous years’  
awards  
forfeited or  
lapsed5    

A$  


  M O’Neill


   2022        2,316,667          1,542,075          384,692          -          -          4,243,434          -    
   2021        1,906,872          465,168          1,647,167          -          -          4,019,207          -    


  G Tiver6


   2022        1,006,419          859,124          -          -          1,129,782          2,995,325          -    
   2021        -          -          -          -          -          -          -    


  S Gregory7


   2022        338,120          190,969          339,201          -          -          868,290          195,116    
   2021        823,331          379,7868          122,257          137,129          -          1,462,503          204,377    


  F Hick9


   2022        790,986          60,000          185,755          -          -          1,036,741          48,274    
   2021        750,091          195,4348          52,486          80,822          -          1,078,833          30,286    


  S Duhe10


   2022        91,558          -          -          -          -          91,558          3,278,284    
   2021        1,039,4398          220,000          11,110          -          -          1,270,549          -    
            US$          US$          US$          US$          US$          US$          US$    


  S McMahon11


   2022        459,638          80,875          -          -          -          540,513          -    
   2021        -          -          -          -          -          -          -    


1.

This is non-IFRS information that is unaudited.

2.

Represents the total fixed annual rewards earned in 2022 and 2021 including salaries, fees, allowances and company contributions to superannuation. This reflects pro-rated amounts for the period that Executives were in KMP roles.

3.

Includes the EIS cash incentive earned in the respective year, which is actually paid in the following year.

4.

Cash incentives earned by Ms O’Neill (A$200,000), Mr Tiver (A$50,000), Mr Gregory (A$90,000) and Ms Hick (A$60,000) include a one-off cash bonus payment in relation to their significant contribution towards the merger of Woodside and BHP’s petroleum business. Mr Tiver’s cash incentives include a further cash bonus payment (A$500,000) as a sign-on benefit to compensate for benefits forgone on leaving the BHP Group.

5.

The value of Restricted Shares, Variable Pay Rights and Equity Rights is calculated using the five-day VWAP leading up to but not including the vesting or forfeiture or lapsing date.

6.

Mr G Tiver commenced with Woodside on 1 February 2022.

7.

Mr S Gregory ceased being an Executive KMP on 31 May 2022.

8.

The 2021 comparative value has been restated to include the superannuation component of the 2021 EIS cash and other cash bonus payments that were earned in 2021 and paid in 2022. This increases the EIS cash and other cash incentives for Mr Gregory by A$19,008 to A$379,786 and Ms Hick by A$17,767 to A$195,434 and the salary, allowances and superannuation for Ms Duhe by A$15,000 to A$1,039,439.

9.

Ms F Hick ceased being an Executive KMP on 28 November 2022.

10.

Ms S Duhe ceased being an Executive KMP on 4 February 2022.

11.

Ms S McMahon commenced with Woodside on 1 June 2022. Ms McMahon was paid in Australian dollars for the period 1 June 2022 to 31 July 2022. Take home pay received has been converted to US dollars using the exchange rate reflective of this period.

Table 6 – 2022 vestings


     Executive           Shares     

                Vesting value  

US$1  


  2018 EIS 3-year Restricted Shares vested on 19 February 2022


M O’Neill


           14,097        275,137    


S Gregory


           12,430        242,602    


F Hick


           6,807        132,855    


  2022 Equity Rights sign on benefit vested on 31 August 2022


G Tiver


           32,307        781,067    


1.

The value of Restricted Shares and Equity Rights is calculated using the five-day VWAP leading up to but not including the vesting date. Amounts were translated to USD based on the exchange rate reflective of the five-day period leading up to but not including the vesting date.


97


Table of Contents

Table 7 – Valuation summary of Executive KMP EIS for 2022 and 2021


Year

    Cash1
US$
     Restricted Shares
3-year vesting period
US$
     Restricted Shares
4-year vesting period
US$
     Restricted Shares
5-year vesting period
US$
    

Performance Rights
5-year vesting period

US$

     Total EIS
US$
 

  M O’Neill

     2022 2      910,591        804,166        350,853        1,539,248        1,051,501        4,656,359  
     2021 3      337,421        745,559        -        813,351        688,613        2,584,944  

  G Tiver

     2022 2      189,809        414,767        -        452,495        309,111        1,366,182  
     2021       -        -        -        -        -        -  

  S McMahon

     2022 2      80,875        177,819        -        193,978        132,511        585,183  
     2021       -        -        -        -        -        -  

  S Gregory4

     2022 2      61,997        135,474        -        147,786        100,956        446,213  
     2021 3      137,878        304,645        -        332,344        281,375        1,056,242  

  F Hick5

     2022       -        -        -        -        -        -  
     2021 3      128,875        284,757        -        310,643        263,002        987,277  

  S Duhe6

     2022       -        -        -        -        -        -  
     2021       -        -        -        -        -        -  


1.

Represents the cash incentive earned in the respective year, which is actually paid in the following year. Amounts were translated to USD using the closing spot rate on 31 December 2022.

2.

The number of Restricted Shares and Performance Rights allocated for 2022 was calculated by dividing the amount of the Executive’s entitlement allocated to Restricted Shares by the face value of Woodside shares. The USD fair value of Restricted Shares and Performance Rights at their date of grant has been estimated by reference to the closing share price at 31 December 2022 and preliminary modelling respectively. Grant date for Senior Executives’ awards has been determined to be the date of the Board of Directors’ approval, being 27 February 2023 while grant date for Ms O’Neill’s award is the date of shareholder approval at the 2023 Woodside Annual General meeting. Any differences between the estimated fair value at 31 December 2022 and the final fair value will be trued-up in the 2023 financial year. The fair value is not related to or indicative of the benefit (if any) that an individual Executive may ultimately realise should these equity instruments vest.

3.

The number of Restricted Shares and Performance Rights allocated for 2021 was calculated post year-end by dividing the amount of the Executive’s entitlement allocated to Restricted Shares and Performance Rights by the face value of Woodside shares. The USD fair value shown above was estimated at 31 December 2021 with reference to the closing share price and preliminary modelling respectively. Grant date for Senior Executives’ awards has been determined to be the date of the Board of Directors’ approval, being 16 February 2022 while grant date for Ms O’Neill’s award is the date of shareholder approval at the 2022 Woodside Annual General Meeting. The final fair value was calculated at these dates and was trued-up in the 2022 financial year. The amount above is not related to or indicative of the benefit (if any) that an individual Executive may ultimately realise should these equity instruments vest.

4.

Mr S Gregory ceased being an Executive KMP on 31 May 2022. The value of Mr Gregory’s EIS award is pro-rated for the period he was an Executive KMP.

5.

Ms F Hick ceased being an Executive KMP on 28 November 2022 and was not eligible for a 2022 EIS award.

6.

Ms S Duhe ceased being an Executive KMP on 4 February 2022 and was not eligible for a 2021 or 2022 EIS award.

Other equity plans

Woodside has a history of providing employees with the opportunity to participate in ownership of shares in the company and using equity to support a competitive base remuneration position, including the legacy Executive Incentive Plan.

Details of prior year allocations are provided in Table 12. The terms applying to prior year grants are described in past Woodside Annual Reports.

Executive Incentive Plan (EIP)

The EIP operated as Woodside’s Executive incentive framework until the end of 2017, after which the Board introduced the EIS. The EIP was used to deliver short-term awards (STAs) and long-term awards (LTAs) to Senior Executives.

The LTA was divided into two portions with each portion subject to a separate RTSR performance hurdle tested over a four-year period. One-third of the LTA was tested against a comparator group that comprises the entities within the ASX 50 index. The remaining two-thirds was tested against an international group of oil and gas companies.

RTSR outcomes are calculated by an external adviser on the fourth anniversary of the allocation. For 2017 awards to Senior Executives, any VPRs that did not vest lapsed in 2022 and are not retested. Awards made to other Executives are eligible for a retest in 2023. VPRs that do not vest following the re-test will lapse. 2017 is the last year of award to which a retest applies.

Executives are entitled to receive dividends on Restricted Shares. There is no entitlement to dividends on VPRs and VPRs do not carry voting rights. Details of prior year allocations are provided in Table 12.

Supplementary Woodside Equity Plan (SWEP)

In October 2011, the Board approved the establishment of the SWEP to enable the offering of targeted retention awards of Equity Rights (ERs) for key capability.

The SWEP was updated in 2022 to broaden eligibility to all employees of a subsidiary of Woodside Energy Group Ltd and ensure compliance in all jurisdictions in which Woodside operates. This facilitated the offer of replacement unvested incentives as required under transitional arrangements for eligible heritage BHP employees transitioning from BHP Group Long-Term Incentive (LTI) plans to VAR offered under Woodside’s VAR arrangements.

The SWEP awards have service conditions and no performance conditions. Each ER entitles the participant to receive a Woodside share or an American Depositary Share on the vesting date three years after the effective grant date.

ERs under both the WEP and the SWEP may vest prior to the vesting date on a change of control or on a pro-rata basis, at the discretion of the CEO, limited to the following circumstances; redundancy, retirement (after six months’ participation), death, termination due to illness or incapacity or total and permanent disablement of a participating employee. An employee whose employment is terminated by resignation or for cause prior to the vesting date will forfeit all of their unvested ERs.

In relation to the applicable cessation of employment treatment for SWEP ERs granted as replacement awards to heritage BHP employees, unless the Board determines otherwise, unvested SWEP ERs will vest on a pro-rata basis in the following circumstances; redundancy, death, termination due to medical illness or incapacity or total and permanent disablement of the participant. For cessation in other circumstances, (and other than where employment is terminated by resignation or for cause), Woodside’s CEO (or Committee of the Board, as applicable) has discretion to permit pro-rata vesting.


98


Table of Contents

There is no entitlement to dividends on ERs and ERs do not carry voting rights.

Minimum Shareholding Requirements (MSR) Policy

The Executive MSR Policy reflects the long-term focus of management and aims to further strengthen alignment with shareholders.

The MSR Policy requires Senior Executives to have acquired and maintained Woodside shares for a minimum total purchase price of at least 100% of their fixed remuneration after a period of five years, and in the case of the CEO a minimum of 200% of fixed remuneration.

Of the Executive KMP, Ms O’Neill meets the MSR requirements. Mr Tiver and Ms McMahon commenced with Woodside in 2022 and will continue to acquire Woodside shares. See Table 14 for details.

Other equity awards

Woodside’s Equity Award Rules apply to EIS and discretionary executive allocations. This allows the Board and CEO to award discretionary allocations of Restricted Shares or Performance Rights to eligible employees and executives.

Contracts for Executive KMP

Each Executive KMP has a contract of employment. Table 8 below contains a summary of the key contractual provisions of the contracts of employment for the continuing Executive KMP.

Table 8 – Summary of contractual provisions for Executive KMP


    Employing company   Contract duration   Termination notice period
company1,2
  Termination notice period
executive
         

  M O’Neill3


Woodside Energy Ltd


Unlimited


6 months


6 months


  G Tiver3


Woodside Energy Ltd


Unlimited


6 months


6 months


  S McMahon3


Woodside Energy USA Services Inc


Unlimited


6 months


3 months


1.

Woodside may choose to terminate the contract immediately by making a payment in lieu of notice equal to the fixed remuneration the Executive KMP would have received during the ‘Company Notice Period’. In the event of termination for serious misconduct or other nominated circumstances, Executive KMP are not entitled to this payment. Any payments made in the event of a termination of an executive contract will be consistent with the Corporations Act 2001 (Cth).

2.

On termination of employment, Executive KMP will be entitled to the payment of any fixed remuneration calculated up to the termination date, any leave entitlement accrued at the termination date and any payment or award permitted under the EIS and Equity Award Rules. Executive KMP are restrained from certain activities for specified periods after termination of their employment in order to protect Woodside’s interests.

3.

Remuneration is reviewed annually or as required to maintain alignment with policy and benchmarks.

Non-executive directors (NEDs)

Remuneration policy

Woodside’s Remuneration Policy for NEDs aims to attract, retain, motivate and to remunerate fairly and responsibly having regard to:


the level of fees paid to NEDs relative to other major Australian listed companies.


the size and complexity of Woodside’s operations.


the responsibilities and work requirements of Board members.

Fees paid to NEDs are recommended by the Human Resources & Compensation Committee (Committee) based on benchmarking from external remuneration consultants and determined by the Board. In 2022, the Board approved an increase to annual Board and committee fees to be effective 1 January 2023. This is the first increase since 2019.

Fees paid to NEDs are subject to an aggregate limit of A$4.25 million per financial year, which was approved by shareholders at the 2019 AGM.

Minimum Shareholding Requirements (MSR) Policy

NEDs are required to have acquired shares for a total purchase price of at least 100% of their pre-tax annual fee after five years on the Board. The NEDs may utilise the Non-executive Directors’ Share Plan (NEDSP) to acquire the shares on market at market value. As the shares are acquired with net fees, the shares in the NEDSP are not subject to any forfeiture conditions.

All NEDs meet the MSR, except Mr Wyatt who joined Woodside on 1 June 2021. Mr Wyatt is participating in the NEDSP and will continue to acquire shares under this plan going forward. See Table 14 for details.

NEDs remuneration structure

NEDs’ remuneration consists of base Board fees and committee fees, plus statutory superannuation contributions or payments in lieu (currently 10.5%). Other payments may be made for additional services outside the scope of Board and Committee duties. NEDs do not earn retirement benefits other than superannuation and are not entitled to any form of performance-linked remuneration in order to preserve their independence.


99


Table of Contents

Table 9 shows the 2022 annual base Board and committee fees for NEDs.

In addition to these fees, NEDs are entitled to reimbursement of reasonable travel, accommodation and other expenses incurred attending meetings of the Board, committees or shareholders, or while engaged on Woodside business. NEDs are not entitled to compensation on termination of their directorships.

An allowance is paid to any NED required to travel internationally to attend Board commitments, compensating for factors related to long-haul travel. Where travel is between six and ten hours, an allowance of A$5,000 gross per trip is paid. Where travel exceeds 10 hours, an allowance of A$10,000 gross per trip is paid.

In 2022, NEDs Frank Cooper, Ben Wyatt and Larry Archibald received an additional payment of A$20,000 each for services provided during the period outside the scope of Board and Committee duties, in connection with the merger with BHP’s petroleum business, including membership of the Due Diligence Committee.

Board fees are not paid to the CEO, as the time spent on Board work and the responsibilities of Board membership are considered in determining the remuneration package provided as part of the normal employment conditions.

The total remuneration paid to, or in respect of, each NED in 2022 is set out in Table 13.

Table 9 – Annual base Board and committee fees for NEDs1


Position    Board2
A$
     Audit & Risk
Committee
A$
     Human Resources &
Compensation Committee
A$
     Sustainability
Committee
A$
     Nominations &
Governance
Committee
A$
 

Chair of the Board3

     723,300                                      

Non-executive directors4

     219,178                                      

Committee chair

              59,360        52,000        47,400        Nil  

Committee member

              31,964        26,500        23,700        Nil  


1.

Fees in this table reflect 2022 annual base Board and committee fees for NEDs.

2.

NEDs receive Board and committee fees plus statutory superannuation (or payments in lieu where statutory superannuation is not required to be paid).

3.

Inclusive of committee work.

4.

Board fees paid to NEDs other than the Chair.

Human Resources & Compensation Committee

The Committee assists the Board to determine appropriate remuneration policies and structures for NEDs and Executives. Further information on the role of the Committee is described in the Corporate Governance section of the Annual Report.

Loans and transactions

No loans or transactions (other than as described in this report) have been made, guaranteed or secured, directly or indirectly, by Woodside or any of its subsidiaries at any time throughout the year, to any KMP including to a KMP related party.

Use of remuneration consultants

From time-to-time, the Committee directly engages independent external advisers to provide input to the process of reviewing the remuneration for NEDs and Executives. The Committee may receive executive remuneration advice directly from external independent remuneration consultants.

Under communications and engagement protocols adopted by the Company, market data reports are provided directly to the Committee Chair, and a consultant provides a statement to the Committee that reports have been prepared free of undue influence from Executive KMP. This process ensures the Committee has full oversight of the review process and therefore it, and the Board, can be satisfied that the work undertaken by external independent remuneration consultants is free from undue influence by Executive KMP.

External benchmarking was obtained in 2022 from external independent remuneration consultants KPMG in support of the 2022 NED fee review at a cost of A$20,000.

Remuneration benchmarking in support of the 2022 review of Executive remuneration was obtained from KPMG at a cost of A$47,500 and Meridian at a cost of US$20,160.

Remuneration benchmarking in support of the 2022 review of CEO remuneration was obtained from KPMG at a cost of A$15,000 and Meridian at a cost of US$16,352.

No remuneration recommendations were received during 2022.


100


Table of Contents

Reporting notes

Reporting in United States dollars

In this report, the remuneration and benefits reported have been presented in US dollars, unless otherwise stated. This is consistent with the functional and presentation currency of the company.

Compensation for Australian-based employees and Australian-based KMP is paid in Australian dollars and, for reporting purposes, converted to US dollars based on the exchange rate reflective of the service period. Compensation for US-based employees and US-based KMP is paid in US dollars. Valuation of equity awards is converted at the spot rate applying when the equity award is granted.

Statutory tables

Table 10 – Compensation of CEO and Senior Executives for the year ended 31 December 2022 and 2021


          FAR     VAR and other incentives                                
          Short-term     Long-term     Short-term     Long-term                                
            Salaries,
fees and
allowances
   

Non-

monetary
benefits1

    Company
contributions to
superannuation
    Cash2,3,4     Equity
Rights5
    Restricted
Shares5
    Performance
Rights5
    Long
Service
Leave
    Termination
benefits
   

Total

Remuneration6

    Performance
related7
 
              $               $       $       $       $       $       $       $       $       A$       %  

M O’Neill8

    2022       1,696,133       35,829       -       1,127,634       -       1,344,879       415,137       41,244       -       4,660,856       6,753,540       62  
Chief Executive Officer and Managing Director     2021       1,431,531       52,614       -       337,421       -       1,263,936       252,056       129,123       -       3,466,681       4,633,501       53  

G Tiver9

    2022       717,042       24,725       28,453       599,364       1,284,700       160,013       46,231       10,197       -       2,870,725       4,144,816       73  

Executive Vice President and Chief Financial Officer

    2021       -       -       -       -       -       -       -       -       -       -       -       -  

S McMahon10

    2022       361,471       57,012       96,084       80,875       221,627       47,143       13,399       -       -       877,611       1,300,287       41  

Executive Vice President

International Operations

    2021       -       -       -       -       -       -       -       -       -       -       -       -  

S Gregory13

    2022       244,076       3,876       8,410       130,448       -       250,799       78,947       20,614       -       737,170       1,030,862       62  
    2021       588,690       15,788       29,403       275,48712       -       440,563       162,46311       18,260       -       1,530,654       2,046,512       57  

F Hick14

    2022       542,533       9,651       19,471       41,294       -       (527,204)       (221,628)       26,595       152,531       43,243       69,494       -  
    2021       540,368       29,989       22,742       141,76312       -       312,798       120,38011       11,742               1,179,782       1,573,248       49  

S Duhe15

    2022       57,495       882       2,668       -       -       -       -       (94,350)       -       (33,305)       (46,436)       -  
    2021       752,079       120,182       27,871 12      159,582       -       (784,939)       (248,380)       14,743               41,138       47,732       -  

P Coleman16

    2022       -       -       -       -       -       -       -       -       -       -       -       -  
    2021       879,481       51,506       8,380       1,249,873       -       2,254,851       1,923,801       543,355       2,447,525       9,358,772       12,219,216       58  

Executive

KMP Total

    2022       3,618,750       131,975       155,086       1,979,615       1,506,327       1,275,630       332,086       4,300       152,531       9,156,300       13,252,563       56  
  2021     4,192,149     270,079     88,396     2,164,126     -     3,487,209     2,210,320     717,223     2,447,525     15,577,027     20,520,209     50  


1.

Reflects the value of allowances and non-monetary benefits (including relocation, travel, health insurance, car parking and any associated fringe benefit tax).

2.

The amount includes the EIS cash incentive earned in the respective year, which is actually paid in the following year. Amounts were translated to USD using the closing spot rate on 31 December 2022.

3.

Cash incentives earned by Ms O’Neill include a one-off cash bonus payment (US$137,646) on merger completion and an accrual (US$78,692) for the second payment expected to be paid in June 2023. The second payment is subject to satisfactory individual performance and continued service.

4.

Cash incentives earned by Mr Tiver (US$33,677), Mr Gregory (US$61,941) and Ms Hick (US$41,294) include a one-off cash bonus payment in relation to their significant contribution towards the merger of Woodside BHP’s petroleum business. Mr Tiver’s cash incentives include a further cash bonus payment (US$355,948) as a sign-on benefit to compensate for benefits forgone on leaving the BHP Group.

5.

In accordance with the requirements of AASB 2 Share-based Payment, the fair value of equity instruments as at their date of grant has been determined with reference to the closing share price at grant date, or by applying the Black-Scholes option pricing technique or applying the binomial valuation method combined with a Monte Carlo simulation. The fair value of equity instruments is amortised over the vesting period from the commencement of the service period, such that ‘total remuneration’ includes a portion of the fair value of unvested equity compensation during the year. The portion of the expense relating to the 2022 EIS has been measured using estimated fair values as disclosed in footnote 2 in Table 7. The amount included as remuneration is not related to or indicative of the benefit (if any) that individual Executives may ultimately realise should these equity instruments vest.

6.

The total remuneration in AUD is converted from USD using the exchange rate reflective of the service period. This non-IFRS unaudited information is included for the purposes of showing the total annual cost of benefits to the company in Australian dollars for the service period.

7.

Performance related outcome percentage is calculated as total variable annual reward divided by the USD total remuneration figure.

8.

Ms M O’Neill elected to receive a cash payment in lieu of all superannuation contributions in accordance with the Superannuation Guarantee (Administration) Act 1992, on the basis of being a Senior Foreign Executive. The cash payment is subject to (PAYG) income tax and paid as part of Ms O’Neill’s normal monthly salary. The amount is included in salaries, fees and allowances.

9.

Mr G Tiver commenced employment with Woodside on 1 February 2022.

10.

Ms S McMahon commenced employment with Woodside on 1 June 2022.

11.

The 2021 comparative value has been restated to include amortisation of the fair value of the 2021 EIS Performance Rights, increasing the expense for Mr Gregory by US$45,747 to US$162,463 and the expense for Ms Hick by US$42,760 to US$120,380.

12.

The 2021 comparative value has been restated to include the superannuation component of the 2021 EIS and other cash bonus payments that were earned in 2021 and paid in 2022. This increases the cash expense for Mr Gregory by US$13,788 to US$275,487, the cash expense for Ms Hick by US$12,888 to US$141,763 and the superannuation expense for Ms Duhe by $10,881 to US$27,871.

13.

Mr S Gregory ceased being an Executive KMP on 31 May 2022.

14.

Ms F Hick ceased being an Executive KMP on 28 November 2022. Ms Hick’s termination benefit of US$152,531 includes salaries, fees and allowances received for the period of 29 November 2022 to 24 February 2023 while on gardening leave.

15.

Ms S Duhe ceased being an Executive KMP on 4 February 2022.

16.

Mr P Coleman ceased being an Executive KMP on 19 April 2021.


101


Table of Contents

Table 11 – Peer group of international oil and gas companies1


   APA Corporation (previously Apache Corporation)    ENI S.p.A    Marathon Oil Company
 
   Canadian Natural Resources    EOG Resources    Occidental Petroleum
 
   ConocoPhillips    Equinor ASA    Santos Ltd
 
   Coterra Energy    Hess Corporation     
 
   Devon Energy    Inpex Corporation     


1.

Peer group updated for 2022 EIS award to maintain alignment with Woodside’s expanded global business activities following the merger with BHP’s petroleum business on 1 June 2022.

Table 12 – Summary of CEO and Senior Executive KMP allocated, vested or lapsed equity


 Name   Type of equity1   Grant date   Vesting date2,3    Awarded but not
vested
     Vested
in 2022
     % of total
vested
     Lapsed
in 2022
     Fair value
of equity4,5,6
           Unamortised
value $7
 

 M O’Neill9

  Restricted Shares   13 February 2019   19 February 2022      -        14,097        100        -        24.71        -  
  Restricted Shares   13 February 2019   19 February 2024      15,379        -        -        -        24.71        74,355  
  Restricted Shares   12 February 2020   18 February 2023      15,025        -        -        -        22.76        11,097  
  Restricted Shares   12 February 2020   18 February 2025      16,391        -        -        -        22.76        129,847  
  Restricted Shares   17 February 2021   24 February 2024      17,697        -        -        -        20.18        98,940  
  Restricted Shares   17 February 2021   24 February 2026      17,697        -        -        -        20.18        182,933  
  Restricted Shares   19 May 2022   19 May 2025      46,861        -        -        -        20.91        532,801  
  Restricted Shares   19 May 2022   19 May 2027      51,122        -        -        -        20.91        734,050  
  Restricted Shares   28 April 2023   28 April 2026      33,143        -        -        -        24.05        618,382  
  Restricted Shares   28 April 2023   28 April 2027      14,591        -        -        -        24.05        285,027  
  Restricted Shares   28 April 2023   28 April 2028      64,013        -        -        -        24.05        1,296,256  
  Performance Rights           13 February 2019         19 February 2024              15,379        -        -        -        16.87        50,763  
  Performance Rights   12 February 2020   18 February 2025      16,391        -        -        -        15.81        90,197  
  Performance Rights   17 February 2021   24 February 2026      23,596        -        -        -        14.44        174,533  
  Performance Rights   19 May 2022   19 May 2027      51,122        -        -        -        13.40        470,410  
  Performance Rights   28 April 2023   28 April 2028      64,013        -        -        -                16.43        885,551  

 G Tiver

  Equity Rights   18 February 2022   31 August 2022      -            32,307        100        -        19.28        -  
  Equity Rights   18 February 2022   31 August 2023      32,307        -        -        -        18.42        250,621  
  Equity Rights   18 February 2022   31 August 2024      32,307        -        -        -        17.60        367,210  
  Equity Rights   18 February 2022   31 August 2025      27,460        -        -        -        16.82        343,936  
  Restricted Shares   27 February 2023   7 March 2026      17,249        -        -        -        24.05        322,221  
  Restricted Shares   27 February 2023   7 March 2028      18,818        -        -        -        24.05        384,697  
    Performance Rights   27 February 2023   7 March 2028      18,818        -        -        -        16.43        262,810  

 S McMahon

  Equity Rights   1 June 2022   31 August 2023      13,355        -        -        -        20.50        145,575  
  Equity Rights   1 June 2022   31 August 2024      14,118        -        -        -        19.59        204,656  
  Equity Rights   1 September 2022   31 August 2025      11,061        -        -        -        18.38        180,671  
  Restricted Shares   27 February 2023   7 March 2026      7,395        -        -        -        24.05        150,190  
  Restricted Shares   27 February 2023   7 March 2028      8,067        -        -        -        24.05        174,306  
  Performance Rights   27 February 2023   7 March 2028      8,067        -        -        -        16.43        119,079  

 S Gregory10

  Restricted Shares   13 February 2019   19 February 2022      -        12,430        100        -        24.71        -  
  Restricted Shares   13 February 2019   19 February 2024      13,560        -        -        -        24.71        62,050  
  Restricted Shares   12 February 2020   18 February 2023      10,099        -        -        -        22.76        7,459  
  Restricted Shares   12 February 2020   18 February 2025      11,018        -        -        -        22.76        87,283  
  Restricted Shares   17 February 2021   24 February 2024      10,132        -        -        -        20.18        56,646  
  Restricted Shares   17 February 2021   24 February 2026      10,132        -        -        -        20.18        104,734  
  Restricted Shares   16 February 2022   24 February 2025      19,148        -        -        -        19.01        188,609  
  Restricted Shares   16 February 2022   24 February 2027      20,889        -        -        -        19.01        267,976  
  Restricted Shares   27 February 2023   7 March 2026      13,611        -        -        -        24.05        249,099  
  Restricted Shares   27 February 2023   7 March 2028      14,849        -        -        -        24.05        299,391  
  RTSR Tested VPRs   1 January 2017   20 February 2022      -        -        -              7,1508        12.06        -  
  Performance Rights   13 February 2019   19 February 2024      13,560        -        -        -        16.87        42,362  
  Performance Rights   12 February 2020   18 February 2025      11,018        -        -        -        15.81        60,630  
  Performance Rights   17 February 2021   24 February 2026      13,509        -        -        -        14.44        99,922  
  Performance Rights   16 February 2022   23 February 2027      20,889        -        -        -        13.76        193,969  
  Performance Rights   27 February 2023   7 March 2028      14,849        -        -        -        16.43        204,532  

 F Hick11

  Restricted Shares   13 February 2019   19 February 2022      -        6,807        100        -        24.71        -  
  Restricted Shares   13 February 2019   19 February 2024      7,426        -        -        -        24.71        -  
  Restricted Shares   12 February 2020   18 February 2023      5,501        -        -        -        22.76        -  
  Restricted Shares   12 February 2020   18 February 2025      6,002        -        -        -        22.76        -  
  Restricted Shares   17 February 2021   24 February 2024      8,367        -        -        -        20.18        -  
  Restricted Shares   17 February 2021   24 February 2026      8,367        -        -        -        20.18        -  
  Restricted Shares   16 February 2022   24 February 2025      17,898        -        -        -        19.01        -  
  Restricted Shares   16 February 2022   24 February 2027      19,525        -        -        -        19.01        -  
  RTSR Tested VPRs   1 January 2016   9 March 2021      -        -        -        1,7698        12.05        -  
  RTSR Tested VPRs   1 January 2017   20 February 2022      4,9448        -        -        -        12.06        -  
  Performance Rights   13 February 2019   19 February 2024      7,426        -        -        -        16.87        -  
  Performance Rights   12 February 2020   18 February 2025      6,002        -        -        -        15.81        -  
  Performance Rights   17 February 2021   24 February 2026      11,156        -        -        -        14.44        -  
  Performance Rights   16 February 2022   23 February 2027      19,525        -        -        -        13.76        -  

 S Duhe12

  Restricted Shares   13 February 2019   19 February 2022      -        -        -        14,604        24.71        -  
  Restricted Shares   13 February 2019   19 February 2024      -        -        -        15,931        24.71        -  
  Restricted Shares   12 February 2020   18 February 2023      -        -        -        11,816        22.76        -  
  Restricted Shares   12 February 2020   18 February 2025      -        -        -        12,890        22.76        -  
  Restricted Shares   17 February 2021   24 February 2024      -        -        -        12,894        20.18        -  
  Restricted Shares   17 February 2021   24 February 2026      -        -        -        12,894        20.18        -  
  RTSR Tested VPRs   1 January 2017   20 February 2022      -        -        -        8688        12.06        -  
  Performance Rights   13 February 2019   19 February 2024      -        -        -        15,931        16.87        -  
  Performance Rights   12 February 2020   18 February 2025      -        -        -        12,890        15.81        -  
    Performance Rights   17 February 2021   24 February 2026      -        -        -        17,193        14.44        -  


1.

For valuation purposes all VPRs and equity rights are treated as if they will be equity settled. Each VPR and Performance Right is a right to receive a fully paid ordinary share in Woodside (or, at the Board’s discretion, as cash equivalent). No amount is payable by the Executive on the grant or vesting of a VPR or Performance Right.


102


Table of Contents
2.

Vesting date and exercise date are the same. Vesting is subject to satisfaction of vesting conditions. Full details of the vesting conditions for all prior year equity grants to Executive KMP are included in the remuneration report for the relevant year.

3.

Any RTSR-tested VPRs allocated to Senior Executives prior to 2017 that do not vest as a result of the first test will be re-tested over a five-year performance period. RTSR-tested VPRs allocated in 2017 and performance rights will not be re-tested. The second test date for earlier VPR allocations is one year after the vesting date listed in the table.

4.

In accordance with the requirements of AASB 2 Share-based Payment, the fair value of VPRs Performance Rights and Equity Rights as at their date of grant has been determined by applying the Black-Scholes option pricing technique or binomial valuation method combined with a Monte Carlo simulation. The amount included as remuneration is not related to or indicative of the benefit (if any) that individual Executives may ultimately realise should these equity instruments vest.

5.

The fair value of Restricted Shares as at their date of grant has been determined by reference to the share price at acquisition. The fair value is not related to or indicative of the benefit (if any) that individual Executive KMP may ultimately realise should these equity instruments.

6.

Fair values for the 2022 EIS with grant date being 27 February 2023 and expected to be 28 April 2023 have been estimated as disclosed in footnote 2 of Table 7. Fair values for the 2021 EIS with grant dates of 16 February 2022 and 19 May 2022 have been trued-up as disclosed in footnote 3 of Table 7.

7.

The maximum value of the equity instruments awarded for future financial years has been determined as the fair value amount at grant date multiplied by the number of equity instruments awarded, less what has been amortised to date. The minimum total value of the equity instruments awarded for future financial years is nil if relevant vesting conditions are not satisfied.

8.

The RTSR-tested VPRs allocated for the 2015 and 2016 performance year have been updated to include any adjustments made as part of the Retail Entitlement Offer.

9.

Ms M O’Neill was granted Performance Rights and Restricted Shares on 19 May 2022 as approved by shareholders at the 2022 Woodside Annual General Meeting under Listing Rule 10.14. The grant of the Performance Rights and Restricted Shares components of Ms O’Neill’s 2022 EIS award is subject to shareholder approval at the 2023 Woodside Annual General Meeting. The grant date for Performance Rights and Restricted Shares is the date of shareholder approval.

10

Mr S Gregory ceased being an Executive KMP on 31 May 2022. Mr Gregory’s Restricted Shares and Performance Rights remain on foot and will vest in the ordinary course subject to the satisfaction of applicable conditions.

11.

Ms F Hick ceased being an Executive KMP on 28 November 2022. Ms Hick’s Restricted Shares, VPR’s and Performance Rights lapsed effective 24 February 2023.

12.

Ms S Duhe resigned on 16 November 2021 and ceased being an Executive KMP on 4 February 2022. Ms Duhe’s Restricted Shares, VPR’s and Performance Rights lapsed on 7 February 2022.


103


Table of Contents

The following table provides a detailed breakdown of the components of remuneration for each of the company’s NEDs.

Table 13 – Total remuneration paid to NEDs in 2022 and 2021


         Short-term      Post-employment                
         Cash salary and allowances      Pension/Superannuation                
 Non-executive director         Board and
        Committee fees
$
     Other fees and allowances
$
               Company contributions
to superannuation
$
     Total
$
     Total
A$4
 

 R Goyder


2022            

     501,606        41,407        16,942        559,955        807,438  
 

2021

     542,997        35,953        16,990        595,940        793,822  

 L Archibald2


20221

     190,602        55,150        -        245,752        353,013  
 

20211

     206,330        35,132        -        241,462        321,639  

 F Cooper


20221

     211,543        14,809        21,683        248,035        356,304  
 

20211

     228,999        15,014        22,327        266,340        354,779  

 S C Goh2


2022

     186,813        27,768        -        214,581        309,419  
 

2021

     202,228        21,452        -        223,680        297,953  

 C Haynes2


2022

     190,602        47,276        -        237,878        343,013  
 

2021

     206,330        20,117        -        226,447        301,639  

 I Macfarlane3


2022

     186,813        28,807        -        215,620        310,917  
 

2021

     202,228        15,294        4,423        221,945        295,642  

 A Pickard2


2022

     203,248        34,703        -        237,951        343,119  
 

2021

     220,020        21,452        -        241,472        321,653  

 S Ryan


2022

     190,602        6,935        19,536        217,073        313,013  
 

2021

     206,330        -        20,117        226,447        301,639  

 G Tilbrook


2022

     210,228        6,935        21,548        238,711        344,214  
 

2021

     227,575        -        22,189        249,764        332,698  

 B Wyatt


20221

     186,813        14,809        22,885        224,507        322,377  
 

20211

     114,868        14,718        16,082        145,668        197,944  

 NEDs total


2022

     2,258,870        278,599        102,594        2,640,063        3,802,827  
   

2021

     2,357,905        179,132        102,128                        2,639,165                        3,519,408  


1.

A proportion of each year’s other fees and allowances includes an additional payment of A$20,000 each for services outside the scope of Board and committee duties, in connection with the merger with BHP’s petroleum business.

2.

As non-residents for Australian tax purposes Mr L Archibald, Ms S C Goh, Dr C Haynes and Ms A Pickard have elected to receive a cash payment in lieu of all superannuation contributions, in accordance with the Superannuation Guarantee (Administration) Act 1992. The cash payment is subject to (PAYG) income tax and paid as part of their normal monthly fees. The amount is included in Other fees and allowances.

3.

Mr I Macfarlane has elected to receive a cash payment in lieu of all superannuation contributions in accordance with the Superannuation Guarantee (Administration) Act 1992, on the basis that he works with multiple employers. The cash payment is subject to (PAYG) income tax and paid as part of his normal monthly fees. The amount is included in Other fees and allowances.

4.

This non-IFRS information is included for the purposes of showing the total annual cost of benefits to the company in Australian dollars for the service period.


104


Table of Contents

Details of shares held by KMP including their personally related entities1 for the 2022 financial year are as follows:

Table 14 – KMP share and equity holdings


 Name   Type of Equity1     


Opening
holding at 1
January
20222


             NEDSP3       
Rights
        granted
 
 
     Rights vested       

Restricted
shares
granted


Restricted
shares vested


Net changes -
Other


Closing
holding at

31 December
20224,5


 Non-executive directors


 R Goyder

  Shares      23,634        -        -        -        -        -        2,529        26,163  

 L Archibald

  Shares      11,977        1,547        -        -        -        -        -        13,524  

 F Cooper

  Shares      13,450        1,445        -        -        -        -        -        14,895  

 S C Goh

  Shares      12,786        1,163        -        -        -        -        -        13,949  

 C Haynes

  Shares      14,598        1,411        -        -        -        -        -        16,009  

 I MacFarlane

  Shares      10,329        562        -        -        -        -        -        10,891  

 A Pickard

  Shares      14,206        1,664        -        -        -        -        -        15,870  

 S Ryan

  Shares      11,910        1,258        -        -        -        -        -        13,168  

 G Tilbrook

  Shares      7,949        -        -        -        -        -        1,998        9,947  

 B Wyatt6

  Shares      -        1,639        -        -        -        -        -        1,639  

 Executive KMP


 M O’Neill

  Equity Rights      -        -        -        -        -        -        -        -  
  Performance Rights            55,366        -        51,122        -        -        -        -        106,488  
  Restricted Shares      96,286        -        -        -        97,983        (14,097)        -        180,172  
  Shares      133,366        -        -        -        -        14,097        -        147,463  
                   

 G Tiver

  Equity Rights      -        -        124,381        (32,307)        -        -        -        92,074  
  Performance Rights      -        -        -        -        -        -        -        -  
  Restricted Shares      -        -        -        -        -        -        -        -  
  Shares      -        -        -        32,307        -        -        (5,231)        27,076  
                   

 S McMahon

  Equity Rights      -        -        38,534        -        -        -        -        38,534  
  Performance Rights      -        -        -        -        -        -        -        -  
  Restricted Shares      -        -        -        -        -        -        -        -  
  Shares      -        -        -        -        -        -        1,212        1,212  
                   

 S Gregory7

  Equity Rights      -        -        -        -        -        -        -        -  
  Performance Rights      45,237        -        20,889        -        -        -        (66,126)        -  
  Restricted Shares      67,371        -        -        -        40,037        (12,430)        (94,978)        -  
  Shares      18,953        -        -        -        -        12,430        (31,383)        -  
                   

 F Hick8

  Equity Rights      -        -        -        -        -        -        -        -  
  Performance Rights      31,297        -        19,525        -        -        -        (50,822)        -  
  Restricted Shares      42,470        -        -        -        37,423        (6,807)        (73,086)        -  
  Shares      7,042        -        -        -        -        6,807        (13,849)        -  
                   

 S Duhe9

  Equity Rights      -        -        -        -        -        -        -        -  
  Performance Rights      46,882        -        -        -        -        -        (46,882)        -  
  Restricted Shares      81,029        -        -        -        -        -        (81,029)        -  
    Shares      15,592        -        -        -        -        -        (15,592)        -  


1.

Personally related entities include a KMP’s spouse, dependants or entities over which they have direct control or significant influence.

2.

Opening holding represents amounts carried forward in respect of KMP.

3.

Related to participation in the Non-executive Directors’ Share Plan (NEDSP).

4.

Closing Shares and Restricted Shares holdings represents Shares and Restricted Shares held by the NEDs and KMP at of December 31 2022. The total Shares and Restricted Shares held by the NEDs and KMP is 491,978 which constitutes less than 1% of all outstanding shares. None of these shares have different voting rights.

5.

Closing rights holdings represents unvested options and rights held at the end of the reporting period. There are no options or rights vested but unexercised as at 31 December 2022.

6.

Mr B Wyatt was appointed as a NED on 1 June 2021. Mr Wyatt is participating in the NEDSP and will continue to acquire shares under this plan going forward.

7.

Mr S Gregory ceased being an Executive KMP on 31 May 2022. Mr Gregory’s Restricted Shares and Performance Rights remain on foot and will vest in the ordinary course subject to the satisfaction of applicable conditions.

8.

Ms F Hick ceased being an Executive KMP on 28 November 2022. Ms Hick’s Restricted Shares and Performance Rights lapsed effective 24 February 2023.

9.

Ms S Duhe ceased to being an Executive KMP on 4 February 2022. Ms Duhe’s Restricted Shares and Performance Rights lapsed on 7 February 2022.


105


Table of Contents

4.3.3 Glossary

Key terms used in the Remuneration Report


 Term    Meaning
 Committee   

The Human Resources & Compensation Committee

 Corporate Scorecard   

A corporate scorecard of key measures that aligns with Woodside’s overall business performance

 EIP   

The Executive Incentive Plan

 EIS   

The Executive Incentive Scheme

 Equity Award Rules   

The rules which govern offers of incentive securities to eligible employees

 ER   

Equity right. ERs are awarded under the WEP and SWEP and each one entitles participants to receive a fully paid share in Woodside on the vesting date (or a cash equivalent in the case of international assignees). No amount is payable by the participants on the grant or vesting of an ER

 Executive   

A senior employee whom the Board has determined to be eligible to participate in the EIS

 Executive Director   

Meg O’Neill

 Executive KMP   

The Executive Director and Senior Executives listed in Table 1A

 FAR   

Fixed Annual Reward

 FID   

Final Investment Decision

 Former CEO   

Peter Coleman. Mr Coleman ceased being an Executive KMP on 19 April 2021

 KMP   

Key management personnel

 KPI   

Key performance indicator

 LTA   

Long-term award

 MSR   

Minimum shareholding requirements

 NED   

Non-executive director

 NEDSP   

The Non-executive Directors’ Share Plan

 Operating Expenditure   

Operating and general, administrative and other expenses incurred in generating revenue from the sale of hydrocarbons from Woodside’s operating assets

 Performance Rights   

Each Performance Right is a right to receive a fully paid ordinary share in Woodside (or, at the Board’s discretion, as cash equivalent). No amount is payable by the Executive on the grant or vesting of a Performance Right

 Restricted Shares   

Woodside ordinary shares that are awarded to Executives as the deferred component of their STA or as a part of their VAR under the EIS. No amount is payable by the Executive on the grant or vesting of a Restricted Share

 Retail Entitlement Offer               

The pro-rata renounceable offer made to Eligible Retail Shareholders to subscribe for 1 new share for every 9 existing shares on 19 February 2018

 Rights   

ERs, Performance Rights and VPRs

 RTSR   

Relative total shareholder return

 Senior Executive   

A Senior Executive listed as KMP in Table 1A, excluding the Executive Director

 STA   

Short-term award

 SWEP   

The Supplementary Woodside Equity Plan

 VAR   

Variable Annual Reward

 VPR   

Variable Pay Right. Each VPR is a right to receive a fully paid ordinary share in Woodside (or, at the Board’s discretion, as cash equivalent). No amount is payable by the Executive on the grant or vesting of a VPR

 WEP   

The Woodside Equity Plan


106


Table of Contents
    
  SECTION 5: FINANCIAL STATEMENTS
    
 
SECTION 5.1
Financial Statements
Table of Contents


F-1


F-3


F-4


F-5


F-6


F-7


F-8


F-8


F-9


F-13


F-14


F-19


F-19


F-19


F-20


F-23


F-24


F-26


F-28


F-29


F-35


F-38


F-39


F-41


F-42


F-43


F-45


F-46


F-47


F-48


F-48


F-49


F-49


F-50


F-52


F-55


F-58


F-59


F-59


F-61


F-61


F-62


F-62


F-64


F-64


F-68


F-69


F-70


F-7
4
 
 
F-1

Table of Contents
Significant changes in the current reporting period
The financial performance and position of the Group were particularly affected by the following events and transactions during the reporting period:
 
·
 
On 18 January 2022, the Group completed the sell-down of a 49% participating interest in the Pluto Train 2 Joint Venture to Global Infrastructure Partners (GIP). As a result, the Group recognised a pre-tax gain of $427 million on the transaction. This includes variable consideration which has been remeasured as at 31 December 2022 with a $71 million revaluation gain recognised as other income (refer to Note B.7).
 
·
 
The Pluto-KGP Interconnector achieved ‘ready for start-up’ and commenced flowing gas from the offshore Pluto fields to Karratha Gas Plant (KGP) for processing in March 2022.
 
·
 
On 1 June 2022, the Group acquired 100% of the issued share capital of BHP Petroleum International Pty Ltd (BHPP) (subsequently renamed Woodside Energy Global Holdings Pty Ltd), which held BHP Group’s oil and gas business (refer to Note B.5).
 
·
 
As part of ongoing rationalisation of the Group’s exploration portfolio, the Group exited the Orphan Basin exploration licences in Canada. As a result, a net expense of $142 million reflecting various exit costs was recognised in exploration and evaluation expenditure (refer to Note A.1).
 
·
 
The Group recognised a $382 million reduction in restoration provisions as a net result of an increase in the risk free rates and current period payments, offset by an increase in cost estimates (refer to Note D.5). The majority of this was recognised as a corresponding decrease in oil and gas properties.
 
·
 
The Group hedged an increased percentage of its exposure to commodity price and foreign exchange risk through commodity swaps and foreign exchange forward derivatives (refer to Note D.6).
 
·
 
The Group recognised a $1,362 million increase to the Pluto PRRT Deferred Tax Asset (DTA), primarily as a result of higher assessable revenue in 2022 and higher forecast assessable revenue driven by changes to pricing assumptions (refer to Note A.5).
 
·
 
The Group recognised a pre-tax impairment reversal of $900 million for the Wheatstone cash-generating unit, primarily due to a revision in LNG price assumptions (refer to Note B.4).
 
F-2

Table of Contents
Financial Statements
Consolidated income statement
for the year ended 31 December 2022
 
    
Notes
    
2022

US$m
      
2021
US$m
      
2020
US$m


Operating revenue
  
A.1
    
 
16,817


6,962


3,600
 
         
Cost of sales
  
A.1
    
 
(6,540)


(3,845)


(2,985)


Gross profit
         
 
10,277


3,117


615
 
         
Other income
  
A.1
    
 
735


139


(36)
 
         
Other expenses
  
A.1
    
 
(2,726)


(811)


(481)
 
         
Impairment losses
  
A.1
    
 
-


(10)


(5,269)
 
         
Impairment reversals
  
A.1
    
 
900


1,058


-


Profit/(loss) before tax and net finance costs
         
 
9,186


3,493


(5,171)
 
         
Finance income
         
 
155


27


58
 
         
Finance costs
  
A.2
    
 
(167)


(230)


(327)


Profit/(loss) before tax
         
 
9,174


3,290


(5,440)
 
         
Petroleum resource rent tax (PRRT) benefit/(expense)
  
A.5
    
 
313


(297)


439
 
         
Income tax (expense)/benefit
  
A.5
    
 
(2,912)


(957)


1,026


Profit/(loss) after tax
         
 
6,575


2,036


(3,975)


Profit/(loss) attributable to:
                                     
         
Equity holders of the parent
         
 
6,498


1,983


(4,028)
 
         
Non-controlling
interest
  
E.8
    
 
77


53


53


Profit/(loss) for the period
         
 
6,575


2,036


(3,975)


Basic earnings/(losses) per share attributable to equity holders of the parent (US cents)
  
A.4
    
 
430.0


206.0


(423.5)


Diluted earnings/(losses) per share attributable to equity holders of the parent (US cents)
  
A.4
    
 
426.3


204.1


(423.5)


The accompanying notes form part of the Financial Statements.
 
F-3

Table of Contents
Consolidated statement of comprehensive income
for the year ended 31 December 2022


2022
US$m


2021
US$m


2020
US$m


Profit/(loss) for the period
    
 
6,575


2,036


(3,975)


Other comprehensive income/(loss)


Items that may be reclassified to the income statement in subsequent periods:
                                
       
Losses on cash flow hedges
    
 
(1,097)


(390)


(136)
 
       
Losses on cash flow hedges reclassified to the income statement
    
 
847


66


52
 
       
Tax recognised within other comprehensive income
    
 
64


(5)


25
 
       
Exchange fluctuations on translation of foreign operations taken to equity
    
 
3


-


-
 
       
Items that will not be reclassified to the income statement in subsequent periods:
                                
       
Remeasurement gains on defined benefit plan
    
 
34


13


2
 
       
Net gain on financial instruments at fair value through other comprehensive income
    
 
2


-


-


Other comprehensive loss for the period, net of tax
    
 
(147)


(316)


(57)


Total comprehensive income/(loss) for the period
    
 
6,428


1,720


(4,032)


Total comprehensive income/(loss) attributable to:
                                
       
Equity holders of the parent
    
 
6,351


1,667


(4,085)
 
       
Non-controlling
interest
    
 
77


53


53


Total comprehensive income/(loss) for the period
    
 
6,428


1,720


(4,032)


The accompanying notes form part of the Financial Statements.
 
F-4

Table of Contents
Consolidated statement of financial position
as at 31 December 2022
 
    
Notes
    
2022
US$m
      
2021
US$m


Current assets
                          
Cash and cash equivalents
  
C.1
    
 
6,201


3,025
 
Receivables
  
D.2
    
 
1,578


368
 
Inventories
  
D.3
    
 
678


202
 
Other financial assets
  
D.6
    
 
677


320
 
Assets held for sale
  
B.7
    
 
-


254
 
Tax receivable
         
 
73


-
 
Other assets
         
 
83


109


Total current assets
         
 
9,290


4,278


Non-current
assets
                          
Receivables
  
D.2
    
 
845


686
 
Inventories
  
D.3
    
 
11


19
 
Other financial assets
  
D.6
    
 
120


107
 
Exploration and evaluation assets
  
B.2
    
 
807


614
 
Oil and gas properties
1
  
B.3
    
 
39,919


18,649
 
Deferred tax assets
  
A.5
    
 
1,959


1,007
 
Lease assets
  
D.7
    
 
1,264


1,080
 
Investments accounted for using the equity method
2
         
 
265


2
 
Goodwill
  
B.5
    
 
4,614


-
 
Other assets
2
         
 
227


32


Total
non-current
assets
         
 
50,031


22,196


Total assets
         
 
59,321


26,474


Current liabilities
                          
Payables
  
D.4
    
 
2,094


639
 
Interest-bearing liabilities
  
C.2
    
 
260


277
 
Other financial liabilities
  
D.6
    
 
654


411
 
Provisions
  
D.5
    
 
1,219


605
 
Tax payable
         
 
1,854


413
 
Lease liabilities
  
D.7
    
 
324


191
 
Other liabilities
         
 
203


86


Total current liabilities
         
 
6,608


2,622


Non-current
liabilities
                          
Interest-bearing liabilities
  
C.2
    
 
4,878


5,153
 
Deferred tax liabilities
  
A.5
    
 
2,457


878
 
Other financial liabilities
  
D.6
    
 
67


161
 
Provisions
  
D.5
    
 
5,960


2,219
 
Tax payable
         
 
36


-
 
Lease liabilities
  
D.7
    
 
1,310


1,176
 
Other liabilities
         
 
878


36


Total
non-current
liabilities
         
 
15,586


9,623


Total liabilities
         
 
22,194


12,245


Net assets
         
 
37,127


14,229


Equity
                          
Issued and fully paid shares
  
C.3
    
 
29,001


9,409
 
Shares reserved for employee share plans
  
C.3
    
 
(38)


(30)
 
Other reserves
  
C.4
    
 
4,031


683
 
Retained earnings
         
 
3,342


3,381


Equity attributable to equity holders of the parent
         
 
36,336


13,443


Non-controlling
interest
  
E.8
    
 
791


786


Total equity
         
 
37,127


14,229


1.
Oil and gas properties includes other plant and equipment which is no longer separately presented in the consolidated statement of financial position. The 2021 amounts have been reclassified to be presented on the same basis.
2.
Investments accounted for using the equity method, which was previously included within other assets (non-current), is separately presented in the consolidated statement of financial position. The 2021 amounts have been reclassified to be presented on the same basis.
The accompanying notes form part of the Financial Statements.
 
F-5

Table of Contents
Consolidated statement of cash flows
for the year ended 31 December 2022
 
    
Notes
    
2022
US$m
    
2021
US$m
      
2020
US$m


Cash flows from/(used in) operating activities
                                   
Profit/(loss) after tax for the period
         
 
6,575


2,036


(3,975)
 
Adjustments for:
                                   
Non-cash items
                                   
Depreciation and amortisation
         
 
2,808


1,582


1,730
 
Depreciation of lease assets
         
 
140


108


94
 
Change in fair value of derivative financial instruments
         
 
960


31


31
 
Net finance costs
         
 
12


203


269
 
Tax expense/(benefit)
         
 
2,599


1,254


(1,465)
 
Exploration and evaluation written off
         
 
164


265


2
 
Impairment losses
  
B.4
    
 
-


10


5,269
 
Impairment reversals
  
B.4
    
 
(900
)


(1,058)


-
 
Restoration movement
         
 
272


68


28
 
Gain on disposal of oil and gas properties (including revaluation gain)
         
 
(494
  
 
-


-
 
Onerous contracts provision
         
 
(245
  
 
(95)


347
 
Other
         
 
(254
  
 
30


(12)
 
Changes in assets and liabilities
                                   
(Increase)/decrease in trade and other receivables
         
 
(77
  
 
(39)


41
 
(Increase)/decrease in inventories
         
 
(146
  
 
(4)


51
 
Increase in lease assets
         
 
-


(16)


-
 
Increase/(decrease) in provisions
         
 
131


(75)


155
 
(Decrease)/increase in lease liabilities
         
 
(31
  
 
(25)


40
 
Increase in other assets and liabilities
         
 
(961
  
 
(128)


(137)
 
Increase/(decrease) in trade and other payables
         
 
184


75


(121)


Cash generated from operations
         
 
10,737


4,222


2,347
 
Purchases of shares and payments relating to employee share plans
         
 
(45
  
 
(47)


(32)
 
Interest received
         
 
108


11


64
 
Dividends received
         
 
19


6


4
 
Borrowing costs relating to operating activities
         
 
(21
  
 
(91)


(180)
 
Income tax
and PRRT
paid
         
 
(1,218
  
 
(271)


(331)
 
Payments for restoration
         
 
(263
  
 
(38)


(23)
 
Payments for hedge collateral
         
 
(506
  
 
-


-


Net cash from operating activities
         
 
8,811


3,792


1,849


Cash flows from/(used in) investing activities
                                   
Cash received on acquisition of BHPP, including cash acquired
  
B.5
    
 
1,082


-


-
 
Payments for capital and exploration expenditure
         
 
(3,136
  
 
(2,406)


(1,418)
 
Borrowing costs relating to investing activities
         
 
(287
  
 
(126)


(57)
 
Advances to other external entities
         
 
(48
  
 
(206)


(110)
 
Proceeds from disposal of non-current assets
         
 
132


9


-
 
Funding of equity accounted investments
         
 
(8
  
 
-


-
 
Payments for acquisition of joint arrangements
  
B.6
    
 
-


(212)


(527)


Net cash used in investing activities
         
 
(2,265
  
 
(2,941)


(2,112)


Cash flows
from/(
used in
)
financing activities
                                   
Proceeds from borrowings
         
 
-


-


600
 
Repayment of borrowings
  
C.2
    
 
(283
  
 
(784)


(83)
 
Borrowing costs relating to financing activities
         
 
(18
  
 
(15)


(21)
 
Repayment of the principal portion of lease liabilities
         
 
(248
  
 
(155)


(71)
 
Borrowing costs relating to lease liabilities
         
 
(10
  
 
(89)


(86)
 
Purchases of shares and payments relating to
Dividend Reinvestment Plan
         
 
(144
  
 
-


-
 
Contributions to non-controlling interests
         
 
(98
  
 
(92)


(111)
 
Dividends paid (net of
Dividend Reinvestment Plan)
         
 
(2,558
  
 
(289)


(454)
 
Net (payments)/proceeds from share issuance
         
 
(5
  
 
-


23


Net cash used in financing activities
         
 
(3,364
)
  
 
(1,424)


(203)
 
 
Net increase/(decrease) in cash held
         
 
3,182


(573)


(466)
 
Cash and cash equivalents at the beginning of the period
         
 
3,025


3,604


4,058
 
Effects of exchange rate changes
         
 
(6
  
 
(6)


12


Cash and cash equivalents at the end of the period
  
C.1
    
 
6,201


3,025


3,604


The accompanying notes form part of the Financial Statements.
 
F-
6

Table of Contents
Consolidated statement of changes in equity
for the year ended 31 December 2022
 
    
Issued
and
fully
paid
shares
   
Reserved
shares
   
Employee
benefits
reserve
   
Foreign
currency
translation
reserve
   
Hedging
reserve
   
Distributable
profits
reserve
   
Other
reserves
   
Retained
earnings
   
Equity
holders
of the
parent
   
Non-
controlling
interest
   
Total
equity
 
Notes
 
C.3
US$m
   
C.3
US$m
   
C.4
US$m
   
C.4
US$m
   
C.4
US$m
   
C.4
US$m
   
C.4
US$m
   
US$m
   
US$m
   
E.8
US$m
   
US$m
 
At 1 January 2022
 
 
9,409


(30)


232


793


(400)


58


-


3,381


13,443


786


14,229
 
Profit for the period
 
 
-


-


-


-


-


-


-


6,498


6,498


77


6,575
 
Other comprehensive income/(loss)
 
 
-


-


-


3


(186)


-


2


34


(147)


-


(147)
 
Total comprehensive income/(loss) for the period
 
 
-


-


-


3


(186)


-


2


6,532


6,351


77


6,428
 
Transfers
 
 
-


-


-


-


-


5,553


-


(5,553)


-


-


-
 
Shares purchased for Dividend Reinvestment Plan
 
 
-


(144)


-


-


-


-


-


-


(144)


-


(144)
 
Dividend Reinvestment Plan
 
 
332


144


-


-


-


-


-


-


476


-


476
 
Shares issued for acquisition of BHPP
 
 
19,265


-


-


-


-


-


-


-


19,265


-


19,265
 
Replacement employee share plan issued for acquisition of BHPP
 
 
-


-


18


-


-


-


-


-


18


-


18
 
Employee share plan purchases
 
 
-


(45)


-


-


-


-


-


-


(45)


-


(45)
 
Employee share plan redemptions
 
 
-


37


(37)


-


-


-


-


-


-


-


-
 
Share-based payments (net of tax)
 
 
-


-


65


-


-


-


-


-


65


-


65
 
Dividends paid
 
 
-


-


-


-


-


(2,070)


-


(1,018)


(3,088)


(72)


(3,160)
 
Transaction costs associated with the issue of shares
 
 
(5)


-


-


-


-


-


-


-


(5)


-


(5)
 
At 31 December 2022
 
 
29,001


(38)


278


796


(586)


3,541


2


3,342


36,336


791


37,127
 
At 1 January 2021
 
 
9,297


(23)


219


793


(71)


462


-


1,398


12,075


800


12,875
 
Profit for the period
 
 
-


-


-


-


-


-


-


1,983


1,983


53


2,036
 
Other comprehensive income/(loss)
 
 
-


-


13


-


(329)


-


-


-


(316)


-


(316)
 
Total comprehensive income/(loss) for the period
 
 
-


-


13


-


(329)


-


-


1,983


1,667


53


1,720
 
Dividend Reinvestment Plan
 
 
112


-


-


-


-


-


-


-


112


-


112
 
Employee share plan purchases
 
 
-


(47)


-


-


-


-


-


-


(47)


-


(47)
 
Employee share plan redemptions
 
 
-


40


(40)


-


-


-


-


-


-


-


-
 
Share-based payments (net of tax)
 
 
-


-


40


-


-


-


-


-


40


-


40
 
Dividends paid
 
 
-


-


-


-


-


(404)


-


-


(404)


(67)


(471)
 
At 31 December 2021
 
 
9,409


(30)


232


793


(400)


58


-


3,381


13,443


786


14,229
 
At 1 January 2020
 
 
9,010


(39)


211


793


(12)


-


-


6,654


16,617


792


17,409
 
Profit/(loss) for the period
 
 
-


-


-


-


-


-


-


(4,028)


(4,028)


53


(3,975)
 
Other comprehensive income/(loss)
 
 
-


-


2


-


(59)


-


-


-


(57)


-


(57)
 
Total comprehensive income/(loss) for the period
 
 
-


-


2


-


(59)


-


-


(4,028)


(4,085)


53


(4,032)
 
Transfers
 
 
-


-


-


-


-


710


-


(710)


-


-


-
 
Dividend Reinvestment Plan
 
 
264


-


-


-


-


-


-


-


264


-


264
 
Shares issued
 
 
23


-


-


-


-


-


-


-


23


-


23
 
Employee share plan purchases
 
 
-


(32)


-


-


-


-


-


-


(32)


-


(32)
 
Employee share plan redemptions
 
 
-


48


(48)


-


-


-


-


-


-


-


-
 
Share-based payments (net of tax)
 
 
-


-


54


-


-


-


-


-


54


-


54
 
Dividends paid
 
 
-


-


-


-


-


(248)


-


(518)


(766)


(45)


(811)
 
At 31 December 2020
 
 
9,297


(23)


219


793


(71)


462


-


1,398


12,075


800


12,875
 
The accompanying notes form part of the Financial Statements.
 
F-7

Table of Contents
Notes to the financial statements
for the year ended 31 December 2022
 
About these statements
Following the approval by shareholders at the Annual General Meeting on 19 May 2022, Woodside Petroleum Ltd has registered the change of company name to Woodside Energy Group Ltd. Woodside Energy Group Ltd and its controlled entities (Woodside or the Group) is a
for-profit
entity limited by shares, incorporated and domiciled in Australia. Its shares are publicly traded on the Australian Securities Exchange (ASX), on the Main Market for listed securities of the London Stock Exchange (LSE) (with trades settled in the form of UK Depository Interests) and on the New York Stock Exchange (NYSE) (in the form of Woodside American Depositary Shares). The nature of the operations and the principal activities of the Group are described in the Directors’ Report and in the segment information in Note A.1.
The financial statements were authorised for issue in accordance with a resolution of the Directors on 27 February 2023.
Statement of compliance
The financial statements are general purpose financial statements, which have been prepared in accordance with the requirements of the International Financial Reporting Standards (IFRS) as issued by the International Accounting Standards Board. They also include additional disclosures required for foreign registrants by the United States Securities and Exchange Commission (US SEC).
Subsequent to the merger with BHPP, BHPP’s accounting policies have been aligned with the Group. The Group’s accounting policies are consistent with those disclosed in the Group’s 2021 Financial Statements except for new policies applicable in 2022. Adoption of new or amended standards and interpretations effective 1 January 2022 did not result in any significant changes to the Group’s accounting policies.
Estimates have been revised, where required, to reflect current market conditions including the impact of
COVID-19
and climate change. Updated assumptions used for impairment assessments and the measurement of onerous contracts are disclosed in Notes B.4 and D.5 respectively; these assumptions could change in the future. New estimates and judgements for significant transactions during the period including the recognition of goodwill as a result of the business combination, the allocation of goodwill to the Group’s cash generating units, and the sell-down of Train 2 are disclosed in Notes B.5, B.4 and B.7 respectively.
Currency
The functional and presentation currency of Woodside and all its material subsidiaries is the US dollar.
Transactions in foreign currencies are initially recorded in the functional currency of the transacting entity at the exchange rates ruling at the date of transaction. Monetary assets and liabilities denominated in foreign currencies at the reporting date are translated at the rates of exchange ruling at that date. Exchange differences in the consolidated financial statements are taken to the income statement.
Rounding of amounts
The financial statements are rounded to the nearest million dollars, except where otherwise indicated.
Basis of preparation
The financial statements have been prepared on a historical cost basis, except for derivative financial instruments and certain other financial assets and financial liabilities, which have been measured at fair value or amortised cost adjusted for changes in fair value attributable to the risks that are being hedged in effective hedge relationships. Where not carried at fair value, if the carrying value of financial assets and financial liabilities does not approximate their fair value, the fair value has been included in the notes to the financial statements.
The financial statements comprise the financial position and results of the Group as at and for the year ended 31 December 2022 (refer to Note E.8).
Subsidiaries are fully consolidated from the date on which control is obtained by the Group and cease to be consolidated from the date at which the Group ceases to have control.
The subsidiaries of the Group apply the same reporting period and accounting policies as the parent company in preparation of the financial statements. All intercompany balances and transactions, including unrealised profits and losses arising from intra-group transactions, have been eliminated in full.
Non-controlling
interests are allocated their share of the net profit after tax in the consolidated income statement and their share of other comprehensive income net of tax in the consolidated statement of comprehensive income and are presented within equity in the consolidated statement of financial position, separately from parent shareholders’ equity.
The consolidated financial statements provide comparative information in respect of the previous periods. Where required, a reclassification of items in the financial statements of the previous periods has been made in accordance with the classification of items in the financial statements of the current period.
 
F-8

Table of Contents
Notes to the financial statements
for the year ended 31 December 2022
 
Climate change and energy transition
Climate considerations
Woodside has considered the impact of climate and the energy transition in assessing the carrying value of its assets and liabilities. This note describes climate-related assumptions that underpin key areas of the financial statements and the potential short- and long-term impacts differing scenarios could have on the financial results and financial position of Woodside.
Financial planning and assumptions
Woodside considers a range of climate and macroeconomic scenarios to help benchmark our long-term price assumptions and inform our decision making to ensure we maintain a resilient financial position. The assumptions applied in assessing amounts within the financial statements are in each case calculated in accordance with the requirements of the applicable accounting standards.
Our long-term price assumptions reflect management’s current ‘best estimate’ scenario in which global governments pursue decarbonisation as well as other goals such as energy security and economic development. All price assumptions consider current legislation in the locations where Woodside operates and place some weight on scenarios in which the transition to a low carbon energy system is sufficiently rapid to meet the goals of the Paris Agreement, as well as scenarios in which the transition is not, or may not be, sufficiently rapid. They also place some weight on a range of other assumptions which can drive prices (e.g. inflation) and which are not related to the Paris goals.
Woodside’s facilities are subject to physical risks such as oceanic conditions and are located in regions that experience tropical cyclones, hurricanes and high ambient temperatures. Woodside has significant experience designing and operating facilities located in harsh environments.
Woodside notes that the high degree of uncertainty around the nature, timing and magnitude of climate-related risks, and the uncertainty as to how the energy transition will evolve, makes it difficult to determine and disclose the risks and their potential impacts with precision.
Woodside continues to monitor the uncertainty around climate change risks and will revise commodity and carbon pricing assumptions accordingly. Oil and gas investment cases include a carbon price assumption which takes into consideration uncertainty around the impact of climate change. Commodity pricing assumptions are key value drivers with greater significance to assets and liabilities than carbon pricing.
Impairment of exploration and evaluation, oil and gas properties and goodwill
In accordance with IFRS, elements of Woodside’s financial statements are based on reasonable and supportable assumptions that represent management’s current best estimate of the range of economic conditions that may exist in the foreseeable future.
The estimation of recoverable amounts for impairment testing includes estimating what an independent market participant would pay to acquire the asset as at the reporting date. Market participants will be guided by their own views on future economic and technical conditions and therefore Woodside considers a range of data sources in determining a future price forecast, including industry and market benchmarks along with asset sales transaction data.
Price forecasts are adjusted for premiums and discounts based on the nature and quality of the product. Brent oil price estimates have considered the impacts of climate policies along with other factors such as industry investment and cost trends. There remains significant uncertainty around how society will respond to the climate challenge.
The energy transition is expected to bring volatility and there is uncertainty as to how commodity prices will develop over the medium and long term. The IEA’s World Energy Outlook 2022 (WEO) explores three main climate change scenarios. The IEA scenarios are not predictions and the IEA does not have a single view on the future of the energy system. There is significant uncertainty as to whether any of these scenarios will eventuate. Because Woodside considers what a market participant would pay to acquire an asset in assessing impairments, these external scenarios are not necessarily consistent with the pricing assumptions used for the Group’s impairment assessment as disclosed in Table A below and Note B.4 Impairment of exploration and evaluation, oil and gas properties and goodwill.
The WEO explores three main scenarios
1
:
 
·
 
The Net Zero Emissions (NZE) by 2050 Scenario
 
·
 
The Announced Pledges Scenario (APS)
 
·
 
The Stated Policies Scenario (STEPS)
Table A: Average real terms 2022 oil price (US$/bbl, Brent)
2
, North Asian LNG price (US$/MMbtu)
2
and carbon price (US$/tCO
2
-e)
3
consistent with IEA dataset compared against Woodside’s assumptions:
 
Average Brent (RT US$/bbl)
  
2023-2026
    
2027-2031
    
2032-2036
    
2037-2040
 
NZE
  
 
59


38


33


31
 
APS
  
 
88


70


65


65
 
STEPS
  
 
92


85


85


88
 
Woodside
  
 
75


70


70


70
 
 
F-9

Table of Contents
Notes to the financial statements
for the year ended 31 December 2022
 
                                                                           
Average North Asian LNG (RT US$/MMbtu)
  
2023-2026
    
2027-2031
    
2032-2036
    
2037-2040
 
NZE
  
 
18


6


6


6
 
APS
  
 
20


9


9


9
 
STEPS
  
 
  21


11


11


11
 
                                     
Woodside
  
 
23


9


9


9


Average Carbon (RT US$/tonne)
  
2023-2026
    
2027-2031
    
2032-2036
    
2037-2040
 
NZE
  
 
100


135


169


199
 
APS
  
 
98


130


154


172
 
STEPS
  
 
80


80


80


80
 
                                     
Woodside
  
 
80


80


80


80


1.
IEA 2022. ‘World Energy Outlook 2022’. All rights reserved.
2.
Based on data from IEA 2022. ‘World Energy Outlook 2022’ as modified by Woodside analysis. Woodside used interpolation techniques to estimate Brent annual price points in between the years for which the IEA disclosed price points. For gas pricing assumptions all non-contracted LNG volumes were assessed at IEA’s Japan import price, as a proxy for North Asian LNG spot price. Woodside used interpolation techniques to estimate annual gas price points in between the years for which the IEA disclosed prices. For oil linked LNG contracts, prices are derived from the Brent forecasts and the terms of the contracts.
3.
Based on data from IEA 2022. ‘World Energy Outlook 2022’ as modified by Woodside analysis. The IEA only provide carbon prices from 2030 onwards. As a result, Woodside used a starting point of US$80/tCO
2
-e consistent with internal carbon cost pricing. Woodside used the 2022 starting price point and the IEA’s published 2030 and 2040 carbon prices for each scenario to interpolate annual price points through to 2040.
Refer to Note B.4 for the sensitivity analysis performed on Woodside’s Brent oil pricing assumptions and the potential impact on the carrying value of Woodside’s non-current assets.
The benchmarked pricing above has limitations and is based on a wide range of assumptions. The impact of the benchmark pricing assumptions could be managed by decisions Woodside could make in response such as acquisitions, divestments or cost reductions as well as other consequential changes. The scenarios must therefore not be interpreted as Woodside’s investment guidance. These are scenarios, not forecasts, and no likelihood is assigned to any of these scenarios eventuating.
Impact on remaining life of assets
Oil and gas properties relating to transferred exploration and evaluation and offshore plant and equipment are depreciated using the unit of production basis over either proved or proved plus probable reserves. The energy transition may result in changes to the expected useful life of oil and gas properties and economically recoverable reserves and resources thereby accelerating depreciation charges or resulting in an impairment.
Restoration and other provisions
The energy transition may result in restoration activities occurring earlier than expected. 54% (2021: 65%) of the Group’s non-current restoration liabilities are expected to be settled more than 10 years in the future.
Restoration cost estimates require judgemental assumptions regarding removal date, environmental legislation and regulations and the extent of restoration activities required.
These cost estimates may change in the future, as a result of increased regulatory scrutiny and the energy transition. Woodside continues to monitor the uncertainty around climate change risks to assess if additional changes to restoration provisions should be recognised.
Onerous contracts
Closure or early termination of activities may lead to supply contracts becoming onerous. As at 31 December 2022, the Corpus Christi contract is expected to return a positive value and on this basis the onerous contract provision has been reversed to nil (2021: $214 million). This and other contractual arrangements could be impacted by adverse market conditions arising from climate-related factors.
Deferred tax assets
The Group has determined that it is probable that sufficient future taxable income will be available to utilise the deferred tax assets relating to carry forward unused tax losses and credits recognised as at 31 December 2022. The recoverability of deferred tax assets is dependent on the Group’s future taxable income which can be impacted by the uncertainty of commodity and carbon pricing.
Regulatory environment
Regulation of climate-related emissions can change over time. Woodside is not currently aware of specific proposals that would materially change the assumptions underpinning the financial statements.
 
F-10

Table of Contents
Notes to the financial statements
for the year ended 31 December 2022
 
 
Financial and capital risk management
The Board of Directors has overall responsibility for the establishment and oversight of the Group’s risk management framework, including review and approval of the Group’s risk management strategy, policy and key risk parameters. The Board of Directors and the Audit and Risk Committee have oversight of the Group’s internal control system and risk management process, including oversight of the internal audit function.
The Group’s management of financial and capital risks is aimed at ensuring that available capital, funding and cash flows are sufficient to:
 
 
·
 
meet the Group’s financial commitments as and when they fall due;


·
 
maintain the capacity to fund its committed project developments;


·
 
pay a reasonable dividend; and


·
 
maintain a long-term credit rating of not less than ‘investment grade’.
 
The Group monitors and tests its forecast financial position against these criteria and, in general, will undertake hedging activity when necessary to ensure that these objectives are achieved.
Other circumstances that may lead to hedging include the management of exposures relating to trading activities. It is, and has been throughout the period, the Group Treasury policy that no speculative trading in financial instruments shall be undertaken. Refer to Section 3.8 Risk Factors for more information on the Group’s objectives, policies and processes for managing financial risk.
The below risks arise in the normal course of the Group’s business.
Risk information can be found in the following sections:
 
Section A
  
Commodity price risk management
  
Page F-13
Section A
  
Foreign exchange risk management
  
Page F-13
Section C
  
Capital risk management
  
Page F-41
Section C
  
Liquidity risk management
  
Page F-41
Section C
  
Interest rate risk management
  
Page F-41
Section D
  
Credit risk management
  
Page F-47
 
 
F-11

Table of Contents
Notes to the financial statements
for the year ended 31 December 2022
 
 
Key estimates and judgements
In applying the Group’s accounting policies, management continually evaluates judgements, estimates and assumptions based on experience and other factors, including expectations of future events that may have an impact on the Group. All judgements, estimates and assumptions made are believed to be reasonable based on the most current set of circumstances known to management, and actual results may differ. Significant judgements, estimates and assumptions made by management in the preparation of these financial statements are found in the following notes:
 
Note A.1
 
Revenue from contracts with customers
 
Page F-14
Note A.5
 
Taxes
 
Page F-20
Note B.2
 
Exploration and evaluation
 
Page F-26
Note B.3
 
Oil and gas properties
 
Page F-28
Note B.4
 
Impairment of exploration and evaluation, oil and gas properties and goodwill
 
Page F-29
Note B.5
 
Business combination
 
Page F-35
Note B.6
 
Significant production and growth asset acquisitions
 
Page F-38
Note B.7
 
Disposal of assets
 
Page F-39
Note D.5
 
Provisions
 
Page F-50
Note D.6
 
Other financial assets and liabilities
 
Page F-52
Note D.7
 
Leases
 
Page F-55
Note E.6
 
Joint arrangements
 
Page F-62
 
 
F-12

Table of Contents
Notes to the financial statements
A. Earnings for the year
for the year ended 31 December 2022
 
In this section
 
This section addresses financial performance of the Group for the reporting period including, where applicable, the accounting policies applied and the key estimates and judgements made. This section also includes the tax position of the Group for and at the end of the reporting period.
 
A.
  
Earnings for the year
    
A.1
  
Segment revenue and expenses
  
Page F-14
A.2
  
Finance costs
  
Page
F-19
A.3
  
Dividends paid and proposed
  
Page
F-19
A.4
  
Earnings/(losses) per share
  
Page
F-19
A.5
  
Taxes
  
Page F-20
Key financial and capital risks in this section
 
Commodity price risk management
The Group’s revenue is exposed to commodity price fluctuations through the sale of hydrocarbons. Commodity price risks are measured by monitoring and stress testing the Group’s forecast financial position to sustained periods of low oil and gas prices. This analysis is regularly performed on the Group’s portfolio and as required for discrete projects and transactions.
The Group’s management of commodity price risk includes the use of commodity derivatives to hedge its exposure (refer to Note D.6). The hedged exposure includes oil-linked revenue related to produced volumes and revenues derived from trading operations. Commodity derivatives protect the Group against downside price risk within its strategic and trading portfolio.
As at the reporting date, the Group held hedging financial instruments with a net liability carrying value of $557 million (2021: $431 million) exposed to commodity price risk. An increase in relevant commodity prices of 10% would increase the instruments’
net liability
by $219 million, the effect of which would be recognised within reserves and/or the income statement in accordance with hedge accounting application. A 10% decrease would have the same but opposite effect. Th
is
 analysis assumes that all other variables remain constant (including the price on underlying physical exposures).
Foreign exchange risk management
Foreign exchange risk arises from future commitments, financial assets and financial liabilities that are not denominated in US dollars.
The majority of the Group’s revenue is denominated in US dollars. The Group is exposed to foreign currency risk arising from operating and capital expenditure incurred in currencies other than US dollars, particularly Australian dollars.
The Group’s management of foreign exchange risk relating to capital expenditure includes the use of forward exchange contract derivatives to hedge its exposure (refer to Note D.6).
As at the reporting date, the Group held hedging financial instruments with a net liability carrying value of $17 million (2021: net asset carrying value of $10 million) exposed to foreign exchange risk.
Measuring the exposure to foreign exchange risk is achieved by regularly monitoring and performing sensitivity analysis on the Group’s financial position.
A reasonably possible change in the exchange rate of the US dollar to the Australian dollar
(+12%/-12%
(2021:
+12%/-12%)),
with all other variables held constant, would not have a material impact on the Group’s equity or the income statement. Refer to Notes C1, C2, D2, D4 and D7 for details of the denominations of cash and cash equivalents, interest-bearing liabilities, receivables, payables and lease liabilities held at 31 December 2022.
The Group entered into foreign exchange forward contracts to fix the Australian dollar to US dollar exchange rate in relation to a portion of the Australian dollar denominated capital expenditure incurred or expected to be incurred under the Scarborough development from 2022 to 2025 (refer to Note D.6). In order to hedge the foreign exchange risk and interest rate risk (refer to Section C) of a Swiss Franc (CHF) denominated medium term note, Woodside holds a number of cross-currency interest rate swaps (refer to Notes C.2 and D.6). The aim of these investments is to convert the fixed interest CHF bond into variable interest US dollar debt.
 
F-13

Table of Contents
Notes to the financial statements
A. Earnings for the year
for the year ended 31 December 2022
 
A.1
 
Segment revenue and expenses
Operating segment information
The Group has identified its operating segments based on the internal reports that are reviewed and used by the Chief Executive Officer (Chief Operating Decision Maker) in assessing performance and determining the allocation of resources.
As a result of the merger with BHPP on 1 June 2022, the Group has transformed into a global energy company which has led to a change in how financial information is reported in the Group. The disclosed operating segments have been updated to reflect this change and the 2021 and 2020 amounts have been restated to be presented on the same basis.
Operating segments outlined below are identified by management based on the nature and geographical location of the business and venture.
 
 
Australia:
 
Exploration, evaluation, development, production and sale of liquified natural gas, pipeline gas, crude oil and condensate and natural gas liquids in Australia.
  
 
International:
 
Exploration, evaluation, development, production and sale of pipeline gas, crude oil and condensate and natural gas liquids in international jurisdictions outside of Australia.
  
 
Marketing:
 
Marketing, Shipping and Trading of Woodside’s oil and gas portfolio (including non-produced volumes) and optimisation activities attributed to Marketing which have generated incremental value.
  
 
Corporate/Other items:
 
Corporate/Other items comprise primarily corporate non-segmental items of revenue and expenses and associated assets and liabilities not allocated to operating segments as they are not considered part of the core operations of any segment.
 
In addition to the updated segments, the Group has reassessed the reporting of revenue from the sale of liquified natural gas on a portfolio basis. With the Marketing segment separately reported for the year ended 31 December 2022, the Group will no longer report revenue from the sale of liquified natural gas on a portfolio basis to better represent the revenues and margins generated by each segment. 2021 and 2020 amounts have been restated to be presented on the same basis.
Major customer information
The Group has two major customers which respectively account for 12% and 9% of the Group’s external revenue. The sales are generated by the Australia and Marketing operating segments (2021: two major customers; 8% and 6% generated by the Australia operating segment and 2020: two major customers; 15% and 13% generated by the Australia operating segment).
 
Geographical Information
  
Revenue from external customers
    
Non-current assets
2
 
     
2022
US$m
    
2021
US$m
    
2020
US$m
    
2022
US$m
    
2021
US$m
 
Asia Pacific
  
 
12,521


6,342


3,362


36,966


18,386
 
Americas
  
 
1,545


-


-


7,057


1
 
Africa
  
 
-


-


-


4,049


2,802
 
Europe
  
 
2,751


620


238


-


-
 
Consolidated
  
 
16,817


6,962


3,600


48,072


21,189
 
 
1.
Revenue is attributable to geographic location based on the location of the customers.
2.
Non-current
assets exclude deferred tax of $1,959 million (2021: $1,007 million).
Recognition and measurement
Revenue from contracts with customers
Revenue is recognised when or as the Group transfers control of products or provides services to a customer at the amount to which the Group expects to be entitled. If the consideration includes a variable component, the Group estimates the amount of the expected consideration receivable. Variable consideration is estimated throughout the contract and is recognised to the extent that it is highly probable a significant reversal will not occur.
 
·
 
Revenue from sale of hydrocarbons
- Revenue from the sale of hydrocarbons is recognised at a point in time when control of the product is transferred to the customer
.
 Revenue from take or pay contracts is recorded as unearned revenue until the product has been drawn by the customer (transfer of control), at which time it is recognised in earnings.
·
 
Other operating revenue
- Revenue earned from LNG processing and other services is recognised over time as the services are rendered.
Expenses
·
 
Royalties, excise and levies
- Royalties, excise and levies are considered to be production-based taxes and are therefore accrued on the basis of the Group’s entitlement to physical production.
·
 
Depreciation and amortisation
- Refer to Note B.3.
·
 
Impairment and impairment reversals
- Refer to Note B.4.
·
 
Leases
- Refer to Note D.7.
·
 
Employee benefits
- Refer to Note E.2.
 
F-14

Notes to the financial statements
A. Earnings for the year
for the year ended 31 December 2022
 
 
Key estimates and judgements
Revenue from contracts with customers
The transaction price at the date control passes for sales made subject to provisional pricing periods in oil and condensate contracts is determined with reference to quoted commodity prices.
Judgement is also used to determine if it is highly probable that a significant reversal will not occur in relation to revenue recognised during open pricing periods in LNG contracts. The Group estimates variable consideration based on available information from contract negotiations and market indicators.
 
 
F-15

Notes to the financial statements
A. Earnings for the year
for the year ended 31 December 2022


Australia


International


Marketing


Corporate/
Other


Consolidated


2022
US$m


2022
US$m


2022
US$m


2022
US$m


2022
US$m


Liquefied natural gas
  
 
8,855


-


2,434


-


11,289
 
Pipeline gas
  
 
1,086


276


-


-


1,362
 
Crude oil and condensate
  
 
2,467


1,273


18


-


3,758
 
Natural gas liquids
  
 
171


26


9


-


206


Revenue from sale of hydrocarbons
  
 
12,579


1,575


2,461


-


16,615


Intersegment revenue
1
  
 
(455
 
 
(5
 
 
460


-


-
 
Processing and services revenue
  
 
175


-


-


-


175
 
Shipping and other revenue
  
 
-


-


27


-


27


Other revenue
  
 
(280
 
 
(5
 
 
487


-


202


Operating revenue
2
  
 
12,299


1,570


2,948


-


16,817


Production costs
  
 
(975
 
 
(313
 
 
-


7


(1,281
Royalties, excise and levies
  
 
(540
 
 
(39
 
 
-


(17
 
 
(596
Insurance
  
 
(35
 
 
(7
 
 
-


(1
 
 
(43
Inventory movement
  
 
44


(3
 
 
-


-


41


Costs of production
  
 
(1,506
 
 
(362
 
 
-


(11
 
 
(1,879
 
 
Land and buildings
  
 
(51
 
 
(3
 
 
-


-


(54
Transferred exploration and evaluation
  
 
(107
 
 
-


-


-


(107
Plant and equipment
  
 
(2,168
 
 
(436
 
 
-


(33
 
 
(2,637
 
 
Oil and gas properties depreciation and amortisation
  
 
(2,326
 
 
(439
 
 
-


(33
 
 
(2,798
 
 
Shipping and direct sales costs
  
 
(312
 
 
(36
 
 
(73
 
 
142


(279
Trading costs
  
 
(14
 
 
-


(1,763
 
 
-


(1,777
Other hydrocarbon costs
  
 
(19
 
 
-


-


-


(19
Other cost of sales
  
 
(4
 
 
-


-


-


(4
Movement in onerous contract provision
3
  
 
-


-


216


-


216


Other cost of sales
  
 
(349
 
 
(36
 
 
(1,620
 
 
142


(1,863
 
 
Cost of sales
  
 
(4,181
 
 
(837
 
 
(1,620
 
 
98


(6,540
 
 
Gross profit
  
 
8,118


733


1,328


98


10,277


Other income
4
  
 
722


4


5


4


735


Exploration and evaluation expenditure
5
  
 
(20
 
 
(277
 
 
-


1


(296
Amortisation of permit acquisition
  
 
(1
 
 
(9
 
 
-


-


(10
Write-offs
6
  
 
-


(164
 
 
-


-


(164
 
 
Exploration and evaluation
  
 
(21
 
 
(450
 
 
-


1


(470
 
 
General, administrative and other costs
7
  
 
(13
 
 
(21
 
 
(10
 
 
(747
 
 
(791
Depreciation of other plant and equipment
  
 
-


-


-


-


-
 
Depreciation of lease assets
  
 
(49
 
 
(11
 
 
-


(80
 
 
(140
Restoration movement
  
 
(234
 
 
(46
 
 
-


8


(272
Other
8
  
 
(8
 
 
(84
 
 
(475
 
 
(486
 
 
(1,053
 
 
Other costs
  
 
(304
 
 
(162
 
 
(485
 
 
(1,305
 
 
(2,256
 
 
Other expenses
  
 
(325
 
 
(612
 
 
(485
 
 
(1,304
 
 
(2,726
 
 
Impairment losses
  
 
-


-


-


-


-


Impairment reversals
9
  
 
900


-


-


-


900


Profit/(loss) before tax and net finance costs
  
 
9,415


125


848


(1,202
 
 
9,186


1.
Intersegment revenue comprises the incremental income net of all associated expenses generated by the Marketing segment’s optimisation of the oil and gas portfolio. The value is incremental income net of incremental costs.
2.
Operating revenue includes revenue from contracts with customers of $16,790 million and sub-lease income of $27 million disclosed within shipping and other revenue.
3.
Comprises changes in estimates of $245 million offset by provisions used of $29 million. Refer to Note D.5 for further details.
4.
Includes initial gain on Train 2 sell-down of $427 million, revaluation gain on the remeasurement of the Train 2 sell-down variable consideration of $71 million, fees and recoveries, foreign exchange gains and other income not associated with the ongoing operations of the business.
5.
Includes $142 million for various costs relating to the Group’s exit from the Orphan Basin exploration licences in Canada.
6.
$125 million relates to costs of unsuccessful wells that have been written off. Refer to Note B.2.
7.
Transaction costs of $419 million incurred as a result of the BHPP merger on 1 June 2022 are included in the Corporate/Other segment. Refer to Note B.5 for details.
8.
Includes losses on hedging activities and changes in fair value of derivative financial instruments of $960 million in the Marketing and Corporate/Other segments and other expenses not associated with the ongoing operations of the business.
9.
Impairment reversals on oil and gas properties. Refer to Note B.4 for more details.
 
F-16

Notes to the financial statements
A. Earnings for the year
for the year ended 31 December 2022
 
    
Australia
   
International
   
Marketing
   
Corporate/
Other
   
Consolidated
 
    
2021
8
US$m
   
2021
8
US$m
   
2021
8
US$m
   
2021
8
US$m
   
2021
US$m


Liquefied natural gas
  
 
3,910


-


1,449


-


5,359
 
Pipeline gas
  
 
43


-


-


-


43
 
Crude oil and condensate
  
 
1,316


-


-


-


1,316
 
Natural gas liquids
  
 
60


-


-


-


60


Revenue from sale of hydrocarbons
  
 
5,329


-


1,449


-


6,778


Intersegment revenue
1
  
 
(236)


-


236


-


-
 
Processing and services revenue
  
 
143


-


-


-


143
 
Shipping and other revenue
  
 
4


-


37


-


41


Other revenue
  
 
(89)


-


273


-


184


Operating revenue
2
  
 
5,240


-


1,722


-


6,962


Production costs
  
 
(489)


-


-


8


(481)
 
Royalties, excise and levies
  
 
(218)


-


-


-


(218)
 
Insurance
  
 
(32)


-


-


1


(31)
 
Inventory movement
  
 
17


-


-


-


17


Costs of production
  
 
(722)


-


-


9


(713)


Land and buildings
  
 
(51
 
 
-


-


-


(51
Transferred exploration and evaluation
  
 
(79
 
 
-


-


-


(79
Plant and equipment
  
 
(1,419
 
 
-


-


-


(1,419
 
 
Oil and gas properties depreciation and amortisation
  
 
(1,549
 
 
-


-


-


(1,549
 
 
Shipping and direct sales costs
  
 
(197
 
 
-


(45
 
 
32


(210
Trading costs
  
 
(3
 
 
-


(1,492
 
 
-


(1,495
Other hydrocarbon costs
  
 
(6
 
 
-


-


-


(6
Other cost of sales
  
 
(11
 
 
-


-


(1
 
 
(12
Movement in onerous contract provision
3
  
 
-


-


140


-


140


Other cost of sales
  
 
(217
 
 
-


(1,397
 
 
31


(1,583
 
 
Cost of sales
  
 
(2,488
 
 
-


(1,397
 
 
40


(3,845
 
 
Gross profit/(loss)
  
 
2,752


-


325


40


3,117


Other income
4
  
 
97


(2
 
 
1


43


139


Exploration and evaluation expenditure
  
 
(16
 
 
(27
 
 
-


(11
 
 
(54
Amortisation of permit acquisition
  
 
-


(2
 
 
-


(1
 
 
(3
Write-offs
5
  
 
-


(265
 
 
-


-


(265
 
 
Exploration and evaluation
  
 
(16
 
 
(294
 
 
-


(12
 
 
(322
 
 
General, administrative and other costs
  
 
(5
 
 
(1
 
 
-


(152
 
 
(158
Depreciation of other plant and equipment
  
 
-


-


-


(30
 
 
(30
Depreciation of lease assets
  
 
(28
 
 
-


-


(80
 
 
(108
Restoration movement
  
 
(80
 
 
12


-


-


(68
Other
6
  
 
(57
 
 
(32
 
 
28


(64
 
 
(125
 
 
Other costs
  
 
(170
 
 
(21
 
 
28


(326
 
 
(489
 
 
Other expenses
  
 
(186
 
 
(315
 
 
28


(338
 
 
(811
 
 
Impairment losses
  
 
(10
 
 
-


-


-


(10
 
 
Impairment reversals
7
  
 
1,058


-


-


-


1,058


Profit/(loss) before tax and net finance costs
  
 
3,711


(317
 
 
354


(255
 
 
3,493


1.
Intersegment revenue comprises the incremental income net of all associated expenses generated by the Marketing segment’s optimisation of the oil and gas portfolio. The value is incremental income net of incremental costs.
2.
Operating revenue includes revenue from contracts with customers of $6,923 million and sub-lease income of $39 million disclosed within shipping and other revenue.
3.
Comprises provisions used of $45 million and changes in estimates of $95 million. Refer to Note D.5 for further details.
4.
Includes other income of $67 million relating to Pluto volumes delivered into Wheatstone’s sales commitments and net foreign exchange gains of $44 million.
5.
$56 million relates to costs of unsuccessful wells. $209 million relates to capitalised costs written off due to the Group’s decision to withdraw from its interests in Myanmar. Refer to Note B.2.
6.
Includes net loss on hedging activities of $91 million, various costs relating to Woodside’s exit from the Kitimat LNG development of $33 million and other expenses not associated with the ongoing operations of the business.
7.
Impairment reversals on oil and gas properties. Refer to Note B.4 for more details.
8.
The 2021 amounts have been restated to reflect the changes in operating segments and portfolio reporting for LNG revenue.
 
F-17

Notes to the financial statements
A. Earnings for the year
for the year ended 31 December 2022
 
    
Australia
   
International
   
Marketing
   
Corporate/
Other
   
Consolidated
 
    
2020
6
US$m
   
2020
6
US$m
   
2020
6
US$m
   
2020
6
US$m
   
2020
US$m


Liquefied natural gas
1
  
 
2,390


-


129


-


2,519
 
Pipeline gas
  
 
73


-


-


-


73
 
Crude oil and condensate
  
 
843


-


-


-


843
 
Natural gas liquids
  
 
16


-


-


-


16


Revenue from sale of hydrocarbons
  
 
3,322


-


129


-


3,451


Intersegment revenue
2
  
 
(47)


-


47


-


-
 
Processing and services revenue
  
 
142


-


-


-


142
 
Shipping and other revenue
  
 
4


-


3


-


7


Other revenue
  
 
99


-


50


-


149


Operating revenue
  
 
3,421


-


179


-


3,600


Production costs
  
 
(486)


-


-


8


(478)
 
Royalties, excise and levies
  
 
(82)


-


-


-


(82)
 
Insurance
  
 
(32)


-


-


1


(31)
 
Inventory movement
  
 
(32)


-


-


-


(32)


Costs of production
  
 
(632)


-


-


9


(623)


Land and buildings
  
 
(55
 
 
-


-


-


(55
Transferred exploration and evaluation
  
 
(99
 
 
-


-


-


(99
Plant and equipment
  
 
(1,535
 
 
-


-


-


(1,535
 
 
Oil and gas properties depreciation and amortisation
  
 
(1,689
 
 
-


-


-


(1,689
 
 
Shipping and direct sales costs
  
 
(146
 
 
-


(3
 
 
38


(111
Trading costs
  
 
(4
 
 
-


(207
 
 
-


(211
Other hydrocarbon costs
  
 
(4
 
 
-


-


-


(4
Other cost of sales
  
 
-


-


-


-


-
 
Movement in onerous contract provision
3
  
 
-


-


(347
 
 
-


(347
 
 
Other cost of sales
  
 
(154
 
 
-


(557
 
 
38


(673
 
 
Cost of sales
  
 
(2,475
 
 
-


(557
 
 
47


(2,985
 
 
Gross profit/(loss)
  
 
946


-


(378
 
 
47


615


Other income
4
  
 
3


(1
 
 
1


(39
 
 
(36
 
 
Exploration and evaluation expenditure
  
 
(26
 
 
(32
 
 
-


(9
 
 
(67
Amortisation of permit acquisition
  
 
(6
 
 
(5
 
 
-


(1
 
 
(12
Write-offs
  
 
-


(2
 
 
-


-


(2
 
 
Exploration and evaluation
  
 
(32
 
 
(39
 
 
-


(10
 
 
(81
 
 
General, administrative and other costs
  
 
(7
 
 
(14
 
 
-


(169
 
 
(190
Depreciation of other plant and equipment
  
 
-


-


-


(29
 
 
(29
Depreciation of lease assets
  
 
(26
 
 
-


-


(68
 
 
(94
Restoration movement
  
 
(65
 
 
37


-


-


(28
Other
4
  
 
(8
 
 
-


-


(51
 
 
(59
 
 
Other costs
  
 
(106
 
 
23


-


(317
 
 
(400
 
 
Other expenses
  
 
(138
 
 
(16
 
 
-


(327
 
 
(481
 
 
Impairment losses
5
  
 
(3,971
 
 
(1,298
 
 
-


-


(5,269
 
 
Impairment reversals
  
 
-


-


-


-


-


Loss before tax and net finance costs
  
 
(3,160
 
 
(1,315
 
 
(377
 
 
(319
 
 
(5,171


1.
Includes an adjustment of $113 million related to price reviews under negotiation for multiple contracts in the Australia segment, reducing revenue recognised in the current and prior periods and increasing other liabilities.
2.
Intersegment revenue comprises the incremental income net of all associated expenses generated by the Marketing segment’s optimisation of the oil and gas portfolio. The value is incremental income net of incremental costs.
3.
Comprised of the recognition of an onerous contract provision $447 million, offset by changes in estimates of $54 million, provisions used of $41 million and a revision of discount rates of $5 million.
4.
Includes foreign exchange gains and losses, gains and losses on hedging activities, cancellation costs and other expenses not associated with the ongoing operations of the business.
5.
The impairment losses represent charges on exploration and evaluation of $1,557 million and oil and gas properties of $3,712 million.
6.
The 2020 amounts have been restated to reflect the changes in operating segments and portfolio reporting for LNG revenue.
 
F-18

Table of Contents
Notes to the financial statements
A. Earnings for the year
for the year ended 31 December 2022
 
A.2
 
Finance costs
 
    
2022
US$m
    
2021
US$m
    
2020
US$m


Interest on interest-bearing liabilities
  
 
212


201


237
 
Interest on lease liabilities
  
 
103


97


86
 
Accretion charge
  
 
110


29


32
 
Other finance costs
  
 
36


26


29
 
Less: Finance costs capitalised against qualifying assets
  
 
(294)


(123)


(57)


167


230


327


A.3
 
Dividends paid and proposed
Woodside Energy Group Ltd, the parent entity, paid and proposed dividends set out below:
 
    
2022
US$m
    
2021
US$m
    
2020
US$m


(a) Dividends paid during the financial year
                          
Prior year fully franked final dividend
1
  
 
1,018


115


518
 
Current year fully franked interim dividend
2
  
 
2,070


289


248


3,088


404


766


(b) Dividend declared subsequent to the reporting period (not recorded as a liability)
                          
Final dividend
3
  
 
2,734


1,018


115


(c) Other information
                          
Current year dividends per share (US cents)
  
 
253


135


38


1.
2022: US$1.05, paid on 23 March 2022
 
2021:
US$0.12, paid on 24 March 2021
 
2020:
US$0.55, paid on 20 March 2020
2.
2022: US$1.09, paid on 6 October 2022
 
2021:
US$0.30, paid on 24 September 2021
 
2020:
US$0.26, paid on 18 September 2020
3.
2022: US$1.44, to be paid on
5 April 2023
 
2021:
US$1.05, paid on 23 March 2022
 
2020:
US$0.12, paid on 24 March 2021
The Dividend Reinvestment Plan (DRP) was approved by the shareholders at the Annual General Meeting in 2003 for activation as required to fund future growth. The DRP was reactivated in 2019 and suspended by the Board of Directors on 27 February 2023.
 
A.4
 
Earnings/(losses) per share
 
    
2022
    
2021
    
2020


Profit/(loss) attributable to equity holders of the parent (US$m)
  
 
6,498


1,983


(4,028)
 
Weighted average number of shares on issue for basic earnings/(loss) per share
  
 
1,511,257,404


      962,604,811


      951,113,086
 
Effect of dilution from contingently issuable shares
  
 
13,061,376


9,023,439


-
 
Weighted average number of shares on issue adjusted for the effect of dilution
1
  
 
1,524,318,780


971,628,250


951,113,086
 
Basic earnings/(losses) per share (US cents)
  
 
430.0


206.0


(423.5)
 
Diluted earnings/(losses) per share (US cents)
  
 
426.3


204.1


(423.5)


1.
The contingently issuable shares in 2020 have an anti-dilutive impact.
Earnings/(losses) per share is calculated by dividing the profit/(loss) for the year attributable to ordinary equity holders of the parent by the weighted average number of ordinary shares on issue during the year. The weighted average number of shares makes allowance for shares reserved for employee share plans. Diluted earnings/(losses) per share is calculated by adjusting basic earnings/(losses) per share by the number of ordinary shares that would be issued on conversion of all the dilutive potential ordinary shares into ordinary shares. At 31 December 2022, 13,061,376 awards (2021: 9,023,439 awards) granted under the Woodside employee share plans are considered dilutive. Total outstanding share awards as at 31 December 2020 were 9,392,203 and considered anti-dilutive due to the loss position in 2020.
There have been no significant transactions involving ordinary shares between the reporting date and the date of completion of these financial statements.
 
F-19

Table of Contents
Notes to the financial statements
A. Earnings for the year
for the year ended 31 December 2022
 
A.5
 
Taxes


2022
                US$m


2021
                US$m


2020
                US$m


(a) Tax expense comprises


Petroleum resource rent tax (PRRT)


Current tax expense
  
 
501


-


-
 
Deferred tax
(benefit)/
expense
  
 
(814)


297


(439)


PRRT
(benefit)/
expense
  
 
(313)


297


(439)


Income tax


Current year


Current tax expense
  
 
2,256


658


275
     
Deferred tax expense/(benefit)
  
 
701


301


(1,308)
 
Adjustment to prior years


Current tax (benefit)/expense
  
 
(276)


(20)


16
 
Deferred tax expense/(benefit)
  
 
231


18


(9)


Income tax expense/(benefit)
  
 
2,912


957


(1,026)


Tax expense/(benefit)
  
 
2,599


1,254


(1,465)


2022
                US$m


2021
                US$m


2020
                US$m


(b) Reconciliation of income tax expense


Profit/(loss) before tax
  
 
9,174


3,290


(5,440)
 
PRRT benefit/(expense)
  
 
313


(297)


439


Profit/(loss) before income tax
  
 
9,487


2,993


(5,001)


Income tax expense/(benefit) calculated at 30%
  
 
2,847


898


(1,500)
 
Effect of tax rate differentials
  
 
(141)


(42)


192
 
Effect of deferred tax assets not recognised
  
 
150


114


270
 
Foreign exchange impact on tax (benefit)/expense
  
 
(44)


(18)


3
 
Adjustment to prior years
  
 
(45)


(2)


7
 
Integration and transaction costs
non-deductible
  
 
142


-


-
 
Other
  
 
3


7


2


Income tax expense/(benefit)
  
 
2,912


957


(1,026)


2022
                US$m


2021
                US$m


2020
                US$m


(c) Reconciliation of PRRT benefit


Profit/(loss) before tax
  
 
9,174


3,290


(5,440)
 
Non-PRRT
assessable (profit)/loss
  
 
(6,197)


(2,134)


3,080


PRRT projects profit/(loss) before tax
  
 
2,977


1,156


(2,360)


PRRT expense/(benefit) calculated at 40%
  
 
1,191


462


(944)
 
(Recognition)/derecognition of Pluto general expenditure
1
  
 
(1,362)


-


627
 
Augmentation
  
 
(175)


(166)


(138)
 
Other
  
 
33


1


16


PRRT expense/(benefit)
  
 
(313)


297


(439)


2022
                US$m


2021
                US$m


2020
                US$m


(d) Deferred tax income statement reconciliation


PRRT


Production and growth assets
  
 
(710)


455


(242)
 
Augmentation for current year
  
 
(175)


(166)


(138)
 
Provisions
  
 
(12)


(29)


(32)
 
Other
  
 
83


37


(27)


PRRT
(benefit)/
expense
  
 
(814)


297


(439)


Income tax


Oil and gas properties
  
 
292


674


(981)
 
Exploration and evaluation assets
  
 
14


(204)


(210)
 
Lease assets and liabilities
  
 
25


1


(16)
 
Provisions
  
 
151


(10)


(106)
 
PRRT assets and liabilities
  
 
236


(88)


134
 
Unused tax losses and tax credits
  
 
19


149


(149)
 
Assets held for sale
  
 
205


(205)


-
 
Derivatives
  
 
21


(11)


16
     
Other
  
 
(31)


13


(5)


Income tax deferred tax expense/(benefit)
  
 
932


319


(1,317)


Deferred tax expense/(benefit)
  
 
118


616


(1,756)


2022
                US$m


2021
                US$m


2020
                US$m


(e) Deferred tax other comprehensive income reconciliation
                         
Income tax
                         
Derivatives
  
 
(64)


5


(25)
 
Other
  
 
(2)


5


6


Deferred income tax (benefit)/expense via other comprehensive income
  
 
(66)


10


(19)


2022

                US$m


2021

                US$m


2020

                US$m


(f) Effective income tax rate: Australian and global operations


Effective income tax rate
2


Australia
  
 
30.0%


30.6
 
 
29.6
Global
  
 
30.7%


32.0
 
 
20.5


1.
The $1,362 million increase of the Pluto PRRT deferred tax asset is due to the recognition of previously unrecognised
deductible
expenditure that is now expected to be utilised to offset future taxable profits.
2.
The global operations ef
fe
ctive income tax rate (ETR) is calculated as the Group’s income tax expense divided by profit before income tax. The Australian operations ETR is calculated with reference to all Australian companies and excludes foreign exchange on settlement and revaluation of income tax liabilities.
 
F-20

Notes to the financial statements
A. Earnings for the year
for the year ended 31 December 2022
 
    
2022
          US$m
   
2021
          US$m


(g) Deferred tax balance sheet reconciliation
                         
Deferred tax assets
                         
PRRT
                         
Production and growth assets
  
 
1,460


767
 
        
Augmentation for current year
  
 
113


166
 
        
Provisions
  
 
271


75
 
        
Other
  
 
(23)


(1)


PRRT deferred tax assets
  
 
1,821


1,007


Income tax
3
                         
Oil and gas properties
  
 
(1,496
 
 
-
 
        
Exploration and evaluation assets
  
 
30


-
 
        
Lease assets and liabilities
  
 
23


-
 
        
Unused tax losses and tax credits
  
 
1,464


-
 
        
Derivatives
  
 
23


-
 
        
Provisions
  
 
60


-
 
        
Other
  
 
34


-


Income tax deferred tax assets
  
 
138


-


Deferred tax assets
  
 
1,959


1,007


Deferred tax liabilities
                         
PRRT
4
                         
Production and growth assets
  
 
1,281


-
 
        
Augmentation for current year
  
 
(62
 
 
-
 
        
Provisions
  
 
(743
 
 
-
 
        
Other
  
 
137


-


PRRT deferred tax liabilities
  
 
613


-


Income tax
                         
Oil and gas properties
  
 
2,857


1,520
 
        
Exploration and evaluation assets
  
 
67


51
 
        
Lease assets and liabilities
  
 
(22
 
 
(38)
 
        
Provisions
  
 
(1,280
 
 
(706)
 
        
PRRT assets and liabilities
  
 
347


303
 
        
Assets held for sale
  
 
-


(205)
          
Derivatives
  
 
(36
 
 
(15)

        
Other
  
 
(89
)  
 
(32)


Income tax deferred tax liabilities
  
 
1,844


878


Deferred tax liabilities
  
 
2,457


878


3
.
The Group was in a net income tax deferred tax l
iability
position in 2021.
4
.
The Group was in a net PRRT deferred tax asset position in 2021.
Tax transparency code
Woodside participates in the Australian Board of Taxation’s voluntary Tax Transparency Code (TTC). To increase public confidence in the contributions and compliance of corporate taxpayers, the TTC recommends public disclosure of tax information. Part A of the recommended disclosures are addressed within this Taxes note and Part B within our Sustainable Development Report, supported by additional information on our website.
Recognition and measurement
Current tax assets and liabilities are measured at the amount expected to be recovered from or paid to the taxation authorities. Deferred tax assets and liabilities are measured at the tax rates that are expected to apply in the period in which the liability is settled or the asset is realised. The tax rates and laws used to determine the amount are based on those that have been enacted or substantially enacted by the end of the reporting period. Income taxes relating to items recognised directly in equity are recognised in equity.
Current taxes
Current tax expense is the expected tax payable on the taxable income for the current year and any adjustment to tax paid in respect of previous years.
Deferred taxes
Deferred tax expense represents movements in the temporary differences between the carrying amount of an asset or liability in the
consolidated
 
statement of financial position and its tax base.
 
F-21

Notes to the financial statements
A. Earnings for the year
for the year ended 31 December 2022
 
With the exception of those noted below, deferred tax liabilities are recognised for all taxable temporary differences.
Deferred tax assets are recognised for deductible temporary differences, unused tax losses and tax credits only if it is probable that sufficient future taxable income will be available to utilise those temporary differences and losses.
Deferred tax is not recognised if the temporary difference arises from goodwill or from the initial recognition (other than in a business combination) of assets and liabilities in a transaction that affects neither accounting profit nor the taxable profit.
In relation to PRRT, the impact of future augmentation on expenditure is included in the determination of future taxable profits when assessing the extent to which a deferred tax asset can be recognised in the consolidated statement of financial position.
Offsetting deferred tax balances
Deferred tax assets and liabilities are offset only if there is a legally enforceable right to offset current tax assets and liabilities and when they relate to income taxes levied by the same taxation authority on either the same taxable entity or different taxable entities that the Group intends to settle its current tax assets and liabilities on a net basis. Refer to Notes E.8 and E.9 for detail on the tax consolidated groups.
 
 
Key estimates and judgements
 
(a) Income tax classification
Judgement is required when determining whether a particular tax is an income tax or another type of tax. PRRT is considered, for accounting purposes, to be an income tax. Accounting for deferred tax is applied to income taxes as described above, but is not applied to other types of taxes, e.g. North West Shelf royalties, excise and levies which are recognised in cost of sales in the income statement.
 
(b) Deferred tax asset recognition
Income
t
ax losses and credits: Deferred tax assets (DTAs) relating to carry forward
unused
tax losses and credits arising from the USA Tax Consolidation Group (USA TCG) of $1,371 million (2021: nil) and $93 million (2021:
nil) arising from regions other than Australia and the USA have been recognised. The Group has determined that it is probable that sufficient future taxable income will be available to utilise those losses within those regions. Refer to Note E.9(a) for details of tax consolidated groups.
 
DTAs relating to carry forward unused tax losses and credits of $250 million from the USA TCG, $146 million from USA entities outside of the USA TCG and $1,061 million from regions other than Australia and the USA have not been recognised as it is not currently probable that the assets will be utilised based on current planned activities in those regions (2021: $497 million unrecognised DTAs).
 
PRRT: The recoverability of PRRT deferred tax assets is primarily assessed with regard to future oil price assumptions impacting forecast future taxable profits. As a result of higher actual and forecast assessable revenues supporting future recoverability of unrecognised quarantined exploration and general expenditure, the Pluto PRRT DTA has increased by $1,362 million. In determining the amount of DTA that is considered probable and eligible for recognition, forecast future taxable profits are risk-adjusted where appropriate by a market premium risk rate to reflect uncertainty inherent in long-term forecasts. A long-term bond rate of 3.2% (31 December 2021: 1.5%) was used for the purposes of augmentation.
 
Certain deferred tax assets on deductible temporary differences have not been recognised on the basis that deductions from future augmentation of the recognised deductible temporary difference will be sufficient to offset future taxable profits. $6,523 million (2021: $4,507 million) relates to the North West Shelf Project, $189 million (2021: $1,432 million) relates to remaining Pluto quarantined exploration expenditure and $831 million (2021: $1,071 million) relates to Wheatstone. A long-term bond rate of 3.2% (31 December 2021: 1.5%) was used for the purposes of augmentation.
 
Had an alternative approach been used to assess recovery of the deferred tax assets, whereby future augmentation was not included in the assessment, additional deferred tax assets would be recognised, with a corresponding benefit to tax expense. It was determined that the approach adopted provides the most meaningful information on the implications of the PRRT regime, whilst ensuring compliance with IAS 12
Income Taxes
.
 
(c) Uncertain tax position
The Group has tax matters, litigation and other claims, for which the timing of resolution and potential economic outflows are uncertain. Where the Group assesses an outcome for any tax matter, litigation or other claim as more likely than not to be accepted by the relevant tax authority, the position is adopted in the reported tax balances.
 
Because of the complexity of some of these positions the ultimate outcome may differ from the current estimate of the position. These differences will be reflected as increases or decreases to tax expense in the period in which new information is available.
 
 
F-22

Table of Contents
Notes to the financial statements
B. Production and growth assets
for the year ended 31 December 2022
 
In this section
 
This section addresses the strategic growth (exploration and evaluation), core producing and development (oil and gas properties) assets position of the Group at the end of the reporting period including, where applicable, the accounting policies and key estimates and judgements applied. This section also includes the impairment position of the Group at the end of the reporting period.
 
B.
  
Production and growth assets
    
B.1
  
Segment production and growth assets
  
Page F-24
B.2
  
Exploration and evaluation
  
Page F-26
B.3
  
Oil and gas properties
  
Page F-28
B.4
  
Impairment of exploration and evaluation, oil and gas properties and goodwill
  
Page F-29
B.5
  
Business combination
  
Page F-3
5
B.6
  
Significant production and growth asset acquisitions
  
Page F-3
8
B.7
  
Disposal of assets
  
Page F-3
9
 
F-23

Table of Contents
Notes to the financial statements
B. Production and growth assets
for the year ended 31 December 2022
 
B.1
 
Segment production and growth assets
 
    
Australia
2022
US$m
   
International
2022
US$m
   
Marketing
2022
US$m
    
Corporate/Other
2022
US$m
    
Consolidated
2022
US$m


Balance as at 31 December
                                          
Asia Pacific
  
 
529


-


-


-


529
 
Americas
  
 
-


240


-


-


240
 
Africa
  
 
-


38


-


-


38


Total exploration and evaluation
  
 
529


278


-


-


807


Balance as at 31 December
                                          
Land and buildings
  
 
802


37


-


1


840
 
Transferred exploration and evaluation
  
 
481


-


-


-


481
 
Plant and equipment
  
 
18,249


4,647


-


161


23,057
 
Projects in
development
1
  
 
5,623


9,795


-


123


15,541


Total oil and gas properties
  
 
25,155


14,479


-


285


39,919


Balance as at 31 December
                                          
Land and buildings
  
 
93


107


-


264


464
 
Plant and equipment
  
 
214


131


-


455


800


Total lease assets
  
 
307


238


-


719


1,264


Additions to exploration and evaluation
2
:
                                          
Exploration
  
 
1


121


-


-


122
 
Evaluation
  
 
19


100


-


-


119
 
Restoration
3
  
 
(1
 
 
-


-


-


(1


19


221


-


-


240


Additions to oil and gas properties
2
:
                                          
Oil and gas properties
  
 
2,252


1,560


-


92


3,904
 
Capitalised borrowings costs
4
  
 
115


179


-


-


294
 
Restoration
3
  
 
(346
 
 
(28
 
 
-


-


(374


2,021


1,711


-


92


3,824


Additions to lease assets
2
:
                                          
Land and buildings
  
 
4


-


-


-


4
 
Plant and equipment
  
 
139


90


-


9


238


143


90


-


9


242


1.
Projects in development include the fair value ascribed to future phases of certain projects acquired through business combinations.
2.
Additions exclude acquisitions through business combinations.
3
.
Relates to changes in restoration provision assumptions.
4
.
Borrowing costs capitalised were at a weighted average interest rate of 3.8%.
Refer to Note A.1 for descriptions of the Group’s segments and geographical regions.
 
F-24

Notes to the financial statements
B. Production and growth assets
for the year ended 31 December 2022
 
    
Australia
2021
2
US$m
    
International
2021
2
US$m
    
Marketing
2021
2
US$m
    
Corporate/Other
2021
2
US$m
    
Consolidated
2021
US$m


Balance as at 31 December
                                            
Asia Pacific
  
 
546


-


-


-


546
 
Americas
  
 
-


-


-


-


-
 
Africa
  
 
-


68


-


-


68


Total exploration and evaluation
  
 
546


68


-


-


614


Balance as at 31 December
                                            
Land and buildings
  
 
738


-


-


1


739
 
Transferred exploration and evaluation
  
 
526


-


-


-


526
 
Plant and equipment
  
 
12,316


3


-


146


12,465
 
Projects in development
  
 
2,646


2,195


-


78


4,919


Total oil and gas properties
  
 
16,226


2,198


-


225


18,649


Balance as at 31 December
                                            
Land and buildings
  
 
76


11


1


289


377
 
Plant and equipment
  
 
133


176


-


394


703


Total lease assets
  
 
209


187


1


683


1,080


Additions to exploration and evaluation:


Exploration
  
 
1


41


-


-


42
 
Evaluation
  
 
451


2


-


-


453
 
Restoration
  
 
6


-


-


-


6


458


43


-


-


501


Additions to oil and gas properties:
                                            
Oil and gas properties
  
 
1,071


1,051


-


57


2,179
 
Capitalised borrowings costs
1
  
 
46


77


-


-


123
 
Restoration
  
 
18


14


-


-


32


1,135


1,142


-


57


2,334


Additions to lease assets:
                                            
Land and buildings
  
 
-


14


-


-


14
 
Plant and equipment
  
 
-


214


-


-


214


-


228


-


-


228


1.
Borrowing costs capitalised were at a weighted average interest rate of 3.6%.
2.
The 2021 amounts have been restated to reflect the changes in operating segments. Refer to ‘Operating segment information’ in Note A.1 for details. In addition, oil and gas properties includes other plant and equipment which is no longer separately presented in the consolidated statement of financial position. The 2021 amounts have been reclassified to be presented on the same basis.
 
F-25

Table of Contents
Notes to the financial statements
B. Production and growth assets
for the year ended 31 December 2022
 
B.2
 
Exploration and
evaluation
 
      
Asia Pacific
US$m
      
Americas
US$m
      
Africa
US$m
      
Total
US$m


Year ended 31 December 2022
                                           
Carrying amount at 1 January 2022
    
 
546


-


68


614
 
Acquisitions through business combination
1
    
 
-


180


-


180
 
Additions
    
 
19


204


17


240
 
Disposals
    
 
-


(10)


-


(10)
 
Amortisation of licence acquisition costs
    
 
-


(8)


(2)


(10)
 
Expensed
2
    
 
-


(126)


(45)


(171)
 
Transferred exploration and evaluation
    
 
(36)


-


-


(36)


Carrying amount at 31 December 2022
    
 
529


240


38


807


Year ended 31 December 2021
3
                                           
Carrying amount at 1 January 2021
    
 
1,981


-


64


2,045
 
Additions
    
 
494


-


7


501
 
Amortisation of licence acquisition costs
    
 
-


-


(3)


(3)
 
Expensed
2
    
 
(265)


-


-


(265)
 
Transferred exploration and evaluation
    
 
(1,664)


-


-


(1,664)


Carrying amount at 31 December 2021
    
 
546


-


68


614


Exploration commitments


Year ended 31 December 2022
    
 
1


1


27


29
 
Year ended 31 December 2021
3
    
 
16


1


77


94


1.
Acquisitions through business combination have been recognised on a provisional basis. Adjustments will be made to the provisional amounts if new information is obtained within 12 months from the acquisition date. Refer to Note B.5 for details.
2.
$125 million (2021: $56 million) relates to costs of unsuccessful wells. For the year ended 31 December 2021, $209 million relates to capitalised
cost
s written off due to the Group’s decision to withdraw its interests in
Myanmar. 
3.
Oceania and Asia have been presented within Asia Pacific for the year ended 31 December 2022. The 2021 amounts have been reclassified to be presented on the same basis.
Recognition and measurement
Expenditure on exploration and evaluation is accounted for in accordance with the area of interest method.
Areas of interest are based on a geographical area for which the rights of tenure are current. All exploration and evaluation expenditure, including general permit activity, geological and geophysical costs and new venture activity costs, is expensed as incurred except for the following:
 
·
 
where the expenditure relates to an exploration discovery for which the assessment of the existence or otherwise of economically recoverable hydrocarbons is not yet complete; or
·
 
where the expenditure is expected to be recouped through successful exploitation of the area of interest, or alternatively, by its sale.
The costs of acquiring interests in new exploration and evaluation licences are capitalised. The costs of drilling exploration wells are initially capitalised pending the results of the well.
Costs are expensed where the well does not result in the successful discovery of economically recoverable hydrocarbons and the recognition of an area of interest.
Subsequent to the recognition of an area of interest, all further evaluation costs relating to that area of interest are capitalised.
Upon approval for the commercial development of an area of interest, accumulated expenditure for the area of interest is transferred to oil and gas properties.
In the consolidated statement of cash flows, those cash flows associated with capitalised exploration and evaluation expenditure, including unsuccessful wells, are classified as cash flows used in investing activities.
Exploration commitments
The Group has exploration expenditure obligations which are contracted for, but not provided for in the financial statements. These obligations may be varied from time to time and are expected to be fulfilled in the normal course of the Group’s operations.
Impairment
Refer to Note B.4 for details on impairment, including any write-offs.
 
F-26

Notes to the financial statements
B. Production and growth assets
for the year ended 31 December 2022


Key estimates and judgements
 
(a) Area of interest
Typically, an area of interest (AOI) is defined by the Group as an individual geographical area whereby the presence of hydrocarbons is considered favourable or proved to exist. The Group has established criteria to recognise and maintain an AOI.
 
(b) Transfer to projects in development
Development activities commence after project sanctioning by the appropriate level of management. Judgement is applied by management in determining when the project is technically feasible and economically viable
 
to transfer to projects in development.
 
F-27

Table of Contents
Notes to the financial statements
B. Production and growth assets
for the year ended 31 December 2022
 
B.3
 
Oil and gas properties


Land
and
buildings


Transferred
exploration and

evaluation


Plant and
equipment


Projects in
development


Total


US$m


US$m


US$m


US$m


        US$m


Year ended 31 December 2022


Carrying amount at 1 January 2022
  
 
739


526


12,465


4,919


18,649
 
Acquisitions through business combinations
1
  
 
64


-


11,952


7,337


19,353
 
Additions
2
  
 
-


-


(508)


4,332


3,824
 
Disposals at written down value
  
 
(3)


(10)


(32)


-


(45)
 
Depreciation and amortisation
  
 
(54)


(107)


(2,637)


-


(2,798)
 
Impairment reversal
3
  
 
87


30


783


-


900
 
Completions and transfers
  
 
7


42


1,034


(1,047)


36


Carrying amount at 31 December 2022
  
 
840


481


23,057


15,541


39,919


At 31 December 2022


Historical cost
  
 
1,765


1,538


45,273


15,937


64,513
 
Accumulated depreciation and impairment
  
 
(925)


(1,057)


(22,216)


(396)


(24,594
)


Net carrying amount
  
 
840


481


23,057


15,541


39,919


Year ended 31 December 2021
4


Carrying amount at 1 January 2021
  
 
749


431


12,091


2,195


15,466
 
Additions
  
 
-


-


13


2,321


2,334
 
Disposals at written down value
  
 
(2)


-


(6)


(22)


(30)
 
Depreciation and amortisation
  
 
(51)


(79)


(1,449)


-


(1,579)
 
Impairment losses
3
  
 
(10)


-


-


-


(10)
 
Impairment reversal
3
  
 
44


66


911


37


1,058
 
Completions and transfers
  
 
11


108


905


640


1,664
 
Transfer to assets held for sale
5
  
 
(2)


-


-


(252)


(254)


Carrying amount at 31 December 2021
  
 
739


526


12,465


4,919


18,649


At 31 December 2021
4


Historical cost
  
 
1,701


1,495


32,796


5,321


41,313
 
Accumulated depreciation and impairment
  
 
(962)


(969)


(20,331)


(402)


(22,664)


Net carrying amount
  
 
739


526


12,465


4,919


18,649


1.
Acquisitions through business combination have been recognised on a provisional basis. Adjustments will be made to the provisional amounts if new information is obtained within 12 months from the acquisition date. Refer to Note B.5 for details. Projects in development include the fair value ascribed to future phases of certain projects acquired through business combinations.
2.
Includes $3,904 million of capital additions and $294 million of capitalised borrowing costs offset by $374 million following changes in restoration provision assumptions.
3.
Refer to Note B.4 for details on impairment losses and impairment reversals.
4.
Oil and gas properties includes other plant and equipment which is no longer separately presented in the consolidated statement of financial position. The 2021 amounts have been reclassified to be presented on the same basis.
5.
Refer to Note B.7 for details on assets held for sale.
Recognition and measurement
Oil and gas properties are stated at cost less accumulated depreciation and impairment charges. Oil and gas properties include the costs to acquire, construct, install or complete production and infrastructure facilities such as pipelines and platforms, capitalised borrowing costs, transferred exploration and evaluation assets, development wells and the estimated cost of dismantling and restoration.
Subsequent capital costs, including major maintenance, are included in the asset’s carrying amount only when it is probable that future economic benefits associated with the item will flow to the Group and the cost of the item can be reliably measured.
Depreciation and amortisation
Oil and gas properties are depreciated to their estimated residual values at rates based on their expected useful lives.
Transferred exploration and evaluation and offshore plant and equipment are depreciated using the unit of production basis over proved plus probable reserves or proved reserves for late life assets. The depreciable amount for the unit of production basis excludes future development costs necessary to bring probable reserves into production.
For certain offshore assets, methodologies using proved and probable reserves are adjusted to best reflect the expected pattern of consumption.
Onshore plant and equipment is depreciated using a straight-line basis over the lesser of useful life and the life of proved plus probable reserves. On a straight-line basis the assets have an estimated useful life of
5-50
years.
All other items of oil and gas properties are depreciated using the straight-line method over their useful life. They are depreciated as follows:
 
·
 
Buildings –
24-50
years;
·
 
Plant and equipment –
2-40
years; and
·
 
Land is not depreciated.
Impairment
Refer to Note B.4 for details on impairment.
Capital commitments
The Group has capital expenditure commitments contracted for, but not provided for in the financial statements, of $7,762 million as at 31 December 2022 (2021: $7,875 million).
 
F-28

Table of Contents
Notes to the financial statements
B. Production and growth assets
for the year ended 31 December 2022
 
Capital expenditure commitments relate predominantly to the Scarborough and Sangomar projects.
 
Key estimates and judgements
(a) Reserves
The estimation of reserves requires significant management judgement and interpretation of complex geological and geophysical models in order to make an assessment of the size, shape, depth and quality of reservoirs, and their anticipated recoveries.
Estimates of oil and natural gas reserves are used to calculate depreciation and amortisation charges for the Group’s oil and gas properties. Judgement is used in determining the economic reserve base applied to each asset. Typically, late life oil assets use proved reserves.
Estimates are reviewed at least annually or when there are changes in the economic circumstances impacting specific assets or asset groups. These changes may impact depreciation, asset carrying values, restoration provisions and deferred tax balances. If proved plus probable (2P) reserves estimates are revised downwards, earnings could be affected by higher depreciation expense or an immediate write-down of the asset’s carrying value.
(b) Depreciation and amortisation
Judgement is required to determine when assets are available for use to commence depreciation and amortisation. Depreciation and amortisation generally commences on first production.
 
 
B.4
 
Impairment of exploration and evaluation, oil and gas properties and goodwill
Exploration and evaluation
Impairment testing
The recoverability of the carrying amount of exploration and evaluation assets is dependent on successful development and commercial exploitation, or alternatively sale of the respective AOI.
Each AOI is reviewed half-yearly to determine whether economic quantities of hydrocarbons have been found, or whether further exploration and evaluation work is underway or planned to support continued carry forward of capitalised costs. Where a potential impairment is indicated for an AOI, an assessment is performed using a fair value less costs to dispose (FVLCD) method to determine its recoverable amount. Upon approval for commercial development, exploration and evaluation assets are assessed for impairment before they are transferred to oil and gas properties.
Impairment calculations
The recoverable amounts of exploration and evaluation assets are determined using FVLCD, as there is no value in use (VIU). Costs to dispose are the incremental costs directly attributable to the disposal of an asset, excluding finance costs and income tax expense.
If the carrying amount of an AOI exceeds its recoverable amount, the AOI is written down to its recoverable amount and an impairment loss is recognised in the consolidated income statement.
For assets previously impaired, if the recoverable amount exceeds the carrying amount, the impairment is reversed, but only to the extent that the asset’s carrying amount does not exceed the carrying amount that would have been recognised if no impairment had occurred.
Oil and gas properties
Impairment testing
The carrying amounts of oil and gas properties are assessed half-yearly to determine whether there is an indicator of impairment or impairment reversal for those assets which have previously been impaired. Indicators of impairment and impairment reversals include changes in reserves, expected future sales prices or costs.
Oil and gas properties are assessed for impairment indicators and impairments on a cash-generating unit (CGU) basis. CGUs are determined as offshore and onshore facilities, infrastructure and associated oil and/or gas fields.
If there is an indicator of impairment or impairment reversal for a CGU, its recoverable amount is calculated and compared with the CGU’s carrying value (refer to impairment calculations below).
Goodwill
For the purpose of impairment testing, goodwill acquired in a business combination is, from the acquisition date, allocated to each of the Group’s cash-generating units (CGUs) that are expected to benefit from the combination, irrespective of whether other assets or liabilities of the acquiree are assigned to those units. Goodwill is tested for impairment at least annually and more frequently if events or changes in circumstances indicate that it might be impaired. Impairment of goodwill is determined by assessing the recoverable amount of each CGU to which the goodwill relates and comparing it with its carrying value which includes deferred taxes (refer to impairment calculations below and Note B.5).
When part of an operation is disposed of, any goodwill associated with the disposed operation is included in the carrying amount of the operation in determining the gain or loss on disposal.
 
F-29

Table of Contents
Notes to the financial statements
B. Production and growth assets
for the year ended 31 December 2022
 
Goodwill and oil and gas impairment calculations
The recoverable amount of an asset or CGU is determined as the higher of its VIU and FVLCD.
VIU is determined by estimating future cash flows after taking into account the risks specific to the asset and discounting these to present value using an appropriate discount rate.
FVLCD is the price that would be received to sell the asset in an orderly transaction between market participants and does not reflect the effects of factors that may be specific to the Group. In determining FVLCD, recent market transactions are considered. If no such transactions can be identified, an appropriate valuation model, such as discounted cash flow techniques, are applied on a
post-tax
basis using an appropriate discount rate and estimates are made about the assumptions market participants would use when pricing the asset or CGU.
If the carrying amount of an asset or CGU, including any allocated goodwill, exceeds its recoverable amount, the asset or CGU is written down to its recoverable amount and an impairment loss is recognised in the consolidated income statement. Any impairment losses are first allocated to reduce the carrying amount of any goodwill allocated, with the remaining impairment losses allocated to the relevant assets.
If the recoverable amount of an asset or CGU exceeds its carrying amount, and that asset has previously been impaired, the impairment is reversed. The carrying amount of the asset or CGU is increased to its recoverable amount, but only to the extent that the carrying amount does not exceed the value that would have been determined, net of depreciation or amortisation, if no impairment had been recognised. Impairments of goodwill are not reversed.
For the year ended 31 December 2022
Goodwill allocation
The Group performed its annual goodwill impairment test as at 31 December 2022.
The carrying amount of goodwill allocated to each CGU, or groups of CGUs and excess recoverable amounts are as follows:
 
  Segment
  
CGU
  
Goodwill carrying
amount
1
 
  
Excess of recoverable amount over
CGU carrying amount
2
           
US$m 
  
US$m 
Australia
  
Pluto-Scarborough
  
2,955 
  
7,656
Australia
  
NWS Gas
  
394 
  
1,399
International
  
Shenzi
  
469 
  
401
International
  
Atlantis
  
513 
  
189
International
  
Other goodwill
  
283 
  
107
Total
       
4,614 


1.
Carrying amount of goodwill as at 31 December 2021 was nil.
2.
Amounts are with reference to the total CGU value including goodwill.
Other goodwill of $283 million (2021: nil) has been allocated across a number of CGUs within the International segment. This represents less than one percent of net assets as at 31 December 2022.
Recognised impairment and impairment reversals
As at 31 December 2022, the Group assessed each AOI and CGU to determine whether an indicator of impairment or impairment reversal existed. The Group identified the following indicators of impairment reversals:


Wheatstone CGU – revision in short- and long-term LNG price assumptions and updated cost and production profiles.
For CGUs where goodwill has been allocated, no impairment was recognised as the recoverable amount exceeds the carrying amount of the CGU.
 
F-30

Table of Contents
Notes to the financial statements
B. Production and growth assets
for the year ended 31 December 2022
 
An impairment reversal was recognised for Wheatstone (refer to Note A.1), with results as follows:


Impairment reversal


Oil and gas properties
 
             
Segment
 
CGU
 
        Recoverable
amount
US$m
   
        Land and
buildings
US$m
   
Transferred
        exploration and
evaluation
US$m
   
        Plant and
equipment
US$m
   
        Total
US$m
 
Australia
 
Wheatstone
 
 
3,456


87


30


783


900
 
Recoverable amounts have been determined using the FVLCD method using discounted cash flow projections, classified as Level 3 on the fair value hierarchy. The carrying amount of each CGU includes all assets allocated to the respective CGU. Refer to key estimates and judgements for further details.
Sensitivity analysis
Recoverable amount valuations are sensitive to changes in certain key accounting estimates and judgements (refer to key estimates and judgements for further details). Reasonable possible changes to these key assumptions are set out below:
 
 
·
 
Post tax discount rate – plus or minus 1.5% (representing a change of 150 basis points)
 
·
 
Commodity pricing – plus or minus 10%
 
·
 
Foreign exchange (FX) rate – plus or minus 12%
 
·
 
Production volumes – plus or minus 4%
Management’s analysis on the impact of reasonable possible changes to these assumptions on recoverable amounts is detailed below.
CGUs with impairment or impairment reversals
Changes in the following key assumptions have been estimated to result in a higher or lower carrying amount
1
than what was determined as at 31 December 2022:
 
            
Sensitivity (US$m)
2
 
                 
CGU
  
Discount rate
increase
3
   
Discount rate
decrease
3
    
Brent price
increase
    
Brent price
decrease
   
FX
increase
   
FX
decrease
    
Production
increase
4
    
Production
decrease
4
 
                 
Wheatstone
  
 
(117
 
 
127


294


(294
 
 
(79
 
 
79


116


(43
 
1
Increases to carrying amounts are limited to historical impairment losses recognised, net of depreciation and amortisation, that would have been recognised had no impairment taken place.
2
The sensitivities represent the reasonable possible changes to discount rate, oil price, FX and production volumes assumptions.
3
The relationship between the discount rate and the carrying amount is non-linear and as such, sensitivities are unlikely to result in a symmetrical impact. Due to the non-linear relationship, the impact of changing the discount rate is likely to be greater at a lower discount rate than at a higher discount rate.
4
The relationship between production and the carrying amount is non-linear due to the proportion of fixed costs. Sensitivities are therefore unlikely to result in a symmetrical impact. A significant change in production volumes would typically require a reassessment of the asset concept and should not be interpreted in isolation.
A change in any of the above assumptions would likely have an impact on other assumptions which, when considered together, may offset. This does not incorporate decisions management may take in order to mitigate the change in assumptions.
 
F-31

Table of Contents
Notes to the financial statements
B. Production and growth assets
for the year ended 31 December 2022
 
CGUs with goodwill
The valuation of CGUs with goodwill are most sensitive to changes in commodity prices and discount rates. Reasonably possible changes in these estimates
which could result in the estimated recoverable amount being equal to the carrying amount, assuming all other variables are held constant, are as follows:


CGU
  
Commodity price
1
 
 
Nominal discount rate


% change
 
 
(absolute terms)
 
Oil and gas properties
  
Pluto-Scarborough
  
 
N/A
2


N/A
2
 
Oil and gas properties
  
NWS Gas
  
 
N/A
2


N/A
2
 
Oil and gas properties
  
Shenzi
  
 
(7%
)


N/A
2
 
Oil and gas properties
  
Atlantis
  
 
(2%
)


10%
 
1.
Brent price applies to Pluto-Scarborough and NWS Gas. WTI price (Brent - $3/bbl) applies to Shenzi and Atlantis.
2.
Management considers there to be no reasonably possible changes in the respective estimate which, in isolation, would result in the estimated recoverable amount being equal to the carrying amount.
A change in any of the above assumptions would have an impact on other assumptions which when considered together may offset. This does not incorporate decisions management may take in order to mitigate the change in assumptions. Management considers there to be no reasonably possible changes in production volumes, carbon prices or foreign exchange rates that would, in isolation result in the estimated recoverable amount being equal to the carrying amount. Analysis of key assumptions which could result in the carrying value to equal the recoverable value provides a basis to assess the magnitude of a reasonable possible change to the carrying amounts of respective CGUs.
 
F-32

Table of Contents
Notes to the financial statements
B.
Production and growth assets
for the year ended 31 December 2022
 
 
Key estimates and judgements
 
CGU determination
Identification of a CGU requires management judgement. In determining CGUs for acquired assets during the reporting period, management has assessed this based on the smallest group of assets that generate significant cash inflows that are independent from other assets or groups of assets.
 
Allocation of goodwill
Allocation of goodwill to the relevant CGUs requires management judgement. The goodwill arising from the merger has been allocated to relevant CGUs which are expected to benefit from the expected synergies as a result of the merger.
 
Recoverable amount calculation key assumptions
In determining the recoverable amount of CGUs, estimates are made regarding the present value of future cash flows when determining the FVLCD. These estimates require significant management judgement and are subject to risk and uncertainty, and hence changes in economic conditions can also affect the assumptions used and the rates used to discount future cash flow estimates.
 
The basis for each estimate used to determine recoverable amounts as at 31 December 2022 is set out below:
 
·
  Resource estimates – 2P and a portion of 2C reserves (where applicable) for oil and gas properties. The reserves are as disclosed in the Reserves and Resources Statement in the 31 December 2022 Annual Report.
·
  Inflation rate – an inflation rate of 2.0% has been applied for US based assets and 2.5% for Australian based assets.
·
  Foreign exchange rates – a rate of $0.75 US$:AU$ is based on management’s view of long-term exchange rates.
·
  Discount rates – a range of
post-tax
discount rates between 8% and 11.5% for CGUs has been applied. The discount rate reflects an assessment of the risks specific to the asset.
·
  Carbon pricing – a long-term price of US$80/tonne of emissions (real terms 2022) is based on management’s assumptions on carbon cost pricing and incorporates an evaluation of climate risk. This is applicable to Australian emissions that exceed facility-specific baselines in accordance with Australian regulations, as well as global emissions that exceed voluntary corporate net emissions targets. Woodside continues to monitor the uncertainty around climate change risks and will revise carbon pricing assumptions accordingly. Refer to Climate change and energy transition section within the basis of preparation for further information.
·
  LNG price – the majority of LNG sales contracts are linked to an oil price marker; accordingly the LNG prices used are consistent with oil price assumptions.
·
  
Brent oil prices – derived from long-term views of global supply and demand, building upon past experience of the industry and consistent with external sources. Prices are adjusted for premiums and discounts based on the nature and quality of the product. Brent oil price estimates have considered the risk of climate policies along with other factors such as industry investment and cost trends. There is significant uncertainty around how society will respond to the climate challenge; Woodside’s pricing assumptions reflect a ‘best estimate’ scenario in which global governments pursue decarbonisation as well as other goals such as energy security and economic development. As with carbon pricing, Woodside continues to monitor this uncertainty and will revise its oil pricing assumptions accordingly in its transition to a lower carbon economy. Further information on climate change risk is provided in the Climate change and energy transition section within the basis of preparation. The nominal Brent oil prices (US$/bbl) used were:


    2023    


    2024    


    2025    


    2026    


    2027    


    2028    


31 December 2022
1
  
 
87    


78    


74    


76    


77    


79    


31 December 2021
2
  
 
71    


68    


69    


70    


72    


73    


1. Long-term oil prices are based on US$70/bbl (2022 real terms) from 2025 and prices are escalated at 2.0% onwards.
2. Long-term oil prices are based on US$65/bbl (2022 real terms) from 2024 and prices are escalated at 2.0% onwards.


For the year ended 31 December 2021
Recognised impairment and impairment reversals
As at 31 December 2021, the Group identified the following indicators for impairment and impairment reversals:
 
·
 
Pluto-Scarborough and Wheatstone CGU - a reduction of 2P total reserves within the Greater Pluto and Wheatstone reserves and resources estimates.
 
·
 
Pluto-Scarborough CGU - additional value generated by Scarborough and Pluto Train 2, which have been combined with Pluto into a new Pluto-Scarborough CGU following the final investment decision for Scarborough and Pluto Train 2 in November 2021.
 
·
 
North West Shelf CGU - updated cost and production profiles, including the impact of third-party processing agreements, and short-term pricing assumptions.
·
 
NWS Oil (Okha) CGU - the reclassification to a late life oil asset due to natural reservoir decline and short-term pricing assumptions.
 
F-33

Table of Contents
Notes to the financial statements
B. Production and growth assets
for the year ended 31 December 2022
 
No impairment was recognised for Wheatstone and NWS Oil (Okha) as the recoverable amount exceeds the carrying amount of the CGU.
Impairment reversals were recognised for Pluto-Scarborough and NWS Gas (refer to Note A.1). The results were as follows:


Impairment reversal


Oil and gas properties
 
Segment
  
CGU
  
Recoverable
amount
US$m
 
  
Land
and
buildings
US$m
 
  
Transferred
exploration and
evaluation
US$m
 
  
Plant and
equipment
US$m
 
  
Projects in
development
US$m
 
  
Total
US$m
 
Producing and
 
Development
  
Pluto-Scarborough
  
 
17,474


42


53


563


24


682
 
Producing
  
North West Shelf
  
 
2,425


2


13


348


13


376
 
    
Total
  
 
19,899


44


66


911


37


1,058
 
The recoverable amounts were determined using the VIU method. The carrying amounts of the CGUs include all assets allocated to the CGU. Refer to key estimates and judgements for further details
.
Sensitivity analysis
Changes in the following key assumptions were estimated to result in a higher or lower carrying amounts
1
than what was determined as at 31 December 2021:
 
              
Sensitivity (US$m)
2


Discount rate:
increase of
1%
3,4
   
Discount rate:
decrease of
1%
   
Brent price:
increase of
10%
   
Brent price:
decrease of
10%
   
FX:
increase of
12%
5
   
FX:
decrease of
12%
 
Oil and gas properties
 
Producing and Development
 
Pluto-Scarborough
 
 
-


-


-


-


-


-
 
   
Producing
 
North West Shelf
 
 
-


-


-


(13)


-


-
 
       
Wheatstone
 
 
(159)


178


438


(438)


(122)


122
 
       
NWS Oil (Okha)
 
 
(4)


4


39


(39)


(28)


28
 
 
1.
Increases to carrying amounts are limited to historical impairment losses recognised, net of depreciation and amortisation that would have been incurred had no impairment taken place.
2.
The sensitivities represent reasonable possible changes to the discount rate, oil price and FX assumptions.
3.
A change of 1% represents 100 basis points.
4.
The relationship between the discount rate and carrying amount is
non-linear
and as such, the sensitivities are unlikely to result in a symmetrical impact. Due to the
non-linear
relationship, the impact of changing the discount rate is likely to be greater at a lower discount rate than at a higher discount rate.
5.
FX sensitivity of
+12%/-12%
was determined based on historical
5-year
standard deviation of AU$/US$.
Impairment on
non-current
assets held for sale
The sale of a portion of the Wheatstone Construction Village resulted in an impairment loss of $10 million as the asset’s carrying value exceeded its FVLCD, which was determined based on the underlying sale agreements, classified as Level 3 on the fair value hierarchy.
For the year ended 31 December 2021, an
 impairment loss of $10 million was recognised in the Australia operating segment of Note A.1.
 
F-3
4

Notes to the financial statements
B. Production and growth assets
for the year ended 31 December 2022
 
 
Key estimates and judgements
 
CGU determination
Identification of a CGU requires management judgement. For the year ended 31 December 2021, management has determined that the Scarborough and Pluto Train 2 development concept integrates with the existing Pluto onshore assets and is the smallest group of assets that generate significant cash inflows that are independent from other assets or group of assets.
 
Recoverable amount calculation key assumptions
In determining the recoverable amount of CGUs, estimates are made regarding the present value of future cash flows when determining the VIU. These estimates require significant management judgement and are subject to risk and uncertainty, and hence changes in economic conditions can also affect the assumptions used and the rates used to discount future cash flow estimates.
 
The basis for each estimate used to determine recoverable amounts as at 31 December 2021 is set out below:
 
·
Resource estimates – 2P reserves for oil and gas properties, except for NWS Oil (Okha) which is based on 1P reserves due to the reclassification to a late life asset. The reserves are as disclosed in the Reserves and resources statement in the 31 December 2021 Annual Report.
·
  Inflation rate – an inflation rate of 2.0% has been applied.
·
  Foreign exchange rates – a rate of $0.75 US$:AU$ is based on management’s view of long-term exchange rates.
·
  Discount rates – a range of
pre-tax
discount rates between 8.9% and 11.6%
(post-tax
discount rate
7.5%-8.5%)
for CGUs has been applied. The discount rate reflects an assessment of the risks specific to the asset.
·
  An evaluation of climate risk is reflected in Woodside’s assumptions on carbon cost pricing, including a long-term Australian carbon price of US$80/tonne of emissions (real terms 2022). This is applicable to Australian emissions that exceed facility-specific baselines in accordance with Australian regulations, as well as global emissions that exceed voluntary corporate net emissions targets. Woodside continues to monitor the uncertainty around climate change risks and will revise carbon pricing assumptions accordingly.
·
  LNG price – the majority of LNG sales contracts are linked to an oil price marker; accordingly the LNG prices used are consistent with oil price assumptions.
·
  Brent oil prices – derived from long-term views of global supply and demand, building upon past experience of the industry and consistent with external sources. Prices are adjusted for premiums and discounts based on the nature and quality of the product. Brent oil price estimates have considered the risk of climate policies along with other factors such as industry investment and cost trends. There is significant uncertainty around how society will respond to the climate challenge; Woodside’s pricing assumptions reflect a ‘most-likely’ scenario in which global governments pursue decarbonisation as well as other goals such as energy security and economic development. As with carbon pricing, Woodside continues to monitor this uncertainty and will revise its oil pricing assumptions accordingly in its transition to a lower carbon economy. Further information on climate change risk is provided in Woodside’s Climate Report 2021. The nominal Brent oil prices (US$/bbl) used were:


    2022


    2023


    2024


    2025


    2026


    2027


31 December 2021
1
  
 
73


71


68


69


70


72


30 June 2020
2
  
 
57


62


67


72


73


75


1. Based on US$65/bbl (2022 real terms) from 2024
with
prices escalated at 2.0% annually thereafter.
2. Based on US$65/bbl (2020 real terms) from 2025 with prices escalated at 2.0% annually thereafter.


B.5
 
Business combination
BHP Petroleum merger
On 17 August 2021, Woodside and BHP Group (BHP) entered into a merger commitment deed to combine their respective oil and gas portfolios by an
all-stock
merger. The Share Sale Agreement (SSA) and the integration and transition services agreement were executed on 22 November 2021. Under the SSA, the merger took economic effect from 1 July 2021 and Woodside became entitled to the economic benefits and risks of the assets and liabilities that were the subject of the merger from that date.
On 19 May 2022, 98.66% of Woodside shareholders voted in favour of the merger at Woodside’s Annual General Meeting.
On 1 June 2022, the transaction was completed with the Group acquiring 100% of the issued share capital of BHP Petroleum International Pty Ltd (subsequently renamed Woodside Energy Global Holdings Pty Ltd), which held BHP’s oil and gas business. In exchange, the Group issued 914,768,948 new Woodside shares to BHP as part of the merger consideration. The transaction has been accounted for as a business combination with an acquisition date of 1 June 2022. The Group’s net profit after tax for the year ended 31 December 2022 incorporates BHPP results from acquisition date. The merger is expected to create opportunities to realise ongoing synergies.
 
F-3
5

Notes to the financial statements
B. Production and growth assets
for the year ended 31 December 2022
 
Due to the size, complexity and timing of the transaction, the assets acquired and liabilities assumed are measured on a provisional basis. As at 31 December 2022, the Allocable Cost Amount (ACA) tax valuation process has been substantially completed with potential adjustments if new information is obtained within 12 months from the acquisition date about facts and circumstances that existed at the acquisition date. Adjustments will be made to the provisional amounts recognised including the value of goodwill.
The merged Group’s financial results could be adversely affected by impairments of goodwill or other intangible assets, the application of future accounting policies or interpretations of existing accounting policies including by regulatory direction, and changes in estimates of decommissioning costs. Details and risks have been included in the Merger Explanatory Memorandum released on 8 April 2022.
Given the purchase consideration was agreed on 22 November 2021 based on a fixed number of shares, the final value of consideration paid was subject to fluctuations in share price until completion on 1 June 2022. This has resulted in a material goodwill number which will be subject to impairment in future, for example should commodity prices decrease.
Details of the purchase consideration and the provisional fair value of goodwill, identifiable assets and liabilities of BHPP acquired are as follows:
 
  Provisional fair value of net identifiable assets and goodwill arising on acquisition date
  
US$m
 
Cash and cash equivalents
  
 
399
 
Receivables
  
 
1,164
 
Inventories
  
 
295
 
Investments accounted for using the equity method
  
 
267
 
Other financial assets
  
 
59
 
Other assets
  
 
114
 
Exploration and evaluation assets
  
 
180
 
Oil and gas properties
  
 
19,353
 
Lease assets
  
 
142
 
Payables
  
 
(910
Provisions
  
 
(4,804
Tax payable
  
 
(365
Deferred tax liabilities
  
 
(576
Lease liabilities
  
 
(268
)
Other liabilities
  
 
(1,054
)
Net identifiable assets acquired
  
 
13,996
 
Goodwill arising on acquisition
  
 
4,614
 
Purchase consideration
  
 
18,610
 
 
Purchase consideration
  
US$m
 
Shares issued, at fair value
  
 
19,265
 
Other reserves (share replacement awards)
  
 
18
 
Provisional locked box payment received
1
  
 
(683
Adjustments to locked box payment
  
 
10
 
Total purchase consideration
  
 
18,610
 
 
1.
Represents the positive net cash flow of $1,513 million generated by BHPP assets
from
the effective date of the business combination offset by the notional dividend distribution of $830 million paid to BHP.
 
Analysis of cash flows on acquisition
  
US$m
 
Cash acquired on acquisition
  
 
399
 
Provisional locked box payment received
  
 
683
 
Net cash flow on acquisition (Included in the consolidated statement of cash flows as investing activities)
  
 
1,082
 
Acquisition-related costs of $419 million that were not directly attributable to the issue of shares are included as an expense in general, administration and other costs in the consolidated income statement. $357 million has been paid and included in the consolidated statement of cash flows as operating activities. Acquisition-related costs of $5 million directly attributable to the issue of shares are included in contributed equity and included in the consolidated statement of cash flows as financing activities.
 
F-3
6

Table of Contents
Notes to the financial statements
B. Production and growth assets
for the year ended 31 December 2022
 
Shares issued, at fair value
The fair value of 914,768,948 shares issued as part of the consideration paid to BHP was $19,265 million. This was based on the published share price on 1 June 2022 of US$21.06 per share.
Provisional locked box payment received
The Group received $683 million as part of the merger consideration which includes the locked box payment of $1,513 million representing the positive net cash flow generated by BHPP assets from the effective date of the transaction to completion date offset by the notional dividend distribution of $830 million paid to BHP.

The $683 million of provisional locked box payment received and the $399 million of cash and cash equivalents acquired as part of the merger have been included within investing activities in the consolidated statement of cash flows.
Revenue and contribution to the Group
The acquired business contributed operating revenue of $4,653 million and profit before tax of $2,042 million to the Group from the acquisition date to 31 December 2022. If the acquisition had occurred on 1 January 2022, consolidated operating revenue and profit before tax would have been higher by $3,115 million and $1,265 million respectively.
Acquired receivables
The fair value of receivables approximates the gross amount of trade receivables. None of the receivables have been impaired and the full contractual amounts are expected to be collected.
Other liabilities
The Group recognised contingent liabilities of $79 million within
o
ther
l
iabilities. This is based on the Group’s assessment of the fair value of contingent liabilities acquired on acquisition, taking into account a range of possible outcomes. 
As at 31 December 2022, there have been no changes to the amount recognised on acquisition date.
Goodwill
Goodwill arising from the acquisition has been recognised as the excess of consideration paid above the fair value of the assets acquired and liabilities assumed as part of the business combination. $1,958 million of the goodwill arises from the deferred tax liability recognised on acquisition as a consequence of asset tax bases received in the merger being lower than the fair value of the assets acquired. The remaining goodwill of $2,656 million reflects the value expected to be generated from the Pluto-Scarborough CGU as a result of the merger. The goodwill is not deductible for tax purposes.
Goodwill is initially measured at cost and is subsequently measured at cost less any accumulated impairment losses. For the purposes of impairment testing, goodwill acquired in a business combination is, from the acquisition date, allocated to each of the Group’s CGUs or groups of CGUs no larger than an operating segment that are expected to benefit from the combination, irrespective of whether other assets or liabilities of the acquiree are assigned to those units.
Where goodwill has been allocated to a CGU and part of the operation within that unit is disposed of, the goodwill associated with the disposed operation is included in the carrying amount of the operation when determining the gain or loss on disposal. Goodwill is not amortised but will be assessed at least annually for impairment and more frequently if events or changes in circumstances indicate that it might be impaired.
Share replacement awards
In accordance with the terms of the SSA, the Group exchanged equity-settled share-based payment awards held by employees of BHPP for equity-settled share-based payment awards of Woodside. The replacement awards are based on service conditions with a vesting date of 31 August 2023 and 31 August 2024. The fair value of the replacement awards on acquisition is $49 million based on a forfeiture rate of 3%. $18 million has been included as part of the purchase consideration and the remaining amount will be recognised as post-acquisition compensation cost.
Business combination accounting
The acquisition method of accounting is used to account for all business combinations, including business combinations involving entities or businesses under common control, regardless of whether equity instruments are issued or liabilities incurred or assumed at the date of exchange. Where equity instruments are issued in an acquisition, the fair value of the instruments is their published market price as at the date of exchange.
Transaction costs arising on the issue of equity instruments are recognised directly in equity. Transaction costs that were not directly attributable to the issue of shares are expensed as incurred.
Contractual assets and liabilities in respect of sales agreements are recognised at fair value.
Restoration provisions are recognised on acquisition at fair value.
 
F-3
7

Table of Contents
Notes to the financial statements
B. Production and growth assets
for the year ended 31 December 2022
 
 
Key estimates and judgements
 
(a)
Fair value determination for net assets acquired
Judgement is required to determine the fair value of assets acquired and liabilities assumed in a business combination, which can have a material impact on resultant goodwill. This includes the use of a cash flow model to estimate the expected future cash flows of the oil and gas assets acquired, based on reserves and resources at acquisition date and the discount rate used. The expected future cash flows are based on estimates of future
production, commodity
and
carbon
prices, operating costs, and forecast capital expenditures at acquisition date.
 
Restoration provisions require judgemental assumptions regarding removal date, environmental legislation and regulations and the extent of restoration activities required in determining the cost estimate.
 
Carry forward tax losses are recognised only if it is probable that sufficient future taxable income will be available to utilise the losses.
 
(b)
Goodwill allocation
Judgement is required in the allocation of goodwill to the Group’s CGUs that are expected to benefit from the synergies of the business combination. Refer to Note B.4 for the details of the goodwill allocation.
 
 
B.6
 
Significant production and growth asset acquisitions
(a) Sangomar - Acquisition from FAR Senegal RSSD SA
On 7 July 2021, Woodside completed the acquisition of FAR Senegal RSSD SA’s interest in the RSSD Joint Venture (13.67% interest in the Sangomar exploitation area and 15% interest in the remaining RSSD evaluation area), for an aggregate purchase price of $212 million. The transaction was accounted for as an asset acquisition.
Additional payments of up to $55 million are contingent on future commodity prices and timing of first oil. The contingent payments terminate on the earliest of 31 December 2027, three years from first oil being sold, and a total contingent payment of $55 million being reached. The contingent payments are accounted for as contingent liabilities in accordance with the Group’s accounting policies.
As at 31 December 2021, Woodside held an 82% interest in the Sangomar exploitation area (2020: 68.33%) and a 90% interest in the remaining RSSD evaluation area (2020: 75%).
Assets acquired and liabilities assumed
The identifiable assets and liabilities acquired as at the date of the acquisition inclusive of transaction costs are:
 
    
US$m


Oil and gas properties
  
 
205
 
Exploration and evaluation
  
 
7
 
Cash acquired
  
 
3
 
Payables
  
 
(13)
 
Net other assets and liabilities assumed
  
 
10


Total identifiable net assets at acquisition
  
 
212


Cash flows on acquisition
 
    
US$m


Purchase cash consideration
  
 
212
 
Transaction costs
  
 
-
 
 
Total purchase consideration
  
 
212


Net cash outflows on acquisition
  
 
212


Key estimates and judgements
 
Nature of acquisition
Judgement was required to determine if the transaction was the acquisition of an asset or a business combination. The Sangomar project was in the early phase of development and a substantive process that had the ability to convert inputs to outputs was not present and therefore the acquisition in 2021 was treated as asset acquisitions.
 
 
F-3
8

Notes to the financial statements
B. Production and growth assets
for the year ended 31 December 2022
 
(b) Sangomar - Acquisition from Capricorn Senegal Limited
On 22 December 2020, Woodside completed the acquisition of Capricorn Senegal Limited’s (Cairn’s) interest in the RSSD Joint Venture (36.44% interest in the Sangomar exploitation area and 40% interest in the remaining RSSD evaluation area) for an aggregate purchase price of $527 million. The transaction was accounted for as an asset acquisition.
Additional payments of up to $100 million are contingent on future commodity prices and the
 
occurrence
of first oil
 
prior to 2025
. The contingent payments are accounted for as contingent liabilities in accordance with the Group’s accounting policies.
Assets acquired and liabilities assumed
The identifiable assets and liabilities acquired as at the date of the acquisition inclusive of transaction costs were:
 
    
US$m


Oil and gas properties
  
 
540
 
Exploration and evaluation
  
 
26
 
Cash acquired
  
 
5
 
Payables
  
 
(51)
 
Net other assets and liabilities assumed
  
 
7


Total identifiable net assets at acquisition
  
 
527


Cash flows on acquisition
 
    
US$m


Purchase cash consideration
  
 
525
 
Transaction costs
  
 
2


Total purchase consideration
  
 
527


Net cash outflows on acquisition
  
 
527


B.7
 
Disposal of assets
Sell-down of Train 2
On 15 November 2021 the Group entered into a sale and purchase agreement with Global Infrastructure Partners (GIP) for the sale of a 49%
non-operating
participating interest in the Pluto Train 2 Joint Venture.
As at 31 December 2021, the Group reclassified the carrying value of the 49% interest in the Pluto Train 2 assets to assets held for sale. There were no recognised liabilities associated with the assets held for sale.
The transaction completed on 18 January 2022, reducing the Group’s participating interest from 100% to 51%. The Group recognised
an initial
pre-tax
gain on sale of $427 million.
The arrangements require GIP to fund its 49% share of capital expenditure from 1 October 2021 and an additional amount of construction capital expenditure of $822 million on behalf of the Group. If the total capital expenditure incurred is less than $5,800 million, GIP will pay Woodside an additional amount equal to 49% of the under-spend. In the event of a cost overrun, Woodside will fund up to $822 million of GIP’s share of the overrun. Delays to the expected
start-up
of production will result in payments by Woodside to GIP in certain circumstances. The arrangements include provisions for GIP to be compensated for exposure to additional Scope 1 emissions liabilities above agreed baselines, and to sell its 49% interest back to Woodside if the status of key regulatory approvals materially changes.
Given judgement was used to determine the consideration received, the Group is required to remeasure the variable consideration at each reporting period. As at 31 December 2022, the variable consideration has been remeasured with a $71 million revaluation gain recognised as other income, with a corresponding reduction to
other liabilities
. The fair value of the remaining unpaid funding from GIP has been netted against the
other liabilities
and will be recognised as oil and gas properties in the future.
 
F-3
9

Notes to the financial statements
B. Production and growth assets
for the year ended 31 December 2022
 
 
Key estimates and judgements
 
Sell-down of Train 2
Given the arrangements include provisions for GIP to sell its 49% interest back to Woodside if the status of key regulatory environmental approvals materially changes and the requirement for Woodside to fund up to $822 million of GIP’s share in the event of a cost overrun, judgement is required to determine if the sell-down of Train 2 constitutes a sale and if a portion of the transaction price should be considered a variable consideration.
 
Judgement was used to determine that the sell-down of Train 2 constituted a sale given the various conditions included in the sale and purchase agreement. The Group determined that a sale occurred as control of the 49% interest was passed to GIP on completion date. Control is determined as the ability to direct the use of, and obtain substantially all of the economic benefits of, the associated interest.
 
Judgement was used to determine if it is highly probable that a significant reversal will not occur in relation to the consideration received. The Group estimated the variable consideration based on the construction capital expenditure cost profile, the development schedule, and assessing the probability and impact of any event which may result in a significant reversal. The constraining estimates of variable consideration have been applied resulting in the initial pre-tax gain on sale of $427 million.
 
The variable consideration is remeasured at each reporting period with any changes recognised through the consolidated income statement. As at 31 December 2022, the variable consideration has been remeasured with a $71 million revaluation gain recognised as other income.
 
 
F-
40

Table of Contents
Notes to the financial statements
C. Debt and capital
for the year ended 31 December 2022
 
In this section
 
This section addresses cash, debt and the capital position of the Group at the end of the reporting period including, where applicable, the accounting policies applied and the key estimates and judgements made.
 
C.
  
Debt and capital
    
C.1
  
Cash and cash equivalents
  
Page F-4
2
C.2
  
Interest-bearing liabilities and financing facilities
  
Page F-4
3
C.3
  
Contributed equity
  
Page F-4
5
C.4
  
Other reserves
  
Page F-4
6
Key financial and capital risks in this section
 
Capital risk management
Group Treasury is responsible for the Group’s capital management including cash, debt and equity. Capital management is undertaken to ensure that a secure, cost-effective and flexible supply of funds is available to meet the Group’s operating and capital expenditure requirements. A stable capital base is maintained from which the Group can pursue its growth aspirations, whilst maintaining a flexible capital structure that allows access to a range of debt and equity markets to both draw upon and repay capital.
The Dividend Reinvestment Plan (DRP) was approved by shareholders at the Annual General Meeting in 2003 for activation as required to fund future growth. The DRP was reactivated in 2019 and suspended by the Board of Directors on 27 February 2023.
A range of financial metrics are monitored, including gearing and cash flow leverage, and Treasury policy breaches and exceptions.
Liquidity risk management
Liquidity risk arises from the financial liabilities of the Group and the Group’s subsequent ability to meet its obligations to repay financial liabilities as and when they fall due. The liquidity position of the Group is managed to ensure sufficient liquid funds are available to meet its financial commitments in a timely and cost-effective manner.
The Group’s liquidity is continually reviewed, including cash flow forecasts to determine the forecast liquidity position and maintain appropriate liquidity levels. At 31 December 2022, the Group had a total of $10,239 million (2021: $6,125 million) of available undrawn facilities and cash at its disposal. The maturity profile of interest-bearing liabilities is disclosed in Note C.2, trade and other payables are disclosed in Note D.4 and lease liabilities are disclosed in Note D.7. Financing facilities available to the Group are disclosed in Note C.2.
Interest rate risk management
Interest rate risk is the risk that the Group’s financial position will fluctuate due to changes in market interest rates.
The Group’s exposure to the risk of changes in market interest rates relates primarily to financial instruments with floating interest rates including long-term debt obligations, cash and short-term deposits. The Group manages its interest rate risk by maintaining an appropriate mix of fixed and floating rate debt. To manage the ratio of fixed rate debt to floating rate debt, the Group may enter into interest rate swaps. The Group holds cross-currency interest rate swaps to hedge the foreign exchange risk (refer to Section A) and interest rate risk of the CHF denominated medium term note. The Group also holds interest rate swaps to hedge the interest rate risk associated with the $600 million syndicated facility. Refer to Notes C.2 and D.6 for further details.
At the reporting date, the Group was exposed to various benchmark interest rates that were not designated in cash flow hedges, primarily through $6,143 million (2021: $2,962 million) on cash and cash equivalents, $83 million (2021: $367 million) on interest-bearing liabilities (excluding transaction costs), $167 million of other financial assets (2021: nil) and $5 million (2021: $9 million) on cross-currency interest rate swaps.
A reasonably possible change in the USD London Interbank Offered Rate (USD LIBOR) (+1.5%/-1.5% (2021: +1.0%/-1.0%)), with all variables held constant, would not have a material impact on the Group’s equity or the income statement in the current period.
The transition of a number of the Group’s financial liabilities from USD LIBOR to SOFR during the year ended 31 December 2022 did not result in a material impact to the Group. The Group’s Treasury function continues to execute the transition of the remaining financial instruments from current benchmark rates to alternative benchmark rates.
 
F-4
1

Table of Contents
Notes to the financial statements
C. Debt and capital
for the year ended 31 December 2022
 
C.1
 
Cash and cash equivalents
 
   
2022
             US$m
   
2021
              US$m


Cash and cash equivalents
               
Cash at bank
 
 
1,222


300
 
Term deposits
 
 
4,967


2,725
 
Restricted cash
 
 
12


-


Total cash and cash equivalents
 
 
6,201


3,025


Recognition and measurement
 
Cash and cash equivalents in the
consolidated
statement of financial position comprise cash at bank and short-term deposits with an original maturity of three months or less. Cash and cash equivalents are stated at face value in the
consolidated
 
statement of financial position. Cash and cash equivalents include $12 million (2021: nil) restricted by legal or contractual arrangements.
 
Foreign exchange risk
 
The following table summarises the Group’s cash and cash equivalents by currency.

   
2022
             US$m
   
2021
            US$m


US dollar
 
 
5,886


2,917
 
Australian dollar
 
 
182


63
 
Other
 
 
133


45


Total cash and cash equivalents
 
 
6,201


3,025


F-4
2

Table of Contents
Notes to the financial statements
C. Debt and capital
for the year ended 31 December 2022
 
C.2
 
Interest-bearing liabilities and financing facilities
 
    
Bilateral
Facilities
   
Syndicated
Facilities
   
JBIC Facility
   
US Bonds
   
Medium Term
Notes
   
Total
 
     
US$m
   
US$m
   
US$m
   
US$m
   
US$m
   
US$m
 
             
Year ended 31 December 2022
                                                
             
At 1 January 2022
  
 
(4
 
 
595


166


4,081


592


5,430
 
             
Repayments
1
  
 
-


-


(83
 
 
-


(200
 
 
(283
             
Fair value adjustment and foreign exchange movement
  
 
-


-


-


-


(7
 
 
(7
             
Transaction costs capitalised and amortised
  
 
(1
 
 
(4
 
 
-


3


-


(2
             
Carrying amount at 31 December 2022
  
 
(5
 
 
591


83


4,084


385


5,138
 
             
Current
  
 
(2
 
 
(3
 
 
83


(3
 
 
185


260
 
             
Non-current
  
 
(3
 
 
594


-


4,087


200


4,878
 
             
Carrying amount at 31 December 2022
  
 
(5
 
 
591


83


4,084


385


5,138
 
             
Undrawn balance at 31 December 2022
  
 
2,050


2,000


-


-


-


4,050
 
             
Year ended 31 December 2021
                                                
             
At 1 January 2021
  
 
(4
 
 
593


250


4,778


597


6,214
 
             
Repayments
1
  
 
-


-


(84
 
 
(700
 
 
-


(784
             
Fair value adjustment and foreign exchange movement
  
 
-


-


-


-


(5
 
 
(5
             
Capitalised borrowing costs
  
 
-


2


-


3


-


5
 
             
Carrying amount at 31 December 2021
  
 
(4
 
 
595


166


4,081


592


5,430
 
             
Current
  
 
(2
 
 
(2
 
 
83


(2
 
 
200


277
 
             
Non-current
  
 
(2
 
 
597


83


4,083


392


5,153
 
             
Carrying amount at 31 December 2021
  
 
(4
 
 
595


166


4,081


592


5,430
 
             
Undrawn balance at 31 December 2021
  
 
1,900


1,200


-


-


-


3,100
 
 
1.
Included in cash flows classified within financing activities
in
the
consolidated
 
statement of cash flows.
Recognition and measurement
All borrowings are initially recognised at fair value less transaction costs. Borrowings are subsequently carried at amortised cost. Any difference between the proceeds received and the redemption amount is recognised in the income statement over the period of the borrowings using the effective interest method.
Borrowings designated as a hedged item are measured at amortised cost adjusted to record changes in the fair value of risks that are being hedged in fair value hedges. The changes in the fair value risks of the hedged item resulted in a gain of $7 million being recorded (2021: gain of $5 million), and a loss of $7 million recorded on the hedging instrument (2021: loss of $7 million).
All bonds, notes and facilities are subject to various covenants and negative pledges restricting future secured borrowings, subject to a number of permitted lien exceptions. Neither the covenants nor the negative pledges have been breached at any time during the reporting period.
Fair value
The carrying amount of interest-bearing liabilities approximates their fair value, with the exception of the Group’s unsecured bonds and the medium term notes. The unsecured bonds have a carrying amount of $4,084 million (2021: $4,081 million) and a fair value of $3,852 million (2021: $4,443 million). The medium term notes have a carrying amount of $385 million (2021: $592 million) and a fair value of $372 million (2021: $604 million). Fair value is calculated based on the present value of future principal and interest cash flows, discounted at the market rate of interest at the reporting date and classified as Level 1 on the fair value hierarchy. Where these cash flows are in a foreign currency, the present value is converted to US dollars at the foreign exchange spot rate prevailing at the reporting date. The Group’s repayment obligations remain unchanged.
Foreign exchange risk
All interest-bearing liabilities are denominated in US dollars, excluding the CHF175 million medium term note.
 
F-4
3

Notes to the financial statements
C. Debt and capital
for the year ended 31 December 2022
 
Maturity profile of interest-bearing liabilities
The table below presents the contractual undiscounted cash flows associated with the Group’s interest-bearing liabilities, representing principal and interest. The figures will not necessarily reconcile with the amounts disclosed in the consolidated statement of financial position.
 
     
2022
                US$m
    
2021
                US$m
 
Due for payment in:
     
1 year or less
  
 
483


470
 
1-2
years
  
 
206


462
 
2-3
years
  
 
1,181


188
 
3-4
years
  
 
962


1,169
 
4-5
years
  
 
908


951
 
More than 5 years
  
 
2,416


3,320


6,156


6,560
 
Amounts exclude transaction costs.
Bilateral facilities
The Group has 14 bilateral loan facilities totalling $2,050 million (2021: 14 bilateral loan facilities totalling $1,900 million). Details of bilateral loan facilities at the reporting date are as follows:
 
Number of facilities
 
Term (years)
 
Currency
 
Extension option
1
 
5 - 6
 
US$
 
Evergreen
5
 
4 - 5
 
US$
 
Evergreen
4
 
3 - 4
 
US$
 
Evergreen
4
 
3
years or less
 
US$
 
Evergreen
Interest rates are based on USD LIBOR or Secured Overnight Financing Rate (SOFR) and margins are fixed at the commencement of the drawdown period. Interest is paid at the end of the drawdown period. Evergreen facilities may be extended continually by a year subject to the bank’s agreement.
Syndicated facility
During the period, Woodside refinanced and increased the existing facilities to $2,000 million, with $800 million expiring on 11 October 2024, $600 million expiring on 12 July 2025 and $600 million expiring on 12 July 2027. Interest rates are based on SOFR and margins are fixed at the commencement of the drawdown period.
On 17 January 2020, the Group completed a $600 million syndicated facility with a term of seven years. Interest is based on the USD LIBOR plus 1.2%. Interest is paid on a quarterly basis.
Japan Bank for International Cooperation (JBIC) facility
On 24 June 2008, the Group entered into a two tranche committed loan facility of $1,000 million and $500 million respectively. The $500 million tranche was repaid in 2013. There is a prepayment option for the remaining balance. Interest rates are based on USD LIBOR. Interest is payable semi-annually in arrears and the principal amortises on a straight-line basis, with equal instalments of principal due on each interest payment date (every six months).
Under this facility, 90% of the receivables from designated Pluto LNG sale and purchase agreements are secured in favour of the lenders through a trust structure, with a required reserve amount of $30 million.
To the extent that this reserve amount remains fully funded and no default notice or acceleration notice has been given, the revenue from Pluto LNG continues to flow directly to the Group from the trust account.
Medium term notes
On 28 August 2015, the Group established a $3,000 million Global Medium Term Notes Programme listed on the Singapore Stock Exchange. Two notes have been issued under this programme as set out below:
 
Maturity date
  
Currency
    
Carrying amount (million)
    
Nominal interest rate
 
       
11 December 2023
  
 
CHF


185


1.00
29 January 2027
  
 
US$


200


3.07
The unutilised program is not considered to be an unused facility.
US bonds
The Group has four unsecured bonds issued in the United States of America as defined in Rule 144A of the
US Securities Act of 1933
as set out below:
 
Maturity date


Carrying amount US$m
    
Nominal interest rate
 
       
5 March 2025
     
 
1,000


                                                  3.65
15 September 2026
     
 
800


3.70
15 March 202
8
     
 
800


3.70
4 March 2029


1,500


4.50
 
F-44

Table of Contents
Notes to the financial statements
C. Debt and capital
for the year ended 31 December 2022
 
Interest on the bonds is payable semi-annually in arrears. During the period, the Group repaid $200 million of the Yucho 2022 Medium Term Note and $83 million of the JBIC facility.
 
C.3
 
Contributed equity
Recognition and measurement
Issued capital
Ordinary shares are classified as equity and recorded at the value of consideration received. The cost of issuing shares is shown in share capital as a deduction, net of tax, from the proceeds.
Reserved shares
Reserved shares are the Group’s own equity instruments, which are reacquired for later use in employee share-based payment arrangements or the Dividend Reinvestment Plan (DRP). These shares are deducted from equity. No gain or loss is recognised in the income statement on the purchase, sale, issue or cancellation of the Group’s own equity instruments.
(a) Issued and fully paid shares
 
 
Number of shares        
US$m        
Year ended 31 December 2022
Opening balance
 
969,631,826
 
 
9,409
 
DRP – ordinary shares issued at US$23.14 (2021 final dividend)
1
 
14,348,997
 
 
332
 
Ordinary shares issued at US$21.06 for the acquisition of BHPP
2
 
914,768,948
 
 
19,265
 
Transaction costs associated to the issue of shares
 
-
 
 
(5)
 
Amounts as at 31 December 2022
 
1,898,749,771
 
 
29,001
 
Year ended 31 December 2021
Opening balance
 
962,225,814
 
 
9,297
 
DRP – ordinary shares issued at US$19.03 (2020 final dividend)
 
1,354,072
 
 
26
 
DRP – ordinary shares issued at US$14.21 (2021 interim dividend)
 
6,051,940
 
 
86
 
Amounts as at 31 December 2021
 
969,631,826
 
 
9,409
 
Year ended 31 December 2020
Opening balance
 
942,286,900
 
 
9,010
 
DRP - ordinary shares issued at A$25.61 (2019 final dividend)
 
12,072,034
 
 
181
 
DRP - ordinary shares issued at A$18.79 (2020 interim dividend)
 
6,091,035
 
 
83
 
Employee share plan - ordinary shares issued at A$18.27 (2017 Woodside equity plan)
 
1,775,845
 
 
23
 
Amounts as at 31 December 2020
 
962,225,814
 
 
9,297
 
 
1.
Relates to ordinary shares issued for the DRP as part of the 2021 final dividend. The Group purchased on-market shares for the issuance of DRP as part of the 2022 interim dividend. Refer to Note C.3(b) for details of the on-market purchases and allocation.
2.
914,768,948 new Woodside shares were issued as consideration for the BHPP merger. Refer to Note B.5 for details.
All shares are a single class with equal rights to dividends, capital, distributions and voting. The Company does not have authorised capital nor par value in relation to its issued shares.
 
F-45

Table of Contents
Notes to the financial statements
C. Debt and capital
for the year ended 31 December 2022
 
(b) Reserved shares


Employee share plans
 
  
Dividend reinvestment plan


Number of shares
 
  
                    US$m
 
  
Number of shares
 
  
                    US$m


Year ended 31 December 2022


Opening balance
  
1,819,744
    
(30)
    
-
    
-
 
         
Purchases during the year
  
2,232,589
    
(45)
    
6,823,092
    
(144)
 
         
Vested/allocated during the year
  
(2,178,556)
    
37
    
(6,823,092)
    
144
 
         
Amounts at 31 December 2022
  
1,873,777
    
(38)
    
-
    
-
 
         
Year ended 31 December 2021
                           
         
Opening balance
  
 
1,766,099


(23)


-


-
 
         
Purchases during the year
  
 
2,683,469


(47)


-


-
 
         
Vested during the year
  
 
(2,629,824)


40


-


-
 
         
Amounts at 31 December 2021
  
 
1,819,744


(30)


-


-
 
         
Year ended 31 December 2020
                                   
         
Opening balance
  
 
1,985,306


(39)


-


-
 
         
Purchases during the year
  
 
2,242,345


(32)


-


-
 
         
Vested during the year
  
 
(2,461,552)


48


-


-
 
         
Amounts at 31 December 2020
  
 
1,766,099


(23)


-


-
 
 
C.4
 
Other reserves
 
       
2022
                    US$m
      
2021
                    US$m
      
2020
                    US$m
 
Other reserves
                                
Employee benefits reserve
    
 
278


232


219
 
Foreign currency translation reserve
    
 
796


793


793
 
Hedging reserve
1
    
 
(586)


(400)


(71)
 
Distributable profits reserve
2
    
 
3,541


58


462
 
Other reserves
    
 
2


-


-


4,031


683


1,403
 
1.
The portion of the hedging reserve relating to settled hedges is $226 million.
2.
For the year ended 31 December 2022, the Group transferred $5,553 million of retained earnings to the distributable profits reserve. The increase was offset by the 2022 interim dividend of $2,070 million which was paid on 6 October 2022.
Nature and purpose
Employee benefits reserve
Used to record share-based payments associated with the employee share plans.
Foreign currency translation reserve
Used to record foreign exchange differences arising from the translation of the financial statements of foreign entities from their functional currency to the Group’s presentation currency.
Hedging reserve
Used to record gains and losses on hedges designated as cash flow hedges, and foreign currency basis spread arising from the designation of a financial instrument as a hedging instrument. Gains and losses accumulated in the cash flow hedge reserve for qualifying assets are capitalised against the carrying amount of that asset and taken to the income statement as the asset is depreciated.
Distributable profits reserve
Used to record distributable profits generated by the Parent entity, Woodside Energy Group Ltd.
Other reserves
Used to record gains and losses on financial instruments at fair value through other comprehensive income.
 
F-4
6

Table of Contents
Notes to the financial statements
D. Other assets
and
liabilities
for the year ended 31 December 2022
 
In this section

 
This section addresses the other assets and liabilities position at the end of the reporting period including, where applicable, the accounting policies applied and the key estimates and judgements made.
 
D.
  
Other assets and liabilities
    
D.1
  
Segment assets and liabilities
  
Page F-4
8
D.2
  
Receivables
  
Page F-4
8
D.3
  
Inventories
  
Page F-4
9
D.4
  
Payables
  
Page F-4
9
D.5
  
Provisions
  
Page F-
50
D.6
  
Other financial assets and liabilities
  
Page F-5
2
D.7
  
Leases
  
Page F-5
5
Key financial and capital risks in this section
 
Credit risk management
Credit risk is the risk that a counterparty will not meet its obligation under a financial instrument or customer contract, leading to a financial loss to the Group. Credit risk arises from the financial assets of the Group, which comprise trade and other receivables, loans receivables and deposits with banks and financial institutions.
The Group manages its credit risk on trade receivables and financial instruments by predominantly dealing with counterparties with an investment grade credit rating. Sufficient collateral is obtained to mitigate the risk of financial loss when transacting with counterparties with below investment grade credit ratings. Customers who wish to trade on unsecured credit terms are subject to credit verification procedures. Receivable balances are monitored on an ongoing basis. As a result, the Group’s exposure to bad debts is not significant. The Group’s maximum credit risk is limited to the carrying amount of its financial assets.
Customer credit risk is managed by the Treasury function subject to the Group’s established policy, procedures and controls relating to customer credit risk management. Credit quality of a customer is assessed based on an extensive credit rating scorecard and individual credit limits are defined in accordance with this assessment. Outstanding customer receivables are regularly monitored. At 31 December 2022
, the Group had nineteen customers (2021: four customers) that owed the Group more than $10 million each and accounted for approximately 79% (2021: 88%) of all trade receivables.
Depending on the product, settlement
terms are 8 to 30 
days from the date of invoice or bill of lading unless otherwise stated in the agreed payment terms. 
The Group considers the probability of default upon initial recognition of the asset and whether there has been a significant depreciation in credit quality on an ongoing basis. A significant decrease in credit quality is defined as a debtor being greater than 30 days past due in making a contractual payment. Credit losses for trade receivables (including lease receivables) and contract assets are determined by applying the simplified approach and are measured at an amount equal to lifetime expected loss. Under the simplified approach, determination of the loss allowance provision and expected loss rate incorporates past experience and forward-looking information, including the outlook for market demand and forward-looking interest rates. A default on other financial assets is considered to be when the counterparty fails to make contractual payments within 60 days of when they fall due.
At 31 December 2022, the Group had a provision for credit losses of nil (2021: nil). Subsequent to 31 December 2022, 99% (2021: 100%) of the trade receivables balance of $1,067 million (2021: $152 million) has been received.
Credit risk from balances with banks is managed by the Treasury function in accordance with the Group’s policy. The Group’s main funds are placed as short-term deposits with reputable financial institutions with strong investment grade credit ratings. At 31 December 2022 and 31 December 2021, there were no significant concentrations of credit risk within the Group and financial instruments are spread amongst a number of financial institutions to minimise the risk of counterparty default. The maximum exposure to financial institution credit risk is represented by the sum of all cash deposits plus accrued interest, bank account balances and fair value of derivative assets. The Group’s counterparty credit policy limits this exposure to commercial and investment banks, according to approved credit limits based on the counterparty’s credit rating.
 
F-4
7

Table of Contents
Notes to the financial statements
D. Other assets and liabilities
for the year ended 31 December 2022
 
D.1
 
Segment assets and liabilities
 
    
2022
            US$m
    
2021
2
US$m


(a) Segment assets
1
                 
Australia
  
 
31,240


            18,163
 
International
  
 
18,084


2,877
 
Marketing
  
 
182


217
 
Corporate/Other
  
 
9,815


5,217


59,321


26,474


2022
            US$m
    
2021
2
US$m


(b) Segment liabilities
1
                 
Australia
  
 
8,104


2,889
 
International
  
 
2,677


435
 
Marketing
  
 
561


639
 
Corporate/Other
  
 
10,852


8,282


22,194


            12,245


1.
Acquisitions through business combination have been recognised on a provisional basis. Adjustments will be made to the provisional amounts if new information is obtained within 12 months from the acquisition date. Refer to Note B.5 for details.
2.
The 2021 amounts have been restated to reflect the changes in operating segments. Refer to ‘Operating segment information’ in Note A.1 for details.
Refer to Note A.1 for descriptions of the Group’s segments. Corporate/other assets mainly comprise cash and cash equivalents, deferred tax assets and lease assets. Corporate/other liabilities mainly comprise interest-bearing liabilities, deferred tax liabilities and lease liabilities.
 
D.2
 
Receivables
 
    
2022
            US$m
    
2021
US$m


(a) Receivables (current)
                 
Trade receivables
1
  
 
1,067


152
 
Other receivables
1
  
 
381


123
 
Loans receivable
  
 
76


75
 
Lease receivables
  
 
35


18
 
Interest receivable
  
 
19


-


1,578


368


(b) Receivables (non-current)
                 
Other receivables
  
 
75


-
 
Loans receivable
  
 
724


627
 
Lease receivables
  
 
46


26
 
Defined benefit plan asset
  
 
-


33


845


                686


1.
Interest-free and settlement terms are usually between 14 and 30 days.
Recognition and measurement
Trade receivables are initially recognised at the transaction price determined under IFRS 15
Revenue from Contracts with Customers
. Other receivables are initially recognised at fair value. Receivables that satisfy the contractual cash flow and business model tests are subsequently measured at amortised cost less an allowance for uncollectable amounts. Uncollectable amounts are determined using the expected loss impairment model. Collectability and impairment are assessed on a regular basis.
Subsequent recoveries of amounts previously written off are credited against other expenses in the consolidated income statement. Certain receivables that do not satisfy the contractual cash flow and business model tests are subsequently measured at fair value (refer to Note D.6).
The Group’s customers are required to pay in accordance with agreed payment terms. Depending on the product, settlement terms are 14 to 30 days from the date of invoice or bill of lading and customers regularly pay on time. There are no significant overdue trade receivables as at the end of the reporting period (2021: nil).
Fair value
The carrying amount of trade and other receivables approximates their fair value.
Foreign exchange risk
The Group held $174 million of receivables at 31 December 2022 (2021: $121 million) in currencies other than US dollars (predominantly Australian dollars).
 
F-4
8

Notes to the financial statements
D. Other assets and liabilities
for the year ended 31 December 2022
 
Loans receivable
On 9 January 2020, Woodside Energy Finance (UK) Ltd entered into a secured loan agreement with Petrosen (the Senegal National Oil Company), to provide up to $450 million for the purpose of funding Sangomar project costs. The facility has a maximum term of 12 years and semi-annual repayments of the loan are due to commence at the earlier of 12 months after RFSU or 30 June 2025. The carrying amount of the loan receivable is $408 million at 31 December 2022 (2021: $335 million), which approximates its fair value. The remaining balance of loans receivable is due from
non-controlling
interests.
 
D.3
 
Inventories
 
    
2022
            US$m
    
2021
            US$m


(a) Inventories (current)
                 
Petroleum products
                 
Goods in transit
  
 
95


35
 
Finished stocks
  
 
103


34
 
Warehouse stores and materials
  
 
480


133


678


202


(b) Inventories
(non-current)
                 
Warehouse stores and materials
  
 
11


19


11


19


Recognition and measurement
Inventories include hydrocarbon stocks, consumable supplies and maintenance spares. Inventories are valued at the lower of cost and net realisable value. Cost is determined on a weighted average basis and includes direct costs and an appropriate portion of fixed and variable production overheads where applicable. Inventories determined to be obsolete or damaged are written down to net realisable value, being the estimated selling price less selling costs.
 
D.4
 
Payables
The following table shows the Group’s payables balances.
 
     
2022
            US$m
    
2021
            US$m
 
Trade payables
1
  
 
759


191
 
Other payables
1
  
 
1,270


390
 
Interest payable
2
  
 
65


58
 
     
Total payables
  
 
2,094


639
 
 
1.
Interest-free and normally settled on 30 day terms.
2.
Details regarding interest-bearing liabilities are contained in Note C.2.
Recognition and measurement
Trade and other payables are carried at amortised cost and are recognised when goods and services are received, whether or not billed to the Group, prior to the end of the reporting period.
Fair value
The carrying amount of payables approximates their fair value.
Foreign exchange risk
The Group held $657 million of payables at 31 December 2022 (2021: $311 million) in currencies other than US dollars (predominantly Australian dollars).
Maturity profile of payables
The Group’s payables balances at 31 December 2022 and 31 December 2021 are due for payment within a year.
 
F-4
9

Table of Contents
Notes to the financial statements
D. Other assets and liabilities
for the year ended 31 December 2022
 
D.5
 
Provisions
 
    
        Restoration
1
US$m
   
        Employee
benefits
US$m
   
Onerous
        contracts
2
US$m
   
Other
        US$m
    
Total
        US$m
 
           
Year ended 31 December 2022
                                         
           
At 1 January 2022
  
 
2,218


286


214


106


2,824
 
           
Acquisitions through business combination
3
  
 
4,310


329


-


165


4,804
 
           
Change in provision
  
 
(382
 
 
(98
 
 
(216
 
 
137


(559
           
Unwinding of present value discount
  
 
107


-


2


1


110
 
           
Carrying amount at 31 December 2022
  
 
6,253


517


-


409


7,179
 
           
Current
  
 
575


331


-


313


1,219
 
           
Non-current
  
 
5,678


186


-


96


5,960
 
           
Net carrying amount
  
 
6,253


517


-


409


7,179
 
           
Year ended 31 December 2021
                                         
           
At 1 January 2021
  
 
2,134


295


349


129


2,907
 
           
Change in provision
  
 
60


(9)


(140)


(23)


(112)
 
           
Unwinding of present value discount
  
 
24


-


5


-


29
 
           
Carrying amount at 31 December 2021
  
 
2,218


286


214


106


2,824
 
           
Current
  
 
235


269


-


101


605
 
           
Non-current
  
 
1,983


17


214


5


2,219
 
           
Net carrying amount
  
 
2,218


286


214


106


2,824
 
 
1.
2022 change in provision is due to a revision of discount rates of $978 million (primarily due to an increase in risk free rates) and provisions used of $262 million, offset by changes in estimates of $858 million. Changes in estimates are due to new activities, increase in scope of removal and cost and rate escalations supported by the most recent estimates and benchmarks.
2.
2022 change in provision is due to changes in estimates of $245 million offset by provisions used of $29 million.
3.
Acquisitions through business combination have been recognised on a provisional basis. Adjustments will be made to the provisional amounts if new information is obtained within 12 months from the acquisition date. Refer to Note B.5 for details.
Recognition and measurement
Provisions are recognised when the Group has a present obligation (legal or constructive) as a result of a past event, it is probable that an outflow of resources embodying economic benefits will be required to settle the obligation and a reliable estimate can be made of the amount of the obligation.
Restoration
The restoration provision is first recognised in the period in which the obligation arises. The nature of restoration activities includes the removal of facilities, abandonment of wells and restoration of affected areas. Restoration provisions are updated annually, with the corresponding movement recognised against the related exploration and evaluation assets or oil and gas properties or expensed for late life projects with no corresponding asset.
Over time, the liability is increased for the change in the present value based on a
pre-tax
discount rate appropriate to the risks inherent in the liability. The unwinding of the discount is recorded as an accretion charge within finance costs. The carrying amount capitalised in oil and gas properties is depreciated over the useful life of the related asset (refer to Note B.3).
Costs incurred that relate to an existing condition caused by past operations, and which do not have a future economic benefit, are expensed.
Employee benefits
Provision is made for employee benefits accumulated as a result of employees rendering services up to the end of the reporting period. These benefits include wages, salaries, annual leave and long service leave.
Liabilities in respect of employees’ services rendered that are not expected to be wholly settled within one year after the end of the period in which the employees render the related services are recognised as long-term employee benefits.
These liabilities are measured at the present value of the estimated future cash outflow to the employees using the projected unit credit method. Liabilities expected to be wholly settled within one year after the end of the period in which the employees render the related services are classified as short-term benefits and are measured at the amount due to be paid.
Onerous contract provision
Provision is made for loss-making contracts at the present value of the lower of the net cost of fulfilling and the cost arising from failure to fulfill each contract.
 
F-
50

Table of Contents
Notes to the financial statements
D. Other assets and liabilities
for the year ended 31 December 2022
 
 
Key estimates and judgements
 
(a) Restoration obligations
The Group estimates the future decommissioning and remediation costs of offshore oil and gas platforms, offshore and onshore production facilities, wells and pipelines at different stages of the development and construction of assets or facilities. In many instances, decommissioning of assets occurs many years into the future.
 
The Group’s restoration obligations are based on compliance with the requirements of relevant regulations which vary for different jurisdictions. For example Australian regulations require full removal for offshore assets unless regulator approval is received to decommission in-situ. The Group maintains technical expertise to ensure that industry learnings, scientific research and local and international guidelines are reviewed in assessing its restoration obligations.
 
The restoration obligation requires judgemental assumptions regarding removal date, environmental legislation and regulations, the extent of restoration activities required, the engineering methodology for estimating cost, technologies used in determining the decommissioning cost, and liability-specific discount rates to determine the present value of these cash flows.
 
The Group applies either the ‘expected outcome’ approach or ‘expected value’ approach in assessing the cost estimate, reflecting a difference in approach to cost estimation for heritage Woodside and heritage BHPP assets. Both approaches are supported by IAS 37
Provisions, Contingent liabilities and Contingent Assets
, produce reliable estimates and are widely used in practice. Heritage Woodside assets refer to assets held by the Group prior to the BHPP merger. Heritage BHPP assets refers to assets acquired from BHP but excludes the commonly held assets by both heritage entities.
 
Expected outcome approach
This approach is used for heritage Woodside assets, and those assets commonly held by both heritage entities. The following cost assumptions are applied:
 
·
 for onshore assets, provision has been made for the removal of production facilities and above ground pipelines using current restoration standards and techniques and taking into account risks and uncertainties; and
·
 for offshore assets, provision has been made for the plug and abandonment of wells and the removal of offshore platform topsides, floating production storage offloading (FPSO) and some subsea infrastructure. It is currently the Group’s assumption that in some regulatory jurisdictions and environments, certain pipelines and infrastructure, parts of offshore platform substructures, and certain subsea infrastructure are decommissioned
in-situ
 where it can be demonstrated that this will deliver equal or better environmental outcomes than full removal and that regulatory approval is obtained where arrangements are satisfactory to the regulator
.
 
Expected value approach
This approach is used for heritage BHPP assets (excluding those commonly held by both heritage entities).
 
For both onshore and offshore assets, provision has been made taking into consideration a risked range of possible removal outcomes, including full removal of certain assets. Individual site provisions are an estimate of the expected value of future cash flows required to rehabilitate the relevant site using current restoration standards and techniques and taking into account risks and uncertainties. Individual site provisions are discounted to their present value using country specific discount rates aligned to the estimated timing of cash outflows.
 
Inherent uncertainties
The basis of the restoration obligation provision for assets with approved decommissioning plans or general directions issued by the regulator can differ from the assumptions disclosed above. Whilst the provisions reflect the Group’s best estimate based on current knowledge and information, further studies and detailed analysis of the restoration activities for individual assets will be performed near the end of their operational life and/or when detailed decommissioning plans are required to be submitted to the relevant regulatory authorities. Actual costs and cash outflows can materially differ from the current estimate as a result of changes in regulations and their application, prices, analysis of site conditions, further studies, timing of restoration and changes in removal technology. These uncertainties may result in actual expenditure differing from amounts included in the provision recognised as at 31 December 2022.

 
A range of pre-tax discount rates between 3.4% and 4.7% (2021: 0.4% to 2.4%) has been applied. If the discount rates were decreased by 0.5% then the provision would be $316 million higher. If the cost estimates were increased by 10% then the provision would be $627 million higher. The proportion of the non-current balance not expected to be settled within 10 years is 54% (2021: 65%).
 
 
F-5
1

Table of Contents
Notes to the financial statements
D. Other assets and liabilities
for the year ended 31 December 2022
 
 
(b) Legal case outcomes
Provisions for legal cases are measured at the present value of the amount expected to settle the claim. Management is required to use judgement when assessing the likely outcome of legal cases, estimating the risked amount and whether a provision or contingent liability should be recognised.
 
(c) Onerous contracts
The onerous contract provision assessment requires management to make certain estimates regarding the unavoidable costs and the expected economic benefits from the contract. These estimates require significant management judgement and are subject to risk and uncertainty, and hence changes in economic conditions can affect the assumptions.
 
As at 31 December 2022, the Corpus Christi contract is expected to return a positive value and on this basis the provision has been reversed to nil (2021: $214 million). Changes in assumptions predominantly relating to the narrowing of the spread between the sales price and purchase price could result in the contract becoming onerous in the future.
 
Assumptions used to determine the present value as at 31 December 2022 are set out below:
 
·
 Remaining contract term – 18 years.
·
 Discount rate – a
pre-tax,
risk free US government bond rate of 4.10% (2021: 1.855%) has been applied.
·
 LNG pricing – forecast sales and purchase prices are subject to a number of price markers. Price assumptions are based on the best information on the market available at measurement date and derived from short- and long-term views of global supply and demand, building upon past experience of the industry and consistent with external sources. The forecasted sales are linked to gas hub prices (Title Transfer Facility (TTF)) at which physical sales are expected to occur and incorporate known sales pricing information
1
. The long-term gas sales price is estimated on the basis of the Group’s Brent price forecast. The estimated purchase price is linked to US gas hub prices (Henry Hub (HH)) at which physical purchases are expected to occur. The nominal TTF, Brent oil prices and HH gas prices used at 31 December 2022 were:
        
 
                2023


                2024


                2025


                2026


                2027


TTF (US$/MMBtu)
  
 
47.9


36.4


22.3


8.8


9.0


Brent (US$/bbl)
  
 
87


78


74


76


77
2


HH (US$/MMBtu)
  
 
6.1


4.7


4.0


4.1


4.2
3
 
   
1. For committed volumes, contracted pricing has been applied.
2. Long-term oil prices are based on US$70/bbl (2022 real terms) from 2025 and prices are escalated at 2.0% onwards.
3. Long-term gas prices are based on US$3.8/MMBtu (2022 real terms) from 2025. All long-term prices are escalated at 2.0%.
 
D.6
 
Other financial assets and liabilities
 
    
2022
            US$m
    
2021
            US$m


Other financial assets
                 
Financial instruments at fair value through profit and loss
                 
Derivative financial instruments designated as hedges
  
 
207


134
 
Other financial assets
  
 
22


293
 
Financial instruments at amortised cost
                 
Hedge collateral
 
(including interest)
  
 
509


-
 
Other financial assets
  
 
30


-
 
Financial instruments at fair value through other comprehensive income


Other financial assets
  
 
29


-


Total other financial assets
  
 
797


427


Current
  
 
677


320
 
Non-current
  
 
120


107


Net carrying amount
  
 
797


427


Other financial liabilities
                 
Financial instruments at fair value through profit and loss
                 
Derivative financial instruments designated as hedges
  
 
721


563
 
Other financial liabilities
  
 
-


9


Total other financial liabilities
  
 
721


572


Current
  
 
654


411
 
Non-current
  
 
67


161


Net carrying amount
  
 
721


572


Recognition and measurement
Other financial assets and liabilities
Receivables subject to provisional pricing adjustments are initially recognised at the transaction price and subsequently measured at fair value with movements recognised in the consolidated income statement.
Derivative financial instruments
Derivative financial instruments that are designated within qualifying hedge relationships are initially recognised at fair value on the date the contract is entered into. For relationships designated as fair value hedges, subsequent fair value movements of the derivative are recognised in the consolidated income statement.
 
F-5
2

Notes to the financial statements
D. Other assets and liabilities
for the year ended 31 December 2022
 
For relationships designated as cash flow hedges, subsequent fair value movements of the derivative for the effective portion of the hedge are recognised in other comprehensive income and accumulated in reserves in equity; fair value movements for the ineffective portion are recognised immediately in the consolidated income statement. Costs of hedging have been separated from the hedging arrangements and deferred to other comprehensive income and accumulated in reserves in equity. Amounts accumulated in equity are reclassified to the consolidated income statement in the periods when the hedged item affects profit or loss.
Hedge effectiveness is determined at the inception of the hedge relationship, and through periodic prospective effectiveness assessments to ensure that an economic relationship exists between the hedged exposure and the hedging instrument. The Group assesses whether the derivative designated in each hedging relationship has been, and is expected to be, effective in offsetting changes in cash flows of the hedged exposure using the hypothetical derivative method.
Ineffectiveness is recognised where the cumulative change in the designated component value of the hedging instrument on an absolute basis exceeds the change in value of the hedged exposure attributable to the hedged risk.
Ineffectiveness may arise where the timing of the transaction changes from what was originally estimated such as delayed shipments or changes in timing of forecast sales. This may also arise where the commodity swap pricing terms do not perfectly match the pricing terms of the LNG revenue contracts.
Fair value
Except for the other financial assets and other financial liabilities set out in this note, there are no material financial assets or financial liabilities carried at fair value.
The fair value of commodity derivative financial instruments is determined based on observable quoted forward pricing and swap models and is classified as Level 2 on the fair value hierarchy. The most frequently applied valuation techniques include forward pricing and swap models that use present value calculations. The models incorporate various inputs including the credit quality of counterparties and forward rate curves of the underlying commodity.
The fair value of interest rate swaps is calculated by discounting estimated future cash flows based on the terms of maturity of each contract, using market interest rates for a similar instrument at the reporting date and is classified as Level 2 on the fair value hierarchy.
The fair value of foreign exchange forward contracts is determined using quoted forward exchange rates at the reporting date and present value calculations based on high credit quality yield curves in the respective currencies and is classified as Level 2 on the fair value hierarchy.
The fair values of other financial assets and other financial liabilities are predominantly determined based on observable quoted forward pricing and are predominantly classified as Level 2 on the fair value hierarchy.
Foreign exchange
The derivative financial instruments include foreign exchange forward contracts that are denominated in Australian dollars. The Group had no material other financial assets and liabilities denominated in currencies other than US dollars.
Hedging activities
During the period, the following hedging activities were undertaken:
 
·
 
The Group hedged a percentage of its oil-linked exposure, entering into oil swap derivatives settling in 2023 in order to achieve a minimum average sales price of $75 per barrel.
·
 
The Group entered into additional separate HH commodity swaps to hedge the purchase leg of the Corpus Christi volumes and separate TTF commodity swaps to hedge the sales leg of Corpus Christi volumes to mitigate pricing risk for 2023 to 2024.
·
 
As a result of hedging activities, approximately 49% of Corpus Christi volumes included in stock in transit for 2022, approximately 82%
of
 2023 volumes and approximately 29%
of
 2024 volumes have hedged pricing risk.
·
 
The Group restruck $150 million of the TTF hedges to reduce the derivative financial liability.
·
 
The Group restruck $92 million of the oil swap hedges to reduce the derivative financial liability. Further
,
the Group also voluntarily placed $506 million as collateral against the oil hedge positions to reduce counterparty credit risk exposure. The collateral will mature in line with hedge settlements in 2023.
·
 
Through the use of foreign exchange forward contracts, the Group hedged its Australian dollar to US dollar exchange rate in relation to a portion of the Australian dollar denominated capital expenditure expected to be incurred under the Scarborough development.
 
F-5
3

Notes to the financial statements
D. Other assets and liabilities
for the year ended 31 December 2022


                        2022
 
 
2021
 
Oil swaps (cash flow hedges)
  
 
Carrying amount (US$m)
  
 
(114)


(1
Notional amount (MMbbl)
  
 
18


30
 
Maturity date
  
 
2023


2022-2023
 
Hedge ratio
  
 
1:1


1:1
 
Weighted average hedged rate (US$/MMbbl)
  
 
79


74
 
HH Corpus Christi commodity swaps (cash flow hedges)
                
Carrying amount (US$m)
  
 
26


31
 
Notional amount (TBtu)
  
 
58


65
 
Maturity date
  
 
2023-2024


2022-2023
 
Hedge ratio
  
 
1:1


1:1
 
Weighted average hedged rate (US$/MMBtu)
  
 
4


3
 
TTF Corpus Christi commodity swaps (cash flow hedges)
                
Carrying amount (US$m)
  
 
(469)


(465
Notional amount (TBtu)
  
 
50


49
 
Maturity date
  
 
2023-2024


2022-2023
 
Hedge ratio
  
 
1:1


1:1
 
Weighted average hedged rate (US$/MMBtu)
  
 
16


9
 
TTF commodity swaps (cash flow hedges)
                
Carrying amount (US$m)
  
 
-


4
 
Notional amount (TBtu)
  
 
-


3
 
Maturity date
  
 
-


2022
 
Hedge ratio
  
 
-


1:1
 
Weighted average hedged rate (US$/MMBtu)
  
 
-


26
 
Interest rate swap (cash flow hedges)
                
Carrying amount (US$m)
  
 
55


(17
Notional amount (US$m)
  
 
600


600
 
Maturity date
  
 
2027


2027
 
Hedge ratio
  
 
1:1


1:1
 
Weighted average hedged rate
  
 
1.7%


1.7%
 
Cross currency interest rate swap (cash flow and fair value hedges)
                
Carrying amount (US$m)
  
 
5


9
 
Notional amount (Swiss Franc)
  
 
175


175
 
Maturity date
  
 
2023


2023
 
Hedge ratio
  
 
1:1


1:1
 
Weighted average hedged rate
  
 
Three month USD LIBOR
+2.8%
   
 
Three month US$ LIBOR
+2.8%
 
FX forwards (cash flow hedges)
                
Carrying amount (US$m)
  
 
(17)


10
 
Notional amount (AUD$m)
  
 
1,037


934
 
Maturity date
  
 
2023-2025


2022-2025
 
Hedge Ratio
  
 
1:1


1:1
 
Weighted average hedged rate (AUD:USD)
  
 
0.68


0.71
 
Hedge ineffectiveness loss of $72 million (2021: $38 million loss) has been recognised in the profit and loss.
Other financial assets
Other financial assets measured at fair value include receivables subject to provisional pricing adjustments of nil (2021: $163 million) and repurchase agreements entered into for the purposes of net settlement rather than for physical delivery of $nil (2021: $69 million).
Interest Rate Benchmark Reform
A fundamental reform of major interest rate benchmarks is being undertaken globally, including the replacement of some interbank offered rates (IBORs) with alternative nearly risk-free rates (referred to as ‘IBOR reform’). The Group has exposures to IBORs on its financial instruments that will be impacted as part of these market-wide initiatives. The Group’s main IBOR exposure at the reporting date is USD LIBOR. In 2020, the Federal Reserve announced that the three-month and
six-month
LIBOR will be phased out and eventually replaced by June 2023.
During the period, the Group has transitioned a number of financial liabilities from USD LIBOR to SOFR and is in the process of transitioning the remaining financial instruments to alternative benchmark rates. The Group has financial liabilities and financial assets with a total carrying value of $670 million (2021: $957 million) and $393 million (2021: $367 million) respectively, which reference USD LIBOR.
The Group has the following hedging relationships which are exposed to interest rate benchmarks impacted by IBOR Reform:
 
·
 
Interest rate swaps to hedge the LIBOR interest rate risk associated with the $600 million syndicated facility (refer to Note C.2). The interest rate swaps are designated as cash flow hedges, converting the variable interest into fixed interest US dollar debt, and mature in 2027.
·
 
A fixed rate 175 million Swiss Franc (CHF) denominated medium term note, which it hedges with cross-currency interest rate swaps designated in both fair value and cash flow hedge relationships. The cross-currency interest rate swaps are referenced to LIBOR (refer to Note C.2).
The transition of a number of the Group’s financial liabilities from USD LIBOR to SOFR during the year ended 31 December 2022 did not result in a material impact to the Group. The Group’s Treasury function continues to execute the transition of the remaining financial instruments from current benchmark rates to alternative benchmark rates.
 
F-5
4

Table of Contents
Notes to the financial statements
D. Other assets and liabilities
for the year ended 31 December 2022


Key estimates and judgements
 
Fair value of other financial assets and liabilities
Estimates have been applied in the measurement of other financial assets and liabilities and, where required, judgement is applied in the settlement of any financial assets or liabilities. In the current period, this included a $3 million periodic adjustment relating to timing which increased other financial liabilities, reflecting the arrangements governing Wheatstone LNG sales (2021: $56 million increase).
 
 
D.7
 
Leases
 
    
Land and buildings
    
Plant and equipment
2
    
Total  
     
US$m
    
US$m
    
                US$m  
Lease assets
                          
       
Year ended 31 December 2022
                          
       
Carrying amount at 1 January 2022
  
 
377


703


1,080
 
       
Acquisitions through business combination
1
  
 
120


22


142
 
       
Additions
  
 
4


238


242
 
       
Lease remeasurements
  
 
5


103


108
 
       
Depreciation
  
 
(42)


(266)


(308)
 
       
Carrying amount at 31 December 2022
  
 
464


800


1,264
 
       
At 31 December 2022
                          
       
Historical cost and remeasurements
  
 
591


1,311


1,902
 
       
Accumulated depreciation, impairment and disposals
  
 
(127)


(511)


(638)

       
Net carrying amount
  
 
464


800


1,264
 
       
Lease liabilities
                          
       
Year ended 31 December 2022
                          
       
At 1 January 2022
  
 
437


930


1,367
 
       
Acquisitions through business combination
1
  
 
245


23


268
 
       
Additions
  
 
1


189


190
 
       
Repayments (principal and interest)
  
 
(60)


(305)


(365)
 
       
Accretion of interest
  
 
25


78


103
 
       
Lease remeasurements
  
 
(25)


96


71
 
       
Carrying amount at 31 December 2022
  
 
623


1,011


1,634
 
Current
  
 
48


276


324
 
Non-current
  
 
575


735


1,310
 
Carrying amount at 31 December 2022
  
 
623


1,011


1,634
 
       
Lease assets
                          
       
Year ended 31 December 2021
                          
       
Carrying amount at 1 January 2021
  
 
392


592


984
 
       
Additions
  
 
14


214


228
 
       
Lease remeasurements
  
 
15


16


31
 
       
Disposals at written down value
  
 
(12)


-


(12)
 
       
Depreciation
  
 
(32)


(119)


(151)
 
       
Carrying amount at 31 December 2021
  
 
377


703


1,080
 
       
At 31 December 2021
                          
       
Historical cost
  
 
462


948


1,410
 
       
Accumulated depreciation and impairment
  
 
(85)


(245)


(330)
 
       
Net carrying amount
  
 
377


703


1,080
 
       
Lease liabilities
                          
       
Year ended 31 December 2021
                          
       
At 1 January 2021
  
 
484


794


1,278
 
       
Additions
  
 
7


244


251
 
       
Repayments (principal and interest)
  
 
(70)


(192)


(262)
 
       
Accretion of interest
  
 
25


72


97
 
       
Lease remeasurements
  
 
(9)


12


3
 
       
Carrying amount at 31 December 2021
  
 
437


930


1,367
 
       
Current
  
 
19


172


191
 
       
Non-current
  
 
418


758


1,176
 
       
Carrying amount at 31 December 2021
  
 
437


930


1,367
 
 
1.
Acquisitions through business combination have been recognised on a provisional basis. Adjustments will be made to
the
provisional amounts if new information is obtained within 12 months from the acquisition date. Refer to Note B.5 for details.
2.
Marine, vessels and carriers have been included within plant and equipment for the year ended 31 December 2022. The 2021 amounts have been reclassified to be presented on the same basis.
 
F-5
5

Table of Contents
Notes to the financial statements
D. Other assets and liabilities
for the year ended 31 December 2022
 
Recognition and measurement
When a contract is entered into, the Group assesses whether the contract contains a lease. A lease arises when the Group has the right to direct the use of an identified asset which is not substitutable and to obtain substantially all economic benefits from the use of the asset throughout the period of use. The leases recognised by the Group predominantly relate to LNG vessels, property and drilling rigs.
The Group separates the lease and
non-lease
components of the contract and accounts for these separately. The Group allocates the consideration in the contract to each component on the basis of their relative stand-alone prices.
Leases as a lessee
Lease assets and lease liabilities are recognised at the lease commencement date, which is when the assets are available for use. The assets are initially measured at cost, which is the present value of future lease payments adjusted for any lease payments made at or before the commencement date, plus any make-good obligations and initial direct costs incurred.
Lease assets are depreciated using the straight-line method over the shorter of their useful life and the lease term. Refer to Note B.3 for the useful lives of assets. Periodic adjustments are made for any
re-measurements
of the lease assets and for impairment losses, assessed in accordance with the Group’s impairment policies.
Lease liabilities are initially measured at the present value of future minimum lease payments, discounted using the Group’s incremental borrowing rate if the rate implicit in the lease cannot be readily determined, and are subsequently measured at amortised cost using the effective interest rate. Minimum lease payments are fixed payments or index-based variable payments incorporating the Group’s expectations of extension options and do not include
non-lease
components of a contract. A portfolio approach was taken when determining the implicit discount rate for LNG vessels with similar terms and conditions on transition.
The lease liability is remeasured when there are changes in future lease payments arising from a change in rates, index or lease terms from exercising an extension or termination option. A corresponding adjustment is made to the carrying amount of the lease assets, with any excess recognised in the consolidated income statement.
There are no restrictions placed upon the lessee by entering into these leases.
Short-term leases and leases of low value
Short-term leases (lease term of 12 months or less) and leases of low value assets are recognised as incurred as an expense in the consolidated income statement. Low value assets comprise plant and equipment.
Foreign exchange risk
The Group held $441 million of lease liabilities at 31 December 2022 (2021: $476 million) in currencies other than the US dollar (predominantly Australian dollars).
Maturity profile of lease liabilities
The table below presents the contractual undiscounted cash flows associated with the Group’s lease liabilities, representing principal and interest. The figures will not necessarily reconcile with the amounts disclosed in the consolidated statement of financial position.


2022
                    US$m


2021
                    US$m
  
 
Due for payment in:
                
1 year or less
  
 
433


283
 
1-2
years
  
 
272


283
 
2-3
years
  
 
199


191
 
3-4
years
  
 
186


171
 
4-5
years
  
 
176


161
 
More than 5 years
  
 
966


789


2,232


1,878
 
 
F-5
6

Notes to the financial statements
D. Other assets and liabilities
for the year ended 31 December 2022
 
Lease commitments
The table below presents the contractual undiscounted cash flows associated with the Group’s future lease commitments for
non-cancellable
leases not yet commenced, representing principal and interest.


2022 
                     US$m


2021
                    US$m
  
 
Due for payment in:
                
Within one year
  
 
67


80
 
After one year but not more than five years
  
 
263


159
 
Later than five years
  
 
1,288


49


1,618


   288
 
Payments of $162 million (2021: $68 million) for short-term leases (lease term of 12 months or less) and payments of $12 million (2021: $18 million) for leases of low value assets were expensed in the consolidated income statement. Total payments for leases in the consolidated statement of cash flows are $525 million (2021: $330 million), with $258 million (2021: $244 million) included in financing activities.
The Group has short-term and low value lease commitments for marine vessels and carriers, property, drill rigs and plant and equipment contracted for, but not provided for in the financial statements, of $60 million (2021: $53 million).
 
 
Key estimates and judgements
 
(a) Control
Judgement is required to assess whether a contract is or contains a lease at inception by assessing whether the Group has the right to direct the use of the identified asset and obtain substantially all the economic benefits from the use of that asset.
 
(b) Lease term
Judgement is required when assessing the term of the lease and whether to include optional extension and termination periods. Option periods are only included in determining the lease term at inception when they are reasonably certain to be exercised.
 
Lease terms are reassessed when a significant change in circumstances occurs. On this basis, possible additional lease payments amounting to $2,323 million (2021: $1,654 million) were not included in the measurement of lease liabilities.
 
(c) lnterest in joint arrangements
Judgement is required to determine the Group’s rights and obligations for lease contracts within joint operations, to assess whether lease liabilities are recognised gross (100%) or in proportion to the Group’s participating interest in the joint operation. This includes an evaluation of whether the lease arrangement contains a sublease with the joint operation.
 
(d) Discount rates
Judgement is required to determine the discount rate, where the discount rate is the Group’s incremental borrowing rate if the rate implicit in the lease cannot be readily determined. The incremental borrowing rate is determined with reference to the Group’s borrowing portfolio at the inception of the arrangement or the time of the modification.
 
 
F-5
7

Table of Contents
Notes to the financial statements
E. Other items
for the year ended 31 December 2022
 
In this section
 
 
This section includes Group structure information and other disclosures.
 
E.
  
Other items
    
E.1
  
Contingent liabilities and assets
  
Page F-5
9
E.2
  
Employee benefits
  
Page F-5
9
E.3
  
Related party transactions
  
Page F-6
1
E.4
  
Auditor remuneration
  
Page F-6
1
E.5
  
Events after the end of the reporting period
  
Page F-6
2
E.6
  
Joint arrangements
  
Page F-6
2
E.7
  
Parent entity information
  
Page F-6
4
E.8
  
Subsidiaries
  
Page F-6
4
E.9
  
Other accounting policies
  
Page F-68
 
F-5
8

Table of Contents
Notes to the financial statements
E. Other items
for the year ended 31 December 2022
 
E.1
 
Contingent liabilities and assets


2022
US$m
 
  
2021
US$m
Contingent
liabilities
at
reporting
date


Contingent liabilities


161


195
 
Guarantees


2


7


163


202
 
Contingent liabilities relate predominantly to possible obligations whose existence will only be confirmed by the occurrence or
non-occurrence
of uncertain future events, and therefore the Group has not provided for such amounts in these financial statements. Additionally, there are a number of other claims and possible claims that have arisen in the course of business against entities in the Group, the outcome of which cannot be estimated at present and for which no amounts have been included in the table above.
The Group has contingent
 assets of $199 million as at 31 December 2022 (2021: nil)
.
 
E.2
 
Employee benefits
 
     
2022
US$m
    
2021
US$m
    
2020
US$m
 
Employee benefits
  
 
415


217


252
 
Share-based payments
  
 
26


12


19
 
Defined contribution plan costs
  
 
41


26


27
 
Defined benefit plan expense
  
 
9


1


2


491


256


300
 
(a) Employee benefits
Employee benefits for the reporting period are as follows:
Recognition and measurement
The Group’s accounting policy for employee benefits other than superannuation is set out in Note D.5. The policy relating to share-based payments is set out in Note E.2(c).
All employees of the Group are entitled to benefits on retirement, disability or death from the Group’s retirement plans. The Group operates a number of pension schemes throughout the world. Employees entitled to defined contribution schemes receive fixed contributions from Group companies and the Group’s legal or constructive obligation is limited to these contributions. Contributions to defined contribution funds are recognised as an expense as they become payable. Prepaid contributions are recognised as an asset to the extent that a cash refund or a reduction in the future payment is available.
(b) Compensation of key management personnel
Key management personnel (KMP) compensation for the financial year was as follows:
 
     
2022
US$
   
2021
US$
   
2020
US$
 
Short-term employee benefits
1
  
 
            5,730,340


6,626,354


5,868,476
 
Post-employment benefits
1
  
 
155,086


88,396


63,805
 
Share-based payments
2
  
 
3,114,043


5,697,529


7,201,653
 
Long-term employee benefits
  
 
4,300


717,223


515,585
 
Termination benefits
  
 
152,531


2,447,525


390,087


9,156,300


          15,577,027


      14,039,606
 
 
1.
The 2021 comparatives for short-term employee benefits and post-employment benefits have been restated to include the superannuation component of the 2021 EIS cash and other cash bonuses for three key management personnel, increasing the short-term employee benefits expense by 
$26,676 to $6,626,354
 
and the post-employee benefits expense by $10,881 to $
88,396.
 
2.
The 2021 comparative for share-based payments has been restated to include amortisation of the fair value of 2021 performance rights for two key management personnel, increasing the expense by $88,507 to $5,697,529.
(c) Share plans
The Group provides benefits to its employees (including KMP) in the form of share-based payments whereby employees render services for shares (equity-settled transactions).
Woodside equity plan (WEP) and supplementary Woodside equity plan (SWEP)
The WEP is available to all permanent employees, but since 1 January 2018 has excluded Executive Incentive Scheme (EIS) participants. The number of Equity Rights (ERs) offered to each eligible employee is determined by the Board, and based on individual performance as assessed under the performance review process. The linking of performance to an allocation allows the Group to recognise and reward eligible employees for high performance. The ERs have no further ongoing performance conditions after allocation, and do not require participants to make any payment in respect of the ERs at grant or at vesting. Each ER entitles the participant to receive a Woodside share on the vesting date three years after the grant date.
For awards made in 2022, the Board amended the terms of the plan to entitle participants to receive a Woodside share on the vesting date, three years after the grant date. Awards made in 2020 and 2021 will vest under the terms of the plan at that time, which provided for 75% vesting of the ERs three years after the grant date and the remaining 25% of the ERs five years after the grant date.
In October 2011, the Board approved the establishment of the SWEP to enable the offering of targeting retention awards of ERs for key capability. The SWEP was updated in 2022 to broaden eligibility to all employees of a subsidiary of Woodside Energy Group Ltd and ensure compliance in all jurisdictions in which Woodside operates. This facilitated the offer of replacement unvested incentives, as required under transitional arrangements for eligible heritage BHP employees transitioning from BHP Group Long-Term Incentive (LTI) plans to VAR offered under Woodside’s VAR arrangements.
 
Each ER entitles the participant to receive a Woodside share or an American Depositary share on the vesting date either one, two, three or four years after the effective grant date, depending on the individual details of each SWEP offered. Participants do not make any payment in respect of the ERs at grant or at vesting.
 
F-5
9

Table of Contents
Notes to the financial statements
E. Other items
for the year ended 31 December 2022
 
Executive Incentive Plans (EIP)
The EIP operated as Woodside’s Executive incentive framework until the end of 2017, after which the Board introduced the EIS. The EIP was used to deliver Short-Term Awards (STAs) and Long-Term Awards (LTAs) to Senior Executives.
Short-Term Awards (STAs)
STAs were delivered in the form of restricted shares to Executives, including all Executive KMP. There are no further performance conditions for vesting of deferred STAs. Participants are not required to make any payments in respect of STA awards at grant or at vesting. Restricted shares entitle their holders to receive dividends.
Long-Term Awards (LTAs)
LTAs were granted in the form of Performance Rights (PRs) to Executives, including all Executive KMP. Vesting of LTAs is subject to achievement of relative total shareholder return (RTSR) targets, with 33% measured against the ASX 50 and the remaining 67% tested against an international group of oil and gas companies. Participants are not entitled to receive dividends and are not required to make any payments in respect of LTA awards at grant or at vesting.
Executive Incentive Scheme (EIS)
The EIS was introduced for the 2018 performance year for all Executives including Executive KMP. The EIS is delivered in the form of a cash incentive, Restricted Shares and Performance Rights. The grant date of the Restricted Shares and Performance Rights has been determined to be subsequent to the performance year, being the date of the Board of Directors’ approval. Accordingly, the 2021 Restricted Shares and Performance Rights were granted on 16 February 2022 for Executives and 19 May 2022 for the CEO and have been included in the table below. The expense estimated as at 31 December 2021 in relation to the 2021 performance year was updated to the fair value on grant date during the period.
The 2022 Restricted Shares and Performance Rights have not been included in the table below as they have not been approved as at 31 December 2022. An expense related to the 2022 performance year has been estimated for Restricted Shares and Performance Rights, using fair value estimates based on inputs at 31 December 2022.
Performance Based Pay Plus (PBP Plus)
PBP Plus is available to senior, permanent employees who are not Executives. Participants receive an annual award of cash and Restricted Shares based on corporate and individual performance, recognising and rewarding eligible employees for high performance.
The grant date of the Restricted Shares has been determined to be subsequent to the performance year, being the date of the Board of Directors’ approval. Accordingly, the 2021 Restricted Shares were granted on 16 February 2022 and have been included in the table below. The expense estimated as at 31 December 2021 in relation to the 2021 performance year was updated to the fair value on grant date during the period.
The 2022 Restricted Shares have not been included in the table below as they have not been approved as at 31 December 2022. An expense related to the 2022 performance year has been estimated for the Restricted Shares, using fair value estimates based on inputs at 31 December 2022.
Recognition and measurement
All compensation under WEP, SWEP and Executive share plans is accounted for as share-based payments to employees for services provided. The cost of equity-settled transactions with employees is measured by reference to the fair values of the equity instruments at the date at which they are granted. The fair value of share-based payments is recognised, together with the corresponding increase in equity, over the period in which the vesting conditions are fulfilled, ending on the date on which the relevant employee becomes fully entitled to the shares. At each balance sheet date, the Group reassesses the number of awards that are expected to vest based on service conditions. The expense recognised each year takes into account the most recent estimate.
The fair value of the benefit provided for the WEP and SWEP is estimated using the Black-Scholes option pricing technique.
The fair value of the restricted shares is estimated as the closing share price at grant date. The fair value of the benefit provided for the RTSR PRs is calculated using the Binomial or Black-Scholes option pricing technique combined with a Monte Carlo simulation methodology, where relevant, using historical volatility to estimate the volatility of the share price in the future.
The number of awards and movements for all share plans are summarised as follows:
 
   
Number of performance awards


            Employee plans                
   
            Executive plans                


WEP
   
SWEP
   
STA
4
   
LTA
4
 
         
 Year ended 31 December 2022
                               
         
 Opening balance
 
 
5,649,783


-


994,436


2,379,220
 
         
 Granted during the year
1,2
,3
 
 
3,017,366


3,046,963


495,800


764,171
 
         
 Vested during the year
 
 
(1,498,065
)


(38,146
)


(450,609
)


(191,736
)
 
         
 Forfeited during the year
 
 
(539,403
)


(124,741
)


(46,430
)


(397,233
)
 
         
 Awards at 31 December 2022
 
 
6,629,681


2,884,076


993,197


2,554,422


US$m


US$m


US$m


US$m
 
         
 Fair value of awards granted during the year
 
 
49


60


9


13
 
 
F-
60

Notes to the financial statements
E. Other items
for the year ended 31 December 2022
 
   
Number of performance awards


         Employee plans                
    
            Executive plans                


WEP
   
SWEP
    
STA
4
   
LTA
4


Year ended 31 December 2021
                                
         
 Opening balance
 
 
5,618,603


-


975,295


      2,798,305
 
         
 Granted during the year
1,2,3
 
 
      2,507,167


-


353,412


553,849
 
         
 Vested during the year
 
 
(1,999,676
 
 
-


        (307,402
 
 
(322,746
         
 Forfeited during the year
 
 
(476,311
 
 
-


(26,869)


(650,188
         
 Awards at 31 December 2021
 
 
5,649,783


-


994,436


2,379,220


US$m


              US$m


US$m


US$m
 
         
 Fair value of awards granted during the year
 
 
39


-


7


9
 
 
1.
For the purpose of valuation, the share price on grant date for the 2022 WEP allocations was $16.30 (2021: $15.17).
2.
For the purpose of valuation, the share price on grant date for the 2022 SWEP allocations was $19.74
 
(202
1
: nil).
3.
For the purpose of valuation, the share price on grant date for Restricted Shares was $19.20 and $19.27 (2021: $20.18) and Performance Rights was $13.08 and $13.71 (2021: $11.66 and $14.44).
4.
Includes awards issued under EIP and EIS.
For more detail on these share plans and performance rights issued to KMPs, refer to the Remuneration Report.
 
E.3
 
Related party transactions
The Group’s related party transactions are predominantly with associates of the Group. During the period, the transactions with related parties include purchases of goods/services of $60.730 million, sale of goods/services of $18.527
 
million and dividend income of $8.294 million. As at 31 December 2022, the total amounts owing to related parties is $1.686 million and amounts owing from related parties is $2.200 million.
 
All transactions to/from related parties are made at arm’s length (normal market rates and on normal commercial terms).
There were no transactions with directors during the year. Key management personnel compensation is disclosed in Note E.2(b).
 
E.4
 
Auditor remuneration
Note not required for the purposes of US reporting.
 
F-6
1

Table of Contents
Notes to the financial statements
E. Other items
for the year ended 31 December 2022
 
E.5
 
Events after the end of the reporting period
The Group has undertaken a review of the depreciation methodology and asset useful lives for oil and gas properties in accordance with its accounting policies and the accounting standards, considering the scale and diversity of the post-merger portfolio and to ensure alignment with common industry practice.
In assessing useful lives of certain oil and gas assets, these have been approximated by reference to either their proved (1P) or proved plus probable (2P) reserves, which is then used in the units of production depreciation calculation.
From 1 January 2023, upstream oil and conventional gas assets will be depreciated over proved reserves (previously proved plus probable, except for certain assets considered late life). Upstream LNG assets will continue to be depreciated over proved plus probable reserves. Multiproduct assets are assessed on a case-by-case basis and aligned to the most appropriate representation of useful life.
The indicative impact to depreciation expense in 2023 resulting from the change in estimate is expected to be an increase of approximately
$600
million. This is an indicative amount and is based on current forecasts which are subject to assumptions and uncertainties.
 
E.6
 
Joint arrangements
(a) Interest percentage in joint ventures
 
         
Group Interest %            
 
  Entity
  
Principal activity
  
          2022
    
               2021  
 
North West Shelf Gas Pty Ltd
  
Contract administration services for venturers for LNG sales to Japan. Marketing and administration services for venturers for gas processing.
  
 
33.3


16.67
 
North West Shelf Liaison Company Pty Ltd
  
Liaison for ventures in the sale of LNG to the Japanese market.
  
 
33.3


16.67
 
China Administration Company Pty Ltd
  
Contract administration services for venturers for LNG sales to China.
  
 
33.3


16.67
 
North West Shelf Shipping Service Company Pty Ltd
  
LNG vessel fleet advisor.
  
 
33.3


16.67
 
       
North West Shelf Lifting Coordinator Pty Ltd
  
Allocating, scheduling and administering the lifting of LNG and pipeline gas.
  
 
33.3


16.67
 
(b) Interest percentage in joint operations


Group Interest %            


          2022
 
  
               2021  
 
  Producing and developing assets


  Australia
  
  
North West Shelf
1
  
 
25.0 - 66.7


12.5 - 50.0
 
     
Greater Enfield and Vincent
  
 
60.0


60.0
 
     
Stybarrow
2
  
 
-


50.0
 
     
Balnaves
  
 
65.0


65.0
 
     
Pluto
  
 
90.0


90.0
 
     
Wheatstone
  
 
13.0 - 65.0


13.0 - 65.0
 
     
Scarborough
2
  
 
-


73.5
 
     
Bass Strait
1
  
 
25.0 - 50.0


-
 
     
Macedon
1
  
 
71.4


-
 
     
Pyrenees
1
  
 
40.0 - 71.4


-
 
     
Griffin
1
  
 
45.0 - 71.0


-
 
     
Minerva
1
  
 
90.0


-
 
     
  International
                 
     
Sangomar
  
 
82.0


82.0
 
     
Atlantis
1
  
 
44.0


-
 
     
Mad Dog
1
  
 
23.9


-
 
     
Shenzi
1
  
 
72.0


-
 
     
Trion
1
  
 
60.0


-
 
     
Greater Angostura
1
  
 
45.0 - 68.5


-
 
     
Calypso
1
  
 
70.0


-
 
 
F-6
2

Notes to the financial statements
E. Other items
for the year ended 31 December 2022


Group Interest %            


          2022
 
  
               2021  
 
Exploration and evaluation assets


  Oceania


Browse Basin
  
 
30.6


30.6
 
     
Carnarvon Basin
3
  
 
31.6 -70.0


15.8 -70.0
 
     
Scarborough
2
,3
  
 
-


50.0
 
     
Bonaparte Basin
  
 
26.7 -35.0


26.7 -35.0
 
     
  Africa
                 
     
Congo
4
  
 
22.5


42.5
 
     
Senega
l
  
 
90.0


90.0
 
     
Egypt
1
  
 
25.0 -45.0


-
 
     
  Americas
                 
     
US Gulf of Mexico
1
  
 
23.9 -75.0


-
 
     
Kitimat
  
 
50.0


50.0
 
     
  Asia
                 
     
Republic of Korea
  
 
50.0


50.0
 
     
Myanmar
5
  
 
40.0 -45.0


40.0 -50.0
 
     
  Caribbean


Barbados
1
  
 
60.0


-
 
     
Trinidad & Tobago
1
  
 
65.0 -70.0


-
 
     
Other joint operations
                 
     
Angel
6
    
20.0
        
-
 
     
Bonaparte Basin
6
    
 
21.0
        
-
 
 
1.
Increase in interests due to the merger with BHPP on 1 June 2022.
2.
No longer recognised as joint operations as the Group’s interest increased to 100% due to the merger with BHPP on 1 June 2022.
3.
The Carnarvon Basin and Scarborough exploration and evaluation assets which were previously presented on the same line, have been separately presented in 2022. The 2021 group interests have been reclassified to be presented on the same basis.
4.
The Group’s interest decreased to 22.5% upon farm-down of interest in June 2022.
5.
The Group relinquished permits AD-1 and AD-8 in 2022. Formalities are pending.
6.
Carbon Capture Storage titles G-10-AP and G-7-AP granted to the Group in 2022.
The principal activities of the joint operations are exploration, development and production of hydrocarbons.
 
 
Key estimates and judgements
 
Accounting for interests in other entities
Judgement is required in assessing the level of control obtained in a transaction to acquire an interest in another entity; depending upon the facts and circumstances in each case, Woodside may obtain control, joint control or significant influence over the entity or arrangement. Judgement is applied when determining the relevant activities of a project and if joint control is held over it.
 
Relevant activities include, but are not limited to, work program and budget approval, investment decision approval, voting rights in joint operating committees, amendments to permits and changes to joint arrangement participant holdings. Transactions which give Woodside control of a business are business combinations. If Woodside obtains joint control of an arrangement, judgement is also required to assess whether the arrangement is a joint operation or a joint venture. If Woodside has neither control nor joint control, it may be in a position to exercise significant influence over the entity, which is then accounted for as an associate.
 
Recognition and measurement
Joint arrangements are arrangements in which two or more parties have joint control. Joint control is the contractual agreed sharing of control of the arrangement which exists only when decisions about the relevant activities require unanimous consent of the parties sharing control. Joint arrangements are classified as either a joint operation or joint venture, based on the rights and obligations arising from the contractual obligations between the parties to the arrangement.
To the extent the joint arrangement provides the Group with rights to the individual assets and obligations arising from the joint arrangement, the arrangement is classified as a joint operation, and as such the Group recognises its:
 
·
 
assets, including its share of any assets held jointly;
·
 
liabilities, including its share of any liabilities incurred jointly;
·
 
revenue from the sale of its share of the output arising from the joint operation;
·
 
share of revenue from the sale of the output by the joint operation; and expenses, including its share of any expenses incurred jointly.
To the extent the joint arrangement provides the Group with rights to the net assets of the arrangement, the investment is classified as a joint venture and accounted for using the equity method.
Joint arrangements acquired which are deemed to be carrying on a business are accounted for applying the principles of
 
IFRS 3
Business Combinations
. Joint arrangements which are not deemed to be carrying on a business are treated as asset acquisitions.
 
F-6
3

Table of Contents
Notes to the financial statements
E. Other items
for the year ended 31 December 2022
 
E.7
 
Parent entity information
Note not required for the purposes of US reporting.
 
E.8
 
Subsidiaries
(a) Subsidiaries
 
Name of entity
  
        Notes 
Ultimate Parent Entity


Woodside Energy Group Ltd
  
 
(1,2,3


Subsidiaries
        
Company name


Woodside Energy Ltd
  
 
(2,3,4
Woodside Browse Pty
Ltd
  
 
(2,4
Woodside Burrup Pty Ltd
  
 
(2,4
Burrup Facilities Company Pty Ltd
  
 
(5
Burrup Train 1 Pty Ltd
  
 
(5
Pluto LNG Pty Ltd
  
 
(5
Woodside Burrup Train 2 A Pty Ltd
  
 
(2,4
Woodside Burrup Train 2 B Pty Ltd
  
 
(2,4
Woodside Energy (LNG Fuels and Power) Pty Ltd
  
 
(2,4
Woodside Energy (Domestic Gas) Pty Ltd
  
 
(2,4
Woodside Energy (Algeria) Pty Ltd
  
 
(2,4
Woodside Energy Australia Asia Holdings Pte Ltd LOGO
  
 
(4
Woodside Energy Holdings International Pty Ltd
  
 
(2,4
Woodside Energy International (Canada) Limited LOGO
  
 
(4
Woodside Energy (Canada LNG) Limited LOGO
  
 
(4
Woodside Energy (Canada PTP) Limited LOGO
  
 
(4
KM LNG Operating General Partnership LOGO
  
 
(9
KM LNG Operating Ltd LOGO
  
 
(4
Woodside Energy Holdings Pty Ltd
  
 
(2,4
Woodside Energy Holdings (USA) Inc LOGO
  
 
(4
Woodside Energy (USA) Inc LOGO
  
 
(4
Gryphon Exploration Company LOGO
  
 
(4
PT Woodside Energy Indonesia LOGO
  
 
(6
Woodside Energy (Cameroon) SARL
  
 
(4
Woodside Energy (Gabon) Pty Ltd
  
 
(2,4
Woodside Energy (Indonesia) Pty Ltd
  
 
(2,4
Woodside Energy (Indonesia II) Pty Ltd
  
 
(2,4
Woodside Energy (Malaysia) Pty Ltd
  
 
(2,4
Woodside Energy (Ireland) Pty Ltd
  
 
(2,4
Woodside Energy (Korea) Pte Ltd LOGO
  
 
(4
Woodside Energy (Korea II) Pte Ltd LOGO
  
 
(4
Woodside Energy (Myanmar) Pte Ltd LOGO
  
 
(4
Woodside Energy (Morocco) Pty Ltd
  
 
(2,4
Woodside Energy (New Zealand) Limited LOGO
  
 
(4
Woodside Energy (New Zealand 55794) Limited LOGO
  
 
(4
Woodside Energy (Peru) Pty Ltd
  
 
(2,4
Woodside Energy (Senegal) Pty Ltd
  
 
(2,4
Woodside Energy (Tanzania) Limited LOGO
  
 
(7
 
F-64

Notes to the financial statements
E. Other items
for the year ended 31 December 2022

 
Name of entity
  
        Notes 
Woodside Energy Holdings II Pty Ltd
  
 
(2,4
Woodside Power Pty Ltd
  
 
(2,4
Woodside Power (Generation) Pty Ltd
  
 
(2,4
Woodside Energy Holdings (South America) Pty Ltd
  
 
(2,4
Woodside Energia (Brasil) Apoio Administrativo L
tda
  
 
(8
Woodside Energy Holdings (UK) Pty Ltd
  
 
(2,4
Woodside Energy (UK) Limited LOGO
  
 
(
4
Woodside Energy Finance (UK) Limited LOGO
  
 
(4
Woodside Energy (Congo) Limited LOGO
  
 
(4
Woodside Energy (Bulgaria) Limited LOGO
  
 
(
4
Woodside Energy Holdings (Senegal) Limited LOGO
  
 
(4
Woodside Energy (Senegal) B.V. LOGO
  
 
(4
Woodside Energy (France) SAS LOGO
  
 
(4
Woodside Energy Iberia S.A. LOGO
  
 
(4
Woodside Energy (N.A.) Ltd LOGO
  
 
(4
Woodside Energy Services (Qingdao) Co Ltd LOGO
  
 
(4
Woodside Energy Julimar Pty Ltd
  
 
(2,4
Woodside Energy (Norway) Pty Ltd
  
 
(2,4
Woodside Energy Technologies Pty Lt
d
  
 
(2,4,14
Woodside Technology Solutions Pty Ltd
  
 
(2,4
Woodside Energy Scarborough Pty Ltd
  
 
(2,4
Woodside Energy Carbon Holdings Pty Ltd
  
 
(2,4
Woodside Energy Carbon (Assets) Pty Ltd
  
 
(2,4
Woodside Energy Carbon (Services) Pty Ltd
  
 
(2,4
Woodside Energy (Financial Advisory Services) Pty Ltd
  
 
(2,4
Woodside Energy Trading Singapore Pte Ltd LOGO
  
 
(4
WelCap Insurance Pte Ltd LOGO
  
 
(4
Woodside Energy Shipping Singapore Pte Ltd LOGO
  
 
(4
Metasource Pty Ltd
  
 
(2,4
Mermaid Sound Port and Marine Services Pty Ltd
  
 
(2,4
Woodside Finance Limited
  
 
(2,4
Woodside Petroleum (Timor Sea 19) Pty Ltd
  
 
(2,4
Woodside Petroleum (Timor Sea 20) Pty Ltd
  
 
(2,4
Woodside Petroleum Holdings Pty Ltd
  
 
(2,4,15
Woodside Energy Global Holdings Pty Ltd
  
 
(2,4
Woodside Energy Global Pty Ltd
  
 
(2,4
Perdido Mexico Pipeline Holdings, S.A. de C.V.  LOGO
  
 
(10
Perdido Mexico Pipeline, S. de R.L. de C.V. LOGO
  
 
(10
Woodside Energy Investments Pty Ltd
  
 
(2,4
Woodside Energia Brasil Investimentos Ltda. ●
  
 
(11
Woodside Energia Brasil Exploração e Produção Ltda. ●
  
 
(4
Woodside Energy (Great Britain) Limited LOGO
  
 
(4
Woodside Energy (North West Shelf) Pty Ltd
  
 
(2,4
Woodside Energy (Trinidad) Holdings Ltd LOGO
  
 
(4
Woodside Energy
(Trinidad-3A)
Ltd
LOGO
  
 
(4
 
F-65

Notes to the financial statements
E. Other items
for the year ended 31 December 2022
 
Name of entity
  
        Notes 
Woodside Energy USA Operations Inc LOGO
  
 
(12
Hamilton Brothers Petroleum Corporation LOGO
  
 
(4
Hamilton Oil Company LLC LOGO
  
 
(4
Woodside Energy Boliviana Inc. LOGO
  
 
(4
Woodside Energy (North America) LLC LOGO
  
 
(4
Woodside Energy (Americas) Inc. LOGO
  
 
(4
Woodside Energy (GOM) Inc. LOGO
  
 
(4
Woodside Energy Hawaii Inc. LOGO
  
 
(4,16
Woodside Energy Resources Inc. LOGO
  
 
(4
Woodside Energy Holdings (Resources) Inc. LOGO
  
 
(4
Woodside Energy USA Services Inc. LOGO
  
 
(4
Woodside Energy Marketing Inc. LOGO
  
 
(4
Woodside Energy (Deepwater) Inc. LOGO
  
 
(4,17
Woodside Energy (Foreign Exploration Holdings) LLC LOGO
  
 
(4
Woodside Energy (Trinidad Block 3) Limited  LOGO
  
 
(4
Woodside Energy (Trinidad Block 6) Limited LOGO
  
 
(4
Woodside Energy (Trinidad Block 5) Limited  LOGO
  
 
(4
Woodside Energy (Trinidad Block 7) Limited LOGO
  
 
(4
Woodside Energy (Trinidad Block 14) Limited LOGO
  
 
(4
Woodside Energy (Trinidad Block 23A) Limited LOGO
  
 
(4
Woodside Energy (Trinidad Block 23B) Limited  LOGO
  
 
(4
Woodside Energy (Trinidad Block 28) Limited LOGO
  
 
(4
Woodside Energy (Trinidad Block 29) Limited LOGO
  
 
(4
Woodside Energy (Bimshire) Limited LOGO
  
 
(4
Woodside Energy (South Africa 3B/4B) Limited LOGO
  
 
(4
Woodside Energy (Egypt) Limited LOGO
  
 
(4
Woodside Energy (Carlisle Bay) Limited LOGO
  
 
(4
Woodside Energy (Mexico) Limit
ed
LOGO
  
 
(4
Woodside Energía Servicios Administrativos,S. de R.L. de C.V. 
  
 
(13
Woodside Energía Servicios de México, S. de R.L. de C.V. 
  
 
(13
Woodside Energy (Mexico Holdings) LLC LOGO
  
 
(4
Operaciones Conjuntas, S. de R.L. de C.V. LOGO
  
 
(13
Woodside Energía Holdings de México, S. de R.L. de C.V. LOGO
  
 
(13
Woodside Petróleo Operaciones de México, S. de R.L. de C.V. LOGO
  
 
(13
Woodside Energy (Australia) Pty Ltd
  
 
(2,4
Woodside Energy (International Exploration) Pty Ltd
  
 
(2,4
Woodside Energy (Bass Strait) Pty Ltd
  
 
(2,4
Woodside Energy (Victoria) Pty Ltd
  
 
(2,4
Woodside Energy Holdings LLC LOGO
  
 
(4
Woodside Energy
(Trinidad-2C)
Ltd
LOGO
  
 
(4
Woodside Energy (Canada) Corporation LOGO
  
 
(4
 
1.
Woodside Energy Group Ltd, previously Woodside Petroleum Ltd, is the ultimate holding company and the head entity within the tax consolidated group.
2.
These companies were members of the Australian tax consolidated group at 31 December 2022.
3.
Woodside Energy Group Ltd and Woodside Energy Ltd are parties to a Deed of Cross Guarantee.
4.
All subsidiaries are wholly owned except those referred to in Notes 5 to 13.
5.
Kansai Electric Power Australia Pty Ltd and Tokyo Gas Pluto Pty Ltd each hold a 5% interest in the shares of these subsidiaries. These subsidiaries are controlled.
6.
PT Woodside Energy Indonesia was incorporated on 27 April 2022. As at 31 December 2022, Woodside Energy Holdings Pty Ltd held a 99% interest in the shares of PT Woodside Energy Indonesia. Woodside Energy Ltd held the remaining 1% interest.
7.
As at 31 December 2022, Woodside Energy Holdings Pty Ltd held >99.99% interest in the shares of Woodside Energy (Tanzania) Limited and Woodside Energy Ltd held the remaining interest.
8.
As at 31 December 2022, Woodside Energy Holdings (South America) Pty Ltd held >99.99% interest in the shares of Woodside Energia (Brasil) Apoio Administrativo Ltda and Woodside Energy Ltd held the remaining interest.
9.
As at 31 December 2022, Woodside Energy International (Canada) Limited and Woodside Energy (Canada LNG) Limited were the general partners of the KM LNG Operating General Partnership holding a 99.99% and 0.01% partnership interest, respectively.
10.
As at 31 December 2022, Woodside Energy Global Holdings Pty Ltd held a 99.99% interest in shares of Perdido Mexico Pipeline Holdings, S.A. de C.V. and Perdido Mexico Pipeline, S. de R.L. de C.V. Woodside Energy Investments Pty Ltd held the remaining 0.01% interest.
11.
As at 31 December 2022, Woodside Energy Investments Pty Ltd held a 99.97% interest in shares of Woodside Energia Brasil Investimentos Ltda. Woodside Energy Global Holdings Pty Ltd held the remaining 0.03% interest.
12.
As at 31 December 2022, Woodside Energy Global Holdings Pty Ltd held 90% voting interest and 37.67% interest in shares of Woodside Energy USA Operations Inc. Woodside Energy Holdings LLC held the remaining 10% voting interest and 62.33% interest in shares.
13.
As at 31 December 2022, Woodside Energy (Mexico) Limited held a 99% interest in shares of Woodside Energía Servicios Administrativos, S. de R.L. de C.V., Woodside Energía Servicios de México, S. de R.L. de C.V., Operaciones Conjuntas, S. de R.L. de C.V. and Woodside Petróleo Operaciones de México, S. de R.L. de C.V. and 99.99% interest in shares of Woodside Energía Holdings de México, S. de R.L. de C.V. Woodside Energy (Mexico Holdings) LLC held the remaining
0.01%-1%
interest.
14.
Woodside Energy Technologies Pty Ltd owns 28.50% in Blue Ocean Seismic Services Limited which is accounted for as an investment in associate.
15.
Woodside Energy (North West Shelf) Pty Ltd and Woodside Petroleum Holdings Pty Ltd owns 16.67% in International Gas Transportation Company Limited respectively. This investment has been accounted for as an investment in associate.
16.
Woodside Energy Hawaii Inc owns 14.96% in Iwilei District Participating Parties LLC which is accounted for as an investment in associate.
17.
Woodside Energy (Deepwater) Inc owns 25% in Caesar Oil Pipeline Company LLC, 22% in Cleopatra Gas Gathering Company LLC and 10% in Marine Well Containment Company LLC. These investments are accounted for as an investment in associate.
All subsidiaries were incorporated in Australia unless identified with one of the following symbols:
 
 
            Bermuda


            Mexico


            Singapore
 
            Brazil
 
u
 
            Indonesia


            Spain
 
            Cameroon


            The Netherlands


            Tanzania
t
 
            Canada


            R. of Trinidad and Tobago
 
p
 
            United Kingdom

 
            China


            New Zealand
 
q
 
            United States


            France


            Saint Lucia


F-6
6

Notes to the financial statements
E. Other items
for the year ended 31 December 2022
 
Classification
Subsidiaries are all the entities over which the Group has the power over the investee such that the Group is able to direct the relevant activities, has exposure, or rights, to variable returns from its involvement with the investee and has the ability to use its power over the investee to affect the amount of the investor’s returns.
(b) Subsidiaries with material
non-controlling
interests
The Group has two Australian subsidiaries with material
non-controlling
interests (NCI).
 
  Name of entity
  
Principal place of business
  
                                            % held by NCI  
 
  Burrup Facilities Company Pty Ltd
  
Australia
  
 
10%  
 
  Burrup Train 1 Pty Ltd
  
Australia
  
 
10%  
 
The NCI in both subsidiaries is 10% held by the same parties (refer to Note E.8(a) footnote 5 for details).
The summarised financial information (including consolidation adjustments but before intercompany eliminations) of subsidiaries with material NCI is as follows:
 
   
2022
   
2021
   
2020
 
    
          US$m
   
                US$m
   
                    US$m
 
       
Burrup Facilities Company Pty Ltd
                       
       
Current assets
 
 
567


518


425
 
       
Non-current
assets
 
 
5,047


5,038


5,224
 
       
Current liabilities
 
 
(68
 
 
(71)


(51)
 
       
Non-current
liabilities
 
 
(528
 
 
(528)


(571)
 
       
Net assets
 
 
5,018


4,957


5,027
 
       
Accumulated balance of NCI
 
 
502


496


503
 
       
Revenue
 
 
889


858


859
 
       
Profit
 
 
489


328


318
 
       
Profit allocated to NCI
 
 
49


33


32
 
       
Dividends paid to NCI
 
 
(43
 
 
(40)


(32)
 
       
Operating
 
 
601


633


652
 
       
Investing
 
 
(45
 
 
(111)


(69)
 
       
Financing
 
 
(556
 
 
(522)


(583)
 
       
Net increase/(decrease) in cash and cash equivalents
 
 
-


-


-
 
       
Burrup Train 1 Pty Ltd
                       
       
Current assets
 
 
429


435


372
 
       
Non-current
assets
 
 
2,900


2,915


3,081
 
       
Current liabilities
 
 
(119
 
 
(110)


(103)
 
       
Non-current
liabilities
 
 
(325
 
 
(345)


(385)
 
       
Net assets
 
 
2,885


2,895


2,965
 
       
Accumulated balance of NCI
 
 
289


290


297
 
       
Revenue
 
 
1,471


1,421


1,423
 
       
Profit
 
 
282


200


208
 
       
Profit allocated to NCI
 
 
28


20


21
 
       
Dividends paid to NCI
 
 
(29
 
 
(27)


(13)
 
       
Operating
 
 
391


393


473
 
       
Investing
 
 
(55
 
 
(4)


(2)
 
       
Financing
 
 
(336
 
 
(389)


(471)
  
       
Net increase/(decrease) in cash and cash equivalents
 
 
-


-


-
 
 
F-6
7

Notes to the financial statements
E. Other items
for the year ended 31 December 2022
 
(c) Deed of Cross Guarantee and Closed Group
Note not required for the purposes of US reporting.
 
E.9
 
Other accounting policies
(a) Summary of other significant accounting policies
Australia tax consolidation
The parent and its wholly owned Australian controlled entities have elected to enter a tax consolidation, with Woodside Energy Group Ltd as the head entity of the tax consolidated group. The members of the Australian tax consolidated group are identified in Note E.8(a).
The tax expense/benefit, deferred tax liabilities and deferred tax assets arising from temporary differences of the members of the tax consolidated group are recognised in the separate financial statements of the members of the tax consolidated group, using the stand-alone approach.
Entities within the tax consolidated group have entered into a tax funding arrangement and a tax sharing agreement with the head entity. Under the tax funding agreement, Woodside Energy Group Ltd and each of the entities in the tax consolidated group have agreed to pay or receive a tax equivalent payment to or from the head entity, based on the current tax liability or current tax asset of the entity.
The tax sharing agreement entered into between members of the tax consolidated group provides for the determination of the allocation of income tax liabilities between the entities, should the head entity default on its tax payment obligations. No amounts have been recognised in the financial statements in respect of this agreement as payment of any amounts under the tax sharing agreement is considered remote.
US tax consolidation
Woodside Energy USA Operations Inc and its wholly owned USA controlled entities have elected to file a consolidated tax return, with Woodside Energy USA Operations Inc as the parent of the tax consolidated group.
The tax expense/benefit, deferred tax liabilities and deferred tax assets arising from temporary differences of the members of the tax consolidated group are computed on a separate company basis.
Entities within the tax consolidated group have entered into a tax sharing agreement. Under the tax sharing agreement, the tax liability for the consolidated group or the utilisation of tax attributes are settled periodically between the members of the group. No amounts have been recognised in the financial statements in respect of this agreement as payment of any amounts under the tax sharing agreement is considered remote.
(b) New and amended accounting standards and interpretations issued but not yet effective
A number of new standards, amendments of standards and interpretations have recently been issued but are not yet effective and have not been adopted by the Group as at the financial reporting date.
The Group has reviewed these standards and interpretations and has determined that none of the new or amended standards will significantly affect the Group’s accounting policies, financial position or performance.
(c) New and amended accounting standards and interpretations adopted
As of 1 January 2022, the Group adopted the following amendments:
 
·
 
Amendments to IFRS 3 Reference to the Conceptual Framework
·
 
Amendments to IFRS 9 Fees in the ‘10 per cent’ Test for Derecognition of Financial Liabilities
·
 
Amendments to IAS 37 Onerous Contracts - Costs of Fulfilling a Contract
These amendments did not impact the financial statements of the Group.
A number of other new standards are also effective from 1 January 2022 but they do not have a material effect on the Group’s financial statements.


F-68

Table of Contents
Directors’ declaration
 
Directors’ declaration
Not required for the purposes of US reporting.
 
F-69

Table of Contents
PwC - Report of Independent Registered Public Accounting Firm
Report of Independent Registered Public Accounting Firm
To the Board of Directors and Shareholders of Woodside Energy Group Ltd
Opinion on the Financial Statements
We have audited the accompanying consolidated statement of financial position of Woodside Energy Group Ltd and its subsidiaries (the “Company”) as of December 31, 2022, and the related consolidated income statement, statement of comprehensive income, statement of cash flows and statement of changes in equity for the year then ended, including the related notes (collectively referred to as the “consolidated financial statements”). In our opinion, the consolidated financial statements present fairly, in all material respects, the financial position of the Company as of December 31, 2022, and the results of its operations and its cash flows for the year then ended in conformity with International Financial Reporting Standards as issued by the International Accounting Standards Board (“IFRS”).
We also have audited the adjustments to the 2021 and 2020 consolidated financial statements to reflect the change in the composition of reportable segments, as described in Notes A.1, B.1 and D.1. In our opinion, such adjustments are appropriate and have been properly applied. We were not engaged to audit, review, or apply any procedures to the 2021 and 2020 consolidated financial statements of the Company other than with respect to the adjustments and, accordingly, we do not express an opinion or any other form of assurance on the 2021 and 2020 consolidated financial statements taken as a whole.
Basis for Opinion
These consolidated financial statements are the responsibility of the Company’s management. Our responsibility is to express an opinion on the Company’s consolidated financial statements based on our audit. We are a public accounting firm registered with the Public Company Accounting Oversight Board (United States) (PCAOB) and are required to be independent with respect to the Company in accordance with the U.S. federal securities laws and the applicable rules and regulations of the Securities and Exchange Commission and the PCAOB.
We conducted our audit of these consolidated financial statements in accordance with the standards of the PCAOB. Those standards require that we plan and perform the audit to obtain reasonable assurance about whether the consolidated financial statements are free of material misstatement, whether due to error or fraud.
Our audit included performing procedures to assess the risks of material misstatement of the consolidated financial statements, whether due to error or fraud, and performing procedures that respond to those risks. Such procedures included examining, on a test basis, evidence regarding the amounts and disclosures in the consolidated financial statements. Our audit also included evaluating the accounting principles used and significant estimates made by management, as well as evaluating the overall presentation of the consolidated financial statements. We believe that our audit provides a reasonable basis for our opinion.
 
F-70

Table of Contents
Critical Audit Matters
The critical audit matters communicated below are matters arising from the current period audit of the consolidated financial statements that were communicated or required to be communicated to the audit committee and that (i) relate to accounts or disclosures that are material to the
consolidated financial statements and (ii) involved our especially challenging, subjective, or complex judgments. The communication of critical audit matters does not alter in any way our opinion on the consolidated
financial statements, taken as a whole, and we are not, by communicating the critical audit matters below, providing separate opinions on the critical audit matters or on the accounts or disclosures to which they relate.
BHP Petroleum business combination – valuation of the fair value of net assets acquired
As described in Note
B.5 to the consolidated financial statements, the Company completed the acquisition of BHP Petroleum for total purchase consideration of $18,610 million on June 1, 2022. The acquisition method of accounting was used by the Company to account for this business combination, under which the fair value of net identifiable assets was provisionally estimated at acquisition date to be $13,996 million, giving rise to goodwill from the acquisition of $4,614 million. As disclosed by management, estimating the fair value of net assets acquired requires the selection of appropriate valuation methodologies which include the use of cash flow models underpinned by significant estimates and assumptions. These assumptions include estimates of acquired oil and gas reserves and resources, estimates of future production and commodity prices, forecast operating costs and capital expenditures, discount rate assumptions, estimates of restoration obligations, assumptions relating to the Company’s ability to utilize acquired tax losses, and estimates of carbon cost.
The principal considerations for our determination that performing procedures relating to the valuation of the fair value of net assets acquired as part of the BHP Petroleum business combination is a critical audit matter are (i) there is a significant level of judgment applied by the Company in determining the fair value of net assets acquired including the use of cash flow models. The Company has also utilized specialists to assist in the estimation of fair value; (ii) this in turn led to a high degree of auditor judgment, effort and subjectivity in performing procedures and evaluating the Company’s methodology, significant assumptions and estimates; and (iii) the nature and extent of audit effort required to perform the procedures and evaluate the Company’s methodology, significant assumptions and estimates required the use of professionals with specialized skill and knowledge.
Addressing the matter involved performing procedures and evaluating audit evidence in connection with forming our overall opinion on the consolidated financial statements. These procedures included, among others (i) evaluating the Company’s accounting for the fair value of net assets acquired in a business combination against the requirements of IFRS, the Share Sale Agreement and our understanding of the acquired net assets of BHP Petroleum; (ii) assessing the methodology applied by the Company to estimate the fair value of assets and liabilities acquired at June 1, 2022, including assessing the reasonableness of significant estimates and assumptions; (iii) evaluating the work of the Company’s specialists involved in the determination of significant assumptions and estimates; (iv) evaluating the disclosures made regarding the business combination in the consolidated financial statements against the requirements of IFRS; and (v) professionals with specialized skill and knowledge were used to assist in evaluating the reasonableness of the Company’s fair value estimates.
Allocation and carrying value of goodwill
As described in Note B.4 and B.5 to the consolidated financial statements, the Company’s acquisition of BHP Petroleum on June 1, 2022 gave rise to goodwill of $4,614 million. At December 31, 2022, the Company conducted its annual goodwill impairment testing. Potential goodwill impairment is identified by the Company comparing an estimate of the recoverable amount of cash generating units (“CGUs”) to their allocated carrying values, including goodwill, with recoverable amount estimated by reference to the higher of fair value less costs of disposal and value in use. Fair value is estimated using cash flow models, incorporating significant judgments and assumptions relating to estimates of oil and gas reserves and resources, estimates of future production and commodity prices, forecast operating costs and capital expenditures incorporating expected inflation and foreign exchange rates, discount rate assumptions, and estimates of carbon cost.
 
F-71

Table of Contents
The principal considerations for our determination that performing procedures relating to the assessment of goodwill impairment and allocation to CGUs is a critical audit matter are (i) there is a significant level of judgment applied by the Company in determining which CGUs are expected to benefit from synergies from the business combination in order to allocate goodwill; (ii) there is a significant level of judgment applied by the Company, as well as the use of the Company’s specialists, in the determination of the significant estimates and assumptions included in impairment testing models; (iii) this in turn led to a high degree of auditor judgment, effort and subjectivity in performing procedures and evaluating the Company’s methodology, significant assumptions and estimates; and (iv) the audit effort involved the use of professionals with specialized skill and knowledge.
Addressing the matter involved performing procedures and evaluating audit evidence in connection with forming our overall opinion on the consolidated financial statements. These procedures included, among others (i) evaluating the appropriateness of the methodology applied to allocate goodwill arising from the business combination to the Company’s CGUs; (ii) assessing the methodology applied by the Company to estimate the CGUs’ fair values of assets and liabilities at December 31, 2022, including assessing the reasonableness of significant estimates and assumptions applied by the Company to estimate recoverable amounts; (iii) evaluating the work of the Company’s specialists involved in the determination of significant assumptions and estimates, (iv) evaluating the disclosures made regarding the goodwill recognised in the consolidated financial statements against the requirements of IFRS; and (v) professionals with specialized skill and knowledge were used to assist in evaluating the appropriateness of the Company’s recoverable amount estimates when testing goodwill for impairment including certain significant assumptions.
Estimation of restoration provisions
As described in Note D.5 to the consolidated financial statements, restoration provisions of $6,253 million have been recognized at December 31, 2022. The estimation of restoration provisions by the Company involves significant judgment in selecting methodologies and assumptions including the removal date, the application of environmental legislation and regulations, the extent of restoration activities required in the future, the methodology for estimating cost and liability-specific discount rates used to estimate the present value of these cash flows.
The principal considerations for our determination that performing procedures relating to estimation of restoration provisions is a critical audit matter are (i) there is a significant level of judgment applied by the Company in selecting methodologies and applying the assumptions mentioned above; (ii) which in turn led to a high degree of auditor judgment, effort and subjectivity in performing procedures and evaluating the Company’s methodologies, significant assumptions and estimates.
Addressing the matter involved performing procedures and evaluating audit evidence in connection with forming our overall opinion on the consolidated financial statements. These procedures included, among others (i) tests of the effectiveness of controls relating to the Company’s assessment of the key judgments and assumptions included within the restoration provision estimate; (ii)
evaluating the appropriateness of the methodologies and significant assumptions applied to estimate the restoration provisions; and (iii) evaluating the disclosures made regarding restoration provisions in the consolidated financial statements against the requirements of IFRS.
Valuation of the Petroleum Resource Rent Tax (PRRT) deferred tax assets (DTAs)
As described in Note A.5 to the consolidated financial statements, the Company has recognized deferred tax assets of $1,959 million, of which $1,821 million relates to PRRT. PRRT is considered, for accounting purposes, to be an income tax. PRRT DTAs are based on estimates of future taxable profits available to recover incurred general and exploration expenditure. The Company’s estimation of the PRRT DTAs involves significant judgments and assumptions including assessing the application of PRRT legislation and regulations, the forecast future taxable profits generated from the Australian assets, which have regard to the future commodity price assumptions, and forecast assessable revenues, exploration and general expenditure.
 
F-72

Table of Contents
The principal considerations for our determination that performing procedures relating to valuation of PRRT DTAs is a critical audit matter are (i) there is a significant level of judgment applied by the Company in determining the recoverability of the PRRT DTAs, including having regard to the judgments and assumptions mentioned above, and considering the specialized knowledge and input of the Company’s specialists informing significant estimates and assumptions; (ii) which in turn led to a high degree of auditor judgment, effort and subjectivity in performing procedures and evaluating the Company’s methodology, significant assumptions and estimates; and (iii) the nature and extent of audit effort required to perform the procedures and evaluate the Company’s methodology, significant assumptions and estimates required the use of professionals with specialized skill and knowledge.
Addressing the matter involved performing procedures and evaluating audit evidence in connection with forming our overall opinion on the consolidated financial statements. These procedures included, among others, (i) assessing the reasonableness of significant judgments and assumptions applied by the Company to estimate the recoverable amount of DTAs; (ii) evaluating the work of the Company’s specialists involved in the determination of significant judgments and estimates; (iii) evaluating the disclosures made regarding the PRRT DTAs recognised in the consolidated financial statements against the requirements of IFRS; and (iv) professionals with specialized skill and knowledge were used to assist in evaluating the appropriateness of the Company’s assessment of recoverability of the PRRT DTAs including certain significant assumptions.
Wheatstone CGU impairment reversal
As described in Note B.4 to the consolidated financial statements, the Company conducted an impairment assessment at December 31, 2022 and estimated the recoverable amount of the Wheatstone CGU. This resulted in the recognition of an impairment reversal of $900 million. The recoverable amount was estimated using a fair value less costs of disposal approach utilizing a cash flow model. The Company’s cash flow model included significant judgments and assumptions relating to oil and gas reserves and resources, estimates of future production and commodity prices, forecast operating costs and capital expenditures incorporating expected inflation and foreign exchange rates, discount rate assumptions, and estimates of carbon costs.
The principal considerations for our determination that performing procedures relating to the assessment of impairment reversal is a critical audit matter are (i) there is a significant level of judgment applied by the Company, including the use of the Company’s specialists, in the determination of the significant estimates and assumptions included in the Wheatstone CGU impairment model; (ii) this in turn led to a high degree of auditor judgment, effort and subjectivity in performing procedures and evaluating the Company’s significant assumptions and estimates; and (iii) the nature and extent of audit effort required to perform the procedures and evaluate the Company’s significant assumptions and estimates required the use of professionals with specialized skill and knowledge.
Addressing the matter involved performing procedures and evaluating audit evidence in connection with forming our overall opinion on the consolidated financial statements. These procedures included, among others, (i) assessing the reasonableness of significant estimates and assumptions applied by the Company; (ii) evaluating the work of the Company’s specialists involved in the determination of significant assumptions and estimates (iii) evaluating the disclosures made regarding the Wheatstone CGU impairment reversal in the consolidated financial statements against the requirements of IFRS; and (iv) professionals with specialized skill and knowledge were used to assist in evaluating the appropriateness of the Company’s recoverable amount estimates.
/s/ PricewaterhouseCoopers
Perth, Australia
February 27, 2023
We have served as the Company’s auditor since 2022.
 
F-73

Table of Contents
EY - Report of Independent Registered Public Accounting Firm
Report of Independent Registered Public Accounting Firm
To the Shareholders and the Board of Directors of Woodside Energy Group Ltd (formerly known as Woodside Petroleum Ltd)
Opinion on the Financial Statements
We have audited, before the effects of the adjustments to retrospectively reflect the change in the composition of reportable segments described in Notes A.1, B.1, and D.1, the statement of financial position of Woodside Energy Group Limited as of December 31, 2021, and December 31, 2020, and the related statements of comprehensive income, changes in equity, and cash flows for each of the two years in the period ended December 31, 2021, and the related notes (collectively referred to as the “consolidated financial statements”). The 2021 and 2020 consolidated financial statements before the effects of the adjustments to retrospectively reflect the change in the composition of reportable segments discussed in Notes A.1, B.1, and D.1, are not presented herein. The 2021 and 2020 consolidated financial statements are the responsibility of the company’s management. Our responsibility is to express an opinion on these financial statements based on our audits.
In our opinion, the 2021 and 2020 consolidated financial statements, before the effects of the adjustments to retrospectively reflect the change in the composition of reportable segments described in Notes A.1, B.1, and D.1, present fairly, in all material respects, the financial position of Woodside Energy Group Limited as of 31 December 2021 and 2020 and the results of its operations and its cash flows for the years then ended in conformity with International Financial Reporting Standards (“IFRS”) as issued by the International Accounting Standards Board.
We were not engaged to audit, review, or apply any procedures to the adjustments to retrospectively reflect the change in the composition of reportable segments described in Notes A.1, B.1, and D.1, and, accordingly, we do not express an opinion or any other form of assurance about whether such adjustments are appropriate and have been properly applied. Those adjustments were audited by PricewaterhouseCoopers.
Basis for Opinion
We are a public accounting firm registered with the Public Company Accounting Oversight Board (United States) (PCAOB) and are required to be independent with respect to the Group in accordance with the U.S. federal securities laws and the applicable rules and regulations of the Securities and Exchange Commission and the PCAOB.
We conducted our audits in accordance with the standards of the PCAOB. Those standards require that we plan and perform the audit to obtain reasonable assurance about whether the financial statements are free of material misstatement, whether due to error or fraud. The Group is not required to have, nor were we engaged to perform, an audit of its internal control over financial reporting. As part of our audits we are required to obtain an understanding of internal control over financial reporting but not for the purpose of expressing an opinion on the effectiveness of the Group’s internal control over financial reporting. Accordingly, we express no such opinion.
Our audits included performing procedures to assess the risks of material misstatement of the financial statements, whether due to error or fraud, and performing procedures that respond to those risks. Such procedures included examining, on a test basis, evidence regarding the amounts and disclosures in the financial statements. Our audits also included evaluating the accounting principles used and significant estimates made by management, as well as evaluating the overall presentation of the financial statements. We believe that our audits provide a reasonable basis for our opinion.
/s/ Ernst & Young
We have served as the Group’s auditor from 1954 to 2022.
Perth, Australia
8 March 2022
 
F-74

Table of Contents
    
  SECTION 6: ADDITIONAL INFORMATION
    
 
SECTION 6.1
Supplementary information on oil and gas - unaudited
In accordance with the requirements of the Financial Accounting Standards Board (FASB) Accounting Standard Codification ‘Extractive
Activities-Oil
and Gas’ (Topic 932) and SEC requirements set out in Subpart 1200 of Regulation
S-K,
the Group is presenting certain disclosures about its oil and gas activities. These disclosures are presented below as supplementary oil and gas information, in addition to information relating to the reserves and production disclosed in section 3.9 of this report.
The information set out in this section is referred to as unaudited as it is not included in the scope of the audit opinion of the independent auditor on Woodside’s Financial Statements.
Reserves
Proved oil and gas reserves information is included in section 3.9 - Reserves Statement.
Capitalised costs relating to oil and gas production activities
The following table shows the aggregate capitalised costs related to oil and gas exploration and production activities, and the related accumulated depreciation, depletion, amortisation and valuation provisions.
 
    
Australia
US$m
    
International
US$m
    
Total
US$m
 
 
  2022


  Unproved properties
  
 
1,154


1,834


2,988
 
       
  Proved
properties
1
  
 
49,190


15,546


64,736
 
       
  Total costs
  
 
50,344


17,380


67,724
 
       
  Less: Accumulated depreciation, depletion, amortisation and valuation provisions
  
 
(24,353)


(2,491)


(26,844)

       
  Net capitalised costs
  
 
25,991


14,889


40,880


  2021


  Unproved properties
  
 
1,172


1,703


2,875
 
       
  Proved
properties
1
  
 
38,352


2,517


40,869
 
       
  Total costs
  
 
39,524


4,220


43,744
 
       
  Less: Accumulated depreciation, depletion, amortisation and valuation provisions
  
 
(22,738)


(1,958)


(24,696)
 
       
  Net capitalised costs
  
 
16,786


2,262


19,048


  2020


  Unproved properties
  
 
2,709


1,750


4,459


Proved properties
1
  
 
35,892


1,377


37,269
 
       
  Total costs
  
 
38,601


3,127


41,728
 
       
  Less: Accumulated depreciation, depletion, amortisation and valuation provisions
  
 
(22,305)


(2,111)


(24,416)

       
  Net capitalised costs
  
 
16,296


1,016


17,312
 
 
  1.
Proved properties include the fair value ascribed to future phases of certain projects acquired through business combinations.
 
A-1

Table of Contents
Costs incurred relating to oil and gas property acquisition, exploration and development activities
The following table shows the costs incurred related to oil and gas property acquisition, exploration and development activities (expensed and capitalised). Amounts shown include interest capitalised.


Australia
US$m
 
    
International
US$m
 
    
Total
US$m
 
  2022


  Acquisitions of proved property
  
 
8,488


11,098


19,586
 
  Acquisitions of unproved property
  
 
-


180


180
 
  Exploration
1
  
 
39


541


580
 
  Development
2
  
 
2,365


1,740


4,105
 
         
  Total costs
3
  
 
10,892


13,559


24,451


  2021
                           
  Acquisitions of proved property
  
 
-


205


205
 
  Acquisitions of unproved property
  
 
-


7


7
 
  Exploration
1
  
 
459


84


543
 
  Development
  
 
1,141


935


2,076
 
         
  Total costs
3
  
 
1,600


1,231


2,831


  2020
                           
  Acquisitions of proved property
  
 
-


540


540
 
  Acquisitions of unproved property
  
 
-


26


26
 
  Exploration
1
  
 
279


117


396
 
  Development
  
 
987


256


1,243
 
         
  Total costs
3
  
 
1,266


939


2,205
 
 
  1.
Represents gross exploration expenditure, including capitalised exploration expenditure, geological and geophysical expenditure and development evaluation costs charged to income as incurred.
  2.
Total development costs includes $3,812 million of expenditure and $294 million of capitalised interest in 2022.
  3.
Total costs include $23,991 million (2021: $2,777 million, 2020: $2,138 million) capitalised during the year.
 
A-2

Table of Contents
Results of operations from oil and gas production activities
 
     
Australia
US$m
    
International
US$m
    
Total
US$m
 
 
  2022


  Oil and gas revenue
  
 
12,453


1,575


14,028
 
       
  Production costs
  
 
(1,277
  
 
(353
  
 
(1,630
       
  Exploration expenses
  
 
(20
  
 
(440
  
 
(460
       
  Depreciation, depletion, amortisation and valuation provision
1
  
 
(1,476
)   
 
(460
  
 
(1,936
)
       
  Production taxes
2
  
 
(429
  
 
(16
  
 
(445
       
  Accretion expense
3
  
 
(85
  
 
(23
  
 
(108
       
  Income taxes
  
 
(2,707
)   
 
(151
  
 
(2,858
)
       
  Royalty-related taxes
4
  
 
(501
  
 
-


(501
       
  
Results of oil and gas producing activities
5
  
 
5,958


132


6,090


  2021


  Oil and gas revenue
  
 
5,624


-


5,624
 
       
  Production costs
  
 
(504
  
 
-


(504
       
  Exploration expenses
  
 
(6
  
 
(48
  
 
(54
       
  Depreciation, depletion, amortisation and valuation provision
1
  
 
(501
  
 
(268
  
 
(769
       
  Production taxes
2
  
 
(218
  
 
-


(218
       
  Accretion expense
3
  
 
(23
  
 
(1
  
 
(24
       
  Income taxes
  
 
(1,312
  
 
-


(1,312
       
  Royalty-related taxes
4
  
 
-


-


-


Results of oil and gas producing activities
5
  
 
3,060


(317
  
 
2,743


  2020


  Oil and gas revenue
  
 
3,339


-


3,339
 
       
  Production costs
  
 
(550
  
 
-


(550
       
  Exploration expenses
  
 
(8
  
 
(59
  
 
(67
       
  Depreciation, depletion, amortisation and valuation provision
1
  
 
(5,833
  
 
(1,137
  
 
(6,970
       
  Production taxes
2
  
 
(82
  
 
-


(82
       
  Accretion expense
3
  
 
(27
  
 
(1
  
 
(28
       
  Income taxes
  
 
948


-


948
 
       
  Royalty-related taxes
4
  
 
-


-


-
 
       
  Results of oil and gas producing activities
5
  
 
(2,213
  
 
(1,197
  
 
(3,410
 
1.
Includes valuation
provision reversal
 of $900 million
in 2022
(2021:
reversal of $
1,048 million
 and
2020:
recognition of
$5,269 million).
2.
Includes royalties and excise duty.
3.
Represents the unwinding of the discount on the closure and rehabilitation provision.
4.
Includes petroleum resource rent tax and petroleum revenue tax where
applicable. Excludes deferred tax expense/ (benefit) of $(814) million (2021: $297 million; 2020: $(439) million). 
5.
This table reflects the results of our oil and gas activities as reported in Note A.1 Segment revenue and expenses in section 5 – Financial Statements. Other income, other expenses, general and administrative costs and amounts relating to the marketing and corporate/other segments within the note are excluded.
 
A-3

Table of Contents
Standardised measure of discounted future net cash flows relating to proved oil and gas reserves (standardised measure)
The following tables set out the standardised measure of discounted future net cash flows, and changes therein, related to the Group’s estimated proved reserves as presented in Reserves, and should be read in conjunction with that disclosure.
The analysis is prepared in compliance with FASB Oil and Gas Disclosure requirements, applying certain prescribed assumptions under Topic 932 including the use of unweighted average
first-day-of-the-month
market prices for the previous
12-months,
year-end
cost factors, currently enacted tax rates and an annual discount factor of 10% to
year-end
quantities of net proved reserves.
Certain key assumptions prescribed under Topic 932 are arbitrary in nature and may not prove to be accurate. The reserve estimates on which the Standard measure is based are subject to revision as further technical information becomes available or economic conditions change.
Discounted future net cash flows like those shown below are not intended to represent estimates of fair value. An estimate of fair value would also take into account, among other things, the expected recovery of reserves in excess of proved reserves, anticipated future changes in commodity prices, exchange rates, development and production costs as well as alternative discount factors representing the time value of money and adjustments for risk inherent in producing oil
and gas.
Woodside standardised measure year ended 31 December.
 
    
Australia
US$m
 
      
International
US$m
 
      
Total
US$m


  2022
                              
       
  Future cash inflows
1
  
 
197,194


38,256


235,450
 
       
  Future production costs
1
  
 
(31,157)


(9,698)


(40,855)
 
       
  Future development costs
2
  
 
(12,259)


(4,487)


(16,746)
 
       
  Future income taxes
  
 
(62,182)


(4,823)


(67,005)
 
  Future net cash flows
  
 
91,596


19,248


110,844
 
       
  Discount at 10% per annum
  
 
(48,924)
      
 
(7,777)


(56,701)
 
       
  Standardised measure
  
 
42,672


11,471


54,143


  2021
                              
       
  Future cash inflows
1
  
 
76,202


5,695


81,897
 
       
  Future production costs
1
  
 
(22,193)


(899)


(23,092)
 
       
  Future development costs
2
  
 
(8,296)
      
 
(2,481)


(10,777)
 
       
  Future income taxes
  
 
(16,266)


(90)
      
 
(16,356)
 
       
  Future net cash flows
  
 
29,447


2,225


31,672
 
       
  Discount at 10% per annum
  
 
(14,793)
      
 
(1,142)


(15,935)
 
       
  Standardised measure
  
 
14,654


1,083


15,737


  2020
                              
       
  Future cash inflows
1
  
 
14,629


-


14,629
 
       
  Future production costs
1
  
 
(3,862)
      
 
-


(3,862)
 
       
  Future development costs
2
  
 
(3,800)


-


(3,800)
 
       
  Future income taxes
  
 
(1,023)
      
 
-


(1,023)
 
       
  Future net cash flows
  
 
5,944


-


5,944
 
       
  Discount at 10% per annum
  
 
(860)
      
 
-


(860)
 
       
  Standardised measure
  
 
5,084


-


5,084
 
 
1.
Woodside have entered multiple term contracts relating to LNG volumes from our producing and sanctioned assets. Under a 2P reserves outcome, we produce a sufficient quantity of LNG to satisfy these contracts within expected timeframes. Therefore, we have not included the revenue and cost impact of LNG shortfalls under a SEC 1P reserves outcome.
2.
Future development costs include decommissioning.
 
A-4

Table of Contents
Changes in the standardised measure are presented in the following table.


2022
          US$m
 
    
2021
          US$m
 
    
2020
          US$m
 
  
Changes in the standardised measure


  Standardised measure at the beginning of the year
    
 
15,737


5,084


10,324
 
       
  Revisions:


  Prices, net of production costs
    
 
22,558


7,741


(5,800)
 
       
  Changes in future development costs
    
 
(873)


20


(29)
 
       
  Revisions of reserves quantity estimates
    
 
5,898


2,109


269
 
       
  Accretion of discount
    
 
4,051


430


1,038
 
       
  Changes in production timing and other
    
 
2,371


3,485


(1,180)
 
       
  Sales of oil and gas, net of production costs
    
 
(10,202)


(5,698)


(2,666)
 
       
  Acquisitions of
reserves-in-place
    
 
28,309


-


-
 
       
  Sales of
reserves-in-place
    
 
-


-


-
 
       
  Previously estimated development costs incurred
    
 
3,339


565


702
 
       
  Extensions, discoveries, and improved recoveries, net of future costs
    
 
-


8,346


44
 
       
  Changes in future income taxes
    
 
(17,045)


(6,345)


2,382
 
 
  Standardised measure at the end of the year
    
 
54,143


15,737


5,084
 
 
1.
Changes in reserves quantities are shown in section 3.9 - Reserves Statement.
Accounting for suspended exploratory well costs
Expenditure on exploration and evaluation is accounted for in accordance with the area of interest method. Areas of interest are based on a geographical area for which the rights of tenure are current. All exploration and evaluation expenditure, including general permit activity, geological and geophysical costs and new venture activity costs, is expensed as incurred except for the following:
 
 
where the expenditure relates to an exploration discovery for which the assessment of the existence or otherwise of economically recoverable hydrocarbons is not yet complete; or
 
 
where the expenditure is expected to be recouped through successful exploitation of the area of interest, or alternatively, by its sale.
The costs of acquiring interests in new exploration and evaluation licences are capitalised. The costs of drilling exploration wells are initially capitalised pending the results of the well.
Costs are expensed where the well does not result in the successful discovery of economically recoverable hydrocarbons and the recognition of an area of interest.
Subsequent to the recognition of an area of interest, all further evaluation costs relating to that area of interest are capitalised.
Upon approval for the commercial development of an area of interest, accumulated expenditure for the area of interest is transferred to oil and gas properties.
In the consolidated statement of cash flows, those cash flows associated with capitalised exploration and evaluation expenditure, including unsuccessful wells, are classified as cash flows used in investing activities.
 
A-5

Table of Contents
The following table provides the changes to the capitalised exploratory well costs that were pending the determination of proved reserves for the three years ended 31 December 2022, 31 December 2021 and 31 December 2020.


2022
US$m
 
    
2021
US$m
 
    
2020
US$m


  Movement in capitalised exploratory well costs
1


  At the beginning of the year
    
 
614


2,045


3,809
 
       
  A
c
quisition to the capitalised exploratory well costs pending the determination of proved reserves
    
 
180


-


-
 
       
  Additions to the capitalised exploratory well costs pending the determination of proved reserves
    
 
111


501


399


Capitalised exploratory well costs expensed
2
,3
    
 
(62)


(268)


(1,571)
 
       
  Capitalised exploratory well costs reclassified to wells, equipment and facilities based on the determination of proved reserves
    
 
(36)


(1,664)


(592)
 
       
  Sale of suspended wells
    
 
-


-


-
 
       
  At the end of the year
    
 
807


614


2,045


1.
Suspended exploratory well costs represent capitalised exploration, evaluation and permit acquisition costs.
 
2.
Includes $1,557 million of impairment losses in 2020.
 
3
.
Includes amortisation of licence acquisition costs.
The following table provides an ageing of capitalised exploratory well costs, based on the date the drilling was completed, and the number of projects for which exploratory well costs has been capitalised for a period greater than one year since the completion of drilling.
1
Exploration activity typically involves drilling multiple wells, over a number of years, to fully evaluate and appraise a project. The term ‘project’ as used in this disclosure refers primarily to individual wells and associated exploratory activities. 


2022
US$m
 
    
2021
    US$m
 
    
2020
    US$m
 
  Ageing of capitalised exploratory well costs


  Exploratory well costs capitalised for a period of one year or less
    
 
124


19


330
 
       
  Exploratory well costs capitalised for a period greater than one year
    
 
683


595


1,715
 
       
  At the end of the year
    
 
807


614


2,045


2022
      
2021
      
2020
 
       
  Number of projects that have been capitalised for a period greater than one year
    
 
21


25


13
 
 
1.
Ageing of exploratory wells considers dates prior to the merger with BHP’s petroleum business which completed on 1 June 2022.
 
A-6


Table of Contents

SECTION 6.2

Three-year financial analysis

Three-year pricing overview

Woodside’s results from operations is strongly influenced by the prices it receives for its products. Over the last three years, oil and gas prices have experienced significant volatility. Oil and gas prices hit record lows in 2020 as the impacts of the COVID-19 pandemic affected world economies. In 2021 prices improved as economic activity increased. In 2022 gas prices hit record highs driven by years of underinvestment and the supply shock caused by Russia’s invasion of Ukraine. In 2022 there was a significant increase in the scale of Woodside’s production portfolio, with the completion of the merger with BHP’s petroleum business on 1 June 2022.

Seasonality

Woodside’s revenue is exposed to commodity price fluctuations through the sale of hydrocarbons. Commodity pricing can be affected by seasonal energy demand movements in different markets.


 Financial results    2022
                US$m
    2021
                US$m
    2020
                US$m
 

 Operating revenue

     16,817       6,962       3,600  

 Cost of sales

     (6,540     (3,845     (2,985

 Gross profit

     10,277       3,117       615  

 Other income

     735       139       (36

 Other expenses

     (2,726     (811     (481

 Impairment losses

     -       (10     (5,269

 Impairment reversals

     900       1,058       -  

 Profit/(loss) before tax and net finance costs

     9,186       3,493       (5,171

 Net finance costs

     (12     (203     (269

 Total tax (expense)/benefit

     (2,599     (1,254     1,465  

 Profit/(loss) after tax

     6,575       2,036       (3,975

 Attributable to equity holders of the parent

     6,498       1,983       (4,028

 Attributable to non-controlling interests

     77       53       53  

 Profit/(loss) for the period

     6,575       2,036       (3,975

Woodside’s profit/(loss) after tax attributable to equity holders of the parent increased to $6,498 million in 2022 from $1,983 million in 2021 and ($4,028) million in 2020.

Operating revenue of $16,817 million increased by $9,855 million, or 142%, from 2021. The increase was driven by the merger with BHP’s petroleum business which completed on 1 June 2022, the Pluto-KGP interconnector, strong operational performance and higher realised prices across all products. Operating revenue increased by $3,362 million from 2020 to 2021, driven primarily by higher trading activity and higher average realised prices resulting from strengthening demand and an improvement in the trading environment.

Cost of sales increased by $2,695 million, or 70%, to $6,540 from 2021. The increase was driven by additional volumes as a result of the merger with BHP’s petroleum business and the Pluto-KGP Interconnector, as well as higher costs related to Corpus Christi and Pluto cargoes. Cost of sales increased by $860 million from 2020 to 2021 primarily due to higher royalties and excise costs as a result of higher pricing and associated revenue.

Other income increased by $596 million, or 429%, to $735 million from 2021, primarily due to a profit on the sell-down of Pluto Train 2. Other income increased by $175 million from 2020 to 2021, primarily due to income from Pluto volumes delivered into Wheatstone’s sales commitment and net foreign exchange gains.

Other expenses increased by $1,915 million, or 236%, to $2,726 million from 2021, primarily due to higher losses on hedging activities and repurchase agreements, and transaction and integration costs relating to the merger with BHP’s petroleum business. The increased activity that comes with a larger, more diverse portfolio of assets has led to an increase in expenses associated to exploration activity and restoration movements. Other expenses increased $330 million from 2020 to 2021, driven by the Group’s decision to exit Myanmar in 2021.


A-7


Table of Contents

In 2022, an impairment reversal of $900 million was recognised for the Wheatstone asset, compared to an impairment reversal of $1,058 million in 2021. For more information on impairment refer to Note B.4 Impairment of goodwill, exploration and evaluation and oil and gas properties in section 5 - Financial Statements.

Net finance costs decreased by $191 million, or 94%, from 2021, to $12 million. This was primarily due to higher interest income generated from higher interest rates and cash balances and a reduction in finance costs due to higher capitalised borrowing costs. Net finance costs decreased $66 million from 2020 to 2021 as a result of a lower finance expense with the redemption of the 2021 US unsecured bond for $700 million and interest capitalised against qualifying assets; finance income was also lower due to a reduction in interest earned on US term deposits driven by lower interest rates and lower balances on deposit.

Total tax expense comprises income tax and petroleum resource rent tax (PRRT). Both income tax expense and PRRT expense increased from 2021 prior to the recognition of additional PRRT deferred tax assets. Higher realised prices in 2022 led to additional PRRT payments however also supported the recognition of additional Pluto deferred tax assets ($1,362 million) which has resulted in a 2022 net PRRT tax benefit. PRRT expense has therefore decreased from 2021 by $610 million, or 205%, to $313 million benefit due to the Pluto deferred tax asset recognition and the impairment reversal in 2021 not present in 2022. PRRT expense increased $736 million from 2020 to 2021, primarily due to the impact of the impairment reversal and the effect of higher operating revenue.

Income tax increased by $1,955 million, or 204%, to $2,912 million. The increases are primarily related to higher profits due to higher prices and additional production. Income tax expense increased $1,983 million from 2020 to 2021, primarily due to higher taxable income from the effect of higher revenue and impairment reversals.

Volumes, realised prices and operating revenues by product

The following describes movements in Woodside’s operating revenues including a discussion of production volumes, sales volumes and realised prices for the years ending 31 December 2022, 2021 and 2020.


      Units   2022     2021     2020  

 Production volumes


 LNG


MMboe

    85.1       70.8       75.0  

 Pipeline gas


MMboe

    28.6       2.5       5.3  

 Crude oil and condensate


MMboe

    38.7       17.3       19.5  

 NGLs


MMboe

    5.3       0.5       0.5  

 Total production


MMboe

    157.7       91.1       100.3  

 Sales volumes


 LNG


MMboe

    96.6       91.2       81.2  

 Pipeline gas


MMboe

    28.4       2.5       5.3  

 Crude oil and condensate


MMboe

    39.3       17.2       19.9  

 NGLs


MMboe

    4.6       0.7       0.4  

 Total sales volumes


MMboe

    168.9       111.6       106.8  
      Units   2022     2021     2020  

 Average realised prices


 LNG


$/boe

    116.9       58.8      
31.2
 

 Pipeline gas


$/boe

    47.8       17.0       13.9  

 Crude oil and condensate


$/boe

    95.8       76.4       42.4  

 NGLs


$/boe

    44.4       82.4       44.3  

 Volume – weighted average


$/boe

    98.4       60.7       32.4  

 Operating revenues


 LNG


$m

    11,289       5,359       2,519  

 Pipeline gas


$m

    1,362       43       73  

 Crude oil and condensate


$m

    3,758       1,316       843  

 NGLs


$m

    206       60       16  

 Operating revenue


$m

    16,615       6,778       3,451  

LNG

Revenue from the sale of LNG increased by $5,930 million, or 111%, to $11,289 million for 2022 from 2021, primarily due to increased volumes following the merger with BHP’s petroleum business and the contribution of the Pluto-KGP interconnector during a period of higher average realised prices.

Revenue from the sale of LNG increased by $2,840 million, or 113%, to $5,359 million for 2021, from 2020 due to an increase in average LNG realised price and additional volumes.

Pipeline gas

Revenue from the sale of pipeline gas increased by $1,319 million, or 3,067%, to $1,362 million for 2022 from 2021, primarily due to increased pipeline gas volumes as a result of the merger with BHP’s petroleum business and higher average realised prices.

Revenue from the sale of pipeline gas decreased by $30 million, or 41%, to $43 million for 2021, from 2020 primarily driven by the expiration of domestic gas contract obligations in June 2020. The average realised price for 2021 remained comparable to the average realised pipeline gas price in 2020.


A-8


Table of Contents

Crude oil and condensate

Revenue from the sale of crude oil and condensate increased by $2,442 million, or 186%, to $3,758 million for 2022 from 2021, due to increased crude oil and condensate volumes primarily as a result of the merger with BHP’s petroleum business as well as higher average realised prices. Revenue from the sale of crude oil and condensate increased by $473 million, or 56%, to $1,316 million due to higher pricing, offset by marginally lower production volumes.

NGLs

Revenue from the sale of NGLs increased by $146 million, or 243%, to $206 million for 2022 from 2021, due to increased NGLs volumes as a result of the merger with BHP’s petroleum business offset by a decreased average realised price. Revenue from the sale of NGLs increased by $44 million, or 275%, to $60 million primarily due to increased prices.

Performance by segment

Woodside has identified its operating segments based on the internal reports that are reviewed and used by the Chief Executive Officer in assessing performance, and are based on the nature and geographical location of the related activity. For more information on our reportable segments, please refer to Note A.1 Segment revenue and expenses in section 5 - Financial Statements.

The merger with BHP’s petroleum business on 1 June 2022 has transformed Woodside into a global energy company and has led to a change in how financial information is reported. Woodside’s 2021 and 2020 segment comparatives have been restated to align with this presentation.

The performance of operating segments is evaluated based on profit before tax and net finance costs and is measured in accordance with Woodside’s accounting policies.

Financing requirements, including cash and debt balances, finance income, finance costs and taxes for Woodside and its subsidiaries are managed at a group level.

Australia

Detailed below is the financial and operating information for our Australian operations comparing 2022, 2021 and 2020.


 Key metric         2022     2021     2020  

 Operating revenue


$m

    12,299       5,240       3,421  

 Profit before tax and net finance costs


$m

    9,415       3,711       (3,160

 Total Production


MMboe

    136.6       91.1       100.3  

 Average realised prices


   LNG


$/boe

    108.5       56.3       31.8  

   Pipeline gas


$/boe

    47.6       17.0       13.9  

   Crude oil and condensate


$/boe

    99.9       76.4       42.4  

   Natural gas liquids


$/boe

    47.2       82.4       44.3  

Financial results

Operating revenue of $12,299 million, has increased by $7,059 million, or 135%, from 2021 underpinned by strong operational reliability, increased volumes and higher realised prices across all products. The increase in volumes was primarily as a result of the merger with BHP’s petroleum business and the contribution of the Pluto-KGP interconnector. Refer to the section entitled ‘Three-year pricing overview’ for more information.

Profit before tax and net finance costs of $9,415 million, has increased by $5,704 million, or 154%, from 2021 primarily due to increased operating revenue and the profit on the sell-down of Pluto Train 2 ($427 million) and an impairment reversal recognised on Wheatstone ($900 million), offset by increased cost of sales ($1,693 million) and increased restoration provisions ($154 million). The increased cost of sales is driven by production and price-linked costs ($808 million) and increased depreciation ($777 million) primarily relating to acquired BHP assets.

Operating revenue increased by $1,819 million in 2021 from 2020 primarily due to higher realised prices across all products and strong operational performance.

Profit before tax and net finance costs increased by $6,871 million in 2021 from 2020 primarily due to increased revenue from higher realised prices, impairment losses recognised for various assets in 2020 not present in 2021 and impairment reversals for NWS Gas and Pluto-Scarborough recognised in 2021 not present in 2020.

Production

The Australia segment achieved an increase in production volumes of 45.5 MMboe in 2022 compared to 2021, primarily due to the merger with BHP’s petroleum business and the Pluto-KGP Interconnector along with strong operational performance.

Production volumes for the Australia segment decreased by 9.2 MMboe in 2021 compared to 2020 primarily due to the expiry of NWS joint domestic gas contract obligations, cessation of production from the Angel field in 2020, turnaround activity on NWS Project and Wheatstone and the impact of weather events in 2021.


A-9


Table of Contents

International

Detailed below is financial and operating information for our international operations comparing 2022, 2021 and 2020.


 Key metric         2022     2021     2020  

 Operating revenue


$m

    1,570       -       -  

 Profit before tax and net finance costs


$m

    125       (317     (1,315

 Total Production


MMboe

    21.1       -       -  

 Average realised


   Pipeline gas


$/boe

    49.0       -       -  

   Crude oil and condensate


$/boe

    88.7       -       -  

   Natural gas liquids


$/boe

    31.3       -       -  

Financial results

Operating revenue of $1,570 million is due to the introduction of sales volumes as a result of the merger with BHP’s petroleum business. For more information refer to Note A.1 Segment revenue and expenses in section 5 – Financial Statements.

Profit before tax and net finance costs of $125 million, has increased by $442 million, or 139%, from 2021 primarily due to increased operating revenue, offset by increased cost of sales ($837 million) and other expenses ($297 million). Increased cost of sales is driven primarily by production and price-linked costs ($352 million) and depreciation ($439 million) as a result of the merger with BHP’s petroleum business. The increased other expenses primarily relates to increased exploration and evaluation expenditure ($250 million) and increased restoration provision movements ($58 million), offset by Myanmar write-offs in 2021 not present in 2022 ($265 million).

There was no operating revenue reported in this segment for 2021 and 2020.

Loss before tax and net finance costs decreased by $998 million in 2021 from 2020 primarily due to impairment losses for Senegal, Canada and Sunrise recognised in 2020 not present in 2021, partially offset by the write-off of Myanmar exploration wells in 2021 following relinquishment of the blocks and withdrawal from Myanmar.

Production

The International segment achieved production of 21.1 MMboe 2022 due to the introduction of volume as a result of the merger with BHP’s petroleum business. Previously no production was recorded within the segment.

Marketing

Detailed below is financial and operating information for our marketing operations comparing 2022, 2021 and 2020.


 Key metric         2022     2021     2020  

 Operating revenue


$m

    2,948       1,722       179  

 Profit before tax and net finance costs


$m

    848       354       (377

 Average realised prices


   LNG


$/boe

    165.6       66.6       22.8  

Financial results

Operating revenue of $2,948 million, has increased by $1,226 million, or 71%, from 2021 primarily due to higher trading revenue due to higher realised prices and optimisation of scheduling and shipping, offset by fewer third-party trades as a result of tight market conditions.

Profit before tax and net finance costs of $848 million, has increased by $494 million, or 140%, from 2021 primarily due to increased operating revenue and movements in onerous contract provisions ($76 million), offset by higher shipping and trading costs ($299 million) and increased other expenses predominantly due to attributable hedging losses and movement on repurchase agreements ($503 million).

Operating revenue has increased by $1,543 million in 2021 from 2020 primarily due to a significant increase in traded LNG cargoes in response to favourable market conditions, including an increase in the number of Corpus Christi cargoes lifted.

Profit before tax and net finance costs increased by $731 million in 2021 from 2020 primarily due to increased trading activity and favourable movements in onerous contract provisions.

Corporate/Other Items

Detailed below is financial information for our Corporate/Other Items comparing 2022, 2021 and 2020.


           2022     2021     2020  

Loss before tax and net finance costs


$m

    (1,202)       (255)       (319)  

Loss before tax and net finance costs of $1,202 million, has increased by $947 million, or 371%, from 2021 primarily due to an increase in other expenses ($966 million) driven by increased general, administrative and other costs primarily as a result of transaction and other costs associated with the merger with BHP’s petroleum business ($595 million) and increased losses on hedging activities ($422 million).

Loss before tax and net finance costs has decreased by $64 million in 2021 from 2020 primarily due to higher foreign exchange gains.


A-10


Table of Contents

Capital and exploration expenditure

Woodside’s capital expenditures vary from year to year depending on the projects that it is undertaking, their stage of development and Woodside’s participating share in these projects. Woodside’s business does not generally require significant sustaining capital in order to maintain production.

Woodside’s exploration expenditures vary from year to year depending on its strategic priorities and the exploration projects which it undertakes.

For more information, refer to Notes B.1 Segment production and growth assets, B.2 Exploration and evaluation and B.3 Oil and gas properties in section 5 - Financial Statements.

Capital and exploration expenditure geographical split


2022

$m


2021

$m


2020

$m


Australia1

    2,351       1,607       1,126  

International2

    2,090       1,121       887  
      4,441       2,728       2,013  


1.

Capital and exploration expenditure incurred in Australia.

2.

Capital and exploration expenditure incurred in all other locations excluding Australia.

Australian capital and exploration expenditure increased by $744 million, or 46%, to $2,351 million from 2021 to 2022 and $481 million from 2020 to 2021 primarily due to continued investment into the Scarborough and Pluto Train 2 assets.

International capital and exploration expenditure increased by $969 million, or 86%, to $2,090 million from 2021, primarily due to continued investment into Sangomar and the introduction of spending in the Gulf of Mexico as a result of the merger with BHP’s petroleum business. The increased expenditure of $234 million from 2020 to 2021 was primarily due to investments in the Sangomar project.

Cash flow analysis

The following section describes movements in Woodside’s cash flows for the years ending 31 December 2022, 2021 and 2020.


2022

$m


2021

$m


2020

$m


Net cash from operating activities

    8,811       3,792       1,849  

Net cash used in investing activities

    (2,265)       (2,941     (2,112

Net cash used in financing activities

    (3,364)       (1,424     (203

Net increase/(decrease) in cash

    3,182       (573     (466

Net cash from operating activities

Net cash from operating activities increased $5,019 million, or 132%, to $8,811 million from 2021, primarily due to increased cash generated from operations ($6,515 million) offset by higher taxes paid due to the higher profits ($947 million), additional restoration payments made as a result of increased decommissioning activities ($225 million) and increased collateral payments made relating to the Brent hedges ($506 million).

Net cash from operating activities increased $1,943 million, or 105%, to $3,792 million from 2020 to 2021, driven by higher cash generated from operations and lower borrowing costs.

Net cash used in investing activities

Net cash used in investing activities decreased $676 million, or 23%, to $2,265 million from 2021, primarily due to cash receipts from the merger with BHP’s petroleum business ($1,082 million), payments made to acquire joint arrangements in 2021 not present in 2022 ($212 million), higher proceeds from the disposal of property, plant and equipment ($123 million) and lower payments made to Petrosen under the loan facility ($158m million) offset by higher capital expenditure predominantly related to Scarborough and Pluto Train 2, excluding the effect of GIP additional contribution to Pluto Train 2.

Net cash used in investing activities increased $829 million, or 39%, to $2,941 million from 2020 to 2021, driven by higher payments for capital and exploration expenditure for Scarborough (which primarily relate to the contingent payment paid on FID) and Sangomar, and higher advances to Petrosen under the loan facility.

Net cash used in financing activities

Net cash used in financing activities increased $1,940 million, or 136%, to $3,364 million from 2021, primarily due to higher dividends paid to external shareholders as a result of the increased NPAT in the current year ($2,269 million), higher repayments for the purchase of shares under the dividend reinvestment plan ($144 million) and lower repayments of borrowings predominantly due to the repayment of the 2021 US bond in the prior period ($501 million).

Net cash used in financing activities increased $1,221 million, or 601%, to $1,424 million from 2020 to 2021, primarily due to higher repayment of borrowings and higher lease repayments due to new drilling leases relating to Sangomar, offset by lower proceeds from borrowings raised and lower net dividends paid.


A-11


Table of Contents

SECTION 6.3

Additional disclosures

Employees

As of 31 December 2022, Woodside had approximately 4,427 employees, the majority of whom are located in Australia and the United States of America (USA). The increase in the number of employees from 2021 was due to the merger with BHP’s petroleum business, which completed on 1 June 2022.

Woodside regularly engages with our workforce and supports freedom of association. Our employees are free to join or not to join a labour union. Woodside strives to maintain a positive relationship with employees and labour unions and believes that the relationship between its management and labour union is generally positive.

Employment region (number of staff by region)1


                            2022


                            2021


                            2020


Australia

     3,338        3,660        3,705  

Africa and Middle East

     50        35        9  

Asia

     71        48        49  

Caribbean2

     108        NPR        NPR  

Europe

     11        8        7  

USA and Canada

     849        13        7  

Total

     4,427        3,764        3,777  

Total number of contractors

     394        267        235  


1.

Vacation students are included in relevant numbers where appropriate.

2.

NPR stands for ‘not previously reported’.

Quantitative and qualitative disclosures about market risk

In the normal course of business, Woodside is exposed to commodity price, foreign currency exchange rate and interest rate risks that could impact Woodside’s financial position and results of operations. Woodside’s risk management strategy with respect to these market risks may include the use of derivative financial instruments. Woodside uses derivative contracts to manage commodity price volatility, foreign exchange rate volatility on capital expenditure plans and interest rate exposure on financing activities.

Actual gains and losses in the future may differ materially from the sensitivity analyses based on changes in the timing and amount of commodity price, foreign currency exchange rate and interest rate movements and Woodside’s actual exposures and derivatives in place at the time of the change, as well as the effectiveness of the derivative to hedge the related exposure.

Commodity price risk management

Woodside’s revenues are primarily derived from sales of LNG, crude oil, condensate, pipeline gas and NGLs. Consequently, Woodside’s results of operations are strongly influenced by the prices it receives for these products, which in the case of oil and condensate are primarily determined by prevailing crude oil prices and in the case of pipeline gas, NGLs and LNG are primarily determined by prevailing crude oil prices as well as some fixed pricing and other price indexes (such as Henry Hub and the Japan Korea Marker). For the year ended 31 December 2022, the majority (approximately 75%) of Woodside’s production was attributed to natural gas, comprising LNG, NGLs and pipeline gas and the remaining portion (approximately 25%) of Woodside’s production was attributed to oil and condensate.

LNG market conditions including, but not limited to, supply and demand, are unpredictable and are beyond Woodside’s control. In particular, supply and demand for, and pricing of, LNG remain sensitive to energy prices, external economic and political factors, weather, climate conditions, natural disasters (including pandemics), timing of FIDs for new operations, construction and start up and operating costs for new LNG supply, buyer preferences for LNG, coal or crude oil and evolving buyer preferences for different LNG price regimes and the energy transition. Buyers and sellers of LNG are increasingly more flexible with the way they transact, and contracts may involve hybrid pricing that is linked to other indices such as the Intercontinental Exchange (ICE) Brent Crude deliverable futures contract (oil price) or the Japanese Crude Cocktail, which is the average price of customs- cleared crude oil imports into Japan as reported in customs statistics. Typically, only LNG supplied from the US was based on a component linked to movements in the US Henry Hub plus certain fixed and variable components. This type of pricing structure may become a component of the weighted average price into Asia and other markets since LNG supply and trade has globalised, and increasingly the lowest cost supply is setting the floor for long-term average global natural gas prices with transportation costs accounting for regional differences. Tenders may also be used by suppliers and buyers, typically for shorter-term contracts. In addition, long-term LNG contracts typically contain price review mechanisms which sometimes need to be resolved by expert determination or arbitration. The use of these independent resolution mechanisms are likely to be more prevalent in volatile commodity markets. Alternatives to fossil fuel-based products for the generation of electricity, for example nuclear power and renewable energy sources, are continually under development and, if these alternatives continue to gain market share, they could also have a material impact on demand for LNG, which in turn may negatively impact Woodside’s business, results of operations and financial condition in the longer-term.


A-12


Table of Contents

Oil prices can be very volatile, and periods of sustained low prices could result in changes to Woodside’s carrying value assumptions and may also reduce the reported net profit for the relevant period. The price of crude oil may be affected by factors beyond Woodside’s control, such as worldwide oil supply and demand, the level of economic activity in the markets Woodside serves, regional political developments and military conflicts (including the ongoing Russia-Ukraine conflict), weather conditions and natural disasters, conservation and environmental protection efforts, the level of crude oil inventories, the ability of OPEC and other major oil-producing or oil-consuming nations to influence global production levels and prices, sanctions on the production or export of oil, governmental regulations and actions, including the imposition of taxes, trade restrictions, market uncertainty and speculative activities by those who buy and sell oil and gas on the world markets, commodity futures trading, availability and capacity of infrastructure, supply chain disruptions, processing facilities and necessary transportation, the price and availability of new technology, the availability and cost of alternative sources of energy, and the impact of climate change considerations and actions towards energy transition on the demand for key commodities which Woodside produces.

The transition to lower carbon sources of energy in many parts of the world (driven by ESG and climate change concerns) may affect demand for Woodside’s products, including crude oil, natural gas and LNG, which in turn may affect the price received (or expected to be received) for these products. Material adverse price impacts (including as a result of the energy transition) may affect the economic performance (including as to margins and cash flows) of, and longevity of production from, Woodside’s existing and future production assets, and ultimately the financial performance of Woodside.

It is impossible to predict future crude oil, LNG and natural gas price movements with certainty. A low crude oil price environment or declines in the price of crude oil, in LNG and natural gas prices, could adversely affect Woodside’s business, results of operations and financial condition and liquidity. They could also negatively impact its ability to access sources of capital, including equity and debt markets. Those circumstances may also adversely impact Woodside’s ability to finance planned capital expenditures, including development projects, and may change the economics of operating certain wells, which could result in a reduction in the volume of Woodside’s reserves. Declines in crude oil, LNG and natural gas prices, especially sustained declines, may also reduce the amount of oil and gas that it can produce economically, reduce the economic viability of planned projects or of assets that it plans to acquire or has acquired and may reduce the expected value and the potential commerciality of exploration and appraisal assets. Those reductions may result in substantial downward adjustments to Woodside’s estimated proved reserves and require additional write-downs of the value of its oil and gas properties.

Sales contracts with the National Gas Company of Trinidad and Tobago relating to production from Woodside’s Trinidad and Tobago operations are linked to ammonia pricing. Similar to crude oil, LNG and natural gas, it is impossible to predict future ammonia prices with certainty.

There can be no assurance that Woodside will successfully manage its exposure to commodity prices. There is also counterparty risk associated with derivative contracts. If any counterparty to Woodside’s derivative instruments were to default or seek bankruptcy protection, it could subject a larger percentage of Woodside’s future oil and gas production to price changes and could have a negative effect on Woodside’s financial performance, including its ability to fund future projects. Whether Woodside engages in hedging and other oil and gas derivative contracts on a limited basis or otherwise, Woodside will remain exposed to fluctuations in crude oil prices.

Foreign exchange and interest rate risk management

Refer to sections A and C in section 5 – Financial Statements for further information on foreign exchange and interest rate risks.

Government regulations

Woodside’s assets and exploration, development, extraction and production operations are subject to a wide range of laws and regulations imposed by governments and regulatory bodies. These regulations touch all aspects of our assets, including how we extract, process and explore for oil and natural gas and how we conduct our business, including regulations governing matters such as environmental protection, land rehabilitation and facilities decommissioning, occupational health and safety, human rights, the rights and interests of First Nations peoples, competition, foreign investment, export, marketing of oil and natural gas and taxes.


A-13


Table of Contents

The ability to extract and process oil and natural gas is fundamental to our business. In most jurisdictions, the rights to explore for and extract petroleum deposits are owned by the government. We obtain the right to access the land and extract the product by entering into licences or leases with the government that owns the oil or natural gas deposit. Usually, the right to explore for oil and natural gas carries with it the obligation to spend a defined amount of money on the exploration, or to undertake particular exploration activities.

We also rely on governments to grant the rights necessary to transport and treat the extracted petroleum to prepare it for sale. The terms of the right, including the time period of the right, vary depending on the laws of the relevant government or terms negotiated with the relevant government.

In certain jurisdictions where we have assets, such as Trinidad and Tobago, and Senegal, a production sharing contract (PSC) governs the relationship between the government and companies (typically referred to as ‘Contractor’) concerning, among other things, how much of the oil and gas extracted from the country each party will receive. Under PSCs, the government awards exclusive rights for the execution of exploration, development and production activities to the Contractor in accordance with the PSC’s terms. Generally speaking the Contractor bears the financial risk of the initiative to explore, develop and ultimately produce the field. When successful, the Contractor is permitted to use a certain set percentage of produced oil and gas to recover its capital and operational expenditures, often called ‘cost oil.’ The remaining production (often called ‘profit oil’) is split between the government and the Contractor at a rate determined by the government and set out in the PSC.

The PSC may also include additional fiscal terms such as royalties, production bonuses and tax treatment, and other contractual terms addressing domestic supply obligations, local content, measurement and valuation. PSCs are bilateral contracts negotiated between the Contractor and the government and so each is necessarily on different terms.

Applicable laws and regulations and any permits that Woodside is required to obtain under these laws, may obligate Woodside to identify, avoid, mitigate and disclose environmental risks in various operational practices, including, among others, through pursuing and obtaining permits before commencing activities, restricting air and water emissions and waste discharges, limiting the type, quantity and concentration of various substances that can be utilised or released into the environment, addressing potential or actual impacts to protected species or cultural resources, monitoring or remediating contamination under certain circumstances, establishing and following certain inspection, testing and maintenance protocols, and disclosing certain operational practices. Moreover, environmental permits required for our operations may be subject to legal challenges by third parties, and such challenges can materially and adversely affect our operations to the extent they delay or prevent obtaining approvals or permits required for our operations, or otherwise require incurring increased costs in order to obtain such approvals or permits. Applicable environmental laws and regulations may also dictate worker health and safety and community notification procedures.

In addition, from time to time, certain trade sanctions are adopted by the United Nations (UN) Security Council and/or various governments, including in the United Kingdom, the United States, the European Union (EU), China and Australia against certain countries, entities or individuals, that may restrict our ability to sell extracted minerals, oil or natural gas to, and/or our ability to purchase goods or services from, these countries, entities or individuals.

This summary focuses on the Australian and United States regulatory regimes. It is not a full summary of the regulatory regimes in those jurisdictions nor is it a complete list of the legislation and regulation that applies to Woodside. Woodside is also subject to environmental and other regulations to varying degrees in each of the jurisdictions in which it has assets and operations.

Australia

In Australia, petroleum exploration and development takes place within a legal framework characterised by a division of responsibilities between the federal and the state or territory governments. Exploration and development conducted onshore and within three nautical miles of the territorial sea baseline of the relevant state or territory are the responsibility of the individual state or territory governments. The Australian federal government has legislative responsibility for Australian offshore petroleum exploration and production beyond the three nautical mile territorial sea, which encompasses the area of most relevance to Woodside’s offshore activities. In addition, Woodside has certain onshore operations in Victoria and Western Australia which are subject to various state legislation.

Environmental regulation

Woodside’s Australian operations are subject to federal, state and local environmental laws and regulations. For offshore petroleum activities, these laws and regulations generally require the acquisition of an approval before any activity commences and require that for any activities, environmental risks are identified and controls put in place to reduce or eliminate the risks. For exploration drilling and seismic activities, this is outlined in an environment plan accepted by independent statutory authority; as an operation goes into construction, commissioning and production, a whole project proposal and revised environment plan is required to be submitted for approval. These laws and regulations also restrict the type, quantity and concentration of various substances that can be utilised or released into the environment in connection with marine and land-based activities; limit or prohibit drilling and seismic or production activities in and near certain environmentally sensitive or protected areas; and impose criminal and civil liabilities for pollution or other unauthorised impacts to the environment resulting from oil, natural gas and petrochemical operations.


A-14


Table of Contents

In addition, Australian environmental laws and regulations also include restrictions on air emissions and water discharges resulting from the operation of drilling equipment, processing facilities, pipelines and transport vessels and require Woodside to periodically report on and manage greenhouse gas emissions. These laws also regulate the use, management and disposal of hazardous materials and general waste; prohibit the clearing of native vegetation without approval and protect Aboriginal heritage and biodiversity; and require Woodside to prepare and implement safety and environmental management plans. Woodside is required to provide bonds for any rehabilitation, clean-up or pollution prevention work that may be necessary as a result of the construction, decommissioning or removal of a pipeline and to report, monitor or remediate contamination under certain circumstances. Woodside is subject to ‘strict liability’ for oil spills, rendering it liable without regard to negligence or fault and may be subject to fines and other penalties for breaches of laws, regulations, licences or approvals.

The requirements imposed by environmental laws and regulations are subject to change and have tended to become stricter over time. The modification of existing foreign or domestic laws or regulations or the adoption of new laws or regulations curtailing exploratory or development drilling for oil and gas for economic, political, social, environmental or other reasons could have a material adverse effect on Woodside’s business, financial condition or results of operations. There is ongoing and increasing public pressure on the government to accelerate its carbon emissions reduction program. At present, state and federal governments are developing carbon regimes designed to achieve net zero outcomes by 2050. As such, there remains significant uncertainty regarding the future of climate change regulation in Australia and the effect it may have on Woodside’s business.

Fair Work Act amendments

In December 2022, the Australian federal government passed the Fair Work Legislation Amendment (Secure Jobs, Better Pay) Act 2022 (Cth) (Act). The Act amends the Fair Work Act 2009 (Cth) and the amendments will take effect during the first half of 2023. In summary, the key changes being implemented through the Act are as follows:


Agreements covering multiple employers: employers can be required to bargain for agreements that cover multiple employers. Employees are also able to take protected industrial action or seek bargaining orders in support of these agreements and there are limits on employers’/employees’ ability to remove themselves as parties to them.


Bargaining disputes: broader powers for the Fair Work Commission to intervene and make workplace determinations (effectively arbitrating an enterprise agreement) where bargaining is ‘intractable’.


Industrial action: the removal of limitations on protected industrial action in relation to multi-enterprise agreements, but the inclusion of an obligation to attend Fair Work Commission mediation/conciliation before protected industrial action is taken (which applies to all forms of enterprise agreements except the ‘cooperative’ multi-enterprise stream where protected industrial action is not available).


Terminating agreements: reduced scope for termination of enterprise agreements, particularly during bargaining, and the sunsetting of ‘zombie’ agreements within 12 months of commencement (unless an extension is granted of up to 4 years).


Enterprise agreement approval process: bargaining may start when an employee bargaining representative gives notice in certain circumstances (and without a majority support determination), certain pre-approval requirements have been removed, the ‘genuinely agreed’ test has been retained, the ‘better off overall test’ (BOOT) has been simplified and must involve a global (not line by line) assessment, the Fair Work Commission can amend an enterprise agreement during the approval process rather than relying on employer undertakings, and parties may apply for a reassessment of the BOOT during the life of the enterprise agreement (e.g. if employees’ work patterns change).

Decommissioning liability amendments

On 2 September 2021, the Australian federal parliament passed the Offshore Petroleum and Greenhouse Gas Storage Amendment (Titles Administration and Other Measures) Act 2021 (Cth) which, among other changes, amends the OPGGSA to impose new trailing liability and change of control provisions. The amendments took effect from 2 March 2022. The changes to the trailing liability regime expand the existing powers of the National Offshore Petroleum Safety and Environmental Management Authority (NOPSEMA) and the Minister including the ability to recall any former titleholder to undertake decommissioning activities on a title area. These powers are retrospective in their application and apply to titles that are currently in force as well as to titles that ceased to be in force on or after 1 January 2021.

Under the new change in control provisions, any change in control must be pre-approved by the National Offshore Petroleum Titles Administrator (NOPTA). A person is said to “control” a titleholder if they hold 20% or more of the voting rights or issued securities in that titleholder. A change of control will occur if a person controls the titleholder (“original controller”) and either another person begins to control the titleholder or the original controller ceases to control the titleholder. In addition to the OPA and regulations, NOPTA will have reference to the applicant suitability guidelines published by the Department of Industry, Science, Energy and Resources, dated 2 March 2022, in determining change of control applications.


A-15


Table of Contents

Santos Barossa decision

In December 2022, the Full Court of the Federal Court of Australia handed down its decision in Santos NA Barossa Pty Ltd v Tipakalippa [2002] FCAFC 193 (Appeal Decision). The Appeal Decision decided certain aspects of the requirements for consultation associated with the acceptance of environment plans for offshore petroleum activities by NOPSEMA under the OPGGSA. Subsequently, NOPSEMA published a guideline for industry entitled “Consultation in the course of preparing an environment plan”. As a consequence of these events, some delays have been experienced by Woodside in obtaining accepted environment plans for petroleum activities in Commonwealth waters. We continue to monitor developments related to this decision. Refer to section 3.9 – Risk factors for further information on risks related to government regulations and other legal developments.

Domestic gas reservation policy

Under a Western Australian State Government policy (“WA Domestic Gas Policy”), introduced in 2006, gas equivalent to 15% of LNG production from LNG export projects is required to be reserved for domestic use as a condition of LNG project approval. The policy contains flexibility, allowing negotiations to occur on a case-by-case basis regarding the method by which the LNG project proponents fulfil their domestic gas commitments, including from alternative sources.

Woodside and its joint venture partners have domestic gas contractual commitments in place with the Western Australian State Government for in respect to the Pluto LNG, Wheatstone and NWS projects. In 2015, the NWS State Agreement (North West Gas Development (Woodside) Agreement 1979) was amended to include a new domestic gas commitment of 15% (or lesser approved amount) of total LNG quantity approved for use, supply or sale overseas. In 2006, in connection with the Pluto LNG project, Woodside entered into an arrangement with the Western Australian State Government to market and make available for supply a quantity of domestic gas. Woodside is not required to supply domestic gas if it is not commercially viable to do so. In January 2021, Woodside signed a further agreement with the State Government in relation to the Pluto LNG project in which Woodside agreed to make 45.6 PJ available for the domestic market, separate and in addition to the 2015 commitment from the NWS Joint Venture. In November 2021, Woodside and BHP Petroleum signed a further domestic gas agreement with the State Government with respect to the Scarborough and Pluto Train 2 project pursuant to which, consistent with the WA Domestic Gas Policy, the Scarborough Joint Venture will make gas equivalent to 15% of its LNG exports available to the domestic market. Woodside also has domestic gas commitments in respect to its interest in the Wheatstone LNG Project under a 2011 agreement with the Western Australian State Government.

Additional major legislation and regulations

Woodside’s Australian offshore operations beyond coastal waters are primarily governed by the Offshore Petroleum and Greenhouse Gas Storage Act 2006 (Cth) (OPGGSA) and related legislation, which establishes a joint authority (Joint Authority) whereby relevant Australian state, territory and federal governments cooperate in the administration and supervision of petroleum activities in offshore areas beyond coastal waters. The OPGGSA provides for the grant of exploration permits, retention leases, production licences, pipeline licences and facilities licences within the areas of the OPGGSA’s jurisdictional operation. Within the coastal waters, petroleum operations are covered by the relevant state or Northern Territory legislation that is substantively similar to the OPGGSA.

The Offshore Petroleum and Greenhouse Gas Storage (Resource Management and Administration) Regulations 2011 (Cth) contain resource management provisions, including a requirement for the holder of a production licence to have in place a Field Development Plan approved by the Joint Authority before petroleum production can commence.

Many of Woodside’s operations rely on pipeline licences to transport oil and gas from the point of production to processing facilities and relevant markets. As mentioned above, the OPGGSA also provides for the grant of pipeline licences within the areas of the OPGGSA’s jurisdictional operation. Pipelines within the coastal waters of Western Australia are licensed under the Petroleum (Submerged Lands) Act 1982 (WA) and pipelines within the coastal waters of Victoria are licensed under the Offshore Petroleum and Greenhouse Gas Storage Act 2010 (Vic). Onshore pipelines in Western Australia are licensed under the Petroleum Pipelines Act 1969 (WA) and onshore pipelines in Victoria are licensed under the Pipelines Act 2005 (Vic).

Woodside is also subject to the following laws, among others:


Various petroleum taxes, including royalties, excise taxes, temporary levies, and the Petroleum Resource Rent Tax.


Australia’s competition laws contained in the Competition and Consumer Act 2010 (Cth), which prohibits, among other things, engaging in conduct with the purpose or effect of substantially lessening competition, price fixing, market sharing or bid rigging. The Act was also recently amended to allow for the imposition of gas price controls in the eastern Australian gas market. The price of gas produced by Woodside and supplied into the eastern Australian gas market is capped at $12/GJ until 23 December 2023. The price cap could be extended at the same or different price. The government also proposes implementing a mandatory code of conduct that will apply to gas supplied by producers like Woodside into the eastern Australia gas market, including a ‘reasonable pricing’ provision.


Laws protecting the rights and interests of First Nations Australians and their cultural heritage. Since 1992, Australian common law has recognised that, in certain circumstances, First Nations Australians may have rights and interests over land and waters in accordance with their traditional laws and customs. The Native Title Act 1993 (Cth) (NTA) and complimentary state legislation recognise and protect the native title rights and interests of native title holders and registered native title claimants. Multiple pieces of Australian state and federal government legislation protect Aboriginal cultural heritage, rights and access to land in Australia and many of these laws are subject to review and change to ensure a greater level of involvement of First Nations Australians in decisions that may impact cultural heritage and other rights and interests.


A-16


Table of Contents
 

The Greater Sunrise Special Regime (GSSR), established pursuant to the Maritime Boundaries Treaty which came into force on 30 August 2019. Woodside holds PSCs and retention leases covering its petroleum interests within GSSR under joint Australian/Timor-Leste administrative control.


The Foreign Acquisitions and Takeovers Act 1975 (Cth) (FATA), regulations under the FATA and Australia’s Foreign Investment Policy, which are intended to encourage foreign investment in Australia that is not contrary to the Australian national interest. As Woodside is a reporting entity of a critical gas asset within the meaning of the Security of Critical Infrastructure Act 2018 (Cth), it is considered a ‘national security business’ under the FATA, meaning that certain investments by foreign investors (including foreign government investors) must be notified to the Australian Government and require prior approval from the Australian Treasurer in accordance with the FATA.


Legislation covering work health and safety (WHS) in both state and federal jurisdictions, with separate onshore and offshore regulation. WHS laws aim to protect people’s health and safety at work by imposing obligations on all parties who are in a position to contribute to the management of workplace risks, including manufacturers and suppliers of equipment and substances, as well as employers, workers, contractors and others. Among other things, Woodside—as operator of both onshore and offshore facilities—is required to develop and comply with a comprehensive ‘safety case’ which describes the facility and provides details on the hazards and risks associated with the facility, the risk controls and the safety management system that will be used to minimise the risks.


Federal and state legislation regarding terms and conditions of employment as set forth in the Fair Work Act 2009 (Cth) (FW Act). Key potential issues which may rise under the FW Act regime for Woodside include a union right of entry to the premises, good faith bargaining principles, and protected industrial action, among others. State legislation regulates matters such as long service leave, workers’ compensation, anti-discrimination and equal opportunity, and work health and safety.

United States

In the United States, numerous federal agencies regulate specific portions of the industry and Woodside’s US operations. The US federal government directly regulates the development of hydrocarbon interests on federal lands, including those in the US Gulf of Mexico (GOM) and elsewhere in the Outer Continental Shelf (OCS). Federal leasing activities in recent years have been subject to material uncertainties, delays, and legal challenges relating to potential impacts from climate change related to new offshore exploration and production or the adequacy of federal environmental reviews required to be performed in connection with GOM lease auctions. Woodside’s hydrocarbon activities on federal offshore oil and natural gas leases in the GOM are subject to extensive regulation and permitting by multiple federal agencies, including the Department of the Interior (DOI), through its agencies the Bureau of Safety and Environmental Enforcement (BSEE), the Bureau of Ocean Energy Management (BOEM) and the Office of Natural Resources Revenue (ONRR). These leases, which contain relatively standardised terms, are awarded by the BOEM based on competitive bidding and require compliance with detailed BSEE and BOEM regulations and orders issued pursuant to various federal laws. Lessees are also required to obtain environmental permits from agencies such as the US Environmental Protection Agency (EPA). Certain OCS activities are also subject to regulation by the US Coast Guard. In addition, offshore pipelines, including those located in the GOM, are subject to stringent federal regulation including under the jurisdiction of the Federal Energy Regulatory Commission (FERC) and the Pipeline and Hazardous Materials Safety Administration (PHMSA), under the US Department of Transportation. The BSEE has also adopted regulations for offshore pipelines under its jurisdiction covering similar matters. Moreover, our US operations in the GOM are subject to extensive requirements related to the plugging and abandonment of wells and decommissioning of offshore structures and equipment. We may be required to post substantial financial assurance, such as surety bonds, or to otherwise demonstrate financial capability, such as through access to insurance, the costs of which could be material. Further, from time to time BOEM has considered increasing its supplemental bonding requirements, and any such increase could generally stress the capacity of the surety bond market to provide sufficient bonds to meet resulting demands from the offshore oil and gas industry. In addition, as a result of the merger with BHP’s petroleum business, we could also be responsible for plugging and abandonment and decommissioning costs for GOM assets formerly owned or operated by BHP if the current operator of record fails to perform, and such costs could have a material and adverse effect on our business, financial condition, or results of operations.

The exploration, production, and transportation of crude oil and natural gas involves risk that hazardous liquids or flammable gases may be released into the environment and may cause substantial harm to the environment, natural resources, or human health and safety. Such incidents, as well as failure to comply with applicable environmental laws and regulations, may result in material expenditures for response actions, significant government civil or criminal fines and penalties, liability to government agencies for natural resources damages, and significant business interruption. In addition, a spill on or related to our properties and operations could expose us to joint and several and strict liability, without regard to fault. Existing and new laws and regulations could require us to evaluate and upgrade existing infrastructure and operational practices on an accelerated basis or pursue additional capital projects, any or all of which could result in increased operating costs, which in turn could have a material and adverse effect on our business, financial condition or results of operations.


A-17


Table of Contents

Laws and regulations are frequently subject to change, and the general trend in the United States has been for these governmental agencies to continue to evaluate and, as necessary, develop and implement new, more restrictive permitting, performance and disclosure requirements, particularly with respect to the protection of the environment, greenhouse gas emissions, natural resources, and worker health and safety. The modification of existing laws or regulations or the adoption of new laws or regulations curtailing or imposing greater restrictions on exploratory or development drilling for oil and gas for economic, political, social, environmental or other reasons could have a material adverse effect on our business, financial condition or results of operations.

Other jurisdictions

In Senegal, Woodside’s PSC and the prospecting, exploration, exploitation and transportation of hydrocarbons, as well as the tax rules for such activities, are primarily governed by Law no. 98-05 dated 8 January 1998 (Petroleum Code) and its implementing decree no. 98-810 dated 6 October 1998. The Petroleum Code determines that the Senegalese Ministry of Petroleum and Energy is the competent authority for its implementation and is responsible for authorising activities for oil and gas prospecting, exploration, exploitation and transportation. A revised Petroleum Code was introduced in 2019, however, the terms of that legislation state that any PSC issued prior to the introduction of the 2019 Petroleum Code retain their legal regime, and as such, the 1998 Petroleum Code continues to apply to Woodside’s PSC. There is also other legislation and regulation that applies to Woodside’s activities in Senegal including, without limitation, in respect of the environment and local content requirements.

Material limitations

Woodside has certain obligations as part of its operations in Western Australia to provide natural gas into the Western Australian domestic market. Please refer to ‘Government regulations - Domestic gas reservation policy’ in this section for further information.

Woodside is subject to ordinary course PSC limitations in Senegal. Refer to ‘Government regulations - Other jurisdictions’ in this section for further information.

Summary of material legal proceedings

Woodside is involved from time to time in legal proceedings and governmental investigations of a character normally incidental to its business, including claims and pending actions against it seeking damages, or clarification or prosecution of legal rights and regulatory inquiries regarding business practices. Insurance or other indemnification protection may offset the financial impact on Woodside of a successful claim.

Except as set forth below, there are no governmental, legal or arbitral proceedings (including any such proceedings which are pending or threatened and of which Woodside is aware) which may have, or have had during the 12 months prior to the date of this report a significant effect on Woodside’s financial position or profitability:


In June 2022, the Environmental Defenders Office Ltd (on behalf of the Australian Conservation Foundation) commenced Federal Court proceedings seeking an injunction to restrain Woodside from carrying out the Scarborough gas project.


In November 2021, the Conservation Council of Western Australia filed an application seeking judicial review of a decision by the CEO of the Western Australian Department of Water and Environmental Regulation to grant Woodside a works approval for the Pluto Train 2 project granted in May 2021. The matter was heard by the Supreme Court of Western Australia in August 2022.


In December 2020, the Conservation Council of Western Australia filed applications seeking judicial review of decisions in respect of approvals under section 45C of the Environmental Protection Act (WA) granted for each of the North West Shelf and Pluto Gas Plant. Each approval was granted in July 2019. The Supreme Court of Western Australia dismissed the proceedings in March 2022.


A-18


Table of Contents

SECTION 6.4

Shareholder statistics

Information in this section is current as at 16 February 2023, unless otherwise stated. References to ‘the company’ or ‘Woodside’ on pages 179-187 are to Woodside Energy Group Ltd and references to shareholdings and other equity on those pages are to equity in Woodside Energy Group Ltd.

Number of shareholdings

There were 649,871 shareholders.

Distribution of shareholdings


 Size of shareholding


Number

of holders


Number

                of shares1


                    % of issued

capital


 1–1,000

     536,529        121,922,981        6.42  

 1,001–5,000

     97,883        203,803,889        10.73  

 5,001–10,000

     10,362        71,332,655        3.76  

 10,001–100,000

     4,953        98,305,225        5.18  

 Greater than 100,000

     144        1,403,385,021        73.91  

 Total

     649,871        1,898,749,771        100  


1.

All issued shares carry voting rights on a one-for-one basis.

Unmarketable parcels

There were 63,775 members holding less than a marketable parcel of shares in the company (based on the closing market price of A$35.00 on 16 February 2023).

 Geographical distribution of shareholders and shareholdings


 Registered address


Number

of holders


Number

                of shares


                    % of issued

capital


 Australia

     630,206        1,886,398,561        99.35  

 New Zealand

     8,089        6,250,112        0.33  

 United Kingdom

     3,345        2,284,909        0.12  

 United States of America

     1,981        1,157,338        0.06  

 Other

     6,250        2,658,851        0.14  

 Total

     649,871        1,898,749,771        100  

US shareholdings


Classification of holder   

Number

of holders


Number
                of shares


                    % of issued
capital


 Registered holders of voting securities

     1,981        1,157,338        0.06  

 ADR holders

     2,528        55,867,523        2.94  

Distribution of rights holdings


 Size of holding


Number

of holders


Number

                of rights


                    % of rights
on issue


 1–1,000

     1,069        708,839        6.2%  

 1,001–5,000

     2,780        5,985,096        52.8%  

 5,001–10,000

     194        1,336,970        11.8%  

 10,001–100,000

     140        2,940,307        25.9%  

 Greater than 100,000

     2        371,388        3.3%  

 Total

     4,185        11,342,600        100%  


A-19


Table of Contents

 Twenty largest shareholders


 Shareholders


Shares

Held


                    % of issued

capital


 HSBC CUSTODY NOMINEES (AUSTRALIA) LIMITED

     540,125,821        28.45  

 J P MORGAN NOMINEES AUSTRALIA PTY LIMITED

     380,329,074        20.03  

 CITICORP NOMINEES PTY LIMITED

     159,728,721        8.41  

 BNP PARIBAS NOMS PTY LTD <DRP>

     56,391,502        2.97  

 CITICORP NOMINEES PTY LIMITED <CITIBANK NY ADR DEP A/C>

     55,867,523        2.94  

 COMPUTERSHARE CLEARING PTY LTD <CCNL DI A/C>

     44,888,188        2.36  

 NATIONAL NOMINEES LIMITED

     44,344,965        2.34  

 BNP PARIBAS NOMINEES PTY LTD ACF CLEARSTREAM

     17,481,477        0.92  

 HSBC CUSTODY NOMINEES (AUSTRALIA) LIMITED <NT-COMNWLTH SUPER CORP A/C>

     12,441,073        0.66  

 CITICORP NOMINEES PTY LIMITED <COLONIAL FIRST STATE INV A/C>

     10,242,867        0.54  

 NETWEALTH INVESTMENTS LIMITED <WRAP SERVICES A/C>

     6,974,985        0.37  

 BNP PARIBAS NOMINEES PTY LTD HUB24 CUSTODIAL SERV LTD <DRP A/C>

     6,183,407        0.33  

 HSBC CUSTODY NOMINEES (AUSTRALIA) LIMITED - A/C 2

     4,180,388        0.22  

 HSBC CUSTODY NOMINEES (AUSTRALIA) LIMITED-GSCO ECA

     3,717,621        0.20  

 ARGO INVESTMENTS LIMITED

     3,321,455        0.17  

 AUSTRALIAN FOUNDATION INVESTMENT COMPANY LIMITED

     2,954,652        0.16  

 MUTUAL TRUST PTY LTD

     2,896,158        0.15  

 AUSTRALIAN FOUNDATION INVESTMENT COMPANY LIMITED

     2,861,381        0.15  

 NETWEALTH INVESTMENTS LIMITED <SUPER SERVICES A/C>

     2,215,564        0.12  

 NAVIGATOR AUSTRALIA LTD <MLC INVESTMENT SETT A/C>

     1,885,392        0.10  
      1,359,032,214      71.58  


Substantial shareholders

Substantial shareholders as disclosed in substantial shareholder notices given to the company are as follows:


Date of last notice


Substantial shareholder    Title of class   

Date

received        


Date of

change        

   Shares held1   

% of total
voting rights1

BlackRock, Inc.   

Ordinary shares


6 February 2023


3 February 2023


100,665,813


5.29

State Street Corporation and subsidiaries   

Ordinary shares


6 September 2022


1 September 2022


95,780,835


5.04

Vanguard Group (The Vanguard Group, Inc. and its controlled entities)    Ordinary shares    23 June 2022    17 June 2022    95,642,3122    5.042


1.

The figures quoted are based on the number owned and voting rights provided in the latest applicable substantial shareholder notice.

2.

As stated in its latest substantial shareholder notice, Vanguard Group also holds 42,270 shares of Woodside ADR.

Buy backs

There are currently no on-market buy backs.

Escrowed and restricted securities

Woodside Energy Group Ltd does not have any restricted securities or securities subject to voluntary escrow on issue.

On-market purchases for Woodside employee incentive plans


Period  

Total shares

purchased            


Average price

paid per share (A$)


Average price

paid per share (US$)


Number of shares

purchased for employee

plans

February 2022

  832,589    28.72    20.68    832,589

September 2022

  1,400,000    30.66    20.01    1,400,000
         

Total

  2,232,589    29.94    20.26    2,232,589


A-20


Table of Contents

Annual General Meeting

The 2023 Annual General Meeting (AGM) of Woodside Energy Group Ltd will be held on 28 April 2023. Details of the business of the meeting will be provided in the AGM notice. The AGM will be webcast live on the internet. An archived version of the webcast will be placed on the Woodside website to enable the proceedings to be viewed at a later time. The closing date for receipt of director nominations was 21 February 2023.


LOGO


For more information on this topic, refer to Woodside’s website for copies of the Chair’s and CEO’s speeches at woodside.com


Documents on display

Documents filed by Woodside on the ASX are available at asx.com.au and documents filed on the LSE are available at data.fca.org.uk/#/nsm/nationalstoragemechanism. Woodside files Annual Reports and other reports and information with the US Securities and Exchange Commission (SEC). These filings are available on the SEC’s website at sec.gov.

Documents filed on the ASX or LSE or with the SEC are not incorporated by reference into this report. The documents referred to in this report as being available on our website, woodside.com, are not incorporated by reference and do not form part of this report.

Woodside Energy Group Ltd

Woodside was registered under Australian corporate law in 1971 and listed on the ASX on 18 November 1971. Woodside’s shares are currently listed on the ASX and LSE under the ticker symbol ‘WDS’ and its American Depositary Shares (ADS) are listed on the NYSE under the symbol ‘WDS’. Following the approval of Woodside shareholders at Woodside’s Annual General Meeting on 19 May 2022, Woodside changed its name from ‘Woodside Petroleum Ltd.’ to ‘Woodside Energy Group Ltd’ effective 20 May 2022.

Woodside’s registered office is Mia Yellagonga, 11 Mount Street, Perth, Western Australia 6000, Australia, telephone +61 8 9348 4000. Additional information about Woodside can be found on its website at woodside.com. The information contained in, or that can be accessed through, Woodside’s website is not intended to be incorporated into this annual report.

Dividend payments

Woodside determines its dividends in US dollars as this is our functional and presentation currency. Woodside pays its dividends in Australian dollars, unless a shareholder’s registered address is in the United Kingdom (UK), where they are paid in UK pounds sterling, or in the United States of America (USA), where they are paid in US dollars.

Shareholders may have their dividends paid directly into any bank or building society account in Australia, the USA or the UK. Payments are electronically credited on the dividend payment date and confirmed by payment advice. To request direct crediting of dividend payments, please contact the share registry or visit the share registry website (investorcentre.com/wds).

Shareholders must make an election to alter their dividend currency by the business day after the record date for the dividend.

Shareholders who reside outside the USA, the UK and Australia may elect to receive their dividend electronically in their local currency using the share registry’s Global Wire Payment Service. For a list of currencies offered and how to subscribe to the service, please contact the share registry.


A-21


Table of Contents


LOGO


For more information on this topic, refer to Woodside’s website for the history of dividends paid by the company at woodside.com

Change of address or banking details

Shareholders should immediately notify the share registry of any change to their address or banking arrangements for dividends electronically credited to a bank account.


LOGO


For more information on this topic, refer to the share registry website to change details at investorcentre.com/wds

Australian Securities Exchange

Investors who hold Woodside shares listed on the ASX seeking information about their shareholdings should contact Woodside’s Australian share registry:

Computershare Investor Services Pty Limited


Address:   

Level 11, 172 St Georges Terrace

Perth WA 6000

Postal address:    GPO Box D182 Perth WA 6840
Telephone:    1300 558 507 (within Australia)
   +61 3 9415 4632 (outside Australia)
Email:    web.queries@computershare.com.au
Website:    investorcentre.com/wds

The share registry can assist with queries on share transfers, dividend payments, the dividend reinvestment plan, notification of tax file numbers and changes of name, address or bank account details.

For security reasons, you will need your Security Reference Number (SRN) or Holder Identification Number (HIN) when communicating with the share registry. The share registry website allows shareholders to make changes to address and banking details online.


LOGO


For more information on this topic, refer to the share registry website for details of shareholdings at investorcentre.com/wds

London Stock Exchange

Woodside shares are traded on the Main Market for listed securities of the London Stock Exchange (with trades settled in the form of UK Depository Interests) under the symbol ‘WDS’. Woodside has appointed Computershare Investor Services PLC as its registrar.

If you have a query regarding your shareholding, please contact Computershare in the United Kingdom:

Computershare Investor Services PLC


Postal address:    Computershare Investor Services PLC
  

The Pavilions, Bridgwater Road,

Bristol BS99 6ZZ

Telephone:    +44 (0)370 703 6075
Email:    WebCorres@computershare.co.uk
Website:    computershare.com/uk


A-22


Table of Contents

American Depositary Receipts

We have an American Depositary Receipts (ADR) program. The ADR program has a 1:1 ordinary share to American Depositary Share (ADS) ratio.

Depositary fees

Citibank serves as the depositary bank for our ADR program. ADR holders agree to the terms in the deposit agreement filed with the SEC for depositing ADSs or surrendering the ADSs for cancellation and for certain services as provided by Citibank. Holders are required to pay all fees for general depositary services provided by Citibank in each of our ADR programs, as set forth in the table below.


Service    Fees
Issuance of ADSs upon deposit of shares.    Up to $0.05 per ADS issued.
Cancellation of ADSs.    Up to $0.05 per ADS cancelled.
Distribution of cash dividends or other cash distributions.    Up to $0.05 per ADS held.
Distribution of ADSs pursuant to (i) stock dividends or other free stock distributions, or (ii) exercise of rights to purchase additional ADSs.   

Up to $0.05 per ADS held.


Distribution of securities other than ADSs or rights to purchase additional ADSs.    Up to $0.05 per ADS held.
ADS Services.    Up to $0.05 per ADS held on the applicable record date(s) established by the Depositary
Registration of ADS transfers.    Up to $0.05 per ADS transferred.
Conversion of ADSs of one series for ADSs of another series.    Up to $0.05 per ADS converted.

Fees payable by the Depositary to the Issuer

Citibank reimburses Woodside for certain expenses Woodside incurs in connection with its ADR program, subject to certain ceilings. These reimbursable expenses currently include, but are not limited to, legal, accounting and reserve engineer fees, listing fees, expenses related to investor relations in the United States, fees payable to service providers for the distribution of material to ADR holders and expenses to remain in compliance with applicable US laws and NYSE listing standards. Citibank has further agreed to waive certain fees in connection with Woodside’s ADR program. These waived expenses currently include, but are not limited to, standard costs associated with the administration of the ADR program and certain fees in connection with issuance of ADRs under Woodside’s equity compensatory plans. For the year ended 31 December 2022, such direct reimbursements and waived fees totalled approximately US$1.6 million, which includes a one-time fixed contribution by Citibank to Woodside and waiver of certain fees in connection with ADR-related costs incurred in connection with the merger with BHP’s petroleum business and NYSE listing. Under certain circumstances, including termination of our ADS program or removal of our Depositary, we may be required to repay to the Depositary a portion of the amounts reimbursed in prior periods.

The ADSs issued under our ADR programs trade on the NYSE under the stock ticker WDS. As of 16 February 2023, there were 55,867,523 ADSs on issue and outstanding in the Woodside ADS program.

For additional information regarding Woodside ADSs, please refer to Exhibit 2.1—Description of Securities to this report on Form 20-F.

ADR holders should deal directly with Citibank on all matters related to their ADRs, using the details below:

Enquiries should be directed to:

Citibank Shareholder Services


Address:   

PO Box 43077

Providence Rhode Island

02940-3077

USA Toll Free:        1-877-CITI-ADR
International:    +1 781 575 4555
Email:    citibank@shareholders-online.com


A-23


Table of Contents

Investor Relations enquiries

Requests for specific information on Woodside can be directed to Investor Relations:


Address:    Woodside Energy Group Ltd
   Mia Yellagonga 11 Mount Street
   Perth WA 6000
Postal address:        GPO Box D188 Perth WA 6840
Telephone:    +61 8 9348 4000
Email:    investor@woodside.com
Website:    woodside.com

Exchange controls

The United States does not presently impose restrictions on the transfer of capital to and from the United States beyond certain currency reporting requirements or economic sanctions regimes. Non-United States resident shareholders may currently receive dividend payments without United States governmental approval so long as the recipient is not a designated target of United States sanctions.

Under Australian foreign exchange controls currently in effect, transfers of capital to and from Australia are not subject to prior government approval and, except as described below, Australia does not restrict the flow of currency into or out of the country. Regulations may be made under the Anti-Money Laundering and Counter-Terrorism Financing Act 2006 of Australia (AML/CTF Act) prohibiting the entering into of transactions involving prescribed foreign countries. As of the date of this report, no such regulations are in place. To control tax evasion and money laundering, the AML/CTF Act also requires certain transactions to be reported to the Australian Transaction Reports and Analysis Center and prohibits reporting entities from providing certain services to customers without having complied with certain obligations under the AML/CTF Act (for example ‘know your customer’ checks). The Autonomous Sanctions Regulations 2011 promulgated under the Autonomous Sanctions Act 2011 of Australia, the Charter of the United Nations Act 1945 of Australia and other acts and regulations in Australia restrict or prohibit payments, transactions or other dealings with assets having a proscribed connection with certain countries or named individuals or entities subject to financial sanctions or identified with terrorism. The Australian Department of Foreign Affairs and Trade maintains a list of all persons and entities subject to financial sanctions or having a proscribed connection with terrorism which is available to the public at the Department of Foreign Affairs and Trade’s website. There are no specific restrictions regarding the remittance of profits, dividends or capital.

Taxation

The following describes the material US and Australian federal income tax considerations of the ownership and disposition of Woodside shares or Woodside ADSs (together, ‘Woodside Securities’) for beneficial owners of Woodside Securities that are US Holders (as defined below). This discussion applies only to Woodside Securities held as a ‘capital asset’ for US federal income tax purposes (generally property held for investment). This summary is based on the provisions of the Internal Revenue Code of 1986, as amended (the ‘Code’), US Treasury regulations, Australian tax law, any tax treaties, administrative rulings, and judicial decisions, all as in effect on the date hereof, and all of which are subject to change and differing interpretations, possibly with retroactive effect. Woodside cannot assure you that any such change or differing interpretation will not significantly alter the tax considerations described in this discussion. Woodside has not sought and will not seek any rulings from the Internal Revenue Service (IRS) or the Australian Taxation Office (ATO) with respect to the statements, positions or conclusions described in the following discussion. Such statements, positions and conclusions are not free from doubt, and there can be no assurance that an applicable tax adviser, the IRS, the ATO or a court will agree with such statements, positions, and conclusions. In addition, statements contained herein that Woodside ‘believes’, ‘expects’, ‘intends’, ‘anticipates’, or other similar phrases are not legal conclusions or opinions.

The following does not purport to be a complete analysis of all potential tax effects resulting from the ownership or disposition of Woodside Securities and does not address all aspects of US and Australian federal income taxation that may be relevant to individual US Holders in light of their particular circumstances. In addition, this summary does not address the Medicare tax on certain investment income, US federal estate or gift tax laws, any state, local, or non-US tax laws (other than Australian federal income tax), any tax treaties, or any other tax laws. Furthermore, this summary does not address all US and Australian federal income tax considerations that may be relevant to certain categories of US Holders that may be subject to special treatment under the US or Australian federal income tax laws, including, but not limited to:


banks, insurance companies, or other financial institutions


A-24


Table of Contents
 

tax-exempt or governmental organisations


dealers in securities or foreign currencies


persons whose functional currency is not the US dollar


persons that actually or constructively own 5% or more of any class of Woodside’s stock (by vote or by value)


corporations that accumulate earnings to avoid US federal income tax


traders in securities that use the mark-to-market method of accounting for US federal income tax purposes


persons subject to the alternative minimum tax


entities or arrangements treated as partnerships or other pass-through entities for US federal income tax purposes or holders of interests therein


persons deemed to sell Woodside Securities under the constructive sale provisions of the Code


real estate investment trusts


regulated investment companies


persons that hold Woodside Securities as part of a straddle, appreciated financial position, synthetic security, hedge, conversion transaction, or other integrated investment or risk reduction transaction.

THIS DISCUSSION IS NOT TAX ADVICE. US HOLDERS SHOULD CONSULT WITH, AND RELY SOLELY UPON, THEIR TAX ADVISERS WITH RESPECT TO THE APPLICATION OF US FEDERAL INCOME TAX LAWS (INCLUDING ANY POTENTIAL CHANGES THERETO) TO THEIR PARTICULAR SITUATIONS, AS WELL AS ANY TAX CONSEQUENCES ARISING UNDER ANY OTHER TAX LAWS, INCLUDING, BUT NOT LIMITED TO, US FEDERAL ESTATE OR GIFT TAX LAWS, THE LAWS OF ANY STATE, LOCAL OR NON-US TAXING JURISDICTION, OR ANY APPLICABLE INCOME TAX TREATY.

US Holder defined

For the purposes of this discussion, the term ‘US Holder’ is used to mean a beneficial owner of Woodside Securities that, for US federal income tax purposes, is:


an individual who is a citizen or resident of the United States;


a corporation (or other entity treated as a corporation for US federal income tax purposes) created or organised in or under the laws of the United States, any state thereof or the District of Columbia


an estate the income of which is subject to US federal income tax regardless of its source


a trust (A) the administration of which is subject to the primary supervision of a US court and which has one or more ‘United States persons’ (within the meaning of Section 7701(a)(30) of the Code) who have the authority to control all substantial decisions of the trust or (B) that has made a valid election under applicable US Treasury regulations to be treated as a United States person.

If a partnership (including an entity or arrangement treated as a partnership for US federal income tax purposes) holds Woodside Securities, the tax treatment of a partner in such partnership might depend upon the status of the partner or the partnership, upon the activities of the partnership and upon certain determinations made at the partnership or partner level. Accordingly, Woodside urges partners in partnerships (including entities or arrangements treated as partnerships for US federal income tax purposes) holding Woodside Securities to consult with, and rely solely upon, their own tax advisers regarding the US federal income and other tax considerations to them of the matters discussed below.

American Depositary Shares

For US federal income tax purposes, US Holders of Woodside ADSs generally should be treated as the beneficial owners of the underlying shares represented by the ADSs and an exchange of ADSs for such underlying shares generally will not be subject to US federal income tax. Throughout the remainder of this discussion, any reference to a holder of Woodside shares is assumed to include holders of Woodside ADSs.

Material US federal income tax considerations for US Holders with respect to the ownership and disposition of Woodside securities

Woodside PFIC considerations

Adverse and burdensome US federal income tax rules and consequences apply to US Holders that hold stock in a non- US corporation classified as a passive foreign investment company (PFIC) for US federal income tax purposes. In general, Woodside would be treated as a PFIC in any taxable year in which, after applying certain look-through rules, either:


1.

at least 75% of its gross income for such taxable year, including its pro rata share of the gross income of any corporation in which it is considered to own at least 25% of the shares by value, consists of passive income (which generally includes dividends, interest, rents and royalties (other than rents or royalties derived from the active conduct of a trade or business) and gains from the disposition of passive assets)


2.

at least 50% of its assets in such taxable year (ordinarily determined based on fair market value and averaged quarterly over the year), including its pro rata share of the assets of any corporation in which Woodside is considered to own at least 25% of the shares by value, produce or are held for the production of passive income.


A-25


Table of Contents

While Woodside does not anticipate becoming a PFIC in the current or future taxable years, there can be no assurance that it will not be a PFIC for any taxable year, as PFIC status is tested each taxable year and depends on the composition of its assets and income in such taxable year. If Woodside is classified as a PFIC for any year during which a US Holder holds Woodside Securities, Woodside will generally continue to be treated as a PFIC for all succeeding years during which such US Holder holds Woodside Securities. Because PFIC status is a fact- intensive determination made on an annual basis and depends on the composition of Woodside’s assets and income at such time, no assurance can be given that Woodside is not or will not become classified as a PFIC. If Woodside were later determined to be a PFIC, you may be unable to make certain advantageous elections with respect to your ownership of Woodside Securities (including a ‘mark-to-market’ election or a ‘qualified electing fund’ election) that would mitigate the adverse consequences of Woodside’s PFIC status, or making such elections retroactively could have adverse tax consequences to you. Woodside has not sought and will not seek any rulings from the IRS or any opinion from any tax adviser as to such tax treatment. Thus, the anticipated reporting position of Woodside described herein is not free from doubt. Woodside is not representing to you that Woodside will not be treated as a PFIC for the current taxable year or any subsequent taxable year.

Consistent with Woodside’s expectation, the remainder of this discussion assumes that Woodside will not be treated as a PFIC in the current taxable year or any subsequent taxable year.

THE PFIC RULES ARE COMPLEX AND UNCERTAIN. US HOLDERS SHOULD CONSULT WITH, AND RELY SOLELY UPON, THEIR TAX ADVISERS TO DETERMINE THE APPLICATION OF THE PFIC RULES TO THEM AND ANY RESULTANT TAX CONSEQUENCES.

Tax characterisation of distributions with respect to Woodside Securities

If Woodside pays a distribution in cash or other property to US Holders of Woodside Securities, such distribution generally will constitute a dividend for US federal income tax purposes to the extent paid from current or accumulated earnings and profits as determined under US federal income tax principles. Distributions in excess of current and accumulated earnings and profits will constitute a return of capital that will be applied against and reduce (but not below zero) the US Holder’s adjusted tax basis in its Woodside Securities. Any remaining excess will be treated as gain realised on the sale of Woodside Securities and will be treated as in the section entitled ‘Gain or loss on sale or other taxable exchange or disposition of Woodside securities’. However, because Woodside does not expect to determine its earnings and profits on the basis of United States federal income tax principles, US holders should expect that any distribution paid will generally be reported to them as a ‘dividend’ for US federal income tax purposes.

The amount of any distribution paid in a foreign currency will be equal to the US dollar value of such currency, translated at the spot rate of exchange on the date such distribution is received, regardless of whether the payment is in fact converted into US dollars at that time. If the distribution is converted into US dollars on the date of receipt, a US Holder should not be required to recognise foreign currency gain or loss in respect of the income attributable to such distribution. A US Holder may have foreign currency gain or loss if the distribution is converted into US dollars after the date of receipt. In general, foreign currency gain or loss will be treated as US-source ordinary income or loss.

Distributions treated as dividends

Dividends paid by Woodside will be taxable to a corporate US Holder at regular rates and will not be eligible for the dividends- received deduction generally allowed to US corporations in respect of dividends received from other US corporations. Dividends Woodside pays to a non-corporate US Holder generally will constitute a ‘qualified dividend’ that will be subject to US federal income tax at the maximum tax rate accorded to long-term capital gains if Woodside Securities are readily tradable on an established securities market in the United States or if Woodside is eligible for certain benefits under the tax treaty between the United States and Australia and certain holding period and other requirements are met, including that Woodside is not classified as a PFIC during the taxable year in which the dividend is paid or a preceding taxable year. If such requirements are not satisfied, a non-corporate US Holder may be subject to tax on the dividend at regular ordinary income tax rates instead of the preferential rate that applies to qualified dividend income. US Holders should consult with, and rely solely upon, their tax advisers regarding the availability of the lower preferential rate for qualified dividend income for any dividends paid with respect to Woodside Securities.

Woodside believes that it currently is, and anticipates continuing to be, eligible for benefits under the tax treaty between the United States and Australia. Under a published IRS Notice, common or ordinary shares, or ADSs representing such shares, are considered to be readily tradable on an established securities market in the United States if they are listed on the NYSE, as the Woodside ADSs are expected to be so listed. However, based on existing guidance, it is unclear whether the shares underlying the ADSs will be considered to be readily tradable on an established securities market in the United States, because only the ADSs will be listed on a securities market in the United States. US Holders are urged to consult with, and rely solely upon, their own tax advisers regarding the availability of the favorable rate applicable to qualified dividend income for any dividends Woodside pays with respect to the ADSs.


A-26


Table of Contents

Dividends paid with respect to Woodside Securities generally will constitute foreign source income for US foreign tax credit limitation purposes. Subject to certain complex conditions and limitations, any Australian taxes withheld on any distributions on Woodside Securities may be eligible for credit against a US Holder’s federal income tax liability or, at such holder’s election, may be eligible as a deduction in computing such holder’s US federal taxable income. If a refund of the tax withheld is available under the laws of Australia or under the tax treaty between the United States and Australia, as amended, the amount of tax withheld that is refundable will not be eligible for such credit against a US Holder’s US federal income tax liability (and will not qualify for the deduction against US federal taxable income). If the dividends constitute qualified dividend income as discussed above, the amount of the dividend taken into account for purposes of calculating the foreign tax credit limitation will generally be limited to the gross amount of the dividend, multiplied by the reduced rate applicable to the qualified dividend income, divided by the highest rate of tax normally applicable to dividends. The limitation on foreign taxes eligible for the credit is calculated separately concerning specific classes of income. For this purpose, dividends distributed by Woodside with respect to Woodside Securities will generally constitute ‘passive category income.’ The rules relating to the determination of the US foreign tax credit are complex, and US Holders are urged to consult with, and rely solely upon, their tax advisers regarding the availability of a foreign tax credit in their particular circumstances and the possibility of claiming an itemised deduction (in lieu of the foreign tax credit) for any foreign taxes paid or withheld.

Withholding tax in Australia.

The Australian withholding tax consequences of dividends paid to non-Australian resident shareholders are outlined in the section entitled material Australian tax considerations’. If Australian dividend withholding tax is payable on dividends from Woodside, US Holders should seek their own tax advice to determine the Australian and US taxation implications.

Gain or loss on sale or other taxable exchange or disposition of Woodside Securities

Upon a sale or other taxable exchange or disposition of Woodside Securities (including any portion of a distribution by Woodside treated as such per the section entitled ‘—Tax Characterisation of Distributions with Respect to Woodside Securities’), a US Holder generally will recognise capital gain or loss in an amount equal to the difference between (i) the sum of the amount of cash and the fair market value of any property received in such exchange or disposition and (ii) the US Holder’s adjusted tax basis in its Woodside Securities so disposed of. A US Holder’s adjusted tax basis in its Woodside Securities generally will equal the US Holder’s purchase price, or if acquired pursuant to the Special Dividend, the fair market value, (in each case, expressed in US dollars) for the Woodside Securities, reduced (but not below zero) by the amount of any prior distributions paid to such US Holder that were treated as a return of capital for US federal income tax purposes. Any such capital gain or loss generally will be long-term capital gain or loss if the US Holder held the Woodside Securities for more than one year. Long-term capital gains recognised by non-corporate US Holders will be eligible to be taxed at reduced rates. In addition, the deductibility of capital losses is subject to limitations.

Gain or loss, if any, realised by a US Holder on the sale or other disposition of Woodside Securities generally will be treated as US source gain or loss for US foreign tax credit limitation purposes. The use of US foreign tax credits relating to any Australian tax imposed upon the sale or other disposition of Woodside Securities may be unavailable or limited and may depend upon the application of the tax treaty between the United States and Australia to such US Holder. US Holders are urged to consult with, and rely solely upon, their own tax advisers regarding the tax consequences if Australian taxes are imposed on or connected with a sale or other disposition of Woodside Securities and their ability to credit any Australian tax against their US federal income tax liability.

Australian CGT consequences.

Australian capital gains tax (CGT) consequences of disposals of Woodside Securities by US holders are outlined in the section entitled ‘Material Australian Tax Considerations—Disposals of Woodside shares’. If any tax is payable in Australia on a gain accruing on the disposal of Woodside Securities, US Holders should seek their own tax advice to determine the Australian and US taxation implications.

Information reporting and backup witholding

Dividends with respect to Woodside Securities and proceeds from the sale or exchange of Woodside Securities may be subject, under certain circumstances, to information reporting and backup withholding. Backup withholding will not apply, however, to a US Holder that (i) is a corporation or entity that is otherwise exempt from backup withholding (which, when required, certifies as to its exempt status) or (ii) furnishes a correct taxpayer identification number and makes any other required certification on IRS Form W-9. Backup withholding is not an additional tax. Rather, the US federal income tax liability (if any) of persons subject to backup withholding will be reduced by the amount of tax withheld. If backup withholding results in an overpayment of taxes, a refund generally may be obtained, provided that the required information is timely furnished to the IRS.


A-27


Table of Contents

Additional information reporting requirements

Certain US Holders may be required to comply with certain reporting requirements relating to the Woodside Securities with respect to the holding of certain foreign financial assets, including stock of foreign issuers (such as Woodside). Penalties can apply if US Holders fail to satisfy such reporting requirements. US Holders are urged to consult with, and rely solely upon, their own tax advisers regarding the application of these rules to their ownership of the Woodside Securities.

Material Australian tax considerations

Dividends (including other distributions treated as dividends for Australian tax purposes) paid by Woodside to a US Holder that is not an Australian resident for Australian tax purposes will generally not be subject to Australian withholding tax if they are fully franked (broadly, where a dividend is franked, tax paid by Woodside is imputed to the shareholders).

Dividends paid to such US Holders, which are not fully franked, will generally be subject to Australian withholding tax not exceeding 15% only to the extent (if any) that the dividend is neither:


franked; nor


declared by Woodside to be conduit foreign income. (Broadly, this means that the relevant part of the dividend is declared to have been paid out of foreign source amounts received by Woodside that are not subject to tax in Australia, such as dividends remitted to Australia by foreign subsidiaries).

The Australian withholding tax outcome described above applies to US Holders who are eligible for benefits under the Tax Convention between Australia and the US as to the Avoidance of Double Taxation (the Australian Tax Treaty). Otherwise, the rate of Australian withholding tax may be 30%.

In contrast, dividends (including other distributions treated as dividends for Australian tax purposes) paid by Woodside to a US Holder may instead by taxed by assessment in Australia if the US Holder:


is an Australian resident for Australian tax purposes (although tax will generally not exceed 15% where the US Holder is eligible for benefits under the Australian Tax Treaty as a treaty resident of the US and any franking credits may be creditable against their Australian income tax liability); or


carries on business in Australia through a permanent establishment as defined in the Australian Tax Treaty, or performs personal services from a fixed base in Australia, and the shareholding in respect of which the dividend is paid is effectively connected with that permanent establishment or fixed base, (however, in such a case any franking credits may be creditable against the Australian income tax liability).

The treatment of dividends outlined above may be modified where the shareholding in Woodside is held through a trust, limited partnership, limited liability company, pension fund, sovereign wealth fund or other investment vehicle. Affected US Holders should seek their own advice in relation to such arrangements.

Material Australian tax considerations—disposals of Woodside Securities

Gains made by US Holders on the sale of Woodside Securities will generally not be taxed in Australia.

However, the precise Australian tax treatment of gains made by US Holders on the sale of Woodside Securities generally depends on whether or not the gain is an Australian sourced gain of an income nature for Australian income tax purposes.

Where the gain is of an income nature, a US Holder will generally only be liable to Australian income tax on an assessment basis (whether or not they are also an Australian resident for Australian tax purposes) if:


they are not eligible for benefits under the Australian Tax Treaty and the gain is sourced in Australia for Australian tax purposes; or


they are eligible for benefits under the Australian Tax Treaty but the gain constitutes any of the following (in which case the gain will be deemed to have an Australian source):


business profits of an enterprise attributable to a permanent establishment situated in Australia through which the enterprise carries on business in Australia; or


income or gains from the alienation of property that form part of the business property of a permanent establishment of an enterprise that the US Holder has in Australia, or pertain to a fixed base available to the US Holder in Australia for the purpose of performing independent personal services; or


income derived from the disposition of shares in a company, the assets of which consist wholly or principally of real property (which includes rights to exploit or to explore for nature resources) situated in Australia, whether such assets are held directly or indirectly through one or more interposed entities.


A-28


Table of Contents

Where the gain is not taxed as Australian sourced income, the US Holder will generally only be liable to Australian capital gains tax on an assessment basis if they acquired (or are deemed to have acquired) their Woodside Securities after 19 September 1985 and one or more of the following applies:


the US Holder is an Australian resident for Australian tax purposes; or


the Woodside Securities have been used by the US Holder in carrying on a business through permanent establishment in Australia; or


the Woodside Securities constitute an ‘indirect Australian real properly interest’ for Australian CGT purposes – this will generally be the case if the US Holder (either alone or together with associates) directly or indirectly owns or owned 10% or more of the issued share capital of Woodside at the time of disposal or throughout a 12-month period during the two years prior to the time of disposal and, at the time of the disposal, the sum of market values of Woodside’s assets (held directly or through interposed entities) that are not taxable Australian real property at that time (which, for these purposes including mining, quarrying or prospecting rights in respect of minerals, petroleum or quarry materials situated in Australia); or


the US Holder is an individual who is not eligible for benefits under the Australian Tax Treaty as a treaty resident of the US and elected on becoming a non-resident of Australia to continue to have the Woodside Securities subject to Australian capital gains tax.

In certain circumstances, if the Woodside Securities constitute an ‘indirect Australian real property interest’ for Australian CGT purposes, the purchaser may be required to withhold under the non-resident CGT withholding regime an amount equal to 12.5% of the purchase price in situations including where the acquisition is undertaken by way of an off-market transfer. Affected US Holders should seek their own advice in relation to how this withholding regime may apply to them.

The comments above on the sale of Woodside Securities do not apply:


to temporary residents of Australia who should seek advice that is specific to their circumstances; or


if the Investment Management Regime (IMR) applies to the US Holder, which exempts from the Australian income tax and capital gains tax gains made on disposal by certain categories of non-resident funds – called IMR entities – of (relevantly) portfolio interests in Australian public companies (subject to a number of conditions). The IMR exemptions broadly apply to widely held IMR entities in relation to their direct investments and indirect investments made through an independent Australian fund manager. The exemptions apply to gains made by IMR entities that are treated as companies for Australian tax purposes as well as gains made by non-resident investors in IMR entities that are treated as trusts and partnerships for Australian tax purposes.

THE FOREGOING DISCUSSION IS NOT TAX ADVICE OR A COMPREHENSIVE DISCUSSION OF ALL US AND AUSTRALIAN FEDERAL INCOME TAX CONSEQUENCES TO US HOLDERS OF WOODSIDE SECURITIES. SUCH HOLDERS SHOULD CONSULT WITH, AND RELY SOLELY UPON, THEIR OWN TAX ADVISERS TO DETERMINE THE SPECIFIC TAX CONSEQUENCES TO THEM OF THE OWNERSHIP AND DISPOSITION OF WOODSIDE SECURITIES, INCLUDING THE EFFECT OF ANY US FEDERAL, STATE, LOCAL, NON-US, OR OTHER TAX LAWS.


A-29


Table of Contents

Events calendar 2023

Key calendar dates for Woodside shareholders in 2023. Please note dates are subject to review.


February

   27               Full-year 2022 results and briefing
   27               Annual Report 2022
   27               US Annual Report 2022 (Form 20-F)
   27               Sustainable Development Report 2022
   27               Climate Report 2022
   

March

   8                 Ex-dividend date for dividend entitlement
  

9                 Record date for dividend entitlements


April


5                 Payment of dividend

   21               First quarter 2023 results
   28               Annual General Meeting
   

June

   30               Half-year end 2023
   

July

   19               Second quarter 2023 results
   

August

   24               Half-year 2023 results
   

October

   18               Third quarter 2023 results
   

November

                      Investor Briefing Day 2023
   

December

   31               Year-end 2023


A-30


Table of Contents

SECTION 6.5

Business directory


AUSTRALIA


Perth (HEAD OFFICE)

Mia Yellagonga

11 Mount Street, Perth WA 6000,

Australia

T: +61 8 9348 4000

Postal address: GPO Box D188, Perth

WA 6840, Australia


Karratha

The Quarter HQ, Level 3, 24 Sharpe Avenue

Karratha WA 6714, Australia

T: 1800 634 988

Postal address: PO Box 517 Karratha

WA 6714, Australia


Roebourne

39 Roe Street, Roebourne WA 6718,

Australia

T: 1800 634 988


Canberra

Suite 12.03, 15 London Circuit, Canberra

ACT 2601, Australia

T: +61 8 9348 4000


Melbourne

Level 3, 162 Collins Street, Melbourne

Victoria 3000, Australia

T: +61 8 9348 4000


Launceston

96 Tamar Street, Launceston Tasmania 7250,

Australia

T: +61 8 9348 4000

AMERICAS


Houston

1500 Post Oak Blvd, Houston TX 77056, USA

T: +1 713 961 8500


Calgary

Suite 3750, 421-7th Avenue SW

Calgary Alberta T2P 4K9, Canada

T: +1 855 956 0916

Postal address: PO Box 22240 Bankers Hall Calgary Alberta T2P 4J6 Canada


Mexico City

Avenida Ejercito Nacional 769 Torre B,

Piso 3, Col. Granada, Migual Hidalgo, Ciudad de Mexico 11520, Mexico

T: +52 55 9156 9635


Port of Spain

Invaders Bay Tower, Invaders Bay off Audrey Jeffers Highway, Port of Spain W.I, Trinidad and Tobago

T: +1 868 821 5200

AFRICA


Dakar

Serenity Building, 1 Route du King Fahd Palace 2nd & 3rd floor, Almadie, Dakar, Senegal

T: +221 32 824 40 60

ASIA-PACIFIC


Beijing

16/F, West Tower, 1607, World Financial Centre

No. 1 East 3rd Ring Middle Road

Chaoyang District, Beijing, 100020

China

T: +86 10 8591 0577


Dili

Palm Business and Trade Centre Block E01-06 Surik Mas, Fatumeta Bairro Pite

Dili, Timor-Leste

T: +670 3310804


Seoul

11F Kwanghwamun Building 149, Sejong-daero, Jongno-gu Seoul 03186, Republic of Korea

T: +82 2 739 3290


Singapore

12 Marina View, Asia Square Tower 2 #18-03 Singapore 018961 Singapore

T: +65 6709 8000


Tokyo

Imperial Tower, 1-1 Uchisaiwaicho

1- Chome Chiyoda-ku Tokyo 100-0011

Japan

T: +81 3 3501 7031

UNITED KINGDOM


London

Level 3, 10-12 Cork Street London, England W1S 3NP United Kingdom

T: +44 20 7009 3900


A-31


Table of Contents

SECTION 6.6

Asset facts

Producing facilities


Australia  


   Asset                           Role   Equity   Infrastructure   Capacity (100% project)   Product

Pluto LNG

  Operator  

90%

  Pluto LNG Plant (onshore gas plant)  

LNG: 4.9 Mtpa

Domestic gas: 25 TJ/d Condensate: 1,140 tonnes/d

  LNG, pipeline gas and condensate
           

Pluto Platform

(steel jacket fixed platform)

  Dry gas: 1,320 MMscf/d   Gas and condensate

North West Shelf1

  Operator  

33.33%

  Karratha Gas Plant (onshore gas plant)  

LNG: 16.9 Mtpa

Domestic Gas: 630 TJ/d

  LNG, pipeline gas,
condensate and NGLs
          Condensate: 14,385 tonnes/d    
      North Rankin Complex (steel jacket fixed platform)  

Dry gas: 60,000 tonnes/d

Condensate: 6,200 tonnes/d

  Gas and condensate
     

Goodwyn A Platform

(steel jacket fixed platform)


Dry gas: 38,000 tonnes/d

Condensate: 18,000 tonnes/d

  Gas and condensate
           

Angel Platform

(steel jacket fixed platform)


Dry gas: 21,500 tonnes/d

Condensate: 5,270 tonnes/d

  Gas and condensate

Wheatstone2

  Non-operator  

13%

  Wheatstone LNG Plant (onshore gas plant)  

LNG: 8.9 Mtpa

Domestic gas: 200 TJ/d Condensate: 8,661 sm3/d

  LNG, pipeline gas and
condensate
            Wheatstone Platform (steel gravity structure platform)  

Dry gas: 1,970 MMscf/d

Condensate: 8,600 sm3/d

  Gas and condensate

Okha FPSO


Operator


50%

  FPSO  

Oil: 60 kbbl/d

Gas: 82 MMscf/d

  Crude oil

Ngujima-Yin FPSO


Operator


60%

  FPSO   Oil: 120 kbbl/d   Oil

Bass Strait

  Non-operator  

50%

  Longford (onshore gas plant)  

Gas: 1,040 TJ/day

Crude oil and condensate: 65,000 bbl/d

Liquefied petroleum gas: 5,150 tonnes/d

Ethane: 850 tonnes/d

  Crude oil and condensate,
pipeline gas and NGLs
      Long Island Point (onshore processing and storage plant)
      Barracouta (steel jacket platform and West Barracouta subsea tieback)
      Snapper (steel jacket platform)    
      Marlin/Turrum (steel jacket platform)    
      Tuna/West Tuna (steel jacket platform and concrete gravity structure)    
        Oil Block (steel jacket platform)    
    32.5%   Kipper (subsea tieback to West Tuna)    

Pyrenees FPSO


Operator


40-71.4%

  FPSO   Oil: 96,000 bbl/d   Crude oil

Macedon


Operator


71.4%

  Onshore single-train gas plant  

Gas: 220 MMscf/d

Condensate: 110 bbl/d

  Pipeline gas


1.

The North West Shelf consists of a number of active joint ventures. Woodside’s participating interest is 33.33% in all of these apart from the NWS joint ventures with CNOOC. Woodside’s participating interest in the CLNG JV is 25% and in the Extended Interest JVs is 31.567%.

2.

The Wheatstone assets processes gas from several offshore gas fields, including the Julimar and Brunello fields, for which Woodside has 65% participating interest and is the operator.


A-32


Table of Contents
International  


   Asset                           Role   Equity   Infrastructure   Capacity (100% project)   Product

Greater Angostura

  Operator  

45%


Angostura – Block 2(c)

(central processing platform)


Oil:100,000 bbl/d

Gas: 340 MMscf/d

  Crude oil and condensate and pipeline gas
       

68.46%

  Ruby – Block 3(a)
(well protector platform)
       

Greater Shenzi


Operator


72%

  Tension leg platform  

Oil: 100,000 bbl/d

Gas: 50 MMscf/d

  LNG, pipeline gas, condensate and NGLs

Atlantis


Non-operator


44%

  Semi-submersible wet tree development  

Oil: 200,000 bbl/d

Gas: 180 MMscf/d

  LNG, pipeline gas and condensate

Mad Dog

  Non-operator  

23.9%


Phase 1 (A-Spar)

(subsea truss spar)


Oil:100,000 bbl/d

Gas: 60 MMscf/d

  Crude oil and condensate, pipeline gas and NGLs
           

Phase 2 (Argos)

(semi-submersible floating)1


Oil: 140,000 bbl/d

Gas: 75 MMscf/d

  Crude oil and condensate, pipeline gas and NGLs


1.

Mad Dog Phase 2 has not achieved ready for start up.

Projects

Post FID


   Asset                           Role   Equity   Infrastructure   Capacity (100% project)   Product
  Scarborough   Operator   100%   Semi-submersible FPU  

Dry gas: 33,582 tonnes/day

LNG: 5.0 Mtpa

Domestic gas: 225 TJ/d

  LNG, pipeline gas and condensate
       

51%


Pluto Train 2 (onshore gas plant)

  Sangomar


Operator

  82%   FPSO   Oil: 100,000 bbl/d   Crude oil

Pre FID


  Asset                           Role   Equity                                                     Product
  Trion   Operator   60%           Crude oil


A-33


Table of Contents

Developments


  Asset   Role    Equity   Product
  Calypso   Operator    70%   Gas
  Browse   Operator    30.6%   LNG, pipeline gas and condensate
  Liard   Operator    100%   Gas
  Non-operator    50%   Gas
  Wildling1   Operator    100%   Crude oil and condensate, pipeline gas and NGLs
  Sunrise   Operator    33.44%   LNG, pipeline gas and condensate
  Myanmar A-62   Joint operator    40%   N/A


1.

Woodside does not plan to pursue any further Wildling development activities in Blocks GC564 or GC520.

2.

Withdrawing; handover in progress.

New energy opportunities1


  Asset   Role    Equity   Product
  H2OK   Operator    100%   Liquid hydrogen
  H2Perth   Operator    100%   Hydrogen and ammonia
  Hydrogen Refueller @H2Perth   Operator    100%   Hydrogen
  H2TAS   Operator    100%   Hydrogen and ammonia
  Woodside Solar   Operator    100%   Solar energy
  Southern Green Hydrogen2   Preferred partner    -   Hydrogen and ammonia
  Heliogen   Non-operating partner    N/A   Solar energy


1.

Subject to FID and regulatory approvals

2.

Woodside’s equity in Southern Green Hydrogen is subject to finalising commercial agreements.

Greenhouse gas assessement permits


  Country                Permit    Role    Joint venture    Comment
  Australia    G-7-AP    Non-operator    Bonaparte CCS Assessment Joint Venture    Located in the Bonaparte Basin off the north-western coast of the Northern Territory
   G-8-AP    Operator    Browse Joint Venture    For carbon capture and storage evaluation for Browse
   G-10-AP    Operator    Northern Carnarvon Basin CCS Joint Venture    Located in the Northern Carnarvon Basin off the north west coast of Western Australia


A-34


Table of Contents

Exploration


  Country                        Permit    Role      Equity    Product
  Asia-Pacific                        

  Australia

   WA-526-P      Non-operator      50%    Gas prone basin
   WA-356-P      Operator      65%    Gas prone basin
   WA-536-P      Operator      65%    Gas prone basin
   WA-550-P      Operator      100%    Gas prone basin
     NT/P86      Operator      100%    Gas prone basin

  Myanmar1

   A-7      Operator      Relinquished, formalities pending    Gas prone basin
   AD-7      Non-operator      Relinquished, formalities pending    Gas prone basin
   AD-1      Joint operator      Relinquished, formalities pending    Gas prone basin
     AD-8      Joint operator      Relinquished, formalities pending    Gas prone basin

  Republic of Korea

   8, 6-1N      Joint operator      Exit initiated    Gas prone basin
         
  Europe                        

  Ireland

   FEL 5/13      Operator     

Exit initiated

   Oil or gas prone basin
         
  Africa                        

  Senegal

   Rufisque, Sangomar and Sangomar Deep      Operator      90%    Oil prone basin

  Congo

   Marine XX      Non-operator      22.5%    Oil or gas prone basin

  Egypt

   Red Sea Block 1      Non-operator      45%    Oil or gas prone basin
   Red Sea Block 3      Non-operator      30%    Oil and gas prone basin
   Red Sea Block 4      Non-operator      25%    Oil and gas prone basin
         
  Caribbean                        

  Barbados

   Carlisle Bay, Bimshire      Operator      60%    Oil or gas prone basin
  Trinidad and Tobago    TTDAA5 MDP2      Operator      65%    Gas prone basin
         
  Latin America                        

  Peru

   108      Non-operator     

Exit initiated

   Oil or gas prone basin
         
  North America                        

  Canada (offshore)

   EL1157      Operator     

Exit initiated


Oil or gas prone basin

     EL1158      Operator     

Exit initiated


Oil or gas prone basin


A-35


Table of Contents
  Country                Permit    Role    Equity    Product
  US Gulf of Mexico    GB 640, GB 641, GB 685, GB 555, GB 556, GB 726, GB 770, GB 771, GB 604, GB 605, GB 647, GB 648, GB 649, GB 772, GB 728, GB 729, GB 773, GB 774, GB 421, GB 464, GB 465, GB 508, GB 509, GB 736, GB 780, GB 824    Non-operator
  

40%


Oil prone basin

       
   GB 574, GB 575, GB 619, GB 529, GB 530, GB 531    Operator    40%3    Oil prone basin
   GB 630, GB 719, GB 720, GB 763, GB 807, GB 501, GB 502, GB 545, GB 676, GB 677, GB 721, GB 762, GB 805, GB 806, GB 851, GB 852, GB 895, GB 672, GB 716, GB 760    Operator    60%    Oil prone basin
   GC 282, GC 237    Non-operator    50%    Oil prone basin
   GB 663, GB 664, GB 678, GC 564, EB 566, EB 567, EB 610, EB 611    Operator    100%    Oil prone basin
   EB 655, EB 656, EB 699, EB 700, EB 701, AC 34, AC 36, AC 78, AC 80, EB 870, EB 871, EB 872, EB 914, EB 915, EB 742, EB 785, EB 786, EB 830, AC 127, AC 170, AC 39, AC 81, AC 82    Operator    70%    Oil prone basin
   MC 798, MC 842    Non-operator    45%    Oil prone basin
   GC 679, GC 768    Non-operator    31.9%    Oil prone basin
   GC 238    Non-operator    60%    Oil prone basin
   MC 368, MC 369, MC 411, MC 412, MC 455, MC 456    Non-operator    25%    Oil prone basin
   GC 80, GC 123, GC 124, GC 168    Operator    75%    Oil prone basin
     GC 738, GC 870    Non-operator    23.9%    Oil prone basin


1.

Woodside announced its decision to withdraw from its interests in Myanmar on 27 January 2022.

2.

Market Development Phase Area (MDP).

3.

Pending regulatory assignment approval.


A-36


Table of Contents

SECTION 6.7

Alternative performance measures

Certain parts of this report contain financial measures that have not been prepared in accordance with IFRS and are not recognised measures of financial performance or liquidity under IFRS. In addition to the financial information contained in this report presented in accordance with IFRS, certain ‘non-GAAP financial measures’ (as defined in Item 10(e) of Regulation S-K under the US Securities Act of 1933, as amended) have been included in this report. These measures include EBIT, EBITDA excluding impairment, Gearing, Underlying NPAT, Net debt, Free cash flow, Capital expenditure, Exploration expenditure, Net tangible assets, and Net tangible asset per ordinary security. These non-IFRS financial measures are defined section 6.8 - Glossary, units of measure and conversion factors. This section provides a reconciliation of these measures to Woodside’s Financial Statements.

Woodside believes that the non-IFRS financial measures it presents provide a useful means through which to examine the underlying performance of its business. These measures, however, should not be considered to be an indication of, or alternative to, corresponding measures of gross profit, net profit, cash flows from operating activities, or other figures determined in accordance with IFRS. In addition, such measures may not be comparable to similar measures presented by other companies.

Undue reliance should not be placed on the non-IFRS financial measures contained in this report, and the non-IFRS financial measures should not be considered in isolation or as a substitute for financial measures computed in accordance with IFRS. Although certain of these data have been extracted or derived from Woodside’s Financial Statements, these data have not been audited or reviewed by Woodside’s independent auditors. You are urged to read carefully the audited Full-year Financial Statements and related notes thereto.


Definition   and calculation of non-IFRS financial information


  Non-IFRS

  financial

  information


Why is the non-IFRS financial

information useful


Calculation

methodology


  EBIT    Used to assess the Group’s operational profitability excluding net finance costs and taxation expense. This assists management in tracking the performance of the Group from its operations only.    Calculated as profit before income tax, PRRT and net finance costs.
  EBITDA excluding   impairment    Used to assess the Group’s operational profitability excluding net finance costs, taxation expense, depreciation and amortisation and impairment losses/reversals. This measure assesses the performance of the Group’s segments and aids decision making of resource allocation.    Calculated as profit before income tax, PRRT, net finance costs, depreciation and amortisation, impairment losses, impairment reversals.
  Underlying NPAT    Used to assess the Group’s financial performance by excluding the impacts of exceptional items. This measure indicates the performance from the Group’s core operations only and is used by management to aid decision making of resource allocation.    Net profit after tax from the Group’s operations excluding any exceptional items (refer to the reconciliation in this section for the list of specific items for each financial year).

  Investment

  expenditure

   Used to assess efficient deployment of capital for oil and gas properties, evaluation capitalised and exploration and evaluation expenditure. Management uses this measure as support for decision making to maintain and improve productive capacity.    Includes capital additions on oil and gas properties, evaluation capitalised and exploration and evaluation expenditure less amortisation of licence acquisition costs and prior year exploration expense written off.
  Capital expenditure    Used to assess efficient deployment of capital for oil and gas properties and evaluation capitalised. Management uses this measure as support for decision making to maintain and improve productive capacity.    Includes capital additions on oil and gas properties and evaluation capitalised.

  Exploration

  expenditure

   Used to assess efficient deployment of capital for exploration and evaluation expenditure. Management uses this measure as support for decision making to maintain and improve productive capacity.    Includes exploration and evaluation expenditure less amortisation of licence acquisition costs and prior year exploration expense written off.
  Free cash flow    Used to evaluate the cash available for financing activities, including shareholder distributions and debt servicing, after investment in maintaining and growing the Group’s operations This measure is used as a key indicator of the level of cash the Group has at its disposal.    Cash flow from operating activities (excluding payments to cash reserves) and cash flow from investing activities.
  Net debt    Net debt measures how the Group manages our balance sheet and capital structure. Management uses this measure to track the level of debt of the Group.    Interest-bearing liabilities and lease liabilities less cash and cash equivalents.
  Net tangible assets    Used to assess the Group’s net assets (excluding intangible) to assess how much risk the Group carries in liquidity, solvency and assets for financing purposes.    The Group’s net assets less goodwill, non-controlling interest and intangible assets.

  Net tangible assets

  per ordinary

  security

   Used by management to assess the Group’s investment strategy in comparison to the Group’s share price.    Net tangible assets divided by the number of issued and fully paid shares.
  Gearing    Used to monitor the Group’s net debt relative to the Group’s total net debt and equity. This measure assists management in monitoring the Group’s leverage.    Net debt divided by the total of net debt and equity attributable to equity holders of the parent.


A-37


Table of Contents

APMs derived from Consolidated Income Statement


2022

                US$m

     2021
                US$m
     2020
                US$m
 

 EBIT/EBITDA excluding impairment


 Net profit/(loss) after tax

     6,575        2,036        (3,975)  

 Adjusted for:


 Finance income

     (155)        (27)        (58)  

 Finance costs

     167        230        327  

 PRRT expense/(benefit)

     (313)        297        (439)  

 Income tax expense/(benefit)

     2,912        957        (1,026)  

 EBIT

     9,186        3,493        (5,171)  

 Adjusted for:


 Oil and gas properties depreciation and amortisation

     2,798        1,549        1,689  

 Amortisation of licence acquisition costs

     10        3        12  

 Depreciation of lease assets

     140        108        94  

 Depreciation of other plant and equipment

     -        30        29  

 Impairment losses

     -        10        5,269  

 Impairment reversals

     (900)        (1,058)        -  

 EBITDA excluding impairment

     11,234        4,135        1,922  


 Underlying NPAT


 Net profit/(loss) after tax attributable to equity holders of the parent

     6,498        1,983        (4,028)  

 Adjusted for the following exceptional items:


 Add: Merger transaction costs

     419        -        -  

 Add: Orphan Basin exit fee

     142        -        -  

 Add: Myanmar exit

     -        209        -  

 Add: Kitimat exit costs

     -        33        -  

 Add: Joint venture recoveries

     -        4        -  

 Add: Impairment losses

     -        -        3,923  

 Add: Recognition of the Corpus Christi onerous contract provision

     -        -        447  

 Add: Other

     -        -        105  

 Less: Derecognition of the Corpus Christi onerous contract provision

     (245)        -        -  

 Less: Impairment reversal (post-tax)

     (630)        (582)        -  

 Less: pluto PRRT DTA recognition

     (954)        -        -  

 Less: Pluto price adjustment

     -        (27)        -  

 Underlying NPAT

     5,230        1,620        447  

APMs derived from Consolidated Cash Flow Statement


      2022
                US$m
     2021
                US$m
     2020
                US$m
 

 Capital expenditure


 Capital additions on evaluation

     119        453        310  

 Capital additions on oil and gas properties

     3,904        2,178        1,591  

 Capital expenditure

     4,023        2,631        1,901  
                      

 Exploration expenditure


 Exploration and evaluation expenditure

     470        322        81  

 Adjusted for:


 Amortisation expense

     (10)        (3)        (12)  

 Prior year expense written off

     (164)        (265)        (2)  

 Exploration capitalised

     122        42        45  

 Exploration expenditure

     418        96        112  

 Investment expenditure

     4,441        2,727        2,013  
                      

 Free cash flow


 Cash flow from operating activities

     8,811        3,792        1,849  

 Adjusted for:


 Payments to cash reserves

     -        -        -  

 Cash flow used in investing activities

     (2,265)        (2,941)        (2,112)  

 Free cash flow

     6,546        851        (263)  


A-38


Table of Contents

APMs derived from Consolidated Balance Sheet


2022
US$m


2021
US$m


2020
US$m


 Net tangible assets per ordinary security

                 37,127        14,229        12,875  

 Net assets


 Adjusted for:


 Goodwill

     (4,614)        -        -  

 Non-controlling interest

     (791)        (786)        (800)  

 Intangible assets

     (55)        (2)        (1)  

 Net tangible assets

     31,667        13,441        12,074  

 Number of issued and fully paid shares

     1,898,749,771                    969,631,826                    962,225,814  

 Net tangible assets per ordinary security

     16.68        13.86        12.55  
                      

 Gearing


 Interest-bearing liabilities (Current and non-current)

     5,138        5,430        6,214  

 Lease liabilities (Current and non-current)

     1,634        1,367        1,278  

 Adjusted for:


 Cash and cash equivalents

     (6,201)        (3,025)        (3,604)  

Add: restricted cash

     12        -        -  

 Net debt

     583        3,772        3,888  

 Equity attributable to equity holders of the parent

     36,336        13,443        12,075  

 Total net debt and equity attributable to equity holders of the parent

     36,919        17,215        15,963  

 Gearing (%)

     1.6        21.9        24.4  


A-39


Table of Contents

SECTION 6.8

Glossary, units of measure and conversion factors

Glossary


$, $m    US dollars unless otherwise stated, millions of dollars
1P    Proved reserves
2C    Best Estimate of Contingent resources
2P    Proved plus Probable reserves
ADR    American Depository Receipts
AGM    Annual General Meeting
ASX    Australian Securities Exchange
A$    Australian dollars
Brent    Intercontinental Exchange (ICE) Brent Crude deliverable futures contract (oil price)
Capital expenditure    Includes capital additions on oil and gas properties and evaluation capitalised
Carbon credit    A tradable financial instrument that is issued by a carbon-crediting program. A carbon credit represents a greenhouse gas emission reduction to, or removal from, the atmosphere equivalent to 1 tCO2-e. calculated as the difference in emissions from a baseline scenario to a project scenario. Carbon credits are uniquely serialised, issued, tracked and retired or administratively cancelled by means of an electronic registry operated by an administrative body, such as a carbon-crediting program
Cash margin    Revenue from sale of produced hydrocarbons less production costs, royalties, excise and levies, insurance, inventory movement, shipping and direct sales costs and other hydrocarbon costs; excludes exploration and evaluation, general administrative and other costs, depreciation and amortisation. PRRT and income tax
CCS    Carbon capture and storage
CCUS    Carbon capture utilisation and storge
CHF    Swiss francs
CO2    Carbon dioxide
CO2-e    CO2 equivalent. The universal unit of measurement to indicate the global warming potential of each of the seven greenhouse gases, expressed in terms of the global warming potential of one unit of carbon dioxide. It is used to evaluate releasing (or avoiding releasing) any greenhouse gas against a common basis1
Condensate    Hydrocarbons that are gaseous in a reservoir but that condense to form liquids as they rise to the surface
cps    Cents per share
Decarbonisation    Woodside uses this term to describe activities or pathways that have the effect of moving towards a state that is lower carbon, as defined in this glossary.
DRP    Dividend reinvestment plan
EBIT    Calculated as profit before income tax. PRRT and net finance costs
EBITDA excluding impairment    Calculated as profit before income tax. PRRT, net finance costs, depreciation and amortisation, impairment losses, impairment reversals
EPS    Earnings per share
Equity greenhouse gas emissions    Woodside sets its Scope 1 and 2 greenhouse gas emissions reduction targets on an equity basis. This ensures that the scope of its emissions reduction targets is aligned with its economic interest in its investments. Equity emissions reflect the greenhouse gas emissions from operations according to Woodside’s share of equity in the operation. Its equity share of an operation reflects its economic interest in the operation, which is the extent of rights it has to the risks and rewards flowing from the operation2
Exploration expenditure    Includes exploration and evaluation expenditure less amortisation of licence acquisition costs and prior year exploration expense written off
FEED    Front-end engineering design
FID    Final investment decision
FPSO    Floating production storage and offloading
FPU    Floating production unit
Free cash flow    Cash flow from operating activities less cash flow from investing activities
FVLCD    Fair value less costs to dispose
GAAP    Generally Accepted Accounting Principles
GDP    Gross domestic product
Gearing    Net debt divided by the total of net debt and equity attributable to equity holders of the parent
GHG or greenhouse gas    The seven greenhouse gases listed in the Kyoto Protocol are; carbon dioxide (CO2); methane (CH4); nitrous oxide (N20); hydrofluorocarbons (HFCs); nitrogen trifluoride (NF3); perfluorocarbons (PFCs); and sulphur hexafluoride (SF6)1
Gross margin    Gross profit divided by operating revenue. Gross profit excludes income tax, PRRT. net finance costs, other income and other expenses
GWF    Greater Western Flank
H1, H2    Halves of the calendar year (H1 is 1 January to 30 June and H2 is 1 July to 31 December)
HSE    Health, safety and environment
IFRS    International Financial Reporting Standards
Investment expenditure    Includes capital expenditure and exploration expenditure
JCC    The Japan Customs-cleared Crude is the average price of customs-cleared crude oil imports into Japan as reported in customs statistics (also known as ‘Japanese Crude Cocktail’) and is used as a reference price for long-term supply LNG contracts
JV    Joint venture
KGP    Karratha Gas Plant
Liquidity    Total cash and cash equivalents and available undrawn debt facilities
LNG    Liquified natural gas
Lower carbon    Woodside uses this term to describe the characteristic of having lower levels of associated potential GHG emissions when compared to historical and/or current conventions or analogues, for example relating to an otherwise similar resource, process, production facility, product or service, or activity


A-40


Table of Contents
Lower carbon portfolio    For Woodside, a lower carbon portfolio is one from which the net equity scope 1 and 2 greenhouse gas emissions, which includes the use of offsets, are being reduced towards targets, and into which new energy products and lower carbon services are planned to be introduced as a complement to existing and new investments in oil and gas.
Lower carbon services    Woodside uses this term to describe technologies, such as CCUS or offsets that could be used by customers to reduce their net greenhouse gas emissions
LSE    London Stock Exchange
Net debt    Interest-bearing liabilities and lease liabilities less cash and cash equivalents
Net equity greenhouse gas emissions    Woodside’s equity share of net greenhouse gas emissions
Net greenhouse gas emissions    Woodside has set its Scope 1 and 2 greenhouse gas emissions reduction targets on a net basis, allowing for both direct emissions reductions from its operations and emissions reductions achieved from the use of offsets. Net greenhouse gas emissions are equal to an entity’s gross greenhouse gas emissions reduced by the number of retired carbon credits
Net profit attributable to equity holders of the parent    Net profit after tax excluding non-controlling interests from the Group’s operations
Net tangible assets    The Group’s net assets less goodwill, non-controlling interest and intangible assets
Net tangible assets per ordinary security    Net tangible assets divided by the number of issued and fully paid shares
Net zero    Net zero emissions are achieved when anthropogenic emissions of greenhouse gases to the atmosphere are balanced by anthropogenic removals over a specified period. Where multiple greenhouse gases are involved, the quantification of net zero emissions depends on the climate metric chosen to compare emissions of different gases (such as global warming potential, global temperature change potential, and others, as well as the chosen time horizon)3
New energy    Woodside uses this term to describe energy technologies, such as hydrogen or ammonia, that are emerging in scale but which are expected to grow during the energy transition due to having lower greenhouse gas emissions at the point of use than conventional fossil fuels
NGLs    Natural gas liquids
NPAT    Net profit after tax
NWS    North West Shelf
NYSE    New York Stock Exchange
Offsets    The compensation for an entity’s greenhouse gas emissions within its scope by achieving an equivalent amount of emission reductions or removals outside the boundary or value chain of that entity
PRRT    Petroleum resources rent tax
PSC    Production sharing contract
PSE    Process safety event
Revenue from ordinary activities    Revenue from the sale of hydrocarbons, processing and services revenue and shipping and other revenue.
RFSU    Ready for start up
RSSD    Rufisque Offshore, Sangomar Offshore and Sangomar Deep Offshore
Scope 1 GHG emissions    Direct GHG emissions. These occur from sources that are owned or controlled by the company, for example, emissions from combustion in owned or controlled boilers, furnaces, vehicles, etc.; emissions from chemical production in owned or controlled process equipment. Woodside estimates greenhouse gas emissions, energy values and global warming potentials are estimated in accordance with the relevant reporting regulations in the jurisdiction where the emissions occur (e.g. Australian National Greenhouse and Energy Reporting (NGER). US EPA Greenhouse Gas Reporting Program (GHGRP)). Australian regulatory reporting principles have been used for emissions in jurisdictions where regulations do not yet exist.2
Scope 2 GHG emissions    Electricity indirect GHG emissions. Scope 2 accounts for GHG emissions from the generation of purchased electricity consumed by the company. Purchased electricity is defined as electricity that is purchased or otherwise brought into the organisational boundary of the company. Scope 2 emissions physically occur at the facility where electricity is generated. Woodside estimates greenhouse gas emissions, energy values and global warming potentials are estimated in accordance with the relevant reporting regulations in the jurisdiction where the emissions occur (e.g. Australian National Greenhouse and Energy Reporting (NGER), US EPA Greenhouse Gas Reporting Program (GHGRP)). Australian regulatory reporting principles have been used for emissions in jurisdictions where regulations do not yet exist.2
Scope 3 GHG emissions    Other indirect GHG emissions. Scope 3 is a reporting category that allows for the treatment of all other indirect emissions. Scope 3 emissions are a consequence of the activities of the company, but occur from sources not owned or controlled by the company. Some examples of Scope 3 activities are extraction and production of purchased materials; transportation of purchased fuels; and use of sold products and services.2
Target    Woodside uses this term to describe an intention to seek the achievement of an outcome, where Woodside considers that it has developed a suitably defined plan or pathway to achieve that outcome
TCFD    Taskforce on Climate-related Financial Disclosures.
Tier 1 PSE    A typical Tier 1 process safety event is loss of containment of hydrocarbons greater than 500 kg (in any one-hour period)
Tier 2 PSE    A typical Tier 2 process safety event is loss of containment of hydrocarbons greater than 50 kg but less than 500 kg (in any one-hour period)
TRIR    Total recordable injury rate. The number of recordable injuries (fatalities, lost workday cases, restricted work day cases and medical treatment cases) per million work hours
Underlying NPAT    Net profit after tax from the Group’s operations excluding any exceptional items
Unit production costs    Production costs ($ million) divided by production volume (MMboe)
US, USA    United States of America
USD    US dollars
WA    Western Australia


1.

See IFRS Foundation 2021: Climate Related Disclosures Prototype. Appendix A. The IFRS published a further consultation document subsequent to the 2021 prototype. As it did not contain a updated definition of Paris-Aligned scenarios Woodside has retained use of the previous edition.

2.

World Resources Institute and World Business Council for Sustainable Development 2004. “GHG Protocol: a corporate accounting and reporting standard”.

3.

IPCC, 2018: Annex I: Glossary [Matthews, J.B.R. (ed.)]. In: Global Warming of 1.5°C. An IPCC Special Report on the impacts of global warming of 1.5°C above pre-industrial levels and related global greenhouse gas emission pathways, in the context of strengthening the global response to the threat of climate change, sustainable development, and efforts to eradicate poverty [Masson-Delmotte, V., P. Zhai, H.-O. Pörtner, D. Roberts, J. Skea, P.R. Shukla, A. Pirani, W. Moufouma-Okia, C. Péan, R. Pidcock, S. Connors, J.B.R. Matthews, Y. Chen, X. Zhou, M.I. Gomis, E. Lonnoy, T. Maycock, M. Tignor, and T. Waterfield (eds.)]. In Press. Page 555.


A-41


Table of Contents

Units of measure


Term      Definition
bbl  

barrel

Bcf  

billion cubic feet of gas

boe  

barrel of oil equivalent

boe/d  

barrels of oil equivalent per day

CO2-e  

carbon dioxide equivalent

Mbbl  

thousand barrels

Mboe  

thousand barrels of oil equivalent

MMboe  

million barrels of oil equivalent

MMBtu  

million British thermal units

MMscf  

million standard cubic feet of gas

Mtpa  

million tonnes per annum

MW  

megawatt

scf  

standard cubic feet of gas

tpd  

tonnes per day

Conversion factors


Product    Unit    Conversion factor
Natural gas    5,700 scf         1 boe
Condensate    1 bbl         1 boe
Oil    1 bbl         1 boe
Natural gas liquids (NGL)    1 bbl         1 boe
Facility    Unit   

LNG conversion factor

Karratha Gas Plant    1 tonne         8.08 boe
Pluto Gas Plant    1 tonne         8.34 boe
Wheatstone    1 tonne         8.27 boe

The LNG conversion factor from tonne to boe is specific to volumes produced at each facility and is based on gas composition which may change over time.


A-42


Table of Contents

SECTION 6.9

Information about this report

Unreasonable prejudice

As permitted by sections 299(3) and 299A(3) of the Corporations Act 2001, we have omitted certain information from our operating and financial review in relation to our business strategy, future prospects and likely developments in our operations and the expected results of those operations in future financial years. We have done this on the basis that such information, if disclosed, would be likely to result in unreasonable prejudice to Woodside (for example, because the information is premature, commercially sensitive, confidential or could give a third-party a commercial advantage). The omitted information relates to our internal budgets, forecasts and estimates, details of our business strategy, and LNG contractual pricing.

Forward-looking statements

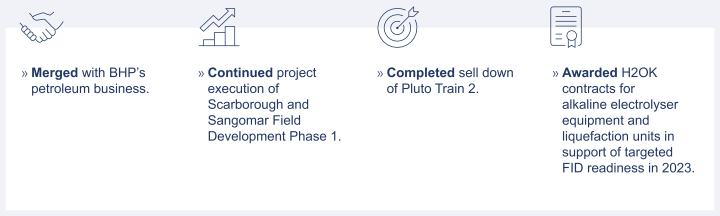
This report may contain forward-looking statements with respect to Woodside’s business and operations, market conditions, results of operations and financial condition, including, for example, but not limited to, statements about expectations regarding long-term demand for Woodside’s products, timing of completion of Woodside’s projects, expected synergies from the merger with BHP’s petroleum business, expectations regarding growth opportunities, Woodside’s strategic framework, Woodside’s dividend policy, future results of projects, operating activities, and new energy products, and expectations regarding the achievement of Woodside’s Scope 1 and 2 net equity emissions reduction and new energy investment target and other climate, sustainability and ESG goals. All forward-looking statements contained in this report reflect Woodside’s views held as at the date of this report. All statements, other than statements of historical or present facts, are forward-looking statements and generally may be identified by the use of forward-looking words such as ‘guidance’, ‘foresee’, ‘likely’, ‘potential’, ‘anticipate’, ‘believe’, ‘aim’, ‘estimate’, ‘expect’, ‘intend’, ‘may’, ‘target’, ‘plan’, ‘forecast’, ‘project’, ‘schedule’, ‘will’, ‘should’, ‘seek’ and other similar words or expressions. Similarly, statements that describe the objectives, plans, goals or expectations of Woodside are or may be forward- looking statements.

The information and statements in this report about Woodside’s future strategy and other forward-looking statements are not guidance, forecasts, guarantees or predictions of future events or performance, but are in the nature of aspirational targets that Woodside has set for itself and its management of the business.

Those statements and any assumptions on which they are based are only opinions and are subject to change without notice and are subject to inherent known and unknown risks, uncertainties, assumptions and other factors, many of which are beyond the control of Woodside, its related bodies corporate and their respective beneficiaries.

Important factors that could cause actual results to differ materially from those in the forward-looking statements include, but are not limited to, fluctuations in commodity prices, actual demand, currency fluctuations, geotechnical factors, drilling and production results, gas commercialisation, development progress, operating results, engineering estimates, reserve estimates, loss of market, industry competition, environmental risks, climate related risks, physical risks, legislative, fiscal and regulatory developments, changes in accounting standards, economic and financial markets conditions in various countries and regions, political risks, project delay or advancement, approvals, cost estimates and the effect of future regulatory or legislative actions on Woodside or the industries in which it operates, including potential changes to tax laws, as well as general economic conditions, prevailing exchange rates and interest rates and conditions in financial markets.

Details of the key risks relating to Woodside and its business can be found in the section 3.8 - Risk factors. You should review and have regard to these risks when considering the information contained in this report.

If any of the assumptions on which a forward-looking statement is based were to change or be found to be incorrect, this would likely cause outcomes to differ from the statements made in this report.

Investors are strongly cautioned not to place undue reliance on any forward-looking statements. Actual results or performance may vary materially from those expressed in, or implied by, any forward-looking statements. None of Woodside nor any of its related bodies corporate, nor any of their respective beneficiaries, nor any person named in this report or involved in the preparation of the information in this report, makes any representation, assurance, guarantee or warranty (either express or implied) as to the accuracy or likelihood of fulfilment of any forward-looking statement, or any outcomes, events or results expressed or implied in any forward-looking statement in this report.

Past performance (including historical financial information and pro forma information) is given for illustrative purposes only. It should not be relied on and is not necessarily a reliable indicator of future performance, including future security prices.


A-43


Table of Contents

Emissions data

All greenhouse gas emissions data in this report are estimates, and our methodologies for measuring or quantifying greenhouse gas emissions may evolve as best practices continue to develop and data quality and quantity continue to improve. Woodside ‘greenhouse gas’ or ‘emissions’ information reported are Scope 1 GHG emissions, Scope 2 GHG emissions, and Scope 3 GHG emissions. For more information on emissions data refer to the Climate Report 2022 and the Sustainable Development Report 2022.

Industry and market data

This report contains industry, market and competitive position data that are based on industry publications and studies conducted by third parties as well as Woodside’s internal estimates and research. These industry publications and third-party studies generally state that the information they contain has been obtained from sources believed to be reliable, although they do not guarantee the accuracy or completeness of such information. While Woodside believes that each of these publications and third-party studies is reliable, Woodside has not independently verified the market and industry data obtained from these third-party sources. Forecasts and other forward-looking information obtained from these sources are subject to the same qualifications and uncertainties as the other forward-looking statements contained in this report and may differ among third-party sources. These forecasts and forward-looking information are subject to uncertainty and risk due to a variety of factors, including those described in section 3.8 - Risk factors and in this section, section 6.9 - Information about this report. These and other factors could cause results to differ materially from those expressed in Woodside’s forecasts or estimates or those of independent third parties. While Woodside believes its internal research is reliable and its selection of industry publications and third-party studies and the description of its market and industry are appropriate, neither such research nor these descriptions have been verified by any independent source.

Basis of Presentation

Woodside’s Financial Statements are prepared in accordance with the Australian Accounting Standards and other authoritative pronouncements of the Australian Accounting Standards Board (AASB) and comply with the International Financial Reporting Standards (IFRS) as issued by the International Accounting Standards Board (IASB).

Other important information

All references to dollars, cents or $ in this report are to US currency, unless otherwise stated.

References to ‘Woodside’ may be references to Woodside Energy Group Ltd or its applicable subsidiaries.

This report does not include any express or implied prices at which Woodside will buy or sell financial products.

This report contains references to Woodside’s website, our Sustainable Development Report 2022 and our Climate Report 2022. These references are for the readers’ convenience only. Woodside is not incorporating by reference into this report any information posted on woodside.com or in the Sustainable Development Report 2022 or our Climate Report 2022. The content of any other websites referred to in this report does not form part of this report.


A-44


Table of Contents

EXHIBITS


1.1

   Constitution of Woodside Energy Group Ltd (incorporated by reference to Exhibit 99.4 to the Woodside’s Form 6-K (File No. 333-264268) filed on May 20, 2022).

2.1*

   Description of Securities

4.1

   Indenture, dated as of 3 November 2003, by and among Woodside Finance Limited, Woodside Petroleum Ltd., Woodside Energy Ltd. And the Bank of New York (incorporated by reference to Exhibit 10.1 of Woodside’s registration statement on Form F-4 (File No. 333-264268) filed on April 13, 2022).

4.2

   Woodside Equity Plan (incorporated by reference to Exhibit 10.1 of Woodside’s registration statement on Form S-8 (File No. 333-267432) filed on September 15, 2022).

4.3

   Supplementary Woodside Equity Plan (incorporated by reference to Exhibit 10.2 of Woodside’s registration statement on Form S-8 (File No. 333-267432) filed on September 15, 2022).

8.1*

   List of subsidiaries of Woodside.

11.1*

   Code of ethics

12.1*

   Chief Executive Officer certification under Section 302 of the Sarbanes-Oxley Act of 2002.

12.2*

   Chief Financial Officer certification under Section 302 of the Sarbanes-Oxley Act of 2002.

13.1#

   Chief Executive Officer certification under Section 906 of the Sarbanes-Oxley Act of 2002.

13.2#

   Chief Financial Officer certification under Section 906 of the Sarbanes-Oxley Act of 2002.

15.1*

   Consent of Ernst & Young

15.2*

   Consent of PricewaterhouseCoopers

101.INS*

   Inline XBRL Instance Document

101.SCH*

   Inline XBRL Taxonomy Extension Schema Document

101.CAL*

   Inline XBRL Taxonomy Extension Calculation Linkbase Document

101.DEF*

   Inline XBRL Taxonomy Extension Definition Linkbase Document

101.LAB*

   Inline XBRL Taxonomy Extension Label Linkbase Document

101.PRE*

   Inline XBRL Taxonomy Extension Presentation Linkbase Document

104*

   Cover page Interactive Data File (embedded within the Inline XBRL document)


*

Filed herewith.

#

Furnished herewith.


A-45


Table of Contents

SIGNATURES

The registrant hereby certifies that it meets all of the requirements for filing on Form 20-F and that it has duly caused and authorized the undersigned to sign this annual report on its behalf.

Woodside Energy Group Ltd

/s/ Marguerite O’Neill

Marguerite O’Neill

Chief Executive Officer

Date: 27 February 2023


A-46