Table of Contents
| OMB APPROVAL | ||
| OMB Number: |
3235-0570 | |
| Expires: |
Nov. 30, 2005 | |
| Estimated average burden | ||
| hours per response: |
5.0 | |
UNITED STATES
SECURITIES AND EXCHANGE COMMISSION
Washington, D.C. 20549
FORM N-CSR
CERTIFIED SHAREHOLDER REPORT OF REGISTERED MANAGEMENT
INVESTMENT COMPANIES
Investment Company Act file number: 811-5687
Strong Common Stock Fund, Inc., on behalf of Strong Advisor Common Stock Fund,
Strong Advisor Endeavor Large Cap Fund, Strong Advisor Focus Fund
and Strong Advisor Technology Fund
(Exact name of registrant as specified in charter)
| P.O. Box 2936 Milwaukee, WI | 53201 | |
| (Address of principal executive offices) | (Zip code) |
Richard Smirl, Strong Capital Management, Inc.
P.O. Box 2936 Milwaukee, WI 53201
(Name and address of agent for service)
Registrant’s telephone number, including area code: (414) 359-3400
Date of fiscal year end: December 31
Date of reporting period: December 31, 2003
Form N-CSR is to be used by management investment companies to file reports with the Commission not later than 10 days after the transmission to stockholders of any report that is required to be transmitted to stockholders under Rule 30e-1 under the Investment Company Act of 1940 (17 CFR 270.30e-1). The Commission may use the information provided on Form N-CSR in its regulatory, disclosure review, inspection, and policymaking roles.
A registrant is required to disclose the information specified by Form N-CSR, and the Commission will make this information public. A registrant is not required to respond to the collection of information contained in Form N-CSR unless the Form displays a currently valid Office of Management and Budget (“OMB”) control number. Please direct comments concerning the accuracy of the information collection burden estimate and any suggestions for reducing the burden to Secretary, Securities and Exchange Commission, 450 Fifth Street, NW, Washington, DC 20549-0609. The OMB has reviewed this collection of information under the clearance requirements of 44 U.S.C. (S) 3507.
Table of Contents
Item 1. Reports to Stockholders
ANNUAL REPORT | December 31, 2003
Strong
ADVISOR EQUITY
Funds
|
| ||
| Strong Advisor Common Stock Fund | ||
| Strong Advisor Mid Cap Growth Fund | ||
| Strong Advisor Small Cap Value Fund | ||
| Strong Advisor U.S. Value Fund | ||
| Strong Advisor Endeavor Large Cap Fund | ||
| Strong Advisor Focus Fund | ||
| Strong Advisor International Core Fund | ||
| Strong Advisor Select Fund | ||
| Strong Advisor Technology Fund | ||
| Strong Advisor U.S. Small/Mid Cap Growth Fund | ||
| Strong Advisor Utilities and Energy Fund | ||
| Strong Advisor Large Company Core Fund | ||
 | ||

Table of Contents
ANNUAL REPORT | December 31, 2003
Strong
Advisor Equity
Funds
| Investment Reviews |
||
| 2 | ||
| 4 | ||
| 6 | ||
| 8 | ||
| 10 | ||
| 12 | ||
| 14 | ||
| 16 | ||
| 18 | ||
| 20 | ||
| 22 | ||
| 24 | ||
| Financial Information |
||
| Schedules of Investments in Securities |
||
| 26 | ||
| 27 | ||
| 29 | ||
| 34 | ||
| 36 | ||
| 38 | ||
| 39 | ||
| 40 | ||
| 41 | ||
| 42 | ||
| 43 | ||
| 44 | ||
| 46 | ||
| 54 | ||
| 60 | ||
| 65 | ||
| 86 | ||
| 110 | ||
| 111 | ||
Table of Contents
A Few Words From Dick Weiss

Market Update — January 1, 2003, to December 31, 2003
One of the great strengths of Strong Capital Management, Inc. (“Strong”), is the autonomy of its different investment teams. Unlike so many institutions where a single investment philosophy predominates and stock selection is done by committee, Strong is comprised of highly independent investment teams with individual philosophies and practices.
This independence notwithstanding, the investment teams share a common objective — adding value for shareholders.
Despite the turmoil surrounding the mutual fund industry and our firm during the last quarter of 2003, Strong’s investment teams performed admirably. According to Lipper, 74 percent of the Strong Funds beat their respective peer indices since their inception.*
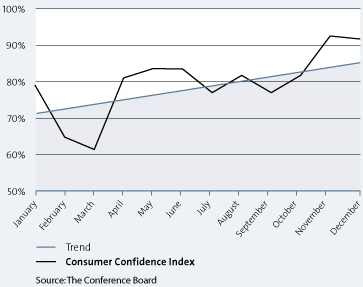
Indeed, 2003 turned out to be a better year than anticipated by the investment world. In October of 2002, the market bottomed, and then began a steady advance upward into 2003. Troubled by the prospect of military conflict with Iraq, the market turned down in January and bottomed again in March. Once the outcome in Iraq
Economic Growth Rebounded in 2003

| * | Results are based on total returns. 110 of 149 funds, including separate share classes, outperformed their Lipper Peer Indices since the funds’ inception through 12-31-03. Investment values fluctuate. Results will vary for other time periods. Does not include effect of any loads (as applicable). |
(Continued on next page)
Table of Contents
became clear, the market anticipated the major business recovery that materialized in the third and fourth quarters, and resumed its forward march. The S&P 500 Index, Dow Jones Industrial Average, and Nasdaq moved up smartly for the remainder of the year.
It was, in effect, a rising tide that lifted many boats. Stocks that had been especially battered by the three-year bear market — either because the market assumed their business models were broken or because they had been pushed to the edge of bankruptcy — enjoyed dramatic recoveries. Once it became clear that the economy had bottomed, many of the most downtrodden stocks rebounded like coiled springs and rose appreciably in the second half of 2003. This is a phenomenon that has typically occurred after tough bear markets and has generally lasted around 6-8 months. I believe we are approaching the end of this phase.
In some instances, I believe going against conventional wisdom in 2004 will spell the difference between average and exceptional performance. For example:
| • | Popular opinion has it that manufacturing — a sector which has suffered for roughly 30 years — will continue to falter in 2004. I disagree. It appears that 2004 may shape up to be the first synchronized global economic recovery in years. That, combined with a weak dollar, should make U.S. manufacturing goods increasingly competitive around the world and bolster the sector’s overall results. |
| • | The energy sector, which significantly underperformed in 2003, looks promising as well. While it participated in the fourth quarter rally, it lagged for the year and was nearing an all-time low, as a percentage of the S&P 500 Index. Energy prices were stronger than most observers expected in 2003. Given the likely increase in demand as the global economy expands, energy prices should remain at the upper end of their normal trading range. This scenario would allow individual energy stocks to play catch-up. |
Table of Contents
Here at home, the U.S. economy shows unmistakable signs of strengthening. Job growth is gaining momentum. Consumer confidence quite clearly is on the rise. All in all, it’s an encouraging combination.
If you accept the premise that there will be a wider divergence of performance this year, diversification becomes essential. It’s going to be harder to make money in 2004 than it was in 2003. But in a market environment where a rising tide will not lift all issues indiscriminately, diversified mutual funds can be a sound and sensible investment option.
Consumer Confidence Increased in 2003
Thank you for investing with Strong.

Richard T. Weiss
Vice Chairman
Strong Financial Corporation
Table of Contents
Strong Advisor Common Stock Fund
Following three consecutive years of declines, the U.S. equity markets staged a strong recovery in 2003. The Strong Advisor Common Stock Fund Class A gained 30.52% for the year (38.50% when excluding the initial sales charge), while the Fund’s broad-based benchmark, the Russell Midcap Index, returned 40.06% for the same period.
Improving economic conditions
This year’s rally was driven by a material improvement in the nation’s economic outlook. Specifically, low interest rates from the Federal Reserve and tax cuts from Washington set the stage for economic recovery. As investors began to anticipate the resurgence of the economy, they regained confidence in investing in various stocks, which helped to drive some of the initial improvements in the market.
By the middle of the year, the continued strengthening of the economy led investors to focus on lower-quality stocks — specifically those with little or no earnings. This hurt the Fund’s relative performance, as we have historically invested in attractively priced companies with higher-quality characteristics and strong, long-term potential. We believe the trend favoring lower-quality, speculative stocks has now reached its conclusion.
Considering private market value
Our analysis of individual companies takes a close look at their competitive strengths, assets, and financial position. We then use that information to gauge a company’s private market value — the price a buyer would be willing to pay for the entire company. Companies that meet our standards and whose stocks are selling at prices lower than their private market value are candidates for inclusion in the Fund.
This process served us relatively well in 2003, as it attracted us to many stocks with strong qualities whose prices had been beaten down to very attractive levels. One example of a stock we identified through our disciplined process is Continental Airlines. Following the terrorist attacks of 9/11, the U.S. airline industry was hit by one of its worst down-turns ever. Many companies were pushed into bankruptcy. We thoroughly evaluated the remaining airlines and added Continental to the portfolio based on its relative strength. It proved to be one of our strongest stocks during the year.
Our analysis of beaten-down segments also helped us add trucking company Ryder Systems and metals company Alcoa to the portfolio during the year. In the technology sector, pessimism about the industry outlook early in the year allowed us to add companies positioned to benefit from improving corporate spending. Among the companies we were able to buy at a discount to private market value was Unisys Corporation. That holding, as well as existing positions in software and semiconductor stocks, performed strongly during the year.
As the economy improved in the second half of the year, most of the market’s performance came from lower-quality companies. This was particularly true in the technology area, where the long bear market had driven many companies to near-bankruptcy level. Given our stock selection criteria, the Fund had an underrepresentation in these stocks compared to the benchmark, which hurt our relative performance for the year. In addition, non-cyclical consumer stocks, such as food and beverage companies, did not fully participate in the market’s rally. Our holdings in this segment also hurt relative performance.
Our overweight position, relative to our benchmark, in energy stocks also hurt the Fund’s performance despite an extremely strong year for commodity prices. While oil prices hovered around $30 per barrel, and natural gas stayed above $5 per cubic foot for most of the year, the performance of energy stocks did not match these high levels. We continue to believe the stocks are attractively valued and that strong underlying fundamentals will in time attract more investors to the sector. Our holdings in the sector remain tilted toward natural gas and energy-service stocks, which we believe are in the best position to benefit from higher commodity prices.
Further improvement in 2004
We believe the market will continue to post positive returns in the coming year, though not at the levels seen in 2003. The economic picture continues to improve, with the employment picture likely stabilizing at year-end. Given both low inventory levels and improving corporate spending, we believe the progress is sustainable. Much of this positive news has already been reflected in stock prices, but in our assessment, stock valuations remain reasonable for this stage of the economic recovery. We therefore anticipate that stocks should continue to appreciate as long as earnings continue to rise.
Thank you for your investment in the Strong Advisor Common Stock Fund.
|
|
| Richard T. Weiss |
| Portfolio Co-Manager |
 |
| Ann M. Miletti |
| Portfolio Co-Manager |
2
Table of Contents
Fund Highlights
Your Fund’s Approach
The Fund invests in common stocks of small- and medium-capitalization companies that the Fund’s managers believe are underpriced yet have attractive growth prospects. The managers base their analysis on a company’s “private market value” — the price an investor would be willing to pay for the entire company given its management, financial health, and growth potential.
Average Annual Total Returns
As of 12-31-03
| Class A1 |
|||
| 1-year |
30.52 | % | |
| 5-year |
7.23 | % | |
| 10-year |
11.32 | % | |
| Since Fund Inception (12-29-89) |
14.80 | % |
| Class A, excluding sales load |
|||
| 1-year |
38.50 | % | |
| 5-year |
— | ||
| 10-year |
— | ||
| Since Fund Inception (12-29-89) |
— |
| Class B1 |
|||
| 1-year |
32.40 | % | |
| 5-year |
7.56 | % | |
| 10-year |
11.57 | % | |
| Since Fund Inception (12-29-89) |
14.98 | % |
| Class C1 |
|||
| 1-year |
36.31 | % | |
| 5-year |
7.86 | % | |
| 10-year |
11.39 | % | |
| Since Fund Inception (12-29-89) |
14.70 | % |
| Class Z2 |
|||
| 1-year |
38.70 | % | |
| 5-year |
8.83 | % | |
| 10-year |
12.35 | % | |
| Since Fund Inception (12-29-89) |
15.67 | % |
Equity funds are volatile investments and should only be considered for long-term goals.
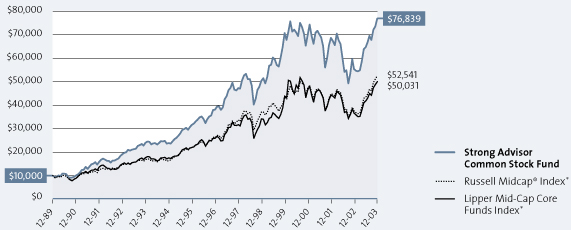
Growth of an Assumed $10,000 Investment†
From 12-29-89 to 12-31-03
Mention of specific securities in this report is not indicative of whether the Fund may make additional purchases of, sell all or a portion of, or continue to hold those securities.
| † | This graph, provided in accordance with SEC regulations, compares a $10,000 investment in the Fund, made at its inception, with the performance of the Russell Midcap® Index and the Lipper Mid-Cap Core Funds Index. Results include the reinvestment of all dividends and capital gains distributions. Performance is historical and does not represent future results. Investment returns and principal value vary, and you may have a gain or loss when you sell shares. Current performance may be lower or higher than the quoted performance. Call us or visit www.Strong.com for the most current performance information. The graph and the Average Annual Total Returns table do not reflect the deduction of taxes, if any, that a shareholder would pay on Fund distributions or the redemption of Fund shares. This graph is based on Class Z shares only; performance for other classes will vary due to differences in fee structures. |
The Fund’s prospectus and statement of additional information may describe restrictions on the percentage of a particular type or quality of security in which the Fund may invest (“Percentage Restrictions”). Percentage Restrictions apply at the time the Fund purchases a security. Circumstances subsequent to the purchase of the security, such as a change in: (1) the Fund’s assets (e.g., due to cash inflows and redemptions); (2) the market value of the security; or (3) the pricing, liquidity, or rating of the security, may cause the Fund to exceed or fall short of the Percentage Restriction. If this happens, the Fund’s continued holding of the security will not constitute a violation of the Percentage Restriction.
From time to time, the Fund’s advisor and/or administrator has waived its fees and/or absorbed Fund expenses, which has resulted in higher returns.
| 1 | Load-adjusted performance reflects the effect of the maximum sales charge of 5.75% for Class A, the applicable contingent deferred sales charge of 5.00% in year 1 and eliminated after year 6 for Class B, and the applicable contingent deferred sales charge of 1.00% and eliminated after 12 months for Class C. The performance of the Class A, B, and C shares is based on the performance of the Fund’s Class Z shares (formerly Retail Class shares) prior to 11-30-00. The performance of the Class A shares is restated to reflect the load and the different expenses of the Class A shares, as applicable. The performance of the Class B shares is restated to reflect the contingent deferred sales charge, the different expenses of the Class B shares, and the conversion to Class A shares after eight years, as applicable. The performance of the Class C shares is restated to reflect the contingent deferred sales charge and the different expenses of the Class C shares, as applicable. |
| 2 | Performance information is for Class Z shares (formerly Retail Class shares). The Strong Advisor Common Stock Fund Class Z shares are closed to new accounts, though the Fund may continue to offer its shares to certain company-sponsored retirement plans, institutional investors meeting specific eligibility requirements, and other limited groups as described in the prospectus. Please consult a prospectus for information about all share classes. |
Because smaller companies often have narrower markets and limited financial resources, investments in these stocks present more risk than investments in those of larger, more established companies.
| * | The Russell Midcap® Index measures the performance of the 800 smallest companies in the Russell 1000 Index, which represent approximately 26% of the total market capitalization of the Russell 1000 Index. The Lipper Mid-Cap Core Funds Index is the average of the 30 largest funds in the Lipper Mid-Cap Core Funds Category. Source of the Russell index data is Standard & Poor’s Micropal. Source of the Lipper index data is Lipper Inc. |
3
Table of Contents
Strong Advisor Mid Cap Growth Fund
After withstanding a fierce bear market, equity investors were generally rewarded with strong positive returns in 2003. For the year ended December 31, 2003, the Strong Advisor Mid Cap Growth Fund Class A recorded a solid return of 26.84% (34.56% when excluding the initial sales charge). This figure did, however, lag the broad-based Russell Midcap Index’s return of 40.06% over the same period.
Many factors drove performance
During the year, several factors combined to create a very favorable investing climate. Among these factors were economic stimulus from new tax cuts, reduction of geopolitical uncertainties, and continued low interest rates and inflation. The positive impact was felt in both growth and value stocks and across nearly all sectors of the economy.
The stocks that were the top contributors to the Fund’s performance over the year came from the consumer sector of the market. As the economy strengthened throughout the year, this area experienced above-average growth. Holdings that were weaker for the Fund came primarily from the technology, healthcare, and energy sectors.
Our investment process
Research drives our process of selecting stocks for the Strong Advisor Mid Cap Growth Fund. For a stock to be chosen, it must display — or have solid prospects for displaying — above-average growth trends in revenue, earnings, or both. Identifying stocks that are experiencing this growth is important. But what matters the most in our investment process is seeking to discern growth trends that are sustainable, as opposed to those that are likely to be short-lived.
In order for a company to make the most of its growth opportunities, it must also have a solid management team in place. For that reason, we analyze management’s track record of execution and often take time to get to know a company’s managers before buying its stock. Through our thorough, hands-on research, we also seek to determine whether their business plan is sensible and offers opportunities for future expansion. Finally, before we add a stock to the portfolio, we consider whether it fits in with our overall economic view, as well as one or more of the important investment themes that guide our market outlook. These trends include the aging of the overall population and the changes technological innovation can bring to virtually every part of the economy.
Ultra Petroleum Corporation is a company that met the above criteria and proved to be an excellent holding for the Fund during the year. Ultra is an energy company, engaged in the exploration and production of crude oil and natural gas. We were attracted to Ultra because we recognized it was growing its natural gas production at an industry-leading rate, and more importantly, because its high production growth rate was likely to continue for several more years, driven by the strength of its drilling prospects and management’s solid track record of execution. Finally, an investment in Ultra made sense given the team’s positive overall outlook for crude oil and natural gas prices.
Our decision to sell a stock is generally based on criteria that are essentially the opposite of our buying criteria. We may sell a stock when we see a deterioration in fundamentals that threatens the sustainability of a company’s existing or prospective growth. Conditions that could cause this may include, but are not limited to, changes we see in the economy, a new competitive threat, or a change in management personnel or direction.
Maintaining a positive outlook
Our outlook for the next few months remains positive, as we expect the economy to continue to benefit from continued low interest rates and inflation. This environment should allow for solid growth in corporate profits, which is beneficial to stock prices.
We will continue to seek out the fastest-growing companies we can identify that fit within the framework of our time-tested investment process.
We thank you for your continued investment in the Strong Advisor Mid Cap Growth Fund.

Brandon Nelson
Portfolio Manager
4
Table of Contents
Fund Highlights
Your Fund’s Approach
The Fund invests in stocks of medium-capitalization companies that the Fund’s manager believes have favorable prospects for growth of earnings and capital appreciation. Although the Fund may invest in stocks of any economic sector, at times it may emphasize one or more particular sectors.
Average Annual Total Returns
As of 12-31-03
| Class A1 |
|||
| 1-year |
26.84 | % | |
| 3-year |
-18.24 | % | |
| 5-year |
-0.92 | % | |
| Since Fund Inception (12-31-96) |
3.07 | % | |
| Class A, excluding sales load |
|||
| 1-year |
34.56 | % | |
| 3-year |
— | ||
| 5-year |
— | ||
| Since Fund Inception (12-31-96) |
— | ||
| Class B1 |
|||
| 1-year |
28.41 | % | |
| 3-year |
-19.21 | % | |
| 5-year |
-0.76 | % | |
| Since Fund Inception (12-31-96) |
3.38 | % | |
| Class C1 |
|||
| 1-year |
32.41 | % | |
| 3-year |
-17.21 | % | |
| 5-year |
-0.36 | % | |
| Since Fund Inception (12-31-96) |
3.38 | % | |
| Class Z2 |
|||
| 1-year |
34.25 | % | |
| 3-year |
-16.70 | % | |
| 5-year |
0.32 | % | |
| Since Fund Inception (12-31-96) |
4.10 | % | |
Equity funds are volatile investments and should only be considered for long-term goals.
Growth of an Assumed $10,000 Investment†
From 12-31-96 to 12-31-03

Mention of specific securities in this report is not indicative of whether the Fund may make additional purchases of, sell all or a portion of, or continue to hold those securities.
| † | This graph, provided in accordance with SEC regulations, compares a $10,000 investment in the Fund, made at its inception, with the performance of the Russell Midcap® Index and the Lipper Mid-Cap Growth Funds Index. Results include the reinvestment of all dividends and capital gains distributions. Performance is historical and does not represent future results. Investment returns and principal value vary, and you may have a gain or loss when you sell shares. Current performance may be lower or higher than the quoted performance. Call us or visit www.Strong.com for the most current performance information. The graph and the Average Annual Total Returns table do not reflect the deduction of taxes, if any, that a shareholder would pay on Fund distributions or the redemption of Fund shares. This graph is based on Class Z shares only; performance for other classes will vary due to differences in fee structures. |
The Fund’s prospectus and statement of additional information may describe restrictions on the percentage of a particular type or quality of security in which the Fund may invest (“Percentage Restrictions”). Percentage Restrictions apply at the time the Fund purchases a security. Circumstances subsequent to the purchase of the security, such as a change in: (1) the Fund’s assets (e.g., due to cash inflows and redemptions); (2) the market value of the security; or (3) the pricing, liquidity, or rating of the security, may cause the Fund to exceed or fall short of the Percentage Restriction. If this happens, the Fund’s continued holding of the security will not constitute a violation of the Percentage Restriction.
From time to time, the Fund’s advisor and/or administrator has waived its fees and/or absorbed Fund expenses, which has resulted in higher returns.
| 1 | Load-adjusted performance reflects the effect of the maximum sales charge of 5.75% for Class A, the applicable contingent deferred sales charge of 5.00% in year 1 and eliminated after year 6 for Class B, and the applicable contingent deferred sales charge of 1.00% and eliminated after 12 months for Class C. The performance of the Class A, B, and C shares is based on the performance of the Fund’s Class Z shares (formerly Retail Class shares) prior to 11-30-00. The performance of Class A shares is restated to reflect the load and the different expenses of the Class A shares, as applicable. The performance of the Class B shares is restated to reflect the contingent deferred sales charge and the different expenses of the Class B shares, as applicable. The performance of the Class C shares is restated to reflect the contingent deferred sales charge and the different expenses of the Class C shares, as applicable. |
| 2 | Performance information is for Class Z shares (formerly Retail Class shares). The Strong Advisor Mid Cap Growth Fund Class Z shares are closed to new accounts, though the Fund may continue to offer its shares to certain company-sponsored retirement plans, institutional investors meeting specific eligibility requirements, and other limited groups as described in the prospectus. Please consult a prospectus for information about all share classes. |
| * | The Russell Midcap® Index measures the performance of the 800 smallest companies in the Russell 1000 Index, which represent approximately 26% of the total market capitalization of the Russell 1000 Index. The Lipper Mid-Cap Growth Funds Index is the average of the 30 largest funds in the Lipper Mid-Cap Growth Funds Category. Source of the Russell index data is Standard & Poor’s Micropal. Source of the Lipper index data is Lipper Inc. |
5
Table of Contents
Strong Advisor Small Cap Value Fund
The Strong Advisor Small Cap Value Fund had a very good year in 2003, both in absolute terms and relative to its broad-based benchmark. The Fund’s Class A shares returned 39.98% or 48.49% when excluding the initial sales charge, placing it just ahead of the broad-based Russell 2000 Index, which returned 47.25%.
A strong year for equities
The past year witnessed a broad and substantial rally for all areas of the equity market. The growth and value styles of investing both performed well. While large-cap stocks, especially those in the technology sector, performed well, small-cap stocks had a very good year. Although the market in 2003 was generally perceived to have been growth-dominated, small-cap stocks in the value style performed exceptionally well.
The Fund’s holdings in stocks from such sectors as materials, industrials, and energy made significant positive contributions to its returns. Also, many of our mining and metals stocks added to the Fund’s returns. These stocks benefited from a favorable supply/demand relationship — that is, demand is good while supply is relatively tight — for silver and gold.
Furthermore, this past year saw a significant weakening of the U.S. dollar, which also aided many of the names in the metals and mining industries. When the dollar loses value relative to foreign currencies, investors tend to favor precious metals, helping to drive the value of these stocks upward. Energy stocks in the portfolio also benefited from a good supply/demand environment. The situation is particularly favorable for companies in the natural gas area.
We kept the Fund’s exposure to technology stocks near to, or slightly lower than, their representation in our benchmark index. Technology stocks performed very strongly over the year, so this positioning could have hurt performance. However, our individual stock selections in this sector were strong and added significant value to the portfolio.
Looking for catalysts
The Fund employs a relative value approach to investing. This means that we look for stocks in all sectors of the marketplace that are attractively priced and have positive fundamental catalysts that could drive their stock price upward in the future. These catalyst qualities can include new products, strong management teams, or favorable dynamics within the company’s industry.
We use a multidimensional, bottom-up stock-selection process. We employ both quantitative analysis (objective number-crunching) and fundamental research (careful, but more subjective study of the company’s specific qualities). For the most part, we use quantitative analysis to narrow down the pool of stocks we consider for the portfolio and then spend most of our time on the hands-on, fundamental research that guides our final selections. We contend that a stock that is attractive from a quantitative basis may not be a good investment if it lacks a catalyst to drive future growth.
The Fund’s allocations to different industries and sectors are driven primarily by our individual stock selections. We generally don’t seek to capitalize on potential market trends by deliberately overweighting or underweighting the portfolio in different market sectors.
United States Steel provides an excellent example of how our stock selection process works. This company’s reasonable valuation and other factors allowed it to pass through our initial quantitative screening process. Then we engaged in closer research and evaluation. What we found was a preeminent steel company with a seasoned, forward-thinking management team and successful operations in eastern Europe. Additionally, the company merged with National Steel in May 2003. The resulting synergies have been a key driving force for success and earnings growth. The stock has been a holding in our portfolio for some time, typifying our long-term approach to most of our holdings.
Possible challenges in 2004
In the past year, stocks moved upward across the market, but in 2004 we believe individual stock selection will become increasingly critical to success. It is our opinion that small-cap stocks can continue to do well this year, as their prices remain attractive and many investors still have relatively low exposure to this asset class.
Additionally, we believe the dollar may continue to drop (but somewhat less drastically) versus other major currencies, and that prices for such commodities as precious metals, natural gas, and oil will continue their upward trend. We intend to position the Fund to benefit from these expected trends.
Thank you for your investment in the Strong Advisor Small Cap Value Fund.

I. Charles Rinaldi
Portfolio Manager
6
Table of Contents
Fund Highlights
Your Fund’s Approach
The Fund invests in stocks of small-capitalization companies that the Fund’s manager believes are undervalued relative to the market based on earnings, cash flow, or asset value. The manager specifically looks for companies whose stock prices may benefit from a positive dynamic of change, such as a new management team, a new product or service, a corporate restructuring, an improved business plan, or a change in the political, economic, or social environment.
Average Annual Total Returns
As of 12-31-03
| Class A1 |
|||
| 1-year |
39.98 | % | |
| 3-year |
15.60 | % | |
| 5-year |
19.97 | % | |
| Since Fund Inception (12-31-97) |
17.49 | % | |
| Class A, excluding sales load |
|||
| 1-year |
48.49 | % | |
| 3-year |
— | ||
| 5-year |
— | ||
| Since Fund Inception (12-31-97) |
— | ||
| Class B1 |
|||
| 1-year |
42.28 | % | |
| 3-year |
16.09 | % | |
| 5-year |
20.50 | % | |
| Since Fund Inception (12-31-97) |
17.91 | % | |
| Class C1 |
|||
| 1-year |
46.34 | % | |
| 3-year |
17.11 | % | |
| 5-year |
20.72 | % | |
| Since Fund Inception (12-31-97) |
18.01 | % | |
| Class Z2 |
|||
| 1-year |
48.70 | % | |
| 3-year |
18.09 | % | |
| 5-year |
21.66 | % | |
| Since Fund Inception (12-31-97) |
18.92 | % | |
Equity funds are volatile investments and should only be considered for long-term goals.
Growth of an Assumed $10,000 Investment†
From 12-31-97 to 12-31-03

Mention of specific securities in this report is not indicative of whether the Fund may make additional purchases of, sell all or a portion of, or continue to hold those securities.
| † | This graph, provided in accordance with SEC regulations, compares a $10,000 investment in the Fund, made at its inception, with the performance of the Russell 2000® Index and the Lipper Small-Cap Value Funds Index. Results include the reinvestment of all dividends and capital gains distributions. Performance is historical and does not represent future results. Investment returns and principal value vary, and you may have a gain or loss when you sell shares. Current performance may be lower or higher than the quoted performance. Call us or visit www.Strong.com for the most current performance information. The graph and the Average Annual Total Returns table do not reflect the deduction of taxes, if any, that a shareholder would pay on Fund distributions or the redemption of Fund shares. This graph is based on Class Z shares only; performance for other classes will vary due to differences in fee structures. |
The Fund’s prospectus and statement of additional information may describe restrictions on the percentage of a particular type or quality of security in which the Fund may invest (“Percentage Restrictions”). Percentage Restrictions apply at the time the Fund purchases a security. Circumstances subsequent to the purchase of the security, such as a change in: (1) the Fund’s assets (e.g., due to cash inflows and redemptions); (2) the market value of the security; or (3) the pricing, liquidity, or rating of the security, may cause the Fund to exceed or fall short of the Percentage Restriction. If this happens, the Fund’s continued holding of the security will not constitute a violation of the Percentage Restriction.
From time to time, the Fund’s advisor and/or administrator has waived its fees and/or absorbed Fund expenses, which has resulted in higher returns.
| 1 | Load-adjusted performance reflects the effect of the maximum sales charge of 5.75% for Class A, the applicable contingent deferred sales charge of 5.00% in year 1 and eliminated after year 6 for Class B, and the applicable contingent deferred sales charge of 1.00% and eliminated after 12 months for Class C. The performance of the Class A, B, and C shares is based on the performance of the Fund’s Class Z shares (formerly Retail Class shares) prior to 11-30-00. The performance of the Class A shares is restated to reflect the load and the different expenses of the Class A shares, as applicable. The performance of the Class B shares is restated to reflect the contingent deferred sales charge and the different expenses of the Class B shares, as applicable. The performance of the Class C shares is restated to reflect the contingent deferred sales charge and the different expenses of the Class C shares, as applicable. |
| 2 | Performance information is for Class Z shares (formerly Retail Class shares). The Strong Advisor Small Cap Value Fund Class Z shares are closed to new accounts, though the Fund may continue to offer its shares to certain company-sponsored retirement plans, institutional investors meeting specific eligibility requirements, and other limited groups as described in the prospectus. |
Please consult a prospectus for information about all share classes.
Because small companies often have narrower markets and limited financial resources, investments in these stocks present more risk than investments in those of larger, more established companies.
| * | The Russell 2000® Index measures the performance of the 2,000 smallest companies in the Russell 3000 Index, which represents approximately 8% of the total market capitalization of the Russell 3000 Index. The Lipper Small-Cap Value Funds Index is the average of the 30 largest funds in the Lipper Small-Cap Value Funds Category. Source of the Russell index data is Standard & Poor’s Micropal. Source of the Lipper index data is Lipper Inc. |
7
Table of Contents
Strong Advisor U.S. Value Fund
The Strong Advisor U.S. Value Fund outperformed its broad-based index, the S&P 500 Index. The Fund’s Class A shares returned 23.00% or 30.48% when excluding the initial sales charge, while the S&P 500 Index returned 28.67%.
In a departure from the previous three years, all categories of the equity markets delivered positive results — and did so decisively. As is typical in the early stages of an economic recovery, throughout the year small-cap stocks outperformed mid-cap stocks, which in turn outperformed large-cap stocks. Our willingness to hold some mid-cap stocks clearly helped our performance relative to the S&P 500 Index.
Individual stock selection drove outperformance
We spend virtually all of our time and effort on bottom-up, fundamental stock research. We were therefore gratified to find that our outperformance relative to our indices was driven in large part by strength in our individual stock selections, led by stocks in the materials (Georgia-Pacific and Phelps Dodge), healthcare (HCA and McKesson), and consumer discretionary (McDonald’s and Metro-Goldwyn-Mayer) sectors. In keeping with our value discipline, we have substantially reduced our exposure to our strongest materials and consumer discretionary stocks, as they have generally doubled in price from their lows. However, we continue to find value in healthcare stocks.
We are overweighted in food stocks relative to the benchmark level, as we find the steady growth, high dividends, and stable cash flow of these businesses very compelling at this time. In addition, as growth-oriented investors rotated out of this sector in search of faster-growth stocks, there was an unusual opportunity to purchase these businesses when they were out of favor and undervalued.
Some notes about energy and tech stocks
As of December 31, 2003, we were overweight in energy stocks relative to our benchmark. We took this position because energy stocks materially underperformed the broader market in 2003. Although we believed the energy stocks we selected may benefit from company-specific factors, it’s generally oil prices that drive the sector’s returns. Because oil prices are denominated in dollars, we believed that the weakened dollar should bolster prices, driving our decision to increase our position in the sector in the fourth quarter. The market appeared to warm up to this idea toward the end of the year, and energy stocks significantly outperformed the market in December.
We reduced our holdings in technology stocks in 2003. We believe that euphoria has begun to return to this area of the market, making the valuations of many companies excessive, in our assessment. In addition, it appears to us that many investors are not considering that most technology companies’ earnings per share will suffer material, negative impact once stock options are properly accounted for. We also reduced our position in financials, particularly in brokers and other areas sensitive to shifts in the markets.
Outlook for the year ahead
The year saw considerable weakness in the U.S. dollar, a condition that is typically more beneficial to larger companies. (Bigger companies are more likely to be exporters, which generally benefit from stronger currencies abroad.) This was not the case in 2003, however, as small caps outperformed larger stocks, continuing a five-year trend. It may be that large-cap investors can look forward to their stocks’ playing catch-up in 2004, particularly if dollar weakness continues.
We will continue to keep our heads down and our eyes open, seeking out companies with solid assets, manageable debt levels, and credible management teams. We will work to buy these companies at attractive prices — which often come when they are temporarily out of favor with the market. Finally, we hope and expect our valuation discipline and focus on risk management will be of greater importance in 2004 than they were in 2003.
Thank you for your investment in the Strong Advisor U.S. Value Fund.

Robert J. Costomiris
Portfolio Manager
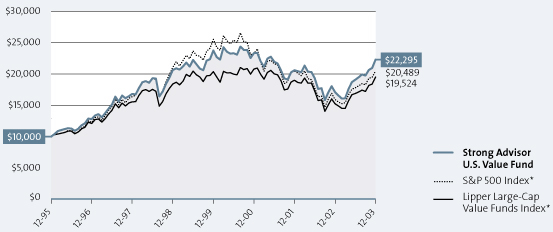
| * | The S&P 500 Index consists of 500 stocks chosen for market size, liquidity, and industry group representation. It is a market value weighted index (stock price times number of shares outstanding), with each stock’s weight in the Index proportionate to its market value. The Lipper Large-Cap Value Funds Index is the average of the 30 largest funds in the Lipper Large-Cap Value Funds Category. Source of the S&P index data is Standard & Poor’s Micropal. Source of the Lipper index data is Lipper Inc. |
8
Table of Contents
Fund Highlights
Your Fund’s Approach
The Fund invests in stocks of U.S. companies that the Fund’s manager believes are undervalued relative to the market based on discounted cash flows, earnings, and asset value. The manager’s philosophy is that improving returns on invested capital drives improving valuations. The manager selects securities by screening for undervalued securities and utilizing fundamental analysis such as management interviews and financial modeling analysis to select those securities with improving returns on capital.
Average Annual Total Returns
As of 12-31-03
| Class A1 |
|||
| 1-year |
23.00 | % | |
| 3-year |
-3.32 | % | |
| 5-year |
0.29 | % | |
| Since Fund Inception (12-29-95) |
9.51 | % | |
| Class A, excluding sales load |
|||
| 1-year |
30.48 | % | |
| 3-year |
— | ||
| 5-year |
— | ||
| Since Fund Inception (12-29-95) |
— | ||
| Class B1 |
|||
| 1-year |
24.37 | % | |
| 3-year |
-3.51 | % | |
| 5-year |
0.41 | % | |
| Since Fund Inception (12-29-95) |
9.62 | % | |
| Class C1 |
|||
| 1-year |
28.42 | % | |
| 3-year |
-2.08 | % | |
| 5-year |
0.81 | % | |
| Since Fund Inception (12-29-95) |
9.62 | % | |
| Class K1 |
|||
| 1-year |
31.03 | % | |
| 3-year |
-0.95 | % | |
| 5-year |
1.90 | % | |
| Since Fund Inception (12-29-95) |
10.76 | % | |
| Class Z2 |
|||
| 1-year |
30.23 | % | |
| 3-year |
-1.49 | % | |
| 5-year |
1.56 | % | |
| Since Fund Inception (12-29-95) |
10.53 | % | |
Equity funds are volatile investments and should only be considered for long-term goals.
Growth of an Assumed $10,000 Investment†
From 12-29-95 to 12-31-03
Mention of specific securities in this report is not indicative of whether the Fund may make additional purchases of, sell all or a portion of, or continue to hold those securities.
| † | This graph, provided in accordance with SEC regulations, compares a $10,000 investment in the Fund, made at its inception, with the performance of the S&P 500 Index (“S&P 500”) and the Lipper Large-Cap Value Funds Index. Results include the reinvestment of all dividends and capital gains distributions. Performance is historical and does not represent future results. Investment returns and principal value vary, and you may have a gain or loss when you sell shares. Current performance may be lower or higher than the quoted performance. Call us or visit www.Strong.com for the most current performance information. The graph and the Average Annual Total Returns table do not reflect the deduction of taxes, if any, that a shareholder would pay on Fund distributions or the redemption of Fund shares. This graph is based on Class Z shares only; performance for other classes will vary due to differences in fee structures. |
The Fund’s prospectus and statement of additional information may describe restrictions on the percentage of a particular type or quality of security in which the Fund may invest (“Percentage Restrictions”). Percentage Restrictions apply at the time the Fund purchases a security. Circumstances subsequent to the purchase of the security, such as a change in: (1) the Fund’s assets (e.g., due to cash inflows and redemptions); (2) the market value of the security; or (3) the pricing, liquidity, or rating of the security, may cause the Fund to exceed or fall short of the Percentage Restriction. If this happens, the Fund’s continued holding of the security will not constitute a violation of the Percentage Restriction.
From time to time, the Fund’s advisor and/or administrator has waived its fees and/or absorbed Fund expenses, which has resulted in higher returns.
| 1 | Load-adjusted performance reflects the effect of the maximum sales charge of 5.75% for Class A, the applicable contingent deferred sales charge of 5.00% in year 1 and eliminated after year 6 for Class B, and the applicable contingent deferred sales charge of 1.00% and eliminated after 12 months for Class C. The performance of the Class A, B, and C shares is based on the performance of the Fund’s Class Z shares (formerly Retail Class shares) prior to 11-30-00. The performance of the Class A shares is restated to reflect the load and the different expenses of the Class A shares. The performance of the Class B shares is restated to reflect the contingent deferred sales charge and the different expenses of the Class B shares, as applicable. The performance of the Class C shares is restated to reflect the contingent deferred sales charge and the different expenses of the Class C shares, as applicable. The performance of Class K shares prior to December 31, 2001, is based on the Fund’s Class Z shares’ performance. Please consult a prospectus for information about all share classes. |
| 2 | Performance information is for Class Z shares. The Strong Advisor U.S. Value Fund Class Z shares are closed to new accounts, though the Fund may continue to offer its shares to certain company-sponsored retirement plans, institutional investors meeting specific eligibility requirements, and other limited groups as described in the prospectus. Please consult a prospectus for information about all share classes. |
9
Table of Contents
Strong Advisor Endeavor Large Cap Fund
For the year ended December 31, 2003, the Strong Advisor Endeavor Large Cap Fund Class A delivered a very solid return, advancing 25.84% (33.51% when excluding the initial sales charge). The Fund’s broad-based benchmark, the S&P 500 Index, returned 28.67%.
We had positioned the Fund to benefit from overall improvement in economic conditions and investor confidence. We were surprised, however, that high-volatility stocks experienced the strongest performance over the past year. This may have hindered our performance relative to the benchmark.
An investigative approach
Our team of portfolio managers and analysts worked diligently in 2003 to research investment opportunities for new and existing holdings for the Fund. Our research process is based on the idea of surrounding a company. This can be likened to the work of investigative journalists, tapping into an extensive network of sources to develop an original investment opinion. We begin surrounding a company by thoroughly analyzing its financial statements, looking for companies that can produce strong earnings growth relative to the investment required to grow their businesses. One of the companies this research led us toward in 2003 was Cisco Systems, the manufacturer of a broad array of networking and communications products.
We then seek to gain perspectives from many key individuals who directly affect the particular company or industry that is the subject of our research. We hold extensive conversations with senior management, but also interview middle managers, sales personnel, and product or channel managers who can provide valuable insights into sales trends, customer interests, and the competitive landscape. These relationships help us to gain an understanding of the effectiveness of new product and customer initiatives. Information from competitors, suppliers, and customers helps to round out our understanding.
In Cisco’s case, our research among component suppliers indicated that business trends were improving across most of the company’s customer base. Indeed, Cisco was able to announce an important new contract with the U.S. Defense Department to build a high-speed data network. Cisco’s solid operating leverage, improving business trends, and reduced product backlog and lead times were all positive for the company’s stock.
Healthy performers for the Fund
Semiconductor manufacturer Intel Corporation was also a solid holding during the period. The semiconductor industry fared well this year, and Intel’s stock rose on the strength in demand as it witnessed a solid push in the markets for servers, desktop computers, and mobile devices. Also, the company continued to benefit from high expectations that its Centrino chipset will allow it to build considerable market share in the growing laptop market.
Finally, as demand for leisure travel improved this year, our carefully researched holdings in the travel sector contributed positively to returns. For example, Royal Caribbean, one of the world’s largest cruise lines, benefited from improved bookings and its strong position among its competitors. As the economy strengthened, we detected improving leisure travel as trends returned to normal after three years of below-average results.
We believe that our research of companies of all sizes is a key advantage even when investing in larger-cap companies. Many large companies compete, form partnerships, or do business with smaller and midsize companies. With research that spans the market capitalization spectrum, we get unusual insights that enhance our ability to build a differentiated portfolio of growth stocks.
A positive outlook overall
We expect economic and corporate earnings growth to continue at a moderate pace in the coming year. Inflation appears to be at a sustainably low level, with strong productivity gains and job growth appearing to pick up. These factors should provide a solid foundation for the equity markets next year.
There is, however, potential for rising interest rates due to a weaker dollar and improving economy, which could hamper stock returns somewhat. In this environment, we intend to continue to maintain a balance of core growth holdings and developing growth stocks in the portfolio. Our aim is to take advantage of the opportunities that may present themselves in 2004, while prudently managing risk.
Thank you for your investment in the Strong Advisor Endeavor Large Cap Fund.
|
|
| Thomas J. Pence |
| Portfolio Co-Manager |
 |
| D. Paul Berg |
| Portfolio Co-Manager |

10
Table of Contents
Fund Highlights
Your Fund’s Approach
The Fund invests in stocks of large-cap companies that its managers believe offer the potential for capital growth. The Fund’s managers seek to identify companies that have the prospect of improving sales and earnings growth rates, enjoy a competitive advantage, and have effective management with a history of making investments that are in the best interests of shareholders.
Average Annual Total Returns
As of 12-31-03
| Class A1 |
|||
| 1-year |
25.84 | % | |
| Since Fund Inception (9-28-01) |
-1.21 | % | |
| Class A, excluding sales load |
|||
| 1-year |
33.51 | % | |
| Since Fund Inception (9-28-01) |
— | ||
| Class B1 |
|||
| 1-year |
27.76 | % | |
| Since Fund Inception (9-28-01) |
-0.84 | % | |
| Class C1 |
|||
| 1-year |
31.76 | % | |
| Since Fund Inception (9-28-01) |
0.93 | % | |
Equity funds are volatile investments and should only be considered for long-term goals.
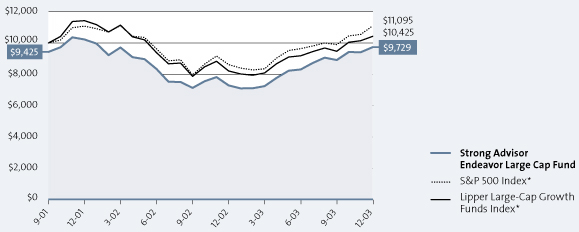
Growth of an Assumed $10,000 Investment†
From 9-28-01 to 12-31-03
Mention of specific securities in this report is not indicative of whether the Fund may make additional purchases of, sell all or a portion of, or continue to hold those securities.
| † | This graph, provided in accordance with SEC regulations, compares a $10,000 investment in the Fund, made at its inception, with the performance of the S&P 500 Index (“S&P 500”) and the Lipper Large-Cap Growth Funds Index. Results include the reinvestment of all dividends and capital gains distributions. Performance is historical and does not represent future results. Investment returns and principal value of the Fund vary, and you may have a gain or loss when you sell shares. Current performance may be lower or higher than the quoted performance. Call us or visit www.Strong.com for the most current performance information. The graph and the Average Annual Total Returns table do not reflect the deduction of taxes, if any, that a shareholder would pay on Fund distributions or the redemption of Fund shares. This graph is based on Class A shares only and reflects the effect of the maximum sales charge of 5.75%; performance for other share classes will vary due to differences in fee structures and sales charges. |
The Fund’s prospectus and statement of additional information may describe restrictions on the percentage of a particular type or quality of security in which the Fund may invest (“Percentage Restrictions”). Percentage Restrictions apply at the time the Fund purchases a security. Circumstances subsequent to the purchase of the security, such as a change in: (1) the Fund’s assets (e.g., due to cash inflows and redemptions); (2) the market value of the security; or (3) the pricing, liquidity, or rating of the security, may cause the Fund to exceed or fall short of the Percentage Restriction. If this happens, the Fund’s continued holding of the security will not constitute a violation of the Percentage Restriction.
From time to time, the Fund’s advisor and/or administrator has waived its fees and/or absorbed Fund expenses, which has resulted in higher returns.
| 1 | Load-adjusted performance reflects the effect of the maximum sales charge of 5.75% for Class A, the applicable contingent sales charge of 5.00% in year 1 and eliminated after year 6 for Class B, and the applicable contingent deferred sales charge of 1.00% and eliminated after 12 months for Class C. |
| * | The S&P 500 Index consists of 500 stocks chosen for market size, liquidity, and industry group representation. It is a market value weighted index (stock price times number of shares outstanding), with each stock’s weight in the Index proportionate to its market value. The Lipper Large-Cap Growth Funds Index is the average of the 30 largest funds in the Lipper Large-Cap Growth Funds Category. Source of the S&P 500 index data is Standard & Poor’s Micropal. Source of the Lipper index data is Lipper Inc. |
11
Table of Contents
Emerging from a three-year bear market, the Strong Advisor Focus Fund Class A posted a solid return of 17.91% for the year (25.05% when excluding the initial sales charge). The Fund’s broad-based benchmark, the S&P 500 Index, returned 28.67% for the same period.
The stock market in 2003 was driven by three major trends. First, the newly enacted tax cuts offered the potential for stimulus to the economy and provided a boost to investors’ anticipated after-tax returns. Second, the economy displayed solid improvement through the year, accelerating in the second half. Third, the credit and capital markets opened up dramatically, giving companies the opportunity to repair troubled balance sheets.
Overall, this environment favored the lowest-quality stocks the most, as the market appeared to understand that it had less reason to worry about these companies’ long-term viability. Our focus and research tends to steer us away from such companies, which accounts for much of our underperformance this past year.
Seeking out fast-growing companies
Our process for selecting individual stocks has proprietary research at its core. The underlying theme to our process is the continual search for companies with superior business models that can achieve earnings growth by increasing their revenues and gaining market share.
Apollo Group is a good example that demonstrates our investment process. The company offers higher education both on campuses and via the Internet through its University of Phoenix operations. The company fits into an important investment theme that we follow, the dramatic economic growth associated with the very large echo boomer generation (that is, the children of the original baby boomers). This generation is now moving into its post-secondary-education years, providing a generous tailwind for the University of Phoenix’s growth.
The company gained market share, strongly outpacing most of the post-secondary education market. Furthermore, it met our criteria for revenue growth, positive earnings surprises, return on invested capital, and consistency of performance. We have supplemented our quantitative research with regular visits to the company to evaluate whether our growth expectations remain reasonable or need to be revised upward or downward.
Choosing when to sell a stock
With Apollo Group we observed times where the price of the stock was near our valuation targets — that is, the price we believed fully reflected its intrinsic value. As we do with other stocks in the portfolio, we took the opportunity to reduce our position in the stock. Because we invest in fast-growing companies, this sell discipline — that is, devising and employing the criteria we use to determine when a stock is no longer appropriate for the Fund — is a vital part of our management process.
Performance ultimately is driven not only by how well we buy a stock, but also by how well we sell it. Our decisions to sell stocks are driven by signs that the stock’s price has risen too high relative to its earnings and growth prospects, and by indications that the growth rates we sought when we bought the stock may not come to fruition. (Similarly, we may choose to increase our position in a company if its stock price dips while its prospects remain good.) Our process has served us well with respect to Apollo Group, and we believe it is a good formula for evaluating, selecting, and eventually selling a wide range of growth stocks over the long term.
Thoughts about 2004
For the near future, we anticipate continued economic strength, with the Federal Reserve taking a benign stance on interest rates through the first half of 2004. We believe that corporate profitability will continue to experience an above-average rate of growth, driven by rebounding domestic and international economies. We believe this should present a reasonable environment for growth-stock investing.
The stock market is dynamic. Among the factors we expect to be paying close attention to in the coming months will be the direction of long-bond rates, the recent weakness in the U.S. dollar relative to major foreign currencies, the environment for corporate credit, and the evolving demand for healthcare services.
We thank you for your investment in the Strong Advisor Focus Fund, and we appreciate the confidence you’ve continued to place in us.
 |
| Thomas C. Ognar |
| Portfolio Manager |
12
Table of Contents
Fund Highlights
Your Fund’s Approach
The Fund focuses on stocks of 30 to 40 companies that its manager believes have favorable prospects for accelerating growth of earnings but are selling at reasonable valuations based on earnings, cash flow, or asset value. The portfolio can include stocks of small-, medium-, or large-capitalization companies.
Average Annual Total Returns
As of 12-31-03
| Class A1 |
|||
| 1-year |
17.91 | % | |
| 3-year |
-18.07 | % | |
| Since Fund Inception (11-30-00) |
-16.92 | % | |
| Class A, excluding sales load |
|||
| 1-year |
25.05 | % | |
| 3-year |
— | ||
| Since Fund Inception (11-30-00) |
— | ||
| Class B1 |
|||
| 1-year |
19.10 | % | |
| 3-year |
-18.88 | % | |
| Since Fund Inception (11-30-00) |
-17.28 | % | |
| Class C1 |
|||
| 1-year |
23.10 | % | |
| 3-year |
-16.90 | % | |
| Since Fund Inception (11-30-00) |
-15.86 | % | |
Equity funds are volatile investments and should only be considered for long-term goals.
Growth of an Assumed $10,000 Investment†
From 11-30-00 to 12-31-03

Mention of specific securities in this report is not indicative of whether the Fund may make additional purchases of, sell all or a portion of, or continue to hold those securities.
| † | This graph, provided in accordance with SEC regulations, compares a $10,000 investment in the Fund, made at its inception, with the performance of the S&P 500 Index (“S&P 500”) and the Lipper Multi-Cap Growth Funds Index. Results include the reinvestment of all dividends and capital gains distributions. Performance is historical and does not represent future results. Investment returns and principal value vary, and you may have a gain or loss when you sell shares. Current performance may be lower or higher than the quoted performance. Call us or visit www.Strong.com for the most current performance information. The graph and the Average Annual Total Returns table do not reflect the deduction of taxes, if any, that a shareholder would pay on Fund distributions or the redemption of Fund shares. This graph is based on Class A shares only and reflects the effect of the maximum sales charge of 5.75%; performance for other classes will vary due to differences in fee structures and sales charges. |
The Fund’s prospectus and statement of additional information may describe restrictions on the percentage of a particular type or quality of security in which the Fund may invest (“Percentage Restrictions”). Percentage Restrictions apply at the time the Fund purchases a security. Circumstances subsequent to the purchase of the security, such as a change in: (1) the Fund’s assets (e.g., due to cash inflows and redemptions); (2) the market value of the security; or (3) the pricing, liquidity, or rating of the security, may cause the Fund to exceed or fall short of the Percentage Restriction. If this happens, the Fund’s continued holding of the security will not constitute a violation of the Percentage Restriction.
From time to time, the Fund’s advisor and/or administrator has waived its fees and/or absorbed Fund expenses, which has resulted in higher returns.
The Fund is nondiversified, meaning it may concentrate its assets in fewer individual holdings than a diversified fund. Therefore, the Fund is more exposed to individual stock volatility and market pressure than a fully diversified fund.
| 1 | Load-adjusted performance reflects the effect of the maximum sales charge of 5.75% for Class A, the applicable contingent deferred sales charge of 5.00% in year 1 and eliminated after year 6 for Class B, and the applicable contingent deferred sales charge of 1.00% and eliminated after 12 months for Class C. |
| * | The S&P 500 Index consists of 500 stocks chosen for market size, liquidity, and industry group representation. It is a market value weighted index (stock price times number of shares outstanding), with each stock’s weight in the Index proportionate to its market value. The Lipper Multi-Cap Growth Funds Index is the average of the 30 largest funds in the Lipper Multi-Cap Growth Funds Category. Source of the S&P index data is Standard & Poor’s Micropal. Source of the Lipper index data is Lipper Inc. |
13
Table of Contents
Strong Advisor International Core Fund
The Strong Advisor International Core Fund Class A rose 23.82% for the year ended December 31, 2003 (31.38% when excluding the initial sales charge). While a solid return for the year, the Fund’s performance lagged the total return of its international benchmark, the MSCI EAFE Index, which gained 38.59% for the year.
Small-cap stocks and lower-quality stocks dominated the global market rally over the past year. Our investment discipline emphasizes higher-quality, large-cap companies, which limited the Fund’s participation in the market’s recovery.
Solid gains around the world
As the global economic recovery gained momentum through the year, all major international equity markets and global sectors enjoyed double-digit gains in U.S. dollar terms. Performance was best in emerging markets, where falling interest rates, attractive share prices, and accelerating growth prospects sparked investor sentiment. The Fund’s investments in Brazil and Mexico were particular beneficiaries of this trend. Asian markets also posted strong returns, especially in the second half of the year.
European markets had less dramatic performance in local currency terms, reflecting the struggling nature of that region’s economy. Germany was a notable exception in Europe. We increased our investment in Germany during the year, emphasizing companies poised for a significant earnings recovery in spite of the strong euro.
A major factor in the Fund’s results was the strength of key foreign currencies compared with the U.S. dollar. For example, the yen rose in value by 10% relative to the dollar, and the euro appreciated by 20%. Differences between the Fund’s currency exposures and those of the MSCI EAFE Index contributed to the Fund’s below-benchmark return.
Lower-quality stocks outperformed
As we have noted, in 2003 the stocks that experienced the greatest returns around the world and across economic sectors were small-capitalization stocks and low-quality stocks sharing such traits as highly leveraged balance sheets, a history of poor acquisition strategies, and volatile earnings results.
The difference in relative performance of small vs. large capitalization stocks was striking around the world. For example, the MSCI Europe Small Cap Index rose 35% in the year, while the MSCI Europe Index climbed just 17%. A similar relationship existed in Asia, where the MSCI Far East Small Cap Index increased 45%, nearly twice the return of the MSCI Far East Index, up 23%. (All returns are based in local currencies.) While some smaller-cap holdings, such as Puma of Germany, did very well for the year, the Fund is generally concentrated on large-cap stocks as part of our long-standing investment process.
The performance gap between low- and high-quality stocks also had an impact on the Fund’s relative performance. Eye-popping increases were experienced by some of the world’s most troubled financial, technology, and industrial stocks. Nevertheless, we remained true to our discipline, eschewing high-risk stocks with questionable fundamentals and favoring instead those that fit key criteria such as solid balance sheets, consistent earnings growth, proven business development strategies, and attractive relative valuations. We intend to maintain our focus on quality, as we believe such an approach is essential to identifying stocks that can survive and prosper over the longer term.
The year did have significant bright spots for the Fund. We identified rising materials prices as a key new trend early in the year, and therefore chose to emphasize that sector within the portfolio. Commodity prices rose on the back of the weaker dollar, reduced production capacity, and renewed demand — especially from China. Three Fund holdings from the sector, Anglo American, Gold Fields, and BHP are among the world’s largest metals and mining firms and were clear beneficiaries of the solid pricing environment for their products. Companhia Vale do Rio Doce, one of the Fund’s best performing stocks in 2003, has the added benefit of very low production costs following the devaluation of Brazil’s currency in January 1999.
Keeping our focus on high quality
Major issues facing global stock markets in 2004 include questions about the durability of the current global economic recovery, the negative effects of a weak U.S. dollar, the potential for rising interest rates across regions, and the ability of China’s expansion to serve as an engine of growth for the world economy and not just the Asian region.
In this environment, we believe investors will once again turn to the large-cap, high-quality stocks this Fund favors.
Thank you for your investment in the Strong Advisor International Core Fund.

Stacy Ho
Portfolio Co-Manager

Katherine Schapiro
Portfolio Co-Manager
14
Table of Contents
Fund Highlights
Your Fund’s Approach
The Fund invests in stocks of any size from any country, including emerging markets, that appear to have strong growth potential and good relative value based on valuation measures such as earnings, cash flow, or asset value. The strategy is comprised of three parts that continually interact: trend identification, stock selection, and risk management.
Average Annual Total Returns
As of 12-31-03
| Class A1 |
|||
| 1-year |
23.82 | % | |
| Since Fund Inception (9-28-01) |
4.09 | % | |
| Class A, excluding sales load |
|||
| 1-year |
31.38 | % | |
| Since Fund Inception (9-28-01) |
— | ||
| Class B1 |
|||
| 1-year |
26.58 | % | |
| Since Fund Inception (9-28-01) |
5.17 | % | |
| Class C1 |
|||
| 1-year |
30.52 | % | |
| Since Fund Inception (9-28-01) |
6.79 | % | |
Equity funds are volatile investments and should only be considered for long-term goals.
Growth of an Assumed $10,000 Investment†
From 9-28-01 to 12-31-03

Mention of specific securities in this report is not indicative of whether the Fund may make additional purchases of, sell all or a portion of, or continue to hold those securities.
| † | This graph, provided in accordance with SEC regulations, compares a $10,000 investment in the Fund, made at its inception, with the performance of the Morgan Stanley Capital International Europe, Australasia, and Far East Index (“MSCI EAFE”) and the Lipper International Funds Index. Results include the reinvestment of all dividends and capital gains distributions. Performance is historical and does not represent future results. Investment returns and principal value of the Fund vary, and you may have a gain or loss when you sell shares. Current performance may be lower or higher than the quoted performance. Call us or visit www.Strong.com for the most current performance information. The graph and the Average Annual Total Returns table do not reflect the deduction of taxes, if any, that a shareholder would pay on Fund distributions or the redemption of Fund shares. This graph is based on Class A shares only and reflects the effect of the maximum sales charge of 5.75%; performance for other share classes will vary due to differences in fee structures and sales charges. |
The Fund’s prospectus and statement of additional information may describe restrictions on the percentage of a particular type or quality of security in which the Fund may invest (“Percentage Restrictions”). Percentage Restrictions apply at the time the Fund purchases a security. Circumstances subsequent to the purchase of the security, such as a change in: (1) the Fund’s assets (e.g., due to cash inflows and redemptions); (2) the market value of the security; or (3) the pricing, liquidity, or rating of the security, may cause the Fund to exceed or fall short of the Percentage Restriction. If this happens, the Fund’s continued holding of the security will not constitute a violation of the Percentage Restriction.
From time to time, the Fund’s advisor and/or administrator has waived its fees and/or absorbed Fund expenses, which has resulted in higher returns.
An investment in this Fund entails the special risks of international investing, including currency exchange fluctuation, government regulations, and the potential for political and economic instability. The Fund’s share price is expected to be more volatile than that of a U.S.-only fund. These risks are generally intensified for investments in emerging markets.
| 1 | Load-adjusted performance reflects the effect of the maximum sales charge of 5.75% for Class A, the applicable contingent sales charge of 5.00% in year 1 and eliminated after year 6 for Class B, and the applicable contingent deferred sales charge of 1.00% and eliminated after 12 months for Class C. |
| * | The MSCI EAFE® Index (Europe, Australasia, Far East) is a free float-adjusted market capitalization index that is designed to measure developed market equity performance, excluding the U.S. and Canada. The Lipper International Funds Index is the average of the 30 largest funds in the Lipper International Funds Category. These funds invest assets in securities with primary trading markets outside of the United States. Source of the MSCI EAFE index data is Standard & Poor’s Micropal. Source of the Lipper index data is Lipper Inc. |
15
Table of Contents
The Strong Advisor Select Fund Class A posted a strong return in 2003. For the year ended December 31, 2003, the Fund returned 29.21% (37.05% when excluding the initial sales charge), outperforming its broad-based benchmark, the S&P 500 Index, which returned 28.67% for the same period.
In an environment that saw virtually every sector of the equity market post solid returns, the Fund’s outperformance relative to the S&P 500 Index was driven by strong individual stock selection.
Investigative approach to investing
Our investment process for the Strong Advisor Select Fund is based on the idea of surrounding a company with research. This can be likened to the work of investigative journalists, tapping into an extensive network of sources to develop an original investment opinion. We begin surrounding a company by thoroughly analyzing its financial statements, looking for companies that can produce strong earnings growth relative to the investment required to grow their businesses. We require each holding in the Fund to display strong barriers to new competitors, which should help support strong or improving returns on capital.
One company this approach led us to was Royal Caribbean Cruises, one of the world’s largest cruise lines. The very nature of the large cruise-line business helps to limit the potential for new entrants to the market. Among the factors that drew us to this company were increased bookings, which resulted from the strengthening economy and receding fears of terrorism. Royal Caribbean Cruises also had a strong position among its competitors. We expect to continue to closely monitor pricing, competition, and demand trends in the travel industry.
Among the most useful elements of our research process is seeking out perspectives from many key individuals who directly affect the particular company or industry that is the subject of our research. We hold extensive conversations with senior management, but we also interview middle managers, sales personnel, and product or channel managers who can provide valuable insights into sales trends, customer interests, and the competitive landscape. These relationships help us to gain an understanding of the effectiveness of new product and customer initiatives. Information from competitors, suppliers, and customers helps to round out our understanding of a company.
Eclectic stock picking
This research helps us to uncover opportunities in a wide range of sectors. For example, another strong performer we identified for the Fund was Harman International Industries, which designs and markets high-fidelity audio products and electronic systems. We were able to determine that Harman was benefiting from rolling out its Harman Infotainment system to higher-end auto manufacturers. That system also helps auto manufacturers decrease costs by simplifying the assembly process. We believed Harman’s customer base should allow it to generate solid long-term revenue and earnings growth.
Our research-driven approach also led us to semiconductor manufacturer Intel Corporation. The semiconductor industry fared well this year, and Intel rose on the strength in demand as it witnessed a solid push in the markets for servers, desktop computers, and mobile devices. The company’s new Centrino chipset should also allow it to build considerable market share in the growing laptop market.
We believe that our research of companies of all sizes is a key advantage even when investing in larger-cap companies. Many large companies compete, form partnerships, or do business with smaller and midsize companies. With research that spans the market-capitalization spectrum, we get unusual, invaluable insights.
Expectations for 2004
While the current environment suggests a positive tone for the equity markets next year, we anticipate that stock valuations will keep returns closer to historic levels (rather than the very high levels seen in 2003). There is some potential for downside risk due to an economic hiccup or unexpected event, and investors are likely to be more selective in the stocks they favor. We believe the stock market’s volatility is also likely to pick up.
Therefore, we intend to stay focused on keeping the right mix of core investments for the Fund and to continue to manage risk by adhering to our strict price targets for individual stocks. We believe the Fund is well-positioned to take advantage of the more discriminating market we are likely to see in the year ahead.
We sincerely appreciate your investment in the Strong Advisor Select Fund.
|
Thomas J. Pence
Portfolio Co-Manager |
Erik J. Voss
Portfolio Co-Manager |


16
Table of Contents
Fund Highlights
Your Fund’s Approach
The Fund invests in the stocks of 30 to 40 small-, medium-, and large-capitalization companies that its managers believe have above-average earnings growth prospects. The Fund’s managers select stocks that have attractive growth prospects, accelerating sales and earnings, and positive fundamentals.
Average Annual Total Returns
As of 12-31-03
| Class A1 |
|||
| 1-year |
29.21 | % | |
| 3-year |
-7.58 | % | |
| Since Fund Inception (12-29-00) |
-7.57 | % | |
| Class A, excluding sales load |
|||
| 1-year |
37.05 | % | |
| 3-year |
— | ||
| Since Fund Inception (12-29-00) |
— | ||
| Class B1 |
|||
| 1-year |
30.88 | % | |
| 3-year |
-7.97 | % | |
| Since Fund Inception (12-29-00) |
-7.56 | % | |
| Class C1 |
|||
| 1-year |
34.88 | % | |
| 3-year |
-6.42 | % | |
| Since Fund Inception (12-29-00) |
-6.41 | % | |
Equity funds are volatile investments and should only be considered for long-term goals.
Growth of an Assumed $10,000 Investment†
From 12-29-00 to 12-31-03

Mention of specific securities in this report is not indicative of whether the Fund may make additional purchases of, sell all or a portion of, or continue to hold those securities.
| † | This graph, provided in accordance with SEC regulations, compares a $10,000 investment in the Fund, made at its inception, with a similar investment in the S&P 500 Index (“S&P 500”) and the Lipper Multi-Cap Growth Funds Index. Results include the reinvestment of all dividends and capital gains distributions. Performance is historical and does not represent future results. Investment returns and principal value vary, and you may have a gain or a loss when you sell shares. Current performance may be lower or higher than the quoted performance. Call us or visit www.Strong.com for the most current performance information. The graph and the Average Annual Total Returns table do not reflect the deduction of taxes, if any, that a shareholder would pay on Fund distributions or the redemption of Fund shares. This graph is based on Class A shares only and reflects the effect of the maximum sales charge of 5.75%; performance for other classes will vary due to differences in fee structures and sales charges. |
The Fund’s prospectus and statement of additional information may describe restrictions on the percentage of a particular type or quality of security in which the Fund may invest (“Percentage Restrictions”). Percentage Restrictions apply at the time the Fund purchases a security. Circumstances subsequent to the purchase of the security, such as a change in: (1) the Fund’s assets (e.g., due to cash inflows and redemptions); (2) the market value of the security; or (3) the pricing, liquidity, or rating of the security, may cause the Fund to exceed or fall short of the Percentage Restriction. If this happens, the Fund’s continued holding of the security will not constitute a violation of the Percentage Restriction.
From time to time, the Fund’s advisor and/or administrator has waived its fees and/or absorbed Fund expenses, which has resulted in higher returns. The Fund is nondiversified, meaning it may concentrate its assets in fewer individual holdings than a diversified fund. Therefore, the Fund is more exposed to individual stock volatility and market pressure than a fully diversified fund.
| 1 | Load-adjusted performance reflects the effect of the maximum sales charge of 5.75% for Class A, the applicable contingent deferred sales charge of 5.00% in year 1 and eliminated after year 6 for Class B, and the applicable contingent deferred sales charge of 1.00% and eliminated after 12 months for Class C. |
| * | The S&P 500 Index consists of 500 stocks chosen for market size, liquidity, and industry group representation. It is a market value weighted index (stock price times number of shares outstanding), with each stock’s weight in the Index proportionate to its market value. The Lipper Multi-Cap Growth Funds Index is the average of the 30 largest funds in the Lipper Multi-Cap Growth Funds Category. Source of the S&P index data is Standard & Poor’s Micropal. Source of the Lipper index data is Lipper Inc. |
17
Table of Contents
Strong Advisor Technology Fund
In a year that saw virtually all sectors of the equity markets post strong returns, technology stocks represented the strongest equity sector in 2003. The Strong Advisor Technology Fund outperformed its broad-based benchmark by substantial margins. For the year ended December 31, 2003, the Fund’s Class A shares returned 65.11% (75.24% when excluding the initial sales charge), while its broad-based index, the S&P 500 Index, returned 28.67%.
A powerful year for tech stocks
In general, technology stocks tend to perform well in periods of expanding economic growth. This past year was no exception, and as the U.S. economy rebounded near the middle of 2003, tech stocks started to move upward as well. The strength of the technology sector rebound is, of course, tempered by the depth of the drop in their prices (fully 75% on average) that took place during the bear market.
Because of this Fund’s size, we were able to invest in a substantial number of small-capitalization stocks, which were the best-performing equity class in 2003. We overweighted the semiconductor group, relative to our benchmark, for the entire year. This further contributed to our strong performance, as this was the top-performing subsector within technology during the year. Individual stock selection also contributed positively to our relative and absolute performance.
Interesting examples from the portfolio
We employ a bottom-up stock-selection process, focusing carefully on a company’s fundamental qualities. This process includes a rigorous evaluation of a company’s management, its market position, ability to be self-financing, and above all, prospects for future growth. We especially like companies offering “best-of-breed” products.
One change in technology investing that has occurred over the past several years has been the relative slowdown in the growth rate of the major end markets: personal computers, wireless telephony, and Internet/networking. The slowdown in these markets has forced a switch in strategy toward newer, but smaller, markets and companies that still have high projected growth rates.
One example would be Fund holding Metrologic Instruments, our best performer for the year with a return of more than 200%. This small but leading technology company specializes in equipment and systems for bar-code scanning and RFID devices (the so-called smart tags being phased in by Wal-Mart and other retailers). We bought the stock based on an accelerated pattern of sales growth caused by new product innovation, as well as an increased potential range of uses for these technologies in hospital and logistics management. While this example is particularly strong, in 2003 we were able to identify several stocks that provided outsized returns for the portfolio.
We strive to maintain diversification among the major technology end markets and we’ve rarely allowed our exposure to a single sub-industry to exceed 30% of assets. In 2003, our semiconductor position briefly reached this level, but that was due in part to strong price appreciation among the stocks in this top-performing area of the market. We’ve usually looked to trim back our positions in individual stocks when they exceed 5% of assets. The aim of all of these diversification efforts is to reduce the relative volatility of the Fund’s performance.
Despite our general bias toward diversification, we will only invest in a particular subsector of the tech market if we can find compelling companies to invest in. During 2003, we sharply reduced our software holdings, for example, as the industry’s long-term growth prospects declined substantially.
During the year, we made successful investments in the biotech and medical technology areas. The prices on these companies were unusually attractive in the spring of 2003, presenting a solid opportunity to buy. Many companies in these industries appreciated strongly over the year — and as each reached a price target that we believed represented full value for the stock, we reduced or entirely sold out of our positions.
Anticipating positive conditions
All indications are that 2004 should provide a climate for good global economic growth. Technology stocks have historically tended to do well in similar environments, giving further cause for optimism. We expect to see recovery in the deteriorating corporate information technology market, as well as continued growth in the personal computer, wireless telephony, and Internet/networking markets. While we expect to see a good year in 2004, we believe it would be unrealistic to expect another one as strong as 2003.
Thank you for your investment in the Strong Advisor Technology Fund.
 |
| James B. Burkart |
| Portfolio Manager |
18
Table of Contents
Fund Highlights
Your Fund’s Approach
The Fund invests in stocks of companies of any size that derive at least 50% of their revenues, expenses, or profits from producing, developing, selling, using, or distributing technology products or services. To select stocks for the Fund, the manager generally looks for several characteristics, including strong revenue growth, overall financial strength, competitive advantages, and effective management.
Average Annual Total Returns
As of 12-31-03
| Class A1 |
|||
| 1-year |
65.11 | % | |
| 3-year |
-8.89 | % | |
| Since Fund Inception (11-30-00) |
-10.86 | % |
| Class A, excluding sales load |
|||
| 1-year |
75.24 | % | |
| 3-year |
— | ||
| Since Fund Inception (11-30-00) |
— |
| Class B1 |
|||
| 1-year |
70.54 | % | |
| 3-year |
-9.07 | % | |
| Since Fund Inception (11-30-00) |
-10.78 | % |
| Class C1 |
|||
| 1-year |
74.48 | % | |
| 3-year |
-7.57 | % | |
| Since Fund Inception (11-30-00) |
-9.65 | % |
Equity funds are volatile investments and should only be considered for long-term goals.
Growth of an Assumed $10,000 Investment†
From 11-30-00 to 12-31-03

Mention of specific securities in this report is not indicative of whether the Fund may make additional purchases of, sell all or a portion of, or continue to hold those securities.
| † | This graph, provided in accordance with SEC regulations, compares a $10,000 investment in the Fund, made at its inception, with the performance of the S&P 500 Index (“S&P 500”) and the Lipper Science and Technology Funds Index. Results include the reinvestment of all dividends and capital gains distributions. Performance is historical and does not represent future results. Investment returns and principal value vary, and you may have a gain or loss when you sell shares. Current performance may be lower or higher than the quoted performance. Call us or visit www.Strong.com for the most current performance information. The graph and the Average Annual Total Returns table do not reflect the deduction of taxes, if any, that a shareholder would pay on Fund distributions or the redemption of Fund shares. This graph is based on Class A shares only and reflects the effect of the maximum sales charge of 5.75%; performance for other classes will vary due to differences in fee structures and sales charges. |
The Fund’s prospectus and statement of additional information may describe restrictions on the percentage of a particular type or quality of security in which the Fund may invest (“Percentage Restrictions”). Percentage Restrictions apply at the time the Fund purchases a security. Circumstances subsequent to the purchase of the security, such as a change in: (1) the Fund’s assets (e.g., due to cash inflows and redemptions); (2) the market value of the security; or (3) the pricing, liquidity, or rating of the security, may cause the Fund to exceed or fall short of the Percentage Restriction. If this happens, the Fund’s continued holding of the security will not constitute a violation of the Percentage Restriction.
From time to time, the Fund’s advisor and/or administrator has waived its fees and/or absorbed Fund expenses, which has resulted in higher returns.
The Fund concentrates its assets in the technology market sector. As a result, the Fund’s shares are likely to fluctuate in value more than those of a fund investing in a broader range of securities.
| 1 | Load-adjusted performance reflects the effect of the maximum sales charge of 5.75% for Class A, the applicable contingent deferred sales charge of 5.00% in year 1 and eliminated after year 6 for Class B, and the applicable contingent deferred sales charge of 1.00% and eliminated after 12 months for Class C. |
| * | The S&P 500 Index consists of 500 stocks chosen for market size, liquidity, and industry group representation. It is a market value weighted index (stock price times number of shares outstanding), with each stock’s weight in the Index proportionate to its market value. The Lipper Science and Technology Funds Index is the average of the 30 largest funds in the Lipper Science and Technology Funds Category. Source of the S&P index data is Standard & Poor’s Micropal. Source of the Lipper index data is Lipper Inc. |
19
Table of Contents
Strong Advisor U.S. Small/Mid Cap Growth Fund
For the year ended December 31, 2003, the Strong Advisor U.S. Small/Mid Cap Growth Fund Class A returned 47.63% (56.72% when excluding the initial sales charge), placing it ahead of its broad-based benchmark, the Russell Midcap Index, which returned 40.06% for the same period.
The economic climate improved as the year progressed, as did the Fund’s performance. We believed that the Federal Reserve would maintain its accommodative stance on interest rates, and we also anticipated that the fiscal stimulus measures — particularly tax cuts — pursued by President Bush in advance of the election year would provide further support for economic recovery.
Based on our economic outlook, we had decided to emphasize in the portfolio those companies and sectors that were positioned to benefit from a recovering economy. This move played a large part in the Fund’s strong relative and absolute performance.
There was also a change in market leadership; where value stocks had prevailed in less certain times, growth stocks came to the fore as the economic recovery took firm hold.
Prepared for recovery
The most notable event in the first half of 2003 was the war in Iraq. Uncertainty leading up to the war caused consumer and business confidence to plummet, making it very difficult to manage growth stock portfolios. In November 2002, however, we had repositioned the Fund in anticipation of improving business conditions and increasing consumer confidence, positioning that hurt performance in the year’s first quarter.
As the major portion of the war came to a quick resolution, however, confidence returned to the economy and the markets. Improvement began in the second quarter, and in the third and fourth quarters the signs of economic recovery become much clearer. The resumption of economic growth coupled with low interest rates and inflation provided a very positive backdrop for small- and mid-cap growth stocks. We expect these positive conditions to continue in 2004.
Favored sectors for the Fund
We added to our holdings in those groups that have traditionally done well coming out of slow economic periods. These include trucking companies, freight forwarders, retailers, restaurants, and technology companies. For different reasons, we also began to add to our position in the energy sector. After three years of almost no drilling among these companies, we began to see an upturn in such activity. This suggested that a new natural-gas production cycle was beginning, which would be a positive development given the very constrained supply situation that existed.
To accommodate these additions to the portfolio, we reduced our holdings among some of the more defensive stocks in our portfolio. While these companies retain appealing characteristics, they historically have underperformed faster-growing sectors during an economic recovery.
Our outlook is positive
The shift in market leadership from value to growth stocks helped drive our performance in 2003. Typically, such cycles of outperformance for an investment style have lasted from three to five years. While we will carefully monitor the market and economic climate for changing conditions, we find this historical pattern to be encouraging as we look to the months and years ahead.
We anticipate that the positive environment for small- and mid-cap growth stocks should persist for some time to come. Based on our research, we believe that corporate profits may exceed expectations in 2004. Continued low interest rates and inflation, along with the still significant amounts of investable cash that remains on the sidelines, could help fuel the next move upward in the broader market in general, and smaller-cap growth stocks specifically.
Thank you for your investment in the Strong Advisor U.S. Small/Mid Cap Growth Fund.
 |
| Thomas L. Press |
| Portfolio Manager |
20
Table of Contents
Fund Highlights
Your Fund’s Approach
The Fund invests in stocks of small- and medium-capitalization U.S. companies that the Fund’s manager believes have favorable prospects for growth of earnings and capital appreciation. To identify these companies, the manager looks for several characteristics, including strong revenue growth, high return on invested capital, overall financial strength, competitive advantages, reasonable current stock price, experienced management, and competence in research, development, and marketing.
Average Annual Total Returns
As of 12-31-03
| Class A1 |
|||
| 1-year |
47.63 | % | |
| Since Fund Inception (3-28-02) |
3.07 | % | |
| Class A, excluding sales load |
|||
| 1-year |
56.72 | % | |
| Since Fund Inception (3-28-02) |
— | ||
| Class B1 |
|||
| 1-year |
51.58 | % | |
| Since Fund Inception (3-28-02) |
4.36 | % | |
| Class C1 |
|||
| 1-year |
55.72 | % | |
| Since Fund Inception (3-28-02) |
6.59 | % | |
Equity funds are volatile investments and should only be considered for long-term goals.
Growth of an Assumed $10,000 Investment†
From 3-28-02 to 12-31-03

Mention of specific securities in this report is not indicative of whether the Fund may make additional purchases of, sell all or a portion of, or continue to hold those securities.
| † | This graph, provided in accordance with SEC regulations, compares a $10,000 investment in the Fund, made at its inception, with the performance of the Russell Midcap® Index and the Lipper Small-Cap Growth Funds Index. Results include the reinvestment of all dividends and capital gains distributions. Performance is historical and does not represent future results. Investment returns and principal value of the Fund vary, and you may have a gain or loss when you sell shares. Current performance may be lower or higher than the quoted performance. Call us or visit www.Strong.com for the most current performance information. The graph and the Total Returns table do not reflect the deduction of taxes, if any, that a shareholder would pay on Fund distributions or the redemption of Fund shares. This graph is based on Class A shares only and reflects the effect of the maximum sales charge of 5.75%; performance for other classes will vary due to differences in fee structures and sales charges. |
The Fund’s prospectus and statement of additional information may describe restrictions on the percentage of a particular type or quality of security in which the Fund may invest (“Percentage Restrictions”). Percentage Restrictions apply at the time the Fund purchases a security. Circumstances subsequent to the purchase of the security, such as a change in: (1) the Fund’s assets (e.g., due to cash inflows and redemptions); (2) the market value of the security; or (3) the pricing, liquidity, or rating of the security, may cause the Fund to exceed or fall short of the Percentage Restriction. If this happens, the Fund’s continued holding of the security will not constitute a violation of the Percentage Restriction.
From time to time, the Fund’s advisor and/or administrator has waived its fees and/or absorbed Fund expenses, which has resulted in higher returns.
| 1 | Load-adjusted performance reflects the effect of the maximum sales charge of 5.75% for Class A, the applicable contingent sales charge of 5.00% in year 1 and eliminated after year 6 for Class B, and the applicable contingent deferred sales charge of 1.00% and eliminated after 12 months for Class C. |
Because smaller companies often have narrower markets and limited financial resources, investments in these stocks present more risk than investments in those of larger, more established companies.
| * | The Russell Midcap® Index measures the performance of the 800 smallest companies in the Russell 1000 Index, which represent approximately 26% of the total market capitalization of the Russell 1000 Index. The Lipper Small-Cap Growth Funds Index is the average of the 30 largest funds in the Lipper Small-Cap Growth Funds Category. Source of the Russell index data is Standard & Poor’s Micropal. Source of the Lipper index data is Lipper Inc. |
21
Table of Contents
Strong Advisor Utilities And Energy Fund
The Strong Advisor Utilities and Energy Fund Class A returned 12.74% for the year (19.61% when excluding the initial sales charge). This lagged the Fund’s broad-based benchmark, the S&P 500 Index, which returned 28.67% for the same period.
For most of the year, the largest gains in the utility group tended to come from companies whose share price had been previously battered down because of liquidity crisis fears, and subsequently presented turnaround situations. Not surprisingly, the outlook for many of these companies was uncertain. As a result, we chose not to participate in some of the more risky companies, and this was the main reason for the underperformance relative to the S&P 500 Index.
We stayed the course with our investment process, and in the year’s fourth quarter, our holdings in stocks of financially strong, dividend-paying utility companies finally received recognition from investors. The Fund’s return in that quarter alone was 12.1%, reflecting good gains in the utility and telephone sectors of the market, as well as significant strength from the energy sector.
How we approach sector allocation
This Fund invests only in stocks of utility companies (including telephone service providers) and energy companies. In deciding how to allocate the Fund’s assets among the different sectors eligible for consideration for the portfolio, we do consider the future prospects for each sector, relative to the others. In other words, we may choose to overweight (relative to our benchmark level) stocks from a specific industry because we believe the sector as a whole is poised for improvement. On the other hand, we may elect to de-emphasize stocks from an area that we believe is due for significant difficulty ahead, whether because of a change in the regulatory environment or a macroeconomic trend.
For the most part, however, our sector allocations are the result of our individual stock selections. This is what drove the portfolio’s current overweighting relative to the index in energy stocks, as we believe the prevailing conditions for these companies position them for strong performance going forward. At year-end, energy stocks represented 32.3% of assets. Ashland Inc. was the strongest of our holdings in the energy sector for the year and was the second-largest contributor to the Fund’s overall performance.
Our individual stock picks have also led us to an underweighted position in telephone stocks, relative to our benchmark level, as the competitive landscape for these companies may present significant challenges. Telephones accounted for just under 7% of assets at the end of the period. Overall, these companies had a small negative impact on performance.
A closer look at electric and gas stocks
Our approach in the electric and gas sectors is to focus on identifying financially strong companies that appear ready to benefit from favorable conditions in the regulatory environment that utilities and energy companies must operate in, that appear to have high-quality assets, and that we believe have strong, competent managers to help the company take advantage of opportunities as they may arise. We believe each of these factors, or a combination of them, can help a company pursue above-average returns.
Another factor we consider carefully is a company’s ability to provide a rising stream of dividends to its shareholders. This factor is important not only for electric and gas stocks, but also for companies in the energy and telephone sectors.
At the end of the year, electric utilities represented 33.1% of the portfolio, while gas utilities were just less than 20% of assets. Constellation Energy experienced the best performance among our holdings in the electric sector, and was the single largest contributor to the entire portfolio’s performance.
The outlook for 2004
In the coming year, we expect to see more investors interested in dividend-paying companies. Because they are strongly represented in the portfolio, the Fund would be well positioned to benefit from such a trend, just as it did in the fourth quarter.
There may be some potential for inflation and rising interest rates in the year ahead, given the very low levels that currently prevail for both. We believe the Fund’s energy component can help to provide useful balance to the portfolio should either condition develop.
Thank you for your continued investment in the Strong Advisor Utilities and Energy Fund.
|
William A. Ferer
Portfolio Co-Manager |
Mark D. Luftig
Portfolio Co-Manager | |
|
William H. Reaves
Portfolio Co-Manager |
Ronald J. Sorenson
Portfolio Co-Manager | |


22
Table of Contents
Fund Highlights
Your Fund’s Approach
The Fund invests in the stocks of U.S. public utility companies and energy companies that pay current dividends and whose earnings are expected to improve. These include companies of any size that provide products and services related to electric power, communications, gas, and water, as well as companies involved in the discovery, development, production, generation, transmission, refinement, measurement, trading, marketing, or distribution of energy.
Average Annual Total Returns1
As of 12-31-03
| Class A2 |
|||
| 1-year |
12.74 | % | |
| Since Fund Inception (7-31-02) |
1.65 | % | |
| Class A, excluding sales load |
|||
| 1-year |
19.61 | % | |
| Since Fund Inception (7-31-02) |
— | ||
| Class B2 |
|||
| 1-year |
13.97 | % | |
| Since Fund Inception (7-31-02) |
2.66 | % | |
| Class C2 |
|||
| 1-year |
17.97 | % | |
| Since Fund Inception (7-31-02) |
5.39 | % | |
Equity funds are volatile investments and should only be considered for long-term goals.
Growth of an Assumed $10,000 Investment†
From 7-31-02 to 12-31-03

Mention of specific securities in this report is not indicative of whether the Fund may make additional purchases of, sell all or a portion of, or continue to hold those securities.
| † | This graph, provided in accordance with SEC regulations, compares a $10,000 investment in the Fund, made at its inception, with the performance of the S&P 500 Index (“S&P 500”) and the Lipper Utility Funds Index. Results include the reinvestment of all dividends and capital gains distributions. Performance is historical and does not represent future results. Investment returns and principal value vary, and you may have a gain or loss when you sell shares. Current performance may be lower or higher than the quoted performance. Call us or visit www.Strong.com for the most current performance information. The graph and the Average Annual Total Returns table do not reflect the deduction of taxes, if any, that a shareholder would pay on Fund distributions or the redemption of Fund shares. This graph is based on Class A shares only and reflects the effect of the maximum sales charge of 5.75%; performance for other classes will vary due to differences in fee structures and sales charges. |
The Fund’s prospectus and statement of additional information may describe restrictions on the percentage of a particular type or quality of security in which the Fund may invest (“Percentage Restrictions”). Percentage Restrictions apply at the time the Fund purchases a security. Circumstances subsequent to the purchase of the security, such as a change in: (1) the Fund’s assets (e.g., due to cash inflows and redemptions); (2) the market value of the security; or (3) the pricing, liquidity, or rating of the security, may cause the Fund to exceed or fall short of the Percentage Restriction. If this happens, the Fund’s continued holding of the security will not constitute a violation of the Percentage Restriction.
From time to time, the Fund’s advisor and/or administrator has waived its fees and/or absorbed Fund expenses, which has resulted in higher returns.
The Fund concentrates its assets in the utilities and energy sectors. As a result, the Fund’s shares are likely to fluctuate in value more than those of a Fund investing in a broader range of securities.
A Fund’s performance, especially for very short time periods, should not be the sole factor in making your investment decision.
| 1 | Total return measures change in the value of an investment in the Fund assuming reinvestment of dividends and capital gains. Total return reflects aggregate change and is not annualized. |
| 2 | Load-adjusted performance reflects the effect of the maximum sales charge of 5.75% for Class A, the applicable contingent deferred sales charge of 5.00% in year 1 and eliminated after year 6 for Class B, and the applicable contingent deferred sales charge of 1.00% and eliminated after 12 months for Class C. |
| * | The S&P 500 Index consists of 500 stocks chosen for market size, liquidity, and industry group representation. It is a market value weighted index (stock price times number of shares outstanding), with each stock’s weight in the Index proportionate to its market value. The Lipper Utility Funds Index is the average of the 30 largest funds in the Lipper Utility Funds Category. Source of the S&P 500 index data is Standard & Poor’s Micropal. Source of the Lipper index data is Lipper Inc. |
23
Table of Contents
Strong Advisor Large Company Core Fund
After three tough years for equity investors, 2003 ended up to be a great year. The Strong Advisor Large Company Core Fund Class A posted a return of 14.68% (22.93% when excluding the initial sales charge). Although that was a strong positive return, it was behind the Fund’s broad-based benchmark, the S&P 500 Index, which rose by 28.67%.
Lower quality prevailed
In 2003, the market rode the dual currents of emotions and liquidity. For their part, emotions began the year at a fairly low level. Over time, the war in Iraq, an improving economy, and the capture of Saddam Hussein led to an ever-growing level of confidence. Liquidity, on the other hand, stayed at very high levels during the entire year. Record-low interest rates, massive fiscal stimulus to the economy in the form of tax cuts, and the decline of the dollar relative to major foreign currencies have all given overextended consumers and corporations alike a chance to repair badly damaged balance sheets.
As is often the case in an environment of easy money, those companies in the greatest financial distress were the biggest beneficiaries of these trends, while those with the strongest balance sheets had the least to gain. According to Merrill Lynch research, S&P 500 companies rated A or better by Standard & Poor’s were up 27.4% for the year, while those companies rated C or D returned a dramatic 80.9%. This is easily one of the best one-year performances for junk-rated companies in history.
While lower-rated companies outperformed in 2003, over the longer term, we believe that the strongest returns will accrue to those companies that have the strongest finances, business models, and management teams. We therefore use an investment approach designed to identify such companies for the Fund.
Portfolio emphasizes higher quality
Our investment process starts with fundamentals — we analyze a company’s management, business model, and its stock price relative to its earnings. Then, we look at technicals — the trend in a stock’s price and in the company’s earnings. Last, but not least, we look at expectations — the current market sentiment toward the stock, indicating how much of the stock’s fundamentals and technicals are already factored into the share price.
The ideal candidate for addition to our portfolio would have strong fundamentals, strong technicals, and low expectations. We do not always make perfect decisions, but our disciplined process is designed to help us outperform our benchmark over time, while keeping risk levels modest. We believe that over long periods of time, the large-cap equity markets are very efficient. An efficient market is similar to games like tennis or golf, in that the goal is to make few mistakes and exploit those rare opportunities when the odds are in your favor.
Because our stock-selection process is designed to select higher-quality companies, we were significantly underweighted in low-quality companies relative to their representation in the index over the past year. This posture largely accounted for the Fund’s underperformance. Somewhat alarmingly (in our view), the market in 2003 appeared very similar to that in 1999 — another year that saw the returns of lower-quality, higher-risk stocks trounce those of higher-quality companies. This kind of short-run aberration poses a clear challenge to managers who remain committed to a higher-quality approach, as we do, but who attempt to outperform on an annual basis.
After a tough relative performance year like 2003, we have analyzed our process — and have found very little to change. We expect to continue to keep the Fund fully invested in stocks that are appealing on the basis of fundamentals, technicals, and expectations. To help manage risk, we expect to keep our allocations to market sectors and industries in line with those of our benchmark.
Keeping an eye on the consensus
Time and again, the market has shown a great ability to prove the consensus wrong, and nobody actually knows what the future holds. We therefore believe it’s prudent to remain flexible and be prepared to move against the consensus when it appears warranted.
Thank you for your investment in the Strong Advisor Large Company Core Fund.

Christopher H. Wiles
Portfolio Co-Manager

Lawrence E. Eakin, Jr.
Portfolio Co-Manager
| * | The S&P 500 Index consists of 500 stocks chosen for market size, liquidity, and industry group representation. It is a market value weighted index (stock price times number of shares outstanding), with each stock’s weight in the Index proportionate to its market value. The Lipper Large-Cap Core Funds Index is the average of the 30 largest funds in the Lipper Large-Cap Core Funds Category. Source of the S&P 500 index data is Standard & Poor’s Micropal. Source of the Lipper index data is Lipper Inc. |
24
Table of Contents
Fund Highlights
Your Fund’s Approach
The Fund invests in securities of approximately 50 large-capitalization companies, which offer the potential for capital growth or which are believed to be undervalued relative to the market based on earnings, cash flow, or asset value, consisting primarily of income-producing equity securities. To select investments, the managers emphasize capital appreciation and current yield and may invest in convertible securities of any quality to generate higher income.
Average Annual Total Returns
As of 12-31-03
| Class A1,2,3 |
|||
| 1-year |
14.68 | % | |
| 3-year |
-3.98 | % | |
| 5-year |
1.72 | % | |
| Since Fund Inception (11-3-97) |
3.75 | % | |
| Class A, excluding sales load |
|||
| 1-year |
22.93 | % | |
| 3-year |
— | ||
| 5-year |
— | ||
| Since Fund Inception (11-3-97) |
— | ||
| Class B1,2 |
|||
| 1-year |
16.74 | % | |
| 3-year |
-4.38 | % | |
| 5-year |
1.60 | % | |
| Since Fund Inception (11-3-97) |
3.76 | % | |
| Class C1,2 |
|||
| 1-year |
20.73 | % | |
| 3-year |
-2.94 | % | |
| 5-year |
1.97 | % | |
| Since Fund Inception (11-3-97) |
3.76 | % | |
| Class K2 |
|||
| 1-year |
23.66 | % | |
| 3-year |
-1.76 | % | |
| 5-year |
3.12 | % | |
| Since Fund Inception (11-3-97) |
4.91 | % | |
Equity funds are volatile investments and should only be considered for long-term goals.
Growth of an Assumed $10,000 Investment†
From 11-3-97 to 12-31-03

Mention of specific securities in this report is not indicative of whether the Fund may make additional purchases of, sell all or a portion of, or continue to hold those securities.
| † | This graph, provided in accordance with SEC regulations, compares a $10,000 investment in the Fund, made at its inception, with the performance of the S&P 500 Index (“S&P 500”) and the Lipper Large-Cap Core Funds Index. Results include the reinvestment of all dividends and capital gains distributions. Performance is historical and does not represent future results. Investment returns and principal value vary, and you may have a gain or loss when you sell shares. Current performance may be lower or higher than the quoted performance. Call us or visit www.Strong.com for the most current performance information. The graph and the Average Annual Total Returns table do not reflect the deduction of taxes, if any, that a shareholder would pay on Fund distributions or the redemption of Fund shares. This graph is based on Class A shares only and reflects the effect of the maximum sales charge of 5.75%; performance for other classes will vary due to differences in fee structures and sales charges. |
The Fund’s prospectus and statement of additional information may describe restrictions on the percentage of a particular type or quality of security in which the Fund may invest (“Percentage Restrictions”). Percentage Restrictions apply at the time the Fund purchases a security. Circumstances subsequent to the purchase of the security, such as a change in: (1) the Fund’s assets (e.g., due to cash inflows and redemptions); (2) the market value of the security; or (3) the pricing, liquidity, or rating of the security, may cause the Fund to exceed or fall short of the Percentage Restriction. If this happens, the Fund’s continued holding of the security will not constitute a violation of the Percentage Restriction.
From time to time, the Fund’s advisor and/or administrator has waived its fees and/or absorbed Fund expenses, which has resulted in higher returns.
| 1 | Load-adjusted performance reflects the effect of the maximum sales charge of 5.75% for Class A, the applicable contingent sales charge of 5.00% in year 1 and eliminated after year 6 for Class B, and the applicable contingent deferred sales charge of 1.00% and eliminated after 12 months for Class C. |
| 2 | Average annual total returns for Class A shares include the effect of the maximum sales charge of 5.75%, which was first charged on 9-17-99 and are based on the performance of the Rockhaven Fund’s Class A shares (the predecessor Fund) prior to 9-16-02. Average annual total returns for Class B shares include the effect of the applicable contingent deferred sales charge, which is 5.00% in year 1 and is eliminated after year 6, and are based on the performance of the Rockhaven Fund’s Class A shares from inception through 9-15-02, restated to reflect the contingent deferred sales charge and the different expenses of the Class B shares, as applicable, and the historical performance of the Strong Advisor Large Company Core Fund’s Class A shares from 9-16-02 to 9-30-02. Average annual total returns for Class C shares include the effect of the applicable contingent deferred sales charge, which is 1.00%, and is eliminated after 12 months and are based on the performance of the Rockhaven Fund’s Class A shares from inception through 9-15-02, restated to reflect the contingent deferred sales charge and the different expenses of the Class C shares, as applicable, and the historical performance of the Strong Advisor Large Company Core Fund’s Class A shares from 9-16-02 to 9-30-02. The performance of the Class K shares is based on the performance of the Rockhaven Fund’s Class A shares from inception through 9-15-02, and the historical performance of the Strong Advisor Large Company Core Fund’s Class A shares from 9-16-02 to 9-30-02, and does not reflect the Fund’s maximum sales charge of 5.75%, which was charged from 9-17-99 through 9-30-02. Please consult a prospectus for information about all share classes. |
| 3 | Average annual total return for Class A shares includes a 1.00% redemption fee (as a percentage of redemption proceeds) imposed on redemptions made within 12 months of purchase. |
25
Table of Contents
| December 31, 2003 |
STRONG ADVISOR COMMON STOCK FUND
| Shares or Principal Amount |
Value (Note 2) | ||||
| Common Stocks 93.5% |
|||||
| Auto Manufacturers 0.8% |
|||||
| Honda Motor Company, Ltd. (JPY) (h) |
295,000 | $ | 13,229,352 | ||
| Auto/Truck - Original Equipment 1.2% |
|||||
| Lear Corporation |
310,000 | 19,012,300 | |||
| Banks - Southeast 0.7% |
|||||
| National Commerce Financial Corporation |
400,000 | 10,912,000 | |||
| Banks - Super Regional 1.8% |
|||||
| Fifth Third Bancorp |
290,000 | 17,139,000 | |||
| Marshall & Ilsley Corporation |
300,000 | 11,475,000 | |||
| 28,614,000 | |||||
| Banks - West/Southwest 1.5% |
|||||
| City National Corporation |
390,000 | 24,226,800 | |||
| Building - Heavy Construction 1.2% |
|||||
| Jacobs Engineering Group, Inc. (b) |
380,000 | 18,243,800 | |||
| Chemicals - Specialty 1.5% |
|||||
| Lonza Group AG (CHF) (h) |
425,000 | 24,366,987 | |||
| Commercial Services - Leasing 1.5% |
|||||
| Ryder Systems, Inc. |
715,000 | 24,417,250 | |||
| Computer - Integrated Systems 1.3% |
|||||
| Symbol Technologies, Inc. |
1,245,000 | 21,028,050 | |||
| Computer - IT Services 2.8% |
|||||
| BearingPoint, Inc. (b) |
2,200,000 | 22,198,000 | |||
| Unisys Corporation (b) |
1,500,000 | 22,275,000 | |||
| 44,473,000 | |||||
| Computer - Software Design 1.7% |
|||||
| Mentor Graphics Corporation (b) |
1,870,000 | 27,189,800 | |||
| Computer Software - Desktop 1.5% |
|||||
| Red Hat, Inc. (b) |
1,300,000 | 24,401,000 | |||
| Containers 1.7% |
|||||
| Pactiv Corporation (b) |
1,140,000 | 27,246,000 | |||
| Cosmetics - Personal Care 1.6% |
|||||
| International Flavors & Fragrances |
725,000 | 25,317,000 | |||
| Diversified Operations 3.1% |
|||||
| Carlisle Companies, Inc. |
420,000 | 25,561,200 | |||
| SPX Corporation (b) |
410,000 | 24,112,100 | |||
| 49,673,300 | |||||
| Electronics - Miscellaneous Components 1.4% |
|||||
| Rockwell Automation, Inc. |
640,000 | 22,784,000 | |||
| Electronics - Semiconductor Manufacturing 1.7% |
|||||
| Fairchild Semiconductor Corporation Class A (b) |
1,050,000 | 26,218,500 | |||
| Finance - Equity REIT 0.8% |
|||||
| Apartment Investment & Management Company Class A |
369,600 | 12,751,200 | |||
| Finance - Publicly Traded Investment Funds - Equity (Non 40 Act) 1.6% |
|||||
| Biotech Holders Trust |
185,000 | 25,032,350 | |||
| Financial Services - Miscellaneous 1.2% |
|||||
| The Bisys Group, Inc. (b) |
1,300,000 | $ | 19,344,000 | ||
| Household - Appliances 1.5% |
|||||
| Maytag Corporation |
850,000 | 23,672,500 | |||
| Insurance - Brokers 1.4% |
|||||
| Arthur J. Gallagher & Company |
670,000 | 21,768,300 | |||
| Insurance - Property/Casualty/Title 3.0% |
|||||
| MBIA, Inc. |
355,000 | 21,026,650 | |||
| RenaissanceRe Holdings, Ltd. |
50,000 | 2,452,500 | |||
| Travelers Property and Casualty Corporation Class A |
1,445,000 | 24,247,100 | |||
| 47,726,250 | |||||
| Internet - E*Commerce 1.0% |
|||||
| InterActiveCorp (b) |
485,000 | 16,456,050 | |||
| Internet - Software 1.3% |
|||||
| DoubleClick, Inc. (b) |
1,955,000 | 19,980,100 | |||
| Leisure - Toys/Games/Hobby 1.4% |
|||||
| Mattel, Inc. |
1,160,000 | 22,353,200 | |||
| Machinery - General Industrial 1.2% |
|||||
| Roper Industries, Inc. |
375,000 | 18,472,500 | |||
| Media - Cable TV 4.6% |
|||||
| Cablevision Systems New York Group Class A (b) |
1,255,000 | 29,354,450 | |||
| Cox Communications, Inc. Class A (b) |
720,000 | 24,804,000 | |||
| Hughes Electronics Corporation (b) |
1,173,083 | 19,414,524 | |||
| 73,572,974 | |||||
| Media - Newspapers 1.1% |
|||||
| Dow Jones & Company, Inc. |
340,000 | 16,949,000 | |||
| Media - Radio/TV 1.6% |
|||||
| Liberty Media Corporation Class A (b) |
2,105,000 | 25,028,450 | |||
| Medical - Biomedical/Biotechnology 3.3% |
|||||
| Celgene Corporation (b) |
670,000 | 30,163,400 | |||
| Medimmune, Inc. (b) |
890,000 | 22,606,000 | |||
| 52,769,400 | |||||
| Medical - Ethical Drugs 1.2% |
|||||
| Biovail Corporation International (b) |
895,000 | 19,233,550 | |||
| Medical - Genetics 1.4% |
|||||
| Affymetrix, Inc. (b) |
868,000 | 21,361,480 | |||
| Medical - Hospitals 1.1% |
|||||
| Universal Health Services, Inc. Class B |
325,000 | 17,459,000 | |||
| Medical/Dental - Services 1.6% |
|||||
| Omnicare, Inc. |
645,000 | 26,051,550 | |||
| Medical/Dental - Supplies 2.7% |
|||||
| Bausch & Lomb, Inc. |
365,000 | 18,943,500 | |||
| Hillenbrand Industries, Inc. |
385,000 | 23,893,100 | |||
| 42,836,600 | |||||
| Metal Ores - Miscellaneous 1.8% |
|||||
| Alcoa, Inc. |
760,000 | 28,880,000 | |||
| Oil & Gas - Drilling 3.1% |
|||||
| Nabors Industries, Ltd. (b) |
530,000 | 21,995,000 | |||
| Noble Corporation (b) |
760,000 | 27,192,800 | |||
| 49,187,800 | |||||
26
Table of Contents
STRONG ADVISOR COMMON STOCK FUND (continued)
| Shares or Principal Amount |
Value (Note 2) |
||||||
| Oil & Gas - Machinery/Equipment 1.7% |
|||||||
| Smith International, Inc. (b) |
665,000 | $ | 27,610,800 | ||||
| Oil & Gas - Refining/Marketing 1.5% |
|||||||
| Valero Energy Corporation |
500,000 | 23,170,000 | |||||
| Oil & Gas - United States Exploration & Production 4.8% |
|||||||
| Apache Corporation |
375,000 | 30,412,500 | |||||
| Burlington Resources, Inc. |
440,000 | 24,367,200 | |||||
| EOG Resources, Inc. |
475,000 | 21,930,750 | |||||
| 76,710,450 | |||||||
| Pollution Control - Services 1.4 % |
|||||||
| Republic Services, Inc. |
870,000 | 22,298,100 | |||||
| Retail - Clothing/Shoes 1.3% |
|||||||
| American Eagle Outfitters, Inc. (b) |
1,235,000 | 20,254,000 | |||||
| Retail - Department Stores 2.3 % |
|||||||
| J.C. Penney Company, Inc. (Holding Company) |
490,000 | 12,877,200 | |||||
| Saks, Inc. (b) |
1,600,000 | 24,064,000 | |||||
| 36,941,200 | |||||||
| Retail - Home Furnishings 1.3 % |
|||||||
| Williams-Sonoma, Inc. (b) |
580,000 | 20,166,600 | |||||
| Retail - Leisure Products 2.4% |
|||||||
| Barnes & Noble, Inc. (b) |
760,000 | 24,966,000 | |||||
| Toys ‘R’ Us, Inc. (b) |
1,000,000 | 12,640,000 | |||||
| 37,606,000 | |||||||
| Retail - Restaurants 1.4% |
|||||||
| Outback Steakhouse, Inc. |
500,000 | 22,105,000 | |||||
| Retail - Super/Mini Markets 1.5 % |
|||||||
| The Kroger Company (b) |
1,280,000 | 23,692,800 | |||||
| Retail/Wholesale - Computer/Cellular 1.3% |
|||||||
| Tech Data Corporation (b) |
530,000 | 21,035,700 | |||||
| Retail/Wholesale - Office Supplies 1.5% |
|||||||
| Office Depot, Inc. (b) |
1,420,000 | 23,728,200 | |||||
| Telecommunications - Wireless Equipment 0.6% |
|||||||
| UTStarcom, Inc. (b) |
265,000 | 9,823,550 | |||||
| Telecommunications - Wireless Services 1.4% |
|||||||
| Sprint Corporation - PCS Group (b) |
4,070,000 | 22,873,400 | |||||
| Textile - Clothing Manufacturers 1.4% |
|||||||
| V.F. Corporation |
500,000 | 21,620,000 | |||||
| Transportation - Airline 1.2% |
|||||||
| Continental Airlines, Inc. Class B (b) |
1,175,000 | 19,117,250 | |||||
| Utility - Electric Power 1.6% |
|||||||
| Reliant Resources, Inc. (b) |
3,500,000 | 25,760,000 | |||||
| Total Common Stocks (Cost $ 1,042,605,380 ) |
1,486,752,443 | ||||||
| Preferred Stocks 0.2% |
|||||||
| Media - Cable TV 0.2% |
|||||||
| News Corporation, Ltd. Sponsored ADR |
131,205 | 3,968,951 | |||||
| Total Preferred Stocks (Cost $ 3,819,157 ) |
3,968,951 | ||||||
| Short-Term Investments (a) 8.6% |
|||||||
| Collateral Received for Securities Lending (f) 3.0% |
|||||||
| Navigator Prime Portfolio |
48,053,386 | $ | 48,053,386 | ||||
| Repurchase Agreements 5.6% |
|||||||
| ABN AMRO Inc. (Dated 12/31/03), 0.95%, Due 1/02/04 (Repurchase proceeds $87,104,597); Collateralized by: United States Government & Agency Issues (c) |
$ | 87,100,000 | 87,100,000 | ||||
| State Street Bank (Dated 12/31/03),0.75%, Due 1/02/04 (Repurchase proceeds $1,532,464); Collateralized by: United States Government & Agency Issues (c) |
1,532,400 | 1,532,400 | |||||
| 88,632,400 | |||||||
| Total Short-Term Investments (Cost $136,685,786) |
136,685,786 | ||||||
| Total Investments in Securities (Cost $1,183,110,323) 102.3% |
1,627,407,180 | ||||||
| Other Assets and Liabilities, Net (2.3%) |
(36,429,558 | ) | |||||
| Net Assets 100.0% |
$ | 1,590,977,622 | |||||
WRITTEN OPTIONS ACTIVITY
| Contracts |
Premiums |
||||||
| Options outstanding at beginning of period (year) |
383 | $ | 2,856,526 | ||||
| Options written during the period (year) |
398 | 2,636,106 | |||||
| Options closed |
(766 | ) | (5,383,177 | ) | |||
| Options expired |
(15 | ) | (109,455 | ) | |||
| Options exercised |
— | — | |||||
| Options outstanding at end of period (year) |
— | $ | — | ||||
STRONG ADVISOR MID CAP GROWTH FUND
| Shares or Principal Amount |
Value (Note 2) | ||||
| Common Stocks 97.0% |
|||||
| Auto/Truck - Original Equipment 2.0% |
|||||
| Cummins, Inc. |
12,000 | $ | 587,280 | ||
| Gentex Corporation |
19,000 | 839,040 | |||
| 1,426,320 | |||||
| Banks - Midwest 0.7% |
|||||
| TCF Financial Corporation |
10,000 | 513,500 | |||
| Banks - West/Southwest 0.5% |
|||||
| Zions Bancorporation |
6,000 | 367,980 | |||
| Beverages - Soft Drinks 1.5% |
|||||
| Cott Corporation (b) |
37,000 | 1,036,370 | |||
| Building - Heavy Construction 0.5% |
|||||
| Chicago Bridge & Iron Company NV |
12,000 | 346,800 | |||
| Building - Resident/Commercial 6.2% |
|||||
| Centex Corporation |
16,700 | 1,797,755 | |||
| Lennar Corporation Class A |
12,000 | 1,152,000 | |||
| NVR, Inc. (b) |
1,500 | 699,000 | |||
| Ryland Group, Inc. |
9,000 | 797,760 | |||
| 4,446,515 | |||||
| Chemicals - Specialty 0.6% |
|||||
| Airgas, Inc. |
20,000 | 429,600 | |||
27
Table of Contents
| SCHEDULES OF INVESTMENTS IN SECURITIES (continued) |
December 31, 2003 |
STRONG ADVISOR MID CAP GROWTH FUND (continued)
| Shares or Principal Amount |
Value (Note 2) | ||||
| Commercial Services - Schools 2.2% |
|||||
| Career Education Corporation (b) |
21,000 | $ | 841,470 | ||
| Corinthian Colleges, Inc. (b) |
13,000 | 722,280 | |||
| 1,563,750 | |||||
| Computer - Data Storage 0.5% |
|||||
| Network Appliance, Inc. (b) |
17,000 | 349,010 | |||
| Computer - IT Services 1.1% |
|||||
| Amdocs, Ltd. (b) |
17,000 | 382,160 | |||
| Anteon International Corporation (b) |
11,000 | 396,550 | |||
| 778,710 | |||||
| Computer - Local Networks 5.2% |
|||||
| Avocent Corporation (b) |
24,000 | 876,480 | |||
| Foundry Networks, Inc. (b) |
14,000 | 383,040 | |||
| Polycom, Inc. (b) |
72,300 | 1,411,296 | |||
| QLogic Corporation (b) |
20,000 | 1,032,000 | |||
| 3,702,816 | |||||
| Computer - Peripheral Equipment 1.4% |
|||||
| Zebra Technologies Corporation (b) |
15,500 | 1,028,735 | |||
| Computer Software - Education/Entertainment 0.3% |
|||||
| Electronic Arts, Inc. (b) |
5,000 | 238,900 | |||
| Computer Software - Enterprise 2.1% |
|||||
| Mercury Interactive Corporation (b) |
16,100 | 783,104 | |||
| VERITAS Software Corporation (b) |
18,800 | 698,608 | |||
| 1,481,712 | |||||
| Computer Software - Security 0.7% |
|||||
| Netscreen Technologies, Inc. (b) |
21,000 | 519,750 | |||
| Electronics - Miscellaneous Components 1.2% |
|||||
| Vishay Intertechnology, Inc. (b) |
36,000 | 824,400 | |||
| Electronics - Scientific Measuring 1.4% |
|||||
| PerkinElmer, Inc. |
58,600 | 1,000,302 | |||
| Electronics - Semiconductor Manufacturing 11.1% |
|||||
| ASML Holding NV (b) |
53,000 | 1,062,650 | |||
| ATI Technologies, Inc. (b) |
29,000 | 438,480 | |||
| Broadcom Corporation Class A (b) |
18,000 | 613,620 | |||
| FormFactor, Inc. (b) |
7,500 | 148,500 | |||
| KLA-Tencor Corporation (b) |
17,300 | 1,014,991 | |||
| MEMC Electronic Materials, Inc. (b) |
60,000 | 577,200 | |||
| Marvell Technology Group, Ltd. (b) |
16,000 | 606,880 | |||
| Microchip Technology, Inc. |
25,000 | 834,000 | |||
| Novellus Systems, Inc. (b) |
13,800 | 580,290 | |||
| SanDisk Corporation (b) |
27,800 | 1,699,692 | |||
| Silicon Laboratories, Inc. (b) |
8,000 | 345,760 | |||
| 7,922,063 | |||||
| Energy - Other 0.8% |
|||||
| Arch Coal, Inc. |
18,400 | 573,528 | |||
| Finance - Consumer/Commercial Loans 2.3% |
|||||
| Americredit Corporation (b) |
102,000 | 1,624,860 | |||
| Finance - Investment Brokers 2.0% |
|||||
| Legg Mason, Inc. |
18,000 | 1,389,240 | |||
| Finance - Investment Management 1.1% |
|||||
| T. Rowe Price Group, Inc. |
17,000 | 805,970 | |||
| Finance - Mortgage & Related Services 2.9% |
|||||
| Doral Financial Corporation |
51,000 | $ | 1,646,280 | ||
| New Century Financial Corporation |
11,000 | 436,370 | |||
| 2,082,650 | |||||
| Finance - Savings & Loan 1.4% |
|||||
| Westcorp |
28,000 | 1,023,400 | |||
| Financial Services - Miscellaneous 0.1% |
|||||
| First Marblehead Corporation (b) |
1,600 | 35,008 | |||
| Household - Consumer Electronics 2.8% |
|||||
| Harman International Industries, Inc. |
27,200 | 2,012,256 | |||
| Internet - Content 1.1% |
|||||
| Ask Jeeves, Inc. (b) |
21,000 | 380,520 | |||
| Yahoo! Inc. (b) |
8,700 | 392,979 | |||
| 773,499 | |||||
| Internet - E*Commerce 2.1% |
|||||
| Amazon.com, Inc. (b) |
8,400 | 442,176 | |||
| University of Phoenix Online (b) |
15,700 | 1,082,201 | |||
| 1,524,377 | |||||
| Internet - Internet Service Provider 1.0% |
|||||
| j2 Global Communications, Inc. |
29,000 | 718,330 | |||
| Leisure - Gaming/Equipment 2.8% |
|||||
| International Game Technology |
55,000 | 1,963,500 | |||
| Machinery - General Industrial 0.5% |
|||||
| IDEX Corporation |
9,000 | 374,310 | |||
| Medical - Biomedical/Biotechnology 3.0% |
|||||
| Celgene Corporation (b) |
14,000 | 630,280 | |||
| Chiron Corporation (b) |
13,000 | 740,870 | |||
| Gilead Sciences, Inc. (b) |
7,200 | 418,608 | |||
| Invitrogen Corporation (b) |
5,000 | 350,000 | |||
| 2,139,758 | |||||
| Medical - Ethical Drugs 0.9% |
|||||
| Kos Pharmaceuticals, Inc. (b) |
14,000 | 602,560 | |||
| Medical - Generic Drugs 5.4% |
|||||
| Barr Laboratories, Inc. (b) |
8,000 | 615,600 | |||
| Mylan Laboratories, Inc. |
14,000 | 353,640 | |||
| Pharmaceutical Resources, Inc. (b) |
19,000 | 1,237,850 | |||
| Taro Pharmaceutical Industries, Ltd. (b) |
21,500 | 1,386,750 | |||
| Teva Pharmaceutical Industries, Ltd. ADR |
5,000 | 283,550 | |||
| 3,877,390 | |||||
| Medical - Products 1.9% |
|||||
| Boston Scientific Corporation (b) |
13,400 | 492,584 | |||
| Cyberonics, Inc. (b) |
26,000 | 832,260 | |||
| 1,324,844 | |||||
| Medical - Systems/Equipment 0.8% |
|||||
| VISX, Inc. (b) |
23,400 | 541,710 | |||
| Medical/Dental - Services 3.0% |
|||||
| Caremark Rx, Inc. (b) |
16,000 | 405,280 | |||
| Inveresk Research Group, Inc. (b) |
41,500 | 1,026,295 | |||
| Omnicare, Inc. |
18,000 | 727,020 | |||
| 2,158,595 | |||||
| Oil & Gas - Drilling 1.2% |
|||||
| Precision Drilling Corporation (b) |
20,300 | 886,704 | |||
| Oil & Gas - Machinery/Equipment 1.4% |
|||||
| Smith International, Inc. (b) |
24,100 | 1,000,632 | |||
28
Table of Contents
STRONG ADVISOR MID CAP GROWTH FUND (continued)
| Shares or Principal Amount |
Value (Note 2) |
||||||
| Oil & Gas - United States Exploration & Production 3.3% |
|||||||
| Evergreen Resources, Inc. (b) |
16,000 | $ | 520,160 | ||||
| Ultra Petroleum Corporation (b) |
42,000 | 1,034,040 | |||||
| XTO Energy, Inc. |
27,766 | 785,778 | |||||
| 2,339,978 | |||||||
| Retail - Clothing/Shoes 2.8% |
|||||||
| Chicos FAS, Inc. (b) |
23,000 | 849,850 | |||||
| Coach, Inc. (b) |
31,000 | 1,170,250 | |||||
| 2,020,100 | |||||||
| Retail - Restaurants 5.4% |
|||||||
| P.F.Chang’s China Bistro, Inc. (b) |
16,100 | 819,168 | |||||
| Panera Bread Company Class A (b) |
16,000 | 632,480 | |||||
| Ruby Tuesday, Inc. |
26,000 | 740,740 | |||||
| Starbucks Corporation (b) |
50,000 | 1,653,000 | |||||
| 3,845,388 | |||||||
| Retail/Wholesale - Office Supplies 1.1% |
|||||||
| Staples, Inc. (b) |
29,000 | 791,700 | |||||
| Telecommunications - Equipment 1.0% |
|||||||
| Adtran, Inc. |
23,000 | 713,000 | |||||
| Telecommunications - Fiber Optics 0.5% |
|||||||
| Corning, Inc. (b) |
34,000 | 354,620 | |||||
| Telecommunications - Wireless Equipment 2.6% |
|||||||
| Research in Motion, Ltd. (b) |
6,000 | 400,980 | |||||
| UTStarcom, Inc. (b) |
39,000 | 1,445,730 | |||||
| 1,846,710 | |||||||
| Telecommunications - Wireless Services 1.3% |
|||||||
| Nextel Communications, Inc. Class A (b) |
32,000 | 897,920 | |||||
| Trucks & Parts - Heavy Duty 1.3% |
|||||||
| Navistar International Corporation (b) |
20,000 | 957,800 | |||||
| Total Common Stocks (Cost $52,687,249) |
69,177,570 | ||||||
| Short-Term Investments (a) 7.8% |
|||||||
| Collateral Received For Securities Lending (f) 3.5% |
|||||||
| Navigator Prime Portfolio |
2,462,934 | 2,462,934 | |||||
| Repurchase Agreements 4.3% |
|||||||
| ABN AMRO Inc. (Dated 12/31/03), 0.95%, Due 1/02/04 (Repurchase proceeds $800,042); Collateralized by: United States Government & Agency Issues (c) |
$ | 800,000 | 800,000 | ||||
| State Street Bank (Dated 12/31/03), 0.75%, Due 1/02/04 (Repurchase proceeds of $2,281,795); Collateralized by: United States Government & Agency Issues (c) |
2,281,700 | 2,281,700 | |||||
| 3,081,700 | |||||||
| Total Short-Term Investments (Cost $5,544,634) |
5,544,634 | ||||||
| Total Investments in Securities (Cost $58,231,883) 104.8% |
74,722,204 | ||||||
| Other Assets and Liabilities, Net (4.8%) |
(3,405,658 | ) | |||||
| Net Assets 100.0% |
$ | 71,316,546 | |||||
WRITTEN OPTIONS ACTIVITY
| Contracts |
Premiums |
||||||
| Options outstanding at beginning of period |
— | $ | — | ||||
| Options written during the period |
526 | 222,102 | |||||
| Options closed |
(526 | ) | (222,102 | ) | |||
| Options expired |
— | — | |||||
| Options exercised |
— | — | |||||
| Options outstanding at end of period |
— | $ | — | ||||
STRONG ADVISOR SMALL CAP VALUE FUND
| Shares or Principal Amount |
Value (Note 2) | ||||
| Common Stocks 95.7% |
|||||
| Aerospace - Defense Equipment 0.2% |
|||||
| Evans & Sutherland Computer Corporation (b) (d) |
700,200 | $ | 3,150,900 | ||
| Apparel - Clothing Manufacturer 0.1% |
|||||
| Guess, Inc. (b) |
209,900 | 2,533,493 | |||
| Apparel - Shoes & Related Manufacturing 0.5% |
|||||
| Wolverine World Wide, Inc. |
494,300 | 10,073,834 | |||
| Auto/Truck - Original Equipment 1.2% |
|||||
| Dura Automotive Systems, Inc. (b) (d) |
1,120,900 | 14,313,893 | |||
| Tower Automotive, Inc. (b) |
1,729,100 | 11,809,753 | |||
| 26,123,646 | |||||
| Auto/Truck – Replacement Parts 0.1% |
|||||
| LKQ Corporation (b) |
93,100 | 1,671,145 | |||
| Banks - Southeast 1.1% |
|||||
| The Colonial BancGroup, Inc. |
474,600 | 8,220,072 | |||
| Hibernia Corporation Class A |
666,260 | 15,663,773 | |||
| 23,883,845 | |||||
| Beverages - Alcoholic 0.6% |
|||||
| Adolph Coors Company Class B (e) |
242,520 | 13,605,372 | |||
| Building - Air Conditioning & Heating Products 0.3% |
|||||
| York International Corporation (e) |
180,100 | 6,627,680 | |||
| Building - Cement/Concrete/Aggregate 0.4% |
|||||
| U.S.Concrete, Inc. (b) |
1,282,900 | 8,274,705 | |||
| Building - Construction Products/Miscellaneous 0.6% |
|||||
| Royal Group Technologies, Ltd. (b) |
1,372,900 | 13,015,092 | |||
| Building - Heavy Construction 2.5% |
|||||
| Chicago Bridge & Iron Company NV (d) |
1,868,900 | 54,011,210 | |||
| Building - Maintenance & Services 0.4% |
|||||
| ABM Industries, Inc. |
518,110 | 9,020,295 | |||
| Building - Paint & Allied Products 0.5% |
|||||
| H.B.Fuller Company (e) |
321,100 | 9,549,514 | |||
29
Table of Contents
| SCHEDULES OF INVESTMENTS IN SECURITIES (continued) |
December 31, 2003 |
STRONG ADVISOR SMALL CAP VALUE FUND (continued)
| Shares or Principal |
Value (Note 2) | ||||
| Chemicals - Basic 1.1% |
|||||
| FMC Corporation (b) (e) |
664,200 | $ | 22,669,146 | ||
| Chemicals - Fertilizers 0.8% |
|||||
| Agrium, Inc. |
1,050,900 | 17,297,814 | |||
| Chemicals - Plastics 2.5% |
|||||
| Intertape Polymer Group, Inc. (b) (d) |
2,426,100 | 30,884,253 | |||
| Intertape Polymer Group, Inc. (Acquired 9/05/03; Cost $680,073) (CAD) (b) (g) (h) |
93,000 | 1,183,128 | |||
| PolyOne Corporation (b) |
3,331,800 | 21,290,202 | |||
| 53,357,583 | |||||
| Chemicals - Specialty 1.4% |
|||||
| OM Group, Inc. (b) (e) |
1,115,200 | 29,207,088 | |||
| Commercial Services - Advertising 1.1% |
|||||
| R.H. Donnelley Corporation (b) (e) |
607,500 | 24,202,800 | |||
| Commercial Services - Consulting 1.1% |
|||||
| Navigant Consulting, Inc. (b) |
1,253,670 | 23,644,216 | |||
| Commercial Services - Healthcare 1.0% |
|||||
| Healthcare Services Group, Inc. |
440,200 | 8,491,458 | |||
| US Oncology, Inc. (b) |
1,209,400 | 13,013,144 | |||
| 21,504,602 | |||||
| Commercial Services - Security/Safety 2.8% |
|||||
| Armor Holdings, Inc. (b) (e) |
747,500 | 19,666,725 | |||
| DHB Industries, Inc. (b) |
1,387,100 | 9,709,700 | |||
| OSI Systems, Inc. (b) (e) |
648,610 | 12,459,798 | |||
| Wackenhut Corrections Corporation (b) (d) |
781,910 | 17,827,548 | |||
| 59,663,771 | |||||
| Commercial Services - Staffing 1.5% |
|||||
| Kforce.com, Inc. (b) (d) |
1,862,485 | 17,395,610 | |||
| MPS Group, Inc. (b) |
1,654,215 | 15,466,910 | |||
| 32,862,520 | |||||
| Computer - Data Storage 0.2% |
|||||
| Iomega Corporation |
713,110 | 4,264,398 | |||
| Computer - Local Networks 0.4% |
|||||
| Black Box Corporation (e) |
195,500 | 9,006,685 | |||
| Computer - Manufacturers 0.0% |
|||||
| Cray, Inc. (b) |
100,000 | 993,000 | |||
| Computer Software - Enterprise 1.6% |
|||||
| JDA Software Group, Inc. (b) (e) |
843,600 | 13,927,836 | |||
| Lightbridge, Inc. (b) (d) |
1,523,100 | 13,860,210 | |||
| TIBCO Software, Inc. (b) |
1,019,500 | 6,902,015 | |||
| 34,690,061 | |||||
| Computer Software - Medical 1.4% |
|||||
| Eclipsys Corporation (b) (e) |
204,725 | 2,382,999 | |||
| IDX Systems Corporation (b) |
1,044,200 | 28,005,444 | |||
| 30,388,443 | |||||
| Containers 0.1% |
|||||
| Constar International, Inc. (b) (d) |
501,900 | 2,705,241 | |||
| Diversified Operations 0.3% |
|||||
| ALLETE, Inc. |
194,085 | 5,939,001 | |||
| Electrical - Equipment 1.0% |
|||||
| Encore Wire Corporation (b) (d) |
1,163,900 | 20,612,669 | |||
| Electronics - Contract Manufacturing 0.6% |
|||||
| Celestica, Inc. (b) (e) |
905,800 | $ | 13,650,406 | ||
| Electronics - Miscellaneous Components 0.8% |
|||||
| Coherent, Inc. (b) |
700,800 | 16,679,040 | |||
| Electronics - Parts Distributors 0.3% |
|||||
| Richardson Electronics, Ltd. |
536,700 | 6,596,043 | |||
| Electronics - Scientific Measuring 0.3% |
|||||
| Newport Corporation (b) |
446,200 | 7,375,686 | |||
| Electronics - Semiconductor Manufacturing 2.0% |
|||||
| ChipPAC, Inc. Class A (b) |
910,400 | 6,909,936 | |||
| Cirrus Logic, Inc. (b) (e) |
2,182,000 | 16,735,940 | |||
| Credence Systems Corporation (b) (e) |
610,500 | 8,034,180 | |||
| TriQuint Semiconductor, Inc. (b) |
639,800 | 4,523,386 | |||
| Zoran Corporation (b) |
349,200 | 6,072,588 | |||
| 42,276,030 | |||||
| Energy - Other 0.4% |
|||||
| Headwaters, Inc. (b) (e) |
440,800 | 8,648,496 | |||
| Finance - Consumer/Commercial Loans 0.5% |
|||||
| World Acceptance Corporation (b) (d) |
584,200 | 11,631,422 | |||
| Finance - Equity REIT 0.5% |
|||||
| American Financial Realty Trust |
624,700 | 10,651,135 | |||
| Finance - Index Tracking Funds 0.2% |
|||||
| iShares Trust Russell 2000 Index Fund |
17,000 | 1,883,600 | |||
| iShares Trust Russell 2000 Value Index Fund |
11,900 | 1,913,520 | |||
| 3,797,120 | |||||
| Finance - Investment Brokers 0.4% |
|||||
| Labranche & Company, Inc. |
749,600 | 8,747,832 | |||
| Food - Miscellaneous Preparation 1.1% |
|||||
| Del Monte Foods Company (b) |
2,156,185 | 22,424,324 | |||
| Insurance - Accident & Health 0.6% |
|||||
| UnumProvident Corporation |
813,600 | 12,830,472 | |||
| Insurance - Life 0.4% |
|||||
| Phoenix Companies, Inc. |
614,100 | 7,393,764 | |||
| Insurance - Property/Casualty/Title 2.5% |
|||||
| Argonaut Group, Inc. (b) |
188,700 | 2,932,398 | |||
| Donegal Group, Inc. Class A |
206,900 | 4,555,938 | |||
| Endurance Specialty Holdings, Ltd. |
338,910 | 11,370,431 | |||
| Mercury General Corporation |
754,800 | 35,135,940 | |||
| 53,994,707 | |||||
| Internet - E*Commerce 0.4% |
|||||
| Stamps.com, Inc. (b) |
1,502,600 | 9,316,120 | |||
| Internet - Internet Service Provider 1.9% |
|||||
| EarthLink, Inc. (b) (e) |
2,718,700 | 27,187,000 | |||
| Net2Phone, Inc. (b) (d) |
1,822,300 | 12,799,640 | |||
| 39,986,640 | |||||
| Internet - Software 0.3% |
|||||
| FreeMarkets, Inc. (b) |
967,700 | 6,473,913 | |||
| Leisure - Services 0.4% |
|||||
| Pegasus Solutions, Inc. (b) (e) |
900,500 | 9,428,235 | |||
30
Table of Contents
STRONG ADVISOR SMALL CAP VALUE FUND (continued)
| Shares or Principal Amount |
Value (Note 2) | ||||
| Machinery - General Industrial 1.9% |
|||||
| Robbins & Myers, Inc. |
371,800 | $ | 7,060,482 | ||
| UNOVA, Inc. (b) |
1,452,900 | 33,344,055 | |||
| 40,404,537 | |||||
| Media - Periodicals 0.3% |
|||||
| Readers Digest Association, Inc. Class A |
370,400 | 5,430,064 | |||
| Medical - Biomedical/Biotechnology 0.3% |
|||||
| CV Therapeutics, Inc. (b) |
406,100 | 5,953,426 | |||
| Medical - Generic Drugs 0.9% |
|||||
| Andrx Group (b) |
809,500 | 19,460,380 | |||
| Medical - Nursing Homes 3.0% |
|||||
| Beverly Enterprises, Inc. (b) |
4,021,900 | 34,548,121 | |||
| Manor Care, Inc. (e) |
837,500 | 28,952,375 | |||
| 63,500,496 | |||||
| Medical - Outpatient/Home Care 0.5% |
|||||
| Gentiva Health Services, Inc. (b) |
756,500 | 9,562,160 | |||
| Medical - Products 1.4% |
|||||
| Allied Healthcare Products, Inc. (b) (d) |
848,200 | 3,265,570 | |||
| Discovery Partners International, Inc. (b) (d) |
1,503,400 | 9,245,910 | |||
| OraSure Technologies, Inc. (b) (e) |
2,071,450 | 16,488,742 | |||
| 29,000,222 | |||||
| Medical - Systems/Equipment 1.1% |
|||||
| Applera Corporation-Applied Biosystems Group (e) |
1,093,900 | 22,654,669 | |||
| Medical/Dental - Services 0.7% |
|||||
| Omnicare, Inc. (e) |
363,400 | 14,677,726 | |||
| Metal Ores - Gold/Silver 8.8% |
|||||
| Apex Silver Mines, Ltd. (b) (d) (e) |
2,115,100 | 44,205,590 | |||
| Glamis Gold, Ltd. (b) (e) |
3,163,200 | 54,153,984 | |||
| Goldcorp, Inc. (e) |
1,930,000 | 30,783,500 | |||
| Harmony Gold Mining Company, Ltd. Sponsored ADR (e) |
2,201,700 | 35,733,591 | |||
| Meridian Gold, Inc. (b) (e) |
1,538,500 | 22,477,485 | |||
| 187,354,150 | |||||
| Metal Ores - Miscellaneous 0.1% |
|||||
| Cleveland-Cliffs, Inc. (b) |
40,000 | 2,038,000 | |||
| Metal Processing & Fabrication 0.1% |
|||||
| Webco Industries, Inc. (b) |
285,460 | 1,170,386 | |||
| Oil & Gas - Drilling 2.9% |
|||||
| Grey Wolf, Inc. (b) |
1,785,100 | 6,676,274 | |||
| Helmerich & Payne, Inc. |
604,180 | 16,874,747 | |||
| Parker Drilling Company (b) |
863,100 | 2,200,905 | |||
| Pride International, Inc. (b) |
976,800 | 18,207,552 | |||
| Transocean, Inc. (b) |
750,300 | 18,014,703 | |||
| 61,974,181 | |||||
| Oil & Gas - Field Services 6.6% |
|||||
| BJ Services Company (b) (e) |
356,100 | 12,783,990 | |||
| Global Industries, Ltd. (b) |
3,894,600 | 20,057,190 | |||
| Key Energy Services, Inc. (b) |
2,241,300 | 23,107,803 | |||
| Layne Christensen Company (b) (d) |
1,514,300 | 17,793,025 | |||
| Matrix Service Company (b) (d) |
841,900 | 15,280,485 | |||
| Newpark Resources, Inc. (b) |
2,706,360 | 12,963,464 | |||
| Oceaneering International, Inc. (b) |
839,160 | 23,496,480 | |||
| Petroleum Helicopters, Inc. (b) |
103,712 | 2,540,944 | |||
| Petroleum Helicopters, Inc. (non-voting) (b) (d) |
174,260 | 4,705,020 | |||
| Willbros Group, Inc. (b) |
617,400 | 7,421,148 | |||
| 140,149,549 | |||||
| Oil & Gas - Machinery/Equipment 0.9% |
|||||
| Input/Output, Inc. (b) |
1,128,690 | $ | 5,090,392 | ||
| Smith International, Inc. (b) (e) |
342,800 | 14,233,056 | |||
| 19,323,448 | |||||
| Oil & Gas - Refining/Marketing 0.3% |
|||||
| Frontier Oil Corporation |
394,300 | 6,789,846 | |||
| Oil & Gas - United States Exploration & Production 9.3% |
|||||
| Forest Oil Corporation (b) (e) |
1,962,400 | 56,065,768 | |||
| McMoRan Exploration Company (b) (d) (e) |
837,500 | 15,703,125 | |||
| Newfield Exploration Company (b) |
280,100 | 12,475,654 | |||
| Noble Energy, Inc. (e) |
527,300 | 23,427,939 | |||
| PetroQuest Energy, Inc. (b) |
360,700 | 1,125,384 | |||
| Pioneer Natural Resources Company (b) |
342,000 | 10,920,060 | |||
| Range Resources Corporation (b) (d) |
4,132,300 | 39,050,235 | |||
| Remington Oil & Gas Corporation (b) |
470,900 | 9,272,021 | |||
| Stone Energy Corporation (b) (e) |
378,700 | 16,075,815 | |||
| Tom Brown, Inc. (b) |
419,200 | 13,519,200 | |||
| 197,635,201 | |||||
| Paper & Paper Products 1.6% |
|||||
| Chesapeake Corporation (e) |
557,780 | 14,770,014 | |||
| Wausau-Mosinee Paper Corporation |
1,369,700 | 18,518,344 | |||
| 33,288,358 | |||||
| Pollution Control - Services 0.8% |
|||||
| Calgon Carbon Corporation (d) |
2,584,600 | 16,050,366 | |||
| Retail - Clothing/Shoes 1.6% |
|||||
| American Eagle Outfitters, Inc. (b) |
692,100 | 11,350,440 | |||
| Foot Locker, Inc. (e) |
587,300 | 13,772,185 | |||
| Too, Inc. (b) (e) |
558,300 | 9,424,104 | |||
| 34,546,729 | |||||
| Retail - Department Stores 0.1% |
|||||
| Dillards, Inc. |
131,500 | 2,164,490 | |||
| Retail - Major Discount Chains 0.2% |
|||||
| Shopko Stores, Inc. (b) (e) |
299,580 | 4,568,595 | |||
| Retail - Miscellaneous 1.1% |
|||||
| Barbeques Galore, Ltd. Sponsored ADR (d) |
434,231 | 1,954,040 | |||
| Sharper Image Corporation (b) (d) (e) |
648,400 | 21,170,260 | |||
| 23,124,300 | |||||
| Retail - Restaurants 0.3% |
|||||
| Darden Restaurants, Inc. |
262,600 | 5,525,104 | |||
| Steel - Producers 5.0% |
|||||
| IPSCO, Inc. |
1,663,400 | 30,889,338 | |||
| Roanoke Electric Steel Corporation |
461,900 | 6,157,127 | |||
| Steel Dynamics, Inc. (b) (e) |
1,342,110 | 31,526,164 | |||
| United States Steel Corporation (e) |
1,052,200 | 36,848,044 | |||
| 105,420,673 | |||||
| Steel - Specialty Alloys 2.2% |
|||||
| Carpenter Technology Corporation |
643,250 | 19,020,903 | |||
| GrafTech International, Ltd. (b) |
2,062,300 | 27,841,050 | |||
| 46,861,953 | |||||
| Telecommunications - Services 0.4% |
|||||
| Cincinnati Bell, Inc. (b) |
1,652,800 | 8,346,640 | |||
| Transportation - Airline 0.9% |
|||||
| Linea Aerea Nacional Chile SA Sponsored ADR |
1,072,200 | 18,763,500 | |||
| Transportation - Services 0.8% |
|||||
| EGL, Inc. (b) (e) |
964,260 | 16,932,405 | |||
31
Table of Contents
| SCHEDULES OF INVESTMENTS IN SECURITIES (continued) |
December 31, 2003 |
STRONG ADVISOR SMALL CAP VALUE FUND (continued)
| Shares or Amount |
Value (Note 2) |
||||||
| Transportation - Ship 0.4% |
|||||||
| Omi Corporation (b) |
931,100 | $ | 8,314,723 | ||||
| Transportation - Truck 0.8% |
|||||||
| Covenant Transport, Inc. Class A (b) (d) |
783,000 | 14,884,830 | |||||
| Overnite Corporation (b) |
95,300 | 2,168,075 | |||||
| 17,052,905 | |||||||
| Total Common Stocks ($1,414,758,493) |
2,034,490,336 | ||||||
| Short-Term Investments (a) 5.2% |
|||||||
| Repurchase Agreements |
|||||||
| ABN AMRO Inc. (Dated 12/31/03),0.95%, Due 1/02/04 (Repurchase proceeds $106,905,642); Collateralized by: United States Government & Agency (c) |
$ | 106,900,000 | 106,900,000 | ||||
| State Street Bank (Dated 12/31/03), 0.75%, Due 1/02/04 (Repurchase proceeds $3,423,743); Collateralized by: United States Government & Agency (c) |
3,423,600 | 3,423,600 | |||||
| Total Short-Term Investments (Cost $110,323,600) |
110,323,600 | ||||||
| Total Investments in Securities (Cost $1,525, 082,093) 100.9% |
2,144,813,936 | ||||||
| Other Assets and Liabilities, Net (0.9%) |
(19,045,322 | ) | |||||
| Net Assets 100.0% |
$ | 2,125,768,614 | |||||
WRITTEN OPTIONS ACTIVITY
| Contracts |
Premiums |
||||||
| Options outstanding at beginning of year |
28,521 | $ | 5,669,788 | ||||
| Options written during the year |
124,999 | 28,319,434 | |||||
| Options closed |
(121,062 | ) | (24,733,936 | ) | |||
| Options expired |
(5,965 | ) | (755,493 | ) | |||
| Options exercised |
(3,671 | ) | (656,548 | ) | |||
| Options outstanding at end of year |
22,822 | $ | 7,843,245 | ||||
WRITTEN CALL OPTIONS DETAIL
| Contracts (100 shares per contract) |
Value (Note 2) |
|||||
| Adolph Coors Company Class B |
||||||
| (Strike Price is $50.00. Expiration date is 1/16/04. Premium received is $31,867.) |
50 | $ | (30,750 | ) | ||
| (Strike Price is $55.00. Expiration date is 1/16/04. Premium received is $48,898.) |
200 | (30,500 | ) | |||
| (Strike Price is $55.00. Expiration date is 2/20/04. Premium received is $11,849.) |
50 | (11,000 | ) | |||
| (Strike Price is $55.00. Expiration date is 4/16/04. Premium received is $42,548.) |
150 | (41,250 | ) | |||
| Apex Silver Mines, Ltd. |
||||||
| (Strike Price is $12.50. Expiration date is 1/16/04. Premium received is $8,850.) |
50 | (42,250 | ) | |||
| Applera Corporation-Applied Biosystems Group |
||||||
| (Strike Price is $20.00. Expiration date is 1/16/04. Premium received is $86,894.) |
550 | (56,375 | ) | |||
| (Strike Price is $20.00. Expiration date is 2/20/04. Premium received is $15,699.) |
100 | (15,250 | ) | |||
| (Strike Price is $20.00. Expiration date is 3/19/04. Premium received is $98,219.) |
500 | (88,750 | ) | |||
| (Strike Price is $22.50. Expiration date is 3/19/04. Premium received is $46,598.) |
300 | (19,500 | ) | |||
| Armor Holdings, Inc. |
||||||
| (Strike Price is $17.50. Expiration date is 5/21/04. Premium received is $296,436.) |
350 | $ | (318,500 | ) | ||
| (Strike Price is $25.00. Expiration date is 5/21/04. Premium received is $91,696.) |
350 | (103,250 | ) | |||
| BJ Services Company |
||||||
| (Strike Price is $30.00. Expiration date is 1/16/04. Premium received is $12,599.) |
50 | (29,250 | ) | |||
| (Strike Price is $32.50. Expiration date is 1/16/04. Premium received is $109,725.) |
425 | (148,750 | ) | |||
| (Strike Price is $35.00. Expiration date is 1/16/04. Premium received is $20,199.) |
100 | (15,250 | ) | |||
| (Strike Price is $32.50. Expiration date is 4/16/04. Premium received is $13,599.) |
50 | (23,000 | ) | |||
| (Strike Price is $35.00. Expiration date is 4/16/04. Premium received is $13,349.) |
50 | (15,625 | ) | |||
| (Strike Price is $37.50. Expiration date is 4/16/04. Premium received is $8,100.) |
50 | (9,125 | ) | |||
| (Strike Price is $35.00. Expiration date is 4/15/05. Premium received is $8,100.) |
50 | (15,625 | ) | |||
| Black Box Corporation |
||||||
| (Strike Price is $45.00. Expiration date is 2/20/04. Premium received is $21,485.) |
100 | (28,250 | ) | |||
| (Strike Price is $35.00. Expiration date is 3/19/04. Premium received is $481,477.) |
500 | (562,500 | ) | |||
| (Strike Price is $40.00. Expiration date is 3/19/04. Premium received is $324,335.) |
550 | (376,750 | ) | |||
| (Strike Price is $45.00. Expiration date is 3/19/04. Premium received is $36,398.) |
200 | (64,000 | ) | |||
| (Strike Price is $40.00. Expiration date is 6/18/04. Premium received is $107,395.) |
200 | (157,000 | ) | |||
| (Strike Price is $45.00. Expiration date is 6/18/04. Premium received is $56,397.) |
200 | (92,000 | ) | |||
| Celestica, Inc. |
||||||
| (Strike Price is $12.50. Expiration date is 1/16/04. Premium received is $14,199.) |
100 | (25,750 | ) | |||
| (Strike Price is $15.00. Expiration date is 1/16/04. Premium received is $81,696.) |
500 | (27,500 | ) | |||
| Chesapeake Corporation |
||||||
| (Strike Price is $20.00. Expiration date is 2/20/04. Premium received is $89,546.) |
150 | (98,250 | ) | |||
| (Strike Price is $22.50. Expiration date is 2/20/04. Premium received is $36,517.) |
200 | (80,000 | ) | |||
| (Strike Price is $20.00. Expiration date is 5/21/04. Premium received is $59,397.) |
200 | (131,000 | ) | |||
| Cirrus Logic, Inc. |
||||||
| (Strike Price is $7.50. Expiration date is 1/16/04. Premium received is $6,900.) |
100 | (5,000 | ) | |||
| Credence Systems Corporation |
||||||
| (Strike Price is $12.50. Expiration date is 1/16/04. Premium received is $18,299.) |
200 | (19,000 | ) | |||
| (Strike Price is $12.50. Expiration date is 2/20/04. Premium received is $13,294.) |
100 | (15,250 | ) | |||
| (Strike Price is $15.00. Expiration date is 2/20/04. Premium received is $25,413.) |
100 | (5,250 | ) | |||
| (Strike Price is $12.50. Expiration date is 5/21/04. Premium received is $19,747.) |
100 | (22,500 | ) | |||
32
Table of Contents
STRONG ADVISOR SMALL CAP VALUE FUND (continued)
| Contracts (100 shares per contract) |
Value (Note 2) |
|||||
| EGL, Inc. |
||||||
| (Strike Price is $15.00. Expiration date is 2/20/04. Premium received is $26,199.) |
100 | $ | (29,000 | ) | ||
| (Strike Price is $17.50. Expiration date is 2/20/04. Premium received is $22,899.) |
200 | (20,500 | ) | |||
| EarthLink, Inc. |
||||||
| (Strike Price is $7.50. Expiration date is 1/16/04. Premium received is $7,400.) |
100 | (25,250 | ) | |||
| Eclipsys Corporation |
||||||
| (Strike Price is $10.00. Expiration date is 1/16/04. Premium received is $38,398.) |
200 | (34,500 | ) | |||
| (Strike Price is $12.50. Expiration date is 1/16/04. Premium received is $13,349.) |
150 | (4,500 | ) | |||
| (Strike Price is $10.00. Expiration date is 3/19/04. Premium received is $17,199.) |
100 | (22,750 | ) | |||
| (Strike Price is $12.50. Expiration date is 3/19/04. Premium received is $24,899.) |
200 | (19,500 | ) | |||
| (Strike Price is $15.00. Expiration date is 6/18/04. Premium received is $16,799.) |
200 | (14,500 | ) | |||
| FMC Corporation |
||||||
| (Strike Price is $25.00. Expiration date is 1/16/04. Premium received is $26,699.) |
100 | (91,500 | ) | |||
| (Strike Price is $25.00. Expiration date is 4/16/04. Premium received is $83,120.) |
200 | (185,000 | ) | |||
| Foot Locker, Inc. |
||||||
| (Strike Price is $12.50. Expiration date is 1/16/04. Premium received is $13,253.) |
47 | (51,230 | ) | |||
| (Strike Price is $20.00. Expiration date is 5/21/04. Premium received is $63,397.) |
200 | (82,000 | ) | |||
| Forest Oil Corporation |
||||||
| (Strike Price is $25.00. Expiration date is 2/20/04. Premium received is $22,799.) |
150 | (57,000 | ) | |||
| (Strike Price is $25.00. Expiration date is 5/21/04. Premium received is $10,600.) |
50 | (22,000 | ) | |||
| Glamis Gold, Ltd. |
||||||
| (Strike Price is $15.00. Expiration date is 2/20/04. Premium received is $10,700.) |
100 | (25,000 | ) | |||
| Goldcorp, Inc. |
||||||
| (Strike Price is $17.50. Expiration date is 4/16/04. Premium received is $10,200.) |
100 | (11,750 | ) | |||
| H.B. Fuller Company |
||||||
| (Strike Price is $25.00. Expiration date is 2/20/04. Premium received is $15,699.) |
100 | (48,000 | ) | |||
| Harmony Gold Mining Company, Ltd. |
||||||
| Sponsored ADR |
||||||
| (Strike Price is $15.00. Expiration date is 1/16/04. Premium received is $48,598.) |
300 | (44,250 | ) | |||
| (Strike Price is $15.00. Expiration date is 2/20/04. Premium received is $12,841.) |
150 | (28,125 | ) | |||
| (Strike Price is $15.00. Expiration date is 5/21/04. Premium received is $59,672.) |
275 | (68,063 | ) | |||
| Headwaters, Inc. |
||||||
| (Strike Price is $15.00. Expiration date is 2/20/04. Premium received is $15,699.) |
100 | (47,000 | ) | |||
| (Strike Price is $20.00. Expiration date is 2/20/04. Premium received is $12,199.) |
100 | (9,750 | ) | |||
| JDA Software Group, Inc. |
||||||
| (Strike Price is $17.50. Expiration date is 4/16/04. Premium received is $337,884.) |
700 | $ | (117,250 | ) | ||
| Manor Care, Inc. |
||||||
| (Strike Price is $32.50. Expiration date is 2/20/04. Premium received is $36,448.) |
225 | (54,562 | ) | |||
| McMoRan Exploration Company |
||||||
| (Strike Price is $17.50. Expiration date is 2/20/04. Premium received is $1,285.) |
5 | (1,263 | ) | |||
| (Strike Price is $17.50. Expiration date is 5/21/04. Premium received is $1,535.) |
5 | (1,725 | ) | |||
| Meridian Gold, Inc. |
||||||
| (Strike Price is $12.50. Expiration date is 1/16/04. Premium received is $51,948.) |
350 | (72,625 | ) | |||
| (Strike Price is $12.50. Expiration date is 4/16/04. Premium received is $32,398.) |
200 | (52,000 | ) | |||
| (Strike Price is $15.00. Expiration date is 4/16/04. Premium received is $22,399.) |
200 | (23,500 | ) | |||
| Noble Energy, Inc. |
||||||
| (Strike Price is $45.00. Expiration date is 5/21/04. Premium received is $13,364.) |
45 | (9,900 | ) | |||
| (Strike Price is $50.00. Expiration date is 5/21/04. Premium received is $4,365.) |
45 | (3,150 | ) | |||
| OM Group, Inc. |
||||||
| (Strike Price is $17.50. Expiration date is 4/16/04. Premium received is $218,090.) |
300 | (270,000 | ) | |||
| (Strike Price is $20.00. Expiration date is 4/16/04. Premium received is $97,395.) |
200 | (137,000 | ) | |||
| (Strike Price is $22.50. Expiration date is 4/16/04. Premium received is $55,047.) |
150 | (72,750 | ) | |||
| OSI Systems, Inc. |
||||||
| (Strike Price is $17.50. Expiration date is 1/16/04. Premium received is $54,397.) |
200 | (35,500 | ) | |||
| (Strike Price is $17.50. Expiration date is 4/16/04. Premium received is $45,636.) |
200 | (55,000 | ) | |||
| Omnicare, Inc. |
||||||
| (Strike Price is $37.50. Expiration date is 1/16/04. Premium received is $21,199.) |
100 | (31,000 | ) | |||
| (Strike Price is $35.00. Expiration date is 3/19/04. Premium received is $268,187.) |
600 | (357,000 | ) | |||
| (Strike Price is $37.50. Expiration date is 3/19/04. Premium received is $5,850.) |
50 | (19,500 | ) | |||
| OraSure Technologies, Inc. |
||||||
| (Strike Price is $7.50. Expiration date is 1/16/04. Premium received is $71,097.) |
300 | (19,500 | ) | |||
| (Strike Price is $10.00. Expiration date is 1/16/04. Premium received is $29,648.) |
300 | (2,250 | ) | |||
| Pegasus Solutions, Inc. |
||||||
| (Strike Price is $12.50. Expiration date is 1/16/04. Premium received is $7,995.) |
100 | (750 | ) | |||
| (Strike Price is $10.00. Expiration date is 7/16/04. Premium received is $15,247.) |
100 | (18,250 | ) | |||
33
Table of Contents
| SCHEDULES OF INVESTMENTS IN SECURITIES (continued) |
December 31, 2003 |
STRONG ADVISOR SMALL CAP VALUE FUND (continued)
| Contracts (100 shares per contract) |
Value (Note 2) |
|||||
| R.H. Donnelley Corporation |
||||||
| (Strike Price is $35.00. Expiration date is 1/16/04. Premium received is $376,182.) |
600 | $ | (291,000 | ) | ||
| (Strike Price is $40.00. Expiration date is 1/16/04. Premium received is $184,891.) |
700 | (50,750 | ) | |||
| Sharper Image Corporation |
||||||
| (Strike Price is $30.00. Expiration date is 1/16/04. Premium received is $28,399.) |
200 | (55,500 | ) | |||
| (Strike Price is $30.00. Expiration date is 2/20/04. Premium received is $166,692.) |
600 | (219,000 | ) | |||
| (Strike Price is $25.00. Expiration date is 5/21/04. Premium received is $596,972.) |
1,000 | (850,000 | ) | |||
| (Strike Price is $30.00. Expiration date is 5/21/04. Premium received is $76,746.) |
250 | (125,000 | ) | |||
| (Strike Price is $35.00. Expiration date is 5/21/04. Premium received is $28,699.) |
100 | (25,500 | ) | |||
| Shopko Stores, Inc. |
||||||
| (Strike Price is $12.50. Expiration date is 3/19/04. Premium received is $183,141.) |
450 | (136,125 | ) | |||
| (Strike Price is $15.00. Expiration date is 3/19/04. Premium received is $41,398.) |
200 | (26,500 | ) | |||
| Smith International, Inc. |
||||||
| (Strike Price is $35.00. Expiration date is 1/16/04. Premium received is $57,207.) |
200 | (132,000 | ) | |||
| (Strike Price is $37.50. Expiration date is 1/16/04. Premium received is $28,299.) |
150 | (62,250 | ) | |||
| (Strike Price is $40.00. Expiration date is 1/16/04. Premium received is $9,350.) |
50 | (10,000 | ) | |||
| (Strike Price is $35.00. Expiration date is 4/16/04. Premium received is $56,697.) |
100 | (71,500 | ) | |||
| (Strike Price is $37.50. Expiration date is 4/16/04. Premium received is $28,699.) |
100 | (51,500 | ) | |||
| (Strike Price is $40.00. Expiration date is 4/16/04. Premium received is $37,048.) |
150 | (51,000 | ) | |||
| Steel Dynamics, Inc. |
||||||
| (Strike Price is $15.00. Expiration date is 5/21/04. Premium received is $68,547.) |
150 | (132,000 | ) | |||
| (Strike Price is $17.50. Expiration date is 5/21/04. Premium received is $51,398.) |
200 | (127,000 | ) | |||
| Stone Energy Corporation |
||||||
| (Strike Price is $40.00. Expiration date is 1/16/04. Premium received is $7,850.) |
50 | (13,125 | ) | |||
| Too, Inc. |
||||||
| (Strike Price is $15.00. Expiration date is 2/20/04. Premium received is $80,746.) |
250 | (58,750 | ) | |||
| (Strike Price is $17.50. Expiration date is 2/20/04. Premium received is $15,499.) |
150 | (13,500 | ) | |||
| United States Steel Corporation |
||||||
| (Strike Price is $22.50. Expiration date is 1/16/04. Premium received is $226,939.) |
350 | (437,500 | ) | |||
| (Strike Price is $25.00. Expiration date is 1/16/04. Premium received is $356,033.) |
650 | (653,250 | ) | |||
| (Strike Price is $35.00. Expiration date is 2/20/04. Premium received is $19,675.) |
100 | (22,750 | ) | |||
| (Strike Price is $25.00. Expiration date is 4/16/04. Premium received is $377,832.) |
550 | (580,250 | ) | |||
| (Strike Price is $30.00. Expiration date is 4/16/04. Premium received is $153,893) |
450 | (290,250 | ) | |||
| York International Corporation |
||||||
| (Strike Price is $30.00. Expiration date is 2/20/04. Premium received is $193,391.) |
200 | $ | (139,000 | ) | ||
| (Strike Price is $35.00. Expiration date is 2/20/04. Premium received is $44,446.) |
200 | (53,000 | ) | |||
| (Strike Price is $35.00. Expiration date is 5/21/04. Premium received is $14,124.) |
50 | (17,500 | ) | |||
| (Strike Price is $40.00. Expiration date is 5/21/04. Premium received is $10,700.) |
100 | (12,250 | ) | |||
| 22,822 | $ | (9,727,393 | ) | |||
STRONG ADVISOR U.S. VALUE FUND
| Shares or Principal Amount |
Value (Note 2) | ||||
| Common Stocks 99.1% |
|||||
| Aerospace - Defense 2.7% |
|||||
| General Dynamics Corporation |
9,000 | $ | 813,510 | ||
| Lockheed Martin Corporation |
24,400 | 1,254,160 | |||
| Raytheon Company |
165,000 | 4,956,600 | |||
| 7,024,270 | |||||
| Auto Manufacturers 0.8% |
|||||
| General Motors Corporation |
38,100 | 2,034,540 | |||
| Banks - Midwest 0.3% |
|||||
| Provident Financial Group, Inc. |
27,000 | 862,650 | |||
| Banks - Money Center 6.1% |
|||||
| Bank of America Corporation |
63,000 | 5,067,090 | |||
| The Bank of New York Company, Inc. |
35,000 | 1,159,200 | |||
| Citigroup, Inc. |
148,500 | 7,208,190 | |||
| J.P. Morgan Chase & Company |
70,000 | 2,571,100 | |||
| 16,005,580 | |||||
| Banks - Northeast 0.8% |
|||||
| Banknorth Group, Inc. |
55,000 | 1,789,150 | |||
| Peoples Bank |
11,400 | 371,640 | |||
| 2,160,790 | |||||
| Banks - Southeast 0.6% |
|||||
| Compass Bancshares, Inc. |
37,000 | 1,454,470 | |||
| Banks - Super Regional 7.6% |
|||||
| Bank One Corporation |
57,000 | 2,598,630 | |||
| Charter One Financial, Inc. |
44,415 | 1,534,538 | |||
| KeyCorp |
41,600 | 1,219,712 | |||
| Mellon Financial Corporation |
28,000 | 899,080 | |||
| National City Corporation |
36,500 | 1,238,810 | |||
| Regions Financial Corporation |
46,000 | 1,711,200 | |||
| SouthTrust Corporation |
39,600 | 1,296,108 | |||
| U.S. Bancorp |
92,800 | 2,763,584 | |||
| Wachovia Corporation |
67,100 | 3,126,189 | |||
| Wells Fargo Company |
59,000 | 3,474,510 | |||
| 19,862,361 | |||||
| Beverages - Alcoholic 0.3% |
|||||
| Anheuser-Busch Companies, Inc. |
13,000 | 684,840 | |||
| Building - Maintenance & Services 2.2% |
|||||
| The ServiceMaster Company |
490,000 | 5,708,500 | |||
| Building Products - Wood 1.0% |
|||||
| Georgia-Pacific Corporation |
18,400 | 564,328 | |||
| Weyerhaeuser Company |
31,200 | 1,996,800 | |||
| 2,561,128 | |||||
34
Table of Contents
STRONG ADVISOR U.S. VALUE FUND (continued)
| Shares or Principal Amount |
Value (Note 2) | ||||
| Chemicals - Basic 1.0% |
|||||
| The Dow Chemical Company |
40,000 | $ | 1,662,800 | ||
| PPG Industries, Inc. |
15,300 | 979,506 | |||
| 2,642,306 | |||||
| Commercial Services - Miscellaneous 0.5% |
|||||
| ARAMARK Corporation Class B |
48,000 | 1,316,160 | |||
| Computer - IT Services 1.8% |
|||||
| International Business Machines Corporation |
40,000 | 3,707,200 | |||
| Unisys Corporation (b) |
70,100 | 1,040,985 | |||
| 4,748,185 | |||||
| Computer - Manufacturers 1.3% |
|||||
| Hewlett-Packard Company |
150,000 | 3,445,500 | |||
| Cosmetics - Personal Care 0.2% |
|||||
| Kimberly-Clark Corporation |
11,000 | 649,990 | |||
| Diversified Operations 3.9% |
|||||
| E.I. Du Pont de Nemours & Company |
50,631 | 2,323,457 | |||
| Emerson Electric Company |
27,900 | 1,806,525 | |||
| ITT Industries, Inc. |
18,000 | 1,335,780 | |||
| Loews Corporation |
19,500 | 964,275 | |||
| Time Warner, Inc. (b) |
115,000 | 2,068,850 | |||
| United Technologies Corporation |
17,200 | 1,630,044 | |||
| 10,128,931 | |||||
| Finance - Equity REIT 0.6% |
|||||
| Equity Office Properties Trust |
30,000 | 859,500 | |||
| Equity Residential Properties Trust |
27,000 | 796,770 | |||
| 1,656,270 | |||||
| Finance - Investment Management 0.6% |
|||||
| T. Rowe Price Group, Inc. |
13,000 | 616,330 | |||
| Waddell & Reed Financial, Inc. Class A |
39,000 | 914,940 | |||
| 1,531,270 | |||||
| Finance - Savings & Loan 0.8% |
|||||
| Washington Mutual, Inc. |
50,000 | 2,006,000 | |||
| Financial Services - Miscellaneous 0.7% |
|||||
| American Express Company |
38,000 | 1,832,740 | |||
| Food - Meat Products 0.1% |
|||||
| Tyson Foods, Inc. Class A |
18,000 | 238,320 | |||
| Food - Miscellaneous Preparation 5.6% |
|||||
| Del Monte Foods Company (b) |
570,000 | 5,928,000 | |||
| General Mills, Inc. |
15,300 | 693,090 | |||
| Kraft Foods, Inc. Class A |
168,900 | 5,441,958 | |||
| Sara Lee Corporation |
115,000 | 2,496,650 | |||
| 14,559,698 | |||||
| Insurance - Accident & Health 0.9% |
|||||
| AFLAC, Inc. |
65,000 | 2,351,700 | |||
| Insurance - Brokers 0.2% |
|||||
| Marsh & McLennan Companies, Inc. |
12,600 | 603,414 | |||
| Insurance - Diversified 2.7% |
|||||
| American International Group, Inc. |
58,500 | 3,877,380 | |||
| John Hancock Financial Services, Inc. |
24,500 | 918,750 | |||
| Principal Financial Group, Inc. |
25,300 | 836,671 | |||
| Prudential Financial, Inc. |
34,100 | 1,424,357 | |||
| 7,057,158 | |||||
| Insurance - Life 0.4% |
|||||
| Lincoln National Corporation |
25,000 | 1,009,250 | |||
| Insurance - Property/Casualty/Title 3.2% |
|||||
| The Allstate Corporation |
32,000 | $ | 1,376,640 | ||
| Chubb Corporation |
16,500 | 1,123,650 | |||
| Hartford Financial Services Group, Inc. |
21,800 | 1,286,854 | |||
| SAFECO Corporation |
71,000 | 2,764,030 | |||
| The St. Paul Companies, Inc. |
20,300 | 804,895 | |||
| Travelers Property and Casualty Corporation Class B |
60,309 | 1,023,444 | |||
| 8,379,513 | |||||
| Leisure - Hotels & Motels 0.4% |
|||||
| Marriott International, Inc. Class A |
23,000 | 1,062,600 | |||
| Leisure - Movies & Related 0.7% |
|||||
| Metro-Goldwyn-Mayer, Inc. (b) |
100,000 | 1,709,000 | |||
| Leisure - Photo Equipment/Related 0.2% |
|||||
| Eastman Kodak Company |
24,200 | 621,214 | |||
| Leisure - Services 0.6% |
|||||
| The Walt Disney Company |
62,000 | 1,446,460 | |||
| Machinery - Construction/Mining 0.5% |
|||||
| Caterpillar, Inc. |
16,000 | 1,328,320 | |||
| Machinery - Farm 0.6% |
|||||
| Deere & Company |
26,000 | 1,691,300 | |||
| Media - Cable TV 1.1% |
|||||
| Comcast Corporation Class A (b) |
58,974 | 1,938,475 | |||
| Cox Communications, Inc. Class A (b) |
25,400 | 875,030 | |||
| 2,813,505 | |||||
| Media - Newspapers 0.9% |
|||||
| Gannett Company, Inc. |
26,200 | 2,335,992 | |||
| Media - Periodicals 0.3% |
|||||
| Readers Digest Association, Inc. Class A |
47,900 | 702,214 | |||
| Media - Radio/TV 3.7% |
|||||
| Clear Channel Communications, Inc. |
80,000 | 3,746,400 | |||
| Liberty Media Corporation Class A (b) |
315,000 | 3,745,350 | |||
| Viacom, Inc. Class B |
49,700 | 2,205,686 | |||
| 9,697,436 | |||||
| Medical - Ethical Drugs 2.3% |
|||||
| Bristol-Myers Squibb Company |
60,400 | 1,727,440 | |||
| Merck & Company, Inc. |
65,000 | 3,003,000 | |||
| Schering-Plough Corporation |
75,000 | 1,304,250 | |||
| 6,034,690 | |||||
| Medical - Hospitals 2.3% |
|||||
| HCA, Inc. |
140,000 | 6,014,400 | |||
| Medical - Wholesale Drugs/Sundries 0.9% |
|||||
| McKesson Corporation |
72,000 | 2,315,520 | |||
| Medical/Dental - Services 0.1% |
|||||
| Medco Health Solutions, Inc. (b) |
7,839 | 266,447 | |||
| Medical/Dental - Supplies 1.8% |
|||||
| Sola International, Inc. (b) |
243,500 | 4,577,800 | |||
| Metal Ores - Miscellaneous 1.6% |
|||||
| Alcoa, Inc. |
52,100 | 1,979,800 | |||
| Phelps Dodge Corporation (b) |
30,000 | 2,282,700 | |||
| 4,262,500 | |||||
35
Table of Contents
| SCHEDULES OF INVESTMENTS IN SECURITIES (continued) |
December 31, 2003 |
STRONG ADVISOR U.S. VALUE FUND (continued)
| Shares or Principal Amount |
Value (Note 2) |
||||||
| Oil & Gas - International Exploration & Production 2.9% |
|||||||
| Kerr McGee Corporation |
129,000 | $ | 5,997,210 | ||||
| Unocal Corporation |
40,200 | 1,480,566 | |||||
| 7,477,776 | |||||||
| Oil & Gas - International Integrated 7.3% |
|||||||
| ChevronTexaco Corporation |
48,000 | 4,146,720 | |||||
| ConocoPhillips |
49,000 | 3,212,930 | |||||
| Exxon Mobil Corporation |
282,000 | 11,562,000 | |||||
| 18,921,650 | |||||||
| Oil & Gas - United States Exploration & Production 2.5% |
|||||||
| Devon Energy Corporation |
115,000 | 6,584,900 | |||||
| Paper & Paper Products 0.6% |
|||||||
| International Paper Company |
39,300 | 1,694,223 | |||||
| Pollution Control - Services 1.7% |
|||||||
| Waste Management, Inc. |
147,000 | 4,351,200 | |||||
| Retail - Department Stores 1.0% |
|||||||
| Federated Department Stores, Inc. |
25,000 | 1,178,250 | |||||
| May Department Stores Company |
44,793 | 1,302,133 | |||||
| 2,480,383 | |||||||
| Retail - Drug Stores 0.4% |
|||||||
| CVS Corporation |
28,200 | 1,018,584 | |||||
| Retail - Restaurants 1.6% |
|||||||
| McDonald’s Corporation |
163,000 | 4,047,290 | |||||
| Retail - Super/Mini Markets 1.1% |
|||||||
| The Kroger Company (b) |
150,000 | 2,776,500 | |||||
| Soap & Cleaning Preparations 0.9% |
|||||||
| The Procter & Gamble Company |
23,000 | 2,297,240 | |||||
| Telecommunications - Services 4.9% |
|||||||
| ALLTEL Corporation |
19,000 | 885,020 | |||||
| AT&T Corporation |
39,400 | 799,820 | |||||
| BellSouth Corporation |
80,000 | 2,264,000 | |||||
| SBC Communications, Inc. |
148,400 | 3,868,788 | |||||
| Sprint Corporation |
51,000 | 837,420 | |||||
| Verizon Communications, Inc. |
117,000 | 4,104,360 | |||||
| 12,759,408 | |||||||
| Telecommunications - Wireless Equipment 0.4% |
|||||||
| Motorola, Inc. |
70,000 | 984,900 | |||||
| Tobacco 1.8% |
|||||||
| Altria Group, Inc. |
55,000 | 2,993,100 | |||||
| Loews Corp - Carolina Group |
67,700 | 1,708,748 | |||||
| 4,701,848 | |||||||
| Transportation - Air Freight 0.3% |
|||||||
| FedEx Corporation |
12,000 | 810,000 | |||||
| Transportation - Rail 0.8% |
|||||||
| Burlington Northern Santa Fe Corporation |
24,800 | 802,280 | |||||
| Norfolk Southern Corporation |
50,000 | 1,182,500 | |||||
| 1,984,780 | |||||||
| Utility - Electric Power 5.1% |
|||||||
| Consolidated Edison, Inc. |
27,000 | 1,161,270 | |||||
| Duke Energy Corporation |
70,000 | 1,431,500 | |||||
| Exelon Corporation |
26,200 | 1,738,632 | |||||
| FPL Group, Inc. |
26,600 | 1,740,172 | |||||
| FirstEnergy Corporation |
169,500 | 5,966,400 | |||||
| The Southern Company |
42,000 | 1,270,500 | |||||
| 13,308,474 | |||||||
| Utility - Gas Distribution 0.9% |
|||||||
| CenterPoint Energy, Inc. |
99,400 | $ | 963,186 | ||||
| Vectren Corporation |
56,700 | 1,397,655 | |||||
| 2,360,841 | |||||||
| Total Common Stocks (Cost $209,232,377) |
257,954,929 | ||||||
| Short-Term Investments (a) 2.2% |
|||||||
| Collateral Received For Securities Lending (f) 1.4% |
|||||||
| Navigator Prime Portfolio |
3,584,475 | 3,584,475 | |||||
| Repurchase Agreements 0.8% |
|||||||
| ABN AMRO Inc. (Dated 12/31/03), 0.95%, Due 1/02/04 (Repurchase proceeds $400,021); Collateralized by: United States Government & Agency Issues (c) |
$ | 400,000 | 400,000 | ||||
| State Street Bank (Dated 12/31/03), 0.75%, Due 1/02/04 (Repurchase proceeds $1,584,266); Collateralized by: United States Government & Agency Issues (c) |
1,584,200 | 1,584,200 | |||||
| 1,984,200 | |||||||
| Total Short-Term Investments (Cost $5,568,675) |
5,568,675 | ||||||
| Total Investments in Securities (Cost $214,801,052) 101.3% |
263,523,604 | ||||||
| Other Assets and Liabilities, Net (1.3%) |
(3,252,423 | ) | |||||
| Net Assets 100.0% |
$ | 260,271,181 | |||||
STRONG ADVISOR ENDEAVOR LARGE CAP FUND
| Shares or Principal Amount |
Value (Note 2) | ||||
| Common Stocks 100.2% |
|||||
| Apparel - Shoes & Related Manufacturing 1.3% |
|||||
| NIKE, Inc. Class B |
7,220 | $ | 494,281 | ||
| Banks - Money Center 3.5% |
|||||
| Citigroup, Inc. |
26,955 | 1,308,396 | |||
| Beverages - Alcoholic 0.5% |
|||||
| Anheuser-Busch Companies, Inc. |
3,610 | 190,175 | |||
| Commercial Services - Schools 2.0% |
|||||
| Career Education Corporation (b) |
19,053 | 763,454 | |||
| Computer - Data Storage 1.9% |
|||||
| EMC Corporation (b) |
54,630 | 705,820 | |||
| Computer - Local Networks 5.1% |
|||||
| Cisco Systems, Inc. (b) |
63,035 | 1,531,120 | |||
| Polycom, Inc. (b) |
20,145 | 393,231 | |||
| 1,924,351 | |||||
| Computer - Manufacturers 1.9% |
|||||
| Dell, Inc. (b) |
20,700 | 702,972 | |||
| Computer Software - Desktop 1.1% |
|||||
| Microsoft Corporation |
14,640 | 403,186 | |||
| Computer Software - Education/Entertainment 3.1% |
|||||
| Electronic Arts, Inc. (b) |
24,320 | 1,162,010 | |||
| Computer Software - Enterprise 1.3% |
|||||
| SAP AG Sponsored ADR |
11,450 | 475,862 | |||
36
Table of Contents
STRONG ADVISOR ENDEAVOR LARGE CAP FUND (continued)
| Shares or Principal Amount |
Value (Note 2) |
||||||
| Diversified Operations 7.2% |
|||||||
| Honeywell International, Inc. |
22,890 | $ | 765,213 | ||||
| Tyco International, Ltd. |
73,275 | 1,941,788 | |||||
| 2,707,001 | |||||||
| Electronics - Scientific Measuring 2.6% |
|||||||
| Teradyne, Inc. (b) |
38,310 | 974,990 | |||||
| Electronics – Semiconductor Manufacturing 11.2% |
|||||||
| Intel Corporation |
65,440 | 2,107,168 | |||||
| KLA-Tencor Corporation (b) |
5,170 | 303,324 | |||||
| Taiwan Semiconductor Manufacturing Company, Ltd. Sponsored ADR (b) |
139,550 | 1,428,992 | |||||
| Texas Instruments, Inc. |
13,780 | 404,856 | |||||
| 4,244,340 | |||||||
| Finance - Consumer/Commercial Loans 1.0% |
|||||||
| SLM Corporation |
10,150 | 382,452 | |||||
| Finance - Investment Brokers 1.1% |
|||||||
| Lehman Brothers Holdings, Inc. |
5,550 | 428,571 | |||||
| Finance - Mortgage & Related Services 1.8% |
|||||||
| Countrywide Financial Corporation |
9,080 | 688,718 | |||||
| Household - Consumer Electronics 1.6% |
|||||||
| Harman International Industries, Inc. |
7,980 | 590,360 | |||||
| Insurance - Diversified 1.4% |
|||||||
| American International Group, Inc. |
8,090 | 536,205 | |||||
| Internet - Content 2.5% |
|||||||
| Yahoo! Inc. (b) |
21,180 | 956,701 | |||||
| Internet - E*Commerce 0.6% |
|||||||
| eBay, Inc. (b) |
3,310 | 213,793 | |||||
| Leisure - Gaming/Equipment 2.0% |
|||||||
| International Game Technology |
21,460 | 766,122 | |||||
| Leisure - Services 2.8% |
|||||||
| Royal Caribbean Cruises, Ltd. |
30,940 | 1,076,403 | |||||
| Leisure - Toys/Games/Hobby 1.3% |
|||||||
| Marvel Enterprises, Inc. (b) |
16,705 | 486,283 | |||||
| Machinery - Farm 1.8% |
|||||||
| Deere & Company |
10,330 | 671,967 | |||||
| Media - Cable TV 3.5% |
|||||||
| EchoStar Communications Corporation Class A (b) |
38,440 | 1,306,960 | |||||
| Media - Newspapers 0.8% |
|||||||
| The E.W. Scripps Company Class A |
3,030 | 285,244 | |||||
| Media - Radio/TV 0.8% |
|||||||
| Clear Channel Communications, Inc. |
6,490 | 303,927 | |||||
| Medical - Biomedical/Biotechnology 5.0% |
|||||||
| Amgen, Inc. (b) |
16,880 | 1,043,184 | |||||
| Genzyme Corporation (b) |
13,660 | 673,984 | |||||
| Gilead Sciences, Inc. (b) |
3,230 | 187,792 | |||||
| 1,904,960 | |||||||
| Medical - Drug/Diversified 2.3% |
|||||||
| Johnson & Johnson |
17,019 | $ | 879,202 | ||||
| Medical - Ethical Drugs 4.8% |
|||||||
| Medicis Pharmaceutical Corporation Class A |
5,350 | 381,455 | |||||
| Pfizer, Inc. |
40,394 | 1,427,120 | |||||
| 1,808,575 | |||||||
| Medical - Generic Drugs 1.2% |
|||||||
| Teva Pharmaceutical Industries, Ltd. ADR |
7,900 | 448,009 | |||||
| Medical – Health Maintenance Organizations 1.1% |
|||||||
| Anthem, Inc.(b) |
5,785 | 433,875 | |||||
| Medical - Products 2.5% |
|||||||
| Boston Scientific Corporation (b) |
14,720 | 541,107 | |||||
| Medtronic, Inc. |
8,280 | 402,490 | |||||
| 943,597 | |||||||
| Oil & Gas - Drilling 3.8% |
|||||||
| ENSCO International, Inc. |
14,190 | 385,542 | |||||
| Nabors Industries, Ltd. (b) |
16,970 | 704,255 | |||||
| Transocean, Inc. (b) |
15,170 | 364,231 | |||||
| 1,454,028 | |||||||
| Oil & Gas - International Integrated 0.8% |
|||||||
| Suncor Energy, Inc. |
11,770 | 294,956 | |||||
| Retail - Home Furnishings 0.8% |
|||||||
| Bed Bath & Beyond, Inc. (b) |
6,920 | 299,982 | |||||
| Retail - Major Discount Chains 2.4% |
|||||||
| Target Corporation |
9,790 | 375,936 | |||||
| Wal-Mart Stores, Inc. |
10,100 | 535,805 | |||||
| 911,741 | |||||||
| Retail/Wholesale - Building Products 3.3% |
|||||||
| The Home Depot, Inc. |
16,390 | 581,681 | |||||
| Lowe’s Companies, Inc. |
11,750 | 650,832 | |||||
| 1,232,513 | |||||||
| Telecommunications - Wireless Equipment 0.8% |
|||||||
| Telefonaktiebolaget LM Ericsson Sponsored ADR (b) |
17,080 | 302,316 | |||||
| Telecommunications - Wireless Services 4.0% |
|||||||
| Nextel Communications, Inc. Class A (b) |
54,240 | 1,521,974 | |||||
| Trucks & Parts - Heavy Duty 1.7% |
|||||||
| Navistar International Corporation (b) |
13,630 | 652,740 | |||||
| Total Common Stocks (Cost $31,365,651) |
37,839,012 | ||||||
| Short-Term Investments (a) 0.2% |
|||||||
| Repurchase Agreements |
|||||||
| State Street Bank (Dated 12/31/03), 0.75%, Due 1/02/04 (Repurchase proceeds $68,403); Collateralized by: United States Government & Agency Issues (c) |
$ | 68,400 | 68,400 | ||||
| Total Short-Term Investments (Cost $68,400) |
68,400 | ||||||
| Total Investments in Securities (Cost $31,434,051) 100.4% |
37,907,412 | ||||||
| Other Assets and Liabilities, Net (0.4%) |
(156,943 | ) | |||||
| Net Assets 100.0% |
$ | 37,750,469 | |||||
37
Table of Contents
| SCHEDULES OF INVESTMENTS IN SECURITIES (continued) |
December 31, 2003 |
| Shares or Principal |
Value (Note 2) |
||||||
| Common Stocks 97.6% |
|||||||
| Building - Heavy Construction 1.8% |
|||||||
| Chicago Bridge & Iron Company NV |
1,900 | $ | 54,910 | ||||
| Commercial Services - Miscellaneous 3.7% |
|||||||
| Paychex, Inc. |
3,100 | 115,320 | |||||
| Commercial Services - Schools 6.9% |
|||||||
| Apollo Group, Inc. Class A (b) |
2,000 | 136,000 | |||||
| Corinthian Colleges, Inc. (b) |
1,400 | 77,784 | |||||
| 213,784 | |||||||
| Computer - Local Networks 7.5% |
|||||||
| Cisco Systems, Inc. (b) |
4,300 | 104,447 | |||||
| Polycom, Inc. (b) |
2,900 | 56,608 | |||||
| QLogic Corporation (b) |
1,400 | 72,240 | |||||
| 233,295 | |||||||
| Computer - Manufacturers 6.8% |
|||||||
| Dell, Inc. (b) |
6,200 | 210,552 | |||||
| Computer Software - Education/Entertainment 1.5% |
|||||||
| Electronic Arts, Inc. (b) |
1,000 | 47,780 | |||||
| Computer Software - Enterprise 1.8% |
|||||||
| VERITAS Software Corporation (b) |
1,500 | 55,740 | |||||
| Electronics - Semiconductor Manufacturing 11.5% |
|||||||
| Analog Devices, Inc. |
3,400 | 155,210 | |||||
| Credence Systems Corporation (b) |
2,900 | 38,164 | |||||
| Intel Corporation |
3,900 | 125,580 | |||||
| Silicon Laboratories, Inc. (b) |
900 | 38,898 | |||||
| 357,852 | |||||||
| Finance - Mortgage & Related Services 2.9% |
|||||||
| Doral Financial Corporation |
2,850 | 91,998 | |||||
| Financial Services - Miscellaneous 0.3% |
|||||||
| Modem Media, Inc. (b) |
1,000 | 8,170 | |||||
| Internet - E*Commerce 5.4% |
|||||||
| eBay, Inc. (b) |
2,600 | 167,934 | |||||
| Leisure - Toys/Games/Hobby 2.8% |
|||||||
| Marvel Enterprises, Inc. (b) |
3,000 | 87,330 | |||||
| Media - Cable TV 2.2% |
|||||||
| EchoStar Communications Corporation Class A (b) |
1,400 | 47,600 | |||||
| Hughes Electronics Corporation (b) |
1,235 | 20,439 | |||||
| 68,039 | |||||||
| Medical - Biomedical/Biotechnology 12.1% |
|||||||
| Digene Corporation (b) |
1,900 | 76,190 | |||||
| Genzyme Corporation (b) |
2,700 | 133,218 | |||||
| Gilead Sciences, Inc. (b) |
2,900 | 168,606 | |||||
| 378,014 | |||||||
| Medical - Products 5.8% |
|||||||
| Boston Scientific Corporation (b) |
3,100 | 113,956 | |||||
| OraSure Technologies, Inc. (b) |
8,600 | 68,456 | |||||
| 182,412 | |||||||
| Medical/Dental - Services 1.5% |
|||||||
| Inveresk Research Group, Inc. (b) |
1,900 | 46,987 | |||||
| Oil & Gas - Machinery/Equipment 2.0% |
|||||||
| Smith International, Inc. (b) |
1,500 | 62,280 | |||||
| Oil & Gas - United States Exploration & Production 3.4% |
|||||||
| Brigham Exploration Company (b) |
4,000 | $ | 32,116 | ||||
| XTO Energy, Inc. |
2,600 | 73,580 | |||||
| 105,696 | |||||||
| Retail - Clothing/Shoes 7.7% |
|||||||
| Chicos FAS, Inc. (b) |
1,000 | 36,950 | |||||
| Coach, Inc. (b) |
2,600 | 98,150 | |||||
| Ross Stores, Inc. |
4,000 | 105,720 | |||||
| 240,820 | |||||||
| Retail - Miscellaneous 4.1% |
|||||||
| PETCO Animal Supplies, Inc. (b) |
2,100 | 63,945 | |||||
| PETsMART, Inc. |
2,700 | 64,260 | |||||
| 128,205 | |||||||
| Retail/Wholesale - Building Products 1.8% |
|||||||
| The Home Depot, Inc. |
1,600 | 56,784 | |||||
| Telecommunications - Fiber Optics 1.9% |
|||||||
| Corning, Inc. (b) |
5,800 | 60,494 | |||||
| Transportation - Airline 2.2% |
|||||||
| AirTran Holdings, Inc. (b) |
1,100 | 13,090 | |||||
| JetBlue Airways Corporation (b) |
2,100 | 55,692 | |||||
| 68,782 | |||||||
| Total Common Stocks (Cost $2,303,216) |
3,043,178 | ||||||
| Preferred Stocks 0.1% |
|||||||
| Media - Cable TV 0.1% |
|||||||
| News Corporation, Ltd. Sponsored ADR |
138 | 4,175 | |||||
| Total Preferred Stocks (Cost $4,016) |
4,175 | ||||||
| Short-Term Investments (a) 2.8% |
|||||||
| Repurchase Agreements |
|||||||
| State Street Bank (Dated 12/31/03), 0.75%, Due 1/02/04 (Repurchase proceeds $87,704); Collateralized by: United States Government & Agency Issues (c) |
$ | 87,700 | 87,700 | ||||
| Total Short-Term Investments (Cost $87,700) |
87,700 | ||||||
| Total Investments in Securities (Cost $2,394,932) 100.5% |
3,135,053 | ||||||
| Other Assets and Liabilities, Net (0.5%) |
(14,879 | ) | |||||
| Net Assets 100.0% |
$ | 3,120,174 | |||||
WRITTEN OPTIONS ACTIVITY
| Contracts |
Premiums |
||||||
| Options outstanding at beginning of period |
— | $ | — | ||||
| Options written during the period |
38 | 9,486 | |||||
| Options closed |
(38 | ) | (9,486 | ) | |||
| Options expired |
— | — | |||||
| Options exercised |
— | — | |||||
| Options outstanding at end of period |
— | $ | — | ||||
38
Table of Contents
STRONG ADVISOR INTERNATIONAL CORE FUND
| Shares or Principal Amount |
Value (Note 2) | ||||
| Common Stocks 96.3% |
|||||
| Australia 1.7% |
|||||
| BHP Billiton, Ltd. |
2,400 | $ | 21,798 | ||
| BlueScope Steel, Ltd. |
800 | 3,369 | |||
| 25,167 | |||||
| Belgium 0.9% |
|||||
| Fortis |
700 | 14,079 | |||
| Bermuda 0.6% |
|||||
| Jardine Matheson Holdings, Ltd. |
965 | 8,782 | |||
| Brazil 1.2% |
|||||
| Companhia Vale do Rio Doce Sponsored ADR (b) |
300 | 17,550 | |||
| Canada 2.9% |
|||||
| Bank of Nova Scotia |
300 | 15,229 | |||
| Encana Corporation |
700 | 27,542 | |||
| 42,771 | |||||
| Finland 0.9% |
|||||
| UPM-Kymmene Oyj |
700 | 13,348 | |||
| France 11.8% |
|||||
| Accor SA |
400 | 18,077 | |||
| Altran Technologies SA (b) |
1,466 | 18,927 | |||
| Aventis SA |
300 | 19,829 | |||
| BNP Paribas SA |
300 | 18,900 | |||
| Essilor International SA |
400 | 20,625 | |||
| Groupe Danone Sponsored ADR |
900 | 29,241 | |||
| L’Oreal SA |
400 | 32,757 | |||
| Total SA Sponsored ADR |
200 | 18,502 | |||
| 176,858 | |||||
| Germany 7.2% |
|||||
| DaimlerChrysler AG |
400 | 18,487 | |||
| Deutsche Bank AG |
225 | 18,475 | |||
| E.On AG |
300 | 19,535 | |||
| Puma AG |
100 | 17,664 | |||
| Schering AG |
280 | 14,187 | |||
| Siemens AG |
250 | 19,888 | |||
| 108,236 | |||||
| Hong Kong 2.9% |
|||||
| Hutchison Whampoa, Ltd. |
3,000 | 22,139 | |||
| Swire Pacific, Ltd. A Shares |
3,400 | 21,023 | |||
| 43,162 | |||||
| Ireland 2.6% |
|||||
| Bank of Ireland |
1,700 | 23,136 | |||
| Ryanair Holdings PLC ADR (b) |
300 | 15,192 | |||
| 38,328 | |||||
| Italy 4.5% |
|||||
| Credito Italiano SA |
2,900 | 15,631 | |||
| ENI Spa |
1,800 | 34,010 | |||
| Telecom Italia Spa (b) |
5,951 | 17,587 | |||
| 67,228 | |||||
| Japan 17.2% |
|||||
| Canon, Inc. ADR |
600 | 28,584 | |||
| The Daimaru, Inc. |
2,000 | 11,166 | |||
| Disco Corporation |
300 | 17,064 | |||
| East Japan Railway Company |
3 | 14,113 | |||
| Hankyu Department Stores, Inc. |
2,000 | 13,449 | |||
| Hitachi, Ltd. |
4,000 | 23,917 | |||
| House Foods Corporation |
1,000 | 11,310 | |||
| Komatsu, Ltd. |
4,800 | 30,439 | |||
| Lawson, Inc. |
400 | 13,712 | |||
| Mitsubishi Heavy Industries, Ltd. |
5,100 | 14,192 | |||
| Nintendo Company, Ltd. |
150 | $ | 13,978 | ||
| Nippon Telegraph and Telephone Corporation |
|||||
| Sponsored ADR |
800 | 19,648 | |||
| Tokyo Gas Company, Ltd. |
5,000 | 17,792 | |||
| Toyota Motor Corporation |
800 | 27,317 | |||
| 256,681 | |||||
| Mexico 1.8% |
|||||
| America Movil ADR Series L |
400 | 10,936 | |||
| Wal-Mart de Mexico SA de CV |
5,400 | 15,443 | |||
| 26,379 | |||||
| Netherlands 4.8% |
|||||
| ING Groep NV |
1,100 | 25,668 | |||
| Koninklijke Philips Electronics NV Sponsored |
|||||
| ADR - New York Registry Shares |
600 | 17,454 | |||
| Royal Dutch Petroleum Company - New York Shares |
300 | 15,717 | |||
| STMicroelectronics NV |
500 | 13,536 | |||
| 72,375 | |||||
| Singapore 3.2% |
|||||
| DBS Group Holdings, Ltd. |
2,600 | 22,526 | |||
| Flextronics International, Ltd. (b) |
1,200 | 17,808 | |||
| Singapore Technologies Engineering, Ltd. |
6,000 | 7,220 | |||
| 47,554 | |||||
| South Africa 1.3% |
|||||
| Gold Fields, Ltd. Sponsored ADR |
1,400 | 19,516 | |||
| South Korea 1.6% |
|||||
| KT Corporation Sponsored ADR |
400 | 7,628 | |||
| Samsung Electronics |
45 | 17,025 | |||
| 24,653 | |||||
| Spain 2.5% |
|||||
| Banco Santander Central Hispano SA |
1,600 | 19,009 | |||
| Telefonica SA Sponsored ADR (b) |
414 | 18,295 | |||
| 37,304 | |||||
| Sweden 3.4% |
|||||
| Autoliv, Inc. |
900 | 34,185 | |||
| Sandvik AB |
500 | 17,249 | |||
| 51,434 | |||||
| Switzerland 5.2% |
|||||
| Nestle SA |
90 | 22,415 | |||
| Novartis AG Sponsored ADR |
500 | 22,945 | |||
| UBS AG Registered |
235 | 16,040 | |||
| Zurich Financial Services AG (b) |
110 | 15,858 | |||
| 77,258 | |||||
| United Kingdom 18.1% |
|||||
| Anglo American PLC |
1,700 | 36,865 | |||
| BP PLC Sponsored ADR |
350 | 17,273 | |||
| Boots Group PLC |
750 | 9,266 | |||
| Diageo PLC |
1,600 | 20,989 | |||
| Exel PLC |
900 | 11,871 | |||
| GlaxoSmithKline PLC Sponsored ADR |
300 | 13,986 | |||
| HSBC Holdings PLC |
1,200 | 18,914 | |||
| HSBC Holdings PLC |
500 | 7,853 | |||
| Lloyds TSB Group PLC |
1,800 | 14,426 | |||
| Reed Elsevier PLC |
1,800 | 15,008 | |||
| Royal Bank of Scotland PLC |
800 | 23,560 | |||
| Tesco PLC |
7,600 | 34,978 | |||
| United Utilities PLC (b) |
1,200 | 10,617 | |||
| Vodafone Group PLC |
14,200 | 35,193 | |||
| 270,799 | |||||
| Total Common Stocks (Cost $ 1,112,585) |
1,439,462 | ||||
39
Table of Contents
| SCHEDULES OF INVESTMENTS IN SECURITIES (continued) |
December 31, 2003 |
STRONG ADVISOR INTERNATIONAL CORE FUND (continued)
| Shares or Principal Amount |
Value (Note 2) | |||||
| Short-Term Investments (a) 2.9% |
||||||
| Repurchase Agreements |
||||||
| State Street Bank (Dated 12/31/03), 0.75%, Due 1/02/04 (Repurchase proceeds $43,102); Collateralized by: United States Government & Agency Issues (c) |
$ | 43,100 | $ | 43,100 | ||
| Total Short-Term Investments (Cost $43,100) |
43,100 | |||||
| Total Investments in Securities (Cost $1,155,685) 99.2% |
1,482,562 | |||||
| Other Assets and Liabilities, Net 0.8% |
11,962 | |||||
| Net Assets 100.0% |
$ | 1,494,524 | ||||
| Shares or Principal Amount |
Value (Note 2) | ||||
| Common Stocks 99.2% |
|||||
| Banks - Money Center 3.6% |
|||||
| Citigroup, Inc. |
61,155 | $ | 2,968,464 | ||
| Commercial Services - Schools 4.1% |
|||||
| Career Education Corporation (b) |
84,800 | 3,397,936 | |||
| Computer - Local Networks 6.4% |
|||||
| Cisco Systems, Inc. (b) |
163,850 | 3,979,916 | |||
| Polycom, Inc. (b) |
67,709 | 1,321,680 | |||
| 5,301,596 | |||||
| Computer - Manufacturers 1.9% |
|||||
| Dell, Inc. (b) |
45,675 | 1,551,123 | |||
| Computer Software - Education/Entertainment 3.1% |
|||||
| Electronic Arts, Inc. (b) |
53,600 | 2,561,008 | |||
| Computer Software - Enterprise 1.0% |
|||||
| SAP AG Sponsored ADR |
19,600 | 814,576 | |||
| Diversified Operations 4.8% |
|||||
| Tyco International, Ltd. |
149,180 | 3,953,270 | |||
| Electronics - Miscellaneous Components 1.1% |
|||||
| Vishay Intertechnology, Inc. (b) |
37,700 | 863,330 | |||
| Electronics - Scientific Measuring 2.9% |
|||||
| Teradyne, Inc. (b) |
93,000 | 2,366,850 | |||
| Electronics - Semiconductor Manufacturing 11.0% |
|||||
| Intel Corporation |
153,000 | 4,926,600 | |||
| Taiwan Semiconductor Manufacturing Company, Ltd. Sponsored ADR (b) |
311,900 | 3,193,856 | |||
| Texas Instruments, Inc. |
30,800 | 904,904 | |||
| 9,025,360 | |||||
| Household - Consumer Electronics 3.8% |
|||||
| Harman International Industries, Inc. |
42,730 | 3,161,165 | |||
| Internet - Content 5.0% |
|||||
| Yahoo! Inc. (b) |
90,910 | 4,106,405 | |||
| Leisure - Gaming/Equipment 1.8% |
|||||
| International Game Technology |
40,800 | $ | 1,456,560 | ||
| Leisure - Services 4.7% |
|||||
| Royal Caribbean Cruises, Ltd. |
110,000 | 3,826,900 | |||
| Leisure - Toys/Games/Hobby 7.4% |
|||||
| Marvel Enterprises, Inc. (b) |
209,190 | 6,089,521 | |||
| Media - Cable TV 4.8% |
|||||
| EchoStar Communications Corporation Class A (b) |
116,820 | 3,971,880 | |||
| Medical - Biomedical/Biotechnology 4.9% |
|||||
| Amgen, Inc. (b) |
30,330 | 1,874,394 | |||
| Genzyme Corporation (b) |
43,800 | 2,161,092 | |||
| 4,035,486 | |||||
| Medical - Ethical Drugs 2.0% |
|||||
| Medicis Pharmaceutical Corporation Class A |
23,600 | 1,682,680 | |||
| Medical - Generic Drugs 1.0% |
|||||
| Teva Pharmaceutical Industries, Ltd. ADR |
14,030 | 795,641 | |||
| Medical - Health Maintenance Organizations 3.8% |
|||||
| Anthem, Inc. (b) |
41,480 | 3,111,000 | |||
| Medical - Products 2.3% |
|||||
| Cyberonics, Inc. (b) |
60,100 | 1,923,801 | |||
| Medical - Systems/Equipment 0.8% |
|||||
| Varian Medical Systems, Inc. (b) |
8,915 | 616,026 | |||
| Oil & Gas - Drilling 5.4% |
|||||
| ENSCO International, Inc. |
61,760 | 1,678,019 | |||
| Nabors Industries, Ltd. (b) |
66,935 | 2,777,803 | |||
| 4,455,822 | |||||
| Oil & Gas - International Integrated 1.0% |
|||||
| Suncor Energy, Inc. |
33,300 | 834,498 | |||
| Retail/Wholesale - Building Products 2.4% |
|||||
| Lowe’s Companies, Inc. |
36,300 | 2,010,657 | |||
| Telecommunications - Wireless Services 4.1% |
|||||
| Nextel Communications, Inc. Class A (b) |
119,800 | 3,361,588 | |||
| Transportation - Airline 1.1% |
|||||
| AirTran Holdings, Inc. (b) |
77,200 | 918,680 | |||
| Trucks & Parts - Heavy Duty 3.0% |
|||||
| Navistar International Corporation (b) |
50,600 | 2,423,234 | |||
| Total Common Stocks (Cost $65,848,140) |
81,585,057 | ||||
40
Table of Contents
STRONG ADVISOR SELECT FUND (continued)
| Shares or Principal Amount |
Value (Note 2) |
||||||
| Short-Term Investments (a) 1.6% |
|||||||
| Repurchase Agreements |
|||||||
| ABN AMRO Inc. (Dated12/31/03), 0.95%, Due 1/02/2004 (Repurchase proceeds $200,011); Collateralized by: United States Government & Agency Issues (c) |
$ | 200,000 | $ | 200,000 | |||
| State Street Bank (Dated 12/31/03), 0.75%, Due 1/02/04 (Repurchase proceeds $1,086,945); Collateralized by: United States Government & Agency Issues (c) |
1,086,900 | 1,086,900 | |||||
| Total Short-Term Investments (Cost $ 1,286,900) |
1,286,900 | ||||||
| Total Investments in Securities (Cost $ 67,135,040) 100.8% |
82,871,957 | ||||||
| Other Assets and Liabilities, Net (0.8%) |
(615,285 | ) | |||||
| Net Assets 100.0% |
$ | 82,256,672 | |||||
STRONG ADVISOR TECHNOLOGY FUND
| Shares or Principal Amount |
Value (Note 2) | ||||
| Common Stocks 95.0% |
|||||
| Commercial Services - Security/Safety 2.9% |
|||||
| Mine Safety Appliances Company |
800 | $ | 63,608 | ||
| Computer - Data Storage 4.7% |
|||||
| Overland Storage, Inc. (b) |
1,000 | 18,800 | |||
| Seagate Technology (b) |
4,400 | 83,160 | |||
| 101,960 | |||||
| Computer - Integrated Systems 1.7% |
|||||
| Stratasys, Inc. (b) |
1,350 | 36,801 | |||
| Computer - IT Services 5.8% |
|||||
| Computer Sciences Corporation (b) |
800 | 35,384 | |||
| International Business Machines Corporation |
1,000 | 92,680 | |||
| 128,064 | |||||
| Computer - Local Networks 5.7% |
|||||
| Brocade Communications Systems, Inc. (b) |
5,100 | 29,478 | |||
| Cisco Systems, Inc. (b) |
1,400 | 34,006 | |||
| Digi International, Inc. (b) |
6,400 | 61,440 | |||
| 124,924 | |||||
| Computer - Manufacturers 2.6% |
|||||
| Dell, Inc. (b) |
1,700 | 57,732 | |||
| Computer - Software Design 4.3% |
|||||
| MSC Software Corporation (b) |
4,900 | 46,305 | |||
| Magma Design Automation (b) |
1,300 | 30,342 | |||
| Nassda Corporation (b) |
1,500 | 10,875 | |||
| Verisity, Ltd. (b) |
600 | 7,650 | |||
| 95,172 | |||||
| Computer Software - Desktop 2.9% |
|||||
| Microsoft Corporation |
2,300 | 63,342 | |||
| Computer Software - Enterprise 1.4% |
|||||
| Nuance Communications, Inc. (b) |
4,100 | 31,324 | |||
| Computer Software - Financial 3.1% |
|||||
| Corillian Corporation (b) |
6,300 | 39,753 | |||
| DST Systems, Inc. (b) |
650 | 27,144 | |||
| 66,897 | |||||
| Computer Software - Security 2.5% |
|||||
| SafeNet, Inc. (b) |
1,100 | $ | 33,847 | ||
| VeriSign, Inc. (b) |
1,300 | 21,190 | |||
| 55,037 | |||||
| Electronics - Military Systems 2.2% |
|||||
| DRS Technologies, Inc. (b) |
1,700 | 47,226 | |||
| Electronics - Miscellaneous Components 3.7% |
|||||
| Benchmark Electronics, Inc. (b) |
2,300 | 80,063 | |||
| Electronics - Scientific Measuring 1.2% |
|||||
| FEI Company (b) |
1,200 | 27,000 | |||
| Electronics - Semiconductor Manufacturing 25.1% |
|||||
| ARM Holdings PLC Sponsored ADR (b) |
3,200 | 22,080 | |||
| ASM International NV (b) |
1,600 | 32,384 | |||
| Asyst Technologies, Inc. (b) |
1,500 | 26,025 | |||
| IXYS Corporation (b) |
3,300 | 30,855 | |||
| Intel Corporation |
2,600 | 83,720 | |||
| LSI Logic Corporation (b) |
5,100 | 45,237 | |||
| Linear Technology Corporation |
2,050 | 86,243 | |||
| LogicVision, Inc. (b) |
1,600 | 7,200 | |||
| Photronics, Inc. (b) |
2,100 | 41,832 | |||
| Pixelworks, Inc. (b) |
5,000 | 55,200 | |||
| Sigma Designs, Inc. (b) |
3,000 | 22,590 | |||
| Texas Instruments, Inc. |
2,400 | 70,512 | |||
| Xilinx, Inc. (b) |
700 | 27,118 | |||
| 550,996 | |||||
| Internet - E*Commerce 2.9% |
|||||
| eBay, Inc. (b) |
1,000 | 64,590 | |||
| Internet - Network Security/Solutions 1.2% |
|||||
| RADWARE, Ltd. (b) |
1,000 | 27,250 | |||
| Internet - Software 7.0% |
|||||
| BEA Systems, Inc. (b) |
1,600 | 19,680 | |||
| DoubleClick, Inc. (b) |
1,900 | 19,418 | |||
| Embarcadero Technologies, Inc. (b) |
1,800 | 28,710 | |||
| F5 Networks, Inc. (b) |
1,100 | 27,610 | |||
| Marimba, Inc. (b) |
10,700 | 58,850 | |||
| 154,268 | |||||
| Medical - Biomedical/Biotechnology 2.8% |
|||||
| Gilead Sciences, Inc. (b) |
600 | 34,884 | |||
| Martek Biosciences Corporation (b) |
400 | 25,988 | |||
| 60,872 | |||||
| Medical - Genetics 2.5% |
|||||
| Diversa Corporation (b) |
1,700 | 15,725 | |||
| Genencor International, Inc. (b) |
2,500 | 39,375 | |||
| 55,100 | |||||
| Oil & Gas - Machinery/Equipment 1.1% |
|||||
| FMC Technologies, Inc. (b) |
1,000 | 23,300 | |||
| Telecommunications - Wireless Equipment 7.7% |
|||||
| Garmin, Ltd. |
570 | 31,054 | |||
| NMS Communications Corporation (b) |
12,600 | 78,624 | |||
| REMEC, Inc. (b) |
2,500 | 21,025 | |||
| Trimble Navigation, Ltd. (b) |
1,000 | 37,240 | |||
| 167,943 | |||||
| Total Common Stocks (Cost $ 1,761,108) |
2,083,469 | ||||
41
Table of Contents
| SCHEDULES OF INVESTMENTS IN SECURITIES (continued) |
December 31, 2003 |
STRONG ADVISOR TECHNOLOGY FUND (continued)
| Shares or Principal Amount |
Value (Note 2) | |||||
| Short-Term Investments (a) 1.0% |
||||||
| Repurchase Agreements |
||||||
| State Street Bank (Dated 12/31/03), 0.75%, Due 1/02/04 (Repurchase proceeds $21,901); Collateralized by: United States Government & Agency Issues (c) |
$ | 21,900 | $ | 21,900 | ||
| Total Short-Term Investments (Cost $ 21,900) |
21,900 | |||||
| Total Investments in Securities (Cost $ 1,783,008) 96.0% |
2,105,369 | |||||
| Other Assets and Liabilities, Net 4.0% |
88,122 | |||||
| Net Assets 100.0% |
$ | 2,193,491 | ||||
STRONG ADVISOR U.S. SMALL/MID CAP GROWTH FUND
| Shares or Principal Amount |
Value (Note 2) | ||||
| Common Stocks 98.7% |
|||||
| Auto/Truck - Original Equipment 1.7% |
|||||
| A.S.V., Inc. (b) |
2,450 | $ | 91,532 | ||
| Building - Resident/Commercial 1.4% |
|||||
| Meritage Corporation (b) |
1,200 | 79,572 | |||
| Commercial Services - Miscellaneous 1.0% |
|||||
| Portfolio Recovery Associates, Inc. (b) |
1,975 | 52,436 | |||
| Commercial Services - Schools 4.7% |
|||||
| Career Education Corporation (b) |
3,742 | 149,942 | |||
| Corinthian Colleges, Inc. (b) |
2,030 | 112,787 | |||
| 262,729 | |||||
| Computer - IT Services 3.3% |
|||||
| Cognizant Technology Solutions Corporation (b) |
1,725 | 78,729 | |||
| SRA International, Inc. Class A (b) |
2,430 | 104,733 | |||
| 183,462 | |||||
| Computer - Local Networks 1.1% |
|||||
| Foundry Networks, Inc. (b) |
2,235 | 61,150 | |||
| Computer - Manufacturers 2.0% |
|||||
| Cray, Inc. (b) |
11,235 | 111,564 | |||
| Computer - Software Design 1.2% |
|||||
| Magma Design Automation (b) |
2,745 | 64,068 | |||
| Computer Software - Desktop 1.2% |
|||||
| Sonic Solutions (b) |
4,500 | 68,850 | |||
| Computer Software - Medical 5.8% |
|||||
| Cerner Corporation (b) |
2,345 | 88,758 | |||
| eResearch Technology, Inc. (b) |
4,602 | 116,983 | |||
| IDX Systems Corporation (b) |
4,385 | 117,606 | |||
| 323,347 | |||||
| Computer Software - Security 2.0% |
|||||
| Netscreen Technologies, Inc. (b) |
4,405 | 109,024 | |||
| Electronics - Contract Manufacturing 1.2% |
|||||
| TTM Technologies, Inc. (b) |
3,900 | 65,832 | |||
| Electronics - Miscellaneous Components 1.0% |
|||||
| Applied Films Corporation (b) |
1,665 | 54,978 | |||
| Electronics - Scientific Measuring 1.0% |
|||||
| Cognex Corporation |
1,975 | 55,774 | |||
| Electronics - Semiconductor Manufacturing 20.6% |
|||||
| Cabot Microelectronics Corporation (b) |
1,020 | $ | 49,980 | ||
| Cree, Inc. (b) |
6,435 | 113,835 | |||
| Cymer, Inc. (b) |
1,060 | 48,961 | |||
| ESS Technology, Inc. (b) |
6,805 | 115,753 | |||
| Integrated Circuit Systems, Inc. (b) |
1,765 | 50,285 | |||
| Integrated Silicon Solution, Inc. (b) |
6,880 | 107,810 | |||
| Lexar Media, Inc. (b) |
7,035 | 122,620 | |||
| OmniVision Technologies, Inc. (b) |
1,855 | 102,489 | |||
| Power Integrations, Inc. (b) |
1,500 | 50,190 | |||
| Rudolph Technologies, Inc. (b) |
4,180 | 102,577 | |||
| SanDisk Corporation (b) |
2,170 | 132,674 | |||
| Trident Microsystems, Inc. (b) |
8,258 | 143,846 | |||
| 1,141,020 | |||||
| Finance - Consumer/Commercial Loans 1.5% |
|||||
| United Panam Financial Corporation (b) |
4,860 | 81,211 | |||
| Financial Services - Miscellaneous 2.0% |
|||||
| Investors Financial Services Corporation |
2,815 | 108,124 | |||
| Insurance - Property/Casualty/Title 1.5% |
|||||
| ProAssurance Corporation (b) |
2,520 | 81,018 | |||
| Internet - E*Commerce 3.2% |
|||||
| Netflix, Inc. (b) |
2,350 | 128,521 | |||
| University of Phoenix Online (b) |
715 | 49,285 | |||
| 177,806 | |||||
| Internet - Internet Service Provider 1.9% |
|||||
| United Online, Inc. (b) |
6,160 | 103,426 | |||
| Internet - Network Security/Solutions 0.7% |
|||||
| iPass, Inc. (b) |
2,465 | 39,514 | |||
| Medical - Biomedical/Biotechnology 1.5% |
|||||
| Ciphergen Biosystems, Inc. (b) |
7,530 | 84,637 | |||
| Medical - Drug/Diversified 2.0% |
|||||
| Salix Pharmaceuticals, Ltd. (b) |
4,955 | 112,330 | |||
| Medical - Generic Drugs 2.4% |
|||||
| American Pharmaceutical Partners, Inc. (b) |
3,900 | 131,040 | |||
| Medical - Nursing Homes 4.1% |
|||||
| Odyssey Healthcare, Inc. (b) |
3,667 | 107,296 | |||
| VistaCare, Inc. Class A (b) |
3,400 | 119,510 | |||
| 226,806 | |||||
| Medical - Products 3.0% |
|||||
| EPIX Medical, Inc. (b) |
4,470 | 72,772 | |||
| I-Flow Corporation (b) |
6,830 | 95,005 | |||
| 167,777 | |||||
| Medical/Dental - Services 2.9% |
|||||
| American Healthways, Inc. (b) |
6,770 | 161,600 | |||
| Oil & Gas - United States Exploration & Production 3.1% |
|||||
| Evergreen Resources, Inc. (b) |
1,995 | 64,857 | |||
| Penn Virginia Corporation |
1,930 | 107,404 | |||
| 172,261 | |||||
| Retail - Clothing/Shoes 3.6% |
|||||
| Hot Topic, Inc. (b) |
3,715 | 109,444 | |||
| Pacific Sunwear of California (b) |
4,372 | 92,337 | |||
| 201,781 | |||||
42
Table of Contents
STRONG ADVISOR U.S. SMALL/MID CAP GROWTH FUND (continued)
| Shares or Principal Amount |
Value (Note 2) |
||||||
| Retail - Miscellaneous 2.2% |
|||||||
| Sharper Image Corporation (b) |
3,665 | $ | 119,662 | ||||
| Retail - Restaurants 2.6% |
|||||||
| Chicago Pizza & Brewery, Inc. (b) |
5,800 | 86,536 | |||||
| P.F. Chang’s China Bistro, Inc. (b) |
1,060 | 53,933 | |||||
| 140,469 | |||||||
| Retail/Wholesale - Building Products 2.7% |
|||||||
| Tractor Supply Company (b) |
3,850 | 149,726 | |||||
| Telecommunications - Wireless Equipment 3.1% |
|||||||
| UTStarcom, Inc. (b) |
4,680 | 173,488 | |||||
| Telecommunications - Wireless Services 3.1% |
|||||||
| Alamosa Holdings, Inc. (b) |
20,670 | 82,887 | |||||
| Nextel Communications, Inc. Class A (b) |
3,240 | 90,914 | |||||
| 173,801 | |||||||
| Transportation - Truck 2.4% |
|||||||
| J.B. Hunt Transport Services, Inc. (b) |
4,885 | 131,944 | |||||
| Total Common Stocks (Cost $4,565,668) |
5,463,759 | ||||||
| Short-Term Investments (a) 3.0% |
|||||||
| Repurchase Agreements |
|||||||
| State Street Bank (Dated 12/31/03), 0.75%, Due 1/02/04 (Repurchase proceeds $166,907); Collateralized by: United States Government & Agency Issues (c) |
$ | 166,900 | 166,900 | ||||
| Total Short-Term Investments (Cost $166,900) |
166,900 | ||||||
| Total Investments in Securities (Cost $4,732,568) 101.7% |
5,630,659 | ||||||
| Other Assets and Liabilities, Net (1.7%) |
(93,456 | ) | |||||
| Net Assets 100.0% |
$ | 5,537,203 | |||||
STRONG ADVISOR UTILITIES AND ENERGY FUND
| Shares or Principal Amount |
Value (Note 2) | |||||
| Common Stocks 92.0% |
||||||
| Chemicals - Specialty 4.5% |
||||||
| Ashland, Inc. |
10,500 | $ | 462,630 | |||
| Oil & Gas - Drilling 2.5% |
||||||
| Nabors Industries, Ltd. (b) |
6,200 | 257,300 | ||||
| Oil & Gas - Field Services 1.6% |
||||||
| Halliburton Company |
6,500 | 169,000 | ||||
| Oil & Gas - International Integrated 18.9% |
||||||
| BP PLC Sponsored ADR |
10,000 | 493,500 | ||||
| ConocoPhillips |
9,600 | 629,472 | ||||
| Exxon Mobil Corporation |
4,200 | 172,200 | ||||
| Royal Dutch Petroleum Company - New York Shares |
6,400 | 335,296 | ||||
| Total SA Sponsored ADR |
3,400 | 314,534 | ||||
| 1,945,002 | ||||||
| Oil & Gas - Machinery/Equipment 1.7% |
||||||
| Weatherford International, Ltd. (b) |
5,000 | 180,000 | ||||
| Oil & Gas - United States Exploration & Production 3.1% |
||||||
| Anadarko Petroleum Corporation |
2,500 | $ | 127,525 | |||
| Devon Energy Corporation |
500 | 28,630 | ||||
| Occidental Petroleum Corporation |
4,000 | 168,960 | ||||
| 325,115 | ||||||
| Oil & Gas - United States Integrated 2.4% |
||||||
| Questar Corporation |
7,000 | 246,050 | ||||
| Telecommunications - Services 4.4% |
||||||
| ALLTEL Corporation |
3,000 | 139,740 | ||||
| BellSouth Corporation |
4,000 | 113,200 | ||||
| SBC Communications, Inc. |
3,500 | 91,245 | ||||
| Verizon Communications, Inc. |
3,000 | 105,240 | ||||
| 449,425 | ||||||
| Telecommunications - Services Foreign 1.9% |
||||||
| BCE, Inc. |
9,000 | 201,240 | ||||
| Telecommunications - Wireless Services 0.5% |
||||||
| AT&T Wireless Services, Inc. (b) |
6,000 | 47,940 | ||||
| Utility - Electric Power 33.1% |
||||||
| The AES Corporation (b) |
3,000 | 28,320 | ||||
| Calpine Corporation (b) |
64,000 | 307,840 | ||||
| Constellation Energy Group, Inc. |
26,000 | 1,018,160 | ||||
| Dominion Resources, Inc. |
8,500 | 542,555 | ||||
| Duke Energy Corporation |
9,000 | 184,050 | ||||
| Exelon Corporation |
7,000 | 464,520 | ||||
| FPL Group, Inc. |
6,000 | 392,520 | ||||
| FirstEnergy Corporation |
3,500 | 123,200 | ||||
| Public Service Enterprise Group, Inc. |
8,000 | 350,400 | ||||
| 3,411,565 | ||||||
| Utility - Gas Distribution 17.4% |
||||||
| Equitable Resources, Inc. |
1,300 | 55,796 | ||||
| ONEOK, Inc. |
35,500 | 783,840 | ||||
| Sempra Energy |
19,000 | 571,140 | ||||
| South Jersey Industries, Inc. |
3,600 | 145,800 | ||||
| UGI Corporation |
7,000 | 237,300 | ||||
| 1,793,876 | ||||||
| Total Common Stocks (Cost $7,950,630) |
9,489,143 | |||||
| Short-Term Investments (a) 8.0% |
||||||
| Repurchase Agreements |
||||||
| State Street Bank (Dated 12/31/03), 0.75%, Due 1/02/04 (Repurchase proceeds $823,334); Collateralized by: United States Government & Agency Issues (c) |
$ | 823,300 | 823,300 | |||
| Total Short-Term Investments (Cost $823,300) |
823,300 | |||||
| Total Investments in Securities (Cost $8,773,930) 100.0% |
10,312,443 | |||||
| Other Assets and Liabilities, Net 0.0% |
2,364 | |||||
| Net Assets 100.0% |
$ | 10,314,807 | ||||
43
Table of Contents
| SCHEDULES OF INVESTMENTS IN SECURITIES (continued) |
December 31, 2003 |
STRONG ADVISOR LARGE COMPANY CORE FUND
| Shares or Principal Amount |
Value (Note 2) | ||||
| Common Stocks 99.5% |
|||||
| Banks - Money Center 7.1% |
|||||
| Bank of America Corporation |
24,300 | $ | 1,954,449 | ||
| Citigroup, Inc. |
82,300 | 3,994,842 | |||
| J.P. Morgan Chase & Company |
63,000 | 2,313,990 | |||
| 8,263,281 | |||||
| Beverages - Alcoholic 2.6% |
|||||
| Anheuser-Busch Companies, Inc. |
57,800 | 3,044,904 | |||
| Building - Heavy Construction 1.7% |
|||||
| Chicago Bridge & Iron Company NV |
68,000 | 1,965,200 | |||
| Building - Resident/Commercial 1.6% |
|||||
| Lennar Corporation Class A |
20,000 | 1,920,000 | |||
| Computer - IT Services 1.7% |
|||||
| International Business Machines Corporation |
21,500 | 1,992,620 | |||
| Computer - Local Networks 2.2% |
|||||
| Cisco Systems, Inc. (b) |
104,500 | 2,538,305 | |||
| Computer - Manufacturers 1.7% |
|||||
| Dell, Inc. (b) |
56,800 | 1,928,928 | |||
| Computer Software - Desktop 3.6% |
|||||
| Microsoft Corporation |
152,000 | 4,186,080 | |||
| Computer Software - Enterprise 1.0% |
|||||
| VERITAS Software Corporation (b) |
30,500 | 1,133,380 | |||
| Diversified Operations 5.5% |
|||||
| 3M Co. |
29,800 | 2,533,894 | |||
| General Electric Company |
124,050 | 3,843,069 | |||
| 6,376,963 | |||||
| Electronics - Military Systems 2.0% |
|||||
| L-3 Communications Corporation (b) |
46,000 | 2,362,560 | |||
| Electronics - Semiconductor Manufacturing 5.6% |
|||||
| Applied Materials, Inc. (b) |
58,500 | 1,313,325 | |||
| Intel Corporation |
106,500 | 3,429,300 | |||
| NVIDIA Corporation (b) |
79,000 | 1,836,750 | |||
| 6,579,375 | |||||
| Finance - Index Tracking Funds 1.0% |
|||||
| MSCI I Shares Emerging Markets Index |
7,000 | 1,147,510 | |||
| Finance - Investment Brokers 1.5% |
|||||
| The Goldman Sachs Group, Inc. |
18,600 | 1,836,378 | |||
| Finance - Savings & Loan 1.0% |
|||||
| Washington Mutual, Inc. |
29,200 | 1,171,504 | |||
| Financial Services - Miscellaneous 2.1% |
|||||
| American Express Company |
50,100 | 2,416,323 | |||
| Food - Dairy Products 2.4% |
|||||
| Dean Foods Company (b) |
84,450 | 2,775,872 | |||
| Food - Miscellaneous Preparation 2.3% |
|||||
| PepsiCo, Inc. |
57,685 | 2,689,275 | |||
| Insurance - Brokers 1.5% |
|||||
| Willis Group Holdings, Ltd. |
51,000 | 1,737,570 | |||
| Insurance - Diversified 3.2% |
|||||
| American International Group, Inc. |
56,650 | $ | 3,754,762 | ||
| Insurance - Property/Casualty/Title 4.0% |
|||||
| The Allstate Corporation |
69,000 | 2,968,380 | |||
| Radian Group, Inc. |
35,000 | 1,706,250 | |||
| 4,674,630 | |||||
| Internet - E*Commerce 1.8% |
|||||
| InterActiveCorp (b) |
61,600 | 2,090,088 | |||
| Media - Cable TV 1.8% |
|||||
| Comcast Corporation Class A (b) |
62,500 | 2,054,375 | |||
| Media - Radio/TV 2.1% |
|||||
| Viacom, Inc. Class B |
54,000 | 2,396,520 | |||
| Medical - Biomedical/Biotechnology 4.6% |
|||||
| Amgen, Inc. (b) |
43,300 | 2,675,940 | |||
| Medimmune, Inc. (b) |
55,300 | 1,404,620 | |||
| Nektar Therapeutics (b) |
96,000 | 1,306,560 | |||
| 5,387,120 | |||||
| Medical - Ethical Drugs 4.9% |
|||||
| Merck & Company, Inc. |
39,000 | 1,801,800 | |||
| Pfizer, Inc. |
109,670 | 3,874,641 | |||
| 5,676,441 | |||||
| Medical - Generic Drugs 3.5% |
|||||
| Barr Laboratories, Inc. (b) |
21,000 | 1,615,950 | |||
| Teva Pharmaceutical Industries, Ltd. ADR |
43,700 | 2,478,227 | |||
| 4,094,177 | |||||
| Metal Ores - Miscellaneous 2.6% |
|||||
| Freeport-McMoran Copper & Gold, Inc. Class B |
72,700 | 3,062,851 | |||
| Metal Products - Fasteners 1.6% |
|||||
| Illinois Tool Works, Inc. |
22,800 | 1,913,148 | |||
| Oil & Gas - International Integrated 3.6% |
|||||
| BP PLC Sponsored ADR |
46,600 | 2,299,710 | |||
| Exxon Mobil Corporation |
46,248 | 1,896,168 | |||
| 4,195,878 | |||||
| Oil & Gas - United States Exploration & |
|||||
| Production 2.0% |
|||||
| Devon Energy Corporation |
41,808 | 2,393,926 | |||
| Retail - Major Discount Chains 1.5% |
|||||
| Wal-Mart Stores, Inc. |
33,200 | 1,761,260 | |||
| Retail/Wholesale - Building Products 2.0% |
|||||
| Lowe’s Companies, Inc. |
42,000 | 2,326,380 | |||
| Retail/Wholesale - Jewelry 2.0% |
|||||
| Tiffany & Company |
51,500 | 2,327,800 | |||
| Soap & Cleaning Preparations 2.0% |
|||||
| The Procter & Gamble Company |
23,000 | 2,297,240 | |||
| Telecommunications - Services 1.4% |
|||||
| AT&T Corporation |
84,000 | 1,705,200 | |||
| Telecommunications - Wireless |
|||||
| Equipment 1.9% |
|||||
| Nokia Corporation Sponsored ADR |
132,000 | 2,244,000 | |||
| Telecommunications - Wireless Services 2.0% |
|||||
| Nextel Communications, Inc. Class A (b) |
84,000 | 2,357,040 | |||
44
Table of Contents
STRONG ADVISOR LARGE COMPANY CORE FUND (continued)
| Shares or Principal Amount |
Value (Note 2) |
||||||
| Utility - Electric Power 1.6% |
|||||||
| The AES Corporation (b) |
193,000 | $ | 1,821,920 | ||||
| Utility - Gas Distribution 1.3% |
|||||||
| Equitable Resources, Inc. |
35,200 | 1,510,784 | |||||
| Total Common Stocks (Cost $103,054,530) |
116,111,568 | ||||||
| Short-Term Investments (a) 0.7% |
|||||||
| Repurchase Agreements |
|||||||
| State Street Bank (Dated 12/31/03), 0.75%, Due 1/02/04 (Repurchase proceeds $856,436); Collateralized by: United States Government & Agency Issues (c) |
$ | 856,400 | 856,400 | ||||
| Total Short-Term Investments (Cost $856,400) |
856,400 | ||||||
| Total Investments in Securities (Cost $103,910,930) 100.2% |
116,967,968 | ||||||
| Other Assets and Liabilities, Net (0.2%) |
(262,709 | ) | |||||
| Net Assets 100.0% |
$ | 116,705,259 | |||||
CURRENCY ABBREVIATIONS
| CAD — CanadianDollars |
| CHF — SwissFranc |
| JPY — Japanese Yen |
LEGEND
| (a) | Short-term investments include any security which has a remaining maturity of less than one year and investments in money market funds. |
| (b) | Non-income producing security. |
| (c) | See Note 2(J) of Notes to Financial Statements. |
| (d) | Affiliated Issuer (See Note 9 of Notes to Financial Statements.) |
| (e) | All or a portion of these securities are held in conjuction with open written option contracts. |
| (f) | See Note 2(K) of Notes to Financial Statements. |
| (g) | Restricted and Illiquid security. |
| (h) | Security trades in foreign currency and is converted to U.S. dollars daily using current exchange rates. |
Percentages are stated as a percent of net assets.
See Notes to Financial Statements.
45
Table of Contents
STATEMENTS OF ASSETS AND LIABILITIES
December 31, 2003
| (In Thousands) | ||||||||||
| Strong Advisor Common Stock Fund |
Strong Advisor Mid Cap Growth Fund |
Strong Advisor Small Cap Value Fund | ||||||||
| Assets: |
||||||||||
| Investments in Securities, at Value Unaffiliated Issuers (Cost of $ 1,183,110, $58,232 and $1,288,073, respectively) |
$ | 1,627,407 | $ | 74,722 | $ | 1,742,313 | ||||
| Affiliated Issuers (Cost of $0, $0 and $237,009, respectively) |
— | — | 402,501 | |||||||
| Receivable for Securities Sold |
15,239 | 326 | 8,939 | |||||||
| Receivable for Fund Shares Sold |
280 | — | 1,976 | |||||||
| Dividends and Interest Receivable |
858 | 9 | 336 | |||||||
| Other Assets |
83 | 36 | 26 | |||||||
| Total Assets |
1,643,867 | 75,093 | 2,156,091 | |||||||
| Liabilities: |
||||||||||
| Payable for Securities Purchased |
— | 1,217 | 6,890 | |||||||
| Written Options, at Value (Premiums Received of $0, $0 and $7,843, respectively) |
— | — | 9,727 | |||||||
| Payable for Fund Shares Redeemed |
4,351 | 51 | 13,162 | |||||||
| Payable Upon Return of Securities on Loan |
48,053 | 2,463 | — | |||||||
| Accrued Operating Expenses and Other Liabilities |
485 | 45 | 543 | |||||||
| Total Liabilities |
52,889 | 3,776 | 30,322 | |||||||
| Net Assets |
$ | 1,590,978 | $ | 71,317 | $ | 2,125,769 | ||||
| Net Assets Consist of: |
||||||||||
| Capital Stock (Par Value and Paid-in Capital) |
$ | 1,260,769 | $ | 173,602 | $ | 1,495,127 | ||||
| Undistributed Net Investment Income (Loss) |
— | — | — | |||||||
| Undistributed Net Realized Gain (Loss) |
(114,097 | ) | (118,775) | 12,794 | ||||||
| Net Unrealized Appreciation (Depreciation) |
444,306 | 16,490 | 617,848 | |||||||
| Net Assets |
$ | 1,590,978 | $ | 71,317 | $ | 2,125,769 | ||||
See Notes to Financial Statements.
46
Table of Contents
STATEMENTS OF ASSETS AND LIABILITIES (continued)
December 31, 2003
| Strong Advisor Stock Fund |
Strong Advisor Mid Cap |
Strong Advisor Value Fund | |||||||
| Class A ($ and shares in full) |
|||||||||
| Net Assets |
$ | 81,067,925 | $ | 9,866,845 | $ | 673,580,278 | |||
| Capital Shares Outstanding (Unlimited Number Authorized) |
3,688,643 | 842,184 | 24,584,538 | ||||||
| Net Asset Value Per Share |
$ | 21.98 | $ | 11.72 | $ | 27.40 | |||
| Public Offering Price Per Share |
|||||||||
| ($21.98 divided by .9425, $11.72 divided by .9425 and $27.40 divided by .9425, respectively) |
$ | 23.32 | $ | 12.44 | $ | 29.07 | |||
| Class B ($ and shares in full) |
|||||||||
| Net Assets |
$ | 38,829,539 | $ | 2,914,146 | $ | 126,152,001 | |||
| Capital Shares Outstanding (Unlimited Number Authorized) |
1,803,432 | 254,256 | 4,709,714 | ||||||
| Net Asset Value Per Share |
$ | 21.53 | $ | 11.46 | $ | 26.79 | |||
| Class C ($ and shares in full) |
|||||||||
| Net Assets |
$ | 34,025,065 | $ | 784,318 | $ | 158,941,842 | |||
| Capital Shares Outstanding (Unlimited Number Authorized) |
1,580,162 | 68,455 | 5,924,252 | ||||||
| Net Asset Value Per Share |
$ | 21.53 | $ | 11.46 | $ | 26.83 | |||
| Class Z ($ and shares in full) |
|||||||||
| Net Assets |
$ | 1,437,055,093 | $ | 57,751,237 | $ | 1,167,094,493 | |||
| Capital Shares Outstanding (Unlimited Number Authorized) |
64,865,229 | 4,943,174 | 42,388,276 | ||||||
| Net Asset Value Per Share |
$ | 22.15 | $ | 11.68 | $ | 27.53 | |||
See Notes to Financial Statements.
47
Table of Contents
STATEMENTS OF ASSETS AND LIABILITIES (continued)
December 31, 2003
| (In Thousands) | ||||
| Strong Advisor U.S. Value Fund |
||||
| Assets: |
||||
| Investments in Securities, at Value (Cost of $214,801) |
$ | 263,524 | ||
| Receivable for Fund Shares Sold |
37 | |||
| Dividends and Interest Receivable |
442 | |||
| Other Assets |
34 | |||
| Total Assets |
264,037 | |||
| Liabilities: |
||||
| Payable for Fund Shares Redeemed |
79 | |||
| Payable Upon Return of Securities on Loan |
3,584 | |||
| Accrued Operating Expenses and Other Liabilities |
103 | |||
| Total Liabilities |
3,766 | |||
| Net Assets |
$ | 260,271 | ||
| Net Assets Consist of: |
||||
| Capital Stock (Par Value and Paid-in Capital) |
$ | 216,792 | ||
| Undistributed Net Investment Income (Loss) |
19 | |||
| Undistributed Net Realized Gain (Loss) |
(5,263 | ) | ||
| Net Unrealized Appreciation (Depreciation) |
48,723 | |||
| Net Assets |
$ | 260,271 | ||
See Notes to Financial Statements.
48
Table of Contents
STATEMENTS OF ASSETS AND LIABILITIES (continued)
December 31, 2003
| Strong Advisor U.S. Value Fund | |||
| Class A ($ and shares in full) |
|||
| Net Assets |
$ | 4,751,796 | |
| Capital Shares Outstanding (Unlimited Number Authorized) |
269,270 | ||
| Net Asset Value Per Share |
$ | 17.65 | |
| Public Offering Price Per Share ($17.65 divided by .9425) |
$ | 18.73 | |
| Class B ($ and shares in full) |
|||
| Net Assets |
$ | 4,958,283 | |
| Capital Shares Outstanding (Unlimited Number Authorized) |
281,040 | ||
| Net Asset Value Per Share |
$ | 17.64 | |
| Class C ($ and shares in full) |
|||
| Net Assets |
$ | 4,229,825 | |
| Capital Shares Outstanding (Unlimited Number Authorized) |
240,859 | ||
| Net Asset Value Per Share |
$ | 17.56 | |
| Class K ($ and shares in full) |
|||
| Net Assets |
$ | 87,368,006 | |
| Capital Shares Outstanding (Unlimited Number Authorized) |
4,987,799 | ||
| Net Asset Value Per Share |
$ | 17.52 | |
| Class Z ($ and shares in full) |
|||
| Net Assets |
$ | 158,963,271 | |
| Capital Shares Outstanding (Unlimited Number Authorized) |
8,943,815 | ||
| Net Asset Value Per Share |
$ | 17.77 | |
See Notes to Financial Statements.
49
Table of Contents
STATEMENTS OF ASSETS AND LIABILITIES (continued)
December 31, 2003
| (In Thousands, Except As Noted) | ||||||||||||
| Strong Advisor Endeavor Large Cap Fund |
Strong Advisor Focus Fund |
Strong Advisor International Core Fund |
||||||||||
| Assets: |
||||||||||||
| Investments in Securities, at Value (Cost of $31,434, $2,395 and $1,156, respectively) |
$ | 37,907 | $ | 3,135 | $ | 1,483 | ||||||
| Receivable for Securities Sold |
213 | 11 | — | |||||||||
| Dividends and Interest Receivable |
16 | — | 2 | |||||||||
| Other Assets |
26 | 22 | 16 | |||||||||
| Total Assets |
38,162 | 3,168 | 1,501 | |||||||||
| Liabilities: |
||||||||||||
| Payable for Securities Purchased |
296 | 27 | — | |||||||||
| Payable for Fund Shares Redeemed |
— | 13 | — | |||||||||
| Short-Term Borrowings on Line of Credit |
100 | — | — | |||||||||
| Accrued Operating Expenses and Other Liabilities |
16 | 8 | 6 | |||||||||
| Total Liabilities |
412 | 48 | 6 | |||||||||
| Net Assets |
$ | 37,750 | $ | 3,120 | $ | 1,495 | ||||||
| Net Assets Consist of: |
||||||||||||
| Capital Stock (Par Value and Paid-in Capital) |
$ | 37,139 | $ | 6,955 | $ | 1,206 | ||||||
| Undistributed Net Investment Income (Loss) |
— | — | 2 | |||||||||
| Undistributed Net Realized Gain (Loss) |
(5,862 | ) | (4,575 | ) | (40 | ) | ||||||
| Net Unrealized Appreciation (Depreciation) |
6,473 | 740 | 327 | |||||||||
| Net Assets |
$ | 37,750 | $ | 3,120 | $ | 1,495 | ||||||
| Class A ($ and shares in full) |
||||||||||||
| Net Assets |
$ | 36,601,078 | $ | 1,584,860 | $ | 584,791 | ||||||
| Capital Shares Outstanding (Unlimited Number Authorized) |
3,631,071 | 264,703 | 50,992 | |||||||||
| Net Asset Value Per Share |
$ | 10.08 | $ | 5.99 | $ | 11.47 | ||||||
| Public Offering Price Per Share ($10.08 divided by .9425, $5.99 divided by .9425 and $11.47 divided by .9425, respectively) |
$ | 10.69 | $ | 6.36 | $ | 12.17 | ||||||
| Class B ($ and shares in full) |
||||||||||||
| Net Assets |
$ | 719,235 | $ | 1,204,864 | $ | 726,636 | ||||||
| Capital Shares Outstanding (Unlimited Number Authorized) |
72,140 | 205,087 | 63,478 | |||||||||
| Net Asset Value Per Share |
$ | 9.97 | $ | 5.87 | $ | 11.45 | ||||||
| Class C ($ and shares in full) |
||||||||||||
| Net Assets |
$ | 430,156 | $ | 330,450 | $ | 183,097 | ||||||
| Capital Shares Outstanding (Unlimited Number Authorized) |
43,141 | 56,259 | 16,013 | |||||||||
| Net Asset Value Per Share |
$ | 9.97 | $ | 5.87 | $ | 11.43 | ||||||
See Notes to Financial Statements.
50
Table of Contents
STATEMENTS OF ASSETS AND LIABILITIES (continued)
December 31, 2003
| (In Thousands, Except As Noted) | ||||||||||||
| Strong Advisor Select Fund |
Strong Advisor Technology Fund |
Strong Advisor U.S. Small/Mid Cap Growth Fund |
||||||||||
| Assets: |
||||||||||||
| Investments in Securities, at Value (Cost of $67,135, $1,783 and $4,733, respectively) |
$ | 82,872 | $ | 2,105 | $ | 5,631 | ||||||
| Receivable for Securities Sold |
— | 175 | — | |||||||||
| Receivable for Fund Shares Sold |
4 | — | 14 | |||||||||
| Dividends and Interest Receivable |
40 | — | — | |||||||||
| Other Assets |
19 | 22 | 9 | |||||||||
| Total Assets |
82,935 | 2,302 | 5,654 | |||||||||
| Liabilities: |
||||||||||||
| Payable for Securities Purchased |
640 | — | 110 | |||||||||
| Payable for Fund Shares Redeemed |
14 | 5 | — | |||||||||
| Short-Term Borrowings on Line of Credit |
— | 100 | — | |||||||||
| Accrued Operating Expenses and Other Liabilities |
24 | 4 | 7 | |||||||||
| Total Liabilities |
678 | 109 | 117 | |||||||||
| Net Assets |
$ | 82,257 | $ | 2,193 | $ | 5,537 | ||||||
| Net Assets Consist of: |
||||||||||||
| Capital Stock (Par Value and Paid-in Capital) |
$ | 72,493 | $ | 2,634 | $ | 4,886 | ||||||
| Undistributed Net Investment Income (Loss) |
— | — | — | |||||||||
| Undistributed Net Realized Gain (Loss) |
(5,973 | ) | (763 | ) | (247 | ) | ||||||
| Net Unrealized Appreciation (Depreciation) |
15,737 | 322 | 898 | |||||||||
| Net Assets |
$ | 82,257 | $ | 2,193 | $ | 5,537 | ||||||
| Class A ($ and shares in full) |
||||||||||||
| Net Assets |
$ | 81,190,076 | $ | 1,318,067 | $ | 2,911,932 | ||||||
| Capital Shares Outstanding (Unlimited Number Authorized) |
9,715,649 | 177,407 | 260,295 | |||||||||
| Net Asset Value Per Share |
$ | 8.36 | $ | 7.43 | $ | 11.19 | ||||||
| Public Offering Price Per Share ($8.36 divided by .9425, $7.43 divided by .9425 and $11.19 divided by .9425, respectively) |
$ | 8.87 | $ | 7.88 | $ | 11.87 | ||||||
| Class B ($ and shares in full) |
||||||||||||
| Net Assets |
$ | 622,212 | $ | 567,026 | $ | 1,121,287 | ||||||
| Capital Shares Outstanding (Unlimited Number Authorized) |
76,108 | 77,427 | 100,272 | |||||||||
| Net Asset Value Per Share |
$ | 8.18 | $ | 7.32 | $ | 11.18 | ||||||
| Class C ($ and shares in full) |
||||||||||||
| Net Assets |
$ | 444,384 | $ | 308,398 | $ | 1,503,984 | ||||||
| Capital Shares Outstanding (Unlimited Number Authorized) |
54,346 | 42,253 | 134,380 | |||||||||
| Net Asset Value Per Share |
$ | 8.18 | $ | 7.30 | $ | 11.19 | ||||||
See Notes to Financial Statements.
51
Table of Contents
STATEMENTS OF ASSETS AND LIABILITIES (continued)
December 31, 2003
| (In Thousands, Except As Noted) |
||||
| Strong Advisor Utilities and Energy Fund |
||||
| Assets: |
||||
| Investments in Securities, at Value (Cost of $ 8,774) |
$ | 10,312 | ||
| Receivable for Securities Sold |
39 | |||
| Receivable for Fund Shares Sold |
60 | |||
| Dividends and Interest Receivable |
20 | |||
| Other Assets |
13 | |||
| Total Assets |
10,444 | |||
| Liabilities: |
||||
| Payable for Securities Purchased |
91 | |||
| Payable for Fund Shares Redeemed |
31 | |||
| Accrued Operating Expenses and Other Liabilities |
7 | |||
| Total Liabilities |
129 | |||
| Net Assets |
$ | 10,315 | ||
| Net Assets Consist of: |
||||
| Capital Stock (Par Value and Paid-in Capital) |
$ | 9,222 | ||
| Undistributed Net Investment Income (Loss) |
1 | |||
| Undistributed Net Realized Gain (Loss) |
(446 | ) | ||
| Net Unrealized Appreciation (Depreciation) |
1,538 | |||
| Net Assets |
$ | 10,315 | ||
| Class A ($ and shares in full) |
||||
| Net Assets |
$ | 9,878,093 | ||
| Capital Shares Outstanding (Unlimited Number Authorized) |
929,689 | |||
| Net Asset Value Per Share |
$ | 10.63 | ||
| Public Offering Price Per Share |
||||
| ($10.63 divided by .9425) |
$ | 11.28 | ||
| Class B ($ and shares in full) |
||||
| Net Assets |
$ | 178,028 | ||
| Capital Shares Outstanding (Unlimited Number Authorized) |
16,736 | |||
| Net Asset Value Per Share |
$ | 10.64 | ||
| Class C ($ and shares in full) |
||||
| Net Assets |
$ | 258,686 | ||
| Capital Shares Outstanding (Unlimited Number Authorized) |
24,358 | |||
| Net Asset Value Per Share |
$ | 10.62 | ||
See Notes to Financial Statements.
52
Table of Contents
STATEMENTS OF ASSETS AND LIABILITIES (continued)
December 31, 2003
| (In Thousands, Except As Noted) | |||
| Strong Advisor Large Company Core Fund | |||
| Assets: |
|||
| Investments in Securities, at Value (Cost of $103,911) |
$ | 116,968 | |
| Receivable for Securities Sold |
2,554 | ||
| Receivable for Fund Shares Sold |
133 | ||
| Dividends and Interest Receivable |
97 | ||
| Other Assets |
15 | ||
| Total Assets |
119,767 | ||
| Liabilities: |
|||
| Payable for Securities Purchased |
2,924 | ||
| Payable for Fund Shares Redeemed |
106 | ||
| Accrued Operating Expenses and Other Liabilities |
32 | ||
| Total Liabilities |
3,062 | ||
| Net Assets |
$ | 116,705 | |
| Net Assets Consist of: |
|||
| Capital Stock (Par Value and Paid-in Capital) |
$ | 102,972 | |
| Undistributed Net Investment Income (Loss) |
— | ||
| Undistributed Net Realized Gain (Loss) |
676 | ||
| Net Unrealized Appreciation (Depreciation) |
13,057 | ||
| Net Assets |
$ | 116,705 | |
| Class A ($ and shares in full) |
|||
| Net Assets |
$ | 67,462,503 | |
| Capital Shares Outstanding (Unlimited Number Authorized) |
6,242,620 | ||
| Net Asset Value Per Share |
$ | 10.81 | |
| Public Offering Price Per Share ($10.81 divided by .9425) |
$ | 11.47 | |
| Class B ($ and shares in full) |
|||
| Net Assets |
$ | 7,558,779 | |
| Capital Shares Outstanding (Unlimited Number Authorized) |
707,189 | ||
| Net Asset Value Per Share |
$ | 10.69 | |
| Class C ($ and shares in full) |
|||
| Net Assets |
$ | 6,311,569 | |
| Capital Shares Outstanding (Unlimited Number Authorized) |
590,559 | ||
| Net Asset Value Per Share |
$ | 10.69 | |
| Class K ($ and shares in full) |
|||
| Net Assets |
$ | 35,372,408 | |
| Capital Shares Outstanding (Unlimited Number Authorized) |
3,262,868 | ||
| Net Asset Value Per Share |
$ | 10.84 | |
See Notes to Financial Statements.
53
Table of Contents
For the Year Ended December 31, 2003
| (In Thousands) | ||||||||||||
| Strong Advisor Common Stock Fund |
Strong Advisor Mid Cap Growth Fund |
Strong Advisor Small Cap Value Fund |
||||||||||
| Income: |
||||||||||||
| Dividends – Unaffiliated Issuers (net of foreign withholding taxes of $81, $4 and $416, respectively) |
$ | 13,001 | $ | 243 | $ | 13,372 | ||||||
| Dividends – Affiliated Issuers |
619 | — | 989 | |||||||||
| Interest |
1,042 | 28 | 940 | |||||||||
| Total Income |
14,662 | 271 | 15,301 | |||||||||
| Expenses (Note 4): |
||||||||||||
| Investment Advisory Fees |
11,794 | 642 | 11,577 | |||||||||
| Administrative Fees |
4,719 | 256 | 4,632 | |||||||||
| Custodian Fees |
97 | 17 | 157 | |||||||||
| Shareholder Servicing Costs |
3,928 | 421 | 4,070 | |||||||||
| Reports to Shareholders |
447 | 89 | 392 | |||||||||
| 12b-1 Fees |
742 | 61 | 3,381 | |||||||||
| Other |
443 | 87 | 457 | |||||||||
| Total Expenses before Expense Offsets |
22,170 | 1,573 | 24,666 | |||||||||
| Expense Offsets |
(218 | ) | (84 | ) | (267 | ) | ||||||
| Expenses, Net |
21,952 | 1,489 | 24,399 | |||||||||
| Net Investment Income (Loss) |
(7,290 | ) | (1,218 | ) | (9,098 | ) | ||||||
| Realized and Unrealized Gain (Loss): |
||||||||||||
| Net Realized Gain (Loss) on: |
||||||||||||
| Investments |
70,630 | 10,253 | 85,409 | |||||||||
| Foreign Currencies |
(6 | ) | — | — | ||||||||
| Futures Contracts |
— | 947 | — | |||||||||
| Written Options |
5,419 | (41 | ) | (2,777 | ) | |||||||
| Net Realized Gain (Loss) |
76,043 | 11,159 | 82,632 | |||||||||
| Net Change in Unrealized Appreciation/Depreciation on: |
||||||||||||
| Investments |
452,630 | 16,288 | 598,145 | |||||||||
| Foreign Currencies |
9 | — | — | |||||||||
| Written Options |
(1,989 | ) | — | (2,502 | ) | |||||||
| Net Change in Unrealized Appreciation/Depreciation |
450,650 | 16,288 | 595,643 | |||||||||
| Net Gain (Loss) on Investments |
526,693 | 27,447 | 678,275 | |||||||||
| Net Increase (Decrease) in Net Assets Resulting from Operations |
$ | 519,403 | $ | 26,229 | $ | 669,177 | ||||||
See Notes to Financial Statements.
54
Table of Contents
STATEMENTS OF OPERATIONS (continued)
For the Year Ended December 31, 2003
| (In Thousands) | ||||
| Strong Advisor U.S. Value Fund |
||||
| Income: |
||||
| Dividends |
$ | 5,123 | ||
| Interest |
70 | |||
| Total Income |
5,193 | |||
| Expenses (Note 4): |
||||
| Investment Advisory Fees |
1,206 | |||
| Administrative Fees |
649 | |||
| Custodian Fees |
14 | |||
| Shareholder Servicing Costs |
1,087 | |||
| Reports to Shareholders |
242 | |||
| 12b-1 Fees |
67 | |||
| Other |
144 | |||
| Total Expenses before Expense Offsets |
3,409 | |||
| Expense Offsets |
(80 | ) | ||
| Expenses, Net |
3,329 | |||
| Net Investment Income (Loss) |
1,864 | |||
| Realized and Unrealized Gain (Loss): |
||||
| Net Realized Gain (Loss) on Investments |
11,073 | |||
| Net Change in Unrealized Appreciation/Depreciation on Investments |
49,990 | |||
| Net Gain (Loss) on Investments |
61,063 | |||
| Net Increase (Decrease) in Net Assets Resulting from Operations |
$ | 62,927 | ||
See Notes to Financial Statements.
55
Table of Contents
STATEMENTS OF OPERATIONS (continued)
For the Year Ended December 31, 2003
| (In Thousands) | ||||||||||||
| Strong Advisor Endeavor Large Cap Fund |
Strong Advisor Focus Fund |
Strong Advisor International Core Fund |
||||||||||
| Income: |
||||||||||||
| Dividends (net of foreign withholding taxes of $1, $0 and $2, respectively) |
$ | 249 | $ | 9 | $ | 21 | ||||||
| Interest |
11 | 1 | 1 | |||||||||
| Total Income |
260 | 10 | 22 | |||||||||
| Expenses (Note 4): |
||||||||||||
| Investment Advisory Fees |
261 | 27 | 8 | |||||||||
| Administrative Fees |
104 | 11 | 3 | |||||||||
| Custodian Fees |
8 | 8 | 18 | |||||||||
| Shareholder Servicing Costs |
70 | 7 | 2 | |||||||||
| 12b-1 Fees |
94 | 21 | 8 | |||||||||
| Professional Fees |
17 | 13 | 15 | |||||||||
| Federal and State Registration Fees |
33 | 28 | 34 | |||||||||
| Other |
10 | 6 | 3 | |||||||||
| Total Expenses before Expense Offsets |
597 | 121 | 91 | |||||||||
| Expense Offsets |
(32 | ) | (64 | ) | (91 | ) | ||||||
| Expenses, Net |
565 | 57 | — | |||||||||
| Net Investment Income (Loss) |
(305 | ) | (47 | ) | 22 | |||||||
| Realized and Unrealized Gain (Loss): |
||||||||||||
| Net Realized Gain (Loss) on: |
||||||||||||
| Investments |
3,624 | 233 | (12 | ) | ||||||||
| Written Options |
— | (8 | ) | — | ||||||||
| Net Realized Gain (Loss) |
3,624 | 225 | (12 | ) | ||||||||
| Net Change in Unrealized Appreciation/Depreciation on Investments |
6,766 | 615 | 342 | |||||||||
| Net Gain (Loss) on Investments |
10,390 | 840 | 330 | |||||||||
| Net Increase (Decrease) in Net Assets Resulting from Operations |
$ | 10,085 | $ | 793 | $ | 352 | ||||||
See Notes to Financial Statements.
56
Table of Contents
STATEMENTS OF OPERATIONS (continued)
For the Year Ended December 31, 2003
| (In Thousands) | ||||||||||||
| Strong Advisor Select Fund |
Strong Advisor Technology Fund |
Strong Advisor U.S. Small/Mid Cap Growth Fund |
||||||||||
| Income: |
||||||||||||
| Dividends (net of foreign withholding taxes of $4, $0 and $0, respectively) |
$ | 384 | $ | 7 | $ | — | ||||||
| Interest |
24 | 1 | 1 | |||||||||
| Total Income |
408 | 8 | 1 | |||||||||
| Expenses (Note 4 ): |
||||||||||||
| Investment Advisory Fees |
545 | 16 | 19 | |||||||||
| Administrative Fees |
218 | 7 | 7 | |||||||||
| Custodian Fees |
9 | 1 | 5 | |||||||||
| Shareholder Servicing Costs |
146 | 4 | 5 | |||||||||
| 12b-1 Fees |
188 | 10 | 16 | |||||||||
| Professional Fees |
20 | 13 | 10 | |||||||||
| Federal and State Registration Fees |
36 | 29 | 42 | |||||||||
| Other |
19 | 3 | 1 | |||||||||
| Total Expenses before Expense Offsets |
1,181 | 83 | 105 | |||||||||
| Expenses Offsets |
(28 | ) | (36 | ) | (46 | ) | ||||||
| Expenses, Net |
1,153 | 47 | 59 | |||||||||
| Net Investment Income (Loss) |
(745 | ) | (39 | ) | (58 | ) | ||||||
| Realized and Unrealized Gain (Loss): |
||||||||||||
| Net Realized Gain (Loss) on Investments |
8,935 | 435 | (68 | ) | ||||||||
| Net Change in Unrealized Appreciation/Depreciation on Investments |
15,584 | 787 | 890 | |||||||||
| Net Gain (Loss) on Investments |
24,519 | 1,222 | 822 | |||||||||
| Net Increase (Decrease) in Net Assets Resulting from Operations |
$ | 23,774 | $ | 1,183 | $ | 764 | ||||||
See Notes to Financial Statements.
57
Table of Contents
STATEMENTS OF OPERATIONS (continued)
For the Year Ended December 31, 2003
| (In Thousands) | ||||
| Strong Advisor Utilities and Energy Fund |
||||
| Income: |
||||
| Dividends (net of foreign withholding taxes of $6) |
$ | 417 | ||
| Interest |
9 | |||
| Total Income |
426 | |||
| Expenses (Note 4): |
||||
| Investment Advisory Fees |
95 | |||
| Administrative Fees |
38 | |||
| Custodian Fees |
9 | |||
| Shareholder Servicing Costs |
25 | |||
| 12b-1 Fees |
34 | |||
| Federal and State Registration Fees |
30 | |||
| Other |
12 | |||
| Total Expenses before Expense Offsets |
243 | |||
| Expense Offsets |
(2 | ) | ||
| Expenses, Net |
241 | |||
| Net Investment Income (Loss) |
185 | |||
| Realized and Unrealized Gain (Loss): |
||||
| Net Realized Gain (Loss) on Investments |
134 | |||
| Net Change in Unrealized Appreciation/Depreciation on Investments |
1,523 | |||
| Net Gain (Loss) on Investments |
1,657 | |||
| Net Increase (Decrease) in Net Assets Resulting from Operations |
$ | 1,842 | ||
See Notes to Financial Statements.
58
Table of Contents
STATEMENTS OF OPERATIONS (continued)
For the Year Ended December 31, 2003
| (In Thousands) | ||||
| Strong Advisor Large Company Core Fund |
||||
| Income: |
||||
| Dividends (net of foreign withholding taxes of $7) |
$ | 948 | ||
| Interest |
32 | |||
| Total Income |
980 | |||
| Expenses (Note 4): |
||||
| Investment Advisory Fees |
510 | |||
| Administrative Fees |
193 | |||
| Custodian Fees |
9 | |||
| Shareholder Servicing Costs |
136 | |||
| Reports to Shareholders |
16 | |||
| 12b-1 Fees |
174 | |||
| Federal and State Registration Fees |
95 | |||
| Other |
18 | |||
| Total Expenses before Expense Offsets |
1,151 | |||
| Expense Offsets |
(194 | ) | ||
| Expenses, Net |
957 | |||
| Net Investment Income (Loss) |
23 | |||
| Realized and Unrealized Gain (Loss): |
||||
| Net Realized Gain (Loss) on Investments |
2,100 | |||
| Net Change in Unrealized Appreciation/Depreciation on Investments |
13,076 | |||
| Net Gain (Loss) on Investments |
15,176 | |||
| Net Increase (Decrease) in Net Assets Resulting from Operations |
$ | 15,199 | ||
See Notes to Financial Statements.
59
Table of Contents
STATEMENTS OF CHANGES IN NET ASSETS
| (In Thousands) | ||||||||||||||||
| Strong Advisor Common Stock Fund |
Strong Advisor Mid Cap Growth Fund |
|||||||||||||||
| Year Ended Dec. 31, 2003 |
Year Ended Dec. 31, 2002 |
Year Ended Dec. 31, 2003 |
Year Ended Dec. 31, 2002 |
|||||||||||||
| Operations: |
||||||||||||||||
| Net Investment Income (Loss) |
$ | (7,290 | ) | $ | (5,135 | ) | $ | (1,218 | ) | $ | (1,515 | ) | ||||
| Net Realized Gain (Loss) |
76,043 | (77,920 | ) | 11,159 | (38,031 | ) | ||||||||||
| Net Change in Unrealized Appreciation/Depreciation |
450,650 | (286,461 | ) | 16,288 | (10,240 | ) | ||||||||||
| Net Increase (Decrease) in Net Assets Resulting from Operations |
519,403 | (369,516 | ) | 26,229 | (49,786 | ) | ||||||||||
| Capital Share Transactions (Note 8): |
||||||||||||||||
| Net Increase (Decrease) in Net Assets from Capital Share Transactions |
(384,712 | ) | 65,320 | (29,181 | ) | (16,104 | ) | |||||||||
| Total Increase (Decrease) in Net Assets |
134,691 | (304,196 | ) | (2,952 | ) | (65,890 | ) | |||||||||
| Net Assets: |
||||||||||||||||
| Beginning of Year |
1,456,287 | 1,760,483 | 74,269 | 140,159 | ||||||||||||
| End of Year |
$ | 1,590,978 | $ | 1,456,287 | $ | 71,317 | $ | 74,269 | ||||||||
| Undistributed Net Investment Income (Loss) |
$ | — | $ | — | $ | — | $ | — | ||||||||
| Strong Advisor Small Cap Value Fund |
||||||||
| Year Ended Dec. 31, 2003 |
Year Ended Dec. 31, 2002 |
|||||||
| Operations: |
||||||||
| Net Investment Income (Loss) |
$ | (9,098 | ) | $ | 794 | |||
| Net Realized Gain (Loss) |
82,632 | (13,119 | ) | |||||
| Net Change in Unrealized Appreciation/Depreciation |
595,643 | (84,823 | ) | |||||
| Net Increase (Decrease) in Net Assets Resulting from Operations |
669,177 | (97,148 | ) | |||||
| Distributions: |
||||||||
| From Net Investment Income: |
||||||||
| Class A |
(248 | ) | — | |||||
| Class B |
(48 | ) | — | |||||
| Class C |
(61 | ) | — | |||||
| Class Z |
(436 | ) | — | |||||
| From Net Realized Gains: |
||||||||
| Class A |
(15,533 | ) | — | |||||
| Class B |
(2,975 | ) | — | |||||
| Class C |
(3,815 | ) | — | |||||
| Class Z |
(27,278 | ) | — | |||||
| Total Distributions |
(50,394 | ) | — | |||||
| Capital Share Transactions (Note 8): |
||||||||
| Net Increase (Decrease) in Net Assets from Capital Share Transactions |
339,695 | 475,362 | ||||||
| Total Increase (Decrease) in Net Assets |
958,478 | 378,214 | ||||||
| Net Assets: |
||||||||
| Beginning of Year |
1,167,291 | 789,077 | ||||||
| End of Year |
$ | 2,125,769 | $ | 1,167,291 | ||||
| Undistributed Net Investment Income (Loss) |
$ | — | $ | 793 | ||||
See Notes to Financial Statements.
60
Table of Contents
STATEMENTS OF CHANGES IN NET ASSETS (continued)
| (In Thousands) | ||||||||
| Strong Advisor U.S. Value Fund |
||||||||
| Year Ended Dec. 31, 2003 |
Year Ended Dec. 31, 2002 |
|||||||
| Operations: |
||||||||
| Net Investment Income (Loss) |
$ | 1,864 | $ | 777 | ||||
| Net Realized Gain (Loss) |
11,073 | (13,672 | ) | |||||
| Net Change in Unrealized Appreciation/Depreciation |
49,990 | (22,399 | ) | |||||
| Net Increase (Decrease) in Net Assets Resulting from Operations |
62,927 | (35,294 | ) | |||||
| Distributions: |
||||||||
| From Net Investment Income: |
||||||||
| Class A |
(36 | ) | (48 | ) | ||||
| Class B |
(11 | ) | (5 | ) | ||||
| Class C |
(9 | ) | (8 | ) | ||||
| Class K |
(523 | ) | (263 | ) | ||||
| Class Z |
(1,255 | ) | (416 | ) | ||||
| From Net Realized Gains: |
||||||||
| Class A |
— | (328 | ) | |||||
| Class B |
— | (213 | ) | |||||
| Class C |
— | (61 | ) | |||||
| Class K |
— | (8 | ) | |||||
| Class Z |
— | (13,995 | ) | |||||
| Total Distributions |
(1,834 | ) | (15,345 | ) | ||||
| Capital Share Transactions (Note 8): |
||||||||
| Net Increase (Decrease) in Net Assets from Capital Share Transactions |
(16,592 | ) | 74,257 | |||||
| Total Increase (Decrease) in Net Assets |
44,501 | 23,618 | ||||||
| Net Assets: |
||||||||
| Beginning of Year |
215,770 | 192,152 | ||||||
| End of Year |
$ | 260,271 | $ | 215,770 | ||||
| Undistributed Net Investment Income (Loss) |
$ | 19 | $ | 4 | ||||
See Notes to Financial Statements.
61
Table of Contents
STATEMENTS OF CHANGES IN NET ASSETS (continued)
| (In Thousands) | ||||||||||||||||
| Strong Advisor Endeavor Large Cap Fund |
Strong Advisor Focus Fund |
|||||||||||||||
| Year Ended Dec. 31, 2003 |
Year Ended Dec. 31, 2002 |
Year Ended Dec. 31, 2003 |
Year Ended Dec. 31, 2002 |
|||||||||||||
| Operations: |
||||||||||||||||
| Net Investment Income (Loss) |
$ | (305 | ) | $ | (337 | ) | $ | (47 | ) | $ | (94 | ) | ||||
| Net Realized Gain (Loss) |
3,624 | (9,424 | ) | 225 | (872 | ) | ||||||||||
| Net Change in Unrealized Appreciation/Depreciation |
6,766 | (148 | ) | 615 | (799 | ) | ||||||||||
| Net Increase (Decrease) in Net Assets Resulting from Operations |
10,085 | (9,909 | ) | 793 | (1,765 | ) | ||||||||||
| Capital Share Transactions (Note 8): |
||||||||||||||||
| Net Increase (Decrease) in Net Assets from |
||||||||||||||||
| Capital Share Transactions |
(1,142 | ) | 10,385 | (1,326 | ) | (1,883 | ) | |||||||||
| Total Increase (Decrease) in Net Assets |
8,943 | 476 | (533 | ) | (3,648 | ) | ||||||||||
| Net Assets: |
||||||||||||||||
| Beginning of Year |
28,807 | 28,331 | 3,653 | 7,301 | ||||||||||||
| End of Year |
$ | 37,750 | $ | 28,807 | $ | 3,120 | $ | 3,653 | ||||||||
| Undistributed Net Investment Income (Loss) |
$ | — | $ | — | $ | — | $ | — | ||||||||
| Strong Advisor Core Fund |
Strong Advisor Select Fund |
|||||||||||||||
| Year Ended Dec. 31, 2003 |
Year Ended Dec. 31, 2002 |
Year Ended Dec. 31, 2003 |
Year Ended Dec. 31, 2002 |
|||||||||||||
| Operations: |
||||||||||||||||
| Net Investment Income (Loss) |
$ | 22 | $ | (3 | ) | $ | (745 | ) | $ | (624 | ) | |||||
| Net Realized Gain (Loss) |
(12 | ) | (28 | ) | 8,935 | (14,593 | ) | |||||||||
| Net Change in Unrealized Appreciation/Depreciation |
342 | (27 | ) | 15,584 | (563 | ) | ||||||||||
| Net Increase (Decrease) in Net Assets Resulting from Operations |
352 | (58 | ) | 23,774 | (15,780 | ) | ||||||||||
| Distributions: |
||||||||||||||||
| From Net Investment Income: |
||||||||||||||||
| Class A |
(7 | ) | — | — | — | |||||||||||
| Class B |
(10 | ) | — | — | — | |||||||||||
| Class C |
(3 | ) | — | — | — | |||||||||||
| From Net Realized Gains: |
||||||||||||||||
| Class A |
— | — | — | (106 | ) | |||||||||||
| Class B |
— | — | — | (1 | ) | |||||||||||
| Total Distributions |
(20 | ) | — | — | (107 | ) | ||||||||||
| Capital Share Transactions (Note 8): |
||||||||||||||||
| Net Increase (Decrease) in Net Assets from Capital Share Transactions |
562 | 347 | 2,173 | 14,803 | ||||||||||||
| Total Increase (Decrease) in Net Assets |
894 | 289 | 25,947 | (1,084 | ) | |||||||||||
| Net Assets: |
||||||||||||||||
| Beginning of Year |
601 | 312 | 56,310 | 57,394 | ||||||||||||
| End of Year |
$ | 1,495 | $ | 601 | $ | 82,257 | $ | 56,310 | ||||||||
| Undistributed Net Investment Income (Loss) |
$ | 2 | $ | — | $ | — | $ | — | ||||||||
See Notes to Financial Statements.
62
Table of Contents
STATEMENTS OF CHANGES IN NET ASSETS (continued)
| (In Thousands) | ||||||||||||||||
| Strong Advisor Technology Fund |
Strong Advisor U.S. Small/Mid Cap Growth Fund |
|||||||||||||||
| Year Ended Dec. 31, 2003 |
Year Ended Dec. 31, 2002 |
Year Ended Dec. 31, 2003 |
Period Ended Dec. 31, 2002 |
|||||||||||||
| (Note 1) | ||||||||||||||||
| Operations: |
||||||||||||||||
| Net Investment Income (Loss) |
$ | (39 | ) | $ | (42 | ) | $ | (58 | ) | $ | (10 | ) | ||||
| Net Realized Gain (Loss) |
435 | (714 | ) | (68 | ) | (180 | ) | |||||||||
| Net Change in Unrealized Appreciation/Depreciation |
787 | (408 | ) | 890 | 8 | |||||||||||
| Net Increase (Decrease) in Net Assets Resulting from Operations |
1,183 | (1,164 | ) | 764 | (182 | ) | ||||||||||
| Capital Share Transactions (Note 8): |
||||||||||||||||
| Net Increase (Decrease) in Net Assets from Capital Share Transactions |
(479 | ) | (262 | ) | 4,011 | 944 | ||||||||||
| Total Increase (Decrease) in Net Assets |
704 | (1,426 | ) | 4,775 | 762 | |||||||||||
| Net Assets: |
||||||||||||||||
| Beginning of Year |
1,489 | 2,915 | 762 | — | ||||||||||||
| End of Year |
$ | 2,193 | $ | 1,489 | $ | 5,537 | $ | 762 | ||||||||
| Undistributed Net Investment Income (Loss) |
$ | — | $ | — | $ | — | $ | — | ||||||||
| Strong Advisor Utilities and Energy Fund |
||||||||
| Year Ended Dec. 31, 2003 |
Period Ended Dec. 31, 2002 |
|||||||
| (Note 1) | ||||||||
| Operations: |
||||||||
| Net Investment Income (Loss) |
$ | 185 | $ | 37 | ||||
| Net Realized Gain (Loss) |
134 | (581 | ) | |||||
| Net Change in Unrealized Appreciation/Depreciation |
1,523 | 16 | ||||||
| Net Increase (Decrease) in Net Assets Resulting from Operations |
1,842 | (528 | ) | |||||
| Distributions: |
||||||||
| From Net Investment Income: |
||||||||
| Class A |
(180 | ) | (36 | ) | ||||
| Class B |
(2 | ) | — | |||||
| Class C |
(2 | ) | (1 | ) | ||||
| Total Distributions |
(184 | ) | (37 | ) | ||||
| Capital Share Transactions (Note 8): |
||||||||
| Net Increase (Decrease) in Net Assets from |
||||||||
| Capital Share Transactions |
2,271 | 6,951 | ||||||
| Total Increase (Decrease) in Net Assets |
3,929 | 6,386 | ||||||
| Net Assets: |
||||||||
| Beginning of Year |
6,386 | — | ||||||
| End of Year |
$ | 10,315 | $ | 6,386 | ||||
| Undistributed Net Investment Income (Loss) |
$ | 1 | $ | — | ||||
See Notes to Financial Statements.
63
Table of Contents
STATEMENTS OF CHANGES IN NET ASSETS (continued)
| (In Thousands) | ||||||||||||
| Strong Advisor Large Company Core Fund |
||||||||||||
| Year Ended Dec. 31, 2003 |
Period Ended Dec. 31, 2002 |
Year Ended Sept. 30, 2002 |
||||||||||
| Operations: |
||||||||||||
| Net Investment Income (Loss) |
$ | 23 | $ | 8 | $ | 42 | ||||||
| Net Realized Gain (Loss) |
2,100 | (233 | ) | (397 | ) | |||||||
| Net Change in Unrealized Appreciation/Depreciation |
13,076 | 611 | (398 | ) | ||||||||
| Net Increase (Decrease) in Net Assets Resulting from Operations |
15,199 | 386 | (753 | ) | ||||||||
| Distributions: |
||||||||||||
| From Net Investment Income: |
||||||||||||
| Class A |
(20 | ) | (6 | ) | (22 | ) | ||||||
| Class K |
(46 | ) | — | — | ||||||||
| From Net Realized Gains: |
||||||||||||
| Class A |
(62 | ) | — | (140 | ) | |||||||
| Class B |
(7 | ) | — | — | ||||||||
| Class C |
(6 | ) | — | — | ||||||||
| Class K |
(33 | ) | — | — | ||||||||
| Total Distributions |
(174 | ) | (6 | ) | (162 | ) | ||||||
| Capital Share Transactions (Note 8): |
||||||||||||
| Net Increase (Decrease) in Net Assets from Capital Share Transactions |
92,004 | 2,841 | 3,279 | |||||||||
| Total Increase (Decrease) in Net Assets |
107,029 | 3,221 | 2,364 | |||||||||
| Net Assets: |
||||||||||||
| Beginning of Year |
9,676 | 6,455 | 4,091 | |||||||||
| End of Year |
$ | 116,705 | $ | 9,676 | $ | 6,455 | ||||||
| Undistributed Net Investment Income (Loss) |
$ | — | $ | 8 | $ | 6 | ||||||
See Notes to Financial Statements.
64
Table of Contents
STRONG ADVISOR COMMON STOCK FUND — CLASS A
| Year Ended |
||||||||||||||||
| Dec. 31, 2003 |
Dec. 31, 2002 |
Dec. 31, 2001 |
Dec. 31, 2000(b)(c) |
|||||||||||||
| Selected Per-Share Data(a) |
||||||||||||||||
| Net Asset Value, Beginning of Period |
$ | 15.87 | $ | 19.71 | $ | 20.15 | $ | 18.90 | ||||||||
| Income From Investment Operations: |
||||||||||||||||
| Net Investment Income (Loss) |
(0.10 | ) | (0.08 | )(d) | (0.04 | ) | (0.00 | )(e) | ||||||||
| Net Realized and Unrealized Gains (Losses) on Investments |
6.21 | (3.76 | ) | (0.36 | ) | 1.28 | ||||||||||
| Total from Investment Operations |
6.11 | (3.84 | ) | (0.40 | ) | 1.28 | ||||||||||
| Less Distributions: |
||||||||||||||||
| From Net Investment Income |
— | — | — | (0.03 | ) | |||||||||||
| From Net Realized Gains |
— | — | (0.04 | ) | — | |||||||||||
| Total Distributions |
— | — | (0.04 | ) | (0.03 | ) | ||||||||||
| Net Asset Value, End of Period |
$ | 21.98 | $ | 15.87 | $ | 19.71 | $ | 20.15 | ||||||||
| Ratios and Supplemental Data |
||||||||||||||||
| Total Return |
+38.5 | % | –19.5 | % | –2.0 | % | +6.8 | % | ||||||||
| Net Assets, End of Period (In Millions) |
$ | 81 | $ | 46 | $ | 28 | $ | 0 | (f) | |||||||
| Ratio of Expenses to Average Net Assets before Expense Offsets |
1.6 | % | 1.6 | % | 1.6 | % | 1.6 | %* | ||||||||
| Ratio of Expenses to Average Net Assets |
1.5 | % | 1.6 | % | 1.6 | % | 1.6 | %* | ||||||||
| Ratio of Net Investment Income (Loss) to Average Net Assets |
(0.6 | )% | (0.5 | )% | (0.5 | )% | (0.2 | )%* | ||||||||
| Portfolio Turnover Rate(g) |
41.8 | % | 64.9 | % | 89.3 | % | 95.4 | % | ||||||||
STRONG ADVISOR COMMON STOCK FUND — CLASS B
| Year Ended |
||||||||||||||||
| Dec. 31, 2003 |
Dec. 31, 2002 |
Dec. 31, 2001 |
Dec. 31, 2000(b)(c) |
|||||||||||||
| Selected Per-Share Data(a) |
||||||||||||||||
| Net Asset Value, Beginning of Period |
$ | 15.67 | $ | 19.62 | $ | 20.16 | $ | 18.90 | ||||||||
| Income From Investment Operations: |
||||||||||||||||
| Net Investment Income (Loss) |
(0.24 | ) | (0.22 | )(d) | (0.09 | ) | (0.01 | ) | ||||||||
| Net Realized and Unrealized Gains (Losses) on Investments |
6.10 | (3.73 | ) | (0.41 | ) | 1.28 | ||||||||||
| Total from Investment Operations |
5.86 | (3.95 | ) | (0.50 | ) | 1.27 | ||||||||||
| Less Distributions: |
||||||||||||||||
| From Net Investment Income |
— | — | — | (0.01 | ) | |||||||||||
| From Net Realized Gains |
— | — | (0.04 | ) | — | |||||||||||
| Total Distributions |
— | — | (0.04 | ) | (0.01 | ) | ||||||||||
| Net Asset Value, End of Period |
$ | 21.53 | $ | 15.67 | $ | 19.62 | $ | 20.16 | ||||||||
| Ratios and Supplemental Data |
||||||||||||||||
| Total Return |
+37.4 | % | –20.1 | % | –2.5 | % | +6.8 | % | ||||||||
| Net Assets, End of Period (In Millions) |
$ | 39 | $ | 24 | $ | 16 | $ | 0 | (f) | |||||||
| Ratio of Expenses to Average Net Assets before Expense Offsets |
2.4 | % | 2.4 | % | 2.5 | % | 2.0 | %* | ||||||||
| Ratio of Expenses to Average Net Assets |
2.3 | % | 2.4 | % | 2.3 | % | 2.0 | %* | ||||||||
| Ratio of Net Investment Income (Loss) to Average Net Assets |
(1.4 | )% | (1.3 | )% | (1.1 | )% | (0.6 | )%* | ||||||||
| Portfolio Turnover Rate(g) |
41.8 | % | 64.9 | % | 89.3 | % | 95.4 | % | ||||||||
| * | Calculated on an annualized basis. |
| (a) | Information presented relates to a share of capital stock of the Fund outstanding for the entire period. |
| (b) | For the period from November 30,2000 (commencement of class) to December 31, 2000. |
| (c) | Per share data reflects a 1.233 for 1.000 share split which occurred on March 8, 2001. |
| (d) | Net investment income (loss) per share represents net investment income (loss) divided by average shares outstanding throughout the year. |
| (e) | Amount calculated is less than $0.005. |
| (f) | Amount is less than $500,000. |
| (g) | Calculated on the basis of the Fund as a whole without distinguishing between the classes of shares issued. |
See Notes to Financial Statements.
65
Table of Contents
FINANCIAL HIGHLIGHTS (continued)
STRONG ADVISOR COMMON STOCK FUND — CLASS C
| Year Ended |
||||||||||||||||
| Dec. 31, 2003 |
Dec. 31, 2002 |
Dec. 31, 2001 |
Dec. 31, 2000(b)(c) |
|||||||||||||
| Selected Per-Share Data(a) |
||||||||||||||||
| Net Asset Value, Beginning of Period |
$ | 15.68 | $ | 19.62 | $ | 20.16 | $ | 18.90 | ||||||||
| Income From Investment Operations: |
||||||||||||||||
| Net Investment Income (Loss) |
(0.25 | ) | (0.22 | )(d) | (0.09 | ) | (0.01 | ) | ||||||||
| Net Realized and Unrealized Gains (Losses) on Investments |
6.10 | (3.72 | ) | (0.41 | ) | 1.28 | ||||||||||
| Total from Investment Operations |
5.85 | (3.94 | ) | (0.50 | ) | 1.27 | ||||||||||
| Less Distributions: |
||||||||||||||||
| From Net Investment Income |
— | — | — | (0.01 | ) | |||||||||||
| From Net Realized Gains |
— | — | (0.04 | ) | — | |||||||||||
| Total Distributions |
— | — | (0.04 | ) | (0.01 | ) | ||||||||||
| Net Asset Value, End of Period |
$ | 21.53 | $ | 15.68 | $ | 19.62 | $ | 20.16 | ||||||||
| Ratios and Supplemental Data |
||||||||||||||||
| Total Return |
+37.3 | % | –20.1 | % | –2.5 | % | +6.8 | % | ||||||||
| Net Assets, End of Period (In Millions) |
$ | 34 | $ | 23 | $ | 15 | $ | 0 | (e) | |||||||
| Ratio of Expenses to Average Net Assets before Expense Offsets |
2.4 | % | 2.4 | % | 2.4 | % | 2.0 | %* | ||||||||
| Ratio of Expenses to Average Net Assets |
2.3 | % | 2.4 | % | 2.2 | % | 2.0 | %* | ||||||||
| Ratio of Net Investment Income (Loss) to Average Net Assets |
(1.4 | )% | (1.3 | )% | (1.1 | )% | (0.6 | )%* | ||||||||
| Portfolio Turnover Rate(f) |
41.8 | % | 64.9 | % | 89.3 | % | 95.4 | % | ||||||||
STRONG ADVISOR COMMON STOCK FUND — CLASS Z
| Year Ended |
||||||||||||||||||||
| Dec. 31, 2003 |
Dec. 31, 2002 |
Dec. 31, 2001 |
Dec. 31, 2000 |
Dec. 31, 1999 |
||||||||||||||||
| Selected Per-Share Data(a) |
||||||||||||||||||||
| Net Asset Value, Beginning of Period |
$ | 15.97 | $ | 19.78 | $ | 20.16 | $ | 25.21 | $ | 21.06 | ||||||||||
| Income From Investment Operations: |
||||||||||||||||||||
| Net Investment Income (Loss) |
(0.09 | ) | (0.05 | )(d) | (0.02 | ) | 0.04 | (0.01 | ) | |||||||||||
| Net Realized and Unrealized Gains (Losses) on Investments |
6.27 | (3.76 | ) | (0.32 | ) | (0.59 | ) | 8.19 | ||||||||||||
| Total from Investment Operations |
6.18 | (3.81 | ) | (0.34 | ) | (0.55 | ) | 8.18 | ||||||||||||
| Less Distributions: |
||||||||||||||||||||
| From Net Investment Income |
— | — | — | (0.04 | ) | — | ||||||||||||||
| From Net Realized Gains |
— | — | (0.04 | ) | (4.46 | ) | (4.03 | ) | ||||||||||||
| Total Distributions |
— | — | (0.04 | ) | (4.50 | ) | (4.03 | ) | ||||||||||||
| Net Asset Value, End of Period |
$ | 22.15 | $ | 15.97 | $ | 19.78 | $ | 20.16 | $ | 25.21 | ||||||||||
| Ratios and Supplemental Data |
||||||||||||||||||||
| Total Return |
+38.7 | % | –19.3 | % | –1.7 | % | –1.2 | % | +40.4 | % | ||||||||||
| Net Assets, End of Period (In Millions) |
$ | 1,437 | $ | 1,363 | $ | 1,703 | $ | 1,719 | $ | 1,733 | ||||||||||
| Ratio of Expenses to Average Net Assets before Expense Offsets |
1.4 | % | 1.3 | % | 1.3 | % | 1.2 | % | 1.2 | % | ||||||||||
| Ratio of Expenses to Average Net Assets |
1.4 | % | 1.3 | % | 1.3 | % | 1.2 | % | 1.2 | % | ||||||||||
| Ratio of Net Investment Income (Loss) to Average Net Assets |
(0.4 | )% | (0.3 | )% | (0.1 | )% | 0.2 | % | (0.1 | )% | ||||||||||
| Portfolio Turnover Rate(f) |
41.8 | % | 64.9 | % | 89.3 | % | 95.4 | % | 80.1 | % | ||||||||||
| * | Calculated on an annualized basis. |
| (a) | Information presented relates to a share of capital stock of the Fund outstanding for the entire period. |
| (b) | For the period from November 30, 2000 (commencement of class) to December 31, 2000. |
| (c) | Per share data reflects a 1.233 for 1.000 share split which occurred on March 8, 2001. |
| (d) | Net investment income (loss) per share represents net investment income (loss) divided by average shares outstanding throughout the year. |
| (e) | Amount is less than $500,000. |
| (f) | Calculated on the basis of the Fund as a whole without distinguishing between the classes of shares issued. |
See Notes to Financial Statements.
66
Table of Contents
FINANCIAL HIGHLIGHTS (continued)
STRONG ADVISOR MID CAP GROWTH FUND — CLASS A
| Year Ended |
||||||||||||||||
| Dec. 31, 2003 |
Dec. 31, 2002 |
Dec. 31, 2001 |
Dec. 31, 2000(b)(c) |
|||||||||||||
| Selected Per-Share Data(a) |
||||||||||||||||
| Net Asset Value, Beginning of Period |
$ | 8.71 | $ | 13.95 | $ | 20.22 | $ | 17.71 | ||||||||
| Income From Investment Operations: |
||||||||||||||||
| Net Investment Income (Loss) |
(0.13 | )(d) | (0.14 | )(d) | (0.22 | )(d) | (0.01 | ) | ||||||||
| Net Realized and Unrealized Gains (Losses) on Investments |
3.14 | (5.10 | ) | (6.05 | ) | 2.52 | ||||||||||
| Total from Investment Operations |
3.01 | (5.24 | ) | (6.27 | ) | 2.51 | ||||||||||
| Less Distributions: |
||||||||||||||||
| From Net Realized Gains |
— | — | (0.00 | )(g) | — | |||||||||||
| Total Distributions |
— | — | (0.00 | )(g) | — | |||||||||||
| Net Asset Value, End of Period |
$ | 11.72 | $ | 8.71 | $ | 13.95 | $ | 20.22 | ||||||||
| Ratios and Supplemental Data |
||||||||||||||||
| Total Return |
+34.6 | % | –37.6 | % | –31.0 | % | +14.2 | % | ||||||||
| Net Assets, End of Period (In Millions) |
$ | 10 | $ | 6 | $ | 7 | $ | 1 | ||||||||
| Ratio of Expenses to Average Net Assets before Expense Offsets |
1.7 | % | 1.6 | % | 1.8 | % | 1.7 | %* | ||||||||
| Ratio of Expenses to Average Net Assets |
1.6 | % | 1.6 | % | 1.8 | % | 1.7 | %* | ||||||||
| Ratio of Net Investment Income (Loss) to Average Net Assets |
(1.3 | )% | (1.3 | )% | (1.4 | )% | (1.3 | )%* | ||||||||
| Portfolio Turnover Rate(e) |
249.6 | % | 526.6 | % | 650.0 | % | 683.7 | % | ||||||||
| STRONG ADVISOR MID CAP GROWTH FUND — CLASS B |
| |||||||||||||||
| Year Ended |
||||||||||||||||
| Dec. 31, 2003 |
Dec. 31, 2002 |
Dec. 31, 2001 |
Dec. 31, 2000(b)(c) |
|||||||||||||
| Selected Per-Share Data(a) |
||||||||||||||||
| Net Asset Value, Beginning of Period |
$ | 8.59 | $ | 13.89 | $ | 20.21 | $ | 17.71 | ||||||||
| Income From Investment Operations: |
||||||||||||||||
| Net Investment Income (Loss) |
(0.22 | )(d) | (0.23 | )(d) | (0.28 | )(d) | (0.02 | ) | ||||||||
| Net Realized and Unrealized Gains (Losses) on Investments |
3.09 | (5.07 | ) | (6.04 | ) | 2.52 | ||||||||||
| Total from Investment Operations |
2.87 | (5.30 | ) | (6.32 | ) | 2.50 | ||||||||||
| Less Distributions: |
||||||||||||||||
| From Net Realized Gains |
— | — | (0.00 | )(g) | — | |||||||||||
| Total Distributions |
— | — | (0.00 | )(g) | — | |||||||||||
| Net Asset Value, End of Period |
$ | 11.46 | $ | 8.59 | $ | 13.89 | $ | 20.21 | ||||||||
| Ratios and Supplemental Data |
||||||||||||||||
| Total Return |
+33.4 | % | –38.2 | % | –31.3 | % | +14.1 | % | ||||||||
| Net Assets, End of Period (In Millions) |
$ | 3 | $ | 2 | $ | 3 | $ | 0 | (f) | |||||||
| Ratio of Expenses to Average Net Assets before Expense Offsets |
2.6 | % | 2.6 | % | 2.9 | % | 2.0 | %* | ||||||||
| Ratio of Expenses to Average Net Assets |
2.4 | % | 2.5 | % | 2.3 | % | 2.0 | %* | ||||||||
| Ratio of Net Investment Income (Loss) to Average Net Assets |
(2.1 | )% | (2.2 | )% | (1.9 | )% | (1.6 | )%* | ||||||||
| Portfolio Turnover Rate(e) |
249.6 | % | 526.6 | % | 650.0 | % | 683.7 | % | ||||||||
| * | Calculated on an annualized basis. |
| (a) | Information presented relates to a share of capital stock of the Fund outstanding for the entire period. |
| (b) | For the period from November 30,2000 (commencement of class) to December 31,2000. |
| (c) | Per share data reflects a 1.053 for 1.000 share split which occurred on March 8,2001. |
| (d) | Net investment income (loss) per share represents net investment income (loss) divided by average shares outstanding throughout the year. |
| (e) | Calculated on the basis of the Fund as a whole without distinguishing between the classes of shares issued. |
| (f) | Amount is less than $500,000. |
| (g) | Amount calculated is less than $0.005. |
See Notes to Financial Statements.
67
Table of Contents
FINANCIAL HIGHLIGHTS (continued)
STRONG ADVISOR MID CAP GROWTH FUND — CLASS C
| Year Ended |
||||||||||||||||
| Dec. 31, 2003 |
Dec. 31, 2002 |
Dec. 31, 2001 |
Dec. 31, 2000(b)(c) |
|||||||||||||
| Selected Per-Share Data(a) |
||||||||||||||||
| Net Asset Value, Beginning of Period |
$ | 8.59 | $ | 13.88 | $ | 20.20 | $ | 17.71 | ||||||||
| Income From Investment Operations: |
||||||||||||||||
| Net Investment Income (Loss) |
(0.21 | )(d) | (0.23 | )(d) | (0.28 | )(d) | (0.02 | ) | ||||||||
| Net Realized and Unrealized Gains (Losses) on Investments |
3.08 | (5.06 | ) | (6.04 | ) | 2.51 | ||||||||||
| Total from Investment Operations |
2.87 | (5.29 | ) | (6.32 | ) | 2.49 | ||||||||||
| Less Distributions: |
||||||||||||||||
| From Net Realized Gains |
— | — | (0.00 | )(g) | — | |||||||||||
| Total Distributions |
— | — | (0.00 | )(g) | — | |||||||||||
| Net Asset Value, End of Period |
$ | 11.46 | $ | 8.59 | $ | 13.88 | $ | 20.20 | ||||||||
| Ratios and Supplemental Data |
||||||||||||||||
| Total Return |
+33.4 | % | –38.1 | % | –31.3 | % | +14.1 | % | ||||||||
| Net Assets, End of Period (In Millions) |
$ | 1 | $ | 1 | $ | 1 | $ | 0 | (e) | |||||||
| Ratio of Expenses to Average Net Assets before Expense Offsets |
2.6 | % | 2.5 | % | 2.8 | % | 2.0 | %* | ||||||||
| Ratio of Expenses to Average Net Assets |
2.4 | % | 2.4 | % | 2.3 | % | 2.0 | %* | ||||||||
| Ratio of Net Investment Income (Loss) to Average Net Assets |
(2.1 | )% | (2.2 | )% | (1.9 | )% | (1.6 | )%* | ||||||||
| Portfolio Turnover Rate(f) |
249.6 | % | 526.6 | % | 650.0 | % | 683.7 | % | ||||||||
STRONG ADVISOR MID CAP GROWTH FUND — CLASS Z
| Year Ended |
||||||||||||||||||||
| Dec. 31, 2003 |
Dec. 31, 2002 |
Dec. 31, 2001 |
Dec. 31, 2000 |
Dec. 31, 1999 |
||||||||||||||||
| Selected Per-Share Data(a) |
||||||||||||||||||||
| Net Asset Value, Beginning of Period |
$ | 8.70 | $ | 13.97 | $ | 20.21 | $ | 23.25 | $ | 13.03 | ||||||||||
| Income From Investment Operations: |
||||||||||||||||||||
| Net Investment Income (Loss) |
(0.14 | )(d) | (0.16 | )(d) | (0.19 | ) | (0.15 | ) | (0.12 | ) | ||||||||||
| Net Realized and Unrealized Gains (Losses) on Investments |
3.12 | (5.11 | ) | (6.05 | ) | (1.90 | ) | 12.08 | ||||||||||||
| Total from Investment Operations |
2.98 | (5.27 | ) | (6.24 | ) | (2.05 | ) | 11.96 | ||||||||||||
| Less Distributions: |
||||||||||||||||||||
| From Net Realized Gains |
— | — | (0.00 | )(g) | (0.99 | ) | (1.74 | ) | ||||||||||||
| Total Distributions |
— | — | (0.00 | )(g) | (0.99 | ) | (1.74 | ) | ||||||||||||
| Net Asset Value, End of Period |
$ | 11.68 | $ | 8.70 | $ | 13.97 | $ | 20.21 | $ | 23.25 | ||||||||||
| Ratios and Supplemental Data |
||||||||||||||||||||
| Total Return |
+34.3 | % | –37.7 | % | –30.9 | % | –8.5 | % | +92.0 | % | ||||||||||
| Net Assets, End of Period (In Millions) |
$ | 58 | $ | 65 | $ | 128 | $ | 185 | $ | 65 | ||||||||||
| Ratio of Expenses to Average Net Assets before Expense Offsets |
1.8 | % | 1.8 | % | 1.6 | % | 1.4 | % | 1.6 | % | ||||||||||
| Ratio of Expenses to Average Net Assets |
1.7 | % | 1.8 | % | 1.6 | % | 1.3 | % | 1.6 | % | ||||||||||
| Ratio of Net Investment Income (Loss) to Average Net Assets |
(1.4 | )% | (1.5 | )% | (1.2 | )% | (0.9 | )% | (1.1 | )% | ||||||||||
| Portfolio Turnover Rate(f) |
249.6 | % | 526.6 | % | 650.0 | % | 683.7 | % | 681.0 | % | ||||||||||
| * | Calculated on an annualized basis. |
| (a) | Information presented relates to a share of capital stock of the Fund outstanding for the entire period. |
| (b) | For the period from November 30,2000 (commencement of class) to December 31, 2000. |
| (c) | Per share data reflects a 1.053 for 1.000 share split which occurred on March 8, 2001. |
| (d) | Net investment income (loss) per share represents net investment income (loss) divided by average shares outstanding throughout the year. |
| (e) | Amount is less than $500,000. |
| (f) | Calculated on the basis of the Fund as a whole without distinguishing between the classes of shares issued. |
| (g) | Amount calculated is less than $0.005. |
See Notes to Financial Statements.
68
Table of Contents
FINANCIAL HIGHLIGHTS (continued)
STRONG ADVISOR SMALL CAP VALUE FUND — CLASS A
| Year Ended |
||||||||||||||||
| Dec. 31, 2003 |
Dec. 31, 2002 |
Dec. 31, 2001 |
Dec. 31, 2000(b) |
|||||||||||||
| Selected Per-Share Data(a) |
||||||||||||||||
| Net Asset Value, Beginning of Period |
$ | 18.92 | $ | 20.17 | $ | 17.17 | $ | 15.36 | ||||||||
| Income From Investment Operations: |
||||||||||||||||
| Net Investment Income (Loss) |
(0.12 | )(c) | 0.03 | (c) | (0.14 | )(c) | (0.00 | )(d) | ||||||||
| Net Realized and Unrealized Gains (Losses) on Investments |
9.26 | (1.28 | ) | 3.18 | 1.81 | |||||||||||
| Total from Investment Operations |
9.14 | (1.25 | ) | 3.04 | 1.81 | |||||||||||
| Less Distributions: |
||||||||||||||||
| From Net Investment Income |
(0.01 | ) | — | — | — | |||||||||||
| From Net Realized Gains |
(0.65 | ) | — | (0.04 | ) | — | ||||||||||
| Total Distributions |
(0.66 | ) | — | (0.04 | ) | — | ||||||||||
| Net Asset Value, End of Period |
$ | 27.40 | $ | 18.92 | $ | 20.17 | $ | 17.17 | ||||||||
| Ratios and Supplemental Data |
||||||||||||||||
| Total Return |
+48.5 | % | –6.2 | % | +17.7 | % | +11.8 | % | ||||||||
| Net Assets, End of Period (In Millions) |
$ | 674 | $ | 335 | $ | 169 | $ | 1 | ||||||||
| Ratio of Expenses to Average Net Assets before Expense Offsets |
1.6 | % | 1.6 | % | 1.6 | % | 1.6 | %* | ||||||||
| Ratio of Expenses to Average Net Assets |
1.5 | % | 1.6 | % | 1.6 | % | 1.6 | %* | ||||||||
| Ratio of Net Investment Income (Loss) to Average Net Assets |
(0.5 | )% | 0.1 | % | (0.7 | )% | (0.8 | )%* | ||||||||
| Portfolio Turnover Rate(e) |
30.2 | % | 28.2 | % | 42.0 | % | 60.3 | % | ||||||||
| STRONG ADVISOR SMALL CAP VALUE FUND — CLASS B |
| |||||||||||||||
| Year Ended |
||||||||||||||||
| Dec. 31, 2003 |
Dec. 31, 2002 |
Dec. 31, 2001 |
Dec. 31, 2000(b) |
|||||||||||||
| Selected Per-Share Data(a) |
||||||||||||||||
| Net Asset Value, Beginning of Period |
$ | 18.66 | $ | 20.05 | $ | 17.16 | $ | 15.36 | ||||||||
| Income From Investment Operations: |
||||||||||||||||
| Net Investment Income (Loss) |
(0.29 | )(c) | (0.14 | )(c) | (0.25 | )(c) | (0.01 | ) | ||||||||
| Net Realized and Unrealized Gains (Losses) on Investments |
9.08 | (1.25 | ) | 3.18 | 1.81 | |||||||||||
| Total from Investment Operations |
8.79 | (1.39 | ) | 2.93 | 1.80 | |||||||||||
| Less Distributions: |
||||||||||||||||
| From Net Investment Income |
(0.01 | ) | — | — | — | |||||||||||
| From Net Realized Gains |
(0.65 | ) | — | (0.04 | ) | — | ||||||||||
| Total Distributions |
(0.66 | ) | — | (0.04 | ) | — | ||||||||||
| Net Asset Value, End of Period |
$ | 26.79 | $ | 18.66 | $ | 20.05 | $ | 17.16 | ||||||||
| Ratios and Supplemental Data |
||||||||||||||||
| Total Return |
+47.3 | % | –6.9 | % | +17.1 | % | +11.7 | % | ||||||||
| Net Assets, End of Period (In Millions) |
$ | 126 | $ | 76 | $ | 40 | $ | 0 | (f) | |||||||
| Ratio of Expenses to Average Net Assets before Expense Offsets |
2.4 | % | 2.4 | % | 2.5 | % | 2.0 | %* | ||||||||
| Ratio of Expenses to Average Net Assets |
2.4 | % | 2.4 | % | 2.3 | % | 1.8 | %* | ||||||||
| Ratio of Net Investment Income (Loss) to Average Net Assets |
(1.4 | )% | (0.7 | )% | (1.4 | )% | (0.8 | )%* | ||||||||
| Portfolio Turnover Rate(e) |
30.2 | % | 28.2 | % | 42.0 | % | 60.3 | % | ||||||||
| * | Calculated on an annualized basis. |
| (a) | Information presented relates to a share of capital stock of the Fund outstanding for the entire period. |
| (b) | For the period from November 30, 2000 (commencement of class) to December 31, 2000. |
| (c) | Net investment income (loss) per share represents net investment income (loss) divided by average shares outstanding throughout the year. |
| (d) | Amount calculated is less than $0.005. |
| (e) | Calculated on the basis of the Fund as a whole without distinguishing between the classes of shares issued. |
| (f) | Amount is less than $500,000. |
See Notes to Financial Statements.
69
Table of Contents
FINANCIAL HIGHLIGHTS (continued)
STRONG ADVISOR SMALL CAP VALUE FUND — CLASS C
| Year Ended |
||||||||||||||||
| Dec. 31, 2003 |
Dec. 31, 2002 |
Dec. 31, 2001 |
Dec. 31, 2000(b) |
|||||||||||||
| Selected Per-Share Data(a) |
||||||||||||||||
| Net Asset Value, Beginning of Period |
$ | 18.68 | $ | 20.07 | $ | 17.17 | $ | 15.36 | ||||||||
| Income From Investment Operations: |
||||||||||||||||
| Net Investment Income (Loss) |
(0.28 | )(c) | (0.13 | )(c) | (0.24 | )(c) | (0.01 | ) | ||||||||
| Net Realized and Unrealized Gains (Losses) on Investments |
9.09 | (1.26 | ) | 3.18 | 1.82 | |||||||||||
| Total from Investment Operations |
8.81 | (1.39 | ) | 2.94 | 1.81 | |||||||||||
| Less Distributions: |
||||||||||||||||
| From Net Investment Income |
(0.01 | ) | — | — | — | |||||||||||
| From Net Realized Gains |
(0.65 | ) | — | (0.04 | ) | — | ||||||||||
| Total Distributions |
(0.66 | ) | — | (0.04 | ) | — | ||||||||||
| Net Asset Value, End of Period |
$ | 26.83 | $ | 18.68 | $ | 20.07 | $ | 17.17 | ||||||||
| Ratios and Supplemental Data |
||||||||||||||||
| Total Return |
+47.3 | % | –6.9 | % | +17.1 | % | +11.8 | % | ||||||||
| Net Assets, End of Period (In Millions) |
$ | 159 | $ | 98 | $ | 38 | $ | 0 | (d) | |||||||
| Ratio of Expenses to Average Net Assets before Expense Offsets |
2.3 | % | 2.4 | % | 2.4 | % | 2.0 | %* | ||||||||
| Ratio of Expenses to Average Net Assets |
2.3 | % | 2.4 | % | 2.2 | % | 1.8 | %* | ||||||||
| Ratio of Net Investment Income (Loss) to Average Net Assets |
(1.3 | )% | (0.6 | )% | (1.4 | )% | (0.7 | )%* | ||||||||
| Portfolio Turnover Rate(e) |
30.2 | % | 28.2 | % | 42.0 | % | 60.3 | % | ||||||||
STRONG ADVISOR SMALL CAP VALUE FUND — CLASS Z
| Year Ended |
||||||||||||||||||||
| Dec. 31, 2003 |
Dec. 31, 2002 |
Dec. 31, 2001 |
Dec. 31, 2000 |
Dec. 31, 1999 |
||||||||||||||||
| Selected Per-Share Data(a) |
||||||||||||||||||||
| Net Asset Value, Beginning of Period |
$ | 18.98 | $ | 20.22 | $ | 17.17 | $ | 13.59 | $ | 10.61 | ||||||||||
| Income From Investment Operations: |
||||||||||||||||||||
| Net Investment Income (Loss) |
(0.09 | )(c) | 0.04 | (c) | (0.08 | ) | 0.00 | (f) | (0.08 | ) | ||||||||||
| Net Realized and Unrealized Gains (Losses) on Investments |
9.30 | (1.28 | ) | 3.17 | 3.58 | 3.06 | ||||||||||||||
| Total from Investment Operations |
9.21 | (1.24 | ) | 3.09 | 3.58 | 2.98 | ||||||||||||||
| Less Distributions: |
||||||||||||||||||||
| From Net Investment Income |
(0.01 | ) | — | — | — | — | ||||||||||||||
| From Net Realized Gains |
(0.65 | ) | — | (0.04 | ) | — | (0.00 | )(f) | ||||||||||||
| Total Distributions |
(0.66 | ) | — | (0.04 | ) | — | (0.00 | )(f) | ||||||||||||
| Net Asset Value, End of Period |
$ | 27.53 | $ | 18.98 | $ | 20.22 | $ | 17.17 | $ | 13.59 | ||||||||||
| Ratios and Supplemental Data |
||||||||||||||||||||
| Total Return |
+48.7 | % | –6.1 | % | +18.0 | % | +26.3 | % | +28.1 | % | ||||||||||
| Net Assets, End of Period (In Millions) |
$ | 1,167 | $ | 659 | $ | 541 | $ | 249 | $ | 45 | ||||||||||
| Ratio of Expenses to Average Net Assets before Expense Offsets |
1.4 | % | 1.5 | % | 1.4 | % | 1.4 | % | 1.7 | % | ||||||||||
| Ratio of Expenses to Average Net Assets |
1.4 | % | 1.5 | % | 1.4 | % | 1.4 | % | 1.7 | % | ||||||||||
| Ratio of Net Investment Income (Loss) to Average Net Assets |
(0.4 | )% | 0.2 | % | (0.5 | )% | 0.0 | %(f) | (1.0 | )% | ||||||||||
| Portfolio Turnover Rate(e) |
30.2 | % | 28.2 | % | 42.0 | % | 60.3 | % | 95.5 | % | ||||||||||
| * | Calculated on an annualized basis. |
| (a) | Information presented relates to a share of capital stock of the Fund outstanding for the entire period. |
| (b) | For the period from November 30, 2000 (commencement of class) to December 31, 2000. |
| (c) | Net investment income (loss) per share represents net investment income (loss) divided by average shares outstanding throughout the year. |
| (d) | Amount is less than $500,000. |
| (e) | Calculated on the basis of the Fund as a whole without distinguishing between the classes of shares issued. |
| (f) | Amount calculated is less than $0.005 or 0.05%. |
See Notes to Financial Statements.
70
Table of Contents
FINANCIAL HIGHLIGHTS (continued)
STRONG ADVISOR U.S. VALUE FUND — CLASS A
| Year Ended |
||||||||||||||||
| Dec. 31, 2003 |
Dec. 31, 2002 |
Dec. 31, 2001 |
Dec. 31, 2000(b)(c) |
|||||||||||||
| Selected Per-Share Data(a) |
||||||||||||||||
| Net Asset Value, Beginning of Period |
$ | 13.66 | $ | 17.83 | $ | 20.65 | $ | 19.99 | ||||||||
| Income From Investment Operations: |
||||||||||||||||
| Net Investment Income (Loss) |
0.14 | 0.12 | (d) | 0.05 | 0.00 | (e) | ||||||||||
| Net Realized and Unrealized Gains (Losses) on Investments |
4.00 | (2.77 | ) | (2.56 | ) | 0.68 | ||||||||||
| Total from Investment Operations |
4.14 | (2.65 | ) | (2.51 | ) | 0.68 | ||||||||||
| Less Distributions: |
||||||||||||||||
| From Net Investment Income |
(0.15 | ) | (0.16 | ) | (0.06 | ) | (0.02 | ) | ||||||||
| From Net Realized Gains |
— | (1.36 | ) | (0.25 | ) | — | ||||||||||
| Total Distributions |
(0.15 | ) | (1.52 | ) | (0.31 | ) | (0.02 | ) | ||||||||
| Net Asset Value, End of Period |
$ | 17.65 | $ | 13.66 | $ | 17.83 | $ | 20.65 | ||||||||
| Ratios and Supplemental Data |
||||||||||||||||
| Total Return |
+30.5 | % | –16.3 | % | –12.2 | % | +3.4 | % | ||||||||
| Net Assets, End of Period (In Millions) |
$ | 5 | $ | 3 | $ | 3 | $ | 0 | (f) | |||||||
| Ratio of Expenses to Average Net Assets before Expense Offsets |
1.4 | % | 1.3 | % | 1.8 | % | 1.3 | %* | ||||||||
| Ratio of Expenses to Average Net Assets |
1.4 | % | 1.3 | % | 1.8 | % | 1.3 | %* | ||||||||
| Ratio of Net Investment Income (Loss) to Average Net Assets |
1.0 | % | 0.9 | % | 0.1 | % | 0.1 | %* | ||||||||
| Portfolio Turnover Rate(g) |
53.4 | % | 89.8 | % | 116.1 | % | 14.4 | % | ||||||||
| STRONG ADVISOR U.S. VALUE FUND — CLASS B
|
| |||||||||||||||
| Year Ended |
||||||||||||||||
| Dec. 31, 2003 |
Dec. 31, 2002 |
Dec. 31, 2001 |
Dec. 31, 2000(b)(c) |
|||||||||||||
| Selected Per-Share Data(a) |
||||||||||||||||
| Net Asset Value, Beginning of Period |
$ | 13.67 | $ | 17.81 | $ | 20.66 | $ | 19.99 | ||||||||
| Income From Investment Operations: |
||||||||||||||||
| Net Investment Income (Loss) |
0.03 | 0.02 | (d) | (0.00 | )(e) | (0.01 | ) | |||||||||
| Net Realized and Unrealized Gains (Losses) on Investments |
3.98 | (2.78 | ) | (2.60 | ) | 0.69 | ||||||||||
| Total from Investment Operations |
4.01 | (2.76 | ) | (2.60 | ) | 0.68 | ||||||||||
| Less Distributions: |
||||||||||||||||
| From Net Investment Income |
(0.04 | ) | (0.02 | ) | — | (0.01 | ) | |||||||||
| From Net Realized Gains |
— | (1.36 | ) | (0.25 | ) | — | ||||||||||
| Total Distributions |
(0.04 | ) | (1.38 | ) | (0.25 | ) | (0.01 | ) | ||||||||
| Net Asset Value, End of Period |
$ | 17.64 | $ | 13.67 | $ | 17.81 | $ | 20.66 | ||||||||
| Ratios and Supplemental Data |
||||||||||||||||
| Total Return |
+29.4 | % | –17.0 | % | –12.6 | % | +3.4 | % | ||||||||
| Net Assets, End of Period (In Millions) |
$ | 5 | $ | 3 | $ | 2 | $ | 0 | (f) | |||||||
| Ratio of Expenses to Average Net Assets before Expense Offsets |
2.2 | % | 2.2 | % | 2.9 | % | 2.0 | %* | ||||||||
| Ratio of Expenses to Average Net Assets |
2.2 | % | 2.1 | % | 2.3 | % | 2.0 | %* | ||||||||
| Ratio of Net Investment Income (Loss) to Average Net Assets |
0.2 | % | 0.1 | % | (0.4 | )% | (0.5 | )%* | ||||||||
| Portfolio Turnover Rate(g) |
53.4 | % | 89.8 | % | 116.1 | % | 14.4 | % | ||||||||
| * | Calculated on an annualized basis. |
| (a) | Information presented relates to a share of capital stock of the Fund outstanding for the entire period. |
| (b) | For the period from November 30, 2000 (commencement of class) to December 31, 2000. |
| (c) | Per share data reflects a 1.023 for 1.000 share split which occurred on March 8, 2001. |
| (d) | Net investment income (loss) per share represents net investment income (loss) divided by average shares outstanding throughout the year. |
| (e) | Amount calculated is less than $0.005. |
| (f) | Amount is less than $500,000. |
| (g) | Calculated on the basis of the Fund as a whole without distinguishing between the classes of shares issued. |
See Notes to Financial Statements.
71
Table of Contents
FINANCIAL HIGHLIGHTS (continued)
STRONG ADVISOR U.S. VALUE FUND — CLASS C
| Year Ended |
||||||||||||||||
| Dec. 31, 2003 |
Dec. 31, 2002 |
Dec. 31, 2001 |
Dec. 31, 2000(b)(c) |
|||||||||||||
| Selected Per-Share Data(a) |
||||||||||||||||
| Net Asset Value, Beginning of Period |
$ | 13.61 | $ | 17.82 | $ | 20.66 | $ | 19.99 | ||||||||
| Income From Investment Operations: |
||||||||||||||||
| Net Investment Income (Loss) |
0.03 | 0.02 | (d) | (0.00 | )(e) | (0.01 | ) | |||||||||
| Net Realized and Unrealized Gains (Losses) on Investments |
3.97 | (2.78 | ) | (2.59 | ) | 0.69 | ||||||||||
| Total from Investment Operations |
4.00 | (2.76 | ) | (2.59 | ) | 0.68 | ||||||||||
| Less Distributions: |
||||||||||||||||
| From Net Investment Income |
(0.05 | ) | (0.09 | ) | — | (0.01 | ) | |||||||||
| From Net Realized Gains |
— | (1.36 | ) | (0.25 | ) | — | ||||||||||
| Total Distributions |
(0.05 | ) | (1.45 | ) | (0.25 | ) | (0.01 | ) | ||||||||
| Net Asset Value, End of Period |
$ | 17.56 | $ | 13.61 | $ | 17.82 | $ | 20.66 | ||||||||
| Ratios and Supplemental Data |
||||||||||||||||
| Total Return |
+29.4 | % | –17.1 | % | –12.6 | % | +3.4 | % | ||||||||
| Net Assets, End of Period (In Millions) |
$ | 4 | $ | 1 | $ | 1 | $ | 0 | (f) | |||||||
| Ratio of Expenses to Average Net Assets before Expense Offsets |
2.2 | % | 2.2 | % | 2.4 | % | 2.0 | %* | ||||||||
| Ratio of Expenses to Average Net Assets |
2.2 | % | 2.2 | % | 2.2 | % | 2.0 | %* | ||||||||
| Ratio of Net Investment Income (Loss) to Average Net Assets |
0.2 | % | 0.2 | % | (0.3 | )% | (0.5 | )%* | ||||||||
| Portfolio Turnover Rate(g) |
53.4 | % | 89.8 | % | 116.1 | % | 14.4 | % | ||||||||
STRONG ADVISOR U.S. VALUE FUND — CLASS K
| Year Ended |
||||||||
| Dec. 31, 2003 |
Dec. 31, 2002 |
|||||||
| Selected Per-Share Data(a) |
||||||||
| Net Asset Value, Beginning of Period |
$ | 13.56 | $ | 17.87 | ||||
| Income From Investment Operations: |
||||||||
| Net Investment Income (Loss) |
0.16 | 0.22 | (d) | |||||
| Net Realized and Unrealized Gains (Losses) on Investments |
4.02 | (2.81 | ) | |||||
| Total from Investment Operations |
4.18 | (2.59 | ) | |||||
| Less Distributions: |
||||||||
| From Net Investment Income |
(0.22 | ) | (0.36 | ) | ||||
| From Net Realized Gains |
— | (1.36 | ) | |||||
| Total Distributions |
(0.22 | ) | (1.72 | ) | ||||
| Net Asset Value, End of Period |
$ | 17.52 | $ | 13.56 | ||||
| Ratios and Supplemental Data |
||||||||
| Total Return |
+31.0 | % | –16.0 | % | ||||
| Net Assets, End of Period (In Millions) |
$ | 87 | $ | 11 | ||||
| Ratio of Expenses to Average Net Assets before Expense Offsets |
1.1 | % | 1.1 | % | ||||
| Ratio of Expenses to Average Net Assets |
1.0 | % | 1.0 | % | ||||
| Ratio of Net Investment Income (Loss) to Average Net Assets |
1.3 | % | 1.6 | % | ||||
| Portfolio Turnover Rate(g) |
53.4 | % | 89.8 | % | ||||
| * | Calculated on an annualized basis. |
| (a) | Information presented relates to a share of capital stock of the Fund outstanding for the entire period. |
| (b) | For the period from November 30, 2000 (commencement of class) to December 31, 2000. |
| (c) | Per share data reflects a 1.023 for 1.000 share split which occurred on March 8, 2001. |
| (d) | Net investment income (loss) per share represents new investment income (loss) divided by average shares outstanding throughout the year. |
| (e) | Amount calculated is less than $0.005. |
| (f) | Amount is less than $500,000. |
| (g) | Calculated on the basis of the Fund as a whole without distinguishing between the classes of shares issued. |
See Notes to Financial Statements.
72
Table of Contents
FINANCIAL HIGHLIGHTS (continued)
STRONG ADVISOR U.S. VALUE FUND — CLASS Z
| Year Ended |
||||||||||||||||||||||||
| Dec. 31, 2003 |
Dec. 31, 2002 |
Dec. 31, 2001 |
Dec. 31, 2000(b) |
Oct. 31, 2000 |
Oct. 31, 1999 |
|||||||||||||||||||
| Selected Per-Share Data(a) |
||||||||||||||||||||||||
| Net Asset Value, Beginning of Period |
$ | 13.74 | $ | 17.87 | $ | 20.65 | $ | 21.63 | $ | 20.58 | $ | 17.20 | ||||||||||||
| Income From Investment Operations: |
||||||||||||||||||||||||
| Net Investment Income (Loss) |
0.15 | 0.05 | (c) | 0.11 | 0.03 | 0.05 | 0.06 | |||||||||||||||||
| Net Realized and Unrealized Gains (Losses) on Investments |
3.99 | (2.79 | ) | (2.53 | ) | (0.52 | ) | 1.53 | 3.39 | |||||||||||||||
| Total from Investment Operations |
4.14 | (2.74 | ) | (2.42 | ) | (0.49 | ) | 1.58 | 3.45 | |||||||||||||||
| Less Distributions: |
||||||||||||||||||||||||
| From Net Investment Income |
(0.11 | ) | (0.03 | ) | (0.11 | ) | (0.03 | ) | (0.05 | ) | (0.07 | ) | ||||||||||||
| From Net Realized Gains |
— | (1.36 | ) | (0.25 | ) | (0.46 | ) | (0.48 | ) | — | ||||||||||||||
| Total Distributions |
(0.11 | ) | (1.39 | ) | (0.36 | ) | (0.49 | ) | (0.53 | ) | (0.07 | ) | ||||||||||||
| Net Asset Value, End of Period |
$ | 17.77 | $ | 13.74 | $ | 17.87 | $ | 20.65 | $ | 21.63 | $ | 20.58 | ||||||||||||
| Ratios and Supplemental Data |
||||||||||||||||||||||||
| Total Return |
+30.2 | % | –16.9 | % | –11.7 | % | –2.2 | % | +7.7 | % | +20.1 | % | ||||||||||||
| Net Assets, End of Period (In Millions) |
$ | 159 | $ | 197 | $ | 186 | $ | 251 | $ | 252 | $ | 182 | ||||||||||||
| Ratio of Expenses to Average Net Assets before Expense Offsets |
1.6 | % | 1.9 | % | 1.2 | % | 1.1 | %* | 1.0 | % | 1.1 | % | ||||||||||||
| Ratio of Expenses to Average Net Assets |
1.6 | % | 1.9 | % | 1.2 | % | 1.1 | %* | 1.0 | % | 1.1 | % | ||||||||||||
| Ratio of Net Investment Income (Loss) to Average Net Assets |
0.8 | % | 0.3 | % | 0.6 | % | 0.8 | %* | 0.3 | % | 0.3 | % | ||||||||||||
| Portfolio Turnover Rate(f) |
53.4 | % | 89.8 | % | 116.1 | % | 14.4 | % | 46.5 | % | 32.3 | % | ||||||||||||
STRONG ADVISOR ENDEAVOR LARGE CAP FUND — CLASS A
| Year Ended |
||||||||||||
| Dec. 31, 2003 |
Dec. 31, 2002 |
Dec. 31, 2001(d) |
||||||||||
| Selected Per-Share Data(a) |
||||||||||||
| Net Asset Value, Beginning of Period |
$ | 7.55 | $ | 10.59 | $ | 10.00 | ||||||
| Income From Investment Operations: |
||||||||||||
| Net Investment Income (Loss) |
(0.07 | )(c) | (0.10 | )(c) | (0.01 | ) | ||||||
| Net Realized and Unrealized Gains (Losses) on Investments |
2.60 | (2.94 | ) | 0.86 | (e) | |||||||
| Total from Investment Operations |
2.53 | (3.04 | ) | 0.85 | ||||||||
| Less Distributions: |
||||||||||||
| From Net Realized Gains |
— | — | (0.26 | ) | ||||||||
| Total Distributions |
— | — | (0.26 | ) | ||||||||
| Net Asset Value, End of Period |
$ | 10.08 | $ | 7.55 | $ | 10.59 | ||||||
| Ratios and Supplemental Data |
||||||||||||
| Total Return |
+33.5 | % | –28.7 | % | +8.5 | % | ||||||
| Net Assets, End of Period (In Millions) |
$ | 37 | $ | 28 | $ | 28 | ||||||
| Ratio of Expenses to Average Net Assets before Expense Offsets |
1.7 | % | 2.0 | % | 2.4 | %* | ||||||
| Ratio of Expenses to Average Net Assets |
1.6 | % | 2.0 | % | 2.4 | %* | ||||||
| Ratio of Net Investment Income (Loss) to Average Net Assets |
(0.9 | )% | (1.2 | )% | (1.1 | )%* | ||||||
| Portfolio Turnover Rate(f) |
234.1 | % | 420.4 | % | 54.0 | % | ||||||
| * | Calculated on an annualized basis. |
| (a) | Information presented relates to a share of capital stock of the Fund outstanding for the entire period. |
| (b) | In 2000, the Fund changed its fiscal year-end from October to December. |
| (c) | Net investment income (loss) per share represents net investment income (loss) divided by average shares outstanding throughout the year. |
| (d) | For the period from September 28, 2001 (commencement of class) to December 31, 2001. |
| (e) | The amount shown may not correlate with the aggregate gains and losses of portfolio securities due to the timing of subscriptions and redemptions of fund shares. |
| (f) | Calculated on the basis of the Fund as a whole without distinguishing between the classes of shares issued. |
See Notes to Financial Statements.
73
Table of Contents
FINANCIAL HIGHLIGHTS (continued)
STRONG ADVISOR ENDEAVOR LARGE CAP FUND — CLASS B
| Year Ended |
||||||||||||
| Dec. 31, 2003 |
Dec. 31, 2002 |
Dec. 31, 2001(b) |
||||||||||
| Selected Per-Share Data(a) |
||||||||||||
| Net Asset Value, Beginning of Period |
$ | 7.51 | $ | 10.57 | $ | 10.00 | ||||||
| Income From Investment Operations: |
||||||||||||
| Net Investment Income (Loss) |
(0.12 | )(c) | (0.12 | )(c) | (0.04 | ) | ||||||
| Net Realized and Unrealized Gains (Losses) on Investments |
2.58 | (2.94 | ) | 0.87 | (d) | |||||||
| Total from Investment Operations |
2.46 | (3.06 | ) | 0.83 | ||||||||
| Less Distributions: |
||||||||||||
| From Net Realized Gains |
— | — | (0.26 | ) | ||||||||
| Total Distributions |
— | — | (0.26 | ) | ||||||||
| Net Asset Value, End of Period |
$ | 9.97 | $ | 7.51 | $ | 10.57 | ||||||
| Ratios and Supplemental Data |
||||||||||||
| Total Return |
+32.8 | % | –29.0 | % | +8.3 | % | ||||||
| Net Assets, End of Period (In Millions) |
$ | 1 | $ | 0 | (e) | $ | 0 | (e) | ||||
| Ratio of Expenses to Average Net Assets before Expense Offsets |
2.5 | % | 4.7 | % | 2.7 | %* | ||||||
| Ratio of Expenses to Average Net Assets |
2.1 | % | 2.2 | % | 2.6 | %* | ||||||
| Ratio of Net Investment Income (Loss) to Average Net Assets |
(1.3 | )% | (1.4 | )% | (1.6 | )%* | ||||||
| Portfolio Turnover Rate(f) |
234.1 | % | 420.4 | % | 54.0 | % | ||||||
| STRONG ADVISOR ENDEAVOR LARGE CAP FUND — CLASS C
|
| |||||||||||
| Year Ended |
||||||||||||
| Dec. 31, 2003 |
Dec. 31, 2002 |
Dec. 31, 2001(b) |
||||||||||
| Selected Per-Share Data(a) |
||||||||||||
| Net Asset Value, Beginning of Period |
$ | 7.51 | $ | 10.57 | $ | 10.00 | ||||||
| Income From Investment Operations: |
||||||||||||
| Net Investment Income (Loss) |
(0.12 | )(c) | (0.13 | )(c) | (0.04 | ) | ||||||
| Net Realized and Unrealized Gains (Losses) on Investments |
2.58 | (2.93 | ) | 0.87 | (d) | |||||||
| Total from Investment Operations |
2.46 | (3.06 | ) | 0.83 | ||||||||
| Less Distributions: |
||||||||||||
| From Net Realized Gains |
— | — | (0.26 | ) | ||||||||
| Total Distributions |
— | — | (0.26 | ) | ||||||||
| Net Asset Value, End of Period |
$ | 9.97 | $ | 7.51 | $ | 10.57 | ||||||
| Ratios and Supplemental Data |
||||||||||||
| Total Return |
+32.8 | % | –29.0 | % | +8.3 | % | ||||||
| Net Assets, End of Period (In Millions) |
$ | 0 | (e) | $ | 0 | (e) | $ | 0 | (e) | |||
| Ratio of Expenses to Average Net Assets before Expense Offsets |
2.6 | % | 4.2 | % | 2.7 | %* | ||||||
| Ratio of Expenses to Average Net Assets |
2.1 | % | 2.3 | % | 2.6 | %* | ||||||
| Ratio of Net Investment Income (Loss) to Average Net Assets |
(1.4 | )% | (1.5 | )% | (1.6 | )%* | ||||||
| Portfolio Turnover Rate(f) |
234.1 | % | 420.4 | % | 54.0 | % | ||||||
| * | Calculated on an annualized basis. |
| (a) | Information presented relates to a share of capital stock of the Fund outstanding for the entire period. |
| (b) | For the period from September 28, 2001 (commencement of class) to December 31, 2001. |
| (c) | Net investment income (loss) per share represents net investment income (loss) divided by average shares outstanding throughout the year. |
| (d) | The amount shown may not correlate with the aggregate gains and losses of portfolio securities due to the timing of subscriptions and redemptions of fund shares. |
| (e) | Amount is less than $500,000. |
| (f) | Calculated on the basis of the Fund as a whole without distinguishing between the classes of shares issued. |
See Notes to Financial Statements.
74
Table of Contents
FINANCIAL HIGHLIGHTS (continued)
STRONG ADVISOR FOCUS FUND — CLASS A
| Year Ended |
||||||||||||||||
| Dec. 31, 2003 |
Dec. 31, 2002 |
Dec. 31, 2001 |
Dec. 31, 2000(b) |
|||||||||||||
| Selected Per-Share Data(a) |
||||||||||||||||
| Net Asset Value, Beginning of Period |
$ | 4.79 | $ | 6.62 | $ | 10.26 | $ | 10.00 | ||||||||
| Income From Investment Operations: |
||||||||||||||||
| Net Investment Income (Loss) |
(0.05 | )(c) | (0.10 | )(c) | (0.07 | ) | (0.01 | ) | ||||||||
| Net Realized and Unrealized Gains (Losses) on Investments |
1.25 | (1.73 | ) | (3.57 | ) | 0.27 | ||||||||||
| Total from Investment Operations |
1.20 | (1.83 | ) | (3.64 | ) | 0.26 | ||||||||||
| Less Distributions: |
||||||||||||||||
| From Net Investment Income |
— | — | — | — | ||||||||||||
| Total Distributions |
— | — | — | — | ||||||||||||
| Net Asset Value, End of Period |
$ | 5.99 | $ | 4.79 | $ | 6.62 | $ | 10.26 | ||||||||
| Ratios and Supplemental Data |
||||||||||||||||
| Total Return |
+25.1 | % | –27.6 | % | –35.5 | % | +2.6 | % | ||||||||
| Net Assets, End of Period (In Millions) |
$ | 2 | $ | 2 | $ | 5 | $ | 1 | ||||||||
| Ratio of Expenses to Average Net Assets before Expense Offsets |
3.0 | % | 2.9 | % | 3.4 | % | 7.3 | %* | ||||||||
| Ratio of Expenses to Average Net Assets |
1.3 | % | 2.1 | % | 1.5 | % | 2.4 | %* | ||||||||
| Ratio of Net Investment Income (Loss) to Average Net Assets |
(1.0 | )% | (1.7 | )% | (0.9 | )% | (1.0 | )%* | ||||||||
| Portfolio Turnover Rate(d) |
248.9 | % | 350.1 | % | 605.7 | % | 45.1 | % | ||||||||
| STRONG ADVISOR FOCUS FUND — CLASS B
|
| |||||||||||||||
| Year Ended |
||||||||||||||||
| Dec. 31, 2003 |
Dec. 31, 2002 |
Dec. 31, 2001 |
Dec. 31, 2000(b) |
|||||||||||||
| Selected Per-Share Data(a) |
||||||||||||||||
| Net Asset Value, Beginning of Period |
$ | 4.73 | $ | 6.55 | $ | 10.23 | $ | 10.00 | ||||||||
| Income From Investment Operations: |
||||||||||||||||
| Net Investment Income (Loss) |
(0.09 | )(c) | (0.11 | )(c) | (0.08 | ) | (0.01 | ) | ||||||||
| Net Realized and Unrealized Gains (Losses) on Investments |
1.23 | (1.71 | ) | (3.60 | ) | 0.24 | ||||||||||
| Total from Investment Operations |
1.14 | (1.82 | ) | (3.68 | ) | 0.23 | ||||||||||
| Less Distributions: |
||||||||||||||||
| From Net Investment Income |
— | — | — | — | ||||||||||||
| Total Distributions |
— | — | — | — | ||||||||||||
| Net Asset Value, End of Period |
$ | 5.87 | $ | 4.73 | $ | 6.55 | $ | 10.23 | ||||||||
| Ratios and Supplemental Data |
||||||||||||||||
| Total Return |
+24.1 | % | –27.8 | % | –36.0 | % | +2.3 | % | ||||||||
| Net Assets, End of Period (In Millions) |
$ | 1 | $ | 1 | $ | 2 | $ | 0 | (e) | |||||||
| Ratio of Expenses to Average Net Assets before Expense Offsets |
3.9 | % | 4.1 | % | 4.6 | % | 8.1 | %* | ||||||||
| Ratio of Expenses to Average Net Assets |
2.0 | % | 2.4 | % | 2.4 | % | 3.1 | %* | ||||||||
| Ratio of Net Investment Income (Loss) to Average Net Assets |
(1.7 | )% | (2.0 | )% | (1.7 | )% | (1.6 | )%* | ||||||||
| Portfolio Turnover Rate(d) |
248.9 | % | 350.1 | % | 605.7 | % | 45.1 | % | ||||||||
| * | Calculated on an annualized basis. |
| (a) | Information presented relates to a share of capital stock of the Fund outstanding for the entire period. |
| (b) | For the period from November 30, 2000 (commencement of class) to December 31, 2000. |
| (c) | Net investment income (loss) per share represents new investment income (loss) divided by average shares outstanding throughout the year. |
| (d) | Calculated on the basis of the Fund as a whole without distinguishing between the classes of shares issued. |
| (e) | Amount is less than $500,000. |
See Notes to Financial Statements.
75
Table of Contents
FINANCIAL HIGHLIGHTS (continued)
STRONG ADVISOR FOCUS FUND — CLASS C
| Year Ended |
||||||||||||||||
| Selected Per-Share Data(a) | Dec. 31, 2003 |
Dec. 31, 2002 |
Dec. 31, 2001 |
Dec. 31, 2000(b) |
||||||||||||
| Net Asset Value, Beginning of Period |
$ | 4.73 | $ | 6.55 | $ | 10.23 | $ | 10.00 | ||||||||
| Income From Investment Operations: |
||||||||||||||||
| Net Investment Income (Loss) |
(0.09 | )(c) | (0.11 | )(c) | (0.09 | ) | (0.02 | ) | ||||||||
| Net Realized and Unrealized Gains (Losses) on Investments |
1.23 | (1.71 | ) | (3.59 | ) | 0.25 | ||||||||||
| Total from Investment Operations |
1.14 | (1.82 | ) | (3.68 | ) | 0.23 | ||||||||||
| Less Distributions: |
||||||||||||||||
| From Net Investment Income |
— | — | — | — | ||||||||||||
| Total Distributions |
— | — | — | — | ||||||||||||
| Net Asset Value, End of Period |
$ | 5.87 | $ | 4.73 | $ | 6.55 | $ | 10.23 | ||||||||
| Ratios and Supplemental Data |
||||||||||||||||
| Total Return |
+24.1 | % | –27.8 | % | –36.0 | % | +2.3 | % | ||||||||
| Net Assets, End of Period (In Millions) |
$ | 0 | (d) | $ | 0 | (d) | $ | 1 | $ | 0 | (d) | |||||
| Ratio of Expenses to Average Net Assets before Expense Offsets |
3.8 | % | 3.9 | % | 4.3 | % | 8.1 | %* | ||||||||
| Ratio of Expenses to Average Net Assets |
1.9 | % | 2.4 | % | 2.4 | % | 4.5 | %* | ||||||||
| Ratio of Net Investment Income (Loss) to Average Net Assets |
(1.6 | )% | (2.0 | )% | (1.7 | )% | (2.7 | )%* | ||||||||
| Portfolio Turnover Rate(e) |
248.9 | % | 350.1 | % | 605.7 | % | 45.1 | % | ||||||||
STRONG ADVISOR INTERNATIONAL CORE FUND — CLASS A
| Year Ended |
||||||||||||
| Selected Per-Share Data(a) | Dec. 31, 2003 |
Dec. 31, 2002 |
Dec. 31, 2001(f) |
|||||||||
| Net Asset Value, Beginning of Period |
$ | 8.84 | $ | 10.41 | $ | 10.00 | ||||||
| Income From Investment Operations: |
||||||||||||
| Net Investment Income (Loss) |
0.18 | (c) | (0.06 | )(c) | (0.03 | ) | ||||||
| Net Realized and Unrealized Gains (Losses) on Investments |
2.59 | (1.51 | ) | 0.44 | ||||||||
| Total from Investment Operations |
2.77 | (1.57 | ) | 0.41 | ||||||||
| Less Distributions: |
||||||||||||
| From Net Investment Income |
(0.14 | ) | — | — | ||||||||
| Total Distributions |
(0.14 | ) | — | — | ||||||||
| Net Asset Value, End of Period |
$ | 11.47 | $ | 8.84 | $ | 10.41 | ||||||
| Ratios and Supplemental Data |
||||||||||||
| Total Return |
+31.4 | % | –15.1 | % | +4.1 | % | ||||||
| Net Assets, End of Period (In Millions) |
$ | 1 | $ | 0 | (d) | $ | 0 | (d) | ||||
| Ratio of Expenses to Average Net Assets before Expense Offsets |
7.7 | % | 52.4 | % | 2.2 | %* | ||||||
| Ratio of Expenses to Average Net Assets |
0.0 | %(g) | 2.2 | % | 2.2 | %* | ||||||
| Ratio of Net Investment Income (Loss) to Average Net Assets |
1.8 | % | (0.6 | )% | (1.1 | )%* | ||||||
| Portfolio Turnover Rate(e) |
88.1 | % | 46.9 | % | 4.0 | % | ||||||
| * | Calculated on an annualized basis. |
| (a) | Information presented relates to a share of capital stock of the Fund outstanding for the entire period. |
| (b) | For the period from November 30, 2000 (commencement of class) to December 31, 2000. |
| (c) | Net investment income (loss) per share represents net investment income (loss) divided by average shares outstanding throughout the year. |
| (d) | Amount is less than $500,000. |
| (e) | Calculated on the basis of the Fund as a whole without distinguishing between the classes of shares issued. |
| (f) | For the period from September 28, 2001 (commencement of class) to December 31, 2001. |
| (g) | Amount calculated is less than 0.05%. |
See Notes to Financial Statements.
76
Table of Contents
FINANCIAL HIGHLIGHTS (continued)
STRONG ADVISOR INTERNATIONAL CORE FUND — CLASS B
| Year Ended |
||||||||||||
| Selected Per-Share Data(a) | Dec. 31, 2003 |
Dec. 31, 2002 |
Dec. 31, 2001(b) |
|||||||||
| Net Asset Value, Beginning of Period |
$ | 8.82 | $ | 10.40 | $ | 10.00 | ||||||
| Income From Investment Operations: |
||||||||||||
| Net Investment Income (Loss) |
0.20 | (c) | (0.08 | )(c) | (0.04 | ) | ||||||
| Net Realized and Unrealized Gains (Losses) on Investments |
2.58 | (1.50 | ) | 0.44 | ||||||||
| Total from Investment Operations |
2.78 | (1.58 | ) | 0.40 | ||||||||
| Less Distributions: |
||||||||||||
| From Net Investment Income |
(0.15 | ) | — | — | ||||||||
| Total Distributions |
(0.15 | ) | — | — | ||||||||
| Net Asset Value, End of Period |
$ | 11.45 | $ | 8.82 | $ | 10.40 | ||||||
| Ratios and Supplemental Data |
||||||||||||
| Total Return |
+31.6 | % | –15.2 | % | +4.0 | % | ||||||
| Net Assets, End of Period (In Millions) |
$ | 1 | $ | 0 | (d) | $ | 0 | (d) | ||||
| Ratio of Expenses to Average Net Assets before Expense Offsets |
8.6 | % | 52.0 | % | 3.0 | %* | ||||||
| Ratio of Expenses to Average Net Assets |
0.0 | %(f) | 2.4 | % | 2.7 | %* | ||||||
| Ratio of Net Investment Income (Loss) to Average Net Assets |
2.0 | % | (0.8 | )% | (1.6 | )%* | ||||||
| Portfolio Turnover Rate(e) |
88.1 | % | 46.9 | % | 4.0 | % | ||||||
STRONG ADVISOR INTERNATIONAL CORE FUND — CLASS C
| Year Ended |
||||||||||||
| Selected Per-Share Data(a) | Dec. 31, 2003 |
Dec. 31, 2002 |
Dec. 31, 2001(b) |
|||||||||
| Net Asset Value, Beginning of Period |
$ | 8.82 | $ | 10.40 | $ | 10.00 | ||||||
| Income From Investment Operations: |
||||||||||||
| Net Investment Income (Loss) |
0.21 | (c) | (0.06 | )(c) | (0.04 | ) | ||||||
| Net Realized and Unrealized Gains (Losses) on Investments |
2.57 | (1.52 | ) | 0.44 | ||||||||
| Total from Investment Operations |
2.78 | (1.58 | ) | 0.40 | ||||||||
| Less Distributions: |
||||||||||||
| From Net Investment Income |
(0.17 | ) | — | — | ||||||||
| Total Distributions |
(0.17 | ) | — | — | ||||||||
| Net Asset Value, End of Period |
$ | 11.43 | $ | 8.82 | $ | 10.40 | ||||||
| Ratios and Supplemental Data |
||||||||||||
| Total Return |
+31.5 | % | –15.2 | % | +4.0 | % | ||||||
| Net Assets, End of Period (In Millions) |
$ | 0 | (d) | $ | 0 | (d) | $ | 0 | (d) | |||
| Ratio of Expenses to Average Net Assets before Expense Offsets |
8.4 | % | 52.5 | % | 3.0 | %* | ||||||
| Ratio of Expenses to Average Net Assets |
0.0 | %(f) | 2.4 | % | 2.7 | %* | ||||||
| Ratio of Net Investment Income (Loss) to Average Net Assets |
2.1 | % | (0.7 | )% | (1.6 | )%* | ||||||
| Portfolio Turnover Rate(e) |
88.1 | % | 46.9 | % | 4.0 | % | ||||||
| * | Calculated on an annualized basis. |
| (a) | Information presented relates to a share of capital stock of the Fund outstanding for the entire period. |
| (b) | For the period from September 28, 2001 (commencement of class) to December 31, 2001. |
| (c) | Net investment income (loss) per share represents net investment income (loss) divided by average shares outstanding throughout the year. |
| (d) | Amount is less than $500,000. |
| (e) | Calculated on the basis of the Fund as a whole without distinguishing between the classes of shares issued. |
| (f) | Amount calculated is less than 0.05%. |
See Notes to Financial Statements.
77
Table of Contents
FINANCIAL HIGHLIGHTS (continued)
STRONG ADVISOR SELECT FUND — CLASS A
| Year Ended |
||||||||||||
| Selected Per-Share Data(a) | Dec. 31, 2003 |
Dec. 31, 2002 |
Dec. 31, 2001 |
|||||||||
| Net Asset Value, Beginning of Period |
$ | 6.10 | $ | 7.99 | $ | 10.00 | ||||||
| Income From Investment Operations: |
||||||||||||
| Net Investment Income (Loss) |
(0.07 | )(b) | (0.07 | )(b) | (0.01 | ) | ||||||
| Net Realized and Unrealized Gains (Losses) on Investments |
2.33 | (1.81 | ) | (2.00 | )(c) | |||||||
| Total from Investment Operations |
2.26 | (1.88 | ) | (2.01 | ) | |||||||
| Less Distributions: |
||||||||||||
| From Net Realized Gains |
— | (0.01 | ) | — | ||||||||
| Total Distributions |
— | (0.01 | ) | — | ||||||||
| Net Asset Value, End of Period |
$ | 8.36 | $ | 6.10 | $ | 7.99 | ||||||
| Ratios and Supplemental Data |
||||||||||||
| Total Return |
+37.1 | % | –23.5 | % | –20.1 | % | ||||||
| Net Assets, End of Period (In Millions) |
$ | 81 | $ | 56 | $ | 57 | ||||||
| Ratio of Expenses to Average Net Assets before Expense Offsets |
1.6 | % | 1.6 | % | 4.4 | % | ||||||
| Ratio of Expenses to Average Net Assets |
1.6 | % | 1.6 | % | 1.7 | % | ||||||
| Ratio of Net Investment Income (Loss) to Average Net Assets |
(1.0 | )% | (1.1 | )% | (0.8 | )% | ||||||
| Portfolio Turnover Rate(d) |
243.6 | % | 437.3 | % | 359.7 | % | ||||||
STRONG ADVISOR SELECT FUND — CLASS B
| Year Ended |
||||||||||||
| Selected Per-Share Data(a) | Dec. 31, 2003 |
Dec. 31, 2002 |
Dec. 31, 2001 |
|||||||||
| Net Asset Value, Beginning of Period |
$ | 6.02 | $ | 7.94 | $ | 10.00 | ||||||
| Income From Investment Operations: |
||||||||||||
| Net Investment Income (Loss) |
(0.12 | )(b) | (0.12 | )(b) | (0.09 | ) | ||||||
| Net Realized and Unrealized Gains (Losses) on Investments |
2.28 | (1.79 | ) | (1.97 | )(c) | |||||||
| Total from Investment Operations |
2.16 | (1.91 | ) | (2.06 | ) | |||||||
| Less Distributions: |
||||||||||||
| From Net Realized Gains |
— | (0.01 | ) | — | ||||||||
| Total Distributions |
— | (0.01 | ) | — | ||||||||
| Net Asset Value, End of Period |
$ | 8.18 | $ | 6.02 | $ | 7.94 | ||||||
| Ratios and Supplemental Data |
||||||||||||
| Total Return |
+35.9 | % | –24.0 | % | –20.6 | % | ||||||
| Net Assets, End of Period (In Millions) |
$ | 1 | $ | 0 | (e) | $ | 0 | (e) | ||||
| Ratio of Expenses to Average Net Assets before Expense Offsets |
2.4 | % | 2.4 | % | 12.4 | % | ||||||
| Ratio of Expenses to Average Net Assets |
2.3 | % | 2.4 | % | 2.5 | % | ||||||
| Ratio of Net Investment Income (Loss) to Average Net Assets |
(1.8 | )% | (1.9 | )% | (1.7 | )% | ||||||
| Portfolio Turnover Rate(d) |
243.6 | % | 437.3 | % | 359.7 | % | ||||||
| (a) | Information presented relates to a share of capital stock of the Fund outstanding for the entire period. |
| (b) | Net investment income (loss) per share represents net investment income (loss) divided by average shares outstanding throughout the year. |
| (c) | The amount shown may not correlate with the aggregate gains and losses of portfolio securities due to the timing of subscriptions and redemptions of fund shares. |
| (d) | Calculated on the basis of the Fund as a while without distinguishing between the classes of shares issued. |
| (e) | Amount is less than $500,000. |
See Notes to Financial Statements.
78
Table of Contents
FINANCIAL HIGHLIGHTS (continued)
STRONG ADVISOR SELECT FUND — CLASS C
| Year Ended |
||||||||||||
| Dec. 31, 2003 |
Dec. 31, 2002 |
Dec. 31, 2001 |
||||||||||
| Selected Per-Share Data(a) |
||||||||||||
| Net Asset Value, Beginning of Period |
$ | 6.02 | $ | 7.93 | $ | 10.00 | ||||||
| Income From Investment Operations: |
||||||||||||
| Net Investment Income (Loss) |
(0.13 | )(b) | (0.12 | )(b) | (0.10 | ) | ||||||
| Net Realized and Unrealized Gains (Losses) on Investments |
2.29 | (1.78 | ) | (1.97 | )(c) | |||||||
| Total from Investment Operations |
2.16 | (1.90 | ) | (2.07 | ) | |||||||
| Less Distributions: |
||||||||||||
| From Net Realized Gains |
— | (0.01 | ) | — | ||||||||
| Total Distributions |
— | (0.01 | ) | — | ||||||||
| Net Asset Value, End of Period |
$ | 8.18 | $ | 6.02 | $ | 7.93 | ||||||
| Ratios and Supplemental Data |
||||||||||||
| Total Return |
+35.9 | % | –24.0 | % | –20.7 | % | ||||||
| Net Assets, End of Period (In Millions) |
$ | 0 | (d) | $ | 0 | (d) | $ | 0 | (d) | |||
| Ratio of Expenses to Average Net Assets before Expense Offsets |
2.5 | % | 2.3 | % | 12.8 | % | ||||||
| Ratio of Expenses to Average Net Assets |
2.4 | % | 2.3 | % | 2.5 | % | ||||||
| Ratio of Net Investment Income (Loss) to Average Net Assets |
(1.8 | )% | (1.8 | )% | (1.7 | )% | ||||||
| Portfolio Turnover Rate(e) |
243.6 | % | 437.3 | % | 359.7 | % | ||||||
STRONG ADVISOR TECHNOLOGY FUND — CLASS A
| Year Ended |
||||||||||||||||
| Dec. 31, 2003 |
Dec. 31, 2002 |
Dec. 31, 2001 |
Dec. 31, 2000(f) |
|||||||||||||
| Selected Per-Share Data(a) |
||||||||||||||||
| Net Asset Value, Beginning of Period |
$ | 4.24 | $ | 7.22 | $ | 9.27 | $ | 10.00 | ||||||||
| Income From Investment Operations: |
||||||||||||||||
| Net Investment Income (Loss) |
(0.10 | )(b) | (0.11 | )(b) | (0.05 | ) | (0.05 | ) | ||||||||
| Net Realized and Unrealized Gains (Losses) on Investments |
3.29 | (2.87 | ) | (1.99 | ) | (0.68 | ) | |||||||||
| Total from Investment Operations |
3.19 | (2.98 | ) | (2.04 | ) | (0.73 | ) | |||||||||
| Less Distributions: |
||||||||||||||||
| From Net Realized Gains |
— | — | (0.01 | ) | — | |||||||||||
| Total Distributions |
— | — | (0.01 | ) | — | |||||||||||
| Net Asset Value, End of Period |
$ | 7.43 | $ | 4.24 | $ | 7.22 | $ | 9.27 | ||||||||
| Ratios and Supplemental Data |
||||||||||||||||
| Total Return |
+75.2 | % | –41.3 | % | –22.0 | % | –7.3 | % | ||||||||
| Net Assets, End of Period (In Millions) |
$ | 1 | $ | 1 | $ | 2 | $ | 0 | (d) | |||||||
| Ratio of Expenses to Average Net Assets before Expense Offsets |
3.6 | % | 3.3 | % | 7.0 | % | 17.2 | %* | ||||||||
| Ratio of Expenses to Average Net Assets |
2.2 | % | 2.3 | % | 1.6 | % | 9.5 | %* | ||||||||
| Ratio of Net Investment Income (Loss) to Average Net Assets |
(1.8 | )% | (2.1 | )% | (1.0 | )% | (8.2 | )%* | ||||||||
| Portfolio Turnover Rate(e) |
184.5 | % | 136.5 | % | 157.9 | % | 49.3 | % | ||||||||
| * | Calculated on an annualized basis. |
| (a) | Information presented relates to a share of capital stock of the Fund outstanding for the entire period. |
| (b) | Net investment income (loss) per share represents new investment income (loss) divided by average shares outstanding throughout the year. |
| (c) | The amount shown may not correlate with the aggregate gains and losses of portfolio securities due to the timing of subscriptions and redemptions of fund shares. |
| (d) | Amount is less than $500,000. |
| (e) | Calculated on the basis of the Fund as a whole without distinguishing between the classes of shares issued. |
| (f) | For the period from November 30, 2000 (commencement of class) to December 31, 2000. |
See Notes to Financial Statements.
79
Table of Contents
FINANCIAL HIGHLIGHTS (continued)
STRONG ADVISOR TECHNOLOGY FUND — CLASS B
| Year Ended |
||||||||||||||||
| Dec. 31, 2003 |
Dec. 31, 2002 |
Dec. 31, 2001 |
Dec. 31, 2000(b) |
|||||||||||||
| Selected Per-Share Data(a) |
||||||||||||||||
| Net Asset Value, Beginning of Period |
$ | 4.17 | $ | 7.13 | $ | 9.26 | $ | 10.00 | ||||||||
| Income From Investment Operations: |
||||||||||||||||
| Net Investment Income (Loss) |
(0.11 | )(c) | (0.11 | )(c) | (0.09 | ) | (0.08 | ) | ||||||||
| Net Realized and Unrealized Gains (Losses) on Investments |
3.26 | (2.85 | ) | (2.03 | ) | (0.66 | ) | |||||||||
| Total from Investment Operations |
3.15 | (2.96 | ) | (2.12 | ) | (0.74 | ) | |||||||||
| Less Distributions: |
||||||||||||||||
| From Net Realized Gains |
— | — | (0.01 | ) | — | |||||||||||
| Total Distributions |
— | — | (0.01 | ) | — | |||||||||||
| Net Asset Value, End of Period |
$ | 7.32 | $ | 4.17 | $ | 7.13 | $ | 9.26 | ||||||||
| Ratios and Supplemental Data |
||||||||||||||||
| Total Return |
+75.5 | % | –41.5 | % | –22.9 | % | –7.4 | % | ||||||||
| Net Assets, End of Period (In Millions) |
$ | 1 | $ | 0 | (d) | $ | 0 | (d) | $ | 0 | (d) | |||||
| Ratio of Expenses to Average Net Assets before Expense Offsets |
4.5 | % | 4.5 | % | 9.3 | % | 17.3 | %* | ||||||||
| Ratio of Expenses to Average Net Assets |
2.2 | % | 2.4 | % | 2.5 | % | 11.1 | %* | ||||||||
| Ratio of Net Investment Income (Loss) to Average Net Assets |
(1.7 | )% | (2.2 | )% | (1.9 | )% | (9.7 | )%* | ||||||||
| Portfolio Turnover Rate(e) |
184.5 | % | 136.5 | % | 157.9 | % | 49.3 | % | ||||||||
| STRONG ADVISOR TECHNOLOGY FUND — CLASS C
|
| |||||||||||||||
| Year Ended |
||||||||||||||||
| Dec. 31, 2003 |
Dec. 31, 2002 |
Dec. 31, 2001 |
Dec. 31, 2000(b) |
|||||||||||||
| Selected Per-Share Data(a) |
||||||||||||||||
| Net Asset Value, Beginning of Period |
$ | 4.16 | $ | 7.11 | $ | 9.26 | $ | 10.00 | ||||||||
| Income From Investment Operations: |
||||||||||||||||
| Net Investment Income (Loss) |
(0.10 | )(c) | (0.12 | )(c) | (0.09 | ) | (0.08 | ) | ||||||||
| Net Realized and Unrealized Gains (Losses) on Investments |
3.24 | (2.83 | ) | (2.05 | ) | (0.66 | ) | |||||||||
| Total from Investment Operations |
3.14 | (2.95 | ) | (2.14 | ) | (0.74 | ) | |||||||||
| Less Distributions: |
||||||||||||||||
| From Net Realized Gains |
— | — | (0.01 | ) | — | |||||||||||
| Total Distributions |
— | — | (0.01 | ) | — | |||||||||||
| Net Asset Value, End of Period |
$ | 7.30 | $ | 4.16 | $ | 7.11 | $ | 9.26 | ||||||||
| Ratios and Supplemental Data |
||||||||||||||||
| Total Return |
+75.5 | % | –41.5 | % | –23.1 | % | –7.4 | % | ||||||||
| Net Assets, End of Period (In Millions) |
$ | 0 | (d) | $ | 0 | (d) | $ | 1 | $ | 0 | (d) | |||||
| Ratio of Expenses to Average Net Assets before Expense Offsets |
4.5 | % | 4.2 | % | 8.9 | % | 17.3 | %* | ||||||||
| Ratio of Expenses to Average Net Assets |
2.2 | % | 2.5 | % | 2.4 | % | 11.1 | %* | ||||||||
| Ratio of Net Investment Income (Loss) to Average Net Assets |
(1.8 | )% | (2.2 | )% | (1.8 | )% | (9.7 | )%* | ||||||||
| Portfolio Turnover Rate(e) |
184.5 | % | 136.5 | % | 157.9 | % | 49.3 | % | ||||||||
| * | Calculated on an annualized basis. |
| (a) | Information presented relates to a share of capital stock of the Fund outstanding for the entire period. |
| (b) | For the period from November 30, 2000 (commencement of class) to December 31, 2000. |
| (c) | Net investment income (loss) per share represents net investment income (loss) divided by average shares outstanding throughout the year. |
| (d) | Amount is less than $500,000. |
| (e) | Calculated on the basis of the Fund as a whole without distinguishing between the classes of shares issued. |
See Notes to Financial Statements.
80
Table of Contents
FINANCIAL HIGHLIGHTS (continued)
STRONG ADVISOR U.S. SMALL/MID CAP GROWTH FUND — CLASS A
| Year Ended |
||||||||
| Dec. 31, 2003 |
Dec. 31, 2002(b) |
|||||||
| Selected Per-Share Data(a) |
||||||||
| Net Asset Value, Beginning of Period |
$ | 7.14 | $ | 10.00 | ||||
| Income From Investment Operations: |
||||||||
| Net Investment Income (Loss) |
(0.24 | )(c) | (0.14 | )(c) | ||||
| Net Realized and Unrealized Gains (Losses) on Investments |
4.29 | (2.72 | ) | |||||
| Total from Investment Operations |
4.05 | (2.86 | ) | |||||
| Less Distributions: |
||||||||
| From Net Investment Income |
— | — | ||||||
| Total Distributions |
— | — | ||||||
| Net Asset Value, End of Period |
$ | 11.19 | $ | 7.14 | ||||
| Ratios and Supplemental Data |
||||||||
| Total Return |
+56.7 | % | –28.6 | % | ||||
| Net Assets, End of Period (In Millions) |
$ | 3 | $ | 0 | (d) | |||
| Ratio of Expenses to Average Net Assets before Expense Offsets |
3.8 | % | 14.1 | %* | ||||
| Ratio of Expenses to Average Net Assets |
2.4 | % | 2.5 | %* | ||||
| Ratio of Net Investment Income (Loss) to Average Net Assets |
(2.4 | )% | (2.4 | )%* | ||||
| Portfolio Turnover Rate(e) |
114.0 | % | 98.1 | % | ||||
STRONG ADVISOR U.S. SMALL/MID CAP GROWTH FUND — CLASS B
| Year Ended |
||||||||
| Dec. 31, 2003 |
Dec. 31, 2002(b) |
|||||||
| Selected Per-Share Data(a) |
||||||||
| Net Asset Value, Beginning of Period |
$ | 7.14 | $ | 10.00 | ||||
| Income From Investment Operations: |
||||||||
| Net Investment Income (Loss) |
(0.23 | )(c) | (0.14 | )(c) | ||||
| Net Realized and Unrealized Gains (Losses) on Investments |
4.27 | (2.72 | ) | |||||
| Total from Investment Operations |
4.04 | (2.86 | ) | |||||
| Less Distributions: |
||||||||
| From Net Investment Income |
— | — | ||||||
| Total Distributions |
— | — | ||||||
| Net Asset Value, End of Period |
$ | 11.18 | $ | 7.14 | ||||
| Ratios and Supplemental Data |
||||||||
| Total Return |
+56.6 | % | –28.6 | % | ||||
| Net Assets, End of Period (In Millions) |
$ | 1 | $ | 0 | (d) | |||
| Ratio of Expenses to Average Net Assets before Expense Offsets |
4.7 | % | 14.9 | %* | ||||
| Ratio of Expenses to Average Net Assets |
2.4 | % | 2.5 | %* | ||||
| Ratio of Net Investment Income (Loss) to Average Net Assets |
(2.4 | )% | (2.4 | )%* | ||||
| Portfolio Turnover Rate(e) |
114.0 | % | 98.1 | % | ||||
| * | Calculated on an annualized basis. |
| (a) | Information presented relates to a share of capital stock of the Fund outstanding for the entire period. |
| (b) | For the period from March 28, 2002 (commencement of class) to December 31, 2002 (Note 1). |
| (c) | Net investment income (loss) per share represents net investment income (loss) divided by average shares outstanding throughout the year. |
| (d) | Amount is less than $500,000. |
| (e) | Calculated on the basis of the Fund as a whole without distinguishing between the classes of shares issued. |
See Notes to Financial Statements.
81
Table of Contents
FINANCIAL HIGHLIGHTS (continued)
STRONG ADVISOR U.S. SMALL/MID CAP GROWTH FUND — CLASS C
| Year Ended |
||||||||
| Dec. 31, 2003 |
Dec. 31, 2002(b) |
|||||||
| Selected Per-Share Data(a) |
||||||||
| Net Asset Value, Beginning of Period |
$ | 7.14 | $ | 10.00 | ||||
| Income From Investment Operations: |
||||||||
| Net Investment Income (Loss) |
(0.23 | )(c) | (0.13 | )(c) | ||||
| Net Realized and Unrealized Gains (Losses) on Investments |
4.28 | (2.73 | ) | |||||
| Total from Investment Operations |
4.05 | (2.86 | ) | |||||
| Less Distributions: |
||||||||
| From Net Investment Income |
— | — | ||||||
| Total Distributions |
— | — | ||||||
| Net Asset Value, End of Period |
$ | 11.19 | $ | 7.14 | ||||
| Ratios and Supplemental Data |
||||||||
| Total Return |
+56.7 | % | –28.6 | % | ||||
| Net Assets, End of Period (In Millions) |
$ | 2 | $ | 0 | (d) | |||
| Ratio of Expenses to Average Net Assets before Expense Offsets |
4.7 | % | 15.3 | %* | ||||
| Ratio of Expenses to Average Net Assets |
2.4 | % | 2.5 | %* | ||||
| Ratio of Net Investment Income (Loss) to Average Net Assets |
(2.3 | )% | (2.4 | )%* | ||||
| Portfolio Turnover Rate(e) |
114.0 | % | 98.1 | % | ||||
STRONG ADVISOR UTILITIES AND ENERGY FUND — CLASS A
| Year Ended |
||||||||
| Dec. 31, 2003 |
Dec. 31, 2002(f) |
|||||||
| Selected Per-Share Data(a) |
||||||||
| Net Asset Value, Beginning of Period |
$ | 9.02 | $ | 10.00 | ||||
| Income From Investment Operations: |
||||||||
| Net Investment Income |
0.14 | 0.08 | (c) | |||||
| Net Realized and Unrealized Gains (Losses) on Investments |
1.61 | (1.00 | ) | |||||
| Total from Investment Operations |
1.75 | (0.92 | ) | |||||
| Less Distributions: |
||||||||
| From Net Investment Income |
(0.14 | ) | (0.06 | ) | ||||
| Total Distributions |
(0.14 | ) | (0.06 | ) | ||||
| Net Asset Value, End of Period |
$ | 10.63 | $ | 9.02 | ||||
| Ratios and Supplemental Data |
||||||||
| Total Return |
+19.6 | % | –9.2 | % | ||||
| Net Assets, End of Period (In Millions) |
$ | 10 | $ | 6 | ||||
| Ratio of Expenses to Average Net Assets before Expense Offsets |
1.9 | % | 2.2 | %* | ||||
| Ratio of Expenses to Average Net Assets |
1.9 | % | 2.2 | %* | ||||
| Ratio of Net Investment Income to Average Net Assets |
1.5 | % | 2.0 | %* | ||||
| Portfolio Turnover Rate(e) |
174.2 | % | 46.2 | % | ||||
| * | Calculated on an annualized basis. |
| (a) | Information presented relates to a share of capital stock of the Fund outstanding for the entire period. |
| (b) | For the period from March 28, 2002 (commencement of class) to December 31, 2002 (Note 1). |
| (c) | Net investment income (loss) per share represents net investment income (loss) divided by average shares outstanding throughout the year. |
| (d) | Amount is less than $500,000. |
| (e) | Calculated on the basis of the Fund as a whole without distinguishing between the classes of shares issued. |
| (f) | For the period from July 31, 2002 (commencement of class) to December 31, 2002 (Note 1). |
See Notes to Financial Statements.
82
Table of Contents
FINANCIAL HIGHLIGHTS (continued)
STRONG ADVISOR UTILITIES AND ENERGY FUND — CLASS B
| Year Ended |
||||||||
| Dec. 31, 2003 |
Dec. 31, 2002(b) |
|||||||
| Selected Per-Share Data(a) |
||||||||
| Net Asset Value, Beginning of Period |
$ | 9.04 | $ | 10.00 | ||||
| Income From Investment Operations: |
||||||||
| Net Investment Income |
0.09 | 0.06 | (c) | |||||
| Net Realized and Unrealized Gains on Investments |
1.62 | (1.00 | ) | |||||
| Total from Investment Operations |
1.71 | (0.94 | ) | |||||
| Less Distributions: |
||||||||
| From Net Investment Income |
(0.11 | ) | (0.02 | ) | ||||
| Total Distributions |
(0.11 | ) | (0.02 | ) | ||||
| Net Asset Value, End of Period |
$ | 10.64 | $ | 9.04 | ||||
| Ratios and Supplemental Data |
||||||||
| Total Return |
+19.0 | % | –9.4 | % | ||||
| Net Assets, End of Period (In Millions) |
$ | 0 | (d) | $ | 0 | (d) | ||
| Ratio of Expenses to Average Net Assets before Expense Offsets |
2.7 | % | 5.1 | %* | ||||
| Ratio of Expenses to Average Net Assets |
2.4 | % | 2.5 | %* | ||||
| Ratio of Net Investment Income to Average Net Assets |
1.0 | % | 1.6 | %* | ||||
| Portfolio Turnover Rate(e) |
174.2 | % | 46.2 | % | ||||
STRONG ADVISOR UTILITIES AND ENERGY FUND — CLASS C
| Year Ended |
||||||||
| Dec. 31, 2003 |
Dec. 31, 2002(b) |
|||||||
| Selected Per-Share Data(a) |
||||||||
| Net Asset Value, Beginning of Period |
$ | 9.02 | $ | 10.00 | ||||
| Income From Investment Operations: |
||||||||
| Net Investment Income (Loss) |
0.09 | 0.05 | (c) | |||||
| Net Realized and Unrealized Gains (Losses) on Investments |
1.61 | (0.99 | ) | |||||
| Total from Investment Operations |
1.70 | (0.94 | ) | |||||
| Less Distributions: |
||||||||
| From Net Investment Income |
(0.10 | ) | (0.04 | ) | ||||
| Total Distributions |
(0.10 | ) | (0.04 | ) | ||||
| Net Asset Value, End of Period |
$ | 10.62 | $ | 9.02 | ||||
| Ratios and Supplemental Data |
||||||||
| Total Return |
+19.0 | % | –9.4 | % | ||||
| Net Assets, End of Period (In Millions) |
$ | 0 | (d) | $ | 0 | (d) | ||
| Ratio of Expenses to Average Net Assets before Expense Offsets |
2.7 | % | 5.3 | %* | ||||
| Ratio of Expenses to Average Net Assets |
2.4 | % | 2.5 | %* | ||||
| Ratio of Net Investment Income to Average Net Assets |
0.9 | % | 1.3 | %* | ||||
| Portfolio Turnover Rate(e) |
174.2 | % | 46.2 | % | ||||
| * | Calculated on an annualized basis. |
| (a) | Information presented relates to a share of capital stock of the Fund outstanding for the entire period. |
| (b) | For the period from July 31, 2002 (commencement of class) to December 31, 2002 (Note 1). |
| (c) | Net investment income (loss) per share represents net investment income (loss) divided by average shares outstanding throughout the year. |
| (d) | Amount is less than $500,000. |
| (e) | Calculated on the basis of the Fund as a whole without distinguishing between the classes of shares issued. |
See Notes to Financial Statements.
83
Table of Contents
FINANCIAL HIGHLIGHTS (continued)
STRONG ADVISOR LARGE COMPANY CORE FUND — CLASS A
| Year Ended |
||||||||||||||||||||||||
| Dec. 31, 2003 |
Dec. 31, 2002(b) |
Sep. 30, 2002(c) |
Sep. 30, 2001 |
Sep. 30, 2000 |
Sep. 30, 1999 |
|||||||||||||||||||
| Selected Per-Share Data(a) |
||||||||||||||||||||||||
| Net Asset Value, Beginning of Period |
$ | 8.81 | $ | 8.24 | $ | 9.65 | $ | 14.67 | $ | 11.72 | $ | 9.71 | ||||||||||||
| Income From Investment Operations: |
||||||||||||||||||||||||
| Net Investment Income |
(0.00 | )(d)(e) | 0.01 | (e) | 0.07 | 0.12 | 0.14 | 0.09 | ||||||||||||||||
| Net Realized and Unrealized Gains (Losses) on Investments |
2.02 | 0.57 | (1.10 | ) | (3.79 | ) | 3.26 | 2.03 | ||||||||||||||||
| Total from Investment Operations |
2.02 | 0.58 | (1.03 | ) | (3.67 | ) | 3.40 | 2.12 | ||||||||||||||||
| Less Distributions: |
||||||||||||||||||||||||
| From Net Investment Income |
(0.01 | ) | (0.01 | ) | (0.05 | ) | (0.12 | ) | (0.14 | ) | (0.11 | ) | ||||||||||||
| From Net Realized Gains |
(0.01 | ) | — | (0.33 | ) | (1.23 | ) | (0.31 | ) | — | ||||||||||||||
| Total Distributions |
(0.02 | ) | (0.01 | ) | (0.38 | ) | (1.35 | ) | (0.45 | ) | (0.11 | ) | ||||||||||||
| Net Asset Value, End of Period |
$ | 10.81 | $ | 8.81 | $ | 8.24 | $ | 9.65 | $ | 14.67 | $ | 11.72 | ||||||||||||
| Ratios and Supplemental Data |
||||||||||||||||||||||||
| Total Return |
+22.9 | % | +7.0 | % | –11.5 | % | –26.4 | % | +29.5 | % | +21.9 | % | ||||||||||||
| Net Assets, End of Period (In Millions) |
$ | 67 | $ | 9 | $ | 6 | $ | 4 | $ | 5 | $ | 3 | ||||||||||||
| Ratio of Expenses to Average Net Assets before Expense Offsets |
1.7 | % | 3.1 | %* | 3.7 | % | 4.7 | % | 3.8 | % | 4.6 | % | ||||||||||||
| Ratio of Expenses to Average Net Assets |
1.5 | % | 1.5 | %* | 1.5 | % | 1.5 | % | 1.5 | % | 1.5 | % | ||||||||||||
| Ratio of Net Investment Income to Average Net Assets |
(0.0 | )%(d) | 0.1 | %* | 0.8 | % | 1.0 | % | 1.1 | % | 0.8 | % | ||||||||||||
| Portfolio Turnover Rate(f) |
148.2 | % | 36.4 | % | 190.4 | % | 221.6 | % | 142.7 | % | 113.4 | % | ||||||||||||
STRONG ADVISOR LARGE COMPANY CORE FUND — CLASS B
| Year Ended |
||||||||
| Dec. 31, 2003 |
Dec. 31, 2002(g) |
|||||||
| Selected Per-Share Data(a) |
||||||||
| Net Asset Value, Beginning of Period |
$ | 8.79 | $ | 8.21 | ||||
| Income From Investment Operations: |
||||||||
| Net Investment Income |
(0.10 | )(e) | (0.02 | )(e) | ||||
| Net Realized and Unrealized Gains on Investments |
2.01 | 0.60 | ||||||
| Total from Investment Operations |
1.91 | 0.58 | ||||||
| Less Distributions: |
||||||||
| From Net Investment Income |
(0.00 | )(d) | — | |||||
| From Net Realized Gains |
(0.01 | ) | — | |||||
| Total Distributions |
(0.01 | ) | — | |||||
| Net Asset Value, End of Period |
$ | 10.69 | $ | 8.79 | ||||
| Ratios and Supplemental Data |
||||||||
| Total Return |
+21.7 | % | +7.1 | % | ||||
| Net Assets, End of Period (In Millions) |
$ | 8 | $ | 0 | (h) | |||
| Ratio of Expenses to Average Net Assets before Expense Offsets |
2.5 | % | 4.2 | %* | ||||
| Ratio of Expenses to Average Net Assets |
2.4 | % | 2.5 | %* | ||||
| Ratio of Net Investment Income to Average Net Assets |
(1.0 | )% | (0.2 | )%* | ||||
| Portfolio Turnover Rate(f) |
148.2 | % | 36.4 | % | ||||
| * | Calculated on an annualized basis. |
| (a) | Information presented relates to a share of capital stock of the Fund outstanding for the entire period. |
| (b) | In 2002, the Fund changed its fiscal year-end from September to December. |
| (c) | Effective September 5, 2002 Strong Capital Management, Inc. assumed the investment advisory responsibilities from Rockhaven Asset Management, LLC. |
| (d) | Amount calculated is less than $0.005 or 0.05%. |
| (e) | Net investment income (loss) per share represents net investment income (loss) divided by average shares outstanding throughout the year. |
| (f) | Calculated on the basis of the Fund as a whole without distinguishing between the classes of shares issued. |
| (g) | For the period from September 30, 2002 (commencement of class) to December 31, 2002. |
| (h) | Amount is less than $500,000. |
See Notes to Financial Statements.
84
Table of Contents
FINANCIAL HIGHLIGHTS (continued)
STRONG ADVISOR LARGE COMPANY CORE FUND — CLASS C
| Year Ended |
||||||||
| Dec. 31, 2003 |
Dec. 31, 2002(b) |
|||||||
| Selected Per-Share Data(a) |
||||||||
| Net Asset Value, Beginning of Period |
$ | 8.79 | $ | 8.21 | ||||
| Income From Investment Operations: |
||||||||
| Net Investment Income (Loss) |
(0.10 | )(c) | (0.02 | )(c) | ||||
| Net Realized and Unrealized Gains (Losses) on Investments |
2.01 | 0.60 | ||||||
| Total from Investment Operations |
1.91 | 0.58 | ||||||
| Less Distributions: |
||||||||
| From Net Investment Income |
— | (0.00 | )(d) | |||||
| From Net Realized Gains (Losses) |
(0.01 | ) | — | |||||
| Total Distributions |
(0.01 | ) | (0.00 | )(d) | ||||
| Net Asset Value, End of Period |
$ | 10.69 | $ | 8.79 | ||||
| Ratios and Supplemental Data |
||||||||
| Total Return |
+21.7 | % | +7.1 | % | ||||
| Net Assets, End of Period (In Millions) |
$ | 6 | $ | 0 | (e) | |||
| Ratio of Expenses to Average Net Assets before Expense Offsets |
2.5 | % | 4.2 | %* | ||||
| Ratio of Expenses to Average Net Assets |
2.4 | % | 2.5 | %* | ||||
| Ratio of Net Investment Income to Average Net Assets |
(1.0 | )% | (0.2 | )%* | ||||
| Portfolio Turnover Rate(f) |
148.2 | % | 36.4 | % | ||||
STRONG ADVISOR LARGE COMPANY CORE FUND — CLASS K
| Year Ended |
||||||||
| Dec. 31, 2003 |
Dec. 31, 2002(b) |
|||||||
| Selected Per-Share Data(a) |
||||||||
| Net Asset Value, Beginning of Period |
$ | 8.80 | $ | 8.21 | ||||
| Income From Investment Operations: |
||||||||
| Net Investment Income |
0.05 | (c) | 0.02 | (c) | ||||
| Net Realized and Unrealized Losses on Investments |
2.03 | 0.59 | ||||||
| Total from Investment Operations |
2.08 | 0.61 | ||||||
| Less Distributions: |
||||||||
| From Net Investment Income |
(0.03 | ) | (0.02 | ) | ||||
| From Net Realized Gains |
(0.01 | ) | — | |||||
| Total Distributions |
(0.04 | ) | (0.02 | ) | ||||
| Net Asset Value, End of Period |
$ | 10.84 | $ | 8.80 | ||||
| Ratios and Supplemental Data |
||||||||
| Total Return |
+23.7 | % | +7.4 | % | ||||
| Net Assets, End of Period (In Millions) |
$ | 35 | $ | 0 | (e) | |||
| Ratio of Expenses to Average Net Assets before Expense Offsets |
1.4 | % | 2.9 | %* | ||||
| Ratio of Expenses to Average Net Assets |
1.0 | % | 1.0 | %* | ||||
| Ratio of Net Investment Income to Average Net Assets |
0.5 | % | 1.1 | %* | ||||
| Portfolio Turnover Rate(f) |
148.2 | % | 36.4 | % | ||||
| * | Calculated on an annualized basis. |
| (a) | Information presented relates to a share of capital stock of the Fund outstanding for the entire period. |
| (b) | For the period from September 30, 2002 (commencement of class) to December 31, 2002. |
| (c) | Net investment income (loss) per share represents net investment income (loss) divided by average shares outstanding throughout the year. |
| (d) | Amount calculated is less than $0.005. |
| (e) | Amount is less than $500,000. |
| (f) | Calculated on the basis of the Fund as a whole without distinguishing between the classes of shares issued. |
See Notes to Financial Statements.
85
Table of Contents
December 31, 2003
| 1. | Organization |
The accompanying financial statements represent the following Strong Advisor Equity Funds (the “Funds”), each with its own investment objectives and policies:
| • | Strong Advisor Common Stock Fund(1) (a series fund of Strong Common Stock Fund, Inc.) |
| • | Strong Advisor Mid Cap Growth Fund(1) (a series fund of Strong Equity Funds, Inc.) |
| • | Strong Advisor Small Cap Value Fund(1) (a series fund of Strong Equity Funds, Inc.) |
| • | Strong Advisor U.S. Value Fund(1) (a series fund of Strong Conservative Equity Funds, Inc.) |
| • | Strong Advisor Endeavor Large Cap Fund(1) (a series fund of Strong Common Stock Fund, Inc.) |
| • | Strong Advisor Focus Fund(2) (a series fund of Strong Common Stock Fund, Inc.) |
| • | Strong Advisor International Core Fund(1) (a series fund of Strong International Equity Funds, Inc.) |
| • | Strong Advisor Select Fund(2) (a series fund of Strong Opportunity Fund, Inc.) |
| • | Strong Advisor Technology Fund(1) (a series fund of Strong Common Stock Fund, Inc.) |
| • | Strong Advisor U.S. Small/Mid Cap Growth Fund(1) (a series fund of Strong Opportunity Fund, Inc.) |
| • | Strong Advisor Utilities and Energy Fund(1) (a series fund of Strong Equity Funds, Inc.) |
| • | Strong Advisor Large Company Core Fund(1) (a series fund of Strong Equity Funds, Inc.) |
| (1) | Diversified Fund. |
| (2) | Non-diversified Fund. |
Each Fund is an open-end management investment company registered under the Investment Company Act of 1940, as amended (“1940 Act”).
Strong Advisor Common Stock Fund, Strong Advisor Mid Cap Growth Fund and Strong Advisor Small Cap Value Fund offer Class A, B, C and Z shares. Strong Advisor U.S. Value Fund offers Class A, B, C, K and Z shares. Strong Advisor Endeavor Large Cap Fund, Strong Advisor Focus Fund, Strong Advisor International Core Fund, Strong Advisor Select Fund, Strong Advisor Technology Fund, Strong Advisor U.S. Small/Mid Cap Growth Fund and Strong Advisor Utilities and Energy Fund offer Class A, B and C shares. Strong Advisor Large Company Core Fund offers Class A, B, C and K shares. All classes of shares differ principally in their respective administration, transfer agent and distribution expenses and sales charges, if any. All classes of shares have identical rights to earnings, assets and voting privileges, except for class-specific expenses and exclusive rights to vote on matters affecting only individual classes.
Class A, B and C shares are available only through financial professionals. Class K shares are primarily available through retirement plans. Class Z shares are available to certain investors and investment professionals who owned Investor Class shares of the Fund on November 30, 2000 and to certain other investors as set forth in the Funds’ prospectuses.
Effective March 28, 2002 (public launch April 1, 2002), Strong Advisor U.S. Small/Mid Cap Growth Fund commenced operations and offers three classes of shares: Class A, B and C.
Effective July 31, 2002 (public launch August 1, 2002), Strong Advisor Utilities and Energy Fund commenced operations and offers three classes of shares: Class A, B and C.
| 2. | Significant Accounting Policies |
The following is a summary of significant accounting policies followed by the Funds in the preparation of their financial statements.
| (A) | Security Valuation — Securities of the Funds traded on a national securities exchange are valued each business day at the last sales price. Securities traded on the NASDAQ Stock Market are valued each business day using the NASDAQ Official Closing Price (“NOCP”). Exchange-traded securities for which there were no transactions and NASDAQ-traded securities for which there is no NOCP are valued at the mean of the bid and ask prices. Securities for which market quotations are not readily available are fair valued as determined in good faith under the general supervision of the Board of Directors. Some of the Fund’s portfolio securities may be listed on foreign exchanges that close before the U.S. markets and that trade on days when the U.S. markets are closed. As a result, management, under the supervision of the Strong Funds’ Board of Directors, will consider significant events affecting foreign securities and the movements of the domestic markets that occur after the close of the foreign markets and before the time a Fund’s net asset value (“NAV”) is calculated in valuing such foreign securities. Securities that are purchased within 60 days of their stated maturity are valued at amortized cost, which approximates fair value. |
The Funds may own certain securities that are restricted as to resale. Restricted securities include Section 4(2) commercial paper, securities issued in a private placement, or securities eligible for resale pursuant to Rule 144A under the Securities Act of 1933. Restricted securities may be determined to be liquid or illiquid. Securities are deemed illiquid based upon
86
Table of Contents
guidelines established by the Funds’ Board of Directors. Illiquid securities are valued after giving due consideration to pertinent factors, such as recent private sales, market conditions, and the issuer’s financial performance. The aggregate cost and fair value of restricted securities held at December 31, 2003, that are deemed illiquid, are as follows:
| Aggregate Cost |
Aggregate Fair Value |
Percent of Net Assets |
|||||||
| Strong Advisor Small Cap Value Fund |
$ | 680,073 | $ | 1,183,128 | 0.1 | % | |||
| (B) | Federal Income and Excise Taxes and Distributions to Shareholders — The Funds intend to comply with the requirements of the Internal Revenue Code of 1986, as amended, applicable to regulated investment companies and to distribute substantially all of their taxable income to their shareholders in a manner which results in no tax cost to the Funds. Therefore, no federal income or excise tax provision is recorded. |
Undistributed income or net realized gains for financial statement purposes may differ from what is determined for federal income tax purposes due to differences in the timing, recognition and characterization of income, and expense and capital gain items for financial statement and tax purposes. Where appropriate, reclassifications between net asset accounts are made for such differences that are permanent in nature. The Funds may utilize earnings and profits distributed to shareholders on redemption of shares as part of the dividends paid deduction.
Each Fund, other than Strong Advisor U.S. Value Fund and Strong Advisor Utilities and Energy Fund, generally pays dividends from net investment income and distributes net realized capital gains, if any, at least annually. Strong Advisor U.S. Value Fund and Strong Advisor Utilities and Energy Fund generally pay dividends from net investment income quarterly and distribute net realized capital gains, if any, at least annually.
| (C) | Realized Gains and Losses on Investment Transactions — Investment security transactions are recorded as of the trade date. Gains or losses realized on investment transactions are determined by comparing the identified cost of the security lot sold with the net sales proceeds. |
| (D) | Certain Investment Risks — The Funds may utilize derivative instruments including options, futures and other instruments with similar characteristics to the extent that they are consistent with the Funds’ investment objectives and limitations. The Funds intend to use such derivative instruments primarily to hedge or protect from adverse movements in securities’ prices, foreign currencies or interest rates. The use of these instruments involves certain risks, including the possibility that the value of the underlying assets or indices fluctuate, the derivative becomes illiquid, imperfect correlation exists between the value of the derivative and the underlying assets or indices, or that the counterparty fails to perform its obligations when due. |
Investments in foreign-denominated assets or forward currency contracts may involve greater risks than domestic investments due to currency rate fluctuations, political and economic instability, different financial reporting standards and taxes, less liquidity, less strict regulation of securities markets and smaller markets with lower trading volume.
| (E) | Futures — Upon entering into a futures contract, the Funds deposit in a segregated account with their custodian, in the name of the broker, cash and/or other liquid investments equal to the minimum “initial margin” requirements of the exchange. Each Fund designates liquid securities as collateral on open futures contracts. The Funds also receive from or pay to the broker an amount of cash equal to the daily fluctuation in the value of the futures contract. Such receipts or payments are known as “variation margin” and are recorded as unrealized gains or losses. When the futures contract is closed, a realized gain or loss is recorded equal to the difference between the value of the contract at the time it was opened and the value at the time it was closed. |
| (F) | Options — The Funds may write put or call options. Premiums received by the Funds upon writing put or call options are recorded as an asset with a corresponding liability that is subsequently adjusted daily to the current market value of the option. Changes between the initial premiums received and the current market value of the options are recorded as unrealized gains or losses. When an option is closed, expired or exercised, the Funds realize a gain or loss and the liability is eliminated. The Funds continue to bear the risk of adverse movements in the price of the underlying asset during the period of the written option, although any potential loss during the period would be reduced by the amount of the option premium received by the Funds. Each Fund designates liquid securities as collateral on open written options contracts. |
| (G) | Foreign Currency Conversion — Securities and other assets and liabilities initially expressed in foreign currencies are converted daily into U.S. dollars based upon current exchange rates. Purchases and sales of foreign securities and foreign income are converted into U.S. dollars based upon currency exchange rates prevailing on the respective dates of such transactions. The effect of changes in foreign exchange rates on realized and unrealized security gains or losses is reflected as a component of such gains or losses. |
87
Table of Contents
NOTES TO FINANCIAL STATEMENTS (continued)
December 31, 2003
| (H) | Forward Foreign Currency Exchange Contracts — Forward foreign currency exchange contracts are valued at the forward rate and are marked-to-market daily. The change in market value is recorded as an unrealized gain or loss. When the contract is closed, the Funds record an exchange gain or loss equal to the difference between the value of the contract at the time it was opened and the value at the time it was closed. |
| (I) | Short Positions — The Funds may engage in short sale transactions. For financial statement purposes, an amount equal to the settlement amount is included in the Statements of Assets and Liabilities as an asset and an equivalent liability. The amount of the liability is subsequently marked-to-market to reflect the current value of the short position. Changes between the amount of the liability and the current market value of the short positions are recorded as unrealized gains or losses. The Funds are liable to the buyer for any dividends payable on securities while those securities are in a short position. If the Funds sell securities short while also holding the long position in the security, they may protect unrealized gains but will lose the opportunity to profit on such securities if the price rises. If the Funds sell securities short when not holding the long position in the security, they will experience a loss if the market price of the security increases between the date of the short sale and the date the security is replaced. |
| (J) | Repurchase Agreements — The Funds may enter into repurchase agreements with institutions that the Funds’ investment advisor, Strong Capital Management, Inc. (“Strong” or the “Advisor”), has determined are creditworthy. Each repurchase transaction is recorded at cost, which approximates fair value. The Funds require that the collateral, represented by cash and/or securities (primarily U.S. government securities), in a repurchase transaction be maintained in a segregated account under the control of the Fund’s custodial bank in a manner sufficient to enable the Funds to liquidate those securities in the event of a default of the counterparty. On a daily basis, the Fund’s custodial bank monitors the value of the collateral, including accrued interest, to ensure it is at least equal to the amounts owed to the Funds under each repurchase agreement. |
| (K) | Securities Lending — The Funds, except Strong Advisor Utilities and Energy Fund and Strong Advisor Large Company Core Fund, have entered into a Securities Lending Agreement (the “Agreement”) with Deutsche Bank, which was subsequently acquired by State Street Bank and Trust Company. Under the terms of the Agreement, the Funds may lend portfolio securities to qualified institutional borrowers in order to earn additional income. The Agreement requires that loans are collateralized at all times by cash and cash equivalents equal to at least 102% of the market value of the aggregate loaned securities, plus accrued interest, and the collateral is marked-to-market daily. Cash collateral received is invested in repurchase agreements, investment funds, government obligations and/or bank obligations. |
At December 31, 2003, Strong Advisor Common Stock Fund, Strong Advisor Mid Cap Growth Fund and Strong Advisor U.S. Value Fund had securities with a market value of $46,764,638, $2,409,719 and $3,501,385, respectively, on loan and had received $48,053,386, $2,462,934 and $3,584,475, respectively, in collateral (both are included within Investments in the Statements of Assets and Liabilities). Amounts earned as interest on investments of cash collateral, net of rebates and other securities lending expenses, are included in Interest Income in the Statements of Operations. For the year ended December 31, 2003, the securities lending income totaled, $118,698, $2,386 and $9,106 for Strong Advisor Common Stock Fund, Strong Advisor Mid Cap Growth Fund and Strong Advisor U.S. Value Fund, respectively.
The three primary risks associated with securities lending are: a borrower defaulting on its obligation to return the securities loaned resulting in a shortfall on the posted collateral; a principal loss arising from the lending agent’s investment of cash collateral; and the inability of the lending Fund to recall a security in time to exercise valuable voting rights or sell the security. In each case, the lending agent has indemnified the Funds for these types of losses.
| (L) | Directed Brokerage — The Funds direct certain portfolio trades to brokers who, in turn, pay a portion of the Funds’ expenses not attributable to the Advisor or its affiliates. Such amounts are included in Expense Offsets reported in the Funds’ Statements of Operations and in Note 4. |
| (M) | Earnings Credit Arrangements — Credits are earned on positive cash balances maintained in custodian accounts. These credits serve to reduce the custodian’s fees incurred by certain Funds and are included in Expense Offsets reported in the Funds’ Statements of Operations and in Note 4. |
| (N) | Expenses — The Funds and other affiliated Strong Funds contract for certain services on a collective basis. The majority of the expenses are directly identifiable to an individual Fund. Expenses that are not readily identifiable to a specific Fund will be allocated in such a manner as deemed equitable, taking into consideration, among other things, the nature and type of expense and the relative sizes of the Strong Funds. |
| (O) | Use of Estimates — The preparation of financial statements in conformity with accounting principles generally accepted in the United States of America requires management to make estimates and assumptions that affect the reported amounts in these financial statements. Actual results could differ from those estimates. |
88
Table of Contents
| (P) | Other — Dividend income and distributions to shareholders are recorded on the ex-dividend date. Interest income is recorded on the accrual basis and includes amortization of premiums and discounts on the interest method. Income, expenses (other than expenses attributable to a specific class), and realized and unrealized gains or losses on investments are allocated to each class of shares based on its relative shares outstanding. |
| (Q) | Redemption Fees — Class A shares of Strong Advisor Large Company Core Fund held for less than 1 year are subject to a redemption fee of 1.00% on the redeemed share’s market value. Effective October 1, 2003, Class A, B and C shares of Strong Advisor International Core Fund held for less than 30 calendar days are subject to a redemption fee of 1.00%, based on the redeemed share’s market value. Redemption fees are paid directly to the Funds. The amount collected for the year ended December 31, 2003 was $12,110 for Strong Advisor Large Company Core Fund. Strong Advisor International Core Fund did not collect any redemption fees during the year. |
| 3. | Related Party Transactions |
The Advisor provides investment advisory and related services to the Funds. Strong Investor Services, Inc. (the “Administrator”), an affiliate of the Advisor, provides administrative, transfer agent and related services to the Funds. Certain officers and, until December 2, 2003, certain directors of the Funds are or were affiliated with the Advisor and the Administrator. Investment advisory and administration fees, which are established by terms of the advisory and administration agreements, are based on the following annualized rates of the average daily net assets of the respective Fund:
| Administrative Fees |
||||||||||||||||||
| Advisory Fees(1) |
Class A |
Class B |
Class C |
Class K |
Class Z |
|||||||||||||
| Strong Advisor Common Stock Fund |
0.75 | % | 0.30 | % | 0.30 | % | 0.30 | % | * | 0.30 | % | |||||||
| Strong Advisor Mid Cap Growth Fund |
0.75 | % | 0.30 | % | 0.30 | % | 0.30 | % | * | 0.30 | % | |||||||
| Strong Advisor Small Cap Value Fund |
0.75 | % | 0.30 | % | 0.30 | % | 0.30 | % | * | 0.30 | % | |||||||
| Strong Advisor U.S. Value Fund |
0.55 | % | 0.30 | % | 0.30 | % | 0.30 | % | 0.25 | % | 0.30 | % | ||||||
| Strong Advisor Endeavor Large Cap Fund |
0.75 | % | 0.30 | % | 0.30 | % | 0.30 | % | * | * | ||||||||
| Strong Advisor Focus Fund |
0.75 | % | 0.30 | % | 0.30 | % | 0.30 | % | * | * | ||||||||
| Strong Advisor International Core Fund |
0.75 | % | 0.30 | % | 0.30 | % | 0.30 | % | * | * | ||||||||
| Strong Advisor Select Fund |
0.75 | % | 0.30 | % | 0.30 | % | 0.30 | % | * | * | ||||||||
| Strong Advisor Technology Fund |
0.75 | % | 0.30 | % | 0.30 | % | 0.30 | % | * | * | ||||||||
| Strong Advisor U.S. Small/Mid Cap Growth Fund |
0.75 | % | 0.30 | % | 0.30 | % | 0.30 | % | * | * | ||||||||
| Strong Advisor Utilities and Energy Fund |
0.75 | % | 0.30 | % | 0.30 | % | 0.30 | % | * | * | ||||||||
| Strong Advisor Large Company Core Fund |
0.75 | % | 0.30 | % | 0.30 | % | 0.30 | % | 0.25 | % | * | |||||||
| * | Does not offer share class. |
| (1) | The Investment Advisory fees are 0.75% for assets under $4 billion, 0.725% for the next $2 billion assets, and 0.70% for assets $6 billion and above. Strong Advisor U.S. Value Fund does not have a breakpoint schedule. |
The Funds’ Advisor and/or Administrator may voluntarily waive or absorb certain expenses at their discretion. The Advisor and/or Administrator has contractually agreed to waive and/or absorb expenses for the following Funds until May 1, 2004, to keep Total Operating Expenses at or below the following percentages:
| Class A |
Class B |
Class C |
Class K |
Class Z |
|||||||||||
| Strong Advisor Common Stock Fund |
* | 2.50 | % | * | ** | * | |||||||||
| Strong Advisor Mid Cap Growth Fund |
* | 2.50 | % | 2.50 | % | ** | * | ||||||||
| Strong Advisor Small Cap Value Fund |
* | * | * | ** | * | ||||||||||
| Strong Advisor U.S. Value Fund |
2.50 | % | 2.50 | % | 2.50 | % | 0.99 | % | * | ||||||
| Strong Advisor Endeavor Large Cap Fund |
* | 2.50 | % | 2.50 | % | ** | * | * | |||||||
| Strong Advisor Focus Fund |
1.50 | % | 2.25 | % | 2.25 | % | ** | * | * | ||||||
| Strong Advisor International Core Fund |
2.50 | % | 2.50 | % | 2.50 | % | ** | * | * | ||||||
| Strong Advisor Select Fund |
2.50 | % | 2.50 | % | 2.50 | % | ** | * | * | ||||||
| Strong Advisor Technology Fund |
2.50 | % | 2.50 | % | 2.50 | % | ** | * | * | ||||||
| Strong Advisor U.S. Small/Mid Cap Growth Fund |
2.50 | % | 2.50 | % | 2.50 | % | ** | * | * | ||||||
| Strong Advisor Utilities and Energy Fund |
* | * | * | ** | * | * | |||||||||
| Strong Advisor Large Company Core Fund |
1.50 | %(1) | 2.50 | % | 2.50 | % | 0.99 | % | * | * |
| * | Contractual rate not applicable to Class. |
| ** | Does not offer share class. |
| (1) | The contractual rate is indefinite and may only be terminated by the Board of Directors of the Funds, but not before May 1, 2004. |
Transfer agent and related service fees for the Funds’ Class Z shares are paid at a rate of $27.00 for each open shareholder account and $4.20 for each closed shareholder account. Transfer agent and related service fees for each of the Funds’ Class A, B, C and K shares are paid at an annual rate of 0.20% of the average daily net assets of each respective class. Transfer agent fees are recorded in Shareholder Servicing Costs in the Funds’ Statements of Operations and in Note 4. The Administrator also allocates
89
Table of Contents
NOTES TO FINANCIAL STATEMENTS (continued)
December 31, 2003
to each Fund certain charges or credits resulting from transfer agency banking activities based on each Class’ level of subscription and redemption activity. Transfer Agency Banking Charges allocated to the Funds by the Administrator, if any, are included in Other Expenses in the Funds’ Statements of Operations and in Note 4. Transfer Agency Banking Credits allocated by the Administrator, if any, serve to reduce the transfer agency expenses incurred by the Funds and are included in Expense Offsets in the Funds’ Statements of Operations and in Note 4. The Administrator is also compensated for certain other out-of-pocket expenses related to transfer agent services.
The Funds have adopted a Rule 12b-1 distribution and service plan under the 1940 Act on behalf of each of the Funds’ Class A, B and C shares. Under the plan, Strong Investments, Inc. (the “Distributor” and an affiliate of the Advisor) is paid an annual rate of 0.25%, 1.00% and 1.00% of the average daily net assets of the Class A, B and C shares, respectively, as compensation for services provided and expenses incurred, including amounts paid to brokers or dealers, in connection with the sale of each Fund’s Class A, B and C shares. See Note 4.
The Funds’ Class A, B and C shares have sales charges charged to shareholders. The Funds’ Class A shares have a maximum 5.75% front-end sales charge. The Funds’ Class A shares, except Strong Advisor Large Company Core Fund, may be subject to a 1.00% contingent deferred sales charge if shares are purchased without an initial sales charge and are redeemed within one year of purchase (usually on purchases of $1,000,000 or more). The Funds’ Class B shares have a maximum 5.00% contingent deferred sales charge. The Funds’ Class C shares have a 1.00% contingent deferred sales charge, if the shares are sold within one year of their original purchase date. Certain of these sales charges may be waived in limited circumstances.
For the year ended December 31, 2003, the Distributor received aggregate sales charges from the sale of Class A shares as follows: Strong Advisor Common Stock Fund $20,159, Strong Advisor Mid Cap Growth Fund $1,456, Strong Advisor Small Cap Value Fund $74,331, Strong Advisor U.S. Value Fund $1,326, Strong Advisor Endeavor Large Cap Fund $107, Strong Advisor Focus Fund $62, Strong Advisor International Core Fund $1,813, Strong Advisor Select Fund $283, Strong Advisor Technology Fund $104, Strong Advisor U.S. Small/Mid Cap Growth Fund $1,873, Strong Advisor Utilities and Energy Fund $637 and Strong Advisor Large Company Core Fund $45,327.
For the year ended December 31, 2003, the Distributor received aggregate contingent deferred sales charges from the redemption of Class A, B, and C shares as follows: Strong Advisor Common Stock Fund $103,617, Strong Advisor Mid Cap Growth Fund $19,250, Strong Advisor Small Cap Value Fund $411,075, Strong Advisor U.S. Value Fund $19,143, Strong Advisor Endeavor Large Cap Fund $3,565, Strong Advisor Focus Fund $16,955, Strong Advisor International Core Fund $1,590, Strong Advisor Select Fund $3,745, Strong Advisor Technology Fund $20, Strong Advisor U.S. Small/Mid Cap Growth Fund $1,656, Strong Advisor Utilities and Energy Fund $0 and Strong Advisor Large Company Core Fund $22,328.
Sales charges are not an expense of the Funds and are not reflected in the financial statements of the Funds.
Next Century Growth Investors, LLC (“Next Century Growth”), an affiliate of the Advisor, manages the investments of Strong Advisor U.S. Small/Mid Cap Growth Fund under a subadvisory agreement with the Advisor. Next Century Growth is compensated by the Advisor (not the Fund) and bears all of its own expenses in providing subadvisory services.
W.H. Reaves & Co., Inc. (“Reaves”) manages the investments of Strong Advisor Utilities and Energy Fund under an agreement with the Advisor. Reaves is compensated by the Advisor (not the Fund) and bears all of its own expenses in providing subadvisory services. The investment subadvisory fees are based on breakpoints ranging from net asset values of $200 million to $2.5 billion. The investment subadvisory fees are also subject to adjustment upward or downward depending on the Fund’s performance measured against a benchmark. The benchmark is 90% of the performance of a blend of utilities and energy indices. In addition, Reaves directly affects purchases and sales of securities for the Fund. In conjunction therewith, brokerage commissions paid to Reaves by the Fund for the year ended December 31, 2003, totaled $64,422.
90
Table of Contents
The Funds may invest cash in money market funds managed by the Advisor, subject to certain limitations.
Certain information regarding related party transactions, excluding the effects of waivers and absorptions, for the year ended December 31, 2003, is as follows:
| Payable to/ (Receivable from) Advisor or Administrator at Dec. 31, 2003 |
Shareholder Servicing Paid to Administrator |
Transfer Agency Banking Charges/(Credits) |
Unaffiliated Directors’ Fees | ||||||||||
| Strong Advisor Common Stock Fund |
$ | 376,686 | $ | 3,931,818 | $ | 11,466 | $ | 36,558 | |||||
| Strong Advisor Mid Cap Growth Fund |
31,964 | 421,603 | 1,681 | 2,318 | |||||||||
| Strong Advisor Small Cap Value Fund |
443,364 | 4,074,021 | 19,998 | 27,074 | |||||||||
| Strong Advisor U.S. Value Fund |
74,121 | 1,088,309 | 25,387 | 4,669 | |||||||||
| Strong Advisor Endeavor Large Cap Fund |
9,788 | 69,819 | 1,655 | 1,191 | |||||||||
| Strong Advisor Focus Fund |
2,708 | 7,483 | 25 | 831 | |||||||||
| Strong Advisor International Core Fund |
(532 | ) | 2,282 | 6 | 756 | ||||||||
| Strong Advisor Select Fund |
16,504 | 145,655 | 1,741 | 1,642 | |||||||||
| Strong Advisor Technology Fund |
254 | 4,477 | 6 | 781 | |||||||||
| Strong Advisor U.S. Small/Mid Cap Growth Fund |
3,235 | 5,188 | 6 | 759 | |||||||||
| Strong Advisor Utilities and Energy Fund |
2,169 | 25,414 | 12 | 819 | |||||||||
| Strong Advisor Large Company Core Fund |
18,007 | 136,488 | 587 | 867 | |||||||||
At December 31, 2003, the Distributor owned 23% of the outstanding shares of Strong Advisor International Core Fund, and Strong Financial Corporation, the Advisor’s parent, owned 10% of Strong Advisor U.S. Small/Mid Cap Growth Fund.
91
Table of Contents
NOTES TO FINANCIAL STATEMENTS (continued)
December 31, 2003
| 4 | Expenses and Expense Offsets |
For the year ended December 31, 2003, the class specific expenses are as follows:
| Administrative Fees |
Shareholder Servicing Costs |
Reports to Shareholders |
12 b-1 Fees |
Other | ||||||||||||
| Strong Advisor Common Stock Fund |
||||||||||||||||
| Class A |
$ | 185,953 | $ | 125,386 | $ | 14,181 | $ | 154,961 | $ | 41 | ||||||
| Class B |
92,421 | 64,365 | 19,790 | 308,069 | 215 | |||||||||||
| Class C |
83,696 | 57,897 | 16,818 | 278,986 | 1,075 | |||||||||||
| Class Z |
4,357,362 | 3,679,886 | 396,587 | — | 15,246 | |||||||||||
| Strong Advisor Mid Cap Growth Fund |
||||||||||||||||
| Class A |
29,340 | 19,746 | 3,620 | 24,450 | 12 | |||||||||||
| Class B |
8,301 | 5,902 | 6,429 | 27,670 | 52 | |||||||||||
| Class C |
2,713 | 1,908 | 2,126 | 9,045 | 36 | |||||||||||
| Class Z |
215,717 | 393,113 | 76,512 | — | 3,284 | |||||||||||
| Strong Advisor Small Cap Value Fund |
||||||||||||||||
| Class A |
1,395,380 | 939,956 | 93,625 | 1,162,817 | 3,441 | |||||||||||
| Class B |
284,393 | 198,322 | 65,900 | 947,977 | 915 | |||||||||||
| Class C |
380,914 | 262,347 | 55,121 | 1,269,712 | 1,841 | |||||||||||
| Class Z |
2,571,489 | 2,669,064 | 176,936 | — | 18,133 | |||||||||||
| Strong Advisor U.S. Value Fund |
||||||||||||||||
| Class A |
10,075 | 6,865 | 1,152 | 8,396 | 85 | |||||||||||
| Class B |
10,896 | 7,573 | 1,987 | 36,320 | 29 | |||||||||||
| Class C |
6,787 | 4,856 | 2,084 | 22,740 | 631 | |||||||||||
| Class K |
43,744 | 35,001 | (65 | ) | — | 1,246 | ||||||||||
| Class Z |
577,375 | 1,033,129 | 236,827 | — | 24,281 | |||||||||||
| Strong Advisor Endeavor Large Cap Fund |
||||||||||||||||
| Class A |
101,753 | 67,877 | 1,987 | 84,794 | 1,677 | |||||||||||
| Class B |
1,661 | 1,152 | 280 | 5,535 | 3 | |||||||||||
| Class C |
971 | 692 | 383 | 3,239 | 72 | |||||||||||
| Strong Advisor Focus Fund |
||||||||||||||||
| Class A |
5,824 | 4,001 | 1,500 | 4,851 | 34 | |||||||||||
| Class B |
3,759 | 2,676 | 2,100 | 12,524 | 11 | |||||||||||
| Class C |
1,065 | 751 | 472 | 3,549 | 35 | |||||||||||
| Strong Advisor International Core Fund |
||||||||||||||||
| Class A |
1,240 | 843 | 128 | 1,032 | 3 | |||||||||||
| Class B |
1,529 | 1,064 | 575 | 5,093 | 3 | |||||||||||
| Class C |
537 | 369 | (421 | ) | 1,805 | 6 | ||||||||||
| Strong Advisor Select Fund |
||||||||||||||||
| Class A |
215,675 | 143,883 | 6,297 | 179,729 | 1,774 | |||||||||||
| Class B |
1,371 | 955 | 225 | 4,569 | 4 | |||||||||||
| Class C |
1,033 | 728 | 245 | 3,442 | 50 | |||||||||||
| Strong Advisor Technology Fund |
||||||||||||||||
| Class A |
4,685 | 3,176 | 602 | 3,904 | 10 | |||||||||||
| Class B |
963 | 672 | 458 | 3,210 | 2 | |||||||||||
| Class C |
865 | 613 | 529 | 2,883 | 10 | |||||||||||
| Strong Advisor U.S. Small/Mid Cap Growth Fund |
||||||||||||||||
| Class A |
3,478 | 2,353 | 34 | 2,898 | 12 | |||||||||||
| Class B |
1,976 | 1,347 | 35 | 6,586 | 3 | |||||||||||
| Class C |
1,940 | 1,327 | 181 | 6,478 | 152 | |||||||||||
| Strong Advisor Utilities and Energy Fund |
||||||||||||||||
| Class A |
36,978 | 24,670 | (201 | ) | 30,815 | 36 | ||||||||||
| Class B |
374 | 256 | 110 | 1,249 | — | |||||||||||
| Class C |
669 | 454 | 116 | 2,231 | 9 | |||||||||||
| Strong Advisor Large Company Core Fund |
||||||||||||||||
| Class A |
116,850 | 78,272 | 7,923 | 97,259 | 149 | |||||||||||
| Class B |
12,514 | 8,376 | 2,320 | 41,779 | 30 | |||||||||||
| Class C |
10,418 | 7,011 | 3,956 | 34,803 | 174 | |||||||||||
| Class K |
53,298 | 42,623 | 1,828 | — | 440 | |||||||||||
92
Table of Contents
For the year ended December 31, 2003, the class specific expense offsets are as follows:
| Expense Waivers and Absorptions |
Transfer Agency Banking Credits |
Directed Brokerage Credits |
Earnings Credits |
|||||||||||||
| Strong Advisor Common Stock Fund |
||||||||||||||||
| Class A |
$ | (188 | ) | $ | (826 | ) | $ | — | $ | — | ||||||
| Class B |
(111 | ) | — | — | — | |||||||||||
| Class C |
(149 | ) | — | — | — | |||||||||||
| Class Z |
(6,490 | ) | — | — | — | |||||||||||
| Fund Level |
(92,189 | ) | — | (117,548 | ) | (620 | ) | |||||||||
| Strong Advisor Mid Cap Growth Fund |
||||||||||||||||
| Class A |
(504 | ) | (892 | ) | — | — | ||||||||||
| Class B |
(3,077 | ) | — | — | — | |||||||||||
| Class C |
(1,092 | ) | — | — | — | |||||||||||
| Class Z |
(24,067 | ) | — | — | — | |||||||||||
| Fund Level |
(4,385 | ) | — | (50,058 | ) | (351 | ) | |||||||||
| Strong Advisor Small Cap Value Fund |
||||||||||||||||
| Class A |
(1,530 | ) | — | — | — | |||||||||||
| Class B |
(374 | ) | — | — | — | |||||||||||
| Class C |
(448 | ) | — | — | — | |||||||||||
| Class Z |
(10,815 | ) | — | — | — | |||||||||||
| Fund Level |
(105,306 | ) | — | (147,666 | ) | (1,314 | ) | |||||||||
| Strong Advisor U.S. Value Fund |
||||||||||||||||
| Class A |
(11 | ) | — | — | — | |||||||||||
| Class B |
(13 | ) | — | — | — | |||||||||||
| Class C |
(629 | ) | — | — | — | |||||||||||
| Class K |
(13,879 | ) | — | — | — | |||||||||||
| Class Z |
(28,087 | ) | — | — | — | |||||||||||
| Fund Level |
(12,957 | ) | — | (24,492 | ) | (416 | ) | |||||||||
| Strong Advisor Endeavor Large Cap Fund |
||||||||||||||||
| Class A |
(259 | ) | — | — | — | |||||||||||
| Class B |
(1,864 | ) | — | — | — | |||||||||||
| Class C |
(1,202 | ) | — | — | — | |||||||||||
| Fund Level |
(2,063 | ) | — | (26,861 | ) | (18 | ) | |||||||||
| Strong Advisor Focus Fund |
||||||||||||||||
| Class A |
(16,011 | ) | — | — | — | |||||||||||
| Class B |
(12,729 | ) | — | — | — | |||||||||||
| Class C |
(3,587 | ) | — | — | — | |||||||||||
| Fund Level |
(26,036 | ) | — | (5,552 | ) | (7 | ) | |||||||||
| Strong Advisor International Core Fund |
||||||||||||||||
| Class A |
(3,266 | ) | — | — | — | |||||||||||
| Class B |
(8,890 | ) | — | — | — | |||||||||||
| Class C |
(2,708 | ) | — | — | — | |||||||||||
| Fund Level |
(75,562 | ) | — | (142 | ) | (2 | ) | |||||||||
| Strong Advisor Select Fund |
||||||||||||||||
| Class A |
(8 | ) | — | — | — | |||||||||||
| Class B |
(103 | ) | — | — | — | |||||||||||
| Class C |
(89 | ) | — | — | — | |||||||||||
| Fund Level |
(4,496 | ) | — | (23,545 | ) | (17 | ) | |||||||||
| Strong Advisor Technology Fund |
||||||||||||||||
| Class A |
(11,509 | ) | — | — | — | |||||||||||
| Class B |
(5,117 | ) | — | — | — | |||||||||||
| Class C |
(4,753 | ) | — | — | — | |||||||||||
| Fund Level |
(7,986 | ) | — | (6,782 | ) | (3 | ) | |||||||||
| Strong Advisor U.S. Small/Mid Cap Growth Fund |
||||||||||||||||
| Class A |
(495 | ) | — | — | — | |||||||||||
| Class B |
(5,573 | ) | — | — | — | |||||||||||
| Class C |
(6,199 | ) | — | — | — | |||||||||||
| Fund Level |
(30,307 | ) | — | (3,765 | ) | (16 | ) | |||||||||
| Strong Advisor Utilities and Energy Fund |
||||||||||||||||
| Class A |
(3 | ) | — | — | — | |||||||||||
| Class B |
(406 | ) | — | — | — | |||||||||||
| Class C |
(578 | ) | — | — | — | |||||||||||
| Fund Level |
(873 | ) | — | — | (8 | ) | ||||||||||
93
Table of Contents
NOTES TO FINANCIAL STATEMENTS (continued)
December 31, 2003
| Expense Waivers and Absorptions |
Transfer Agency Banking Credits |
Directed Brokerage Credits |
Earnings Credits |
||||||||||||
| Strong Advisor Large Company Core Fund |
|||||||||||||||
| Class A |
$ | (68,875 | ) | $ | — | $ | — | $ | — | ||||||
| Class B |
(659 | ) | — | — | — | ||||||||||
| Class C |
(2,305 | ) | — | — | — | ||||||||||
| Class K |
(81,268 | ) | — | — | — | ||||||||||
| Fund Level |
(19,437 | ) | — | (21,281 | ) | (291 | ) | ||||||||
| 5. | Line of Credit |
The Strong Funds have established a line of credit agreement (“LOC”) with certain financial institutions, which expires October 8, 2004, to be used for temporary or emergency purposes, primarily for financing redemption payments. Combined borrowings among all participating Strong Funds are subject to a $350 million cap on the total LOC. For an individual Fund, borrowings under the LOC are limited to either the lesser of 15% of the market value of the Fund’s total assets or any explicit borrowing limits in the Fund’s registration statement. The principal amount of each borrowing under the LOC is due not more than 45 days after the date of the borrowing. Borrowings under the LOC bear interest based on prevailing market rates as defined in the LOC. A commitment fee of 0.09% per annum is incurred on the unused portion of the LOC and is allocated to all participating Strong Funds based on their net asset values. For the year ended December 31, 2003, there were no borrowings by Strong Advisor Common Stock Fund, Strong Advisor Small Cap Value Fund, Strong Advisor Select Fund and Strong Advisor U.S. Small/Mid Cap Growth Fund under the LOC. Strong Advisor Mid Cap Growth Fund, Strong Advisor Endeavor Large Cap Fund, Strong Advisor Focus Fund, Strong Advisor Technology Fund, Strong Advisor Utilities and Energy Fund and Strong Advisor Large Company Core Fund had minimal borrowings under the LOC during the year. During the year ended December 31, 2003, Strong Advisor U.S. Value Fund and Strong Advisor International Core Fund had an outstanding average daily balance of $363,562 and $1,918, respectively, under the LOC. The maximum amount outstanding during the year was $26,900,000 and $200,000, respectively. Interest expense amounted to $6,488 and $32 respectively, for the year ended December 31, 2003. At December 31, 2003, Strong Advisor Endeavor Large Cap Fund and Strong Advisor Technology each had outstanding borrowings of $100,000 under the LOC.
| 6. | Investment Transactions |
The aggregate purchases and sales of long-term securities during the year ended December 31, 2003, are as follows:
| Purchases |
Sales | |||||
| Strong Advisor Common Stock Fund |
$ | 596,599,289 | $ | 906,382,164 | ||
| Strong Advisor Mid Cap Growth Fund |
204,751,702 | 235,521,238 | ||||
| Strong Advisor Small Cap Value Fund |
693,447,295 | 434,546,266 | ||||
| Strong Advisor U.S. Value Fund |
114,320,976 | 127,311,785 | ||||
| Strong Advisor Endeavor Large Cap Fund |
78,660,319 | 79,093,164 | ||||
| Strong Advisor Focus Fund |
8,472,373 | 9,654,295 | ||||
| Strong Advisor International Core Fund |
1,457,037 | 906,740 | ||||
| Strong Advisor Select Fund |
173,226,696 | 170,178,437 | ||||
| Strong Advisor Technology Fund |
3,703,988 | 4,270,736 | ||||
| Strong Advisor U.S. Small/Mid Cap Growth Fund |
6,672,067 | 2,754,473 | ||||
| Strong Advisor Utilities and Energy Fund |
21,481,795 | 19,520,066 | ||||
| Strong Advisor Large Company Core Fund |
188,414,623 | 96,992,355 | ||||
There were no purchases or sales of long-term U.S. government securities during the year ended December 31, 2003.
94
Table of Contents
| 7. | Income Tax Information |
The following information for the Funds is presented on an income tax basis as of December 31, 2003:
| Cost of Investments |
Gross Unrealized Appreciation |
Gross Unrealized (Depreciation) |
Net Unrealized Appreciation/ (Depreciation) on Investments |
Distributable Ordinary Income |
Distributable Long-Term Capital Gains | ||||||||||||||
| Strong Advisor Common Stock Fund |
$ | 1,200,688,003 | $ | 446,953,480 | $ | (20,234,303 | ) | $ | 426,719,177 | $ | — | $ | — | ||||||
| Strong Advisor Mid Cap Growth Fund |
58,984,207 | 16,094,839 | (356,842 | ) | 15,737,997 | — | — | ||||||||||||
| Strong Advisor Small Cap Value Fund |
1,534,448,403 | 643,322,847 | (32,957,314 | ) | 610,365,533 | — | 23,150,056 | ||||||||||||
| Strong Advisor U.S. Value Fund |
216,193,980 | 50,353,484 | (3,023,860 | ) | 47,329,624 | 19,290 | — | ||||||||||||
| Strong Advisor Endeavor Large Cap Fund |
31,651,154 | 6,516,337 | (260,079 | ) | 6,256,258 | — | — | ||||||||||||
| Strong Advisor Focus Fund |
2,490,952 | 679,017 | (34,916 | ) | 644,101 | — | — | ||||||||||||
| Strong Advisor International Core Fund |
1,165,556 | 317,454 | (448 | ) | 317,006 | 2,131 | — | ||||||||||||
| Strong Advisor Select Fund |
67,373,483 | 16,243,711 | (745,237 | ) | 15,498,474 | — | — | ||||||||||||
| Strong Advisor Technology Fund |
1,783,008 | 425,264 | (102,903 | ) | 322,361 | — | — | ||||||||||||
| Strong Advisor U.S. Small/Mid Cap Growth Fund |
4,733,584 | 945,400 | (48,325 | ) | 897,075 | — | — | ||||||||||||
| Strong Advisor Utilities and Energy Fund |
8,900,475 | 1,472,630 | (60,662 | ) | 1,411,968 | 883 | — | ||||||||||||
| Strong Advisor Large Company Core Fund |
104,879,041 | 12,279,958 | (191,031 | ) | 12,088,927 | 1,633,867 | 16,644 | ||||||||||||
The difference between cost amounts for financial statement and federal income tax purposes is due primarily to timing differences in recognizing certain gains and losses on security transactions.
The tax components of dividends paid during the years ended December 31, 2003 and 2002, capital loss carryovers (expiring in varying amounts through 2011) as of December 31, 2003, and tax basis post-October losses as of December 31, 2003, which are not recognized for tax purposes until the first day of the following fiscal year, are
| 2003 Income Tax Information |
2002 Income Tax Information |
|||||||||||||||||||
| Ordinary Income Distributions |
Long-Term Capital Gains Distributions |
Net Capital Loss Carryovers |
Post-October Losses |
Ordinary Income Distributions |
Long-Term Capital Gains Distributions |
|||||||||||||||
| Strong Advisor Common Stock Fund |
$ | — | $ | — | $ | 96,520,387 | $ | — | $ | — | $ | — | ||||||||
| Strong Advisor Mid Cap Growth Fund |
— | — | 118,022,208 | — | — | — | ||||||||||||||
| Strong Advisor Small Cap Value Fund |
793,398 | 49,600,777 | — | — | — | — | ||||||||||||||
| Strong Advisor U.S. Value Fund |
1,833,699 | — | 3,870,281 | — | 1,026,838 | 14,318,230 | ||||||||||||||
| Strong Advisor Endeavor Large Cap Fund |
— | — | 5,639,429 | 5,454 | — | — | ||||||||||||||
| Strong Advisor Focus Fund |
— | — | 4,477,452 | — | — | — | ||||||||||||||
| Strong Advisor International Core Fund |
19,549 | — | 30,255 | — | — | — | ||||||||||||||
| Strong Advisor Select Fund |
— | — | 5,735,050 | — | 106,837 | — | ||||||||||||||
| Strong Advisor Technology Fund |
— | — | 763,150 | — | — | — | ||||||||||||||
| Strong Advisor U.S. Small/Mid Cap Growth Fund |
— | — | 107,537 | 138,702 | — | — | ||||||||||||||
| Strong Advisor Utilities and Energy Fund |
184,358 | — | 313,921 | — | 36,612 | — | ||||||||||||||
| Strong Advisor Large Company Core Fund |
71,868 | 101,831 | — | 6,338 | 6,435 | (1) | — | (1) | ||||||||||||
| (1) | For the period from October 1, 2002 through December 31, 2002. Ordinary income distributions and long-term capital gains distributions during the year ended September 30, 2002 are $161,409 and $10, respectively. |
For corporate shareholders in the Funds, the percentage of ordinary dividend income distributed for the year ended December 31, 2003, which is designated as qualifying for the dividends-received deduction, is as follows (unaudited): Strong Advisor Common Stock Fund 0.0%, Strong Advisor Mid Cap Growth Fund 0.0%, Strong Advisor Small Cap Value Fund 100.0%, Strong Advisor U.S. Value Fund 100.0%, Strong Advisor Endeavor Large Cap Fund 0.0%, Strong Advisor Focus Fund 0.0%, Strong Advisor International Core Fund 0.0%, Strong Advisor Select Fund 0.0%, Strong Advisor Technology Fund 0.0%, Strong Advisor U.S. Small/Mid Cap Growth Fund 0.0%, Strong Advisor Utilities and Energy Fund 100.0% and Strong Advisor Large Company Core Fund 100.0%.
For shareholders in the Funds, the percentage of dividend income distributed for the year ended December 31, 2003, which is designated as qualified dividend income under the Jobs and Growth Tax Relief Act of 2003, is as follows (unaudited): Strong Advisor Common Stock Fund 0.0%, Strong Advisor Mid Cap Growth Fund 0.0%, Strong Advisor Small Cap Value Fund 0.0%, Strong Advisor U.S. Value Fund 100.0%, Strong Advisor Endeavor Large Cap Fund 0.0%, Strong Advisor Focus Fund 0.0%, Strong Advisor International Core Fund 100.0%, Strong Advisor Select Fund 0.0%, Strong Advisor Technology Fund 0.0%, Strong Advisor U.S. Small/Mid Cap Growth Fund 0.0%, Strong Advisor Utilities and Energy Fund 100.0% and Strong Advisor Large Company Core Fund 89.0%.
95
Table of Contents
NOTES TO FINANCIAL STATEMENTS (continued)
December 31, 2003
Capital loss carryovers utilized during the year ended December 31, 2003, are as follows: Strong Advisor Common Stock Fund $67,032,864, Strong Advisor Mid Cap Growth Fund $8,733,556, Strong Advisor Small Cap Value Fund $8,884,388, Strong Advisor U.S. Value Fund $11,033,594, Strong Advisor Endeavor Large Cap Fund $3,065,532, Strong Advisor Focus Fund $140,948, Strong Advisor International Core Fund $0, Strong Advisor Select Fund $6,665,132, Strong Advisor Technology Fund $350,551, Strong Advisor U.S. Small/Mid Cap Growth Fund $34,724, Strong Advisor Utilities and Energy Fund $214,223 and Strong Advisor Large Company Core Fund $1,015,803.
| 8. | Capital Share Transactions |
| Strong Advisor Common Stock Fund |
Strong Advisor Mid Cap Growth Fund |
|||||||||||||||
| Year Ended Dec. 31, 2003 |
Year Ended Dec. 31, 2002 |
Year Ended Dec. 31, 2003 |
Year Ended Dec. 31, 2002 |
|||||||||||||
| Capital Share Transactions of Each Class of Shares of the Funds Were as Follows: |
||||||||||||||||
| CLASS A |
||||||||||||||||
| Proceeds from Shares Sold |
$ | 62,389,061 | $ | 44,443,102 | $ | 29,891,257 | $ | 7,852,624 | ||||||||
| Proceeds from Reinvestment of Distributions |
— | — | — | — | ||||||||||||
| Payment for Shares Redeemed |
(48,584,158 | ) | (16,422,398 | ) | (29,161,740 | ) | (5,960,849 | ) | ||||||||
| Net Increase (Decrease) in Net Assets from Capital Share Transactions |
13,804,903 | 28,020,704 | 729,517 | 1,891,775 | ||||||||||||
| CLASS B |
||||||||||||||||
| Proceeds from Shares Sold |
8,099,013 | 16,279,382 | 490,452 | 1,063,833 | ||||||||||||
| Proceeds from Reinvestment of Distributions |
— | — | — | — | ||||||||||||
| Payment for Shares Redeemed |
(3,494,374 | ) | (2,796,033 | ) | (720,050 | ) | (490,422 | ) | ||||||||
| Net Increase (Decrease) in Net Assets from Capital Share Transactions |
4,604,639 | 13,483,349 | (229,598 | ) | 573,411 | |||||||||||
| CLASS C |
||||||||||||||||
| Proceeds from Shares Sold |
9,917,355 | 17,829,709 | 326,442 | 674,422 | ||||||||||||
| Proceeds from Reinvestment of Distributions |
— | — | — | — | ||||||||||||
| Payment for Shares Redeemed |
(8,090,361 | ) | (4,291,269 | ) | (698,172 | ) | (491,641 | ) | ||||||||
| Net Increase (Decrease) in Net Assets from Capital Share Transactions |
1,826,994 | 13,538,440 | (371,730 | ) | 182,781 | |||||||||||
| CLASS Z |
||||||||||||||||
| Proceeds from Shares Sold |
203,644,369 | 343,017,540 | 31,734,000 | 29,008,599 | ||||||||||||
| Proceeds from Reinvestment of Distributions |
— | — | — | — | ||||||||||||
| Payment for Shares Redeemed |
(608,593,067 | ) | (332,740,001 | ) | (61,043,159 | ) | (47,760,745 | ) | ||||||||
| Net Increase (Decrease) in Net Assets from Capital Share Transactions |
(404,948,698 | ) | 10,277,539 | (29,309,159 | ) | (18,752,146 | ) | |||||||||
| Net Increase (Decrease) in Net Assets from Capital Share Transactions |
$ | (384,712,162 | ) | $ | 65,320,032 | $ | (29,180,970 | ) | $ | (16,104,179 | ) | |||||
96
Table of Contents
| Strong Advisor Common Stock Fund |
Strong Advisor Mid Cap Growth Fund |
|||||||||||
| Year Ended Dec. 31, 2003 |
Year Ended Dec. 31, 2002 |
Year Ended Dec. 31, 2003 |
Year Ended Dec. 31, 2002 |
|||||||||
| Transactions in Shares of Each Class of the Funds Were as Follows: |
||||||||||||
| CLASS A |
||||||||||||
| Sold |
3,431,779 | 2,544,987 | 3,106,763 | 696,029 | ||||||||
| Issued in Reinvestment of Distributions |
— | — | — | — | ||||||||
| Redeemed |
(2,666,367 | ) | (1,023,173 | ) | (2,955,165 | ) | (538,918 | ) | ||||
| Net Increase (Decrease) in Shares |
765,412 | 1,521,814 | 151,598 | 157,111 | ||||||||
| CLASS B |
||||||||||||
| Sold |
457,112 | 925,237 | 50,542 | 99,311 | ||||||||
| Issued in Reinvestment of Distributions |
— | — | — | — | ||||||||
| Redeemed |
(198,050 | ) | (177,926 | ) | (70,959 | ) | (52,425 | ) | ||||
| Net Increase (Decrease) in Shares |
259,062 | 747,311 | (20,417 | ) | 46,886 | |||||||
| CLASS C |
||||||||||||
| Sold |
546,220 | 998,772 | 34,377 | 58,173 | ||||||||
| Issued in Reinvestment of Distributions |
— | — | — | — | ||||||||
| Redeemed |
(442,002 | ) | (267,172 | ) | (69,097 | ) | (47,063 | ) | ||||
| Net Increase (Decrease) in Shares |
104,218 | 731,600 | (34,720 | ) | 11,110 | |||||||
| CLASS Z |
||||||||||||
| Sold |
11,182,299 | 18,893,016 | 3,193,498 | 2,521,554 | ||||||||
| Issued in Reinvestment of Distributions |
— | — | — | — | ||||||||
| Redeemed |
(31,635,485 | ) | (19,634,686 | ) | (5,725,809 | ) | (4,229,449 | ) | ||||
| Net Increase (Decrease) in Shares |
(20,453,186 | ) | (741,670 | ) | (2,532,311 | ) | (1,707,895 | ) | ||||
97
Table of Contents
NOTES TO FINANCIAL STATEMENTS (continued)
December 31, 2003
| Strong Advisor Small Cap Value Fund |
||||||||
| Year Ended Dec. 31, 2003 |
Year Ended Dec. 31, 2002 |
|||||||
| Capital Share Transactions in Each Class of Shares of the Fund Were as Follows: |
||||||||
| CLASS A |
||||||||
| Proceeds from Shares Sold |
$ | 320,685,110 | $ | 320,021,001 | ||||
| Proceeds from Reinvestment of Distributions |
15,265,206 | — | ||||||
| Payment for Shares Redeemed |
(184,534,476 | ) | (125,640,272 | ) | ||||
| Net Increase (Decrease) in Net Assets from Capital Share Transactions |
151,415,840 | 194,380,729 | ||||||
| CLASS B |
||||||||
| Proceeds from Shares Sold |
23,520,790 | 50,127,708 | ||||||
| Proceeds from Reinvestment of Distributions |
2,765,426 | — | ||||||
| Payment for Shares Redeemed |
(12,814,273 | ) | (8,138,529 | ) | ||||
| Net Increase (Decrease) in Net Assets from Capital Share Transactions |
13,471,943 | 41,989,179 | ||||||
| CLASS C |
||||||||
| Proceeds from Shares Sold |
50,717,429 | 83,189,864 | ||||||
| Proceeds from Reinvestment of Distributions |
3,207,242 | — | ||||||
| Payment for Shares Redeemed |
(42,529,352 | ) | (14,066,931 | ) | ||||
| Net Increase (Decrease) in Net Assets from Capital Share Transactions |
11,395,319 | 69,122,933 | ||||||
| CLASS Z |
||||||||
| Proceeds from Shares Sold |
568,392,266 | 374,821,378 | ||||||
| Proceeds from Reinvestment of Distributions |
27,317,931 | — | ||||||
| Payment for Shares Redeemed |
(432,298,660 | ) | (204,951,882 | ) | ||||
| Net Increase (Decrease) in Net Assets from Capital Share Transactions |
163,411,537 | 169,869,496 | ||||||
| Net Increase (Decrease) in Net Assets from Capital Share Transactions |
$ | 339,694,639 | $ | 475,362,337 | ||||
98
Table of Contents
| Strong Advisor Small Cap Value Fund |
||||||
| Year Ended Dec. 31, 2003 |
Year Ended Dec. 31, 2002 |
|||||
| Transactions in Shares of Each Class of the Fund Were as Follows: |
||||||
| CLASS A |
||||||
| Sold |
14,585,227 | 15,657,871 | ||||
| Issued in Reinvestment of Distributions |
588,254 | — | ||||
| Redeemed |
(8,277,317 | ) | (6,346,438 | ) | ||
| Net Increase (Decrease) in Shares |
6,896,164 | 9,311,433 | ||||
| CLASS B |
||||||
| Sold |
1,128,906 | 2,465,423 | ||||
| Issued in Reinvestment of Distributions |
108,960 | — | ||||
| Redeemed |
(590,325 | ) | (420,462 | ) | ||
| Net Increase (Decrease) in Shares |
647,541 | 2,044,961 | ||||
| CLASS C |
||||||
| Sold |
2,388,522 | 4,083,997 | ||||
| Issued in Reinvestment of Distributions |
126,120 | — | ||||
| Redeemed |
(1,842,815 | ) | (736,820 | ) | ||
| Net Increase (Decrease) in Shares |
671,827 | 3,347,177 | ||||
| CLASS Z |
||||||
| Sold |
25,560,482 | 18,350,666 | ||||
| Issued in Reinvestment of Distributions |
1,047,467 | — | ||||
| Redeemed |
(18,917,370 | ) | (10,421,280 | ) | ||
| Net Increase (Decrease) in Shares |
7,690,579 | 7,929,386 | ||||
99
Table of Contents
NOTES TO FINANCIAL STATEMENTS (continued)
December 31, 2003
| Strong Advisor U.S. Value Fund |
||||||||
| Year Ended Dec. 31, 2003 |
Year Ended Dec. 31, 2002 |
|||||||
| Capital Share Transactions of Each Class of Shares of the Fund Were as Follows: |
||||||||
| CLASS A |
||||||||
| Proceeds from Shares Sold |
$ | 2,442,595 | $ | 5,473,330 | ||||
| Proceeds from Reinvestment of Distributions |
33,629 | 370,177 | ||||||
| Payment for Shares Redeemed |
(1,164,555 | ) | (4,576,333 | ) | ||||
| Net Increase (Decrease) in Net Assets from Capital Share Transactions |
1,311,669 | 1,267,174 | ||||||
| CLASS B |
||||||||
| Proceeds from Shares Sold |
1,532,091 | 1,666,852 | ||||||
| Proceeds from Reinvestment of Distributions |
9,048 | 176,747 | ||||||
| Payment for Shares Redeemed |
(708,664 | ) | (485,944 | ) | ||||
| Net Increase (Decrease) in Net Assets from Capital Share Transactions |
832,475 | 1,357,655 | ||||||
| CLASS C |
||||||||
| Proceeds from Shares Sold |
2,936,148 | 1,315,639 | ||||||
| Proceeds from Reinvestment of Distributions |
7,949 | 25,857 | ||||||
| Payment for Shares Redeemed |
(802,924 | ) | (267,268 | ) | ||||
| Net Increase (Decrease) in Net Assets from Capital Share Transactions |
2,141,173 | 1,074,228 | ||||||
| CLASS K |
||||||||
| Proceeds from Shares Sold |
75,594,336 | 13,002,981 | ||||||
| Proceeds from Reinvestment of Distributions |
26,245 | 9,930 | ||||||
| Payment for Shares Redeemed |
(5,956,750 | ) | (1,156,304 | ) | ||||
| Net Increase (Decrease) in Net Assets from Capital Share Transactions |
69,663,831 | 11,856,607 | ||||||
| CLASS Z |
||||||||
| Proceeds from Shares Sold |
65,563,705 | $ | 118,873,719 | |||||
| Proceeds from Reinvestment of Distributions |
421,710 | 9,855,988 | ||||||
| Payment for Shares Redeemed |
(156,527,039 | ) | (70,028,503 | ) | ||||
| Net Increase (Decrease) in Net Assets from Capital Share Transactions |
(90,541,624 | ) | 58,701,204 | |||||
| Net Increase (Decrease) in Net Assets from Capital Share Transactions |
$ | (16,592,476 | ) | $ | 74,256,868 | |||
100
Table of Contents
| Strong Advisor U.S. Value Fund |
||||||
| Year Ended Dec. 31, 2003 |
Year Ended Dec. 31, 2002 |
|||||
| Transactions in Shares of Each Class of the Fund Were as Follows: |
||||||
| CLASS A |
||||||
| Sold |
158,971 | 338,473 | ||||
| Issued in Reinvestment of Distributions |
2,133 | 22,294 | ||||
| Redeemed |
(76,619 | ) | (322,986 | ) | ||
| Net Increase (Decrease) in Shares |
84,485 | 37,781 | ||||
| CLASS B |
||||||
| Sold |
101,156 | 111,965 | ||||
| Issued in Reinvestment of Distributions |
558 | 10,387 | ||||
| Redeemed |
(49,252 | ) | (33,910 | ) | ||
| Net Increase (Decrease) in Shares |
52,462 | 88,442 | ||||
| CLASS C |
||||||
| Sold |
187,092 | 87,390 | ||||
| Issued in Reinvestment of Distributions |
485 | 1,601 | ||||
| Redeemed |
(51,438 | ) | (18,614 | ) | ||
| Net Increase (Decrease) in Shares |
136,139 | 70,377 | ||||
| CLASS K |
||||||
| Sold |
4,541,506 | 910,728 | ||||
| Issued in Reinvestment of Distributions |
1,657 | 611 | ||||
| Redeemed |
(382,792 | ) | (83,911 | ) | ||
| Net Increase (Decrease) in Shares |
4,160,371 | 827,428 | ||||
| CLASS Z |
||||||
| Sold |
4,464,350 | 7,547,227 | ||||
| Issued in Reinvestment of Distributions |
26,615 | 577,220 | ||||
| Redeemed |
(9,915,698 | ) | (4,185,995 | ) | ||
| Net Increase (Decrease) in Shares |
(5,424,733 | ) | 3,938,452 | |||
101
Table of Contents
NOTES TO FINANCIAL STATEMENTS (continued)
December 31, 2003
| Strong Advisor Endeavor Large Cap Fund |
Strong Advisor Focus Fund |
|||||||||||||||
| Year Ended Dec. 31, 2003 |
Year Ended Dec. 31, 2002 |
Year Ended Dec. 31, 2003 |
Year Ended Dec. 31, 2002 |
|||||||||||||
| Capital Share Transactions of Each Class of Shares of the Funds Were as Follows: |
||||||||||||||||
| CLASS A |
||||||||||||||||
| Proceeds from Shares Sold |
$ | 11,550,715 | $ | 16,393,415 | $ | 133,502 | $ | 452,000 | ||||||||
| Proceeds from Reinvestment of Distributions |
— | — | — | — | ||||||||||||
| Payment for Shares Redeemed |
(13,087,873 | ) | (6,400,225 | ) | (1,033,507 | ) | (2,024,184 | ) | ||||||||
| Net Increase (Decrease) in Net Assets from Capital Share Transactions |
(1,537,158 | ) | 9,993,190 | (900,005 | ) | (1,572,184 | ) | |||||||||
| CLASS B |
||||||||||||||||
| Proceeds from Shares Sold |
545,692 | 266,871 | 33,725 | 198,008 | ||||||||||||
| Proceeds from Reinvestment of Distributions |
— | — | — | — | ||||||||||||
| Payment for Shares Redeemed |
(294,637 | ) | (15,344 | ) | (391,552 | ) | (275,731 | ) | ||||||||
| Net Increase (Decrease) in Net Assets from Capital Share Transactions |
251,055 | 251,527 | (357,827 | ) | (77,723 | ) | ||||||||||
| CLASS C |
||||||||||||||||
| Proceeds from Shares Sold |
236,667 | 178,334 | 128,342 | 51,385 | ||||||||||||
| Proceeds from Reinvestment of Distributions |
— | — | — | — | ||||||||||||
| Payment for Shares Redeemed |
(92,284 | ) | (38,097 | ) | (196,335 | ) | (284,139 | ) | ||||||||
| Net Increase (Decrease) in Net Assets from Capital Share Transactions |
144,383 | 140,237 | (67,993 | ) | (232,754 | ) | ||||||||||
| Net Increase (Decrease) in Net Assets from Capital Share Transactions |
$ | (1,141,720 | ) | $ | 10,384,954 | $ | (1,325,825 | ) | $ | (1,882,661 | ) | |||||
| Transactions in Shares of Each Class of the Funds Were as Follows: |
||||||||||||||||
| CLASS A |
||||||||||||||||
| Sold |
1,382,830 | 1,855,501 | 26,782 | 77,432 | ||||||||||||
| Issued in Reinvestment of Distributions |
— | — | — | — | ||||||||||||
| Redeemed |
(1,497,908 | ) | (761,825 | ) | (189,152 | ) | (358,043 | ) | ||||||||
| Net Increase (Decrease) in Shares |
(115,078 | ) | 1,093,676 | (162,370 | ) | (280,611 | ) | |||||||||
| CLASS B |
||||||||||||||||
| Sold |
66,016 | 33,834 | 6,628 | 34,187 | ||||||||||||
| Issued in Reinvestment of Distributions |
— | — | — | — | ||||||||||||
| Redeemed |
(36,913 | ) | (2,149 | ) | (74,150 | ) | (50,690 | ) | ||||||||
| Net Increase (Decrease) in Shares |
29,103 | 31,685 | (67,522 | ) | (16,503 | ) | ||||||||||
| CLASS C |
||||||||||||||||
| Sold |
27,852 | 20,442 | 25,997 | 9,049 | ||||||||||||
| Issued in Reinvestment of Distributions |
— | — | — | — | ||||||||||||
| Redeemed |
(10,494 | ) | (4,900 | ) | (37,048 | ) | (51,781 | ) | ||||||||
| Net Increase (Decrease) in Shares |
17,358 | 15,542 | (11,051 | ) | (42,732 | ) | ||||||||||
102
Table of Contents
| Strong Advisor International Core Fund |
Strong Advisor Select Fund |
|||||||||||||||
| Year Ended Dec. 31, 2003 |
Year Ended Dec. 31, 2002 |
Year Ended Dec. 31, 2003 |
Year Ended Dec. 31, 2002 |
|||||||||||||
| Capital Share Transactions of Each Class of Shares of the Funds Were as Follows: |
||||||||||||||||
| CLASS A |
||||||||||||||||
| Proceeds from Shares Sold |
$ | 451,750 | $ | 82,717 | $ | 28,987,396 | $ | 28,329,556 | ||||||||
| Proceeds from Reinvestment of Distributions |
6,485 | — | — | 105,337 | ||||||||||||
| Payment for Shares Redeemed |
(163,951 | ) | (8,947 | ) | (27,068,354 | ) | (13,665,422 | ) | ||||||||
| Net Increase (Decrease) in Net Assets from Capital Share Transactions |
294,284 | 73,770 | 1,919,042 | 14,769,471 | ||||||||||||
| CLASS B |
||||||||||||||||
| Proceeds from Shares Sold |
346,867 | 211,824 | 257,127 | 224,679 | ||||||||||||
| Proceeds from Reinvestment of Distributions |
6,923 | — | — | 605 | ||||||||||||
| Payment for Shares Redeemed |
(65,208 | ) | (4,153 | ) | (103,058 | ) | (246,523 | ) | ||||||||
| Net Increase (Decrease) in Net Assets from Capital Share Transactions |
288,582 | 207,671 | 154,069 | (21,239 | ) | |||||||||||
| CLASS C |
||||||||||||||||
| Proceeds from Shares Sold |
562,293 | 65,008 | 204,823 | 96,740 | ||||||||||||
| Proceeds from Reinvestment of Distributions |
2,436 | — | — | 325 | ||||||||||||
| Payment for Shares Redeemed |
(585,411 | ) | — | (104,606 | ) | (42,582 | ) | |||||||||
| Net Increase (Decrease) in Net Assets from Capital Share Transactions |
(20,682 | ) | 65,008 | 100,217 | 54,483 | |||||||||||
| Net Increase (Decrease) in Net Assets from Capital Share Transactions |
$ | 562,184 | $ | 346,449 | $ | 2,173,328 | $ | 14,802,715 | ||||||||
| Transactions in Shares of Each Class of the Funds Were as Follows: |
||||||||||||||||
| CLASS A |
||||||||||||||||
| Sold |
47,151 | 9,212 | 4,305,907 | 4,115,416 | ||||||||||||
| Issued in Reinvestment of Distributions |
570 | — | — | 16,256 | ||||||||||||
| Redeemed |
(14,929 | ) | (1,012 | ) | (3,730,994 | ) | (2,090,284 | ) | ||||||||
| Net Increase (Decrease) in Shares |
32,792 | 8,200 | 574,913 | 2,041,388 | ||||||||||||
| CLASS B |
||||||||||||||||
| Sold |
36,895 | 23,290 | 37,614 | 34,824 | ||||||||||||
| Issued in Reinvestment of Distributions |
609 | — | — | 94 | ||||||||||||
| Redeemed |
(6,823 | ) | (493 | ) | (14,269 | ) | (39,516 | ) | ||||||||
| Net Increase (Decrease) in Shares |
30,681 | 22,797 | 23,345 | (4,598 | ) | |||||||||||
| CLASS C |
||||||||||||||||
| Sold |
58,481 | 7,033 | 29,859 | 14,551 | ||||||||||||
| Issued in Reinvestment of Distributions |
215 | — | — | 51 | ||||||||||||
| Redeemed |
(59,716 | ) | — | (13,880 | ) | (6,407 | ) | |||||||||
| Net Increase (Decrease) in Shares |
(1,020 | ) | 7,033 | 15,979 | 8,195 | |||||||||||
103
Table of Contents
NOTES TO FINANCIAL STATEMENTS (continued)
December 31, 2003
| Strong Advisor Technology Fund |
Strong Advisor U.S. Small/Mid Cap Growth Fund |
|||||||||||||||
| Year Ended Dec. 31, 2003 |
Year Ended Dec. 31, 2002 |
Year Ended Dec. 31, 2003 |
Period Ended Dec. 31, 2002 |
|||||||||||||
| (Note 1) | ||||||||||||||||
| Capital Share Transactions of Each Class of Shares of the Funds Were as Follows: |
||||||||||||||||
| CLASS A |
||||||||||||||||
| Proceeds from Shares Sold |
$ | 475,649 | $ | 266,907 | $ | 2,506,870 | $ | 346,166 | ||||||||
| Proceeds from Reinvestment of Distributions |
— | — | — | — | ||||||||||||
| Payment for Shares Redeemed |
(1,132,211 | ) | (459,954 | ) | (182,320 | ) | (1,000 | ) | ||||||||
| Net Increase (Decrease) in Net Assets from Capital Share Transactions |
(656,562 | ) | (193,047 | ) | 2,324,550 | 345,166 | ||||||||||
| CLASS B |
||||||||||||||||
| Proceeds from Shares Sold |
285,676 | 12,000 | 711,067 | 371,166 | ||||||||||||
| Proceeds from Reinvestment of Distributions |
— | — | — | — | ||||||||||||
| Payment for Shares Redeemed |
(18,271 | ) | (12,910 | ) | (132,452 | ) | (2,815 | ) | ||||||||
| Net Increase (Decrease) in Net Assets from Capital Share Transactions |
267,405 | (910 | ) | 578,615 | 368,351 | |||||||||||
| CLASS C |
||||||||||||||||
| Proceeds from Shares Sold |
38,794 | 30,503 | 1,161,876 | 230,374 | ||||||||||||
| Proceeds from Reinvestment of Distributions |
— | — | — | — | ||||||||||||
| Payment for Shares Redeemed |
(128,137 | ) | (98,665 | ) | (53,800 | ) | — | |||||||||
| Net Increase (Decrease) in Net Assets from Capital Share Transactions |
(89,343 | ) | (68,162 | ) | 1,108,076 | 230,374 | ||||||||||
| Net Increase (Decrease) in Net Assets from Capital Share Transactions |
$ | (478,500 | ) | $ | (262,119 | ) | $ | 4,011,241 | $ | 943,891 | ||||||
| Transactions in Shares of Each Class of the Funds Were as Follows: |
||||||||||||||||
| CLASS A |
||||||||||||||||
| Sold |
83,030 | 42,387 | 237,549 | 39,538 | ||||||||||||
| Issued in Reinvestment of Distributions |
— | — | — | — | ||||||||||||
| Redeemed |
(168,601 | ) | (77,487 | ) | (16,651 | ) | (141 | ) | ||||||||
| Net Increase (Decrease) in Shares |
(85,571 | ) | (35,100 | ) | 220,898 | 39,397 | ||||||||||
| CLASS B |
||||||||||||||||
| Sold |
47,464 | 1,820 | 69,682 | 42,958 | ||||||||||||
| Issued in Reinvestment of Distributions |
— | — | — | — | ||||||||||||
| Redeemed |
(2,590 | ) | (3,407 | ) | (11,990 | ) | (378 | ) | ||||||||
| Net Increase (Decrease) in Shares |
44,874 | (1,587 | ) | 57,692 | 42,580 | |||||||||||
| CLASS C |
||||||||||||||||
| Sold |
5,992 | 4,804 | 114,610 | 24,692 | ||||||||||||
| Issued in Reinvestment of Distributions |
— | — | — | — | ||||||||||||
| Redeemed |
(21,193 | ) | (20,272 | ) | (4,922 | ) | — | |||||||||
| Net Increase (Decrease) in Shares |
(15,201 | ) | (15,468 | ) | 109,688 | 24,692 | ||||||||||
104
Table of Contents
| Strong Advisor Utilities and Energy Fund |
||||||||
| Year Ended Dec. 31, 2003 |
Period Ended Dec. 31, 2002 |
|||||||
| (Note 1) | ||||||||
| Capital Share Transactions of Each Class of Shares of the Fund Were as Follows: |
||||||||
| CLASS A |
||||||||
| Proceeds from Shares Sold |
$ | 10,745,467 | $ | 6,765,504 | ||||
| Proceeds from Reinvestment of Distributions |
57,522 | 4,689 | ||||||
| Payment for Shares Redeemed |
(8,634,471 | ) | (108,685 | ) | ||||
| Net Increase (Decrease) in Net Assets from Capital Share Transactions |
2,168,518 | 6,661,508 | ||||||
| CLASS B |
||||||||
| Proceeds from Shares Sold |
50,393 | 113,000 | ||||||
| Proceeds from Reinvestment of Distributions |
232 | 31 | ||||||
| Payment for Shares Redeemed |
— | — | ||||||
| Net Increase (Decrease) in Net Assets from Capital Share Transactions |
50,625 | 113,031 | ||||||
| CLASS C |
||||||||
| Proceeds from Shares Sold |
61,694 | 176,187 | ||||||
| Proceeds from Reinvestment of Distributions |
1,418 | 310 | ||||||
| Payment for Shares Redeemed |
(11,717 | ) | — | |||||
| Net Increase (Decrease) in Net Assets from Capital Share Transactions |
51,395 | 176,497 | ||||||
| Net Increase (Decrease) in Net Assets from Capital Share Transactions |
$ | 2,270,538 | $ | 6,951,036 | ||||
| Transactions in Shares of Each Class of the Fund Were as Follows: |
||||||||
| CLASS A |
||||||||
| Sold |
1,122,369 | 689,582 | ||||||
| Issued in Reinvestment of Distributions |
5,985 | 518 | ||||||
| Redeemed |
(876,335 | ) | (12,430 | ) | ||||
| Net Increase (Decrease) in Shares |
252,019 | 677,670 | ||||||
| CLASS B |
||||||||
| Sold |
5,210 | 11,499 | ||||||
| Issued in Reinvestment of Distributions |
24 | 3 | ||||||
| Redeemed |
— | — | ||||||
| Net Increase (Decrease) in Shares |
5,234 | 11,502 | ||||||
| CLASS C |
||||||||
| Sold |
6,587 | 18,747 | ||||||
| Issued in Reinvestment of Distributions |
145 | 34 | ||||||
| Redeemed |
(1,155 | ) | — | |||||
| Net Increase (Decrease) in Shares |
5,577 | 18,781 | ||||||
105
Table of Contents
NOTES TO FINANCIAL STATEMENTS (continued)
December 31, 2003
| Strong Advisor Large Company Core Fund |
||||||||||||
| Year Ended Dec. 31, 2003 |
Period Ended Dec. 31, 2002 |
Year Ended Sept. 30, 2002 |
||||||||||
| Capital Share Transactions of Each Class of Shares of the Fund Were as Follows: |
||||||||||||
| CLASS A |
||||||||||||
| Proceeds from Shares Sold |
$ | 59,864,417 | $ | 2,892,737 | $ | 3,325,537 | ||||||
| Proceeds from Reinvestment of Distributions |
78,573 | 5,268 | 138,369 | |||||||||
| Payment for Shares Redeemed |
(9,871,639 | ) | (832,881 | ) | (484,661 | ) | ||||||
| Net Increase (Decrease) in Net Assets from Capital Share Transactions |
50,071,351 | 2,065,124 | 2,979,245 | |||||||||
| CLASS B |
||||||||||||
| Proceeds from Shares Sold |
6,531,413 | 391,098 | 100,000 | |||||||||
| Proceeds from Reinvestment of Distributions |
5,649 | — | — | |||||||||
| Payment for Shares Redeemed |
(411,263 | ) | — | — | ||||||||
| Net Increase (Decrease) in Net Assets from Capital Share Transactions |
6,125,799 | 391,098 | 100,000 | |||||||||
| CLASS C |
||||||||||||
| Proceeds from Shares Sold |
5,690,544 | 385,146 | 100,000 | |||||||||
| Proceeds from Reinvestment of Distributions |
5,296 | 69 | — | |||||||||
| Payment for Shares Redeemed |
(624,699 | ) | — | — | ||||||||
| Net Increase (Decrease) in Net Assets from Capital Share Transactions |
5,071,141 | 385,215 | 100,000 | |||||||||
| CLASS K |
||||||||||||
| Proceeds from Shares Sold |
33,605,594 | — | 100,000 | |||||||||
| Proceeds from Reinvestment of Distributions |
78,412 | — | — | |||||||||
| Payment for Shares Redeemed |
(2,948,367 | ) | — | — | ||||||||
| Net Increase (Decrease) in Net Assets from Capital Share Transactions |
30,735,639 | — | 100,000 | |||||||||
| Net Increase (Decrease) in Net Assets from Capital Share Transactions |
$ | 92,003,930 | $ | 2,841,437 | $ | 3,279,245 | ||||||
106
Table of Contents
| Strong Advisor Large Company Core Fund |
|||||||||
| Year Ended Dec. 31, 2003 |
Period Ended Dec. 31, 2002 |
Year Ended Sept. 30, 2002 |
|||||||
| Transactions in Shares of Each Class of the Fund Were as Follows: |
|||||||||
| CLASS A |
|||||||||
| Sold |
6,235,824 | 322,256 | 359,651 | ||||||
| Issued in Reinvestment of Distributions |
7,791 | 599 | 13,573 | ||||||
| Redeemed |
(976,959 | ) | (93,720 | ) | (50,178 | ) | |||
| Net Increase (Decrease) in Shares |
5,266,656 | 229,135 | 323,046 | ||||||
| CLASS B |
|||||||||
| Sold |
691,767 | 43,625 | 12,173 | ||||||
| Issued in Reinvestment of Distributions |
549 | — | — | ||||||
| Redeemed |
(40,925 | ) | — | — | |||||
| Net Increase (Decrease) in Shares |
651,391 | 43,625 | 12,173 | ||||||
| CLASS C |
|||||||||
| Sold |
596,467 | 42,953 | 12,173 | ||||||
| Issued in Reinvestment of Distributions |
512 | 8 | — | ||||||
| Redeemed |
(61,554 | ) | — | — | |||||
| Net Increase (Decrease) in Shares |
535,425 | 42,961 | 12,173 | ||||||
| CLASS K |
|||||||||
| Sold |
3,545,081 | 7 | 12,173 | ||||||
| Issued in Reinvestment of Distributions |
8,183 | — | — | ||||||
| Redeemed |
(302,576 | ) | — | — | |||||
| Net Increase (Decrease) in Shares |
3,250,688 | 7 | 12,173 | ||||||
107
Table of Contents
NOTES TO FINANCIAL STATEMENTS (continued)
December 31, 2003
| 9. | Investments in Affiliates |
Affiliated issuers, as defined under the 1940 Act, include any Fund of the Strong Funds and any issuer in which the Fund’s holdings of an issuer represent 5% or more of the outstanding voting securities of the issuer. A summary of transactions in the securities of these issuers during the year ended December 31, 2003 is as follows:
| Balance of Shares Held Jan. 1, 2003 |
Gross Purchases and Additions |
Gross Sales Reductions |
Balance of Shares Held Dec. 31, 2003 |
Value Dec. 31, 2003 |
Investment Jan. 1, 2003 - |
Realized Gain/Loss on Sales |
||||||||||||||
| Strong Advisor Common Stock Fund |
||||||||||||||||||||
| Strong Heritage Money Fund -Institutional Class |
154,500,000 | — | (154,500,000 | ) | — | $ | — | $ | 619,097 | $ | — | |||||||||
| Strong Advisor Small Cap Value Fund |
||||||||||||||||||||
| Allied Healthcare Products, Inc. |
427,790 | 420,410 | — | 848,200 | 3,265,570 | — | — | |||||||||||||
| Apex Silver Mines, Ltd. |
1,888,100 | 233,000 | (6,000 | ) | 2,115,100 | 44,205,590 | — | 42,846 | ||||||||||||
| Barbeques Galore, Ltd. Sponsored ADR |
414,120 | 20,111 | — | 434,231 | 1,954,040 | 86,624 | — | |||||||||||||
| Calgon Carbon Corporation |
2,230,390 | 356,710 | (2,500 | ) | 2,584,600 | 16,050,366 | 286,034 | (1,437 | ) | |||||||||||
| Chicago Bridge & Iron Company NV |
957,830 | 1,002,430 | * | (91,360 | ) | 1,868,900 | 54,011,210 | 221,150 | 822,483 | |||||||||||
| Constar International, Inc. |
706,500 | 273,700 | (478,300 | ) | 501,900 | 2,705,241 | — | (2,812,829 | ) | |||||||||||
| Covenant Transport, Inc. Class A |
361,200 | 459,300 | (37,500 | ) | 783,000 | 14,884,830 | — | 371,257 | ||||||||||||
| Discovery Partners International, Inc. |
1,207,180 | 359,820 | (63,600 | ) | 1,503,400 | 9,245,910 | — | (11,691 | ) | |||||||||||
| Dura Automotive Systems, Inc. |
865,300 | 468,600 | (213,000 | ) | 1,120,900 | 14,313,893 | — | 414,625 | ||||||||||||
| Encore Wire Corporation |
942,700 | 226,900 | (5,700 | ) | 1,163,900 | 20,612,669 | — | 19,183 | ||||||||||||
| Evans & Sutherland Computer Corporation |
533,800 | 166,400 | — | 700,200 | 3,150,900 | — | — | |||||||||||||
| Greka Energy Corporation |
362,400 | 92,700 | (455,100 | ) | — | — | — | (1,114,309 | ) | |||||||||||
| Intertape Polymer Group, Inc. |
2,045,300 | 420,900 | (40,100 | ) | 2,426,100 | 30,884,253 | — | (87,593 | ) | |||||||||||
| Kforce.com, Inc. |
1,172,500 | 699,985 | (10,000 | ) | 1,862,485 | 17,395,610 | — | 6,043 | ||||||||||||
| Layne Christensen Company |
— | 1,514,300 | — | 1,514,300 | 17,793,025 | — | — | |||||||||||||
| Lightbridge, Inc. |
1,168,700 | 365,000 | (10,600 | ) | 1,523,100 | 13,860,210 | — | 33,241 | ||||||||||||
| Matrix Service Company |
426,900 | 448,100 | * | (33,100 | ) | 841,900 | 15,280,485 | — | 604,221 | |||||||||||
| McMoRan Exploration Company |
831,700 | 89,600 | (83,800 | ) | 837,500 | 15,703,125 | — | (85,103 | ) | |||||||||||
| Net2Phone,Inc. |
1,526,600 | 355,700 | — | 1,822,300 | 12,799,640 | — | — | |||||||||||||
| Petroleum Helicopters, Inc.(non-voting) |
147,980 | 26,280 | — | 174,260 | 4,705,020 | — | — | |||||||||||||
| Range Resources Corporation |
3,397,800 | 754,500 | (20,000 | ) | 4,132,300 | 39,050,235 | — | 134,001 | ||||||||||||
| Rofin-Sinar Technologies, Inc. |
630,000 | 33,085 | (663,085 | ) | — | — | — | 6,325,916 | ||||||||||||
| Sharper Image Corporation |
861,750 | 263,050 | (476,400 | ) | 648,400 | 21,170,260 | — | 6,510,589 | ||||||||||||
| Strong Heritage Money Fund - Institutional Class |
78,000,000 | — | (78,000,000 | ) | — | — | 394,687 | — | ||||||||||||
| Wackenhut Corrections Corporation |
472,160 | 352,690 | (42,940 | ) | 781,910 | 17,827,548 | — | 40,288 | ||||||||||||
| World Acceptance Corporation |
1,101,700 | 80,000 | (597,500 | ) | 584,200 | 11,631,422 | — | 7,172,258 | ||||||||||||
| * | Increase due to stock split. |
108
Table of Contents
| 10. | Special Meeting of Shareholders of Strong Advisor Mid Cap Growth Fund |
On August 1, 2003, the Strong Advisor Mid Cap Growth Fund’s and Strong Growth Fund’s Board of Directors approved the reorganization of the Strong Advisor Mid Cap Growth Fund into the Strong Growth Fund, subject to shareholder approval at a meeting scheduled for October 31, 2003, which was adjourned. A new meeting date has not been set. Effective after the close of the market on August 22, 2003, the Strong Advisor Mid Cap Growth Fund was closed to new investors. Effective January 30, 2004, the Strong Advisor Mid Cap Growth Fund was reopened to new investors.
| 11. | Special Meeting of Shareholders of Strong Multi Cap Value Fund |
On August 1, 2003, the Strong Multi Cap Value Fund’s and Strong Advisor Small Cap Value Fund’s Board of Directors approved the reorganization of the Strong Multi Cap Value Fund into the Strong Advisor Small Cap Value Fund, subject to shareholder approval at a meeting scheduled for October 31, 2003, which was adjourned. A new meeting date has not been set. Effective after the close of the market on August 22, 2003, the Strong Multi Cap Value Fund was closed to new investors. Effective January 30, 2004, the Strong Multi Cap Value Fund was reopened to new investors.
| 12. | Special Meeting of Shareholders of Strong Advisor U.S. Value Fund |
On August 1, 2003, the Board of Directors of the Strong Advisor U.S. Value Fund met and approved a subadvisory agreement between Matrix Asset Advisors, Inc. and Strong Capital Management, Inc., subject to shareholder approval at a meeting scheduled for October 31, 2003, which was adjourned. A new meeting date has not been set.
| 13. | Legal Proceedings |
The United States Securities and Exchange Commission (“SEC”), the New York Attorney General (“NYAG”), the Wisconsin Attorney General (“WAG”), and the Wisconsin Department of Financial Institutions (“WDFI”) are investigating active trading of the Strong Funds by employees of Strong, including Richard S. Strong, former employee and Chairman of Strong. The Independent Directors of the Strong Funds are also investigating these matters, with the assistance of counsel and an independent consulting firm. Fund expenses related to the investigation are reimbursed by Strong. The Independent Directors intend to obtain appropriate redress if they determine that the Strong Funds were harmed. In addition, Strong has received a subpoena from the West Virginia Attorney General (“WVAG”) requesting documents, if any, related to market timing and late trading practices. Effective November 2, 2003, the Independent Directors accepted Mr. Strong’s resignation as Chairman of the Strong Funds’ Boards. Effective December 2, 2003, Mr. Strong resigned as Director of the Strong Funds’ Boards, as Chairman, Chief Investment Officer and Director of Strong, and as Chairman and Director of Strong Financial Corporation, and its affiliates.
Strong is aware of a complaint filed and simultaneously settled on September 3, 2003 (the “Complaint”), by NYAG on behalf of the State of New York, against Canary Capital Partners, LLC, et al. (collectively, “Canary”), which alleges that Canary engaged in certain improper trading practices characterized as “late-day trading” and “market timing” with various mutual funds. Strong and certain Strong Funds are referenced, although not named as parties in the Complaint, with respect to the market timing allegations. On September 5, 2003, the SEC began an inquiry based on matters related to, and set forth in, the Complaint. On September 24, 2003, the WDFI asked that certain information and documents be provided related to the matters referenced in the Complaint.
Strong is currently cooperating with the NYAG, the SEC, the WAG, the WDFI, and the WVAG with respect to their separate inquires into these matters. On September 26, 2003, Strong announced its commitment to make appropriate reimbursement if it is determined that the transactions set forth in the Complaint adversely affected investors in the Strong Funds referenced in the Complaint. On October 30, 2003, Mr. Strong announced that he has committed to personally compensate the Strong Funds for any financial losses they may have experienced as a result of his transactions.
As of the date of this Report, Strong is aware of multiple shareholder class and derivative actions (“Actions”) filed since September 4, 2003, with respect to the factual matters referenced in the Complaint naming, among others, Strong, Strong Funds, Strong affiliates, and certain of their officers and directors as defendants. These Actions have been filed in the following federal and state courts: U.S. District Court for the Southern District of New York; U.S. District Court, District of New Jersey; U.S. District Court, Eastern District of Wisconsin, Milwaukee Division; U.S. District Court, Western District of Wisconsin; Superior Court of New Jersey Law Division of Hudson; State of Wisconsin Circuit Court, Milwaukee County; State of Wisconsin Circuit Court, Waukesha County; Supreme Court of the State of New York; Superior Court of the State of California, County of Los Angeles; and U.S. District Court, District of Connecticut. The Actions generally allege, among other things, that the defendants violated their fiduciary duty to fund shareholders and certain retirement plan participants, and made false and misleading statements in the funds’ prospectuses in violation of federal and state securities laws. The Actions generally seek one or more of the following: compensatory damages, punitive damages, special damages, exemplary damages, rescission, restitution, payment of plaintiffs’ attorneys’ fees and experts’ fees, and/or replacement of the Board of Directors of the Strong Funds. Additional lawsuits may be filed in the same or other venues presenting allegations and demands for relief. Strong expects that any such lawsuits would contain allegations including the matters discussed here and that the demands for relief would not materially differ from those described above. Based on available information, Strong and the Strong Funds do not currently believe that any of the pending Actions or the regulatory inquires will have a material impact on any of the Strong Funds.
109
Table of Contents
REPORT OF INDEPENDENT AUDITORS
To the Board of Directors and Shareholders of
Strong Advisor Equity Funds:
In our opinion, the accompanying statements of assets and liabilities, including the schedules of investments in securities, and the related statements of operations and of changes in net assets and the financial highlights present fairly, in all material respects, the financial position of Strong Advisor Common Stock Fund, Strong Advisor Mid Cap Growth Fund, Strong Advisor Small Cap Value Fund, Strong Advisor U.S. Value Fund, Strong Advisor Endeavor Large Cap Fund, Strong Advisor Focus Fund, Strong Advisor International Core Fund, Strong Advisor Select Fund, Strong Advisor Technology Fund, Strong Advisor U.S. Small/Mid Cap Growth Fund, Strong Advisor Utilities and Energy Fund and Strong Advisor Large Company Core Fund (all twelve collectively constituting Strong Advisor Equity Funds, hereafter referred to as the “Funds”) at December 31, 2003, and the results of each of their operations, the changes in each of their net assets and their financial highlights for the periods indicated, in conformity with accounting principles generally accepted in the United States of America. These financial statements and financial highlights (hereafter referred to as “financial statements”) are the responsibility of the Funds’ management; our responsibility is to express an opinion on these financial statements based on our audits. We conducted our audits of these financial statements in accordance with auditing standards generally accepted in the United States of America, which require that we plan and perform the audit to obtain reasonable assurance about whether the financial statements are free of material misstatement. An audit includes examining, on a test basis, evidence supporting the amounts and disclosures in the financial statements, assessing the accounting principles used and significant estimates made by management, and evaluating the overall financial statement presentation. We believe that our audits, which included confirmation of securities at December 31, 2003 by correspondence with the custodian and brokers, provide a reasonable basis for our opinion.
PricewaterhouseCoopers LLP
Milwaukee, Wisconsin
February 3, 2004
110
Table of Contents
Each officer and director holds the same position with the 27 registered open-end management investment companies consisting of 72 mutual funds (“Strong Funds”).
Willie D. Davis (DOB 7-24-34), Director of the Strong Funds since July 1994.
Mr. Davis has been President and Chief Executive Officer of All Pro Broadcasting, Inc., since 1977; Director of Wisconsin Energy Corporation (formerly WICOR, Inc., a utility company) since 1990, Metro Goldwyn Mayer, Inc. (an entertainment company), since 1998, Bassett Furniture Industries, Inc., since 1997, Checker’s Drive-In Restaurants, Inc. (formerly Rally’s Hamburgers, Inc.), since 1994, Johnson Controls, Inc. (an industrial company), since 1992, MGM Mirage (formerly MGM Grand, Inc., an entertainment/hotel company) since 1990, Dow Chemical Company since 1988, Sara Lee Corporation (a food/consumer products company) since 1983, Alliance Bank since 1980, Manpower, Inc. (a worldwide provider of staffing services), since 2001, and Kmart Corporation (a discount consumer products company) from 1985 to 2003; and Trustee of the University of Chicago since 1980 and Marquette University since 1988.
Gordon B. Greer (DOB 2-17-32), Director of the Strong Funds since March 2002.
Mr. Greer was Of Counsel for Bingham McCutchen LLP (a law firm previously known as Bingham Dana LLP) from 1997 to February 2002 and Partner of Bingham McCutchen LLP from 1967 to 1997. On behalf of Bingham McCutchen LLP, Mr. Greer provided representation to the disinterested directors of the Strong Funds from 1991 to February 2002. Bingham McCutchen LLP has provided representation to the Independent Directors of the Strong Funds since 1991.
Stanley Kritzik (DOB 1-9-30), Director of the Strong Funds since January 1995 and Chairman of the Audit Committee of the Strong Funds since July 2000.
Mr. Kritzik has been Partner of Metropolitan Associates (a real estate firm) since 1962; Director of Wisconsin Health Information Network since November 1997, Health Network Ventures, Inc., from 1992 to April 2000, Aurora Health Care from September 1987 to September 2002; and Member of the Board of Governors of Snowmass Village Resort Association from October 1999 until October 2002.
Neal Malicky (DOB 9-14-34), Director of the Strong Funds since December 1999.
Mr. Malicky has been President Emeritus of Baldwin-Wallace College since July 2000; Chancellor of Baldwin-Wallace College from July 1999 to June 2000; President of Baldwin-Wallace College from July 1981 to June 1999; Director of Aspire Learning Corporation since June 2000; Trustee of Southwest Community Health Systems, Cleveland Scholarship Program, and The National Conference for Community and Justice until 2001; President of the National Association of Schools and Colleges of the United Methodist Church, Chairperson of the Association of Independent Colleges and Universities of Ohio, and Secretary of the National Association of Independent Colleges and Universities until 2001.
William F. Vogt (DOB 7-19-47), Director and Chairman of the Independent Directors Committee of the Strong Funds since January 1995.
Mr. Vogt has been Senior Vice President of IDX Systems Corporation (a management consulting firm) since June 2001; President of Vogt Management Consulting, Inc., from July 1990 to June 2001; and former Fellow of the American College of Medical Practice Executives.
111
Table of Contents
DIRECTORS AND OFFICERS (continued)
Ane K. Ohm (DOB 10-16-69), Anti-Money Laundering Compliance Officer of the Strong Funds since November 2002.
Ms. Ohm has been Anti-Money Laundering Compliance Officer of Strong Financial Corporation since February 2003; Assistant Executive Vice President of Strong Financial Corporation since November 2003; Executive Vice President of the Advisor since December 2001; Director of Mutual Fund Administration of Strong Investor Services, Inc., since April 2001; and Marketing Services Manager of Strong Investments, Inc., from November 1998 to April 2001.
Christopher O. Petersen (DOB 1-18-70), Vice President and Assistant Secretary of the Strong Funds since May 2003.
Mr. Petersen has been Managing Counsel of Strong Financial Corporation since March 2003; Corporate Counsel at U.S. Bancorp Asset Management, Inc., from May 2001 to March 2003; Corporate Counsel at First American Asset Management, a division of U.S. Bank National Association (“FAAM”), from September 1999 to May 2001; Compliance Officer at FAAM from January 1999 to September 1999; and Associate Attorney at Mauzy Law Firm from September 1997 to December 1998.
Richard W. Smirl (DOB 4-18-67), Vice President of the Strong Funds since February 2002 and Secretary of the Strong Funds since November 2001.
Mr. Smirl has been Senior Counsel of Strong Financial Corporation since December 2001; Assistant Secretary of Strong Financial Corporation from December 2001 to February 2003; Secretary of Strong Financial Corporation since February 2003; Assistant Executive Vice President of the Advisor since December 2001; Chief Legal Officer of the Advisor since February 2003; Secretary of the Advisor since November 2002; Assistant Secretary of the Advisor from December 2001 to November 2002; Senior Counsel of the Advisor from July 2000 to December 2001; General Counsel of Strong Investments, Inc. (“Distributor”), since November 2001; Secretary of the Distributor since July 2000; Vice President and Chief Compliance Officer of the Distributor from July 2000 to December 2003; Lead Counsel of the Distributor from July 2000 to November 2001; Vice President of Strong Investor Services, Inc., since December 2001; Assistant Secretary of Strong Investor Services, Inc., from December 2001 to May 2003; Secretary of Strong Investor Services, Inc., since May 2003; Partner at Keesal, Young & Logan LLP (a law firm) from September 1999 to July 2000; and Associate at Keesal, Young & Logan LLP from September 1992 to September 1999.
Gilbert L. Southwell III (DOB 4-13-54), Assistant Secretary of the Strong Funds since July 2001.
Mr. Southwell has been Associate Counsel of Strong Financial Corporation since December 2001; Assistant Secretary of the Advisor since December 2002; Associate Counsel of the Advisor from April 2001 to December 2001; Partner at Michael, Best & Friedrich, LLP (a law firm) from October 1999 to March 2001; and Assistant General Counsel of U.S. Bank, National Association (formerly Firstar Bank, N.A.) and/or certain of its subsidiaries from November 1984 to September 1999.
John W. Widmer (DOB 1-19-65), Treasurer of the Strong Funds since April 1999.
Mr. Widmer has been Treasurer of the Advisor since April 1999; Assistant Treasurer of Strong Financial Corporation since December 2001; Assistant Secretary of Strong Financial Corporation from December 2001 to January 2003; Treasurer of Strong Service Corporation since April 1999; Treasurer and Assistant Secretary of Strong Investor Services, Inc., since July 2001; and Manager of the Financial Management and Sales Reporting Systems department of the Advisor from May 1997 to April 1999.
Thomas M. Zoeller (DOB 2-21-64), Vice President of the Strong Funds since October 1999.
Mr. Zoeller has been Executive Vice President of the Advisor since April 2001; Chief Financial Officer of the Advisor since February 1998; Secretary of the Advisor from December 2001 to November 2002; Member of the Office of the Chief Executive of Strong Financial Corporation since May 2001; Chief Financial Officer and Treasurer of Strong Investments, Inc., since October 1993; Executive Vice President of Strong Investor Services, Inc., since July 2001; Secretary of Strong Investor Services, Inc., from July 2001 to May 2003; Executive Vice President, Chief Financial Officer, and Secretary of Strong Service Corporation since December 2001; Treasurer of Strong Service Corporation from September 1996 to April 1999; Vice President of Strong Service Corporation from April 1999 to December 2001; Member of the Office of the Chief Executive of the Advisor from November 1998 until May 2001; and Senior Vice President of the Advisor from February 1998 to April 2001.
Except for Messrs. Davis, Kritzik, Malicky, and Vogt, the address of all of the Directors and Officers is P.O. Box 2936, Milwaukee, WI 53201. Mr. Davis’s address is 161 North La Brea, Inglewood, CA 90301. Mr. Kritzik’s address is 1123 North Astor Street, Milwaukee, WI 53202. Mr. Malicky’s address is 4608 Turnberry Drive, Lawrence, KS 66047. Mr. Vogt’s address is P.O. Box 7657, Avon, CO 81620.
The statement of additional information contains additional information about fund directors and officers and is available without charge, upon request, by calling 1-800-368-3863.
112
Table of Contents
NOTES
113
Table of Contents
NOTES
114
Table of Contents
Directors
Willie D. Davis
Gordon B. Greer
Stanley Kritzik
Neal Malicky
William F. Vogt
Officers
Phillip O. Peterson, President (effective January 2004)
Thomas M. Zoeller, Vice President
Richard W. Smirl, Vice President and Secretary
Christopher O. Petersen, Vice President and Assistant Secretary
Gilbert L. Southwell III, Assistant Secretary
John W. Widmer, Treasurer
Ane K. Ohm, Anti-Money Laundering Compliance Officer
Investment Advisor
Strong Capital Management, Inc.
P.O. Box 2936, Milwaukee, Wisconsin 53201
Distributor
Strong Investments, Inc.
P.O. Box 2936, Milwaukee, Wisconsin 53201
Custodian
State Street Bank and Trust Company
801 Pennsylvania Avenue, Kansas City, Missouri 64105
Transfer Agent and Dividend-Disbursing Agent
Strong Investor Services, Inc.
P.O. Box 2936, Milwaukee, Wisconsin 53201
Independent Accountants
PricewaterhouseCoopers LLP
100 East Wisconsin Avenue, Milwaukee, Wisconsin 53202
Legal Counsel
Godfrey & Kahn, S.C.
780 North Water Street, Milwaukee, Wisconsin 53202
115
Table of Contents
Strong Investments
P.O. Box 2936 | Milwaukee, WI 53201
www.Strong.com
To order a free prospectus kit,
call 1-800-368-1030
To learn more about our funds, discuss an
existing account, or conduct a transaction,
call 1-800-368-3863
To receive a free copy of the policies and
procedures the funds use to determine
how to vote proxies relating to portfolio
securities, call 1-800-368-3863, or visit the
Securities and Exchange Commission’s
web site at www.sec.gov
If you are a Financial Professional,
call 1-800-368-1683
Visit our web site at
www.Strong.com
This report does not constitute an offer for the sale of securities. Strong Funds are offered for sale by prospectus only. Securities are offered through Strong Investments, Inc. RT40962 02-04
AEQY/WH2006 12-03
Table of Contents
| Item 2. | Code of Ethics |
(a) As of the end of the period covered by this report, the registrant has adopted a code of ethics that applies to the registrant’s principal executive officer, principal financial officer, principal accounting officer or controller, or persons performing similar functions. A copy of the code of ethics is filed as an exhibit to this Form N-CSR.
(b) During the period covered by this report, no amendments were made to the provisions of the code of ethics adopted in 2(a) above.
(c) During the period covered by this report, no implicit or explicit waivers to the provisions of the code of ethics adopted in 2(a) above were granted.
| Item 3. | Audit Committee Financial Expert |
The registrant’s Board of Directors has determined that independent director Stanley Kritzik qualifies as an Audit Committee financial expert. The designation of a person as an “Audit Committee financial expert” does not mean that the person has any greater duties, obligations, or liability than those imposed on the person without the “Audit Committee financial expert” designation. Similarly, the designation of a person as an “Audit Committee financial expert” does not affect the duties, obligations, or liability of any other member of the Audit Committee or Board of Directors.
| Item 4. | Principal Accountant Fees and Services |
(a) – (d) Aggregate fees billed to the registrant for the last two fiscal years for professional services rendered by the registrant’s principal accountant were as follows:
| 2003 | ||||||||||||
| Audit Fees |
Audit Related |
Tax Fees |
Other Fees | |||||||||
| Strong Common Stock Fund, Inc. |
$ | 81,425 | $ | — | $ | 8,477 | $ | — | ||||
| 2002 | ||||||||||||
| Audit Fees |
Audit Related |
Tax Fees |
Other Fees | |||||||||
| Strong Common Stock Fund, Inc. |
$ | 53,966 | $ | — | $ | 14,606 | $ | — | ||||
Audit fees include amounts related to the audit of the registrant’s annual financial statements and services normally provided by the accountant in connection with statutory and regulatory filings. Audit-related fees include amounts reasonably related to the performance of the audit of the registrant’s financial statements, specifically the review of regulatory filings related to reorganizations and new share classes. Tax fees include amounts related to tax compliance, tax planning, and tax advice. Other fees include the registrant’s pro-rata share of amounts for products and services other than those reported above.
(e) (1) The Audit Committee is required to preapprove audit and non-audit services performed for the Funds by the independent auditor in order to assure that the provision of such services does not impair the auditor’s independence. The Audit Committee also is required to preapprove certain non-audit services performed by the Funds’ independent auditor for the Funds’ investment adviser and certain of the adviser’s affiliates if the services relate directly to the operations and financial reporting of the Funds. Unless a type of service to be provided by the independent auditor has received preapproval, it will require specific preapproval by the Audit Committee. Any proposed services exceeding preapproved cost levels will require separate preapproval by the Audit Committee.
Notwithstanding any provision of this Policy, the Audit Committee is not required to preapprove services for which preapproval is not required by applicable law, including de minimis services (defined as non-audit services that constitute no more than 5% of the total amount of revenues paid to the independent auditor during the year in which the services are provided) and grandfathered services.
The Audit Committee may delegate preapproval authority to one or more of its members. The member or members to whom such authority is delegated shall report any preapproval decisions to the Audit Committee at its next scheduled meeting. The Audit Committee does not delegate its responsibility to preapprove services performed by the independent auditor to management.
(2) No services included in (b) – (d) above were approved pursuant to paragraph (c)(7)(i)(C) of Rule 2-01 of Regulation S-X.
(f) Not applicable.
(g) The aggregate fees billed for the most recent fiscal year and the preceding fiscal year by the registrant’s principal accountant for non-audit services rendered to the registrant, its investment adviser, and any entity controlling, controlled by, or under common control with the investment adviser that provides ongoing services to the registrant were $254,000 and $266,000, respectively.
(h) All non-audit services rendered in (g) above were pre-approved by the registrant’s audit committee. Accordingly, these services were considered by the registrant’s audit committee in maintaining the principal accountant’s independence.
| Item 5 – 6. [Reserved] |
| Item 7. | Disclosure of Proxy Voting Policies and Procedures for Closed-End Management Investment Companies |
Not applicable to this Registrant, insofar as the Registrant is not a closed-end management investment company.
| Item 8. | [Reserved] |
| Item 9. | Controls and Procedures |
(a) An evaluation was performed within 90 days from the date hereof under the supervision of the Registrant’s management, including the principal executive officer and treasurer, regarding the effectiveness of the registrant’s disclosure controls and procedures. Based on that evaluation, it was determined that such disclosure controls and procedures provide reasonable assurance that the material information required to be disclosed by the Registrant in the reports its files or submits on Form N-CSR (1) is accumulated and communicated to the Registrant’s management, including its principal executive officer and treasurer, to allow timely decisions regarding required disclosure, and (2) is recorded, processed, summarized, and reported within the time periods specified in the Commission’s rules and forms.
(b) There were no significant changes in the Registrant’s internal controls or in other factors that could significantly affect these controls subsequent to the date of the evaluation referenced in (a) above, including any corrective actions with regard to significant deficiencies and material weaknesses.
| Item 10. | Exhibits |
The following exhibits are attached to this Form N-CSR:
| 10(a) | Code of Ethics required by Item 2 of Form N-CSR | |
| 10(b)(1) | Certification of Principal Executive Officer Required by Section 302 of the Sarbanes-Oxley Act of 2002 | |
| 10(b)(2) | Certification of Principal Financial Officer Required by Section 302 of the Sarbanes-Oxley Act of 2002 | |
| 10(c) | Certification of Chief Executive Officer and Chief Financial Officer Required by Section 906 of the Sarbanes-Oxley Act of 2002 | |
Signatures
Pursuant to the requirements of the Securities Exchange Act of 1934 and the Investment Company Act of 1940, the Registrant has duly caused this report to be signed on its behalf by the undersigned, thereunto duly authorized.
Strong Common Stock Fund, Inc., on behalf of Strong Advisor Common Stock Fund, and Strong Advisor Endeavor Large Cap Fund, Strong Advisor Focus Fund and Strong Advisor Technology Fund
| By: | /s/ Richard W. Smirl | |
| Richard W. Smirl, Vice President and Secretary | ||
| Date: February 24, 2004 | ||
Pursuant to the requirements of the Securities Exchange Act of 1934 and the Investment Company Act of 1940, this report has been signed below by the following persons on behalf of the registrant and in the capacities and on the dates indicated.
| By: | /s/ Thomas M. Zoeller | |
| Thomas M. Zoeller, Principal Executive Officer | ||
| Date: February 24, 2004 | ||
| By: | /s/ John W. Widmer | |
| John W. Widmer, Treasurer (Principal Financial Officer) | ||
| Date: February 24, 2004 | ||