|
OMB APPROVAL
|
|
OMB Number: 3235-0570
Expires: January 31, 2017
Estimated average burden hours per response: 20.6
|
UNITED STATES
SECURITIES AND EXCHANGE COMMISSION
Washington, D.C. 20549
FORM N-CSR
CERTIFIED SHAREHOLDER REPORT OF REGISTERED
MANAGEMENT INVESTMENT COMPANIES
Investment Company Act file number 811-05685
Williamsburg Investment Trust
(Exact name of registrant as specified in charter)
|
225 Pictoria Drive, Suite 450 Cincinnati, Ohio
|
45246
|
|
(Address of principal executive offices)
|
(Zip code)
|
W. Lee H. Dunham, Esq.
Sullivan & Worcester LLP One Post Office Square Boston, Massachusetts 02109
(Name and address of agent for service)
Registrant's telephone number, including area code: (513) 587-3400
Date of fiscal year end: March 31, 2015
Date of reporting period: September 30, 2014
Form N-CSR is to be used by management investment companies to file reports with the Commission not later than 10 days after the transmission to stockholders of any report that is required to be transmitted to stockholders under Rule 30e-1 under the Investment Company Act of 1940 (17 CFR 270.30e-1). The Commission may use the information provided on Form N-CSR in its regulatory, disclosure review, inspection, and policymaking roles.
A registrant is required to disclose the information specified by Form N-CSR, and the Commission will make this information public. A registrant is not required to respond to the collection of information contained in Form N-CSR unless the Form displays a currently valid Office of Management and Budget ("OMB") control number. Please direct comments concerning the accuracy of the information collection burden estimate and any suggestions for reducing the burden to Secretary, Securities and Exchange Commission, 450 Fifth Street, NW, Washington, DC 20549-0609. The OMB has reviewed this collection of information under the clearance requirements of 44 U.S.C. § 3507.
| Item 1. | Reports to Stockholders. |
 SEMI-ANNUAL REPORT
September 30, 2014
(Unaudited) |
|
THE DAVENPORT FUNDS
LETTER TO SHAREHOLDERS |
November 3, 2014
|
Dear Shareholders,
The third quarter brought a bumpier ride for equity investors. The S&P 500 Index eked out a modest gain of 1.13% for the quarter, but volatility increased and the Index closed the quarter with a 1.40% decline for September. Meanwhile, the small cap oriented Russell 2000 Index posted a 7.36% decline for the quarter and was down 6.05% in the month of September alone. Year-to-date, the S&P 500 was still up a very respectable 8.34% at September 30, while the Russell 2000 was down 4.41%.
The S&P 500's resilience seems to belie recent weakness elsewhere in the market. While the S&P 500 still resides near an all-time high, many areas of the market have experienced meaningful declines. This is evidenced in part by the wide performance spread between the S&P 500 and the Russell 2000. Indeed, we've seen many stocks pull back 20%+ from their recent highs. It seems the market's advance has become increasingly "narrow." In other words, it's been driven by a few pockets of strength that create a misleading façade.
As noted in prior writings, many continue to call for a market "correction." After all, the market (as measured by the S&P 500) hasn't experienced a 10%+ move to the downside in roughly 3 years. However, a "stealth" correction already seems to be underway. It seems to be happening sector by sector, with fewer and fewer areas being left unharmed. Thus far, the pain has been most acute in more cyclical areas such as energy and industrial stocks, which are most sensitive to slowing global growth, and small-cap stocks. By October 10th, the Russell 2000 had declined over 10% from its high, thereby officially qualifying as a "correction." Biotechnology is one of a few areas that have been bright spots, as the industry's growth prospects are more immune to economic conditions. Suffice it to say, the market's narrow advance has created a very challenging environment for "active" money managers. In fact, Morningstar recently pointed out the vast majority of mutual funds are underperforming their benchmarks this year.
While we are pleased to be enjoying another up year, we have been disappointed with our recent relative performance. The third quarter was particularly tough for The Davenport Funds when compared to their respective benchmarks. We provide more detail in each Fund's discussion below; however, it's safe to say we've been penalized both by what we own and what we don't own. Unfortunately, we have too little exposure to the aforementioned pockets of strength. We generally aren't inclined to chase today's popular stocks for fear they are becoming a little too popular. To the contrary, we're more likely to consider adding to laggards where our conviction levels remain high and valuations have become more attractive. It's challenging and sometimes frustrating to go against the grain, but it can often be rewarding.
In the near-term, we hope to play a little "catch up" as some of our holdings post better results. More importantly, we expect to continue delivering on our long-term promise of generating competitive returns while assuming below average risk. We may not always capture all the upside of up markets; however, we hope to avoid some of the downside in more turbulent times. This has been the case in the past as evidenced by our Funds' performance in tougher market environments. Tame expectations and still reasonable valuations lead us to remain constructive on stocks. But, given the market's run over the past few years, we think it makes sense to be increasingly attentive to risk, and we may take steps to further upgrade the quality of our holdings.
1
Davenport Core Fund
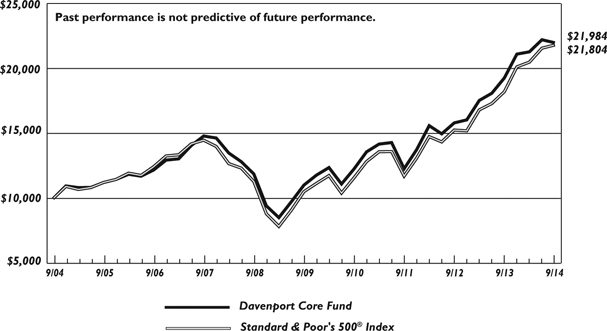
The following chart represents Davenport Core Fund (the "Core Fund") performance and the performance of the S&P 500 Index*, the Core Fund's primary benchmark, for the periods ended September 30, 2014.
|
Q3 2014
|
1 Year
|
3 Years**
|
5 Years**
|
10 Years**
|
Since Inception** 1/15/1998
|
Expense Ratio
|
|
|
Core Fund
|
-1.02%
|
14.08%
|
21.40%
|
14.80%
|
8.20%
|
6.23%
|
0.94%
|
|
S&P 500 Index*
|
1.13%
|
19.73%
|
22.99%
|
15.70%
|
8.11%
|
6.41%
|
—
|
Past performance is no guarantee of future results. Investment return and principal value of an investment will fluctuate so that an investor's shares, when redeemed, may be worth more or less than their original cost. Current performance may be lower or higher than the performance data quoted. Performance data, current to the most recent month end, may be obtained by calling 1-800-281-3217.
| * | The S&P 500 Index is comprised of 500 U.S. stocks and is an indicator of the performance of the overall U.S. stock market. An investor cannot invest in an index and its returns are not indicative of the performance of any specific investment. |
| ** | Annualized. |
The Core Fund declined 1.02% during the third quarter, versus a 1.13% gain for the S&P 500 Index. Year-to-date, the Fund is up 4.17%, relative to the 8.34% gain for the S&P 500. Below, we provide a discussion of recent performance in addition to highlighting a few new ideas that we believe enhance the quality of the Core Fund.
Biotechnology stocks Amgen (AMGN) and Celgene (CELG) were top performers during the period alongside other Health Care names such as WellPoint (WLP) and AmerisourceBergen (ABC). Following what proved to be a timely add, CME Group (CME) was another top contributor as volumes on its exchanges spiked in tandem with increased volatility and expectations for higher interest rates. The Industrials, Information Technology and Energy sectors were the primary sources of weakness during the quarter. Significant declines in American Airlines (AAL) and Chicago Bridge & Iron (CBI) compounded general weakness across the Industrials sector during the quarter. We elected to sell the CBI position given a lack of clarity in the company's outlook in addition to waning confidence in management. In terms of technology, weakness in Activision Blizzard (ATVI) and QUALCOMM (QCOM), coupled with a lack of exposure to some of the industry's best performers weighed on results. Recently purchased Range Resources (RRC) was the key detractor in the Energy sector, as natural gas prices fell due to new supplies and an unseasonably mild summer.
We initiated positions in confectionary products giant Hershey (HSY), and leading oil service company Schlumberger (SLB), during the quarter. While in completely different industries, key similarities include trusted brands, leading market share, and well-respected management teams with strong track records of value creation. Furthermore, we note that each stock had pulled back at the time of purchase due to near-term factors that we feel do not impact the significant long-term earnings power of the franchise. Ultimately, we feel owning these quality businesses at reasonable prices upgrade the quality of the Core Fund while enabling outperformance throughout a complete market cycle.
Given the disappointing nature of recent relative results, we feel it is appropriate to provide some longer-term context with respect to our performance and investment philosophy. As we have communicated in the past, we strive to capture most of the market's upside while taking on less risk. Hence, we have cautioned that while we typically outperform in a down market, we may lag in
2
periods of extreme or prolonged market strength. The past five years have produced one of the more robust bull markets in recent history, and yet, over the five year period ended September 30, 2014, our strategy has managed to capture roughly 95% of the market's upside while taking modestly less risk (as measured by standard deviation).* Though we are never content to underperform in any environment, we remain confident in the Fund's positioning for the long term.
| * | Source: Zephyr StyleADVISOR. Risk is measured by standard deviation, which is the variability of returns around the average return. Core Funds standard deviation for the period: 12.88%; S&P 500 standard deviation for the period: 13.20%. |
New Positions
Citigroup, Incorporated (C) Despite being very well capitalized, C is the only large bank trading below its tangible book value. As management continues to improve operations, we expect the stock to rerate higher.
Dish Network Corporation – Class A (DISH) We purchased a position in this highly cash generative satellite TV company given its optionality associated with highly valuable spectrum assets and the founder and CEO's superior track record of value creation through savvy capital allocation.
Hershey Company (The) (HSY) We purchased this well-known chocolate maker as shares have sold off concerning short-term issues, presenting an attractive opportunity into this defensible franchise with 9%-11% annual earnings growth.
PVH Corporation (PVH) We purchased this position because we are impressed with management's track record of creating value through acquisition, and we think PVH is poised to grow earnings substantially as it folds in its recent acquisition of Calvin Klein jeanswear and underwear.
Schlumberger Limited (SLB) We purchased a position in this leading oil services company after a pullback in oil prices, as we believe the company's self-help initiatives will improve returns.
Increased Positions
Range Resources Corporation (RRC) We added to this best-in-class natural gas and liquids producer after a cool summer prompted a selloff in natural gas prices, creating an attractive entry point.
Decreased Positions
American Airlines Group, Incorporated (AAL) We chipped our position, electing to take some profits after a sharp move up. We continue to see additional upside surrounding the AMR/USAirways merger and believe our industry thesis is intact.
WellPoint, Incorporated (WLP) We chipped our position after a strong run, electing to take profits given continued uncertainty in the Health Care sector.
Wells Fargo & Company (WFC) We chipped our position after a period of outperformance, but continue to view WFC as the highest-quality U.S. bank.
Positions Sold
Chicago Bridge & Iron Company NV (CBI) We sold our position given challenges including a stretched balance sheet and tough industry that left us less confident they would be able to turn strong end-market tailwinds into shareholder value.
3
McDonald's Corporation (MCD) We sold our position as we feel persisting revenue headwinds may limit meaningful expansion in the stock's valuation.
National Oilwell Varco, Incorporated (NOV) We sold this oil and gas capital equipment maker in favor of a more attractive opportunity.
Valero Energy Corporation (VLO) We sold our position due to increased volatility surrounding concerns that the domestic ban on crude oil exports may be repealed.
Wal-Mart Stores, Incorporated (WMT) We sold our position as we think the company will continue to struggle in its attempt to grow same-store sales.
Davenport Value & Income Fund
The following chart represents Davenport Value & Income Fund (the "Value & Income Fund") performance and the performance of the S&P 500 Index*, the Value & Income Fund's primary benchmark, and the Lipper Equity Income Index for the periods ended September 30, 2014.
|
Q3 2014
|
1 Year
|
3 Year**
|
Since Inception**
12/31/2010 |
Expense Ratio
|
30 Day
SEC Yield |
|
|
Value & Income Fund
|
-0.54%
|
15.16%
|
21.65%
|
15.45%
|
1.07%
|
1.92%
|
|
S&P 500 Index*
|
1.13%
|
19.73%
|
22.99%
|
15.19%
|
—
|
—
|
|
Lipper Equity Income Index*
|
-0.62%
|
16.09%
|
20.50%
|
13.37%
|
—
|
—
|
Past performance is no guarantee of future results. Investment return and principal value of an investment will fluctuate so that an investor's shares, when redeemed, may be worth more or less than their original cost. Current performance may be lower or higher than the performance data quoted. Performance data, current to the most recent month end, may be obtained by calling 1-800-281-3217.
| * | The S&P 500 Index is comprised of 500 U.S. stocks and is an indicator of the performance of the overall U.S. stock market. The Lipper Equity Income Fund Index is an unmanaged index of the 30 largest funds, based on total year-end net asset value, in the Lipper Equity Income Fund Index. An investor cannot invest in an index and its returns are not indicative of the performance of any specific investment. |
| ** | Annualized. |
The Value & Income Fund declined 0.54% during the third quarter, versus the 1.13% gain for the S&P 500 Index and the 0.62% decline for the Lipper Equity Income Index. Year-to-date as of September 30, the Value & Income Fund is up 5.15% relative to gains of 8.34% and 6.54%, respectively, for the S&P 500 and Lipper Equity Income Index. Despite a more hawkish tone from the Federal Reserve System (Fed) in its September meeting, stocks with above-average dividends tended to outperform the broader indices as their defensive qualities seemed to outweigh concerns over rising rates.
Archer Daniels Midland (ADM) was the Value & Income Fund's top performing stock during the quarter. Results have benefitted nicely from booming agricultural production, while new management's focus on cost improvements and returns on capital have helped the shares rerate higher. The Energy category has served as a drag on performance for much of the year given our more modest exposure to oil levered exploration and production companies amid rising oil prices. However, this trend reversed during the quarter as positions in Marathon Petroleum (MPC), Kinder Morgan (KMI) and Occidental Petroleum (OXY) proved to be more resilient as oil prices declined. The Consumer Discretionary and Industrials categories were the biggest drags
4
on performance during the quarter. Within Consumer Discretionary, Six Flags (SIX) gave back gains from the beginning of the year alongside concerns over soft visitation trends. Industrial names Eaton (ETN) and Watsco (WSO) were also meaningful detractors as disappointing results compounded increasingly bearish industry sentiment.
We initiated a position in Verizon (VZ) during the quarter. VZ is one of two major diversified telecommunications companies in the United States, serving over 100 million customers. Wireless accounts for two-thirds of revenue with wireline (including cable and internet service FiOS) accounting for the remainder. In late February, VZ bought back Vodafone's 45% ownership stake in VZ Wireless in a transaction valued at $130 billion. VZ now fully owns and controls the industry-leading wireless carrier in the U.S., which should benefit from growing mobility for years to come. Furthermore, we are attracted to the defensive earnings stream this vital service provides in more difficult economic times (it almost seems there are some consumers who would part with their homes before turning off their cell phones). These attributes should allow for returns on capital to continue rising over time. Finally, we note that VZ has a generous dividend that currently yields 4.4% and has room to go higher.
We also initiated a position in Lamar Advertising (LAMR). LAMR is the third largest outdoor advertising company in the U.S., focused primarily on small to mid-sized markets where larger competitors such as Clear Channel and CBS Outdoor do not operate. The company has a long-standing history in many of these markets, having pursued an aggressive acquisition strategy which has enabled it to gain huge market shares that run in the 80% plus range in many markets. We are attracted to the company's strong cash flows, enabled by low operating costs, minimal capital needs and useful lives of assets well in excess of depreciable lives. Earlier this year, the company received a Private Letter Ruling (PLR) from the IRS, enabling it to convert to a Real Estate Investment Trust (REIT). Initially, the company will pay a dividend of roughly $2.50 per share (6.7% yield), which we believe can grow at 10% per year alongside low single digit organic growth, cost reductions and increased cash flow contribution from the rollout of digital billboards. Finally, we note that the CEO Sean Reilly is a descendant of the founder and has served in various capacities at Lamar since 1978. The Reilly family has been a great steward of shareholder interests over time and currently owns 16% of the outstanding shares (controls approximately 65% of the voting power).
Given the low interest rate environment and uncharted course of the Fed, we have spent much time in prior communications discussing the Fund's ability to withstand rising interest rates and perform alongside an improving economy. Though we continue to position ourselves for these scenarios, we feel an often overlooked component of this strategy is its relative defensiveness in tougher times. Ultimately, we feel our focus on cash flow, quality of management, valuation and sustainable dividends creates a balanced approach that can not only keep up with the good times, but help preserve capital and income when markets turn down.
There is no guarantee that a company will continue to pay a dividend.
New Positions
Lamar Advertising Company (LAMR) We purchased a position in this billboard advertising company which recently converted to a REIT, pays a 6.7% yield that we expect can grow 10% per annum, and trades at an inexpensive valuation.
5
Verizon Communications, Incorporated (VZ) We purchased a position in this leading U.S. telecommunications provider for its defensible business, generous dividend yield and strong multiyear growth opportunity in wireless communications demand. Current yield: 4.4%
Waddell & Reed Financial, Incorporated (WDR) We purchased this high quality asset manager after fund manager departures prompted a selloff in the stock. Current yield: 2.6%
Increased Positions
Eastman Chemical Company (EMN) We added to EMN after shares sold off in response to an update in the company's earnings guidance, which we viewed as a buying opportunity. Current yield: 1.7%
Kinder Morgan, Incorporated (KMI) We added to the largest energy infrastructure company in North America after KMI announced plans to acquire its daughter Master Limited Partnerships (MLPs), lowering its overall cost of capital and increasing competitiveness. Current yield: 4.5%
Decreased Positions
Marathon Petroleum Corporation (MPC) We chipped this refiner amid fears of a repeal of the U.S. crude export ban. Current yield: 2.2%
WellPoint, Incorporated (WLP) WLP has been a great stock for us and we elected to chip the position given continued uncertainty in the Health Care sector. Current yield: 1.5%
Positions Sold
BP plc – ADR (BP) We sold BP given increased concerns around environmental liabilities and Russian exposure. Current yield: 4.8%
Fidelity National Financial Ventures (FNFV) We sold this small stub position that FNF created to track the value of its investments. We continue to hold our position in FNF. Current yield: n/a
GlaxoSmithKline plc – ADR (GSK) We sold our position, as GSK's growth in core drug franchises has slowed. As a result, we see increased risks to cash flow and the sustainability of the recently increased dividend. Current yield: 4.8%
Realty Income Corporation (O) O gave us strong performance in a short period of time, moving from a bargain to more fairly valued. We sold the stock to put the proceeds in a situation with further upside potential. Current yield: 4.8%
Davenport Equity Opportunities Fund
The following chart represents Davenport Equity Opportunities Fund (the "Equity Opportunities Fund") performance and the performance of the Russell Midcap Index*, the Equity Opportunity Fund's primary benchmark, and the S&P 500 Index for the periods ended September 30, 2014.
|
Q3 2014
|
1 Year
|
3 Year**
|
Since Inception** 12/31/2010
|
Expense Ratio
|
|
|
Equity Opportunities Fund
|
-3.66%
|
12.59%
|
23.17%
|
15.97%
|
0.98%
|
|
Russell Midcap Index*
|
-1.66%
|
15.83%
|
23.79%
|
14.53%
|
—
|
|
S&P 500 Index*
|
1.13%
|
19.73%
|
22.99%
|
15.19%
|
—
|
6
Past performance is no guarantee of future results. Investment return and principal value of an investment will fluctuate so that an investor's shares, when redeemed, may be worth more or less than their original cost. Current performance may be lower or higher than the performance data quoted. Performance data, current to the most recent month end, may be obtained by calling 1-800-281-3217.
| * | The Russell Midcap Index measures the performance of the 800 smallest companies in the Russell 1000, which represent approximately 25% of the total market capitalization of the Russell 1000. The S&P 500 Index is comprised of 500 U.S. stocks and is an indicator of the performance of the overall U.S. stock market. An investor cannot invest in an index and its returns are not indicative of the performance of any specific investment. |
| ** | Annualized. |
The Equity Opportunities Fund experienced a rough third quarter. The Fund declined 3.66% for the period as compared to a more modest 1.66% drop for the Russell Midcap Index and a 1.13% gain for the S&P 500 Index. As another point of reference, the Russell 2000 Index declined a more severe 7.36% for the quarter. Each of these benchmarks is a bit imperfect and we have a stated goal of outperforming each of them long term. Recently, the S&P 500 has been the most challenging comparison given its larger-cap bias and relative resilience, which has been supported by a narrowing group of market leaders. Year-to-date as of September 30, the Equity Opportunities Fund was up 4.87% versus gains of 6.87% and 8.34% for the Russell Midcap and S&P 500, respectively. The Russell 2000 ended the quarter down 4.41% year-to-date.
This was certainly one of the more difficult quarters we've seen in a while, both in an absolute sense and from a relative vantage point. However, we did have a few bright spots worth mentioning. Hanesbrands (HBI) continued its momentum from the prior quarter. Acquisition synergies, a heightened focus on premium/higher margin apparel and lower cotton costs have supported ongoing strength in the stock. Another core holding, American Tower (AMT), also remained strong alongside solid earnings momentum and enthusiasm surrounding their opportunity to exploit growing wireless demand in emerging markets. Lastly, recent purchase Alcoa (AA) was a standout due to both higher aluminum prices and support for the company's efforts to emphasize less commodity-sensitive businesses. We still like all of these companies and maintain meaningful holdings in them, but used recent strength as an opportunity to trim our positions under the assumption that more depressed situations may possess more upside.
A number of our holdings struggled in the third quarter. In many of these cases, recent declines would appear to present longer-term opportunity. Within the Industrials sector, both American Airlines (AAL) and Colfax (CFX) were particularly weak. AAL has been a great stock since our purchase, but "hot money" has fled the scene recently on fears of near-term earnings pressure. True, higher labor costs and rising competition in international routes may cool the company's momentum, but we still think merger synergies and structural change in the industry will result in meaningfully higher earnings power. We also note that declining jet fuel prices could provide a shot in the arm. Shares of CFX have been hurt as investors focus on the company's exposure to Europe (and a weaker Euro) and the Energy sector, a key end market that is contending with lower oil and gas prices. We acknowledge the macro backdrop doesn't favor the company right now, but management is comprised of exceptional capital allocators who are uniquely adept at making acquisitions. Hence, we have used price weakness to add to our position.
A few consumer stocks hurt us as well. Chief among these were CarMax (KMX) and Penn National Gaming (PENN). These are very different situations, with KMX being a long-term growth story and PENN more of a "deep value" situation, but they and our other domestic consumer holdings should benefit from lower gas prices, easing comparisons (last winter was tough on the sector),
7
and improving employment trends. While more of an international story, we've recently added to our holdings in the sector with the purchase of Discovery Communications (DISCA). DISCA is a global media company best known for channels such as Discovery, TLC and Animal Planet. The company has done a phenomenal job of building brands and viewership here in the U.S. and is now replicating that success abroad. In fact, DISCA has more channels in more countries than any media company. We think the company has a unique platform that should allow sustainable double-digit Earnings Per Share (EPS) growth as its increasing global scale begets higher advertising and distribution revenue. We are also intrigued by the company's capital allocation. Since 2010, it has aggressively repurchased stock, reducing the share count by 24%. More recently, DISCA has been acquiring European media assets, which appear attractively priced relative to U.S. assets and should allow the company to build distribution scale in those markets. On a final note, we also like the involvement of renowned investor Dr. John Malone, who has a 4% economic interest in DISCA and owns 22% of the voting stock.
Another stock we recently purchased is NRG Energy (NRG). Power prices have languished since the 2008 financial crisis as demand has weakened and natural gas prices are down significantly (power prices tend to move with natural gas, the marginal input). Low prices and a punitive regulatory regime have led to a very challenging operating environment for competitive power producers. However, NRG's forward-thinking management team has taken advantage of the down cycle to complete a number of large acquisitions at rock bottom prices, becoming the nation's largest competitive power generator. Trading at a 10%+ Free Cash Flow (FCF) yield, the stock offers compelling value today and provides significant optionality for a rebound in power prices. In the meantime, we think management will continue creating significant value for shareholders in related areas such as renewables, where NRG has grown to the nation's third largest renewable operator and has begun to monetize this stable, high-return income stream through the IPO of NRG Yield (NYLD).
As evidenced by our recent purchases, we remain laser focused on stories of talented managers that have the ability to reinvest capital at high rates of return. We continue to believe such stories of savvy capital allocation can yield years of compounding growth. While we haven't kept pace with the market in recent months, we are confident our collection of businesses can produce above-average returns over time. Furthermore, should markets decline, we think such businesses may possess less downside than the broader indices. As was the case in 2011, we hope the Equity Opportunities Fund will prove somewhat defensive in a more turbulent environment.
New Positions
Discovery Communications, Incorporated – Class A (DISCA) We purchased and subsequently added to this media company backed by John Malone, as we see a long growth runway and strong track record of value-creating capital allocation.
NRG Energy, Incorporated (NRG) We purchased a position in this integrated wholesale power generator given the company's strong cash generation, leverage to rising natural gas and power prices and management's strong track record.
8
Increased Positions
Capital One Financial Corporation (COF) We added to this inexpensive bank and credit card company as COF is posting results showing encouraging loan growth, reserve developments and returns on capital.
Colfax Corporation (CFX) We added to this industrial company that we believe to be one of the more compelling "value compounders" on our radar screen.
Pall Corporation (PLL) We added to this high quality industrial company after a sector-related selloff.
Penn National Gaming, Incorporated (PENN) We added to our position as we think the risk/reward looks even more favorable as results seem to be stabilizing and new projects should drive growth.
Decreased Positions
Alcoa, Incorporated (AA) We chipped our position following strong year-to-date performance as we are concerned aluminum prices may have gotten ahead of themselves ahead of an important London Metals Exchange court hearing.
American Tower Corporation (AMT) We chipped our position in this global wireless tower operator as the stock has become an outsized position following a period of strong performance.
Hanesbrands, Incorporated (HBI) We chipped our position after the stock's strong outperformance.
Positions Sold
Fastenal Company (FAST) We sold our position after underwhelming earnings leverage on sluggish sales growth dampened our enthusiasm.
Fidelity National Financial Ventures (FNFV) We sold this small stub position that FNF created to track the value of its investments. We continue to hold our position in FNF.
O'Reilly Automotive, Incorporated (ORLY) After increasing nearly sixfold since our purchase a few years ago, we sold our position in ORLY as we feel the stock now adequately reflects the strong prospects for the company.
Valero Energy Corporation (VLO) We sold our position due to increased volatility surrounding concerns that the domestic ban on crude oil exports may be repealed.
We thank you for your trust and look forward to reporting back to you in 2015.
Sincerely,
John P. Ackerly, IV
President, The Davenport Funds
President, The Davenport Funds
9
DAVENPORT CORE FUND
PERFORMANCE INFORMATION (Unaudited)
PERFORMANCE INFORMATION (Unaudited)
Comparison of the Change in Value of a $10,000 Investment in
Davenport Core Fund and the Standard & Poor's 500® Index
|
Average Annual Total Returns(a)
(for periods ended September 30, 2014) |
|||
|
1 Year
|
5 Years
|
10 Years
|
|
|
Davenport Core Fund
|
14.08%
|
14.80%
|
8.20%
|
|
Standard & Poor's 500® Index
|
19.73%
|
15.70%
|
8.11%
|
| (a) | The total returns shown do not reflect the deduction of taxes that a shareholder would pay on Fund distributions or the redemption of Fund shares. |
10
DAVENPORT VALUE & INCOME FUND
PERFORMANCE INFORMATION (Unaudited)
PERFORMANCE INFORMATION (Unaudited)
Comparison of the Change in Value of a $10,000 Investment in
Davenport Value & Income Fund, the Standard & Poor's 500® Index
and the Lipper Equity Income Index

|
Average Annual Total Returns(a)
(for periods ended September 30, 2014) |
||
|
1 Year
|
Since Inception(b)
|
|
|
Davenport Value & Income Fund
|
15.16%
|
15.45%
|
|
Standard & Poor's 500® Index
|
19.73%
|
15.19%
|
|
Lipper Equity Income Index
|
16.09%
|
13.37%
|
| (a) | The total returns shown do not reflect the deduction of taxes that a shareholder would pay on Fund distributions or the redemption of Fund shares. |
| (b) | Commencement of operations was December 31, 2010. |
11
DAVENPORT EQUITY OPPORTUNITIES FUND
PERFORMANCE INFORMATION (Unaudited)
PERFORMANCE INFORMATION (Unaudited)
Comparison of the Change in Value of a $10,000 Investment in
Davenport Equity Opportunities Fund, the Russell Midcap® Index,
and the Standard & Poor's® 500 Index

|
Average Annual Total Returns(a)
(for periods ended September 30, 2014) |
||
|
1 Year
|
Since Inception(b)
|
|
|
Davenport Equity Opportunities Fund
|
12.59%
|
15.97%
|
|
Russell Midcap® Index
|
15.83%
|
14.53%
|
|
Standard & Poor's 500® Index
|
19.73%
|
15.19%
|
| (a) | The total returns shown do not reflect the deduction of taxes that a shareholder would pay on Fund distributions or the redemption of Fund shares. |
| (b) | Commencement of operations was December 31, 2010. |
12
DAVENPORT CORE FUND
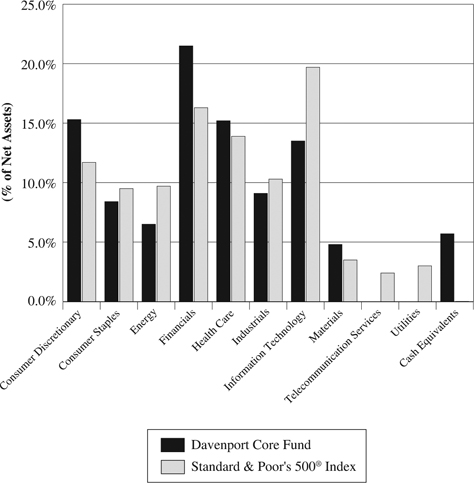
PORTFOLIO INFORMATION
September 30, 2014 (Unaudited)
PORTFOLIO INFORMATION
September 30, 2014 (Unaudited)
Sector Allocation vs. the Standard & Poor's 500® Index
Top Ten Equity Holdings
|
Security Description
|
% of Net Assets
|
|
Brookfield Asset Management, Inc. - Class A
|
3.2%
|
|
American Tower Corporation
|
2.9%
|
|
Capital One Financial Corporation
|
2.9%
|
|
Markel Corporation
|
2.8%
|
|
Berkshire Hathaway, Inc. - Class B
|
2.6%
|
|
Celgene Corporation
|
2.5%
|
|
CarMax, Inc.
|
2.5%
|
|
Danaher Corporation
|
2.4%
|
|
AmerisourceBergen Corporation
|
2.2%
|
|
Accenture plc - Class A
|
2.2%
|
13
DAVENPORT VALUE & INCOME FUND
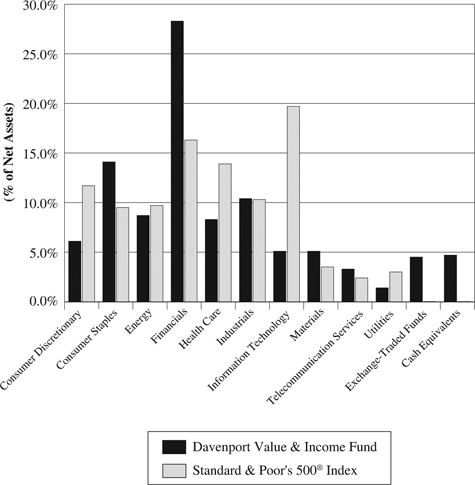
PORTFOLIO INFORMATION
September 30, 2014 (Unaudited)
PORTFOLIO INFORMATION
September 30, 2014 (Unaudited)
Sector Allocation vs. the Standard & Poor's 500® Index
Top Ten Equity Holdings
|
Security Description
|
% of Net Assets
|
|
W.P. Carey, Inc.
|
3.1%
|
|
Archer-Daniels-Midland Company
|
3.0%
|
|
Wells Fargo & Company
|
2.8%
|
|
Johnson & Johnson
|
2.8%
|
|
Markel Corporation
|
2.7%
|
|
Sun Communities, Inc.
|
2.5%
|
|
Capital One Financial Corporation
|
2.5%
|
|
Hartford Financial Services Group, Inc. (The)
|
2.4%
|
|
SPDR EURO STOXX 50 ETF
|
2.4%
|
|
Kinder Morgan, Inc.
|
2.4%
|
14
DAVENPORT EQUITY OPPORTUNITIES FUND
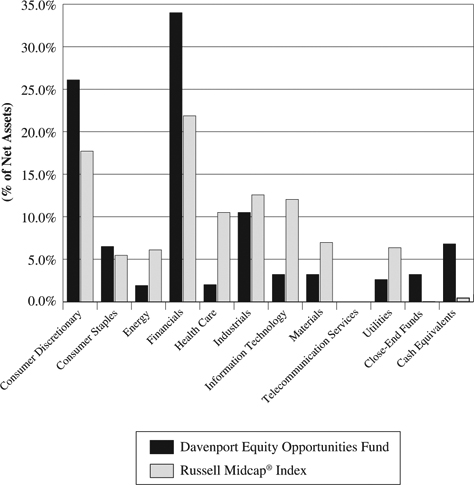
PORTFOLIO INFORMATION
September 30, 2014 (Unaudited)
PORTFOLIO INFORMATION
September 30, 2014 (Unaudited)
Sector Allocation vs. the Russell Midcap® Index
Top Ten Equity Holdings
|
Security Description
|
% of Net Assets
|
|
Penn National Gaming, Inc.
|
5.8%
|
|
Markel Corporation
|
5.6%
|
|
Brookfield Asset Management, Inc. - Class A
|
5.2%
|
|
CarMax, Inc.
|
4.9%
|
|
Gaming and Leisure Properties, Inc.
|
4.8%
|
|
American Tower Corporation
|
4.6%
|
|
Capital One Financial Corporation
|
4.4%
|
|
Cabela's, Inc.
|
3.8%
|
|
Colfax Corporation
|
3.4%
|
|
J.M. Smucker Company (The)
|
3.4%
|
15
DAVENPORT CORE FUND
SCHEDULE OF INVESTMENTS
September 30, 2014 (Unaudited)
SCHEDULE OF INVESTMENTS
September 30, 2014 (Unaudited)
|
COMMON STOCKS — 94.3%
|
Shares
|
Value
|
||||||
|
Consumer Discretionary — 15.3%
|
||||||||
|
Amazon.com, Inc. (a)
|
16,363
|
$
|
5,276,086
|
|||||
|
CarMax, Inc. (a)
|
162,807
|
7,562,385
|
||||||
|
DIRECTV (a)
|
60,515
|
5,235,758
|
||||||
|
Dish Network Corporation - Class A (a)
|
68,875
|
4,447,947
|
||||||
|
General Motors Company
|
136,775
|
4,368,594
|
||||||
|
Liberty Media Corporation - Series A (a)
|
42,337
|
1,997,460
|
||||||
|
Liberty Media Corporation - Series C (a)
|
84,674
|
3,978,831
|
||||||
|
PVH Corporation
|
37,972
|
4,600,308
|
||||||
|
Starbucks Corporation
|
49,290
|
3,719,423
|
||||||
|
Walt Disney Company (The)
|
50,256
|
4,474,292
|
||||||
|
45,661,084
|
||||||||
|
Consumer Staples — 8.4%
|
||||||||
|
Anheuser-Busch InBev SA/NV - ADR
|
37,495
|
4,156,321
|
||||||
|
Flowers Foods, Inc.
|
60,699
|
1,114,433
|
||||||
|
Hershey Company (The)
|
48,065
|
4,586,843
|
||||||
|
J.M. Smucker Company (The)
|
53,077
|
5,254,092
|
||||||
|
Nestlé SA - ADR
|
67,827
|
4,994,102
|
||||||
|
PepsiCo, Inc.
|
51,241
|
4,770,025
|
||||||
|
24,875,816
|
||||||||
|
Energy — 6.5%
|
||||||||
|
Chevron Corporation
|
39,402
|
4,701,447
|
||||||
|
Exxon Mobil Corporation
|
59,502
|
5,596,163
|
||||||
|
Range Resources Corporation
|
68,802
|
4,665,463
|
||||||
|
Schlumberger Ltd.
|
42,920
|
4,364,535
|
||||||
|
19,327,608
|
||||||||
|
Financials — 21.5%
|
||||||||
|
American Tower Corporation
|
90,837
|
8,505,068
|
||||||
|
Berkshire Hathaway, Inc. - Class B (a)
|
56,886
|
7,858,232
|
||||||
|
Brookfield Asset Management, Inc. - Class A
|
210,488
|
9,463,540
|
||||||
|
Capital One Financial Corporation
|
104,087
|
8,495,581
|
||||||
|
Citigroup, Inc.
|
89,812
|
4,654,058
|
||||||
|
CME Group, Inc.
|
79,336
|
6,343,310
|
||||||
|
JPMorgan Chase & Company
|
75,323
|
4,537,458
|
||||||
|
Markel Corporation (a)
|
13,013
|
8,278,220
|
||||||
|
Wells Fargo & Company
|
112,316
|
5,825,831
|
||||||
|
63,961,298
|
||||||||
|
Health Care — 15.2%
|
||||||||
|
AmerisourceBergen Corporation
|
85,985
|
6,646,641
|
||||||
|
Amgen, Inc.
|
35,975
|
5,053,049
|
||||||
|
Baxter International, Inc.
|
73,108
|
5,246,961
|
||||||
|
Celgene Corporation (a)
|
80,000
|
7,582,400
|
||||||
|
Express Scripts Holding Company (a)
|
81,126
|
5,729,929
|
||||||
|
Johnson & Johnson
|
54,138
|
5,770,569
|
||||||
16
DAVENPORT CORE FUND
SCHEDULE OF INVESTMENTS (Continued)
SCHEDULE OF INVESTMENTS (Continued)
|
COMMON STOCKS — 94.3% (Continued)
|
Shares
|
Value
|
||||||
|
Health Care — 15.2% (Continued)
|
||||||||
|
Valeant Pharmaceuticals International, Inc. (a)
|
32,823
|
$
|
4,306,378
|
|||||
|
WellPoint, Inc.
|
40,341
|
4,825,590
|
||||||
|
45,161,517
|
||||||||
|
Industrials — 9.1%
|
||||||||
|
American Airlines Group, Inc.
|
103,060
|
3,656,569
|
||||||
|
Cummins, Inc.
|
26,524
|
3,500,638
|
||||||
|
Danaher Corporation
|
92,577
|
7,034,000
|
||||||
|
General Electric Company
|
144,275
|
3,696,325
|
||||||
|
Parker Hannifin Corporation
|
37,945
|
4,331,422
|
||||||
|
United Technologies Corporation
|
45,484
|
4,803,110
|
||||||
|
27,022,064
|
||||||||
|
Information Technology — 13.5%
|
||||||||
|
Accenture plc - Class A
|
80,761
|
6,567,485
|
||||||
|
Activision Blizzard, Inc.
|
203,288
|
4,226,357
|
||||||
|
Apple, Inc.
|
51,590
|
5,197,692
|
||||||
|
Automatic Data Processing, Inc.
|
53,420
|
4,438,134
|
||||||
|
Cisco Systems, Inc.
|
173,988
|
4,379,278
|
||||||
|
Google, Inc. - Class A (a)
|
6,370
|
3,748,172
|
||||||
|
Google, Inc. - Class C (a)
|
6,370
|
3,677,783
|
||||||
|
QUALCOMM, Inc.
|
52,860
|
3,952,342
|
||||||
|
Visa, Inc. - Class A
|
19,269
|
4,111,427
|
||||||
|
40,298,670
|
||||||||
|
Materials — 4.8%
|
||||||||
|
Alcoa, Inc.
|
344,698
|
5,546,191
|
||||||
|
Monsanto Company
|
34,491
|
3,880,582
|
||||||
|
Praxair, Inc.
|
38,078
|
4,912,062
|
||||||
|
14,338,835
|
||||||||
|
Total Common Stocks (Cost $199,867,149)
|
$
|
280,646,892
|
||||||
17
DAVENPORT CORE FUND
SCHEDULE OF INVESTMENTS (Continued)
SCHEDULE OF INVESTMENTS (Continued)
|
MONEY MARKET FUNDS — 1.9%
|
Shares
|
Value
|
||||||
|
First American Treasury Obligations Fund - Class Z, 0.00% (b) (Cost $5,771,006)
|
5,771,006
|
$
|
5,771,006
|
|||||
|
Total Investments at Value — 96.2% (Cost $205,638,155)
|
$
|
286,417,898
|
||||||
|
Other Assets in Excess of Liabilities — 3.8%
|
11,220,535
|
|||||||
|
Net Assets — 100.0%
|
$
|
297,638,433
|
||||||
ADR - American Depositary Receipt.
| (a) | Non-income producing security. |
| (b) | The rate shown is the 7-day effective yield as of September 30, 2014. |
See accompanying notes to financial statements.
18
DAVENPORT VALUE & INCOME FUND
SCHEDULE OF INVESTMENTS
September 30, 2014 (Unaudited)
SCHEDULE OF INVESTMENTS
September 30, 2014 (Unaudited)
|
COMMON STOCKS — 90.8%
|
Shares
|
Value
|
||||||
|
Consumer Discretionary — 6.1%
|
||||||||
|
H&R Block, Inc.
|
162,955
|
$
|
5,053,235
|
|||||
|
Lamar Advertising Company - Class A
|
98,770
|
4,864,422
|
||||||
|
McDonald's Corporation
|
56,295
|
5,337,329
|
||||||
|
Penn National Gaming, Inc. (a)
|
105,725
|
1,185,177
|
||||||
|
Six Flags Entertainment Corporation
|
127,450
|
4,383,006
|
||||||
|
20,823,169
|
||||||||
|
Consumer Staples — 14.1%
|
||||||||
|
Altria Group, Inc.
|
112,181
|
5,153,595
|
||||||
|
Anheuser-Busch InBev SA/NV - ADR
|
51,995
|
5,763,646
|
||||||
|
Archer-Daniels-Midland Company
|
202,055
|
10,325,010
|
||||||
|
Coca-Cola Company (The)
|
134,650
|
5,744,169
|
||||||
|
Diageo plc - ADR
|
33,035
|
3,812,239
|
||||||
|
PepsiCo, Inc.
|
70,810
|
6,591,703
|
||||||
|
Philip Morris International, Inc.
|
55,885
|
4,660,809
|
||||||
|
Wal-Mart Stores, Inc.
|
76,732
|
5,867,696
|
||||||
|
47,918,867
|
||||||||
|
Energy — 8.7%
|
||||||||
|
Chevron Corporation
|
50,211
|
5,991,177
|
||||||
|
Exxon Mobil Corporation
|
63,430
|
5,965,591
|
||||||
|
Kinder Morgan, Inc.
|
212,860
|
8,161,052
|
||||||
|
Marathon Petroleum Corporation
|
57,550
|
4,872,759
|
||||||
|
Occidental Petroleum Corporation
|
46,640
|
4,484,436
|
||||||
|
29,475,015
|
||||||||
|
Financials — 28.3%
|
||||||||
|
Aflac, Inc.
|
106,095
|
6,180,034
|
||||||
|
Capital One Financial Corporation
|
102,445
|
8,361,561
|
||||||
|
Citigroup, Inc.
|
138,705
|
7,187,693
|
||||||
|
Equity Lifestyle Properties, Inc.
|
171,555
|
7,267,070
|
||||||
|
FNF Group
|
207,405
|
5,753,415
|
||||||
|
Gaming and Leisure Properties, Inc.
|
141,119
|
4,360,577
|
||||||
|
Hartford Financial Services Group, Inc. (The)
|
223,875
|
8,339,344
|
||||||
|
JPMorgan Chase & Company
|
109,505
|
6,596,581
|
||||||
|
Markel Corporation (a)
|
14,356
|
9,132,569
|
||||||
|
Sun Communities, Inc.
|
169,203
|
8,544,751
|
||||||
|
W.P. Carey, Inc.
|
163,279
|
10,412,302
|
||||||
|
Waddell & Reed Financial, Inc. - Class A
|
94,125
|
4,865,321
|
||||||
|
Wells Fargo & Company
|
184,450
|
9,567,422
|
||||||
|
96,568,640
|
||||||||
|
Health Care — 8.3%
|
||||||||
|
Johnson & Johnson
|
89,630
|
9,553,662
|
||||||
|
Merck & Company, Inc.
|
100,985
|
5,986,391
|
||||||
|
Teva Pharmaceutical Industries Ltd. - ADR
|
134,810
|
7,246,037
|
||||||
19
DAVENPORT VALUE & INCOME FUND
SCHEDULE OF INVESTMENTS (Continued)
SCHEDULE OF INVESTMENTS (Continued)
|
COMMON STOCKS — 90.8%(Continued)
|
Shares
|
Value
|
||||||
|
Health Care — 8.3% (Continued)
|
||||||||
|
WellPoint, Inc.
|
47,150
|
$
|
5,640,083
|
|||||
|
28,426,173
|
||||||||
|
Industrials — 10.4%
|
||||||||
|
3M Company
|
44,610
|
6,320,345
|
||||||
|
Eaton Corporation plc
|
92,227
|
5,844,425
|
||||||
|
General Electric Company
|
315,695
|
8,088,106
|
||||||
|
Illinois Tool Works, Inc.
|
59,535
|
5,025,944
|
||||||
|
Raytheon Company
|
51,586
|
5,242,169
|
||||||
|
Watsco, Inc.
|
58,565
|
5,047,132
|
||||||
|
35,568,121
|
||||||||
|
Information Technology — 5.1%
|
||||||||
|
Automatic Data Processing, Inc.
|
82,980
|
6,893,978
|
||||||
|
Cisco Systems, Inc.
|
204,325
|
5,142,860
|
||||||
|
Hewlett-Packard Company
|
151,195
|
5,362,887
|
||||||
|
17,399,725
|
||||||||
|
Materials — 5.1%
|
||||||||
|
E.I. du Pont de Nemours and Company
|
80,790
|
5,797,491
|
||||||
|
Eastman Chemical Company
|
76,800
|
6,212,352
|
||||||
|
Nucor Corporation
|
98,230
|
5,331,924
|
||||||
|
17,341,767
|
||||||||
|
Telecommunication Services — 3.3%
|
||||||||
|
TELUS Corporation
|
131,970
|
4,510,735
|
||||||
|
Verizon Communications, Inc.
|
134,080
|
6,702,659
|
||||||
|
11,213,394
|
||||||||
|
Utilities — 1.4%
|
||||||||
|
Dominion Resources, Inc.
|
67,245
|
4,645,957
|
||||||
|
Total Common Stocks (Cost $258,845,348)
|
$
|
309,380,828
|
||||||
|
EXCHANGE-TRADED FUNDS — 4.5%
|
Shares
|
Value
|
||||||
|
db X-trackers Harvest CSI 300 China A-Shares ETF (a)
|
270,920
|
$
|
6,981,609
|
|||||
|
SPDR EURO STOXX 50 ETF
|
209,270
|
8,308,019
|
||||||
|
Total Exchange-Traded Funds (Cost $13,526,593)
|
$
|
15,289,628
|
||||||
20
DAVENPORT VALUE & INCOME FUND
SCHEDULE OF INVESTMENTS (Continued)
SCHEDULE OF INVESTMENTS (Continued)
|
MONEY MARKET FUNDS — 2.9%
|
Shares
|
Value
|
||||||
|
First American Treasury Obligations Fund - Class Z, 0.00% (b) (Cost $9,987,192)
|
9,987,192
|
$
|
9,987,192
|
|||||
|
Total Investments at Value — 98.2% (Cost $282,359,133)
|
$
|
334,657,648
|
||||||
|
Other Assets in Excess of Liabilities — 1.8%
|
6,181,725
|
|||||||
|
Net Assets — 100.0%
|
$
|
340,839,373
|
||||||
ADR - American Depositary Receipt.
| (a) | Non-income producing security. |
| (b) | The rate shown is the 7-day effective yield as of September 30, 2014. |
See accompanying notes to financial statements.
21
DAVENPORT EQUITY OPPORTUNITIES FUND
SCHEDULE OF INVESTMENTS
September 30, 2014 (Unaudited)
SCHEDULE OF INVESTMENTS
September 30, 2014 (Unaudited)
|
COMMON STOCKS — 90.0%
|
Shares
|
Value
|
||||||
|
Consumer Discretionary — 26.1%
|
||||||||
|
Amazon.com, Inc. (a)
|
17,825
|
$
|
5,747,493
|
|||||
|
Cabela's, Inc. (a)
|
126,620
|
7,457,918
|
||||||
|
CarMax, Inc. (a)
|
207,870
|
9,655,561
|
||||||
|
Discovery Communications, Inc. - Class A (a)
|
84,070
|
3,177,846
|
||||||
|
Discovery Communications, Inc. - Class C (a)
|
84,070
|
3,134,130
|
||||||
|
Hanesbrands, Inc.
|
52,270
|
5,615,889
|
||||||
|
Krispy Kreme Doughnuts, Inc. (a)
|
319,475
|
5,482,191
|
||||||
|
Penn National Gaming, Inc. (a)
|
1,031,809
|
11,566,579
|
||||||
|
51,837,607
|
||||||||
|
Consumer Staples — 6.5%
|
||||||||
|
Church & Dwight Company, Inc.
|
87,965
|
6,171,624
|
||||||
|
J.M. Smucker Company (The)
|
67,190
|
6,651,138
|
||||||
|
12,822,762
|
||||||||
|
Energy — 1.9%
|
||||||||
|
Ultra Petroleum Corporation (a)
|
160,339
|
3,729,485
|
||||||
|
Financials — 34.0%
|
||||||||
|
American Tower Corporation
|
98,350
|
9,208,510
|
||||||
|
Brookfield Asset Management, Inc. - Class A
|
228,190
|
10,259,422
|
||||||
|
Capital One Financial Corporation
|
107,046
|
8,737,095
|
||||||
|
Fairfax Financial Holdings Ltd.
|
8,618
|
3,845,429
|
||||||
|
FNF Group
|
116,665
|
3,236,287
|
||||||
|
Gaming and Leisure Properties, Inc.
|
307,004
|
9,486,424
|
||||||
|
Markel Corporation (a)
|
17,595
|
11,193,059
|
||||||
|
Portfolio Recovery Associates, Inc. (a)
|
93,855
|
4,902,047
|
||||||
|
Sun Communities, Inc.
|
130,642
|
6,597,421
|
||||||
|
67,465,694
|
||||||||
|
Health Care — 2.0%
|
||||||||
|
Henry Schein, Inc. (a)
|
34,965
|
4,072,374
|
||||||
|
Industrials — 10.5%
|
||||||||
|
American Airlines Group, Inc.
|
162,995
|
5,783,063
|
||||||
|
Colfax Corporation (a)
|
119,195
|
6,790,539
|
||||||
|
Pall Corporation
|
62,295
|
5,214,091
|
||||||
|
Watsco, Inc.
|
35,045
|
3,020,178
|
||||||
|
20,807,871
|
||||||||
|
Information Technology — 3.2%
|
||||||||
|
Intuit, Inc.
|
72,870
|
6,387,056
|
||||||
|
Materials — 3.2%
|
||||||||
|
Alcoa, Inc.
|
396,080
|
6,372,927
|
||||||
22
DAVENPORT EQUITY OPPORTUNITIES FUND
SCHEDULE OF INVESTMENTS (Continued)
SCHEDULE OF INVESTMENTS (Continued)
|
COMMON STOCKS — 90.0% (Continued)
|
Shares
|
Value
|
||||||
|
Utilities — 2.6%
|
||||||||
|
NRG Energy, Inc.
|
169,825
|
$
|
5,176,266
|
|||||
|
Total Common Stocks (Cost $159,296,809)
|
$
|
178,672,042
|
||||||
|
CLOSED-END FUNDS — 3.2%
|
Shares
|
Value
|
||||||
|
Morgan Stanley China A Share Fund, Inc. (Cost $6,200,802)
|
264,855
|
$
|
6,435,976
|
|||||
|
MONEY MARKET FUNDS — 2.9%
|
Shares
|
Value
|
||||||
|
First American Treasury Obligations Fund - Class Z, 0.00% (b) (Cost $5,691,794)
|
5,691,794
|
$
|
5,691,794
|
|||||
|
Total Investments at Value — 96.1% (Cost $171,189,405)
|
$
|
190,799,812
|
||||||
|
Other Assets in Excess of Liabilities — 3.9%
|
7,666,335
|
|||||||
|
Net Assets — 100.0%
|
$
|
198,466,147
|
||||||
| (a) | Non-income producing security. |
| (b) | The rate shown is the 7-day effective yield as of September 30, 2014. |
See accompanying notes to financial statements.
23
THE DAVENPORT FUNDS
STATEMENTS OF ASSETS AND LIABILITIES
September 30, 2014 (Unaudited)
STATEMENTS OF ASSETS AND LIABILITIES
September 30, 2014 (Unaudited)
|
Davenport
Core Fund |
Davenport
Value &
Income
Fund |
Davenport Equity Opportunities Fund
|
||||||||||
|
ASSETS
|
||||||||||||
|
Investments in securities:
|
||||||||||||
|
At acquisition cost
|
$
|
205,638,155
|
$
|
282,359,133
|
$
|
171,189,405
|
||||||
|
At market value (Note 2)
|
$
|
286,417,898
|
$
|
334,657,648
|
$
|
190,799,812
|
||||||
|
Cash
|
7,999,487
|
4,969,476
|
6,964,398
|
|||||||||
|
Dividends receivable
|
170,489
|
1,044,405
|
323,814
|
|||||||||
|
Receivable for securities sold
|
3,274,931
|
—
|
—
|
|||||||||
|
Receivable for capital shares sold
|
160,724
|
660,152
|
766,753
|
|||||||||
|
Other assets
|
29,549
|
31,110
|
24,198
|
|||||||||
|
TOTAL ASSETS
|
298,053,078
|
341,362,791
|
198,878,975
|
|||||||||
|
LIABILITIES
|
||||||||||||
|
Payable for capital shares redeemed
|
169,510
|
258,887
|
250,698
|
|||||||||
|
Accrued investment advisory fees (Note 4)
|
208,457
|
218,391
|
135,658
|
|||||||||
|
Payable to administrator (Note 4)
|
32,550
|
35,950
|
24,050
|
|||||||||
|
Other accrued expenses and liabilities
|
4,128
|
10,190
|
2,422
|
|||||||||
|
TOTAL LIABILITIES
|
414,645
|
523,418
|
412,828
|
|||||||||
|
NET ASSETS
|
$
|
297,638,433
|
$
|
340,839,373
|
$
|
198,466,147
|
||||||
|
Net assets consist of:
|
||||||||||||
|
Paid-in capital
|
$
|
208,513,833
|
$
|
282,302,656
|
$
|
169,590,338
|
||||||
|
Accumulated net investment income
|
31,709
|
321,083
|
405,018
|
|||||||||
|
Accumulated net realized gains from security transactions
|
8,313,148
|
5,917,119
|
8,860,384
|
|||||||||
|
Net unrealized appreciation on investments
|
80,779,743
|
52,298,515
|
19,610,407
|
|||||||||
|
Net assets
|
$
|
297,638,433
|
$
|
340,839,373
|
$
|
198,466,147
|
||||||
|
Shares of beneficial interest outstanding
(unlimited number of shares authorized, $0.01 par value) |
15,714,744
|
23,232,888
|
13,210,603
|
|||||||||
|
Net asset value, offering price and redemption price per share (Note 2)
|
$
|
18.94
|
$
|
14.67
|
$
|
15.02
|
||||||
See accompanying notes to financial statements.
24
THE DAVENPORT FUNDS
STATEMENTS OF OPERATIONS
Six Months Ended September 30, 2014 (Unaudited)
STATEMENTS OF OPERATIONS
Six Months Ended September 30, 2014 (Unaudited)
|
Davenport
Core Fund |
Davenport
Value &
Income
Fund |
Davenport Equity Opportunities Fund
|
||||||||||
|
INVESTMENT INCOME
|
||||||||||||
|
Dividends
|
$
|
2,233,917
|
$
|
4,644,635
|
$
|
1,340,264
|
||||||
|
Foreign withholding taxes on dividends
|
(76,985
|
)
|
(49,655
|
)
|
(10,656
|
)
|
||||||
|
TOTAL INVESTMENT INCOME
|
2,156,932
|
4,594,980
|
1,329,608
|
|||||||||
|
EXPENSES
|
||||||||||||
|
Investment advisory fees (Note 4)
|
1,107,239
|
1,228,767
|
713,820
|
|||||||||
|
Administration fees (Note 4)
|
180,689
|
197,112
|
128,904
|
|||||||||
|
Registration and filing fees
|
17,847
|
23,286
|
20,351
|
|||||||||
|
Postage and supplies
|
15,276
|
15,781
|
17,151
|
|||||||||
|
Professional fees
|
15,440
|
15,682
|
11,953
|
|||||||||
|
Compliance service fees (Note 4)
|
14,190
|
15,442
|
10,292
|
|||||||||
|
Custodian and bank service fees
|
11,452
|
14,158
|
8,338
|
|||||||||
|
Printing of shareholder reports
|
6,078
|
6,468
|
5,428
|
|||||||||
|
Insurance expense
|
5,701
|
6,111
|
3,664
|
|||||||||
|
Trustees' fees and expenses (Note 4)
|
3,242
|
3,242
|
3,242
|
|||||||||
|
Other expenses
|
1,211
|
1,320
|
1,079
|
|||||||||
|
TOTAL EXPENSES
|
1,378,365
|
1,527,369
|
924,222
|
|||||||||
|
NET INVESTMENT INCOME
|
778,567
|
3,067,611
|
405,386
|
|||||||||
|
REALIZED AND UNREALIZED GAINS (LOSSES) ON INVESTMENTS
|
||||||||||||
|
Net realized gains from security transactions
|
8,334,164
|
5,918,906
|
8,860,961
|
|||||||||
|
Net change in unrealized appreciation/depreciation on investments
|
365,693
|
1,101,725
|
(8,610,428
|
)
|
||||||||
|
NET REALIZED AND UNREALIZED GAINS ON INVESTMENTS
|
8,699,857
|
7,020,631
|
250,533
|
|||||||||
|
NET INCREASE IN NET ASSETS FROM OPERATIONS
|
$
|
9,478,424
|
$
|
10,088,242
|
$
|
655,919
|
||||||
See accompanying notes to financial statements.
25
DAVENPORT CORE FUND
STATEMENTS OF CHANGES IN NET ASSETS
STATEMENTS OF CHANGES IN NET ASSETS
|
Six Months Ended September 30,
2014 (Unaudited)
|
Year
Ended March 31, 2014 |
|||||||
|
FROM OPERATIONS
|
||||||||
|
Net investment income
|
$
|
778,567
|
$
|
1,587,651
|
||||
|
Net realized gains from security transactions
|
8,334,164
|
24,247,628
|
||||||
|
Net change in unrealized appreciation/depreciation on investments
|
365,693
|
21,071,593
|
||||||
|
Net increase in net assets from operations
|
9,478,424
|
46,906,872
|
||||||
|
DISTRIBUTIONS TO SHAREHOLDERS
|
||||||||
|
From net investment income
|
(773,860
|
)
|
(1,572,542
|
)
|
||||
|
From net realized gains from security transactions
|
(14,094,415
|
)
|
(11,297,772
|
)
|
||||
|
Decrease in net assets from distributions to shareholders
|
(14,868,275
|
)
|
(12,870,314
|
)
|
||||
|
FROM CAPITAL SHARE TRANSACTIONS
|
||||||||
|
Proceeds from shares sold
|
19,560,680
|
44,315,591
|
||||||
|
Net asset value of shares issued in reinvestment of distributions to shareholders
|
14,382,586
|
12,476,055
|
||||||
|
Payments for shares redeemed
|
(12,146,200
|
)
|
(20,495,991
|
)
|
||||
|
Net increase in net assets from capital share transactions
|
21,797,066
|
36,295,655
|
||||||
|
TOTAL INCREASE IN NET ASSETS
|
16,407,215
|
70,332,213
|
||||||
|
NET ASSETS
|
||||||||
|
Beginning of period
|
281,231,218
|
210,899,005
|
||||||
|
End of period
|
$
|
297,638,433
|
$
|
281,231,218
|
||||
|
ACCUMULATED NET INVESTMENT INCOME
|
$
|
31,709
|
$
|
27,002
|
||||
|
CAPITAL SHARE ACTIVITY
|
||||||||
|
Shares sold
|
1,010,339
|
2,414,969
|
||||||
|
Shares reinvested
|
762,394
|
681,244
|
||||||
|
Shares redeemed
|
(631,487
|
)
|
(1,117,243
|
)
|
||||
|
Net increase in shares outstanding
|
1,141,246
|
1,978,970
|
||||||
|
Shares outstanding at beginning of period
|
14,573,498
|
12,594,528
|
||||||
|
Shares outstanding at end of period
|
15,714,744
|
14,573,498
|
||||||
See accompanying notes to financial statements.
26
DAVENPORT VALUE & INCOME FUND
STATEMENTS OF CHANGES IN NET ASSETS
STATEMENTS OF CHANGES IN NET ASSETS
|
Six Months Ended September 30,
2014 (Unaudited)
|
Year
Ended March 31, 2014 |
|||||||
|
FROM OPERATIONS
|
||||||||
|
Net investment income
|
$
|
3,067,611
|
$
|
5,531,182
|
||||
|
Net realized gains from security transactions
|
5,918,906
|
14,211,440
|
||||||
|
Net change in unrealized appreciation/depreciation on investments
|
1,101,725
|
22,127,758
|
||||||
|
Net increase in net assets from operations
|
10,088,242
|
41,870,380
|
||||||
|
DISTRIBUTIONS TO SHAREHOLDERS
|
||||||||
|
From net investment income
|
(3,003,238
|
)
|
(5,277,593
|
)
|
||||
|
From net realized gains from security transactions
|
(8,286,615
|
)
|
(9,157,892
|
)
|
||||
|
Decrease in net assets from distributions to shareholders
|
(11,289,853
|
)
|
(14,435,485
|
)
|
||||
|
FROM CAPITAL SHARE TRANSACTIONS
|
||||||||
|
Proceeds from shares sold
|
39,437,719
|
87,997,225
|
||||||
|
Net asset value of shares issued in reinvestment of distributions to shareholders
|
10,387,750
|
13,263,859
|
||||||
|
Payments for shares redeemed
|
(12,072,093
|
)
|
(21,298,242
|
)
|
||||
|
Net increase in net assets from capital share transactions
|
37,753,376
|
79,962,842
|
||||||
|
TOTAL INCREASE IN NET ASSETS
|
36,551,765
|
107,397,737
|
||||||
|
NET ASSETS
|
||||||||
|
Beginning of period
|
304,287,608
|
196,889,871
|
||||||
|
End of period
|
$
|
340,839,373
|
$
|
304,287,608
|
||||
|
ACCUMULATED NET INVESTMENT INCOME
|
$
|
321,083
|
$
|
256,710
|
||||
|
CAPITAL SHARE ACTIVITY
|
||||||||
|
Shares sold
|
2,654,970
|
6,314,504
|
||||||
|
Shares reinvested
|
703,022
|
959,324
|
||||||
|
Shares redeemed
|
(813,284
|
)
|
(1,522,285
|
)
|
||||
|
Net increase in shares outstanding
|
2,544,708
|
5,751,543
|
||||||
|
Shares outstanding at beginning of period
|
20,688,180
|
14,936,637
|
||||||
|
Shares outstanding at end of period
|
23,232,888
|
20,688,180
|
||||||
See accompanying notes to financial statements.
27
DAVENPORT EQUITY OPPORTUNITIES FUND
STATEMENTS OF CHANGES IN NET ASSETS
STATEMENTS OF CHANGES IN NET ASSETS
|
Six Months Ended September 30,
2014 (Unaudited)
|
Year
Ended March 31, 2014 |
|||||||
|
FROM OPERATIONS
|
||||||||
|
Net investment income
|
$
|
405,386
|
$
|
2,650,696
|
||||
|
Net realized gains from security transactions
|
8,860,961
|
14,022,701
|
||||||
|
Net change in unrealized appreciation/depreciation on investments
|
(8,610,428
|
)
|
10,046,548
|
|||||
|
Net increase in net assets from operations
|
655,919
|
26,719,945
|
||||||
|
DISTRIBUTIONS TO SHAREHOLDERS
|
||||||||
|
From net investment income
|
(2,452,135
|
)
|
(224,384
|
)
|
||||
|
From net realized gains from security transactions
|
(8,921,254
|
)
|
(7,464,989
|
)
|
||||
|
Decrease in net assets from distributions to shareholders
|
(11,373,389
|
)
|
(7,689,373
|
)
|
||||
|
FROM CAPITAL SHARE TRANSACTIONS
|
||||||||
|
Proceeds from shares sold
|
32,260,703
|
54,980,702
|
||||||
|
Net asset value of shares issued in reinvestment of distributions to shareholders
|
10,969,996
|
7,445,644
|
||||||
|
Payments for shares redeemed
|
(8,536,141
|
)
|
(9,646,854
|
)
|
||||
|
Net increase in net assets from capital share transactions
|
34,694,558
|
52,779,492
|
||||||
|
TOTAL INCREASE IN NET ASSETS
|
23,977,088
|
71,810,064
|
||||||
|
NET ASSETS
|
||||||||
|
Beginning of period
|
174,489,059
|
102,678,995
|
||||||
|
End of period
|
$
|
198,466,147
|
$
|
174,489,059
|
||||
|
ACCUMULATED NET INVESTMENT INCOME
|
$
|
405,018
|
$
|
2,451,767
|
||||
|
CAPITAL SHARE ACTIVITY
|
||||||||
|
Shares sold
|
2,065,031
|
3,699,725
|
||||||
|
Shares reinvested
|
719,344
|
510,464
|
||||||
|
Shares redeemed
|
(541,677
|
)
|
(651,385
|
)
|
||||
|
Net increase in shares outstanding
|
2,242,698
|
3,558,804
|
||||||
|
Shares outstanding at beginning of period
|
10,967,905
|
7,409,101
|
||||||
|
Shares outstanding at end of period
|
13,210,603
|
10,967,905
|
||||||
See accompanying notes to financial statements.
28
DAVENPORT CORE FUND
FINANCIAL HIGHLIGHTS
FINANCIAL HIGHLIGHTS
Selected Per Share Data and Ratios for a Share Outstanding Throughout Each Period
|
Six Months Ended
Sept. 30, 2014 |
Years Ended March 31,
|
|||||||||||||||||||||||
|
(Unaudited)
|
2014
|
2013
|
2012
|
2011
|
2010
|
|||||||||||||||||||
|
Net asset value at beginning of period
|
$
|
19.30
|
$
|
16.75
|
$
|
15.00
|
$
|
13.73
|
$
|
12.05
|
$
|
8.36
|
||||||||||||
|
Income from investment operations:
|
||||||||||||||||||||||||
|
Net investment income
|
0.05
|
0.12
|
0.11
|
0.09
|
0.07
|
0.08
|
||||||||||||||||||
|
Net realized and unrealized gains on investments
|
0.58
|
3.39
|
1.75
|
1.27
|
1.68
|
3.69
|
||||||||||||||||||
|
Total from investment operations
|
0.63
|
3.51
|
1.86
|
1.36
|
1.75
|
3.77
|
||||||||||||||||||
|
Less distributions:
|
||||||||||||||||||||||||
|
Dividends from net investment income
|
(0.05
|
)
|
(0.12
|
)
|
(0.11
|
)
|
(0.09
|
)
|
(0.07
|
)
|
(0.08
|
)
|
||||||||||||
|
Distributions from net realized gains
|
(0.94
|
)
|
(0.84
|
)
|
—
|
—
|
—
|
—
|
||||||||||||||||
|
Total distributions
|
(0.99
|
)
|
(0.96
|
)
|
(0.11
|
)
|
(0.09
|
)
|
(0.07
|
)
|
(0.08
|
)
|
||||||||||||
|
Net asset value at end of period
|
$
|
18.94
|
$
|
19.30
|
$
|
16.75
|
$
|
15.00
|
$
|
13.73
|
$
|
12.05
|
||||||||||||
|
Total return (a)
|
3.31
|
%(b)
|
21.32
|
%
|
12.47
|
%
|
9.99
|
%
|
14.61
|
%
|
45.20
|
%
|
||||||||||||
|
Net assets at end of period (000's)
|
$
|
297,638
|
$
|
281,231
|
$
|
210,899
|
$
|
174,898
|
$
|
159,894
|
$
|
132,662
|
||||||||||||
|
Ratio of total expenses to average net assets
|
0.93
|
%(c)
|
0.94
|
%
|
0.95
|
%
|
0.96
|
%
|
0.99
|
%
|
1.00
|
%
|
||||||||||||
|
Ratio of net investment income to average net assets
|
0.53
|
%(c)
|
0.64
|
%
|
0.71
|
%
|
0.66
|
%
|
0.58
|
%
|
0.75
|
%
|
||||||||||||
|
Portfolio turnover rate
|
16
|
%(b)
|
29
|
%
|
26
|
%
|
19
|
%
|
34
|
%
|
25
|
%
|
||||||||||||
| (a) | Total return is a measure of the change in value of an investment in the Fund over the period covered, which assumes any dividends or capital gains distributions are reinvested in shares of the Fund. Returns shown do not reflect the deduction of taxes a shareholder would pay on Fund distributions or the redemption of Fund shares. |
| (b) | Not annualized. |
| (c) | Annualized. |
See accompanying notes to financial statements.
29
DAVENPORT VALUE & INCOME FUND
FINANCIAL HIGHLIGHTS
FINANCIAL HIGHLIGHTS
Selected Per Share Data and Ratios for a Share Outstanding Throughout Each Period
|
Six Months Ended
Sept. 30, 2014 (Unaudited) |
Year
Ended March 31, 2014 |
Year
Ended March 31, 2013 |
Year
Ended March 31, 2012 |
Period
Ended March 31, 2011 (a) |
||||||||||||||||
|
Net asset value at beginning of period
|
$
|
14.71
|
$
|
13.18
|
$
|
11.51
|
$
|
10.50
|
$
|
10.00
|
||||||||||
|
Income from investment operations:
|
||||||||||||||||||||
|
Net investment income
|
0.14
|
0.30
|
0.28
|
0.23
|
0.04
|
|||||||||||||||
|
Net realized and unrealized gains on investments
|
0.35
|
2.04
|
1.81
|
1.02
|
0.49
|
|||||||||||||||
|
Total from investment operations
|
0.49
|
2.34
|
2.09
|
1.25
|
0.53
|
|||||||||||||||
|
Less distributions:
|
||||||||||||||||||||
|
Dividends from net investment income
|
(0.14
|
)
|
(0.29
|
)
|
(0.27
|
)
|
(0.23
|
)
|
(0.03
|
)
|
||||||||||
|
Distributions from net realized gains
|
(0.39
|
)
|
(0.52
|
)
|
(0.15
|
)
|
(0.01
|
)
|
—
|
|||||||||||
|
Total distributions
|
(0.53
|
)
|
(0.81
|
)
|
(0.42
|
)
|
(0.24
|
)
|
(0.03
|
)
|
||||||||||
|
Net asset value at end of period
|
$
|
14.67
|
$
|
14.71
|
$
|
13.18
|
$
|
11.51
|
$
|
10.50
|
||||||||||
|
Total return (b)
|
3.25
|
%(c)
|
18.25
|
%
|
18.69
|
%
|
12.23
|
%
|
5.35
|
%(c)
|
||||||||||
|
Net assets at end of period (000's)
|
$
|
340,839
|
$
|
304,288
|
$
|
196,890
|
$
|
98,757
|
$
|
48,831
|
||||||||||
|
Ratio of total expenses to average net assets
|
0.93
|
%(d)
|
0.94
|
%
|
0.96
|
%
|
1.04
|
%
|
1.25
|
%(d)
|
||||||||||
|
Ratio of net investment income to average net assets
|
1.85
|
%(d)
|
2.22
|
%
|
2.37
|
%
|
2.30
|
%
|
1.99
|
%(d)
|
||||||||||
|
Portfolio turnover rate
|
11
|
%(c)
|
32
|
%
|
29
|
%
|
27
|
%
|
10
|
%(c)
|
||||||||||
| (a) | Represents the period from commencement of operations (December 31, 2010) through March 31, 2011. |
| (b) | Total return is a measure of the change in value of an investment in the Fund over the period covered, which assumes any dividends or capital gains distributions are reinvested in shares of the Fund. Returns shown do not reflect the deduction of taxes a shareholder would pay on Fund distributions or the redemption of Fund shares. |
| (c) | Not annualized. |
| (d) | Annualized. |
See accompanying notes to financial statements.
30
DAVENPORT EQUITY OPPORTUNITIES FUND
FINANCIAL HIGHLIGHTS
FINANCIAL HIGHLIGHTS
Selected Per Share Data and Ratios for a Share Outstanding Throughout Each Period
|
Six Months Ended
Sept. 30, 2014 (Unaudited) |
Year
Ended March 31, 2014 |
Year
Ended March 31, 2013 |
Year
Ended March 31, 2012 |
Period
Ended March 31, 2011 (a) |
||||||||||||||||
|
Net asset value at beginning of period
|
$
|
15.91
|
$
|
13.86
|
$
|
11.96
|
$
|
10.72
|
$
|
10.00
|
||||||||||
|
Income (loss) from investment operations:
|
||||||||||||||||||||
|
Net investment income (loss)
|
0.02
|
0.24
|
0.03
|
(0.02
|
)
|
(0.01
|
)
|
|||||||||||||
|
Net realized and unrealized gains on investments
|
0.07
|
2.65
|
2.17
|
1.30
|
0.73
|
|||||||||||||||
|
Total from investment operations
|
0.09
|
2.89
|
2.20
|
1.28
|
0.72
|
|||||||||||||||
|
Less distributions:
|
||||||||||||||||||||
|
Dividends from net investment income
|
(0.21
|
)
|
(0.02
|
)
|
(0.02
|
)
|
—
|
—
|
||||||||||||
|
Distributions from net realized gains
|
(0.77
|
)
|
(0.82
|
)
|
(0.28
|
)
|
(0.04
|
)
|
—
|
|||||||||||
|
Total distributions
|
(0.98
|
)
|
(0.84
|
)
|
(0.30
|
)
|
(0.04
|
)
|
—
|
|||||||||||
|
Net asset value at end of period
|
$
|
15.02
|
$
|
15.91
|
$
|
13.86
|
$
|
11.96
|
$
|
10.72
|
||||||||||
|
Total return (b)
|
0.52
|
%(c)
|
21.57
|
%
|
18.77
|
%
|
12.00
|
%
|
7.20
|
%(c)
|
||||||||||
|
Net assets at end of period (000's)
|
$
|
198,466
|
$
|
174,489
|
$
|
102,679
|
$
|
59,135
|
$
|
34,375
|
||||||||||
|
Ratio of total expenses to average net assets
|
0.97
|
%(d)
|
0.97
|
%
|
1.01
|
%
|
1.10
|
%
|
1.25
|
%(d)
|
||||||||||
|
Ratio of net investment income (loss) to average net assets
|
0.40
|
%(d)
|
1.96
|
%
|
0.23
|
%
|
(0.22
|
%)
|
(0.40%
|
)(d)
|
||||||||||
|
Portfolio turnover rate
|
19
|
%(c)
|
49
|
%
|
41
|
%
|
35
|
%
|
6
|
%(c)
|
||||||||||
| (a) | Represents the period from commencement of operations (December 31, 2010) through March 31, 2011. |
| (b) | Total return is a measure of the change in value of an investment in the Fund over the period covered, which assumes any dividends or capital gains distributions are reinvested in shares of the Fund. Returns shown do not reflect the deduction of taxes a shareholder would pay on Fund distributions or the redemption of Fund shares. |
| (c) | Not annualized. |
| (d) | Annualized. |
See accompanying notes to financial statements.
31
THE DAVENPORT FUNDS
NOTES TO FINANCIAL STATEMENTS
September 30, 2014 (Unaudited)
NOTES TO FINANCIAL STATEMENTS
September 30, 2014 (Unaudited)
1. Organization
Davenport Core Fund, Davenport Value & Income Fund and Davenport Equity Opportunities Fund (individually, a "Fund," and, collectively, the "Funds") are each a no-load series of the Williamsburg Investment Trust (the "Trust"), an open-end management investment company registered under the Investment Company Act of 1940. The Trust was organized as a Massachusetts business trust on July 18, 1988. Other series of the Trust are not incorporated in this report. Davenport Core Fund began operations on January 15, 1998. Davenport Value & Income Fund and Davenport Equity Opportunities Fund each began operations on December 31, 2010.
Davenport Core Fund's investment objective is long term growth of capital.
Davenport Value & Income Fund's investment objective is to achieve long term growth while generating current income through dividend payments on portfolio securities.
Davenport Equity Opportunities Fund's investment objective is long term capital appreciation.
Davenport Core Fund and Davenport Value & Income Fund are each classified as a diversified fund. Davenport Equity Opportunities Fund is classified as a non-diversified fund.
2. Significant Accounting Policies
The following is a summary of the Funds' significant accounting policies. The policies are in conformity with accounting principles generally accepted in the United States of America ("GAAP").
Securities valuation — The Funds' portfolio securities are valued as of the close of business of the regular session of the New York Stock Exchange (normally 4:00 p.m., Eastern time). Securities traded on a national stock exchange are valued based upon the closing price on the principal exchange where the security is traded, if available, otherwise, at the last quoted bid price. Securities which are quoted by NASDAQ are valued at the NASDAQ Official Closing Price.
Fixed income securities are valued on the basis of prices provided by an independent pricing service. The prices provided by the pricing service are determined with consideration given to institutional bid and last sale prices and take into account securities prices, yields, maturities, call features, ratings, institutional trading in similar groups of securities and developments related to specific securities.
When market quotations are not readily available, if a pricing service cannot provide a price or the investment adviser believes the price received from the pricing service is not indicative of fair value, securities will be valued in good faith at fair value using methods consistent with those determined by the Board of Trustees and will be classified as Level 2 or 3 within the fair value hierarchy (see below), depending on the inputs used. Such methods of fair valuation may include,
32
THE DAVENPORT FUNDS
NOTES TO FINANCIAL STATEMENTS (Continued)
NOTES TO FINANCIAL STATEMENTS (Continued)
but are not limited to: multiple of earnings, multiple of book value, discount from market of a similar freely traded security, purchase price of the security, subsequent private transactions in the security or related securities, or a combination of these and other factors.
GAAP establishes a single authoritative definition of fair value, sets out a framework for measuring fair value and requires additional disclosures about fair value measurements.
Various inputs are used in determining the value of the Funds' investments. These inputs are summarized in the three broad levels listed below:
• Level 1 – quoted prices in active markets for identical securities
• Level 2 – other significant observable inputs
• Level 3 – significant unobservable inputs
The inputs or methodology used for valuing securities are not necessarily an indication of the risks associated with investing in those securities. The inputs used to measure fair value may fall into different levels of the fair value hierarchy. In such cases, for disclosure purposes, the level in the fair value hierarchy within which the fair value measurement falls in its entirety is determined based on the lowest level input that is significant to the fair value measurement.
The following is a summary of the inputs used to value the Funds' investments as of September 30, 2014 by security type:
|
Davenport Core Fund
|
Level 1
|
Level 2
|
Level 3
|
Total
|
||||||||||||
|
Common Stocks
|
$
|
280,646,892
|
$
|
—
|
$
|
—
|
$
|
280,646,892
|
||||||||
|
Money Market Funds
|
5,771,006
|
—
|
—
|
5,771,006
|
||||||||||||
|
Total
|
$
|
286,417,898
|
$
|
—
|
$
|
—
|
$
|
286,417,898
|
||||||||
|
Davenport Value & Income Fund
|
Level 1
|
Level 2
|
Level 3
|
Total
|
||||||||||||
|
Common Stocks
|
$
|
309,380,828
|
$
|
—
|
$
|
—
|
$
|
309,380,828
|
||||||||
|
Exchange-Traded Funds
|
15,289,628
|
—
|
—
|
15,289,628
|
||||||||||||
|
Money Market Funds
|
9,987,192
|
—
|
—
|
9,987,192
|
||||||||||||
|
Total
|
$
|
334,657,648
|
$
|
—
|
$
|
—
|
$
|
334,657,648
|
||||||||
|
Davenport Equity Opportunities Fund
|
Level 1
|
Level 2
|
Level 3
|
Total
|
||||||||||||
|
Common Stocks
|
$
|
178,672,042
|
$
|
—
|
$
|
—
|
$
|
178,672,042
|
||||||||
|
Closed-End Funds
|
6,435,976
|
—
|
—
|
6,435,976
|
||||||||||||
|
Money Market Funds
|
5,691,794
|
—
|
—
|
5,691,794
|
||||||||||||
|
Total
|
$
|
190,799,812
|
$
|
—
|
$
|
—
|
$
|
190,799,812
|
||||||||
33
THE DAVENPORT FUNDS
NOTES TO FINANCIAL STATEMENTS (Continued)
NOTES TO FINANCIAL STATEMENTS (Continued)
Refer to each Fund's Schedule of Investments for a listing of the securities by sector type. As of September 30, 2014, the Funds did not have any transfers in and out of any Level. There were no Level 2 or Level 3 securities or derivative instruments held by the Funds as of September 30, 2014. It is the Funds' policy to recognize transfers into and out of any Level at the end of the reporting period.
Share valuation — The net asset value per share of each Fund is calculated daily by dividing the total value of its assets, less liabilities, by the number of shares outstanding. The offering price and redemption price per share of each Fund is equal to the net asset value per share.
Investment income — Interest income is accrued as earned. Dividend income is recorded on the ex-dividend date. Discounts and premiums on fixed-income securities purchased are amortized using the interest method.
Security transactions — Security transactions are accounted for on trade date for financial reporting purposes. Gains and losses on securities sold are determined on a specific identification basis.
Common expenses — Common expenses of the Trust are allocated among the series of the Trust based on relative net assets of each series or the nature of the services performed and the relative applicability to each series.
Distributions to shareholders — Dividends arising from net investment income, if any, are declared and paid quarterly to shareholders of Davenport Core Fund and Davenport Value & Income Fund; and declared and paid annually to shareholders of Davenport Equity Opportunities Fund. Net realized short-term capital gains, if any, may be distributed throughout the year and net realized long-term capital gains, if any, are distributed at least once each year. The amount of distributions from net investment income and net realized gains are determined in accordance with federal income tax regulations which may differ from GAAP. Dividends and distributions are recorded on the ex-dividend date.
The tax character of distributions paid during the periods ended September 30, 2014 and March 31, 2014 is as follows:
|
Periods
Ended |
Ordinary
Income |
Long-Term
Capital Gains |
Total
Distributions |
||||||||||
|
Davenport Core Fund
|
9/30/14
|
$
|
1,880,830
|
$
|
12,987,445
|
$
|
14,868,275
|
||||||
|
3/31/14
|
$
|
1,949,919
|
$
|
10,920,395
|
$
|
12,870,314
|
|||||||
|
Davenport Value & Income Fund
|
9/30/14
|
$
|
3,457,152
|
$
|
7,832,701
|
$
|
11,289,853
|
||||||
|
3/31/14
|
$
|
7,813,611
|
$
|
6,621,874
|
$
|
14,435,485
|
|||||||
|
Davenport Equity Opportunities Fund
|
9/30/14
|
$
|
6,946,179
|
$
|
4,427,210
|
$
|
11,373,389
|
||||||
|
3/31/14
|
$
|
1,238,779
|
$
|
6,450,594
|
$
|
7,689,373
|
|||||||
34
THE DAVENPORT FUNDS
NOTES TO FINANCIAL STATEMENTS (Continued)
NOTES TO FINANCIAL STATEMENTS (Continued)
Estimates — The preparation of financial statements in conformity with GAAP requires management to make estimates and assumptions that affect the reported amounts of assets and liabilities and disclosure of contingent assets and liabilities as of the date of the financial statements and the reported amounts of income and expenses during the reporting period. Actual results could differ from those estimates.
Federal income tax — Each Fund has qualified and intends to continue to qualify as a regulated investment company under the Internal Revenue Code of 1986 (the "Code"). Qualification generally will relieve the Funds of liability for federal income taxes to the extent 100% of their net investment income and net realized capital gains are distributed in accordance with the Code. Accordingly, no provision for income tax has been made.
In order to avoid imposition of the excise tax applicable to regulated investment companies, it is also each Fund's intention to declare as dividends in each calendar year at least 98% of its net investment income (earned during the calendar year) and 98.2% of its net realized capital gains (earned during the twelve months ended October 31) plus undistributed amounts from prior years.
The following information is computed on a tax basis for each item as of September 30, 2014:
|
Davenport
Core Fund |
Davenport
Value & Income Fund |
Davenport
Equity Opportunities Fund |
||||||||||
|
Cost of portfolio investments
|
$
|
205,650,633
|
$
|
282,382,149
|
$
|
171,190,080
|
||||||
|
Gross unrealized appreciation
|
$
|
82,410,025
|
$
|
55,774,072
|
$
|
26,844,313
|
||||||
|
Gross unrealized depreciation
|
(1,642,760
|
)
|
(3,498,573
|
)
|
(7,234,581
|
)
|
||||||
|
Net unrealized appreciation
|
80,767,265
|
52,275,499
|
19,609,732
|
|||||||||
|
Undistributed ordinary income
|
31,709
|
343,891
|
405,018
|
|||||||||
|
Other gains
|
8,325,626
|
5,917,327
|
8,861,059
|
|||||||||
|
Accumulated earnings
|
$
|
89,124,600
|
$
|
58,536,717
|
$
|
28,875,809
|
||||||
The difference between the federal income tax cost and the financial statement cost of the Funds' portfolio investments is due to certain timing differences in the recognition of capital gains and losses under income tax regulations and GAAP. These timing differences are temporary in nature and are due to the tax deferral of losses on wash sales and adjustments to basis on publicly traded partnerships.
The Funds recognize the tax benefits or expenses of uncertain tax positions only when the position is "more likely than not" to be sustained assuming examination by tax authorities. Management has reviewed the tax positions taken on Federal income tax returns for the current and all applicable open tax years (tax years ended March 31, 2011 through March 31, 2014) of each Fund and has concluded that no provision for unrecognized tax benefits or expenses is required in these financial statements.
35
THE DAVENPORT FUNDS
NOTES TO FINANCIAL STATEMENTS (Continued)
NOTES TO FINANCIAL STATEMENTS (Continued)
3. Investment Transactions
During the six months ended September 30, 2014, the cost of purchases and proceeds from sales and maturities of investment securities, other than short-term investments and U.S. Government securities, totaled $47,507,574 and $43,660,980, respectively, for Davenport Core Fund; $63,707,404 and $35,501,447, respectively, for Davenport Value & Income Fund; and $56,328,411 and $33,909,039, respectively, for Davenport Equity Opportunities Fund.
4. Transactions with Related Parties
INVESTMENT ADVISORY AGREEMENTS
Each Fund's investments are managed by Davenport & Company LLC (the "Adviser") under the terms of an Investment Advisory Agreement. Under the Investment Advisory Agreement, each Fund pays the Adviser a fee, which is computed and accrued daily and paid monthly, at an annual rate of .75% on its average daily net assets. Certain officers of the Trust are also officers of the Adviser.
OTHER SERVICE PROVIDERS
Ultimus Fund Solutions, LLC ("Ultimus") provides fund administration, fund accounting, compliance and transfer agent services to the Funds. The Funds pay Ultimus fees in accordance with the agreements for such services. In addition, the Funds pay out-of-pocket expenses including, but not limited to, postage, supplies, and costs of pricing the Funds' portfolio securities. Certain officers of the Trust are also officers of Ultimus, or of Ultimus Fund Distributors, LLC (the "Distributor"), the principal underwriter of each Fund's shares and an affiliate of Ultimus. The Distributor is compensated by the Adviser (not the Funds) for acting as principal underwriter.
COMPENSATION OF TRUSTEES
Trustees and officers affiliated with an investment adviser to the Trust or Ultimus are not compensated by the Trust for their services. Each Trustee who is not an affiliated person of the Adviser or Ultimus receives from the Trust an annual retainer of $12,000, payable quarterly; a fee of $1,500 for attendance at each meeting of the Board of Trustees (except that such fee is $2,500 for the independent chairman); and $1,000 for attendance at each meeting of any committee of the Board (except that such fee is $1,500 for the committee chairman); plus reimbursement of travel and other expenses incurred in attending meetings. Prior to July 1, 2014, the annual retainer was $10,000.
5. Sector Risk
If a Fund has significant investments in the securities of issuers in industries within a particular sector, any development affecting that sector will have a greater impact on the value of the net assets of the Fund than would be the case if the Fund did not have significant investments in that sector. In addition, this may increase the risk of loss of an investment in the Fund and increase the volatility of the Fund's net asset value per share. From time to time, circumstances may affect a particular sector and the companies within such sector. For instance, economic or market
36
THE DAVENPORT FUNDS
NOTES TO FINANCIAL STATEMENTS (Continued)
NOTES TO FINANCIAL STATEMENTS (Continued)
factors, regulation or deregulation, or other developments may negatively impact all companies in a particular sector and therefore the value of the Fund's portfolio would be adversely affected. As of September 30, 2014, Davenport Value & Income Fund had 28.3% of the value of its net assets invested in stocks within the Financials sector and Davenport Equity Opportunities Fund had 26.1% and 34.0% of the value of its net assets invested in stocks within the Consumer Discretionary sector and Financials sector, respectively.
6. Contingencies and Commitments
The Funds indemnify the Trust's officers and Trustees for certain liabilities that might arise from their performance of their duties to the Funds. Additionally, in the normal course of business the Funds enter into contracts that contain a variety of representations and warranties and which provide general indemnifications. The Funds' maximum exposure under these arrangements is unknown, as this would involve future claims that may be made against the Funds that have not yet occurred. However, based on experience, the Funds expect the risk of loss to be remote.
7. Subsequent Events
The Funds are required to recognize in the financial statements the effects of all subsequent events that provide additional evidence about conditions that existed as of the date of the Statements of Assets and Liabilities. For non-recognized subsequent events that must be disclosed to keep the financial statements from being misleading, the Funds are required to disclose the nature of the event as well as an estimate of its financial effect, or a statement that such an estimate cannot be made. Management has evaluated subsequent events through the issuance of these financial statements and has noted no such events.
37
THE DAVENPORT FUNDS
YOUR FUNDS' EXPENSES (Unaudited)
YOUR FUNDS' EXPENSES (Unaudited)
We believe it is important for you to understand the impact of costs on your investment. All mutual funds have operating expenses. As a shareholder of the Funds, you incur ongoing costs, including management fees and other expenses. These ongoing costs, which are deducted from each Fund's gross income, directly reduce the investment return of the Funds.
A mutual fund's ongoing costs are expressed as a percentage of its average net assets. This figure is known as the expense ratio. The following examples are intended to help you understand the ongoing costs (in dollars) of investing in the Funds and to compare these costs with the ongoing costs of investing in other mutual funds. The examples below are based on an investment of $1,000 made at the beginning of the period shown and held for the entire period (April 1, 2014 through September 30, 2014).
The table below illustrates each Fund's ongoing costs in two ways:
Actual fund return – This section helps you to estimate the actual expenses that you paid over the period. The "Ending Account Value" shown is derived from each Fund's actual return, and the third column shows the dollar amount of operating expenses that would have been paid by an investor who started with $1,000 in the Funds. You may use the information here, together with the amount you invested, to estimate the expenses that you paid over the period.
To do so, simply divide your account value by $1,000 (for example, an $8,600 account value divided by $1,000 = 8.6), then multiply the result by the number given for the Funds under the heading "Expenses Paid During Period."
Hypothetical 5% return – This section is intended to help you compare each Fund's ongoing costs with those of other mutual funds. It assumes that each Fund had an annual return of 5% before expenses during the period shown, but that the expense ratio is unchanged. In this case, because the return used is not each Fund's actual return, the results do not apply to your investment. The example is useful in making comparisons because the Securities and Exchange Commission ("SEC") requires all mutual funds to calculate expenses based on a 5% return. You can assess each Fund's ongoing costs by comparing this hypothetical example with the hypothetical examples that appear in shareholder reports of other funds.
Note that expenses shown in the table are meant to highlight and help you compare ongoing costs only. The Funds do not charge sales loads or redemption fees.
The calculations assume no shares were bought or sold during the period. Your actual costs may have been higher or lower, depending on the amount of your investment and the timing of any purchases or redemptions.
More information about each Fund's expenses, including historical annual expense ratios, can be found in this report. For additional information on operating expenses and other shareholder costs, please refer to the Funds' prospectus.
38
THE DAVENPORT FUNDS
YOUR FUNDS' EXPENSES (Unaudited) (Continued)
YOUR FUNDS' EXPENSES (Unaudited) (Continued)
|
Davenport Core Fund
|
Beginning
Account Value April 1, 2014 |
Ending
Account Value Sept. 30, 2014
|
Expenses Paid
During Period*
|
|
Based on Actual Fund Return
|
$1,000.00
|
$1,033.10
|
$4.74
|
|
Based on Hypothetical 5% Return (before expenses)
|
$1,000.00
|
$1,020.41
|
$4.71
|
|
*
|
Expenses are equal to Davenport Core Fund's annualized expense ratio of 0.93% for the period, multiplied by the average account value over the period, multiplied by 183/365 (to reflect the one-half year period).
|
|
Davenport Value & Income Fund
|
Beginning
Account Value April 1, 2014 |
Ending
Account Value Sept. 30, 2014
|
Expenses Paid
During Period*
|
|
Based on Actual Fund Return
|
$1,000.00
|
$1,032.50
|
$4.74
|
|
Based on Hypothetical 5% Return (before expenses)
|
$1,000.00
|
$1,020.41
|
$4.71
|
|
*
|
Expenses are equal to Davenport Value & Income Fund's annualized expense ratio of 0.93% for the period, multiplied by the average account value over the period, multiplied by 183/365 (to reflect the one-half year period).
|
|
Davenport Equity Opportunities Fund
|
Beginning
Account Value April 1, 2014 |
Ending
Account Value Sept. 30, 2014
|
Expenses Paid
During Period*
|
|
Based on Actual Fund Return
|
$1,000.00
|
$1,005.20
|
$4.88
|
|
Based on Hypothetical 5% Return (before expenses)
|
$1,000.00
|
$1,020.21
|
$4.91
|
|
*
|
Expenses are equal to Davenport Equity Opportunities Fund's annualized expense ratio of 0.97% for the period, multiplied by the average account value over the period, multiplied by 183/365 (to reflect the one-half year period).
|
39
THE DAVENPORT FUNDS
OTHER INFORMATION (Unaudited)
OTHER INFORMATION (Unaudited)
A description of the policies and procedures that the Funds use to vote proxies relating to portfolio securities is available without charge upon request by calling toll-free 1-800-281-3217, or on the SEC's website at http://www.sec.gov. Information regarding how the Funds voted proxies relating to portfolio securities during the most recent 12-month period ended June 30 is also available without charge upon request by calling toll-free 1-800-281-3217, or on the SEC's website at http://www.sec.gov.
The Trust files a complete listing of portfolio holdings for the Funds with the SEC as of the end of the first and third quarters of each fiscal year on Form N-Q. These filings are available upon request by calling 1-800-281-3217. Furthermore, you may obtain a copy of these filings on the SEC's website at http://www.sec.gov. The Trust's Forms N-Q may also be reviewed and copied at the SEC's Public Reference Room in Washington, DC, and information on the operation of the Public Reference Room may be obtained by calling 1-800-SEC-0330.
A complete listing of portfolio holdings for the Funds is updated daily and can be reviewed at the Funds' website at http://www.investdavenport.com.
40
|
PRIVACY NOTICE
|
|
FACTS
|
WHAT DO THE DAVENPORT FUNDS DO WITH YOUR PERSONAL INFORMATION?
|
||
|
Why?
|
Financial companies choose how they share your personal information. Federal law gives consumers the right to limit some but not all sharing. Federal law also requires us to tell you how we collect, share, and protect your personal information. Please read this notice carefully to understand what we do.
|
||
|
What?
|
The types of personal information we collect and share depend on the product or service you have with us. This information can include:
§ Social Security number
§ Assets
§ Retirement Assets
§ Transaction History
§ Checking Account Information
§ Purchase History
§ Account Balances
§ Account Transactions
§ Wire Transfer Instructions
When you are no longer our customer, we continue to share your information as described in this notice.
|
||
|
How?
|
All financial companies need to share your personal information to run their everyday business. In the section below, we list the reasons financial companies can share their customers' personal information; the reasons The Davenport Funds choose to share; and whether you can limit this sharing.
|
||
|
Reasons we can share your personal information
|
Do The Davenport
Funds share?
|
Can you limit
this sharing?
|
|
|
For our everyday business purposes – Such as to process your transactions, maintain your account(s), respond to court orders and legal investigations, or report to credit bureaus
|
Yes
|
No
|
|
|
For our marketing purposes – to offer our products and services to you
|
No
|
We don't share
|
|
|
For joint marketing with other financial companies
|
No
|
We don't share
|
|
|
For our affiliates' everyday business purposes – information about your creditworthiness
|
No
|
We don't share
|
|
|
For nonaffiliates to market to you
|
No
|
We don't share
|
|
|
Questions?
|
Call 1-800-281-3217
|
||
41
|
Who we are
|
|
|
Who is providing this notice?
|
Williamsburg Investment Trust
Ultimus Fund Distributors, LLC
Ultimus Fund Solutions, LLC
|
|
What we do
|
|
|
How do The Davenport Funds protect my personal information?
|
To protect your personal information from unauthorized access and use, we use security measures that comply with federal law. These measures include computer safeguards and secured files and buildings.
Our service providers are held accountable for adhering to strict policies and procedures to prevent any misuse of your nonpublic personal information.
|
|
How do The Davenport Funds collect my personal information?
|
We collect your personal information, for example, when you
§ Provide account information
§ Give us your contact information
§ Make deposits or withdrawals from your account
§ Make a wire transfer
§ Tell us where to send the money
§ Tell us who receives the money
§ Show your government-issued ID
§ Show your driver's license
We also collect your personal information from other companies.
|
|
Why can't I limit all sharing?
|
Federal law gives you the right to limit only
§ Sharing for affiliates' everyday business purposes – information about your creditworthiness
§ Affiliates from using your information to market to you
§ Sharing for nonaffiliates to market to you
State laws and individual companies may give you additional rights to limit sharing.
|
|
Definitions
|
|
|
Affiliates
|
Companies related by common ownership or control. They can be financial and nonfinancial companies.
§ Davenport & Company LLC, the investment adviser to The Davenport Funds, could be deemed to be an affiliate.
|
|
Nonaffiliates
|
Companies not related by common ownership or control. They can be financial and nonfinancial companies
§ The Davenport Funds do not share with nonaffiliates so they can market to you
|
|
Joint marketing
|
A formal agreement between nonaffiliated financial companies that together market financial products or services to you.
§ The Davenport Funds don't jointly market.
|
42
This page intentionally left blank.
This page intentionally left blank.
|
THE DAVENPORT FUNDS
Investment Adviser
Davenport & Company LLC One James Center 901 East Cary Street Richmond, Virginia 23219-4037 Administrator
Ultimus Fund Solutions, LLC P.O. Box 46707 Cincinnati, Ohio 45246-0707 1-800-281-3217 Custodian
US Bank NA 425 Walnut Street Cincinnati, Ohio 45202 Independent Registered Public
Accounting Firm Ernst & Young LLP 1900 Scripps Center 312 Walnut Street Cincinnati, Ohio 45202 Legal Counsel
Sullivan & Worcester LLP One Post Office Square Boston, Massachusetts 02109 Board of Trustees
Robert S. Harris, Ph.D., Chairman John P. Ackerly, IV John T. Bruce J. Finley Lee, Jr., Ph.D. Harris V. Morrissette Elizabeth W. Robertson Officers
John P. Ackerly, IV, President George L. Smith, III, Vice President |

Davenport & Company LLC
One James Center
901 East Cary Street
Richmond, VA 23219
Member: NYSE • SIPC
Toll Free: (800) 846-6666
www.investdavenport.com
|
|
||||||
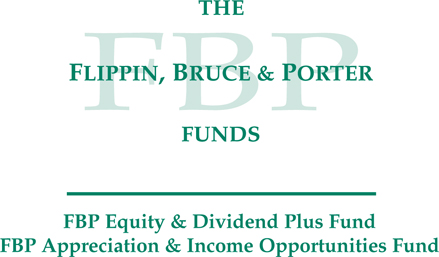 Semi-Annual Report
September 30, 2014
(Unaudited)
No-Load Funds
|
||||||
|
|
|
Letter to Shareholders
|
November 6, 2014
|
We are pleased to report on the Flippin, Bruce & Porter Funds and their investments for the semi-annual period ended September 30, 2014 and to provide some additional information since we last communicated with you.
Economic and Market Update
Investment returns were positive across this reporting period but most of the gains were achieved by mid July, when domestic stock market indexes achieved record high levels, global bond markets rallied, and international equity markets strengthened. The unusually strong environment for the markets was fueled by a continuing commitment by central bankers around the world to keep interest rates low, which reinforced the belief that global economic growth would be improving. Investor expectations began to change during the summer, initially driven by heightened awareness that increasingly worrisome geopolitical issues were brewing. The rising threat posed by Islamic extremists in Iraq and Syria and the ongoing conflict between Russia and the Ukraine were the two most obvious factors contributing to the climate of fear that emerged then. Slowing growth worldwide, particularly in China and Europe, became potentially an even more significant risk factor for the domestic economy. The result of these concerns was increasing stock market volatility and a sluggish return environment to end the period.
Despite these risks, domestic GDP numbers as reported during the last two quarters were generally positive and were consistent with continued economic growth of between 2.5% and 3%. Other measures such as new home sales, existing home prices and unemployment claims also pointed to economic strength. As we expected, the weakness in GDP reported early in 2014 has proven to be a temporary, weather related anomaly. While GDP numbers under 3% are not cause for celebration, the slow and steady nature of the expansion could indicate that it may be extended and last longer than a normal expansion. European economies, on the other hand, have shown signs of slowing. This divergence has led to different actions from central bankers. In the E.U., bankers continued to provide stimulus by lowering key rates while the U.S. Federal Reserve (the "Fed") maintained its planned phase-out of quantitative easing. The Fed did, however, imply that the timing of expected interest rate increases in 2015 will be dependent on economic reports between now and then, leaving the door open for rates to remain lower for longer if conditions warrant.
Equity markets have continued to display added volatility since September 30, and markets have recovered from a modest correction. Earnings season is upon us and companies generally have reported reasonable growth in earnings and, just as importantly, have guided for modest increases in 2015. Stock market valuations still appear reasonable even though they are above recent levels, and both of our Fund's equities trade at a discount to the market. Alternative investment choices, namely bonds and cash, continue to offer limited appeal. U.S. companies with significant international revenues will face some headwinds due to the dollar's strength and weaker global growth, however, long term we expect the growth in earnings to continue. Recent stimulative measures announced by Japan and expected additional measures by the European Central Bank should improve international growth prospects. Also, improving consumer confidence and lower energy prices should be a net positive. Therefore, we continue to have a positive outlook for the equity markets for longer time horizons.
1
FBP Equity & Dividend Plus Fund Review
FBP Equity & Dividend Plus Fund returned 4.50% for the semi-annual period ended September 30, 2014. The S&P 500 Index (the "Index"), a broad measure of stock returns was up 6.42%. More aggressive growth and momentum stocks were in vogue this period, continuing a trend from last year. The best performing sectors for the Fund were Information Technology, Consumer Discretionary and Telecommunication Services. Intel, Apple and Best Buy showed nice gains as did CenturyLink, which was a new addition last period. Materials stocks were negatively affected by declining commodity prices. And the early fears of declining oil prices began to affect oil related stocks, causing Transocean to be the Fund's weakest performer. Emerson Electric and most Industrials lagged the market as concerns began to emerge about the strength of the global economy. Even though all of our Health Care stocks generated positive total returns during the quarter, the Fund's holdings lagged the S&P sector as growth oriented biotech's were strong.
We initiated new positions in IBM, First Niagara and MetLife during the period and eliminated several others. IBM, one of the largest and most well-respected companies in the world, is working to successfully adapt to market changes and should be well positioned in services, cloud computing and intelligence. We anticipate rising dividends over time from this technology stalwart. First Niagara Financial Group is a regional bank holding company based in Buffalo, NY. The company has plans to ramp up capital spending on technology to enhance its customer offerings and to improve its operating efficiency. The downside is that the current earnings outlook for the company is dampened. We believe the short term earnings issue provides an opportunity for long term investors to enter the stock. The 3.8% dividend yield gives us strong cash returns while we wait for earnings to normalize. MetLife, one of the largest life insurers in the country, was also purchased. Its acquisition of AIG's Asian business proved to be a nice strategic move that adds scale and diversification to its strong domestic group life business. The recent decision by the Fed to include the company on its list of systemically important financial institutions was a modest negative since it will involve added regulatory scrutiny and expense. The stock price decline following the news provided an opportunity for us to acquire the stock at what we consider to be attractive levels. Bank of New York Mellon, 3M and Sonoco were successful investments for the Fund that were eliminated as their stock prices reached our targets. Additionally, their dividend yields were no longer as attractive.
FBP Appreciation & Income Opportunities Fund Review
FBP Appreciation & Income Opportunities Fund returned 2.73% for the semi-annual period ended September 30, 2014. The S&P 500 Index returned 6.42% and the Barclays U.S. Government/Credit Index returned 2.10% over the same period. Just as with our Equity & Dividend Plus Fund, the best performing sectors for the Fund were Information Technology, Consumer Discretionary and Telecommunication Services. In addition to Intel, Best Buy and CenturyLink, FedEx and Archer-Daniels also produced nice gains. Materials stocks were negatively affected by declining commodity prices. And the early fears of declining oil prices began to affect oil related stocks, causing Transocean and Peabody Energy to generate weak returns. In the midst of a turnaround, Avon Products continues to disappoint. The Fund's Health Care holdings lagged the S&P sector as growth oriented biotech's were strong. The asset allocation of the Fund continues to have a very positive effect on performance since equities continue to outperform fixed investments. The Fund was 76.9% equity, 5.2% fixed income and 17.9% cash at period end. In hindsight, we should have had more of the Fund's cash invested in fixed income assets. Interest rates have stayed much lower, much longer than we anticipated. However, with the Fed now closer to reversing course and letting interest rates normalize, we plan to be patient and wait for attractive opportunities.
2
We added a new position in Peabody Energy, a global leader in mining and one of the largest coal producers in the world. It is a low cost producer both domestically and globally, with resources in the Permian River Basin and the Illinois Basin, as well as in Queensland and New South Wales in Australia. These assets provide exposure domestically and to markets like India and China that have a growing need for coal in their rapidly modernizing economies.
Lockheed Martin, a very successful investment for the Fund, was eliminated during the quarter. Lockheed was originally purchased during a period when investors were very negative about the defense industry due to concerns over future spending cuts. While deep cuts did happen, fears proved to be worse than reality, management did an excellent job managing through the industry change and the stock now reflects a market multiple of 16 times earnings, approximately twice the multiple when purchased.
We want to thank you for your continued support and investment in the Flippin, Bruce & Porter Funds. Please visit our website at www.fbpfunds.com for information on your Funds and the investment philosophy and process we utilize to achieve their investment objectives.

John T. Bruce, CFA
President - Portfolio Manager
November 4, 2014
President - Portfolio Manager
November 4, 2014
Data presented reflects past performance, which is no guarantee of future results. Investment results and principal value will fluctuate so that shares, when redeemed, may be worth more or less than their original cost. Due to market volatility, current performance may be higher or lower than the performance shown. Updated performance information, current through the most recent month-end, is available by contacting the Funds at 1-866-738-1127.
This report is submitted for the general information of the shareholders of the Funds. It reflects our views, opinions and portfolio holdings as of September 30, 2014, the end of the reporting period. These views are subject to change at any time based upon market or other conditions. For more current information throughout the year please visit www.fbpfunds.com or call the Funds at 1-866-738-1127. This report is not authorized for distribution to prospective investors in the Funds unless accompanied by a current prospectus.
3
THE FLIPPIN, BRUCE & PORTER FUNDS
COMPARATIVE PERFORMANCE CHARTS
(Unaudited)
COMPARATIVE PERFORMANCE CHARTS
(Unaudited)
Performance for each Fund is compared to the most appropriate broad-based index, the S&P 500® Index, an unmanaged index of 500 large common stocks. Results are also compared to the Consumer Price Index, a measure of inflation.
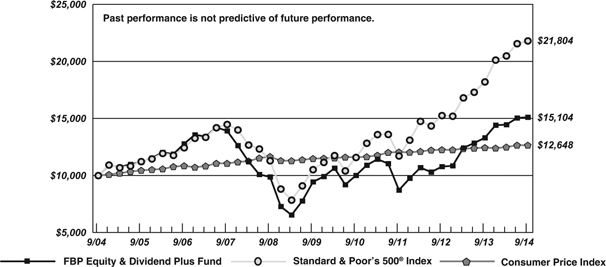
FBP Equity & Dividend Plus Fund
Comparison of the Change in Value of a $10,000 Investment in FBP Equity & Dividend Plus
Fund, the Standard & Poor's 500® Index and the Consumer Price Index
4
THE FLIPPIN, BRUCE & PORTER FUNDS
COMPARATIVE PERFORMANCE CHARTS
(Unaudited) (Continued)
COMPARATIVE PERFORMANCE CHARTS
(Unaudited) (Continued)
FBP Appreciation & Income Opportunities Fund
Comparison of the Change in Value of a $10,000 Investment in FBP Appreciation & Income
Opportunities Fund, the Standard & Poor's 500® Index and the Consumer Price Index
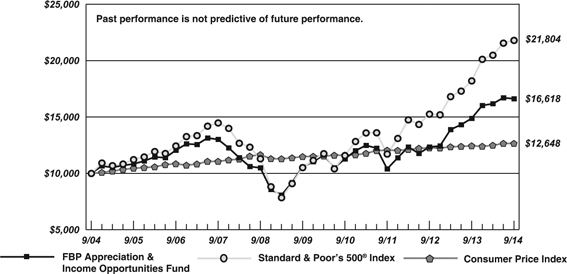
|
Average Annual Total Returns(a)
(for periods ended September 30, 2014)
|
|||
|
|
1 Year
|
5 Years
|
10 Years
|
|
FBP Equity & Dividend Plus Fund
|
13.52%
|
9.86%
|
4.21%
|
|
FBP Appreciation & Income Opportunities Fund
|
11.68%
|
9.46%
|
5.21%
|
|
Standard & Poor's 500® Index
|
19.73%
|
15.70%
|
8.11%
|
|
Consumer Price Index
|
1.69%
|
1.96%
|
2.38%
|
|
(a)
|
Total returns are a measure of the change in value of an investment in the Funds over the periods covered, which assumes any dividends or capital gains distributions are reinvested in shares of the Funds. Returns do not reflect the deduction of taxes a shareholder would pay on the Funds' distributions or the redemption of Fund shares.
|
5
FBP EQUITY & DIVIDEND PLUS FUND
PORTFOLIO INFORMATION
September 30, 2014 (Unaudited)
PORTFOLIO INFORMATION
September 30, 2014 (Unaudited)
|
General Information
|
|
|
Net Asset Value Per Share
|
$25.65
|
|
Total Net Assets (Millions)
|
$30.1
|
|
Current Expense Ratio
|
1.07%
|
|
Portfolio Turnover (not annualized)
|
8%
|
|
Fund Inception Date
|
7/30/1993
|
|
Stock Characteristics
|
FBP Equity &
Dividend Plus Fund
|
S&P 500® Index
|
|
Number of Stocks
|
48
|
500
|
|
Weighted Avg Market Capitalization (Billions)
|
$124.1
|
$130.7
|
|
Price-to-Earnings Ratio (Bloomberg 1 Yr. Forecast EPS)
|
13.0
|
15.3
|
|
Price-to-Book Value
|
2.0
|
2.7
|
|
Asset Allocation (% of Net Assets)
|
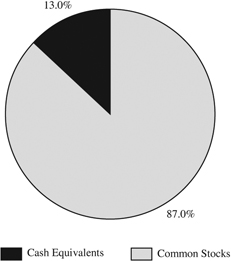 |
|
Sector Diversification vs. the S&P 500® Index
|
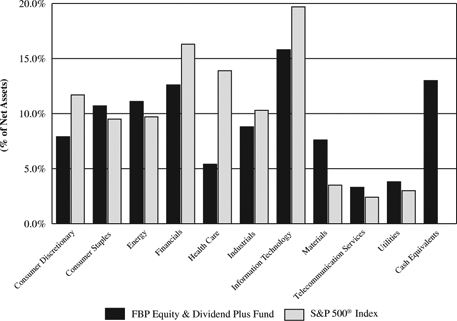
|
Ten Largest Equity Holdings
|
% of Net Assets
|
|
JPMorgan Chase & Company
|
3.4%
|
|
ConocoPhillips
|
3.1%
|
|
Apple, Inc.
|
3.0%
|
|
Royal Dutch Shell plc - Class A - ADR
|
3.0%
|
|
PepsiCo, Inc.
|
2.7%
|
|
Cisco Systems, Inc.
|
2.7%
|
|
ConAgra Foods, Inc.
|
2.5%
|
|
Merck & Company, Inc.
|
2.5%
|
|
Chevron Corporation
|
2.5%
|
|
Best Buy Company, Inc.
|
2.5%
|
6
FBP APPRECIATION & INCOME OPPORTUNITIES FUND
PORTFOLIO INFORMATION
September 30, 2014 (Unaudited)
PORTFOLIO INFORMATION
September 30, 2014 (Unaudited)
|
General Information
|
|
|
Net Asset Value Per Share
|
$18.95
|
|
Total Net Assets (Millions)
|
$40.0
|
|
Current Expense Ratio
|
1.00%
|
|
Portfolio Turnover (not annualized)
|
3%
|
|
Fund Inception Date
|
7/3/1989
|
|
Asset Allocation (% of Net Assets)
|
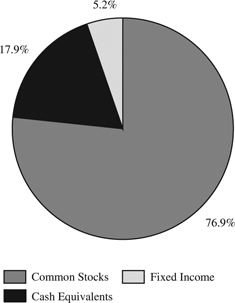 |
|
Common Stock Portfolio (76.9% of Net Assets)
|
|
|
Number of Stocks
|
56
|
|
Weighted Avg Market Capitalization (Billion)
|
$113.1
|
|
Price-to-Earnings Ratio (Bloomberg 1 Yr. Forecast EPS)
|
12.6
|
|
Price-to-Book Value
|
1.7
|
|
Ten Largest Equity Holdings
|
% of Net Assets
|
|
JPMorgan Chase & Company
|
3.1%
|
|
Bank of America Corporation
|
2.9%
|
|
MetLife, Inc.
|
2.7%
|
|
Johnson & Johnson
|
2.7%
|
|
Cisco Systems, Inc.
|
2.5%
|
|
ConocoPhillips
|
2.4%
|
|
Lincoln National Corporation
|
2.3%
|
|
E.I. du Pont de Nemours and Company
|
2.2%
|
|
Hewlett-Packard Company
|
2.1%
|
|
Apple, Inc.
|
2.1%
|
|
Five Largest Sectors
|
% of Net Assets
|
|
Financials
|
18.2%
|
|
Energy
|
12.1%
|
|
Information Technology
|
11.6%
|
|
Materials
|
8.6%
|
|
Health Care
|
6.8%
|
|
Fixed-Income Portfolio (5.2% of Net Assets)
|
|
|
Number of Fixed-Income Securities
|
4
|
|
Average Quality
|
BBB+
|
|
Average Weighted Maturity
|
1.0 yrs.
|
|
Average Effective Duration
|
0.7 yrs.
|
|
Sector Breakdown
|
% of Net Assets
|
|
Financials
|
3.2%
|
|
Industrials
|
1.3%
|
|
Municipal Bonds
|
0.7%
|
7
FBP EQUITY & DIVIDEND PLUS FUND
SCHEDULE OF INVESTMENTS
September 30, 2014 (Unaudited)
SCHEDULE OF INVESTMENTS
September 30, 2014 (Unaudited)
|
COMMON STOCKS — 87.0%
|
Shares
|
Value
|
||||||
|
Consumer Discretionary — 7.9%
|
||||||||
|
Best Buy Company, Inc. (a)
|
22,000
|
$
|
738,980
|
|||||
|
Kohl's Corporation (a)
|
9,000
|
549,270
|
||||||
|
Staples, Inc.
|
38,000
|
459,800
|
||||||
|
Target Corporation
|
9,900
|
620,532
|
||||||
|
2,368,582
|
||||||||
|
Consumer Staples — 10.7%
|
||||||||
|
Coca-Cola Company (The)
|
16,000
|
682,560
|
||||||
|
ConAgra Foods, Inc. (a)
|
23,000
|
759,920
|
||||||
|
PepsiCo, Inc. (a)
|
8,800
|
819,192
|
||||||
|
Procter & Gamble Company (The)
|
8,500
|
711,790
|
||||||
|
Sysco Corporation
|
6,700
|
254,265
|
||||||
|
3,227,727
|
||||||||
|
Energy — 11.1%
|
||||||||
|
Chevron Corporation
|
6,300
|
751,716
|
||||||
|
ConocoPhillips (a)
|
12,200
|
933,544
|
||||||
|
Occidental Petroleum Corporation
|
4,000
|
384,600
|
||||||
|
Royal Dutch Shell plc - Class A - ADR
|
12,000
|
913,560
|
||||||
|
Transocean Ltd.
|
10,900
|
348,473
|
||||||
|
3,331,893
|
||||||||
|
Financials — 12.6%
|
||||||||
|
BB&T Corporation
|
10,000
|
372,100
|
||||||
|
First Niagara Financial Group, Inc.
|
53,000
|
441,490
|
||||||
|
HSBC Holdings plc - ADR
|
10,200
|
518,976
|
||||||
|
JPMorgan Chase & Company
|
17,000
|
1,024,080
|
||||||
|
Manulife Financial Corporation
|
20,000
|
385,000
|
||||||
|
MetLife, Inc.
|
5,500
|
295,460
|
||||||
|
People's United Financial, Inc.
|
33,400
|
483,298
|
||||||
|
Prudential Financial, Inc.
|
3,000
|
263,820
|
||||||
|
3,784,224
|
||||||||
|
Health Care — 5.4%
|
||||||||
|
Johnson & Johnson
|
2,600
|
277,134
|
||||||
|
Merck & Company, Inc. (a)
|
12,800
|
758,784
|
||||||
|
Pfizer, Inc.
|
20,000
|
591,400
|
||||||
|
1,627,318
|
||||||||
|
Industrials — 8.8%
|
||||||||
|
Avery Dennison Corporation
|
5,000
|
223,250
|
||||||
|
Emerson Electric Company
|
10,600
|
663,348
|
||||||
|
General Electric Company
|
27,000
|
691,740
|
||||||
|
Koninklijke Philips N.V.
|
14,482
|
459,224
|
||||||
|
R.R. Donnelley & Sons Company
|
36,400
|
599,144
|
||||||
|
2,636,706
|
||||||||
8
FBP EQUITY & DIVIDEND PLUS FUND
SCHEDULE OF INVESTMENTS (Continued)
SCHEDULE OF INVESTMENTS (Continued)
|
COMMON STOCKS — 87.0% (Continued)
|
Shares
|
Value
|
||||||
|
Information Technology — 15.8%
|
||||||||
|
Apple, Inc. (a)
|
9,100
|
$
|
916,825
|
|||||
|
Applied Materials, Inc. (a)
|
15,000
|
324,150
|
||||||
|
Cisco Systems, Inc.
|
32,000
|
805,440
|
||||||
|
Hewlett-Packard Company (a)
|
19,500
|
691,665
|
||||||
|
Intel Corporation (a)
|
16,000
|
557,120
|
||||||
|
International Business Machines Corporation
|
1,600
|
303,728
|
||||||
|
Microsoft Corporation
|
12,500
|
579,500
|
||||||
|
Western Union Company (The)
|
37,000
|
593,480
|
||||||
|
4,771,908
|
||||||||
|
Materials — 7.6%
|
||||||||
|
E.I. du Pont de Nemours and Company (a)
|
5,000
|
358,800
|
||||||
|
Freeport-McMoRan Copper & Gold, Inc.
|
8,400
|
274,260
|
||||||
|
Nucor Corporation (a)
|
10,000
|
542,800
|
||||||
|
Potash Corporation of Saskatchewan, Inc.
|
12,600
|
435,456
|
||||||
|
Rio Tinto plc - ADR (a)
|
8,600
|
422,948
|
||||||
|
Sealed Air Corporation (a)
|
7,000
|
244,160
|
||||||
|
2,278,424
|
||||||||
|
Telecommunication Services — 3.3%
|
||||||||
|
AT&T, Inc.
|
18,000
|
634,320
|
||||||
|
CenturyLink, Inc.
|
9,000
|
368,010
|
||||||
|
1,002,330
|
||||||||
|
Utilities — 3.8%
|
||||||||
|
FirstEnergy Corporation
|
19,000
|
637,830
|
||||||
|
PPL Corporation
|
15,300
|
502,452
|
||||||
|
1,140,282
|
||||||||
|
Total Common Stocks (Cost $19,735,160)
|
$
|
26,169,394
|
||||||
9
FBP EQUITY & DIVIDEND PLUS FUND
SCHEDULE OF INVESTMENTS (Continued)
SCHEDULE OF INVESTMENTS (Continued)
|
MONEY MARKET FUNDS — 13.6%
|
Shares
|
Value
|
||||||
|
Fidelity Institutional Money Market Government Portfolio - Class I, 0.01% (b)
|
2,983,618
|
$
|
2,983,618
|
|||||
|
First American Government Obligations Fund - Class Z, 0.01% (b)
|
1,119,115
|
1,119,115
|
||||||
|
Total Money Market Funds (Cost $4,102,733)
|
$
|
4,102,733
|
||||||
|
Total Investments at Value — 100.6% (Cost $23,837,893)
|
$
|
30,272,127
|
||||||
|
Liabilities in Excess of Other Assets — (0.6%)
|
(191,587
|
)
|
||||||
|
Net Assets — 100.0%
|
$
|
30,080,540
|
||||||
ADR - American Depositary Receipt.
| (a) | Security covers a written call option. |
| (b) | The rate shown is the 7-day effective yield as of September 30, 2014. |
See accompanying notes to financial statements.
10
FBP EQUITY & DIVIDEND PLUS FUND
SCHEDULE OF OPEN OPTION CONTRACTS
September 30, 2014 (Unaudited)
SCHEDULE OF OPEN OPTION CONTRACTS
September 30, 2014 (Unaudited)
|
COVERED CALL OPTIONS
|
Option
Contracts
|
Value of
Options |
Premiums Received
|
|||||||||
|
Apple, Inc.,
|
||||||||||||
|
04/17/2015 at $105
|
30
|
$
|
15,750
|
$
|
16,633
|
|||||||
|
Applied Materials, Inc.,
|
||||||||||||
|
01/17/2015 at $25
|
150
|
4,500
|
15,444
|
|||||||||
|
Best Buy Company, Inc.,
|
||||||||||||
|
12/20/2014 at $30
|
100
|
45,000
|
14,696
|
|||||||||
|
ConAgra Foods, Inc.,
|
||||||||||||
|
12/20/2014 at $33
|
110
|
11,000
|
8,465
|
|||||||||
|
ConocoPhillips,
|
||||||||||||
|
01/17/2015 at $82.5
|
58
|
5,336
|
9,451
|
|||||||||
|
E.I. du Pont de Nemours and Company,
|
||||||||||||
|
01/17/2015 at $67.5
|
25
|
13,125
|
5,124
|
|||||||||
|
Hewlett-Packard Company,
|
||||||||||||
|
01/17/2015 at $35
|
90
|
19,350
|
19,076
|
|||||||||
|
Intel Corporation,
|
||||||||||||
|
01/17/2015 at $30
|
60
|
31,500
|
9,657
|
|||||||||
|
04/17/2015 at $37
|
100
|
14,500
|
12,696
|
|||||||||
|
Kohl's Corporation,
|
||||||||||||
|
04/17/2015 at $62.5
|
30
|
9,600
|
7,559
|
|||||||||
|
Merck & Company, Inc.,
|
||||||||||||
|
01/17/2015 at $60
|
45
|
8,955
|
8,998
|
|||||||||
|
Nucor Corporation,
|
||||||||||||
|
04/17/2015 at $57.5
|
50
|
9,650
|
8,348
|
|||||||||
|
PepsiCo, Inc.,
|
||||||||||||
|
01/17/2015 at $92.5
|
40
|
12,480
|
6,278
|
|||||||||
|
Rio Tinto plc - ADR,
|
||||||||||||
|
01/17/2015 at $62.5
|
43
|
860
|
8,147
|
|||||||||
|
Sealed Air Corporation,
|
||||||||||||
|
01/17/2015 at $35
|
70
|
13,300
|
10,287
|
|||||||||
|
$
|
214,906
|
$
|
160,859
|
|||||||||
See accompanying notes to financial statements.
11
FBP APPRECIATION & INCOME OPPORTUNITIES FUND
SCHEDULE OF INVESTMENTS
September 30, 2014 (Unaudited)
SCHEDULE OF INVESTMENTS
September 30, 2014 (Unaudited)
|
COMMON STOCKS — 76.9%
|
Shares
|
Value
|
||||||
|
Consumer Discretionary — 5.0%
|
||||||||
|
Best Buy Company, Inc. (a)
|
20,000
|
$
|
671,800
|
|||||
|
Kohl's Corporation (a)
|
9,500
|
579,785
|
||||||
|
Staples, Inc.
|
35,000
|
423,500
|
||||||
|
Target Corporation
|
5,000
|
313,400
|
||||||
|
1,988,485
|
||||||||
|
Consumer Staples — 4.4%
|
||||||||
|
Archer-Daniels-Midland Company (a)
|
8,000
|
408,800
|
||||||
|
Avon Products, Inc.
|
24,000
|
302,400
|
||||||
|
CVS Caremark Corporation
|
3,800
|
302,442
|
||||||
|
PepsiCo, Inc. (a)
|
4,200
|
390,978
|
||||||
|
Wal-Mart Stores, Inc.
|
4,500
|
344,115
|
||||||
|
1,748,735
|
||||||||
|
Energy — 12.1%
|
||||||||
|
Baker Hughes, Inc. (a)
|
9,000
|
585,540
|
||||||
|
Chevron Corporation
|
5,000
|
596,600
|
||||||
|
ConocoPhillips (a)
|
12,500
|
956,500
|
||||||
|
Devon Energy Corporation
|
12,000
|
818,160
|
||||||
|
Occidental Petroleum Corporation
|
4,200
|
403,830
|
||||||
|
Peabody Energy Corporation
|
26,000
|
321,880
|
||||||
|
Royal Dutch Shell plc - Class A - ADR
|
11,000
|
837,430
|
||||||
|
Transocean Ltd.
|
10,000
|
319,700
|
||||||
|
4,839,640
|
||||||||
|
Financials — 18.2%
|
||||||||
|
Bank of America Corporation
|
69,000
|
1,176,450
|
||||||
|
Bank of New York Mellon Corporation (The)
|
13,500
|
522,855
|
||||||
|
Capital One Financial Corporation
|
4,000
|
326,480
|
||||||
|
Comerica, Inc.
|
7,000
|
349,020
|
||||||
|
First Niagara Financial Group, Inc.
|
35,000
|
291,550
|
||||||
|
JPMorgan Chase & Company
|
20,300
|
1,222,872
|
||||||
|
Lincoln National Corporation (a)
|
17,500
|
937,650
|
||||||
|
Manulife Financial Corporation
|
24,000
|
462,000
|
||||||
|
MetLife, Inc.
|
20,000
|
1,074,400
|
||||||
|
People's United Financial, Inc.
|
18,000
|
260,460
|
||||||
|
Travelers Companies, Inc. (The)
|
7,000
|
657,580
|
||||||
|
7,281,317
|
||||||||
|
Health Care — 6.8%
|
||||||||
|
Johnson & Johnson
|
10,000
|
1,065,900
|
||||||
|
Merck & Company, Inc.
|
14,000
|
829,920
|
||||||
|
Pfizer, Inc.
|
28,000
|
827,960
|
||||||
|
2,723,780
|
||||||||
12
FBP APPRECIATION & INCOME OPPORTUNITIES FUND
SCHEDULE OF INVESTMENTS (Continued)
SCHEDULE OF INVESTMENTS (Continued)
|
COMMON STOCKS — 76.9% (Continued)
|
Shares
|
Value
|
||||||
|
Industrials — 5.9%
|
||||||||
|
Allegion plc
|
1,582
|
$
|
75,367
|
|||||
|
Avery Dennison Corporation
|
11,500
|
513,475
|
||||||
|
FedEx Corporation (a)
|
1,200
|
193,740
|
||||||
|
General Electric Company
|
17,000
|
435,540
|
||||||
|
Ingersoll-Rand plc
|
4,700
|
264,892
|
||||||
|
Koninklijke Philips N.V.
|
15,517
|
492,044
|
||||||
|
R.R. Donnelley & Sons Company
|
23,000
|
378,580
|
||||||
|
2,353,638
|
||||||||
|
Information Technology — 11.6%
|
||||||||
|
Apple, Inc. (a)
|
8,400
|
846,300
|
||||||
|
Cisco Systems, Inc.
|
40,000
|
1,006,800
|
||||||
|
Hewlett-Packard Company (a)
|
24,000
|
851,280
|
||||||
|
Intel Corporation (a)
|
10,000
|
348,200
|
||||||
|
International Business Machines Corporation
|
1,300
|
246,779
|
||||||
|
Microsoft Corporation (a)
|
17,000
|
788,120
|
||||||
|
Western Union Company (The)
|
34,000
|
545,360
|
||||||
|
4,632,839
|
||||||||
|
Materials — 8.6%
|
||||||||
|
E.I. du Pont de Nemours and Company (a)
|
12,000
|
861,120
|
||||||
|
Freeport-McMoRan Copper & Gold, Inc.
|
9,000
|
293,850
|
||||||
|
Mosaic Company (The)
|
6,000
|
266,460
|
||||||
|
Nucor Corporation (a)
|
8,000
|
434,240
|
||||||
|
Rio Tinto plc - ADR (a)
|
9,000
|
442,620
|
||||||
|
Sealed Air Corporation (a)
|
20,000
|
697,600
|
||||||
|
Sonoco Products Company
|
12,000
|
471,480
|
||||||
|
3,467,370
|
||||||||
|
Telecommunication Services — 2.1%
|
||||||||
|
AT&T, Inc.
|
15,000
|
528,600
|
||||||
|
CenturyLink, Inc.
|
8,000
|
327,120
|
||||||
|
855,720
|
||||||||
|
Utilities — 2.2%
|
||||||||
|
FirstEnergy Corporation
|
13,000
|
436,410
|
||||||
|
PPL Corporation
|
14,000
|
459,760
|
||||||
|
896,170
|
||||||||
|
Total Common Stocks (Cost $19,711,664)
|
$
|
30,787,694
|
||||||
13
FBP APPRECIATION & INCOME OPPORTUNITIES FUND
SCHEDULE OF INVESTMENTS (Continued)
SCHEDULE OF INVESTMENTS (Continued)
|
CORPORATE BONDS — 4.5%
|
Par Value
|
Value
|
||||||
|
Financials — 3.2%
|
||||||||
|
Berkley (W.R.) Corporation, 5.60%, due 05/15/2015
|
$
|
750,000
|
$
|
771,400
|
||||
|
Prudential Financial, Inc., 3.00%, due 05/12/2016
|
500,000
|
516,140
|
||||||
|
1,287,540
|
||||||||
|
Industrials — 1.3%
|
||||||||
|
Equifax, Inc., 4.45%, due 12/01/2014
|
500,000
|
500,733
|
||||||
|
Total Corporate Bonds (Cost $1,755,423)
|
$
|
1,788,273
|
||||||
|
MUNICIPAL BONDS — 0.7%
|
Par Value
|
Value
|
||||||
|
Wise Co., Virginia, Industrial Dev. Authority, Revenue, 1.70%, due 02/01/2017 (Cost $299,111)
|
$
|
300,000
|
$
|
299,559
|
||||
|
MONEY MARKET FUNDS — 18.0%
|
Shares
|
Value
|
||||||
|
Fidelity Institutional Money Market Government Portfolio - Class I, 0.01% (b)
|
3,961,234
|
$
|
3,961,234
|
|||||
|
First American Government Obligations Fund - Class Z, 0.01% (b)
|
3,256,167
|
3,256,167
|
||||||
|
Total Money Market Funds (Cost $7,217,401)
|
$
|
7,217,401
|
||||||
|
Total Investments at Value — 100.1% (Cost $28,983,599)
|
$
|
40,092,927
|
||||||
|
Liabilities in Excess of Other Assets — (0.1%)
|
(48,353
|
)
|
||||||
|
Net Assets — 100.0%
|
$
|
40,044,574
|
||||||
ADR - American Depositary Receipt.
| (a) | Security covers a written call option. |
| (b) | The rate shown is the 7-day effective yield as of September 30, 2014. |
See accompanying notes to financial statements.
14
FBP APPRECIATION & INCOME OPPORTUNITIES FUND
SCHEDULE OF OPEN OPTION CONTRACTS
September 30, 2014 (Unaudited)
SCHEDULE OF OPEN OPTION CONTRACTS
September 30, 2014 (Unaudited)
|
COVERED CALL OPTIONS
|
Option
Contracts
|
Value of
Options |
Premiums Received
|
|||||||||
|
Apple, Inc.,
|
||||||||||||
|
04/17/2015 at $110
|
28
|
$
|
10,108
|
$
|
11,814
|
|||||||
|
Archer-Daniels-Midland Company,
|
||||||||||||
|
01/17/2015 at $47
|
80
|
37,600
|
12,616
|
|||||||||
|
Baker Hughes, Inc.,
|
||||||||||||
|
10/18/2014 at $65
|
40
|
7,520
|
16,550
|
|||||||||
|
Best Buy Company, Inc.,
|
||||||||||||
|
12/20/2014 at $30
|
100
|
45,000
|
14,996
|
|||||||||
|
ConocoPhillips,
|
||||||||||||
|
01/17/2015 at $82.5
|
25
|
2,300
|
4,074
|
|||||||||
|
E.I. du Pont de Nemours and Company,
|
||||||||||||
|
01/17/2015 at $67.5
|
40
|
21,000
|
8,198
|
|||||||||
|
Fedex Corporation,
|
||||||||||||
|
01/17/2015 at $155
|
6
|
6,510
|
2,982
|
|||||||||
|
Hewlett-Packard Company,
|
||||||||||||
|
01/17/2015 at $35
|
80
|
17,200
|
17,387
|
|||||||||
|
Intel Corporation,
|
||||||||||||
|
01/17/2015 at $30
|
30
|
15,750
|
4,829
|
|||||||||
|
04/17/2015 at $37
|
30
|
4,350
|
3,809
|
|||||||||
|
Kohl's Corporation,
|
||||||||||||
|
04/17/2015 at $62.5
|
40
|
12,800
|
10,478
|
|||||||||
|
Lincoln National Corporation,
|
||||||||||||
|
04/17/2015 at $57.5
|
30
|
7,260
|
8,159
|
|||||||||
|
04/17/2015 at $60
|
20
|
3,760
|
4,139
|
|||||||||
|
Microsoft Corporation,
|
||||||||||||
|
04/17/2015 at $47
|
30
|
6,330
|
5,309
|
|||||||||
|
Nucor Corporation,
|
||||||||||||
|
04/17/2015 at $57.5
|
40
|
7,720
|
7,198
|
|||||||||
|
PepsiCo, Inc.,
|
||||||||||||
|
01/17/2015 at $92.5
|
10
|
3,120
|
1,569
|
|||||||||
|
Rio Tinto plc - ADR,
|
||||||||||||
|
01/17/2015 at $62.5
|
45
|
900
|
8,525
|
|||||||||
|
Sealed Air Corporation,
|
||||||||||||
|
04/17/2015 at $37
|
100
|
15,000
|
17,696
|
|||||||||
|
$
|
224,228
|
$
|
160,328
|
|||||||||
See accompanying notes to financial statements.
15
THE FLIPPIN, BRUCE & PORTER FUNDS
STATEMENTS OF ASSETS AND LIABILITIES
September 30, 2014 (Unaudited)
STATEMENTS OF ASSETS AND LIABILITIES
September 30, 2014 (Unaudited)
|
FBP Equity
& Dividend Plus Fund |
FBP
Appreciation & Income Opportunities Fund |
|||||||
|
ASSETS
|
||||||||
|
Investments in securities:
|
||||||||
|
At acquisition cost
|
$
|
23,837,893
|
$
|
28,983,599
|
||||
|
At value (Note 2)
|
$
|
30,272,127
|
$
|
40,092,927
|
||||
|
Cash
|
—
|
1,302
|
||||||
|
Dividends and interest receivable
|
51,801
|
72,128
|
||||||
|
Receivable for capital shares sold
|
3,507
|
163,639
|
||||||
|
Other assets
|
5,673
|
3,853
|
||||||
|
TOTAL ASSETS
|
30,333,108
|
40,333,849
|
||||||
|
LIABILITIES
|
||||||||
|
Covered call options, at value (Notes 2 and 5) (premiums received $160,859 and $160,328, respectively)
|
214,906
|
224,228
|
||||||
|
Distributions payable
|
3,906
|
17,169
|
||||||
|
Payable for capital shares redeemed
|
6,450
|
12,181
|
||||||
|
Accrued investment advisory fees (Note 4)
|
14,221
|
21,954
|
||||||
|
Payable to administrator (Note 4)
|
5,700
|
5,700
|
||||||
|
Other accrued expenses
|
7,385
|
8,043
|
||||||
|
TOTAL LIABILITIES
|
252,568
|
289,275
|
||||||
|
NET ASSETS
|
$
|
30,080,540
|
$
|
40,044,574
|
||||
|
Net assets consist of:
|
||||||||
|
Paid-in capital
|
$
|
23,014,281
|
$
|
28,416,922
|
||||
|
Accumulated (distributions in excess of) net investment income
|
329
|
(14,698
|
)
|
|||||
|
Accumulated net realized gains from security transactions
|
685,743
|
596,922
|
||||||
|
Net unrealized appreciation (depreciation) on:
|
||||||||
|
Investments
|
6,434,234
|
11,109,328
|
||||||
|
Option contracts
|
(54,047
|
)
|
(63,900
|
)
|
||||
|
Net assets
|
$
|
30,080,540
|
$
|
40,044,574
|
||||
|
Shares of beneficial interest outstanding (unlimited number of shares authorized, $0.01 par value)
|
1,172,581
|
2,113,340
|
||||||
|
Net asset value, offering price and redemption price per share (Note 2)
|
$
|
25.65
|
$
|
18.95
|
||||
See accompanying notes to financial statements.
16
THE FLIPPIN, BRUCE & PORTER FUNDS
STATEMENTS OF OPERATIONS
Six Months Ended September 30, 2014 (Unaudited)
STATEMENTS OF OPERATIONS
Six Months Ended September 30, 2014 (Unaudited)
|
FBP Equity
& Dividend Plus Fund |
FBP Appreciation
& Income Opportunities Fund |
|||||||
|
INVESTMENT INCOME
|
||||||||
|
Dividends
|
$
|
438,963
|
$
|
445,543
|
||||
|
Foreign withholding taxes on dividends
|
(5,224
|
)
|
(4,255
|
)
|
||||
|
Interest
|
—
|
37,373
|
||||||
|
TOTAL INVESTMENT INCOME
|
433,739
|
478,661
|
||||||
|
EXPENSES
|
||||||||
|
Investment advisory fees (Note 4)
|
102,125
|
142,054
|
||||||
|
Administration fees (Note 4)
|
30,000
|
30,000
|
||||||
|
Professional fees
|
8,345
|
8,703
|
||||||
|
Registration and filing fees
|
6,273
|
4,273
|
||||||
|
Compliance service fees (Note 4)
|
4,200
|
4,200
|
||||||
|
Custodian and bank service fees
|
3,825
|
4,461
|
||||||
|
Postage and supplies
|
4,612
|
3,653
|
||||||
|
Printing of shareholder reports
|
4,846
|
3,026
|
||||||
|
Trustees' fees and expenses (Note 4)
|
3,242
|
3,242
|
||||||
|
Insurance expense
|
776
|
1,038
|
||||||
|
Other expenses
|
3,549
|
4,174
|
||||||
|
TOTAL EXPENSES
|
171,793
|
208,824
|
||||||
|
Fees voluntarily waived by the Adviser (Note 4)
|
(15,687
|
)
|
(5,889
|
)
|
||||
|
NET EXPENSES
|
156,106
|
202,935
|
||||||
|
NET INVESTMENT INCOME
|
277,633
|
275,726
|
||||||
|
REALIZED AND UNREALIZED GAINS (LOSSES) ON INVESTMENTS
|
||||||||
|
Net realized gains (losses) from:
|
||||||||
|
Security transactions
|
852,969
|
644,329
|
||||||
|
Option contracts (Note 5)
|
9,163
|
(47,239
|
)
|
|||||
|
Net change in unrealized appreciation/depreciation on:
|
||||||||
|
Investments
|
125,087
|
232,549
|
||||||
|
Option contracts (Note 5)
|
(4,579
|
)
|
(3,930
|
)
|
||||
|
NET REALIZED AND UNREALIZED GAINS ON INVESTMENTS
|
982,640
|
825,709
|
||||||
|
NET INCREASE IN NET ASSETS FROM OPERATIONS
|
$
|
1,260,273
|
$
|
1,101,435
|
||||
See accompanying notes to financial statements.
17
THE FLIPPIN, BRUCE & PORTER FUNDS
STATEMENTS OF CHANGES IN NET ASSETS
STATEMENTS OF CHANGES IN NET ASSETS
|
FBP Equity &
Dividend Plus Fund |
FBP Appreciation
& Income Opportunities Fund |
|||||||||||||||
|
Six Months Ended
Sept. 30, 2014 (Unaudited) |
Year Ended
March 31, 2014 |
Six Months Ended
Sept. 30, 2014 (Unaudited) |
Year Ended
March 31, 2014 |
|||||||||||||
|
FROM OPERATIONS
|
||||||||||||||||
|
Net investment income
|
$
|
277,633
|
$
|
466,278
|
$
|
275,726
|
$
|
528,175
|
||||||||
|
Net realized gains (losses) from:
|
||||||||||||||||
|
Security transactions
|
852,969
|
1,384,299
|
644,329
|
1,586,562
|
||||||||||||
|
Option contracts (Note 5)
|
9,163
|
(84,400
|
)
|
(47,239
|
)
|
(137,226
|
)
|
|||||||||
|
Net realized gains from in-kind redemptions (Note 2)
|
—
|
235,484
|
—
|
210,674
|
||||||||||||
|
Net change in unrealized appreciation/depreciation on:
|
||||||||||||||||
|
Investments
|
125,087
|
1,583,397
|
232,549
|
3,640,782
|
||||||||||||
|
Option contracts (Note 5)
|
(4,579
|
)
|
246,913
|
(3,930
|
)
|
76,649
|
||||||||||
|
Net increase in net assets from operations
|
1,260,273
|
3,831,971
|
1,101,435
|
5,905,616
|
||||||||||||
|
DISTRIBUTIONS TO SHAREHOLDERS
|
||||||||||||||||
|
From net investment income
|
(281,930
|
)
|
(462,094
|
)
|
(282,891
|
)
|
(556,942
|
)
|
||||||||
|
From net realized gains from security transactions
|
—
|
—
|
(856,148
|
)
|
(1,448,777
|
)
|
||||||||||
|
Decrease in net assets from distributions to shareholders
|
(281,930
|
)
|
(462,094
|
)
|
(1,139,039
|
)
|
(2,005,719
|
)
|
||||||||
|
FROM CAPITAL SHARE TRANSACTIONS
|
||||||||||||||||
|
Proceeds from shares sold
|
2,497,753
|
3,288,580
|
670,916
|
739,705
|
||||||||||||
|
Net asset value of shares issued in reinvestment of distributions to shareholders
|
274,487
|
449,317
|
1,053,274
|
1,842,320
|
||||||||||||
|
Payments for shares redeemed
|
(1,463,904
|
)
|
(1,883,877
|
)
|
(1,592,696
|
)
|
(3,356,340
|
)
|
||||||||
|
Net increase (decrease) in net assets from capital share transactions
|
1,308,336
|
1,854,020
|
131,494
|
(774,315
|
)
|
|||||||||||
|
TOTAL INCREASE IN NET ASSETS
|
2,286,679
|
5,223,897
|
93,890
|
3,125,582
|
||||||||||||
|
NET ASSETS
|
||||||||||||||||
|
Beginning of period
|
27,793,861
|
22,569,964
|
39,950,684
|
36,825,102
|
||||||||||||
|
End of period
|
$
|
30,080,540
|
$
|
27,793,861
|
$
|
40,044,574
|
$
|
39,950,684
|
||||||||
|
ACCUMULATED (DISTRIBUTIONS IN EXCESS OF) NET INVESTMENT INCOME
|
$
|
329
|
$
|
4,626
|
$
|
(14,698
|
)
|
$
|
(7,533
|
)
|
||||||
|
CAPITAL SHARE ACTIVITY
|
||||||||||||||||
|
Shares sold
|
98,290
|
140,207
|
34,917
|
40,597
|
||||||||||||
|
Shares reinvested
|
10,697
|
18,951
|
55,149
|
103,512
|
||||||||||||
|
Shares redeemed
|
(58,060
|
)
|
(78,999
|
)
|
(82,980
|
)
|
(183,790
|
)
|
||||||||
|
Net increase (decrease) in shares outstanding
|
50,927
|
80,159
|
7,086
|
(39,681
|
)
|
|||||||||||
|
Shares outstanding at beginning of period
|
1,121,654
|
1,041,495
|
2,106,254
|
2,145,935
|
||||||||||||
|
Shares outstanding at end of period
|
1,172,581
|
1,121,654
|
2,113,340
|
2,106,254
|
||||||||||||
See accompanying notes to financial statements.
18
FBP EQUITY & DIVIDEND PLUS FUND
FINANCIAL HIGHLIGHTS
FINANCIAL HIGHLIGHTS
Selected Per Share Data and Ratios for a Share Outstanding Throughout Each Period
|
Six Months Ended
Sept. 30, 2014 |
Years Ended March 31,
|
|||||||||||||||||||||||
|
(Unaudited)
|
2014
|
2013
|
2012
|
2011
|
2010
|
|||||||||||||||||||
|
Net asset value at beginning of period
|
$
|
24.78
|
$
|
21.67
|
$
|
19.10
|
$
|
20.70
|
$
|
19.42
|
$
|
12.02
|
||||||||||||
|
Income (loss) from investment operations:
|
||||||||||||||||||||||||
|
Net investment income
|
0.24
|
0.42
|
0.47
|
0.23
|
0.15
|
0.12
|
||||||||||||||||||
|
Net realized and unrealized gains (losses) on investments
|
0.87
|
3.11
|
2.56
|
(1.59
|
)
|
1.27
|
7.41
|
|||||||||||||||||
|
Total from investment operations
|
1.11
|
3.53
|
3.03
|
(1.36
|
)
|
1.42
|
7.53
|
|||||||||||||||||
|
Less distributions:
|
||||||||||||||||||||||||
|
Dividends from net investment income
|
(0.24
|
)
|
(0.42
|
)
|
(0.46
|
)
|
(0.24
|
)
|
(0.14
|
)
|
(0.13
|
)
|
||||||||||||
|
Net asset value at end of period
|
$
|
25.65
|
$
|
24.78
|
$
|
21.67
|
$
|
19.10
|
$
|
20.70
|
$
|
19.42
|
||||||||||||
|
Total return (a)
|
4.50
|
%(b)
|
16.40
|
%
|
16.19
|
%
|
(6.49
|
%)
|
7.40
|
%
|
62.84
|
%
|
||||||||||||
|
Net assets at end of period (000's)
|
$
|
30,081
|
$
|
27,794
|
$
|
22,570
|
$
|
23,194
|
$
|
27,407
|
$
|
28,617
|
||||||||||||
|
Ratio of total expenses to average net assets
|
1.18
|
%(c)
|
1.21
|
%
|
1.29
|
%
|
1.29
|
%
|
1.19
|
%
|
1.19
|
%
|
||||||||||||
|
Ratio of net expenses to average net assets (d)
|
1.07
|
%(c)
|
1.07
|
%
|
1.07
|
%
|
1.07
|
%
|
1.07
|
%
|
1.07
|
%
|
||||||||||||
|
Ratio of net investment income to average net assets (d)
|
1.90
|
%(c)
|
1.82
|
%
|
2.40
|
%
|
1.24
|
%
|
0.78
|
%
|
0.74
|
%
|
||||||||||||
|
Portfolio turnover rate
|
8
|
%(b)
|
24
|
%
|
32
|
%
|
46
|
%
|
25
|
%
|
21
|
%
|
||||||||||||
| (a) | Total return is a measure of the change in value of an investment in the Fund over the period covered, which assumes any dividends or capital gains distributions are reinvested in shares of the Fund. Returns shown do not reflect the deduction of taxes a shareholder would pay on Fund distributions or the redemption of Fund shares. |
| (b) | Not annualized. |
| (c) | Annualized. |
| (d) | Ratios were determined after voluntary advisory fee waivers by the Adviser (Note 4). |
See accompanying notes to financial statements.
19
FBP APPRECIATION & INCOME OPPORTUNITIES FUND
FINANCIAL HIGHLIGHTS
FINANCIAL HIGHLIGHTS
Selected Per Share Data and Ratios for a Share Outstanding Throughout Each Period
|
Six Months Ended
Sept. 30, 2014 |
Years Ended March 31,
|
|||||||||||||||||||||||
|
(Unaudited)
|
2014
|
2013
|
2012
|
2011
|
2010
|
|||||||||||||||||||
|
Net asset value at beginning of period
|
$
|
18.97
|
$
|
17.16
|
$
|
15.85
|
$
|
16.35
|
$
|
15.49
|
$
|
10.97
|
||||||||||||
|
Income (loss) from investment operations:
|
||||||||||||||||||||||||
|
Net investment income
|
0.13
|
0.25
|
0.29
|
0.26
|
0.24
|
0.27
|
||||||||||||||||||
|
Net realized and unrealized gains (losses) on investments
|
0.39
|
2.50
|
1.61
|
(0.46
|
)
|
0.88
|
4.53
|
|||||||||||||||||
|
Total from investment operations
|
0.52
|
2.75
|
1.90
|
(0.20
|
)
|
1.12
|
4.80
|
|||||||||||||||||
|
Less distributions:
|
||||||||||||||||||||||||
|
Dividends from net investment income
|
(0.13
|
)
|
(0.26
|
)
|
(0.30
|
)
|
(0.30
|
)
|
(0.26
|
)
|
(0.28
|
)
|
||||||||||||
|
Distributions from net realized gains
|
(0.41
|
)
|
(0.68
|
)
|
(0.29
|
)
|
—
|
—
|
—
|
|||||||||||||||
|
Total distributions
|
(0.54
|
)
|
(0.94
|
)
|
(0.59
|
)
|
(0.30
|
)
|
(0.26
|
)
|
(0.28
|
)
|
||||||||||||
|
Net asset value at end of period
|
$
|
18.95
|
$
|
18.97
|
$
|
17.16
|
$
|
15.85
|
$
|
16.35
|
$
|
15.49
|
||||||||||||
|
Total return (a)
|
2.73
|
%(b)
|
16.50
|
%
|
12.51
|
%
|
(1.13
|
%)
|
7.35
|
%
|
44.01
|
%
|
||||||||||||
|
Net assets at end of period (000's)
|
$
|
40,045
|
$
|
39,951
|
$
|
36,825
|
$
|
39,520
|
$
|
46,406
|
$
|
45,507
|
||||||||||||
|
Ratio of total expenses to average net assets
|
1.03
|
%(c)
|
1.03
|
%
|
1.06
|
%
|
1.06
|
%
|
1.03
|
%
|
1.03
|
%
|
||||||||||||
|
Ratio of net expenses to average net assets (d)
|
1.00
|
%(c)
|
1.00
|
%
|
1.00
|
%
|
1.00
|
%
|
1.00
|
%
|
1.00
|
%
|
||||||||||||
|
Ratio of net investment income to average net assets (d)
|
1.36
|
%(c)
|
1.36
|
%
|
1.83
|
%
|
1.71
|
%
|
1.59
|
%
|
1.90
|
%
|
||||||||||||
|
Portfolio turnover rate
|
3
|
%(b)
|
10
|
%
|
15
|
%
|
17
|
%
|
24
|
%
|
24
|
%
|
||||||||||||
| (a) | Total return is a measure of the change in value of an investment in the Fund over the period covered, which assumes any dividends or capital gains distributions are reinvested in shares of the Fund. Returns shown do not reflect the deduction of taxes a shareholder would pay on Fund distributions or the redemption of Fund shares. |
| (b) | Not annualized. |
| (c) | Annualized. |
| (d) | Ratios were determined after voluntary advisory fee waivers by the Adviser (Note 4). |
See accompanying notes to financial statements.
20
THE FLIPPIN, BRUCE & PORTER FUNDS
NOTES TO FINANCIAL STATEMENTS
September 30, 2014 (Unaudited)
NOTES TO FINANCIAL STATEMENTS
September 30, 2014 (Unaudited)
1. Organization
FBP Equity & Dividend Plus Fund and FBP Appreciation & Income Opportunities Fund (the "Funds") are no-load, diversified series of Williamsburg Investment Trust (the "Trust"), an open-end management investment company registered under the Investment Company Act of 1940. The Trust was organized as a Massachusetts business trust on July 18, 1988. Other series of the Trust are not included in this report.
FBP Equity & Dividend Plus Fund seeks to provide above-average and growing income while also achieving long-term growth of capital.
FBP Appreciation & Income Opportunities Fund seeks long term capital appreciation and current income, assuming a moderate level of investment risk.
2. Significant Accounting Policies
The following is a summary of the Funds' significant accounting policies. The policies are in conformity with accounting principles generally accepted in the United States of America ("GAAP").
Securities valuation — The Funds' portfolio securities are valued as of the close of business of the regular session of the New York Stock Exchange (normally 4:00 p.m., Eastern time). Securities traded on a national stock exchange are valued based upon the closing price on the principal exchange where the security is traded, if available, otherwise, at the last quoted bid price. Securities which are quoted by NASDAQ are valued at the NASDAQ Official Closing Price. Call options written by the Funds are valued at the then current market quotation, using the ask price as of the close of each day on the principal exchanges on which they are traded.
Fixed income securities are valued on the basis of prices provided by an independent pricing service. The prices provided by the pricing service are determined with consideration given to institutional bid and last sale prices and take into account securities prices, yields, maturities, call features, ratings, institutional trading in similar groups of securities and developments related to specific securities and will be classified as Level 2 within the fair value hierarchy (see below).
When market quotations are not readily available, if a pricing service cannot provide a price or the investment adviser believes the price received from the pricing service is not indicative of fair value, securities will be valued in good faith at fair value using methods consistent with those determined by the Board of Trustees and will be classified as Level 2 or 3 within the fair value hierarchy, depending on the inputs used. Such methods of fair valuation may include, but are not limited to: multiple of earnings, multiple of book value, discount from market of a similar freely traded security, purchase price of the security, subsequent private transactions in the security or related securities, or a combination of these and other factors.
21
THE FLIPPIN, BRUCE & PORTER FUNDS
NOTES TO FINANCIAL STATEMENTS (Continued)
NOTES TO FINANCIAL STATEMENTS (Continued)
GAAP establishes a single authoritative definition of fair value, sets out a framework for measuring fair value and requires additional disclosures about fair value measurements. Various inputs are used in determining the value of each Fund's investments. These inputs are summarized in the three broad levels listed below:
| • | Level 1 – quoted prices in active markets for identical securities |
| • | Level 2 – other significant observable inputs |
| • | Level 3 – significant unobservable inputs |
Fixed income securities, including corporate bonds and municipal bonds, held by FBP Appreciation & Income Opportunities Fund are classified as Level 2 since the values for such securities are based on prices provided by an independent pricing service that utilizes various "other significant observable inputs" including bid and ask quotations, prices of similar securities and interest rates, among other factors.
The inputs or methodology used for valuing securities are not necessarily an indication of the risks associated with investing in those securities. The inputs used to measure fair value may fall into different levels of the fair value hierarchy. In such cases, for disclosure purposes, the level in the fair value hierarchy within which the fair value measurement falls in its entirety is determined based on the lowest level input that is significant to the fair value measurement.
The following is a summary of the inputs used to value each Fund's investments and other financial instruments as of September 30, 2014 by security type:
|
FBP Equity & Dividend Plus Fund
|
Level 1
|
Level 2
|
Level 3
|
Total
|
||||||||||||
|
Investments in Securities:
|
||||||||||||||||
|
Common Stocks
|
$
|
26,169,394
|
$
|
—
|
$
|
—
|
$
|
26,169,394
|
||||||||
|
Money Market Funds
|
4,102,733
|
—
|
—
|
4,102,733
|
||||||||||||
|
Total
|
$
|
30,272,127
|
$
|
—
|
$
|
—
|
$
|
30,272,127
|
||||||||
|
Other Financial Instruments:
|
||||||||||||||||
|
Written Covered Call Options
|
$
|
(214,906
|
)
|
$
|
—
|
$
|
—
|
$
|
(214,906
|
)
|
||||||
|
Total
|
$
|
(214,906
|
)
|
$
|
—
|
$
|
—
|
$
|
(214,906
|
)
|
||||||
|
FBP Appreciation & Income Opportunities Fund
|
Level 1
|
Level 2
|
Level 3
|
Total
|
||||||||||||
|
Investments in Securities:
|
||||||||||||||||
|
Common Stocks
|
$
|
30,787,694
|
$
|
—
|
$
|
—
|
$
|
30,787,694
|
||||||||
|
Corporate Bonds
|
—
|
1,788,273
|
—
|
1,788,273
|
||||||||||||
|
Municipal Bonds
|
—
|
299,559
|
—
|
299,559
|
||||||||||||
|
Money Market Funds
|
7,217,401
|
—
|
—
|
7,217,401
|
||||||||||||
|
Total
|
$
|
38,005,095
|
$
|
2,087,832
|
$
|
—
|
$
|
40,092,927
|
||||||||
|
Other Financial Instruments:
|
||||||||||||||||
|
Written Covered Call Options
|
$
|
(224,228
|
)
|
$
|
—
|
$
|
—
|
$
|
(224,228
|
)
|
||||||
|
Total
|
$
|
(224,228
|
)
|
$
|
—
|
$
|
—
|
$
|
(224,228
|
)
|
||||||
22
THE FLIPPIN, BRUCE & PORTER FUNDS
NOTES TO FINANCIAL STATEMENTS (Continued)
NOTES TO FINANCIAL STATEMENTS (Continued)
Refer to each Fund's Schedule of Investments for a listing of the common stocks and corporate bonds by sector type. As of September 30, 2014, the Funds did not have any transfers in and out of any Level. There were no Level 3 securities held by the Funds as of September 30, 2014. It is the Funds' policy to recognize transfers into and out of any Level at the end of the reporting period.
Share valuation — The net asset value per share of each Fund is calculated daily by dividing the total value of its assets, less liabilities, by the number of shares outstanding. The offering price and redemption price per share of each Fund is equal to its net asset value per share.
Investment income — Interest income is accrued as earned. Dividend income is recorded on the ex-dividend date. Discounts and premiums on fixed income securities purchased are amortized using the interest method.
Distributions to shareholders — Dividends arising from net investment income are declared and paid quarterly to shareholders of each Fund. Net realized short-term capital gains, if any, may be distributed throughout the year and net realized long-term capital gains, if any, are distributed at least once each year. The amount of distributions from net investment income and net realized gains are determined in accordance with federal income tax regulations, which may differ from GAAP. These "book/tax" differences are either temporary or permanent in nature. Dividends and distributions are recorded on the ex-dividend date. The tax character of distributions paid during the periods ended September 30, 2014 and March 31, 2014 was as follows:
|
|
Period
Ended |
Ordinary
Income
|
Long-Term Capital Gains
|
Total Distributions
|
|||||||||
|
FBP Equity & Dividend Plus Fund
|
9/30/2014
|
$
|
281,930
|
$
|
—
|
$
|
281,930
|
||||||
|
3/31/2014
|
$
|
462,094
|
$
|
—
|
$
|
462,094
|
|||||||
|
FBP Appreciation & Income Opportunities Fund
|
9/30/2014
|
$
|
282,891
|
$
|
856,148
|
$
|
1,139,039
|
||||||
|
3/31/2014
|
$
|
559,059
|
$
|
1,446,660
|
$
|
2,005,719
|
|||||||
Security transactions — Security transactions are accounted for on trade date for financial reporting purposes. Gains and losses on securities sold are determined on a specific identification basis.
Common expenses — Common expenses of the Trust are allocated among the series of the Trust based on relative net assets of each series or the nature of the services performed and the relative applicability to each series.
Options transactions — When the Funds' investment adviser believes that individual portfolio securities held by the Funds are approaching the top of the adviser's growth and price expectations, covered call options may be written (sold) against such securities and the Funds will receive a premium in return. The Funds write options only for income generation and hedging purposes and not for speculation. The premiums received from writing the options are recorded as a liability and are subsequently valued daily at the closing prices on their primary exchanges. Premiums received from writing options which expire are treated as realized gains. Premiums received from writing options which are exercised increase the proceeds used to calculate the realized gain or loss on the sale of the security. If a closing purchase transaction is used to terminate a Fund's obligation on a call option, a gain or loss will be realized, depending upon whether the price of the closing purchase transaction is more or less than the premium previously received on the call option written.
23
THE FLIPPIN, BRUCE & PORTER FUNDS
NOTES TO FINANCIAL STATEMENTS (Continued)
NOTES TO FINANCIAL STATEMENTS (Continued)
The Funds may also purchase put options on stock indices. By purchasing a put option on a stock index, a Fund could hedge the risk of a general market decline. The value of the put option would be expected to rise as a result of a market decline and thus could offset all or a portion of losses resulting from declines in the prices of individual securities held by a Fund. However, option premiums tend to decrease over time as the expiration date nears. Therefore, because of the cost of the option (in the form of premium and transaction costs), the Fund would suffer a loss on the put option if prices do not decline, or do not decline sufficiently, to offset the deterioration in the value of the option premium. Premiums paid for buying options that expire are treated as realized losses. Premiums paid from buying options which are exercised decrease the proceeds used to calculate the realized gain or loss on the exercise of the options.
Estimates — The preparation of financial statements in conformity with GAAP requires management to make estimates and assumptions that affect the reported amounts of assets and liabilities and the disclosure of contingent assets and liabilities as of the date of the financial statements and the reported amounts of income and expenses during the reporting period. Actual results could differ from those estimates.
Federal income tax — Each Fund has qualified and intends to continue to qualify as a regulated investment company under the Internal Revenue Code of 1986 (the "Code"). Qualification generally will relieve the Funds of liability for federal income taxes to the extent 100% of their net investment income and any net realized capital gains are distributed in accordance with the Code. Accordingly, no provision for income tax has been made.
In order to avoid imposition of the excise tax applicable to regulated investment companies, it is also each Fund's intention to declare as dividends in each calendar year at least 98% of its net investment income (earned during the calendar year) and 98.2% of its net realized capital gains (earned during the twelve months ended October 31) plus undistributed amounts from prior years.
The following information is computed on a tax basis for each item as of September 30, 2014:
|
FBP Equity
& Dividend Plus Fund |
FBP Appreciation & Income Opportunities
Fund |
|||||||
|
Tax cost of portfolio investments
|
$
|
23,837,893
|
$
|
28,999,244
|
||||
|
Gross unrealized appreciation
|
$
|
6,831,302
|
$
|
11,812,649
|
||||
|
Gross unrealized depreciation
|
(397,068
|
)
|
(718,966
|
)
|
||||
|
Net unrealized appreciation on investments
|
6,434,234
|
11,093,683
|
||||||
|
Net unrealized depreciation on option contracts
|
(54,047
|
)
|
(63,900
|
)
|
||||
|
Undistributed ordinary income
|
4,235
|
18,116
|
||||||
|
Capital loss carryforwards
|
(176,389
|
)
|
—
|
|||||
|
Other gains
|
862,132
|
596,922
|
||||||
|
Other temporary differences
|
(3,906
|
)
|
(17,169
|
)
|
||||
|
Accumulated earnings
|
$
|
7,066,259
|
$
|
11,627,652
|
||||
As of September 30, 2014, the tax cost of written options for FBP Equity & Dividend Plus Fund and FBP Appreciation & Income Opportunities Fund is $160,859 and $160,328, respectively.
24
THE FLIPPIN, BRUCE & PORTER FUNDS
NOTES TO FINANCIAL STATEMENTS (Continued)
NOTES TO FINANCIAL STATEMENTS (Continued)
The difference between the federal income tax cost of portfolio investments and the financial statement cost for FBP Appreciation & Income Opportunities Fund is due to certain differences in the recognition of capital gains and losses under income tax regulations and GAAP. These "book/tax" differences are temporary in nature and are primarily due to differing methods in the amortization of discounts and premiums on fixed income securities.
As of March 31, 2014, FBP Equity & Dividend Plus Fund had short-term capital loss carryforwards for federal income tax purposes of $176,389, which expire on March 31, 2018. These capital loss carryforwards may be utilized in the current and future years to offset net realized capital gains, if any, prior to distributing such gains to shareholders. Under the Regulated Investment Company Modernization Act of 2010 (the "Act"), net capital losses realized after March 31, 2011 may be carried forward indefinitely and their character is retained as short-term and/or long-term losses. Under the law in effect prior to the Act, pre-enactment net capital losses were carried forward for eight years and treated as short-term losses. As a transition rule, the Act requires that post-enactment net capital losses be used before pre-enactment net capital losses. Therefore, there may be a greater likelihood that all or a portion of the FBP Equity & Dividend Plus Fund's capital loss carryovers may expire without being utilized.
During the year ended March 31, 2014, FBP Equity & Dividend Plus Fund and FBP Appreciation & Income Opportunities Fund realized $235,484 and $210,674, respectively, of net capital gains resulting from in-kind redemptions (redemptions in which shareholders who redeemed Fund shares received securities held by the Fund rather than cash). The Fund recognizes a gain on in-kind redemptions to the extent that the value of the distributed securities on the date of redemption exceeds the cost of those securities. Such gains are not taxable to the Fund and are not required to be distributed to shareholders.
The Funds recognize the tax benefits or expenses of uncertain tax positions only when the position is "more likely than not" to be sustained assuming examination by tax authorities. Management has reviewed the tax positions taken on federal income tax returns for the current and all open tax years (tax years ended March 31, 2011 through March 31, 2014) of each Fund and has concluded that no provision for unrecognized tax benefits or expenses is required in these financial statements.
3. Investment Transactions
During the six months ended September 30, 2014, cost of purchases and proceeds from sales and maturities of investment securities, other than short-term investments and U.S. Government securities, totaled $2,132,229 and $2,580,795, respectively, for FBP Equity & Dividend Plus Fund and $1,065,722 and $1,478,201, respectively, for FBP Appreciation & Income Opportunities Fund.
4. Transactions with Related Parties
INVESTMENT ADVISORY AGREEMENTS
Each Fund's investments are managed by Flippin, Bruce & Porter, Inc. (the "Adviser") under the terms of an Investment Advisory Agreement. Under the Investment Advisory Agreements, each Fund pays the Adviser a fee, which is computed and accrued daily and paid monthly, at an annual rate of .70% of its average daily net assets up to $250 million; .65% of the next $250 million of such assets; and .50% of such assets in excess of $500 million.
25
THE FLIPPIN, BRUCE & PORTER FUNDS
NOTES TO FINANCIAL STATEMENTS (Continued)
NOTES TO FINANCIAL STATEMENTS (Continued)
During the six months ended September 30, 2014, the Adviser voluntarily waived $15,687 and $5,889 of its investment advisory fees from FBP Equity & Dividend Plus Fund and FBP Appreciation & Income Opportunities Fund, respectively.
Certain officers of the Trust are also officers of the Adviser.
OTHER SERVICE PROVIDERS
Ultimus Fund Solutions, LLC ("Ultimus") provides fund administration, fund accounting, compliance and transfer agent services to the Funds. The Funds pay Ultimus fees in accordance with the agreements for such services. In addition, the Funds pay out-of-pocket expenses including, but not limited to, postage, supplies, and costs of pricing the Funds' portfolio securities. Certain officers of the Trust are also officers of Ultimus, or of Ultimus Fund Distributors, LLC (the "Distributor"), the principal underwriter of each Fund's shares and an affiliate of Ultimus. The Distributor is compensated by the Adviser (not the Funds) for acting as principal underwriter.
COMPENSATION OF TRUSTEES
Trustees and officers affiliated with the Adviser or Ultimus are not compensated by the Trust for their services. Each Trustee who is not an affiliated person of the Adviser or Ultimus receives from the Trust an annual retainer of $12,000, payable quarterly; a fee of $1,500 for attendance at each meeting of the Board of Trustees (except that such fee is $2,500 for the independent chariman); and a fee of $1,000 for attendance at each meeting of any committee of the Board (except that such fee is $1,500 for the committee chairman); plus reimbursement of travel and other expenses incurred in attending meetings. Prior to July 1, 2014, the annual retainer was $10,000.
5. Derivatives Transactions
Transactions in option contracts written by the Funds during the six months ended September 30, 2014 were as follows:
|
FBP Equity & Dividend Plus Fund |
FBP Appreciation
& Income Opportunities Fund |
|||||||||||||||
|
Option
Contracts
|
Option
Premiums
|
Option
Contracts
|
Option
Premiums
|
|||||||||||||
|
Options outstanding at beginning of period
|
1,053
|
$
|
162,724
|
493
|
$
|
107,372
|
||||||||||
|
Options written
|
1,046
|
169,274
|
734
|
143,779
|
||||||||||||
|
Options cancelled in a closing purchase transaction
|
(230
|
)
|
(28,634
|
)
|
(45
|
)
|
(9,065
|
)
|
||||||||
|
Options expired
|
(206
|
)
|
(35,419
|
)
|
(112
|
)
|
(21,244
|
)
|
||||||||
|
Options exercised
|
(662
|
)
|
(107,086
|
)
|
(296
|
)
|
(60,514
|
)
|
||||||||
|
Options outstanding at end of period
|
1,001
|
$
|
160,859
|
774
|
$
|
160,328
|
||||||||||
26
THE FLIPPIN, BRUCE & PORTER FUNDS
NOTES TO FINANCIAL STATEMENTS (Continued)
NOTES TO FINANCIAL STATEMENTS (Continued)
The location in the Statements of Assets and Liabilities of the Funds' derivative positions is as follows:
FBP Equity & Dividend Plus Fund
|
Fair Value |
|||||||||||||
|
Type of Derivative
|
Location
|
Asset
Derivatives
|
Liability Derivatives
|
Gross Notional Amount Outstanding September 30,
2014 |
|||||||||
|
Covered call options written
|
Covered call options, at value
|
—
|
$
|
(214,906
|
)
|
$
|
(4,374,550
|
)
|
|||||
FBP Appreciation & Income Opportunities Fund
|
Fair Value |
|||||||||||||
|
Type of Derivative
|
Location
|
Asset
Derivatives
|
Liability
Derivatives
|
Gross Notional Amount Outstanding September 30,
2014 |
|||||||||
|
Covered call options written
|
Covered call options, at value
|
—
|
$
|
(224,228
|
)
|
$
|
(3,886,350
|
)
|
|||||
The average monthly notional amount of option contracts written during the six months ended September 30, 2014 was $3,597,263 and $2,662,786 for FBP Equity & Dividend Plus Fund and FBP Appreciation & Income Opportunities Fund, respectively.
The Funds held no put option contracts on stock indices as of September 30, 2014. The average notional amount of put option contracts purchased during the six months ended September 30, 2014 for FBP Equity & Dividend Plus Fund and FBP Appreciation & Income Opportunities Fund was $1,608,892 and $2,413,338, respectively.
Transactions in derivative instruments during the six months ended September 30, 2014 by the Funds are recorded in the following location in the Statements of Operations:
FBP Equity & Dividend Plus Fund
|
Type of Derivative
|
Location
|
Net
Realized Gains (Losses) |
Location
|
Change in Unrealized Gains (Losses)
|
||||||
|
Covered call options written
|
Net realized gains (losses) from option contracts
|
$
|
60,340
|
Net change in unrealized appreciation/depreciation on option contracts
|
$
|
(4,579
|
)
|
|||
|
Purchased index put options
|
Net realized gains (losses) from option contracts
|
$
|
(51,177
|
)
|
Net change in unrealized appreciation/depreciation on option contracts
|
$
|
—
|
|||
27
THE FLIPPIN, BRUCE & PORTER FUNDS
NOTES TO FINANCIAL STATEMENTS (Continued)
NOTES TO FINANCIAL STATEMENTS (Continued)
FBP Appreciation & Income Opportunities Fund
|
Type of Derivative
|
Location
|
Net
Realized Gains (Losses) |
Location
|
Change in Unrealized Gains (Losses)
|
||||||
|
Covered call options written
|
Net realized gains (losses)
from option contracts
|
$
|
29,527
|
Net change in unrealized appreciation/depreciation on option contracts
|
$
|
(3,930
|
)
|
|||
|
Purchased index put options
|
Net realized gains (losses)
from option contracts
|
$
|
(76,766
|
)
|
Net change in unrealized appreciation/depreciation on option contracts
|
$
|
—
|
|||
6. Contingencies and Commitments
The Funds indemnify the Trust's officers and Trustees for certain liabilities that might arise from their performance of their duties to the Funds. Additionally, in the normal course of business the Funds enter into contracts that contain a variety of representations and warranties and which provide general indemnifications. The Funds' maximum exposure under these arrangements is unknown, as this would involve future claims that may be made against the Funds that have not yet occurred. However, based on experience, the Funds expect the risk of loss to be remote.
7. Subsequent Events
The Funds are required to recognize in the financial statements the effects of all subsequent events that provide additional evidence about conditions that existed as of the date of the Statements of Assets and Liabilities. For non-recognized subsequent events that must be disclosed to keep the financial statements from being misleading, the Funds are required to disclose the nature of the event as well as an estimate of its financial effect, or a statement that such an estimate cannot be made. Management has evaluated subsequent events through the issuance of these financial statements and has noted no such events.
28
THE FLIPPIN, BRUCE & PORTER FUNDS
ABOUT YOUR FUNDS' EXPENSES (Unaudited)
ABOUT YOUR FUNDS' EXPENSES (Unaudited)
We believe it is important for you to understand the impact of costs on your investment. All mutual funds have operating expenses. As a shareholder of the Funds, you incur ongoing costs, including management fees and other operating expenses. These ongoing costs, which are deducted from each Fund's gross income, directly reduce the investment return of the Funds.
A mutual fund's ongoing costs are expressed as a percentage of its average net assets. This figure is known as the expense ratio. The following examples are intended to help you understand the ongoing costs (in dollars) of investing in the Funds and to compare these costs with the ongoing costs of investing in other mutual funds. The examples below are based on an investment of $1,000 made at the beginning of the period shown and held for the entire period (April 1, 2014 through September 30, 2014).
The table below illustrates each Fund's ongoing costs in two ways:
Actual fund return – This section helps you to estimate the actual expenses that you paid over the period. The "Ending Account Value" shown is derived from each Fund's actual return, and the third column shows the dollar amount of operating expenses that would have been paid by an investor who started with $1,000 in the Funds. You may use the information here, together with the amount you invested, to estimate the expenses that you paid over the period.
To do so, simply divide your account value by $1,000 (for example, an $8,600 account value divided by $1,000 = 8.6), then multiply the result by the number given for the Funds under the heading "Expenses Paid During Period."
Hypothetical 5% return – This section is intended to help you compare the Funds' ongoing costs with those of other mutual funds. It assumes that each Fund had an annual return of 5% before expenses during the period shown, but that the expense ratio is unchanged. In this case, because the returns used are not the Funds' actual returns, the results do not apply to your investment. The example is useful in making comparisons because the Securities and Exchange Commission ("SEC") requires all mutual funds to calculate expenses based on a 5% return. You can assess each Fund's ongoing costs by comparing this hypothetical example with the hypothetical examples that appear in shareholder reports of other funds.
Note that expenses shown in the table are meant to highlight and help you compare ongoing costs only. The Funds do not charge sales loads or redemption fees.
The calculations assume no shares were bought or sold during the period. Your actual costs may have been higher or lower, depending on the amount of your investment and the timing of any purchases or redemptions.
More information about the Funds' expenses, including annual expense ratios for the past five fiscal years, can be found in this report. For additional information on operating expenses and other shareholder costs, please refer to the Funds' prospectus.
29
THE FLIPPIN, BRUCE & PORTER FUNDS
ABOUT YOUR FUNDS' EXPENSES (Unaudited) (Continued)
ABOUT YOUR FUNDS' EXPENSES (Unaudited) (Continued)
FBP Equity & Dividend Plus Fund
|
Beginning
Account Value April 1, 2014 |
Ending
Account Value September 30, 2014 |
Expenses Paid
During Period* |
|
|
Based on Actual Fund Return
|
$1,000.00
|
$1,045.00 |
$5.49
|
|
Based on Hypothetical 5% Return (before expenses)
|
$1,000.00
|
$1,019.70 |
$5.42
|
|
*
|
Expenses are equal to the FBP Equity & Dividend Plus Fund's annualized expense ratio of 1.07% for the period, multiplied by the average account value over the period, multiplied by 183/365 (to reflect the one-half year period).
|
FBP Appreciation & Income Opportunities Fund
|
Beginning
Account Value April 1, 2014 |
Ending
Account Value September 30, 2014 |
Expenses Paid
During Period* |
|
|
Based on Actual Fund Return
|
$1,000.00
|
$1,027.30 |
$5.08
|
|
Based on Hypothetical 5% Return (before expenses)
|
$1,000.00
|
$1,020.05 |
$5.06
|
|
*
|
Expenses are equal to the FBP Appreciation & Income Opportunities Fund's annualized expense ratio of 1.00% for the period, multiplied by the average account value over the period, multiplied by 183/365 (to reflect the one-half year period).
|
OTHER INFORMATION (Unaudited)
The Trust files a complete listing of portfolio holdings for the Funds with the SEC as of the end of the first and third quarters of each fiscal year on Form N-Q. The filings are available upon request, by calling 1-800-327-9375. Furthermore, you may obtain a copy of these filings on the SEC's website at http://www.sec.gov. The Trust's Forms N-Q may also be reviewed and copied at the SEC's Public Reference Room in Washington, DC, and information on the operation of the Public Reference Room may be obtained by calling 1-800-SEC-0330.
A description of the policies and procedures that the Funds use to determine how to vote proxies relating to portfolio securities is available without charge upon request by calling toll-free 1-800-327-9375, or on the SEC's website at http://www.sec.gov. Information regarding how the Funds voted proxies relating to portfolio securities during the most recent 12-month period ended June 30 is also available without charge upon request by calling toll-free 1-800-327-9375, or on the SEC's website at http://www.sec.gov.
30
This page intentionally left blank.
This page intentionally left blank.
This page intentionally left blank.
|
|
|||||||
 |
|||||||
|
Investment Adviser
Flippin, Bruce & Porter, Inc.
800 Main Street, Second Floor
P.O. Box 6138
Lynchburg, Virginia 24505
Toll-Free 1-800-327-9375
www.fbpfunds.com
Administrator
Ultimus Fund Solutions, LLC
P.O. Box 46707
Cincinnati, Ohio 45246-0707
Toll-Free 1-866-738-1127
Custodian
US Bank NA
425 Walnut Street
Cincinnati, Ohio 45202
Independent Registered
Public Accounting Firm Ernst & Young LLP
1900 Scripps Center
312 Walnut Street
Cincinnati, Ohio 45202
|
Legal Counsel
Sullivan & Worcester LLP
One Post Office Square
Boston, Massachusetts 02109
Officers
John T. Bruce, President
and Portfolio Manager
John M. Flippin, Vice President
John H. Hanna, IV, Vice President
David J. Marshall, Vice President R. Gregory Porter, III,
Vice President
Trustees
Robert S. Harris, Ph.D., Chairman
John P. Ackerly, IV
John T. Bruce
J. Finley Lee, Jr., Ph.D.
Harris V. Morrissette
Elizabeth W. Robertson
|
||||||
|
|
|||||||
|
THE
GOVERNMENT STREET
FUNDS
No-Load Mutual Funds
Semi-Annual Report
September 30, 2014
(Unaudited)
|

|
The Government Street Equity Fund
The Government Street Mid-Cap Fund
The Alabama Tax Free Bond Fund
|
|
LETTER FROM THE PRESIDENT
|
October, 2014
|
Dear Fellow Shareholders:
We are enclosing for your review the Semi-Annual Reports of The Government Street Funds for the six months ended September 30, 2014.
The Government Street Equity Fund
The Government Street Equity Fund had a positive return of 5.80% for the semiannual fiscal period ended September 30, 2014. By comparison, the S&P 500 Index and the Morningstar Large Cap Blend Equity category were up 6.42% and 4.56%, respectively. The large cap section of domestic markets continues to be positively affected by the dynamics of the S&P 100 Index which has remained in a positive up trend since the low point reached in March 2009. The S&P 100 is up 20.48% in the previous 12 months.
The most recent quarter has been filled with geopolitical events, universal health concerns, international economic malaise and election related negative rhetoric that has resulted in a return of volatility to the markets. This has presented an investment puzzle. Domestic market returns have continued to be generally favorable, but with great concerns. Investors seem to be looking for the trigger that will result in significant market retrenchment.
Slow, but steady progress in corporate earnings has continued to improve balance sheets, provide funds for corporate stock redemptions and lower the current fiscal deficit. Further, lower oil prices, continuing low interest rates, higher employment numbers and prospects for energy self sufficiency seem to activate stock purchases at every attempt for the market to retrench.
The behavioral and the financial cross-currents set up interesting investment cross-currents. Which will win out? Time will certainly give the answer. In the short run, we believe the domestic market, though volatile, will continue to be generally positive. Further, it seems that the current conditions are favorable to the area of the market that The Government Street Equity Fund represents - the large capitalization domestic market space.
In this environment, we believe that the most basic of risk control measures available, diversification in quality companies, is mandatory. As of September 30, 2014, The Government Street Equity Fund's portfolio included investments in 102 individual common stocks, 3 multiple stock holdings represented by Exchange Traded Funds (ETFs) and 1 Exchange Traded Note (ETN). The cash reserves were approximately 4.0% of the portfolio.
The ETFs' and ETN's internal holdings broaden investment participation to emphasize mid-capitalization domestic securities and master limited partnerships. In the aggregate, these multi-faceted investments accounted for approximately 9.7% of the Fund's portfolio.
1
The top 10 holdings in The Government Street Equity Fund as of September 30, 2014 were:
|
Security Description
|
% of Net Assets
|
|
Apple, Inc.
|
4.8%
|
|
Vanguard Mid-Cap ETF
|
3.4%
|
|
JPMorgan Alerian MLP Index ETN
|
2.9%
|
|
Disney Walt Company (The)
|
2.5%
|
|
Visa, Inc. - Class A
|
2.3%
|
|
iShares Core S&P Mid-Cap ETF
|
2.3%
|
|
MasterCard, Inc. - Class A
|
2.1%
|
|
ConocoPhillips
|
2.0%
|
|
General Dynamics Corporation
|
2.0%
|
|
Gilead Sciences, Inc.
|
1.8%
|
The significant positive individual performances of securities held for the entire six month period as measured by the internal rate of return were:
|
Shire plc - ADR
|
95.45%
|
|
Google, Inc. - Class C
|
77.00%
|
|
Gilead Sciences, Inc.
|
50.23%
|
|
Micron Technology, Inc.
|
44.75%
|
|
Intel Corporation
|
34.66%
|
|
Protective Life Corporation
|
33.01%
|
The 5 worst individual performances of securities held for the entire six month period as measured by the internal rate of return were:
|
Old Republic International Corporation
|
-10.78%
|
|
Range Resources Corporation
|
-14.82%
|
|
Tractor Supply Company
|
-14.96%
|
|
Google, Inc. - Class A
|
-25.07%
|
|
Manitowoc Company, Inc. (The)
|
-26.47%
|
The Fund's best performing economic sector for the six months was Health Care at 19.95%, followed by Industrials at 10.55%. The worst performing sector was Consumer Staples at -0.43%.
Note: The investment performances listed for economic sectors and securities in the two preceding paragraphs are extracted from an in-house independent internal rate of return computation by the Advent Axys portfolio accounting system. The calculations are gross investment returns.
There is not a discernible pattern in the performance of the 5 best and worst stocks over the six month period. However, in the total picture of the portfolio's performance, stocks in the Telecommunication Services, Utilities and Consumer Staples sectors, generally considered to be defensive, were the underperformers. The Fund's holdings within these sectors had returns of 2.20%, 7.94% and -0.43%, respectively. These sectors are typically good dividend payers and very stable in pricing action. They were left behind by a market focused on Health Care (+19.95%), Information Technology (+9.25%) and Industrials (+10.55%). The results definitely did not display a normal risk aversion pattern associated with the perception of uncertain times.
2
As of September 30, 2014, the Fund's assets were $94,040,217 and the net asset value per share was $65.81. The portfolio turnover rate for the previous six months was 9%. The net expense ratio was 0.84%. The twelve month total return was 16.08%.
The Government Street Mid Cap Fund
The Government Street Mid-Cap Fund produced a calendar year to date return of 2.28% as of September 30, 2014 while the Fund's benchmark, the S&P MidCap 400 Index (the "S&P 400"), produced a year to date return of 3.21%. The S&P 400 is an index maintained by the Standard & Poor's Index Committee that selects companies with market capitalizations between $1.4 billion and $5.9 billion. The goal of the index is to identify companies that represent the risk and reward characteristics of mid-sized companies. For the year ended September 30, 2014, The Government Street Mid-Cap Fund returned 10.89% while the S&P 400 had a one year return of 11.82%. Within the Fund, the Health Care and Information Technology sectors were the top two contributors to performance while the Utilities and Consumer Staples sectors were the top detractors for the most recent 12 month period. The Fund's portfolio also included 10% to 12% in ETFs and ETNs that provided exposure to asset classes not included in the S&P 400 which contributed positively to performance. Some of the biggest individual stock contributors to the Fund's performance over the past year were ONEOK, Inc. (+45%), Shire plc - ADR (+117%), SanDisk Corporation (+67%) and Illumina, Inc. (+103%).
The longer term performance of the Fund has been very competitive when compared to the S&P 400, as well as large-cap stocks as measured by the S&P 500 Index and small-cap stocks as measured by the Russell 2000 Index. The average annual total returns for the 3 years and 5 years ended September 30, 2014 are shown in the following table:
|
HOLDING
|
3 YEARS
TOTAL RETURN |
5 YEARS
TOTAL RETURN |
|
The Government Street Mid-Cap Fund
|
18.63%
|
14.58%
|
|
S&P 400 Index
|
22.43%
|
16.37%
|
|
S&P 500 Index
|
22.99%
|
15.70%
|
|
Russell 2000 Index
|
21.26%
|
14.29%
|
Equities continue their march upward as the current bull market passes the 5 year mark. With low interest rates and low, yet positive, economic growth, the current "goldilocks" environment is providing a strong tailwind for stocks. Low borrowing costs combined with aggressive cost controls have led to impressive earnings growth in recent years. Strong earnings growth has driven stock buybacks which have also contributed to market gains. Going forward, earnings gains may be harder to come by as corporate costs have already been driven to historically low levels. If the tightening labor market starts to lead to wage pressure for companies, we may begin to see some reversion from record high profit margins. Current earnings multiples are within historic norms so the market appears to be reasonably valued. Bear markets typically develop as the result of economic recession or interest rate dislocation, both of which seem remote in the near future. As always, a strong case can be made for and against continued growth in the markets, which is why it is important to maintain a long-term
3
focus and realize that the enduring trend is up with intermittent periods of dislocation. This is why it is imperative to develop an individualized long-term plan and eliminate the need to make decisions during periods of market unrest.
As of September 30, 2014, the net assets of the Government Street Mid-Cap Fund were $49,155,524 and the net asset value per share was $21.71. The portfolio turnover rate for the previous six months was 4%. The net expense ratio for the Fund is 1.05%. The twelve month total return was 20.25%.
The Alabama Tax Free Bond Fund
Monetary policy and the wind-down of the Federal Reserve's quantitative easing bond buying program continued to be the primary focus of fixed income investors at the end of the third quarter 2014. Municipal bond yields continued to decline, defying expectations of higher rates by most investors. During the third quarter, Federal Reserve Chair Janet Yellen reiterated the Fed's plan to keep rates at current levels for a considerable period of time after bond buying ends. Yellen has indicated that all of their decisions will be data dependent, not calendar driven.
The key to the Fed's monetary policy decisions is the outlook for inflation, wages, and employment. In the three months ended August 31, 2014, the inflation rate ticked back down or stabilized at levels below the Fed's long-term target of 2%. Specifically, the core CPI rate fell to 1.7% as of August 31, 2014, while the core PCE inflation rate (the Fed's preferred inflation measure) held steady at 1.5%. Inflation expectations remained relatively stable as well. With this inflation backdrop, the Fed has more leeway to remain accommodative and core bond interest rates are unlikely to move sharply higher. Extremely low rates in Europe and other developed economies also should contribute to keeping a lid on Treasury bond yields (i.e., Treasuries should remain in demand among global bond investors due to their relatively attractive yields as well as a strengthening U.S. dollar).
Wage growth is another economic indicator the Fed and the markets are watching closely. Both average hourly earnings and real (inflation-adjusted) hourly earnings increased slightly over the past three months to 2.1% and 0.4% year-over-year growth, respectively. But they remain well below what Yellen has said she wants to see as evidence of a healthy labor market—probably at least 3% nominal wage growth and 1% real wage growth. Broader indicators of labor's share of the economy also suggest we are still early in the cycle of wage gains. As we've noted before, while additional wage growth and a rising labor income would be healthy for the economy, it has potentially negative implications for corporate profit margins (which remain around historical highs) and earnings growth.
On the employment front, despite a disappointing August number, job gains (U.S. nonfarm payrolls) continued to be reasonably strong—averaging 207,000 per month over the past three months through August. For the first eight months of 2014, job growth has averaged 215,000 per month, the highest rate since 1999. However, the recovery in jobs following the 2008 financial crisis continues to lag what is typical after previous U.S. recessions. The unemployment rate dropped slightly to 6.1% in August, still well above the Fed's estimate of "full employment" in the low-5% range. However, the labor force participation rate remains stuck at a 36-year low, exerting a downward
4
bias to the unemployment rate. Taking these and other employment indicators into account, the Fed reiterated its view that "there remains significant underutilization of labor resources."
The Alabama Tax Free Bond Fund maintains a generally defensive posture and continues to focus on short duration Alabama tax-exempt issues at the higher end of the quality spectrum. The duration of the portfolio as of September 30, 2014 was 2.8 years, down from 3.3 years on March 31, 2014. More than 98% of the portfolio was invested in securities rated A, AA, or AAA by Moody's or Standard & Poor's rating agencies.
The total return for the six months ended September 30, 2014 was 0.97% while the Fund's benchmark, the Barclays 7-Year Municipal Bond Index, produced a return of 3.14%. The Fund's weighted average maturity was 3.0 years, down from 3.7 years at the end of the last fiscal year. The net assets of the Fund as of September 30, 2014 were $30,522,065 and the net asset value per share was $10.54. The portfolio turnover for the previous six months was 0%. The ratio of net investment income to average net assets was 1.36% and the ratio of net expenses to average net assets was 0.65%. The twelve month return was 2.93%.
Thank you for your continued confidence in The Government Street Funds. Please call us if we can be of further service to you.
Very truly yours,

Thomas W. Leavell
President
Leavell Investment Management, Inc.
The Government Street Funds
Data presented reflects past performance, which is no guarantee of future results. Investment results and principal value will fluctuate so that shares, when redeemed, may be worth more or less than their original cost. Due to market volatility, current performance may be higher or lower than the performance shown.
This report is submitted for the general information of the shareholders of the Funds. The report is not authorized for distribution to prospective investors in the Funds unless it is accompanied by a current prospectus.
This report reflects our views, opinions and portfolio holdings as of September 30, 2014, the end of the reporting period. These views are subject to change at any time based upon market or other conditions. For more current information throughout the year please visit www.leavellinvestments.com.
5
THE GOVERNMENT STREET EQUITY FUND PORTFOLIO INFORMATION
September 30, 2014 (Unaudited)
September 30, 2014 (Unaudited)
Asset Allocation
(% of Net Assets)
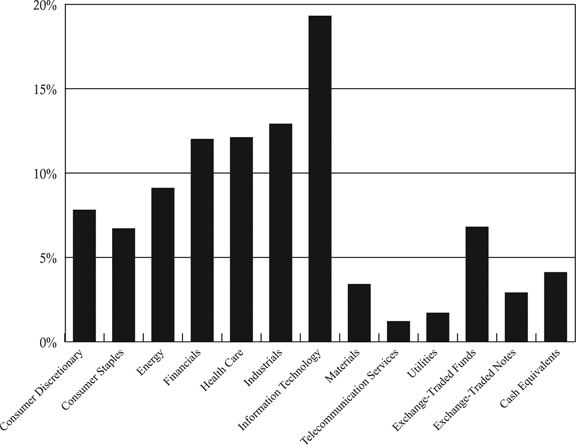
Top Ten Equity Holdings
|
Security Description
|
% of Net Assets
|
|
Apple, Inc.
|
4.8%
|
|
Vanguard Mid-Cap ETF
|
3.4%
|
|
JPMorgan Alerian MLP Index ETN
|
2.9%
|
|
Walt Disney Company (The)
|
2.5%
|
|
iShares Core S&P Mid-Cap ETF
|
2.3%
|
|
Visa, Inc. - Class A
|
2.3%
|
|
MasterCard, Inc. - Class A
|
2.1%
|
|
General Dynamics Corporation
|
2.0%
|
|
ConocoPhillips
|
2.0%
|
|
Gilead Sciences, Inc.
|
1.8%
|
6
THE GOVERNMENT STREET MID-CAP FUND PORTFOLIO INFORMATION
September 30, 2014 (Unaudited)
September 30, 2014 (Unaudited)
Asset Allocation
(% of Net Assets)

Top Ten Equity Holdings
|
Security Description
|
% of Net Assets
|
|
Vanguard Mid-Cap ETF
|
2.6%
|
|
Guggenheim Mid-Cap Core ETF
|
2.6%
|
|
JPMorgan Alerian MLP Index ETN
|
2.0%
|
|
Schwab U.S. Mid-Cap ETF
|
1.7%
|
|
iShares Nasdaq Biotechnology ETF
|
1.7%
|
|
Mid-American Apartment Communities. Inc.
|
1.6%
|
|
Church & Dwight Company, Inc.
|
1.5%
|
|
Hormel Foods Corporation
|
1.3%
|
|
ONEOK, Inc.
|
1.2%
|
|
Snap-on, Inc.
|
1.1%
|
7
THE ALABAMA TAX FREE BOND FUND
PORTFOLIO INFORMATION
September 30, 2014 (Unaudited)
PORTFOLIO INFORMATION
September 30, 2014 (Unaudited)
Asset Allocation
(% of Net Assets)
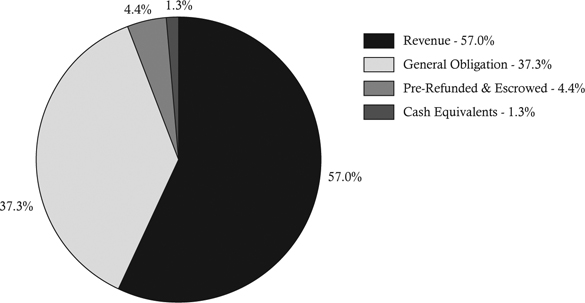
|
Distribution by Rating
|
||
|
Rating
|
% of Holdings
|
|
|
AAA
|
8.0%
|
|
|
AA
|
82.6%
|
|
|
A
|
8.1%
|
|
|
Not Rated
|
1.3%
|
|
8
GOVERNMENT STREET EQUITY FUND
SCHEDULE OF INVESTMENTS
September 30, 2014 (Unaudited)
SCHEDULE OF INVESTMENTS
September 30, 2014 (Unaudited)
|
COMMON STOCKS — 86.2%
|
Shares
|
Value
|
||||||
|
Consumer Discretionary — 7.8%
|
||||||||
|
Comcast Corporation - Class A
|
30,000
|
$
|
1,613,400
|
|||||
|
Home Depot, Inc. (The)
|
2,200
|
201,828
|
||||||
|
Johnson Controls, Inc.
|
15,400
|
677,600
|
||||||
|
Lowe's Companies, Inc.
|
7,000
|
370,440
|
||||||
|
McDonald's Corporation
|
6,500
|
616,265
|
||||||
|
NIKE, Inc. - Class B
|
11,300
|
1,007,960
|
||||||
|
Tractor Supply Company
|
9,000
|
553,590
|
||||||
|
Walt Disney Company (The)
|
26,125
|
2,325,909
|
||||||
|
7,366,992
|
||||||||
|
Consumer Staples — 6.7%
|
||||||||
|
Altria Group, Inc.
|
16,700
|
767,198
|
||||||
|
Anheuser-Busch InBev SA/NV - ADR
|
10,000
|
1,108,500
|
||||||
|
Coca-Cola Company (The)
|
12,000
|
511,920
|
||||||
|
CVS Health Corporation
|
6,000
|
477,540
|
||||||
|
Kraft Foods Group, Inc.
|
8,278
|
466,879
|
||||||
|
McCormick & Company, Inc. - Non-Voting Shares
|
7,000
|
468,300
|
||||||
|
Mondelēz International, Inc. - Class A
|
28,336
|
970,933
|
||||||
|
Philip Morris International, Inc.
|
7,860
|
655,524
|
||||||
|
Procter & Gamble Company (The)
|
10,000
|
837,400
|
||||||
|
6,264,194
|
||||||||
|
Energy — 9.1%
|
||||||||
|
Apache Corporation
|
2,489
|
233,642
|
||||||
|
BP plc - ADR
|
6,000
|
263,700
|
||||||
|
Chevron Corporation
|
6,100
|
727,852
|
||||||
|
ConocoPhillips
|
24,500
|
1,874,740
|
||||||
|
Halliburton Company
|
7,000
|
451,570
|
||||||
|
Phillips 66
|
14,300
|
1,162,733
|
||||||
|
Pioneer Natural Resources Company
|
7,500
|
1,477,275
|
||||||
|
Range Resources Corporation
|
8,000
|
542,480
|
||||||
|
Schlumberger Ltd.
|
5,500
|
559,295
|
||||||
|
Spectra Energy Corporation
|
10,000
|
392,600
|
||||||
|
TransCanada Corporation
|
16,000
|
824,480
|
||||||
|
8,510,367
|
||||||||
|
Financials — 12.0%
|
||||||||
|
Aflac, Inc.
|
10,565
|
615,411
|
||||||
|
American Capital Ltd. (a)
|
12,990
|
183,939
|
||||||
|
American Express Company
|
7,000
|
612,780
|
||||||
|
American International Group, Inc.
|
21,000
|
1,134,420
|
||||||
|
Banco Bilbao Vizcaya Argentina, S.A. - ADR
|
37,000
|
444,000
|
||||||
9
GOVERNMENT STREET EQUITY FUND
SCHEDULE OF INVESTMENTS (Continued)
SCHEDULE OF INVESTMENTS (Continued)
|
COMMON STOCKS — 86.2% (Continued)
|
Shares
|
Value
|
||||||
|
Financials — 12.0% (Continued)
|
||||||||
|
Brookfield Asset Management, Inc. - Class A
|
19,000
|
$
|
854,240
|
|||||
|
Cullen/Frost Bankers, Inc.
|
14,500
|
1,109,395
|
||||||
|
Goldman Sachs Group, Inc. (The)
|
6,000
|
1,101,420
|
||||||
|
JPMorgan Chase & Company
|
28,000
|
1,686,720
|
||||||
|
KKR & Company, L.P.
|
20,000
|
446,000
|
||||||
|
Mid-America Apartment Communities, Inc.
|
8,394
|
551,066
|
||||||
|
Old Republic International Corporation
|
20,000
|
285,600
|
||||||
|
Protective Life Corporation
|
12,000
|
832,920
|
||||||
|
Regions Financial Corporation
|
17,000
|
170,680
|
||||||
|
Wells Fargo & Company
|
24,000
|
1,244,880
|
||||||
|
11,273,471
|
||||||||
|
Health Care — 12.1%
|
||||||||
|
Abbott Laboratories
|
11,000
|
457,490
|
||||||
|
AbbVie, Inc.
|
11,500
|
664,240
|
||||||
|
Actavis plc (a)
|
2,100
|
506,688
|
||||||
|
Alexion Pharmaceuticals, Inc. (a)
|
2,190
|
363,146
|
||||||
|
Cardinal Health, Inc.
|
15,000
|
1,123,800
|
||||||
|
CareFusion Corporation (a)
|
7,000
|
316,750
|
||||||
|
Cerner Corporation (a)
|
8,355
|
497,707
|
||||||
|
Gilead Sciences, Inc. (a)
|
16,000
|
1,703,200
|
||||||
|
Henry Schein, Inc. (a)
|
3,500
|
407,645
|
||||||
|
Illumina, Inc. (a)
|
3,500
|
573,720
|
||||||
|
Novartis AG - ADR
|
8,000
|
753,040
|
||||||
|
Pfizer, Inc.
|
27,000
|
798,390
|
||||||
|
Regeneron Pharmaceuticals, Inc. (a)
|
2,300
|
829,196
|
||||||
|
Shire plc - ADR
|
3,000
|
777,150
|
||||||
|
Techne Corporation
|
10,000
|
935,500
|
||||||
|
Waters Corporation (a)
|
6,475
|
641,802
|
||||||
|
11,349,464
|
||||||||
|
Industrials — 12.9%
|
||||||||
|
Allegion plc
|
3,333
|
158,784
|
||||||
|
Boeing Company (The)
|
1,500
|
191,070
|
||||||
|
Emerson Electric Company
|
15,000
|
938,700
|
||||||
|
General Dynamics Corporation
|
15,000
|
1,906,350
|
||||||
|
General Electric Company
|
34,000
|
871,080
|
||||||
|
Ingersoll-Rand plc
|
10,000
|
563,600
|
||||||
|
Lockheed Martin Corporation
|
5,000
|
913,900
|
||||||
|
Manitowoc Company, Inc. (The)
|
7,000
|
164,150
|
||||||
|
Norfolk Southern Corporation
|
10,000
|
1,116,000
|
||||||
|
Quanta Services, Inc. (a)
|
12,500
|
453,625
|
||||||
|
Southwest Airlines Company
|
3,000
|
101,310
|
||||||
10
GOVERNMENT STREET EQUITY FUND
SCHEDULE OF INVESTMENTS (Continued)
SCHEDULE OF INVESTMENTS (Continued)
|
COMMON STOCKS — 86.2% (Continued)
|
Shares
|
Value
|
||||||
|
Industrials — 12.9% (Continued)
|
||||||||
|
Stericycle, Inc. (a)
|
7,000
|
$
|
815,920
|
|||||
|
Trinity Industries, Inc.
|
24,500
|
1,144,640
|
||||||
|
Union Pacific Corporation
|
11,000
|
1,192,620
|
||||||
|
United Technologies Corporation
|
15,500
|
1,636,800
|
||||||
|
12,168,549
|
||||||||
|
Information Technology — 19.3%
|
||||||||
|
Accenture plc - Class A
|
9,500
|
772,540
|
||||||
|
Adobe Systems, Inc. (a)
|
5,000
|
345,950
|
||||||
|
Alliance Data Systems Corporation (a)
|
1,200
|
297,924
|
||||||
|
Apple, Inc.
|
45,185
|
4,552,389
|
||||||
|
Automatic Data Processing, Inc.
|
12,400
|
1,030,192
|
||||||
|
Google, Inc. - Class A (a)
|
1,400
|
823,774
|
||||||
|
Google, Inc. - Class C (a)
|
1,400
|
808,304
|
||||||
|
Intel Corporation
|
7,000
|
243,740
|
||||||
|
International Business Machines Corporation
|
5,500
|
1,044,065
|
||||||
|
MasterCard, Inc. - Class A
|
26,750
|
1,977,360
|
||||||
|
Micron Technology, Inc. (a)
|
28,000
|
959,280
|
||||||
|
Oracle Corporation
|
11,000
|
421,080
|
||||||
|
QUALCOMM, Inc.
|
11,000
|
822,470
|
||||||
|
TE Connectivity Ltd.
|
11,000
|
608,190
|
||||||
|
Texas Instruments, Inc.
|
10,000
|
476,900
|
||||||
|
Visa, Inc. - Class A
|
10,000
|
2,133,700
|
||||||
|
Western Digital Corporation
|
6,500
|
632,580
|
||||||
|
Yahoo!, Inc. (a)
|
5,000
|
203,750
|
||||||
|
18,154,188
|
||||||||
|
Materials — 3.4%
|
||||||||
|
Dow Chemical Company (The)
|
9,000
|
471,960
|
||||||
|
Ecolab, Inc.
|
6,000
|
688,980
|
||||||
|
Freeport-McMoRan, Inc.
|
12,932
|
422,230
|
||||||
|
Monsanto Company
|
9,000
|
1,012,590
|
||||||
|
Praxair, Inc.
|
5,000
|
645,000
|
||||||
|
3,240,760
|
||||||||
|
Telecommunication Services — 1.2%
|
||||||||
|
Telstra Corporation Ltd. - ADR
|
30,000
|
697,800
|
||||||
|
Verizon Communications, Inc.
|
8,000
|
399,920
|
||||||
|
1,097,720
|
||||||||
|
Utilities — 1.7%
|
||||||||
|
Duke Energy Corporation
|
7,250
|
542,083
|
||||||
|
Southern Company (The)
|
11,000
|
480,150
|
||||||
|
Wisconsin Energy Corporation
|
14,000
|
602,000
|
||||||
|
1,624,233
|
||||||||
|
Total Common Stocks (Cost $47,461,565)
|
$
|
81,049,938
|
||||||
11
GOVERNMENT STREET EQUITY FUND
SCHEDULE OF INVESTMENTS (Continued)
SCHEDULE OF INVESTMENTS (Continued)
|
EXCHANGE-TRADED FUNDS — 6.8%
|
Shares
|
Value
|
||||||
|
iShares Core S&P Mid-Cap ETF
|
16,000
|
$
|
2,187,840
|
|||||
|
ProShares Large Cap Core Plus
|
11,000
|
1,056,660
|
||||||
|
Vanguard Mid-Cap ETF
|
26,900
|
3,155,639
|
||||||
|
Total Exchange-Traded Funds (Cost $4,103,312)
|
$
|
6,400,139
|
||||||
|
EXCHANGE-TRADED NOTES — 2.9%
|
Shares
|
Value
|
||||||
|
JPMorgan Alerian MLP Index ETN (Cost $1,865,627)
|
52,000
|
$
|
2,760,160
|
|||||
|
WARRANTS — 0.0% (b)
|
Shares
|
Value
|
||||||
|
American International Group, Inc., 01/19/2021 at $45 (a) (Cost $13,600)
|
800
|
$
|
19,120
|
|||||
|
COMMERCIAL PAPER — 4.5%
|
Par Value
|
Value
|
||||||
|
U.S. Bank, N.A., discount, 0.02% (c), due 10/01/2014 (Cost $4,246,000)
|
$
|
4,246,000
|
$
|
4,246,000
|
||||
|
MONEY MARKET FUNDS — 0.1%
|
Shares
|
Value
|
||||||
|
Invesco STIT — STIC Prime Portfolio (The) - Institutional Class, 0.01% (d) (Cost $72,708)
|
72,708
|
$
|
72,708
|
|||||
|
Total Investments at Value — 100.5% Cost $57,762,812)
|
$
|
94,548,065
|
||||||
|
Liabilities in Excess of Other Assets — (0.5%)
|
(507,848
|
)
|
||||||
|
Net Assets — 100.0%
|
$
|
94,040,217
|
||||||
ADR - American Depositary Receipt.
| (a) | Non-income producing security. |
| (b) | Percentage rounds to less than 0.1%. |
| (c) | Rate shown is the annualized yield at time of purchase, not a coupon rate. |
| (d) | The rate shown is the 7-day effective yield as of September 30, 2014. |
See accompanying notes to financial statements.
12
GOVERNMENT STREET MID-CAP FUND
SCHEDULE OF INVESTMENTS
September 30, 2014 (Unaudited)
SCHEDULE OF INVESTMENTS
September 30, 2014 (Unaudited)
|
COMMON STOCKS — 84.2%
|
Shares
|
Value
|
||||||
|
Consumer Discretionary — 12.2%
|
||||||||
|
BorgWarner, Inc.
|
5,600
|
$
|
294,616
|
|||||
|
Buffalo Wild Wings, Inc. (a)
|
2,235
|
300,093
|
||||||
|
Chico's FAS, Inc.
|
7,100
|
104,867
|
||||||
|
Dollar Tree, Inc. (a)
|
5,300
|
297,171
|
||||||
|
Family Dollar Stores, Inc.
|
2,800
|
216,272
|
||||||
|
Gildan Activewear, Inc. - Class A
|
6,700
|
366,624
|
||||||
|
Hasbro, Inc.
|
3,525
|
193,857
|
||||||
|
HomeAway, Inc. (a)
|
2,500
|
88,750
|
||||||
|
Jarden Corporation (a)
|
7,425
|
446,317
|
||||||
|
Leggett & Platt, Inc.
|
2,000
|
69,840
|
||||||
|
Liberty Global plc - Series A (a)
|
5,475
|
232,907
|
||||||
|
Liberty Global plc - Series C (a)
|
4,475
|
183,542
|
||||||
|
Nordstrom, Inc.
|
3,900
|
266,643
|
||||||
|
O'Reilly Automotive, Inc. (a)
|
2,825
|
424,767
|
||||||
|
Panera Bread Company - Class A (a)
|
2,090
|
340,085
|
||||||
|
PetSmart, Inc.
|
4,500
|
315,405
|
||||||
|
PVH Corporation
|
3,700
|
448,255
|
||||||
|
Ross Stores, Inc.
|
6,000
|
453,480
|
||||||
|
Service Corporation International
|
15,200
|
321,328
|
||||||
|
Tiffany & Company
|
3,475
|
334,677
|
||||||
|
VF Corporation
|
4,700
|
310,341
|
||||||
|
6,009,837
|
||||||||
|
Consumer Staples — 4.6%
|
||||||||
|
Church & Dwight Company, Inc.
|
10,800
|
757,728
|
||||||
|
Energizer Holdings, Inc.
|
2,500
|
308,025
|
||||||
|
Hormel Foods Corporation
|
12,000
|
616,680
|
||||||
|
J.M. Smucker Company (The)
|
4,700
|
465,253
|
||||||
|
Tyson Foods, Inc. - Class A
|
3,000
|
118,110
|
||||||
|
2,265,796
|
||||||||
|
Energy — 5.6%
|
||||||||
|
Cameron International Corporation (a)
|
4,010
|
266,184
|
||||||
|
Cimarex Energy Company
|
3,250
|
411,223
|
||||||
|
Murphy Oil Corporation
|
3,740
|
212,843
|
||||||
|
Noble Corporation plc
|
5,360
|
119,099
|
||||||
|
ONEOK, Inc.
|
9,200
|
603,060
|
||||||
|
Paragon Offshore plc (a)
|
1,786
|
10,984
|
||||||
|
Peabody Energy Corporation
|
8,200
|
101,516
|
||||||
|
Range Resources Corporation
|
3,500
|
237,335
|
||||||
|
Schlumberger Ltd.
|
3,134
|
318,696
|
||||||
|
Ultra Petroleum Corporation (a)
|
9,900
|
230,274
|
||||||
|
Valero Energy Corporation
|
4,950
|
229,037
|
||||||
|
2,740,251
|
||||||||
13
GOVERNMENT STREET MID-CAP FUND
SCHEDULE OF INVESTMENTS (Continued)
SCHEDULE OF INVESTMENTS (Continued)
|
COMMON STOCKS — 84.2% (Continued)
|
Shares
|
Value
|
||||||
|
Financials — 15.9%
|
||||||||
|
Alexander & Baldwin, Inc.
|
3,000
|
$
|
107,910
|
|||||
|
Alleghany Corporation (a)
|
765
|
319,885
|
||||||
|
American Financial Group, Inc.
|
6,600
|
382,074
|
||||||
|
Arch Capital Group Ltd. (a)
|
5,650
|
309,168
|
||||||
|
Arthur J. Gallagher & Company
|
6,750
|
306,180
|
||||||
|
Axis Capital Holdings Ltd.
|
5,000
|
236,650
|
||||||
|
Bank of Hawaii Corporation
|
6,000
|
340,860
|
||||||
|
Berkley (W.R.) Corporation
|
6,450
|
308,310
|
||||||
|
CME Group, Inc.
|
2,735
|
218,677
|
||||||
|
Cullen/Frost Bankers, Inc.
|
4,400
|
336,644
|
||||||
|
Eaton Vance Corporation
|
8,500
|
320,705
|
||||||
|
Everest Re Group Ltd.
|
2,050
|
332,120
|
||||||
|
HCC Insurance Holdings, Inc.
|
4,575
|
220,927
|
||||||
|
IntercontinentalExchange, Inc.
|
1,850
|
360,842
|
||||||
|
Jones Lang LaSalle, Inc.
|
2,800
|
353,752
|
||||||
|
Kemper Corporation
|
6,200
|
211,730
|
||||||
|
Mid-America Apartment Communities, Inc.
|
11,800
|
774,670
|
||||||
|
NASDAQ OMX Group, Inc. (The)
|
9,500
|
402,990
|
||||||
|
New York Community Bancorp, Inc.
|
12,970
|
205,834
|
||||||
|
Old Republic International Corporation
|
21,400
|
305,592
|
||||||
|
PNC Financial Services Group, Inc. (The)
|
2,745
|
234,917
|
||||||
|
Potlatch Corporation
|
6,941
|
279,098
|
||||||
|
Rayonier, Inc.
|
5,250
|
163,485
|
||||||
|
Realty Income Corporation
|
5,025
|
204,970
|
||||||
|
SEI Investments Company
|
10,000
|
361,600
|
||||||
|
Westamerica Bancorporation
|
4,370
|
203,292
|
||||||
|
7,802,882
|
||||||||
|
Health Care — 10.6%
|
||||||||
|
Bio-Rad Laboratories, Inc. - Class A (a)
|
2,500
|
283,500
|
||||||
|
Charles River Laboratories International, Inc. (a)
|
4,000
|
238,960
|
||||||
|
Chemed Corporation
|
2,000
|
205,800
|
||||||
|
Computer Programs & Systems, Inc.
|
2,300
|
132,227
|
||||||
|
Covance, Inc. (a)
|
4,000
|
314,800
|
||||||
|
Covidien plc
|
2,500
|
216,275
|
||||||
|
Endo International plc (a)
|
3,000
|
205,020
|
||||||
|
Ensign Group, Inc. (The)
|
5,000
|
174,000
|
||||||
|
Henry Schein, Inc. (a)
|
3,000
|
349,410
|
||||||
|
Hologic, Inc. (a)
|
7,000
|
170,310
|
||||||
|
Illumina, Inc. (a)
|
2,000
|
327,840
|
||||||
|
MEDNAX, Inc. (a)
|
4,000
|
219,280
|
||||||
|
ResMed, Inc.
|
6,500
|
320,255
|
||||||
|
Shire plc - ADR
|
1,500
|
388,575
|
||||||
|
Techne Corporation
|
4,500
|
420,975
|
||||||
14
GOVERNMENT STREET MID-CAP FUND
SCHEDULE OF INVESTMENTS (Continued)
SCHEDULE OF INVESTMENTS (Continued)
|
COMMON STOCKS — 84.2% (Continued)
|
Shares
|
Value
|
||||||
|
Health Care — 10.6% (Continued)
|
||||||||
|
Teleflex, Inc.
|
4,000
|
$
|
420,160
|
|||||
|
United Therapeutics Corporation (a)
|
1,800
|
231,570
|
||||||
|
Universal Health Services, Inc. - Class B
|
2,500
|
261,250
|
||||||
|
Valeant Pharmaceuticals International, Inc. (a)
|
1,000
|
131,200
|
||||||
|
Waters Corporation (a)
|
2,000
|
198,240
|
||||||
|
5,209,647
|
||||||||
|
Industrials — 12.7%
|
||||||||
|
AMETEK, Inc.
|
1,350
|
67,783
|
||||||
|
C.H. Robinson Worldwide, Inc.
|
5,000
|
331,600
|
||||||
|
Clean Harbors, Inc. (a)
|
1,000
|
53,920
|
||||||
|
Deluxe Corporation
|
5,000
|
275,800
|
||||||
|
Donaldson Company, Inc.
|
12,000
|
487,560
|
||||||
|
Engility Holdings, Inc. (a)
|
500
|
15,585
|
||||||
|
Expeditors International of Washington, Inc.
|
6,000
|
243,480
|
||||||
|
Fastenal Company
|
9,950
|
446,755
|
||||||
|
Graco, Inc.
|
6,000
|
437,880
|
||||||
|
ITT Corporation
|
3,000
|
134,820
|
||||||
|
Jacobs Engineering Group, Inc. (a)
|
4,475
|
218,470
|
||||||
|
Joy Global, Inc.
|
2,000
|
109,080
|
||||||
|
L-3 Communications Holdings, Inc.
|
3,000
|
356,760
|
||||||
|
ManpowerGroup, Inc.
|
4,000
|
280,400
|
||||||
|
Matson, Inc.
|
3,000
|
75,090
|
||||||
|
MSC Industrial Direct Company, Inc. - Class A
|
5,000
|
427,300
|
||||||
|
Pentair plc
|
2,400
|
157,176
|
||||||
|
Snap-on, Inc.
|
4,275
|
517,617
|
||||||
|
SPX Corporation
|
5,000
|
469,650
|
||||||
|
Stericycle, Inc. (a)
|
2,400
|
279,744
|
||||||
|
Timken Company (The)
|
5,000
|
211,950
|
||||||
|
Valmont Industries, Inc.
|
1,500
|
202,395
|
||||||
|
Waste Connections, Inc.
|
6,000
|
291,120
|
||||||
|
WESCO International, Inc. (a)
|
1,850
|
144,781
|
||||||
|
6,236,716
|
||||||||
|
Information Technology — 12.6%
|
||||||||
|
ADTRAN, Inc.
|
8,000
|
164,240
|
||||||
|
Arrow Electronics, Inc. (a)
|
8,600
|
476,010
|
||||||
|
Cree, Inc. (a)
|
5,820
|
238,329
|
||||||
|
Diebold, Inc.
|
6,000
|
211,920
|
||||||
|
DST Systems, Inc.
|
4,000
|
335,680
|
||||||
|
FARO Technologies, Inc. (a)
|
5,000
|
253,750
|
||||||
|
Harris Corporation
|
6,000
|
398,400
|
||||||
|
IAC/InterActiveCorporation
|
4,000
|
263,600
|
||||||
|
Integrated Device Technology, Inc. (a)
|
10,000
|
159,500
|
||||||
|
Jack Henry & Associates, Inc.
|
9,000
|
500,940
|
||||||
15
GOVERNMENT STREET MID-CAP FUND
SCHEDULE OF INVESTMENTS (Continued)
SCHEDULE OF INVESTMENTS (Continued)
|
COMMON STOCKS — 84.2% (Continued)
|
Shares
|
Value
|
||||||
|
Information Technology — 12.6% (Continued)
|
||||||||
|
Lam Research Corporation
|
6,000
|
$
|
448,200
|
|||||
|
Linear Technology Corporation
|
6,000
|
266,340
|
||||||
|
Microchip Technology, Inc.
|
5,000
|
236,150
|
||||||
|
National Instruments Corporation
|
12,000
|
371,160
|
||||||
|
NetApp, Inc.
|
5,000
|
214,800
|
||||||
|
Polycom, Inc. (a)
|
8,000
|
98,280
|
||||||
|
Rackspace Hosting, Inc. (a)
|
4,000
|
130,200
|
||||||
|
Rovi Corporation (a)
|
6,000
|
118,470
|
||||||
|
SanDisk Corporation
|
5,000
|
489,750
|
||||||
|
Solera Holdings, Inc.
|
4,000
|
225,440
|
||||||
|
Xilinx, Inc.
|
7,000
|
296,450
|
||||||
|
Zebra Technologies Corporation - Class A (a)
|
4,000
|
283,880
|
||||||
|
6,181,489
|
||||||||
|
Materials — 6.9%
|
||||||||
|
Airgas, Inc.
|
4,000
|
442,600
|
||||||
|
Albemarle Corporation
|
8,000
|
471,200
|
||||||
|
Ashland, Inc.
|
3,000
|
312,300
|
||||||
|
Cabot Corporation
|
4,000
|
203,080
|
||||||
|
Martin Marietta Materials, Inc.
|
2,500
|
322,350
|
||||||
|
Packaging Corporation of America
|
5,000
|
319,100
|
||||||
|
Rayonier Advanced Materials, Inc.
|
1,750
|
57,592
|
||||||
|
Scotts Miracle-Gro Company (The) - Class A
|
4,000
|
220,000
|
||||||
|
Sonoco Products Company
|
5,000
|
196,450
|
||||||
|
Steel Dynamics, Inc.
|
12,000
|
271,320
|
||||||
|
TimkenSteel Corporation
|
2,500
|
116,225
|
||||||
|
Valspar Corporation (The)
|
6,000
|
473,940
|
||||||
|
3,406,157
|
||||||||
|
Utilities — 3.1%
|
||||||||
|
AGL Resources, Inc.
|
8,400
|
431,256
|
||||||
|
Great Plains Energy, Inc.
|
9,050
|
218,739
|
||||||
|
One Gas, Inc.
|
3,000
|
102,750
|
||||||
|
SCANA Corporation
|
7,530
|
373,563
|
||||||
|
Vectren Corporation
|
10,600
|
422,940
|
||||||
|
1,549,248
|
||||||||
|
Total Common Stocks (Cost $22,744,484)
|
$
|
41,402,023
|
||||||
16
GOVERNMENT STREET MID-CAP FUND
SCHEDULE OF INVESTMENTS (Continued)
SCHEDULE OF INVESTMENTS (Continued)
|
PREFERRED STOCKS — 0.0% (b)
|
Shares
|
Value
|
||||||
|
Tyson Foods, Inc. (Cost $24,338)
|
500
|
$
|
25,180
|
|||||
|
EXCHANGE-TRADED FUNDS — 8.6%
|
Shares
|
Value
|
||||||
|
Guggenheim Mid-Cap Core ETF
|
26,000
|
$
|
1,256,060
|
|||||
|
iShares Nasdaq Biotechnology ETF
|
3,025
|
827,731
|
||||||
|
Schwab U.S. Mid-Cap ETF
|
22,000
|
851,396
|
||||||
|
Vanguard Mid-Cap ETF
|
10,850
|
1,272,813
|
||||||
|
Total Exchange-Traded Funds (Cost $3,083,702)
|
$
|
4,208,000
|
||||||
|
EXCHANGE-TRADED NOTES — 2.0%
|
Shares
|
Value
|
||||||
|
JPMorgan Alerian MLP Index ETN (Cost $698,490)
|
18,700
|
$
|
992,596
|
|||||
|
COMMERCIAL PAPER — 5.6%
|
Par Value
|
Value
|
||||||
|
U.S. Bank, N.A., discount, 0.02% (c), due 10/01/2014
|
$
|
1,370,000
|
$
|
1,370,000
|
||||
|
U.S. Bank, N.A., discount, 0.02% (c), due 10/01/2014
|
1,371,000
|
1,371,000
|
||||||
|
Total Commercial Paper (Cost $2,741,000)
|
$
|
2,741,000
|
||||||
|
MONEY MARKET FUNDS — 0.2%
|
Shares
|
Value
|
||||||
|
Invesco STIT - STIC Prime Portfolio (The) - Institutional Class, 0.01% (d) (Cost $78,404)
|
78,404
|
$
|
78,404
|
|||||
|
Total Investments at Value — 100.6% (Cost $29,370,418)
|
$
|
49,447,203
|
||||||
|
Liabilities in Excess of Other Assets — (0.6%)
|
(291,679
|
)
|
||||||
|
Net Assets — 100.0%
|
$
|
49,155,524
|
||||||
ADR - American Depositary Receipt.
| (a) | Non-income producing security. |
| (b) | Percentage rounds to less than 0.1%. |
| (c) | Rate shown is the annualized yield at time of purchase, not a coupon rate. |
| (d) | The rate shown is the 7-day effective yield as of September 30, 2014. |
See accompanying notes to financial statements.
17
THE ALABAMA TAX FREE BOND FUND
SCHEDULE OF INVESTMENTS
September 30, 2014 (Unaudited)
SCHEDULE OF INVESTMENTS
September 30, 2014 (Unaudited)
|
ALABAMA FIXED RATE REVENUE AND GENERAL OBLIGATION (GO) BONDS — 98.7%
|
Par Value
|
Value
|
||||||
|
Alabama Drinking Water Financing Auth., Series A, Rev.,
|
||||||||
|
5.00%, due 08/15/2018
|
$
|
400,000
|
$
|
412,020
|
||||
|
3.00%, due 08/15/2019
|
530,000
|
571,393
|
||||||
|
Alabama State Public School & College Auth., Capital Improvements, Rev.,
|
||||||||
|
5.00%, due 12/01/2017
|
470,000
|
533,285
|
||||||
|
Alabama State Public School & College Auth., Capital Improvements, Series A, Rev.,
|
||||||||
|
4.00%, due 02/01/2017
|
250,000
|
270,160
|
||||||
|
3.75%, due 02/01/2018
|
200,000
|
219,424
|
||||||
|
Alabama State Public School & College Auth., Capital Improvements, Series D, Rev.,
|
||||||||
|
2.00%, due 09/01/2018
|
565,000
|
587,832
|
||||||
|
Alabama State, GO,
|
||||||||
|
5.00%, due 02/01/2016
|
575,000
|
584,401
|
||||||
|
Alabaster, AL, Water Rev.,
|
||||||||
|
3.00%, due 09/01/2017
|
400,000
|
422,280
|
||||||
|
Anniston, AL, Waterworks & Sewer Board, Water & Sewer Rev.,
|
||||||||
|
3.50%, due 06/01/2016
|
500,000
|
522,355
|
||||||
|
Athens, AL, Electric Rev., Warrants,
|
||||||||
|
3.00%, due 06/01/2016
|
510,000
|
528,579
|
||||||
|
3.00%, due 06/01/2019
|
375,000
|
399,979
|
||||||
|
Athens, AL, GO, Warrants,
|
||||||||
|
4.00%, due 09/01/2018
|
300,000
|
332,826
|
||||||
|
Auburn University, AL, General Fee Rev.,
|
||||||||
|
5.00%, due 06/01/2018
|
315,000
|
361,179
|
||||||
|
5.00%, due 06/01/2020
|
350,000
|
414,627
|
||||||
|
Auburn, AL, Refunding & Capital Improvements, Series B, GO, Warrants,
|
||||||||
|
4.00%, due 08/01/2018
|
200,000
|
222,056
|
||||||
|
Auburn, AL, School, Series A, GO, Warrants,
|
||||||||
|
5.00%, due 08/01/2018
|
500,000
|
575,890
|
||||||
|
Baldwin Co., AL, Board of Education, Rev.,
|
||||||||
|
5.00%, due 07/01/2018
|
590,000
|
649,000
|
||||||
|
Baldwin Co., AL, GO, Warrants,
|
||||||||
|
5.00%, due 02/01/2015
|
200,000
|
200,806
|
||||||
|
4.00%, due 06/01/2019
|
200,000
|
222,352
|
||||||
|
Baldwin Co., AL, Series A, GO, Warrants,
|
||||||||
|
5.00%, due 02/01/2017
|
320,000
|
352,829
|
||||||
18
THE ALABAMA TAX FREE BOND FUND
SCHEDULE OF INVESTMENTS (Continued)
SCHEDULE OF INVESTMENTS (Continued)
|
ALABAMA FIXED RATE REVENUE AND GENERAL OBLIGATION (GO) BONDS — 98.7% (Continued)
|
Par Value
|
Value
|
||||||
|
Birmingham, AL, Waterworks Board, Water Rev.,
|
||||||||
|
5.00%, due 01/01/2017
|
$
|
400,000
|
$
|
437,240
|
||||
|
3.625%, due 07/01/2018
|
250,000
|
271,602
|
||||||
|
Calera, AL, GO, Warrants,
|
||||||||
|
3.00%, due 12/01/2016
|
250,000
|
262,475
|
||||||
|
3.00%, due 12/01/2017
|
410,000
|
434,038
|
||||||
|
Calhoun Co., AL, Gas Tax Anticipation, Series A, Rev., Warrants,
|
||||||||
|
4.00%, due 03/01/2016
|
445,000
|
465,296
|
||||||
|
Chambers Co., AL, Gasoline Tax Anticipation, Rev., Warrants,
|
||||||||
|
2.00%, due 11/01/2019
|
290,000
|
290,194
|
||||||
|
Chelsea, AL, GO,
|
||||||||
|
4.00%, due 05/01/2015
|
260,000
|
265,236
|
||||||
|
Decatur, AL, Sewer Rev., Warrants,
|
||||||||
|
3.00%, due 08/15/2019
|
500,000
|
537,030
|
||||||
|
Enterprise, AL, GO, School Warrants,
|
||||||||
|
4.00%, due 02/01/2016
|
400,000
|
419,296
|
||||||
|
Florence, AL, Board of Education, Rev.,
|
||||||||
|
3.00%, due 03/01/2016
|
500,000
|
516,670
|
||||||
|
Florence, AL, Electric Rev., Warrants,
|
||||||||
|
3.10%, due 06/01/2015
|
300,000
|
304,884
|
||||||
|
3.50%, due 06/01/2017
|
515,000
|
547,399
|
||||||
|
Florence, AL, GO, Warrants,
|
||||||||
|
4.00%, due 08/01/2018
|
575,000
|
633,846
|
||||||
|
Foley, AL, GO, Warrants,
|
||||||||
|
4.00%, due 01/01/2015
|
315,000
|
318,046
|
||||||
|
Foley, AL, Utilities Board, Utilities Rev.,
|
||||||||
|
4.00%, due 11/01/2018
|
710,000
|
789,513
|
||||||
|
4.00%, due 11/01/2019
|
225,000
|
253,337
|
||||||
|
4.50%, due 11/01/2019
|
250,000
|
261,692
|
||||||
|
Gadsden, AL, GO, School Warrants,
|
||||||||
|
3.00%, due 08/01/2015
|
250,000
|
255,250
|
||||||
|
Homewood, AL, Board of Education, Special Tax School Warrants,
|
||||||||
|
4.00%, due 04/01/2017
|
500,000
|
538,795
|
||||||
|
Homewood, AL, GO, Warrants,
|
||||||||
|
5.00%, due 09/01/2015
|
250,000
|
260,960
|
||||||
|
Hoover City, AL, Board of Education, Special Tax School Warrants,
|
||||||||
|
4.00%, due 02/15/2020
|
470,000
|
529,234
|
||||||
19
THE ALABAMA TAX FREE BOND FUND
SCHEDULE OF INVESTMENTS (Continued)
SCHEDULE OF INVESTMENTS (Continued)
|
ALABAMA FIXED RATE REVENUE AND GENERAL OBLIGATION (GO) BONDS — 98.7% (Continued)
|
Par Value
|
Value
|
||||||
|
Houston Co., AL, GO,
|
||||||||
|
4.75%, due 10/15/2016
|
$
|
500,000
|
$
|
500,965
|
||||
|
Huntsville, AL, Electric Systems, Rev.,
|
||||||||
|
3.00%, due 12/01/2016
|
375,000
|
395,423
|
||||||
|
Huntsville, AL, GO, Capital Improvement Warrants,
|
||||||||
|
4.00%, due 03/01/2015
|
550,000
|
558,932
|
||||||
|
Huntsville, AL, GO, Refunding and Capital Improvement Warrants,
|
||||||||
|
4.00%, due 09/01/2016
|
500,000
|
534,480
|
||||||
|
4.00%, due 09/01/2018
|
500,000
|
559,135
|
||||||
|
Jacksonville, AL, GO, Warrants,
|
||||||||
|
2.00%, due 09/01/2016
|
200,000
|
204,548
|
||||||
|
Limestone Co., AL, Board of Education, Special Tax Warrants,
|
||||||||
|
3.00%, due 11/01/2019
|
560,000
|
587,580
|
||||||
|
Macon Co., AL, GO, Warrants,
|
||||||||
|
4.25%, due 10/01/2027,
|
||||||||
|
Prerefunded 10/01/2017 @ 100
|
200,000
|
221,658
|
||||||
|
Madison Co., AL, Board of Education, Rev., Tax Anticipation Warrants,
|
||||||||
|
2.00%, due 09/01/2019
|
220,000
|
225,014
|
||||||
|
Madison Co., AL, Series A, Water Rev., Warrants,
|
||||||||
|
2.00%, due 07/01/2017
|
250,000
|
258,083
|
||||||
|
Madison Co., AL, Water & Wastewater Board, Rev.,
|
||||||||
|
3.00%, due 12/01/2019
|
430,000
|
463,660
|
||||||
|
Montgomery, AL, GO, Warrants,
|
||||||||
|
3.00%, due 11/01/2014
|
500,000
|
501,180
|
||||||
|
2.50%, due 04/01/2021
|
500,000
|
510,300
|
||||||
|
Montgomery, AL, Waterworks & Sanitation, Rev.,
|
||||||||
|
5.00%, due 09/01/2017
|
250,000
|
280,698
|
||||||
|
Morgan Co., AL, Board of Education, Rev., Capital Outlay Warrants,
|
||||||||
|
4.00%, due 03/01/2019
|
250,000
|
277,015
|
||||||
|
Mountain Brook, AL, City Board of Education, GO, Warrants,
|
||||||||
|
3.00%, due 03/01/2020
|
300,000
|
320,760
|
||||||
|
North Alabama Gas District, Rev.,
|
||||||||
|
3.00%, due 06/01/2020
|
420,000
|
433,427
|
||||||
20
THE ALABAMA TAX FREE BOND FUND
SCHEDULE OF INVESTMENTS (Continued)
SCHEDULE OF INVESTMENTS (Continued)
|
ALABAMA FIXED RATE REVENUE AND GENERAL OBLIGATION (GO) BONDS — 98.7% (Continued)
|
Par Value
|
Value
|
||||||
|
Opelika, AL, GO, Warrants,
|
||||||||
|
2.00%, due 11/01/2017
|
$
|
275,000
|
$
|
284,155
|
||||
|
Opelika, AL, Utilities Board, Series B, Rev.,
|
||||||||
|
3.00%, due 06/01/2016
|
475,000
|
493,311
|
||||||
|
3.00%, due 06/01/2018
|
215,000
|
229,010
|
||||||
|
Orange Beach, AL, GO, Warrants,
|
||||||||
|
4.00%, due 02/01/2018
|
200,000
|
220,162
|
||||||
|
5.00%, due 02/01/2019
|
240,000
|
277,990
|
||||||
|
Prattville, AL, Waterworks Board, Rev.,
|
||||||||
|
3.00%, due 08/01/2017
|
290,000
|
304,938
|
||||||
|
Sheffield, AL, Electric Rev.,
|
||||||||
|
4.00%, due 07/01/2017
|
600,000
|
654,228
|
||||||
|
Sumter Co., AL, School Rev., Warrants,
|
||||||||
|
4.50%, due 02/01/2031,
|
||||||||
|
Prerefunded 02/01/2016 @ 100
|
500,000
|
527,990
|
||||||
|
Trussville, AL, GO,
|
||||||||
|
5.00%, due 10/01/2019
|
400,000
|
472,944
|
||||||
|
Tuscaloosa, AL, Series B, GO, Warrants,
|
||||||||
|
4.00%, due 01/01/2020
|
500,000
|
562,635
|
||||||
|
University of Alabama, AL, Rev.,
|
||||||||
|
4.00%, due 10/01/2014
|
500,000
|
500,055
|
||||||
|
University of Alabama, AL, Series A, Rev.,
|
||||||||
|
3.00%, due 07/01/2016
|
340,000
|
355,789
|
||||||
|
5.00%, due 07/01/2017
|
245,000
|
274,099
|
||||||
|
Vestavia Hills, AL, GO, Warrants,
|
||||||||
|
4.00%, due 02/01/2018
|
515,000
|
564,425
|
||||||
|
Vestavia Hills, AL, Series A, GO, Warrants,
|
||||||||
|
3.00%, due 02/01/2018
|
240,000
|
255,785
|
||||||
|
Wetumpka, AL, Waterworks & Sewer, Rev.,
|
||||||||
|
4.00%, due 03/01/2018
|
320,000
|
342,419
|
||||||
|
Total Alabama Fixed Rate Revenue and General Obligation (GO) Bonds (Cost $29,498,398)
|
$
|
30,128,099
|
||||||
21
THE ALABAMA TAX FREE BOND FUND
SCHEDULE OF INVESTMENTS (Continued)
SCHEDULE OF INVESTMENTS (Continued)
|
MONEY MARKET FUNDS — 0.6%
|
Shares
|
Value
|
||||||
|
Alpine Municipal Money Market Fund - Class I, 0.02% (a) (Cost $165,125)
|
165,125
|
$
|
165,125
|
|||||
|
Total Investments at Value — 99.3% (Cost $29,663,523)
|
$
|
30,293,224
|
||||||
|
Other Assets in Excess of Liabilities — 0.7%
|
228,841
|
|||||||
|
Net Assets — 100.0%
|
$
|
30,522,065
|
||||||
| (a) | The rate shown is the 7-day effective yield as of September 30, 2014 |
See accompanying notes to financial statements.
22
THE GOVERNMENT STREET FUNDS
STATEMENTS OF ASSETS AND LIABILITIES
September 30, 2014 (Unaudited)
STATEMENTS OF ASSETS AND LIABILITIES
September 30, 2014 (Unaudited)
|
Government Street
Equity Fund |
Government
Street Mid-Cap Fund |
Alabama
Tax Free Bond Fund |
||||||||||
|
ASSETS
|
||||||||||||
|
Investments in securities:
|
||||||||||||
|
At acquisition cost
|
$
|
57,762,812
|
$
|
29,370,418
|
$
|
29,663,523
|
||||||
|
At value (Note 2)
|
$
|
94,548,065
|
$
|
49,447,203
|
$
|
30,293,224
|
||||||
|
Cash
|
5,351
|
—
|
—
|
|||||||||
|
Dividends and interest receivable
|
103,548
|
21,675
|
264,054
|
|||||||||
|
Receivable for capital shares sold
|
50,703
|
100
|
—
|
|||||||||
|
Other assets
|
13,488
|
10,506
|
8,591
|
|||||||||
|
TOTAL ASSETS
|
94,721,155
|
49,479,484
|
30,565,869
|
|||||||||
|
LIABILITIES
|
||||||||||||
|
Distributions payable
|
4,932
|
—
|
3,124
|
|||||||||
|
Payable for investment securities purchased
|
386,480
|
267,122
|
—
|
|||||||||
|
Payable for capital shares redeemed
|
211,702
|
—
|
25,218
|
|||||||||
|
Accrued investment advisory fees (Note 4)
|
61,823
|
46,088
|
5,442
|
|||||||||
|
Payable to administrator (Note 4)
|
10,250
|
6,400
|
5,125
|
|||||||||
|
Other accrued expenses
|
5,751
|
4,350
|
4,895
|
|||||||||
|
TOTAL LIABILITIES
|
680,938
|
323,960
|
43,804
|
|||||||||
|
NET ASSETS
|
$
|
94,040,217
|
$
|
49,155,524
|
$
|
30,522,065
|
||||||
|
Net assets consist of:
|
||||||||||||
|
Paid-in capital
|
$
|
52,449,930
|
$
|
27,275,711
|
$
|
29,955,725
|
||||||
|
Accumulated net investment income
|
1,101
|
43,654
|
—
|
|||||||||
|
Accumulated net realized gains (losses) from security transactions
|
4,803,933
|
1,759,374
|
(63,361
|
)
|
||||||||
|
Net unrealized appreciation on investments
|
36,785,253
|
20,076,785
|
629,701
|
|||||||||
|
Net assets
|
$
|
94,040,217
|
$
|
49,155,524
|
$
|
30,522,065
|
||||||
|
Shares of beneficial interest outstanding (unlimited number of shares authorized, $0.01 par value)
|
1,428,974
|
2,263,870
|
2,897,074
|
|||||||||
|
Net asset value, offering price and redemption price per share (Note 2)
|
$
|
65.81
|
$
|
21.71
|
$
|
10.54
|
||||||
See accompanying notes to financial statements.
23
THE GOVERNMENT STREET FUNDS
STATEMENTS OF OPERATIONS
Six Months Ended September 30, 2014 (Unaudited)
STATEMENTS OF OPERATIONS
Six Months Ended September 30, 2014 (Unaudited)
|
Government
Street Equity Fund |
Government
Street Mid-Cap Fund |
Alabama
Tax Free Bond Fund |
||||||||||
|
INVESTMENT INCOME
|
||||||||||||
|
Dividends
|
$
|
845,780
|
$
|
372,970
|
$
|
37
|
||||||
|
Foreign withholding taxes on dividends
|
(6,597
|
)
|
(282
|
)
|
—
|
|||||||
|
Interest
|
276
|
234
|
319,676
|
|||||||||
|
TOTAL INVESTMENT INCOME
|
839,459
|
372,922
|
319,713
|
|||||||||
|
EXPENSES
|
||||||||||||
|
Investment advisory fees (Note 4)
|
283,817
|
197,002
|
55,699
|
|||||||||
|
Administration fees (Note 4)
|
56,785
|
35,621
|
27,000
|
|||||||||
|
Professional fees
|
10,130
|
8,918
|
8,285
|
|||||||||
|
Account maintenance fees
|
13,865
|
7,550
|
3,923
|
|||||||||
|
Compliance fees and expenses (Note 4)
|
5,309
|
4,391
|
3,946
|
|||||||||
|
Registration and filing fees
|
5,079
|
4,645
|
3,870
|
|||||||||
|
Custodian and bank service fees
|
5,927
|
3,186
|
2,419
|
|||||||||
|
Postage and supplies
|
4,152
|
3,542
|
3,074
|
|||||||||
|
Trustees' fees and expenses (Note 4)
|
3,242
|
3,242
|
3,242
|
|||||||||
|
Printing of shareholder reports
|
4,350
|
2,668
|
2,086
|
|||||||||
|
Pricing costs
|
1,043
|
1,480
|
6,074
|
|||||||||
|
Insurance expense
|
2,098
|
1,351
|
861
|
|||||||||
|
Other expenses
|
3,314
|
1,190
|
1,932
|
|||||||||
|
TOTAL EXPENSES
|
399,111
|
274,786
|
122,411
|
|||||||||
|
Fees voluntarily waived by the Adviser (Note 4)
|
—
|
—
|
(18,969
|
)
|
||||||||
|
NET EXPENSES
|
399,111
|
274,786
|
103,442
|
|||||||||
|
NET INVESTMENT INCOME
|
440,348
|
98,136
|
216,271
|
|||||||||
|
REALIZED AND UNREALIZED GAINS (LOSSES) ON INVESTMENTS
|
||||||||||||
|
Net realized gains (losses) from security transactions
|
1,705,161
|
485,999
|
(10,382
|
)
|
||||||||
|
Net realized gains from in-kind redemptions (Note 2)
|
3,609,846
|
3,329,346
|
—
|
|||||||||
|
Net change in unrealized appreciation (depreciation) on investments
|
(394,571
|
)
|
(3,474,728
|
)
|
93,188
|
|||||||
|
NET REALIZED AND UNREALIZED GAINS ON INVESTMENTS
|
4,920,436
|
340,617
|
82,806
|
|||||||||
|
NET INCREASE IN NET ASSETS FROM OPERATIONS
|
$
|
5,360,784
|
$
|
438,753
|
$
|
299,077
|
||||||
See accompanying notes to financial statements.
24
THE GOVERNMENT STREET FUNDS
STATEMENTS OF CHANGES IN NET ASSETS
STATEMENTS OF CHANGES IN NET ASSETS
|
Government Street
Equity Fund |
Government Street
Mid-Cap Fund |
|||||||||||||||
|
Six Months Ended
Sept. 30, 2014 (Unaudited) |
Year
Ended March 31, 2014 |
Six Months Ended
Sept. 30, 2014 (Unaudited) |
Year
Ended March 31, 2014 |
|||||||||||||
|
FROM OPERATIONS
|
||||||||||||||||
|
Net investment income
|
$
|
440,348
|
$
|
936,908
|
$
|
98,136
|
$
|
215,501
|
||||||||
|
Net realized gains from security transactions
|
1,705,161
|
422,386
|
485,999
|
198,853
|
||||||||||||
|
Net realized gains from in-kind redemptions (Note 2)
|
3,609,846
|
5,368,195
|
3,329,346
|
1,694,001
|
||||||||||||
|
Net change in unrealized appreciation (depreciation) on investments
|
(394,571
|
)
|
8,023,767
|
(3,474,728
|
)
|
6,861,214
|
||||||||||
|
Net increase in net assets from operations
|
5,360,784
|
14,751,256
|
438,753
|
8,969,569
|
||||||||||||
|
DISTRIBUTIONS TO SHAREHOLDERS
|
||||||||||||||||
|
From net investment income
|
(439,682
|
)
|
(917,652
|
)
|
—
|
(270,068
|
)
|
|||||||||
|
From net realized capital gains on security transactions
|
(429,807
|
)
|
(14,611
|
)
|
(209,998
|
)
|
(44,110
|
)
|
||||||||
|
Decrease in net assets from distributions to shareholders
|
(869,489
|
)
|
(932,263
|
)
|
(209,998
|
)
|
(314,178
|
)
|
||||||||
|
FROM CAPITAL SHARE TRANSACTIONS
|
||||||||||||||||
|
Proceeds from shares sold
|
3,646,408
|
8,616,023
|
428,316
|
3,573,791
|
||||||||||||
|
Net asset value of shares issued in reinvestment of distributions to shareholders
|
852,572
|
893,022
|
193,490
|
279,774
|
||||||||||||
|
Payments for shares redeemed
|
(9,237,124
|
)
|
(10,729,648
|
)
|
(6,570,214
|
)
|
(3,551,749
|
)
|
||||||||
|
Net increase (decrease) in net assets from capital share transactions
|
(4,738,144
|
)
|
(1,220,603
|
)
|
(5,948,408
|
)
|
301,816
|
|||||||||
|
TOTAL INCREASE (DECREASE) IN NET ASSETS
|
(246,849
|
)
|
12,598,390
|
(5,719,653
|
)
|
8,957,207
|
||||||||||
|
NET ASSETS
|
||||||||||||||||
|
Beginning of period
|
94,287,066
|
81,688,676
|
54,875,177
|
45,917,970
|
||||||||||||
|
End of period
|
$
|
94,040,217
|
$
|
94,287,066
|
$
|
49,155,524
|
$
|
54,875,177
|
||||||||
|
ACCUMULATED (DISTRIBUTIONS IN EXCESS OF) NET INVESTMENT INCOME
|
$
|
1,101
|
$
|
435
|
$
|
43,654
|
$
|
(54,482
|
)
|
|||||||
|
CAPITAL SHARE ACTIVITY
|
||||||||||||||||
|
Shares sold
|
56,148
|
147,014
|
19,363
|
183,688
|
||||||||||||
|
Shares reinvested
|
12,964
|
15,199
|
8,619
|
13,169
|
||||||||||||
|
Shares redeemed
|
(142,079
|
)
|
(183,959
|
)
|
(295,808
|
)
|
(179,903
|
)
|
||||||||
|
Net increase (decrease) in shares outstanding
|
(72,967
|
)
|
(21,746
|
)
|
(267,826
|
)
|
16,954
|
|||||||||
|
Shares outstanding, beginning of period
|
1,501,941
|
1,523,687
|
2,531,696
|
2,514,742
|
||||||||||||
|
Shares outstanding, end of period
|
1,428,974
|
1,501,941
|
2,263,870
|
2,531,696
|
||||||||||||
See accompanying notes to financial statements.
25
THE GOVERNMENT STREET FUNDS
STATEMENTS OF CHANGES IN NET ASSETS (Continued)
STATEMENTS OF CHANGES IN NET ASSETS (Continued)
|
Alabama Tax Free
Bond Fund |
||||||||
|
Six Months Ended
Sept. 30, 2014 (Unaudited) |
Year
Ended March 31, 2014 |
|||||||
|
FROM OPERATIONS
|
||||||||
|
Net investment income
|
$
|
216,271
|
$
|
465,168
|
||||
|
Net realized losses from security transactions
|
(10,382
|
)
|
(3,126
|
)
|
||||
|
Net change in unrealized appreciation (depreciation) on investments
|
93,188
|
(352,648
|
)
|
|||||
|
Net increase in net assets from operations
|
299,077
|
109,394
|
||||||
|
DISTRIBUTIONS TO SHAREHOLDERS
|
||||||||
|
From net investment income
|
(216,262
|
)
|
(466,887
|
)
|
||||
|
FROM CAPITAL SHARE TRANSACTIONS
|
||||||||
|
Proceeds from shares sold
|
975,797
|
2,039,630
|
||||||
|
Net asset value of shares issued in reinvestment of distributions to shareholders
|
194,092
|
412,246
|
||||||
|
Payments for shares redeemed
|
(3,360,581
|
)
|
(2,729,087
|
)
|
||||
|
Net decrease in net assets from capital share transactions
|
(2,190,692
|
)
|
(277,211
|
)
|
||||
|
TOTAL DECREASE IN NET ASSETS
|
(2,107,877
|
)
|
(634,704
|
)
|
||||
|
NET ASSETS
|
||||||||
|
Beginning of period
|
32,629,942
|
33,264,646
|
||||||
|
End of period
|
$
|
30,522,065
|
$
|
32,629,942
|
||||
|
ACCUMULATED (DISTRIBUTION IN EXCESS OF)
NET INVESTMENT INCOME |
$
|
—
|
$
|
(9
|
)
|
|||
|
CAPITAL SHARE ACTIVITY
|
||||||||
|
Shares sold
|
92,420
|
194,253
|
||||||
|
Shares reinvested
|
18,400
|
39,198
|
||||||
|
Shares redeemed
|
(318,423
|
)
|
(259,072
|
)
|
||||
|
Net decrease in shares outstanding
|
(207,603
|
)
|
(25,621
|
)
|
||||
|
Shares outstanding, beginning of period
|
3,104,677
|
3,130,298
|
||||||
|
Shares outstanding, end of period
|
2,897,074
|
3,104,677
|
||||||
See accompanying notes to financial statements.
26
THE GOVERNMENT STREET EQUITY FUND
FINANCIAL HIGHLIGHTS
FINANCIAL HIGHLIGHTS
Selected Per Share Data and Ratios for a Share Outstanding Throughout Each Period
|
Six Months Ended
Sept. 30, 2014 |
Years Ended March 31,
|
|||||||||||||||||||||||
|
(Unaudited)
|
2014
|
2013
|
2012
|
2011
|
2010
|
|||||||||||||||||||
|
Net asset value at beginning of period
|
$
|
62.78
|
$
|
53.61
|
$
|
50.42
|
$
|
48.00
|
$
|
40.89
|
$
|
26.72
|
||||||||||||
|
Income from investment operations:
|
||||||||||||||||||||||||
|
Net investment income
|
0.31
|
0.62
|
0.64
|
0.47
|
0.39
|
0.40
|
||||||||||||||||||
|
Net realized and unrealized gains on investments
|
3.33
|
9.17
|
4.21
|
2.66
|
7.19
|
14.17
|
||||||||||||||||||
|
Total from investment operations
|
3.64
|
9.79
|
4.85
|
3.13
|
7.58
|
14.57
|
||||||||||||||||||
|
Less distributions:
|
||||||||||||||||||||||||
|
Dividends from net investment income
|
(0.31
|
)
|
(0.61
|
)
|
(0.64
|
)
|
(0.48
|
)
|
(0.39
|
)
|
(0.40
|
)
|
||||||||||||
|
Distributions from net realized gains
|
(0.30
|
)
|
(0.01
|
)
|
(1.02
|
)
|
(0.23
|
)
|
(0.08
|
)
|
—
|
|||||||||||||
|
Total distributions
|
(0.61
|
)
|
(0.62
|
)
|
(1.66
|
)
|
(0.71
|
)
|
(0.47
|
)
|
(0.40
|
)
|
||||||||||||
|
Net asset value at end of period
|
$
|
65.81
|
$
|
62.78
|
$
|
53.61
|
$
|
50.42
|
$
|
48.00
|
$
|
40.89
|
||||||||||||
|
Total return (a)
|
5.80
|
%(b)
|
18.34
|
%
|
9.93
|
%
|
6.67
|
%
|
18.69
|
%
|
54.71
|
%
|
||||||||||||
|
Net assets at end of period (000's)
|
$
|
94,040
|
$
|
94,287
|
$
|
81,689
|
$
|
72,268
|
$
|
66,373
|
$
|
57,766
|
||||||||||||
|
Ratio of total expenses to average net assets
|
0.84
|
%(c)
|
0.84
|
%
|
0.85
|
%
|
0.87
|
%
|
0.88
|
%
|
0.90
|
%
|
||||||||||||
|
Ratio of net investment income to average net assets
|
0.93
|
%(c)
|
1.06
|
%
|
1.29
|
%
|
1.01
|
%
|
0.92
|
%
|
1.14
|
%
|
||||||||||||
|
Portfolio turnover rate
|
9
|
%(b)
|
36
|
%
|
38
|
%
|
36
|
%
|
26
|
%
|
30
|
%
|
||||||||||||
| (a) | Total return is a measure of the change in value of an investment in the Fund over the period covered, which assumes any dividends or capital gains distributions are reinvested in shares of the Fund. Returns do not reflect the deduction of taxes a shareholder would pay on Fund distributions or the redemption of Fund shares. |
| (b) | Not annualized. |
| (c) | Annualized. |
See accompanying notes to financial statements.
27
THE GOVERNMENT STREET MID-CAP FUND
FINANCIAL HIGHLIGHTS
FINANCIAL HIGHLIGHTS
Selected Per Share Data and Ratios for a Share Outstanding Throughout Each Period
|
Six Months Ended
Sept. 30, 2014 |
Years Ended March 31,
|
|||||||||||||||||||||||
|
(Unaudited)
|
2014
|
2013
|
2012
|
2011
|
2010
|
|||||||||||||||||||
|
Net asset value at beginning of period
|
$
|
21.68
|
$
|
18.26
|
$
|
16.26
|
$
|
15.89
|
$
|
12.87
|
$
|
8.46
|
||||||||||||
|
Income from investment operations:
|
||||||||||||||||||||||||
|
Net investment income
|
0.04
|
0.09
|
0.10
|
0.04
|
0.03
|
0.05
|
||||||||||||||||||
|
Net realized and unrealized gains on investments
|
0.08
|
3.46
|
2.05
|
0.37
|
3.03
|
4.41
|
||||||||||||||||||
|
Total from investment operations
|
0.12
|
3.55
|
2.15
|
0.41
|
3.06
|
4.46
|
||||||||||||||||||
|
Less distributions:
|
||||||||||||||||||||||||
|
Dividends from net investment income
|
—
|
(0.11
|
)
|
(0.11
|
)
|
(0.04
|
)
|
(0.03
|
)
|
(0.05
|
)
|
|||||||||||||
|
In excess of net investment income
|
—
|
—
|
—
|
—
|
(0.01
|
)
|
—
|
|||||||||||||||||
|
Distributions from net realized gains
|
(0.09
|
)
|
(0.02
|
)
|
(0.04
|
)
|
(0.00
|
)(a)
|
—
|
—
|
||||||||||||||
|
Total distributions
|
(0.09
|
)
|
(0.13
|
)
|
(0.15
|
)
|
(0.04
|
)
|
(0.04
|
)
|
(0.05
|
)
|
||||||||||||
|
Net asset value at end of period
|
$
|
21.71
|
$
|
21.68
|
$
|
18.26
|
$
|
16.26
|
$
|
15.89
|
$
|
12.87
|
||||||||||||
|
Total return (b)
|
0.53
|
%(c)
|
19.43
|
%
|
13.35
|
%
|
2.59
|
%
|
23.80
|
%
|
52.73
|
%
|
||||||||||||
|
Net assets at end of period (000's)
|
$
|
49,156
|
$
|
54,875
|
$
|
45,918
|
$
|
39,843
|
$
|
39,983
|
$
|
32,198
|
||||||||||||
|
Ratio of net expenses to average net assets
|
1.05
|
%(d)
|
1.06
|
%
|
1.08
|
%
|
1.09
|
%
|
1.13
|
%
|
1.13
|
%(e)
|
||||||||||||
|
Ratio of net investment income to average net assets
|
0.37
|
%(d)
|
0.43
|
%
|
0.63
|
%
|
0.29
|
%
|
0.21
|
%
|
0.47
|
%
|
||||||||||||
|
Portfolio turnover rate
|
4
|
%(c)
|
10
|
%
|
12
|
%
|
18
|
%
|
20
|
%
|
10
|
%
|
||||||||||||
| (a) | Amount rounds to less than $0.01 per share. |
| (b) | Total return is a measure of the change in value of an investment in the Fund over the period covered, which assumes any dividends or capital gains distributions are reinvested in shares of the Fund. Returns do not reflect the deduction of taxes a shareholder would pay on Fund distributions or the redemption of Fund shares. |
| (c) | Not annualized. |
| (d) | Annualized. |
| (e) | Absent voluntary advisory fee waivers by the Adviser, the ratio of expenses to average net assets would have been 1.18% for the year ended March 31, 2010. |
See accompanying notes to financial statements.
28
THE ALABAMA TAX FREE BOND FUND
FINANCIAL HIGHLIGHTS
FINANCIAL HIGHLIGHTS
Selected Per Share Data and Ratios for a Share Outstanding Throughout Each Period
|
Six Months Ended
Sept. 30, 2014 |
Years Ended March 31,
|
|||||||||||||||||||||||
|
(Unaudited)
|
2014
|
2013
|
2012
|
2011
|
2010
|
|||||||||||||||||||
|
Net asset value at beginning of period
|
$
|
10.51
|
$
|
10.63
|
$
|
10.64
|
$
|
10.45
|
$
|
10.53
|
$
|
10.54
|
||||||||||||
|
Income (loss) from investment operations:
|
||||||||||||||||||||||||
|
Net investment income
|
0.07
|
0.15
|
0.18
|
0.23
|
0.26
|
0.28
|
||||||||||||||||||
|
Net realized and unrealized gains (losses) on investments
|
0.03
|
(0.12
|
)
|
(0.01
|
)
|
0.19
|
(0.07
|
)
|
(0.00
|
)(a)
|
||||||||||||||
|
Total from investment operations
|
0.10
|
0.03
|
0.17
|
0.42
|
0.19
|
0.28
|
||||||||||||||||||
|
Less distributions:
|
||||||||||||||||||||||||
|
Dividends from net investment income
|
(0.07
|
)
|
(0.15
|
)
|
(0.18
|
)
|
(0.23
|
)
|
(0.27
|
)
|
(0.28
|
)
|
||||||||||||
|
Distributions from net realized gains
|
—
|
—
|
—
|
—
|
(0.00
|
)(a)
|
(0.01
|
)
|
||||||||||||||||
|
Total distributions
|
(0.07
|
)
|
(0.15
|
)
|
(0.18
|
)
|
(0.23
|
)
|
(0.27
|
)
|
(0.29
|
)
|
||||||||||||
|
Net asset value at end of period
|
$
|
10.54
|
$
|
10.51
|
$
|
10.63
|
$
|
10.64
|
$
|
10.45
|
$
|
10.53
|
||||||||||||
|
Total return (b)
|
0.97
|
%(c)
|
0.28
|
%
|
1.64
|
%
|
4.04
|
%
|
1.78
|
%
|
2.88
|
%
|
||||||||||||
|
Net assets at end of period (000's)
|
$
|
30,522
|
$
|
32,630
|
$
|
33,265
|
$
|
24,719
|
$
|
27,026
|
$
|
29,716
|
||||||||||||
|
Ratio of total expenses to average net assets
|
0.77
|
%(d)
|
0.76
|
%
|
0.76
|
%
|
0.80
|
%
|
0.77
|
%
|
0.75
|
%
|
||||||||||||
|
Ratio of net expenses to average net assets (e)
|
0.65
|
%(d)
|
0.65
|
%
|
0.65
|
%
|
0.65
|
%
|
0.65
|
%
|
0.65
|
%
|
||||||||||||
|
Ratio of net investment income to average net assets (e)
|
1.36
|
%(d)
|
1.41
|
%
|
1.70
|
%
|
2.17
|
%
|
2.51
|
%
|
2.85
|
%
|
||||||||||||
|
Portfolio turnover rate
|
0
|
%
|
10
|
%
|
7
|
%
|
18
|
%
|
21
|
%
|
32
|
%
|
||||||||||||
| (a) | Amount rounds to less than $0.01 per share. |
| (b) | Total return is a measure of the change in value of an investment in the Fund over the period covered, which assumes any dividends or capital gains distributions are reinvested in shares of the Fund. Returns do not reflect the deduction of taxes a shareholder would pay on Fund distributions or the redemption of Fund shares. |
| (c) | Not annualized. |
| (d) | Annualized. |
| (e) | Ratios were determined after voluntary advisory fee waivers by the Adviser (Note 4). |
See accompanying notes to financial statements.
29
THE GOVERNMENT STREET FUNDS
NOTES TO FINANCIAL STATEMENTS
September 30, 2014 (Unaudited)
NOTES TO FINANCIAL STATEMENTS
September 30, 2014 (Unaudited)
1. Organization
The Government Street Equity Fund, The Government Street Mid-Cap Fund and The Alabama Tax Free Bond Fund (the "Funds") are each a no-load series of the Williamsburg Investment Trust (the "Trust"), an open-end management investment company registered under the Investment Company Act of 1940. The Government Street Equity Fund and The Government Street Mid-Cap Fund are each a diversified fund and The Alabama Tax Free Bond Fund is a non-diversified fund. The Trust was organized as a Massachusetts business trust on July 18, 1988. Other series of the Trust are not included in this report.
The Government Street Equity Fund's investment objective is to seek capital appreciation.
The Government Street Mid-Cap Fund's investment objective is to seek capital appreciation.
The Alabama Tax Free Bond Fund's investment objectives are to provide current income exempt from federal income taxes and from the personal income taxes of Alabama and to preserve capital.
2. Significant Accounting Policies
The following is a summary of the Funds' significant accounting policies. The policies are in conformity with accounting principles generally accepted in the United States of America ("GAAP").
Securities valuation — The Funds' portfolio securities are valued as of the close of business of the regular session of the New York Stock Exchange (normally 4:00 p.m., Eastern time). Securities traded on a national stock exchange are valued based upon the closing price on the principal exchange where the security is traded, if available, otherwise, at the last quoted bid price. Securities which are quoted by NASDAQ are valued at the NASDAQ Official Closing Price.
Fixed income securities may be valued on the basis of prices provided by an independent pricing service. The prices provided by the pricing service are determined with consideration given to institutional bid and last sale prices and take into account securities prices, yields, maturities, call features, ratings, institutional trading in similar groups of securities and developments related to specific securities.
When market quotations are not readily available, if a pricing service cannot provide a price or the investment adviser believes the price received from the pricing service is not indicative of fair value, securities will be valued in good faith at fair value using procedures established by and under the general supervision of the Board of Trustees and will be classified as Level 2 or 3 within the fair value hierarchy (see below), depending on the inputs used. Such methods of fair valuation may include, but are
30
THE GOVERNMENT STREET FUNDS
NOTES TO FINANCIAL STATEMENTS (Continued)
NOTES TO FINANCIAL STATEMENTS (Continued)
not limited to: multiple of earnings, multiple of book value, discount from market of a similar freely traded security, purchase price of the security, subsequent private transactions in the security or related securities, or a combination of these and other factors.
GAAP establishes a single authoritative definition of fair value, sets out a framework for measuring fair value and requires additional disclosures about fair value measurements.
Various inputs are used in determining the value of each of the Fund's investments. These inputs are summarized in the three broad levels listed below:
| • | Level 1 – quoted prices in active markets for identical securities |
| • | Level 2 – other significant observable inputs |
| • | Level 3 – significant unobservable inputs |
Fixed income securities, including municipal bonds, are classified as Level 2 since the values for such securities are based on prices provided by an independent pricing service that utilizes various "other significant observable inputs" including bid and ask quotations, prices of similar securities and interest rates, among other factors. Commercial paper held by the Funds is classified as Level 2 since it is valued at amortized cost, which approximates the current fair value of the security and is not obtained from a quoted price in an active market.
The inputs or methodology used for valuing securities are not necessarily an indication of the risks associated with investing in those securities. The inputs used to measure fair value may fall into different levels of the fair value hierarchy. In such cases, for disclosure purposes, the level in the fair value hierarchy within which the fair value measurement falls in its entirety is determined based on the lowest level input that is significant to the fair value measurement.
The following is a summary of the inputs used to value each Fund's investments as of September 30, 2014 by security type:
|
The Government Street Equity Fund
|
Level 1
|
Level 2
|
Level 3
|
Total
|
||||||||||||
|
Common Stocks
|
$
|
81,049,938
|
$
|
—
|
$
|
—
|
$
|
81,049,938
|
||||||||
|
Exchange-Traded Funds
|
6,400,139
|
—
|
—
|
6,400,139
|
||||||||||||
|
Exchange-Traded Notes
|
2,760,160
|
—
|
—
|
2,760,160
|
||||||||||||
|
Warrants
|
19,120
|
—
|
—
|
19,120
|
||||||||||||
|
Commercial Paper
|
—
|
4,246,000
|
—
|
4,246,000
|
||||||||||||
|
Money Market Funds
|
72,708
|
—
|
—
|
72,708
|
||||||||||||
|
Total
|
$
|
90,302,065
|
$
|
4,246,000
|
$
|
—
|
$
|
94,548,065
|
||||||||
31
THE GOVERNMENT STREET FUNDS
NOTES TO FINANCIAL STATEMENTS (Continued)
NOTES TO FINANCIAL STATEMENTS (Continued)
|
The Government Street Mid-Cap Fund
|
Level 1
|
Level 2
|
Level 3
|
Total
|
||||||||||||
|
Common Stocks
|
$
|
41,402,023
|
$
|
—
|
$
|
—
|
$
|
41,402,023
|
||||||||
|
Preferred Stocks
|
25,180
|
—
|
—
|
25,180
|
||||||||||||
|
Exchange-Traded Funds
|
4,208,000
|
—
|
—
|
4,208,000
|
||||||||||||
|
Exchange-Traded Notes
|
992,596
|
—
|
—
|
992,596
|
||||||||||||
|
Commercial Paper
|
—
|
2,741,000
|
—
|
2,741,000
|
||||||||||||
|
Money Market Funds
|
78,404
|
—
|
—
|
78,404
|
||||||||||||
|
Total
|
$
|
46,706,203
|
$
|
2,741,000
|
$
|
—
|
$
|
49,447,203
|
||||||||
|
The Alabama Tax Free Bond Fund
|
Level 1
|
Level 2
|
Level 3
|
Total
|
||||||||||||
|
Municipal Bonds
|
$
|
—
|
$
|
30,128,099
|
$
|
—
|
$
|
30,128,099
|
||||||||
|
Money Market Funds
|
165,125
|
—
|
—
|
165,125
|
||||||||||||
|
Total
|
$
|
165,125
|
$
|
30,128,099
|
$
|
—
|
$
|
30,293,224
|
||||||||
Refer to The Government Street Equity Fund's and The Government Street Mid-Cap Fund's Schedules of Investments for a listing of the common stocks by sector type. As of September 30, 2014, the Funds did not have any transfers in and out of any Level. There were no Level 3 securities or derivative instruments held by the Funds as of September 30, 2014. It is the Funds' policy to recognize transfers into and out of any Level at the end of the reporting period.
Share valuation — The net asset value per share of each Fund is calculated daily by dividing the total value of its assets, less liabilities, by the number of shares outstanding. The offering price and redemption price per share of each Fund is equal to the net asset value per share.
Investment income — Interest income is accrued as earned. Dividend income is recorded on the ex-dividend date. Discounts and premiums on fixed-income securities purchased are amortized using the interest method.
Distributions to shareholders — Dividends arising from net investment income are declared and paid quarterly to shareholders of The Government Street Equity Fund; declared and paid annually to shareholders of The Government Street Mid-Cap Fund; and declared daily and paid monthly to shareholders of The Alabama Tax Free Bond Fund. Net realized short-term capital gains, if any, may be distributed throughout the year and net realized long-term capital gains, if any, are distributed at least once each year. The amount of distributions from net investment income and net realized gains are determined in accordance with federal income tax regulations, which may differ from GAAP. These "book/tax" differences are either temporary or permanent in nature.
32
THE GOVERNMENT STREET FUNDS
NOTES TO FINANCIAL STATEMENTS (Continued)
NOTES TO FINANCIAL STATEMENTS (Continued)
The tax character of distributions paid during the periods ended September 30, 2014 and March 31, 2014 is as follows:
|
Period
Ended |
Ordinar
Income
|
Exempt-Interest Dividends
|
Long-Term
Gains
|
Total Distributions
|
|||||||||||||
|
The Government Street Equity Fund
|
9/30/14
|
$
|
439,682
|
$
|
—
|
$
|
429,807
|
$
|
869,489
|
||||||||
|
3/31/14
|
$
|
917,652
|
$
|
—
|
$
|
14,611
|
$
|
932,263
|
|||||||||
|
The Government Street Mid-Cap Fund
|
9/30/14
|
$
|
—
|
$
|
—
|
$
|
209,998
|
$
|
209,998
|
||||||||
|
3/31/14
|
$
|
270,068
|
$
|
—
|
$
|
44,110
|
$
|
314,178
|
|||||||||
|
The Alabama Tax Free Bond Fund
|
9/30/14
|
$
|
—
|
$
|
216,262
|
$
|
—
|
$
|
216,262
|
||||||||
|
3/31/14
|
$
|
1,238
|
$
|
465,649
|
$
|
—
|
$
|
466,887
|
|||||||||
Security transactions — Security transactions are accounted for on trade date for financial reporting purposes. Gains and losses on securities sold are determined on a specific identification basis.
Common expenses — Common expenses of the Trust are allocated among the series of the Trust based on relative net assets of each series or the nature of the services performed and the relative applicability to each series.
Estimates — The preparation of financial statements in conformity with GAAP requires management to make estimates and assumptions that affect the reported amounts of assets and liabilities and the disclosure of contingent assets and liabilities as of the date of the financial statements and the reported amounts of income and expenses during the reporting period. Actual results could differ from those estimates.
Federal income tax — Each Fund has qualified and intends to continue to qualify as a regulated investment company under the Internal Revenue Code of 1986 (the "Code"). Qualification generally will relieve the Funds of liability for federal income taxes to the extent 100% of their net investment income and any realized capital gains are distributed in accordance with the Code. Accordingly, no provision for income tax has been made.
In order to avoid imposition of the excise tax applicable to regulated investment companies, it is also each Fund's intention to declare as dividends in each calendar year at least 98% of its net investment income (earned during the calendar year) and 98.2% of its net realized capital gains (earned during the twelve months ended October 31) plus undistributed amounts from prior years.
33
THE GOVERNMENT STREET FUNDS
NOTES TO FINANCIAL STATEMENTS (Continued)
NOTES TO FINANCIAL STATEMENTS (Continued)
The following information is computed on a tax basis for each item as of September 30, 2014:
|
The Government
Street Equity Fund
|
The Government
Street Mid-Cap Fund
|
The Alabama
Tax Free Bond Fund
|
||||||||||
|
Cost of portfolio investments
|
$
|
57,762,032
|
$
|
29,370,418
|
$
|
29,663,523
|
||||||
|
Gross unrealized appreciation
|
$
|
37,105,616
|
$
|
20,468,915
|
$
|
664,255
|
||||||
|
Gross unrealized depreciation
|
(319,583
|
)
|
(392,130
|
)
|
(34,554
|
)
|
||||||
|
Net unrealized appreciation
|
36,786,033
|
20,076,785
|
629,701
|
|||||||||
|
Undistributed ordinary income
|
6,033
|
43,654
|
—
|
|||||||||
|
Undistributed tax exempt income
|
—
|
—
|
3,124
|
|||||||||
|
Undistributed long-term gains
|
3,097,992
|
1,273,376
|
—
|
|||||||||
|
Capital loss carryforwards
|
—
|
—
|
(52,979
|
)
|
||||||||
|
Other gains (losses)
|
1,705,161
|
485,998
|
(10,382
|
)
|
||||||||
|
Other temporary differences
|
(4,932
|
)
|
—
|
(3,124
|
)
|
|||||||
|
Total distributable earnings
|
$
|
41,590,287
|
$
|
21,879,813
|
$
|
566,340
|
||||||
The difference between the federal income tax cost and the financial statement cost of portfolio investments for The Government Street Equity Fund is due to certain timing differences in the recognition of capital gains and losses under income tax regulations and GAAP. These timing differences are temporary in nature and are due to adjustments to basis on publicly traded partnerships.
As of March 31, 2014, The Alabama Tax Free Bond Fund had a short-term capital loss carryforward for federal income tax purposes of $23,075 and a long-term capital loss carryforward for federal income tax purposes of $29,904, both of which may be carried forward indefinitely. These capital loss carryforwards are available to offset realized capital gains in the current and future years, thereby reducing future taxable gains distributions.
During the six months ended September 30, 2014, The Government Street Equity Fund and The Government Street Mid-Cap Fund realized $3,609,846 and $3,329,346, respectively, of net capital gains resulting from in-kind redemptions (redemptions in which shareholders who redeemed Fund shares received securities held by the Fund rather than cash). The Funds recognize a gain on in-kind redemptions to the extent that the value of the distributed securities on the date of redemption exceeds the cost of those securities. Such gains are not taxable to the Funds and are not required to be distributed to shareholders. The Funds have reclassified these amounts against paid-in capital. These reclassifications are reflected on the Statements of Assets and Liabilities. Such reclassifications, the result of permanent differences between the financial statement and income tax reporting requirements, had no effect on each Fund's net assets or net asset value per share.
34
THE GOVERNMENT STREET FUNDS
NOTES TO FINANCIAL STATEMENTS (Continued)
NOTES TO FINANCIAL STATEMENTS (Continued)
The Funds recognize the tax benefits or expenses of uncertain tax positions only when the position is "more likely than not" to be sustained assuming examination by tax authorities. Management has reviewed the tax positions taken on federal income tax returns for the current and all open tax years (tax years ended March 31, 2011 through March 31, 2014) of each Fund and has concluded that no provision for unrecognized tax benefits or expenses is required in these financial statements.
3. Investment Transactions
During the six months ended September 30, 2014, cost of purchases and proceeds from sales and maturities of investment securities, other than short-term investments and U.S. government securities, totaled $8,070,077 and $14,260,019, respectively, for The Government Street Equity Fund; $2,110,190 and $8,962,243, respectively, for The Government Street Mid-Cap Fund; and $0 and $1,744,413, respectively, for The Alabama Tax Free Bond Fund.
4. Transactions with Related Parties
INVESTMENT ADVISORY AGREEMENT
The Funds' investments are managed by Leavell Investment Management, Inc. (the "Adviser") under the terms of an Investment Advisory Agreement. The Government Street Equity Fund pays the Adviser a fee, which is computed and accrued daily and paid monthly, at an annual rate of .60% of its average daily net assets up to $100 million and .50% of such assets in excess of $100 million. The Government Street Mid-Cap Fund pays the Adviser a fee, which is computed and accrued daily and paid monthly, at an annual rate of .75% of its average daily net assets. The Alabama Tax Free Bond Fund pays the Adviser a fee, which is computed and accrued daily and paid monthly, at an annual rate of .35% of its average daily net assets up to $100 million and .25% of such assets in excess of $100 million.
During the six months ended September 30, 2014, the Adviser voluntarily undertook to limit the total operating expenses of The Alabama Tax Free Bond Fund to .65% of the Fund's average daily net assets. Accordingly, the Adviser waived $18,969 of its investment advisory fees from The Alabama Tax Free Bond Fund during the six months ended September 30, 2014.
Certain officers of the Trust are also officers of the Adviser.
35
THE GOVERNMENT STREET FUNDS
NOTES TO FINANCIAL STATEMENTS (Continued)
NOTES TO FINANCIAL STATEMENTS (Continued)
OTHER SERVICE PROVIDERS
Ultimus Fund Solutions, LLC ("Ultimus") provides fund administration, fund accounting, compliance and transfer agent services to the Funds. The Funds pay Ultimus fees in accordance with the agreements for such services. In addition, the Funds pay out-of-pocket expenses including, but not limited to, postage, supplies, and costs of pricing the Funds' portfolio securities. Certain officers of the Trust are also officers of Ultimus, or of Ultimus Fund Distributors, LLC (the "Distributor"), the principal underwriter of each Fund's shares and an affiliate of Ultimus. The Distributor is compensated by the Adviser (not the Funds) for acting as principal underwriter.
COMPENSATION OF TRUSTEES
Trustees and officers affiliated with the Adviser or Ultimus are not compensated by the Trust for their services. Each Trustee who is not an affiliated person of the Adviser or Ultimus receives from the Trust an annual retainer of $12,000, payable quarterly; a fee of $1,500 for attendance at each meeting of the Board of Trustees (except that such fee is $2,500 for the independent chairman); and $1,000 for attendance at each meeting of any committee of the Board (except that such fee is $1,500 for the committee chairman); plus reimbursement of travel and other expenses incurred in attending meetings. Prior to July 1, 2014, the annual retainer was $10,000.
5. Contingencies and Commitments
The Funds indemnify the Trust's officers and Trustees for certain liabilities that might arise from their performance of their duties to the Funds. Additionally, in the normal course of business the Funds enter into contracts that contain a variety of representations and warranties and which provide general indemnifications. The Funds' maximum exposure under these arrangements is unknown, as this would involve future claims that may be made against the Funds that have not yet occurred. However, based on experience, the Funds expect the risk of loss to be remote.
6. Concentration of Credit Risk
The Alabama Tax Free Bond Fund invests primarily in debt instruments of municipal issuers in the state of Alabama. The issuers' abilities to meet their obligations may be affected by economic developments in the state or its region, as well as disruptions in the credit markets and the economy, generally.
36
THE GOVERNMENT STREET FUNDS
NOTES TO FINANCIAL STATEMENTS (Continued)
NOTES TO FINANCIAL STATEMENTS (Continued)
7. Subsequent Events
The Funds are required to recognize in the financial statements the effects of all subsequent events that provide additional evidence about conditions that existed as of the date of the Statements of Assets and Liabilities. For non-recognized subsequent events that must be disclosed to keep the financial statements from being misleading, the Funds are required to disclose the nature of the event as well as an estimate of its financial effect, or a statement that such an estimate cannot be made. Management has evaluated subsequent events through the issuance of these financial statements and has noted no such events.
37
THE GOVERNMENT STREET FUNDS
ABOUT YOUR FUNDS' EXPENSES (Unaudited)
ABOUT YOUR FUNDS' EXPENSES (Unaudited)
We believe it is important for you to understand the impact of costs on your investment. All mutual funds have operating expenses. As a shareholder of the Funds, you incur ongoing costs, including management fees and other expenses. These ongoing costs, which are deducted from each Fund's gross income, directly reduce the investment returns of the Funds.
A mutual fund's ongoing costs are expressed as a percentage of its average net assets. This figure is known as the expense ratio. The following examples are intended to help you understand the ongoing costs (in dollars) of investing in the Funds and to compare these costs with the ongoing costs of investing in other mutual funds. The examples below are based on an investment of $1,000 made at the beginning of the period shown and held for the entire period (April 1, 2014 through September 30, 2014).
The table below illustrates each Fund's ongoing costs in two ways:
Actual fund return – This section helps you to estimate the actual expenses that you paid over the period. The "Ending Account Value" shown is derived from each Fund's actual return, and the third column shows the dollar amount of operating expenses that would have been paid by an investor who started with $1,000 in the Funds. You may use the information here, together with the amount you invested, to estimate the expenses that you paid over the period.
To do so, simply divide your account value by $1,000 (for example, an $8,600 account value divided by $1,000 = 8.6), then multiply the result by the number given for the Funds under the heading "Expenses Paid During Period."
Hypothetical 5% return – This section is intended to help you compare the Funds' ongoing costs with those of other mutual funds. It assumes that each Fund had an annual return of 5% before expenses during the period shown, but that the expense ratio is unchanged. In this case, because the returns used are not the Funds' actual returns, the results do not apply to your investment. The example is useful in making comparisons because the Securities and Exchange Commission (the "SEC") requires all mutual funds to calculate expenses based on a 5% return. You can assess each Fund's ongoing costs by comparing this hypothetical example with the hypothetical examples that appear in shareholder reports of other funds.
Note that expenses shown in the table are meant to highlight and help you compare ongoing costs only. The Funds do not charge sales loads or redemption fees.
The calculations assume no shares were bought or sold during the period. Your actual costs may have been higher or lower, depending on the amount of your investment and the timing of any purchases or redemptions.
38
THE GOVERNMENT STREET FUNDS
ABOUT YOUR FUNDS' EXPENSES (Unaudited)
ABOUT YOUR FUNDS' EXPENSES (Unaudited)
(Continued)
More information about the Funds' expenses, including historical expense ratios, can be found in this report. For additional information on operating expenses and other shareholder costs, please refer to the Funds' prospectus.
|
Beginning
Account Value April 1, 2014 |
Ending
Account Value Sept. 30, 2014 |
Expenses
Paid During Period* |
|
|
The Government Street Equity Fund
|
|||
|
Based on Actual Fund Return
|
$1,000.00
|
$1,058.00
|
$4.33
|
|
Based on Hypothetical 5% Return (before expenses)
|
$1,000.00
|
$1,020.86
|
$4.26
|
|
The Government Street Mid-Cap Fund
|
|||
|
Based on Actual Fund Return
|
$1,000.00
|
$1,005.30
|
$5.28
|
|
Based on Hypothetical 5% Return (before expenses)
|
$1,000.00
|
$1,019.80
|
$5.32
|
|
The Alabama Tax Free Bond Fund
|
|||
|
Based on Actual Fund Return
|
$1,000.00
|
$1,009.70
|
$3.27
|
|
Based on Hypothetical 5% Return (before expenses)
|
$1,000.00
|
$1,021.81
|
$3.29
|
|
*
|
Expenses are equal to the Funds' annualized expense ratios for the period as stated below, multiplied by the average account value over the period, multiplied by 183/365 (to reflect the one-half year period).
|
|
The Government Street Equity Fund
|
0.84%
|
|
The Government Street Mid-Cap Fund
|
1.05%
|
|
The Alabama Tax Free Bond Fund
|
0.65%
|
39
THE GOVERNMENT STREET FUNDS
OTHER INFORMATION (Unaudited)
OTHER INFORMATION (Unaudited)
A description of the policies and procedures that the Funds use to vote proxies relating to portfolio securities is available without charge upon request by calling toll-free 1-866-738-1125, or on the SEC's website at http://www.sec.gov. Information regarding how the Funds voted proxies relating to portfolio securities during the most recent 12-month period ended June 30 is also available without charge upon request by calling toll-free 1-866-738-1125 or on the SEC's website at http://www.sec.gov.
The Trust files a complete listing of portfolio holdings for the Funds with the SEC as of the end of the first and third quarters of each fiscal year on Form N-Q. The filings are available upon request, by calling 1-866-738-1125. Furthermore, you may obtain a copy of these filings on the SEC's website at http://www.sec.gov. The Trust's Forms N-Q may also be reviewed and copied at the SEC's Public Reference Room in Washington, DC, and information on the operation of the Public Reference Room may be obtained by calling 1-800-SEC-0330.
40
THE GOVERNMENT STREET FUNDS
DISCLOSURE REGARDING APPROVAL OF INVESTMENT ADVISORY AGREEMENTS (Unaudited)
DISCLOSURE REGARDING APPROVAL OF INVESTMENT ADVISORY AGREEMENTS (Unaudited)
On July 21, 2014, at a Special Meeting of Shareholders, shareholders of The Government Street Equity Fund, The Government Street Mid-Cap Fund and The Alabama Tax Free Bond Fund (the "Funds") approved new Investment Advisory Agreements (the "New Advisory Agreements") on behalf of each Fund. This Special Meeting was called due to a change in control of Leavell Investment Management, Inc. (the "Adviser") which, when effected, caused each Fund's investment advisory agreement in effect prior to July 21, 2014 (the "Former Advisory Agreements") to terminate. Prior to submitting the New Advisory Agreements to shareholders for approval at the Special Meeting, the Board of Trustees, including a majority of the Independent Trustees, approved the New Advisory Agreements with the Adviser on behalf of the Funds at an in-person meeting held on May 20, 2014. Below is a discussion of the factors considered by the Board of Trustees along with the conclusions with respect thereto that formed the basis for the Board's approvals of the New Advisory Agreements.
In selecting the Adviser and approving the New Advisory Agreements, the Trustees considered all information they deemed reasonably necessary to evaluate the terms of the Agreements. The principal areas of review by the Trustees were the nature, extent and quality of the services provided by the Adviser and the reasonableness of the fees charged for those services. The Trustees considered the information they received when they last approved the continuance of the Former Advisory Agreements at an in-person meeting held on February 25, 2014. The Independent Trustees consulted with experienced counsel for the Independent Trustees, who is independent of the Adviser, during their deliberations.
The Board of Trustees gave substantial weight to the Adviser's representations that: (i) the responsibilities of the Adviser under the New Advisory Agreements are the same in all material respects as under the Former Advisory Agreements; (ii) the operations of the Adviser and the level or quality of advisory services provided to the Funds will not be materially affected as a result of the New Advisory Agreements; (iii) the same personnel of the Adviser who provide investment advisory services to the Funds under the Former Advisory Agreements will continue to do so upon approval of the New Advisory Agreements; (iv) the management fee payable by each Fund will be at the same rate as the compensation under the Former Advisory Agreements; and (v) the financial condition of the Adviser will not be adversely affected by the change in control.
The Trustees' evaluation of the quality of the Adviser's services took into account their knowledge and experience gained through meetings with and reports of the Adviser's senior management over the course of the preceding year. Both short-term and long-term investment performance of the Funds was considered. Each Fund's performance was compared to its performance benchmark and to that of competitive funds with similar investment objectives. The Trustees also considered the scope and
41
THE GOVERNMENT STREET FUNDS
DISCLOSURE REGARDING APPROVAL OF INVESTMENT ADVISORY AGREEMENTS (Unaudited) (Continued)
DISCLOSURE REGARDING APPROVAL OF INVESTMENT ADVISORY AGREEMENTS (Unaudited) (Continued)
quality of the in-house capabilities of the Adviser and other resources dedicated to performing services for the Funds. The quality of administrative and other services, including the Adviser's role in coordinating the activities of the Funds' other service providers, were considered in light of the Funds' compliance with investment policies and applicable laws and regulations and of related reports by management and the Funds' independent public accounting firm in periodic meetings with the Trust's Audit Committee. The Trustees also considered the business reputation of the Adviser, the qualifications of its key investment and compliance personnel, and its financial resources.
In reviewing the fees payable under the New Advisory Agreements, the Trustees compared the advisory fees and overall expense levels of each Fund with those of competitive funds with similar investment objectives. The Trustees considered information provided by the Adviser concerning the Adviser's profitability with respect to each Fund, including the assumptions and methodology used in preparing the profitability information, in light of applicable case law relating to advisory fees. For these purposes, the Trustees took into account not only the fees paid by the Funds, but also so-called "fallout" benefits to the Adviser. The Trustees also considered the Adviser's representations that all of the Funds' portfolio trades were executed based on the best price and execution available, and that the Adviser does not participate in any soft dollar or directed brokerage arrangements. The Trustees further considered that the Adviser does not participate in any revenue sharing arrangements relating to the Funds. In evaluating the Funds' advisory fees, the Trustees took into account the complexity and quality of the investment management of the Funds.
Based upon their review of this information, the Independent Trustees concluded that: (i) based upon the performance of The Government Street Equity Fund and The Government Street Mid-Cap Fund during the fiscal year ended March 31, 2014, as well as their longer term performance, the Adviser has provided quality services to those Funds; (ii) although the short-term and long-term performance of The Alabama Tax Free Bond Fund has lagged its benchmark index and the average returns for comparably managed funds, such Fund is managed in a conservative investment style and has satisfactorily met the goal of providing tax-exempt income with limited exposure to credit and maturity risks; (iii) the investment advisory fees payable to the Adviser by each Fund are competitive with similarly managed funds, and the Independent Trustees believe the fees to be reasonable given the scope and quality of investment advisory services provided by the Adviser and other services provided to shareholders; (iv) the total operating expense ratio of each Fund is less than the average expense ratio for comparably managed funds, according to statistics derived from Morningstar, Inc.; (v) the Adviser's voluntary commitment to cap overall operating expenses of The Alabama Tax Free Bond Fund through advisory fee waivers
42
THE GOVERNMENT STREET FUNDS
DISCLOSURE REGARDING APPROVAL OF INVESTMENT ADVISORY AGREEMENTS (Unaudited) (Continued)
DISCLOSURE REGARDING APPROVAL OF INVESTMENT ADVISORY AGREEMENTS (Unaudited) (Continued)
has enabled that Fund to further increase returns for shareholders; and (vi) the level of the Adviser's profitability with respect to its management of the Funds is reasonable. Given the current size of the Funds and their expected growth, the Independent Trustees did not believe that at the present time it would be relevant to consider the extent to which economies of scale would be realized as the Funds grow, and whether fee levels reflect these economies of scale. The Independent Trustees also considered the "fallout" benefits to, and the profitability of, the Adviser with respect to the Funds, but given the amounts involved viewed these as secondary factors in connection with the evaluation of the reasonableness of the advisory fees paid by the Funds.
No single factor was considered in isolation or to be determinative to the decision of the Trustees to approve the New Advisory Agreements and each Trustee weighed the various factors as he or she deemed appropriate. Rather the Trustees concluded, in light of a weighing and balancing of all factors considered, that approval of each New Advisory Agreement is in the best interests of each Fund and its shareholders. The Board of Trustees noted that the scope, quality, and nature of services to be provided by the Adviser, and the fees to be paid to the Adviser, under each of the New Advisory Agreements will be substantially identical to the scope, quality and nature of services provided, and fees paid, under each of the Former Advisory Agreements. After full consideration of the above factors as well as other factors, the Board of Trustees, with the Independent Trustees voting separately, unanimously concluded that approval of each of the New Advisory Agreements was in the best interest of the Funds and their shareholders and recommended approval of each of the New Advisory Agreements to the Funds' shareholders.
43
WILLIAMSBURT INVESTMENT TRUST
RESULTS OF SPECIAL MEETING OF SHAREHOLDERS
(Unaudited)
RESULTS OF SPECIAL MEETING OF SHAREHOLDERS
(Unaudited)
On July 21, 2014, a Special Meeting of Shareholders of The Government Street Equity Fund, The Government Street Mid-Cap Fund and The Alabama Tax Free Bond Fund (the "Government Street Funds"), each a series of the Trust, was held for the purpose of approving a proposed new investment advisory agreement by and between the Trust and the Adviser, on behalf of each of the Government Street Funds, as a result of a change in the ownership structure of the Adviser.
Shareholders approved a new investment advisory agreement with respect to each Government Street Fund under which the Adviser will continue to act as the investment adviser by a vote as follows:
|
Fund
|
For
|
Against
|
Abstain
|
For Votes
as % of Shares Voted |
|
The Government Street Equity Fund
|
1,196,086.619
|
0
|
89.002
|
99.99%
|
|
The Government Street Mid-Cap Fund
|
2,337,436.765
|
0
|
0
|
100%
|
|
The Alabama Tax Free Bond Fund
|
2,574,711.440
|
0
|
0
|
100%
|
44
This page intentionally left blank.
|
|
||||||||
|
The Government Street Funds
|
||||||||
|
No Load Mutual Funds
|
||||||||
|
Investment Adviser
Leavell Investment Management, Inc.
210 St. Joseph Street
Mobile, AL 36602
Administrator
Ultimus Fund Solutions, LLC
P.O. Box 46707
Cincinnati, OH 45246-0707
1-866-738-1125
Legal Counsel
Sullivan & Worcester LLP
One Post Office Square
Boston, MA 02109
Independent Registered Public Accounting Firm
Ernst & Young LLP
1900 Scripps Center
312 Walnut Street
Cincinnati, OH 45202
Board of Trustees
Robert S. Harris, Ph.D., Chairman
John P. Ackerly, IV
John T. Bruce
J. Finley Lee, Jr., Ph.D.
Harris V. Morrissette
Elizabeth W. Robertson
Portfolio Managers
Thomas W. Leavell,
The Government Street Equity Fund
The Government Street Mid-Cap Fund
Timothy S. Healey,
The Government Street Mid-Cap Fund
The Alabama Tax Free Bond Fund
Richard E. Anthony, Jr., CFA,
The Government Street Mid-Cap Fund
Michael J. Hofto, CFA,
The Government Street Mid-Cap Fund
|
||||||||
|
|
|
|
||||||||
|
THE
JAMESTOWN
FUNDS
No-Load Funds
The Jamestown Balanced Fund
The Jamestown Equity Fund
The Jamestown Tax Exempt Virginia Fund
SEMI-ANNUAL REPORT
September 30, 2014
(Unaudited)
Investment Adviser
Lowe, Brockenbrough & Company, Inc.
Richmond, Virginia
|
||||||||
|
|
|
LETTER TO SHAREHOLDERS
|
November 10, 2014
|
The Jamestown Balanced Fund
For the six months ended September 30, 2014, The Jamestown Balanced Fund (the "Fund") returned 3.93% compared to a 4.33% return for a blend of 60% S&P 500 Index/40% Barclays Intermediate U.S. Government/Credit Index. Equity markets rose during the first half of the fiscal year as markets overcame geopolitical concerns in Europe and the Middle East, the Federal Reserve ended their bond purchase program, and worries about global growth arose. The Barclays Intermediate U.S. Government/Credit Index returned 1.20% as short term interest rates rose slightly while long term interest rates fell modestly during the period. Corporate spreads were modestly tighter over the six month period.
The Fund underperformed during the first half of the fiscal year due to slight underperformance in both the bond and equity portions of the portfolio. The bond portion of the Fund benefitted from an overweight in corporate bonds, while the underweight to longer dated bonds hurt performance. In the equity market, Information Technology and Health Care sectors led the market higher, while the Energy, Industrials, Utilities, and Consumer Discretionary sectors lagged during the first half of the fiscal year. The equity portion of the Fund underperformed the S&P 500 Index during the period largely due to sector allocation, primarily from the drag of the cash position in a rising market. Stock selection was positive as strong selection in the Materials, Consumer Staples, and Industrials sectors more than offset the negative selection in the Consumer Discretionary and Information Technology sectors. As of September 30, 2014, the largest sector overweights in the equity portion of the Fund were in the Health Care and Industrials sectors. The largest sector underweights in the Fund were in the Utilities, Telecommunication Services, and Consumer Staples sectors.
While U.S. growth has improved, economic conditions remain sluggish in Europe and Japan. U.S. government bond yields are higher than those of Europe and Japan, leading to incremental demand for U.S. debt. Subdued inflation enabled long maturity yields to drop as the yield curve continues to flatten. We continue to have a shorter duration than the Barclays Intermediate U.S. Government/Credit Index and have maintained our overweight in corporate bonds at the expense of Treasuries. As of September 30, the Fund had 64.4% invested in equities, 29.4% in fixed income, and 6.2% in cash equivalents.
The S&P 500 Index has slightly outperformed corporate earnings growth so far this fiscal year as valuation has expanded modestly. We believe that further upside will likely depend more on future earnings growth rather than further expansion in valuation. The market was trading at about 16X earnings as of September 30, 2014, slightly above the historical average. The interest rate environment has been supportive as rates fell during the most recent quarter despite the Federal Reserve moving to end their bond buying program. The U.S. economy continues to grow modestly while inflation remains well contained. Concerns about global growth, especially in Europe, have led to increased volatility, but overall global growth has continued on the moderate pace that has been in place for the past several years.
We continue to evaluate the factors above and look for the opportunity to buy high-quality businesses trading at reasonable prices. Our biggest concerns continue to be the very elevated level of profit margins currently enjoyed by public companies, as well as the pace of global economic growth. Margins are likely to be supported until there is significant pressure from wage growth or an economic slowdown, neither of which appear imminent.
1
Jamestown Equity Fund
For the six months ended September 30, 2014, The Jamestown Equity Fund (the "Fund") returned 5.60% compared to 6.42% for the S&P 500 Index. Equity markets rose during the first half of the fiscal year as markets overcame geopolitical concerns in Europe and the Middle East, the Federal Reserve ended their bond purchase program, and worries about global growth arose. The Information Technology and Health Care sectors led the market higher, while the Energy, Industrials, Utilities, and Consumer Discretionary sectors lagged during the first half of the fiscal year. The Jamestown Equity Fund underperformed the S&P 500 Index during the first half of the fiscal year largely due to sector allocation, primarily from the drag of the cash position in a rising market. Stock selection was positive as strong selection in the Materials, Consumer Staples, and Industrials sectors more than offset the negative selection in the Consumer Discretionary and Information Technology sectors.
The S&P 500 Index has slightly outperformed corporate earnings growth so far this fiscal year as valuation has expanded modestly. We believe that further upside will likely depend more on future earnings growth rather than further expansion in valuation. The market was trading at about 16X earnings as of September 30, slightly above the historical average. The interest rate environment has been supportive as rates fell during the most recent quarter despite the Federal Reserve moving to end its bond buying program. The U.S. economy continues to grow modestly while inflation remains well contained. Concerns about global growth, especially in Europe, have led to increased volatility, but overall global growth has continued on the moderate pace that has been in place for the past several years.
We continue to evaluate the factors above and look for the opportunity to buy high-quality businesses trading at reasonable prices. Our biggest concerns continue to be the very elevated level of profit margins currently enjoyed by public companies, as well as the pace of global economic growth. Margins are likely to be supported until there is significant pressure from wage growth or an economic slowdown, neither of which appear imminent.
As of September 30, 2014, the largest sector overweights in the portfolio were in the Health Care and Industrials sectors. The largest sector underweights in the Fund were in the Utilities, Telecommunication Services, and the Consumer Staples sectors.
Jamestown Tax Exempt Virginia Fund
For the six-month period ended September 30, 2014, The Jamestown Tax Exempt Virginia Fund (the "Fund") returned 1.65%. By comparison, the Barclays 5-year Municipal Bond Index posted a return of 2.08% and the Barclays 1-10 year Municipal Blend Index (the "Benchmark") gained 2.43% for the period. For the month of September, 2014, the Fund's SEC 30-day yield was 1.67%, which is a taxable equivalent yield of 2.95% for investors subject to the maximum 43.4% federal income tax rate.
Bond prices gained and yields declined during the six-month period. While U.S. growth has improved, economic conditions remain sluggish in Europe and Japan. U.S. government bond yields are higher than those of Europe and Japan, leading to incremental demand for U.S. debt. Subdued inflation enabled long maturity yields to drop as the yield curve continues to flatten. Rising geopolitical tensions also resulted in greater demand for safe haven assets such as U.S. Treasuries. As expected, the Federal Reserve steadily reduced its bond purchases this year and ended the bond-buying program in October. Despite some price weakness in September,
2
municipal bonds outperformed Treasuries during the six-month period. Tax exempt bond funds and ETFs saw steady inflows in 2014, in contrast to the heavy net redemptions that prevailed in 2013. Supply/demand imbalance has kept tax exempt bond valuations on the rich side most of the year. Primary market issuance has remained below average while investor demand has been buoyant.
The Fund's relative performance can be attributed to its intermediate maturity structure and its emphasis on high credit quality. The municipal yield curve flattened during the period, with yields on long maturities dropping more than those on short and intermediate maturities. This resulted in outperformance for long maturity bonds. The Fund's overweight in short maturities caused performance to lag that of the Benchmark. At September 30, 2014, the Fund's average stated maturity was 5.6 years, compared to 5.2 years at the beginning of the period, and the effective duration increased to 3.7 years from 3.5 years.
Quality spreads narrowed during the period as income-starved investors moved down in quality to earn incremental yield. The relatively rich trading levels of Virginia credits puts the Fund at a modest yield disadvantage compared to national benchmarks. However, the Fund's income distributions to Virginia residents are exempt from both federal and state taxation.
We expect the Fund will remain cautiously positioned with regard to interest rate sensitivity while seeking opportunities to enhance the income for the Fund's investors.
 |
 |
|
Charles M. Caravati, III, CFA
President
Jamestown Balanced Fund
Jamestown Equity Fund
|
Joseph A. Jennings, III, CFA
President
Jamestown Tax Exempt Virginia Fund
|
Data presented reflects past performance, which is no guarantee of future results. Investment results and principal value will fluctuate so that shares, when redeemed, may be worth more or less than their original cost. Due to market volatility, current performance may be higher or lower than the performance shown. Performance data, current to the most recent month end, may be obtained by calling 1-866-738-1126.
This report is submitted for the general information of the shareholders of the Funds. The report is not authorized for distribution to prospective investors in the Funds unless it is accompanied by a current prospectus.
This report reflects our views, opinions and portfolio holdings as of September 30, 2014, the end of the reporting period. These views are subject to change at any time based upon market or other conditions. For more current information throughout the year please visit www.jamestownfunds.com. The Funds are distributed by Ultimus Fund Distributors, LLC.
3
THE JAMESTOWN BALANCED FUND
PERFORMANCE INFORMATION (Unaudited)
PERFORMANCE INFORMATION (Unaudited)
Comparison of the Change in Value of a $10,000 Investment in
The Jamestown Balanced Fund, the Standard & Poor's 500® Index and the
60% S&P 500® Index / 40% Barclays Intermediate U.S. Government/Credit Index
The Jamestown Balanced Fund, the Standard & Poor's 500® Index and the
60% S&P 500® Index / 40% Barclays Intermediate U.S. Government/Credit Index
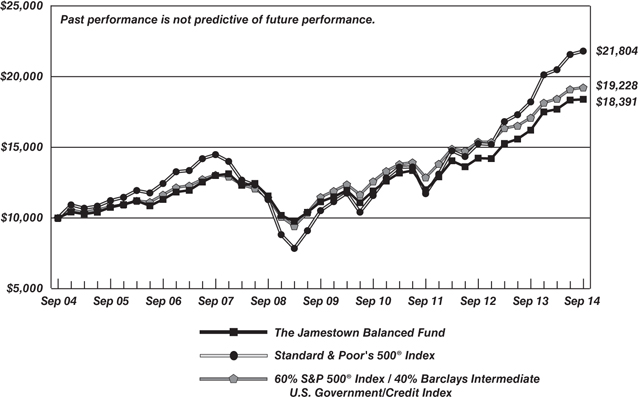
|
Average Annual Total Returns(a)
(for periods ended September 30, 2014) |
|||
|
1 Year
|
5 Years
|
10 Years
|
|
|
The Jamestown Balanced Fund
|
13.43%
|
10.54%
|
6.28%
|
|
Standard & Poor's 500® Index
|
19.73%
|
15.70%
|
8.11%
|
|
60% S&P 500® Index / 40% Barclays Intermediate U.S. Government/Credit Index
|
12.51%
|
10.88%
|
6.76%
|
| (a) | Total return is a measure of the change in value of an investment in the Fund over the periods covered, which assumes any dividends or capital gains distributions are reinvested in shares of the Fund. Returns shown do not reflect the deduction of taxes a shareholder would pay on Fund distributions or the redemption of Fund shares. |
4
THE JAMESTOWN EQUITY FUND
PERFORMANCE INFORMATION (Unaudited)
PERFORMANCE INFORMATION (Unaudited)
Comparison of the Change in Value of a $10,000 Investment in
The Jamestown Equity Fund and the Standard & Poor's 500® Index
The Jamestown Equity Fund and the Standard & Poor's 500® Index
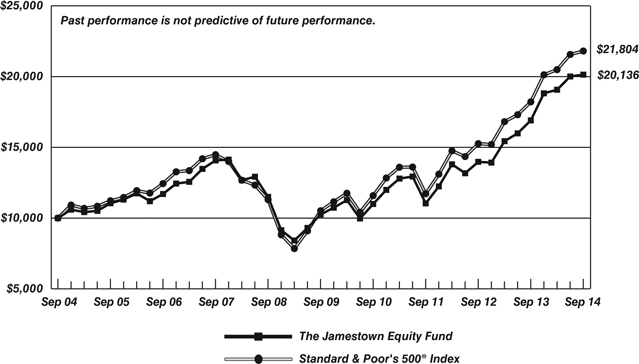
|
Average Annual Total Returns(a)
(for periods ended September 30, 2014) |
|||
|
1 Year
|
5 Years
|
10 Years
|
|
|
The Jamestown Equity Fund
|
19.13%
|
14.44%
|
7.25%
|
|
Standard & Poor's 500® Index
|
19.73%
|
15.70%
|
8.11%
|
| (a) | Total return is a measure of the change in value of an investment in the Fund over the periods covered, which assumes any dividends or capital gains distributions are reinvested in shares of the Fund. Returns shown do not reflect the deduction of taxes a shareholder would pay on Fund distributions or the redemption of Fund shares. |
5
THE JAMESTOWN TAX EXEMPT VIRGINIA FUND
PERFORMANCE INFORMATION (Unaudited)
PERFORMANCE INFORMATION (Unaudited)
Comparison of the Change in Value of a $10,000 Investment in
The Jamestown Tax Exempt Virginia Fund, the Barclays 1-10 Year Municipal Blend Index*,
the Barclays 5-Year Municipal Bond Index** and the Barclays Municipal Bond Index
The Jamestown Tax Exempt Virginia Fund, the Barclays 1-10 Year Municipal Blend Index*,
the Barclays 5-Year Municipal Bond Index** and the Barclays Municipal Bond Index
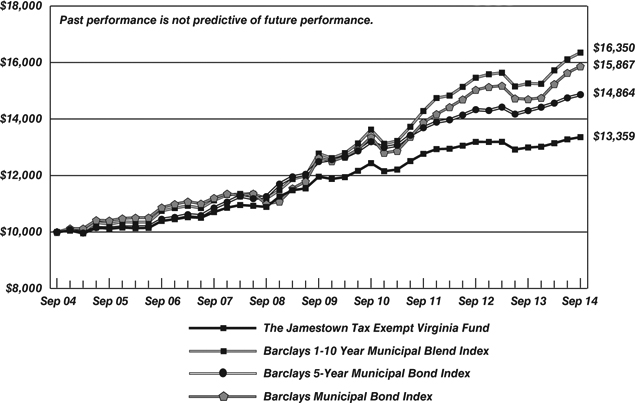
|
Average Annual Total Returns(a)
(for periods ended September 30, 2014) |
|||
|
1 Year
|
5 Years
|
10 Years
|
|
|
The Jamestown Tax Exempt Virginia Fund
|
2.82%
|
2.24%
|
2.94%
|
|
Barclays 1-10 Year Municipal Blend Index
|
7.13%
|
5.05%
|
5.04%
|
|
Barclays 5-Year Municipal Bond Index
|
3.96%
|
3.54%
|
4.04%
|
|
Barclays Municipal Bond Index
|
7.93%
|
4.67%
|
4.72%
|
| * | The Barclays 1-10 Year Municipal Blend Index is an unmanaged, market value-weighted index which covers the short and intermediate components of the U.S. investment-grade tax-exempt bond market. Because the composition of this Index is more representative of the maturity structure of the Jamestown Tax Exempt Virginia Fund than the Barclays 5-Year Municipal Bond Index, which represents a more narrow maturity band on the yield curve, the Barclays 1-10 Year Municipal Blend Index is believed to be the most appropriate broad-based securities market index against which to compare the Fund's performance. |
| ** | The Barclays 5-Year Municipal Bond Index is an unmanaged index generally representative of 5-year tax-exempt bonds. Previously, this Index was used as the Fund's primary benchmark. |
| (a) | Total return is a measure of the change in value of an investment in the Fund over the periods covered, which assumes any dividends or capital gains distributions are reinvested in shares of the Fund. Returns shown do not reflect the deduction of taxes a shareholder would pay on Fund distributions or the redemption of Fund shares. |
6
THE JAMESTOWN BALANCED FUND
PORTFOLIO INFORMATION
September 30, 2014 (Unaudited)
PORTFOLIO INFORMATION
September 30, 2014 (Unaudited)
|
Asset Allocation (% of Net Assets)
|
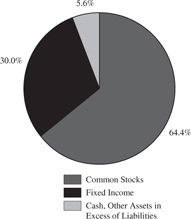 |
|
Ten Largest Equity Holdings
|
% of
Net Assets |
|
Apple, Inc.
|
2.7%
|
|
General Electric Company
|
1.8%
|
|
JPMorgan Chase & Company
|
1.7%
|
|
Actavis plc
|
1.6%
|
|
LyondellBasell Industries NV - Class A
|
1.6%
|
|
Amgen, Inc.
|
1.5%
|
|
Discover Financial Services
|
1.5%
|
|
Cisco Systems, Inc.
|
1.5%
|
|
Principal Financial Group, Inc.
|
1.4%
|
|
United Technologies Corporation
|
1.4%
|
|
Equity Sector Concentration vs. the S&P 500® Index (64.4% of Net Assets)
|
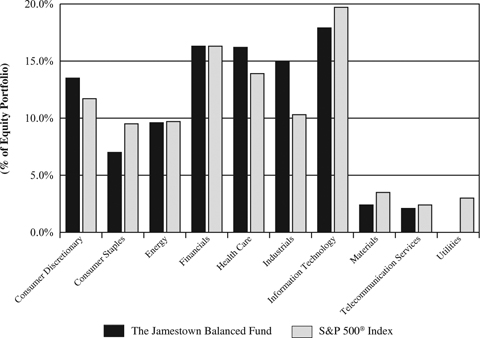
|
Fixed-Income Portfolio (30.0% of Net Assets)
|
Credit Quality
|
Composite Quality
|
||
|
Average Stated Maturity (Years)
|
3.42
|
AAA
|
43.4%
|
|
|
Average Duration (Years)
|
3.08
|
AA
|
14.5%
|
|
|
Average Coupon
|
3.95%
|
A
|
33.3%
|
|
|
Average Yield to Maturity
|
1.45%
|
BBB
|
8.8%
|
|
|
Sector Breakdown
|
% of Fixed
Income Portfolio
|
|||
|
U.S. Treasury Obligations
|
26.9%
|
|||
|
U.S. Government Agency Obligations
|
9.8%
|
|||
|
Corporate Bonds
|
56.7%
|
|||
|
Mortgage-Backed Securities
|
4.7%
|
|||
|
Municipal Bonds
|
1.9%
|
|||
7
THE JAMESTOWN EQUITY FUND
PORTFOLIO INFORMATION
September 30, 2014 (Unaudited)
PORTFOLIO INFORMATION
September 30, 2014 (Unaudited)
|
Asset Allocation (% of Net Assets)
|
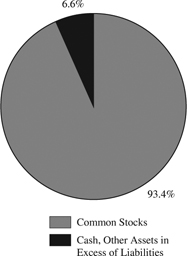 |
|
Ten Largest Equity Holdings
|
% of
Net Assets |
|
Apple, Inc.
|
4.2%
|
|
General Electric Company
|
2.5%
|
|
JPMorgan Chase & Company
|
2.4%
|
|
Amgen, Inc.
|
2.2%
|
|
CVS Health Corporation
|
2.2%
|
|
AmerisourceBergen Corporation
|
2.2%
|
|
Ameriprise Financial, Inc.
|
2.2%
|
|
Actavis plc
|
2.2%
|
|
Discover Financial Services
|
2.1%
|
|
McKesson Corporation
|
2.0%
|
|
Sector Concentration vs. the S&P 500® Index
|
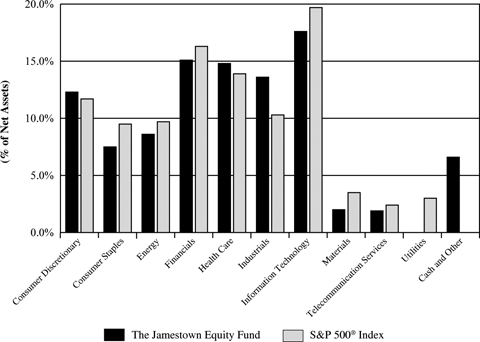
8
THE JAMESTOWN TAX EXEMPT VIRGINIA FUND
PORTFOLIO INFORMATION
September 30, 2014 (Unaudited)
PORTFOLIO INFORMATION
September 30, 2014 (Unaudited)
|
Characteristics
|
|
|
30-day SEC Yield
|
1.67%
|
|
Tax-Equivalent Yield
|
2.95%*
|
|
Average Stated Maturity (years)
|
5.6
|
|
Average Duration (years)
|
3.7
|
|
Average Quality
|
AA
|
|
Number of Issues
|
54
|
|
* Assumes a maximum 43.4% federal tax rate.
|
|
|
Maturity Breakdown
(% of Portfolio) |
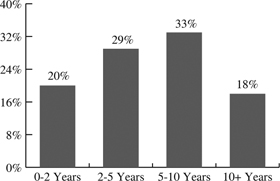 |
|
Credit Quality (% of Portfolio)
|
Sector Diversification (% of Portfolio)
|
|
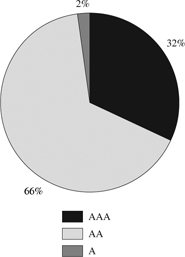 |
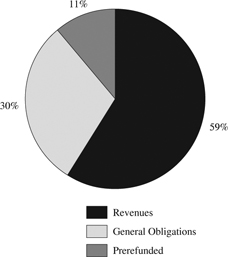 |
9
THE JAMESTOWN BALANCED FUND
SCHEDULE OF INVESTMENTS
September 30, 2014 (Unaudited)
SCHEDULE OF INVESTMENTS
September 30, 2014 (Unaudited)
|
COMMON STOCKS — 64.4%
|
Shares
|
Value
|
||||||
|
Consumer Discretionary — 8.7%
|
||||||||
|
Comcast Corporation - Class A
|
4,700
|
$
|
252,766
|
|||||
|
Dollar Tree, Inc. (a)
|
4,500
|
252,315
|
||||||
|
Johnson Controls, Inc.
|
5,400
|
237,600
|
||||||
|
Macy's, Inc.
|
4,200
|
244,356
|
||||||
|
Priceline Group, Inc. (The) (a)
|
105
|
121,651
|
||||||
|
TJX Companies, Inc. (The)
|
4,300
|
254,431
|
||||||
|
Viacom, Inc. - Class B
|
2,900
|
223,126
|
||||||
|
1,586,245
|
||||||||
|
Consumer Staples — 4.5%
|
||||||||
|
Archer-Daniels-Midland Company
|
4,500
|
229,950
|
||||||
|
CVS Health Corporation
|
3,100
|
246,729
|
||||||
|
PepsiCo, Inc.
|
2,200
|
204,798
|
||||||
|
Procter & Gamble Company (The)
|
1,700
|
142,358
|
||||||
|
823,835
|
||||||||
|
Energy — 6.1%
|
||||||||
|
Apache Corporation
|
2,300
|
215,901
|
||||||
|
Baker Hughes, Inc.
|
1,800
|
117,108
|
||||||
|
Chevron Corporation
|
1,500
|
178,980
|
||||||
|
Hess Corporation
|
2,600
|
245,232
|
||||||
|
Marathon Oil Corporation
|
4,900
|
184,191
|
||||||
|
Noble Corporation plc
|
8,000
|
177,760
|
||||||
|
1,119,172
|
||||||||
|
Financials — 10.5%
|
||||||||
|
Ameriprise Financial, Inc.
|
2,000
|
246,760
|
||||||
|
Discover Financial Services
|
4,200
|
270,438
|
||||||
|
Invesco Ltd.
|
4,650
|
183,582
|
||||||
|
JPMorgan Chase & Company
|
5,200
|
313,248
|
||||||
|
MetLife, Inc.
|
4,600
|
247,112
|
||||||
|
Morgan Stanley
|
4,100
|
141,737
|
||||||
|
PNC Financial Services Group, Inc. (The)
|
2,850
|
243,903
|
||||||
|
Principal Financial Group, Inc.
|
5,000
|
262,350
|
||||||
|
1,909,130
|
||||||||
|
Health Care — 10.4%
|
||||||||
|
Abbott Laboratories
|
3,000
|
124,770
|
||||||
|
AbbVie, Inc.
|
2,500
|
144,400
|
||||||
|
Actavis plc (a)
|
1,200
|
289,536
|
||||||
|
Aetna, Inc.
|
2,000
|
162,000
|
||||||
|
AmerisourceBergen Corporation
|
3,200
|
247,360
|
||||||
|
Amgen, Inc.
|
2,000
|
280,920
|
||||||
|
McKesson Corporation
|
1,300
|
253,071
|
||||||
|
Thermo Fisher Scientific, Inc.
|
2,100
|
255,570
|
||||||
|
UnitedHealth Group, Inc.
|
1,600
|
138,000
|
||||||
|
1,895,627
|
||||||||
10
THE JAMESTOWN BALANCED FUND
SCHEDULE OF INVESTMENTS (Continued)
SCHEDULE OF INVESTMENTS (Continued)
|
COMMON STOCKS — 64.4% (Continued)
|
Shares
|
Value
|
||||||
|
Industrials — 9.7%
|
||||||||
|
Dover Corporation
|
3,000
|
$
|
240,990
|
|||||
|
Eaton Corporation plc
|
3,500
|
221,795
|
||||||
|
FedEx Corporation
|
1,500
|
242,175
|
||||||
|
General Electric Company
|
12,850
|
329,217
|
||||||
|
Norfolk Southern Corporation
|
2,200
|
245,520
|
||||||
|
Ryder System, Inc.
|
2,500
|
224,925
|
||||||
|
United Technologies Corporation
|
2,425
|
256,080
|
||||||
|
1,760,702
|
||||||||
|
Information Technology — 11.6%
|
||||||||
|
Apple, Inc.
|
4,900
|
493,675
|
||||||
|
Cisco Systems, Inc.
|
10,500
|
264,285
|
||||||
|
EMC Corporation
|
8,500
|
248,710
|
||||||
|
Google, Inc. - Class A (a)
|
325
|
191,233
|
||||||
|
Google, Inc. - Class C (a)
|
325
|
187,642
|
||||||
|
Microsoft Corporation
|
3,700
|
171,532
|
||||||
|
Oracle Corporation
|
4,800
|
183,744
|
||||||
|
QUALCOMM, Inc.
|
3,300
|
246,741
|
||||||
|
TE Connectivity Ltd.
|
2,100
|
116,109
|
||||||
|
2,103,671
|
||||||||
|
Materials — 1.6%
|
||||||||
|
LyondellBasell Industries N.V. - Class A
|
2,600
|
282,516
|
||||||
|
Telecommunication Services — 1.3%
|
||||||||
|
Verizon Communications, Inc.
|
4,900
|
244,951
|
||||||
|
Total Common Stocks (Cost $6,516,084)
|
$
|
11,725,849
|
||||||
|
U.S. TREASURY OBLIGATIONS — 8.1%
|
Par Value
|
Value
|
||||||
|
U.S. Treasury Notes — 8.1%
|
||||||||
|
4.25%, 11/15/2014
|
$
|
350,000
|
$
|
351,791
|
||||
|
0.375%, 08/31/2015
|
300,000
|
300,762
|
||||||
|
4.25%, 11/15/2017
|
400,000
|
437,875
|
||||||
|
2.625%, 08/15/2020
|
175,000
|
180,906
|
||||||
|
2.125%, 08/15/2021
|
120,000
|
119,400
|
||||||
|
2.75%, 02/15/2024
|
80,000
|
81,881
|
||||||
|
Total U.S. Treasury Obligations (Cost $1,436,658)
|
$
|
1,472,615
|
||||||
11
THE JAMESTOWN BALANCED FUND
SCHEDULE OF INVESTMENTS (Continued)
SCHEDULE OF INVESTMENTS (Continued)
|
U.S. GOVERNMENT AGENCY OBLIGATIONS — 2.9%
|
Par Value
|
Value
|
||||||
|
Federal Home Loan Mortgage Corporation — 2.9%
|
||||||||
|
5.25%, due 04/18/2016 (Cost $498,444)
|
$
|
500,000
|
$
|
536,794
|
||||
|
CORPORATE BONDS — 17.0%
|
Par Value
|
Value
|
||||||
|
Consumer Discretionary — 1.1%
|
||||||||
|
Anheuser-Busch Companies, Inc.,
4.50%, due 04/01/2018 |
$
|
100,000
|
$
|
108,786
|
||||
|
Comcast Corporation,
5.70%, due 07/01/2019 |
75,000
|
86,652
|
||||||
|
195,438
|
||||||||
|
Consumer Staples — 2.3%
|
||||||||
|
Colgate-Palmolive Company,
1.95%, due 02/01/2023 |
100,000
|
92,889
|
||||||
|
General Mills, Inc.,
5.70%, due 02/15/2017 |
150,000
|
165,706
|
||||||
|
PepsiCo, Inc.,
3.10%, due 01/15/2015 |
75,000
|
75,597
|
||||||
|
Wal-Mart Stores, Inc.,
4.25%, due 04/15/2021 |
75,000
|
82,548
|
||||||
|
416,740
|
||||||||
|
Energy — 1.2%
|
||||||||
|
Shell International Finance B.V.,
4.30%, due 09/22/2019 |
100,000
|
109,795
|
||||||
|
Total Capital S.A.,
3.00%, due 06/24/2015 |
100,000
|
101,925
|
||||||
|
211,720
|
||||||||
|
Financials — 6.0%
|
||||||||
|
Aflac, Inc.,
2.65%, due 02/15/2017 |
75,000
|
77,310
|
||||||
|
American Express Credit Corporation,
2.125%, due 03/18/2019 |
80,000
|
79,673
|
||||||
|
BB&T Corporation,
2.15%, due 03/22/2017 |
100,000
|
101,627
|
||||||
|
Berkshire Hathaway Financial Corporation,
2.90%, due 10/15/2020 |
100,000
|
101,649
|
||||||
|
General Electric Capital Corporation,
4.65%, due 10/17/2021 |
84,000
|
92,523
|
||||||
|
Goldman Sachs Group, Inc.,
3.70%, due 08/01/2015 |
100,000
|
102,515
|
||||||
|
JPMorgan Chase & Company,
3.40%, due 06/24/2015 |
110,000
|
112,308
|
||||||
12
THE JAMESTOWN BALANCED FUND
SCHEDULE OF INVESTMENTS (Continued)
SCHEDULE OF INVESTMENTS (Continued)
|
CORPORATE BONDS — 17.0% (Continued)
|
Par Value
|
Value
|
||||||
|
Financials — 6.0% (Continued)
|
||||||||
|
JPMorgan Chase & Company,
1.125%, due 05/16/2017 |
$
|
95,000
|
$
|
94,637
|
||||
|
PNC Funding Corporation,
5.125%, due 02/08/2020 |
110,000
|
124,025
|
||||||
|
Royal Bank of Canada,
2.30%, due 07/20/2016 |
100,000
|
102,683
|
||||||
|
Wells Fargo Bank,
5.75%, due 05/16/2016 |
105,000
|
113,137
|
||||||
|
1,102,087
|
||||||||
|
Health Care — 3.2%
|
||||||||
|
Amgen, Inc.,
5.85%, due 06/01/2017 |
125,000
|
139,238
|
||||||
|
GlaxoSmithKline plc,
5.65%, due 05/15/2018 |
200,000
|
226,405
|
||||||
|
Medtronic, Inc.,
4.75%, due 09/15/2015 |
100,000
|
104,077
|
||||||
|
Novartis Securities Investment Ltd.,
5.125%, due 02/10/2019 |
100,000
|
112,306
|
||||||
|
582,026
|
||||||||
|
Industrials — 0.5%
|
||||||||
|
Illinois Tool Works, Inc.,
3.50%, due 03/01/2024 |
100,000
|
101,628
|
||||||
|
Information Technology — 0.9%
|
||||||||
|
Cisco Systems, Inc.,
4.95%, due 02/15/2019 |
71,000
|
79,462
|
||||||
|
Oracle Corporation,
2.50%, due 10/15/2022 |
100,000
|
95,570
|
||||||
|
175,032
|
||||||||
|
Telecommunication Services — 1.0%
|
||||||||
|
Discovery Communications, Inc.,
5.05%, due 06/01/2020 |
100,000
|
110,893
|
||||||
|
Verizon Communications, Inc.,
2.50%, due 09/15/2016 |
65,000
|
66,709
|
||||||
|
177,602
|
||||||||
|
Utilities — 0.8%
|
||||||||
|
Virginia Electric & Power Company,
5.00%, due 06/30/2019 |
125,000
|
140,551
|
||||||
|
Total Corporate Bonds (Cost $3,017,290)
|
$
|
3,102,824
|
||||||
13
THE JAMESTOWN BALANCED FUND
SCHEDULE OF INVESTMENTS (Continued)
SCHEDULE OF INVESTMENTS (Continued)
|
MORTGAGE-BACKED SECURITIES — 1.4%
|
Par Value
|
Value
|
||||||
|
Federal Home Loan Mortgage Corporation — 0.4%
|
||||||||
|
Pool #A97047, 4.50%, due 02/01/2041
|
$
|
60,947
|
$
|
65,792
|
||||
|
Federal National Mortgage Association — 1.0%
|
||||||||
|
Pool #618465, 5.00%, due 12/01/2016
|
11,696
|
12,527
|
||||||
|
Pool #255455, 5.00%, due 10/01/2024
|
39,780
|
43,876
|
||||||
|
Pool #255702, 5.00%, due 05/01/2025
|
52,153
|
57,522
|
||||||
|
Pool #808413, 5.50%, due 01/01/2035
|
59,231
|
66,172
|
||||||
|
180,097
|
||||||||
|
Government National Mortgage Association — 0.0% (b)
|
||||||||
|
Pool #781344, 6.50%, due 10/15/2031
|
8,211
|
9,419
|
||||||
|
Total Mortgage-Backed Securities (Cost $234,846)
|
$
|
255,308
|
||||||
|
VIRGINIA REVENUE AND GENERAL OBLIGATION (GO) BONDS — 0.6%
|
Par Value
|
Value
|
||||||
|
Virginia State, Build America Bonds, Taxable, GO, 2.95%, due 06/01/2019 (Cost $99,954)
|
$
|
100,000
|
$
|
105,779
|
||||
|
Total Investments at Value — 94.4% (Cost $11,803,276)
|
$
|
17,199,169
|
||||||
|
Other Assets in Excess of Liabilities — 5.6%
|
1,022,310
|
|||||||
|
Net Assets — 100.0%
|
$
|
18,221,479
|
||||||
| (a) | Non-income producing security. |
| (b) | Percentage rounds to less than 0.1%. |
See accompanying notes to financial statements.
14
THE JAMESTOWN EQUITY FUND
SCHEDULE OF INVESTMENTS
September 30, 2014 (Unaudited)
SCHEDULE OF INVESTMENTS
September 30, 2014 (Unaudited)
|
COMMON STOCKS — 93.4%
|
Shares
|
Value
|
||||||
|
Consumer Discretionary — 12.3%
|
||||||||
|
Comcast Corporation - Class A
|
11,500
|
$
|
618,470
|
|||||
|
Dollar Tree, Inc. (a)
|
10,700
|
599,949
|
||||||
|
Johnson Controls, Inc.
|
12,700
|
558,800
|
||||||
|
Macy's, Inc.
|
10,000
|
581,800
|
||||||
|
Priceline Group, Inc. (The) (a)
|
300
|
347,574
|
||||||
|
TJX Companies, Inc. (The)
|
9,800
|
579,866
|
||||||
|
Viacom, Inc. - Class B
|
6,800
|
523,192
|
||||||
|
3,809,651
|
||||||||
|
Consumer Staples — 7.5%
|
||||||||
|
Archer-Daniels-Midland Company
|
10,700
|
546,770
|
||||||
|
CVS Health Corporation
|
8,600
|
684,474
|
||||||
|
PepsiCo, Inc.
|
5,100
|
474,759
|
||||||
|
Procter & Gamble Company (The)
|
3,800
|
318,212
|
||||||
|
Wal-Mart Stores, Inc.
|
3,800
|
290,586
|
||||||
|
2,314,801
|
||||||||
|
Energy — 8.6%
|
||||||||
|
Apache Corporation
|
5,300
|
497,511
|
||||||
|
Baker Hughes, Inc.
|
4,300
|
279,758
|
||||||
|
Chevron Corporation
|
3,500
|
417,620
|
||||||
|
Hess Corporation
|
6,300
|
594,216
|
||||||
|
Marathon Oil Corporation
|
12,200
|
458,598
|
||||||
|
Noble Corporation plc
|
18,500
|
411,070
|
||||||
|
2,658,773
|
||||||||
|
Financials — 15.1%
|
||||||||
|
Ameriprise Financial, Inc.
|
5,500
|
678,590
|
||||||
|
Discover Financial Services
|
9,900
|
637,461
|
||||||
|
Invesco Ltd.
|
11,650
|
459,942
|
||||||
|
JPMorgan Chase & Company
|
12,500
|
753,000
|
||||||
|
MetLife, Inc.
|
11,000
|
590,920
|
||||||
|
Morgan Stanley
|
9,700
|
335,329
|
||||||
|
PNC Financial Services Group, Inc. (The)
|
7,100
|
607,618
|
||||||
|
Principal Financial Group, Inc.
|
12,000
|
629,640
|
||||||
|
4,692,500
|
||||||||
|
Health Care — 14.8%
|
||||||||
|
Abbott Laboratories
|
6,600
|
274,494
|
||||||
|
AbbVie, Inc.
|
6,000
|
346,560
|
||||||
|
Actavis plc (a)
|
2,780
|
670,758
|
||||||
|
Aetna, Inc.
|
4,600
|
372,600
|
||||||
|
AmerisourceBergen Corporation
|
8,800
|
680,240
|
||||||
15
THE JAMESTOWN EQUITY FUND
SCHEDULE OF INVESTMENTS (Continued)
SCHEDULE OF INVESTMENTS (Continued)
|
COMMON STOCKS — 93.4% (Continued)
|
Shares
|
Value
|
||||||
|
Health Care — 14.8% (Continued)
|
||||||||
|
Amgen, Inc.
|
4,900
|
$
|
688,254
|
|||||
|
McKesson Corporation
|
3,250
|
632,678
|
||||||
|
Thermo Fisher Scientific, Inc.
|
5,000
|
608,500
|
||||||
|
UnitedHealth Group, Inc.
|
3,800
|
327,750
|
||||||
|
4,601,834
|
||||||||
|
Industrials — 13.6%
|
||||||||
|
Dover Corporation
|
6,750
|
542,227
|
||||||
|
Eaton Corporation plc
|
8,500
|
538,645
|
||||||
|
FedEx Corporation
|
3,600
|
581,220
|
||||||
|
General Electric Company
|
30,400
|
778,848
|
||||||
|
Norfolk Southern Corporation
|
5,300
|
591,480
|
||||||
|
Ryder System, Inc.
|
6,250
|
562,313
|
||||||
|
United Technologies Corporation
|
5,800
|
612,480
|
||||||
|
4,207,213
|
||||||||
|
Information Technology — 17.6%
|
||||||||
|
Apple, Inc.
|
12,900
|
1,299,675
|
||||||
|
Cisco Systems, Inc.
|
24,000
|
604,080
|
||||||
|
EMC Corporation
|
21,000
|
614,460
|
||||||
|
Google, Inc. - Class A (a)
|
750
|
441,307
|
||||||
|
Google, Inc. - Class C (a)
|
750
|
433,020
|
||||||
|
International Business Machines Corporation
|
1,800
|
341,694
|
||||||
|
Microsoft Corporation
|
8,300
|
384,788
|
||||||
|
Oracle Corporation
|
12,100
|
463,188
|
||||||
|
QUALCOMM, Inc.
|
7,700
|
575,729
|
||||||
|
TE Connectivity Ltd.
|
5,300
|
293,037
|
||||||
|
5,450,978
|
||||||||
|
Materials — 2.0%
|
||||||||
|
LyondellBasell Industries N.V. - Class A
|
5,700
|
619,362
|
||||||
|
Telecommunication Services — 1.9%
|
||||||||
|
Verizon Communications, Inc.
|
11,600
|
579,884
|
||||||
|
Total Common Stocks — 93.4% (Cost $16,480,404)
|
$
|
28,934,996
|
||||||
|
Other Assets in Excess of Liabilities — 6.6%
|
2,054,043
|
|||||||
|
Net Assets — 100.0%
|
$
|
30,989,039
|
||||||
| (a) | Non-income producing security. |
See accompanying notes to financial statements.
16
THE JAMESTOWN TAX EXEMPT VIRGINIA FUND
SCHEDULE OF INVESTMENTS
September 30, 2014 (Unaudited)
SCHEDULE OF INVESTMENTS
September 30, 2014 (Unaudited)
|
VIRGINIA REVENUE AND GENERAL OBLIGATION (GO) BONDS — 91.7%
|
Par Value
|
Value
|
||||||
|
Capital Region Airport Commission,
Virginia, Airport Revenue, 4.50%, due 07/01/2016 |
$
|
520,000
|
$
|
555,963
|
||||
|
Chesterfield Co., Virginia, GO,
5.00%, due 01/01/2025 |
460,000
|
567,714
|
||||||
|
Chesterfield Co., Virginia, GO,
5.00%, due 01/01/2020 |
700,000
|
769,139
|
||||||
|
5.00%, due 01/01/2024
|
250,000
|
297,975
|
||||||
|
Fairfax Co., Virginia, Industrial Dev. Authority, Revenue,
5.00%, due 05/15/2022 |
750,000
|
849,825
|
||||||
|
Fairfax Co., Virginia, Sewer, Revenue,
4.50%, due 07/15/2030 |
250,000
|
277,252
|
||||||
|
Fairfax Co., Virginia, Water, Revenue,
5.00%, due 04/01/2027 |
500,000
|
595,395
|
||||||
|
Fauquier Co., Virginia, GO,
5.00%, due 07/01/2017, |
||||||||
|
prerefunded 07/01/2016 @ 100
|
500,000
|
541,140
|
||||||
|
Hampton Roads Sanitation District, Virginia,
Wastewater, Revenue, 5.00%, due 04/01/2022 |
400,000
|
453,640
|
||||||
|
Hampton Roads Sanitation District, Virginia,
Wastewater, Series A, Revenue, 5.00%, due 01/01/2027 |
400,000
|
462,552
|
||||||
|
Hampton, Virginia, GO,
5.00%, due 04/01/2020, |
||||||||
|
prerefunded 04/01/2015 @ 100
|
500,000
|
512,285
|
||||||
|
5.00%, due 04/01/2025
|
500,000
|
588,875
|
||||||
|
Harrisonburg, Virginia, GO,
5.00%, due 07/15/2022 |
350,000
|
424,263
|
||||||
|
Henrico Co., Virginia, Public Improvement, Series A, GO,
5.00%, due 12/01/2015 |
250,000
|
264,050
|
||||||
|
Henrico Co., Virginia, Water & Sewer, Revenue,
5.00%, due 05/01/2020 |
350,000
|
408,156
|
||||||
|
5.00%, due 05/01/2022
|
430,000
|
501,702
|
||||||
|
James City, Virginia, School District, GO,
5.00%, due 12/15/2018 |
500,000
|
529,095
|
||||||
|
Leesburg, Virginia, GO,
5.00%, due 09/15/2016 |
500,000
|
545,475
|
||||||
|
Lynchburg, Virginia, GO,
5.00%, due 06/01/2015 |
500,000
|
516,260
|
||||||
|
Lynchburg, Virginia, Public Improvement, Series A, GO,
5.00%, due 08/01/2019 |
625,000
|
734,900
|
||||||
|
Manassas, Virginia, Public Improvement, Series D, GO,
5.00%, due 07/01/2019 |
250,000
|
295,152
|
||||||
17
THE JAMESTOWN TAX EXEMPT VIRGINIA FUND
SCHEDULE OF INVESTMENTS (Continued)
SCHEDULE OF INVESTMENTS (Continued)
|
VIRGINIA REVENUE AND GENERAL OBLIGATION (GO) BONDS — 91.7% (Continued)
|
Par Value
|
Value
|
||||||
|
New Kent Co., Virginia, Economic Dev. Authority, Revenue,
5.00%, due 02/01/2019 |
$
|
500,000
|
$
|
545,825
|
||||
|
Portsmouth, Virginia, GO,
5.00%, due 04/01/2016, |
||||||||
|
prerefunded 04/01/2015 @ 100
|
160,000
|
163,920
|
||||||
|
5.00%, due 04/01/2016
|
90,000
|
92,190
|
||||||
|
Portsmouth, Virginia, Series D, GO,
4.00%, due 12/01/2017 |
215,000
|
236,865
|
||||||
|
Prince William Co., Virginia, Lease Participation Certificates,
5.00%, due 10/01/2020 |
500,000
|
589,710
|
||||||
|
Roanoke, Virginia, Public Improvement, Series A, GO,
5.00%, due 07/15/2025 |
400,000
|
481,360
|
||||||
|
Southeastern Public Service Authority, Virginia, Revenue,
5.00%, due 07/01/2015, ETM |
510,000
|
528,442
|
||||||
|
Spotsylvania Co., Virginia, Economic
Dev. Authority, Revenue, 5.00%, due 06/01/2021 |
300,000
|
357,549
|
||||||
|
Spotsylvania Co., Virginia, GO,
5.00%, due 01/15/2023 |
400,000
|
486,704
|
||||||
|
Spotsylvania Co., Virginia, Water & Sewer, Revenue,
5.00%, due 06/01/2026 |
500,000
|
515,175
|
||||||
|
Suffolk, Virginia, Public Improvement, Series A, GO,
4.00%, due 08/01/2018 |
250,000
|
279,352
|
||||||
|
Upper Occoquan, Virginia, Sewer Authority, Revenue,
5.15%, due 07/01/2020 |
250,000
|
285,463
|
||||||
|
Virginia Beach, Virginia, Public Improvement, GO,
5.00%, due 06/01/2021, |
||||||||
|
prerefunded 06/01/2019 @ 100
|
250,000
|
294,420
|
||||||
|
Virginia Biotechnology Research Partnership Authority, Lease Revenue,
5.00%, due 09/01/2020 |
500,000
|
594,490
|
||||||
|
Virginia College Building Authority,
Educational Facilities, Revenue, 5.00%, due 04/01/2017 |
500,000
|
511,640
|
||||||
|
5.00%, due 03/01/2019
|
250,000
|
290,233
|
||||||
|
4.00%, due 09/01/2026
|
500,000
|
550,805
|
||||||
|
Virginia Commonwealth Transportation Board, Federal
Highway Reimbursement Anticipation Notes, Revenue, 5.00%, due 03/15/2025 |
500,000
|
596,275
|
||||||
|
5.00%, due 09/28/2015
|
500,000
|
523,990
|
||||||
|
Virginia Polytechnic Institute & State University,
General and Athletic Facilities, Series D, Revenue, 5.00%, due 06/01/2016 |
115,000
|
116,615
|
||||||
18
THE JAMESTOWN TAX EXEMPT VIRGINIA FUND
SCHEDULE OF INVESTMENTS (Continued)
SCHEDULE OF INVESTMENTS (Continued)
|
VIRGINIA REVENUE AND GENERAL OBLIGATION (GO) BONDS — 91.7% (Continued)
|
Par Value
|
Value
|
||||||
|
Virginia Small Business Financing Authority,
Healthcare Facilities, Revenue, 5.00%, due 11/01/2017 |
$
|
250,000
|
$
|
280,685
|
||||
|
Virginia State Commonwealth Transportation Board,
Federal Transportation Grant Anticipation Notes, Series A, Revenue, 5.00%, due 03/15/2023 |
500,000
|
594,750
|
||||||
|
Virginia State Public Building Authority,
Public Facilities, Series D, Revenue, 5.00%, due 08/01/2016 |
1,000,000
|
1,002,310
|
||||||
|
Virginia State Public School Authority, Revenue,
5.00%, due 08/01/2023 |
500,000
|
599,755
|
||||||
|
Virginia State Public School Authority, Series A, Revenue,
5.00%, due 08/01/2020 |
585,000
|
634,778
|
||||||
|
Virginia State Public School Authority, Series B-1, Revenue,
5.00%, due 08/01/2018 |
500,000
|
576,535
|
||||||
|
Virginia State Resources Authority, Clean Water, Revenue,
5.00%, due 10/01/2021 |
500,000
|
588,775
|
||||||
|
Virginia State Resources Authority, Infrastructure, Revenue,
5.00%, due 11/01/2024, |
||||||||
|
prerefunded 11/01/2018 @ 100
|
15,000
|
17,448
|
||||||
|
5.00%, due 11/01/2024
|
485,000
|
555,820
|
||||||
|
Virginia State Resources Authority,
Infrastructure, Series B, Revenue, 5.00%, due 11/01/2024 |
150,000
|
180,132
|
||||||
|
Virginia State, Series B, GO,
5.00%, due 06/01/2017 |
250,000
|
279,425
|
||||||
|
Total Virginia Revenue and General Obligation (GO) Bonds (Cost $22,996,921)
|
$
|
24,042,244
|
||||||
|
WASHINGTON, D.C. REVENUE BONDS — 2.2%
|
Par Value
|
Value
|
||||||
|
Metropolitan Washington Airports Authority, Series C, Revenue,
|
||||||||
|
5.00%, due 10/01/2022 (Cost $505,375)
|
$
|
500,000
|
$
|
570,785
|
||||
|
EXCHANGE-TRADED FUNDS — 0.5%
|
Shares
|
Value
|
||||||
|
SPDR Nuveen Barclays Short Term Municipal Bond ETF (Cost $120,500)
|
5,000
|
$
|
122,050
|
|||||
19
THE JAMESTOWN TAX EXEMPT VIRGINIA FUND
SCHEDULE OF INVESTMENTS (Continued)
SCHEDULE OF INVESTMENTS (Continued)
|
MONEY MARKET FUNDS — 4.6%
|
Shares
|
Value
|
||||||
|
Fidelity Tax Exempt Portfolio - Class I, 0.01% (a) (Cost $1,217,602)
|
1,217,602
|
$
|
1,217,602
|
|||||
|
Total Investments at Value — 99.0% (Cost $24,840,398)
|
$
|
25,952,681
|
||||||
|
Other Assets in Excess of Liabilities — 1.0%
|
259,742
|
|||||||
|
Net Assets — 100.0%
|
$
|
26,212,423
|
||||||
ETM - Escrowed to Maturity.
| (a) | The rate shown is the 7-day effective yield as of September 30, 2014. |
See accompanying notes to financial statements.
20
THE JAMESTOWN FUNDS
STATEMENTS OF ASSETS AND LIABILITIES
September 30, 2014 (Unaudited)
STATEMENTS OF ASSETS AND LIABILITIES
September 30, 2014 (Unaudited)
|
The
Jamestown Balanced Fund |
The Jamestown
Equity Fund |
The
Jamestown Tax Exempt Virginia Fund |
||||||||||
|
ASSETS
|
||||||||||||
|
Investments in securities:
|
||||||||||||
|
At acquisition cost
|
$
|
11,803,276
|
$
|
16,480,404
|
$
|
24,840,398
|
||||||
|
At value (Note 2)
|
$
|
17,199,169
|
$
|
28,934,996
|
$
|
25,952,681
|
||||||
|
Cash
|
921,652
|
2,011,941
|
—
|
|||||||||
|
Dividends and interest receivable
|
67,998
|
26,775
|
312,359
|
|||||||||
|
Receivable for investment securities sold
|
78,173
|
64,975
|
—
|
|||||||||
|
Receivable for capital shares sold
|
—
|
615
|
—
|
|||||||||
|
Other assets
|
2,182
|
7,993
|
6,931
|
|||||||||
|
TOTAL ASSETS
|
18,269,174
|
31,047,295
|
26,271,971
|
|||||||||
|
LIABILITIES
|
||||||||||||
|
Distributions payable
|
5,075
|
2,835
|
6,126
|
|||||||||
|
Payable for capital shares redeemed
|
23,307
|
32,350
|
39,895
|
|||||||||
|
Accrued investment advisory fees (Note 4)
|
9,370
|
16,864
|
4,745
|
|||||||||
|
Payable to administrator (Note 4)
|
5,515
|
5,515
|
5,015
|
|||||||||
|
Other accrued expenses
|
4,428
|
692
|
3,767
|
|||||||||
|
TOTAL LIABILITIES
|
47,695
|
58,256
|
59,548
|
|||||||||
|
NET ASSETS
|
$
|
18,221,479
|
$
|
30,989,039
|
$
|
26,212,423
|
||||||
|
Net assets consist of:
|
||||||||||||
|
Paid-in capital
|
$
|
12,084,321
|
$
|
17,097,979
|
$
|
25,111,249
|
||||||
|
Accumulated (distributions in excess of) net investment income
|
(54,858
|
)
|
872
|
—
|
||||||||
|
Accumulated net realized gains (losses) from security transactions
|
796,123
|
1,435,596
|
(11,109
|
)
|
||||||||
|
Net unrealized appreciation on investments
|
5,395,893
|
12,454,592
|
1,112,283
|
|||||||||
|
Net assets
|
$
|
18,221,479
|
$
|
30,989,039
|
$
|
26,212,423
|
||||||
|
Shares of beneficial interest outstanding
(unlimited number of shares authorized, $0.01 par value) |
1,217,914
|
1,395,819
|
2,570,599
|
|||||||||
|
Net asset value, offering price and redemption price per share (Note 2)
|
$
|
14.96
|
$
|
22.20
|
$
|
10.20
|
||||||
See accompanying notes to financial statements.
21
THE JAMESTOWN FUNDS
STATEMENTS OF OPERATIONS
Six Months Ended September 30, 2014 (Unaudited)
STATEMENTS OF OPERATIONS
Six Months Ended September 30, 2014 (Unaudited)
|
The Jamestown Balanced
Fund |
The Jamestown Equity
Fund |
The Jamestown Tax Exempt Virginia
Fund |
||||||||||
|
INVESTMENT INCOME
|
||||||||||||
|
Dividends
|
$
|
124,084
|
$
|
287,155
|
$
|
540
|
||||||
|
Interest
|
79,996
|
—
|
416,908
|
|||||||||
|
TOTAL INVESTMENT INCOME
|
204,080
|
287,155
|
417,448
|
|||||||||
|
EXPENSES
|
||||||||||||
|
Investment advisory fees (Note 4)
|
60,850
|
100,905
|
52,604
|
|||||||||
|
Administration fees (Note 4)
|
30,000
|
30,000
|
27,000
|
|||||||||
|
Professional fees
|
8,090
|
8,124
|
7,979
|
|||||||||
|
Trustees' fees and expenses (Note 4)
|
3,242
|
3,242
|
3,242
|
|||||||||
|
Compliance service fees (Note 4)
|
3,100
|
3,100
|
3,100
|
|||||||||
|
Pricing costs
|
3,513
|
509
|
4,918
|
|||||||||
|
Account maintenance fees
|
1,223
|
3,665
|
3,845
|
|||||||||
|
Printing of shareholder reports
|
2,637
|
4,370
|
1,692
|
|||||||||
|
Custodian and bank service fees
|
2,521
|
3,234
|
2,675
|
|||||||||
|
Registration and filing fees
|
2,962
|
3,495
|
1,917
|
|||||||||
|
Other expenses
|
2,599
|
6,391
|
5,083
|
|||||||||
|
TOTAL EXPENSES
|
120,737
|
167,035
|
114,055
|
|||||||||
|
Fees voluntarily waived by the Adviser (Note 4)
|
(3,000
|
)
|
—
|
(23,313
|
)
|
|||||||
|
Expenses reimbursed through a directed brokerage arrangement (Note 5)
|
(3,000
|
)
|
(6,000
|
)
|
—
|
|||||||
|
NET EXPENSES
|
114,737
|
161,035
|
90,742
|
|||||||||
|
NET INVESTMENT INCOME
|
89,343
|
126,120
|
326,706
|
|||||||||
|
REALIZED AND UNREALIZED GAINS (LOSSES) ON INVESTMENTS
|
||||||||||||
|
Net realized gains on security transactions
|
837,733
|
1,503,299
|
9,427
|
|||||||||
|
Net realized gains from in-kind redemptions (Note 2)
|
350,159
|
—
|
—
|
|||||||||
|
Net change in unrealized appreciation/depreciation on investments
|
(554,108
|
)
|
40,607
|
80,229
|
||||||||
|
NET REALIZED AND UNREALIZED GAINS ON INVESTMENTS
|
633,784
|
1,543,906
|
89,656
|
|||||||||
|
NET INCREASE IN NET ASSETS FROM OPERATIONS
|
$
|
723,127
|
$
|
1,670,026
|
$
|
416,362
|
||||||
See accompanying notes to financial statements.
22
THE JAMESTOWN FUNDS
STATEMENTS OF CHANGES IN NET ASSETS
STATEMENTS OF CHANGES IN NET ASSETS
|
The Jamestown
Balanced Fund |
The Jamestown
Equity Fund |
|||||||||||||||
|
Six Months Ended
Sept. 30, 2014 (Unaudited) |
Year
Ended March 31, 2014 |
Six Months Ended
Sept. 30, 2014 (Unaudited) |
Year
Ended March 31, 2014 |
|||||||||||||
|
FROM OPERATIONS
|
||||||||||||||||
|
Net investment income
|
$
|
89,343
|
$
|
176,046
|
$
|
126,120
|
$
|
217,453
|
||||||||
|
Net realized gains on security transactions
|
837,733
|
1,929,585
|
1,503,299
|
3,074,559
|
||||||||||||
|
Net realized gains from in-kind redemptions (Note 2)
|
350,159
|
—
|
—
|
—
|
||||||||||||
|
Net change in unrealized appreciation/depreciation on investments
|
(554,108
|
)
|
750,659
|
40,607
|
3,084,810
|
|||||||||||
|
Net increase in net assets from operations
|
723,127
|
2,856,290
|
1,670,026
|
6,376,822
|
||||||||||||
|
DISTRIBUTIONS TO SHAREHOLDERS
|
||||||||||||||||
|
From net investment income
|
(111,548
|
)
|
(206,179
|
)
|
(129,136
|
)
|
(214,899
|
)
|
||||||||
|
From net realized gains from security transactions
|
(920,584
|
)
|
(1,348,960
|
)
|
(1,851,187
|
)
|
(2,036,342
|
)
|
||||||||
|
Decrease in net assets from distributions to shareholders
|
(1,032,132
|
)
|
(1,555,139
|
)
|
(1,980,323
|
)
|
(2,251,241
|
)
|
||||||||
|
FROM CAPITAL SHARE TRANSACTIONS
|
||||||||||||||||
|
Proceeds from shares sold
|
66,938
|
73,538
|
191,505
|
1,644,087
|
||||||||||||
|
Net asset value of shares issued in reinvestment of distributions to shareholders
|
940,876
|
1,443,519
|
1,880,442
|
2,153,131
|
||||||||||||
|
Payments for shares redeemed
|
(1,280,745
|
)
|
(3,678,492
|
)
|
(1,518,199
|
)
|
(5,492,882
|
)
|
||||||||
|
Net increase (decrease) in net assets from capital share transactions
|
(272,931
|
)
|
(2,161,435
|
)
|
553,748
|
(1,695,664
|
)
|
|||||||||
|
TOTAL INCREASE (DECREASE)
IN NET ASSETS |
(581,936
|
)
|
(860,284
|
)
|
243,451
|
2,429,917
|
||||||||||
|
NET ASSETS
|
||||||||||||||||
|
Beginning of period
|
18,803,415
|
19,663,699
|
30,745,588
|
28,315,671
|
||||||||||||
|
End of period
|
$
|
18,221,479
|
$
|
18,803,415
|
$
|
30,989,039
|
$
|
30,745,588
|
||||||||
|
ACCUMULATED (DISTRIBUTIONS IN EXCESS OF) NET INVESTMENT INCOME
|
$
|
(54,858
|
)
|
$
|
(42,176
|
)
|
$
|
872
|
$
|
3,888
|
||||||
|
CAPITAL SHARE ACTIVITY
|
||||||||||||||||
|
Shares sold
|
4,557
|
4,911
|
8,703
|
77,915
|
||||||||||||
|
Shares reinvested
|
64,875
|
98,321
|
89,162
|
103,431
|
||||||||||||
|
Shares redeemed
|
(86,108
|
)
|
(248,509
|
)
|
(70,137
|
)
|
(257,766
|
)
|
||||||||
|
Net increase (decrease) in shares outstanding
|
(16,676
|
)
|
(145,277
|
)
|
27,728
|
(76,420
|
)
|
|||||||||
|
Shares outstanding, beginning of period
|
1,234,590
|
1,379,867
|
1,368,091
|
1,444,511
|
||||||||||||
|
Shares outstanding, end of period
|
1,217,914
|
1,234,590
|
1,395,819
|
1,368,091
|
||||||||||||
See accompanying notes to financial statements.
23
THE JAMESTOWN FUNDS
STATEMENTS OF CHANGES IN NET ASSETS (Continued)
STATEMENTS OF CHANGES IN NET ASSETS (Continued)
|
The Jamestown Tax Exempt
Virginia Fund |
||||||||
|
Six Months Ended
Sept. 30, 2014 (Unaudited) |
Year
Ended March 31, 2014 |
|||||||
|
FROM OPERATIONS
|
||||||||
|
Net investment income
|
$
|
326,706
|
$
|
676,375
|
||||
|
Net realized gains (losses) on security transactions
|
9,427
|
(20,536
|
)
|
|||||
|
Net change in unrealized appreciation/depreciation on investments
|
80,229
|
(773,876
|
)
|
|||||
|
Net increase (decrease) in net assets from operations
|
416,362
|
(118,037
|
)
|
|||||
|
DISTRIBUTIONS TO SHAREHOLDERS
|
||||||||
|
From net investment income
|
(326,727
|
)
|
(676,352
|
)
|
||||
|
From net realized gains from security transactions
|
—
|
(12,336
|
)
|
|||||
|
Decrease in net assets from distributions to shareholders
|
(326,727
|
)
|
(688,688
|
)
|
||||
|
FROM CAPITAL SHARE TRANSACTIONS
|
||||||||
|
Proceeds from shares sold
|
613,055
|
1,324,814
|
||||||
|
Net asset value of shares issued in reinvestment of distributions to shareholders
|
284,136
|
586,079
|
||||||
|
Payments for shares redeemed
|
(1,058,425
|
)
|
(2,602,167
|
)
|
||||
|
Net decrease in net assets from capital share transactions
|
(161,234
|
)
|
(691,274
|
)
|
||||
|
TOTAL DECREASE IN NET ASSETS
|
(71,599
|
)
|
(1,497,999
|
)
|
||||
|
NET ASSETS
|
||||||||
|
Beginning of period
|
26,284,022
|
27,782,021
|
||||||
|
End of period
|
$
|
26,212,423
|
$
|
26,284,022
|
||||
|
UNDISTRIBUTED NET INVESTMENT INCOME
|
$
|
—
|
$
|
21
|
||||
|
CAPITAL SHARE ACTIVITY
|
||||||||
|
Shares sold
|
60,128
|
130,015
|
||||||
|
Shares reinvested
|
27,819
|
57,356
|
||||||
|
Shares redeemed
|
(103,722
|
)
|
(253,628
|
)
|
||||
|
Net decrease in shares outstanding
|
(15,775
|
)
|
(66,257
|
)
|
||||
|
Shares outstanding, beginning of period
|
2,586,374
|
2,652,631
|
||||||
|
Shares outstanding, end of period
|
2,570,599
|
2,586,374
|
||||||
See accompanying notes to financial statements.
24
THE JAMESTOWN BALANCED FUND
FINANCIAL HIGHLIGHTS
FINANCIAL HIGHLIGHTS
Selected Per Share Data and Ratios for a Share Outstanding Throughout Each Period
|
Six Months Ended
Sept. 30, 2014 |
Years Ended March 31,
|
|||||||||||||||||||||||
|
(Unaudited)
|
2014
|
2013
|
2012
|
2011
|
2010
|
|||||||||||||||||||
|
Net asset value at beginning of period
|
$
|
15.23
|
$
|
14.25
|
$
|
13.86
|
$
|
13.16
|
$
|
12.11
|
$
|
10.09
|
||||||||||||
|
Income from investment operations:
|
||||||||||||||||||||||||
|
Net investment income
|
0.07
|
0.14
|
0.15
|
0.14
|
0.16
|
0.22
|
||||||||||||||||||
|
Net realized and unrealized gains on investments
|
0.50
|
2.06
|
0.98
|
0.71
|
1.06
|
2.04
|
||||||||||||||||||
|
Total from investment operations
|
0.57
|
2.20
|
1.13
|
0.85
|
1.22
|
2.26
|
||||||||||||||||||
|
Less distributions:
|
||||||||||||||||||||||||
|
Dividends from net investment income
|
(0.09
|
)
|
(0.16
|
)
|
(0.16
|
)
|
(0.15
|
)
|
(0.17
|
)
|
(0.24
|
)
|
||||||||||||
|
Distributions from net realized gains
|
(0.75
|
)
|
(1.06
|
)
|
(0.58
|
)
|
—
|
—
|
—
|
|||||||||||||||
|
Total distributions
|
(0.84
|
)
|
(1.22
|
)
|
(0.74
|
)
|
(0.15
|
)
|
(0.17
|
)
|
(0.24
|
)
|
||||||||||||
|
Net asset value at end of period
|
$
|
14.96
|
$
|
15.23
|
$
|
14.25
|
$
|
13.86
|
$
|
13.16
|
$
|
12.11
|
||||||||||||
|
Total return (a)
|
3.93
|
%(b)
|
15.92
|
%
|
8.68
|
%
|
6.56
|
%
|
10.24
|
%
|
22.56
|
%
|
||||||||||||
|
Net assets at end of period (000's)
|
$
|
18,221
|
$
|
18,803
|
$
|
19,664
|
$
|
19,048
|
$
|
21,331
|
$
|
22,183
|
||||||||||||
|
Ratio of total expenses to average net assets
|
1.29
|
%(c)
|
1.25
|
%
|
1.29
|
%
|
1.28
|
%
|
1.24
|
%
|
1.20
|
%
|
||||||||||||
|
Ratio of net expenses to average net assets (d)
|
1.23
|
%(c)
|
1.19
|
%
|
1.22
|
%
|
1.21
|
%
|
1.18
|
%
|
1.11
|
%
|
||||||||||||
|
Ratio of net investment income to average net assets (d)
|
0.95
|
%(c)
|
0.91
|
%
|
1.11
|
%
|
1.08
|
%
|
1.31
|
%
|
1.98
|
%
|
||||||||||||
|
Portfolio turnover rate
|
13
|
%(b)
|
21
|
%
|
21
|
%
|
20
|
%
|
30
|
%
|
40
|
%
|
||||||||||||
| (a) | Total return is a measure of the change in value of an investment in the Fund over the period covered, which assumes any dividends or capital gains distributions are reinvested in shares of the Fund. Returns do not reflect the deduction of taxes a shareholder would pay on Fund distributions or the redemption of Fund shares. |
| (b) | Not annualized. |
| (c) | Annualized. |
| (d) | Ratios were determined based on net expenses after voluntary advisory fee waivers by the Adviser (Note 4) and/or expense reimbursements through a directed brokerage arrangement (Note 5). |
See accompanying notes to financial statements.
25
THE JAMESTOWN EQUITY FUND
FINANCIAL HIGHLIGHTS
FINANCIAL HIGHLIGHTS
Selected Per Share Data and Ratios for a Share Outstanding Throughout Each Period
|
Six Months Ended
Sept. 30, 2014 |
Years Ended March 31,
|
|||||||||||||||||||||||
|
(Unaudited)
|
2014
|
2013
|
2012
|
2011
|
2010
|
|||||||||||||||||||
|
Net asset value at beginning of period
|
$
|
22.47
|
$
|
19.60
|
$
|
17.73
|
$
|
16.54
|
$
|
14.67
|
$
|
11.01
|
||||||||||||
|
Income from investment operations:
|
||||||||||||||||||||||||
|
Net investment income
|
0.09
|
0.15
|
0.15
|
0.09
|
0.09
|
0.10
|
||||||||||||||||||
|
Net realized and unrealized gains on investments
|
1.08
|
4.30
|
1.93
|
1.21
|
1.87
|
3.64
|
||||||||||||||||||
|
Total from investment operations
|
1.17
|
4.45
|
2.08
|
1.30
|
1.96
|
3.74
|
||||||||||||||||||
|
Less distributions:
|
||||||||||||||||||||||||
|
Dividends from net investment income
|
(0.09
|
)
|
(0.15
|
)
|
(0.15
|
)
|
(0.11
|
)
|
(0.09
|
)
|
(0.08
|
)
|
||||||||||||
|
Distributions from net realized gains
|
(1.35
|
)
|
(1.43
|
)
|
(0.06
|
)
|
—
|
—
|
—
|
|||||||||||||||
|
Total distributions
|
(1.44
|
)
|
(1.58
|
)
|
(0.21
|
)
|
(0.11
|
)
|
(0.09
|
)
|
(0.08
|
)
|
||||||||||||
|
Net asset value at end of period
|
$
|
22.20
|
$
|
22.47
|
$
|
19.60
|
$
|
17.73
|
$
|
16.54
|
$
|
14.67
|
||||||||||||
|
Total return (a)
|
5.60
|
%(b)
|
23.55
|
%
|
11.84
|
%
|
7.89
|
%
|
13.48
|
%
|
33.96
|
%
|
||||||||||||
|
Net assets at end of period (000's)
|
$
|
30,989
|
$
|
30,746
|
$
|
28,316
|
$
|
27,703
|
$
|
28,359
|
$
|
26,534
|
||||||||||||
|
Ratio of total expenses to average net assets
|
1.08
|
%(c)
|
1.07
|
%
|
1.11
|
%
|
1.11
|
%
|
1.13
|
%
|
1.16
|
%
|
||||||||||||
|
Ratio of net expenses to average net assets (d)
|
1.04
|
%(c)
|
1.03
|
%
|
1.06
|
%
|
1.06
|
%
|
1.09
|
%
|
1.12
|
%
|
||||||||||||
|
Ratio of net investment income to average net assets (d)
|
0.81
|
%(c)
|
0.72
|
%
|
0.81
|
%
|
0.56
|
%
|
0.56
|
%
|
0.78
|
%
|
||||||||||||
|
Portfolio turnover rate
|
13
|
%(b)
|
21
|
%
|
28
|
%
|
28
|
%
|
49
|
%
|
59
|
%
|
||||||||||||
| (a) | Total return is a measure of the change in value of an investment in the Fund over the period covered, which assumes any dividends or capital gains distributions are reinvested in shares of the Fund. Returns do not reflect the deduction of taxes a shareholder would pay on Fund distributions or the redemption of Fund shares. |
| (b) | Not annualized. |
| (c) | Annualized. |
| (d) | Ratios were determined based on net expenses after expense reimbursements through a directed brokerage arrangement (Note 5). |
See accompanying notes to financial statements.
26
THE JAMESTOWN TAX EXEMPT VIRGINIA FUND
FINANCIAL HIGHLIGHTS
FINANCIAL HIGHLIGHTS
Selected Per Share Data and Ratios for a Share Outstanding Throughout Each Period
|
Six Months Ended
Sept. 30, 2014 |
Years Ended March 31,
|
|||||||||||||||||||||||
|
(Unaudited)
|
2014
|
2013
|
2012
|
2011
|
2010
|
|||||||||||||||||||
|
Net asset value at beginning of period
|
$
|
10.16
|
$
|
10.47
|
$
|
10.57
|
$
|
10.25
|
$
|
10.33
|
$
|
10.24
|
||||||||||||
|
Income (loss) from investment operations:
|
||||||||||||||||||||||||
|
Net investment income
|
0.13
|
0.26
|
0.26
|
0.29
|
0.29
|
0.30
|
||||||||||||||||||
|
Net realized and unrealized gains (losses) on investments
|
0.04
|
(0.30
|
)
|
(0.06
|
)
|
0.32
|
(0.06
|
)
|
0.11
|
|||||||||||||||
|
Total from investment operations
|
0.17
|
(0.04
|
)
|
0.20
|
0.61
|
0.23
|
0.41
|
|||||||||||||||||
|
Less distributions:
|
||||||||||||||||||||||||
|
Dividends from net investment income
|
(0.13
|
)
|
(0.26
|
)
|
(0.27
|
)
|
(0.29
|
)
|
(0.29
|
)
|
(0.31
|
)
|
||||||||||||
|
Distributions from net realized gains
|
—
|
(0.01
|
)
|
(0.03
|
)
|
(0.00
|
)(a)
|
(0.02
|
)
|
(0.01
|
)
|
|||||||||||||
|
Total distributions
|
(0.13
|
)
|
(0.27
|
)
|
(0.30
|
)
|
(0.29
|
)
|
(0.31
|
)
|
(0.32
|
)
|
||||||||||||
|
Net asset value at end of period
|
$
|
10.20
|
$
|
10.16
|
$
|
10.47
|
$
|
10.57
|
$
|
10.25
|
$
|
10.33
|
||||||||||||
|
Total return (b)
|
1.65
|
%(c)
|
(0.37
|
%)
|
1.88
|
%
|
6.03
|
%
|
2.26
|
%
|
4.04
|
%
|
||||||||||||
|
Net assets at end of period (000's)
|
$
|
26,212
|
$
|
26,284
|
$
|
27,782
|
$
|
30,063
|
$
|
30,368
|
$
|
32,905
|
||||||||||||
|
Ratio of total expenses to average net assets
|
0.87
|
%(d)
|
0.88
|
%
|
0.76
|
%
|
0.77
|
%
|
0.76
|
%
|
0.75
|
%
|
||||||||||||
|
Ratio of net expenses to average net assets (e)
|
0.69
|
%(d)
|
0.69
|
%
|
0.69
|
%
|
0.69
|
%
|
0.69
|
%
|
0.69
|
%
|
||||||||||||
|
Ratio of net investment income to average net assets (e)
|
2.48
|
%(d)
|
2.59
|
%
|
2.50
|
%
|
2.75
|
%
|
2.78
|
%
|
2.89
|
%
|
||||||||||||
|
Portfolio turnover rate
|
11
|
%(c)
|
1
|
%
|
15
|
%
|
2
|
%
|
8
|
%
|
16
|
%
|
||||||||||||
| (a) | Amount rounds to less than a penny per share. |
| (b) | Total return is a measure of the change in value of an investment in the Fund over the period covered, which assumes any dividends or capital gains distributions are reinvested in shares of the Fund. Returns do not reflect the deduction of taxes a shareholder would pay on Fund distributions or the redemption of Fund shares. |
| (c) | Not annualized. |
| (d) | Annualized. |
| (e) | Ratios were determined after voluntary advisory fee waivers by the Adviser (Note 4). |
See accompanying notes to financial statements.
27
THE JAMESTOWN FUNDS
NOTES TO FINANCIAL STATEMENTS
September 30, 2014 (Unaudited)
NOTES TO FINANCIAL STATEMENTS
September 30, 2014 (Unaudited)
1. Organization
The Jamestown Balanced Fund, The Jamestown Equity Fund and The Jamestown Tax Exempt Virginia Fund (individually, a "Fund," and, collectively, the "Funds") are each a no-load series of Williamsburg Investment Trust (the "Trust"), an open-end management investment company registered under the Investment Company Act of 1940. The Jamestown Balanced Fund and The Jamestown Equity Fund are each a diversified fund and The Jamestown Tax Exempt Virginia Fund is a non-diversified fund. The Trust was organized as a Massachusetts business trust on July 18, 1988. Other series of the Trust are not included in this report.
The Jamestown Balanced Fund's investment objectives are long-term growth of capital and income.
The Jamestown Equity Fund's investment objective is long-term growth of capital.
The Jamestown Tax Exempt Virginia Fund's investment objectives are to provide current income exempt from federal income taxes and from the personal income taxes of Virginia, to preserve capital, to limit credit risk and to take advantage of opportunities to increase and enhance the value of a shareholder's investment.
2. Significant Accounting Policies
The following is a summary of the Funds' significant accounting policies. The policies are in conformity with accounting principles generally accepted in the United States of America ("GAAP").
Securities valuation — The Funds' portfolio securities are each valued as of the close of business of the regular session of the New York Stock Exchange (normally 4:00 p.m., Eastern time). Securities traded on a national stock exchange are generally valued based upon the closing price on the principal exchange where the security is traded, if available, otherwise, at the last quoted bid price. Securities which are quoted by NASDAQ are valued at the NASDAQ Official Closing Price.
Fixed income securities are valued on the basis of prices provided by an independent pricing service. The prices provided by the pricing service are determined with consideration given to institutional bid and last sale prices and take into account securities prices, yields, maturities, call features, ratings, institutional trading in similar groups of securities and developments related to specific securities.
When market quotations are not readily available, securities may be valued on the basis of prices provided by an independent pricing service. If a pricing service cannot provide a price or the investment adviser believes the price received from the pricing service is not indicative of fair value, securities will be valued in good faith at fair value using methods consistent with those established by and under the general supervision of the Board of Trustees and will be classified as Level 2 or 3 within the fair value hierarchy (see below), depending on the inputs used. Such methods of fair valuation may include, but are not limited to: multiple of earnings, multiple of book value, discount from market of a similar freely traded security, purchase price of the security, subsequent private transactions in the security or related securities, or a combination of these and other factors.
28
THE JAMESTOWN FUNDS
NOTES TO FINANCIAL STATEMENTS (Continued)
NOTES TO FINANCIAL STATEMENTS (Continued)
GAAP establishes a single authoritative definition of fair value, sets out a framework for measuring fair value and requires additional disclosures about fair value measurements.
Various inputs are used in determining the value of each Fund's investments. These inputs are summarized in the three broad levels listed below:
| • | Level 1 – quoted prices in active markets for identical securities |
| • | Level 2 – other significant observable inputs |
| • | Level 3 – significant unobservable inputs |
Fixed income securities, including obligations of the U.S. Treasury and U.S. Government agencies, corporate bonds, mortgage-backed securities and municipal bonds, are classified as Level 2 since the values for such securities are based on prices provided by an independent pricing service that utilizes various "other significant observable inputs" including bid and ask quotations, prices of similar securities and interest rates, among other factors.
The inputs or methodology used for valuing securities are not necessarily an indication of the risks associated with investing in those securities. The inputs used to measure fair value may fall into different levels of the fair value hierarchy. In such cases, for disclosure purposes, the level in the fair value hierarchy within which the fair value measurement falls in its entirety is determined based on the lowest level input that is significant to the fair value measurement.
The following is a summary of the inputs used to value each Fund's investments as of September 30, 2014 by security type:
|
The Jamestown Balanced Fund
|
Level 1
|
Level 2
|
Level 3
|
Total
|
||||||||||||
|
Common Stocks
|
$
|
11,725,849
|
$
|
—
|
$
|
—
|
$
|
11,725,849
|
||||||||
|
U.S. Treasury Obligations
|
—
|
1,472,615
|
—
|
1,472,615
|
||||||||||||
|
U.S. Government Agency Obligations
|
—
|
536,794
|
—
|
536,794
|
||||||||||||
|
Corporate Bonds
|
—
|
3,102,824
|
—
|
3,102,824
|
||||||||||||
|
Mortgage-Backed Securities
|
—
|
255,308
|
—
|
255,308
|
||||||||||||
|
Municipal Bonds
|
—
|
105,779
|
—
|
105,779
|
||||||||||||
|
Total
|
$
|
11,725,849
|
$
|
5,473,320
|
$
|
—
|
$
|
17,199,169
|
||||||||
|
The Jamestown Equity Fund
|
Level 1
|
Level 2
|
Level 3
|
Total
|
||||||||||||
|
Common Stocks
|
$
|
28,934,996
|
$
|
—
|
$
|
—
|
$
|
28,934,996
|
||||||||
|
Total
|
$
|
28,934,996
|
$
|
—
|
$
|
—
|
$
|
28,934,996
|
||||||||
|
The Jamestown Tax Exempt Virginia Fund
|
Level 1
|
Level 2
|
Level 3
|
Total
|
||||||||||||
|
Municipal Bonds
|
$
|
—
|
$
|
24,613,029
|
$
|
—
|
$
|
24,613,029
|
||||||||
|
Exchange-Traded Funds
|
122,050
|
—
|
—
|
122,050
|
||||||||||||
|
Money Market Funds
|
1,217,602
|
—
|
—
|
1,217,602
|
||||||||||||
|
Total
|
$
|
1,339,652
|
$
|
24,613,029
|
$
|
—
|
$
|
25,952,681
|
||||||||
29
THE JAMESTOWN FUNDS
NOTES TO FINANCIAL STATEMENTS (Continued)
NOTES TO FINANCIAL STATEMENTS (Continued)
Refer to The Jamestown Balanced Fund's and The Jamestown Equity Fund's Schedules of Investments for a listing of the common stocks and corporate bonds by sector type. As of September 30, 2014, the Funds did not have any transfers in and out of any Level. There were no Level 3 securities or derivative instruments held by the Funds as of September 30, 2014. It is the Funds' policy to recognize transfers into and out of any Level at the end of the reporting period.
Share valuation — The net asset value per share of each Fund is calculated daily by dividing the total value of its assets, less liabilities, by the number of shares outstanding. The offering price and redemption price per share of each Fund is equal to the net asset value per share.
Investment income — Interest income is accrued as earned. Dividend income is recorded on the ex-dividend date. Discounts and premiums on fixed income securities purchased are amortized using the interest method.
Distributions to shareholders — Dividends arising from net investment income, if any, are declared and paid quarterly to shareholders of The Jamestown Balanced Fund and The Jamestown Equity Fund. Dividends arising from net investment income are declared daily and paid monthly to shareholders of The Jamestown Tax Exempt Virginia Fund. Net realized short-term capital gains, if any, may be distributed throughout the year and net realized long-term capital gains, if any, are distributed at least once each year. The amount of distributions from net investment income and net realized gains are determined in accordance with federal income tax regulations which may differ from GAAP. These "book/tax" differences are permanent in nature and are primarily due to differing treatments of net short-term gains. Dividends and distributions are recorded on the ex-dividend date.
The tax character of distributions paid during the periods ended September 30, 2014 and March 31, 2014 was as follows:
|
Periods
Ended
|
Ordinary
Income
|
Long-Term Capital Gains
|
Exempt-Interest Dividends
|
Total Distributions
|
|||||||||||||
|
The Jamestown Balanced Fund
|
9/30/14
|
$
|
156,788
|
$
|
875,344
|
$
|
—
|
$
|
1,032,132
|
||||||||
|
3/31/14
|
$
|
457,405
|
$
|
1,097,734
|
$
|
—
|
$
|
1,555,139
|
|||||||||
|
The Jamestown Equity Fund
|
9/30/14
|
$
|
223,357
|
$
|
1,756,966
|
$
|
—
|
$
|
1,980,323
|
||||||||
|
3/31/14
|
$
|
382,664
|
$
|
1,868,577
|
$
|
—
|
$
|
2,251,241
|
|||||||||
|
The Jamestown Tax Exempt Virginia Fund
|
9/30/14
|
$
|
—
|
$
|
—
|
$
|
326,727
|
$
|
326,727
|
||||||||
|
3/31/14
|
$
|
23
|
$
|
12,336
|
$
|
676,329
|
$
|
688,688
|
|||||||||
Security transactions — Security transactions are accounted for on trade date for financial reporting purposes. Gains and losses on securities sold are determined on a specific identification basis.
30
THE JAMESTOWN FUNDS
NOTES TO FINANCIAL STATEMENTS (Continued)
NOTES TO FINANCIAL STATEMENTS (Continued)
Securities traded on a "to-be-announced" basis — The Jamestown Balanced Fund may trade securities on a "to-be-announced" ("TBA") basis. In a TBA transaction, the Fund has committed to purchase securities for which all specific information is not yet known at the time of the trade, particularly the face amount in mortgage-backed securities transactions. Securities purchased on a TBA basis are not settled until they are delivered to the Fund, normally 15 to 45 days later. These transactions are subject to market fluctuations and their current value is determined in the same manner as for other portfolio securities.
Common expenses — Common expenses of the Trust are allocated among the series of the Trust based on relative net assets of each series or the nature of the services performed and the relative applicability to each series.
Estimates — The preparation of financial statements in conformity with GAAP requires management to make estimates and assumptions that affect the reported amounts of assets and liabilities and the disclosure of contingent assets and liabilities as of the date of the financial statements and the reported amounts of income and expenses during the reporting period. Actual results could differ from those estimates.
Federal income tax — Each Fund has qualified and intends to continue to qualify as a regulated investment company under the Internal Revenue Code of 1986 (the "Code"). Qualification generally will relieve the Funds of liability for federal income taxes to the extent 100% of their net investment income and net realized gains are distributed in accordance with the Code. Accordingly, no provision for income taxes has been made.
In order to avoid imposition of the excise tax applicable to regulated investment companies, it is also each Fund's intention to declare as dividends in each calendar year at least 98% of its net investment income (earned during the calendar year) and 98.2% of its net realized capital gains (earned during the twelve months ended October 31) plus undistributed amounts from prior years.
The tax character of distributable earnings at September 30, 2014 was as follows:
|
The Jamestown Balanced Fund
|
The Jamestown Equity Fund
|
The Jamestown Tax Exempt Virginia Fund
|
||||||||||
|
Cost of portfolio investments
|
$
|
11,890,977
|
$
|
16,546,990
|
$
|
24,840,398
|
||||||
|
Gross unrealized appreciation
|
$
|
5,418,826
|
$
|
12,557,010
|
$
|
1,150,101
|
||||||
|
Gross unrealized depreciation
|
(110,634
|
)
|
(169,004
|
)
|
(37,818
|
)
|
||||||
|
Net unrealized appreciation on investments
|
5,308,192
|
12,388,006
|
1,112,283
|
|||||||||
|
Accumulated ordinary income
|
29,407
|
78,681
|
—
|
|||||||||
|
Accumulated tax exempt income
|
—
|
—
|
6,126
|
|||||||||
|
Other gains
|
804,634
|
1,427,208
|
9,427
|
|||||||||
|
Capital loss carryforwards
|
—
|
—
|
(20,536
|
)
|
||||||||
|
Other temporary differences
|
(5,075
|
)
|
(2,835
|
)
|
(6,126
|
)
|
||||||
|
Total distributable earnings
|
$
|
6,137,158
|
$
|
13,891,060
|
$
|
1,101,174
|
||||||
31
THE JAMESTOWN FUNDS
NOTES TO FINANCIAL STATEMENTS (Continued)
NOTES TO FINANCIAL STATEMENTS (Continued)
The difference between the federal income tax cost of portfolio investments and the financial statement cost for The Jamestown Balanced Fund and The Jamestown Equity Fund is due to certain timing differences in the recognition of capital gains or losses under income tax regulations and GAAP. These "book/tax" differences are temporary in nature and are primarily due to the tax deferral of losses on wash sales and/or differing methods in the amortization of premium on fixed income securities.
For the six months ended September 30, 2014, The Jamestown Balanced Fund reclassified $9,523 of distributions in excess of net investment income against accumulated net realized gains from security transactions on the Statements of Assets and Liabilities due to permanent differences in the recognition of capital gains or losses under income tax regulations and GAAP. These differences are primarily due to the tax treatment of certain debt obligations and paydown adjustments. Such reclassifications had no effect on the Fund's net assets or net asset value per share.
During the six months ended September 30, 2014, The Jamestown Balanced Fund realized $350,159 of net capital gains resulting from in-kind redemptions (redemptions in which shareholders who redeemed Fund shares received securities held by the Fund rather than cash). The Fund recognizes a gain on in-kind redemptions to the extent that the value of the distributed securities on the date of redemption exceeds the cost of those securities. Such gains are not taxable to the Fund and are not required to be distributed to shareholders. The Fund has reclassified these amounts against paid-in capital. This reclassification is reflected on the Statements of Assets and Liabilities. Such reclassification, the result of permanent differences between the financial statement and income tax reporting requirements, had no effect on the Fund's net assets or net asset value per share.
As of March 31, 2014, The Jamestown Tax Exempt Virginia Fund had a long-term capital loss carryforward of $20,536 for federal income tax purposes. This capital loss carryforward, which does not expire, may be utilized in the current and future years to offset net realized capital gains, if any, prior to distributing such gains to shareholders.
The Funds recognize the tax benefits or expenses of uncertain tax positions only when the position is "more likely than not" to be sustained assuming examination by tax authorities. Management has reviewed the tax positions taken on Federal income tax returns for the current and all open tax years (tax years ended March 31, 2011 through March 31, 2014) of each Fund and has concluded that no provision for unrecognized tax benefits or expenses is required in these financial statements.
32
THE JAMESTOWN FUNDS
NOTES TO FINANCIAL STATEMENTS (Continued)
NOTES TO FINANCIAL STATEMENTS (Continued)
3. Investment Transactions
Investment transactions, other than short-term investments and U.S. government securities, were as follows for the six months ended September 30, 2014:
|
The Jamestown Balanced Fund
|
The Jamestown Equity Fund
|
The Jamestown Tax Exempt Virginia Fund
|
||||||||||
|
Purchase of investment securities
|
$
|
2,129,989
|
$
|
3,893,744
|
$
|
2,658,306
|
||||||
|
Proceeds from sales and maturities of investment securities
|
$
|
3,203,557
|
$
|
4,891,347
|
$
|
3,001,802
|
||||||
4. Transactions with Related Parties
INVESTMENT ADVISORY AGREEMENTS
Each Fund's investments are managed by Lowe, Brockenbrough & Company, Inc. (the "Adviser") under the terms of an Investment Advisory Agreement. The Jamestown Balanced Fund pays the Adviser a fee, which is computed and accrued daily and paid monthly, at an annual rate of .65% of its average daily net assets up to $250 million, .60% of the next $250 million of such assets and .55% of such assets in excess of $500 million. The Jamestown Equity Fund pays the Adviser a fee, which is computed and accrued daily and paid monthly, at an annual rate of .65% of its average daily net assets up to $500 million and .55% of such assets in excess of $500 million. The Jamestown Tax Exempt Virginia Fund pays the Adviser a fee, which is computed and accrued daily and paid monthly, at an annual rate of .40% of its average daily net assets up to $250 million, .35% of the next $250 million of such assets and .30% of such assets in excess of $500 million. Certain officers of the Trust are also officers of the Adviser.
In order to reduce the annual operating expenses of The Jamestown Balanced Fund, the Adviser voluntarily waived $3,000 of its investment advisory fees during the six months ended September 30, 2014. Additionally, during the six months ended September 30, 2014, the Adviser voluntarily undertook to limit the total annual operating expenses of The Jamestown Tax Exempt Virginia Fund to .69% of its average daily net assets; accordingly, the Adviser voluntarily waived $23,313 of its investment advisory fees during the six months ended September 30, 2014.
OTHER SERVICE PROVIDERS
Ultimus Fund Solutions, LLC ("Ultimus") provides fund administration, fund accounting, compliance and transfer agent services to the Funds. Pursuant to servicing agreements with Ultimus, the Funds pay Ultimus fees in accordance with such agreements. Certain officers of the Trust are also officers of Ultimus, or of Ultimus Fund Distributors, LLC (the "Distributor"), the principal underwriter of each Fund's shares and an affiliate of Ultimus. The Distributor is compensated by the Adviser (not the Funds) for acting as principal underwriter.
33
THE JAMESTOWN FUNDS
NOTES TO FINANCIAL STATEMENTS (Continued)
NOTES TO FINANCIAL STATEMENTS (Continued)
COMPENSATION OF TRUSTEES
Trustees and officers affiliated with the Adviser or Ultimus are not compensated by the Trust for their services. Each Trustee who is not an affiliated person of the Adviser or Ultimus receives from the Trust an annual retainer of $12,000, payable quarterly; a fee of $1,500 for attendance at each meeting of the Board of Trustees (except that such fee is $2,500 for the independent chairman); and $1,000 for attendance at each meeting of any committee of the Board (except that such fee is $1,500 for the committee chairman); plus reimbursement of travel and other expenses incurred in attending meetings. Prior to July 1, 2014, the annual retainer was $10,000.
5. Brokerage Arrangement
In order to reduce the total operating expenses of The Jamestown Balanced Fund and The Jamestown Equity Fund, a portion of each Fund's operating expenses have been paid through an arrangement with a third-party broker-dealer who is compensated through commission trades. Payment of expenses by the broker-dealer is based on a percentage of commissions earned. Expenses reimbursed through the brokerage arrangement totaled $3,000 and $6,000 for The Jamestown Balanced Fund and The Jamestown Equity Fund, respectively, for the six months ended September 30, 2014.
6. Contingencies and Commitments
The Funds indemnify the Trust's officers and Trustees for certain liabilities that might arise from their performance of their duties to the Funds. Additionally, in the normal course of business the Funds enter into contracts that contain a variety of representations and warranties and which provide general indemnifications. The Funds' maximum exposure under these arrangements is unknown, as this would involve future claims that may be made against the Funds that have not yet occurred. However, based on experience, the Funds expect the risk of loss to be remote.
7. Concentration of Credit Risk
The Jamestown Tax Exempt Virginia Fund invests primarily in debt instruments of municipal issuers in the Commonwealth of Virginia. The issuers' abilities to meet their obligations may be affected by economic developments in the Commonwealth or its region, as well as disruptions in the credit markets and the economy, generally.
8. Subsequent Events
The Funds are required to recognize in the financial statements the effects of all subsequent events that provide additional evidence about conditions that existed as of the date of the Statements of Assets and Liabilities. For non-recognized subsequent events that must be disclosed to keep the financial statements from being misleading, the Funds are required to disclose the nature of the event as well as an estimate of its financial effect, or a statement that such an estimate cannot be made. Management has evaluated subsequent events through the issuance of these financial statements and has noted no such events.
34
THE JAMESTOWN FUNDS
ABOUT YOUR FUNDS' EXPENSES (Unaudited)
ABOUT YOUR FUNDS' EXPENSES (Unaudited)
We believe it is important for you to understand the impact of costs on your investment. All mutual funds have operating expenses. As a shareholder of the Funds, you incur ongoing costs, including management fees and other expenses. The following examples are intended to help you understand your ongoing costs (in dollars) of investing in the Funds and to compare these costs with the ongoing costs of investing in other mutual funds.
A mutual fund's ongoing costs are expressed as a percentage of its average net assets. This figure is known as the expense ratio. The expenses in the table below are based on an investment of $1,000 made at the beginning of the period shown and held for the entire period (April 1, 2014 through September 30, 2014).
The table below illustrates each Fund's costs in two ways:
Actual fund return – This section helps you to estimate the actual expenses that you paid over the period. The "Ending Account Value" shown is derived from each Fund's actual return, and the third column shows the dollar amount of operating expenses that would have been paid by an investor who started with $1,000 in the Funds. You may use the information here, together with the amount you invested, to estimate the expenses that you paid over the period.
To do so, simply divide your account value by $1,000 (for example, an $8,600 account value divided by $1,000 = 8.6), then multiply the result by the number given for the Funds under the heading "Expenses Paid During Period."
Hypothetical 5% return – This section is intended to help you compare the Funds' ongoing costs with those of other mutual funds. It assumes that each Fund had an annual return of 5% before expenses during the period shown, but that the expense ratio is unchanged. In this case, because the returns used are not the Funds' actual returns, the results do not apply to your investment. The example is useful in making comparisons because the Securities and Exchange Commission ("SEC") requires all mutual funds to calculate expenses based on a 5% return. You can assess each Fund's ongoing costs by comparing this hypothetical example with the hypothetical examples that appear in shareholder reports of other funds.
Note that expenses shown in the table are meant to highlight and help you compare ongoing costs only. The Funds do not charge sales loads or redemption fees.
The calculations assume no shares were bought or sold during the period. Your actual costs may have been higher or lower, depending on the amount of your investment and the timing of any purchases or redemptions.
More information about the Funds' expenses, including annual expense ratios for the prior five fiscal years, can be found in this report. For additional information on operating expenses and other shareholder costs, please refer to the Funds' prospectus.
35
THE JAMESTOWN FUNDS
ABOUT YOUR FUNDS' EXPENSES (Unaudited) (Continued)
ABOUT YOUR FUNDS' EXPENSES (Unaudited) (Continued)
|
Beginning
Account Value April 1, 2014 |
Ending
Account Value September 30, 2014 |
Expenses Paid
During Period*
|
|
|
The Jamestown Balanced Fund
|
|||
|
Based on Actual Fund Return
|
$1,000.00
|
$1,039.30
|
$6.29
|
|
Based on Hypothetical 5% Return (before expenses)
|
$1,000.00
|
$1,018.90
|
$6.23
|
|
The Jamestown Equity Fund
|
|||
|
Based on Actual Fund Return
|
$1,000.00
|
$1,056.00
|
$5.36
|
|
Based on Hypothetical 5% Return (before expenses)
|
$1,000.00
|
$1,019.85
|
$5.27
|
|
The Jamestown Tax Exempt Virginia Fund
|
|||
|
Based on Actual Fund Return
|
$1,000.00
|
$1,016.50
|
$3.49
|
|
Based on Hypothetical 5% Return (before expenses)
|
$1,000.00
|
$1,021.61
|
$3.50
|
| * | Expenses are equal to the Funds' annualized expense ratios for the period as stated below, multiplied by the average account value over the period, multiplied by 183/365 (to reflect the one-half year period). With respect to The Jamestown Balanced Fund and The Jamestown Equity Fund, the annualized expense ratios exclude any reimbursements received through a directed brokerage arrangement (Note 5). |
|
The Jamestown Balanced Fund
|
1.23%
|
|
The Jamestown Equity Fund
|
1.04%
|
|
The Jamestown Tax Exempt Virginia Fund
|
0.69%
|
36
THE JAMESTOWN FUNDS
OTHER INFORMATION (Unaudited)
OTHER INFORMATION (Unaudited)
A description of the policies and procedures that the Funds use to vote proxies relating to portfolio securities is available without charge upon request by calling toll-free 1-866-738-1126, or on the SEC's website at http://www.sec.gov. Information regarding how the Funds voted proxies relating to portfolio securities during the most recent 12-month period ended June 30 is also available without charge upon request by calling toll-free 1-866-738-1126, or on the SEC's website at http://www.sec.gov.
The Trust files a complete listing of portfolio holdings of the Funds with the SEC as of the end of the first and third quarters of each fiscal year on Form N-Q. The filings are available upon request, by calling 1-866-738-1126. Furthermore, you may obtain a copy of these filings on the SEC's website at http://www.sec.gov. The Trust's Forms N-Q may also be reviewed and copied at the SEC's Public Reference Room in Washington, DC, and information on the operation of the Public Reference Room may be obtained by calling 1-800-SEC-0330.
37
|
|
||||||||
|
THE JAMESTOWN FUNDS
www.jamestownfunds.com
Investment Adviser
Lowe, Brockenbrough & Company, Inc.
1802 Bayberry Court
Suite 400
Richmond, Virginia 23226
Administrator
Ultimus Fund Solutions, LLC
P.O. Box 46707
Cincinnati, Ohio 45246-0707
(Toll-Free) 1-866-738-1126
Independent Registered
Public Accounting Firm Ernst & Young LLP
1900 Scripps Center
312 Walnut Street
Cincinnati, Ohio 45202
Legal Counsel
Sullivan & Worcester LLP
One Post Office Square
Boston, Massachusetts 02109
Board of Trustees
John P. Ackerly, IV
John T. Bruce
Robert S. Harris, Ph.D.
J. Finley Lee, Jr., Ph.D.
Harris V. Morrissette
Elizabeth W. Robertson
|
||||||||
|
|
| Item 2. | Code of Ethics. |
Not required
| Item 3. | Audit Committee Financial Expert. |
Not required
| Item 4. | Principal Accountant Fees and Services. |
Not required
| Item 5. | Audit Committee of Listed Registrants. |
Not applicable
| Item 6. | Schedule of Investments. |
| (a) | Not applicable [schedule filed with Item 1] |
| (b) | Not applicable |
| Item 7. | Disclosure of Proxy Voting Policies and Procedures for Closed-End Management Investment Companies. |
Not applicable
| Item 8. | Portfolio Managers of Closed-End Management Investment Companies. |
Not applicable
| Item 9. | Purchases of Equity Securities by Closed-End Management Investment Company and Affiliated Purchasers. |
Not applicable
| Item 10. | Submission of Matters to a Vote of Security Holders. |
The registrant's Nominating Committee shall review shareholder recommendations to fill vacancies on the registrant's board of trustees if such recommendations are submitted in writing, addressed to the Committee at the registrant's offices and meet any minimum qualifications adopted by the Committee. The Committee may adopt, by resolution, a policy regarding its procedures for considering candidates for the board of trustees, including any recommended by shareholders.
| Item 11. | Controls and Procedures. |
(a) Based on their evaluation of the registrant's disclosure controls and procedures (as defined in Rule 30a-3(c) under the Investment Company Act of 1940) as of a date within 90 days of the filing date of this report, the registrant's principal executive officers and principal financial officer have concluded that such disclosure controls and procedures are reasonably designed and are operating effectively to ensure that material information relating to the registrant, including its consolidated subsidiaries, is made known to them by others within those entities, particularly during the period in which this report is being prepared, and that the information required in filings on Form N-CSR is recorded, processed, summarized, and reported on a timely basis.
(b) There were no changes in the registrant's internal control over financial reporting (as defined in Rule 30a-3(d) under the Investment Company Act of 1940) that occurred during the second fiscal quarter of the period covered by this report that have materially affected, or are reasonably likely to materially affect, the registrant's internal control over financial reporting.
| Item 12. | Exhibits. |
File the exhibits listed below as part of this Form. Letter or number the exhibits in the sequence indicated.
(a)(1) Any code of ethics, or amendment thereto, that is the subject of the disclosure required by Item 2, to the extent that the registrant intends to satisfy the Item 2 requirements through filing of an exhibit: Not required
(a)(2) A separate certification for each principal executive officer and principal financial officer of the registrant as required by Rule 30a-2(a) under the Act (17 CFR 270.30a-2(a)): Attached hereto
(a)(3) Any written solicitation to purchase securities under Rule 23c-1 under the Act (17 CFR 270.23c-1) sent or given during the period covered by the report by or on behalf of the registrant to 10 or more persons: Not applicable
(b) Certifications required by Rule 30a-2(b) under the Act (17 CFR 270.30a-2(b)): Attached hereto
|
Exhibit 99.CERT
|
Certifications required by Rule 30a-2(a) under the Act
|
|
Exhibit 99.906CERT
|
Certifications required by Rule 30a-2(b) under the Act
|
SIGNATURES
Pursuant to the requirements of the Securities Exchange Act of 1934 and the Investment Company Act of 1940, the registrant has duly caused this report to be signed on its behalf by the undersigned, thereunto duly authorized.
(Registrant) Williamsburg Investment Trust
|
By (Signature and Title)*
|
/s/ Tina H. Bloom
|
||
|
Tina H. Bloom, Secretary and Chief Compliance Officer
|
|||
|
Date
|
December 2, 2014
|
||
|
Pursuant to the requirements of the Securities Exchange Act of 1934 and the Investment Company Act of 1940, this report has been signed below by the following persons on behalf of the registrant and in the capacities and on the dates indicated.
|
|||
|
By (Signature and Title)*
|
/s/ John T. Bruce
|
||
|
John T. Bruce, President (FBP Equity & Dividend
Plus Fund and FBP Appreciation & Income Opportunities Fund)
|
|||
|
Date
|
December 2, 2014
|
||
|
By (Signature and Title)*
|
/s/ Thomas W. Leavell
|
||
|
Thomas W. Leavell, President (The Government Street Equity Fund, The Government Street Mid-Cap Fund and The Alabama Tax Free Bond Fund)
|
|||
|
Date
|
December 2, 2014
|
||
|
By (Signature and Title)*
|
/s/ Charles M. Caravati III
|
||
|
Charles M. Caravati III, President (The Jamestown Balanced Fund and The Jamestown Equity Fund)
|
|||
|
Date
|
December 2, 2014
|
||
|
By (Signature and Title)*
|
/s/ Joseph A. Jennings III
|
||
|
Joseph A. Jennings III, President (The Jamestown Tax Exempt Virginia Fund)
|
|||
|
Date
|
December 2, 2014
|
||
|
By (Signature and Title)*
|
/s/ John P. Ackerly IV
|
||
|
John P. Ackerly IV, President (The Davenport Core Fund, Davenport Value & Income Fund and Davenport Equity Opportunities Fund)
|
|||
|
Date
|
December 2, 2014
|
||
|
By (Signature and Title)*
|
/s/ Mark J. Seger
|
||
|
Mark J. Seger, Treasurer
|
|||
|
Date
|
December 2, 2014
|
||
* Print the name and title of each signing officer under his or her signature.