UNITED STATES
SECURITIES AND EXCHANGE COMMISSION
Washington, DC 20549
FORM N-CSRS
CERTIFIED SHAREHOLDER REPORT OF REGISTERED
MANAGEMENT INVESTMENT COMPANIES
Investment Company Act file number 811-05583
Franklin Templeton
Variable Insurance Products Trust
(Exact name of registrant as specified in charter)
One Franklin Parkway,
San Mateo, CA 94403-1906
(Address of principal executive offices) (Zip code)
Craig S. Tyle,
One Franklin Parkway,
San Mateo, CA 94403-1906
(Name and address of agent for service)
Registrant’s telephone number, including area code: (650) 312-2000
Date of fiscal year end: 12/31
Date of reporting period: 06/30/16
| Item 1. | Reports to Stockholders. |

|
Semiannual Report June 30, 2016 |
Franklin Templeton
Variable Insurance Products Trust

Franklin Templeton Variable Insurance
Products Trust Semiannual Report
| Table of Contents | ||||
| Important Notes to Performance Information | i | |||
| Fund Summaries | ||||
| Franklin Founding Funds Allocation VIP Fund |
FFA-1 | |||
| Franklin Global Real Estate VIP Fund |
FGR-1 | |||
| *Prospectus Supplement |
FGR-7 | |||
| Franklin Growth and Income VIP Fund |
FGI-1 | |||
| Franklin High Income VIP Fund |
FH-1 | |||
| Franklin Income VIP Fund |
FI-1 | |||
| Franklin Large Cap Growth VIP Fund |
FLG-1 | |||
| Franklin Mutual Global Discovery VIP Fund |
MGD-1 | |||
| Franklin Mutual Shares VIP Fund |
MS-1 | |||
| Franklin Rising Dividends VIP Fund |
FRD-1 | |||
| Franklin Small Cap Value VIP Fund |
FSV-1 | |||
| *Prospectus Supplement |
FSV-6 | |||
| Franklin Small-Mid Cap Growth VIP Fund |
FSC-1 | |||
| Franklin Strategic Income VIP Fund |
FSI-1 | |||
| Franklin U.S. Government Securities VIP Fund |
FUS-1 | |||
| Templeton Developing Markets VIP Fund |
TD-1 | |||
| Templeton Foreign VIP Fund |
TF-1 | |||
| *Prospectus Supplement |
TF-6 | |||
| Templeton Global Bond VIP Fund |
TGB-1 | |||
| Templeton Growth VIP Fund |
TG-1 | |||
| *Prospectus Supplement |
TG-8 | |||
| Index Descriptions | I-1 | |||
| Shareholder Information | SI-1 | |||
*Not part of the semiannual report. Retain for your records.
| Not FDIC Insured | | | May Lose Value | | | No Bank Guarantee |
MASTER CLASS – 1
FRANKLIN TEMPLETON VARIABLE INSURANCE PRODUCTS TRUST
Important Notes to
Performance Information
| Semiannual Report | i |
Franklin Founding Funds Allocation VIP Fund
This semiannual report for Franklin Founding Funds Allocation VIP Fund covers the period ended June 30, 2016.
Class 1 Performance Summary as of June 30, 2016
The Fund’s Class 1 shares delivered a +2.29% total return* for the six-month period ended June 30, 2016.
*The Fund has an expense reduction contractually guaranteed through at least 4/30/17. Fund investment results reflect the expense reduction, to the extent applicable; without this reduction, the results would have been lower.
Performance reflects the Fund’s Class 1 operating expenses, but does not include any contract fees, expenses or sales charges. If they had been included, performance would be lower. These charges and deductions, particularly for variable life policies, can have a significant effect on contract values and insurance benefits. See the contract prospectus for a complete description of these expenses, including sales charges.
Performance data represent past performance, which does not guarantee future results. Investment return and principal value will fluctuate, and you may have a gain or loss when you sell your shares. Current performance may differ from figures shown.
| Semiannual Report | FFA-1 |
FRANKLIN FOUNDING FUNDS ALLOCATION VIP FUND
1. Source: Morningstar. One cannot invest directly in an index, and an index is not representative of the Fund’s portfolio. Please see Index Descriptions following the Fund Summaries.
| FFA-2 | Semiannual Report |
FRANKLIN FOUNDING FUNDS ALLOCATION VIP FUND
During the six months under review, Franklin Income VIP Fund – Class 1 and Franklin Mutual Shares VIP Fund – Class 1 outperformed the S&P 500. Templeton Growth VIP Fund – Class 1 underperformed the MSCI World Index.
Thank you for your participation in Franklin Founding Funds Allocation VIP Fund. We look forward to serving your future investment needs.
The foregoing information reflects our analysis, opinions and portfolio holdings as of June 30, 2016, the end of the reporting period. The way we implement our main investment strategies and the resulting portfolio holdings may change depending on factors such as market and economic conditions. These opinions may not be relied upon as investment advice or an offer for a particular security. The information is not a complete analysis of every aspect of any market, country, industry, security or the Fund. Statements of fact are from sources considered reliable, but the investment manager makes no representation or warranty as to their completeness or accuracy. Although historical performance is no guarantee of future results, these insights may help you understand our investment management philosophy.
2. Please see Index Descriptions following the Fund Summaries.
| Semiannual Report | FFA-3 |
FRANKLIN FOUNDING FUNDS ALLOCATION VIP FUND
Class 1 Fund Expenses
| Class 1 | Beginning Account Value 1/1/16 |
Ending Account Value 6/30/16 |
Expenses 1/1/16–6/30/16 |
Expenses 1/1/16–6/30/16 |
||||||||||||
| Actual |
$ | 1,000 | $ | 1,022.90 | $ | 0.50 | $ | 3.82 | ||||||||
| Hypothetical (5% return before expenses) |
$ | 1,000 | $ | 1,024.37 | $ | 0.50 | $ | 3.82 | ||||||||
*Expenses are calculated using the most recent six-month annualized expense ratio excluding expenses of the underlying funds, net of expense waivers, for the Fund’s Class 1 shares (0.10%), which does not include any ongoing expenses of the Contract for which the Fund is an investment option, multiplied by the average account value over the period, multiplied by 182/366 to reflect the one-half year period.
**Expenses are calculated using the most recent six-month annualized expense ratio including expenses of the underlying funds, net of expense waivers, for the Fund’s Class 1 shares (0.76%), which does not include any ongoing expenses of the Contract for which the Fund is an investment option, multiplied by the average account value over the period, multiplied by 182/366 to reflect the one-half year period.
| FFA-4 | Semiannual Report |
FRANKLIN TEMPLETON VARIABLE INSURANCE PRODUCTS TRUST
Financial Highlights
Franklin Founding Funds Allocation VIP Fund
| Six Months Ended (unaudited) |
Year Ended December 31, | |||||||||||||||||||||||
| 2015 | 2014 | 2013 | 2012 | 2011 | ||||||||||||||||||||
| Class 1 | ||||||||||||||||||||||||
| Per share operating performance (for a share outstanding throughout the period) |
||||||||||||||||||||||||
| Net asset value, beginning of period |
$6.80 | $7.47 | $7.47 | $8.55 | $7.63 | $7.73 | ||||||||||||||||||
|
|
|
|||||||||||||||||||||||
| Income from investment operationsa: | ||||||||||||||||||||||||
| Net investment incomeb,c |
0.16 | 0.26 | 0.22 | 0.30 | 0.26 | 0.25 | ||||||||||||||||||
| Net realized and unrealized gains (losses) |
(0.01 | ) | (0.68 | ) | 0.02 | 1.42 | 0.90 | (0.35 | ) | |||||||||||||||
|
|
|
|||||||||||||||||||||||
| Total from investment operations |
0.15 | (0.42 | ) | 0.24 | 1.72 | 1.16 | (0.10 | ) | ||||||||||||||||
|
|
|
|||||||||||||||||||||||
| Less distributions from: | ||||||||||||||||||||||||
| Net investment income |
(0.29 | ) | (0.24 | ) | (0.23 | ) | (1.15 | ) | (0.24 | ) | (— | )d | ||||||||||||
| Net realized gains |
(0.23 | ) | (0.01 | ) | (0.01 | ) | (1.65 | ) | — | — | ||||||||||||||
|
|
|
|||||||||||||||||||||||
| Total distributions |
(0.52 | ) | (0.25 | ) | (0.24 | ) | (2.80 | ) | (0.24 | ) | (— | )d | ||||||||||||
|
|
|
|||||||||||||||||||||||
| Net asset value, end of period |
$6.43 | $6.80 | $7.47 | $7.47 | $8.55 | $7.63 | ||||||||||||||||||
|
|
|
|||||||||||||||||||||||
| Total returne |
2.29% | (5.93)% | 3.05% | 24.14% | 15.56% | (1.28)% | ||||||||||||||||||
| Ratios to average net assetsf | ||||||||||||||||||||||||
| Expenses before waiver and payments by affiliatesg |
0.12% | 0.11% | 0.11% | 0.11% | 0.11% | 0.11% | ||||||||||||||||||
| Expenses net of waiver and payments by affiliatesg |
0.10% | 0.10% | 0.10% | 0.10% | 0.10% | 0.10% | ||||||||||||||||||
| Net investment incomec |
4.90% | 3.51% | 2.88% | 3.67% | 4.06% | 3.44% | ||||||||||||||||||
| Supplemental data | ||||||||||||||||||||||||
| Net assets, end of period (000’s) |
$1,035 | $1,083 | $1,114 | $952 | $767 | $470 | ||||||||||||||||||
| Portfolio turnover rate |
0.10% | 0.26% | 4.80% | 3.91% | 28.46% | h | 58.42% | |||||||||||||||||
aThe amount shown for a share outstanding throughout the period may not correlate with the Statement of Operations for the period due to the timing of sales and repurchases of the Fund’s shares in relation to income earned and/or fluctuating fair value of the investments of the Fund.
bBased on average daily shares outstanding.
cRecognition of net investment income by the Fund is affected by the timing of declaration of dividends by the Underlying Funds in which the Fund invests.
dAmount rounds to less than $0.01 per share.
eTotal return does not include fees, charges or expenses imposed by the variable annuity and life insurance contracts for which Franklin Templeton Variable Insurance Products Trust serves as an underlying investment vehicle. Total return is not annualized for periods less than one year.
fRatios are annualized for periods less than one year.
gDoes not include expenses of the Underlying Funds in which the Fund invests. The weighted average indirect expenses of the Underlying Funds was 0.66% for the period ended June 30, 2016.
hExcludes the value of portfolio securities delivered as a result of a redemption in-kind.
| The accompanying notes are an integral part of these financial statements. | Semiannual Report | FFA-5 |
FRANKLIN TEMPLETON VARIABLE INSURANCE PRODUCTS TRUST
FINANCIAL HIGHLIGHTS
Franklin Founding Funds Allocation VIP Fund (continued)
| Six Months Ended June 30, 2016 (unaudited) |
Year Ended December 31, | |||||||||||||||||||||||
| 2015 | 2014 | 2013 | 2012 | 2011 | ||||||||||||||||||||
| Class 2 | ||||||||||||||||||||||||
| Per share operating performance (for a share outstanding throughout the period) |
||||||||||||||||||||||||
| Net asset value, beginning of period |
$6.75 | $7.42 | $7.42 | $8.51 | $7.59 | $7.71 | ||||||||||||||||||
|
|
|
|||||||||||||||||||||||
| Income from investment operationsa: | ||||||||||||||||||||||||
| Net investment incomeb,c |
0.15 | 0.24 | 0.20 | 0.27 | 0.25 | 0.23 | ||||||||||||||||||
| Net realized and unrealized gains (losses) |
(— | )d | (0.68 | ) | 0.02 | 1.42 | 0.89 | (0.35 | ) | |||||||||||||||
|
|
|
|||||||||||||||||||||||
| Total from investment operations |
0.15 | (0.44 | ) | 0.22 | 1.69 | 1.14 | (0.12 | ) | ||||||||||||||||
|
|
|
|||||||||||||||||||||||
| Less distributions from: | ||||||||||||||||||||||||
| Net investment income |
(0.27 | ) | (0.22 | ) | (0.21 | ) | (1.13 | ) | (0.22 | ) | (— | )d | ||||||||||||
| Net realized gains |
(0.23 | ) | (0.01 | ) | (0.01 | ) | (1.65 | ) | — | — | ||||||||||||||
|
|
|
|||||||||||||||||||||||
| Total distributions |
(0.50 | ) | (0.23 | ) | (0.22 | ) | (2.78 | ) | (0.22 | ) | (— | )d | ||||||||||||
|
|
|
|||||||||||||||||||||||
| Net asset value, end of period |
$6.40 | $6.75 | $7.42 | $7.42 | $8.51 | $7.59 | ||||||||||||||||||
|
|
|
|||||||||||||||||||||||
| Total returne |
2.31% | (6.21)% | 2.85% | 23.77% | 15.33% | (1.54)% | ||||||||||||||||||
| Ratios to average net assetsf | ||||||||||||||||||||||||
| Expenses before waiver and payments by affiliatesg |
0.37% | 0.36% | 0.36% | 0.36% | 0.36% | 0.36% | ||||||||||||||||||
| Expenses net of waiver and payments by affiliatesg |
0.35% | 0.35% | 0.35% | 0.35% | 0.35% | 0.35% | ||||||||||||||||||
| Net investment incomec |
4.65% | 3.26% | 2.63% | 3.42% | 3.81% | 3.19% | ||||||||||||||||||
| Supplemental data | ||||||||||||||||||||||||
| Net assets, end of period (000’s) |
$462,197 | $480,715 | $557,704 | $547,506 | $472,686 | $448,101 | ||||||||||||||||||
| Portfolio turnover rate |
0.10% | 0.26% | 4.80% | 3.91% | 28.46% | h | 58.42% | |||||||||||||||||
aThe amount shown for a share outstanding throughout the period may not correlate with the Statement of Operations for the period due to the timing of sales and repurchases of the Fund’s shares in relation to income earned and/or fluctuating fair value of the investments of the Fund.
bBased on average daily shares outstanding.
cRecognition of net investment income by the Fund is affected by the timing of declaration of dividends by the Underlying Funds in which the Fund invests.
dAmount rounds to less than $0.01 per share.
eTotal return does not include fees, charges or expenses imposed by the variable annuity and life insurance contracts for which Franklin Templeton Variable Insurance Products Trust serves as an underlying investment vehicle. Total return is not annualized for periods less than one year.
fRatios are annualized for periods less than one year.
gDoes not include expenses of the Underlying Funds in which the Fund invests. The weighted average indirect expenses of the Underlying Funds was 0.66% for the period ended June 30, 2016.
hExcludes the value of portfolio securities delivered as a result of a redemption in-kind.
| FFA-6 | Semiannual Report | The accompanying notes are an integral part of these financial statements. |
FRANKLIN TEMPLETON VARIABLE INSURANCE PRODUCTS TRUST
FINANCIAL HIGHLIGHTS
Franklin Founding Funds Allocation VIP Fund (continued)
| Six Months Ended June 30, 2016 (unaudited) |
Year Ended December 31, | |||||||||||||||||||||||
| 2015 | 2014 | 2013 | 2012 | 2011 | ||||||||||||||||||||
| Class 4 | ||||||||||||||||||||||||
| Per share operating performance (for a share outstanding throughout the period) |
||||||||||||||||||||||||
| Net asset value, beginning of period |
$6.87 | $7.54 | $7.54 | $8.49 | $7.58 | $7.71 | ||||||||||||||||||
|
|
|
|||||||||||||||||||||||
| Income from investment operationsa: | ||||||||||||||||||||||||
| Net investment incomeb,c |
0.15 | 0.23 | 0.20 | 0.26 | 0.30 | 0.24 | ||||||||||||||||||
| Net realized and unrealized gains (losses) |
(0.01 | ) | (0.68 | ) | 0.02 | 1.43 | 0.83 | (0.37 | ) | |||||||||||||||
|
|
|
|||||||||||||||||||||||
| Total from investment operations |
0.14 | (0.45 | ) | 0.22 | 1.69 | 1.13 | (0.13 | ) | ||||||||||||||||
|
|
|
|||||||||||||||||||||||
| Less distributions from: | ||||||||||||||||||||||||
| Net investment income |
(0.26 | ) | (0.21 | ) | (0.21 | ) | (0.99 | ) | (0.22 | ) | (— | )d | ||||||||||||
| Net realized gains |
(0.23 | ) | (0.01 | ) | (0.01 | ) | (1.65 | ) | — | — | ||||||||||||||
|
|
|
|||||||||||||||||||||||
| Total distributions |
(0.49 | ) | (0.22 | ) | (0.22 | ) | (2.64 | ) | (0.22 | ) | (— | )d | ||||||||||||
|
|
|
|||||||||||||||||||||||
| Net asset value, end of period |
$6.52 | $6.87 | $7.54 | $7.54 | $8.49 | $7.58 | ||||||||||||||||||
|
|
|
|||||||||||||||||||||||
| Total returne |
2.11% | (6.24)% | 2.75% | 23.68% | 15.17% | (1.67)% | ||||||||||||||||||
| Ratios to average net assetsf | ||||||||||||||||||||||||
| Expenses before waiver and payments by affiliatesg |
0.47% | 0.46% | 0.46% | 0.46% | 0.46% | 0.46% | ||||||||||||||||||
| Expenses net of waiver and payments by affiliatesg |
0.45% | 0.45% | 0.45% | 0.45% | 0.45% | 0.45% | ||||||||||||||||||
| Net investment incomec |
4.55% | 3.16% | 2.53% | 3.32% | 3.71% | 3.09% | ||||||||||||||||||
| Supplemental data | ||||||||||||||||||||||||
| Net assets, end of period (000’s) |
$518,950 | $550,825 | $702,324 | $676,781 | $493,813 | $2,860,928 | ||||||||||||||||||
| Portfolio turnover rate |
0.10% | 0.26% | 4.80% | 3.91% | 28.46% | h | 58.42% | |||||||||||||||||
aThe amount shown for a share outstanding throughout the period may not correlate with the Statement of Operations for the period due to the timing of sales and repurchases of the Fund’s shares in relation to income earned and/or fluctuating fair value of the investments of the Fund.
bBased on average daily shares outstanding.
cRecognition of net investment income by the Fund is affected by the timing of declaration of dividends by the Underlying Funds in which the Fund invests.
dAmount rounds to less than $0.01 per share.
eTotal return does not include fees, charges or expenses imposed by the variable annuity and life insurance contracts for which Franklin Templeton Variable Insurance Products Trust serves as an underlying investment vehicle. Total return is not annualized for periods less than one year.
fRatios are annualized for periods less than one year.
gDoes not include expenses of the Underlying Funds in which the Fund invests. The weighted average indirect expenses of the Underlying Funds was 0.66% for the period ended June 30, 2016.
hExcludes the value of portfolio securities delivered as a result of a redemption in-kind.
| The accompanying notes are an integral part of these financial statements. | Semiannual Report | FFA-7 |
FRANKLIN TEMPLETON VARIABLE INSURANCE PRODUCTS TRUST
Statement of Investments, June 30, 2016 (unaudited)
| Franklin Founding Funds Allocation VIP Fund
|
||||||||||
| Shares | Value | |||||||||
| Investments in Underlying Fundsa |
|
|||||||||
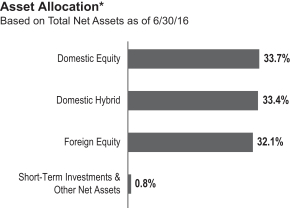
| Domestic Equity 33.7% |
||||||||||
| Franklin Mutual Shares VIP Fund, Class 1 |
16,253,153 | $ | 330,914,202 | |||||||
|
|
|
|||||||||
| Domestic Hybrid 33.4% |
||||||||||
| Franklin Income VIP Fund, Class 1 |
22,323,253 | 328,151,825 | ||||||||
|
|
|
|||||||||
| Foreign Equity 32.1% |
||||||||||
| Templeton Growth VIP Fund, Class 1 |
25,696,831 | 315,557,091 | ||||||||
|
|
|
|||||||||
| Total Investments in Underlying Funds (Cost $784,229,704) 99.2% |
974,623,118 | |||||||||
| Other Assets, less Liabilities 0.8% |
7,558,183 | |||||||||
|
|
|
|||||||||
| Net Assets 100.0% |
$ | 982,181,301 | ||||||||
|
|
|
|||||||||
aSee Note 3(d) regarding investments in Underlying Funds.
| FFA-8 | Semiannual Report | The accompanying notes are an integral part of these financial statements. |
FRANKLIN TEMPLETON VARIABLE INSURANCE PRODUCTS TRUST
Financial Statements
Statement of Assets and Liabilities
June 30, 2016 (unaudited)
| Franklin Founding Funds Allocation VIP Fund |
||||
| Assets: |
||||
| Investments in Securities: |
||||
| Cost – Non-controlled affiliates (Note 3d) |
$ | 784,229,704 | ||
|
|
|
|||
| Value – Non-controlled affiliates (Note 3d) |
$ | 974,623,118 | ||
| Cash |
4,176,196 | |||
| Receivables: |
||||
| Investment securities sold |
5,000,000 | |||
| Capital shares sold |
134,283 | |||
| Other assets |
451 | |||
|
|
|
|||
| Total assets |
983,934,048 | |||
|
|
|
|||
| Liabilities: |
||||
| Payables: |
||||
| Capital shares redeemed |
1,106,038 | |||
| Administrative fees |
68,260 | |||
| Distribution fees |
498,299 | |||
| Accrued expenses and other liabilities |
80,150 | |||
|
|
|
|||
| Total liabilities |
1,752,747 | |||
|
|
|
|||
| Net assets, at value |
$ | 982,181,301 | ||
|
|
|
|||
| Net assets consist of: |
||||
| Paid-in capital |
$ | 810,321,282 | ||
| Undistributed net investment income |
20,620,378 | |||
| Net unrealized appreciation (depreciation) |
190,393,414 | |||
| Accumulated net realized gain (loss) |
(39,153,773 | ) | ||
|
|
|
|||
| Net assets, at value |
$ | 982,181,301 | ||
|
|
|
|||
| Class 1: | ||||
| Net assets, at value |
$ | 1,035,040 | ||
|
|
|
|||
| Shares outstanding |
160,873 | |||
|
|
|
|||
| Net asset value and maximum offering price per share |
$ | 6.43 | ||
|
|
|
|||
| Class 2: | ||||
| Net assets, at value |
$ | 462,196,500 | ||
|
|
|
|||
| Shares outstanding |
72,251,827 | |||
|
|
|
|||
| Net asset value and maximum offering price per share |
$ | 6.40 | ||
|
|
|
|||
| Class 4: | ||||
| Net assets, at value |
$ | 518,949,761 | ||
|
|
|
|||
| Shares outstanding |
79,613,340 | |||
|
|
|
|||
| Net asset value and maximum offering price per share |
$ | 6.52 | ||
|
|
|
|||
| The accompanying notes are an integral part of these financial statements. | Semiannual Report | FFA-9 |
FRANKLIN TEMPLETON VARIABLE INSURANCE PRODUCTS TRUST
FINANCIAL STATEMENTS
Statement of Operations
for the six months ended June 30, 2016 (unaudited)
| Franklin Founding Funds Allocation VIP Fund |
||||
| Investment income: |
||||
| Dividends from Non-controlled affiliates (Note 3d) |
$ | 24,362,675 | ||
|
|
|
|||
| Expenses: |
||||
| Administrative fees (Note 3a) |
486,881 | |||
| Distribution fees: (Note 3b) |
||||
| Class 2 |
570,343 | |||
| Class 4 |
903,913 | |||
| Reports to shareholders |
47,234 | |||
| Professional fees |
16,921 | |||
| Trustees’ fees and expenses |
2,614 | |||
| Other |
7,077 | |||
|
|
|
|||
| Total expenses |
2,034,983 | |||
| Expenses waived/paid by affiliates (Note 3e) |
(73,848 | ) | ||
|
|
|
|||
| Net expenses |
1,961,135 | |||
|
|
|
|||
| Net investment income |
22,401,540 | |||
|
|
|
|||
| Realized and unrealized gains (losses): |
||||
| Net realized gain (loss) from: |
||||
| Sale of investments in Non-controlled affiliates (Note 3d) |
574,880 | |||
| Realized gain distribution by Non-controlled affiliates (Note 3d) |
12,581,004 | |||
|
|
|
|||
| Net realized gain (loss) |
13,155,884 | |||
|
|
|
|||
| Net change in unrealized appreciation (depreciation) on investments |
(16,032,961 | ) | ||
|
|
|
|||
| Net realized and unrealized gain (loss) |
(2,877,077 | ) | ||
|
|
|
|||
| Net increase (decrease) in net assets resulting from operations |
$ | 19,524,463 | ||
|
|
|
|||
| FFA-10 | Semiannual Report | The accompanying notes are an integral part of these financial statements. |
FRANKLIN TEMPLETON VARIABLE INSURANCE PRODUCTS TRUST
FINANCIAL STATEMENTS
Statements of Changes in Net Assets
| Franklin Founding Funds Allocation VIP Fund | ||||||||
| Six Months Ended June 30, 2016 (unaudited) |
Year Ended December 31, 2015 |
|||||||
| Increase (decrease) in net assets: |
||||||||
| Operations: |
||||||||
| Net investment income |
$ | 22,401,540 | $ | 37,413,879 | ||||
| Net realized gain (loss) |
13,155,884 | 35,400,605 | ||||||
| Net change in unrealized appreciation (depreciation) |
(16,032,961 | ) | (142,745,103 | ) | ||||
|
|
|
|||||||
| Net increase (decrease) in net assets resulting from operations |
19,524,463 | (69,930,619 | ) | |||||
|
|
|
|||||||
| Distributions to shareholders from: |
||||||||
| Net investment income: |
||||||||
| Class 1 |
(42,945 | ) | (36,795 | ) | ||||
| Class 2 |
(18,199,649 | ) | (15,525,526 | ) | ||||
| Class 4 |
(19,362,702 | ) | (17,645,320 | ) | ||||
| Net realized gains: |
||||||||
| Class 1 |
(33,890 | ) | (1,845 | ) | ||||
| Class 2 |
(15,405,932 | ) | (848,940 | ) | ||||
| Class 4 |
(17,041,268 | ) | (1,013,211 | ) | ||||
|
|
|
|||||||
| Total distributions to shareholders |
(70,086,386 | ) | (35,071,637 | ) | ||||
|
|
|
|||||||
| Capital share transactions: (Note 2) |
||||||||
| Class 1 |
5,200 | 76,918 | ||||||
| Class 2 |
5,604,467 | (28,851,107 | ) | |||||
| Class 4 |
(5,489,399 | ) | (94,741,812 | ) | ||||
|
|
|
|||||||
| Total capital share transactions |
120,268 | (123,516,001 | ) | |||||
|
|
|
|||||||
| Net increase (decrease) in net assets |
(50,441,655 | ) | (228,518,257 | ) | ||||
| Net assets: |
||||||||
| Beginning of period |
1,032,622,956 | 1,261,141,213 | ||||||
|
|
|
|||||||
| End of period |
$ | 982,181,301 | $ | 1,032,622,956 | ||||
|
|
|
|||||||
| Undistributed net investment income included in net assets: |
||||||||
| End of period |
$ | 20,620,378 | $ | 35,824,134 | ||||
|
|
|
|||||||
| The accompanying notes are an integral part of these financial statements. | Semiannual Report | FFA-11 |
FRANKLIN TEMPLETON VARIABLE INSURANCE PRODUCTS TRUST
Notes to Financial Statements (unaudited)
Franklin Founding Funds Allocation VIP Fund
| FFA-12 | Semiannual Report |
FRANKLIN TEMPLETON VARIABLE INSURANCE PRODUCTS TRUST
NOTES TO FINANCIAL STATEMENTS (UNAUDITED)
Franklin Founding Funds Allocation VIP Fund (continued)
2. Shares of Beneficial Interest
At June 30, 2016, there were an unlimited number of shares authorized (without par value). Transactions in the Fund’s shares were as follows:
| Six Months Ended June 30, 2016 |
Year Ended December 31, 2015 |
|||||||||||||||||||
| Shares | Amount | Shares | Amount | |||||||||||||||||
| Class 1 Shares: | ||||||||||||||||||||
| Shares sold |
12,476 | $ | 83,200 | 19,319 | $ | 143,699 | ||||||||||||||
| Shares issued in reinvestment of distributions |
12,138 | 76,835 | 5,229 | 38,640 | ||||||||||||||||
| Shares redeemed |
(22,971 | ) | (154,835 | ) | (14,405 | ) | (105,421 | ) | ||||||||||||
|
|
|
|||||||||||||||||||
| Net increase (decrease) |
1,643 | $ | 5,200 | 10,143 | $ | 76,918 | ||||||||||||||
|
|
|
|||||||||||||||||||
| Class 2 Shares: | ||||||||||||||||||||
| Shares sold |
3,111,474 | $ | 21,036,796 | 6,246,409 | $ | 45,291,801 | ||||||||||||||
| Shares issued in reinvestment of distributions |
5,334,219 | 33,605,581 | 2,227,819 | 16,374,466 | ||||||||||||||||
| Shares redeemed |
(7,372,913 | ) | (49,037,910 | ) | (12,470,063 | ) | (90,517,374 | ) | ||||||||||||
|
|
|
|||||||||||||||||||
| Net increase (decrease) |
1,072,780 | $ | 5,604,467 | (3,995,835 | ) | $ | (28,851,107 | ) | ||||||||||||
|
|
|
|||||||||||||||||||
| Class 4 Shares: | ||||||||||||||||||||
| Shares sold |
771,190 | $ | 5,227,115 | 2,856,721 | $ | 21,294,894 | ||||||||||||||
| Shares issued in reinvestment of distributions |
5,670,400 | 36,403,970 | 2,494,456 | 18,658,531 | ||||||||||||||||
| Shares redeemed |
(7,059,820 | ) | (47,120,484 | ) | (18,324,962 | ) | (134,695,237 | ) | ||||||||||||
|
|
|
|||||||||||||||||||
| Net increase (decrease) |
(618,230 | ) | $ | (5,489,399 | ) | (12,973,785 | ) | $ | (94,741,812 | ) | ||||||||||
|
|
|
|||||||||||||||||||
3. Transactions With Affiliates
Franklin Resources, Inc. is the holding company for various subsidiaries that together are referred to as Franklin Templeton Investments. Certain officers and trustees of the Fund are also officers and/or directors of the following subsidiaries:
| Subsidiary | Affiliation | |
| Franklin Templeton Services, LLC (FT Services) |
Administrative manager | |
| Franklin Templeton Distributors, Inc. (Distributors) |
Principal underwriter | |
| Franklin Templeton Investor Services, LLC (Investor Services) |
Transfer agent |
| Semiannual Report | FFA-13 |
FRANKLIN TEMPLETON VARIABLE INSURANCE PRODUCTS TRUST
NOTES TO FINANCIAL STATEMENTS
Franklin Founding Funds Allocation VIP Fund (continued)
3. Transactions With Affiliates (continued)
a. Administrative Fees
The Fund pays an administrative fee to FT Services of 0.10% per year of the average daily net assets of the Fund for administrative services including monitoring and rebalancing the percentage of the Fund’s investments in the Underlying Funds.
b. Distribution Fees
The Board has adopted distribution plans for Class 2 and Class 4 shares pursuant to Rule 12b-1 under the 1940 Act. Under the Fund’s compensation distribution plans, the Fund pays Distributors for costs incurred in connection with the servicing, sale and distribution of the Fund’s shares up to 0.35% per year of its average daily net assets of each class. The Board has agreed to limit the current rate to 0.25% per year for Class 2. The plan year, for purposes of monitoring compliance with the maximum annual plan rates, is February 1 through January 31.
c. Transfer Agent Fees
Investor Services, under terms of an agreement, performs shareholder servicing for the Fund and is not paid by the Fund for the services.
d. Investments in Underlying Funds
The Fund invests in Underlying Funds which are managed by Franklin Advisers, Inc. (Advisers), an affiliate of FT Services. The Fund does not invest in Underlying Funds for the purpose of exercising a controlling influence over the management or policies.
Investments in Underlying Funds for the period ended June 30, 2016, were as follows:
| Underlying Funds | Number of Shares Held at Beginning of Period |
Gross Additions |
Gross Reductions |
Number of Shares Held at End of Period |
Value at End of Period |
Investment Income |
Realized Gain (Loss) |
% of Underlying Fund Shares Outstanding Held at End of Period |
||||||||||||||||||||||||
| Non-Controlled Affiliates | ||||||||||||||||||||||||||||||||
| Franklin Income VIP Fund, Class 1 |
23,343,030 | 1,232,945 | (2,252,722 | ) | 22,323,253 | $ | 328,151,825 | $ | 16,820,344 | $ | (2,422,697 | ) | 5.4% | |||||||||||||||||||
| Franklin Mutual Shares VIP Fund, Class 1 |
17,510,038 | — | (1,256,885 | ) | 16,253,153 | 330,914,202 | — | (140,318 | ) | 7.8% | ||||||||||||||||||||||
| Templeton Growth VIP Fund, Class 1 |
25,118,084 | 1,645,407 | (1,066,660 | ) | 25,696,831 | 315,557,091 | 7,542,331 | 15,718,899 | a | 23.9% | ||||||||||||||||||||||
|
|
|
|||||||||||||||||||||||||||||||
| Total |
$ | 974,623,118 | $ | 24,362,675 | $ | 13,155,884 | ||||||||||||||||||||||||||
|
|
|
|||||||||||||||||||||||||||||||
aIncludes realized gain distributions received.
e. Waiver and Expense Reimbursements
FT Services has contractually agreed in advance to waive or limit its fees and to assume as its own expense certain expenses otherwise payable by the Fund so that the expenses (excluding distribution fees and acquired fund fees and expenses) for each class of the Fund do not exceed 0.10%, based on the average net assets of each class (other than certain non-routine expenses or costs, including those relating to litigation, indemnification, reorganizations, and liquidations) until April 30, 2017. Total expenses waived or paid are not subject to recapture subsequent to the Fund’s fiscal year end.
4. Expense Offset Arrangement
The Fund has entered into an arrangement with its custodian whereby credits realized as a result of uninvested cash balances are used to reduce a portion of the Fund’s custodian expenses. During the period ended June 30, 2016, there were no credits earned.
| FFA-14 | Semiannual Report |
FRANKLIN TEMPLETON VARIABLE INSURANCE PRODUCTS TRUST
NOTES TO FINANCIAL STATEMENTS
Franklin Founding Funds Allocation VIP Fund (continued)
5. Income Taxes
At June 30, 2016, the cost of investments and net unrealized appreciation (depreciation) for income tax purposes were as follows:
| Cost of investments |
$ | 836,104,895 | ||
|
|
|
|||
| Unrealized appreciation |
$ | 190,393,414 | ||
| Unrealized depreciation |
(51,875,191 | ) | ||
|
|
|
|||
| Net unrealized appreciation (depreciation) |
$ | 138,518,223 | ||
|
|
|
Differences between income and/or capital gains as determined on a book basis and a tax basis are primarily due to differing treatment of wash sales.
6. Investment Transactions
Purchases and sales of Underlying Funds (excluding short term securities) for the period ended June 30, 2016, aggregated $1,000,000 and $70,798,834, respectively.
7. Credit Facility
The Fund, together with other U.S. registered and foreign investment funds (collectively, Borrowers), managed by Franklin Templeton Investments, are borrowers in a joint syndicated senior unsecured credit facility totaling $2 billion (Global Credit Facility) which matures on February 10, 2017. This Global Credit Facility provides a source of funds to the Borrowers for temporary and emergency purposes, including the ability to meet future unanticipated or unusually large redemption requests.
Under the terms of the Global Credit Facility, the Fund shall, in addition to interest charged on any borrowings made by the Fund and other costs incurred by the Fund, pay its share of fees and expenses incurred in connection with the implementation and maintenance of the Global Credit Facility, based upon its relative share of the aggregate net assets of all of the Borrowers, including an annual commitment fee of 0.07% based upon the unused portion of the Global Credit Facility. Effective February 12, 2016, the annual commitment fee is 0.15%. These fees are reflected in other expenses in the Statement of Operations. During the period ended June 30, 2016, the Fund did not use the Global Credit Facility.
8. Fair Value Measurements
The Fund follows a fair value hierarchy that distinguishes between market data obtained from independent sources (observable inputs) and the Fund’s own market assumptions (unobservable inputs). These inputs are used in determining the value of the Fund’s financial instruments and are summarized in the following fair value hierarchy:
| • | Level 1 – quoted prices in active markets for identical financial instruments |
| • | Level 2 – other significant observable inputs (including quoted prices for similar financial instruments, interest rates, prepayment speed, credit risk, etc.) |
| • | Level 3 – significant unobservable inputs (including the Fund’s own assumptions in determining the fair value of financial instruments) |
The input levels are not necessarily an indication of the risk or liquidity associated with financial instruments at that level.
For movements between the levels within the fair value hierarchy, the Fund has adopted a policy of recognizing the transfers as of the date of the underlying event which caused the movement.
At June 30, 2016, all of the Fund’s investments in financial instruments carried at fair value were valued using Level 1 inputs. For detailed categories, see the accompanying Statement of Investments.
9. Subsequent Events
The Fund has evaluated subsequent events through the issuance of the financial statements and determined that no events have occurred that require disclosure.
| Semiannual Report | FFA-15 |
FRANKLIN TEMPLETON VARIABLE INSURANCE PRODUCTS TRUST
Tax Information (unaudited)
Franklin Founding Funds Allocation VIP Fund
During the fiscal year ended December 31, 2015, the Fund, a qualified fund of funds under Section 852(g)(2) of Internal Revenue Code (Code), received an allocation of foreign taxes paid from one or more of its underlying funds. As shown in the table below, the Fund hereby reports to shareholders the foreign source income and foreign taxes paid by underlying funds, pursuant to Section 853 of the Code. This written statement will allow shareholders of record on June 14, 2016, to treat their proportionate share of foreign taxes paid by the underlying funds as having been paid directly by them. The shareholder shall consider these amounts as foreign taxes paid in the tax year in which they receive the Fund distribution.
The following table provides a detailed analysis of foreign tax paid and foreign source income as reported by the Fund, to Class 1, Class 2, and Class 4 shareholders of record.
| Class | Foreign Tax Paid Per Share |
Foreign Source Income Per Share | ||
| Class 1 |
$0.0039 | $0.0675 | ||
| Class 2 |
$0.0039 | $0.0675 | ||
| Class 4 |
$0.0039 | $0.0675 |
Foreign Tax Paid Per Share (Column 1) is the amount per share available to you, as a tax credit (assuming you held your shares in the Fund for a minimum of 16 days during the 31-day period beginning 15 days before the ex-dividend date of the Fund’s distribution to which the foreign taxes relate), or, as a tax deduction.
Foreign Source Income Per Share (Column 2) is the amount per share of income dividends attributable to foreign securities held by the Fund, plus any foreign taxes withheld on these dividends.
| FFA-16 | Semiannual Report |
Franklin Global Real Estate VIP Fund
This semiannual report for Franklin Global Real Estate VIP Fund covers the period ended June 30, 2016.
Class 1 Performance Summary as of June 30, 2016
The Fund’s Class 1 shares delivered a +7.05% total return* for the six-month period ended June 30, 2016.
*The Fund has a fee waiver associated with any investment in a Franklin Templeton money fund and/or Franklin Templeton fund, as applicable, contractually guaranteed through at least the Fund’s current fiscal year-end. Fund investment results reflect the fee waiver, to the extent applicable; without this reduction, the results would have been lower.
Performance reflects the Fund’s Class 1 operating expenses, but does not include any contract fees, expenses or sales charges. If they had been included, performance would be lower. These charges and deductions, particularly for variable life policies, can have a significant effect on contract values and insurance benefits. See the contract prospectus for a complete description of these expenses, including sales charges.
Performance data represent past performance, which does not guarantee future results. Investment return and principal value will fluctuate, and you may have a gain or loss when you sell your shares. Current performance may differ from figures shown.
| Semiannual Report | FGR-1 |
FRANKLIN GLOBAL REAL ESTATE VIP FUND
volatility increased after the U.S. Federal Reserve’s (Fed’s) June decision to keep its federal funds target range unchanged, while providing a cautious stance on further interest rate hikes. In addition, global economic concerns and the U.K.’s historic referendum to leave the European Union (EU), also known as the “Brexit,” contributed to volatile global stock markets.
Oil prices fell at the beginning of the review period, largely due to strong global supply, but recovered in the period’s second half amid oilfield outages and continued demand growth. Meanwhile, commodity prices increased for most of the review period as oversupply for a host of commodities shrank and the
1. Source: Morningstar. One cannot invest directly in an index, and an index is not representative of the Fund’s portfolio. Please see Index Descriptions following the Fund Summaries.
| FGR-2 | Semiannual Report |
FRANKLIN GLOBAL REAL ESTATE VIP FUND
hinted at carrying out flexible open market operations to stabilize its financial markets.
In emerging markets, economic growth generally moderated during the review period. Brazil’s economy witnessed its longest recession since the 1930s amid political and economic turmoil, while Russia’s economy continued to contract. The Bank of Russia reduced its key interest rate in an attempt to revive its economy. China’s economic growth slowed marginally in 2016’s first quarter compared to the previous quarter, but remained largely in line with the government’s target. The People’s Bank of China cut its cash reserve requirement ratio for the country’s banks and effectively devalued the renminbi against the U.S. dollar to the lowest level in more than five years. Overall, emerging market stocks, as measured by the MSCI Emerging Markets Index, rose for the six-month period.2
Global Real Estate Market Overview
According to the FTSE EPRA/NAREIT Developed Index, in U.S. dollar terms, Canada outpaced the index and led global real estate markets. Australia, New Zealand and Germany also posted solid results. In contrast, some markets represented in the index lost value, including the U.K., Italy, the Guernsey Islands and Spain. At period-end, the U.S. was the index’s largest country weighting.
Investment Strategy
We seek to limit price volatility by investing across markets and property types and seek to provide a consistently high level of income in our pursuit of high total return. When selecting investments for the Fund’s portfolio, we apply a “bottom-up”
2. Please see Index Descriptions following the Fund Summaries.
| Semiannual Report | FGR-3 |
FRANKLIN GLOBAL REAL ESTATE VIP FUND
stock selection process that incorporates macro-level views in the evaluation process. Our portfolio construction process combines bottom-up analysis of individual stock and real estate market fundamentals and top-down macro overlays to provide country/regional, property type, and company size perspectives in identifying international/local cyclical and thematic trends that highlight investment opportunities.
Manager’s Discussion
During the six months under review, key contributors to the Fund’s performance relative to the FTSE EPRA/NAREIT Developed Index included an overweighting in the specialty sector, with holdings such as U.S.-based data center company CoreSite.3 Shares of CoreSite rose during the period, and significantly outperformed the specialty sector and the benchmark. The company reported strong financial results in its first quarter report with strong gains during the trailing one-year period. Investors also seemed encouraged by leasing demand for its new data centers as well as the company’s conservative debt level. An underweighting in the diversified sector also boosted results.4 We bought German residential property operator ADO Properties at the initial public offering, after we found the company attractive in relation to net asset value, asset quality and location in comparison to the German residential peer group. ADO Properties performed well in our internal analysis and based on analysts’ anticipation of potential further yield compression in German residential valuations, as indicated by transactions in the market. The company outperformed its peer group operationally, with stronger-than-average rental growth and projected 5% growth for the full year 2016. The projected growth seemed low to us after ADO Properties achieved 5.9% in the first quarter of 2016. Within the shopping center sector, the Fund’s investment in U.S.-based shopping center operator Regency Centers also supported returns.5 The stock generated solid returns during the reporting period that were well above the average for U.S. retail REITs and also outperformed the benchmark. Regency’s financial results for the first quarter of 2016 were positive, in our view, as operating profit grew faster than average among shopping center REITs. The company’s management team also raised the earnings guidance for the full year 2016.
In contrast, key detractors from the Fund’s relative performance included stock selection in the office space sector.6 Shares of
U.K.-based office REIT Derwent London lagged the overall property benchmark over the reporting period along with other U.K. property stocks after Britain unexpectedly voted to leave the European Union. This development unraveled amid political turmoil and effectively caused the British pound to decline versus the U.S. dollar during the period. Fundamentally, Derwent has been showing healthy demand, strong rental growth and low vacancy in the West End and fringes of London City. The company traded at what we considered an attractive discount, with a very conservative balance sheet. In our opinion, Derwent has one of the best management teams in the European property sector, and we believed the shares were oversold. The Fund’s positioning in the retail property sector also weighed on results.7 Shares of U.K.-based Land Securities Group also sold off over the reporting period due to the unexpected Brexit vote and its negative effect on the value of the British pound. The company traded at what we considered an attractive discount, much lower than its 10-year historical average. Land Securities
| Top 10 Holdings | ||||
| 6/30/16 | ||||
| Company Sector/Industry, Country |
% of Total Net Assets |
|||
| Simon Property Group Inc. Retail REITs, U.S. |
5.8% | |||
| Unibail-Rodamco SE Retail REITs, France |
2.7% | |||
| Mitsui Fudosan Co. Ltd. Diversified Real Estate Activities, Japan |
2.5% | |||
| Public Storage Specialized REITs, U.S. |
2.4% | |||
| Ventas Inc. Health Care REITs, U.S. |
2.2% | |||
| Prologis Inc. Industrial REITs, U.S. |
2.2% | |||
| Boston Properties Inc. Office REITs, U.S. |
2.1% | |||
| Welltower Inc. Health Care REITs, U.S. |
2.1% | |||
| Mitsubishi Estate Co. Ltd. Diversified Real Estate Activities, Japan |
2.0% | |||
| Scentre Group Retail REITs, Australia |
2.0% | |||
The dollar value, number of shares or principal amount, and names of all portfolio holdings are listed in the Fund’s Statement of Investments (SOI).
3. Specialty holdings are in office REITs and specialized REITs in the SOI.
4. Diversified holdings are in diversified real estate activities, diversified real estate activities, diversified REITs, real estate development and real estate operating companies and residential REITs in the SOI.
5. Shopping center holdings are in diversified REITs, residential REITs and retail REITs in the SOI.
6. Office space holdings are in office REITs and real estate operating companies in the SOI.
7. Retail property holdings are in diversified REITs, real estate operating companies and retail REITs in the SOI.
| FGR-4 | Semiannual Report |
FRANKLIN GLOBAL REAL ESTATE VIP FUND
8. Apartment holdings are in real estate operating companies, residential REITs and retail REITs in the SOI.
| Semiannual Report | FGR-5 |
FRANKLIN GLOBAL REAL ESTATE VIP FUND
Class 1 Fund Expenses
| Class 1 | Beginning Account Value 1/1/16 |
Ending Account Value 6/30/16 |
Fund-Level Expenses 1/1/16–6/30/16 |
|||||||||
| Actual |
$ | 1,000 | $ | 1,070.50 | $ | 5.77 | ||||||
| Hypothetical (5% return before expenses) |
$ | 1,000 | $ | 1,019.29 | $ | 5.62 | ||||||
*Expenses are calculated using the most recent six-month annualized expense ratio, net of expense waivers, for the Fund’s Class 1 shares (1.12%), which does not include any ongoing expenses of the Contract for which the Fund is an investment option, multiplied by the average account value over the period, multiplied by 182/366 to reflect the one-half year period.
| FGR-6 | Semiannual Report |
SUPPLEMENT DATED JULY 18, 2016
TO THE PROSPECTUSES DATED MAY 1, 2016
OF
FRANKLIN GLOBAL REAL ESTATE VIP FUND
FRANKLIN SMALL CAP VALUE VIP FUND
(Series of Franklin Templeton Variable Insurance Products Trust)
IMPORTANT NOTICE REGARDING CHANGE IN INVESTMENT POLICY
The prospectus of Franklin Small Cap Value VIP Fund is amended as follows:
I. The first paragraph under the “FUND SUMMARIES” – “Principal Investment Strategies” section, on page FSV-S1, is replaced with the following:
Under normal market conditions, the Fund invests at least 80% of its net assets in investments of small-capitalization (small-cap) companies. Small-cap companies are companies with market capitalizations (the total market value of a company’s outstanding stock) under $3.5 billion at the time of purchase. Effective September 30, 2016, the definition of small-cap companies will be revised to read as follows: Small-cap companies are companies with market capitalizations (the total market value of a company’s outstanding stock) not exceeding either: 1) the highest market capitalization in the Russell 2000 Index; or 2) the 12-month average of the highest market capitalization in the Russell 2000 Index, whichever is greater, at the time of purchase. As of May 31, 2016, the highest market capitalization in the Russell 2000 Index was $5.96 billion.
II. The “Performance” section, on page FSV-S3, is revised to add the following:
| 1 Year | 5 Years | 10 Years | ||||
| Russell 2000 Value Index (index reflects no deduction for fees, expenses or taxes) 1 | -7.47% | 7.67% | 5.58% |
| 1. | Performance figures as of December 31, 2015. The Russell 2000 Value Index is replacing the Russell 2500 Value Index as the Fund’s benchmark. The investment manager believes the composition of the Russell 2000 Value Index more accurately reflects the Fund’s holdings. |
No one index is representative of the Fund’s portfolio.
III. Effective September 30, 2016, the first paragraph under the “FUND DETAILS” – “Principal Investment Policies and Practices” section on page FSV D-1 is replaced with the following:
Under normal market conditions, the Fund invests at least 80% of its net assets in investments of small-capitalization (small-cap) companies. Shareholders will be given at least 60 days’ advance notice of any change to this 80% policy. Small-cap companies are companies with market capitalizations (the total market value of a company’s outstanding stock) under $3.5 billion at the time of purchase. Effective September 30, 2016, the definition of small-cap companies will be revised to read as follows: Under normal market conditions, the Fund invests at least 80% of its net assets in investments of small-capitalization (small-cap) companies. Small-cap companies are companies with market capitalizations (the total market value of a company’s outstanding stock) not exceeding either: 1) the highest market
| FGR-7 |
capitalization in the Russell 2000 Index; or 2) the 12-month average of the highest market capitalization in the Russell 2000 Index, whichever is greater, at the time of purchase. As of May 31, 2016, the highest market capitalization in the Russell 2000 Index was $5.96 billion.
The prospectus of Franklin Global Real Estate VIP Fund is amended as follows:
The “FUND DETAILS” – “Management” section, on page FGR D-6, is revised to show the address of Franklin Templeton Institutional, LLC (FT Institutional) as 280 Park Avenue, New York, NY 10017.
Please keep this supplement with your prospectuses for future reference.
| FGR-8 |
FRANKLIN TEMPLETON VARIABLE INSURANCE PRODUCTS TRUST
Financial Highlights
Franklin Global Real Estate VIP Fund
|
Six Months Ended (unaudited) |
Year Ended December 31, | |||||||||||||||||||||||
| 2015 | 2014 | 2013 | 2012 | 2011 | ||||||||||||||||||||
| Class 1 | ||||||||||||||||||||||||
| Per share operating performance (for a share outstanding throughout the period) |
||||||||||||||||||||||||
| Net asset value, beginning of period |
$15.93 | $16.36 | $14.29 | $14.66 | $11.47 | $13.12 | ||||||||||||||||||
|
|
|
|||||||||||||||||||||||
| Income from investment operationsa: | ||||||||||||||||||||||||
| Net investment incomeb |
0.16 | 0.24 | 0.26 | 0.24 | 0.25 | 0.21 | ||||||||||||||||||
| Net realized and unrealized gains (losses) |
0.96 | (0.12 | ) | 1.92 | 0.13 | 2.94 | (0.83 | ) | ||||||||||||||||
|
|
|
|||||||||||||||||||||||
| Total from investment operations |
1.12 | 0.12 | 2.18 | 0.37 | 3.19 | (0.62 | ) | |||||||||||||||||
|
|
|
|||||||||||||||||||||||
| Less distributions from net investment income and net foreign currency gains |
(0.24 | ) | (0.55 | ) | (0.11 | ) | (0.74 | ) | — | (1.03 | ) | |||||||||||||
|
|
|
|||||||||||||||||||||||
| Net asset value, end of period |
$16.81 | $15.93 | $16.36 | $14.29 | $14.66 | $11.47 | ||||||||||||||||||
|
|
|
|||||||||||||||||||||||
| Total returnc |
7.05% | 0.83% | 15.27% | 2.61% | 27.81% | (5.45)% | ||||||||||||||||||
| Ratios to average net assetsd | ||||||||||||||||||||||||
| Expenses before waiver and payments by affiliates |
1.12% | 1.11% | 1.10% | 1.10% | 1.11% | 1.12% | ||||||||||||||||||
| Expenses net of waiver and payments by affiliates |
1.12% | e | 1.11% | 1.10% | f | 1.10% | 1.07% | 0.98% | ||||||||||||||||
| Net investment income |
1.99% | 1.49% | 1.66% | 1.62% | 1.92% | 1.64% | ||||||||||||||||||
| Supplemental data | ||||||||||||||||||||||||
| Net assets, end of period (000’s) |
$31,716 | $32,161 | $35,686 | $34,276 | $38,329 | $33,670 | ||||||||||||||||||
| Portfolio turnover rate |
13.82% | 23.35% | 16.67% | 21.29% | 22.29% | 28.95% | ||||||||||||||||||
aThe amount shown for a share outstanding throughout the period may not correlate with the Statement of Operations for the period due to the timing of sales and repurchases of the Fund’s shares in relation to income earned and/or fluctuating fair value of the investments of the Fund.
bBased on average daily shares outstanding.
cTotal return does not include fees, charges or expenses imposed by the variable annuity and life insurance contracts for which Franklin Templeton Variable Insurance Products Trust serves as an underlying investment vehicle. Total return is not annualized for periods less than one year.
dRatios are annualized for periods less than one year.
eBenefit of waiver and payments by affiliates rounds to less than 0.01%.
fBenefit of expense reduction rounds to less than 0.01%.
| The accompanying notes are an integral part of these financial statements. | Semiannual Report | FGR-9 |
FRANKLIN TEMPLETON VARIABLE INSURANCE PRODUCTS TRUST
FINANCIAL HIGHLIGHTS
Franklin Global Real Estate VIP Fund (continued)
|
Six Months Ended (unaudited) |
Year Ended December 31, | |||||||||||||||||||||||
| 2015 | 2014 | 2013 | 2012 | 2011 | ||||||||||||||||||||
| Class 2 | ||||||||||||||||||||||||
| Per share operating performance (for a share outstanding throughout the period) |
||||||||||||||||||||||||
| Net asset value, beginning of period |
$15.52 | $15.95 | $13.93 | $14.27 | $11.20 | $12.83 | ||||||||||||||||||
|
|
|
|||||||||||||||||||||||
| Income from investment operationsa: | ||||||||||||||||||||||||
| Net investment incomeb |
0.13 | 0.20 | 0.21 | 0.20 | 0.21 | 0.17 | ||||||||||||||||||
| Net realized and unrealized gains (losses) |
0.94 | (0.12 | ) | 1.88 | 0.13 | 2.86 | (0.81 | ) | ||||||||||||||||
|
|
|
|||||||||||||||||||||||
| Total from investment operations |
1.07 | 0.08 | 2.09 | 0.33 | 3.07 | (0.64 | ) | |||||||||||||||||
|
|
|
|||||||||||||||||||||||
| Less distributions from net investment income and net foreign currency gains |
(0.19 | ) | (0.51 | ) | (0.07 | ) | (0.67 | ) | — | (0.99 | ) | |||||||||||||
|
|
|
|||||||||||||||||||||||
| Net asset value, end of period |
$16.40 | $15.52 | $15.95 | $13.93 | $14.27 | $11.20 | ||||||||||||||||||
|
|
|
|||||||||||||||||||||||
| Total returnc |
6.93% | 0.57% | 15.01% | 2.32% | 27.41% | (5.65)% | ||||||||||||||||||
| Ratios to average net assetsd | ||||||||||||||||||||||||
| Expenses before waiver and payments by affiliates |
1.37% | 1.36% | 1.35% | 1.35% | 1.36% | 1.37% | ||||||||||||||||||
| Expenses net of waiver and payments by affiliates |
1.37% | e | 1.36% | 1.35% | f | 1.35% | 1.32% | 1.23% | ||||||||||||||||
| Net investment income |
1.74% | 1.24% | 1.41% | 1.37% | 1.67% | 1.39% | ||||||||||||||||||
| Supplemental data | ||||||||||||||||||||||||
| Net assets, end of period (000’s) |
$284,040 | $287,473 | $333,554 | $328,825 | $344,044 | $292,356 | ||||||||||||||||||
| Portfolio turnover rate |
13.82% | 23.35% | 16.67% | 21.29% | 22.29% | 28.95% | ||||||||||||||||||
aThe amount shown for a share outstanding throughout the period may not correlate with the Statement of Operations for the period due to the timing of sales and repurchases of the Fund’s shares in relation to income earned and/or fluctuating fair value of the investments of the Fund.
bBased on average daily shares outstanding.
cTotal return does not include fees, charges or expenses imposed by the variable annuity and life insurance contracts for which Franklin Templeton Variable Insurance Products Trust serves as an underlying investment vehicle. Total return is not annualized for periods less than one year.
dRatios are annualized for periods less than one year.
eBenefit of waiver and payments by affiliates rounds to less than 0.01%.
fBenefit of expense reduction rounds to less than 0.01%.
| FGR-10 | Semiannual Report | The accompanying notes are an integral part of these financial statements. |
FRANKLIN TEMPLETON VARIABLE INSURANCE PRODUCTS TRUST
Statement of Investments, June 30, 2016 (unaudited)
| Franklin Global Real Estate VIP Fund | ||||||||||||||
| Country | Shares | Value | ||||||||||||
| Common Stocks 99.3% |
||||||||||||||
| Diversified Real Estate Activities 8.7% |
||||||||||||||
| CapitaLand Ltd. |
Singapore | 1,311,462 | $ | 2,989,337 | ||||||||||
| City Developments Ltd. |
Singapore | 204,100 | 1,233,526 | |||||||||||
| Mitsubishi Estate Co. Ltd. |
Japan | 348,360 | 6,317,872 | |||||||||||
| Mitsui Fudosan Co. Ltd. |
Japan | 355,857 | 8,033,702 | |||||||||||
| New World Development Co. Ltd. |
Hong Kong | 2,558,000 | 2,591,482 | |||||||||||
| Sun Hung Kai Properties Ltd. |
Hong Kong | 291,533 | 3,494,586 | |||||||||||
| Tokyo Tatemono Co. Ltd. |
Japan | 158,207 | 1,871,982 | |||||||||||
| The Wharf Holdings Ltd. |
Hong Kong | 180,906 | 1,093,581 | |||||||||||
|
|
|
|||||||||||||
| 27,626,068 | ||||||||||||||
|
|
|
|||||||||||||
| Diversified REITs 4.9% |
||||||||||||||
| Activia Properties Inc. |
Japan | 309 | 1,627,654 | |||||||||||
| a | Activia Properties Inc., 144A |
Japan | 98 | 516,214 | ||||||||||
| Hulic REIT Inc. |
Japan | 922 | 1,676,607 | |||||||||||
| Kenedix Office Investment Corp. |
Japan | 458 | 2,718,509 | |||||||||||
| Land Securities Group PLC |
United Kingdom | 262,881 | 3,641,960 | |||||||||||
| Spirit Realty Capital Inc. |
United States | 181,300 | 2,315,201 | |||||||||||
| United Urban Investment Corp. |
Japan | 885 | 1,586,188 | |||||||||||
| VEREIT Inc. |
United States | 127,900 | 1,296,906 | |||||||||||
|
|
|
|||||||||||||
| 15,379,239 | ||||||||||||||
|
|
|
|||||||||||||
| Health Care REITs 6.6% |
||||||||||||||
| HCP Inc. |
United States | 79,241 | 2,803,547 | |||||||||||
| OMEGA Healthcare Investors Inc. |
United States | 68,300 | 2,318,785 | |||||||||||
| Physicians Realty Trust |
United States | 90,200 | 1,895,102 | |||||||||||
| Ventas Inc. |
United States | 97,287 | 7,084,439 | |||||||||||
| Welltower Inc. |
United States | 87,164 | 6,639,282 | |||||||||||
|
|
|
|||||||||||||
| 20,741,155 | ||||||||||||||
|
|
|
|||||||||||||
| Homebuilding 0.3% |
||||||||||||||
| D.R. Horton Inc. |
United States | 32,680 | 1,028,766 | |||||||||||
|
|
|
|||||||||||||
| Hotel & Resort REITs 2.5% |
||||||||||||||
| Hoshino Resorts REIT Inc. |
Japan | 104 | 1,302,077 | |||||||||||
| Host Hotels & Resorts Inc. |
United States | 204,467 | 3,314,410 | |||||||||||
| Summit Hotel Properties Inc. |
United States | 141,600 | 1,874,784 | |||||||||||
| Sunstone Hotel Investors Inc. |
United States | 125,112 | 1,510,102 | |||||||||||
|
|
|
|||||||||||||
| 8,001,373 | ||||||||||||||
|
|
|
|||||||||||||
| Hotels, Resorts & Cruise Lines 0.6% |
||||||||||||||
| Hilton Worldwide Holdings Inc. |
United States | 32,390 | 729,747 | |||||||||||
| Melia Hotels International SA |
Spain | 97,629 | 1,047,331 | |||||||||||
|
|
|
|||||||||||||
| 1,777,078 | ||||||||||||||
|
|
|
|||||||||||||
| Industrial REITs 6.7% |
||||||||||||||
| Duke Realty Corp. |
United States | 147,800 | 3,940,348 | |||||||||||
| First Industrial Realty Trust Inc. |
United States | 98,200 | 2,731,924 | |||||||||||
| Goodman Group |
Australia | 534,838 | 2,836,432 | |||||||||||
| Mapletree Logistics Trust |
Singapore | 1,508,730 | 1,120,192 | |||||||||||
| Nippon Prologis REIT Inc. |
Japan | 955 | 2,321,036 | |||||||||||
| b | PLA Administradora Industrial S de RL de CV |
Mexico | 501,100 | 852,807 | ||||||||||
| a,b | PLA Administradora Industrial S de RL de CV, 144A |
Mexico | 303,870 | 517,147 | ||||||||||
| Prologis Inc. |
United States | 138,564 | 6,795,178 | |||||||||||
|
|
|
|||||||||||||
| 21,115,064 | ||||||||||||||
|
|
|
|||||||||||||
| Semiannual Report | FGR-11 |
FRANKLIN TEMPLETON VARIABLE INSURANCE PRODUCTS TRUST
STATEMENT OF INVESTMENTS (UNAUDITED)
Franklin Global Real Estate VIP Fund (continued)
| Country | Shares | Value | ||||||||||||
| Common Stocks (continued) |
||||||||||||||
| Office REITs 11.7% |
||||||||||||||
| Alexandria Real Estate Equities Inc. |
United States | 36,107 | $ | 3,737,797 | ||||||||||
| Boston Properties Inc. |
United States | 50,880 | 6,711,072 | |||||||||||
| Daiwa Office Investment Corp. |
Japan | 67 | 395,091 | |||||||||||
| a | Daiwa Office Investment Corp., 144A |
Japan | 172 | 1,014,263 | ||||||||||
| Derwent London PLC |
United Kingdom | 60,999 | 2,125,311 | |||||||||||
| Dexus Property Group |
Australia | 343,335 | 2,309,964 | |||||||||||
| Great Portland Estates PLC |
United Kingdom | 251,726 | 2,102,856 | |||||||||||
| Highwoods Properties Inc. |
United States | 61,917 | 3,269,218 | |||||||||||
| Japan Real Estate Investment Corp. |
Japan | 478 | 2,934,418 | |||||||||||
| Kilroy Realty Corp. |
United States | 43,618 | 2,891,437 | |||||||||||
| Mack-Cali Realty Corp. |
United States | 87,500 | 2,362,500 | |||||||||||
| SL Green Realty Corp. |
United States | 19,193 | 2,043,479 | |||||||||||
| Vornado Realty Trust |
United States | 49,368 | 4,942,724 | |||||||||||
|
|
|
|||||||||||||
| 36,840,130 | ||||||||||||||
|
|
|
|||||||||||||
| Real Estate Development 2.9% |
||||||||||||||
| Cheung Kong Property Holdings Ltd. |
Hong Kong | 758,500 | 4,741,572 | |||||||||||
| China Overseas Land & Investment Ltd. |
China | 428,657 | 1,353,633 | |||||||||||
| China Resources Land Ltd. |
China | 456,000 | 1,063,821 | |||||||||||
| Sino Land Co. Ltd. |
Hong Kong | 1,194,288 | 1,948,803 | |||||||||||
|
|
|
|||||||||||||
| 9,107,829 | ||||||||||||||
|
|
|
|||||||||||||
| Real Estate Operating Companies 7.0% |
||||||||||||||
| ADO Properties SA |
Germany | 21,040 | 807,325 | |||||||||||
| a | ADO Properties SA, 144A |
Germany | 40,981 | 1,572,481 | ||||||||||
| Deutsche Euroshop AG |
Germany | 33,797 | 1,541,596 | |||||||||||
| a | Deutsche Euroshop AG, 144A |
Germany | 6,999 | 319,248 | ||||||||||
| Fabege AB |
Sweden | 75,020 | 1,266,609 | |||||||||||
| c | First Capital Realty Inc. |
Canada | 89,600 | 1,536,674 | ||||||||||
| Global Logistic Properties Ltd. |
Singapore | 522,070 | 699,659 | |||||||||||
| Hemfosa Fastigheter AB |
Sweden | 157,732 | 1,613,145 | |||||||||||
| b | Hispania Activos Inmobiliarios SOCIMI SA |
Spain | 81,971 | 955,329 | ||||||||||
| Hongkong Land Holdings Ltd. |
Hong Kong | 193,143 | 1,176,241 | |||||||||||
| Hufvudstaden AB, A |
Sweden | 135,616 | 2,118,123 | |||||||||||
| Hysan Development Co. Ltd. |
Hong Kong | 431,347 | 1,912,539 | |||||||||||
| Unite Group PLC |
United Kingdom | 151,949 | 1,256,174 | |||||||||||
| Vonovia SE |
Germany | 150,503 | 5,470,914 | |||||||||||
|
|
|
|||||||||||||
| 22,246,057 | ||||||||||||||
|
|
|
|||||||||||||
| Residential REITs 10.0% |
||||||||||||||
| Apartment Investment & Management Co., A |
United States | 80,005 | 3,533,021 | |||||||||||
| AvalonBay Communities Inc. |
United States | 25,567 | 4,612,031 | |||||||||||
| Canadian Apartment Properties REIT |
Canada | 103,700 | 2,661,320 | |||||||||||
| Education Realty Trust Inc. |
United States | 51,500 | 2,376,210 | |||||||||||
| Equity Lifestyle Properties Inc. |
United States | 50,200 | 4,018,510 | |||||||||||
| Equity Residential |
United States | 64,428 | 4,437,801 | |||||||||||
| Essex Property Trust Inc. |
United States | 6,405 | 1,460,916 | |||||||||||
| Invincible Investment Corp. |
Japan | 4,399 | 2,760,157 | |||||||||||
| Post Properties Inc. |
United States | 33,000 | 2,014,650 | |||||||||||
| UDR Inc. |
United States | 103,531 | 3,822,365 | |||||||||||
|
|
|
|||||||||||||
| 31,696,981 | ||||||||||||||
|
|
|
|||||||||||||
| FGR-12 | Semiannual Report |
FRANKLIN TEMPLETON VARIABLE INSURANCE PRODUCTS TRUST
STATEMENT OF INVESTMENTS (UNAUDITED)
Franklin Global Real Estate VIP Fund (continued)
| Country | Shares | Value | ||||||||||||
| Common Stocks (continued) |
||||||||||||||
| Retail REITs 29.1% |
||||||||||||||
| British Land Co. PLC |
United Kingdom | 303,431 | $ | 2,455,891 | ||||||||||
| Equity One Inc. |
United States | 77,300 | 2,487,514 | |||||||||||
| Eurocommercial Properties NV, IDR |
Netherlands | 39,855 | 1,700,915 | |||||||||||
| Federal Realty Investment Trust |
United States | 21,009 | 3,478,040 | |||||||||||
| General Growth Properties Inc. |
United States | 92,917 | 2,770,785 | |||||||||||
| Hammerson PLC |
United Kingdom | 350,553 | 2,514,759 | |||||||||||
| Kimco Realty Corp. |
United States | 147,369 | 4,624,439 | |||||||||||
| Klepierre |
France | 100,200 | 4,431,997 | |||||||||||
| Link REIT |
Hong Kong | 521,288 | 3,547,617 | |||||||||||
| The Macerich Co. |
United States | 16,464 | 1,405,861 | |||||||||||
| National Retail Properties Inc. |
United States | 65,000 | 3,361,800 | |||||||||||
| Realty Income Corp. |
United States | 83,503 | 5,791,768 | |||||||||||
| Regency Centers Corp. |
United States | 54,393 | 4,554,326 | |||||||||||
| Scentre Group |
Australia | 1,692,033 | 6,209,470 | |||||||||||
| Simon Property Group Inc. |
United States | 84,508 | 18,329,785 | |||||||||||
| Smart Real Estate Investment Trust |
Canada | 64,100 | 1,895,070 | |||||||||||
| Taubman Centers Inc. |
United States | 29,682 | 2,202,405 | |||||||||||
| Unibail-Rodamco SE |
France | 33,004 | 8,559,251 | |||||||||||
| Vicinity Centres |
Australia | 1,459,695 | 3,614,771 | |||||||||||
| Weingarten Realty Investors |
United States | 71,410 | 2,914,956 | |||||||||||
| Westfield Corp. |
Australia | 626,150 | 4,974,032 | |||||||||||
|
|
|
|||||||||||||
| 91,825,452 | ||||||||||||||
|
|
|
|||||||||||||
| Specialized REITs 8.3% |
||||||||||||||
| Coresite Realty Corp. |
United States | 34,487 | 3,058,652 | |||||||||||
| CubeSmart |
United States | 110,184 | 3,402,482 | |||||||||||
| CyrusOne Inc. |
United States | 39,000 | 2,170,740 | |||||||||||
| Digital Realty Trust Inc. |
United States | 47,243 | 5,149,015 | |||||||||||
| Extra Space Storage Inc. |
United States | 49,304 | 4,562,592 | |||||||||||
| Public Storage |
United States | 30,214 | 7,722,396 | |||||||||||
|
|
|
|||||||||||||
| 26,065,877 | ||||||||||||||
|
|
|
|||||||||||||
| Total Common Stocks (Cost $195,715,530) |
313,451,069 | |||||||||||||
|
|
|
|||||||||||||
| Short Term Investments 1.0% |
||||||||||||||
| Principal Amount | ||||||||||||||
| Repurchase Agreements (Cost $1,721,221) 0.5% |
||||||||||||||
| d | Joint Repurchase Agreement, 0.382%, 7/01/16 |
United States | $ | 1,721,221 | 1,721,221 | |||||||||
|
|
|
|||||||||||||
| BNP Paribas Securities Corp. (Maturity Value $558,249) |
||||||||||||||
| Collateralized by U.S. Government Agency Securities, |
||||||||||||||
| Semiannual Report | FGR-13 |
FRANKLIN TEMPLETON VARIABLE INSURANCE PRODUCTS TRUST
STATEMENT OF INVESTMENTS (UNAUDITED)
Franklin Global Real Estate VIP Fund (continued)
| Country | Shares | Value | ||||||||||||
| e | Investments from Cash Collateral Received for Loaned Securities 0.5% |
|||||||||||||
| Money Market Funds (Cost $1,229,000) 0.4% |
||||||||||||||
| b,f | Institutional Fiduciary Trust Money Market Portfolio |
1,229,000 | $ | 1,229,000 | ||||||||||
|
|
|
|||||||||||||
| Principal Amount | ||||||||||||||
| Repurchase Agreements (Cost $307,431) 0.1% |
||||||||||||||
| d | Joint Repurchase Agreement, 0.40%, 7/01/16 |
United States | $ | 307,431 | 307,431 | |||||||||
| BNP Paribas Securities Corp. |
||||||||||||||
| Collateralized by gU.S. Treasury Bill, 10/27/16; U.S. Treasury Bond, 8.75% - 9.00%, 11/15/18 - 5/15/20; U.S. Treasury Note, 0.363% - 4.75%, 9/15/16 - 3/31/21; U.S. Treasury Note, Index Linked, 2.625%, 7/15/17; and U.S. Treasury Strips, 8/15/16 - 2/15/21 (valued at $313,580) |
||||||||||||||
|
|
|
|||||||||||||
| Total Investments from Cash Collateral Received for Loaned Securities (Cost $1,536,431) |
1,536,431 | |||||||||||||
|
|
|
|||||||||||||
| Total Investments (Cost $198,973,182) 100.3% |
316,708,721 | |||||||||||||
| Other Assets, less Liabilities (0.3)% |
(952,494 | ) | ||||||||||||
|
|
|
|||||||||||||
| Net Assets 100.0% |
$ | 315,756,227 | ||||||||||||
|
|
|
|||||||||||||
See Abbreviations on page FGR-25.
aSecurity was purchased pursuant to Rule 144A under the Securities Act of 1933 and may be sold in transactions exempt from registration only to qualified institutional buyers or in a public offering registered under the Securities Act of 1933. These securities have been deemed liquid under guidelines approved by the Trust’s Board of Trustees. At June 30, 2016, the aggregate value of these securities was $3,939,353, representing 1.2% of net assets.
bNon-income producing.
cA portion or all of the security is on loan at June 30, 2016. See Note 1(d).
dSee Note 1(c) regarding joint repurchase agreement.
eSee Note 1(d) regarding securities on loan.
fSee Note 3(e) regarding investments in affiliated management investment companies.
gThe security is traded on a discount basis with no stated coupon rate.
| FGR-14 | Semiannual Report | The accompanying notes are an integral part of these financial statements. |
FRANKLIN TEMPLETON VARIABLE INSURANCE PRODUCTS TRUST
Financial Statements
Statement of Assets and Liabilities
June 30, 2016 (unaudited)
| Franklin Global Real Estate VIP Fund |
||||
| Assets: |
||||
| Investments in securities: |
||||
| Cost - Unaffiliated issuers |
$ | 195,715,530 | ||
| Cost - Non-controlled affiliates (Note 3e) |
1,229,000 | |||
| Cost - Repurchase agreements |
2,028,652 | |||
|
|
|
|||
| Total cost of investments |
$ | 198,973,182 | ||
|
|
|
|||
| Value - Unaffiliated issuers |
$ | 313,451,069 | ||
| Value - Non-controlled affiliates (Note 3e) |
1,229,000 | |||
| Value - Repurchase agreements |
2,028,652 | |||
|
|
|
|||
| Total value of investments (Includes securities loaned in the amount of $1,459,808) |
316,708,721 | |||
| Foreign currency, at value (cost $50,238) |
50,789 | |||
| Receivables: |
||||
| Investment securities sold |
1,338,440 | |||
| Capital shares sold |
6,412 | |||
| Dividends |
1,084,626 | |||
| European Union tax reclaims |
59,682 | |||
| Other assets |
141 | |||
|
|
|
|||
| Total assets |
319,248,811 | |||
|
|
|
|||
| Liabilities: |
||||
| Payables: |
||||
| Investment securities purchased |
1,139,626 | |||
| Capital shares redeemed |
325,407 | |||
| Management fees |
266,533 | |||
| Distribution fees |
116,497 | |||
| Payable upon return of securities loaned |
1,536,431 | |||
| Accrued expenses and other liabilities |
108,090 | |||
|
|
|
|||
| Total liabilities |
3,492,584 | |||
|
|
|
|||
| Net assets, at value |
$ | 315,756,227 | ||
|
|
|
|||
| Net assets consist of: |
||||
| Paid-in capital |
$ | 498,874,531 | ||
| Distributions in excess of net investment income |
(1,130,107 | ) | ||
| Net unrealized appreciation (depreciation) |
117,740,515 | |||
| Accumulated net realized gain (loss) |
(299,728,712 | ) | ||
|
|
|
|||
| Net assets, at value |
$ | 315,756,227 | ||
|
|
|
|||
| Class 1: | ||||
| Net assets, at value |
$ | 31,716,093 | ||
|
|
|
|||
| Shares outstanding |
1,886,767 | |||
|
|
|
|||
| Net asset value and maximum offering price per share |
$ | 16.81 | ||
|
|
|
|||
| Class 2: | ||||
| Net assets, at value |
$ | 284,040,134 | ||
|
|
|
|||
| Shares outstanding |
17,321,804 | |||
|
|
|
|||
| Net asset value and maximum offering price per share |
$ | 16.40 | ||
|
|
|
|||
| The accompanying notes are an integral part of these financial statements. | Semiannual Report | FGR-15 |
FRANKLIN TEMPLETON VARIABLE INSURANCE PRODUCTS TRUST
FINANCIAL STATEMENTS
Statement of Operations
for the six months ended June 30, 2016 (unaudited)
| Franklin Global Real Estate VIP Fund |
||||
| Investment income: |
||||
| Dividends |
$ | 4,728,344 | ||
| Interest |
3,133 | |||
| Income from securities loaned (net of fees and rebates) |
6,346 | |||
|
|
|
|||
| Total investment income |
4,737,823 | |||
|
|
|
|||
| Expenses: |
||||
| Management fees (Note 3a) |
1,604,148 | |||
| Distribution fees - Class 2 (Note 3c) |
343,524 | |||
| Custodian fees (Note 4) |
9,886 | |||
| Reports to shareholders |
44,663 | |||
| Professional fees |
38,361 | |||
| Trustees’ fees and expenses |
771 | |||
| Other |
6,724 | |||
|
|
|
|||
| Total expenses |
2,048,077 | |||
| Expenses waived/paid by affiliates (Note 3e) |
(501 | ) | ||
|
|
|
|||
| Net expenses |
2,047,576 | |||
|
|
|
|||
| Net investment income |
2,690,247 | |||
|
|
|
|||
| Realized and unrealized gains (losses): |
||||
| Net realized gain (loss) from: |
||||
| Investments |
10,126,494 | |||
| Realized gain distributions from REITs |
1,268,398 | |||
| Foreign currency transactions |
38,582 | |||
|
|
|
|||
| Net realized gain (loss) |
11,433,474 | |||
|
|
|
|||
| Net change in unrealized appreciation (depreciation) on: |
||||
| Investments |
6,279,495 | |||
| Translation of other assets and liabilities denominated in foreign currencies |
6,851 | |||
|
|
|
|||
| Net change in unrealized appreciation (depreciation) |
6,286,346 | |||
|
|
|
|||
| Net realized and unrealized gain (loss) |
17,719,820 | |||
|
|
|
|||
| Net increase (decrease) in net assets resulting from operations |
$ | 20,410,067 | ||
|
|
|
|||
| FGR-16 | Semiannual Report | The accompanying notes are an integral part of these financial statements. |
FRANKLIN TEMPLETON VARIABLE INSURANCE PRODUCTS TRUST
FINANCIAL STATEMENTS
Statements of Changes in Net Assets
| Franklin Global Real Estate VIP Fund | ||||||||
| Six Months Ended June 30, 2016 (unaudited) |
Year Ended December 31, 2015 |
|||||||
| Increase (decrease) in net assets: |
||||||||
| Operations: |
||||||||
| Net investment income |
$ | 2,690,247 | $ | 4,420,691 | ||||
| Net realized gain (loss) |
11,433,474 | 25,460,067 | ||||||
| Net change in unrealized appreciation (depreciation) |
6,286,346 | (27,803,613 | ) | |||||
|
|
|
|||||||
| Net increase (decrease) in net assets resulting from operations |
20,410,067 | 2,077,145 | ||||||
|
|
|
|||||||
| Distributions to shareholders from: |
||||||||
| Net investment income: |
||||||||
| Class 1 |
(442,226 | ) | (1,164,404 | ) | ||||
| Class 2 |
(3,274,922 | ) | (10,130,962 | ) | ||||
|
|
|
|||||||
| Total distributions to shareholders |
(3,717,148 | ) | (11,295,366 | ) | ||||
|
|
|
|||||||
| Capital share transactions: (Note 2) |
||||||||
| Class 1 |
(2,109,365 | ) | (2,627,260 | ) | ||||
| Class 2 |
(18,461,447 | ) | (37,760,478 | ) | ||||
|
|
|
|||||||
| Total capital share transactions |
(20,570,812 | ) | (40,387,738 | ) | ||||
|
|
|
|||||||
| Net increase (decrease) in net assets |
(3,877,893 | ) | (49,605,959 | ) | ||||
| Net assets: |
||||||||
| Beginning of period |
319,634,120 | 369,240,079 | ||||||
|
|
|
|||||||
| End of period |
$ | 315,756,227 | $ | 319,634,120 | ||||
|
|
|
|||||||
| Distributions in excess of net investment income included in net assets: |
||||||||
| End of period |
$ | (1,130,107 | ) | $ | (103,206 | ) | ||
|
|
|
|||||||
| The accompanying notes are an integral part of these financial statements. | Semiannual Report | FGR-17 |
FRANKLIN TEMPLETON VARIABLE INSURANCE PRODUCTS TRUST
Notes to Financial Statements (unaudited)
Franklin Global Real Estate VIP Fund
| FGR-18 | Semiannual Report |
FRANKLIN TEMPLETON VARIABLE INSURANCE PRODUCTS TRUST
NOTES TO FINANCIAL STATEMENTS (UNAUDITED)
Franklin Global Real Estate VIP Fund (continued)
| Semiannual Report | FGR-19 |
FRANKLIN TEMPLETON VARIABLE INSURANCE PRODUCTS TRUST
NOTES TO FINANCIAL STATEMENTS (UNAUDITED)
Franklin Global Real Estate VIP Fund (continued)
1. Organization and Significant Accounting Policies (continued)
d. Securities Lending (continued)
close of Fund business each day; any additional collateral required due to changes in security values is delivered to the Fund on the next business day. The collateral is deposited into a joint cash account with other funds and is used to invest in a money market fund managed by Franklin Advisers, Inc., an affiliate of the Fund, and/or a joint repurchase agreement. The Fund may receive income from the investment of cash collateral, in addition to lending fees and rebates paid by the borrower. Income from securities loaned, net of fees paid to the securities lending agent and/or third-party vendor, is reported separately in the Statement of Operations. The Fund bears the market risk with respect to the collateral investment, securities loaned, and the risk that the agent may default on its obligations to the Fund. If the borrower defaults on its obligation to return the securities loaned, the Fund has the right to repurchase the securities in the open market using the collateral received. The securities lending agent has agreed to indemnify the Fund in the event of default by a third party borrower.
e. Income and Deferred Taxes
It is the Fund’s policy to qualify as a regulated investment company under the Internal Revenue Code. The Fund intends to distribute to shareholders substantially all of its taxable income and net realized gains to relieve it from federal income and if applicable, excise taxes. As a result, no provision for U.S. federal income taxes is required.
The Fund may be subject to foreign taxation related to income received, capital gains on the sale of securities and certain foreign currency transactions in the foreign jurisdictions in which it invests. Foreign taxes, if any, are recorded based on the tax regulations and rates that exist in the foreign markets in which the Fund invests. When a capital gain tax is determined to apply, the Fund records an estimated deferred tax liability in an amount that would be payable if the securities were disposed of on the valuation date. As a result of several court cases, in certain countries across the European Union, the Fund filed additional tax reclaims for previously withheld taxes on dividends earned in those countries (EU reclaims). These additional filings are subject to various administrative proceedings by the local jurisdictions’ tax authorities within the European Union, as well as a number of related judicial proceedings. Income recognized,
if any, for EU reclaims is reflected as other income in the Statement of Operations and any related receivable, if any, is reflected as European Union tax reclaims in the Statement of Assets and Liabilities. When uncertainty exists as to the ultimate resolution of these proceedings, the likelihood of receipt of these EU reclaims, and the potential timing of payment, no amounts are reflected in the financial statements.
The Fund may recognize an income tax liability related to its uncertain tax positions under U.S. GAAP when the uncertain tax position has a less than 50% probability that it will be sustained upon examination by the tax authorities based on its technical merits. As of June 30, 2016, the Fund has determined that no tax liability is required in its financial statements related to uncertain tax positions for any open tax years (or expected to be taken in future tax years). Open tax years are those that remain subject to examination and are based on each tax jurisdiction’s statute of limitation.
f. Security Transactions, Investment Income, Expenses and Distributions
Security transactions are accounted for on trade date. Realized gains and losses on security transactions are determined on a specific identification basis. Interest income and estimated expenses are accrued daily. Dividend income is recorded on the ex-dividend date except for certain dividends from foreign securities where the dividend rate is not available. In such cases, the dividend is recorded as soon as the information is received by the Fund. Distributions to shareholders are recorded on the ex-dividend date and are determined according to income tax regulations (tax basis). Distributable earnings determined on a tax basis may differ from earnings recorded in accordance with U.S. GAAP. These differences may be permanent or temporary. Permanent differences are reclassified among capital accounts to reflect their tax character. These reclassifications have no impact on net assets or the results of operations. Temporary differences are not reclassified, as they may reverse in subsequent periods.
Common expenses incurred by the Trust are allocated among the Funds based on the ratio of net assets of each Fund to the combined net assets of the Trust. Fund specific expenses are charged directly to the fund that incurred the expense.
Realized and unrealized gains and losses and net investment income, not including class specific expenses, are allocated daily to each class of shares based upon the relative proportion of net
| FGR-20 | Semiannual Report |
FRANKLIN TEMPLETON VARIABLE INSURANCE PRODUCTS TRUST
NOTES TO FINANCIAL STATEMENTS (UNAUDITED)
Franklin Global Real Estate VIP Fund (continued)
2. Shares of Beneficial Interest
At June 30, 2016, there were an unlimited number of shares authorized (without par value). Transactions in the Fund’s shares were as follows:
| Six Months Ended June 30, 2016 |
Year Ended December 31, 2015 |
|||||||||||||||||||
| Shares | Amount | Shares | Amount | |||||||||||||||||
| Class 1 Shares: | ||||||||||||||||||||
| Shares sold |
4,155 | $ | 68,358 | 18,700 | $ | 311,427 | ||||||||||||||
| Shares issued in reinvestment of distributions |
27,081 | 442,226 | 74,498 | 1,164,404 | ||||||||||||||||
| Shares redeemed |
(163,843 | ) | (2,619,949 | ) | (255,495 | ) | (4,103,091 | ) | ||||||||||||
|
|
|
|||||||||||||||||||
| Net increase (decrease) |
(132,607 | ) | $ | (2,109,365 | ) | (162,297 | ) | $ | (2,627,260 | ) | ||||||||||
|
|
|
|||||||||||||||||||
| Class 2 Shares: | ||||||||||||||||||||
| Shares sold |
206,324 | $ | 3,246,851 | 502,026 | $ | 8,041,404 | ||||||||||||||
| Shares issued in reinvestment of distributions |
205,582 | 3,274,922 | 664,325 | 10,130,962 | ||||||||||||||||
| Shares redeemed |
(1,617,022 | ) | (24,983,220 | ) | (3,555,406 | ) | (55,932,844 | ) | ||||||||||||
|
|
|
|||||||||||||||||||
| Net increase (decrease) |
(1,205,116 | ) | $ | (18,461,447 | ) | (2,389,055 | ) | $ | (37,760,478 | ) | ||||||||||
|
|
|
|||||||||||||||||||
3. Transactions With Affiliates
Franklin Resources, Inc. is the holding company for various subsidiaries that together are referred to as Franklin Templeton Investments. Certain officers and trustees of the Fund are also officers and/or directors of the following subsidiaries:
| Subsidiary | Affiliation | |
| Franklin Templeton Institutional, LLC (FT Institutional) |
Investment manager | |
| Franklin Templeton Services, LLC (FT Services) |
Administrative manager | |
| Franklin Templeton Distributors, Inc. (Distributors) |
Principal underwriter | |
| Franklin Templeton Investor Services, LLC (Investor Services) |
Transfer agent |
| Semiannual Report | FGR-21 |
FRANKLIN TEMPLETON VARIABLE INSURANCE PRODUCTS TRUST
NOTES TO FINANCIAL STATEMENTS (UNAUDITED)
Franklin Global Real Estate VIP Fund (continued)
3. Transactions With Affiliates (continued)
a. Management Fees
The Fund pays an investment management fee to FT Institutional based on the average daily net assets of the Fund as follows:
| Annualized Fee Rate | Net Assets | |
| 1.050% |
Up to and including $500 million | |
| 0.950% |
Over $500 million, up to and including $1 billion | |
| 0.900% |
Over $1 billion, up to and including $1.5 billion | |
| 0.850% |
Over $1.5 billion, up to and including $6.5 billion | |
| 0.830% |
Over $6.5 billion, up to and including $11.5 billion | |
| 0.810% |
Over $11.5 billion, up to and including $16.5 billion | |
| 0.790% |
Over $16.5 billion, up to and including $19 billion | |
| 0.780% |
Over $19 billion, up to and including $21.5 billion | |
| 0.770% |
In excess of $21.5 billion |
For the period ended June 30, 2016, the annualized effective investment management fee rate was 1.050% of the Fund’s average daily net assets.
b. Administrative Fees
Under an agreement with FT Institutional, FT Services provides administrative services to the Fund. The fee is paid by FT Institutional based on Fund’s average daily net assets, and is not an additional expense of the Fund.
c. Distribution Fees
The Board has adopted a distribution plan for Class 2 shares pursuant to Rule 12b-1 under the 1940 Act. Under the Fund’s compensation distribution plan, the Fund pays Distributors for costs incurred in connection with the servicing, sale and distribution of the Fund’s shares up to 0.35% per year of its average daily net assets. The Board has agreed to limit the current rate to 0.25% per year for Class 2. The plan year, for purposes of monitoring compliance with the maximum annual plan rate, is February 1 through January 31.
d. Transfer Agent Fees
Investor Services, under terms of an agreement, performs shareholder servicing for the Fund and is not paid by the Fund for the services.
e. Investments in Affiliated Management Investment Companies
The Fund invests in one or more affiliated management investment companies for purposes other than exercising a controlling influence over the management or policies. Management fees paid by the Fund are waived on assets invested in the affiliated management investment companies, as noted in the Statement of Operations, in an amount not to exceed the management and administrative fees paid directly or indirectly by each affiliate.
| FGR-22 | Semiannual Report |
FRANKLIN TEMPLETON VARIABLE INSURANCE PRODUCTS TRUST
NOTES TO FINANCIAL STATEMENTS (UNAUDITED)
Franklin Global Real Estate VIP Fund (continued)
| Number of Shares Held at Beginning of Period |
Gross Additions |
Gross Reductions |
Number of Shares Held at End of Period |
Value at End of Period |
Investment Income |
Realized Gain (Loss) |
% of Affiliated Fund Shares Outstanding Held at End of Period |
|||||||||||||||||||||||||
| Non-Controlled Affiliates | ||||||||||||||||||||||||||||||||
| Institutional Fiduciary Trust Money Market Portfolio |
— | 4,176,000 | (2,947,000 | ) | 1,229,000 | $ | 1,229,000 | $ | — | $ | — | —%a | ||||||||||||||||||||
|
|
|
|||||||||||||||||||||||||||||||
aRounds to less than 0.1%.
4. Expense Offset Arrangement
The Fund has entered into an arrangement with its custodian whereby credits realized as a result of uninvested cash balances are used to reduce a portion of the Fund’s custodian expenses. During the period ended June 30, 2016, there were no credits earned.
5. Income Taxes
For tax purposes, capital losses may be carried over to offset future capital gains. Capital loss carryforwards with no expiration, if any, must be fully utilized before those losses with expiration dates.
At December 31, 2015, capital loss carryforwards were as follows:
| Capital loss carryforwards subject to expiration: |
||||
| 2016 |
$ | 91,815,455 | ||
| 2017 |
207,448,609 | |||
| 2018 |
2,192,369 | |||
|
|
|
|||
| Total capital loss carryforwards |
$ | 301,456,433 | ||
|
|
|
At June 30, 2016, the cost of investments and net unrealized appreciation (depreciation) for income tax purposes were as follows:
| Cost of investments |
$ | 214,182,571 | ||
|
|
|
|||
| Unrealized appreciation |
$ | 121,901,115 | ||
| Unrealized depreciation |
(19,374,965 | ) | ||
|
|
|
|||
| Net unrealized appreciation (depreciation) |
$ | 102,526,150 | ||
|
|
|
Differences between income and/or capital gains as determined on a book basis and a tax basis are primarily due to differing treatment of passive foreign investment company shares.
6. Investment Transactions
Purchases and sales of investments (excluding short term securities) for the period ended June 30, 2016, aggregated $42,418,201 and $60,124,891, respectively.
At June 30, 2016, in connection with securities lending transactions, the Fund loaned equity investments and received $1,536,431 of cash collateral. The gross amount of recognized liability for such transactions is included in payable upon return of securities loaned in the Statement of Assets and Liabilities. The agreements can be terminated at any time.
| Semiannual Report | FGR-23 |
FRANKLIN TEMPLETON VARIABLE INSURANCE PRODUCTS TRUST
NOTES TO FINANCIAL STATEMENTS (UNAUDITED)
Franklin Global Real Estate VIP Fund (continued)
7. Concentration of Risk
Investing in foreign securities may include certain risks and considerations not typically associated with investing in U.S. securities, such as fluctuating currency values and changing local and regional economic, political and social conditions, which may result in greater market volatility. In addition, certain foreign securities may not be as liquid as U.S. securities.
The Fund invests a large percentage of its total assets in REIT securities. Such concentration may subject the Fund to special risks associated with real estate securities. These securities may be more sensitive to economic or regulatory developments due to a variety of factors such as local, regional, national and global economic conditions, interest rates and tax considerations.
8. Credit Facility
The Fund, together with other U.S. registered and foreign investment funds (collectively, Borrowers), managed by Franklin Templeton Investments, are borrowers in a joint syndicated senior unsecured credit facility totaling $2 billion (Global Credit Facility) which matures on February 10, 2017. This Global Credit Facility provides a source of funds to the Borrowers for temporary and emergency purposes, including the ability to meet future unanticipated or unusually large redemption requests.
Under the terms of the Global Credit Facility, the Fund shall, in addition to interest charged on any borrowings made by the Fund and other costs incurred by the Fund, pay its share of fees and expenses incurred in connection with the implementation and maintenance of the Global Credit Facility, based upon its relative share of the aggregate net assets of all of the Borrowers, including an annual commitment fee of 0.07% based upon the unused portion of the Global Credit Facility. Effective February 12, 2016, the annual commitment fee is 0.15%. These fees are reflected in other expenses in the Statement of Operations. During the period ended June 30, 2016, the Fund did not use the Global Credit Facility.
9. Fair Value Measurements
The Fund follows a fair value hierarchy that distinguishes between market data obtained from independent sources (observable inputs) and the Fund’s own market assumptions (unobservable inputs). These inputs are used in determining the value of the Fund’s financial instruments and are summarized in the following fair value hierarchy:
| • | Level 1 – quoted prices in active markets for identical financial instruments |
| • | Level 2 – other significant observable inputs (including quoted prices for similar financial instruments, interest rates, prepayment speed, credit risk, etc.) |
| • | Level 3 – significant unobservable inputs (including the Fund’s own assumptions in determining the fair value of financial instruments) |
The input levels are not necessarily an indication of the risk or liquidity associated with financial instruments at that level.
For movements between the levels within the fair value hierarchy, the Fund has adopted a policy of recognizing the transfers as of the date of the underlying event which caused the movement.
A summary of inputs used as of June 30, 2016, in valuing the Fund’s assets carried at fair value, is as follows:
| Level 1 | Level 2 | Level 3 | Total | |||||||||||||
| Assets: | ||||||||||||||||
| Investments in Securities: |
||||||||||||||||
| Equity Investmentsa |
$ | 313,451,069 | $ | — | $ | — | $ | 313,451,069 | ||||||||
| Short Term Investments |
1,229,000 | 2,028,652 | — | 3,257,652 | ||||||||||||
|
|
|
|||||||||||||||
| Total Investments in Securities |
$ | 314,680,069 | $ | 2,028,652 | $ | — | $ | 316,708,721 | ||||||||
|
|
|
|||||||||||||||
aFor detailed categories, see the accompanying Statement of Investments.
| FGR-24 | Semiannual Report |
FRANKLIN TEMPLETON VARIABLE INSURANCE PRODUCTS TRUST
NOTES TO FINANCIAL STATEMENTS (UNAUDITED)
Franklin Global Real Estate VIP Fund (continued)
10. Subsequent Events
The Fund has evaluated subsequent events through the issuance of the financial statements and determined that no events have occurred that require disclosure.
Abbreviations
| Selected Portfolio | ||
| IDR | International Depositary Receipt | |
| REIT | Real Estate Investment Trust | |
| Semiannual Report | FGR-25 |
Franklin Growth and Income VIP Fund
This semiannual report for Franklin Growth and Income VIP Fund covers the period ended June 30, 2016.
Class 1 Performance Summary as of June 30, 2016
The Fund’s Class 1 shares delivered a +4.23% total return for the six-month period ended June 30, 2016.
Performance reflects the Fund’s Class 1 operating expenses, but does not include any contract fees, expenses or sales charges. If they had been included, performance would be lower. These charges and deductions, particularly for variable life policies, can have a significant effect on contract values and insurance benefits. See the contract prospectus for a complete description of these expenses, including sales charges.
Performance data represent past performance, which does not guarantee future results. Investment return and principal value will fluctuate, and you may have a gain or loss when you sell your shares. Current performance may differ from figures shown.
| Semiannual Report | FGI-1 |
FRANKLIN GROWTH AND INCOME VIP FUND
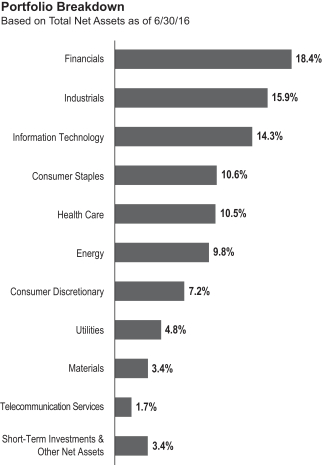
Price Index, remained subdued overall even though it spiked to the highest level in three years in April mainly due to a rebound in energy prices.
After raising its target range for the federal funds rate to 0.25%–0.50% at its December meeting, the Federal Reserve (Fed) maintained the rate through period-end. Although the Fed indicated a potential interest rate hike in June, subsequent reports showed job additions slowed substantially in May. Consequently, at its June meeting, the Fed kept the federal funds rate unchanged, and indicated that in determining the timing and size of future adjustments to the target range, it will assess realized and expected economic conditions relative to its objectives of maximum employment and 2.00% inflation. The Fed expects economic conditions to evolve in a manner that could warrant only gradual increases in the federal funds rate.
1. Source: Morningstar.
2. Source: Lipper, a Thomson Reuters Company.
One cannot invest directly in an index, and an index is not representative of the Fund’s portfolio. Please see Index Descriptions following the Fund Summaries.
3. Source: Bureau of Labor Statistics.
| FGI-2 | Semiannual Report |
FRANKLIN GROWTH AND INCOME VIP FUND
driven by strong performance from the commercial and industrial lines of business. A slight improvement in recycled commodity prices also positively affected the company. Industrial products and equipment manufacturer Illinois Tool Works posted strong earnings results for the fourth quarter of 2015, which were partially driven by excellent cost controls and strength in its consumer-facing businesses. The company also completed a medium-sized acquisition within its automotive original equipment manufacturer division that appeared attractive to us.
In the energy sector, multinational energy corporation Chevron recovered strongly as the company’s cash flow profile improved. The company provided updated earnings guidance related to capital spending for the next several years that gave investors a roadmap to cash flow neutrality, an important topic for all energy producers in a lower price environment. Anglo-Dutch multinational oil and gas company Royal Dutch Shell performed well during the period as it closed its acquisition of BG Group and announced further cost cutting and capital spending reduction measures. In addition, Shell held a Capital Markets Day in early June in which the management team provided additional information related to the integration of BG Group and a long-term outlook for cash flow generation that
| Semiannual Report | FGI-3 |
FRANKLIN GROWTH AND INCOME VIP FUND
4. This holding is found in the convertible preferred stock section of the SOI.
5. Sold by period-end.
| FGI-4 | Semiannual Report |
FRANKLIN GROWTH AND INCOME VIP FUND
| Semiannual Report | FGI-5 |
FRANKLIN GROWTH AND INCOME VIP FUND
Class 1 Fund Expenses
| Class 1 | Beginning Account Value 1/1/16 |
Ending Account Value 6/30/16 |
Fund-Level
Expenses 1/1/16–6/30/16 |
|||||||||
| Actual |
$ | 1,000 | $ | 1,042.30 | $ | 3.00 | ||||||
| Hypothetical (5% return before expenses) |
$ | 1,000 | $ | 1,021.93 | $ | 2.97 | ||||||
*Expenses are calculated using the most recent six-month annualized expense ratio for the Fund’s Class 1 shares (0.59%), which does not include any ongoing expenses of the Contract for which the Fund is an investment option, multiplied by the average account value over the period, multiplied by 182/366 to reflect the one-half year period.
| FGI-6 | Semiannual Report |
FRANKLIN TEMPLETON VARIABLE INSURANCE PRODUCTS TRUST
Financial Highlights
Franklin Growth and Income VIP Fund
| Six Months Ended (unaudited) |
Year Ended December 31, | |||||||||||||||||||||||
| 2015 | 2014 | 2013 | 2012 | 2011 | ||||||||||||||||||||
| Class 1 | ||||||||||||||||||||||||
| Per share operating performance (for a share outstanding throughout the period) |
||||||||||||||||||||||||
| Net asset value, beginning of period |
$15.94 | $17.02 | $15.97 | $12.64 | $11.60 | $11.76 | ||||||||||||||||||
|
|
|
|||||||||||||||||||||||
| Income from investment operationsa: | ||||||||||||||||||||||||
| Net investment incomeb |
0.23 | 0.45 | 0.53 | c | 0.33 | 0.35 | 0.33 | |||||||||||||||||
| Net realized and unrealized gains (losses) |
0.41 | (0.54 | ) | 0.95 | 3.40 | 1.08 | (0.03 | ) | ||||||||||||||||
|
|
|
|||||||||||||||||||||||
| Total from investment operations |
0.64 | (0.09 | ) | 1.48 | 3.73 | 1.43 | 0.30 | |||||||||||||||||
|
|
|
|||||||||||||||||||||||
| Less distributions from: | ||||||||||||||||||||||||
| Net investment income |
(0.46 | ) | (0.61 | ) | (0.43 | ) | (0.40 | ) | (0.39 | ) | (0.46 | ) | ||||||||||||
| Net realized gains |
(1.24 | ) | (0.38 | ) | — | — | — | — | ||||||||||||||||
|
|
|
|||||||||||||||||||||||
| Total distributions |
(1.70 | ) | (0.99 | ) | (0.43 | ) | (0.40 | ) | (0.39 | ) | (0.46 | ) | ||||||||||||
|
|
|
|||||||||||||||||||||||
| Net asset value, end of period |
$14.88 | $15.94 | $17.02 | $15.97 | $12.64 | $11.60 | ||||||||||||||||||
|
|
|
|||||||||||||||||||||||
| Total returnd |
4.23% | (0.62)% | 9.40% | 29.96% | 12.53% | 2.64% | ||||||||||||||||||
| Ratios to average net assetse | ||||||||||||||||||||||||
| Expenses |
0.59% | 0.58% | 0.57% | f | 0.58% | f | 0.60% | 0.59% | ||||||||||||||||
| Net investment income |
3.00% | 2.74% | 3.26% | c | 2.29% | 2.86% | 2.80% | |||||||||||||||||
| Supplemental data | ||||||||||||||||||||||||
| Net assets, end of period (000’s) |
$162,109 | $144,663 | $168,961 | $175,860 | $154,463 | $156,830 | ||||||||||||||||||
| Portfolio turnover rate |
25.09% | 48.81% | 20.54% | 35.16% | 30.00% | 32.93% | ||||||||||||||||||
aThe amount shown for a share outstanding throughout the period may not correlate with the Statement of Operations for the period due to the timing of sales and repurchases of the Fund’s shares in relation to income earned and/or fluctuating fair value of the investments of the Fund.
bBased on average daily shares outstanding.
cNet investment income per share includes approximately $0.12 per share related to income received in the form of special dividends paid in connection with certain Fund holdings. Excluding this amount, the ratio of net investment income to average net assets would have been 2.53%.
dTotal return does not include fees, charges or expenses imposed by the variable annuity and life insurance contracts for which Franklin Templeton Variable Insurance Products Trust serves as an underlying investment vehicle. Total return is not annualized for periods less than one year.
eRatios are annualized for periods less than one year.
fBenefit of expense reduction rounds to less than 0.01%.
| The accompanying notes are an integral part of these financial statements. | Semiannual Report | FGI-7 |
FRANKLIN TEMPLETON VARIABLE INSURANCE PRODUCTS TRUST
FINANCIAL HIGHLIGHTS
Franklin Growth and Income VIP Fund (continued)
|
Six Months Ended (unaudited) |
Year Ended December 31, | |||||||||||||||||||||||
| 2015 | 2014 | 2013 | 2012 | 2011 | ||||||||||||||||||||
| Class 2 | ||||||||||||||||||||||||
| Per share operating performance (for a share outstanding throughout the period) |
||||||||||||||||||||||||
| Net asset value, beginning of period |
$15.68 | $16.76 | $15.73 | $12.46 | $11.44 | $11.60 | ||||||||||||||||||
|
|
|
|||||||||||||||||||||||
| Income from investment operationsa: | ||||||||||||||||||||||||
| Net investment incomeb |
0.21 | 0.40 | 0.48 | c | 0.29 | 0.32 | 0.29 | |||||||||||||||||
| Net realized and unrealized gains (losses) |
0.40 | (0.54 | ) | 0.94 | 3.35 | 1.05 | (0.02 | ) | ||||||||||||||||
|
|
|
|||||||||||||||||||||||
| Total from investment operations |
0.61 | (0.14 | ) | 1.42 | 3.64 | 1.37 | 0.27 | |||||||||||||||||
|
|
|
|||||||||||||||||||||||
| Less distributions from: | ||||||||||||||||||||||||
| Net investment income |
(0.42 | ) | (0.56 | ) | (0.39 | ) | (0.37 | ) | (0.35 | ) | (0.43 | ) | ||||||||||||
| Net realized gains |
(1.24 | ) | (0.38 | ) | — | — | — | — | ||||||||||||||||
|
|
|
|||||||||||||||||||||||
| Total distributions |
(1.66 | ) | (0.94 | ) | (0.39 | ) | (0.37 | ) | (0.35 | ) | (0.43 | ) | ||||||||||||
|
|
|
|||||||||||||||||||||||
| Net asset value, end of period |
$14.63 | $15.68 | $16.76 | $15.73 | $12.46 | $11.44 | ||||||||||||||||||
|
|
|
|||||||||||||||||||||||
| Total returnd |
4.08% | (0.91)% | 9.14% | 29.60% | 12.23% | 2.41% | ||||||||||||||||||
| Ratios to average net assetse | ||||||||||||||||||||||||
| Expenses |
0.84% | 0.83% | 0.82% | f | 0.83% | f | 0.85% | 0.84% | ||||||||||||||||
| Net investment income |
2.75% | 2.49% | 3.01% | c | 2.04% | 2.61% | 2.55% | |||||||||||||||||
| Supplemental data | ||||||||||||||||||||||||
| Net assets, end of period (000’s) |
$126,589 | $124,691 | $138,191 | $150,966 | $131,400 | $129,309 | ||||||||||||||||||
| Portfolio turnover rate |
25.09% | 48.81% | 20.54% | 35.16% | 30.00% | 32.93% | ||||||||||||||||||
aThe amount shown for a share outstanding throughout the period may not correlate with the Statement of Operations for the period due to the timing of sales and repurchases of the Fund’s shares in relation to income earned and/or fluctuating fair value of the investments of the Fund.
bBased on average daily shares outstanding.
cNet investment income per share includes approximately $0.12 per share related to income received in the form of special dividends paid in connection with certain Fund holdings. Excluding this amount, the ratio of net investment income to average net assets would have been 2.28%.
dTotal return does not include fees, charges or expenses imposed by the variable annuity and life insurance contracts for which Franklin Templeton Variable Insurance Products Trust serves as an underlying investment vehicle. Total return is not annualized for periods less than one year.
eRatios are annualized for periods less than one year.
fBenefit of expense reduction rounds to less than 0.01%.
| FGI-8 | Semiannual Report | The accompanying notes are an integral part of these financial statements. |
FRANKLIN TEMPLETON VARIABLE INSURANCE PRODUCTS TRUST
Statement of Investments, June 30, 2016 (unaudited)
| Franklin Growth and Income VIP Fund
|
||||||||||||||
| Country | Shares | Value | ||||||||||||
| Common Stocks 85.1% |
||||||||||||||
| Consumer Discretionary 6.2% |
||||||||||||||
| Ford Motor Co. |
United States | 295,000 | $ | 3,708,150 | ||||||||||
| Lowe’s Cos. Inc. |
United States | 60,200 | 4,766,034 | |||||||||||
| Newell Brands Inc. |
United States | 56,000 | 2,719,920 | |||||||||||
| Nordstrom Inc. |
United States | 32,500 | 1,236,625 | |||||||||||
| Target Corp. |
United States | 79,700 | 5,564,654 | |||||||||||
|
|
|
|||||||||||||
| 17,995,383 | ||||||||||||||
|
|
|
|||||||||||||
| Consumer Staples 10.6% |
||||||||||||||
| Anheuser-Busch InBev NV, ADR |
Belgium | 30,600 | 4,029,408 | |||||||||||
| CVS Health Corp. |
United States | 56,000 | 5,361,440 | |||||||||||
| Kimberly-Clark Corp. |
United States | 23,000 | 3,162,040 | |||||||||||
| The Kraft Heinz Co. |
United States | 68,000 | 6,016,640 | |||||||||||
| PepsiCo Inc. |
United States | 69,900 | 7,405,206 | |||||||||||
| Reynolds American Inc. |
United States | 84,500 | 4,557,085 | |||||||||||
|
|
|
|||||||||||||
| 30,531,819 | ||||||||||||||
|
|
|
|||||||||||||
| Energy 8.5% |
||||||||||||||
| Anadarko Petroleum Corp. |
United States | 26,700 | 1,421,775 | |||||||||||
| BP PLC, ADR |
United Kingdom | 76,000 | 2,698,760 | |||||||||||
| Chevron Corp. |
United States | 68,500 | 7,180,855 | |||||||||||
| ConocoPhillips |
United States | 43,000 | 1,874,800 | |||||||||||
| Exxon Mobil Corp. |
United States | 50,744 | 4,756,743 | |||||||||||
| Royal Dutch Shell PLC, A, ADR |
United Kingdom | 57,300 | 3,164,106 | |||||||||||
| Schlumberger Ltd. |
United States | 43,300 | 3,424,164 | |||||||||||
|
|
|
|||||||||||||
| 24,521,203 | ||||||||||||||
|
|
|
|||||||||||||
| Financials 17.2% |
||||||||||||||
| Arthur J. Gallagher & Co. |
United States | 92,900 | 4,422,040 | |||||||||||
| BB&T Corp. |
United States | 84,000 | 2,991,240 | |||||||||||
| BlackRock Inc. |
United States | 16,200 | 5,548,986 | |||||||||||
| Host Hotels & Resorts Inc. |
United States | 189,000 | 3,063,690 | |||||||||||
| JPMorgan Chase & Co. |
United States | 140,970 | 8,759,876 | |||||||||||
| MetLife Inc. |
United States | 70,678 | 2,815,105 | |||||||||||
| Morgan Stanley |
United States | 156,000 | 4,052,880 | |||||||||||
| T. Rowe Price Group Inc. |
United States | 62,100 | 4,531,437 | |||||||||||
| U.S. Bancorp |
United States | 148,300 | 5,980,939 | |||||||||||
| Wells Fargo & Co. |
United States | 156,600 | 7,411,878 | |||||||||||
|
|
|
|||||||||||||
| 49,578,071 | ||||||||||||||
|
|
|
|||||||||||||
| Health Care 7.6% |
||||||||||||||
| AstraZeneca PLC, ADR |
United Kingdom | 89,900 | 2,714,081 | |||||||||||
| Eli Lilly & Co. |
United States | 73,100 | 5,756,625 | |||||||||||
| Johnson & Johnson |
United States | 19,600 | 2,377,480 | |||||||||||
| Medtronic PLC |
United States | 68,000 | 5,900,360 | |||||||||||
| Pfizer Inc. |
United States | 143,400 | 5,049,114 | |||||||||||
|
|
|
|||||||||||||
| 21,797,660 | ||||||||||||||
|
|
|
|||||||||||||
| Industrials 14.4% |
||||||||||||||
| Deere & Co. |
United States | 26,000 | 2,107,040 | |||||||||||
| General Electric Co. |
United States | 241,200 | 7,592,976 | |||||||||||
| Illinois Tool Works Inc. |
United States | 41,300 | 4,301,808 | |||||||||||
| Lockheed Martin Corp. |
United States | 23,000 | 5,707,910 | |||||||||||
| Nielsen Holdings PLC |
United States | 62,000 | 3,222,140 | |||||||||||
| Semiannual Report | FGI-9 |
FRANKLIN TEMPLETON VARIABLE INSURANCE PRODUCTS TRUST
STATEMENT OF INVESTMENTS (UNAUDITED)
Franklin Growth and Income VIP Fund (continued)
| Country | Shares | Value | ||||||||||||
| Common Stocks (continued) |
||||||||||||||
| Industrials (continued) |
||||||||||||||
| Raytheon Co. |
United States | 40,700 | $ | 5,533,165 | ||||||||||
| Republic Services Inc. |
United States | 87,400 | 4,484,494 | |||||||||||
| United Parcel Service Inc., B |
United States | 36,700 | 3,953,324 | |||||||||||
| United Technologies Corp. |
United States | 46,300 | 4,748,065 | |||||||||||
|
|
|
|||||||||||||
| 41,650,922 | ||||||||||||||
|
|
|
|||||||||||||
| Information Technology 12.5% |
||||||||||||||
| Apple Inc. |
United States | 46,600 | 4,454,960 | |||||||||||
| Broadcom Ltd. |
Singapore | 6,500 | 1,010,100 | |||||||||||
| Cisco Systems Inc. |
United States | 218,008 | 6,254,649 | |||||||||||
| Intel Corp. |
United States | 132,800 | 4,355,840 | |||||||||||
| Microsoft Corp. |
United States | 184,400 | 9,435,748 | |||||||||||
| Oracle Corp. |
United States | 116,500 | 4,768,345 | |||||||||||
| Texas Instruments Inc. |
United States | 93,300 | 5,845,245 | |||||||||||
|
|
|
|||||||||||||
| 36,124,887 | ||||||||||||||
|
|
|
|||||||||||||
| Materials 3.4% |
||||||||||||||
| BASF SE |
Germany | 45,000 | 3,428,413 | |||||||||||
| The Dow Chemical Co. |
United States | 41,800 | 2,077,878 | |||||||||||
| International Paper Co. |
United States | 104,300 | 4,420,234 | |||||||||||
|
|
|
|||||||||||||
| 9,926,525 | ||||||||||||||
|
|
|
|||||||||||||
| Telecommunication Services 1.7% |
||||||||||||||
| Rogers Communications Inc., B |
Canada | 49,100 | 1,983,640 | |||||||||||
| Verizon Communications Inc. |
United States | 53,000 | 2,959,520 | |||||||||||
|
|
|
|||||||||||||
| 4,943,160 | ||||||||||||||
|
|
|
|||||||||||||
| Utilities 3.0% |
||||||||||||||
| Dominion Resources Inc. |
United States | 57,600 | 4,488,768 | |||||||||||
| Xcel Energy Inc. |
United States | 93,300 | 4,177,974 | |||||||||||
|
|
|
|||||||||||||
| 8,666,742 | ||||||||||||||
|
|
|
|||||||||||||
| Total Common Stocks (Cost $192,052,292) |
245,736,372 | |||||||||||||
|
|
|
|||||||||||||
| a | Equity-Linked Securities 5.3% |
|||||||||||||
| Consumer Discretionary 1.0% |
||||||||||||||
| b | Bank of America Merrill Lynch into Dollar General Corp., 6.00%, 144A |
United States | 35,000 | 2,875,268 | ||||||||||
|
|
|
|||||||||||||
| Energy 1.3% |
||||||||||||||
| b | JPMorgan Chase & Co. into Anadarko Petroleum Co., 9.00%, 144A |
United States | 35,000 | 1,800,690 | ||||||||||
| b | JPMorgan Chase & Co. into Schlumberger Ltd., 7.00%, 144A |
United States | 24,000 | 1,859,904 | ||||||||||
|
|
|
|||||||||||||
| 3,660,594 | ||||||||||||||
|
|
|
|||||||||||||
| Financials 1.2% |
||||||||||||||
| b | Goldman Sachs Group Inc. into Charles Schwab Corp., 7.00%, 144A |
United States | 130,000 | 3,380,676 | ||||||||||
|
|
|
|||||||||||||
| Information Technology 1.8% |
||||||||||||||
| b | Barclays Bank PLC into Broadcom Ltd., 9.00%, 144A |
Singapore | 20,000 | 3,057,340 | ||||||||||
| b | The Goldman Sachs International into Intel Corp., 7.00%, 144A |
United States | 69,000 | 2,279,553 | ||||||||||
|
|
|
|||||||||||||
| 5,336,893 | ||||||||||||||
|
|
|
|||||||||||||
| Total Equity-Linked Securities (Cost $15,246,110) |
15,253,431 | |||||||||||||
|
|
|
|||||||||||||
| FGI-10 | Semiannual Report |
FRANKLIN TEMPLETON VARIABLE INSURANCE PRODUCTS TRUST
STATEMENT OF INVESTMENTS (UNAUDITED)
Franklin Growth and Income VIP Fund (continued)
| Country | Shares | Value | ||||||||||||
| c | Convertible Preferred Stocks 6.2% |
|||||||||||||
| Health Care 2.9% |
||||||||||||||
| Allergan PLC, 5.50%, cvt. pfd. |
United States | 5,700 | $ | 4,751,634 | ||||||||||
| Teva Pharmaceutical Industries Ltd., 4.42%, cvt. pfd. |
Israel | 4,300 | 3,556,100 | |||||||||||
|
|
|
|||||||||||||
| 8,307,734 | ||||||||||||||
|
|
|
|||||||||||||
| Industrials 1.5% |
||||||||||||||
| Stanley Black & Decker Inc., 6.25%, cvt. pfd. |
United States | 38,300 | 4,446,630 | |||||||||||
|
|
|
|||||||||||||
| Utilities 1.8% |
||||||||||||||
| NextEra Energy Inc., 3.48%, cvt. pfd. |
United States | 80,000 | 5,182,400 | |||||||||||
|
|
|
|||||||||||||
| Total Convertible Preferred Stocks |
17,936,764 | |||||||||||||
|
|
|
|||||||||||||
| Total Investments before Short Term Investments |
278,926,567 | |||||||||||||
|
|
|
|||||||||||||
| Principal Amount | ||||||||||||||
| Short Term Investments (Cost $9,847,047) 3.4% |
||||||||||||||
| Repurchase Agreements |
||||||||||||||
| d | Joint Repurchase Agreement, 0.382%, 7/01/16 |
United States | $ | 9,847,047 | 9,847,047 | |||||||||
| BNP Paribas Securities Corp. (Maturity Value $3,193,727) |
||||||||||||||
| Collateralized by U.S. Government Agency Securities, |
||||||||||||||
|
|
|
|||||||||||||
| Total Investments (Cost $235,099,242) 100.0% |
288,773,614 | |||||||||||||
| Other Assets, less Liabilities (0.0)%† |
(75,394 | ) | ||||||||||||
|
|
|
|||||||||||||
| Net Assets 100.0% |
$ | 288,698,220 | ||||||||||||
|
|
|
|||||||||||||
See Abbreviations on page 21.
†Rounds to less than 0.1% of net assets.
aSee Note 1(d) regarding equity-linked securities.
bSecurity was purchased pursuant to Rule 144A under the Securities Act of 1933 and may be sold in transactions exempt from registration only to qualified institutional buyers or in a public offering registered under the Securities Act of 1933. These securities have been deemed liquid under guidelines approved by the Trust’s Board of Trustees. At June 30, 2016, the aggregate value of these securities was $15,253,431, representing 5.3% of net assets.
cVariable rate security. The rate shown represents the yield at period end.
dSee Note 1(c) regarding joint repurchase agreement.
| The accompanying notes are an integral part of these financial statements. | Semiannual Report | FGI-11 |
FRANKLIN TEMPLETON VARIABLE INSURANCE PRODUCTS TRUST
Financial Statements
Statement of Assets and Liabilities
June 30, 2016 (unaudited)
| Franklin Growth and Income VIP Fund |
||||
| Assets: |
||||
| Investments in securities: |
||||
| Cost - Unaffiliated issuers |
$ | 225,252,195 | ||
| Cost - Repurchase agreements |
9,847,047 | |||
|
|
|
|||
| Total cost of investments |
$ | 235,099,242 | ||
|
|
|
|||
| Value - Unaffiliated issuers |
$ | 278,926,567 | ||
| Value - Repurchase agreements |
9,847,047 | |||
|
|
|
|||
| Total value of investments |
288,773,614 | |||
| Receivables: |
||||
| Capital shares sold |
257,643 | |||
| Dividends |
496,334 | |||
| Other assets |
119 | |||
|
|
|
|||
| Total assets |
289,527,710 | |||
|
|
|
|||
| Liabilities: |
||||
| Payables: |
||||
| Investment securities purchased |
395,567 | |||
| Capital shares redeemed |
201,001 | |||
| Management fees |
125,205 | |||
| Distribution fees |
51,453 | |||
| Accrued expenses and other liabilities |
56,264 | |||
|
|
|
|||
| Total liabilities |
829,490 | |||
|
|
|
|||
| Net assets, at value |
$ | 288,698,220 | ||
|
|
|
|||
| Net assets consist of: |
||||
| Paid-in capital |
$ | 225,710,200 | ||
| Undistributed net investment income |
3,832,597 | |||
| Net unrealized appreciation (depreciation) |
53,671,960 | |||
| Accumulated net realized gain (loss) |
5,483,463 | |||
|
|
|
|||
| Net assets, at value |
$ | 288,698,220 | ||
|
|
|
|||
| Class 1: | ||||
| Net assets, at value |
$ | 162,109,433 | ||
|
|
|
|||
| Shares outstanding |
10,895,681 | |||
|
|
|
|||
| Net asset value and maximum offering price per share |
$ | 14.88 | ||
|
|
|
|||
| Class 2: | ||||
| Net assets, at value |
$ | 126,588,787 | ||
|
|
|
|||
| Shares outstanding |
8,650,021 | |||
|
|
|
|||
| Net asset value and maximum offering price per share |
$ | 14.63 | ||
|
|
|
|||
| FGI-12 | Semiannual Report | The accompanying notes are an integral part of these financial statements. |
FRANKLIN TEMPLETON VARIABLE INSURANCE PRODUCTS TRUST
FINANCIAL STATEMENTS
Statement of Operations
for the six months ended June 30, 2016 (unaudited)
| Franklin Growth and Income VIP Fund |
||||
| Investment income: |
||||
| Dividends |
$ | 4,882,413 | ||
| Interest |
11,713 | |||
|
|
|
|||
| Total investment income |
4,894,126 | |||
|
|
|
|||
| Expenses: |
||||
| Management fees (Note 3a) |
737,401 | |||
| Distribution fees - Class 2 (Note 3c) |
149,964 | |||
| Custodian fees (Note 4) |
1,160 | |||
| Reports to shareholders |
36,439 | |||
| Professional fees |
19,224 | |||
| Trustees’ fees and expenses |
642 | |||
| Other |
5,829 | |||
|
|
|
|||
| Total expenses |
950,659 | |||
|
|
|
|||
| Net investment income |
3,943,467 | |||
|
|
|
|||
| Realized and unrealized gains (losses): |
||||
| Net realized gain (loss) from: |
||||
| Investments |
5,395,762 | |||
| Foreign currency transactions |
(20,772 | ) | ||
|
|
|
|||
| Net realized gain (loss) |
5,374,990 | |||
|
|
|
|||
| Net change in unrealized appreciation (depreciation) on: |
||||
| Investments |
3,411,429 | |||
| Translation of other assets and liabilities denominated in foreign currencies |
(67 | ) | ||
|
|
|
|||
| Net change in unrealized appreciation (depreciation) |
3,411,362 | |||
|
|
|
|||
| Net realized and unrealized gain (loss) |
8,786,352 | |||
|
|
|
|||
| Net increase (decrease) in net assets resulting from operations |
$ | 12,729,819 | ||
|
|
|
|||
| The accompanying notes are an integral part of these financial statements. | Semiannual Report | FGI-13 |
FRANKLIN TEMPLETON VARIABLE INSURANCE PRODUCTS TRUST
FINANCIAL STATEMENTS
Statements of Changes in Net Assets
| Franklin Growth and Income VIP Fund | ||||||||
| Six Months Ended June 30, 2016 (unaudited) |
Year Ended December 31, 2015 |
|||||||
| Increase (decrease) in net assets: |
||||||||
| Operations: |
||||||||
| Net investment income |
$ | 3,943,467 | $ | 7,562,301 | ||||
| Net realized gain (loss) |
5,374,990 | 21,830,508 | ||||||
| Net change in unrealized appreciation (depreciation) |
3,411,362 | (31,573,522 | ) | |||||
|
|
|
|||||||
| Net increase (decrease) in net assets resulting from operations |
12,729,819 | (2,180,713 | ) | |||||
|
|
|
|||||||
| Distributions to shareholders from: |
||||||||
| Net investment income: |
||||||||
| Class 1 |
(4,525,424 | ) | (5,633,682 | ) | ||||
| Class 2 |
(3,230,836 | ) | (4,366,077 | ) | ||||
| Net realized gains: |
||||||||
| Class 1 |
(12,121,008 | ) | (3,526,285 | ) | ||||
| Class 2 |
(9,525,503 | ) | (2,955,426 | ) | ||||
|
|
|
|||||||
| Total distributions to shareholders |
(29,402,771 | ) | (16,481,470 | ) | ||||
|
|
|
|||||||
| Capital share transactions: (Note 2) |
||||||||
| Class 1 |
26,165,418 | (14,135,093 | ) | |||||
| Class 2 |
9,851,154 | (5,000,453 | ) | |||||
|
|
|
|||||||
| Total capital share transactions |
36,016,572 | (19,135,546 | ) | |||||
|
|
|
|||||||
| Net increase (decrease) in net assets |
19,343,620 | (37,797,729 | ) | |||||
| Net assets: |
||||||||
| Beginning of period |
269,354,600 | 307,152,329 | ||||||
|
|
|
|||||||
| End of period |
$ | 288,698,220 | $ | 269,354,600 | ||||
|
|
|
|||||||
| Undistributed net investment income included in net assets: |
||||||||
| End of period |
$ | 3,832,597 | $ | 7,645,390 | ||||
|
|
|
|||||||
| FGI-14 | Semiannual Report | The accompanying notes are an integral part of these financial statements. |
FRANKLIN TEMPLETON VARIABLE INSURANCE PRODUCTS TRUST
Notes to Financial Statements (unaudited)
Franklin Growth and Income VIP Fund
| Semiannual Report | FGI-15 |
FRANKLIN TEMPLETON VARIABLE INSURANCE PRODUCTS TRUST
NOTES TO FINANCIAL STATEMENTS (UNAUDITED)
Franklin Growth and Income VIP Fund (continued)
1. Organization and Significant Accounting Policies (continued)
a. Financial Instrument Valuation (continued)
close of trading in foreign stock markets through a series of country specific market proxies (such as baskets of American Depositary Receipts, futures contracts and exchange traded funds). These price movements are measured against established trigger thresholds for each specific market proxy to assist in determining if an event has occurred that may call into question the reliability of the values of the foreign securities held by the Fund. If such an event occurs, the securities may be valued using fair value procedures, which may include the use of independent pricing services.
When the last day of the reporting period is a non-business day, certain foreign markets may be open on those days that the NYSE is closed, which could result in differences between the value of the Fund’s portfolio securities on the last business day and the last calendar day of the reporting period. Any significant security valuation changes due to an open foreign market are adjusted and reflected by the Fund for financial reporting purposes.
b. Foreign Currency Translation
Portfolio securities and other assets and liabilities denominated in foreign currencies are translated into U.S. dollars based on the exchange rate of such currencies against U.S. dollars on the date of valuation. The Fund may enter into foreign currency exchange contracts to facilitate transactions denominated in a foreign currency. Purchases and sales of securities, income and expense items denominated in foreign currencies are translated into U.S. dollars at the exchange rate in effect on the transaction date. Portfolio securities and assets and liabilities denominated in foreign currencies contain risks that those currencies will decline in value relative to the U.S. dollar. Occasionally, events may impact the availability or reliability of foreign exchange rates used to convert the U.S. dollar equivalent value. If such an event occurs, the foreign exchange rate will be valued at fair value using procedures established and approved by the Board.
The Fund does not separately report the effect of changes in foreign exchange rates from changes in market prices on securities held. Such changes are included in net realized and unrealized gain or loss from investments in the Statement of Operations.
Realized foreign exchange gains or losses arise from sales of foreign currencies, currency gains or losses realized between the trade and settlement dates on securities transactions and the difference between the recorded amounts of dividends, interest, and foreign withholding taxes and the U.S. dollar equivalent of the amounts actually received or paid. Net unrealized foreign exchange gains and losses arise from changes in foreign exchange rates on foreign denominated assets and liabilities other than investments in securities held at the end of the reporting period.
c. Joint Repurchase Agreement
The Fund enters into a joint repurchase agreement whereby its uninvested cash balance is deposited into a joint cash account with other funds managed by the investment manager or an affiliate of the investment manager and is used to invest in one or more repurchase agreements. The value and face amount of the joint repurchase agreement are allocated to the funds based on their pro-rata interest. A repurchase agreement is accounted for as a loan by the Fund to the seller, collateralized by securities which are delivered to the Fund’s custodian. The fair value, including accrued interest, of the initial collateralization is required to be at least 102% of the dollar amount invested by the funds, with the value of the underlying securities marked to market daily to maintain coverage of at least 100%. Repurchase agreements are subject to the terms of Master Repurchase Agreements (MRAs) with approved counterparties (sellers). The MRAs contain various provisions, including but not limited to events of default and maintenance of collateral for repurchase agreements. In the event of default by either the seller or the Fund, certain MRAs may permit the non-defaulting party to net and close-out all transactions, if any, traded under such agreements. The Fund may sell securities it holds as collateral and apply the proceeds towards the repurchase price and any other amounts owed by the seller to the Fund in the event of default by the seller. This could involve costs or delays in addition to a loss on the securities if their value falls below the repurchase price owed by the seller. The joint repurchase agreement held by the Fund at period end, as indicated in the Statement of Investments, had been entered into on June 30, 2016.
d. Equity-Linked Securities
The Fund invests in equity-linked securities. Equity-linked securities are hybrid financial instruments that generally combine both debt and equity characteristics into a single note form. Income received from equity-linked securities is recorded
| FGI-16 | Semiannual Report |
FRANKLIN TEMPLETON VARIABLE INSURANCE PRODUCTS TRUST
NOTES TO FINANCIAL STATEMENTS (UNAUDITED)
Franklin Growth and Income VIP Fund (continued)
| Semiannual Report | FGI-17 |
FRANKLIN TEMPLETON VARIABLE INSURANCE PRODUCTS TRUST
NOTES TO FINANCIAL STATEMENTS (UNAUDITED)
Franklin Growth and Income VIP Fund (continued)
1. Organization and Significant Accounting Policies (continued)
h. Guarantees and Indemnifications
Under the Trust’s organizational documents, its officers and trustees are indemnified by the Trust against certain liabilities arising out of the performance of their duties to the Trust.
Additionally, in the normal course of business, the Trust, on behalf of the Fund, enters into contracts with service providers that contain general indemnification clauses. The Trust’s maximum exposure under these arrangements is unknown as this would involve future claims that may be made against the Trust that have not yet occurred. Currently, the Trust expects the risk of loss to be remote.
2. Shares of Beneficial Interest
At June 30, 2016, there were an unlimited number of shares authorized (without par value). Transactions in the Fund’s shares were as follows:
| Six Months Ended June 30, 2016 |
Year Ended December 31, 2015 |
|||||||||||||||||||
| Shares | Amount | Shares | Amount | |||||||||||||||||
| Class 1 Shares: | ||||||||||||||||||||
| Shares sold |
1,334,647 | $ | 19,772,904 | 10,666 | $ | 171,797 | ||||||||||||||
| Shares issued in reinvestment of distributions |
1,140,948 | 16,646,432 | 568,589 | 9,159,967 | ||||||||||||||||
| Shares redeemed |
(656,960 | ) | (10,253,918 | ) | (1,429,423 | ) | (23,466,857 | ) | ||||||||||||
|
|
|
|||||||||||||||||||
| Net increase (decrease) |
1,818,635 | $ | 26,165,418 | (850,168 | ) | $ | (14,135,093 | ) | ||||||||||||
|
|
|
|||||||||||||||||||
| Class 2 Shares: | ||||||||||||||||||||
| Shares sold |
490,366 | $ | 7,464,144 | 871,092 | $ | 13,824,195 | ||||||||||||||
| Shares issued in reinvestment of distributions |
888,943 | 12,756,339 | 461,342 | 7,321,503 | ||||||||||||||||
| Shares redeemed |
(681,012 | ) | (10,369,329 | ) | (1,627,140 | ) | (26,146,151 | ) | ||||||||||||
|
|
|
|||||||||||||||||||
| Net increase (decrease) |
698,297 | $ | 9,851,154 | (294,706 | ) | $ | (5,000,453 | ) | ||||||||||||
|
|
|
|||||||||||||||||||
3. Transactions With Affiliates
Franklin Resources, Inc. is the holding company for various subsidiaries that together are referred to as Franklin Templeton Investments. Certain officers and trustees of the Fund are also officers and/or directors of the following subsidiaries:
| Subsidiary | Affiliation | |
| Franklin Advisers, Inc. (Advisers) |
Investment manager | |
| Franklin Templeton Services, LLC (FT Services) |
Administrative manager | |
| Franklin Templeton Distributors, Inc. (Distributors) |
Principal underwriter | |
| Franklin Templeton Investor Services, LLC (Investor Services) |
Transfer agent |
| FGI-18 | Semiannual Report |
FRANKLIN TEMPLETON VARIABLE INSURANCE PRODUCTS TRUST
NOTES TO FINANCIAL STATEMENTS (UNAUDITED)
Franklin Growth and Income VIP Fund (continued)
a. Management Fees
The Fund pays an investment management fee to Advisers based on the average daily net assets of the Fund as follows:
| Annualized Fee Rate | Net Assets | |
| 0.625% |
Up to and including $100 million | |
| 0.500% |
Over $100 million, up to and including $250 million | |
| 0.450% |
Over $250 million, up to and including $7.5 billion | |
| 0.440% |
Over $7.5 billion, up to and including $10 billion | |
| 0.430% |
Over $10 billion, up to and including $12.5 billion | |
| 0.420% |
Over $12.5 billion, up to and including $15 billion | |
| 0.400% |
In excess of $15 billion |
For the period ended June 30, 2016, the annualized effective investment management fee rate was 0.541% of the Fund’s average daily net assets.
b. Administrative Fees
Under an agreement with Advisers, FT Services provides administrative services to the Fund. The fee is paid by Advisers based on the Fund’s average daily net assets, and is not an additional expense of the Fund.
c. Distribution Fees
The Board has adopted a distribution plan for Class 2 shares pursuant to Rule 12b-1 under the 1940 Act. Under the Fund’s compensation distribution plan, the Fund pays Distributors for costs incurred in connection with the servicing, sale and distribution of the Fund’s shares up to 0.35% per year of its average daily net assets. The Board has agreed to limit the current rate to 0.25% per year for Class 2. The plan year, for purposes of monitoring compliance with the maximum annual plan rates, is February 1 through January 31.
d. Transfer Agent Fees
Investor Services, under terms of an agreement, performs shareholder servicing for the Fund and is not paid by the Fund for the services.
4. Expense Offset Arrangement
The Fund has entered into an arrangement with its custodian whereby credits realized as a result of uninvested cash balances are used to reduce a portion of the Fund’s custodian expenses. During the period ended June 30, 2016, there were no credits earned.
5. Income Taxes
At June 30, 2016, the cost of investments and net unrealized appreciation (depreciation) for income tax purposes were as follows:
| Cost of investments |
$ | 235,085,565 | ||
|
|
|
|||
| Unrealized appreciation |
$ | 60,482,902 | ||
| Unrealized depreciation |
(6,794,853 | ) | ||
|
|
|
|||
| Net unrealized appreciation (depreciation) |
$ | 53,688,049 | ||
|
|
|
Differences between income and/or capital gains as determined on a book basis and a tax basis are primarily due to differing treatments of bond discounts and premiums and wash sales.
| Semiannual Report | FGI-19 |
FRANKLIN TEMPLETON VARIABLE INSURANCE PRODUCTS TRUST
NOTES TO FINANCIAL STATEMENTS (UNAUDITED)
Franklin Growth and Income VIP Fund (continued)
6. Investment Transactions
Purchases and sales of investments (excluding short term securities) for the period ended June 30, 2016, aggregated $71,066,572 and $67,480,836, respectively.
7. Credit Facility
The Fund, together with other U.S. registered and foreign investment funds (collectively, Borrowers), managed by Franklin Templeton Investments, are borrowers in a joint syndicated senior unsecured credit facility totaling $2 billion (Global Credit Facility) which matures on February 10, 2017. This Global Credit Facility provides a source of funds to the Borrowers for temporary and emergency purposes, including the ability to meet future unanticipated or unusually large redemption requests.
Under the terms of the Global Credit Facility, the Fund shall, in addition to interest charged on any borrowings made by the Fund and other costs incurred by the Fund, pay its share of fees and expenses incurred in connection with the implementation and maintenance of the Global Credit Facility, based upon its relative share of the aggregate net assets of all of the Borrowers, including an annual commitment fee of 0.07% based upon the unused portion of the Global Credit Facility. Effective February 12, 2016, the annual commitment fee is 0.15%. These fees are reflected in other expenses in the Statement of Operations. During the period ended June 30, 2016, the Fund did not use the Global Credit Facility.
8. Fair Value Measurements
The Fund follows a fair value hierarchy that distinguishes between market data obtained from independent sources (observable inputs) and the Fund’s own market assumptions (unobservable inputs). These inputs are used in determining the value of the Fund’s financial instruments and are summarized in the following fair value hierarchy:
| • | Level 1 – quoted prices in active markets for identical financial instruments |
| • | Level 2 – other significant observable inputs (including quoted prices for similar financial instruments, interest rates, prepayment speed, credit risk, etc.) |
| • | Level 3 – significant unobservable inputs (including the Fund’s own assumptions in determining the fair value of financial instruments) |
The input levels are not necessarily an indication of the risk or liquidity associated with financial instruments at that level.
For movements between the levels within the fair value hierarchy, the Fund has adopted a policy of recognizing the transfers as of the date of the underlying event which caused the movement.
A summary of inputs used as of June 30, 2016, in valuing the Fund’s assets carried at fair value, is as follows:
| Level 1 | Level 2 | Level 3 | Total | |||||||||||||
| Assets: | ||||||||||||||||
| Investments in Securities: |
||||||||||||||||
| Equity Investmentsa,b |
$ | 263,673,136 | $ | — | $ | — | $ | 263,673,136 | ||||||||
| Equity-Linked Securities |
— | 15,253,431 | — | 15,253,431 | ||||||||||||
| Short Term Investments |
— | 9,847,047 | — | 9,847,047 | ||||||||||||
|
|
|
|||||||||||||||
| Total Investments in Securities |
$ | 263,673,136 | $ | 25,100,478 | $ | — | $ | 288,773,614 | ||||||||
|
|
|
|||||||||||||||
aIncludes common and convertible preferred stocks.
bFor detailed categories, see the accompanying Statement of Investments.
| FGI-20 | Semiannual Report |
FRANKLIN TEMPLETON VARIABLE INSURANCE PRODUCTS TRUST
NOTES TO FINANCIAL STATEMENTS (UNAUDITED)
Franklin Growth and Income VIP Fund (continued)
9. Subsequent Events
The Fund has evaluated subsequent events through the issuance of the financial statements and determined that no events have occurred that require disclosure.
Abbreviations
| Selected Portfolio | ||
| ADR | American Depositary Receipt | |
| Semiannual Report | FGI-21 |
Franklin High Income VIP Fund
This semiannual report for Franklin High Income VIP Fund covers the period ended June 30, 2016.
Class 1 Performance Summary as of June 30, 2016
The Fund’s Class 1 shares delivered a +8.28% total return for the six-month period ended June 30, 2016.
Performance reflects the Fund’s Class 1 operating expenses, but does not include any contract fees, expenses or sales charges. If they had been included, performance would be lower. These charges and deductions, particularly for variable life policies, can have a significant effect on contract values and insurance benefits. See the contract prospectus for a complete description of these expenses, including sales charges.
Performance data represent past performance, which does not guarantee future results. Investment return and principal value will fluctuate, and you may have a gain or loss when you sell your shares. Current performance may differ from figures shown.
| Semiannual Report | FH-1 |
FRANKLIN HIGH INCOME VIP FUND
Fund Goals and Main Investments
The Fund seeks a high level of current income with capital appreciation as a secondary goal. Under normal market conditions, the Fund invests predominantly in high yield, lower rated debt securities and preferred stocks.
Fund Risks
All investments involve risks, including possible loss of principal. The risks associated with higher yielding, lower rated securities include higher risk of default and loss of principal. Changes in the financial strength of a bond issuer or in a bond’s credit rating may affect its value. In addition, interest rate movements will affect the Fund’s share price and yield. Bond prices generally move in the opposite direction of interest rates. Thus, as prices of bonds in the Fund adjust to a rise in interest rates, the Fund’s share price may decline. Investment in foreign securities also involves special risks, including currency fluctuations, and political and economic uncertainty. The Fund is actively managed but there is no guarantee that the manager’s investment decisions will produce the desired results. The Fund’s prospectus also includes a description of the main investment risks.
Performance Overview
You can find the Fund’s six-month total return in the Performance Summary. In comparison, the Fund’s benchmark, the Credit Suisse (CS) High Yield Index, posted a +9.19% total return for the period under review.1 The Fund’s peers, as measured by the Lipper VIP High Yield Funds Classification Average, delivered a +6.52% total return.2
Economic and Market Overview
The U.S. economy grew moderately, as measured by gross domestic product in 2016’s first and second quarters, driven by consumer spending and exports. A decline in private inventory investment and nonresidential fixed investment contributed to the moderation. Although the unemployment rate rose from 4.7% in May to 4.9% in June, the increase was due to additional people entering the labor force, and for the entire period under review, unemployment declined slightly.3 Home sales and prices rose amid relatively low mortgage rates. Monthly retail sales grew during most of the review period, and rose to the highest level in April in more than a year, due to a broad-based increase across most retail categories. Inflation, as measured by
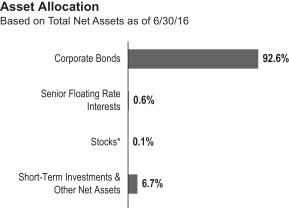
*Includes common and convertible preferred shares.
the Consumer Price Index, remained subdued overall even though it spiked to the highest level in three years in April mainly due to a rebound in energy prices.
After raising its target range for the federal funds rate to 0.25%–0.50% at its December meeting, the Federal Reserve (Fed) maintained the rate through-period end. Although the Fed hinted at an interest rate hike in June, subsequent reports showed job additions slowed substantially in May. Consequently, at its June meeting, the Fed kept the federal funds rates unchanged, and indicated that in determining the timing and size of future adjustments to the target range, it will assess realized and expected economic conditions relative to its objectives of maximum employment and 2.00% inflation. The Fed expects economic conditions to evolve in a manner that could warrant only gradual increases in the federal funds rate.
The 10-year Treasury yield, which moves inversely to price, declined during the period. It declined from a period high of 2.27% on December 31, 2015, and remained relatively low through period-end, reflecting investors’ concerns about global economic uncertainty. Negative interest rates in Japan and Europe, and central banks’ purchases of government bonds, also put downward pressure on U.S. yields. It touched a period low of 1.46% on June 27, 2016, and ended the period at 1.49%, after the Fed kept short-term interest rates unchanged and fears of Britain’s exit from the European Union (also known as the “Brexit”) boosted safe-haven buying by investors.
1. Source: Credit Suisse Group.
2. Source: Lipper, a Thomson Reuters Company.
One cannot invest directly in an index, and an index is not representative of the Fund’s portfolio. Please see Index Descriptions following the Fund Summaries.
3. Source: Bureau of Labor Statistics.
| FH-2 | Semiannual Report |
FRANKLIN HIGH INCOME VIP FUND
earnings growth and margin improvements may have already peaked and leverage ratios have ticked higher over the past few years, given the significant refinancing activity and earnings growth over the past several years, non-commodity high yield issuers have experienced below-average default rates. Spreads tightened during the period for many non-commodity related issuers, but given the prospect for more stable credit fundamentals, we still believed valuations to be relatively attractive across many of these industries.
In terms of the Fund’s performance, during the period the Fund underperformed the CS High Yield Index but outperformed the return of peer funds, as measured by the Lipper High Yield Funds Classification Average. The underperformance against the CS High Yield Index was primarily due to the Fund’s larger positioning in the energy sector as well as certain holdings in the media and health care sectors.4
During the period, we drew on our fundamental research process to make individual investment decisions and to overweight and underweight certain industries relative to our benchmark in an effort to potentially outperform. Overall, our industry exposure had a negative impact on relative returns during the period. For example, our overweighted position and security selection in the cable industry detracted from performance.5 Significant new issuance, merger and acquisition activity, a highly competitive landscape and potential spectrum sales caused volatility in the industry. Our overweighted position in large cap issuer Intelsat Jackson Holdings, a dominant player in the satellite market, also hurt Fund performance as the company’s highly leveraged balance sheet was pressured in the face of uncertain demand.
4. The health care sector comprises health care equipment and services and pharmaceuticals, biotechnology and life sciences in the SOI.
5. Cable is part of media in the SOI.
| Semiannual Report | FH-3 |
FRANKLIN HIGH INCOME VIP FUND
6. Metals and mining is part of materials in the SOI.
7. The aerospace and defense sector is part of capital goods in the SOI. The information technology sector comprises software and services and technology, hardware and equipment in the SOI.
| FH-4 | Semiannual Report |
FRANKLIN HIGH INCOME VIP FUND
Class 1 Fund Expenses
| Class 1 | Beginning Account Value 1/1/16 |
Ending Account Value 6/30/16 |
Fund-Level Expenses 1/1/16–6/30/16 |
|||||||||
| Actual |
$ | 1,000 | $ | 1,082.80 | $ | 3.16 | ||||||
| Hypothetical (5% return before expenses) |
$ | 1,000 | $ | 1,021.83 | $ | 3.07 | ||||||
*Expenses are calculated using the most recent six-month annualized expense ratio for the Fund’s Class 1 shares (0.61%), which does not include any ongoing expenses of the Contract for which the Fund is an investment option, multiplied by the average account value over the period, multiplied by 182/366 to reflect the one-half year period.
| Semiannual Report | FH-5 |
FRANKLIN TEMPLETON VARIABLE INSURANCE PRODUCTS TRUST
Financial Highlights
Franklin High Income VIP Fund
| Six Months Ended (unaudited) |
Year Ended December 31, | |||||||||||||||||||||||
| 2015 | 2014 | 2013 | 2012 | 2011 | ||||||||||||||||||||
| Class 1 | ||||||||||||||||||||||||
| Per share operating performance (for a share outstanding throughout the period) |
||||||||||||||||||||||||
| Net asset value, beginning of period |
$5.63 | $6.62 | $7.02 | $7.01 | $6.52 | $6.63 | ||||||||||||||||||
|
|
|
|||||||||||||||||||||||
| Income from investment operationsa: | ||||||||||||||||||||||||
| Net investment incomeb |
0.17 | 0.39 | 0.42 | 0.46 | 0.48 | 0.50 | ||||||||||||||||||
| Net realized and unrealized gains (losses) |
0.29 | (0.93 | ) | (0.38 | ) | 0.09 | 0.51 | (0.19 | ) | |||||||||||||||
|
|
|
|||||||||||||||||||||||
| Total from investment operations |
0.46 | (0.54 | ) | 0.04 | 0.55 | 0.99 | 0.31 | |||||||||||||||||
|
|
|
|||||||||||||||||||||||
| Less distributions from net investment income |
(0.42 | ) | (0.45 | ) | (0.44 | ) | (0.54 | ) | (0.50 | ) | (0.42 | ) | ||||||||||||
|
|
|
|||||||||||||||||||||||
| Net asset value, end of period |
$5.67 | $5.63 | $6.62 | $7.02 | $7.01 | $6.52 | ||||||||||||||||||
|
|
|
|||||||||||||||||||||||
| Total returnc |
8.28% | (8.88)% | 0.21% | 8.17% | 15.94% | 4.63% | ||||||||||||||||||
| Ratios to average net assetsd | ||||||||||||||||||||||||
| Expenses |
0.61% | e | 0.59% | e | 0.57% | e | 0.58% | e | 0.58% | 0.58% | ||||||||||||||
| Net investment income |
6.09% | 6.20% | 6.00% | 6.63% | 7.15% | 7.52% | ||||||||||||||||||
| Supplemental data | ||||||||||||||||||||||||
| Net assets, end of period (000’s) |
$26,977 | $26,835 | $34,552 | $39,300 | $42,166 | $41,971 | ||||||||||||||||||
| Portfolio turnover rate |
12.24% | 28.56% | 39.46% | 30.78% | 37.03% | 45.11% | ||||||||||||||||||
aThe amount shown for a share outstanding throughout the period may not correlate with the Statement of Operations for the period due to the timing of sales and repurchases of the Fund’s shares in relation to income earned and/or fluctuating fair value of the investments of the Fund.
bBased on average daily shares outstanding.
cTotal return does not include fees, charges or expenses imposed by the variable annuity and life insurance contracts for which Franklin Templeton Variable Insurance Products Trust serves as an underlying investment vehicle. Total return is not annualized for periods less than one year.
dRatios are annualized for periods less than one year.
eBenefit of expense reduction rounds to less than 0.01%.
| FH-6 | Semiannual Report | The accompanying notes are an integral part of these financial statements. |
FRANKLIN TEMPLETON VARIABLE INSURANCE PRODUCTS TRUST
FINANCIAL HIGHLIGHTS
Franklin High Income VIP Fund (continued)
| Six Months Ended (unaudited) |
Year Ended December 31, | |||||||||||||||||||||||
| 2015 | 2014 | 2013 | 2012 | 2011 | ||||||||||||||||||||
| Class 2 | ||||||||||||||||||||||||
| Per share operating performance (for a share outstanding throughout the period) |
||||||||||||||||||||||||
| Net asset value, beginning of period |
$5.44 | $6.41 | $6.81 | $6.82 | $6.36 | $6.47 | ||||||||||||||||||
|
|
|
|||||||||||||||||||||||
| Income from investment operationsa: | ||||||||||||||||||||||||
| Net investment incomeb |
0.16 | 0.36 | 0.39 | 0.43 | 0.46 | 0.47 | ||||||||||||||||||
| Net realized and unrealized gains (losses) |
0.29 | (0.90 | ) | (0.37 | ) | 0.08 | 0.48 | (0.18 | ) | |||||||||||||||
|
|
|
|||||||||||||||||||||||
| Total from investment operations |
0.45 | (0.54 | ) | 0.02 | 0.51 | 0.94 | 0.29 | |||||||||||||||||
|
|
|
|||||||||||||||||||||||
| Less distributions from net investment income |
(0.41 | ) | (0.43 | ) | (0.42 | ) | (0.52 | ) | (0.48 | ) | (0.40 | ) | ||||||||||||
|
|
|
|||||||||||||||||||||||
| Net asset value, end of period |
$5.48 | $5.44 | $6.41 | $6.81 | $6.82 | $6.36 | ||||||||||||||||||
|
|
|
|||||||||||||||||||||||
| Total returnc |
8.26% | (9.12)% | (0.02)% | 7.83% | 15.56% | 4.56% | ||||||||||||||||||
| Ratios to average net assetsd | ||||||||||||||||||||||||
| Expenses |
0.86% | e | 0.84% | e | 0.82% | e | 0.83% | e | 0.83% | 0.83% | ||||||||||||||
| Net investment income |
5.84% | 5.95% | 5.75% | 6.38% | 6.90% | 7.27% | ||||||||||||||||||
| Supplemental data | ||||||||||||||||||||||||
| Net assets, end of period (000’s) |
$212,063 | $205,339 | $261,944 | $291,826 | $281,851 | $249,452 | ||||||||||||||||||
| Portfolio turnover rate |
12.24% | 28.56% | 39.46% | 30.78% | 37.03% | 45.11% | ||||||||||||||||||
aThe amount shown for a share outstanding throughout the period may not correlate with the Statement of Operations for the period due to the timing of sales and repurchases of the Fund’s shares in relation to income earned and/or fluctuating fair value of the investments of the Fund.
bBased on average daily shares outstanding.
cTotal return does not include fees, charges or expenses imposed by the variable annuity and life insurance contracts for which Franklin Templeton Variable Insurance Products Trust serves as an underlying investment vehicle. Total return is not annualized for periods less than one year.
dRatios are annualized for periods less than one year.
eBenefit of expense reduction rounds to less than 0.01%.
| The accompanying notes are an integral part of these financial statements. | Semiannual Report | FH-7 |
FRANKLIN TEMPLETON VARIABLE INSURANCE PRODUCTS TRUST
FINANCIAL HIGHLIGHTS
Franklin High Income VIP Fund (continued)
| Six Months Ended (unaudited) |
Year Ended December 31, | |||||||||||||||||||||||
| 2015 | 2014 | 2013 | 2012 | 2011 | ||||||||||||||||||||
| Class 4 | ||||||||||||||||||||||||
| Per share operating performance (for a share outstanding throughout the period) |
||||||||||||||||||||||||
| Net asset value, beginning of period |
$5.56 | $6.54 | $6.94 | $6.94 | $6.46 | $6.57 | ||||||||||||||||||
|
|
|
|||||||||||||||||||||||
| Income from investment operationsa: | ||||||||||||||||||||||||
| Net investment incomeb |
0.16 | 0.37 | 0.39 | 0.43 | 0.46 | 0.47 | ||||||||||||||||||
| Net realized and unrealized gains (losses) |
0.29 | (0.92 | ) | (0.38 | ) | 0.08 | 0.49 | (0.18 | ) | |||||||||||||||
|
|
|
|||||||||||||||||||||||
| Total from investment operations |
0.45 | (0.55 | ) | 0.01 | 0.51 | 0.95 | 0.29 | |||||||||||||||||
|
|
|
|||||||||||||||||||||||
| Less distributions from net investment income |
(0.40 | ) | (0.43 | ) | (0.41 | ) | (0.51 | ) | (0.47 | ) | (0.40 | ) | ||||||||||||
|
|
|
|||||||||||||||||||||||
| Net asset value, end of period |
$5.61 | $5.56 | $6.54 | $6.94 | $6.94 | $6.46 | ||||||||||||||||||
|
|
|
|||||||||||||||||||||||
| Total returnc |
8.16% | (9.20)% | (0.15)% | 7.72% | 15.50% | 4.39% | ||||||||||||||||||
| Ratios to average net assetsd | ||||||||||||||||||||||||
| Expenses |
0.96% | e | 0.94% | e | 0.92% | e | 0.93% | e | 0.93% | 0.93% | ||||||||||||||
| Net investment income |
5.74% | 5.85% | 5.65% | 6.28% | 6.80% | 7.17% | ||||||||||||||||||
| Supplemental data | ||||||||||||||||||||||||
| Net assets, end of period (000’s) |
$22,798 | $21,708 | $25,740 | $27,789 | $27,664 | $27,055 | ||||||||||||||||||
| Portfolio turnover rate |
12.24% | 28.56% | 39.46% | 30.78% | 37.03% | 45.11% | ||||||||||||||||||
aThe amount shown for a share outstanding throughout the period may not correlate with the Statement of Operations for the period due to the timing of sales and repurchases of the Fund’s shares in relation to income earned and/or fluctuating fair value of the investments of the Fund.
bBased on average daily shares outstanding.
cTotal return does not include fees, charges or expenses imposed by the variable annuity and life insurance contracts for which Franklin Templeton Variable Insurance Products Trust serves as an underlying investment vehicle. Total return is not annualized for periods less than one year.
dRatios are annualized for periods less than one year.
eBenefit of expense reduction rounds to less than 0.01%.
| FH-8 | Semiannual Report | The accompanying notes are an integral part of these financial statements. |
FRANKLIN TEMPLETON VARIABLE INSURANCE PRODUCTS TRUST
Statement of Investments, June 30, 2016 (unaudited)
| Franklin High Income VIP Fund
|
||||||||||||||
| Country | Shares | Value | ||||||||||||
| Common Stocks (Cost $334,368) 0.0%† |
||||||||||||||
| Transportation 0.0%† |
||||||||||||||
| a,b | CEVA Holdings LLC |
United Kingdom | 224 | $ | 78,498 | |||||||||
|
|
|
|||||||||||||
| Convertible Preferred Stocks 0.1% |
||||||||||||||
| Transportation 0.1% |
||||||||||||||
| a,b | CEVA Holdings LLC, cvt. pfd., A-1 |
United Kingdom | 6 | 3,150 | ||||||||||
| a,b | CEVA Holdings LLC, cvt. pfd., A-2 |
United Kingdom | 486 | 169,928 | ||||||||||
|
|
|
|||||||||||||
| Total Convertible Preferred Stocks (Cost $731,855) |
173,078 | |||||||||||||
|
|
|
|||||||||||||
| Principal Amount* | ||||||||||||||
| Corporate Bonds 92.6% |
||||||||||||||
| Automobiles & Components 1.6% |
||||||||||||||
| Fiat Chrysler Automobiles NV, senior note, 5.25%, 4/15/23 |
United Kingdom | 3,000,000 | 2,987,774 | |||||||||||
| The Goodyear Tire & Rubber Co., |
||||||||||||||
| senior bond, 5.00%, 5/31/26 |
United States | 1,000,000 | 1,021,250 | |||||||||||
| senior note, 5.125%, 11/15/23 |
United States | 300,000 | 311,250 | |||||||||||
|
|
|
|||||||||||||
| 4,320,274 | ||||||||||||||
|
|
|
|||||||||||||
| Banks 5.3% |
||||||||||||||
| c | Bank of America Corp., junior sub. bond, M, 8.125% to 5/15/18, FRN thereafter, Perpetual |
United States | 2,500,000 | 2,509,375 | ||||||||||
| CIT Group Inc., senior note, |
||||||||||||||
| 5.375%, 5/15/20 |
United States | 1,000,000 | 1,045,000 | |||||||||||
| 5.00%, 8/15/22 |
United States | 2,700,000 | 2,754,000 | |||||||||||
| c | Citigroup Inc., junior sub. bond, M, 6.30% to 5/15/24, FRN thereafter, Perpetual |
United States | 2,800,000 | 2,789,220 | ||||||||||
| c | JPMorgan Chase & Co., junior sub. bond, R, 6.00% to 8/01/23, FRN thereafter, Perpetual |
United States | 2,500,000 | 2,559,375 | ||||||||||
| Royal Bank of Scotland Group PLC, sub. note, 6.125%, 12/15/22 |
United Kingdom | 2,000,000 | 2,098,910 | |||||||||||
|
|
|
|||||||||||||
| 13,755,880 | ||||||||||||||
|
|
|
|||||||||||||
| Capital Goods 1.3% |
||||||||||||||
| d | Bombardier Inc., senior bond, 144A, 7.50%, 3/15/25 |
Canada | 600,000 | 522,000 | ||||||||||
| Navistar International Corp., senior bond, 8.25%, 11/01/21 |
United States | 1,400,000 | 990,500 | |||||||||||
| TransDigm Inc., |
||||||||||||||
| senior sub. bond, 6.50%, 7/15/24 |
United States | 1,000,000 | 1,010,000 | |||||||||||
| senior sub. bond, 6.50%, 5/15/25 |
United States | 200,000 | 201,250 | |||||||||||
| d senior sub. bond, 144A, 6.375%, 6/15/26 |
United States | 300,000 | 299,625 | |||||||||||
| senior sub. note, 6.00%, 7/15/22 |
United States | 500,000 | 505,090 | |||||||||||
|
|
|
|||||||||||||
| 3,528,465 | ||||||||||||||
|
|
|
|||||||||||||
| Commercial & Professional Services 1.6% |
||||||||||||||
| d | Acosta Inc., senior note, 144A, 7.75%, 10/01/22 |
United States | 2,000,000 | 1,765,000 | ||||||||||
| b,e | Goss Graphic Systems Inc., senior sub. note, 12.25%, 11/19/05 |
United States | 1,912,374 | 191 | ||||||||||
| United Rentals North America Inc., senior bond, 5.75%, 11/15/24 |
United States | 2,500,000 | 2,531,250 | |||||||||||
|
|
|
|||||||||||||
| 4,296,441 | ||||||||||||||
|
|
|
|||||||||||||
| Consumer Durables & Apparel 3.3% |
||||||||||||||
| d | Hanesbrands Inc., senior bond, 144A, 4.875%, 5/15/26 |
United States | 1,600,000 | 1,613,760 | ||||||||||
| KB Home, |
||||||||||||||
| senior bond, 7.50%, 9/15/22 |
United States | 2,100,000 | 2,173,500 | |||||||||||
| senior note, 7.00%, 12/15/21 |
United States | 700,000 | 707,000 | |||||||||||
| d | Newell Brands Inc., senior note, 144A, 5.00%, 11/15/23 |
United States | 1,200,000 | 1,261,884 | ||||||||||
| Semiannual Report | FH-9 |
FRANKLIN TEMPLETON VARIABLE INSURANCE PRODUCTS TRUST
STATEMENT OF INVESTMENTS (UNAUDITED)
Franklin High Income VIP Fund (continued)
| Country | Principal Amount* | Value | ||||||||||||
| Corporate Bonds (continued) |
||||||||||||||
| Consumer Durables & Apparel (continued) |
||||||||||||||
| d | Taylor Morrison Communities Inc./Monarch Communities Inc., |
|||||||||||||
| 5.25%, 4/15/21 |
United States | 900,000 | $ | 902,250 | ||||||||||
| 5.875%, 4/15/23 |
United States | 600,000 | 606,000 | |||||||||||
| 5.625%, 3/01/24 |
United States | 1,500,000 | 1,470,000 | |||||||||||
|
|
|
|||||||||||||
| 8,734,394 | ||||||||||||||
|
|
|
|||||||||||||
| Consumer Services 3.7% |
||||||||||||||
| d | 1011778 BC ULC/New Red Finance Inc., |
|||||||||||||
| secured note, second lien, 144A, 6.00%, 4/01/22 |
Canada | 2,000,000 | 2,079,380 | |||||||||||
| senior secured note, first lien, 144A, 4.625%, 1/15/22 |
Canada | 900,000 | 915,750 | |||||||||||
| d | 24 Hour Holdings III LLC, senior note, 144A, 8.00%, 6/01/22 |
United States | 2,500,000 | 1,906,250 | ||||||||||
| d,e | Fontainebleau Las Vegas, senior secured bond, first lien, 144A, 11.00%, 6/15/15 |
United States | 1,700,000 | 3,358 | ||||||||||
| d | International Game Technology PLC, senior secured bond, 144A, 6.50%, 2/15/25 |
United States | 2,500,000 | 2,525,000 | ||||||||||
| d | Wynn Las Vegas LLC/Wynn Las Vegas Capital Corp., senior bond, 144A, 5.50%, 3/01/25 |
United States | 1,100,000 | 1,068,375 | ||||||||||
| d | Wynn Macau Ltd., senior note, 144A, 5.25%, 10/15/21 |
Macau | 1,200,000 | 1,161,000 | ||||||||||
|
|
|
|||||||||||||
| 9,659,113 | ||||||||||||||
|
|
|
|||||||||||||
| Diversified Financials 4.3% |
||||||||||||||
| AerCap Ireland Capital Ltd./AerCap Global Aviation Trust, senior note, 4.625%, 10/30/20 |
Netherlands | 1,700,000 | 1,760,359 | |||||||||||
| Deutsche Bank AG, sub. bond, 4.296% to 5/24/23, FRN thereafter, 5/24/28 |
Germany | 1,300,000 | 1,145,495 | |||||||||||
| d | KFC Holding Co./Pizza Hut Holdings LLC/Taco Bell of America LLC, senior note, 144A, |
|||||||||||||
| 5.00%, 6/01/24 |
United States | 1,000,000 | 1,027,500 | |||||||||||
| 5.25%, 6/01/26 |
United States | 1,000,000 | 1,027,500 | |||||||||||
| d | Lincoln Finance Ltd., senior secured note, 144A, 7.375%, 4/15/21 |
Netherlands | 1,600,000 | 1,662,000 | ||||||||||
| Navient Corp., senior note, 5.50%, 1/15/19 |
United States | 3,500,000 | 3,528,875 | |||||||||||
| d | OneMain Financial Holdings Inc., senior note, 144A, 7.25%, 12/15/21 |
United States | 1,100,000 | 1,058,750 | ||||||||||
|
|
|
|||||||||||||
| 11,210,479 | ||||||||||||||
|
|
|
|||||||||||||
| Energy 13.7% |
||||||||||||||
| California Resources Corp., |
||||||||||||||
| d secured note, second lien, 144A, 8.00%, 12/15/22 |
United States | 2,155,000 | 1,532,744 | |||||||||||
| senior bond, 6.00%, 11/15/24 |
United States | 621,000 | 305,842 | |||||||||||
| senior note, 5.50%, 9/15/21 |
United States | 184,000 | 93,840 | |||||||||||
| Calumet Specialty Products Partners LP/Calumet Finance Corp., senior note, |
||||||||||||||
| 7.75%, 4/15/23 |
United States | 1,500,000 | 1,068,750 | |||||||||||
| d 144A, 11.50%, 1/15/21 |
United States | 600,000 | 676,500 | |||||||||||
| CGG SA, senior note, 6.875%, 1/15/22 |
France | 2,300,000 | 1,012,000 | |||||||||||
| e,f | CHC Helicopter SA, |
|||||||||||||
| senior note, 9.375%, 6/01/21 |
Canada | 260,000 | 37,700 | |||||||||||
| senior secured note, first lien, 9.25%, 10/15/20 |
Canada | 2,700,000 | 1,215,000 | |||||||||||
| d | Cheniere Corpus Christi Holdings LLC, senior secured note, 144A, 7.00%, 6/30/24 |
United States | 1,000,000 | 1,028,130 | ||||||||||
| d | Chesapeake Energy Corp., secured note, second lien, 144A, 8.00%, 12/15/22 |
United States | 1,830,000 | 1,560,075 | ||||||||||
| FH-10 | Semiannual Report |
FRANKLIN TEMPLETON VARIABLE INSURANCE PRODUCTS TRUST
STATEMENT OF INVESTMENTS (UNAUDITED)
Franklin High Income VIP Fund (continued)
| Country | Principal Amount* | Value | ||||||||||||
| Corporate Bonds (continued) |
||||||||||||||
| Energy (continued) |
||||||||||||||
| CONSOL Energy Inc., senior note, |
||||||||||||||
| 5.875%, 4/15/22 |
United States | 1,100,000 | $ | 966,625 | ||||||||||
| 8.00%, 4/01/23 |
United States | 1,800,000 | 1,602,000 | |||||||||||
| CSI Compressco LP/CSI Compressco Finance Inc., senior note, 7.25%, 8/15/22 |
United States | 700,000 | 577,500 | |||||||||||
| Energy Transfer Equity LP, |
||||||||||||||
| senior note, first lien, 7.50%, 10/15/20 |
United States | 2,600,000 | 2,769,000 | |||||||||||
| senior secured bond, first lien, 5.875%, 1/15/24 |
United States | 400,000 | 391,000 | |||||||||||
| senior secured bond, first lien, 5.50%, 6/01/27 |
United States | 500,000 | 472,500 | |||||||||||
| e | Energy XXI Gulf Coast Inc., senior note, |
|||||||||||||
| 7.50%, 12/15/21 |
United States | 1,000,000 | 115,000 | |||||||||||
| 6.875%, 3/15/24 |
United States | 500,000 | 57,500 | |||||||||||
| d | EnQuest PLC, senior note, 144A, 7.00%, 4/15/22 |
United Kingdom | 2,500,000 | 1,528,125 | ||||||||||
| e | EPL Oil & Gas Inc., senior note, 8.25%, 2/15/18 |
United States | 1,400,000 | 154,000 | ||||||||||
| d | Ferrellgas LP/Ferrellgas Finance Corp., senior note, 144A, 6.75%, 6/15/23 |
United States | 2,400,000 | 2,118,000 | ||||||||||
| b,e | Goodrich Petroleum Corp., secured note, second lien, 144A, 8.875%, 3/15/18 |
United States | 1,250 | g | 125,000 | |||||||||
| e | Halcon Resources Corp., |
|||||||||||||
| senior note, 8.875%, 5/15/21 |
United States | 1,800,000 | 369,000 | |||||||||||
| d senior secured note, third lien, 144A, 13.00%, 2/15/22 |
United States | 1,170,000 | 625,950 | |||||||||||
| d,e | Linn Energy LLC/Finance Corp., senior secured note, second lien, 144A, 12.00%, 12/15/20 |
United States | 1,800,000 | 625,500 | ||||||||||
| Martin Midstream Partners LP/Martin Midstream Finance Corp., senior note, 7.25%, 2/15/21 |
United States | 1,100,000 | 1,023,000 | |||||||||||
| Memorial Resource Development Corp., senior note, 5.875%, 7/01/22 |
United States | 1,100,000 | 1,100,000 | |||||||||||
| e | Midstates Petroleum Co. Inc./LLC, senior note, 9.25%, 6/01/21 |
United States | 1,500,000 | 22,500 | ||||||||||
| d | Murray Energy Corp., secured note, second lien, 144A, 11.25%, 4/15/21 |
United States | 1,200,000 | 342,000 | ||||||||||
| d,e | Peabody Energy Corp., secured note, second lien, 144A, 10.00%, 3/15/22 |
United States | 2,700,000 | 364,500 | ||||||||||
| e | Penn Virginia Corp., senior note, 8.50%, 5/01/20 |
United States | 1,200,000 | 468,000 | ||||||||||
| QEP Resources Inc., senior bond, |
||||||||||||||
| 5.375%, 10/01/22 |
United States | 1,000,000 | 937,500 | |||||||||||
| 5.25%, 5/01/23 |
United States | 1,500,000 | 1,387,500 | |||||||||||
| Sabine Pass Liquefaction LLC, |
||||||||||||||
| first lien, 5.625%, 2/01/21 |
United States | 2,400,000 | 2,436,000 | |||||||||||
| first lien, 5.625%, 4/15/23 |
United States | 900,000 | 907,875 | |||||||||||
| senior secured note, first lien, 5.75%, 5/15/24 |
United States | 200,000 | 199,500 | |||||||||||
| Sanchez Energy Corp., senior note, |
||||||||||||||
| 7.75%, 6/15/21 |
United States | 1,800,000 | 1,534,500 | |||||||||||
| 6.125%, 1/15/23 |
United States | 1,000,000 | 777,500 | |||||||||||
| Weatherford International Ltd., senior note, |
||||||||||||||
| 7.75%, 6/15/21 |
United States | 1,000,000 | 977,500 | |||||||||||
| 8.25%, 6/15/23 |
United States | 1,300,000 | 1,238,250 | |||||||||||
| WPX Energy Inc., senior note, 8.25%, 8/01/23 |
United States | 1,000,000 | 1,007,500 | |||||||||||
|
|
|
|||||||||||||
| 35,750,906 | ||||||||||||||
|
|
|
|||||||||||||
| Food, Beverage & Tobacco 2.6% |
||||||||||||||
| Cott Beverages Inc., senior note, 6.75%, 1/01/20 |
United States | 1,100,000 | 1,150,875 | |||||||||||
| d | Dole Food Co. Inc., senior secured note, 144A, 7.25%, 5/01/19 |
United States | 500,000 | 500,000 | ||||||||||
| Semiannual Report | FH-11 |
FRANKLIN TEMPLETON VARIABLE INSURANCE PRODUCTS TRUST
STATEMENT OF INVESTMENTS (UNAUDITED)
Franklin High Income VIP Fund (continued)
| Country | Principal Amount* | Value | ||||||||||||
| Corporate Bonds (continued) |
||||||||||||||
| Food, Beverage & Tobacco (continued) |
||||||||||||||
| d | JBS USA LLC/Finance Inc., |
|||||||||||||
| senior bond, 144A, 5.875%, 7/15/24 |
United States | 1,500,000 | $ | 1,460,625 | ||||||||||
| senior note, 144A, 8.25%, 2/01/20 |
United States | 1,000,000 | 1,040,000 | |||||||||||
| Post Holdings Inc., senior note, |
||||||||||||||
| 7.375%, 2/15/22 |
United States | 1,600,000 | 1,688,000 | |||||||||||
| d 144A, 6.75%, 12/01/21 |
United States | 600,000 | 636,000 | |||||||||||
| d 144A, 6.00%, 12/15/22 |
United States | 300,000 | 308,625 | |||||||||||
|
|
|
|||||||||||||
| 6,784,125 | ||||||||||||||
|
|
|
|||||||||||||
| Health Care Equipment & Services 5.6% |
||||||||||||||
| d | Acadia Healthcare Co. Inc., senior note, 144A, 6.50%, 3/01/24 |
United States | 700,000 | 712,250 | ||||||||||
| Alere Inc., senior sub. note, 6.50%, 6/15/20 |
United States | 200,000 | 200,000 | |||||||||||
| CHS/Community Health Systems Inc., senior note, |
||||||||||||||
| 7.125%, 7/15/20 |
United States | 700,000 | 652,463 | |||||||||||
| 6.875%, 2/01/22 |
United States | 2,300,000 | 2,024,000 | |||||||||||
| DaVita HealthCare Partners Inc., senior bond, 5.125%, 7/15/24 |
United States | 2,000,000 | 2,025,950 | |||||||||||
| HCA Inc., |
||||||||||||||
| senior bond, 5.875%, 5/01/23 |
United States | 1,000,000 | 1,068,750 | |||||||||||
| senior bond, 5.375%, 2/01/25 |
United States | 1,500,000 | 1,541,250 | |||||||||||
| senior secured note, first lien, 5.00%, 3/15/24 |
United States | 2,300,000 | 2,386,250 | |||||||||||
| d | MPH Acquisition Holdings LLC, senior note, 144A, 7.125%, 6/01/24 |
United States | 400,000 | 421,000 | ||||||||||
| Tenet Healthcare Corp., senior note, |
||||||||||||||
| 5.00%, 3/01/19 |
United States | 200,000 | 194,500 | |||||||||||
| 8.125%, 4/01/22 |
United States | 3,000,000 | 3,089,400 | |||||||||||
| 6.75%, 6/15/23 |
United States | 300,000 | 288,375 | |||||||||||
|
|
|
|||||||||||||
| 14,604,188 | ||||||||||||||
|
|
|
|||||||||||||
| Materials 13.2% |
||||||||||||||
| d | American Builders & Contractors Supply Co. Inc., senior note, 144A, 5.625%, 4/15/21 |
United States | 2,100,000 | 2,178,750 | ||||||||||
| ArcelorMittal, senior note, |
||||||||||||||
| 6.50%, 3/01/21 |
France | 1,900,000 | 1,961,702 | |||||||||||
| 6.125%, 6/01/25 |
France | 700,000 | 700,000 | |||||||||||
| d | Ardagh Packaging Finance PLC/Ardagh MP Holdings USA Inc., senior note, 144A, |
|||||||||||||
| 7.00%, 11/15/20 |
Luxembourg | 176,471 | 173,824 | |||||||||||
| 6.75%, 1/31/21 |
Luxembourg | 300,000 | 302,250 | |||||||||||
| 6.00%, 6/30/21 |
Luxembourg | 1,900,000 | 1,895,250 | |||||||||||
| d | Barminco Finance Pty. Ltd., senior note, 144A, 9.00%, 6/01/18 |
Australia | 1,600,000 | 1,329,504 | ||||||||||
| d | Blue Cube Spinco Inc., senior bond, 144A, 10.00%, 10/15/25 |
United States | 1,200,000 | 1,392,000 | ||||||||||
| d | BlueScope Steel Ltd./BlueScope Steel Finance, senior note, 144A, 7.125%, 5/01/18 |
Australia | 738,000 | 767,520 | ||||||||||
| d | Cemex Finance LLC, senior secured note, first lien, 144A, 6.00%, 4/01/24 |
Mexico | 1,700,000 | 1,652,553 | ||||||||||
| d | Cemex SAB de CV, senior secured bond, first lien, 144A, 6.125%, 5/05/25 |
Mexico | 1,400,000 | 1,364,244 | ||||||||||
| The Chemours Co., |
||||||||||||||
| senior bond, 7.00%, 5/15/25 |
United States | 500,000 | 421,875 | |||||||||||
| senior note, 6.625%, 5/15/23 |
United States | 1,800,000 | 1,539,000 | |||||||||||
| d | CVR Partners LP/CVR Nitrogen Finance Corp., 144A, 9.25%, 6/15/23 |
United States | 1,000,000 | 1,021,250 | ||||||||||
| d | Eldorado Gold Corp., senior note, 144A, 6.125%, 12/15/20 |
Canada | 1,600,000 | 1,608,000 | ||||||||||
| FH-12 | Semiannual Report |
FRANKLIN TEMPLETON VARIABLE INSURANCE PRODUCTS TRUST
STATEMENT OF INVESTMENTS (UNAUDITED)
Franklin High Income VIP Fund (continued)
| Country | Principal Amount* | Value | ||||||||||||
| Corporate Bonds (continued) |
||||||||||||||
| Materials (continued) |
||||||||||||||
| d | First Quantum Minerals Ltd., senior note, 144A, |
|||||||||||||
| 6.75%, 2/15/20 |
Canada | 2,000,000 | $ | 1,680,000 | ||||||||||
| 7.00%, 2/15/21 |
Canada | 1,836,000 | 1,484,865 | |||||||||||
| d | FMG Resources (August 2006) Pty. Ltd., senior secured note, 144A, 9.75%, 3/01/22 |
Australia | 1,000,000 | 1,110,000 | ||||||||||
| d | NOVA Chemicals Corp., senior bond, 144A, 5.00%, 5/01/25 |
Canada | 2,000,000 | 1,985,000 | ||||||||||
| d | Owens-Brockway Glass Container Inc., senior note, 144A, |
|||||||||||||
| 5.00%, 1/15/22 |
United States | 1,400,000 | 1,407,000 | |||||||||||
| 5.875%, 8/15/23 |
United States | 600,000 | 631,377 | |||||||||||
| d | Platform Specialty Products Corp., senior note, 144A, |
|||||||||||||
| 10.375%, 5/01/21 |
United States | 300,000 | 303,000 | |||||||||||
| 6.50%, 2/01/22 |
United States | 1,500,000 | 1,327,500 | |||||||||||
| d | Rain CII Carbon LLC/CII Carbon Corp., second lien, 144A, 8.25%, 1/15/21 |
United States | 1,200,000 | 978,000 | ||||||||||
| d | Reynolds Group Issuer Inc./Reynolds Group Issuer LLC/Reynolds Group Issuer Luxembourg SA, |
|||||||||||||
| first lien, 144A, 5.125%, 7/15/23 |
United States | 1,200,000 | 1,216,500 | |||||||||||
| senior note, 144A, 7.00%, 7/15/24 |
United States | 500,000 | 515,687 | |||||||||||
| Steel Dynamics Inc., |
||||||||||||||
| senior bond, 5.50%, 10/01/24 |
United States | 800,000 | 820,000 | |||||||||||
| senior note, 5.125%, 10/01/21 |
United States | 800,000 | 821,000 | |||||||||||
| d | Summit Materials LLC/Summit Materials Finance Corp., senior note, 144A, 8.50%, 4/15/22 |
United States | 1,800,000 | 1,914,750 | ||||||||||
| e | Verso Paper Holdings LLC/Inc., senior secured note, first lien, 11.75%, 1/15/19 |
United States | 451,000 | 77,798 | ||||||||||
|
|
|
|||||||||||||
| 34,580,199 | ||||||||||||||
|
|
|
|||||||||||||
| Media 10.2% |
||||||||||||||
| d | Altice U.S. Finance I Corp., senior secured bond, 144A, 5.50%, 5/15/26 |
United States | 1,500,000 | 1,503,750 | ||||||||||
| AMC Networks Inc., senior note, 5.00%, 4/01/24 |
United States | 1,500,000 | 1,490,437 | |||||||||||
| CCO Holdings LLC/CCO Holdings Capital Corp., senior bond, |
||||||||||||||
| 5.25%, 9/30/22 |
United States | 1,000,000 | 1,028,750 | |||||||||||
| d 144A, 5.375%, 5/01/25 |
United States | 800,000 | 814,000 | |||||||||||
| d 144A, 5.75%, 2/15/26 |
United States | 500,000 | 516,250 | |||||||||||
| Clear Channel Worldwide Holdings Inc., |
||||||||||||||
| senior note, 6.50%, 11/15/22 |
United States | 1,000,000 | 1,005,000 | |||||||||||
| senior sub. note, 7.625%, 3/15/20 |
United States | 1,100,000 | 1,052,150 | |||||||||||
| CSC Holdings LLC, senior note, |
||||||||||||||
| 6.75%, 11/15/21 |
United States | 1,500,000 | 1,533,750 | |||||||||||
| 5.25%, 6/01/24 |
United States | 1,000,000 | 910,000 | |||||||||||
| DISH DBS Corp., senior note, 5.875%, 11/15/24 |
United States | 3,500,000 | 3,281,250 | |||||||||||
| Gannett Co. Inc., |
||||||||||||||
| senior bond, 6.375%, 10/15/23 |
United States | 2,000,000 | 2,132,500 | |||||||||||
| senior note, 5.125%, 7/15/20 |
United States | 500,000 | 516,875 | |||||||||||
| iHeartCommunications Inc., |
||||||||||||||
| senior secured bond, first lien, 9.00%, 3/01/21 |
United States | 2,500,000 | 1,771,875 | |||||||||||
| senior secured note, first lien, 9.00%, 9/15/22 |
United States | 700,000 | 488,250 | |||||||||||
| d | Radio One Inc., senior sub. note, 144A, 9.25%, 2/15/20 |
United States | 800,000 | 712,000 | ||||||||||
| d | Sirius XM Radio Inc., senior bond, 144A, 6.00%, 7/15/24 |
United States | 2,500,000 | 2,590,625 | ||||||||||
| d | Virgin Media Finance PLC, senior bond, 144A, 6.375%, 4/15/23 |
United Kingdom | 1,700,000 | 1,708,500 | ||||||||||
| Semiannual Report | FH-13 |
FRANKLIN TEMPLETON VARIABLE INSURANCE PRODUCTS TRUST
STATEMENT OF INVESTMENTS (UNAUDITED)
Franklin High Income VIP Fund (continued)
| Country | Principal Amount* | Value | ||||||||||||
| Corporate Bonds (continued) |
||||||||||||||
| Media (continued) |
||||||||||||||
| d | Virgin Media Secured Finance PLC, senior secured bond, first lien, 144A, 5.50%, 1/15/25 |
United Kingdom | 1,100,000 | $ | 1,084,875 | |||||||||
| d | WMG Acquisition Corp., senior note, 144A, 5.625%, 4/15/22 |
United States | 2,500,000 | 2,565,625 | ||||||||||
|
|
|
|||||||||||||
| 26,706,462 | ||||||||||||||
|
|
|
|||||||||||||
| Pharmaceuticals, Biotechnology & Life Sciences 3.7% |
||||||||||||||
| d | Concordia International Corp., senior note, 144A, 7.00%, 4/15/23 |
Canada | 1,300,000 | 1,114,750 | ||||||||||
| d | Endo Finance LLC/Endo Ltd./Endo Finco Inc., |
|||||||||||||
| senior bond, 144A, 6.00%, 2/01/25 |
United States | 1,500,000 | 1,308,750 | |||||||||||
| senior note, 144A, 6.00%, 7/15/23 |
United States | 700,000 | 619,500 | |||||||||||
| Horizon Pharma Inc., senior note, 6.625%, 5/01/23 |
United States | 2,500,000 | 2,325,000 | |||||||||||
| d | Jaguar Holding Co. II/Pharmaceutical Product Development LLC, senior note, 144A, 6.375%, 8/01/23 |
United States | 900,000 | 922,500 | ||||||||||
| d | Valeant Pharmaceuticals International, senior note, 144A, 6.375%, 10/15/20 |
United States | 3,000,000 | 2,595,000 | ||||||||||
| d | Valeant Pharmaceuticals International Inc., |
|||||||||||||
| senior bond, 144A, 6.125%, 4/15/25 |
United States | 700,000 | 563,500 | |||||||||||
| senior note, 144A, 5.625%, 12/01/21 |
United States | 300,000 | 249,000 | |||||||||||
|
|
|
|||||||||||||
| 9,698,000 | ||||||||||||||
|
|
|
|||||||||||||
| Real Estate 1.1% |
||||||||||||||
| Equinix Inc., senior bond, 5.375%, 4/01/23 |
United States | 2,800,000 | 2,905,000 | |||||||||||
|
|
|
|||||||||||||
| Retailing 1.4% |
||||||||||||||
| d | Argos Merger Sub Inc., senior note, 144A, 7.125%, 3/15/23 |
United States | 1,600,000 | 1,650,000 | ||||||||||
| Netflix Inc., senior bond, 5.875%, 2/15/25 |
United States | 1,900,000 | 2,002,125 | |||||||||||
|
|
|
|||||||||||||
| 3,652,125 | ||||||||||||||
|
|
|
|||||||||||||
| Semiconductors & Semiconductor Equipment 0.8% |
||||||||||||||
| d | Microsemi Corp., senior note, 144A, 9.125%, 4/15/23 |
United States | 700,000 | 773,500 | ||||||||||
| d | Qorvo Inc., senior bond, 144A, 7.00%, 12/01/25 |
United States | 1,200,000 | 1,272,000 | ||||||||||
|
|
|
|||||||||||||
| 2,045,500 | ||||||||||||||
|
|
|
|||||||||||||
| Software & Services 3.0% |
||||||||||||||
| d | BMC Software Finance Inc., senior note, 144A, 8.125%, 7/15/21 |
United States | 3,000,000 | 2,265,000 | ||||||||||
| d | First Data Corp., |
|||||||||||||
| second lien, 144A, 5.75%, 1/15/24 |
United States | 2,900,000 | 2,885,500 | |||||||||||
| senior note, 144A, 7.00%, 12/01/23 |
United States | 700,000 | 713,125 | |||||||||||
| Infor (U.S.) Inc., senior note, 6.50%, 5/15/22 |
United States | 2,000,000 | 1,898,760 | |||||||||||
|
|
|
|||||||||||||
| 7,762,385 | ||||||||||||||
|
|
|
|||||||||||||
| Technology Hardware & Equipment 3.0% |
||||||||||||||
| d | Blackboard Inc., senior note, 144A, 7.75%, 11/15/19 |
United States | 2,000,000 | 1,690,000 | ||||||||||
| d | CommScope Technologies Finance LLC, senior bond, 144A, 6.00%, 6/15/25 |
United States | 1,600,000 | 1,648,000 | ||||||||||
| d | Diamond 1 Finance Corp./Diamond 2 Finance Corp., |
|||||||||||||
| senior note, 144A, 5.875%, 6/15/21 |
United States | 300,000 | 307,734 | |||||||||||
| senior note, 144A, 7.125%, 6/15/24 |
United States | 300,000 | 313,801 | |||||||||||
| senior secured bond, first lien, 144A, 5.45%, 6/15/23 |
United States | 700,000 | 726,873 | |||||||||||
| senior secured bond, first lien, 144A, 6.02%, 6/15/26 |
United States | 500,000 | 519,703 | |||||||||||
| d | Western Digital Corp., senior note, 144A, 10.50%, 4/01/24 |
United States | 2,400,000 | 2,574,000 | ||||||||||
|
|
|
|||||||||||||
| 7,780,111 | ||||||||||||||
|
|
|
|||||||||||||
| FH-14 | Semiannual Report |
FRANKLIN TEMPLETON VARIABLE INSURANCE PRODUCTS TRUST
STATEMENT OF INVESTMENTS (UNAUDITED)
Franklin High Income VIP Fund (continued)
| Country | Principal Amount* | Value | ||||||||||||
| Corporate Bonds (continued) |
||||||||||||||
| Telecommunication Services 9.1% |
||||||||||||||
| CenturyLink Inc., |
||||||||||||||
| senior bond, 6.75%, 12/01/23 |
United States | 300,000 | $ | 295,875 | ||||||||||
| senior note, 6.45%, 6/15/21 |
United States | 400,000 | 407,500 | |||||||||||
| senior note, 5.80%, 3/15/22 |
United States | 2,500,000 | 2,436,725 | |||||||||||
| d | Digicel Group Ltd., senior note, 144A, 8.25%, 9/30/20 |
Bermuda | 1,500,000 | 1,257,120 | ||||||||||
| d | Digicel Ltd., senior note, 144A, 6.00%, 4/15/21 |
Bermuda | 2,200,000 | 1,894,750 | ||||||||||
| Intelsat Jackson Holdings SA, |
||||||||||||||
| senior bond, 5.50%, 8/01/23 |
Luxembourg | 1,500,000 | 960,000 | |||||||||||
| senior note, 7.50%, 4/01/21 |
Luxembourg | 3,800,000 | 2,641,000 | |||||||||||
| Sprint Communications Inc., senior note, |
||||||||||||||
| 8.375%, 8/15/17 |
United States | 1,500,000 | 1,545,000 | |||||||||||
| d 144A, 9.00%, 11/15/18 |
United States | 3,000,000 | 3,206,250 | |||||||||||
| Sprint Corp., senior bond, |
||||||||||||||
| 7.875%, 9/15/23 |
United States | 500,000 | 411,250 | |||||||||||
| 7.125%, 6/15/24 |
United States | 500,000 | 398,125 | |||||||||||
| T-Mobile USA Inc., |
||||||||||||||
| senior bond, 6.50%, 1/15/24 |
United States | 900,000 | 950,625 | |||||||||||
| senior bond, 6.375%, 3/01/25 |
United States | 1,600,000 | 1,678,000 | |||||||||||
| senior note, 6.542%, 4/28/20 |
United States | 1,600,000 | 1,650,016 | |||||||||||
| senior note, 6.125%, 1/15/22 |
United States | 200,000 | 210,500 | |||||||||||
| senior note, 6.00%, 4/15/24 |
United States | 600,000 | 625,500 | |||||||||||
| d | Wind Acquisition Finance SA, |
|||||||||||||
| secured note, second lien, 144A, 7.375%, 4/23/21 |
Italy | 3,000,000 | 2,859,015 | |||||||||||
| senior secured note, first lien, 144A, 4.75%, 7/15/20 |
Italy | 500,000 | 492,500 | |||||||||||
|
|
|
|||||||||||||
| 23,919,751 | ||||||||||||||
|
|
|
|||||||||||||
| Transportation 0.9% |
||||||||||||||
| d | Florida East Coast Holdings Corp., |
|||||||||||||
| secured note, first lien, 144A, 6.75%, 5/01/19 |
United States | 900,000 | 900,000 | |||||||||||
| senior note, 144A, 9.75%, 5/01/20 |
United States | 500,000 | 427,500 | |||||||||||
| d | Stena International SA, senior secured bond, first lien, 144A, 5.75%, 3/01/24 |
Sweden | 1,300,000 | 1,072,500 | ||||||||||
|
|
|
|||||||||||||
| 2,400,000 | ||||||||||||||
|
|
|
|||||||||||||
| Utilities 3.2% |
||||||||||||||
| Calpine Corp., |
||||||||||||||
| senior bond, 5.75%, 1/15/25 |
United States | 1,200,000 | 1,171,500 | |||||||||||
| senior note, 5.375%, 1/15/23 |
United States | 1,300,000 | 1,274,000 | |||||||||||
| d senior secured bond, first lien, 144A, 5.875%, 1/15/24 |
United States | 400,000 | 418,000 | |||||||||||
| d | InterGen NV, secured bond, 144A, 7.00%, 6/30/23 |
Netherlands | 3,000,000 | 2,137,500 | ||||||||||
| NRG Yield Operating LLC, senior bond, 5.375%, 8/15/24 |
United States | 2,000,000 | 2,000,000 | |||||||||||
| Talen Energy Supply LLC, senior bond, 6.50%, 6/01/25 |
United States | 700,000 | 584,500 | |||||||||||
| d,e | Texas Competitive Electric Holdings Co. LLC/Texas Competitive |
|||||||||||||
| Electric Holdings Finance Inc., senior secured note, first lien, 144A, 11.50%, 10/01/20 |
United States | 2,500,000 | 856,250 | |||||||||||
|
|
|
|||||||||||||
| 8,441,750 | ||||||||||||||
|
|
|
|||||||||||||
| Total Corporate Bonds (Cost $273,011,528) |
242,535,548 | |||||||||||||
|
|
|
|||||||||||||
| h,i | Senior Floating Rate Interests (Cost $1,515,654) 0.6% |
|||||||||||||
| Household & Personal Products 0.6% |
||||||||||||||
| Sun Products Corp., Tranche B Term Loan, 5.50%, 3/23/20 |
United States | 1,524,607 | 1,527,466 | |||||||||||
|
|
|
|||||||||||||
| Semiannual Report | FH-15 |
FRANKLIN TEMPLETON VARIABLE INSURANCE PRODUCTS TRUST
STATEMENT OF INVESTMENTS (UNAUDITED)
Franklin High Income VIP Fund (continued)
| Country | Shares | Value | ||||||||||||
| Escrows and Litigation Trusts (Cost $ —) 0.0% |
||||||||||||||
| a,b | NewPage Corp., Litigation Trust |
United States | 2,500,000 | $ | — | |||||||||
|
|
|
|||||||||||||
| Total Investments before Short Term Investments |
244,314,590 | |||||||||||||
|
|
|
|||||||||||||
| Principal Amount* | ||||||||||||||
| Short Term Investments (Cost $6,138,978) 2.4% |
||||||||||||||
| Repurchase Agreements 2.4% |
||||||||||||||
| j | Joint Repurchase Agreement, 0.382%, 7/01/16 |
United States | 6,138,978 | 6,138,978 | ||||||||||
| BNP Paribas Securities Corp. (Maturity Value $1,991,076) |
||||||||||||||
| Collateralized by U.S. Government Agency Securities, |
||||||||||||||
|
|
|
|||||||||||||
| Total Investments (Cost $281,732,383) 95.7% |
250,453,568 | |||||||||||||
| Other Assets, less Liabilities 4.3% |
11,385,555 | |||||||||||||
|
|
|
|||||||||||||
| Net Assets 100.0% |
$ | 261,839,123 | ||||||||||||
|
|
|
|||||||||||||
See Abbreviations on page FH-26.
†Rounds to less than 0.1% of net assets.
*The principal amount is stated in U.S. dollars unless otherwise indicated.
aNon-income producing.
bSecurity has been deemed illiquid because it may not be able to be sold within seven days. At June 30, 2016, the aggregate value of these securities was $376,767, representing 0.1% of net assets.
cPerpetual security with no stated maturity date.
dSecurity was purchased pursuant to Rule 144A under the Securities Act of 1933 and may be sold in transactions exempt from registration only to qualified institutional buyers or in a public offering registered under the Securities Act of 1933. These securities have been deemed liquid under guidelines approved by the Trust’s Board of Trustees. At June 30, 2016, the aggregate value of these securities was $118,323,476, representing 45.2% of net assets.
eSee Note 7 regarding defaulted securities.
fAt June 30, 2016, pursuant to the Fund’s policies and the requirements of applicable securities law, the Fund is restricted from trading these securities at period end.
gPrincipal amount is stated in 1,000 Units.
hSee Note 1(d) regarding senior floating rate interests.
iThe coupon rate shown represents the rate at period end.
j See Note 1(c) regarding joint repurchase agreement.
| FH-16 | Semiannual Report | The accompanying notes are an integral part of these financial statements. |
FRANKLIN TEMPLETON VARIABLE INSURANCE PRODUCTS TRUST
Financial Statements
Statement of Assets and Liabilities
June 30, 2016 (unaudited)
| Franklin High Income VIP Fund |
||||
| Assets: |
||||
| Investments in securities: |
||||
| Cost - Unaffiliated issuers |
$ | 275,593,405 | ||
| Cost - Repurchase agreements |
6,138,978 | |||
|
|
|
|||
| Total cost of investments |
$ | 281,732,383 | ||
|
|
|
|||
| Value - Unaffiliated issuers |
$ | 244,314,590 | ||
| Value - Repurchase agreements |
6,138,978 | |||
|
|
|
|||
| Total value of investments |
250,453,568 | |||
| Receivables: |
||||
| Investment securities sold |
2,461,918 | |||
| Capital shares sold |
5,319,321 | |||
| Interest |
4,029,675 | |||
| Other assets |
114 | |||
|
|
|
|||
| Total assets |
262,264,596 | |||
|
|
|
|||
| Liabilities: |
||||
| Payables: |
||||
| Capital shares redeemed |
139,627 | |||
| Management fees |
115,850 | |||
| Distribution fees |
100,363 | |||
| Trustees’ fees and expenses |
23 | |||
| Reports to shareholders |
40,904 | |||
| Professional fees |
21,956 | |||
| Accrued expenses and other liabilities |
6,750 | |||
|
|
|
|||
| Total liabilities |
425,473 | |||
|
|
|
|||
| Net assets, at value |
$ | 261,839,123 | ||
|
|
|
|||
| Net assets consist of: |
||||
| Paid-in capital |
$ | 315,989,450 | ||
| Undistributed net investment income |
5,579,077 | |||
| Net unrealized appreciation (depreciation) |
(31,278,815 | ) | ||
| Accumulated net realized gain (loss) |
(28,450,589 | ) | ||
|
|
|
|||
| Net assets, at value |
$ | 261,839,123 | ||
|
|
|
|||
| Class 1: | ||||
| Net assets, at value |
$ | 26,977,476 | ||
|
|
|
|||
| Shares outstanding |
4,754,968 | |||
|
|
|
|||
| Net asset value and maximum offering price per share |
$ | 5.67 | ||
|
|
|
|||
| Class 2: | ||||
| Net assets, at value |
$ | 212,063,417 | ||
|
|
|
|||
| Shares outstanding |
38,690,817 | |||
|
|
|
|||
| Net asset value and maximum offering price per share |
$ | 5.48 | ||
|
|
|
|||
| Class 4: | ||||
| Net assets, at value |
$ | 22,798,230 | ||
|
|
|
|||
| Shares outstanding |
4,061,095 | |||
|
|
|
|||
| Net asset value and maximum offering price per share |
$ | 5.61 | ||
|
|
|
|||
| The accompanying notes are an integral part of these financial statements. | Semiannual Report | FH-17 |
FRANKLIN TEMPLETON VARIABLE INSURANCE PRODUCTS TRUST
FINANCIAL STATEMENTS
Statement of Operations
for the six months ended June 30, 2016 (unaudited)
| Franklin High Income VIP Fund |
||||
| Investment income: |
||||
| Interest |
$ | 8,351,258 | ||
|
|
|
|||
| Expenses: |
||||
| Management fees (Note 3a) |
684,216 | |||
| Distribution fees: (Note 3c) |
||||
| Class 2 |
251,137 | |||
| Class 4 |
38,637 | |||
| Custodian fees (Note 4) |
1,079 | |||
| Reports to shareholders |
40,148 | |||
| Professional fees |
25,113 | |||
| Trustees’ fees and expenses |
669 | |||
| Other |
11,312 | |||
|
|
|
|||
| Total expenses |
1,052,311 | |||
| Expense reductions (Note 4) |
(17 | ) | ||
|
|
|
|||
| Net expenses |
1,052,294 | |||
|
|
|
|||
| Net investment income |
7,298,964 | |||
|
|
|
|||
| Realized and unrealized gains (losses): |
||||
| Net realized gain (loss) from investments |
(3,421,920 | ) | ||
| Net change in unrealized appreciation (depreciation) on investments |
15,969,619 | |||
|
|
|
|||
| Net realized and unrealized gain (loss) |
12,547,699 | |||
|
|
|
|||
| Net increase (decrease) in net assets resulting from operations |
$ | 19,846,663 | ||
|
|
|
|||
| FH-18 | Semiannual Report | The accompanying notes are an integral part of these financial statements. |
FRANKLIN TEMPLETON VARIABLE INSURANCE PRODUCTS TRUST
FINANCIAL STATEMENTS
Statements of Changes in Net Assets
| Franklin High Income VIP Fund | ||||||||
| Six Months Ended June 30, 2016 (unaudited) |
Year Ended December 31, 2015 |
|||||||
| Increase (decrease) in net assets: |
||||||||
| Operations: |
||||||||
| Net investment income |
$ | 7,298,964 | $ | 17,823,602 | ||||
| Net realized gain (loss) |
(3,421,920 | ) | (8,895,014 | ) | ||||
| Net change in unrealized appreciation (depreciation) |
15,969,619 | (34,561,954 | ) | |||||
|
|
|
|||||||
| Net increase (decrease) in net assets resulting from operations |
19,846,663 | (25,633,366 | ) | |||||
|
|
|
|||||||
| Distributions to shareholders from: |
||||||||
| Net investment income: |
||||||||
| Class 1 |
(1,890,311 | ) | (2,177,640 | ) | ||||
| Class 2 |
(14,579,216 | ) | (17,219,440 | ) | ||||
| Class 4 |
(1,529,698 | ) | (1,604,998 | ) | ||||
|
|
|
|||||||
| Total distributions to shareholders |
(17,999,225 | ) | (21,002,078 | ) | ||||
|
|
|
|||||||
| Capital share transactions: (Note 2) |
||||||||
| Class 1 |
(80,442 | ) | (2,896,859 | ) | ||||
| Class 2 |
5,355,423 | (18,609,864 | ) | |||||
| Class 4 |
834,627 | (212,162 | ) | |||||
|
|
|
|||||||
| Total capital share transactions |
6,109,608 | (21,718,885 | ) | |||||
|
|
|
|||||||
| Net increase (decrease) in net assets |
7,957,046 | (68,354,329 | ) | |||||
| Net assets: |
||||||||
| Beginning of period |
253,882,077 | 322,236,406 | ||||||
|
|
|
|||||||
| End of period |
$ | 261,839,123 | $ | 253,882,077 | ||||
|
|
|
|||||||
| Undistributed net investment income included in net assets: |
||||||||
| End of period |
$ | 5,579,077 | $ | 16,279,338 | ||||
|
|
|
|||||||
| The accompanying notes are an integral part of these financial statements. | Semiannual Report | FH-19 |
FRANKLIN TEMPLETON VARIABLE INSURANCE PRODUCTS TRUST
Notes to Financial Statements (unaudited)
Franklin High Income VIP Fund
| FH-20 | Semiannual Report |
FRANKLIN TEMPLETON VARIABLE INSURANCE PRODUCTS TRUST
NOTES TO FINANCIAL STATEMENTS (UNAUDITED)
Franklin High Income VIP Fund (continued)
| Semiannual Report | FH-21 |
FRANKLIN TEMPLETON VARIABLE INSURANCE PRODUCTS TRUST
NOTES TO FINANCIAL STATEMENTS (UNAUDITED)
Franklin High Income VIP Fund (continued)
1. Organization and Significant Accounting Policies (continued)
c. Joint Repurchase Agreement (continued)
and close-out all transactions, if any, traded under such agreements. The Fund may sell securities it holds as collateral and apply the proceeds towards the repurchase price and any other amounts owed by the seller to the Fund in the event of default by the seller. This could involve costs or delays in addition to a loss on the securities if their value falls below the repurchase price owed by the seller. The joint repurchase agreement held by the Fund at period end, as indicated in the Statement of Investments, had been entered into on June 30, 2016.
d. Senior Floating Rate Interests
The Fund invests in senior secured corporate loans that pay interest at rates which are periodically reset by reference to a base lending rate plus a spread. These base lending rates are generally the prime rate offered by a designated U.S. bank or the London InterBank Offered Rate (LIBOR). Senior secured corporate loans often require prepayment of principal from excess cash flows or at the discretion of the borrower. As a result, actual maturity may be substantially less than the stated maturity. Senior secured corporate loans in which the Fund invests are generally readily marketable, but may be subject to certain restrictions on resale.
e. Income and Deferred Taxes
It is the Fund’s policy to qualify as a regulated investment company under the Internal Revenue Code. The Fund intends to distribute to shareholders substantially all of its taxable income and net realized gains to relieve it from federal income and if applicable, excise taxes. As a result, no provision for U.S. federal income taxes is required.
The Fund may be subject to foreign taxation related to income received, capital gains on the sale of securities and certain foreign currency transactions in the foreign jurisdictions in which it invests. Foreign taxes, if any, are recorded based on the tax regulations and rates that exist in the foreign markets in which the Fund invests. When a capital gain tax is determined to apply, the Fund records an estimated deferred tax liability in an amount that would be payable if the securities were disposed of on the valuation date.
The Fund may recognize an income tax liability related to its uncertain tax positions under U.S. GAAP when the uncertain
tax position has a less than 50% probability that it will be sustained upon examination by the tax authorities based on its technical merits. As of June 30, 2016, the Fund has determined that no tax liability is required in its financial statements related to uncertain tax positions for any open tax years (or expected to be taken in future tax years). Open tax years are those that remain subject to examination and are based on each tax jurisdiction’s statute of limitation.
f. Security Transactions, Investment Income, Expenses and Distributions
Security transactions are accounted for on trade date. Realized gains and losses on security transactions are determined on a specific identification basis. Interest income and estimated expenses are accrued daily. Amortization of premium and accretion of discount on debt securities are included in interest income. Facility fees are recognized as income over the expected term of the loan. Distributions to shareholders are recorded on the ex-dividend date and are determined according to income tax regulations (tax basis). Distributable earnings determined on a tax basis may differ from earnings recorded in accordance with U.S. GAAP. These differences may be permanent or temporary. Permanent differences are reclassified among capital accounts to reflect their tax character. These reclassifications have no impact on net assets or the results of operations. Temporary differences are not reclassified, as they may reverse in subsequent periods.
Common expenses incurred by the Trust are allocated among the Funds based on the ratio of net assets of each Fund to the combined net assets of the Trust. Fund specific expenses are charged directly to the fund that incurred the expense.
Realized and unrealized gains and losses and net investment income, not including class specific expenses, are allocated daily to each class of shares based upon the relative proportion of net assets of each class. Differences in per share distributions, by class, are generally due to differences in class specific expenses.
g. Accounting Estimates
The preparation of financial statements in accordance with U.S. GAAP requires management to make estimates and assumptions that affect the reported amounts of assets and liabilities at the date of the financial statements and the amounts of income and expenses during the reporting period. Actual results could differ from those estimates.
| FH-22 | Semiannual Report |
FRANKLIN TEMPLETON VARIABLE INSURANCE PRODUCTS TRUST
NOTES TO FINANCIAL STATEMENTS (UNAUDITED)
Franklin High Income VIP Fund (continued)
2. Shares of Beneficial Interest
At June 30, 2016, there were an unlimited number of shares authorized (without par value). Transactions in the Fund’s shares were as follows:
| Six Months Ended June 30, 2016 |
Year Ended December 31, 2015 |
|||||||||||||||||||
| Shares | Amount | Shares | Amount | |||||||||||||||||
| Class 1 Shares: | ||||||||||||||||||||
| Shares sold |
48,240 | $ | 275,100 | 75,416 | $ | 488,620 | ||||||||||||||
| Shares issued in reinvestment of distributions |
336,354 | 1,890,311 | 345,109 | 2,177,640 | ||||||||||||||||
| Shares redeemed |
(395,202 | ) | (2,245,853 | ) | (874,142 | ) | (5,563,119 | ) | ||||||||||||
|
|
|
|||||||||||||||||||
| Net increase (decrease) |
(10,608 | ) | $ | (80,442 | ) | (453,617 | ) | $ | (2,896,859 | ) | ||||||||||
|
|
|
|||||||||||||||||||
| Class 2 Shares: | ||||||||||||||||||||
| Shares sold |
3,993,563 | $ | 21,674,166 | 8,301,712 | $ | 51,141,411 | ||||||||||||||
| Shares issued in reinvestment of distributions |
2,684,938 | 14,579,216 | 2,818,239 | 17,219,440 | ||||||||||||||||
| Shares redeemed |
(5,704,303 | ) | (30,897,959 | ) | (14,249,319 | ) | (86,970,715 | ) | ||||||||||||
|
|
|
|||||||||||||||||||
| Net increase (decrease) |
974,198 | $ | 5,355,423 | (3,129,368 | ) | $ | (18,609,864 | ) | ||||||||||||
|
|
|
|||||||||||||||||||
| Class 4 Shares: | ||||||||||||||||||||
| Shares sold |
175,339 | $ | 949,644 | 185,105 | $ | 1,139,732 | ||||||||||||||
| Shares issued in reinvestment of distributions |
275,125 | 1,529,698 | 256,800 | 1,604,998 | ||||||||||||||||
| Shares redeemed |
(290,428 | ) | (1,644,715 | ) | (474,184 | ) | (2,956,892 | ) | ||||||||||||
|
|
|
|||||||||||||||||||
| Net increase (decrease) |
160,036 | $ | 834,627 | (32,279 | ) | $ | (212,162 | ) | ||||||||||||
|
|
|
|||||||||||||||||||
3. Transactions With Affiliates
Franklin Resources, Inc. is the holding company for various subsidiaries that together are referred to as Franklin Templeton Investments. Certain officers and trustees of the Fund are also officers and/or directors of the following subsidiaries:
| Subsidiary | Affiliation | |
| Franklin Advisers, Inc. (Advisers) |
Investment manager | |
| Franklin Templeton Services, LLC (FT Services) |
Administrative manager | |
| Franklin Templeton Distributors, Inc. (Distributors) |
Principal underwriter | |
| Franklin Templeton Investor Services, LLC (Investor Services) |
Transfer agent |
| Semiannual Report | FH-23 |
FRANKLIN TEMPLETON VARIABLE INSURANCE PRODUCTS TRUST
NOTES TO FINANCIAL STATEMENTS (UNAUDITED)
Franklin High Income VIP Fund (continued)
3. Transactions With Affiliates (continued)
a. Management Fees
The Fund pays an investment management fee to Advisers based on the average daily net assets of the Fund as follows:
| Annualized Fee Rate | Net Assets | |
| 0.625% |
Up to and including $100 million | |
| 0.500% |
Over $100 million, up to and including $250 million | |
| 0.450% |
Over $250 million, up to and including $7.5 billion | |
| 0.440% |
Over $7.5 billion, up to and including $10 billion | |
| 0.430% |
Over $10 billion, up to and including $12.5 billion | |
| 0.420% |
Over $12.5 billion, up to and including $15 billion | |
| 0.400% |
In excess of $15 billion |
For the period ended June 30, 2016, the annualized effective investment management fee rate was 0.549% of the Fund’s average daily net assets.
b. Administrative Fees
Under an agreement with Advisers, FT Services provides administrative services to the Fund. The fee is paid by Advisers based on the Fund’s average daily net assets, and is not an additional expense of the Fund.
c. Distribution Fees
The Board has adopted distribution plans for Class 2 and Class 4 shares pursuant to Rule 12b-1 under the 1940 Act. Under the Fund’s compensation distribution plans, the Fund pays Distributors for costs incurred in connection with the servicing, sale and distribution of the Fund’s shares up to 0.35% per year of its average daily net assets of each class. The Board has agreed to limit the current rate to 0.25% per year for Class 2. The plan year, for purposes of monitoring compliance with the maximum annual plan rates, is February 1 through January 31.
d. Transfer Agent Fees
Investor Services, under terms of an agreement, performs shareholder servicing for the Fund and is not paid by the Fund for the services.
4. Expense Offset Arrangement
The Fund has entered into an arrangement with its custodian whereby credits realized as a result of uninvested cash balances are used to reduce a portion of the Fund’s custodian expenses. During the period ended June 30, 2016, the custodian fees were reduced as noted in the Statement of Operations.
5. Income Taxes
For tax purposes, capital losses may be carried over to offset future capital gains. Capital loss carryforwards with no expiration, if any, must be fully utilized before those losses with expiration dates.
| FH-24 | Semiannual Report |
FRANKLIN TEMPLETON VARIABLE INSURANCE PRODUCTS TRUST
NOTES TO FINANCIAL STATEMENTS (UNAUDITED)
Franklin High Income VIP Fund (continued)
At June 30, 2016, capital loss carryforwards were as follows:
| Capital loss carryforwards subject to expiration: |
||||
| 2016 |
$ | 5,148,804 | ||
| 2017 |
10,621,353 | |||
| Capital loss carryforwards not subject to expiration: |
||||
| Short term |
79,444 | |||
| Long term |
9,179,067 | |||
|
|
|
|||
| Total capital loss carryforwards |
$ | 25,028,668 | ||
|
|
|
|||
At June 30, 2016, the cost of investments and net unrealized appreciation (depreciation) for income tax purposes were as follows:
| Cost of investments |
$ | 282,994,655 | ||
|
|
|
|||
| Unrealized appreciation |
$ | 4,038,847 | ||
| Unrealized depreciation |
(36,579,934 | ) | ||
|
|
|
|||
| Net unrealized appreciation (depreciation) |
$ | (32,541,087 | ) | |
|
|
|
Differences between income and/or capital gains as determined on a book basis and a tax basis are primarily due to differing treatments of defaulted securities, bond discounts and premiums, and wash sales.
6. Investment Transactions
Purchases and sales of investments (excluding short term securities) for the period ended June 30, 2016, aggregated $29,309,337 and $33,186,100, respectively.
7. Credit Risk and Defaulted Securities
At June 30, 2016, the Fund had 95.5% of its portfolio invested in high yield securities, senior secured floating rate notes, or other securities rated below investment grade. These securities may be more sensitive to economic conditions causing greater price volatility and are potentially subject to a greater risk of loss due to default than higher rated securities.
The Fund held defaulted securities and/or other securities for which the income has been deemed uncollectible. At June 30, 2016, the aggregate value of these securities was $5,117,247, representing 2.0% of the Fund’s net assets. The Fund discontinues accruing income on securities for which income has been deemed uncollectible and provides an estimate for losses on interest receivable. The securities have been identified in the accompanying Statement of Investments.
8. Credit Facility
The Fund, together with other U.S. registered and foreign investment funds (collectively, Borrowers), managed by Franklin Templeton Investments, are borrowers in a joint syndicated senior unsecured credit facility totaling $2 billion (Global Credit Facility) which matures on February 10, 2017. This Global Credit Facility provides a source of funds to the Borrowers for temporary and emergency purposes, including the ability to meet future unanticipated or unusually large redemption requests.
Under the terms of the Global Credit Facility, the Fund shall, in addition to interest charged on any borrowings made by the Fund and other costs incurred by the Fund, pay its share of fees and expenses incurred in connection with the implementation and maintenance of the Global Credit Facility, based upon its relative share of the aggregate net assets of all of the Borrowers, including an annual commitment fee of 0.07% based upon the unused portion of the Global Credit Facility. Effective February 12, 2016, the annual commitment fee is 0.15%. These fees are reflected in other expenses in the Statement of Operations. During the period ended June 30, 2016, the Fund did not use the Global Credit Facility.
| Semiannual Report | FH-25 |
FRANKLIN TEMPLETON VARIABLE INSURANCE PRODUCTS TRUST
NOTES TO FINANCIAL STATEMENTS (UNAUDITED)
Franklin High Income VIP Fund (continued)
9. Fair Value Measurements
The Fund follows a fair value hierarchy that distinguishes between market data obtained from independent sources (observable inputs) and the Fund’s own market assumptions (unobservable inputs). These inputs are used in determining the value of the Fund’s financial instruments and are summarized in the following fair value hierarchy:
| • | Level 1 – quoted prices in active markets for identical financial instruments |
| • | Level 2 – other significant observable inputs (including quoted prices for similar financial instruments, interest rates, prepayment speed, credit risk, etc.) |
| • | Level 3 – significant unobservable inputs (including the Fund’s own assumptions in determining the fair value of financial instruments) |
The input levels are not necessarily an indication of the risk or liquidity associated with financial instruments at that level.
For movements between the levels within the fair value hierarchy, the Fund has adopted a policy of recognizing the transfers as of the date of the underlying event which caused the movement.
A summary of inputs used as of June 30, 2016, in valuing the Fund’s assets carried at fair value, is as follows:
| Level 1 | Level 2 | Level 3 | Total | |||||||||||||
| Assets: | ||||||||||||||||
| Investments in Securities |
||||||||||||||||
| Equity Investmentsa,b |
$ | — | $ | — | $ | 251,576 | $ | 251,576 | ||||||||
| Corporate Bonds |
— | 242,384,499 | 151,049 | 242,535,548 | ||||||||||||
| Senior Floating Rate Interests |
— | 1,527,466 | — | 1,527,466 | ||||||||||||
| Escrows and Litigation Trusts |
— | — | — | c | — | |||||||||||
| Short Term Investments |
— | 6,138,978 | — | 6,138,978 | ||||||||||||
|
|
|
|||||||||||||||
| Total Investments in Securities |
$ | — | $ | 250,050,943 | $ | 402,625 | $ | 250,453,568 | ||||||||
|
|
|
|||||||||||||||
aIncludes common and convertible preferred stocks.
bFor detailed categories, see the accompanying Statement of Investments.
cIncludes securities determined to have no value at June 30, 2016.
A reconciliation of assets in which Level 3 inputs are used in determining fair value is presented when there are significant Level 3 financial instruments at the end of the period.
10. Subsequent Events
The Fund has evaluated subsequent events through the issuance of the financial statements and determined that no events have occurred that require disclosure.
Abbreviations
| Selected Portfolio | ||
| FRN | Floating Rate Note | |
| FH-26 | Semiannual Report |
Franklin Income VIP Fund
We are pleased to bring you Franklin Income VIP Fund’s semiannual report for the period ended June 30, 2016.
Class 1 Performance Summary as of June 30, 2016
The Fund’s Class 1 shares delivered a +5.84% total return* for the six-month period ended June 30, 2016.
*The Fund has a fee waiver associated with any investment in a Franklin Templeton money fund and/or Franklin Templeton fund, as applicable, contractually guaranteed through at least the Fund’s current fiscal year-end. Fund investment results reflect the fee waiver, to the extent applicable; without this reduction, the results would have been lower.
Performance reflects the Fund’s Class 1 operating expenses, but does not include any contract fees, expenses or sales charges. If they had been included, performance would be lower. These charges and deductions, particularly for variable life policies, can have a significant effect on contract values and insurance benefits. See the contract prospectus for a complete description of these expenses, including sales charges.
Performance data represent past performance, which does not guarantee future results. Investment return and principal value will fluctuate, and you may have a gain or loss when you sell your shares. Current performance may differ from figures shown.
| Semiannual Report | FI-1 |
FRANKLIN INCOME VIP FUND
review, unemployment declined slightly.2 Home sales and prices rose amid relatively low mortgage rates. Monthly retail sales grew during most of the review period, and rose to the highest level in April in more than a year, due to a broad-based increase across most retail categories. Inflation, as measured by the Consumer Price Index, remained subdued overall even though it spiked to the highest level in three years in April mainly due to a rebound in energy prices.
After raising its target range for the federal funds rate to 0.25%–0.50% at its December meeting, the Federal Reserve (Fed) maintained the rate through-period end. Although the Fed hinted at an interest rate hike in June, subsequent reports showed job additions slowed substantially in May. Consequently, at its
1. Source: Morningstar. One cannot invest directly in an index, and an index is not representative of the Fund’s portfolio. Please see Index Descriptions following the Fund Summaries.
2. Source: Bureau of Labor Statistics.
| FI-2 | Semiannual Report |
FRANKLIN INCOME VIP FUND
The utilities sector was a significant contributor to Fund results. PG&E, The Southern Company and Xcel Energy delivered positive performance. Utilities have performed well as investors sought their perceived earnings stability and relatively high dividend yields. We trimmed some of our utility positions after we found opportunities in other sectors.
Industrials was another equity contributor during the period, and our position in General Electric helped results. The company continued to streamline its operations by divesting non-core businesses in an effort to increase its focus on the areas where it is a market leader. Defense contractors Lockheed Martin3 and Raytheon were strong performers as they benefited from a strengthening budget outlook due to continued political instability abroad. Both companies surpassed consensus investor expectations during the reporting period.
In contrast, the equity consumer discretionary and financials sectors were major detractors during the period. In consumer discretionary, auto makers General Motors, Fiat Chrysler3 and Ford Motor hurt Fund performance. Among financials, our positions in insurer MetLife, banking and financial services provider Wells Fargo & Co. and financial services firm
JPMorganChase & Co. were detrimental to results.
Most fixed income sectors delivered positive returns during the period. Within fixed income, the communications sector was a major contributor.4 Sprint bonds performed well as the company significantly increased its liquidity, which could provide the capital necessary to continue to improve its competitive position in the marketplace. Mass media company
3. Not held at period-end.
4. Communications holdings are in consumer discretionary and telecommunication services in the fixed income section of the SOI.
| Semiannual Report | FI-3 |
FRANKLIN INCOME VIP FUND
| Top Five Fixed Income and Senior Floating Rate Interests Holdings* |
||||
| 6/30/16 | ||||
| Issuer Sector/Industry |
% of Total Net Assets |
|||
| Weatherford International Ltd. Energy |
1.6% | |||
| CHS/Community Health Systems Inc. Health Care |
1.6% | |||
| DISH DBS Corp. Consumer Discretionary |
1.5% | |||
| Citigroup Inc. Financials |
1.3% | |||
| iHeartCommunications Inc. Consumer Discretionary |
1.2% | |||
*Does not include convertible bonds.
The dollar value, number of shares or principal amount, and names of all portfolio holdings are listed in the Fund’s Statement of Investments (SOI).
iHeartCommunications also did well as the company continued to post solid operating results and reduce its debt load.
Another significant contributor in fixed income was the technology sector.5 Our positions in business service management software developer BMC Software and payment technology company First Data, along with a new position in data storage company Western Digital, were standout performers.
Thank you for your participation in Franklin Income VIP Fund. We look forward to serving your future investment needs.
The foregoing information reflects our analysis, opinions and portfolio holdings as of June 30, 2016, the end of the reporting period. The way we implement our main investment strategies and the resulting portfolio holdings may change depending on factors such as market and economic conditions. These opinions may not be relied upon as investment advice or an offer for a particular security. The information is not a complete analysis of every aspect of any market, country, industry, security or the Fund. Statements of fact are from sources considered reliable, but the investment manager makes no representation or warranty as to their completeness or accuracy. Although historical performance is no guarantee of future results, these insights may help you understand our investment management philosophy.
5. Technology holdings are in information technology in the fixed income section of the SOI.
| FI-4 | Semiannual Report |
FRANKLIN INCOME VIP FUND
Class 1 Fund Expenses
| Class 1 | Beginning Account Value 1/1/16 |
Ending Account Value 6/30/16 |
Fund-Level
Expenses 1/1/16–6/30/16 |
|||||||||
| Actual |
$ | 1,000 | $ | 1,058.40 | $ | 2.25 | ||||||
| Hypothetical (5% return before expenses) |
$ | 1,000 | $ | 1,022.68 | $ | 2.21 | ||||||
*Expenses are calculated using the most recent six-month annualized expense ratio, net of expense waivers, for the Fund’s Class 1 shares (0.44%), which does not include any ongoing expenses of the Contract for which the Fund is an investment option, multiplied by the average account value over the period, multiplied by 182/366 to reflect the one-half year period.
| Semiannual Report | FI-5 |
FRANKLIN TEMPLETON VARIABLE INSURANCE PRODUCTS TRUST
Financial Highlights
Franklin Income VIP Fund
| Six Months Ended June 30, 2016 (unaudited) |
Year Ended December 31, | |||||||||||||||||||||||
| 2015 | 2014 | 2013 | 2012 | 2011 | ||||||||||||||||||||
| Class 1 | ||||||||||||||||||||||||
| Per share operating performance (for a share outstanding throughout the period) |
||||||||||||||||||||||||
| Net asset value, beginning of period |
$14.64 | $16.48 | $16.53 | $15.47 | $14.68 | $15.16 | ||||||||||||||||||
|
|
|
|||||||||||||||||||||||
| Income from investment operationsa: | ||||||||||||||||||||||||
| Net investment incomeb |
0.33 | 0.71 | 0.72 | 0.81 | 0.91 | 0.96 | ||||||||||||||||||
| Net realized and unrealized gains (losses) |
0.51 | (1.78 | ) | 0.11 | 1.31 | 0.90 | (0.54 | ) | ||||||||||||||||
|
|
|
|||||||||||||||||||||||
| Total from investment operations |
0.84 | (1.07 | ) | 0.83 | 2.12 | 1.81 | 0.42 | |||||||||||||||||
|
|
|
|||||||||||||||||||||||
| Less distributions from net investment income |
(0.78 | ) | (0.77 | ) | (0.88 | ) | (1.06 | ) | (1.02 | ) | (0.90 | ) | ||||||||||||
|
|
|
|||||||||||||||||||||||
| Net asset value, end of period |
$14.70 | $14.64 | $16.48 | $16.53 | $15.47 | $14.68 | ||||||||||||||||||
|
|
|
|||||||||||||||||||||||
| Total returnc |
5.84% | (6.84)% | 4.92% | 14.18% | 12.91% | 2.71% | ||||||||||||||||||
| Ratios to average net assetsd | ||||||||||||||||||||||||
| Expenses before waiver and payments by affiliates |
0.47% | 0.46% | 0.47% | 0.47% | 0.47% | 0.47% | ||||||||||||||||||
| Expenses net of waiver and payments by affiliates |
0.44% | e | 0.46% | e,f | 0.47% | e | 0.47% | e | 0.47% | 0.47% | e | |||||||||||||
| Net investment income |
4.52% | 4.47% | 4.26% | 5.07% | 6.03% | 6.35% | ||||||||||||||||||
| Supplemental data | ||||||||||||||||||||||||
| Net assets, end of period (000’s) |
$662,361 | $604,228 | $714,664 | $695,004 | $584,391 | $1,300,935 | ||||||||||||||||||
| Portfolio turnover rate |
27.34% | 31.53% | 24.77% | 21.71% | 26.66% | g | 28.65% | |||||||||||||||||
aThe amount shown for a share outstanding throughout the period may not correlate with the Statement of Operations for the period due to the timing of sales and repurchases of the Fund’s shares in relation to income earned and/or fluctuating fair value of the investments of the Fund.
bBased on average daily shares outstanding.
cTotal return does not include fees, charges or expenses imposed by the variable annuity and life insurance contracts for which Franklin Templeton Variable Insurance Products Trust serves as an underlying investment vehicle. Total return is not annualized for periods less than one year.
dRatios are annualized for periods less than one year.
eBenefit of expense reduction rounds to less than 0.01%.
fBenefit of waiver and payments by affiliates rounds to less than 0.01%.
gExcludes the value of portfolio securities delivered as a result of a redemption in-kind.
| FI-6 | Semiannual Report | The accompanying notes are an integral part of these financial statements. |
FRANKLIN TEMPLETON VARIABLE INSURANCE PRODUCTS TRUST
FINANCIAL HIGHLIGHTS
Franklin Income VIP Fund (continued)
| Six Months Ended (unaudited) |
Year Ended December 31, | |||||||||||||||||||||||
| 2015 | 2014 | 2013 | 2012 | 2011 | ||||||||||||||||||||
| Class 2 | ||||||||||||||||||||||||
| Per share operating performance (for a share outstanding throughout the period) |
||||||||||||||||||||||||
| Net asset value, beginning of period |
$14.20 | $16.00 | $16.07 | $15.07 | $14.32 | $14.82 | ||||||||||||||||||
|
|
|
|||||||||||||||||||||||
| Income from investment operationsa: | ||||||||||||||||||||||||
| Net investment incomeb |
0.30 | 0.65 | 0.66 | 0.75 | 0.85 | 0.90 | ||||||||||||||||||
| Net realized and unrealized gains (losses) |
0.49 | (1.73 | ) | 0.11 | 1.27 | 0.88 | (0.53 | ) | ||||||||||||||||
|
|
|
|||||||||||||||||||||||
| Total from investment operations |
0.79 | (1.08 | ) | 0.77 | 2.02 | 1.73 | 0.37 | |||||||||||||||||
|
|
|
|||||||||||||||||||||||
| Less distributions from net investment income |
(0.74 | ) | (0.72 | ) | (0.84 | ) | (1.02 | ) | (0.98 | ) | (0.87 | ) | ||||||||||||
|
|
|
|||||||||||||||||||||||
| Net asset value, end of period |
$14.25 | $14.20 | $16.00 | $16.07 | $15.07 | $14.32 | ||||||||||||||||||
|
|
|
|||||||||||||||||||||||
| Total returnc |
5.65% | (7.05)% | 4.62% | 13.94% | 12.65% | 2.38% | ||||||||||||||||||
| Ratios to average net assetsd | ||||||||||||||||||||||||
| Expenses before waiver and payments by affiliates |
0.72% | 0.71% | 0.72% | 0.72% | 0.72% | 0.72% | ||||||||||||||||||
| Expenses net of waiver and payments by affiliates |
0.69% | e | 0.71% | e,f | 0.72% | e | 0.72% | e | 0.72% | 0.72% | e | |||||||||||||
| Net investment income |
4.27% | 4.22% | 4.01% | 4.82% | 5.78% | 6.10% | ||||||||||||||||||
| Supplemental data | ||||||||||||||||||||||||
| Net assets, end of period (000’s) |
$4,921,752 | $4,907,599 | $6,022,804 | $6,188,045 | $6,182,997 | $5,915,637 | ||||||||||||||||||
| Portfolio turnover rate |
27.34% | 31.53% | 24.77% | 21.71% | 26.66% | g | 28.65% | |||||||||||||||||
aThe amount shown for a share outstanding throughout the period may not correlate with the Statement of Operations for the period due to the timing of sales and repurchases of the Fund’s shares in relation to income earned and/or fluctuating fair value of the investments of the Fund.
bBased on average daily shares outstanding.
cTotal return does not include fees, charges or expenses imposed by the variable annuity and life insurance contracts for which Franklin Templeton Variable Insurance Products Trust serves as an underlying investment vehicle. Total return is not annualized for periods less than one year.
dRatios are annualized for periods less than one year.
eBenefit of expense reduction rounds to less than 0.01%.
fBenefit of waiver and payments by affiliates rounds to less than 0.01%.
gExcludes the value of portfolio securities delivered as a result of a redemption in-kind.
| The accompanying notes are an integral part of these financial statements. | Semiannual Report | FI-7 |
FRANKLIN TEMPLETON VARIABLE INSURANCE PRODUCTS TRUST
FINANCIAL HIGHLIGHTS
Franklin Income VIP Fund (continued)
| Six Months Ended (unaudited) |
Year Ended December 31, | |||||||||||||||||||||||
| 2015 | 2014 | 2013 | 2012 | 2011 | ||||||||||||||||||||
| Class 4 | ||||||||||||||||||||||||
| Per share operating performance (for a share outstanding throughout the period) |
||||||||||||||||||||||||
| Net asset value, beginning of period |
$14.49 | $16.31 | $16.36 | $15.32 | $14.54 | $15.04 | ||||||||||||||||||
|
|
|
|||||||||||||||||||||||
| Income from investment operationsa: | ||||||||||||||||||||||||
| Net investment incomeb |
0.30 | 0.65 | 0.66 | 0.75 | 0.85 | 0.90 | ||||||||||||||||||
| Net realized and unrealized gains (losses) |
0.50 | (1.76 | ) | 0.11 | 1.30 | 0.90 | (0.54 | ) | ||||||||||||||||
|
|
|
|||||||||||||||||||||||
| Total from investment operations |
0.80 | (1.11 | ) | 0.77 | 2.05 | 1.75 | 0.36 | |||||||||||||||||
|
|
|
|||||||||||||||||||||||
| Less distributions from net investment income |
(0.72 | ) | (0.71 | ) | (0.82 | ) | (1.01 | ) | (0.97 | ) | (0.86 | ) | ||||||||||||
|
|
|
|||||||||||||||||||||||
| Net asset value, end of period |
$14.57 | $14.49 | $16.31 | $16.36 | $15.32 | $14.54 | ||||||||||||||||||
|
|
|
|||||||||||||||||||||||
| Total returnc |
5.61% | (7.15)% | 4.52% | 13.85% | 12.56% | 2.29% | ||||||||||||||||||
| Ratios to average net assetsd | ||||||||||||||||||||||||
| Expenses before waiver and payments by affiliates |
0.82% | 0.81% | 0.82% | 0.82% | 0.82% | 0.82% | ||||||||||||||||||
| Expenses net of waiver and payments by affiliates |
0.79% | e | 0.81% | e,f | 0.82% | e | 0.82% | e | 0.82% | 0.82% | e | |||||||||||||
| Net investment income |
4.17% | 4.12% | 3.91% | 4.72% | 5.68% | 6.00% | ||||||||||||||||||
| Supplemental data | ||||||||||||||||||||||||
| Net assets, end of period (000’s) |
$304,884 | $306,023 | $378,545 | $397,652 | $436,405 | $431,435 | ||||||||||||||||||
| Portfolio turnover rate |
27.34% | 31.53% | 24.77% | 21.71% | 26.66% | g | 28.65% | |||||||||||||||||
aThe amount shown for a share outstanding throughout the period may not correlate with the Statement of Operations for the period due to the timing of sales and repurchases of the Fund’s shares in relation to income earned and/or fluctuating fair value of the investments of the Fund.
bBased on average daily shares outstanding.
cTotal return does not include fees, charges or expenses imposed by the variable annuity and life insurance contracts for which Franklin Templeton Variable Insurance Products Trust serves as an underlying investment vehicle. Total return is not annualized for periods less than one year.
dRatios are annualized for periods less than one year.
eBenefit of expense reduction rounds to less than 0.01%.
fBenefit of waiver and payments by affiliates rounds to less than 0.01%.
gExcludes the value of portfolio securities delivered as a result of a redemption in-kind.
| FI-8 | Semiannual Report | The accompanying notes are an integral part of these financial statements. |
FRANKLIN TEMPLETON VARIABLE INSURANCE PRODUCTS TRUST
Statement of Investments, June 30, 2016 (unaudited)
| Franklin Income VIP Fund
|
||||||||||||||
| Country | Shares | Value | ||||||||||||
| Common Stocks 44.6% |
||||||||||||||
| Consumer Discretionary 3.2% |
||||||||||||||
| Ford Motor Co. |
United States | 4,643,943 | $ | 58,374,363 | ||||||||||
| General Motors Co. |
United States | 2,224,426 | 62,951,257 | |||||||||||
| Nordstrom Inc. |
United States | 200,000 | 7,610,000 | |||||||||||
| Target Corp. |
United States | 839,100 | 58,585,962 | |||||||||||
|
|
|
|||||||||||||
| 187,521,582 | ||||||||||||||
|
|
|
|||||||||||||
| Consumer Staples 1.2% |
||||||||||||||
| The Coca-Cola Co. |
United States | 150,000 | 6,799,500 | |||||||||||
| PepsiCo Inc. |
United States | 584,000 | 61,868,960 | |||||||||||
|
|
|
|||||||||||||
| 68,668,460 | ||||||||||||||
|
|
|
|||||||||||||
| Energy 7.8% |
||||||||||||||
| Anadarko Petroleum Corp. |
United States | 500,000 | 26,625,000 | |||||||||||
| BP PLC, ADR |
United Kingdom | 1,800,000 | 63,918,000 | |||||||||||
| Chevron Corp. |
United States | 1,055,000 | 110,595,650 | |||||||||||
| Denbury Resources Inc. |
United States | 292,400 | 1,049,716 | |||||||||||
| Occidental Petroleum Corp. |
United States | 436,000 | 32,944,160 | |||||||||||
| a | PetroQuest Energy Inc. |
United States | 12,250 | 40,792 | ||||||||||
| a,b | Rex Energy Corp. |
United States | 75,000 | 43,527 | ||||||||||
| Royal Dutch Shell PLC, A, ADR |
United Kingdom | 3,021,748 | 166,860,925 | |||||||||||
| a | Sanchez Energy Corp. |
United States | 14,825 | 104,668 | ||||||||||
| Total SA, B, ADR |
France | 1,192,900 | 57,378,490 | |||||||||||
|
|
|
|||||||||||||
| 459,560,928 | ||||||||||||||
|
|
|
|||||||||||||
| Financials 3.3% |
||||||||||||||
| Host Hotels & Resorts Inc. |
United States | 1,500,000 | 24,315,000 | |||||||||||
| JPMorgan Chase & Co. |
United States | 485,100 | 30,144,114 | |||||||||||
| MetLife Inc. |
United States | 1,145,108 | 45,609,652 | |||||||||||
| U.S. Bancorp |
United States | 1,000,000 | 40,330,000 | |||||||||||
| Wells Fargo & Co. |
United States | 1,100,000 | 52,063,000 | |||||||||||
|
|
|
|||||||||||||
| 192,461,766 | ||||||||||||||
|
|
|
|||||||||||||
| Health Care 5.6% |
||||||||||||||
| AstraZeneca PLC |
United Kingdom | 1,000,000 | 59,562,978 | |||||||||||
| Bristol-Myers Squibb Co. |
United States | 394,396 | 29,007,826 | |||||||||||
| Eli Lilly & Co. |
United States | 764,800 | 60,228,000 | |||||||||||
| Pfizer Inc. |
United States | 2,638,975 | 92,918,310 | |||||||||||
| Roche Holding AG |
Switzerland | 136,500 | 35,813,595 | |||||||||||
| Sanofi, ADR |
France | 1,208,292 | 50,567,020 | |||||||||||
|
|
|
|||||||||||||
| 328,097,729 | ||||||||||||||
|
|
|
|||||||||||||
| Industrials 6.4% |
||||||||||||||
| a,c | CEVA Holdings LLC |
United Kingdom | 13,012 | 4,554,291 | ||||||||||
| Deere & Co. |
United States | 350,000 | 28,364,000 | |||||||||||
| General Electric Co. |
United States | 3,976,200 | 125,170,776 | |||||||||||
| Raytheon Co. |
United States | 480,000 | 65,256,000 | |||||||||||
| Republic Services Inc. |
United States | 527,300 | 27,055,763 | |||||||||||
| Union Pacific Corp. |
United States | 600,000 | 52,350,000 | |||||||||||
| United Technologies Corp. |
United States | 700,000 | 71,785,000 | |||||||||||
|
|
|
|||||||||||||
| 374,535,830 | ||||||||||||||
|
|
|
|||||||||||||
| Information Technology 6.3% |
||||||||||||||
| Analog Devices Inc. |
United States | 400,000 | 22,656,000 | |||||||||||
| Apple Inc. |
United States | 915,317 | 87,504,305 | |||||||||||
| Semiannual Report | FI-9 |
FRANKLIN TEMPLETON VARIABLE INSURANCE PRODUCTS TRUST
STATEMENT OF INVESTMENTS (UNAUDITED)
Franklin Income VIP Fund (continued)
| Country | Shares | Value | ||||||||||||
| Common Stocks (continued) |
||||||||||||||
| Information Technology (continued) |
||||||||||||||
| Cisco Systems Inc. |
United States | 900,000 | $ | 25,821,000 | ||||||||||
| a | First Data Holdings Inc., B |
United States | 1,559,550 | 17,264,219 | ||||||||||
| Intel Corp. |
United States | 1,727,000 | 56,645,600 | |||||||||||
| Microsoft Corp. |
United States | 1,333,500 | 68,235,195 | |||||||||||
| QUALCOMM Inc. |
United States | 550,000 | 29,463,500 | |||||||||||
| Texas Instruments Inc. |
United States | 1,000,000 | 62,650,000 | |||||||||||
|
|
|
|||||||||||||
| 370,239,819 | ||||||||||||||
|
|
|
|||||||||||||
| Materials 3.2% |
||||||||||||||
| BASF SE |
Germany | 387,500 | 29,522,449 | |||||||||||
| The Dow Chemical Co. |
United States | 1,525,700 | 75,842,547 | |||||||||||
| The Mosaic Co. |
United States | 1,100,000 | 28,798,000 | |||||||||||
| Rio Tinto PLC, ADR |
United Kingdom | 1,800,000 | 56,340,000 | |||||||||||
|
|
|
|||||||||||||
| 190,502,996 | ||||||||||||||
|
|
|
|||||||||||||
| Telecommunication Services 1.6% |
||||||||||||||
| BCE Inc. |
Canada | 466,000 | 22,050,337 | |||||||||||
| Telstra Corp. Ltd. |
Australia | 3,446,331 | 14,292,637 | |||||||||||
| Verizon Communications Inc. |
United States | 1,075,000 | 60,028,000 | |||||||||||
|
|
|
|||||||||||||
| 96,370,974 | ||||||||||||||
|
|
|
|||||||||||||
| Utilities 6.0% |
||||||||||||||
| Dominion Resources Inc. |
United States | 862,056 | 67,180,024 | |||||||||||
| Duke Energy Corp. |
United States | 702,500 | 60,267,475 | |||||||||||
| PG&E Corp. |
United States | 935,300 | 59,784,376 | |||||||||||
| Public Service Enterprise Group Inc. |
United States | 923,500 | 43,044,335 | |||||||||||
| Sempra Energy |
United States | 368,300 | 41,993,566 | |||||||||||
| The Southern Co. |
United States | 888,200 | 47,634,166 | |||||||||||
| Xcel Energy Inc. |
United States | 810,964 | 36,314,968 | |||||||||||
|
|
|
|||||||||||||
| 356,218,910 | ||||||||||||||
|
|
|
|||||||||||||
| Total Common Stocks (Cost $2,250,285,831) |
2,624,178,994 | |||||||||||||
|
|
|
|||||||||||||
| d | Equity-Linked Securities 4.3% |
|||||||||||||
| Consumer Discretionary 1.4% |
||||||||||||||
| e | Morgan Stanley into Ford Motors, 8.50%, 144A |
United States | 2,485,000 | 31,512,037 | ||||||||||
| e | Royal Bank of Canada into Target Corp., 6.00%, 144A |
United States | 700,000 | 49,862,820 | ||||||||||
|
|
|
|||||||||||||
| 81,374,857 | ||||||||||||||
|
|
|
|||||||||||||
| Financials 0.5% |
||||||||||||||
| e | Citigroup Inc. into Bank of America Corp., 7.50%, 144A |
United States | 2,100,000 | 28,004,130 | ||||||||||
|
|
|
|||||||||||||
| Health Care 0.5% |
||||||||||||||
| e | JPMorgan Chase & Co. into Merck & Co. Inc., 6.25%, 144A |
United States | 500,000 | 28,643,350 | ||||||||||
|
|
|
|||||||||||||
| Information Technology 1.9% |
||||||||||||||
| e | JPMorgan Chase & Co. into Oracle Corp., 6.00%, 144A |
United States | 700,000 | 28,880,180 | ||||||||||
| e | Wells Fargo & Co. into Intel Corp., 7.00%, 144A |
United States | 1,700,000 | 55,578,950 | ||||||||||
| e | Wells Fargo Bank N.A into Cisco Systems Inc., 7.25%, 144A |
United States | 1,050,000 | 29,731,800 | ||||||||||
|
|
|
|||||||||||||
| 114,190,930 | ||||||||||||||
|
|
|
|||||||||||||
| Total Equity-Linked Securities (Cost $260,718,300) |
252,213,267 | |||||||||||||
|
|
|
|||||||||||||
| FI-10 | Semiannual Report |
FRANKLIN TEMPLETON VARIABLE INSURANCE PRODUCTS TRUST
STATEMENT OF INVESTMENTS (UNAUDITED)
Franklin Income VIP Fund (continued)
| Country | Shares | Value | ||||||||||||
| Convertible Preferred Stocks 3.7% |
||||||||||||||
| Consumer Discretionary 0.1% |
||||||||||||||
| Fiat Chrysler Automobiles NV, 7.875%, cvt. pfd. |
United Kingdom | 85,000 | $ | 5,016,700 | ||||||||||
|
|
|
|||||||||||||
| Energy 0.0%† |
||||||||||||||
| Sanchez Energy Corp., 6.50%, cvt. pfd., B |
United States | 54,200 | 1,198,497 | |||||||||||
|
|
|
|||||||||||||
| Financials 1.8% |
||||||||||||||
| Bank of America Corp., 7.25%, cvt. pfd., L |
United States | 64,600 | 77,197,000 | |||||||||||
| FelCor Lodging Trust Inc., 7.80%, cvt. pfd., A |
United States | 167,325 | 4,214,917 | |||||||||||
| a | FNMA, 5.375%, cvt. pfd. |
United States | 475 | 5,996,875 | ||||||||||
| Wells Fargo & Co., 7.50%, cvt. pfd., A |
United States | 15,000 | 19,488,000 | |||||||||||
|
|
|
|||||||||||||
| 106,896,792 | ||||||||||||||
|
|
|
|||||||||||||
| Health Care 0.3% |
||||||||||||||
| Allergan PLC, 5.50%, cvt. pfd. |
United States | 9,500 | 7,919,390 | |||||||||||
| Teva Pharmaceutical Industries Ltd., 7.00%, cvt. pfd. |
Israel | 15,000 | 12,405,000 | |||||||||||
|
|
|
|||||||||||||
| 20,324,390 | ||||||||||||||
|
|
|
|||||||||||||
| Industrials 0.1% |
||||||||||||||
| a,c | CEVA Holdings LLC, cvt. pfd., A-1 |
United Kingdom | 397 | 208,425 | ||||||||||
| a,c | CEVA Holdings LLC, cvt. pfd., A-2 |
United Kingdom | 14,711 | 5,148,815 | ||||||||||
|
|
|
|||||||||||||
| 5,357,240 | ||||||||||||||
|
|
|
|||||||||||||
| Information Technology 0.3% |
||||||||||||||
| a,e | Mandatory Exchangeable Trust, 5.75%, cvt. pfd., 144A |
China | 150,000 | 15,335,250 | ||||||||||
|
|
|
|||||||||||||
| Materials 0.3% |
||||||||||||||
| Alcoa Inc., 5.375%, cvt. pfd. |
United States | 500,000 | 16,435,000 | |||||||||||
|
|
|
|||||||||||||
| Utilities 0.8% |
||||||||||||||
| Dominion Resources Inc., 6.375%, cvt. pfd., A |
United States | 162,000 | 8,398,080 | |||||||||||
| Dominion Resources Inc., 6.00%, cvt. pfd., B |
United States | 145,000 | 8,714,500 | |||||||||||
| NextEra Energy Inc., 6.371%, cvt. pfd. |
United States | 500,000 | 32,390,000 | |||||||||||
|
|
|
|||||||||||||
| 49,502,580 | ||||||||||||||
|
|
|
|||||||||||||
| Total Convertible Preferred Stocks |
220,066,449 | |||||||||||||
|
|
|
|||||||||||||
| Preferred Stocks (Cost $8,750,000) 0.2% |
||||||||||||||
| Financials 0.2% |
||||||||||||||
| Morgan Stanley, 6.375%, pfd., I |
United States | 350,000 | 9,467,500 | |||||||||||
|
|
|
|||||||||||||
| Principal Amount* | ||||||||||||||
| Convertible Bonds 0.5% |
||||||||||||||
| Energy 0.5% |
||||||||||||||
| Cobalt International Energy Inc., cvt., senior bond, 3.125%, 5/15/24 |
United States | 10,000,000 | 3,400,000 | |||||||||||
| Stone Energy Corp., cvt., senior note, 1.75%, 3/01/17 |
United States | 10,000,000 | 4,643,750 | |||||||||||
| Weatherford International Ltd., cvt., senior note, 5.875%, 7/01/21 |
United States | 22,000,000 | 23,966,250 | |||||||||||
|
|
|
|||||||||||||
| Total Convertible Bonds (Cost $39,520,943) |
32,010,000 | |||||||||||||
|
|
|
|||||||||||||
| Corporate Bonds 32.3% |
||||||||||||||
| Consumer Discretionary 4.0% |
||||||||||||||
| e | 24 Hour Holdings III LLC, senior note, 144A, 8.00%, 6/01/22 |
United States | 500,000 | 381,250 | ||||||||||
| e | Altice Luxembourg SA, senior secured note, 144A, 7.75%, 5/15/22 |
Luxembourg | 3,000,000 | 3,041,250 | ||||||||||
| e | Argos Merger Sub Inc., senior note, 144A, 7.125%, 3/15/23 |
United States | 3,000,000 | 3,093,750 | ||||||||||
| Semiannual Report | FI-11 |
FRANKLIN TEMPLETON VARIABLE INSURANCE PRODUCTS TRUST
STATEMENT OF INVESTMENTS (UNAUDITED)
Franklin Income VIP Fund (continued)
| Country | Principal Amount* | Value | ||||||||||||
| Corporate Bonds (continued) |
||||||||||||||
| Consumer Discretionary (continued) |
||||||||||||||
| CCO Holdings LLC/CCO Holdings Capital Corp., |
||||||||||||||
| senior bond, 5.125%, 2/15/23 |
United States | 10,000,000 | $ | 10,150,000 | ||||||||||
| e senior bond, 144A, 5.75%, 2/15/26 |
United States | 5,000,000 | 5,162,500 | |||||||||||
| e senior note, 144A, 5.875%, 4/01/24 |
United States | 5,000,000 | 5,225,000 | |||||||||||
| DISH DBS Corp., |
||||||||||||||
| senior bond, 5.00%, 3/15/23 |
United States | 35,000,000 | 31,937,500 | |||||||||||
| e senior bond, 144A, 7.75%, 7/01/26 |
United States | 15,000,000 | 15,525,000 | |||||||||||
| senior note, 5.875%, 7/15/22 |
United States | 30,000,000 | 29,250,000 | |||||||||||
| senior note, 5.875%, 11/15/24 |
United States | 9,400,000 | 8,812,500 | |||||||||||
| Dollar General Corp., senior bond, 3.25%, 4/15/23 |
United States | 5,000,000 | 5,199,180 | |||||||||||
| Fiat Chrysler Automobiles NV, senior note, 5.25%, 4/15/23 |
United Kingdom | 11,300,000 | 11,253,952 | |||||||||||
| iHeartCommunications Inc., |
||||||||||||||
| senior secured bond, first lien, 9.00%, 3/01/21 |
United States | 19,400,000 | 13,749,750 | |||||||||||
| senior secured note, first lien, 9.00%, 12/15/19 |
United States | 18,000,000 | 13,747,500 | |||||||||||
| senior secured note, first lien, 9.00%, 9/15/22 |
United States | 12,200,000 | 8,509,500 | |||||||||||
| e | International Game Technology PLC, |
|||||||||||||
| senior secured bond, 144A, 6.50%, 2/15/25 |
United States | 8,500,000 | 8,585,000 | |||||||||||
| senior secured note, 144A, 6.25%, 2/15/22 |
United States | 8,500,000 | 8,691,250 | |||||||||||
| KB Home, senior bond, 7.50%, 9/15/22 |
United States | 6,500,000 | 6,727,500 | |||||||||||
| e | Shea Homes LP/Shea Homes Funding Corp., |
|||||||||||||
| senior bond, 144A, 6.125%, 4/01/25 |
United States | 10,000,000 | 10,000,000 | |||||||||||
| senior note, 144A, 5.875%, 4/01/23 |
United States | 5,000,000 | 4,975,000 | |||||||||||
| e | Sirius XM Radio Inc., senior bond, 144A, 6.00%, 7/15/24 |
United States | 10,000,000 | 10,362,500 | ||||||||||
| e | Univision Communications Inc., senior secured note, first lien, |
|||||||||||||
| 5/15/23 |
United States | 10,000,000 | 9,975,000 | |||||||||||
| 2/15/25 |
United States | 7,140,000 | 7,086,450 | |||||||||||
| e | Virgin Media Secured Finance PLC, senior secured bond, first lien, 144A, 5.50%, 1/15/25 |
United Kingdom | 7,000,000 | 6,903,750 | ||||||||||
|
|
|
|||||||||||||
| 238,345,082 | ||||||||||||||
|
|
|
|||||||||||||
| Consumer Staples 0.3% |
||||||||||||||
| Cott Beverages Inc., senior note, 5.375%, 7/01/22 |
United States | 2,500,000 | 2,509,375 | |||||||||||
| e | JBS USA LLC/Finance Inc., senior note, 144A, 7.25%, 6/01/21 |
United States | 12,500,000 | 13,000,000 | ||||||||||
|
|
|
|||||||||||||
| 15,509,375 | ||||||||||||||
|
|
|
|||||||||||||
| Energy 5.2% |
||||||||||||||
| Antero Resources Corp., senior note, 5.375%, 11/01/21 |
United States | 5,000,000 | 4,925,000 | |||||||||||
| Bill Barrett Corp., senior note, |
||||||||||||||
| 7.625%, 10/01/19 |
United States | 30,000,000 | 24,600,000 | |||||||||||
| 7.00%, 10/15/22 |
United States | 16,358,000 | 11,859,550 | |||||||||||
| Calumet Specialty Products Partners LP/Calumet Finance Corp., |
||||||||||||||
| senior note, 6.50%, 4/15/21 |
United States | 9,500,000 | 6,840,000 | |||||||||||
| Chesapeake Energy Corp., |
||||||||||||||
| e secured note, second lien, 144A, 8.00%, 12/15/22 |
United States | 33,550,000 | 28,601,375 | |||||||||||
| senior note, 7.25%, 12/15/18 |
United States | 10,000,000 | 8,750,000 | |||||||||||
| f senior note, FRN, 3.878%, 4/15/19 |
United States | 10,000,000 | 7,575,000 | |||||||||||
| e | Denbury Resources Inc., senior secured note, 144A, |
United States | 7,200,000 | 7,236,000 | ||||||||||
| e,g | Energy XXI Gulf Coast Inc., senior secured note, second lien, 144A, 11.00%, 3/15/20 |
United States | 26,516,000 | 10,738,980 | ||||||||||
| FI-12 | Semiannual Report |
FRANKLIN TEMPLETON VARIABLE INSURANCE PRODUCTS TRUST
STATEMENT OF INVESTMENTS (UNAUDITED)
Franklin Income VIP Fund (continued)
| Country | Principal Amount* | Value | ||||||||||||
| Corporate Bonds (continued) |
||||||||||||||
| Energy (continued) |
||||||||||||||
| e | EnQuest PLC, senior note, 144A, 7.00%, 4/15/22 |
United Kingdom | 11,000,000 | $ | 6,723,750 | |||||||||
| Ferrellgas LP/Ferrellgas Finance Corp., senior note, |
United States | 5,000,000 | 4,612,500 | |||||||||||
| e | Halcon Resources Corp., |
|||||||||||||
| secured note, second lien, 144A, 8.625%, 2/01/20 |
United States | 9,000,000 | 8,533,080 | |||||||||||
| g senior secured note, third lien, 144A, 13.00%, 2/15/22 |
United States | 1,100,000 | 588,500 | |||||||||||
| Kinder Morgan Inc., |
||||||||||||||
| senior note, MTN, 7.75%, 1/15/32 |
United States | 22,000,000 | 24,728,176 | |||||||||||
| e senior secured bond, first lien, 144A, 5.625%, 11/15/23 |
United States | 7,000,000 | 7,511,700 | |||||||||||
| e | McDermott International Inc., second lien, 144A, 8.00%, 5/01/21 |
United States | 12,592,000 | 10,892,080 | ||||||||||
| e | NGPL PipeCo LLC, secured note, 144A, 7.119%, 12/15/17 |
United States | 3,750,000 | 3,928,125 | ||||||||||
| e | PetroQuest Energy Inc., second lien, 144A, 10.00%, 2/15/21 |
United States | 1,653,000 | 1,140,570 | ||||||||||
| e | Rex Energy Corp., second lien, 144A, 1.00% to 10/01/17, |
United States | 5,000,000 | 1,125,000 | ||||||||||
| e | Sabine Pass Liquefaction LLC, senior secured bond, 144A, |
United States | 15,000,000 | 15,000,000 | ||||||||||
| Sanchez Energy Corp., senior note, 7.75%, 6/15/21 |
United States | 22,000,000 | 18,755,000 | |||||||||||
| Stone Energy Corp., senior bond, 7.50%, 11/15/22 |
United States | 26,905,000 | 12,241,775 | |||||||||||
| h | W&T Offshore Inc., senior note, 8.50%, 6/15/19 |
United States | 45,000,000 | 11,250,000 | ||||||||||
| Weatherford International Ltd., senior note, |
||||||||||||||
| i 5.125%, 9/15/20 |
United States | 12,500,000 | 11,831,250 | |||||||||||
| 7.75%, 6/15/21 |
United States | 25,000,000 | 24,437,500 | |||||||||||
| i 4.50%, 4/15/22 |
United States | 9,900,000 | 8,538,750 | |||||||||||
| 8.25%, 6/15/23 |
United States | 27,500,000 | 26,193,750 | |||||||||||
|
|
|
|||||||||||||
| 309,157,411 | ||||||||||||||
|
|
|
|||||||||||||
| Financials 3.3% |
||||||||||||||
| j | Bank of America Corp., junior sub. bond, |
|||||||||||||
| AA, 6.10% to 3/17/25, FRN thereafter, Perpetual |
United States | 8,000,000 | 8,130,000 | |||||||||||
| M, 8.125% to 5/15/18, FRN thereafter, Perpetual |
United States | 5,000,000 | 5,018,750 | |||||||||||
| j | Citigroup Inc., junior sub. bond, |
|||||||||||||
| 5.35% to 5/15/23, FRN thereafter, Perpetual |
United States | 10,000,000 | 9,420,500 | |||||||||||
| 5.90% to 2/15/23, FRN thereafter, Perpetual |
United States | 12,500,000 | 12,343,750 | |||||||||||
| 5.95% to 1/30/23, FRN thereafter, Perpetual |
United States | 4,500,000 | 4,452,188 | |||||||||||
| M, 6.30% to 5/15/24, FRN thereafter, Perpetual |
United States | 16,800,000 | 16,735,320 | |||||||||||
| O, 5.875% to 3/27/20, FRN thereafter, Perpetual |
United States | 25,000,000 | 24,031,250 | |||||||||||
| Q, 5.95% to 8/15/20, FRN thereafter, Perpetual |
United States | 10,000,000 | 9,761,500 | |||||||||||
| Iron Mountain Inc., senior sub. bond, 5.75%, 8/15/24 |
United States | 3,000,000 | 3,045,000 | |||||||||||
| iStar Inc., senior note, 5.00%, 7/01/19 |
United States | 3,500,000 | 3,281,250 | |||||||||||
| j | JPMorgan Chase & Co., junior sub. bond, |
|||||||||||||
| I, 7.90% to 4/30/19, FRN thereafter, Perpetual |
United States | 50,000,000 | 51,062,500 | |||||||||||
| R, 6.00% to 8/01/23, FRN thereafter, Perpetual |
United States | 3,200,000 | 3,276,000 | |||||||||||
| V, 5.00% to 7/30/19, FRN thereafter, Perpetual |
United States | 10,000,000 | 9,575,000 | |||||||||||
| j | Morgan Stanley, junior sub. bond, 5.55% to 7/15/20, FRN |
United States | 7,300,000 | 7,240,505 | ||||||||||
| Navient Corp., senior note, 6.125%, 3/25/24 |
United States | 5,000,000 | 4,412,500 | |||||||||||
| e | OneMain Financial Holdings Inc., senior note, 144A, |
|||||||||||||
| 6.75%, 12/15/19 |
United States | 10,000,000 | 9,787,500 | |||||||||||
| 7.25%, 12/15/21 |
United States | 5,000,000 | 4,812,500 | |||||||||||
| j | Wells Fargo & Co., junior sub. bond, S, 5.90% to 6/15/24, FRN thereafter, Perpetual |
United States | 7,900,000 | 8,137,000 | ||||||||||
|
|
|
|||||||||||||
| 194,523,013 | ||||||||||||||
|
|
|
|||||||||||||
| Semiannual Report | FI-13 |
FRANKLIN TEMPLETON VARIABLE INSURANCE PRODUCTS TRUST
STATEMENT OF INVESTMENTS (UNAUDITED)
Franklin Income VIP Fund (continued)
| Country | Principal Amount* | Value | ||||||||||||
| Corporate Bonds (continued) |
||||||||||||||
| Health Care 5.5% |
||||||||||||||
| CHS/Community Health Systems Inc., senior note, |
||||||||||||||
| 8.00%, 11/15/19 |
United States | 49,800,000 | $ | 48,866,250 | ||||||||||
| 7.125%, 7/15/20 |
United States | 15,000,000 | 13,981,350 | |||||||||||
| 6.875%, 2/01/22 |
United States | 33,500,000 | 29,480,000 | |||||||||||
| e | Concordia International Corp., senior note, 144A, 9.50%, 10/21/22 |
Canada | 5,000,000 | 4,687,500 | ||||||||||
| DaVita HealthCare Partners Inc., senior bond, 5.125%, 7/15/24 |
United States | 5,000,000 | 5,064,875 | |||||||||||
| e | Endo Finance LLC, senior note, 144A, 5.75%, 1/15/22 |
United States | 17,500,000 | 15,879,500 | ||||||||||
| e | Endo Finance LLC/Endo Ltd./Endo Finco Inc., |
|||||||||||||
| senior bond, 144A, 6.00%, 2/01/25 |
United States | 10,000,000 | 8,725,000 | |||||||||||
| senior note, 144A, 6.00%, 7/15/23 |
United States | 10,000,000 | 8,850,000 | |||||||||||
| HCA Inc., |
||||||||||||||
| senior bond, 5.875%, 5/01/23 |
United States | 7,500,000 | 8,015,625 | |||||||||||
| senior note, 7.50%, 2/15/22 |
United States | 25,000,000 | 28,487,500 | |||||||||||
| senior secured bond, first lien, 5.25%, 4/15/25 |
United States | 5,000,000 | 5,237,500 | |||||||||||
| senior secured note, first lien, 5.00%, 3/15/24 |
United States | 10,400,000 | 10,790,000 | |||||||||||
| e | Mallinckrodt International Finance SA/Mallinckrodt CB LLC, |
|||||||||||||
| 5.75%, 8/01/22 |
United States | 12,000,000 | 11,482,500 | |||||||||||
| 5.625%, 10/15/23 |
United States | 10,000,000 | 9,362,500 | |||||||||||
| 5.50%, 4/15/25 |
United States | 10,000,000 | 8,971,200 | |||||||||||
| Tenet Healthcare Corp., senior note, |
||||||||||||||
| 8.125%, 4/01/22 |
United States | 35,000,000 | 36,043,000 | |||||||||||
| 6.75%, 6/15/23 |
United States | 23,200,000 | 22,301,000 | |||||||||||
| e | Valeant Pharmaceuticals International, senior note, 144A, |
United States | 2,500,000 | 2,162,500 | ||||||||||
| e | Valeant Pharmaceuticals International Inc., |
|||||||||||||
| senior bond, 144A, 6.125%, 4/15/25 |
United States | 9,400,000 | 7,567,000 | |||||||||||
| senior note, 144A, 6.75%, 8/15/18 |
United States | 8,325,000 | 8,051,274 | |||||||||||
| senior note, 144A, 5.375%, 3/15/20 |
United States | 15,000,000 | 12,890,625 | |||||||||||
| senior note, 144A, 5.875%, 5/15/23 |
United States | 12,500,000 | 10,156,250 | |||||||||||
| e | Vizient Inc., senior note, 144A, 10.375%, 3/01/24 |
United States | 5,000,000 | 5,375,000 | ||||||||||
|
|
|
|||||||||||||
| 322,427,949 | ||||||||||||||
|
|
|
|||||||||||||
| Industrials 2.3% |
||||||||||||||
| The ADT Corp., senior note, 3.50%, 7/15/22 |
United States | 10,500,000 | 9,673,125 | |||||||||||
| e | Algeco Scotsman Global Finance PLC, senior secured note, first lien, 144A, 8.50%, 10/15/18 |
United Kingdom | 9,900,000 | 7,969,500 | ||||||||||
| e | Bombardier Inc., senior bond, 144A, |
|||||||||||||
| 6.125%, 1/15/23 |
Canada | 5,000,000 | 4,300,000 | |||||||||||
| 7.50%, 3/15/25 |
Canada | 11,000,000 | 9,570,000 | |||||||||||
| e | CEVA Group PLC, senior note, first lien, 144A, 4.00%, 5/01/18 |
United Kingdom | 12,691,882 | 11,359,234 | ||||||||||
| Hertz Corp., senior note, 6.75%, 4/15/19 |
United States | 10,000,000 | 10,210,770 | |||||||||||
| Navistar International Corp., senior bond, 8.25%, 11/01/21 |
United States | 5,675,000 | 4,015,063 | |||||||||||
| e | Prime Security Services Borrower LLC/Prime Finance Inc., |
United States | 6,000,000 | 6,375,000 | ||||||||||
| TransDigm Inc., |
||||||||||||||
| senior sub. bond, 6.50%, 7/15/24 |
United States | 10,000,000 | 10,100,000 | |||||||||||
| e senior sub. bond, 144A, 6.375%, 6/15/26 |
United States | 6,200,000 | 6,192,250 | |||||||||||
| senior sub. note, 6.00%, 7/15/22 |
United States | 7,700,000 | 7,778,386 | |||||||||||
| United Rentals North America Inc., senior bond, 6.125%, 6/15/23 |
United States | 11,400,000 | 11,927,250 | |||||||||||
| FI-14 | Semiannual Report |
FRANKLIN TEMPLETON VARIABLE INSURANCE PRODUCTS TRUST
STATEMENT OF INVESTMENTS (UNAUDITED)
Franklin Income VIP Fund (continued)
| Country | Principal Amount* | Value | ||||||||||||
| Corporate Bonds (continued) |
||||||||||||||
| Industrials (continued) |
||||||||||||||
| e | XPO Logistics Inc., senior note, 144A, |
|||||||||||||
| 7.875%, 9/01/19 |
United States | 6,700,000 | $ | 6,850,750 | ||||||||||
| 6.50%, 6/15/22 |
United States | 28,480,000 | 27,305,200 | |||||||||||
|
|
|
|||||||||||||
| 133,626,528 | ||||||||||||||
|
|
|
|||||||||||||
| Information Technology 3.4% |
||||||||||||||
| e | BMC Software Finance Inc., senior note, 144A, 8.125%, 7/15/21 |
United States | 16,500,000 | 12,457,500 | ||||||||||
| e | CommScope Inc., |
|||||||||||||
| senior bond, 144A, 5.50%, 6/15/24 |
United States | 10,000,000 | 10,187,500 | |||||||||||
| senior note, 144A, 5.00%, 6/15/21 |
United States | 8,422,000 | 8,634,655 | |||||||||||
| e | Diamond 1 Finance Corp./Diamond 2 Finance Corp., |
|||||||||||||
| senior note, 144A, 5.875%, 6/15/21 |
United States | 3,600,000 | 3,692,808 | |||||||||||
| senior note, 144A, 7.125%, 6/15/24 |
United States | 3,600,000 | 3,765,607 | |||||||||||
| senior secured bond, first lien, 144A, 5.45%, 6/15/23 |
United States | 21,100,000 | 21,910,029 | |||||||||||
| senior secured bond, first lien, 144A, 6.02%, 6/15/26 |
United States | 16,200,000 | 16,838,377 | |||||||||||
| senior secured note, first lien, 144A, 4.42%, 6/15/21 |
United States | 21,400,000 | 22,018,974 | |||||||||||
| e | First Data Corp., |
|||||||||||||
| second lien, 144A, 5.75%, 1/15/24 |
United States | 5,000,000 | 4,975,000 | |||||||||||
| senior note, 144A, 7.00%, 12/01/23 |
United States | 25,000,000 | 25,468,750 | |||||||||||
| senior secured note, first lien, 144A, 5.375%, 8/15/23 |
United States | 5,000,000 | 5,096,300 | |||||||||||
| e | Micron Technology Inc., senior secured note, 144A, 7.50%, 9/15/23 |
United States | 5,000,000 | 5,358,000 | ||||||||||
| e | Microsemi Corp., senior note, 144A, 9.125%, 4/15/23 |
United States | 5,500,000 | 6,077,500 | ||||||||||
| NCR Corp., senior note, |
||||||||||||||
| 5.00%, 7/15/22 |
United States | 5,500,000 | 5,417,500 | |||||||||||
| 6.375%, 12/15/23 |
United States | 7,000,000 | 7,175,000 | |||||||||||
| e | Western Digital Corp., |
|||||||||||||
| senior note, 144A, 10.50%, 4/01/24 |
United States | 30,000,000 | 32,175,000 | |||||||||||
| senior secured note, 144A, 7.375%, 4/01/23 |
United States | 10,000,000 | 10,675,000 | |||||||||||
|
|
|
|||||||||||||
| 201,923,500 | ||||||||||||||
|
|
|
|||||||||||||
| Materials 2.1% |
||||||||||||||
| e | Ardagh Packaging Finance PLC/Ardagh MP Holdings USA Inc., senior note, 144A, |
|||||||||||||
| 6.25%, 1/31/19 |
Luxembourg | 7,500,000 | 7,659,375 | |||||||||||
| 4.625%, 5/15/23 |
Luxembourg | 15,000,000 | 14,887,500 | |||||||||||
| 7.25%, 5/15/24 |
Luxembourg | 10,200,000 | 10,480,500 | |||||||||||
| e | Cemex Finance LLC, senior secured note, first lien, 144A, |
Mexico | 14,700,000 | 14,289,723 | ||||||||||
| e | First Quantum Minerals Ltd., senior note, 144A, 7.00%, 2/15/21 |
Canada | 2,000,000 | 1,617,500 | ||||||||||
| e | FMG Resources (August 2006) Pty. Ltd., senior secured note, 144A, 9.75%, 3/01/22 |
Australia | 27,000,000 | 29,970,000 | ||||||||||
| e | Platform Specialty Products Corp., senior note, 144A, |
United States | 3,500,000 | 3,097,500 | ||||||||||
| Reynolds Group Issuer Inc./Reynolds Group Issuer LLC/Reynolds Group Issuer Luxembourg SA, |
||||||||||||||
| first lien, 5.75%, 10/15/20 |
United States | 12,500,000 | 12,942,750 | |||||||||||
| e first lien, 144A, 5.125%, 7/15/23 |
United States | 4,300,000 | 4,359,125 | |||||||||||
| senior note, 9.875%, 8/15/19 |
United States | 3,476,000 | 3,593,315 | |||||||||||
| e senior note, 144A, 7.00%, 7/15/24 |
United States | 2,000,000 | 2,062,750 | |||||||||||
| senior secured note, first lien, 6.875%, 2/15/21 |
United States | 7,900,000 | 8,137,000 | |||||||||||
| e,f senior secured note, first lien, 144A, FRN, 4.127%, 7/15/21 |
United States | 7,600,000 | 7,638,000 | |||||||||||
|
|
|
|||||||||||||
| 120,735,038 | ||||||||||||||
|
|
|
|||||||||||||
| Semiannual Report | FI-15 |
FRANKLIN TEMPLETON VARIABLE INSURANCE PRODUCTS TRUST
STATEMENT OF INVESTMENTS (UNAUDITED)
Franklin Income VIP Fund (continued)
| Country | Principal Amount* | Value | ||||||||||||
| Corporate Bonds (continued) |
||||||||||||||
| Telecommunication Services 3.9% |
||||||||||||||
| Consolidated Communications Inc., senior note, 6.50%, 10/01/22 |
United States | 15,000,000 | $ | 13,537,500 | ||||||||||
| Frontier Communications Corp., senior note, |
||||||||||||||
| 9.25%, 7/01/21 |
United States | 7,400,000 | 7,862,500 | |||||||||||
| 10.50%, 9/15/22 |
United States | 10,000,000 | 10,618,750 | |||||||||||
| 7.125%, 1/15/23 |
United States | 7,800,000 | 7,020,000 | |||||||||||
| Intelsat Jackson Holdings SA, senior bond, 5.50%, 8/01/23 |
Luxembourg | 8,400,000 | 5,376,000 | |||||||||||
| e | Neptune Finco Corp., senior bond, 144A, 10.875%, 10/15/25 |
United States | 13,000,000 | 14,860,560 | ||||||||||
| Sprint Capital Corp., senior note, 6.90%, 5/01/19 |
United States | 3,500,000 | 3,360,000 | |||||||||||
| Sprint Communications Inc., |
||||||||||||||
| 11.50%, 11/15/21 |
United States | 30,000,000 | 29,790,000 | |||||||||||
| senior note, 7.00%, 8/15/20 |
United States | 7,500,000 | 6,740,625 | |||||||||||
| e senior note, 144A, 9.00%, 11/15/18 |
United States | 11,900,000 | 12,718,125 | |||||||||||
| Sprint Corp., |
||||||||||||||
| senior bond, 7.875%, 9/15/23 |
United States | 37,500,000 | 30,843,750 | |||||||||||
| senior bond, 7.125%, 6/15/24 |
United States | 8,200,000 | 6,529,250 | |||||||||||
| senior note, 7.625%, 2/15/25 |
United States | 15,000,000 | 11,943,750 | |||||||||||
| T-Mobile USA Inc., |
||||||||||||||
| senior bond, 6.625%, 4/01/23 |
United States | 15,000,000 | 15,913,050 | |||||||||||
| senior note, 6.25%, 4/01/21 |
United States | 12,000,000 | 12,562,440 | |||||||||||
| senior note, 6.633%, 4/28/21 |
United States | 7,500,000 | 7,865,625 | |||||||||||
| senior note, 6.731%, 4/28/22 |
United States | 5,000,000 | 5,276,500 | |||||||||||
| e | Telecom Italia SpA, senior note, 144A, 5.303%, 5/30/24 |
Italy | 5,000,000 | 5,025,000 | ||||||||||
| e | Wind Acquisition Finance SA, secured note, second lien, |
Italy | 11,500,000 | 10,959,557 | ||||||||||
| Zayo Group LLC/Zayo Capital Inc., senior note, 6.375%, 5/15/25 |
United States | 10,000,000 | 10,237,500 | |||||||||||
|
|
|
|||||||||||||
| 229,040,482 | ||||||||||||||
|
|
|
|||||||||||||
| Utilities 2.3% |
||||||||||||||
| Calpine Corp., |
||||||||||||||
| senior bond, 5.75%, 1/15/25 |
United States | 15,000,000 | 14,643,750 | |||||||||||
| senior note, 5.375%, 1/15/23 |
United States | 19,500,000 | 19,110,000 | |||||||||||
| senior note, 5.50%, 2/01/24 |
United States | 5,000,000 | 4,850,000 | |||||||||||
| e senior secured bond, 144A, 5.25%, 6/01/26 |
United States | 15,000,000 | 15,000,000 | |||||||||||
| Dynegy Inc., senior note, |
||||||||||||||
| 6.75%, 11/01/19 |
United States | 38,000,000 | 38,285,000 | |||||||||||
| 7.375%, 11/01/22 |
United States | 20,000,000 | 19,400,000 | |||||||||||
| 5.875%, 6/01/23 |
United States | 8,000,000 | 7,080,000 | |||||||||||
| e | InterGen NV, secured bond, 144A, 7.00%, 6/30/23 |
Netherlands | 25,000,000 | 17,812,500 | ||||||||||
|
|
|
|||||||||||||
| 136,181,250 | ||||||||||||||
|
|
|
|||||||||||||
| Total Corporate Bonds (Cost $1,957,294,074) |
1,901,469,628 | |||||||||||||
|
|
|
|||||||||||||
| f,k | Senior Floating Rate Interests 3.4% |
|||||||||||||
| Consumer Discretionary 1.2% |
||||||||||||||
| Belk Inc., Closing Date Term Loan, 5.75%, 12/12/22 |
United States | 24,937,500 | 19,950,000 | |||||||||||
| iHeartCommunications Inc., |
||||||||||||||
| Tranche D Term Loan, 7.21%, 1/30/19 |
United States | 35,864,664 | 26,360,528 | |||||||||||
| Tranche E Term Loan, 7.96%, 7/30/19 |
United States | 13,142,769 | 9,668,149 | |||||||||||
| Petco Animal Supplies Inc., Tranche B-1 Term Loans, |
United States | 14,962,500 | 14,925,094 | |||||||||||
|
|
|
|||||||||||||
| 70,903,771 | ||||||||||||||
|
|
|
|||||||||||||
| FI-16 | Semiannual Report |
FRANKLIN TEMPLETON VARIABLE INSURANCE PRODUCTS TRUST
STATEMENT OF INVESTMENTS (UNAUDITED)
Franklin Income VIP Fund (continued)
| Country | Principal Amount* | Value | ||||||||||||
| Senior Floating Rate Interests (continued) |
||||||||||||||
| Energy 0.1% |
||||||||||||||
| h | W&T Offshore Inc., Second Lien Term Loan, 9.00%, 5/15/20 |
United States | 11,000,000 | $ | 6,435,000 | |||||||||
|
|
|
|||||||||||||
| Financials 0.7% |
||||||||||||||
| First Eagle Investment Management, Initial Term Loans, |
United States | 39,800,000 | 39,169,846 | |||||||||||
|
|
|
|||||||||||||
| Health Care 0.3% |
||||||||||||||
| Vizient Inc., Initial Term Loan, 6.25%, 2/10/23 |
United States | 19,950,000 | 20,074,687 | |||||||||||
|
|
|
|||||||||||||
| Industrials 0.8% |
||||||||||||||
| CEVA Group PLC, Pre-Funded L/C, 6.50%, 3/19/21 |
United States | 5,382,266 | 4,453,825 | |||||||||||
| CEVA Intercompany BV, Dutch BV Term Loan, 6.50%, 3/19/21 |
Netherlands | 5,585,714 | 4,622,179 | |||||||||||
| CEVA Logistics Canada ULC, Canadian Term Loan, 6.50%, 3/19/21 |
Canada | 963,054 | 796,927 | |||||||||||
| CEVA Logistics U.S. Holdings Inc., U.S. Term Loan, 6.50%, 3/19/21 |
United States | 7,704,434 | 6,375,419 | |||||||||||
| Commercial Barge Line Co., Initial Term Loan, 9.75%, 11/12/20 |
United States | 9,875,000 | 9,233,125 | |||||||||||
| Navistar Inc., Tranche B Term Loans, 6.50%, 8/07/20 |
United States | 6,050,616 | 5,737,999 | |||||||||||
| XPO Logistics Inc., First Lien Term Loan, 5.50%, 10/29/21 |
United States | 14,925,000 | 14,962,313 | |||||||||||
|
|
|
|||||||||||||
| 46,181,787 | ||||||||||||||
|
|
|
|||||||||||||
| Information Technology 0.2% |
||||||||||||||
| Western Digital Corp., U.S. Term B Loan, 6.25%, 4/29/23 |
United States | 10,000,000 | 10,056,250 | |||||||||||
|
|
|
|||||||||||||
| Materials 0.1% |
||||||||||||||
| l | FMG America Finance Inc. (Fortescue Metals Group), Loans, |
Australia | 8,802,754 | 8,445,142 | ||||||||||
|
|
|
|||||||||||||
| Total Senior Floating Rate Interests |
201,266,483 | |||||||||||||
|
|
|
|||||||||||||
| Shares | ||||||||||||||
| Escrows and Litigation Trusts (Cost $62,602) 0.0% |
||||||||||||||
| a,c | Motors Liquidation Co., Escrow Account, cvt. pfd., C |
United States | 1,400,000 | — | ||||||||||
|
|
|
|||||||||||||
| Total Investments before Short Term Investments (Cost $4,975,612,507) |
5,240,672,321 | |||||||||||||
|
|
|
|||||||||||||
| Short Term Investments 10.6% |
||||||||||||||
| Money Market Funds (Cost $620,850,617) 10.5% |
||||||||||||||
| a,m | Institutional Fiduciary Trust Money Market Portfolio |
United States | 620,850,617 | 620,850,617 | ||||||||||
|
|
|
|||||||||||||
| n | Investments from Cash Collateral Received for Loaned Securities 0.1% |
|||||||||||||
| Money Market Funds (Cost $2,193,000) 0.1% |
||||||||||||||
| a,m | Institutional Fiduciary Trust Money Market Portfolio |
United States | 2,193,000 | 2,193,000 | ||||||||||
|
|
|
|||||||||||||
| Principal Amount* | ||||||||||||||
| Repurchase Agreements (Cost $548,698) 0.0%† |
||||||||||||||
| o | Joint Repurchase Agreement, 0.40%, 7/01/16 |
United States | 548,698 | 548,698 | ||||||||||
| BNP Paribas Securities Corp. |
||||||||||||||
| Collateralized by pU.S. Treasury Bill, 10/27/16; U.S.
Treasury Bond, 8.75% - 9.00%, 11/15/18 - 5/15/20; U.S. Treasury Note, 0.363% - 4.75%, 9/15/16 - 3/31/21; U.S. Treasury Note, Index Linked, 2.625%, 7/15/17; and U.S. Treasury Strips, |
||||||||||||||
|
|
|
|||||||||||||
| Semiannual Report | FI-17 |
FRANKLIN TEMPLETON VARIABLE INSURANCE PRODUCTS TRUST
STATEMENT OF INVESTMENTS (UNAUDITED)
Franklin Income VIP Fund (continued)
| Country | Principal Amount* | Value | ||||||||||||
| Total Investments from Cash Collateral Received for Loaned Securities (Cost $2,741,698) |
$ | 2,741,698 | ||||||||||||
|
|
|
|||||||||||||
| Total Investments (Cost $5,599,204,822) 99.6% |
5,864,264,636 | |||||||||||||
| Other Assets, less Liabilities 0.4% |
24,732,606 | |||||||||||||
|
|
|
|||||||||||||
| Net Assets 100.0% |
$ | 5,888,997,242 | ||||||||||||
|
|
|
|||||||||||||
See Abbreviations on page FI-31.
†Rounds to less than 0.1% of net assets.
*The principal amount is stated in U.S. dollars unless otherwise indicated.
aNon-income producing.
bSee Note 8 regarding restricted securities.
cSecurity has been deemed illiquid because it may not be able to be sold within seven days. At June 30, 2016, the aggregate value of these securities was $9,911,531, representing 0.2% of net assets.
dSee Note 1(e) regarding equity-linked securities.
eSecurity was purchased pursuant to Rule 144A under the Securities Act of 1933 and may be sold in transactions exempt from registration only to qualified institutional buyers or in a public offering registered under the Securities Act of 1933. These securities have been deemed liquid under guidelines approved by the Trust’s Board of Trustees. At June 30, 2016, the aggregate value of these securities was $1,052,026,875, representing 17.9% of net assets.
fThe coupon rate shown represents the rate at period end.
gSee Note 7 regarding defaulted securities.
hAt June 30, 2016, pursuant to the Fund’s policies and the requirements of applicable securities law, the Fund is restricted from trading these securities at period end.
iA portion or all of the security is on loan at June 30, 2016. See Note 1(f).
jPerpetual security with no stated maturity date.
kSee Note 1(g) regarding senior floating rate interests.
lSecurity purchased on a when-issued or delayed delivery basis. See Note 1(d)
mSee Note 3(e) regarding investments in affiliated management investment companies.
nSee Note 1(f) regarding securities on loan.
oSee Note 1(c) regarding joint repurchase agreement.
pThe security is traded on a discount basis with no stated coupon rate.
| FI-18 | Semiannual Report | The accompanying notes are an integral part of these financial statements. | |||
FRANKLIN TEMPLETON VARIABLE INSURANCE PRODUCTS TRUST
Financial Statements
Statement of Assets and Liabilities
June 30, 2016 (unaudited)
| Franklin Income VIP Fund |
||||
| Assets: |
||||
| Investments in securities: |
||||
| Cost - Unaffiliated issuers |
$ | 4,975,612,507 | ||
| Cost - Non-controlled affiliates (Note 3e) |
623,043,617 | |||
| Cost - Repurchase agreements |
548,698 | |||
|
|
|
|||
| Total cost of investments |
$ | 5,599,204,822 | ||
|
|
|
|||
| Value - Unaffiliated issuers |
$ | 5,240,672,321 | ||
| Value - Non-controlled affiliates (Note 3e) |
623,043,617 | |||
| Value - Repurchase agreements |
548,698 | |||
|
|
|
|||
| Total value of investments (includes securities loaned in the amount of $2,678,775) |
5,864,264,636 | |||
| Cash |
1,145,137 | |||
| Receivables: |
||||
| Investment securities sold |
11,241,511 | |||
| Capital shares sold |
1,360,933 | |||
| Dividends and interest |
43,295,458 | |||
| Other assets |
2,596 | |||
|
|
|
|||
| Total assets |
5,921,310,271 | |||
|
|
|
|||
| Liabilities: |
||||
| Payables: |
||||
| Investment securities purchased |
14,792,929 | |||
| Capital shares redeemed |
10,003,701 | |||
| Management fees |
2,022,479 | |||
| Distribution fees |
2,206,106 | |||
| Payable upon return of securities loaned |
2,741,698 | |||
| Accrued expenses and other liabilities |
546,116 | |||
|
|
|
|||
| Total liabilities |
32,313,029 | |||
|
|
|
|||
| Net assets, at value |
$ | 5,888,997,242 | ||
|
|
|
|||
| Net assets consist of: |
||||
| Paid-in capital |
$ | 6,516,515,028 | ||
| Undistributed net investment income |
114,134,037 | |||
| Net unrealized appreciation (depreciation) |
265,056,283 | |||
| Accumulated net realized gain (loss) |
(1,006,708,106 | ) | ||
|
|
|
|||
| Net assets, at value |
$ | 5,888,997,242 | ||
|
|
|
|||
| The accompanying notes are an integral part of these financial statements. | Semiannual Report | FI-19 |
FRANKLIN TEMPLETON VARIABLE INSURANCE PRODUCTS TRUST
FINANCIAL STATEMENTS
Statement of Assets and Liabilities (continued)
June 30, 2016 (unaudited)
| Franklin Income VIP Fund |
||||
| Class 1: | ||||
| Net assets, at value |
$ | 662,360,607 | ||
|
|
|
|||
| Shares outstanding |
45,059,036 | |||
|
|
|
|||
| Net asset value and maximum offering price per share |
$ | 14.70 | ||
|
|
|
|||
| Class 2: | ||||
| Net assets, at value |
$ | 4,921,752,376 | ||
|
|
|
|||
| Shares outstanding |
345,275,478 | |||
|
|
|
|||
| Net asset value and maximum offering price per share |
$ | 14.25 | ||
|
|
|
|||
| Class 4: | ||||
| Net assets, at value |
$ | 304,884,259 | ||
|
|
|
|||
| Shares outstanding |
20,925,006 | |||
|
|
|
|||
| Net asset value and maximum offering price per share |
$ | 14.57 | ||
|
|
|
|||
| FI-20 | Semiannual Report | The accompanying notes are an integral part of these financial statements. |
FRANKLIN TEMPLETON VARIABLE INSURANCE PRODUCTS TRUST
FINANCIAL STATEMENTS
Statement of Operations
for the six months ended June 30, 2016 (unaudited)
| Franklin Income VIP Fund |
||||
| Investment income: |
||||
| Dividends |
$ | 63,556,036 | ||
| Interest |
76,102,592 | |||
| Income from securities loaned (net of fees and rebates) |
643,258 | |||
|
|
|
|||
| Total investment income |
140,301,886 | |||
|
|
|
|||
| Expenses: |
||||
| Management fees (Note 3a) |
12,868,273 | |||
| Distribution fees: (Note 3c) |
||||
| Class 2 |
5,926,691 | |||
| Class 4 |
520,427 | |||
| Custodian fees (Note 4) |
32,269 | |||
| Reports to shareholders |
240,681 | |||
| Professional fees |
74,421 | |||
| Trustees’ fees and expenses |
14,842 | |||
| Other |
62,152 | |||
|
|
|
|||
| Total expenses |
19,739,756 | |||
| Expense reductions (Note 4) |
(209 | ) | ||
| Expenses waived/paid by affiliates (Note 3e) |
(885,284 | ) | ||
|
|
|
|||
| Net expenses |
18,854,263 | |||
|
|
|
|||
| Net investment income |
121,447,623 | |||
|
|
|
|||
| Realized and unrealized gains (losses): |
||||
| Net realized gain (loss) from: |
||||
| Investments |
(53,085,640 | ) | ||
| Foreign currency transactions |
466,935 | |||
|
|
|
|||
| Net realized gain (loss) |
(52,618,705 | ) | ||
|
|
|
|||
| Net change in unrealized appreciation (depreciation) on: |
||||
| Investments |
247,556,039 | |||
| Translation of other assets and liabilities denominated in foreign currencies |
6,414 | |||
|
|
|
|||
| Net change in unrealized appreciation (depreciation) |
247,562,453 | |||
|
|
|
|||
| Net realized and unrealized gain (loss) |
194,943,748 | |||
|
|
|
|||
| Net increase (decrease) in net assets resulting from operations |
$ | 316,391,371 | ||
|
|
|
|||
| The accompanying notes are an integral part of these financial statements. | Semiannual Report | FI-21 |
FRANKLIN TEMPLETON VARIABLE INSURANCE PRODUCTS TRUST
FINANCIAL STATEMENTS
Statements of Changes in Net Assets
| Franklin Income VIP Fund | ||||||||
| Six Months Ended June 30, 2016 (unaudited) |
Year Ended December 31, 2015 |
|||||||
| Increase (decrease) in net assets: |
||||||||
| Operations: |
||||||||
| Net investment income |
$ | 121,447,623 | $ | 280,263,160 | ||||
| Net realized gain (loss) |
(52,618,705 | ) | (198,185,492 | ) | ||||
| Net change in unrealized appreciation (depreciation) |
247,562,453 | (544,397,831 | ) | |||||
|
|
|
|||||||
| Net increase (decrease) in net assets resulting from operations |
316,391,371 | (462,320,163 | ) | |||||
|
|
|
|||||||
| Distributions to shareholders from: |
||||||||
| Net investment income: |
||||||||
| Class 1 |
(33,648,018 | ) | (32,196,540 | ) | ||||
| Class 2 |
(243,664,291 | ) | (260,631,132 | ) | ||||
| Class 4 |
(14,419,491 | ) | (15,803,892 | ) | ||||
|
|
|
|||||||
| Total distributions to shareholders |
(291,731,800 | ) | (308,631,564 | ) | ||||
|
|
|
|||||||
| Capital share transactions: (Note 2) |
||||||||
| Class 1 |
52,709,878 | (31,781,112 | ) | |||||
| Class 2 |
(3,067,770 | ) | (463,715,750 | ) | ||||
| Class 4 |
(3,155,246 | ) | (31,713,868 | ) | ||||
|
|
|
|||||||
| Total capital share transactions |
46,486,862 | (527,210,730 | ) | |||||
|
|
|
|||||||
| Net increase (decrease) in net assets |
71,146,433 | (1,298,162,457 | ) | |||||
| Net assets: |
||||||||
| Beginning of period |
5,817,850,809 | 7,116,013,266 | ||||||
|
|
|
|||||||
| End of period |
$ | 5,888,997,242 | $ | 5,817,850,809 | ||||
|
|
|
|||||||
| Undistributed net investment income included in net assets: |
||||||||
| End of period |
$ | 114,134,037 | $ | 284,418,214 | ||||
|
|
|
|||||||
| FI-22 | Semiannual Report | The accompanying notes are an integral part of these financial statements. |
FRANKLIN TEMPLETON VARIABLE INSURANCE PRODUCTS TRUST
Notes to Financial Statements (unaudited)
Franklin Income VIP Fund
| Semiannual Report | FI-23 |
FRANKLIN TEMPLETON VARIABLE INSURANCE PRODUCTS TRUST
NOTES TO FINANCIAL STATEMENTS (UNAUDITED)
Franklin Income VIP Fund (continued)
1. Organization and Significant Accounting Policies (continued)
a. Financial Instrument Valuation (continued)
The VC employs various methods for calibrating these valuation approaches including a regular review of key inputs and assumptions, transactional back-testing or disposition analysis, and reviews of any related market activity.
Trading in securities on foreign securities stock exchanges and OTC markets may be completed before 4 p.m. Eastern time. In addition, trading in certain foreign markets may not take place on every NYSE business day. Occasionally, events occur between the time at which trading in a foreign security is completed and the close of the NYSE that might call into question the reliability of the value of a portfolio security held by the Fund. As a result, differences may arise between the value of the Fund’s portfolio securities as determined at the foreign market close and the latest indications of value at the close of the NYSE. In order to minimize the potential for these differences, the VC monitors price movements following the close of trading in foreign stock markets through a series of country specific market proxies (such as baskets of American Depositary Receipts, futures contracts and exchange traded funds). These price movements are measured against established trigger thresholds for each specific market proxy to assist in determining if an event has occurred that may call into question the reliability of the values of the foreign securities held by the Fund. If such an event occurs, the securities may be valued using fair value procedures, which may include the use of independent pricing services.
When the last day of the reporting period is a non-business day, certain foreign markets may be open on those days that the NYSE is closed, which could result in differences between the value of the Fund’s portfolio securities on the last business day and the last calendar day of the reporting period. Any significant security valuation changes due to an open foreign market are adjusted and reflected by the Fund for financial reporting purposes.
b. Foreign Currency Translation
Portfolio securities and other assets and liabilities denominated in foreign currencies are translated into U.S. dollars based on the exchange rate of such currencies against U.S. dollars on the date of valuation. The Fund may enter into foreign currency exchange contracts to facilitate transactions denominated in a
foreign currency. Purchases and sales of securities, income and expense items denominated in foreign currencies are translated into U.S. dollars at the exchange rate in effect on the transaction date. Portfolio securities and assets and liabilities denominated in foreign currencies contain risks that those currencies will decline in value relative to the U.S. dollar. Occasionally, events may impact the availability or reliability of foreign exchange rates used to convert the U.S. dollar equivalent value. If such an event occurs, the foreign exchange rate will be valued at fair value using procedures established and approved by the Board.
The Fund does not separately report the effect of changes in foreign exchange rates from changes in market prices on securities held. Such changes are included in net realized and unrealized gain or loss from investments in the Statement of Operations.
Realized foreign exchange gains or losses arise from sales of foreign currencies, currency gains or losses realized between the trade and settlement dates on securities transactions and the difference between the recorded amounts of dividends, interest, and foreign withholding taxes and the U.S. dollar equivalent of the amounts actually received or paid. Net unrealized foreign exchange gains and losses arise from changes in foreign exchange rates on foreign denominated assets and liabilities other than investments in securities held at the end of the reporting period.
c. Joint Repurchase Agreement
The Fund enters into a joint repurchase agreement whereby its uninvested cash balance is deposited into a joint cash account with other funds managed by the investment manager or an affiliate of the investment manager and is used to invest in one or more repurchase agreements. The value and face amount of the joint repurchase agreement are allocated to the funds based on their pro-rata interest. A repurchase agreement is accounted for as a loan by the Fund to the seller, collateralized by securities which are delivered to the Fund’s custodian. The fair value, including accrued interest, of the initial collateralization is required to be at least 102% of the dollar amount invested by the funds, with the value of the underlying securities marked to market daily to maintain coverage of at least 100%. Repurchase agreements are subject to the terms of Master Repurchase Agreements (MRAs) with approved counterparties (sellers). The MRAs contain various provisions, including but not limited to events of default and maintenance of collateral for repurchase agreements. In the event of default by either the seller or the
| FI-24 | Semiannual Report |
FRANKLIN TEMPLETON VARIABLE INSURANCE PRODUCTS TRUST
NOTES TO FINANCIAL STATEMENTS (UNAUDITED)
Franklin Income VIP Fund (continued)
| Semiannual Report | FI-25 |
FRANKLIN TEMPLETON VARIABLE INSURANCE PRODUCTS TRUST
NOTES TO FINANCIAL STATEMENTS (UNAUDITED)
Franklin Income VIP Fund (continued)
1. Organization and Significant Accounting Policies (continued)
h. Income and Deferred Taxes (continued)
certain countries across the European Union, the Fund filed additional tax reclaims for previously withheld taxes on dividends earned in those countries (EU reclaims). These additional filings are subject to various administrative proceedings by the local jurisdictions’ tax authorities within the European Union, as well as a number of related judicial proceedings. Income recognized, if any, for EU reclaims is reflected as other income in the Statement of Operations and any related receivable, if any, is reflected as European Union tax reclaims in the Statement of Assets and Liabilities. When uncertainty exists as to the ultimate resolution of these proceedings, the likelihood of receipt of these EU reclaims, and the potential timing of payment, no amounts are reflected in the financial statements.
The Fund may recognize an income tax liability related to its uncertain tax positions under U.S. GAAP when the uncertain tax position has a less than 50% probability that it will be sustained upon examination by the tax authorities based on its technical merits. As of June 30, 2016, the Fund has determined that no tax liability is required in its financial statements related to uncertain tax positions for any open tax years (or expected to be taken in future tax years). Open tax years are those that remain subject to examination and are based on each tax jurisdiction’s statute of limitation.
i. Security Transactions, Investment Income, Expenses and Distributions
Security transactions are accounted for on trade date. Realized gains and losses on security transactions are determined on a specific identification basis. Interest income and estimated expenses are accrued daily. Amortization of premium and accretion of discount on debt securities are included in interest income. Facility fees are recognized as income over the expected term of the loan. Dividend income is recorded on the ex-dividend date except for certain dividends from foreign securities where the dividend rate is not available. In such cases, the dividend is recorded as soon as the information is received by the Fund. Distributions to shareholders are recorded on the ex-dividend date and are determined according to income tax regulations (tax basis). Distributable earnings determined on a tax basis may differ from earnings recorded in accordance with U.S. GAAP. These differences may be permanent or temporary.
Permanent differences are reclassified among capital accounts to reflect their tax character. These reclassifications have no impact on net assets or the results of operations. Temporary differences are not reclassified, as they may reverse in subsequent periods.
Common expenses incurred by the Trust are allocated among the Funds based on the ratio of net assets of each Fund to the combined net assets of the Trust. Fund specific expenses are charged directly to the fund that incurred the expense.
Realized and unrealized gains and losses and net investment income, not including class specific expenses, are allocated daily to each class of shares based upon the relative proportion of net assets of each class. Differences in per share distributions, by class, are generally due to differences in class specific expenses.
j. Accounting Estimates
The preparation of financial statements in accordance with U.S. GAAP requires management to make estimates and assumptions that affect the reported amounts of assets and liabilities at the date of the financial statements and the amounts of income and expenses during the reporting period. Actual results could differ from those estimates.
k. Guarantees and Indemnifications
Under the Trust’s organizational documents, its officers and trustees are indemnified by the Trust against certain liabilities arising out of the performance of their duties to the Trust. Additionally, in the normal course of business, the Trust, on behalf of the Fund, enters into contracts with service providers that contain general indemnification clauses. The Trust’s maximum exposure under these arrangements is unknown as this would involve future claims that may be made against the Trust that have not yet occurred. Currently, the Trust expects the risk of loss to be remote.
| FI-26 | Semiannual Report |
FRANKLIN TEMPLETON VARIABLE INSURANCE PRODUCTS TRUST
NOTES TO FINANCIAL STATEMENTS (UNAUDITED)
Franklin Income VIP Fund (continued)
2. Shares of Beneficial Interest
At June 30, 2016, there were an unlimited number of shares authorized (without par value). Transactions in the Fund’s shares were as follows:
Shares of Beneficial Interest
| Six Months Ended June 30, 2016 |
Year Ended December 31, 2015 |
|||||||||||||||||||
| Shares | Amount | Shares | Amount | |||||||||||||||||
| Class 1 Shares: | ||||||||||||||||||||
| Shares sold |
4,785,593 | $ | 67,213,855 | 1,738,174 | $ | 27,618,019 | ||||||||||||||
| Shares issued in reinvestment of distributions |
2,331,810 | 33,648,018 | 2,040,338 | 32,196,540 | ||||||||||||||||
| Shares redeemed |
(3,330,652 | ) | (48,151,995 | ) | (5,869,235 | ) | (91,595,671 | ) | ||||||||||||
|
|
|
|||||||||||||||||||
| Net increase (decrease) |
3,786,751 | $ | 52,709,878 | (2,090,723 | ) | $ | (31,781,112 | ) | ||||||||||||
|
|
|
|||||||||||||||||||
| Class 2 Shares: | ||||||||||||||||||||
| Shares sold |
13,766,595 | $ | 198,995,920 | 21,413,080 | $ | 334,630,165 | ||||||||||||||
| Shares issued in reinvestment of distributions |
17,417,033 | 243,664,291 | 17,001,378 | 260,631,132 | ||||||||||||||||
| Shares redeemed |
(31,552,736 | ) | (445,727,981 | ) | (69,202,126 | ) | (1,058,977,047 | ) | ||||||||||||
|
|
|
|||||||||||||||||||
| Net increase (decrease) |
(369,108 | ) | $ | (3,067,770 | ) | (30,787,668 | ) | $ | (463,715,750 | ) | ||||||||||
|
|
|
|||||||||||||||||||
| Class 4 Shares: | ||||||||||||||||||||
| Shares sold |
973,176 | $ | 13,969,897 | 2,745,531 | $ | 43,147,056 | ||||||||||||||
| Shares issued in reinvestment of distributions |
1,008,356 | 14,419,491 | 1,010,479 | 15,803,892 | ||||||||||||||||
| Shares redeemed |
(2,182,132 | ) | (31,544,634 | ) | (5,843,737 | ) | (90,664,816 | ) | ||||||||||||
|
|
|
|||||||||||||||||||
| Net increase (decrease) |
(200,600 | ) | $ | (3,155,246 | ) | (2,087,727 | ) | $ | (31,713,868 | ) | ||||||||||
|
|
|
|||||||||||||||||||
3. Transactions With Affiliates
Franklin Resources, Inc. is the holding company for various subsidiaries that together are referred to as Franklin Templeton Investments. Certain officers and trustees of the Fund are also officers and/or directors of the following subsidiaries:
| Subsidiary | Affiliation | |
| Franklin Advisers, Inc. (Advisers) |
Investment manager | |
| Franklin Templeton Services, LLC (FT Services) |
Administrative manager | |
| Franklin Templeton Distributors, Inc. (Distributors) |
Principal underwriter | |
| Franklin Templeton Investor Services, LLC (Investor Services) |
Transfer agent |
a. Management Fees
The Fund pays an investment management fee to Advisers based on the average daily net assets of the Fund as follows:
| Annualized Fee Rate | Net Assets | |
| 0.625% |
Up to and including $100 million | |
| 0.500% |
Over $100 million, up to and including $250 million | |
| 0.450% |
Over $250 million, up to and including $7.5 billion | |
| 0.440% |
Over $7.5 billion, up to and including $10 billion | |
| 0.430% |
Over $10 billion, up to and including $12.5 billion | |
| 0.420% |
Over $12.5 billion, up to and including $15 billion | |
| 0.400% |
In excess of $15 billion |
| Semiannual Report | FI-27 |
FRANKLIN TEMPLETON VARIABLE INSURANCE PRODUCTS TRUST
NOTES TO FINANCIAL STATEMENTS (UNAUDITED)
Franklin Income VIP Fund (continued)
3. Transactions With Affiliates (continued)
For the period ended June 30, 2016, the annualized effective investment management fee rate was 0.454% of the Fund’s average daily net assets.
b. Administrative Fees
Under an agreement with Advisers, FT Services provides administrative services to the Fund. The fee is paid by Advisers based on the Fund’s average daily net assets, and is not an additional expense of the Fund.
c. Distribution Fees
The Board has adopted distribution plans for Class 2 and Class 4 shares pursuant to Rule 12b-1 under the 1940 Act. Under the Fund’s compensation distribution plans, the Fund pays Distributors for costs incurred in connection with the servicing, sale and distribution of the Fund’s shares up to 0.35%, per year of its average daily net assets of each class. The Board has agreed to limit the current rate to 0.25% per year for Class 2. The plan year, for purposes of monitoring compliance with the maximum annual plan rates, is February 1 through January 31.
d. Transfer Agent Fees
Investor Services, under terms of an agreement, performs shareholder servicing for the Fund and is not paid by the Fund for the services.
e. Investments in Affiliated Management Investment Companies
The Fund invests in one or more affiliated management investment companies for purposes other than exercising a controlling influence over the management or policies. Management fees paid by the Fund are waived on assets invested in the affiliated management investment companies, as noted in the Statement of Operations, in an amount not to exceed the management and administrative fees paid directly or indirectly by each affiliate.
| Number of Shares Held at Beginning of Period |
Gross Additions |
Gross Reductions |
Number of Shares Held at End of Period |
Value at End of Period |
Investment Income |
Realized Gain (Loss) |
% of Affiliated Fund Shares Outstanding Held at End of Period |
|||||||||||||||||||||||||
| Non-Controlled Affiliates | ||||||||||||||||||||||||||||||||
| Institutional Fiduciary Trust Money |
589,053,827 | 665,929,014 | (631,939,224 | ) | 623,043,617 | $ | 623,043,617 | $ | — | $ | — | 3.2% | ||||||||||||||||||||
|
|
|
|||||||||||||||||||||||||||||||
f. Other Affiliated Transactions
At June 30, 2016, Franklin Templeton Variable Insurance Products Trust — Franklin Founding Funds Allocation VIP Fund owned 5.4% of the Fund’s outstanding shares.
4. Expense Offset Arrangement
The Fund has entered into an arrangement with its custodian whereby credits realized as a result of uninvested cash balances are used to reduce a portion of the Fund’s custodian expenses. During the period ended June 30, 2016, the custodian fees were reduced as noted in the Statement of Operations.
| FI-28 | Semiannual Report |
FRANKLIN TEMPLETON VARIABLE INSURANCE PRODUCTS TRUST
NOTES TO FINANCIAL STATEMENTS (UNAUDITED)
Franklin Income VIP Fund (continued)
5. Income Taxes
For tax purposes, capital losses may be carried over to offset future capital gains. Capital loss carryforwards with no expiration, if any, must be fully utilized before those losses with expiration dates.
At December 31, 2015, capital loss carryforwards were as follows:
| Capital loss carryforwards subject to expiration: |
||||
| 2016 |
$ | 51,901,081 | ||
| 2017 |
521,405,875 | |||
| 2018 |
157,561,044 | |||
| Capital loss carryforwards not subject to expiration: |
||||
| Short term |
73,992,456 | |||
| Long term |
144,130,633 | |||
|
|
|
|||
| Total capital loss carryforwards |
$ | 948,991,089 | ||
|
|
|
At June 30, 2016, the cost of investments and net unrealized appreciation (depreciation) for income tax purposes were as follows:
| Cost of investments |
$ | 5,592,883,388 | ||
|
|
|
|||
| Unrealized appreciation |
$ | 666,310,350 | ||
| Unrealized depreciation |
(394,929,102 | ) | ||
|
|
|
|||
| Net unrealized appreciation (depreciation) |
$ | 271,381,248 | ||
|
|
|
Differences between income and/or capital gains as determined on a book basis and a tax basis are primarily due to differing treatments of bond discounts and premiums and equity-linked securities.
6. Investment Transactions
Purchases and sales of investments (excluding short term securities) for the period ended June 30, 2016, aggregated $1,358,778,213 and $1,379,809,114, respectively.
At June 30, 2016, in connection with securities lending transactions, the Fund loaned corporate bonds and received $2,741,698 of cash collateral. The gross amount of recognized liability for such transactions is included in payable upon return of securities loaned in the Statement of Assets and Liabilities. The agreements can be terminated at any time.
7. Credit Risk and Defaulted Securities
At June 30, 2016, the Fund had 32.7% of its portfolio invested in high yield, senior secured floating rate notes, or other securities rated below investment grade. These securities may be more sensitive to economic conditions causing greater price volatility and are potentially subject to a greater risk of loss due to default than higher rated securities.
The Fund held defaulted securities and/or other securities for which the income has been deemed uncollectible. At June 30, 2016, the aggregate value of these securities was $11,327,480, representing 0.2% of the Fund’s net assets. The Fund discontinues accruing income on securities for which income has been deemed uncollectible and provides an estimate for losses on interest receivable. The securities have been identified in the accompanying Statement of Investments.
8. Restricted Securities
The Fund invests in securities that are restricted under the Securities Act of 1933 (1933 Act) or which are subject to legal, contractual, or other agreed upon restrictions on resale. Restricted securities are often purchased in private placement transactions, and cannot be sold without prior registration unless the sale is pursuant to an exemption under the 1933 Act. Disposal of these securities
| Semiannual Report | FI-29 |
FRANKLIN TEMPLETON VARIABLE INSURANCE PRODUCTS TRUST
NOTES TO FINANCIAL STATEMENTS (UNAUDITED)
Franklin Income VIP Fund (continued)
8. Restricted Securities (continued)
may require greater effort and expense, and prompt sale at an acceptable price may be difficult. The Fund may have registration rights for restricted securities. The issuer generally incurs all registration costs.
At June 30, 2016, the Fund held investments in restricted securities, excluding certain securities exempt from registration under the 1933 Act deemed to be liquid, as follows:
| Shares | Issuer | Acquisition Date |
Cost | Value | ||||||||||
| 75,000 | aRex Energy Corp. (Value is 0.0%b of Net Assets) |
12/16/14 | $ | 3,860,972 | $ | 43,527 | ||||||||
|
|
|
|||||||||||||
a The Fund also invests in unrestricted securities or other investments in the issuer, valued at $1,125,000 as of June, 30, 2016.
bRounds to less than 0.1% of net assets.
9. Credit Facility
The Fund, together with other U.S. registered and foreign investment funds (collectively, Borrowers), managed by Franklin Templeton Investments, are borrowers in a joint syndicated senior unsecured credit facility totaling $2 billion (Global Credit Facility) which matures on February 10, 2017. This Global Credit Facility provides a source of funds to the Borrowers for temporary and emergency purposes, including the ability to meet future unanticipated or unusually large redemption requests.
Under the terms of the Global Credit Facility, the Fund shall, in addition to interest charged on any borrowings made by the Fund and other costs incurred by the Fund, pay its share of fees and expenses incurred in connection with the implementation and maintenance of the Global Credit Facility, based upon its relative share of the aggregate net assets of all of the Borrowers, including an annual commitment fee of 0.07% based upon the unused portion of the Global Credit Facility. Effective February 12, 2016, the annual commitment fee is 0.15%. These fees are reflected in other expenses in the Statement of Operations. During the period ended June 30, 2016, the Fund did not use the Global Credit Facility.
10. Fair Value Measurements
The Fund follows a fair value hierarchy that distinguishes between market data obtained from independent sources (observable inputs) and the Fund’s own market assumptions (unobservable inputs). These inputs are used in determining the value of the Fund’s financial instruments and are summarized in the following fair value hierarchy:
| • | Level 1 – quoted prices in active markets for identical financial instruments |
| • | Level 2 – other significant observable inputs (including quoted prices for similar financial instruments, interest rates, prepayment speed, credit risk, etc.) |
| • | Level 3 – significant unobservable inputs (including the Fund’s own assumptions in determining the fair value of financial instruments) |
The input levels are not necessarily an indication of the risk or liquidity associated with financial instruments at that level.
For movements between the levels within the fair value hierarchy, the Fund has adopted a policy of recognizing the transfers as of the date of the underlying event which caused the movement.
| FI-30 | Semiannual Report |
FRANKLIN TEMPLETON VARIABLE INSURANCE PRODUCTS TRUST
NOTES TO FINANCIAL STATEMENTS (UNAUDITED)
Franklin Income VIP Fund (continued)
A summary of inputs used as of June 30, 2016, in valuing the Fund’s assets carried at fair value, is as follows:
| Level 1 | Level 2 | Level 3 | Total | |||||||||||||
| Assets: | ||||||||||||||||
| Investments in Securities: |
||||||||||||||||
| Equity Investments:a |
||||||||||||||||
| Energy |
$ | 459,517,401 | $ | 1,198,497 | $ | 43,527 | $ | 460,759,425 | ||||||||
| Financials |
302,829,183 | 5,996,875 | — | 308,826,058 | ||||||||||||
| Industrials |
369,981,539 | — | 9,911,531 | 379,893,070 | ||||||||||||
| Information Technology |
352,975,600 | 32,599,469 | — | 385,575,069 | ||||||||||||
| All Other Equity Investments b |
1,318,659,321 | — | — | 1,318,659,321 | ||||||||||||
| Equity-Linked Securities |
— | 252,213,267 | — | 252,213,267 | ||||||||||||
| Convertible Bonds |
— | 32,010,000 | — | 32,010,000 | ||||||||||||
| Corporate Bonds |
1,901,469,628 | 1,901,469,628 | ||||||||||||||
| Senior Floating Rate Interests |
— | 201,266,483 | — | 201,266,483 | ||||||||||||
| Escrows and Litigation Trusts |
— | — | — | c | — | |||||||||||
| Short Term Investments |
623,043,617 | 548,698 | — | 623,592,315 | ||||||||||||
|
|
|
|||||||||||||||
| Total Investments in Securities |
$ | 3,427,006,661 | $ | 2,427,302,917 | $ | 9,955,058 | $ | 5,864,264,636 | ||||||||
|
|
|
|||||||||||||||
aIncludes common, preferred and convertible preferred stocks.
bFor detailed categories, see the accompanying Statement of Investments.
cIncludes securities determined to have no value at June 30, 2016.
A reconciliation of assets in which Level 3 inputs are used in determining fair value is presented when there are significant Level 3 financial instruments at the end of the period.
11. Subsequent Events
The Fund has evaluated subsequent events through the issuance of the financial statements and determined that no events have occurred that require disclosure.
Abbreviations
| Selected Portfolio | ||
| ADR | American Depositary Receipt | |
| FNMA | Federal National Mortgage Association | |
| FRN | Floating Rate Note | |
| L/C | Letter of Credit | |
| MTN | Medium Term Note | |
| Semiannual Report | FI-31 |
Franklin Large Cap Growth VIP Fund
This semiannual report for Franklin Large Cap Growth VIP Fund covers the period ended June 30, 2016.
Class 1 Performance Summary as of June 30, 2016
The Fund’s Class 1 shares had a -6.23% total return for the six-month period ended June 30, 2016.
Performance reflects the Fund’s Class 1 operating expenses, but does not include any contract fees, expenses or sales charges. If they had been included, performance would be lower. These charges and deductions, particularly for variable life policies, can have a significant effect on contract values and insurance benefits. See the contract prospectus for a complete description of these expenses, including sales charges.
Performance data represent past performance, which does not guarantee future results. Investment return and principal value will fluctuate, and you may have a gain or loss when you sell your shares. Current performance may differ from figures shown.
| Semiannual Report | FLG-1 |
FRANKLIN LARGE CAP GROWTH VIP FUND
1. Please see Index Descriptions following the Fund Summaries.
2. Source: Morningstar. One cannot invest directly in an index, and an index is not representative of the Fund’s portfolio. Please see Index Descriptions following the Fund Summaries.
3. Source: Bureau of Labor Statistics.
| FLG-2 | Semiannual Report |
FRANKLIN LARGE CAP GROWTH VIP FUND
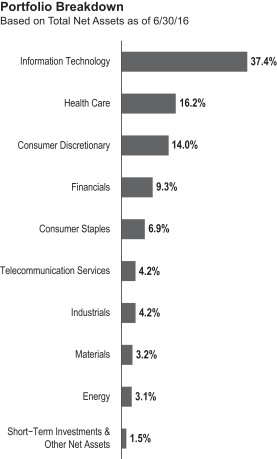
Key contributors from other sectors included Diamondback Energy and Edwards Lifesciences. Texas-based oil and natural gas provider Diamondback Energy weathered the volatility of oil prices in the first quarter of 2016 and benefited later during the period when oil prices recovered slightly. Similar to its competitors, the company reduced drilling and spending due to lower oil prices, but Diamondback was able to raise capital through equity issuance, kept its leverage ratios low and maintained its production growth through the downturn of the cycle. The company’s terrestrial location in the Permian Basin of West Texas also provided relatively low U.S. oil drilling costs, providing an advantageous position for Diamondback during a period where oil prices declined to historic lows. Shares of medical devices company Edwards Lifesciences rose due to the company’s greater-than-expected sales and profits in 2015’s fourth quarter as well as company management’s higher guidance for 2016 sales and profits. In addition, the company released data showing low mortality and stroke rates in studies of its transcatheter heart valves in patients deemed to be under intermediate risk for potential traditional surgical valve replacement procedures.
| Semiannual Report | FLG-3 |
FRANKLIN LARGE CAP GROWTH VIP FUND
Thank you for your participation in Franklin Large Cap Growth VIP Fund. We look forward to to serving your future investment needs.
The foregoing information reflects our analysis, opinions and portfolio holdings as of June 30, 2016, the end of the reporting period. The way we implement our main investment strategies and the resulting portfolio holdings may change depending on factors such as market and economic conditions. These opinions may not be relied upon as investment advice or an offer for a particular security. The information is not a complete analysis of every aspect of any market, country, industry, security or the Fund. Statements of fact are from sources considered reliable, but the investment manager makes no representation or warranty as to their completeness or accuracy. Although historical performance is no guarantee of future results, these insights may help you understand our investment management philosophy.
| FLG-4 | Semiannual Report |
FRANKLIN LARGE CAP GROWTH VIP FUND
Class 1 Fund Expenses
| Class 1 | Beginning Account Value 1/1/16 |
Ending Account Value 6/30/16 |
Fund-Level Expenses 1/1/16–6/30/16 |
|||||||||
| Actual |
$ | 1,000 | $ | 937.70 | $ | 3.85 | ||||||
| Hypothetical (5% return before expenses) |
$ | 1,000 | $ | 1,020.89 | $ | 4.02 | ||||||
*Expenses are calculated using the most recent six-month annualized expense ratio for the Fund’s Class 1 shares (0.80%), which does not include any ongoing expenses of the Contract for which the Fund is an investment option, multiplied by the average account value over the period, multiplied by 182/366 to reflect the one-half year period.
| Semiannual Report | FLG-5 |
FRANKLIN TEMPLETON VARIABLE INSURANCE PRODUCTS TRUST
Financial Highlights
Franklin Large Cap Growth VIP Fund
|
Six Months Ended (unaudited) |
Year Ended December 31, | |||||||||||||||||||||||
| 2015 | 2014 | 2013 | 2012 | 2011 | ||||||||||||||||||||
| Class 1 | ||||||||||||||||||||||||
| Per share operating performance (for a share outstanding throughout the period) |
||||||||||||||||||||||||
| Net asset value, beginning of period |
$18.42 | $23.26 | $20.91 | $16.43 | $14.75 | $15.07 | ||||||||||||||||||
|
|
|
|||||||||||||||||||||||
| Income from investment operationsa: | ||||||||||||||||||||||||
| Net investment income (loss)b |
(0.02 | ) | (0.06 | ) | 0.11 | 0.24 | 0.21 | 0.15 | ||||||||||||||||
| Net realized and unrealized gains (losses) |
(1.13 | ) | 1.56 | 2.54 | 4.48 | 1.65 | (0.33 | ) | ||||||||||||||||
|
|
|
|||||||||||||||||||||||
| Total from investment operations |
(1.15 | ) | 1.50 | 2.65 | 4.72 | 1.86 | (0.18 | ) | ||||||||||||||||
|
|
|
|||||||||||||||||||||||
| Less distributions from: | ||||||||||||||||||||||||
| Net investment income |
— | (0.13 | ) | (0.30 | ) | (0.24 | ) | (0.18 | ) | (0.14 | ) | |||||||||||||
| Net realized gains |
(0.27 | ) | (6.21 | ) | — | — | — | — | ||||||||||||||||
|
|
|
|||||||||||||||||||||||
| Total distributions |
(0.27 | ) | (6.34 | ) | (0.30 | ) | (0.24 | ) | (0.18 | ) | (0.14 | ) | ||||||||||||
|
|
|
|||||||||||||||||||||||
| Net asset value, end of period |
$17.00 | $18.42 | $23.26 | $20.91 | $16.43 | $14.75 | ||||||||||||||||||
|
|
|
|||||||||||||||||||||||
| Total returnc |
(6.23)% | 5.89% | 12.74% | 28.92% | 12.65% | (1.22)% | ||||||||||||||||||
| Ratios to average net assetsd | ||||||||||||||||||||||||
| Expenses |
0.80% | 0.78% | 0.79% | 0.79% | 0.80% | 0.80% | ||||||||||||||||||
| Net investment income (loss) |
(0.23)% | (0.27)% | 0.50% | 1.27% | 1.31% | 0.99% | ||||||||||||||||||
| Supplemental data | ||||||||||||||||||||||||
| Net assets, end of period (000’s) |
$42,266 | $47,864 | $54,971 | $54,291 | $46,756 | $48,666 | ||||||||||||||||||
| Portfolio turnover rate |
17.35% | 23.23% | 93.53% | 28.27% | 33.88% | 56.61% | ||||||||||||||||||
aThe amount shown for a share outstanding throughout the period may not correlate with the Statement of Operations for the period due to the timing of sales and repurchases of the Fund’s shares in relation to income earned and/or fluctuating fair value of the investments of the Fund.
bBased on average daily shares outstanding.
cTotal return does not include fees, charges or expenses imposed by the variable annuity and life insurance contracts for which Franklin Templeton Variable Insurance Products Trust serves as an underlying investment vehicle. Total return is not annualized for periods less than one year.
dRatios are annualized for periods less than one year.
| FLG-6 | Semiannual Report | The accompanying notes are an integral part of these financial statements. |
FRANKLIN TEMPLETON VARIABLE INSURANCE PRODUCTS TRUST
FINANCIAL HIGHLIGHTS
Franklin Large Cap Growth VIP Fund (continued)
|
Six Months Ended (unaudited) |
Year Ended December 31, | |||||||||||||||||||||||
| 2015 | 2014 | 2013 | 2012 | 2011 | ||||||||||||||||||||
| Class 2 | ||||||||||||||||||||||||
| Per share operating performance (for a share outstanding throughout the period) |
||||||||||||||||||||||||
| Net asset value, beginning of period |
$18.09 | $22.94 | $20.62 | $16.20 | $14.54 | $14.86 | ||||||||||||||||||
|
|
|
|||||||||||||||||||||||
| Income from investment operationsa: | ||||||||||||||||||||||||
| Net investment income (loss)b |
(0.04 | ) | (0.11 | ) | 0.06 | 0.19 | 0.17 | 0.11 | ||||||||||||||||
| Net realized and unrealized gains (losses) |
(1.11 | ) | 1.54 | 2.50 | 4.42 | 1.62 | (0.33 | ) | ||||||||||||||||
|
|
|
|||||||||||||||||||||||
| Total from investment operations |
(1.15 | ) | 1.43 | 2.56 | 4.61 | 1.79 | (0.22 | ) | ||||||||||||||||
|
|
|
|||||||||||||||||||||||
| Less distributions from: | ||||||||||||||||||||||||
| Net investment income |
— | (0.07 | ) | (0.24 | ) | (0.19 | ) | (0.13 | ) | (0.10 | ) | |||||||||||||
| Net realized gains |
(0.27 | ) | (6.21 | ) | — | — | — | — | ||||||||||||||||
|
|
|
|||||||||||||||||||||||
| Total distributions |
(0.27 | ) | (6.28 | ) | (0.24 | ) | (0.19 | ) | (0.13 | ) | (0.10 | ) | ||||||||||||
|
|
|
|||||||||||||||||||||||
| Net asset value, end of period |
$16.67 | $18.09 | $22.94 | $20.62 | $16.20 | $14.54 | ||||||||||||||||||
|
|
|
|||||||||||||||||||||||
| Total returnc |
(6.34)% | 5.62% | 12.46% | 28.63% | 12.37% | (1.51)% | ||||||||||||||||||
| Ratios to average net assetsd | ||||||||||||||||||||||||
| Expenses |
1.05% | 1.03% | 1.04% | 1.04% | 1.05% | 1.05% | ||||||||||||||||||
| Net investment income (loss) |
(0.48)% | (0.52)% | 0.25% | 1.02% | 1.06% | 0.74% | ||||||||||||||||||
| Supplemental data | ||||||||||||||||||||||||
| Net assets, end of period (000’s) |
$188,608 | $223,807 | $256,098 | $285,477 | $278,989 | $293,226 | ||||||||||||||||||
| Portfolio turnover rate |
17.35% | 23.23% | 93.53% | 28.27% | 33.88% | 56.61% | ||||||||||||||||||
aThe amount shown for a share outstanding throughout the period may not correlate with the Statement of Operations for the period due to the timing of sales and repurchases of the Fund’s shares in relation to income earned and/or fluctuating fair value of the investments of the Fund.
bBased on average daily shares outstanding.
cTotal return does not include fees, charges or expenses imposed by the variable annuity and life insurance contracts for which Franklin Templeton Variable Insurance Products Trust serves as an underlying investment vehicle. Total return is not annualized for periods less than one year.
dRatios are annualized for periods less than one year.
| The accompanying notes are an integral part of these financial statements. | Semiannual Report | FLG-7 |
FRANKLIN TEMPLETON VARIABLE INSURANCE PRODUCTS TRUST
Statement of Investments, June 30, 2016 (unaudited)
| Franklin Large Cap Growth VIP Fund
|
||||||||||
| Shares | Value | |||||||||
| Common Stocks 98.5% |
||||||||||
| Consumer Discretionary 14.0% |
||||||||||
| a | Amazon.com Inc. |
10,869 | $ | 7,778,074 | ||||||
| a | Buffalo Wild Wings Inc. |
8,868 | 1,232,209 | |||||||
| a | Charter Communications Inc., A |
13,227 | 3,024,221 | |||||||
| Delphi Automotive PLC (United Kingdom) |
16,539 | 1,035,341 | ||||||||
| Lowe’s Cos. Inc. |
36,621 | 2,899,285 | ||||||||
| Newell Brands Inc. |
25,144 | 1,221,244 | ||||||||
| NIKE Inc., B |
41,227 | 2,275,730 | ||||||||
| a | The Priceline Group Inc. |
1,890 | 2,359,495 | |||||||
| Starbucks Corp. |
87,516 | 4,998,914 | ||||||||
| a | Under Armour Inc., A |
32,912 | 1,320,759 | |||||||
| The Walt Disney Co. |
42,894 | 4,195,891 | ||||||||
|
|
|
|||||||||
| 32,341,163 | ||||||||||
|
|
|
|||||||||
| Consumer Staples 6.9% |
||||||||||
| Constellation Brands Inc., A |
32,850 | 5,433,390 | ||||||||
| a | Monster Beverage Corp. |
35,565 | 5,715,651 | |||||||
| Reynolds American Inc. |
44,868 | 2,419,731 | ||||||||
| a | WhiteWave Foods Co., A |
48,482 | 2,275,745 | |||||||
|
|
|
|||||||||
| 15,844,517 | ||||||||||
|
|
|
|||||||||
| Energy 3.1% |
||||||||||
| Anadarko Petroleum Corp. |
42,990 | 2,289,217 | ||||||||
| a | Diamondback Energy Inc. |
27,704 | 2,526,882 | |||||||
| Halliburton Co. |
52,730 | 2,388,142 | ||||||||
|
|
|
|||||||||
| 7,204,241 | ||||||||||
|
|
|
|||||||||
| Financials 9.3% |
||||||||||
| a | Affiliated Managers Group Inc. |
13,296 | 1,871,678 | |||||||
| American Tower Corp. |
30,987 | 3,520,433 | ||||||||
| BlackRock Inc. |
6,351 | 2,175,408 | ||||||||
| a | CBRE Group Inc. |
93,603 | 2,478,608 | |||||||
| The Charles Schwab Corp. |
127,404 | 3,224,595 | ||||||||
| Equinix Inc. |
8,973 | 3,479,101 | ||||||||
| Moody’s Corp. |
18,739 | 1,756,032 | ||||||||
| a | Signature Bank |
24,559 | 3,067,910 | |||||||
|
|
|
|||||||||
| 21,573,765 | ||||||||||
|
|
|
|||||||||
| Health Care 16.2% |
||||||||||
| a,b | Acerta Pharma BV (Netherlands) |
9,780,975 | 520,348 | |||||||
| a | Allergan PLC |
34,867 | 8,057,415 | |||||||
| a | Biogen Inc. |
11,954 | 2,890,716 | |||||||
| a | Celgene Corp. |
79,073 | 7,798,970 | |||||||
| a | Edwards Lifesciences Corp. |
41,620 | 4,150,762 | |||||||
| a | Envision Healthcare Holdings Inc. |
78,387 | 1,988,678 | |||||||
| Gilead Sciences Inc. |
41,454 | 3,458,093 | ||||||||
| a | Heron Therapeutics Inc. |
58,452 | 1,055,058 | |||||||
| a | Illumina Inc. |
13,708 | 1,924,329 | |||||||
| a | Impax Laboratories Inc. |
30,480 | 878,434 | |||||||
| a | Incyte Corp. |
16,260 | 1,300,475 | |||||||
| Medtronic PLC |
26,784 | 2,324,048 | ||||||||
| a | Regeneron Pharmaceuticals Inc. |
3,065 | 1,070,390 | |||||||
|
|
|
|||||||||
| 37,417,716 | ||||||||||
|
|
|
|||||||||
| FLG-8 | Semiannual Report |
FRANKLIN TEMPLETON VARIABLE INSURANCE PRODUCTS TRUST
STATEMENT OF INVESTMENTS (UNAUDITED)
Franklin Large Cap Growth VIP Fund (continued)
| Shares | Value | |||||||||
| Common Stocks (continued) |
||||||||||
| Industrials 4.2% |
||||||||||
| Allegiant Travel Co. |
10,149 | $ | 1,537,573 | |||||||
| General Electric Co. |
80,230 | 2,525,640 | ||||||||
| Hexcel Corp. |
40,001 | 1,665,642 | ||||||||
| a | IHS Inc., A |
19,155 | 2,214,510 | |||||||
| Raytheon Co. |
4,231 | 575,204 | ||||||||
| Roper Technologies Inc. |
7,010 | 1,195,626 | ||||||||
|
|
|
|||||||||
| 9,714,195 | ||||||||||
|
|
|
|||||||||
| Information Technology 37.4% |
||||||||||
| a | Adobe Systems Inc. |
38,070 | 3,646,725 | |||||||
| a | Alphabet Inc., A |
7,970 | 5,607,134 | |||||||
| a | Alphabet Inc., C |
6,546 | 4,530,487 | |||||||
| Apple Inc. |
61,315 | 5,861,714 | ||||||||
| Broadcom Ltd. (Singapore) |
16,639 | 2,585,701 | ||||||||
| a | BroadSoft Inc. |
31,077 | 1,275,089 | |||||||
| a | Cognizant Technology Solutions Corp., A |
39,049 | 2,235,165 | |||||||
| a | Electronic Arts Inc. |
58,172 | 4,407,111 | |||||||
| a | Facebook Inc., A |
94,714 | 10,823,916 | |||||||
| a | Fiserv Inc. |
22,573 | 2,454,362 | |||||||
| MasterCard Inc., A |
85,879 | 7,562,505 | ||||||||
| Microsoft Corp. |
92,891 | 4,753,233 | ||||||||
| a | Mobileye NV (Israel) |
31,229 | 1,440,906 | |||||||
| NVIDIA Corp. |
18,034 | 847,778 | ||||||||
| a | NXP Semiconductors NV (Netherlands) |
47,622 | 3,730,708 | |||||||
| a | Palo Alto Networks Inc. |
17,547 | 2,151,964 | |||||||
| a | Red Hat Inc. |
32,895 | 2,388,177 | |||||||
| a | Salesforce.com Inc. |
37,264 | 2,959,134 | |||||||
| a | ServiceNow Inc. |
31,383 | 2,083,831 | |||||||
| a | Tyler Technologies Inc. |
22,699 | 3,784,150 | |||||||
| a | ViaSat Inc. |
22,618 | 1,614,925 | |||||||
| Visa Inc., A |
120,007 | 8,900,919 | ||||||||
| Xilinx Inc. |
12,575 | 580,085 | ||||||||
|
|
|
|||||||||
| 86,225,719 | ||||||||||
|
|
|
|||||||||
| Materials 3.2% |
||||||||||
| a | Axalta Coating Systems Ltd. |
80,389 | 2,132,720 | |||||||
| Ecolab Inc. |
20,671 | 2,451,581 | ||||||||
| Martin Marietta Materials Inc. |
14,291 | 2,743,872 | ||||||||
|
|
|
|||||||||
| 7,328,173 | ||||||||||
|
|
|
|||||||||
| Telecommunication Services 4.2% |
||||||||||
| a | SBA Communications Corp. |
73,501 | 7,933,698 | |||||||
| a | T-Mobile U.S. Inc. |
42,405 | 1,834,864 | |||||||
|
|
|
|||||||||
| 9,768,562 | ||||||||||
|
|
|
|||||||||
| Total Common Stocks (Cost $164,978,391) |
227,418,051 | |||||||||
|
|
|
|||||||||
| Semiannual Report | FLG-9 |
FRANKLIN TEMPLETON VARIABLE INSURANCE PRODUCTS TRUST
STATEMENT OF INVESTMENTS (UNAUDITED)
Franklin Large Cap Growth VIP Fund (continued)
| Principal Amount | Value | |||||||||
| Short Term Investments (Cost $4,941,497) 2.1% |
||||||||||
| Repurchase Agreements 2.1% |
||||||||||
| c | Joint Repurchase Agreement, 0.382%, 7/01/16 (Maturity Value $4,941,549) |
$ | 4,941,497 | $ | 4,941,497 | |||||
| BNP Paribas Securities Corp. (Maturity Value $1,602,693) |
||||||||||
| Collateralized by U.S. Government Agency Securities, 0.187% - 5.50%, 7/18/16 - 5/06/21; |
||||||||||
|
|
|
|||||||||
| Total Investments (Cost $169,919,888) 100.6% |
232,359,548 | |||||||||
| Other Assets, less Liabilities (0.6)% |
(1,485,859 | ) | ||||||||
|
|
|
|||||||||
| Net Assets 100.0% |
$ | 230,873,689 | ||||||||
|
|
|
|||||||||
aNon-income producing.
bSee Note 7 regarding restricted securities.
cSee Note 1(c) regarding joint repurchase agreement.
| FLG-10 | Semiannual Report | The accompanying notes are an integral part of these financial statements. |
FRANKLIN TEMPLETON VARIABLE INSURANCE PRODUCTS TRUST
Financial Statements
Statement of Assets and Liabilities
June 30, 2016 (unaudited)
| Franklin Large Cap Growth VIP Fund |
||||
| Assets: |
||||
| Investments in securities: |
||||
| Cost - Unaffiliated issuers |
$ | 164,978,391 | ||
| Cost - Repurchase agreements |
4,941,497 | |||
|
|
|
|||
| Total cost of investments |
$ | 169,919,888 | ||
|
|
|
|||
| Value - Unaffiliated issuers |
$ | 227,418,051 | ||
| Value - Repurchase agreements |
4,941,497 | |||
|
|
|
|||
| Total value of investments |
232,359,548 | |||
| Receivables: |
||||
| Investment securities sold |
819,435 | |||
| Capital shares sold |
463,211 | |||
| Dividends |
70,916 | |||
| Other assets |
114 | |||
|
|
|
|||
| Total assets |
233,713,224 | |||
|
|
|
|||
| Liabilities: |
||||
| Payables: |
||||
| Investment securities purchased |
2,189,564 | |||
| Capital shares redeemed |
372,621 | |||
| Management fees |
144,375 | |||
| Distribution fees |
80,521 | |||
| Accrued expenses and other liabilities |
52,454 | |||
|
|
|
|||
| Total liabilities |
2,839,535 | |||
|
|
|
|||
| Net assets, at value |
$ | 230,873,689 | ||
|
|
|
|||
| Net assets consist of: |
||||
| Paid-in capital |
$ | 165,158,178 | ||
| Undistributed net investment income (loss) |
(515,999 | ) | ||
| Net unrealized appreciation (depreciation) |
62,403,868 | |||
| Accumulated net realized gain (loss) |
3,827,642 | |||
|
|
|
|||
| Net assets, at value |
$ | 230,873,689 | ||
|
|
|
|||
| Class 1: | ||||
| Net assets, at value |
$ | 42,265,876 | ||
|
|
|
|||
| Shares outstanding |
2,485,663 | |||
|
|
|
|||
| Net asset value and maximum offering price per share |
$ | 17.00 | ||
|
|
|
|||
| Class 2: | ||||
| Net assets, at value |
$ | 188,607,813 | ||
|
|
|
|||
| Shares outstanding |
11,314,459 | |||
|
|
|
|||
| Net asset value and maximum offering price per share |
$ | 16.67 | ||
|
|
|
|||
| The accompanying notes are an integral part of these financial statements. | Semiannual Report | FLG-11 |
FRANKLIN TEMPLETON VARIABLE INSURANCE PRODUCTS TRUST
FINANCIAL STATEMENTS
Statement of Operations
for the six months ended June 30, 2016 (unaudited)
| Franklin Large Cap Growth VIP Fund |
||||
| Investment income: |
||||
| Dividends |
$ | 669,515 | ||
| Interest |
4,475 | |||
|
|
|
|||
| Total investment income |
673,990 | |||
|
|
|
|||
| Expenses: |
||||
| Management fees (Note 3a) |
892,171 | |||
| Distribution fees - Class 2 (Note 3c) |
243,482 | |||
| Custodian fees (Note 4) |
1,218 | |||
| Reports to shareholders |
29,694 | |||
| Professional fees |
17,684 | |||
| Trustees’ fees and expenses |
671 | |||
| Other |
5,069 | |||
|
|
|
|||
| Total expenses |
1,189,989 | |||
|
|
|
|||
| Net investment income (loss) |
(515,999 | ) | ||
|
|
|
|||
| Realized and unrealized gains (losses): |
||||
| Net realized gain (loss) from: |
||||
| Investments |
4,318,281 | |||
| Foreign currency transactions |
(2,434 | ) | ||
|
|
|
|||
| Net realized gain (loss) |
4,315,847 | |||
|
|
|
|||
| Net change in unrealized appreciation (depreciation) on investments |
(21,317,538 | ) | ||
|
|
|
|||
| Net realized and unrealized gain (loss) |
(17,001,691 | ) | ||
|
|
|
|||
| Net increase (decrease) in net assets resulting from operations |
$ | (17,517,690 | ) | |
|
|
|
|||
| FLG-12 | Semiannual Report | The accompanying notes are an integral part of these financial statements. |
FRANKLIN TEMPLETON VARIABLE INSURANCE PRODUCTS TRUST
FINANCIAL STATEMENTS
Statements of Changes in Net Assets
| Franklin Large Cap Growth VIP Fund | ||||||||
| Six Months Ended June 30, 2016 (unaudited) |
Year Ended December 31, 2015 |
|||||||
| Increase (decrease) in net assets: |
||||||||
| Operations: |
||||||||
| Net investment income (loss) |
$ | (515,999 | ) | $ | (1,428,248 | ) | ||
| Net realized gain (loss) |
4,315,847 | 3,534,624 | ||||||
| Net change in unrealized appreciation (depreciation) |
(21,317,538 | ) | 15,220,871 | |||||
|
|
|
|||||||
| Net increase (decrease) in net assets resulting from operations |
(17,517,690 | ) | 17,327,247 | |||||
|
|
|
|||||||
| Distributions to shareholders from: |
||||||||
| Net investment income: |
||||||||
| Class 1 |
— | (286,901 | ) | |||||
| Class 2 |
— | (675,379 | ) | |||||
| Net realized gains: |
||||||||
| Class 1 |
(673,017 | ) | (13,634,161 | ) | ||||
| Class 2 |
(3,070,097 | ) | (63,414,142 | ) | ||||
|
|
|
|||||||
| Total distributions to shareholders |
(3,743,114 | ) | (78,010,583 | ) | ||||
|
|
|
|||||||
| Capital share transactions: (Note 2) |
||||||||
| Class 1 |
(1,942,011 | ) | 3,730,750 | |||||
| Class 2 |
(17,594,143 | ) | 17,554,979 | |||||
|
|
|
|||||||
| Total capital share transactions |
(19,536,154 | ) | 21,285,729 | |||||
|
|
|
|||||||
| Net increase (decrease) in net assets |
(40,796,958 | ) | (39,397,607 | ) | ||||
| Net assets: |
||||||||
| Beginning of period |
271,670,647 | 311,068,254 | ||||||
|
|
|
|||||||
| End of period |
$ | 230,873,689 | $ | 271,670,647 | ||||
|
|
|
|||||||
| Undistributed net investment income (loss) included in net assets: |
||||||||
| End of period |
$ | (515,999 | ) | $ | — | |||
|
|
|
|||||||
| The accompanying notes are an integral part of these financial statements. | Semiannual Report | FLG-13 |
FRANKLIN TEMPLETON VARIABLE INSURANCE PRODUCTS TRUST
Notes to Financial Statements (unaudited)
Franklin Large Cap Growth VIP Fund
| FLG-14 | Semiannual Report |
FRANKLIN TEMPLETON VARIABLE INSURANCE PRODUCTS TRUST
NOTES TO FINANCIAL STATEMENTS (UNAUDITED)
Franklin Large Cap Growth VIP Fund (continued)
| Semiannual Report | FLG-15 |
FRANKLIN TEMPLETON VARIABLE INSURANCE PRODUCTS TRUST
NOTES TO FINANCIAL STATEMENTS (UNAUDITED)
Franklin Large Cap Growth VIP Fund (continued)
1. Organization and Significant Accounting Policies (continued)
d. Income and Deferred Taxes (continued)
tax regulations and rates that exist in the foreign markets in which the Fund invests. When a capital gain tax is determined to apply, the Fund records an estimated deferred tax liability in an amount that would be payable if the securities were disposed of on the valuation date.
The Fund may recognize an income tax liability related to its uncertain tax positions under U.S. GAAP when the uncertain tax position has a less than 50% probability that it will be sustained upon examination by the tax authorities based on its technical merits. As of June 30, 2016, the Fund has determined that no tax liability is required in its financial statements related to uncertain tax positions for any open tax years (or expected to be taken in future tax years). Open tax years are those that remain subject to examination and are based on each tax jurisdiction’s statute of limitation.
e. Security Transactions, Investment Income, Expenses and Distributions
Security transactions are accounted for on trade date. Realized gains and losses on security transactions are determined on a specific identification basis. Interest income and estimated expenses are accrued daily. Dividend income is recorded on the ex-dividend date except for certain dividends from foreign securities where the dividend rate is not available. In such cases, the dividend is recorded as soon as the information is received by the Fund. Distributions to shareholders are recorded on the ex-dividend date and are determined according to income tax regulations (tax basis). Distributable earnings determined on a tax basis may differ from earnings recorded in accordance with U.S. GAAP. These differences may be permanent or temporary. Permanent differences are reclassified among capital accounts to
reflect their tax character. These reclassifications have no impact on net assets or the results of operations. Temporary differences are not reclassified, as they may reverse in subsequent periods.
Common expenses incurred by the Trust are allocated among the Funds based on the ratio of net assets of each Fund to the combined net assets of the Trust. Fund specific expenses are charged directly to the fund that incurred the expense.
Realized and unrealized gains and losses and net investment income, not including class specific expenses, are allocated daily to each class of shares based upon the relative proportion of net assets of each class. Differences in per share distributions, by class, are generally due to differences in class specific expenses.
f. Accounting Estimates
The preparation of financial statements in accordance with U.S. GAAP requires management to make estimates and assumptions that affect the reported amounts of assets and liabilities at the date of the financial statements and the amounts of income and expenses during the reporting period. Actual results could differ from those estimates.
g. Guarantees and Indemnifications
Under the Trust’s organizational documents, its officers and trustees are indemnified by the Trust against certain liabilities arising out of the performance of their duties to the Trust. Additionally, in the normal course of business, the Trust, on behalf of the Fund, enters into contracts with service providers that contain general indemnification clauses. The Trust’s maximum exposure under these arrangements is unknown as this would involve future claims that may be made against the Trust that have not yet occurred. Currently, the Trust expects the risk of loss to be remote.
| FLG-16 | Semiannual Report |
FRANKLIN TEMPLETON VARIABLE INSURANCE PRODUCTS TRUST
NOTES TO FINANCIAL STATEMENTS (UNAUDITED)
Franklin Large Cap Growth VIP Fund (continued)
2. Shares of Beneficial Interest
At June 30, 2016, there were an unlimited number of shares authorized (without par value). Transactions in the Fund’s shares were as follows:
| Six Months Ended June 30, 2016 |
Year Ended December 31, 2015 |
|||||||||||||||||
| Shares | Amount | Shares | Amount | |||||||||||||||
| Class 1 Shares: | ||||||||||||||||||
| Shares sold |
4,983 | $ | 83,004 | 5,480 | $ | 124,849 | ||||||||||||
| Shares issued in reinvestment of distributions |
39,404 | 673,017 | 740,482 | 13,921,062 | ||||||||||||||
| Shares redeemed |
(157,123 | ) | (2,698,032 | ) | (510,479 | ) | (10,315,161 | ) | ||||||||||
|
|
|
|||||||||||||||||
| Net increase (decrease) |
(112,736 | ) | $ | (1,942,011 | ) | 235,483 | $ | 3,730,750 | ||||||||||
|
|
|
|||||||||||||||||
| Class 2 Shares: | ||||||||||||||||||
| Shares sold |
315,688 | $ | 5,299,478 | 700,609 | $ | 14,776,651 | ||||||||||||
| Shares issued in reinvestment of distributions |
183,399 | 3,070,097 | 3,468,048 | 64,089,521 | ||||||||||||||
| Shares redeemed |
(1,558,860 | ) | (25,963,718 | ) | (2,958,403 | ) | (61,311,193 | ) | ||||||||||
|
|
|
|||||||||||||||||
| Net increase (decrease) |
(1,059,773 | ) | $ | (17,594,143 | ) | 1,210,254 | $ | 17,554,979 | ||||||||||
|
|
|
|||||||||||||||||
3. Transactions With Affiliates
Franklin Resources, Inc. is the holding company for various subsidiaries that together are referred to as Franklin Templeton Investments. Certain officers and trustees of the Fund are also officers and/or directors of the following subsidiaries:
| Subsidiary | Affiliation | |
| Franklin Advisers, Inc. (Advisers) |
Investment manager | |
| Franklin Templeton Services, LLC (FT Services) |
Administrative manager | |
| Franklin Templeton Distributors, Inc. (Distributors) |
Principal underwriter | |
| Franklin Templeton Investor Services, LLC (Investor Services) |
Transfer agent |
a. Management Fees
The Fund pays an investment management fee to Advisers based on the average daily net assets of the Fund as follows:
| Annualized Fee Rate | Net Assets | |
| 0.750% |
Up to and including $500 million | |
| 0.625% |
Over $500 million, up to and including $1 billion | |
| 0.500% |
In excess of $1 billion |
For the period ended June 30, 2016, the annualized effective investment management fee rate was 0.750% of the Fund’s average daily net assets.
b. Administrative Fees
Under an agreement with Advisers, FT Services provides administrative services to the Fund. The fee is paid by Advisers based on the Fund’s average daily net assets, and is not an additional expense of the Fund.
| Semiannual Report | FLG-17 |
FRANKLIN TEMPLETON VARIABLE INSURANCE PRODUCTS TRUST
NOTES TO FINANCIAL STATEMENTS (UNAUDITED)
Franklin Large Cap Growth VIP Fund (continued)
3. Transactions With Affiliates (continued)
c. Distribution Fees
The Board has adopted a distribution plan for Class 2 shares pursuant to Rule 12b-1 under the 1940 Act. Under the Fund’s compensation distribution plan, the Fund pays Distributors for costs incurred in connection with the servicing, sale and distribution of the Fund’s shares up to 0.35% per year of its average daily net assets. The Board has agreed to limit the current rate to 0.25% per year for Class 2. The plan year, for purposes of monitoring compliance with the maximum annual plan rate, is February 1 through January 31.
d. Transfer Agent Fees
Investor Services, under terms of an agreement, performs shareholder servicing for the Fund and is not paid by the Fund for the services.
4. Expense Offset Arrangement
The Fund has entered into an arrangement with its custodian whereby credits realized as a result of uninvested cash balances are used to reduce a portion of the Fund’s custodian expenses. During the period ended June 30, 2016, there were no credits earned.
5. Income Taxes
At June 30, 2016, the cost of investments and net unrealized appreciation (depreciation) for income tax purposes were as follows:
| Cost of investments |
$ | 170,249,970 | ||
|
|
|
|||
| Unrealized appreciation |
$ | 67,732,234 | ||
| Unrealized depreciation |
(5,622,656 | ) | ||
|
|
|
|||
| Net unrealized appreciation (depreciation) |
$ | 62,109,578 | ||
|
|
|
Differences between income and/or capital gains as determined on a book basis and a tax basis are primarily due to differing treatment of wash sales.
6. Investment Transactions
Purchases and sales of investments (excluding short term securities) for the period ended June 30, 2016, aggregated $41,580,516 and $66,836,376, respectively.
7. Restricted Securities
The Fund invests in securities that are restricted under the Securities Act of 1933 (1933 Act) or which are subject to legal, contractual, or other agreed upon restrictions on resale. Restricted securities are often purchased in private placement transactions, and cannot be sold without prior registration unless the sale is pursuant to an exemption under the 1933 Act. Disposal of these securities may require greater effort and expense, and prompt sale at an acceptable price may be difficult. The Fund may have registration rights for restricted securities. The issuer generally incurs all registration costs.
At June 30, 2016, the Fund held investments in restricted securities, excluding certain securities exempt from registration under the 1933 Act deemed to be liquid, as follows:
| Shares | Issuer | Acquisition Date |
Cost | Value | ||||||||||
| 9,780,975 | Acerta Pharma BV (Value is 0.2% of Net Assets) |
5/06/15 | $ | 562,683 | $ | 520,348 | ||||||||
|
|
|
|||||||||||||
| FLG-18 | Semiannual Report |
FRANKLIN TEMPLETON VARIABLE INSURANCE PRODUCTS TRUST
NOTES TO FINANCIAL STATEMENTS (UNAUDITED)
Franklin Large Cap Growth VIP Fund (continued)
8. Credit Facility
The Fund, together with other U.S. registered and foreign investment funds (collectively, Borrowers), managed by Franklin Templeton Investments, are borrowers in a joint syndicated senior unsecured credit facility totaling $2 billion (Global Credit Facility) which matures on February 10, 2017. This Global Credit Facility provides a source of funds to the Borrowers for temporary and emergency purposes, including the ability to meet future unanticipated or unusually large redemption requests.
Under the terms of the Global Credit Facility, the Fund shall, in addition to interest charged on any borrowings made by the Fund and other costs incurred by the Fund, pay its share of fees and expenses incurred in connection with the implementation and maintenance of the Global Credit Facility, based upon its relative share of the aggregate net assets of all of the Borrowers, including an annual commitment fee of 0.07% based upon the unused portion of the Global Credit Facility. Effective February 12, 2016, the annual commitment fee is 0.15%. These fees are reflected in other expenses in the Statement of Operations. During the period ended June 30, 2016, the Fund did not use the Global Credit Facility.
9. Fair Value Measurements
The Fund follows a fair value hierarchy that distinguishes between market data obtained from independent sources (observable inputs) and the Fund’s own market assumptions (unobservable inputs). These inputs are used in determining the value of the Fund’s financial instruments and are summarized in the following fair value hierarchy:
| • | Level 1 – quoted prices in active markets for identical financial instruments |
| • | Level 2 – other significant observable inputs (including quoted prices for similar financial instruments, interest rates, prepayment speed, credit risk, etc.) |
| • | Level 3 – significant unobservable inputs (including the Fund’s own assumptions in determining the fair value of financial instruments) |
The input levels are not necessarily an indication of the risk or liquidity associated with financial instruments at that level.
For movements between the levels within the fair value hierarchy, the Fund has adopted a policy of recognizing the transfers as of the date of the underlying event which caused the movement.
A summary of inputs used as of June 30, 2016, in valuing the Fund’s assets carried at fair value, is as follows:
| Level 1 | Level 2 | Level 3 | Total | |||||||||||||
| Assets: | ||||||||||||||||
| Investments in Securities: |
||||||||||||||||
| Equity Investments:a |
||||||||||||||||
| Health Care |
$ | 36,897,368 | $ | — | $ | 520,348 | $ | 37,417,716 | ||||||||
| All Other Equity Investmentsb |
190,000,335 | — | — | 190,000,335 | ||||||||||||
| Short Term Investments |
— | 4,941,497 | — | 4,941,497 | ||||||||||||
|
|
|
|||||||||||||||
| Total Investments in Securities |
$ | 226,897,703 | $ | 4,941,497 | $ | 520,348 | $ | 232,359,548 | ||||||||
|
|
|
|||||||||||||||
| Receivables: |
||||||||||||||||
| Investment Securities Sold |
$ | — | $ | — | $ | 819,435 | $ | 819,435 | ||||||||
|
|
|
|||||||||||||||
aIncludes common stocks.
bFor detailed categories, see the accompanying Statement of Investments.
| Semiannual Report | FLG-19 |
FRANKLIN TEMPLETON VARIABLE INSURANCE PRODUCTS TRUST
NOTES TO FINANCIAL STATEMENTS (UNAUDITED)
Franklin Large Cap Growth VIP Fund (continued)
9. Fair Value Measurements (continued)
A reconciliation of assets in which Level 3 inputs are used in determining fair value is presented when there are significant Level 3 financial instruments at the end of the period. At June 30, 2016, the reconciliation of assets is as follows:
| Balance at Beginning of Period |
Purchases (Sales) |
Transfers Into (Out of) Level 3 |
Cost Basis Adjustments |
Net Realized Gain (Loss) |
Net Unrealized Appreciation (Depreciation) |
Balance at End of Period |
Net Change in Unrealized Appreciation (Depreciation) on Assets Held at Period End |
|||||||||||||||||||||||||
| Assets: | ||||||||||||||||||||||||||||||||
| Investments in Securities: |
||||||||||||||||||||||||||||||||
| Equity Investments:a |
||||||||||||||||||||||||||||||||
| Health Care |
$ | 2,694,736 | $ | (2,277,653 | ) | $ | — | $ | — | $ | 1,589,929 | $ | (1,486,664 | ) | $ | 520,348 | $ | (649,948 | ) | |||||||||||||
|
|
|
|||||||||||||||||||||||||||||||
| Receivables: | ||||||||||||||||||||||||||||||||
| Investment Securities Sold |
$ | — | $ | — | $ | 813,595 | b | $ | — | $ | — | $ | 5,840 | $ | 819,435 | $ | 5,840 | |||||||||||||||
|
|
|
|||||||||||||||||||||||||||||||
aIncludes common stocks.
bThe receivable was transferred into Level 3 as a result of it being discounted to reflect the current fair value.
Significant unobservable valuation inputs developed by the VLOC for material Level 3 financial instruments and impact to fair value as a result of changes in unobservable valuation inputs as of June 30, 2016, are as follows:
| Description | Fair Value at End of Period |
Valuation Technique |
Unobservable Inputs | Amount | Impact to Fair Value if Input Increasesa |
|||||||||||
| Assets: | ||||||||||||||||
| Investments in Securities: |
||||||||||||||||
| Equity Investments:b |
||||||||||||||||
| Health Care |
$ | 520,348 | Probability Weighted Discounted Cash Flow Model | Free Cash Flowc | $ | 3,000 (mil | ) | Increase | ||||||||
| Discount for lack of marketability | 12.5% | Decreased | ||||||||||||||
| Receivables: | ||||||||||||||||
| Investment Securities Sold |
$ | 819,435 | Discounted Cash Flow Model | Discount Rate |
1.2% | Decrease | ||||||||||
aRepresents the directional change in the fair value of the Level 3 financial instruments that would result from a significant and reasonable increase in the corresponding input. A significant and reasonable decrease in input would have the opposite effect. Significant impacts, if any, to fair value and/or net assets have been indicated.
bIncludes common stocks.
cIncludes probability assumptions for various outcomes of contingent payments for clinical trials and regulatory approvals.
dRepresents a significant impact to fair value and net assets.
10. Subsequent Events
The Fund has evaluated subsequent events through the issuance of the financial statements and determined that no events have occurred that require disclosure.
| FLG-20 | Semiannual Report |
Franklin Mutual Global Discovery VIP Fund
This semiannual report for Franklin Mutual Global Discovery VIP Fund covers the period ended June 30, 2016.
Class 1 Performance Summary as of June 30, 2016
The Fund’s Class 1 shares had a -0.40% total return* for the six-month period ended June 30, 2016.
*The Fund has a fee waiver associated with any investment in a Franklin Templeton money fund and/or Franklin Templeton fund, as applicable, contractually guaranteed through at least the Fund’s current fiscal year-end. Fund investment results reflect the fee waiver, to the extent applicable; without this reduction, the results would have been lower.
Performance reflects the Fund’s Class 1 operating expenses, but does not include any contract fees, expenses or sales charges. If they had been included, performance would be lower. These charges and deductions, particularly for variable life policies, can have a significant effect on contract values and insurance benefits. See the contract prospectus for a complete description of these expenses, including sales charges.
Performance data represent past performance, which does not guarantee future results. Investment return and principal value will fluctuate, and you may have a gain or loss when you sell your shares. Current performance may differ from figures shown.
| Semiannual Report | MGD-1 |
FRANKLIN MUTUAL GLOBAL DISCOVERY VIP FUND
1. Source: Morningstar. One cannot invest directly in an index, and an index is not representative of the Fund’s portfolio. Please see Index Descriptions following the Fund Summaries.
2. Please see Index Descriptions following the Fund Summaries.
| MGD-2 | Semiannual Report |
FRANKLIN MUTUAL GLOBAL DISCOVERY VIP FUND
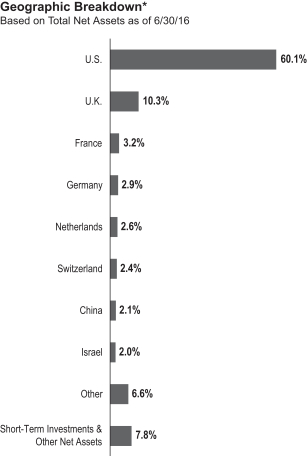
value. After the financially distressed company is reorganized, often in bankruptcy court, the old debt is typically replaced with new securities issued by the financially stronger company.
The other piece of our investment strategy is participating in arbitrage situations, another highly specialized field. When companies announce proposed mergers or takeovers, commonly referred to as “deals,” the target company may trade at a discount to the bid it ultimately accepts. One form of arbitrage involves purchasing the target company’s stock when it is trading below the value we believe it would receive in a deal. In keeping with our commitment to a relatively conservative investment approach, we typically focus our arbitrage efforts on announced deals, and eschew rumored deals or other situations we consider relatively risky.
| Semiannual Report | MGD-3 |
FRANKLIN MUTUAL GLOBAL DISCOVERY VIP FUND
precipitous fall of the British pound that followed the Brexit vote. In this respect, the Fund’s exposure to U.K. equities was predominantly through a number of these global companies. Also, the Fund has only a modest exposure to European financials, particularly in banks.
Although the Brexit vote is clearly a negative surprise, we do not believe it will usher in a new global financial crisis similar to the one experienced eight years ago. While markets reacted brutally to the U.K.’s decision to leave the EU, we have not seen any systemic shock like the one that followed the fall of Lehman Brothers in 2008. We also believe that, eventually, the U.K. and the EU will come to an acceptable agreement concerning trade relations.
Three of the Fund’s top 10 positions at period-end were in health care.3 Merck, Medtronic and Switzerland-based Novartis are global companies that meet important customer needs with products protected by intellectual property. This focus on innovation that improves the lives of customers gives us confidence in the sustainability of their businesses. In addition, we feel that each has strong financial characteristics, including the ability to invest in research and development and acquisitions, while also providing material returns to shareholders, and trading at valuations that are attractive from our perspective as value investors.
The Fund also featured two information technology firms among its larger positions: Microsoft and Symantec.4 Microsoft features a strong global business based on innovation and meeting customer needs, including its fast-growing cloud business,
3. The health care sector comprises health care equipment and supplies, health care providers and services, and pharmaceuticals in the SOI.
4. The information technology sector comprises communications equipment, Internet software and services, IT services, semiconductors and semiconductor equipment, and software in the SOI.
| MGD-4 | Semiannual Report |
FRANKLIN MUTUAL GLOBAL DISCOVERY VIP FUND
| Semiannual Report | MGD-5 |
FRANKLIN MUTUAL GLOBAL DISCOVERY VIP FUND
| Top 10 Equity Holdings | ||||
| 6/30/16 | ||||
| Company Sector/Industry, Country |
% of Total Net Assets |
|||
| Microsoft Corp. | 3.1% | |||
| Software, U.S. | ||||
| Merck & Co. Inc. | 2.8% | |||
| Pharmaceuticals, U.S. | ||||
| Medtronic PLC | 2.3% | |||
| Health Care Equipment & Supplies, U.S. | ||||
| Royal Dutch Shell, PLC | 2.2% | |||
| Oil, Gas & Consumable Fuels, U.K. | ||||
| British American Tobacco PLC | 1.9% | |||
| Tobacco, U.K. | ||||
| Wells Fargo & Co. | 1.9% | |||
| Banks, U.S. | ||||
| Chubb Ltd. | 1.8% | |||
| Insurance, U.S. | ||||
| Vodafone Group PLC | 1.7% | |||
| Wireless Telecommunication Services, U.K. | ||||
| American International Group Inc. | 1.7% | |||
| Insurance, U.S. | ||||
| Novartis AG | 1.7% | |||
| Pharmaceuticals, Switzerland | ||||
The dollar value, number of shares or principal amount, and names of all portfolio holdings are listed in the Fund’s Statement of Investments (SOI).
the detrimental effects of low interest rates, ongoing concerns about the health of the global economy, and challenging conditions in capital markets. In addition, the bank’s share price was negatively impacted by a disappointing strategic update in early March that included limited downsizing of the investment banking unit and a dividend cut to fund an accelerated rundown of its non-core activities.
Citigroup is a U.S.-based diversified financial services company. Shares of the lender followed the broad-based decline of global financial stocks in late June after the U.K. Brexit vote. The stock also dropped sharply in January and early February, driven by ongoing investor concerns about global economic health (an area of particular relevance for Citigroup given its significant presence outside the U.S.), scaled back expectations regarding potential interest rate hikes by the U.S. Fed, concerns regarding financial sector exposure to energy companies and the
challenging conditions for capital market operations. Citigroup’s stock price was further impacted in mid-January by a weak set of quarterly results, including soft revenue and higher credit costs, due in part to a US$250 million charge to cover potential future losses in its oil and gas portfolio. However, we continue to view Citigroup as a cheaply valued bank with best-in-class capital levels that is focused on controlling costs, scaling back its non-core activities and returning excess capital to shareholders.
During the period, the Fund held currency forwards and futures to somewhat hedge the currency risk of the portfolio’s non-U.S. dollar investments. The currency forwards had a positive impact on the Fund’s performance, and currency futures had a negligible impact.
What is a currency forward?
A currency forward is an agreement between the Fund and a counterparty to buy or sell a foreign currency in exchange for another currency at a specific exchange rate on a future date.
What is a future?
A future is an agreement between the Fund and a counterparty made through a U.S. or foreign futures exchange to buy or sell an underlying instrument or asset at a specific price on a future date.
Thank you for your participation in Franklin Mutual Global Discovery VIP Fund. We look forward to serving your future investment needs.
The foregoing information reflects our analysis, opinions and portfolio holdings as of June 30, 2016, the end of the reporting period. The way we implement our main investment strategies and the resulting portfolio holdings may change depending on factors such as market and economic conditions. These opinions may not be relied upon as investment advice or an offer for a particular security. The information is not a complete analysis of every aspect of any market, country, industry, security or the Fund. Statements of fact are from sources considered reliable, but the investment manager makes no representation or warranty as to their completeness or accuracy. Although historical performance is no guarantee of future results, these insights may help you understand our investment management philosophy.
| MGD-6 | Semiannual Report |
FRANKLIN MUTUAL GLOBAL DISCOVERY VIP FUND
Class 1 Fund Expenses
| Class 1 | Beginning Account Value 1/1/16 |
Ending Account Value 6/30/16 |
Fund-Level Expenses 1/1/16–6/30/16 |
|||||||||
| Actual |
$ | 1,000 | $ | 996.00 | $ | 4.96 | ||||||
| Hypothetical (5% return before expenses) |
$ | 1,000 | $ | 1,019.89 | $ | 5.02 | ||||||
*Expenses are calculated using the most recent six-month annualized expense ratio, net of expense waivers, for the Fund’s Class 1 shares (1.00%), which does not include any ongoing expenses of the Contract for which the Fund is an investment option, multiplied by the average account value over the period, multiplied by 182/366 to reflect the one-half year period.
| Semiannual Report | MGD-7 |
FRANKLIN TEMPLETON VARIABLE INSURANCE PRODUCTS TRUST
Financial Highlights
Franklin Mutual Global Discovery VIP Fund
| Six Months Ended June 30, 2016 (unaudited) |
Year Ended December 31, | |||||||||||||||||||||||
| 2015 | 2014 | 2013 | 2012 | 2011 | ||||||||||||||||||||
| Class 1 | ||||||||||||||||||||||||
| Per share operating performance (for a share outstanding throughout the period) |
||||||||||||||||||||||||
| Net asset value, beginning of period |
$19.85 | $22.61 | $23.31 | $20.55 | $19.66 | $21.16 | ||||||||||||||||||
|
|
|
|||||||||||||||||||||||
| Income from investment operationsa: | ||||||||||||||||||||||||
| Net investment incomeb |
0.29 | 0.37 | 0.68 | c | 0.46 | 0.43 | 0.52 | |||||||||||||||||
| Net realized and unrealized gains (losses) |
(0.37 | ) | (1.17 | ) | 0.76 | 5.03 | 2.21 | (1.09 | ) | |||||||||||||||
|
|
|
|||||||||||||||||||||||
| Total from investment operations |
(0.08 | ) | (0.80 | ) | 1.44 | 5.49 | 2.64 | (0.57 | ) | |||||||||||||||
|
|
|
|||||||||||||||||||||||
| Less distributions from: | ||||||||||||||||||||||||
| Net investment income |
— | (0.69 | ) | (0.57 | ) | (0.58 | ) | (0.64 | ) | (0.50 | ) | |||||||||||||
| Net realized gains |
— | (1.27 | ) | (1.57 | ) | (2.15 | ) | (1.11 | ) | (0.43 | ) | |||||||||||||
|
|
|
|||||||||||||||||||||||
| Total distributions |
— | (1.96 | ) | (2.14 | ) | (2.73 | ) | (1.75 | ) | (0.93 | ) | |||||||||||||
|
|
|
|||||||||||||||||||||||
| Net asset value, end of period |
$19.77 | $19.85 | $22.61 | $23.31 | $20.55 | $19.66 | ||||||||||||||||||
|
|
|
|||||||||||||||||||||||
| Total returnd |
(0.40)% | (3.39)% | 5.98% | 27.95% | 13.63% | (2.73)% | ||||||||||||||||||
| Ratios to average net assetse | ||||||||||||||||||||||||
| Expensesf |
1.00% | g,h | 1.02% | g,h | 1.00% | g | 0.97% | g | 0.99% | 0.97% | g | |||||||||||||
| Expenses incurred in connection with securities sold short |
—% | i | 0.02% | 0.03% | —% | i | —% | i | —% | i | ||||||||||||||
| Net investment income |
3.03% | 1.71% | 2.85% | c | 2.13% | 2.12% | 2.34% | |||||||||||||||||
| Supplemental data | ||||||||||||||||||||||||
| Net assets, end of period (000’s) |
$2,754 | $2,632 | $2,313 | $2,465 | $1,136 | $974 | ||||||||||||||||||
| Portfolio turnover rate |
8.70% | 21.88% | 22.18% | 15.58% | 25.63% | 26.17% | j | |||||||||||||||||
aThe amount shown for a share outstanding throughout the period may not correlate with the Statement of Operations for the period due to the timing of sales and repurchases of the Fund’s shares in relation to income earned and/or fluctuating fair value of the investments of the Fund.
bBased on average daily shares outstanding.
cNet investment income per share includes approximately $0.34 per share related to income received in the form of special dividends in connection with certain Fund holdings. Excluding this amount, the ratio of net investment income to average net assets would have been 1.40%.
dTotal return does not include fees, charges or expenses imposed by the variable annuity and life insurance contracts for which the Franklin Templeton Variable Insurance Products Trust serves as an underlying investment vehicle. Total return is not annualized for periods less than one year.
eRatios are annualized for periods less than one year.
fIncludes dividend and/or interest expense on securities sold short and security borrowing fees, if any. See below for the ratios of such expenses to average net assets for the periods presented. See Note 1(g).
gBenefit of expense reduction rounds to less than 0.01%.
hBenefit of waiver and payments by affiliates rounds to less than 0.01%.
iRounds to less than 0.01%.
jExcludes the value of portfolio securities delivered as a result of a redemption in-kind.
| MGD-8 | Semiannual Report | The accompanying notes are an integral part of these financial statements. |
FRANKLIN TEMPLETON VARIABLE INSURANCE PRODUCTS TRUST
FINANCIAL HIGHLIGHTS
Franklin Mutual Global Discovery VIP Fund (continued)
| Six Months Ended (unaudited) |
Year Ended December 31, | |||||||||||||||||||||||
| 2015 | 2014 | 2013 | 2012 | 2011 | ||||||||||||||||||||
| Class 2 | ||||||||||||||||||||||||
| Per share operating performance (for a share outstanding throughout the period) |
||||||||||||||||||||||||
| Net asset value, beginning of period |
$19.37 | $22.11 | $22.84 | $20.17 | $19.30 | $20.80 | ||||||||||||||||||
|
|
|
|||||||||||||||||||||||
| Income from investment operationsa: | ||||||||||||||||||||||||
| Net investment incomeb |
0.26 | 0.32 | 0.60 | c | 0.42 | 0.38 | 0.43 | |||||||||||||||||
| Net realized and unrealized gains (losses) |
(0.36 | ) | (1.16 | ) | 0.75 | 4.92 | 2.15 | (1.04 | ) | |||||||||||||||
|
|
|
|||||||||||||||||||||||
| Total from investment operations |
(0.10 | ) | (0.84 | ) | 1.35 | 5.34 | 2.53 | (0.61 | ) | |||||||||||||||
|
|
|
|||||||||||||||||||||||
| Less distributions from: | ||||||||||||||||||||||||
| Net investment income |
— | (0.63 | ) | (0.51 | ) | (0.52 | ) | (0.55 | ) | (0.46 | ) | |||||||||||||
| Net realized gains |
— | (1.27 | ) | (1.57 | ) | (2.15 | ) | (1.11 | ) | (0.43 | ) | |||||||||||||
|
|
|
|||||||||||||||||||||||
| Total distributions |
— | (1.90 | ) | (2.08 | ) | (2.67 | ) | (1.66 | ) | (0.89 | ) | |||||||||||||
|
|
|
|||||||||||||||||||||||
| Net asset value, end of period |
$19.27 | $19.37 | $22.11 | $22.84 | $20.17 | $19.30 | ||||||||||||||||||
|
|
|
|||||||||||||||||||||||
| Total returnd |
(0.52)% | (3.65)% | 5.71% | 27.61% | 13.36% | (2.96)% | ||||||||||||||||||
| Ratios to average net assetse | ||||||||||||||||||||||||
| Expensesf |
1.25% | g,h | 1.27% | g,h | 1.25% | g | 1.22% | g | 1.24% | 1.22% | g | |||||||||||||
| Expenses incurred in connection with securities sold short |
—% | i | 0.02% | 0.03% | —% | i | —%i | —% | i | |||||||||||||||
| Net investment income |
2.78% | 1.46% | 2.60% | c | 1.88% | 1.87% | 2.09% | |||||||||||||||||
| Supplemental data | ||||||||||||||||||||||||
| Net assets, end of period (000’s) |
$597,645 | $629,366 | $685,711 | $684,780 | $660,465 | $712,161 | ||||||||||||||||||
| Portfolio turnover rate |
8.70% | 21.88% | 22.18% | 15.58% | 25.63% | 26.17% | j | |||||||||||||||||
aThe amount shown for a share outstanding throughout the period may not correlate with the Statement of Operations for the period due to the timing of sales and repurchases of the Fund’s shares in relation to income earned and/or fluctuating fair value of the investments of the Fund.
bBased on average daily shares outstanding.
cNet investment income per share includes approximately $0.34 per share related to income received in the form of special dividends in connection with certain Fund holdings. Excluding this amount, the ratio of net investment income to average net assets would have been 1.15%.
dTotal return does not include fees, charges or expenses imposed by the variable annuity and life insurance contracts for which the Franklin Templeton Variable Insurance Products Trust serves as an underlying investment vehicle. Total return is not annualized for periods less than one year.
eRatios are annualized for periods less than one year.
fIncludes dividend and/or interest expense on securities sold short and security borrowing fees, if any. See below for the ratios of such expenses to average net assets for the periods presented. See Note 1(g).
gBenefit of expense reduction rounds to less than 0.01%.
hBenefit of waiver and payments by affiliates rounds to less than 0.01%.
iRounds to less than 0.01%.
jExcludes the value of portfolio securities delivered as a result of a redemption in-kind.
| The accompanying notes are an integral part of these financial statements. | Semiannual Report | MGD-9 |
FRANKLIN TEMPLETON VARIABLE INSURANCE PRODUCTS TRUST
FINANCIAL HIGHLIGHTS
Franklin Mutual Global Discovery VIP Fund (continued)
| Six Months Ended (unaudited) |
Year Ended December 31, | |||||||||||||||||||||||
| 2015 | 2014 | 2013 | 2012 | 2011 | ||||||||||||||||||||
| Class 4 | ||||||||||||||||||||||||
| Per share operating performance (for a share outstanding throughout the period) |
||||||||||||||||||||||||
| Net asset value, beginning of period |
$19.66 | $22.39 | $23.10 | $20.38 | $19.50 | $21.02 | ||||||||||||||||||
|
|
|
|||||||||||||||||||||||
| Income from investment operationsa: | ||||||||||||||||||||||||
| Net investment incomeb |
0.25 | 0.30 | 0.61 | c | 0.40 | 0.36 | 0.40 | |||||||||||||||||
| Net realized and unrealized gains (losses) |
(0.37 | ) | (1.17 | ) | 0.73 | 4.97 | 2.19 | (1.05 | ) | |||||||||||||||
|
|
|
|||||||||||||||||||||||
| Total from investment operations |
(0.12 | ) | (0.87 | ) | 1.34 | 5.37 | 2.55 | (0.65 | ) | |||||||||||||||
|
|
|
|||||||||||||||||||||||
| Less distributions from: | ||||||||||||||||||||||||
| Net investment income |
— | (0.59 | ) | (0.48 | ) | (0.50 | ) | (0.56 | ) | (0.44 | ) | |||||||||||||
| Net realized gains |
— | (1.27 | ) | (1.57 | ) | (2.15 | ) | (1.11 | ) | (0.43 | ) | |||||||||||||
|
|
|
|||||||||||||||||||||||
| Total distributions |
— | (1.86 | ) | (2.05 | ) | (2.65 | ) | (1.67 | ) | (0.87 | ) | |||||||||||||
|
|
|
|||||||||||||||||||||||
| Net asset value, end of period |
$19.54 | $19.66 | $22.39 | $23.10 | $20.38 | $19.50 | ||||||||||||||||||
|
|
|
|||||||||||||||||||||||
| Total returnd |
(0.61)% | (3.74)% | 5.60% | 27.52% | 13.27% | (3.08)% | ||||||||||||||||||
| Ratios to average net assetse | ||||||||||||||||||||||||
| Expensesf |
1.35% | g,h | 1.37% | g,h | 1.35% | g | 1.32% | g | 1.34% | 1.32% | g | |||||||||||||
| Expenses incurred in connection with securities sold short |
—% | i | 0.02% | 0.03% | —% | i | —% | i | —% | i | ||||||||||||||
| Net investment income |
2.68% | 1.36% | 2.50% | c | 1.78% | 1.77% | 1.99% | |||||||||||||||||
| Supplemental data | ||||||||||||||||||||||||
| Net assets, end of period (000’s) |
$45,021 | $49,054 | $59,961 | $70,354 | $62,346 | $66,695 | ||||||||||||||||||
| Portfolio turnover rate |
8.70% | 21.88% | 22.18% | 15.58% | 25.63% | 26.17% | j | |||||||||||||||||
aThe amount shown for a share outstanding throughout the period may not correlate with the Statement of Operations for the period due to the timing of sales and repurchases of the Fund’s shares in relation to income earned and/or fluctuating fair value of the investments of the Fund.
bBased on average daily shares outstanding.
cNet investment income per share includes approximately $0.34 per share related to income received in the form of special dividends in connection with certain Fund holdings. Excluding this amount, the ratio of net investment income to average net assets would have been 1.05%.
dTotal return does not include fees, charges or expenses imposed by the variable annuity and life insurance contracts for which the Franklin Templeton Variable Insurance Products Trust serves as an underlying investment vehicle. Total return is not annualized for periods less than one year.
eRatios are annualized for periods less than one year.
fIncludes dividend and/or interest expense on securities sold short and security borrowing fees, if any. See below for the ratios of such expenses to average net assets for the periods presented. See Note 1(g).
gBenefit of expense reduction rounds to less than 0.01%.
hBenefit of waiver and payments by affiliates rounds to less than 0.01%.
iRounds to less than 0.01%.
jExcludes the value of portfolio securities delivered as a result of a redemption in-kind.
| MGD-10 | Semiannual Report | The accompanying notes are an integral part of these financial statements. |
FRANKLIN TEMPLETON VARIABLE INSURANCE PRODUCTS TRUST
Statement of Investments, June 30, 2016 (unaudited)
| Franklin Mutual Global Discovery VIP Fund
|
||||||||||||||
| Country | Shares/Units | Value | ||||||||||||
| Common Stocks and Other Equity Interests 86.3% |
||||||||||||||
| Aerospace & Defense 0.6% |
||||||||||||||
| B/E Aerospace Inc. |
United States | 65,840 | $ | 3,040,163 | ||||||||||
| a | KLX Inc. |
United States | 32,920 | 1,020,520 | ||||||||||
|
|
|
|||||||||||||
| 4,060,683 | ||||||||||||||
|
|
|
|||||||||||||
| Auto Components 0.7% |
||||||||||||||
| Cie Generale des Etablissements Michelin, B |
France | 30,800 | 2,913,028 | |||||||||||
| a,b | International Automotive Components Group Brazil LLC |
Brazil | 424,073 | 6,981 | ||||||||||
| a,b,c | International Automotive Components Group North America LLC |
United States | 4,052,916 | 1,788,009 | ||||||||||
|
|
|
|||||||||||||
| 4,708,018 | ||||||||||||||
|
|
|
|||||||||||||
| Automobiles 1.3% |
||||||||||||||
| General Motors Co. |
United States | 214,110 | 6,059,313 | |||||||||||
| Hyundai Motor Co. |
South Korea | 20,953 | 2,462,942 | |||||||||||
|
|
|
|||||||||||||
| 8,522,255 | ||||||||||||||
|
|
|
|||||||||||||
| Banks 13.6% |
||||||||||||||
| Barclays PLC |
United Kingdom | 2,052,511 | 3,793,230 | |||||||||||
| d | BNP Paribas SA |
France | 117,870 | 5,201,139 | ||||||||||
| Capital Bank Financial Corp., A |
United States | 78,494 | 2,260,627 | |||||||||||
| e | Capital Bank Financial Corp., B, 144A, non-voting |
United States | 269,922 | 7,773,754 | ||||||||||
| CIT Group Inc. |
United States | 174,912 | 5,581,442 | |||||||||||
| Citigroup Inc. |
United States | 229,050 | 9,709,429 | |||||||||||
| Citizens Financial Group Inc. |
United States | 310,923 | 6,212,242 | |||||||||||
| a | Commerzbank AG |
Germany | 276,968 | 1,790,418 | ||||||||||
| HSBC Holdings PLC |
United Kingdom | 586,355 | 3,642,619 | |||||||||||
| JPMorgan Chase & Co. |
United States | 131,280 | 8,157,739 | |||||||||||
| KB Financial Group Inc. |
South Korea | 56,047 | 1,585,034 | |||||||||||
| PNC Financial Services Group Inc. |
United States | 105,531 | 8,589,168 | |||||||||||
| Societe Generale SA |
France | 118,614 | 3,714,005 | |||||||||||
| Standard Chartered PLC |
United Kingdom | 374,211 | 2,817,201 | |||||||||||
| SunTrust Banks Inc. |
United States | 111,578 | 4,583,624 | |||||||||||
| Wells Fargo & Co. |
United States | 256,320 | 12,131,626 | |||||||||||
|
|
|
|||||||||||||
| 87,543,297 | ||||||||||||||
|
|
|
|||||||||||||
| Beverages 1.3% |
||||||||||||||
| PepsiCo Inc. |
United States | 76,807 | 8,136,933 | |||||||||||
|
|
|
|||||||||||||
| Chemicals 0.3% |
||||||||||||||
| Syngenta AG |
Switzerland | 4,660 | 1,785,991 | |||||||||||
|
|
|
|||||||||||||
| Communications Equipment 2.6% |
||||||||||||||
| Cisco Systems Inc. |
United States | 359,180 | 10,304,874 | |||||||||||
| Nokia Corp., ADR |
Finland | 519,486 | 2,955,876 | |||||||||||
| Nokia OYJ, A |
Finland | 611,269 | 3,463,630 | |||||||||||
|
|
|
|||||||||||||
| 16,724,380 | ||||||||||||||
|
|
|
|||||||||||||
| Construction Materials 0.5% |
||||||||||||||
| a | LafargeHolcim Ltd., B |
Switzerland | 78,676 | 3,267,621 | ||||||||||
|
|
|
|||||||||||||
| Consumer Finance 0.4% |
||||||||||||||
| a | Ally Financial Inc. |
United States | 151,600 | 2,587,812 | ||||||||||
|
|
|
|||||||||||||
| Diversified Financial Services 0.4% |
||||||||||||||
| Voya Financial Inc. |
United States | 101,650 | 2,516,854 | |||||||||||
|
|
|
|||||||||||||
| Semiannual Report | MGD-11 |
FRANKLIN TEMPLETON VARIABLE INSURANCE PRODUCTS TRUST
STATEMENT OF INVESTMENTS (UNAUDITED)
Franklin Mutual Global Discovery VIP Fund (continued)
| Country | Shares/Units | Value | ||||||||||||
| Common Stocks and Other Equity Interests (continued) |
||||||||||||||
| Diversified Telecommunication Services 0.9% |
||||||||||||||
| China Telecom Corp. Ltd., H |
China | 13,642,104 | $ | 6,083,906 | ||||||||||
| a,f,g | Global Crossing Holdings Ltd., Contingent Distribution |
United States | 2,236,777 | — | ||||||||||
|
|
|
|||||||||||||
| 6,083,906 | ||||||||||||||
|
|
|
|||||||||||||
| Energy Equipment & Services 1.3% |
||||||||||||||
| Baker Hughes Inc. |
United States | 178,964 | 8,076,645 | |||||||||||
|
|
|
|||||||||||||
| Food & Staples Retailing 4.1% |
||||||||||||||
| CVS Health Corp. |
United States | 46,236 | 4,426,635 | |||||||||||
| Empire Co. Ltd., A |
Canada | 252,979 | 3,761,107 | |||||||||||
| Metro AG |
Germany | 226,924 | 6,918,987 | |||||||||||
| a | Rite Aid Corp. |
United States | 391,098 | 2,929,324 | ||||||||||
| Walgreens Boots Alliance Inc. |
United States | 102,904 | 8,568,816 | |||||||||||
|
|
|
|||||||||||||
| 26,604,869 | ||||||||||||||
|
|
|
|||||||||||||
| Health Care Equipment & Supplies 4.8% |
||||||||||||||
| Medtronic PLC |
United States | 168,500 | 14,620,745 | |||||||||||
| St. Jude Medical Inc. |
United States | 103,840 | 8,099,520 | |||||||||||
| Stryker Corp. |
United States | 69,848 | 8,369,886 | |||||||||||
|
|
|
|||||||||||||
| 31,090,151 | ||||||||||||||
|
|
|
|||||||||||||
| Health Care Providers & Services 0.4% |
||||||||||||||
| Cigna Corp. |
United States | 20,116 | 2,574,647 | |||||||||||
|
|
|
|||||||||||||
| Hotels, Restaurants & Leisure 1.7% |
||||||||||||||
| Accor SA |
France | 233,913 | 9,006,625 | |||||||||||
| Sands China Ltd. |
Hong Kong | 648,800 | 2,165,886 | |||||||||||
|
|
|
|||||||||||||
| 11,172,511 | ||||||||||||||
|
|
|
|||||||||||||
| Independent Power & Renewable Electricity Producers 0.7% |
||||||||||||||
| NRG Energy Inc. |
United States | 299,277 | 4,486,162 | |||||||||||
|
|
|
|||||||||||||
| Industrial Conglomerates 1.8% |
||||||||||||||
| Jardine Strategic Holdings Ltd. |
Hong Kong | 103,903 | 3,135,793 | |||||||||||
| Koninklijke Philips NV |
Netherlands | 328,294 | 8,160,512 | |||||||||||
|
|
|
|||||||||||||
| 11,296,305 | ||||||||||||||
|
|
|
|||||||||||||
| Insurance 8.4% |
||||||||||||||
| a | Alleghany Corp. |
United States | 2,730 | 1,500,353 | ||||||||||
| The Allstate Corp. |
United States | 98,929 | 6,920,084 | |||||||||||
| American International Group Inc. |
United States | 204,833 | 10,833,617 | |||||||||||
| China Pacific Insurance Group Co. Ltd., H |
China | 845,908 | 2,845,697 | |||||||||||
| Chubb Ltd. |
United States | 88,840 | 11,612,276 | |||||||||||
| MetLife Inc. |
United States | 100,526 | 4,003,951 | |||||||||||
| NN Group NV |
Netherlands | 323,882 | 8,913,625 | |||||||||||
| XL Group PLC |
Ireland | 235,290 | 7,837,510 | |||||||||||
|
|
|
|||||||||||||
| 54,467,113 | ||||||||||||||
|
|
|
|||||||||||||
| Internet Software & Services 0.4% |
||||||||||||||
| a | LinkedIn Corp., A |
United States | 13,756 | 2,603,323 | ||||||||||
|
|
|
|||||||||||||
| IT Services 0.7% |
||||||||||||||
| Xerox Corp. |
United States | 503,738 | 4,780,474 | |||||||||||
|
|
|
|||||||||||||
| Machinery 0.7% |
||||||||||||||
| Caterpillar Inc. |
United States | 58,695 | 4,449,668 | |||||||||||
|
|
|
|||||||||||||
| MGD-12 | Semiannual Report |
FRANKLIN TEMPLETON VARIABLE INSURANCE PRODUCTS TRUST
STATEMENT OF INVESTMENTS (UNAUDITED)
Franklin Mutual Global Discovery VIP Fund (continued)
| Country | Shares/Units | Value | ||||||||||||
| Common Stocks and Other Equity Interests (continued) |
||||||||||||||
| Marine 1.3% |
||||||||||||||
| A.P. Moeller-Maersk AS, B |
Denmark | 6,595 | $ | 8,567,811 | ||||||||||
|
|
|
|||||||||||||
| Media 4.5% |
||||||||||||||
| CBS Corp., B |
United States | 91,632 | 4,988,446 | |||||||||||
| a | Charter Communications Inc., A |
United States | 30,386 | 6,947,455 | ||||||||||
| a | DISH Network Corp., A |
United States | 90,990 | 4,767,876 | ||||||||||
| a | Liberty Global PLC LiLAC, C |
United Kingdom | 10,735 | 348,784 | ||||||||||
| a | Liberty Global PLC, C |
United Kingdom | 86,040 | 2,465,046 | ||||||||||
| Time Warner Inc. |
United States | 66,132 | 4,863,347 | |||||||||||
| Twenty-First Century Fox Inc., B |
United States | 170,160 | 4,636,860 | |||||||||||
|
|
|
|||||||||||||
| 29,017,814 | ||||||||||||||
|
|
|
|||||||||||||
| Metals & Mining 1.1% |
||||||||||||||
| Freeport-McMoRan Inc., B |
United States | 186,260 | 2,074,937 | |||||||||||
| ThyssenKrupp AG |
Germany | 242,203 | 4,841,686 | |||||||||||
|
|
|
|||||||||||||
| 6,916,623 | ||||||||||||||
|
|
|
|||||||||||||
| Multiline Retail 0.3% |
||||||||||||||
| Macy’s Inc. |
United States | 58,280 | 1,958,791 | |||||||||||
|
|
|
|||||||||||||
| Oil, Gas & Consumable Fuels 7.0% |
||||||||||||||
| Anadarko Petroleum Corp. |
United States | 29,831 | 1,588,501 | |||||||||||
| Apache Corp. |
United States | 70,011 | 3,897,512 | |||||||||||
| BP PLC |
United Kingdom | 1,028,014 | 6,005,958 | |||||||||||
| China Shenhua Energy Co. Ltd., H |
China | 2,009,534 | 3,693,515 | |||||||||||
| CONSOL Energy Inc. |
United States | 219,381 | 3,529,840 | |||||||||||
| Kinder Morgan Inc. |
United States | 296,590 | 5,552,165 | |||||||||||
| Marathon Oil Corp. |
United States | 444,196 | 6,667,382 | |||||||||||
| Royal Dutch Shell PLC, A (EUR Traded) |
United Kingdom | 327,191 | 8,959,297 | |||||||||||
| Royal Dutch Shell PLC, A (GBP Traded) |
United Kingdom | 179,410 | 4,898,138 | |||||||||||
| a,b,c | Warrior Met Coal LLC, A |
United States | 1,841 | 185,603 | ||||||||||
| a,b,c | Warrior Met Coal LLC, B |
United States | 4,306 | 434,115 | ||||||||||
|
|
|
|||||||||||||
| 45,412,026 | ||||||||||||||
|
|
|
|||||||||||||
| Paper & Forest Products 0.0%† |
||||||||||||||
| a | Verso Corp. |
United States | 36,624 | 732 | ||||||||||
|
|
|
|||||||||||||
| Pharmaceuticals 7.8% |
||||||||||||||
| Eli Lilly & Co. |
United States | 133,748 | 10,532,655 | |||||||||||
| GlaxoSmithKline PLC |
United Kingdom | 262,323 | 5,612,244 | |||||||||||
| Merck & Co. Inc. |
United States | 316,208 | 18,216,743 | |||||||||||
| Novartis AG, ADR |
Switzerland | 129,601 | 10,693,378 | |||||||||||
| Teva Pharmaceutical Industries Ltd., ADR |
Israel | 100,252 | 5,035,658 | |||||||||||
|
|
|
|||||||||||||
| 50,090,678 | ||||||||||||||
|
|
|
|||||||||||||
| Semiconductors & Semiconductor Equipment 0.2% |
||||||||||||||
| SK Hynix Inc. |
South Korea | 53,632 | 1,507,432 | |||||||||||
|
|
|
|||||||||||||
| Software 6.4% |
||||||||||||||
| a | Check Point Software Technologies Ltd. |
Israel | 95,512 | 7,610,396 | ||||||||||
| Microsoft Corp. |
United States | 386,252 | 19,764,515 | |||||||||||
| Open Text Corp. |
Canada | 86,150 | 5,096,634 | |||||||||||
| Symantec Corp. |
United States | 425,161 | 8,732,807 | |||||||||||
|
|
|
|||||||||||||
| 41,204,352 | ||||||||||||||
|
|
|
|||||||||||||
| Semiannual Report | MGD-13 |
FRANKLIN TEMPLETON VARIABLE INSURANCE PRODUCTS TRUST
STATEMENT OF INVESTMENTS (UNAUDITED)
Franklin Mutual Global Discovery VIP Fund (continued)
| Country | Shares/Units | Value | ||||||||||||
| Common Stocks and Other Equity Interests (continued) |
||||||||||||||
| Specialty Retail 0.8% |
||||||||||||||
| Kingfisher PLC |
United Kingdom | 1,151,830 | $ | 4,953,117 | ||||||||||
|
|
|
|||||||||||||
| Technology Hardware, Storage & Peripherals 2.3% |
||||||||||||||
| EMC Corp. |
United States | 299,800 | 8,145,566 | |||||||||||
| Hewlett Packard Enterprise Co. |
United States | 190,760 | 3,485,185 | |||||||||||
| HP Inc. |
United States | 190,760 | 2,394,038 | |||||||||||
| Lenovo Group Ltd. |
China | 1,500,454 | 903,160 | |||||||||||
|
|
|
|||||||||||||
| 14,927,949 | ||||||||||||||
|
|
|
|||||||||||||
| Tobacco 5.3% |
||||||||||||||
| Altria Group Inc. |
United States | 131,874 | 9,094,031 | |||||||||||
| British American Tobacco PLC |
United Kingdom | 188,332 | 12,161,833 | |||||||||||
| Philip Morris International Inc. |
United States | 41,509 | 4,222,296 | |||||||||||
| Reynolds American Inc. |
United States | 159,669 | 8,610,949 | |||||||||||
|
|
|
|||||||||||||
| 34,089,109 | ||||||||||||||
|
|
|
|||||||||||||
| Wireless Telecommunication Services 1.7% |
||||||||||||||
| Vodafone Group PLC |
United Kingdom | 3,618,505 | 10,983,918 | |||||||||||
|
|
|
|||||||||||||
| Total Common Stocks and Other Equity Interests |
557,169,970 | |||||||||||||
|
|
|
|||||||||||||
| Preferred Stocks 1.7% |
||||||||||||||
| Automobiles 0.8% |
||||||||||||||
| h | Volkswagen AG, 0.157%, pfd. |
Germany | 40,296 | 4,843,885 | ||||||||||
|
|
|
|||||||||||||
| Diversified Financial Services 0.9% |
||||||||||||||
| a,b | Hightower Holding LLC, pfd., A, Series 2 |
United States | 2,172,000 | 5,821,394 | ||||||||||
|
|
|
|||||||||||||
| Total Preferred Stocks (Cost $12,871,859) |
10,665,279 | |||||||||||||
|
|
|
|||||||||||||
| Principal Amount* | ||||||||||||||
| Corporate Bonds, Notes and Senior Floating Rate Interests 3.7% |
||||||||||||||
| e | Avaya Inc., senior note, 144A, 10.50%, 3/01/21 |
United States | 1,270,000 | 285,750 | ||||||||||
| i,j | Belk Inc., Closing Date Term Loan, 5.75%, 12/12/22 |
United States | 1,945,125 | 1,556,100 | ||||||||||
| iHeartCommunications Inc., |
||||||||||||||
| senior secured note, first lien, 9.00%, 12/15/19 |
United States | 5,184,000 | 3,959,280 | |||||||||||
| i,jTranche D Term Loan, 7.21%, 1/30/19 |
United States | 6,889,154 | 5,063,528 | |||||||||||
| i,jTranche E Term Loan, 7.96%, 7/30/19 |
United States | 2,213,881 | 1,628,586 | |||||||||||
| e | Valeant Pharmaceuticals International, |
|||||||||||||
| senior bond, 144A, 6.75%, 8/15/21 |
United States | 487,000 | 417,602 | |||||||||||
| senior bond, 144A, 7.25%, 7/15/22 |
United States | 241,000 | 207,911 | |||||||||||
| senior note, 144A, 6.375%, 10/15/20 |
United States | 2,995,000 | 2,590,675 | |||||||||||
| i,j,k | Veritas Software Corp., |
|||||||||||||
| Term B1, 6.625%, 6/15/23 |
United States | 20,948 | EUR | 19,840 | ||||||||||
| Term Loan B1, 6.625%, 1/27/23 |
United States | 2,004,775 | 1,754,178 | |||||||||||
| Term Loan B2, 8.625%, 1/27/23 |
United States | 1,935,027 | 1,661,705 | |||||||||||
| e | Veritas U.S. Inc./Veritas Bermuda Ltd., senior note, 144A, 10.50%, 2/01/24 |
United States | 2,419,000 | 2,068,245 | ||||||||||
| e | Western Digital Corp., senior note, 144A, 10.50%, 4/01/24 |
United States | 2,318,000 | 2,486,055 | ||||||||||
|
|
|
|||||||||||||
| Total Corporate Bonds, Notes and Senior Floating Rate Interests (Cost $27,363,872) |
23,699,455 | |||||||||||||
|
|
|
|||||||||||||
| MGD-14 | Semiannual Report |
FRANKLIN TEMPLETON VARIABLE INSURANCE PRODUCTS TRUST
STATEMENT OF INVESTMENTS (UNAUDITED)
Franklin Mutual Global Discovery VIP Fund (continued)
| Country | Principal Amount* | Value | ||||||||||||
| Corporate Bonds, Notes and Senior Floating Rate Interests in Reorganization 0.8% |
||||||||||||||
| b,l | Broadband Ventures III LLC, secured promissory note, |
United States | 595 | $ | — | |||||||||
| i,j,l | Caesars Entertainment Operating Co. Inc., Term B-7 Loans, |
United States | 1,176,090 | 1,188,831 | ||||||||||
| i,j,l | Texas Competitive Electric Holdings Co. LLC, Term Loans, |
United States | 5,912,264 | 1,983,074 | ||||||||||
| e,l | Texas Competitive Electric Holdings Co. LLC/Texas Competitive Electric Holdings Finance Inc., senior secured note, first lien, 144A, 11.50%, 10/01/20 |
United States | 5,895,000 | 2,019,037 | ||||||||||
| e,l,m | Walter Energy Inc., second lien, 144A, PIK, 11.50%, 4/01/20 |
United States | 801,340 | 280 | ||||||||||
|
|
|
|||||||||||||
| Total Corporate Bonds, Notes and Senior Floating Rate Interests in Reorganization (Cost $12,095,094) |
5,191,222 | |||||||||||||
|
|
|
|||||||||||||
| Shares | ||||||||||||||
| Companies in Liquidation 0.1% |
||||||||||||||
| a | Adelphia Recovery Trust |
United States | 5,379,562 | 11,297 | ||||||||||
| a,f | Adelphia Recovery Trust, Arahova Contingent Value Vehicle, Contingent Distribution |
United States | 386,774 | 3,868 | ||||||||||
| a,f,g | Century Communications Corp., Contingent Distribution |
United States | 1,074,000 | — | ||||||||||
| a,b | FIM Coinvestor Holdings I, LLC |
United States | 2,077,368 | — | ||||||||||
| a,n | Lehman Brothers Holdings Inc., Bankruptcy Claim |
United States | 17,348,669 | 542,146 | ||||||||||
| a,g | NewPage Corp., Litigation Trust |
United States | 4,854,000 | — | ||||||||||
| a,f,g | Tribune Media Litigation Trust, Contingent Distribution |
United States | 56,925 | — | ||||||||||
|
|
|
|||||||||||||
| Total Companies in Liquidation (Cost $1,632,483) |
557,311 | |||||||||||||
|
|
|
|||||||||||||
| Principal Amount* | ||||||||||||||
| Municipal Bonds (Cost $2,115,492) 0.2% |
||||||||||||||
| Puerto Rico Commonwealth GO, Refunding, Series A, |
United States | 2,261,000 | 1,512,044 | |||||||||||
|
|
|
|||||||||||||
| Total Investments before Short Term Investments |
598,795,281 | |||||||||||||
|
|
|
|||||||||||||
| Short Term Investments 7.5% |
||||||||||||||
| U.S. Government and Agency Securities 6.7% |
||||||||||||||
| o | FHLB, 7/01/16 |
United States | 11,900,000 | 11,900,000 | ||||||||||
| o,p | U.S. Treasury Bill, 7/07/16 - 12/08/16 |
United States | 31,000,000 | 30,982,921 | ||||||||||
|
|
|
|||||||||||||
| Total U.S. Government and Agency Securities (Cost $42,871,955) |
42,882,921 | |||||||||||||
|
|
|
|||||||||||||
| Total Investments before Money Market Funds and Repurchase Agreements (Cost $592,111,324) |
641,678,202 | |||||||||||||
|
|
|
|||||||||||||
| Shares | ||||||||||||||
| q | Investments from Cash Collateral Received for Loaned Securities 0.8% |
|||||||||||||
| Money Market Funds (Cost $4,344,000) 0.7% |
||||||||||||||
| a,r | Institutional Fiduciary Trust Money Market Portfolio |
United States | 4,344,000 | 4,344,000 | ||||||||||
|
|
|
|||||||||||||
| Semiannual Report | MGD-15 |
FRANKLIN TEMPLETON VARIABLE INSURANCE PRODUCTS TRUST
STATEMENT OF INVESTMENTS (UNAUDITED)
Franklin Mutual Global Discovery VIP Fund (continued)
| Country | Principal Amount* | Value | ||||||||||||
| Investments from Cash Collateral Received for Loaned Securities (continued) |
||||||||||||||
| Repurchase Agreements (Cost $1,086,324) 0.1% |
||||||||||||||
| s | Joint Repurchase Agreement, 0.40%, 7/01/16 |
United States | 1,086,324 | $ | 1,086,324 | |||||||||
| BNP Paribas Securities Corp. |
||||||||||||||
| Collateralized by oU.S. Treasury Bill, 10/27/16; U.S. Treasury Bond, 8.75% - 9.00%, 11/15/18 - 5/15/20; U.S. Treasury Note, 0.363% - 4.75%, 9/15/16 - 3/31/21; U.S. Treasury Note, Index Linked, 2.625%, 7/15/17; and U.S. Treasury Strips, 8/15/16 - 2/15/21 (valued at $1,108,051) |
||||||||||||||
|
|
|
|||||||||||||
| Total Investments from Cash Collateral Received for Loaned Securities (Cost $5,430,324) |
5,430,324 | |||||||||||||
|
|
|
|||||||||||||
| Total Investments (Cost $597,541,648) 100.3% |
647,108,526 | |||||||||||||
| Securities Sold Short (0.6)% |
(3,554,567 | ) | ||||||||||||
| Other Assets, less Liabilities 0.3% |
1,866,113 | |||||||||||||
|
|
|
|||||||||||||
| Net Assets 100.0% |
$ | 645,420,072 | ||||||||||||
|
|
|
|||||||||||||
| Shares | ||||||||||||||
| t | Securities Sold Short (Proceeds $3,486,096) (0.6)% |
|||||||||||||
| Common Stocks (0.6)% |
||||||||||||||
| Health Care Equipment & Supplies (0.6)% |
||||||||||||||
| Abbott Laboratories |
United States | 90,424 | $ | (3,554,567 | ) | |||||||||
|
|
|
|||||||||||||
†Rounds to less than 0.1% of net assets.
*The principal amount is stated in U.S. dollars unless otherwise indicated.
aNon-income producing.
bSee Note 8 regarding restricted securities.
cAt June 30, 2016, pursuant to the Fund’s policies and the requirements of applicable securities law, the Fund is restricted from trading this security at period end.
dA portion or all of the security is on loan at June 30, 2016. See Note 1(h).
eSecurity was purchased pursuant to Rule 144A under the Securities Act of 1933 and may be sold in transactions exempt from registration only to qualified institutional buyers or in a public offering registered under the Securities Act of 1933. These securities have been deemed liquid under guidelines approved by the Trust’s Board of Trustees. At June 30, 2016, the aggregate value of these securities was $17,849,309, representing 2.8% of net assets.
fContingent distributions represent the right to receive additional distributions, if any, during the reorganization of the underlying company. Shares represent total underlying principal of debt securities.
gSecurity has been deemed illiquid because it may not be able to be sold within seven days. At June 30, 2016, the aggregate value of these securities was $-.
hVariable rate security. The rate shown represents the yield at period end.
iSee Note 1(i) regarding senior floating rate interests.
jThe coupon rate shown represents the rate at period end.
kSecurity purchased on a when-issued or delayed delivery basis. See Note 1(d).
lSee Note 7 regarding credit risk and defaulted securities.
mIncome may be received in additional securities and/or cash.
nBankruptcy claims represent the right to receive distributions, if any, during the liquidation of the underlying pool of assets. Shares represent amount of allowed unsecured claims.
oThe security is traded on a discount basis with no stated coupon rate.
pA portion or all of the security has been segregated as collateral for securities sold short and open forward contracts. At June 30, 2016, the aggregate value of these securities and/or cash pledged amounted to $5,374,722, representing 0.8% of net assets.
qSee Note 1(h) regarding securities on loan.
rSee Note 3(e) regarding investments in affiliated management investment companies.
sSee Note 1(c) regarding joint repurchase agreement.
tSee Note 1(g) regarding securities sold short.
| MGD-16 | Semiannual Report |
FRANKLIN TEMPLETON VARIABLE INSURANCE PRODUCTS TRUST
STATEMENT OF INVESTMENTS (UNAUDITED)
Franklin Mutual Global Discovery VIP Fund (continued)
At June 30, 2016 , the Fund had the following futures contracts outstanding. See Note 1(d).
| Futures Contracts | ||||||||||||||||||||||||
| Description | Type | Number of Contracts |
Notional Value |
Expiration Date |
Unrealized Appreciation |
Unrealized Depreciation |
||||||||||||||||||
| Currency Contracts | ||||||||||||||||||||||||
| EUR/USD |
Short | 207 | $ | 28,740,656 | 9/19/16 | $ | 802,876 | — | ||||||||||||||||
| GBP/USD |
Short | 219 | 18,133,200 | 9/19/16 | 1,725,498 | — | ||||||||||||||||||
|
|
|
|
|
|||||||||||||||||||||
| Total Futures Contracts |
|
$ | 46,873,856 | $ | 2,528,374 | — | ||||||||||||||||||
|
|
|
|
|
|||||||||||||||||||||
| Net unrealized appreciation (depreciation) |
|
$ | 2,528,374 | |||||||||||||||||||||
|
|
|
|||||||||||||||||||||||
At June, 30, 2016 the Fund had the following forward exchange contracts outstanding. See Note 1(d).
| Forward Exchange Contracts | ||||||||||||||||||||||||||||
| Currency | Counterpartya | Type | Quantity | Contract Amount |
Settlement Date |
Unrealized Appreciation |
Unrealized Depreciation |
|||||||||||||||||||||
| OTC Forward Exchange Contracts | ||||||||||||||||||||||||||||
| South Korean Won |
BOFA | Buy | 203,895,016 | $ | 174,909 | 7/12/16 | $ | 2,402 | $ | (459 | ) | |||||||||||||||||
| South Korean Won |
BOFA | Sell | 2,460,910,507 | 2,141,843 | 7/12/16 | 7,390 | (64 | ) | ||||||||||||||||||||
| South Korean Won |
FBCO | Sell | 1,958,645,921 | 1,706,881 | 7/12/16 | 8,012 | — | |||||||||||||||||||||
| South Korean Won |
HSBC | Buy | 202,880,750 | 172,291 | 7/12/16 | 3,682 | — | |||||||||||||||||||||
| South Korean Won |
HSBC | Sell | 2,263,081,028 | 1,969,641 | 7/12/16 | 9,993 | (3,279 | ) | ||||||||||||||||||||
| Canadian Dollar |
HSBC | Buy | 83,520 | 64,125 | 7/19/16 | 519 | — | |||||||||||||||||||||
| Canadian Dollar |
HSBC | Sell | 170,991 | 130,596 | 7/19/16 | — | (1,750 | ) | ||||||||||||||||||||
| Canadian Dollar |
SSBT | Buy | 578,177 | 446,271 | 7/19/16 | 2,107 | (872 | ) | ||||||||||||||||||||
| Canadian Dollar |
SSBT | Sell | 5,350,408 | 4,176,476 | 7/19/16 | 35,506 | (221 | ) | ||||||||||||||||||||
| British Pound |
BOFA | Buy | 1,168,799 | 1,657,685 | 8/19/16 | — | (98,482 | ) | ||||||||||||||||||||
| British Pound |
BOFA | Sell | 87,210 | 116,861 | 8/19/16 | 622 | (101 | ) | ||||||||||||||||||||
| British Pound |
BONY | Sell | 52,452 | 70,658 | 8/19/16 | 686 | — | |||||||||||||||||||||
| British Pound |
FBCO | Sell | 25,065 | 33,872 | 8/19/16 | 434 | — | |||||||||||||||||||||
| British Pound |
HSBC | Sell | 149,357 | 199,942 | 8/19/16 | 881 | (184 | ) | ||||||||||||||||||||
| British Pound |
SSBT | Buy | 57,587 | 81,039 | 8/19/16 | — | (4,217 | ) | ||||||||||||||||||||
| British Pound |
SSBT | Sell | 15,088,998 | 21,954,930 | 8/19/16 | 1,826,109 | (230 | ) | ||||||||||||||||||||
| Euro |
BOFA | Buy | 1,239,103 | 1,380,666 | 8/19/16 | 6,260 | (9,036 | ) | ||||||||||||||||||||
| Euro |
BOFA | Sell | 17,838 | 20,208 | 8/19/16 | 372 | — | |||||||||||||||||||||
| Euro |
BONY | Buy | 1,354,681 | 1,510,659 | 8/19/16 | 5,025 | (9,271 | ) | ||||||||||||||||||||
| Euro |
FBCO | Buy | 1,885,685 | 2,096,660 | 8/19/16 | 10,708 | (10,476 | ) | ||||||||||||||||||||
| Euro |
HSBC | Buy | 1,332,250 | 1,484,817 | 8/19/16 | 6,289 | (9,636 | ) | ||||||||||||||||||||
| Euro |
SSBT | Buy | 1,500,925 | 1,673,164 | 8/19/16 | 7,238 | (11,366 | ) | ||||||||||||||||||||
| Euro |
SSBT | Sell | 42,127,397 | 48,151,109 | 8/19/16 | 1,305,204 | — | |||||||||||||||||||||
|
|
|
|||||||||||||||||||||||||||
| Total Forward Exchange Contracts |
|
$ | 3,239,439 | $ | (159,644 | ) | ||||||||||||||||||||||
|
|
|
|||||||||||||||||||||||||||
| Net unrealized appreciation (depreciation) |
|
$ | 3,079,795 | |||||||||||||||||||||||||
|
|
|
|||||||||||||||||||||||||||
aMay be comprised of multiple contracts with the same counterparty, currency and settlement date.
See Abbreviations on page MGD-34.
| Semiannual Report | MGD-17 |
FRANKLIN TEMPLETON VARIABLE INSURANCE PRODUCTS TRUST
Financial Statements
Statement of Assets and Liabilities
June 30, 2016 (unaudited)
| Franklin Mutual Global Discovery VIP Fund |
||||
| Assets: |
||||
| Investments in securities: |
||||
| Cost - Unaffiliated issuers |
$ | 592,111,324 | ||
| Cost - Non-controlled affiliates (Note 3e) |
4,344,000 | |||
| Cost - Repurchase agreements |
1,086,324 | |||
|
|
|
|||
| Total cost of investments |
$ | 597,541,648 | ||
|
|
|
|||
| Value - Unaffiliated issuers |
$ | 641,678,202 | ||
| Value - Non-controlled affiliates (Note 3e) |
4,344,000 | |||
| Value - Repurchase agreements |
1,086,324 | |||
|
|
|
|||
| Total value of investments (includes securities loaned in the amount of $5,201,095) |
647,108,526 | |||
| Cash |
382,648 | |||
| Restricted cash (Note 1e) |
3,400,000 | |||
| Foreign currency, at value (cost and $558,534) |
554,999 | |||
| Receivables: |
||||
| Investment securities sold |
3,144,833 | |||
| Capital shares sold |
47,895 | |||
| Dividends and interest |
2,591,334 | |||
| European Union tax reclaims |
295,461 | |||
| Due from brokers |
5,061,455 | |||
| Variation margin |
330,769 | |||
| Unrealized appreciation on OTC forward exchange contracts |
3,239,439 | |||
| Other assets |
103,577 | |||
|
|
|
|||
| Total assets |
666,260,936 | |||
|
|
|
|||
| Liabilities: |
||||
| Payables: |
||||
| Investment securities purchased |
7,117,834 | |||
| Capital shares redeemed |
229,641 | |||
| Management fees |
496,718 | |||
| Distribution fees |
277,424 | |||
| Securities sold short, at value (proceeds $3,486,096) |
3,554,567 | |||
| Payable upon return of securities loaned |
5,430,324 | |||
| Due to brokers |
3,400,000 | |||
| Unrealized depreciation on OTC forward exchange contracts |
159,644 | |||
| Accrued expenses and other liabilities |
174,712 | |||
|
|
|
|||
| Total liabilities |
20,840,864 | |||
|
|
|
|||
| Net assets, at value |
$ | 645,420,072 | ||
|
|
|
|||
| Net assets consist of: |
||||
| Paid-in capital |
$ | 507,790,976 | ||
| Undistributed net investment income |
19,021,183 | |||
| Net unrealized appreciation (depreciation) |
55,053,830 | |||
| Accumulated net realized gain (loss) |
63,554,083 | |||
|
|
|
|||
| Net assets, at value |
$ | 645,420,072 | ||
|
|
|
|||
| MGD-18 | Semiannual Report | The accompanying notes are an integral part of these financial statements. |
FRANKLIN TEMPLETON VARIABLE INSURANCE PRODUCTS TRUST
FINANCIAL STATEMENTS
Statement of Assets and Liabilities (continued)
June 30, 2016 (unaudited)
| Franklin Mutual Global Discovery VIP Fund |
||||
| Class 1: | ||||
| Net assets, at value |
$ | 2,754,446 | ||
|
|
|
|||
| Shares outstanding |
139,328 | |||
|
|
|
|||
| Net asset value and maximum offering price per share |
$ | 19.77 | ||
|
|
|
|||
| Class 2: | ||||
| Net assets, at value |
$ | 597,644,787 | ||
|
|
|
|||
| Shares outstanding |
31,014,267 | |||
|
|
|
|||
| Net asset value and maximum offering price per share |
$ | 19.27 | ||
|
|
|
|||
| Class 4: | ||||
| Net assets, at value |
$ | 45,020,839 | ||
|
|
|
|||
| Shares outstanding |
2,303,695 | |||
|
|
|
|||
| Net asset value and maximum offering price per share |
$ | 19.54 | ||
|
|
|
|||
| The accompanying notes are an integral part of these financial statements. | Annual Report | MGD-19 |
FRANKLIN TEMPLETON VARIABLE INSURANCE PRODUCTS TRUST
FINANCIAL STATEMENTS
Statement of Operations
for the six months ended June 30, 2016 (unaudited)
| Franklin Mutual Global Discovery VIP Fund |
||||
| Investment income: |
||||
| Dividends (net of foreign taxes of $591,941) |
$ | 11,213,920 | ||
| Interest |
1,416,949 | |||
| Income from securities loaned (net of fees and rebates) |
231,423 | |||
|
|
|
|||
| Total investment income |
12,862,292 | |||
|
|
|
|||
| Expenses: |
||||
| Management fees (Note 3a) |
3,003,533 | |||
| Distribution fees: (Note 3c) |
||||
| Class 2 |
739,006 | |||
| Class 4 |
79,762 | |||
| Custodian fees (Note 4) |
14,338 | |||
| Reports to shareholders |
73,761 | |||
| Professional fees |
69,711 | |||
| Trustees’ fees and expenses |
1,639 | |||
| Dividends on securities sold short |
10,364 | |||
| Other |
18,135 | |||
|
|
|
|||
| Total expenses |
4,010,249 | |||
| Expense reductions (Note 4) |
(588 | ) | ||
| Expenses waived/paid by affiliates (Note 3e) |
(6,619 | ) | ||
|
|
|
|||
| Net expenses |
4,003,042 | |||
|
|
|
|||
| Net investment income |
8,859,250 | |||
|
|
|
|||
| Realized and unrealized gains (losses): |
||||
| Net realized gain (loss) from: |
||||
| Investments |
17,460,328 | |||
| Foreign currency transactions |
(1,249,979 | ) | ||
| Futures contracts |
(430,004 | ) | ||
| Securities sold short |
(125,155 | ) | ||
|
|
|
|||
| Net realized gain (loss) |
15,655,190 | |||
|
|
|
|||
| Net change in unrealized appreciation (depreciation) on: |
||||
| Investments |
(33,204,832 | ) | ||
| Translation of other assets and liabilities denominated in foreign currencies |
2,231,725 | |||
| Futures contracts |
1,985,026 | |||
|
|
|
|||
| Net change in unrealized appreciation (depreciation) |
(28,988,081 | ) | ||
|
|
|
|||
| Net realized and unrealized gain (loss) |
(13,332,891 | ) | ||
|
|
|
|||
| Net increase (decrease) in net assets resulting from operations |
$ | (4,473,641 | ) | |
|
|
|
|||
| MGD-20 | Semiannual Report | The accompanying notes are an integral part of these financial statements. |
FRANKLIN TEMPLETON VARIABLE INSURANCE PRODUCTS TRUST
FINANCIAL STATEMENTS
Statements of Changes in Net Assets
| Franklin Mutual Global Discovery VIP Fund | ||||||||
| Six Months Ended June 30, 2016 (unaudited) |
Year Ended December 31, 2015 |
|||||||
| Increase (decrease) in net assets: |
||||||||
| Operations: |
||||||||
| Net investment income |
$ | 8,859,250 | $ | 10,694,516 | ||||
| Net realized gain (loss) |
15,655,190 | 57,004,189 | ||||||
| Net change in unrealized appreciation (depreciation) |
(28,988,081 | ) | (93,151,143 | ) | ||||
|
|
|
|||||||
| Net increase (decrease) in net assets resulting from operations |
(4,473,641 | ) | (25,452,438 | ) | ||||
|
|
|
|||||||
| Distributions to shareholders from: |
||||||||
| Net investment income: |
||||||||
| Class 1 |
— | (79,470 | ) | |||||
| Class 2 |
— | (18,967,567 | ) | |||||
| Class 4 |
— | (1,406,194 | ) | |||||
| Net realized gains: |
||||||||
| Class 1 |
— | (146,560 | ) | |||||
| Class 2 |
— | (38,175,344 | ) | |||||
| Class 4 |
— | (3,020,502 | ) | |||||
|
|
|
|||||||
| Total distributions to shareholders |
— | (61,795,637 | ) | |||||
|
|
|
|||||||
| Capital share transactions: (Note 2) |
||||||||
| Class 1 |
128,335 | 643,019 | ||||||
| Class 2 |
(27,582,757 | ) | 24,374,278 | |||||
| Class 4 |
(3,704,488 | ) | (4,702,254 | ) | ||||
|
|
|
|||||||
| Total capital share transactions |
(31,158,910 | ) | 20,315,043 | |||||
|
|
|
|||||||
| Net increase (decrease) in net assets |
(35,632,551 | ) | (66,933,032 | ) | ||||
| Net assets: |
||||||||
| Beginning of period |
681,052,623 | 747,985,655 | ||||||
|
|
|
|||||||
| End of period |
$ | 645,420,072 | $ | 681,052,623 | ||||
|
|
|
|||||||
| Undistributed net investment income included in net assets: |
||||||||
| End of period |
$ | 19,021,183 | $ | 10,161,933 | ||||
|
|
|
|||||||
| The accompanying notes are an integral part of these financial statements. | Semiannual Report | MGD-21 |
FRANKLIN TEMPLETON VARIABLE INSURANCE PRODUCTS TRUST
Notes to Financial Statements (unaudited)
Franklin Mutual Global Discovery VIP Fund
| MGD-22 | Semiannual Report |
FRANKLIN TEMPLETON VARIABLE INSURANCE PRODUCTS TRUST
NOTES TO FINANCIAL STATEMENTS (UNAUDITED)
Franklin Mutual Global Discovery VIP Fund (continued)
| Semiannual Report | MGD-23 |
FRANKLIN TEMPLETON VARIABLE INSURANCE PRODUCTS TRUST
NOTES TO FINANCIAL STATEMENTS (UNAUDITED)
Franklin Mutual Global Discovery VIP Fund (continued)
1. Organization and Significant Accounting Policies (continued)
c. Joint Repurchase Agreement (continued)
value, including accrued interest, of the initial collateralization is required to be at least 102% of the dollar amount invested by the funds, with the value of the underlying securities marked to market daily to maintain coverage of at least 100%. Repurchase agreements are subject to the terms of Master Repurchase Agreements (MRAs) with approved counterparties (sellers). The MRAs contain various provisions, including but not limited to events of default and maintenance of collateral for repurchase agreements. In the event of default by either the seller or the Fund, certain MRAs may permit the non-defaulting party to net and close-out all transactions, if any, traded under such agreements. The Fund may sell securities it holds as collateral and apply the proceeds towards the repurchase price and any other amounts owed by the seller to the Fund in the event of default by the seller. This could involve costs or delays in addition to a loss on the securities if their value falls below the repurchase price owed by the seller. The joint repurchase agreement held by the Fund at period end, as indicated in the Statement of Investments, had been entered into on June 30, 2016.
d. Securities Purchased on a When-Issued or Delayed Delivery Basis
The Fund purchases securities on a when-issued or delayed delivery basis, with payment and delivery scheduled for a future date. These transactions are subject to market fluctuations and are subject to the risk that the value at delivery may be more or less than the trade date purchase price. Although the Fund will generally purchase these securities with the intention of holding the securities, it may sell the securities before the settlement date. Sufficient assets have been segregated for these securities.
e. Derivative Financial Instruments
The Fund invested in derivatives in order to manage risk or gain exposure to various other investments or markets. Derivatives are financial contracts based on an underlying or notional amount, require no initial investment or an initial net investment that is smaller than would normally be required to have a similar response to changes in market factors, and require or permit net settlement. Derivatives contain various risks including the
potential inability of the counterparty to fulfill their obligations under the terms of the contract, the potential for an illiquid secondary market, and/or the potential for market movements
which expose the Fund to gains or losses in excess of the amounts shown in the Statement of Assets and Liabilities. Realized gain and loss and unrealized appreciation and depreciation on these contracts for the period are included in the Statement of Operations.
Derivative counterparty credit risk is managed through a formal evaluation of the creditworthiness of all potential counterparties. The Fund attempts to reduce its exposure to counterparty credit risk on OTC derivatives, whenever possible, by entering into International Swaps and Derivatives Association (ISDA) master agreements with certain counterparties. These agreements contain various provisions, including but not limited to collateral requirements, events of default, or early termination. Termination events applicable to the counterparty include certain deteriorations in the credit quality of the counterparty. Termination events applicable to the Fund include failure of the Fund to maintain certain net asset levels and/or limit the decline in net assets over various periods of time. In the event of default or early termination, the ISDA master agreement gives the non-defaulting party the right to net and close-out all transactions traded, whether or not arising under the ISDA agreement, to one net amount payable by one counterparty to the other. However, absent an event of default or early termination, OTC derivative assets and liabilities are presented gross and not offset in the Statement of Assets and Liabilities. Early termination by the counterparty may result in an immediate payment by the Fund of any net liability owed to that counterparty under the ISDA agreement. At June 30, 2016, the Fund had OTC derivatives in a net liability position for such contracts of $94,656.
Collateral requirements differ by type of derivative. Collateral or initial margin requirements are set by the broker or exchange clearing house for exchange traded and centrally cleared derivatives. Initial margin deposited is held at the exchange and can be in the form of cash and/or securities. For OTC derivatives traded under an ISDA master agreement, posting of collateral is required by either the Fund or the applicable counterparty if the total net exposure of all OTC derivatives with the applicable counterparty exceeds the minimum transfer amount, which typically ranges from $100,000 to $250,000, and can vary depending on the counterparty and the type of the agreement. Generally, collateral is determined at the close of Fund business each day and any additional collateral required due to changes in derivative values may be delivered by the Fund or the counterparty within a few business days. Collateral pledged
| MGD-24 | Semiannual Report |
FRANKLIN TEMPLETON VARIABLE INSURANCE PRODUCTS TRUST
NOTES TO FINANCIAL STATEMENTS (UNAUDITED)
Franklin Mutual Global Discovery VIP Fund (continued)
| Semiannual Report | MGD-25 |
FRANKLIN TEMPLETON VARIABLE INSURANCE PRODUCTS TRUST
NOTES TO FINANCIAL STATEMENTS (UNAUDITED)
Franklin Mutual Global Discovery VIP Fund (continued)
1. Organization and Significant Accounting Policies (continued)
j. Income and Deferred Taxes
It is the Fund’s policy to qualify as a regulated investment company under the Internal Revenue Code. The Fund intends to distribute to shareholders substantially all of its taxable income and net realized gains to relieve it from federal income and if applicable, excise taxes. As a result, no provision for U.S. federal income taxes is required.
The Fund may be subject to foreign taxation related to income received, capital gains on the sale of securities and certain foreign currency transactions in the foreign jurisdictions in which it invests. Foreign taxes, if any, are recorded based on the tax regulations and rates that exist in the foreign markets in which the Fund invests. When a capital gain tax is determined to apply, the Fund records an estimated deferred tax liability in an amount that would be payable if the securities were disposed of on the valuation date. As a result of several court cases, in certain countries across the European Union, the Fund filed additional tax reclaims for previously withheld taxes on dividends earned in those countries (EU reclaims). These additional filings are subject to various administrative proceedings by the local jurisdictions’ tax authorities within the European Union, as well as a number of related judicial proceedings. Income recognized, if any, for EU reclaims is reflected as other income in the Statement of Operations and any related receivable, if any, is reflected as European Union tax reclaims in the Statement of Assets and Liabilities. When uncertainty exists as to the ultimate resolution of these proceedings, the likelihood of receipt of these EU reclaims, and the potential timing of payment, no amounts are reflected in the financial statements.
The Fund may recognize an income tax liability related to its uncertain tax positions under U.S. GAAP when the uncertain tax position has a less than 50% probability that it will be sustained upon examination by the tax authorities based on its technical merits. As of June 30, 2016, the Fund has determined that no tax liability is required in its financial statements related to uncertain tax positions for any open tax years (or expected to be taken in future tax years). Open tax years are those that
remain subject to examination and are based on each tax jurisdiction’s statute of limitation.
k. Security Transactions, Investment Income, Expenses and Distributions
Security transactions are accounted for on trade date. Realized gains and losses on security transactions are determined on a specific identification basis. Interest income and estimated expenses are accrued daily. Amortization of premium and accretion of discount on debt securities are included in interest income. Dividend income and dividends declared on securities sold short are recorded on the ex-dividend date except for certain dividends from foreign securities where the dividend rate is not available. In such cases, the dividend is recorded as soon as the information is received by the Fund. Distributions to shareholders are recorded on the ex-dividend date and are determined according to income tax regulations (tax basis). Distributable earnings determined on a tax basis may differ from earnings recorded in accordance with U.S. GAAP. These differences may be permanent or temporary. Permanent differences are reclassified among capital accounts to reflect their tax character. These reclassifications have no impact on net assets or the results of operations. Temporary differences are not reclassified, as they may reverse in subsequent periods.
Common expenses incurred by the Trust are allocated among the Funds based on the ratio of net assets of each Fund to the combined net assets of the Trust. Fund specific expenses are charged directly to the fund that incurred the expense.
Realized and unrealized gains and losses and net investment income, not including class specific expenses, are allocated daily to each class of shares based upon the relative proportion of net assets of each class. Differences in per share distributions, by class, are generally due to differences in class specific expenses.
l. Accounting Estimates
The preparation of financial statements in accordance with U.S. GAAP requires management to make estimates and assumptions that affect the reported amounts of assets and liabilities at the date of the financial statements and the amounts of income and expenses during the reporting period. Actual results could differ from those estimates.
| MGD-26 | Semiannual Report |
FRANKLIN TEMPLETON VARIABLE INSURANCE PRODUCTS TRUST
NOTES TO FINANCIAL STATEMENTS (UNAUDITED)
Franklin Mutual Global Discovery VIP Fund (continued)
m. Guarantees and Indemnifications
2. Shares of Beneficial Interest
At June 30, 2016, there were an unlimited number of shares authorized (without par value). Transactions in the Fund’s shares were as follows:
| Six Months Ended June 30, 2016 |
Year Ended December 31, 2015 |
|||||||||||||||||||
| Shares | Amount | Shares | Amount | |||||||||||||||||
| Class 1 Shares: | ||||||||||||||||||||
| Shares sold |
13,955 | $ | 266,819 | 29,371 | $ | 659,819 | ||||||||||||||
| Shares issued in reinvestment of distributions |
— | — | 11,573 | 226,030 | ||||||||||||||||
| Shares redeemed |
(7,227 | ) | (138,484 | ) | (10,639 | ) | (242,830 | ) | ||||||||||||
|
|
|
|||||||||||||||||||
| Net increase (decrease) |
6,728 | $ | 128,335 | 30,305 | $ | 643,019 | ||||||||||||||
|
|
|
|||||||||||||||||||
| Class 2 Shares: | ||||||||||||||||||||
| Shares sold |
754,545 | $ | 14,161,497 | 2,941,446 | $ | 64,431,215 | ||||||||||||||
| Shares issued in reinvestment of distributions |
— | — | 2,996,482 | 57,142,910 | ||||||||||||||||
| Shares redeemed |
(2,228,840 | ) | (41,744,254 | ) | (4,457,652 | ) | (97,199,847 | ) | ||||||||||||
|
|
|
|||||||||||||||||||
| Net increase (decrease) |
(1,474,295 | ) | $ | (27,582,757 | ) | 1,480,276 | $ | 24,374,278 | ||||||||||||
|
|
|
|||||||||||||||||||
| Class 4 Shares: | ||||||||||||||||||||
| Shares sold |
79,340 | $ | 1,477,095 | 121,580 | $ | 2,592,251 | ||||||||||||||
| Shares issued in reinvestment of distributions |
— | — | 228,652 | 4,426,697 | ||||||||||||||||
| Shares redeemed |
(271,273 | ) | (5,181,583 | ) | (532,685 | ) | (11,721,202 | ) | ||||||||||||
|
|
|
|||||||||||||||||||
| Net increase (decrease) |
(191,933 | ) | $ | (3,704,488 | ) | (182,453 | ) | $ | (4,702,254 | ) | ||||||||||
|
|
|
|||||||||||||||||||
3. Transactions With Affiliates
Franklin Resources, Inc. is the holding company for various subsidiaries that together are referred to as Franklin Templeton Investments. Certain officers and trustees of the Fund are also officers and/or directors of the following subsidiaries:
| Subsidiary | Affiliation | |
| Franklin Mutual Advisers, LLC (Franklin Mutual) |
Investment manager | |
| Franklin Templeton Services, LLC (FT Services) |
Administrative manager | |
| Franklin Templeton Distributors, Inc. (Distributors) |
Principal underwriter | |
| Franklin Templeton Investor Services, LLC (Investor Services) |
Transfer agent |
| Semiannual Report | MGD-27 |
FRANKLIN TEMPLETON VARIABLE INSURANCE PRODUCTS TRUST
NOTES TO FINANCIAL STATEMENTS (UNAUDITED)
Franklin Mutual Global Discovery VIP Fund (continued)
3. Transactions With Affiliates (continued)
a. Management Fees
The Fund pays an investment management fee to Franklin Mutual based on the average daily net assets of the Fund as follows:
| Annualized Fee Rate | Net Assets | |
| 0.950% |
Up to and including $200 million | |
| 0.935% |
Over $200 million, up to and including $700 million | |
| 0.900% |
Over $700 million, up to and including $1.2 billion | |
| 0.875% |
Over $1.2 billion, up to and including $4 billion | |
| 0.845% |
Over $4 billion, up to and including $7 billion | |
| 0.825% |
Over $7 billion, up to and including $10 billion | |
| 0.805% |
In excess of $10 billion |
For the period ended June 30, 2016, the annualized effective investment management fee rate was 0.940% of the Fund’s average daily net assets.
b. Administrative Fees
Under an agreement with Franklin Mutual, FT Services provides administrative services to the Fund. The fee is paid by Franklin Mutual based on the Fund’s average daily net assets, and is not an additional expense of the Fund.
c. Distribution Fees
The Board has adopted a distribution plans for Class 2 and Class 4 shares pursuant to Rule 12b-1 under the 1940 Act. Under the Fund’s compensation distribution plans, the Fund pays Distributors for costs incurred in connection with the servicing, sale and distribution of the Fund’s shares up to 0.35% per year of its average daily net assets of each class. The Board has agreed to limit the current rate to 0.25% per year for Class 2. The plan year, for purposes of monitoring compliance with the maximum annual plan rates, is February 1 through January 31.
d. Transfer Agent Fees
Investor Services, under terms of an agreement, performs shareholder servicing for the Fund and is not paid by the Fund for the services.
e. Investments in Affiliated Management Investment Companies
The Fund invests in one or more affiliated management investment companies for purposes other than exercising a controlling influence over the management or policies. Management fees paid by the Fund are waived on assets invested in the affiliated management investment companies, as noted in the Statement of Operations, in an amount not to exceed the management and administrative fees paid directly or indirectly by each affiliate.
| Number of Shares Held at Beginning of Period |
Gross Additions |
Gross Reductions |
Number of Shares Held at End of Period |
Value at End of Period |
Investment Income |
Realized Gain (Loss) |
% of Affiliated Fund Shares Outstanding Held at End of Period |
|||||||||||||||||||||||||
| Non-Controlled Affiliates | ||||||||||||||||||||||||||||||||
| Institutional Fiduciary Trust Money Market Portfolio |
— | 74,008,000 | (69,664,000 | ) | 4,344,000 | $ | 4,344,000 | $ | — | $ | — | —%a | ||||||||||||||||||||
|
|
|
|||||||||||||||||||||||||||||||
a Amount rounds to less than 0.1%.
| MGD-28 | Semiannual Report |
FRANKLIN TEMPLETON VARIABLE INSURANCE PRODUCTS TRUST
NOTES TO FINANCIAL STATEMENTS (UNAUDITED)
Franklin Mutual Global Discovery VIP Fund (continued)
4. Expense Offset Arrangement
The Fund has entered into an arrangement with its custodian whereby credits realized as a result of uninvested cash balances are used to reduce a portion of the Fund’s custodian expenses. During the period ended June 30, 2016, the custodian fees were reduced as noted in the Statement of Operations.
5. Income Taxes
At June 30, 2016, the cost of investments and net unrealized appreciation (depreciation) for income tax purposes were as follows:
| Cost of investments |
$ | 597,705,934 | ||
|
|
|
|||
| Unrealized appreciation |
$ | 127,653,884 | ||
| Unrealized depreciation |
(78,251,292 | ) | ||
|
|
|
|||
| Net unrealized appreciation (depreciation) |
$ | 49,402,592 | ||
|
|
|
Differences between income and/or capital gains as determined on a book basis and a tax basis are primarily due to differing treatments of foreign currency transactions.
6. Investment Transactions
Purchases and sales of investments (excluding short term securities and securities sold short) for the period ended June 30, 2016, aggregated $53,520,394 and $96,425,420, respectively.
At June 30, 2016, in connection with securities lending transactions, the Fund loaned equity investments and received $5,430,324 of cash collateral. The gross amount of recognized liability for such transactions is included in payable upon return of securities loaned in the Statement of Assets and Liabilities. The agreements can be terminated at any time.
7. Credit Risk And Defaulted Securities
The Fund may purchase the pre-default or defaulted debt of distressed companies. Distressed companies are financially troubled and are about to be or are already involved in financial restructuring or bankruptcy. Risks associated with purchasing these securities include the possibility that the bankruptcy or other restructuring process takes longer than expected, or that distributions in restructuring are less than anticipated, either or both of which may result in unfavorable consequences to the Fund. If it becomes probable that the income on debt securities, including those of distressed companies, will not be collected, the Fund discontinues accruing income and recognizes an adjustment for uncollectible interest.
At June 30, 2016, the aggregate long value of distressed company securities for which interest recognition has been discontinued was $5,191,222, representing 0.8% of the Fund’s net assets. For information as to specific securities, see the accompanying Statement of Investments.
8. Restricted Securities
The Fund invests in securities that are restricted under the Securities Act of 1933 (1933 Act) or which are subject to legal, contractual, or other agreed upon restrictions on resale. Restricted securities are often purchased in private placement transactions, and cannot be sold without prior registration unless the sale is pursuant to an exemption under the 1933 Act. Disposal of these securities may require greater effort and expense, and prompt sale at an acceptable price may be difficult. The Fund may have registration rights for restricted securities. The issuer generally incurs all registration costs.
| Semiannual Report | MGD-29 |
FRANKLIN TEMPLETON VARIABLE INSURANCE PRODUCTS TRUST
NOTES TO FINANCIAL STATEMENTS (UNAUDITED)
Franklin Mutual Global Discovery VIP Fund (continued)
8. Restricted Securities (continued)
At June 30, 2016, the Fund held investments in restricted securities, excluding certain securities exempt from registration under the 1933 Act deemed to be liquid, as follows:
| Principal Amount/ Shares/ Units |
Issuer | Acquisition Date | Cost | Value | ||||||||||
| 595 | Broadband Ventures III LLC, secured promissory note, 5.00%, 2/01/12 |
7/01/10 - 11/30/12 | $ | 595 | $ | — | ||||||||
| 2,077,368 | FIM Coinvestor Holdings I, LLC |
11/20/06 - 6/02/09 | — | — | ||||||||||
| 2,172,000 | Hightower Holding LLC, pfd., A, Series 2 |
6/10/10 - 5/10/12 | 5,430,000 | 5,821,394 | ||||||||||
| 424,073 | International Automotive Components Group Brazil LLC |
4/13/06 - 12/26/08 | 281,629 | 6,981 | ||||||||||
| 4,052,916 | International Automotive Components Group North America LLC |
1/12/06 - 3/18/13 | 3,247,714 | 1,788,009 | ||||||||||
| 1,841 | Warrior Met Coal LLC, A |
9/19/14 - 12/04/14 | 2,420,000 | 185,603 | ||||||||||
| 4,306 | Warrior Met Coal LLC, B |
03/31/16 - 06/23/16 | 344,500 | 434,115 | ||||||||||
|
|
|
|||||||||||||
| Total Restricted Securities (Value is 1.3% of Net Assets) |
$ | 11,724,438 | $ | 8,236,102 | ||||||||||
|
|
|
|||||||||||||
9. Other Derivative Information
At June 30, 2016, the Fund’s investments in derivative contracts are reflected in the Statement of Assets and Liabilities as follows:
| Asset Derivatives |
Liability Derivatives |
|||||||||||
| Derivative Contracts as Hedging Instruments |
Statement of Assets and Liabilities Location |
Fair Value | Statement of Assets and Liabilities Location |
Fair Value | ||||||||
| Foreign exchange contracts |
Variation margin | 2,528,374 | a | Variation margin | — | |||||||
| Unrealized appreciation on OTC forward exchange contracts |
3,239,439 | Unrealized depreciation on |
159,644 | |||||||||
|
|
|
|
|
|||||||||
| Totals |
$ | 5,767,813 | $ | 159,644 | ||||||||
|
|
|
|
|
|||||||||
aThis amount reflects the cumulative appreciation (depreciation) of futures contracts as reported in the Statement of Investments. Only the variation margin receivable/payable at year end is separately reported within the Statement of Assets and Liabilities. Prior variation margin movements were recorded to cash upon receipt or payment.
For the period ended June 30, 2016, the effect of derivative contracts in the Fund’s Statement of Operations was as follows:
| Derivative Contracts Not Accounted for as Hedging Instruments |
Statement of Operations Locations |
Net Realized Gain (Loss) for the Period |
Statement of Operations Locations |
Net Change in Unrealized Appreciation (Depreciation) for the Period |
||||||||
| Net realized gain (loss) from: |
Net change in unrealized appreciation (depreciation) on: |
|||||||||||
| Foreign exchange contracts |
Foreign currency transactions |
(1,201,867 | )a | Translation of other assets and liabilities denominated in foreign currencies |
2,253,295 | a | ||||||
| Futures contracts |
(430,004 | ) | Futures contracts |
1,985,026 | ||||||||
|
|
|
|
|
|||||||||
| Totals |
$ | (1,631,871 | ) | $ | 4,238,321 | |||||||
|
|
|
|
|
|||||||||
aForward exchange contracts are included in net realized gain (loss) from foreign currency transactions and net change in unrealized appreciation (depreciation) on translation of other assets and liabilities denominated in foreign currencies in the Statement of Operations.
| MGD-30 | Semiannual Report |
FRANKLIN TEMPLETON VARIABLE INSURANCE PRODUCTS TRUST
NOTES TO FINANCIAL STATEMENTS (UNAUDITED)
Franklin Mutual Global Discovery VIP Fund (continued)
For the period ended June, 30 2016, the average month end fair value of derivatives represented 0.5% of average month end net assets. The average month end number of open derivative contracts for the period was 51.
See Note 1(d) regarding derivative financial instruments.
10. Credit Facility
The Fund, together with other U.S. registered and foreign investment funds (collectively, Borrowers), managed by Franklin Templeton Investments, are borrowers in a joint syndicated senior unsecured credit facility totaling $2 billion (Global Credit Facility) which matures on February 10, 2017. This Global Credit Facility provides a source of funds to the Borrowers for temporary and emergency purposes, including the ability to meet future unanticipated or unusually large redemption requests.
Under the terms of the Global Credit Facility, the Fund shall, in addition to interest charged on any borrowings made by the Fund and other costs incurred by the Fund, pay its share of fees and expenses incurred in connection with the implementation and maintenance of the Global Credit Facility, based upon its relative share of the aggregate net assets of all of the Borrowers, including an annual commitment fee of 0.07% based upon the unused portion of the Global Credit Facility. Effective February 12, 2016, the annual commitment fee is 0.15%. These fees are reflected in other expenses in the Statement of Operations. During the period ended June 30, 2016, the Fund did not use the Global Credit Facility.
11. Fair Value Measurements
The Fund follows a fair value hierarchy that distinguishes between market data obtained from independent sources (observable inputs) and the Fund’s own market assumptions (unobservable inputs). These inputs are used in determining the value of the Fund’s financial instruments and are summarized in the following fair value hierarchy:
| • | Level 1 – quoted prices in active markets for identical financial instruments |
| • | Level 2 – other significant observable inputs (including quoted prices for similar financial instruments, interest rates, prepayment speed, credit risk, etc.) |
| • | Level 3 – significant unobservable inputs (including the Fund’s own assumptions in determining the fair value of financial instruments) |
The input levels are not necessarily an indication of the risk or liquidity associated with financial instruments at that level.
For movements between the levels within the fair value hierarchy, the Fund has adopted a policy of recognizing the transfers as of the date of the underlying event which caused the movement.
| Semiannual Report | MGD-31 |
FRANKLIN TEMPLETON VARIABLE INSURANCE PRODUCTS TRUST
NOTES TO FINANCIAL STATEMENTS (UNAUDITED)
Franklin Mutual Global Discovery VIP Fund (continued)
11. Fair Value Measurements (continued)
A summary of inputs used as of June 30, 2016, in valuing the Fund’s assets and liabilities carried at fair value, is as follows:
| Level 1 | Level 2 | Level 3 | Total | |||||||||||||
| Assets: | ||||||||||||||||
| Investments in Securities: |
||||||||||||||||
| Equity Investments:a |
||||||||||||||||
| Auto Components |
$ | 2,913,028 | $ | — | $ | 1,794,990 | $ | 4,708,018 | ||||||||
| Banks |
79,769,543 | 7,773,754 | — | 87,543,297 | ||||||||||||
| Diversified Financial Services |
2,516,854 | — | 5,821,394 | 8,338,248 | ||||||||||||
| Oil, Gas & Consumable Fuels |
44,792,308 | — | 619,718 | 45,412,026 | ||||||||||||
| All Other Equity Investmentsb |
421,833,660 | — | — | c | 421,833,660 | |||||||||||
| Corporate Bonds, Notes and Senior Floating Rate Interests |
— | 23,699,455 | — | 23,699,455 | ||||||||||||
| Corporate Notes and Senior Floating Rate Interests in Reorganization |
— | 5,191,222 | — | c | 5,191,222 | |||||||||||
| Companies in Liquidation |
11,297 | 546,014 | — | c | 557,311 | |||||||||||
| Municipal Bonds |
— | 1,512,044 | — | 1,512,044 | ||||||||||||
| Short Term Investments |
35,326,921 | 12,986,324 | — | 48,313,245 | ||||||||||||
|
|
|
|||||||||||||||
| Total Investments in Securities |
$ | 587,163,611 | $ | 51,708,813 | $ | 8,236,102 | $ | 647,108,526 | ||||||||
|
|
|
|||||||||||||||
| Other Financial Instruments: |
||||||||||||||||
| Futures Contracts |
$ | 2,528,374 | $ | — | $ | — | $ | 2,528,375 | ||||||||
| Forward Exchange Contracts |
— | 3,239,439 | — | 3,239,439 | ||||||||||||
|
|
|
|||||||||||||||
| Total Other Financial Instruments |
$ | 2,528,374 | $ | 3,239,439 | $ | — | $ | 5,767,814 | ||||||||
|
|
|
|||||||||||||||
| Liabilities: | ||||||||||||||||
| Other Financial Instruments: |
||||||||||||||||
| Securities Sold Short |
$ | 3,554,567 | $ | — | $ | — | $ | 3,554,567 | ||||||||
| Forward Exchange Contracts |
— | 159,644 | — | 159,644 | ||||||||||||
|
|
|
|||||||||||||||
| Total Other Financial Instruments |
$ | 3,554,567 | $ | 159,644 | $ | — | $ | 3,714,211 | ||||||||
|
|
|
|||||||||||||||
aIncludes common and preferred stocks as well as other equity investments.
bFor detailed categories, see the accompanying Statement of Investments.
cIncludes securities determined to have no value at June 30, 2016.
| MGD-32 | Semiannual Report |
FRANKLIN TEMPLETON VARIABLE INSURANCE PRODUCTS TRUST
NOTES TO FINANCIAL STATEMENTS (UNAUDITED)
Franklin Mutual Global Discovery VIP Fund (continued)
A reconciliation of assets in which Level 3 inputs are used in determining fair value is presented when there are significant Level 3 financial instruments at the end of the period. At June 30, 2016, the reconciliation of assets is as follows:
| Balance at Beginning of Period |
Purchases | Sales | Transfers Into Level 3a |
Transfers Out of Level 3b |
Cost Basis Adjustments |
Net Realized Gain (Loss) |
Net Unrealized |
Balance at End of Period |
Net Change
in Held at Period End |
|||||||||||||||||||||||||||||||
| Assets | ||||||||||||||||||||||||||||||||||||||||
| Investments in Securities: |
||||||||||||||||||||||||||||||||||||||||
| Equity Investments:c |
||||||||||||||||||||||||||||||||||||||||
| Auto Components |
$ | 2,192,388 | $ | — | $ | — | $ | — | $ | — | $ | — | $ | — | $ | (397,398 | ) | $ | 1,794,990 | $ | (397,398 | ) | ||||||||||||||||||
| Diversified Financial Services |
5,157,849 | — | — | — | — | — | — | 663,545 | 5,821,394 | 663,545 | ||||||||||||||||||||||||||||||
| Oil, Gas & Consumable Fuels |
— | 344,500 | — | 221,058 | — | — | — | 54,160 | 619,718 | 54,160 | ||||||||||||||||||||||||||||||
| Corporate Bonds and Notes in Reorganization |
2,053 | d | — | — | — | (280 | ) | — | — | (1,773 | ) | — | d | — | ||||||||||||||||||||||||||
|
|
|
|||||||||||||||||||||||||||||||||||||||
| Total Investments in Securities | $ | 7,352,290 | $ | 344,500 | $ | — | $ | 221,058 | $ | (280 | ) | $ | — | $ | — | $ | 318,534 | $ | 8,236,102 | $ | 320,307 | |||||||||||||||||||
|
|
|
|||||||||||||||||||||||||||||||||||||||
aThe investments were transferred into Level 3 as result of the unavailability of other significant observable valuation inputs. May include amounts related to a corporate action.
bThe investments were transferred out of Level 3 as a result of the availability of other significant observable valuation inputs.
cIncludes common and preferred stocks as well as other equity investments.
dIncludes securities determined to have no value.
Significant unobservable valuation inputs developed by the VC for material Level 3 financial instruments and impact to fair value as a result of changes in unobservable valuation inputs as of June 30, 2016, are as follows:
| Description | Fair Value at End of Year |
Valuation Technique |
Unobservable Input | Amount/ Range |
Impact to Fair Value if Input Increasesa |
|||||||||||
| Assets: | ||||||||||||||||
| Investments in Securities |
||||||||||||||||
| Equity Investments:b |
||||||||||||||||
| Auto Components |
$ | 1,788,009 | Market comparables |
Discount for lack of marketability Average EV / EBITDA multiple |
|
10% 3.2x |
|
|
Decrease Increase |
c d | ||||||
| Diversified Financial Services |
5,821,394 | Discounted Cash Flow Model |
Cost of Equity Long-term revenue growth rate Adjusted EBITDA margin |
|
17% 6.2% - 24.3% |
|
|
Decrease Increase Increase |
d d d | |||||||
| All Other Investmentse |
626,699 | |||||||||||||||
| Total |
$ | 8,236,102 | ||||||||||||||
aRepresents the directional change in the fair value of the Level 3 financial instruments that would result from a significant and reasonable increase in the corresponding input. A significant and reasonable decrease in input would have the opposite effect. Significant impacts, if any, to fair value and/or net assets have been indicated.
bIncludes common and preferred stocks.
cRepresents a significant impact to fair value but not net assets.
dRepresents a significant impact to fair value and net assets.
eIncludes fair value of immaterial financial instruments developed using various valuation techniques and unobservable inputs. May also include financial instruments with values derived using prior transaction prices or third party pricing information without adjustment for which such inputs are also unobservable.
| Semiannual Report | MGD-33 |
FRANKLIN TEMPLETON VARIABLE INSURANCE PRODUCTS TRUST
NOTES TO FINANCIAL STATEMENTS (UNAUDITED)
Franklin Mutual Global Discovery VIP Fund (continued)
11. Fair Value Measurements (continued)
Abbreviations List
| EBITDA | Earnings before interest, taxes, depreciation and amortization | |
| EV | Enterprise value | |
12. Subsequent Events
The Fund has evaluated subsequent events through the issuance of the financial statements and determined that no events have occurred that require disclosure.
Abbreviations
| Counterparty | Currency | Selected Portfolio | ||||||||
| BOFA | Bank of America N.A. | EUR | Euro | ADR | American Depositary Receipt | |||||
| BONY | Bank of New York Mellon | GBP | British Pound | FHLB | Federal Home Loan Bank | |||||
| FBCO | Credit Suisse Group AG | USD | United States Dollar | GO | General Obligation | |||||
| HSBC | HSBC Bank USA, N.A. | PIK | Payment-In-Kind | |||||||
| SSBT | State Street Bank and Trust Co. | |||||||||
| MGD-34 | Semiannual Report |
Franklin Mutual Shares VIP Fund
We are pleased to bring you Franklin Mutual Shares VIP Fund’s semiannual report for the period ended June 30, 2016.
Class 1 Performance Summary as of June 30, 2016
The Fund’s Class 1 shares delivered a +4.52% total return* for the six-month period ended June 30, 2016.
*The Fund has a fee waiver associated with any investment in a Franklin Templeton money fund and/or Franklin Templeton fund, as applicable, contractually guaranteed through at least the Fund’s current fiscal year-end. Fund investment results reflect the fee waiver, to the extent applicable; without this reduction, the results would have been lower.
Performance reflects the Fund’s Class 1 operating expenses, but does not include any contract fees, expenses or sales charges. If they had been included, performance would be lower. These charges and deductions, particularly for variable life policies, can have a significant effect on contract values and insurance benefits. See the contract prospectus for a complete description of these expenses, including sales charges.
Performance data represent past performance, which does not guarantee future results. Investment return and principal value will fluctuate, and you may have a gain or loss when you sell your shares. Current performance may differ from figures shown.
| Semiannual Report | MS-1 |
FRANKLIN MUTUAL SHARES VIP FUND
1. Source: Morningstar. One cannot invest directly in an index, and an index is not representative of the Fund’s portfolio. Please see Index Descriptions following the Fund Summaries.
2. Please see Index Descriptions following the Fund Summaries.
| MS-2 | Semiannual Report |
FRANKLIN MUTUAL SHARES VIP FUND
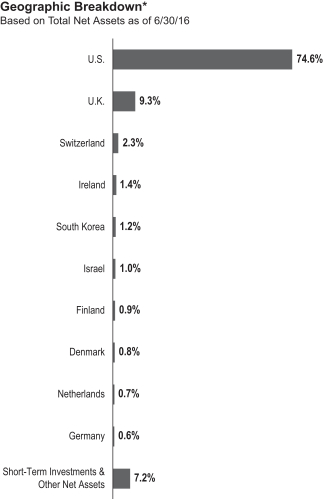
bankrupt companies’ debt at a substantial discount to face value. After the financially distressed company is reorganized, often in bankruptcy court, the old debt is typically replaced with new securities issued by the financially stronger company.
The other piece of our investment strategy is participating in arbitrage situations, another highly specialized field. When companies announce proposed mergers or takeovers, commonly referred to as “deals,” the target company may trade at a discount to the bid it ultimately accepts. One form of arbitrage involves purchasing the target company’s stock when it is trading below the value we believe it would receive in a deal. In keeping with our commitment to a relatively conservative investment approach, we typically focus our arbitrage efforts on announced deals, and eschew rumored deals or other situations we consider relatively risky.
| Semiannual Report | MS-3 |
FRANKLIN MUTUAL SHARES VIP FUND
predominantly through a number of these global companies. Also, the Fund has only a modest exposure to European financials, particularly in banks.
Although the Brexit vote is clearly a negative surprise, we do not believe it will usher in a new global financial crisis similar to the one experienced eight years ago. While markets reacted brutally to the U.K.’s decision to leave the EU, we have not seen any systemic shock like the one that followed the fall of Lehman Brothers in 2008. We also believe that, eventually, the U.K. and the EU will come to an acceptable agreement concerning trade relations.
Three of the Fund’s larger positions at period-end were in health care.3 Merck, Medtronic and Switzerland-based Novartis are global companies that meet important customer needs with products protected by intellectual property. This focus on innovation that improves the lives of customers gives us confidence in the sustainability of their businesses. In addition, we feel that each has strong financial characteristics, including the ability to invest in research and development and acquisitions, while also providing material returns to shareholders, and trading at valuations that are attractive from our perspective as value investors.
The Fund also featured three information technology firms among its larger positions: Microsoft, Symantec and Samsung Electronics.4 Microsoft features a strong global business based on innovation and meeting customer needs, including its fast-growing cloud business, while also returning excess capital to shareholders through dividends and share buybacks. Symantec
3. The health care sector comprises health care equipment and supplies, health care providers and services, and pharmaceuticals in the SOI.
4. The information technology sector comprises communications equipment; Internet software and services; IT services; software; and technology hardware, storage and peripherals in the SOI.
| MS-4 | Semiannual Report |
FRANKLIN MUTUAL SHARES VIP FUND
| Semiannual Report | MS-5 |
FRANKLIN MUTUAL SHARES VIP FUND
Thank you for your participation in Franklin Mutual Shares VIP Fund. We look forward to serving your future investment needs.
The foregoing information reflects our analysis, opinions and portfolio holdings as of June 30, 2016, the end of the reporting period. The way we implement our main investment strategies and the resulting portfolio holdings may change depending on factors such as market and economic conditions. These opinions may not be relied upon as investment advice or an offer for a particular security. The information is not a complete analysis of every aspect of any market, country, industry, security or the Fund. Statements of fact are from sources considered reliable, but the investment manager makes no representation or warranty as to their completeness or accuracy. Although historical performance is no guarantee of future results, these insights may help you understand our investment management philosophy.
| MS-6 | Semiannual Report |
FRANKLIN MUTUAL SHARES VIP FUND
Class 1 Fund Expenses
| Class 1 | Beginning Account Value 1/1/16 |
Ending Account Value 6/30/16 |
Fund-Level Expenses 1/1/16–6/30/16 |
|||||||||
| Actual |
$ | 1,000 | $ | 1,045.20 | $ | 3.61 | ||||||
| Hypothetical (5% return before expenses) |
$ | 1,000 | $ | 1,021.33 | $ | 3.57 | ||||||
*Expenses are calculated using the most recent six-month annualized expense ratio, net of expense waivers, for the Fund’s Class 1 shares (0.71%), which does not include any ongoing expenses of the Contract for which the Fund is an investment option, multiplied by the average account value over the period, multiplied by 182/366 to reflect the one-half year period.
| Semiannual Report | MS-7 |
FRANKLIN TEMPLETON VARIABLE INSURANCE PRODUCTS TRUST
Financial Highlights
Franklin Mutual Shares VIP Fund
| Six Months Ended (unaudited) |
Year Ended December 31, | |||||||||||||||||||||||
| 2015 | 2014 | 2013 | 2012 | 2011 | ||||||||||||||||||||
| Class 1 | ||||||||||||||||||||||||
| Per share operating performance (for a share outstanding throughout the period) |
||||||||||||||||||||||||
| Net asset value, beginning of period |
$19.48 | $22.91 | $21.92 | $17.45 | $15.57 | $16.14 | ||||||||||||||||||
|
|
|
|||||||||||||||||||||||
| Income from investment operationsa: | ||||||||||||||||||||||||
| Net investment incomeb |
0.31 | c | 0.44 | 0.62 | d | 0.42 | 0.35 | 0.38 | e | |||||||||||||||
| Net realized and unrealized gains (losses) |
0.57 | (1.54 | ) | 1.01 | 4.52 | 1.92 | (0.53 | ) | ||||||||||||||||
|
|
|
|||||||||||||||||||||||
| Total from investment operations |
0.88 | (1.10 | ) | 1.63 | 4.94 | 2.27 | (0.15 | ) | ||||||||||||||||
|
|
|
|||||||||||||||||||||||
| Less distributions from: | ||||||||||||||||||||||||
| Net investment income |
— | (0.77 | ) | (0.52 | ) | (0.47 | ) | (0.39 | ) | (0.42 | ) | |||||||||||||
| Net realized gains |
— | (1.56 | ) | (0.12 | ) | — | — | — | ||||||||||||||||
|
|
|
|||||||||||||||||||||||
| Total distributions |
— | (2.33 | ) | (0.64 | ) | (0.47 | ) | (0.39 | ) | (0.42 | ) | |||||||||||||
|
|
|
|||||||||||||||||||||||
| Net asset value, end of period |
$20.36 | $19.48 | $22.91 | $21.92 | $17.45 | $15.57 | ||||||||||||||||||
|
|
|
|||||||||||||||||||||||
| Total returnf |
4.52% | (4.69)% | 7.38% | 28.53% | 14.61% | (0.79)% | ||||||||||||||||||
| Ratios to average net assetsg | ||||||||||||||||||||||||
| Expensesh |
0.71% | i,j | 0.73% | i,j | 0.73% | i | 0.71% | i | 0.71% | 0.73% | i | |||||||||||||
| Expenses incurred in connection with securities sold short |
—% | k | 0.02% | 0.03% | —% | k | —% | k | —% | k | ||||||||||||||
| Net investment income |
3.29% | c | 2.00% | 2.83% | d | 2.08% | 2.06% | 2.28% | e | |||||||||||||||
| Supplemental data | ||||||||||||||||||||||||
| Net assets, end of period (000’s) |
$573,679 | $643,438 | $656,463 | $552,163 | $449,343 | $1,170,781 | ||||||||||||||||||
| Portfolio turnover rate |
13.90% | 19.88% | 21.33% | 24.05% | 34.07% | l | 41.02% | |||||||||||||||||
aThe amount shown for a share outstanding throughout the period may not correlate with the Statement of Operations for the period due to the timing of sales and repurchases of the Fund’s shares in relation to income earned and/or fluctuating fair value of the investments of the Fund.
bBased on average daily shares outstanding.
cNet investment income per share includes approximately $0.06 per share related to income received in the form of special dividends in connection with certain Fund holdings. Excluding this amount, the ratio of net investment income to average net assets would have been 2.69%.
dNet investment income per share includes approximately $0.23 per share related to income received in the form of special dividends in connection with certain Fund holdings. Excluding this amount, the ratio of net investment income to average net assets would have been 1.79%.
eNet investment income per share includes approximately $0.02 per share related to income received that had previously been deemed uncollectible. Excluding this amount, the ratio of net investment income to average net assets would have been 2.14%.
fTotal return does not include fees, charges or expenses imposed by the variable annuity and life insurance contracts for which Franklin Templeton Variable Insurance Products Trust serves as an underlying investment vehicle. Total return is not annualized for periods less than one year.
gRatios are annualized for periods less than one year.
hIncludes dividend and/or interest expense on securities sold short and security borrowing fees, if any. See below for the ratios of such expenses to average net assets for the periods presented. See Note 1(f).
iBenefit of expense reduction rounds to less than 0.01%.
jBenefit of waiver and payments by affiliates rounds to less than 0.01%.
kRounds to less than 0.01%.
lExcludes the value of portfolio securities delivered as a result of a redemption in-kind.
| MS-8 | Semiannual Report | The accompanying notes are an integral part of these financial statements. |
FRANKLIN TEMPLETON VARIABLE INSURANCE PRODUCTS TRUST
FINANCIAL HIGHLIGHTS
Franklin Mutual Shares VIP Fund (continued)
| Six Months Ended (unaudited) |
Year Ended December 31, | |||||||||||||||||||||||
| 2015 | 2014 | 2013 | 2012 | 2011 | ||||||||||||||||||||
| Class 2 | ||||||||||||||||||||||||
| Per share operating performance (for a share outstanding throughout the period) |
||||||||||||||||||||||||
| Net asset value, beginning of period |
$19.20 | $22.60 | $21.63 | $17.23 | $15.38 | $15.95 | ||||||||||||||||||
|
|
|
|||||||||||||||||||||||
| Income from investment operationsa: | ||||||||||||||||||||||||
| Net investment incomeb |
0.29 | c | 0.38 | 0.58 | d | 0.36 | 0.30 | 0.32 | e | |||||||||||||||
| Net realized and unrealized gains (losses) |
0.55 | (1.51 | ) | 0.97 | 4.46 | 1.90 | (0.51 | ) | ||||||||||||||||
|
|
|
|||||||||||||||||||||||
| Total from investment operations |
0.84 | (1.13 | ) | 1.55 | 4.82 | 2.20 | (0.19 | ) | ||||||||||||||||
|
|
|
|||||||||||||||||||||||
| Less distributions from: | ||||||||||||||||||||||||
| Net investment income |
— | (0.71 | ) | (0.46 | ) | (0.42 | ) | (0.35 | ) | (0.38 | ) | |||||||||||||
| Net realized gains |
— | (1.56 | ) | (0.12 | ) | — | — | — | ||||||||||||||||
|
|
|
|||||||||||||||||||||||
| Total distributions |
— | (2.27 | ) | (0.58 | ) | (0.42 | ) | (0.35 | ) | (0.38 | ) | |||||||||||||
|
|
|
|||||||||||||||||||||||
| Net asset value, end of period |
$20.04 | $19.20 | $22.60 | $21.63 | $17.23 | $15.38 | ||||||||||||||||||
|
|
|
|||||||||||||||||||||||
| Total returnf |
4.37% | (4.94)% | 7.12% | 28.26% | 14.24% | (1.04)% | ||||||||||||||||||
| Ratios to average net assetsg | ||||||||||||||||||||||||
| Expensesh |
0.96% | i,j | 0.98% | i,j | 0.98% | i | 0.96% | i | 0.96% | 0.98% | i | |||||||||||||
| Expenses incurred in connection with securities sold short |
—% | k | 0.02% | 0.03% | —% | k | —% | k | —% | k | ||||||||||||||
| Net investment income |
3.04% | c | 1.75% | 2.58% | d | 1.83% | 1.81% | 2.03% | e | |||||||||||||||
| Supplemental data | ||||||||||||||||||||||||
| Net assets, end of period (000’s) |
$3,497,123 | $3,353,505 | $4,218,342 | $4,558,547 | $4,069,803 | $3,913,220 | ||||||||||||||||||
| Portfolio turnover rate |
13.90% | 19.88% | 21.33% | 24.05% | 34.07% | l | 41.02% | |||||||||||||||||
aThe amount shown for a share outstanding throughout the period may not correlate with the Statement of Operations for the period due to the timing of sales and repurchases of the Fund’s shares in relation to income earned and/or fluctuating fair value of the investments of the Fund.
bBased on average daily shares outstanding.
cNet investment income per share includes approximately $0.06 per share related to income received in the form of special dividends in connection with certain Fund holdings. Excluding this amount, the ratio of net investment income to average net assets would have been 2.44%.
dNet investment income per share includes approximately $0.23 per share related to income received in the form of special dividends in connection with certain Fund holdings. Excluding this amount, the ratio of net investment income to average net assets would have been 1.54%.
eNet investment income per share includes approximately $0.02 per share related to income received that had previously been deemed uncollectible. Excluding this amount, the ratio of net investment income to average net assets would have been 1.89%.
fTotal return does not include fees, charges or expenses imposed by the variable annuity and life insurance contracts for which Franklin Templeton Variable Insurance Products Trust serves as an underlying investment vehicle. Total return is not annualized for periods less than one year.
gRatios are annualized for periods less than one year.
hIncludes dividend and/or interest expense on securities sold short and security borrowing fees, if any. See below for the ratios of such expenses to average net assets for the periods presented. See Note 1(f).
iBenefit of expense reduction rounds to less than 0.01%.
jBenefit of waiver and payments by affiliates rounds to less than 0.01%.
kRounds to less than 0.01%.
lExcludes the value of portfolio securities delivered as a result of a redemption in-kind.
| The accompanying notes are an integral part of these financial statements. | Semiannual Report | MS-9 |
FRANKLIN TEMPLETON VARIABLE INSURANCE PRODUCTS TRUST
FINANCIAL HIGHLIGHTS
Franklin Mutual Shares VIP Fund (continued)
| Six Months Ended (unaudited) |
Year Ended December 31, | |||||||||||||||||||||||
| 2015 | 2014 | 2013 | 2012 | 2011 | ||||||||||||||||||||
| Class 4 | ||||||||||||||||||||||||
| Per share operating performance (for a share outstanding throughout the period) |
||||||||||||||||||||||||
| Net asset value, beginning of period |
$19.32 | $22.72 | $21.74 | $17.31 | $15.45 | $16.03 | ||||||||||||||||||
|
|
|
|||||||||||||||||||||||
| Income from investment operationsa: | ||||||||||||||||||||||||
| Net investment incomeb |
0.28 | c | 0.36 | 0.57 | d | 0.34 | 0.28 | 0.30 | e | |||||||||||||||
| Net realized and unrealized gains (losses) |
0.56 | (1.52 | ) | 0.96 | 4.49 | 1.91 | (0.51 | ) | ||||||||||||||||
|
|
|
|||||||||||||||||||||||
| Total from investment operations |
0.84 | (1.16 | ) | 1.53 | 4.83 | 2.19 | (0.21 | ) | ||||||||||||||||
|
|
|
|||||||||||||||||||||||
| Less distributions from: | ||||||||||||||||||||||||
| Net investment income |
— | (0.68 | ) | (0.43 | ) | (0.40 | ) | (0.33 | ) | (0.37 | ) | |||||||||||||
| Net realized gains |
— | (1.56 | ) | (0.12 | ) | — | — | — | ||||||||||||||||
|
|
|
|||||||||||||||||||||||
| Total distributions |
— | (2.24 | ) | (0.55 | ) | (0.40 | ) | (0.33 | ) | (0.37 | ) | |||||||||||||
|
|
|
|||||||||||||||||||||||
| Net asset value, end of period |
$20.16 | $19.32 | $22.72 | $21.74 | $17.31 | $15.45 | ||||||||||||||||||
|
|
|
|||||||||||||||||||||||
| Total returnf |
4.35% | (5.05)% | 7.04% | 28.05% | 14.20% | (1.12)% | ||||||||||||||||||
| Ratios to average net assetsg | ||||||||||||||||||||||||
| Expensesh |
1.06% | i,j | 1.08% | i,j | 1.08% | i | 1.06% | i | 1.06% | 1.08% | i | |||||||||||||
| Expenses incurred in connection with securities sold short |
—% | k | 0.02% | 0.03% | —% | k | —% | k | —% | k | ||||||||||||||
| Net investment income |
2.94% | c | 1.65% | 2.48% | d | 1.73% | 1.71% | 1.93%e | ||||||||||||||||
| Supplemental data | ||||||||||||||||||||||||
| Net assets, end of period (000’s) |
$124,453 | $130,978 | $158,020 | $188,153 | $165,015 | $162,049 | ||||||||||||||||||
| Portfolio turnover rate |
13.90% | 19.88% | 21.33% | 24.05% | 34.07% | l | 41.02% | |||||||||||||||||
aThe amount shown for a share outstanding throughout the period may not correlate with the Statement of Operations for the period due to the timing of sales and repurchases of the Fund’s shares in relation to income earned and/or fluctuating fair value of the investments of the Fund.
bBased on average daily shares outstanding.
cNet investment income per share includes approximately $0.06 per share related to income received in the form of special dividends in connection with certain Fund holdings. Excluding this amount, the ratio of net investment income to average net assets would have been 2.34%.
dNet investment income per share includes approximately $0.23 per share related to income received in the form of special dividends in connection with certain Fund holdings. Excluding this amount, the ratio of net investment income to average net assets would have been 1.44%.
eNet investment income per share includes approximately $0.02 per share related to income received that had previously been deemed uncollectible. Excluding this amount, the ratio of net investment income to average net assets would have been 1.79%.
fTotal return does not include fees, charges or expenses imposed by the variable annuity and life insurance contracts for which Franklin Templeton Variable Insurance Products Trust serves as an underlying investment vehicle. Total return is not annualized for periods less than one year.
gRatios are annualized for periods less than one year.
hIncludes dividend and/or interest expense on securities sold short and security borrowing fees, if any. See below for the ratios of such expenses to average net assets for the periods presented. See Note 1(f).
iBenefit of expense reduction rounds to less than 0.01%.
jBenefit of waiver and payments by affiliates rounds to less than 0.01%.
kRounds to less than 0.01%.
lExcludes the value of portfolio securities delivered as a result of a redemption in-kind.
| MS-10 | Semiannual Report | The accompanying notes are an integral part of these financial statements. |
FRANKLIN TEMPLETON VARIABLE INSURANCE PRODUCTS TRUST
Statement of Investments, June 30, 2016 (unaudited)
| Franklin Mutual Shares VIP Fund
|
||||||||||||||
| Country | Shares/Units | Value | ||||||||||||
| Common Stocks and Other Equity Interests 86.7% |
||||||||||||||
| Aerospace & Defense 1.1% |
||||||||||||||
| B/E Aerospace Inc. |
United States | 403,812 | $ | 18,646,019 | ||||||||||
| Huntington Ingalls Industries Inc. |
United States | 128,388 | 21,573,036 | |||||||||||
| a | KLX Inc. |
United States | 224,586 | 6,962,166 | ||||||||||
|
|
|
|||||||||||||
| 47,181,221 | ||||||||||||||
|
|
|
|||||||||||||
| Auto Components 0.2% |
||||||||||||||
| a,b | International Automotive Components Group Brazil LLC |
Brazil | 1,730,515 | 28,490 | ||||||||||
| a,b,c | International Automotive Components Group North America LLC |
United States | 15,382,424 | 6,786,202 | ||||||||||
|
|
|
|||||||||||||
| 6,814,692 | ||||||||||||||
|
|
|
|||||||||||||
| Automobiles 1.2% |
||||||||||||||
| General Motors Co. |
United States | 1,770,350 | 50,100,905 | |||||||||||
|
|
|
|||||||||||||
| Banks 8.9% |
||||||||||||||
| Barclays PLC |
United Kingdom | 10,534,300 | 19,468,360 | |||||||||||
| CIT Group Inc. |
United States | 1,024,773 | 32,700,506 | |||||||||||
| Citigroup Inc. |
United States | 970,749 | 41,150,050 | |||||||||||
| Citizens Financial Group Inc. |
United States | 1,937,906 | 38,719,362 | |||||||||||
| Columbia Banking System Inc. |
United States | 86,923 | 2,439,059 | |||||||||||
| a | FCB Financial Holdings Inc., A |
United States | 493,723 | 16,786,582 | ||||||||||
| Guaranty Bancorp |
United States | 209,583 | 3,500,036 | |||||||||||
| JPMorgan Chase & Co. |
United States | 1,010,070 | 62,765,750 | |||||||||||
| PNC Financial Services Group Inc. |
United States | 997,559 | 81,191,327 | |||||||||||
| State Bank Financial Corp. |
United States | 352,200 | 7,167,270 | |||||||||||
| SunTrust Banks Inc. |
United States | 820,282 | 33,697,185 | |||||||||||
| Wells Fargo & Co. |
United States | 698,860 | 33,077,044 | |||||||||||
|
|
|
|||||||||||||
| 372,662,531 | ||||||||||||||
|
|
|
|||||||||||||
| Beverages 1.2% |
||||||||||||||
| PepsiCo Inc. |
United States | 469,472 | 49,735,864 | |||||||||||
|
|
|
|||||||||||||
| Chemicals 0.3% |
||||||||||||||
| a,d,e | Dow Corning Corp., Contingent Distribution |
United States | 100,000 | — | ||||||||||
| FMC Corp. |
United States | 265,145 | 12,278,865 | |||||||||||
|
|
|
|||||||||||||
| 12,278,865 | ||||||||||||||
|
|
|
|||||||||||||
| Communications Equipment 2.5% |
||||||||||||||
| Cisco Systems Inc. |
United States | 2,331,170 | 66,881,267 | |||||||||||
| Nokia Corp., ADR |
Finland | 3,299,845 | 18,776,118 | |||||||||||
| Nokia OYJ, A |
Finland | 3,670,248 | 20,796,707 | |||||||||||
|
|
|
|||||||||||||
| 106,454,092 | ||||||||||||||
|
|
|
|||||||||||||
| Construction Materials 0.5% |
||||||||||||||
| a | LafargeHolcim Ltd., B |
Switzerland | 547,060 | 22,720,841 | ||||||||||
|
|
|
|||||||||||||
| Consumer Finance 0.4% |
||||||||||||||
| a | Ally Financial Inc. |
United States | 943,970 | 16,113,568 | ||||||||||
|
|
|
|||||||||||||
| Containers & Packaging 1.9% |
||||||||||||||
| International Paper Co. |
United States | 1,163,335 | 49,302,137 | |||||||||||
| WestRock Co. |
United States | 742,632 | 28,866,106 | |||||||||||
|
|
|
|||||||||||||
| 78,168,243 | ||||||||||||||
|
|
|
|||||||||||||
| Diversified Financial Services 0.6% |
||||||||||||||
| Voya Financial Inc. |
United States | 959,810 | 23,764,896 | |||||||||||
|
|
|
|||||||||||||
| Semiannual Report | MS-11 |
FRANKLIN TEMPLETON VARIABLE INSURANCE PRODUCTS TRUST
STATEMENT OF INVESTMENTS (UNAUDITED)
Franklin Mutual Shares VIP Fund (continued)
| Country | Shares/Units | Value | ||||||||||||
| Common Stocks and Other Equity Interests (continued) |
||||||||||||||
| Diversified Telecommunication Services 0.7% |
||||||||||||||
| a,d,e | Global Crossing Holdings Ltd., Contingent Distribution |
United States | 9,005,048 | $ | — | |||||||||
| Koninklijke KPN NV |
Netherlands | 8,378,890 | 30,271,984 | |||||||||||
|
|
|
|||||||||||||
| 30,271,984 | ||||||||||||||
|
|
|
|||||||||||||
| Electrical Equipment 0.1% |
||||||||||||||
| a | Sensata Technologies Holding NV |
United States | 78,547 | 2,740,505 | ||||||||||
|
|
|
|||||||||||||
| Energy Equipment & Services 1.2% |
||||||||||||||
| Baker Hughes Inc. |
United States | 1,088,065 | 49,104,373 | |||||||||||
|
|
|
|||||||||||||
| Food & Staples Retailing 3.9% |
||||||||||||||
| CVS Health Corp. |
United States | 431,273 | 41,290,077 | |||||||||||
| The Kroger Co. |
United States | 1,298,210 | 47,761,146 | |||||||||||
| a | Rite Aid Corp. |
United States | 2,439,970 | 18,275,375 | ||||||||||
| Walgreens Boots Alliance Inc. |
United States | 654,058 | 54,463,410 | |||||||||||
|
|
|
|||||||||||||
| 161,790,008 | ||||||||||||||
|
|
|
|||||||||||||
| Health Care Equipment & Supplies 6.1% |
||||||||||||||
| Medtronic PLC |
United States | 1,650,202 | 143,188,028 | |||||||||||
| St. Jude Medical Inc. |
United States | 647,790 | 50,527,620 | |||||||||||
| Stryker Corp. |
United States | 507,821 | 60,852,190 | |||||||||||
|
|
|
|||||||||||||
| 254,567,838 | ||||||||||||||
|
|
|
|||||||||||||
| Health Care Providers & Services 0.4% |
||||||||||||||
| Cigna Corp. |
United States | 142,154 | 18,194,290 | |||||||||||
|
|
|
|||||||||||||
| Household Products 0.2% |
||||||||||||||
| Energizer Holdings Inc. |
United States | 196,162 | 10,100,381 | |||||||||||
|
|
|
|||||||||||||
| Independent Power & Renewable Electricity Producers 0.4% |
||||||||||||||
| NRG Energy Inc. |
United States | 1,162,434 | 17,424,886 | |||||||||||
|
|
|
|||||||||||||
| Insurance 10.2% |
||||||||||||||
| a | Alleghany Corp. |
United States | 108,258 | 59,496,432 | ||||||||||
| The Allstate Corp. |
United States | 613,700 | 42,928,315 | |||||||||||
| American International Group Inc. |
United States | 1,447,756 | 76,571,815 | |||||||||||
| Chubb Ltd. |
United States | 492,785 | 64,411,927 | |||||||||||
| MetLife Inc. |
United States | 1,019,123 | 40,591,669 | |||||||||||
| White Mountains Insurance Group Ltd. |
United States | 100,879 | 84,940,118 | |||||||||||
| XL Group PLC |
Ireland | 1,746,940 | 58,190,571 | |||||||||||
|
|
|
|||||||||||||
| 427,130,847 | ||||||||||||||
|
|
|
|||||||||||||
| Internet Software & Services 0.4% |
||||||||||||||
| a | LinkedIn Corp., A |
United States | 86,421 | 16,355,174 | ||||||||||
|
|
|
|||||||||||||
| IT Services 0.8% |
||||||||||||||
| Xerox Corp. |
United States | 3,596,839 | 34,134,002 | |||||||||||
|
|
|
|||||||||||||
| Machinery 1.8% |
||||||||||||||
| Caterpillar Inc. |
United States | 622,346 | 47,180,050 | |||||||||||
| CNH Industrial NV |
United Kingdom | 888,427 | 6,389,990 | |||||||||||
| CNH Industrial NV, special voting |
United Kingdom | 1,844,814 | 13,268,780 | |||||||||||
| Federal Signal Corp. |
United States | 757,221 | 9,753,007 | |||||||||||
|
|
|
|||||||||||||
| 76,591,827 | ||||||||||||||
|
|
|
|||||||||||||
| MS-12 | Semiannual Report |
FRANKLIN TEMPLETON VARIABLE INSURANCE PRODUCTS TRUST
STATEMENT OF INVESTMENTS (UNAUDITED)
Franklin Mutual Shares VIP Fund (continued)
| Country | Shares/Units | Value | ||||||||||||
| Common Stocks and Other Equity Interests (continued) |
||||||||||||||
| Marine 0.8% |
||||||||||||||
| A.P. Moeller-Maersk AS, B |
Denmark | 25,629 | $ | 33,295,592 | ||||||||||
|
|
|
|||||||||||||
| Media 6.4% |
||||||||||||||
| CBS Corp., B |
United States | 971,977 | 52,914,428 | |||||||||||
| a | Charter Communications Inc., A |
United States | 244,513 | 55,905,452 | ||||||||||
| a | DISH Network Corp., A |
United States | 559,965 | 29,342,166 | ||||||||||
| Relx PLC |
United Kingdom | 2,868,050 | 52,621,789 | |||||||||||
| Time Warner Inc. |
United States | 396,698 | 29,173,171 | |||||||||||
| Twenty-First Century Fox Inc., B |
United States | 1,768,325 | 48,186,856 | |||||||||||
|
|
|
|||||||||||||
| 268,143,862 | ||||||||||||||
|
|
|
|||||||||||||
| Metals & Mining 1.0% |
||||||||||||||
| Freeport-McMoRan Inc., B |
United States | 1,660,406 | 18,496,923 | |||||||||||
| ThyssenKrupp AG |
Germany | 1,147,037 | 22,929,498 | |||||||||||
|
|
|
|||||||||||||
| 41,426,421 | ||||||||||||||
|
|
|
|||||||||||||
| Multiline Retail 0.5% |
||||||||||||||
| Macy’s Inc. |
United States | 677,570 | 22,773,128 | |||||||||||
|
|
|
|||||||||||||
| Oil, Gas & Consumable Fuels 6.6% |
||||||||||||||
| Anadarko Petroleum Corp. |
United States | 175,487 | 9,344,683 | |||||||||||
| Apache Corp. |
United States | 355,280 | 19,778,437 | |||||||||||
| BP PLC |
United Kingdom | 4,322,322 | 25,252,268 | |||||||||||
| CONSOL Energy Inc. |
United States | 1,236,955 | 19,902,606 | |||||||||||
| Kinder Morgan Inc. |
United States | 2,649,790 | 49,604,069 | |||||||||||
| Marathon Oil Corp. |
United States | 3,204,744 | 48,103,207 | |||||||||||
| Royal Dutch Shell PLC, A (EUR Traded) |
United Kingdom | 1,916,196 | 52,470,172 | |||||||||||
| Royal Dutch Shell PLC, A (GBP Traded) |
United Kingdom | 1,048,110 | 28,614,834 | |||||||||||
| a,b,c | Warrior Met Coal LLC, A |
United States | 12,324 | 1,242,461 | ||||||||||
| a,b,c | Warrior Met Coal LLC, B |
United States | 28,821 | 2,905,629 | ||||||||||
| The Williams Cos. Inc. |
United States | 845,109 | 18,279,708 | |||||||||||
|
|
|
|||||||||||||
| 275,498,074 | ||||||||||||||
|
|
|
|||||||||||||
| Personal Products 0.3% |
||||||||||||||
| a | Edgewell Personal Care Co. |
United States | 171,722 | 14,495,054 | ||||||||||
|
|
|
|||||||||||||
| Pharmaceuticals 8.1% |
||||||||||||||
| Eli Lilly & Co. |
United States | 1,132,890 | 89,215,088 | |||||||||||
| Merck & Co. Inc. |
United States | 2,381,018 | 137,170,447 | |||||||||||
| Novartis AG, ADR |
Switzerland | 868,321 | 71,645,166 | |||||||||||
| Teva Pharmaceutical Industries Ltd., ADR |
Israel | 844,197 | 42,404,015 | |||||||||||
|
|
|
|||||||||||||
| 340,434,716 | ||||||||||||||
|
|
|
|||||||||||||
| Real Estate Investment Trusts (REITs) 0.4% |
||||||||||||||
| Alexander’s Inc. |
United States | 40,126 | 16,420,763 | |||||||||||
|
|
|
|||||||||||||
| Real Estate Management & Development 0.0%† |
||||||||||||||
| a | Forestar Group Inc. |
United States | 161,671 | 1,922,268 | ||||||||||
|
|
|
|||||||||||||
| Software 6.4% |
||||||||||||||
| CA Inc. |
United States | 1,584,119 | 52,006,627 | |||||||||||
| Microsoft Corp. |
United States | 2,773,357 | 141,912,677 | |||||||||||
| Symantec Corp. |
United States | 3,540,461 | 72,721,069 | |||||||||||
|
|
|
|||||||||||||
| 266,640,373 | ||||||||||||||
|
|
|
|||||||||||||
| Semiannual Report | MS-13 |
FRANKLIN TEMPLETON VARIABLE INSURANCE PRODUCTS TRUST
STATEMENT OF INVESTMENTS (UNAUDITED)
Franklin Mutual Shares VIP Fund (continued)
| Country | Shares/Units | Value | ||||||||||||
| Common Stocks and Other Equity Interests (continued) |
|
|||||||||||||
| Specialty Retail 0.3% |
||||||||||||||
| a | Office Depot Inc. |
United States | 3,432,180 | $ | 11,360,516 | |||||||||
|
|
|
|||||||||||||
| Technology Hardware, Storage & Peripherals 3.4% |
||||||||||||||
| EMC Corp. |
United States | 1,779,400 | 48,346,298 | |||||||||||
| Hewlett Packard Enterprise Co. |
United States | 1,418,347 | 25,913,199 | |||||||||||
| HP Inc. |
United States | 1,418,347 | 17,800,255 | |||||||||||
| Samsung Electronics Co. Ltd. |
South Korea | 41,741 | 51,599,602 | |||||||||||
|
|
|
|||||||||||||
| 143,659,354 | ||||||||||||||
|
|
|
|||||||||||||
| Tobacco 6.3% |
||||||||||||||
| Altria Group Inc. |
United States | 822,008 | 56,685,672 | |||||||||||
| British American Tobacco PLC |
United Kingdom | 1,256,027 | 81,109,906 | |||||||||||
| Imperial Brands PLC |
United Kingdom | 1,103,817 | 59,660,613 | |||||||||||
| Philip Morris International Inc. |
United States | 187,960 | 19,119,291 | |||||||||||
| Reynolds American Inc. |
United States | 889,694 | 47,981,197 | |||||||||||
|
|
|
|||||||||||||
| 264,556,679 | ||||||||||||||
|
|
|
|||||||||||||
| Wireless Telecommunication Services 1.2% |
||||||||||||||
| Vodafone Group PLC |
United Kingdom | 17,026,844 | 51,684,731 | |||||||||||
|
|
|
|||||||||||||
| Total Common Stocks and Other Equity Interests |
3,636,713,364 | |||||||||||||
|
|
|
|||||||||||||
| Principal Amount* |
||||||||||||||
| Corporate Bonds, Notes and Senior Floating Rate Interests 4.5% |
||||||||||||||
| Avaya Inc., |
||||||||||||||
| fsenior note, 144A, 10.50%, 3/01/21 |
United States | 22,449,000 | 5,051,025 | |||||||||||
| fsenior secured note, 144A, 7.00%, 4/01/19 |
United States | 12,923,000 | 9,272,253 | |||||||||||
| g,hTerm B-3 Loan, 5.134%, 10/26/17 |
United States | 12,791,927 | 9,932,931 | |||||||||||
|
g,hTerm B-6 Loan, 6.50%, 3/30/18 |
United States | 6,741,721 | 4,986,770 | |||||||||||
| g,hTerm B-7 Loan, 6.25%, 5/29/20 |
United States | 6,441,346 | 4,578,721 | |||||||||||
| g,hBelk Inc., Closing Date Term Loan, 5.75%, 12/12/22 |
United States | 11,827,358 | 9,461,886 | |||||||||||
| iHeartCommunications Inc., |
||||||||||||||
| senior secured note, first lien, 9.00%, 12/15/19 |
United States | 26,449,000 | 20,200,424 | |||||||||||
| g,hTranche D Term Loan, 7.21%, 1/30/19 |
United States | 34,746,619 | 25,538,765 | |||||||||||
| g,hTranche E Term Loan, 7.96%, 7/30/19 |
United States | 11,168,253 | 8,215,646 | |||||||||||
| g,hToys R Us-Delaware Inc., |
||||||||||||||
| FILO Loans, 8.25%, 10/24/19 |
United States | 2,560,000 | 2,486,784 | |||||||||||
| Term B-4 Loan, 9.75%, 4/24/20 |
United States | 21,350,214 | 18,539,095 | |||||||||||
| f Valeant Pharmaceuticals International, |
||||||||||||||
| senior bond, 144A, 6.75%, 8/15/21 |
United States | 2,964,000 | 2,541,630 | |||||||||||
| senior bond, 144A, 7.25%, 7/15/22 |
United States | 1,460,000 | 1,259,542 | |||||||||||
| senior note, 144A, 6.375%, 10/15/20 |
United States | 18,159,000 | 15,707,535 | |||||||||||
| g,h,iVeritas Software Corp., |
||||||||||||||
| Term B1, 6.625%, 6/15/23 |
United States | 130,673 | EUR | 123,767 | ||||||||||
| Term Loan B1, 6.625%, 1/27/23 |
United States | 12,657,595 | 11,075,396 | |||||||||||
| Term Loan B2, 8.625%, 1/27/23 |
United States | 12,220,990 | 10,494,775 | |||||||||||
| f Veritas U.S. Inc./Veritas Bermuda Ltd., senior note, 144A, 10.50%, 2/01/24 |
United States | 15,122,000 | 12,929,310 | |||||||||||
| f Western Digital Corp., senior note, 144A, 10.50%, 4/01/24 |
United States | 14,089,000 | 15,110,453 | |||||||||||
|
|
|
|||||||||||||
| Total Corporate Bonds, Notes and Senior Floating Rate Interests (Cost $225,180,826) |
187,506,708 | |||||||||||||
|
|
|
|||||||||||||
| MS-14 | Semiannual Report |
FRANKLIN TEMPLETON VARIABLE INSURANCE PRODUCTS TRUST
STATEMENT OF INVESTMENTS (UNAUDITED)
Franklin Mutual Shares VIP Fund (continued)
| Country | Principal Amount* |
Value | ||||||||||||
| Corporate Bonds, Notes and Senior Floating Rate Interests in Reorganization 1.7% |
||||||||||||||
| b,j | Broadband Ventures III LLC, secured promissory note, |
United States | 1,754 | $ | — | |||||||||
| g,h,j | Caesars Entertainment Operating Co. Inc., |
|||||||||||||
| Term B-5-B Loans, 1.50%, 3/01/17 |
United States | 3,251,752 | 3,208,396 | |||||||||||
| Term B-6-B Loans, 1.50%, 3/01/17 |
United States | 15,503,483 | 15,542,242 | |||||||||||
| Term B-7 Loans, 1.50%, 3/01/17 |
United States | 9,850,500 | 9,957,210 | |||||||||||
| j | Samson Investment Co., senior note, 9.75%, 2/15/20 |
United States | 16,690,000 | 375,525 | ||||||||||
| g,h,j | Texas Competitive Electric Holdings Co. LLC, Term Loans, |
United States | 90,618,405 | 30,394,954 | ||||||||||
| f,j | Texas Competitive Electric Holdings Co. LLC/Texas Competitive Electric Holdings Finance Inc., senior secured note, first lien, 144A, 11.50%, 10/01/20 |
United States | 39,308,000 | 13,462,990 | ||||||||||
| f,j,k | Walter Energy Inc., second lien, 144A, PIK, 11.50%, 4/01/20 |
United States | 5,419,860 | 1,897 | ||||||||||
|
|
|
|||||||||||||
| Total Corporate Bonds, Notes and Senior Floating Rate Interests in Reorganization (Cost $151,787,519) |
72,943,214 | |||||||||||||
|
|
|
|||||||||||||
| Shares | ||||||||||||||
| Companies in Liquidation 0.1% |
||||||||||||||
| a | Adelphia Recovery Trust |
United States | 29,283,354 | 61,495 | ||||||||||
| a,d | Adelphia Recovery Trust, Arahova Contingent Value Vehicle, Contingent Distribution |
United States | 1,955,453 | 19,555 | ||||||||||
| a,b,c,l | CB FIM Coinvestors LLC |
United States | 6,400,507 | — | ||||||||||
| a,d,e | Century Communications Corp., Contingent Distribution |
United States | 5,487,000 | — | ||||||||||
| a,b | FIM Coinvestor Holdings I, LLC |
United States | 8,006,950 | — | ||||||||||
| a,m | Lehman Brothers Holdings Inc., Bankruptcy Claim |
United States | 144,058,799 | 4,501,837 | ||||||||||
| a,d,e | Tribune Media Litigation Trust, Contingent Distribution |
United States | 394,052 | — | ||||||||||
| a,d,e | Tropicana Litigation Trust, Contingent Distribution |
United States | 18,305,000 | — | ||||||||||
|
|
|
|||||||||||||
| Total Companies in Liquidation (Cost $11,547,282) |
4,582,887 | |||||||||||||
|
|
|
|||||||||||||
| Principal Amount* |
||||||||||||||
| Municipal Bonds (Cost $17,936,522) 0.3% |
||||||||||||||
| Puerto Rico Commonwealth GO, Refunding, Series A, |
United States | 20,409,000 | 13,648,519 | |||||||||||
|
|
|
|||||||||||||
| Total Investments before Short Term Investments (Cost $3,350,334,168) |
3,915,394,692 | |||||||||||||
|
|
|
|||||||||||||
| Short Term Investments 6.7% |
||||||||||||||
| U.S. Government and Agency Securities 6.7% |
||||||||||||||
| n | FHLB, 7/01/16 |
United States | 20,000,000 | 20,000,000 | ||||||||||
| n,o | U.S. Treasury Bill, 7/07/16 - 12/08/16 |
United States | 259,200,000 | 259,061,072 | ||||||||||
|
|
|
|||||||||||||
| Total U.S. Government and Agency Securities (Cost $278,985,270) |
279,061,072 | |||||||||||||
|
|
|
|||||||||||||
| Total Investments (Cost $3,629,319,438) 100.0% |
4,194,455,764 | |||||||||||||
| Semiannual Report | MS-15 |
FRANKLIN TEMPLETON VARIABLE INSURANCE PRODUCTS TRUST
STATEMENT OF INVESTMENTS (UNAUDITED)
Franklin Mutual Shares VIP Fund (continued)
| Country | Principal Amount* |
Value | ||||||||||||
| Securities Sold Short (0.5)% |
$ | (22,174,574 | ) | |||||||||||
| Other Assets, less Liabilities 0.5% |
22,974,164 | |||||||||||||
|
|
|
|||||||||||||
| Net Assets 100.0% |
$ | 4,195,255,354 | ||||||||||||
|
|
|
|||||||||||||
| Shares | ||||||||||||||
| p | Securities Sold Short (Proceeds $21,743,820) (0.5)% |
|||||||||||||
| Common Stocks (0.5)% |
||||||||||||||
| Health Care Equipment & Supplies (0.5)% |
||||||||||||||
| Abbott Laboratories |
United States | 564,095 | $ | (22,174,574 | ) | |||||||||
|
|
|
|||||||||||||
†Rounds to less than 0.1% of net assets.
*The principal amount is stated in U.S. dollars unless otherwise indicated.
aNon-income producing.
bSee Note 8 regarding restricted securities.
cAt June 30, 2016, pursuant to the Fund’s policies and the requirements of applicable securities law, the Fund is restricted from trading these securities at period end.
dContingent distributions represent the right to receive additional distributions, if any, during the reorganization of the underlying company. Shares represent total underlying principal of debt securities.
eSecurity has been deemed illiquid because it may not be able to be sold within seven days. At June 30, 2016, the aggregate value of these securities was $-.
fSecurity was purchased pursuant to Rule 144A under the Securities Act of 1933 and may be sold in transactions exempt from registration only to qualified institutional buyers or in a public offering registered under the Securities Act of 1933. These securities have been deemed liquid under guidelines approved by the Trust’s Board of Trustees. At June 30, 2016, the aggregate value of these securities was $75,336,635, representing 1.8% of net assets.
gSee Note 1(h) regarding senior floating rate interests.
hThe coupon rate shown represents the rate at period end.
iSecurity purchased on a when-issued or delayed delivery basis. See Note 1(c).
jSee Note 7 regarding credit risk and defaulted securities.
kIncome may be received in additional securities and/or cash.
lSee Note 10 regarding holdings of 5% voting securities.
mBankruptcy claims represent the right to receive distributions, if any, during the liquidation of the underlying pool of assets. Shares represent amount of allowed unsecured claims.
nThe security is traded on a discount basis with no stated coupon rate.
oA portion or all of the security has been segregated as collateral for securities sold short and open forward contracts. At June 30, 2016, the aggregate value of these securities and/or cash pledged amounted to $33,235,061, representing 0.8% of net assets.
pSee Note 1(f) regarding securities sold short.
| MS-16 | Semiannual Report |
FRANKLIN TEMPLETON VARIABLE INSURANCE PRODUCTS TRUST
STATEMENT OF INVESTMENTS (UNAUDITED)
Franklin Mutual Shares VIP Fund (continued)
At June 30, 2016, the Fund had the following futures contracts outstanding. See Note 1(d).
| Futures Contracts | ||||||||||||||||||||||||
| Description | Type | Number of Contracts |
Notional Value |
Expiration Date |
Unrealized Appreciation |
Unrealized Depreciation |
||||||||||||||||||
| Currency Contracts | ||||||||||||||||||||||||
| EUR/USD |
Short | 497 | $ | 69,005,344 | 9/19/16 | $ | 1,926,039 | $ | — | |||||||||||||||
| GBP/USD |
Short | 1,349 | 111,697,200 | 9/19/16 | 10,629,372 | — | ||||||||||||||||||
|
|
|
|||||||||||||||||||||||
| Total Futures Contracts |
|
$ | 12,555,411 | $ | — | |||||||||||||||||||
|
|
|
|||||||||||||||||||||||
| Net unrealized appreciation (depreciation) |
|
$ | 12,555,411 | |||||||||||||||||||||
|
|
|
|||||||||||||||||||||||
At June 30, 2016, the Fund had the following forward exchange contracts outstanding. See Note 1(d).
| Forward Exchange Contracts | ||||||||||||||||||||||||||||
| Currency | Counterpartya | Type | Quantity | Contract Amount |
Settlement Date |
Unrealized Appreciation |
Unrealized Depreciation |
|||||||||||||||||||||
| OTC Forward Exchange Contracts | ||||||||||||||||||||||||||||
| South Korean Won |
BOFA | Sell | 12,942,780,859 | $ | 11,220,901 | 7/12/16 | $ | 33,133 | $ | (38,398 | ) | |||||||||||||||||
| South Korean Won |
FBCO | Sell | 9,054,928,438 | 7,891,005 | 7/12/16 | 37,042 | — | |||||||||||||||||||||
| South Korean Won |
HSBC | Sell | 36,293,597,203 | 31,573,074 | 7/12/16 | 156,317 | (63,180 | ) | ||||||||||||||||||||
| British Pound |
BOFA | Buy | 4,483,316 | 6,353,843 | 8/19/16 | — | (373,001 | ) | ||||||||||||||||||||
| British Pound |
BOFA | Sell | 1,356,985 | 1,817,068 | 8/19/16 | 8,622 | (1,802 | ) | ||||||||||||||||||||
| British Pound |
BONY | Sell | 1,897,833 | 2,550,433 | 8/19/16 | 18,683 | — | |||||||||||||||||||||
| British Pound |
FBCO | Sell | 347,504 | 469,600 | 8/19/16 | 6,022 | — | |||||||||||||||||||||
| British Pound |
HSBC | Sell | 4,479,387 | 5,994,889 | 8/19/16 | 22,575 | (3,286 | ) | ||||||||||||||||||||
| British Pound |
SSBT | Sell | 102,928,697 | 149,011,570 | 8/19/16 | 11,750,243 | (47,793 | ) | ||||||||||||||||||||
| Euro |
BOFA | Buy | 2,951,888 | 3,282,507 | 8/19/16 | 8,370 | (8,360 | ) | ||||||||||||||||||||
| Euro |
BOFA | Sell | 1,408,000 | 1,569,212 | 8/19/16 | 3,507 | — | |||||||||||||||||||||
| Euro |
BONY | Buy | 1,516,875 | 1,691,941 | 8/19/16 | 5,711 | (10,878 | ) | ||||||||||||||||||||
| Euro |
BONY | Sell | 491,475 | 546,486 | 8/19/16 | — | (37 | ) | ||||||||||||||||||||
| Euro |
FBCO | Buy | 1,860,238 | 2,074,960 | 8/19/16 | 7,347 | (13,712 | ) | ||||||||||||||||||||
| Euro |
HSBC | Buy | 1,326,645 | 1,474,820 | 8/19/16 | 7,147 | (6,729 | ) | ||||||||||||||||||||
| Euro |
HSBC | Sell | 1,084,139 | 1,205,963 | 8/19/16 | 394 | — | |||||||||||||||||||||
| Euro |
SSBT | Buy | 1,840,384 | 2,051,318 | 8/19/16 | 8,226 | (13,027 | ) | ||||||||||||||||||||
| Euro |
SSBT | Sell | 74,262,081 | 84,862,540 | 8/19/16 | 2,282,682 | — | |||||||||||||||||||||
|
|
|
|||||||||||||||||||||||||||
| Total Forward Exchange Contracts |
|
$ | 14,356,021 | $ | (580,203 | ) | ||||||||||||||||||||||
|
|
|
|||||||||||||||||||||||||||
| Net unrealized appreciation (depreciation) |
|
$ | 13,775,818 | |||||||||||||||||||||||||
|
|
|
|||||||||||||||||||||||||||
aMay be comprised of multiple contracts with the same counterparty, currency and settlement date.
See Abbreviations on page MS-32.
| The accompanying notes are an integral part of these financial statements. | Semiannual Report | MS-17 |
FRANKLIN TEMPLETON VARIABLE INSURANCE PRODUCTS TRUST
Financial Statements
Statement of Assets and Liabilities
June 30, 2016 (unaudited)
| Franklin Mutual Shares VIP Fund |
||||
| Assets: |
||||
| Investments in securities: |
||||
| Cost |
$ | 3,629,319,438 | ||
|
|
|
|||
| Value |
$ | 4,194,455,764 | ||
| Cash |
377,405 | |||
| Restricted cash (Note 1e) |
14,230,000 | |||
| Foreign currency, at value (cost $1,829,635) |
1,818,195 | |||
| Receivables: |
||||
| Investment securities sold |
13,211,093 | |||
| Capital shares sold |
152,485 | |||
| Dividends and interest |
15,769,792 | |||
| European Union tax reclaims |
1,176,537 | |||
| Due from brokers |
29,107,255 | |||
| Variation margin |
1,740,831 | |||
| Unrealized appreciation on OTC forward exchange contracts |
14,356,021 | |||
| Other assets |
1,965 | |||
|
|
|
|||
| Total assets |
4,286,397,343 | |||
|
|
|
|||
| Liabilities: |
||||
| Payables: |
||||
| Investment securities purchased |
47,351,119 | |||
| Capital shares redeemed |
2,367,018 | |||
| Management fees |
2,320,697 | |||
| Distribution fees |
1,491,134 | |||
| Securities sold short, at value (proceeds $21,743,820) |
22,174,574 | |||
| Due to brokers |
14,230,000 | |||
| Unrealized depreciation on OTC forward exchange contracts |
580,203 | |||
| Accrued expenses and other liabilities |
627,244 | |||
|
|
|
|||
| Total liabilities |
91,141,989 | |||
|
|
|
|||
| Net assets, at value |
$ | 4,195,255,354 | ||
|
|
|
|||
| Net assets consist of: |
||||
| Paid-in capital |
$ | 3,073,799,095 | ||
| Undistributed net investment income |
137,448,740 | |||
| Net unrealized appreciation (depreciation) |
590,764,634 | |||
| Accumulated net realized gain (loss) |
393,242,885 | |||
|
|
|
|||
| Net assets, at value |
$ | 4,195,255,354 | ||
|
|
|
|||
| MS-18 | Semiannual Report | The accompanying notes are an integral part of these financial statements. |
FRANKLIN TEMPLETON VARIABLE INSURANCE PRODUCTS TRUST
FINANCIAL STATEMENTS
Statement of Assets and Liabilities (continued)
June 30, 2016 (unaudited)
| Franklin Mutual Shares VIP Fund |
||||
| Class 1: | ||||
| Net assets, at value |
$ | 573,679,228 | ||
|
|
|
|||
| Shares outstanding |
28,182,444 | |||
|
|
|
|||
| Net asset value and maximum offering price per share |
$ | 20.36 | ||
|
|
|
|||
| Class 2: | ||||
| Net assets, at value |
$ | 3,497,122,865 | ||
|
|
|
|||
| Shares outstanding |
174,515,262 | |||
|
|
|
|||
| Net asset value and maximum offering price per share |
$ | 20.04 | ||
|
|
|
|||
| Class 4: | ||||
| Net assets, at value |
$ | 124,453,261 | ||
|
|
|
|||
| Shares outstanding |
6,174,619 | |||
|
|
|
|||
| Net asset value and maximum offering price per share |
$ | 20.16 | ||
|
|
|
|||
| The accompanying notes are an integral part of these financial statements. | Semiannual Report | MS-19 |
FRANKLIN TEMPLETON VARIABLE INSURANCE PRODUCTS TRUST
FINANCIAL STATEMENTS
Statement of Operations
for the six months ended June 30, 2016 (unaudited)
| Franklin Mutual Shares VIP Fund |
||||
| Investment income: |
||||
| Dividends |
$ | 64,649,928 | ||
| Interest |
13,823,664 | |||
| Income from securities loaned (net of fees and rebates) |
348,125 | |||
|
|
|
|||
| Total investment income |
78,821,717 | |||
|
|
|
|||
| Expenses: |
||||
| Management fees (Note 3a) |
13,574,515 | |||
| Distribution fees: (Note 3c) |
||||
| Class 2 |
4,065,160 | |||
| Class 4 |
216,451 | |||
| Custodian fees (Note 4) |
48,568 | |||
| Reports to shareholders |
198,500 | |||
| Professional fees |
91,752 | |||
| Trustees’ fees and expenses |
10,526 | |||
| Dividends on securities sold short |
65,460 | |||
| Other |
45,146 | |||
|
|
|
|||
| Total expenses |
18,316,078 | |||
| Expense reductions (Note 4) |
(3,132 | ) | ||
| Expenses waived/paid by affiliates (Note 3e) |
(6,015 | ) | ||
|
|
|
|||
| Net expenses |
18,306,931 | |||
|
|
|
|||
| Net investment income |
60,514,786 | |||
|
|
|
|||
| Realized and unrealized gains (losses): |
||||
| Net realized gain (loss) from: |
||||
| Investments |
75,479,023 | |||
| Foreign currency transactions |
1,084,479 | |||
| Futures contracts |
2,138,093 | |||
| Securities sold short |
(763,869 | ) | ||
|
|
|
|||
| Net realized gain (loss) |
77,937,726 | |||
|
|
|
|||
| Net change in unrealized appreciation (depreciation) on: |
||||
| Investments |
1,901,159 | |||
| Translation of other assets and liabilities denominated in foreign currencies |
8,436,769 | |||
| Futures contracts |
9,293,172 | |||
|
|
|
|||
| Net change in unrealized appreciation (depreciation) |
19,631,100 | |||
|
|
|
|||
| Net realized and unrealized gain (loss) |
97,568,826 | |||
|
|
|
|||
| Net increase (decrease) in net assets resulting from operations |
$ | 158,083,612 | ||
|
|
|
|||
| MS-20 | Semiannual Report | The accompanying notes are an integral part of these financial statements. |
FRANKLIN TEMPLETON VARIABLE INSURANCE PRODUCTS TRUST
FINANCIAL STATEMENTS
Statements of Changes in Net Assets
| Franklin Mutual Shares VIP Fund | ||||||||
| Six Months Ended June 30, 2016 (unaudited) |
Year Ended December 31, 2015 |
|||||||
| Increase (decrease) in net assets: |
||||||||
| Operations: |
||||||||
| Net investment income |
$ | 60,514,786 | $ | 84,027,000 | ||||
| Net realized gain (loss) |
77,937,726 | 361,237,169 | ||||||
| Net change in unrealized appreciation (depreciation) |
19,631,100 | (663,206,334 | ) | |||||
|
|
|
|||||||
| Net increase (decrease) in net assets resulting from operations |
158,083,612 | (217,942,165 | ) | |||||
|
|
|
|||||||
| Distributions to shareholders from: |
||||||||
| Net investment income: |
||||||||
| Class 1 |
— | (22,253,593 | ) | |||||
| Class 2 |
— | (115,505,343 | ) | |||||
| Class 4 |
— | (4,240,573 | ) | |||||
| Net realized gains: |
||||||||
| Class 1 |
— | (44,812,385 | ) | |||||
| Class 2 |
— | (254,851,880 | ) | |||||
| Class 4 |
— | (9,773,474 | ) | |||||
|
|
|
|||||||
| Total distributions to shareholders |
— | (451,437,248 | ) | |||||
|
|
|
|||||||
| Capital share transactions: (Note 2) |
||||||||
| Class 1 |
(86,685,734 | ) | 85,321,567 | |||||
| Class 2 |
7,573,914 | (314,542,720 | ) | |||||
| Class 4 |
(11,637,728 | ) | (6,302,871 | ) | ||||
|
|
|
|||||||
| Total capital share transactions |
(90,749,548 | ) | (235,524,024 | ) | ||||
|
|
|
|||||||
| Net increase (decrease) in net assets |
67,334,064 | (904,903,437 | ) | |||||
| Net assets: |
||||||||
| Beginning of period |
4,127,921,290 | 5,032,824,727 | ||||||
|
|
|
|||||||
| End of period |
$ | 4,195,255,354 | $ | 4,127,921,290 | ||||
|
|
|
|||||||
| Undistributed net investment income included in net assets: |
||||||||
| End of period |
$ | 137,448,740 | $ | 77,363,379 | ||||
|
|
|
|||||||
| The accompanying notes are an integral part of these financial statements. | Semiannual Report | MS-21 |
FRANKLIN TEMPLETON VARIABLE INSURANCE PRODUCTS TRUST
Notes to Financial Statements (unaudited)
Franklin Mutual Shares VIP Fund
| MS-22 | Semiannual Report |
FRANKLIN TEMPLETON VARIABLE INSURANCE PRODUCTS TRUST
NOTES TO FINANCIAL STATEMENTS (UNAUDITED)
Franklin Mutual Shares VIP Fund (continued)
| Semiannual Report | MS-23 |
FRANKLIN TEMPLETON VARIABLE INSURANCE PRODUCTS TRUST
NOTES TO FINANCIAL STATEMENTS (UNAUDITED)
Franklin Mutual Shares VIP Fund (continued)
1. Organization and Significant Accounting Policies (continued)
d. Derivative Financial Instruments (continued)
settlement. Derivatives contain various risks including the potential inability of the counterparty to fulfill their obligations under the terms of the contract, the potential for an illiquid secondary market, and/or the potential for market movements which expose the Fund to gains or losses in excess of the amounts shown in the Statement of Assets and Liabilities. Realized gain and loss and unrealized appreciation and depreciation on these contracts for the period are included in the Statement of Operations.
Derivative counterparty credit risk is managed through a formal evaluation of the creditworthiness of all potential counterparties. The Fund attempts to reduce its exposure to counterparty credit risk on OTC derivatives, whenever possible, by entering into International Swaps and Derivatives Association (ISDA) master agreements with certain counterparties. These agreements contain various provisions, including but not limited to collateral requirements, events of default, or early termination. Termination events applicable to the counterparty include certain deteriorations in the credit quality of the counterparty. Termination events applicable to the Fund include failure of the Fund to maintain certain net asset levels and/or limit the decline in net assets over various periods of time. In the event of default or early termination, the ISDA master agreement gives the non-defaulting party the right to net and close-out all transactions traded, whether or not arising under the ISDA agreement, to one net amount payable by one counterparty to the other. However, absent an event of default or early termination, OTC derivative assets and liabilities are presented gross and not offset in the Statement of Assets and Liabilities. Early termination by the counterparty may result in an immediate payment by the Fund of any net liability owed to that counterparty under the ISDA agreement. At June 30, 2016, the Fund had OTC derivatives in a net liability position of $367,929 and the aggregate value of collateral pledged for such contracts was $189,850.
Collateral requirements differ by type of derivative. Collateral or initial margin requirements are set by the broker or exchange clearing house for exchange traded and centrally cleared derivatives. Initial margin deposited is held at the exchange and can be in the form of cash and/or securities. For OTC derivatives traded under an ISDA master agreement, posting of collateral is required by either the Fund or the applicable
counterparty if the total net exposure of all OTC derivatives with the applicable counterparty exceeds the minimum transfer amount, which typically ranges from $100,000 to $250,000, and can vary depending on the counterparty and the type of the agreement. Generally, collateral is determined at the close of Fund business each day and any additional collateral required due to changes in derivative values may be delivered by the Fund or the counterparty within a few business days. Collateral pledged and/or received by the Fund for OTC derivatives, if any, is held in segregated accounts with the Fund’s custodian/counterparty broker and can be in the form of cash and/or securities. Unrestricted cash may be invested according to the Fund’s investment objectives. To the extent that the amounts due to the Fund from its counterparties are not subject to collateralization or are not fully collateralized, the Fund bears the risk of loss from counterparty non-performance.
At June 30, 2016, the Fund received $315,449 in United Kingdom Treasury Bonds as collateral for derivatives.
The Fund entered into exchange traded futures contracts primarily to manage exposure to certain foreign currencies. A futures contract is an agreement between the Fund and a counterparty to buy or sell an asset for a specified price on a future date. Required initial margins are pledged by the Fund, and the daily change in fair value is accounted for as a variation margin payable or receivable in the Statement of Assets and Liabilities.
The Fund entered into OTC forward exchange contracts primarily to manage exposure to certain foreign currencies. A forward exchange contract is an agreement between the Fund and a counterparty to buy or sell a foreign currency at a specific exchange rate on a future date.
See Note 9 regarding other derivative information.
e. Restricted Cash
At June 30, 2016, the Fund held restricted cash in connection with investments in certain derivative securities. Restricted cash is held in a segregated account with the Fund’s custodian and is reflected in the Statement of Assets and Liabilities.
f. Securities Sold Short
The Fund is engaged in selling securities short, which obligates the Fund to replace a borrowed security with the same security at current fair value. The Fund incurs a loss if the price of the security increases between the date of the short sale and the date
| MS-24 | Semiannual Report |
FRANKLIN TEMPLETON VARIABLE INSURANCE PRODUCTS TRUST
NOTES TO FINANCIAL STATEMENTS (UNAUDITED)
Franklin Mutual Shares VIP Fund (continued)
| Semiannual Report | MS-25 |
FRANKLIN TEMPLETON VARIABLE INSURANCE PRODUCTS TRUST
NOTES TO FINANCIAL STATEMENTS (UNAUDITED)
Franklin Mutual Shares VIP Fund (continued)
1. Organization and Significant Accounting Policies (continued)
i. Income and Deferred Taxes (continued)
tax position has a less than 50% probability that it will be sustained upon examination by the tax authorities based on its technical merits. As of June 30, 2016, the Fund has determined that no tax liability is required in its financial statements related to uncertain tax positions for any open tax years (or expected to be taken in future tax years). Open tax years are those that remain subject to examination and are based on each tax jurisdiction’s statute of limitation.
j. Security Transactions, Investment Income, Expenses and Distributions
Security transactions are accounted for on trade date. Realized gains and losses on security transactions are determined on a specific identification basis. Interest income and estimated expenses are accrued daily. Amortization of premium and accretion of discount on debt securities are included in interest income. Dividend income and dividends declared on securities sold short are recorded on the ex-dividend date except for certain dividends from foreign securities where the dividend rate is not available. In such cases, the dividend is recorded as soon as the information is received by the Fund. Distributions to shareholders are recorded on the ex-dividend date and are determined according to income tax regulations (tax basis). Distributable earnings determined on a tax basis may differ from earnings recorded in accordance with U.S. GAAP. These differences may be permanent or temporary. Permanent differences are reclassified among capital accounts to reflect their tax character. These reclassifications have no impact on net assets or the results of operations. Temporary differences are not reclassified, as they may reverse in subsequent periods.
Common expenses incurred by the Trust are allocated among the Funds based on the ratio of net assets of each Fund to the combined net assets of the Trust. Fund specific expenses are charged directly to the fund that incurred the expense.
Realized and unrealized gains and losses and net investment income, not including class specific expenses, are allocated daily to each class of shares based upon the relative proportion of net assets of each class. Differences in per share distributions, by class, are generally due to differences in class specific expenses.
k. Accounting Estimates
The preparation of financial statements in accordance with U.S. GAAP requires management to make estimates and assumptions that affect the reported amounts of assets and liabilities at the date of the financial statements and the amounts of income and expenses during the reporting period. Actual results could differ from those estimates.
l. Guarantees and Indemnifications
Under the Trust’s organizational documents, its officers and trustees are indemnified by the Trust against certain liabilities arising out of the performance of their duties to the Trust. Additionally, in the normal course of business, the Trust, on behalf of the Fund, enters into contracts with service providers that contain general indemnification clauses. The Trust’s maximum exposure under these arrangements is unknown as this would involve future claims that may be made against the Trust that have not yet occurred. Currently, the Trust expects the risk of loss to be remote.
| MS-26 | Semiannual Report |
FRANKLIN TEMPLETON VARIABLE INSURANCE PRODUCTS TRUST
NOTES TO FINANCIAL STATEMENTS (UNAUDITED)
Franklin Mutual Shares VIP Fund (continued)
2. Shares of Beneficial Interest
At June 30, 2016, there were an unlimited number of shares authorized (without par value). Transactions in the Fund’s shares were as follows:
| Six Months Ended June 30, 2016 |
Year Ended December 31, 2015 |
|||||||||||||||||||
| Shares | Amount | Shares | Amount | |||||||||||||||||
| Class 1 Shares: | ||||||||||||||||||||
| Shares sold |
1,416,640 | $ | 27,184,561 | 5,200,808 | $ | 114,565,674 | ||||||||||||||
| Shares issued in reinvestment of distributions |
— | — | 3,480,331 | 67,065,978 | ||||||||||||||||
| Shares redeemed |
(6,268,532 | ) | (113,870,295 | ) | (4,296,684 | ) | (96,310,085 | ) | ||||||||||||
|
|
|
|||||||||||||||||||
| Net increase (decrease) |
(4,851,892 | ) | $ | (86,685,734 | ) | 4,384,455 | $ | 85,321,567 | ||||||||||||
|
|
|
|||||||||||||||||||
| Class 2 Shares: | ||||||||||||||||||||
| Shares sold |
16,366,410 | $ | 322,602,853 | 8,995,477 | $ | 199,602,688 | ||||||||||||||
| Shares issued in reinvestment of distributions |
— | — | 19,482,232 | 370,357,223 | ||||||||||||||||
| Shares redeemed |
(16,526,753 | ) | (315,028,939 | ) | (40,426,538 | ) | (884,502,631 | ) | ||||||||||||
|
|
|
|||||||||||||||||||
| Net increase (decrease) |
(160,343 | ) | $ | 7,573,914 | (11,948,829 | ) | $ | (314,542,720 | ) | |||||||||||
|
|
|
|||||||||||||||||||
| Class 4 Shares: | ||||||||||||||||||||
| Shares sold |
121,047 | $ | 2,291,311 | 465,090 | $ | 9,850,242 | ||||||||||||||
| Shares issued in reinvestment of distributions |
— | — | 732,186 | 14,014,047 | ||||||||||||||||
| Shares redeemed |
(725,906 | ) | (13,929,039 | ) | (1,372,567 | ) | (30,167,160 | ) | ||||||||||||
|
|
|
|||||||||||||||||||
| Net increase (decrease) |
(604,859 | ) | $ | (11,637,728 | ) | (175,291 | ) | $ | (6,302,871 | ) | ||||||||||
|
|
|
|||||||||||||||||||
3. Transactions With Affiliates
Franklin Resources, Inc. is the holding company for various subsidiaries that together are referred to as Franklin Templeton Investments. Certain officers and trustees of the Fund are also officers and/or directors of the following subsidiaries:
| Subsidiary | Affiliation | |
| Franklin Mutual Advisers, LLC (Franklin Mutual) |
Investment manager | |
| Franklin Templeton Services, LLC (FT Services) |
Administrative manager | |
| Franklin Templeton Distributors, Inc. (Distributors) |
Principal underwriter | |
| Franklin Templeton Investor Services, LLC (Investor Services) |
Transfer agent |
a. Management Fees
The Fund pays an investment management fee to Franklin Mutual based on the average daily net assets of the Fund as follows:
| Annualized Fee Rate | Net Assets | |
| 0.750% |
Up to and including $200 million | |
| 0.735% |
Over $200 million, up to and including $700 million | |
| 0.700% |
Over $700 million, up to and including $1.2 billion | |
| 0.675% |
Over $1.2 billion, up to and including $5 billion | |
| 0.645% |
Over $5 billion, up to and including $10 billion | |
| 0.625% |
Over $10 billion, up to and including $15 billion | |
| 0.605% |
Over $15 billion, up to and including $20 billion | |
| 0.585% |
In excess of $20 billion |
| Semiannual Report | MS-27 |
FRANKLIN TEMPLETON VARIABLE INSURANCE PRODUCTS TRUST
NOTES TO FINANCIAL STATEMENTS (UNAUDITED)
Franklin Mutual Shares VIP Fund (continued)
3. Transactions With Affiliates (continued)
a. Management Fees (continued)
For the period ended June 30, 2016, the annualized effective investment management fee rate was 0.689% of the Fund’s average daily net assets.
b. Administrative Fees
Under an agreement with Franklin Mutual, FT Services provides administrative services to the Fund. The fee is paid by Franklin Mutual based on Fund’s average daily net assets, and is not an additional expense of the Fund.
c. Distribution Fees
The Board has adopted distribution plans for Class 2 and Class 4 shares pursuant to Rule 12b-1 under the 1940 Act. Under the Fund’s compensation distribution plans, the Fund pays Distributors for costs incurred in connection with the servicing, sale and distribution of the Fund’s shares up to 0.35% per year of its average daily net assets of each class. The Board has agreed to limit the current rate to 0.25% per year for Class 2. The plan year, for purposes of monitoring compliance with the maximum annual plan rates, is February 1 through January 31.
d. Transfer Agent Fees
Investor Services, under terms of an agreement, performs shareholder servicing for the Fund and is not paid by the Fund for the services.
e. Investments in Affiliated Management Investment Companies
The Fund invests in one or more affiliated management investment companies for purposes other than exercising a controlling influence over the management or policies. Management fees paid by the Fund are waived on assets invested in the affiliated management investment companies, as noted in the Statement of Operations, in an amount not to exceed the management and administrative fees paid directly or indirectly by each affiliate.
| Number of Shares Held at Beginning of Period |
Gross Additions |
Gross Reductions |
Number of Shares Held at End of Period |
Value at End of Period |
Investment Income |
Realized Gain (Loss) |
% of Affiliated Fund Shares Outstanding Held at End of Period |
|||||||||||||||||||||||||
| Non-Controlled Affiliates | ||||||||||||||||||||||||||||||||
| Institutional Fiduciary Trust Money Market Portfolio |
— | 50,978,000 | (50,978,000 | ) | — | $ | — | $ | — | $ | — | —% | ||||||||||||||||||||
|
|
|
|||||||||||||||||||||||||||||||
f. Other Affiliated Transactions
At June 30, 2016, Franklin Templeton Variable Insurance Products Trust – Franklin Founding Funds Allocation VIP Fund owned 7.8% of the Fund’s outstanding shares.
4. Expense Offset Arrangement
The Fund has entered into an arrangement with its custodian whereby credits realized as a result of uninvested cash balances are used to reduce a portion of the Fund’s custodian expenses. During the period ended June 30, 2016, the custodian fees were reduced as noted in the Statement of Operations.
| MS-28 | Semiannual Report |
FRANKLIN TEMPLETON VARIABLE INSURANCE PRODUCTS TRUST
NOTES TO FINANCIAL STATEMENTS (UNAUDITED)
Franklin Mutual Shares VIP Fund (continued)
5. Income Taxes
At June 30, 2016, the cost of investments and net unrealized appreciation (depreciation) for income tax purposes were as follows:
| Cost of investments |
$ | 3,657,681,618 | ||
|
|
|
|||
| Unrealized appreciation |
$ | 1,018,936,970 | ||
| Unrealized depreciation |
(482,162,824 | ) | ||
|
|
|
|||
| Net unrealized appreciation (depreciation) |
$ | 536,774,146 | ||
|
|
|
Differences between income and/or capital gains as determined on a book basis and a tax basis are primarily due to differing treatments of foreign currency transactions.
6. Investment Transactions
Purchases and sales of investments (excluding short term securities and securities sold short) for the period ended June 30, 2016, aggregated $547,316,857 and $526,557,935, respectively.
7. Credit Risk And Defaulted Securities
The Fund may purchase the pre-default or defaulted debt of distressed companies. Distressed companies are financially troubled and are about to be or are already involved in financial restructuring or bankruptcy. Risks associated with purchasing these securities include the possibility that the bankruptcy or other restructuring process takes longer than expected, or that distributions in restructuring are less than anticipated, either or both of which may result in unfavorable consequences to the Fund. If it becomes probable that the income on debt securities, including those of distressed companies, will not be collected, the Fund discontinues accruing income and recognizes an adjustment for uncollectible interest.
At June 30, 2016, the aggregate long value of distressed company securities for which interest recognition has been discontinued was $72,943,214, representing 1.7% of the Fund’s net assets. For information as to specific securities, see the accompanying Statement of Investments.
8. Restricted Securities
The Fund invests in securities that are restricted under the Securities Act of 1933 (1933 Act) or which are subject to legal, contractual, or other agreed upon restrictions on resale. Restricted securities are often purchased in private placement transactions, and cannot be sold without prior registration unless the sale is pursuant to an exemption under the 1933 Act. Disposal of these securities may require greater effort and expense, and prompt sale at an acceptable price may be difficult. The Fund may have registration rights for restricted securities. The issuer generally incurs all registration costs.
| Semiannual Report | MS-29 |
FRANKLIN TEMPLETON VARIABLE INSURANCE PRODUCTS TRUST
NOTES TO FINANCIAL STATEMENTS (UNAUDITED)
Franklin Mutual Shares VIP Fund (continued)
8. Restricted Securities (continued)
At June 30, 2016, the Fund held investments in restricted securities, excluding certain securities exempt from registration under the 1933 Act deemed to be liquid, as follows:
| Principal Amount/ Shares/ Units |
Issuer | Acquisition Dates |
Cost | Value | ||||||||||
| 1,754 | Broadband Ventures III LLC, secured promissory note, 5.00%, 2/01/12 |
7/01/10 - 11/30/12 | $ | 1,754 | $ | — | ||||||||
| 6,400,507 | CB FIM Coinvestors LLC |
1/15/09 - 6/02/09 | — | — | ||||||||||
| 8,006,950 | FIM Coinvestor Holdings I, LLC |
11/20/06 - 6/02/09 | — | — | ||||||||||
| 1,730,515 | International Automotive Components Group Brazil LLC |
4/13/06 - 12/26/08 | 1,149,241 | 28,490 | ||||||||||
| 15,382,424 | International Automotive Components Group North America LLC |
1/12/06 - 3/18/13 | 12,591,586 | 6,786,202 | ||||||||||
| 12,324 | Warrior Met Coal LLC, A |
9/19/14 - 12/04/14 | 16,187,328 | 1,242,461 | ||||||||||
| 28,821 | Warrior Met Coal LLC, B |
3/31/16 - 6/23/16 | 2,305,674 | 2,905,629 | ||||||||||
|
|
|
|||||||||||||
| Total Restricted Securities (Value is 0.3% of Net Assets) |
$ | 32,235,583 | $ | 10,962,782 | ||||||||||
|
|
|
|||||||||||||
9. Other Derivative Information
At June 30, 2016, the Fund’s investments in derivative contracts are reflected in the Statement of Assets and Liabilities as follows:
| Asset Derivatives |
Liability Derivatives |
|||||||||||
| Derivative Contracts Not Accounted for as Hedging Instruments |
Statement of Assets and Liabilities Location |
Fair Value | Statement of Assets and Liabilities Location |
Fair Value | ||||||||
| Foreign exchange contracts |
Variation margin | $ | 12,555,411 | a | Variation margin | $ | — | |||||
| Unrealized appreciation on OTC forward exchange contracts |
14,356,021 | Unrealized depreciation on |
$ | 580,203 | ||||||||
|
|
|
|
|
|||||||||
| Totals |
$ | 26,911,432 | $ | 580,203 | ||||||||
|
|
|
|
|
|||||||||
aThis amount reflects the cumulative appreciation (depreciation) of futures contracts as reported in the Statement of Investments. Only the variation margin receivable/payable at period end is separately reported within the Statement of Assets and Liabilities. Prior variation margin movements were recorded to cash upon receipt or payment.
For the period ended June 30, 2016, the effect of derivative contracts in the Fund’s Statement of Operations was as follows:
| Derivative Contracts Not Accounted for as Hedging Instruments |
Statement of Operations Locations |
Net Realized Gain (Loss) for the Period |
Statement of Operations Locations |
Net Change in Unrealized Appreciation (Depreciation) for the Period |
||||||||
| Net realized gain (loss) from: |
Net change in unrealized appreciation (depreciation) on: |
|||||||||||
| Foreign exchange contracts |
Foreign currency transactions |
1,396,057 | a | Translation of other assets and liabilities denominated in foreign currencies |
8,627,990 | a | ||||||
| Futures contracts |
2,138,093 | Futures contracts |
9,293,172 | |||||||||
|
|
|
|
|
|||||||||
| Totals |
$ | 3,534,150 | $ | 17,921,162 | ||||||||
|
|
|
|
|
|||||||||
aForward exchange contracts are included in net realized gain (loss) from foreign currency transactions and net change in unrealized appreciation (depreciation) on translation of other assets and liabilities denominated in foreign currencies in the Statement of Operations.
| MS-30 | Semiannual Report |
FRANKLIN TEMPLETON VARIABLE INSURANCE PRODUCTS TRUST
NOTES TO FINANCIAL STATEMENTS (UNAUDITED)
Franklin Mutual Shares VIP Fund (continued)
For the period ended June, 30 2016, the average month end fair value of derivatives represented 0.4% of average month end net assets. The average month end number of open derivative contracts for the period was 39.
See Note 1(d) regarding derivative financial instruments.
10. Holdings of 5% Voting Securities of Portfolio Companies
The 1940 Act defines “affiliated companies” to include investments in portfolio companies in which a fund owns 5% or more of the outstanding voting securities. Investments in “affiliated companies” for the Fund for the period ended June 30, 2016, were as shown below.
| Name of Issuer | Number of Shares Held at Beginning of Period |
Gross Additions |
Gross Reductions |
Number of Shares Held at End of Period |
Value at End of Period |
Investment Income |
Realized Gain (Loss) |
|||||||||||||||||||||
| Non-Controlled Affiliates | ||||||||||||||||||||||||||||
| CB FIM Coinvestors LLC (Value is 0.0% of Net Assets) |
6,400,507 | — | — | 6,400,507 | $ | — | $ | — | $ | — | ||||||||||||||||||
|
|
|
|||||||||||||||||||||||||||
11. Credit Facility
The Fund, together with other U.S. registered and foreign investment funds (collectively, Borrowers), managed by Franklin Templeton Investments, are borrowers in a joint syndicated senior unsecured credit facility totaling $2 billion (Global Credit Facility) which matures on February 10, 2017. This Global Credit Facility provides a source of funds to the Borrowers for temporary and emergency purposes, including the ability to meet future unanticipated or unusually large redemption requests.
Under the terms of the Global Credit Facility, the Fund shall, in addition to interest charged on any borrowings made by the Fund and other costs incurred by the Fund, pay its share of fees and expenses incurred in connection with the implementation and maintenance of the Global Credit Facility, based upon its relative share of the aggregate net assets of all of the Borrowers, including an annual commitment fee of 0.07% based upon the unused portion of the Global Credit Facility. Effective February 12, 2016, the annual commitment fee is 0.15%. These fees are reflected in other expenses in the Statement of Operations. During the period ended June 30, 2016, the Fund did not use the Global Credit Facility.
12. Fair Value Measurements
The Fund follows a fair value hierarchy that distinguishes between market data obtained from independent sources (observable inputs) and the Fund’s own market assumptions (unobservable inputs). These inputs are used in determining the value of the Fund’s financial instruments and are summarized in the following fair value hierarchy:
| • | Level 1 – quoted prices in active markets for identical financial instruments |
| • | Level 2 – other significant observable inputs (including quoted prices for similar financial instruments, interest rates, prepayment speed, credit risk, etc.) |
| • | Level 3 – significant unobservable inputs (including the Fund’s own assumptions in determining the fair value of financial instruments) |
The input levels are not necessarily an indication of the risk or liquidity associated with financial instruments at that level.
For movements between the levels within the fair value hierarchy, the Fund has adopted a policy of recognizing the transfers as of the date of the underlying event which caused the movement.
| Semiannual Report | MS-31 |
FRANKLIN TEMPLETON VARIABLE INSURANCE PRODUCTS TRUST
NOTES TO FINANCIAL STATEMENTS (UNAUDITED)
Franklin Mutual Shares VIP Fund (continued)
12. Fair Value Measurements (continued)
A summary of inputs used as of June 30, 2016, in valuing the Fund’s assets and liabilities carried at fair value, is as follows:
| Level 1 | Level 2 | Level 3 | Total | |||||||||||||
| Assets: | ||||||||||||||||
| Investments in Securities: |
||||||||||||||||
| Equity Investments:a |
||||||||||||||||
| Auto Components |
$ | — | $ | — | $ | 6,814,692 | $ | 6,814,692 | ||||||||
| Machinery |
63,323,047 | 13,268,780 | — | 76,591,827 | ||||||||||||
| Oil, Gas & Consumable Fuels |
271,349,984 | — | 4,148,090 | 275,498,074 | ||||||||||||
| All other Equity Investmentsb |
3,277,808,771 | — | — | c | 3,277,808,771 | |||||||||||
| Corporate Bonds, Notes and Senior Floating Rate Interests |
— | 187,506,708 | — | 187,506,708 | ||||||||||||
| Corporate Bonds, Notes and Senior Floating Rate Interests in Reorganization |
— | 72,943,214 | — | c | 72,943,214 | |||||||||||
| Companies in Liquidation |
61,495 | 4,521,392 | — | c | 4,582,887 | |||||||||||
| Municipal Bonds |
— | 13,648,519 | — | 13,648,519 | ||||||||||||
| Short Term Investments |
259,061,072 | 20,000,000 | — | 279,061,072 | ||||||||||||
|
|
|
|||||||||||||||
| Total Investments in Securities |
$ | 3,871,604,369 | $ | 311,888,613 | $ | 10,962,782 | $ | 4,194,455,764 | ||||||||
|
|
|
|||||||||||||||
| Other Financial Instruments: |
||||||||||||||||
| Futures Contracts |
$ | 12,555,411 | $ | — | $ | — | $ | 12,555,411 | ||||||||
| Forward Exchange Contracts |
— | 14,356,021 | — | 14,356,021 | ||||||||||||
|
|
|
|||||||||||||||
| Total Other Financial Instruments |
$ | 12,555,411 | $ | 14,356,021 | $ | — | $ | 26,911,432 | ||||||||
|
|
|
|||||||||||||||
| Liabilities: | ||||||||||||||||
| Other Financial Instruments: |
||||||||||||||||
| Securities Sold Short |
$ | 22,174,574 | $ | — | $ | — | $ | 22,174,574 | ||||||||
| Forward Exchange Contracts |
— | 580,203 | — | 580,203 | ||||||||||||
|
|
|
|||||||||||||||
| Total Other Financial Instruments |
$ | 22,174,574 | $ | 580,203 | $ | — | $ | 22,754,777 | ||||||||
|
|
|
|||||||||||||||
aIncludes common stocks as well as other equity investments.
bFor detailed categories, see the accompanying Statement of Investments.
cIncludes securities determined to have no value at June 30, 2016.
A reconciliation of assets in which Level 3 inputs are used in determining fair value is presented when there are significant Level 3 financial instruments at the end of the period.
13. Subsequent Events
The Fund has evaluated subsequent events through the issuance of the financial statements and determined that no events have occurred that require disclosure.
Abbreviations
| Counterparty | Currency | Selected Portfolio | ||||||||
| BOFA | Bank of America Corp. | CAD |
Canadian Dollar |
ADR | American Depositary Receipt | |||||
| BONY | Bank of New York Mellon | EUR | Euro | FHLB | Federal Home Loan Bank | |||||
| FBCO | Credit Suisse Group AG | GBP | British Pound | GO | General Obligation | |||||
| HSBC | HSBC Bank USA, N.A. | PIK | Payment-In-Kind | |||||||
| SSBT | State Street Bank and Trust Co., N.A. | |||||||||
| BOFA |
Bank of America Corp. |
|||||||||
| MS-32 | Semiannual Report |
Franklin Rising Dividends VIP Fund
We are pleased to bring you Franklin Rising Dividends VIP Fund’s semiannual report for the period ended June 30, 2016.
Class 1 Performance Summary as of June 30, 2016
The Fund’s Class 1 shares delivered a +10.08% total return* for the six-month period ended June 30, 2016.
*The Fund has a fee waiver associated with any investment in a Franklin Templeton money fund and/or Franklin Templeton fund, as applicable, contractually guaranteed through at least the Fund’s current fiscal year-end. Fund investment results reflect the fee waiver, to the extent applicable; without this reduction, the results would have been lower.
Performance reflects the Fund’s Class 1 operating expenses, but does not include any contract fees, expenses or sales charges. If they had been included, performance would be lower. These charges and deductions, particularly for variable life policies, can have a significant effect on contract values and insurance benefits. See the contract prospectus for a complete description of these expenses, including sales charges.
Performance data represent past performance, which does not guarantee future results. Investment return and principal value will fluctuate, and you may have a gain or loss when you sell your shares. Current performance may differ from figures shown.
| Semiannual Report | FRD-1 |
FRANKLIN RISING DIVIDENDS VIP FUND
1. Source: Morningstar. One cannot invest directly in an index, and an index is not representative of the Fund’s portfolio. Please see Index Descriptions following the Fund Summaries.
2. Source: Bureau of Labor Statistics.
| FRD-2 | Semiannual Report |
FRANKLIN RISING DIVIDENDS VIP FUND
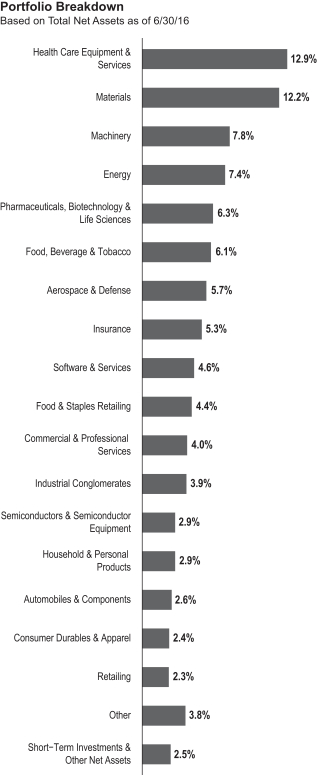
| Semiannual Report | FRD-3 |
FRANKLIN RISING DIVIDENDS VIP FUND
Thank you for your participation in Franklin Rising Dividends VIP Fund. We look forward to serving your future investment needs.
The foregoing information reflects our analysis, opinions and portfolio holdings as of June 30, 2016, the end of the reporting period. The way we implement our main investment strategies and the resulting portfolio holdings may change depending on factors such as market and economic conditions. These opinions may not be relied upon as investment advice or an offer for a particular security. The information is not a complete analysis of every aspect of any market, country, industry, security or the Fund. Statements of fact are from sources considered reliable, but the investment manager makes no representation or warranty as to their completeness or accuracy. Although historical performance is no guarantee of future results, these insights may help you understand our investment management philosophy.
| FRD-4 | Semiannual Report |
FRANKLIN RISING DIVIDENDS VIP FUND
Class 1 Fund Expenses
| Class 1 | Beginning Account Value 1/1/16 |
Ending Account Value 6/30/16 |
Fund-Level Expenses Incurred During Period* 1/1/16–6/30/16 |
|||||||||
| Actual |
$ | 1,000 | $ | 1,100.80 | $ | 3.29 | ||||||
| Hypothetical (5% return before expenses) |
$ | 1,000 | $ | 1,021.73 | $ | 3.17 | ||||||
*Expenses are calculated using the most recent six-month annualized expense ratio, net of expenses waivers, for the Fund’s Class 1 shares (0.63%), which does not include any ongoing expenses of the Contract for which the Fund is an investment option, multiplied by the average account value over the period, multiplied by 182/366 to reflect the one-half year period.
| Semiannual Report | FRD-5 |
FRANKLIN TEMPLETON VARIABLE INSURANCE PRODUCTS TRUST
Financial Highlights
Franklin Rising Dividends VIP Fund
| Six Months Ended (unaudited) |
Year Ended December 31, | |||||||||||||||||||||||
| 2015 | 2014 | 2013 | 2012 | 2011 | ||||||||||||||||||||
| Class 1 | ||||||||||||||||||||||||
| Per share operating performance (for a share outstanding throughout the period) |
||||||||||||||||||||||||
| Net asset value, beginning of period |
$25.26 | $29.63 | $28.14 | $22.03 | $20.01 | $19.15 | ||||||||||||||||||
|
|
|
|||||||||||||||||||||||
| Income from investment operationsa: | ||||||||||||||||||||||||
| Net investment incomeb |
0.22 | 0.45 | 0.45 | 0.40 | 0.41 | 0.36 | ||||||||||||||||||
| Net realized and unrealized gains (losses) |
2.28 | (1.33 | ) | 2.03 | 6.16 | 2.00 | 0.83 | |||||||||||||||||
|
|
|
|||||||||||||||||||||||
| Total from investment operations |
2.50 | (0.88 | ) | 2.48 | 6.56 | 2.41 | 1.19 | |||||||||||||||||
|
|
|
|||||||||||||||||||||||
| Less distributions from: | ||||||||||||||||||||||||
| Net investment income |
(0.44 | ) | (0.48 | ) | (0.44 | ) | (0.45 | ) | (0.39 | ) | (0.33 | ) | ||||||||||||
| Net realized gains |
(3.18 | ) | (3.01 | ) | (0.55 | ) | — | — | — | |||||||||||||||
|
|
|
|||||||||||||||||||||||
| Total distributions |
(3.62 | ) | (3.49 | ) | (0.99 | ) | (0.45 | ) | (0.39 | ) | (0.33 | ) | ||||||||||||
|
|
|
|||||||||||||||||||||||
| Net asset value, end of period |
$24.14 | $25.26 | $29.63 | $28.14 | $22.03 | $20.01 | ||||||||||||||||||
|
|
|
|||||||||||||||||||||||
| Total returnc |
10.08% | (3.42)% | 9.01% | 30.05% | 12.18% | 6.29% | ||||||||||||||||||
| Ratios to average net assetsd | ||||||||||||||||||||||||
| Expenses before waiver and payments by affiliates |
0.64% | 0.63% | 0.62% | 0.61% | 0.63% | 0.63% | ||||||||||||||||||
| Expenses net of waiver and payments by affiliates |
0.63% | 0.63% | e | 0.62% | e | 0.61% | 0.63% | 0.63% | ||||||||||||||||
| Net investment income |
1.67% | 1.65% | 1.58% | 1.59% | 1.96% | 1.87% | ||||||||||||||||||
| Supplemental data | ||||||||||||||||||||||||
| Net assets, end of period (000’s) |
$173,216 | $143,376 | $160,480 | $168,380 | $141,455 | $140,297 | ||||||||||||||||||
| Portfolio turnover rate |
3.71% | 4.74% | 8.61% | 0.07% | 11.19% | 12.76% | ||||||||||||||||||
aThe amount shown for a share outstanding throughout the period may not correlate with the Statement of Operations for the period due to the timing of sales and repurchases of the Fund’s shares in relation to income earned and/or fluctuating fair value of the investments of the Fund.
bBased on average daily shares outstanding.
cTotal return does not include fees, charges or expenses imposed by the variable annuity and life insurance contracts for which Franklin Templeton Variable Insurance Products Trust serves as an underlying investment vehicle. Total return is not annualized for periods less than one year.
dRatios are annualized for periods less than one year.
eBenefit of waiver and payments by affiliates rounds to less than 0.01%.
| FRD-6 | Semiannual Report | The accompanying notes are an integral part of these financial statements. |
FRANKLIN TEMPLETON VARIABLE INSURANCE PRODUCTS TRUST
FINANCIAL HIGHLIGHTS
Franklin Rising Dividends VIP Fund (continued)
| Six Months Ended June 30, 2016 (unaudited) |
Year Ended December 31, | |||||||||||||||||||||||
| 2015 | 2014 | 2013 | 2012 | 2011 | ||||||||||||||||||||
| Class 2 | ||||||||||||||||||||||||
| Per share operating performance (for a share outstanding throughout the period) |
||||||||||||||||||||||||
| Net asset value, beginning of period |
$24.72 | $29.06 | $27.62 | $21.64 | $19.65 | $18.82 | ||||||||||||||||||
|
|
|
|||||||||||||||||||||||
| Income from investment operationsa: | ||||||||||||||||||||||||
| Net investment incomeb |
0.18 | 0.37 | 0.37 | 0.33 | 0.35 | 0.31 | ||||||||||||||||||
| Net realized and unrealized gains (losses) |
2.23 | (1.29 | ) | 1.99 | 6.04 | 1.98 | 0.81 | |||||||||||||||||
|
|
|
|||||||||||||||||||||||
| Total from investment operations |
2.41 | (0.92 | ) | 2.36 | 6.37 | 2.33 | 1.12 | |||||||||||||||||
|
|
|
|||||||||||||||||||||||
| Less distributions from: | ||||||||||||||||||||||||
| Net investment income |
(0.37 | ) | (0.41 | ) | (0.37 | ) | (0.39 | ) | (0.34 | ) | (0.29 | ) | ||||||||||||
| Net realized gains |
(3.18 | ) | (3.01 | ) | (0.55 | ) | — | — | — | |||||||||||||||
|
|
|
|||||||||||||||||||||||
| Total distributions |
(3.55 | ) | (3.42 | ) | (0.92 | ) | (0.39 | ) | (0.34 | ) | (0.29 | ) | ||||||||||||
|
|
|
|||||||||||||||||||||||
| Net asset value, end of period |
$23.58 | $24.72 | $29.06 | $27.62 | $21.64 | $19.65 | ||||||||||||||||||
|
|
|
|||||||||||||||||||||||
| Total returnc |
9.93% | (3.65)% | 8.72% | 29.69% | 11.96% | 6.00% | ||||||||||||||||||
| Ratios to average net assetsd | ||||||||||||||||||||||||
| Expenses before waiver and payments by affiliates |
0.89% | 0.88% | 0.87% | 0.86% | 0.88% | 0.88% | ||||||||||||||||||
| Expenses net of waiver and payments by affiliates |
0.88% | 0.88% | e | 0.87% | e | 0.86% | 0.88% | 0.88% | ||||||||||||||||
| Net investment income |
1.42% | 1.40% | 1.33% | 1.34% | 1.71% | 1.62% | ||||||||||||||||||
| Supplemental data | ||||||||||||||||||||||||
| Net assets, end of period (000’s) |
$1,513,384 | $1,310,783 | $1,667,816 | $1,752,012 | $1,550,084 | $1,523,396 | ||||||||||||||||||
| Portfolio turnover rate |
3.71% | 4.74% | 8.61% | 0.07% | 11.19% | 12.76% | ||||||||||||||||||
aThe amount shown for a share outstanding throughout the period may not correlate with the Statement of Operations for the period due to the timing of sales and repurchases of the Fund’s shares in relation to income earned and/or fluctuating fair value of the investments of the Fund.
bBased on average daily shares outstanding.
cTotal return does not include fees, charges or expenses imposed by the variable annuity and life insurance contracts for which Franklin Templeton Variable Insurance Products Trust serves as an underlying investment vehicle. Total return is not annualized for periods less than one year.
dRatios are annualized for periods less than one year.
eBenefit of waiver and payments by affiliates rounds to less than 0.01%.
| The accompanying notes are an integral part of these financial statements. | Semiannual Report | FRD-7 |
FRANKLIN TEMPLETON VARIABLE INSURANCE PRODUCTS TRUST
FINANCIAL HIGHLIGHTS
Franklin Rising Dividends VIP Fund (continued)
| Six Months Ended (unaudited) |
Year Ended December 31, | |||||||||||||||||||||||
| 2015 | 2014 | 2013 | 2012 | 2011 | ||||||||||||||||||||
| Class 4 | ||||||||||||||||||||||||
| Per share operating performance (for a share outstanding throughout the period) |
||||||||||||||||||||||||
| Net asset value, beginning of period |
$24.81 | $29.19 | $27.76 | $21.78 | $19.83 | $19.04 | ||||||||||||||||||
|
|
|
|||||||||||||||||||||||
| Income from investment operationsa: | ||||||||||||||||||||||||
| Net investment incomeb |
0.16 | 0.35 | 0.35 | 0.32 | 0.35 | 0.31 | ||||||||||||||||||
| Net realized and unrealized gains (losses) |
2.25 | (1.31 | ) | 2.00 | 6.07 | 1.96 | 0.80 | |||||||||||||||||
|
|
|
|||||||||||||||||||||||
| Total from investment operations |
2.41 | (0.96 | ) | 2.35 | 6.39 | 2.31 | 1.11 | |||||||||||||||||
|
|
|
|||||||||||||||||||||||
| Less distributions from: | ||||||||||||||||||||||||
| Net investment income |
(0.36 | ) | (0.41 | ) | (0.37 | ) | (0.41 | ) | (0.36 | ) | (0.32 | ) | ||||||||||||
| Net realized gains |
(3.18 | ) | (3.01 | ) | (0.55 | ) | — | — | — | |||||||||||||||
|
|
|
|||||||||||||||||||||||
| Total distributions |
(3.54 | ) | (3.42 | ) | (0.92 | ) | (0.41 | ) | (0.36 | ) | (0.32 | ) | ||||||||||||
|
|
|
|||||||||||||||||||||||
| Net asset value, end of period |
$23.68 | $24.81 | $29.19 | $27.76 | $21.78 | $19.83 | ||||||||||||||||||
|
|
|
|||||||||||||||||||||||
| Total returnc |
9.90% | (3.75)% | 8.62% | 29.57% | 11.78% | 5.89% | ||||||||||||||||||
| Ratios to average net assetsd | ||||||||||||||||||||||||
| Expenses before waiver and payments by affiliates |
0.99% | 0.98% | 0.97% | 0.96% | 0.98% | 0.98% | ||||||||||||||||||
| Expenses net of waiver and payments by affiliates |
0.98% | 0.98% | e | 0.97% | e | 0.96% | 0.98% | 0.98% | ||||||||||||||||
| Net investment income |
1.32% | 1.30% | 1.23% | 1.24% | 1.61% | 1.52% | ||||||||||||||||||
| Supplemental data | ||||||||||||||||||||||||
| Net assets, end of period (000’s) |
$24,216 | $20,453 | $15,503 | $12,028 | $6,432 | $3,020 | ||||||||||||||||||
| Portfolio turnover rate |
3.71% | 4.74% | 8.61% | 0.07% | 11.19% | 12.76% | ||||||||||||||||||
aThe amount shown for a share outstanding throughout the period may not correlate with the Statement of Operations for the period due to the timing of sales and repurchases of the Fund’s shares in relation to income earned and/or fluctuating fair value of the investments of the Fund.
bBased on average daily shares outstanding.
cTotal return does not include fees, charges or expenses imposed by the variable annuity and life insurance contracts for which Franklin Templeton Variable Insurance Products Trust serves as an underlying investment vehicle. Total return is not annualized for periods less than one year.
dRatios are annualized for periods less than one year.
eBenefit of waiver and payments by affiliates rounds to less than 0.01%.
| FRD-8 | Semiannual Report | The accompanying notes are an integral part of these financial statements. |
FRANKLIN TEMPLETON VARIABLE INSURANCE PRODUCTS TRUST
Statement of Investments, June 30, 2016 (unaudited)
| Franklin Rising Dividends VIP Fund
|
||||||||||
| Shares | Value | |||||||||
| Common Stocks 97.5% |
||||||||||
| Aerospace & Defense 5.7% |
||||||||||
| General Dynamics Corp. |
157,911 | $ | 21,987,528 | |||||||
| Honeywell International Inc. |
251,900 | 29,301,008 | ||||||||
| United Technologies Corp. |
453,011 | 46,456,278 | ||||||||
|
|
|
|||||||||
| 97,744,814 | ||||||||||
|
|
|
|||||||||
| Automobiles & Components 2.6% |
||||||||||
| Johnson Controls Inc. |
1,015,500 | 44,946,030 | ||||||||
|
|
|
|||||||||
| Commercial & Professional Services 4.0% |
||||||||||
| ABM Industries Inc. |
779,288 | 28,428,426 | ||||||||
| Brady Corp., A |
204,079 | 6,236,654 | ||||||||
| Cintas Corp. |
194,675 | 19,103,458 | ||||||||
| Matthews International Corp., A |
251,442 | 13,990,233 | ||||||||
|
|
|
|||||||||
| 67,758,771 | ||||||||||
|
|
|
|||||||||
| Consumer Durables & Apparel 2.4% |
||||||||||
| Leggett & Platt Inc. |
332,800 | 17,009,408 | ||||||||
| NIKE Inc., B |
445,100 | 24,569,520 | ||||||||
|
|
|
|||||||||
| 41,578,928 | ||||||||||
|
|
|
|||||||||
| Consumer Services 1.8% |
||||||||||
| McDonald’s Corp. |
207,045 | 24,915,795 | ||||||||
| Yum! Brands Inc. |
72,900 | 6,044,868 | ||||||||
|
|
|
|||||||||
| 30,960,663 | ||||||||||
|
|
|
|||||||||
| Diversified Financials 0.3% |
||||||||||
| State Street Corp. |
110,500 | 5,958,160 | ||||||||
|
|
|
|||||||||
| Energy 7.4% |
||||||||||
| Chevron Corp. |
290,700 | 30,474,081 | ||||||||
| EOG Resources Inc. |
33,600 | 2,802,912 | ||||||||
| Exxon Mobil Corp. |
358,500 | 33,605,790 | ||||||||
| Occidental Petroleum Corp. |
370,790 | 28,016,892 | ||||||||
| Schlumberger Ltd. |
398,000 | 31,473,840 | ||||||||
|
|
|
|||||||||
| 126,373,515 | ||||||||||
|
|
|
|||||||||
| Food & Staples Retailing 4.4% |
||||||||||
| CVS Health Corp. |
203,000 | 19,435,220 | ||||||||
| Wal-Mart Stores Inc. |
381,800 | 27,879,036 | ||||||||
| Walgreens Boots Alliance Inc. |
326,000 | 27,146,020 | ||||||||
|
|
|
|||||||||
| 74,460,276 | ||||||||||
|
|
|
|||||||||
| Food, Beverage & Tobacco 6.1% |
||||||||||
| Archer-Daniels-Midland Co. |
713,000 | 30,580,570 | ||||||||
| Bunge Ltd. |
307,700 | 18,200,455 | ||||||||
| McCormick & Co. Inc. |
208,900 | 22,283,363 | ||||||||
| PepsiCo Inc. |
308,500 | 32,682,490 | ||||||||
|
|
|
|||||||||
| 103,746,878 | ||||||||||
|
|
|
|||||||||
| Health Care Equipment & Services 12.9% |
||||||||||
| Abbott Laboratories |
641,800 | 25,229,158 | ||||||||
| Becton, Dickinson and Co. |
295,400 | 50,096,886 | ||||||||
| DENTSPLY SIRONA Inc. |
4,000 | 248,160 | ||||||||
| Medtronic PLC |
602,000 | 52,235,540 | ||||||||
| Stryker Corp. |
420,200 | 50,352,566 | ||||||||
| Semiannual Report | FRD-9 |
FRANKLIN TEMPLETON VARIABLE INSURANCE PRODUCTS TRUST
STATEMENT OF INVESTMENTS (UNAUDITED)
Franklin Rising Dividends VIP Fund (continued)
| Shares | Value | |||||||||
| Common Stocks (continued) |
||||||||||
| Health Care Equipment & Services (continued) |
||||||||||
| West Pharmaceutical Services Inc. |
567,318 | $ | 43,048,090 | |||||||
|
|
|
|||||||||
| 221,210,400 | ||||||||||
|
|
|
|||||||||
| Household & Personal Products 2.9% |
||||||||||
| Colgate-Palmolive Co. |
191,000 | 13,981,200 | ||||||||
| The Procter & Gamble Co. |
415,300 | 35,163,451 | ||||||||
|
|
|
|||||||||
| 49,144,651 | ||||||||||
|
|
|
|||||||||
| Industrial Conglomerates 3.9% |
||||||||||
| Carlisle Cos. Inc. |
101,061 | 10,680,127 | ||||||||
| Roper Technologies Inc. |
333,043 | 56,803,814 | ||||||||
|
|
|
|||||||||
| 67,483,941 | ||||||||||
|
|
|
|||||||||
| Insurance 5.3% |
||||||||||
| Aflac Inc. |
276,200 | 19,930,592 | ||||||||
| Arthur J. Gallagher & Co. |
660,000 | 31,416,000 | ||||||||
| Erie Indemnity Co., A |
277,385 | 27,555,426 | ||||||||
| Old Republic International Corp. |
449,208 | 8,665,222 | ||||||||
| RLI Corp. |
41,300 | 2,840,614 | ||||||||
|
|
|
|||||||||
| 90,407,854 | ||||||||||
|
|
|
|||||||||
| Machinery 7.8% |
||||||||||
| Donaldson Co. Inc. |
350,068 | 12,028,337 | ||||||||
| Dover Corp. |
771,976 | 53,513,376 | ||||||||
| Hillenbrand Inc. |
888,300 | 26,684,532 | ||||||||
| Pentair PLC (United Kingdom) |
704,800 | 41,082,792 | ||||||||
|
|
|
|||||||||
| 133,309,037 | ||||||||||
|
|
|
|||||||||
| Materials 12.2% |
||||||||||
| Air Products and Chemicals Inc. |
364,000 | 51,702,560 | ||||||||
| Albemarle Corp. |
706,700 | 56,048,377 | ||||||||
| Bemis Co. Inc. |
147,499 | 7,594,723 | ||||||||
| Ecolab Inc. |
115,600 | 13,710,160 | ||||||||
| Nucor Corp. |
447,055 | 22,088,988 | ||||||||
| Praxair Inc. |
506,460 | 56,921,039 | ||||||||
|
|
|
|||||||||
| 208,065,847 | ||||||||||
|
|
|
|||||||||
| Media 0.9% |
||||||||||
| John Wiley & Sons Inc., A |
310,700 | 16,212,326 | ||||||||
|
|
|
|||||||||
| Pharmaceuticals, Biotechnology & Life Sciences 6.3% |
||||||||||
| AbbVie Inc. |
300,800 | 18,622,528 | ||||||||
| Johnson & Johnson |
381,800 | 46,312,340 | ||||||||
| Perrigo Co. PLC |
208,500 | 18,904,695 | ||||||||
| Pfizer Inc. |
669,700 | 23,580,137 | ||||||||
| Roche Holding AG, ADR (Switzerland) |
25,000 | 823,750 | ||||||||
|
|
|
|||||||||
| 108,243,450 | ||||||||||
|
|
|
|||||||||
| Retailing 2.3% |
||||||||||
| The Gap Inc. |
556,300 | 11,804,686 | ||||||||
| Ross Stores Inc. |
174,300 | 9,881,067 | ||||||||
| Target Corp. |
100,800 | 7,037,856 | ||||||||
| Tiffany & Co. |
161,500 | 9,793,360 | ||||||||
|
|
|
|||||||||
| 38,516,969 | ||||||||||
|
|
|
|||||||||
| FRD-10 | Semiannual Report |
FRANKLIN TEMPLETON VARIABLE INSURANCE PRODUCTS TRUST
STATEMENT OF INVESTMENTS (UNAUDITED)
Franklin Rising Dividends VIP Fund (continued)
| Shares | Value | |||||||||
| Common Stocks (continued) |
||||||||||
| Semiconductors & Semiconductor Equipment 2.9% |
||||||||||
| Linear Technology Corp. |
375,000 | $ | 17,448,750 | |||||||
| QUALCOMM Inc. |
210,300 | 11,265,771 | ||||||||
| Texas Instruments Inc. |
347,200 | 21,752,080 | ||||||||
|
|
|
|||||||||
| 50,466,601 | ||||||||||
|
|
|
|||||||||
| Software & Services 4.6% |
||||||||||
| Accenture PLC, A |
202,000 | 22,884,580 | ||||||||
| Microsoft Corp. |
1,107,900 | 56,691,243 | ||||||||
|
|
|
|||||||||
| 79,575,823 | ||||||||||
|
|
|
|||||||||
| Trading Companies & Distributors 0.4% |
||||||||||
| W.W. Grainger Inc. |
28,100 | 6,385,725 | ||||||||
|
|
|
|||||||||
| Transportation 0.4% |
||||||||||
| United Parcel Service Inc., B |
55,900 | 6,021,548 | ||||||||
|
|
|
|||||||||
| Total Common Stocks (Cost $997,198,060) |
1,668,572,207 | |||||||||
|
|
|
|||||||||
| Short Term Investments (Cost $42,377,646) 2.5% |
||||||||||
| Money Market Funds 2.5% |
||||||||||
| a,b | Institutional Fiduciary Trust Money Market Portfolio |
42,377,646 | 42,377,646 | |||||||
|
|
|
|||||||||
| Total Investments (Cost $1,039,575,706) 100.0% |
1,710,949,853 | |||||||||
| Other Assets, less Liabilities (0.0)%† |
(133,591 | ) | ||||||||
|
|
|
|||||||||
| Net Assets 100.0% |
$ | 1,710,816,262 | ||||||||
|
|
|
|||||||||
See Abbreviations on page FRD-20.
†Rounds to less than 0.1% of net assets.
aNon-income producing.
bSee Note 3(e) regarding investments in affiliated management investment companies.
| The accompanying notes are an integral part of these financial statements. | Semiannual Report | FRD-11 |
FRANKLIN TEMPLETON VARIABLE INSURANCE PRODUCTS TRUST
Financial Statements
Statement of Assets and Liabilities
June 30, 2016 (unaudited)
| Franklin Rising Dividends VIP Fund |
||||
| Assets: |
||||
| Investments in securities: |
||||
| Cost - Unaffiliated issuers |
$ | 997,198,060 | ||
| Cost - Non-controlled affiliates (Note 3e) |
42,377,646 | |||
|
|
|
|||
| Total cost of investments |
$ | 1,039,575,706 | ||
|
|
|
|||
| Value - Unaffiliated issuers |
$ | 1,668,572,207 | ||
| Value - Non-controlled affiliates (Note 3e) |
42,377,646 | |||
|
|
|
|||
| Total value of investments |
1,710,949,853 | |||
| Receivables: |
||||
| Capital shares sold |
727,638 | |||
| Dividends |
2,080,600 | |||
| Other assets |
662 | |||
|
|
|
|||
| Total assets |
1,713,758,753 | |||
|
|
|
|||
| Liabilities: |
||||
| Payables: |
||||
| Capital shares redeemed |
1,322,632 | |||
| Management fees |
834,652 | |||
| Distribution fees |
632,986 | |||
| Accrued expenses and other liabilities |
152,221 | |||
|
|
|
|||
| Total liabilities |
2,942,491 | |||
|
|
|
|||
| Net assets, at value |
$ | 1,710,816,262 | ||
|
|
|
|||
| Net assets consist of: |
||||
| Paid-in capital |
$ | 999,791,522 | ||
| Undistributed net investment income |
11,352,134 | |||
| Net unrealized appreciation (depreciation) |
671,374,147 | |||
| Accumulated net realized gain (loss) |
28,298,459 | |||
|
|
|
|||
| Net assets, at value |
$ | 1,710,816,262 | ||
|
|
|
|||
| Class 1: | ||||
| Net assets, at value |
$ | 173,215,641 | ||
|
|
|
|||
| Shares outstanding |
7,176,527 | |||
|
|
|
|||
| Net asset value and maximum offering price per share |
$ | 24.14 | ||
|
|
|
|||
| Class 2: | ||||
| Net assets, at value |
$ | 1,513,384,354 | ||
|
|
|
|||
| Shares outstanding |
64,177,767 | |||
|
|
|
|||
| Net asset value and maximum offering price per share |
$ | 23.58 | ||
|
|
|
|||
| Class 4: | ||||
| Net assets, at value |
$ | 24,216,267 | ||
|
|
|
|||
| Shares outstanding |
1,022,765 | |||
|
|
|
|||
| Net asset value and maximum offering price per share |
$ | 23.68 | ||
|
|
|
|||
| FRD-12 | Semiannual Report | The accompanying notes are an integral part of these financial statements. |
FRANKLIN TEMPLETON VARIABLE INSURANCE PRODUCTS TRUST
FINANCIAL STATEMENTS
Statement of Operations
for the six months ended June 30, 2016 (unaudited)
| Franklin Rising Dividends VIP Fund |
||||
| Investment income: |
||||
| Dividends |
$ | 17,805,404 | ||
|
|
|
|||
| Expenses: |
||||
| Management fees (Note 3a) |
4,796,393 | |||
| Distribution fees: (Note 3c) |
||||
| Class 2 |
1,710,039 | |||
| Class 4 |
36,700 | |||
| Custodian fees (Note 4) |
6,285 | |||
| Reports to shareholders |
95,519 | |||
| Professional fees |
26,737 | |||
| Trustees’ fees and expenses |
3,792 | |||
| Other |
14,814 | |||
|
|
|
|||
| Total expenses |
6,690,279 | |||
| Expenses waived/paid by affiliates (Note 3e) |
(68,753 | ) | ||
|
|
|
|||
| Net expenses |
6,621,526 | |||
|
|
|
|||
| Net investment income |
11,183,878 | |||
|
|
|
|||
| Realized and unrealized gains (losses): |
||||
| Net realized gain (loss) from: |
||||
| Investments |
28,396,610 | |||
| Foreign currency transactions |
(295 | ) | ||
|
|
|
|||
| Net realized gain (loss) |
28,396,315 | |||
|
|
|
|||
| Net change in unrealized appreciation (depreciation) on investments |
111,088,473 | |||
|
|
|
|||
| Net realized and unrealized gain (loss) |
139,484,788 | |||
|
|
|
|||
| Net increase (decrease) in net assets resulting from operations |
$ | 150,668,666 | ||
|
|
|
|||
| The accompanying notes are an integral part of these financial statements. | Semiannual Report | FRD-13 |
FRANKLIN TEMPLETON VARIABLE INSURANCE PRODUCTS TRUST
FINANCIAL STATEMENTS
Statements of Changes in Net Assets
| Franklin Rising Dividends VIP Fund | ||||||||
| Six Months Ended June 30, 2016 (unaudited) |
Year Ended December 31, 2015 |
|||||||
| Increase (decrease) in net assets: |
||||||||
| Operations: |
||||||||
| Net investment income |
$ | 11,183,878 | $ | 23,865,895 | ||||
| Net realized gain (loss) |
28,396,315 | 200,231,316 | ||||||
| Net change in unrealized appreciation (depreciation) |
111,088,473 | (288,246,073 | ) | |||||
|
|
|
|||||||
| Net increase (decrease) in net assets resulting from operations |
150,668,666 | (64,148,862 | ) | |||||
|
|
|
|||||||
| Distributions to shareholders from: |
||||||||
| Net investment income: |
||||||||
| Class 1 |
(2,718,521 | ) | (2,507,451 | ) | ||||
| Class 2 |
(20,665,957 | ) | (22,189,853 | ) | ||||
| Class 4 |
(304,600 | ) | (275,517 | ) | ||||
| Net realized gains: |
||||||||
| Class 1 |
(19,761,965 | ) | (15,606,236 | ) | ||||
| Class 2 |
(177,746,238 | ) | (164,222,373 | ) | ||||
| Class 4 |
(2,696,441 | ) | (2,002,122 | ) | ||||
|
|
|
|||||||
| Total distributions to shareholders |
(223,893,722 | ) | (206,803,552 | ) | ||||
|
|
|
|||||||
| Capital share transactions: (Note 2) |
||||||||
| Class 1 |
35,543,569 | 6,114,953 | ||||||
| Class 2 |
269,153,106 | (112,317,852 | ) | |||||
| Class 4 |
4,732,993 | 7,967,834 | ||||||
|
|
|
|||||||
| Total capital share transactions |
309,429,668 | (98,235,065 | ) | |||||
|
|
|
|||||||
| Net increase (decrease) in net assets |
236,204,612 | (369,187,479 | ) | |||||
| Net assets: |
||||||||
| Beginning of period |
1,474,611,650 | 1,843,799,129 | ||||||
|
|
|
|||||||
| End of period |
$ | 1,710,816,262 | $ | 1,474,611,650 | ||||
|
|
|
|||||||
| Undistributed net investment income included in net assets: |
||||||||
| End of period |
$ | 11,352,134 | $ | 23,857,334 | ||||
|
|
|
|||||||
| FRD-14 | Semiannual Report | The accompanying notes are an integral part of these financial statements. |
FRANKLIN TEMPLETON VARIABLE INSURANCE PRODUCTS TRUST
Notes to Financial Statements (unaudited)
Franklin Rising Dividends VIP Fund
| Semiannual Report | FRD-15 |
FRANKLIN TEMPLETON VARIABLE INSURANCE PRODUCTS TRUST
NOTES TO FINANCIAL STATEMENTS (UNAUDITED)
Franklin Rising Dividends VIP Fund (continued)
1. Organization and Significant Accounting Policies (continued)
a. Financial Instrument Valuation (continued)
These price movements are measured against established trigger thresholds for each specific market proxy to assist in determining if an event has occurred that may call into question the reliability of the values of the foreign securities held by the Fund. If such an event occurs, the securities may be valued using fair value procedures, which may include the use of independent pricing services.
When the last day of the reporting period is a non-business day, certain foreign markets may be open on those days that the NYSE is closed, which could result in differences between the value of the Fund’s portfolio securities on the last business day and the last calendar day of the reporting period. Any significant security valuation changes due to an open foreign market are adjusted and reflected by the Fund for financial reporting purposes.
b. Foreign Currency Translation
Portfolio securities and other assets and liabilities denominated in foreign currencies are translated into U.S. dollars based on the exchange rate of such currencies against U.S. dollars on the date of valuation. The Fund may enter into foreign currency exchange contracts to facilitate transactions denominated in a foreign currency. Purchases and sales of securities, income and expense items denominated in foreign currencies are translated into U.S. dollars at the exchange rate in effect on the transaction date. Portfolio securities and assets and liabilities denominated in foreign currencies contain risks that those currencies will decline in value relative to the U.S. dollar. Occasionally, events may impact the availability or reliability of foreign exchange rates used to convert the U.S. dollar equivalent value. If such an event occurs, the foreign exchange rate will be valued at fair value using procedures established and approved by the Board.
The Fund does not separately report the effect of changes in foreign exchange rates from changes in market prices on securities held. Such changes are included in net realized and unrealized gain or loss from investments in the Statement of Operations.
Realized foreign exchange gains or losses arise from sales of foreign currencies, currency gains or losses realized between the trade and settlement dates on securities transactions and the
difference between the recorded amounts of dividends, interest, and foreign withholding taxes and the U.S. dollar equivalent of the amounts actually received or paid. Net unrealized foreign exchange gains and losses arise from changes in foreign exchange rates on foreign denominated assets and liabilities other than investments in securities held at the end of the reporting period.
c. Income and Deferred Taxes
It is the Fund’s policy to qualify as a regulated investment company under the Internal Revenue Code. The Fund intends to distribute to shareholders substantially all of its taxable income and net realized gains to relieve it from federal income and if applicable, excise taxes. As a result, no provision for U.S. federal income taxes is required.
The Fund may be subject to foreign taxation related to income received, capital gains on the sale of securities and certain foreign currency transactions in the foreign jurisdictions in which it invests. Foreign taxes, if any, are recorded based on the tax regulations and rates that exist in the foreign markets in which the Fund invests. When a capital gain tax is determined to apply, the Fund records an estimated deferred tax liability in an amount that would be payable if the securities were disposed of on the valuation date.
The Fund may recognize an income tax liability related to its uncertain tax positions under U.S. GAAP when the uncertain tax position has a less than 50% probability that it will be sustained upon examination by the tax authorities based on its technical merits. As of June 30, 2016, the Fund has determined that no tax liability is required in its financial statements related to uncertain tax positions for any open tax years (or expected to be taken in future tax years). Open tax years are those that remain subject to examination and are based on each tax jurisdiction’s statute of limitation.
d. Security Transactions, Investment Income, Expenses and Distributions
Security transactions are accounted for on trade date. Realized gains and losses on security transactions are determined on a specific identification basis. Estimated expenses are accrued daily. Dividend income is recorded on the ex-dividend date except for certain dividends from foreign securities where the dividend rate is not available. In such cases, the dividend is recorded as soon as the information is received by the Fund.
| FRD-16 | Semiannual Report |
FRANKLIN TEMPLETON VARIABLE INSURANCE PRODUCTS TRUST
NOTES TO FINANCIAL STATEMENTS (UNAUDITED)
Franklin Rising Dividends VIP Fund (continued)
2. Shares of Beneficial Interest
At June 30, 2016, there were an unlimited number of shares authorized (without par value). Transactions in the Fund’s shares were as follows:
| Six Months Ended June 30, 2016 |
Year Ended December 31, 2015 |
|||||||||||||||||
| Shares | Amount | Shares | Amount | |||||||||||||||
| Class 1 Shares: | ||||||||||||||||||
| Shares sold |
1,036,049 | $ | 25,362,123 | 379,085 | $ | 9,885,431 | ||||||||||||
| Shares issued in reinvestment of distributions |
944,162 | 22,480,486 | 689,257 | 18,113,687 | ||||||||||||||
| Shares redeemed |
(480,135 | ) | (12,299,040 | ) | (808,697 | ) | (21,884,165 | ) | ||||||||||
|
|
|
|||||||||||||||||
| Net increase (decrease) |
1,500,076 | $ | 35,543,569 | 259,645 | $ | 6,114,953 | ||||||||||||
|
|
|
|||||||||||||||||
| Class 2 Shares: | ||||||||||||||||||
| Shares sold |
7,138,983 | $ | 182,931,863 | 4,959,597 | $ | 130,929,237 | ||||||||||||
| Shares issued in reinvestment of distributions |
8,526,523 | 198,412,195 | 7,239,310 | 186,412,226 | ||||||||||||||
| Shares redeemed |
(4,512,098 | ) | (112,190,952 | ) | (16,563,559 | ) | (429,659,315 | ) | ||||||||||
|
|
|
|||||||||||||||||
| Net increase (decrease) |
11,153,408 | $ | 269,153,106 | (4,364,652 | ) | $ | (112,317,852 | ) | ||||||||||
|
|
|
|||||||||||||||||
| Class 4 Shares: | ||||||||||||||||||
| Shares sold |
160,992 | $ | 4,041,048 | 322,291 | $ | 8,758,972 | ||||||||||||
| Shares issued in reinvestment of distributions |
128,469 | 3,001,041 | 88,076 | 2,277,639 | ||||||||||||||
| Shares redeemed |
(91,042 | ) | (2,309,096 | ) | (117,097 | ) | (3,068,777 | ) | ||||||||||
|
|
|
|||||||||||||||||
| Net increase (decrease) |
198,419 | $ | 4,732,993 | 293,270 | $ | 7,967,834 | ||||||||||||
|
|
|
|||||||||||||||||
| Semiannual Report | FRD-17 |
FRANKLIN TEMPLETON VARIABLE INSURANCE PRODUCTS TRUST
NOTES TO FINANCIAL STATEMENTS (UNAUDITED)
Franklin Rising Dividends VIP Fund (continued)
3. Transactions With Affiliates
Franklin Resources, Inc. is the holding company for various subsidiaries that together are referred to as Franklin Templeton Investments. Certain officers and trustees of the Fund are also officers and/or directors of the following subsidiaries:
| Subsidiary | Affiliation | |
| Franklin Advisory Services, LLC (Advisory Services) |
Investment manager | |
| Franklin Templeton Services, LLC (FT Services) |
Administrative manager | |
| Franklin Templeton Distributors, Inc. (Distributors) |
Principal underwriter | |
| Franklin Templeton Investor Services, LLC (Investor Services) |
Transfer agent |
a. Management Fees
The Fund pays an investment management fee to Advisory Services based on the average daily net assets of the Fund as follows:
| Annualized Fee Rate | Net Assets | |
| 0.750% |
Up to and including $500 million | |
| 0.625% |
Over $500 million, up to and including $1 billion | |
| 0.500% |
In excess of $1 billion |
For the period ended June 30, 2016, the annualized effective investment management fee rate was 0.620% of the Fund’s average daily net assets.
b. Administrative Fees
Under an agreement with Advisory Services, FT Services provides administrative services to the Fund. The fee is paid by Advisory Services based on the Fund’s average daily net assets, and is not an additional expense of the Fund.
c. Distribution Fees
The Board has adopted distribution plans for Class 2 and Class 4 shares pursuant to Rule 12b-1 under the 1940 Act. Under the Fund’s compensation distribution plans, the Fund pays Distributors for costs incurred in connection with the servicing, sale and distribution of the Fund’s shares up to 0.35% per year of its average daily net assets of each class. The Board has agreed to limit the current rate to 0.25% per year for Class 2. The plan year, for purposes of monitoring compliance with the maximum annual plan rates, is February 1 through January 31.
d. Transfer Agent Fees
Investor Services, under terms of an agreement, performs shareholder servicing for the Fund and is not paid by the Fund for the services.
e. Investments in Affiliated Management Investment Companies
The Fund invests in one or more affiliated management investment companies for purposes other than exercising a controlling influence over the management or policies. Management fees paid by the Fund are waived on assets invested in the affiliated management investment companies, as noted in the Statement of Operations, in an amount not to exceed the management and administrative fees paid directly or indirectly by each affiliate. Prior to January 1, 2014, the waiver was accounted for as a reduction to management fees.
| FRD-18 | Semiannual Report |
FRANKLIN TEMPLETON VARIABLE INSURANCE PRODUCTS TRUST
NOTES TO FINANCIAL STATEMENTS (UNAUDITED)
Franklin Rising Dividends VIP Fund (continued)
| Number of Shares Held at Beginning of Period |
Gross Additions |
Gross Reductions |
Number Held at |
Value at End of Period |
Investment Income |
Realized Gain (Loss) |
% of Affiliated Fund Shares Outstanding Held at End of Period |
|||||||||||||||||||||||||
| Non-Controlled Affiliates | ||||||||||||||||||||||||||||||||
| Institutional Fiduciary Trust Money Market Portfolio |
292,061 | 171,295,976 | (129,210,391 | ) | 42,377,646 | $ | 42,377,646 | $ | — | $ | — | 0.2% | ||||||||||||||||||||
|
|
|
|||||||||||||||||||||||||||||||
4. Expense Offset Arrangement
The Fund has entered into an arrangement with its custodian whereby credits realized as a result of uninvested cash balances are used to reduce a portion of the Fund’s custodian expenses. During the period ended June 30, 2016, there were no credits earned.
5. Income Taxes
At June 30, 2016, the cost of investments and net unrealized appreciation (depreciation) for income tax purposes were as follows:
| Cost of investments |
$ | 1,039,627,088 | ||
|
|
|
|||
| Unrealized appreciation |
$ | 703,297,133 | ||
| Unrealized depreciation |
(31,974,368 | ) | ||
|
|
|
|||
| Net unrealized appreciation (depreciation) |
$ | 671,322,765 | ||
|
|
|
Differences between income and/or capital gains as determined on a book basis and a tax basis are primarily due to differing treatment of wash sales.
6. Investment Transactions
Purchases and sales of investments (excluding short term securities) for the period ended June 30, 2016, aggregated $135,059,575 and $56,433,669, respectively.
7. Credit Facility
The Fund, together with other U.S. registered and foreign investment funds (collectively, Borrowers), managed by Franklin Templeton Investments, are borrowers in a joint syndicated senior unsecured credit facility totaling $2 billion (Global Credit Facility) which matures on February 10, 2017. This Global Credit Facility provides a source of funds to the Borrowers for temporary and emergency purposes, including the ability to meet future unanticipated or unusually large redemption requests.
Under the terms of the Global Credit Facility, the Fund shall, in addition to interest charged on any borrowings made by the Fund and other costs incurred by the Fund, pay its share of fees and expenses incurred in connection with the implementation and maintenance of the Global Credit Facility, based upon its relative share of the aggregate net assets of all of the Borrowers, including an annual commitment fee of 0.07% based upon the unused portion of the Global Credit Facility. Effective February 12, 2016, the annual commitment fee is 0.15%. These fees are reflected in other expenses in the Statement of Operations. During the period ended June 30, 2016, the Fund did not use the Global Credit Facility.
| Semiannual Report | FRD-19 |
FRANKLIN TEMPLETON VARIABLE INSURANCE PRODUCTS TRUST
NOTES TO FINANCIAL STATEMENTS (UNAUDITED)
Franklin Rising Dividends VIP Fund (continued)
8. Fair Value Measurements
The Fund follows a fair value hierarchy that distinguishes between market data obtained from independent sources (observable inputs) and the Fund’s own market assumptions (unobservable inputs). These inputs are used in determining the value of the Fund’s financial instruments and are summarized in the following fair value hierarchy:
| • | Level 1 – quoted prices in active markets for identical financial instruments |
| • | Level 2 – other significant observable inputs (including quoted prices for similar financial instruments, interest rates, prepayment speed, credit risk, etc.) |
| • | Level 3 – significant unobservable inputs (including the Fund’s own assumptions in determining the fair value of financial instruments) |
The input levels are not necessarily an indication of the risk or liquidity associated with financial instruments at that level.
For movements between the levels within the fair value hierarchy, the Fund has adopted a policy of recognizing the transfers as of the date of the underlying event which caused the movement.
At June 30, 2016, all of the Fund’s investments in financial instruments carried at fair value were valued using Level 1 inputs. For detailed categories, see the accompanying Statement of Investments.
9. Subsequent Events
The Fund has evaluated subsequent events through the issuance of the financial statements and determined that no events have occurred that require disclosure.
Abbreviations
| Selected Portfolio | ||
| ADR | American Depositary Receipt | |
| FRD-20 | Semiannual Report |
Franklin Small Cap Value VIP Fund
We are pleased to bring you Franklin Small Cap Value VIP Fund’s semiannual report for the period ended June 30, 2016.
Class 1 Performance Summary as of June 30, 2016
The Fund’s Class 1 shares delivered a +11.34% total return* for the six-month period ended June 30, 2016.
*The Fund has a fee waiver associated with any investment in a Franklin Templeton money fund and/or Franklin Templeton fund, as applicable, contractually guaranteed through at least the Fund’s current fiscal year-end. Fund investment results reflect the fee waiver, to the extent applicable; without this reduction, the results would have been lower.
Performance reflects the Fund’s Class 1 operating expenses, but does not include any contract fees, expenses or sales charges. If they had been included, performance would be lower. These charges and deductions, particularly for variable life policies, can have a significant effect on contract values and insurance benefits. See the contract prospectus for a complete description of these expenses, including sales charges.
Performance data represent past performance, which does not guarantee future results. Investment return and principal value will fluctuate, and you may have a gain or loss when you sell your shares. Current performance may differ from figures shown.
| Semiannual Report | FSV-1 |
FRANKLIN SMALL CAP VALUE VIP FUND
1. Source: Morningstar. One cannot invest directly in an index, and an index is not representative of the Fund’s portfolio. Please see Index Descriptions following the Fund Summaries.
2. Source: Bureau of Labor Statistics.
3. Please see Index Descriptions following the Fund Summaries.
| FSV-2 | Semiannual Report |
FRANKLIN SMALL CAP VALUE VIP FUND
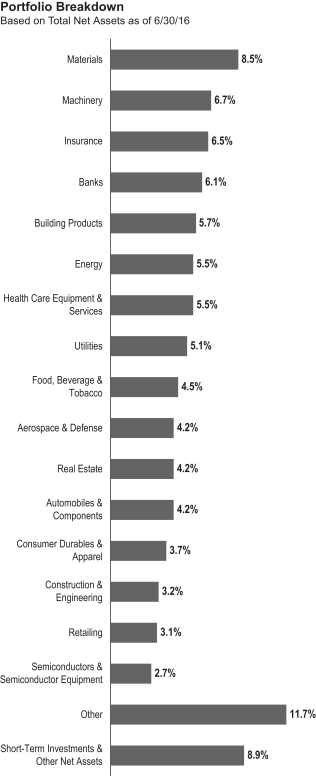
| Semiannual Report | FSV-3 |
FRANKLIN SMALL CAP VALUE VIP FUND
| Top 10 Holdings | ||||
| 6/30/16 | ||||
| Company Sector/Industry |
% of Total Net Assets |
|||
| Maple Leaf Foods Inc. (Canada) Food, Beverage & Tobacco |
2.8% | |||
| LTC Properties Inc. Real Estate |
2.7% | |||
| IDACORP Inc. Utilities |
2.6% | |||
| Spire Inc. Utilities |
2.4% | |||
| Astec Industries Inc. Machinery |
2.4% | |||
| Sensient Technologies Corp. Materials |
2.4% | |||
| Drew Industries Inc. Automobiles & Components |
2.2% | |||
| Universal Forest Products Inc. Building Products |
2.1% | |||
| AAR Corp. Aerospace & Defense |
2.1% | |||
| Carlisle Cos. Inc. Industrial Conglomerates |
2.0% | |||
The dollar value, number of shares or principal amount, and names of all portfolio holdings are listed in the Fund’s Statement of Investments.
environment and ongoing expenses related to U.S. Food and Drug Administration compliance issues at one of its plants.
During the period, we initiated several positions including Cubic, a transit and defense systems provider; Spirit Airlines, an airline operator; and Brinker International, a restaurant operator. The Fund also added to holdings including Lakeland Financial, a bank; Esterline Technologies, a specialized manufacturing company serving the aerospace and defense markets; and Brandywine Realty, a real estate investment trust; among several others. Conversely, we exited some positions including the aforementioned Axiall, StanCorp Financial and Ingram Micro. We reduced our positions in Regal Beloit, La-Z-Boy and Teleflex, among others.
Thank you for your continued participation in Franklin Small Cap Value VIP Fund. We look forward to serving your future investment needs.
The foregoing information reflects our analysis, opinions and portfolio holdings as of June 30, 2016, the end of the reporting period. The way we implement our main investment strategies and the resulting portfolio holdings may change depending on factors such as market and economic conditions. These opinions may not be relied upon as investment advice or an offer for a particular security. The information is not a complete analysis of every aspect of any market, country, industry, security or the Fund. Statements of fact are from sources considered reliable, but the investment manager makes no representation or warranty as to their completeness or accuracy. Although historical performance is no guarantee of future results, these insights may help you understand our investment management philosophy.
| FSV-4 | Semiannual Report |
FRANKLIN SMALL CAP VALUE VIP FUND
Class 1 Fund Expenses
| Class 1 | Beginning Account Value 1/1/16 |
Ending Account Value 6/30/16 |
Fund-Level Expenses Incurred During Period* 1/1/16–6/30/16 |
|||||||||
| Actual |
$ | 1,000 | $ | 1,113.40 | $ | 3.36 | ||||||
| Hypothetical (5% return before expenses) |
$ | 1,000 | $ | 1,021.68 | $ | 3.22 | ||||||
*Expenses are calculated using the most recent six-month annualized expense ratio, net of expenses waivers, for the Fund’s Class 1 shares (0.64%), which does not include any ongoing expenses of the Contract for which the Fund is an investment option, multiplied by the average account value over the period, multiplied by 182/366 to reflect the one-half year period.
| Semiannual Report | FSV-5 |
SUPPLEMENT DATED JULY 18, 2016
TO THE PROSPECTUSES DATED MAY 1, 2016
OF
FRANKLIN GLOBAL REAL ESTATE VIP FUND
FRANKLIN SMALL CAP VALUE VIP FUND
(Series of Franklin Templeton Variable Insurance Products Trust)
IMPORTANT NOTICE REGARDING CHANGE IN INVESTMENT POLICY
The prospectus of Franklin Small Cap Value VIP Fund is amended as follows:
I. The first paragraph under the “FUND SUMMARIES” – “Principal Investment Strategies” section, on page FSV-S1, is replaced with the following:
Under normal market conditions, the Fund invests at least 80% of its net assets in investments of small-capitalization (small-cap) companies. Small-cap companies are companies with market capitalizations (the total market value of a company’s outstanding stock) under $3.5 billion at the time of purchase. Effective September 30, 2016, the definition of small-cap companies will be revised to read as follows: Small-cap companies are companies with market capitalizations (the total market value of a company’s outstanding stock) not exceeding either: 1) the highest market capitalization in the Russell 2000 Index; or 2) the 12-month average of the highest market capitalization in the Russell 2000 Index, whichever is greater, at the time of purchase. As of May 31, 2016, the highest market capitalization in the Russell 2000 Index was $5.96 billion.
II. The “Performance” section, on page FSV-S3, is revised to add the following:
| 1 Year | 5 Years | 10 Years | ||||||||||
| Russell 2000 Value Index (index reflects no deduction for fees, expenses or taxes) 1 | -7.47% | 7.67% | 5.58% | |||||||||
| 1. | Performance figures as of December 31, 2015. The Russell 2000 Value Index is replacing the Russell 2500 Value Index as the Fund’s benchmark. The investment manager believes the composition of the Russell 2000 Value Index more accurately reflects the Fund’s holdings. |
No one index is representative of the Fund’s portfolio.
III. Effective September 30, 2016, the first paragraph under the “FUND DETAILS” – “Principal Investment Policies and Practices” section on page FSV D-1 is replaced with the following:
Under normal market conditions, the Fund invests at least 80% of its net assets in investments of small-capitalization (small-cap) companies. Shareholders will be given at least 60 days’ advance notice of any change to this 80% policy. Small-cap companies are companies with market capitalizations (the total market value of a company’s outstanding stock) under $3.5 billion at the time of purchase. Effective September 30, 2016, the definition of small-cap companies will be revised to read as follows: Under normal market conditions, the Fund invests at least 80% of its net assets in investments of small-capitalization (small-cap) companies. Small-cap companies are companies with market capitalizations (the total market value of a company’s outstanding stock) not exceeding either: 1) the highest market capitalization in the Russell 2000 Index; or 2) the 12-month average of the highest market capitalization
| FSV-6 |
in the Russell 2000 Index, whichever is greater, at the time of purchase. As of May 31, 2016, the highest market capitalization in the Russell 2000 Index was $5.96 billion.
The prospectus of Franklin Global Real Estate VIP Fund is amended as follows:
The “FUND DETAILS” – “Management” section, on page FGR D-6, is revised to show the address of Franklin Templeton Institutional, LLC (FT Institutional) as 280 Park Avenue, New York, NY 10017.
Please keep this supplement with your prospectuses for future reference.
| FSV-7 |
FRANKLIN TEMPLETON VARIABLE INSURANCE PRODUCTS TRUST
Financial Highlights
Franklin Small Cap Value VIP Fund
| Six Months Ended (unaudited) |
Year Ended December 31, | |||||||||||||||||||||||
| 2015 | 2014 | 2013 | 2012 | 2011 | ||||||||||||||||||||
| Class 1 | ||||||||||||||||||||||||
| Per share operating performance (for a share outstanding throughout the period) |
||||||||||||||||||||||||
| Net asset value, beginning of period |
$18.12 | $22.81 | $24.54 | $18.58 | $15.82 | $16.55 | ||||||||||||||||||
|
|
|
|||||||||||||||||||||||
| Income from investment operationsa: | ||||||||||||||||||||||||
| Net investment incomeb |
0.08 | 0.21 | 0.19 | 0.19 | 0.29 | c | 0.16 | |||||||||||||||||
| Net realized and unrealized gains (losses) |
1.93 | (1.53 | ) | 0.06 | 6.45 | 2.64 | (0.74 | ) | ||||||||||||||||
|
|
|
|||||||||||||||||||||||
| Total from investment operations |
2.01 | (1.32 | ) | 0.25 | 6.64 | 2.93 | (0.58 | ) | ||||||||||||||||
|
|
|
|||||||||||||||||||||||
| Less distributions from: | ||||||||||||||||||||||||
| Net investment income |
(0.21 | ) | (0.20 | ) | (0.20 | ) | (0.32 | ) | (0.17 | ) | (0.15 | ) | ||||||||||||
| Net realized gains |
(2.92 | ) | (3.17 | ) | (1.78 | ) | (0.36 | ) | — | — | ||||||||||||||
|
|
|
|||||||||||||||||||||||
| Total distributions |
(3.13 | ) | (3.37 | ) | (1.98 | ) | (0.68 | ) | (0.17 | ) | (0.15 | ) | ||||||||||||
|
|
|
|||||||||||||||||||||||
| Net asset value, end of period |
$17.00 | $18.12 | $22.81 | $24.54 | $18.58 | $15.82 | ||||||||||||||||||
|
|
|
|||||||||||||||||||||||
| Total returnd |
11.34% | (7.18)% | 0.88% | 36.50% | 18.75% | (3.53)% | ||||||||||||||||||
| Ratios to average net assetse | ||||||||||||||||||||||||
| Expenses before waiver and payments by affiliates |
0.67% | 0.65% | 0.63% | 0.63% | 0.67% | 0.66% | ||||||||||||||||||
| Expenses net of waiver and payments by affiliates |
0.64% | 0.64% | f | 0.63% | f,g | 0.63% | 0.67% | 0.66% | ||||||||||||||||
| Net investment income |
0.88% | 1.04% | 0.82% | 0.90% | 1.70% | c | 1.02% | |||||||||||||||||
| Supplemental data | ||||||||||||||||||||||||
| Net assets, end of period (000’s) |
$49,070 | $45,897 | $57,843 | $62,408 | $40,133 | $39,374 | ||||||||||||||||||
| Portfolio turnover rate |
18.06% | 27.05% | 19.45% | 10.44% | 5.84% | 14.39% | ||||||||||||||||||
aThe amount shown for a share outstanding throughout the period may not correlate with the Statement of Operations for the period due to the timing of sales and repurchases of the Fund’s shares in relation to income earned and/or fluctuating fair value of the investments of the Fund.
bBased on average daily shares outstanding.
cNet investment income per share includes approximately $0.10 per share related to income received in the form of special dividends in connection with certain fund holdings. Excluding this amount, the ratio of net investment income to average net assets would have been 1.10%.
dTotal return does not include fees, charges or expenses imposed by the variable annuity and life insurance contracts for which Franklin Templeton Variable Insurance Products Trust serves as an underlying investment vehicle. Total return is not annualized for periods less than one year.
eRatios are annualized for periods less than one year.
fBenefit of expense reduction rounds to less than 0.01%.
gBenefit of waiver and payments by affiliates rounds to less than 0.01%.
| FSV-8 | Semiannual Report | The accompanying notes are an integral part of these financial statements. |
FRANKLIN TEMPLETON VARIABLE INSURANCE PRODUCTS TRUST
FINANCIAL HIGHLIGHTS
Franklin Small Cap Value VIP Fund (continued)
| Six Months Ended (unaudited) |
Year Ended December 31, | |||||||||||||||||||||||
| 2015 | 2014 | 2013 | 2012 | 2011 | ||||||||||||||||||||
| Class 2 | ||||||||||||||||||||||||
| Per share operating performance (for a share outstanding throughout the period) |
||||||||||||||||||||||||
| Net asset value, beginning of period |
$17.68 | $22.32 | $24.07 | $18.23 | $15.53 | $16.25 | ||||||||||||||||||
|
|
|
|||||||||||||||||||||||
| Income from investment operationsa: | ||||||||||||||||||||||||
| Net investment incomeb |
0.06 | 0.16 | 0.13 | 0.14 | 0.24 | c | 0.12 | |||||||||||||||||
| Net realized and unrealized gains (losses) |
1.88 | (1.49 | ) | 0.05 | 6.34 | 2.59 | (0.73 | ) | ||||||||||||||||
|
|
|
|||||||||||||||||||||||
| Total from investment operations |
1.94 | (1.33 | ) | 0.18 | 6.48 | 2.83 | (0.61 | ) | ||||||||||||||||
|
|
|
|||||||||||||||||||||||
| Less distributions from: | ||||||||||||||||||||||||
| Net investment income |
(0.16 | ) | (0.14 | ) | (0.15 | ) | (0.28 | ) | (0.13 | ) | (0.11 | ) | ||||||||||||
| Net realized gains |
(2.92 | ) | (3.17 | ) | (1.78 | ) | (0.36 | ) | — | — | ||||||||||||||
|
|
|
|||||||||||||||||||||||
| Total distributions |
(3.08 | ) | (3.31 | ) | (1.93 | ) | (0.64 | ) | (0.13 | ) | (0.11 | ) | ||||||||||||
|
|
|
|||||||||||||||||||||||
| Net asset value, end of period |
$16.54 | $17.68 | $22.32 | $24.07 | $18.23 | $15.53 | ||||||||||||||||||
|
|
|
|||||||||||||||||||||||
| Total returnd |
11.22% | (7.39)% | 0.57% | 36.24% | 18.39% | (3.76)% | ||||||||||||||||||
| Ratios to average net assetse | ||||||||||||||||||||||||
| Expenses before waiver and payments by affiliates |
0.92% | 0.90% | 0.88% | 0.88% | 0.92% | 0.91% | ||||||||||||||||||
| Expenses net of waiver and payments by affiliates |
0.89% | 0.89% | f | 0.88% | f,g | 0.88% | 0.92% | 0.91% | ||||||||||||||||
| Net investment income |
0.63% | 0.79% | 0.57% | 0.65% | 1.45% | c | 0.77% | |||||||||||||||||
| Supplemental data | ||||||||||||||||||||||||
| Net assets, end of period (000’s) |
$1,243,228 | $1,172,173 | $1,445,325 | $1,606,802 | $1,286,573 | $1,211,168 | ||||||||||||||||||
| Portfolio turnover rate |
18.06% | 27.05% | 19.45% | 10.44% | 5.84% | 14.39% | ||||||||||||||||||
aThe amount shown for a share outstanding throughout the period may not correlate with the Statement of Operations for the period due to the timing of sales and repurchases of the Fund’s shares in relation to income earned and/or fluctuating fair value of the investments of the Fund.
bBased on average daily shares outstanding.
cNet investment income per share includes approximately $0.10 per share related to income received in the form of special dividends in connection with certain fund holdings. Excluding this amount, the ratio of net investment income to average net assets would have been 0.85%.
dTotal return does not include fees, charges or expenses imposed by the variable annuity and life insurance contracts for which Franklin Templeton Variable Insurance Products Trust serves as an underlying investment vehicle. Total return is not annualized for periods less than one year.
eRatios are annualized for periods less than one year.
fBenefit of expense reduction rounds to less than 0.01%.
gBenefit of waiver and payments by affiliates rounds to less than 0.01%.
| The accompanying notes are an integral part of these financial statements. | Semiannual Report | FSV-9 |
FRANKLIN TEMPLETON VARIABLE INSURANCE PRODUCTS TRUST
FINANCIAL HIGHLIGHTS
Franklin Small Cap Value VIP Fund (continued)
| Six Months Ended (unaudited) |
Year Ended December 31, | |||||||||||||||||||||||
| 2015 | 2014 | 2013 | 2012 | 2011 | ||||||||||||||||||||
| Class 4 | ||||||||||||||||||||||||
| Per share operating performance (for a share outstanding throughout the period) |
||||||||||||||||||||||||
| Net asset value, beginning of period |
$17.96 | $22.63 | $24.37 | $18.44 | $15.71 | $16.44 | ||||||||||||||||||
|
|
|
|||||||||||||||||||||||
| Income from investment operationsa: | ||||||||||||||||||||||||
| Net investment incomeb |
0.05 | 0.14 | 0.11 | 0.12 | 0.22 | c | 0.11 | |||||||||||||||||
| Net realized and unrealized gains (losses) |
1.92 | (1.52 | ) | 0.05 | 6.42 | 2.63 | (0.75 | ) | ||||||||||||||||
|
|
|
|||||||||||||||||||||||
| Total from investment operations |
1.97 | (1.38 | ) | 0.16 | 6.54 | 2.85 | (0.64 | ) | ||||||||||||||||
|
|
|
|||||||||||||||||||||||
| Less distributions from: | ||||||||||||||||||||||||
| Net investment income |
(0.14 | ) | (0.12 | ) | (0.12 | ) | (0.25 | ) | (0.12 | ) | (0.09 | ) | ||||||||||||
| Net realized gains |
(2.92 | ) | (3.17 | ) | (1.78 | ) | (0.36 | ) | — | — | ||||||||||||||
|
|
|
|||||||||||||||||||||||
| Total distributions |
(3.06 | ) | (3.29 | ) | (1.90 | ) | (0.61 | ) | (0.12 | ) | (0.09 | ) | ||||||||||||
|
|
|
|||||||||||||||||||||||
| Net asset value, end of period |
$16.87 | $17.96 | $22.63 | $24.37 | $18.44 | $15.71 | ||||||||||||||||||
|
|
|
|||||||||||||||||||||||
| Total returnd |
11.20% | (7.52)% | 0.48% | 36.12% | 18.27% | (3.87)% | ||||||||||||||||||
| Ratios to average net assetse | ||||||||||||||||||||||||
| Expenses before waiver and payments by affiliates |
1.02% | 1.00% | 0.98% | 0.98% | 1.02% | 1.01% | ||||||||||||||||||
| Expenses net of waiver and payments by affiliates |
0.99% | 0.99% | f | 0.98% | f,g | 0.98% | 1.02% | 1.01% | ||||||||||||||||
| Net investment income |
0.53% | 0.69% | 0.47% | 0.55% | 1.35% | c | 0.67% | |||||||||||||||||
| Supplemental data | ||||||||||||||||||||||||
| Net assets, end of period (000’s) |
$27,397 | $26,128 | $30,452 | $35,936 | $32,424 | $34,284 | ||||||||||||||||||
| Portfolio turnover rate |
18.06% | 27.05% | 19.45% | 10.44% | 5.84% | 14.39% | ||||||||||||||||||
aThe amount shown for a share outstanding throughout the period may not correlate with the Statement of Operations for the period due to the timing of sales and repurchases of the Fund’s shares in relation to income earned and/or fluctuating fair value of the investments of the Fund.
bBased on average daily shares outstanding.
cNet investment income per share includes approximately $0.10 per share related to income received in the form of special dividends in connection with certain fund holdings. Excluding this amount, the ratio of net investment income to average net assets would have been 0.75%.
dTotal return does not include fees, charges or expenses imposed by the variable annuity and life insurance contracts for which Franklin Templeton Variable Insurance Products Trust serves as an underlying investment vehicle. Total return is not annualized for periods less than one year.
eRatios are annualized for periods less than one year.
fBenefit of expense reduction rounds to less than 0.01%.
gBenefit of waiver and payments by affiliates rounds to less than 0.01%.
| FSV-10 | Semiannual Report | The accompanying notes are an integral part of these financial statements. |
FRANKLIN TEMPLETON VARIABLE INSURANCE PRODUCTS TRUST
Statement of Investments, June 30, 2016 (unaudited)
| Franklin Small Cap Value VIP Fund
|
||||||||||
| Shares | Value | |||||||||
| Common Stocks 90.5% |
||||||||||
| Aerospace & Defense 4.2% |
||||||||||
| AAR Corp. |
1,209,300 | $ | 28,225,062 | |||||||
| Cubic Corp. |
397,200 | 15,951,552 | ||||||||
| a | Esterline Technologies Corp. |
185,900 | 11,533,236 | |||||||
|
|
|
|||||||||
| 55,709,850 | ||||||||||
|
|
|
|||||||||
| Automobiles & Components 4.2% |
||||||||||
| Drew Industries Inc. |
335,700 | 28,480,788 | ||||||||
| Gentex Corp. |
440,700 | 6,808,815 | ||||||||
| Thor Industries Inc. |
251,900 | 16,308,006 | ||||||||
| Winnebago Industries Inc. |
149,000 | 3,415,080 | ||||||||
|
|
|
|||||||||
| 55,012,689 | ||||||||||
|
|
|
|||||||||
| Banks 6.1% |
||||||||||
| BNC Bancorp. |
327,646 | 7,440,841 | ||||||||
| Chemical Financial Corp. |
591,154 | 22,044,132 | ||||||||
| Columbia Banking System Inc. |
453,000 | 12,711,180 | ||||||||
| EverBank Financial Corp. |
783,400 | 11,641,324 | ||||||||
| Lakeland Financial Corp. |
362,200 | 17,027,022 | ||||||||
| Peoples Bancorp Inc. |
257,000 | 5,600,030 | ||||||||
| TrustCo Bank Corp. NY |
684,300 | 4,386,363 | ||||||||
|
|
|
|||||||||
| 80,850,892 | ||||||||||
|
|
|
|||||||||
| Building Products 5.7% |
||||||||||
| a | Armstrong Flooring Inc. |
240,600 | 4,078,170 | |||||||
| a | Gibraltar Industries Inc. |
496,800 | 15,683,976 | |||||||
| Griffon Corp. |
436,600 | 7,361,076 | ||||||||
| Insteel Industries Inc. |
82,400 | 2,355,816 | ||||||||
| Simpson Manufacturing Co. Inc. |
433,400 | 17,322,998 | ||||||||
| Universal Forest Products Inc. |
306,888 | 28,445,449 | ||||||||
|
|
|
|||||||||
| 75,247,485 | ||||||||||
|
|
|
|||||||||
| Commercial & Professional Services 2.5% |
||||||||||
| a | Huron Consulting Group Inc. |
171,300 | 10,349,946 | |||||||
| McGrath RentCorp |
488,218 | 14,934,588 | ||||||||
| MSA Safety Inc. |
153,113 | 8,043,026 | ||||||||
|
|
|
|||||||||
| 33,327,560 | ||||||||||
|
|
|
|||||||||
| Construction & Engineering 3.2% |
||||||||||
| Argan Inc. |
12,200 | 508,984 | ||||||||
| EMCOR Group Inc. |
338,000 | 16,649,880 | ||||||||
| Granite Construction Inc. |
561,900 | 25,594,545 | ||||||||
|
|
|
|||||||||
| 42,753,409 | ||||||||||
|
|
|
|||||||||
| Consumer Durables & Apparel 3.7% |
||||||||||
| a | BRP Inc. (Canada) |
824,200 | 13,184,904 | |||||||
| Brunswick Corp. |
49,900 | 2,261,468 | ||||||||
| a | Crocs Inc. |
1,318,000 | 14,867,040 | |||||||
| Hooker Furniture Corp. |
179,000 | 3,846,710 | ||||||||
| La-Z-Boy Inc. |
296,500 | 8,248,630 | ||||||||
| a | M/I Homes Inc. |
376,300 | 7,085,729 | |||||||
|
|
|
|||||||||
| 49,494,481 | ||||||||||
|
|
|
|||||||||
| Consumer Services 0.8% |
||||||||||
| Brinker International Inc. |
246,300 | 11,214,039 | ||||||||
|
|
|
|||||||||
| Semiannual Report | FSV-11 |
FRANKLIN TEMPLETON VARIABLE INSURANCE PRODUCTS TRUST
STATEMENT OF INVESTMENTS (UNAUDITED)
Franklin Small Cap Value VIP Fund (continued)
| Shares | Value | |||||||||
| Common Stocks (continued) |
||||||||||
| Electrical Equipment 2.0% |
||||||||||
| EnerSys |
280,110 | $ | 16,658,142 | |||||||
| Regal Beloit Corp. |
167,500 | 9,220,875 | ||||||||
|
|
|
|||||||||
| 25,879,017 | ||||||||||
|
|
|
|||||||||
| Energy 4.9% |
||||||||||
| Energen Corp. |
280,107 | 13,503,958 | ||||||||
| a | Helix Energy Solutions Group Inc. |
599,600 | 4,053,296 | |||||||
| Hunting PLC (United Kingdom) |
2,086,200 | 13,352,348 | ||||||||
| a | Natural Gas Services Group Inc. |
51,800 | 1,186,220 | |||||||
| a | Oil States International Inc. |
567,900 | 18,672,552 | |||||||
| a | Unit Corp. |
940,700 | 14,637,292 | |||||||
|
|
|
|||||||||
| 65,405,666 | ||||||||||
|
|
|
|||||||||
| Food, Beverage & Tobacco 4.5% |
||||||||||
| AGT Food and Ingredients Inc. (Canada) |
116,600 | 3,202,642 | ||||||||
| Dairy Crest Group PLC (United Kingdom) |
484,804 | 3,474,602 | ||||||||
| GrainCorp Ltd. (Australia) |
408,300 | 2,628,275 | ||||||||
| a | Landec Corp. |
848,600 | 9,130,936 | |||||||
| Maple Leaf Foods Inc. (Canada) |
1,704,400 | 36,393,775 | ||||||||
| a | Omega Protein Corp. |
222,700 | 4,451,773 | |||||||
|
|
|
|||||||||
| 59,282,003 | ||||||||||
|
|
|
|||||||||
| Health Care Equipment & Services 5.5% |
||||||||||
| Hill-Rom Holdings Inc. |
407,400 | 20,553,330 | ||||||||
| Invacare Corp. |
213,300 | 2,587,329 | ||||||||
| STERIS PLC |
357,500 | 24,578,125 | ||||||||
| Teleflex Inc. |
141,900 | 25,160,289 | ||||||||
|
|
|
|||||||||
| 72,879,073 | ||||||||||
|
|
|
|||||||||
| Industrial Conglomerates 2.0% |
||||||||||
| Carlisle Cos. Inc. |
245,400 | 25,933,872 | ||||||||
|
|
|
|||||||||
| Insurance 6.5% |
||||||||||
| Arthur J. Gallagher & Co. |
168,200 | 8,006,320 | ||||||||
| Aspen Insurance Holdings Ltd. |
466,400 | 21,631,632 | ||||||||
| Endurance Specialty Holdings Ltd. |
116,300 | 7,810,708 | ||||||||
| The Hanover Insurance Group Inc. |
183,200 | 15,502,384 | ||||||||
| Old Republic International Corp. |
877,800 | 16,932,762 | ||||||||
| Validus Holdings Ltd. |
317,800 | 15,441,902 | ||||||||
|
|
|
|||||||||
| 85,325,708 | ||||||||||
|
|
|
|||||||||
| Machinery 6.7% |
||||||||||
| Astec Industries Inc. |
561,900 | 31,550,685 | ||||||||
| Franklin Electric Co. Inc. |
134,464 | 4,444,035 | ||||||||
| Hillenbrand Inc. |
277,500 | 8,336,100 | ||||||||
| b | Lindsay Corp. |
132,800 | 9,011,808 | |||||||
| Mueller Industries Inc. |
692,700 | 22,083,276 | ||||||||
| Mueller Water Products Inc., A |
860,100 | 9,822,342 | ||||||||
| Watts Water Technologies Inc., A |
55,000 | 3,204,300 | ||||||||
|
|
|
|||||||||
| 88,452,546 | ||||||||||
|
|
|
|||||||||
| Materials 8.5% |
||||||||||
| A Schulman Inc. |
4,766 | 116,386 | ||||||||
| AptarGroup Inc. |
65,000 | 5,143,450 | ||||||||
| Carpenter Technology Corp. |
164,800 | 5,426,864 | ||||||||
| FSV-12 | Semiannual Report |
FRANKLIN TEMPLETON VARIABLE INSURANCE PRODUCTS TRUST
STATEMENT OF INVESTMENTS (UNAUDITED)
Franklin Small Cap Value VIP Fund (continued)
| Shares | Value | |||||||||
| Common Stocks (continued) |
||||||||||
| Materials (continued) |
||||||||||
| a | Detour Gold Corp. (Canada) |
700,700 | $ | 17,526,990 | ||||||
| H.B. Fuller Co. |
513,640 | 22,595,024 | ||||||||
| Minerals Technologies Inc. |
106,100 | 6,026,480 | ||||||||
| OceanaGold Corp. (Australia) |
2,871,800 | 10,957,336 | ||||||||
| RPM International Inc. |
147,900 | 7,387,605 | ||||||||
| Sensient Technologies Corp. |
443,800 | 31,527,552 | ||||||||
| Stepan Co. |
86,600 | 5,155,298 | ||||||||
|
|
|
|||||||||
| 111,862,985 | ||||||||||
|
|
|
|||||||||
| Pharmaceuticals, Biotechnology & Life Sciences 1.9% |
||||||||||
| Gerresheimer AG (Germany) |
336,000 | 25,729,351 | ||||||||
|
|
|
|||||||||
| Real Estate 4.2% |
||||||||||
| Brandywine Realty Trust |
1,151,700 | 19,348,560 | ||||||||
| LTC Properties Inc. |
689,800 | 35,683,354 | ||||||||
|
|
|
|||||||||
| 55,031,914 | ||||||||||
|
|
|
|||||||||
| Retailing 3.1% |
||||||||||
| Caleres Inc. |
430,400 | 10,419,984 | ||||||||
| The Cato Corp., A |
366,200 | 13,813,064 | ||||||||
| a | Genesco Inc. |
174,708 | 11,235,471 | |||||||
| a | West Marine Inc. |
610,700 | 5,123,773 | |||||||
|
|
|
|||||||||
| 40,592,292 | ||||||||||
|
|
|
|||||||||
| Semiconductors & Semiconductor Equipment 2.7% |
||||||||||
| Cohu Inc. |
736,000 | 7,985,600 | ||||||||
| MKS Instruments Inc. |
458,400 | 19,738,704 | ||||||||
| a | Photronics Inc. |
840,800 | 7,491,528 | |||||||
|
|
|
|||||||||
| 35,215,832 | ||||||||||
|
|
|
|||||||||
| Software & Services 0.7% |
||||||||||
| Mentor Graphics Corp. |
408,900 | 8,693,214 | ||||||||
|
|
|
|||||||||
| Telecommunication Services 0.1% |
||||||||||
| a | ORBCOMM Inc. |
175,900 | 1,750,205 | |||||||
|
|
|
|||||||||
| Transportation 1.7% |
||||||||||
| a | SAIA Inc. |
368,000 | 9,251,520 | |||||||
| a | Spirit Airlines Inc. |
284,600 | 12,770,002 | |||||||
|
|
|
|||||||||
| 22,021,522 | ||||||||||
|
|
|
|||||||||
| Utilities 5.1% |
||||||||||
| Connecticut Water Service Inc. |
29,200 | 1,641,040 | ||||||||
| IDACORP Inc. |
412,689 | 33,572,250 | ||||||||
| Spire Inc. |
452,000 | 32,019,680 | ||||||||
|
|
|
|||||||||
| 67,232,970 | ||||||||||
|
|
|
|||||||||
| Total Common Stocks (Cost $903,759,714) |
1,194,898,575 | |||||||||
|
|
|
|||||||||
| Principal Amount | ||||||||||
| Corporate Bonds (Cost $9,106,623) 0.6% |
||||||||||
| Energy 0.6% |
||||||||||
| Unit Corp., senior sub. note, 6.625%, 5/15/21 |
$ | 9,632,000 | 7,488,880 | |||||||
|
|
|
|||||||||
| Total Investments before Short Term Investments (Cost $912,866,337) |
1,202,387,455 | |||||||||
|
|
|
|||||||||
| Semiannual Report | FSV-13 |
FRANKLIN TEMPLETON VARIABLE INSURANCE PRODUCTS TRUST
STATEMENT OF INVESTMENTS (UNAUDITED)
Franklin Small Cap Value VIP Fund (continued)
| Shares | Value | |||||||||
| Short Term Investments 9.4% |
||||||||||
| Money Market Funds (Cost $118,437,435) 9.0% |
||||||||||
| a,c | Institutional Fiduciary Trust Money Market Portfolio |
118,437,435 | $ | 118,437,435 | ||||||
|
|
|
|||||||||
| d | Investments from Cash Collateral Received for Loaned Securities 0.4% |
|
||||||||
| Money Market Funds (Cost $4,833,000) 0.3% |
||||||||||
| a,c | Institutional Fiduciary Trust Money Market Portfolio |
4,833,000 | 4,833,000 | |||||||
|
|
|
|||||||||
| Principal Amount | ||||||||||
| Repurchase Agreements (Cost $1,208,821) 0.1% |
||||||||||
| e | Joint Repurchase Agreement, 0.40%, 7/01/16 (Maturity Value $1,208,834) |
$ | 1,208,821 | 1,208,821 | ||||||
| BNP Paribas Securities Corp. |
||||||||||
| Collateralized by fU.S. Treasury Bill, 10/27/16; U.S. Treasury Bond, 8.75% - 9.00%, 11/15/18 - 5/15/20; U.S. Treasury Note, 0.363% - 4.75%, 9/15/16 - 3/31/21; U.S. Treasury Note, Index Linked, 2.625%, 7/15/17; and U.S. Treasury Strips, 8/15/16 - 2/15/21 (valued at $1,232,998) |
||||||||||
|
|
|
|||||||||
| Total Investments from Cash Collateral Received for Loaned Securities (Cost $6,041,821) |
6,041,821 | |||||||||
|
|
|
|||||||||
| Total Investments (Cost $1,037,345,593) 100.5% |
1,326,866,711 | |||||||||
| Other Assets, less Liabilities (0.5)% |
(7,171,548 | ) | ||||||||
|
|
|
|||||||||
| Net Assets 100.0% |
$ | 1,319,695,163 | ||||||||
|
|
|
|||||||||
aNon-income producing.
bA portion or all of the security is on loan at June 30, 2016. See Note 1(d).
cSee Note 3(e) regarding investments in affiliated management investment companies.
dSee Note 1(d) regarding securities on loan.
eSee Note 1(c) regarding joint repurchase agreement.
fThe security is traded on a discount basis with no stated coupon rate.
| FSV-14 | Semiannual Report | The accompanying notes are an integral part of these financial statements. |
FRANKLIN TEMPLETON VARIABLE INSURANCE PRODUCTS TRUST
Financial Statements
Statement of Assets and Liabilities
June 30, 2016 (unaudited)
| Franklin Small VIP Fund |
||||
| Assets: |
||||
| Investments in securities: |
||||
| Cost - Unaffiliated issuers |
$ | 912,866,337 | ||
| Cost - Non-controlled affiliates (Note 3e) |
123,270,435 | |||
| Cost - Repurchase agreements |
1,208,821 | |||
|
|
|
|||
| Total cost of investments |
$ | 1,037,345,593 | ||
|
|
|
|||
| Value - Unaffiliated issuers |
$ | 1,202,387,455 | ||
| Value - Non-controlled affiliates (Note 3e) |
123,270,435 | |||
| Value - Repurchase agreements |
1,208,821 | |||
|
|
|
|||
| Total value of investments (Includes securities loaned in the amount of $5,835,960) |
1,326,866,711 | |||
| Receivables: |
||||
| Investment securities sold |
1,683,518 | |||
| Capital shares sold |
295,150 | |||
| Dividends and interest |
732,797 | |||
| Other assets |
550 | |||
|
|
|
|||
| Total assets |
1,329,578,726 | |||
|
|
|
|||
| Liabilities: |
||||
| Payables: |
||||
| Investment securities purchased |
1,377,885 | |||
| Capital shares redeemed |
1,124,980 | |||
| Management fees |
647,235 | |||
| Distribution fees |
521,659 | |||
| Payable upon return of securities loaned |
6,041,821 | |||
| Accrued expenses and other liabilities |
169,983 | |||
|
|
|
|||
| Total liabilities |
9,883,563 | |||
|
|
|
|||
| Net assets, at value |
$ | 1,319,695,163 | ||
|
|
|
|||
| Net assets consist of: |
||||
| Paid-in capital |
$ | 989,821,505 | ||
| Undistributed net investment income |
4,257,803 | |||
| Net unrealized appreciation (depreciation) |
289,513,430 | |||
| Accumulated net realized gain (loss) |
36,102,425 | |||
|
|
|
|||
| Net assets, at value |
$ | 1,319,695,163 | ||
|
|
|
|||
| Class 1: | ||||
| Net assets, at value |
$ | 49,069,903 | ||
|
|
|
|||
| Shares outstanding |
2,886,310 | |||
|
|
|
|||
| Net asset value and maximum offering price per share |
$ | 17.00 | ||
|
|
|
|||
| Class 2: | ||||
| Net assets, at value |
$ | 1,243,228,035 | ||
|
|
|
|||
| Shares outstanding |
75,171,623 | |||
|
|
|
|||
| Net asset value and maximum offering price per share |
$ | 16.54 | ||
|
|
|
|||
| Class 4: | ||||
| Net assets, at value |
$ | 27,397,225 | ||
|
|
|
|||
| Shares outstanding |
1,623,966 | |||
|
|
|
|||
| Net asset value and maximum offering price per share |
$ | 16.87 | ||
|
|
|
|||
| The accompanying notes are an integral part of these financial statements. | Semiannual Report | FSV-15 |
FRANKLIN TEMPLETON VARIABLE INSURANCE PRODUCTS TRUST
FINANCIAL STATEMENTS
Statement of Operations
for the six months ended June 30, 2016 (unaudited)
| Franklin Small Cap Value VIP Fund |
||||
| Investment income: |
||||
| Dividends |
$ | 8,917,088 | ||
| Interest |
360,339 | |||
| Income from securities loaned (net of fees and rebates) |
90,055 | |||
|
|
|
|||
| Total investment income |
9,367,482 | |||
|
|
|
|||
| Expenses: |
||||
| Management fees (Note 3a) |
3,909,296 | |||
| Distribution fees: (Note 3c) |
||||
| Class 2 |
1,445,260 | |||
| Class 4 |
44,858 | |||
| Custodian fees (Note 4) |
8,581 | |||
| Reports to shareholders |
125,666 | |||
| Professional fees |
25,171 | |||
| Trustees’ fees and expenses |
3,150 | |||
| Other |
11,641 | |||
|
|
|
|||
| Total expenses |
5,573,623 | |||
| Expenses waived/paid by affiliates (Note 3e) |
(147,166 | ) | ||
|
|
|
|||
| Net expenses |
5,426,457 | |||
|
|
|
|||
| Net investment income |
3,941,025 | |||
|
|
|
|||
| Realized and unrealized gains (losses): |
||||
| Net realized gain (loss) from: |
||||
| Investments |
37,653,256 | |||
| Foreign currency transactions |
(102,440 | ) | ||
|
|
|
|||
| Net realized gain (loss) |
37,550,816 | |||
|
|
|
|||
| Net change in unrealized appreciation (depreciation) on: |
||||
| Investments |
92,102,341 | |||
| Translation of other assets and liabilities denominated in foreign currencies |
(7,306 | ) | ||
|
|
|
|||
| Net change in unrealized appreciation (depreciation) |
92,095,035 | |||
|
|
|
|||
| Net realized and unrealized gain (loss) |
129,645,851 | |||
|
|
|
|||
| Net increase (decrease) in net assets resulting from operations |
$ | 133,586,876 | ||
|
|
|
|||
| FSV-16 | Semiannual Report | The accompanying notes are an integral part of these financial statements. |
FRANKLIN TEMPLETON VARIABLE INSURANCE PRODUCTS TRUST
FINANCIAL STATEMENTS
Statements of Changes in Net Assets
| Franklin Small Cap Value VIP Fund | ||||||||
| Six Months Ended June 30, 2016 (unaudited) |
Year Ended December 31,2015 |
|||||||
| Increase (decrease) in net assets: |
||||||||
| Operations: |
||||||||
| Net investment income |
$ | 3,941,025 | $ | 11,196,499 | ||||
| Net realized gain (loss) |
37,550,816 | 195,958,536 | ||||||
| Net change in unrealized appreciation (depreciation) |
92,095,035 | (310,285,782 | ) | |||||
|
|
|
|||||||
| Net increase (decrease) in net assets resulting from operations |
133,586,876 | (103,130,747 | ) | |||||
|
|
|
|||||||
| Distributions to shareholders from: |
||||||||
| Net investment income: |
||||||||
| Class 1 |
(515,096 | ) | (483,179 | ) | ||||
| Class 2 |
(10,103,275 | ) | (8,399,662 | ) | ||||
| Class 4 |
(189,568 | ) | (155,331 | ) | ||||
| Net realized gains: |
||||||||
| Class 1 |
(7,134,342 | ) | (7,665,840 | ) | ||||
| Class 2 |
(185,669,944 | ) | (193,180,034 | ) | ||||
| Class 4 |
(4,020,473 | ) | (4,250,502 | ) | ||||
|
|
|
|||||||
| Total distributions to shareholders |
(207,632,698 | ) | (214,134,548 | ) | ||||
|
|
|
|||||||
| Capital share transactions: (Note 2) |
||||||||
| Class 1 |
5,767,197 | (165,713 | ) | |||||
| Class 2 |
141,046,017 | 25,699,762 | ||||||
| Class 4 |
2,730,004 | 2,309,001 | ||||||
|
|
|
|||||||
| Total capital share transactions |
149,543,218 | 27,843,050 | ||||||
|
|
|
|||||||
| Net increase (decrease) in net assets |
75,497,396 | (289,422,245 | ) | |||||
| Net assets: |
||||||||
| Beginning of period |
1,244,197,767 | 1,533,620,012 | ||||||
|
|
|
|||||||
| End of period |
$ | 1,319,695,163 | $ | 1,244,197,767 | ||||
|
|
|
|||||||
| Undistributed net investment income included in net assets: |
||||||||
| End of period |
$ | 4,257,803 | $ | 11,124,717 | ||||
|
|
|
|||||||
| The accompanying notes are an integral part of these financial statements. | Semiannual Report | FSV-17 |
FRANKLIN TEMPLETON VARIABLE INSURANCE PRODUCTS TRUST
Notes to Financial Statements (unaudited)
Franklin Small Cap Value VIP Fund
| FSV-18 | Semiannual Report |
FRANKLIN TEMPLETON VARIABLE INSURANCE PRODUCTS TRUST
NOTES TO FINANCIAL STATEMENTS (UNAUDITED)
Franklin Small Cap Value VIP Fund (continued)
| Semiannual Report | FSV-19 |
FRANKLIN TEMPLETON VARIABLE INSURANCE PRODUCTS TRUST
NOTES TO FINANCIAL STATEMENTS (UNAUDITED)
Franklin Small Cap Value VIP Fund (continued)
1. Organization and Significant Accounting Policies (continued)
c. Joint Repurchase Agreement (continued)
by the Fund at period end, as indicated in the Statement of Investments, had been entered into on June 30, 2016.
d. Securities Lending
The Fund participates in an agency based securities lending program to earn additional income. The Fund receives cash collateral against the loaned securities in an amount equal to at least 102% of the fair value of the loaned securities. Collateral is maintained over the life of the loan in an amount not less than 100% of the fair value of loaned securities, as determined at the close of Fund business each day; any additional collateral required due to changes in security values is delivered to the Fund on the next business day. The collateral is deposited into a joint cash account with other funds and is used to invest in a money market fund managed by Franklin Advisers, Inc., an affiliate of the Fund, and/or a joint repurchase agreement. The Fund may receive income from the investment of cash collateral, in addition to lending fees and rebates paid by the borrower. Income from securities loaned, net of fees paid to the securities lending agent and/or third-party vendor, is reported separately in the Statement of Operations. The Fund bears the market risk with respect to the collateral investment, securities loaned, and the risk that the agent may default on its obligations to the Fund. If the borrower defaults on its obligation to return the securities loaned, the Fund has the right to repurchase the securities in the open market using the collateral received. The securities lending agent has agreed to indemnify the Fund in the event of default by a third party borrower.
e. Income and Deferred Taxes
It is the Fund’s policy to qualify as a regulated investment company under the Internal Revenue Code. The Fund intends to distribute to shareholders substantially all of its taxable income and net realized gains to relieve it from federal income and if applicable, excise taxes. As a result, no provision for U.S. federal income taxes is required.
The Fund may be subject to foreign taxation related to income received, capital gains on the sale of securities and certain foreign currency transactions in the foreign jurisdictions in which it invests. Foreign taxes, if any, are recorded based on the tax regulations and rates that exist in the foreign markets in which
the Fund invests. When a capital gain tax is determined to apply, the Fund records an estimated deferred tax liability in an amount that would be payable if the securities were disposed of on the valuation date.
The Fund may recognize an income tax liability related to its uncertain tax positions under U.S. GAAP when the uncertain tax position has a less than 50% probability that it will be sustained upon examination by the tax authorities based on its technical merits. As of June 30, 2016, the Fund has determined that no tax liability is required in its financial statements related to uncertain tax positions for any open tax years (or expected to be taken in future tax years). Open tax years are those that remain subject to examination and are based on each tax jurisdiction’s statute of limitation.
f. Security Transactions, Investment Income, Expenses and Distributions
Security transactions are accounted for on trade date. Realized gains and losses on security transactions are determined on a specific identification basis. Interest income and estimated expenses are accrued daily. Amortization of premium and accretion of discount on debt securities are included in interest income. Dividend income is recorded on the ex-dividend date except for certain dividends from foreign securities where the dividend rate is not available. In such cases, the dividend is recorded as soon as the information is received by the Fund. Distributions to shareholders are recorded on the ex-dividend date and are determined according to income tax regulations (tax basis). Distributable earnings determined on a tax basis may differ from earnings recorded in accordance with U.S. GAAP. These differences may be permanent or temporary. Permanent differences are reclassified among capital accounts to reflect their tax character. These reclassifications have no impact on net assets or the results of operations. Temporary differences are not reclassified, as they may reverse in subsequent periods.
Common expenses incurred by the Trust are allocated among the Funds based on the ratio of net assets of each Fund to the combined net assets of the Trust. Fund specific expenses are charged directly to the fund that incurred the expense.
Realized and unrealized gains and losses and net investment income, not including class specific expenses, are allocated daily to each class of shares based upon the relative proportion of net assets of each class. Differences in per share distributions, by class, are generally due to differences in class specific expenses.
| FSV-20 | Semiannual Report |
FRANKLIN TEMPLETON VARIABLE INSURANCE PRODUCTS TRUST
NOTES TO FINANCIAL STATEMENTS (UNAUDITED)
Franklin Small Cap Value VIP Fund (continued)
2. Shares of Beneficial Interest
At June 30, 2016, there were an unlimited number of shares authorized (without par value). Transactions in the Fund’s shares were as follows:
| Six Months Ended June 30, 2016 |
Year Ended December 31, 2015 |
|||||||||||||||||||
| Shares | Amount | Shares | Amount | |||||||||||||||||
| Class 1 Shares: | ||||||||||||||||||||
| Shares sold |
69,382 | $ | 1,262,552 | 97,924 | $ | 2,017,340 | ||||||||||||||
| Shares issued in reinvestment of distributions |
456,683 | 7,649,438 | 407,044 | 8,149,019 | ||||||||||||||||
| Shares redeemed |
(173,182 | ) | (3,144,793 | ) | (507,751 | ) | (10,332,072 | ) | ||||||||||||
|
|
|
|||||||||||||||||||
| Net increase (decrease) |
352,883 | $ | 5,767,197 | (2,783 | ) | $ | (165,713 | ) | ||||||||||||
|
|
|
|||||||||||||||||||
| Class 2 Shares: | ||||||||||||||||||||
| Shares sold |
2,756,238 | $ | 49,544,180 | 3,551,318 | $ | 71,764,155 | ||||||||||||||
| Shares issued in reinvestment of distributions |
12,018,000 | 195,773,219 | 10,305,710 | 201,579,696 | ||||||||||||||||
| Shares redeemed |
(5,914,169 | ) | (104,271,382 | ) | (12,288,306 | ) | (247,644,089 | ) | ||||||||||||
|
|
|
|||||||||||||||||||
| Net increase (decrease) |
8,860,069 | $ | 141,046,017 | 1,568,722 | $ | 25,699,762 | ||||||||||||||
|
|
|
|||||||||||||||||||
| Class 4 Shares: | ||||||||||||||||||||
| Shares sold |
122,353 | $ | 2,213,903 | 220,435 | $ | 4,535,105 | ||||||||||||||
| Shares issued in reinvestment of distributions |
253,312 | 4,210,041 | 221,510 | 4,405,833 | ||||||||||||||||
| Shares redeemed |
(206,169 | ) | (3,693,940 | ) | (332,844 | ) | (6,631,937 | ) | ||||||||||||
|
|
|
|||||||||||||||||||
| Net increase (decrease) |
169,496 | $ | 2,730,004 | 109,101 | $ | 2,309,001 | ||||||||||||||
|
|
|
|||||||||||||||||||
3. Transactions With Affiliates
Franklin Resources, Inc. is the holding company for various subsidiaries that together are referred to as Franklin Templeton Investments. Certain officers and trustees of the Fund are also officers and/or directors of the following subsidiaries:
| Subsidiary | Affiliation | |
| Franklin Advisory Services, LLC (Advisory Services) |
Investment manager | |
| Franklin Templeton Services, LLC (FT Services) |
Administrative manager | |
| Franklin Templeton Distributors, Inc. (Distributors) |
Principal underwriter | |
| Franklin Templeton Investor Services, LLC (Investor Services) |
Transfer agent |
| Semiannual Report | FSV-21 |
FRANKLIN TEMPLETON VARIABLE INSURANCE PRODUCTS TRUST
NOTES TO FINANCIAL STATEMENTS (UNAUDITED)
Franklin Small Cap Value VIP Fund (continued)
3. Transactions With Affiliates (continued)
a. Management Fees
The Fund pays an investment management fee to Advisory Services based on the average daily net assets of the Fund as follows:
| Annualized Fee Rate | Net Assets | |
| 0.750% |
Up to and including $200 million | |
| 0.635% |
Over $200 million, up to and including $700 million | |
| 0.600% |
Over $700 million, up to and including $1.2 billion | |
| 0.575% |
Over $1.2 billion, up to and including $1.3 billion | |
| 0.475% |
In excess of $1.3 billion |
For the period ended June 30, 2016, the effective management fee rate was 0.637% of the Fund’s average daily net assets.
b. Administrative Fees
Under an agreement with Advisory Services, FT Services provides administrative services to the Fund. The fee is paid by Advisory Services based on the Fund’s average daily net assets, and is not an additional expense of the Fund.
c. Distribution Fees
The Board has adopted distribution plans for Class 2 and Class 4 shares pursuant to Rule 12b-1 under the 1940 Act. Under the Fund’s compensation distribution plans, the Fund pays Distributors for costs incurred in connection with the servicing, sale and distribution of the Fund’s shares up to 0.35% per year of its average daily net assets of each class. The Board has agreed to limit the current rate to 0.25% per year for Class 2. The plan year, for purposes of monitoring compliance with the maximum annual plan rates, is February 1 through January 31.
d. Transfer Agent Fees
Investor Services, under terms of an agreement, performs shareholder servicing for the Fund and is not paid by the Fund for the services.
e. Investments in Affiliated Management Investment Companies
The Fund invests in one or more affiliated management investment companies for purposes other than exercising a controlling influence over the management or policies. Management fees paid by the Fund are waived on assets invested in the affiliated management investment companies, as noted in the Statement of Operations, in an amount not to exceed the management and administrative fees paid directly or indirectly by each affiliate. Prior to January 1, 2014, the waiver was accounted for as a reduction to management fees.
| Number of Shares Held at Beginning of Period |
Gross Additions |
Gross Reductions |
Number of Shares Held at End of Period |
Value at End of Period |
Investment Income |
Realized Gain (Loss) |
% of Affiliated Fund Shares Outstanding Held at End of Period |
|||||||||||||||||||||||
| Non-Controlled Affiliates | ||||||||||||||||||||||||||||||
| Institutional Fiduciary Trust Money |
103,357,618 | 156,371,810 | (136,458,993 | ) | 123,270,435 | $ | 123,270,435 | $ | — | $ | — | 0.6% | ||||||||||||||||||
|
|
|
|
|
|
|
|||||||||||||||||||||||||
| FSV-22 | Semiannual Report |
FRANKLIN TEMPLETON VARIABLE INSURANCE PRODUCTS TRUST
NOTES TO FINANCIAL STATEMENTS (UNAUDITED)
Franklin Small Cap Value VIP Fund (continued)
4. Expense Offset Arrangement
The Fund has entered into an arrangement with its custodian whereby credits realized as a result of uninvested cash balances are used to reduce a portion of the Fund’s custodian expenses. During the period ended June 30, 2016, there were no credits earned.
5. Income taxes
At June 30, 2016, the cost of investments and net unrealized appreciation (depreciation) for income tax purposes were as follows:
| Cost of investments |
$ | 1,040,055,242 | ||
|
|
|
|||
| Unrealized appreciation |
$ | 349,012,578 | ||
| Unrealized depreciation |
(62,201,109 | ) | ||
|
|
|
|||
| Net unrealized appreciation (depreciation) |
$ | 286,811,469 | ||
|
|
|
Differences between income and/or capital gains as determined on a book basis and a tax basis are primarily due to differing treatments of passive foreign investment company shares and wash sales.
6. Investment Transactions
Purchases and sales of investments (excluding short term securities) for the period ended June 30, 2016, aggregated $207,892,601 and $277,013,252, respectively.
At June 30, 2016, in connection with securities lending transactions, the Fund loaned equity investments and received $6,041,821 of cash collateral. The gross amount of recognized liability for such transactions is included in payable upon return of securities loaned in the Statement of Assets and Liabilities. The agreements can be terminated at any time.
7. Credit Facility
The Fund, together with other U.S. registered and foreign investment funds (collectively, Borrowers), managed by Franklin Templeton Investments, are borrowers in a joint syndicated senior unsecured credit facility totaling $2 billion (Global Credit Facility) which matures on February 10, 2017. This Global Credit Facility provides a source of funds to the Borrowers for temporary and emergency purposes, including the ability to meet future unanticipated or unusually large redemption requests.
Under the terms of the Global Credit Facility, the Fund shall, in addition to interest charged on any borrowings made by the Fund and other costs incurred by the Fund, pay its share of fees and expenses incurred in connection with the implementation and maintenance of the Global Credit Facility, based upon its relative share of the aggregate net assets of all of the Borrowers, including an annual commitment fee of 0.07% based upon the unused portion of the Global Credit Facility. Effective February 12, 2016, the annual commitment fee is 0.15%. These fees are reflected in other expenses in the Statement of Operations. During the period ended June 30, 2016, the Fund did not use the Global Credit Facility.
8. Fair Value Measurements
The Fund follows a fair value hierarchy that distinguishes between market data obtained from independent sources (observable inputs) and the Fund’s own market assumptions (unobservable inputs). These inputs are used in determining the value of the Fund’s financial instruments and are summarized in the following fair value hierarchy:
| • | Level 1 – quoted prices in active markets for identical financial instruments |
| • | Level 2 – other significant observable inputs (including quoted prices for similar financial instruments, interest rates, prepayment speed, credit risk, etc.) |
| • | Level 3 – significant unobservable inputs (including the Fund’s own assumptions in determining the fair value of financial instruments) |
| Semiannual Report | FSV-23 |
FRANKLIN TEMPLETON VARIABLE INSURANCE PRODUCTS TRUST
NOTES TO FINANCIAL STATEMENTS (UNAUDITED)
Franklin Small Cap Value VIP Fund (continued)
8. Fair Value Measurements (continued)
The input levels are not necessarily an indication of the risk or liquidity associated with financial instruments at that level.
For movements between the levels within the fair value hierarchy, the Fund has adopted a policy of recognizing the transfers as of the date of the underlying event which caused the movement.
A summary of inputs used as of June 30, 2016, in valuing the Fund’s assets carried at fair value, is as follows:
| Level 1 | Level 2 | Level 3 | Total | |||||||||||||
| Assets: | ||||||||||||||||
| Investments in Securities |
||||||||||||||||
| Equity Investmentsa |
$ | 1,194,898,575 | $ | — | $ | — | $ | 1,194,898,575 | ||||||||
| Corporate Bonds |
— | 7,488,880 | — | 7,488,880 | ||||||||||||
| Short Term Investments |
123,270,435 | 1,208,821 | — | 124,479,256 | ||||||||||||
|
|
|
|||||||||||||||
| Total Investments in Securities |
$ | 1,318,169,010 | $ | 8,697,701 | $ | — | $ | 1,326,866,711 | ||||||||
|
|
|
|||||||||||||||
aFor detailed categories, see the accompanying Statement of Investments.
9. Subsequent Events
The Fund has evaluated subsequent events through the issuance of the financial statements and determined that no events have occurred that require disclosure.
| FSV-24 | Semiannual Report |
Franklin Small-Mid Cap Growth VIP Fund
This semiannual report for Franklin Small-Mid Cap Growth VIP Fund covers the period ended June 30, 2016.
Class 1 Performance Summary as of June 30, 2016
The Fund’s Class 1 shares had a -0.53% total return* for the six-month period ended June 30, 2016.
*The Fund has a fee waiver associated with any investment in a Franklin Templeton money fund and/or Franklin Templeton fund, as applicable, contractually guaranteed through at least the Fund’s current fiscal year-end. Fund investment results reflect the fee waiver, to the extent applicable; without this reduction, the results would have been lower.
Performance reflects the Fund’s Class 1 operating expenses, but does not include any contract fees, expenses or sales charges. If they had been included, performance would be lower. These charges and deductions, particularly for variable life policies, can have a significant effect on contract values and insurance benefits. See the contract prospectus for a complete description of these expenses, including sales charges.
Performance data represent past performance, which does not guarantee future results. Investment return and principal value will fluctuate, and you may have a gain or loss when you sell your shares. Current performance may differ from figures shown.
| Semiannual Report | FSC-1 |
FRANKLIN SMALL-MID CAP GROWTH VIP FUND
1. Please see Index Descriptions following the Fund Summaries.
2. Source: Morningstar. One cannot invest directly in an index, and an index is not representative of the Fund’s portfolio. Please see Index Descriptions following the Fund Summaries.
3. Bureau of Labor Statistics.
| FSC-2 | Semiannual Report |
FRANKLIN SMALL-MID CAP GROWTH VIP FUND
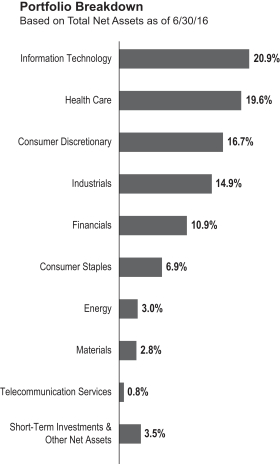
our view. TreeHouse serves an array of customers including Wal-Mart, Safeway and Whole Foods, and near the beginning of the period, expanded its base by acquiring ConAgra’s private brands business at what we believed was an attractive price. In our analysis, this acquisition will benefit TreeHouse for many years. Additionally, during the period the company was able to double its revenue base, broaden its portfolio and ultimately increase its value proposition to retailers. We further believe there are substantial cost and revenue synergies, which are not fully appreciated in consensus expectations.
Other notable contributors to the Fund’s relative performance included oil and natural gas provider Concho Resources and geospatial information products and services provider DigitalGlobe. Concho Resources improved drilling efficiencies during the period. This improvement along with the company’s overall operational performance supported 2017 guidance for double-digit production growth, well above the market’s perceived value. The company continued to be relatively conservative in drilling its
| Semiannual Report | FSC-3 |
FRANKLIN SMALL-MID CAP GROWTH VIP FUND
Thank you for your participation in Franklin Small-Mid Cap Growth VIP Fund. We look forward to serving your future investment needs.
The foregoing information reflects our analysis, opinions and portfolio holdings as of June 30, 2016, the end of the reporting period. The way we implement our main investment strategies and the resulting portfolio holdings may change depending on factors such as market and economic conditions. These opinions may not be relied upon as investment advice or an offer for a particular security. The information is not a complete analysis of every aspect of any market, country, industry, security or the Fund. Statements of fact are from sources considered reliable, but the investment manager makes no representation or warranty as to their completeness or accuracy. Although historical performance is no guarantee of future results, these insights may help you understand our investment management philosophy.
| FSC-4 | Semiannual Report |
FRANKLIN SMALL-MID CAP GROWTH VIP FUND
Class 1 Fund Expenses
| Class 1 | Beginning Account Value 1/1/16 |
Ending Account Value 6/30/16 |
Fund-Level Expenses 1/1/16–6/30/16 |
|||||||||
| Actual |
$ | 1,000 | $ | 994.70 | $ | 4.12 | ||||||
| Hypothetical (5% return before expenses) |
$ | 1,000 | $ | 1,020.74 | $ | 4.17 | ||||||
*Expenses are calculated using the most recent six-month annualized expense ratio, net of expense waivers, for the Fund’s Class 1 shares (0.83%), which does not include any ongoing expenses of the Contract for which the Fund is an investment option, multiplied by the average account value over the period, multiplied by 182/366 to reflect the one-half year period.
| Semiannual Report | FSC-5 |
FRANKLIN TEMPLETON VARIABLE INSURANCE PRODUCTS TRUST
Financial Highlights
Franklin Small-Mid Cap Growth VIP Fund
|
Six Months Ended (unaudited) |
Year Ended December 31, | |||||||||||||||||||||||
| 2015 | 2014 | 2013 | 2012 | 2011 | ||||||||||||||||||||
| Class 1 | ||||||||||||||||||||||||
| Per share operating performance (for a share outstanding throughout the period) |
||||||||||||||||||||||||
| Net asset value, beginning of period |
$19.09 | $24.95 | $28.38 | $21.87 | $21.19 | $22.21 | ||||||||||||||||||
|
|
|
|||||||||||||||||||||||
| Income from investment operationsa: | ||||||||||||||||||||||||
| Net investment income (loss)b |
(0.01 | ) | — | c,d | (0.07 | ) | (0.09 | ) | (0.01 | )e | (0.05 | ) | ||||||||||||
| Net realized and unrealized gains (losses) |
(0.09 | ) | (0.03 | ) | 2.04 | 8.19 | 2.27 | (0.97 | ) | |||||||||||||||
|
|
|
|||||||||||||||||||||||
| Total from investment operations |
(0.10 | ) | (0.03 | ) | 1.97 | 8.10 | 2.26 | (1.02 | ) | |||||||||||||||
|
|
|
|||||||||||||||||||||||
| Less distributions from net realized gains |
(2.06 | ) | (5.83 | ) | (5.40 | ) | (1.59 | ) | (1.58 | ) | — | |||||||||||||
|
|
|
|||||||||||||||||||||||
| Net asset value, end of period |
$16.93 | $19.09 | $24.95 | $28.38 | $21.87 | $21.19 | ||||||||||||||||||
|
|
|
|||||||||||||||||||||||
| Total returnf |
(0.53)% | (2.44)% | 7.78% | 38.50% | 11.12% | (4.59)% | ||||||||||||||||||
| Ratios to average net assetsg | ||||||||||||||||||||||||
| Expenses before waiver and payments by affiliates |
0.84% | 0.81% | 0.80% | 0.80% | 0.80% | 0.79% | ||||||||||||||||||
| Expenses net of waiver and payments by affiliates |
0.83% | h | 0.81% | i | 0.80% | i | 0.80% | h | 0.80% | 0.79% | ||||||||||||||
| Net investment income (loss) |
(0.08)% | 0.01% | d | (0.29)% | (0.35)% | (0.03)% | e | (0.21)% | ||||||||||||||||
| Supplemental data | ||||||||||||||||||||||||
| Net assets, end of period (000’s) |
$81,189 | $87,866 | $99,803 | $98,020 | $75,977 | $76,384 | ||||||||||||||||||
| Portfolio turnover rate |
14.04% | 37.85% | 48.73% | 42.77% | 41.44% | 45.00% | ||||||||||||||||||
aThe amount shown for a share outstanding throughout the period may not correlate with the Statement of Operations for the period due to the timing of sales and repurchases of the Fund’s shares in relation to income earned and/or fluctuating fair value of the investments of the Fund.
bBased on average daily shares outstanding.
cAmount rounds to less than $0.01 per share.
dNet investment income per share includes approximately $0.05 per share related to income received in the form of special dividends in connection with certain Fund holdings. Excluding this amount, the ratio of net investment income to average net assets would have been (0.24)%.
eNet investment income per share includes approximately $0.03 per share related to income received in the form of special dividends in connection with certain Fund holdings. Excluding this amount, the ratio of net investment income to average net assets would have been (0.16)%.
fTotal return does not include fees, charges or expenses imposed by the variable annuity and life insurance contracts for which Franklin Templeton Variable Insurance Products Trust serves as an underlying investment vehicle. Total return is not annualized for periods less than one year.
gRatios are annualized for periods less than one year.
hBenefit of expense reduction rounds to less than 0.01%.
iBenefit of waiver and payments by affiliates rounds to less than 0.01%.
| FSC-6 | Semiannual Report | The accompanying notes are an integral part of these financial statements. |
FRANKLIN TEMPLETON VARIABLE INSURANCE PRODUCTS TRUST
FINANCIAL HIGHLIGHTS
Franklin Small-Mid Cap Growth VIP Fund (continued)
|
Six Months Ended (unaudited) |
Year Ended December 31, | |||||||||||||||||||||||
| 2015 | 2014 | 2013 | 2012 | 2011 | ||||||||||||||||||||
| Class 2 | ||||||||||||||||||||||||
| Per share operating performance (for a share outstanding throughout the period) |
||||||||||||||||||||||||
| Net asset value, beginning of period |
$17.69 | $23.56 | $27.16 | $21.04 | $20.49 | $21.54 | ||||||||||||||||||
|
|
|
|||||||||||||||||||||||
| Income from investment operationsa: | ||||||||||||||||||||||||
| Net investment income (loss)b |
(0.03 | ) | (0.05 | )c | (0.13 | ) | (0.14 | ) | (0.06 | )d | (0.10 | ) | ||||||||||||
| Net realized and unrealized gains (losses) |
(0.08 | ) | 0.01 | 1.93 | 7.85 | 2.19 | (0.95 | ) | ||||||||||||||||
|
|
|
|||||||||||||||||||||||
| Total from investment operations |
(0.11 | ) | (0.04 | ) | 1.80 | 7.71 | 2.13 | (1.05 | ) | |||||||||||||||
|
|
|
|||||||||||||||||||||||
| Less distributions from net realized gains |
(2.06 | ) | (5.83 | ) | (5.40 | ) | (1.59 | ) | (1.58 | ) | — | |||||||||||||
|
|
|
|||||||||||||||||||||||
| Net asset value, end of period |
$15.52 | $17.69 | $23.56 | $27.16 | $21.04 | $20.49 | ||||||||||||||||||
|
|
|
|||||||||||||||||||||||
| Total returne |
(0.63)% | (2.66)% | 7.47% | 38.15% | 10.85% | (4.87)% | ||||||||||||||||||
| Ratios to average net assetsf | ||||||||||||||||||||||||
| Expenses before waiver and payments by affiliates |
1.09% | 1.06% | 1.05% | 1.05% | 1.05% | 1.04% | ||||||||||||||||||
| Expenses net of waiver and payments by affiliates |
1.08% | g | 1.06% | h | 1.05% | h | 1.05% | g | 1.05% | 1.04% | ||||||||||||||
| Net investment income (loss) |
(0.33)% | (0.24)% | c | (0.54)% | (0.60)% | (0.28)% | d | (0.46)% | ||||||||||||||||
| Supplemental data | ||||||||||||||||||||||||
| Net assets, end of period (000’s) |
$447,066 | $478,649 | $582,772 | $660,806 | $670,193 | $717,086 | ||||||||||||||||||
| Portfolio turnover rate |
14.04% | 37.85% | 48.73% | 42.77% | 41.44% | 45.00% | ||||||||||||||||||
aThe amount shown for a share outstanding throughout the period may not correlate with the Statement of Operations for the period due to the timing of sales and repurchases of the Fund’s shares in relation to income earned and/or fluctuating fair value of the investments of the Fund.
bBased on average daily shares outstanding.
cNet investment income per share includes approximately $0.05 per share related to income received in the form of special dividends in connection with certain Fund holdings. Excluding this amount, the ratio of net investment income to average net assets would have been (0.49)%.
dNet investment income per share includes approximately $0.03 per share related to income received in the form of special dividends in connection with certain Fund holdings. Excluding this amount, the ratio of net investment income to average net assets would have been (0.41)%.
eTotal return does not include fees, charges or expenses imposed by the variable annuity and life insurance contracts for which Franklin Templeton Variable Insurance Products Trust serves as an underlying investment vehicle. Total return is not annualized for periods less than one year.
fRatios are annualized for periods less than one year.
gBenefit of expense reduction rounds to less than 0.01%.
hBenefit of waiver and payments by affiliates rounds to less than 0.01%.
| The accompanying notes are an integral part of these financial statements. | Semiannual Report | FSC-7 |
FRANKLIN TEMPLETON VARIABLE INSURANCE PRODUCTS TRUST
FINANCIAL HIGHLIGHTS
Franklin Small-Mid Cap Growth VIP Fund (continued)
| Six Months Ended June 30, 2016 (unaudited) |
Year Ended December 31, | |||||||||||||||||||||||
| 2015 | 2014 | 2013 | 2012 | 2011 | ||||||||||||||||||||
| Class 4 | ||||||||||||||||||||||||
| Per share operating performance (for a share outstanding throughout the period) |
||||||||||||||||||||||||
| Net asset value, beginning of period |
$18.23 | $24.14 | $27.72 | $21.47 | $20.90 | $21.98 | ||||||||||||||||||
|
|
|
|||||||||||||||||||||||
| Income from investment operationsa: | ||||||||||||||||||||||||
| Net investment income (loss)b |
(0.04 | ) | (0.07 | )c | (0.16 | ) | (0.17 | ) | (0.09 | )d | (0.12 | ) | ||||||||||||
| Net realized and unrealized gains (losses) |
(0.09 | ) | (0.01 | ) | 1.98 | 8.01 | 2.24 | (0.96 | ) | |||||||||||||||
|
|
|
|||||||||||||||||||||||
| Total from investment operations |
(0.13 | ) | (0.08 | ) | 1.82 | 7.84 | 2.15 | (1.08 | ) | |||||||||||||||
|
|
|
|||||||||||||||||||||||
| Less distributions from net realized gains |
(2.06 | ) | (5.83 | ) | (5.40 | ) | (1.59 | ) | (1.58 | ) | — | |||||||||||||
|
|
|
|||||||||||||||||||||||
| Net asset value, end of period |
$16.04 | $18.23 | $24.14 | $27.72 | $21.47 | $20.90 | ||||||||||||||||||
|
|
|
|||||||||||||||||||||||
| Total returne |
(0.73)% | (2.77)% | 7.39% | 37.99% | 10.79% | (4.91)% | ||||||||||||||||||
| Ratios to average net assetsf | ||||||||||||||||||||||||
| Expenses before waiver and payments by affiliates |
1.19% | 1.16% | 1.15% | 1.15% | 1.15% | 1.14% | ||||||||||||||||||
| Expenses net of waiver and payments by affiliates |
1.18% | g | 1.16% | h | 1.15% | h | 1.15% | g | 1.15% | 1.14% | ||||||||||||||
| Net investment income (loss) |
(0.43)% | (0.34)% | c | (0.64)% | (0.70)% | (0.38)% | d | (0.56)% | ||||||||||||||||
| Supplemental data | ||||||||||||||||||||||||
| Net assets, end of period (000’s) |
$13,845 | $15,105 | $16,384 | $19,132 | $12,000 | $12,664 | ||||||||||||||||||
| Portfolio turnover rate |
14.04% | 37.85% | 48.73% | 42.77% | 41.44% | 45.00% | ||||||||||||||||||
aThe amount shown for a share outstanding throughout the period may not correlate with the Statement of Operations for the period due to the timing of sales and repurchases of the Fund’s shares in relation to income earned and/or fluctuating fair value of the investments of the Fund.
bBased on average daily shares outstanding.
cNet investment income per share includes approximately $0.05 per share related to income received in the form of special dividends in connection with certain Fund holdings. Excluding this amount, the ratio of net investment income to average net assets would have been (0.59)%.
dNet investment income per share includes approximately $0.03 per share related to income received in the form of special dividends in connection with certain Fund holdings. Excluding this amount, the ratio of net investment income to average net assets would have been (0.51)%.
eTotal return does not include fees, charges or expenses imposed by the variable annuity and life insurance contracts for which Franklin Templeton Variable Insurance Products Trust serves as an underlying investment vehicle. Total return is not annualized for periods less than one year.
fRatios are annualized for periods less than one year.
gBenefit of expense reduction rounds to less than 0.01%.
hBenefit of waiver and payments by affiliates rounds to less than 0.01%.
| FSC-8 | Semiannual Report | The accompanying notes are an integral part of these financial statements. |
FRANKLIN TEMPLETON VARIABLE INSURANCE PRODUCTS TRUST
Statement of Investments, June 30, 2016 (unaudited)
| Franklin Small-Mid Cap Growth VIP Fund
|
||||||||||
| Shares | Value | |||||||||
| Common Stocks 96.2% |
||||||||||
| Consumer Discretionary 16.4% |
||||||||||
| Advance Auto Parts Inc. |
21,200 | $ | 3,426,555 | |||||||
| a | Buffalo Wild Wings Inc. |
30,500 | 4,237,975 | |||||||
| Delphi Automotive PLC (United Kingdom) |
62,900 | 3,937,540 | ||||||||
| Dick’s Sporting Goods Inc. |
142,600 | 6,425,556 | ||||||||
| a | Dollar Tree Inc. |
82,000 | 7,727,680 | |||||||
| a | Global Eagle Entertainment Inc. |
299,100 | 1,986,024 | |||||||
| a | Grand Canyon Education Inc. |
105,500 | 4,211,560 | |||||||
| Hanesbrands Inc. |
210,500 | 5,289,865 | ||||||||
| a | IMAX Corp. (Canada) |
141,000 | 4,156,680 | |||||||
| L Brands Inc. |
91,300 | 6,128,969 | ||||||||
| b | Marriott International Inc., A |
62,800 | 4,173,688 | |||||||
| Newell Brands Inc. |
91,616 | 4,449,789 | ||||||||
| a | Norwegian Cruise Line Holdings Ltd. |
107,400 | 4,278,816 | |||||||
| a | NVR Inc. |
2,300 | 4,094,782 | |||||||
| a | O’Reilly Automotive Inc. |
15,700 | 4,256,270 | |||||||
| Polaris Industries Inc. |
40,300 | 3,294,928 | ||||||||
| Ross Stores Inc. |
71,600 | 4,059,004 | ||||||||
| Tractor Supply Co. |
60,100 | 5,479,918 | ||||||||
| a,b | Under Armour Inc., A |
58,176 | 2,334,603 | |||||||
| a | Under Armour Inc., C |
51,036 | 1,857,700 | |||||||
| a,b | Zoe’s Kitchen Inc. |
88,700 | 3,217,149 | |||||||
|
|
|
|||||||||
| 89,025,051 | ||||||||||
|
|
|
|||||||||
| Consumer Staples 6.9% |
||||||||||
| Constellation Brands Inc., A |
73,200 | 12,107,280 | ||||||||
| a | Monster Beverage Corp. |
60,300 | 9,690,813 | |||||||
| Pinnacle Foods Inc. |
38,300 | 1,772,907 | ||||||||
| a | TreeHouse Foods Inc. |
65,600 | 6,733,840 | |||||||
| a | WhiteWave Foods Co., A |
150,200 | 7,050,388 | |||||||
|
|
|
|||||||||
| 37,355,228 | ||||||||||
|
|
|
|||||||||
| Energy 3.0% |
||||||||||
| Cabot Oil & Gas Corp., A |
184,900 | 4,759,326 | ||||||||
| a | Concho Resources Inc. |
50,400 | 6,011,208 | |||||||
| EQT Corp. |
34,600 | 2,679,078 | ||||||||
| a | Matador Resources Co. |
5,100 | 100,980 | |||||||
| Superior Energy Services Inc. |
143,000 | 2,632,630 | ||||||||
|
|
|
|||||||||
| 16,183,222 | ||||||||||
|
|
|
|||||||||
| Financials 10.9% |
||||||||||
| a | Affiliated Managers Group Inc. |
42,800 | 6,024,956 | |||||||
| Arthur J. Gallagher & Co. |
105,200 | 5,007,520 | ||||||||
| a | CBRE Group Inc. |
150,500 | 3,985,240 | |||||||
| Equinix Inc. |
25,225 | 9,780,489 | ||||||||
| Intercontinental Exchange Inc. |
39,208 | 10,035,680 | ||||||||
| Lazard Ltd. LP, A |
143,400 | 4,270,452 | ||||||||
| Moody’s Corp. |
37,100 | 3,476,641 | ||||||||
| a | Signature Bank |
56,500 | 7,057,980 | |||||||
| a | SVB Financial Group |
12,000 | 1,141,920 | |||||||
| Willis Towers Watson PLC |
66,400 | 8,254,184 | ||||||||
|
|
|
|||||||||
| 59,035,062 | ||||||||||
|
|
|
|||||||||
| Semiannual Report | FSC-9 |
FRANKLIN TEMPLETON VARIABLE INSURANCE PRODUCTS TRUST
STATEMENT OF INVESTMENTS (UNAUDITED)
Franklin Small-Mid Cap Growth VIP Fund (continued)
| Shares | Value | |||||||||
| Common Stocks (continued) |
||||||||||
| Health Care 19.6% |
||||||||||
| a,b | Acadia Pharmaceuticals Inc. |
38,970 | $ | 1,264,966 | ||||||
| a | Akorn Inc. |
175,100 | 4,987,723 | |||||||
| a | BioMarin Pharmaceutical Inc. |
31,047 | 2,415,457 | |||||||
| a,b | Celldex Therapeutics Inc. |
137,000 | 601,430 | |||||||
| a | Cerner Corp. |
87,700 | 5,139,220 | |||||||
| The Cooper Cos. Inc. |
48,200 | 8,269,674 | ||||||||
| a | DaVita HealthCare Partners Inc. |
79,400 | 6,139,208 | |||||||
| DENTSPLY SIRONA Inc. |
75,100 | 4,659,204 | ||||||||
| a | DexCom Inc. |
79,027 | 6,269,212 | |||||||
| a | Edwards Lifesciences Corp. |
89,500 | 8,925,835 | |||||||
| a | Envision Healthcare Holdings Inc. |
77,943 | 1,977,414 | |||||||
| a,b | Heron Therapeutics Inc. |
83,742 | 1,511,543 | |||||||
| a | Hologic Inc. |
195,600 | 6,767,760 | |||||||
| a | Impax Laboratories Inc. |
96,700 | 2,786,894 | |||||||
| a | Incyte Corp. |
35,800 | 2,863,284 | |||||||
| a | Insulet Corp. |
60,985 | 1,844,186 | |||||||
| a | Mallinckrodt PLC |
94,326 | 5,733,134 | |||||||
| a | Medivation Inc. |
49,794 | 3,002,578 | |||||||
| a | Mettler-Toledo International Inc. |
18,600 | 6,787,512 | |||||||
| a | Neurocrine Biosciences Inc. |
25,615 | 1,164,202 | |||||||
| a | Nevro Corp. |
71,900 | 5,303,344 | |||||||
| a,b | Penumbra Inc. |
26,569 | 1,580,856 | |||||||
| Perrigo Co. PLC |
29,090 | 2,637,590 | ||||||||
| a | Pfenex Inc. |
159,200 | 1,332,504 | |||||||
| a | Quintiles Transnational Holdings Inc. |
124,200 | 8,112,744 | |||||||
| a,b | Revance Therapeutics Inc. |
109,200 | 1,485,120 | |||||||
| a | SciClone Pharmaceuticals Inc. |
81,342 | 1,062,327 | |||||||
| a,b | TherapeuticsMD Inc. |
175,000 | 1,487,500 | |||||||
|
|
|
|||||||||
| 106,112,421 | ||||||||||
|
|
|
|||||||||
| Industrials 14.9% |
||||||||||
| Acuity Brands Inc. |
15,800 | 3,917,768 | ||||||||
| Allegiant Travel Co. |
12,492 | 1,892,538 | ||||||||
| AMETEK Inc. |
174,600 | 8,071,758 | ||||||||
| B/E Aerospace Inc. |
108,600 | 5,014,605 | ||||||||
| a | DigitalGlobe Inc. |
235,100 | 5,028,789 | |||||||
| Dun & Bradstreet Corp. |
48,900 | 5,957,976 | ||||||||
| a | Genesee & Wyoming Inc. |
112,200 | 6,614,190 | |||||||
| a | HD Supply Holdings Inc. |
211,000 | 7,347,020 | |||||||
| Hexcel Corp. |
120,200 | 5,005,128 | ||||||||
| a | IHS Inc., A |
60,500 | 6,994,405 | |||||||
| J.B. Hunt Transport Services Inc. |
37,000 | 2,994,410 | ||||||||
| Robert Half International Inc. |
155,000 | 5,914,800 | ||||||||
| Roper Technologies Inc. |
57,370 | 9,785,027 | ||||||||
| a | Sensata Technologies Holding NV |
68,400 | 2,386,476 | |||||||
| a | Verisk Analytics Inc. |
46,100 | 3,737,788 | |||||||
|
|
|
|||||||||
| 80,662,678 | ||||||||||
|
|
|
|||||||||
| Information Technology 20.9% |
||||||||||
| a | 2U Inc. |
170,700 | 5,020,287 | |||||||
| a | Alliance Data Systems Corp. |
18,600 | 3,644,112 | |||||||
| Analog Devices Inc. |
20,000 | 1,132,800 | ||||||||
| FSC-10 | Semiannual Report |
FRANKLIN TEMPLETON VARIABLE INSURANCE PRODUCTS TRUST
STATEMENT OF INVESTMENTS (UNAUDITED)
Franklin Small-Mid Cap Growth VIP Fund (continued)
| Shares | Value | |||||||||
| Common Stocks (continued) |
||||||||||
| Information Technology (continued) |
||||||||||
| a | ANSYS Inc. |
35,800 | $ | 3,248,850 | ||||||
| a | Atlassian Corp. PLC (Australia) |
57,400 | 1,486,660 | |||||||
| a | Bottomline Technologies (de) Inc. |
95,400 | 2,053,962 | |||||||
| Cognex Corp. |
125,200 | 5,396,120 | ||||||||
| a | CoStar Group Inc. |
37,600 | 8,221,616 | |||||||
| CSRA Inc. |
212,400 | 4,976,532 | ||||||||
| a | Electronic Arts Inc. |
146,300 | 11,083,688 | |||||||
| Fidelity National Information Services Inc. |
69,200 | 5,098,656 | ||||||||
| a | FleetCor Technologies Inc. |
38,900 | 5,567,757 | |||||||
| a | GoDaddy Inc., A |
133,300 | 4,157,627 | |||||||
| a | Integrated Device Technology Inc. |
40,000 | 805,200 | |||||||
| Intersil Corp., A |
383,800 | 5,196,652 | ||||||||
| Lam Research Corp. |
41,300 | 3,471,678 | ||||||||
| Microchip Technology Inc. |
56,000 | 2,842,560 | ||||||||
| a | NXP Semiconductors NV (Netherlands) |
110,068 | 8,622,727 | |||||||
| a | Palo Alto Networks Inc. |
44,400 | 5,445,216 | |||||||
| a | Proofpoint Inc. |
38,200 | 2,410,038 | |||||||
| a | Red Hat Inc. |
80,200 | 5,822,520 | |||||||
| a | ServiceNow Inc. |
70,800 | 4,701,120 | |||||||
| a | Vantiv Inc., A |
117,500 | 6,650,500 | |||||||
| a | ViaSat Inc. |
54,452 | 3,887,873 | |||||||
| a | Workday Inc., A |
35,400 | 2,643,318 | |||||||
|
|
|
|||||||||
| 113,588,069 | ||||||||||
|
|
|
|||||||||
| Materials 2.8% |
||||||||||
| a | Axalta Coating Systems Ltd. |
268,800 | 7,131,264 | |||||||
| Martin Marietta Materials Inc. |
42,600 | 8,179,200 | ||||||||
|
|
|
|||||||||
| 15,310,464 | ||||||||||
|
|
|
|||||||||
| Telecommunication Services 0.8% |
||||||||||
| a | SBA Communications Corp. |
41,800 | 4,511,892 | |||||||
|
|
|
|||||||||
| Total Common Stocks (Cost $393,093,579) |
521,784,087 | |||||||||
|
|
|
|||||||||
| Preferred Stocks 0.3% |
||||||||||
| Consumer Discretionary 0.3% |
||||||||||
| a,c | DraftKings Inc., pfd., D |
115,528 | 440,462 | |||||||
| a,c | DraftKings Inc., pfd., D-1 |
284,105 | 1,083,178 | |||||||
|
|
|
|||||||||
| Total Preferred Stocks (Cost $2,800,003) |
1,523,640 | |||||||||
|
|
|
|||||||||
| Total Investments before Short Term Investments (Cost $395,893,582) |
523,307,727 | |||||||||
|
|
|
|||||||||
| Short Term Investments 5.3% |
||||||||||
| Money Market Funds (Cost $12,543,362) 2.3% |
||||||||||
| a,d | Institutional Fiduciary Trust Money Market Portfolio |
12,543,362 | 12,543,362 | |||||||
|
|
|
|||||||||
| Semiannual Report | FSC-11 |
FRANKLIN TEMPLETON VARIABLE INSURANCE PRODUCTS TRUST
STATEMENT OF INVESTMENTS (UNAUDITED)
Franklin Small-Mid Cap Growth VIP Fund (continued)
| Shares | Value | |||||||||
| e | Investments from Cash Collateral Received for Loaned Securities |
|||||||||
| Money Market Funds 3.0% |
||||||||||
| a,d | Institutional Fiduciary Trust Money Market Portfolio |
15,832,625 | $ | 15,832,625 | ||||||
|
|
|
|||||||||
| Total Investments (Cost $424,269,569) 101.8% |
551,683,714 | |||||||||
| Other Assets, less Liabilities (1.8)% |
(9,583,463 | ) | ||||||||
|
|
|
|||||||||
| Net Assets 100.0% |
$ | 542,100,251 | ||||||||
|
|
|
|||||||||
aNon-income producing.
bA portion or all of the security is on loan at June 30, 2016. See Note 1(c).
cSee Note 7 regarding restricted securities.
dSee Note 3(e) regarding investments in affiliated management investment companies.
eSee Note 1(c) regarding securities on loan.
| FSC-12 | Semiannual Report | The accompanying notes are an integral part of these financial statements. |
FRANKLIN TEMPLETON VARIABLE INSURANCE PRODUCTS TRUST
Financial Statements
Statement of Assets and Liabilities
June 30, 2016 (unaudited)
| Franklin Small-Mid Cap Growth VIP Fund |
||||
| Assets: |
||||
| Investments in securities: |
||||
| Cost - Unaffiliated issuers |
$ | 395,893,582 | ||
| Cost - Non-controlled affiliates (Note 3e) |
28,375,987 | |||
|
|
|
|||
| Total cost of investments |
$ | 424,269,569 | ||
|
|
|
|||
| Value - Unaffiliated issuers |
$ | 523,307,727 | ||
| Value - Non-controlled affiliates (Note 3e) |
28,375,987 | |||
|
|
|
|||
| Total value of investments (includes securities loaned in the amount of $15,819,120) |
551,683,714 | |||
| Receivables: |
||||
| Investment securities sold |
7,518,557 | |||
| Capital shares sold |
94,175 | |||
| Dividends and interest |
348,175 | |||
| Due from custodian |
76,823 | |||
| Other assets |
246 | |||
|
|
|
|||
| Total assets |
559,721,690 | |||
|
|
|
|||
| Liabilities: |
||||
| Payables: |
||||
| Investment securities purchased |
345,979 | |||
| Capital shares redeemed |
391,506 | |||
| Management fees |
346,915 | |||
| Distribution fees |
194,501 | |||
| Payable upon return of securities loaned |
16,180,800 | |||
| Accrued expenses and other liabilities |
161,738 | |||
|
|
|
|||
| Total liabilities |
17,621,439 | |||
|
|
|
|||
| Net assets, at value |
$ | 542,100,251 | ||
|
|
|
|||
| Net assets consist of: |
||||
| Paid-in capital |
$ | 411,627,629 | ||
| Undistributed net investment income (loss) |
(793,998 | ) | ||
| Net unrealized appreciation (depreciation) |
127,414,145 | |||
| Accumulated net realized gain (loss) |
3,852,475 | |||
|
|
|
|||
| Net assets, at value |
$ | 542,100,251 | ||
|
|
|
|||
| Class 1: | ||||
| Net assets, at value |
$ | 81,189,094 | ||
|
|
|
|||
| Shares outstanding |
4,794,490 | |||
|
|
|
|||
| Net asset value and maximum offering price per share |
$ | 16.93 | ||
|
|
|
|||
| Class 2: | ||||
| Net assets, at value |
$ | 447,065,712 | ||
|
|
|
|||
| Shares outstanding |
28,810,093 | |||
|
|
|
|||
| Net asset value and maximum offering price per share |
$ | 15.52 | ||
|
|
|
|||
| Class 4: | ||||
| Net assets, at value |
$ | 13,845,445 | ||
|
|
|
|||
| Shares outstanding |
862,966 | |||
|
|
|
|||
| Net asset value and maximum offering price per share |
$ | 16.04 | ||
|
|
|
|||
| The accompanying notes are an integral part of these financial statements. | Semiannual Report | FSC-13 |
FRANKLIN TEMPLETON VARIABLE INSURANCE PRODUCTS TRUST
FINANCIAL STATEMENTS
Statement of Operations
for the six months ended June 30, 2016 (unaudited)
| Franklin Small-Mid Cap Growth VIP Fund |
||||
| Investment income: |
||||
| Dividends |
$ | 1,836,503 | ||
| Income from securities loaned (net of fees and rebates) |
148,426 | |||
|
|
|
|||
| Total investment income |
1,984,929 | |||
|
|
|
|||
| Expenses: |
||||
| Management fees (Note 3a) |
2,108,719 | |||
| Distribution fees: (Note 3c) |
||||
| Class 2 |
547,142 | |||
| Class 4 |
24,059 | |||
| Custodian fees (Note 4) |
2,526 | |||
| Reports to shareholders |
103,068 | |||
| Professional fees |
21,432 | |||
| Trustees’ fees and expenses |
1,502 | |||
| Other |
6,613 | |||
|
|
|
|||
| Total expenses |
2,815,061 | |||
| Expense reductions (Note 4) |
(24 | ) | ||
| Expenses waived/paid by affiliates (Note 3e) |
(36,110 | ) | ||
|
|
|
|||
| Net expenses |
2,778,927 | |||
|
|
|
|||
| Net investment income (loss) |
(793,998 | ) | ||
|
|
|
|||
| Realized and unrealized gains (losses): |
||||
| Net realized gain (loss) from investments |
4,815,924 | |||
|
|
|
|||
| Net change in unrealized appreciation (depreciation) on investments |
(9,384,738 | ) | ||
|
|
|
|||
| Net realized and unrealized gain (loss) |
(4,568,814 | ) | ||
|
|
|
|||
| Net increase (decrease) in net assets resulting from operations |
$ | (5,362,812 | ) | |
|
|
|
|||
| FSC-14 | Semiannual Report | The accompanying notes are an integral part of these financial statements. |
FRANKLIN TEMPLETON VARIABLE INSURANCE PRODUCTS TRUST
FINANCIAL STATEMENTS
Statements of Changes in Net Assets
| Franklin Small-Mid Cap Growth VIP Fund | ||||||||
| Six Months Ended June 30, 2016 (unaudited) |
Year Ended December 31, 2015 |
|||||||
| Increase (decrease) in net assets: |
||||||||
| Operations: |
||||||||
| Net investment income (loss) |
$ | (793,998 | ) | $ | (1,403,843 | ) | ||
| Net realized gain (loss) |
4,815,924 | 63,022,161 | ||||||
| Net change in unrealized appreciation (depreciation) |
(9,384,738 | ) | (74,279,798 | ) | ||||
|
|
|
|||||||
| Net increase (decrease) in net assets resulting from operations |
(5,362,812 | ) | (12,661,480 | ) | ||||
|
|
|
|||||||
| Distributions to shareholders from: |
||||||||
| Net realized gains: |
||||||||
| Class 1 |
(8,833,462 | ) | (22,509,343 | ) | ||||
| Class 2 |
(52,547,749 | ) | (135,758,632 | ) | ||||
| Class 4 |
(1,581,894 | ) | (4,098,814 | ) | ||||
|
|
|
|||||||
| Total distributions to shareholders |
(62,963,105 | ) | (162,366,789 | ) | ||||
|
|
|
|||||||
| Capital share transactions: (Note 2) |
||||||||
| Class 1 |
2,842,337 | 12,480,207 | ||||||
| Class 2 |
25,516,987 | 41,958,103 | ||||||
| Class 4 |
446,499 | 3,251,391 | ||||||
|
|
|
|||||||
| Total capital share transactions |
28,805,823 | 57,689,701 | ||||||
|
|
|
|||||||
| Net increase (decrease) in net assets |
(39,520,094 | ) | (117,338,568 | ) | ||||
| Net assets: |
||||||||
| Beginning of period |
581,620,345 | 698,958,913 | ||||||
|
|
|
|||||||
| End of period |
$ | 542,100,251 | $ | 581,620,345 | ||||
|
|
|
|||||||
| Undistributed net investment income (loss) included in net assets: |
||||||||
| End of period |
$ | (793,998 | ) | $ | — | |||
|
|
|
|||||||
| The accompanying notes are an integral part of these financial statements. | Semiannual Report | FSC-15 |
FRANKLIN TEMPLETON VARIABLE INSURANCE PRODUCTS TRUST
Notes to Financial Statements (unaudited)
Franklin Small-Mid Cap Growth VIP Fund
| FSC-16 | Semiannual Report |
FRANKLIN TEMPLETON VARIABLE INSURANCE PRODUCTS TRUST
NOTES TO FINANCIAL STATEMENTS (UNAUDITED)
Franklin Small-Mid Cap Growth VIP Fund (continued)
| Semiannual Report | FSC-17 |
FRANKLIN TEMPLETON VARIABLE INSURANCE PRODUCTS TRUST
NOTES TO FINANCIAL STATEMENTS (UNAUDITED)
Franklin Small-Mid Cap Growth VIP Fund (continued)
1. Organization and Significant Accounting Policies (continued)
d. Income and Deferred Taxes (continued)
The Fund may recognize an income tax liability related to its uncertain tax positions under U.S. GAAP when the uncertain tax position has a less than 50% probability that it will be sustained upon examination by the tax authorities based on its technical merits. As of June 30, 2016, the Fund has determined that no tax liability is required in its financial statements related to uncertain tax positions for any open tax years (or expected to be taken in future tax returns). Open tax years are those that remain subject to examination and are based on each tax jurisdiction’s statute of limitation.
e. Security Transactions, Investment Income, Expenses and Distributions
Security transactions are accounted for on trade date. Realized gains and losses on security transactions are determined on a specific identification basis. Dividend income is recorded on the ex-dividend date except for certain dividends from foreign securities where the dividend rate is not available. In such cases, the dividend is recorded as soon as the information is received by the Fund. Distributions to shareholders are recorded on the ex-dividend date and are determined according to income tax regulations (tax basis). Distributable earnings determined on a tax basis may differ from earnings recorded in accordance with U.S. GAAP. These differences may be permanent or temporary. Permanent differences are reclassified among capital accounts to reflect their tax character. These reclassifications have no impact on net assets or the results of operations. Temporary differences are not reclassified, as they may reverse in subsequent periods.
Common expenses incurred by the Trust are allocated among the Funds based on the ratio of net assets of each Fund to the combined net assets of the Trust. Fund specific expenses are charged directly to the fund that incurred the expense.
Realized and unrealized gains and losses and net investment income, not including class specific expenses, are allocated daily to each class of shares based upon the relative proportion of net assets of each class. Differences in per share distributions, by class, are generally due to differences in class specific expenses.
f. Accounting Estimates
The preparation of financial statements in accordance with U.S. GAAP requires management to make estimates and assumptions that affect the reported amounts of assets and liabilities at the date of the financial statements and the amounts of income and expenses during the reporting period. Actual results could differ from those estimates.
g. Guarantees and Indemnifications
Under the Trust’s organizational documents, its officers and trustees are indemnified by the Trust against certain liabilities arising out of the performance of their duties to the Trust. Additionally, in the normal course of business, the Trust, on behalf of the Fund, enters into contracts with service providers that contain general indemnification clauses. The Trust’s maximum exposure under these arrangements is unknown as this would involve future claims that may be made against the Trust that have not yet occurred. Currently, the Trust expects the risk of loss to be remote.
| FSC-18 | Semiannual Report |
FRANKLIN TEMPLETON VARIABLE INSURANCE PRODUCTS TRUST
NOTES TO FINANCIAL STATEMENTS (UNAUDITED)
Franklin Small-Mid Cap Growth VIP Fund (continued)
2. Shares of Beneficial Interest
At June 30, 2016, there were an unlimited number of shares authorized (without par value). Transactions in the Fund’s shares were as follows:
| Six Months Ended June 30, 2016 |
Year Ended December 31, 2015 |
|||||||||||||||||||
| Shares | Amount | Shares | Amount | |||||||||||||||||
| Class 1 Shares: | ||||||||||||||||||||
| Shares sold |
76,632 | $ | 1,376,820 | 195,710 | $ | 4,581,670 | ||||||||||||||
| Shares issued in reinvestment of distributions |
521,764 | 8,833,462 | 1,062,262 | 22,509,343 | ||||||||||||||||
| Shares redeemed |
(406,483 | ) | (7,367,945 | ) | (655,587 | ) | (14,610,806 | ) | ||||||||||||
|
|
|
|||||||||||||||||||
| Net increase (decrease) |
191,913 | $ | 2,842,337 | 602,385 | $ | 12,480,207 | ||||||||||||||
|
|
|
|||||||||||||||||||
| Class 2 Shares: | ||||||||||||||||||||
| Shares sold |
644,220 | $ | 10,808,921 | 1,198,268 | $ | 26,202,656 | ||||||||||||||
| Shares issued in reinvestment of distributions |
3,385,809 | 52,547,749 | 6,905,322 | 135,758,632 | ||||||||||||||||
| Shares redeemed |
(2,279,883 | ) | (37,839,683 | ) | (5,776,970 | ) | (120,003,185 | ) | ||||||||||||
|
|
|
|||||||||||||||||||
| Net increase (decrease) |
1,750,146 | $ | 25,516,987 | 2,326,620 | $ | 41,958,103 | ||||||||||||||
|
|
|
|||||||||||||||||||
| Class 4 Shares: | ||||||||||||||||||||
| Shares sold |
61,135 | $ | 1,034,422 | 239,982 | $ | 5,202,958 | ||||||||||||||
| Shares issued in reinvestment of distributions |
98,560 | 1,581,894 | 202,211 | 4,098,814 | ||||||||||||||||
| Shares redeemed |
(125,457 | ) | (2,169,817 | ) | (292,263 | ) | (6,050,381 | ) | ||||||||||||
|
|
|
|||||||||||||||||||
| Net increase (decrease) |
34,238 | $ | 446,499 | 149,930 | $ | 3,251,391 | ||||||||||||||
|
|
|
|||||||||||||||||||
3. Transactions With Affiliates
Franklin Resources, Inc. is the holding company for various subsidiaries that together are referred to as Franklin Templeton Investments. Certain officers and trustees of the Fund are also officers and/or directors of the following subsidiaries:
| Subsidiary | Affiliation | |
| Franklin Advisers, Inc. (Advisers) |
Investment manager | |
| Franklin Templeton Services, LLC (FT Services) |
Administrative manager | |
| Franklin Templeton Distributors, Inc. (Distributors) |
Principal underwriter | |
| Franklin Templeton Investor Services, LLC (Investor Services) |
Transfer agent |
a. Management Fees
The Fund pays an investment management fee to Advisers based on the average daily net assets of the Fund as follows:
| Annualized Fee Rate | Net Assets | |
| 0.800% |
Up to and including $500 million | |
| 0.700% |
Over $500 million, up to and including $1 billion | |
| 0.650% |
Over $1 billion, up to and including $1.5 billion | |
| 0.600% |
Over $1.5 billion, up to and including $6.5 billion | |
| 0.575% |
Over $6.5 billion, up to and including $11.5 billion | |
| 0.550% |
Over $11.5 billion, up to and including $16.5 billion | |
| 0.540% |
Over $16.5 billion, up to and including $19 billion | |
| 0.530% |
Over $19 billion, up to and including $21.5 billion | |
| 0.520% |
In excess of $21.5 billion |
| Semiannual Report | FSC-19 |
FRANKLIN TEMPLETON VARIABLE INSURANCE PRODUCTS TRUST
NOTES TO FINANCIAL STATEMENTS (UNAUDITED)
Franklin Small-Mid Cap Growth VIP Fund (continued)
3. Transactions With Affiliates (continued)
a. Management Fees (continued)
For the period ended June 30, 2016, the annualized effective investment management fee rate was 0.793% of the Fund’s average daily net assets.
b. Administrative Fees
Under an agreement with Advisers, FT Services provides administrative services to the Fund. The fee is paid by Advisers based on the Fund’s average daily net assets, and is not an additional expense of the Fund.
c. Distribution Fees
The Board has adopted distribution plans for Class 2 and Class 4 shares pursuant to Rule 12b-1 under the 1940 Act. Under the Fund’s compensation distribution plans, the Fund pays Distributors for costs incurred in connection with the servicing, sale and distribution of the Fund’s shares up to per year of its average daily net assets of each class. The Board has agreed to limit the current rate to 0.25% per year for Class 2. The plan year, for purposes of monitoring compliance with the maximum annual plan rates, is February 1 through January 31.
d. Transfer Agent Fees
Investor Services, under terms of an agreement, performs shareholder servicing for the Fund and is not paid by the Fund for the services.
e. Investments in Affiliated Management Investment Companies
The Fund invests in one or more affiliated management investment companies for purposes other than exercising a controlling influence over the management or policies. Management fees paid by the Fund are waived on assets invested in the affiliated management investment companies, as noted in the Statement of Operations, in an amount not to exceed the management and administrative fees paid directly or indirectly by each affiliate. Prior to January 1, 2014, the waiver was accounted for as a reduction to management fees.
| Number of Shares Held at Beginning of Period |
Gross Additions |
Gross Reductions |
Number of Shares Held at End of Period |
Value at End of Period |
Investment Income |
Realized Gain (Loss) |
% of Affiliated Fund Shares Outstanding Held at End of Year |
|||||||||||||||||||||||||
| Non-Controlled Affiliates | ||||||||||||||||||||||||||||||||
| Institutional Fiduciary Trust Money Market Portfolio |
33,143,168 | 148,397,175 | (153,164,356 | ) | 28,375,987 | $ | 28,375,987 | $ | — | $ | — | 0.1% | ||||||||||||||||||||
|
|
|
|||||||||||||||||||||||||||||||
4. Expense Offset Arrangement
The Fund has entered into an arrangement with its custodian whereby credits realized as a result of uninvested cash balances are used to reduce a portion of the Fund’s custodian expenses. During the period ended June 30, 2016, the custodian fees were reduced as noted in the Statement of Operations.
| FSC-20 | Semiannual Report |
FRANKLIN TEMPLETON VARIABLE INSURANCE PRODUCTS TRUST
NOTES TO FINANCIAL STATEMENTS (UNAUDITED)
Franklin Small-Mid Cap Growth VIP Fund (continued)
5. Income Taxes
At June 30, 2016, the cost of investments and net unrealized appreciation (depreciation) for income tax purposes were as follows:
| Cost of investments |
$ | 425,102,628 | ||
|
|
|
|||
| Unrealized appreciation |
$ | 153,725,600 | ||
| Unrealized depreciation |
(27,144,514 | ) | ||
|
|
|
|||
| Net unrealized appreciation (depreciation) |
$ | 126,581,086 | ||
|
|
|
Differences between income and/or capital gains as determined on a book basis and a tax basis are primarily due to differing treatments of wash sales.
6. Investment Transactions
Purchases and sales of investments (excluding short term securities) for the period ended June 30, 2016, aggregated $74,960,730 and $115,974,275, respectively.
At June 30, 2016, in connection with securities lending transactions, the Fund loaned equity investments and received $16,180,800 of cash collateral. The gross amount of recognized liability for such transactions is included in payable upon return of securities loaned in the Statement of Assets and Liabilities. The agreements can be terminated at any time.
7. Restricted Securities
The Fund invests in securities that are restricted under the Securities Act of 1933 (1933 Act) or which are subject to legal, contractual, or other agreed upon restrictions on resale. Restricted securities are often purchased in private placement transactions, and cannot be sold without prior registration unless the sale is pursuant to an exemption under the 1933 Act. Disposal of these securities may require greater effort and expense, and prompt sale at an acceptable price may be difficult. The Fund may have registration rights for restricted securities. The issuer generally incurs all registration costs.
At June 30, 2016, the Fund held investments in restricted securities, excluding certain securities exempt from registration under the 1933 Act deemed to be liquid, as follows:
| Shares | Issuer | Acquisition Date |
Cost | Value | ||||||||||
| 115,528 | DraftKings Inc., pfd., D |
8/07/15 | $ | 622,222 | $ | 440,462 | ||||||||
| 284,105 | DraftKings Inc., pfd., D-1 |
8/07/15 | 2,177,781 | 1,083,178 | ||||||||||
|
|
|
|||||||||||||
| Total Restricted Securities (Value is 0.3% of Net Assets) |
$ | 2,800,003 | $ | 1,523,640 | ||||||||||
|
|
|
|||||||||||||
8. Credit Facility
The Fund, together with other U.S. registered and foreign investment funds (collectively, Borrowers), managed by Franklin Templeton Investments, are borrowers in a joint syndicated senior unsecured credit facility totaling $2 billion (Global Credit Facility) which matures on February 10, 2017. This Global Credit Facility provides a source of funds to the Borrowers for temporary and emergency purposes, including the ability to meet future unanticipated or unusually large redemption requests.
Under the terms of the Global Credit Facility, the Fund shall, in addition to interest charged on any borrowings made by the Fund and other costs incurred by the Fund, pay its share of fees and expenses incurred in connection with the implementation and maintenance of the Global Credit Facility, based upon its relative share of the aggregate net assets of all of the Borrowers, including an annual commitment fee of 0.07% based upon the unused portion of the Global Credit Facility. Effective February 12, 2016, the annual commitment fee is 0.15%. These fees are reflected in other expenses in the Statement of Operations. During the period ended June 30, 2016, the Fund did not use the Global Credit Facility.
| Semiannual Report | FSC-21 |
FRANKLIN TEMPLETON VARIABLE INSURANCE PRODUCTS TRUST
NOTES TO FINANCIAL STATEMENTS (UNAUDITED)
Franklin Small-Mid Cap Growth VIP Fund (continued)
9. Fair Value Measurements
The Fund follows a fair value hierarchy that distinguishes between market data obtained from independent sources (observable inputs) and the Fund’s own market assumptions (unobservable inputs). These inputs are used in determining the value of the Fund’s financial instruments and are summarized in the following fair value hierarchy:
| • | Level 1 – quoted prices in active markets for identical financial instruments |
| • | Level 2 – other significant observable inputs (including quoted prices for similar financial instruments, interest rates, prepayment speed, credit risk, etc.) |
| • | Level 3 – significant unobservable inputs (including the Fund’s own assumptions in determining the fair value of financial instruments) |
The input levels are not necessarily an indication of the risk or liquidity associated with financial instruments at that level.
For movements between the levels within the fair value hierarchy, the Fund has adopted a policy of recognizing the transfers as of the date of the underlying event which caused the movement.
A summary of inputs used as of June 30, 2016, in valuing the Fund’s assets carried at fair value, is as follows:
| Level 1 | Level 2 | Level 3 | Total | |||||||||||||
| Assets: | ||||||||||||||||
| Investments in Securities: |
||||||||||||||||
| Equity Investments:a |
||||||||||||||||
| Consumer Discretionary |
$ | 89,025,051 | $ | — | $ | 1,523,640 | $ | 90,548,691 | ||||||||
| All Other Equity Investmentsb |
432,759,036 | — | — | 432,759,036 | ||||||||||||
| Short Term Investments |
28,375,987 | — | — | 28,375,987 | ||||||||||||
|
|
|
|||||||||||||||
| Total Investments in Securities |
$ | 550,160,074 | $ | — | $ | 1,523,640 | $ | 551,683,714 | ||||||||
|
|
|
|||||||||||||||
aIncludes common and preferred stocks.
bFor detailed categories, see the accompanying Statement of Investments.
10. Subsequent Events
The Fund has evaluated subsequent events through the issuance of the financial statements and determined that no events have occurred that require disclosure.
| FSC-22 | Semiannual Report |
Franklin Strategic Income VIP Fund
This semiannual report for Franklin Strategic Income VIP Fund covers the period ended June 30, 2016.
Class 1 Performance Summary as of June 30, 2016
The Fund’s Class 1 shares delivered a +4.32% total return* for the six-month period ended June 30, 2016.
*The Fund has a fee waiver associated with any investment in a Franklin Templeton money fund and/or Franklin Templeton fund as applicable, contractually guaranteed through at least the Fund’s current fiscal year-end. Fund investment results reflect the fee waiver, to the extent applicable; without this reduction, the results would have been lower.
Performance reflects the Fund’s Class 1 operating expenses, but does not include any contract fees, expenses or sales charges. If they had been included, performance would be lower. These charges and deductions, particularly for variable life policies, can have a significant effect on contract values and insurance benefits. See the contract prospectus for a complete description of these expenses, including sales charges.
Performance data represent past performance, which does not guarantee future results. Investment return and principal value will fluctuate, and you may have a gain or loss when you sell your shares. Current performance may differ from figures shown.
| Semiannual Report | FSI-1 |
FRANKLIN STRATEGIC INCOME VIP FUND
1. Source: Morningstar.
2. Source: Lipper, a Thomson Reuters Company.
One cannot invest directly in an index, and an index is not representative of the Fund’s portfolio. Please see Index Descriptions following the Fund Summaries.
3. Source: Bureau of Labor Statistics.
| FSI-2 | Semiannual Report |
FRANKLIN STRATEGIC INCOME VIP FUND
| Semiannual Report | FSI-3 |
FRANKLIN STRATEGIC INCOME VIP FUND
| FSI-4 | Semiannual Report |
FRANKLIN STRATEGIC INCOME VIP FUND
Class 1 Fund Expenses
| Class 1 | Beginning Account Value 1/1/16 |
Ending Account Value 6/30/16 |
Fund-Level
Expenses 1/1/16–6/30/16 |
|||||||||
| Actual |
$ | 1,000 | $ | 1,043.20 | $ | 3.05 | ||||||
| Hypothetical (5% return before expenses) |
$ | 1,000 | $ | 1,021.88 | $ | 3.02 | ||||||
*Expenses are calculated using the most recent six-month annualized expense ratio, net of expense waivers, for the Fund’s Class 1 shares (0.60%), which does not include any ongoing expenses of the Contract for which the Fund is an investment option, multiplied by the average account value over the period, multiplied by 182/366 to reflect the one-half year period.
| Semiannual Report | FSI-5 |
FRANKLIN TEMPLETON VARIABLE INSURANCE PRODUCTS TRUST
Consolidated Financial Highlights
Franklin Strategic Income VIP Fund
| Six Months Ended (unaudited) |
Year Ended December 31, | |||||||||||||||||||||||
| 2015 | 2014 | 2013 | 2012 | 2011 | ||||||||||||||||||||
| Class 1 |
||||||||||||||||||||||||
| Per share operating performance (for a share outstanding throughout the period) |
||||||||||||||||||||||||
| Net asset value, beginning of period |
$10.55 | $11.90 | $12.64 | $13.17 | $12.55 | $12.99 | ||||||||||||||||||
|
|
|
|||||||||||||||||||||||
| Income from investment operationsa: | ||||||||||||||||||||||||
| Net investment incomeb |
0.24 | 0.53 | 0.54 | 0.59 | 0.65 | 0.69 | ||||||||||||||||||
| Net realized and unrealized gains (losses) |
0.21 | (0.91 | ) | (0.25 | ) | (0.15 | ) | 0.92 | (0.32 | ) | ||||||||||||||
|
|
|
|||||||||||||||||||||||
| Total from investment operations |
0.45 | (0.38 | ) | 0.29 | 0.44 | 1.57 | 0.37 | |||||||||||||||||
|
|
|
|||||||||||||||||||||||
| Less distributions from: | ||||||||||||||||||||||||
| Net investment income and net foreign currency gains |
(0.39 | ) | (0.77 | ) | (0.78 | ) | (0.80 | ) | (0.93 | ) | (0.81 | ) | ||||||||||||
| Net realized gains |
— | (0.20 | ) | (0.25 | ) | (0.17 | ) | (0.02 | ) | — | ||||||||||||||
|
|
|
|||||||||||||||||||||||
| Total distributions |
(0.39 | ) | (0.97 | ) | (1.03 | ) | (0.97 | ) | (0.95 | ) | (0.81 | ) | ||||||||||||
|
|
|
|||||||||||||||||||||||
| Net asset value, end of period |
$10.61 | $10.55 | $11.90 | $12.64 | $13.17 | $12.55 | ||||||||||||||||||
|
|
|
|||||||||||||||||||||||
| Total returnc |
4.32% | (3.62)% | 2.12% | 3.52% | 13.12% | 2.78% | ||||||||||||||||||
| Ratios to average net assetsd | ||||||||||||||||||||||||
| Expenses before waiver and payments by affiliates |
0.67% | e | 0.63% | 0.63% | 0.60% | 0.58% | 0.60% | |||||||||||||||||
| Expenses net of waiver and payments by affiliates |
0.60% | e,f | 0.62% | f | 0.62% | f | 0.60% | f | 0.58% | 0.60% | f | |||||||||||||
| Net investment income |
4.48% | 4.71% | 4.34% | 4.58% | 5.04% | 5.36% | ||||||||||||||||||
| Supplemental data | ||||||||||||||||||||||||
| Net assets, end of period (000’s) |
$417,298 | $441,658 | $574,850 | $705,493 | $1,019,537 | $1,043,690 | ||||||||||||||||||
| Portfolio turnover rate |
56.48% | 85.85% | 55.64% | 48.06% | 49.98% | 55.65% | ||||||||||||||||||
| Portfolio turnover rate excluding mortgage dollar rollsg |
30.10% | 51.47% | 48.86% | 47.01% | 48.75% | 55.65% | ||||||||||||||||||
aThe amount shown for a share outstanding throughout the period may not correlate with the Consolidated Statement of Operations for the period due to the timing of sales and repurchases of the Fund’s shares in relation to income earned and/or fluctuating fair value of the investments of the Fund.
bBased on average daily shares outstanding.
cTotal return does not include fees, charges or expenses imposed by the variable annuity and life insurance contracts for which Franklin Templeton Variable Insurance Products Trust serves as an underlying investment vehicle. Total return is not annualized for periods less than one year.
dRatios are annualized for periods less than one year.
eRatios are adjusted to exclude the effects of annualization for non-recurring expenses.
fBenefit of expense reduction rounds to less than 0.01%.
gSee Note 1(h) regarding mortgage dollar rolls.
| FSI-6 | Semiannual Report | The accompanying notes are an integral part of these consolidated financial statements. | |||||
FRANKLIN TEMPLETON VARIABLE INSURANCE PRODUCTS TRUST
CONSOLIDATED FINANCIAL HIGHLIGHTS
Franklin Strategic Income VIP Fund (continued)
| Six Months Ended (unaudited) |
Year Ended December 31, | |||||||||||||||||||||||
| 2015 | 2014 | 2013 | 2012 | 2011 | ||||||||||||||||||||
| Class 2 | ||||||||||||||||||||||||
| Per share operating performance (for a share outstanding throughout the period) |
||||||||||||||||||||||||
| Net asset value, beginning of period |
$10.21 | $11.55 | $12.30 | $12.84 | $12.27 | $12.72 | ||||||||||||||||||
|
|
|
|||||||||||||||||||||||
| Income from investment operationsa: | ||||||||||||||||||||||||
| Net investment incomeb |
0.22 | 0.49 | 0.49 | 0.54 | 0.60 | 0.64 | ||||||||||||||||||
| Net realized and unrealized gains (losses) |
0.20 | (0.89 | ) | (0.24 | ) | (0.13 | ) | 0.89 | (0.30 | ) | ||||||||||||||
|
|
|
|||||||||||||||||||||||
| Total from investment operations |
0.42 | (0.40 | ) | 0.25 | 0.41 | 1.49 | 0.34 | |||||||||||||||||
|
|
|
|||||||||||||||||||||||
| Less distributions from: | ||||||||||||||||||||||||
| Net investment income and net foreign currency gains |
(0.36 | ) | (0.74 | ) | (0.75 | ) | (0.78 | ) | (0.90 | ) | (0.79 | ) | ||||||||||||
| Net realized gains |
— | (0.20 | ) | (0.25 | ) | (0.17 | ) | (0.02 | ) | — | ||||||||||||||
|
|
|
|||||||||||||||||||||||
| Total distributions |
(0.36 | ) | (0.94 | ) | (1.00 | ) | (0.95 | ) | (0.92 | ) | (0.79 | ) | ||||||||||||
|
|
|
|||||||||||||||||||||||
| Net asset value, end of period |
$10.27 | $10.21 | $11.55 | $12.30 | $12.84 | $12.27 | ||||||||||||||||||
|
|
|
|||||||||||||||||||||||
| Total returnc |
4.19% | (3.87)% | 1.86% | 3.32% | 12.75% | 2.57% | ||||||||||||||||||
| Ratios to average net assetsd | ||||||||||||||||||||||||
| Expenses before waiver and payments by affiliates |
0.92% | e | 0.88% | 0.88% | 0.85% | 0.83% | 0.85% | |||||||||||||||||
| Expenses net of waiver and payments by affiliates |
0.85% | e,f | 0.87% | f | 0.87% | f | 0.85% | f | 0.83% | 0.85% | f | |||||||||||||
| Net investment income |
4.23% | 4.46% | 4.09% | 4.33% | 4.79% | 5.11% | ||||||||||||||||||
| Supplemental data | ||||||||||||||||||||||||
| Net assets, end of period (000’s) |
$202,076 | $202,192 | $206,571 | $175,307 | $158,451 | $123,749 | ||||||||||||||||||
| Portfolio turnover rate |
56.48% | 85.85% | 55.64% | 48.06% | 49.98% | 55.65% | ||||||||||||||||||
| Portfolio turnover rate excluding mortgage dollar rollsg |
30.10% | 51.47% | 48.86% | 47.01% | 48.75% | 55.65% | ||||||||||||||||||
aThe amount shown for a share outstanding throughout the period may not correlate with the Consolidated Statement of Operations for the period due to the timing of sales and repurchases of the Fund’s shares in relation to income earned and/or fluctuating fair value of the investments of the Fund.
bBased on average daily shares outstanding.
cTotal return does not include fees, charges or expenses imposed by the variable annuity and life insurance contracts for which Franklin Templeton Variable Insurance Products Trust serves as an underlying investment vehicle. Total return is not annualized for periods less than one year.
dRatios are annualized for periods less than one year.
eRatios are adjusted to exclude the effects of annualization for non-recurring expenses.
fBenefit of expense reduction rounds to less than 0.01%.
gSee Note 1(h) regarding mortgage dollar rolls.
| The accompanying notes are an integral part of these consolidated financial statements. | Semiannual Report | FSI-7 |
FRANKLIN TEMPLETON VARIABLE INSURANCE PRODUCTS TRUST
CONSOLIDATED FINANCIAL HIGHLIGHTS
Franklin Strategic Income VIP Fund (continued)
| Six Months Ended (unaudited) |
Year Ended December 31, | |||||||||||||||||||||||
| 2015 | 2014 | 2013 | 2012 | 2011 | ||||||||||||||||||||
| Class 4 | ||||||||||||||||||||||||
| Per share operating performance (for a share outstanding throughout the period) |
||||||||||||||||||||||||
| Net asset value, beginning of period |
$10.44 | $11.78 | $12.51 | $13.04 | $12.44 | $12.88 | ||||||||||||||||||
|
|
|
|||||||||||||||||||||||
| Income from investment operationsa: | ||||||||||||||||||||||||
| Net investment incomeb |
0.22 | 0.49 | 0.49 | 0.54 | 0.60 | 0.64 | ||||||||||||||||||
| Net realized and unrealized gains (losses) |
0.22 | (0.91 | ) | (0.25 | ) | (0.14 | ) | 0.91 | (0.31 | ) | ||||||||||||||
|
|
|
|||||||||||||||||||||||
| Total from investment operations |
0.44 | (0.42 | ) | 0.24 | 0.40 | 1.51 | 0.33 | |||||||||||||||||
|
|
|
|||||||||||||||||||||||
| Less distributions from: | ||||||||||||||||||||||||
| Net investment income and net foreign currency gains |
(0.35 | ) | (0.72 | ) | (0.72 | ) | (0.76 | ) | (0.89 | ) | (0.77 | ) | ||||||||||||
| Net realized gains |
— | (0.20 | ) | (0.25 | ) | (0.17 | ) | (0.02 | ) | — | ||||||||||||||
|
|
|
|||||||||||||||||||||||
| Total distributions |
(0.35 | ) | (0.92 | ) | (0.97 | ) | (0.93 | ) | (0.91 | ) | (0.77 | ) | ||||||||||||
|
|
|
|||||||||||||||||||||||
| Net asset value, end of period |
$10.53 | $10.44 | $11.78 | $12.51 | $13.04 | $12.44 | ||||||||||||||||||
|
|
|
|||||||||||||||||||||||
| Total returnc |
4.20% | (3.98)% | 1.75% | 3.17% | 12.67% | 2.46% | ||||||||||||||||||
| Ratios to average net assetsd | ||||||||||||||||||||||||
| Expenses before waiver and payments by affiliates |
1.02% | e | 0.98% | 0.98% | 0.95% | 0.93% | 0.95% | |||||||||||||||||
| Expenses net of waiver and payments by affiliates |
0.95% | e,f | 0.97% | f | 0.97% | f | 0.95% | f | 0.93% | 0.95% | f | |||||||||||||
| Net investment income |
4.13% | 4.36% | 3.99% | 4.23% | 4.69% | 5.01% | ||||||||||||||||||
| Supplemental data | ||||||||||||||||||||||||
| Net assets, end of period (000’s) |
$86,558 | $92,965 | $113,986 | $134,970 | $196,479 | $188,786 | ||||||||||||||||||
| Portfolio turnover rate |
56.48% | 85.85% | 55.64% | 48.06% | 49.98% | 55.65% | ||||||||||||||||||
| Portfolio turnover rate excluding mortgage dollar rollsg |
30.10% | 51.47% | 48.86% | 47.01% | 48.75% | 55.65% | ||||||||||||||||||
aThe amount shown for a share outstanding throughout the period may not correlate with the Consolidated Statement of Operations for the period due to the timing of sales and repurchases of the Fund’s shares in relation to income earned and/or fluctuating fair value of the investments of the Fund.
bBased on average daily shares outstanding.
cTotal return does not include fees, charges or expenses imposed by the variable annuity and life insurance contracts for which Franklin Templeton Variable Insurance Products Trust serves as an underlying investment vehicle. Total return is not annualized for periods less than one year.
dRatios are annualized for periods less than one year.
eRatios are adjusted to exclude the effects of annualization for non-recurring expenses.
fBenefit of expense reduction rounds to less than 0.01%.
gSee Note 1(h) regarding mortgage dollar rolls.
| FSI-8 | Semiannual Report | The accompanying notes are an integral part of these consolidated financial statements. |
FRANKLIN TEMPLETON VARIABLE INSURANCE PRODUCTS TRUST
Consolidated Statement of Investments, June 30, 2016 (unaudited)
| Franklin Strategic Income VIP Fund
|
||||||||||||||
| Country | Shares/Units | Value | ||||||||||||
| Common Stocks and Other Equity Interests 0.7% |
||||||||||||||
| Consumer Services 0.7% |
||||||||||||||
| a,b,c | Turtle Bay Resort |
United States | 1,901,449 | $ | 4,943,766 | |||||||||
|
|
|
|||||||||||||
| Energy 0.0%† |
||||||||||||||
| a,d | Warrior Met Coal LLC, A |
United States | 1,499 | 151,124 | ||||||||||
|
|
|
|||||||||||||
| Health Care Equipment & Services 0.0%† |
||||||||||||||
| a | New Millennium Holdco Inc. |
United States | 9,504 | 32,670 | ||||||||||
|
|
|
|||||||||||||
| Transportation 0.0%† |
||||||||||||||
| a,e | CEVA Holdings LLC |
United Kingdom | 224 | 78,498 | ||||||||||
|
|
|
|||||||||||||
| Total Common Stocks and Other Equity Interests |
5,206,058 | |||||||||||||
|
|
|
|||||||||||||
| Management Investment Companies 8.0% |
||||||||||||||
| Diversified Financials 8.0% |
||||||||||||||
| f | Franklin Lower Tier Floating Rate Fund |
United States | 3,089,922 | 30,652,026 | ||||||||||
| f | Franklin Middle Tier Floating Rate Fund |
United States | 2,637,222 | 25,554,680 | ||||||||||
|
|
|
|||||||||||||
| Total Management Investment Companies |
56,206,706 | |||||||||||||
|
|
|
|||||||||||||
| Convertible Preferred Stocks 0.0%† |
||||||||||||||
| Transportation 0.0%† |
||||||||||||||
| a,e | CEVA Holdings LLC, cvt. pfd., A-1 |
United Kingdom | 6 | 3,150 | ||||||||||
| a,e | CEVA Holdings LLC, cvt. pfd., A-2 |
United Kingdom | 486 | 169,928 | ||||||||||
|
|
|
|||||||||||||
| Total Convertible Preferred Stocks (Cost $731,856) |
173,078 | |||||||||||||
|
|
|
|||||||||||||
| Principal Amount* | ||||||||||||||
| Corporate Bonds 41.7% |
||||||||||||||
| Automobiles & Components 0.7% |
||||||||||||||
| Fiat Chrysler Automobiles NV, senior note, 5.25%, 4/15/23 |
United Kingdom | 3,500,000 | 3,485,738 | |||||||||||
| The Goodyear Tire & Rubber Co., |
||||||||||||||
| senior bond, 5.00%, 5/31/26 |
United States | 1,000,000 | 1,021,250 | |||||||||||
| senior note, 5.125%, 11/15/23 |
United States | 400,000 | 415,000 | |||||||||||
|
|
|
|||||||||||||
| 4,921,988 | ||||||||||||||
|
|
|
|||||||||||||
| Banks 4.3% |
||||||||||||||
| Bank of America Corp., senior note, |
||||||||||||||
| 5.65%, 5/01/18 |
United States | 1,500,000 | 1,608,174 | |||||||||||
| 3.50%, 4/19/26 |
United States | 3,800,000 | 3,939,008 | |||||||||||
| CIT Group Inc., senior note, |
||||||||||||||
| 5.375%, 5/15/20 |
United States | 1,000,000 | 1,045,000 | |||||||||||
| 5.00%, 8/15/22 |
United States | 2,500,000 | 2,550,000 | |||||||||||
| Citigroup Inc., |
||||||||||||||
| senior note, 3.875%, 10/25/23 |
United States | 3,000,000 | 3,224,772 | |||||||||||
| senior note, 3.30%, 4/27/25 |
United States | 300,000 | 308,026 | |||||||||||
| senior note, 3.40%, 5/01/26 |
United States | 3,100,000 | 3,187,854 | |||||||||||
| sub. bond, 5.50%, 9/13/25 |
United States | 500,000 | 561,758 | |||||||||||
| sub. note, 4.05%, 7/30/22 |
United States | 300,000 | 317,550 | |||||||||||
| Semiannual Report | FSI-9 |
FRANKLIN TEMPLETON VARIABLE INSURANCE PRODUCTS TRUST
CONSOLIDATED STATEMENT OF INVESTMENTS (UNAUDITED)
Franklin Strategic Income VIP Fund (continued)
| Country | Principal Amount* | Value | ||||||||||||
| Corporate Bonds (continued) |
||||||||||||||
| Banks (continued) |
||||||||||||||
| JPMorgan Chase & Co., |
||||||||||||||
| g junior sub. bond, R, 6.00% to 8/01/23, FRN thereafter, Perpetual |
United States | 1,500,000 | $ | 1,535,625 | ||||||||||
| g junior sub. bond, X, 6.10% to 10/01/24, FRN thereafter, Perpetual |
United States | 500,000 | 516,250 | |||||||||||
| senior bond, 3.30%, 4/01/26 |
United States | 400,000 | 414,649 | |||||||||||
| senior note, 4.25%, 10/15/20 |
United States | 1,000,000 | 1,090,696 | |||||||||||
| sub. note, 3.375%, 5/01/23 |
United States | 1,000,000 | 1,021,221 | |||||||||||
| sub. note, 3.875%, 9/10/24 |
United States | 1,000,000 | 1,036,445 | |||||||||||
| Royal Bank of Scotland Group PLC, sub. note, 6.125%, 12/15/22 |
United Kingdom | 700,000 | 734,619 | |||||||||||
| Wells Fargo & Co., |
||||||||||||||
| g junior sub. bond, S, 5.90% to 6/15/24, FRN thereafter, Perpetual |
United States | 1,500,000 | 1,545,000 | |||||||||||
| senior note, 2.60%, 7/22/20 |
United States | 700,000 | 719,882 | |||||||||||
| senior note, 3.00%, 4/22/26 |
United States | 5,000,000 | 5,103,080 | |||||||||||
|
|
|
|||||||||||||
| 30,459,609 | ||||||||||||||
|
|
|
|||||||||||||
| Capital Goods 0.4% |
||||||||||||||
| h | Bombardier Inc., senior bond, 144A, 7.50%, 3/15/25 |
Canada | 500,000 | 435,000 | ||||||||||
| e | Erickson Air-Crane Inc., Purchase Price Notes, 6.00%, 11/02/20 |
United States | 136,004 | 102,346 | ||||||||||
| Navistar International Corp., senior bond, 8.25%, 11/01/21 |
United States | 1,400,000 | 990,500 | |||||||||||
| TransDigm Inc., |
||||||||||||||
| senior sub. bond, 6.50%, 7/15/24 |
United States | 500,000 | 505,000 | |||||||||||
| senior sub. bond, 6.50%, 5/15/25 |
United States | 200,000 | 201,250 | |||||||||||
| h senior sub. bond, 144A, 6.375%, 6/15/26 |
United States | 400,000 | 399,500 | |||||||||||
| senior sub. note, 6.00%, 7/15/22 |
United States | 400,000 | 404,072 | |||||||||||
|
|
|
|||||||||||||
| 3,037,668 | ||||||||||||||
|
|
|
|||||||||||||
| Commercial & Professional Services 0.1% |
||||||||||||||
| United Rentals North America Inc., senior bond, 5.875%, 9/15/26 |
United States | 700,000 | 698,250 | |||||||||||
|
|
|
|||||||||||||
| Consumer Durables & Apparel 0.7% |
||||||||||||||
| h | Hanesbrands Inc., senior bond, 144A, 4.875%, 5/15/26 |
United States | 1,500,000 | 1,512,900 | ||||||||||
| KB Home, senior note, |
||||||||||||||
| 4.75%, 5/15/19 |
United States | 1,000,000 | 1,007,500 | |||||||||||
| 7.00%, 12/15/21 |
United States | 1,200,000 | 1,212,000 | |||||||||||
| Toll Brothers Finance Corp., senior bond, 5.625%, 1/15/24 |
United States | 1,100,000 | 1,146,750 | |||||||||||
|
|
|
|||||||||||||
| 4,879,150 | ||||||||||||||
|
|
|
|||||||||||||
| Consumer Services 1.7% |
||||||||||||||
| h | 1011778 BC ULC/New Red Finance Inc., secured note, second lien, 144A, 6.00%, 4/01/22 |
Canada | 2,000,000 | 2,079,380 | ||||||||||
| h,i | Fontainebleau Las Vegas, senior secured bond, first lien, 144A, 11.00%, 6/15/15 |
United States | 2,500,000 | 4,937 | ||||||||||
| h | International Game Technology PLC, senior secured bond, 144A, 6.50%, 2/15/25 |
United States | 3,300,000 | 3,333,000 | ||||||||||
| h | KFC Holding Co./Pizza Hut Holdings LLC/Taco Bell of America LLC, senior note, 144A, |
|||||||||||||
| 5.00%, 6/01/24 |
United States | 900,000 | 924,750 | |||||||||||
| 5.25%, 6/01/26 |
United States | 800,000 | 822,000 | |||||||||||
| Marriott International Inc., senior bond, 3.75%, 10/01/25 |
United States | 3,000,000 | 3,212,886 | |||||||||||
| MGM Resorts International, senior note, 6.75%, 10/01/20 |
United States | 200,000 | 219,500 | |||||||||||
| h | Wynn Las Vegas LLC/Wynn Las Vegas Capital Corp., senior bond, 144A, 5.50%, 3/01/25 |
United States | 700,000 | 679,875 | ||||||||||
| h | Wynn Macau Ltd., senior note, 144A, 5.25%, 10/15/21 |
Macau | 1,300,000 | 1,257,750 | ||||||||||
|
|
|
|||||||||||||
| 12,534,078 | ||||||||||||||
|
|
|
|||||||||||||
| FSI-10 | Semiannual Report |
FRANKLIN TEMPLETON VARIABLE INSURANCE PRODUCTS TRUST
CONSOLIDATED STATEMENT OF INVESTMENTS (UNAUDITED)
Franklin Strategic Income VIP Fund (continued)
| Country | Principal Amount* | Value | ||||||||||||
| Corporate Bonds (continued) |
||||||||||||||
| Diversified Financials 2.8% |
||||||||||||||
| AerCap Ireland Capital Ltd./AerCap Global Aviation Trust, senior note, |
||||||||||||||
| 4.25%, 7/01/20 |
Netherlands | 1,300,000 | $ | 1,331,720 | ||||||||||
| 4.625%, 10/30/20 |
Netherlands | 500,000 | 517,753 | |||||||||||
| 5.00%, 10/01/21 |
Netherlands | 1,100,000 | 1,150,847 | |||||||||||
| Capital One Financial Corp., senior note, 3.20%, 2/05/25 |
United States | 800,000 | 809,342 | |||||||||||
| Deutsche Bank AG, sub. bond, 4.296% to 5/24/23, FRN thereafter, 5/24/28 |
Germany | 2,700,000 | 2,379,105 | |||||||||||
| E*TRADE Financial Corp., senior note, |
||||||||||||||
| 5.375%, 11/15/22 |
United States | 700,000 | 742,000 | |||||||||||
| 4.625%, 9/15/23 |
United States | 800,000 | 814,000 | |||||||||||
| The Goldman Sachs Group Inc., senior note, 3.50%, 1/23/25 |
United States | 3,000,000 | 3,089,472 | |||||||||||
| h | Lincoln Finance Ltd., senior secured note, 144A, 6.875%, 4/15/21 |
Netherlands | 600,000 | EUR | 714,969 | |||||||||
| Morgan Stanley, |
||||||||||||||
| senior note, 3.875%, 1/27/26 |
United States | 3,200,000 | 3,413,779 | |||||||||||
| sub. bond, 3.95%, 4/23/27 |
United States | 1,000,000 | 1,010,883 | |||||||||||
| Navient Corp., senior note, |
||||||||||||||
| 8.45%, 6/15/18 |
United States | 1,000,000 | 1,085,000 | |||||||||||
| 5.50%, 1/15/19 |
United States | 1,500,000 | 1,512,375 | |||||||||||
| 5.875%, 3/25/21 |
United States | 700,000 | 663,684 | |||||||||||
| 6.125%, 3/25/24 |
United States | 500,000 | 441,250 | |||||||||||
|
|
|
|||||||||||||
| 19,676,179 | ||||||||||||||
|
|
|
|||||||||||||
| Energy 5.3% |
||||||||||||||
| Access Midstream Partner LP/ACMP Finance Corp., senior note, 6.125%, 7/15/22 |
United States | 600,000 | 616,073 | |||||||||||
| Apache Corp., senior bond, 2.625%, 1/15/23 |
United States | 1,900,000 | 1,885,516 | |||||||||||
| i | BreitBurn Energy Partners LP/BreitBurn Finance Corp., senior bond, 7.875%, 4/15/16 |
United States | 2,300,000 | 494,500 | ||||||||||
| h | California Resources Corp., secured note, second lien, 144A, 8.00%, 12/15/22 |
United States | 716,000 | 509,255 | ||||||||||
| h | Calumet Specialty Products Partners LP/Calumet Finance Corp., senior note, 144A, 11.50%, 1/15/21 |
United States | 800,000 | 902,000 | ||||||||||
| CGG SA, senior note, |
||||||||||||||
| 6.50%, 6/01/21 |
France | 1,800,000 | 801,000 | |||||||||||
| 6.875%, 1/15/22 |
France | 200,000 | 88,000 | |||||||||||
| c,i | CHC Helicopter SA, |
|||||||||||||
| senior note, 9.375%, 6/01/21 |
Canada | 260,000 | 37,700 | |||||||||||
| senior secured note, first lien, 9.25%, 10/15/20 |
Canada | 2,205,000 | 992,250 | |||||||||||
| h | Cheniere Corpus Christi Holdings LLC, senior secured note, 144A, 7.00%, 6/30/24 |
United States | 800,000 | 822,504 | ||||||||||
| h | Chesapeake Energy Corp., secured note, second lien, 144A, 8.00%, 12/15/22 |
United States | 755,000 | 643,638 | ||||||||||
| Clayton Williams Energy Inc., senior note, 7.75%, 4/01/19 |
United States | 1,300,000 | 988,000 | |||||||||||
| CONSOL Energy Inc., senior note, 5.875%, 4/15/22 |
United States | 2,500,000 | 2,196,875 | |||||||||||
| Energy Transfer Equity LP, senior note, first lien, 7.50%, 10/15/20 |
United States | 1,900,000 | 2,023,500 | |||||||||||
| Energy Transfer Partners LP, senior note, 5.20%, 2/01/22 |
United States | 1,000,000 | 1,054,889 | |||||||||||
| i | Energy XXI Gulf Coast Inc., |
|||||||||||||
| senior note, 9.25%, 12/15/17 |
United States | 1,500,000 | 172,500 | |||||||||||
| senior note, 6.875%, 3/15/24 |
United States | 800,000 | 92,000 | |||||||||||
| h senior secured note, second lien, 144A, 11.00%, 3/15/20 |
United States | 700,000 | 283,500 | |||||||||||
| h | EnQuest PLC, senior note, 144A, 7.00%, 4/15/22 |
United Kingdom | 1,100,000 | 672,375 | ||||||||||
| Semiannual Report | FSI-11 |
FRANKLIN TEMPLETON VARIABLE INSURANCE PRODUCTS TRUST
CONSOLIDATED STATEMENT OF INVESTMENTS (UNAUDITED)
Franklin Strategic Income VIP Fund (continued)
| Country | Principal Amount* | Value | ||||||||||||
| Corporate Bonds (continued) |
||||||||||||||
| Energy (continued) |
||||||||||||||
| Freeport-McMoRan Oil & Gas LLC/FCX Oil & Gas Inc., senior note, 6.875%, 2/15/23 |
United States | 672,000 | $ | 651,840 | ||||||||||
| h,j | Gaz Capital SA, (OJSC Gazprom), loan participation, senior note, 144A, 3.85%, 2/06/20 |
Russia | 1,500,000 | 1,518,577 | ||||||||||
| i | Halcon Resources Corp., |
|||||||||||||
| senior note, 8.875%, 5/15/21 |
United States | 1,400,000 | 287,000 | |||||||||||
| h senior secured note, third lien, 144A, 13.00%, 2/15/22 |
United States | 1,000,000 | 535,000 | |||||||||||
| h | Kinder Morgan Finance Co. LLC, senior secured note, 144A, 6.00%, 1/15/18 |
United States | 2,000,000 | 2,105,168 | ||||||||||
| Kinder Morgan Inc., senior note, 6.50%, 9/15/20 |
United States | 1,500,000 | 1,654,812 | |||||||||||
| h,i | Linn Energy LLC/Finance Corp., senior secured note, second lien, 144A, 12.00%, 12/15/20 |
United States | 2,000,000 | 695,000 | ||||||||||
| h | LUKOIL International Finance BV, senior note, 144A, 4.563%, 4/24/23 |
Russia | 2,500,000 | 2,537,225 | ||||||||||
| Martin Midstream Partners LP/Martin Midstream Finance Corp., senior note, 7.25%, 2/15/21 |
United States | 2,000,000 | 1,860,000 | |||||||||||
| i | Midstates Petroleum Co. Inc./LLC, senior note, 9.25%, 6/01/21 |
United States | 1,500,000 | 22,500 | ||||||||||
| PBF Holding Co. LLC, first lien, 8.25%, 2/15/20 |
United States | 1,000,000 | 1,042,500 | |||||||||||
| h,i | Peabody Energy Corp., secured note, second lien, 144A, 10.00%, 3/15/22 |
United States | 3,000,000 | 405,000 | ||||||||||
| i | Penn Virginia Corp., senior note, 8.50%, 5/01/20 |
United States | 1,500,000 | 585,000 | ||||||||||
| Regency Energy Partners LP/Regency Energy Finance Corp., |
||||||||||||||
| 5.875%, 3/01/22 |
United States | 200,000 | 212,639 | |||||||||||
| 5.00%, 10/01/22 |
United States | 500,000 | 513,774 | |||||||||||
| Sabine Pass Liquefaction LLC, |
||||||||||||||
| first lien, 5.625%, 2/01/21 |
United States | 2,000,000 | 2,030,000 | |||||||||||
| first lien, 5.625%, 4/15/23 |
United States | 900,000 | 907,875 | |||||||||||
| senior secured note, first lien, 5.75%, 5/15/24 |
United States | 300,000 | 299,250 | |||||||||||
| Sanchez Energy Corp., senior note, |
||||||||||||||
| 7.75%, 6/15/21 |
United States | 900,000 | 767,250 | |||||||||||
| 6.125%, 1/15/23 |
United States | 300,000 | 233,250 | |||||||||||
| c | W&T Offshore Inc., senior note, 8.50%, 6/15/19 |
United States | 2,000,000 | 500,000 | ||||||||||
| Weatherford International Ltd., senior note, |
||||||||||||||
| 7.75%, 6/15/21 |
United States | 800,000 | 782,000 | |||||||||||
| 8.25%, 6/15/23 |
United States | 1,000,000 | 952,500 | |||||||||||
| WPX Energy Inc., senior note, 8.25%, 8/01/23 |
United States | 900,000 | 906,750 | |||||||||||
|
|
|
|||||||||||||
| 37,280,985 | ||||||||||||||
|
|
|
|||||||||||||
| Food & Staples Retailing 0.8% |
||||||||||||||
| h | Cencosud SA, senior note, 144A, |
|||||||||||||
| 4.875%, 1/20/23 |
Chile | 1,500,000 | 1,544,288 | |||||||||||
| 5.15%, 2/12/25 |
Chile | 1,500,000 | 1,543,725 | |||||||||||
| Walgreens Boots Alliance Inc., senior note, 3.80%, 11/18/24 |
United States | 2,500,000 | 2,654,522 | |||||||||||
|
|
|
|||||||||||||
| 5,742,535 | ||||||||||||||
|
|
|
|||||||||||||
| Food, Beverage & Tobacco 1.1% |
||||||||||||||
| Anheuser-Busch InBev Finance Inc., senior note, 3.30%, 2/01/23 |
Belgium | 1,300,000 | 1,369,673 | |||||||||||
| h | JBS USA LLC/Finance Inc., senior note, 144A, |
|||||||||||||
| 8.25%, 2/01/20 |
United States | 2,500,000 | 2,600,000 | |||||||||||
| 5.75%, 6/15/25 |
United States | 500,000 | 472,500 | |||||||||||
| h | Post Holdings Inc., senior note, 144A, |
|||||||||||||
| 6.75%, 12/01/21 |
United States | 1,700,000 | 1,802,000 | |||||||||||
| FSI-12 | Semiannual Report |
FRANKLIN TEMPLETON VARIABLE INSURANCE PRODUCTS TRUST
CONSOLIDATED STATEMENT OF INVESTMENTS (UNAUDITED)
Franklin Strategic Income VIP Fund (continued)
| Country | Principal Amount* | Value | ||||||||||||
| Corporate Bonds (continued) |
||||||||||||||
| Food, Beverage & Tobacco (continued) |
||||||||||||||
| h | Post Holdings Inc., senior note, 144A, (continued) |
|||||||||||||
| 6.00%, 12/15/22 |
United States | 500,000 | $ | 514,375 | ||||||||||
| 7.75%, 3/15/24 |
United States | 1,000,000 | 1,101,250 | |||||||||||
|
|
|
|||||||||||||
| 7,859,798 | ||||||||||||||
|
|
|
|||||||||||||
| Health Care Equipment & Services 1.9% |
||||||||||||||
| Alere Inc., senior sub. note, 6.50%, 6/15/20 |
United States | 900,000 | 900,000 | |||||||||||
| CHS/Community Health Systems Inc., |
||||||||||||||
| senior note, 8.00%, 11/15/19 |
United States | 1,500,000 | 1,471,875 | |||||||||||
| senior note, 6.875%, 2/01/22 |
United States | 400,000 | 352,000 | |||||||||||
| senior secured note, first lien, 5.125%, 8/15/18 |
United States | 121,000 | 123,269 | |||||||||||
| DaVita HealthCare Partners Inc., |
||||||||||||||
| senior bond, 5.125%, 7/15/24 |
United States | 500,000 | 506,487 | |||||||||||
| senior bond, 5.00%, 5/01/25 |
United States | 900,000 | 894,375 | |||||||||||
| senior note, 5.75%, 8/15/22 |
United States | 1,500,000 | 1,575,000 | |||||||||||
| HCA Inc., |
||||||||||||||
| senior bond, 5.875%, 5/01/23 |
United States | 1,500,000 | 1,603,125 | |||||||||||
| senior note, 7.50%, 2/15/22 |
United States | 700,000 | 797,650 | |||||||||||
| senior secured bond, first lien, 5.875%, 3/15/22 |
United States | 1,000,000 | 1,090,000 | |||||||||||
| senior secured bond, first lien, 5.25%, 4/15/25 |
United States | 600,000 | 628,500 | |||||||||||
| h | MPH Acquisition Holdings LLC, senior note, 144A, 7.125%, 6/01/24 |
United States | 400,000 | 421,000 | ||||||||||
| Stryker Corp., senior bond, 3.50%, 3/15/26 |
United States | 500,000 | 531,782 | |||||||||||
| Tenet Healthcare Corp., senior note, |
||||||||||||||
| 5.00%, 3/01/19 |
United States | 500,000 | 486,250 | |||||||||||
| 5.50%, 3/01/19 |
United States | 1,200,000 | 1,188,000 | |||||||||||
| 8.125%, 4/01/22 |
United States | 1,000,000 | 1,029,800 | |||||||||||
|
|
|
|||||||||||||
| 13,599,113 | ||||||||||||||
|
|
|
|||||||||||||
| Insurance 1.1% |
||||||||||||||
| MetLife Inc., senior note, |
||||||||||||||
| 3.60%, 4/10/24 |
United States | 2,400,000 | 2,534,844 | |||||||||||
| 3.00%, 3/01/25 |
United States | 300,000 | 304,233 | |||||||||||
| h | Nippon Life Insurance Co., sub. bond, 144A, 5.10% to 10/16/24, FRN thereafter, 10/16/44 |
Japan | 3,500,000 | 3,784,847 | ||||||||||
| Prudential Financial Inc., 3.50%, 5/15/24 |
United States | 800,000 | 833,075 | |||||||||||
|
|
|
|||||||||||||
| 7,456,999 | ||||||||||||||
|
|
|
|||||||||||||
| Materials 5.0% |
||||||||||||||
| ArcelorMittal, senior note, |
||||||||||||||
| 6.50%, 3/01/21 |
France | 2,700,000 | 2,787,682 | |||||||||||
| 6.125%, 6/01/25 |
France | 300,000 | 300,000 | |||||||||||
| h | Ardagh Packaging Finance PLC/Ardagh MP Holdings USA Inc., senior note, 144A, |
|||||||||||||
| 7.00%, 11/15/20 |
Luxembourg | 105,882 | 104,294 | |||||||||||
| 6.75%, 1/31/21 |
Luxembourg | 200,000 | 201,500 | |||||||||||
| 6.00%, 6/30/21 |
Luxembourg | 1,300,000 | 1,296,750 | |||||||||||
| h | Barminco Finance Pty. Ltd., senior note, 144A, 9.00%, 6/01/18 |
Australia | 1,500,000 | 1,246,410 | ||||||||||
| h | Cemex Finance LLC, senior secured note, first lien, 144A, 6.00%, 4/01/24 |
Mexico | 1,000,000 | 972,090 | ||||||||||
| h | Cemex SAB de CV, |
|||||||||||||
| first lien, 144A, 5.70%, 1/11/25 |
Mexico | 1,500,000 | 1,427,130 | |||||||||||
| secured note, 144A, 5.875%, 3/25/19 |
Mexico | 1,000,000 | 1,025,200 | |||||||||||
| Semiannual Report | FSI-13 |
FRANKLIN TEMPLETON VARIABLE INSURANCE PRODUCTS TRUST
CONSOLIDATED STATEMENT OF INVESTMENTS (UNAUDITED)
Franklin Strategic Income VIP Fund (continued)
| Country | Principal Amount* | Value | ||||||||||||
| Corporate Bonds (continued) |
||||||||||||||
| Materials (continued) |
||||||||||||||
| h | Ceramtec Group GmbH, senior note, 144A, 8.25%, 8/15/21 |
Germany | 1,200,000 | EUR | $ | 1,410,917 | ||||||||
| The Chemours Co., |
||||||||||||||
| senior bond, 7.00%, 5/15/25 |
United States | 500,000 | 421,875 | |||||||||||
| senior note, 6.625%, 5/15/23 |
United States | 2,000,000 | 1,710,000 | |||||||||||
| h | First Quantum Minerals Ltd., senior note, 144A, |
|||||||||||||
| 6.75%, 2/15/20 |
Canada | 700,000 | 588,000 | |||||||||||
| 7.00%, 2/15/21 |
Canada | 825,000 | 667,219 | |||||||||||
| h | FMG Resources (August 2006) Pty. Ltd., senior secured note, 144A, 9.75%, 3/01/22 |
Australia | 1,700,000 | 1,887,000 | ||||||||||
| Freeport-McMoRan Inc., senior note, 4.55%, 11/14/24 |
United States | 2,500,000 | 2,200,000 | |||||||||||
| h | Glencore Finance Canada Ltd., senior bond, 144A, |
Switzerland | 1,000,000 | 1,001,165 | ||||||||||
| h | Glencore Funding LLC, senior note, 144A, |
|||||||||||||
| 4.125%, 5/30/23 |
Switzerland | 600,000 | 552,811 | |||||||||||
| 4.625%, 4/29/24 |
Switzerland | 250,000 | 234,250 | |||||||||||
| h | INVISTA Finance LLC, senior secured note, 144A, 4.25%, 10/15/19 |
United States | 3,000,000 | 2,940,000 | ||||||||||
| Novelis Inc., senior note, 8.75%, 12/15/20 |
Canada | 1,600,000 | 1,668,720 | |||||||||||
| h | Owens-Brockway Glass Container Inc., senior note, 144A, |
|||||||||||||
| 5.00%, 1/15/22 |
United States | 1,400,000 | 1,407,000 | |||||||||||
| 5.875%, 8/15/23 |
United States | 700,000 | 736,606 | |||||||||||
| Reynolds Group Issuer Inc./Reynolds Group Issuer LLC/Reynolds Group Issuer Luxembourg SA, |
||||||||||||||
| first lien, 5.75%, 10/15/20 |
United States | 700,000 | 724,794 | |||||||||||
| h first lien, 144A, 5.125%, 7/15/23 |
United States | 700,000 | 709,625 | |||||||||||
| h senior note, 144A, 8.25%, 2/15/21 |
United States | 1,000,000 | 1,046,300 | |||||||||||
| h senior note, 144A, 7.00%, 7/15/24 |
United States | 300,000 | 309,413 | |||||||||||
| h | Sealed Air Corp., |
|||||||||||||
| senior bond, 144A, 5.125%, 12/01/24 |
United States | 1,000,000 | 1,031,250 | |||||||||||
| senior bond, 144A, 5.50%, 9/15/25 |
United States | 400,000 | 417,500 | |||||||||||
| senior note, 144A, 4.875%, 12/01/22 |
United States | 1,000,000 | 1,032,500 | |||||||||||
| Steel Dynamics Inc., |
||||||||||||||
| senior bond, 5.50%, 10/01/24 |
United States | 1,000,000 | 1,025,000 | |||||||||||
| senior note, 5.125%, 10/01/21 |
United States | 1,000,000 | 1,026,250 | |||||||||||
| h | U.S. Coatings Acquisition Inc./Flash Dutch 2 BV, 144A, |
United States | 1,000,000 | EUR | 1,155,735 | |||||||||
| i | Verso Paper Holdings LLC/Inc., senior secured note, first lien, 11.75%, 1/15/16 |
United States | 451,000 | 77,798 | ||||||||||
|
|
|
|||||||||||||
| 35,342,784 | ||||||||||||||
|
|
|
|||||||||||||
| Media 4.1% |
||||||||||||||
| 21st Century Fox America Inc., senior note, 3.00%, 9/15/22 |
United States | 500,000 | 522,824 | |||||||||||
| h | Altice U.S. Finance I Corp., senior secured bond, 144A, |
United States | 1,200,000 | 1,203,000 | ||||||||||
| AMC Networks Inc., senior note, 5.00%, 4/01/24 |
United States | 1,100,000 | 1,092,987 | |||||||||||
| CCO Holdings LLC/CCO Holdings Capital Corp., senior bond, |
||||||||||||||
| 5.25%, 9/30/22 |
United States | 2,700,000 | 2,777,625 | |||||||||||
| h144A, 5.375%, 5/01/25 |
United States | 900,000 | 915,750 | |||||||||||
| Clear Channel Worldwide Holdings Inc., |
||||||||||||||
| senior note, 6.50%, 11/15/22 |
United States | 1,000,000 | 1,005,000 | |||||||||||
| senior sub. note, 7.625%, 3/15/20 |
United States | 200,000 | 183,500 | |||||||||||
| senior sub. note, 7.625%, 3/15/20 |
United States | 500,000 | 478,250 | |||||||||||
| FSI-14 | Semiannual Report |
FRANKLIN TEMPLETON VARIABLE INSURANCE PRODUCTS TRUST
CONSOLIDATED STATEMENT OF INVESTMENTS (UNAUDITED)
Franklin Strategic Income VIP Fund (continued)
| Country | Principal Amount* | Value | ||||||||||||
| Corporate Bonds (continued) |
||||||||||||||
| Media (continued) |
||||||||||||||
| CSC Holdings LLC, senior note, |
||||||||||||||
| 6.75%, 11/15/21 |
United States | 2,500,000 | $ | 2,556,250 | ||||||||||
| 5.25%, 6/01/24 |
United States | 200,000 | 182,000 | |||||||||||
| DISH DBS Corp., senior note, |
||||||||||||||
| 6.75%, 6/01/21 |
United States | 500,000 | 519,375 | |||||||||||
| 5.875%, 7/15/22 |
United States | 500,000 | 487,500 | |||||||||||
| 5.875%, 11/15/24 |
United States | 500,000 | 468,750 | |||||||||||
| Gannett Co. Inc., |
||||||||||||||
| senior bond, 6.375%, 10/15/23 |
United States | 1,000,000 | 1,066,250 | |||||||||||
| h senior bond, 144A, 5.50%, 9/15/24 |
United States | 300,000 | 310,125 | |||||||||||
| senior note, 5.125%, 7/15/20 |
United States | 1,000,000 | 1,033,750 | |||||||||||
| iHeartCommunications Inc., |
||||||||||||||
| senior secured bond, first lien, 9.00%, 3/01/21 |
United States | 2,400,000 | 1,701,000 | |||||||||||
| senior secured note, first lien, 9.00%, 9/15/22 |
United States | 700,000 | 488,250 | |||||||||||
| h | Sirius XM Radio Inc., senior bond, 144A, |
|||||||||||||
| 6.00%, 7/15/24 |
United States | 1,700,000 | 1,761,625 | |||||||||||
| 5.375%, 4/15/25 |
United States | 800,000 | 798,500 | |||||||||||
| Time Warner Cable Inc., senior note, 4.00%, 9/01/21 |
United States | 1,300,000 | 1,382,545 | |||||||||||
| h | Unitymedia Hessen GmbH & Co. KG/Unitymedia NRW GmbH, senior secured note, first lien, 144A, 5.625%, 4/15/23 |
Germany | 640,000 | EUR | 751,893 | |||||||||
| h | Unitymedia KabelBW GmbH, senior bond, 144A, 6.125%, 1/15/25 |
Germany | 1,700,000 | 1,717,170 | ||||||||||
| h | Univision Communications Inc., senior secured note, first lien, 144A, 5.125%, 2/15/25 |
United States | 2,500,000 | 2,481,250 | ||||||||||
| h | Virgin Media Finance PLC, senior bond, 144A, 6.375%, 10/15/24 |
United Kingdom | 900,000 | GBP | 1,200,954 | |||||||||
| h | Virgin Media Secured Finance PLC, senior secured bond, first lien, 144A, 5.50%, 1/15/25 |
United Kingdom | 1,900,000 | 1,873,875 | ||||||||||
|
|
|
|||||||||||||
| 28,959,998 | ||||||||||||||
|
|
|
|||||||||||||
| Pharmaceuticals, Biotechnology & Life Sciences 3.1% |
||||||||||||||
| AbbVie Inc., senior note, 3.60%, 5/14/25 |
United States | 2,500,000 | 2,624,522 | |||||||||||
| Actavis Funding SCS, senior bond, 3.80%, 3/15/25 |
United States | 2,200,000 | 2,293,232 | |||||||||||
| Baxalta Inc., senior note, 4.00%, 6/23/25 |
United States | 2,500,000 | 2,610,692 | |||||||||||
| Biogen Inc., senior note, 3.625%, 9/15/22 |
United States | 1,500,000 | 1,594,682 | |||||||||||
| h | Endo Finance LLC/Endo Ltd./Endo Finco Inc., |
|||||||||||||
| senior bond, 144A, 6.00%, 2/01/25 |
United States | 1,200,000 | 1,047,000 | |||||||||||
| senior note, 144A, 6.00%, 7/15/23 |
United States | 700,000 | 619,500 | |||||||||||
| Gilead Sciences Inc., senior bond, 3.65%, 3/01/26 |
United States | 3,000,000 | 3,267,981 | |||||||||||
| Grifols Worldwide Operations Ltd., senior note, 5.25%, 4/01/22 |
United States | 800,000 | 818,000 | |||||||||||
| h | Jaguar Holding Co. II/Pharmaceutical Product Development LLC, senior note, 144A, 6.375%, 8/01/23 |
United States | 1,400,000 | 1,435,000 | ||||||||||
| h | Valeant Pharmaceuticals International, senior note, 144A, |
United States | 2,400,000 | 2,076,000 | ||||||||||
| h | Valeant Pharmaceuticals International Inc., |
|||||||||||||
| senior bond, 144A, 6.125%, 4/15/25 |
United States | 300,000 | 241,500 | |||||||||||
| senior note, 144A, 5.50%, 3/01/23 |
United States | 400,000 | 323,250 | |||||||||||
| Zoetis Inc., senior bond, 3.25%, 2/01/23 |
United States | 2,500,000 | 2,551,518 | |||||||||||
|
|
|
|||||||||||||
| 21,502,877 | ||||||||||||||
|
|
|
|||||||||||||
| Real Estate 0.6% |
||||||||||||||
| American Tower Corp., senior bond, 3.375%, 10/15/26 |
United States | 1,400,000 | 1,411,018 | |||||||||||
| Equinix Inc., senior bond, |
||||||||||||||
| 5.375%, 4/01/23 |
United States | 2,500,000 | 2,593,750 | |||||||||||
| Semiannual Report | FSI-15 |
FRANKLIN TEMPLETON VARIABLE INSURANCE PRODUCTS TRUST
CONSOLIDATED STATEMENT OF INVESTMENTS (UNAUDITED)
Franklin Strategic Income VIP Fund (continued)
| Country | Principal Amount* | Value | ||||||||||||
| Corporate Bonds (continued) |
||||||||||||||
| Real Estate (continued) |
||||||||||||||
| Equinix Inc., senior bond, (continued) |
||||||||||||||
| 5.875%, 1/15/26 |
United States | 200,000 | $ | 209,000 | ||||||||||
|
|
|
|||||||||||||
| 4,213,768 | ||||||||||||||
|
|
|
|||||||||||||
| Retailing 0.8% |
||||||||||||||
| h | Argos Merger Sub Inc., senior note, 144A, 7.125%, 3/15/23 |
United States | 1,400,000 | 1,443,750 | ||||||||||
| h | Dollar Tree Inc., senior note, 144A, 5.75%, 3/01/23 |
United States | 900,000 | 960,750 | ||||||||||
| h,i | Edcon Ltd., secured note, 144A, 9.50%, 3/01/18 |
South Africa | 1,800,000 | EUR | 609,363 | |||||||||
| Netflix Inc., senior bond, 5.875%, 2/15/25 |
United States | 2,300,000 | 2,423,625 | |||||||||||
|
|
|
|||||||||||||
| 5,437,488 | ||||||||||||||
|
|
|
|||||||||||||
| Semiconductors & Semiconductor Equipment 0.2% |
||||||||||||||
| h | Qorvo Inc., senior bond, 144A, 7.00%, 12/01/25 |
United States | 1,400,000 | 1,484,000 | ||||||||||
|
|
|
|||||||||||||
| Software & Services 0.7% |
||||||||||||||
| h | BMC Software Finance Inc., senior note, 144A, 8.125%, 7/15/21 |
United States | 2,600,000 | 1,963,000 | ||||||||||
| h | First Data Corp., |
|||||||||||||
| second lien, 144A, 5.75%, 1/15/24 |
United States | 2,100,000 | 2,089,500 | |||||||||||
| senior note, 144A, 7.00%, 12/01/23 |
United States | 700,000 | 713,125 | |||||||||||
|
|
|
|||||||||||||
| 4,765,625 | ||||||||||||||
|
|
|
|||||||||||||
| Technology Hardware & Equipment 0.5% |
||||||||||||||
| h,k | CommScope Holdings Co. Inc., senior note, 144A, PIK, |
United States | 92,000 | 95,198 | ||||||||||
| h | CommScope Technologies Finance LLC, senior bond, 144A, |
United States | 1,000,000 | 1,030,000 | ||||||||||
| h | Diamond 1 Finance Corp./Diamond 2 Finance Corp., |
|||||||||||||
| 5.875%, 6/15/21 |
United States | 300,000 | 307,734 | |||||||||||
| 7.125%, 6/15/24 |
United States | 200,000 | 209,200 | |||||||||||
| h | Western Digital Corp., senior note, 144A, 10.50%, 4/01/24 |
United States | 2,000,000 | 2,145,000 | ||||||||||
|
|
|
|||||||||||||
| 3,787,132 | ||||||||||||||
|
|
|
|||||||||||||
| Telecommunication Services 3.5% |
||||||||||||||
| AT&T Inc., senior bond, 3.40%, 5/15/25 |
United States | 1,900,000 | 1,948,060 | |||||||||||
| CenturyLink Inc., |
||||||||||||||
| senior bond, 6.75%, 12/01/23 |
United States | 700,000 | 690,375 | |||||||||||
| senior bond, 5.625%, 4/01/25 |
United States | 900,000 | 804,375 | |||||||||||
| senior note, 6.00%, 4/01/17 |
United States | 500,000 | 514,375 | |||||||||||
| senior note, 6.45%, 6/15/21 |
United States | 500,000 | 509,375 | |||||||||||
| h | Digicel Group Ltd., senior note, 144A, 8.25%, 9/30/20 |
Bermuda | 1,200,000 | 1,005,696 | ||||||||||
| h | Digicel Ltd., senior note, 144A, |
|||||||||||||
| 6.00%, 4/15/21 |
Bermuda | 1,000,000 | 861,250 | |||||||||||
| 6.75%, 3/01/23 |
Bermuda | 300,000 | 256,826 | |||||||||||
| Intelsat Jackson Holdings SA, |
||||||||||||||
| senior bond, 6.625%, 12/15/22 |
Luxembourg | 1,600,000 | 1,088,000 | |||||||||||
| senior note, 7.25%, 10/15/20 |
Luxembourg | 1,000,000 | 717,500 | |||||||||||
| senior note, 7.50%, 4/01/21 |
Luxembourg | 500,000 | 347,500 | |||||||||||
| h | Millicom International Cellular SA, senior note, 144A, |
Luxembourg | 2,200,000 | 2,266,990 | ||||||||||
| Sprint Communications Inc., senior note, |
||||||||||||||
| 8.375%, 8/15/17 |
United States | 1,200,000 | 1,236,000 | |||||||||||
| 6.00%, 11/15/22 |
United States | 500,000 | 395,950 | |||||||||||
| FSI-16 | Semiannual Report |
FRANKLIN TEMPLETON VARIABLE INSURANCE PRODUCTS TRUST
CONSOLIDATED STATEMENT OF INVESTMENTS (UNAUDITED)
Franklin Strategic Income VIP Fund (continued)
| Country | Principal Amount* | Value | ||||||||||||
| Corporate Bonds (continued) |
||||||||||||||
| Telecommunication Services (continued) |
||||||||||||||
| Sprint Communications Inc., senior note, (continued) |
||||||||||||||
|
h 144A, 9.00%, 11/15/18 |
United States | 1,500,000 | $ | 1,603,125 | ||||||||||
|
h 144A, 7.00%, 3/01/20 |
United States | 800,000 | 841,592 | |||||||||||
| Sprint Corp., senior bond, 7.875%, 9/15/23 |
United States | 500,000 | 411,250 | |||||||||||
| T-Mobile USA Inc., |
||||||||||||||
| senior bond, 6.50%, 1/15/24 |
United States | 500,000 | 528,125 | |||||||||||
| senior bond, 6.375%, 3/01/25 |
United States | 1,300,000 | 1,363,375 | |||||||||||
| senior note, 6.542%, 4/28/20 |
United States | 1,400,000 | 1,443,764 | |||||||||||
| senior note, 6.125%, 1/15/22 |
United States | 200,000 | 210,500 | |||||||||||
| senior note, 6.00%, 4/15/24 |
United States | 200,000 | 208,500 | |||||||||||
| Verizon Communications Inc., senior note, 5.15%, 9/15/23 |
United States | 2,000,000 | 2,333,726 | |||||||||||
| h | Wind Acquisition Finance SA, senior secured note, 144A, |
|||||||||||||
| 4.00%, 7/15/20 |
Italy | 1,200,000 | EUR | 1,320,938 | ||||||||||
| 7.00%, 4/23/21 |
Italy | 1,500,000 | EUR | 1,632,459 | ||||||||||
|
|
|
|||||||||||||
| 24,539,626 | ||||||||||||||
|
|
|
|||||||||||||
| Transportation 0.3% |
||||||||||||||
| h | Florida East Coast Holdings Corp., |
|||||||||||||
| secured note, first lien, 144A, 6.75%, 5/01/19 |
United States | 900,000 | 900,000 | |||||||||||
| senior note, 144A, 9.75%, 5/01/20 |
United States | 400,000 | 342,000 | |||||||||||
| h | Stena International SA, senior secured bond, first lien, 144A, 5.75%, 3/01/24 |
Sweden | 900,000 | 742,500 | ||||||||||
|
|
|
|||||||||||||
| 1,984,500 | ||||||||||||||
|
|
|
|||||||||||||
| Utilities 2.0% |
||||||||||||||
| Calpine Corp., |
||||||||||||||
| senior bond, 5.75%, 1/15/25 |
United States | 1,200,000 | 1,171,500 | |||||||||||
| senior note, 5.375%, 1/15/23 |
United States | 1,300,000 | 1,274,000 | |||||||||||
| g,h | EDF SA, sub. note, 144A, 5.25% to 1/29/23, FRN thereafter, |
France | 3,000,000 | 2,879,745 | ||||||||||
| Exelon Corp., senior bond, 3.95%, 6/15/25 |
United States | 1,800,000 | 1,928,786 | |||||||||||
| h | InterGen NV, secured bond, 144A, 7.00%, 6/30/23 |
Netherlands | 2,500,000 | 1,781,250 | ||||||||||
| Sempra Energy, |
||||||||||||||
| senior bond, 3.55%, 6/15/24 |
United States | 700,000 | 735,237 | |||||||||||
| senior note, 3.75%, 11/15/25 |
United States | 1,100,000 | 1,177,866 | |||||||||||
| The Southern Co., senior bond, 3.25%, 7/01/26 |
United States | 2,100,000 | 2,187,692 | |||||||||||
| h,i | Texas Competitive Electric Holdings Co. LLC/Texas Competitive Electric Holdings Finance Inc., senior secured note, first lien, 144A, 11.50%, 10/01/20 |
United States | 3,000,000 | 1,027,500 | ||||||||||
|
|
|
|||||||||||||
| 14,163,576 | ||||||||||||||
|
|
|
|||||||||||||
| Total Corporate Bonds (Cost $315,755,484) |
294,327,726 | |||||||||||||
|
|
|
|||||||||||||
| l,m | Senior Floating Rate Interests 11.1% |
|||||||||||||
| Automobiles & Components 0.3% |
||||||||||||||
| TI Group Automotive Systems LLC, Initial U.S. Term Loan, 4.50%, 6/25/22 |
United States | 2,120,934 | 2,083,818 | |||||||||||
|
|
|
|||||||||||||
| Capital Goods 0.3% |
||||||||||||||
| Doncasters U.S. Finance LLC, Second Lien Term Loan, 9.50%, 10/09/20 |
United States | 76,701 | 71,572 | |||||||||||
| n | Leidos (Abacus Innovations Corp.), B Term Loan, 5.25%, 8/31/23 |
United States | 161,767 | 161,868 | ||||||||||
| Sensus USA Inc., Term Loan, 6.50%, 4/05/23 |
United States | 1,780,000 | 1,766,650 | |||||||||||
| Semiannual Report | FSI-17 |
FRANKLIN TEMPLETON VARIABLE INSURANCE PRODUCTS TRUST
CONSOLIDATED STATEMENT OF INVESTMENTS (UNAUDITED)
Franklin Strategic Income VIP Fund (continued)
| Country | Principal Amount* | Value | ||||||||||||
| l,m | Senior Floating Rate Interests (continued) |
|||||||||||||
| Capital Goods (continued) |
||||||||||||||
| Ventia Pty. Ltd., Term B Loans, 5.50%, 5/21/22 |
Australia | 42,394 | $ | 42,765 | ||||||||||
|
|
|
|||||||||||||
| 2,042,855 | ||||||||||||||
|
|
|
|||||||||||||
| Commercial & Professional Services 0.1% |
||||||||||||||
| Kar Auction Services Inc., Tranche B-3 Term Loan, 4.25%, 3/09/23 |
United States | 888,834 | 894,574 | |||||||||||
|
|
|
|||||||||||||
| Consumer Durables & Apparel 0.1% |
||||||||||||||
| n | Prime Security Services Borrower LLC, Term Loan B, 4.75%, 5/02/22 |
United States | 672,857 | 674,539 | ||||||||||
|
|
|
|||||||||||||
| Consumer Services 0.9% |
||||||||||||||
| n | Affinity Gaming LLC, Initial Term Loan, 6.50%, 6/22/23 |
United States | 558,303 | 558,478 | ||||||||||
| c,e | Fitness International LLC, Term B Loan, 5.50%, 7/01/20 |
United States | 3,919,925 | 3,890,525 | ||||||||||
| n | KFC Holding Co./Pizza Hut Holdings LLC/Taco Bell of America LLC (Yum Brands), Term B Loans, 5.25%, 6/16/23 |
United States | 320,000 | 321,100 | ||||||||||
| n | Travelport Finance Luxembourg S.A.R.L., Term Loan B, 6.50%, 9/02/21 |
Luxembourg | 500,000 | 496,875 | ||||||||||
| c,k | Turtle Bay Holdings LLC, Term Loan B, PIK, 3.25%, 6/30/17 |
United States | 1,173,614 | 1,158,948 | ||||||||||
|
|
|
|||||||||||||
| 6,425,926 | ||||||||||||||
|
|
|
|||||||||||||
| Diversified Financials 0.3% |
||||||||||||||
| First Eagle Investment Management, Initial Term Loans, 4.75%, 12/01/22 |
United States | 880,187 | 866,251 | |||||||||||
| Guggenheim Partners Investment Management Holdings LLC, Initial Term Loan, 4.25%, 7/22/20 |
United States | 917,876 | 918,019 | |||||||||||
|
|
|
|||||||||||||
| 1,784,270 | ||||||||||||||
|
|
|
|||||||||||||
| Energy 1.6% |
||||||||||||||
| c,e | Bowie Resource Holdings LLC, |
|||||||||||||
| First Lien Initial Term Loan, 8.75%, 8/16/20 |
United States | 2,964,578 | 2,490,245 | |||||||||||
| Second Lien Initial Term Loan, 12.50%, 2/16/21 |
United States | 1,248,332 | 1,017,391 | |||||||||||
| n | Fieldwood Energy LLC, Loans, 3.875%, 10/01/18 |
United States | 3,706,974 | 3,243,602 | ||||||||||
| c | Foresight Energy LLC, Term Loans, 7.50%, 8/21/20 |
United States | 1,372,000 | 1,131,900 | ||||||||||
| McDermott Finance LLC, Term Loan, 8.25%, 4/16/19 |
United States | 148,504 | 148,690 | |||||||||||
| OSG Bulk Ships Inc., Initial Term Loan, 5.25%, 8/05/19 |
United States | 1,074,903 | 1,041,312 | |||||||||||
| OSG International Inc., Initial Term Loan, 5.75%, 8/05/19 |
United States | 1,958,429 | 1,938,845 | |||||||||||
|
|
|
|||||||||||||
| 11,011,985 | ||||||||||||||
|
|
|
|||||||||||||
| Health Care Equipment & Services 0.3% |
||||||||||||||
| Community Health Systems Inc., 2018 Term F Loans, 3.924%, 12/31/18 |
United States | 1,968,070 | 1,955,770 | |||||||||||
| Cotiviti Corp., Second Lien Initial Term Loan, 8.00%, 5/13/22 |
United States | 27,678 | 27,713 | |||||||||||
| New Millennium Holdco Inc., Closing Date Term Loan, 7.50%, 12/18/20 |
United States | 323,713 | 237,524 | |||||||||||
| Team Health Inc., Tranche B Term Loan, 3.75%, 11/23/22 |
United States | 107,221 | 107,279 | |||||||||||
|
|
|
|||||||||||||
| 2,328,286 | ||||||||||||||
|
|
|
|||||||||||||
| Materials 1.1% |
||||||||||||||
| n | The Chemours Co. LLC, Tranche B Term Loan, 3.75%, 5/12/22 |
United States | 3,239,023 | 3,136,453 | ||||||||||
| Cyanco Intermediate Corp., Initial Term Loan, 5.50%, 5/01/20 |
United States | 181,753 | 174,634 | |||||||||||
| FMG America Finance Inc. (Fortescue Metals Group), Loans, 4.25%, 6/30/19 |
Australia | 1,794,164 | 1,721,276 | |||||||||||
| Huntsman International LLC, Extended Term Loan B, 3.46% - 3.557%, 4/19/19 |
United States | 374,700 | 373,763 | |||||||||||
| Novelis Inc., Initial Term Loan, 4.00%, 6/02/22 |
Canada | 794,039 | 788,381 | |||||||||||
| FSI-18 | Semiannual Report |
FRANKLIN TEMPLETON VARIABLE INSURANCE PRODUCTS TRUST
CONSOLIDATED STATEMENT OF INVESTMENTS (UNAUDITED)
Franklin Strategic Income VIP Fund (continued)
| Country | Principal Amount* | Value | ||||||||||||
| l,m | Senior Floating Rate Interests (continued) |
|||||||||||||
| Materials (continued) |
||||||||||||||
| OCI Beaumont LLC, Term B-3 Loan, 7.75%, 8/20/19 |
United States | 1,741,027 | $ | 1,741,027 | ||||||||||
|
|
|
|||||||||||||
| 7,935,534 | ||||||||||||||
|
|
|
|||||||||||||
| Media 1.4% |
||||||||||||||
| n | Charter Communications Operating LLC (CCO Safari), Term A Loan, 4.50%, 5/18/21 |
United States | 1,020,000 | 1,009,800 | ||||||||||
| CSC Holdings Inc. (Cablevision), Initial Term Loans, 5.00%, 10/09/22 |
United States | 1,880,685 | 1,888,208 | |||||||||||
| Radio One Inc., Term Loan B, 5.14%, 12/31/18 |
United States | 6,799,164 | 6,782,166 | |||||||||||
|
|
|
|||||||||||||
| 9,680,174 | ||||||||||||||
|
|
|
|||||||||||||
| Pharmaceuticals, Biotechnology & Life Sciences 1.5% |
||||||||||||||
| n | Endo Luxembourg Finance Co. I S.A.R.L. and Endo LLC, 2015 Incremental Term B Loans, 3.75%, 9/25/22 |
United States | 2,787,868 | 2,749,782 | ||||||||||
| Grifols Worldwide Operations USA Inc., US Tranche B Term Loan, 3.46%, 2/27/21 |
United States | 2,738,822 | 2,741,624 | |||||||||||
| Valeant Pharmaceuticals International Inc., |
||||||||||||||
| nSeries C-2 Tranche B Term Loan, 4.75%, 12/11/19 |
United States | 675,627 | 657,891 | |||||||||||
| Series D-2 Tranche B Term Loan, 4.50%, 2/13/19 |
United States | 1,299,537 | 1,265,424 | |||||||||||
| Series F-1 Tranche B Term Loan, 5.00%, 4/01/22 |
United States | 3,317,217 | 3,230,601 | |||||||||||
|
|
|
|||||||||||||
| 10,645,322 | ||||||||||||||
|
|
|
|||||||||||||
| Retailing 0.6% |
||||||||||||||
| Ascena Retail Group Inc., Tranche B Term Loan, 5.25%, 8/21/22 |
United States | 3,700,559 | 3,536,347 | |||||||||||
| PetSmart Inc., Term Loans, 4.25%, 3/10/22 |
United States | 349,118 | 348,265 | |||||||||||
|
|
|
|||||||||||||
| 3,884,612 | ||||||||||||||
|
|
|
|||||||||||||
| Semiconductors & Semiconductor Equipment 0.8% |
||||||||||||||
| Avago Technologies Cayman Finance Ltd., Term B-1 Dollar Loans, 4.25%, 2/01/23 |
United States | 2,835,743 | 2,839,092 | |||||||||||
| MACOM Technology Solutions Holdings Inc., Initial Term Loan, 4.50%, 5/07/21 |
United States | 513,128 | 515,694 | |||||||||||
| n | MKS Instruments Inc., Tranche B-1 Term Loans, 4.25%, 4/29/23 |
United States | 549,856 | 551,116 | ||||||||||
| ON Semiconductor Corp., Closing Date Term Loans, 5.25%, 3/31/23 |
United States | 1,758,635 | 1,770,882 | |||||||||||
|
|
|
|||||||||||||
| 5,676,784 | ||||||||||||||
|
|
|
|||||||||||||
| Software & Services 0.7% |
||||||||||||||
| Match Group Inc., Term B-1 Loans, 5.50%, 11/16/22 |
United States | 398,817 | 402,805 | |||||||||||
| MoneyGram International Inc., Term Loan, 4.25%, 3/27/20 |
United States | 5,087,411 | 4,842,580 | |||||||||||
|
|
|
|||||||||||||
| 5,245,385 | ||||||||||||||
|
|
|
|||||||||||||
| Technology Hardware & Equipment 0.5% |
||||||||||||||
| Ciena Corp., Term Loan, 3.75%, 7/15/19 |
United States | 226,374 | 225,384 | |||||||||||
| Dell International LLC, Term B-2 Loan, 4.00%, 4/29/20 |
United States | 1,337,611 | 1,336,942 | |||||||||||
| Western Digital Corp., U.S. Term B Loan, 6.25%, 4/29/23 |
United States | 1,641,833 | 1,651,069 | |||||||||||
| n | Zebra Technologies Corp., Refinancing Term Loan, 4.00%, 10/27/21 |
United States | 385,821 | 387,187 | ||||||||||
|
|
|
|||||||||||||
| 3,600,582 | ||||||||||||||
|
|
|
|||||||||||||
| Telecommunication Services 0.2% |
||||||||||||||
| Intelsat Jackson Holdings SA, Tranche B-2 Term Loan, 3.75%, 6/30/19 |
Luxembourg | 559,178 | 508,153 | |||||||||||
| Windstream Corp., Tranche B-5 Term Loan, 3.50%, 8/08/19 |
United States | 563,930 | 562,051 | |||||||||||
|
|
|
|||||||||||||
| 1,070,204 | ||||||||||||||
|
|
|
|||||||||||||
| Semiannual Report | FSI-19 |
FRANKLIN TEMPLETON VARIABLE INSURANCE PRODUCTS TRUST
CONSOLIDATED STATEMENT OF INVESTMENTS (UNAUDITED)
Franklin Strategic Income VIP Fund (continued)
| Country | Principal Amount* | Value | ||||||||||||
| l,m | Senior Floating Rate Interests (continued) |
|||||||||||||
| Transportation 0.2% |
||||||||||||||
| n | The Hertz Corp., Term Loan B, 5.25%, 6/17/23 |
United States | 333,319 | $ | 333,893 | |||||||||
| Navios Maritime Midstream Partners LP, Initial Term Loan, 5.50%, 6/18/20 |
Marshall Islands | 1,292,085 | 1,240,401 | |||||||||||
| Navios Maritime Partners LP, Initial Term Loan, 5.25%, 6/27/18 |
Marshall Islands | 61,049 | 53,265 | |||||||||||
|
|
|
|||||||||||||
| 1,627,559 | ||||||||||||||
|
|
|
|||||||||||||
| Utilities 0.2% |
||||||||||||||
| Calpine Corp., Term Loan (B6), 4.00%, 1/15/23 |
United States | 632,118 | 628,957 | |||||||||||
| n | EFS Cogen Holdings I LLC (Linden), Term Loan B, 6.75%, 6/30/23 |
United States | 181,098 | 181,550 | ||||||||||
| n | NRG Energy Inc., Term Loan B, 5.25%, 6/20/23 |
United States | 870,000 | 863,475 | ||||||||||
|
|
|
|||||||||||||
| 1,673,982 | ||||||||||||||
|
|
|
|||||||||||||
| Total Senior Floating Rate Interests |
78,286,391 | |||||||||||||
|
|
|
|||||||||||||
| Foreign Government and Agency Securities 11.7% |
||||||||||||||
| Government of Hungary, senior note, 6.25%, 1/29/20 |
Hungary | 1,500,000 | 1,669,057 | |||||||||||
| Government of Indonesia, |
||||||||||||||
| 6.125%, 5/15/28 |
Indonesia | 34,000,000,000 | IDR | 2,267,096 | ||||||||||
| FR34, 12.80%, 6/15/21 |
Indonesia | 17,235,000,000 | IDR | 1,601,207 | ||||||||||
| senior bond, FR53, 8.25%, 7/15/21 |
Indonesia | 46,000,000,000 | IDR | 3,626,037 | ||||||||||
| senior bond, FR70, 8.375%, 3/15/24 |
Indonesia | 26,500,000,000 | IDR | 2,118,495 | ||||||||||
| Government of Malaysia, |
||||||||||||||
| senior bond, 3.814%, 2/15/17 |
Malaysia | 2,500,000 | MYR | 625,096 | ||||||||||
| senior bond, 4.24%, 2/07/18 |
Malaysia | 1,800,000 | MYR | 456,165 | ||||||||||
| senior note, 3.172%, 7/15/16 |
Malaysia | 32,500,000 | MYR | 8,071,378 | ||||||||||
| senior note, 3.394%, 3/15/17 |
Malaysia | 16,000,000 | MYR | 3,992,035 | ||||||||||
| senior note, 4.012%, 9/15/17 |
Malaysia | 23,400,000 | MYR | 5,891,106 | ||||||||||
| Government of Mexico, |
||||||||||||||
| 7.25%, 12/15/16 |
Mexico | 930,330 | o MXN | 5,155,013 | ||||||||||
| 7.75%, 12/14/17 |
Mexico | 345,000 | o MXN | 1,976,363 | ||||||||||
| senior note, 8.50%, 12/13/18 |
Mexico | 1,405,000 | o MXN | 8,310,105 | ||||||||||
| senior note, M, 5.00%, 6/15/17 |
Mexico | 750,000 | o MXN | 4,125,023 | ||||||||||
| h | Government of Serbia, senior note, 144A, |
|||||||||||||
| 4.875%, 2/25/20 |
Serbia | 4,000,000 | 4,132,660 | |||||||||||
| 7.25%, 9/28/21 |
Serbia | 200,000 | 229,513 | |||||||||||
| Government of Sri Lanka, |
||||||||||||||
| A, 6.40%, 8/01/16 |
Sri Lanka | 19,500,000 | LKR | 133,617 | ||||||||||
| B, 6.40%, 10/01/16 |
Sri Lanka | 16,000,000 | LKR | 109,076 | ||||||||||
| Government of the Philippines, senior note, 2.875%, 5/22/17 |
Philippines | 77,000,000 | PHP | 1,643,149 | ||||||||||
| h | Government of Ukraine, 144A, |
|||||||||||||
| 7.75%, 9/01/22 |
Ukraine | 500,000 | 485,638 | |||||||||||
| 7.75%, 9/01/23 |
Ukraine | 969,000 | 937,532 | |||||||||||
| 7.75%, 9/01/24 |
Ukraine | 969,000 | 930,807 | |||||||||||
| 7.75%, 9/01/25 |
Ukraine | 969,000 | 926,863 | |||||||||||
| 7.75%, 9/01/26 |
Ukraine | 969,000 | 922,997 | |||||||||||
| 7.75%, 9/01/27 |
Ukraine | 969,000 | 919,581 | |||||||||||
| a,p VRI, GDP Linked Securities, 5/31/40 |
Ukraine | 1,952,000 | 641,720 | |||||||||||
| q | Government of Uruguay, senior bond, Index Linked, 4.375%, 12/15/28 |
Uruguay | 193,402,842 | UYU | 5,699,379 | |||||||||
| Nota Do Tesouro Nacional, |
||||||||||||||
| 10.00%, 1/01/21 |
Brazil | 5,000 | r BRL | 1,454,115 | ||||||||||
| FSI-20 | Semiannual Report |
FRANKLIN TEMPLETON VARIABLE INSURANCE PRODUCTS TRUST
CONSOLIDATED STATEMENT OF INVESTMENTS (UNAUDITED)
Franklin Strategic Income VIP Fund (continued)
| Country | Principal Amount* | Value | ||||||||||||
| Foreign Government and Agency Securities (continued) |
|
|||||||||||||
| Nota Do Tesouro Nacional, (continued) |
||||||||||||||
| 10.00%,1/01/23 |
Brazil | 4,000 | r BRL | $ | 1,136,570 | |||||||||
| sIndex Linked, 6.00%, 8/15/16 |
Brazil | 1,604 | r BRL | 1,442,889 | ||||||||||
| sIndex Linked, 6.00%, 8/15/18 |
Brazil | 5,525 | r BRL | 4,946,158 | ||||||||||
| sIndex Linked, 6.00%, 5/15/23 |
Brazil | 3,350 | r BRL | 2,975,643 | ||||||||||
| senior note, 10.00%, 1/01/17 |
Brazil | 7,500 | r BRL | 2,294,065 | ||||||||||
| q | Uruguay Notas del Tesoro, 18, Index Linked, 2.25%, 8/23/17 |
Uruguay | 30,349,593 | UYU | 957,103 | |||||||||
|
|
|
|||||||||||||
| Total Foreign Government and Agency Securities (Cost $92,839,860) |
82,803,251 | |||||||||||||
|
|
|
|||||||||||||
| U.S. Government and Agency Securities 4.3% |
||||||||||||||
| U.S. Treasury Bond, |
||||||||||||||
| 7.875%, 2/15/21 |
United States | 900,000 | 1,181,004 | |||||||||||
| 6.50%, 11/15/26 |
United States | 2,400,000 | 3,557,390 | |||||||||||
| qIndex Linked, 0.625%, 1/15/24 |
United States | 4,880,214 | 5,115,553 | |||||||||||
| U.S. Treasury Note, |
||||||||||||||
| 4.625%, 2/15/17 |
United States | 600,000 | 615,668 | |||||||||||
| 3.75%, 11/15/18 |
United States | 7,000,000 | 7,516,250 | |||||||||||
| 2.75%, 2/15/24 |
United States | 4,000,000 | 4,417,344 | |||||||||||
| qIndex Linked, 2.125%, 1/15/19 |
United States | 779,956 | 837,118 | |||||||||||
| qIndex Linked, 0.625%, 7/15/21 |
United States | 1,698,247 | 1,789,594 | |||||||||||
| qIndex Linked, 0.125%, 7/15/24 |
United States | 5,057,578 | 5,115,300 | |||||||||||
|
|
|
|||||||||||||
| Total U.S. Government and Agency Securities |
30,145,221 | |||||||||||||
|
|
|
|||||||||||||
| Asset-Backed Securities and Commercial |
||||||||||||||
| Banks 2.5% |
||||||||||||||
| Banc of America Commercial Mortgage Trust, 2006-4, AJ, 5.695%, 7/10/46 |
United States | 1,807,000 | 1,763,154 | |||||||||||
| l | Bear Stearns Adjustable Rate Mortgage Trust, 2004-4, A6, FRN, 2.977%, 6/25/34 |
United States | 1,634,821 | 1,623,410 | ||||||||||
| Bear Stearns Commercial Mortgage Securities Trust, |
||||||||||||||
| l2006-PW11, AJ, FRN, 5.429%, 3/11/39 |
United States | 1,000,000 | 962,266 | |||||||||||
| 2006-PW13, AJ, 5.611%, 9/11/41 |
United States | 2,310,000 | 2,311,541 | |||||||||||
| l | CD Mortgage Trust, 2006-CD3, AJ, FRN, 5.688%, 10/15/48 |
United States | 2,700,000 | 1,622,295 | ||||||||||
| Citigroup Commercial Mortgage Trust, |
||||||||||||||
| 2006-C5, AJ, 5.482%, 10/15/49 |
United States | 1,667,000 | 1,492,074 | |||||||||||
| l2007-C6, AM, FRN, 5.712%, 12/10/49 |
United States | 1,700,000 | 1,707,817 | |||||||||||
| CSAIL Commercial Mortgage Trust, 2015-C1, A4, 3.505%, 4/15/50 |
United States | 915,000 | 991,765 | |||||||||||
| l | CWABS Asset-Backed Certificates Trust, 2005-11, AF4, FRN, 5.21%, 3/25/34 |
United States | 1,275,000 | 1,275,535 | ||||||||||
| l | Greenwich Capital Commercial Funding Corp., 2006-GG7, AJ, FRN, 5.773%, 7/10/38 |
United States | 1,560,000 | 1,441,838 | ||||||||||
| JP Morgan Chase Commercial Mortgage Securities Trust, |
||||||||||||||
| 2006-CB17, AM, 5.464%, 12/12/43 |
United States | 760,000 | 741,827 | |||||||||||
| l2006-LDP7, AJ, FRN, 5.988%, 4/17/45 |
United States | 635,000 | 478,342 | |||||||||||
| l | Merrill Lynch Mortgage Investors Trust, 2005-A6, 2A3, FRN, 0.833%, 8/25/35 |
United States | 251,535 | 242,543 | ||||||||||
| l | Morgan Stanley Capital I Trust, 2006-HQ8, AJ, FRN, 5.421%, 3/12/44 |
United States | 79,193 | 79,093 | ||||||||||
| Wells Fargo Mortgage Backed Securities Trust, |
||||||||||||||
| l2004-W, A9, FRN, 2.766%, 11/25/34 |
United States | 864,206 | 875,515 | |||||||||||
| Semiannual Report | FSI-21 |
FRANKLIN TEMPLETON VARIABLE INSURANCE PRODUCTS TRUST
CONSOLIDATED STATEMENT OF INVESTMENTS (UNAUDITED)
Franklin Strategic Income VIP Fund (continued)
| Country | Principal Amount* | Value | ||||||||||||
| Asset-Backed Securities and Commercial Mortgage-Backed Securities (continued) |
||||||||||||||
| Banks (continued) |
||||||||||||||
| Wells Fargo Mortgage Backed Securities Trust, (continued) |
||||||||||||||
| 2007-3, 3A1, 5.50%, 4/25/22 |
United States | 198,389 | $ | 203,376 | ||||||||||
|
|
|
|||||||||||||
| 17,812,391 | ||||||||||||||
|
|
|
|||||||||||||
| Diversified Financials 3.5% |
||||||||||||||
| h,l | Atrium X, 10A, C, 144A, FRN, 3.233%, 7/16/25 |
United States | 1,400,000 | 1,345,736 | ||||||||||
| h,l | Atrium XI, 11A, C, 144A, FRN, 3.838%, 10/23/25 |
Cayman Islands | 1,820,000 | 1,808,461 | ||||||||||
| Banc of America Commercial Mortgage Trust, 2015-UBS7, |
||||||||||||||
| A3, 3.441%, 9/15/48 |
United States | 1,050,000 | 1,135,627 | |||||||||||
| A4, 3.705%, 9/15/48 |
United States | 1,170,000 | 1,288,498 | |||||||||||
| h,l | BCAP LLC Trust, 2009-RR1, 2A2, 144A, FRN, 2.896%, 5/26/35 |
United States | 440,000 | 412,999 | ||||||||||
| h,l | Catamaran CLO Ltd., 2013-1A, C, 144A, FRN, 3.234%, 1/27/25 |
United States | 1,130,000 | 1,078,235 | ||||||||||
| h,l | Cent CDO Ltd., 2007-15A, A2B, 144A, FRN, 0.996%, 3/11/21 |
United States | 1,251,000 | 1,177,792 | ||||||||||
| h,l | Cent CLO LP, 2013-17A, D, 144A, FRN, 3.637%, 1/30/25 |
United States | 784,314 | 764,918 | ||||||||||
| h,l | CIFC Funding Ltd., 2007-3A, A1J, 144A, FRN, 1.036%, 7/26/21 |
United States | 960,000 | 948,355 | ||||||||||
| h | Core Industrial Trust, 2015-CALW, A, 144A, 3.04%, 2/10/34 |
United States | 1,410,000 | 1,486,331 | ||||||||||
| h,l | CT CDO IV Ltd., 2006-4A, A1, 144A, FRN, 0.758%, 10/20/43 |
United States | 21,284 | 21,238 | ||||||||||
| h,l | Cumberland Park CLO Ltd., 2015-2A, |
|||||||||||||
| B, 144A, FRN, 2.734%, 7/20/26 |
United States | 1,080,000 | 1,077,991 | |||||||||||
| C, 144A, FRN, 3.484%, 7/20/26 |
United States | 190,000 | 185,814 | |||||||||||
| h,l | Eaton Vance CDO Ltd., 2014-1A, |
|||||||||||||
| B, 144A, FRN, 2.678%, 7/15/26 |
United States | 426,000 | 419,504 | |||||||||||
| C, 144A, FRN, 3.628%, 7/15/26 |
United States | 167,100 | 161,724 | |||||||||||
| h,l | Eleven Madison Trust Mortgage Trust, 2015-11MD, A, 144A, FRN, 3.555%, 9/10/35 |
United States | 1,350,000 | 1,472,160 | ||||||||||
| l | FHLMC Structured Agency Credit Risk Debt Notes, |
|||||||||||||
| 2014-DN1, M2, FRN, 2.653%, 2/25/24 |
United States | 1,500,000 | 1,521,069 | |||||||||||
| 2014-HQ2, M2, FRN, 2.653%, 9/25/24 |
United States | 1,000,000 | 1,001,237 | |||||||||||
| 2015-HQ1, M2, FRN, 2.653%, 3/25/25 |
United States | 1,000,000 | 1,004,720 | |||||||||||
| h | G-Force LLC, 2005-RRA, C, 144A, 5.20%, 8/22/36 |
United States | 2,000,000 | 1,935,460 | ||||||||||
| l | Impac Secured Assets Trust, 2007-2, FRN, 0.703%, 4/25/37 |
United States | 260,144 | 242,513 | ||||||||||
| h,l | Invitation Homes Trust, 2015-SFR1, A, 144A, FRN, 1.896%, 3/17/32 |
United States | 1,443,976 | 1,446,434 | ||||||||||
| l | MortgageIT Trust, 2004-1, A2, FRN, 1.353%, 11/25/34 |
United States | 315,540 | 299,456 | ||||||||||
| h,l | Newcastle CDO Ltd., 2004-5A, 1, 144A, FRN, 0.98%, 12/24/39 |
United States | 4,628 | 4,619 | ||||||||||
| l | Opteum Mortgage Acceptance Corp. Trust, 2005-4, 1APT, FRN, 0.763%, 11/25/35 |
United States | 500,881 | 470,402 | ||||||||||
| l | Structured Asset Securities Corp., 2005-2XS, 2A2, FRN, 1.946%, 2/25/35 |
United States | 300,701 | 287,980 | ||||||||||
| l | Thornburg Mortgage Securities Trust, 2005-1, A3, FRN, 2.537%, 4/25/45 |
United States | 246,796 | 247,413 | ||||||||||
| h,l | Voya CLO Ltd., |
|||||||||||||
| 2013-1A, B, 144A, FRN, 3.528%, 4/15/24 |
United States | 270,000 | 264,789 | |||||||||||
| 2013-2A, B, 144A, FRN, 3.318%, 4/25/25 |
United States | 1,080,000 | 1,041,422 | |||||||||||
|
|
|
|||||||||||||
| 24,552,897 | ||||||||||||||
|
|
|
|||||||||||||
| Total Asset-Backed Securities and Commercial Mortgage-Backed Securities (Cost $41,999,135) |
42,365,288 | |||||||||||||
|
|
|
|||||||||||||
| Mortgage-Backed Securities 7.9% |
||||||||||||||
| l | Federal Home Loan Mortgage Corp. (FHLMC) Adjustable |
|||||||||||||
| FHLMC, 2.688%, 1/01/33 |
United States | 48,274 | 50,398 | |||||||||||
|
|
|
|||||||||||||
| FSI-22 | Semiannual Report |
FRANKLIN TEMPLETON VARIABLE INSURANCE PRODUCTS TRUST
CONSOLIDATED STATEMENT OF INVESTMENTS (UNAUDITED)
Franklin Strategic Income VIP Fund (continued)
| Country | Principal Amount* | Value | ||||||||||||
| Mortgage-Backed Securities (continued) |
||||||||||||||
| Federal Home Loan Mortgage Corp. (FHLMC) Fixed Rate 3.0% |
||||||||||||||
| FHLMC Gold 15 Year, 5.50%, 7/01/17 - 7/01/19 |
United States | 43,932 | $ | 45,746 | ||||||||||
| FHLMC Gold 15 Year, 6.00%, 5/01/17 |
United States | 1,005 | 1,017 | |||||||||||
| n | FHLMC Gold 30 Year, 3.00%, 7/01/46 |
United States | 5,750,000 | 5,959,936 | ||||||||||
| n | FHLMC Gold 30 Year, 3.50%, 7/01/46 |
United States | 5,448,000 | 5,744,150 | ||||||||||
| n | FHLMC Gold 30 Year, 4.00%, 7/01/46 |
United States | 7,635,000 | 8,171,900 | ||||||||||
| FHLMC Gold 30 Year, 5.00%, 4/01/34 - 8/01/35 |
United States | 335,427 | 371,927 | |||||||||||
| FHLMC Gold 30 Year, 5.50%, 3/01/33 - 1/01/35 |
United States | 254,078 | 285,021 | |||||||||||
| FHLMC Gold 30 Year, 6.00%, 4/01/33 - 2/01/36 |
United States | 257,253 | 295,373 | |||||||||||
| FHLMC Gold 30 Year, 6.50%, 11/01/27 - 6/01/36 |
United States | 46,687 | 53,991 | |||||||||||
| FHLMC Gold 30 Year, 7.00%, 9/01/21 - 4/01/30 |
United States | 21,201 | 23,230 | |||||||||||
| FHLMC Gold 30 Year, 7.50%, 8/01/30 - 7/01/31 |
United States | 1,105 | 1,200 | |||||||||||
|
|
|
|||||||||||||
| 20,953,491 | ||||||||||||||
|
|
|
|||||||||||||
| l | Federal National Mortgage Association (FNMA) Adjustable |
|||||||||||||
| FNMA, 2.522% - 2.53%, 12/01/34 - 4/01/20 |
United States | 139,563 | 147,278 | |||||||||||
|
|
|
|||||||||||||
| Federal National Mortgage Association (FNMA) Fixed Rate 3.4% |
||||||||||||||
| FNMA 15 Year, 2.50%, 7/01/22 - 6/01/27 |
United States | 462,076 | 479,614 | |||||||||||
| FNMA 15 Year, 4.50%, 6/01/19 - 3/01/20 |
United States | 72,297 | 74,329 | |||||||||||
| FNMA 15 Year, 5.00%, 10/01/17 - 6/01/18 |
United States | 37,997 | 39,079 | |||||||||||
| FNMA 15 Year, 5.50%, 1/01/17 - 11/01/18 |
United States | 165,262 | 169,129 | |||||||||||
| n | FNMA 30 Year, 3.00%, 7/01/46 |
United States | 5,750,000 | 5,967,422 | ||||||||||
| n | FNMA 30 Year, 3.50%, 7/01/46 |
United States | 6,327,000 | 6,675,232 | ||||||||||
| n | FNMA 30 Year, 4.00%, 7/01/46 |
United States | 8,100,000 | 8,683,612 | ||||||||||
| n | FNMA 30 Year, 4.50%, 7/01/46 |
United States | 1,620,000 | 1,768,489 | ||||||||||
| FNMA 30 Year, 5.00%, 4/01/30 |
United States | 90,806 | 100,812 | |||||||||||
| FNMA 30 Year, 6.50%, 6/01/28 - 10/01/37 |
United States | 244,557 | 284,386 | |||||||||||
|
|
|
|||||||||||||
| 24,242,104 | ||||||||||||||
|
|
|
|||||||||||||
| Government National Mortgage Association (GNMA) Fixed |
||||||||||||||
| GNMA I SF 30 Year, 5.00%, 11/15/33 - 7/15/34 |
United States | 335,582 | 379,891 | |||||||||||
| GNMA I SF 30 Year, 6.50%, 2/15/32 |
United States | 2,049 | 2,339 | |||||||||||
| GNMA I SF 30 Year, 7.00%, 10/15/28 - 6/15/32 |
United States | 17,722 | 18,125 | |||||||||||
| GNMA I SF 30 Year, 7.50%, 9/15/30 |
United States | 1,443 | 1,734 | |||||||||||
| n | GNMA II SF 30 Year, 3.00%, 7/01/46 |
United States | 4,400,000 | 4,599,031 | ||||||||||
| n | GNMA II SF 30 Year, 3.50%, 7/01/46 |
United States | 4,770,000 | 5,062,163 | ||||||||||
| GNMA II SF 30 Year, 5.00%, 9/20/33 - 11/20/33 |
United States | 95,437 | 107,424 | |||||||||||
| GNMA II SF 30 Year, 6.00%, 11/20/34 |
United States | 112,692 | 132,880 | |||||||||||
| GNMA II SF 30 Year, 6.50%, 4/20/31 - 2/20/34 |
United States | 53,970 | 64,632 | |||||||||||
| GNMA II SF 30 Year, 7.50%, 1/20/28 - 4/20/32 |
United States | 12,636 | 15,010 | |||||||||||
|
|
|
|||||||||||||
| 10,383,229 | ||||||||||||||
|
|
|
|||||||||||||
| Total Mortgage-Backed Securities |
55,776,500 | |||||||||||||
|
|
|
|||||||||||||
| Municipal Bonds 1.0% |
||||||||||||||
| Illinois State GO, Build America Bonds, 7.35%, 7/01/35 |
United States | 1,000,000 | 1,111,660 | |||||||||||
| New York City HDC Capital Fund Grant Program Revenue, New York City Housing Authority Program, Series B1, 5.00%, 7/01/33 |
United States | 500,000 | 599,150 | |||||||||||
| Semiannual Report | FSI-23 |
FRANKLIN TEMPLETON VARIABLE INSURANCE PRODUCTS TRUST
CONSOLIDATED STATEMENT OF INVESTMENTS (UNAUDITED)
Franklin Strategic Income VIP Fund (continued)
| Country | Principal Amount* | Value | ||||||||||||
| Municipal Bonds (continued) |
||||||||||||||
| Port Authority of New York and New Jersey Revenue, Consolidated, One Hundred Ninety-First Series, 4.823%, 6/01/45 |
United States | 2,415,000 | $ | 2,668,020 | ||||||||||
| Puerto Rico Electric Power Authority Power Revenue, |
||||||||||||||
| Series A, 6.75%, 7/01/36 |
United States | 3,465,000 | 2,286,900 | |||||||||||
| Series XX, 5.25%, 7/01/40 |
United States | 165,000 | 108,900 | |||||||||||
|
|
|
|||||||||||||
| Total Municipal Bonds (Cost $7,293,734) |
6,774,630 | |||||||||||||
|
|
|
|||||||||||||
| Shares | ||||||||||||||
| Escrows and Litigation Trusts (Cost $—) 0.0% |
||||||||||||||
| Materials 0.0% |
||||||||||||||
| a,e | NewPage Corp., Litigation Trust |
United States | 2,500,000 | — | ||||||||||
|
|
|
|||||||||||||
| Total Investments before Short Term Investments (Cost $684,786,330) |
652,064,849 | |||||||||||||
|
|
|
|||||||||||||
| Short Term Investments (Cost $104,709,404) 14.8% |
||||||||||||||
| Money Market Funds 14.8% |
||||||||||||||
| a,f | Institutional Fiduciary Trust Money Market Portfolio |
United States | 104,709,404 | 104,709,404 | ||||||||||
|
|
|
|||||||||||||
| Total Investments (Cost $789,495,734) 107.2% |
756,774,253 | |||||||||||||
| Other Assets, less Liabilities (7.2)% |
(50,842,338 | ) | ||||||||||||
|
|
|
|||||||||||||
| Net Assets 100.0% |
$ | 705,931,915 | ||||||||||||
|
|
|
|||||||||||||
†Rounds to less than 0.1% of net assets.
*The principal amount is stated in U.S. dollars unless otherwise indicated.
aNon-income producing.
bThe security is owned by FT Holdings Corporation III, a wholly-owned subsidiary of the Fund. See Note 1(g).
cAt June 30, 2016, pursuant to the Fund’s policies and the requirements of applicable securities law, the Fund is restricted from trading these securities at period end.
dSee Note 8 regarding restricted securities.
eSecurity has been deemed illiquid because it may not be able to be sold within seven days. At June 30, 2016, the aggregate value of these securities was $7,752,083, representing 1.1% of net assets.
fSee Note 3(e) regarding investments in affiliated management investment companies.
gPerpetual security with no stated maturity date.
hSecurity was purchased pursuant to Rule 144A under the Securities Act of 1933 and may be sold in transactions exempt from registration only to qualified institutional buyers or in a public offering registered under the Securities Act of 1933. These securities have been deemed liquid under guidelines approved by the Trust’s Board of Trustees. At June 30, 2016, the aggregate value of these securities was $137,428,129, representing 19.5% of net assets.
iSee Note 7 regarding defaulted securities.
jSee Note 1(f) regarding loan participation notes.
kIncome may be received in additional securities and/or cash.
lThe coupon rate shown represents the rate at period end.
mSee Note 1(i) regarding senior floating rate interests.
nA portion or all of the security purchased on a when-issued, delayed delivery or to-be-announced (TBA) basis. See Note 1(c).
oPrincipal amount is stated in 100 Mexican Peso Units.
pThe principal represents the notional amount. See Note 1(d) regarding value recovery instruments.
qPrincipal amount of security is adjusted for inflation. See Note 1(k).
rPrincipal amount is stated in 1,000 Brazilian Real Units.
sRedemption price at maturity is adjusted for inflation. See Note 1(k).
| FSI-24 | Semiannual Report |
FRANKLIN TEMPLETON VARIABLE INSURANCE PRODUCTS TRUST
CONSOLIDATED STATEMENT OF INVESTMENTS (UNAUDITED)
Franklin Strategic Income VIP Fund (continued)
At June 30, 2016, the Fund had the following forward exchange contracts outstanding. See Note 1(d).
| Forward Exchange Contracts | ||||||||||||||||||||||||||||
| Currency | Counterpartya | Type | Quantity | Contract Amount |
Settlement Date |
Unrealized Appreciation |
Unrealized Depreciation |
|||||||||||||||||||||
| OTC Forward Exchange Contracts | ||||||||||||||||||||||||||||
| Australian Dollar |
DBAB | Sell | 8,308,345 | $ | 5,802,542 | 8/18/16 | $ | — | $ | (383,192 | ) | |||||||||||||||||
| Chilean Peso |
BZWS | Buy | 477,650,000 | 647,705 | 8/18/16 | 70,672 | — | |||||||||||||||||||||
| Chilean Peso |
BZWS | Sell | 477,650,000 | 709,469 | 8/18/16 | — | (8,908 | ) | ||||||||||||||||||||
| Chilean Peso |
DBAB | Buy | 454,000,000 | 623,416 | 8/18/16 | 59,391 | — | |||||||||||||||||||||
| Chilean Peso |
DBAB | Sell | 454,000,000 | 670,804 | 8/18/16 | — | (12,004 | ) | ||||||||||||||||||||
| Chilean Peso |
JPHQ | Buy | 234,301,000 | 323,085 | 8/18/16 | 29,300 | — | |||||||||||||||||||||
| Chilean Peso |
JPHQ | Sell | 234,301,000 | 348,533 | 8/18/16 | — | (3,852 | ) | ||||||||||||||||||||
| Chilean Peso |
MSCO | Buy | 220,380,000 | 303,805 | 8/18/16 | 27,643 | — | |||||||||||||||||||||
| Chilean Peso |
MSCO | Sell | 220,380,000 | 327,946 | 8/18/16 | — | (3,501 | ) | ||||||||||||||||||||
| Euro |
BZWS | Sell | 299,944 | 334,112 | 8/18/16 | 3,604 | (3,019 | ) | ||||||||||||||||||||
| Euro |
DBAB | Buy | 1,289,108 | 1,462,493 | 8/18/16 | — | (29,050 | ) | ||||||||||||||||||||
| Euro |
DBAB | Sell | 3,531,984 | 4,031,451 | 8/18/16 | 104,007 | — | |||||||||||||||||||||
| Euro |
HSBC | Sell | 142,717 | 162,622 | 8/18/16 | 3,925 | — | |||||||||||||||||||||
| Euro |
JPHQ | Buy | 1,062,400 | 1,206,378 | 8/18/16 | — | (25,027 | ) | ||||||||||||||||||||
| Euro |
JPHQ | Sell | 7,087,804 | 7,848,994 | 8/18/16 | 57,724 | (90,121 | ) | ||||||||||||||||||||
| Indian Rupee |
CITI | Buy | 4,537,000 | 65,849 | 8/18/16 | 794 | — | |||||||||||||||||||||
| Indian Rupee |
DBAB | Buy | 301,181,000 | 4,393,596 | 8/18/16 | 30,384 | — | |||||||||||||||||||||
| Indian Rupee |
HSBC | Buy | 144,338,000 | 2,094,283 | 8/18/16 | 25,865 | — | |||||||||||||||||||||
| Japanese Yen |
BZWS | Sell | 136,513,000 | 1,164,191 | 8/18/16 | — | (159,717 | ) | ||||||||||||||||||||
| Japanese Yen |
CITI | Sell | 127,820,000 | 1,090,170 | 8/18/16 | — | (149,433 | ) | ||||||||||||||||||||
| Japanese Yen |
DBAB | Buy | 1,324,000,000 | 11,733,532 | 8/18/16 | 1,106,665 | — | |||||||||||||||||||||
| Japanese Yen |
DBAB | Sell | 2,059,291,000 | 18,221,995 | 8/18/16 | — | (1,749,078 | ) | ||||||||||||||||||||
| Japanese Yen |
GSCO | Sell | 42,760,000 | 364,691 | 8/18/16 | — | (49,997 | ) | ||||||||||||||||||||
| Japanese Yen |
HSBC | Sell | 413,980,000 | 3,603,788 | 8/18/16 | — | (411,004 | ) | ||||||||||||||||||||
| Japanese Yen |
JPHQ | Sell | 566,799,000 | 5,016,492 | 8/18/16 | — | (480,343 | ) | ||||||||||||||||||||
| Australian Dollar |
DBAB | Sell | 1,950,000 | 1,403,025 | 10/20/16 | — | (45,581 | ) | ||||||||||||||||||||
| British Pound |
DBAB | Sell | 687,472 | 1,004,878 | 10/20/16 | 87,088 | — | |||||||||||||||||||||
| British Pound |
JPHQ | Sell | 250,000 | 360,156 | 10/20/16 | 26,401 | — | |||||||||||||||||||||
| Euro |
BZWS | Sell | 2,261,311 | 2,564,440 | 10/20/16 | 43,686 | — | |||||||||||||||||||||
| Euro |
CITI | Sell | 1,058,200 | 1,198,832 | 10/20/16 | 19,223 | — | |||||||||||||||||||||
| Euro |
DBAB | Buy | 576,388 | 655,353 | 10/20/16 | — | (12,835 | ) | ||||||||||||||||||||
| Euro |
DBAB | Sell | 6,800,000 | 7,761,470 | 10/20/16 | 181,297 | — | |||||||||||||||||||||
| Euro |
GSCO | Sell | 369,000 | 419,405 | 10/20/16 | 8,070 | — | |||||||||||||||||||||
| Euro |
JPHQ | Sell | 6,561,135 | 7,435,275 | 10/20/16 | 121,372 | — | |||||||||||||||||||||
| Japanese Yen |
BZWS | Sell | 60,047,000 | 544,496 | 10/20/16 | — | (39,375 | ) | ||||||||||||||||||||
| Japanese Yen |
CITI | Sell | 31,757,000 | 287,547 | 10/20/16 | — | (21,244 | ) | ||||||||||||||||||||
| Japanese Yen |
DBAB | Sell | 27,184,000 | 246,234 | 10/20/16 | — | (18,091 | ) | ||||||||||||||||||||
| Japanese Yen |
HSBC | Sell | 147,626,000 | 1,337,059 | 10/20/16 | — | (98,392 | ) | ||||||||||||||||||||
| Japanese Yen |
JPHQ | Sell | 366,653,000 | 3,320,591 | 10/20/16 | — | (244,583 | ) | ||||||||||||||||||||
| Euro |
CITI | Sell | 1,073,000 | 1,209,808 | 12/15/16 | 11,008 | — | |||||||||||||||||||||
| Euro |
JPHQ | Sell | 1,230,591 | 1,398,321 | 12/15/16 | 23,454 | — | |||||||||||||||||||||
| Indian Rupee |
DBAB | Buy | 96,375,000 | 1,399,782 | 12/15/16 | — | (11,191 | ) | ||||||||||||||||||||
| Japanese Yen |
DBAB | Sell | 405,702,500 | 3,856,744 | 12/15/16 | — | (97,476 | ) | ||||||||||||||||||||
| Japanese Yen |
JPHQ | Sell | 425,150,000 | 4,037,243 | 12/15/16 | — | (106,523 | ) | ||||||||||||||||||||
| Japanese Yen |
MSCO | Sell | 12,500,000 | 118,568 | 12/15/16 | — | (3,265 | ) | ||||||||||||||||||||
|
|
|
|||||||||||||||||||||||||||
| Total Forward Exchange Contracts |
|
$ | 2,041,573 | $ | (4,256,802 | ) | ||||||||||||||||||||||
|
|
|
|||||||||||||||||||||||||||
| Net unrealized appreciation (depreciation) |
|
$ | (2,215,229 | ) | ||||||||||||||||||||||||
|
|
|
|||||||||||||||||||||||||||
aMay be comprised of multiple contracts with the same counterparty, currency and settlement date.
| Semiannual Report | FSI-25 |
FRANKLIN TEMPLETON VARIABLE INSURANCE PRODUCTS TRUST
CONSOLIDATED STATEMENT OF INVESTMENTS (UNAUDITED)
Franklin Strategic Income VIP Fund (continued)
At June 30, 2016, the Fund had the following credit default swap contracts outstanding. See Note 1(d).
Credit Default Swap Contracts
| Description | Periodic Payment Rate |
Counterparty / Exchange |
Notional Amounta |
Expiration Date |
Unamortized Upfront Payments (Receipts) |
Unrealized Appreciation |
Unrealized Depreciation |
Value | Ratingb | |||||||||||||||||||||||||||
| Centrally Cleared Swap Contracts | ||||||||||||||||||||||||||||||||||||
| Contracts to Sell Protectionc | ||||||||||||||||||||||||||||||||||||
| Traded Index | ||||||||||||||||||||||||||||||||||||
| CDX.NA.HY.26 |
5.00 | % | ICE | $ | 12,100,000 | 6/20/21 | $ | 347,130 | $ | 64,218 | $ | — | $ | 411,348 | |
Non Investment Grade |
| |||||||||||||||||||
|
|
|
|||||||||||||||||||||||||||||||||||
| OTC Swap Contracts | ||||||||||||||||||||||||||||||||||||
| Contracts to Sell Protectionc | ||||||||||||||||||||||||||||||||||||
| Traded Index | ||||||||||||||||||||||||||||||||||||
| MCDX.NA.26 |
1.00 | % | CITI | 2,100,000 | 6/20/21 | 5,636 | 1,619 | — | 7,255 | |
Investment Grade |
| ||||||||||||||||||||||||
| MCDX.NA.26 |
1.00 | % | GSCO | 10,000,000 | 6/20/21 | 24,461 | 10,084 | — | 34,545 | |
Investment Grade |
| ||||||||||||||||||||||||
|
|
|
|||||||||||||||||||||||||||||||||||
| Total OTC Swap Contracts |
|
30,097 | 11,703 | — | 41,800 | |||||||||||||||||||||||||||||||
|
|
|
|||||||||||||||||||||||||||||||||||
| Total Credit Default Swap Contracts |
|
$ | 377,227 | $ | 75,921 | $ | — | $ | 453,148 | |||||||||||||||||||||||||||
|
|
|
|||||||||||||||||||||||||||||||||||
| Net unrealized appreciation (depreciation) |
|
$ | 75,921 | |||||||||||||||||||||||||||||||||
|
|
|
|||||||||||||||||||||||||||||||||||
aFor contracts to sell protection, the notional amount is equal to the maximum potential amount of the future payments and no recourse provisions have been entered into in association with the contracts.
bBased on internal ratings for index swaps. Internal ratings based on mapping into equivalent ratings from external vendors.
cThe Fund enters contracts to sell protection to create a long credit position. Performance triggers include failure to pay or bankruptcy of the underlying securities for traded index swaps.
See Note 9 regarding other derivative information.
See Abbreviations on page FSI-44.
| FSI-26 | Semiannual Report | The accompanying notes are an integral part of these consolidated financial statements. |
FRANKLIN TEMPLETON VARIABLE INSURANCE PRODUCTS TRUST
Consolidated Financial Statements
Consolidated Statement of Assets and Liabilities
June 30, 2016 (unaudited)
| Franklin Strategic Income VIP Fund |
||||
| Assets: |
||||
| Investments in securities: |
||||
| Cost - Unaffiliated issuers |
$ | 628,163,783 | ||
| Cost - Non-controlled affiliates (Note 3e) |
161,331,951 | |||
|
|
|
|||
| Total cost of investments |
$ | 789,495,734 | ||
|
|
|
|||
| Value - Unaffiliated issuers |
$ | 595,858,143 | ||
| Value - Non-controlled affiliates (Note 3e) |
160,916,110 | |||
|
|
|
|||
| Total value of investments |
756,774,253 | |||
| Cash |
991,647 | |||
| Restricted Cash (Note 1e) |
56,000 | |||
| Foreign currency, at value (cost $15,794) |
15,994 | |||
| Receivables: |
||||
| Investment securities sold |
1,638,134 | |||
| Capital shares sold |
187,293 | |||
| Dividends and interest |
5,227,831 | |||
| Due from brokers |
2,601,571 | |||
| Variation margin |
59,964 | |||
| OTC swap contracts (upfront payments $31,271) |
30,097 | |||
| Unrealized appreciation on OTC forward exchange contracts |
2,041,573 | |||
| Unrealized appreciation on OTC swap contracts |
11,703 | |||
| Other assets |
334 | |||
|
|
|
|||
| Total assets |
769,636,394 | |||
|
|
|
|||
| Liabilities: |
||||
| Payables: |
||||
| Investment securities purchased |
58,393,757 | |||
| Capital shares redeemed |
316,049 | |||
| Management fees |
295,436 | |||
| Distribution fees |
134,436 | |||
| Due to brokers |
56,000 | |||
| Unrealized depreciation on OTC forward exchange contracts |
4,256,802 | |||
| Deferred tax |
52,292 | |||
| Accrued expenses and other liabilities |
199,707 | |||
|
|
|
|||
| Total liabilities |
63,704,479 | |||
|
|
|
|||
| Net assets, at value |
$ | 705,931,915 | ||
|
|
|
|||
| Net assets consist of: |
||||
| Paid-in capital |
$ | 757,767,362 | ||
| Undistributed net investment income |
13,248,509 | |||
| Net unrealized appreciation (depreciation) |
(34,861,315 | ) | ||
| Accumulated net realized gain (loss) |
(30,222,641 | ) | ||
|
|
|
|||
| Net assets, at value |
$ | 705,931,915 | ||
|
|
|
|||
| The accompanying notes are an integral part of these consolidated financial statements. | Semiannual Report | FSI-27 |
FRANKLIN TEMPLETON VARIABLE INSURANCE PRODUCTS TRUST
CONSOLIDATED FINANCIAL STATEMENTS
Consolidated Statement of Assets and Liabilities (continued)
June 30, 2016 (unaudited)
| Franklin Strategic Income VIP Fund |
||||
| Class 1: | ||||
| Net assets, at value |
$ | 417,297,638 | ||
|
|
|
|||
| Shares outstanding |
39,318,343 | |||
|
|
|
|||
| Net asset value and maximum offering price per share |
$ | 10.61 | ||
|
|
|
|||
| Class 2: | ||||
| Net assets, at value |
$ | 202,076,361 | ||
|
|
|
|||
| Shares outstanding |
19,670,006 | |||
|
|
|
|||
| Net asset value and maximum offering price per share |
$ | 10.27 | ||
|
|
|
|||
| Class 4: | ||||
| Net assets, at value |
$ | 86,557,916 | ||
|
|
|
|||
| Shares outstanding |
8,219,183 | |||
|
|
|
|||
| Net asset value and maximum offering price per share |
$ | 10.53 | ||
|
|
|
|||
| FSI-28 | Semiannual Report | The accompanying notes are an integral part of these consolidated financial statements. |
FRANKLIN TEMPLETON VARIABLE INSURANCE PRODUCTS TRUST
CONSOLIDATED FINANCIAL STATEMENTS
Consolidated Statement of Operations
for the six months ended June 30, 2016 (unaudited)
| Franklin Strategic Income VIP Fund |
||||
| Investment income: |
||||
| Dividends: |
||||
| Unaffiliated issuers |
$ | 1,521,849 | ||
| Non-controlled affiliates (Note 3e) |
1,053,032 | |||
| Interest |
15,424,708 | |||
|
|
|
|||
| Total investment income |
17,999,589 | |||
|
|
|
|||
| Expenses: |
||||
| Management fees (Note 3a) |
2,105,551 | |||
| Distribution fees: (Note 3c) |
||||
| Class 2 |
246,406 | |||
| Class 4 |
154,951 | |||
| Custodian fees (Note 4) |
41,507 | |||
| Reports to shareholders |
89,215 | |||
| Professional fees |
46,166 | |||
| Trustees’ fees and expenses |
1,858 | |||
| Other |
117,667 | |||
|
|
|
|||
| Total expenses |
2,803,321 | |||
| Expense reductions (Note 4) |
(546 | ) | ||
| Expenses waived/paid by affiliates (Note 3e) |
(259,879 | ) | ||
|
|
|
|||
| Net expenses |
2,542,896 | |||
|
|
|
|||
| Net investment income |
15,456,693 | |||
|
|
|
|||
| Realized and unrealized gains (losses): |
||||
| Net realized gain (loss) from: |
||||
| Investments: |
||||
| Unaffiliated issuers |
(11,436,886 | ) | ||
| Non-controlled affiliates (Note 3e) |
(40,253 | ) | ||
| Foreign currency transactions |
(2,874,372 | ) | ||
| Swap contracts |
173,507 | |||
|
|
|
|||
| Net realized gain (loss) |
(14,178,004 | ) | ||
|
|
|
|||
| Net change in unrealized appreciation (depreciation) on: |
||||
| Investments |
31,055,144 | |||
| Translation of other assets and liabilities denominated in foreign currencies |
(2,744,114 | ) | ||
| Swap contracts |
33,313 | |||
| Change in deferred taxes on unrealized appreciation |
(46,106 | ) | ||
|
|
|
|||
| Net change in unrealized appreciation (depreciation) |
28,298,237 | |||
|
|
|
|||
| Net realized and unrealized gain (loss) |
14,120,233 | |||
|
|
|
|||
| Net increase (decrease) in net assets resulting from operations |
$ | 29,576,926 | ||
|
|
|
|||
| The accompanying notes are an integral part of these consolidated financial statements. | Semiannual Report | FSI-29 |
FRANKLIN TEMPLETON VARIABLE INSURANCE PRODUCTS TRUST
CONSOLIDATED FINANCIAL STATEMENTS
Consolidated Statements of Changes in Net Assets
| Franklin Strategic Income VIP Fund | ||||||||
| Six Months Ended June 30, 2016 (unaudited) |
Year Ended December 31, 2015 |
|||||||
| Increase (decrease) in net assets: |
||||||||
| Operations: |
||||||||
| Net investment income |
$ | 15,456,693 | $ | 38,231,958 | ||||
| Net realized gain (loss) |
(14,178,004 | ) | (11,348,194 | ) | ||||
| Net change in unrealized appreciation (depreciation) |
28,298,237 | (55,936,500 | ) | |||||
|
|
|
|||||||
| Net increase (decrease) in net assets resulting from operations |
29,576,926 | (29,052,736 | ) | |||||
|
|
|
|||||||
| Distributions to shareholders from: |
||||||||
| Net investment income and net foreign currency gains: |
||||||||
| Class 1 |
(15,028,685 | ) | (33,228,366 | ) | ||||
| Class 2 |
(6,934,919 | ) | (13,693,486 | ) | ||||
| Class 4 |
(2,790,452 | ) | (6,782,412 | ) | ||||
| Net realized gains: |
||||||||
| Class 1 |
— | (8,524,986 | ) | |||||
| Class 2 |
— | (3,636,551 | ) | |||||
| Class 4 |
— | (1,855,841 | ) | |||||
|
|
|
|||||||
| Total distributions to shareholders |
(24,754,056 | ) | (67,721,642 | ) | ||||
|
|
|
|||||||
| Capital share transactions: (Note 2) |
||||||||
| Class 1 |
(27,179,498 | ) | (74,671,750 | ) | ||||
| Class 2 |
(1,330,842 | ) | 21,200,703 | |||||
| Class 4 |
(7,196,285 | ) | (8,346,246 | ) | ||||
|
|
|
|||||||
| Total capital share transactions |
(35,706,625 | ) | (61,817,293 | ) | ||||
|
|
|
|||||||
| Net increase (decrease) in net assets |
(30,883,755 | ) | (158,591,671 | ) | ||||
| Net assets: |
||||||||
| Beginning of period |
736,815,670 | 895,407,341 | ||||||
|
|
|
|||||||
| End of period |
$ | 705,931,915 | $ | 736,815,670 | ||||
|
|
|
|||||||
| Undistributed net investment income included in net assets: |
||||||||
| End of period |
$ | 13,248,509 | $ | 23,766,482 | ||||
|
|
|
|||||||
| FSI-30 | Semiannual Report | The accompanying notes are an integral part of these consolidated financial statements. |
FRANKLIN TEMPLETON VARIABLE INSURANCE PRODUCTS TRUST
Notes to Consolidated Financial Statements (unaudited)
Franklin Strategic Income VIP Fund
| Semiannual Report | FSI-31 |
FRANKLIN TEMPLETON VARIABLE INSURANCE PRODUCTS TRUST
NOTES TO CONSOLIDATED FINANCIAL STATEMENTS (UNAUDITED)
Franklin Strategic Income VIP Fund (continued)
1. Organization and Significant Accounting Policies (continued)
a. Financial Instrument Valuation (continued)
valuation inputs, when arriving at fair value. The VC primarily employs a market-based approach which may use related or comparable assets or liabilities, recent transactions, market multiples, book values, and other relevant information for the investment to determine the fair value of the investment. An income-based valuation approach may also be used in which the anticipated future cash flows of the investment are discounted to calculate fair value. Discounts may also be applied due to the nature or duration of any restrictions on the disposition of the investments. Due to the inherent uncertainty of valuations of such investments, the fair values may differ significantly from the values that would have been used had an active market existed. The VC employs various methods for calibrating these valuation approaches including a regular review of key inputs and assumptions, transactional back-testing or disposition analysis, and reviews of any related market activity.
Trading in securities on foreign securities stock exchanges and OTC markets may be completed before 4 p.m. Eastern time. In addition, trading in certain foreign markets may not take place on every NYSE business day. Occasionally, events occur between the time at which trading in a foreign security is completed and the close of the NYSE that might call into question the reliability of the value of a portfolio security held by the Fund. As a result, differences may arise between the value of the Fund’s portfolio securities as determined at the foreign market close and the latest indications of value at the close of the NYSE. In order to minimize the potential for these differences, the VC monitors price movements following the close of trading in foreign stock markets through a series of country specific market proxies (such as baskets of American Depositary Receipts, futures contracts and exchange traded funds). These price movements are measured against established trigger thresholds for each specific market proxy to assist in determining if an event has occurred that may call into question the reliability of the values of the foreign securities held by the Fund. If such an event occurs, the securities may be valued using fair value procedures, which may include the use of independent pricing services.
When the last day of the reporting period is a non-business day, certain foreign markets may be open on those days that the NYSE is closed, which could result in differences between the value of the Fund’s portfolio securities on the last business day
and the last calendar day of the reporting period. Any significant security valuation changes due to an open foreign market are adjusted and reflected by the Fund for financial reporting purposes.
b. Foreign Currency Translation
Portfolio securities and other assets and liabilities denominated in foreign currencies are translated into U.S. dollars based on the exchange rate of such currencies against U.S. dollars on the date of valuation. The Fund may enter into foreign currency exchange contracts to facilitate transactions denominated in a foreign currency. Purchases and sales of securities, income and expense items denominated in foreign currencies are translated into U.S. dollars at the exchange rate in effect on the transaction date. Portfolio securities and assets and liabilities denominated in foreign currencies contain risks that those currencies will decline in value relative to the U.S. dollar. Occasionally, events may impact the availability or reliability of foreign exchange rates used to convert the U.S. dollar equivalent value. If such an event occurs, the foreign exchange rate will be valued at fair value using procedures established and approved by the Board.
The Fund does not separately report the effect of changes in foreign exchange rates from changes in market prices on securities held. Such changes are included in net realized and unrealized gain or loss from investments in the Consolidated Statement of Operations.
Realized foreign exchange gains or losses arise from sales of foreign currencies, currency gains or losses realized between the trade and settlement dates on securities transactions and the difference between the recorded amounts of dividends, interest, and foreign withholding taxes and the U.S. dollar equivalent of the amounts actually received or paid. Net unrealized foreign exchange gains and losses arise from changes in foreign exchange rates on foreign denominated assets and liabilities other than investments in securities held at the end of the reporting period.
c. Securities Purchased on a When-Issued or Delayed Delivery and TBA Basis
The Fund purchases securities on a when issued or delayed delivery and to-be-announced (TBA) basis, with payment and delivery scheduled for a future date. These transactions are subject to market fluctuations and are subject to the risk that the value at delivery may be more or less than the trade date purchase price.
| FSI-32 | Semiannual Report |
FRANKLIN TEMPLETON VARIABLE INSURANCE PRODUCTS TRUST
NOTES TO CONSOLIDATED FINANCIAL STATEMENTS (UNAUDITED)
Franklin Strategic Income VIP Fund (continued)
| Semiannual Report | FSI-33 |
FRANKLIN TEMPLETON VARIABLE INSURANCE PRODUCTS TRUST
NOTES TO CONSOLIDATED FINANCIAL STATEMENTS (UNAUDITED)
Franklin Strategic Income VIP Fund (continued)
1. Organization and Significant Accounting Policies (continued)
d. Derivative Financial Instruments (continued)
settlement amount equal to the notional amount of the credit default swap less the recovery value of the referenced debt obligation, or other agreed upon amount. For centrally cleared credit default swaps, required initial margins are pledged by the Fund,
and the daily change in fair value is accounted for as a variation margin payable or receivable in the Consolidated Statement of Assets and Liabilities. Over the term of the contract, the buyer pays the seller a periodic stream of payments, provided that no event of default has occurred. Such periodic payments are accrued daily as an unrealized appreciation or depreciation until the payments are made, at which time they are realized. Upfront payments and receipts are reflected in the Consolidated Statement of Assets and Liabilities and represent compensating factors between stated terms of the credit default swap agreement and prevailing market conditions (credit spreads and other relevant factors). These upfront payments and receipts are amortized over the term of the contract as a realized gain or loss in the Consolidated Statement of Operations.
The Fund invests in value recovery instruments (VRI) primarily to gain exposure to growth risk. Periodic payments from VRI are dependent on established benchmarks for underlying variables. VRI has a notional amount, which is used to calculate amounts of payments to holders. Payments are recorded upon receipt as realized gains in the Consolidated Statement of Operations. The risks of investing in VRI include growth risk, liquidity, and the potential loss of investment.
See Note 9 regarding other derivative information.
e. Restricted Cash
At June 30, 2016, the Fund held restricted cash in connection with investments in certain derivative securities. Restricted cash is held in a segregated account with the Fund’s custodian and is reflected in the Consolidated Statement of Assets and Liabilities.
f. Loan Participation Notes
The Fund invests in loan participation notes (Participations). Participations are loans originally issued to a borrower by one or more financial institutions (the Lender) and subsequently sold to other investors, such as the Fund. Participations typically result in the Fund having a contractual relationship only with the
Lender and not with the borrower. The Fund has the right to receive from the Lender any payments of principal, interest and fees which the Lender received from the borrower. The Fund generally has no rights to either enforce compliance by the borrower with the terms of the loan agreement or to any collateral relating to the original loan. As a result, the Fund assumes the credit risk of both the borrower and the Lender that is selling the Participation. The Participations may also involve interest rate risk and liquidity risk, including the potential default or insolvency of the borrower and/or the Lender.
g. Investments in FT Holdings Corporation III (FT Subsidiary)
The Fund invests in certain financial instruments through its investment in FT Subsidiary. FT Subsidiary is a Delaware Corporation, is a wholly-owned subsidiary of the Fund, and is able to invest in certain financial instruments consistent with the investment objective of the Fund. At June 30, 2016, FT Subsidiary’s investment, Turtle Bay Resort, as well as any other assets and liabilities of FT Subsidiary are reflected in the Fund’s Consolidated Statement of Investments and Consolidated Statement of Assets and Liabilities. The financial statements have been consolidated and include the accounts of the Fund and FT Subsidiary. All intercompany transactions and balances have been eliminated. At June 30, 2016, the net assets of FT Subsidiary were $4,946,757, representing less than 1% of the Fund’s consolidated net assets. The Fund’s investment in FT Subsidiary is limited to 25% of consolidated assets.
h. Mortgage Dollar Rolls
The Fund enters into mortgage dollar rolls, typically on a TBA basis. Mortgage dollar rolls are agreements between the Fund and a financial institution where the Fund sells (or buys) mortgage-backed securities for delivery on a specified date and simultaneously contracts to repurchase (or sell) substantially similar (same type, coupon, and maturity) securities at a future date and at a predetermined price. Gains or losses are realized on the initial sale, and the difference between the repurchase price and the sale price is recorded as an unrealized gain or loss to the Fund upon entering into the mortgage dollar roll. In addition, the Fund may invest the cash proceeds that are received from the initial sale. During the period between the sale and repurchase, the Fund is not entitled to principal and interest paid on the mortgage backed securities. Transactions in mortgage dollar rolls are accounted for as purchases and sales and may result in an increase to the Fund’s portfolio turnover rate. The risks of mortgage dollar roll transactions include the potential inability of the counterparty to fulfill its obligations.
| FSI-34 | Semiannual Report |
FRANKLIN TEMPLETON VARIABLE INSURANCE PRODUCTS TRUST
NOTES TO CONSOLIDATED FINANCIAL STATEMENTS (UNAUDITED)
Franklin Strategic Income VIP Fund (continued)
| Semiannual Report | FSI-35 |
FRANKLIN TEMPLETON VARIABLE INSURANCE PRODUCTS TRUST
NOTES TO CONSOLIDATED FINANCIAL STATEMENTS (UNAUDITED)
Franklin Strategic Income VIP Fund (continued)
1. Organization and Significant Accounting Policies (continued)
m. Guarantees and Indemnifications
Under the Trust’s organizational documents, its officers and trustees are indemnified by the Trust against certain liabilities arising out of the performance of their duties to the Trust.
Additionally, in the normal course of business, the Trust, on behalf of the Fund, enters into contracts with service providers that contain general indemnification clauses. The Trust’s maximum exposure under these arrangements is unknown as this would involve future claims that may be made against the Trust that have not yet occurred. Currently, the Trust expects the risk of loss to be remote.
2. Shares of Beneficial Interest
At June 30, 2016, there were an unlimited number of shares authorized (without par value). Transactions in the Fund’s shares were as follows:
| Six Months Ended June 30, 2016 |
Year Ended December 31, 2015 |
|||||||||||||||||||
| Shares | Amount | Shares | Amount | |||||||||||||||||
| Class 1 Shares: | ||||||||||||||||||||
| Shares sold |
218,687 | $ | 2,335,020 | 342,063 | $ | 3,944,392 | ||||||||||||||
| Shares issued in reinvestment of distributions |
1,427,226 | 15,028,685 | 3,778,584 | 41,753,352 | ||||||||||||||||
| Shares redeemed |
(4,200,110 | ) | (44,543,203 | ) | (10,556,150 | ) | (120,369,494 | ) | ||||||||||||
|
|
|
|||||||||||||||||||
| Net increase (decrease) |
(2,554,197 | ) | $ | (27,179,498 | ) | (6,435,503 | ) | $ | (74,671,750 | ) | ||||||||||
|
|
|
|||||||||||||||||||
| Class 2 Shares: | ||||||||||||||||||||
| Shares sold |
1,375,480 | $ | 14,106,061 | 4,486,606 | $ | 49,551,393 | ||||||||||||||
| Shares issued in reinvestment of distributions |
679,894 | 6,934,919 | 1,618,117 | 17,330,037 | ||||||||||||||||
| Shares redeemed |
(2,194,026 | ) | (22,371,822 | ) | (4,183,880 | ) | (45,680,727 | ) | ||||||||||||
|
|
|
|||||||||||||||||||
| Net increase (decrease) |
(138,652 | ) | $ | (1,330,842 | ) | 1,920,843 | $ | 21,200,703 | ||||||||||||
|
|
|
|||||||||||||||||||
| Class 4 Shares: | ||||||||||||||||||||
| Shares sold |
81,563 | $ | 853,837 | 512,101 | $ | 6,000,050 | ||||||||||||||
| Shares issued in reinvestment of distributions |
267,029 | 2,790,452 | 788,162 | 8,638,254 | ||||||||||||||||
| Shares redeemed |
(1,032,538 | ) | (10,840,574 | ) | (2,071,680 | ) | (22,984,550 | ) | ||||||||||||
|
|
|
|||||||||||||||||||
| Net increase (decrease) |
(683,946 | ) | $ | (7,196,285 | ) | (771,417 | ) | $ | (8,346,246 | ) | ||||||||||
|
|
|
|||||||||||||||||||
3. Transactions with Affiliates
Franklin Resources, Inc. is the holding company for various subsidiaries that together are referred to as Franklin Templeton Investments. Certain officers and trustees of the Fund are also officers and/or directors of the following subsidiaries:
| Subsidiary | Affiliation | |
| Franklin Advisers, Inc. (Advisers) |
Investment manager | |
| Franklin Templeton Services, LLC (FT Services) |
Administrative manager | |
| Franklin Templeton Distributors, Inc. (Distributors) |
Principal underwriter | |
| Franklin Templeton Investor Services, LLC (Investor Services) |
Transfer agent |
| FSI-36 | Semiannual Report |
FRANKLIN TEMPLETON VARIABLE INSURANCE PRODUCTS TRUST
NOTES TO CONSOLIDATED FINANCIAL STATEMENTS (UNAUDITED)
Franklin Strategic Income VIP Fund (continued)
a. Management Fees
The Fund pays an investment management fee to Advisers based on the average daily net assets of the Fund as follows:
| Annualized Fee Rate | Net Assets | |
| 0.625% |
Up to and including $500 million | |
| 0.525% |
Over $500 million, up to and including $1 billion | |
| 0.480% |
Over $1 billion, up to and including $1.5 billion | |
| 0.435% |
Over $1.5 billion, up to and including $6.5 billion | |
| 0.415% |
Over $6.5 billion, up to and including $11.5 billion | |
| 0.400% |
Over $11.5 billion, up to and including $16.5 billion | |
| 0.390% |
Over $16.5 billion, up to and including $19 billion | |
| 0.380% |
Over $19 billion, up to and including $21.5 billion | |
| 0.370% |
In excess of $21.5 billion |
For the period ended June 30, 2016, the annualized effective investment management fee rate was 0.595% of the Fund’s average daily net assets.
b. Administrative Fees
Under an agreement with Advisers, FT Services provides administrative services to the Fund. The fee is paid by Advisers based on the Fund’s average daily net assets, and is not an additional expense of the Fund.
c. Distribution Fees
The Board has adopted distribution plans for Class 2 and Class 4 shares pursuant to Rule 12b-1 under the 1940 Act. Under the Fund’s compensation distribution plans, the Fund pays Distributors for costs incurred in connection with the servicing, sale and distribution of the Fund’s shares up to 0.25% and 0.35% per year of its average daily net assets of Class 2 and Class 4, respectively. The plan year, for purposes of monitoring compliance with the maximum annual plan rates, is February 1 through January 31.
d. Transfer Agent Fees
Investor Services, under terms of an agreement, performs shareholder servicing for the Fund and is not paid by the Fund for the services.
e. Investments in Affiliated Management Investment Companies
The Fund invests in one or more affiliated management investment companies for purposes other than exercising a controlling influence over the management or policies. Management fees paid by the Fund are waived on assets invested in the affiliated management investment companies, as noted in the Consolidated Statement of Operations, in an amount not to exceed the management and administrative fees paid directly or indirectly by each affiliate. Prior to January 1, 2014, the waiver was accounted for as a reduction to management fees.
| Semiannual Report | FSI-37 |
FRANKLIN TEMPLETON VARIABLE INSURANCE PRODUCTS TRUST
NOTES TO CONSOLIDATED FINANCIAL STATEMENTS (UNAUDITED)
Franklin Strategic Income VIP Fund (continued)
3. Transactions with Affiliates (continued)
e. Investments in Affiliated Management Investment Companies (continued)
| Number of Shares Held at Beginning of Period |
Gross Additions |
Gross Reductions |
Number of Shares Held at End of Period |
Value at End of Period |
Investment Income |
Realized Gain (Loss) |
% of Affiliated of Period |
|||||||||||||||||||||||||
| Non-Controlled Affiliates | ||||||||||||||||||||||||||||||||
| Franklin Lower Tier Floating Rate Fund |
3,135,765 | 46,063 | (91,906 | ) | 3,089,922 | $ | 30,652,026 | $ | 257,407 | $ | (7,353 | ) | 7.1% | |||||||||||||||||||
| Franklin Middle Tier Floating Rate Fund |
2,704,835 | 26,387 | (94,000 | ) | 2,637,222 | 25,554,680 | 795,625 | (32,900 | ) | 7.4% | ||||||||||||||||||||||
| Institutional Fiduciary Trust Money Market Portfolio |
63,296,131 | 106,708,771 | (65,295,498 | ) | 104,709,404 | 104,709,404 | — | — | 0.5% | |||||||||||||||||||||||
|
|
|
|||||||||||||||||||||||||||||||
| Total |
$ | 160,916,110 | $ | 1,053,032 | $ | (40,253 | ) | |||||||||||||||||||||||||
|
|
|
|||||||||||||||||||||||||||||||
4. Expense Offset Arrangement
The Fund has entered into an arrangement with its custodian whereby credits realized as a result of uninvested cash balances are used to reduce a portion of the Fund’s custodian expenses. During the period ended June 30, 2016, the custodian fees were reduced as noted in the Consolidated Statement of Operations.
5. Income Taxes
For tax purposes, capital losses may be carried over to offset future capital gains, if any. At December 31, 2015, the capital loss carryforwards were as follows:
| Capital loss carryforwards: |
||||
| Short term |
$ | 1,542,457 | ||
| Long term |
15,007,905 | |||
|
|
|
|||
| Total capital loss carryforwards |
$ | 16,550,362 | ||
|
|
|
At June 30, 2016, the cost of investments and net unrealized appreciation (depreciation) for income tax purposes were as follows:
| Cost of investments |
$ | 791,055,209 | ||
|
|
|
|||
| Unrealized appreciation |
$ | 21,540,419 | ||
| Unrealized depreciation |
(55,821,375 | ) | ||
|
|
|
|||
| Net unrealized appreciation (depreciation) |
$ | (34,280,956 | ) | |
|
|
|
Differences between income and/or capital gains as determined on a book basis and a tax basis are primarily due to differing treatments of foreign currency transactions and bond discounts and premiums.
6. Investment Transactions
Purchases and sales of investments (excluding short term securities) for the period ended June 30, 2016, aggregated $430,620,784 and $473,133,896, respectively.
7. Credit Risk and Defaulted Securities
At June 30, 2016, the Fund had 49.3% of its portfolio invested in high yield, senior secured floating rate notes, or other securities rated below investment grade. These securities may be more sensitive to economic conditions causing greater price volatility and are potentially subject to a greater risk of loss due to default than higher rated securities.
| FSI-38 | Semiannual Report |
FRANKLIN TEMPLETON VARIABLE INSURANCE PRODUCTS TRUST
NOTES TO CONSOLIDATED FINANCIAL STATEMENTS (UNAUDITED)
Franklin Strategic Income VIP Fund (continued)
The Fund held defaulted securities and/or other securities for which the income has been deemed uncollectible. At June 30, 2016, the aggregate value of these securities was $6,321,548, representing 0.9% of the Fund’s net assets. The Fund discontinues accruing income on securities for which income has been deemed uncollectible and provides an estimate for losses on interest receivable. The securities have been identified in the accompanying Consolidated Statement of Investments.
8. Restricted Securities
The Fund invests in securities that are restricted under the Securities Act of 1933 (1933 Act) or which are subject to legal, contractual, or other agreed upon restrictions on resale. Restricted securities are often purchased in private placement transactions, and cannot be sold without prior registration unless the sale is pursuant to an exemption under the 1933 Act. Disposal of these securities may require greater effort and expense, and prompt sale at an acceptable price may be difficult. The Fund may have registration rights for restricted securities. The issuer generally incurs all registration costs.
At June 30, 2016, the Fund held investments in restricted securities, excluding certain securities exempt from registration under the 1933 Act deemed to be liquid, as follows:
| Units | Issuer | Acquisition Date |
Cost | Value | ||||||||||
| 1,499 | Warrior Met Coal LLC, A (Value is 0.0%a of Net Assets) |
3/31/16 | $ | 2,911,693 | $ | 151,124 | ||||||||
|
|
|
|||||||||||||
aRounds to less than 0.1% of net assets.
9. Other Derivative Information
At June 30, 2016, the Fund’s investments in derivative contracts are reflected in the Consolidated Statement of Assets and Liabilities as follows:
| Asset Derivatives |
Liability Derivatives |
|||||||||||
| Derivative Contracts Not Accounted for as Hedging Instruments |
Consolidated Statement of Assets and Liabilities Location |
Fair Value | Consolidated Statement of Assets and Liabilities Location |
Fair Value | ||||||||
| Foreign exchange contracts |
Unrealized appreciation on OTC forward exchange contracts | $ | 2,041,573 | Unrealized depreciation on OTC forward exchange contracts | $ | 4,256,802 | ||||||
| Credit contracts |
Variation margin |
64,218 | a | Variation margin |
— | |||||||
| OTC swap contracts (upfront payments) | 30,097 | OTC swap contracts (upfront receipts) | — | |||||||||
| Unrealized appreciation on OTC swap contracts | 11,703 | Unrealized depreciation on OTC swap contracts | — | |||||||||
| Value recovery instruments |
Investments in securities, at value |
641,720 | ||||||||||
|
|
|
|
|
|||||||||
| Totals |
$ | 2,789,311 | $ | 4,256,802 | ||||||||
|
|
|
|
|
|||||||||
aThis amount reflects the cumulative appreciation (depreciation) of centrally cleared swap contracts as reported in the Consolidated Statement of Investments. Only the variation margin receivable/payable at period end is separately reported within the Consolidated Statement of Assets and Liabilities. Prior variation margin movements were recorded to cash upon receipt or payment.
| Semiannual Report | FSI-39 |
FRANKLIN TEMPLETON VARIABLE INSURANCE PRODUCTS TRUST
NOTES TO CONSOLIDATED FINANCIAL STATEMENTS (UNAUDITED)
Franklin Strategic Income VIP Fund (continued)
9. Other Derivative Information (continued)
For the period ended June 30, 2016, the effect of derivative contracts in the Fund’s Consolidated Statement of Operations was as follows:
| Derivative Contracts Not Accounted for as Hedging Instruments |
Consolidated Statement of Operations Locations |
Net Realized Gain (Loss) for the Period |
Consolidated Statement of Operations Locations |
Net Change in Unrealized Appreciation (Depreciation) for the Period |
||||||||
| Net realized gain (loss) from: | Net change in unrealized appreciation (depreciation) on: | |||||||||||
| Foreign exchange contracts |
Foreign currency transactions |
$ | (3,157,029 | )a | Translation of other assets and liabilities denominated in foreign currencies |
$ | (2,759,069 | )a | ||||
| Credit contracts |
Swap contracts |
173,507 | Swap contracts |
33,313 | ||||||||
| Value recovery instruments |
Investments |
— | Investments |
(146,400 | ) | |||||||
|
|
|
|
|
|||||||||
| Totals |
$ | (2,983,522 | ) | $ | (2,872,156 | ) | ||||||
|
|
|
|
|
|||||||||
aForward exchange contracts are included in net realized gain (loss) from foreign currency transactions and net change in unrealized appreciation (depreciation) on translation of other assets and liabilities denominated in foreign currencies in the Consolidated Statement of Operations.
At June 30, 2016, the Fund’s OTC derivative assets and liabilities are as follows:
| Gross and Net Amounts of Assets and Liabilities Presented in the Consolidated Statement of Assets and Liabilities |
||||||||
| Assetsa | Liabilitiesa | |||||||
| Derivatives | ||||||||
| Forward exchange contracts |
$ | 2,041,573 | $ | 4,256,802 | ||||
| Swap contracts |
41,800 | — | ||||||
|
|
|
|||||||
| Total |
$ | 2,083,373 | $ | 4,256,802 | ||||
|
|
|
|||||||
aAbsent an event of default or early termination, OTC derivative assets and liabilities are presented gross and not offset in the Consolidated Statement of Assets and Liabilities.
| FSI-40 | Semiannual Report |
FRANKLIN TEMPLETON VARIABLE INSURANCE PRODUCTS TRUST
NOTES TO CONSOLIDATED FINANCIAL STATEMENTS (UNAUDITED)
Franklin Strategic Income VIP Fund (continued)
At June 30, 2016, the Fund’s OTC derivative assets, which may be offset against the Fund’s OTC derivative liabilities and collateral received from the counterparty, are as follows:
| Amounts Not Offset in the Consolidated Statement of Assets and Liabilities |
||||||||||||||||||||
| Gross and Net Amounts of Assets Presented in the Consolidated Statement of Assets and Liabilities |
Financial Instruments Available for Offset |
Financial Instruments Collateral Received |
Cash Collateral Receiveda |
Net Amount (Not less than zero) |
||||||||||||||||
| Counterparty | ||||||||||||||||||||
| BZWS |
$ | 117,962 | $ | (117,962 | ) | $ | — | $ | — | $ | — | |||||||||
| CITI |
38,280 | (38,280 | ) | — | — | — | ||||||||||||||
| DBAB |
1,568,832 | (1,568,832 | ) | — | — | — | ||||||||||||||
| GSCO |
42,615 | (42,615 | ) | — | — | — | ||||||||||||||
| HSBC |
29,790 | (29,790 | ) | — | — | — | ||||||||||||||
| JPHQ |
258,251 | (258,251 | ) | — | — | — | ||||||||||||||
| MSCO |
27,643 | (6,766 | ) | — | (20,877 | ) | — | |||||||||||||
|
|
|
|||||||||||||||||||
| Total |
$ | 2,083,373 | $ | (2,062,496 | ) | $ | — | $ | (20,877 | ) | $ | — | ||||||||
|
|
|
|||||||||||||||||||
aIn some instances, the collateral amount disclosed in the table above was adjusted due to the requirement to limit collateral amounts to avoid the effect of overcollateralization. Actual collateral received and/or pledged may be more than the amounts disclosed herein.
At June 30, 2016, the Fund’s OTC derivative liabilities, which may be offset against the Fund’s OTC derivative assets and collateral pledged to the counterparty, are as follows:
| Amounts Not Offset in the Consolidated Statement of Assets and Liabilities |
||||||||||||||||||||
|
Gross and Net Assets and Liabilities |
Financial Instruments Available for Offset |
Financial Instruments Collateral Pledged |
Cash Collateral Pledgeda |
Net Amount (Not less than zero) |
||||||||||||||||
| Counterparty | ||||||||||||||||||||
| BZWS |
$ | 211,019 | $ | (117,962 | ) | $ | — | $ | — | $ | 93,057 | |||||||||
| CITI |
170,677 | (38,280 | ) | — | — | 132,397 | ||||||||||||||
| DBAB |
2,358,498 | (1,568,832 | ) | — | (780,000 | ) | 9,666 | |||||||||||||
| GSCO |
49,997 | (42,615 | ) | — | — | 7,382 | ||||||||||||||
| HSBC |
509,396 | (29,790 | ) | — | (330,000 | ) | 149,606 | |||||||||||||
| JPHQ |
950,449 | (258,251 | ) | — | (692,198 | ) | — | |||||||||||||
| MSCO |
6,766 | (6,766 | ) | — | — | — | ||||||||||||||
|
|
|
|||||||||||||||||||
| Total |
$ | 4,256,802 | $ | (2,062,496 | ) | $ | — | $ | (1,802,198 | ) | $ | 392,108 | ||||||||
|
|
|
|||||||||||||||||||
aIn some instances, the collateral amounts disclosed in the table above were adjusted due to the requirement to limit collateral amounts to avoid the effect of overcollateralization. Actual collateral received and/or pledged may be more than the amounts disclosed herein.
For the period ended June, 30 2016, the average month end fair value of derivatives represented 0.7% of average month end net assets. The average month end number of open derivative contracts for the period was 56.
See Note 1(d) regarding derivative financial instruments.
See Abbreviations on page FSI-44.
| Semiannual Report | FSI-41 |
FRANKLIN TEMPLETON VARIABLE INSURANCE PRODUCTS TRUST
NOTES TO CONSOLIDATED FINANCIAL STATEMENTS (UNAUDITED)
Franklin Strategic Income VIP Fund (continued)
10. Credit Facility
The Fund, together with other U.S. registered and foreign investment funds (collectively, Borrowers), managed by Franklin Templeton Investments, are borrowers in a joint syndicated senior unsecured credit facility totaling $2 billion (Global Credit Facility) which matures on February 10, 2017. This Global Credit Facility provides a source of funds to the Borrowers for temporary and emergency purposes, including the ability to meet future unanticipated or unusually large redemption requests.
Under the terms of the Global Credit Facility, the Fund shall, in addition to interest charged on any borrowings made by the Fund and other costs incurred by the Fund, pay its share of fees and expenses incurred in connection with the implementation and maintenance of the Global Credit Facility, based upon its relative share of the aggregate net assets of all of the Borrowers, including an annual commitment fee of 0.07% based upon the unused portion of the Global Credit Facility. Effective February 12, 2016, the annual commitment fee is 0.15%. These fees are reflected in other expenses in the Consolidated Statement of Operations. During the period ended June 30, 2016, the Fund did not use the Global Credit Facility.
11. Fair Value Measurements
The Fund follows a fair value hierarchy that distinguishes between market data obtained from independent sources (observable inputs) and the Fund’s own market assumptions (unobservable inputs). These inputs are used in determining the value of the Fund’s financial instruments and are summarized in the following fair value hierarchy:
| • | Level 1 – quoted prices in active markets for identical financial instruments |
| • | Level 2 – other significant observable inputs (including quoted prices for similar financial instruments, interest rates, prepayment speed, credit risk, etc.) |
| • | Level 3 – significant unobservable inputs (including the Fund’s own assumptions in determining the fair value of financial instruments) |
The input levels are not necessarily an indication of the risk or liquidity associated with financial instruments at that level.
For movements between the levels within the fair value hierarchy, the Fund has adopted a policy of recognizing the transfers as of the date of the underlying event which caused the movement.
| FSI-42 | Semiannual Report |
FRANKLIN TEMPLETON VARIABLE INSURANCE PRODUCTS TRUST
NOTES TO CONSOLIDATED FINANCIAL STATEMENTS (UNAUDITED)
Franklin Strategic Income VIP Fund (continued)
A summary of inputs used as of June 30, 2016, in valuing the Fund’s assets and liabilities carried at fair value, is as follows:
| Level 1 | Level 2 | Level 3 | Total | |||||||||||||
| Assets: | ||||||||||||||||
| Investments in Securities: |
||||||||||||||||
| Equity Investments:a |
||||||||||||||||
| Consumer Services |
$ | — | $ | 4,943,766 | $ | — | $ | 4,943,766 | ||||||||
| Energy |
— | — | 151,124 | 151,124 | ||||||||||||
| Health Care Equipment & Services |
— | 32,670 | — | 32,670 | ||||||||||||
| Transportation |
— | — | 251,576 | 251,576 | ||||||||||||
| Management Investment Companies |
56,206,706 | — | — | 56,206,706 | ||||||||||||
| Corporate Bonds |
— | 294,197,943 | 129,783 | 294,327,726 | ||||||||||||
| Senior Floating Rate Interests |
— | 78,286,391 | — | 78,286,391 | ||||||||||||
| Foreign Government and Agency Securities |
— | 82,803,251 | — | 82,803,251 | ||||||||||||
| U.S. Government and Agency Securities |
— | 30,145,221 | — | 30,145,221 | ||||||||||||
| Asset-Backed Securities and Commercial Mortgage-Backed Securities |
— | 42,365,288 | — | 42,365,288 | ||||||||||||
| Mortgage-Backed Securities |
— | 55,776,500 | — | 55,776,500 | ||||||||||||
| Municipal Bonds |
— | 6,774,630 | — | 6,774,630 | ||||||||||||
| Escrows and Litigation Trusts |
— | — | — | b | — | |||||||||||
| Short Term Investments |
104,709,404 | — | — | 104,709,404 | ||||||||||||
|
|
|
|||||||||||||||
| Total Investments in Securities |
$ | 160,916,110 | $ | 595,325,660 | $ | 532,483 | $ | 756,774,253 | ||||||||
|
|
|
|||||||||||||||
| Other Financial Instruments: |
||||||||||||||||
| Forward Exchange Contracts |
$ | — | $ | 2,041,573 | $ | — | $ | 2,041,573 | ||||||||
| Swap Contracts |
— | 75,921 | — | 75,921 | ||||||||||||
|
|
|
|||||||||||||||
| Total Other Financial Instruments |
$ | — | $ | 2,117,494 | $ | — | $ | 2,117,494 | ||||||||
|
|
|
|||||||||||||||
| Liabilities: | ||||||||||||||||
| Other Financial Instruments: |
||||||||||||||||
| Forward Exchange Contracts |
$ | — | $ | 4,256,802 | $ | — | $ | 4,256,802 | ||||||||
|
|
|
|||||||||||||||
aIncludes common and convertible preferred stocks and management investment companies as well as other equity investments.
bIncludes securities determined to have no value at June 30, 2016.
A reconciliation of assets in which Level 3 inputs are used in determining fair value is presented when there are significant Level 3 financial instruments at the end of the period.
12. Subsequent Events
The Fund has evaluated subsequent events through the issuance of the financial statements and determined that no events have occurred that require disclosure.
| Semiannual Report | FSI-43 |
FRANKLIN TEMPLETON VARIABLE INSURANCE PRODUCTS TRUST
NOTES TO CONSOLIDATED FINANCIAL STATEMENTS (UNAUDITED)
Franklin Strategic Income VIP Fund (continued)
Abbreviations
| Counterparty/Exchange |
Currency | Selected Portfolio | ||||||||
| BZWS | Barclays Bank PLC | BRL | Brazilian Real | CDO | Collateralized Debt Obligation | |||||
| CITI | Citigroup, Inc. | EUR | Euro | CLO | Collateralized Loan Obligation | |||||
| DBAB | Deutsche Bank AG | GBP | British Pound | FRN | Floating Rate Note | |||||
| GSCO | The Goldman Sachs Group, Inc. | IDR | Indonesian Rupiah | GDP | Gross Domestic Product | |||||
| HSBC | HSBC Bank USA, N.A. | LKR | Sri Lankan Rupee | GO | General Obligation | |||||
| ICE |
Intercontinental Exchange |
MXN | Mexican Peso | HDC | Housing Development Corp. | |||||
| JPHQ |
JP Morgan Chase & Co. |
MYR | Malaysian Ringgit | PIK | Payment-In-Kind | |||||
| MSCO | Morgan Stanley |
PHP | Philippine Peso | SF | Single Family | |||||
| UYU | Uruguayan Peso | VRI | Value Recovery Instrument | |||||||
| FSI-44 | Semiannual Report |
Franklin U.S. Government Securities VIP Fund
This semiannual report for Franklin U.S. Government Securities VIP Fund covers the period ended June 30, 2016.
Class 1 Performance Summary as of June 30, 2016
The Fund’s Class 1 shares delivered a +2.43% total return for the six-month period ended June 30, 2016.
Performance reflects the Fund’s Class 1 operating expenses, but does not include any contract fees, expenses or sales charges. If they had been included, performance would be lower. These charges and deductions, particularly for variable life policies, can have a significant effect on contract values and insurance benefits. See the contract prospectus for a complete description of these expenses, including sales charges.
Performance data represent past performance, which does not guarantee future results. Investment return and principal value will fluctuate, and you may have a gain or loss when you sell your shares. Current performance may differ from figures shown.
| Semiannual Report | FUS-1 |
FRANKLIN U.S. GOVERNMENT SECURITIES VIP FUND
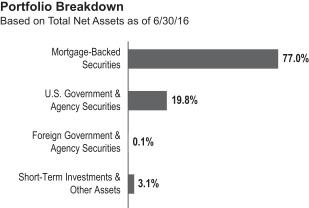
retail categories. Inflation, as measured by the Consumer Price Index, remained subdued overall even though it spiked to the highest level in three years in April mainly due to a rebound in energy prices.
After raising its target range for the federal funds rate to 0.25%–0.50% at its December meeting, the Federal Reserve (Fed) maintained the rate through-period end. Although the Fed hinted at an interest rate hike in June, subsequent reports showed job additions slowed substantially in May. Consequently, at its June meeting, the Fed kept the federal funds rates unchanged, and indicated that in determining the timing and size of future adjustments to the target range, it will assess realized and expected economic conditions relative to its objectives of maximum employment and 2.00% inflation. The Fed expects economic conditions to evolve in a manner that could warrant only gradual increases in the federal funds rate.
The 10-year Treasury yield, which moves inversely to price, declined during the period. It declined from a period high of 2.27% on December 31, 2015, and remained relatively low through period-end, reflecting investors’ concerns about global economic uncertainty. Negative interest rates in Japan and Europe, and central banks’ purchases of government bonds also put downward pressure on U.S. yields. It touched a period low of 1.46% on June 27, 2016, and ended the period at 1.49%, after the Fed kept short-term interest rates unchanged and fears of Britain’s exit from the European Union boosted safe-haven buying by investors.
1. Source: Morningstar.
2. Source: Lipper, a Thomson Reuters Company.
One cannot invest directly in an index, and an index is not representative of the Fund’s portfolio. Please see Index Descriptions following the Fund Summaries.
3. Source: Bureau of Labor Statistics.
| FUS-2 | Semiannual Report |
FRANKLIN U.S. GOVERNMENT SECURITIES VIP FUND
| Semiannual Report | FUS-3 |
FRANKLIN U.S. GOVERNMENT SECURITIES VIP FUND
Class 1 Fund Expenses
| Class 1 | Beginning Account Value 1/1/16 |
Ending Account Value 6/30/16 |
Fund-Level Expenses 1/1/16–6/30/16 |
|||||||||
| Actual |
$ | 1,000 | $ | 1,024.30 | $ | 2.47 | ||||||
| Hypothetical (5% return before expenses) |
$ | 1,000 | $ | 1,022.43 | $ | 2.46 | ||||||
*Expenses are calculated using the most recent six-month annualized expense ratio for the Fund’s Class 1 shares (0.49%), which does not include any ongoing expenses of the Contract for which the Fund is an investment option, multiplied by the average account value over the period, multiplied by 182/366 to reflect the one-half year period.
| FUS-4 | Semiannual Report |
FRANKLIN TEMPLETON VARIABLE INSURANCE PRODUCTS TRUST
Financial Highlights
Franklin U.S. Government Securities VIP Fund
|
Six Months Ended (unaudited) |
Year Ended December 31, | |||||||||||||||||||||||
| 2015 | 2014 | 2013 | 2012 | 2011 | ||||||||||||||||||||
| Class 1 | ||||||||||||||||||||||||
| Per share operating performance (for a share outstanding throughout the period) |
||||||||||||||||||||||||
| Net asset value, beginning of period |
$12.74 | $13.00 | $12.91 | $13.57 | $13.67 | $13.34 | ||||||||||||||||||
|
|
|
|||||||||||||||||||||||
| Income from investment operationsa: | ||||||||||||||||||||||||
| Net investment incomeb |
0.12 | 0.21 | 0.24 | 0.24 | 0.32 | 0.42 | ||||||||||||||||||
| Net realized and unrealized gains (losses) |
0.19 | (0.12 | ) | 0.22 | (0.51 | ) | (0.03 | ) | 0.36 | |||||||||||||||
|
|
|
|||||||||||||||||||||||
| Total from investment operations |
0.31 | 0.09 | 0.46 | (0.27 | ) | 0.29 | 0.78 | |||||||||||||||||
|
|
|
|||||||||||||||||||||||
| Less distributions from net investment income |
(0.35 | ) | (0.35 | ) | (0.37 | ) | (0.39 | ) | (0.39 | ) | (0.45 | ) | ||||||||||||
|
|
|
|||||||||||||||||||||||
| Net asset value, end of period |
$12.70 | $12.74 | $13.00 | $12.91 | $13.57 | $13.67 | ||||||||||||||||||
|
|
|
|||||||||||||||||||||||
| Total returnc |
2.43% | 0.71% | 3.64% | (1.99)% | 2.12% | 5.96% | ||||||||||||||||||
| Ratios to average net assetsd | ||||||||||||||||||||||||
| Expenses |
0.49% | 0.50% | e | 0.49% | e | 0.49% | e | 0.50% | 0.51% | |||||||||||||||
| Net investment income |
1.85% | 1.64% | 1.84% | 1.84% | 2.36% | 3.11% | ||||||||||||||||||
| Supplemental data | ||||||||||||||||||||||||
| Net assets, end of period (000’s) |
$78,545 | $79,620 | $90,656 | $99,947 | $126,536 | $136,628 | ||||||||||||||||||
| Portfolio turnover rate |
47.79% | 61.91% | 42.88% | 69.47% | 45.89% | 37.89% | ||||||||||||||||||
| Portfolio turnover rate excluding mortgage dollar rollsf |
47.79% | 61.91% | 42.88% | 67.80% | 45.89% | 37.89% | ||||||||||||||||||
aThe amount shown for a share outstanding throughout the period may not correlate with the Statement of Operations for the period due to the timing of sales and repurchases of the Fund’s shares in relation to income earned and/or fluctuating fair value of the investments of the Fund.
bBased on average daily shares outstanding.
cTotal return does not include fees, charges or expenses imposed by the variable annuity and life insurance contracts for which Franklin Templeton Variable Insurance Products Trust serves as an underlying investment vehicle. Total return is not annualized for periods less than one year.
dRatios are annualized for periods less than one year.
eBenefit of expense reduction rounds to less than 0.01%.
fSee Note 1(d) regarding mortgage dollar rolls.
| The accompanying notes are an integral part of these financial statements. | Semiannual Report | FUS-5 |
FRANKLIN TEMPLETON VARIABLE INSURANCE PRODUCTS TRUST
FINANCIAL HIGHLIGHTS
Franklin U.S. Government Securities VIP Fund (continued)
|
Six Months Ended (unaudited) |
Year Ended December 31, | |||||||||||||||||||||||
| 2015 | 2014 | 2013 | 2012 | 2011 | ||||||||||||||||||||
| Class 2 | ||||||||||||||||||||||||
| Per share operating performance (for a share outstanding throughout the period) |
||||||||||||||||||||||||
| Net asset value, beginning of period |
$12.47 | $12.73 | $12.65 | $13.31 | $13.42 | $13.11 | ||||||||||||||||||
|
|
|
|||||||||||||||||||||||
| Income from investment operationsa: | ||||||||||||||||||||||||
| Net investment incomeb |
0.10 | 0.18 | 0.20 | 0.21 | 0.28 | 0.38 | ||||||||||||||||||
| Net realized and unrealized gains (losses) |
0.19 | (0.12 | ) | 0.22 | (0.50 | ) | (0.03 | ) | 0.35 | |||||||||||||||
|
|
|
|||||||||||||||||||||||
| Total from investment operations |
0.29 | 0.06 | 0.42 | (0.29 | ) | 0.25 | 0.73 | |||||||||||||||||
|
|
|
|||||||||||||||||||||||
| Less distributions from net investment income |
(0.32 | ) | (0.32 | ) | (0.34 | ) | (0.37 | ) | (0.36 | ) | (0.42 | ) | ||||||||||||
|
|
|
|||||||||||||||||||||||
| Net asset value, end of period |
$12.44 | $12.47 | $12.73 | $12.65 | $13.31 | $13.42 | ||||||||||||||||||
|
|
|
|||||||||||||||||||||||
| Total returnc |
2.31% | 0.47% | 3.38% | (2.24)% | 1.89% | 5.68% | ||||||||||||||||||
| Ratios to average net assetsd | ||||||||||||||||||||||||
| Expenses |
0.74% | 0.75% | e | 0.74% | e | 0.74% | e | 0.75% | 0.76% | |||||||||||||||
| Net investment income |
1.60% | 1.39% | 1.59% | 1.59% | 2.11% | 2.86% | ||||||||||||||||||
| Supplemental data | ||||||||||||||||||||||||
| Net assets, end of period (000’s) |
$1,353,724 | $1,311,974 | $1,369,037 | $1,267,994 | $1,206,089 | $894,699 | ||||||||||||||||||
| Portfolio turnover rate |
47.79% | 61.91% | 42.88% | 69.47% | 45.89% | 37.89% | ||||||||||||||||||
| Portfolio turnover rate excluding mortgage dollar rollsf |
47.79% | 61.91% | 42.88% | 67.80% | 45.89% | 37.89% | ||||||||||||||||||
aThe amount shown for a share outstanding throughout the period may not correlate with the Statement of Operations for the period due to the timing of sales and repurchases of the Fund’s shares in relation to income earned and/or fluctuating fair value of the investments of the Fund.
bBased on average daily shares outstanding.
cTotal return does not include fees, charges or expenses imposed by the variable annuity and life insurance contracts for which Franklin Templeton Variable Insurance Products Trust serves as an underlying investment vehicle. Total return is not annualized for periods less than one year.
dRatios are annualized for periods less than one year.
eBenefit of expense reduction rounds to less than 0.01%.
fSee Note 1(d) regarding mortgage dollar rolls.
| FUS-6 | Semiannual Report | The accompanying notes are an integral part of these financial statements. |
FRANKLIN TEMPLETON VARIABLE INSURANCE PRODUCTS TRUST
Statement of Investments, June 30, 2016 (unaudited)
| Franklin U.S. Government Securities VIP Fund | ||||||||||
| Principal Amount* | Value | |||||||||
| Foreign Government and Agency Securities (Cost $1,739,797) 0.1% |
| |||||||||
| a | International Bank for Reconstruction and Development, Principal Strip, 7/15/17 (Supranational) |
1,761,000 | $ | 1,742,322 | ||||||
|
|
|
|||||||||
| Mortgage-Backed Securities 77.0% |
||||||||||
| b | Federal Home Loan Mortgage Corp. (FHLMC) Adjustable Rate 2.0% |
|||||||||
| FHLMC, 2.711% - 2.713%, 5/01/37 - 6/01/37 |
9,718,618 | 10,191,381 | ||||||||
| FHLMC, 2.799%, 4/01/40 |
11,294,459 | 11,958,224 | ||||||||
| FHLMC, 2.911% - 3.035%, 3/01/36 - 5/01/38 |
5,857,032 | 6,195,145 | ||||||||
|
|
|
|||||||||
| 28,344,750 | ||||||||||
|
|
|
|||||||||
| Federal Home Loan Mortgage Corp. (FHLMC) Fixed Rate 6.4% |
||||||||||
| FHLMC Gold 15 Year, 4.50%, 3/01/25 - 4/01/25 |
1,810,743 | 1,910,687 | ||||||||
| FHLMC Gold 30 Year, 3.00%, 5/01/43 |
582,437 | 605,198 | ||||||||
| FHLMC Gold 30 Year, 3.00%, 6/01/46 |
44,000,000 | 45,661,294 | ||||||||
| FHLMC Gold 30 Year, 3.50%, 3/01/32 - 5/01/43 |
5,796,660 | 6,210,782 | ||||||||
| FHLMC Gold 30 Year, 3.50%, 9/01/45 |
9,146,281 | 9,659,941 | ||||||||
| FHLMC Gold 30 Year, 4.00%, 9/01/40 - 12/01/41 |
9,837,275 | 10,568,486 | ||||||||
| FHLMC Gold 30 Year, 4.50%, 5/01/40 - 7/01/41 |
4,147,692 | 4,554,464 | ||||||||
| FHLMC Gold 30 Year, 5.00%, 9/01/33 - 4/01/40 |
6,304,161 | 6,970,410 | ||||||||
| FHLMC Gold 30 Year, 5.50%, 7/01/33 - 5/01/38 |
1,946,488 | 2,194,543 | ||||||||
| FHLMC Gold 30 Year, 6.00%, 1/01/24 - 8/01/35 |
1,287,688 | 1,479,837 | ||||||||
| FHLMC Gold 30 Year, 6.50%, 12/01/23 - 5/01/35 |
651,425 | 749,189 | ||||||||
| FHLMC Gold 30 Year, 7.00%, 4/01/24 - 6/01/32 |
250,956 | 282,704 | ||||||||
| FHLMC Gold 30 Year, 7.50%, 12/01/22 - 5/01/24 |
4,768 | 5,018 | ||||||||
| FHLMC Gold 30 Year, 8.00%, 9/01/21 - 5/01/22 |
4,811 | 5,418 | ||||||||
| FHLMC Gold 30 Year, 8.50%, 10/01/21 - 7/01/31 |
427,325 | 545,336 | ||||||||
| FHLMC PC 30 Year, 8.00%, 1/01/17 - 5/01/17 |
846 | 847 | ||||||||
| FHLMC PC 30 Year, 8.50%, 9/01/20 |
234 | 237 | ||||||||
|
|
|
|||||||||
| 91,404,391 | ||||||||||
|
|
|
|||||||||
| b | Federal National Mortgage Association (FNMA) Adjustable Rate 6.3% |
|||||||||
| FNMA, 1.638% - 2.461%, 12/01/16 - 10/01/44 |
11,481,416 | 12,088,845 | ||||||||
| FNMA, 2.462% - 2.582%, 10/01/19 - 12/01/40 |
12,446,230 | 13,053,370 | ||||||||
| FNMA, 2.586% - 2.598%, 4/01/27 - 8/01/36 |
9,995,301 | 10,527,258 | ||||||||
| FNMA, 2.603%, 10/01/35 |
9,526,114 | 10,079,664 | ||||||||
| FNMA, 2.605% - 2.85%, 9/01/18 - 12/01/40 |
12,513,432 | 13,117,167 | ||||||||
| FNMA, 2.857% - 2.888%, 9/01/26 - 12/01/38 |
2,480,581 | 2,625,354 | ||||||||
| FNMA, 2.895%, 9/01/37 |
26,504,988 | 28,026,257 | ||||||||
| FNMA, 2.912% - 7.22%, 8/01/18 - 3/01/47 |
1,479,763 | 1,531,757 | ||||||||
|
|
|
|||||||||
| 91,049,672 | ||||||||||
|
|
|
|||||||||
| Federal National Mortgage Association (FNMA) Fixed Rate 8.1% |
||||||||||
| FNMA 15 Year, 2.64%, 7/01/25 |
2,500,000 | 2,605,923 | ||||||||
| FNMA 15 Year, 2.77%, 4/01/25 |
3,500,000 | 3,669,938 | ||||||||
| FNMA 15 Year, 2.99%, 11/01/24 |
3,000,000 | 3,212,875 | ||||||||
| FNMA 15 Year, 3.14%, 10/01/25 |
4,000,000 | 4,310,225 | ||||||||
| FNMA 15 Year, 3.28%, 7/01/27 |
4,000,000 | 4,295,459 | ||||||||
| FNMA 15 Year, 3.51%, 8/01/23 |
3,000,000 | 3,313,199 | ||||||||
| FNMA 15 Year, 5.50%, 11/01/16 - 1/01/25 |
1,978,251 | 2,171,023 | ||||||||
| FNMA 15 Year, 6.00%, 8/01/17 - 9/01/17 |
34,659 | 35,123 | ||||||||
| FNMA 30 Year, 3.00%, 12/01/42 |
272,650 | 283,279 | ||||||||
| FNMA 30 Year, 3.50%, 7/01/45 |
46,031,444 | 48,607,435 | ||||||||
| FNMA 30 Year, 4.00%, 1/01/41 - 7/01/41 |
11,556,396 | 12,431,986 | ||||||||
| FNMA 30 Year, 4.50%, 8/01/40 - 6/01/41 |
11,496,753 | 12,604,187 | ||||||||
| Semiannual Report | FUS-7 |
FRANKLIN TEMPLETON VARIABLE INSURANCE PRODUCTS TRUST
STATEMENT OF INVESTMENTS (UNAUDITED)
Franklin U.S. Government Securities VIP Fund (continued)
| Principal Amount* | Value | |||||||||
| Mortgage-Backed Securities (continued) |
||||||||||
| Federal National Mortgage Association (FNMA) Fixed Rate (continued) |
||||||||||
| FNMA 30 Year, 5.00%, 3/01/34 - 7/01/41 |
7,791,940 | $ | 8,677,799 | |||||||
| FNMA 30 Year, 5.50%, 12/01/32 - 8/01/35 |
2,767,505 | 3,130,326 | ||||||||
| FNMA 30 Year, 6.00%, 1/01/24 - 8/01/38 |
3,468,581 | 3,977,629 | ||||||||
| FNMA 30 Year, 6.50%, 1/01/24 - 9/01/36 |
617,900 | 711,650 | ||||||||
| FNMA 30 Year, 7.50%, 4/01/23 - 8/01/25 |
21,243 | 22,466 | ||||||||
| FNMA 30 Year, 8.00%, 3/01/22 - 2/01/25 |
106,932 | 111,189 | ||||||||
| FNMA 30 Year, 8.50%, 3/01/20 - 6/01/21 |
699 | 747 | ||||||||
| FNMA 30 Year, 9.00%, 10/01/26 |
91,990 | 99,661 | ||||||||
| FNMA GL 30 Year, 8.00%, 8/01/19 |
7,483 | 7,537 | ||||||||
| FNMA PL 30 Year, 5.50%, 4/01/34 |
1,468,497 | 1,638,022 | ||||||||
|
|
|
|||||||||
| 115,917,678 | ||||||||||
|
|
|
|||||||||
| Government National Mortgage Association (GNMA) Fixed Rate 54.2% |
||||||||||
| GNMA I SF 30 Year, 3.00%, 7/15/42 |
661,843 | 695,499 | ||||||||
| GNMA I SF 30 Year, 4.50%, 1/15/39 - 3/15/40 |
12,322,600 | 13,658,759 | ||||||||
| GNMA I SF 30 Year, 4.50%, 3/15/40 - 4/15/41 |
11,925,712 | 13,222,567 | ||||||||
| GNMA I SF 30 Year, 4.50%, 6/15/41 |
1,060,458 | 1,170,967 | ||||||||
| GNMA I SF 30 Year, 5.00%, 6/15/30 - 9/15/39 |
12,633,680 | 14,212,712 | ||||||||
| GNMA I SF 30 Year, 5.00%, 9/15/39 - 1/15/40 |
8,686,946 | 9,828,176 | ||||||||
| GNMA I SF 30 Year, 5.00%, 2/15/40 - 6/15/40 |
12,633,560 | 14,301,649 | ||||||||
| GNMA I SF 30 Year, 5.00%, 9/15/40 |
1,349,021 | 1,511,497 | ||||||||
| GNMA I SF 30 Year, 5.50%, 12/15/28 - 10/15/39 |
8,463,017 | 9,646,439 | ||||||||
| GNMA I SF 30 Year, 6.00%, 11/15/23 - 11/15/38 |
4,379,041 | 5,062,948 | ||||||||
| GNMA I SF 30 Year, 6.50%, 5/15/23 - 9/15/38 |
2,239,519 | 2,590,026 | ||||||||
| GNMA I SF 30 Year, 7.00%, 9/15/22 - 1/15/32 |
601,653 | 643,280 | ||||||||
| GNMA I SF 30 Year, 7.50%, 2/15/17 - 8/15/33 |
646,699 | 760,693 | ||||||||
| GNMA I SF 30 Year, 8.00%, 3/15/17 - 5/15/24 |
165,868 | 172,332 | ||||||||
| GNMA I SF 30 Year, 8.50%, 6/15/22 - 12/15/24 |
59,561 | 62,560 | ||||||||
| GNMA I SF 30 Year, 9.00%, 4/15/17 - 5/15/20 |
11,014 | 11,066 | ||||||||
| GNMA I SF 30 Year, 9.50%, 8/15/16 - 12/15/20 |
36,955 | 37,816 | ||||||||
| GNMA I SF 30 Year, 10.00%, 11/15/17 - 8/15/21 |
20,957 | 21,667 | ||||||||
| GNMA II SF 30 Year, 3.00%, 12/20/42 - 2/20/45 |
3,876,290 | 4,058,374 | ||||||||
| GNMA II SF 30 Year, 3.00%, 9/20/45 |
14,137,459 | 14,799,413 | ||||||||
| GNMA II SF 30 Year, 3.50%, 12/20/40 - 7/20/42 |
3,564,826 | 3,799,141 | ||||||||
| GNMA II SF 30 Year, 3.50%, 8/20/42 |
11,057,975 | 11,787,408 | ||||||||
| GNMA II SF 30 Year, 3.50%, 9/20/42 |
31,547,715 | 33,628,761 | ||||||||
| GNMA II SF 30 Year, 3.50%, 10/20/42 |
9,614,843 | 10,249,093 | ||||||||
| GNMA II SF 30 Year, 3.50%, 11/20/42 |
18,770,107 | 20,008,291 | ||||||||
| GNMA II SF 30 Year, 3.50%, 12/20/42 |
14,034,618 | 14,960,432 | ||||||||
| GNMA II SF 30 Year, 3.50%, 1/20/43 |
23,568,009 | 25,122,712 | ||||||||
| GNMA II SF 30 Year, 3.50%, 3/20/43 |
8,728,576 | 9,304,386 | ||||||||
| GNMA II SF 30 Year, 3.50%, 4/20/43 |
11,038,578 | 11,766,786 | ||||||||
| GNMA II SF 30 Year, 3.50%, 5/20/43 |
19,826,535 | 21,130,637 | ||||||||
| GNMA II SF 30 Year, 3.50%, 6/20/43 |
9,036,333 | 9,631,374 | ||||||||
| GNMA II SF 30 Year, 3.50%, 8/20/43 |
448,055 | 477,504 | ||||||||
| GNMA II SF 30 Year, 3.50%, 2/20/46 |
31,118,439 | 33,082,794 | ||||||||
| GNMA II SF 30 Year, 3.50%, 3/20/46 |
158,653,681 | 168,709,486 | ||||||||
| GNMA II SF 30 Year, 3.50%, 5/20/46 |
4,987,781 | 5,303,762 | ||||||||
| c | GNMA II SF 30 Year, 3.50%, 7/01/46 |
10,110,000 | 10,729,238 | |||||||
| GNMA II SF 30 Year, 4.00%, 11/20/39 - 1/20/41 |
12,247,573 | 13,202,529 | ||||||||
| GNMA II SF 30 Year, 4.00%, 2/20/41 - 9/20/41 |
7,781,403 | 8,385,298 | ||||||||
| FUS-8 | Semiannual Report |
FRANKLIN TEMPLETON VARIABLE INSURANCE PRODUCTS TRUST
STATEMENT OF INVESTMENTS (UNAUDITED)
Franklin U.S. Government Securities VIP Fund (continued)
| Principal Amount* | Value | |||||||||
| Mortgage-Backed Securities (continued) |
||||||||||
| Government National Mortgage Association (GNMA) Fixed Rate (continued) |
||||||||||
| GNMA II SF 30 Year, 4.00%, 11/20/41 - 12/20/41 |
12,174,215 | $ | 13,110,185 | |||||||
| GNMA II SF 30 Year, 4.00%, 2/20/44 |
3,757,703 | 4,052,374 | ||||||||
| GNMA II SF 30 Year, 4.00%, 2/20/46 |
21,605,803 | 23,138,744 | ||||||||
| GNMA II SF 30 Year, 4.00%, 3/20/46 |
15,097,633 | 16,195,172 | ||||||||
| GNMA II SF 30 Year, 4.00%, 4/20/46 |
31,329,447 | 33,561,513 | ||||||||
| GNMA II SF 30 Year, 4.00%, 5/20/46 |
72,289,531 | 77,439,831 | ||||||||
| GNMA II SF 30 Year, 4.50%, 10/20/39 - 5/20/41 |
12,300,453 | 13,433,437 | ||||||||
| GNMA II SF 30 Year, 4.50%, 6/20/41 - 7/20/41 |
11,514,107 | 12,577,337 | ||||||||
| GNMA II SF 30 Year, 4.50%, 9/20/41 -10/20/41 |
10,935,467 | 11,945,283 | ||||||||
| GNMA II SF 30 Year, 4.50%, 3/20/42 - 2/20/44 |
9,764,347 | 10,593,460 | ||||||||
| GNMA II SF 30 Year, 4.50%, 10/20/44 |
5,402,470 | 5,808,547 | ||||||||
| GNMA II SF 30 Year, 5.00%, 9/20/33 - 6/20/40 |
8,974,862 | 10,053,790 | ||||||||
| GNMA II SF 30 Year, 5.00%, 8/20/41 - 6/20/44 |
11,307,201 | 12,440,160 | ||||||||
| GNMA II SF 30 Year, 5.50%, 5/20/34 - 6/20/38 |
7,112,983 | 7,981,148 | ||||||||
| GNMA II SF 30 Year, 6.00%, 11/20/23 - 7/20/39 |
4,446,868 | 5,186,783 | ||||||||
| GNMA II SF 30 Year, 6.50%, 12/20/27 - 4/20/34 |
653,803 | 774,828 | ||||||||
| GNMA II SF 30 Year, 7.00%, 5/20/32 |
11,253 | 13,822 | ||||||||
| GNMA II SF 30 Year, 7.50%, 11/20/17 - 5/20/33 |
121,345 | 137,304 | ||||||||
| GNMA II SF 30 Year, 8.00%, 8/20/26 |
7,589 | 9,346 | ||||||||
| GNMA II SF 30 Year, 9.50%, 4/20/25 |
2,378 | 2,390 | ||||||||
|
|
|
|||||||||
| 776,203,526 | ||||||||||
|
|
|
|||||||||
| Total Mortgage-Backed Securities (Cost $1,086,325,168) |
1,102,920,017 | |||||||||
|
|
|
|||||||||
| U.S. Government and Agency Securities 19.8% |
||||||||||
| Federal Agricultural Mortgage Corp., |
||||||||||
| 1.41%, 3/06/20 |
10,000,000 | 10,093,750 | ||||||||
| 2.66%, 4/12/22 |
7,000,000 | 7,465,493 | ||||||||
| 4.30%, 5/13/19 |
1,010,000 | 1,108,261 | ||||||||
| d | Federal Agricultural Mortgage Corp. Guaranteed Trust 07-1, 144A, 5.125%, 4/19/17 |
13,000,000 | 13,468,923 | |||||||
| FHLB, |
||||||||||
| 2.625%, 9/12/25 |
20,000,000 | 21,392,360 | ||||||||
| 4.75%, 12/16/16 |
17,000,000 | 17,330,293 | ||||||||
| 5.25%, 6/05/17 |
9,000,000 | 9,387,216 | ||||||||
| FICO, |
||||||||||
| 1P, Strip, 5/11/18 |
10,000,000 | 9,852,300 | ||||||||
| 12, Strip, 6/06/18 |
4,627,000 | 4,560,279 | ||||||||
| 13P, Strip, 12/27/18 |
2,500,000 | 2,451,628 | ||||||||
| 15P, Strip, 3/07/19 |
1,798,000 | 1,756,596 | ||||||||
| 16, Strip, 4/05/17 |
12,367,000 | 12,303,792 | ||||||||
| A-P, Strip, 2/08/18 |
1,000,000 | 988,396 | ||||||||
| B-P, Strip, 4/06/18 |
1,405,000 | 1,387,873 | ||||||||
| D-P, Strip, 9/26/19 |
7,605,000 | 7,379,253 | ||||||||
| E-P, Strip, 11/02/18 |
8,896,000 | 8,739,404 | ||||||||
| Israel Government Agency for International Development Bond, |
||||||||||
| 5.50%, 9/18/23 |
12,000,000 | 15,189,108 | ||||||||
| 7-Z, U.S. Government Guaranteed, Strip, 8/15/22 |
5,619,000 | 5,058,331 | ||||||||
| U.S. Government Guaranteed, Strip, 5/01/17 |
5,000,000 | 4,974,860 | ||||||||
| New Valley Generation IV, secured bond, 4.687%, 1/15/22 |
2,253,572 | 2,464,919 | ||||||||
| Semiannual Report | FUS-9 |
FRANKLIN TEMPLETON VARIABLE INSURANCE PRODUCTS TRUST
STATEMENT OF INVESTMENTS (UNAUDITED)
Franklin U.S. Government Securities VIP Fund (continued)
| Principal Amount* | Value | |||||||||
| U.S. Government and Agency Securities (continued) |
||||||||||
| Overseas Private Investment Corp., A, zero cpn., |
||||||||||
| 2/19/18 |
682,174 | $ | 720,236 | |||||||
| 11/15/20 |
2,575,000 | 3,115,971 | ||||||||
| Private Export Funding Corp., |
||||||||||
| secured bond, 2.80%, 5/15/22 |
9,000,000 | 9,655,740 | ||||||||
| secured note, LL, 2.25%, 3/15/20 |
1,700,000 | 1,764,263 | ||||||||
| senior secured note, MM, 2.30%, 9/15/20 |
3,500,000 | 3,603,922 | ||||||||
| SBA, |
||||||||||
| bFRN, 3.375%, 3/25/18 |
132,652 | 133,075 | ||||||||
| PC, 1996-20L, 1, 6.70%, 12/01/16 |
16,676 | 16,914 | ||||||||
| PC, 1997-20G, 1, 6.85%, 7/01/17 |
43,868 | 44,743 | ||||||||
| PC, 1998-20I, 1, 6.00%, 9/01/18 |
195,556 | 203,952 | ||||||||
| Tunisia Government Agency for International Development Bonds, 1.686%, 7/16/19 |
7,000,000 | 7,116,970 | ||||||||
| TVA, |
||||||||||
| 1.875%, 8/15/22 |
6,000,000 | 6,153,654 | ||||||||
| 5.88%, 4/01/36 |
5,000,000 | 7,264,055 | ||||||||
| Strip, 11/01/18 |
2,644,000 | 2,592,772 | ||||||||
| Strip, 6/15/19 |
5,973,000 | 5,819,804 | ||||||||
| Strip, 6/15/20 |
6,138,000 | 5,826,460 | ||||||||
| U.S. Treasury Bond, |
||||||||||
| 2.50%, 2/15/46 |
4,000,000 | 4,169,064 | ||||||||
| eIndex Linked, 1.75%, 1/15/28 |
9,135,176 | 10,695,829 | ||||||||
| eIndex Linked, 2.00%, 1/15/26 |
13,258,219 | 15,618,288 | ||||||||
| eIndex Linked, 3.625%, 4/15/28 |
7,395,306 | 10,248,275 | ||||||||
| U.S. Treasury Note, |
||||||||||
| 0.875%, 11/30/16 |
2,500,000 | 2,505,478 | ||||||||
| 1.25%, 1/31/19 |
10,000,000 | 10,150,000 | ||||||||
| 1.75%, 10/31/18 |
3,000,000 | 3,077,226 | ||||||||
| eIndex Linked, 0.125%, 4/15/19 |
10,209,274 | 10,429,682 | ||||||||
| Ukraine Government Agency for International Development Bonds, 1.844%, 5/16/19 |
5,000,000 | 5,108,540 | ||||||||
|
|
|
|||||||||
| Total U.S. Government and Agency Securities |
283,387,948 | |||||||||
|
|
|
|||||||||
| Total Investments before Short Term Investments |
1,388,050,287 | |||||||||
|
|
|
|||||||||
| Short Term Investments (Cost $52,859,736) 3.7% |
||||||||||
| Repurchase Agreements 3.7% |
||||||||||
| f | Joint Repurchase Agreement, 0.382%, 7/01/16 (Maturity Value $52,860,297) |
52,859,736 | 52,859,736 | |||||||
| BNP Paribas Securities Corp. (Maturity Value $17,144,180) Deutsche Bank Securities Inc. (Maturity Value $5,285,501) HSBC Securities (USA) Inc. (Maturity Value $29,145,053) Merrill Lynch, Pierce, Fenner & Smith Inc. (Maturity Value $1,285,563) |
||||||||||
| Collateralized by U.S. Government Agency Securities, 0.187% - 5.50%, 7/18/16 - 5/06/21; U.S. Government Agency Securities, Strips, 6/01/17; and U.S. Treasury Note, 0.75% - 3.25%, 11/30/16 - 9/30/20 (valued at $53,939,146) |
||||||||||
|
|
|
|||||||||
| Total Investments (Cost $1,415,597,131) 100.6% |
1,440,910,023 | |||||||||
| Other Assets, less Liabilities (0.6)% |
(8,640,720 | ) | ||||||||
|
|
|
|||||||||
| Net Assets 100.0% |
$ | 1,432,269,303 | ||||||||
|
|
|
|||||||||
| FUS-10 | Semiannual Report |
FRANKLIN TEMPLETON VARIABLE INSURANCE PRODUCTS TRUST
STATEMENT OF INVESTMENTS (UNAUDITED)
Franklin U.S. Government Securities VIP Fund (continued)
See Abbreviations on page FUS-20.
*The principal amount is stated in U.S. dollars unless otherwise indicated.
aA supranational organization is an entity formed by two or more central governments through international treaties.
bThe coupon rate shown represents the rate at period end.
cSecurity purchased on a to-be-announced (TBA) basis. See Note 1(c).
dSecurity was purchased pursuant to Rule 144A under the Securities Act of 1933 and may be sold in transactions exempt from registration only to qualified institutional buyers or in a public offering registered under the Securities Act of 1933. This security has been deemed liquid under guidelines approved by the Trust’s Board of Trustees. At June 30, 2016, the value of this security was $13,468,923, representing 0.9% of net assets.
ePrincipal amount of security is adjusted for inflation. See Note 1(f).
fSee Note 1(b) regarding joint repurchase agreement.
| The accompanying notes are an integral part of these financial statements. | Semiannual Report | FUS-11 |
FRANKLIN TEMPLETON VARIABLE INSURANCE PRODUCTS TRUST
Financial Statements
Statement of Assets and Liabilities
June 30, 2016 (unaudited)
| Franklin U.S. Government Securities VIP Fund |
||||
| Assets: |
||||
| Investments in securities: |
||||
| Cost - Unaffiliated issuers |
$ | 1,362,737,395 | ||
| Cost - Repurchase agreements |
52,859,736 | |||
|
|
|
|||
| Total cost of investments |
$ | 1,415,597,131 | ||
|
|
|
|||
| Value - Unaffiliated issuers |
$ | 1,388,050,287 | ||
| Value - Repurchase agreements |
52,859,736 | |||
|
|
|
|||
| Total value of investments |
1,440,910,023 | |||
| Receivables: |
||||
| Investment securities sold |
426,634 | |||
| Capital shares sold |
364,326 | |||
| Interest |
4,452,934 | |||
| Other assets |
674 | |||
|
|
|
|||
| Total assets |
1,446,154,591 | |||
|
|
|
|||
| Liabilities: |
||||
| Payables: |
||||
| Investment securities purchased |
10,702,337 | |||
| Capital shares redeemed |
1,911,759 | |||
| Management fees |
544,330 | |||
| Distribution fees |
557,600 | |||
| Accrued expenses and other liabilities |
169,262 | |||
|
|
|
|||
| Total liabilities |
13,885,288 | |||
|
|
|
|||
| Net assets, at value |
$ | 1,432,269,303 | ||
|
|
|
|||
| Net assets consist of: |
||||
| Paid-in capital |
$ | 1,452,546,349 | ||
| Undistributed net investment income |
5,620,453 | |||
| Net unrealized appreciation (depreciation) |
25,312,892 | |||
| Accumulated net realized gain (loss) |
(51,210,391 | ) | ||
|
|
|
|||
| Net assets, at value |
$ | 1,432,269,303 | ||
|
|
|
|||
| Class 1: | ||||
| Net assets, at value |
$ | 78,544,997 | ||
|
|
|
|||
| Shares outstanding |
6,183,195 | |||
|
|
|
|||
| Net asset value and maximum offering price per share |
$ | 12.70 | ||
|
|
|
|||
| Class 2: | ||||
| Net assets, at value |
$ | 1,353,724,306 | ||
|
|
|
|||
| Shares outstanding |
108,821,880 | |||
|
|
|
|||
| Net asset value and maximum offering price per share |
$ | 12.44 | ||
|
|
|
|||
| FUS-12 | Semiannual Report | The accompanying notes are an integral part of these financial statements. |
FRANKLIN TEMPLETON VARIABLE INSURANCE PRODUCTS TRUST
FINANCIAL STATEMENTS
Statement of Operations
for the six months ended June 30, 2016 (unaudited)
| Franklin U.S. Government Securities VIP Fund |
||||
| Investment income: |
||||
| Interest |
$ | 21,607,335 | ||
| Paydown gain (loss) |
(5,128,192 | ) | ||
|
|
|
|||
| Total investment income |
16,479,143 | |||
|
|
|
|||
| Expenses: |
||||
| Management fees (Note 3a) |
3,291,904 | |||
| Distribution fees - Class 2 (Note 3c) |
1,662,825 | |||
| Custodian fees (Note 4) |
6,282 | |||
| Reports to shareholders |
91,515 | |||
| Professional fees |
29,283 | |||
| Trustees’ fees and expenses |
3,167 | |||
| Other |
55,546 | |||
|
|
|
|||
| Total expenses |
5,140,522 | |||
|
|
|
|||
| Net investment income |
11,338,621 | |||
|
|
|
|||
| Realized and unrealized gains (losses): |
||||
| Net realized gain (loss) from investments |
2,072,441 | |||
| Net change in unrealized appreciation (depreciation) on investments |
18,688,466 | |||
|
|
|
|||
| Net realized and unrealized gain (loss) |
20,760,907 | |||
|
|
|
|||
| Net increase (decrease) in net assets resulting from operations |
$ | 32,099,528 | ||
|
|
|
|||
| The accompanying notes are an integral part of these financial statements. | Semiannual Report | FUS-13 |
FRANKLIN TEMPLETON VARIABLE INSURANCE PRODUCTS TRUST
FINANCIAL STATEMENTS
Statements of Changes in Net Assets
| Franklin U.S. Government Securities VIP Fund | ||||||||
| Six Months Ended June 30, 2016 (unaudited) |
Year Ended December 31, 2015 |
|||||||
| Increase (decrease) in net assets: |
||||||||
| Operations: |
||||||||
| Net investment income |
$ | 11,338,621 | $ | 20,148,189 | ||||
| Net realized gain (loss) |
2,072,441 | (225,412 | ) | |||||
| Net change in unrealized appreciation (depreciation) |
18,688,466 | (12,815,304 | ) | |||||
|
|
|
|||||||
| Net increase (decrease) in net assets resulting from operations |
32,099,528 | 7,107,473 | ||||||
|
|
|
|||||||
| Distributions to shareholders from: |
||||||||
| Net investment income: |
||||||||
| Class 1 |
(2,105,837 | ) | (2,296,272 | ) | ||||
| Class 2 |
(33,509,224 | ) | (33,598,882 | ) | ||||
|
|
|
|||||||
| Total distributions to shareholders |
(35,615,061 | ) | (35,895,154 | ) | ||||
|
|
|
|||||||
| Capital share transactions: (Note 2) |
||||||||
| Class 1 |
(857,367 | ) | (9,377,525 | ) | ||||
| Class 2 |
45,047,617 | (29,933,456 | ) | |||||
|
|
|
|||||||
| Total capital share transactions |
44,190,250 | (39,310,981 | ) | |||||
|
|
|
|||||||
| Net increase (decrease) in net assets |
40,674,717 | (68,098,662 | ) | |||||
| Net assets: |
||||||||
| Beginning of period |
1,391,594,586 | 1,459,693,248 | ||||||
|
|
|
|||||||
| End of period |
$ | 1,432,269,303 | $ | 1,391,594,586 | ||||
|
|
|
|||||||
| Undistributed net investment income included in net assets: |
||||||||
| End of period |
$ | 5,620,453 | $ | 29,896,893 | ||||
|
|
|
|||||||
| FUS-14 | Semiannual Report | The accompanying notes are an integral part of these financial statements. |
FRANKLIN TEMPLETON VARIABLE INSURANCE PRODUCTS TRUST
Notes to Financial Statements (unaudited)
Franklin U.S. Government Securities VIP Fund
| Semiannual Report | FUS-15 |
FRANKLIN TEMPLETON VARIABLE INSURANCE PRODUCTS TRUST
NOTES TO FINANCIAL STATEMENTS (UNAUDITED)
Franklin U.S. Government Securities VIP Fund (continued)
1. Organization and Significant Accounting Policies (continued)
b. Joint Repurchase Agreement (continued)
Agreements (MRAs) with approved counterparties (sellers). The MRAs contain various provisions, including but not limited to events of default and maintenance of collateral for repurchase agreements. In the event of default by either the seller or the Fund, certain MRAs may permit the non-defaulting party to net and close-out all transactions, if any, traded under such agreements. The Fund may sell securities it holds as collateral and apply the proceeds towards the repurchase price and any other amounts owed by the seller to the Fund in the event of default by the seller. This could involve costs or delays in addition to a loss on the securities if their value falls below the repurchase price owed by the seller. The joint repurchase agreement held by the Fund at period end, as indicated in the Statement of Investments, had been entered into on June 30, 2016.
c. Securities Purchased on a TBA Basis
The Fund purchases securities on a to-be-announced (TBA) basis, with payment and delivery scheduled for a future date. These transactions are subject to market fluctuations and are subject to the risk that the value at delivery may be more or less than the trade date purchase price. Sufficient assets have been segregated for these securities.
d. Mortgage Dollar Rolls
The Fund enters into mortgage dollar rolls, typically on a TBA basis. Mortgage dollar rolls are agreements between the Fund and a financial institution where the Fund sells (or buys) mortgage-backed securities for delivery on a specified date and simultaneously contracts to repurchase (or sell) substantially similar (same type, coupon, and maturity) securities at a future date and at a predetermined price. Gains or losses are realized on the initial sale, and the difference between the repurchase price and the sale price is recorded as an unrealized gain or loss to the Fund upon entering into the mortgage dollar roll. In addition, the Fund may invest the cash proceeds that are received from the initial sale. During the period between the sale and repurchase, the Fund is not entitled to principal and interest paid on the mortgage backed securities. Transactions in mortgage dollar rolls are accounted for as purchases and sales and may result in an increase to the Fund’s portfolio turnover
rate. The risks of mortgage dollar roll transactions include the potential inability of the counterparty to fulfill its obligations.
e. Income Taxes
It is the Fund’s policy to qualify as a regulated investment company under the Internal Revenue Code. The Fund intends to distribute to shareholders substantially all of its taxable income and net realized gains to relieve it from federal income and if applicable, excise taxes. As a result, no provision for U.S. federal income taxes is required.
The Fund may recognize an income tax liability related to its uncertain tax positions under U.S. GAAP when the uncertain tax position has a less than 50% probability that it will be sustained upon examination by the tax authorities based on its technical merits. As of June 30, 2016, the Fund has determined that no tax liability is required in its financial statements related to uncertain tax positions for any open tax years (or expected to be taken in future tax years). Open tax years are those that remain subject to examination and are based on each tax jurisdiction’s statute of limitation.
f. Security Transactions, Investment Income, Expenses and Distributions
Security transactions are accounted for on trade date. Realized gains and losses on security transactions are determined on a specific identification basis. Interest income and estimated expenses are accrued daily. Amortization of premium and accretion of discount on debt securities are included in interest income. Paydown gains and losses are recorded separately in the Statement of Operations. Distributions to shareholders are recorded on the ex-dividend date and are determined according to income tax regulations (tax basis). Distributable earnings determined on a tax basis may differ from earnings recorded in accordance with U.S. GAAP. These differences may be permanent or temporary. Permanent differences are reclassified among capital accounts to reflect their tax character. These reclassifications have no impact on net assets or the results of operations. Temporary differences are not reclassified, as they may reverse in subsequent periods.
Common expenses incurred by the Trust are allocated among the Funds based on the ratio of net assets of each Fund to the combined net assets of the Trust. Fund specific expenses are charged directly to the fund that incurred the expense.
| FUS-16 | Semiannual Report |
FRANKLIN TEMPLETON VARIABLE INSURANCE PRODUCTS TRUST
NOTES TO FINANCIAL STATEMENTS (UNAUDITED)
Franklin U.S. Government Securities VIP Fund (continued)
2. Shares of Beneficial Interest
At June 30, 2016, there were an unlimited number of shares authorized (without par value). Transactions in the Fund’s shares were as follows:
| Six Months Ended June 30, 2016 |
Year Ended December 31, 2015 |
|||||||||||||||||
| Shares | Amount | Shares | Amount | |||||||||||||||
| Class 1 Shares: | ||||||||||||||||||
| Shares sold |
211,841 | $ | 2,728,835 | 250,539 | $ | 3,217,512 | ||||||||||||
| Shares issued in reinvestment of distributions |
166,207 | 2,105,837 | 181,380 | 2,296,272 | ||||||||||||||
| Shares redeemed |
(442,184 | ) | (5,692,039 | ) | (1,156,708 | ) | (14,891,309 | ) | ||||||||||
|
|
|
|||||||||||||||||
| Net increase (decrease) |
(64,136 | ) | $ | (857,367 | ) | (724,789 | ) | $ | (9,377,525 | ) | ||||||||
|
|
|
|||||||||||||||||
| Class 2 Shares: | ||||||||||||||||||
| Shares sold |
11,551,533 | $ | 145,430,505 | 11,683,320 | $ | 147,121,730 | ||||||||||||
| Shares issued in reinvestment of distributions |
2,700,179 | 33,509,224 | 2,709,587 | 33,598,882 | ||||||||||||||
| Shares redeemed |
(10,623,033 | ) | (133,892,112 | ) | (16,725,979 | ) | (210,654,068 | ) | ||||||||||
|
|
|
|||||||||||||||||
| Net increase (decrease) |
3,628,679 | $ | 45,047,617 | (2,333,072 | ) | $ | (29,933,456 | ) | ||||||||||
|
|
|
|||||||||||||||||
3. Transactions With Affiliates
Franklin Resources, Inc. is the holding company for various subsidiaries that together are referred to as Franklin Templeton Investments. Certain officers and trustees of the Fund are also officers and/or directors of the following subsidiaries:
| Subsidiary | Affiliation | |
| Franklin Advisers, Inc. (Advisers) |
Investment manager | |
| Franklin Templeton Services, LLC (FT Services) |
Administrative manager | |
| Franklin Templeton Distributors, Inc. (Distributors) |
Principal underwriter | |
| Franklin Templeton Investor Services, LLC (Investor Services) |
Transfer agent |
| Semiannual Report | FUS-17 |
FRANKLIN TEMPLETON VARIABLE INSURANCE PRODUCTS TRUST
NOTES TO FINANCIAL STATEMENTS
Franklin U.S. Government Securities VIP Fund (continued)
3. Transactions With Affiliates (continued)
a. Management Fees
The Fund pays an investment management fee to Advisers based on the average daily net assets of the Fund as follows:
| Annualized Fee Rate | Net Assets | |
| 0.625% |
Up to and including $100 million | |
| 0.500% |
Over $100 million, up to and including $250 million | |
| 0.450% |
Over $250 million, up to and including $7.5 billion | |
| 0.440% |
Over $7.5 billion, up to and including $10 billion | |
| 0.430% |
Over $10 billion, up to and including $12.5 billion | |
| 0.420% |
Over $12.5 billion, up to and including $15 billion | |
| 0.400% |
In excess of $15 billion |
For the period ended June 30, 2016, the annualized effective investment management fee rate was 0.468% of the Fund’s average daily net assets.
b. Administrative Fees
Under an agreement with Advisers, FT Services provides administrative services to the Fund. The fee is paid by Advisers based on the Fund’s average daily net assets, and is not an additional expense of the Fund.
c. Distribution Fees
The Board has adopted a distribution plan for Class 2 shares pursuant to Rule 12b-1 under the 1940 Act. Under the Fund’s compensation distribution plan, the Fund pays Distributors for costs incurred in connection with the servicing, sale and distribution of the Fund’s shares up to 0.35% per year of its average daily net assets. The Board has agreed to limit the current rate to 0.25% per year for Class 2. The plan year, for purposes of monitoring compliance with the maximum annual plan rate, is February 1 through January 31.
d. Transfer Agent Fees
Investor Services, under terms of an agreement, performs shareholder servicing for the Fund and is not paid by the Fund for the services.
4. Expense Offset Arrangement
The Fund has entered into an arrangement with its custodian whereby credits realized as a result of uninvested cash balances are used to reduce a portion of the Fund’s custodian expenses. During the period ended June 30, 2016, there were no credits earned.
| FUS-18 | Semiannual Report |
FRANKLIN TEMPLETON VARIABLE INSURANCE PRODUCTS TRUST
NOTES TO FINANCIAL STATEMENTS (UNAUDITED)
Franklin U.S. Government Securities VIP Fund (continued)
5. Income Taxes
For tax purposes, capital losses may be carried over to offset future capital gains. Capital loss carryforwards with no expiration, if any, must be fully utilized before those losses with expiration dates.
At December 31, 2015, capital loss carryforwards were as follows:
| Capital loss carryforwards subject to expiration: |
||||
| 2016 |
$ | 841,479 | ||
| 2017 |
401,851 | |||
| 2018 |
426,637 | |||
| Capital loss carryforwards not subject to expiration: |
||||
| Short term |
22,577,474 | |||
| Long term |
28,868,019 | |||
|
|
|
|||
| Total capital loss carryforwards |
$ | 53,115,460 | ||
|
|
|
|||
At June 30, 2016, the cost of investments and net unrealized appreciation (depreciation) for income tax purposes were as follows:
| Cost of investments |
$ | 1,422,488,373 | ||
|
|
|
|||
| Unrealized appreciation |
$ | 28,504,599 | ||
| Unrealized depreciation |
(10,082,949 | ) | ||
|
|
|
|||
| Net unrealized appreciation (depreciation) |
$ | 18,421,650 | ||
|
|
|
Differences between income and/or capital gains as determined on a book basis and a tax basis are primarily due to differing treatments of paydown losses and bond discounts and premiums.
6. Investment Transactions
Purchases and sales of investments (excluding short term securities) for the period ended June 30, 2016, aggregated $680,130,391 and $654,699,261, respectively.
7. Credit Facility
The Fund, together with other U.S. registered and foreign investment funds (collectively, Borrowers), managed by Franklin Templeton Investments, are borrowers in a joint syndicated senior unsecured credit facility totaling $2 billion (Global Credit Facility) which matures on February 10, 2017. This Global Credit Facility provides a source of funds to the Borrowers for temporary and emergency purposes, including the ability to meet future unanticipated or unusually large redemption requests.
Under the terms of the Global Credit Facility, the Fund shall, in addition to interest charged on any borrowings made by the Fund and other costs incurred by the Fund, pay its share of fees and expenses incurred in connection with the implementation and maintenance of the Global Credit Facility, based upon its relative share of the aggregate net assets of all of the Borrowers, including an annual commitment fee of 0.07% based upon the unused portion of the Global Credit Facility. Effective February 12, 2016, the annual commitment fee is 0.15%. These fees are reflected in other expenses in the Statement of Operations. During the period ended June 30, 2016, the Fund did not use the Global Credit Facility.
| Semiannual Report | FUS-19 |
FRANKLIN TEMPLETON VARIABLE INSURANCE PRODUCTS TRUST
NOTES TO FINANCIAL STATEMENTS (UNAUDITED)
Franklin U.S. Government Securities VIP Fund (continued)
8. Fair Value Measurements
The Fund follows a fair value hierarchy that distinguishes between market data obtained from independent sources (observable inputs) and the Fund’s own market assumptions (unobservable inputs). These inputs are used in determining the value of the Fund’s financial instruments and are summarized in the following fair value hierarchy:
| • | Level 1 – quoted prices in active markets for identical financial instruments |
| • | Level 2 – other significant observable inputs (including quoted prices for similar financial instruments, interest rates, prepayment speed, credit risk, etc.) |
| • | Level 3 – significant unobservable inputs (including the Fund’s own assumptions in determining the fair value of financial instruments) |
The input levels are not necessarily an indication of the risk or liquidity associated with financial instruments at that level.
For movements between the levels within the fair value hierarchy, the Fund has adopted a policy of recognizing the transfers as of the date of the underlying event which caused the movement.
At June 30, 2016, all of the Fund’s investments in financial instruments carried at fair value were valued using Level 2 inputs.
9. Subsequent Events
The Fund has evaluated subsequent events through the issuance of the financial statements and determined that no events have occurred that require disclosure.
Abbreviations
| Selected Portfolio | ||
| FHLB | Federal Home Loan Bank | |
| FICO | Financing Corp. | |
| FRN | Floating Rate Note | |
| GL | Government Loan | |
| PC | Participation Certificate | |
| PL | Project Loan | |
| SBA | Small Business Administration | |
| SF | Single Family | |
| TVA | Tennessee Valley Authority | |
| FUS-20 | Semiannual Report |
Templeton Developing Markets VIP Fund
We are pleased to bring you Templeton Developing Markets VIP Fund’s semiannual report for the period ended June 30, 2016.
Class 1 Performance Summary as of June 30, 2016
The Fund’s Class 1 shares delivered a +10.65% total return* for the six-month period ended June 30, 2016.
*The Fund has a fee waiver associated with any investment in a Franklin Templeton money fund and/or other Franklin Templeton fund, as applicable, contractually guaranteed through at least the Fund’s current fiscal year-end. Fund investment results reflect the fee waiver, to the extent applicable; without this reduction, the results would have been lower.
Performance reflects the Fund’s Class 1 operating expenses, but does not include any contract fees, expenses or sales charges. If they had been included, performance would be lower. These charges and deductions, particularly for variable life policies, can have a significant effect on contract values and insurance benefits. See the contract prospectus for a complete description of these expenses, including sales charges.
Performance data represent past performance, which does not guarantee future results. Investment return and principal value will fluctuate, and you may have a gain or loss when you sell your shares. Current performance may differ from figures shown.
| Semiannual Report | TD-1 |
TEMPLETON DEVELOPING MARKETS VIP FUND
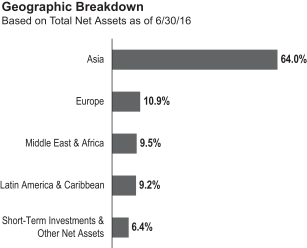
stimulus measures. Russia’s economy remained in recession in 2016’s first quarter amid declines in manufacturing, construction and wholesale and retail trade, as did Brazil’s economy, amid weakness in investment and domestic consumption.
Several emerging market central banks, including those of Mexico and South Africa, raised their benchmark interest rates to control inflation and support their currencies, while some, including South Korea and Hungary, lowered their benchmark interest rates to promote economic growth. The Reserve Bank of India cut its benchmark interest rate to a five-year low and took steps to increase monetary liquidity. The Bank of Russia reduced its key interest rate in June, citing lower inflation expectations amid an economic recession. Although the People’s Bank of China (PBOC) left its benchmark interest rate unchanged, it employed other monetary easing measures that included cutting the cash reserve requirement ratio for the country’s banks in February and effectively devaluing the renminbi against the U.S. dollar to the lowest level in more than five years.
Emerging market stocks recovered from the heightened volatility in early 2016 caused by a plunge in China’s domestic market on January 4, which triggered the country’s new circuit-breaker system and halted trading. Further hurting stocks were a collapse in crude oil prices and investor concerns about global economic growth. However, emerging market stocks began to rebound in late January as crude oil prices rose and the PBOC implemented monetary stimulus measures. Further bolstering investor sentiment during the period were monetary easing measures by other major central banks, notably the Bank of Japan and the European
1. Source: Morningstar. One cannot invest directly in an index, and an index is not representative of the Fund’s portfolio. Please see Index Descriptions following the Fund Summaries.
| TD-2 | Semiannual Report |
TEMPLETON DEVELOPING MARKETS VIP FUND
Central Bank (ECB); the finalization of a new debt deal for Greece; and a price increase in most commodities. Although the U.K.’s referendum vote to leave the European Union led to stock declines globally, emerging market stocks overall rebounded by period-end as many investors grew optimistic that the Bank of England and the ECB would introduce additional monetary easing measures. In this environment, emerging market stocks, as measured by the MSCI EM Index, generated a +6.60% total return, with all major regions posting positive returns.1
Investment Strategy
We employ a fundamental research, value-oriented, long-term investment approach. We focus on the market price of a company’s securities relative to our evaluation of its long-term earnings, asset value and cash flow potential. We also consider a company’s profit and loss outlook, balance sheet strength, cash flow trends and asset value in relation to the current price. Our analysis considers the company’s corporate governance behavior as well as its position in its sector, the economic framework and political environment. We invest in securities without regard to benchmark comparisons.
Manager’s Discussion
During the six months under review, key contributors to the Fund’s absolute performance included our investments in Banco Bradesco, Itau Unibanco Holding and TSMC (Taiwan Semiconductor Manufacturing Co.).
Banco Bradesco and Itau Unibanco, two of Brazil’s largest financial conglomerates, provide a full range of banking and financial services. The initiation of impeachment proceedings against President Dilma Rousseff, which led to her suspension for up to 180 days, boosted investor confidence about the Brazilian market overall as many investors grew optimistic about the takeover of Vice President Michel Temer as acting president. Although both companies reported weaker-than-expected first quarter 2016 net income, largely due to higher loan-loss provisions, their stocks participated in the Brazilian stock market’s substantial rally in 2016’s first half. Other favorable factors included the Brazilian real’s appreciation, an improvement in business sentiment and some positive economic data.
TSMC is the world’s largest independent integrated circuit foundry. Its better-than-expected first quarter 2016 revenues and agreement with Apple to be the exclusive supplier of processors for the next-generation iPhones, leading to higher
revenue growth expectations for 2016’s second half, supported share price performance. Additionally, development of technologies in other areas, such as mobile computing and high-performance computing devices, led many investors to adopt a positive view on the company.
In contrast, key detractors from the Fund’s absolute performance included our positions in Brilliance China Automotive Holdings, China Life Insurance and Baidu.
Chinese shares experienced substantial weakness in early January, as the effect of growth concerns were exacerbated by uncertainty about the country’s foreign exchange policy. This uncertainty resulted in the renminbi’s devaluation, and Chinese authorities’ equity market intervention, which further rattled investor confidence. The renminbi continued to weaken against the U.S. dollar during the period, reaching the lowest level in more than five years. A rebound in Chinese stocks in the latter part of the reporting period failed to completely offset earlier declines.
Brilliance China Automotive is a major Chinese automobile manufacturer with a joint venture with German luxury automobile manufacturer BMW for the production and sale of BMW 3-series and 5-series vehicles in China. Reduced earnings in 2016’s first quarter, resulting from lower sales and higher-than-expected selling expenses, hurt the company’s share price. Investor sentiment, however, improved later in the period due to expectations that new product launches could drive sales and profitability in 2016’s second half.
China Life Insurance is one of China’s largest life insurance companies. Disappointing earnings in 2016’s first quarter, due mainly to lower investment income combined with concerns
| Top 10 Countries | ||||
| 6/30/16 | ||||
| % of Total Net Assets |
||||
| China | 17.7% | |||
| South Korea | 12.5% | |||
| India | 10.3% | |||
| Taiwan | 9.9% | |||
| South Africa | 8.5% | |||
| Brazil | 8.2% | |||
| U.K. | 5.2% | |||
| Thailand | 4.7% | |||
| Russia | 3.3% | |||
| Hong Kong | 3.2% | |||
| Semiannual Report | TD-3 |
TEMPLETON DEVELOPING MARKETS VIP FUND
about a lower interest rate environment and the renminbi’s depreciation, hurt the company’s stock price. Further dampening market sentiment were worries that the company’s recent acquisitions of commercial banks might raise its risk profile.
Baidu is China’s leading Internet search engine and online marketing solutions provider, with the largest website in China and among the largest globally. The company also operates an e-commerce platform with an online payment tool; develops and markets web application software; and provides a variety of services and products, including entertainment products and human resource related services. Its shares fell after the company was criticized for misleading users with search results, leading the Chinese government to institute new Internet regulations, which prompted the company to lower its second quarter 2016 revenue outlook.
In the past six months, we increased the Fund’s investments notably in South Korea, Russia, Taiwan and Saudi Arabia2 as we continued to invest in opportunities we considered more attractive. In sector terms, we increased investments largely in information technology (IT), energy, materials and consumer discretionary.3 Key purchases included an additional investment in South Korea-based Samsung Electronics, a leading global electronics manufacturer, as well as new positions in Alibaba Group Holding, China’s largest e-commerce company, and Saudi Basic Industries,2 one of the world’s largest petrochemical producers and one of the Middle East’s largest steel manufacturers.
Conversely, we reduced the Fund’s investments largely in South Africa, India and China, primarily through China H shares, as we sought to focus on opportunities we considered to be more attractively valued within our investment universe.4 We also conducted some sales in Thailand. In sector terms, some of the largest sales were in consumer staples, telecommunication services and financials.5 Key sales included reducing the Fund’s
holdings in Belgium-listed Anheuser-Busch InBev, a global brewer; and Tata Consultancy Services, an Indian IT consulting and services firm. We also closed the Fund’s position in China Construction Bank, a Chinese financial and banking services provider.
Thank you for your participation in Templeton Developing Markets VIP Fund. We look forward to serving your future investment needs.
| Top 10 Holdings | ||||
| 6/30/16 | ||||
| Company Sector/Industry, Country |
% of Total Net Assets |
|||
| Taiwan Semiconductor Manufacturing Co. Ltd. Semiconductors & Semiconductor Equipment, Taiwan |
5.9 | % | ||
| Samsung Electronics Co. Ltd. Technology Hardware, Storage & Peripherals, |
5.3 | % | ||
| Unilever PLC Personal Products, U.K. |
5.2 | % | ||
| Naspers Ltd. Media, South Africa |
5.0 | % | ||
| Tencent Holdings Ltd. Internet Software & Services, China |
4.0 | % | ||
| Itau Unibanco Holding SA Banks, Brazil |
3.0 | % | ||
| Brilliance China Automotive Holdings Ltd. Automobiles, China |
3.1 | % | ||
| Banco Bradesco SA Banks, Brazil |
2.8 | % | ||
| China Mobile Ltd. Wireless Telecommunication Services, China |
2.1 | % | ||
| Hon Hai Precision Industry Co. Ltd. Electronic Equipment, Instruments & Components, Taiwan |
2.1 | % | ||
The dollar value, number of shares or principal amount, and names of all portfolio holdings are listed in the Fund’s Statement of Investments (SOI).
2. Investments were made through participatory notes, which are equity access products structured as debt obligations and are issued or backed by banks and broker-dealers and designed to replicate equity market exposure in frontier markets where direct investment is either impossible or difficult due to local investment restrictions.
3. The IT sector comprises electronic equipment, instruments and components; Internet software and services; IT services; semiconductors and semiconductor equipment; software; and technology hardware, storage and peripherals in the SOI. The energy sector comprises oil, gas and consumable fuels in the SOI. The materials sector comprises chemicals, construction materials, metals and mining, and paper and forest products in the SOI. The consumer discretionary sector comprises auto components; automobiles; distributors; hotels, restaurants and leisure; Internet and catalog retail; media; and textiles, apparel and luxury goods in the SOI.
4. “China H” denotes shares of China-incorporated, Hong Kong Stock Exchange-listed companies with most businesses in China.
5. The consumer staples sector comprises beverages, food and staples retailing, food products and personal products in the SOI. The telecommunication services sector comprises diversified telecommunication services and wireless telecommunication services in the SOI. The financials sector comprises banks, capital markets, diversified financial services, insurance, and real estate management and development in the SOI.
| TD-4 | Semiannual Report |
TEMPLETON DEVELOPING MARKETS VIP FUND
| Semiannual Report | TD-5 |
TEMPLETON DEVELOPING MARKETS VIP FUND
Class 1 Fund Expenses
| Class 1 | Beginning Account Value 1/1/16 |
Ending Account Value 6/30/16 |
Fund-Level Expenses 1/1/16–6/30/16 |
|||||||||
| Actual |
$ | 1,000 | $ | 1,106.50 | $ | 7.11 | ||||||
| Hypothetical (5% return before expenses) |
$ | 1,000 | $ | 1,018.12 | $ | 6.81 | ||||||
*Expenses are calculated using the most recent six-month annualized expense ratio, net of expense waivers, for the Fund’s Class 1 shares (1.36%), which does not include any ongoing expenses of the Contract for which the Fund is an investment option, multiplied by the average account value over the period, multiplied by 182/366 to reflect the one-half year period.
| TD-6 | Semiannual Report |
FRANKLIN TEMPLETON VARIABLE INSURANCE PRODUCTS TRUST
Financial Highlights
Templeton Developing Markets VIP Fund
| Six Months Ended (unaudited) |
Year Ended December 31, | |||||||||||||||||||||||
| 2015 | 2014 | 2013 | 2012 | 2011 | ||||||||||||||||||||
| Class 1 | ||||||||||||||||||||||||
| Per share operating performance (for a share outstanding throughout the period) |
||||||||||||||||||||||||
| Net asset value, beginning of period |
$6.37 | $9.27 | $10.26 | $10.58 | $9.50 | $11.40 | ||||||||||||||||||
|
|
|
|||||||||||||||||||||||
| Income from investment operationsa: | ||||||||||||||||||||||||
| Net investment incomeb |
0.03 | 0.06 | 0.15 | c | 0.13 | 0.19 | 0.17 | |||||||||||||||||
| Net realized and unrealized gains (losses) |
0.65 | (1.63 | ) | (0.97 | ) | (0.22 | ) | 1.06 | (1.94 | ) | ||||||||||||||
|
|
|
|||||||||||||||||||||||
| Total from investment operations |
0.68 | (1.57 | ) | (0.82 | ) | (0.09 | ) | 1.25 | (1.77 | ) | ||||||||||||||
|
|
|
|||||||||||||||||||||||
| Less distributions from: | ||||||||||||||||||||||||
| Net investment income |
(0.08 | ) | (0.20 | ) | (0.17 | ) | (0.23 | ) | (0.17 | ) | (0.13 | ) | ||||||||||||
| Net realized gains |
— | (1.13 | ) | — | — | — | — | |||||||||||||||||
|
|
|
|||||||||||||||||||||||
| Total distributions |
(0.08 | ) | (1.33 | ) | (0.17 | ) | (0.23 | ) | (0.17 | ) | (0.13 | ) | ||||||||||||
|
|
|
|||||||||||||||||||||||
| Redemption fees |
— | — | — | d | — | d | — | d | — | d | ||||||||||||||
|
|
|
|||||||||||||||||||||||
| Net asset value, end of period |
$6.97 | $6.37 | $9.27 | $10.26 | $10.58 | $9.50 | ||||||||||||||||||
|
|
|
|||||||||||||||||||||||
| Total returne |
10.65% | (19.42)% | (8.09)% | (0.73)% | 13.40% | (15.67)% | ||||||||||||||||||
| Ratios to average net assetsf | ||||||||||||||||||||||||
| Expenses before waiver and payments by affiliates |
1.38% | 1.33% | 1.36% | 1.35% | 1.35% | 1.40% | ||||||||||||||||||
| Expenses net of waiver and payments by affiliates |
1.36% | 1.32% | 1.36% | g | 1.35% | 1.35% | 1.40% | |||||||||||||||||
| Net investment income |
1.09% | 0.74% | 1.51% | c | 1.25% | 1.93% | 1.57% | |||||||||||||||||
| Supplemental data | ||||||||||||||||||||||||
| Net assets, end of period (000’s) |
$81,400 | $77,000 | $114,487 | $145,707 | $203,568 | $232,544 | ||||||||||||||||||
| Portfolio turnover rate |
11.14% | 71.69% | 82.87% | 44.59% | 24.45% | 14.90% | ||||||||||||||||||
aThe amount shown for a share outstanding throughout the period may not correlate with the Statement of Operations for the period due to the timing of sales and repurchases of the Fund’s shares in relation to income earned and/or fluctuating fair value of the investments of the Fund.
bBased on average daily shares outstanding.
cNet investment income per share includes approximately $0.04 per share related to income received in the form of special dividends in connection with certain fund holdings. Excluding this amount, the ratio of net investment income to average net assets would have been 1.11%.
dAmount rounds to less than $0.01 per share.
eTotal return does not include fees, charges or expenses imposed by the variable annuity and life insurance contracts for which Franklin Templeton Variable Insurance Products Trust serves as an underlying investment vehicle. Total return is not annualized for periods less than one year.
fRatios are annualized for periods less than one year.
gBenefit of waiver and payments by affiliates rounds to less than 0.01%.
| The accompanying notes are an integral part of these financial statements. | Semiannual Report | TD-7 |
FRANKLIN TEMPLETON VARIABLE INSURANCE PRODUCTS TRUST
FINANCIAL HIGHLIGHTS
Templeton Developing Markets VIP Fund (continued)
| Six Months Ended (unaudited) |
Year Ended December 31, | |||||||||||||||||||||||
| 2015 | 2014 | 2013 | 2012 | 2011 | ||||||||||||||||||||
| Class 2 | ||||||||||||||||||||||||
| Per share operating performance (for a share outstanding throughout the period) |
||||||||||||||||||||||||
| Net asset value, beginning of period |
$6.32 | $9.20 | $10.19 | $10.50 | $9.42 | $11.30 | ||||||||||||||||||
|
|
|
|||||||||||||||||||||||
| Income from investment operationsa: | ||||||||||||||||||||||||
| Net investment incomeb |
0.03 | 0.04 | 0.12 | c | 0.10 | 0.17 | 0.14 | |||||||||||||||||
| Net realized and unrealized gains (losses) |
0.64 | (1.61 | ) | (0.96 | ) | (0.21 | ) | 1.05 | (1.92 | ) | ||||||||||||||
|
|
|
|||||||||||||||||||||||
| Total from investment operations |
0.67 | (1.57 | ) | (0.84 | ) | (0.11 | ) | 1.22 | (1.78 | ) | ||||||||||||||
|
|
|
|||||||||||||||||||||||
| Less distributions from: | ||||||||||||||||||||||||
| Net investment income |
(0.06 | ) | (0.18 | ) | (0.15 | ) | (0.20 | ) | (0.14 | ) | (0.10 | ) | ||||||||||||
| Net realized gains |
— | (1.13 | ) | — | — | — | — | |||||||||||||||||
|
|
|
|||||||||||||||||||||||
| Total distributions |
(0.06 | ) | (1.31 | ) | (0.15 | ) | (0.20 | ) | (0.14 | ) | (0.10 | ) | ||||||||||||
|
|
|
|||||||||||||||||||||||
| Redemption fees |
— | — | — | d | — | d | — | d | — | d | ||||||||||||||
|
|
|
|||||||||||||||||||||||
| Net asset value, end of period |
$6.93 | $6.32 | $9.20 | $10.19 | $10.50 | $9.42 | ||||||||||||||||||
|
|
|
|||||||||||||||||||||||
| Total returne |
10.58% | (19.60)% | (8.39)% | (0.92)% | 13.16% | (15.86)% | ||||||||||||||||||
| Ratios to average net assetsf | ||||||||||||||||||||||||
| Expenses before waiver and payments by affiliates |
1.63% | 1.58% | 1.61% | 1.60% | 1.60% | 1.65% | ||||||||||||||||||
| Expenses net of waiver and payments by affiliates |
1.61% | 1.57% | 1.61% | g | 1.60% | 1.60% | 1.65% | |||||||||||||||||
| Net investment income |
0.84% | 0.49% | 1.26% | c | 1.00% | 1.68% | 1.32% | |||||||||||||||||
| Supplemental data | ||||||||||||||||||||||||
| Net assets, end of period (000’s) |
$209,100 | $192,120 | $250,813 | $274,683 | $291,638 | $295,223 | ||||||||||||||||||
| Portfolio turnover rate |
11.14% | 71.69% | 82.87% | 44.59% | 24.45% | 14.90% | ||||||||||||||||||
aThe amount shown for a share outstanding throughout the period may not correlate with the Statement of Operations for the period due to the timing of sales and repurchases of the Fund’s shares in relation to income earned and/or fluctuating fair value of the investments of the Fund.
bBased on average daily shares outstanding.
cNet investment income per share includes approximately $0.04 per share related to income received in the form of special dividends in connection with certain fund holdings. Excluding this amount, the ratio of net investment income to average net assets would have been 0.86%.
dAmount rounds to less than $0.01 per share.
eTotal return does not include fees, charges or expenses imposed by the variable annuity and life insurance contracts for which Franklin Templeton Variable Insurance Products Trust serves as an underlying investment vehicle. Total return is not annualized for periods less than one year.
fRatios are annualized for periods less than one year.
gBenefit of waiver and payments by affiliates rounds to less than 0.01%.
| TD-8 | Semiannual Report | The accompanying notes are an integral part of these financial statements. |
FRANKLIN TEMPLETON VARIABLE INSURANCE PRODUCTS TRUST
FINANCIAL HIGHLIGHTS
Templeton Developing Markets VIP Fund (continued)
| Six Months Ended (unaudited) |
Year Ended December 31, | |||||||||||||||||||||||
| 2015 | 2014 | 2013 | 2012 | 2011 | ||||||||||||||||||||
| Class 4 | ||||||||||||||||||||||||
| Per share operating performance (for a share outstanding throughout the period) |
||||||||||||||||||||||||
| Net asset value, beginning of period |
$6.34 | $9.22 | $10.20 | $10.50 | $9.42 | $11.30 | ||||||||||||||||||
|
|
|
|||||||||||||||||||||||
| Income from investment operationsa: | ||||||||||||||||||||||||
| Net investment incomeb |
0.02 | 0.03 | 0.12 | c | 0.10 | 0.16 | 0.13 | |||||||||||||||||
| Net realized and unrealized gains (losses) |
0.64 | (1.62 | ) | (0.97 | ) | (0.21 | ) | 1.04 | (1.91 | ) | ||||||||||||||
|
|
|
|||||||||||||||||||||||
| Total from investment operations |
0.66 | (1.59 | ) | (0.85 | ) | (0.11 | ) | 1.20 | (1.78 | ) | ||||||||||||||
|
|
|
|||||||||||||||||||||||
| Less distributions from: | ||||||||||||||||||||||||
| Net investment income |
(0.04 | ) | (0.16 | ) | (0.13 | ) | (0.19 | ) | (0.12 | ) | (0.10 | ) | ||||||||||||
| Net realized gains |
— | (1.13 | ) | — | — | — | — | |||||||||||||||||
|
|
|
|||||||||||||||||||||||
| Total distributions |
(0.04 | ) | (1.29 | ) | (0.13 | ) | (0.19 | ) | (0.12 | ) | (0.10 | ) | ||||||||||||
|
|
|
|||||||||||||||||||||||
| Redemption fees |
— | — | — | d | — | d | — | d | — | d | ||||||||||||||
|
|
|
|||||||||||||||||||||||
| Net asset value, end of period |
$6.96 | $6.34 | $9.22 | $10.20 | $10.50 | $9.42 | ||||||||||||||||||
|
|
|
|||||||||||||||||||||||
| Total returne |
10.49% | (19.70)% | (8.48)% | (1.07)% | 13.06% | (15.88)% | ||||||||||||||||||
| Ratios to average net assetsf | ||||||||||||||||||||||||
| Expenses before waiver and payments by affiliates |
1.73% | 1.68% | 1.71% | 1.70% | 1.70% | 1.75% | ||||||||||||||||||
| Expenses net of waiver and payments by affiliates |
1.71% | 1.67% | 1.71% | g | 1.70% | 1.70% | 1.75% | |||||||||||||||||
| Net investment income |
0.74% | 0.39% | 1.16% | c | 0.90% | 1.58% | 1.22% | |||||||||||||||||
| Supplemental data | ||||||||||||||||||||||||
| Net assets, end of period (000’s) |
$6,872 | $7,109 | $11,106 | $15,225 | $23,341 | $24,380 | ||||||||||||||||||
| Portfolio turnover rate |
11.14% | 71.69% | 82.87% | 44.59% | 24.45% | 14.90% | ||||||||||||||||||
aThe amount shown for a share outstanding throughout the period may not correlate with the Statement of Operations for the period due to the timing of sales and repurchases of the Fund’s shares in relation to income earned and/or fluctuating fair value of the investments of the Fund.
bBased on average daily shares outstanding.
cNet investment income per share includes approximately $0.04 per share related to income received in the form of special dividends in connection with certain fund holdings. Excluding this amount, the ratio of net investment income to average net assets would have been 0.76%.
dAmount rounds to less than $0.01 per share.
eTotal return does not include fees, charges or expenses imposed by the variable annuity and life insurance contracts for which Franklin Templeton Variable Insurance Products Trust serves as an underlying investment vehicle. Total return is not annualized for periods less than one year.
fRatios are annualized for periods less than one year.
gBenefit of waiver and payments by affiliates rounds to less than 0.01%.
| The accompanying notes are an integral part of these financial statements. | Semiannual Report | TD-9 |
FRANKLIN TEMPLETON VARIABLE INSURANCE PRODUCTS TRUST
Statement of Investments, June 30, 2016 (unaudited)
| Templeton Developing Markets VIP Fund | ||||||||||||||
| Industry | Shares | Value | ||||||||||||
| Common Stocks 86.8% |
||||||||||||||
| Argentina 0.3% |
||||||||||||||
| a | Grupo Clarin SA, B, GDR, Reg S |
Media | 9,190 | $ | 182,881 | |||||||||
| MercadoLibre Inc. |
Internet Software & Services | 5,600 | 787,753 | |||||||||||
|
|
|
|||||||||||||
| 970,634 | ||||||||||||||
|
|
|
|||||||||||||
| Belgium 1.4% |
||||||||||||||
| Anheuser-Busch InBev NV |
Beverages | 31,970 | 4,173,048 | |||||||||||
|
|
|
|||||||||||||
| Brazil 2.4% |
||||||||||||||
| CETIP SA - Mercados Organizados |
Capital Markets | 160,600 | 2,190,045 | |||||||||||
| Duratex SA |
Paper & Forest Products | 175,743 | 465,189 | |||||||||||
| M Dias Branco SA |
Food Products | 72,900 | 2,404,120 | |||||||||||
| Mahle-Metal Leve SA Industria e Comercio |
Auto Components | 132,600 | 947,674 | |||||||||||
| Totvs SA |
Software | 112,200 | 1,067,074 | |||||||||||
|
|
|
|||||||||||||
| 7,074,102 | ||||||||||||||
|
|
|
|||||||||||||
| Cambodia 1.1% |
||||||||||||||
| NagaCorp Ltd. |
Hotels, Restaurants & Leisure | 4,824,000 | 3,208,352 | |||||||||||
|
|
|
|||||||||||||
| China 17.7% |
||||||||||||||
| b | Alibaba Group Holding Ltd., ADR |
Internet Software & Services | 36,690 | 2,917,956 | ||||||||||
| b | Baidu Inc., ADR |
Internet Software & Services | 33,200 | 5,482,980 | ||||||||||
| Brilliance China Automotive Holdings Ltd. |
Automobiles | 8,909,300 | 9,083,330 | |||||||||||
| China Life Insurance Co. Ltd., H |
Insurance | 855,000 | 1,831,564 | |||||||||||
| China Mobile Ltd. |
Wireless Telecommunication Services | 550,500 | 6,297,247 | |||||||||||
| China Petroleum and Chemical Corp., H |
Oil, Gas & Consumable Fuels | 8,024,000 | 5,781,330 | |||||||||||
| COSCO Pacific Ltd. |
Transportation Infrastructure | 1,046,200 | 1,038,318 | |||||||||||
| Dah Chong Hong Holdings Ltd. |
Distributors | 1,746,100 | 821,461 | |||||||||||
| NetEase Inc., ADR |
Internet Software & Services | 20,103 | 3,884,302 | |||||||||||
| Poly Culture Group Corp. Ltd., H |
Media | 229,200 | 529,983 | |||||||||||
| Tencent Holdings Ltd. |
Internet Software & Services | 522,100 | 11,863,997 | |||||||||||
| Uni-President China Holdings Ltd. |
Food Products | 3,563,300 | 2,994,505 | |||||||||||
|
|
|
|||||||||||||
| 52,526,973 | ||||||||||||||
|
|
|
|||||||||||||
| Hong Kong 3.2% |
||||||||||||||
| Dairy Farm International Holdings Ltd. |
Food & Staples Retailing | 454,133 | 3,060,856 | |||||||||||
| MGM China Holdings Ltd. |
Hotels, Restaurants & Leisure | 2,612,800 | 3,381,154 | |||||||||||
| Sands China Ltd. |
Hotels, Restaurants & Leisure | 936,000 | 3,124,645 | |||||||||||
|
|
|
|||||||||||||
| 9,566,655 | ||||||||||||||
|
|
|
|||||||||||||
| Hungary 1.0% |
||||||||||||||
| Richter Gedeon Nyrt |
Pharmaceuticals | 145,180 | 2,884,456 | |||||||||||
|
|
|
|||||||||||||
| India 10.3% |
||||||||||||||
| Bajaj Holdings and Investment Ltd. |
Diversified Financial Services | 25,190 | 621,374 | |||||||||||
| Biocon Ltd. |
Biotechnology | 476,812 | 5,235,454 | |||||||||||
| Dr. Reddy’s Laboratories Ltd. |
Pharmaceuticals | 84,890 | 4,252,687 | |||||||||||
| Glenmark Pharmaceuticals Ltd. |
Pharmaceuticals | 91,248 | 1,080,113 | |||||||||||
| ICICI Bank Ltd. |
Banks | 1,348,450 | 4,805,206 | |||||||||||
| Infosys Ltd. |
IT Services | 183,099 | 3,175,707 | |||||||||||
| Oil & Natural Gas Corp. Ltd. |
Oil, Gas & Consumable Fuels | 722,700 | 2,315,722 | |||||||||||
| Reliance Industries Ltd. |
Oil, Gas & Consumable Fuels | 206,000 | 2,957,536 | |||||||||||
| Tata Chemicals Ltd. |
Chemicals | 238,500 | 1,520,661 | |||||||||||
| Tata Consultancy Services Ltd. |
IT Services | 97,300 | 3,680,039 | |||||||||||
| b | Tata Motors Ltd., A |
Automobiles | 252,016 | 1,089,208 | ||||||||||
|
|
|
|||||||||||||
| 30,733,707 | ||||||||||||||
|
|
|
|||||||||||||
| TD-10 | Semiannual Report |
FRANKLIN TEMPLETON VARIABLE INSURANCE PRODUCTS TRUST
STATEMENT OF INVESTMENTS (UNAUDITED)
Templeton Developing Markets VIP Fund (continued)
| Industry | Shares | Value | ||||||||||||
| Common Stocks (continued) |
||||||||||||||
| Indonesia 3.1% |
||||||||||||||
| Astra International Tbk PT |
Automobiles | 10,115,100 | $ | 5,665,222 | ||||||||||
| Bank Danamon Indonesia Tbk PT |
Banks | 5,707,000 | 1,529,066 | |||||||||||
| Semen Indonesia (Persero) Tbk PT |
Construction Materials | 2,764,700 | 1,956,476 | |||||||||||
|
|
|
|||||||||||||
| 9,150,764 | ||||||||||||||
|
|
|
|||||||||||||
| Mexico 0.6% |
||||||||||||||
| America Movil SAB de CV, L, ADR |
Wireless Telecommunication Services | 82,000 | 1,005,320 | |||||||||||
| Nemak SAB de CV |
Auto Components | 652,700 | 764,463 | |||||||||||
| b | Telesites SAB de CV |
Diversified Telecommunication Services | 82,000 | 50,690 | ||||||||||
|
|
|
|||||||||||||
| 1,820,473 | ||||||||||||||
|
|
|
|||||||||||||
| Nigeria 0.0%† |
||||||||||||||
| Nigerian Breweries PLC |
Beverages | 167,352 | 79,635 | |||||||||||
|
|
|
|||||||||||||
| Pakistan 1.0% |
||||||||||||||
| Habib Bank Ltd. |
Banks | 1,550,000 | 2,915,036 | |||||||||||
|
|
|
|||||||||||||
| Peru 0.1% |
||||||||||||||
| b | Compania de Minas Buenaventura SA, ADR |
Metals & Mining | 29,800 | 356,110 | ||||||||||
|
|
|
|||||||||||||
| Philippines 0.4% |
||||||||||||||
| b | Bloomberry Resorts Corp. |
Hotels, Restaurants & Leisure | 9,038,300 | 1,274,135 | ||||||||||
|
|
|
|||||||||||||
| Russia 3.3% |
||||||||||||||
| LUKOIL PJSC, ADR |
Oil, Gas & Consumable Fuels | 41,300 | 1,725,101 | |||||||||||
| LUKOIL PJSC, ADR (London Stock Exchange). |
Oil, Gas & Consumable Fuels | 38,600 | 1,612,322 | |||||||||||
| a,b | Mail.ru Group Ltd., GDR, Reg S |
Internet Software & Services | 170,359 | 3,100,534 | ||||||||||
| b | Yandex NV, A |
Internet Software & Services | 150,078 | 3,279,204 | ||||||||||
|
|
|
|||||||||||||
| 9,717,161 | ||||||||||||||
|
|
|
|||||||||||||
| Singapore 0.1% |
||||||||||||||
| DBS Group Holdings Ltd. |
Banks | 25,196 | 294,828 | |||||||||||
|
|
|
|||||||||||||
| South Africa 8.5% |
||||||||||||||
| Massmart Holdings Ltd. |
Food & Staples Retailing | 190,769 | 1,632,387 | |||||||||||
| MTN Group Ltd. |
Wireless Telecommunication Services | 317,596 | 3,082,568 | |||||||||||
| Naspers Ltd., N |
Media | 97,448 | 14,823,942 | |||||||||||
| Remgro Ltd. |
Diversified Financial Services | 331,043 | 5,725,189 | |||||||||||
|
|
|
|||||||||||||
| 25,264,086 | ||||||||||||||
|
|
|
|||||||||||||
| South Korea 12.5% |
||||||||||||||
| Daelim Industrial Co. Ltd. |
Construction & Engineering | 38,487 | 2,537,443 | |||||||||||
| Fila Korea Ltd. |
Textiles, Apparel & Luxury Goods | 33,470 | 2,639,297 | |||||||||||
| Hankook Tire Co. Ltd. |
Auto Components | 21,600 | 955,636 | |||||||||||
| Hanon Systems |
Auto Components | 196,951 | 1,793,974 | |||||||||||
| Hyundai Development Co. |
Construction & Engineering | 113,940 | 3,909,231 | |||||||||||
| iMarketkorea Inc. |
Trading Companies & Distributors | 70,490 | 709,340 | |||||||||||
| Interpark Holdings Corp. |
Internet & Catalog Retail | 112,922 | 583,839 | |||||||||||
| KT Skylife Co. Ltd. |
Media | 176,060 | 2,474,254 | |||||||||||
| Samsung Electronics Co. Ltd. |
Technology Hardware, Storage & Peripherals | 12,667 | 15,658,757 | |||||||||||
| SK Hynix Inc. |
Semiconductors & Semiconductor Equipment | 185,090 | 5,202,315 | |||||||||||
| Youngone Corp. |
Textiles, Apparel & Luxury Goods | 22,200 | 797,300 | |||||||||||
|
|
|
|||||||||||||
| 37,261,386 | ||||||||||||||
|
|
|
|||||||||||||
| Taiwan 9.9% |
||||||||||||||
| Catcher Technology Co. Ltd. |
Technology Hardware, Storage & Peripherals | 308,000 | 2,271,386 | |||||||||||
| Semiannual Report | TD-11 |
FRANKLIN TEMPLETON VARIABLE INSURANCE PRODUCTS TRUST
STATEMENT OF INVESTMENTS (UNAUDITED)
Templeton Developing Markets VIP Fund (continued)
| Industry | Shares | Value | ||||||||||||
| Common Stocks (continued) |
||||||||||||||
| Taiwan (continued) |
||||||||||||||
| Hon Hai Precision Industry Co. Ltd. |
Electronic Equipment, Instruments & Components | 2,455,000 | $ | 6,289,008 | ||||||||||
| Largan Precision Co. Ltd. |
Electronic Equipment, Instruments & Components | 14,000 | 1,280,236 | |||||||||||
| Pegatron Corp. |
Technology Hardware, Storage & Peripherals | 973,800 | 2,050,105 | |||||||||||
| Taiwan Semiconductor Manufacturing Co. Ltd. |
Semiconductors & Semiconductor Equipment | 3,483,000 | 17,574,523 | |||||||||||
|
|
|
|||||||||||||
| 29,465,258 | ||||||||||||||
|
|
|
|||||||||||||
| Thailand 4.7% |
||||||||||||||
| Kasikornbank PCL, fgn. |
Banks | 604,100 | 2,967,177 | |||||||||||
| Kiatnakin Bank PCL, fgn. |
Banks | 1,009,800 | 1,250,749 | |||||||||||
| Land and Houses PCL, fgn. |
Real Estate Management & Development | 4,853,900 | 1,250,791 | |||||||||||
| PTT Exploration and Production PCL, fgn. |
Oil, Gas & Consumable Fuels | 584,500 | 1,393,846 | |||||||||||
| Siam Commercial Bank PCL, fgn. |
Banks | 306,400 | 1,212,688 | |||||||||||
| Thai Beverage PCL, fgn. |
Beverages | 8,564,600 | 5,786,677 | |||||||||||
|
|
|
|||||||||||||
| 13,861,928 | ||||||||||||||
|
|
|
|||||||||||||
| United Kingdom 5.2% |
||||||||||||||
| Unilever PLC |
Personal Products | 321,139 | 15,325,519 | |||||||||||
|
|
|
|||||||||||||
| Total Common Stocks (Cost $240,029,348) |
257,924,246 | |||||||||||||
|
|
|
|||||||||||||
| c | Participatory Notes 1.0% |
|||||||||||||
| Saudi Arabia 1.0% |
||||||||||||||
| d | Deutsche Bank AG/London, Samba Financial Group, 144A, 9/27/16 |
Banks | 143,055 | 762,766 | ||||||||||
| d | HSBC Bank PLC, |
|||||||||||||
| Saudi Basic Industries Corp., 144A, 10/31/16 |
Chemicals | 102,390 | 2,211,064 | |||||||||||
| Savola Al-Azizia United Co., 144A, 2/06/17 |
Food Products | 2,500 | 24,394 | |||||||||||
|
|
|
|||||||||||||
| Total Participatory Notes (Cost $3,135,038) |
2,998,224 | |||||||||||||
|
|
|
|||||||||||||
| Preferred Stocks 5.8% |
||||||||||||||
| Brazil 5.8% |
||||||||||||||
| e | Banco Bradesco SA, 4.4%, ADR, pfd. |
Banks | 1,054,850 | 8,238,378 | ||||||||||
| e | Itau Unibanco Holding SA, 3.8%, ADR, pfd. |
Banks | 964,711 | 9,106,872 | ||||||||||
|
|
|
|||||||||||||
| Total Preferred Stocks (Cost $13,340,627) |
17,345,250 | |||||||||||||
|
|
|
|||||||||||||
| Total Investments before Short Term Investments (Cost $256,505,013) |
278,267,720 | |||||||||||||
|
|
|
|||||||||||||
| TD-12 | Semiannual Report |
FRANKLIN TEMPLETON VARIABLE INSURANCE PRODUCTS TRUST
STATEMENT OF INVESTMENTS (UNAUDITED)
Templeton Developing Markets VIP Fund (continued)
| Shares | Value | |||||||||
| Short Term Investments (Cost $19,660,526) 6.6% |
||||||||||
| Money Market Funds 6.6% |
||||||||||
| United States 6.6% |
||||||||||
| b,f | Institutional Fiduciary Trust Money Market Portfolio |
19,660,526 | $ | 19,660,526 | ||||||
|
|
|
|||||||||
| Total Investments (Cost $276,165,539) 100.2% |
297,928,246 | |||||||||
| Other Assets, less Liabilities (0.2)% |
(555,483 | ) | ||||||||
|
|
|
|||||||||
| Net Assets 100.0% |
$ | 297,372,763 | ||||||||
|
|
|
|||||||||
See Abbreviations on page TD-24.
†Rounds to less than 0.1% of net assets.
aSecurity was purchased pursuant to Regulation S under the Securities Act of 1933, which exempts from registration securities offered and sold outside of the United States. Such a security cannot be sold in the United States without either an effective registration statement filed pursuant to the Securities Act of 1933, or pursuant to an exemption from registration. These securities have been deemed liquid under guidelines approved by the Trust’s Board of Trustees. At June 30, 2016, the aggregate value of these securities was $3,283,415, representing 1.1% of net assets.
bNon-income producing.
cSee Note 1(c) regarding Participatory Notes.
dSecurity was purchased pursuant to Rule 144A under the Securities Act of 1933 and may be sold in transactions exempt from registration only to qualified institutional buyers or in a public offering registered under the Securities Act of 1933. These securities have been deemed liquid under guidelines approved by the Trust’s Board of Trustees. At June 30, 2016, the aggregate value of these securities was $2,998,224, representing 1.0% of net assets.
eVariable rate security. The rate shown represents the yield at period end.
fSee Note 3(e) regarding investments in affiliated management investment companies.
| The accompanying notes are an integral part of these financial statements. | Semiannual Report | TD-13 |
FRANKLIN TEMPLETON VARIABLE INSURANCE PRODUCTS TRUST
Financial Statements
Statement of Assets and Liabilities
June 30, 2016 (unaudited)
| Templeton Developing Markets VIP Fund |
||||
| Assets: |
||||
| Investments in securities: |
||||
| Cost - Unaffiliated issuers |
$ | 256,505,013 | ||
| Cost - Non-controlled affiliates (Note 3e) |
19,660,526 | |||
|
|
|
|||
| Total cost of investments |
$ | 276,165,539 | ||
|
|
|
|||
| Value - Unaffiliated issuers |
$ | 278,267,720 | ||
| Value - Non-controlled affiliates (Note 3e) |
19,660,526 | |||
|
|
|
|||
| Total value of investments |
297,928,246 | |||
| Cash |
66,447 | |||
| Foreign currency, at value (cost $145,410) |
145,191 | |||
| Receivables: |
||||
| Investment securities sold |
631,136 | |||
| Capital shares sold |
48,269 | |||
| Dividends |
942,318 | |||
| Foreign tax |
51,726 | |||
| Other assets |
122 | |||
|
|
|
|||
| Total assets |
299,813,455 | |||
|
|
|
|||
| Liabilities: |
||||
| Payables: |
||||
| Investment securities purchased |
1,404,468 | |||
| Capital shares redeemed |
356,909 | |||
| Management fees |
290,870 | |||
| Distribution fees |
86,818 | |||
| Deferred tax |
181,511 | |||
| Accrued expenses and other liabilities |
120,116 | |||
|
|
|
|||
| Total liabilities |
2,440,692 | |||
|
|
|
|||
| Net assets, at value |
$ | 297,372,763 | ||
|
|
|
|||
| Net assets consist of: |
||||
| Paid-in capital |
$ | 324,511,157 | ||
| Distributions in excess of net investment income |
(4,380,311 | ) | ||
| Net unrealized appreciation (depreciation) |
21,535,884 | |||
| Accumulated net realized gain (loss) |
(44,293,967 | ) | ||
|
|
|
|||
| Net assets, at value |
$ | 297,372,763 | ||
|
|
|
|||
| TD-14 | Semiannual Report | The accompanying notes are an integral part of these financial statements. |
FRANKLIN TEMPLETON VARIABLE INSURANCE PRODUCTS TRUST
FINANCIAL STATEMENTS
Statement of Assets and Liabilities (continued)
June 30, 2016 (unaudited)
| Templeton Developing Markets VIP Fund |
||||
| Class 1: | ||||
| Net assets, at value |
$ | 81,400,243 | ||
|
|
|
|||
| Shares outstanding |
11,675,684 | |||
|
|
|
|||
| Net asset value and maximum offering price per share |
$ | 6.97 | ||
|
|
|
|||
| Class 2: | ||||
| Net assets, at value |
$ | 209,100,296 | ||
|
|
|
|||
| Shares outstanding |
30,194,223 | |||
|
|
|
|||
| Net asset value and maximum offering price per share |
$ | 6.93 | ||
|
|
|
|||
| Class 4: | ||||
| Net assets, at value |
$ | 6,872,224 | ||
|
|
|
|||
| Shares outstanding |
987,522 | |||
|
|
|
|||
| Net asset value and maximum offering price per share |
$ | 6.96 | ||
|
|
|
|||
| The accompanying notes are an integral part of these financial statements. | Semiannual Report | TD-15 |
FRANKLIN TEMPLETON VARIABLE INSURANCE PRODUCTS TRUST
FINANCIAL STATEMENTS
Statement of Operations
for the six months ended June 30, 2016 (unaudited)
| Templeton Developing Markets VIP Fund |
||||
| Investment income: |
||||
| Dividends (net of foreign taxes of $512,365) |
$ | 3,333,470 | ||
|
|
|
|||
| Expenses: |
||||
| Management fees (Note 3a) |
1,695,727 | |||
| Distribution fees: (Note 3c) |
||||
| Class 2 |
238,127 | |||
| Class 4 |
11,849 | |||
| Custodian fees (Note 4) |
36,749 | |||
| Reports to shareholdersr |
107,600 | |||
| Professional fees |
32,423 | |||
| Trustees’ fees and expenses |
747 | |||
| Other |
9,497 | |||
|
|
|
|||
| Total expenses |
2,132,719 | |||
| Expenses waived/paid by affiliates (Note 3e) |
(35,065 | ) | ||
|
|
|
|||
| Net expenses |
2,097,654 | |||
|
|
|
|||
| Net investment income |
1,235,816 | |||
|
|
|
|||
| Realized and unrealized gains (losses): |
||||
| Net realized gain (loss) from: |
||||
| Investments |
3,017,201 | |||
| Foreign currency transactions |
17,003 | |||
|
|
|
|||
| Net realized gain (loss) |
3,034,204 | |||
|
|
|
|||
| Net change in unrealized appreciation (depreciation) on: |
||||
| Investments |
23,613,299 | |||
| Translation of other assets and liabilities denominated in foreign currencies |
(5,840 | ) | ||
| Change in deferred taxes on unrealized appreciation |
(61,659 | ) | ||
|
|
|
|||
| Net change in unrealized appreciation (depreciation) |
23,545,800 | |||
|
|
|
|||
| Net realized and unrealized gain (loss) |
26,580,004 | |||
|
|
|
|||
| Net increase (decrease) in net assets resulting from operations |
$ | 27,815,820 | ||
|
|
|
|||
| TD-16 | Semiannual Report | The accompanying notes are an integral part of these financial statements. |
FRANKLIN TEMPLETON VARIABLE INSURANCE PRODUCTS TRUST
FINANCIAL STATEMENTS
Statements of Changes in Net Assets
| Templeton Developing Markets VIP Fund | ||||||||
| Six Months Ended June 30, 2016 (unaudited) |
Year Ended December 31, 2015 |
|||||||
| Increase (decrease) in net assets: |
||||||||
| Operations: |
||||||||
| Net investment income |
$ | 1,235,816 | $ | 1,869,006 | ||||
| Net realized gain (loss) |
3,034,204 | (40,238,876 | ) | |||||
| Net change in unrealized appreciation (depreciation) |
23,545,800 | (29,184,006 | ) | |||||
|
|
|
|||||||
| Net increase (decrease) in net assets resulting from operations |
27,815,820 | (67,553,876 | ) | |||||
|
|
|
|||||||
| Distributions to shareholders from: |
||||||||
| Net investment income: |
||||||||
| Class 1 |
(875,960 | ) | (2,280,023 | ) | ||||
| Class 2 |
(1,674,699 | ) | (4,605,588 | ) | ||||
| Class 4 |
(44,436 | ) | (178,865 | ) | ||||
| Net realized gains: |
||||||||
| Class 1 |
— | (12,555,712 | ) | |||||
| Class 2 |
— | (29,329,089 | ) | |||||
| Class 4 |
— | (1,242,906 | ) | |||||
|
|
|
|||||||
| Total distributions to shareholders |
(2,595,095 | ) | (50,192,183 | ) | ||||
|
|
|
|||||||
| Capital share transactions: (Note 2) |
||||||||
| Class 1 |
(2,381,952 | ) | (3,228,881 | ) | ||||
| Class 2 |
(833,043 | ) | 21,548,017 | |||||
| Class 4 |
(862,694 | ) | (748,959 | ) | ||||
|
|
|
|||||||
| Total capital share transactions |
(4,077,689 | ) | 17,570,177 | |||||
|
|
|
|||||||
| Net increase (decrease) in net assets |
21,143,036 | (100,175,882 | ) | |||||
| Net assets: |
||||||||
| Beginning of period |
276,229,727 | 376,405,609 | ||||||
|
|
|
|||||||
| End of period |
$ | 297,372,763 | $ | 276,229,727 | ||||
|
|
|
|||||||
| Distributions in excess of net investment income included in net assets: |
||||||||
| End of period |
$ | (4,380,311 | ) | $ | (3,021,032 | ) | ||
|
|
|
|||||||
| The accompanying notes are an integral part of these financial statements. | Semiannual Report | TD-17 |
FRANKLIN TEMPLETON VARIABLE INSURANCE PRODUCTS TRUST
Notes to Financial Statements (unaudited)
Templeton Developing Markets VIP Fund
| TD-18 | Semiannual Report |
FRANKLIN TEMPLETON VARIABLE INSURANCE PRODUCTS TRUST
NOTES TO FINANCIAL STATEMENTS (UNAUDITED)
Templeton Developing Markets VIP Fund (continued)
| Semiannual Report | TD-19 |
FRANKLIN TEMPLETON VARIABLE INSURANCE PRODUCTS TRUST
NOTES TO FINANCIAL STATEMENTS (UNAUDITED)
Templeton Developing Markets VIP Fund (continued)
1. Organization and Significant Accounting Policies (continued)
e. Income and Deferred Taxes (continued)
distribute to shareholders substantially all of its taxable income and net realized gains to relieve it from federal income and if applicable, excise taxes. As a result, no provision for U.S. federal income taxes is required.
The Fund may be subject to foreign taxation related to income received, capital gains on the sale of securities and certain foreign currency transactions in the foreign jurisdictions in which it invests. Foreign taxes, if any, are recorded based on the tax regulations and rates that exist in the foreign markets in which the Fund invests. When a capital gain tax is determined to apply, the Fund records an estimated deferred tax liability in an amount that would be payable if the securities were disposed of on the valuation date.
The Fund may recognize an income tax liability related to its uncertain tax positions under U.S. GAAP when the uncertain tax position has a less than 50% probability that it will be sustained upon examination by the tax authorities based on its technical merits. As of June 30, 2016, the Fund has determined that no tax liability is required in its financial statements related to uncertain tax positions for any open tax years (or expected to be taken in future tax years). Open tax years are those that remain subject to examination and are based on each tax jurisdiction’s statute of limitation.
f. Security Transactions, Investment Income, Expenses and Distributions
Security transactions are accounted for on trade date. Realized gains and losses on security transactions are determined on a specific identification basis. Estimated expenses are accrued daily. Dividend income is recorded on the ex-dividend date except for certain dividends from foreign securities where the dividend rate is not available. In such cases, the dividend is recorded as soon as the information is received by the Fund. Distributions to shareholders are recorded on the ex-dividend
date and are determined according to income tax regulations (tax basis). Distributable earnings determined on a tax basis may differ from earnings recorded in accordance with U.S. GAAP. These differences may be permanent or temporary. Permanent differences are reclassified among capital accounts to reflect their tax character. These reclassifications have no impact on net assets or the results of operations. Temporary differences are not reclassified, as they may reverse in subsequent periods.
Common expenses incurred by the Trust are allocated among the Funds based on the ratio of net assets of each Fund to the combined net assets of the Trust. Fund specific expenses are charged directly to the fund that incurred the expense.
Realized and unrealized gains and losses and net investment income, not including class specific expenses, are allocated daily to each class of shares based upon the relative proportion of net assets of each class. Differences in per share distributions, by class, are generally due to differences in class specific expenses.
g. Accounting Estimates
The preparation of financial statements in accordance with U.S. GAAP requires management to make estimates and assumptions that affect the reported amounts of assets and liabilities at the date of the financial statements and the amounts of income and expenses during the reporting period. Actual results could differ from those estimates.
h. Guarantees and Indemnifications
Under the Trust’s organizational documents, its officers and trustees are indemnified by the Trust against certain liabilities arising out of the performance of their duties to the Trust. Additionally, in the normal course of business, the Trust, on behalf of the Fund, enters into contracts with service providers that contain general indemnification clauses. The Trust’s maximum exposure under these arrangements is unknown as this would involve future claims that may be made against the Trust that have not yet occurred. Currently, the Trust expects the risk of loss to be remote.
| TD-20 | Semiannual Report |
FRANKLIN TEMPLETON VARIABLE INSURANCE PRODUCTS TRUST
NOTES TO FINANCIAL STATEMENTS (UNAUDITED)
Templeton Developing Markets VIP Fund (continued)
2. Shares of Beneficial Interest
At June 30, 2016, there were an unlimited number of shares authorized (without par value). Transactions in the Fund’s shares were as follows:
| Six Months Ended June 30, 2016 |
Year Ended December 31, 2015 |
|||||||||||||||||||
| Shares | Amount | Shares | Amount | |||||||||||||||||
| Class 1 Shares: | ||||||||||||||||||||
| Shares sold |
778,391 | $ | 5,167,288 | 1,121,738 | $ | 9,288,141 | ||||||||||||||
| Shares issued in reinvestment of distributions |
130,351 | 875,960 | 1,921,727 | 14,835,735 | ||||||||||||||||
| Shares redeemed |
(1,315,296 | ) | (8,425,200 | ) | (3,309,863 | ) | (27,352,757 | ) | ||||||||||||
|
|
|
|||||||||||||||||||
| Net increase (decrease) |
(406,554 | ) | $ | (2,381,952 | ) | (266,398 | ) | $ | (3,228,881 | ) | ||||||||||
|
|
|
|||||||||||||||||||
| Class 2 Shares: | ||||||||||||||||||||
| Shares sold |
3,196,718 | $ | 20,939,741 | 4,635,193 | $ | 35,599,642 | ||||||||||||||
| Shares issued in reinvestment of distributions |
251,079 | 1,674,699 | 4,430,114 | 33,934,677 | ||||||||||||||||
| Shares redeemed |
(3,648,421 | ) | (23,447,483 | ) | (5,930,164 | ) | (47,986,302 | ) | ||||||||||||
|
|
|
|||||||||||||||||||
| Net increase (decrease) |
(200,624 | ) | $ | (833,043 | ) | 3,135,143 | $ | 21,548,017 | ||||||||||||
|
|
|
|||||||||||||||||||
| Class 4 Shares: | ||||||||||||||||||||
| Shares sold |
29,812 | $ | 196,593 | 96,241 | $ | 723,497 | ||||||||||||||
| Shares issued in reinvestment of distributions |
6,622 | 44,436 | 184,886 | 1,421,771 | ||||||||||||||||
| Shares redeemed |
(169,843 | ) | (1,103,723 | ) | (364,639 | ) | (2,894,227 | ) | ||||||||||||
|
|
|
|||||||||||||||||||
| Net increase (decrease) |
(133,409 | ) | $ | (862,694 | ) | (83,512 | ) | $ | (748,959 | ) | ||||||||||
|
|
|
|||||||||||||||||||
3. Transactions With Affiliates
Franklin Resources, Inc. is the holding company for various subsidiaries that together are referred to as Franklin Templeton Investments. Certain officers and trustees of the Fund are also officers and/or trustees of the following subsidiaries:
| Subsidiary | Affiliation | |
| Templeton Asset Management Ltd. (TAML) |
Investment manager | |
| Franklin Templeton Services, LLC (FT Services) |
Administrative manager | |
| Franklin Templeton Distributors, Inc. (Distributors) |
Principal underwriter | |
| Franklin Templeton Investor Services, LLC (Investor Services) |
Transfer agent |
a. Management Fees
The Fund pays an investment management fee to TAML based on the average daily net assets of the Fund as follows:
| Annualized Fee Rate | Net Assets | |
| 1.250% |
Up to and including $200 million | |
| 1.235% |
Over $200 million, up to and including $700 million | |
| 1.200% |
Over $700 million, up to and including $1 billion | |
| 1.150% |
Over $1 billion, up to and including $1.2 billion | |
| 1.125% |
Over $1.2 billion, up to and including $5 billion | |
| 1.075% |
Over $5 billion, up to and including $10 billion | |
| 1.025% |
Over $10 billion, up to and including $15 billion | |
| 0.975% |
Over $15 billion, up to and including $20 billion | |
| 0.925% |
In excess of $20 billion |
| Semiannual Report | TD-21 |
FRANKLIN TEMPLETON VARIABLE INSURANCE PRODUCTS TRUST
NOTES TO FINANCIAL STATEMENTS (UNAUDITED)
Templeton Developing Markets VIP Fund (continued)
3. Transactions With Affiliates (continued)
a. Management Fees (continued)
For the period ended June 30, 2016, the annualized effective investment management fee rate was 1.245% of the Fund’s average daily net assets.
b. Administrative Fees
Under an agreement with TAML, FT Services provides administrative services to the Fund. The fee is paid by TAML based on Fund’s average daily net assets, and is not an additional expense of the Fund.
c. Distribution Fees
The Board has adopted distribution plans for Class 2 and Class 4 shares pursuant to Rule 12b-1 under the 1940 Act. Under the Fund’s compensation distribution plans, the Fund pays Distributors for costs incurred in connection with the servicing, sale and distribution of the Fund’s shares up to 0.25% and 0.35% per year of its average daily net assets of Class 2 and Class 4, respectively. The plan year, for purposes of monitoring compliance with the maximum annual plan rates, is February 1 through January 31.
d. Transfer Agent Fees
Investor Services, under terms of an agreement, performs shareholder servicing for the Fund and is not paid by the Fund for the services.
e. Investments in Affiliated Management Investment Companies
The Fund invests in one or more affiliated management investment companies for purposes other than exercising a controlling influence over the management or policies. Management fees paid by the Fund are waived on assets invested in the affiliated management investment companies, as noted in the Statement of Operations, in an amount not to exceed the management and administrative fees paid directly or indirectly by each affiliate. Prior to January 1, 2014, the waiver was accounted for as a reduction to management fees.
| Number of Shares Held at Beginning of Period |
Gross Additions |
Gross Reductions |
Number of Shares Held at End of Period |
Value at End of Period |
Investment Income |
Realized Gain (Loss) |
% of Affiliated Fund Shares Outstanding Held at End of Period |
|||||||||||||||||||||||
| Non-Controlled Affiliates | ||||||||||||||||||||||||||||||
| Institutional Fiduciary Trust Money Market Portfolio |
36,108,301 | 25,230,444 | (41,678,219 | ) | 19,660,526 | $ | 19,660,526 | $ | — | $ | — | 0.1% | ||||||||||||||||||
|
|
|
|
|
|
|
|||||||||||||||||||||||||
4. Expense Offset Arrangement
The Fund has entered into an arrangement with its custodian whereby credits realized as a result of uninvested cash balances are used to reduce a portion of the Fund’s custodian expenses. During the period ended June 30, 2016, there were no credits earned.
5. Income Taxes
For tax purposes, capital losses may be carried over to offset future capital gains, if any.
| TD-22 | Semiannual Report |
FRANKLIN TEMPLETON VARIABLE INSURANCE PRODUCTS TRUST
NOTES TO FINANCIAL STATEMENTS (UNAUDITED)
Templeton Developing Markets VIP Fund (continued)
At December 31, 2015, capital loss carryforwards were as follows:
| Capital loss carryforwards not subject to expiration: |
||||
| Short term |
$ | 22,864,241 | ||
| Long term |
18,453,194 | |||
|
|
|
|||
| Total capital loss carryforwards |
$ | 41,317,435 | ||
|
|
|
At June 30, 2016, the cost of investments and net unrealized appreciation (depreciation) for income tax purposes were as follows:
| Cost of investments |
$ | 286,569,446 | ||
|
|
|
|||
| Unrealized appreciation |
$ | 43,397,312 | ||
| Unrealized depreciation |
(32,038,512 | ) | ||
|
|
|
|||
| Net unrealized appreciation (depreciation) |
$ | 11,358,800 | ||
|
|
|
Differences between income and/or capital gains as determined on a book basis and a tax basis are primarily due to differing treatments of corporate actions and wash sales.
6. Investment Transactions
Purchases and sales of investments (excluding short term securities) for the period ended June 30, 2016, aggregated $38,758,493 and $28,055,332, respectively.
7. Concentration of Risk
Investing in foreign securities may include certain risks and considerations not typically associated with investing in U.S. securities, such as fluctuating currency values and changing local and regional economic, political and social conditions, which may result in greater market volatility. In addition, certain foreign securities may not be as liquid as U.S. securities.
8. Credit Facility
The Fund, together with other U.S. registered and foreign investment funds (collectively, Borrowers), managed by Franklin Templeton Investments, are borrowers in a joint syndicated senior unsecured credit facility totaling $2 billion (Global Credit Facility) which matures on February 10, 2017. This Global Credit Facility provides a source of funds to the Borrowers for temporary and emergency purposes, including the ability to meet future unanticipated or unusually large redemption requests.
Under the terms of the Global Credit Facility, the Fund shall, in addition to interest charged on any borrowings made by the Fund and other costs incurred by the Fund, pay its share of fees and expenses incurred in connection with the implementation and maintenance of the Global Credit Facility, based upon its relative share of the aggregate net assets of all of the Borrowers, including an annual commitment fee of 0.07% based upon the unused portion of the Global Credit Facility. Effective February 12, 2016, the annual commitment fee is 0.15%. These fees are reflected in other expenses in the Statement of Operations. During the period ended June 30, 2016, the Fund did not use the Global Credit Facility.
9. Fair Value Measurements
The Fund follows a fair value hierarchy that distinguishes between market data obtained from independent sources (observable inputs) and the Fund’s own market assumptions (unobservable inputs). These inputs are used in determining the value of the Fund’s financial instruments and are summarized in the following fair value hierarchy:
| • | Level 1 – quoted prices in active markets for identical financial instruments |
| • | Level 2 – other significant observable inputs (including quoted prices for similar financial instruments, interest rates, prepayment speed, credit risk, etc.) |
| Semiannual Report | TD-23 |
FRANKLIN TEMPLETON VARIABLE INSURANCE PRODUCTS TRUST
NOTES TO FINANCIAL STATEMENTS (UNAUDITED)
Templeton Developing Markets VIP Fund (continued)
9. Fair Value Measurements (continued)
| • | Level 3 – significant unobservable inputs (including the Fund’s own assumptions in determining the fair value of financial instruments) |
The input levels are not necessarily an indication of the risk or liquidity associated with financial instruments at that level.
For movements between the levels within the fair value hierarchy, the Fund has adopted a policy of recognizing the transfers as of the date of the underlying event which caused the movement.
A summary of inputs used as of June 30, 2016, in valuing the Fund’s assets carried at fair value, is as follows:
| Level 1 | Level 2 | Level 3 | Total | |||||||||||||
| Assets: | ||||||||||||||||
| Investments in Securities |
||||||||||||||||
| Equity Investments:a |
||||||||||||||||
| Russia |
$ | 7,992,060 | $ | 1,725,101 | $ | — | $ | 9,717,161 | ||||||||
| All Other Equity Investmentsb |
265,552,335 | — | — | 265,552,335 | ||||||||||||
| Participatory Notes |
— | 2,998,224 | — | 2,998,224 | ||||||||||||
| Short Term Investments |
19,660,526 | — | — | 19,660,526 | ||||||||||||
|
|
|
|||||||||||||||
| Total Investments in Securities |
$ | 293,204,921 | $ | 4,723,325 | $ | — | $ | 297,928,246 | ||||||||
|
|
|
|||||||||||||||
aIncludes common and preferred stocks.
bFor detailed categories, see the accompanying Statement of Investments.
10. Subsequent Events
The Fund has evaluated subsequent events through the issuance of the financial statements and determined that no events have occurred that require disclosure.
Abbreviations
| Selected Portfolio | ||
| ADR | American Depositary Receipt | |
| GDR | Global Depositary Receipt | |
| TD-24 | Semiannual Report |
FRANKLIN TEMPLETON VARIABLE INSURANCE PRODUCTS TRUST
Tax Information (unaudited)
Templeton Developing Markets VIP Fund
At December 31, 2015, more than 50% of the Fund’s total assets were invested in securities of foreign issuers. In most instances, foreign taxes were withheld from income paid to the Fund on these investments. As shown in the table below, the Fund hereby reports to shareholders the foreign source income and foreign taxes paid, pursuant to Section 853 of the Internal Revenue Code. This written statement will allow shareholders of record on June 14, 2016, to treat their proportionate share of foreign taxes paid by the Fund as having been paid directly by them. The shareholder shall consider these amounts as foreign taxes paid in the tax year in which they receive the Fund distribution.
The following table provides a detailed analysis of foreign tax paid, and foreign source income as reported by the Fund, to Class 1, Class 2, and Class 4 shareholders of record.
| Class | Foreign Tax Paid Per Share |
Foreign Source Income Per Share | ||
| Class 1 |
$0.0167 | $0.1053 | ||
| Class 2 |
$0.0167 | $0.0864 | ||
| Class 4 |
$0.0167 | $0.0739 |
Foreign Tax Paid Per Share (Column 1) is the amount per share available to you, as a tax credit (assuming you held your shares in the Fund for a minimum of 16 days during the 31-day period beginning 15 days before the ex-dividend date of the Fund’s distribution to which the foreign taxes relate), or, as a tax deduction.
Foreign Source Income Per Share (Column 2) is the amount per share of income dividends attributable to foreign securities held by the Fund, plus any foreign taxes withheld on these dividends.
| Semiannual Report | TD-25 |
Templeton Foreign VIP Fund
This semiannual report for Templeton Foreign VIP Fund covers the period ended June 30, 2016.
Class 1 Performance Summary as of June 30, 2016
The Fund’s Class 1 shares had a -2.34% total return* for the six-month period ended June 30, 2016.
*The Fund has a fee waiver associated with any investment in a Franklin Templeton money fund and/or Franklin Templeton fund, as appli- cable, contractually guaranteed through at least the Fund’s current fiscal year-end. Fund investment results reflect the fee waiver, to the extent applicable; without this reduction, the results would have been lower.
Performance reflects the Fund’s Class 1 operating expenses, but does not include any contract fees, expenses or sales charges. If they had been included, performance would be lower. These charges and deductions, particularly for variable life policies, can have a significant effect on contract values and insurance benefits. See the contract prospectus for a complete description of these expenses, including sales charges.
Performance data represent past performance, which does not guarantee future results. Investment return and principal value will fluctuate, and you may have a gain or loss when you sell your shares. Current performance may differ from figures shown.
| Semiannual Report | TF-1 |
TEMPLETON FOREIGN VIP FUND
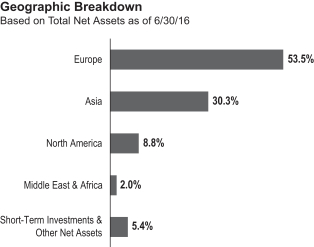
decision to keep its federal funds target range unchanged, while providing a cautious stance on further interest rate hikes. In addition, global economic concerns and the U.K.’s historic referendum to leave the European Union (EU), also known as the “Brexit”, contributed to volatile global stock markets.
Oil prices fell at the beginning of the review period, largely due to strong global supply, but recovered in the period’s second half amid oilfield outages and continued demand growth. Meanwhile, commodity prices increased for most of the review period as oversupply for a host of commodities shrank and the market appeared to be on the path of rebalancing after hitting a glut-induced bottom earlier in the year. Gold prices continued to rise following the Brexit referendum as some investors turned to safe haven investing. The U.S. dollar generally depreciated against most currencies during the period, which increased returns of many foreign assets in U.S. dollar terms. In this environment, global developed market stocks overall, as measured by the MSCI World Index, rose slightly during the period.2
The U.S. economy grew moderately, as measured by gross domestic product (GDP) in 2016’s first and second quarters, driven by consumer spending and exports. A decline in private inventory investment and nonresidential fixed investment contributed to the moderation. The Fed maintained its target interest rate during the review period after raising it for the first time in nine years at its December meeting. The Fed kept its target rate unchanged in its June meeting mainly due to a substantial slowdown in job additions toward period-end. The Fed expects economic conditions to evolve in a manner that could warrant only gradual increases in the federal funds rate.
1. Source: Morningstar. One cannot invest directly in an index, and an index is not representative of the Fund’s portfolio. Please see Index Descriptions following the Fund Summaries.
2. Please see Index Descriptions following the Fund Summaries.
| TF-2 | Semiannual Report |
TEMPLETON FOREIGN VIP FUND
3. The materials sector comprises chemicals, construction materials, and metals and mining in the SOI.
4. The energy sector comprises energy equipment and services and oil, gas and consumable fuels in the SOI. The information technology sector comprises electronic equipment, instruments and components; Internet software and services; semiconductors and semiconductor equipment; and technology hardware, storage and peripherals in the SOI.
| Semiannual Report | TF-3 |
TEMPLETON FOREIGN VIP FUND
Thank you for your participation in Templeton Foreign VIP Fund. We look forward to serving your future investment needs.
The foregoing information reflects our analysis, opinions and portfolio holdings as of June 30, 2016, the end of the reporting period. The way we implement our main investment strategies and the resulting portfolio holdings may change depending on factors such as market and economic conditions. These opinions may not be relied upon as investment advice or an offer for a particular security. The information is not a complete analysis of every aspect of any market, country, industry, security or the Fund. Statements of fact are from sources considered reliable, but the investment manager makes no representation or warranty as to their completeness or accuracy. Although historical performance is no guarantee of future results, these insights may help you understand our investment management philosophy.
5. The financials sector comprises banks, capital markets, diversified financial services and insurance in the SOI.
6. The health care sector comprises health care equipment and supplies, health care providers and services, life sciences tools and services and pharmaceuticals in the SOI. The consumer staples sector comprises beverages and food and staples retailing in the SOI.
| TF-4 | Semiannual Report |
TEMPLETON FOREIGN VIP FUND
Class 1 Fund Expenses
| Class 1 | Beginning Account Value 1/1/16 |
Ending Account Value 6/30/16 |
Fund-Level Expenses Incurred During Period* 1/1/16–6/30/16 |
|||||||||
| Actual |
$ | 1,000 | $ | 976.60 | $ | 3.83 | ||||||
| Hypothetical (5% return before expenses) |
$ | 1,000 | $ | 1,020.98 | $ | 3.92 | ||||||
*Expenses are calculated using the most recent six-month annualized expense ratio, net of expense waivers, for the Fund’s Class 1 shares (0.78%), which does not include any ongoing expenses of the Contract for which the Fund is an investment option, multiplied by the average account value over the period, multiplied by 182/366 to reflect the one-half year period.
| Semiannual Report | TF-5 |
SUPPLEMENT DATED JUNE 27, 2016
TO THE PROSPECTUSES DATED MAY 1, 2016
OF
TEMPLETON FOREIGN VIP FUND
TEMPLETON GROWTH VIP FUND
(Series of Franklin Templeton Variable Insurance Products Trust)
Effective June 30, 2016, the prospectus is amended as follows:
I. The benchmark for the Templeton Foreign VIP Fund has changed from the MSCI EAFE Index to the MSCI ACWI EX USA Index. The “Fund Summary – Performance – Average Annual Total Returns” table on page TF-S4 is revised to add the following:
| 1 Year | 5 Years | 10 Years | ||||
| MSCI All Country World ex-US Index (index reflects no deduction for fees, expenses or taxes)1 | -5.25% | 1.51% | 3.38% |
| 1. | Performance figures as of December 31, 2015. The MSCI All Country World ex-US Index is replacing the MSCI EAFE Index as the Fund’s benchmark. The investment manager believes the composition of the MSCI All Country World ex-US Index more accurately reflects the Fund’s holdings. |
II. The benchmark for the Templeton Growth VIP Fund has changed from the MSCI World Index to the MSCI ACWI Index. The “Fund Summary – Performance – Average Annual Total Returns” table on page TG-S3 is revised to add the following:
| 1 Year | 5 Years | 10 Years | ||||
| MSCI All Country World Index (index reflects no deduction for fees, expenses or taxes)1 |
-1.84% | 6.66% | 5.31% |
| 1. | Performance figures as of December 31, 2015. The MSCI All Country World Index is replacing the MSCI World Index as the Fund’s benchmark. The investment manager believes the composition of the MSCI All Country World Index more accurately reflects the Fund’s holdings. |
Please keep this supplement with your prospectus for future reference.
| TF-6 |
FRANKLIN TEMPLETON VARIABLE INSURANCE PRODUCTS TRUST
Financial Highlights
Templeton Foreign VIP Fund
| Six Months Ended (unaudited) |
Year Ended December 31, | |||||||||||||||||||||||
| 2015 | 2014 | 2013 | 2012 | 2011 | ||||||||||||||||||||
| Class 1 | ||||||||||||||||||||||||
| Per share operating performance (for a share outstanding throughout the period) |
||||||||||||||||||||||||
| Net asset value, beginning of period |
$13.46 | $15.34 | $17.56 | $14.63 | $12.78 | $14.54 | ||||||||||||||||||
|
|
|
|||||||||||||||||||||||
| Income from investment operationsa: | ||||||||||||||||||||||||
| Net investment incomeb |
0.23 | 0.31 | 0.53 | c | 0.34 | 0.38 | 0.42 | |||||||||||||||||
| Net realized and unrealized gains (losses) |
(0.55 | ) | (1.16 | ) | (2.39 | ) | 3.00 | 1.91 | (1.90 | ) | ||||||||||||||
|
|
|
|||||||||||||||||||||||
| Total from investment operations |
(0.32 | ) | (0.85 | ) | (1.86 | ) | 3.34 | 2.29 | (1.48 | ) | ||||||||||||||
|
|
|
|||||||||||||||||||||||
| Less distributions from: | ||||||||||||||||||||||||
| Net investment income |
(0.29 | ) | (0.53 | ) | (0.36 | ) | (0.41 | ) | (0.44 | ) | (0.28 | ) | ||||||||||||
| Net realized gains |
(0.23 | ) | (0.50 | ) | — | — | — | — | ||||||||||||||||
|
|
|
|||||||||||||||||||||||
| Total distributions |
(0.52 | ) | (1.03 | ) | (0.36 | ) | (0.41 | ) | (0.44 | ) | (0.28 | ) | ||||||||||||
|
|
|
|||||||||||||||||||||||
| Redemption fees |
— | — | — | d | — | d | — | d | — | d | ||||||||||||||
|
|
|
|||||||||||||||||||||||
| Net asset value, end of period |
$12.62 | $13.46 | $15.34 | $17.56 | $14.63 | $12.78 | ||||||||||||||||||
|
|
|
|||||||||||||||||||||||
| Total returne |
(2.34)% | (6.31)% | (10.89)% | 23.27% | 18.60% | (10.44)% | ||||||||||||||||||
| Ratios to average net assetsf | ||||||||||||||||||||||||
| Expenses before waiver and payments by affiliates |
0.80% | 0.78% | 0.77% | 0.78% | 0.79% | 0.79% | ||||||||||||||||||
| Expenses net of waiver and payments by affiliates |
0.78% | 0.78% | g | 0.77% | g | 0.78% | 0.79% | 0.79% | h | |||||||||||||||
| Net investment income |
3.63% | 2.05% | 3.11% | c | 2.16% | 2.84% | 2.92% | |||||||||||||||||
| Supplemental data | ||||||||||||||||||||||||
| Net assets, end of period (000’s) |
$199,506 | $214,172 | $248,355 | $298,468 | $265,924 | $254,292 | ||||||||||||||||||
| Portfolio turnover rate |
9.77% | 15.15% | 25.71% | 23.61% | 12.53% | 21.09% | ||||||||||||||||||
aThe amount shown for a share outstanding throughout the period may not correlate with the Statement of Operations for the period due to the timing of sales and repurchases of the Fund’s shares in relation to income earned and/or fluctuating fair value of the investments of the Fund.
bBased on average daily shares outstanding.
cNet investment income per share includes approximately $0.16 per share related to income received in the form of special dividends in connection with certain Fund holdings. Excluding these amounts, the ratio of net investment income to average net assets would have been 2.13%.
dAmount rounds to less than $0.01 per share.
eTotal return does not include fees, charges or expenses imposed by the variable annuity and life insurance contracts for which Franklin Templeton Variable Insurance Products Trust serves as an underlying investment vehicle. Total return is not annualized for periods less than one year.
fRatios are annualized for periods less than one year.
gBenefit of waiver and payments by affiliates rounds to less than 0.01%.
hBenefit of expense reduction rounds to less than 0.01%.
| The accompanying notes are an integral part of these financial statements. | Semiannual Report | TF-7 |
FRANKLIN TEMPLETON VARIABLE INSURANCE PRODUCTS TRUST
FINANCIAL HIGHLIGHTS
Templeton Foreign VIP Fund (continued)
| Six Months Ended (unaudited) |
Year Ended December 31, | |||||||||||||||||||||||
| 2015 | 2014 | 2013 | 2012 | 2011 | ||||||||||||||||||||
| Class 2 | ||||||||||||||||||||||||
| Per share operating performance (for a share outstanding throughout the period) |
||||||||||||||||||||||||
| Net asset value, beginning of period |
$13.20 | $15.05 | $17.24 | $14.37 | $12.56 | $14.29 | ||||||||||||||||||
|
|
|
|||||||||||||||||||||||
| Income from investment operationsa: | ||||||||||||||||||||||||
| Net investment incomeb |
0.21 | 0.27 | 0.48 | c | 0.30 | 0.34 | 0.37 | |||||||||||||||||
| Net realized and unrealized gains (losses) |
(0.54 | ) | (1.13 | ) | (2.35 | ) | 2.94 | 1.87 | (1.86 | ) | ||||||||||||||
|
|
|
|||||||||||||||||||||||
| Total from investment operations |
(0.33 | ) | (0.86 | ) | (1.87 | ) | 3.24 | 2.21 | (1.49 | ) | ||||||||||||||
|
|
|
|||||||||||||||||||||||
| Less distributions from: | ||||||||||||||||||||||||
| Net investment income |
(0.26 | ) | (0.49 | ) | (0.32 | ) | (0.37 | ) | (0.40 | ) | (0.24 | ) | ||||||||||||
| Net realized gains |
(0.23 | ) | (0.50 | ) | — | — | — | — | ||||||||||||||||
|
|
|
|||||||||||||||||||||||
| Total distributions |
(0.49 | ) | (0.99 | ) | (0.32 | ) | (0.37 | ) | (0.40 | ) | (0.24 | ) | ||||||||||||
|
|
|
|||||||||||||||||||||||
| Redemption fees |
— | — | — | d | — | d | — | d | — | d | ||||||||||||||
|
|
|
|||||||||||||||||||||||
| Net asset value, end of period |
$12.38 | $13.20 | $15.05 | $17.24 | $14.37 | $12.56 | ||||||||||||||||||
|
|
|
|||||||||||||||||||||||
| Total returne |
(2.51)% | (6.49)% | (11.13)% | 22.97% | 18.23% | (10.63)% | ||||||||||||||||||
| Ratios to average net assetsf | ||||||||||||||||||||||||
| Expenses before waiver and payments by affiliates |
1.05% | 1.03% | 1.02% | 1.03% | 1.04% | 1.04% | ||||||||||||||||||
| Expenses net of waiver and payments by affiliates |
1.03% | 1.03% | g | 1.02% | g | 1.03% | 1.04% | 1.04% | h | |||||||||||||||
| Net investment income |
3.38% | 1.80% | 2.86% | c | 1.91% | 2.59% | 2.67% | |||||||||||||||||
| Supplemental data | ||||||||||||||||||||||||
| Net assets, end of period (000’s) |
$1,426,801 | $1,456,854 | $1,645,571 | $1,873,586 | $1,744,231 | $1,679,412 | ||||||||||||||||||
| Portfolio turnover rate |
9.77% | 15.15% | 25.71% | 23.61% | 12.53% | 21.09% | ||||||||||||||||||
aThe amount shown for a share outstanding throughout the period may not correlate with the Statement of Operations for the period due to the timing of sales and repurchases of the Fund’s shares in relation to income earned and/or fluctuating fair value of the investments of the Fund.
bBased on average daily shares outstanding.
cNet investment income per share includes approximately $0.16 per share related to income received in the form of special dividends in connection with certain Fund holdings. Excluding these amounts, the ratio of net investment income to average net assets would have been 1.88%.
dAmount rounds to less than $0.01 per share.
eTotal return does not include fees, charges or expenses imposed by the variable annuity and life insurance contracts for which Franklin Templeton Variable Insurance Products Trust serves as an underlying investment vehicle. Total return is not annualized for periods less than one year.
fRatios are annualized for periods less than one year.
gBenefit of waiver and payments by affiliates rounds to less than 0.01%.
hBenefit of expense reduction rounds to less than 0.01%.
| TF-8 | Semiannual Report | The accompanying notes are an integral part of these financial statements. |
FRANKLIN TEMPLETON VARIABLE INSURANCE PRODUCTS TRUST
FINANCIAL HIGHLIGHTS
Templeton Foreign VIP Fund (continued)
| Six Months Ended (unaudited) |
Year Ended December 31, | |||||||||||||||||||||||
| 2015 | 2014 | 2013 | 2012 | 2011 | ||||||||||||||||||||
| Class 4 | ||||||||||||||||||||||||
| Per share operating performance (for a share outstanding throughout the period) |
||||||||||||||||||||||||
| Net asset value, beginning of period |
$13.29 | $15.16 | $17.37 | $14.48 | $12.66 | $14.43 | ||||||||||||||||||
|
|
|
|||||||||||||||||||||||
| Income from investment operationsa: | ||||||||||||||||||||||||
| Net investment incomeb |
0.21 | 0.25 | 0.46 | c | 0.28 | 0.33 | 0.36 | |||||||||||||||||
| Net realized and unrealized gains (losses) |
(0.55 | ) | (1.14 | ) | (2.36 | ) | 2.97 | 1.89 | (1.88 | ) | ||||||||||||||
|
|
|
|||||||||||||||||||||||
| Total from investment operations |
(0.34 | ) | (0.89 | ) | (1.90 | ) | 3.25 | 2.22 | (1.52 | ) | ||||||||||||||
|
|
|
|||||||||||||||||||||||
| Less distributions from: | ||||||||||||||||||||||||
| Net investment income |
(0.24 | ) | (0.48 | ) | (0.31 | ) | (0.36 | ) | (0.40 | ) | (0.25 | ) | ||||||||||||
| Net realized gains |
(0.23 | ) | (0.50 | ) | — | — | — | — | ||||||||||||||||
|
|
|
|||||||||||||||||||||||
| Total distributions |
(0.47 | ) | (0.98 | ) | (0.31 | ) | (0.36 | ) | (0.40 | ) | (0.25 | ) | ||||||||||||
|
|
|
|||||||||||||||||||||||
| Redemption fees |
— | — | — | d | — | d | — | d | — | d | ||||||||||||||
|
|
|
|||||||||||||||||||||||
| Net asset value, end of period |
$12.48 | $13.29 | $15.16 | $17.37 | $14.48 | $12.66 | ||||||||||||||||||
|
|
|
|||||||||||||||||||||||
| Total returne |
(2.52)% | (6.65)% | (11.22)% | 22.86% | 18.14% | (10.74)% | ||||||||||||||||||
| Ratios to average net assetsf | ||||||||||||||||||||||||
| Expenses before waiver and payments by affiliates |
1.15% | 1.13% | 1.12% | 1.13% | 1.14% | 1.14% | ||||||||||||||||||
| Expenses net of waiver and payments by affiliates |
1.13% | 1.13% | g | 1.12% | g | 1.13% | 1.14% | 1.14% | h | |||||||||||||||
| Net investment income |
3.28% | 1.70% | 2.76% | c | 1.81% | 2.49% | 2.57% | |||||||||||||||||
| Supplemental data | ||||||||||||||||||||||||
| Net assets, end of period (000’s) |
$465,647 | $472,189 | $503,143 | $513,098 | $416,277 | $353,346 | ||||||||||||||||||
| Portfolio turnover rate |
9.77% | 15.15% | 25.71% | 23.61% | 12.53% | 21.09% | ||||||||||||||||||
aThe amount shown for a share outstanding throughout the period may not correlate with the Statement of Operations for the period due to the timing of sales and repurchases of the Fund’s shares in relation to income earned and/or fluctuating fair value of the investments of the Fund.
bBased on average daily shares outstanding.
cNet investment income per share includes approximately $0.16 per share related to income received in the form of special dividends in connection with certain Fund holdings. Excluding these amounts, the ratio of net investment income to average net assets would have been 1.78%.
dAmount rounds to less than $0.01 per share.
eTotal return does not include fees, charges or expenses imposed by the variable annuity and life insurance contracts for which Franklin Templeton Variable Insurance Products Trust serves as an underlying investment vehicle. Total return is not annualized for periods less than one year.
fRatios are annualized for periods less than one year.
gBenefit of waiver and payments by affiliates rounds to less than 0.01%.
hBenefit of expense reduction rounds to less than 0.01%.
| The accompanying notes are an integral part of these financial statements. | Semiannual Report | TF-9 |
FRANKLIN TEMPLETON VARIABLE INSURANCE PRODUCTS TRUST
Statement of Investments, June 30, 2016 (unaudited)
| Templeton Foreign VIP Fund
|
||||||||||||||
| Country | Shares | Value | ||||||||||||
| Common Stocks 94.6% |
||||||||||||||
| Aerospace & Defense 1.2% |
||||||||||||||
| BAE Systems PLC |
United Kingdom | 3,520,780 | $ | 24,599,746 | ||||||||||
|
|
|
|||||||||||||
| Airlines 0.7% |
||||||||||||||
| Deutsche Lufthansa AG |
Germany | 1,235,150 | 14,436,153 | |||||||||||
|
|
|
|||||||||||||
| Auto Components 3.0% |
||||||||||||||
| Cie Generale des Etablissements Michelin, B |
France | 308,070 | 29,136,902 | |||||||||||
| Hyundai Mobis Co. Ltd. |
South Korea | 121,198 | 26,495,043 | |||||||||||
| Sumitomo Rubber Industries Ltd. |
Japan | 485,500 | 6,407,519 | |||||||||||
|
|
|
|||||||||||||
| 62,039,464 | ||||||||||||||
|
|
|
|||||||||||||
| Automobiles 3.6% |
||||||||||||||
| Hero Motocorp Ltd. |
India | 199,386 | 9,387,598 | |||||||||||
| Hyundai Motor Co. |
South Korea | 102,386 | 12,035,067 | |||||||||||
| Nissan Motor Co. Ltd. |
Japan | 4,424,800 | 39,327,271 | |||||||||||
| Toyota Motor Corp., ADR |
Japan | 136,317 | 13,630,337 | |||||||||||
|
|
|
|||||||||||||
| 74,380,273 | ||||||||||||||
|
|
|
|||||||||||||
| Banks 12.7% |
||||||||||||||
| Bangkok Bank PCL, fgn. |
Thailand | 3,061,900 | 14,123,798 | |||||||||||
| Barclays PLC |
United Kingdom | 10,039,930 | 18,554,718 | |||||||||||
| BNP Paribas SA |
France | 918,660 | 40,536,848 | |||||||||||
| Hana Financial Group Inc. |
South Korea | 2,065,805 | 41,665,914 | |||||||||||
| HSBC Holdings PLC |
United Kingdom | 4,928,400 | 30,109,901 | |||||||||||
| ING Groep NV, IDR |
Netherlands | 1,388,234 | 14,143,648 | |||||||||||
| KB Financial Group Inc., ADR |
South Korea | 1,216,406 | 34,618,915 | |||||||||||
| Societe Generale SA |
France | 400,690 | 12,546,281 | |||||||||||
| Standard Chartered PLC |
United Kingdom | 2,939,781 | 22,131,778 | |||||||||||
| UniCredit SpA |
Italy | 7,093,840 | 15,511,401 | |||||||||||
| United Overseas Bank Ltd. |
Singapore | 1,574,400 | 21,532,055 | |||||||||||
|
|
|
|||||||||||||
| 265,475,257 | ||||||||||||||
|
|
|
|||||||||||||
| Beverages 0.8% |
||||||||||||||
| Suntory Beverage & Food Ltd. |
Japan | 386,100 | 17,272,157 | |||||||||||
|
|
|
|||||||||||||
| Building Products 1.0% |
||||||||||||||
| Compagnie de Saint-Gobain |
France | 539,170 | 20,559,809 | |||||||||||
|
|
|
|||||||||||||
| Capital Markets 1.6% |
||||||||||||||
| Credit Suisse Group AG |
Switzerland | 1,208,852 | 12,768,430 | |||||||||||
| GAM Holding AG |
Switzerland | 654,050 | 6,935,168 | |||||||||||
| UBS Group AG |
Switzerland | 1,130,080 | 14,552,920 | |||||||||||
|
|
|
|||||||||||||
| 34,256,518 | ||||||||||||||
|
|
|
|||||||||||||
| Chemicals 0.8% |
||||||||||||||
| Johnson Matthey PLC |
United Kingdom | 420,711 | 15,712,939 | |||||||||||
|
|
|
|||||||||||||
| Construction & Engineering 1.5% |
||||||||||||||
| a | Carillion PLC |
United Kingdom | 3,835,100 | 11,955,883 | ||||||||||
| Sinopec Engineering Group Co. Ltd. |
China | 21,447,000 | 19,184,525 | |||||||||||
|
|
|
|||||||||||||
| 31,140,408 | ||||||||||||||
|
|
|
|||||||||||||
| Construction Materials 1.1% |
||||||||||||||
| CRH PLC |
Ireland | 829,830 | 23,947,815 | |||||||||||
|
|
|
|||||||||||||
| Diversified Financial Services 0.4% |
||||||||||||||
| Deutsche Boerse AG |
Germany | 109,190 | 8,912,713 | |||||||||||
|
|
|
|||||||||||||
| TF-10 | Semiannual Report |
FRANKLIN TEMPLETON VARIABLE INSURANCE PRODUCTS TRUST
STATEMENT OF INVESTMENTS (UNAUDITED)
Templeton Foreign VIP Fund (continued)
| Country | Shares | Value | ||||||||||||
| Common Stocks (continued) |
||||||||||||||
| Diversified Telecommunication Services 3.0% |
||||||||||||||
| China Telecom Corp. Ltd., H |
China | 53,618,357 | $ | 23,911,930 | ||||||||||
| Telefonica SA, ADR |
Spain | 2,390,332 | 22,660,347 | |||||||||||
| Telenor ASA |
Norway | 948,934 | 15,608,363 | |||||||||||
|
|
|
|||||||||||||
| 62,180,640 | ||||||||||||||
|
|
|
|||||||||||||
| Electrical Equipment 1.2% |
||||||||||||||
| ABB Ltd. |
Switzerland | 1,255,890 | 24,600,570 | |||||||||||
|
|
|
|||||||||||||
| Electronic Equipment, Instruments & Components 1.1% |
||||||||||||||
| Kingboard Chemical Holdings Ltd. |
Hong Kong | 11,646,000 | 23,086,503 | |||||||||||
|
|
|
|||||||||||||
| Energy Equipment & Services 7.1% |
||||||||||||||
| Ensign Energy Services Inc. |
Canada | 2,009,500 | 11,275,346 | |||||||||||
| Petrofac Ltd. |
United Kingdom | 2,312,160 | 23,924,345 | |||||||||||
| Precision Drilling Corp. |
Canada | 4,296,000 | 22,775,018 | |||||||||||
| SBM Offshore NV |
Netherlands | 2,879,260 | 33,508,326 | |||||||||||
| b | Subsea 7 SA |
United Kingdom | 2,173,050 | 21,118,505 | ||||||||||
| Technip SA |
France | 315,910 | 17,116,701 | |||||||||||
| Tenaris SA |
Italy | 1,320,175 | 19,063,920 | |||||||||||
|
|
|
|||||||||||||
| 148,782,161 | ||||||||||||||
|
|
|
|||||||||||||
| Food & Staples Retailing 1.8% |
||||||||||||||
| Metro AG |
Germany | 500,660 | 15,265,287 | |||||||||||
| b | Tesco PLC |
United Kingdom | 9,230,860 | 21,527,442 | ||||||||||
|
|
|
|||||||||||||
| 36,792,729 | ||||||||||||||
|
|
|
|||||||||||||
| Health Care Equipment & Supplies 0.7% |
||||||||||||||
| Getinge AB, B |
Sweden | 737,270 | 15,054,154 | |||||||||||
|
|
|
|||||||||||||
| Health Care Providers & Services 1.9% |
||||||||||||||
| Shanghai Pharmaceuticals Holding Co. Ltd., H |
China | 6,579,500 | 14,484,576 | |||||||||||
| Sinopharm Group Co. Ltd. |
China | 5,173,200 | 24,637,620 | |||||||||||
|
|
|
|||||||||||||
| 39,122,196 | ||||||||||||||
|
|
|
|||||||||||||
| Household Durables 0.4% |
||||||||||||||
| Haier Electronics Group Co. Ltd. |
China | 5,826,000 | 8,905,949 | |||||||||||
|
|
|
|||||||||||||
| Industrial Conglomerates 1.2% |
||||||||||||||
| Siemens AG |
Germany | 238,364 | 24,290,366 | |||||||||||
|
|
|
|||||||||||||
| Insurance 6.3% |
||||||||||||||
| Aegon NV |
Netherlands | 4,546,720 | 17,814,610 | |||||||||||
| Aviva PLC |
United Kingdom | 3,272,090 | 17,185,876 | |||||||||||
| AXA SA |
France | 1,317,458 | 26,036,474 | |||||||||||
| China Life Insurance Co. Ltd., H |
China | 5,057,000 | 10,833,007 | |||||||||||
| Chubb Ltd. |
United States | 190,979 | 24,962,865 | |||||||||||
| Muenchener Rueckversicherungs-Gesellschaft AG |
Germany | 69,590 | 11,605,523 | |||||||||||
| NN Group NV |
Netherlands | 463,600 | 12,758,833 | |||||||||||
| Swiss Re AG |
Switzerland | 133,120 | 11,558,160 | |||||||||||
|
|
|
|||||||||||||
| 132,755,348 | ||||||||||||||
|
|
|
|||||||||||||
| Internet Software & Services 0.7% |
||||||||||||||
| b | Baidu Inc., ADR |
China | 85,110 | 14,055,917 | ||||||||||
|
|
|
|||||||||||||
| Life Sciences Tools & Services 1.2% |
||||||||||||||
| b | MorphoSys AG |
Germany | 195,900 | 8,117,005 | ||||||||||
| b | QIAGEN NV |
Netherlands | 829,071 | 17,939,832 | ||||||||||
|
|
|
|||||||||||||
| 26,056,837 | ||||||||||||||
|
|
|
|||||||||||||
| Semiannual Report | TF-11 |
FRANKLIN TEMPLETON VARIABLE INSURANCE PRODUCTS TRUST
STATEMENT OF INVESTMENTS (UNAUDITED)
Templeton Foreign VIP Fund (continued)
| Country | Shares | Value | ||||||||||||
| Common Stocks (continued) |
||||||||||||||
| Metals & Mining 5.8% |
||||||||||||||
| Barrick Gold Corp. |
Canada | 1,328,790 | $ | 28,369,666 | ||||||||||
| Glencore PLC |
Switzerland | 10,884,600 | 22,183,924 | |||||||||||
| HudBay Minerals Inc. |
Canada | 2,956,000 | 14,115,409 | |||||||||||
| Silver Wheaton Corp. |
Canada | 2,430,900 | 57,212,034 | |||||||||||
|
|
|
|||||||||||||
| 121,881,033 | ||||||||||||||
|
|
|
|||||||||||||
| Multiline Retail 0.6% |
||||||||||||||
| Marks & Spencer Group PLC |
United Kingdom | 2,982,260 | 12,673,251 | |||||||||||
|
|
|
|||||||||||||
| Oil, Gas & Consumable Fuels 9.5% |
||||||||||||||
| BP PLC |
United Kingdom | 8,425,285 | 49,222,976 | |||||||||||
| Eni SpA |
Italy | 1,623,262 | 26,161,259 | |||||||||||
| Kunlun Energy Co. Ltd. |
China | 9,276,000 | 7,651,838 | |||||||||||
| LUKOIL PJSC, ADR |
Russia | 160,535 | 6,705,547 | |||||||||||
| PTT Exploration and Production PCL, fgn. |
Thailand | 4,120,100 | 9,825,125 | |||||||||||
| Royal Dutch Shell PLC, A |
United Kingdom | 16,803 | 458,745 | |||||||||||
| Royal Dutch Shell PLC, B |
United Kingdom | 1,461,343 | 40,179,199 | |||||||||||
| Suncor Energy Inc. |
Canada | 922,000 | 25,574,243 | |||||||||||
| Total SA, B |
France | 695,596 | 33,492,690 | |||||||||||
|
|
|
|||||||||||||
| 199,271,622 | ||||||||||||||
|
|
|
|||||||||||||
| Pharmaceuticals 10.4% |
||||||||||||||
| Bayer AG |
Germany | 216,810 | 21,658,343 | |||||||||||
| GlaxoSmithKline PLC |
United Kingdom | 1,330,855 | 28,472,848 | |||||||||||
| Merck KGaA |
Germany | 238,710 | 24,124,258 | |||||||||||
| Novartis AG |
Switzerland | 166,850 | 13,700,469 | |||||||||||
| Roche Holding AG |
Switzerland | 144,650 | 37,951,916 | |||||||||||
| Sanofi |
France | 455,845 | 37,906,909 | |||||||||||
| Teva Pharmaceutical Industries Ltd., ADR |
Israel | 809,648 | 40,668,619 | |||||||||||
| UCB SA |
Belgium | 164,360 | 12,259,389 | |||||||||||
|
|
|
|||||||||||||
| 216,742,751 | ||||||||||||||
|
|
|
|||||||||||||
| Semiconductors & Semiconductor Equipment 1.4% |
||||||||||||||
| a | GCL-Poly Energy Holdings Ltd. |
China | 141,417,000 | 18,592,031 | ||||||||||
| Infineon Technologies AG |
Germany | 764,445 | 11,009,232 | |||||||||||
|
|
|
|||||||||||||
| 29,601,263 | ||||||||||||||
|
|
|
|||||||||||||
| Specialty Retail 0.5% |
||||||||||||||
| Kingfisher PLC |
United Kingdom | 2,345,266 | 10,085,148 | |||||||||||
|
|
|
|||||||||||||
| Technology Hardware, Storage & Peripherals 6.0% |
||||||||||||||
| CANON Inc. |
Japan | 533,600 | 15,048,269 | |||||||||||
| Konica Minolta Inc. |
Japan | 883,700 | 6,332,007 | |||||||||||
| Quanta Computer Inc. |
Taiwan | 7,299,000 | 13,825,151 | |||||||||||
| Samsung Electronics Co. Ltd. |
South Korea | 73,014 | 90,258,818 | |||||||||||
|
|
|
|||||||||||||
| 125,464,245 | ||||||||||||||
|
|
|
|||||||||||||
| Trading Companies & Distributors 2.0% |
||||||||||||||
| ITOCHU Corp. |
Japan | 1,944,700 | 23,340,166 | |||||||||||
| Posco Daewoo Corp. |
South Korea | 869,005 | 18,846,509 | |||||||||||
|
|
|
|||||||||||||
| 42,186,675 | ||||||||||||||
|
|
|
|||||||||||||
| TF-12 | Semiannual Report |
FRANKLIN TEMPLETON VARIABLE INSURANCE PRODUCTS TRUST
STATEMENT OF INVESTMENTS (UNAUDITED)
Templeton Foreign VIP Fund (continued)
| Country | Shares | Value | ||||||||||||
| Common Stocks (continued) |
||||||||||||||
| Wireless Telecommunication Services 3.4% |
||||||||||||||
| China Mobile Ltd. |
China | 1,370,500 | $ | 15,677,342 | ||||||||||
| SoftBank Group Corp. |
Japan | 691,900 | 38,783,918 | |||||||||||
| Vodafone Group PLC, ADR |
United Kingdom | 562,353 | 17,371,084 | |||||||||||
|
|
|
|||||||||||||
| 71,832,344 | ||||||||||||||
|
|
|
|||||||||||||
| Total Common Stocks (Cost $2,075,756,553) |
1,978,154,954 | |||||||||||||
|
|
|
|||||||||||||
| Short Term Investments 4.9% |
||||||||||||||
| Money Market Funds (Cost $96,144,526) 4.6% |
||||||||||||||
| b,c | Institutional Fiduciary Trust Money Market Portfolio |
United States | 96,144,526 | 96,144,526 | ||||||||||
|
|
|
|||||||||||||
| d | Investments from Cash Collateral Received for Loaned Securities (Cost $7,952,392) 0.3% |
|||||||||||||
| Money Market Funds 0.3% |
||||||||||||||
| b,c | Institutional Fiduciary Trust Money Market Portfolio |
United States | 7,952,392 | 7,952,392 | ||||||||||
|
|
|
|||||||||||||
| Total Investments (Cost $2,179,853,471) 99.5% |
2,082,251,872 | |||||||||||||
| Other Assets, less Liabilities 0.5% |
9,702,033 | |||||||||||||
|
|
|
|||||||||||||
| Net Assets 100.0% |
$ | 2,091,953,905 | ||||||||||||
|
|
|
|||||||||||||
See Abbreviations on page TF-23.
aA portion or all of the security is on loan at June 30, 2016. See Note 1(c).
bNon-income producing.
cSee Note 3(e) regarding investments in affiliated management investment companies.
dSee Note 1(c) regarding securities on loan.
| The accompanying notes are an integral part of these financial statements. | Semiannual Report | TF-13 |
FRANKLIN TEMPLETON VARIABLE INSURANCE PRODUCTS TRUST
Financial Statements
Statements of Assets and Liabilities
June 30, 2016 (unaudited)
| Templeton Foreign VIP Fund |
||||
| Assets: |
||||
| Investments in securities: |
||||
| Cost - Unaffiliated issuers |
$ | 2,075,756,553 | ||
| Cost - Non-controlled affiliates (Note 3e) |
104,096,918 | |||
|
|
|
|||
| Total cost of investments |
$ | 2,179,853,471 | ||
|
|
|
|||
| Value - Unaffiliated issuers |
$ | 1,978,154,954 | ||
| Value - Non-controlled affiliates (Note 3e) |
104,096,918 | |||
|
|
|
|||
| Total value of investments (includes securities loaned in the amount $7,113,392) |
2,082,251,872 | |||
| Cash |
390,128 | |||
| Foreign currency, at value (cost and $832,589) |
832,971 | |||
| Receivables: |
||||
| Capital shares sold |
12,368,417 | |||
| Dividends |
7,050,048 | |||
| European Union tax reclaims |
911,264 | |||
| Other assets |
929 | |||
|
|
|
|||
| Total assets |
2,103,805,629 | |||
|
|
|
|||
| Liabilities: |
||||
| Payables: |
||||
| Investment securities purchased |
837,392 | |||
| Capital shares redeemed |
477,473 | |||
| Management fees |
1,271,163 | |||
| Distribution fees |
876,960 | |||
| Payable upon return of securities loaned |
7,952,392 | |||
| Deferred tax |
33,155 | |||
| Accrued expenses and other liabilities |
403,189 | |||
|
|
|
|||
| Total liabilities |
11,851,724 | |||
|
|
|
|||
| Net assets, at value |
$ | 2,091,953,905 | ||
|
|
|
|||
| Net assets consist of: |
||||
| Paid-in capital |
$ | 2,217,200,126 | ||
| Undistributed net investment income |
35,402,855 | |||
| Net unrealized appreciation (depreciation) |
(97,800,662 | ) | ||
| Accumulated net realized gain (loss) |
(62,848,414 | ) | ||
|
|
|
|||
| Net assets, at value |
$ | 2,091,953,905 | ||
|
|
|
|||
| Class 1: | ||||
| Net assets, at value |
$ | 199,506,011 | ||
|
|
|
|||
| Shares outstanding |
15,809,200 | |||
|
|
|
|||
| Net asset value and maximum offering price per share |
$ | 12.62 | ||
|
|
|
|||
| Class 2: | ||||
| Net assets, at value |
$ | 1,426,800,919 | ||
|
|
|
|||
| Shares outstanding |
115,215,844 | |||
|
|
|
|||
| Net asset value and maximum offering price per share |
$ | 12.38 | ||
|
|
|
|||
| Class 4: | ||||
| Net assets, at value |
$ | 465,646,975 | ||
|
|
|
|||
| Shares outstanding |
37,304,306 | |||
|
|
|
|||
| Net asset value and maximum offering price per share |
$ | 12.48 | ||
|
|
|
|||
| TF-14 | Semiannual Report | The accompanying notes are an integral part of these financial statements. |
FRANKLIN TEMPLETON VARIABLE INSURANCE PRODUCTS TRUST
FINANCIAL STATEMENTS
Statements of Operations
for the six months ended June 30, 2016 (unaudited)
| Templeton Foreign VIP Fund |
||||
| Investment income: |
||||
| Dividends (net of foreign taxes of $4,947,590) |
$ | 44,477,165 | ||
| Income from securities loaned (net of fees and rebates) |
630,762 | |||
|
|
|
|||
| Total investment income |
45,107,927 | |||
|
|
|
|||
| Expenses: |
||||
| Management fees (Note 3a) |
7,750,108 | |||
| Distribution fees: (Note 3c) |
||||
| Class 2 |
1,740,923 | |||
| Class 4 |
792,740 | |||
| Custodian fees (Note 4) |
109,911 | |||
| Reports to shareholders |
176,552 | |||
| Professional fees |
81,601 | |||
| Trustees’ fees and expenses |
5,210 | |||
| Other |
27,294 | |||
|
|
|
|||
| Total expenses |
10,684,339 | |||
| Expenses waived/paid by affiliates (Note 3e) |
(179,099 | ) | ||
|
|
|
|||
| Net expenses |
10,505,240 | |||
|
|
|
|||
| Net investment income |
34,602,687 | |||
|
|
|
|||
| Realized and unrealized gains (losses): |
||||
| Net realized gain (loss) from: |
||||
| Investments |
(58,413,743 | ) | ||
| Foreign currency transactions |
229,870 | |||
|
|
|
|||
| Net realized gain (loss) |
(58,183,873 | ) | ||
|
|
|
|||
| Net change in unrealized appreciation (depreciation) on: |
||||
| Investments |
(31,139,542 | ) | ||
| Translation of other assets and liabilities denominated in foreign currencies |
(32,859 | ) | ||
| Change in deferred taxes on unrealized appreciation |
55,339 | |||
|
|
|
|||
| Net change in unrealized appreciation (depreciation) |
(31,117,062 | ) | ||
|
|
|
|||
| Net realized and unrealized gain (loss) |
(89,300,935 | ) | ||
|
|
|
|||
| Net increase (decrease) in net assets resulting from operations |
$ | (54,698,248 | ) | |
|
|
|
|||
| The accompanying notes are an integral part of these financial statements. | Semiannual Report | TF-15 |
FRANKLIN TEMPLETON VARIABLE INSURANCE PRODUCTS TRUST
FINANCIAL STATEMENTS
Statements of Changes in Net Assets
| Templeton Foreign VIP Fund | ||||||||
| Six Months Ended June 30, 2016 (unaudited) |
Year Ended December 31, 2015 |
|||||||
| Increase (decrease) in net assets: |
||||||||
| Operations: |
||||||||
| Net investment income |
$ | 34,602,687 | $ | 42,572,642 | ||||
| Net realized gain (loss) |
(58,183,873 | ) | 36,800,340 | |||||
| Net change in unrealized appreciation (depreciation) |
(31,117,062 | ) | (219,790,040 | ) | ||||
|
|
|
|||||||
| Net increase (decrease) in net assets resulting from operations |
(54,698,248 | ) | (140,417,058 | ) | ||||
|
|
|
|||||||
| Distributions to shareholders from: |
||||||||
| Net investment income: |
||||||||
| Class 1 |
(4,469,747 | ) | (8,346,614 | ) | ||||
| Class 2 |
(28,417,976 | ) | (51,791,116 | ) | ||||
| Class 4 |
(8,605,853 | ) | (15,312,865 | ) | ||||
| Net realized gains: |
||||||||
| Class 1 |
(3,504,221 | ) | (7,826,999 | ) | ||||
| Class 2 |
(25,453,391 | ) | (52,898,439 | ) | ||||
| Class 4 |
(8,118,929 | ) | (16,028,658 | ) | ||||
|
|
|
|||||||
| Total distributions to shareholders |
(78,570,117 | ) | (152,204,691 | ) | ||||
|
|
|
|||||||
| Capital share transactions: (Note 2) |
||||||||
| Class 1 |
(1,643,566 | ) | (4,016,954 | ) | ||||
| Class 2 |
61,864,384 | 11,936,472 | ||||||
| Class 4 |
21,786,823 | 30,848,243 | ||||||
|
|
|
|||||||
| Total capital share transactions |
82,007,641 | 38,767,761 | ||||||
|
|
|
|||||||
| Net increase (decrease) in net assets |
(51,260,724 | ) | (253,853,988 | ) | ||||
| Net assets: |
||||||||
| Beginning of period |
2,143,214,629 | 2,397,068,617 | ||||||
|
|
|
|||||||
| End of period |
$ | 2,091,953,905 | $ | 2,143,214,629 | ||||
|
|
|
|||||||
| Undistributed net investment income included in net assets: |
||||||||
| End of period |
$ | 35,402,855 | $ | 42,293,744 | ||||
|
|
|
|||||||
| TF-16 | Semiannual Report | The accompanying notes are an integral part of these financial statements. |
FRANKLIN TEMPLETON VARIABLE INSURANCE PRODUCTS TRUST
Notes to Financial Statements (unaudited)
Templeton Foreign VIP Fund
| Semiannual Report | TF-17 |
FRANKLIN TEMPLETON VARIABLE INSURANCE PRODUCTS TRUST
NOTES TO FINANCIAL STATEMENTS (UNAUDITED)
Templeton Foreign VIP Fund (continued)
1. Organization and Significant Accounting Policies (continued)
a. Financial Instrument Valuation (continued)
These price movements are measured against established trigger thresholds for each specific market proxy to assist in determining if an event has occurred that may call into question the reliability of the values of the foreign securities held by the Fund. If such an event occurs, the securities may be valued using fair value procedures, which may include the use of independent pricing services.
When the last day of the reporting period is a non-business day, certain foreign markets may be open on those days that the NYSE is closed, which could result in differences between the value of the Fund’s portfolio securities on the last business day and the last calendar day of the reporting period. Any significant security valuation changes due to an open foreign market are adjusted and reflected by the Fund for financial reporting purposes.
b. Foreign Currency Translation
Portfolio securities and other assets and liabilities denominated in foreign currencies are translated into U.S. dollars based on the exchange rate of such currencies against U.S. dollars on the date of valuation. The Fund may enter into foreign currency exchange contracts to facilitate transactions denominated in a foreign currency. Purchases and sales of securities, income and expense items denominated in foreign currencies are translated into U.S. dollars at the exchange rate in effect on the transaction date. Portfolio securities and assets and liabilities denominated in foreign currencies contain risks that those currencies will decline in value relative to the U.S. dollar. Occasionally, events may impact the availability or reliability of foreign exchange rates used to convert the U.S. dollar equivalent value. If such an event occurs, the foreign exchange rate will be valued at fair value using procedures established and approved by the Board.
The Fund does not separately report the effect of changes in foreign exchange rates from changes in market prices on securities held. Such changes are included in net realized and unrealized gain or loss from investments in the Statement of Operations.
Realized foreign exchange gains or losses arise from sales of foreign currencies, currency gains or losses realized between the trade and settlement dates on securities transactions and the difference between the recorded amounts of dividends, interest, and foreign withholding taxes and the U.S. dollar equivalent of the
amounts actually received or paid. Net unrealized foreign exchange gains and losses arise from changes in foreign exchange rates on foreign denominated assets and liabilities other than investments in securities held at the end of the reporting period.
c. Securities Lending
The Fund participates in an agency based securities lending program to earn additional income. The Fund receives cash collateral against the loaned securities in an amount equal to at least 102% of the fair value of the loaned securities. Collateral is maintained over the life of the loan in an amount not less than 100% of the fair value of loaned securities, as determined at the close of Fund business each day; any additional collateral required due to changes in security values is delivered to the Fund on the next business day. The collateral is deposited into a joint cash account with other funds and is used to invest in a money market fund managed by Franklin Advisers, Inc., an affiliate of the Fund. The Fund may receive income from the investment of cash collateral, in addition to lending fees and rebates paid by the borrower. Income from securities loaned, net of fees paid to the securities lending agent and/or third-party vendor, is reported separately in the Statement of Operations. The Fund bears the market risk with respect to the collateral investment, securities loaned, and the risk that the agent may default on its obligations to the Fund. If the borrower defaults on its obligation to return the securities loaned, the Fund has the right to repurchase the securities in the open market using the collateral received. The securities lending agent has agreed to indemnify the Fund in the event of default by a third party borrower.
d. Income and Deferred Taxes
It is the Fund’s policy to qualify as a regulated investment company under the Internal Revenue Code. The Fund intends to distribute to shareholders substantially all of its taxable income and net realized gains to relieve it from federal income and if applicable, excise taxes. As a result, no provision for U.S. federal income taxes is required.
The Fund may be subject to foreign taxation related to income received, capital gains on the sale of securities and certain foreign currency transactions in the foreign jurisdictions in which it invests. Foreign taxes, if any, are recorded based on the tax regulations and rates that exist in the foreign markets in which the Fund invests. When a capital gain tax is determined to apply, the Fund records an estimated deferred tax liability in
| TF-18 | Semiannual Report |
FRANKLIN TEMPLETON VARIABLE INSURANCE PRODUCTS TRUST
NOTES TO FINANCIAL STATEMENTS (UNAUDITED)
Templeton Foreign VIP Fund (continued)
| Semiannual Report | TF-19 |
FRANKLIN TEMPLETON VARIABLE INSURANCE PRODUCTS TRUST
NOTES TO FINANCIAL STATEMENTS (UNAUDITED)
Templeton Foreign VIP Fund (continued)
2. Shares of Beneficial Interest
At June 30, 2016, there were an unlimited number of shares authorized (without par value). Transactions in the Fund’s shares were as follows:
| Six Months Ended June 30, 2016 |
Year Ended December 31, 2015 |
|||||||||||||||||||
| Shares | Amount | Shares | Amount | |||||||||||||||||
| Class 1 Shares: | ||||||||||||||||||||
| Shares sold |
187,606 | $ | 2,408,488 | 454,466 | $ | 6,842,816 | ||||||||||||||
| Shares issued in reinvestment of distributions |
633,861 | 7,973,968 | 1,057,790 | 16,173,612 | ||||||||||||||||
| Shares redeemed |
(924,389 | ) | (12,026,022 | ) | (1,792,103 | ) | (27,033,382 | ) | ||||||||||||
|
|
|
|||||||||||||||||||
| Net increase (decrease) |
(102,922 | ) | $ | (1,643,566 | ) | (279,847 | ) | $ | (4,016,954 | ) | ||||||||||
|
|
|
|||||||||||||||||||
| Class 2 Shares: | ||||||||||||||||||||
| Shares sold |
8,819,370 | $ | 113,983,326 | 14,594,828 | $ | 213,082,680 | ||||||||||||||
| Shares issued in reinvestment of distributions |
4,365,589 | 53,871,367 | 6,974,654 | 104,689,555 | ||||||||||||||||
| Shares redeemed |
(8,362,774 | ) | (105,990,309 | ) | (20,492,400 | ) | (305,835,763 | ) | ||||||||||||
|
|
|
|||||||||||||||||||
| Net increase (decrease) |
4,822,185 | $ | 61,864,384 | 1,077,082 | $ | 11,936,472 | ||||||||||||||
|
|
|
|||||||||||||||||||
| Class 4 Shares: | ||||||||||||||||||||
| Shares sold |
2,906,866 | $ | 36,677,027 | 5,690,434 | $ | 80,692,209 | ||||||||||||||
| Shares issued on reinvestment of distributions |
1,344,436 | 16,724,782 | 2,072,852 | 31,341,523 | ||||||||||||||||
| Shares redeemed |
(2,473,404 | ) | (31,614,986 | ) | (5,429,602 | ) | (81,185,489 | ) | ||||||||||||
|
|
|
|||||||||||||||||||
| Net increase (decrease) |
1,777,898 | $ | 21,786,823 | 2,333,684 | $ | 30,848,243 | ||||||||||||||
|
|
|
|||||||||||||||||||
3. Transactions With Affiliates
Franklin Resources, Inc. is the holding company for various subsidiaries that together are referred to as Franklin Templeton Investments. Certain officers and trustees of the Fund are also officers and/or directors of the following subsidiaries:
| Subsidiary | Affiliation | |
| Templeton Investment Counsel, LLC (TIC) |
Investment manager | |
| Franklin Templeton Services, LLC (FT Services) |
Administrative manager | |
| Franklin Templeton Distributors, Inc. (Distributors) |
Principal underwriter | |
| Franklin Templeton Investor Services, LLC (Investor Services) |
Transfer agent |
a. Management Fees
The Fund pays an investment management fee to TIC based on the average daily net assets of the Fund as follows:
| Annualized Fee Rate | Net Assets | |
| 0.900% |
Up to and including $200 million | |
| 0.810% |
Over $200 million, up to and including $700 million | |
| 0.775% |
Over $700 million, up to and including $1.2 billion | |
| 0.750% |
Over $1.2 billion, up to and including $1.3 billion | |
| 0.675% |
Over $1.3 billion, up to and including $10 billion | |
| 0.655% |
Over $10 billion, up to and including $15 billion | |
| 0.635% |
Over $15 billion, up to and including $20 billion | |
| 0.615% |
In excess of $20 billion |
| TF-20 | Semiannual Report |
FRANKLIN TEMPLETON VARIABLE INSURANCE PRODUCTS TRUST
NOTES TO FINANCIAL STATEMENTS (UNAUDITED)
Templeton Foreign VIP Fund (continued)
For the period ended June 30, 2016, the annualized effective investment management fee rate was 0.758% of the Fund’s average daily net assets.
b. Administrative Fees
Under an agreement with TIC, FT Services provides administrative services to the Fund. The fee is paid by TIC based on the Fund’s average daily net assets, and is not an additional expense of the Fund.
c. Distribution Fees
The Board has adopted distribution plans for Class 2 and Class 4 shares pursuant to Rule 12b-1 under the 1940 Act. Under the Fund’s compensation distribution plans, the Fund pays Distributors for costs incurred in connection with the servicing, sale and distribution of the Fund’s shares up to 0.25% and 0.35% per year of its average daily net assets of Class 2 and Class 4, respectively. The plan year, for purposes of monitoring compliance with the maximum annual plan rates, is February 1 through January 31.
d. Transfer Agent Fees
Investor Services, under terms of an agreement, performs shareholder servicing for the Fund and is not paid by the Fund for the services.
e. Investments in Affiliated Management Investment Companies
The Fund invests in one or more affiliated management investment companies for purposes other than exercising a controlling influence over the management or policies. Management fees paid by the Fund are waived on assets invested in the affiliated management investment companies, as noted in the Statement of Operations, in an amount not to exceed the management and administrative fees paid directly or indirectly by each affiliate. Prior to January 1, 2014, the waiver was accounted for as a reduction to management fees.
| Number of Shares Held at Beginning of Period |
Gross Additions |
Gross Reductions |
Number of Shares Held at End of Period |
Value
at End of Period |
Investment Income |
Realized Gain (Loss) |
% of Affiliated Fund Shares Outstanding Held at End of Period |
|||||||||||||||||||||||||
| Non-Controlled Affiliates | ||||||||||||||||||||||||||||||||
| Institutional Fiduciary Trust Money Market Portfolio |
71,421,269 | 685,470,192 | (652,794,543 | ) | 104,096,918 | $ | 104,096,918 | $ | — | $ | — | 0.5% | ||||||||||||||||||||
|
|
|
|||||||||||||||||||||||||||||||
4. Expense Offset Arrangement
The Fund has entered into an arrangement with its custodian whereby credits realized as a result of uninvested cash balances are used to reduce a portion of the Fund’s custodian expenses. During the period ended June 30, 2016, there were no credits earned.
5. Income Taxes
At June 30, 2016, the cost of investments and net unrealized appreciation (depreciation) for income tax purposes were as follows:
| Cost of investments |
$ | 2,184,560,139 | ||
|
|
|
|||
| Unrealized appreciation |
$ | 267,302,947 | ||
| Unrealized depreciation |
(369,611,214 | ) | ||
|
|
|
|||
| Net unrealized appreciation (depreciation) |
$ | (102,308,267 | ) | |
|
|
|
Differences between income and/or capital gains as determined on a book basis and a tax basis are primarily due to differing treatment of foreign capital gains tax.
| Semiannual Report | TF-21 |
FRANKLIN TEMPLETON VARIABLE INSURANCE PRODUCTS TRUST
NOTES TO FINANCIAL STATEMENTS (UNAUDITED)
Templeton Foreign VIP Fund (continued)
6. Investment Transactions
Purchases and sales of investments (excluding short term securities) for the period ended June 30, 2016, aggregated $199,100,919 and $194,372,981, respectively.
At June 30, 2016, in connection with securities lending transactions, the Fund loaned equity investments and received $7,952,392 of cash collateral. The gross amount of recognized liability for such transactions is included in payable upon return of securities loaned in the Statement of Assets and Liabilities. The agreements can be terminated at any time.
7. Concentration of Risk
Investing in foreign securities may include certain risks and considerations not typically associated with investing in U.S. securities, such as fluctuating currency values and changing local and regional economic, political and social conditions, which may result in greater market volatility. In addition, certain foreign securities may not be as liquid as U.S. securities.
8. Credit Facility
The Fund, together with other U.S. registered and foreign investment funds (collectively, Borrowers), managed by Franklin Templeton Investments, are borrowers in a joint syndicated senior unsecured credit facility totaling $2 billion (Global Credit Facility) which matures on February 10, 2017. This Global Credit Facility provides a source of funds to the Borrowers for temporary and emergency purposes, including the ability to meet future unanticipated or unusually large redemption requests.
Under the terms of the Global Credit Facility, the Fund shall, in addition to interest charged on any borrowings made by the Fund and other costs incurred by the Fund, pay its share of fees and expenses incurred in connection with the implementation and maintenance of the Global Credit Facility, based upon its relative share of the aggregate net assets of all of the Borrowers, including an annual commitment fee of 0.07% based upon the unused portion of the Global Credit Facility. Effective February 12, 2016, the annual commitment fee is 0.15%. These fees are reflected in other expenses in the Statement of Operations. During the period ended June 30, 2016, the Fund did not use the Global Credit Facility.
9. Fair Value Measurements
The Fund follows a fair value hierarchy that distinguishes between market data obtained from independent sources (observable inputs) and the Fund’s own market assumptions (unobservable inputs). These inputs are used in determining the value of the Fund’s financial instruments and are summarized in the following fair value hierarchy:
| • | Level 1 – quoted prices in active markets for identical financial instruments |
| • | Level 2 – other significant observable inputs (including quoted prices for similar financial instruments, interest rates, prepayment speed, credit risk, etc.) |
| • | Level 3 – significant unobservable inputs (including the Fund’s own assumptions in determining the fair value of financial instruments) |
The input levels are not necessarily an indication of the risk or liquidity associated with financial instruments at that level.
For movements between the levels within the fair value hierarchy, the Fund has adopted a policy of recognizing the transfers as of the date of the underlying event which caused the movement.
A summary of inputs used as of June 30, 2016, in valuing the Fund’s assets carried at fair value were valued using Level 1 inputs. For detailed categories, see the accompanying Statement of Investments.
| TF-22 | Semiannual Report |
FRANKLIN TEMPLETON VARIABLE INSURANCE PRODUCTS TRUST
NOTES TO FINANCIAL STATEMENTS (UNAUDITED)
Templeton Foreign VIP Fund (continued)
10. Subsequent Events
The Fund has evaluated subsequent events through the issuance of the financial statements and determined that no events have occurred that require disclosure.
Abbreviations
| Selected Portfolio | ||
| ADR | American Depositary Receipt | |
| IDR | International Depositary Receipt | |
| Semiannual Report | TF-23 |
FRANKLIN TEMPLETON VARIABLE INSURANCE PRODUCTS TRUST
Tax Information (unaudited)
Templeton Foreign VIP Fund
At December 31, 2015, more than 50% of the Fund’s total assets were invested in securities of foreign issuers. In most instances, foreign taxes were withheld from income paid to the Fund on these investments. As shown in the table below, the Fund hereby reports to shareholders the foreign source income and foreign taxes paid, pursuant to Section 853 of the Internal Revenue Code. This written statement will allow shareholders of record on June 14, 2016, to treat their proportionate share of foreign taxes paid by the Fund as having been paid directly by them. The shareholder shall consider these amounts as foreign taxes paid in the tax year in which they receive the Fund distribution.
The following table provides a detailed analysis of foreign tax paid, and foreign source income as reported by the Fund, to Class 1, Class 2, and Class 4 shareholders of record.
| Class | Foreign Tax Paid Per Share |
Foreign Source Income Per Share | ||
| Class 1 |
$0.0241 | $0.3139 | ||
| Class 2 |
$0.0241 | $0.2779 | ||
| Class 4 |
$0.0241 | $0.2651 |
Foreign Tax Paid Per Share (Column 1) is the amount per share available to you, as a tax credit (assuming you held your shares in the Fund for a minimum of 16 days during the 31-day period beginning 15 days before the ex-dividend date of the Fund’s distribution to which the foreign taxes relate), or, as a tax deduction.
Foreign Source Income Per Share (Column 2) is the amount per share of income dividends attributable to foreign securities held by the Fund, plus any foreign taxes withheld on these dividends.
| TF-24 | Semiannual Report |
Templeton Global Bond VIP Fund
This semiannual report for Templeton Global Bond VIP Fund covers the period ended June 30, 2016.
Class 1 Performance Summary as of June 30, 2016
The Fund’s Class 1 shares had a -1.69% total return* for the six-month period ended June 30, 2016.
*The Fund has a fee waiver associated with any investment in a Franklin Templeton money fund and/or Franklin Templeton fund, as applicable, contractually guaranteed through at least the Fund’s current fiscal year-end. Fund investment results reflect the fee waiver, to the extent applicable; without this reduction, the results would have been lower.
Performance reflects the Fund’s Class 1 operating expenses, but does not include any contract fees, expenses or sales charges. If they had been included, performance would be lower. These charges and deductions, particularly for variable life policies, can have a significant effect on contract values and insurance benefits. See the contract prospectus for a complete description of these expenses, including sales charges.
Performance data represent past performance, which does not guarantee future results. Investment return and principal value will fluctuate, and you may have a gain or loss when you sell your shares. Current performance may differ from figures shown.
| Semiannual Report | TGB-1 |
TEMPLETON GLOBAL BOND VIP FUND
Fund Goal and Main Investments
The Fund seeks high current income, consistent with preservation of capital, with capital appreciation as a secondary consideration. Under normal market conditions, the Fund invests at least 80% of its net assets in bonds, which include debt securities of any maturity, such as bonds, notes, bills and debentures.
Fund Risks
All investments involve risks, including possible loss of principal. Currency rates may fluctuate significantly over short periods of time, and can reduce returns. Derivatives, including currency management strategies, involve costs and can create economic leverage in the portfolio that may result in significant volatility and cause the Fund to participate in losses (as well as enable gains) on an amount that exceeds the Fund’s initial investment. The Fund may not achieve the anticipated benefits and may realize losses when a counterparty fails to perform as promised. Foreign securities involve special risks, including currency fluctuations and economic and political uncertainties. Investments in emerging markets involve heightened risks related to the same factors, in addition to those associated with these markets’ smaller size and lesser liquidity. Sovereign debt securities are subject to various risks in addition to those relating to debt securities and foreign securities generally, including, but not limited to, the risk that a government entity may be unwilling or unable to pay interest and repay principal on its sovereign debt, or otherwise meet its obligations when due. Investments in lower rated bonds include higher risk of default and loss of principal. Changes in interest rates will affect the value of the Fund’s portfolio and its share price and yield. Bond prices generally move in the opposite direction of interest rates. As prices of bonds in the Fund adjust to a rise in interest rates, the Fund’s share price may decline. The markets for particular securities or types of securities are or may become relatively illiquid. Reduced liquidity will have an adverse impact on the security’s value and on the Fund’s ability to sell such securities when necessary to meet the Fund’s liquidity needs or in response to a specific market event. The Fund is also nondiversified, which involves the risk of greater price fluctuation than a more diversified portfolio. Changes in the financial strength of a bond issuer or in a bond’s credit rating may affect its value. The Fund is actively managed but there is no guarantee that the manager’s investment decisions will produce the desired results. The Fund’s prospectus also includes a description of the main investment risks.
Performance Overview
You can find the Fund’s six-month total return in the Performance Summary. For comparison, the Fund’s benchmarks, the J.P. Morgan (JPM) Global Government Bond Index (GGBI) posted a +10.58% total return and the Citigroup World Government Bond Index, posted a +10.74% total return for the same period.1
Economic and Market Overview
Global markets experienced periods of heightened volatility during the six-month period, as declines in oil prices and concerns about economic conditions in China and growth across the globe appeared at times to have negative effects on investor sentiment. Despite the near-term volatility, our medium-term investment convictions remained intact and we held the view that global market fundamentals would eventually re-emerge. During the second half of the period, a number of emerging markets recovered from the extraordinarily low valuation levels of January and February to achieve what we viewed as compelling positive appreciation for the full six-month period.
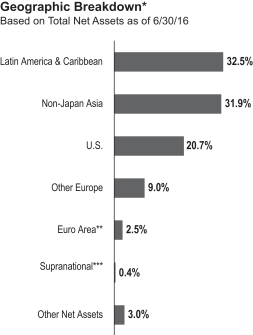
*Figures are stated as a percentage of total and may not equal 100% or may be negative due to rounding, use of any derivatives, unsettled trades or other factors.
**The Fund’s euro area investments were in Slovenia and Portugal.
***The Fund’s supranational investment was denominated in the Mexican peso.
1. Source: Morningstar. One cannot invest directly in an index, and an index is not representative of the Fund’s portfolio. Please see Index Descriptions following the Fund Summaries.
| TGB-2 | Semiannual Report |
TEMPLETON GLOBAL BOND VIP FUND
| Semiannual Report | TGB-3 |
TEMPLETON GLOBAL BOND VIP FUND
What is duration?
Duration is a measure of a bond’s price sensitivity to interest rate changes. In general, a portfolio of securities with a lower duration can be expected to be less sensitive to interest rate changes than a portfolio with a higher duration.
What is an interest rate swap?
An interest rate swap is an agreement between two parties to exchange interest rate obligations, generally one based on an interest rate fixed to maturity and the other based on an interest rate that changes in accordance with changes in a designated benchmark (for example, LIBOR, prime, commercial paper or other benchmarks).
During the period, the Fund’s negative absolute performance was primarily attributable to currency positions. Interest rate strategies contributed to absolute return while sovereign credit exposures had a largely neutral effect. Among currencies, the Fund’s net-negative positions in the Japanese yen and the euro detracted from absolute performance. However, currency positions in Asia ex-Japan and Latin America contributed. The Fund maintained a defensive approach regarding interest rates in developed and emerging markets. Select duration exposures in Latin America and Asia ex-Japan contributed to absolute performance, while negative duration exposure to U.S. Treasuries detracted.
Relative to the JPM GGBI benchmark, the Fund’s underperformance was primarily attributable to interest rate strategies followed by currency positions. Sovereign credit exposures had a largely neutral effect on relative return. The Fund maintained a defensive approach regarding interest rates in developed and emerging markets. Select underweighted duration exposures in Europe detracted from relative performance, as did underweighted duration exposures in Japan and the U.S. However, select duration exposures in Latin America and Asia ex-Japan contributed to relative return. Among currencies, the Fund’s underweighted positions in the Japanese yen and the euro detracted from relative performance. However, overweighted currency positions in Asia ex-Japan and Latin America contributed to relative return, as did underweighted exposure to the British pound.
Thank you for your participation in Templeton Global Bond VIP Fund. We look forward to serving your future investment needs.
The foregoing information reflects our analysis, opinions and portfolio holdings as of June 30, 2016, the end of the reporting period. The way we implement our main investment strategies and the resulting portfolio holdings may change depending on factors such as market and economic conditions. These opinions may not be relied upon as investment advice or an offer for a particular security. The information is not a complete analysis of every aspect of any market, country, industry, security or the Fund. Statements of fact are from sources considered reliable, but the investment manager makes no representation or warranty as to their completeness or accuracy. Although historical performance is no guarantee of future results, these insights may help you understand our investment management philosophy.
| Currency Breakdown* | ||||
| 6/30/16 | ||||
| % of Total Net Assets |
||||
| Americas | 139.5% | |||
| U.S. Dollar | 103.6% | |||
| Mexican Peso | 21.3% | |||
| Brazilian Real | 9.4% | |||
| Chilean Peso | 3.0% | |||
| Peruvian Nuevo Sol | 0.1% | |||
| Asia Pacific | 2.4% | |||
| Malaysian Ringgit | 14.4% | |||
| Indonesian Rupiah | 9.7% | |||
| Indian Rupee | 6.8% | |||
| Philippine Peso | 2.7% | |||
| Sri Lankan Rupee | 1.2% | |||
| Singapore Dollar | 0.1% | |||
| Japanese Yen | -32.5% | |||
| Europe | -33.0% | |||
| Polish Zloty | 3.1% | |||
| Euro | -36.1% | |||
| Australia & New Zealand | -8.9% | |||
| Australian Dollar | -8.9% | |||
*Figures are stated as a percentage of total and may not equal 100% or may be negative due to rounding, use of any derivatives, unsettled trades or other factors.
The dollar value, number of shares or principal amount, and names of all portfolio holdings are listed in the Fund’s Statement of Investments (SOI).
| TGB-4 | Semiannual Report |
TEMPLETON GLOBAL BOND VIP FUND
Class 1 Fund Expenses
| Class 1 | Beginning Account Value 1/1/16 |
Ending Account Value 6/30/16 |
Fund-Level Expenses 1/1/16–6/30/16 |
|||||||||
| Actual |
$ | 1,000 | $ | 983.10 | $ | 2.37 | ||||||
| Hypothetical (5% return before expenses) |
$ | 1,000 | $ | 1,022.48 | $ | 2.41 | ||||||
*Expenses are calculated using the most recent six-month annualized expense ratio, net of expense waivers, for the Fund’s Class 1 shares (0.48%), which does not include any ongoing expenses of the Contract for which the Fund is an investment option, multiplied by the average account value over the period, multiplied by 182/366 to reflect the one-half year period.
| Semiannual Report | TGB-5 |
FRANKLIN TEMPLETON VARIABLE INSURANCE PRODUCTS TRUST
Financial Highlights
Templeton Global Bond VIP Fund
| Six Months Ended June 30, 2016 (unaudited) |
Year Ended December 31, | |||||||||||||||||||||||
| 2015 | 2014 | 2013 | 2012 | 2011 | ||||||||||||||||||||
| Class 1 | ||||||||||||||||||||||||
| Per share operating performance (for a share outstanding throughout the period) |
||||||||||||||||||||||||
| Net asset value, beginning of period |
$16.34 | $18.56 | $19.15 | $20.01 | $18.61 | $19.94 | ||||||||||||||||||
|
|
|
|||||||||||||||||||||||
| Income from investment operationsa: | ||||||||||||||||||||||||
| Net investment incomeb |
0.29 | 0.52 | 0.58 | 0.64 | 0.72 | 0.87 | ||||||||||||||||||
| Net realized and unrealized gains (losses) |
(0.57 | ) | (1.22 | ) | (0.16 | ) | (0.30 | ) | 1.99 | (0.92 | ) | |||||||||||||
|
|
|
|||||||||||||||||||||||
| Total from investment operations |
(0.28 | ) | (0.70 | ) | 0.42 | 0.34 | 2.71 | (0.05 | ) | |||||||||||||||
|
|
|
|||||||||||||||||||||||
| Less distributions from: | ||||||||||||||||||||||||
| Net investment income and net foreign currency gains |
— | (1.43 | ) | (1.01 | ) | (0.96 | ) | (1.28 | ) | (1.15 | ) | |||||||||||||
| Net realized gains |
(0.01 | ) | (0.09 | ) | — | (0.24 | ) | (0.03 | ) | (0.13 | ) | |||||||||||||
|
|
|
|||||||||||||||||||||||
| Total distributions |
(0.01 | ) | (1.52 | ) | (1.01 | ) | (1.20 | ) | (1.31 | ) | (1.28 | ) | ||||||||||||
|
|
|
|||||||||||||||||||||||
| Redemption fees |
— | — | — | c | — | c | — | c | — | c | ||||||||||||||
|
|
|
|||||||||||||||||||||||
| Net asset value, end of period |
$16.05 | $16.34 | $18.56 | $19.15 | $20.01 | $18.61 | ||||||||||||||||||
|
|
|
|||||||||||||||||||||||
| Total returnd |
(1.69)% | (4.10)% | 2.12% | 1.89% | 15.31% | (0.61)% | ||||||||||||||||||
| Ratios to average net assetse | ||||||||||||||||||||||||
| Expenses before waiver and payments by affiliates |
0.52% | 0.52% | 0.51% | 0.51% | 0.55% | 0.56% | ||||||||||||||||||
| Expenses net of waiver and payments by affiliatesf |
0.48% | 0.52% | g | 0.51% | 0.51% | 0.55% | 0.56% | |||||||||||||||||
| Net investment income |
3.70% | 2.99% | 3.08% | 3.26% | 3.71% | 4.40% | ||||||||||||||||||
| Supplemental data | ||||||||||||||||||||||||
| Net assets, end of period (000’s) |
$278,297 | $292,802 | $323,491 | $280,963 | $307,142 | $269,819 | ||||||||||||||||||
| Portfolio turnover rate |
26.80% | 51.58% | 39.14% | 34.39% | 43.26% | 34.18% | ||||||||||||||||||
aThe amount shown for a share outstanding throughout the period may not correlate with the Statement of Operations for the period due to the timing of sales and repurchases of the Fund’s shares in relation to income earned and/or fluctuating fair value of the investments of the Fund.
bBased on average daily shares outstanding.
cAmount rounds to less than $0.01 per share.
dTotal return does not include fees, charges or expenses imposed by the variable annuity and life insurance contracts for which Franklin Templeton Variable Insurance Products Trust serves as an underlying investment vehicle. Total return is not annualized for periods less than one year.
eRatios are annualized for periods less than one year.
fBenefit of expense reduction rounds to less than 0.01%.
gBenefit of waiver and payments by affiliates rounds to less than 0.01%.
| TGB-6 | Semiannual Report | The accompanying notes are an integral part of these financial statements. |
FRANKLIN TEMPLETON VARIABLE INSURANCE PRODUCTS TRUST
FINANCIAL HIGHLIGHTS
Templeton Global Bond VIP Fund (continued)
| Six Months Ended June 30, 2016 (unaudited) |
Year Ended December 31, | |||||||||||||||||||||||
| 2015 | 2014 | 2013 | 2012 | 2011 | ||||||||||||||||||||
| Class 2 | ||||||||||||||||||||||||
| Per share operating performance (for a share outstanding throughout the period) |
||||||||||||||||||||||||
| Net asset value, beginning of period |
$15.80 | $17.99 | $18.60 | $19.47 | $18.15 | $19.49 | ||||||||||||||||||
|
|
|
|||||||||||||||||||||||
| Income from investment operationsa: | ||||||||||||||||||||||||
| Net investment incomeb |
0.26 | 0.46 | 0.52 | 0.57 | 0.65 | 0.79 | ||||||||||||||||||
| Net realized and unrealized gains (losses) |
(0.56 | ) | (1.17 | ) | (0.17 | ) | (0.27 | ) | 1.94 | (0.89 | ) | |||||||||||||
|
|
|
|||||||||||||||||||||||
| Total from investment operations |
(0.30 | ) | (0.71 | ) | 0.35 | 0.30 | 2.59 | (0.10 | ) | |||||||||||||||
|
|
|
|||||||||||||||||||||||
| Less distributions from: | ||||||||||||||||||||||||
| Net investment income and net foreign currency gains |
— | (1.39 | ) | (0.96 | ) | (0.93 | ) | (1.24 | ) | (1.11 | ) | |||||||||||||
| Net realized gains |
(0.01 | ) | (0.09 | ) | — | (0.24 | ) | (0.03 | ) | (0.13 | ) | |||||||||||||
|
|
|
|||||||||||||||||||||||
| Total distributions |
(0.01 | ) | (1.48 | ) | (0.96 | ) | (1.17 | ) | (1.27 | ) | (1.24 | ) | ||||||||||||
|
|
|
|||||||||||||||||||||||
| Redemption fees |
— | — | — | c | — | c | — | c | — | c | ||||||||||||||
|
|
|
|||||||||||||||||||||||
| Net asset value, end of period |
$15.49 | $15.80 | $17.99 | $18.60 | $19.47 | $18.15 | ||||||||||||||||||
|
|
|
|||||||||||||||||||||||
| Total returnd |
(1.88)% | (4.30)% | 1.83% | 1.63% | 15.07% | (0.87)% | ||||||||||||||||||
| Ratios to average net assetse | ||||||||||||||||||||||||
| Expenses before waiver and payments by affiliates |
0.77% | 0.77% | 0.76% | 0.76% | 0.80% | 0.81% | ||||||||||||||||||
| Expenses net of waiver and payments by affiliatesf |
0.73% | 0.77% | g | 0.76% | 0.76% | 0.80% | 0.81% | |||||||||||||||||
| Net investment income |
3.45% | 2.74% | 2.83% | 3.01% | 3.46% | 4.15% | ||||||||||||||||||
| Supplemental data | ||||||||||||||||||||||||
| Net assets, end of period (000’s) |
$2,845,200 | $2,971,667 | $3,177,638 | $2,826,039 | $2,418,229 | $1,812,814 | ||||||||||||||||||
| Portfolio turnover rate |
26.80% | 51.58% | 39.14% | 34.39% | 43.26% | 34.18% | ||||||||||||||||||
aThe amount shown for a share outstanding throughout the period may not correlate with the Statement of Operations for the period due to the timing of sales and repurchases of the Fund’s shares in relation to income earned and/or fluctuating fair value of the investments of the Fund.
bBased on average daily shares outstanding.
cAmount rounds to less than $0.01 per share.
dTotal return does not include fees, charges or expenses imposed by the variable annuity and life insurance contracts for which Franklin Templeton Variable Insurance Products Trust serves as an underlying investment vehicle. Total return is not annualized for periods less than one year.
eRatios are annualized for periods less than one year.
fBenefit of expense reduction rounds to less than 0.01%.
gBenefit of waiver and payments by affiliates rounds to less than 0.01%.
| The accompanying notes are an integral part of these financial statements. | Semiannual Report | TGB-7 |
FRANKLIN TEMPLETON VARIABLE INSURANCE PRODUCTS TRUST
FINANCIAL HIGHLIGHTS
Templeton Global Bond VIP Fund (continued)
| Six Months Ended June 30, 2016 (unaudited) |
Year Ended December 31, | |||||||||||||||||||||||
| 2015 | 2014 | 2013 | 2012 | 2011 | ||||||||||||||||||||
| Class 4 | ||||||||||||||||||||||||
| Per share operating performance (for a share outstanding throughout the period) |
||||||||||||||||||||||||
| Net asset value, beginning of period |
$16.18 | $18.38 | $18.97 | $19.82 | $18.44 | $19.78 | ||||||||||||||||||
|
|
|
|||||||||||||||||||||||
| Income from investment operationsa: | ||||||||||||||||||||||||
| Net investment incomeb |
0.26 | 0.46 | 0.51 | 0.56 | 0.64 | 0.79 | ||||||||||||||||||
| Net realized and unrealized gains (losses) |
(0.57 | ) | (1.21 | ) | (0.18 | ) | (0.28 | ) | 1.98 | (0.91 | ) | |||||||||||||
|
|
|
|||||||||||||||||||||||
| Total from investment operations |
(0.31 | ) | (0.75 | ) | 0.33 | 0.28 | 2.62 | (0.12 | ) | |||||||||||||||
|
|
|
|||||||||||||||||||||||
| Less distributions from: | ||||||||||||||||||||||||
| Net investment income and net foreign currency gains |
— | (1.36 | ) | (0.92 | ) | (0.89 | ) | (1.21 | ) | (1.09 | ) | |||||||||||||
| Net realized gains |
(0.01 | ) | (0.09 | ) | — | (0.24 | ) | (0.03 | ) | (0.13 | ) | |||||||||||||
|
|
|
|||||||||||||||||||||||
| Total distributions |
(0.01 | ) | (1.45 | ) | (0.92 | ) | (1.13 | ) | (1.24 | ) | (1.22 | ) | ||||||||||||
|
|
|
|||||||||||||||||||||||
| Redemption fees |
— | — | — | c | — | c | — | c | — | c | ||||||||||||||
|
|
|
|||||||||||||||||||||||
| Net asset value, end of period |
$15.86 | $16.18 | $18.38 | $18.97 | $19.82 | $18.44 | ||||||||||||||||||
|
|
|
|||||||||||||||||||||||
| Total returnd |
(1.89)% | (4.39)% | 1.69% | 1.54% | 14.97% | (0.96)% | ||||||||||||||||||
| Ratios to average net assetse | ||||||||||||||||||||||||
| Expenses before waiver and payments by affiliates |
0.87% | 0.87% | 0.86% | 0.86% | 0.90% | 0.91% | ||||||||||||||||||
| Expenses net of waiver and payments by affiliatesf |
0.83% | 0.87% | g | 0.86% | 0.86% | 0.90% | 0.91% | |||||||||||||||||
| Net investment income |
3.35% | 2.64% | 2.73% | 2.91% | 3.36% | 4.05% | ||||||||||||||||||
| Supplemental data | ||||||||||||||||||||||||
| Net assets, end of period (000’s) |
$96,735 | $103,045 | $111,199 | $118,145 | $163,241 | $151,695 | ||||||||||||||||||
| Portfolio turnover rate |
26.80% | 51.58% | 39.14% | 34.39% | 43.26% | 34.18% | ||||||||||||||||||
aThe amount shown for a share outstanding throughout the period may not correlate with the Statement of Operations for the period due to the timing of sales and repurchases of the Fund’s shares in relation to income earned and/or fluctuating fair value of the investments of the Fund.
bBased on average daily shares outstanding.
cAmount rounds to less than $0.01 per share.
dTotal return does not include fees, charges or expenses imposed by the variable annuity and life insurance contracts for which Franklin Templeton Variable Insurance Products Trust serves as an underlying investment vehicle. Total return is not annualized for periods less than one year.
eRatios are annualized for periods less than one year.
fBenefit of expense reduction rounds to less than 0.01%.
gBenefit of waiver and payments by affiliates rounds to less than 0.01%.
| TGB-8 | Semiannual Report | The accompanying notes are an integral part of these financial statements. |
FRANKLIN TEMPLETON VARIABLE INSURANCE PRODUCTS TRUST
Statement of Investments, June 30, 2016 (unaudited)
| Templeton Global Bond VIP Fund
|
||||||||||
| Principal Amount* | Value | |||||||||
| Foreign Government and Agency Securities 73.1% |
||||||||||
| Brazil 9.4% |
||||||||||
| Letra Tesouro Nacional, Strip, |
||||||||||
| 7/01/16 |
1,190a | BRL | $ | 370,384 | ||||||
| 10/01/16 |
4,700a | BRL | 1,414,899 | |||||||
| 1/01/17 |
46,660a | BRL | 13,610,764 | |||||||
| 1/01/18 |
28,770a | BRL | 7,476,406 | |||||||
| 1/01/19 |
38,960a | BRL | 9,069,720 | |||||||
| 7/01/19 |
102,840a | BRL | 22,653,959 | |||||||
| Nota Do Tesouro Nacional, |
||||||||||
| 10.00%, 1/01/21 |
6,620a | BRL | 1,925,248 | |||||||
| 10.00%, 1/01/23 |
402,350a | BRL | 114,324,685 | |||||||
| 10.00%, 1/01/25 |
48,340a | BRL | 13,540,807 | |||||||
| 10.00%, 1/01/27 |
26,400a | BRL | 7,283,180 | |||||||
| b Index Linked, 6.00%, 8/15/16 |
14,388a | BRL | 12,942,824 | |||||||
| b Index Linked, 6.00%, 5/15/17 |
202a | BRL | 181,350 | |||||||
| b Index Linked, 6.00%, 8/15/18 |
15,665a | BRL | 14,023,811 | |||||||
| b Index Linked, 6.00%, 5/15/19 |
8,578a | BRL | 7,698,535 | |||||||
| b Index Linked, 6.00%, 8/15/20 |
1,090a | BRL | 971,979 | |||||||
| b Index Linked, 6.00%, 8/15/22 |
18,770a | BRL | 16,711,621 | |||||||
| b Index Linked, 6.00%, 5/15/23 |
5,716a | BRL | 5,077,246 | |||||||
| b Index Linked, 6.00%, 8/15/24 |
3,110a | BRL | 2,793,389 | |||||||
| b Index Linked, 6.00%, 5/15/45 |
10,825a | BRL | 9,704,744 | |||||||
| senior note, 10.00%, 1/01/17 |
113,220a | BRL | 34,631,210 | |||||||
| senior note, 10.00%, 1/01/19 |
21,390a | BRL | 6,364,291 | |||||||
|
|
|
|||||||||
| 302,771,052 | ||||||||||
|
|
|
|||||||||
| Colombia 2.1% |
||||||||||
| Government of Colombia, senior bond, |
||||||||||
| 7.75%, 4/14/21 |
2,386,000,000 | COP | 841,625 | |||||||
| 4.375%, 3/21/23 |
362,000,000 | COP | 106,348 | |||||||
| 9.85%, 6/28/27 |
576,000,000 | COP | 232,217 | |||||||
| Titulos De Tesoreria B, |
||||||||||
| 5.00%, 11/21/18 |
2,882,000,000 | COP | 950,301 | |||||||
| 7.75%, 9/18/30 |
71,450,000,000 | COP | 24,741,106 | |||||||
| senior bond, 11.25%, 10/24/18 |
5,135,000,000 | COP | 1,921,086 | |||||||
| senior bond, 7.00%, 5/04/22 |
7,908,000,000 | COP | 2,699,847 | |||||||
| senior bond, 10.00%, 7/24/24 |
17,731,000,000 | COP | 7,056,364 | |||||||
| senior bond, 7.50%, 8/26/26 |
47,952,000,000 | COP | 16,323,369 | |||||||
| senior bond, 6.00%, 4/28/28 |
25,729,000,000 | COP | 7,737,907 | |||||||
| senior note, 7.00%, 9/11/19 |
4,056,000,000 | COP | 1,397,178 | |||||||
| senior note, B, 11.00%, 7/24/20 |
9,167,000,000 | COP | 3,595,649 | |||||||
|
|
|
|||||||||
| 67,602,997 | ||||||||||
|
|
|
|||||||||
| India 4.6% |
||||||||||
| Government of India, |
||||||||||
| senior bond, 7.80%, 5/03/20 |
270,800,000 | INR | 4,078,219 | |||||||
| senior bond, 8.35%, 5/14/22 |
212,700,000 | INR | 3,265,328 | |||||||
| senior bond, 9.15%, 11/14/24 |
2,409,000,000 | INR | 39,009,150 | |||||||
| senior bond, 8.33%, 7/09/26 |
1,482,000,000 | INR | 23,004,175 | |||||||
| senior bond, 8.15%, 11/24/26 |
2,159,000,000 | INR | 33,031,960 | |||||||
| senior bond, 8.28%, 9/21/27 |
217,800,000 | INR | 3,362,982 | |||||||
| senior bond, 8.60%, 6/02/28 |
747,500,000 | INR | 11,819,469 | |||||||
| senior note, 7.28%, 6/03/19 |
28,000,000 | INR | 416,333 | |||||||
| Semiannual Report | TGB-9 |
FRANKLIN TEMPLETON VARIABLE INSURANCE PRODUCTS TRUST
STATEMENT OF INVESTMENTS (UNAUDITED)
Templeton Global Bond VIP Fund (continued)
| Principal Amount* | Value | |||||||||
| Foreign Government and Agency Securities (continued) |
||||||||||
| India (continued) |
||||||||||
| senior note, 7.16%, 5/20/23 |
133,700,000 | INR | $ | 1,939,313 | ||||||
| senior note, 8.83%, 11/25/23 |
1,805,900,000 | INR | 28,516,766 | |||||||
|
|
|
|||||||||
| 148,443,695 | ||||||||||
|
|
|
|||||||||
| Indonesia 5.8% |
||||||||||
| Government of Indonesia, |
||||||||||
| 7.875%, 4/15/19 |
187,065,000,000 | IDR | 14,420,111 | |||||||
| 6.125%, 5/15/28 |
37,000,000 | IDR | 2,467 | |||||||
| 8.375%, 3/15/34 |
81,180,000,000 | IDR | 6,528,195 | |||||||
| FR31, 11.00%, 11/15/20 |
243,080,000,000 | IDR | 20,973,404 | |||||||
| FR34, 12.80%, 6/15/21 |
392,506,000,000 | IDR | 36,465,535 | |||||||
| FR35, 12.90%, 6/15/22 |
71,229,000,000 | IDR | 6,825,049 | |||||||
| FR36, 11.50%, 9/15/19 |
49,810,000,000 | IDR | 4,229,845 | |||||||
| FR39, 11.75%, 8/15/23 |
5,491,000,000 | IDR | 513,775 | |||||||
| FR40, 11.00%, 9/15/25 |
46,856,000,000 | IDR | 4,379,729 | |||||||
| FR43, 10.25%, 7/15/22 |
147,832,000,000 | IDR | 12,766,417 | |||||||
| FR44, 10.00%, 9/15/24 |
4,454,000,000 | IDR | 389,862 | |||||||
| FR46, 9.50%, 7/15/23 |
226,780,000,000 | IDR | 19,180,916 | |||||||
| FR47, 10.00%, 2/15/28 |
12,000,000 | IDR | 1,083 | |||||||
| FR48, 9.00%, 9/15/18 |
16,920,000,000 | IDR | 1,325,427 | |||||||
| FR61, 7.00%, 5/15/22 |
244,849,000,000 | IDR | 18,249,012 | |||||||
| senior bond, 5.625%, 5/15/23 |
258,951,000,000 | IDR | 17,790,944 | |||||||
| senior bond, 7.00%, 5/15/27 |
25,000,000 | IDR | 1,828 | |||||||
| senior bond, 9.00%, 3/15/29 |
20,350,000,000 | IDR | 1,718,873 | |||||||
| senior bond, FR53, 8.25%, 7/15/21 |
90,288,000,000 | IDR | 7,117,123 | |||||||
| senior bond, FR56, 8.375%, 9/15/26 |
42,188,000,000 | IDR | 3,416,549 | |||||||
| senior bond, FR70, 8.375%, 3/15/24 |
136,475,000,000 | IDR | 10,910,248 | |||||||
| senior note, 8.50%, 10/15/16 |
3,358,000,000 | IDR | 255,890 | |||||||
|
|
|
|||||||||
| 187,462,282 | ||||||||||
|
|
|
|||||||||
| Lithuania 0.4% |
||||||||||
| c | Government of Lithuania, 144A, 7.375%, 2/11/20 |
10,170,000 | 12,020,940 | |||||||
|
|
|
|||||||||
| Malaysia 4.1% |
||||||||||
| Government of Malaysia, |
||||||||||
| 3.314%, 10/31/17 |
153,634,000 | MYR | 38,373,215 | |||||||
| senior bond, 3.814%, 2/15/17 |
63,785,000 | MYR | 15,948,705 | |||||||
| senior bond, 4.24%, 2/07/18 |
44,360,000 | MYR | 11,241,942 | |||||||
| senior note, 3.394%, 3/15/17 |
125,470,000 | MYR | 31,305,037 | |||||||
| senior note, 4.012%, 9/15/17 |
147,790,000 | MYR | 37,207,119 | |||||||
|
|
|
|||||||||
| 134,076,018 | ||||||||||
|
|
|
|||||||||
| Mexico 19.6% |
||||||||||
| Government of Mexico, |
||||||||||
| 7.25%, 12/15/16 |
18,216,300d | MXN | 100,937,589 | |||||||
| 7.75%, 12/14/17 |
33,461,300d | MXN | 191,685,973 | |||||||
| senior note, 8.50%, 12/13/18 |
55,958,000d | MXN | 330,972,871 | |||||||
| e | Mexican Udibonos, Index Linked, |
|||||||||
| 3.50%, 12/14/17 |
610,890f | MXN | 3,458,462 | |||||||
| 4.00%, 6/13/19 |
419,299f | MXN | 2,428,177 | |||||||
| 2.50%, 12/10/20 |
330,219f | MXN | 1,828,220 | |||||||
|
|
|
|||||||||
| 631,311,292 | ||||||||||
|
|
|
|||||||||
| TGB-10 | Semiannual Report |
FRANKLIN TEMPLETON VARIABLE INSURANCE PRODUCTS TRUST
STATEMENT OF INVESTMENTS (UNAUDITED)
Templeton Global Bond VIP Fund (continued)
| Principal Amount* | Value | |||||||||
| Foreign Government and Agency Securities (continued) |
||||||||||
| Peru 0.1% |
||||||||||
| Government of Peru, senior bond, 7.84%, 8/12/20 |
11,090,000 | PEN | $ | 3,691,942 | ||||||
|
|
|
|||||||||
| Philippines 1.4% |
||||||||||
| Government of the Philippines, |
||||||||||
| senior bond, 9.125%, 9/04/16 |
31,840,000 | PHP | 682,949 | |||||||
| senior note, 2.875%, 5/22/17 |
101,890,000 | PHP | 2,174,291 | |||||||
| senior note, 5.875%, 1/31/18 |
32,450,000 | PHP | 718,705 | |||||||
| senior note, 5.00%, 8/18/18 |
64,060,000 | PHP | 1,417,038 | |||||||
| senior note, 3.875%, 11/22/19 |
764,340,000 | PHP | 16,708,779 | |||||||
| senior note, 3.375%, 8/20/20 |
731,340,000 | PHP | 15,834,992 | |||||||
| senior note, 5-72, 2.125%, 5/23/18 |
352,258,000 | PHP | 7,449,464 | |||||||
|
|
|
|||||||||
| 44,986,218 | ||||||||||
|
|
|
|||||||||
| Poland 3.1% |
||||||||||
| Government of Poland, |
||||||||||
| 4.75%, 10/25/16 |
215,845,000 | PLN | 55,265,733 | |||||||
| 5.75%, 9/23/22 |
48,750,000 | PLN | 14,760,339 | |||||||
| g FRN, 1.75%, 1/25/17 |
59,279,000 | PLN | 15,053,642 | |||||||
| g FRN, 1.75%, 1/25/21 |
60,135,000 | PLN | 15,040,801 | |||||||
|
|
|
|||||||||
| 100,120,515 | ||||||||||
|
|
|
|||||||||
| Portugal 2.4% |
||||||||||
| Government of Portugal, |
||||||||||
| c 144A, 5.125%, 10/15/24 |
28,820,000 | 29,000,557 | ||||||||
| h Reg S, 3.875%, 2/15/30 |
41,530,000 | EUR | 48,381,443 | |||||||
| h senior bond, Reg S, 4.95%, 10/25/23 |
284,900 | EUR | 365,856 | |||||||
| h senior bond, Reg S, 5.65%, 2/15/24 |
712,400 | EUR | 941,738 | |||||||
|
|
|
|||||||||
| 78,689,594 | ||||||||||
|
|
|
|||||||||
| Serbia 1.4% |
||||||||||
| c | Government of Serbia, senior note, 144A, |
|||||||||
| 5.25%, 11/21/17 |
4,590,000 | 4,743,008 | ||||||||
| 4.875%, 2/25/20 |
6,700,000 | 6,922,205 | ||||||||
| 7.25%, 9/28/21 |
29,750,000 | 34,140,059 | ||||||||
|
|
|
|||||||||
| 45,805,272 | ||||||||||
|
|
|
|||||||||
| Slovenia 0.1% |
||||||||||
| c | Government of Slovenia, senior note, 144A, 5.50%, 10/26/22 |
2,027,000 | 2,306,979 | |||||||
|
|
|
|||||||||
| South Korea 13.0% |
||||||||||
| Korea Monetary Stabilization Bond, senior note, |
||||||||||
| 2.46%, 8/02/16 |
49,449,700,000 | KRW | 42,943,519 | |||||||
| 1.56%, 8/09/16 |
33,975,300,000 | KRW | 29,483,154 | |||||||
| 2.22%, 10/02/16 |
9,647,500,000 | KRW | 8,389,786 | |||||||
| 1.61%, 11/09/16 |
33,034,700,000 | KRW | 28,695,117 | |||||||
| 2.07%, 12/02/16 |
36,552,800,000 | KRW | 31,821,142 | |||||||
| 1.57%, 1/09/17 |
2,940,100,000 | KRW | 2,554,865 | |||||||
| 1.96%, 2/02/17 |
16,503,100,000 | KRW | 14,378,201 | |||||||
| 1.70%, 8/02/17 |
9,221,100,000 | KRW | 8,038,830 | |||||||
| 1.56%, 10/02/17 |
54,756,600,000 | KRW | 47,689,839 | |||||||
| 1.49%, 2/02/18 |
11,176,000,000 | KRW | 9,733,243 | |||||||
| Korea Treasury Bond, senior note, |
||||||||||
| 5.00%, 9/10/16 |
2,806,000,000 | KRW | 2,451,305 | |||||||
| Semiannual Report | TGB-11 |
FRANKLIN TEMPLETON VARIABLE INSURANCE PRODUCTS TRUST
STATEMENT OF INVESTMENTS (UNAUDITED)
Templeton Global Bond VIP Fund (continued)
| Principal Amount* | Value | |||||||||
| Foreign Government and Agency Securities (continued) |
||||||||||
| South Korea (continued) |
||||||||||
| 3.00%, 12/10/16 |
54,968,060,000 | KRW | $ | 48,052,254 | ||||||
| 2.00%, 12/10/17 |
49,196,500,000 | KRW | 43,141,744 | |||||||
| 1.75%, 12/10/18 |
12,303,900,000 | KRW | 10,806,520 | |||||||
| 1.50%, 6/10/19 |
32,658,800,000 | KRW | 28,548,955 | |||||||
| 2.75%, 9/10/19 |
1,850,000,000 | KRW | 1,679,675 | |||||||
| 2.00%, 3/10/21 |
64,648,810,000 | KRW | 57,923,032 | |||||||
| 1.375%, 9/10/21 |
2,884,000,000 | KRW | 2,513,351 | |||||||
|
|
|
|||||||||
| 418,844,532 | ||||||||||
|
|
|
|||||||||
| Sri Lanka 1.2% |
||||||||||
| Government of Sri Lanka, |
||||||||||
| 8.25%, 3/01/17 |
41,710,000 | LKR | 283,016 | |||||||
| 8.00%, 6/15/17 |
40,210,000 | LKR | 269,694 | |||||||
| 10.60%, 7/01/19 |
1,071,930,000 | LKR | 7,208,465 | |||||||
| 10.60%, 9/15/19 |
704,060,000 | LKR | 4,712,123 | |||||||
| 8.00%, 11/01/19 |
40,210,000 | LKR | 249,202 | |||||||
| 9.25%, 5/01/20 |
153,220,000 | LKR | 972,179 | |||||||
| 11.20%, 7/01/22 |
69,990,000 | LKR | 464,018 | |||||||
| A, 6.40%, 8/01/16 |
109,200,000 | LKR | 748,258 | |||||||
| A, 5.80%, 1/15/17 |
112,300,000 | LKR | 755,579 | |||||||
| A, 7.50%, 8/15/18 |
63,830,000 | LKR | 408,106 | |||||||
| A, 8.00%, 11/15/18 |
512,300,000 | LKR | 3,287,617 | |||||||
| A, 9.00%, 5/01/21 |
861,720,000 | LKR | 5,311,460 | |||||||
| A, 11.00%, 8/01/21 |
575,640,000 | LKR | 3,813,123 | |||||||
| B, 6.40%, 10/01/16 |
119,100,000 | LKR | 811,931 | |||||||
| B, 8.50%, 7/15/18 |
146,350,000 | LKR | 956,991 | |||||||
| C, 8.50%, 4/01/18 |
483,480,000 | LKR | 3,184,198 | |||||||
| D, 8.50%, 6/01/18 |
633,000,000 | LKR | 4,150,244 | |||||||
|
|
|
|||||||||
| 37,586,204 | ||||||||||
|
|
|
|||||||||
| i | Supranational 0.4% |
|||||||||
| Inter-American Development Bank, senior note, 7.50%, 12/05/24 |
200,000,000 | MXN | 12,312,321 | |||||||
|
|
|
|||||||||
| Ukraine 4.0% |
||||||||||
| c | Government of Ukraine, 144A, |
|||||||||
| 7.75%, 9/01/19 |
4,249,000 | 4,206,510 | ||||||||
| 7.75%, 9/01/20 |
14,822,000 | 14,553,722 | ||||||||
| 7.75%, 9/01/21 |
14,769,000 | 14,418,605 | ||||||||
| 7.75%, 9/01/22 |
14,769,000 | 14,344,760 | ||||||||
| 7.75%, 9/01/23 |
14,769,000 | 14,289,377 | ||||||||
| 7.75%, 9/01/24 |
14,769,000 | 14,186,880 | ||||||||
| 7.75%, 9/01/25 |
14,769,000 | 14,126,770 | ||||||||
| 7.75%, 9/01/26 |
14,658,000 | 13,962,111 | ||||||||
| 7.75%, 9/01/27 |
14,658,000 | 13,910,442 | ||||||||
| j,kVRI, GDP Linked Securities, 5/31/40 |
29,978,000 | 9,855,268 | ||||||||
|
|
|
|||||||||
| 127,854,445 | ||||||||||
|
|
|
|||||||||
| Total Foreign Government and Agency Securities |
2,355,886,298 | |||||||||
|
|
|
|||||||||
| TGB-12 | Semiannual Report |
FRANKLIN TEMPLETON VARIABLE INSURANCE PRODUCTS TRUST
STATEMENT OF INVESTMENTS (UNAUDITED)
Templeton Global Bond VIP Fund (continued)
| Principal Amount* | Value | |||||||||
| Quasi-Sovereign and Corporate Bonds 0.1% |
||||||||||
| South Korea 0.0%† |
||||||||||
| The Export-Import Bank of Korea, senior note, 4.625%, 2/20/17 |
230,000 | EUR | $ | 262,687 | ||||||
|
|
|
|||||||||
| Ukraine 0.1% |
||||||||||
| c,l | Ukreximbank, (BIZ Finance PLC), loan participation, senior note, 144A, 9.75%, 1/22/25 |
2,480,000 | 2,368,400 | |||||||
|
|
|
|||||||||
| Total Quasi-Sovereign and Corporate Bonds (Cost $2,474,227) |
2,631,087 | |||||||||
|
|
|
|||||||||
| Total Investments before Short Term Investments (Cost $2,458,126,886) |
2,358,517,385 | |||||||||
|
|
|
|||||||||
| Short Term Investments 23.8% |
||||||||||
| Foreign Government and Agency Securities 3.1% |
||||||||||
| Malaysia 0.3% |
||||||||||
| m | Bank of Negara Monetary Note, 9/15/16 |
15,520,000 | MYR | 3,832,081 | ||||||
| m | Malaysia Treasury Bill, 1/20/17 |
16,710,000 | MYR | 4,098,898 | ||||||
|
|
|
|||||||||
| 7,930,979 | ||||||||||
|
|
|
|||||||||
| Mexico 1.3% |
||||||||||
| m | Mexico Treasury Bill, 8/18/16 - 3/30/17 |
74,675,640n | MXN | 40,110,408 | ||||||
|
|
|
|||||||||
| Philippines 1.0% |
||||||||||
| m | Philippine Treasury Bill, 7/06/16 - 6/07/17 |
1,587,780,000 | PHP | 33,529,477 | ||||||
|
|
|
|||||||||
| South Korea 0.5% |
||||||||||
| Korea Monetary Stabilization Bond, senior note, |
||||||||||
| 1.57%, 7/09/16 |
5,579,800,000 | KRW | 4,840,835 | |||||||
| 1.52%, 9/09/16 |
8,119,500,000 | KRW | 7,047,210 | |||||||
| 1.53%, 10/08/16 |
5,289,000,000 | KRW | 4,591,575 | |||||||
|
|
|
|||||||||
| 16,479,620 | ||||||||||
|
|
|
|||||||||
| Total Foreign Government and Agency Securities (Cost $99,521,036) |
98,050,484 | |||||||||
|
|
|
|||||||||
| Total Investments before Money Market Funds and Repurchase Agreements (Cost $2,557,647,922) |
2,456,567,869 | |||||||||
|
|
|
|||||||||
| Shares | ||||||||||
| Money Market Funds (Cost $409,277,955) 12.7% |
||||||||||
| United States 12.7% |
||||||||||
| j,o | Institutional Fiduciary Trust Money Market Portfolio |
409,277,955 | 409,277,955 | |||||||
| Principal Amount* | ||||||||||
| Repurchase Agreements (Cost $256,694,916) 8.0% |
||||||||||
| United States 8.0% |
||||||||||
| p | Joint Repurchase Agreement, 0.382%, 7/01/16 (Maturity Value $256,697,640) |
256,694,916 | 256,694,916 | |||||||
| BNP Paribas Securities Corp. (Maturity Value $83,254,745) |
||||||||||
| Deutsche Bank Securities Inc. (Maturity Value $25,667,197) |
||||||||||
| HSBC Securities (USA) Inc. (Maturity Value $141,532,811) |
||||||||||
| Merrill Lynch, Pierce, Fenner & Smith Inc. (Maturity Value $6,242,887) |
||||||||||
| Collateralized by U.S. Government Agency Securities, 0.187% - 5.50%, 7/18/16 - 5/06/21; U.S. Government Agency Securities, Strips, 6/01/17; and U.S. Treasury Note, 0.75% - 3.25%, 11/30/16 - 9/30/20 (valued at $261,936,697) |
||||||||||
|
|
|
|||||||||
| Semiannual Report | TGB-13 |
FRANKLIN TEMPLETON VARIABLE INSURANCE PRODUCTS TRUST
STATEMENT OF INVESTMENTS (UNAUDITED)
Templeton Global Bond VIP Fund (continued)
| Value | ||||||||||
| Total Investments (Cost $3,223,620,793) 97.0% |
$ | 3,122,540,740 | ||||||||
| Other Assets, less Liabilities 3.0% |
97,691,358 | |||||||||
|
|
|
|||||||||
| Net Assets 100.0% |
$ | 3,220,232,098 | ||||||||
|
|
|
|||||||||
†Rounds to less than 0.1% of net assets.
*The principal amount is stated in U.S. dollars unless otherwise indicated.
aPrincipal amount is stated in 1,000 Brazilian Real Units.
bRedemption price at maturity is adjusted for inflation. See Note 1(h).
cSecurity was purchased pursuant to Rule 144A under the Securities Act of 1933 and may be sold in transactions exempt from registration only to qualified institutional buyers or in a public offering registered under the Securities Act of 1933. These securities have been deemed liquid under guidelines approved by the Trust’s Board of Trustees. At June 30, 2016, the aggregate value of these securities was $219,356,593, representing 6.8% of net assets.
dPrincipal amount is stated in 100 Mexican Peso Units.
ePrincipal amount of security is adjusted for inflation. See Note 1(h).
fPrincipal amount is stated in Unidad de Inversion Units.
gThe coupon rate shown represents the rate at period end.
hSecurity was purchased pursuant to Regulation S under the Securities Act of 1933, which exempts from registration securities offered and sold outside of the United States. Such a security cannot be sold in the United States without either an effective registration statement filed pursuant to the Securities Act of 1933, or pursuant to an exemption from registration. These securities have been deemed liquid under guidelines approved by the Trust’s Board of Trustees. At June 30, 2016, the aggregate value of these securities was $49,689,037, representing 1.5% of net assets.
iA supranational organization is an entity formed by two or more central governments through international treaties.
jNon-income producing.
kThe principal represents the notional amount. See Note 1(d) regarding value recovery instruments.
lSee Note 1(f) regarding loan participation notes.
mThe security is traded on a discount basis with no stated coupon rate.
nPrincipal amount is stated in 10 Mexican Peso Units.
oSee Note 3(e) regarding investments in affiliated management investment companies.
pSee Note 1(c) regarding joint repurchase agreement.
| TGB-14 | Semiannual Report |
FRANKLIN TEMPLETON VARIABLE INSURANCE PRODUCTS TRUST
STATEMENT OF INVESTMENTS (UNAUDITED)
Templeton Global Bond VIP Fund (continued)
At June 30, 2016, the Fund had the following forward exchange contracts outstanding. See Note 1(d).
| Forward Exchange Contracts | ||||||||||||||||||||||||||||||||
| Currency | Counterpartya | Type | Quantity | Contract Amount* |
Settlement Date |
Unrealized Appreciation |
Unrealized Depreciation |
|||||||||||||||||||||||||
| OTC Forward Exchange Contracts | ||||||||||||||||||||||||||||||||
| Chilean Peso |
MSCO | Buy | 1,967,876,500 | 2,822,138 | 7/05/16 | $ | 149,633 | $ | — | |||||||||||||||||||||||
| Chilean Peso |
MSCO | Sell | 1,967,876,500 | 2,914,293 | 7/05/16 | — | (57,477 | ) | ||||||||||||||||||||||||
| Malaysian Ringgit |
JPHQ | Buy | 5,661,200 | 1,476,193 | 7/05/16 | — | (70,731 | ) | ||||||||||||||||||||||||
| Malaysian Ringgit |
JPHQ | Sell | 5,661,200 | 1,380,780 | 7/05/16 | — | (24,681 | ) | ||||||||||||||||||||||||
| Euro |
BZWS | Buy | 16,339,700 | 18,128,897 | 7/06/16 | 11,417 | — | |||||||||||||||||||||||||
| Euro |
BZWS | Sell | 16,339,700 | 18,109,435 | 7/06/16 | 66,567 | (97,446 | ) | ||||||||||||||||||||||||
| Chilean Peso |
DBAB | Buy | 3,166,824,000 | 4,654,219 | 7/07/16 | 127,220 | — | |||||||||||||||||||||||||
| Chilean Peso |
DBAB | Sell | 3,166,824,000 | 4,772,907 | 7/07/16 | — | (8,532 | ) | ||||||||||||||||||||||||
| Euro |
DBAB | Sell | 2,285,618 | 2,467,942 | 7/07/16 | — | (69,643 | ) | ||||||||||||||||||||||||
| Japanese Yen |
DBAB | Sell | 770,370,000 | 6,512,224 | 7/07/16 | — | (948,800 | ) | ||||||||||||||||||||||||
| Japanese Yen |
JPHQ | Sell | 1,415,975,000 | 11,849,064 | 7/07/16 | — | (1,864,636 | ) | ||||||||||||||||||||||||
| Chilean Peso |
DBAB | Buy | 1,148,389,500 | 1,679,055 | 7/11/16 | 54,185 | — | |||||||||||||||||||||||||
| Chilean Peso |
DBAB | Sell | 1,148,389,500 | 1,730,806 | 7/11/16 | — | (2,435 | ) | ||||||||||||||||||||||||
| Chilean Peso |
MSCO | Buy | 4,089,449,500 | 6,036,667 | 7/11/16 | 135,454 | — | |||||||||||||||||||||||||
| Euro |
BZWS | Sell | 8,485,276 | 9,677,525 | 7/11/16 | 255,423 | — | |||||||||||||||||||||||||
| Japanese Yen |
BZWS | Sell | 1,689,110,000 | 15,816,599 | 7/11/16 | — | (544,439 | ) | ||||||||||||||||||||||||
| Malaysian Ringgit |
HSBC | Buy | 4,010,000 | 1,032,016 | 7/11/16 | — | (36,633 | ) | ||||||||||||||||||||||||
| Chilean Peso |
DBAB | Buy | 1,148,389,500 | 1,689,181 | 7/14/16 | 43,565 | — | |||||||||||||||||||||||||
| Euro |
JPHQ | Sell | 3,907,000 | 4,452,788 | 7/14/16 | 113,945 | — | |||||||||||||||||||||||||
| Euro |
DBAB | Sell | 19,913,000 | 22,085,343 | 7/15/16 | 175,066 | (204,545 | ) | ||||||||||||||||||||||||
| Euro |
JPHQ | Sell | 29,033,000 | 31,700,842 | 7/15/16 | — | (542,398 | ) | ||||||||||||||||||||||||
| Japanese Yen |
BZWS | Sell | 1,089,820,000 | 9,271,907 | 7/15/16 | — | (1,285,604 | ) | ||||||||||||||||||||||||
| Japanese Yen |
JPHQ | Sell | 708,450,000 | 6,021,982 | 7/15/16 | — | (841,050 | ) | ||||||||||||||||||||||||
| Malaysian Ringgit |
JPHQ | Buy | 1,700,000 | 383,574 | 7/15/16 | 38,367 | — | |||||||||||||||||||||||||
| Chilean Peso |
DBAB | Buy | 1,231,460,000 | 1,817,519 | 7/18/16 | 39,862 | — | |||||||||||||||||||||||||
| Chilean Peso |
MSCO | Buy | 2,285,090,000 | 3,316,483 | 7/18/16 | 130,061 | — | |||||||||||||||||||||||||
| Euro |
BZWS | Sell | 1,161,439 | 1,306,125 | 7/18/16 | 16,119 | — | |||||||||||||||||||||||||
| Euro |
GSCO | Sell | 3,095,000 | 3,472,466 | 7/18/16 | 34,860 | — | |||||||||||||||||||||||||
| Euro |
HSBC | Sell | 6,919,000 | 7,821,065 | 7/18/16 | 136,155 | — | |||||||||||||||||||||||||
| Euro |
MSCO | Sell | 9,679,000 | 10,685,616 | 7/18/16 | — | (64,817 | ) | ||||||||||||||||||||||||
| Indian Rupee |
JPHQ | Buy | 82,107,000 | 1,218,838 | 7/18/16 | — | (6,332 | ) | ||||||||||||||||||||||||
| Euro |
BZWS | Sell | 30,339,000 | 33,233,341 | 7/19/16 | — | (465,344 | ) | ||||||||||||||||||||||||
| Japanese Yen |
HSBC | Sell | 536,380,000 | 4,567,074 | 7/19/16 | — | (629,693 | ) | ||||||||||||||||||||||||
| Japanese Yen |
SCNY | Sell | 707,660,000 | 6,072,094 | 7/19/16 | — | (784,136 | ) | ||||||||||||||||||||||||
| Malaysian Ringgit |
JPHQ | Buy | 25,688,213 | 6,142,186 | 7/19/16 | 233,009 | — | |||||||||||||||||||||||||
| Euro |
BZWS | Sell | 8,551,980 | 9,552,391 | 7/20/16 | 53,025 | — | |||||||||||||||||||||||||
| Euro |
HSBC | Sell | 12,569,000 | 14,251,486 | 7/20/16 | 290,097 | — | |||||||||||||||||||||||||
| Indian Rupee |
DBAB | Buy | 491,655,000 | 7,302,787 | 7/20/16 | — | (44,865 | ) | ||||||||||||||||||||||||
| Malaysian Ringgit |
DBAB | Buy | 11,455,000 | 2,644,275 | EUR | 7/20/16 | — | (94,423 | ) | |||||||||||||||||||||||
| Chilean Peso |
DBAB | Buy | 1,801,070,000 | 2,612,897 | 7/21/16 | 102,838 | — | |||||||||||||||||||||||||
| Euro |
BZWS | Sell | 2,638,000 | 2,892,343 | 7/21/16 | — | (38,003 | ) | ||||||||||||||||||||||||
| Euro |
UBSW | Sell | 678,250 | 773,724 | 7/21/16 | 20,309 | — | |||||||||||||||||||||||||
| Chilean Peso |
BZWS | Buy | 3,010,700,000 | 4,416,135 | 7/22/16 | 123,104 | — | |||||||||||||||||||||||||
| Euro |
BZWS | Sell | 2,771,748 | 3,148,674 | 7/22/16 | 69,642 | — | |||||||||||||||||||||||||
| Euro |
MSCO | Sell | 12,182,000 | 13,316,753 | 7/22/16 | — | (215,776 | ) | ||||||||||||||||||||||||
| Malaysian Ringgit |
DBAB | Buy | 12,933,000 | 2,660,126 | EUR | 7/22/16 | 254,385 | — | ||||||||||||||||||||||||
| Chilean Peso |
DBAB | Buy | 3,444,155,000 | 5,060,841 | 7/25/16 | 130,440 | — | |||||||||||||||||||||||||
| Euro |
BZWS | Sell | 744,197 | 836,232 | 7/25/16 | 9,438 | — | |||||||||||||||||||||||||
| Euro |
DBAB | Sell | 1,759,000 | 1,939,720 | 7/25/16 | — | (14,507 | ) | ||||||||||||||||||||||||
| Euro |
JPHQ | Sell | 28,236,000 | 30,741,663 | 7/25/16 | — | (628,174 | ) | ||||||||||||||||||||||||
| Indian Rupee |
DBAB | Buy | 79,271,000 | 1,179,663 | 7/25/16 | — | (10,468 | ) | ||||||||||||||||||||||||
| Japanese Yen |
CITI | Sell | 913,412,000 | 7,426,235 | 7/25/16 | — | (1,425,089 | ) | ||||||||||||||||||||||||
| Japanese Yen |
JPHQ | Sell | 1,407,000,000 | 11,437,165 | 7/25/16 | — | (2,197,222 | ) | ||||||||||||||||||||||||
| Malaysian Ringgit |
HSBC | Buy | 14,613,000 | 3,376,776 | 7/25/16 | 249,278 | — | |||||||||||||||||||||||||
| Semiannual Report | TGB-15 |
FRANKLIN TEMPLETON VARIABLE INSURANCE PRODUCTS TRUST
STATEMENT OF INVESTMENTS (UNAUDITED)
Templeton Global Bond VIP Fund (continued)
| Forward Exchange Contracts | ||||||||||||||||||||||||||||||||
| Currency | Counterpartya | Type | Quantity | Contract Amount* |
Settlement Date |
Unrealized Appreciation |
Unrealized Depreciation |
|||||||||||||||||||||||||
| OTC Forward Exchange Contracts (continued) | ||||||||||||||||||||||||||||||||
| Chilean Peso |
JPHQ | Buy | 337,685,000 | 502,867 | 7/26/16 | $ | 6,068 | $ | — | |||||||||||||||||||||||
| Malaysian Ringgit |
HSBC | Buy | 7,209,825 | 1,664,510 | 7/26/16 | 124,484 | — | |||||||||||||||||||||||||
| Euro |
DBAB | Sell | 9,260,000 | 10,267,408 | 7/27/16 | 77,536 | (98,639 | ) | ||||||||||||||||||||||||
| Indian Rupee |
DBAB | Buy | 229,138,000 | 3,401,440 | 7/27/16 | — | (22,984 | ) | ||||||||||||||||||||||||
| Malaysian Ringgit |
DBAB | Buy | 16,628,000 | 3,850,411 | EUR | 7/27/16 | — | (152,228 | ) | |||||||||||||||||||||||
| Malaysian Ringgit |
JPHQ | Buy | 9,715,000 | 2,481,481 | 7/27/16 | — | (70,931 | ) | ||||||||||||||||||||||||
| Chilean Peso |
DBAB | Buy | 3,155,970,500 | 4,674,343 | 7/28/16 | 81,211 | — | |||||||||||||||||||||||||
| Euro |
BOFA | Sell | 25,428,600 | 28,887,907 | 7/28/16 | 633,888 | — | |||||||||||||||||||||||||
| Euro |
CITI | Sell | 10,044,053 | 11,332,905 | 7/28/16 | 186,148 | (13,310 | ) | ||||||||||||||||||||||||
| Euro |
GSCO | Sell | 11,263,000 | 12,418,809 | 7/28/16 | — | (95,644 | ) | ||||||||||||||||||||||||
| Chilean Peso |
MSCO | Buy | 1,967,876,500 | 2,908,135 | 7/29/16 | 56,866 | — | |||||||||||||||||||||||||
| Euro |
BOFA | Sell | 39,711,800 | 44,736,002 | 7/29/16 | 630,289 | (20,188 | ) | ||||||||||||||||||||||||
| Euro |
BZWS | Sell | 30,572,361 | 33,792,253 | 7/29/16 | — | (178,330 | ) | ||||||||||||||||||||||||
| Euro |
CITI | Sell | 4,998,400 | 5,466,595 | 7/29/16 | — | (87,394 | ) | ||||||||||||||||||||||||
| Euro |
DBAB | Sell | 57,063,000 | 62,503,957 | 7/29/16 | — | (901,789 | ) | ||||||||||||||||||||||||
| Euro |
GSCO | Sell | 30,376,000 | 33,605,273 | 7/29/16 | — | (147,123 | ) | ||||||||||||||||||||||||
| Euro |
HSBC | Sell | 25,974,891 | 28,819,142 | 7/29/16 | — | (42,947 | ) | ||||||||||||||||||||||||
| Euro |
JPHQ | Sell | 11,263,000 | 12,561,511 | 7/29/16 | 46,591 | — | |||||||||||||||||||||||||
| Indian Rupee |
DBAB | Buy | 609,812,988 | 9,032,794 | 7/29/16 | — | (44,729 | ) | ||||||||||||||||||||||||
| Indian Rupee |
HSBC | Buy | 679,529,000 | 10,064,711 | 7/29/16 | — | (49,097 | ) | ||||||||||||||||||||||||
| Indian Rupee |
JPHQ | Buy | 358,075,000 | 5,307,960 | 7/29/16 | — | (30,274 | ) | ||||||||||||||||||||||||
| Japanese Yen |
BZWS | Sell | 1,079,470,000 | 8,837,430 | 7/29/16 | — | (1,624,360 | ) | ||||||||||||||||||||||||
| Japanese Yen |
DBAB | Sell | 897,860,782 | 7,617,123 | 7/29/16 | — | (1,084,583 | ) | ||||||||||||||||||||||||
| Malaysian Ringgit |
HSBC | Buy | 3,005,000 | 701,038 | 7/29/16 | 44,545 | — | |||||||||||||||||||||||||
| Malaysian Ringgit |
JPHQ | Buy | 17,021,000 | 4,322,245 | 7/29/16 | — | (99,091 | ) | ||||||||||||||||||||||||
| Malaysian Ringgit |
JPHQ | Buy | 16,628,000 | 3,780,122 | EUR | 7/29/16 | — | (74,650 | ) | |||||||||||||||||||||||
| Chilean Peso |
MSCO | Buy | 1,941,852,000 | 2,777,447 | 8/03/16 | 147,010 | — | |||||||||||||||||||||||||
| Euro |
BOFA | Sell | 32,701,000 | 37,465,536 | 8/03/16 | 1,123,050 | — | |||||||||||||||||||||||||
| Chilean Peso |
MSCO | Buy | 2,286,905,000 | 3,437,714 | 8/04/16 | 6,087 | — | |||||||||||||||||||||||||
| Euro |
BZWS | Sell | 16,622,598 | 18,460,333 | 8/05/16 | — | (14,655 | ) | ||||||||||||||||||||||||
| Euro |
HSBC | Sell | 11,263,000 | 12,433,226 | 8/05/16 | — | (84,901 | ) | ||||||||||||||||||||||||
| Euro |
JPHQ | Sell | 5,724,900 | 6,320,433 | 8/05/16 | — | (42,439 | ) | ||||||||||||||||||||||||
| Indian Rupee |
HSBC | Buy | 240,033,500 | 3,570,344 | 8/05/16 | — | (36,719 | ) | ||||||||||||||||||||||||
| Chilean Peso |
DBAB | Buy | 3,166,824,000 | 4,762,141 | 8/08/16 | 4,993 | — | |||||||||||||||||||||||||
| Malaysian Ringgit |
DBAB | Buy | 143,249,150 | 32,381,471 | EUR | 8/08/16 | — | (461,907 | ) | |||||||||||||||||||||||
| Malaysian Ringgit |
HSBC | Buy | 21,208,085 | 5,290,119 | 8/08/16 | — | (29,590 | ) | ||||||||||||||||||||||||
| Malaysian Ringgit |
JPHQ | Buy | 1,100,000 | 274,794 | 8/08/16 | — | (1,946 | ) | ||||||||||||||||||||||||
| Chilean Peso |
DBAB | Buy | 760,285,000 | 1,122,192 | 8/09/16 | 22,189 | — | |||||||||||||||||||||||||
| Euro |
CITI | Sell | 6,421,600 | 7,364,227 | 8/09/16 | 225,975 | — | |||||||||||||||||||||||||
| Euro |
GSCO | Sell | 2,990,000 | 3,420,620 | 8/09/16 | 96,935 | — | |||||||||||||||||||||||||
| Indian Rupee |
DBAB | Buy | 457,757,494 | 6,785,060 | 8/09/16 | — | (50,837 | ) | ||||||||||||||||||||||||
| Indian Rupee |
JPHQ | Buy | 60,607,000 | 898,807 | 8/09/16 | — | (7,197 | ) | ||||||||||||||||||||||||
| Euro |
CITI | Sell | 7,698,954 | 8,456,146 | 8/10/16 | — | (102,325 | ) | ||||||||||||||||||||||||
| Indian Rupee |
DBAB | Buy | 39,609,000 | 586,600 | 8/10/16 | — | (3,998 | ) | ||||||||||||||||||||||||
| Japanese Yen |
CITI | Sell | 751,731,000 | 6,085,265 | 8/10/16 | — | (1,203,106 | ) | ||||||||||||||||||||||||
| Malaysian Ringgit |
HSBC | Buy | 1,320,000 | 316,965 | 8/10/16 | 10,434 | — | |||||||||||||||||||||||||
| South Korean Won |
HSBC | Buy | 21,363,430,000 | 18,182,416 | 8/10/16 | 340,909 | — | |||||||||||||||||||||||||
| South Korean Won |
HSBC | Sell | 21,363,430,000 | 17,707,680 | 8/10/16 | — | (815,646 | ) | ||||||||||||||||||||||||
| Euro |
BOFA | Sell | 2,643,000 | 3,022,648 | 8/11/16 | 84,475 | — | |||||||||||||||||||||||||
| Euro |
DBAB | Sell | 4,845,000 | 5,348,614 | 8/11/16 | — | (37,482 | ) | ||||||||||||||||||||||||
| Euro |
JPHQ | Sell | 6,343,900 | 6,981,462 | 8/11/16 | — | (70,933 | ) | ||||||||||||||||||||||||
| Euro |
MSCO | Sell | 4,572,000 | 5,225,407 | 8/11/16 | 142,801 | — | |||||||||||||||||||||||||
| Malaysian Ringgit |
HSBC | Buy | 2,230,000 | 535,993 | 8/11/16 | 17,096 | — | |||||||||||||||||||||||||
| Euro |
GSCO | Sell | 2,279,000 | 2,603,062 | 8/12/16 | 69,448 | — | |||||||||||||||||||||||||
| Euro |
SCNY | Sell | 629,000 | 718,708 | 8/12/16 | 19,435 | — | |||||||||||||||||||||||||
| Malaysian Ringgit |
HSBC | Buy | 6,100,000 | 1,427,234 | 8/12/16 | 85,656 | — | |||||||||||||||||||||||||
| TGB-16 | Semiannual Report |
FRANKLIN TEMPLETON VARIABLE INSURANCE PRODUCTS TRUST
STATEMENT OF INVESTMENTS (UNAUDITED)
Templeton Global Bond VIP Fund (continued)
| Forward Exchange Contracts | ||||||||||||||||||||||||||||||||
| Currency | Counterpartya | Type | Quantity | Contract Amount* |
Settlement Date |
Unrealized Appreciation |
Unrealized Depreciation |
|||||||||||||||||||||||||
| OTC Forward Exchange Contracts (continued) | ||||||||||||||||||||||||||||||||
| South Korean Won |
HSBC | Buy | 11,980,000,000 | 1,262,275,045 | JPY | 8/12/16 | $ | — | $ | (1,852,044 | ) | |||||||||||||||||||||
| Euro |
DBAB | Sell | 7,243,000 | 8,300,116 | 8/15/16 | 247,034 | — | |||||||||||||||||||||||||
| Euro |
MSCO | Sell | 1,962,500 | 2,215,790 | 8/15/16 | 33,797 | — | |||||||||||||||||||||||||
| Euro |
SCNY | Sell | 4,346,000 | 4,971,172 | 8/15/16 | 139,100 | — | |||||||||||||||||||||||||
| Chilean Peso |
MSCO | Buy | 2,572,200,000 | 3,735,785 | 8/16/16 | 133,452 | — | |||||||||||||||||||||||||
| Euro |
JPHQ | Sell | 3,942,000 | 4,456,687 | 8/16/16 | 73,640 | — | |||||||||||||||||||||||||
| Euro |
MSCO | Sell | 5,391,000 | 6,165,687 | 8/16/16 | 171,520 | — | |||||||||||||||||||||||||
| Indian Rupee |
DBAB | Buy | 239,338,000 | 3,544,031 | 8/16/16 | — | (27,251 | ) | ||||||||||||||||||||||||
| Indian Rupee |
HSBC | Buy | 402,232,000 | 5,955,666 | 8/16/16 | — | (45,357 | ) | ||||||||||||||||||||||||
| Japanese Yen |
JPHQ | Sell | 1,518,680,000 | 13,576,704 | 8/16/16 | — | (1,150,524 | ) | ||||||||||||||||||||||||
| Chilean Peso |
DBAB | Buy | 2,509,219,500 | 3,674,090 | 8/17/16 | 100,070 | — | |||||||||||||||||||||||||
| Euro |
MSCO | Sell | 1,962,500 | 2,200,335 | 8/17/16 | 18,183 | — | |||||||||||||||||||||||||
| Singapore Dollar |
BZWS | Buy | 4,886,000 | 3,473,377 | 8/17/16 | 152,637 | — | |||||||||||||||||||||||||
| Singapore Dollar |
BZWS | Sell | 4,886,000 | 3,453,858 | 8/17/16 | — | (172,157 | ) | ||||||||||||||||||||||||
| Singapore Dollar |
HSBC | Buy | 3,667,000 | 2,607,181 | 8/17/16 | 114,185 | — | |||||||||||||||||||||||||
| Chilean Peso |
MSCO | Buy | 2,572,200,000 | 3,699,091 | 8/18/16 | 169,450 | — | |||||||||||||||||||||||||
| Euro |
BZWS | Sell | 7,066,000 | 7,910,210 | 8/18/16 | 53,065 | — | |||||||||||||||||||||||||
| Japanese Yen |
DBAB | Sell | 838,612,000 | 6,811,781 | 8/18/16 | — | (1,321,106 | ) | ||||||||||||||||||||||||
| Euro |
DBAB | Sell | 5,073,398 | 5,755,922 | 8/19/16 | 114,275 | — | |||||||||||||||||||||||||
| Euro |
UBSW | Sell | 3,245,000 | 3,687,245 | 8/19/16 | 78,786 | — | |||||||||||||||||||||||||
| Chilean Peso |
MSCO | Buy | 3,307,630,000 | 4,732,961 | 8/22/16 | 239,863 | — | |||||||||||||||||||||||||
| Euro |
DBAB | Sell | 3,964,000 | 4,421,366 | 8/22/16 | 12,893 | — | |||||||||||||||||||||||||
| Euro |
JPHQ | Sell | 23,160,581 | 26,068,128 | 8/22/16 | 310,611 | — | |||||||||||||||||||||||||
| Japanese Yen |
HSBC | Sell | 1,621,372,000 | 13,158,351 | 8/22/16 | — | (2,567,865 | ) | ||||||||||||||||||||||||
| Japanese Yen |
JPHQ | Sell | 1,135,828,000 | 9,216,653 | 8/22/16 | — | (1,800,114 | ) | ||||||||||||||||||||||||
| Chilean Peso |
JPHQ | Buy | 931,485,000 | 1,319,290 | 8/23/16 | 81,016 | — | |||||||||||||||||||||||||
| Euro |
DBAB | Sell | 3,887,000 | 4,368,599 | 8/23/16 | 45,602 | — | |||||||||||||||||||||||||
| Indian Rupee |
JPHQ | Buy | 378,455,000 | 5,551,579 | 8/23/16 | 2,729 | — | |||||||||||||||||||||||||
| Euro |
GSCO | Sell | 4,454,000 | 5,017,609 | 8/24/16 | 63,832 | — | |||||||||||||||||||||||||
| Japanese Yen |
BZWS | Sell | 376,247,000 | 3,069,400 | 8/24/16 | — | (580,186 | ) | ||||||||||||||||||||||||
| Japanese Yen |
DBAB | Sell | 371,821,000 | 3,310,962 | 8/24/16 | — | (295,692 | ) | ||||||||||||||||||||||||
| Euro |
BOFA | Sell | 2,680,925 | 3,004,237 | 8/26/16 | 22,271 | — | |||||||||||||||||||||||||
| Euro |
JPHQ | Sell | 4,730,771 | 5,297,574 | 8/26/16 | 35,586 | — | |||||||||||||||||||||||||
| Euro |
SCNY | Sell | 13,581,483 | 15,820,526 | 8/26/16 | 713,982 | — | |||||||||||||||||||||||||
| Japanese Yen |
JPHQ | Sell | 1,135,833,000 | 9,641,146 | 8/26/16 | — | (1,377,138 | ) | ||||||||||||||||||||||||
| Euro |
DBAB | Sell | 9,808,244 | 10,968,903 | 8/29/16 | 58,099 | — | |||||||||||||||||||||||||
| Euro |
JPHQ | Sell | 17,833,294 | 20,419,019 | 8/29/16 | 581,057 | — | |||||||||||||||||||||||||
| Japanese Yen |
DBAB | Sell | 685,950,000 | 5,766,709 | 8/29/16 | — | (888,096 | ) | ||||||||||||||||||||||||
| Japanese Yen |
JPHQ | Sell | 751,903,000 | 6,318,592 | 8/29/16 | — | (976,062 | ) | ||||||||||||||||||||||||
| Malaysian Ringgit |
JPHQ | Buy | 8,340,000 | 1,972,564 | 8/30/16 | 94,798 | — | |||||||||||||||||||||||||
| Chilean Peso |
CITI | Buy | 3,039,493,000 | 4,371,170 | 8/31/16 | 194,841 | — | |||||||||||||||||||||||||
| Chilean Peso |
DBAB | Buy | 1,359,282,000 | 1,944,888 | 8/31/16 | 97,064 | — | |||||||||||||||||||||||||
| Euro |
BZWS | Sell | 13,673,773 | 15,143,840 | 8/31/16 | — | (68,240 | ) | ||||||||||||||||||||||||
| Euro |
DBAB | Sell | 1,058,312 | 1,196,951 | 8/31/16 | 19,578 | — | |||||||||||||||||||||||||
| Euro |
SCNY | Sell | 11,263,000 | 12,662,653 | 8/31/16 | 132,559 | — | |||||||||||||||||||||||||
| Japanese Yen |
BZWS | Sell | 1,576,550,000 | 14,065,037 | 8/31/16 | — | (1,231,363 | ) | ||||||||||||||||||||||||
| Japanese Yen |
JPHQ | Sell | 372,662,000 | 3,118,471 | 8/31/16 | — | (497,264 | ) | ||||||||||||||||||||||||
| Euro |
HSBC | Sell | 18,537,726 | 20,481,036 | 9/01/16 | — | (143,020 | ) | ||||||||||||||||||||||||
| Japanese Yen |
HSBC | Sell | 1,247,125,000 | 11,075,710 | 9/01/16 | — | (1,024,997 | ) | ||||||||||||||||||||||||
| Chilean Peso |
DBAB | Buy | 4,798,143,500 | 6,901,883 | 9/02/16 | 304,744 | — | |||||||||||||||||||||||||
| Euro |
DBAB | Sell | 1,732,000 | 1,894,115 | 9/02/16 | — | (32,890 | ) | ||||||||||||||||||||||||
| Chilean Peso |
DBAB | Buy | 1,271,380,000 | 1,818,856 | 9/06/16 | 90,032 | — | |||||||||||||||||||||||||
| Chilean Peso |
MSCO | Buy | 1,941,852,000 | 2,769,524 | 9/06/16 | 146,029 | — | |||||||||||||||||||||||||
| Euro |
DBAB | Sell | 13,545,300 | 14,936,912 | 9/06/16 | 45,436 | (181,297 | ) | ||||||||||||||||||||||||
| Euro |
JPHQ | Sell | 20,765,000 | 23,527,472 | 9/06/16 | 420,850 | — | |||||||||||||||||||||||||
| Indian Rupee |
JPHQ | Buy | 139,661,000 | 2,032,911 | 9/06/16 | 12,185 | — | |||||||||||||||||||||||||
| Semiannual Report | TGB-17 |
FRANKLIN TEMPLETON VARIABLE INSURANCE PRODUCTS TRUST
STATEMENT OF INVESTMENTS (UNAUDITED)
Templeton Global Bond VIP Fund (continued)
| Forward Exchange Contracts | ||||||||||||||||||||||||||||||||
| Currency | Counterpartya | Type | Quantity | Contract Amount* |
Settlement Date |
Unrealized Appreciation |
Unrealized Depreciation |
|||||||||||||||||||||||||
| OTC Forward Exchange Contracts (continued) | ||||||||||||||||||||||||||||||||
| South Korean Won |
GSCO | Sell | 44,346,000,000 | 37,075,495 | 9/07/16 | $ | — | $ | (1,362,823 | ) | ||||||||||||||||||||||
| Euro |
GSCO | Sell | 2,033,100 | 2,315,091 | 9/08/16 | 52,542 | — | |||||||||||||||||||||||||
| Chilean Peso |
JPHQ | Buy | 612,933,000 | 892,721 | 9/09/16 | 27,311 | — | |||||||||||||||||||||||||
| Euro |
CITI | Sell | 31,404,613 | 35,772,995 | 9/09/16 | 822,758 | — | |||||||||||||||||||||||||
| Euro |
HSBC | Sell | 3,999,292 | 4,555,573 | 9/09/16 | 104,756 | — | |||||||||||||||||||||||||
| Euro |
MSCO | Sell | 5,225,000 | 5,955,836 | 9/09/16 | 140,927 | — | |||||||||||||||||||||||||
| Euro |
SCNY | Sell | 2,400,751 | 2,734,600 | 9/09/16 | 62,800 | — | |||||||||||||||||||||||||
| Japanese Yen |
BZWS | Sell | 1,712,605,900 | 15,172,051 | 9/09/16 | — | (1,451,075 | ) | ||||||||||||||||||||||||
| Chilean Peso |
DBAB | Buy | 1,866,989,500 | 2,749,009 | 9/12/16 | 52,655 | — | |||||||||||||||||||||||||
| Chilean Peso |
JPHQ | Buy | 1,792,000,000 | 2,617,166 | 9/13/16 | 71,728 | — | |||||||||||||||||||||||||
| Euro |
GSCO | Sell | 8,105,300 | 9,207,621 | 9/13/16 | 185,777 | — | |||||||||||||||||||||||||
| Australian Dollar |
CITI | Sell | 28,906,000 | 20,823,304 | 9/14/16 | — | (677,069 | ) | ||||||||||||||||||||||||
| Indian Rupee |
CITI | Buy | 69,318,000 | 1,026,857 | 9/14/16 | — | (13,059 | ) | ||||||||||||||||||||||||
| Indian Rupee |
DBAB | Buy | 258,123,000 | 3,822,912 | 9/14/16 | — | (47,778 | ) | ||||||||||||||||||||||||
| Malaysian Ringgit |
HSBC | Buy | 796,554,000 | 192,404,348 | 9/14/16 | 4,956,588 | — | |||||||||||||||||||||||||
| Euro |
BOFA | Sell | 17,769,000 | 20,039,345 | 9/15/16 | 259,450 | — | |||||||||||||||||||||||||
| Euro |
CITI | Sell | 861,168 | 972,216 | 9/15/16 | 13,590 | — | |||||||||||||||||||||||||
| Euro |
JPHQ | Sell | 541,000 | 609,623 | 9/16/16 | 7,375 | — | |||||||||||||||||||||||||
| Japanese Yen |
CITI | Sell | 286,112,008 | 2,532,682 | 9/16/16 | — | (245,282 | ) | ||||||||||||||||||||||||
| South Korean Won |
CITI | Sell | 11,790,000,000 | 9,730,131 | 9/19/16 | — | (488,078 | ) | ||||||||||||||||||||||||
| South Korean Won |
HSBC | Sell | 35,487,000,000 | 29,068,644 | 9/19/16 | — | (1,687,387 | ) | ||||||||||||||||||||||||
| Chilean Peso |
DBAB | Buy | 1,757,372,000 | 2,526,412 | 9/20/16 | 108,890 | — | |||||||||||||||||||||||||
| Chilean Peso |
JPHQ | Buy | 1,501,938,000 | 2,172,471 | 9/20/16 | 79,789 | — | |||||||||||||||||||||||||
| Japanese Yen |
BZWS | Sell | 981,707,504 | 8,158,168 | 9/20/16 | — | (1,375,278 | ) | ||||||||||||||||||||||||
| Japanese Yen |
CITI | Sell | 1,866,452,000 | 16,830,045 | 9/23/16 | — | (1,297,649 | ) | ||||||||||||||||||||||||
| Japanese Yen |
MSCO | Sell | 575,230,000 | 5,189,124 | 9/23/16 | — | (397,729 | ) | ||||||||||||||||||||||||
| Japanese Yen |
BZWS | Sell | 983,714,840 | 8,775,137 | 9/26/16 | — | (780,352 | ) | ||||||||||||||||||||||||
| Japanese Yen |
DBAB | Sell | 725,287,000 | 6,536,355 | 9/26/16 | — | (508,850 | ) | ||||||||||||||||||||||||
| South Korean Won |
HSBC | Sell | 35,125,000,000 | 30,192,977 | 9/26/16 | — | (247,313 | ) | ||||||||||||||||||||||||
| Malaysian Ringgit |
HSBC | Buy | 20,347,000 | 5,046,254 | 9/28/16 | — | (7,124 | ) | ||||||||||||||||||||||||
| Philippine Peso |
JPHQ | Buy | 123,740,000 | 2,651,382 | 9/28/16 | — | (35,591 | ) | ||||||||||||||||||||||||
| South Korean Won |
HSBC | Sell | 35,292,000,000 | 30,115,198 | 9/28/16 | — | (469,245 | ) | ||||||||||||||||||||||||
| Chilean Peso |
DBAB | Buy | 1,407,243,000 | 2,044,371 | 9/30/16 | 63,992 | — | |||||||||||||||||||||||||
| Euro |
DBAB | Sell | 14,880,000 | 16,867,968 | 10/03/16 | 292,069 | — | |||||||||||||||||||||||||
| Australian Dollar |
GSCO | Sell | 127,700,540 | 97,063,903 | 10/06/16 | 2,152,181 | — | |||||||||||||||||||||||||
| Japanese Yen |
JPHQ | Sell | 1,415,975,000 | 12,775,637 | 10/06/16 | — | (984,554 | ) | ||||||||||||||||||||||||
| Euro |
JPHQ | Sell | 6,370,000 | 7,197,399 | 10/07/16 | 100,262 | — | |||||||||||||||||||||||||
| Japanese Yen |
JPHQ | Sell | 1,415,975,000 | 11,884,369 | 10/07/16 | — | (1,876,403 | ) | ||||||||||||||||||||||||
| Euro |
DBAB | Sell | 18,880,000 | 21,406,750 | 10/11/16 | 368,218 | — | |||||||||||||||||||||||||
| Japanese Yen |
HSBC | Sell | 2,816,800,000 | 23,703,454 | 10/11/16 | — | (3,675,479 | ) | ||||||||||||||||||||||||
| Chilean Peso |
DBAB | Buy | 1,148,389,500 | 1,717,475 | 10/12/16 | 1,100 | — | |||||||||||||||||||||||||
| Euro |
HSBC | Sell | 8,692,000 | 9,857,684 | 10/13/16 | 171,160 | — | |||||||||||||||||||||||||
| Japanese Yen |
BZWS | Sell | 1,426,300,000 | 12,005,387 | 10/13/16 | — | (1,859,235 | ) | ||||||||||||||||||||||||
| Japanese Yen |
DBAB | Sell | 1,406,600,000 | 11,843,058 | 10/13/16 | — | (1,830,066 | ) | ||||||||||||||||||||||||
| Malaysian Ringgit |
DBAB | Buy | 60,000,000 | 12,390,550 | EUR | 10/17/16 | 1,039,478 | — | ||||||||||||||||||||||||
| South Korean Won |
HSBC | Sell | 60,991,000,000 | 52,676,081 | 10/18/16 | — | (177,368 | ) | ||||||||||||||||||||||||
| Japanese Yen |
JPHQ | Sell | 652,895,000 | 5,559,439 | 10/19/16 | — | (788,759 | ) | ||||||||||||||||||||||||
| Japanese Yen |
BZWS | Sell | 735,200,000 | 6,190,767 | 10/24/16 | — | (959,204 | ) | ||||||||||||||||||||||||
| Euro |
BZWS | Sell | 5,604,306 | 6,239,134 | 10/27/16 | — | (9,916 | ) | ||||||||||||||||||||||||
| Malaysian Ringgit |
JPHQ | Buy | 7,468,000 | 1,900,496 | 10/31/16 | — | (53,055 | ) | ||||||||||||||||||||||||
| South Korean Won |
HSBC | Sell | 15,755,000,000 | 13,644,827 | 11/02/16 | — | (7,712 | ) | ||||||||||||||||||||||||
| Euro |
DBAB | Sell | 224,556 | 250,110 | 11/04/16 | — | (360 | ) | ||||||||||||||||||||||||
| Euro |
DBAB | Sell | 15,875,000 | 17,454,563 | 11/09/16 | — | (256,004 | ) | ||||||||||||||||||||||||
| Japanese Yen |
CITI | Sell | 341,992,119 | 2,841,410 | 11/09/16 | — | (486,781 | ) | ||||||||||||||||||||||||
| Euro |
CITI | Sell | 5,658,426 | 6,115,910 | 11/14/16 | — | (198,046 | ) | ||||||||||||||||||||||||
| Euro |
JPHQ | Sell | 8,969,211 | 9,693,161 | 11/14/16 | — | (315,135 | ) | ||||||||||||||||||||||||
| TGB-18 | Semiannual Report |
FRANKLIN TEMPLETON VARIABLE INSURANCE PRODUCTS TRUST
STATEMENT OF INVESTMENTS (UNAUDITED)
Templeton Global Bond VIP Fund (continued)
| Forward Exchange Contracts | ||||||||||||||||||||||||||||||||
| Currency | Counterpartya | Type | Quantity | Contract Amount* |
Settlement Date |
Unrealized Appreciation |
Unrealized Depreciation |
|||||||||||||||||||||||||
| OTC Forward Exchange Contracts (continued) | ||||||||||||||||||||||||||||||||
| Japanese Yen |
CITI | Sell | 796,524,000 | 6,545,517 | 11/14/16 | $ | — | $ | (1,207,715 | ) | ||||||||||||||||||||||
| Japanese Yen |
GSCO | Sell | 490,555,000 | 4,525,332 | 11/14/16 | — | (249,649 | ) | ||||||||||||||||||||||||
| Japanese Yen |
HSBC | Sell | 413,563,000 | 3,395,845 | 11/14/16 | — | (629,708 | ) | ||||||||||||||||||||||||
| Japanese Yen |
JPHQ | Sell | 335,950,000 | 2,756,377 | 11/14/16 | — | (513,704 | ) | ||||||||||||||||||||||||
| Japanese Yen |
SCNY | Sell | 366,681,000 | 3,382,728 | 11/14/16 | — | (186,483 | ) | ||||||||||||||||||||||||
| South Korean Won |
CITI | Sell | 11,823,000,000 | 10,113,340 | 11/14/16 | — | (131,677 | ) | ||||||||||||||||||||||||
| Australian Dollar |
JPHQ | Sell | 100,287,000 | 73,349,912 | 11/16/16 | — | (1,080,926 | ) | ||||||||||||||||||||||||
| Japanese Yen |
CITI | Sell | 366,680,000 | 3,022,295 | 11/16/16 | — | (547,208 | ) | ||||||||||||||||||||||||
| Japanese Yen |
MSCO | Sell | 300,000,000 | 2,471,475 | 11/16/16 | — | (448,922 | ) | ||||||||||||||||||||||||
| Japanese Yen |
SCNY | Sell | 340,600,700 | 3,146,084 | 11/16/16 | — | (169,547 | ) | ||||||||||||||||||||||||
| South Korean Won |
CITI | Sell | 13,902,000,000 | 11,881,036 | 11/16/16 | — | (165,456 | ) | ||||||||||||||||||||||||
| Euro |
DBAB | Sell | 2,768,730 | 3,008,834 | 11/17/16 | — | (81,026 | ) | ||||||||||||||||||||||||
| South Korean Won |
HSBC | Sell | 48,866,000,000 | 41,653,667 | 11/17/16 | — | (690,078 | ) | ||||||||||||||||||||||||
| Euro |
DBAB | Sell | 2,240,000 | 2,430,960 | 11/18/16 | — | (68,946 | ) | ||||||||||||||||||||||||
| Japanese Yen |
DBAB | Sell | 796,770,000 | 6,561,180 | 11/18/16 | — | (1,195,758 | ) | ||||||||||||||||||||||||
| South Korean Won |
HSBC | Sell | 26,952,000,000 | 22,962,300 | 11/18/16 | — | (392,311 | ) | ||||||||||||||||||||||||
| Australian Dollar |
CITI | Sell | 13,307,000 | 9,632,937 | 11/21/16 | — | (241,515 | ) | ||||||||||||||||||||||||
| Japanese Yen |
CITI | Sell | 2,094,073,000 | 18,183,218 | 11/21/16 | — | (2,206,170 | ) | ||||||||||||||||||||||||
| Malaysian Ringgit |
HSBC | Buy | 4,326,000 | 1,067,489 | 11/21/16 | 1,916 | — | |||||||||||||||||||||||||
| South Korean Won |
DBAB | Sell | 13,920,000,000 | 11,832,609 | 11/23/16 | — | (229,318 | ) | ||||||||||||||||||||||||
| Japanese Yen |
HSBC | Sell | 207,909,000 | 1,911,631 | 11/25/16 | — | (113,062 | ) | ||||||||||||||||||||||||
| South Korean Won |
HSBC | Sell | 35,277,000,000 | 29,594,799 | 11/25/16 | — | (973,230 | ) | ||||||||||||||||||||||||
| Euro |
DBAB | Sell | 837,570 | 904,626 | 11/28/16 | — | (30,502 | ) | ||||||||||||||||||||||||
| Japanese Yen |
BOFA | Sell | 1,085,075,000 | 9,933,219 | 11/28/16 | — | (634,972 | ) | ||||||||||||||||||||||||
| Japanese Yen |
SCNY | Sell | 937,086,000 | 8,597,316 | 11/28/16 | — | (529,521 | ) | ||||||||||||||||||||||||
| Malaysian Ringgit |
HSBC | Buy | 3,317,000 | 809,716 | 11/30/16 | 10,009 | — | |||||||||||||||||||||||||
| Euro |
GSCO | Sell | 463,000 | 496,405 | 12/02/16 | — | (20,607 | ) | ||||||||||||||||||||||||
| South Korean Won |
HSBC | Sell | 42,561,000,000 | 35,916,456 | 12/02/16 | — | (962,767 | ) | ||||||||||||||||||||||||
| Japanese Yen |
HSBC | Sell | 2,052,400,000 | 19,199,252 | 12/09/16 | — | (799,593 | ) | ||||||||||||||||||||||||
| Australian Dollar |
JPHQ | Sell | 29,260,000 | 20,823,728 | 12/12/16 | — | (872,818 | ) | ||||||||||||||||||||||||
| Japanese Yen |
CITI | Sell | 2,595,800,000 | 24,453,268 | 12/12/16 | — | (843,744 | ) | ||||||||||||||||||||||||
| Australian Dollar |
JPHQ | Sell | 43,169,000 | 31,855,053 | 12/13/16 | — | (154,028 | ) | ||||||||||||||||||||||||
| Japanese Yen |
DBAB | Sell | 595,700,000 | 5,630,541 | 12/13/16 | — | (175,017 | ) | ||||||||||||||||||||||||
| Japanese Yen |
HSBC | Sell | 1,798,900,000 | 16,986,780 | 12/13/16 | — | (544,894 | ) | ||||||||||||||||||||||||
| Japanese Yen |
JPHQ | Sell | 1,666,680,000 | 15,731,782 | 12/13/16 | — | (511,306 | ) | ||||||||||||||||||||||||
| Australian Dollar |
CITI | Sell | 29,097,000 | 21,477,078 | 12/14/16 | — | (97,105 | ) | ||||||||||||||||||||||||
| Australian Dollar |
JPHQ | Sell | 14,544,000 | 10,411,759 | 12/14/16 | — | (371,996 | ) | ||||||||||||||||||||||||
| Euro |
MSCO | Sell | 1,412,000 | 1,567,461 | 12/14/16 | — | (10,019 | ) | ||||||||||||||||||||||||
| Malaysian Ringgit |
JPHQ | Buy | 13,361,013 | 3,270,350 | 12/14/16 | 29,963 | — | |||||||||||||||||||||||||
| Euro |
JPHQ | Sell | 5,095,000 | 5,670,378 | 12/15/16 | — | (21,964 | ) | ||||||||||||||||||||||||
| South Korean Won |
CITI | Sell | 8,844,000,000 | 7,525,528 | 12/15/16 | — | (137,631 | ) | ||||||||||||||||||||||||
| Japanese Yen |
HSBC | Sell | 1,455,540,000 | 13,828,045 | 12/16/16 | — | (359,121 | ) | ||||||||||||||||||||||||
| South Korean Won |
DBAB | Sell | 13,919,000,000 | 11,838,099 | 12/20/16 | — | (222,335 | ) | ||||||||||||||||||||||||
| Malaysian Ringgit |
JPHQ | Buy | 5,661,200 | 1,373,578 | 1/05/17 | 23,649 | — | |||||||||||||||||||||||||
| Japanese Yen |
GSCO | Sell | 329,010,000 | 2,808,307 | 1/10/17 | — | (401,832 | ) | ||||||||||||||||||||||||
| Japanese Yen |
JPHQ | Sell | 1,415,975,000 | 12,041,525 | 1/10/17 | — | (1,774,092 | ) | ||||||||||||||||||||||||
| Euro |
BZWS | Sell | 6,181,000 | 6,804,230 | 1/11/17 | — | (108,846 | ) | ||||||||||||||||||||||||
| Euro |
CITI | Sell | 5,040,000 | 5,555,718 | 1/13/17 | — | (81,662 | ) | ||||||||||||||||||||||||
| Euro |
SCNY | Sell | 15,572,000 | 17,132,314 | 1/13/17 | — | (285,400 | ) | ||||||||||||||||||||||||
| Japanese Yen |
CITI | Sell | 138,680,000 | 1,190,938 | 1/17/17 | — | (162,533 | ) | ||||||||||||||||||||||||
| Japanese Yen |
SCNY | Sell | 415,980,000 | 3,561,503 | 1/17/17 | — | (498,326 | ) | ||||||||||||||||||||||||
| Euro |
JPHQ | Sell | 27,973,000 | 30,980,237 | 1/19/17 | — | (315,729 | ) | ||||||||||||||||||||||||
| Japanese Yen |
JPHQ | Sell | 652,895,000 | 5,639,417 | 1/19/17 | — | (733,131 | ) | ||||||||||||||||||||||||
| Euro |
DBAB | Sell | 6,791,000 | 7,496,824 | 1/23/17 | — | (102,088 | ) | ||||||||||||||||||||||||
| Euro |
JPHQ | Sell | 300,000 | 331,089 | 1/23/17 | — | (4,601 | ) | ||||||||||||||||||||||||
| Japanese Yen |
DBAB | Sell | 858,140,000 | 7,434,611 | 1/23/17 | — | (942,549 | ) | ||||||||||||||||||||||||
| Semiannual Report | TGB-19 |
FRANKLIN TEMPLETON VARIABLE INSURANCE PRODUCTS TRUST
STATEMENT OF INVESTMENTS (UNAUDITED)
Templeton Global Bond VIP Fund (continued)
| Forward Exchange Contracts | ||||||||||||||||||||||||||||||||
| Currency | Counterpartya | Type | Quantity | Contract Amount* |
Settlement Date |
Unrealized Appreciation |
Unrealized Depreciation |
|||||||||||||||||||||||||
| OTC Forward Exchange Contracts (continued) | ||||||||||||||||||||||||||||||||
| Euro |
GSCO | Sell | 4,711,000 | 5,169,804 | 1/27/17 | $ | — | $ | (102,485 | ) | ||||||||||||||||||||||
| Japanese Yen |
GSCO | Sell | 944,420,000 | 8,062,147 | 1/27/17 | — | (1,158,742 | ) | ||||||||||||||||||||||||
| Japanese Yen |
JPHQ | Sell | 490,100,000 | 4,183,918 | 1/27/17 | — | (601,196 | ) | ||||||||||||||||||||||||
| Japanese Yen |
DBAB | Sell | 8,368,505,770 | 71,452,406 | 1/30/17 | — | (10,263,615 | ) | ||||||||||||||||||||||||
| Japanese Yen |
HSBC | Sell | 1,162,462,488 | 9,927,092 | 1/31/17 | — | (1,424,466 | ) | ||||||||||||||||||||||||
| Euro |
BZWS | Sell | 7,003,000 | 7,935,274 | 2/08/17 | 94,202 | — | |||||||||||||||||||||||||
| Japanese Yen |
JPHQ | Sell | 1,719,500,000 | 14,857,666 | 2/08/17 | — | (1,938,750 | ) | ||||||||||||||||||||||||
| Japanese Yen |
SCNY | Sell | 1,720,000,000 | 14,894,096 | 2/08/17 | — | (1,907,204 | ) | ||||||||||||||||||||||||
| Euro |
CITI | Sell | 6,572,000 | 7,450,118 | 2/09/17 | 91,335 | — | |||||||||||||||||||||||||
| Euro |
GSCO | Sell | 2,045,000 | 2,308,396 | 2/09/17 | 18,574 | — | |||||||||||||||||||||||||
| Japanese Yen |
BZWS | Sell | 1,720,220,000 | 14,916,280 | 2/09/17 | — | (1,887,836 | ) | ||||||||||||||||||||||||
| Japanese Yen |
CITI | Sell | 366,860,000 | 3,181,787 | 2/09/17 | — | (401,917 | ) | ||||||||||||||||||||||||
| Japanese Yen |
JPHQ | Sell | 1,723,960,000 | 14,912,633 | 2/09/17 | — | (1,928,018 | ) | ||||||||||||||||||||||||
| Euro |
DBAB | Sell | 1,738,000 | 1,957,544 | 2/10/17 | 11,399 | — | |||||||||||||||||||||||||
| Euro |
HSBC | Sell | 1,800,000 | 2,025,432 | 2/10/17 | 9,861 | — | |||||||||||||||||||||||||
| Euro |
BZWS | Sell | 6,341,000 | 7,266,152 | 2/13/17 | 164,905 | — | |||||||||||||||||||||||||
| Euro |
GSCO | Sell | 2,038,000 | 2,324,074 | 2/16/17 | 41,461 | — | |||||||||||||||||||||||||
| Euro |
SCNY | Sell | 657,000 | 748,606 | 2/16/17 | 12,748 | — | |||||||||||||||||||||||||
| Japanese Yen |
CITI | Sell | 2,056,230,000 | 18,507,416 | 2/16/17 | — | (1,584,627 | ) | ||||||||||||||||||||||||
| Japanese Yen |
GSCO | Sell | 1,205,250,280 | 10,779,075 | 2/16/17 | — | (997,788 | ) | ||||||||||||||||||||||||
| Japanese Yen |
HSBC | Sell | 1,035,240,000 | 9,188,657 | 2/16/17 | — | (926,985 | ) | ||||||||||||||||||||||||
| Japanese Yen |
JPHQ | Sell | 1,034,700,000 | 9,137,311 | 2/16/17 | — | (973,054 | ) | ||||||||||||||||||||||||
| Malaysian Ringgit |
HSBC | Buy | 4,899,000 | 1,146,904 | 2/21/17 | 59,811 | — | |||||||||||||||||||||||||
| Euro |
BZWS | Sell | 9,798,000 | 11,006,583 | 2/22/17 | 29,971 | — | |||||||||||||||||||||||||
| Japanese Yen |
BZWS | Sell | 343,460,000 | 3,106,268 | 2/27/17 | — | (251,250 | ) | ||||||||||||||||||||||||
| Japanese Yen |
HSBC | Sell | 1,131,678,000 | 10,219,095 | 2/27/17 | — | (843,705 | ) | ||||||||||||||||||||||||
| Euro |
BOFA | Sell | 2,694,506 | 3,004,590 | 2/28/17 | — | (14,755 | ) | ||||||||||||||||||||||||
| Euro |
DBAB | Sell | 1,530,900 | 1,708,714 | 2/28/17 | — | (6,745 | ) | ||||||||||||||||||||||||
| Euro |
DBAB | Sell | 2,579,651 | 2,881,651 | 3/01/17 | — | (9,107 | ) | ||||||||||||||||||||||||
| Japanese Yen |
DBAB | Sell | 229,660,000 | 2,063,933 | 3/01/17 | — | (181,303 | ) | ||||||||||||||||||||||||
| Japanese Yen |
JPHQ | Sell | 848,300,000 | 7,609,846 | 3/03/17 | — | (684,090 | ) | ||||||||||||||||||||||||
| Japanese Yen |
HSBC | Sell | 400,800,000 | 3,569,012 | 3/06/17 | — | (350,128 | ) | ||||||||||||||||||||||||
| Euro |
DBAB | Sell | 1,536,000 | 1,702,687 | 3/07/17 | — | (18,963 | ) | ||||||||||||||||||||||||
| Malaysian Ringgit |
JPHQ | Buy | 14,772,000 | 3,578,142 | 3/20/17 | 56,341 | — | |||||||||||||||||||||||||
| Malaysian Ringgit |
HSBC | Buy | 36,880,000 | 8,974,328 | 3/22/17 | 98,813 | — | |||||||||||||||||||||||||
| Japanese Yen |
JPHQ | Sell | 285,510,329 | 2,593,756 | 3/24/17 | — | (200,045 | ) | ||||||||||||||||||||||||
| Philippine Peso |
JPHQ | Buy | 17,950,000 | 377,061 | 3/29/17 | — | (231 | ) | ||||||||||||||||||||||||
| Japanese Yen |
JPHQ | Sell | 172,207,000 | 1,537,617 | 3/31/17 | — | (147,982 | ) | ||||||||||||||||||||||||
| Malaysian Ringgit |
HSBC | Buy | 7,790,000 | 1,927,979 | 3/31/17 | — | (12,219 | ) | ||||||||||||||||||||||||
| Malaysian Ringgit |
JPHQ | Buy | 3,956,000 | 1,010,447 | 4/11/17 | — | (38,007 | ) | ||||||||||||||||||||||||
| Japanese Yen |
CITI | Sell | 261,800,000 | 2,460,526 | 4/13/17 | — | (103,523 | ) | ||||||||||||||||||||||||
| Japanese Yen |
BOFA | Sell | 700,840,000 | 6,516,817 | 4/18/17 | — | (348,699 | ) | ||||||||||||||||||||||||
| Japanese Yen |
JPHQ | Sell | 1,233,160,000 | 11,517,702 | 4/20/17 | — | (563,571 | ) | ||||||||||||||||||||||||
| Japanese Yen |
JPHQ | Sell | 917,650,000 | 8,509,247 | 4/21/17 | — | (481,376 | ) | ||||||||||||||||||||||||
| South Korean Won |
HSBC | Sell | 46,898,000,000 | 41,144,010 | 4/25/17 | 510,334 | — | |||||||||||||||||||||||||
| South Korean Won |
HSBC | Sell | 13,067,000,000 | 11,402,766 | 4/26/17 | 81,179 | — | |||||||||||||||||||||||||
| Indonesian Rupiah |
JPHQ | Buy | 1,721,000,000,000 | 122,316,987 | 5/03/17 | 1,237,891 | — | |||||||||||||||||||||||||
| Japanese Yen |
BOFA | Sell | 1,105,661,700 | 10,312,085 | 5/18/17 | — | (533,720 | ) | ||||||||||||||||||||||||
| Japanese Yen |
CITI | Sell | 1,104,534,000 | 10,296,525 | 5/18/17 | — | (538,217 | ) | ||||||||||||||||||||||||
| Japanese Yen |
BOFA | Sell | 1,102,846,375 | 10,244,741 | 5/19/17 | — | (573,933 | ) | ||||||||||||||||||||||||
| Japanese Yen |
HSBC | Sell | 1,106,730,400 | 10,280,821 | 5/19/17 | — | (575,955 | ) | ||||||||||||||||||||||||
| Japanese Yen |
BOFA | Sell | 1,105,842,500 | 10,234,033 | 5/22/17 | — | (615,496 | ) | ||||||||||||||||||||||||
| Japanese Yen |
JPHQ | Sell | 715,709,000 | 6,644,716 | 5/22/17 | — | (377,175 | ) | ||||||||||||||||||||||||
| Malaysian Ringgit |
HSBC | Buy | 298,500 | 72,224 | 5/23/17 | 1,025 | — | |||||||||||||||||||||||||
| Japanese Yen |
CITI | Sell | 1,370,500,000 | 12,982,646 | 6/08/17 | — | (473,748 | ) | ||||||||||||||||||||||||
| Japanese Yen |
CITI | Sell | 310,702,000 | 2,980,098 | 6/16/17 | — | (71,660 | ) | ||||||||||||||||||||||||
| TGB-20 | Semiannual Report |
FRANKLIN TEMPLETON VARIABLE INSURANCE PRODUCTS TRUST
STATEMENT OF INVESTMENTS (UNAUDITED)
Templeton Global Bond VIP Fund (continued)
| Forward Exchange Contracts | ||||||||||||||||||||||||||||||||
| Currency | Counterpartya | Type | Quantity | Contract Amount* |
Settlement Date |
Unrealized Appreciation |
Unrealized Depreciation |
|||||||||||||||||||||||||
| OTC Forward Exchange Contracts (continued) | ||||||||||||||||||||||||||||||||
| Japanese Yen |
JPHQ | Sell | 702,800,000 | 6,738,029 | 6/16/17 | $ | — | $ | (164,969 | ) | ||||||||||||||||||||||
| Japanese Yen |
DBAB | Sell | 1,453,310,000 | 13,915,662 | 6/19/17 | — | (360,875 | ) | ||||||||||||||||||||||||
| Japanese Yen |
CITI | Sell | 1,086,780,000 | 10,588,528 | 6/20/17 | — | (87,896 | ) | ||||||||||||||||||||||||
| Philippine Peso |
JPHQ | Buy | 251,010,000 | 5,332,696 | 6/21/17 | — | (82,395 | ) | ||||||||||||||||||||||||
| Japanese Yen |
DBAB | Sell | 1,455,820,000 | 14,145,161 | 6/22/17 | — | (157,963 | ) | ||||||||||||||||||||||||
|
|
|
|||||||||||||||||||||||||||||||
| Total Forward Exchange Contracts |
|
$ | 26,393,217 | $ | (121,021,815 | ) | ||||||||||||||||||||||||||
|
|
|
|||||||||||||||||||||||||||||||
| Net unrealized appreciation (depreciation) |
|
$ | (94,628,598 | ) | ||||||||||||||||||||||||||||
|
|
|
|||||||||||||||||||||||||||||||
aMay be comprised of multiple contracts with the same counterparty, currency and settlement date.
*In U.S. dollars unless otherwise indicated.
See Abbreviations on page TGB-37.
| The accompanying notes are an integral part of these financial statements. | Semiannual Report | TGB-21 |
FRANKLIN TEMPLETON VARIABLE INSURANCE PRODUCTS TRUST
STATEMENT OF INVESTMENTS (UNAUDITED)
Templeton Global Bond VIP Fund (continued)
At June 30, 2016, the Fund had the following interest rate swap contracts outstanding. See Note 1(d).
| Interest Rate Swap Contracts | ||||||||||||||||||||
| Description | Counterparty / Exchange |
Notional Amount |
Expiration Date |
Unrealized Appreciation |
Unrealized Depreciation |
|||||||||||||||
| Centrally Cleared Swap Contracts | ||||||||||||||||||||
| Receive Floating rate 3-month USD BBA LIBOR |
LCH | $ | 183,490,000 | 10/17/17 | $ | — | $ | (660,008 | ) | |||||||||||
| Receive Floating rate 3-month USD BBA LIBOR |
CME | 13,090,000 | 10/04/23 | — | (1,542,641 | ) | ||||||||||||||
| Receive Floating rate 3-month USD BBA LIBOR |
CME | 13,090,000 | 10/04/23 | — | (1,561,802 | ) | ||||||||||||||
| Receive Floating rate 3-month USD BBA LIBOR |
CME | 13,090,000 | 10/07/23 | — | (1,532,664 | ) | ||||||||||||||
| Receive Floating rate 3-month USD BBA LIBOR |
LCH | 34,000,000 | 7/07/24 | — | (4,349,405 | ) | ||||||||||||||
| Receive Floating rate 3-month USD BBA LIBOR |
LCH | 114,670,000 | 1/22/25 | — | (6,871,359 | ) | ||||||||||||||
| Receive Floating rate 3-month USD BBA LIBOR |
LCH | 143,340,000 | 1/23/25 | — | (9,263,673 | ) | ||||||||||||||
| Receive Floating rate 3-month USD BBA LIBOR |
LCH | 84,590,000 | 1/27/25 | — | (5,486,360 | ) | ||||||||||||||
| Receive Floating rate 3-month USD BBA LIBOR |
LCH | 21,150,000 | 1/29/25 | — | (1,304,134 | ) | ||||||||||||||
| Receive Floating rate 3-month USD BBA LIBOR |
LCH | 17,910,000 | 1/30/25 | — | (1,108,943 | ) | ||||||||||||||
| Receive Floating rate 3-month USD BBA LIBOR |
LCH | 28,210,000 | 2/03/25 | — | (1,438,799 | ) | ||||||||||||||
| Receive Floating rate 3-month USD BBA LIBOR |
CME | 6,370,000 | 10/04/43 | — | (2,731,909 | ) | ||||||||||||||
| Receive Floating rate 3-month USD BBA LIBOR |
CME | 6,370,000 | 10/04/43 | — | (2,759,338 | ) | ||||||||||||||
| Receive Floating rate 3-month USD BBA LIBOR |
CME | 6,370,000 | 10/07/43 | — | (2,740,936 | ) | ||||||||||||||
|
|
|
|||||||||||||||||||
| Total Centrally Cleared Swap Contracts |
|
— | (43,351,971 | ) | ||||||||||||||||
|
|
|
|||||||||||||||||||
| OTC Swap Contracts | ||||||||||||||||||||
| Receive Floating rate 3-month USD BBA LIBOR |
JPHQ | 3,240,000 | 3/04/21 | — | (423,880 | ) | ||||||||||||||
| Receive Floating rate 3-month USD BBA LIBOR |
DBAB | 14,630,000 | 3/28/21 | — | (1,885,719 | ) | ||||||||||||||
| Receive Floating rate 3-month USD BBA LIBOR |
CITI | 7,460,000 | 2/25/41 | — | (4,120,780 | ) | ||||||||||||||
| Receive Floating rate 3-month USD BBA LIBOR |
JPHQ | 7,460,000 | 2/25/41 | — | (4,125,040 | ) | ||||||||||||||
| Receive Floating rate 3-month USD BBA LIBOR |
JPHQ | 5,600,000 | 2/28/41 | — | (3,069,988 | ) | ||||||||||||||
| Receive Floating rate 3-month USD BBA LIBOR |
JPHQ | 1,870,000 | 3/01/41 | — | (1,013,233 | ) | ||||||||||||||
|
|
|
|||||||||||||||||||
| Total OTC Swap Contracts |
|
— | (14,638,640 | ) | ||||||||||||||||
|
|
|
|||||||||||||||||||
| Total Interest Rate Swap Contracts |
|
— | (57,990,611 | ) | ||||||||||||||||
|
|
|
|||||||||||||||||||
| Net unrealized appreciation (depreciation) |
|
$ | (57,990,611 | ) | ||||||||||||||||
|
|
|
|||||||||||||||||||
See Abbreviations on page TGB-37.
| TGB-22 | Semiannual Report |
FRANKLIN TEMPLETON VARIABLE INSURANCE PRODUCTS TRUST
Financial Statements
Statement of Assets and Liabilities
June 30, 2016 (unaudited)
| Templeton Global Bond VIP Fund |
||||
| Assets: |
||||
| Investments in securities: |
||||
| Cost - Unaffiliated issuers |
$ | 2,557,647,922 | ||
| Cost - Non-controlled affiliates (Note 3e) |
409,277,955 | |||
| Cost - Repurchase agreements |
256,694,916 | |||
|
|
|
|||
| Total cost of investments |
$ | 3,223,620,793 | ||
|
|
|
|||
| Value - Unaffiliated issuers |
$ | 2,456,567,869 | ||
| Value - Non-controlled affiliates (Note 3e) |
409,277,955 | |||
| Value - Repurchase agreements |
256,694,916 | |||
|
|
|
|||
| Total value of investments |
3,122,540,740 | |||
| Cash |
29,974,182 | |||
| Restricted cash (Note 1e) |
1,600,000 | |||
| Foreign currency, at value (cost $4,964,407) |
4,990,093 | |||
| Receivables: |
||||
| Investment securities sold |
6,752,572 | |||
| Capital shares sold |
3,131,452 | |||
| Interest |
33,722,605 | |||
| Due from brokers |
135,469,596 | |||
| Variation margin |
841,495 | |||
| Unrealized appreciation on OTC forward exchange contracts |
26,393,217 | |||
| Other assets |
1,549 | |||
|
|
|
|||
| Total assets |
3,365,417,501 | |||
|
|
|
|||
| Liabilities: |
||||
| Payables: |
||||
| Capital shares redeemed |
1,655,124 | |||
| Management fees |
1,084,565 | |||
| Distribution fees |
1,233,441 | |||
| Due to Brokers |
1,600,000 | |||
| Unrealized depreciation on OTC forward exchange contracts |
121,021,815 | |||
| Unrealized depreciation on OTC swap contracts |
14,638,640 | |||
| Deferred tax |
2,704,577 | |||
| Accrued expenses and other liabilities |
1,247,241 | |||
|
|
|
|||
| Total liabilities |
145,185,403 | |||
|
|
|
|||
| Net assets, at value |
$ | 3,220,232,098 | ||
|
|
|
|||
| Net assets consist of: |
||||
| Paid-in capital |
$ | 3,609,495,955 | ||
| Undistributed net investment income |
16,213,348 | |||
| Net unrealized appreciation (depreciation) |
(254,899,959 | ) | ||
| Accumulated net realized gain (loss) |
(150,577,246 | ) | ||
|
|
|
|||
| Net assets, at value |
$ | 3,220,232,098 | ||
|
|
|
|||
| The accompanying notes are an integral part of these financial statements. | Semiannual Report | TGB-23 |
FRANKLIN TEMPLETON VARIABLE INSURANCE PRODUCTS TRUST
FINANCIAL STATEMENTS
Statement of Assets and Liabilities (continued)
June 30, 2016 (unaudited)
| Templeton Global Bond VIP Fund |
||||
| Class 1: | ||||
| Net assets, at value |
$ | 278,296,990 | ||
|
|
|
|||
| Shares outstanding |
17,342,308 | |||
|
|
|
|||
| Net asset value and maximum offering price per share |
$ | 16.05 | ||
|
|
|
|||
| Class 2: | ||||
| Net assets, at value |
$ | 2,845,199,990 | ||
|
|
|
|||
| Shares outstanding |
183,652,651 | |||
|
|
|
|||
| Net asset value and maximum offering price per share |
$ | 15.49 | ||
|
|
|
|||
| Class 4: | ||||
| Net assets, at value |
$ | 96,735,118 | ||
|
|
|
|||
| Shares outstanding |
6,099,715 | |||
|
|
|
|||
| Net asset value and maximum offering price per share |
$ | 15.86 | ||
|
|
|
|||
| TGB-24 | Semiannual Report | The accompanying notes are an integral part of these financial statements. |
FRANKLIN TEMPLETON VARIABLE INSURANCE PRODUCTS TRUST
FINANCIAL STATEMENTS
Statement of Operations
for the six months ended June 30, 2016 (unaudited)
| Templeton Global Bond VIP Fund |
||||
| Investment income: |
||||
| Interest (net of foreign taxes $2,033,094) |
$ | 62,874,141 | ||
| Inflation principal adjustments |
4,162,464 | |||
|
|
|
|||
| Total investment income |
67,036,605 | |||
|
|
|
|||
| Expenses: |
||||
| Management fees (Note 3a) |
7,336,218 | |||
| Distribution fees: (Note 3c) |
||||
| Class 2 |
3,537,960 | |||
| Class 4 |
171,420 | |||
| Custodian fees (Note 4) |
636,673 | |||
| Reports to shareholders |
213,242 | |||
| Professional fees |
70,147 | |||
| Trustees’ fees and expenses |
7,898 | |||
| Other |
82,559 | |||
|
|
|
|||
| Total expenses |
12,056,117 | |||
| Expense reductions (Note 4) |
(16,136 | ) | ||
| Expenses waived/paid by affiliates (Note 3e) |
(629,909 | ) | ||
|
|
|
|||
| Net expenses |
11,410,072 | |||
|
|
|
|||
| Net investment income |
55,626,533 | |||
|
|
|
|||
| Realized and unrealized gains (losses): |
||||
| Net realized gain (loss) from: |
||||
| Investments |
(80,174,616 | ) | ||
| Foreign currency transactions |
(65,130,361 | ) | ||
| Swap contracts |
(5,253,316 | ) | ||
|
|
|
|||
| Net realized gain (loss) |
(150,558,293 | ) | ||
|
|
|
|||
| Net change in unrealized appreciation (depreciation) on: |
||||
| Investments |
190,576,925 | |||
| Translation of other assets and liabilities denominated in foreign currencies |
(114,540,381 | ) | ||
| Swap contracts |
(42,663,972 | ) | ||
| Change in deferred taxes on unrealized appreciation |
(1,318,225 | ) | ||
|
|
|
|||
| Net change in unrealized appreciation (depreciation) |
32,054,347 | |||
|
|
|
|||
| Net realized and unrealized gain (loss) |
(118,503,946 | ) | ||
|
|
|
|||
| Net increase (decrease) in net assets resulting from operations |
$ | (62,877,413 | ) | |
|
|
|
|||
| The accompanying notes are an integral part of these financial statements. | Semiannual Report | TGB-25 |
FRANKLIN TEMPLETON VARIABLE INSURANCE PRODUCTS TRUST
FINANCIAL STATEMENTS
Statements of Changes in Net Assets
| Templeton Global Bond VIP Fund | ||||||||
| Six Months Ended June 30, 2016 |
Year Ended December 31, 2015 |
|||||||
| Increase (decrease) in net assets: |
||||||||
| Operations: |
||||||||
| Net investment income |
$ | 55,626,533 | $ | 97,606,372 | ||||
| Net realized gain (loss) |
(150,558,293 | ) | 69,448,149 | |||||
| Net change in unrealized appreciation (depreciation) |
32,054,347 | (322,119,799 | ) | |||||
|
|
|
|||||||
| Net increase (decrease) in net assets resulting from operations |
(62,877,413 | ) | (155,065,278 | ) | ||||
|
|
|
|||||||
| Distributions to shareholders from: |
||||||||
| Net investment income and net foreign currency gains: |
||||||||
| Class 1 |
— | (24,254,176 | ) | |||||
| Class 2 |
— | (245,964,961 | ) | |||||
| Class 4 |
— | (8,346,133 | ) | |||||
| Net realized gains: |
||||||||
| Class 1 |
(230,623 | ) | (1,526,914 | ) | ||||
| Class 2 |
(2,445,769 | ) | (15,975,209 | ) | ||||
| Class 4 |
(81,295 | ) | (550,981 | ) | ||||
|
|
|
|||||||
| Total distributions to shareholders |
(2,757,687 | ) | (296,618,374 | ) | ||||
|
|
|
|||||||
| Capital share transactions: (Note 2) |
||||||||
| Class 1 |
(9,159,882 | ) | 8,052,024 | |||||
| Class 2 |
(68,229,811 | ) | 193,114,598 | |||||
| Class 4 |
(4,257,897 | ) | 5,703,235 | |||||
|
|
|
|||||||
| Total capital share transactions |
(81,647,590 | ) | 206,869,857 | |||||
|
|
|
|||||||
| Net increase (decrease) in net assets |
(147,282,690 | ) | (244,813,795 | ) | ||||
| Net assets: |
||||||||
| Beginning of period |
3,367,514,788 | 3,612,328,583 | ||||||
|
|
|
|||||||
| End of period |
$ | 3,220,232,098 | $ | 3,367,514,788 | ||||
|
|
|
|||||||
| Undistributed net investment income (distributions in excess of net investment income) included in net assets: |
||||||||
| End of period |
$ | 16,213,348 | $ | (39,413,185 | ) | |||
|
|
|
|||||||
| TGB-26 | Semiannual Report | The accompanying notes are an integral part of these financial statements. |
FRANKLIN TEMPLETON VARIABLE INSURANCE PRODUCTS TRUST
Notes to Financial Statements (unaudited)
Templeton Global Bond VIP Fund
| Semiannual Report | TGB-27 |
FRANKLIN TEMPLETON VARIABLE INSURANCE PRODUCTS TRUST
NOTES TO FINANCIAL STATEMENTS (UNAUDITED)
Templeton Global Bond VIP Fund (continued)
1. Organization and Significant Accounting Policies (continued)
b. Foreign Currency Translation
Portfolio securities and other assets and liabilities denominated in foreign currencies are translated into U.S. dollars based on the exchange rate of such currencies against U.S. dollars on the date of valuation. The Fund may enter into foreign currency exchange contracts to facilitate transactions denominated in a foreign currency. Purchases and sales of securities, income and expense items denominated in foreign currencies are translated into U.S. dollars at the exchange rate in effect on the transaction date. Portfolio securities and assets and liabilities denominated in foreign currencies contain risks that those currencies will decline in value relative to the U.S. dollar. Occasionally, events may impact the availability or reliability of foreign exchange rates used to convert the U.S. dollar equivalent value. If such an event occurs, the foreign exchange rate will be valued at fair value using procedures established and approved by the Board.
The Fund does not separately report the effect of changes in foreign exchange rates from changes in market prices on securities held. Such changes are included in net realized and unrealized gain or loss from investments in the Statement of Operations.
Realized foreign exchange gains or losses arise from sales of foreign currencies, currency gains or losses realized between the trade and settlement dates on securities transactions and the difference between the recorded amounts of dividends, interest, and foreign withholding taxes and the U.S. dollar equivalent of the amounts actually received or paid. Net unrealized foreign exchange gains and losses arise from changes in foreign exchange rates on foreign denominated assets and liabilities other than investments in securities held at the end of the reporting period.
c. Joint Repurchase Agreement
The Fund enters into a joint repurchase agreement whereby its uninvested cash balance is deposited into a joint cash account with other funds managed by the investment manager or an affiliate of the investment manager and is used to invest in one or more repurchase agreements. The value and face amount of the joint repurchase agreement are allocated to the funds based on their pro-rata interest. A repurchase agreement is accounted for as a loan by the Fund to the seller, collateralized by securities which are delivered to the Fund’s custodian. The fair
value, including accrued interest, of the initial collateralization is required to be at least 102% of the dollar amount invested by the funds, with the value of the underlying securities marked to market daily to maintain coverage of at least 100%. Repurchase agreements are subject to the terms of Master Repurchase Agreements (MRAs) with approved counterparties (sellers). The MRAs contain various provisions, including but not limited to events of default and maintenance of collateral for repurchase agreements. In the event of default by either the seller or the Fund, certain MRAs may permit the non-defaulting party to net and close-out all transactions, if any, traded under such agreements. The Fund may sell securities it holds as collateral and apply the proceeds towards the repurchase price and any other amounts owed by the seller to the Fund in the event of default by the seller. This could involve costs or delays in addition to a loss on the securities if their value falls below the repurchase price owed by the seller. The joint repurchase agreement held by the Fund at period end, as indicated in the Statement of Investments, had been entered into on June 30, 2016.
d. Derivative Financial Instruments
The Fund invested in derivatives in order to manage risk or gain exposure to various other investments or markets. Derivatives are financial contracts based on an underlying or notional amount, require no initial investment or an initial net investment that is smaller than would normally be required to have a similar response to changes in market factors, and require or permit net settlement. Derivatives contain various risks including the potential inability of the counterparty to fulfill their obligations under the terms of the contract, the potential for an illiquid secondary market, and/or the potential for market movements which expose the Fund to gains or losses in excess of the amounts shown in the Statement of Assets and Liabilities. Realized gain and loss and unrealized appreciation and depreciation on these contracts for the period are included in the Statement of Operations.
Derivative counterparty credit risk is managed through a formal evaluation of the creditworthiness of all potential counterparties. The Fund attempts to reduce its exposure to counterparty credit risk on OTC derivatives, whenever possible, by entering into International Swaps and Derivatives Association (ISDA) master agreements with certain counterparties. These agreements contain various provisions, including but not limited to collateral requirements, events of default, or early termination. Termination events applicable to the counterparty include
| TGB-28 | Semiannual Report |
FRANKLIN TEMPLETON VARIABLE INSURANCE PRODUCTS TRUST
NOTES TO FINANCIAL STATEMENTS (UNAUDITED)
Templeton Global Bond VIP Fund (continued)
| Semiannual Report | TGB-29 |
FRANKLIN TEMPLETON VARIABLE INSURANCE PRODUCTS TRUST
NOTES TO FINANCIAL STATEMENTS (UNAUDITED)
Templeton Global Bond VIP Fund (continued)
1. Organization and Significant Accounting Policies (continued)
g. Income and Deferred Taxes
It is the Fund’s policy to qualify as a regulated investment company under the Internal Revenue Code. The Fund intends to distribute to shareholders substantially all of its taxable income and net realized gains to relieve it from federal income and if applicable, excise taxes. As a result, no provision for U.S. federal income taxes is required.
The Fund may be subject to foreign taxation related to income received, capital gains on the sale of securities and certain foreign currency transactions in the foreign jurisdictions in which it invests. Foreign taxes, if any, are recorded based on the tax regulations and rates that exist in the foreign markets in which the Fund invests. When a capital gain tax is determined to apply, the Fund records an estimated deferred tax liability in an amount that would be payable if the securities were disposed of on the valuation date.
The Fund may recognize an income tax liability related to its uncertain tax positions under U.S. GAAP when the uncertain tax position has a less than 50% probability that it will be sustained upon examination by the tax authorities based on its technical merits. As of June 30, 2016, the Fund has determined that no tax liability is required in its financial statements related to uncertain tax positions for any open tax years (or expected to be taken in future tax years). Open tax years are those that remain subject to examination and are based on each tax jurisdiction’s statute of limitation.
h. Security Transactions, Investment Income, Expenses and Distributions
Security transactions are accounted for on trade date. Realized gains and losses on security transactions are determined on a specific identification basis. Interest income and estimated expenses are accrued daily. Amortization of premium and accretion of discount on debt securities are included in interest income. Distributions to shareholders are recorded on the ex-dividend date and are determined according to income tax regulations (tax basis). Distributable earnings determined on a tax basis may differ from earnings recorded in accordance with U.S. GAAP. These differences may be permanent or temporary. Permanent differences are reclassified among capital accounts to reflect their tax character. These reclassifications have no
impact on net assets or the results of operations. Temporary differences are not reclassified, as they may reverse in subsequent periods.
Common expenses incurred by the Trust are allocated among the Funds based on the ratio of net assets of each Fund to the combined net assets of the Trust. Fund specific expenses are charged directly to the fund that incurred the expense.
Realized and unrealized gains and losses and net investment income, not including class specific expenses, are allocated daily to each class of shares based upon the relative proportion of net assets of each class. Differences in per share distributions, by class, are generally due to differences in class specific expenses.
Inflation-indexed bonds are adjusted for inflation through periodic increases or decreases in the security’s interest accruals, face amount, or principal redemption value, by amounts corresponding to the rate of inflation as measured by an index. Any increase or decrease in the face amount or principal redemption value will be included as inflation principal adjustments in the Statement of Operations.
i. Accounting Estimates
The preparation of financial statements in accordance with U.S. GAAP requires management to make estimates and assumptions that affect the reported amounts of assets and liabilities at the date of the financial statements and the amounts of income and expenses during the reporting period. Actual results could differ from those estimates.
j. Guarantees and Indemnifications
Under the Trust’s organizational documents, its officers and trustees are indemnified by the Trust against certain liabilities arising out of the performance of their duties to the Trust. Additionally, in the normal course of business, the Trust, on behalf of the Fund, enters into contracts with service providers that contain general indemnification clauses. The Trust’s maximum exposure under these arrangements is unknown as this would involve future claims that may be made against the Trust that have not yet occurred. Currently, the Trust expects the risk of loss to be remote.
| TGB-30 | Semiannual Report |
FRANKLIN TEMPLETON VARIABLE INSURANCE PRODUCTS TRUST
NOTES TO FINANCIAL STATEMENTS (UNAUDITED)
Templeton Global Bond VIP Fund (continued)
2. Shares of Beneficial Interest
At June 30, 2016, there were an unlimited number of shares authorized (without par value). Transactions in the Fund’s shares were as follows:
| Six Months Ended June 30, 2016 |
Year Ended December 31, 2015 |
|||||||||||||||||||
| Shares | Amount | Shares | Amount | |||||||||||||||||
| Class 1 Shares: | ||||||||||||||||||||
| Shares sold |
1,095,974 | $ | 17,496,721 | 3,348,667 | $ | 58,944,948 | ||||||||||||||
| Shares issued in reinvestment of distributions |
14,671 | 230,623 | 1,514,753 | 25,781,090 | ||||||||||||||||
| Shares redeemed |
(1,684,007 | ) | (26,887,226 | ) | (4,380,221 | ) | (76,674,014 | ) | ||||||||||||
|
|
|
|||||||||||||||||||
| Net increase (decrease) |
(573,362 | ) | $ | (9,159,882 | ) | 483,199 | $ | 8,052,024 | ||||||||||||
|
|
|
|||||||||||||||||||
| Class 2 Shares: | ||||||||||||||||||||
| Shares sold |
6,966,062 | $ | 107,599,786 | 15,666,500 | $ | 268,873,539 | ||||||||||||||
| Shares issued in reinvestment of distributions |
161,118 | 2,445,769 | 15,904,078 | 261,940,170 | ||||||||||||||||
| Shares redeemed |
(11,574,219 | ) | (178,275,366 | ) | (20,123,134 | ) | (337,699,111 | ) | ||||||||||||
|
|
|
|||||||||||||||||||
| Net increase (decrease) |
(4,447,039 | ) | $ | (68,229,811 | ) | 11,447,444 | $ | 193,114,598 | ||||||||||||
|
|
|
|||||||||||||||||||
| Class 4 Shares: | ||||||||||||||||||||
| Shares sold |
376,857 | $ | 5,953,469 | 1,068,838 | $ | 18,598,516 | ||||||||||||||
| Shares issued in reinvestment of distributions |
5,231 | 81,295 | 527,080 | 8,897,114 | ||||||||||||||||
| Shares redeemed |
(651,097 | ) | (10,292,661 | ) | (1,276,578 | ) | (21,792,395 | ) | ||||||||||||
|
|
|
|||||||||||||||||||
| Net increase (decrease) |
(269,009 | ) | $ | (4,257,897 | ) | 319,340 | $ | 5,703,235 | ||||||||||||
|
|
|
|||||||||||||||||||
3. Transactions with Affiliates
Franklin Resources, Inc. is the holding company for various subsidiaries that together are referred to as Franklin Templeton Investments. Certain officers and trustees of the Fund are also officers and/or directors of the following subsidiaries:
| Subsidiary | Affiliation | |
| Franklin Advisers, Inc. (Advisers) |
Investment manager | |
| Franklin Templeton Services, LLC (FT Services) |
Administrative manager | |
| Franklin Templeton Distributors, Inc. (Distributors) |
Principal underwriter | |
| Franklin Templeton Investor Services, LLC (Investor Services) |
Transfer agent |
a. Management Fees
The Fund pays an investment management fee to Advisers based on the average daily net assets of the Fund as follows:
| Annualized Fee Rate | Net Assets | |
| 0.625% |
Up to and including $100 million | |
| 0.500% |
Over $100 million, up to and including $250 million | |
| 0.450% |
Over $250 million, up to and including $7.5 billion | |
| 0.440% |
Over $7.5 billion, up to and including $10 billion | |
| 0.430% |
Over $10 billion, up to and including $12.5 billion | |
| 0.420% |
Over $12.5 billion, up to and including $15 billion | |
| 0.400% |
In excess of $15 billion |
For the period ended June 30, 2016, the effective management fee rate was 0.458% of the Fund’s average daily net assets.
| Semiannual Report | TGB-31 |
FRANKLIN TEMPLETON VARIABLE INSURANCE PRODUCTS TRUST
NOTES TO FINANCIAL STATEMENTS (UNAUDITED)
Templeton Global Bond VIP Fund (continued)
3. Transactions with Affiliates (continued)
b. Administrative Fees
Under an agreement with Advisers, FT Services provides administrative services to the Fund. The fee is paid by Advisers based on the Fund’s average daily net assets, and is not an additional expense of the Fund.
c. Distribution Fees
The Board has adopted distribution plans for Class 2 and Class 4 shares pursuant to Rule 12b-1 under the 1940 Act. Under the Fund’s compensation distribution plans, the Fund pays Distributors for costs incurred in connection with the servicing, sale and distribution of the Fund’s shares up to 0.25% and 0.35% per year of its average daily net assets of Class 2 and Class 4, respectively. The plan year, for purposes of monitoring compliance with the maximum annual plan rates, is February 1 through January 31.
d. Transfer Agent Fees
Investor Services, under terms of an agreement, performs shareholder servicing for the Fund and is not paid by the Fund for the services.
e. Investments in Affiliated Management Investment Companies
The Fund invests in one or more affiliated management investment companies for purposes other than exercising a controlling influence over the management or policies. Management fees paid by the Fund are waived on assets invested in the affiliated management investment companies, as noted in the Statement of Operations, in an amount not to exceed the management and administrative fees paid directly or indirectly by each affiliate.
| Number of Shares |
Gross Additions |
Gross Reductions |
Number of Shares End
of |
Value at End of |
Investment Income |
Realized Gain (Loss) |
% of Affiliated Fund Shares Outstanding Held at End of Period |
|||||||||||||||||||||||||
| Non-Controlled Affiliates | ||||||||||||||||||||||||||||||||
| Institutional Fiduciary Trust Money |
420,632,565 | 339,715,815 | (351,070,425 | ) | 409,277,955 | $ | 409,277,955 | $ | — | $ | — | 2.1% | ||||||||||||||||||||
|
|
|
|||||||||||||||||||||||||||||||
4. Expense Offset Arrangement
The Fund has entered into an arrangement with its custodian whereby credits realized as a result of uninvested cash balances are used to reduce a portion of the Fund’s custodian expenses. During the period ended June 30, 2016, the custodian fees were reduced as noted in the Statement of Operations.
5. Income Taxes
At June 30, 2016, the cost of investments and net unrealized appreciation (depreciation) for income tax purposes were as follows:
| Cost of investments |
$ | 3,242,512,437 | ||
|
|
|
|||
| Unrealized appreciation |
$ | 74,103,507 | ||
| Unrealized depreciation |
(194,075,204 | ) | ||
|
|
|
|||
| Net unrealized appreciation (depreciation) |
$ | (119,971,697 | ) | |
|
|
|
Differences between income and/or capital gains as determined on a book basis and a tax basis are primarily due to differing treatments of foreign currency transactions and inflation related adjustments on foreign securities.
6. Investment Transactions
Purchases and sales of investments (excluding short term securities) for the period ended June 30, 2016, aggregated $819,373,666 and $596,492,510, respectively.
| TGB-32 | Semiannual Report |
FRANKLIN TEMPLETON VARIABLE INSURANCE PRODUCTS TRUST
NOTES TO FINANCIAL STATEMENTS (UNAUDITED)
Templeton Global Bond VIP Fund (continued)
7. Credit Risk
At June 30, 2016, the Fund had 19.1% of its portfolio invested in high yield or other securities rated below investment grade. These securities may be more sensitive to economic conditions causing greater price volatility and are potentially subject to a greater risk of loss due to default than higher rated securities.
8. Concentration of Risk
Investing in foreign securities may include certain risks and considerations not typically associated with investing in U.S. securities, such as fluctuating currency values and changing local and regional economic, political and social conditions, which may result in greater market volatility. In addition, certain foreign securities may not be as liquid as U.S. securities.
9. Other Derivative Information
At June 30, 2016, the Fund’s investments in derivative contracts are reflected in the Statement of Assets and Liabilities as follows:
| Asset Derivatives |
Liability Derivatives |
|||||||||||
| Derivative Contracts Not Accounted for as Hedging Instruments |
Statement of Assets and Liabilities Location |
Fair Value | Statement of Assets and Liabilities Location |
Fair Value | ||||||||
| Interest rate contracts |
Variation margin | $ | — | a | Variation margin | $ | 43,351,971 | a | ||||
| Unrealized appreciation on OTC swap contracts |
— | Unrealized depreciation on OTC swap contracts |
14,638,640 | |||||||||
| Foreign exchange contracts |
Unrealized appreciation on OTC forward exchange contracts |
26,393,217 | Unrealized depreciation on OTC forward exchange contracts |
121,021,815 | ||||||||
| Value Recovery Instruments |
Investments in securities, at value |
9,855,268 | ||||||||||
|
|
|
|
|
|||||||||
| Totals |
$ | 36,248,485 | $ | 179,012,426 | ||||||||
|
|
|
|
|
|||||||||
aThis amount reflects the cumulative appreciation (depreciation) of centrally cleared swaps contracts as reported in the Statement of Investments. Only the variation margin receivable/payable at period end is separately reported within the Statement of Assets and Liabilities. Prior variation margin movements were recorded to cash upon receipt or payment.
For the period ended June 30, 2016, the effect of derivative contracts in the Fund’s Statement of Operations was as follows:
| Derivative Contracts Not Accounted for as Hedging Instruments |
Statement of Operations Locations |
Net Realized Gain (Loss) for the Period |
Statement of Operations Locations |
Net Change in Unrealized Appreciation (Depreciation) for the Period |
||||||||
| Net realized gain (loss) from: |
Net change in unrealized appreciation (depreciation) on: |
|||||||||||
| Interest rate contracts |
Swap contracts |
$ | (5,253,316 | ) | Swap contracts |
$ | (42,663,972 | ) | ||||
| Foreign exchange contracts |
Foreign currency transactions |
(59,110,552 | )a | Translation of other assets and liabilities denominated in foreign currencies |
(116,352,198 | )a | ||||||
| Value Recovery Instruments |
Investments |
— | Investments |
(2,248,351 | ) | |||||||
|
|
|
|
|
|||||||||
| Totals |
$ | (64,363,868 | ) | $ | (161,264,521 | ) | ||||||
|
|
|
|
|
|||||||||
aForward exchange contracts are included in net realized gain (loss) from foreign currency transactions and net change in unrealized appreciation (depreciation) on translation of other assets and liabilities denominated in foreign currencies in the Statement of Operations.
| Semiannual Report | TGB-33 |
FRANKLIN TEMPLETON VARIABLE INSURANCE PRODUCTS TRUST
NOTES TO FINANCIAL STATEMENTS (UNAUDITED)
Templeton Global Bond VIP Fund (continued)
9. Other Derivative Information (continued)
At June 30, 2016, the Fund’s OTC derivative assets and liabilities are as follows:
| Gross and Net Amounts of Assets and Liabilities Presented in the Statement of Assets and Liabilities |
||||||||
| Assetsa | Liabilitiesa | |||||||
| Derivatives | ||||||||
| Forward Exchange Contracts |
$ | 26,393,217 | $ | 121,021,815 | ||||
| Swap Contracts |
— | 14,638,640 | ||||||
|
|
|
|||||||
| Total |
$ | 26,393,217 | $ | 135,660,455 | ||||
|
|
|
|||||||
aAbsent an event of default or early termination, OTC derivative assets and liabilities are presented gross and not offset in the Statement of Assets and Liabilities.
At June 30, 2016, the Fund’s OTC derivative assets, which may be offset against the Fund’s OTC derivative liabilities and collateral received from the counterparty, are as follows:
| Amounts Not Offset in the Statement of Assets and Liabilities |
||||||||||||||||||||
| Gross and Net Amounts of Assets Presented in the Statement of Assets and Liabilities |
Financial Instruments Available for Offset |
Financial Instruments Collateral Received |
Cash Collateral Received |
Net Amount (Not less than zero) |
||||||||||||||||
| Counterparty | ||||||||||||||||||||
| BOFA |
$ | 2,753,423 | $ | (2,741,763 | ) | $ | — | $ | 630,000 | $ | 641,660 | |||||||||
| BZWS |
1,099,515 | (1,099,515 | ) | — | — | — | ||||||||||||||
| CITI |
1,534,647 | (1,534,647 | ) | — | — | — | ||||||||||||||
| DBAB |
4,186,118 | (4,186,118 | ) | — | — | — | ||||||||||||||
| GSCO |
2,715,610 | (2,715,610 | ) | — | 590,000 | 590,000 | ||||||||||||||
| HSBC |
7,418,291 | (7,418,291 | ) | — | — | — | ||||||||||||||
| JPHQ |
3,684,761 | (3,684,761 | ) | — | — | — | ||||||||||||||
| MSCO |
1,821,133 | (1,194,740 | ) | — | 380,000 | 1,006,393 | ||||||||||||||
| SCNY |
1,080,624 | (1,080,624 | ) | — | — | — | ||||||||||||||
| UBSW |
99,095 | — | — | — | 99,095 | |||||||||||||||
|
|
|
|||||||||||||||||||
| Total |
$ | 26,393,217 | $ | (25,656,069 | ) | $ | — | $ | 1,600,000 | $ | 2,337,148 | |||||||||
|
|
|
|||||||||||||||||||
| TGB-34 | Semiannual Report |
FRANKLIN TEMPLETON VARIABLE INSURANCE PRODUCTS TRUST
NOTES TO FINANCIAL STATEMENTS (UNAUDITED)
Templeton Global Bond VIP Fund (continued)
At June 30, 2016, the Fund’s OTC derivative liabilities, which may be offset against the Fund’s OTC derivative assets and collateral pledged to the counterparty, are as follows:
| Amounts Not Offset in the Statement of Assets and Liabilities |
||||||||||||||||||||
|
Gross and Net Assets and Liabilities |
Financial Instruments Available for Offset |
Financial Instruments Collateral Pledged |
Cash Collateral Pledgeda |
Net Amount (Not less than zero) |
||||||||||||||||
| Counterparty | ||||||||||||||||||||
| BOFA |
$ | 2,741,763 | $ | (2,741,763 | ) | $ | — | $ | — | $ | — | |||||||||
| BZWS |
14,983,119 | (1,099,515 | ) | — | (13,840,000 | ) | 43,604 | |||||||||||||
| CITI |
19,441,972 | (1,534,647 | ) | — | (17,907,325 | ) | — | |||||||||||||
| DBAB |
25,578,613 | (4,186,118 | ) | — | (21,392,495 | ) | — | |||||||||||||
| GSCO |
4,536,693 | (2,715,610 | ) | — | — | 1,821,083 | ||||||||||||||
| HSBC |
23,228,359 | (7,418,291 | ) | — | (13,830,000 | ) | 1,980,068 | |||||||||||||
| JPHQ |
39,594,579 | (3,684,761 | ) | — | (35,909,818 | ) | — | |||||||||||||
| MSCO |
1,194,740 | (1,194,740 | ) | — | — | — | ||||||||||||||
| SCNY |
4,360,617 | (1,080,624 | ) | — | (3,279,993 | ) | — | |||||||||||||
| UBSW |
— | — | — | — | — | |||||||||||||||
|
|
|
|||||||||||||||||||
| Total |
$ | 135,660,455 | $ | (25,656,069 | ) | $ | — | $ | (106,159,631 | ) | $ | 3,844,755 | ||||||||
|
|
|
|||||||||||||||||||
aIn some instances, the collateral amounts disclosed in the table above were adjusted due to the requirement to limit collateral amounts to avoid the effect of overcollateralization. Actual collateral received and/or pledged may be more than the amounts disclosed herein.
For the period ended June, 30 2016, the average month end fair value of derivatives represented 5.6% of average month end net assets. The average month end number of open derivative contracts for the period was 402.
See Note 1(d) regarding derivative financial instruments.
See Abbreviations on page TGB-37
10. Credit Facility
The Fund, together with other U.S. registered and foreign investment funds (collectively, Borrowers), managed by Franklin Templeton Investments, are borrowers in a joint syndicated senior unsecured credit facility totaling $2 billion (Global Credit Facility) which matures on February 10, 2017. This Global Credit Facility provides a source of funds to the Borrowers for temporary and emergency purposes, including the ability to meet future unanticipated or unusually large redemption requests.
Under the terms of the Global Credit Facility, the Fund shall, in addition to interest charged on any borrowings made by the Fund and other costs incurred by the Fund, pay its share of fees and expenses incurred in connection with the implementation and maintenance of the Global Credit Facility, based upon its relative share of the aggregate net assets of all of the Borrowers, including an annual commitment fee of 0.07% based upon the unused portion of the Global Credit Facility. Effective February 12, 2016, the annual commitment fee is 0.15%. These fees are reflected in other expenses in the Statement of Operations. During the period ended June 30, 2016, the Fund did not use the Global Credit Facility.
| Semiannual Report | TGB-35 |
FRANKLIN TEMPLETON VARIABLE INSURANCE PRODUCTS TRUST
NOTES TO FINANCIAL STATEMENTS (UNAUDITED)
Templeton Global Bond VIP Fund (continued)
11. Fair Value Measurements
The Fund follows a fair value hierarchy that distinguishes between market data obtained from independent sources (observable inputs) and the Fund’s own market assumptions (unobservable inputs). These inputs are used in determining the value of the Fund’s financial instruments and are summarized in the following fair value hierarchy:
| • | Level 1 – quoted prices in active markets for identical financial instruments |
| • | Level 2 – other significant observable inputs (including quoted prices for similar financial instruments, interest rates, prepayment speed, credit risk, etc.) |
| • | Level 3 – significant unobservable inputs (including the Fund’s own assumptions in determining the fair value of financial instruments) |
The input levels are not necessarily an indication of the risk or liquidity associated with financial instruments at that level.
For movements between the levels within the fair value hierarchy, the Fund has adopted a policy of recognizing the transfers as of the date of the underlying event which caused the movement.
A summary of inputs used as of June 30, 2016, in valuing the Fund’s assets and liabilities carried at fair value, is as follows:
| Level 1 | Level 2 | Level 3 | Total | |||||||||||||
| Assets: | ||||||||||||||||
| Investments in Securities: |
||||||||||||||||
| Foreign Government and Agency Securitiesa |
$ | — | $ | 2,355,886,298 | $ | — | $ | 2,355,886,298 | ||||||||
| Quasi-Sovereign and Corporate Bondsa |
— | 2,631,087 | — | 2,631,087 | ||||||||||||
| Short Term Investments |
409,277,955 | 354,745,400 | — | 764,023,355 | ||||||||||||
|
|
|
|||||||||||||||
| Total Investments in Securities |
$ | 409,277,955 | $ | 2,713,262,785 | $ | — | $ | 3,122,540,740 | ||||||||
|
|
|
|||||||||||||||
| Other Financial Instruments |
||||||||||||||||
| Forward Exchange Contracts |
$ | — | $ | 26,393,217 | $ | — | $ | 26,393,217 | ||||||||
|
|
|
|||||||||||||||
| Liabilities: | ||||||||||||||||
| Other Financial Instruments |
||||||||||||||||
| Forward Exchange Contracts |
$ | — | $ | 121,021,815 | $ | — | $ | 121,021,815 | ||||||||
| Swap Contracts |
— | 57,990,611 | — | 57,990,611 | ||||||||||||
|
|
|
|||||||||||||||
| Total Other Financial Instruments |
$ | — | $ | 179,012,426 | $ | — | $ | 179,012,426 | ||||||||
|
|
|
|||||||||||||||
aFor detailed categories, see the accompanying Statement of Investments.
12. Subsequent Events
The Fund has evaluated subsequent events through the issuance of the financial statements and determined that no events have occurred that require disclosure.
| TGB-36 | Semiannual Report |
FRANKLIN TEMPLETON VARIABLE INSURANCE PRODUCTS TRUST
NOTES TO FINANCIAL STATEMENTS (UNAUDITED)
Templeton Global Bond VIP Fund (continued)
Abbreviations
| Counterparty/Exchange | Currency | Selected Portfolio | ||||||||
| BOFA | Bank of America Corp. | BRL | Brazilian Real | BBA | British Bankers Association | |||||
| BZWS | Barclays Bank PLC | COP | Colombian Peso | FRN | Floating Rate Note | |||||
| CITI | Citigroup, Inc. | EUR | Euro | GDP | Gross Domestic Product | |||||
| CME | Chicago Mercantile Exchange | IDR | Indonesian Rupiah | LIBOR | London InterBank Offered Rate | |||||
| DBAB | Deutsche Bank AG | INR | Indian Rupee | VRI | Value Recovery Instrument | |||||
| GSCO | Goldman Sachs Group, Inc. | JPY | Japanese Yen | |||||||
| HSBC | HSBC Bank USA N.A. | KRW | South Korean Won | |||||||
| JPHQ | JP Morgan Chase & Co. | LKR | Sri Lankan Rupee | |||||||
| LCH | London Clearing House | MXN | Mexican Peso | |||||||
| MSCO | Morgan Stanley | MYR | Malaysian Ringgit | |||||||
| SCNY | Standard Chartered Bank | PEN | Peruvian Nuevo Sol | |||||||
| UBSW | UBS AG | PHP | Philippine Peso | |||||||
| PLN | Polish Zloty | |||||||||
| Semiannual Report | TGB-37 |
Templeton Growth VIP Fund
This semiannual report for Templeton Growth VIP Fund covers the period ended June 30, 2016.
Class 1 Performance Summary as of June 30, 2016
The Fund’s Class 1 shares had a -3.12% total return* for the six-month period ended June 30, 2016.
*The Fund has a fee waiver associated with any investment in a Franklin Templeton money fund and/or Franklin Templeton fund, as applicable, contractually guaranteed through at least the Fund’s current fiscal year-end. Fund investment results reflect the fee waiver, to the extent applicable; without this reduction, the results would have been lower.
Performance reflects the Fund’s Class 1 operating expenses, but does not include any contract fees, expenses or sales charges. If they had been included, performance would be lower. These charges and deductions, particularly for variable life policies, can have a significant effect on contract values and insurance benefits. See the contract prospectus for a complete description of these expenses, including sales charges.
Performance data represent past performance, which does not guarantee future results. Investment return and principal value will fluctuate, and you may have a gain or loss when you sell your shares. Current performance may differ from figures shown.
| Semiannual Report | TG-1 |
TEMPLETON GROWTH VIP FUND
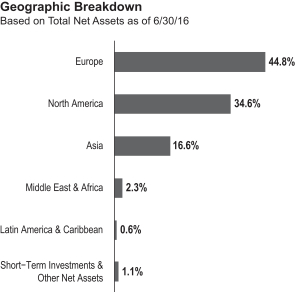
addition, global economic concerns and the U.K.’s historic referendum to leave the European Union (EU), also known as the “Brexit,” contributed to volatile global stock markets.
Oil prices fell at the beginning of the review period, largely due to strong global supply, but recovered in the period’s second half amid oilfield outages and continued demand growth. Meanwhile, commodity prices increased for most of the review period as oversupply for a host of commodities shrank and the market appeared to be on the path of rebalancing after hitting a glut-induced bottom earlier in the year. Gold prices continued to rise following the Brexit referendum as some investors turned to safe haven investing. The U.S. dollar generally depreciated against most currencies during the period, which increased returns of many foreign assets in U.S. dollar terms. In this environment, global developed market stocks overall, as measured by the MSCI World Index, rose slightly during the period.
The U.S. economy grew moderately, as measured by gross domestic product (GDP) in 2016’s first and second quarters, driven by consumer spending and exports. A decline in private inventory investment and nonresidential fixed investment contributed to the moderation. The Fed maintained its target interest rate during the review period after raising it for the first time in nine years at its December meeting. The Fed kept its target rate unchanged in its June meeting mainly due to a substantial slowdown in job additions toward period-end. The Fed expects economic conditions to evolve in a manner that could warrant only gradual increases in the federal funds rate.
1. Source: Morningstar. One cannot invest directly in an index, and an index is not representative of the Fund’s portfolio. Please see Index Descriptions following the Fund Summaries.
| TG-2 | Semiannual Report |
TEMPLETON GROWTH VIP FUND
company’s potential long-term earnings, asset value and cash flow. Among factors we may consider are a company’s historical value measures, including price/earnings ratio, profit margins and liquidation value. We do in-depth research to construct a bargain list from which we buy.
Manager’s Discussion
Global equities finished the period slightly higher during the period under review, recouping losses early in the period and weathering late volatility related to the U.K.’s Brexit referendum. Investors also evaluated modest economic improvements and sustained policy resolve against continued global deflationary pressures, Chinese financial volatility and mounting uncertainty about the future of Europe. The Fund trailed its benchmark, the MSCI ACWI, during the period as the increasingly uncertain, low-conviction environment continued to primarily favor expensive momentum stocks, pressuring the Fund’s value-oriented holdings.
At the sector level, stock selection and an overweighted allocation in the financials sector was among the Fund’s largest
2. Please see Index Descriptions following the Fund Summaries.
| Semiannual Report | TG-3 |
TEMPLETON GROWTH VIP FUND
3. The financials sector comprises banks, capital markets, consumer finance and insurance in the SOI.
4. The health care sector comprises biotechnology, health care equipment and supplies, life sciences tools and services, and pharmaceuticals in the SOI.
5. The industrials sector comprises aerospace and defense, air freight and logistics, airlines, commercial services and supplies, construction and engineering, industrial conglomerates and machinery in the SOI.
6. The consumer staples sector comprises food and staples retailing in the SOI.
7. The energy sector comprises energy equipment and services and oil, gas and consumable fuels in the SOI.
| TG-4 | Semiannual Report |
TEMPLETON GROWTH VIP FUND
8. The information technology sector comprises communications equipment; Internet software and services; software; and technology hardware, storage and peripherals in the SOI.
9. The consumer discretionary sector comprises auto components; automobiles; media; specialty retail; and textiles, apparel and luxury goods in the SOI. The materials sector comprises chemicals, construction materials, and metals and mining in the SOI.
| Semiannual Report | TG-5 |
TEMPLETON GROWTH VIP FUND
securities capable of generating superior investment returns over a long-term horizon.
Thank you for your participation in Templeton Growth VIP Fund. We look forward to serving your future investment needs.
The foregoing information reflects our analysis, opinions and portfolio holdings as of June 30, 2016, the end of the reporting period. The way we implement our main investment strategies and the resulting portfolio holdings may change depending on factors such as market and economic conditions. These opinions may not be relied upon as investment advice or an offer for a particular security. The information is not a complete analysis of every aspect of any market, country, industry, security or the Fund. Statements of fact are from sources considered reliable, but the investment manager makes no representation or warranty as to their completeness or accuracy. Although historical performance is no guarantee of future results, these insights may help you understand our investment management philosophy.
| TG-6 | Semiannual Report |
TEMPLETON GROWTH VIP FUND
Class 1 Fund Expenses
| Class 1 | Beginning Account Value 1/1/16 |
Ending Account Value 6/30/16 |
Fund-Level Expenses 1/1/16–6/30/16 |
|||||||||
| Actual |
$ | 1,000 | $ | 968.80 | $ | 4.01 | ||||||
| Hypothetical (5% return before expenses) |
$ | 1,000 | $ | 1,020.79 | $ | 4.12 | ||||||
*Expenses are calculated using the most recent six-month annualized expense ratio, net of expense waivers, for the Fund’s Class 1 shares (0.82%), which does not include any ongoing expenses of the Contract for which the Fund is an investment option, multiplied by the average account value over the period, multiplied by 182/366 to reflect the one-half year period.
| Semiannual Report | TG-7 |
SUPPLEMENT DATED JUNE 27, 2016
TO THE PROSPECTUSES DATED MAY 1, 2016
OF
TEMPLETON FOREIGN VIP FUND
TEMPLETON GROWTH VIP FUND
(Series of Franklin Templeton Variable Insurance Products Trust)
Effective June 30, 2016, the prospectus is amended as follows:
I. The benchmark for the Templeton Foreign VIP Fund has changed from the MSCI EAFE Index to the MSCI ACWI EX USA Index. The “Fund Summary – Performance – Average Annual Total Returns” table on page TF-S4 is revised to add the following:
| 1 Year | 5 Years | 10 Years | ||||||||||
| MSCI All Country World ex-US Index (index reflects no deduction for fees, expenses or taxes)1 |
-5.25% | 1.51% | 3.38% | |||||||||
| 1. | Performance figures as of December 31, 2015. The MSCI All Country World ex-US Index is replacing the MSCI EAFE Index as the Fund’s benchmark. The investment manager believes the composition of the MSCI All Country World ex-US Index more accurately reflects the Fund’s holdings. |
II. The benchmark for the Templeton Growth VIP Fund has changed from the MSCI World Index to the MSCI ACWI Index. The “Fund Summary – Performance – Average Annual Total Returns” table on page TG-S3 is revised to add the following:
| 1 Year | 5 Years | 10 Years | ||||||||||
| MSCI All Country World Index (index reflects no deduction for fees, expenses or taxes)1 |
-1.84% | 6.66% | 5.31% | |||||||||
| 1. | Performance figures as of December 31, 2015. The MSCI All Country World Index is replacing the MSCI World Index as the Fund’s benchmark. The investment manager believes the composition of the MSCI All Country World Index more accurately reflects the Fund’s holdings. |
Please keep this supplement with your prospectus for future reference.
| TG-8 |
FRANKLIN TEMPLETON VARIABLE INSURANCE PRODUCTS TRUST
Financial Highlights
Templeton Growth VIP Fund
|
Six Months Ended (unaudited) |
Year Ended December 31, | |||||||||||||||||||||||
| 2015 | 2014 | 2013 | 2012 | 2011 | ||||||||||||||||||||
| Class 1 | ||||||||||||||||||||||||
| Per share operating performance (for a share outstanding throughout the period) |
||||||||||||||||||||||||
| Net asset value, beginning of period |
$13.54 | $14.85 | $15.47 | $12.16 | $10.27 | $11.19 | ||||||||||||||||||
|
|
|
|||||||||||||||||||||||
| Income from investment operationsa: | ||||||||||||||||||||||||
| Net investment incomeb |
0.18 | 0.28 | 0.38 | c | 0.22 | 0.27 | 0.25 | |||||||||||||||||
| Net realized and unrealized gains (losses) |
(0.61 | ) | (1.17 | ) | (0.75 | ) | 3.49 | 1.88 | (0.99 | ) | ||||||||||||||
|
|
|
|||||||||||||||||||||||
| Total from investment operations |
(0.43 | ) | (0.89 | ) | (0.37 | ) | 3.71 | 2.15 | (0.74 | ) | ||||||||||||||
|
|
|
|||||||||||||||||||||||
| Less distributions from: | ||||||||||||||||||||||||
| Net investment income |
(0.31 | ) | (0.42 | ) | (0.25 | ) | (0.40 | ) | (0.26 | ) | (0.18 | ) | ||||||||||||
| Net realized gains |
(0.52 | ) | — | — | — | — | — | |||||||||||||||||
|
|
|
|||||||||||||||||||||||
| Total distributions |
(0.83 | ) | (0.42 | ) | (0.25 | ) | (0.40 | ) | (0.26 | ) | (0.18 | ) | ||||||||||||
|
|
|
|||||||||||||||||||||||
| Net asset value, end of period |
$12.28 | $13.54 | $14.85 | $15.47 | $12.16 | $10.27 | ||||||||||||||||||
|
|
|
|||||||||||||||||||||||
| Total returnd |
(3.12)% | (6.24)% | (2.53)% | 31.05% | 21.40% | (6.80)% | ||||||||||||||||||
| Ratios to average net assetse | ||||||||||||||||||||||||
| Expenses |
0.82% | f | 0.80% | f | 0.78% | 0.78% | g | 0.78% | g | 0.78% | g | |||||||||||||
| Net investment income |
2.78% | 1.96% | 2.46% | c | 1.62% | 2.31% | 2.22% | |||||||||||||||||
| Supplemental data | ||||||||||||||||||||||||
| Net assets, end of period (000’s) |
$431,610 | $468,548 | $572,860 | $588,409 | $476,954 | $1,200,682 | ||||||||||||||||||
| Portfolio turnover rate |
11.45% | 20.92% | 17.46% | 11.60% | 18.73% | h | 42.13% | h | ||||||||||||||||
aThe amount shown for a share outstanding throughout the period may not correlate with the Statement of Operations for the period due to the timing of sales and repurchases of the Fund’s shares in relation to income earned and/or fluctuating fair value of the investments of the Fund.
bBased on average daily shares outstanding.
cNet investment income per share includes approximately $0.09 per share related to income received in the form of special dividends in connection with certain Fund holdings. Excluding this amount, the ratio of net investment income to average net assets would have been 1.88%.
dTotal return does not include fees, charges or expenses imposed by the variable annuity and life insurance contracts for which Franklin Templeton Variable Insurance Products Trust serves as an underlying investment vehicle. Total return is not annualized for periods less than one year.
eRatios are annualized for periods less than one year.
fBenefit of waiver and payments by affiliates rounds to less than 0.01%.
gBenefit of expense reduction rounds to less than 0.01%.
hExcludes the value of portfolio securities delivered as a result of redemption in-kind.
| The accompanying notes are an integral part of these financial statements. | Semiannual Report | TG-9 |
FRANKLIN TEMPLETON VARIABLE INSURANCE PRODUCTS TRUST
FINANCIAL HIGHLIGHTS
Templeton Growth VIP Fund (continued)
| Six Months Ended (unaudited) |
Year Ended December 31, | |||||||||||||||||||||||
| 2015 | 2014 | 2013 | 2012 | 2011 | ||||||||||||||||||||
| Class 2 | ||||||||||||||||||||||||
| Per share operating performance (for a share outstanding throughout the period) |
||||||||||||||||||||||||
| Net asset value, beginning of period |
$13.32 | $14.61 | $15.23 | $11.97 | $10.11 | $11.01 | ||||||||||||||||||
|
|
|
|||||||||||||||||||||||
| Income from investment operationsa: | ||||||||||||||||||||||||
| Net investment incomeb |
0.16 | 0.25 | 0.34 | c | 0.19 | 0.21 | 0.21 | |||||||||||||||||
| Net realized and unrealized gains (losses) |
(0.60 | ) | (1.16 | ) | (0.75 | ) | 3.44 | 1.88 | (0.96 | ) | ||||||||||||||
|
|
|
|||||||||||||||||||||||
| Total from investment operations |
(0.44 | ) | (0.91 | ) | (0.41 | ) | 3.63 | 2.09 | (0.75 | ) | ||||||||||||||
|
|
|
|||||||||||||||||||||||
| Less distributions from: | ||||||||||||||||||||||||
| Net investment income |
(0.27 | ) | (0.38 | ) | (0.21 | ) | (0.37 | ) | (0.23 | ) | (0.15 | ) | ||||||||||||
| Net realized gains |
(0.52 | ) | — | — | — | — | — | |||||||||||||||||
|
|
|
|||||||||||||||||||||||
| Total distributions |
(0.79 | ) | (0.38 | ) | (0.21 | ) | (0.37 | ) | (0.23 | ) | (0.15 | ) | ||||||||||||
|
|
|
|||||||||||||||||||||||
| Net asset value, end of period |
$12.09 | $13.32 | $14.61 | $15.23 | $11.97 | $10.11 | ||||||||||||||||||
|
|
|
|||||||||||||||||||||||
| Total returnd |
(3.26)% | (6.49)% | (2.81)% | 30.82% | 21.07% | (6.97)% | ||||||||||||||||||
| Ratios to average net assetse | ||||||||||||||||||||||||
| Expenses |
1.07% | f | 1.05% | f | 1.03% | 1.03% | g | 1.03% | g | 1.03% | g | |||||||||||||
| Net investment income |
2.53% | 1.71% | 2.21% | c | 1.37% | 2.06% | 1.97% | |||||||||||||||||
| Supplemental data | ||||||||||||||||||||||||
| Net assets, end of period (000’s) |
$833,994 | $921,895 | $1,171,896 | $1,450,304 | $1,352,554 | $1,254,193 | ||||||||||||||||||
| Portfolio turnover rate |
11.45% | 20.92% | 17.46% | 11.60% | 18.73% | h | 42.13% | h | ||||||||||||||||
aThe amount shown for a share outstanding throughout the period may not correlate with the Statement of Operations for the period due to the timing of sales and repurchases of the Fund’s shares in relation to income earned and/or fluctuating fair value of the investments of the Fund.
bBased on average daily shares outstanding.
cNet investment income per share includes approximately $0.09 per share related to income received in the form of special dividends in connection with certain Fund holdings. Excluding this amount, the ratio of net investment income to average net assets would have been 1.63%.
dTotal return does not include fees, charges or expenses imposed by the variable annuity and life insurance contracts for which Franklin Templeton Variable Insurance Products Trust serves as an underlying investment vehicle. Total return is not annualized for periods less than one year.
eRatios are annualized for periods less than one year.
fBenefit of waiver and payments by affiliates rounds to less than 0.01%.
gBenefit of expense reduction rounds to less than 0.01%.
hExcludes the value of portfolio securities delivered as a result of redemption in-kind.
| TG-10 | Semiannual Report | The accompanying notes are an integral part of these financial statements. |
FRANKLIN TEMPLETON VARIABLE INSURANCE PRODUCTS TRUST
FINANCIAL HIGHLIGHTS
Templeton Growth VIP Fund (continued)
|
Six Months Ended (unaudited) |
Year Ended December 31, | |||||||||||||||||||||||
| 2015 | 2014 | 2013 | 2012 | 2011 | ||||||||||||||||||||
| Class 4 | ||||||||||||||||||||||||
| Per share operating performance (for a share outstanding throughout the period) |
||||||||||||||||||||||||
| Net asset value, beginning of period |
$13.44 | $14.73 | $15.35 | $12.07 | $10.19 | $11.11 | ||||||||||||||||||
|
|
|
|||||||||||||||||||||||
| Income from investment operationsa: | ||||||||||||||||||||||||
| Net investment incomeb |
0.15 | 0.23 | 0.33 | c | 0.17 | 0.20 | 0.20 | |||||||||||||||||
| Net realized and unrealized gains (losses) |
(0.61 | ) | (1.16 | ) | (0.76 | ) | 3.47 | 1.90 | (0.98 | ) | ||||||||||||||
|
|
|
|||||||||||||||||||||||
| Total from investment operations |
(0.46 | ) | (0.93 | ) | (0.43 | ) | 3.64 | 2.10 | (0.78 | ) | ||||||||||||||
|
|
|
|||||||||||||||||||||||
| Less distributions from: | ||||||||||||||||||||||||
| Net investment income |
(0.25 | ) | (0.36 | ) | (0.19 | ) | (0.36 | ) | (0.22 | ) | (0.14 | ) | ||||||||||||
| Net realized gains |
(0.52 | ) | — | — | — | — | — | |||||||||||||||||
|
|
|
|||||||||||||||||||||||
| Total distributions |
(0.77 | ) | (0.36 | ) | (0.19 | ) | (0.36 | ) | (0.22 | ) | (0.14 | ) | ||||||||||||
|
|
|
|||||||||||||||||||||||
| Net asset value, end of period |
$12.21 | $13.44 | $14.73 | $15.35 | $12.07 | $10.19 | ||||||||||||||||||
|
|
|
|||||||||||||||||||||||
| Total returnd |
(3.36)% | (6.54)% | (2.88)% | 30.64% | 21.02% | (7.14)% | ||||||||||||||||||
| Ratios to average net assetse | ||||||||||||||||||||||||
| Expenses |
1.17% | f | 1.15% | f | 1.13% | 1.13% | g | 1.13% | g | 1.13% | g | |||||||||||||
| Net investment income |
2.43% | 1.61% | 2.11% | c | 1.27% | 1.96% | 1.87% | |||||||||||||||||
| Supplemental data | ||||||||||||||||||||||||
| Net assets, end of period (000’s) |
$44,232 | $47,777 | $59,989 | $72,683 | $67,158 | $56,170 | ||||||||||||||||||
| Portfolio turnover rate |
11.45% | 20.92% | 17.46% | 11.60% | 18.73% | h | 42.13% | h | ||||||||||||||||
aThe amount shown for a share outstanding throughout the period may not correlate with the Statement of Operations for the period due to the timing of sales and repurchases of the Fund’s shares in relation to income earned and/or fluctuating fair value of the investments of the Fund.
bBased on average daily shares outstanding.
cNet investment income per share includes approximately $0.09 per share related to income received in the form of special dividends in connection with certain Fund holdings. Excluding this amount, the ratio of net investment income to average net assets would have been 1.53%.
dTotal return does not include fees, charges or expenses imposed by the variable annuity and life insurance contracts for which Franklin Templeton Variable Insurance Products Trust serves as an underlying investment vehicle. Total return is not annualized for periods less than one year.
eRatios are annualized for periods less than one year.
fBenefit of waiver and payments by affiliates rounds to less than 0.01%.
gBenefit of expense reduction rounds to less than 0.01%.
hExcludes the value of portfolio securities delivered as a result of redemption in-kind.
| The accompanying notes are an integral part of these financial statements. | Semiannual Report | TG-11 |
FRANKLIN TEMPLETON VARIABLE INSURANCE PRODUCTS TRUST
Statement of Investments, June 30, 2016 (unaudited)
| Templeton Growth VIP Fund
|
||||||||||||||
| Country | Shares | Value | ||||||||||||
| Common Stocks 98.3% |
||||||||||||||
| Aerospace & Defense 1.2% |
||||||||||||||
| BAE Systems PLC |
United Kingdom | 2,319,032 | $ | 16,203,114 | ||||||||||
|
|
|
|||||||||||||
| Air Freight & Logistics 0.7% |
||||||||||||||
| United Parcel Service Inc., B |
United States | 89,100 | 9,597,852 | |||||||||||
|
|
|
|||||||||||||
| Airlines 1.6% |
||||||||||||||
| Deutsche Lufthansa AG |
Germany | 1,844,334 | 21,556,158 | |||||||||||
|
|
|
|||||||||||||
| Auto Components 1.2% |
||||||||||||||
| Cie Generale des Etablissements Michelin, B |
France | 166,359 | 15,734,041 | |||||||||||
|
|
|
|||||||||||||
| Automobiles 3.5% |
||||||||||||||
| Hero Motocorp Ltd. |
India | 220,820 | 10,396,765 | |||||||||||
| Hyundai Motor Co. |
South Korea | 178,330 | 20,961,982 | |||||||||||
| Nissan Motor Co. Ltd. |
Japan | 1,696,510 | 15,078,446 | |||||||||||
|
|
|
|||||||||||||
| 46,437,193 | ||||||||||||||
|
|
|
|||||||||||||
| Banks 16.6% |
||||||||||||||
| Bangkok Bank PCL, NVDR |
Thailand | 913,600 | 4,123,166 | |||||||||||
| Barclays PLC |
United Kingdom | 5,731,140 | 10,591,676 | |||||||||||
| BNP Paribas SA |
France | 428,187 | 18,894,206 | |||||||||||
| Citigroup Inc. |
United States | 737,470 | 31,261,353 | |||||||||||
| Credit Agricole SA |
France | 1,783,136 | 14,962,690 | |||||||||||
| DBS Group Holdings Ltd. |
Singapore | 932,690 | 10,913,758 | |||||||||||
| HSBC Holdings PLC |
United Kingdom | 3,242,064 | 19,807,285 | |||||||||||
| ING Groep NV, IDR |
Netherlands | 1,475,166 | 15,029,332 | |||||||||||
| JPMorgan Chase & Co. |
United States | 335,530 | 20,849,834 | |||||||||||
| KB Financial Group Inc. |
South Korea | 657,984 | 18,608,080 | |||||||||||
| Standard Chartered PLC |
United Kingdom | 2,883,083 | 21,704,934 | |||||||||||
| SunTrust Banks Inc. |
United States | 478,520 | 19,657,602 | |||||||||||
| UniCredit SpA |
Italy | 4,892,781 | 10,698,562 | |||||||||||
|
|
|
|||||||||||||
| 217,102,478 | ||||||||||||||
|
|
|
|||||||||||||
| Biotechnology 3.1% |
||||||||||||||
| Amgen Inc. |
United States | 184,830 | 28,121,884 | |||||||||||
| Gilead Sciences Inc. |
United States | 141,830 | 11,831,459 | |||||||||||
|
|
|
|||||||||||||
| 39,953,343 | ||||||||||||||
|
|
|
|||||||||||||
| Capital Markets 2.5% |
||||||||||||||
| Credit Suisse Group AG |
Switzerland | 1,308,590 | 13,821,906 | |||||||||||
| Morgan Stanley |
United States | 528,920 | 13,741,342 | |||||||||||
| UBS Group AG |
Switzerland | 451,380 | 5,812,772 | |||||||||||
|
|
|
|||||||||||||
| 33,376,020 | ||||||||||||||
|
|
|
|||||||||||||
| Chemicals 1.0% |
||||||||||||||
| Akzo Nobel NV |
Netherlands | 204,762 | 12,811,524 | |||||||||||
|
|
|
|||||||||||||
| Commercial Services & Supplies 0.6% |
||||||||||||||
| a | Serco Group PLC |
United Kingdom | 4,886,178 | 7,257,966 | ||||||||||
|
|
|
|||||||||||||
| Communications Equipment 2.4% |
||||||||||||||
| Cisco Systems Inc. |
United States | 778,890 | 22,346,354 | |||||||||||
| Ericsson, B |
Sweden | 1,155,432 | 8,784,010 | |||||||||||
|
|
|
|||||||||||||
| 31,130,364 | ||||||||||||||
|
|
|
|||||||||||||
| Construction & Engineering 0.6% |
||||||||||||||
| b | FLSmidth & Co. A/S |
Denmark | 216,580 | 7,689,518 | ||||||||||
|
|
|
|||||||||||||
| TG-12 | Semiannual Report |
FRANKLIN TEMPLETON VARIABLE INSURANCE PRODUCTS TRUST
STATEMENT OF INVESTMENTS (UNAUDITED)
Templeton Growth VIP Fund (continued)
| Country | Shares | Value | ||||||||||||
| Common Stocks (continued) |
||||||||||||||
| Construction Materials 1.2% |
||||||||||||||
| CRH PLC |
Ireland | 552,471 | $ | 15,943,595 | ||||||||||
|
|
|
|||||||||||||
| Consumer Finance 1.4% |
||||||||||||||
| Capital One Financial Corp. |
United States | 286,660 | 18,205,777 | |||||||||||
|
|
|
|||||||||||||
| Diversified Telecommunication Services 3.0% |
||||||||||||||
| China Telecom Corp. Ltd., ADR |
China | 179,195 | 8,061,983 | |||||||||||
| Singapore Telecommunications Ltd. |
Singapore | 4,679,470 | 14,349,193 | |||||||||||
| Telefonica SA |
Spain | 1,787,635 | 16,786,209 | |||||||||||
|
|
|
|||||||||||||
| 39,197,385 | ||||||||||||||
|
|
|
|||||||||||||
| Energy Equipment & Services 2.4% |
||||||||||||||
| Baker Hughes Inc. |
United States | 301,680 | 13,614,818 | |||||||||||
| Halliburton Co. |
United States | 375,850 | 17,022,247 | |||||||||||
| Technip SA |
France | 16,050 | 869,624 | |||||||||||
|
|
|
|||||||||||||
| 31,506,689 | ||||||||||||||
|
|
|
|||||||||||||
| Food & Staples Retailing 2.6% |
||||||||||||||
| Metro AG |
Germany | 587,740 | 17,920,384 | |||||||||||
| a | Tesco PLC |
United Kingdom | 6,655,808 | 15,522,120 | ||||||||||
|
|
|
|||||||||||||
| 33,442,504 | ||||||||||||||
|
|
|
|||||||||||||
| Health Care Equipment & Supplies 1.9% |
||||||||||||||
| Getinge AB, B |
Sweden | 925,050 | 18,888,392 | |||||||||||
| Medtronic PLC |
United States | 74,440 | 6,459,159 | |||||||||||
|
|
|
|||||||||||||
| 25,347,551 | ||||||||||||||
|
|
|
|||||||||||||
| Industrial Conglomerates 2.3% |
||||||||||||||
| Siemens AG |
Germany | 164,562 | 16,769,609 | |||||||||||
| a | Toshiba Corp. |
Japan | 4,835,860 | 12,942,452 | ||||||||||
|
|
|
|||||||||||||
| 29,712,061 | ||||||||||||||
|
|
|
|||||||||||||
| Insurance 3.9% |
||||||||||||||
| Aegon NV |
Netherlands | 3,053,986 | 11,965,894 | |||||||||||
| American International Group Inc. |
United States | 312,040 | 16,503,796 | |||||||||||
| AXA SA |
France | 474,608 | 9,379,516 | |||||||||||
| China Life Insurance Co. Ltd., H |
China | 6,041,230 | 12,941,405 | |||||||||||
|
|
|
|||||||||||||
| 50,790,611 | ||||||||||||||
|
|
|
|||||||||||||
| Internet Software & Services 1.4% |
||||||||||||||
| a | Alphabet Inc., A |
United States | 25,760 | 18,122,933 | ||||||||||
|
|
|
|||||||||||||
| Life Sciences Tools & Services 0.6% |
||||||||||||||
| a | QIAGEN NV |
Netherlands | 385,000 | 8,330,813 | ||||||||||
|
|
|
|||||||||||||
| Machinery 0.5% |
||||||||||||||
| a | Navistar International Corp. |
United States | 598,440 | 6,995,764 | ||||||||||
|
|
|
|||||||||||||
| Media 3.7% |
||||||||||||||
| Comcast Corp., A |
United States | 297,202 | 19,374,598 | |||||||||||
| Sky PLC |
United Kingdom | 1,074,857 | 12,153,658 | |||||||||||
| Twenty-First Century Fox Inc., A |
United States | 641,182 | 17,343,973 | |||||||||||
|
|
|
|||||||||||||
| 48,872,229 | ||||||||||||||
|
|
|
|||||||||||||
| Metals & Mining 2.4% |
||||||||||||||
| Glencore PLC |
Switzerland | 8,733,900 | 17,800,578 | |||||||||||
| MMC Norilsk Nickel PJSC, ADR |
Russia | 1,040,760 | 13,831,701 | |||||||||||
|
|
|
|||||||||||||
| 31,632,279 | ||||||||||||||
|
|
|
|||||||||||||
| Semiannual Report | TG-13 |
FRANKLIN TEMPLETON VARIABLE INSURANCE PRODUCTS TRUST
STATEMENT OF INVESTMENTS (UNAUDITED)
Templeton Growth VIP Fund (continued)
| Country | Shares | Value | ||||||||||||
| Common Stocks (continued) |
||||||||||||||
| Oil, Gas & Consumable Fuels 11.8% |
||||||||||||||
| Apache Corp. |
United States | 305,930 | $ | 17,031,123 | ||||||||||
| BP PLC |
United Kingdom | 3,841,161 | 22,441,184 | |||||||||||
| a | Chesapeake Energy Corp. |
United States | 2,179,440 | 9,328,003 | ||||||||||
| Eni SpA |
Italy | 866,889 | 13,971,194 | |||||||||||
| Galp Energia SGPS SA, B |
Portugal | 1,110,730 | 15,410,684 | |||||||||||
| Kunlun Energy Co. Ltd. |
China | 17,103,030 | 14,108,410 | |||||||||||
| Royal Dutch Shell PLC, A |
United Kingdom | 15,359 | 419,322 | |||||||||||
| Royal Dutch Shell PLC, B |
United Kingdom | 1,303,219 | 35,831,626 | |||||||||||
| Total SA, B |
France | 544,729 | 26,228,500 | |||||||||||
|
|
|
|||||||||||||
| 154,770,046 | ||||||||||||||
|
|
|
|||||||||||||
| Pharmaceuticals 8.7% |
||||||||||||||
| a | Allergan PLC |
United States | 93,324 | 21,566,243 | ||||||||||
| Eli Lilly & Co. |
United States | 175,170 | 13,794,638 | |||||||||||
| Merck KGaA |
Germany | 166,284 | 16,804,818 | |||||||||||
| Roche Holding AG |
Switzerland | 45,563 | 11,954,394 | |||||||||||
| Sanofi |
France | 227,717 | 18,936,366 | |||||||||||
| Teva Pharmaceutical Industries Ltd., ADR |
Israel | 609,830 | 30,631,761 | |||||||||||
|
|
|
|||||||||||||
| 113,688,220 | ||||||||||||||
|
|
|
|||||||||||||
| Software 4.2% |
||||||||||||||
| Microsoft Corp. |
United States | 584,689 | 29,918,536 | |||||||||||
| Oracle Corp. |
United States | 627,880 | 25,699,128 | |||||||||||
|
|
|
|||||||||||||
| 55,617,664 | ||||||||||||||
|
|
|
|||||||||||||
| Specialty Retail 0.3% |
||||||||||||||
| Kingfisher PLC |
United Kingdom | 871,388 | 3,747,156 | |||||||||||
|
|
|
|||||||||||||
| Technology Hardware, Storage & Peripherals 6.5% |
||||||||||||||
| Apple Inc. |
United States | 70,200 | 6,711,120 | |||||||||||
| Hewlett Packard Enterprise Co. |
United States | 677,340 | 12,375,002 | |||||||||||
| HP Inc. |
United States | 677,340 | 8,500,617 | |||||||||||
| Samsung Electronics Co. Ltd. |
South Korea | 46,020 | 56,889,238 | |||||||||||
|
|
|
|||||||||||||
| 84,475,977 | ||||||||||||||
|
|
|
|||||||||||||
| Textiles, Apparel & Luxury Goods 1.2% |
||||||||||||||
| a | Michael Kors Holdings Ltd. |
United States | 313,480 | 15,510,990 | ||||||||||
|
|
|
|||||||||||||
| Wireless Telecommunication Services 3.3% |
||||||||||||||
| SoftBank Group Corp. |
Japan | 346,820 | 19,440,726 | |||||||||||
| a | Turkcell Iletisim Hizmetleri AS, ADR |
Turkey | 1,653,543 | 15,129,918 | ||||||||||
| Vodafone Group PLC |
United Kingdom | 2,681,677 | 8,140,191 | |||||||||||
|
|
|
|||||||||||||
| 42,710,835 | ||||||||||||||
|
|
|
|||||||||||||
| Total Common Stocks (Cost $1,270,383,846) |
1,287,470,650 | |||||||||||||
|
|
|
|||||||||||||
| Preferred Stocks (Cost $13,187,730) 0.6% |
||||||||||||||
| Oil, Gas & Consumable Fuels 0.6% |
||||||||||||||
| a | Petroleo Brasileiro SA, ADR, pfd. |
Brazil | 1,315,652 | 7,643,938 | ||||||||||
|
|
|
|||||||||||||
| Total Investments before Short Term Investments (Cost $1,283,571,576) |
1,295,114,588 | |||||||||||||
|
|
|
|||||||||||||
| TG-14 | Semiannual Report |
FRANKLIN TEMPLETON VARIABLE INSURANCE PRODUCTS TRUST
STATEMENT OF INVESTMENTS (UNAUDITED)
Templeton Growth VIP Fund (continued)
| Country | Principal Amount | Value | ||||||||||||
| Short Term Investments 1.1% |
||||||||||||||
| Time Deposits Cost ($12,500,000) 1.0% |
||||||||||||||
| Royal Bank of Canada, 0.30%, 7/01/16 |
United States | $ | 12,500,000 | $ | 12,500,000 | |||||||||
|
|
|
|||||||||||||
| Total Investments before Money Market Funds (Cost $1,296,071,576) |
1,307,614,588 | |||||||||||||
|
|
|
|||||||||||||
| Shares | ||||||||||||||
| c | Investments from Cash Collateral Received for Loaned Securities (Cost $1,890,000) 0.1% |
|||||||||||||
| Money Market Funds 0.1% |
||||||||||||||
| a,d | Institutional Fiduciary Trust Money Market Portfolio |
United States | 1,890,000 | 1,890,000 | ||||||||||
|
|
|
|||||||||||||
| Total Investments (Cost $1,297,961,576) 100.0% |
1,309,504,588 | |||||||||||||
| Other Assets, less Liabilities 0.0%† |
331,365 | |||||||||||||
|
|
|
|||||||||||||
| Net Assets 100.0% |
$ | 1,309,835,953 | ||||||||||||
|
|
|
|||||||||||||
See Abbreviations on page TG-25.
†Rounds to less than 0.1% of net assets.
aNon-income producing.
bA portion or all of the security is on loan at June 30, 2016. See Note 1(c).
cSee Note 1(c) regarding securities on loan.
dSee Note 3(e) regarding investments in affiliated management investment companies.
| The accompanying notes are an integral part of these financial statements. | Semiannual Report | TG-15 |
FRANKLIN TEMPLETON VARIABLE INSURANCE PRODUCTS TRUST
Financial Statements
Statement of Assets and Liabilities
June 30, 2016 (unaudited)
| Templeton Growth VIP Fund |
||||
| Assets: |
||||
| Investments in securities: |
||||
| Cost - Unaffiliated issuers |
$ | 1,296,071,576 | ||
| Cost - Non-controlled affiliates (Note 3e) |
1,890,000 | |||
|
|
|
|||
| Total cost of investments |
$ | 1,297,961,576 | ||
|
|
|
|||
| Value - Unaffiliated issuers |
$ | 1,307,614,588 | ||
| Value - Non-controlled affiliates (Note 3e) |
1,890,000 | |||
|
|
|
|||
| Total value of investments (Includes securities loaned in the amount of $1,775,214) |
1,309,504,588 | |||
| Cash |
609,409 | |||
| Receivables: |
||||
| Investment securities sold |
710,810 | |||
| Capital shares sold |
170,327 | |||
| Dividends and interest |
2,692,729 | |||
| European Union tax reclaims |
776,715 | |||
| Other assets |
614 | |||
|
|
|
|||
| Total assets |
1,314,465,192 | |||
|
|
|
|||
| Liabilities: |
||||
| Payables: |
||||
| Investment securities purchased |
869,326 | |||
| Capital shares redeemed |
164,874 | |||
| Management fees |
849,147 | |||
| Distribution fees |
382,255 | |||
| Trustees’ fees and expenses |
113 | |||
| Payable upon return of securities loaned |
1,890,000 | |||
| Deferred tax |
183,091 | |||
| Accrued expenses and other liabilities |
290,433 | |||
|
|
|
|||
| Total liabilities |
4,629,239 | |||
|
|
|
|||
| Net assets, at value |
$ | 1,309,835,953 | ||
|
|
|
|||
| Net assets consist of: |
||||
| Paid-in capital |
$ | 1,278,199,035 | ||
| Undistributed net investment income |
17,326,375 | |||
| Net unrealized appreciation (depreciation) |
11,297,284 | |||
| Accumulated net realized gain (loss) |
3,013,259 | |||
|
|
|
|||
| Net assets, at value |
$ | 1,309,835,953 | ||
|
|
|
|||
| Class 1: | ||||
| Net assets, at value |
$ | 431,609,518 | ||
|
|
|
|||
| Shares outstanding |
35,152,726 | |||
|
|
|
|||
| Net asset value and maximum offering price per share |
$ | 12.28 | ||
|
|
|
|||
| Class 2: | ||||
| Net assets, at value |
$ | 833,994,449 | ||
|
|
|
|||
| Shares outstanding |
68,958,905 | |||
|
|
|
|||
| Net asset value and maximum offering price per share |
$ | 12.09 | ||
|
|
|
|||
| Class 4: | ||||
| Net assets, at value |
$ | 44,231,986 | ||
|
|
|
|||
| Shares outstanding |
3,621,488 | |||
|
|
|
|||
| Net asset value and maximum offering price per share |
$ | 12.21 | ||
|
|
|
|||
| TG-16 | Semiannual Report | The accompanying notes are an integral part of these financial statements. |
FRANKLIN TEMPLETON VARIABLE INSURANCE PRODUCTS TRUST
FINANCIAL STATEMENTS
Statement of Operations
for the six months ended June 30, 2016 (unaudited)
| Templeton Growth VIP Fund |
||||
| Investment income: |
||||
| Dividends (net of foreign taxes of $2,484,424) |
$ | 23,319,623 | ||
| Interest |
23,655 | |||
| Income from securities loaned (net of fees and rebates) |
577,010 | |||
|
|
|
|||
| Total investment income |
23,920,288 | |||
|
|
|
|||
| Expenses: |
||||
| Management fees (Note 3a) |
5,202,717 | |||
| Distribution fees: (Note 3c) |
||||
| Class 2 |
1,060,850 | |||
| Class 4 |
78,194 | |||
| Custodian fees (Note 4) |
54,578 | |||
| Reports to shareholders |
116,592 | |||
| Professional fees |
68,020 | |||
| Trustees’ fees and expenses |
3,707 | |||
| Other |
21,283 | |||
|
|
|
|||
| Total expenses |
6,605,941 | |||
| Expenses waived/paid by affiliates (Note 3e) |
(31,099 | ) | ||
|
|
|
|||
| Net expenses |
6,574,842 | |||
|
|
|
|||
| Net investment income |
17,345,446 | |||
|
|
|
|||
| Realized and unrealized gains (losses): |
||||
| Net realized gain (loss) from: |
||||
| Investments |
14,146,163 | |||
| Foreign currency transactions |
(103,604 | ) | ||
|
|
|
|||
| Net realized gain (loss) |
14,042,559 | |||
|
|
|
|||
| Net change in unrealized appreciation (depreciation) on: |
||||
| Investments |
(77,916,782 | ) | ||
| Translation of other assets and liabilities denominated in foreign currencies |
13,821 | |||
| Change in deferred taxes on unrealized appreciation |
(87,409 | ) | ||
|
|
|
|||
| Net change in unrealized appreciation (depreciation) |
(77,990,370 | ) | ||
|
|
|
|||
| Net realized and unrealized gain (loss) |
(63,947,811 | ) | ||
|
|
|
|||
| Net increase (decrease) in net assets resulting from operations |
$ | (46,602,365 | ) | |
|
|
|
|||
| The accompanying notes are an integral part of these financial statements. | Semiannual Report | TG-17 |
FRANKLIN TEMPLETON VARIABLE INSURANCE PRODUCTS TRUST
FINANCIAL STATEMENTS
Statements of Changes in Net Assets
| Templeton Growth VIP Fund | ||||||||
| Six Months Ended June 30, 2016 (unaudited) |
Year Ended December 31, 2015 |
|||||||
| Increase (decrease) in net assets: |
||||||||
| Operations: |
||||||||
| Net investment income |
$ | 17,345,446 | $ | 29,759,073 | ||||
| Net realized gain (loss) |
14,042,559 | 131,046,091 | ||||||
| Net change in unrealized appreciation (depreciation) |
(77,990,370 | ) | (259,448,984 | ) | ||||
|
|
|
|||||||
| Net increase (decrease) in net assets resulting from operations |
(46,602,365 | ) | (98,643,820 | ) | ||||
|
|
|
|||||||
| Distributions to shareholders from: |
||||||||
| Net investment income: |
||||||||
| Class 1 |
(10,324,588 | ) | (15,123,132 | ) | ||||
| Class 2 |
(17,569,557 | ) | (28,110,279 | ) | ||||
| Class 4 |
(854,329 | ) | (1,358,156 | ) | ||||
| Net realized gains: |
||||||||
| Class 1 |
(17,221,955 | ) | — | |||||
| Class 2 |
(33,791,595 | ) | — | |||||
| Class 4 |
(1,749,579 | ) | — | |||||
|
|
|
|||||||
| Total distributions to shareholders |
(81,511,603 | ) | (44,591,567 | ) | ||||
|
|
|
|||||||
| Capital share transactions: (Note 2) |
||||||||
| Class 1 |
4,902,712 | (58,388,439 | ) | |||||
| Class 2 |
(5,619,491 | ) | (157,221,222 | ) | ||||
| Class 4 |
447,131 | (7,679,959 | ) | |||||
|
|
|
|||||||
| Total capital share transactions |
(269,648 | ) | (223,289,620 | ) | ||||
|
|
|
|||||||
| Net increase (decrease) in net assets |
(128,383,616 | ) | (366,525,007 | ) | ||||
| Net assets: |
||||||||
| Beginning of period |
1,438,219,569 | 1,804,744,576 | ||||||
|
|
|
|||||||
| End of period |
$ | 1,309,835,953 | $ | 1,438,219,569 | ||||
|
|
|
|||||||
| Undistributed net investment income included in net assets: |
||||||||
| End of period |
$ | 17,326,375 | $ | 28,729,403 | ||||
|
|
|
|||||||
| TG-18 | Semiannual Report | The accompanying notes are an integral part of these financial statements. |
FRANKLIN TEMPLETON VARIABLE INSURANCE PRODUCTS TRUST
Notes to Financial Statements (unaudited)
Templeton Growth VIP Fund
| Semiannual Report | TG-19 |
FRANKLIN TEMPLETON VARIABLE INSURANCE PRODUCTS TRUST
NOTES TO FINANCIAL STATEMENTS (UNAUDITED)
Templeton Growth VIP Fund (continued)
1. Organization and Significant Accounting Policies (continued)
a. Financial Instrument Valuation (continued)
Receipts, futures contracts and exchange traded funds). These price movements are measured against established trigger thresholds for each specific market proxy to assist in determining if an event has occurred that may call into question the reliability of the values of the foreign securities held by the Fund. If such an event occurs, the securities may be valued using fair value procedures, which may include the use of independent pricing services.
When the last day of the reporting period is a non-business day, certain foreign markets may be open on those days that the NYSE is closed, which could result in differences between the value of the Fund’s portfolio securities on the last business day and the last calendar day of the reporting period. Any significant security valuation changes due to an open foreign market are adjusted and reflected by the Fund for financial reporting purposes.
b. Foreign Currency Translation
Portfolio securities and other assets and liabilities denominated in foreign currencies are translated into U.S. dollars based on the exchange rate of such currencies against U.S. dollars on the date of valuation. The Fund may enter into foreign currency exchange contracts to facilitate transactions denominated in a foreign currency. Purchases and sales of securities, income and expense items denominated in foreign currencies are translated into U.S. dollars at the exchange rate in effect on the transaction date. Portfolio securities and assets and liabilities denominated in foreign currencies contain risks that those currencies will decline in value relative to the U.S. dollar. Occasionally, events may impact the availability or reliability of foreign exchange rates used to convert the U.S. dollar equivalent value. If such an event occurs, the foreign exchange rate will be valued at fair value using procedures established and approved by the Board.
The Fund does not separately report the effect of changes in foreign exchange rates from changes in market prices on securities held. Such changes are included in net realized and unrealized gain or loss from investments in the Statement of Operations.
Realized foreign exchange gains or losses arise from sales of foreign currencies, currency gains or losses realized between the trade and settlement dates on securities transactions and the
difference between the recorded amounts of dividends, interest, and foreign withholding taxes and the U.S. dollar equivalent of the amounts actually received or paid. Net unrealized foreign exchange gains and losses arise from changes in foreign exchange rates on foreign denominated assets and liabilities other than investments in securities held at the end of the reporting period.
c. Securities Lending
The Fund participates in an agency based securities lending program to earn additional income. The Fund receives cash collateral against the loaned securities in an amount equal to at least 102% of the fair value of the loaned securities. Collateral is maintained over the life of the loan in an amount not less than 100% of the fair value of loaned securities, as determined at the close of Fund business each day; any additional collateral required due to changes in security values is delivered to the Fund on the next business day. The collateral is deposited into a joint cash account with other funds and is used to invest in a money market fund managed by Franklin Advisers, Inc., an affiliate of the Fund. The Fund may receive income from the investment of cash collateral, in addition to lending fees and rebates paid by the borrower. Income from securities loaned, net of fees paid to the securities lending agent and/or third-party vendor, is reported separately in the Statement of Operations. The Fund bears the market risk with respect to the collateral investment, securities loaned, and the risk that the agent may default on its obligations to the Fund. If the borrower defaults on its obligation to return the securities loaned, the Fund has the right to repurchase the securities in the open market using the collateral received. The securities lending agent has agreed to indemnify the Fund in the event of default by a third party borrower.
d. Income and Deferred Taxes
It is the Fund’s policy to qualify as a regulated investment company under the Internal Revenue Code. The Fund intends to distribute to shareholders substantially all of its taxable income and net realized gains to relieve it from federal income and if applicable, excise taxes. As a result, no provision for U.S. federal income taxes is required.
The Fund may be subject to foreign taxation related to income received, capital gains on the sale of securities and certain foreign currency transactions in the foreign jurisdictions in which it invests. Foreign taxes, if any, are recorded based on the
| TG-20 | Semiannual Report |
FRANKLIN TEMPLETON VARIABLE INSURANCE PRODUCTS TRUST
NOTES TO FINANCIAL STATEMENTS (UNAUDITED)
Templeton Growth VIP Fund (continued)
| Semiannual Report | TG-21 |
FRANKLIN TEMPLETON VARIABLE INSURANCE PRODUCTS TRUST
NOTES TO FINANCIAL STATEMENTS (UNAUDITED)
Templeton Growth VIP Fund (continued)
2. Shares of Beneficial Interest
At June 30, 2016, there were an unlimited number of shares authorized (without par value). Transactions in the Fund’s shares were as follows:
| Six Months Ended June 30, 2016 |
Year Ended December 31, 2015 |
|||||||||||||||||
| Shares | Amount | Shares | Amount | |||||||||||||||
| Class 1 Shares: | ||||||||||||||||||
| Shares sold |
53,442 | $ | 681,940 | 326,516 | $ | 4,799,095 | ||||||||||||
| Shares issued in reinvestment of distributions |
2,252,375 | 27,546,543 | 1,016,340 | 15,123,132 | ||||||||||||||
| Shares redeemed |
(1,760,451 | ) | (23,325,771 | ) | (5,310,550 | ) | (78,310,666 | ) | ||||||||||
|
|
|
|||||||||||||||||
| Net increase (decrease) |
545,366 | $ | 4,902,712 | (3,967,694 | ) | $ | (58,388,439 | ) | ||||||||||
|
|
|
|||||||||||||||||
| Class 2 Shares: | ||||||||||||||||||
| Shares sold |
2,201,679 | $ | 27,977,357 | 2,945,698 | $ | 42,909,317 | ||||||||||||
| Shares issued in reinvestment of distributions |
4,262,336 | 51,361,152 | 1,917,482 | 28,110,279 | ||||||||||||||
| Shares redeemed |
(6,706,636 | ) | (84,958,000 | ) | (15,863,936 | ) | (228,240,818 | ) | ||||||||||
|
|
|
|||||||||||||||||
| Net increase (decrease) |
(242,621 | ) | $ | (5,619,491 | ) | (11,000,756 | ) | $ | (157,221,222 | ) | ||||||||
|
|
|
|||||||||||||||||
| Class 4 Shares: | ||||||||||||||||||
| Shares sold |
237,607 | $ | 2,869,898 | 307,977 | $ | 4,289,876 | ||||||||||||
| Shares issued in reinvestment of distributions |
213,961 | 2,603,908 | 91,767 | 1,358,156 | ||||||||||||||
| Shares redeemed |
(386,137 | ) | (5,026,675 | ) | (916,167 | ) | (13,327,991 | ) | ||||||||||
|
|
|
|||||||||||||||||
| Net increase (decrease) |
65,431 | $ | 447,131 | (516,423 | ) | $ | (7,679,959 | ) | ||||||||||
|
|
|
|||||||||||||||||
3. Transactions With Affiliates
Franklin Resources, Inc. is the holding company for various subsidiaries that together are referred to as Franklin Templeton Investments. Certain officers and trustees of the Fund are also officers and/or directors of the following subsidiaries:
| Subsidiary | Affiliation | |
| Templeton Global Advisors Limited (TGAL) |
Investment manager | |
| Franklin Templeton Services, LLC (FT Services) |
Administrative manager | |
| Franklin Templeton Distributors, Inc. (Distributors) |
Principal underwriter | |
| Franklin Templeton Investor Services, LLC (Investor Services) |
Transfer agent |
a. Management Fees
The Fund pays an investment management fee to TGAL based on the average daily net assets of the Fund as follows:
| Annualized Fee Rate | Net Assets | |
| 1.000% |
Up to and including $100 million | |
| 0.900% |
Over $100 million, up to and including $250 million | |
| 0.800% |
Over $250 million, up to and including $500 million | |
| 0.750% |
Over $500 million, up to and including $1 billion | |
| 0.700% |
Over $1 billion, up to and including $5 billion | |
| 0.675% |
Over $5 billion, up to and including $10 billion | |
| 0.655% |
Over $10 billion, up to and including $15 billion | |
| 0.635% |
Over $15 billion, up to and including $20 billion | |
| 0.615% |
In excess of $20 billion |
| TG-22 | Semiannual Report |
FRANKLIN TEMPLETON VARIABLE INSURANCE PRODUCTS TRUST
NOTES TO FINANCIAL STATEMENTS
Templeton Growth VIP Fund (continued)
For the period ended June 30, 2016, the effective management fee rate was 0.783% of the Fund’s average daily net assets.
b. Administrative Fees
Under an agreement with TGAL, FT Services provides administrative services to the Fund. The fee is paid by TGAL based on the Fund’s average daily net assets, and is not an additional expense of the Fund.
c. Distribution Fees
The Board has adopted distribution plans for Class 2 and Class 4 shares pursuant to Rule 12b-1 under the 1940 Act. Under the Fund’s compensation distribution plans, the Fund pays Distributors for costs incurred in connection with the servicing, sale and distribution of the Fund’s shares up to 0.35% per year of its average daily net assets of each class. The Board has agreed to limit the current rate to 0.25% per year for Class 2. The plan year, for purposes of monitoring compliance with the maximum annual plan rates, is February 1 through January 31.
d. Transfer Agent Fees
Investor Services, under terms of an agreement, performs shareholder servicing for the Fund and is not paid by the Fund for the services.
e. Investments in Affiliated Management Investment Companies
The Fund invests in one or more affiliated management investment companies for purposes other than exercising a controlling influence over the management or policies. Management fees paid by the Fund are waived on assets invested in the affiliated management investment companies, as noted in the Statement of Operations, in an amount not to exceed the management and administrative fees paid directly or indirectly by each affiliate.
| Number of Shares Held at Beginning of Period |
Gross Additions |
Gross Reductions |
Number of Shares Held at End of Period |
Value at End of Period |
Investment Income |
Realized Gain (Loss) |
% of Affiliated Fund Shares Outstanding Held at End of Period |
|||||||||||||||||||||||||
| Non-Controlled Affiliates | ||||||||||||||||||||||||||||||||
| Institutional Fiduciary Trust Money |
8,864,598 | 260,839,711 | (267,814,309 | ) | 1,890,000 | $ | 1,890,000 | $ | — | $ | — | 0.0%a | ||||||||||||||||||||
|
|
|
|||||||||||||||||||||||||||||||
aRounds to less than 0.1%
f. Other Affiliated Transactions
At June 30, 2016, Franklin Templeton Variable Insurance Products Trust — Franklin Founding Funds Allocation VIP Fund owned 23.9% of the Fund’s outstanding shares.
4. Expense Offset Arrangement
The Fund has entered into an arrangement with its custodian whereby credits realized as a result of uninvested cash balances are used to reduce a portion of the Fund’s custodian expenses. During the period ended June 30, 2016, there were no credits earned.
| Semiannual Report | TG-23 |
FRANKLIN TEMPLETON VARIABLE INSURANCE PRODUCTS TRUST
NOTES TO FINANCIAL STATEMENTS (UNAUDITED)
Templeton Growth VIP Fund (continued)
5. Income Taxes
At June 30, 2016, the cost of investments and net unrealized appreciation (depreciation) for income tax purposes were as follows:
| Cost of investments |
$ | 1,316,201,155 | ||
|
|
|
|||
| Unrealized appreciation |
$ | 230,477,139 | ||
| Unrealized depreciation |
(237,173,706 | ) | ||
|
|
|
|||
| Net unrealized appreciation (depreciation) |
$ | (6,696,567 | ) | |
|
|
|
Differences between income and/or capital gains as determined on a book basis and a tax basis are primarily due to differing treatments of foreign capital gains tax and wash sales.
6. Investment Transactions
Purchases and sales of investments (excluding short term securities) for the period ended June 30, 2016, aggregated $152,491,978 and $211,775,101, respectively.
At June 30, 2016, in connection with securities lending transactions, the Fund loaned equity investments and received $1,890,000 of cash collateral. The gross amount of recognized liability for such transactions is included in payable upon return of securities loaned in the Statement of Assets and Liabilities. The agreements can be terminated at any time.
7. Concentration of Risk
Investing in foreign securities may include certain risks and considerations not typically associated with investing in U.S. securities, such as fluctuating currency values and changing local and regional economic, political and social conditions, which may result in greater market volatility. In addition, certain foreign securities may not be as liquid as U.S. securities.
8. Credit Facility
The Fund, together with other U.S. registered and foreign investment funds (collectively, Borrowers), managed by Franklin Templeton Investments, are borrowers in a joint syndicated senior unsecured credit facility totaling $2 billion (Global Credit Facility) which matures on February 10, 2017. This Global Credit Facility provides a source of funds to the Borrowers for temporary and emergency purposes, including the ability to meet future unanticipated or unusually large redemption requests.
Under the terms of the Global Credit Facility, the Fund shall, in addition to interest charged on any borrowings made by the Fund and other costs incurred by the Fund, pay its share of fees and expenses incurred in connection with the implementation and maintenance of the Global Credit Facility, based upon its relative share of the aggregate net assets of all of the Borrowers, including an annual commitment fee of 0.07% based upon the unused portion of the Global Credit Facility. Effective February 12, 2016, the annual commitment fee is 0.15%. These fees are reflected in other expenses in the Statement of Operations. During the period ended June 30, 2016, the Fund did not use the Global Credit Facility.
9. Fair Value Measurements
The Fund follows a fair value hierarchy that distinguishes between market data obtained from independent sources (observable inputs) and the Fund’s own market assumptions (unobservable inputs). These inputs are used in determining the value of the Fund’s financial instruments and are summarized in the following fair value hierarchy:
| • | Level 1 – quoted prices in active markets for identical financial instruments |
| • | Level 2 – other significant observable inputs (including quoted prices for similar financial instruments, interest rates, prepayment speed, credit risk, etc.) |
| TG-24 | Semiannual Report |
FRANKLIN TEMPLETON VARIABLE INSURANCE PRODUCTS TRUST
NOTES TO FINANCIAL STATEMENTS
Templeton Growth VIP Fund (continued)
| • | Level 3 – significant unobservable inputs (including the Fund’s own assumptions in determining the fair value of financial instruments) |
The input levels are not necessarily an indication of the risk or liquidity associated with financial instruments at that level.
For movements between the levels within the fair value hierarchy, the Fund has adopted a policy of recognizing the transfers as of the date of the underlying event which caused the movement.
A summary of inputs used as of June 30, 2016, in valuing the Fund’s assets carried at fair value, is as follows:
| Level 1 | Level 2 | Level 3 | Total | |||||||||||||
| Assets: | ||||||||||||||||
| Investments in Securities |
||||||||||||||||
| Equity Investmentsa,b |
$ | 1,295,114,588 | $ | — | $ | — | $ | 1,295,114,588 | ||||||||
| Short Term Investments |
1,890,000 | 12,500,000 | — | 14,390,000 | ||||||||||||
|
|
|
|||||||||||||||
| Total Investments in Securities |
$ | 1,297,004,588 | $ | 12,500,000 | $ | — | $ | 1,309,504,588 | ||||||||
|
|
|
|||||||||||||||
aIncludes common and preferred stocks.
bFor detailed categories, see the accompanying Statement of Investments.
10. Subsequent Events
The Fund has evaluated subsequent events through the issuance of the financial statements and determined that no events have occurred that require disclosure.
Abbreviations
| ADR | American Depositary Receipt | |
| IDR | International Depositary Receipt | |
| Semiannual Report | TG-25 |
FRANKLIN TEMPLETON VARIABLE INSURANCE PRODUCTS TRUST
Tax Information (unaudited)
Templeton Growth VIP Fund
At December 31, 2015, more than 50% of the Fund’s total assets were invested in securities of foreign issuers. In most instances, foreign taxes were withheld from income paid to the Fund on these investments. As shown in the table below, the Fund hereby reports to shareholders the foreign source income and foreign taxes paid, pursuant to Section 853 of the Internal Revenue Code. This written statement will allow shareholders of record on June 14, 2016, to treat their proportionate share of foreign taxes paid by the Fund as having been paid directly by them. The shareholder shall consider these amounts as foreign taxes paid in the tax year in which they receive the Fund distribution.
The following table provides a detailed analysis of foreign tax paid, and foreign source income as reported by the Fund, to Class 1, Class 2, and Class 4 shareholders of record.
| Class | Foreign Tax Paid Per Share |
Foreign Source Income Per Share | ||
| Class 1 |
$0.0227 | $0.2591 | ||
| Class 2 |
$0.0227 | $0.2276 | ||
| Class 4 |
$0.0227 | $0.2146 |
Foreign Tax Paid Per Share (Column 1) is the amount per share available to you, as a tax credit (assuming you held your shares in the Fund for a minimum of 16 days during the 31-day period beginning 15 days before the ex-dividend date of the Fund’s distribution to which the foreign taxes relate), or, as a tax deduction.
Foreign Source Income Per Share (Column 2) is the amount per share of income dividends attributable to foreign securities held by the Fund, plus any foreign taxes withheld on these dividends.
| TG-26 | Semiannual Report |
FRANKLIN TEMPLETON VARIABLE INSURANCE PRODUCTS TRUST
Index Descriptions
| Semiannual Report | I-1 |
FRANKLIN TEMPLETON VARIABLE INSURANCE PRODUCTS TRUST
| I-2 | Semiannual Report |
FRANKLIN TEMPLETON VARIABLE INSURANCE PRODUCTS TRUST
| Semiannual Report | SI-1 |
FRANKLIN TEMPLETON VARIABLE INSURANCE PRODUCTS TRUST
SHAREHOLDER INFORMATION
| SI-2 | Semiannual Report |
FRANKLIN TEMPLETON VARIABLE INSURANCE PRODUCTS TRUST
SHAREHOLDER INFORMATION
| Semiannual Report | SI-3 |
FRANKLIN TEMPLETON VARIABLE INSURANCE PRODUCTS TRUST
SHAREHOLDER INFORMATION
| SI-4 | Semiannual Report |
FRANKLIN TEMPLETON VARIABLE INSURANCE PRODUCTS TRUST
SHAREHOLDER INFORMATION
| Semiannual Report | SI-5 |
FRANKLIN TEMPLETON VARIABLE INSURANCE PRODUCTS TRUST
SHAREHOLDER INFORMATION
| SI-6 | Semiannual Report |
FRANKLIN TEMPLETON VARIABLE INSURANCE PRODUCTS TRUST
SHAREHOLDER INFORMATION
| Semiannual Report | SI-7 |

Franklin Templeton Variable Insurance Products Trust (FTVIP) shares are not offered to the public; they are offered and sold only to:
(1) insurance company separate accounts (Separate Account) to serve as the underlying investment vehicle for variable contracts;
(2) certain qualified plans; and (3) other mutual funds (funds of funds).
Authorized for distribution to investors in Separate Accounts only when accompanied or preceded by the current prospectus for the applicable contract, which includes the Separate Account and the FTVIP prospectuses. Investors should carefully consider a fund’s investment goals, risks, charges and expenses before investing. The prospectus contains this and other information; please read it carefully before investing.
To help ensure we provide you with quality service, all calls to and from our service areas are monitored and/or recorded.
| ©2016 Franklin Templeton Investments. All rights reserved. | VIP1 S 08/16 |
| Item 2. | Code of Ethics. |
| (a) | The Registrant has adopted a code of ethics that applies to its principal executive officers and principal financial and accounting officer. |
| (c) | N/A |
| (d) | N/A |
| (f) | Pursuant to Item 12(a)(1), the Registrant is attaching as an exhibit a copy of its code of ethics that applies to its principal executive officers and principal financial and accounting officer. |
| Item 3. | Audit Committee Financial Expert. |
| (a)(1) | The Registrant has an audit committee financial expert serving on its audit committee. | |
| (2) | The audit committee financial expert is John B. Wilson and he is “independent” as defined under the relevant Securities and Exchange Commission Rules and Releases. |
| Item 4. | Principal Accountant Fees and Services. N/A |
| Item 5. | Audit Committee of Listed Registrants. N/A |
| Item 6. | Schedule of Investments. N/A |
| Item 7. | Disclosure of Proxy Voting Policies and Procedures for Closed-End Management Investment Companies. N/A |
| Item 8. | Portfolio Managers of Closed-End Management Investment Companies. N/A |
| Item 9. | Purchases of Equity Securities by Closed-End Management Investment Company and Affiliated Purchasers. N/A |
| Item 10. | Submission of Matters to a Vote of Security Holders. |
There have been no changes to the procedures by which shareholders may recommend nominees to the Registrant’s Board of Trustees that would require disclosure herein.
| Item 11. | Controls and Procedures. |
(a) Evaluation of Disclosure Controls and Procedures. The Registrant maintains disclosure controls and procedures that are designed to ensure that information required to be disclosed in the Registrant’s filings under the Securities Exchange Act of 1934 and the Investment Company Act of 1940 is recorded, processed, summarized and reported within the periods specified in the rules and forms of the Securities and Exchange Commission. Such information is accumulated and communicated to the Registrant’s management, including its principal executive officer and principal financial officer, as appropriate, to allow timely decisions regarding required disclosure. The Registrant’s management, including the principal executive officer and the principal financial officer, recognizes that any set of controls and procedures, no matter how well designed and operated, can provide only reasonable assurance of achieving the desired control objectives.
Within 90 days prior to the filing date of this Shareholder Report on Form N-CSR, the Registrant had carried out an evaluation, under the supervision and with the participation of the Registrant’s management, including the Registrant’s principal executive officer and the Registrant’s principal financial officer, of the effectiveness of the design and operation of the Registrant’s disclosure controls and procedures. Based on such evaluation, the Registrant’s principal executive officer and principal financial officer concluded that the Registrant’s disclosure controls and procedures are effective.
(b) Changes in Internal Controls. There have been no changes in the Registrant’s internal controls or in other factors that could materially affect the internal controls over financial reporting subsequent to the date of their evaluation in connection with the preparation of this Shareholder Report on Form N-CSR.
| Item 12. | Exhibits. |
(a)(1) Code of Ethics
(a)(2) Certifications pursuant to Section 302 of the Sarbanes-Oxley Act of 2002 of Laura F. Fergerson, Chief Executive Officer – Finance and Administration, and Gaston Gardey, Chief Financial Officer and Chief Accounting Officer
(b) Certifications pursuant to Section 906 of the Sarbanes-Oxley Act of 2002 of Laura F. Fergerson, Chief Executive Officer – Finance and Administration, and Gaston Gardey, Chief Financial Officer and Chief Accounting Officer
SIGNATURES
Pursuant to the requirements of the Securities Exchange Act of 1934 and the Investment Company Act of 1940, the registrant has duly caused this report to be signed on its behalf by the undersigned, thereunto duly authorized.
Franklin Templeton Variable Insurance Products Trust
| By | /s/ LAURA F. FERGERSON | |
| Laura F. Fergerson | ||
| Chief Executive Officer – Finance and Administration |
Date August 25, 2016
Pursuant to the requirements of the Securities Exchange Act of 1934 and the Investment Company Act of 1940, this report has been signed below by the following persons on behalf of the registrant and in the capacities and on the dates indicated.
| By | /s/ LAURA F. FERGERSON | |
| Laura F. Fergerson | ||
| Chief Executive Officer – Finance and Administration |
Date August 25, 2016
| By | /s/ GASTON GARDEY | |
| Gaston Gardey | ||
| Chief Financial Officer and Chief Accounting Officer |
Date August 25, 2016