UNITED STATES
SECURITIES AND EXCHANGE COMMISSION
Washington, DC 20549
FORM N-CSRS
CERTIFIED SHAREHOLDER REPORT OF REGISTERED
MANAGEMENT INVESTMENT COMPANIES
Investment Company Act file number 811-05583
Franklin Templeton
Variable Insurance Products Trust
(Exact name of registrant as specified in charter)
One Franklin Parkway,
San Mateo, CA 94403-1906
(Address of principal executive offices) (Zip code)
Craig S. Tyle,
One Franklin Parkway,
San Mateo, CA 94403-1906
(Name and address of agent for service)
Registrant’s telephone number, including area code: (650) 312-2000
Date of fiscal year end: 12/31
Date of reporting period: 06/30/14
| Item 1. | Reports to Stockholders. |

|
Semiannual Report June 30, 2014 |
Franklin Templeton
Variable Insurance Products Trust

Franklin Templeton Variable Insurance
Products Trust Semiannual Report
| Table of Contents | ||||
| Important Notes to Performance Information | i | |||
| Fund Summaries | ||||
| Franklin Flex Cap Growth VIP Fund (formerly, Franklin Flex Cap Growth Securities Fund) |
FFC-1 | |||
| Franklin Founding Funds Allocation VIP Fund (formerly, Franklin Templeton VIP Founding Funds Allocation Fund) |
FFA-1 | |||
| Franklin Global Real Estate VIP Fund (formerly, Franklin Global Real Estate Securities Fund) |
FGR-1 | |||
| Franklin Growth and Income VIP Fund (formerly, Franklin Growth and Income Securities Fund) |
FGI-1 | |||
| Franklin High Income VIP Fund (formerly, Franklin High Income Securities Fund) |
FH-1 | |||
| Franklin Income VIP Fund (formerly, Franklin Income Securities Fund) |
FI-1 | |||
| Franklin Large Cap Growth VIP Fund (formerly, Franklin Large Cap Growth Securities Fund) |
FLG-1 | |||
| Franklin Large Cap Value VIP Fund (formerly, Franklin Large Cap Value Securities Fund) |
FLV-1 | |||
| *Prospectus Supplements |
FLV-6 | |||
| Franklin Mutual Global Discovery VIP Fund (formerly, Mutual Global Discovery Securities Fund) |
MGD-1 | |||
| *Prospectus Supplement |
MGD-7 | |||
| Franklin Mutual Shares VIP Fund (formerly, Mutual Shares Securities Fund) |
MS-1 | |||
| *Prospectus Supplement |
MS-7 | |||
| Franklin Rising Dividends VIP Fund (formerly, Franklin Rising Dividends Securities Fund) |
FRD-1 | |||
| Franklin Small Cap Value VIP Fund (formerly, Franklin Small Cap Value Securities Fund) |
FSV-1 | |||
| *Prospectus Supplements |
FSV-6 | |||
| Franklin Small-Mid Cap Growth VIP Fund (formerly, Franklin Small-Mid Cap Growth Securities Fund) |
FSC-1 | |||
| Franklin Strategic Income VIP Fund (formerly, Franklin Strategic Income Securities Fund) |
FSI-1 | |||
| Franklin U.S. Government Securities VIP Fund (formerly, Franklin U.S. Government Fund) |
FUS-1 | |||
| *Statement of Additional Information Supplement |
FUS-5 | |||
| Templeton Developing Markets VIP Fund (formerly, Templeton Developing Markets Securities Fund) |
TD-1 | |||
| *Prospectus Supplement |
TD-7 | |||
| Templeton Foreign VIP Fund (formerly, Templeton Foreign Securities Fund) |
TF-1 | |||
| *Prospectus Supplement |
TF-6 | |||
| Templeton Global Bond VIP Fund (formerly, Templeton Global Bond Securities Fund) |
TGB-1 | |||
| Templeton Growth VIP Fund (formerly, Templeton Growth Securities Fund) |
TG-1 | |||
| Index Descriptions | I-1 | |||
| Shareholder Information | SI-1 | |||
*Not part of the semiannual report. Retain for your records.
| Not FDIC Insured | | | May Lose Value | | | No Bank Guarantee |
MASTER CLASS – 2
FRANKLIN TEMPLETON VARIABLE INSURANCE PRODUCTS TRUST
Important Notes to
Performance Information
Performance data is historical and cannot predict or guarantee future results. Principal value and investment return will fluctuate with market conditions, and you may have a gain or loss when you withdraw your money. Inception dates of the funds may have preceded the effective dates of the subaccounts, contracts, or their availability in all states.
When reviewing the index comparisons, please keep in mind that indexes have a number of inherent performance differentials over the funds. First, unlike the funds, which must hold a minimum amount of cash to maintain liquidity, indexes do not have a cash component. Second, the funds are actively managed and, thus, are subject to management fees to cover salaries of securities analysts or portfolio managers in addition to other expenses. Indexes are unmanaged and do not include any commissions or other expenses typically associated with investing in securities. Third, indexes often contain a different mix of securities than the fund to which they are compared. Additionally, please remember that indexes are simply a measure of performance and cannot be invested in directly.
| i |
Franklin Flex Cap Growth VIP Fund
(Formerly, Franklin Flex Cap Growth Securities Fund)
This semiannual report for Franklin Flex Cap Growth VIP Fund covers the period ended June 30, 2014.
Class 2 Performance Summary as of June 30, 2014
Franklin Flex Cap Growth VIP Fund – Class 2 delivered a +4.64% total return* for the six-month period ended June 30, 2014.
*The Fund has an expense reduction contractually guaranteed through at least 4/30/15 and a fee waiver associated with its investments in a Franklin Templeton money fund, contractually guaranteed through at least its current fiscal year-end. Fund investment results reflect the expense reduction and fee waiver, to the extent applicable; without these reductions, the results would have been lower.
Performance reflects the Fund’s Class 2 operating expenses, but does not include any contract fees, expenses or sales charges. If they had been included, performance would be lower. These charges and deductions, particularly for variable life policies, can have a significant effect on contract values and insurance benefits. See the contract prospectus for a complete description of these expenses, including sales charges.
Performance data represent past performance, which does not guarantee future results. Investment return and principal value will fluctuate, and you may have a gain or loss when you sell your shares. Current performance may differ from figures shown.
| Semiannual Report | FFC-1 |
FRANKLIN FLEX CAP GROWTH VIP FUND
1. Source: © 2014 Morningstar. One cannot invest directly in an index, and an index is not representative of the Fund’s portfolio. Please see Index Descriptions following the Fund Summaries.
2. Source: Bureau of Labor Statistics.
3. Please see Index Descriptions following the Fund Summaries.
| FFC-2 | Semiannual Report |
FRANKLIN FLEX CAP GROWTH VIP FUND
In contrast, key detractors from the Fund’s relative performance included stock selection in the consumer staples, financials, information technology (IT) and consumer discretionary
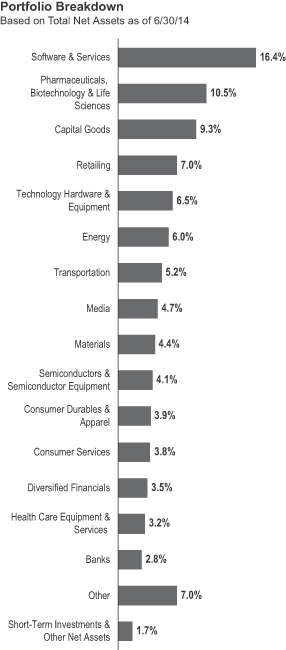
4. The health care sector comprises health care equipment and services; and pharmaceuticals, biotechnology and life sciences in the SOI. The industrials sector comprises capital goods, commercial and professional services, and transportation in the SOI.
| Semiannual Report | FFC-3 |
FRANKLIN FLEX CAP GROWTH VIP FUND
Thank you for your participation in Franklin Flex Cap Growth VIP Fund. We look forward to serving your future investment needs.
The foregoing information reflects our analysis, opinions and portfolio holdings as of June 30, 2014, the end of the reporting period. The way we implement our main investment strategies and the resulting portfolio holdings may change depending on factors such as market and economic conditions. These opinions may not be relied upon as investment advice or an offer for a particular security. The information is not a complete analysis of every aspect of any market, country, industry, security or the Fund. Statements of fact are from sources considered reliable, but the investment manager makes no representation or warranty as to their completeness or accuracy. Although historical performance is no guarantee of future results, these insights may help you understand our investment management philosophy.
5. The consumer staples sector comprises food and staples retailing; and food, beverage and tobacco in the SOI. The financials sector comprises banks, diversified financials, insurance and real estate in the SOI. The IT sector comprises semiconductors and semiconductor equipment, software and services, and technology hardware and equipment in the SOI. The consumer discretionary sector comprises automobiles and components, consumer durables and apparel, consumer services, media and retailing in the SOI.
| FFC-4 | Semiannual Report |
FRANKLIN FLEX CAP GROWTH VIP FUND
Class 2 Fund Expenses
| Class 2 | Beginning Account Value 1/1/14 |
Ending Account Value 6/30/14 |
Fund-Level Expenses 1/1/14–6/30/14 |
|||||||||
| Actual | $1,000 | $1,046.40 | $4.77 | |||||||||
| Hypothetical (5% return before expenses) | $1,000 | $1,020.13 | $4.71 | |||||||||
*Expenses are calculated using the most recent six-month annualized expense ratio, net of expense waivers, for the Fund’s Class 2 shares (0.94%), which does not include any ongoing expenses of the Contract for which the Fund is an investment option, multiplied by the average account value over the period, multiplied by 181/365 to reflect the one-half year period.
| Semiannual Report | FFC-5 |
FRANKLIN TEMPLETON VARIABLE INSURANCE PRODUCTS TRUST
Financial Highlights
Franklin Flex Cap Growth VIP Fund
| Six Months Ended (unaudited) |
Year Ended December 31, | |||||||||||||||||||||||
| 2013 | 2012 | 2011 | 2010 | 2009 | ||||||||||||||||||||
| Class 2 | ||||||||||||||||||||||||
| Per share operating performance (for a share outstanding throughout the period) |
||||||||||||||||||||||||
| Net asset value, beginning of period |
$18.11 | $13.21 | $12.09 | $12.70 | $10.93 | $8.22 | ||||||||||||||||||
|
|
|
|||||||||||||||||||||||
| Income from investment operationsa: | ||||||||||||||||||||||||
| Net investment income (loss)b |
(0.05 | ) | (0.01 | ) | 0.01 | (0.02 | ) | (0.02 | ) | (— | )c | |||||||||||||
| Net realized and unrealized gains (losses) |
0.83 | 4.95 | 1.11 | (0.59 | ) | 1.79 | 2.71 | |||||||||||||||||
|
|
|
|||||||||||||||||||||||
| Total from investment operations |
0.78 | 4.94 | 1.12 | (0.61 | ) | 1.77 | 2.71 | |||||||||||||||||
|
|
|
|||||||||||||||||||||||
| Less distributions from: | ||||||||||||||||||||||||
| Net investment income |
— | (— | )c | — | — | — | — | |||||||||||||||||
| Net realized gains |
(2.51 | ) | (0.04 | ) | — | — | — | — | ||||||||||||||||
|
|
|
|||||||||||||||||||||||
| Total distributions |
(2.51 | ) | (0.04 | ) | — | — | — | — | ||||||||||||||||
|
|
|
|||||||||||||||||||||||
| Net asset value, end of period |
$16.38 | $18.11 | $13.21 | $12.09 | $12.70 | $10.93 | ||||||||||||||||||
|
|
|
|||||||||||||||||||||||
| Total returnd |
4.64% | 37.48% | 9.26% | (4.80)% | 16.19% | 32.97% | ||||||||||||||||||
| Ratios to average net assetse | ||||||||||||||||||||||||
| Expenses before waiver and payments by affiliates |
1.18% | 1.18% | 1.18% | 1.16% | 1.18% | 1.19% | ||||||||||||||||||
| Expenses net of waiver and payments by affiliates |
0.94% | 0.93% | 0.93% | 0.93% | 0.93% | 0.93% | f | |||||||||||||||||
| Net investment income (loss) |
(0.53)% | (0.09)% | 0.09% | (0.14)% | (0.17)% | (0.01)% | ||||||||||||||||||
| Supplemental data | ||||||||||||||||||||||||
| Net assets, end of period (000’s) |
$172,678 | $169,123 | $159,122 | $188,527 | $227,774 | $244,768 | ||||||||||||||||||
| Portfolio turnover rate |
22.55% | 52.15% | 43.50% | 63.99% | 60.00% | 33.64% | ||||||||||||||||||
aThe amount shown for a share outstanding throughout the period may not correlate with the Statement of Operations for the period due to the timing of sales and repurchases of the Fund shares in relation to income earned and/or fluctuating fair value of the investments of the Fund.
bBased on average daily shares outstanding.
cAmount rounds to less than $0.01 per share.
dTotal return does not include fees, charges or expenses imposed by the variable annuity and life insurance contracts for which the Franklin Templeton Variable Insurance Products Trust serves as an underlying investment vehicle. Total return is not annualized for periods less than one year.
eRatios are annualized for periods less than one year.
fBenefit of expense reduction rounds to less than 0.01%.
| FFC-6 | Semiannual Report | The accompanying notes are an integral part of these financial statements. |
FRANKLIN TEMPLETON VARIABLE INSURANCE PRODUCTS TRUST
FINANCIAL HIGHLIGHTS
Franklin Flex Cap Growth VIP Fund (continued)
| Six Months Ended (unaudited) |
Year Ended December 31, | |||||||||||||||||||||||
| 2013 | 2012 | 2011 | 2010 | 2009 | ||||||||||||||||||||
| Class 4 | ||||||||||||||||||||||||
| Per share operating performance (for a share outstanding throughout the period) |
||||||||||||||||||||||||
| Net asset value, beginning of period |
$17.96 | $13.12 | $12.01 | $12.63 | $10.88 | $8.21 | ||||||||||||||||||
|
|
|
|||||||||||||||||||||||
| Income from investment operationsa: | ||||||||||||||||||||||||
| Net investment income (loss)b |
(0.06 | ) | (0.03 | ) | (— | )c | (0.03 | ) | (0.03 | ) | (0.01 | ) | ||||||||||||
| Net realized and unrealized gains (losses) |
0.82 | 4.91 | 1.11 | (0.59 | ) | 1.78 | 2.69 | |||||||||||||||||
|
|
|
|||||||||||||||||||||||
| Total from investment operations |
0.76 | 4.88 | 1.11 | (0.62 | ) | 1.75 | 2.68 | |||||||||||||||||
|
|
|
|||||||||||||||||||||||
| Less distributions from: | ||||||||||||||||||||||||
| Net investment income |
— | — | — | — | — | (0.01 | ) | |||||||||||||||||
| Net realized gains |
(2.51 | ) | (0.04 | ) | — | — | — | — | ||||||||||||||||
|
|
|
|||||||||||||||||||||||
| Total distributions |
(2.51 | ) | (0.04 | ) | — | — | — | (0.01 | ) | |||||||||||||||
|
|
|
|||||||||||||||||||||||
| Net asset value, end of period |
$16.21 | $17.96 | $13.12 | $12.01 | $12.63 | $10.88 | ||||||||||||||||||
|
|
|
|||||||||||||||||||||||
| Total returnd |
4.56% | 37.28% | 9.24% | (4.91)% | 16.08% | 32.69% | ||||||||||||||||||
| Ratios to average net assetse | ||||||||||||||||||||||||
| Expenses before waiver and payments by affiliates |
1.28% | 1.28% | 1.28% | 1.26% | 1.28% | 1.29% | ||||||||||||||||||
| Expenses net of waiver and payments by affiliates |
1.04% | 1.03% | 1.03% | 1.03% | 1.03% | 1.03% | f | |||||||||||||||||
| Net investment income (loss) |
(0.63)% | (0.19)% | (0.01)% | (0.24)% | (0.27)% | (0.11)% | ||||||||||||||||||
| Supplemental data | ||||||||||||||||||||||||
| Net assets, end of period (000’s) |
$260,633 | $251,339 | $216,607 | $270,598 | $263,746 | $218,798 | ||||||||||||||||||
| Portfolio turnover rate |
22.55% | 52.15% | 43.50% | 63.99% | 60.00% | 33.64% | ||||||||||||||||||
aThe amount shown for a share outstanding throughout the period may not correlate with the Statement of Operations for the period due to the timing of sales and repurchases of the Fund shares in relation to income earned and/or fluctuating fair value of the investments of the Fund.
bBased on average daily shares outstanding.
cAmount rounds to less than $0.01 per share.
dTotal return does not include fees, charges or expenses imposed by the variable annuity and life insurance contracts for which the Franklin Templeton Variable Insurance Products Trust serves as an underlying investment vehicle. Total return is not annualized for periods less than one year.
eRatios are annualized for periods less than one year.
fBenefit of expense reduction rounds to less than 0.01%.
| The accompanying notes are an integral part of these financial statements. | Semiannual Report | FFC-7 |
FRANKLIN TEMPLETON VARIABLE INSURANCE PRODUCTS TRUST
Statement of Investments, June 30, 2014 (unaudited)
| Franklin Flex Cap Growth VIP Fund | ||||||||||
| Shares | Value | |||||||||
| Common Stocks 98.3% |
||||||||||
| Automobiles & Components 1.1% |
||||||||||
| BorgWarner Inc. |
50,000 | $ | 3,259,500 | |||||||
| a | Tesla Motors Inc. |
6,000 | 1,440,360 | |||||||
|
|
|
|||||||||
| 4,699,860 | ||||||||||
|
|
|
|||||||||
| Banks 2.8% |
||||||||||
| a | Signature Bank |
37,500 | 4,731,750 | |||||||
| a | SVB Financial Group |
37,500 | 4,373,250 | |||||||
| a | Talmer Bancorp Inc., A |
90,000 | 1,241,100 | |||||||
| a | Texas Capital Bancshares Inc. |
30,000 | 1,618,500 | |||||||
|
|
|
|||||||||
| 11,964,600 | ||||||||||
|
|
|
|||||||||
| Capital Goods 9.3% |
||||||||||
| Acuity Brands Inc. |
12,500 | 1,728,125 | ||||||||
| a | Chart Industries Inc. |
27,500 | 2,275,350 | |||||||
| a | Colfax Corp. |
50,000 | 3,727,000 | |||||||
| Cummins Inc. |
8,000 | 1,234,320 | ||||||||
| a | DigitalGlobe Inc. |
70,000 | 1,946,000 | |||||||
| a | HD Supply Holdings Inc. |
40,000 | 1,135,600 | |||||||
| Honeywell International Inc. |
46,500 | 4,322,175 | ||||||||
| a,b | The Keyw Holding Corp. |
83,150 | 1,045,195 | |||||||
| The Manitowoc Co. Inc. |
90,000 | 2,957,400 | ||||||||
| a | NOW Inc./DE |
5,000 | 181,050 | |||||||
| Pall Corp. |
40,000 | 3,415,600 | ||||||||
| Precision Castparts Corp. |
20,000 | 5,048,000 | ||||||||
| a | Proto Labs Inc. |
27,500 | 2,252,800 | |||||||
| Rockwell Automation Inc. |
19,000 | 2,378,040 | ||||||||
| Roper Industries Inc. |
22,000 | 3,212,220 | ||||||||
| a | United Rentals Inc. |
31,500 | 3,298,995 | |||||||
|
|
|
|||||||||
| 40,157,870 | ||||||||||
|
|
|
|||||||||
| Commercial & Professional Services 1.9% |
||||||||||
| a | IHS Inc., A |
16,600 | 2,252,122 | |||||||
| Nielsen NV |
45,000 | 2,178,450 | ||||||||
| a | Stericycle Inc. |
19,530 | 2,312,743 | |||||||
| a | Verisk Analytics Inc., A |
22,500 | 1,350,450 | |||||||
|
|
|
|||||||||
| 8,093,765 | ||||||||||
|
|
|
|||||||||
| Consumer Durables & Apparel 3.9% |
||||||||||
| a | GoPro Inc., A |
7,540 | 305,747 | |||||||
| a | Kate Spade & Co. |
30,000 | 1,144,200 | |||||||
| a,b | Lululemon Athletica Inc. |
28,000 | 1,133,440 | |||||||
| a | Michael Kors Holdings Ltd. |
45,000 | 3,989,250 | |||||||
| NIKE Inc., B |
55,000 | 4,265,250 | ||||||||
| a,b | TRI Pointe Homes Inc. |
85,000 | 1,336,200 | |||||||
| a | Under Armour Inc., A |
80,000 | 4,759,200 | |||||||
|
|
|
|||||||||
| 16,933,287 | ||||||||||
|
|
|
|||||||||
| Consumer Services 3.8% |
||||||||||
| a | Buffalo Wild Wings Inc. |
12,500 | 2,071,375 | |||||||
| a | Chipotle Mexican Grill Inc. |
3,400 | 2,014,534 | |||||||
| a | Chuy’s Holdings Inc. |
28,570 | 1,037,091 | |||||||
| a | Hilton Worldwide Holdings Inc. |
50,000 | 1,165,000 | |||||||
| Las Vegas Sands Corp. |
41,500 | 3,163,130 | ||||||||
| a,b | Noodles & Co. |
50,000 | 1,719,500 | |||||||
| FFC-8 | Semiannual Report |
FRANKLIN TEMPLETON VARIABLE INSURANCE PRODUCTS TRUST
STATEMENT OF INVESTMENTS (UNAUDITED)
Franklin Flex Cap Growth VIP Fund (continued)
| Shares | Value | |||||||||
| Common Stocks (continued) |
||||||||||
| Consumer Service (continued) |
||||||||||
| Wynn Resorts Ltd. |
25,000 | $ | 5,189,000 | |||||||
|
|
|
|||||||||
| 16,359,630 | ||||||||||
|
|
|
|||||||||
| Diversified Financials 3.5% |
||||||||||
| a | Affiliated Managers Group Inc. |
14,500 | 2,978,300 | |||||||
| Discover Financial Services |
60,000 | 3,718,800 | ||||||||
| Evercore Partners Inc. |
25,000 | 1,441,000 | ||||||||
| Financial Engines Inc. |
23,440 | 1,061,363 | ||||||||
| Intercontinental Exchange Inc. |
11,000 | 2,077,900 | ||||||||
| T. Rowe Price Group Inc. |
46,500 | 3,925,065 | ||||||||
|
|
|
|||||||||
| 15,202,428 | ||||||||||
|
|
|
|||||||||
| Energy 6.0% |
||||||||||
| Anadarko Petroleum Corp. |
40,000 | 4,378,800 | ||||||||
| a | Diamondback Energy Inc. |
27,000 | 2,397,600 | |||||||
| a | Eclipse Resources Corp. |
49,350 | 1,240,166 | |||||||
| a | FMC Technologies Inc. |
35,000 | 2,137,450 | |||||||
| National Oilwell Varco Inc. |
20,000 | 1,647,000 | ||||||||
| Noble Energy Inc. |
28,500 | 2,207,610 | ||||||||
| a | Oasis Petroleum Inc. |
60,000 | 3,353,400 | |||||||
| Oceaneering International Inc. |
25,000 | 1,953,250 | ||||||||
| a | Rice Energy Inc. |
65,000 | 1,979,250 | |||||||
| Schlumberger Ltd. |
40,000 | 4,718,000 | ||||||||
|
|
|
|||||||||
| 26,012,526 | ||||||||||
|
|
|
|||||||||
| Food & Staples Retailing 0.8% |
||||||||||
| a | Sprouts Farmers Markets LLC |
12,000 | 392,640 | |||||||
| Whole Foods Market Inc. |
77,500 | 2,993,825 | ||||||||
|
|
|
|||||||||
| 3,386,465 | ||||||||||
|
|
|
|||||||||
| Food, Beverage & Tobacco 1.4% |
||||||||||
| a | Boston Beer Inc., A |
8,000 | 1,788,160 | |||||||
| Mead Johnson Nutrition Co., A |
23,500 | 2,189,495 | ||||||||
| a | Monster Beverage Corp. |
31,000 | 2,201,930 | |||||||
|
|
|
|||||||||
| 6,179,585 | ||||||||||
|
|
|
|||||||||
| Health Care Equipment & Services 3.2% |
||||||||||
| a | Cerner Corp. |
50,000 | 2,579,000 | |||||||
| a | DaVita HealthCare Partners Inc. |
38,100 | 2,755,392 | |||||||
| a | DexCom Inc. |
27,500 | 1,090,650 | |||||||
| a | Envision Healthcare Holdings Inc. |
100,000 | 3,591,000 | |||||||
| McKesson Corp. |
20,000 | 3,724,200 | ||||||||
|
|
|
|||||||||
| 13,740,242 | ||||||||||
|
|
|
|||||||||
| Insurance 0.2% |
||||||||||
| Aflac Inc. |
17,500 | 1,089,375 | ||||||||
|
|
|
|||||||||
| Materials 4.4% |
||||||||||
| Cytec Industries Inc. |
57,500 | 6,061,650 | ||||||||
| Ecolab Inc. |
77,000 | 8,573,180 | ||||||||
| Praxair Inc. |
32,500 | 4,317,300 | ||||||||
|
|
|
|||||||||
| 18,952,130 | ||||||||||
|
|
|
|||||||||
| Semiannual Report | FFC-9 |
FRANKLIN TEMPLETON VARIABLE INSURANCE PRODUCTS TRUST
STATEMENT OF INVESTMENTS (UNAUDITED)
Franklin Flex Cap Growth VIP Fund (continued)
| Shares | Value | |||||||||
| Common Stocks (continued) |
||||||||||
| Media 4.7% |
||||||||||
| a | Charter Communications Inc., A |
25,000 | $ | 3,959,500 | ||||||
| a | Discovery Communications Inc., C |
38,000 | 2,758,420 | |||||||
| a | Imax Corp. (Canada) |
50,000 | 1,424,000 | |||||||
| a | Sirius XM Holdings Inc. |
950,000 | 3,287,000 | |||||||
| Twenty-First Century Fox Inc., B |
110,000 | 3,765,300 | ||||||||
| The Walt Disney Co. |
60,000 | 5,144,400 | ||||||||
|
|
|
|||||||||
| 20,338,620 | ||||||||||
|
|
|
|||||||||
| Pharmaceuticals, Biotechnology & Life Sciences 10.5% |
||||||||||
| a | Actavis PLC |
46,500 | 10,371,825 | |||||||
| a | Alnylam Pharmaceuticals Inc. |
38,000 | 2,400,460 | |||||||
| a | Biogen Idec Inc. |
17,500 | 5,517,925 | |||||||
| Bristol-Myers Squibb Co. |
70,000 | 3,395,700 | ||||||||
| a | Celgene Corp. |
54,000 | 4,637,520 | |||||||
| a | Celldex Therapeutics Inc. |
130,000 | 2,121,600 | |||||||
| a | Gilead Sciences Inc. |
74,000 | 6,135,340 | |||||||
| a | Illumina Inc. |
25,000 | 4,463,500 | |||||||
| a | Karyopharm Therapeutics Inc. |
22,500 | 1,047,375 | |||||||
| Perrigo Co. PLC |
18,640 | 2,716,966 | ||||||||
| a | Quintiles Transnational Holdings Inc. |
46,500 | 2,477,985 | |||||||
| a | Revance Therapeutics Inc. |
7,500 | 255,000 | |||||||
|
|
|
|||||||||
| 45,541,196 | ||||||||||
|
|
|
|||||||||
| Real Estate 0.9% |
||||||||||
| American Tower Corp. |
43,500 | 3,914,130 | ||||||||
|
|
|
|||||||||
| Retailing 7.0% |
||||||||||
| a | Amazon.com Inc. |
20,000 | 6,495,600 | |||||||
| a,b | The Container Store Group Inc. |
14,650 | 406,977 | |||||||
| Dick’s Sporting Goods Inc. |
45,000 | 2,095,200 | ||||||||
| GNC Holdings Inc., A |
35,000 | 1,193,500 | ||||||||
| a | HomeAway Inc. |
60,000 | 2,089,200 | |||||||
| a | Liberty Ventures, A |
35,000 | 2,583,000 | |||||||
| Lithia Motors Inc. |
20,000 | 1,881,400 | ||||||||
| a | LKQ Corp. |
45,000 | 1,201,050 | |||||||
| a | Lumber Liquidators Holdings Inc. |
19,000 | 1,443,050 | |||||||
| a | Netflix Inc. |
7,500 | 3,304,500 | |||||||
| a | The Priceline Group Inc. |
5,000 | 6,015,000 | |||||||
| Tractor Supply Co. |
28,500 | 1,721,400 | ||||||||
|
|
|
|||||||||
| 30,429,877 | ||||||||||
|
|
|
|||||||||
| Semiconductors & Semiconductor Equipment 4.1% |
||||||||||
| a | Cavium Inc. |
50,000 | 2,483,000 | |||||||
| Microchip Technology Inc. |
90,000 | 4,392,900 | ||||||||
| a | Nanometrics Inc. |
50,000 | 912,500 | |||||||
| a | NXP Semiconductors NV (Netherlands) |
92,500 | 6,121,650 | |||||||
| Xilinx Inc. |
85,000 | 4,021,350 | ||||||||
|
|
|
|||||||||
| 17,931,400 | ||||||||||
|
|
|
|||||||||
| Software & Services 16.4% |
||||||||||
| a | Alliance Data Systems Corp. |
11,500 | 3,234,375 | |||||||
| a | ANSYS Inc. |
27,500 | 2,085,050 | |||||||
| a | Bottomline Technologies Inc. |
32,500 | 972,400 | |||||||
| FFC-10 | Semiannual Report |
FRANKLIN TEMPLETON VARIABLE INSURANCE PRODUCTS TRUST
STATEMENT OF INVESTMENTS (UNAUDITED)
Franklin Flex Cap Growth VIP Fund (continued)
| Shares | Value | |||||||||
| Common Stocks (continued) |
||||||||||
| Software & Services (continued) |
||||||||||
| a | BroadSoft Inc. |
50,000 | $ | 1,319,500 | ||||||
| a | CoStar Group Inc. |
13,000 | 2,056,210 | |||||||
| a | Demandware Inc. |
25,000 | 1,734,250 | |||||||
| a | Electronic Arts Inc. |
60,000 | 2,152,200 | |||||||
| a | Facebook Inc., A |
100,000 | 6,729,000 | |||||||
| a,b | FireEye Inc. |
15,000 | 608,250 | |||||||
| a | FleetCor Technologies Inc. |
29,000 | 3,822,200 | |||||||
| a | Fortinet Inc. |
60,000 | 1,507,800 | |||||||
| a | Global Eagle Entertainment Inc. |
70,000 | 868,000 | |||||||
| Google Inc., A |
10,900 | 6,372,903 | ||||||||
| a | Google Inc., C |
10,000 | 5,752,800 | |||||||
| a | Guidewire Software Inc. |
25,000 | 1,016,500 | |||||||
| a | LinkedIn Corp., A |
11,500 | 1,971,905 | |||||||
| MasterCard Inc., A |
112,500 | 8,265,375 | ||||||||
| a | NetSuite Inc. |
20,000 | 1,737,600 | |||||||
| a | Pandora Media Inc. |
45,000 | 1,327,500 | |||||||
| a | Salesforce.com Inc. |
55,000 | 3,194,400 | |||||||
| a | ServiceNow Inc. |
22,500 | 1,394,100 | |||||||
| a | Splunk Inc. |
18,000 | 995,940 | |||||||
| a | Twitter Inc. |
65,000 | 2,663,050 | |||||||
| Visa Inc., A |
32,500 | 6,848,075 | ||||||||
| a | Workday Inc. |
16,000 | 1,437,760 | |||||||
| a | Yelp Inc. |
16,000 | 1,226,880 | |||||||
|
|
|
|||||||||
| 71,294,023 | ||||||||||
|
|
|
|||||||||
| Technology Hardware & Equipment 6.5% |
||||||||||
| Apple Inc. |
122,500 | 11,383,925 | ||||||||
| a | Palo Alto Networks Inc. |
20,000 | 1,677,000 | |||||||
| QUALCOMM Inc. |
70,000 | 5,544,000 | ||||||||
| SanDisk Corp. |
31,000 | 3,237,330 | ||||||||
| a | Stratasys Ltd. |
18,000 | 2,045,340 | |||||||
| a | Trimble Navigation Ltd. |
55,000 | 2,032,250 | |||||||
| a,b | Ubiquiti Networks Inc. |
54,000 | 2,440,260 | |||||||
|
|
|
|||||||||
| 28,360,105 | ||||||||||
|
|
|
|||||||||
| Telecommunication Services 0.7% |
||||||||||
| a | SBA Communications Corp. |
28,000 | 2,864,400 | |||||||
|
|
|
|||||||||
| Transportation 5.2% |
||||||||||
| Canadian Pacific Railway Ltd. (Canada) |
20,000 | 3,622,800 | ||||||||
| Expeditors International of Washington Inc. |
27,010 | 1,192,762 | ||||||||
| a | Genesee & Wyoming Inc. |
32,500 | 3,412,500 | |||||||
| a | Hub Group Inc., A |
72,500 | 3,654,000 | |||||||
| Kansas City Southern |
22,500 | 2,418,975 | ||||||||
| a | Kirby Corp. |
15,000 | 1,757,100 | |||||||
| a | Spirit Airlines Inc. |
45,000 | 2,845,800 | |||||||
| Union Pacific Corp. |
36,000 | 3,591,000 | ||||||||
|
|
|
|||||||||
| 22,494,937 | ||||||||||
|
|
|
|||||||||
| Total Common Stocks (Cost $267,220,308) |
425,940,451 | |||||||||
|
|
|
|||||||||
| Semiannual Report | FFC-11 |
FRANKLIN TEMPLETON VARIABLE INSURANCE PRODUCTS TRUST
STATEMENT OF INVESTMENTS (UNAUDITED)
Franklin Flex Cap Growth VIP Fund (continued)
| Shares | Value | |||||||||
| Short Term Investments 3.7% |
||||||||||
| Money Market Funds (Cost $7,679,231) 1.8% |
||||||||||
| a,c | Institutional Fiduciary Trust Money Market Portfolio |
7,679,231 | $ | 7,679,231 | ||||||
|
|
|
|||||||||
| d | Investments from Cash Collateral Received for Loaned Securities 1.9% |
|||||||||
| Money Market Funds (Cost $8,306,925) 1.9% |
||||||||||
| e | BNY Mellon Overnight Government Fund, 0.082% |
8,306,925 | 8,306,925 | |||||||
|
|
|
|||||||||
| Total Investments (Cost $283,206,464) 102.0% |
441,926,607 | |||||||||
| Other Assets, less Liabilities (2.0)% |
(8,615,368 | ) | ||||||||
|
|
|
|||||||||
| Net Assets 100.0% |
$ | 433,311,239 | ||||||||
|
|
|
|||||||||
aNon-income producing.
bA portion or all of the security is on loan at June 30, 2014. See Note 1(b).
cSee Note 3(e) regarding investments in the Institutional Fiduciary Trust Money Market Portfolio.
dSee Note 1(b) regarding securities on loan.
eThe rate shown is the annualized seven-day yield at period end.
| FFC-12 | Semiannual Report | The accompanying notes are an integral part of these financial statements. |
FRANKLIN TEMPLETON VARIABLE INSURANCE PRODUCTS TRUST
Financial Statements
Statement of Assets and Liabilities
June 30, 2014 (unaudited)
| Franklin Flex Cap Growth VIP Fund |
||||
| Assets: | ||||
| Investments in securities: |
||||
| Cost - Unaffiliated issuers |
$ | 275,527,233 | ||
| Cost - Sweep Money Fund (Note 3e) |
7,679,231 | |||
|
|
|
|||
| Total cost of investments |
$ | 283,206,464 | ||
|
|
|
|||
| Value - Unaffiliated issuers |
$ | 434,247,376 | ||
| Value - Sweep Money Fund (Note 3e) |
7,679,231 | |||
|
|
|
|||
| Total value of investments (Includes securities loaned in the amount of $8,140,558) |
441,926,607 | |||
| Receivables: |
||||
| Investment securities sold |
285,242 | |||
| Capital shares sold |
284,961 | |||
| Dividends and interest |
159,890 | |||
| Other assets |
194 | |||
|
|
|
|||
| Total assets |
442,656,894 | |||
|
|
|
|||
| Liabilities: | ||||
| Payables: |
||||
| Investment securities purchased |
368,334 | |||
| Capital shares redeemed |
163,803 | |||
| Management fees |
234,539 | |||
| Distribution fees |
216,024 | |||
| Payable upon return of securities loaned |
8,306,925 | |||
| Accrued expenses and other liabilities |
56,030 | |||
|
|
|
|||
| Total liabilities |
9,345,655 | |||
|
|
|
|||
| Net assets, at value |
$ | 433,311,239 | ||
|
|
|
|||
| Net assets consist of: | ||||
| Paid-in capital |
$ | 245,879,262 | ||
| Distributions in excess of net investment income |
(1,235,254 | ) | ||
| Net unrealized appreciation (depreciation) |
158,720,143 | |||
| Accumulated net realized gain (loss) |
29,947,088 | |||
|
|
|
|||
| Net assets, at value |
$ | 433,311,239 | ||
|
|
|
|||
| Class 2: | ||||
| Net assets, at value |
$ | 172,677,808 | ||
|
|
|
|||
| Shares outstanding |
10,543,560 | |||
|
|
|
|||
| Net asset value and maximum offering price per share |
$ | 16.38 | ||
|
|
|
|||
| Class 4: | ||||
| Net assets, at value |
$ | 260,633,431 | ||
|
|
|
|||
| Shares outstanding |
16,074,342 | |||
|
|
|
|||
| Net asset value and maximum offering price per share |
$ | 16.21 | ||
|
|
|
|||
| The accompanying notes are an integral part of these financial statements. | Semiannual Report | FFC-13 |
FRANKLIN TEMPLETON VARIABLE INSURANCE PRODUCTS TRUST
FINANCIAL STATEMENTS
Statement of Operations
for the six months ended June 30, 2014 (unaudited)
| Franklin Flex Cap Growth VIP Fund |
||||
| Investment income: | ||||
| Dividends |
$ | 726,001 | ||
| Income from securities loaned |
131,379 | |||
|
|
|
|||
| Total investment income |
857,380 | |||
|
|
|
|||
| Expenses: | ||||
| Management fees (Note 3a) |
1,891,266 | |||
| Distribution fees: (Note 3c) |
||||
| Class 2 |
212,066 | |||
| Class 4 |
435,988 | |||
| Custodian fees (Note 4) |
1,762 | |||
| Reports to shareholders |
35,049 | |||
| Professional fees |
19,825 | |||
| Trustees’ fees and expenses |
812 | |||
| Other |
5,642 | |||
|
|
|
|||
| Total expenses |
2,602,410 | |||
| Expenses waived/paid by affiliates (Note 3e and 3f) |
(509,776 | ) | ||
|
|
|
|||
| Net expenses |
2,092,634 | |||
|
|
|
|||
| Net investment income (loss) |
(1,235,254 | ) | ||
|
|
|
|||
| Realized and unrealized gains (losses): | ||||
| Net realized gain (loss) from investments |
30,818,423 | |||
| Net change in unrealized appreciation (depreciation) on investments |
(10,744,417 | ) | ||
|
|
|
|||
| Net realized and unrealized gain (loss) |
20,074,006 | |||
|
|
|
|||
| Net increase (decrease) in net assets resulting from operations |
$ | 18,838,752 | ||
|
|
|
|||
| FFC-14 | Semiannual Report | The accompanying notes are an integral part of these financial statements. |
FRANKLIN TEMPLETON VARIABLE INSURANCE PRODUCTS TRUST
FINANCIAL STATEMENTS
Statements of Changes in Net Assets
| Franklin Flex Cap Growth VIP Fund | ||||||||
| Six Months Ended June 30, 2014 (unaudited) |
Year Ended December 31, 2013 |
|||||||
| Increase (decrease) in net assets: | ||||||||
| Operations: |
||||||||
| Net investment income (loss) |
$ | (1,235,254 | ) | $ | (590,415 | ) | ||
| Net realized gain (loss) from investments |
30,818,423 | 60,105,842 | ||||||
| Net change in unrealized appreciation (depreciation) on investments |
(10,744,417 | ) | 67,788,666 | |||||
|
|
|
|||||||
| Net increase (decrease) in net assets resulting from operations |
18,838,752 | 127,304,093 | ||||||
|
|
|
|||||||
| Distributions to shareholders from: |
||||||||
| Net investment income: |
||||||||
| Class 2 |
— | (6,555 | ) | |||||
| Net realized gains: |
||||||||
| Class 2 |
(23,244,460 | ) | (449,397 | ) | ||||
| Class 4 |
(34,835,360 | ) | (654,813 | ) | ||||
|
|
|
|||||||
| Total distributions to shareholders |
(58,079,820 | ) | (1,110,765 | ) | ||||
|
|
|
|||||||
| Capital share transactions: (Note 2) |
||||||||
| Class 2 |
19,343,498 | (41,676,643 | ) | |||||
| Class 4 |
32,747,296 | (39,784,837 | ) | |||||
|
|
|
|||||||
| Total capital share transactions |
52,090,794 | (81,461,480 | ) | |||||
|
|
|
|||||||
| Net increase (decrease) in net assets |
12,849,726 | 44,731,848 | ||||||
| Net assets: | ||||||||
| Beginning of period |
420,461,513 | 375,729,665 | ||||||
|
|
|
|||||||
| End of period |
$ | 433,311,239 | $ | 420,461,513 | ||||
|
|
|
|||||||
| Distributions in excess of net investment income included in net assets: | ||||||||
| End of period |
$ | (1,235,254 | ) | $ | — | |||
|
|
|
|||||||
| The accompanying notes are an integral part of these financial statements. | Semiannual Report | FFC-15 |
FRANKLIN TEMPLETON VARIABLE INSURANCE PRODUCTS TRUST
Notes to Financial Statements (unaudited)
Franklin Flex Cap Growth VIP Fund
| FFC-16 | Semiannual Report |
FRANKLIN TEMPLETON VARIABLE INSURANCE PRODUCTS TRUST
NOTES TO FINANCIAL STATEMENTS (UNAUDITED)
Franklin Flex Cap Growth VIP Fund (continued)
| Semiannual Report | FFC-17 |
FRANKLIN TEMPLETON VARIABLE INSURANCE PRODUCTS TRUST
NOTES TO FINANCIAL STATEMENTS (UNAUDITED)
Franklin Flex Cap Growth VIP Fund (continued)
2. Shares of Beneficial Interest
At June 30, 2014, there were an unlimited number of shares authorized (without par value). Transactions in the Fund’s shares were as follows:
| Six Months Ended June 30, 2014 |
Year Ended December 31, 2013 |
|||||||||||||||||
| Shares | Amount | Shares | Amount | |||||||||||||||
| Class 2 Shares: | ||||||||||||||||||
| Shares sold |
902,608 | $ | 16,488,181 | 1,113,999 | $ | 16,865,422 | ||||||||||||
| Shares issued in reinvestment of distributions |
1,454,597 | 23,244,460 | 30,996 | 455,952 | ||||||||||||||
| Shares redeemed |
(1,153,222 | ) | (20,389,143 | ) | (3,846,981 | ) | (58,998,017 | ) | ||||||||||
|
|
|
|||||||||||||||||
| Net increase (decrease) |
1,203,983 | $ | 19,343,498 | (2,701,986 | ) | $ | (41,676,643 | ) | ||||||||||
|
|
|
|||||||||||||||||
| Class 4 Shares: | ||||||||||||||||||
| Shares sold |
794,036 | $ | 14,170,794 | 1,584,158 | $ | 24,181,871 | ||||||||||||
| Shares issued on reinvestment of distributions |
2,201,982 | 34,835,359 | 44,850 | 654,813 | ||||||||||||||
| Shares redeemed |
(915,095 | ) | (16,258,857 | ) | (4,145,079 | ) | (64,621,521 | ) | ||||||||||
|
|
|
|||||||||||||||||
| Net increase (decrease) |
2,080,923 | $ | 32,747,296 | (2,516,071 | ) | $ | (39,784,837 | ) | ||||||||||
|
|
|
|||||||||||||||||
3. Transactions With Affiliates
Franklin Resources, Inc. is the holding company for various subsidiaries that together are referred to as Franklin Templeton Investments. Certain officers and trustees of the Fund are also officers and/or directors of the following subsidiaries:
| Subsidiary | Affiliation | |
| Franklin Advisers, Inc. (Advisers) | Investment manager | |
| Franklin Templeton Services, LLC (FT Services) | Administrative manager | |
| Franklin Templeton Distributors, Inc. (Distributors) | Principal underwriter | |
| Franklin Templeton Investor Services, LLC (Investor Services) | Transfer agent |
a. Management Fees
The Fund pays an investment management fee to Advisers based on the average daily net assets of the Fund as follows:
| Annualized Fee Rate | Net Assets | |
| 1.000% | Up to and including $100 million | |
| 0.900% | Over $100 million, up to and including $250 million | |
| 0.850% | Over $250 million, up to and including $10 billion | |
| 0.800% | Over $10 billion, up to and including $12.5 billion | |
| 0.775% | Over $12.5 billion, up to and including $15 billion | |
| 0.750% | In excess of $15 billion |
b. Administrative Fees
Under an agreement with Advisers, FT Services provides administrative services to the Fund. The fee is paid by Advisers based on the Fund’s average daily net assets, and is not an additional expense of the Fund.
| FFC-18 | Semiannual Report |
FRANKLIN TEMPLETON VARIABLE INSURANCE PRODUCTS TRUST
NOTES TO FINANCIAL STATEMENTS (UNAUDITED)
Franklin Flex Cap Growth VIP Fund (continued)
c. Distribution Fees
The Board has adopted distribution plans for Class 2 and Class 4 shares pursuant to Rule 12b-1 under the 1940 Act. Under the Fund’s compensation distribution plans, the Fund pays Distributors for costs incurred in connection with the servicing, sale and distribution of the Fund’s shares up to 0.35% per year of its average daily net assets of each class. Some distribution fees are not charged on shares held by affiliates. The Board has agreed to limit the current rate to 0.25% per year for Class 2. The plan year, for purposes of monitoring compliance with the maximum annual plan rates, is February 1 through January 31.
d. Transfer Agent Fees
Investor Services, under terms of an agreement, performs shareholder servicing for the Fund and is not paid by the Fund for the services.
e. Investment in Institutional Fiduciary Trust Money Market Portfolio
The Fund invests in the Institutional Fiduciary Trust Money Market Portfolio (Sweep Money Fund), an affiliated open-end management investment company. Management fees paid by the Fund are waived on assets invested in the Sweep Money Fund, in an amount not to exceed the management and administrative fees paid directly or indirectly by the Sweep Money Fund, as noted on the Statement of Operations. Prior to January 1, 2014, the waiver was accounted for as a reduction to management fees.
f. Waiver and Expense Reimbursements
Advisers has contractually agreed in advance to waive or limit its fees and to assume as its own expense certain expenses otherwise payable by the Fund so that the expenses (excluding distribution fees, and acquired fund fees and expenses) for Class 2 and Class 4 of the Fund do not exceed 0.71% based on the average net assets of each class (other than certain non-routine expenses or costs, including those relating to litigation, indemnification, reorganizations, and liquidations) until April 30, 2015. Prior to May 1, 2014, expenses were limited to 0.68%.
4. Expense Offset Arrangement
The Fund has entered into an arrangement with its custodian whereby credits realized as a result of uninvested cash balances are used to reduce a portion of the Fund’s custodian expenses. During the period ended June 30, 2014, there were no credits earned.
5. Income Taxes
At June 30, 2014, the cost of investments and net unrealized appreciation (depreciation) for income tax purposes were as follows:
| Cost of investments |
$283,895,172 | |
|
| ||
| Unrealized appreciation |
$161,493,993 | |
| Unrealized depreciation |
(3,462,558) | |
|
| ||
| Net unrealized appreciation (depreciation) |
$158,031,435 | |
|
| ||
Differences between income and/or capital gains as determined on a book basis and a tax basis are primarily due to differing treatments of wash sales.
6. Investment Transactions
Purchases and sales of investments (excluding short term securities) for the period ended June 30, 2014, aggregated $94,598,343 and $111,072,701, respectively.
| Semiannual Report | FFC-19 |
FRANKLIN TEMPLETON VARIABLE INSURANCE PRODUCTS TRUST
NOTES TO FINANCIAL STATEMENTS (UNAUDITED)
Franklin Flex Cap Growth VIP Fund (continued)
7. Credit Facility
The Fund, together with other U.S. registered and foreign investment funds (collectively, Borrowers), managed by Franklin Templeton Investments, are borrowers in a joint syndicated senior unsecured credit facility totaling $1.5 billion (Global Credit Facility) which matures on February 13, 2015. This Global Credit Facility provides a source of funds to the Borrowers for temporary and emergency purposes, including the ability to meet future unanticipated or unusually large redemption requests.
Under the terms of the Global Credit Facility, the Fund shall, in addition to interest charged on any borrowings made by the Fund and other costs incurred by the Fund, pay its share of fees and expenses incurred in connection with the implementation and maintenance of the Global Credit Facility, based upon its relative share of the aggregate net assets of all of the Borrowers, including an annual commitment fee of 0.07% based upon the unused portion of the Global Credit Facility. These fees are reflected in other expenses on the Statement of Operations. During the period ended June 30, 2014, the Fund did not use the Global Credit Facility.
8. Fair Value Measurements
The Fund follows a fair value hierarchy that distinguishes between market data obtained from independent sources (observable inputs) and the Fund’s own market assumptions (unobservable inputs). These inputs are used in determining the value of the Fund’s financial instruments and are summarized in the following fair value hierarchy:
| • | Level 1 – quoted prices in active markets for identical financial instruments |
| • | Level 2 – other significant observable inputs (including quoted prices for similar financial instruments, interest rates, prepayment speed, credit risk, etc.) |
| • | Level 3 – significant unobservable inputs (including the Fund’s own assumptions in determining the fair value of financial instruments) |
The input levels are not necessarily an indication of the risk or liquidity associated with financial instruments at that level.
For movements between the levels within the fair value hierarchy, the Fund has adopted a policy of recognizing the transfers as of the date of the underlying event which caused the movement.
A summary of inputs used as of June 30, 2014, in valuing the Fund’s assets carried at fair value, is as follows:
| Level 1 | Level 2 | Level 3 | Total | |||||||||||||
| Assets: | ||||||||||||||||
| Investments in Securities: |
||||||||||||||||
| Equity Investmentsa,b |
$ | 425,940,451 | $ | — | $ | — | $ | 425,940,451 | ||||||||
| Short Term Investments |
7,679,231 | 8,306,925 | — | 15,986,156 | ||||||||||||
|
|
|
|||||||||||||||
| Total Investments in Securities |
$ | 433,619,682 | $ | 8,306,925 | $ | — | $ | 441,926,607 | ||||||||
|
|
|
|||||||||||||||
aIncludes common stocks.
bFor detailed categories, see the accompanying Statement of Investments.
9. New Accounting Pronouncements
In June 2014, the Financial Accounting Standards Board issued Accounting Standards Update (ASU) No. 2014-11, Transfers and Servicing (Topic 860), Repurchase-to-Maturity Transactions, Repurchase Financings, and Disclosures. The ASU changes the accounting for certain repurchase agreements and expands disclosure requirements related to repurchase agreements, securities lending, repurchase-to-maturity and similar transactions. The ASU is effective for interim and annual reporting periods beginning after December 15, 2014. Management is currently evaluating the impact, if any, of applying this provision.
| FFC-20 | Semiannual Report |
FRANKLIN TEMPLETON VARIABLE INSURANCE PRODUCTS TRUST
NOTES TO FINANCIAL STATEMENTS (UNAUDITED)
Franklin Flex Cap Growth VIP Fund (continued)
10. Subsequent Events
The Fund has evaluated subsequent events through the issuance of the financial statements and determined that no events have occurred that require disclosure.
| Semiannual Report | FFC-21 |
Franklin Founding Funds Allocation VIP Fund
(Formerly, Franklin Templeton VIP Founding Funds Allocation Fund)
We are pleased to bring you Franklin Founding Funds Allocation VIP Fund’s semiannual report for the period ended June 30, 2014.
Class 2 Performance Summary as of June 30, 2014
Franklin Founding Funds Allocation VIP Fund – Class 2 delivered a +7.56% total return* for the six-month period ended June 30, 2014.
*The Fund has an expense reduction contractually guaranteed through at least 4/30/15 and a fee waiver associated with its investments in a Franklin Templeton money fund, guaranteed through at least its current fiscal year-end. Fund investment results reflect the expense reduction and fee waiver, to the extent applicable; without these reductions, the results would have been lower.
Performance reflects the Fund’s Class 2 operating expenses, but does not include any contract fees, expenses or sales charges. If they had been included, performance would be lower. These charges and deductions, particularly for variable life policies, can have a significant effect on contract values and insurance benefits. See the contract prospectus for a complete description of these expenses, including sales charges.
Performance data represent past performance, which does not guarantee future results. Investment return and principal value will fluctuate, and you may have a gain or loss when you sell your shares. Current performance may differ from figures shown.
| Semiannual Report | FFA-1 |
FRANKLIN FOUNDING FUNDS ALLOCATION VIP FUND
1. Source: © 2014 Morningstar. One cannot invest directly in an index, and an index is not representative of the Fund’s portfolio. Please see Index Descriptions following the Fund Summaries.
2. Source: Bureau of Labor Statistics.
| FFA-2 | Semiannual Report |
FRANKLIN FOUNDING FUNDS ALLOCATION VIP FUND
| Semiannual Report | FFA-3 |
FRANKLIN FOUNDING FUNDS ALLOCATION VIP FUND
Class 2 Fund Expenses
| Class 2 | Beginning Account Value 1/1/14 |
Ending Account Value 6/30/14 |
Fund-Level Expenses 1/1/14–6/30/14 |
Fund-Level Expenses 1/1/14–6/30/14 |
||||||||||||
| Actual | $1,000 | $1,075.60 | $1.80 | $5.15 | ||||||||||||
| Hypothetical (5% return before expenses) | $1,000 | $1,023.06 | $1.76 | $5.01 | ||||||||||||
*Expenses are calculated using the most recent six-month annualized expense ratio excluding expenses of the underlying funds, net of expense waivers, for the Fund’s Class 2 shares (0.35%), which does not include any ongoing expenses of the Contract for which the Fund is an investment option, multiplied by the average account value over the period, multiplied by 181/365 to reflect the one-half year period.
**Expenses are calculated using the most recent six-month annualized expense ratio including expenses of the underlying funds, net of expense waivers, for the Fund’s Class 2 shares (1.00%), which does not include any ongoing expenses of the Contract for which the Fund is an investment option, multiplied by the average account value over the period, multiplied by 181/365 to reflect the one-half year period.
| FFA-4 | Semiannual Report |
FRANKLIN TEMPLETON VARIABLE INSURANCE PRODUCTS TRUST
Financial Highlights
Franklin Founding Funds Allocation VIP Fund
| Six Months Ended June 30, 2014 (unaudited) |
Year Ended December 31, | |||||||||||||||||||||||
| 2013 | 2012 | 2011 | 2010 | 2009 | ||||||||||||||||||||
| Class 1 | ||||||||||||||||||||||||
| Per share operating performance (for a share outstanding throughout the period) |
||||||||||||||||||||||||
| Net asset value, beginning of period |
$7.47 | $8.55 | $7.63 | $7.73 | $7.15 | $5.61 | ||||||||||||||||||
|
|
|
|||||||||||||||||||||||
| Income from investment operationsa: | ||||||||||||||||||||||||
| Net investment incomeb,c |
0.17 | 0.30 | 0.26 | 0.25 | 0.24 | 0.26 | ||||||||||||||||||
| Net realized and unrealized gains (losses) |
0.40 | 1.42 | 0.90 | (0.35 | ) | 0.52 | 1.46 | |||||||||||||||||
|
|
|
|||||||||||||||||||||||
| Total from investment operations |
0.57 | 1.72 | 1.16 | (0.10 | ) | 0.76 | 1.72 | |||||||||||||||||
|
|
|
|||||||||||||||||||||||
| Less distributions from: | ||||||||||||||||||||||||
| Net investment income |
(0.23 | ) | (1.15 | ) | (0.24 | ) | — | d | (0.18 | ) | (0.18 | ) | ||||||||||||
| Net realized gains |
(0.01 | ) | (1.65 | ) | — | — | — | d | — | |||||||||||||||
|
|
|
|||||||||||||||||||||||
| Total distributions |
(0.24 | ) | (2.80 | ) | (0.24 | ) | — | d | (0.18 | ) | (0.18 | ) | ||||||||||||
|
|
|
|||||||||||||||||||||||
| Net asset value, end of period |
$7.80 | $7.47 | $8.55 | $7.63 | $7.73 | $7.15 | ||||||||||||||||||
|
|
|
|||||||||||||||||||||||
| Total returne |
7.61% | 24.14% | 15.56% | (1.28)% | 10.64% | 30.47% | ||||||||||||||||||
| Ratios to average net assetsf | ||||||||||||||||||||||||
| Expenses before waiver and payments by affiliatesg |
0.11% | 0.11% | 0.11% | 0.11% | 0.11% | 0.12% | ||||||||||||||||||
| Expenses net of waiver and payments by affiliatesg |
0.10% | 0.10% | 0.10% | 0.10% | 0.10% | 0.10% | ||||||||||||||||||
| Net investment incomec |
4.44% | 3.67% | 4.06% | 3.44% | 3.04% | 4.16% | ||||||||||||||||||
| Supplemental data | ||||||||||||||||||||||||
| Net assets, end of period (000’s) |
$1,151 | $952 | $767 | $470 | $437 | $629 | ||||||||||||||||||
| Portfolio turnover rate |
0.84% | 3.91% | 28.46% | h | 58.42% | 17.81% | 4.23% | |||||||||||||||||
aThe amount shown for a share outstanding throughout the period may not correlate with the Statement of Operations for the period due to the timing of sales and repurchases of the Fund shares in relation to income earned and/or fluctuating fair value of the investments of the Fund.
bBased on average daily shares outstanding.
cRecognition of net investment income by the Fund is affected by the timing of declaration of dividends by the Underlying Funds in which the Fund invests.
dAmount rounds to less than $0.01 per share.
eTotal return does not include fees, charges or expenses imposed by the variable annuity and life insurance contracts for which the Franklin Templeton Variable Insurance Products Trust serves as an underlying investment vehicle. Total return is not annualized for periods less than one year.
fRatios are annualized for periods less than one year.
gDoes not include expenses of the Underlying Funds in which the Fund invests. The weighted average indirect expenses of the Underlying Funds was 0.65% for the period ended June 30, 2014.
hExcludes the value of portfolio securities delivered as a result of a redemption in-kind.
| The accompanying notes are an integral part of these financial statements. | Semiannual Report | FFA-5 |
FRANKLIN TEMPLETON VARIABLE INSURANCE PRODUCTS TRUST
FINANCIAL HIGHLIGHTS
Franklin Founding Funds Allocation VIP Fund (continued)
| Six Months Ended June 30, 2014 (unaudited) |
Year Ended December 31, | |||||||||||||||||||||||
| 2013 | 2012 | 2011 | 2010 | 2009 | ||||||||||||||||||||
| Class 2 | ||||||||||||||||||||||||
| Per share operating performance (for a share outstanding throughout the period) |
||||||||||||||||||||||||
| Net asset value, beginning of period |
$7.42 | $8.51 | $7.59 | $7.71 | $7.14 | $5.61 | ||||||||||||||||||
|
|
|
|||||||||||||||||||||||
| Income from investment operationsa: | ||||||||||||||||||||||||
| Net investment incomeb,c |
0.16 | 0.27 | 0.25 | 0.23 | 0.21 | 0.26 | ||||||||||||||||||
| Net realized and unrealized gains (losses) |
0.40 | 1.42 | 0.89 | (0.35 | ) | 0.52 | 1.44 | |||||||||||||||||
|
|
|
|||||||||||||||||||||||
| Total from investment operations |
0.56 | 1.69 | 1.14 | (0.12 | ) | 0.73 | 1.70 | |||||||||||||||||
|
|
|
|||||||||||||||||||||||
| Less distributions from: | ||||||||||||||||||||||||
| Net investment income |
(0.21 | ) | (1.13 | ) | (0.22 | ) | — | d | (0.16 | ) | (0.17 | ) | ||||||||||||
| Net realized gains |
(0.01 | ) | (1.65 | ) | — | — | — | d | — | |||||||||||||||
|
|
|
|||||||||||||||||||||||
| Total distributions |
(0.22 | ) | (2.78 | ) | (0.22 | ) | — | d | (0.16 | ) | (0.17 | ) | ||||||||||||
|
|
|
|||||||||||||||||||||||
| Net asset value, end of period |
$7.76 | $7.42 | $8.51 | $7.59 | $7.71 | $7.14 | ||||||||||||||||||
|
|
|
|||||||||||||||||||||||
| Total returne |
7.56% | 23.77% | 15.33% | (1.54)% | 10.25% | 30.25% | ||||||||||||||||||
| Ratios to average net assetsf | ||||||||||||||||||||||||
| Expenses before waiver and payments by affiliatesg |
0.36% | 0.36% | 0.36% | 0.36% | 0.36% | 0.37% | ||||||||||||||||||
| Expenses net of waiver and payments by affiliatesg |
0.35% | 0.35% | 0.35% | 0.35% | 0.35% | 0.35% | ||||||||||||||||||
| Net investment incomec |
4.19% | 3.42% | 3.81% | 3.19% | 2.79% | 3.91% | ||||||||||||||||||
| Supplemental data | ||||||||||||||||||||||||
| Net assets, end of period (000’s) |
$580,673 | $547,506 | $472,686 | $448,101 | $488,057 | $474,176 | ||||||||||||||||||
| Portfolio turnover rate |
0.84% | 3.91% | 28.46% | h | 58.42% | 17.81% | 4.23% | |||||||||||||||||
aThe amount shown for a share outstanding throughout the period may not correlate with the Statement of Operations for the period due to the timing of sales and repurchases of the Fund shares in relation to income earned and/or fluctuating fair value of the investments of the Fund.
bBased on average daily shares outstanding.
cRecognition of net investment income by the Fund is affected by the timing of declaration of dividends by the Underlying Funds in which the Fund invests.
dAmount rounds to less than $0.01 per share.
eTotal return does not include fees, charges or expenses imposed by the variable annuity and life insurance contracts for which the Franklin Templeton Variable Insurance Products Trust serves as an underlying investment vehicle. Total return is not annualized for periods less than one year.
fRatios are annualized for periods less than one year.
gDoes not include expenses of the Underlying Funds in which the Fund invests. The weighted average indirect expenses of the Underlying Funds was 0.65% for the period ended June 30, 2014.
hExcludes the value of portfolio securities delivered as a result of a redemption in-kind.
| FFA-6 | Semiannual Report | The accompanying notes are an integral part of these financial statements. |
FRANKLIN TEMPLETON VARIABLE INSURANCE PRODUCTS TRUST
FINANCIAL HIGHLIGHTS
Franklin Founding Funds Allocation VIP Fund (continued)
| Six Months Ended June 30, 2014 (unaudited) |
Year Ended December 31, | |||||||||||||||||||||||
| 2013 | 2012 | 2011 | 2010 | 2009 | ||||||||||||||||||||
| Class 4 | ||||||||||||||||||||||||
| Per share operating performance (for a share outstanding throughout the period) |
||||||||||||||||||||||||
| Net asset value, beginning of period |
$7.54 | $8.49 | $7.58 | $7.71 | $7.14 | $5.62 | ||||||||||||||||||
|
|
|
|||||||||||||||||||||||
| Income from investment operationsa: | ||||||||||||||||||||||||
| Net investment incomeb,c |
0.16 | 0.26 | 0.30 | 0.24 | 0.19 | 0.23 | ||||||||||||||||||
| Net realized and unrealized gains (losses) |
0.40 | 1.43 | 0.83 | (0.37 | ) | 0.54 | 1.46 | |||||||||||||||||
|
|
|
|||||||||||||||||||||||
| Total from investment operations |
0.56 | 1.69 | 1.13 | (0.13 | ) | 0.73 | 1.69 | |||||||||||||||||
|
|
|
|||||||||||||||||||||||
| Less distributions from: | ||||||||||||||||||||||||
| Net investment income |
(0.21 | ) | (0.99 | ) | (0.22 | ) | — | d | (0.16 | ) | (0.17 | ) | ||||||||||||
| Net realized gains |
(0.01 | ) | (1.65 | ) | — | — | — | d | — | |||||||||||||||
|
|
|
|||||||||||||||||||||||
| Total distributions |
(0.22 | ) | (2.64 | ) | (0.22 | ) | — | d | (0.16 | ) | (0.17 | ) | ||||||||||||
|
|
|
|||||||||||||||||||||||
| Net asset value, end of period |
$7.88 | $7.54 | $8.49 | $7.58 | $7.71 | $7.14 | ||||||||||||||||||
|
|
|
|||||||||||||||||||||||
| Total returne |
7.38% | 23.68% | 15.17% | (1.67)% | 10.24% | 30.06% | ||||||||||||||||||
| Ratios to average net assetsf | ||||||||||||||||||||||||
| Expenses before waiver and payments by affiliatesg |
0.46% | 0.46% | 0.46% | 0.46% | 0.46% | 0.47% | ||||||||||||||||||
| Expenses net of waiver and payments by affiliatesg |
0.45% | 0.45% | 0.45% | 0.45% | 0.45% | 0.45% | ||||||||||||||||||
| Net investment incomec |
4.09% | 3.32% | 3.71% | 3.09% | 2.69% | 3.81% | ||||||||||||||||||
| Supplemental data | ||||||||||||||||||||||||
| Net assets, end of period (000’s) |
$772,343 | $676,781 | $493,813 | $2,860,928 | $3,036,272 | $1,424,479 | ||||||||||||||||||
| Portfolio turnover rate |
0.84% | 3.91% | 28.46% | h | 58.42% | 17.81% | 4.23% | |||||||||||||||||
aThe amount shown for a share outstanding throughout the period may not correlate with the Statement of Operations for the period due to the timing of sales and repurchases of the Fund shares in relation to income earned and/or fluctuating fair value of the investments of the Fund.
bBased on average daily shares outstanding.
cRecognition of net investment income by the Fund is affected by the timing of declaration of dividends by the Underlying Funds in which the Fund invests.
dAmount rounds to less than $0.01 per share.
eTotal return does not include fees, charges or expenses imposed by the variable annuity and life insurance contracts for which the Franklin Templeton Variable Insurance Products Trust serves as an underlying investment vehicle. Total return is not annualized for periods less than one year.
fRatios are annualized for periods less than one year.
gDoes not include expenses of the Underlying Funds in which the Fund invests. The weighted average indirect expenses of the Underlying Funds was 0.65% for the period ended June 30, 2014.
hExcludes the value of portfolio securities delivered as a result of a redemption in-kind.
| The accompanying notes are an integral part of these financial statements. | Semiannual Report | FFA-7 |
FRANKLIN TEMPLETON VARIABLE INSURANCE PRODUCTS TRUST
Statement of Investments, June 30, 2014 (unaudited)
| Franklin Founding Funds Allocation VIP Fund | ||||||||||
| Shares | Value | |||||||||
| Investments in Underlying Fundsa |
||||||||||
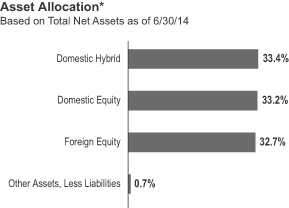
| Domestic Equity 33.2% |
||||||||||
| Franklin Mutual Shares VIP Fund, Class 1 |
18,936,414 | $ | 448,982,373 | |||||||
|
|
|
|||||||||
| Domestic Hybrid 33.4% |
||||||||||
| Franklin Income VIP Fund, Class 1 |
26,195,253 | 452,130,067 | ||||||||
|
|
|
|||||||||
| Foreign Equity 32.7% |
||||||||||
| Templeton Growth VIP Fund, Class 1 |
27,657,629 | 443,351,791 | ||||||||
|
|
|
|||||||||
| Total Investments in Underlying Funds (Cost $926,822,104) 99.3% |
1,344,464,231 | |||||||||
| Other Assets, less Liabilities 0.7% |
9,702,787 | |||||||||
|
|
|
|||||||||
| Net Assets 100.0% |
$ | 1,354,167,018 | ||||||||
|
|
|
|||||||||
aSee Note 3(d) regarding investments in Underlying Funds.
| FFA-8 | Semiannual Report | The accompanying notes are an integral part of these financial statements. |
FRANKLIN TEMPLETON VARIABLE INSURANCE PRODUCTS TRUST
Financial Statements
Statement of Assets and Liabilities
June 30, 2014 (unaudited)
| Franklin Founding Funds Allocation VIP Fund |
||||
| Assets: | ||||
| Investments in Underlying Funds: (Note 3d) |
||||
| Cost |
$ | 926,822,104 | ||
|
|
|
|||
| Value |
$ | 1,344,464,231 | ||
| Cash |
11,773,254 | |||
| Receivables from capital shares sold |
544,614 | |||
| Other assets |
557 | |||
|
|
|
|||
| Total assets |
1,356,782,656 | |||
|
|
|
|||
| Liabilities: | ||||
| Payables: |
||||
| Capital shares redeemed |
1,719,605 | |||
| Administrative fees |
110,625 | |||
| Distribution fees |
683,349 | |||
| Accrued expenses and other liabilities |
102,059 | |||
|
|
|
|||
| Total liabilities |
2,615,638 | |||
|
|
|
|||
| Net assets, at value |
$ | 1,354,167,018 | ||
|
|
|
|||
| Net assets consist of: | ||||
| Paid-in capital |
$ | 966,796,580 | ||
| Undistributed net investment income |
24,525,575 | |||
| Net unrealized appreciation (depreciation) |
417,642,127 | |||
| Accumulated net realized gain (loss) |
(54,797,264 | ) | ||
|
|
|
|||
| Net assets, at value |
$ | 1,354,167,018 | ||
|
|
|
|||
| Class 1: | ||||
| Net assets, at value |
$ | 1,151,029 | ||
|
|
|
|||
| Shares outstanding |
147,549 | |||
|
|
|
|||
| Net asset value and maximum offering price per share |
$ | 7.80 | ||
|
|
|
|||
| Class 2: | ||||
| Net assets, at value |
$ | 580,673,048 | ||
|
|
|
|||
| Shares outstanding |
74,857,408 | |||
|
|
|
|||
| Net asset value and maximum offering price per share |
$ | 7.76 | ||
|
|
|
|||
| Class 4: | ||||
| Net assets, at value |
$ | 772,342,941 | ||
|
|
|
|||
| Shares outstanding |
97,977,361 | |||
|
|
|
|||
| Net asset value and maximum offering price per share |
$ | 7.88 | ||
|
|
|
|||
| The accompanying notes are an integral part of these financial statements. | Semiannual Report | FFA-9 |
FRANKLIN TEMPLETON VARIABLE INSURANCE PRODUCTS TRUST
FINANCIAL STATEMENTS
Statement of Operations
for the six months ended June 30, 2014 (unaudited)
| Franklin Founding Funds Allocation VIP Fund |
||||
| Investment income: | ||||
| Dividends from Underlying Funds (Note 3d) |
$ | 28,723,207 | ||
|
|
|
|||
| Expenses: | ||||
| Administrative fees (Note 3a) |
632,163 | |||
| Distribution fees: (Note 3b) |
||||
| Class 2 |
692,588 | |||
| Class 4 |
1,243,310 | |||
| Reports to shareholders |
43,856 | |||
| Professional fees |
16,957 | |||
| Trustees’ fees and expenses |
2,017 | |||
| Other |
5,083 | |||
|
|
|
|||
| Total expenses |
2,635,974 | |||
| Expenses waived/paid by affiliates (Note 3e) |
(67,947 | ) | ||
|
|
|
|||
| Net expenses |
2,568,027 | |||
|
|
|
|||
| Net investment income |
26,155,180 | |||
|
|
|
|||
| Realized and unrealized gains (losses): | ||||
| Net realized gain (loss) from sale of investments in Underlying Funds (Note 3d) |
161,144 | |||
| Net change in unrealized appreciation (depreciation) on investments in Underlying Funds |
66,817,178 | |||
|
|
|
|||
| Net realized and unrealized gain (loss) |
66,978,322 | |||
|
|
|
|||
| Net increase (decrease) in net assets resulting from operations |
$ | 93,133,502 | ||
|
|
|
|||
| FFA-10 | Semiannual Report | The accompanying notes are an integral part of these financial statements. |
FRANKLIN TEMPLETON VARIABLE INSURANCE PRODUCTS TRUST
FINANCIAL STATEMENTS
Statements of Changes in Net Assets
| Franklin Founding Funds Allocation VIP Fund |
||||||||
| Six Months Ended June 30, 2014 (unaudited) |
Year Ended December 31, 2013 |
|||||||
| Increase (decrease) in net assets: | ||||||||
| Operations: |
||||||||
| Net investment income |
$ | 26,155,180 | $ | 36,642,567 | ||||
| Net realized gain (loss) from Underlying Funds |
161,144 | 3,163,496 | ||||||
| Net change in unrealized appreciation (depreciation) on investments in Underlying Funds |
66,817,178 | 190,487,276 | ||||||
|
|
|
|||||||
| Net increase (decrease) in net assets resulting from operations |
93,133,502 | 230,293,339 | ||||||
|
|
|
|||||||
| Distributions to shareholders from: |
||||||||
| Net investment income: |
||||||||
| Class 1 |
(32,764 | ) | (113,893 | ) | ||||
| Class 2 |
(15,578,364 | ) | (60,502,595 | ) | ||||
| Class 4 |
(19,895,877 | ) | (59,385,848 | ) | ||||
| Net realized gains: |
||||||||
| Class 1 |
(924 | ) | (162,965 | ) | ||||
| Class 2 |
(475,173 | ) | (88,234,067 | ) | ||||
| Class 4 |
(618,180 | ) | (98,339,718 | ) | ||||
|
|
|
|||||||
| Total distributions to shareholders |
(36,601,282 | ) | (306,739,086 | ) | ||||
|
|
|
|||||||
| Capital share transactions: (Note 2) |
||||||||
| Class 1 |
152,758 | 268,891 | ||||||
| Class 2 |
8,580,862 | 115,298,186 | ||||||
| Class 4 |
63,663,182 | 218,850,531 | ||||||
|
|
|
|||||||
| Total capital share transactions |
72,396,802 | 334,417,608 | ||||||
|
|
|
|||||||
| Net increase (decrease) in net assets |
128,929,022 | 257,971,861 | ||||||
| Net assets: | ||||||||
| Beginning of period |
1,225,237,996 | 967,266,135 | ||||||
|
|
|
|||||||
| End of period |
$ | 1,354,167,018 | $ | 1,225,237,996 | ||||
|
|
|
|||||||
| Undistributed net investment income included in net assets: | ||||||||
| End of period |
$ | 24,525,575 | $ | 33,877,400 | ||||
|
|
|
|||||||
| The accompanying notes are an integral part of these financial statements. | Semiannual Report | FFA-11 |
FRANKLIN TEMPLETON VARIABLE INSURANCE PRODUCTS TRUST
Notes to Financial Statements (unaudited)
Franklin Founding Funds Allocation VIP Fund
| FFA-12 | Semiannual Report |
FRANKLIN TEMPLETON VARIABLE INSURANCE PRODUCTS TRUST
NOTES TO FINANCIAL STATEMENTS (UNAUDITED)
Franklin Founding Funds Allocation VIP Fund (continued)
2. Shares of Beneficial Interest
At June 30, 2014, there were an unlimited number of shares authorized (without par value). Transactions in the Fund’s shares were as follows:
| Six Months Ended June 30, 2014 |
Year Ended December 31, 2013 |
|||||||||||||||||
| Shares | Amount | Shares | Amount | |||||||||||||||
| Class 1 Shares: | ||||||||||||||||||
| Shares sold |
28,555 | $ | 218,952 | 24,967 | $ | 213,393 | ||||||||||||
| Shares issued in reinvestment of distributions |
4,341 | 33,688 | 41,633 | 276,858 | ||||||||||||||
| Shares redeemed |
(12,749 | ) | (99,882 | ) | (28,865 | ) | (221,360 | ) | ||||||||||
|
|
|
|||||||||||||||||
| Net increase (decrease) |
20,147 | $ | 152,758 | 37,735 | $ | 268,891 | ||||||||||||
|
|
|
|||||||||||||||||
| Class 2 Shares: | ||||||||||||||||||
| Shares sold |
5,098,393 | $ | 38,795,902 | 9,475,437 | $ | 72,686,096 | ||||||||||||
| Shares issued in reinvestment of distributions |
2,082,171 | 16,053,537 | 22,467,774 | 148,736,662 | ||||||||||||||
| Shares redeemed |
(6,093,855 | ) | (46,268,577 | ) | (13,700,538 | ) | (106,124,572 | ) | ||||||||||
|
|
|
|||||||||||||||||
| Net increase (decrease) |
1,086,709 | $ | 8,580,862 | 18,242,673 | $ | 115,298,186 | ||||||||||||
|
|
|
|||||||||||||||||
| Class 4 Shares: | ||||||||||||||||||
| Shares sold |
9,238,126 | $ | 71,557,762 | 14,101,836 | $ | 107,566,000 | ||||||||||||
| Shares issued on reinvestment of distributions |
2,616,589 | 20,514,057 | 23,436,191 | 157,725,566 | ||||||||||||||
| Shares redeemed |
(3,652,082 | ) | (28,408,637 | ) | (5,915,495 | ) | (46,441,035 | ) | ||||||||||
|
|
|
|||||||||||||||||
| Net increase (decrease) |
8,202,633 | $ | 63,663,182 | 31,622,532 | $ | 218,850,531 | ||||||||||||
|
|
|
|||||||||||||||||
| Semiannual Report | FFA-13 |
FRANKLIN TEMPLETON VARIABLE INSURANCE PRODUCTS TRUST
NOTES TO FINANCIAL STATEMENTS (UNAUDITED)
Franklin Founding Funds Allocation VIP Fund (continued)
3. Transactions With Affiliates
Franklin Resources, Inc. is the holding company for various subsidiaries that together are referred to as Franklin Templeton Investments. Certain officers and trustees of the Fund are also officers and/or directors/trustees of certain of the Underlying Funds and of the following subsidiaries:
| Subsidiary | Affiliation | |
| Franklin Templeton Services, LLC (FT Services) | Administrative manager | |
| Franklin Templeton Distributors, Inc. (Distributors) | Principal underwriter | |
| Franklin Templeton Investor Services, LLC (Investor Services) | Transfer agent |
a. Administrative Fees
The Fund pays an administrative fee to FT Services of 0.10% per year of the average daily net assets of the Fund for administrative services including monitoring and rebalancing the percentage of the Fund’s investments in the Underlying Funds.
b. Distribution Fees
The Board has adopted distribution plans for Class 2 and Class 4 shares pursuant to Rule 12b-1 under the 1940 Act. Under the Fund’s compensation distribution plans, the Fund pays Distributors for costs incurred in connection with the servicing, sale and distribution of the Fund’s shares up to 0.35% per year of its average daily net assets of each class. Some distribution fees are not charged on shares held by affiliates. The Board has agreed to limit the current rate to 0.25% per year for Class 2. The plan year, for purposes of monitoring compliance with the maximum annual plan rates, is February 1 through January 31.
c. Transfer Agent Fees
Investor Services, under terms of an agreement, performs shareholder servicing for the Fund and is not paid by the Fund for the services.
d. Investments in Underlying Funds
The Fund invests primarily in the Underlying Funds which are managed by affiliates of the Fund’s administrative manager, FT Services. The Fund does not invest in the Underlying Funds for the purpose of exercising a controlling influence over the management or policies. Investments in Underlying Funds for the period ended June 30, 2014, were as follows:
| Underlying Funds | Number of Shares Held at Beginning of Period |
Gross Additions |
Gross Reductions |
Number of Shares Held at End of Period |
Value at End of Period |
Investment Income |
Realized Capital Gain (Loss) |
% of Underlying Fund Shares Outstanding Held at End of Period |
||||||||||||||||||||||||
| Franklin Income VIP Fund, Class 1a |
24,462,601 | 1,919,003 | 186,351 | 26,195,253 | $ | 452,130,067 | $ | 21,984,390 | $ | 60,228 | 5.69% | |||||||||||||||||||||
| Franklin Mutual Shares VIP Fund, Class 1b |
18,485,942 | 675,408 | 224,936 | 18,936,414 | 448,982,373 | — | 78,472 | 8.19% | ||||||||||||||||||||||||
| Templeton Growth VIP Fund, Class 1c |
26,312,175 | 1,489,216 | 143,762 | 27,657,629 | 443,351,791 | 6,738,817 | 22,444 | 20.96% | ||||||||||||||||||||||||
|
|
|
|||||||||||||||||||||||||||||||
| Total |
$ | 1,344,464,231 | $ | 28,723,207 | $ | 161,144 | ||||||||||||||||||||||||||
|
|
|
|||||||||||||||||||||||||||||||
aEffective May 1, 2014, the Franklin Income Securities Fund was renamed the Franklin Income VIP Fund.
bEffective May 1, 2014, the Mutual Shares Securities Fund was renamed the Franklin Mutual Shares VIP Fund.
cEffective May 1, 2014, the Templeton Growth Securities Fund was renamed the Templeton Growth VIP Fund.
| FFA-14 | Semiannual Report |
FRANKLIN TEMPLETON VARIABLE INSURANCE PRODUCTS TRUST
NOTES TO FINANCIAL STATEMENTS (UNAUDITED)
Franklin Founding Funds Allocation VIP Fund (continued)
e. Waiver and Expense Reimbursements
FT Services contractually agreed in advance to waive or limit its fees and to assume as its own expense certain expenses otherwise payable by the Fund so that the expenses (excluding distribution fees, and acquired fund fees and expenses) for each class of the Fund do not exceed 0.10% based on the average net assets of each class (other than certain non-routine expenses or costs, including those relating to litigation, indemnification, reorganizations, and liquidations) until April 30, 2015.
4. Expense Offset Arrangement
The Fund has entered into an arrangement with its custodian whereby credits realized as a result of uninvested cash balances are used to reduce a portion of the Fund’s custodian expenses. During the period ended June 30, 2014, there were no credits earned.
5. Income Taxes
At June 30, 2014, the cost of investments and net unrealized appreciation (depreciation) for income tax purposes were as follows:
| Cost of investments |
$981,768,613 | |
|
| ||
| Unrealized appreciation |
$362,695,618 | |
| Unrealized depreciation |
— | |
|
| ||
| Net unrealized appreciation (depreciation) |
$362,695,618 | |
|
| ||
Differences between income and/or capital gains as determined on a book basis and a tax basis are primarily due to differing treatment of wash sales.
6. Investment Transactions
Purchases and sales of Underlying Funds (excluding short term securities) for the period ended June 30, 2014, aggregated $71,723,207 and $10,620,662, respectively.
7. Credit Facility
The Fund, together with other U.S. registered and foreign investment funds (collectively, Borrowers), managed by Franklin Templeton Investments, are borrowers in a joint syndicated senior unsecured credit facility totaling $1.5 billion (Global Credit Facility) which matures on February 13, 2015. This Global Credit Facility provides a source of funds to the Borrowers for temporary and emergency purposes, including the ability to meet future unanticipated or unusually large redemption requests.
Under the terms of the Global Credit Facility, the Fund shall, in addition to interest charged on any borrowings made by the Fund and other costs incurred by the Fund, pay its share of fees and expenses incurred in connection with the implementation and maintenance of the Global Credit Facility, based upon its relative share of the aggregate net assets of all of the Borrowers, including an annual commitment fee of 0.07% based upon the unused portion of the Global Credit Facility. These fees are reflected in other expenses on the Statement of Operations. During the period ended June 30, 2014, the Fund did not use the Global Credit Facility.
| Semiannual Report | FFA-15 |
FRANKLIN TEMPLETON VARIABLE INSURANCE PRODUCTS TRUST
NOTES TO FINANCIAL STATEMENTS (UNAUDITED)
Franklin Founding Funds Allocation VIP Fund (continued)
8. Fair Value Measurements
The Fund follows a fair value hierarchy that distinguishes between market data obtained from independent sources (observable inputs) and the Fund’s own market assumptions (unobservable inputs). These inputs are used in determining the value of the Fund’s financial instruments and are summarized in the following fair value hierarchy:
| • | Level 1 – quoted prices in active markets for identical financial instruments |
| • | Level 2 – other significant observable inputs (including quoted prices for similar financial instruments, interest rates, prepayment speed, credit risk, etc.) |
| • | Level 3 – significant unobservable inputs (including the Fund’s own assumptions in determining the fair value of financial instruments) |
The input levels are not necessarily an indication of the risk or liquidity associated with financial instruments at that level.
For movements between the levels within the fair value hierarchy, the Fund has adopted a policy of recognizing the transfers as of the date of the underlying event which caused the movement.
At June 30, 2014, all of the Fund’s investments in financial instruments carried at fair value were valued using Level 1 inputs. For detailed categories, see the accompanying Statement of Investments.
9. Subsequent Events
The Fund has evaluated subsequent events through the issuance of the financial statements and determined that no events have occurred that require disclosure.
| FFA-16 | Semiannual Report |
FRANKLIN TEMPLETON VARIABLE INSURANCE PRODUCTS TRUST
TAX INFORMATION (UNAUDITED)
Franklin Founding Funds Allocation VIP Fund
During the fiscal year ended December 31, 2013, the Fund, a qualified fund of funds under Section 852(g)(2) of Internal Revenue Code (Code), received an allocation of foreign taxes paid from one or more of its underlying funds. As shown in the table below, the Fund hereby reports to shareholders the foreign source income and foreign taxes paid by underlying funds, pursuant to Section 853 of the Code. This written statement will allow shareholders of record on June 12, 2014, to treat their proportionate share of foreign taxes paid by the underlying funds as having been paid directly by them. The shareholder shall consider these amounts as foreign taxes paid in the tax year in which they receive the Fund distribution.
The following table provides a detailed analysis of foreign tax paid, and foreign source income as reported by the Fund, to Class 1, Class 2, and Class 4 shareholders of record.
| Class | Foreign Tax Paid Per Share |
Foreign Source Income Per Share | ||
| Class 1 | $0.0057 | $0.0504 | ||
| Class 2 | $0.0057 | $0.0504 | ||
| Class 4 | $0.0057 | $0.0504 |
Foreign Tax Paid Per Share (Column 1) is the amount per share available to you, as a tax credit (assuming you held your shares in the Fund for a minimum of 16 days during the 31-day period beginning 15 days before the ex-dividend date of the Fund’s distribution to which the foreign taxes relate), or, as a tax deduction.
Foreign Source Income Per Share (Column 2) is the amount per share of income dividends attributable to foreign securities held by the Fund, plus any foreign taxes withheld on these dividends.
| Semiannual Report | FFA-17 |
Franklin Global Real Estate VIP Fund
(Formerly, Franklin Global Real Estate Securities Fund)
This semiannual report for Franklin Global Real Estate VIP Fund covers the period ended June 30, 2014.
Class 2 Performance Summary as of June 30, 2014
Franklin Global Real Estate VIP Fund – Class 2 delivered a total return of +11.33% for the six-month period ended June 30, 2014.
Performance reflects the Fund’s Class 2 operating expenses, but does not include any contract fees, expenses or sales charges. If they had been included, performance would be lower. These charges and deductions, particularly for variable life policies, can have a significant effect on contract values and insurance benefits. See the contract prospectus for a complete description of these expenses, including sales charges.
Performance data represent past performance, which does not guarantee future results. Investment return and principal value will fluctuate, and you may have a gain or loss when you sell your shares. Current performance may differ from figures shown.
| Semiannual Report | FGR-1 |
FRANKLIN GLOBAL REAL ESTATE VIP FUND
1. Source: © 2014 Morningstar. One cannot invest directly in an index, and an index is not representative of the Fund’s portfolio. Please see Index Descriptions following the Fund Summaries.
2. Source: Bureau of Labor Statistics.
| FGR-2 | Semiannual Report |
FRANKLIN GLOBAL REAL ESTATE VIP FUND
Stocks in developed markets advanced overall during the period amid a generally accommodative monetary policy environment, continued strength in corporate earnings and signs of an economic recovery. Global government and corporate bonds delivered solid performance as interest rates in many developed market countries remained low. Gold prices rose during the period, and oil prices increased amid supply concerns related to geopolitical tensions. The U.S. dollar was relatively flat compared to most currencies.
Global Real Estate Market Overview
Overall, global real estate markets rose during the six months under review. According to the FTSE EPRA/NAREIT Developed Index, in U.S. dollar terms, Italy, Greece and Spain led global real estate markets. France, Australia and the Netherlands also posted robust results. In contrast, some markets represented in the index lost value, including China and Japan.
Investment Strategy
We seek to limit price volatility by investing across markets and property types and seek to provide a consistently high level of income in our pursuit of high total return. When selecting investments for the Fund’s portfolio, we apply a “bottom-up” stock selection process that incorporates macro-level views in the evaluation process. Our portfolio construction process combines bottom-up analysis of individual stock and real estate market fundamentals and top-down macro overlays to provide country/regional, property type, and company size perspectives in identifying international/local cyclical and thematic trends that highlight investment opportunities.
Manager’s Discussion
During the six months under review, key contributors to the Fund’s performance relative to the FTSE EPRA/NAREIT Developed Index included stock selection in the residential sector. Shares of U.S.-based apartment management company Essex Property Trust benefited from very strong fundamentals in west coast apartment markets, particularly the San Francisco Bay Area and Seattle. Revenue for the first quarter of 2014 compared with the year-ago period was well above guidance and expectations and was the highest in its peer group. In addition, Essex closed its acquisition of BRE Properties (also a Fund holding) in April, with the communication around integration and synergies better than expected, in our view.
Security selection in the office space sector, with holdings such as mid-capitalization office REIT Kilroy Realty, also enhanced relative performance over the period. In our view, Kilroy is a dominant office landlord in the U.S. west coast with a portfolio concentrated in San Diego, West Los Angeles, San Francisco and Seattle. The stock’s robust performance during the reporting period largely reflected strong office fundamentals across its west coast markets. The company has grown rapidly as it successfully expanded to San Francisco and Seattle where
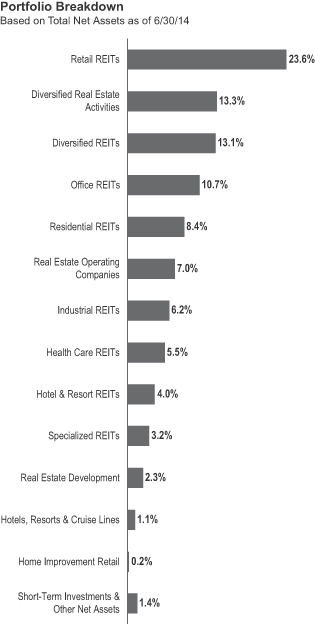
| Semiannual Report | FGR-3 |
FRANKLIN GLOBAL REAL ESTATE VIP FUND
| FGR-4 | Semiannual Report |
FRANKLIN GLOBAL REAL ESTATE VIP FUND
markets. Additionally, investor sentiment for the company further deteriorated given the lack of visibility about the company’s share-buyback and asset sales program.
Thank you for your participation in Franklin Global Real Estate VIP Fund. We look forward to serving your future investment needs.
The foregoing information reflects our analysis, opinions and portfolio holdings as of June 30, 2014, the end of the reporting period. The way we implement our main investment strategies and the resulting portfolio holdings may change depending on factors such as market and economic conditions. These opinions may not be relied upon as investment advice or an offer for a particular security. The information is not a complete analysis of every aspect of any market, country, industry, security or the Fund. Statements of fact are from sources considered reliable, but the investment manager makes no representation or warranty as to their completeness or accuracy. Although historical performance is no guarantee of future results, these insights may help you understand our investment management philosophy.
| Semiannual Report | FGR-5 |
FRANKLIN GLOBAL REAL ESTATE VIP FUND
Class 2 Fund Expenses
| Class 2 | Beginning Account Value 1/1/14 |
Ending Account Value 6/30/14 |
Fund-Level Expenses 1/1/14–6/30/14 |
|||||||||
| Actual | $1,000 | $1,113.30 | $7.07 | |||||||||
| Hypothetical (5% return before expenses) | $1,000 | $1,018.10 | $6.76 | |||||||||
*Expenses are calculated using the most recent six-month annualized expense ratio for the Fund’s Class 2 shares (1.35%), which does not include any ongoing expenses of the Contract for which the Fund is an investment option, multiplied by the average account value over the period, multiplied by 181/365 to reflect the one-half year period.
| FGR-6 | Semiannual Report |
FRANKLIN TEMPLETON VARIABLE INSURANCE PRODUCTS TRUST
Financial Highlights
Franklin Global Real Estate VIP Fund
| Six Months Ended June 30, 2014 (unaudited) |
Year Ended December 31, | |||||||||||||||||||||||
| 2013 | 2012 | 2011 | 2010 | 2009 | ||||||||||||||||||||
| Class 1 | ||||||||||||||||||||||||
| Per share operating performance (for a share outstanding throughout the period) |
||||||||||||||||||||||||
| Net asset value, beginning of period |
$14.29 | $14.66 | $11.47 | $13.12 | $11.16 | $10.84 | ||||||||||||||||||
|
|
|
|||||||||||||||||||||||
| Income from investment operationsa: | ||||||||||||||||||||||||
| Net investment incomeb |
0.12 | 0.24 | 0.25 | 0.21 | 0.38 | 0.30 | ||||||||||||||||||
| Net realized and unrealized gains (losses) |
1.52 | 0.13 | 2.94 | (0.83 | ) | 1.94 | 1.36 | |||||||||||||||||
|
|
|
|||||||||||||||||||||||
| Total from investment operations |
1.64 | 0.37 | 3.19 | (0.62 | ) | 2.32 | 1.66 | |||||||||||||||||
|
|
|
|||||||||||||||||||||||
| Less distributions from net investment income and net |
(0.11 | ) | (0.74 | ) | — | (1.03 | ) | (0.36 | ) | (1.34 | ) | |||||||||||||
|
|
|
|||||||||||||||||||||||
| Net asset value, end of period |
$15.82 | $14.29 | $14.66 | $11.47 | $13.12 | $11.16 | ||||||||||||||||||
|
|
|
|||||||||||||||||||||||
| Total returnc |
11.46% | 2.61% | 27.81% | (5.45)% | 21.24% | 19.41% | ||||||||||||||||||
| Ratios to average net assetsd | ||||||||||||||||||||||||
| Expenses before waiver and payments by affiliates |
1.10% | 1.10% | 1.11% | 1.12% | 1.11% | 1.11% | ||||||||||||||||||
| Expenses net of waiver and payments by affiliates |
1.10% | 1.10% | 1.07% | 0.98% | 0.86% | 0.76% | e | |||||||||||||||||
| Net investment income |
1.65% | 1.62% | 1.92% | 1.64% | 3.24% | 3.13% | ||||||||||||||||||
| Supplemental data | ||||||||||||||||||||||||
| Net assets, end of period (000’s) |
$36,539 | $34,276 | $38,329 | $33,670 | $40,430 | $38,486 | ||||||||||||||||||
| Portfolio turnover rate |
9.44% | 21.29% | 22.29% | 28.95% | 76.52% | 87.34% | ||||||||||||||||||
aThe amount shown for a share outstanding throughout the period may not correlate with the Statement of Operations for the period due to the timing of sales and repurchases of the Fund shares in relation to income earned and/or fluctuating fair value of the investments of the Fund.
bBased on average daily shares outstanding.
cTotal return does not include fees, charges or expenses imposed by the variable annuity and life insurance contracts for which the Franklin Templeton Variable Insurance Products Trust serves as an underlying investment vehicle. Total return is not annualized for periods less than one year.
dRatios are annualized for periods less than one year.
eBenefit of expense reduction rounds to less than 0.01%.
| The accompanying notes are an integral part of these financial statements. | Semiannual Report | FGR-7 |
FRANKLIN TEMPLETON VARIABLE INSURANCE PRODUCTS TRUST
FINANCIAL HIGHLIGHTS
Franklin Global Real Estate VIP Fund (continued)
| Six Months Ended June 30, 2014 (unaudited) |
Year Ended December 31, | |||||||||||||||||||||||
| 2013 | 2012 | 2011 | 2010 | 2009 | ||||||||||||||||||||
| Class 2 | ||||||||||||||||||||||||
| Per share operating performance (for a share outstanding throughout the period) |
||||||||||||||||||||||||
| Net asset value, beginning of period |
$13.93 | $14.27 | $11.20 | $12.83 | $10.92 | $10.61 | ||||||||||||||||||
|
|
|
|||||||||||||||||||||||
| Income from investment operationsa: | ||||||||||||||||||||||||
| Net investment incomeb |
0.10 | 0.20 | 0.21 | 0.17 | 0.34 | 0.27 | ||||||||||||||||||
| Net realized and unrealized gains (losses) |
1.48 | 0.13 | 2.86 | (0.81 | ) | 1.90 | 1.33 | |||||||||||||||||
|
|
|
|||||||||||||||||||||||
| Total from investment operations |
1.58 | 0.33 | 3.07 | (0.64 | ) | 2.24 | 1.60 | |||||||||||||||||
|
|
|
|||||||||||||||||||||||
| Less distributions from net investment income and net foreign currency gains |
(0.07 | ) | (0.67 | ) | — | (0.99 | ) | (0.33 | ) | (1.29 | ) | |||||||||||||
|
|
|
|||||||||||||||||||||||
| Net asset value, end of period |
$15.44 | $13.93 | $14.27 | $11.20 | $12.83 | $10.92 | ||||||||||||||||||
|
|
|
|||||||||||||||||||||||
| Total returnc |
11.33% | 2.32% | 27.41% | (5.65)% | 20.97% | 19.08% | ||||||||||||||||||
| Ratios to average net assetsd | ||||||||||||||||||||||||
| Expenses before waiver and payments by affiliates |
1.35% | 1.35% | 1.36% | 1.37% | 1.36% | 1.36% | ||||||||||||||||||
| Expenses net of waiver and payments by affiliates |
1.35% | 1.35% | 1.32% | 1.23% | 1.11% | 1.01% | e | |||||||||||||||||
| Net investment income |
1.40% | 1.37% | 1.67% | 1.39% | 2.99% | 2.88% | ||||||||||||||||||
| Supplemental data | ||||||||||||||||||||||||
| Net assets, end of period (000’s) |
$344,319 | $328,825 | $344,044 | $292,356 | $352,854 | $345,445 | ||||||||||||||||||
| Portfolio turnover rate |
9.44% | 21.29% | 22.29% | 28.95% | 76.52% | 87.34% | ||||||||||||||||||
aThe amount shown for a share outstanding throughout the period may not correlate with the Statement of Operations for the period due to the timing of sales and repurchases of the Fund shares in relation to income earned and/or fluctuating fair value of the investments of the Fund.
bBased on average daily shares outstanding.
cTotal return does not include fees, charges or expenses imposed by the variable annuity and life insurance contracts for which the Franklin Templeton Variable Insurance Products Trust serves as an underlying investment vehicle. Total return is not annualized for periods less than one year.
dRatios are annualized for periods less than one year.
eBenefit of expense reduction rounds to less than 0.01%.
| FGR-8 | Semiannual Report | The accompanying notes are an integral part of these financial statements. |
FRANKLIN TEMPLETON VARIABLE INSURANCE PRODUCTS TRUST
Statement of Investments, June 30, 2014 (unaudited)
| Franklin Global Real Estate VIP Fund | ||||||||||||||
| Country | Shares/ Warrants |
Value | ||||||||||||
| Common Stocks and Other Equity Interests 98.6% |
||||||||||||||
| Diversified Real Estate Activities 13.3% |
||||||||||||||
| CapitaLand Ltd. |
Singapore | 971,262 | $ | 2,493,112 | ||||||||||
| Hang Lung Properties Ltd. |
Hong Kong | 788,248 | 2,430,714 | |||||||||||
| Mitsubishi Estate Co. Ltd. |
Japan | 479,360 | 11,834,355 | |||||||||||
| Mitsui Fudosan Co. Ltd. |
Japan | 554,857 | 18,709,753 | |||||||||||
| Sun Hung Kai Properties Ltd. |
Hong Kong | 380,533 | 5,224,047 | |||||||||||
| Sun Hung Kai Properties Ltd., wts., 4/22/16 |
Hong Kong | 31,644 | 41,319 | |||||||||||
| Tokyo Tatemono Co. Ltd. |
Japan | 550,815 | 5,094,651 | |||||||||||
| The Wharf Holdings Ltd. |
Hong Kong | 650,906 | 4,703,048 | |||||||||||
|
|
|
|||||||||||||
| 50,530,999 | ||||||||||||||
|
|
|
|||||||||||||
| Diversified REITs 13.1% |
||||||||||||||
| a | Activia Properties Inc., 144A |
Japan | 198 | 1,741,454 | ||||||||||
| American Assets Trust Inc. |
United States | 70,939 | 2,450,942 | |||||||||||
| British Land Co. PLC |
United Kingdom | 412,931 | 4,963,918 | |||||||||||
| Canadian REIT |
Canada | 59,414 | 2,562,192 | |||||||||||
| a,b | Hulic REIT Inc., 144A |
Japan | 1,235 | 1,961,517 | ||||||||||
| Kenedix Office Investment Corp. |
Japan | 695 | 3,780,119 | |||||||||||
| Land Securities Group PLC |
United Kingdom | 377,481 | 6,691,996 | |||||||||||
| a,b | Lar Espana Real Estate Socimi SA, 144A |
Spain | 80,084 | 1,041,875 | ||||||||||
| Liberty Property Trust |
United States | 29,106 | 1,103,991 | |||||||||||
| Mirvac Group |
Australia | 2,402,537 | 4,045,584 | |||||||||||
| Spirit Realty Capital Inc. |
United States | 102,100 | 1,159,856 | |||||||||||
| Stockland |
Australia | 969,206 | 3,547,486 | |||||||||||
| Suntec REIT |
Singapore | 1,585,730 | 2,302,307 | |||||||||||
| Vornado Realty Trust |
United States | 78,768 | 8,406,909 | |||||||||||
| Wereldhave N.V. |
Netherlands | 23,000 | 2,138,670 | |||||||||||
| WP Carey Inc. |
United States | 31,426 | 2,023,834 | |||||||||||
|
|
|
|||||||||||||
| 49,922,650 | ||||||||||||||
|
|
|
|||||||||||||
| Health Care REITs 5.5% |
||||||||||||||
| HCP Inc. |
United States | 104,141 | 4,309,355 | |||||||||||
| Health Care REIT Inc. |
United States | 88,464 | 5,544,039 | |||||||||||
| Sabra Health Care REIT Inc. |
United States | 62,526 | 1,795,121 | |||||||||||
| Senior Housing Properties Trust |
United States | 71,282 | 1,731,440 | |||||||||||
| Ventas Inc. |
United States | 117,387 | 7,524,507 | |||||||||||
|
|
|
|||||||||||||
| 20,904,462 | ||||||||||||||
|
|
|
|||||||||||||
| Home Improvement Retail 0.2% |
||||||||||||||
| The Home Depot Inc. |
United States | 10,820 | 875,987 | |||||||||||
|
|
|
|||||||||||||
| Hotel & Resort REITs 4.0% |
||||||||||||||
| CDL Hospitality Trusts |
Singapore | 696,478 | 983,276 | |||||||||||
| Hoshino Resorts REIT Inc. |
Japan | 98 | 846,454 | |||||||||||
| Host Hotels & Resorts Inc. |
United States | 342,967 | 7,548,704 | |||||||||||
| Pebblebrook Hotel Trust |
United States | 109,022 | 4,029,453 | |||||||||||
| Sunstone Hotel Investors Inc. |
United States | 118,827 | 1,774,087 | |||||||||||
|
|
|
|||||||||||||
| 15,181,974 | ||||||||||||||
|
|
|
|||||||||||||
| Hotels, Resorts & Cruise Lines 1.1% |
||||||||||||||
| Melia Hotels International SA |
Spain | 78,881 | 968,431 | |||||||||||
| b | NH Hoteles SA |
Spain | 109,081 | 646,073 | ||||||||||
| Starwood Hotels & Resorts Worldwide Inc. |
United States | 32,054 | 2,590,604 | |||||||||||
|
|
|
|||||||||||||
| 4,205,108 | ||||||||||||||
|
|
|
|||||||||||||
| Semiannual Report | FGR-9 |
FRANKLIN TEMPLETON VARIABLE INSURANCE PRODUCTS TRUST
STATEMENT OF INVESTMENTS (UNAUDITED)
Franklin Global Real Estate VIP Fund (continued)
| Country | Shares/ Warrants |
Value | ||||||||||||
| Common Stocks and Other Equity Interests (continued) |
||||||||||||||
| Industrial REITs 6.2% |
||||||||||||||
| Ascendas REIT |
Singapore | 722,308 | $ | 1,332,618 | ||||||||||
| a | Ascendas REIT, 144A |
Singapore | 159,961 | 295,119 | ||||||||||
| First Industrial Realty Trust Inc. |
United States | 58,300 | 1,098,372 | |||||||||||
| Goodman Group |
Australia | 984,768 | 4,691,354 | |||||||||||
| Mapletree Logistics Trust |
Singapore | 1,978,530 | 1,848,945 | |||||||||||
| Nippon Prologis REIT Inc. |
Japan | 784 | 1,827,953 | |||||||||||
| a | Nippon Prologis REIT Inc., 144A |
Japan | 903 | 2,105,410 | ||||||||||
| Prologis Inc. |
United States | 197,664 | 8,122,014 | |||||||||||
| STAG Industrial Inc. |
United States | 99,852 | 2,397,447 | |||||||||||
|
|
|
|||||||||||||
| 23,719,232 | ||||||||||||||
|
|
|
|||||||||||||
| Office REITs 10.7% |
||||||||||||||
| Alexandria Real Estate Equities Inc. |
United States | 44,507 | 3,455,524 | |||||||||||
| Boston Properties Inc. |
United States | 57,180 | 6,757,532 | |||||||||||
| Brandywine Realty Trust |
United States | 177,846 | 2,774,398 | |||||||||||
| Coresite Realty Corp. |
United States | 17,287 | 571,681 | |||||||||||
| Derwent London PLC |
United Kingdom | 84,299 | 3,864,523 | |||||||||||
| Digital Realty Trust Inc. |
United States | 33,743 | 1,967,892 | |||||||||||
| Douglas Emmett Inc. |
United States | 82,167 | 2,318,753 | |||||||||||
| Great Portland Estates PLC |
United Kingdom | 386,126 | 4,255,158 | |||||||||||
| Highwoods Properties Inc. |
United States | 62,117 | 2,605,808 | |||||||||||
| Japan Real Estate Investment Corp. |
Japan | 524 | 3,051,774 | |||||||||||
| Kilroy Realty Corp. |
United States | 63,918 | 3,980,813 | |||||||||||
| SL Green Realty Corp. |
United States | 48,693 | 5,327,501 | |||||||||||
|
|
|
|||||||||||||
| 40,931,357 | ||||||||||||||
|
|
|
|||||||||||||
| Real Estate Development 2.3% |
||||||||||||||
| China Overseas Land & Investment Ltd. |
China | 518,657 | 1,258,089 | |||||||||||
| b | Howard Hughes Corp. |
United States | 11,916 | 1,880,702 | ||||||||||
| Keppel Land Ltd. |
Singapore | 821,676 | 2,227,782 | |||||||||||
| KWG Property Holdings Ltd. |
China | 1,703,000 | 977,795 | |||||||||||
| Sino Land Co. Ltd. |
Hong Kong | 1,496,288 | 2,455,700 | |||||||||||
|
|
|
|||||||||||||
| 8,800,068 | ||||||||||||||
|
|
|
|||||||||||||
| Real Estate Operating Companies 7.0% |
||||||||||||||
| Castellum AB |
Sweden | 106,040 | 1,880,789 | |||||||||||
| Deutsche Euroshop AG |
Germany | 38,467 | 1,901,699 | |||||||||||
| a | Deutsche Euroshop AG, 144A |
Germany | 9,299 | 459,716 | ||||||||||
| b | Gagfah SA |
Germany | 94,100 | 1,713,263 | ||||||||||
| a,b | Gagfah SA, 144A |
Germany | 19,690 | 358,493 | ||||||||||
| Global Logistic Properties Ltd. |
Singapore | 1,672,170 | 3,621,593 | |||||||||||
| b | Hemfosa Fastigheter AB |
Sweden | 28,340 | 476,144 | ||||||||||
| a,b | Hemfosa Fastigheter AB, 144A |
Sweden | 42,980 | 722,112 | ||||||||||
| a,b | Hispania Activos Inmobiliarios SAU, 144A |
Spain | 38,663 | 535,030 | ||||||||||
| Hong Kong Land Holdings Ltd. |
Hong Kong | 810,843 | 5,408,323 | |||||||||||
| Hufvudstaden AB, A |
Sweden | 178,196 | 2,501,801 | |||||||||||
| Hysan Development Co. Ltd. |
Hong Kong | 564,347 | 2,650,456 | |||||||||||
| LEG Immobilien AG |
Germany | 6,420 | 432,516 | |||||||||||
| a,b | LEG Immobilien AG, 144A |
Germany | 37,210 | 2,506,841 | ||||||||||
| Unite Group PLC |
United Kingdom | 188,995 | 1,274,229 | |||||||||||
| a | Unite Group PLC, 144A |
United Kingdom | 10,534 | 71,022 | ||||||||||
|
|
|
|||||||||||||
| 26,514,027 | ||||||||||||||
|
|
|
|||||||||||||
| FGR-10 | Semiannual Report |
FRANKLIN TEMPLETON VARIABLE INSURANCE PRODUCTS TRUST
STATEMENT OF INVESTMENTS (UNAUDITED)
Franklin Global Real Estate VIP Fund (continued)
| Country | Shares/ Warrants |
Value | ||||||||||||
| Common Stocks and Other Equity Interests (continued) |
||||||||||||||
| Residential REITs 8.4% |
||||||||||||||
| Apartment Investment & Management Co., A |
United States | 91,605 | $ | 2,956,093 | ||||||||||
| AvalonBay Communities Inc. |
United States | 32,567 | 4,630,702 | |||||||||||
| Boardwalk REIT |
Canada | 27,336 | 1,672,790 | |||||||||||
| Camden Property Trust |
United States | 18,421 | 1,310,654 | |||||||||||
| Education Realty Trust Inc. |
United States | 74,300 | 797,982 | |||||||||||
| Equity Lifestyle Properties Inc. |
United States | 63,300 | 2,795,328 | |||||||||||
| Equity Residential |
United States | 115,128 | 7,253,064 | |||||||||||
| Essex Property Trust Inc. |
United States | 28,705 | 5,307,842 | |||||||||||
| Post Properties Inc. |
United States | 28,388 | 1,517,622 | |||||||||||
| UDR Inc. |
United States | 129,031 | 3,694,158 | |||||||||||
|
|
|
|||||||||||||
| 31,936,235 | ||||||||||||||
|
|
|
|||||||||||||
| Retail REITs 23.6% |
||||||||||||||
| a | CapitaMall Trust, 144A |
Singapore | 433,279 | 686,421 | ||||||||||
| CBL & Associates Properties Inc. |
United States | 45,972 | 873,468 | |||||||||||
| DDR Corp. |
United States | 115,716 | 2,040,073 | |||||||||||
| Eurocommercial Properties NV, IDR |
Netherlands | 39,075 | 1,927,476 | |||||||||||
| Federal Realty Investment Trust |
United States | 27,709 | 3,350,572 | |||||||||||
| Federation Centres |
Australia | 843,365 | 1,981,015 | |||||||||||
| General Growth Properties Inc. |
United States | 253,917 | 5,982,285 | |||||||||||
| Hammerson PLC |
United Kingdom | 462,753 | 4,592,805 | |||||||||||
| Kimco Realty Corp. |
United States | 172,069 | 3,954,146 | |||||||||||
| Klepierre |
France | 94,000 | 4,790,624 | |||||||||||
| The Link REIT |
Hong Kong | 972,788 | 5,233,923 | |||||||||||
| The Macerich Co. |
United States | 34,864 | 2,327,172 | |||||||||||
| Ramco-Gershenson Properties Trust |
United States | 68,113 | 1,132,038 | |||||||||||
| Realty Income Corp. |
United States | 40,103 | 1,781,375 | |||||||||||
| Regency Centers Corp. |
United States | 42,893 | 2,388,282 | |||||||||||
| RioCan REIT |
Canada | 103,826 | 2,658,810 | |||||||||||
| b | Scentre Group |
Australia | 1,469,216 | 4,435,152 | ||||||||||
| Simon Property Group Inc. |
United States | 118,608 | 19,722,138 | |||||||||||
| Taubman Centers Inc. |
United States | 16,282 | 1,234,338 | |||||||||||
| Unibail-Rodamco SE |
France | 46,104 | 13,413,481 | |||||||||||
| Weingarten Realty Investors |
United States | 60,110 | 1,974,012 | |||||||||||
| Westfield Corp. |
Australia | 508,928 | 3,432,695 | |||||||||||
|
|
|
|||||||||||||
| 89,912,301 | ||||||||||||||
|
|
|
|||||||||||||
| Specialized REITs 3.2% | ||||||||||||||
| CubeSmart |
United States | 41,184 | 754,491 | |||||||||||
| Extra Space Storage Inc. |
United States | 70,204 | 3,738,363 | |||||||||||
| Public Storage |
United States | 45,014 | 7,713,149 | |||||||||||
|
|
|
|||||||||||||
| 12,206,003 | ||||||||||||||
|
|
|
|||||||||||||
| Total Common Stocks and Other Equity Interests |
375,640,403 | |||||||||||||
|
|
|
|||||||||||||
| Semiannual Report | FGR-11 |
FRANKLIN TEMPLETON VARIABLE INSURANCE PRODUCTS TRUST
STATEMENT OF INVESTMENTS (UNAUDITED)
Franklin Global Real Estate VIP Fund (continued)
| Country | Principal Amount | Value | ||||||||||||
| Short Term Investments (Cost $4,395,660) 1.2% |
||||||||||||||
| Repurchase Agreements (Cost $4,395,660) 1.2% |
||||||||||||||
| c | Joint Repurchase Agreement, 0.064%, 7/01/14 (Maturity Value $4,395,668) BNP Paribas Securities Corp. (Maturity Value $887,837) |
United States | $ | 4,395,660 | $ | 4,395,660 | ||||||||
| Collateralized by U.S. Government Agency Securities, 0.00% - 6.21%, 1/16/15 - 5/04/37; dU.S. Government Agency Discount Notes, 12/24/14 - 1/30/15; U.S. Government Agency Securities, Strips, 5/15/30; U.S. Treasury Bonds, 7.50% - 8.875%, 11/15/16 - 2/15/19; U.S. Treasury Notes, 0.25% - 4.50%, 7/15/15 - 4/30/18; and U.S. Treasury Notes, Index Linked, 1.375%, 7/15/18 (valued at $4,484,322) |
||||||||||||||
|
|
|
|||||||||||||
| Total Investments (Cost $242,039,046) 99.8% |
380,036,063 | |||||||||||||
| Other Assets, less Liabilities 0.2% |
822,070 | |||||||||||||
|
|
|
|||||||||||||
| Net Assets 100.0% |
$ | 380,858,133 | ||||||||||||
|
|
|
|||||||||||||
See Abbreviations on page FGR-23.
aSecurity was purchased pursuant to Rule 144A under the Securities Act of 1933 and may be sold in transactions exempt from registration only to qualified institutional buyers or in a public offering registered under the Securities Act of 1933. These securities have been deemed liquid under guidelines approved by the Trust’s Board of Trustees. At June 30, 2014, the aggregate value of these securities was $12,485,010, representing 3.28% of net assets.
bNon-income producing.
cSee Note 1(c) regarding joint repurchase agreement.
dThe security is traded on a discount basis with no stated coupon rate.
| FGR-12 | Semiannual Report | The accompanying notes are an integral part of these financial statements. |
FRANKLIN TEMPLETON VARIABLE INSURANCE PRODUCTS TRUST
Financial Statements
Statement of Assets and Liabilities
June 30, 2014 (unaudited)
| Franklin Global Real Estate VIP Fund |
||||
| Assets: | ||||
| Investments in securities: |
||||
| Cost - Unaffiliated issuers |
$ | 237,643,386 | ||
| Cost - Repurchase agreements |
4,395,660 | |||
|
|
|
|||
| Total cost of investments |
$ | 242,039,046 | ||
|
|
|
|||
| Value - Unaffiliated issuers |
$ | 375,640,403 | ||
| Value - Repurchase agreements |
4,395,660 | |||
|
|
|
|||
| Total value of investments |
380,036,063 | |||
| Foreign currency, at value (cost and $50,069) |
50,184 | |||
| Receivables: |
||||
| Investment securities sold |
244,831 | |||
| Capital shares sold |
18,209 | |||
| Dividends |
1,555,424 | |||
| Other assets |
165 | |||
|
|
|
|||
| Total assets |
381,904,876 | |||
|
|
|
|||
| Liabilities: | ||||
| Payables: |
||||
| Capital shares redeemed |
430,883 | |||
| Management fees |
328,017 | |||
| Distribution fees |
142,873 | |||
| Reports to shareholders |
109,481 | |||
| Accrued expenses and other liabilities |
35,489 | |||
|
|
|
|||
| Total liabilities |
1,046,743 | |||
|
|
|
|||
| Net assets, at value |
$ | 380,858,133 | ||
|
|
|
|||
| Net assets consist of: | ||||
| Paid-in capital |
$ | 583,200,149 | ||
| Distributions in excess of net investment income |
(5,284,357 | ) | ||
| Net unrealized appreciation (depreciation) |
138,004,320 | |||
| Accumulated net realized gain (loss) |
(335,061,979 | ) | ||
|
|
|
|||
| Net assets, at value |
$ | 380,858,133 | ||
|
|
|
|||
| The accompanying notes are an integral part of these financial statements. | Semiannual Report | FGR-13 |
FRANKLIN TEMPLETON VARIABLE INSURANCE PRODUCTS TRUST
FINANCIAL STATEMENTS
Statement of Assets and Liabilities (continued)
June 30, 2014 (unaudited)
| Franklin Global Real Estate VIP Fund |
||||
| Class 1: | ||||
| Net assets, at value |
$ | 36,539,095 | ||
|
|
|
|||
| Shares outstanding |
2,309,454 | |||
|
|
|
|||
| Net asset value and maximum offering price per share |
$ | 15.82 | ||
|
|
|
|||
| Class 2: | ||||
| Net assets, at value |
$ | 344,319,038 | ||
|
|
|
|||
| Shares outstanding |
22,293,801 | |||
|
|
|
|||
| Net asset value and maximum offering price per share |
$ | 15.44 | ||
|
|
|
|||
| FGR-14 | Semiannual Report | The accompanying notes are an integral part of these financial statements. |
FRANKLIN TEMPLETON VARIABLE INSURANCE PRODUCTS TRUST
FINANCIAL STATEMENTS
Statement of Operations
for the six months ended June 30, 2014 (unaudited)
| Franklin Global Real Estate VIP Fund |
||||
| Investment income: | ||||
| Dividends (net of foreign taxes of $385,750) |
$ | 5,021,512 | ||
| Interest |
618 | |||
|
|
|
|||
| Total investment income |
5,022,130 | |||
|
|
|
|||
| Expenses: | ||||
| Management fees (Note 3a) |
1,916,198 | |||
| Distribution fees - Class 2 (Note 3c) |
412,664 | |||
| Custodian fees (Note 4) |
13,155 | |||
| Reports to shareholders |
41,986 | |||
| Professional fees |
26,823 | |||
| Trustees’ fees and expenses |
710 | |||
| Other |
8,911 | |||
|
|
|
|||
| Total expenses |
2,420,447 | |||
|
|
|
|||
| Net investment income |
2,601,683 | |||
|
|
|
|||
| Realized and unrealized gains (losses): | ||||
| Net realized gain (loss) from: |
||||
| Investments |
10,891,725 | |||
| Realized gain distributions from REITs |
1,145,225 | |||
| Foreign currency transactions |
(31,668 | ) | ||
|
|
|
|||
| Net realized gain (loss) |
12,005,282 | |||
|
|
|
|||
| Net change in unrealized appreciation (depreciation) on: |
||||
| Investments |
25,135,025 | |||
| Translation of other assets and liabilities denominated in foreign currencies |
10,594 | |||
|
|
|
|||
| Net change in unrealized appreciation (depreciation) |
25,145,619 | |||
|
|
|
|||
| Net realized and unrealized gain (loss) |
37,150,901 | |||
|
|
|
|||
| Net increase (decrease) in net assets resulting from operations |
$ | 39,752,584 | ||
|
|
|
|||
| The accompanying notes are an integral part of these financial statements. | Semiannual Report | FGR-15 |
FRANKLIN TEMPLETON VARIABLE INSURANCE PRODUCTS TRUST
FINANCIAL STATEMENTS
Statements of Changes in Net Assets
| Franklin Global Real Estate VIP Fund | ||||||||
| Six Months Ended June 30, 2014 (unaudited) |
Year Ended December 31, 2013 |
|||||||
| Increase (decrease) in net assets: | ||||||||
| Operations: |
||||||||
| Net investment income |
$ | 2,601,683 | $ | 5,357,758 | ||||
| Net realized gain (loss) from investments, realized gain distributions from REITs and foreign currency transactions |
12,005,282 | 16,305,580 | ||||||
| Net change in unrealized appreciation (depreciation) on investments, translation |
25,145,619 | (13,068,801 | ) | |||||
|
|
|
|||||||
| Net increase (decrease) in net assets resulting from operations |
39,752,584 | 8,594,537 | ||||||
|
|
|
|||||||
| Distributions to shareholders from net investment income: |
||||||||
| Net investment income: |
||||||||
| Class 1 |
(245,080 | ) | (1,817,696 | ) | ||||
| Class 2 |
(1,512,651 | ) | (15,833,743 | ) | ||||
|
|
|
|||||||
| Total distributions to shareholders |
(1,757,731 | ) | (17,651,439 | ) | ||||
|
|
|
|||||||
| Capital share transactions: (Note 2) |
||||||||
| Class 1 |
(1,344,681 | ) | (3,263,237 | ) | ||||
| Class 2 |
(18,893,190 | ) | (6,951,491 | ) | ||||
|
|
|
|||||||
| Total capital share transactions |
(20,237,871 | ) | (10,214,728 | ) | ||||
|
|
|
|||||||
| Net increase (decrease) in net assets |
17,756,982 | (19,271,630 | ) | |||||
| Net assets: | ||||||||
| Beginning of period |
363,101,151 | 382,372,781 | ||||||
|
|
|
|||||||
| End of period |
$ | 380,858,133 | $ | 363,101,151 | ||||
|
|
|
|||||||
| Distributions in excess of net investment income included in net assets: |
||||||||
| End of period |
$ | (5,284,357 | ) | $ | (6,128,309 | ) | ||
|
|
|
|||||||
| FGR-16 | Semiannual Report | The accompanying notes are an integral part of these financial statements. |
FRANKLIN TEMPLETON VARIABLE INSURANCE PRODUCTS TRUST
Notes to Financial Statements (unaudited)
Franklin Global Real Estate VIP Fund
| Semiannual Report | FGR-17 |
FRANKLIN TEMPLETON VARIABLE INSURANCE PRODUCTS TRUST
NOTES TO FINANCIAL STATEMENTS (UNAUDITED)
Franklin Global Real Estate VIP Fund (continued)
the Fund’s portfolio securities as determined at the foreign market close and the latest indications of value at the close of the NYSE. In order to minimize the potential for these differences, the VLOC monitors price movements following the close of trading in foreign stock markets through a series of country specific market proxies (such as baskets of American Depositary Receipts, futures contracts and exchange traded funds). These price movements are measured against established trigger thresholds for each specific market proxy to assist in determining if an event has occurred that may call into question the reliability of the values of the foreign securities held by the Fund. If such an event occurs, the securities may be valued using fair value procedures, which may include the use of independent pricing services.
Also, when the last day of the reporting period is a non-business day, certain foreign markets may be open on those days that the NYSE is closed, which could result in differences between the value of the Fund’s portfolio securities on the last business day and the last calendar day of the reporting period. Any significant security valuation changes due to an open foreign market are adjusted and reflected by the Fund for financial reporting purposes.
b. Foreign Currency Translation
Portfolio securities and other assets and liabilities denominated in foreign currencies are translated into U.S. dollars based on the exchange rate of such currencies against U.S. dollars on the date of valuation. The Fund may enter into foreign currency exchange contracts to facilitate transactions denominated in a foreign currency. Purchases and sales of securities, income and expense items denominated in foreign currencies are translated into U.S. dollars at the exchange rate in effect on the transaction date. Portfolio securities and assets and liabilities denominated in foreign currencies contain risks that those currencies will decline in value relative to the U.S. dollar. Occasionally, events may impact the availability or reliability of foreign exchange rates used to convert the U.S. dollar equivalent value. If such an event occurs, the foreign exchange rate will be valued at fair value using procedures established and approved by the Board.
FRANKLIN TEMPLETON VARIABLE INSURANCE PRODUCTS TRUST
NOTES TO FINANCIAL STATEMENTS (UNAUDITED)
Franklin Global Real Estate VIP Fund (continued)
| Semiannual Report | FGR-19 |
FRANKLIN TEMPLETON VARIABLE INSURANCE PRODUCTS TRUST
NOTES TO FINANCIAL STATEMENTS (UNAUDITED)
Franklin Global Real Estate VIP Fund (continued)
2. Shares of Beneficial Interest
At June 30, 2014, there were an unlimited number of shares authorized (without par value). Transactions in the Fund’s shares were as follows:
| Six Months Ended June 30, 2014 |
Year Ended December 31, 2013 |
|||||||||||||||||
| Shares | Amount | Shares | Amount | |||||||||||||||
| Class 1 Shares: | ||||||||||||||||||
| Shares sold |
35,227 | $ | 497,856 | 36,029 | $ | 545,808 | ||||||||||||
| Shares issued in reinvestment of distributions |
15,710 | 245,080 | 127,468 | 1,817,696 | ||||||||||||||
| Shares redeemed |
(140,668 | ) | (2,087,617 | ) | (379,619 | ) | (5,626,741 | ) | ||||||||||
|
|
|
|||||||||||||||||
| Net increase (decrease) |
(89,731 | ) | $ | (1,344,681 | ) | (216,122 | ) | $ | (3,263,237 | ) | ||||||||
|
|
|
|||||||||||||||||
| Class 2 Shares: | ||||||||||||||||||
| Shares sold |
224,217 | $ | 3,234,700 | 1,380,638 | $ | 20,243,191 | ||||||||||||
| Shares issued in reinvestment of distributions |
99,321 | 1,512,651 | 1,136,665 | 15,833,743 | ||||||||||||||
| Shares redeemed |
(1,634,408 | ) | (23,640,541 | ) | (3,013,876 | ) | (43,028,425 | ) | ||||||||||
|
|
|
|||||||||||||||||
| Net increase (decrease) |
(1,310,870 | ) | $ | (18,893,190 | ) | (496,573 | ) | $ | (6,951,491 | ) | ||||||||
|
|
|
|||||||||||||||||
3. Transactions With Affiliates
Franklin Resources, Inc. is the holding company for various subsidiaries that together are referred to as Franklin Templeton Investments. Certain officers and trustees of the Fund are also officers and/or directors of the following subsidiaries:
| Subsidiary | Affiliation | |
| Franklin Templeton Institutional, LLC (FT Institutional) | Investment manager | |
| Franklin Templeton Services, LLC (FT Services) | Administrative manager | |
| Franklin Templeton Distributors, Inc. (Distributors) | Principal underwriter | |
| Franklin Templeton Investor Services, LLC (Investor Services) | Transfer agent |
a. Management Fees
The Fund pays an investment management fee to FT Institutional based on the average daily net assets of the Fund as follows:
| Annualized Fee Rate | Net Assets | |
| 1.050% | Up to and including $500 million | |
| 0.950% | Over $500 million, up to and including $1 billion | |
| 0.900% | Over $1 billion, up to and including $1.5 billion | |
| 0.850% | Over $1.5 billion, up to and including $6.5 billion | |
| 0.830% | Over $6.5 billion, up to and including $11.5 billion | |
| 0.810% | Over $11.5 billion, up to and including $16.5 billion | |
| 0.790% | Over $16.5 billion, up to and including $19 billion | |
| 0.780% | Over $19 billion, up to and including $21.5 billion | |
| 0.770% | In excess of $21.5 billion |
| FGR-20 | Semiannual Report |
FRANKLIN TEMPLETON VARIABLE INSURANCE PRODUCTS TRUST
NOTES TO FINANCIAL STATEMENTS (UNAUDITED)
Franklin Global Real Estate VIP Fund (continued)
b. Administrative Fees
Under an agreement with FT Institutional, FT Services provides administrative services to the Fund. The fee is paid by FT Institutional based on the Fund’s average daily net assets, and is not an additional expense of the Fund.
c. Distribution Fees
The Board has adopted a distribution plan for Class 2 shares pursuant to Rule 12b-1 under the 1940 Act. Under the Fund’s compensation distribution plan, the Fund pays Distributors for costs incurred in connection with the servicing, sale and distribution of the Fund’s shares up to 0.35% per year of its average daily net assets of Class 2. Some distribution fees are not charged on shares held by affiliates. The Board has agreed to limit the current rate to 0.25% per year for Class 2. The plan year, for purposes of monitoring compliance with the maximum annual plan rate, is February 1 through January 31.
d. Transfer Agent Fees
Investor Services, under terms of an agreement, performs shareholder servicing for the Fund and is not paid by the Fund for the services.
4. Expense Offset Arrangement
The Fund has entered into an arrangement with its custodian whereby credits realized as a result of uninvested cash balances are used to reduce a portion of the Fund’s custodian expenses. During the period ended June 30, 2014, there were no credits earned.
5. Income Taxes
For tax purposes, capital losses may be carried over to offset future capital gains. Capital loss carryforwards with no expiration, if any, must be fully utilized before those losses with expiration dates.
At December 31, 2013, capital loss carryforwards were as follows:
| Capital loss carryforwards expiring in: |
||||
| 2016 |
$ | 126,624,881 | ||
| 2017 |
207,448,609 | |||
| 2018 |
2,192,369 | |||
|
|
|
|||
| $ | 336,265,859 | |||
|
|
|
At June 30, 2014, the cost of investments and net unrealized appreciation (depreciation) for income tax purposes were as follows:
| Cost of investments |
$ | 260,355,318 | ||
|
|
|
|||
| Unrealized appreciation |
$ | 131,257,620 | ||
| Unrealized depreciation |
(11,576,875 | ) | ||
|
|
|
|||
| Net unrealized appreciation (depreciation) |
$ | 119,680,745 | ||
|
|
|
|||
Differences between income and/or capital gains as determined on a book basis and a tax basis are primarily due to differing treatment of passive foreign investment company shares and wash sales.
6. Investment Transactions
Purchases and sales of investments (excluding short term securities) for the period ended June 30, 2014, aggregated $34,365,080 and $52,121,385, respectively.
| Semiannual Report | FGR-21 |
FRANKLIN TEMPLETON VARIABLE INSURANCE PRODUCTS TRUST
NOTES TO FINANCIAL STATEMENTS (UNAUDITED)
Franklin Global Real Estate VIP Fund (continued)
7. Concentration of Risk
Investing in foreign securities may include certain risks and considerations not typically associated with investing in U.S. securities, such as fluctuating currency values and changing local and regional economic, political and social conditions, which may result in greater market volatility. In addition, certain foreign securities may not be as liquid as U.S. securities.
8. Credit Facility
The Fund, together with other U.S. registered and foreign investment funds (collectively, Borrowers), managed by Franklin Templeton Investments, are borrowers in a joint syndicated senior unsecured credit facility totaling $1.5 billion (Global Credit Facility) which matures on February 13, 2015. This Global Credit Facility provides a source of funds to the Borrowers for temporary and emergency purposes, including the ability to meet future unanticipated or unusually large redemption requests.
Under the terms of the Global Credit Facility, the Fund shall, in addition to interest charged on any borrowings made by the Fund and other costs incurred by the Fund, pay its share of fees and expenses incurred in connection with the implementation and maintenance of the Global Credit Facility, based upon its relative share of the aggregate net assets of all of the Borrowers, including an annual commitment fee of 0.07% based upon the unused portion of the Global Credit Facility. These fees are reflected in other expenses on the Statement of Operations. During the period ended June 30, 2014, the Fund did not use the Global Credit Facility.
9. Fair Value Measurements
The Fund follows a fair value hierarchy that distinguishes between market data obtained from independent sources (observable inputs) and the Fund’s own market assumptions (unobservable inputs). These inputs are used in determining the value of the Fund’s financial instruments and are summarized in the following fair value hierarchy:
| • | Level 1 – quoted prices in active markets for identical financial instruments |
| • | Level 2 – other significant observable inputs (including quoted prices for similar financial instruments, interest rates, prepayment speed, credit risk, etc.) |
| • | Level 3 – significant unobservable inputs (including the Fund’s own assumptions in determining the fair value of financial instruments) |
The input levels are not necessarily an indication of the risk or liquidity associated with financial instruments at that level.
For movements between the levels within the fair value hierarchy, the Fund has adopted a policy of recognizing the transfers as of the date of the underlying event which caused the movement.
A summary of inputs used as of June 30, 2014, in valuing the Fund’s assets carried at fair value, is as follows:
| Level 1 | Level 2 | Level 3 | Total | |||||||||||||
| Assets: | ||||||||||||||||
| Investments in Securities: |
||||||||||||||||
| Equity Investmentsa |
$ | 375,640,403 | $ | — | $ | — | $ | 375,640,403 | ||||||||
| Short Term Investments |
— | 4,395,660 | — | 4,395,660 | ||||||||||||
|
|
|
|||||||||||||||
| Total Investments in Securities |
$ | 375,640,403 | $ | 4,395,660 | $ | — | $ | 380,036,063 | ||||||||
|
|
|
|||||||||||||||
aFor detailed categories, see the accompanying Statement of Investments.
| FGR-22 | Semiannual Report |
FRANKLIN TEMPLETON VARIABLE INSURANCE PRODUCTS TRUST
NOTES TO FINANCIAL STATEMENTS (UNAUDITED)
Franklin Global Real Estate VIP Fund (continued)
10. New Accounting Pronouncements
In June 2014, the Financial Accounting Standards Board issued Accounting Standards Update (ASU) No. 2014-11, Transfers and Servicing (Topic 860), Repurchase-to-Maturity Transactions, Repurchase Financings, and Disclosures. The ASU changes the accounting for certain repurchase agreements and expands disclosure requirements related to repurchase agreements, securities lending, repurchase-to-maturity and similar transactions. The ASU is effective for interim and annual reporting periods beginning after December 15, 2014. Management is currently evaluating the impact, if any, of applying this provision.
11. Subsequent Events
The Fund has evaluated subsequent events through the issuance of the financial statements and determined that no events have occurred that require disclosure.
Abbreviations
| Selected Portfolio | ||
| IDR | International Depositary Receipt | |
| REIT | Real Estate Investment Trust | |
| Semiannual Report | FGR-23 |
FRANKLIN TEMPLETON VARIABLE INSURANCE PRODUCTS TRUST
TAX INFORMATION (UNAUDITED)
Franklin Global Real Estate VIP Fund
At December 31, 2013, more than 50% of the Fund’s total assets were invested in securities of foreign issuers. In most instances, foreign taxes were withheld from income paid to the Fund on these investments. As shown in the table below, the Fund hereby reports to shareholders the foreign source income and foreign taxes paid, pursuant to Section 853 of the Internal Revenue Code. This written statement will allow shareholders of record on June 12, 2014, to treat their proportionate share of foreign taxes paid by the Fund as having been paid directly by them. The shareholder shall consider these amounts as foreign taxes paid in the tax year in which they receive the Fund distribution.
The following table provides a detailed analysis of foreign tax paid, and foreign source income as reported by the Fund, to Class 1 and Class 2 shareholders of record.
| Class | Foreign Tax Paid Per Share |
Foreign Source Income Per Share |
||||||
| Class 1 | $0.0235 | $0.1142 | ||||||
| Class 2 | $0.0235 | $0.0816 | ||||||
Foreign Tax Paid Per Share (Column 1) is the amount per share available to you, as a tax credit (assuming you held your shares in the Fund for a minimum of 16 days during the 31-day period beginning 15 days before the ex-dividend date of the Fund’s distribution to which the foreign taxes relate), or as a tax deduction.
Foreign Source Income Per Share (Column 2) is the amount per share of income dividends attributable to foreign securities held by the Fund, plus any foreign taxes withheld on these dividends.
| FGR-24 | Semiannual Report |
Franklin Growth and Income VIP Fund
(Formerly, Franklin Growth and Income Securities Fund)
This semiannual report for Franklin Growth and Income VIP Fund covers the period ended June 30, 2014.
Class 2 Performance Summary as of June 30, 2014
Franklin Growth and Income VIP Fund – Class 2 delivered a +5.88% total return for the six-month period ended June 30, 2014.
Performance reflects the Fund’s Class 2 operating expenses, but does not include any contract fees, expenses or sales charges. If they had been included, performance would be lower. These charges and deductions, particularly for variable life policies, can have a significant effect on contract values and insurance benefits. See the contract prospectus for a complete description of these expenses, including sales charges.
Performance data represent past performance, which does not guarantee future results. Investment return and principal value will fluctuate, and you may have a gain or loss when you sell your shares. Current performance may differ from figures shown.
| Semiannual Report | FGI-1 |
FRANKLIN GROWTH AND INCOME VIP FUND
Fund Goals and Main Investments: Franklin Growth and Income VIP Fund seeks capital appreciation with current income as a secondary goal. Under normal market conditions, the Fund invests predominantly in equity securities, including securities convertible into common stock.
Fund Risks: All investments involve risks, including possible loss of principal. Stock prices fluctuate, sometimes rapidly and dramatically, due to factors affecting individual companies, particular industries or sectors, or general market conditions. Convertible securities are subject to the risks of stocks when the underlying stock price is high relative to the conversion price and debt securities when the underlying stock price is low relative to the conversion price. The Fund’s investment in foreign securities also involves special risks, including currency fluctuations and economic as well as political uncertainty. The Fund is actively managed but there is no guarantee that the manager’s investment decisions will produce the desired results. The Fund’s prospectus also includes a description of the main investment risks.
Performance Overview
You can find the Fund’s six-month total return in the Performance Summary. In comparison, the Fund’s benchmark, the Standard & Poor’s® 500 Index (S&P 500®), produced a +7.14% total return.1 The Fund’s peers as measured by the Lipper VIP Equity Income Funds Classification Average, posted a +6.87% return for the same period.2
Economic and Market Overview
The U.S. economy showed some signs of recovery during the six-month period ended June 30, 2014, despite a first-quarter contraction in gross domestic product. Manufacturing activity expanded, and the unemployment rate declined to 6.1% in June 2014 from 6.7% in December 2013.3 Except for a sharp increase in March, retail sales rose at a modest pace that missed consensus expectations. The housing market had some weather-related weakness early in 2014, but home sales picked up in the spring and home prices were higher than a year ago.
The Federal Reserve Board (Fed) began reducing bond purchases by $10 billion a month in January 2014, based on earlier largely positive economic and employment data. Although
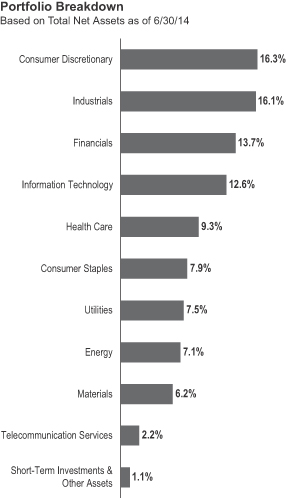
economic data in early 2014 were soft, Fed Chair Janet Yellen kept the pace of asset-purchase tapering intact while adopting a more qualitative approach to rate-hike guidance. However, the Fed pledged to keep interest rates low for a considerable time after the asset-purchase program ends, depending on inflation and employment trends. In June, the Fed lowered projections for near- and long-term economic growth even as it maintained the pace of tapering.
Investors’ confidence grew as corporate profits rose and generally favorable economic data indicated continued recovery despite brief sell-offs when many investors reacted to the Fed’s statements, political instability in certain emerging markets and
1. © 2014 Morningstar.
2. Source: Lipper, a Thomson Reuters Company.
One cannot invest directly in an index, and an index is not representative of the Fund’s portfolio. Please see Index Descriptions following the Fund Summaries.
3. Source: Bureau of Labor Statistics.
| FGI-2 | Semiannual Report |
FRANKLIN GROWTH AND INCOME VIP FUND
were among the top performers. Shares of Eli Lilly gained after the company reported positive phase III trial results for two cancer drugs. The company agreed to acquire the animal health division of Novartis to strengthen its global animal health division.
In contrast, our investments in the telecommunication services sector hindered the Fund’s results. U.K.-based telecommunication services provider Vodafone Group’s share price fell after the company’s fiscal year 2014 revenue declined because of stiff competition and regulatory headwinds in Europe. The company also provided sluggish revenue guidance for fiscal year 2015. Other key individual detractors included software solutions company CA, discount retailer Target, payroll processor Paychex and insurer Aflac. CA detracted from relative returns after it reported lower revenues in the fiscal 2014 fourth quarter. A credit card data breach announced in December 2013 and problems with a Canadian expansion continued to weigh on Target’s stock, although fourth-quarter 2013 earnings still beat estimates. The stock was also affected by concerns over management changes.
4. Please see Index Descriptions following the Fund Summaries.
| Semiannual Report | FGI-3 |
FRANKLIN GROWTH AND INCOME VIP FUND
| FGI-4 | Semiannual Report |
FRANKLIN GROWTH AND INCOME VIP FUND
Class 2 Fund Expenses
| Class 2 | Beginning Account Value 1/1/14 |
Ending Account Value 6/30/14 |
Fund-Level Expenses 1/1/14–6/30/14 |
|||||||||
| Actual | $1,000 | $1,058.80 | $4.24 | |||||||||
| Hypothetical (5% return before expenses) | $1,000 | $1,020.68 | $4.16 | |||||||||
*Expenses are calculated using the most recent six-month annualized expense ratio for the Fund’s Class 2 shares (0.83%), which does not include any ongoing expenses of the Contract for which the Fund is an investment option, multiplied by the average account value over the period, multiplied by 181/365 to reflect the one-half year period.
| Semiannual Report | FGI-5 |
FRANKLIN TEMPLETON VARIABLE INSURANCE PRODUCTS TRUST
Financial Highlights
Franklin Growth and Income VIP Fund
| Six Months Ended June 30, 2014 (unaudited) |
Year Ended December 31, | |||||||||||||||||||||||
| 2013 | 2012 | 2011 | 2010 | 2009 | ||||||||||||||||||||
| Class 1 | ||||||||||||||||||||||||
| Per share operating performance (for a share outstanding throughout the period) |
||||||||||||||||||||||||
| Net asset value, beginning of period |
$15.97 | $12.64 | $11.60 | $11.76 | $10.47 | $ 8.72 | ||||||||||||||||||
|
|
|
|||||||||||||||||||||||
| Income from investment operationsa: | ||||||||||||||||||||||||
| Net investment incomeb |
0.32 | c | 0.33 | 0.35 | 0.33 | 0.38 | 0.31 | |||||||||||||||||
| Net realized and unrealized gains (losses) |
0.64 | 3.40 | 1.08 | (0.03 | ) | 1.32 | 1.92 | |||||||||||||||||
|
|
|
|||||||||||||||||||||||
| Total from investment operations |
0.96 | 3.73 | 1.43 | 0.30 | 1.70 | 2.23 | ||||||||||||||||||
|
|
|
|||||||||||||||||||||||
| Less distributions from net investment income |
(0.43 | ) | (0.40 | ) | (0.39 | ) | (0.46 | ) | (0.41 | ) | (0.48 | ) | ||||||||||||
|
|
|
|||||||||||||||||||||||
| Net asset value, end of period |
$16.50 | $15.97 | $12.64 | $11.60 | $11.76 | $10.47 | ||||||||||||||||||
|
|
|
|||||||||||||||||||||||
| Total returnd |
6.05% | 29.96% | 12.53% | 2.64% | 16.93% | 26.82% | ||||||||||||||||||
| Ratios to average net assetse | ||||||||||||||||||||||||
| Expenses |
0.58% | f | 0.58% | f | 0.60% | 0.59% | 0.59% | 0.60% | f | |||||||||||||||
| Net investment income |
4.06% | c | 2.29% | 2.86% | 2.80% | 3.62% | 3.46% | |||||||||||||||||
| Supplemental data | ||||||||||||||||||||||||
| Net assets, end of period (000’s) |
$174,280 | $175,860 | $154,463 | $156,830 | $176,590 | $174,403 | ||||||||||||||||||
| Portfolio turnover rate |
9.12% | 35.16% | 30.00% | 32.93% | 26.83% | 51.05% | ||||||||||||||||||
aThe amount shown for a share outstanding throughout the period may not correlate with the Statement of Operations for the period due to the timing of sales and repurchases of the Fund shares in relation to income earned and/or fluctuating fair value of the investments of the Fund.
bBased on average daily shares outstanding.
cNet investment income per share includes approximately $0.12 per share received in the form of a special dividend paid in connection with certain Fund holdings. Excluding this amount, the ratio of net investment income to average net assets would have been 2.60%.
dTotal return does not include fees, charges or expenses imposed by the variable annuity and life insurance contracts for which the Franklin Templeton Variable Insurance Products Trust serves as an underlying investment vehicle. Total return is not annualized for periods less than one year.
eRatios are annualized for periods less than one year.
fBenefit of expense reduction rounds to less than 0.01%.
| FGI-6 | Semiannual Report | The accompanying notes are an integral part of these financial statements. |
FRANKLIN TEMPLETON VARIABLE INSURANCE PRODUCTS TRUST
FINANCIAL HIGHLIGHTS
Franklin Growth and Income VIP Fund (continued)
| Six Months Ended June 30, 2014 (unaudited) |
Year Ended December 31, | |||||||||||||||||||||||
| 2013 | 2012 | 2011 | 2010 | 2009 | ||||||||||||||||||||
| Class 2 | ||||||||||||||||||||||||
| Per share operating performance (for a share outstanding throughout the period) |
||||||||||||||||||||||||
| Net asset value, beginning of period |
$15.73 | $12.46 | $11.44 | $11.60 | $10.33 | $ 8.59 | ||||||||||||||||||
|
|
|
|||||||||||||||||||||||
| Income from investment operationsa: | ||||||||||||||||||||||||
| Net investment incomeb |
0.30 | c | 0.29 | 0.32 | 0.29 | 0.35 | 0.28 | |||||||||||||||||
| Net realized and unrealized gains (losses) |
0.62 | 3.35 | 1.05 | (0.02 | ) | 1.31 | 1.90 | |||||||||||||||||
|
|
|
|||||||||||||||||||||||
| Total from investment operations |
0.92 | 3.64 | 1.37 | 0.27 | 1.66 | 2.18 | ||||||||||||||||||
|
|
|
|||||||||||||||||||||||
| Less distributions from net investment income |
(0.39 | ) | (0.37 | ) | (0.35 | ) | (0.43 | ) | (0.39 | ) | (0.44 | ) | ||||||||||||
|
|
|
|||||||||||||||||||||||
| Net asset value, end of period |
$16.26 | $15.73 | $12.46 | $11.44 | $11.60 | $10.33 | ||||||||||||||||||
|
|
|
|||||||||||||||||||||||
| Total returnd |
5.88% | 29.60% | 12.23% | 2.41% | 16.68% | 26.55% | ||||||||||||||||||
| Ratios to average net assetse | ||||||||||||||||||||||||
| Expenses |
0.83% | f | 0.83% | f | 0.85% | 0.84% | 0.84% | 0.85% | f | |||||||||||||||
| Net investment income |
3.81% | c | 2.04% | 2.61% | 2.55% | 3.37% | 3.21% | |||||||||||||||||
| Supplemental data | ||||||||||||||||||||||||
| Net assets, end of period (000’s) |
$145,062 | $150,966 | $131,400 | $129,309 | $151,481 | $152,077 | ||||||||||||||||||
| Portfolio turnover rate |
9.12% | 35.16% | 30.00% | 32.93% | 26.83% | 51.05% | ||||||||||||||||||
aThe amount shown for a share outstanding throughout the period may not correlate with the Statement of Operations for the period due to the timing of sales and repurchases of the Fund shares in relation to income earned and/or fluctuating fair value of the investments of the Fund.
bBased on average daily shares outstanding.
cNet investment income per share includes approximately $0.12 per share received in the form of a special dividend paid in connection with certain Fund holdings. Excluding this amount, the ratio of net investment income to average net assets would have been 2.35%.
dTotal return does not include fees, charges or expenses imposed by the variable annuity and life insurance contracts for which the Franklin Templeton Variable Insurance Products Trust serves as an underlying investment vehicle. Total return is not annualized for periods less than one year.
eRatios are annualized for periods less than one year.
fBenefit of expense reduction rounds to less than 0.01%.
| The accompanying notes are an integral part of these financial statements. | Semiannual Report | FGI-7 |
FRANKLIN TEMPLETON VARIABLE INSURANCE PRODUCTS TRUST
Statement of Investments, June 30, 2014 (unaudited)
| Franklin Growth and Income VIP Fund | ||||||||||||||
| Country | Shares | Value | ||||||||||||
| Common Stocks 92.4% |
||||||||||||||
| Consumer Discretionary 16.3% |
||||||||||||||
| a | Amazon.com Inc. |
United States | 15,000 | $ | 4,871,700 | |||||||||
| Ford Motor Co. |
United States | 384,000 | 6,620,160 | |||||||||||
| General Motors Co. |
United States | 34,388 | 1,248,284 | |||||||||||
| L Brands Inc. |
United States | 97,800 | 5,736,948 | |||||||||||
| Lowe’s Cos. Inc. |
United States | 93,600 | 4,491,864 | |||||||||||
| McDonald’s Corp. |
United States | 62,700 | 6,316,398 | |||||||||||
| NIKE Inc., B |
United States | 71,900 | 5,575,845 | |||||||||||
| Starwood Hotels & Resorts Worldwide Inc. |
United States | 80,000 | 6,465,600 | |||||||||||
| Target Corp. |
United States | 89,400 | 5,180,730 | |||||||||||
| Wynn Resorts Ltd. |
United States | 27,500 | 5,707,900 | |||||||||||
|
|
|
|||||||||||||
| 52,215,429 | ||||||||||||||
|
|
|
|||||||||||||
| Consumer Staples 7.9% |
||||||||||||||
| Diageo PLC, ADR |
United Kingdom | 45,300 | 5,765,331 | |||||||||||
| Mead Johnson Nutrition Co., A |
United States | 66,300 | 6,177,171 | |||||||||||
| Nestle SA |
Switzerland | 52,800 | 4,090,162 | |||||||||||
| PepsiCo Inc. |
United States | 70,900 | 6,334,206 | |||||||||||
| The Procter & Gamble Co. |
United States | 36,500 | 2,868,535 | |||||||||||
|
|
|
|||||||||||||
| 25,235,405 | ||||||||||||||
|
|
|
|||||||||||||
| Energy 6.0% |
||||||||||||||
| BP PLC, ADR |
United Kingdom | 59,900 | 3,159,725 | |||||||||||
| Chevron Corp. |
United States | 26,800 | 3,498,740 | |||||||||||
| Exxon Mobil Corp. |
United States | 57,644 | 5,803,598 | |||||||||||
| Royal Dutch Shell PLC, A, ADR |
United Kingdom | 80,200 | 6,606,074 | |||||||||||
|
|
|
|||||||||||||
| 19,068,137 | ||||||||||||||
|
|
|
|||||||||||||
| Financials 12.0% |
||||||||||||||
| Aflac Inc. |
United States | 84,200 | 5,241,450 | |||||||||||
| Bank of America Corp. |
United States | 149,000 | 2,290,130 | |||||||||||
| BlackRock Inc. |
United States | 20,300 | 6,487,880 | |||||||||||
| JPMorgan Chase & Co. |
United States | 111,170 | 6,405,615 | |||||||||||
| Marsh & McLennan Cos. Inc. |
United States | 77,300 | 4,005,686 | |||||||||||
| MetLife Inc. |
United States | 60,723 | 3,373,770 | |||||||||||
| T. Rowe Price Group Inc. |
United States | 54,000 | 4,558,140 | |||||||||||
| Wells Fargo & Co. |
United States | 113,200 | 5,949,792 | |||||||||||
|
|
|
|||||||||||||
| 38,312,463 | ||||||||||||||
|
|
|
|||||||||||||
| Health Care 9.3% |
||||||||||||||
| Bristol-Myers Squibb Co. |
United States | 45,400 | 2,202,354 | |||||||||||
| Eli Lilly & Co. |
United States | 88,700 | 5,514,479 | |||||||||||
| Johnson & Johnson |
United States | 51,800 | 5,419,316 | |||||||||||
| Pfizer Inc. |
United States | 152,600 | 4,529,168 | |||||||||||
| Roche Holding AG |
Switzerland | 21,800 | 6,501,776 | |||||||||||
| Sanofi, ADR |
France | 102,900 | 5,471,193 | |||||||||||
|
|
|
|||||||||||||
| 29,638,286 | ||||||||||||||
|
|
|
|||||||||||||
| Industrials 14.1% |
||||||||||||||
| The Boeing Co. |
United States | 33,900 | 4,313,097 | |||||||||||
| Cummins Inc. |
United States | 35,000 | 5,400,150 | |||||||||||
| Emerson Electric Co. |
United States | 89,100 | 5,912,676 | |||||||||||
| General Electric Co. |
United States | 190,600 | 5,008,968 | |||||||||||
| Honeywell International Inc. |
United States | 61,700 | 5,735,015 | |||||||||||
| FGI-8 | Semiannual Report |
FRANKLIN TEMPLETON VARIABLE INSURANCE PRODUCTS TRUST
STATEMENT OF INVESTMENTS (UNAUDITED)
Franklin Growth and Income VIP Fund (continued)
| Country | Shares | Value | ||||||||||||
| Common Stocks (continued) |
||||||||||||||
| Industrials (continued) |
||||||||||||||
| Lockheed Martin Corp. |
United States | 40,000 | $ | 6,429,200 | ||||||||||
| Republic Services Inc. |
United States | 191,300 | 7,263,661 | |||||||||||
| United Parcel Service Inc., B |
United States | 47,700 | 4,896,882 | |||||||||||
|
|
|
|||||||||||||
| 44,959,649 | ||||||||||||||
|
|
|
|||||||||||||
| Information Technology 12.6% |
||||||||||||||
| CA Inc. |
United States | 179,400 | 5,155,956 | |||||||||||
| Cisco Systems Inc. |
United States | 261,808 | 6,505,929 | |||||||||||
| Intel Corp. |
United States | 187,400 | 5,790,660 | |||||||||||
| Maxim Integrated Products Inc. |
United States | 196,400 | 6,640,284 | |||||||||||
| Microsoft Corp. |
United States | 165,700 | 6,909,690 | |||||||||||
| Paychex Inc. |
United States | 98,300 | 4,085,348 | |||||||||||
| Seagate Technology PLC |
United States | 90,600 | 5,147,892 | |||||||||||
|
|
|
|||||||||||||
| 40,235,759 | ||||||||||||||
|
|
|
|||||||||||||
| Materials 6.2% |
||||||||||||||
| BHP Billiton PLC |
United Kingdom | 130,800 | 4,229,173 | |||||||||||
| The Dow Chemical Co. |
United States | 128,200 | 6,597,172 | |||||||||||
| Freeport-McMoRan Copper & Gold Inc., B |
United States | 103,288 | 3,770,012 | |||||||||||
| Potash Corp. of Saskatchewan Inc. |
Canada | 134,400 | 5,101,824 | |||||||||||
|
|
|
|||||||||||||
| 19,698,181 | ||||||||||||||
|
|
|
|||||||||||||
| Telecommunication Services 2.2% |
||||||||||||||
| AT&T Inc. |
United States | 98,297 | 3,475,782 | |||||||||||
| Verizon Communications Inc. |
United States | 29,601 | 1,448,377 | |||||||||||
| Vodafone Group PLC, ADR |
United Kingdom | 65,172 | 2,176,093 | |||||||||||
|
|
|
|||||||||||||
| 7,100,252 | ||||||||||||||
|
|
|
|||||||||||||
| Utilities 5.8% |
||||||||||||||
| Dominion Resources Inc. |
United States | 60,700 | 4,341,264 | |||||||||||
| Duke Energy Corp. |
United States | 65,603 | 4,867,086 | |||||||||||
| PG&E Corp. |
United States | 126,800 | 6,088,936 | |||||||||||
| Xcel Energy Inc. |
United States | 103,400 | 3,332,582 | |||||||||||
|
|
|
|||||||||||||
| 18,629,868 | ||||||||||||||
|
|
|
|||||||||||||
| Total Common Stocks (Cost $213,583,961) |
295,093,429 | |||||||||||||
|
|
|
|||||||||||||
| Convertible Preferred Stocks 6.5% |
||||||||||||||
| Energy 1.1% |
||||||||||||||
| b | Chesapeake Energy Corp., 5.75%, cvt. pfd., 144A |
United States | 2,700 | 3,427,313 | ||||||||||
|
|
|
|||||||||||||
| Financials 1.7% |
||||||||||||||
| Bank of America Corp., 7.25%, cvt. pfd., L |
United States | 3,100 | 3,617,700 | |||||||||||
| MetLife Inc., 5.00%, cvt. pfd. |
United States | 55,100 | 1,760,996 | |||||||||||
|
|
|
|||||||||||||
| 5,378,696 | ||||||||||||||
|
|
|
|||||||||||||
| Industrials 2.0% |
||||||||||||||
| Genesee & Wyoming Inc., 5.00%, cvt. pfd. |
United States | 9,200 | 1,245,634 | |||||||||||
| Stanley Black & Decker Inc., 6.25%, cvt., pfd. |
United States | 45,300 | 5,165,559 | |||||||||||
|
|
|
|||||||||||||
| 6,411,193 | ||||||||||||||
|
|
|
|||||||||||||
| Semiannual Report | FGI-9 |
FRANKLIN TEMPLETON VARIABLE INSURANCE PRODUCTS TRUST
STATEMENT OF INVESTMENTS (UNAUDITED)
Franklin Growth and Income VIP Fund (continued)
| Country | Shares | Value | ||||||||||||
| Convertible Preferred Stocks (continued) |
||||||||||||||
| Utilities 1.7% |
||||||||||||||
| NextEra Energy Inc., 5.799%, cvt. pfd. |
United States | 62,000 | $ | 3,538,340 | ||||||||||
| NextEra Energy Inc., 5.889%, cvt. pfd. |
United States | 28,100 | 1,826,219 | |||||||||||
|
|
|
|||||||||||||
| 5,364,559 | ||||||||||||||
|
|
|
|||||||||||||
| Total Convertible Preferred Stock (Cost $16,011,683) |
20,581,761 | |||||||||||||
|
|
|
|||||||||||||
| Total Investments before Short Term Investments |
315,675,190 | |||||||||||||
|
|
|
|||||||||||||
| Principal Amount | ||||||||||||||
| Short Term Investments (Cost $3,751,836) 1.1% |
||||||||||||||
| Repurchase Agreements 1.1% |
||||||||||||||
| c | Joint Repurchase Agreement, 0.064%, 7/01/14 (Maturity Value $3,751,842) BNP Paribas Securities Corp. (Maturity Value $757,797) |
United States | $ | 3,751,836 | 3,751,836 | |||||||||
| Collateralized by U.S. Government Agency Securities, 0.00% - 6.21%, 1/16/15 - 5/04/37; dU.S. Government Agency Discount Notes, 12/24/14 - 1/30/15; U.S. Government Agency Securities, Strips, 5/15/30; U.S. Treasury Bonds, 7.50% - 8.875%, 11/15/16 - 2/15/19; U.S. Treasury Notes, 0.25% - 4.50%, 7/15/15 - 4/30/18; and U.S. Treasury Notes, Index Linked, 1.375%, 7/15/18 (valued at $3,827,512) |
||||||||||||||
|
|
|
|||||||||||||
| Total Investments (Cost $233,347,480) 100.0% |
319,427,026 | |||||||||||||
| Other Assets, less Liabilities (0.0)%† |
(85,113 | ) | ||||||||||||
|
|
|
|||||||||||||
| Net Assets 100.0% |
$ | 319,341,913 | ||||||||||||
|
|
|
|||||||||||||
See Abbreviations on page FGI-20.
†Rounds to less than 0.1% of net assets.
aNon-income producing.
bSecurity was purchased pursuant to Rule 144A under the Securities Act of 1933 and may be sold in transactions exempt from registration only to qualified institutional buyers or in a public offering registered under the Securities Act of 1933. This security has been deemed liquid under guidelines approved by the Trust’s Board of Trustees. At June 30, 2014, the value of this security was $3,427,313, representing 1.07% of net assets.
cSee Note 1(c) regarding joint repurchase agreement.
dThe security is traded on a discount basis with no stated coupon rate.
| FGI-10 | Semiannual Report | The accompanying notes are an integral part of these financial statements. |
FRANKLIN TEMPLETON VARIABLE INSURANCE PRODUCTS TRUST
Financial Statements
Statement of Assets and Liabilities
June 30, 2014 (unaudited)
| Franklin Growth and Income VIP Fund |
||||
| Assets: | ||||
| Investments in securities: |
||||
| Cost - Unaffiliated issuers |
$ | 229,595,644 | ||
| Cost - Repurchase agreements |
3,751,836 | |||
|
|
|
|||
| Total cost of investments |
$ | 233,347,480 | ||
|
|
|
|||
| Value - Unaffiliated issuers |
$ | 315,675,190 | ||
| Value - Repurchase agreements |
3,751,836 | |||
|
|
|
|||
| Total value of investments |
319,427,026 | |||
| Receivables: |
||||
| Capital shares sold |
15,562 | |||
| Dividends |
526,979 | |||
| Other assets |
144 | |||
|
|
|
|||
| Total assets |
319,969,711 | |||
|
|
|
|||
| Liabilities: | ||||
| Payables: |
||||
| Capital shares redeemed |
311,927 | |||
| Management fees |
138,090 | |||
| Distribution fees |
60,338 | |||
| Reports to shareholders |
89,338 | |||
| Accrued expenses and other liabilities |
28,105 | |||
|
|
|
|||
| Total liabilities |
627,798 | |||
|
|
|
|||
| Net assets, at value |
$ | 319,341,913 | ||
|
|
|
|||
| Net assets consist of: | ||||
| Paid-in capital |
$ | 230,358,844 | ||
| Undistributed net investment income |
6,281,244 | |||
| Net unrealized appreciation (depreciation) |
86,082,029 | |||
| Accumulated net realized gain (loss) |
(3,380,204 | ) | ||
|
|
|
|||
| Net assets, at value |
$ | 319,341,913 | ||
|
|
|
|||
| Class 1: | ||||
| Net assets, at value |
$ | 174,280,047 | ||
|
|
|
|||
| Shares outstanding |
10,565,021 | |||
|
|
|
|||
| Net asset value and maximum offering price per share |
$ | 16.50 | ||
|
|
|
|||
| Class 2: | ||||
| Net assets, at value |
$ | 145,061,866 | ||
|
|
|
|||
| Shares outstanding |
8,920,216 | |||
|
|
|
|||
| Net asset value and maximum offering price per share |
$ | 16.26 | ||
|
|
|
|||
| The accompanying notes are an integral part of these financial statements. | Semiannual Report | FGI-11 |
FRANKLIN TEMPLETON VARIABLE INSURANCE PRODUCTS TRUST
FINANCIAL STATEMENTS
Statement of Operations
for the six months ended June 30, 2014 (unaudited)
| Franklin Growth and Income VIP Fund |
||||
| Investment income: | ||||
| Dividends |
$ | 7,294,083 | ||
| Interest |
807 | |||
|
|
|
|||
| Total investment income |
7,294,890 | |||
|
|
|
|||
| Expenses: | ||||
| Management fees (Note 3a) |
831,662 | |||
| Distribution fees - Class 2 (Note 3c) |
179,810 | |||
| Custodian fees (Note 4) |
1,927 | |||
| Reports to shareholders |
47,537 | |||
| Professional fees |
21,839 | |||
| Trustees’ fees and expenses |
636 | |||
| Other |
6,081 | |||
|
|
|
|||
| Total expenses |
1,089,492 | |||
| Expense reductions (Note 4) |
(6 | ) | ||
|
|
|
|||
| Net expenses |
1,089,486 | |||
|
|
|
|||
| Net investment income |
6,205,404 | |||
|
|
|
|||
| Realized and unrealized gains (losses): | ||||
| Net realized gain (loss) from: |
||||
| Investments |
13,782,924 | |||
| Foreign currency transactions |
25,363 | |||
|
|
|
|||
| Net realized gain (loss) |
13,808,287 | |||
|
|
|
|||
| Net change in unrealized appreciation (depreciation) on: |
||||
| Investments |
(1,896,516 | ) | ||
| Translation of other assets and liabilities denominated in foreign currencies |
(24 | ) | ||
|
|
|
|||
| Net change in unrealized appreciation (depreciation) |
(1,896,540 | ) | ||
|
|
|
|||
| Net realized and unrealized gain (loss) |
11,911,747 | |||
|
|
|
|||
| Net increase (decrease) in net assets resulting from operations |
$ | 18,117,151 | ||
|
|
|
|||
| FGI-12 | Semiannual Report | The accompanying notes are an integral part of these financial statements. |
FRANKLIN TEMPLETON VARIABLE INSURANCE PRODUCTS TRUST
FINANCIAL STATEMENTS
Statements of Changes in Net Assets
| Franklin Growth and Income VIP Fund | ||||||||
| Six Months Ended June 30, 2014 (unaudited) |
Year Ended December 31, 2013 |
|||||||
| Increase (decrease) in net assets: | ||||||||
| Operations: |
||||||||
| Net investment income |
$ | 6,205,404 | $ | 6,736,411 | ||||
| Net realized gain (loss) from investments and foreign currency transactions |
13,808,287 | 28,487,148 | ||||||
| Net change in unrealized appreciation (depreciation) on investments and translation of other assets and liabilities denominated in foreign currencies |
(1,896,540 | ) | 45,062,156 | |||||
|
|
|
|||||||
| Net increase (decrease) in net assets resulting from operations |
18,117,151 | 80,285,715 | ||||||
|
|
|
|||||||
| Distributions to shareholders from: |
||||||||
| Net investment income: |
||||||||
| Class 1 |
(4,441,593 | ) | (4,583,247 | ) | ||||
| Class 2 |
(3,421,107 | ) | (3,711,240 | ) | ||||
|
|
|
|||||||
| Total distributions to shareholders |
(7,862,700 | ) | (8,294,487 | ) | ||||
|
|
|
|||||||
| Capital share transactions: (Note 2) |
||||||||
| Class 1 |
(7,107,978 | ) | (17,413,301 | ) | ||||
| Class 2 |
(10,630,861 | ) | (13,615,221 | ) | ||||
|
|
|
|||||||
| Total capital share transactions |
(17,738,839 | ) | (31,028,522 | ) | ||||
|
|
|
|||||||
| Net increase (decrease) in net assets |
(7,484,388 | ) | 40,962,706 | |||||
| Net assets: | ||||||||
| Beginning of period |
326,826,301 | 285,863,595 | ||||||
|
|
|
|||||||
| End of period |
$ | 319,341,913 | $ | 326,826,301 | ||||
|
|
|
|||||||
| Undistributed net investment income included in net assets: | ||||||||
| End of period |
$ | 6,281,244 | $ | 7,938,540 | ||||
|
|
|
|||||||
| The accompanying notes are an integral part of these financial statements. | Semiannual Report | FGI-13 |
FRANKLIN TEMPLETON VARIABLE INSURANCE PRODUCTS TRUST
Notes to Financial Statements (unaudited)
Franklin Growth and Income VIP Fund
| FGI-14 | Semiannual Report |
FRANKLIN TEMPLETON VARIABLE INSURANCE PRODUCTS TRUST
NOTES TO FINANCIAL STATEMENTS (UNAUDITED)
Franklin Growth and Income VIP Fund (continued)
| Semiannual Report | FGI-15 |
FRANKLIN TEMPLETON VARIABLE INSURANCE PRODUCTS TRUST
NOTES TO FINANCIAL STATEMENTS (UNAUDITED)
Franklin Growth and Income VIP Fund (continued)
1. Organization and Significant Accounting Policies (continued)
d. Income and Deferred Taxes (continued)
The Fund may be subject to foreign taxation related to income received, capital gains on the sale of securities and certain foreign currency transactions in the foreign jurisdictions in which it invests. Foreign taxes, if any, are recorded based on the tax regulations and rates that exist in the foreign markets in which the Fund invests. When a capital gain tax is determined to apply the Fund records an estimated deferred tax liability in an amount that would be payable if the securities were disposed of on the valuation date.
The Fund recognizes the tax benefits of uncertain tax positions only when the position is “more likely than not” to be sustained upon examination by the tax authorities based on the technical merits of the tax position. As of June 30, 2014, and for all open tax years, the Fund has determined that no liability for unrecognized tax benefits is required in the Fund’s financial statements related to uncertain tax positions taken on a tax return (or expected to be taken on future tax returns). Open tax years are those that remain subject to examination and are based on each tax jurisdiction statute of limitation.
e. Security Transactions, Investment Income, Expenses and Distributions
Security transactions are accounted for on trade date. Realized gains and losses on security transactions are determined on a specific identification basis. Interest income and estimated expenses are accrued daily. Dividend income is recorded on the ex-dividend date except that certain dividends from foreign securities are recognized as soon as the Fund is notified of the ex-dividend date. Distributions to shareholders are recorded on the ex-dividend date and are determined according to income tax regulations (tax basis). Distributable earnings determined on a tax basis may differ from earnings recorded in accordance with accounting principles generally accepted in the United
States of America. These differences may be permanent or temporary. Permanent differences are reclassified among capital accounts to reflect their tax character. These reclassifications have no impact on net assets or the results of operations. Temporary differences are not reclassified, as they may reverse in subsequent periods.
Common expenses incurred by the Trust are allocated among the funds based on the ratio of net assets of each fund to the combined net assets of the Trust. Fund specific expenses are charged directly to the fund that incurred the expense.
Realized and unrealized gains and losses and net investment income, not including class specific expenses, are allocated daily to each class of shares based upon the relative proportion of net assets of each class. Differences in per share distributions, by class, are generally due to differences in class specific expenses.
f. Accounting Estimates
The preparation of financial statements in accordance with U.S. GAAP requires management to make estimates and assumptions that affect the reported amounts of assets and liabilities at the date of the financial statements and the amounts of income and expenses during the reporting period. Actual results could differ from those estimates.
g. Guarantees and Indemnifications
Under the Trust’s organizational documents, its officers and trustees are indemnified by the Trust against certain liabilities arising out of the performance of their duties to the Trust. Additionally, in the normal course of business, the Trust, on behalf of the Fund, enters into contracts with service providers that contain general indemnification clauses. The Trust’s maximum exposure under these arrangements is unknown as this would involve future claims that may be made against the Trust that have not yet occurred. Currently, the Trust expects the risk of loss to be remote.
| FGI-16 | Semiannual Report |
FRANKLIN TEMPLETON VARIABLE INSURANCE PRODUCTS TRUST
NOTES TO FINANCIAL STATEMENTS (UNAUDITED)
Franklin Growth and Income VIP Fund (continued)
2. Shares of Beneficial Interest
At June 30, 2014, there were an unlimited number of shares authorized (without par value). Transactions in the Fund’s shares were as follows:
| Six Months Ended June 30, 2014 |
Year Ended December 31, 2013 |
|||||||||||||||||
| Shares | Amount | Shares | Amount | |||||||||||||||
| Class 1 Shares: | ||||||||||||||||||
| Shares sold |
1,448 | $ | 23,814 | 37,520 | $ | 537,654 | ||||||||||||
| Shares issued in reinvestment of distributions |
273,329 | 4,441,593 | 326,675 | 4,583,247 | ||||||||||||||
| Shares redeemed |
(718,652 | ) | (11,573,385 | ) | (1,571,602 | ) | (22,534,202 | ) | ||||||||||
|
|
|
|||||||||||||||||
| Net increase (decrease) |
(443,875 | ) | $ | (7,107,978 | ) | (1,207,407 | ) | $ | (17,413,301 | ) | ||||||||
|
|
|
|||||||||||||||||
| Class 2 Shares: | ||||||||||||||||||
| Shares sold |
90,325 | $ | 1,443,178 | 905,864 | $ | 12,758,976 | ||||||||||||
| Shares issued in reinvestment of distributions |
213,552 | 3,421,107 | 268,347 | 3,711,240 | ||||||||||||||
| Shares redeemed |
(978,621 | ) | (15,495,146 | ) | (2,124,043 | ) | (30,085,437 | ) | ||||||||||
|
|
|
|||||||||||||||||
| Net increase (decrease) |
(674,744 | ) | $ | (10,630,861 | ) | (949,832 | ) | $ | (13,615,221 | ) | ||||||||
|
|
|
|||||||||||||||||
3. Transactions With Affiliates
Franklin Resources, Inc. is the holding company for various subsidiaries that together are referred to as Franklin Templeton Investments. Certain officers and trustees of the Fund are also officers and/or directors of the following subsidiaries:
| Subsidiary | Affiliation | |
| Franklin Advisers, Inc. (Advisers) | Investment manager | |
| Franklin Templeton Services, LLC (FT Services) | Administrative manager | |
| Franklin Templeton Distributors, Inc. (Distributors) | Principal underwriter | |
| Franklin Templeton Investor Services, LLC (Investor Services) | Transfer agent |
a. Management Fees
The Fund pays an investment management fee to Advisers based on the average daily net assets of the Fund as follows:
| Annualized Fee Rate | Net Assets | |
| 0.625% | Up to and including $100 million | |
| 0.500% | Over $100 million, up to and including $250 million | |
| 0.450% | Over $250 million, up to and including $7.5 billion | |
| 0.440% | Over $7.5 billion, up to and including $10 billion | |
| 0.430% | Over $10 billion, up to and including $12.5 billion | |
| 0.420% | Over $12.5 billion, up to and including $15 billion | |
| 0.400% | In excess of $15 billion |
b. Administrative Fees
Under an agreement with Advisers, FT Services provides administrative services to the Fund. The fee is paid by Advisers based on the Fund’s average daily net assets, and is not an additional expense of the Fund.
| Semiannual Report | FGI-17 |
FRANKLIN TEMPLETON VARIABLE INSURANCE PRODUCTS TRUST
NOTES TO FINANCIAL STATEMENTS (UNAUDITED)
Franklin Growth and Income VIP Fund (continued)
3. Transactions With Affiliates (continued)
c. Distribution Fees
The Board has adopted a distribution plan for Class 2 shares pursuant to Rule 12b-1 under the 1940 Act. Under the Fund’s compensation distribution plan, the Fund pays Distributors for costs incurred in connection with the servicing, sale and distribution of the Fund’s shares up to 0.35% per year of its average daily net assets. Some distribution fees are not charged on shares held by affiliates. The Board has agreed to limit the current rate to 0.25% per year for Class 2. The plan year, for purposes of monitoring compliance with the maximum annual plan rate, is February 1 through January 31.
d. Transfer Agent Fees
Investor Services, under terms of an agreement, performs shareholder servicing for the Fund and is not paid by the Fund for the services.
4. Expense Offset Arrangement
The Fund has entered into an arrangement with its custodian whereby credits realized as a result of uninvested cash balances are used to reduce a portion of the Fund’s custodian expenses. During the period ended June 30, 2014, the custodian fees were reduced as noted in the Statement of Operations.
5. Income Taxes
For tax purposes, capital losses may be carried over to offset future capital gains. Capital loss carryforwards with no expiration, if any, must be fully utilized before those losses with expiration dates.
At December 31, 2013, the Fund had capital loss carryforwards of $17,127,212, expiring in 2017.
At June 30, 2014, the cost of investments and net unrealized appreciation (depreciation) for income tax purposes were as follows:
| Cost of investments |
$ | 233,418,700 | ||
|
|
|
|||
| Unrealized appreciation |
$ | 87,286,289 | ||
| Unrealized depreciation |
(1,277,963 | ) | ||
|
|
|
|||
| Net unrealized appreciation (depreciation) |
$ | 86,008,326 | ||
|
|
|
|||
Differences between income and/or capital gains as determined on a book basis and a tax basis are primarily due to differing treatments of bond discounts and premiums, corporate actions, and equity-linked securities.
6. Investment Transactions
Purchases and sales of investments (excluding short term securities) for the period ended June 30, 2014, aggregated $28,683,148 and $52,033,049, respectively.
7. Credit Facility
The Fund, together with other U.S. registered and foreign investment funds (collectively, Borrowers), managed by Franklin Templeton Investments, are borrowers in a joint syndicated senior unsecured credit facility totaling $1.5 billion (Global Credit Facility) which matures on February 13, 2015. This Global Credit Facility provides a source of funds to the Borrowers for temporary and emergency purposes, including the ability to meet future unanticipated or unusually large redemption requests.
| FGI-18 | Semiannual Report |
FRANKLIN TEMPLETON VARIABLE INSURANCE PRODUCTS TRUST
NOTES TO FINANCIAL STATEMENTS (UNAUDITED)
Franklin Growth and Income VIP Fund (continued)
Under the terms of the Global Credit Facility, the Fund shall, in addition to interest charged on any borrowings made by the Fund and other costs incurred by the Fund, pay its share of fees and expenses incurred in connection with the implementation and maintenance of the Global Credit Facility, based upon its relative share of the aggregate net assets of all of the Borrowers, including an annual commitment fee of 0.07% based upon the unused portion of the Global Credit Facility. These fees are reflected in other expenses on the Statement of Operations. During the period ended June 30, 2014, the Fund did not use the Global Credit Facility.
8. Fair Value Measurements
The Fund follows a fair value hierarchy that distinguishes between market data obtained from independent sources (observable inputs) and the Fund’s own market assumptions (unobservable inputs). These inputs are used in determining the value of the Fund’s financial instruments and are summarized in the following fair value hierarchy:
| • | Level 1 – quoted prices in active markets for identical financial instruments |
| • | Level 2 – other significant observable inputs (including quoted prices for similar financial instruments, interest rates, prepayment speed, credit risk, etc.) |
| • | Level 3 – significant unobservable inputs (including the Fund’s own assumptions in determining the fair value of financial instruments) |
The input levels are not necessarily an indication of the risk or liquidity associated with financial instruments at that level.
For movements between the levels within the fair value hierarchy, the Fund has adopted a policy of recognizing the transfers as of the date of the underlying event which caused the movement.
A summary of inputs used as of June 30, 2014, in valuing the Fund’s assets carried at fair value, is as follows:
| Level 1 | Level 2 | Level 3 | Total | |||||||||||||
| Assets: | ||||||||||||||||
| Investments in Securities: |
||||||||||||||||
| Equity Investments:a |
||||||||||||||||
| Energy |
$ | 19,068,137 | $ | 3,427,313 | $ | — | $ | 22,495,450 | ||||||||
| All Other Equity Investmentsb |
293,179,740 | — | — | 293,179,740 | ||||||||||||
| Short Term Investments |
— | 3,751,836 | — | 3,751,836 | ||||||||||||
|
|
|
|||||||||||||||
| Total Investments in Securities |
$ | 312,247,877 | $ | 7,179,149 | $ | — | $ | 319,427,026 | ||||||||
|
|
|
|||||||||||||||
aIncludes common and convertible preferred stocks.
bFor detailed categories, see the accompanying Statement of Investments.
9. New Accounting Pronouncements
In June 2014, the Financial Accounting Standards Board issued Accounting Standards Update (ASU) No. 2014-11, Transfers and Servicing (Topic 860), Repurchase-to-Maturity Transactions, Repurchase Financings, and Disclosures. The ASU changes the accounting for certain repurchase agreements and expands disclosure requirements related to repurchase agreements, securities lending, repurchase-to-maturity and similar transactions. The ASU is effective for interim and annual reporting periods beginning after December 15, 2014. Management is currently evaluating the impact, if any, of applying this provision.
| Semiannual Report | FGI-19 |
FRANKLIN TEMPLETON VARIABLE INSURANCE PRODUCTS TRUST
NOTES TO FINANCIAL STATEMENTS (UNAUDITED)
Franklin Growth and Income VIP Fund (continued)
10. Subsequent Events
The Fund has evaluated subsequent events through the issuance of the financial statements and determined that no events have occurred that require disclosure.
Abbreviations
| Selected Portfolio | ||
| ADR | American Depositary Receipt | |
| FGI-20 | Semiannual Report |
Franklin High Income VIP Fund
(Formerly, Franklin High Income Securities Fund)
This semiannual report for Franklin High Income VIP Fund covers the period ended June 30, 2014.
Class 2 Performance Summary as of June 30, 2014
Franklin High Income VIP Fund – Class 2 delivered a +5.59% total return for the six-month period ended June 30, 2014.
Performance reflects the Fund’s Class 2 operating expenses, but does not include any contract fees, expenses or sales charges. If they had been included, performance would be lower. These charges and deductions, particularly for variable life policies, can have a significant effect on contract values and insurance benefits. See the contract prospectus for a complete description of these expenses, including sales charges.
Performance data represent past performance, which does not guarantee future results. Investment return and principal value will fluctuate, and you may have a gain or loss when you sell your shares. Current performance may differ from figures shown.
| Semiannual Report | FH-1 |
FRANKLIN HIGH INCOME VIP FUND
1. Source: Credit Suisse.
2. Source: Lipper, a Thomson Reuters Company.
One cannot invest directly in an index, and an index is not representative of the Fund’s portfolio. Please see Index Descriptions following the Fund Summaries.
3. Source: Bureau of Labor Statistics.
| FH-2 | Semiannual Report |
FRANKLIN HIGH INCOME VIP FUND
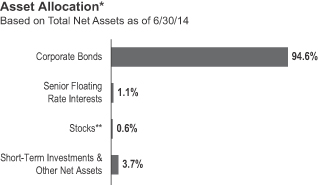
Although some of the Fund’s industry positioning enhanced relative performance versus its benchmark, certain other weightings had a negative impact. For example, the paper industry continued to face pricing pressures and a secular demand decline, which caused us to hold an underweighted position.5 However, some industry consolidation boosted certain bond prices and helped this relatively small industry to outperform the benchmark. Similarly, we underweighted the aerospace sector and this positioning also proved to be a relative performance detractor. A historically highly volatile subsector in aerospace, airlines recently enjoyed the benefits of enhanced capacity management after a wave of consolidation.6 This boosted bond prices and helped drive performance.
In contrast, we slightly overweighted the gaming industry.7 Given the industry is dependent on discretionary consumer spending, top-line revenue results were soft for many operators. In addition, new casinos continued to open and cause some gaming markets to show signs of being oversaturated. Lastly, bond prices of large capitalization issuer Caesar’s Entertainment fell as a balance sheet restructuring loomed. In addition to having a slightly overweighted gaming industry positioning, the Fund held Caesar’s senior secured bonds, which moved lower during the period and contributed to the sector’s underperformance.
To a small extent, the portfolio utilized derivatives, including currency forwards and credit derivatives through a high yield
4. Automotive is part of automobiles and components in the SOI.
5. Paper is part of materials in the SOI.
6. Aerospace is part of capital goods in the SOI.
7. Gaming is part of consumer services in the SOI.
| Semiannual Report | FH-3 |
FRANKLIN HIGH INCOME VIP FUND
| FH-4 | Semiannual Report |
FRANKLIN HIGH INCOME VIP FUND
Class 2 Fund Expenses
| Class 2 | Beginning Account Value 1/1/14 |
Ending Account Value 6/30/14 |
Fund-Level Expenses 1/1/14–6/30/14 |
|||||||||
| Actual | $1,000 | $1,055.90 | $4.18 | |||||||||
| Hypothetical (5% return before expenses) | $1,000 | $1,020.73 | $4.11 | |||||||||
*Expenses are calculated using the most recent six-month annualized expense ratio for the Fund’s Class 2 shares (0.82%), which does not include any ongoing expenses of the Contract for which the Fund is an investment option, multiplied by the average account value over the period, multiplied by 181/365 to reflect the one-half year period.
| Semiannual Report | FH-5 |
FRANKLIN TEMPLETON VARIABLE INSURANCE PRODUCTS TRUST
Financial Highlights
Franklin High Income VIP Fund
| Six Months Ended (unaudited) |
Year Ended December 31, | |||||||||||||||||||||||
| 2013 | 2012 | 2011 | 2010 | 2009 | ||||||||||||||||||||
| Class 1 | ||||||||||||||||||||||||
| Per share operating performance (for a share outstanding throughout the period) |
||||||||||||||||||||||||
| Net asset value, beginning of period |
$7.02 | $7.01 | $6.52 | $6.63 | $6.26 | $4.68 | ||||||||||||||||||
|
|
|
|||||||||||||||||||||||
| Income from investment operationsa: | ||||||||||||||||||||||||
| Net investment incomeb |
0.22 | 0.46 | 0.48 | 0.50 | 0.49 | 0.46 | ||||||||||||||||||
| Net realized and unrealized gains (losses) |
0.18 | 0.09 | 0.51 | (0.19 | ) | 0.32 | 1.50 | |||||||||||||||||
|
|
|
|||||||||||||||||||||||
| Total from investment operations |
0.40 | 0.55 | 0.99 | 0.31 | 0.81 | 1.96 | ||||||||||||||||||
|
|
|
|||||||||||||||||||||||
| Less distributions from net investment income |
(0.44 | ) | (0.54 | ) | (0.50 | ) | (0.42 | ) | (0.44 | ) | (0.38 | ) | ||||||||||||
|
|
|
|||||||||||||||||||||||
| Net asset value, end of period |
$6.98 | $7.02 | $7.01 | $6.52 | $6.63 | $6.26 | ||||||||||||||||||
|
|
|
|||||||||||||||||||||||
| Total returnc |
5.66% | 8.17% | 15.94% | 4.63% | 13.71% | 42.99% | ||||||||||||||||||
| Ratios to average net assetsd | ||||||||||||||||||||||||
| Expenses |
0.57% | e | 0.58% | e | 0.58% | 0.58% | 0.61% | 0.63% | e | |||||||||||||||
| Net investment income |
6.08% | 6.63% | 7.15% | 7.52% | 7.71% | 8.33% | ||||||||||||||||||
| Supplemental data | ||||||||||||||||||||||||
| Net assets, end of period (000’s) |
$38,889 | $39,300 | $42,166 | $41,971 | $48,051 | $48,855 | ||||||||||||||||||
| Portfolio turnover rate |
14.32% | 30.78% | 37.03% | 45.11% | 60.80% | 26.41% | ||||||||||||||||||
aThe amount shown for a share outstanding throughout the period may not correlate with the Statement of Operations for the period due to the timing of sales and repurchases of the Fund shares in relation to income earned and/or fluctuating fair value of the investments of the Fund.
bBased on average daily shares outstanding.
cTotal return does not include fees, charges or expenses imposed by the variable annuity and life insurance contracts for which the Franklin Templeton Variable Insurance Products Trust serves as an underlying investment vehicle. Total return is not annualized for periods less than one year.
dRatios are annualized for periods less than one year.
eBenefit of expense reduction rounds to less than 0.01%.
| FH-6 | Semiannual Report | The accompanying notes are an integral part of these financial statements. |
FRANKLIN TEMPLETON VARIABLE INSURANCE PRODUCTS TRUST
FINANCIAL HIGHLIGHTS
Franklin High Income VIP Fund (continued)
| Six Months Ended June 30, 2014 (unaudited) |
Year Ended December 31, | |||||||||||||||||||||||
| 2013 | 2012 | 2011 | 2010 | 2009 | ||||||||||||||||||||
| Class 2 | ||||||||||||||||||||||||
| Per share operating performance (for a share outstanding throughout the period) |
||||||||||||||||||||||||
| Net asset value, beginning of period |
$6.81 | $6.82 | $6.36 | $6.47 | $6.13 | $4.59 | ||||||||||||||||||
|
|
|
|||||||||||||||||||||||
| Income from investment operationsa: | ||||||||||||||||||||||||
| Net investment incomeb |
0.20 | 0.43 | 0.46 | 0.47 | 0.47 | 0.44 | ||||||||||||||||||
| Net realized and unrealized gains (losses) |
0.18 | 0.08 | 0.48 | (0.18 | ) | 0.30 | 1.47 | |||||||||||||||||
|
|
|
|||||||||||||||||||||||
| Total from investment operations |
0.38 | 0.51 | 0.94 | 0.29 | 0.77 | 1.91 | ||||||||||||||||||
|
|
|
|||||||||||||||||||||||
| Less distributions from net investment income |
(0.42 | ) | (0.52 | ) | (0.48 | ) | (0.40 | ) | (0.43 | ) | (0.37 | ) | ||||||||||||
|
|
|
|||||||||||||||||||||||
| Net asset value, end of period |
$6.77 | $6.81 | $6.82 | $6.36 | $6.47 | $6.13 | ||||||||||||||||||
|
|
|
|||||||||||||||||||||||
| Total returnc |
5.59% | 7.83% | 15.56% | 4.56% | 13.26% | 42.70% | ||||||||||||||||||
| Ratios to average net assetsd | ||||||||||||||||||||||||
| Expenses |
0.82% | e | 0.83% | e | 0.83% | 0.83% | 0.86% | 0.88% | e | |||||||||||||||
| Net investment income |
5.83% | 6.38% | 6.90% | 7.27% | 7.46% | 8.08% | ||||||||||||||||||
| Supplemental data | ||||||||||||||||||||||||
| Net assets, end of period (000’s) |
$319,222 | $291,826 | $281,851 | $249,452 | $239,824 | $198,567 | ||||||||||||||||||
| Portfolio turnover rate |
14.32% | 30.78% | 37.03% | 45.11% | 60.80% | 26.41% | ||||||||||||||||||
aThe amount shown for a share outstanding throughout the period may not correlate with the Statement of Operations for the period due to the timing of sales and repurchases of the Fund shares in relation to income earned and/or fluctuating fair value of the investments of the Fund.
bBased on average daily shares outstanding.
cTotal return does not include fees, charges or expenses imposed by the variable annuity and life insurance contracts for which the Franklin Templeton Variable Insurance Products Trust serves as an underlying investment vehicle. Total return is not annualized for periods less than one year.
dRatios are annualized for periods less than one year.
eBenefit of expense reduction rounds to less than 0.01%.
| The accompanying notes are an integral part of these financial statements. | Semiannual Report | FH-7 |
FRANKLIN TEMPLETON VARIABLE INSURANCE PRODUCTS TRUST
FINANCIAL HIGHLIGHTS
Franklin High Income VIP Fund (continued)
| Six Months Ended (unaudited) |
Year Ended December 31, | |||||||||||||||||||||||
| 2013 | 2012 | 2011 | 2010 | 2009 | ||||||||||||||||||||
| Class 4 | ||||||||||||||||||||||||
| Per share operating performance (for a share outstanding throughout the period) |
||||||||||||||||||||||||
| Net asset value, beginning of period |
$6.94 | $6.94 | $6.46 | $6.57 | $6.22 | $4.67 | ||||||||||||||||||
|
|
|
|||||||||||||||||||||||
| Income from investment operationsa: | ||||||||||||||||||||||||
| Net investment incomeb |
0.20 | 0.43 | 0.46 | 0.47 | 0.47 | 0.45 | ||||||||||||||||||
| Net realized and unrealized gains (losses) |
0.18 | 0.08 | 0.49 | (0.18 | ) | 0.31 | 1.48 | |||||||||||||||||
|
|
|
|||||||||||||||||||||||
| Total from investment operations |
0.38 | 0.51 | 0.95 | 0.29 | 0.78 | 1.93 | ||||||||||||||||||
|
|
|
|||||||||||||||||||||||
| Less distributions from net investment income |
(0.41 | ) | (0.51 | ) | (0.47 | ) | (0.40 | ) | (0.43 | ) | (0.38 | ) | ||||||||||||
|
|
|
|||||||||||||||||||||||
| Net asset value, end of period |
$6.91 | $6.94 | $6.94 | $6.46 | $6.57 | $6.22 | ||||||||||||||||||
|
|
|
|||||||||||||||||||||||
| Total returnc |
5.50% | 7.72% | 15.50% | 4.39% | 13.31% | 42.36% | ||||||||||||||||||
| Ratios to average net assetsd | ||||||||||||||||||||||||
| Expenses |
0.92% | e | 0.93% | e | 0.93% | 0.93% | 0.96% | 0.98% | e | |||||||||||||||
| Net investment income |
5.73% | 6.28% | 6.80% | 7.17% | 7.36% | 7.98% | ||||||||||||||||||
| Supplemental data | ||||||||||||||||||||||||
| Net assets, end of period (000’s) |
$28,716 | $27,789 | $27,664 | $27,055 | $25,934 | $15,105 | ||||||||||||||||||
| Portfolio turnover rate |
14.32% | 30.78% | 37.03% | 45.11% | 60.80% | 26.41% | ||||||||||||||||||
aThe amount shown for a share outstanding throughout the period may not correlate with the Statement of Operations for the period due to the timing of sales and repurchases of the Fund shares in relation to income earned and/or fluctuating fair value of the investments of the Fund.
bBased on average daily shares outstanding.
cTotal return does not include fees, charges or expenses imposed by the variable annuity and life insurance contracts for which the Franklin Templeton Variable Insurance Products Trust serves as an underlying investment vehicle. Total return is not annualized for periods less than one year.
dRatios are annualized for periods less than one year.
eBenefit of expense reduction rounds to less than 0.01%.
| FH-8 | Semiannual Report | The accompanying notes are an integral part of these financial statements. |
FRANKLIN TEMPLETON VARIABLE INSURANCE PRODUCTS TRUST
Statement of Investments, June 30, 2014 (unaudited)
| Franklin High Income VIP Fund | ||||||||||||||
| Country | Shares | Value | ||||||||||||
| Common Stocks 0.2% |
||||||||||||||
| Materials 0.1% |
||||||||||||||
| NewPage Holdings Inc. |
United States | 5,000 | $ | 415,000 | ||||||||||
|
|
|
|||||||||||||
| Transportation 0.1% |
||||||||||||||
| a | CEVA Holdings LLC |
United Kingdom | 224 | 246,708 | ||||||||||
|
|
|
|||||||||||||
| Total Common Stocks (Cost $1,274,328) |
661,708 | |||||||||||||
|
|
|
|||||||||||||
| Convertible Preferred Stocks 0.2% |
||||||||||||||
| Transportation 0.2% |
||||||||||||||
| a | CEVA Holdings LLC, cvt. pfd., A-1 |
United Kingdom | 6 | 8,700 | ||||||||||
| a | CEVA Holdings LLC, cvt. pfd., A-2 |
United Kingdom | 486 | 534,061 | ||||||||||
|
|
|
|||||||||||||
| Total Convertible Preferred Stocks (Cost $731,856) |
542,761 | |||||||||||||
|
|
|
|||||||||||||
| Preferred Stocks (Cost $770,000) 0.2% |
||||||||||||||
| Diversified Financials 0.2% |
||||||||||||||
| GMAC Capital Trust I, 8.125%, pfd. |
United States | 30,800 | 840,840 | |||||||||||
|
|
|
|||||||||||||
| Principal Amount* | ||||||||||||||
| Corporate Bonds 94.6% |
||||||||||||||
| Automobiles & Components 1.1% |
||||||||||||||
| The Goodyear Tire & Rubber Co., senior note, 6.50%, 3/01/21 |
United States | 2,200,000 | 2,398,000 | |||||||||||
| b | International Automotive Components Group SA, senior secured note, 144A, 9.125%, 6/01/18 |
United States | 1,600,000 | 1,709,000 | ||||||||||
|
|
|
|||||||||||||
| 4,107,000 | ||||||||||||||
|
|
|
|||||||||||||
| Banks 4.5% |
||||||||||||||
| c | Bank of America Corp., junior sub. bond, M, 8.125% to 5/15/18, FRN thereafter, Perpetual |
United States | 2,500,000 | 2,825,995 | ||||||||||
| CIT Group Inc., senior note, |
||||||||||||||
| 5.375%, 5/15/20 |
United States | 1,700,000 | 1,831,218 | |||||||||||
| 5.00%, 8/15/22 |
United States | 2,700,000 | 2,804,625 | |||||||||||
| c | Citigroup Inc., junior sub. bond, M, 6.30% to 5/15/24, FRN thereafter, Perpetual |
United States | 2,800,000 | 2,864,722 | ||||||||||
| c | JPMorgan Chase & Co., junior sub. bond, |
|||||||||||||
| 5.00% to 7/30/19, FRN thereafter, Perpetual |
United States | 1,400,000 | 1,398,877 | |||||||||||
| 6.00% to 8/01/23, FRN thereafter, Perpetual |
United States | 2,500,000 | 2,562,500 | |||||||||||
| Royal Bank of Scotland Group PLC, sub. note, |
||||||||||||||
| 6.125%, 12/15/22 |
United Kingdom | 2,000,000 | 2,191,250 | |||||||||||
| 5.125%, 5/28/24 |
United Kingdom | 900,000 | 912,938 | |||||||||||
|
|
|
|||||||||||||
| 17,392,125 | ||||||||||||||
|
|
|
|||||||||||||
| Capital Goods 2.5% |
||||||||||||||
| b | Abengoa Finance SAU, senior note, 144A, |
|||||||||||||
| 8.875%, 11/01/17 |
Spain | 2,500,000 | 2,829,688 | |||||||||||
| 7.75%, 2/01/20 |
Spain | 400,000 | 446,250 | |||||||||||
| Navistar International Corp., senior note, 8.25%, 11/01/21 |
United States | 1,500,000 | 1,571,250 | |||||||||||
| b | Oshkosh Corp., senior note, 144A, 5.375%, 3/01/22 |
United States | 1,000,000 | 1,035,000 | ||||||||||
| Terex Corp., senior note, 6.00%, 5/15/21 |
United States | 1,200,000 | 1,299,000 | |||||||||||
| b | TransDigm Inc., |
|||||||||||||
| senior sub. bond, 144A, 6.50%, 7/15/24 |
United States | 500,000 | 521,250 | |||||||||||
| senior sub. note, 144A, 6.00%, 7/15/22 |
United States | 500,000 | 514,375 | |||||||||||
| b | Zachry Holdings Inc., senior note, 144A, 7.50%, 2/01/20 |
United States | 1,400,000 | 1,508,500 | ||||||||||
|
|
|
|||||||||||||
| 9,725,313 | ||||||||||||||
|
|
|
|||||||||||||
| Semiannual Report | FH-9 |
FRANKLIN TEMPLETON VARIABLE INSURANCE PRODUCTS TRUST
STATEMENT OF INVESTMENTS (UNAUDITED)
Franklin High Income VIP Fund (continued)
| Country | Principal Amount* | Value | ||||||||||||
| Corporate Bonds (continued) |
||||||||||||||
| Commercial & Professional Services 1.9% |
||||||||||||||
| ADS Waste Holdings Inc., senior note, 8.25%, 10/01/20 |
United States | 2,500,000 | $ | 2,706,250 | ||||||||||
| b | Algeco Scotsman Global Finance PLC, senior secured note, first lien, 144A, 8.50%, 10/15/18 |
United Kingdom | 1,500,000 | 1,606,875 | ||||||||||
| d,e | Goss Graphic Systems Inc., senior sub. note, 12.25%, 11/19/05 |
United States | 1,912,374 | 191 | ||||||||||
| United Rentals North America Inc., senior bond, 5.75%, 11/15/24 |
United States | 1,400,000 | 1,457,750 | |||||||||||
| West Corp., senior note, 7.875%, 1/15/19 |
United States | 1,500,000 | 1,596,563 | |||||||||||
|
|
|
|||||||||||||
| 7,367,629 | ||||||||||||||
|
|
|
|||||||||||||
| Consumer Durables & Apparel 3.2% |
||||||||||||||
| KB Home, |
||||||||||||||
| senior bond, 7.50%, 9/15/22 |
United States | 2,100,000 | 2,341,500 | |||||||||||
| senior note, 4.75%, 5/15/19 |
United States | 600,000 | 606,000 | |||||||||||
| senior note, 7.00%, 12/15/21 |
United States | 700,000 | 764,750 | |||||||||||
| Springs Industries Inc., secured note, 6.25%, 6/01/21 |
United States | 700,000 | 717,500 | |||||||||||
| Standard Pacific Corp., senior note, 6.25%, 12/15/21 |
United States | 1,500,000 | 1,608,750 | |||||||||||
| b | Taylor Morrison Communities Inc./Monarch Communities Inc., senior note, 144A, |
|||||||||||||
| 7.75%, 4/15/20 |
United States | 1,140,000 | 1,251,150 | |||||||||||
| 5.25%, 4/15/21 |
United States | 900,000 | 918,000 | |||||||||||
| 5.625%, 3/01/24 |
United States | 1,000,000 | 995,000 | |||||||||||
| Toll Brothers Finance Corp., senior bond, 5.625%, 1/15/24 |
United States | 1,300,000 | 1,391,000 | |||||||||||
| Visant Corp., senior note, 10.00%, 10/01/17 |
United States | 1,900,000 | 1,781,250 | |||||||||||
|
|
|
|||||||||||||
| 12,374,900 | ||||||||||||||
|
|
|
|||||||||||||
| Consumer Services 2.8% |
||||||||||||||
| b | 24 Hour Holdings III LLC, senior note, 144A, 8.00%, 6/01/22 |
United States | 1,500,000 | 1,500,000 | ||||||||||
| Caesars Entertainment Operating Co. Inc., senior secured note, |
||||||||||||||
| 11.25%, 6/01/17 |
United States | 3,000,000 | 2,760,000 | |||||||||||
| first lien, 9.00%, 2/15/20 |
United States | 800,000 | 673,000 | |||||||||||
| b,d | Fontainebleau Las Vegas, senior secured note, first lien, 144A, |
|||||||||||||
| 11.00%, 6/15/15 |
United States | 1,700,000 | 10,625 | |||||||||||
| b | Landry’s Inc., senior note, 144A, 9.375%, 5/01/20 |
United States | 1,600,000 | 1,768,000 | ||||||||||
| MGM Resorts International, senior note, |
||||||||||||||
| 6.875%, 4/01/16 |
United States | 1,200,000 | 1,311,000 | |||||||||||
| 8.625%, 2/01/19 |
United States | 400,000 | 478,500 | |||||||||||
| 6.625%, 12/15/21 |
United States | 300,000 | 334,125 | |||||||||||
| Pinnacle Entertainment Inc., |
||||||||||||||
| senior note, 6.375%, 8/01/21 |
United States | 600,000 | 636,000 | |||||||||||
| senior sub. note, 7.75%, 4/01/22 |
United States | 1,100,000 | 1,201,750 | |||||||||||
|
|
|
|||||||||||||
| 10,673,000 | ||||||||||||||
|
|
|
|||||||||||||
| Diversified Financials 3.1% |
||||||||||||||
| Ally Financial Inc., senior note, 7.50%, 9/15/20 |
United States | 1,500,000 | 1,813,125 | |||||||||||
| General Motors Financial Co. Inc., senior note, 3.25%, 5/15/18 |
United States | 900,000 | 913,500 | |||||||||||
| b | Neuberger Berman Group LLC/Finance Corp., senior note, 144A, |
|||||||||||||
| 5.625%, 3/15/20 |
United States | 500,000 | 531,250 | |||||||||||
| 5.875%, 3/15/22 |
United States | 600,000 | 643,500 | |||||||||||
| b | Nuveen Investments Inc., senior note, 144A, 9.50%, 10/15/20 |
United States | 2,000,000 | 2,380,000 | ||||||||||
| SLM Corp., senior note, |
||||||||||||||
| 8.45%, 6/15/18 |
United States | 1,800,000 | 2,131,875 | |||||||||||
| 5.50%, 1/15/19 |
United States | 3,500,000 | 3,727,500 | |||||||||||
|
|
|
|||||||||||||
| 12,140,750 | ||||||||||||||
|
|
|
|||||||||||||
| FH-10 | Semiannual Report |
FRANKLIN TEMPLETON VARIABLE INSURANCE PRODUCTS TRUST
STATEMENT OF INVESTMENTS (UNAUDITED)
Franklin High Income VIP Fund (continued)
| Country | Principal Amount* | Value | ||||||||||||
| Corporate Bonds (continued) |
||||||||||||||
| Energy 23.3% |
||||||||||||||
| Antero Resources Finance Corp., senior note, 5.375%, 11/01/21 |
United States | 1,000,000 | $ | 1,047,500 | ||||||||||
| Carrizo Oil & Gas Inc., senior note, |
||||||||||||||
| 8.625%, 10/15/18 |
United States | 2,000,000 | 2,117,500 | |||||||||||
| 7.50%, 9/15/20 |
United States | 500,000 | 551,250 | |||||||||||
| b | CGG SA, senior note, 144A, 6.875%, 1/15/22 |
France | 2,500,000 | 2,506,250 | ||||||||||
| Chaparral Energy Inc., senior note, |
||||||||||||||
| 9.875%, 10/01/20 |
United States | 1,400,000 | 1,585,500 | |||||||||||
| 8.25%, 9/01/21 |
United States | 600,000 | 661,500 | |||||||||||
| CHC Helicopter SA, |
||||||||||||||
| senior note, 9.375%, 6/01/21 |
Canada | 400,000 | 429,000 | |||||||||||
| senior secured note, first lien, 9.25%, 10/15/20 |
Canada | 2,700,000 | 2,956,500 | |||||||||||
| Chesapeake Energy Corp., senior note, |
||||||||||||||
| 6.625%, 8/15/20 |
United States | 3,000,000 | 3,465,000 | |||||||||||
| 6.125%, 2/15/21 |
United States | 1,000,000 | 1,125,000 | |||||||||||
| Clayton Williams Energy Inc., senior note, 7.75%, 4/01/19 |
United States | 2,400,000 | 2,556,000 | |||||||||||
| CONSOL Energy Inc., senior note, |
||||||||||||||
| 8.25%, 4/01/20 |
United States | 1,000,000 | 1,087,500 | |||||||||||
| 6.375%, 3/01/21 |
United States | 300,000 | 320,250 | |||||||||||
| b 144A, 5.875%, 4/15/22 |
United States | 1,100,000 | 1,155,000 | |||||||||||
| b | Drill Rigs Holdings Inc., secured note, 144A, 6.50%, 10/01/17 |
United States | 2,000,000 | 2,055,000 | ||||||||||
| Eagle Rock Energy Partners LP/Finance Corp., senior note, |
||||||||||||||
| 8.375%, 6/01/19 |
United States | 2,500,000 | 2,712,500 | |||||||||||
| Energy Transfer Equity LP, senior note, |
||||||||||||||
| 7.50%, 10/15/20 |
United States | 3,000,000 | 3,480,000 | |||||||||||
| b first lien, 144A, 5.875%, 1/15/24 |
United States | 400,000 | 420,000 | |||||||||||
| Energy XXI Gulf Coast Inc., senior note, |
||||||||||||||
| 7.50%, 12/15/21 |
United States | 1,000,000 | 1,075,000 | |||||||||||
| b 144A, 6.875%, 3/15/24 |
United States | 1,200,000 | 1,227,000 | |||||||||||
| b | EnQuest PLC, senior note, 144A, 7.00%, 4/15/22 |
United Kingdom | 1,000,000 | 1,038,125 | ||||||||||
| EPL Oil & Gas Inc., senior note, 8.25%, 2/15/18 |
United States | 1,400,000 | 1,505,000 | |||||||||||
| Goodrich Petroleum Corp., senior note, 8.875%, 3/15/19 |
United States | 2,500,000 | 2,675,000 | |||||||||||
| Halcon Resources Corp., senior note, |
||||||||||||||
| 8.875%, 5/15/21 |
United States | 2,500,000 | 2,700,000 | |||||||||||
| 9.25%, 2/15/22 |
United States | 1,100,000 | 1,207,250 | |||||||||||
| b | Kinder Morgan Finance Co. LLC, senior secured note, 144A, 6.00%, 1/15/18 |
United States | 1,500,000 | 1,646,250 | ||||||||||
| b | Kinder Morgan Inc., |
|||||||||||||
| senior secured bond, first lien, 144A, 5.625%, 11/15/23 |
United States | 1,500,000 | 1,548,750 | |||||||||||
| senior secured note, 144A, 5.00%, 2/15/21 |
United States | 600,000 | 625,500 | |||||||||||
| Kodiak Oil & Gas Corp., senior note, |
||||||||||||||
| 8.125%, 12/01/19 |
United States | 1,400,000 | 1,557,500 | |||||||||||
| 5.50%, 1/15/21 |
United States | 500,000 | 523,750 | |||||||||||
| Linn Energy LLC/Finance Corp., senior note, |
||||||||||||||
| 6.50%, 5/15/19 |
United States | 600,000 | 636,000 | |||||||||||
| 8.625%, 4/15/20 |
United States | 2,000,000 | 2,170,000 | |||||||||||
| 7.75%, 2/01/21 |
United States | 700,000 | 758,625 | |||||||||||
| Martin Midstream Partners LP/Martin Midstream Finance Corp., senior note, 7.25%, 2/15/21 |
United States | 1,100,000 | 1,171,500 | |||||||||||
| b,f | Memorial Resource Development Corp., senior note, 144A, 5.875%, 7/01/22 |
United States | 700,000 | 708,750 | ||||||||||
| Midstates Petroleum Co. Inc./LLC, senior note, 9.25%, 6/01/21 |
United States | 1,500,000 | 1,657,500 | |||||||||||
| Semiannual Report | FH-11 |
FRANKLIN TEMPLETON VARIABLE INSURANCE PRODUCTS TRUST
STATEMENT OF INVESTMENTS (UNAUDITED)
Franklin High Income VIP Fund (continued)
| Country | Principal Amount* | Value | ||||||||||||
| Corporate Bonds (continued) |
||||||||||||||
| Energy (continued) |
||||||||||||||
| b | Murray Energy Corp., senior secured note, 144A, 8.625%, 6/15/21 |
United States | 1,300,000 | $ | 1,413,750 | |||||||||
| b | Oasis Petroleum Inc., senior note, 144A, 6.875%, 3/15/22 |
United States | 1,500,000 | 1,642,500 | ||||||||||
| b | Ocean Rig UDW Inc., senior note, 144A, 7.25%, 4/01/19 |
United States | 1,200,000 | 1,191,000 | ||||||||||
| Offshore Group Investment Ltd., |
||||||||||||||
| senior bond, first lien, 7.125%, 4/01/23 |
United States | 1,000,000 | 1,022,500 | |||||||||||
| senior secured note, first lien, 7.50%, 11/01/19 |
United States | 2,000,000 | 2,118,750 | |||||||||||
| PBF Holding Co. LLC, first lien, 8.25%, 2/15/20 |
United States | 2,500,000 | 2,737,500 | |||||||||||
| Peabody Energy Corp., senior note, |
||||||||||||||
| 6.50%, 9/15/20 |
United States | 1,700,000 | 1,721,250 | |||||||||||
| 6.25%, 11/15/21 |
United States | 1,700,000 | 1,702,125 | |||||||||||
| Penn Virginia Corp., senior note, 8.50%, 5/01/20 |
United States | 1,200,000 | 1,347,000 | |||||||||||
| Penn Virginia Resource Partners LP/Finance Corp., senior note, |
||||||||||||||
| 8.375%, 6/01/20 |
United States | 1,094,000 | 1,243,057 | |||||||||||
| 6.50%, 5/15/21 |
United States | 600,000 | 657,000 | |||||||||||
| QEP Resources Inc., senior note, |
||||||||||||||
| 5.375%, 10/01/22 |
United States | 1,500,000 | 1,552,500 | |||||||||||
| 5.25%, 5/01/23 |
United States | 1,000,000 | 1,027,500 | |||||||||||
| QR Energy LP/QRE Finance, senior note, 9.25%, 8/01/20 |
United States | 1,900,000 | 2,085,250 | |||||||||||
| Quicksilver Resources Inc., |
||||||||||||||
| b,g secured note, second lien, 144A, FRN, 7.00%, 6/21/19 |
United States | 1,300,000 | 1,274,000 | |||||||||||
| senior note, 9.125%, 8/15/19 |
United States | 1,000,000 | 932,500 | |||||||||||
| Sabine Pass Liquefaction LLC, |
||||||||||||||
| first lien, 5.625%, 2/01/21 |
United States | 2,400,000 | 2,550,000 | |||||||||||
| first lien, 5.625%, 4/15/23 |
United States | 900,000 | 940,500 | |||||||||||
| b senior secured note, first lien, 144A, 5.75%, 5/15/24 |
United States | 200,000 | 208,750 | |||||||||||
| b | Samson Investment Co., senior note, 144A, 9.75%, 2/15/20 |
United States | 2,500,000 | 2,646,875 | ||||||||||
| b | Sanchez Energy Corp., senior note, 144A, |
|||||||||||||
| 7.75%, 6/15/21 |
United States | 1,800,000 | 1,962,000 | |||||||||||
| 6.125%, 1/15/23 |
United States | 600,000 | 621,000 | |||||||||||
| W&T Offshore Inc., senior note, 8.50%, 6/15/19 |
United States | 2,600,000 | 2,821,000 | |||||||||||
|
|
|
|||||||||||||
| 90,081,057 | ||||||||||||||
|
|
|
|||||||||||||
| Food, Beverage & Tobacco 2.8% |
||||||||||||||
| Del Monte Corp., senior note, 7.625%, 2/15/19 |
United States | 2,102,000 | 2,193,122 | |||||||||||
| b | Dole Food Co. Inc., senior secured note, 144A, 7.25%, 5/01/19 |
United States | 1,600,000 | 1,622,000 | ||||||||||
| b | JBS USA LLC/Finance Inc., |
|||||||||||||
| senior bond, 144A, 5.875%, 7/15/24 |
United States | 600,000 | 599,250 | |||||||||||
| senior note, 144A, 8.25%, 2/01/20 |
United States | 2,600,000 | 2,834,000 | |||||||||||
| senior note, 144A, 7.25%, 6/01/21 |
United States | 400,000 | 431,000 | |||||||||||
| b | Post Holdings Inc., senior note, 144A, |
|||||||||||||
| 6.75%, 12/01/21 |
United States | 1,000,000 | 1,063,750 | |||||||||||
| 7.375%, 2/15/22 |
United States | 1,600,000 | 1,736,000 | |||||||||||
| 6.00%, 12/15/22 |
United States | 300,000 | 306,750 | |||||||||||
|
|
|
|||||||||||||
| 10,785,872 | ||||||||||||||
|
|
|
|||||||||||||
| Health Care Equipment & Services 6.1% |
||||||||||||||
| Alere Inc., |
||||||||||||||
| senior note, 7.25%, 7/01/18 |
United States | 2,200,000 | 2,409,000 | |||||||||||
| senior sub. note, 6.50%, 6/15/20 |
United States | 300,000 | 316,500 | |||||||||||
| Aviv Healthcare Properties LP/Aviv Healthcare Capital Corp., senior note, |
||||||||||||||
| 7.75%, 2/15/19 |
United States | 1,500,000 | 1,605,000 | |||||||||||
| 6.00%, 10/15/21 |
United States | 400,000 | 426,000 | |||||||||||
| FH-12 | Semiannual Report |
FRANKLIN TEMPLETON VARIABLE INSURANCE PRODUCTS TRUST
STATEMENT OF INVESTMENTS (UNAUDITED)
Franklin High Income VIP Fund (continued)
| Country | Principal Amount* | Value | ||||||||||||
| Corporate Bonds (continued) |
||||||||||||||
| Health Care Equipment & Services (continued) |
||||||||||||||
| CHS/Community Health Systems Inc., |
||||||||||||||
| senior note, 8.00%, 11/15/19 |
United States | 1,700,000 | $ | 1,865,750 | ||||||||||
| senior note, 7.125%, 7/15/20 |
United States | 700,000 | 761,250 | |||||||||||
| bsenior note, 144A, 6.875%, 2/01/22 |
United States | 300,000 | 319,500 | |||||||||||
| senior secured note, 5.125%, 8/15/18 |
United States | 1,500,000 | 1,576,875 | |||||||||||
| DaVita HealthCare Partners Inc., senior bond, 5.125%, 7/15/24 |
United States | 1,400,000 | 1,411,375 | |||||||||||
| ExamWorks Group Inc., senior note, 9.00%, 7/15/19 |
United States | 1,300,000 | 1,436,500 | |||||||||||
| HCA Inc., |
||||||||||||||
| senior note, 7.50%, 2/15/22 |
United States | 800,000 | 925,000 | |||||||||||
| senior note, 5.875%, 5/01/23 |
United States | 2,500,000 | 2,621,875 | |||||||||||
| senior secured bond, 7.25%, 9/15/20 |
United States | 900,000 | 965,250 | |||||||||||
| senior secured note, 5.875%, 3/15/22 |
United States | 1,000,000 | 1,087,500 | |||||||||||
| senior secured note, first lien, 5.00%, 3/15/24 |
United States | 2,300,000 | 2,337,536 | |||||||||||
| Tenet Healthcare Corp., senior note, |
||||||||||||||
| 8.125%, 4/01/22 |
United States | 3,000,000 | 3,480,000 | |||||||||||
| b144A, 5.00%, 3/01/19 |
United States | 200,000 | 203,250 | |||||||||||
|
|
|
|||||||||||||
| 23,748,161 | ||||||||||||||
|
|
|
|||||||||||||
| Materials 12.4% |
||||||||||||||
| ArcelorMittal, senior note, 6.00%, 3/01/21 |
Luxembourg | 1,900,000 | 2,056,702 | |||||||||||
| b | Ardagh Packaging Finance PLC, senior note, 144A, 9.125%, 10/15/20 |
Luxembourg | 600,000 | 666,750 | ||||||||||
| b | Ardagh Packaging Finance PLC/Ardagh MP Holdings USA Inc., |
|||||||||||||
| senior note, 144A, 6.25%, 1/31/19 |
Luxembourg | 300,000 | 308,250 | |||||||||||
| senior note, 144A, 7.00%, 11/15/20 |
Luxembourg | 176,471 | 183,309 | |||||||||||
| senior note, 144A, 6.75%, 1/31/21 |
Luxembourg | 300,000 | 311,625 | |||||||||||
| f senior note, 144A, 6.00%, 6/30/21 |
Luxembourg | 1,900,000 | 1,898,813 | |||||||||||
| senior secured note, first lien, 144A, 7.375%, 10/15/17 |
Luxembourg | 600,000 | 634,125 | |||||||||||
| b | Barminco Finance Pty. Ltd., senior note, 144A, 9.00%, 6/01/18 |
Australia | 2,000,000 | 1,965,000 | ||||||||||
| b | BlueScope Steel Ltd./BlueScope Steel Finance, senior note, 144A, 7.125%, 5/01/18 |
Australia | 2,000,000 | 2,167,500 | ||||||||||
| b | Cemex Finance LLC, senior secured note, 144A, 6.00%, 4/01/24 |
Mexico | 1,200,000 | 1,253,250 | ||||||||||
| b | Cemex SAB de CV, senior secured note, 144A, 9.00%, 1/11/18 |
Mexico | 2,500,000 | 2,696,875 | ||||||||||
| b | Constellium NV, senior note, 144A, 5.75%, 5/15/24 |
Netherlands | 3,200,000 | 3,332,000 | ||||||||||
| b | Eldorado Gold Corp., senior note, 144A, 6.125%, 12/15/20 |
Canada | 3,100,000 | 3,146,500 | ||||||||||
| b | Exopack Holding Corp., senior note, 144A, 10.00%, 6/01/18 |
United States | 500,000 | 538,750 | ||||||||||
| b | First Quantum Minerals Ltd., senior note, 144A, |
|||||||||||||
| 6.75%, 2/15/20 |
Canada | 2,000,000 | 2,070,000 | |||||||||||
| 7.00%, 2/15/21 |
Canada | 1,836,000 | 1,897,965 | |||||||||||
| b | FMG Resources (August 2006) Pty. Ltd., senior note, 144A, |
|||||||||||||
| 6.875%, 2/01/18 |
Australia | 2,000,000 | 2,105,000 | |||||||||||
| 8.25%, 11/01/19 |
Australia | 500,000 | 546,250 | |||||||||||
| 6.875%, 4/01/22 |
Australia | 200,000 | 215,250 | |||||||||||
| b | Ineos Finance PLC, senior secured note, 144A, |
|||||||||||||
| 8.375%, 2/15/19 |
Switzerland | 200,000 | 219,500 | |||||||||||
| 7.50%, 5/01/20 |
Switzerland | 500,000 | 546,250 | |||||||||||
| b | Ineos Group Holdings SA, senior note, 144A, |
|||||||||||||
| 6.125%, 8/15/18 |
Switzerland | 1,300,000 | 1,350,375 | |||||||||||
| 5.875%, 2/15/19 |
Switzerland | 700,000 | 719,250 | |||||||||||
| Novelis Inc., senior note, 8.75%, 12/15/20 |
Canada | 1,300,000 | 1,449,500 | |||||||||||
| Olin Corp., senior bond, 5.50%, 8/15/22 |
United States | 3,200,000 | 3,408,000 | |||||||||||
| b | Orion Engineered Carbons Bondco GmbH, senior secured note, first lien, 144A, 9.625%, 6/15/18 |
Germany | 1,400,000 | 1,512,875 | ||||||||||
| Semiannual Report | FH-13 |
FRANKLIN TEMPLETON VARIABLE INSURANCE PRODUCTS TRUST
STATEMENT OF INVESTMENTS (UNAUDITED)
Franklin High Income VIP Fund (continued)
| Country | Principal Amount* | Value | ||||||||||||
| Corporate Bonds (continued) |
||||||||||||||
| Materials (continued) |
||||||||||||||
| b,h | Orion Engineered Carbons Finance & Co. SCA, senior note, 144A, PIK, 9.25%, 8/01/19 |
Germany | 500,000 | $ | 522,750 | |||||||||
| b | Polymer Group Inc., senior note, 144A, 6.875%, 6/01/19 |
United States | 900,000 | 918,000 | ||||||||||
| b | Rain CII Carbon LLC/Corp., second lien, 144A, 8.25%, 1/15/21 |
United States | 1,200,000 | 1,266,000 | ||||||||||
| Reynolds Group Issuer Inc./LLC/SA, |
||||||||||||||
| first lien, 5.75%, 10/15/20 |
United States | 1,400,000 | 1,484,000 | |||||||||||
| senior note, 8.50%, 5/15/18 |
United States | 2,800,000 | 2,933,000 | |||||||||||
| senior note, 9.00%, 4/15/19 |
United States | 200,000 | 212,750 | |||||||||||
| senior note, 9.875%, 8/15/19 |
United States | 200,000 | 222,750 | |||||||||||
| senior note, 8.25%, 2/15/21 |
United States | 400,000 | 437,000 | |||||||||||
| b | Sealed Air Corp., senior note, 144A, |
|||||||||||||
| 8.125%, 9/15/19 |
United States | 800,000 | 885,000 | |||||||||||
| 6.50%, 12/01/20 |
United States | 500,000 | 565,000 | |||||||||||
| 8.375%, 9/15/21 |
United States | 600,000 | 690,000 | |||||||||||
| b | U.S. Coatings Acquisition Inc./Flash Dutch 2 BV, senior note, 144A, 7.375%, 5/01/21 |
United States | 700,000 | 766,500 | ||||||||||
|
|
|
|||||||||||||
| 48,102,414 | ||||||||||||||
|
|
|
|||||||||||||
| Media 9.4% |
||||||||||||||
| b | Altice Financing SA, secured note, first lien, 144A, 6.50%, 1/15/22 |
Luxembourg | 300,000 | 319,313 | ||||||||||
| Cablevision Systems Corp., senior note, 7.75%, 4/15/18 |
United States | 1,000,000 | 1,135,000 | |||||||||||
| CCO Holdings LLC/CCO Holdings Capital Corp., |
||||||||||||||
| senior bond, 5.25%, 9/30/22 |
United States | 900,000 | 918,000 | |||||||||||
| senior note, 6.50%, 4/30/21 |
United States | 1,500,000 | 1,603,125 | |||||||||||
| Clear Channel Communications Inc., senior secured bond, first lien, 9.00%, 3/01/21 |
United States | 3,000,000 | 3,221,250 | |||||||||||
| Clear Channel Worldwide Holdings Inc., |
||||||||||||||
| senior note, 6.50%, 11/15/22 |
United States | 1,000,000 | 1,082,500 | |||||||||||
| senior sub. note, 7.625%, 3/15/20 |
United States | 1,100,000 | 1,192,125 | |||||||||||
| senior sub. note, 7.625%, 3/15/20 |
United States | 200,000 | 215,000 | |||||||||||
| CSC Holdings LLC, senior note, |
||||||||||||||
| 6.75%, 11/15/21 |
United States | 1,500,000 | 1,655,625 | |||||||||||
| b 144A, 5.25%, 6/01/24 |
United States | 1,000,000 | 986,250 | |||||||||||
| DISH DBS Corp., senior note, |
||||||||||||||
| 7.125%, 2/01/16 |
United States | 2,000,000 | 2,167,500 | |||||||||||
| 6.75%, 6/01/21 |
United States | 1,500,000 | 1,713,750 | |||||||||||
| b | Gannett Co. Inc., |
|||||||||||||
| senior bond, 144A, 6.375%, 10/15/23 |
United States | 2,000,000 | 2,140,000 | |||||||||||
| senior note, 144A, 5.125%, 7/15/20 |
United States | 1,400,000 | 1,443,750 | |||||||||||
| b | The Nielsen Co. (Luxembourg) S.a.r.l., senior note, 144A, 5.50%, 10/01/21 |
United States | 900,000 | 935,437 | ||||||||||
| b | Nielsen Finance LLC/Co., senior note, 144A, 5.00%, 4/15/22 |
United States | 1,100,000 | 1,111,687 | ||||||||||
| b | Radio One Inc., senior sub. note, 144A, 9.25%, 2/15/20 |
United States | 800,000 | 870,000 | ||||||||||
| b | Sirius XM Radio Inc., senior bond, 144A, 6.00%, 7/15/24 |
United States | 2,000,000 | 2,085,000 | ||||||||||
| b | Univision Communications Inc., senior secured note, 144A, |
|||||||||||||
| 6.875%, 5/15/19 |
United States | 2,500,000 | 2,675,000 | |||||||||||
| 7.875%, 11/01/20 |
United States | 700,000 | 773,500 | |||||||||||
| b | UPCB Finance III Ltd., senior secured note, 144A, 6.625%, 7/01/20 |
Netherlands | 1,000,000 | 1,070,000 | ||||||||||
| b | UPCB Finance VI Ltd., senior secured note, 144A, 6.875%, 1/15/22 |
Netherlands | 500,000 | 548,750 | ||||||||||
| b | Videotron Ltd., senior bond, 144A, 5.375%, 6/15/24 |
Canada | 800,000 | 822,000 | ||||||||||
| b | Virgin Media Finance PLC., senior bond, 144A, 6.375%, 4/15/23 |
United Kingdom | 1,700,000 | 1,853,000 | ||||||||||
| FH-14 | Semiannual Report |
FRANKLIN TEMPLETON VARIABLE INSURANCE PRODUCTS TRUST
STATEMENT OF INVESTMENTS (UNAUDITED)
Franklin High Income VIP Fund (continued)
| Country | Principal Amount* | Value | ||||||||||||
| Corporate Bonds (continued) |
||||||||||||||
| Media (continued) |
||||||||||||||
| b | Virgin Media Secured Finance PLC, senior secured bond, first lien, 144A, 5.50%, 1/15/25 |
United Kingdom | 1,100,000 | $ | 1,142,625 | |||||||||
| b | VTR Finance BV, senior secured note, 144A, 6.875%, 1/15/24 |
Chile | 900,000 | 968,247 | ||||||||||
| b | WMG Acquisition Corp., senior note, 144A, 5.625%, 4/15/22 |
United States | 1,500,000 | 1,513,125 | ||||||||||
|
|
|
|||||||||||||
| 36,161,559 | ||||||||||||||
|
|
|
|||||||||||||
| Pharmaceuticals, Biotechnology & Life Sciences 2.7% |
||||||||||||||
| b | inVentiv Health Inc., senior secured note, 144A, 9.00%, 1/15/18 |
United States | 600,000 | 648,000 | ||||||||||
| b,h | Jaguar Holding Co. I, senior note, 144A, PIK, 9.375%, 10/15/17 |
United States | 1,200,000 | 1,248,000 | ||||||||||
| b | Jaguar Holding Co. II/Merger Sub Inc., senior note, 144A, 9.50%, 12/01/19 |
United States | 700,000 | 768,250 | ||||||||||
| Par Pharmaceutical Cos. Inc., senior note, 7.375%, 10/15/20 |
United States | 3,300,000 | 3,601,125 | |||||||||||
| b | Salix Pharmaceuticals Ltd., senior note, 144A, 6.00%, 1/15/21 |
United States | 400,000 | 430,000 | ||||||||||
| b | Valeant Pharmaceuticals International Inc., senior note, 144A, |
|||||||||||||
| 7.50%, 7/15/21 |
United States | 200,000 | 222,250 | |||||||||||
| 5.625%, 12/01/21 |
United States | 300,000 | 309,000 | |||||||||||
| b | VPI Escrow Corp., senior note, 144A, 6.375%, 10/15/20 |
United States | 3,000,000 | 3,198,750 | ||||||||||
|
|
|
|||||||||||||
| 10,425,375 | ||||||||||||||
|
|
|
|||||||||||||
| Retailing 0.9% |
||||||||||||||
| b | American Builders & Contractors Supply Co. Inc., senior note, 144A, 5.625%, 4/15/21 |
United States | 2,100,000 | 2,178,750 | ||||||||||
| b | New Look Bondco I PLC, secured note, 144A, 8.375%, 5/14/18 |
United Kingdom | 1,000,000 | 1,074,375 | ||||||||||
|
|
|
|||||||||||||
| 3,253,125 | ||||||||||||||
|
|
|
|||||||||||||
| Semiconductors & Semiconductor Equipment 0.3% |
||||||||||||||
| Freescale Semiconductor Inc., senior note, 8.05%, 2/01/20 |
United States | 1,028,000 | 1,112,810 | |||||||||||
|
|
|
|||||||||||||
| Software & Services 3.3% |
||||||||||||||
| b | BMC Software Finance Inc., senior note, 144A, 8.125%, 7/15/21 |
United States | 2,000,000 | 2,067,500 | ||||||||||
| Equinix Inc., senior bond, 5.375%, 4/01/23 |
United States | 3,300,000 | 3,390,750 | |||||||||||
| First Data Corp., |
||||||||||||||
| senior bond, 12.625%, 1/15/21 |
United States | 1,800,000 | 2,220,750 | |||||||||||
| senior note, 11.25%, 1/15/21 |
United States | 1,000,000 | 1,170,000 | |||||||||||
| b senior secured bond, 144A, 8.25%, 1/15/21 |
United States | 2,500,000 | 2,750,000 | |||||||||||
| Sterling International Inc., senior note, 11.00%, 10/01/19 |
United States | 1,200,000 | 1,293,000 | |||||||||||
|
|
|
|||||||||||||
| 12,892,000 | ||||||||||||||
|
|
|
|||||||||||||
| Technology Hardware & Equipment 1.0% |
||||||||||||||
| b | Alcatel-Lucent USA Inc., senior note, 144A, 6.75%, 11/15/20 |
France | 2,400,000 | 2,568,000 | ||||||||||
| b | Blackboard Inc., senior note, 144A, 7.75%, 11/15/19 |
United States | 900,000 | 945,000 | ||||||||||
| b,h | CommScope Holdings Co. Inc., senior note, 144A, PIK, 6.625%, 6/01/20 |
United States | 400,000 | 429,000 | ||||||||||
|
|
|
|||||||||||||
| 3,942,000 | ||||||||||||||
|
|
|
|||||||||||||
| Telecommunication Services 9.4% |
||||||||||||||
| CenturyLink Inc., |
||||||||||||||
| senior bond, 6.75%, 12/01/23 |
United States | 100,000 | 109,750 | |||||||||||
| senior note, 6.45%, 6/15/21 |
United States | 400,000 | 436,000 | |||||||||||
| senior note, 5.80%, 3/15/22 |
United States | 2,500,000 | 2,615,625 | |||||||||||
| b | Digicel Group Ltd., senior note, 144A, 8.25%, 9/30/20 |
Bermuda | 2,000,000 | 2,205,000 | ||||||||||
| b | Digicel Ltd., senior note, 144A, 6.00%, 4/15/21 |
Bermuda | 1,200,000 | 1,242,750 | ||||||||||
| Semiannual Report | FH-15 |
FRANKLIN TEMPLETON VARIABLE INSURANCE PRODUCTS TRUST
STATEMENT OF INVESTMENTS (UNAUDITED)
Franklin High Income VIP Fund (continued)
| Country | Principal Amount* | Value | ||||||||||||
| Corporate Bonds (continued) |
||||||||||||||
| Telecommunication Services (continued) |
||||||||||||||
| b | eAccess Ltd., senior note, 144A, 8.25%, 4/01/18 |
Japan | 1,800,000 | $ | 1,951,875 | |||||||||
| Frontier Communications Corp., |
||||||||||||||
| senior bond, 7.625%, 4/15/24 |
United States | 200,000 | 216,250 | |||||||||||
| senior note, 8.50%, 4/15/20 |
United States | 2,000,000 | 2,370,000 | |||||||||||
| senior note, 8.75%, 4/15/22 |
United States | 900,000 | 1,048,500 | |||||||||||
| senior note, 7.875%, 1/15/27 |
United States | 200,000 | 207,750 | |||||||||||
| Intelsat Jackson Holdings SA, |
||||||||||||||
| senior bond, 5.50%, 8/01/23 |
Luxembourg | 1,500,000 | 1,496,250 | |||||||||||
| senior note, 7.25%, 10/15/20 |
Luxembourg | 900,000 | 972,000 | |||||||||||
| senior note, 7.50%, 4/01/21 |
Luxembourg | 3,800,000 | 4,180,000 | |||||||||||
| b | Millicom International Cellular SA, senior note, 144A, 6.625%, 10/15/21 |
Luxembourg | 1,500,000 | 1,629,375 | ||||||||||
| b | Sprint Corp., |
|||||||||||||
| senior bond, 144A, 7.125%, 6/15/24 |
United States | 500,000 | 531,250 | |||||||||||
| senior note, 144A, 7.875%, 9/15/23 |
United States | 500,000 | 557,500 | |||||||||||
| Sprint Nextel Corp., senior note, |
||||||||||||||
| 8.375%, 8/15/17 |
United States | 3,000,000 | 3,513,750 | |||||||||||
| b 144A, 9.00%, 11/15/18 |
United States | 3,000,000 | 3,645,000 | |||||||||||
| b 144A, 7.00%, 3/01/20 |
United States | 300,000 | 346,500 | |||||||||||
| T-Mobile USA Inc., |
||||||||||||||
| senior bond, 6.50%, 1/15/24 |
United States | 400,000 | 428,500 | |||||||||||
| senior note, 6.542%, 4/28/20 |
United States | 1,600,000 | 1,734,000 | |||||||||||
| senior note, 6.125%, 1/15/22 |
United States | 200,000 | 213,000 | |||||||||||
| b | Wind Acquisition Finance SA, senior secured note, 144A, |
|||||||||||||
| f 4.75%, 7/15/20 |
Italy | 1,000,000 | 1,009,375 | |||||||||||
| 7.375%, 4/23/21 |
Italy | 3,500,000 | 3,764,687 | |||||||||||
|
|
|
|||||||||||||
| 36,424,687 | ||||||||||||||
|
|
|
|||||||||||||
| Transportation 1.8% |
||||||||||||||
| b | Florida East Coast Holdings Corp., |
|||||||||||||
| secured note, first lien, 144A, 6.75%, 5/01/19 |
United States | 900,000 | 952,875 | |||||||||||
| senior note, 144A, 9.75%, 5/01/20 |
United States | 500,000 | 530,625 | |||||||||||
| Hertz Corp., senior note, |
||||||||||||||
| 7.50%, 10/15/18 |
United States | 1,100,000 | 1,155,000 | |||||||||||
| 6.75%, 4/15/19 |
United States | 2,200,000 | 2,343,000 | |||||||||||
| b | Stena AB, senior bond, 144A, 7.00%, 2/01/24 |
Sweden | 1,000,000 | 1,067,500 | ||||||||||
| b | Stena International SA, secured bond, 144A, 5.75%, 3/01/24 |
Sweden | 1,000,000 | 1,017,500 | ||||||||||
|
|
|
|||||||||||||
| 7,066,500 | ||||||||||||||
|
|
|
|||||||||||||
| Utilities 2.1% |
||||||||||||||
| b | Calpine Corp., |
|||||||||||||
| senior secured bond, first lien, 144A, 5.875%, 1/15/24 |
United States | 400,000 | 424,000 | |||||||||||
| senior secured note, 144A, 7.875%, 7/31/20 |
United States | 654,000 | 712,860 | |||||||||||
| senior secured note, 144A, 7.50%, 2/15/21 |
United States | 1,170,000 | 1,270,913 | |||||||||||
| senior secured note, 144A, 7.875%, 1/15/23 |
United States | 782,000 | 875,840 | |||||||||||
| senior secured note, first lien, 144A, 6.00%, 1/15/22 |
United States | 100,000 | 108,250 | |||||||||||
| b | InterGen NV, secured bond, 144A, 7.00%, 6/30/23 |
Netherlands | 2,000,000 | 2,080,000 | ||||||||||
| b,f | NGL Energy Partners LP/NGL Energy Finance Corp., senior note, 144A, 5.125%, 7/15/19 |
United States | 500,000 | 503,750 | ||||||||||
| FH-16 | Semiannual Report |
FRANKLIN TEMPLETON VARIABLE INSURANCE PRODUCTS TRUST
STATEMENT OF INVESTMENTS (UNAUDITED)
Franklin High Income VIP Fund (continued)
| Country | Principal Amount* | Value | ||||||||||||
| Corporate Bonds (continued) |
||||||||||||||
| Utilities (continued) |
||||||||||||||
| b,d | Texas Competitive Electric Holdings Co. LLC/Texas Competitive Electric Holdings Finance Inc., senior secured note, 144A, 11.50%, 10/01/20 |
United States | 2,500,000 | $ | 2,293,750 | |||||||||
|
|
|
|||||||||||||
| 8,269,363 | ||||||||||||||
|
|
|
|||||||||||||
| Total Corporate Bonds (Cost $345,104,897) |
366,045,640 | |||||||||||||
|
|
|
|||||||||||||
| g,i | Senior Floating Rate Interests 1.1% |
|||||||||||||
| Capital Goods 0.2% |
||||||||||||||
| Navistar Inc., Tranche B Term Loan, 5.75%, 8/17/17 |
United States | 760,128 | 776,518 | |||||||||||
|
|
|
|||||||||||||
| Household & Personal Products 0.6% |
||||||||||||||
| Sun Products Corp., Tranche B Term Loan, 5.50%, 3/23/20 |
United States | 2,346,427 | 2,308,297 | |||||||||||
|
|
|
|||||||||||||
| Utilities 0.3% |
||||||||||||||
| d | Texas Competitive Electric Holdings Co. LLC,Term Loan, 4.737%, 10/10/17 |
United States | 1,431,288 | 1,187,970 | ||||||||||
|
|
|
|||||||||||||
| Total Senior Floating Rate Interests |
4,272,785 | |||||||||||||
|
|
|
|||||||||||||
| Shares | ||||||||||||||
| Escrow Accounts and Litigation Trusts (Cost $ —) 0.0% |
|
|||||||||||||
| a,e | NewPage Corp., Litigation Trust |
United States | 2,500,000 | — | ||||||||||
|
|
|
|||||||||||||
| Total Investments before Short Term Investments |
372,363,734 | |||||||||||||
|
|
|
|||||||||||||
| Principal Amount* | ||||||||||||||
| Short Term Investments (Cost $10,908,707) 2.8% |
||||||||||||||
| Repurchase Agreements 2.8% |
||||||||||||||
| j | Joint Repurchase Agreement, 0.064%, 7/01/14 BNP Paribas Securities Corp. (Maturity Value $2,203,345) Credit Suisse Securities (USA) LLC (Maturity Value $1,101,672) Deutsche Bank Securities Inc. (Maturity Value $828,300) HSBC Securities (USA) Inc. (Maturity Value $4,627,154) Merrill Lynch, Pierce, Fenner & Smith Inc. (Maturity Value $2,148,255) |
|
United States |
|
|
10,908,707 |
|
|
10,908,707 |
| ||||
| Collateralized by U.S. Government Agency Securities, 0.00% - 6.21%, 1/16/15 - 05/04/37; kU.S. Government Agency Discount Notes, 12/24/14 - 1/30/15; U.S. Government Agency Securities, Strips, 5/15/30; U.S. Treasury Bonds, 7.50% - 8.875%, 11/15/16 - 2/15/19; U.S. Treasury Notes, 0.25% - 4.50%, 7/15/15 - 4/30/18; and U.S. Treasury Notes, Index Linked, 1.375%, 7/15/18 (valued at $11,128,739) |
||||||||||||||
|
|
|
|||||||||||||
| Total Investments (Cost $363,137,008) 99.1% |
383,272,441 | |||||||||||||
| Other Assets, less Liabilities 0.9% |
3,554,488 | |||||||||||||
|
|
|
|||||||||||||
| Net Assets 100.0% |
$ | 386,826,929 | ||||||||||||
|
|
|
|||||||||||||
| Semiannual Report | FH-17 |
FRANKLIN TEMPLETON VARIABLE INSURANCE PRODUCTS TRUST
STATEMENT OF INVESTMENTS (UNAUDITED)
Franklin High Income VIP Fund (continued)
*The principal amount is stated in U.S. dollars unless otherwise indicated.
aNon-income producing.
bSecurity was purchased pursuant to Rule 144A under the Securities Act of 1933 and may be sold in transactions exempt from registration only to qualified institutional buyers or in a public offering registered under the Securities Act of 1933. These securities have been deemed liquid under guidelines approved by the Trust’s Board of Trustees. At June 30, 2014, the aggregate value of these securities was $157,888,908, representing 40.82% of net assets.
cPerpetual security with no stated maturity date.
dSee Note 7 regarding defaulted securities.
eSecurity has been deemed illiquid because it may not be able to be sold within seven days. At June 30, 2014, the aggregate value of these securities was $191, representing less than 0.01% of net assets.
fSecurity purchased on a when-issued basis. See Note 1(d).
gThe coupon rate shown represents the rate at period end.
hIncome may be received in additional securities and/or cash.
iSee Note 1(f) regarding senior floating rate interests.
jSee Note 1(c) regarding joint repurchase agreement.
kThe security is traded on a discount basis with no stated coupon rate.
| FH-18 | Semiannual Report |
FRANKLIN TEMPLETON VARIABLE INSURANCE PRODUCTS TRUST
STATEMENT OF INVESTMENTS (UNAUDITED)
Franklin High Income VIP Fund (continued)
At June 30, 2014, the Fund had the following forward exchange contracts outstanding. See Note 1(e).
| Forward Exchange Contracts | ||||||||||||||||||||||||||||
| Currency | Counterpartya | Type | Quantity | Contract Amount |
Settlement Date |
Unrealized Appreciation |
Unrealized Depreciation |
|||||||||||||||||||||
| Euro |
DBAB | Buy | 600,000 | $ | 821,850 | 12/17/14 | $ | 400 | $ | — | ||||||||||||||||||
| Euro |
DBAB | Sell | 600,000 | 823,230 | 12/17/14 | 980 | — | |||||||||||||||||||||
|
|
|
|||||||||||||||||||||||||||
| Net unrealized appreciation (depreciation) |
|
$ | 1,380 | |||||||||||||||||||||||||
|
|
|
|||||||||||||||||||||||||||
a May be comprised of multiple contracts using the same currency and settlement date.
See Abbreviations on page FH-32.
| The accompanying notes are an integral part of these financial statements. | Semiannual Report | FH-19 |
FRANKLIN TEMPLETON VARIABLE INSURANCE PRODUCTS TRUST
Financial Statements
Statement of Assets and Liabilities
June 30, 2014 (unaudited)
| Franklin High Income VIP Fund |
||||
| Assets: | ||||
| Investments in securities: |
||||
| Cost - Unaffiliated issuers |
$ | 352,228,301 | ||
| Cost - Repurchase agreements |
10,908,707 | |||
|
|
|
|||
| Total cost of investments |
$ | 363,137,008 | ||
|
|
|
|||
| Value - Unaffiliated issuers |
$ | 372,363,734 | ||
| Value - Repurchase agreements |
10,908,707 | |||
|
|
|
|||
| Total value of investments |
383,272,441 | |||
| Cash |
47,761 | |||
| Receivables: |
||||
| Investment securities sold |
1,987,227 | |||
| Capital shares sold |
220,903 | |||
| Dividends and interest |
5,939,737 | |||
| Unrealized appreciation on forward exchange contracts |
1,380 | |||
| Other assets |
202 | |||
|
|
|
|||
| Total assets |
391,469,651 | |||
|
|
|
|||
| Liabilities: | ||||
| Payables: |
||||
| Investment securities purchased |
4,100,000 | |||
| Capital shares redeemed |
113,424 | |||
| Management fees |
163,164 | |||
| Distribution fees |
149,927 | |||
| Accrued expenses and other liabilities |
116,207 | |||
|
|
|
|||
| Total liabilities |
4,642,722 | |||
|
|
|
|||
| Net assets, at value |
$ | 386,826,929 | ||
|
|
|
|||
| Net assets consist of: | ||||
| Paid-in capital |
$ | 378,065,415 | ||
| Undistributed net investment income |
8,996,075 | |||
| Net unrealized appreciation (depreciation) |
20,136,813 | |||
| Accumulated net realized gain (loss) |
(20,371,374 | ) | ||
|
|
|
|||
| Net assets, at value |
$ | 386,826,929 | ||
|
|
|
|||
| FH-20 | Semiannual Report | The accompanying notes are an integral part of these financial statements. |
FRANKLIN TEMPLETON VARIABLE INSURANCE PRODUCTS TRUST
FINANCIAL STATEMENTS
Statement of Assets and Liabilities (continued)
June 30, 2014 (unaudited)
| Franklin High Income VIP Fund |
||||
| Class 1: | ||||
| Net assets, at value |
$ | 38,888,569 | ||
|
|
|
|||
| Shares outstanding |
5,575,009 | |||
|
|
|
|||
| Net asset value and maximum offering price per share |
$ | 6.98 | ||
|
|
|
|||
| Class 2: | ||||
| Net assets, at value |
$ | 319,222,108 | ||
|
|
|
|||
| Shares outstanding |
47,180,079 | |||
|
|
|
|||
| Net asset value and maximum offering price per share |
$ | 6.77 | ||
|
|
|
|||
| Class 4: | ||||
| Net assets, at value |
$ | 28,716,252 | ||
|
|
|
|||
| Shares outstanding |
4,157,264 | |||
|
|
|
|||
| Net asset value and maximum offering price per share |
$ | 6.91 | ||
|
|
|
|||
| The accompanying notes are an integral part of these financial statements. | Semiannual Report | FH-21 |
FRANKLIN TEMPLETON VARIABLE INSURANCE PRODUCTS TRUST
FINANCIAL STATEMENTS
Statement of Operations
for the six months ended June 30, 2014 (unaudited)
| Franklin High Income VIP Fund |
||||
| Investment income: | ||||
| Dividends |
$ | 34,831 | ||
| Interest |
12,324,689 | |||
|
|
|
|||
| Total investment income |
12,359,520 | |||
|
|
|
|||
| Expenses: | ||||
| Management fees (Note 3a) |
960,520 | |||
| Distribution fees: (Note 3c) |
||||
| Class 2 |
381,563 | |||
| Class 4 |
49,457 | |||
| Custodian fees (Note 4) |
1,610 | |||
| Reports to shareholders |
47,996 | |||
| Professional fees |
22,340 | |||
| Trustees’ fees and expenses |
734 | |||
| Other |
21,254 | |||
|
|
|
|||
| Total expenses |
1,485,474 | |||
| Expense reductions (Note 4) |
(6 | ) | ||
|
|
|
|||
| Net expenses |
1,485,468 | |||
|
|
|
|||
| Net investment income |
10,874,052 | |||
|
|
|
|||
| Realized and unrealized gains (losses): | ||||
| Net realized gain (loss) from: |
||||
| Investments |
2,977,734 | |||
| Foreign currency transactions |
(7,180 | ) | ||
|
|
|
|||
| Net realized gain (loss) |
2,970,554 | |||
|
|
|
|||
| Net change in unrealized appreciation (depreciation) on: |
||||
| Investments |
6,187,390 | |||
| Translation of other assets and liabilities denominated in foreign currencies |
3,947 | |||
|
|
|
|||
| Net change in unrealized appreciation (depreciation) |
6,191,337 | |||
|
|
|
|||
| Net realized and unrealized gain (loss) |
9,161,891 | |||
|
|
|
|||
| Net increase (decrease) in net assets resulting from operations |
$ | 20,035,943 | ||
|
|
|
|||
| FH-22 | Semiannual Report | The accompanying notes are an integral part of these financial statements. |
FRANKLIN TEMPLETON VARIABLE INSURANCE PRODUCTS TRUST
FINANCIAL STATEMENTS
Statements of Changes in Net Assets
| Franklin High Income VIP Fund | ||||||||
| Six Months Ended June 30, 2014 (unaudited) |
Year Ended December 31, 2013 |
|||||||
| Increase (decrease) in net assets: | ||||||||
| Operations: |
||||||||
| Net investment income |
$ | 10,874,052 | $ | 22,562,058 | ||||
| Net realized gain (loss) from investments and foreign currency transactions |
2,970,554 | 5,546,800 | ||||||
| Net change in unrealized appreciation (depreciation) on investments and translation of other assets and liabilities denominated in foreign currencies |
6,191,337 | (1,216,918 | ) | |||||
|
|
|
|||||||
| Net increase (decrease) in net assets resulting from operations |
20,035,943 | 26,891,940 | ||||||
|
|
|
|||||||
| Distributions to shareholders from: |
||||||||
| Net investment income: |
||||||||
| Class 1 |
(2,292,485 | ) | (2,998,716 | ) | ||||
| Class 2 |
(18,595,621 | ) | (20,021,935 | ) | ||||
| Class 4 |
(1,613,962 | ) | (1,982,283 | ) | ||||
|
|
|
|||||||
| Total distributions to shareholders |
(22,502,068 | ) | (25,002,934 | ) | ||||
|
|
|
|||||||
| Capital share transactions: (Note 2) |
||||||||
| Class 1 |
(263,567 | ) | (3,089,037 | ) | ||||
| Class 2 |
29,609,426 | 8,408,156 | ||||||
| Class 4 |
1,032,146 | 25,255 | ||||||
|
|
|
|||||||
| Total capital share transactions |
30,378,005 | 5,344,374 | ||||||
|
|
|
|||||||
| Net increase (decrease) in net assets |
27,911,880 | 7,233,380 | ||||||
| Net assets: | ||||||||
| Beginning of period |
358,915,049 | 351,681,669 | ||||||
|
|
|
|||||||
| End of period |
$ | 386,826,929 | $ | 358,915,049 | ||||
|
|
|
|||||||
| Undistributed net investment income included in net assets: | ||||||||
| End of period |
$ | 8,996,075 | $ | 20,624,091 | ||||
|
|
|
|||||||
| The accompanying notes are an integral part of these financial statements. | Semiannual Report | FH-23 |
FRANKLIN TEMPLETON VARIABLE INSURANCE PRODUCTS TRUST
Notes to Financial Statements (unaudited)
Franklin High Income VIP Fund
| FH-24 | Semiannual Report |
FRANKLIN TEMPLETON VARIABLE INSURANCE PRODUCTS TRUST
NOTES TO FINANCIAL STATEMENTS (UNAUDITED)
Franklin High Income VIP Fund (continued)
| Semiannual Report | FH-25 |
FRANKLIN TEMPLETON VARIABLE INSURANCE PRODUCTS TRUST
NOTES TO FINANCIAL STATEMENTS (UNAUDITED)
Franklin High Income VIP Fund (continued)
1. Organization and Significant Accounting Policies (continued)
c. Joint Repurchase Agreement (continued)
for as a loan by the Fund to the seller, collateralized by securities which are delivered to the Fund’s custodian. The fair value, including accrued interest, of the initial collateralization is required to be at least 102% of the dollar amount invested by the funds, with the value of the underlying securities marked to market daily to maintain coverage of at least 100%. Repurchase agreements are subject to the terms of Master Repurchase Agreements (MRAs) with approved counterparties (sellers). The MRAs contain various provisions, including but not limited to events of default and maintenance of collateral for repurchase agreements. In the event of default by either the seller or the Fund, certain MRAs may permit the non-defaulting party to net and close-out all transactions, if any, traded under such agreements. The Fund may sell securities it holds as collateral and apply the proceeds towards the repurchase price and any other amounts owed by the seller to the Fund in the event of default by the seller. This could involve costs or delays in addition to a loss on the securities if their value falls below the repurchase price owed by the seller. The joint repurchase agreement held by the Fund at period end, as indicated in the Statement of Investments, had been entered into on June 30, 2014.
d. Securities Purchased on a When-Issued Basis
The Fund purchases securities on a when-issued basis, with payment and delivery scheduled for a future date. These transactions are subject to market fluctuations and are subject to the risk that the value at delivery may be more or less than the trade date purchase price. Although the Fund will generally purchase these securities with the intention of holding the securities, it may sell the securities before the settlement date. Sufficient assets have been segregated for these securities.
e. Derivative Financial Instruments
The Fund invested in derivatives in order to manage risk or gain exposure to various other investments or markets. Derivatives are financial contracts based on an underlying or notional amount, require no initial investment or an initial net investment that is smaller than would normally be required to have a similar response to changes in market factors, and require or permit net settlement. Derivatives contain various risks including the potential inability of the counterparty to fulfill their obligations under the terms of the contract, the potential for an illiquid
secondary market, and/or the potential for market movements which expose the Fund to gains or losses in excess of the amounts shown on the Statement of Assets and Liabilities. Realized gain and loss and unrealized appreciation and depreciation on these contracts for the period are included in the Statement of Operations.
Derivative counterparty credit risk is managed through a formal evaluation of the creditworthiness of all potential counterparties. The Fund attempts to reduce its exposure to counterparty credit risk on OTC derivatives, whenever possible, by entering into International Swaps and Derivatives Association (ISDA) master agreements with certain counterparties. These agreements contain various provisions, including but not limited to collateral requirements, events of default, or early termination. Termination events applicable to the counterparty include certain deteriorations in the credit quality of the counterparty. Termination events applicable to the Fund include failure of the Fund to maintain certain net asset levels and/or limit the decline in net assets over various periods of time. In the event of default or early termination, the ISDA master agreement gives the non-defaulting party the right to net and close-out all transactions traded, whether or not arising under the ISDA agreement, to one net amount payable by one counterparty to the other. However, absent an event of default or early termination, OTC derivative assets and liabilities are presented gross and not offset in the Statement of Assets and Liabilities. Early termination by the counterparty may result in an immediate payment by the Fund of any net liability owed to that counterparty under the ISDA agreement. At June 30, 2014, the Fund had no OTC derivatives in a net liability position for such contracts.
Collateral requirements differ by type of derivative. Collateral terms are contract specific for OTC derivatives. For OTC derivatives traded under an ISDA master agreement, posting of collateral is required by either the fund or the applicable counterparty if the total net exposure of all OTC derivatives with the applicable counterparty exceeds the minimum transfer amount, which typically ranges from $100,000 to $250,000, and can vary depending on the counterparty and the type of the agreement. Generally, collateral is determined at the close of fund business each day and any additional collateral required due to changes in derivative values may be delivered by the fund or the counterparty within a few business days. Collateral pledged and/or received by the fund, if any, is held in segregated accounts with the fund’s custodian/counterparty broker and can be in the form
| FH-26 | Semiannual Report |
FRANKLIN TEMPLETON VARIABLE INSURANCE PRODUCTS TRUST
NOTES TO FINANCIAL STATEMENTS (UNAUDITED)
Franklin High Income VIP Fund (continued)
| Semiannual Report | FH-27 |
FRANKLIN TEMPLETON VARIABLE INSURANCE PRODUCTS TRUST
NOTES TO FINANCIAL STATEMENTS (UNAUDITED)
Franklin High Income VIP Fund (continued)
1. Organization and Significant Accounting Policies (continued)
j. Guarantees and Indemnifications
Under the Trust’s organizational documents, its officers and trustees are indemnified by the Trust against certain liabilities arising out of the performance of their duties to the Trust.
Additionally, in the normal course of business, the Trust, on behalf of the Fund, enters into contracts with service providers that contain general indemnification clauses. The Trust’s maximum exposure under these arrangements is unknown as this would involve future claims that may be made against the Trust that have not yet occurred. Currently, the Trust expects the risk of loss to be remote.
2. Shares of Beneficial Interest
At June 30, 2014, there were an unlimited number of shares authorized (without par value). Transactions in the Fund’s shares were as follows:
| Six Months Ended June 30, 2014 |
Year Ended December 31, 2013 |
|||||||||||||||||
| Shares | Amount | Shares | Amount | |||||||||||||||
| Class 1 Shares: | ||||||||||||||||||
| Shares sold |
39,418 | $ | 283,449 | 296,126 | $ | 2,094,060 | ||||||||||||
| Shares issued in reinvestment of distributions |
329,854 | 2,292,485 | 448,910 | 2,998,716 | ||||||||||||||
| Shares redeemed |
(395,149 | ) | (2,839,501 | ) | (1,160,278 | ) | (8,181,813 | ) | ||||||||||
|
|
|
|||||||||||||||||
| Net increase (decrease) |
(25,877 | ) | $ | (263,567 | ) | (415,242 | ) | $ | (3,089,037 | ) | ||||||||
|
|
|
|||||||||||||||||
| Class 2 Shares: | ||||||||||||||||||
| Shares sold |
6,614,219 | $ | 46,185,549 | 8,384,624 | $ | 56,291,181 | ||||||||||||
| Shares issued in reinvestment of distributions |
2,754,907 | 18,595,621 | 3,085,044 | 20,021,935 | ||||||||||||||
| Shares redeemed |
(5,034,138 | ) | (35,171,744 | ) | (9,961,173 | ) | (67,904,960 | ) | ||||||||||
|
|
|
|||||||||||||||||
| Net increase (decrease) |
4,334,988 | $ | 29,609,426 | 1,508,495 | $ | 8,408,156 | ||||||||||||
|
|
|
|||||||||||||||||
| Class 4 Shares: | ||||||||||||||||||
| Shares sold |
150,401 | $ | 1,072,695 | 232,056 | $ | 1,586,635 | ||||||||||||
| Shares issued on reinvestment of distributions |
234,247 | 1,613,962 | 299,438 | 1,982,283 | ||||||||||||||
| Shares redeemed |
(231,394 | ) | (1,654,511 | ) | (515,161 | ) | (3,543,663 | ) | ||||||||||
|
|
|
|||||||||||||||||
| Net increase (decrease) |
153,254 | $ | 1,032,146 | 16,333 | $ | 25,255 | ||||||||||||
|
|
|
|||||||||||||||||
3. Transactions With Affiliates
Franklin Resources, Inc. is the holding company for various subsidiaries that together are referred to as Franklin Templeton Investments. Certain officers and trustees of the Fund are also officers and/or directors of the following subsidiaries:
| Subsidiary | Affiliation | |
| Franklin Advisers, Inc. (Advisers) | Investment manager | |
| Franklin Templeton Services, LLC (FT Services) | Administrative manager | |
| Franklin Templeton Distributors, Inc. (Distributors) | Principal underwriter | |
| Franklin Templeton Investor Services, LLC (Investor Services) | Transfer agent |
| FH-28 | Semiannual Report |
FRANKLIN TEMPLETON VARIABLE INSURANCE PRODUCTS TRUST
NOTES TO FINANCIAL STATEMENTS (UNAUDITED)
Franklin High Income VIP Fund (continued)
a. Management Fees
The Fund pays an investment management fee to Advisers based on the average daily net assets of the Fund as follows:
| Annualized Fee Rate | Net Assets | |
| 0.625% | Up to and including $100 million | |
| 0.500% | Over $100 million, up to and including $250 million | |
| 0.450% | Over $250 million, up to and including $7.5 billion | |
| 0.440% | Over $7.5 billion, up to and including $10 billion | |
| 0.430% | Over $10 billion, up to and including $12.5 billion | |
| 0.420% | Over $12.5 billion, up to and including $15 billion | |
| 0.400% | In excess of $15 billion |
b. Administrative Fees
Under an agreement with Advisers, FT Services provides administrative services to the Fund. The fee is paid by Advisers based on the Fund’s average daily net assets, and is not an additional expense of the Fund.
c. Distribution Fees
The Board has adopted distribution plans for Class 2 and Class 4 shares pursuant to Rule 12b-1 under the 1940 Act. Under the Fund’s compensation distribution plans, the Fund pays Distributors for costs incurred in connection with the servicing, sale and distribution of the Fund’s shares up to 0.35% per year of its average daily net assets. Some distribution fees are not charged on shares held by affiliates. The Board has agreed to limit the current rate to 0.25% per year for Class 2. The plan year, for purposes of monitoring compliance with the maximum annual plan rate, is February 1 through January 31.
d. Transfer Agent Fees
Investor Services, under terms of an agreement, performs shareholder servicing for the Fund and is not paid by the Fund for the services.
4. Expense Offset Arrangement
The Fund has entered into an arrangement with its custodian whereby credits realized as a result of uninvested cash balances are used to reduce a portion of the Fund’s custodian expenses. During the period ended June 30, 2014, the custodian fees were reduced as noted in the Statement of Operations.
5. Income Taxes
For tax purposes, capital losses may be carried over to offset future capital gains. Capital loss carryforwards with no expiration, if any, must be fully utilized before those losses with expiration dates.
At December 31, 2013, capital loss carryforwards were as follows:
| Capital loss carryforwards subject to expiration: |
||
| 2014 |
$ 40,420 | |
| 2015 |
4,493,289 | |
| 2016 |
8,150,741 | |
| 2017 |
10,621,353 | |
|
| ||
| Total capital loss carryforwards |
$23,305,803 | |
|
|
| Semiannual Report | FH-29 |
FRANKLIN TEMPLETON VARIABLE INSURANCE PRODUCTS TRUST
NOTES TO FINANCIAL STATEMENTS (UNAUDITED)
Franklin High Income VIP Fund (continued)
5. Income Taxes (continued)
At June 30, 2014, the cost of investments and net unrealized appreciation (depreciation) for income tax purposes were as follows:
| Cost of investments |
$ | 363,949,536 | ||
|
|
|
|||
| Unrealized appreciation |
$ | 23,514,254 | ||
| Unrealized depreciation |
(4,191,349 | ) | ||
|
|
|
|||
| Net unrealized appreciation (depreciation) |
$ | 19,322,905 | ||
|
|
|
|||
Differences between income and/or capital gains as determined on a book basis and a tax basis are primarily due to differing treatments of bond discounts and premiums.
6. Investment Transactions
Purchases and sales of investments (excluding short term securities) for the period ended June 30, 2014, aggregated $75,435,522 and $51,426,030, respectively.
7. Credit Risk and Defaulted Securities
At June 30, 2014, the Fund had 98.39 % of its portfolio invested in high yield, senior secured floating rate notes, or other securities rated below investment grade. These securities may be more sensitive to economic conditions causing greater price volatility and are potentially subject to a greater risk of loss due to default than higher rated securities.
The Fund held defaulted securities and/or other securities for which the income has been deemed uncollectible. At June 30, 2014, the aggregate value of these securities was $3,492,536, representing 0.90% of the Fund’s net assets. The Fund discontinues accruing income on securities for which income has been deemed uncollectible and provides an estimate for losses on interest receivable. The securities have been identified on the accompanying Statement of Investments.
8. Other Derivative Information
At June 30, 2014, the Fund’s investments in derivative contracts are reflected on the Statement of Assets and Liabilities as follows:
| Asset Derivatives | Liability Derivatives | |||||||||
| Derivative Contracts Not Accounted for as Hedging Instruments |
Statement of Assets and Liabilities Location |
Fair Value Amount |
Statement of Assets and Liabilities Location |
Fair Value Amount |
||||||
| Foreign exchange contracts |
Unrealized appreciation on forward exchange contracts |
$1,380 | Unrealized depreciation on forward exchange contracts |
$ | — | |||||
For the period ended June 30, 2014, the effect of derivative contracts on the Fund’s Statement of Operations was as follows:
| Derivative Contracts Not Accounted for as Hedging Instruments |
Statement of Operations Locations | Realized Gain (Loss) for the Period |
Change in Unrealized Appreciation (Depreciation) for the Period | |||
| Foreign exchange contracts |
Net realized gain (loss) from foreign currency transactions / Net change in unrealized appreciation (depreciation) on translation of other assets and liabilities denominated in foreign currencies |
$ — | $3,947 |
For the period ended June 30, 2014, the average month end fair value of derivatives represented less than .01% of average month end net assets. The average month end number of open derivative contracts for the period was 2.
See Note 1(e) regarding derivative financial instruments.
| FH-30 | Semiannual Report |
FRANKLIN TEMPLETON VARIABLE INSURANCE PRODUCTS TRUST
NOTES TO FINANCIAL STATEMENTS (UNAUDITED)
Franklin High Income VIP Fund (continued)
9. Credit Facility
The Fund, together with other U.S. registered and foreign investment funds (collectively, Borrowers), managed by Franklin Templeton Investments, are borrowers in a joint syndicated senior unsecured credit facility totaling $1.5 billion (Global Credit Facility) which matures on February 13, 2015. This Global Credit Facility provides a source of funds to the Borrowers for temporary and emergency purposes, including the ability to meet future unanticipated or unusually large redemption requests.
Under the terms of the Global Credit Facility, the Fund shall, in addition to interest charged on any borrowings made by the Fund and other costs incurred by the Fund, pay its share of fees and expenses incurred in connection with the implementation and maintenance of the Global Credit Facility, based upon its relative share of the aggregate net assets of all of the Borrowers, including an annual commitment fee of 0.07% based upon the unused portion of the Global Credit Facility. These fees are reflected in other expenses on the Statement of Operations. During the period ended June 30, 2014, the Fund did not use the Global Credit Facility.
10. Fair Value Measurements
The Fund follows a fair value hierarchy that distinguishes between market data obtained from independent sources (observable inputs) and the Fund’s own market assumptions (unobservable inputs). These inputs are used in determining the value of the Fund’s financial instruments and are summarized in the following fair value hierarchy:
| • | Level 1 – quoted prices in active markets for identical financial instruments |
| • | Level 2 – other significant observable inputs (including quoted prices for similar financial instruments, interest rates, prepayment speed, credit risk, etc.) |
| • | Level 3 – significant unobservable inputs (including the Fund’s own assumptions in determining the fair value of financial instruments) |
The input levels are not necessarily an indication of the risk or liquidity associated with financial instruments at that level.
For movements between the levels within the fair value hierarchy, the Fund has adopted a policy of recognizing the transfers as of the date of the underlying event which caused the movement.
A summary of inputs used as of June 30, 2014, in valuing the Fund’s assets carried at fair value, is as follows:
| Level 1 | Level 2 | Level 3 | Total | |||||||||||||
| Assets: | ||||||||||||||||
| Investments in Securities: |
||||||||||||||||
| Equity Investments:a |
||||||||||||||||
| Materials |
$ | — | $ | 415,000 | $ | — | $ | 415,000 | ||||||||
| Transportation |
— | 789,469 | — | 789,469 | ||||||||||||
| All Other Equity Investmentsb |
840,840 | — | — | 840,840 | ||||||||||||
| Corporate Bonds |
— | 366,034,824 | 10,816 | 366,045,640 | ||||||||||||
| Senior Floating Rate Interests |
— | 4,272,785 | — | 4,272,785 | ||||||||||||
| Escrow Accounts and Litigation Trusts |
— | — | — | c | — | |||||||||||
| Short Term Investments |
— | 10,908,707 | — | 10,908,707 | ||||||||||||
|
|
|
|||||||||||||||
| Total Investments in Securities |
$ | 840,840 | $ | 382,420,785 | $ | 10,816 | $ | 383,272,441 | ||||||||
|
|
|
|||||||||||||||
| Other Financial Instruments |
||||||||||||||||
| Forward Exchange Contracts |
$ | — | $ | 1,380 | $ | — | $ | 1,380 | ||||||||
|
|
|
|||||||||||||||
aIncludes common, preferred, and convertible preferred stocks as well as other equity investments.
bFor detailed categories, see the accompanying Statement of Investments.
cIncludes securities determined to have no value at June 30, 2014.
| Semiannual Report | FH-31 |
FRANKLIN TEMPLETON VARIABLE INSURANCE PRODUCTS TRUST
NOTES TO FINANCIAL STATEMENTS (UNAUDITED)
Franklin High Income VIP Fund (continued)
10. Fair Value Measurements (continued)
A reconciliation of assets in which Level 3 inputs are used in determining fair value is presented when there are significant Level 3 financial instruments at the end of the period.
11. New Accounting Pronouncements
In June 2014, the Financial Accounting Standards Board issued Accounting Standards Update (ASU) No. 2014-11, Transfers and Servicing (Topic 860), Repurchase-to-Maturity Transactions, Repurchase Financings, and Disclosures. The ASU changes the accounting for certain repurchase agreements and expands disclosure requirements related to repurchase agreements, securities lending, repurchase-to-maturity and similar transactions. The ASU is effective for interim and annual reporting periods beginning after December 15, 2014. Management is currently evaluating the impact, if any, of applying this provision.
12. Subsequent Events
The Fund has evaluated subsequent events through the issuance of the financial statements and determined that no events have occurred that require disclosure.
Abbreviations
| Counterparty | Selected Portfolio | |||||
| DBAB | Deutsche Bank AG | FRN | Floating Rate Note | |||
| PIK | Payment-In-Kind | |||||
| FH-32 | Semiannual Report |
Franklin Income VIP Fund
(Formerly, Franklin Income Securities Fund)
We are pleased to bring you Franklin Income VIP Fund’s semiannual report for the period ended June 30, 2014.
Class 2 Performance Summary as of June 30, 2014
Franklin Income VIP Fund – Class 2 delivered a +9.72% total return for the six-month period ended June 30, 2014.
Performance reflects the Fund’s Class 2 operating expenses, but does not include any contract fees, expenses or sales charges. If they had been included, performance would be lower. These charges and deductions, particularly for variable life policies, can have a significant effect on contract values and insurance benefits. See the contract prospectus for a complete description of these expenses, including sales charges.
Performance data represent past performance, which does not guarantee future results. Investment return and principal value will fluctuate, and you may have a gain or loss when you sell your shares. Current performance may differ from figures shown.
| Semiannual Report | FI-1 |
FRANKLIN INCOME VIP FUND
1. Source: © 2014 Morningstar. One cannot invest directly in an index, and an index is not representative of the Fund’s portfolio. Please see Index Descriptions following the Fund Summaries.
2. Source: Bureau of Labor Statistics.
3. Please see Index Description following the Fund Summaries.
| FI-2 | Semiannual Report |
FRANKLIN INCOME VIP FUND
Manager’s Discussion
Although the Fund remained diversified during the six months under review, the portfolio’s asset mix remained heavily tilted toward equities including common stocks and convertible securities. We slightly increased the Fund’s overall equity weighting from 60.0% to 61.1% of total net assets, particularly with additions to the information technology and utilities sectors. In contrast, we decreased the Fund’s equity sector weightings in energy, industrials and consumer staples during the period. The Fund’s fixed income exposure decreased from 35.7% to 33.1% of total net assets. We focused on corporate bonds, primarily high yield bonds. We believed that investor concerns regarding the potential for higher long-term interest rates going forward, as well as narrowing credit spreads during the period warranted a selective approach to holding high yield bonds. The Fund’s cash position increased during the period from 4.3% to 5.8% of total net assets.
During the six months under review, the Fund’s equity and fixed income components contributed to absolute performance. Many of the Fund’s equity sectors aided results and outperformed the broader equity market, led by utilities, energy, information technology, health care and materials. Utilities including Dynegy and Exelon generally outperformed broader equity markets, supported by factors including investors’ continued attraction to yield-oriented investments, relatively stable interest rates and a decline in the benchmark 10-year Treasury yield. Prices for a wide variety of raw materials, including U.S. crude oil and precious metals, rose during the period, and these higher price levels supported results across the energy and materials sectors. In this environment, Royal Dutch Shell and Halliburton in energy and The Dow Chemical Co. and LyondellBasell Industries in materials boosted Fund results. In contrast, the Fund had a number of notable individual equity detractors during the period. General Electric in industrials suffered from weak U.S. economic growth in the beginning of 2014. In consumer discretionary, mass-market retailer Target suffered losses after experiencing a customer data breach and problems with a Canadian expansion, and General Motors’ shares were negatively affected by a massive faulty vehicle recall.
Most fixed income securities performed well during the period, driven by continued low interest rates and a favorable environment for credit fundamentals featuring robust new issuance levels that facilitated access to capital. These conditions enabled many companies to reduce debt, extend maturities and reduce overall debt financing costs, factors we felt could help default levels remain fairly low. Major fixed income contributors during the period included CC Media Holdings4 and Sprint in communications5 and First Data in technology.6 Notable individual detractors included Caesars Entertainment Operating Company in consumer cyclical,7 Genon Energy8 in electric utility9 and Walter Energy in basic industry.10
| Portfolio Breakdown | ||||
| 6/30/14 | ||||
| % of Total Net Assets |
||||
| Equity* | 61.1% | |||
| Utilities | 13.2% | |||
| Energy | 11.3% | |||
| Materials | 9.6% | |||
| Financials | 9.1% | |||
| Health Care | 6.2% | |||
| Information Technology | 3.7% | |||
| Industrials | 3.3% | |||
| Other | 4.7% | |||
| Fixed Income | 33.1% | |||
| Energy | 7.4% | |||
| Consumer Discretionary | 6.0% | |||
| Information Technology | 4.7% | |||
| Telecommunication Services | 3.4% | |||
| Financials | 3.0% | |||
| Materials | 2.9% | |||
| Health Care | 2.0% | |||
| Other | 3.7% | |||
| Short-Term Investments & Other Net Assets | 5.8% | |||
*Includes convertible bonds.
| Semiannual Report | FI-3 |
4. CC Media Holdings comprises Clear Channel Communications, Inc. and Clear Channel Worldwide Holdings, Inc. in the SOI.
5. Communications holdings are in consumer discretionary and telecommunication services in the fixed income section of the SOI.
6. Technology holdings are in information technology in the fixed income section of the SOI.
7. Consumer cyclical holdings are in consumer discretionary and industrials in the fixed income section of the SOI.
8. Sold by period-end.
9. Electric utility holdings are in utilities in the fixed income section of the SOI.
10. Basic industry holdings are in energy and materials in the fixed income section of the SOI.
FRANKLIN INCOME VIP FUND
| FI-4 | Semiannual Report |
FRANKLIN INCOME VIP FUND
Class 2 Fund Expenses
| Class 2 | Beginning Account Value 1/1/14 |
Ending Account Value 6/30/14 |
Fund-Level Expenses 1/1/14–6/30/14 |
|||||||||
| Actual | $1,000 | $1,097.20 | $3.74 | |||||||||
| Hypothetical (5% return before expenses) | $1,000 | $1,021.22 | $3.61 | |||||||||
*Expenses are calculated using the most recent six-month annualized expense ratio for the Fund’s Class 2 shares (0.72%), which does not include any ongoing expenses of the Contract for which the Fund is an investment option, multiplied by the average account value over the period, multiplied by 181/365 to reflect the one-half year period.
| Semiannual Report | FI-5 |
FRANKLIN TEMPLETON VARIABLE INSURANCE PRODUCTS TRUST
Financial Highlights
Franklin Income VIP Fund
| Six Months Ended June 30, 2014 (unaudited) |
Year Ended December 31, | |||||||||||||||||||||||
| 2013 | 2012 | 2011 | 2010 | 2009 | ||||||||||||||||||||
| Class 1 | ||||||||||||||||||||||||
| Per share operating performance (for a share outstanding throughout the period) |
||||||||||||||||||||||||
| Net asset value, beginning of period |
$16.53 | $15.47 | $14.68 | $15.16 | $14.43 | $11.53 | ||||||||||||||||||
|
|
|
|||||||||||||||||||||||
| Income from investment operationsa: | ||||||||||||||||||||||||
| Net investment incomeb |
0.38 | 0.81 | 0.91 | 0.96 | 0.89 | 0.91 | ||||||||||||||||||
| Net realized and unrealized gains (losses) |
1.23 | 1.31 | 0.90 | (0.54 | ) | 0.85 | 3.08 | |||||||||||||||||
|
|
|
|||||||||||||||||||||||
| Total from investment operations |
1.61 | 2.12 | 1.81 | 0.42 | 1.74 | 3.99 | ||||||||||||||||||
|
|
|
|||||||||||||||||||||||
| Less distributions from net investment income |
(0.88 | ) | (1.06 | ) | (1.02 | ) | (0.90 | ) | (1.01 | ) | (1.09 | ) | ||||||||||||
|
|
|
|||||||||||||||||||||||
| Net asset value, end of period |
$17.26 | $16.53 | $15.47 | $14.68 | $15.16 | $14.43 | ||||||||||||||||||
|
|
|
|||||||||||||||||||||||
| Total returnc |
9.89% | 14.18% | 12.91% | 2.71% | 12.87% | 35.88% | ||||||||||||||||||
| Ratios to average net assetsd | ||||||||||||||||||||||||
| Expenses |
0.47% | e | 0.47% | e | 0.47% | 0.47% | e | 0.47% | e | 0.47% | e | |||||||||||||
| Net investment income |
4.53% | 5.07% | 6.03% | 6.35% | 6.28% | 7.23% | ||||||||||||||||||
| Supplemental data | ||||||||||||||||||||||||
| Net assets, end of period (000’s) |
$764,282 | $695,004 | $584,391 | $1,300,935 | $1,449,028 | $910,504 | ||||||||||||||||||
| Portfolio turnover rate |
7.62% | 21.71% | 26.66% | f | 28.65% | 41.65% | 42.30% | |||||||||||||||||
aThe amount shown for a share outstanding throughout the period may not correlate with the Statement of Operations for the period due to the timing of sales and repurchases of the Fund shares in relation to income earned and/or fluctuating fair value of the investments of the Fund.
bBased on average daily shares outstanding.
cTotal return does not include fees, charges or expenses imposed by the variable annuity and life insurance contracts for which the Franklin Templeton Variable Insurance Products Trust serves as an underlying investment vehicle. Total return is not annualized for periods less than one year.
dRatios are annualized for periods less than one year.
eBenefit of expense reduction rounds to less than 0.01%.
fExcludes the value of portfolio securities delivered as a result of a redemption in-kind.
| FI-6 | Semiannual Report | The accompanying notes are an integral part of these financial statements. |
FRANKLIN TEMPLETON VARIABLE INSURANCE PRODUCTS TRUST
FINANCIAL HIGHLIGHTS
Franklin Income VIP Fund (continued)
| Six Months Ended June 30, 2014 (unaudited) |
Year Ended December 31, | |||||||||||||||||||||||
| 2013 | 2012 | 2011 | 2010 | 2009 | ||||||||||||||||||||
| Class 2 | ||||||||||||||||||||||||
| Per share operating performance (for a share outstanding throughout the period) |
||||||||||||||||||||||||
| Net asset value, beginning of period |
$16.07 | $15.07 | $14.32 | $14.82 | $14.12 | $11.30 | ||||||||||||||||||
|
|
|
|||||||||||||||||||||||
| Income from investment operationsa: | ||||||||||||||||||||||||
| Net investment incomeb |
0.35 | 0.75 | 0.85 | 0.90 | 0.86 | 0.86 | ||||||||||||||||||
| Net realized and unrealized gains (losses) |
1.20 | 1.27 | 0.88 | (0.53 | ) | 0.82 | 3.01 | |||||||||||||||||
|
|
|
|||||||||||||||||||||||
| Total from investment operations |
1.55 | 2.02 | 1.73 | 0.37 | 1.68 | 3.87 | ||||||||||||||||||
|
|
|
|||||||||||||||||||||||
| Less distributions from net investment income |
(0.84 | ) | (1.02 | ) | (0.98 | ) | (0.87 | ) | (0.98 | ) | (1.05 | ) | ||||||||||||
|
|
|
|||||||||||||||||||||||
| Net asset value, end of period |
$16.78 | $16.07 | $15.07 | $14.32 | $14.82 | $14.12 | ||||||||||||||||||
|
|
|
|||||||||||||||||||||||
| Total returnc |
9.72% | 13.94% | 12.65% | 2.38% | 12.67% | 35.59% | ||||||||||||||||||
| Ratios to average net assetsd | ||||||||||||||||||||||||
| Expenses |
0.72% | e | 0.72% | e | 0.72% | 0.72% | e | 0.72% | e | 0.72% | e | |||||||||||||
| Net investment income |
4.28% | 4.82% | 5.78% | 6.10% | 6.03% | 6.98% | ||||||||||||||||||
| Supplemental data | ||||||||||||||||||||||||
| Net assets, end of period (000’s) |
$6,577,658 | $6,188,045 | $6,182,997 | $5,915,637 | $6,309,207 | $6,114,898 | ||||||||||||||||||
| Portfolio turnover rate |
7.62% | 21.71% | 26.66% | f | 28.65% | 41.65% | 42.30% | |||||||||||||||||
aThe amount shown for a share outstanding throughout the period may not correlate with the Statement of Operations for the period due to the timing of sales and repurchases of the Fund shares in relation to income earned and/or fluctuating fair value of the investments of the Fund.
bBased on average daily shares outstanding.
cTotal return does not include fees, charges or expenses imposed by the variable annuity and life insurance contracts for which the Franklin Templeton Variable Insurance Products Trust serves as an underlying investment vehicle. Total return is not annualized for periods less than one year.
dRatios are annualized for periods less than one year.
eBenefit of expense reduction rounds to less than 0.01%.
fExcludes the value of portfolio securities delivered as a result of a redemption in-kind.
| The accompanying notes are an integral part of these financial statements. | Semiannual Report | FI-7 |
FRANKLIN TEMPLETON VARIABLE INSURANCE PRODUCTS TRUST
FINANCIAL HIGHLIGHTS
Franklin Income VIP Fund (continued)
| Six Months Ended June 30, 2014 (unaudited) |
Year Ended December 31, | |||||||||||||||||||||||
| 2013 | 2012 | 2011 | 2010 | 2009 | ||||||||||||||||||||
| Class 4 | ||||||||||||||||||||||||
| Per share operating performance (for a share outstanding throughout the period) |
||||||||||||||||||||||||
| Net asset value, beginning of period |
$16.36 | $15.32 | $14.54 | $15.04 | $14.33 | $11.49 | ||||||||||||||||||
|
|
|
|||||||||||||||||||||||
| Income from investment operationsa: | ||||||||||||||||||||||||
| Net investment incomeb |
0.35 | 0.75 | 0.85 | 0.90 | 0.85 | 0.86 | ||||||||||||||||||
| Net realized and unrealized gains (losses) |
1.22 | 1.30 | 0.90 | (0.54 | ) | 0.84 | 3.06 | |||||||||||||||||
|
|
|
|||||||||||||||||||||||
| Total from investment operations |
1.57 | 2.05 | 1.75 | 0.36 | 1.69 | 3.92 | ||||||||||||||||||
|
|
|
|||||||||||||||||||||||
| Less distributions from net investment income |
(0.82 | ) | (1.01 | ) | (0.97 | ) | (0.86 | ) | (0.98 | ) | (1.08 | ) | ||||||||||||
|
|
|
|||||||||||||||||||||||
| Net asset value, end of period |
$17.11 | $16.36 | $15.32 | $14.54 | $15.04 | $14.33 | ||||||||||||||||||
|
|
|
|||||||||||||||||||||||
| Total returnc |
9.65% | 13.85% | 12.56% | 2.29% | 12.54% | 35.37% | ||||||||||||||||||
| Ratios to average net assetsd | ||||||||||||||||||||||||
| Expenses |
0.82% | e | 0.82% | e | 0.82% | 0.82% | e | 0.82% | e | 0.82% | e | |||||||||||||
| Net investment income |
4.18% | 4.72% | 5.68% | 6.00% | 5.93% | 6.88% | ||||||||||||||||||
| Supplemental data | ||||||||||||||||||||||||
| Net assets, end of period (000’s) |
$412,489 | $397,652 | $436,405 | $431,435 | $415,541 | $347,733 | ||||||||||||||||||
| Portfolio turnover rate |
7.62% | 21.71% | 26.66% | f | 28.65% | 41.65% | 42.30% | |||||||||||||||||
aThe amount shown for a share outstanding throughout the period may not correlate with the Statement of Operations for the period due to the timing of sales and repurchases of the Fund shares in relation to income earned and/or fluctuating fair value of the investments of the Fund.
bBased on average daily shares outstanding.
cTotal return does not include fees, charges or expenses imposed by the variable annuity and life insurance contracts for which the Franklin Templeton Variable Insurance Products Trust serves as an underlying investment vehicle. Total return is not annualized for periods less than one year.
dRatios are annualized for periods less than one year.
eBenefit of expense reduction rounds to less than 0.01%.
fExcludes the value of portfolio securities delivered as a result of a redemption in-kind.
| FI-8 | Semiannual Report | The accompanying notes are an integral part of these financial statements. |
FRANKLIN TEMPLETON VARIABLE INSURANCE PRODUCTS TRUST
Statement of Investments, June 30, 2014 (unaudited)
| Franklin Income VIP Fund | ||||||||||||||
| Country | Shares/ Warrants |
Value | ||||||||||||
| Common Stocks and Other Equity Interests 54.9% |
||||||||||||||
| Consumer Discretionary 1.4% |
||||||||||||||
| a,b | Dex Media Inc. |
United States | 458,876 | $ | 5,111,878 | |||||||||
| Ford Motor Co. |
United States | 3,000,000 | 51,720,000 | |||||||||||
| General Motors Co. |
United States | 384,539 | 13,958,766 | |||||||||||
| Target Corp. |
United States | 600,000 | 34,770,000 | |||||||||||
|
|
|
|||||||||||||
| 105,560,644 | ||||||||||||||
|
|
|
|||||||||||||
| Consumer Staples 1.2% |
||||||||||||||
| The Coca-Cola Co. |
UnitedStates | 729,800 | 30,914,328 | |||||||||||
| Nestle SA |
Switzerland | 150,000 | 11,619,778 | |||||||||||
| PepsiCo Inc. |
United States | 584,000 | 52,174,560 | |||||||||||
|
|
|
|||||||||||||
| 94,708,666 | ||||||||||||||
|
|
|
|||||||||||||
| Energy 9.5% |
||||||||||||||
| BP PLC, ADR |
United Kingdom | 2,750,000 | 145,062,500 | |||||||||||
| Canadian Oil Sands Ltd. |
Canada | 2,212,700 | 50,169,334 | |||||||||||
| Chevron Corp. |
United States | 561,000 | 73,238,550 | |||||||||||
| Exxon Mobil Corp. |
United States | 884,850 | 89,086,698 | |||||||||||
| Halliburton Co. |
United States | 1,151,700 | 81,782,217 | |||||||||||
| Royal Dutch Shell PLC, A, ADR |
United Kingdom | 1,951,748 | 160,765,483 | |||||||||||
| Spectra Energy Corp. |
United States | 600,000 | 25,488,000 | |||||||||||
| Total SA, B, ADR |
France | 732,900 | 52,915,380 | |||||||||||
| Transocean Ltd. |
United States | 500,000 | 22,515,000 | |||||||||||
| The Williams Cos. Inc. |
United States | 563,900 | 32,824,619 | |||||||||||
|
|
|
|||||||||||||
| 733,847,781 | ||||||||||||||
|
|
|
|||||||||||||
| Financials 6.3% |
||||||||||||||
| Banco Santander SA |
Spain | 2,357,359 | 24,631,815 | |||||||||||
| Bank of America Corp. |
United States | 4,909,800 | 75,463,626 | |||||||||||
| Barclays PLC |
United Kingdom | 3,473,166 | 12,647,304 | |||||||||||
| Citigroup Inc. |
United States | 350,000 | 16,485,000 | |||||||||||
| Commonwealth Bank of Australia |
Australia | 374,700 | 28,588,917 | |||||||||||
| HSBC Holdings PLC |
United Kingdom | 4,341,457 | 44,047,143 | |||||||||||
| JPMorgan Chase & Co. |
United States | 1,606,400 | 92,560,768 | |||||||||||
| MetLife Inc. |
United States | 500,000 | 27,780,000 | |||||||||||
| a | Scentre Group |
Australia | 5,089,110 | 15,362,599 | ||||||||||
| Wells Fargo & Co. |
United States | 2,863,100 | 150,484,536 | |||||||||||
|
|
|
|||||||||||||
| 488,051,708 | ||||||||||||||
|
|
|
|||||||||||||
| Health Care 6.2% |
||||||||||||||
| Eli Lilly & Co. |
United States | 434,800 | 27,031,516 | |||||||||||
| Johnson & Johnson |
United States | 617,800 | 64,634,236 | |||||||||||
| Merck & Co. Inc. |
United States | 3,023,200 | 174,892,120 | |||||||||||
| Pfizer Inc. |
United States | 3,055,375 | 90,683,530 | |||||||||||
| Roche Holding AG |
Switzerland | 257,719 | 76,863,816 | |||||||||||
| Sanofi, ADR |
France | 868,292 | 46,167,086 | |||||||||||
|
|
|
|||||||||||||
| 480,272,304 | ||||||||||||||
|
|
|
|||||||||||||
| Industrials 3.1% |
||||||||||||||
| a | CEVA Holdings LLC |
United Kingdom | 13,012 | 14,313,486 | ||||||||||
| Deere & Co. |
United States | 100,000 | 9,055,000 | |||||||||||
| General Electric Co. |
United States | 4,341,500 | 114,094,620 | |||||||||||
| Lockheed Martin Corp. |
United States | 253,200 | 40,696,836 | |||||||||||
| Republic Services Inc. |
United States | 527,300 | 20,021,581 | |||||||||||
| Waste Management Inc. |
United States | 1,028,200 | 45,991,386 | |||||||||||
|
|
|
|||||||||||||
| 244,172,909 | ||||||||||||||
|
|
|
|||||||||||||
| Semiannual Report | FI-9 |
FRANKLIN TEMPLETON VARIABLE INSURANCE PRODUCTS TRUST
STATEMENT OF INVESTMENTS (UNAUDITED)
Franklin Income VIP Fund (continued)
| Country | Shares/ Warrants |
Value | ||||||||||||
| Common Stocks and Other Equity Interests (continued) |
||||||||||||||
| Information Technology 3.4% |
||||||||||||||
| Apple Inc. |
United States | 350,000 | $ | 32,525,500 | ||||||||||
| Cisco Systems Inc. |
United States | 1,534,600 | 38,134,810 | |||||||||||
| a,c,d | First Data Holdings Inc., B |
United States | 4,929,600 | 19,718,400 | ||||||||||
| Intel Corp. |
United States | 3,679,300 | 113,690,370 | |||||||||||
| QUALCOMM Inc. |
United States | 200,000 | 15,840,000 | |||||||||||
| Texas Instruments Inc. |
United States | 924,800 | 44,196,192 | |||||||||||
|
|
|
|||||||||||||
| 264,105,272 | ||||||||||||||
|
|
|
|||||||||||||
| Materials 9.4% |
||||||||||||||
| Agrium Inc. |
Canada | 650,000 | 59,559,500 | |||||||||||
| a | AngloGold Ashanti Ltd., ADR |
South Africa | 199,655 | 3,436,063 | ||||||||||
| Barrick Gold Corp. |
Canada | 1,903,176 | 34,828,121 | |||||||||||
| BHP Billiton PLC |
United Kingdom | 2,566,292 | 82,976,241 | |||||||||||
| The Dow Chemical Co. |
United States | 3,207,200 | 165,042,512 | |||||||||||
| E. I. du Pont de Nemours and Co. |
United States | 1,047,500 | 68,548,400 | |||||||||||
| Freeport-McMoRan Copper & Gold Inc., B |
United States | 1,709,971 | 62,413,942 | |||||||||||
| Goldcorp Inc. |
Canada | 1,508,600 | 42,105,026 | |||||||||||
| LyondellBasell Industries NV, A |
United States | 1,050,000 | 102,532,500 | |||||||||||
| The Mosaic Co. |
United States | 200,000 | 9,890,000 | |||||||||||
| Newmont Mining Corp. |
United States | 735,317 | 18,706,464 | |||||||||||
| Rio Tinto PLC, ADR |
United Kingdom | 1,500,000 | 81,420,000 | |||||||||||
|
|
|
|||||||||||||
| 731,458,769 | ||||||||||||||
|
|
|
|||||||||||||
| Telecommunication Services 1.6% |
||||||||||||||
| AT&T Inc. |
United States | 2,000,000 | 70,720,000 | |||||||||||
| CenturyLink Inc. |
United States | 500,000 | 18,100,000 | |||||||||||
| Telstra Corp. Ltd. |
Australia | 4,946,331 | 24,310,493 | |||||||||||
| Verizon Communications Inc. |
United States | 101,992 | 4,990,469 | |||||||||||
| Vodafone Group PLC |
United Kingdom | 2,115,279 | 7,058,348 | |||||||||||
|
|
|
|||||||||||||
| 125,179,310 | ||||||||||||||
|
|
|
|||||||||||||
| Utilities 12.8% |
||||||||||||||
| AGL Resources Inc. |
United States | 290,732 | 15,998,982 | |||||||||||
| American Electric Power Co. Inc. |
United States | 1,300,000 | 72,501,000 | |||||||||||
| Dominion Resources Inc. |
United States | 800,000 | 57,216,000 | |||||||||||
| Duke Energy Corp. |
United States | 1,302,500 | 96,632,475 | |||||||||||
| a,b | Dynegy Inc. |
United States | 1,750,000 | 60,900,000 | ||||||||||
| a,b | Dynegy Inc., wts., 10/02/17 |
United States | 242,666 | 1,123,543 | ||||||||||
| Entergy Corp. |
United States | 738,100 | 60,590,629 | |||||||||||
| Exelon Corp. |
United States | 2,450,000 | 89,376,000 | |||||||||||
| FirstEnergy Corp. |
United States | 1,095,900 | 38,049,648 | |||||||||||
| a | HK Electric Investments/HK Electric Investments Ltd. |
Hong Kong | 7,500,000 | 5,080,350 | ||||||||||
| NextEra Energy Inc. |
United States | 651,300 | 66,745,224 | |||||||||||
| PG&E Corp. |
United States | 1,736,600 | 83,391,532 | |||||||||||
| Pinnacle West Capital Corp. |
United States | 260,500 | 15,067,320 | |||||||||||
| PPL Corp. |
United States | 1,615,400 | 57,395,162 | |||||||||||
| Public Service Enterprise Group Inc. |
United States | 1,823,500 | 74,380,565 | |||||||||||
| Sempra Energy |
United States | 368,300 | 38,564,693 | |||||||||||
| The Southern Co. |
United States | 1,500,000 | 68,070,000 | |||||||||||
| TECO Energy Inc. |
United States | 1,753,700 | 32,408,376 | |||||||||||
| Xcel Energy Inc. |
United States | 1,710,964 | 55,144,370 | |||||||||||
|
|
|
|||||||||||||
| 988,635,869 | ||||||||||||||
|
|
|
|||||||||||||
| Total Common Stocks and Other Equity Interests |
4,255,993,232 | |||||||||||||
|
|
|
|||||||||||||
| FI-10 | Semiannual Report |
FRANKLIN TEMPLETON VARIABLE INSURANCE PRODUCTS TRUST
STATEMENT OF INVESTMENTS (UNAUDITED)
Franklin Income VIP Fund (continued)
| Country | Shares/ Warrants |
Value | ||||||||||||
| e | Equity-Linked Securities 1.1% |
|||||||||||||
| Energy 0.8% |
||||||||||||||
| f | Barclays Bank PLC into Devon Energy Corp., 6.00%, 144A |
United States | 650,000 | $ | 46,242,235 | |||||||||
| f | Barclays Bank PLC into Weatherford International Inc., 7.50%, 144A |
United States | 850,000 | 16,076,050 | ||||||||||
|
|
|
|||||||||||||
| 62,318,285 | ||||||||||||||
|
|
|
|||||||||||||
| Information Technology 0.3% |
||||||||||||||
| f | Wells Fargo & Co. into Broadcom Corp., 7.00%, 144A |
United States | 600,000 | 18,681,600 | ||||||||||
|
|
|
|||||||||||||
| Total Equity-Linked Securities (Cost $70,190,000) |
80,999,885 | |||||||||||||
|
|
|
|||||||||||||
| Convertible Preferred Stocks 3.7% |
||||||||||||||
| Energy 0.6% |
||||||||||||||
| Halcon Resources Corp., 5.75%, cvt. pfd., A |
United States | 10,000 | 11,940,000 | |||||||||||
| Sanchez Energy Corp., 6.50%, cvt. pfd., B |
United States | 200,000 | 19,325,780 | |||||||||||
| SandRidge Energy Inc., 7.00%, cvt. pfd. |
United States | 121,600 | 13,540,160 | |||||||||||
|
|
|
|||||||||||||
| 44,805,940 | ||||||||||||||
|
|
|
|||||||||||||
| Financials 2.5% |
||||||||||||||
| Bank of America Corp., 7.25%, cvt. pfd., L |
United States | 78,200 | 91,259,400 | |||||||||||
| FelCor Lodging Trust Inc., 7.80%, cvt. pfd., A |
United States | 347,325 | 9,068,656 | |||||||||||
| a | FNMA, 5.38%, cvt. pfd. |
United States | 475 | 15,200,000 | ||||||||||
| MetLife Inc., 5.00%, cvt. pfd. |
United States | 455,925 | 14,571,363 | |||||||||||
| Wells Fargo & Co., 7.50%, cvt. pfd., A |
United States | 53,000 | 64,342,000 | |||||||||||
|
|
|
|||||||||||||
| 194,441,419 | ||||||||||||||
|
|
|
|||||||||||||
| Industrials 0.2% |
||||||||||||||
| a | CEVA Holdings LLC, cvt. pfd., A-1 |
United Kingdom | 397 | 575,650 | ||||||||||
| a | CEVA Holdings LLC, cvt. pfd., A-2 |
United Kingdom | 14,711 | 16,181,990 | ||||||||||
|
|
|
|||||||||||||
| 16,757,640 | ||||||||||||||
|
|
|
|||||||||||||
| Materials 0.0%† |
||||||||||||||
| ArcelorMittal, 6.00%, cvt. pfd. |
Luxembourg | 160,000 | 3,598,400 | |||||||||||
|
|
|
|||||||||||||
| Utilities 0.4% |
||||||||||||||
| Dominion Resources Inc., 6.00%, cvt. pfd., B |
United States | 145,000 | 8,412,900 | |||||||||||
| Dominion Resources Inc., 6.125%, cvt. pfd., A |
United States | 145,000 | 8,359,250 | |||||||||||
| Dominion Resources Inc., 6.375%, cvt. pfd., A |
United States | 162,000 | 8,525,250 | |||||||||||
| NextEra Energy Inc., 5.889%, cvt. pfd. |
United States | 83,100 | 5,400,669 | |||||||||||
|
|
|
|||||||||||||
| 30,698,069 | ||||||||||||||
|
|
|
|||||||||||||
| Total Convertible Preferred Stocks (Cost $255,372,542) |
290,301,468 | |||||||||||||
|
|
|
|||||||||||||
| Preferred Stocks 0.3% |
||||||||||||||
| Financials 0.3% |
||||||||||||||
| a | FHLMC, 8.375%, pfd., Z |
United States | 745,175 | 8,129,859 | ||||||||||
| a | FNMA, 6.75%, pfd. |
United States | 434,150 | 3,959,448 | ||||||||||
| a | FNMA, 7.625%, pfd., R |
United States | 694,650 | 6,494,978 | ||||||||||
| a | FNMA, 8.25%, pfd. |
United States | 739,375 | 7,652,531 | ||||||||||
|
|
|
|||||||||||||
| Total Preferred Stocks (Cost $65,333,750) |
26,236,816 | |||||||||||||
|
|
|
|||||||||||||
| Semiannual Report | FI-11 |
FRANKLIN TEMPLETON VARIABLE INSURANCE PRODUCTS TRUST
STATEMENT OF INVESTMENTS (UNAUDITED)
Franklin Income VIP Fund (continued)
| Country | Principal Amount* |
Value | ||||||||||||
| Convertible Bonds 1.1% |
||||||||||||||
| Consumer Discretionary 0.5% |
||||||||||||||
| f | Volkswagen International Finance, cvt., sub. note, 144A, 5.50%, 11/09/15 |
Germany | 25,000,000 | EUR | $ | 40,169,047 | ||||||||
|
|
|
|||||||||||||
| Energy 0.4% |
||||||||||||||
| Cobalt International Energy Inc., cvt., senior bond, 3.125%, 5/15/24 |
United States | 25,000,000 | 26,984,375 | |||||||||||
|
|
|
|||||||||||||
| Materials 0.2% |
||||||||||||||
| Cemex SAB de CV, cvt., sub. note, |
||||||||||||||
| 3.25%, 3/15/16 |
Mexico | 1,700,000 | 2,481,745 | |||||||||||
| 3.75%, 3/15/18 |
Mexico | 7,920,000 | 12,046,439 | |||||||||||
|
|
|
|||||||||||||
| 14,528,184 | ||||||||||||||
|
|
|
|||||||||||||
| Total Convertible Bonds (Cost $66,064,226) |
81,681,606 | |||||||||||||
|
|
|
|||||||||||||
| Corporate Bonds 30.4% |
||||||||||||||
| Consumer Discretionary 5.1% |
||||||||||||||
| f | Academy Ltd./Finance Corp., senior note, 144A, 9.25%, 8/01/19 |
United States | 5,300,000 | 5,710,750 | ||||||||||
| Cablevision Systems Corp., senior note, 7.75%, 4/15/18 |
United States | 10,000,000 | 11,350,000 | |||||||||||
| Caesars Entertainment Operating Co. Inc., senior secured note, 11.25%, 6/01/17 |
United States | 2,500,000 | 2,300,000 | |||||||||||
| f | CBS Outdoor Americas Capital LLC/CBS Outdoor Americas Capital Corp., |
|||||||||||||
| senior bond, 144A, 5.625%, 2/15/24 |
United States | 1,600,000 | 1,656,000 | |||||||||||
| senior note, 144A, 5.25%, 2/15/22 |
United States | 1,600,000 | 1,648,000 | |||||||||||
| CCO Holdings LLC/CCO Holdings Capital Corp., |
||||||||||||||
| senior bond, 5.75%, 1/15/24 |
United States | 15,000,000 | 15,375,000 | |||||||||||
| senior note, 6.50%, 4/30/21 |
United States | 15,000,000 | 16,031,250 | |||||||||||
| Chrysler Group LLC/CG Co-Issuer Inc., senior secured note, |
||||||||||||||
| 8.00%, 6/15/19 |
United States | 25,000,000 | 27,281,250 | |||||||||||
| 8.25%, 6/15/21 |
United States | 15,400,000 | 17,479,000 | |||||||||||
| Clear Channel Communications Inc., |
||||||||||||||
| gsenior note, PIK, 14.00%, 2/01/21 |
United States | 13,332,000 | 13,671,593 | |||||||||||
| senior secured bond, first lien, 9.00%, 3/01/21 |
United States | 24,100,000 | 25,877,375 | |||||||||||
| senior secured note, first lien, 9.00%, 12/15/19 |
United States | 18,000,000 | 19,260,000 | |||||||||||
| Clear Channel Worldwide Holdings Inc., senior sub. note, 7.625%, 3/15/20 |
United States | 8,750,000 | 9,482,813 | |||||||||||
| CSC Holdings LLC, senior note, 6.75%, 11/15/21 |
United States | 15,400,000 | 16,997,750 | |||||||||||
| Cumulus Media Holdings Inc., senior note, 7.75%, 5/01/19 |
United States | 10,000,000 | 10,537,500 | |||||||||||
| g | Dex Media Inc., senior sub. note, PIK, 14.00%, 1/29/17 |
United States | 15,985,148 | 10,840,056 | ||||||||||
| DISH DBS Corp., senior bond, 5.00%, 3/15/23 |
United States | 15,000,000 | 15,318,750 | |||||||||||
| The Goodyear Tire & Rubber Co., senior note, |
||||||||||||||
| 8.25%, 8/15/20 |
United States | 4,900,000 | 5,402,250 | |||||||||||
| 6.50%, 3/01/21 |
United States | 12,600,000 | 13,734,000 | |||||||||||
| HD Supply Inc., senior note, 7.50%, 7/15/20 |
United States | 10,000,000 | 10,975,000 | |||||||||||
| f | Jaguar Land Rover Automotive PLC, 144A, 8.125%, 5/15/21 |
United Kingdom | 2,118,000 | 2,397,025 | ||||||||||
| KB Home, |
||||||||||||||
| senior bond, 7.50%, 9/15/22 |
United States | 6,500,000 | 7,247,500 | |||||||||||
| senior note, 7.25%, 6/15/18 |
United States | 10,600,000 | 11,978,000 | |||||||||||
| f | Laureate Education Inc., 144A, 9.25%, 9/01/19 |
United States | 5,000,000 | 5,175,000 | ||||||||||
| MGM Resorts International, senior note, |
||||||||||||||
| 6.625%, 7/15/15 |
United States | 3,200,000 | 3,368,000 | |||||||||||
| 10.00%, 11/01/16 |
United States | 10,000,000 | 11,875,000 | |||||||||||
| 8.625%, 2/01/19 |
United States | 3,700,000 | 4,426,125 | |||||||||||
| 5.25%, 3/31/20 |
United States | 5,000,000 | 5,212,500 | |||||||||||
| 6.75%, 10/01/20 |
United States | 5,500,000 | 6,153,125 | |||||||||||
| FI-12 | Semiannual Report |
FRANKLIN TEMPLETON VARIABLE INSURANCE PRODUCTS TRUST
STATEMENT OF INVESTMENTS (UNAUDITED)
Franklin Income VIP Fund (continued)
| Country | Principal Amount* |
Value | ||||||||||||
| Corporate Bonds (continued) |
||||||||||||||
| Consumer Discretionary (continued) |
||||||||||||||
| f | Numericable Group SA, first lien, senior note, 144A, 6.00%, 5/15/22 |
France | 10,000,000 | $ | 10,440,700 | |||||||||
| Shea Homes LP/Funding Corp., senior secured note, 8.625%, 5/15/19 |
United States | 6,700,000 | 7,336,500 | |||||||||||
| f | Sirius XM Radio Inc., senior bond, 144A, 6.00%, 7/15/24 |
United States | 14,600,000 | 15,220,500 | ||||||||||
| f | Univision Communications Inc., senior secured note, 144A, |
|||||||||||||
| 6.875%, 5/15/19 |
United States | 15,000,000 | 16,050,000 | |||||||||||
| 5.125%, 5/15/23 |
United States | 10,000,000 | 10,637,500 | |||||||||||
| f | UPCB Finance III Ltd., senior secured note, 144A, 6.625%, 7/01/20 |
Netherlands | 7,500,000 | 8,025,000 | ||||||||||
| f | Virgin Media Secured Finance PLC, senior secured bond, first lien, 144A, 5.50%, 1/15/25 |
United Kingdom | 7,000,000 | 7,271,250 | ||||||||||
| Visant Corp., senior note, 10.00%, 10/01/17 |
United States | 12,800,000 | 12,000,000 | |||||||||||
|
|
|
|||||||||||||
| 395,742,062 | ||||||||||||||
|
|
|
|||||||||||||
| Consumer Staples 1.0% |
||||||||||||||
| Alliance One International Inc., secured note, second lien, 9.875%, 7/15/21 |
United States | 10,000,000 | 10,300,000 | |||||||||||
| f | Boparan Finance PLC, senior note, 144A, |
|||||||||||||
| 9.75%, 4/30/18 |
United Kingdom | 2,000,000 | EUR | 2,949,453 | ||||||||||
| 9.875%, 4/30/18 |
United Kingdom | 7,500,000 | GBP | 13,828,635 | ||||||||||
| f | Innovation Ventures LLC/Finance Corp., secured note, 144A, 9.50%, 8/15/19 |
United States | 5,000,000 | 4,950,000 | ||||||||||
| f | JBS USA LLC/Finance Inc., senior note, 144A, |
|||||||||||||
| 8.25%, 2/01/20 |
United States | 10,000,000 | 10,900,000 | |||||||||||
| 7.25%, 6/01/21 |
United States | 17,400,000 | 18,748,500 | |||||||||||
| SUPERVALU Inc., senior note, 8.00%, 5/01/16 |
United States | 5,000,000 | 5,518,750 | |||||||||||
| U.S. Foods Inc., 8.50%, 6/30/19 |
United States | 10,000,000 | 10,715,000 | |||||||||||
|
|
|
|||||||||||||
| 77,910,338 | ||||||||||||||
|
|
|
|||||||||||||
| Energy 6.8% |
||||||||||||||
| Alpha Natural Resources Inc., senior note, 6.25%, 6/01/21 |
United States | 2,500,000 | 1,781,250 | |||||||||||
| Antero Resources Finance Corp., senior note, 5.375%, 11/01/21 |
United States | 2,200,000 | 2,304,500 | |||||||||||
| Arch Coal Inc., senior note, |
||||||||||||||
| h 7.00%, 6/15/19 |
United States | 5,500,000 | 4,193,750 | |||||||||||
| 7.25%, 6/15/21 |
United States | 12,500,000 | 9,187,500 | |||||||||||
| Bill Barrett Corp., senior note, 7.00%, 10/15/22 |
United States | 5,000,000 | 5,325,000 | |||||||||||
| f | Calumet Specialty Products Partners LP/Calumet Finance Corp., senior note, 144A, 6.50%, 4/15/21 |
United States | 5,000,000 | 5,125,000 | ||||||||||
| CGG SA, senior note, 6.50%, 6/01/21 |
France | 12,500,000 | 12,468,750 | |||||||||||
| CHC Helicopter SA, senior secured note, first lien, 9.25%, 10/15/20 |
Canada | 22,500,000 | 24,637,500 | |||||||||||
| CONSOL Energy Inc., senior note, |
||||||||||||||
| 8.25%, 4/01/20 |
United States | 1,800,000 | 1,957,500 | |||||||||||
| f 144A, 5.875%, 4/15/22 |
United States | 21,500,000 | 22,575,000 | |||||||||||
| Denbury Resources Inc., senior note, 5.50%, 5/01/22 |
United States | 7,500,000 | 7,678,125 | |||||||||||
| El Paso Corp., senior note, MTN, 7.75%, 1/15/32 |
United States | 22,000,000 | 24,365,000 | |||||||||||
| Energy XXI Gulf Coast Inc., senior note, 9.25%, 12/15/17 |
United States | 10,000,000 | 10,700,000 | |||||||||||
| f | EnQuest PLC, senior note, 144A, 7.00%, 4/15/22 |
United Kingdom | 13,000,000 | 13,495,625 | ||||||||||
| EP Energy LLC/Finance Inc., senior note, 9.375%, 5/01/20 |
United States | 10,000,000 | 11,500,000 | |||||||||||
| EXCO Resources Inc., senior note, 7.50%, 9/15/18 |
United States | 10,500,000 | 10,815,000 | |||||||||||
| f | Expro Finance Luxembourg, senior secured note, 144A, 8.50%, 12/15/16 |
United Kingdom | 16,840,000 | 17,608,325 | ||||||||||
| f | Gibson Energy Inc., senior note, 144A, 6.75%, 7/15/21 |
Canada | 7,000,000 | 7,612,500 | ||||||||||
| Halcon Resources Corp., senior note, |
||||||||||||||
| 9.75%, 7/15/20 |
United States | 10,000,000 | 10,962,500 | |||||||||||
| 9.25%, 2/15/22 |
United States | 5,800,000 | 6,365,500 | |||||||||||
| Semiannual Report | FI-13 |
FRANKLIN TEMPLETON VARIABLE INSURANCE PRODUCTS TRUST
STATEMENT OF INVESTMENTS (UNAUDITED)
Franklin Income VIP Fund (continued)
| Country | Principal Amount* |
Value | ||||||||||||
| Corporate Bonds (continued) |
||||||||||||||
| Energy (continued) |
||||||||||||||
| f | Kinder Morgan Inc., |
|||||||||||||
| senior secured bond, first lien, 144A, 5.625%, 11/15/23 |
United States | 9,800,000 | $ | 10,118,500 | ||||||||||
| senior secured note, 144A, 5.00%, 2/15/21 |
United States | 2,400,000 | 2,502,000 | |||||||||||
| Linn Energy LLC/Finance Corp., senior note, 8.625%, 4/15/20 |
United States | 20,000,000 | 21,700,000 | |||||||||||
| Magnum Hunter Resources Corp., senior note, 9.75%, 5/15/20 |
United States | 5,000,000 | 5,550,000 | |||||||||||
| Midstates Petroleum Co. Inc./LLC, senior note, 10.75%, 10/01/20 |
United States | 5,000,000 | 5,700,000 | |||||||||||
| f | Niska Gas Storage Canada ULC/Finance Corp., senior note, 144A, 6.50%, 4/01/19 |
United States | 11,500,000 | 11,083,125 | ||||||||||
| f | Ocean Rig UDW Inc., senior note, 144A, 7.25%, 4/01/19 |
United States | 7,500,000 | 7,443,750 | ||||||||||
| Peabody Energy Corp., senior note, 6.25%, 11/15/21 |
United States | 15,000,000 | 15,018,750 | |||||||||||
| Penn Virginia Corp., senior note, 8.50%, 5/01/20 |
United States | 8,600,000 | 9,653,500 | |||||||||||
| Plains Exploration & Production Co., senior note, 6.50%, 11/15/20 |
United States | 10,000,000 | 11,137,500 | |||||||||||
| Quicksilver Resources Inc., senior note, 9.125%, 8/15/19 |
United States | 20,000,000 | 18,650,000 | |||||||||||
| Regency Energy Partners LP/Regency Energy Finance Corp., senior note, 5.875%, 3/01/22 |
United States | 3,900,000 | 4,246,125 | |||||||||||
| f | Rice Energy Inc., senior note, 144A, 6.25%, 5/01/22 |
United States | 2,700,000 | 2,770,875 | ||||||||||
| Sabine Pass Liquefaction LLC, |
||||||||||||||
| first lien, 5.625%, 2/01/21 |
United States | 15,100,000 | 16,043,750 | |||||||||||
| f senior secured note, first lien, 144A, 5.75%, 5/15/24 |
United States | 9,900,000 | 10,333,125 | |||||||||||
| Sabine Pass LNG LP, |
||||||||||||||
| first lien, 6.50%, 11/01/20 |
United States | 10,000,000 | 10,875,000 | |||||||||||
| senior secured note, 7.50%, 11/30/16 |
United States | 10,000,000 | 11,100,000 | |||||||||||
| f | Samson Investment Co., senior note, 144A, 9.75%, 2/15/20 |
United States | 26,300,000 | 27,845,125 | ||||||||||
| f | Sanchez Energy Corp., senior note, 144A, |
|||||||||||||
| 7.75%, 6/15/21 |
United States | 9,300,000 | 10,137,000 | |||||||||||
| 6.125%, 1/15/23 |
United States | 6,200,000 | 6,417,000 | |||||||||||
| SandRidge Energy Inc., senior note, |
||||||||||||||
| 8.75%, 1/15/20 |
United States | 20,000,000 | 21,600,000 | |||||||||||
| 7.50%, 3/15/21 |
United States | 15,000,000 | 16,331,250 | |||||||||||
| 8.125%, 10/15/22 |
United States | 10,000,000 | 11,062,500 | |||||||||||
| 7.50%, 2/15/23 |
United States | 6,600,000 | 7,194,000 | |||||||||||
| W&T Offshore Inc., senior note, 8.50%, 6/15/19 |
United States | 40,500,000 | 43,942,500 | |||||||||||
|
|
|
|||||||||||||
| 529,113,700 | ||||||||||||||
|
|
|
|||||||||||||
| Financials 3.0% |
||||||||||||||
| Ally Financial Inc., senior note, 6.25%, 12/01/17 |
United States | 3,900,000 | 4,368,000 | |||||||||||
| i | Bank of America Corp., junior sub. bond, M, 8.125% to 5/15/18, FRN thereafter, Perpetual |
United States | 5,000,000 | 5,651,990 | ||||||||||
| f | Ceridian LLC/Comdata Inc., senior note, 144A, 8.125%, 11/15/17 |
United States | 5,000,000 | 5,062,500 | ||||||||||
| i | Citigroup Inc., |
|||||||||||||
| junior sub. bond, M, 6.30% to 5/15/24, FRN thereafter, Perpetual |
United States | 16,800,000 | 17,188,332 | |||||||||||
| junior sub. note, 5.90% to 2/15/23, FRN thereafter, Perpetual |
United States | 12,500,000 | 12,679,838 | |||||||||||
| E*TRADE Financial Corp., senior note, 6.00%, 11/15/17 |
United States | 12,500,000 | 13,062,500 | |||||||||||
| International Lease Finance Corp., senior note, 8.75%, 3/15/17 |
United States | 15,000,000 | 17,465,625 | |||||||||||
| i | JPMorgan Chase & Co., |
|||||||||||||
| junior sub. bond, 5.00% to 7/30/19, FRN thereafter, Perpetual |
United States | 10,000,000 | 9,991,980 | |||||||||||
| junior sub. bond, 6.00% to 8/01/23, FRN thereafter, Perpetual |
United States | 3,200,000 | 3,280,000 | |||||||||||
| junior sub. note, 1, 7.90% to 4/30/19, FRN thereafter, Perpetual |
United States | 85,000,000 | 95,625,000 | |||||||||||
| Morgan Stanley, senior note, 5.50%, 1/26/20 |
United States | 15,000,000 | 17,186,655 | |||||||||||
| Nationstar Mortgage LLC/Nationstar Capital Corp., senior note, 9.625%, 5/01/19 |
United States | 5,000,000 | 5,600,000 | |||||||||||
| FI-14 | Semiannual Report |
FRANKLIN TEMPLETON VARIABLE INSURANCE PRODUCTS TRUST
STATEMENT OF INVESTMENTS (UNAUDITED)
Franklin Income VIP Fund (continued)
| Country | Principal Amount* |
Value | ||||||||||||
| Corporate Bonds (continued) |
||||||||||||||
| Financials (continued) |
||||||||||||||
| f | Nuveen Investments Inc., senior note, 144A, 9.50%, 10/15/20 |
United States | 3,600,000 | $ | 4,284,000 | |||||||||
| i | PNC Financial Services Group Inc., junior sub. note, 4.85% to 6/01/23, FRN thereafter, Perpetual |
United States | 8,000,000 | 7,710,000 | ||||||||||
| SLM Corp., senior note, 6.125%, 3/25/24 |
United States | 5,000,000 | 5,081,250 | |||||||||||
| i | Wells Fargo & Co., S, junior sub. bond, 5.90% to 6/15/14, FRN thereafter, Perpetual |
United States | 7,900,000 | 8,383,875 | ||||||||||
|
|
|
|||||||||||||
| 232,621,545 | ||||||||||||||
|
|
|
|||||||||||||
| Health Care 2.0% |
||||||||||||||
| f | CHS/Community Health Systems Inc., senior note, 144A, |
|||||||||||||
| 5.125%, 8/01/21 |
United States | 2,600,000 | 2,678,000 | |||||||||||
| 6.875%, 2/01/22 |
United States | 6,400,000 | 6,816,000 | |||||||||||
| HCA Inc., |
||||||||||||||
| senior note, 7.50%, 2/15/22 |
United States | 25,000,000 | 28,906,250 | |||||||||||
| senior note, 5.875%, 5/01/23 |
United States | 7,500,000 | 7,865,625 | |||||||||||
| senior secured note, 6.50%, 2/15/20 |
United States | 16,500,000 | 18,603,750 | |||||||||||
| senior secured note, first lien, 5.00%, 3/15/24 |
United States | 10,400,000 | 10,569,728 | |||||||||||
| b,f,g | Jaguar Holding Co. I, senior note, 144A, PIK, 9.375%, 10/15/17 |
United States | 10,200,000 | 10,608,000 | ||||||||||
| f | MPH Acquisition Holdings LLC, senior note, 144A, 6.625%, 4/01/22 |
United States | 5,000,000 | 5,250,000 | ||||||||||
| Tenet Healthcare Corp., senior note, |
||||||||||||||
| 8.00%, 8/01/20 |
United States | 10,426,000 | 11,325,243 | |||||||||||
| 8.125%, 4/01/22 |
United States | 22,500,000 | 26,100,000 | |||||||||||
| f 144A, 5.00%, 3/01/19 |
United States | 3,400,000 | 3,455,250 | |||||||||||
| j FRN, 9.25%, 2/01/15 |
United States | 13,000,000 | 13,670,800 | |||||||||||
| f | Valeant Pharmaceuticals International Inc., senior note, 144A, 7.50%, 7/15/21 |
United States | 7,700,000 | 8,556,625 | ||||||||||
|
|
|
|||||||||||||
| 154,405,271 | ||||||||||||||
|
|
|
|||||||||||||
| Industrials 1.3% |
||||||||||||||
| f | Abengoa Finance SAU, senior note, 144A, 8.875%, 11/01/17 |
Spain | 12,900,000 | 14,601,187 | ||||||||||
| f | Algeco Scotsman Global Finance PLC, |
|||||||||||||
| senior note, 144A, 10.75%, 10/15/19 |
United Kingdom | 5,000,000 | 5,234,375 | |||||||||||
| senior secured note, first lien, 144A, 8.50%, 10/15/18 |
United Kingdom | 9,900,000 | 10,605,375 | |||||||||||
| f | Bombardier Inc., senior bond, 144A, 6.125%, 1/15/23 |
Canada | 7,500,000 | 7,762,500 | ||||||||||
| f | CEVA Group PLC, |
|||||||||||||
| secured note, 144A, 9.00%, 9/01/21 |
United Kingdom | 5,000,000 | 5,178,125 | |||||||||||
| senior note, first lien, 144A, 4.00%, 5/01/18 |
United Kingdom | 12,691,882 | 11,739,991 | |||||||||||
| Hertz Corp., senior note, 6.75%, 4/15/19 |
United States | 4,500,000 | 4,792,500 | |||||||||||
| Navistar International Corp., senior note, 8.25%, 11/01/21 |
United States | 16,300,000 | 17,074,250 | |||||||||||
| f | Stena AB, senior bond, 144A, 7.00%, 2/01/24 |
Sweden | 5,800,000 | 6,191,500 | ||||||||||
| f | TransDigm Inc., |
|||||||||||||
| senior sub. bond, 144A, 6.50%, 7/15/24 |
United States | 2,700,000 | 2,814,750 | |||||||||||
| senior sub. note, 144A, 6.00%, 7/15/22 |
United States | 2,700,000 | 2,777,625 | |||||||||||
| United Rentals North America Inc., senior sub. note, 8.375%, 9/15/20 |
United States | 8,800,000 | 9,702,000 | |||||||||||
|
|
|
|||||||||||||
| 98,474,178 | ||||||||||||||
|
|
|
|||||||||||||
| Information Technology 4.3% |
||||||||||||||
| f | BMC Software Finance Inc., senior note, 144A, 8.125%, 7/15/21 |
United States | 16,500,000 | 17,056,875 | ||||||||||
| f,g | Boxer Parent Co. Inc., senior note, 144A, PIK, 9.75%, 10/15/19 |
United States | 10,000,000 | 9,800,000 | ||||||||||
| CDW LLC/Finance Corp., senior note, 8.50%, 4/01/19 |
United States | 13,725,000 | 14,925,937 | |||||||||||
| f,g | CommScope Holdings Co. Inc., senior note, 144A, PIK, 7.375%, 6/01/20 |
United States | 11,200,000 | 12,012,000 | ||||||||||
| Semiannual Report | FI-15 |
FRANKLIN TEMPLETON VARIABLE INSURANCE PRODUCTS TRUST
STATEMENT OF INVESTMENTS (UNAUDITED)
Franklin Income VIP Fund (continued)
| Country | Principal Amount* |
Value | ||||||||||||
| Corporate Bonds (continued) |
||||||||||||||
| Information Technology (continued) |
||||||||||||||
| First Data Corp., |
||||||||||||||
| senior bond, 12.625%, 1/15/21 |
United States | 80,000,000 | $ | 98,700,000 | ||||||||||
| f senior secured bond, 144A, 8.25%, 1/15/21 |
United States | 45,000,000 | 49,500,000 | |||||||||||
| f,g senior secured note, 144A, PIK, 8.75%, 1/15/22 |
United States | 33,188,000 | 36,797,195 | |||||||||||
| Freescale Semiconductor Inc., senior note, |
||||||||||||||
| 8.05%, 2/01/20 |
United States | 15,606,000 | 16,893,495 | |||||||||||
| 10.75%, 8/01/20 |
United States | 54,846,000 | 62,113,095 | |||||||||||
| Infor U.S. Inc., senior note, 9.375%, 4/01/19 |
United States | 4,100,000 | 4,581,750 | |||||||||||
| Sterling International Inc., senior note, 11.00%, 10/01/19 |
United States | 7,500,000 | 8,081,250 | |||||||||||
|
|
|
|||||||||||||
| 330,461,597 | ||||||||||||||
|
|
|
|||||||||||||
| Materials 2.9% |
||||||||||||||
| AngloGold Ashanti Holdings PLC, senior note, 8.50%, 7/30/20 |
South Africa | 6,000,000 | 6,753,750 | |||||||||||
| f | Ardagh Packaging Finance PLC/Ardagh MP Holdings USA Inc., |
|||||||||||||
| 6.25%, 1/31/19 |
Luxembourg | 2,800,000 | 2,877,000 | |||||||||||
| 6.75%, 1/31/21 |
Luxembourg | 3,000,000 | 3,116,250 | |||||||||||
| f | Cemex Finance LLC, senior secured note, 144A, |
|||||||||||||
| 9.375%, 10/12/22 |
Mexico | 7,100,000 | 8,386,875 | |||||||||||
| 6.00%, 4/01/24 |
Mexico | 14,700,000 | 15,352,312 | |||||||||||
| f | Cemex SAB de CV, senior secured note, 144A, |
|||||||||||||
| 9.00%, 1/11/18 |
Mexico | 5,581,000 | 6,020,504 | |||||||||||
| 9.50%, 6/15/18 |
Mexico | 12,000,000 | 13,807,500 | |||||||||||
| f | Consolidated Minerals Ltd., senior secured note, 144A, 8.00%, 5/15/20 |
Jersey Islands | 5,000,000 | 4,918,750 | ||||||||||
| Dynacast International LLC/Finance Inc., 9.25%, 7/15/19 |
United States | 5,000,000 | 5,525,000 | |||||||||||
| f | First Quantum Minerals Ltd., senior note, 144A, |
|||||||||||||
| 6.75%, 2/15/20 |
Canada | 2,300,000 | 2,380,500 | |||||||||||
| 7.00%, 2/15/21 |
Canada | 2,300,000 | 2,377,625 | |||||||||||
| f | FMG Resources (August 2006) Pty. Ltd., senior note, 144A, |
|||||||||||||
| 6.875%, 2/01/18 |
Australia | 11,900,000 | 12,524,750 | |||||||||||
| 8.25%, 11/01/19 |
Australia | 15,000,000 | 16,387,500 | |||||||||||
| HudBay Minerals Inc., senior note, 9.50%, 10/01/20 |
Canada | 10,000,000 | 11,050,000 | |||||||||||
| f | Ineos Finance PLC, senior secured note, 144A, 8.375%, 2/15/19 |
Switzerland | 5,100,000 | 5,597,250 | ||||||||||
| f | Ineos Group Holdings SA, senior note, 144A, 5.75%, 2/15/19 |
Switzerland | 5,700,000 | EUR | 8,083,949 | |||||||||
| f | Kerling PLC, senior secured note, 144A, 10.625%, 2/01/17 |
United Kingdom | 9,400,000 | EUR | 13,693,665 | |||||||||
| f | Orion Engineered Carbons Bondco GmbH, |
|||||||||||||
| senior secured bond, 144A, 10.00%, 6/15/18 |
Germany | 7,920,000 | EUR | 11,713,727 | ||||||||||
| senior secured note, first lien, 144A, 9.625%, 6/15/18 |
Germany | 10,100,000 | 10,914,312 | |||||||||||
| f,g | Orion Engineered Carbons Finance & Co. SCA, senior note, 144A, PIK, 9.25%, 8/01/19 |
Germany | 4,800,000 | 5,018,400 | ||||||||||
| Reynolds Group Issuer Inc./LLC/SA, |
||||||||||||||
| first lien, 5.75%, 10/15/20 |
United States | 14,200,000 | 15,052,000 | |||||||||||
| senior note, 9.00%, 4/15/19 |
United States | 5,000,000 | 5,318,750 | |||||||||||
| senior note, 9.875%, 8/15/19 |
United States | 16,800,000 | 18,711,000 | |||||||||||
| senior note, 8.25%, 2/15/21 |
United States | 5,200,000 | 5,681,000 | |||||||||||
| senior secured note, 6.875%, 2/15/21 |
United States | 10,000,000 | 10,841,250 | |||||||||||
| Walter Energy Inc., senior note, 9.875%, 12/15/20 |
United States | 7,000,000 | 4,392,500 | |||||||||||
|
|
|
|||||||||||||
| 226,496,119 | ||||||||||||||
|
|
|
|||||||||||||
| Telecommunication Services 3.4% |
||||||||||||||
| f | Altice SA, senior secured note, 144A, 7.75%, 5/15/22 |
Luxembourg | 3,000,000 | 3,198,540 | ||||||||||
| FI-16 | Semiannual Report |
FRANKLIN TEMPLETON VARIABLE INSURANCE PRODUCTS TRUST
STATEMENT OF INVESTMENTS (UNAUDITED)
Franklin Income VIP Fund (continued)
| Country | Principal Amount* |
Value | ||||||||||||
| Corporate Bonds (continued) |
||||||||||||||
| Telecommunication Services (continued) |
||||||||||||||
| CenturyLink Inc., senior bond, 6.75%, 12/01/23 |
United States | 1,700,000 | $ | 1,865,750 | ||||||||||
| Frontier Communications Corp., senior note, |
||||||||||||||
| 8.50%, 4/15/20 |
United States | 12,900,000 | 15,286,500 | |||||||||||
| 9.25%, 7/01/21 |
United States | 7,400,000 | 8,889,250 | |||||||||||
| 7.125%, 1/15/23 |
United States | 8,800,000 | 9,372,000 | |||||||||||
| Intelsat Jackson Holdings SA, senior bond, 5.50%, 8/01/23 |
Luxembourg | 8,400,000 | 8,379,000 | |||||||||||
| f | Sprint Corp., |
|||||||||||||
| senior bond, 144A, 7.125%, 6/15/24 |
United States | 8,200,000 | 8,712,500 | |||||||||||
| senior note, 144A, 7.875%, 9/15/23 |
United States | 37,500,000 | 41,812,500 | |||||||||||
| Sprint Nextel Corp., |
||||||||||||||
| 11.50%, 11/15/21 |
United States | 30,000,000 | 40,650,000 | |||||||||||
| senior note, 9.125%, 3/01/17 |
United States | 13,300,000 | 15,610,875 | |||||||||||
| senior note, 7.00%, 8/15/20 |
United States | 5,000,000 | 5,556,250 | |||||||||||
| f senior note, 144A, 9.00%, 11/15/18 |
United States | 20,000,000 | 24,300,000 | |||||||||||
| T-Mobile USA Inc., |
||||||||||||||
| senior bond, 6.625%, 4/01/23 |
United States | 15,000,000 | 16,350,000 | |||||||||||
| senior note, 6.542%, 4/28/20 |
United States | 11,200,000 | 12,138,000 | |||||||||||
| senior note, 6.633%, 4/28/21 |
United States | 5,000,000 | 5,431,250 | |||||||||||
| senior note, 6.731%, 4/28/22 |
United States | 5,000,000 | 5,412,500 | |||||||||||
| f | Telecom Italia SpA, senior note, 144A, 5.303%, 5/30/24 |
Italy | 7,500,000 | 7,537,500 | ||||||||||
| Verizon Communications Inc., |
||||||||||||||
| senior bond, 6.55%, 9/15/43 |
United States | 7,300,000 | 9,205,081 | |||||||||||
| senior note, 5.15%, 9/15/23 |
United States | 6,900,000 | 7,731,954 | |||||||||||
| f | Wind Acquisition Finance SA, senior secured note, 144A, 7.375%, 4/23/21 |
Italy | 15,000,000 | 16,134,375 | ||||||||||
|
|
|
|||||||||||||
| 263,573,825 | ||||||||||||||
|
|
|
|||||||||||||
| Utilities 0.6% |
||||||||||||||
| f | Calpine Corp., senior secured note, 144A, |
|||||||||||||
| 7.875%, 7/31/20 |
United States | 4,542,000 | 4,950,780 | |||||||||||
| 7.50%, 2/15/21 |
United States | 11,970,000 | 13,002,413 | |||||||||||
| 7.875%, 1/15/23 |
United States | 4,448,000 | 4,981,760 | |||||||||||
| f | InterGen NV, secured bond, 144A, 7.00%, 6/30/23 |
Netherlands | 25,000,000 | 26,000,000 | ||||||||||
|
|
|
|||||||||||||
| 48,934,953 | ||||||||||||||
|
|
|
|||||||||||||
| Total Corporate Bonds (Cost $2,133,534,510) |
2,357,733,588 | |||||||||||||
|
|
|
|||||||||||||
| j,k | Senior Floating Rate Interests 2.7% |
|||||||||||||
| Consumer Discretionary 0.9% |
||||||||||||||
| Clear Channel Communications Inc., |
||||||||||||||
| Tranche B Term Loan, 3.80%, 1/29/16 |
United States | 711,676 | 707,448 | |||||||||||
| Tranche D Term Loan, 6.90%, 1/30/19 |
United States | 50,864,664 | 50,743,860 | |||||||||||
| Tranche E Term Loan, 7.65%, 7/30/19 |
United States | 13,142,769 | 13,198,441 | |||||||||||
| Dex Media West LLC, Term Loan B, 8.00%, 12/30/16 |
United States | 1,219,214 | 1,127,773 | |||||||||||
| SuperMedia Inc., Exit Term Loan, 11.60%, 12/31/16 |
United States | 799,290 | 678,397 | |||||||||||
|
|
|
|||||||||||||
| 66,455,919 | ||||||||||||||
|
|
|
|||||||||||||
| Consumer Staples 0.2% |
||||||||||||||
| U.S. Foods Inc., Term Loan, 4.50%, 3/31/19 |
United States | 14,850,000 | 14,887,125 | |||||||||||
|
|
|
|||||||||||||
| Energy 0.6% |
||||||||||||||
| Drillships Financing Holding Inc., Tranche B-1 Term Loan, 6.00%, 3/31/21 |
Marshall Islands | 14,962,312 | 15,186,746 | |||||||||||
| Fieldwood Energy LLC, Second Lien Closing Date Loans, 8.375%, 9/30/20 |
United States | 10,000,000 | 10,341,040 | |||||||||||
| Semiannual Report | FI-17 |
FRANKLIN TEMPLETON VARIABLE INSURANCE PRODUCTS TRUST
STATEMENT OF INVESTMENTS (UNAUDITED)
Franklin Income VIP Fund (continued)
| Country | Principal Amount* |
Value | ||||||||||||
| Senior Floating Rate Interests (continued) |
||||||||||||||
| Energy (continued) |
||||||||||||||
| Quicksilver Resources Inc., Second Lien Loans, 7.00%, 6/21/19 |
United States | 25,000,000 | $ | 24,484,375 | ||||||||||
|
|
|
|||||||||||||
| 50,012,161 | ||||||||||||||
|
|
|
|||||||||||||
| Industrials 0.6% |
||||||||||||||
| Altegrity Inc., |
||||||||||||||
| Tranche B Term Loan, 5.00%, 2/21/15 |
United States | 12,332,706 | 12,247,919 | |||||||||||
| Tranche D Term Loan, 7.75%, 2/21/15 |
United States | 12,440,382 | 12,393,730 | |||||||||||
| CEVA Group PLC, Pre-Funded L/C, 6.50%, 3/19/21 |
United States | 5,418,719 | 5,322,765 | |||||||||||
| Ceva Intercompany B.V., Dutch BV Term Loan, 6.50%, 3/19/21 |
Netherlands | 5,700,000 | 5,600,250 | |||||||||||
| CEVA Logistics Canada ULC, Canadian Term Loan, 6.50%, 3/19/21 |
Canada | 982,759 | 965,560 | |||||||||||
| CEVA Logistics U.S. Holdings Inc., U.S. Term Loan, 6.50%, 3/19/21 |
United States | 7,862,069 | 7,722,847 | |||||||||||
| Navistar Inc., Tranche B Term Loan, 5.75%, 8/17/17 |
United States | 6,081,022 | 6,212,147 | |||||||||||
|
|
|
|||||||||||||
| 50,465,218 | ||||||||||||||
|
|
|
|||||||||||||
| Information Technology 0.4% |
||||||||||||||
| First Data Corp., 2018 Term Loan, 4.154%, 3/24/18 |
United States | 22,436,455 | 22,510,899 | |||||||||||
| SRA International Inc., Term Loan, 6.50%, 7/20/18 |
United States | 7,714,286 | 7,752,857 | |||||||||||
|
|
|
|||||||||||||
| 30,263,756 | ||||||||||||||
|
|
|
|||||||||||||
| Total Senior Floating Rate Interests |
212,084,179 | |||||||||||||
|
|
|
|||||||||||||
| Shares | ||||||||||||||
| Escrows and Litigation Trusts 0.0%† |
||||||||||||||
| a,l | Dynegy Holdings Inc., Escrow Account |
United States | 149,699,000 | — | ||||||||||
| a | Motors Liquidation Co., Escrow Account, cvt. pfd., C |
United States | 1,400,000 | 14,000 | ||||||||||
| a,l | SuperMedia Inc., Litigation Trust |
United States | 3,472,135 | — | ||||||||||
|
|
|
|||||||||||||
| Total Escrows and Litigation Trusts |
14,000 | |||||||||||||
|
|
|
|||||||||||||
| Total Investments before Short Term Investments |
7,305,044,774 | |||||||||||||
|
|
|
|||||||||||||
| FI-18 | Semiannual Report |
FRANKLIN TEMPLETON VARIABLE INSURANCE PRODUCTS TRUST
STATEMENT OF INVESTMENTS (UNAUDITED)
Franklin Income VIP Fund (continued)
| Country | Principal Amount* |
Value | ||||||||||||
| Short Term Investments 1.0% |
||||||||||||||
| Repurchase Agreements (Cost $76,482,610) 1.0% |
||||||||||||||
| m | Joint Repurchase Agreement, 0.064%, 7/01/14 (Maturity Value $76,482,747) |
United States | 76,482,610 | $ | 76,482,610 | |||||||||
| BNP Paribas Securities Corp. (Maturity Value $15,447,985) |
||||||||||||||
| Credit Suisse Securities (USA) LLC (Maturity Value $7,723,993) |
||||||||||||||
| Deutsche Bank Securities Inc. (Maturity Value $5,807,335) |
||||||||||||||
| HSBC Securities (USA) Inc. (Maturity Value $32,441,687) |
||||||||||||||
| Merrill Lynch, Pierce, Fenner & Smith Inc. (Maturity Value $15,061,747) |
||||||||||||||
| Collateralized by U.S. Government Agency Securities, 0.00% - 6.21%, |
||||||||||||||
| ` | Shares | |||||||||||||
| o | Investments from Cash Collateral Received for Loaned Securities (Cost $221,520) 0.0%† |
|||||||||||||
| Money Market Funds 0.0%† |
||||||||||||||
| p | BNY Mellon Overnight Government Fund, 0.082% |
United States | 221,520 | 221,520 | ||||||||||
|
|
|
|||||||||||||
| Total Investments (Cost $6,079,062,721) 95.2% |
7,381,748,904 | |||||||||||||
| Other Assets, less Liabilities 4.8% |
372,680,666 | |||||||||||||
|
|
|
|||||||||||||
| Net Assets 100.0% |
$ | 7,754,429,570 | ||||||||||||
|
|
|
|||||||||||||
See Abbreviations on page FI-32.
†Rounds to less than 0.1% of net assets.
*The principal amount is stated in U.S. dollars unless otherwise indicated.
aNon-income producing.
bAt June 30, 2014, pursuant to the Fund’s policies and the requirements of applicable securities law, the Fund may be restricted from trading these securities for a limited or extended period of time due to ownership limits and/or potential possession of material non-public information.
cSecurity purchased on a delayed delivery basis. See Note 1(d).
dSee Note 8 regarding restricted securities.
eSee Note 1(e) regarding equity-linked securities.
fSecurity was purchased pursuant to Rule 144A under the Securities Act of 1933 and may be sold in transactions exempt from registration only to qualified institutional buyers or in a public offering registered under the Securities Act of 1933. These securities have been deemed liquid under guidelines approved by the Trust’s Board of Trustees. At June 30, 2014, the aggregate value of these securities was $944,427,305, representing 12.18% of net assets.
gIncome may be received in additional securities and/or cash.
hA portion or all of the security is on loan at June 30, 2014. See Note 1(f).
iPerpetual security with no stated maturity date.
jThe coupon rate shown represents the rate at period end.
kSee Note 1(g) regarding senior floating rate interests.
lSecurity has been deemed illiquid because it may not be able to be sold within seven days.
mSee Note 1(c) regarding joint repurchase agreement.
nThe security is traded on a discount basis with no stated coupon rate.
oSee Note 1(f) regarding securities on loan.
pThe rate shown is the annualized seven-day yield at period end.
| The accompanying notes are an integral part of these financial statements. | Semiannual Report | FI-19 |
FRANKLIN TEMPLETON VARIABLE INSURANCE PRODUCTS TRUST
Financial Statements
Statement of Assets and Liabilities
June 30, 2014 (unaudited)
| Franklin Income VIP Fund |
||||
| Assets: | ||||
| Investments in securities: |
||||
| Cost - Unaffiliated issuers |
$ | 6,002,580,111 | ||
| Cost - Repurchase agreements |
76,482,610 | |||
|
|
|
|||
| Total cost of investments |
$ | 6,079,062,721 | ||
|
|
|
|||
| Value - Unaffiliated issuers |
$ | 7,305,266,294 | ||
| Value - Repurchase agreements |
76,482,610 | |||
|
|
|
|||
| Total value of investments (includes securities loaned in the amount $216,550) |
7,381,748,904 | |||
| Cash |
350,754,938 | |||
| Receivables: |
||||
| Investment securities sold |
3,802,160 | |||
| Capital shares sold |
2,898,038 | |||
| Dividends and interest |
59,082,237 | |||
| Other assets |
3,338 | |||
|
|
|
|||
| Total assets |
7,798,289,615 | |||
|
|
|
|||
| Liabilities: | ||||
| Payables: |
||||
| Investment securities purchased |
27,818,400 | |||
| Capital shares redeemed |
9,034,387 | |||
| Management fees |
2,856,659 | |||
| Distribution fees |
2,950,985 | |||
| Payable upon return of securities loaned |
221,520 | |||
| Accrued expenses and other liabilities |
978,094 | |||
|
|
|
|||
| Total liabilities |
43,860,045 | |||
|
|
|
|||
| Net assets, at value |
$ | 7,754,429,570 | ||
|
|
|
|||
| Net assets consist of: | ||||
| Paid-in capital |
$ | 7,280,731,483 | ||
| Undistributed net investment income |
132,841,540 | |||
| Net unrealized appreciation (depreciation) |
1,302,756,859 | |||
| Accumulated net realized gain (loss) |
(961,900,312 | ) | ||
|
|
|
|||
| Net assets, at value |
$ | 7,754,429,570 | ||
|
|
|
|||
| FI-20 | Semiannual Report | The accompanying notes are an integral part of these financial statements. |
FRANKLIN TEMPLETON VARIABLE INSURANCE PRODUCTS TRUST
FINANCIAL STATEMENTS
Statement of Assets and Liabilities (continued)
June 30, 2014 (unaudited)
| Franklin Income VIP Fund |
||||
| Class 1: | ||||
| Net assets, at value |
$ | 764,282,259 | ||
|
|
|
|||
| Shares outstanding |
44,284,419 | |||
|
|
|
|||
| Net asset value and maximum offering price per share |
$ | 17.26 | ||
|
|
|
|||
| Class 2: | ||||
| Net assets, at value |
$ | 6,577,658,277 | ||
|
|
|
|||
| Shares outstanding |
392,094,629 | |||
|
|
|
|||
| Net asset value and maximum offering price per share |
$ | 16.78 | ||
|
|
|
|||
| Class 4: | ||||
| Net assets, at value |
$ | 412,489,034 | ||
|
|
|
|||
| Shares outstanding |
24,112,731 | |||
|
|
|
|||
| Net asset value and maximum offering price per share |
$ | 17.11 | ||
|
|
|
|||
| The accompanying notes are an integral part of these financial statements. | Semiannual Report | FI-21 |
FRANKLIN TEMPLETON VARIABLE INSURANCE PRODUCTS TRUST
FINANCIAL STATEMENTS
Statement of Operations
for the six months ended June 30, 2014 (unaudited)
| Franklin Income VIP Fund |
||||
| Investment income: | ||||
| Dividends |
$ | 80,760,905 | ||
| Interest |
103,484,028 | |||
| Income from securities loaned |
559,713 | |||
|
|
|
|||
| Total investment income |
184,804,646 | |||
|
|
|
|||
| Expenses: | ||||
| Management fees (Note 3a) |
16,742,930 | |||
| Distribution fees: (Note 3c) |
||||
| Class 2 |
7,845,902 | |||
| Class 4 |
703,467 | |||
| Custodian fees (Note 4) |
53,390 | |||
| Reports to shareholders |
361,660 | |||
| Professional fees |
77,862 | |||
| Trustees’ fees and expenses |
19,264 | |||
| Other |
74,027 | |||
|
|
|
|||
| Total expenses |
25,878,502 | |||
| Expense reductions (Note 4) |
(356 | ) | ||
|
|
|
|||
| Net expenses |
25,878,146 | |||
|
|
|
|||
| Net investment income |
158,926,500 | |||
|
|
|
|||
| Realized and unrealized gains (losses): | ||||
| Net realized gain (loss) from: |
||||
| Investments |
83,353,512 | |||
| Foreign currency transactions |
(296,578 | ) | ||
|
|
|
|||
| Net realized gain (loss) |
83,056,934 | |||
|
|
|
|||
| Net change in unrealized appreciation (depreciation) on: |
||||
| Investments |
452,238,485 | |||
| Translation of other assets and liabilities denominated in foreign currencies |
(43,297 | ) | ||
|
|
|
|||
| Net change in unrealized appreciation (depreciation) |
452,195,188 | |||
|
|
|
|||
| Net realized and unrealized gain (loss) |
535,252,122 | |||
|
|
|
|||
| Net increase (decrease) in net assets resulting from operations |
$ | 694,178,622 | ||
|
|
|
|||
| FI-22 | Semiannual Report | The accompanying notes are an integral part of these financial statements. |
FRANKLIN TEMPLETON VARIABLE INSURANCE PRODUCTS TRUST
FINANCIAL STATEMENTS
Statements of Changes in Net Assets
| Franklin Income VIP Fund | ||||||||
| Six Months Ended June 30, 2014 (unaudited) |
Year Ended December 31, 2013 |
|||||||
| Increase (decrease) in net assets: | ||||||||
| Operations: |
||||||||
| Net investment income |
$ | 158,926,500 | $ | 352,220,004 | ||||
| Net realized gain (loss) from investments and foreign currency transactions |
83,056,934 | 58,814,586 | ||||||
| Net change in unrealized appreciation (depreciation) on investments and translation of other assets and liabilities denominated in foreign currencies |
452,195,188 | 532,304,482 | ||||||
|
|
|
|||||||
| Net increase (decrease) in net assets resulting from operations |
694,178,622 | 943,339,072 | ||||||
|
|
|
|||||||
| Distributions to shareholders from: |
||||||||
| Net investment income: |
||||||||
| Class 1 |
(37,211,436 | ) | (40,171,484 | ) | ||||
| Class 2 |
(314,580,044 | ) | (401,855,498 | ) | ||||
| Class 4 |
(19,237,312 | ) | (27,978,841 | ) | ||||
|
|
|
|||||||
| Total distributions to shareholders |
(371,028,792 | ) | (470,005,823 | ) | ||||
|
|
|
|||||||
| Capital share transactions (Note 2) |
||||||||
| Class 1 |
38,237,054 | 66,533,168 | ||||||
| Class 2 |
115,787,004 | (397,831,491 | ) | |||||
| Class 4 |
(3,445,547 | ) | (65,127,276 | ) | ||||
|
|
|
|||||||
| Total capital share transactions |
150,578,511 | (396,425,599 | ) | |||||
|
|
|
|||||||
| Net increase (decrease) in net assets |
473,728,341 | 76,907,650 | ||||||
| Net assets: | ||||||||
| Beginning of period |
7,280,701,229 | 7,203,793,579 | ||||||
|
|
|
|||||||
| End of period |
$ | 7,754,429,570 | $ | 7,280,701,229 | ||||
|
|
|
|||||||
| Undistributed net investment income included in net assets: | ||||||||
| End of period |
$ | 132,841,540 | $ | 344,943,832 | ||||
|
|
|
|||||||
| The accompanying notes are an integral part of these financial statements. | Semiannual Report | FI-23 |
FRANKLIN TEMPLETON VARIABLE INSURANCE PRODUCTS TRUST
Notes to Financial Statements (unaudited)
Franklin Income VIP Fund
| FI-24 | Semiannual Report |
FRANKLIN TEMPLETON VARIABLE INSURANCE PRODUCTS TRUST
NOTES TO FINANCIAL STATEMENTS (UNAUDITED)
Franklin Income VIP Fund (continued)
| Semiannual Report | FI-25 |
FRANKLIN TEMPLETON VARIABLE INSURANCE PRODUCTS TRUST
NOTES TO FINANCIAL STATEMENTS (UNAUDITED)
Franklin Income VIP Fund (continued)
1. Organization and Significant Accounting Policies (continued)
c. Joint Repurchase Agreement (continued)
repurchase price and any other amounts owed by the seller to the Fund in the event of default by the seller. This could involve costs or delays in addition to a loss on the securities if their value falls below the repurchase price owed by the seller. The joint repurchase agreement held by the Fund at period end, as indicated in the Statement of Investments, had been entered into on June 30, 2014.
d. Securities Purchased on a Delayed Delivery Basis
The Fund purchases securities on a delayed delivery basis, with payment and delivery scheduled for a future date. These transactions are subject to market fluctuations and are subject to the risk that the value at delivery may be more or less than the trade date purchase price. Although the Fund will generally purchase these securities with the intention of holding the securities, it may sell the securities before the settlement date. Sufficient assets have been segregated for these securities.
e. Equity-Linked Securities
The Fund invests in equity-linked securities. Equity-linked securities are hybrid financial instruments that generally combine both debt and equity characteristics into a single note form. Income received from equity-linked securities is recorded as realized gains in the Statement of Operations and may be based on the performance of an underlying equity security, an equity index, or an option position. The risks of investing in equity-linked securities include unfavorable price movements in the underlying security and the credit risk of the issuing financial institution. There may be no guarantee of a return of principal with equity-linked securities and the appreciation potential may be limited. Equity-linked securities may be more volatile and less liquid than other investments held by the Fund.
f. Securities Lending
The Fund participates in an agency based securities lending program. The Fund receives cash collateral against the loaned securities in an amount equal to at least 102% of the fair value of the loaned securities. Collateral is maintained over the life of the loan in an amount not less than 100% of the fair value of loaned securities, as determined at the close of fund business each day; any additional collateral required due to changes in security
values is delivered to the Fund on the next business day. The collateral is invested in a non-registered money fund as indicated on the Statement of Investments. The Fund receives income from the investment of cash collateral, in addition to lending fees and rebates paid by the borrower. The Fund bears the market risk with respect to the collateral investment, securities loaned, and the risk that the agent may default on its obligations to the Fund. The securities lending agent has agreed to indemnify the Fund in the event of default by a third party borrower.
g. Senior Floating Rate Interests
The Fund invests in senior secured corporate loans that pay interest at rates which are periodically reset by reference to a base lending rate plus a spread. These base lending rates are generally the prime rate offered by a designated U.S. bank or the London InterBank Offered Rate (LIBOR). Senior secured corporate loans often require prepayment of principal from excess cash flows or at the discretion of the borrower. As a result, actual maturity may be substantially less than the stated maturity. Senior secured corporate loans in which the Fund invests are generally readily marketable, but may be subject to certain restrictions on resale.
h. Income and Deferred Taxes
It is the Fund’s policy to qualify as a regulated investment company under the Internal Revenue Code. The Fund intends to distribute to shareholders substantially all of its taxable income and net realized gains to relieve it from federal income and if applicable, excise taxes. As a result, no provision for U.S. federal income taxes is required.
The Fund may be subject to foreign taxation related to income received, capital gains on the sale of securities and certain foreign currency transactions in the foreign jurisdictions in which it invests. Foreign taxes, if any, are recorded based on the tax regulations and rates that exist in the foreign markets in which the Fund invests. When a capital gain tax is determined to apply the Fund records an estimated deferred tax liability in an amount that would be payable if the securities were disposed of on the valuation date.
The Fund recognizes the tax benefits of uncertain tax positions only when the position is “more likely than not” to be sustained upon examination by the tax authorities based on the technical merits of the tax position. As of June 30, 2014, and for all open tax years, the Fund has determined that no liability for
| FI-26 | Semiannual Report |
FRANKLIN TEMPLETON VARIABLE INSURANCE PRODUCTS TRUST
NOTES TO FINANCIAL STATEMENTS (UNAUDITED)
Franklin Income VIP Fund (continued)
2. Shares of Beneficial Interest
At June 30, 2014, there were an unlimited number of shares authorized (without par value). Transactions in the Fund’s shares were as follows:
| Six Months Ended June 30, 2014 |
Year Ended December 31, 2013 |
|||||||||||||||||
| Shares | Amount | Shares | Amount | |||||||||||||||
| Class 1 Shares: | ||||||||||||||||||
| Shares sold |
1,295,389 | $ | 22,423,714 | 4,144,696 | $ | 65,962,113 | ||||||||||||
| Shares issued in reinvestment of distributions |
2,182,489 | 37,211,436 | 2,620,449 | 40,171,484 | ||||||||||||||
| Shares redeemed |
(1,250,764 | ) | (21,398,096 | ) | (2,480,546 | ) | (39,600,429 | ) | ||||||||||
|
|
|
|||||||||||||||||
| Net increase (decrease) |
2,227,114 | $ | 38,237,054 | 4,284,599 | $ | 66,533,168 | ||||||||||||
|
|
|
|||||||||||||||||
| Semiannual Report | FI-27 |
FRANKLIN TEMPLETON VARIABLE INSURANCE PRODUCTS TRUST
NOTES TO FINANCIAL STATEMENTS (UNAUDITED)
Franklin Income VIP Fund (continued)
2. Shares of Beneficial Interest (continued)
| Six Months Ended June 30, 2014 |
Year Ended December 31, 2013 |
|||||||||||||||||
| Shares | Amount | Shares | Amount | |||||||||||||||
| Class 2 Shares: | ||||||||||||||||||
| Shares sold |
16,531,918 | $ | 275,993,700 | 35,402,352 | $ | 551,266,014 | ||||||||||||
| Shares issued in reinvestment of distributions |
18,973,465 | 314,580,044 | 26,915,974 | 401,855,498 | ||||||||||||||
| Shares redeemed |
(28,553,126 | ) | (474,786,740 | ) | (87,475,715 | ) | (1,350,953,003 | ) | ||||||||||
|
|
|
|||||||||||||||||
| Net increase (decrease) |
6,952,257 | $ | 115,787,004 | (25,157,389 | ) | $ | (397,831,491 | ) | ||||||||||
|
|
|
|||||||||||||||||
| Class 4 Shares: | ||||||||||||||||||
| Shares sold |
1,797,456 | $ | 30,493,495 | 3,337,474 | $ | 52,791,548 | ||||||||||||
| Shares issued on reinvestment of distributions |
1,137,629 | 19,237,312 | 1,839,503 | 27,978,841 | ||||||||||||||
| Shares redeemed |
(3,134,749 | ) | (53,176,354 | ) | (9,346,237 | ) | (145,897,665 | ) | ||||||||||
|
|
|
|||||||||||||||||
| Net increase (decrease) |
(199,664 | ) | $ | (3,445,547 | ) | (4,169,260 | ) | $ | (65,127,276 | ) | ||||||||
|
|
|
|||||||||||||||||
3. Transactions With Affiliates
Franklin Resources, Inc. is the holding company for various subsidiaries that together are referred to as Franklin Templeton Investments. Certain officers and trustees of the Fund are also officers and/or directors of the following subsidiaries:
| Subsidiary | Affiliation | |
| Franklin Advisers, Inc. (Advisers) | Investment manager | |
| Templeton Investment Counsel, LLC (TIC) | Investment manager | |
| Franklin Templeton Services, LLC (FT Services) | Administrative manager | |
| Franklin Templeton Distributors, Inc. (Distributors) | Principal underwriter | |
| Franklin Templeton Investor Services, LLC (Investor Services) | Transfer agent |
a. Management Fees
The Fund pays an investment management fee to Advisers based on the average daily net assets of the Fund as follows:
| Annualized Fee Rate |
Net Assets | |
| 0.625% | Up to and including $100 million | |
| 0.500% | Over $100 million, up to and including $250 million | |
| 0.450% | Over $250 million, up to and including $7.5 billion | |
| 0.440% | Over $7.5 billion, up to and including $10 billion | |
| 0.430% | Over $10 billion, up to and including $12.5 billion | |
| 0.420% | Over $12.5 billion, up to and including $15 billion | |
| 0.400% | In excess of $15 billion |
Under a subadvisory agreement, TIC, an affiliate of Advisers, provides subadvisory services to the Fund. The subadvisory fee is paid by Advisers based on the average daily net assets, and is not an additional expense of the Fund. Effective February 1, 2014, the subadvisory agreement was terminated.
| FI-28 | Semiannual Report |
FRANKLIN TEMPLETON VARIABLE INSURANCE PRODUCTS TRUST
NOTES TO FINANCIAL STATEMENTS (UNAUDITED)
Franklin Income VIP Fund (continued)
b. Administrative Fees
Under an agreement with Advisers, FT Services provides administrative services to the Fund. The fee is paid by Advisers based on the Fund’s average daily net assets, and is not an additional expense of the Fund.
c. Distribution Fees
The Board has adopted distribution plans for Class 2 and Class 4 shares pursuant to Rule 12b-1 under the 1940 Act. Under the Fund’s compensation distribution plans, the Fund pays Distributors for costs incurred in connection with the servicing, sale and distribution of the Fund’s shares up to 0.35% per year of its average daily net assets of each class. Some distribution fees are not charged on shares held by affiliates. The Board has agreed to limit the current rate to 0.25% per year for Class 2. The plan year, for purposes of monitoring compliance with the maximum annual plan rates, is February 1 through January 31.
d. Transfer Agent Fees
Investor Services, under terms of an agreement, performs shareholder servicing for the Fund and is not paid by the Fund for the services.
4. Expense Offset Arrangement
The Fund has entered into an arrangement with its custodian whereby credits realized as a result of uninvested cash balances are used to reduce a portion of the Fund’s custodian expenses. During the period ended June 30, 2014, the custodian fees were reduced as noted in the Statement of Operations.
5. Income Taxes
For tax purposes, capital losses may be carried over to offset future capital gains. Capital loss carryforwards with no expiration, if any, must be fully utilized before those losses with expiration dates.
At December 31, 2013, capital loss carryforwards were as follows:
| Capital loss carryforwards subject to expiration: |
||
| 2016 |
$ 310,746,276 | |
| 2017 |
521,405,875 | |
| 2018 |
157,561,044 | |
| Capital loss carryforwards not subject to expiration: |
||
| Long term |
54,314,457 | |
|
| ||
| Total capital loss carryforwards |
$1,044,027,652 | |
|
| ||
At June 30, 2014, the cost of investments and net unrealized appreciation (depreciation) for income tax purposes were as follows:
| Cost of investments |
$6,092,002,038 | |
|
| ||
| Unrealized appreciation |
$1,578,629,284 | |
| Unrealized depreciation |
(288,882,418) | |
|
| ||
| Net unrealized appreciation (depreciation) |
$1,289,746,866 | |
|
| ||
Differences between income and/or capital gains as determined on a book basis and a tax basis are primarily due to differing treatments of defaulted securities, passive foreign investment company shares, payments-in-kind, bond discounts and premiums, corporate actions and wash sales.
| Semiannual Report | FI-29 |
FRANKLIN TEMPLETON VARIABLE INSURANCE PRODUCTS TRUST
NOTES TO FINANCIAL STATEMENTS (UNAUDITED)
Franklin Income VIP Fund (continued)
6. Investment Transactions
Purchases and sales of investments (excluding short term securities) for the period ended June 30, 2014, aggregated $543,448,589 and $759,472,982 respectively.
7. Credit Risk
At June 30, 2014, the Fund had 32.51% of its portfolio invested in high yield, senior secured floating rate notes, or other securities rated below investment grade. These securities may be more sensitive to economic conditions causing greater price volatility and are potentially subject to a greater risk of loss due to default than higher rated securities.
8. Restricted Securities
The Fund invests in securities that are restricted under the Securities Act of 1933 (1933 Act) or which are subject to legal, contractual, or other agreed upon restrictions on resale. Restricted securities are often purchased in private placement transactions, and cannot be sold without prior registration unless the sale is pursuant to an exemption under the 1933 Act. Disposal of these securities may require greater effort and expense, and prompt sale at an acceptable price may be difficult. The Fund may have registration rights for restricted securities. The issuer generally incurs all registration costs.
At June 30, 2014, the Fund held investments in restricted securities, excluding certain securities exempt from registration under the 1933 Act deemed to be liquid, as follows:
| Shares | Issuer | Acquisition Date |
Cost | Value | ||||||||||||
| 4,929,600 | First Data Holdings Inc., B (Value is 0.25% of Net Assets) |
6/26/14 | $ | 19,718,400 | $ | 19,718,400 | ||||||||||
|
|
|
|||||||||||||||
9. Credit Facility
The Fund, together with other U.S. registered and foreign investment funds (collectively, Borrowers), managed by Franklin Templeton Investments, are borrowers in a joint syndicated senior unsecured credit facility totaling $1.5 billion (Global Credit Facility) which matures on February 13, 2015. This Global Credit Facility provides a source of funds to the Borrowers for temporary and emergency purposes, including the ability to meet future unanticipated or unusually large redemption requests.
Under the terms of the Global Credit Facility, the Fund shall, in addition to interest charged on any borrowings made by the Fund and other costs incurred by the Fund, pay its share of fees and expenses incurred in connection with the implementation and maintenance of the Global Credit Facility, based upon its relative share of the aggregate net assets of all of the Borrowers, including an annual commitment fee of 0.07% based upon the unused portion of the Global Credit Facility. These fees are reflected in other expenses on the Statement of Operations. During the period ended June 30, 2014, the Fund did not use the Global Credit Facility.
10. Fair Value Measurements
The Fund follows a fair value hierarchy that distinguishes between market data obtained from independent sources (observable inputs) and the Fund’s own market assumptions (unobservable inputs). These inputs are used in determining the value of the Fund’s financial instruments and are summarized in the following fair value hierarchy:
| • | Level 1 – quoted prices in active markets for identical financial instruments |
| • | Level 2 – other significant observable inputs (including quoted prices for similar financial instruments, interest rates, prepayment speed, credit risk, etc.) |
| • | Level 3 – significant unobservable inputs (including the Fund’s own assumptions in determining the fair value of financial instruments) |
| FI-30 | Semiannual Report |
FRANKLIN TEMPLETON VARIABLE INSURANCE PRODUCTS TRUST
NOTES TO FINANCIAL STATEMENTS (UNAUDITED)
Franklin Income VIP Fund (continued)
The input levels are not necessarily an indication of the risk or liquidity associated with financial instruments at that level.
For movements between the levels within the fair value hierarchy, the Fund has adopted a policy of recognizing the transfers as of the date of the underlying event which caused the movement.
A summary of inputs used as of June 30, 2014, in valuing the Fund’s assets carried at fair value, is as follows:
| Level 1 | Level 2 | Level 3 | Total | |||||||||||||
| Assets: | ||||||||||||||||
| Investments in Securities: |
||||||||||||||||
| Equity Investments:a |
||||||||||||||||
| Energy |
$ | 733,847,781 | $ | 44,805,940 | $ | — | $ | 778,653,721 | ||||||||
| Financials |
693,529,943 | 15,200,000 | — | 708,729,943 | ||||||||||||
| Industrials |
229,859,423 | 31,071,126 | — | 260,930,549 | ||||||||||||
| Information Technology |
244,386,872 | — | 19,718,400 | 264,105,272 | ||||||||||||
| All Other Equity Investmentsb |
2,560,112,031 | — | — | 2,560,112,031 | ||||||||||||
| Equity-Linked Securities |
— | 80,999,885 | — | 80,999,885 | ||||||||||||
| Convertible Bonds |
— | 81,681,606 | — | 81,681,606 | ||||||||||||
| Corporate Bonds |
— | 2,357,733,588 | — | 2,357,733,588 | ||||||||||||
| Senior Floating Rate Interests |
— | 212,084,179 | — | 212,084,179 | ||||||||||||
| Escrows and Litigation Trusts |
— | — | 14,000 | c | 14,000 | |||||||||||
| Short Term Investments |
— | 76,704,130 | — | 76,704,130 | ||||||||||||
|
|
|
|||||||||||||||
| Total Investments in Securities |
$ | 4,461,736,050 | $ | 2,900,280,454 | $ | 19,732,400 | $ | 7,381,748,904 | ||||||||
|
|
|
|||||||||||||||
aIncludes common, preferred, and convertible preferred stocks as well as other equity investments.
bFor detailed categories, see the accompanying Statement of Investments.
c Includes securities determined to have no value at June 30, 2014.
A reconciliation of assets in which Level 3 inputs are used in determining fair value is presented when there are significant Level 3 financial instruments at the end of the period.
11. New Accounting Pronouncements
In June 2014, the Financial Accounting Standards Board issued Accounting Standards Update (ASU) No. 2014-11, Transfers and Servicing (Topic 860), Repurchase-to-Maturity Transactions, Repurchase Financings, and Disclosures. The ASU changes the accounting for certain repurchase agreements and expands disclosure requirements related to repurchase agreements, securities lending, repurchase-to-maturity and similar transactions. The ASU is effective for interim and annual reporting periods beginning after December 15, 2014. Management is currently evaluating the impact, if any, of applying this provision.
12. Subsequent Events
The Fund has evaluated subsequent events through the issuance of the financial statements and determined that no events have occurred that require disclosure.
| Semiannual Report | FI-31 |
FRANKLIN TEMPLETON VARIABLE INSURANCE PRODUCTS TRUST
NOTES TO FINANCIAL STATEMENTS (UNAUDITED)
Franklin Income VIP Fund (continued)
Abbreviations
| Currency | Selected Portfolio | |||||
| EUR | Euro | ADR | American Depositary Receipt | |||
| GBP | British Pound | FHLMC | Federal Home Loan Mortgage Corp. | |||
| FNMA | Federal National Mortgage Association | |||||
| FRN | Floating Rate Note | |||||
| L/C | Letter of Credit | |||||
| MTN | Medium Term Note | |||||
| PIK | Payment-In-Kind | |||||
| FI-32 | Semiannual Report |
Franklin Large Cap Growth VIP Fund
(Formerly, Franklin Large Cap Growth Securities Fund)
We are pleased to bring you Franklin Large Cap Growth VIP Fund’s semiannual report for the period ended June 30, 2014.
Class 2 Performance Summary as of June 30, 2014
Franklin Large Cap Growth VIP Fund – Class 2 delivered a total return of +8.20% for the six-month period ended June 30, 2014.
Performance reflects the Fund’s Class 2 operating expenses, but does not include any contract fees, expenses or sales charges. If they had been included, performance would be lower. These charges and deductions, particularly for variable life policies, can have a significant effect on contract values and insurance benefits. See the contract prospectus for a complete description of these expenses, including sales charges.
Performance data represent past performance, which does not guarantee future results. Investment return and principal value will fluctuate, and you may have a gain or loss when you sell your shares. Current performance may differ from figures shown.
| Semiannual Report | FLG-1 |
FRANKLIN LARGE CAP GROWTH VIP FUND
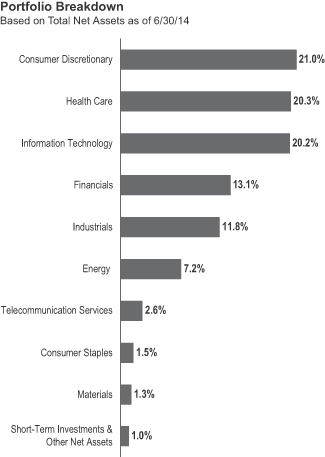
The Federal Reserve Board (Fed) began reducing bond purchases by $10 billion a month in January 2014, based on earlier largely positive economic and employment data. Although economic data in early 2014 were soft, Fed Chair Janet Yellen kept the pace of asset-purchase tapering intact while adopting a more qualitative approach to rate-hike guidance. However, the Fed pledged to keep interest rates low for a considerable time after the asset-purchase program ends, depending on inflation and employment trends. In June, the Fed lowered projections for near- and long-term economic growth even as it maintained the pace of tapering.
Investors’ confidence grew as corporate profits rose and generally favorable economic data indicated continued recovery despite brief sell-offs when many investors reacted to the Fed’s
1. Please see Index Descriptions following the Fund Summaries.
2. © 2014 Morningstar. One cannot invest directly in an index, and an index is not representative of the Fund’s portfolio. Please see Index Descriptions following the Fund Summaries.
3. Source: Bureau of Labor Statistics.
| FLG-2 | Semiannual Report |
FRANKLIN LARGE CAP GROWTH VIP FUND
specialty pharmaceuticals portfolio. Actavis also reported stronger-than-expected quarterly earnings, boosted by its acquisition of specialty drug maker Warner Chilcott in 2013. Aetna’s stock price gained after the company reported better-than-expected first-quarter results, driven by growth in new customers, and raised its 2014 guidance. The stock also benefited as investors’ concerns abated over the impact of the Affordable Care Act. Within consumer discretionary, automotive components manufacturer BorgWarner helped the Fund’s performance. The company reported better-than-expected fourth-quarter 2013 and first-quarter 2014 results and raised its full-year guidance given the potential benefits of acquiring engine component maker Gustav Wahler. In other sectors, personal computing and mobile communication device developer Apple was a key contributor.
In contrast, the Fund’s stock selection in consumer staples and an underweighting in utilities detracted from relative performance. Whole Foods Market in the consumer staples
4. Not part of the index.
| Semiannual Report | FLG-3 |
FRANKLIN LARGE CAP GROWTH VIP FUND
| FLG-4 | Semiannual Report |
5. Sold by period-end.
FRANKLIN LARGE CAP GROWTH VIP FUND
Class 2 Fund Expenses
| Class 2 | Beginning Account Value 1/1/14 |
Ending Account Value 6/30/14 |
Fund-Level Expenses 1/1/14–6/30/14 |
|||||||||
| Actual | $1,000 | $1,082.00 | $5.37 | |||||||||
| Hypothetical (5% return before expenses) | $1,000 | $1,019.64 | $5.21 | |||||||||
*Expenses are calculated using the most recent six-month annualized expense ratio for the Fund’s Class 2 shares (1.04%), which does not include any ongoing expenses of the Contract for which the Fund is an investment option, multiplied by the average account value over the period, multiplied by 181/365 to reflect the one-half year period.
| Semiannual Report | FLG-5 |
FRANKLIN TEMPLETON VARIABLE INSURANCE PRODUCTS TRUST
Financial Highlights
Franklin Large Cap Growth VIP Fund
| Six Months Ended (unaudited) |
Year Ended December 31, | |||||||||||||||||||||||
| 2013 | 2012 | 2011 | 2010 | 2009 | ||||||||||||||||||||
| Class 1 | ||||||||||||||||||||||||
| Per share operating performance (for a share outstanding throughout the period) |
||||||||||||||||||||||||
| Net asset value, beginning of period |
$20.91 | $16.43 | $14.75 | $15.07 | $13.62 | $10.66 | ||||||||||||||||||
|
|
|
|||||||||||||||||||||||
| Income from investment operationsa: | ||||||||||||||||||||||||
| Net investment incomeb |
0.10 | 0.24 | 0.21 | 0.15 | 0.12 | 0.12 | ||||||||||||||||||
| Net realized and unrealized gains (losses) |
1.65 | 4.48 | 1.65 | (0.33 | ) | 1.48 | 3.04 | |||||||||||||||||
|
|
|
|||||||||||||||||||||||
| Total from investment operations |
1.75 | 4.72 | 1.86 | (0.18 | ) | 1.60 | 3.16 | |||||||||||||||||
|
|
|
|||||||||||||||||||||||
| Less distributions from net investment income |
(0.30 | ) | (0.24 | ) | (0.18 | ) | (0.14 | ) | (0.15 | ) | (0.20 | ) | ||||||||||||
|
|
|
|||||||||||||||||||||||
| Net asset value, end of period |
$22.36 | $20.91 | $16.43 | $14.75 | $15.07 | $13.62 | ||||||||||||||||||
|
|
|
|||||||||||||||||||||||
| Total returnc |
8.37% | 28.92% | 12.65% | (1.22)% | 11.85% | 30.04% | ||||||||||||||||||
| Ratios to average net assetsd | ||||||||||||||||||||||||
| Expenses |
0.79% | 0.79% | 0.80% | 0.80% | 0.79% | 0.81% | e | |||||||||||||||||
| Net investment income |
0.94% | 1.27% | 1.31% | 0.99% | 0.86% | 1.03% | ||||||||||||||||||
| Supplemental data | ||||||||||||||||||||||||
| Net assets, end of period (000's) |
$55,741 | $54,291 | $46,756 | $48,666 | $58,265 | $58,287 | ||||||||||||||||||
| Portfolio turnover rate |
58.95% | 28.27% | 33.88% | 56.61% | 46.75% | 71.95% | ||||||||||||||||||
aThe amount shown for a share outstanding throughout the period may not correlate with the Statement of Operations for the period due to the timing of sales and repurchases of the Fund shares in relation to income earned and/or fluctuating fair value of the investments of the Fund.
bBased on average daily shares outstanding.
cTotal return does not include fees, charges or expenses imposed by the variable annuity and life insurance contracts for which the Franklin Templeton Variable Insurance Products Trust serves as an underlying investment vehicle. Total return is not annualized for periods less than one year.
dRatios are annualized for periods less than one year.
eBenefit of expense reduction rounds to less than 0.01%.
| FLG-6 | Semiannual Report | The accompanying notes are an integral part of these financial statements. |
FRANKLIN TEMPLETON VARIABLE INSURANCE PRODUCTS TRUST
FINANCIAL HIGHLIGHTS
Franklin Large Cap Growth VIP Fund (continued)
| Six Months Ended June 30, 2014 (unaudited) |
Year Ended December 31, | |||||||||||||||||||||||
| 2013 | 2012 | 2011 | 2010 | 2009 | ||||||||||||||||||||
| Class 2 | ||||||||||||||||||||||||
| Per share operating performance (for a share outstanding throughout the period) |
||||||||||||||||||||||||
| Net asset value, beginning of period |
$20.62 | $16.20 | $14.54 | $14.86 | $13.43 | $10.50 | ||||||||||||||||||
|
|
|
|||||||||||||||||||||||
| Income from investment operationsa: | ||||||||||||||||||||||||
| Net investment incomeb |
0.07 | 0.19 | 0.17 | 0.11 | 0.08 | 0.09 | ||||||||||||||||||
| Net realized and unrealized gains (losses) |
1.62 | 4.42 | 1.62 | (0.33 | ) | 1.46 | 3.00 | |||||||||||||||||
|
|
|
|||||||||||||||||||||||
| Total from investment operations |
1.69 | 4.61 | 1.79 | (0.22 | ) | 1.54 | 3.09 | |||||||||||||||||
|
|
|
|||||||||||||||||||||||
| Less distributions from net investment income |
(0.24 | ) | (0.19 | ) | (0.13 | ) | (0.10 | ) | (0.11 | ) | (0.16 | ) | ||||||||||||
|
|
|
|||||||||||||||||||||||
| Net asset value, end of period |
$22.07 | $20.62 | $16.20 | $14.54 | $14.86 | $13.43 | ||||||||||||||||||
|
|
|
|||||||||||||||||||||||
| Total returnc |
8.20% | 28.63% | 12.37% | (1.51)% | 11.59% | 29.73% | ||||||||||||||||||
| Ratios to average net assetsd | ||||||||||||||||||||||||
| Expenses |
1.04% | 1.04% | 1.05% | 1.05% | 1.04% | 1.06% | e | |||||||||||||||||
| Net investment income |
0.69% | 1.02% | 1.06% | 0.74% | 0.61% | 0.78% | ||||||||||||||||||
| Supplemental data | ||||||||||||||||||||||||
| Net assets, end of period (000's) |
$265,707 | $285,477 | $278,989 | $293,226 | $357,405 | $373,821 | ||||||||||||||||||
| Portfolio turnover rate |
58.95% | 28.27% | 33.88% | 56.61% | 46.75% | 71.95% | ||||||||||||||||||
aThe amount shown for a share outstanding throughout the period may not correlate with the Statement of Operations for the period due to the timing of sales and repurchases of the Fund shares in relation to income earned and/or fluctuating fair value of the investments of the Fund.
bBased on average daily shares outstanding.
cTotal return does not include fees, charges or expenses imposed by the variable annuity and life insurance contracts for which the Franklin Templeton Variable Insurance Products Trust serves as an underlying investment vehicle. Total return is not annualized for periods less than one year.
dRatios are annualized for periods less than one year.
eBenefit of expense reduction rounds to less than 0.01%.
| The accompanying notes are an integral part of these financial statements. | Semiannual Report | FLG-7 |
FRANKLIN TEMPLETON VARIABLE INSURANCE PRODUCTS TRUST
Statement of Investments, June 30, 2014 (unaudited)
| Franklin Large Cap Growth VIP Fund | ||||||||||
| Shares | Value | |||||||||
| Common Stocks 99.0% |
||||||||||
| Consumer Discretionary 21.0% |
||||||||||
| a | Amazon.com Inc. |
18,302 | $ | 5,944,123 | ||||||
| a | AMC Networks Inc., A |
26,415 | 1,624,258 | |||||||
| BorgWarner Inc. |
78,090 | 5,090,687 | ||||||||
| CBS Corp., B |
52,341 | 3,252,470 | ||||||||
| a | Chipotle Mexican Grill Inc. |
7,195 | 4,263,109 | |||||||
| a | DISH Network Corp., A |
26,884 | 1,749,611 | |||||||
| Harman International Industries Inc. |
29,216 | 3,138,675 | ||||||||
| a | Kate Spade & Co. |
65,120 | 2,483,677 | |||||||
| Las Vegas Sands Corp. |
83,344 | 6,352,480 | ||||||||
| Lowe's Cos. Inc. |
48,700 | 2,337,113 | ||||||||
| a | Michael Kors Holdings Ltd. |
33,053 | 2,930,148 | |||||||
| a | Netflix Inc. |
6,826 | 3,007,536 | |||||||
| NIKE Inc., B |
31,200 | 2,419,560 | ||||||||
| a | The Priceline Group Inc. |
3,753 | 4,514,859 | |||||||
| Starbucks Corp. |
64,084 | 4,958,820 | ||||||||
| Target Corp. |
40,918 | 2,371,198 | ||||||||
| Twenty-First Century Fox Inc., B |
73,542 | 2,517,343 | ||||||||
| a | Under Armour Inc., A |
61,977 | 3,687,012 | |||||||
| The Walt Disney Co. |
56,601 | 4,852,970 | ||||||||
|
|
|
|||||||||
| 67,495,649 | ||||||||||
|
|
|
|||||||||
| Consumer Staples 1.5% |
||||||||||
| Mead Johnson Nutrition Co., A |
17,100 | 1,593,207 | ||||||||
| PepsiCo Inc. |
18,178 | 1,624,022 | ||||||||
| The Procter & Gamble Co. |
19,971 | 1,569,521 | ||||||||
|
|
|
|||||||||
| 4,786,750 | ||||||||||
|
|
|
|||||||||
| Energy 7.2% |
||||||||||
| Anadarko Petroleum Corp. |
46,531 | 5,093,749 | ||||||||
| Devon Energy Corp. |
44,100 | 3,501,540 | ||||||||
| a | Eclipse Resources Corp. |
31,748 | 797,827 | |||||||
| Halliburton Co. |
74,700 | 5,304,447 | ||||||||
| a | Oasis Petroleum Inc. |
55,000 | 3,073,950 | |||||||
| Schlumberger Ltd. |
45,370 | 5,351,391 | ||||||||
|
|
|
|||||||||
| 23,122,904 | ||||||||||
|
|
|
|||||||||
| Financials 13.1% |
||||||||||
| American Express Co. |
18,000 | 1,707,660 | ||||||||
| Aon PLC |
26,932 | 2,426,304 | ||||||||
| Bank of America Corp. |
213,587 | 3,282,832 | ||||||||
| BlackRock Inc. |
6,800 | 2,173,280 | ||||||||
| Capital One Financial Corp. |
19,466 | 1,607,892 | ||||||||
| a | CBRE Group Inc. |
105,148 | 3,368,942 | |||||||
| Citigroup Inc. |
66,276 | 3,121,599 | ||||||||
| Discover Financial Services |
46,400 | 2,875,872 | ||||||||
| Intercontinental Exchange Inc. |
16,318 | 3,082,470 | ||||||||
| Invesco Ltd. |
81,300 | 3,069,075 | ||||||||
| MetLife Inc. |
39,900 | 2,216,844 | ||||||||
| a | Signature Bank |
26,343 | 3,323,960 | |||||||
| U.S. Bancorp |
74,913 | 3,245,231 | ||||||||
| Wells Fargo & Co. |
126,800 | 6,664,608 | ||||||||
|
|
|
|||||||||
| 42,166,569 | ||||||||||
|
|
|
|||||||||
| FLG-8 | Semiannual Report |
FRANKLIN TEMPLETON VARIABLE INSURANCE PRODUCTS TRUST
STATEMENT OF INVESTMENTS (UNAUDITED)
Franklin Large Cap Growth VIP Fund (continued)
| Shares | Value | |||||||||
| Common Stocks (continued) |
||||||||||
| Health Care 20.3% |
||||||||||
| a | Actavis PLC |
37,861 | $ | 8,444,896 | ||||||
| Aetna Inc. |
80,689 | 6,542,264 | ||||||||
| Allergan Inc. |
12,200 | 2,064,484 | ||||||||
| a | Biogen Idec Inc. |
10,079 | 3,178,010 | |||||||
| a | Celgene Corp. |
61,138 | 5,250,532 | |||||||
| a | Gilead Sciences Inc. |
115,096 | 9,542,609 | |||||||
| a | HMS Holdings Corp. |
146,300 | 2,985,983 | |||||||
| a | Illumina Inc. |
19,846 | 3,543,305 | |||||||
| a | Incyte Corp. |
33,103 | 1,868,333 | |||||||
| a | InterMune Inc. |
38,168 | 1,685,117 | |||||||
| a | Jazz Pharmaceuticals PLC |
11,117 | 1,634,310 | |||||||
| Johnson & Johnson |
30,855 | 3,228,050 | ||||||||
| a | Karyopharm Therapeutics Inc. |
52,300 | 2,434,565 | |||||||
| a | Medivation Inc. |
53,103 | 4,093,179 | |||||||
| Perrigo Co. PLC |
22,466 | 3,274,644 | ||||||||
| a | Valeant Pharmaceuticals International Inc. (Canada) |
23,962 | 3,022,088 | |||||||
| Zoetis Inc. |
78,413 | 2,530,388 | ||||||||
|
|
|
|||||||||
| 65,322,757 | ||||||||||
|
|
|
|||||||||
| Industrials 11.8% |
||||||||||
| Allegiant Travel Co. |
13,599 | 1,601,554 | ||||||||
| a | American Airlines Group Inc. |
95,595 | 4,106,761 | |||||||
| The Boeing Co. |
21,300 | 2,709,999 | ||||||||
| Caterpillar Inc. |
21,000 | 2,282,070 | ||||||||
| a | Colfax Corp. |
60,538 | 4,512,503 | |||||||
| a | DigitalGlobe Inc. |
68,400 | 1,901,520 | |||||||
| Flowserve Corp. |
41,301 | 3,070,729 | ||||||||
| a | Hexcel Corp. |
43,133 | 1,764,140 | |||||||
| Kansas City Southern |
18,900 | 2,031,939 | ||||||||
| Precision Castparts Corp. |
18,258 | 4,608,319 | ||||||||
| Rockwell Automation Inc. |
12,665 | 1,585,151 | ||||||||
| Towers Watson & Co. |
13,921 | 1,450,986 | ||||||||
| Union Pacific Corp. |
16,044 | 1,600,389 | ||||||||
| United Technologies Corp. |
41,900 | 4,837,355 | ||||||||
|
|
|
|||||||||
| 38,063,415 | ||||||||||
|
|
|
|||||||||
| Information Technology 20.2% |
||||||||||
| a | Adobe Systems Inc. |
47,073 | 3,406,202 | |||||||
| Apple Inc. |
86,933 | 8,078,684 | ||||||||
| Broadcom Corp., A |
43,412 | 1,611,453 | ||||||||
| a | BroadSoft Inc. |
71,870 | 1,896,649 | |||||||
| a | Facebook Inc., A |
95,683 | 6,438,509 | |||||||
| Google Inc., A |
8,238 | 4,816,512 | ||||||||
| a | Google Inc., C |
8,363 | 4,811,067 | |||||||
| Intersil Corp., A |
80,100 | 1,197,495 | ||||||||
| a | LinkedIn Corp., A |
9,856 | 1,690,008 | |||||||
| MasterCard Inc., A |
63,300 | 4,650,651 | ||||||||
| Microsoft Corp. |
118,400 | 4,937,280 | ||||||||
| a | NetSuite Inc. |
28,043 | 2,436,376 | |||||||
| a | NXP Semiconductors NV (Netherlands) |
38,242 | 2,530,856 | |||||||
| a | Palo Alto Networks Inc. |
21,324 | 1,788,017 | |||||||
| QUALCOMM Inc. |
59,038 | 4,675,810 | ||||||||
| Semiannual Report | FLG-9 |
FRANKLIN TEMPLETON VARIABLE INSURANCE PRODUCTS TRUST
STATEMENT OF INVESTMENTS (UNAUDITED)
Franklin Large Cap Growth VIP Fund (continued)
| Shares | Value | |||||||||
| Common Stocks (continued) |
||||||||||
| Information Technology (continued) |
||||||||||
| a | Salesforce.com Inc. |
45,000 | $ | 2,613,600 | ||||||
| a | ServiceNow Inc. |
32,792 | 2,031,792 | |||||||
| a | Ubiquiti Networks Inc. |
46,576 | 2,104,769 | |||||||
| Visa Inc., A |
15,400 | 3,244,934 | ||||||||
|
|
|
|||||||||
| 64,960,664 | ||||||||||
|
|
|
|||||||||
| Materials 1.3% |
||||||||||
| E. I. du Pont de Nemours and Co. |
38,000 | 2,486,720 | ||||||||
| Martin Marietta Materials Inc. |
12,340 | 1,629,497 | ||||||||
|
|
|
|||||||||
| 4,116,217 | ||||||||||
|
|
|
|||||||||
| Telecommunication Services 2.6% |
||||||||||
| a | SBA Communications Corp. |
81,392 | 8,326,402 | |||||||
|
|
|
|||||||||
| Total Common Stocks (Cost $227,604,367) |
318,361,327 | |||||||||
|
|
|
|||||||||
| Principal Amount | ||||||||||
| Short Term Investments (Cost $1,845,163) 0.6% |
||||||||||
| Repurchase Agreements 0.6% |
||||||||||
| b | Joint Repurchase Agreement, 0.064%, 7/01/14 (Maturity Value $1,845,166) BNP Paribas Securities Corp. (Maturity Value $372,687) |
$1,845,163 | 1,845,163 | |||||||
| Collateralized by U.S. Government Agency Securities, 0.00% - 6.21%, 1/16/15 - 5/04/37; cU.S. Government Agency Discount Notes, 12/24/14 - 1/30/15; |
||||||||||
|
|
|
|||||||||
| Total Investments (Cost $229,449,530) 99.6% |
320,206,490 | |||||||||
| Other Assets, less Liabilities 0.4% |
1,241,306 | |||||||||
|
|
|
|||||||||
| Net Assets 100.0% |
$ | 321,447,796 | ||||||||
|
|
|
|||||||||
aNon-income producing.
bSee Note 1(c) regarding joint repurchase agreement.
cThe security is traded on a discount basis with no stated coupon rate.
| FLG-10 | Semiannual Report | The accompanying notes are an integral part of these financial statements. |
FRANKLIN TEMPLETON VARIABLE INSURANCE PRODUCTS TRUST
Financial Statements
Statement of Assets and Liabilities
June 30, 2014 (unaudited)
| Franklin Large Cap Growth VIP Fund |
||||
| Assets: | ||||
| Investments in securities: |
||||
| Cost - Unaffiliated issuers |
$ | 227,604,367 | ||
| Cost - Repurchase agreements |
1,845,163 | |||
|
|
|
|||
| Total cost of investments |
$ | 229,449,530 | ||
|
|
|
|||
| Value - Unaffiliated issuers |
$ | 318,361,327 | ||
| Value - Repurchase agreements |
1,845,163 | |||
|
|
|
|||
| Total value of investments |
320,206,490 | |||
| Receivables: |
||||
| Investment securities sold |
14,745,263 | |||
| Capital shares sold |
318,693 | |||
| Dividends |
122,518 | |||
| Other assets |
149 | |||
|
|
|
|||
| Total assets |
335,393,113 | |||
|
|
|
|||
| Liabilities: | ||||
| Payables: |
||||
| Investment securities purchased |
12,679,836 | |||
| Capital shares redeemed |
847,615 | |||
| Management fees |
196,958 | |||
| Distribution fees |
109,645 | |||
| Accrued expenses and other liabilities |
111,263 | |||
|
|
|
|||
| Total liabilities |
13,945,317 | |||
|
|
|
|||
| Net assets, at value |
$ | 321,447,796 | ||
|
|
|
|||
| Net assets consist of: | ||||
| Paid-in capital |
$ | 187,049,163 | ||
| Undistributed net investment income |
1,210,032 | |||
| Net unrealized appreciation (depreciation) |
90,756,960 | |||
| Accumulated net realized gain (loss) |
42,431,641 | |||
|
|
|
|||
| Net assets, at value |
$ | 321,447,796 | ||
|
|
|
|||
| Class 1: | ||||
| Net assets, at value |
$ | 55,740,598 | ||
|
|
|
|||
| Shares outstanding |
2,493,288 | |||
|
|
|
|||
| Net asset value and maximum offering price per share |
$ | 22.36 | ||
|
|
|
|||
| Class 2: | ||||
| Net assets, at value |
$ | 265,707,198 | ||
|
|
|
|||
| Shares outstanding |
12,037,956 | |||
|
|
|
|||
| Net asset value and maximum offering price per share |
$ | 22.07 | ||
|
|
|
|||
| The accompanying notes are an integral part of these financial statements. | Semiannual Report | FLG-11 |
FRANKLIN TEMPLETON VARIABLE INSURANCE PRODUCTS TRUST
FINANCIAL STATEMENTS
Statement of Operations
for the six months ended June 30, 2014 (unaudited)
| Franklin Large Cap Growth VIP Fund |
||||
| Investment income: | ||||
| Dividends |
$ | 2,774,560 | ||
| Interest |
1,707 | |||
|
|
|
|||
| Total investment income |
2,776,267 | |||
|
|
|
|||
| Expenses: | ||||
| Management fees (Note 3a) |
1,204,121 | |||
| Distribution fees - Class 2 (Note 3c) |
334,223 | |||
| Custodian fees (Note 4) |
1,603 | |||
| Reports to shareholders |
45,591 | |||
| Professional fees |
18,012 | |||
| Trustees' fees and expenses |
698 | |||
| Other |
4,835 | |||
|
|
|
|||
| Total expenses |
1,609,083 | |||
|
|
|
|||
| Net investment income |
1,167,184 | |||
|
|
|
|||
| Realized and unrealized gains (losses): | ||||
| Net realized gain (loss) from: |
||||
| Investments |
72,636,180 | |||
| Foreign currency transactions |
(3,691 | ) | ||
|
|
|
|||
| Net realized gain (loss) |
72,632,489 | |||
|
|
|
|||
| Net change in unrealized appreciation (depreciation) on investments |
(48,700,612 | ) | ||
|
|
|
|||
| Net realized and unrealized gain (loss) |
23,931,877 | |||
|
|
|
|||
| Net increase (decrease) in net assets resulting from operations |
$ | 25,099,061 | ||
|
|
|
|||
| FLG-12 | Semiannual Report | The accompanying notes are an integral part of these financial statements. |
FRANKLIN TEMPLETON VARIABLE INSURANCE PRODUCTS TRUST
FINANCIAL STATEMENTS
Statements of Changes in Net Assets
| Franklin Large Cap Growth VIP Fund | ||||||||
| Six Months Ended June 30, 2014 (unaudited) |
Year Ended December 31, 2013 |
|||||||
| Increase (decrease) in net assets: | ||||||||
| Operations: |
||||||||
| Net investment income |
$ | 1,167,184 | $ | 3,571,905 | ||||
| Net realized gain (loss) from investments and foreign currency transactions |
72,632,489 | 34,945,789 | ||||||
| Net change in unrealized appreciation (depreciation) on investments |
(48,700,612 | ) | 46,349,997 | |||||
|
|
|
|||||||
| Net increase (decrease) in net assets resulting from operations |
25,099,061 | 84,867,691 | ||||||
|
|
|
|||||||
| Distributions to shareholders from: |
||||||||
| Net investment income: |
||||||||
| Class 1 |
(729,509 | ) | (652,010 | ) | ||||
| Class 2 |
(2,842,675 | ) | (3,061,884 | ) | ||||
|
|
|
|||||||
| Total distributions to shareholders |
(3,572,184 | ) | (3,713,894 | ) | ||||
|
|
|
|||||||
| Capital share transactions: (Note 2) |
||||||||
| Class 1 |
(2,151,939 | ) | (4,699,193 | ) | ||||
| Class 2 |
(37,695,532 | ) | (62,431,458 | ) | ||||
|
|
|
|||||||
| Total capital share transactions |
(39,847,471 | ) | (67,130,651 | ) | ||||
|
|
|
|||||||
| Net increase (decrease) in net assets |
(18,320,594 | ) | 14,023,146 | |||||
| Net assets: | ||||||||
| Beginning of period |
339,768,390 | 325,745,244 | ||||||
|
|
|
|||||||
| End of period |
$ | 321,447,796 | $ | 339,768,390 | ||||
|
|
|
|||||||
| Undistributed net investment income included in net assets: | ||||||||
| End of period |
$ | 1,210,032 | $ | 3,615,032 | ||||
|
|
|
|||||||
| The accompanying notes are an integral part of these financial statements. | Semiannual Report | FLG-13 |
FRANKLIN TEMPLETON VARIABLE INSURANCE PRODUCTS TRUST
Notes to Financial Statements (unaudited)
Franklin Large Cap Growth VIP Fund
| FLG-14 | Semiannual Report |
FRANKLIN TEMPLETON VARIABLE INSURANCE PRODUCTS TRUST
NOTES TO FINANCIAL STATEMENTS (UNAUDITED)
Franklin Large Cap Growth VIP Fund (continued)
| Semiannual Report | FLG-15 |
FRANKLIN TEMPLETON VARIABLE INSURANCE PRODUCTS TRUST
NOTES TO FINANCIAL STATEMENTS (UNAUDITED)
Franklin Large Cap Growth VIP Fund (continued)
1. Organization and Significant Accounting Policies (continued)
d. Income and Deferred Taxes (continued)
and net realized gains to relieve it from federal income and if applicable, excise taxes. As a result, no provision for U.S. federal income taxes is required.
The Fund may be subject to foreign taxation related to income received, capital gains on the sale of securities and certain foreign currency transactions in the foreign jurisdictions in which it invests. Foreign taxes, if any, are recorded based on the tax regulations and rates that exist in the foreign markets in which the Fund invests. When a capital gain tax is determined to apply the Fund records an estimated deferred tax liability in an amount that would be payable if the securities were disposed of on the valuation date.
The Fund recognizes the tax benefits of uncertain tax positions only when the position is “more likely than not” to be sustained upon examination by the tax authorities based on the technical merits of the tax position. As of June 30, 2014, and for all open tax years, the Fund has determined that no liability for unrecognized tax benefits is required in the Fund's financial statements related to uncertain tax positions taken on a tax return (or expected to be taken on future tax returns). Open tax years are those that remain subject to examination and are based on each tax jurisdiction statute of limitation.
e. Security Transactions, Investment Income, Expenses and Distributions
Security transactions are accounted for on trade date. Realized gains and losses on security transactions are determined on a specific identification basis. Interest income and estimated expenses are accrued daily. Dividend income is recorded on the ex-dividend date. Distributions to shareholders are recorded on the ex-dividend date and are determined according to income tax regulations (tax basis). Distributable earnings determined on a tax basis may differ from earnings recorded in accordance
with accounting principles generally accepted in the United States of America. These differences may be permanent or temporary. Permanent differences are reclassified among capital accounts to reflect their tax character. These reclassifications have no impact on net assets or the results of operations. Temporary differences are not reclassified, as they may reverse in subsequent periods.
Common expenses incurred by the Trust are allocated among the funds based on the ratio of net assets of each fund to the combined net assets of the Trust. Fund specific expenses are charged directly to the fund that incurred the expense.
Realized and unrealized gains and losses and net investment income, not including class specific expenses, are allocated daily to each class of shares based upon the relative proportion of net assets of each class. Differences in per share distributions, by class, are generally due to differences in class specific expenses.
f. Accounting Estimates
The preparation of financial statements in accordance with U.S. GAAP requires management to make estimates and assumptions that affect the reported amounts of assets and liabilities at the date of the financial statements and the amounts of income and expenses during the reporting period. Actual results could differ from those estimates.
g. Guarantees and Indemnifications
Under the Trust's organizational documents, its officers and trustees are indemnified by the Trust against certain liabilities arising out of the performance of their duties to the Trust. Additionally, in the normal course of business, the Trust, on behalf of the Fund, enters into contracts with service providers that contain general indemnification clauses. The Trust's maximum exposure under these arrangements is unknown as this would involve future claims that may be made against the Trust that have not yet occurred. Currently, the Trust expects the risk of loss to be remote.
| FLG-16 | Semiannual Report |
FRANKLIN TEMPLETON VARIABLE INSURANCE PRODUCTS TRUST
NOTES TO FINANCIAL STATEMENTS (UNAUDITED)
Franklin Large Cap Growth VIP Fund (continued)
2. Shares of Beneficial Interest
At June 30, 2014, there were an unlimited number of shares authorized (without par value). Transactions in the Fund's shares were as follows:
| Six Months Ended June 30, 2014 |
Year Ended December 31, 2013 |
|||||||||||||||||
| Shares | Amount | Shares | Amount | |||||||||||||||
| Class 1 Shares: | ||||||||||||||||||
| Shares sold | 21,961 | $ | 459,843 | 49,133 | $ | 921,214 | ||||||||||||
| Shares issued in reinvestment of distributions | 33,235 | 729,509 | 35,282 | 652,010 | ||||||||||||||
| Shares redeemed | (157,859 | ) | (3,341,291 | ) | (333,854 | ) | (6,272,417 | ) | ||||||||||
|
|
|
|||||||||||||||||
| Net increase (decrease) |
(102,663 | ) | $ | (2,151,939 | ) | (249,439 | ) | $ | (4,699,193 | ) | ||||||||
|
|
|
|||||||||||||||||
| Class 2 Shares: | ||||||||||||||||||
| Shares sold | 134,579 | $ | 2,829,028 | 1,055,133 | $ | 19,291,413 | ||||||||||||
| Shares issued in reinvestment of distributions | 131,120 | 2,842,675 | 167,774 | 3,061,884 | ||||||||||||||
| Shares redeemed | (2,071,584 | ) | (43,367,235 | ) | (4,595,616 | ) | (84,784,755 | ) | ||||||||||
|
|
|
|||||||||||||||||
| Net increase (decrease) |
(1,805,885 | ) | $ | (37,695,532 | ) | (3,372,709 | ) | $ | (62,431,458 | ) | ||||||||
|
|
|
|||||||||||||||||
3. Transactions With Affiliates
Franklin Resources, Inc. is the holding company for various subsidiaries that together are referred to as Franklin Templeton Investments. Certain officers and trustees of the Fund are also officers and/or directors of the following subsidiaries:
| Subsidiary | Affiliation | |
| Franklin Advisers, Inc. (Advisers) | Investment manager | |
| Franklin Templeton Services, LLC (FT Services) | Administrative manager | |
| Franklin Templeton Distributors, Inc. (Distributors) | Principal underwriter | |
| Franklin Templeton Investor Services, LLC (Investor Services) | Transfer agent |
a. Management Fees
The Fund pays an investment management fee to Advisers based on the average daily net assets of the Fund as follows:
| Annualized Fee Rate | Net Assets | |
| 0.750% | Up to and including $500 million | |
| 0.625% | Over $500 million, up to and including $1 billion | |
| 0.500% | In excess of $1 billion |
b. Administrative Fees
Under an agreement with Advisers, FT Services provides administrative services to the Fund. The fee is paid by Advisers based on the Fund's average daily net assets, and is not an additional expense of the Fund.
| Semiannual Report | FLG-17 |
FRANKLIN TEMPLETON VARIABLE INSURANCE PRODUCTS TRUST
NOTES TO FINANCIAL STATEMENTS (UNAUDITED)
Franklin Large Cap Growth VIP Fund (continued)
3. Transactions With Affiliates (continued)
c. Distribution Fees
The Board has adopted a distribution plan for Class 2 shares pursuant to Rule 12b-1 under the 1940 Act. Under the Fund's compensation distribution plan, the Fund pays Distributors for costs incurred in connection with the servicing, sale and distribution of the Fund's shares up to 0.35% per year of its average daily net assets. Some distribution fees are not charged on shares held by affiliates. The Board has agreed to limit the current rate to 0.25% per year for Class 2. The plan year, for purposes of monitoring compliance with the maximum annual plan rate, is February 1 through January 31.
d. Transfer Agent Fees
Investor Services, under terms of an agreement, performs shareholder servicing for the Fund and is not paid by the Fund for the services.
4. Expense Offset Arrangement
The Fund has entered into an arrangement with its custodian whereby credits realized as a result of uninvested cash balances are used to reduce a portion of the Fund’s custodian expenses. During the period ended June 30, 2014, there were no credits earned.
5. Income Taxes
For tax purposes, capital losses may be carried over to offset future capital gains. Capital loss carryforwards with no expiration, if any, must be fully utilized before those losses with expiration dates.
At December 31, 2013, the Fund had capital loss carryforwards of $ 25,430,360 expiring in 2017.
At June 30, 2014, the cost of investments and net unrealized appreciation (depreciation) for income tax purposes were as follows:
| Cost of investments |
$ | 230,050,092 | ||
|
|
|
|||
| Unrealized appreciation |
$ | 91,649,892 | ||
| Unrealized depreciation |
(1,493,494 | ) | ||
|
|
|
|||
| Net unrealized appreciation (depreciation) |
$ | 90,156,398 | ||
|
|
|
|||
Differences between income and/or capital gains as determined on a book basis and a tax basis are primarily due to differing treatments of wash sales.
6. Investment Transactions
Purchases and sales of investments (excluding short term securities) for the period ended June 30, 2014, aggregated $184,764,821 and $ 219,395,725, respectively.
7. Credit Facility
The Fund, together with other U.S. registered and foreign investment funds (collectively, Borrowers), managed by Franklin Templeton Investments, are borrowers in a joint syndicated senior unsecured credit facility totaling $1.5 billion (Global Credit Facility) which matures on February 13, 2015. This Global Credit Facility provides a source of funds to the Borrowers for temporary and emergency purposes, including the ability to meet future unanticipated or unusually large redemption requests.
| FLG-18 | Semiannual Report |
FRANKLIN TEMPLETON VARIABLE INSURANCE PRODUCTS TRUST
NOTES TO FINANCIAL STATEMENTS (UNAUDITED)
Franklin Large Cap Growth VIP Fund (continued)
Under the terms of the Global Credit Facility, the Fund shall, in addition to interest charged on any borrowings made by the Fund and other costs incurred by the Fund, pay its share of fees and expenses incurred in connection with the implementation and maintenance of the Global Credit Facility, based upon its relative share of the aggregate net assets of all of the Borrowers, including an annual commitment fee of 0.07% based upon the unused portion of the Global Credit Facility. These fees are reflected in other expenses on the Statement of Operations. During the period ended June 30, 2014, the Fund did not use the Global Credit Facility.
8. Fair Value Measurements
The Fund follows a fair value hierarchy that distinguishes between market data obtained from independent sources (observable inputs) and the Fund’s own market assumptions (unobservable inputs). These inputs are used in determining the value of the Fund’s financial instruments and are summarized in the following fair value hierarchy:
| • | Level 1 – quoted prices in active markets for identical financial instruments |
| • | Level 2 – other significant observable inputs (including quoted prices for similar financial instruments, interest rates, prepayment speed, credit risk, etc.) |
| • | Level 3 – significant unobservable inputs (including the Fund’s own assumptions in determining the fair value of financial instruments) |
The input levels are not necessarily an indication of the risk or liquidity associated with financial instruments at that level.
For movements between the levels within the fair value hierarchy, the Fund has adopted a policy of recognizing the transfers as of the date of the underlying event which caused the movement.
A summary of inputs used as of June 30, 2014, in valuing the Fund’s assets carried at fair value, is as follows:
| Level 1 | Level 2 | Level 3 | Total | |||||||||||||
| Assets: | ||||||||||||||||
| Investments in Securities: |
||||||||||||||||
| Equity Investmentsa |
$ | 318,361,327 | $ | — | $ | — | $ | 318,361,327 | ||||||||
| Short Term Investments |
— | 1,845,163 | — | 1,845,163 | ||||||||||||
|
|
|
|||||||||||||||
| Total Investments in Securities |
$ | 318,361,327 | $ | 1,845,163 | $ | — | $ | 320,206,490 | ||||||||
|
|
|
|||||||||||||||
aFor detailed categories, see the accompanying Statement of Investments.
9. New Accounting Pronouncements
In June 2014, the Financial Accounting Standards Board issued Accounting Standards Update (ASU) No. 2014-11, Transfers and Servicing (Topic 860), Repurchase-to-Maturity Transactions, Repurchase Financings, and Disclosures. The ASU changes the accounting for certain repurchase agreements and expands disclosure requirements related to repurchase agreements, securities lending, repurchase-to-maturity and similar transactions. The ASU is effective for interim and annual reporting periods beginning after December 15, 2014. Management is currently evaluating the impact, if any, of applying this provision.
10. Subsequent Events
The Fund has evaluated subsequent events through the issuance of the financial statements and determined that no events have occurred that require disclosure.
| Semiannual Report | FLG-19 |
Franklin Large Cap Value VIP Fund
(Formerly, Franklin Large Cap Value Securities Fund)
This semiannual report for Franklin Large Cap Value VIP Fund covers the period ended June 30, 2014.
Class 2 Performance Summary as of June 30, 2014
Franklin Large Cap Value VIP Fund – Class 2 delivered a +6.21% total return* for the six-month period ended June 30, 2014.
*The Fund has an expense reduction contractually guaranteed through at least 4/30/15 and a fee waiver associated with its investments in a Franklin Templeton money fund, contractually guaranteed through at least its current fiscal year-end. Fund investment results reflect the expense reduction and fee waiver, to the extent applicable; without these reductions, the results would have been lower.
Performance reflects the Fund’s Class 2 operating expenses, but does not include any contract fees, expenses or sales charges. If they had been included, performance would be lower. These charges and deductions, particularly for variable life policies, can have a significant effect on contract values and insurance benefits. See the contract prospectus for a complete description of these expenses, including sales charges.
Performance data represent past performance, which does not guarantee future results. Investment return and principal value will fluctuate, and you may have a gain or loss when you sell your shares. Current performance may differ from figures shown.
| Semiannual Report | FLV-1 |
FRANKLIN LARGE CAP VALUE VIP FUND
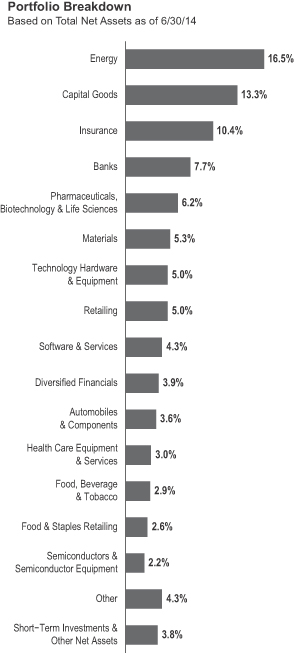
1. Please see Index Descriptions following the Fund Summaries.
2. Source: © 2014 Morningstar. One cannot invest directly in an index, and an index is not representative of the Fund’s portfolio. Please see Index Descriptions following the Fund Summaries.
3. Source: Bureau of Labor Statistics.
| FLV-2 | Semiannual Report |
FRANKLIN LARGE CAP VALUE VIP FUND
Detractors from performance included Citigroup, State Street and Bunge. Citigroup, a financial services company, declined amid weaker trading activity in fixed income and currencies as a result of global uncertainty. Shares of State Street, an institutional financial services provider, suffered as earnings were negatively affected by an issuance of preferred equity to optimize the company’s capital structure. Bunge, a global agribusiness and food company, reported a sizable trading loss reflected in its first-quarter earnings results.
We initiated six new positions: CVS Caremark, a drug store operator; Teradata, an analytic data solutions provider; Principal Financial Group, a global financial services firm; First Solar, a manufacturer and designer of solar modules and solutions; Symantec, an information technology security solutions provider; and Progressive, a property and casualty insurer. We added to our holdings in Abbott Laboratories, Capital One Financial and Family Dollar Stores, among others. We liquidated our position in Knowles, which we received from a spin-off of Dover, and reduced a number of holdings including Gilead Sciences, Prudential Financial and the aforementioned Citigroup.
| Semiannual Report | FLV-3 |
FRANKLIN LARGE CAP VALUE VIP FUND
Thank you for your participation in Franklin Large Cap Value VIP Fund.
The foregoing information reflects our analysis, opinions and portfolio holdings as of June 30, 2014, the end of the reporting period. The way we implement our main investment strategies and the resulting portfolio holdings may change depending on factors such as market and economic conditions. These opinions may not be relied upon as investment advice or an offer for a particular security. The information is not a complete analysis of every aspect of any market, country, industry, security or the Fund. Statements of fact are from sources considered reliable, but the investment manager makes no representation or warranty as to their completeness or accuracy. Although historical performance is no guarantee of future results, these insights may help you understand our investment management philosophy.
| FLV-4 | Semiannual Report |
FRANKLIN LARGE CAP VALUE VIP FUND
Class 2 Fund Expenses
| Class 2 | Beginning Account Value 1/1/14 |
Ending Account Value 6/30/14 |
Fund-Level Expenses 1/1/14–6/30/14 |
|||||||||
| Actual | $1,000 | $1,062.10 | $4.60 | |||||||||
| Hypothetical (5% return before expenses) | $1,000 | $1,020.33 | $4.51 | |||||||||
*Expenses are calculated using the most recent six-month annualized expense ratio, net of expense waivers, for the Fund’s Class 2 shares (0.90%), which does not include any ongoing expenses of the Contract for which the Fund is an investment option, multiplied by the average account value over the period, multiplied by 181/365 to reflect the one-half year period.
| Semiannual Report | FLV-5 |
SUPPLEMENT DATED MAY 1, 2014
TO THE PROSPECTUS DATED MAY 1, 2014
OF
FRANKLIN LARGE CAP VALUE VIP FUND
(A series of Franklin Templeton Variable Insurance Products Trust)
The prospectus is amended as follows:
I. The “Fund Summaries – Portfolio Managers” section on page FLV-S4 is revised to read as follows:
Portfolio Managers
WILLIAM J. LIPPMAN President of Advisory Services and portfolio manager of the Fund since inception (2005).
JAKOV STIPANOV, CFA Portfolio Manager of Advisory Services and portfolio manager of the Fund since May 2014.
DONALD G. TAYLOR, CPA Chief Investment Officer of Advisory Services and portfolio manager of the Fund since inception (2005).
BRUCE C. BAUGHMAN, CPA Senior Vice President of Advisory Services and portfolio manager of the Fund since inception (2005).
II. The “Fund Details – Management” section disclosure concerning the portfolio management team beginning on page FLV-D5 is revised to read as follows:
The Fund is managed by a team of dedicated professionals focused on investments of large capitalization companies believed undervalued. The portfolio managers of the team are as follows:
| WILLIAM J. LIPPMAN President of Advisory Services |
Mr. Lippman assumed the duties of lead portfolio manager in 2007 and has been a portfolio manager of the Fund since its inception (2005). He has primary responsibility for the investments of the Fund. He has final authority over all aspects of the Fund’s investment portfolio, including but not limited to, purchases and sales of individual securities, portfolio risk assessment, and the management of daily cash balances in accordance with anticipated investment management requirements. The degree to which he may perform these functions, and the nature of these functions, may change from time to time. He joined Franklin Templeton Investments in 1988. |
| FLV-6 |
| JAKOV STIPANOV, CFA Portfolio Manager of Advisory Services |
Mr. Stipanov has been a portfolio manager of the Fund since May 2014, providing support to the lead portfolio manager(s) as needed. He joined Franklin Templeton Investments in 2010. Prior to joining Franklin Templeton Investments he served as an equity analyst with Systematic Financial where he conducted company-specific research spanning the market capitalization spectrum. He was a portfolio assistant with Scudder, Stevens and Clark and an analyst with Stein Roe Farnham, where he conducted fundamental research coverage on the technology sector. | |
| DONALD G. TAYLOR, CPA Chief Investment Officer of Advisory Services |
Mr. Taylor has been a portfolio manager of the Fund since its inception (2005), providing support to the lead portfolio manager(s) as needed. He joined Franklin Templeton Investments in 1996. | |
| BRUCE C. BAUGHMAN, CPA Senior Vice President of Advisory Services |
Mr. Baughman has been a portfolio manager of the Fund since its inception (2005), providing support to the lead portfolio manager(s) as needed. He joined Franklin Templeton Investments in 1988. | |
Please keep this supplement with your prospectus for future reference
| FLV-7 |
SUPPLEMENT DATED AUGUST 1, 2014
TO THE PROSPECTUS DATED MAY 1, 2014
OF
FRANKLIN LARGE CAP VALUE VIP FUND
(A series of Franklin Templeton Variable Insurance Products Trust)
The prospectus is amended to add the following:
On July 16, 2014, the Board of Trustees of Franklin Templeton Variable Insurance Products Trust (Trust) on behalf of Franklin Large Cap Value VIP Fund (Fund) approved a proposal to terminate and liquidate the Fund. The liquidation is anticipated to occur on or about November 7, 2014, but may be delayed if unforeseen circumstances arise.
Effective at the close of market on October 1, 2014, the Fund is closed to all new investments.
Contract owners should refer to documents provided by their insurance companies concerning the effect of the liquidation and any steps they may need to take. In addition, in considering new purchases or transfers, contract owners may want to refer to their contract and Trust prospectuses or consult with their investment representatives to consider other investment options.
Please keep this supplement for future reference.
| FLV-8 |
FRANKLIN TEMPLETON VARIABLE INSURANCE PRODUCTS TRUST
Financial Highlights
Franklin Large Cap Value VIP Fund
| Six Months Ended (unaudited) |
Year Ended December 31, | |||||||||||||||||||||||
| 2013 | 2012 | 2011 | 2010 | 2009 | ||||||||||||||||||||
| Class 2 | ||||||||||||||||||||||||
| Per share operating performance (for a share outstanding throughout the period) |
||||||||||||||||||||||||
| Net asset value, beginning of period |
$14.82 | $11.07 | $9.83 | $10.50 | $9.36 | $7.54 | ||||||||||||||||||
|
|
|
|||||||||||||||||||||||
| Income from investment operationsa: | ||||||||||||||||||||||||
| Net investment incomeb |
0.08 | 0.14 | 0.15 | 0.14 | 0.12 | 0.17 | ||||||||||||||||||
| Net realized and unrealized gains (losses) |
0.84 | 3.79 | 1.25 | (0.69 | ) | 1.19 | 1.81 | |||||||||||||||||
|
|
|
|||||||||||||||||||||||
| Total from investment operations |
0.92 | 3.93 | 1.40 | (0.55 | ) | 1.31 | 1.98 | |||||||||||||||||
|
|
|
|||||||||||||||||||||||
| Less distributions from net investment income |
(0.18 | ) | (0.18 | ) | (0.16 | ) | (0.12 | ) | (0.17 | ) | (0.16 | ) | ||||||||||||
|
|
|
|||||||||||||||||||||||
| Net asset value, end of period |
$15.56 | $14.82 | $11.07 | $9.83 | $10.50 |
|
$9.36 |
| ||||||||||||||||
|
|
|
|||||||||||||||||||||||
| Total returnc |
6.21% | 35.75% | 14.44% | (5.26)% | 14.27% | 26.76% | ||||||||||||||||||
| Ratios to average net assetsd | ||||||||||||||||||||||||
| Expenses before waiver and payments by affiliates |
1.42% | 1.41% | 1.42% | 1.39% | 1.40% | 1.38% | ||||||||||||||||||
| Expenses net of waiver and payments by affiliates |
0.90% | 0.90% | 0.90% | 0.90% | 0.90% | 0.90% | ||||||||||||||||||
| Net investment income |
1.05% | 1.08% | 1.42% | 1.35% | 1.25% | 2.15% | ||||||||||||||||||
| Supplemental data | ||||||||||||||||||||||||
| Net assets, end of period (000’s) |
$34,493 | $38,813 | $31,148 | $34,091 | $40,183 | $35,892 | ||||||||||||||||||
| Portfolio turnover rate |
4.78% | 10.75% | 29.50% | 20.31% | 13.91% | 15.64% | ||||||||||||||||||
aThe amount shown for a share outstanding throughout the period may not correlate with the Statement of Operations for the period due to the timing of sales and repurchases of the Fund shares in relation to income earned and/or fluctuating fair value of the investments of the Fund.
bBased on average daily shares outstanding.
cTotal return does not include fees, charges or expenses imposed by the variable annuity and life insurance contracts for which the Franklin Templeton Variable Insurance Products Trust serves as an underlying investment vehicle. Total return is not annualized for periods less than one year.
dRatios are annualized for periods less than one year.
| The accompanying notes are an integral part of these financial statements. | Semiannual Report | FLV-9 |
FRANKLIN TEMPLETON VARIABLE INSURANCE PRODUCTS TRUST
Statement of Investments, June 30, 2014 (unaudited)
| Franklin Large Cap Value VIP Fund | ||||||||||
| Shares | Value | |||||||||
| Common Stocks 96.2% |
||||||||||
| Automobiles & Components 3.6% |
||||||||||
| BorgWarner Inc. |
7,800 | $ | 508,482 | |||||||
| Johnson Controls Inc. |
14,500 | 723,985 | ||||||||
|
|
|
|||||||||
| 1,232,467 | ||||||||||
|
|
|
|||||||||
| Banks 7.7% |
||||||||||
| Bank of America Corp. |
22,500 | 345,825 | ||||||||
| Citigroup Inc. |
13,700 | 645,270 | ||||||||
| Comerica Inc. |
11,000 | 551,760 | ||||||||
| KeyCorp |
42,000 | 601,860 | ||||||||
| U.S. Bancorp |
11,600 | 502,512 | ||||||||
|
|
|
|||||||||
| 2,647,227 | ||||||||||
|
|
|
|||||||||
| Capital Goods 13.3% |
||||||||||
| 3M Co. |
3,900 | 558,636 | ||||||||
| Dover Corp. |
5,500 | 500,225 | ||||||||
| Eaton Corp. PLC |
8,700 | 671,466 | ||||||||
| General Dynamics Corp. |
4,100 | 477,855 | ||||||||
| General Electric Co. |
16,600 | 436,248 | ||||||||
| Illinois Tool Works Inc. |
4,600 | 402,776 | ||||||||
| Parker Hannifin Corp. |
4,300 | 540,639 | ||||||||
| Rockwell Automation Inc. |
2,300 | 287,868 | ||||||||
| Stanley Black & Decker Inc. |
2,500 | 219,550 | ||||||||
| United Technologies Corp. |
4,300 | 496,435 | ||||||||
|
|
|
|||||||||
| 4,591,698 | ||||||||||
|
|
|
|||||||||
| Consumer Durables & Apparel 1.3% |
||||||||||
| NIKE Inc., B |
6,000 | 465,300 | ||||||||
|
|
|
|||||||||
| Consumer Services 0.6% |
||||||||||
| McDonald’s Corp. |
2,000 | 201,480 | ||||||||
|
|
|
|||||||||
| Diversified Financials 3.9% |
||||||||||
| a | Berkshire Hathaway Inc., A |
1 | 189,900 | |||||||
| Capital One Financial Corp. |
3,300 | 272,580 | ||||||||
| Northern Trust Corp. |
4,500 | 288,945 | ||||||||
| State Street Corp. |
8,600 | 578,436 | ||||||||
|
|
|
|||||||||
| 1,329,861 | ||||||||||
|
|
|
|||||||||
| Energy 16.5% |
||||||||||
| Apache Corp. |
5,200 | 523,224 | ||||||||
| Baker Hughes Inc. |
8,800 | 655,160 | ||||||||
| Chevron Corp. |
3,200 | 417,760 | ||||||||
| ConocoPhillips |
6,200 | 531,526 | ||||||||
| Denbury Resources Inc. |
17,000 | 313,820 | ||||||||
| Devon Energy Corp. |
7,200 | 571,680 | ||||||||
| Ensco PLC, A |
6,800 | 377,876 | ||||||||
| Exxon Mobil Corp. |
4,700 | 473,196 | ||||||||
| HollyFrontier Corp. |
6,500 | 283,985 | ||||||||
| Noble Corp. PLC |
8,000 | 268,480 | ||||||||
| Occidental Petroleum Corp. |
4,300 | 441,309 | ||||||||
| Phillips 66 |
2,700 | 217,161 | ||||||||
| Schlumberger Ltd. |
1,500 | 176,925 | ||||||||
| Valero Energy Corp. |
8,500 | 425,850 | ||||||||
|
|
|
|||||||||
| 5,677,952 | ||||||||||
|
|
|
|||||||||
| FLV-10 | Semiannual Report |
FRANKLIN TEMPLETON VARIABLE INSURANCE PRODUCTS TRUST
STATEMENT OF INVESTMENTS (UNAUDITED)
Franklin Large Cap Value VIP Fund (continued)
| Shares | Value | |||||||||
| Common Stocks (continued) |
||||||||||
| Food & Staples Retailing 2.6% |
||||||||||
| CVS Caremark Corp. |
4,000 | $ | 301,480 | |||||||
| Wal-Mart Stores Inc. |
1,900 | 142,633 | ||||||||
| Walgreen Co. |
6,200 | 459,606 | ||||||||
|
|
|
|||||||||
| 903,719 | ||||||||||
|
|
|
|||||||||
| Food, Beverage & Tobacco 2.9% |
||||||||||
| Archer-Daniels-Midland Co. |
10,500 | 463,155 | ||||||||
| Bunge Ltd. |
7,300 | 552,172 | ||||||||
|
|
|
|||||||||
| 1,015,327 | ||||||||||
|
|
|
|||||||||
| Health Care Equipment & Services 3.0% |
||||||||||
| Abbott Laboratories |
5,700 | 233,130 | ||||||||
| Becton, Dickinson and Co. |
4,600 | 544,180 | ||||||||
| Covidien PLC |
2,800 | 252,504 | ||||||||
|
|
|
|||||||||
| 1,029,814 | ||||||||||
|
|
|
|||||||||
| Household & Personal Products 0.9% |
||||||||||
| The Procter & Gamble Co. |
3,800 | 298,642 | ||||||||
|
|
|
|||||||||
| Insurance 10.4% |
||||||||||
| Aflac Inc. |
9,100 | 566,475 | ||||||||
| The Allstate Corp. |
12,000 | 704,640 | ||||||||
| The Chubb Corp. |
4,100 | 377,897 | ||||||||
| MetLife Inc. |
13,400 | 744,504 | ||||||||
| Principal Financial Group Inc. |
2,000 | 100,960 | ||||||||
| The Progressive Corp. |
3,100 | 78,616 | ||||||||
| Prudential Financial Inc. |
8,600 | 763,422 | ||||||||
| The Travelers Cos. Inc. |
2,800 | 263,396 | ||||||||
|
|
|
|||||||||
| 3,599,910 | ||||||||||
|
|
|
|||||||||
| Materials 5.3% |
||||||||||
| Air Products and Chemicals Inc. |
1,700 | 218,654 | ||||||||
| Alcoa Inc. |
49,300 | 734,077 | ||||||||
| Nucor Corp. |
12,300 | 605,775 | ||||||||
| Praxair Inc. |
2,000 | 265,680 | ||||||||
|
|
|
|||||||||
| 1,824,186 | ||||||||||
|
|
|
|||||||||
| Pharmaceuticals, Biotechnology & Life Sciences 6.2% |
||||||||||
| a | Gilead Sciences Inc. |
8,600 | 713,026 | |||||||
| Merck & Co. Inc. |
10,000 | 578,500 | ||||||||
| Pfizer Inc. |
14,900 | 442,232 | ||||||||
| Teva Pharmaceutical Industries Ltd., ADR (Israel) |
7,500 | 393,150 | ||||||||
|
|
|
|||||||||
| 2,126,908 | ||||||||||
|
|
|
|||||||||
| Retailing 5.0% |
||||||||||
| Family Dollar Stores Inc. |
3,200 | 211,648 | ||||||||
| The Home Depot Inc. |
6,200 | 501,952 | ||||||||
| Nordstrom Inc. |
5,900 | 400,787 | ||||||||
| a | Office Depot Inc. |
14,000 | 79,660 | |||||||
| Target Corp. |
9,300 | 538,935 | ||||||||
|
|
|
|||||||||
| 1,732,982 | ||||||||||
|
|
|
|||||||||
| Semiconductors & Semiconductor Equipment 2.2% |
||||||||||
| a | First Solar Inc. |
1,500 | 106,590 | |||||||
| Semiannual Report | FLV-11 |
FRANKLIN TEMPLETON VARIABLE INSURANCE PRODUCTS TRUST
STATEMENT OF INVESTMENTS (UNAUDITED)
Franklin Large Cap Value VIP Fund (continued)
| Shares | Value | |||||||||
| Common Stocks (continued) |
||||||||||
| Semiconductors & Semiconductor Equipment (continued) |
||||||||||
| Maxim Integrated Products Inc. |
9,300 | $ | 314,433 | |||||||
| Microchip Technology Inc. |
7,000 | 341,670 | ||||||||
|
|
|
|||||||||
| 762,693 | ||||||||||
|
|
|
|||||||||
| Software & Services 4.3% |
||||||||||
| International Business Machines Corp. |
2,300 | 416,921 | ||||||||
| Microsoft Corp. |
5,500 | 229,350 | ||||||||
| Symantec Corp. |
4,000 | 91,600 | ||||||||
| a | Teradata Corp. |
4,375 | 175,875 | |||||||
| Xerox Corp. |
47,100 | 585,924 | ||||||||
|
|
|
|||||||||
| 1,499,670 | ||||||||||
|
|
|
|||||||||
| Technology Hardware & Equipment 5.0% |
||||||||||
| Cisco Systems Inc. |
17,400 | 432,390 | ||||||||
| Corning Inc. |
35,500 | 779,225 | ||||||||
| EMC Corp. |
5,300 | 139,602 | ||||||||
| QUALCOMM Inc. |
3,700 | 293,040 | ||||||||
| TE Connectivity Ltd. |
1,500 | 92,760 | ||||||||
|
|
|
|||||||||
| 1,737,017 | ||||||||||
|
|
|
|||||||||
| Transportation 1.2% |
||||||||||
| Norfolk Southern Corp. |
4,100 | 422,423 | ||||||||
|
|
|
|||||||||
| Utilities 0.3% |
||||||||||
| Exelon Corp. |
2,500 | 91,200 | ||||||||
|
|
|
|||||||||
| Total Common Stocks (Cost $19,331,684) |
33,190,476 | |||||||||
|
|
|
|||||||||
| Short Term Investments (Cost $1,480,453) 4.3% |
||||||||||
| Money Market Funds 4.3% |
||||||||||
| a,b | Institutional Fiduciary Trust Money Market Portfolio |
1,480,453 | 1,480,453 | |||||||
|
|
|
|||||||||
| Total Investments (Cost $20,812,137) 100.5% |
34,670,929 | |||||||||
| Other Assets, less Liabilities (0.5)% |
(177,768 | ) | ||||||||
|
|
|
|||||||||
| Net Assets 100.0% |
$ | 34,493,161 | ||||||||
|
|
|
|||||||||
See Abbreviations on page FLV-21.
aNon-income producing.
bSee Note 3(e) regarding investments in the Institutional Fiduciary Trust Money Market Portfolio.
| FLV-12 | Semiannual Report | The accompanying notes are an integral part of these financial statements. |
FRANKLIN TEMPLETON VARIABLE INSURANCE PRODUCTS TRUST
Financial Statements
Statement of Assets and Liabilities
June 30, 2014 (unaudited)
| Franklin Large Cap Value VIP Fund |
||||
| Assets: | ||||
| Investments in securities: |
||||
| Cost - Unaffiliated issuers |
$19,331,684 | |||
| Cost - Sweep Money Fund (Note 3e) |
1,480,453 | |||
|
|
|
|||
| Total cost of investments |
$20,812,137 | |||
|
|
|
|||
| Value - Unaffiliated issuers |
$33,190,476 | |||
| Value - Sweep Money Fund (Note 3e) |
1,480,453 | |||
|
|
|
|||
| Total value of investments |
34,670,929 | |||
| Receivables: |
||||
| Investment securities sold |
41,989 | |||
| Capital shares sold |
16,267 | |||
| Dividends |
43,232 | |||
|
|
|
|||
| Total assets |
34,772,417 | |||
|
|
|
|||
| Liabilities: | ||||
| Payables: |
||||
| Investment securities purchased |
100,001 | |||
| Capital shares redeemed |
125,975 | |||
| Management fees |
13,583 | |||
| Distribution fees |
14,247 | |||
| Professional fees |
16,113 | |||
| Accrued expenses and other liabilities |
9,337 | |||
|
|
|
|||
| Total liabilities |
279,256 | |||
|
|
|
|||
| Net assets, at value |
$34,493,161 | |||
|
|
|
|||
| Net assets consist of: | ||||
| Paid-in capital |
$22,872,514 | |||
| Undistributed net investment income |
193,990 | |||
| Net unrealized appreciation (depreciation) |
13,858,792 | |||
| Accumulated net realized gain (loss) |
(2,432,135 | ) | ||
|
|
|
|||
| Net assets, at value |
$34,493,161 | |||
|
|
|
|||
| Class 2: | ||||
| Net assets, at value |
$34,493,161 | |||
|
|
|
|||
| Shares outstanding |
2,217,353 | |||
|
|
|
|||
| Net asset value and maximum offering price per share |
$ 15.56 | |||
|
|
|
|||
| The accompanying notes are an integral part of these financial statements. | Semiannual Report | FLV-13 |
FRANKLIN TEMPLETON VARIABLE INSURANCE PRODUCTS TRUST
FINANCIAL STATEMENTS
Statement of Operations
for the six months ended June 30, 2014 (unaudited)
| Franklin Large Cap Value VIP Fund |
||||
| Investment income: | ||||
| Dividends |
$ | 339,337 | ||
|
|
|
|||
| Expenses: | ||||
| Management fees (Note 3a) |
173,990 | |||
| Distribution fees: Class 2 (Note 3c) |
43,438 | |||
| Custodian fees (Note 4) |
152 | |||
| Reports to shareholders |
7,652 | |||
| Professional fees |
17,355 | |||
| Other |
3,759 | |||
|
|
|
|||
| Total expenses |
246,346 | |||
| Expenses waived/paid by affiliates (Note 3e and 3f) |
(89,814 | ) | ||
|
|
|
|||
| Net expenses |
156,532 | |||
|
|
|
|||
| Net investment income |
182,805 | |||
|
|
|
|||
| Realized and unrealized gains (losses): | ||||
| Net realized gain (loss) from investments |
2,890,225 | |||
| Net change in unrealized appreciation (depreciation) on investments |
(1,118,246 | ) | ||
|
|
|
|||
| Net realized and unrealized gain (loss) |
1,771,979 | |||
|
|
|
|||
| Net increase (decrease) in net assets resulting from operations |
$ | 1,954,784 | ||
|
|
|
|||
| FLV-14 | Semiannual Report | The accompanying notes are an integral part of these financial statements. |
FRANKLIN TEMPLETON VARIABLE INSURANCE PRODUCTS TRUST
FINANCIAL STATEMENTS
Statements of Changes in Net Assets
| Franklin Large Cap Value VIP Fund | ||||||||
| Six Months Ended June 30, 2014 (unaudited) |
Year Ended December 31, 2013 |
|||||||
| Increase (decrease) in net assets: | ||||||||
| Operations: |
||||||||
| Net investment income |
$ | 182,805 | $ | 388,717 | ||||
| Net realized gain (loss) from investments |
2,890,225 | 1,635,761 | ||||||
| Net change in unrealized appreciation (depreciation) on investments |
(1,118,246 | ) | 8,779,216 | |||||
|
|
|
|||||||
| Net increase (decrease) in net assets resulting from operations |
1,954,784 | 10,803,694 | ||||||
|
|
|
|||||||
| Distributions to shareholders from net investment income: Class 2 |
(386,881 | ) | (481,480 | ) | ||||
| Capital share transactions: Class 2 (Note 2) |
(5,887,509 | ) | (2,657,434 | ) | ||||
|
|
|
|||||||
| Net increase (decrease) in net assets |
(4,319,606 | ) | 7,664,780 | |||||
| Net assets: | ||||||||
| Beginning of period |
38,812,767 | 31,147,987 | ||||||
|
|
|
|||||||
| End of period |
$ | 34,493,161 | $ | 38,812,767 | ||||
|
|
|
|||||||
| Undistributed net investment income included in net assets: | ||||||||
| End of period |
$ | 193,990 | $ | 398,066 | ||||
|
|
|
|||||||
| The accompanying notes are an integral part of these financial statements. | Semiannual Report | FLV-15 |
FRANKLIN TEMPLETON VARIABLE INSURANCE PRODUCTS TRUST
Notes to Financial Statements (unaudited)
Franklin Large Cap Value VIP Fund
| FLV-16 | Semiannual Report |
FRANKLIN TEMPLETON VARIABLE INSURANCE PRODUCTS TRUST
NOTES TO FINANCIAL STATEMENTS (UNAUDITED)
Franklin Large Cap Value VIP Fund (continued)
| Semiannual Report | FLV-17 |
FRANKLIN TEMPLETON VARIABLE INSURANCE PRODUCTS TRUST
NOTES TO FINANCIAL STATEMENTS (UNAUDITED)
Franklin Large Cap Value VIP Fund (continued)
2. Shares of Beneficial Interest
At June 30, 2014, there were an unlimited number of shares authorized (without par value). Transactions in the Fund’s shares were as follows:
| Six Months Ended June 30, 2014 |
Year Ended December 31, 2013 |
|||||||||||||||||
| Shares | Amount | Shares | Amount | |||||||||||||||
| Class 2 Shares: | ||||||||||||||||||
| Shares sold |
166,970 | $ | 2,523,157 | 883,791 | $ | 11,420,212 | ||||||||||||
| Shares issued in reinvestment of distributions |
25,073 | 386,881 | 37,912 | 481,480 | ||||||||||||||
| Shares redeemed |
(594,296 | ) | (8,797,547 | ) | (1,116,968 | ) | (14,559,126 | ) | ||||||||||
|
|
|
|||||||||||||||||
| Net increase (decrease) |
(402,253 | ) | $ | (5,887,509 | ) | (195,265 | ) | $ | (2,657,434 | ) | ||||||||
|
|
|
|||||||||||||||||
3. Transactions With Affiliates
Franklin Resources, Inc. is the holding company for various subsidiaries that together are referred to as Franklin Templeton Investments. Certain officers and trustees of the Fund are also officers and/or directors of the following subsidiaries:
| Subsidiary | Affiliation | |
| Franklin Advisory Services, LLC (Advisory Services) | Investment manager | |
| Franklin Templeton Services, LLC (FT Services) | Administrative manager | |
| Franklin Templeton Distributors, Inc. (Distributors) | Principal underwriter | |
| Franklin Templeton Investor Services, LLC (Investor Services) | Transfer agent |
a. Management Fees
The Fund pays an investment management fee to Advisory Services based on the average daily net assets of the Fund as follows:
| Annualized Fee Rate | Net Assets | |
| 1.000% | Up to and including $500 million | |
| 0.900% | Over $500 million, up to and including $1 billion | |
| 0.850% | Over $1 billion, up to and including $1.5 billion | |
| 0.800% | Over $1.5 billion, up to and including $6.5 billion | |
| 0.775% | Over $6.5 billion, up to and including $11.5 billion | |
| 0.750% | Over $11.5 billion, up to and including $16.5 billion | |
| 0.740% | Over $16.5 billion, up to and including $19 billion | |
| 0.730% | Over $19 billion, up to and including $21.5 billion | |
| 0.720% | In excess of $21.5 billion |
b. Administrative Fees
Under an agreement with Advisory Services, FT Services provides administrative services to the Fund. The fee is paid by Advisory Services based on the Fund’s average daily net assets, and is not an additional expense of the Fund.
| FLV-18 | Semiannual Report |
FRANKLIN TEMPLETON VARIABLE INSURANCE PRODUCTS TRUST
NOTES TO FINANCIAL STATEMENTS (UNAUDITED)
Franklin Large Cap Value VIP Fund (continued)
c. Distribution Fees
The Board has adopted a distribution plan for Class 2 shares pursuant to Rule 12b-1 under the 1940 Act. Under the Fund’s compensation distribution plan, the Fund pays Distributors for costs incurred in connection with the servicing, sale and distribution of the Fund’s shares up to 0.35% per year of its average daily net assets. Some distribution fees are not charged on shares held by affiliates. The Board has agreed to limit the current rate to 0.25% per year for Class 2. The plan year, for purposes of monitoring compliance with the maximum annual plan rate, is February 1 through January 31.
d. Transfer Agent Fees
Investor Services, under terms of an agreement, performs shareholder servicing for the Fund and is not paid by the Fund for the services.
e. Investment in Institutional Fiduciary Trust Money Market Portfolio
The Fund invests in the Institutional Fiduciary Trust Money Market Portfolio (Sweep Money Fund), an affiliated open-end management investment company. Management fees paid by the Fund are waived on assets invested in the Sweep Money Fund, in an amount not to exceed the management and administrative fees paid directly or indirectly by the Sweep Money Fund, as noted on the Statement of Operations. Prior to January 1, 2014 the waiver was accounted for as a reduction to management fees.
f. Waiver and Expense Reimbursements
Advisory Services has contractually agreed in advance to waive or limit its fees and to assume as its own expense certain expenses otherwise payable by the Fund so that the expenses (excluding distribution fees, and acquired fund fees and expenses) do not exceed 0.65% (other than certain non-routine expenses or costs, including those relating to litigation, indemnification, reorganizations, and liquidations) until April 30, 2015.
4. Expense Offset Arrangement
The Fund has entered into an arrangement with its custodian whereby credits realized as a result of uninvested cash balances are used to reduce a portion of the Fund’s custodian expenses. During the period ended June 30, 2014, there were no credits earned.
5. Income Taxes
For tax purposes, capital losses may be carried over to offset future capital gains. Capital loss carryforwards with no expiration, if any, must be fully utilized before those losses with expiration dates.
At December 31, 2013, capital loss carryforwards were as follows:
| Capital loss carryforwards subject to expiration: |
||
| 2016 |
$1,797,418 | |
| 2017 |
2,320,965 | |
| 2018 |
1,173,534 | |
|
| ||
| $5,291,917 | ||
|
|
At June 30, 2014, the cost of investments and net unrealized appreciation (depreciation) for income tax purposes were as follows:
| Cost of investments |
$20,840,113 | |
|
| ||
| Unrealized appreciation |
$14,019,170 | |
| Unrealized depreciation |
(188,354) | |
|
| ||
| Net unrealized appreciation (depreciation) |
$13,830,816 | |
|
| ||
| Semiannual Report | FLV-19 |
FRANKLIN TEMPLETON VARIABLE INSURANCE PRODUCTS TRUST
NOTES TO FINANCIAL STATEMENTS (UNAUDITED)
Franklin Large Cap Value VIP Fund (continued)
5. Income Taxes (continued)
Differences between income and/or capital gains as determined on a book basis and a tax basis are primarily due to differing treatment of wash sales.
6. Investment Transactions
Purchases and sales of investments (excluding short term securities) for the period ended June 30, 2014, aggregated $1,635,417 and $7,882,536, respectively.
7. Credit Facility
The Fund, together with other U.S. registered and foreign investment funds (collectively, Borrowers), managed by Franklin Templeton Investments, are borrowers in a joint syndicated senior unsecured credit facility totaling $1.5 billion (Global Credit Facility) which matures on February 13, 2015. This Global Credit Facility provides a source of funds to the Borrowers for temporary and emergency purposes, including the ability to meet future unanticipated or unusually large redemption requests.
Under the terms of the Global Credit Facility, the Fund shall, in addition to interest charged on any borrowings made by the Fund and other costs incurred by the Fund, pay its share of fees and expenses incurred in connection with the implementation and maintenance of the Global Credit Facility, based upon its relative share of the aggregate net assets of all of the Borrowers, including an annual commitment fee of 0.07% based upon the unused portion of the Global Credit Facility. These fees are reflected in other expenses on the Statement of Operations. During the period ended June 30, 2014, the Fund did not use the Global Credit Facility.
8. Fair Value Measurements
The Fund follows a fair value hierarchy that distinguishes between market data obtained from independent sources (observable inputs) and the Fund’s own market assumptions (unobservable inputs). These inputs are used in determining the value of the Fund’s financial instruments and are summarized in the following fair value hierarchy:
| • | Level 1 – quoted prices in active markets for identical financial instruments |
| • | Level 2 – other significant observable inputs (including quoted prices for similar financial instruments, interest rates, prepayment speed, credit risk, etc.) |
| • | Level 3 – significant unobservable inputs (including the Fund’s own assumptions in determining the fair value of financial instruments) |
The input levels are not necessarily an indication of the risk or liquidity associated with financial instruments at that level.
For movements between the levels within the fair value hierarchy, the Fund has adopted a policy of recognizing the transfers as of the date of the underlying event which caused the movement.
At June 30, 2014, all of the Fund’s investments in financial instruments carried at fair value were valued using Level 1inputs. For detailed categories, see the accompanying Statement of Investments.
9. New Accounting Pronouncements
In June 2014, the Financial Accounting Standards Board issued Accounting Standards Update (ASU) No. 2014-11, Transfers and Servicing (Topic 860), Repurchase-to-Maturity Transactions, Repurchase Financings, and Disclosures. The ASU changes the accounting for certain repurchase agreements and expands disclosure requirements related to repurchase agreements, securities lending, repurchase-to-maturity and similar transactions. The ASU is effective for interim and annual reporting periods beginning after December 15, 2014. Management is currently evaluating the impact, if any, of applying this provision.
| FLV-20 | Semiannual Report |
FRANKLIN TEMPLETON VARIABLE INSURANCE PRODUCTS TRUST
NOTES TO FINANCIAL STATEMENTS (UNAUDITED)
Franklin Large Cap Value VIP Fund (continued)
10. Subsequent Events
The Fund has evaluated subsequent events through the issuance of the financial statements and determined that no events have occurred that require disclosure, except for the following:
On July 16, 2014, the Board approved a proposal to terminate and liquidate the Fund. The Fund is scheduled to liquidate on or about November 7, 2014.
Abbreviations
| Selected Portfolio: | ||
| ADR | American Depositary Receipt | |
| Semiannual Report | FLV-21 |
Franklin Mutual Global Discovery VIP Fund
(Formerly, Mutual Global Discovery Securities Fund)
We are pleased to bring you Franklin Mutual Global Discovery VIP Fund’s
semiannual report for the period ended June 30, 2014.
Class 2 Performance Summary as of June 30, 2014
Franklin Mutual Global Discovery VIP Fund – Class 2 delivered a +7.22% total return for the six-month period ended June 30, 2014.
Performance reflects the Fund’s Class 2 operating expenses, but does not include any contract fees, expenses or sales charges. If they had been included, performance would be lower. These charges and deductions, particularly for variable life policies, can have a significant effect on contract values and insurance benefits. See the contract prospectus for a complete description of these expenses, including sales charges.
Performance data represent past performance, which does not guarantee future results. Investment return and principal value will fluctuate, and you may have a gain or loss when you sell your shares. Current performance may differ from figures shown.
| Semiannual Report | MGD-1 |
FRANKLIN MUTUAL GLOBAL DISCOVERY VIP FUND
1. Source: © 2014 Morningstar. One cannot invest directly in an index, and an index is not representative of the Fund’s portfolio. Please see Index Descriptions following the Fund Summaries.
| MGD-2 | Semiannual Report |
FRANKLIN MUTUAL GLOBAL DISCOVERY VIP FUND
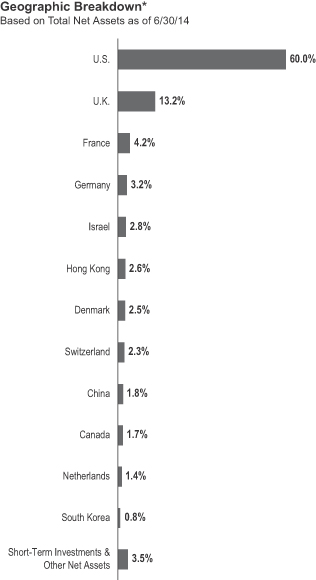
Manager’s Discussion
Many Fund holdings increased in value during the review period. Top contributors included pharmaceutical companies Teva Pharmaceutical Industries and Merck & Co. and technology leader Apple.
| Semiannual Report | MGD-3 |
FRANKLIN MUTUAL GLOBAL DISCOVERY VIP FUND
During the period under review, some of the Fund’s investments negatively affected performance. These included mobile telecommunications company Vodafone Group, retailer Metro and financial services firm KB Financial Group.
In May, U.K.-based Vodafone Group reported fiscal fourth-quarter results (the company has a March 31 fiscal year-end) as earnings fell short of expectations and capital spending increased significantly, following Vodafone’s strategic decision to significantly upgrade its network to offer a differentiated level of service. The company believed that consumers would be willing to pay a premium for network quality as data usage increases. We agreed with this position; however, in the near term, earnings were likely to be under pressure. With the possibility of a merger with AT&T on hold, we believed the primary near-term catalysts were potential market consolidation in Europe, disposals of non-core assets and the resolution of a tax dispute with India’s government, which could pave the way for an initial public offering (IPO) of Vodafone’s India business.
Upheaval in Ukraine disrupted Germany-based retailer Metro’s plans to pursue a partial IPO of its Russia cash-and-carry business. The potential IPO, which was put on hold in mid-March, was being closely watched as it would have provided a benchmark valuation for this important Metro operation and also raised capital to fund growth and further reduce debt. Shares of Metro rebounded slightly in May as quarterly results revealed that operations in Russia continued to perform well with a slight uptick in business, small market share gains and intentions to
| MGD-4 | Semiannual Report |
FRANKLIN MUTUAL GLOBAL DISCOVERY VIP FUND
| Semiannual Report | MGD-5 |
FRANKLIN MUTUAL GLOBAL DISCOVERY VIP FUND
Class 2 Fund Expenses
| Class 2 | Beginning Account Value 1/1/14 |
Ending Account Value 6/30/14 |
Fund-Level Expenses Incurred During Period* 1/1/14–6/30/14 |
|||||||||
| Actual | $1,000 | $1,072.20 | $6.37 | |||||||||
| Hypothetical (5% return before expenses) | $1,000 | $1,018.65 | $6.21 | |||||||||
*Expenses are calculated using the most recent six-month annualized expense ratio for the Fund’s Class 2 shares (1.24%), which does not include any ongoing expenses of the Contract for which the Fund is an investment option, multiplied by the average account value over the period, multiplied by 181/365 to reflect the one-half year period.
| MGD-6 | Semiannual Report |
SUPPLEMENT DATED AUGUST 1, 2014
TO THE PROSPECTUS DATED MAY 1, 2014
OF
FRANKLIN MUTUAL GLOBAL DISCOVERY VIP FUND
(a series of Franklin Templeton Variable Insurance Products Trust)
The prospectus is amended as follows:
I. The “Fund Summary – Annual Fund Operating Expenses” table beginning on page MGD-S1 in the Fund’s Class 1 prospectus is replaced with the following:
Annual Fund Operating Expenses
(expenses that you pay each year as a percentage of the value of your investment)
| Class 1 | ||||
| Management fees1 | 0.94% | |||
| Distribution and service (12b-1) fees | None | |||
| Other expenses1 | 0.03% | |||
| Total annual Fund operating expenses | 0.97% | |||
| 1. | Management fees and other expenses have been restated to reflect current fiscal year fees and expenses as a result of the bundling of the Fund’s investment management agreement with its fund administration agreement effective May 1, 2014. Such combined investment management fees are described further under “Management” in the Fund’s prospectus. Total annual fund operating expenses are not affected by such bundling. |
II. The “Fund Summary – Annual Fund Operating Expenses” table beginning on page MGD-S1 in the Fund’s Class 2 prospectus is replaced with the following:
Annual Fund Operating Expenses
(expenses that you pay each year as a percentage of the value of your investment)
| Class 2 | ||||
| Management fees1 | 0.94% | |||
| Distribution and service (12b-1) fees | 0.25% | |||
| Other expenses1 | 0.03% | |||
| Total annual Fund operating expenses | 1.22% | |||
1. Management fees and other expenses have been restated to reflect current fiscal year fees and expenses as a result of the bundling of the Fund’s investment management agreement with its fund administration agreement effective May 1, 2014. Such combined investment management fees are described further under “Management” in the Fund’s prospectus. Total annual fund operating expenses are not affected by such bundling.
III. The “Fund Summary – Annual Fund Operating Expenses” table beginning on page MGD-S1 in the Fund’s Class 4 prospectus is replaced with the following:
Annual Fund Operating Expenses
(expenses that you pay each year as a percentage of the value of your investment)
| Class 4 | ||||
| Management fees1 | 0.94% | |||
| Distribution and service (12b-1) fees | 0.35% | |||
| Other expenses1 | 0.03% | |||
| Total annual Fund operating expenses | 1.32% | |||
| MGD-7 |
| 1. | Management fees and other expenses have been restated to reflect current fiscal year fees and expenses as a result of the bundling of the Fund’s investment management agreement with its fund administration agreement effective May 1, 2014. Such combined investment management fees are described further under “Management” in the Fund’s prospectus. Total annual fund operating expenses are not affected by such bundling. |
IV. The following is added as the second to last paragraph in the “Fund Details – Management” section of each Class’ prospectus beginning on page MGD-D8:
Effective May 1, 2014, the Fund’s investment management agreement was bundled with its fund administration agreement, including the fees payable to the Fund’s administrator thereunder, as approved by the board of trustees. The fee payable to the administrator under the Fund’s administration agreement, prior to May 1, 2014, was a monthly fee under the following fee schedule of the Fund’s average daily net assets:
| • | 0.150% up to and including $200 million; |
| • | 0.135% over $200 million, up to and including $700 million; |
| • | 0.100% over $700 million, up to and including $1.2 billion; |
| • | 0.075% in excess of $1.2 billion. |
As of such date, the Fund’s investment management fees became a monthly fee at the annual rate of the value of the Fund’s average daily net assets as set forth below:
| • | 0.950% up to and including $200 million; |
| • | 0.935% over $200 million, up to and including $700 million; |
| • | 0.900% over $700 million, up to and including $1.2 billion; |
| • | 0.875% over $1.2 billion, up to and including $4 billion; |
| • | 0.845% over $4 billion, up to and including $7 billion; |
| • | 0.825% over $7 billion, up to and including $10 billion; |
| • | 0.805% in excess of $10 billion. |
Please keep this supplement with your prospectus for future reference.
| MGD-8 |
FRANKLIN TEMPLETON VARIABLE INSURANCE PRODUCTS TRUST
Financial Highlights
Franklin Mutual Global Discovery VIP Fund
| Six Months Ended June 30, 2014 (unaudited) |
Year Ended December 31, | |||||||||||||||||||||||
| 2013 | 2012 | 2011 | 2010 | 2009 | ||||||||||||||||||||
| Class 1 | ||||||||||||||||||||||||
| Per share operating performance (for a share outstanding throughout the period) |
||||||||||||||||||||||||
| Net asset value, beginning of period |
$23.31 | $20.55 | $19.66 | $21.16 | $19.14 | $16.12 | ||||||||||||||||||
|
|
|
|||||||||||||||||||||||
| Income from investment operationsa: | ||||||||||||||||||||||||
| Net investment incomeb |
0.55 | c | 0.46 | 0.43 | 0.52 | 0.38 | 0.19 | d | ||||||||||||||||
| Net realized and unrealized gains (losses) |
1.17 | 5.03 | 2.21 | (1.09 | ) | 1.94 | 3.57 | |||||||||||||||||
|
|
|
|||||||||||||||||||||||
| Total from investment operations |
1.72 | 5.49 | 2.64 | (0.57 | ) | 2.32 | 3.76 | |||||||||||||||||
|
|
|
|||||||||||||||||||||||
| Less distributions from: | ||||||||||||||||||||||||
| Net investment income |
— | (0.58 | ) | (0.64 | ) | (0.50 | ) | (0.30 | ) | (0.26 | ) | |||||||||||||
| Net realized gains |
— | (2.15 | ) | (1.11 | ) | (0.43 | ) | — | (0.48 | ) | ||||||||||||||
|
|
|
|||||||||||||||||||||||
| Total distributions |
— | (2.73 | ) | (1.75 | ) | (0.93 | ) | (0.30 | ) | (0.74 | ) | |||||||||||||
|
|
|
|||||||||||||||||||||||
| Net asset value, end of period |
$25.03 | $23.31 | $20.55 | $19.66 | $21.16 | $19.14 | ||||||||||||||||||
|
|
|
|||||||||||||||||||||||
| Total returne |
7.38% | 27.95% | 13.63% | (2.73)% | 12.24% | 23.63% | ||||||||||||||||||
| Ratios to average net assetsf | ||||||||||||||||||||||||
| Expensesg |
0.99% | h | 0.97% | h | 0.99% | 0.97% | h | 1.00% | h | 1.06% | h | |||||||||||||
| Expenses incurred in connection with securities sold short |
0.01% | —% | i | —% | i | —% | i | 0.02% | 0.09% | |||||||||||||||
| Net investment income |
4.75% | c | 2.13% | 2.12% | 2.34% | 1.93% | 1.07% | d | ||||||||||||||||
| Supplemental data | ||||||||||||||||||||||||
| Net assets, end of period (000’s) |
$1,905 | $2,465 | $1,136 | $974 | $84,213 | $86,755 | ||||||||||||||||||
| Portfolio turnover rate |
11.83% | 15.58% | 25.63% | 26.17% | j | 49.31% | 43.35% | |||||||||||||||||
aThe amount shown for a share outstanding throughout the period may not correlate with the Statement of Operations for the period due to the timing of sales and repurchases of the Fund shares in relation to income earned and/or fluctuating market value of the investments of the Fund.
bBased on average daily shares outstanding.
cNet investment income per share includes approximately $0.34 per share received in the form of special dividends paid in connection with certain Fund’s holdings. Excluding these amounts, the ratio of net investment income to average net assets would have been 1.83%.
dNet investment income per share includes approximately $(0.03) per share related to an adjustment for uncollectible interest. Excluding the effect of this adjustment, the ratio of net investment income to average net assets would have been 1.26%.
eTotal return does not include fees, charges or expenses imposed by the variable annuity and life insurance contracts for which the Franklin Templeton Variable Insurance Products Trust serves as an underlying investment vehicle. Total return is not annualized for periods less than one year.
fRatios are annualized for periods less than one year.
gIncludes dividend or interest expense on securities sold short and security borrowing fees, if any. See below for the ratios of such expenses to average net assets for the periods presented. See Note 1(d).
hBenefit of expense reduction rounds to less than 0.01%.
iRounds to less than 0.01%.
jExcludes the value of portfolio securities delivered as a result of a redemption in-kind.
| The accompanying notes are an integral part of these financial statements. | Semiannual Report | MGD-9 |
FRANKLIN TEMPLETON VARIABLE INSURANCE PRODUCTS TRUST
FINANCIAL HIGHLIGHTS
Franklin Mutual Global Discovery VIP Fund (continued)
| Six Months Ended June 30, 2014 (unaudited) |
Year Ended December 31, | |||||||||||||||||||||||
| 2013 | 2012 | 2011 | 2010 | 2009 | ||||||||||||||||||||
| Class 2 | ||||||||||||||||||||||||
| Per share operating performance (for a share outstanding throughout the period) |
||||||||||||||||||||||||
| Net asset value, beginning of period |
$22.84 | $20.17 | $19.30 | $20.80 | $18.81 | $15.85 | ||||||||||||||||||
|
|
|
|||||||||||||||||||||||
| Income from investment operationsa: | ||||||||||||||||||||||||
| Net investment incomeb |
0.52 | c | 0.42 | 0.38 | 0.43 | 0.33 | 0.14 | d | ||||||||||||||||
| Net realized and unrealized gains (losses) |
1.13 | 4.92 | 2.15 | (1.04 | ) | 1.91 | 3.50 | |||||||||||||||||
|
|
|
|||||||||||||||||||||||
| Total from investment operations |
1.65 | 5.34 | 2.53 | (0.61 | ) | 2.24 | 3.64 | |||||||||||||||||
|
|
|
|||||||||||||||||||||||
| Less distributions from: | ||||||||||||||||||||||||
| Net investment income |
— | (0.52 | ) | (0.55 | ) | (0.46 | ) | (0.25 | ) | (0.20 | ) | |||||||||||||
| Net realized gains |
— | (2.15 | ) | (1.11 | ) | (0.43 | ) | — | (0.48 | ) | ||||||||||||||
|
|
|
|||||||||||||||||||||||
| Total distributions |
— | (2.67 | ) | (1.66 | ) | (0.89 | ) | (0.25 | ) | (0.68 | ) | |||||||||||||
|
|
|
|||||||||||||||||||||||
| Net asset value, end of period |
$24.49 | $22.84 | $20.17 | $19.30 | $20.80 | $18.81 | ||||||||||||||||||
|
|
|
|||||||||||||||||||||||
| Total returne |
7.22% | 27.61% | 13.36% | (2.96)% | 11.96% | 23.31% | ||||||||||||||||||
| Ratios to average net assetsf | ||||||||||||||||||||||||
| Expensesg |
1.24% | h | 1.22% | h | 1.24% | 1.22% | h | 1.25% | h | 1.31% | h | |||||||||||||
| Expenses incurred in connection with securities sold short |
0.01% | —% | i | —% | i | —% | i | 0.02% | 0.09% | |||||||||||||||
| Net investment income |
4.50% | c | 1.88% | 1.87% | 2.09% | 1.68% | 0.82% | d | ||||||||||||||||
| Supplemental data | ||||||||||||||||||||||||
| Net assets, end of period (000’s) |
$719,617 | $684,780 | $660,465 | $712,161 | $1,351,223 | $1,309,852 | ||||||||||||||||||
| Portfolio turnover rate |
11.83% | 15.58% | 25.63% | 26.17%j | 49.31% | 43.35% | ||||||||||||||||||
aThe amount shown for a share outstanding throughout the period may not correlate with the Statement of Operations for the period due to the timing of sales and repurchases of the Fund shares in relation to income earned and/or fluctuating market value of the investments of the Fund.
bBased on average daily shares outstanding.
cNet investment income per share includes approximately $0.34 per share received in the form of special dividends paid in connection with certain Fund’s holdings. Excluding these amounts, the ratio of net investment income to average net assets would have been 1.58%.
dNet investment income per share includes approximately $(0.03) per share related to an adjustment for uncollectible interest. Excluding the effect of this adjustment, the ratio of net investment income to average net assets would have been 1.01%.
eTotal return does not include fees, charges or expenses imposed by the variable annuity and life insurance contracts for which the Franklin Templeton Variable Insurance Products Trust serves as an underlying investment vehicle. Total return is not annualized for periods less than one year.
fRatios are annualized for periods less than one year.
gIncludes dividend or interest expense on securities sold short and security borrowing fees, if any. See below for the ratios of such expenses to average net assets for the periods presented. See Note 1(d).
hBenefit of expense reduction rounds to less than 0.01%.
iRounds to less than 0.01%.
jExcludes the value of portfolio securities delivered as a result of a redemption in-kind.
| MGD-10 | Semiannual Report | The accompanying notes are an integral part of these financial statements. |
FRANKLIN TEMPLETON VARIABLE INSURANCE PRODUCTS TRUST
FINANCIAL HIGHLIGHTS
Franklin Mutual Global Discovery VIP Fund (continued)
| Six Months Ended June 30, 2014 (unaudited) |
Year Ended December 31, | |||||||||||||||||||||||
| 2013 | 2012 | 2011 | 2010 | 2009 | ||||||||||||||||||||
| Class 4 | ||||||||||||||||||||||||
| Per share operating performance (for a share outstanding throughout the period) |
||||||||||||||||||||||||
| Net asset value, beginning of period |
$23.10 | $20.38 | $19.50 | $21.02 | $19.02 | $16.07 | ||||||||||||||||||
|
|
|
|||||||||||||||||||||||
| Income from investment operationsa: | ||||||||||||||||||||||||
| Net investment incomeb |
0.52 | c | 0.40 | 0.36 | 0.40 | 0.31 | 0.11 | d | ||||||||||||||||
| Net realized and unrealized gains (losses) |
1.14 | 4.97 | 2.19 | (1.05 | ) | 1.94 | 3.56 | |||||||||||||||||
|
|
|
|||||||||||||||||||||||
| Total from investment operations |
1.66 | 5.37 | 2.55 | (0.65 | ) | 2.25 | 3.67 | |||||||||||||||||
|
|
|
|||||||||||||||||||||||
| Less distributions from: | ||||||||||||||||||||||||
| Net investment income |
— | (0.50 | ) | (0.56 | ) | (0.44 | ) | (0.25 | ) | (0.24 | ) | |||||||||||||
| Net realized gains |
— | (2.15 | ) | (1.11 | ) | (0.43 | ) | — | (0.48 | ) | ||||||||||||||
|
|
|
|||||||||||||||||||||||
| Total distributions |
— | (2.65 | ) | (1.67 | ) | (0.87 | ) | (0.25 | ) | (0.72 | ) | |||||||||||||
|
|
|
|||||||||||||||||||||||
| Net asset value, end of period |
$24.76 | $23.10 | $20.38 | $19.50 | $21.02 | $19.02 | ||||||||||||||||||
|
|
|
|||||||||||||||||||||||
| Total returne |
7.19% | 27.52% | 13.27% | (3.08)% | 11.87% | 23.19% | ||||||||||||||||||
| Ratios to average net assetsf | ||||||||||||||||||||||||
| Expensesg |
1.34% | h | 1.32% | h | 1.34% | 1.32% | h | 1.35% | h | 1.41% | h | |||||||||||||
| Expenses incurred in connection with securities sold short |
0.01% | —% | i | —% | i | —% | i | 0.02% | 0.09% | |||||||||||||||
| Net investment income |
4.40% | c | 1.78% | 1.77% | 1.99% | 1.58% | 0.72% | d | ||||||||||||||||
| Supplemental data | ||||||||||||||||||||||||
| Net assets, end of period (000’s) |
$68,436 | $70,354 | $62,346 | $66,695 | $70,613 | $59,178 | ||||||||||||||||||
| Portfolio turnover rate |
11.83% | 15.58% | 25.63% | 26.17% | j | 49.31% | 43.35% | |||||||||||||||||
aThe amount shown for a share outstanding throughout the period may not correlate with the Statement of Operations for the period due to the timing of sales and repurchases of the Fund shares in relation to income earned and/or fluctuating market value of the investments of the Fund.
bBased on average daily shares outstanding.
cNet investment income per share includes approximately $0.34 per share received in the form of special dividends paid in connection with certain Fund’s holdings. Excluding these amounts, the ratio of net investment income to average net assets would have been 1.48%.
dNet investment income per share includes approximately $(0.03) per share related to an adjustment for uncollectible interest. Excluding the effect of this adjustment, the ratio of net investment income to average net assets would have been 0.91%.
eTotal return does not include fees, charges or expenses imposed by the variable annuity and life insurance contracts for which the Franklin Templeton Variable Insurance Products Trust serves as an underlying investment vehicle. Total return is not annualized for periods less than one year.
fRatios are annualized for periods less than one year.
gIncludes dividend or interest expense on securities sold short and security borrowing fees, if any. See below for the ratios of such expenses to average net assets for the periods presented. See Note 1(d).
hBenefit of expense reduction rounds to less than 0.01%.
iRounds to less than 0.01%.
jExcludes the value of portfolio securities delivered as a result of a redemption in-kind.
| The accompanying notes are an integral part of these financial statements. | Semiannual Report | MGD-11 |
FRANKLIN TEMPLETON VARIABLE INSURANCE PRODUCTS TRUST
Statement of Investments, June 30, 2014 (unaudited)
| Franklin Mutual Global Discovery VIP Fund | ||||||||||||||
| Country | Shares/Units | Value | ||||||||||||
| Common Stocks and Other Equity Interests 90.9% |
||||||||||||||
| Aerospace & Defense 1.5% |
||||||||||||||
| a | B/E Aerospace Inc. |
United States | 52,340 | $ | 4,840,927 | |||||||||
| Safran SA |
France | 107,185 | 7,018,500 | |||||||||||
|
|
|
|||||||||||||
| 11,859,427 | ||||||||||||||
|
|
|
|||||||||||||
| Auto Components 0.9% |
||||||||||||||
| Cie Generale des Etablissements Michelin, B |
France | 30,800 | 3,680,544 | |||||||||||
| a,b | International Automotive Components Group Brazil LLC |
Brazil | 424,073 | 67,627 | ||||||||||
| a,b,c | International Automotive Components Group North America, LLC |
United States | 4,052,916 | 3,739,950 | ||||||||||
|
|
|
|||||||||||||
| 7,488,121 | ||||||||||||||
|
|
|
|||||||||||||
| Automobiles 0.8% |
||||||||||||||
| General Motors Co. |
United States | 181,030 | 6,571,389 | |||||||||||
|
|
|
|||||||||||||
| Banks 11.9% |
||||||||||||||
| a,b,d | The Bankshares Inc. |
United States | 800,000 | 4,109,947 | ||||||||||
| Barclays PLC |
United Kingdom | 990,101 | 3,605,387 | |||||||||||
| BNP Paribas SA |
France | 107,180 | 7,272,098 | |||||||||||
| a | Capital Bank Financial Corp., A |
United States | 78,494 | 1,853,243 | ||||||||||
| a,e | Capital Bank Financial Corp., B, 144A, non-voting |
United States | 269,922 | 6,372,859 | ||||||||||
| CIT Group Inc. |
United States | 108,462 | 4,963,221 | |||||||||||
| Citigroup Inc. |
United States | 229,050 | 10,788,255 | |||||||||||
| HSBC Holdings PLC |
United Kingdom | 586,355 | 5,948,985 | |||||||||||
| Industrial and Commercial Bank of China Ltd., H |
China | 6,040,679 | 3,819,046 | |||||||||||
| JPMorgan Chase & Co. |
United States | 131,280 | 7,564,354 | |||||||||||
| KB Financial Group Inc. |
South Korea | 101,400 | 3,526,957 | |||||||||||
| PNC Financial Services Group Inc. |
United States | 112,821 | 10,046,710 | |||||||||||
| Societe Generale SA |
France | 64,534 | 3,380,827 | |||||||||||
| SunTrust Banks Inc. |
United States | 117,939 | 4,724,636 | |||||||||||
| Wells Fargo & Co. |
United States | 307,140 | 16,143,278 | |||||||||||
|
|
|
|||||||||||||
| 94,119,803 | ||||||||||||||
|
|
|
|||||||||||||
| Beverages 1.4% |
||||||||||||||
| Coca-Cola Enterprises Inc. |
United States | 55,506 | 2,652,076 | |||||||||||
| PepsiCo Inc. |
United States | 90,367 | 8,073,388 | |||||||||||
|
|
|
|||||||||||||
| 10,725,464 | ||||||||||||||
|
|
|
|||||||||||||
| Capital Markets 1.2% |
||||||||||||||
| Credit Suisse Group AG |
Switzerland | 264,483 | 7,563,048 | |||||||||||
| Morgan Stanley |
United States | 53,407 | 1,726,648 | |||||||||||
|
|
|
|||||||||||||
| 9,289,696 | ||||||||||||||
|
|
|
|||||||||||||
| Communications Equipment 1.1% |
||||||||||||||
| Cisco Systems Inc. |
United States | 359,180 | 8,925,623 | |||||||||||
|
|
|
|||||||||||||
| Consumer Finance 0.5% |
||||||||||||||
| a | Ally Financial Inc. |
United States | 151,600 | 3,624,756 | ||||||||||
|
|
|
|||||||||||||
| Diversified Consumer Services 0.1% |
||||||||||||||
| a | Cengage Learning Holdings II LP |
United States | 22,762 | 802,361 | ||||||||||
|
|
|
|||||||||||||
| Diversified Financial Services 1.3% |
||||||||||||||
| a | ING Groep NV, IDR |
Netherlands | 756,040 | 10,622,783 | ||||||||||
|
|
|
|||||||||||||
| Diversified Telecommunication Services 0.0% |
||||||||||||||
| a,f,g | Global Crossing Holdings Ltd., Contingent Distribution |
United States | 2,236,777 | — | ||||||||||
|
|
|
|||||||||||||
| MGD-12 | Semiannual Report |
FRANKLIN TEMPLETON VARIABLE INSURANCE PRODUCTS TRUST
STATEMENT OF INVESTMENTS (UNAUDITED)
Franklin Mutual Global Discovery VIP Fund (continued)
| Country | Shares/Units | Value | ||||||||||||
| Common Stocks and Other Equity Interests (continued) |
||||||||||||||
| Energy Equipment & Services 2.7% |
||||||||||||||
| Baker Hughes Inc. |
United States | 147,071 | $ | 10,949,436 | ||||||||||
| Ensco PLC, A |
United States | 83,364 | 4,632,538 | |||||||||||
| Transocean Ltd. |
United States | 120,473 | 5,424,899 | |||||||||||
|
|
|
|||||||||||||
| 21,006,873 | ||||||||||||||
|
|
|
|||||||||||||
| Food & Staples Retailing 4.9% |
||||||||||||||
| China Resources Enterprise Ltd. |
China | 851,619 | 2,373,407 | |||||||||||
| CVS Caremark Corp. |
United States | 46,236 | 3,484,807 | |||||||||||
| Empire Co. Ltd., A |
Canada | 72,193 | 4,911,927 | |||||||||||
| a | Metro AG |
Germany | 318,004 | 13,861,664 | ||||||||||
| Tesco PLC |
United Kingdom | 1,412,832 | 6,870,928 | |||||||||||
| Walgreen Co. |
United States | 98,012 | 7,265,629 | |||||||||||
|
|
|
|||||||||||||
| 38,768,362 | ||||||||||||||
|
|
|
|||||||||||||
| Health Care Equipment & Supplies 2.6% |
||||||||||||||
| Medtronic Inc. |
United States | 257,980 | 16,448,805 | |||||||||||
| Stryker Corp. |
United States | 46,588 | 3,928,300 | |||||||||||
|
|
|
|||||||||||||
| 20,377,105 | ||||||||||||||
|
|
|
|||||||||||||
| Health Care Providers & Services 1.8% |
||||||||||||||
| Cigna Corp. |
United States | 152,861 | 14,058,626 | |||||||||||
|
|
|
|||||||||||||
| Hotels, Restaurants & Leisure 1.5% |
||||||||||||||
| Accor SA |
France | 233,913 | 12,169,418 | |||||||||||
|
|
|
|||||||||||||
| Independent Power & Renewable Electricity Producers 1.4% |
||||||||||||||
| NRG Energy Inc. |
United States | 299,277 | 11,133,104 | |||||||||||
|
|
|
|||||||||||||
| Industrial Conglomerates 2.7% |
||||||||||||||
| Jardine Matheson Holdings Ltd. |
Hong Kong | 123,597 | 7,330,538 | |||||||||||
| Jardine Strategic Holdings Ltd. |
Hong Kong | 371,698 | 13,280,769 | |||||||||||
| Siemens AG |
Germany | 3,785 | 499,936 | |||||||||||
|
|
|
|||||||||||||
| 21,111,243 | ||||||||||||||
|
|
|
|||||||||||||
| Insurance 7.7% |
||||||||||||||
| ACE Ltd. |
United States | 163,160 | 16,919,692 | |||||||||||
| a | Alleghany Corp. |
United States | 2,730 | 1,196,067 | ||||||||||
| The Allstate Corp. |
United States | 104,847 | 6,156,616 | |||||||||||
| American International Group Inc. |
United States | 243,553 | 13,293,123 | |||||||||||
| China Pacific Insurance (Group) Co. Ltd., H |
China | 1,127,908 | 3,987,469 | |||||||||||
| E-L Financial Corp. Ltd. |
Canada | 5,378 | 3,560,287 | |||||||||||
| MetLife Inc. |
United States | 63,096 | 3,505,614 | |||||||||||
| a,b | Olympus Re Holdings Ltd. |
United States | 2,140 | — | ||||||||||
| PartnerRe Ltd. |
United States | 58,470 | 6,385,508 | |||||||||||
| PICC Property and Casualty Co. Ltd., H |
China | 228,457 | 346,645 | |||||||||||
| Zurich Insurance Group AG |
Switzerland | 17,558 | 5,292,049 | |||||||||||
|
|
|
|||||||||||||
| 60,643,070 | ||||||||||||||
|
|
|
|||||||||||||
| IT Services 1.1% |
||||||||||||||
| Xerox Corp. |
United States | 720,967 | 8,968,829 | |||||||||||
|
|
|
|||||||||||||
| Marine 2.5% |
||||||||||||||
| A.P. Moeller-Maersk AS, B |
Denmark | 7,825 | 19,444,654 | |||||||||||
|
|
|
|||||||||||||
| Media 5.1% |
||||||||||||||
| CBS Corp., B |
United States | 72,249 | 4,489,553 | |||||||||||
| Comcast Corp., Special A |
United States | 48,623 | 2,593,064 | |||||||||||
| Semiannual Report | MGD-13 |
FRANKLIN TEMPLETON VARIABLE INSURANCE PRODUCTS TRUST
STATEMENT OF INVESTMENTS (UNAUDITED)
Franklin Mutual Global Discovery VIP Fund (continued)
| Country | Shares/Units | Value | ||||||||||||
| Common Stocks and Other Equity Interests (continued) |
||||||||||||||
| Media (continued) |
||||||||||||||
| a | DIRECTV |
United States | 93,680 | $ | 7,963,737 | |||||||||
| Reed Elsevier PLC |
United Kingdom | 251,872 | 4,051,432 | |||||||||||
| Time Warner Cable Inc. |
United States | 62,129 | 9,151,602 | |||||||||||
| a | Tribune Co., A |
United States | 43,818 | 3,726,721 | ||||||||||
| a | Tribune Co., B |
United States | 26,867 | 2,285,038 | ||||||||||
| Twenty-First Century Fox Inc., B |
United States | 170,160 | 5,824,577 | |||||||||||
|
|
|
|||||||||||||
| 40,085,724 | ||||||||||||||
|
|
|
|||||||||||||
| Metals & Mining 2.8% |
||||||||||||||
| Anglo American PLC |
United Kingdom | 275,805 | 6,748,993 | |||||||||||
| Freeport-McMoRan Copper & Gold Inc., B |
United States | 135,280 | 4,937,720 | |||||||||||
| a | ThyssenKrupp AG |
Germany | 344,296 | 10,038,152 | ||||||||||
|
|
|
|||||||||||||
| 21,724,865 | ||||||||||||||
|
|
|
|||||||||||||
| Multiline Retail 0.7% |
||||||||||||||
| Kohl’s Corp. |
United States | 99,870 | 5,261,152 | |||||||||||
|
|
|
|||||||||||||
| Oil, Gas & Consumable Fuels 8.8% |
||||||||||||||
| Apache Corp. |
United States | 149,500 | 15,042,690 | |||||||||||
| BG Group PLC |
United Kingdom | 229,790 | 4,856,226 | |||||||||||
| BP PLC |
United Kingdom | 1,028,014 | 9,057,800 | |||||||||||
| China Shenhua Energy Co. Ltd., H |
China | 1,242,931 | 3,592,263 | |||||||||||
| CONSOL Energy Inc. |
United States | 114,311 | 5,266,308 | |||||||||||
| Marathon Oil Corp. |
United States | 178,885 | 7,141,089 | |||||||||||
| Royal Dutch Shell PLC, A |
United Kingdom | 469,862 | 19,458,003 | |||||||||||
| Talisman Energy Inc. |
Canada | 468,250 | 4,963,450 | |||||||||||
|
|
|
|||||||||||||
| 69,377,829 | ||||||||||||||
|
|
|
|||||||||||||
| Paper & Forest Products 0.2% |
||||||||||||||
| NewPage Holdings Inc. |
United States | 19,416 | 1,611,528 | |||||||||||
|
|
|
|||||||||||||
| Personal Products 0.6% |
||||||||||||||
| Avon Products Inc. |
United States | 337,600 | 4,932,336 | |||||||||||
|
|
|
|||||||||||||
| Pharmaceuticals 7.3% |
||||||||||||||
| AstraZeneca PLC |
United Kingdom | 85,840 | 6,375,735 | |||||||||||
| AstraZeneca PLC, ADR |
United Kingdom | 35,792 | 2,659,704 | |||||||||||
| Eli Lilly & Co. |
United States | 118,220 | 7,349,737 | |||||||||||
| a | Hospira Inc. |
United States | 44,053 | 2,263,003 | ||||||||||
| Merck & Co. Inc. |
United States | 346,558 | 20,048,380 | |||||||||||
| Novartis AG, ADR |
Switzerland | 60,628 | 5,488,653 | |||||||||||
| Teva Pharmaceutical Industries Ltd., ADR |
Israel | 257,877 | 13,517,912 | |||||||||||
|
|
|
|||||||||||||
| 57,703,124 | ||||||||||||||
|
|
|
|||||||||||||
| Real Estate Management & Development 0.5% |
||||||||||||||
| g | Canary Wharf Group PLC |
United Kingdom | 487,324 | 3,705,733 | ||||||||||
|
|
|
|||||||||||||
| Semiconductors & Semiconductor Equipment 0.3% |
||||||||||||||
| a | SK Hynix Semiconductor Inc. |
South Korea | 53,632 | 2,572,958 | ||||||||||
|
|
|
|||||||||||||
| Software 4.7% |
||||||||||||||
| a | Check Point Software Technologies Ltd. |
Israel | 130,472 | 8,745,538 | ||||||||||
| Microsoft Corp. |
United States | 487,458 | 20,326,999 | |||||||||||
| Symantec Corp. |
United States | 364,800 | 8,353,920 | |||||||||||
|
|
|
|||||||||||||
| 37,426,457 | ||||||||||||||
|
|
|
|||||||||||||
| MGD-14 | Semiannual Report |
FRANKLIN TEMPLETON VARIABLE INSURANCE PRODUCTS TRUST
STATEMENT OF INVESTMENTS (UNAUDITED)
Franklin Mutual Global Discovery VIP Fund (continued)
| Country | Shares/Units | Value | ||||||||||||
| Common Stocks and Other Equity Interests (continued) |
||||||||||||||
| Specialty Retail 0.8% |
||||||||||||||
| Kingfisher PLC |
United Kingdom | 973,910 | $ | 5,982,932 | ||||||||||
|
|
|
|||||||||||||
| Technology Hardware, Storage & Peripherals 3.1% |
||||||||||||||
| Apple Inc. |
United States | 203,847 | 18,943,502 | |||||||||||
| Hewlett-Packard Co. |
United States | 172,177 | 5,798,921 | |||||||||||
|
|
|
|||||||||||||
| 24,742,423 | ||||||||||||||
|
|
|
|||||||||||||
| Tobacco 4.9% |
||||||||||||||
| Altria Group Inc. |
United States | 176,234 | 7,391,254 | |||||||||||
| British American Tobacco PLC |
United Kingdom | 220,778 | 13,139,722 | |||||||||||
| Lorillard Inc. |
United States | 197,019 | 12,012,248 | |||||||||||
| Philip Morris International Inc. |
United States | 75,124 | 6,333,704 | |||||||||||
|
|
|
|||||||||||||
| 38,876,928 | ||||||||||||||
|
|
|
|||||||||||||
| Wireless Telecommunication Services 1.5% |
||||||||||||||
| Vodafone Group PLC |
United Kingdom | 3,618,505 | 12,074,373 | |||||||||||
|
|
|
|||||||||||||
| Total Common Stocks and Other Equity Interests |
717,789,069 | |||||||||||||
|
|
|
|||||||||||||
| Preferred Stocks 0.7% |
||||||||||||||
| Automobiles 0.1% |
||||||||||||||
| Volkswagen AG, pfd. |
Germany | 4,196 | 1,102,123 | |||||||||||
|
|
|
|||||||||||||
| Diversified Financial Services 0.6% |
||||||||||||||
| a,b | Hightower Holding LLC, pfd., A, Series 2 |
United States | 2,172,000 | 4,388,309 | ||||||||||
|
|
|
|||||||||||||
| Total Preferred Stocks (Cost $6,518,663) |
5,490,432 | |||||||||||||
|
|
|
|||||||||||||
| Principal Amount* |
||||||||||||||
| Corporate Notes and Senior Floating Rate Interests 2.9% |
|
|||||||||||||
| e | American Airlines Inc., senior secured note, 144A, 7.50%, 3/15/16 |
United States | 3,487,000 | 3,628,659 | ||||||||||
| h,i | Cengage Learning Acquisitions Inc., First Lien Exit Term Loan, 7.00%, 3/31/20 |
United States | 147,630 | 149,737 | ||||||||||
| Clear Channel Communications Inc., |
United States | 5,184,000 | 5,546,880 | |||||||||||
| h,iTranche B Term Loan, 3.80%, 1/29/16 |
United States | 102,224 | 101,616 | |||||||||||
| h,iTranche C Term Loan, 3.80%, 1/29/16 |
United States | 15,975 | 15,831 | |||||||||||
| h,iTranche D Term Loan, 6.90%, 1/30/19 |
United States | 6,889,154 | 6,872,792 | |||||||||||
| h,iTranche E Term Loan, 7.65%, 7/30/19 |
United States | 2,213,881 | 2,223,259 | |||||||||||
| h,i | JC Penney Corp. Inc., Term Loan, 6.00%, 5/22/18 |
United States | 726,660 | 735,030 | ||||||||||
| e | NGPL PipeCo LLC, |
|||||||||||||
| secured note, 144A, 7.119%, 12/15/17 |
United States | 1,086,000 | 1,107,720 | |||||||||||
| senior secured note, 144A, 9.625%, 6/01/19 |
United States | 2,369,000 | 2,605,900 | |||||||||||
|
|
|
|||||||||||||
| Total Corporate Notes and Senior Floating Rate Interests (Cost $21,226,808) |
22,987,424 | |||||||||||||
|
|
|
|||||||||||||
| Semiannual Report | MGD-15 |
FRANKLIN TEMPLETON VARIABLE INSURANCE PRODUCTS TRUST
STATEMENT OF INVESTMENTS (UNAUDITED)
Franklin Mutual Global Discovery VIP Fund (continued)
| Country | Principal Amount* | Value | ||||||||||||
| Corporate Notes and Senior Floating Rate Interests in Reorganization 1.3% |
||||||||||||||
| b,j | Broadband Ventures III LLC, secured promissory note, 5.00%, 2/01/12 |
United States | 595 | $ | — | |||||||||
| h,i | Texas Competitive Electric Holdings Co. LLC, Extended Term Loan, 4.651%, 10/10/17 |
United States | 5,912,264 | 4,907,179 | ||||||||||
| e,j | Texas Competitive Electric Holdings Co. LLC/Texas Competitive Electric Holdings Finance Inc., senior secured note, 144A, 11.50%, 10/01/20 |
United States | 5,895,000 | 5,408,662 | ||||||||||
|
|
|
|||||||||||||
| Total Corporate Notes and Senior Floating Rate Interests in Reorganization (Cost $10,574,327) |
10,315,841 | |||||||||||||
|
|
|
|||||||||||||
| Shares | ||||||||||||||
| Companies in Liquidation 1.0% |
||||||||||||||
| a | Adelphia Recovery Trust |
United States | 5,379,562 | 53,796 | ||||||||||
| a,f | Adelphia Recovery Trust, Arahova Contingent Value Vehicle, Contingent Distribution |
United States | 386,774 | 4,641 | ||||||||||
| a,f,g | Century Communications Corp., Contingent Distribution |
United States | 1,074,000 | — | ||||||||||
| a,b | FIM Coinvestor Holdings I, LLC |
United States | 2,077,368 | — | ||||||||||
| a,k | Lehman Brothers Holdings Inc., Bankruptcy Claim |
United States | 17,348,669 | 7,958,702 | ||||||||||
| a,f,g | NewPage Corp., Litigation Trust, Contingent Distribution |
United States | 4,854,000 | — | ||||||||||
| a,f,g | Tribune Litigation Trust, Contingent Distribution |
United States | 56,883 | — | ||||||||||
|
|
|
|||||||||||||
| Total Companies in Liquidation (Cost $8,239,386) |
8,017,139 | |||||||||||||
|
|
|
|||||||||||||
| Principal Amount* | ||||||||||||||
| Municipal Bonds (Cost $2,109,740) 0.2% |
||||||||||||||
| Puerto Rico Commonwealth GO, Refunding, Series A, 8.00%, 7/01/35 |
United States | 2,261,000 | 1,991,805 | |||||||||||
|
|
|
|||||||||||||
| Total Investments before Short Term Investments |
766,591,710 | |||||||||||||
|
|
|
|||||||||||||
| Short Term Investments 3.2% |
||||||||||||||
| U.S. Government and Agency Securities 3.2% |
||||||||||||||
| l | FHLB, 7/01/13 |
United States | 5,100,000 | 5,100,000 | ||||||||||
| l,m | U.S. Treasury Bills, 8/21/14 - 12/26/14 |
United States | 20,000,000 | 19,998,314 | ||||||||||
|
|
|
|||||||||||||
| Total U.S. Government and Agency Securities |
25,098,314 | |||||||||||||
|
|
|
|||||||||||||
| Total Investments (Cost $577,880,748) 100.2% |
791,690,024 | |||||||||||||
| Securities Sold Short (0.5)% |
(4,306,247 | ) | ||||||||||||
| Other Assets, less Liabilities 0.3% |
2,573,302 | |||||||||||||
|
|
|
|||||||||||||
| Net Assets 100.0% |
$ | 789,957,079 | ||||||||||||
|
|
|
|||||||||||||
| MGD-16 | Semiannual Report |
FRANKLIN TEMPLETON VARIABLE INSURANCE PRODUCTS TRUST
STATEMENT OF INVESTMENTS (UNAUDITED)
Franklin Mutual Global Discovery VIP Fund (continued)
| Country | Shares | Value | ||||||||||||
| n | Securities Sold Short (Proceeds $4,275,367) (0.5)% |
|||||||||||||
| Common Stocks (0.5)% |
||||||||||||||
| Diversified Telecommunication Services (0.5)% |
||||||||||||||
| AT&T Inc. |
United States | 121,783 | $ | (4,306,247 | ) | |||||||||
|
|
|
|||||||||||||
*The principal amount is stated in U.S. dollars unless otherwise indicated.
aNon-income producing.
bSee Note 9 regarding restricted securities.
cAt June 30, 2014, pursuant to the Fund’s policies and the requirements of applicable securities law, the Fund may be restricted from trading this security for a limited or extended period of time due to ownership limits and/or potential possession of material non-public information.
dSee Note 11 regarding holdings of 5% voting securities.
eSecurity was purchased pursuant to Rule 144A under the Securities Act of 1933 and may be sold in transactions exempt from registration only to qualified institutional buyers or in a public offering registered under the Securities Act of 1933. These securities have been deemed liquid under guidelines approved by the Trust’s Board of Trustees. At June 30, 2014, the aggregate value of these securities was $19,123,800, representing 2.42% of net assets.
fContingent distributions represent the right to receive additional distributions, if any, during the reorganization of the underlying company. Shares represent total underlying principal of debt securities.
gSecurity has been deemed illiquid because it may not be able to be sold within seven days. At June 30, 2014, the aggregate value of these securities was $3,705,733, representing 0.47% of net assets.
hSee Note 1(f) regarding senior floating rate interests.
iThe coupon rate shown represents the rate at period end.
jSee Note 7 regarding credit risk and defaulted securities.
kBankruptcy claims represent the right to receive distributions, if any, during the liquidation of the underlying pool of assets. Shares represent amount of allowed unsecured claims.
lThe security is traded on a discount basis with no stated coupon rate.
mSecurity or a portion of the security has been pledged as collateral for securities sold short, open futures and forward contracts. At June 30, 2014, the aggregate value of these securities and/or cash pledged as collateral was $6,794,004, representing 0.86% of net assets.
nSee Note 1(d) regarding securities sold short.
| The accompanying notes are an integral part of these financial statements. | Semiannual Report | MGD-17 |
FRANKLIN TEMPLETON VARIABLE INSURANCE PRODUCTS TRUST
STATEMENT OF INVESTMENTS (UNAUDITED)
Franklin Mutual Global Discovery VIP Fund (continued)
At June 30, 2014, the Fund had the following futures contracts outstanding. See Note 1(c).
Futures Contracts
| Description | Type | Number of Contracts |
Notional Value |
Expiration Date |
Unrealized Appreciation |
Unrealized Depreciation |
||||||||||||||||||
| Currency Contracts | ||||||||||||||||||||||||
| CHF/USD |
Short | 2 | 282,175 | 9/15/14 | $ | — | $ | (2,057 | ) | |||||||||||||||
| EUR/USD |
Short | 244 | 41,778,900 | 9/15/14 | — | (451,497 | ) | |||||||||||||||||
| GBP/USD |
Short | 189 | 20,193,469 | 9/15/14 | — | (374,327 | ) | |||||||||||||||||
|
|
|
|||||||||||||||||||||||
| Net unrealized appreciation (depreciation) |
|
$ | (827,881 | ) | ||||||||||||||||||||
|
|
|
|||||||||||||||||||||||
At June 30, 2014, the Fund had the following forward exchange contracts outstanding. See Note 1(c).
| Forward Exchange Contracts | ||||||||||||||||||||||||||||
| Currency | Counterpartya | Type | Quantity | Contract Amount |
Settlement Date |
Unrealized Appreciation |
Unrealized Depreciation |
|||||||||||||||||||||
| Euro |
BOFA | Buy | 6,525,313 | $ | 9,010,761 | 7/17/14 | $ | 868 | $ | (74,921 | ) | |||||||||||||||||
| Euro |
BOFA | Sell | 8,428,476 | 11,461,049 | 7/17/14 | 44 | (82,170 | ) | ||||||||||||||||||||
| Euro |
BONY | Buy | 2,470,160 | 3,418,616 | 7/17/14 | 538 | (36,159 | ) | ||||||||||||||||||||
| Euro |
BONY | Sell | 105,362 | 143,506 | 7/17/14 | — | (792 | ) | ||||||||||||||||||||
| Euro |
BZWS | Buy | 3,235,710 | 4,448,528 | 7/17/14 | 570 | (17,649 | ) | ||||||||||||||||||||
| Euro |
BZWS | Sell | 123,581 | 167,816 | 7/17/14 | — | (1,433 | ) | ||||||||||||||||||||
| Euro |
HSBC | Buy | 1,443,640 | 1,988,044 | 7/17/14 | 562 | (11,477 | ) | ||||||||||||||||||||
| Euro |
HSBC | Sell | 760,149 | 1,037,538 | 7/17/14 | 138 | (3,659 | ) | ||||||||||||||||||||
| Euro |
SCBT | Buy | 1,917,958 | 2,641,247 | 7/17/14 | 625 | (15,141 | ) | ||||||||||||||||||||
| Euro |
SCBT | Sell | 7,092,890 | 9,646,706 | 7/17/14 | — | (67,325 | ) | ||||||||||||||||||||
| Euro |
SSBT | Buy | 850,468 | 1,173,524 | 7/17/14 | 502 | (9,271 | ) | ||||||||||||||||||||
| Euro |
SSBT | Sell | 80,886 | 110,739 | 7/17/14 | — | (38 | ) | ||||||||||||||||||||
| British Pound |
BOFA | Buy | 83,408 | 138,653 | 7/21/14 | 4,050 | — | |||||||||||||||||||||
| British Pound |
BOFA | Sell | 3,319,230 | 5,420,296 | 7/21/14 | — | (258,568 | ) | ||||||||||||||||||||
| British Pound |
BONY | Buy | 448,427 | 745,873 | 7/21/14 | 21,340 | — | |||||||||||||||||||||
| British Pound |
BZWS | Buy | 67,815 | 112,614 | 7/21/14 | 3,411 | — | |||||||||||||||||||||
| British Pound |
BZWS | Sell | 6,997,908 | 11,526,947 | 7/21/14 | — | (445,760 | ) | ||||||||||||||||||||
| British Pound |
HSBC | Buy | 255,992 | 425,526 | 7/21/14 | 12,450 | — | |||||||||||||||||||||
| British Pound |
HSBC | Sell | 1,189,530 | 1,952,018 | 7/21/14 | — | (83,146 | ) | ||||||||||||||||||||
| British Pound |
SCBT | Buy | 717,483 | 1,193,619 | 7/21/14 | 33,921 | — | |||||||||||||||||||||
| British Pound |
SSBT | Buy | 918,284 | 1,527,189 | 7/21/14 | 43,902 | — | |||||||||||||||||||||
| South Korean Won |
BOFA | Buy | 310,084,649 | 295,649 | 8/12/14 | 10,246 | — | |||||||||||||||||||||
| South Korean Won |
BOFA | Sell | 1,325,019,344 | 1,237,197 | 8/12/14 | — | (69,917 | ) | ||||||||||||||||||||
| South Korean Won |
FBCO | Buy | 218,156,256 | 202,447 | 8/12/14 | 12,761 | — | |||||||||||||||||||||
| South Korean Won |
FBCO | Sell | 2,738,683,324 | 2,549,662 | 8/12/14 | — | (152,013 | ) | ||||||||||||||||||||
| South Korean Won |
HSBC | Buy | 206,890,725 | 192,200 | 8/12/14 | 11,895 | — | |||||||||||||||||||||
| South Korean Won |
HSBC | Sell | 2,657,359,260 | 2,483,025 | 8/12/14 | — | (138,425 | ) | ||||||||||||||||||||
| Swiss Franc |
BOFA | Buy | 44,504 | 49,940 | 8/12/14 | 261 | — | |||||||||||||||||||||
| Swiss Franc |
BOFA | Sell | 847,989 | 962,393 | 8/12/14 | 7,422 | (1,568 | ) | ||||||||||||||||||||
| Swiss Franc |
BZWS | Sell | 452,860 | 514,072 | 8/12/14 | 4,339 | (1,096 | ) | ||||||||||||||||||||
| Swiss Franc |
DBAB | Buy | 50,700 | 56,683 | 8/12/14 | 507 | — | |||||||||||||||||||||
| Swiss Franc |
DBAB | Sell | 44,100 | 49,162 | 8/12/14 | — | (583 | ) | ||||||||||||||||||||
| Swiss Franc |
FBCO | Buy | 27,667 | 30,983 | 8/12/14 | 225 | — | |||||||||||||||||||||
| Swiss Franc |
HSBC | Buy | 9,600 | 10,825 | 8/12/14 | 4 | — | |||||||||||||||||||||
| Swiss Franc |
SSBT | Buy | 46,696 | 52,309 | 8/12/14 | 364 | — | |||||||||||||||||||||
| Swiss Franc |
SSBT | Sell | 596,400 | 672,263 | 8/12/14 | 1,969 | (2,450 | ) | ||||||||||||||||||||
| British Pound |
BOFA | Buy | 750,236 | 1,275,027 | 8/19/14 | 8,317 | (69 | ) | ||||||||||||||||||||
| British Pound |
BOFA | Sell | 2,431,447 | 4,082,000 | 8/19/14 | — | (76,981 | ) | ||||||||||||||||||||
| British Pound |
BZWS | Buy | 285,713 | 485,046 | 8/19/14 | 3,666 | — | |||||||||||||||||||||
| British Pound |
BZWS | Sell | 3,403,001 | 5,699,484 | 8/19/14 | — | (121,337 | ) | ||||||||||||||||||||
| British Pound |
DBAB | Buy | 220,657 | 376,458 | 8/19/14 | 975 | — | |||||||||||||||||||||
| British Pound |
FBCO | Buy | 834,172 | 1,418,638 | 8/19/14 | 8,258 | (48 | ) | ||||||||||||||||||||
| British Pound |
HSBC | Buy | 161,462 | 271,031 | 8/19/14 | 5,149 | — | |||||||||||||||||||||
| MGD-18 | Semiannual Report |
FRANKLIN TEMPLETON VARIABLE INSURANCE PRODUCTS TRUST
STATEMENT OF INVESTMENTS (UNAUDITED)
Franklin Mutual Global Discovery VIP Fund (continued)
| Forward Exchange Contracts (continued) | ||||||||||||||||||||||||||||
| Currency | Counterpartya | Type | Quantity | Contract Amount |
Settlement Date |
Unrealized Appreciation |
Unrealized Depreciation |
|||||||||||||||||||||
| British Pound |
HSBC | Sell | 3,058,343 | $ | 5,130,103 | 8/19/14 | $ | — | $ | (101,181 | ) | |||||||||||||||||
| British Pound |
SCBT | Buy | 46,855 | 78,776 | 8/19/14 | 1,369 | — | |||||||||||||||||||||
| British Pound |
SSBT | Buy | 734,860 | 1,244,805 | 8/19/14 | 12,171 | — | |||||||||||||||||||||
| British Pound |
SSBT | Sell | 36,516 | 61,528 | 8/19/14 | — | (932 | ) | ||||||||||||||||||||
| Euro |
BOFA | Buy | 1,591,235 | 2,174,345 | 8/29/14 | 9,463 | (4,231 | ) | ||||||||||||||||||||
| Euro |
BOFA | Sell | 5,576,275 | 7,629,068 | 8/29/14 | — | (8,972 | ) | ||||||||||||||||||||
| Euro |
BONY | Buy | 944,124 | 1,303,618 | 8/29/14 | — | (10,414 | ) | ||||||||||||||||||||
| Euro |
BZWS | Buy | 1,012,197 | 1,398,032 | 8/29/14 | 13 | (11,600 | ) | ||||||||||||||||||||
| Euro |
BZWS | Sell | 5,576,328 | 7,623,621 | 8/29/14 | — | (14,493 | ) | ||||||||||||||||||||
| Euro |
HSBC | Buy | 1,164,010 | 1,597,241 | 8/29/14 | 332 | (3,184 | ) | ||||||||||||||||||||
| Euro |
SCBT | Buy | 1,256,570 | 1,727,336 | 8/29/14 | 694 | (6,857 | ) | ||||||||||||||||||||
| Euro |
SSBT | Buy | 472,730 | 654,958 | 8/29/14 | 16 | (7,457 | ) | ||||||||||||||||||||
| Canadian Dollar |
BOFA | Sell | 63,530 | 57,229 | 9/18/14 | — | (2,224 | ) | ||||||||||||||||||||
| Canadian Dollar |
BONY | Buy | 84,783 | 77,870 | 9/18/14 | 1,471 | — | |||||||||||||||||||||
| Canadian Dollar |
BONY | Sell | 29,982 | 28,053 | 9/18/14 | — | (4 | ) | ||||||||||||||||||||
| Canadian Dollar |
BZWS | Buy | 16,526 | 15,215 | 9/18/14 | 250 | — | |||||||||||||||||||||
| Canadian Dollar |
BZWS | Sell | 8,514,917 | 7,655,234 | 9/18/14 | — | (313,170 | ) | ||||||||||||||||||||
| Canadian Dollar |
HSBC | Buy | 42,609 | 39,132 | 9/18/14 | 742 | — | |||||||||||||||||||||
| Canadian Dollar |
SCBT | Sell | 239,182 | 219,359 | 9/18/14 | — | (4,472 | ) | ||||||||||||||||||||
| Canadian Dollar |
SSBT | Buy | 42,609 | 39,133 | 9/18/14 | 741 | — | |||||||||||||||||||||
| British Pound |
BOFA | Sell | 3,854,240 | 6,466,644 | 10/22/14 | — | (121,847 | ) | ||||||||||||||||||||
| British Pound |
DBAB | Buy | 275,120 | 460,979 | 10/22/14 | 9,315 | — | |||||||||||||||||||||
| British Pound |
HSBC | Buy | 28,817 | 49,070 | 10/22/14 | 190 | — | |||||||||||||||||||||
| British Pound |
SSBT | Sell | 4,506,805 | 7,559,187 | 10/22/14 | — | (144,808 | ) | ||||||||||||||||||||
| Euro |
BOFA | Sell | 5,932,560 | 8,138,327 | 11/17/14 | 11,335 | (1,982 | ) | ||||||||||||||||||||
| Euro |
BZWS | Sell | 7,494,892 | 10,284,229 | 11/17/14 | 15,706 | (1,205 | ) | ||||||||||||||||||||
| Euro |
HSBC | Sell | 1,035,802 | 1,420,044 | 11/17/14 | 1,639 | (883 | ) | ||||||||||||||||||||
| Euro |
SCBT | Sell | 160,000 | 217,947 | 11/17/14 | — | (1,290 | ) | ||||||||||||||||||||
| Euro |
SSBT | Sell | 67,534 | 92,095 | 11/17/14 | — | (442 | ) | ||||||||||||||||||||
| British Pound |
BOFA | Sell | 2,983,987 | 5,016,082 | 11/21/14 | — | (82,990 | ) | ||||||||||||||||||||
| British Pound |
SSBT | Sell | 2,645,137 | 4,446,475 | 11/21/14 | — | (73,567 | ) | ||||||||||||||||||||
|
|
|
|||||||||||||||||||||||||||
| Unrealized appreciation (depreciation) |
|
264,726 | (2,590,201 | ) | ||||||||||||||||||||||||
|
|
|
|||||||||||||||||||||||||||
| Net unrealized appreciation (depreciation) |
|
$ | (2,325,475 | ) | ||||||||||||||||||||||||
|
|
|
|||||||||||||||||||||||||||
aMay be comprised of multiple contracts using the same currency and settlement date.
See Abbreviations on page MGD-35.
| Semiannual Report | MGD-19 |
FRANKLIN TEMPLETON VARIABLE INSURANCE PRODUCTS TRUST
Financial Statements
Statement of Assets and Liabilities
June 30, 2014 (unaudited)
| Franklin Mutual Global Discovery VIP Fund |
||||
| Assets: | ||||
| Investments in securities: |
||||
| Cost - Unaffiliated issuers |
$ | 569,880,748 | ||
| Cost - Non-controlled affiliated issuers (Note 11) |
8,000,000 | |||
|
|
|
|||
| Total cost of investments |
$ | 577,880,748 | ||
|
|
|
|||
| Value - Unaffiliated issuers |
$ | 787,580,077 | ||
| Value - Non-controlled affiliated issuers (Note 11) |
4,109,947 | |||
|
|
|
|||
| Total value of investments |
791,690,024 | |||
| Cash |
347,483 | |||
| Foreign currency, at value (cost $697,311) |
699,399 | |||
| Receivables: |
||||
| Investment securities sold |
1,408,082 | |||
| Capital shares sold |
278,506 | |||
| Dividends and interest |
2,134,413 | |||
| Due from brokers |
4,413,564 | |||
| Unrealized appreciation on forward exchange contracts |
264,726 | |||
| Other assets |
158,978 | |||
|
|
|
|||
| Total assets |
801,395,175 | |||
|
|
|
|||
| Liabilities: | ||||
| Payables: |
||||
| Capital shares redeemed |
3,132,303 | |||
| Management fees |
609,569 | |||
| Distribution fees |
338,757 | |||
| Variation margin |
250,125 | |||
| Securities sold short, at value (proceeds $4,275,367) |
4,306,247 | |||
| Unrealized depreciation on forward exchange contracts |
2,590,201 | |||
| Accrued expenses and other liabilities |
210,894 | |||
|
|
|
|||
| Total liabilities |
11,438,096 | |||
|
|
|
|||
| Net assets, at value |
$ | 789,957,079 | ||
|
|
|
|||
| Net assets consist of: | ||||
| Paid-in capital |
$ | 483,196,611 | ||
| Undistributed net investment income |
32,001,349 | |||
| Net unrealized appreciation (depreciation) |
210,647,733 | |||
| Accumulated net realized gain (loss) |
64,111,386 | |||
|
|
|
|||
| Net assets, at value |
$ | 789,957,079 | ||
|
|
|
|||
| MGD-20 | Semiannual Report | The accompanying notes are an integral part of these financial statements. |
FRANKLIN TEMPLETON VARIABLE INSURANCE PRODUCTS TRUST
FINANCIAL STATEMENTS
Statement of Assets and Liabilities (continued)
June 30, 2014 (unaudited)
| Franklin Mutual Global Discovery VIP Fund |
||||
| Class 1: | ||||
| Net assets, at value |
$ | 1,904,506 | ||
|
|
|
|||
| Shares outstanding |
76,083 | |||
|
|
|
|||
| Net asset value and maximum offering price per share |
$ | 25.03 | ||
|
|
|
|||
| Class 2: | ||||
| Net assets, at value |
$ | 719,616,869 | ||
|
|
|
|||
| Shares outstanding |
29,378,209 | |||
|
|
|
|||
| Net asset value and maximum offering price per share |
$ | 24.49 | ||
|
|
|
|||
| Class 4: | ||||
| Net assets, at value |
$ | 68,435,704 | ||
|
|
|
|||
| Shares outstanding |
2,764,511 | |||
|
|
|
|||
| Net asset value and maximum offering price per share |
$ | 24.76 | ||
|
|
|
|||
| The accompanying notes are an integral part of these financial statements. | Semiannual Report | MGD-21 |
FRANKLIN TEMPLETON VARIABLE INSURANCE PRODUCTS TRUST
FINANCIAL STATEMENTS
Statement of Operations
for the six months ended June 30, 2014 (unaudited)
| Franklin Mutual Global Discovery VIP Fund |
||||
| Investment income: | ||||
| Dividends |
$ | 20,157,380 | ||
| Interest |
1,533,206 | |||
| Income from securities loaned |
5,057 | |||
|
|
|
|||
| Total investment income |
21,695,643 | |||
|
|
|
|||
| Expenses: | ||||
| Management fees (Note 3a) |
3,202,234 | |||
| Administrative fees (Note 3b) |
337,573 | |||
| Distribution fees: (Note 3c) |
||||
| Class 2 |
856,042 | |||
| Class 4 |
120,919 | |||
| Custodian fees (Note 4) |
16,152 | |||
| Reports to shareholders |
69,386 | |||
| Professional fees |
50,812 | |||
| Trustees’ fees and expenses |
1,492 | |||
| Dividends on securities sold short |
50,286 | |||
| Other |
14,997 | |||
|
|
|
|||
| Total expenses |
4,719,893 | |||
| Expense reductions (Note 4) |
(31 | ) | ||
|
|
|
|||
| Net expenses |
4,719,862 | |||
|
|
|
|||
| Net investment income |
16,975,781 | |||
|
|
|
|||
| Realized and unrealized gains (losses): | ||||
| Net realized gain (loss) from: |
||||
| Investments |
17,446,502 | |||
| Foreign currency transactions |
(3,684,920 | ) | ||
| Futures contracts |
94,687 | |||
| Securities sold short |
49,526 | |||
|
|
|
|||
| Net realized gain (loss) |
13,905,795 | |||
|
|
|
|||
| Net change in unrealized appreciation (depreciation) on: |
||||
| Investments |
21,328,311 | |||
| Translation of other assets and liabilities denominated in foreign currencies |
1,472,594 | |||
|
|
|
|||
| Net change in unrealized appreciation (depreciation) |
22,800,905 | |||
|
|
|
|||
| Net realized and unrealized gain (loss) |
36,706,700 | |||
|
|
|
|||
| Net increase (decrease) in net assets resulting from operations |
$ | 53,682,481 | ||
|
|
|
|||
| MGD-22 | Semiannual Report | The accompanying notes are an integral part of these financial statements. |
FRANKLIN TEMPLETON VARIABLE INSURANCE PRODUCTS TRUST
FINANCIAL STATEMENTS
Statements of Changes in Net Assets
| Franklin Mutual Global Discovery VIP Fund | ||||||||
| Six Months Ended June 30, 2014 (unaudited) |
Year Ended December 31, 2013 |
|||||||
| Increase (decrease) in net assets: | ||||||||
| Operations: |
||||||||
| Net investment income |
$ | 16,975,781 | $ | 14,042,917 | ||||
| Net realized gain (loss) from investments, written options, foreign currency transactions, futures contracts and securities sold short |
13,905,795 | 51,438,971 | ||||||
| Net change in unrealized appreciation (depreciation) on investments and translation of other assets and liabilities denominated in foreign currencies |
22,800,905 | 116,840,987 | ||||||
|
|
|
|||||||
| Net increase (decrease) in net assets resulting from operations |
53,682,481 | 182,322,875 | ||||||
|
|
|
|||||||
| Distributions to shareholders from: |
||||||||
| Net investment income: |
||||||||
| Class 1 |
— | (52,604 | ) | |||||
| Class 2 |
— | (14,417,027 | ) | |||||
| Class 4 |
— | (1,382,402 | ) | |||||
| Net realized gains: |
||||||||
| Class 1 |
— | (195,304 | ) | |||||
| Class 2 |
— | (59,917,989 | ) | |||||
| Class 4 |
— | (5,990,316 | ) | |||||
|
|
|
|||||||
| Total distributions to shareholders |
— | (81,955,642 | ) | |||||
|
|
|
|||||||
| Capital share transactions: (Note 2) |
||||||||
| Class 1 |
(695,319 | ) | 1,149,200 | |||||
| Class 2 |
(13,861,052 | ) | (67,039,527 | ) | ||||
| Class 4 |
(6,767,889 | ) | (825,524 | ) | ||||
|
|
|
|||||||
| Total capital share transactions |
(21,324,260 | ) | (66,715,851 | ) | ||||
|
|
|
|||||||
| Net increase (decrease) in net assets |
32,358,221 | 33,651,382 | ||||||
| Net assets: | ||||||||
| Beginning of period |
757,598,858 | 723,947,476 | ||||||
|
|
|
|||||||
| End of period |
$ | 789,957,079 | $ | 757,598,858 | ||||
|
|
|
|||||||
| Undistributed net investment income included in net assets: | ||||||||
| End of period |
$ | 32,001,349 | $ | 15,025,568 | ||||
|
|
|
|||||||
| The accompanying notes are an integral part of these financial statements. | Semiannual Report | MGD-23 |
FRANKLIN TEMPLETON VARIABLE INSURANCE PRODUCTS TRUST
Notes to Financial Statements (unaudited)
Franklin Mutual Global Discovery VIP Fund
| MGD-24 | Semiannual Report |
FRANKLIN TEMPLETON VARIABLE INSURANCE PRODUCTS TRUST
NOTES TO FINANCIAL STATEMENTS (UNAUDITED)
Franklin Mutual Global Discovery VIP Fund (continued)
| Semiannual Report | MGD-25 |
FRANKLIN TEMPLETON VARIABLE INSURANCE PRODUCTS TRUST
NOTES TO FINANCIAL STATEMENTS (UNAUDITED)
Franklin Mutual Global Discovery VIP Fund (continued)
1. Organization and Significant Accounting Policies (continued)
c. Derivative Financial Instruments (continued)
under the terms of the contract, the potential for an illiquid secondary market, and/or the potential for market movements which expose the Fund to gains or losses in excess of the amounts shown on the Statement of Assets and Liabilities. Realized gain and loss and unrealized appreciation and depreciation on these contracts for the period are included in the Statement of Operations.
Derivative counterparty credit risk is managed through a formal evaluation of the creditworthiness of all potential counterparties. The Fund attempts to reduce its exposure to counterparty credit risk on OTC derivatives, whenever possible, by entering into International Swaps and Derivatives Association (ISDA) master agreements with certain counterparties. These agreements contain various provisions, including but not limited to collateral requirements, events of default, or early termination. Termination events applicable to the counterparty include certain deteriorations in the credit quality of the counterparty. Termination events applicable to the Fund include failure of the Fund to maintain certain net asset levels and/or limit the decline in net assets over various periods of time. In the event of default or early termination, the ISDA master agreement gives the non-defaulting party the right to net and close-out all transactions traded, whether or not arising under the ISDA agreement, to one net amount payable by one counterparty to the other. However, absent an event of default or early termination, OTC derivative assets and liabilities are presented gross and not offset in the Statement of Assets and Liabilities. Early termination by the counterparty may result in an immediate payment by the Fund of any net liability owed to that counterparty under the ISDA agreement. At June 30, 2014, the Fund had OTC derivatives in a net liability position of $2,156,389 and the aggregate value of collateral pledged for such contracts was $1,527,548.
Collateral requirements differ by type of derivative. Collateral or initial margin requirements are set by the broker or exchange clearing house for exchange traded and centrally cleared derivatives. Initial margin deposited is held at the exchange and can be in the form of cash and/or securities. For OTC derivatives traded under an ISDA master agreement, posting of collateral is required by either the fund or the applicable counterparty if the total net exposure of all OTC derivatives with the applicable counterparty exceeds the minimum transfer
amount, which typically ranges from $100,000 to $250,000, and can vary depending on the counterparty and the type of the agreement. Generally, collateral is determined at the close of fund business each day and any additional collateral required due to changes in derivative values may be delivered by the fund or the counterparty within a few business days. Collateral pledged and/or received by the fund for OTC derivatives, if any, is held in segregated accounts with the fund’s custodian/counterparty broker and can be in the form of cash and/or securities. Unrestricted cash may be invested according to the Fund’s investment objectives.
The Fund entered into exchange traded futures contracts primarily to manage exposure to certain foreign currencies. A futures contract is an agreement between the Fund and a counterparty to buy or sell an asset for a specified price on a future date. Required initial margins are pledged by the Fund, and the daily change in fair value is accounted for as a variation margin payable or receivable on the Statement of Assets and Liabilities.
The Fund entered into OTC forward exchange contracts primarily to manage exposure to certain foreign currencies. A forward exchange contract is an agreement between the Fund and a counterparty to buy or sell a foreign currency at a specific exchange rate on a future date.
The Fund purchased or wrote exchange traded option contracts primarily to manage exposure to equity price risk. An option is a contract entitling the holder to purchase or sell a specific amount of shares or units of an asset or notional amount of a swap (swaption), at a specified price. Options purchased are recorded as an asset while options written are recorded as a liability. Upon exercise of an option, the acquisition cost or sales proceeds of the underlying investment is adjusted by any premium received or paid. Upon expiration of an option, any premium received or paid is recorded as a realized gain or loss. Upon closing an option other than through expiration or exercise, the difference between the premium and the cost to close the position is recorded as a realized gain or loss.
See Notes 6 and 10 regarding investment transactions and other derivative information, respectively.
d. Securities Sold Short
The Fund is engaged in selling securities short, which obligates the Fund to replace a borrowed security with the same security at current fair value. The Fund incurs a loss if the price of the security increases between the date of the short sale and the date
| MGD-26 | Semiannual Report |
FRANKLIN TEMPLETON VARIABLE INSURANCE PRODUCTS TRUST
NOTES TO FINANCIAL STATEMENTS (UNAUDITED)
Franklin Mutual Global Discovery VIP Fund (continued)
| Semiannual Report | MGD-27 |
FRANKLIN TEMPLETON VARIABLE INSURANCE PRODUCTS TRUST
NOTES TO FINANCIAL STATEMENTS (UNAUDITED)
Franklin Mutual Global Discovery VIP Fund (continued)
1. Organization and Significant Accounting Policies (continued)
h. Security Transactions, Investment Income, Expenses and Distributions (continued)
Distributable earnings determined on a tax basis may differ from earnings recorded in accordance with accounting principles generally accepted in the United States of America. These differences may be permanent or temporary. Permanent differences are reclassified among capital accounts to reflect their tax character. These reclassifications have no impact on net assets or the results of operations. Temporary differences are not reclassified, as they may reverse in subsequent periods.
Common expenses incurred by the Trust are allocated among the funds based on the ratio of net assets of each fund to the combined net assets of the Trust. Fund specific expenses are charged directly to the fund that incurred the expense.
Realized and unrealized gains and losses and net investment income, not including class specific expenses, are allocated daily to each class of shares based upon the relative proportion of net
assets of each class. Differences in per share distributions, by class, are generally due to differences in class specific expenses.
i. Accounting Estimates
The preparation of financial statements in accordance with U.S. GAAP requires management to make estimates and assumptions that affect the reported amounts of assets and liabilities at the date of the financial statements and the amounts of income and expenses during the reporting period. Actual results could differ from those estimates.
j. Guarantees and Indemnifications
Under the Trust’s organizational documents, its officers and trustees are indemnified by the Trust against certain liabilities arising out of the performance of their duties to the Trust. Additionally, in the normal course of business, the Trust, on behalf of the Fund, enters into contracts with service providers that contain general indemnification clauses. The Trust’s maximum exposure under these arrangements is unknown as this would involve future claims that may be made against the Trust that have not yet occurred. Currently, the Trust expects the risk of loss to be remote.
2. Shares of Beneficial Interest
At June 30, 2014, there were an unlimited number of shares authorized (without par value). Transactions in the Fund’s shares were as follows:
| Six Months Ended June 30, 2014 |
Year Ended December 31, 2013 |
|||||||||||||||||
| Shares | Amount | Shares | Amount | |||||||||||||||
| Class 1 Shares: | ||||||||||||||||||
| Shares sold |
6,835 | $ | 162,044 | 44,760 | $ | 1,035,207 | ||||||||||||
| Shares issued in reinvestment of distributions |
— | — | 11,601 | 247,908 | ||||||||||||||
| Shares redeemed |
(36,487 | ) | (857,363 | ) | (5,936 | ) | (133,915 | ) | ||||||||||
|
|
|
|||||||||||||||||
| Net increase (decrease) |
(29,652 | ) | $ | (695,319 | ) | 50,425 | $ | 1,149,200 | ||||||||||
|
|
|
|||||||||||||||||
| Class 2 Shares: | ||||||||||||||||||
| Shares sold |
2,119,975 | $ | 49,569,013 | 4,182,129 | $ | 92,856,510 | ||||||||||||
| Shares issued in reinvestment of distributions |
— | — | 3,546,518 | 74,335,016 | ||||||||||||||
| Shares redeemed |
(2,719,401 | ) | (63,430,065 | ) | (10,488,139 | ) | (234,231,053 | ) | ||||||||||
|
|
|
|||||||||||||||||
| Net increase (decrease) |
(599,426 | ) | $ | (13,861,052 | ) | (2,759,492 | ) | $ | (67,039,527 | ) | ||||||||
|
|
|
|||||||||||||||||
| Class 4 Shares: | ||||||||||||||||||
| Shares sold |
38,965 | $ | 905,748 | 372,331 | $ | 8,412,949 | ||||||||||||
| Shares issued on reinvestment of distributions |
— | — | 347,770 | 7,372,718 | ||||||||||||||
| Shares redeemed |
(320,453 | ) | (7,673,637 | ) | (733,968 | ) | (16,611,191 | ) | ||||||||||
|
|
|
|||||||||||||||||
| Net increase (decrease) |
(281,488 | ) | $ | (6,767,889 | ) | (13,867 | ) | $ | (825,524 | ) | ||||||||
|
|
|
|||||||||||||||||
| MGD-28 | Semiannual Report |
FRANKLIN TEMPLETON VARIABLE INSURANCE PRODUCTS TRUST
NOTES TO FINANCIAL STATEMENTS (UNAUDITED)
Franklin Mutual Global Discovery VIP Fund (continued)
3. Transactions With Affiliates
Franklin Resources, Inc. is the holding company for various subsidiaries that together are referred to as Franklin Templeton Investments. Certain officers and trustees of the Fund are also officers and/or directors of the following subsidiaries:
| Subsidiary | Affiliation | |
| Franklin Mutual Advisers, LLC (Franklin Mutual) | Investment manager | |
| Franklin Templeton Services, LLC (FT Services) | Administrative manager | |
| Franklin Templeton Distributors, Inc. (Distributors) | Principal underwriter | |
| Franklin Templeton Investor Services, LLC (Investor Services) | Transfer agent |
a. Management Fees
The Fund pays an investment management fee to Franklin Mutual based on the average daily net assets of the Fund as follows:
| Annualized Fee Rate | Net Assets | |
| 0.950% | Up to and including $200 million | |
| 0.935% | Over $200 million, up to and including $700 million | |
| 0.900% | Over $700 million, up to and including $1.2 billion | |
| 0.875% | Over $1.2 billion, up to and including $4 billion | |
| 0.845% | Over $4 billion, up to and including $7 billion | |
| 0.825% | Over $7 billion, up to and including $10 billion | |
| 0.805% | In excess of $10 billion |
Effective May 1, 2014, the Fund combined its investment management and administration agreements as approved by the Board. The fees paid under the combined agreement do not exceed the aggregate fees that were paid under the separate agreements.
Prior to May 1, 2014, the Fund paid fees to Franklin Mutual based on the average daily net assets of the Fund as follows:
| Annualized Fee Rate | Net Assets | |
| 0.800% | Up to and including $4 billion | |
| 0.770% | Over $4 billion, up to and including $7 billion | |
| 0.750% | Over $7 billion, up to and including $10 billion | |
| 0.730% | In excess of $10 billion |
b. Administrative Fees
Effective May 1, 2014, under an agreement with Franklin Mutual, FT Services provides administrative services to the Fund. The fee is paid by Franklin Mutual based on the Fund’s average daily net assets, and is not an additional expense of the Fund.
Prior to May 1, 2014, the Fund paid fees to FT Services based on the average daily net assets of the Fund as follows:
| Annualized Fee Rate | Net Assets | |
| 0.150% | Up to and including $200 million | |
| 0.135% | Over $200 million, up to and including $700 million | |
| 0.100% | Over $700 million, up to and including $1.2 billion | |
| 0.075% | In excess of $1.2 billion |
| Semiannual Report | MGD-29 |
FRANKLIN TEMPLETON VARIABLE INSURANCE PRODUCTS TRUST
NOTES TO FINANCIAL STATEMENTS (UNAUDITED)
Franklin Mutual Global Discovery VIP Fund (continued)
3. Transactions With Affiliates (continued)
c. Distribution Fees
The Board has adopted distribution plans for Class 2 and Class 4 shares pursuant to Rule 12b-1 under the 1940 Act. Under the Fund’s compensation distribution plans, the Fund pays Distributors for costs incurred in connection with the servicing, sale and distribution of the Fund’s shares up to 0.35% per year of its average daily net assets of each class. Some distribution fees are not charged on shares held by affiliates. The Board has agreed to limit the current rate to 0.25% per year for Class 2. The plan year, for purposes of monitoring compliance with the maximum annual plan rates, is February 1 through January 31.
d. Transfer Agent Fees
Investor Services, under terms of an agreement, performs shareholder servicing for the Fund and is not paid by the Fund for the services.
4. Expense Offset Arrangement
The Fund has entered into an arrangement with its custodian whereby credits realized as a result of uninvested cash balances are used to reduce a portion of the Fund’s custodian expenses. During the period ended June 30, 2014, the custodian fees were reduced as noted in the Statement of Operations.
5. Income Taxes
At June 30, 2014, the cost of investments and net unrealized appreciation (depreciation) for income tax purposes were as follows:
| Cost of investments |
$578,318,568 | |
|
| ||
| Unrealized appreciation |
$233,935,780 | |
| Unrealized depreciation |
(20,564,324) | |
|
| ||
| Net unrealized appreciation (depreciation) |
$213,371,456 | |
|
| ||
Differences between income and/or capital gains as determined on a book basis and a tax basis are primarily due to differing treatments of foreign currency transactions, tax straddles and bond discounts and premiums.
6. Investment Transactions
Purchases and sales of investments (excluding short term securities and securities sold short) for the period ended June 30, 2014, aggregated $86,605,841 and $93,293,552, respectively.
Transactions in options written during the period ended June 30, 2014, were as follows:
| Number of Contracts |
Premiums Received |
|||||||
| Options outstanding at December 31, 2013 |
— | $ | — | |||||
| Options written |
40 | 19,962 | ||||||
| Options expired |
— | — | ||||||
| Options exercised |
(40 | ) | (19,962 | ) | ||||
| Options closed |
— | — | ||||||
|
|
|
|||||||
| Options outstanding at June 30, 2014 |
— | $ | — | |||||
|
|
|
|||||||
See Notes 1(c) and 10 regarding derivative financial instruments and other derivative information, respectively.
7. Credit Risk and Defaulted Securities
The Fund may purchase the pre-default or defaulted debt of distressed companies. Distressed companies are financially troubled and are about to be or are already involved in financial restructuring or bankruptcy. Risks associated with purchasing these securities
| MGD-30 | Semiannual Report |
FRANKLIN TEMPLETON VARIABLE INSURANCE PRODUCTS TRUST
NOTES TO FINANCIAL STATEMENTS (UNAUDITED)
Franklin Mutual Global Discovery VIP Fund (continued)
include the possibility that the bankruptcy or other restructuring process takes longer than expected, or that distributions in restructuring are less than anticipated, either or both of which may result in unfavorable consequences to the Fund. If it becomes probable that the income on debt securities, including those of distressed companies, will not be collected, the Fund discontinues accruing income and recognizes an adjustment for uncollectible interest.
At June 30, 2014, the aggregate long value of distressed company securities for which interest recognition has been discontinued was $5,408,662, representing 0.68% of the Fund’s net assets. For information as to specific securities, see the accompanying Statement of Investments.
8. Concentration of Risk
Investing in foreign securities may include certain risks and considerations not typically associated with investing in U.S. securities, such as fluctuating currency values and changing local and regional economic, political and social conditions, which may result in greater market volatility. In addition, certain foreign securities may not be as liquid as U.S. securities.
9. Restricted Securities
The Fund invests in securities that are restricted under the Securities Act of 1933 (1933 Act) or which are subject to legal, contractual, or other agreed upon restrictions on resale. Restricted securities are often purchased in private placement transactions, and cannot be sold without prior registration unless the sale is pursuant to an exemption under the 1933 Act. Disposal of these securities may require greater effort and expense, and prompt sale at an acceptable price may be difficult. The Fund may have registration rights for restricted securities. The issuer generally incurs all registration costs.
At June 30, 2014, the Fund held investments in restricted securities, excluding certain securities exempt from registration under the 1933 Act deemed to be liquid, as follows:
| Principal Amount/ Shares |
Issuer | Acquisition Dates |
Cost | Value | ||||||||||
| 800,000 | The Bankshares Inc. | 3/22/07 | $ | 8,000,000 | $ | 4,109,947 | ||||||||
| 595 | Broadband Ventures III LLC, secured promissory note, 5.00%, 2/01/12 | 7/01/10 - 11/30/12 | 595 | — | ||||||||||
| 2,077,368 | FIM Coinvestor Holdings I, LLC | 11/20/06 - 6/02/09 | — | — | ||||||||||
| 2,172,000 | Hightower Holding LLC, pfd., A, Series 2 | 6/10/10 - 5/10/12 | 5,430,000 | 4,388,309 | ||||||||||
| 424,073 | International Automotive Components Group Brazil LLC | 4/13/06 - 12/26/08 | 281,629 | 67,627 | ||||||||||
| 4,052,916 | International Automotive Components Group North America, LLC | 1/12/06 - 3/18/13 | 3,247,714 | 3,739,950 | ||||||||||
| 2,140 | Olympus Re Holdings Ltd. | 12/19/01 | 200,477 | — | ||||||||||
|
|
|
|||||||||||||
| Total Restricted Securities (Value is 1.56% of Net Assets) |
$ | 17,160,415 | $ | 12,305,833 | ||||||||||
|
|
|
|||||||||||||
10. Other Derivative Information
At June 30, 2014, the Fund’s investments in derivative contracts are reflected on the Statement of Assets and Liabilities as follows:
| Asset Derivatives | Liability Derivatives | |||||||
| Derivative Contracts Not Accounted for as Hedging Instruments |
Statement of Assets and Liabilities Location |
Fair Value Amount |
Statement of Assets and Liabilities Location |
Fair Value Amount | ||||
| Foreign exchange contracts |
Unrealized appreciation on forward exchange contracts |
$264,726 | Unrealized depreciation on forward exchange contracts / Net assets consist of - net unrealized appreciation (depreciation) |
$3,418,082a | ||||
aIncludes cumulative appreciation (depreciation) of futures contracts as reported in the Statement of Investments. Only current day’s variation margin is separately reported within the Statement of Assets and Liabilities.
| Semiannual Report | MGD-31 |
FRANKLIN TEMPLETON VARIABLE INSURANCE PRODUCTS TRUST
NOTES TO FINANCIAL STATEMENTS (UNAUDITED)
Franklin Mutual Global Discovery VIP Fund (continued)
10. Other Derivative Information (continued)
For the period June 30, 2014 ended, the effect of derivative contracts on the Fund’s Statement of Operations was as follows:
| Derivative Contracts Not Accounted for as Hedging Instruments |
Statement of Operations Locations |
Realized Gain (Loss) for the Period |
Change in Unrealized Appreciation (Depreciation) for the Period | |||
| Foreign exchange contracts | Net realized gain (loss) from foreign currency transactions and futures contracts / Net change in unrealized appreciation (depreciation) on translation of other assets and liabilities denominated in foreign currencies |
$(3,635,941) | $1,486,188 | |||
For the period ended June 30, 2014, the average month end fair value of derivatives represented 0.45% of average month end net assets. The average month end number of open derivative contracts for the period was 218.
See Notes 1(c) and 6 regarding derivative financial instruments and investments transactions, respectively.
11. Holdings of 5% Voting Securities of Portfolio Companies
The 1940 Act defines “affiliated companies” to include investments in portfolio companies in which a fund owns 5% or more of the outstanding voting securities. Investments in “affiliated companies” for the Fund for the period ended June 30, 2014, were as shown below.
| Name of Issuer | Number of Shares Held at Beginning of Period |
Gross Additions |
Gross Reductions |
Number of Shares Held at End of Period |
Value at End of Period |
Investment Income |
Realized Capital Gain (Loss) |
|||||||||||||||||||||
| Non-Controlled Affiliates |
||||||||||||||||||||||||||||
| The Bankshares Inc. (Value is 0.52% of Net Assets) |
800,000 | — | — | 800,000 | $ | 4,109,947 | $ | — | $ | — | ||||||||||||||||||
|
|
|
|||||||||||||||||||||||||||
12. Credit Facility
The Fund, together with other U.S. registered and foreign investment funds (collectively, Borrowers), managed by Franklin Templeton Investments, are borrowers in a joint syndicated senior unsecured credit facility totaling $1.5 billion (Global Credit Facility) which matures on February 13, 2015. This Global Credit Facility provides a source of funds to the Borrowers for temporary and emergency purposes, including the ability to meet future unanticipated or unusually large redemption requests.
Under the terms of the Global Credit Facility, the Fund shall, in addition to interest charged on any borrowings made by the Fund and other costs incurred by the Fund, pay its share of fees and expenses incurred in connection with the implementation and maintenance of the Global Credit Facility, based upon its relative share of the aggregate net assets of all of the Borrowers, including an annual commitment fee of 0.07% based upon the unused portion of the Global Credit Facility. These fees are reflected in other expenses on the Statement of Operations. During the period ended June 30, 2014, the Fund did not use the Global Credit Facility.
13. Fair Value Measurements
The Fund follows a fair value hierarchy that distinguishes between market data obtained from independent sources (observable inputs) and the Fund’s own market assumptions (unobservable inputs). These inputs are used in determining the value of the Fund’s financial instruments and are summarized in the following fair value hierarchy:
| • | Level 1 – quoted prices in active markets for identical financial instruments |
| • | Level 2 – other significant observable inputs (including quoted prices for similar financial instruments, interest rates, prepayment speed, credit risk, etc.) |
| MGD-32 | Semiannual Report |
FRANKLIN TEMPLETON VARIABLE INSURANCE PRODUCTS TRUST
NOTES TO FINANCIAL STATEMENTS (UNAUDITED)
Franklin Mutual Global Discovery VIP Fund (continued)
13. Fair Value Measurements (continued)
| • | Level 3 – significant unobservable inputs (including the Fund’s own assumptions in determining the fair value of financial instruments) |
The input levels are not necessarily an indication of the risk or liquidity associated with financial instruments at that level.
For movements between the levels within the fair value hierarchy, the Fund has adopted a policy of recognizing the transfers as of the date of the underlying event which caused the movement.
A summary of inputs used as of June 30, 2014, in valuing the Fund’s assets and liabilities carried at fair value, is as follows:
| Level 1 | Level 2 | Level 3 | Total | |||||||||||||
| Assets: | ||||||||||||||||
| Investments in Securities |
||||||||||||||||
| Equity Investments:a |
||||||||||||||||
| Auto Components |
$ | 3,680,544 | $ | — | $ | 3,807,577 | $ | 7,488,121 | ||||||||
| Banks |
83,636,997 | 6,372,859 | 4,109,947 | 94,119,803 | ||||||||||||
| Diversified Financial Services |
10,622,783 | — | 4,388,309 | 15,011,092 | ||||||||||||
| Paper & Forest Products |
— | 1,611,528 | — | 1,611,528 | ||||||||||||
| Real Estate Management & Development |
— | — | 3,705,733 | 3,705,733 | ||||||||||||
| All Other Equity Investmentsb |
601,343,224 | — | — | c | 601,343,224 | |||||||||||
| Corporate Notes and Senior Floating Rate Interests |
— | 22,987,424 | — | 22,987,424 | ||||||||||||
| Corporate Notes and Senior Floating Rate Interests in Reorganization |
— | 10,315,841 | — | c | 10,315,841 | |||||||||||
| Companies in Liquidation |
53,796 | 7,963,343 | — | c | 8,017,139 | |||||||||||
| Municipal Bonds |
— | 1,991,805 | — | 1,991,805 | ||||||||||||
| Short Term Investments |
19,998,314 | 5,100,000 | — | 25,098,314 | ||||||||||||
|
|
|
|||||||||||||||
| Total Investments in Securities |
$ | 719,335,658 | $ | 56,342,800 | $ | 16,011,566 | $ | 791,690,024 | ||||||||
|
|
|
|||||||||||||||
| Other Financial Instruments |
||||||||||||||||
| Forward Exchange Contracts |
$ | — | $ | 264,726 | $ | — | $ | 264,726 | ||||||||
|
|
|
|||||||||||||||
| Liabilities: | ||||||||||||||||
| Other Financial Instruments |
||||||||||||||||
| Securities Sold Short |
$ | 4,306,247 | $ | — | $ | — | $ | 4,306,247 | ||||||||
| Futures Contracts |
827,881 | — | — | 827,881 | ||||||||||||
| Forward Exchange Contracts |
— | 2,590,201 | — | 2,590,201 | ||||||||||||
|
|
|
|||||||||||||||
| Total Other Financial Instruments |
$ | 5,134,128 | $ | 2,590,201 | $ | — | $ | 7,724,329 | ||||||||
|
|
|
|||||||||||||||
aIncludes common and preferred stocks as well as other equity investments.
bFor detailed categories, see the accompanying Statement of Investments.
cIncludes securities determined to have no value at June 30, 2014.
| Semiannual Report | MGD-33 |
FRANKLIN TEMPLETON VARIABLE INSURANCE PRODUCTS TRUST
NOTES TO FINANCIAL STATEMENTS (UNAUDITED)
Franklin Mutual Global Discovery VIP Fund (continued)
13. Fair Value Measurements (continued)
A reconciliation of assets in which Level 3 inputs are used in determining fair value is presented when there are significant Level 3 financial instruments at the end of the period. At June 30, 2014, the reconciliation of assets is as follows:
| Balance at Beginning of Period |
Purchases | Sales | Transfers Into (Out of) Level 3 |
Cost Basis Adjustmentsa |
Net Realized Gain (Loss) |
Net Unrealized Gain (Loss) |
Balance at End of Period |
Net Change in Unrealized Appreciation (Depreciation) on Assets Held at Period End |
||||||||||||||||||||||||||||
| Assets: | ||||||||||||||||||||||||||||||||||||
| Investments in Securities: |
||||||||||||||||||||||||||||||||||||
| Equity Investments:b |
||||||||||||||||||||||||||||||||||||
| Auto Components |
$ | 2,375,839 | $ | — | $ | — | $ | — | $ | — | $ | — | $ | 1,431,738 | $ | 3,807,577 | $ | 1,431,738 | ||||||||||||||||||
| Banks |
3,815,192 | — | — | — | — | — | 294,755 | 4,109,947 | 294,755 | |||||||||||||||||||||||||||
| Diversified Financial Services |
4,131,361 | — | — | — | — | — | 256,948 | 4,388,309 | 256,948 | |||||||||||||||||||||||||||
| Insurance |
410,692 | c | — | (391,596 | ) | — | — | (184,109 | ) | 165,013 | — | c | — | |||||||||||||||||||||||
| Real Estate Management & Development |
2,518,473 | — | — | — | — | — | 1,187,260 | 3,705,733 | 1,187,260 | |||||||||||||||||||||||||||
|
|
|
|||||||||||||||||||||||||||||||||||
| Total |
$ | 13,251,557 | $ | — | $ | (391,596 | ) | $ | — | $ | — | $ | (184,109 | ) | $ | 3,335,714 | $ | 16,011,566 | $ | 3,170,701 | ||||||||||||||||
|
|
|
|||||||||||||||||||||||||||||||||||
aMay include accretion, amortization, partnership adjustments, and/or other cost basis adjustments.
bIncludes common and preferred stocks as well as other equity investments.
cIncludes securities determined to have no value.
Significant unobservable valuation inputs developed by the VLOC for material Level 3 financial instruments and impact to fair value as a result of changes in unobservable valuation inputs as of June 30, 2014, are as follows:
| Description | Fair Value at End of Period |
Valuation Technique |
Unobservable Inputs | Amount/ Range |
Impact to Fair Value if Input Increasesa |
|||||||||||
| Assets: | ||||||||||||||||
| Investments in Securities |
||||||||||||||||
| Equity Investments:b |
||||||||||||||||
| Auto Components |
$ | 3,739,950 | Market comparables | Discount for lack of marketability EV / EBITDA multiple |
|
10% 4.1x |
|
|
Decrease Increase |
c d | ||||||
| Banks |
4,109,947 | Market comparables | Discount for lack of marketability | 5% | Decrease | c | ||||||||||
| Diversified Financial Services |
4,388,309 | Discounted cash flow model | Cost of equity Long-term revenue growth rate Adjusted EBITDA margin |
|
17% 6.2% - 26.6% 11.2% - 21.6% |
|
|
Decrease Increase Increase |
d c | |||||||
| Real Estate Management & Development |
3,705,733 | Market comparables | Discount for lack of marketability | 8% | Decrease | c | ||||||||||
| All Other Investmentse | 67,627 | |||||||||||||||
| Total | $ | 16,011,566 | ||||||||||||||
aRepresents the directional change in the fair value of the Level 3 investments that would result from a significant and reasonable increase in the corresponding input. A significant and reasonable decrease in the input would have the opposite effect. Significant impacts, if any, to fair value and/or net assets have been indicated.
bIncludes common and convertible preferred stocks.
cRepresents a significant impact to fair value but not net assets.
dRepresents a significant impact to fair value and net assets.
eIncludes fair value of immaterial investments developed using various valuation techniques and unobservable inputs. May also include investments with values derived using prior transaction prices or third party pricing information without adjustment for which such inputs are also unobservable.
| MGD-34 | Semiannual Report |
FRANKLIN TEMPLETON VARIABLE INSURANCE PRODUCTS TRUST
NOTES TO FINANCIAL STATEMENTS (UNAUDITED)
Franklin Mutual Global Discovery VIP Fund (continued)
Abbreviations List
| EBITDA | Earnings before interest, taxes, depreciation and amortization | |
| EV | Enterprise value | |
14. New Accounting Pronouncements
In June 2014, the Financial Accounting Standards Board issued Accounting Standards Update (ASU) No. 2014-11, Transfers and Servicing (Topic 860), Repurchase-to-Maturity Transactions, Repurchase Financings, and Disclosures. The ASU changes the accounting for certain repurchase agreements and expands disclosure requirements related to repurchase agreements, securities lending, repurchase-to-maturity and similar transactions. The ASU is effective for interim and annual reporting periods beginning after December 15, 2014. Management is currently evaluating the impact, if any, of applying this provision.
15. Subsequent Events
The Fund has evaluated subsequent events through the issuance of the financial statements and determined that no events have occurred that require disclosure.
Abbreviations
| Counterparty | Currency | Selected Portfolio | ||||||||
| BOFA | Bank of America N.A. | CHF | Swiss Franc | ADR | American Depositary Receipt | |||||
| BONY | Bank of New York Mellon | EUR | Euro | FHLB | Federal Home Loan Bank | |||||
| BZWS | Barclays Bank PLC | GBP | British Pound | GO | General Obligation | |||||
| DBAB | Deutsche Bank AG | USD | United States Dollar | IDR | International Depositary Receipt | |||||
| FBCO | Credit Suisse Group AG | |||||||||
| HSBC | HSBC Bank USA, N.A. | |||||||||
| SCBT | Standard Chartered Bank | |||||||||
| SSBT | State Street Bank and Trust Co. | |||||||||
| Semiannual Report | MGD-35 |
Franklin Mutual Shares VIP Fund
(Formerly, Mutual Shares Securities Fund)
We are pleased to bring you Franklin Mutual Shares VIP Fund’s semiannual report for the period ended June 30, 2014.
Class 2 Performance Summary as of June 30, 2014
Franklin Mutual Shares VIP Fund – Class 2 delivered a total return of +8.04% for the six-month period ended June 30, 2014.
Performance reflects the Fund’s Class 2 operating expenses, but does not include any contract fees, expenses or sales charges. If they had been included, performance would be lower. These charges and deductions, particularly for variable life policies, can have a significant effect on contract values and insurance benefits. See the contract prospectus for a complete description of these expenses, including sales charges.
Performance data represent past performance, which does not guarantee future results. Investment return and principal value will fluctuate, and you may have a gain or loss when you sell your shares. Current performance may differ from figures shown.
| Semiannual Report | MS-1 |
FRANKLIN MUTUAL SHARES VIP FUND
1. Source: © 2014 Morningstar. One cannot invest directly in an index, and an index is not representative of the Fund’s portfolio. Please see Index Descriptions following the Fund Summaries.
2. Source: Bureau of Labor Statistics.
| MS-2 | Semiannual Report |
FRANKLIN MUTUAL SHARES VIP FUND
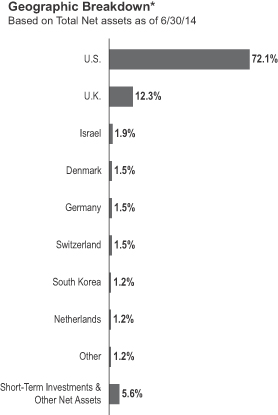
Manager’s Discussion
Many Fund holdings increased in value during the six-month period. Top contributors included Teva Pharmaceutical Industries, technology leader Apple and energy services firm Baker Hughes.
Shares of Israel-based Teva Pharmaceutical Industries rose notably in the first quarter of 2014, supported by positive developments related to the company’s most profitable drug, Copaxone, which is used to prevent the relapse of multiple sclerosis. In March, the U.S. Supreme Court agreed to hear Teva’s patent appeal, which could lead to potential delays in generic competition for Copaxone. In addition, the U.S. Food and Drug Administration (FDA) had delays approving a generic for Copaxone while Teva has done a good job converting more patients to its new formulation of the drug. This should help the company retain a higher portion of revenues and cash flows from this highly profitable product. Also supporting the share price was the announcement of a new chief executive officer (CEO), who the market believed could successfully execute on
| Semiannual Report | MS-3 |
FRANKLIN MUTUAL SHARES VIP FUND
| MS-4 | Semiannual Report |
FRANKLIN MUTUAL SHARES VIP FUND
| Semiannual Report | MS-5 |
FRANKLIN MUTUAL SHARES VIP FUND
Class 2 Fund Expenses
| Class 2 | Beginning Account Value 1/1/14 |
Ending Account Value 6/30/14 |
Fund-Level Expenses 1/1/14–6/30/14 |
|||||||||
| Actual | $1,000 | $1,080.40 | $5.00 | |||||||||
| Hypothetical (5% return before expenses) | $1,000 | $1,019.98 | $4.86 | |||||||||
*Expenses are calculated using the most recent six-month annualized expense ratio for the Fund’s Class 2 shares (0.97%), which does not include any ongoing expenses of the Contract for which the Fund is an investment option, multiplied by the average account value over the period, multiplied by 181/365 to reflect the one-half year period.
| MS-6 | Semiannual Report |
SUPPLEMENT DATED AUGUST 1, 2014
TO THE PROSPECTUS DATED MAY 1, 2014
OF
FRANKLIN MUTUAL SHARES VIP FUND
(a series of Franklin Templeton Variable Insurance Products Trust)
The prospectus is amended as follows:
I. The “Fund Summary – Annual Fund Operating Expenses” table beginning on page MS-S1 in the Fund’s Class 1 prospectus is replaced with the following:
Annual Fund Operating Expenses
(expenses that you pay each year as a percentage of the value of your investment)
| Class 1 | ||||
| Management fees1 | 0.69% | |||
| Distribution and service (12b-1) fees | None | |||
| Other expenses1 | 0.02% | |||
| Total annual Fund operating expenses | 0.71% | |||
| 1. | Management fees and other expenses have been restated to reflect current fiscal year fees and expenses as a result of the bundling of the Fund’s investment management agreement with its fund administration agreement effective May 1, 2014. Such combined investment management fees are described further under “Management” in the Fund’s prospectus. Total annual fund operating expenses are not affected by such bundling. |
II. The “Fund Summary – Annual Fund Operating Expenses” table beginning on page MS-S1 in the Fund’s Class 2 prospectus is replaced with the following:
Annual Fund Operating Expenses
(expenses that you pay each year as a percentage of the value of your investment)
| Class 2 | ||||
| Management fees1 | 0.69% | |||
| Distribution and service (12b-1) fees | 0.25% | |||
| Other expenses1 | 0.02% | |||
| Total annual Fund operating expenses | 0.96% | |||
| 1. | Management fees and other expenses have been restated to reflect current fiscal year fees and expenses as a result of the bundling of the Fund’s investment management agreement with its fund administration agreement effective May 1, 2014. Such combined investment management fees are described further under “Management” in the Fund’s prospectus. Total annual fund operating expenses are not affected by such bundling. |
III. The “Fund Summary – Annual Fund Operating Expenses” table beginning on page MS-S1 in the Fund’s Class 4 prospectus is replaced with the following:
Annual Fund Operating Expenses
(expenses that you pay each year as a percentage of the value of your investment)
| Class 4 | ||||
| Management fees1 | 0.69% | |||
| Distribution and service (12b-1) fees | 0.35% | |||
| Other expenses1 | 0.02% | |||
| Total annual Fund operating expenses | 1.06% | |||
| MS-7 |
| 1. | Management fees and other expenses have been restated to reflect current fiscal year fees and expenses as a result of the bundling of the Fund’s investment management agreement with its fund administration agreement effective May 1, 2014. Such combined investment management fees are described further under “Management” in the Fund’s prospectus. Total annual fund operating expenses are not affected by such bundling. |
IV. The following is added as the second to last paragraph in the “Fund Details – Management” section of each Class’ prospectus beginning on page MS-D8:
Effective May 1, 2014, the Fund’s investment management agreement was bundled with its fund administration agreement, including the fees payable to the Fund’s administrator thereunder, as approved by the board of trustees. The fee payable to the administrator under the Fund’s administration agreement, prior to May 1, 2014, was a monthly fee under the following fee schedule of the Fund’s average daily net assets:
| • | 0.150% up to and including $200 million; |
| • | 0.135% over $200 million, up to and including $700 million; |
| • | 0.100% over $700 million, up to and including $1.2 billion; |
| • | 0.075% in excess of $1.2 billion. |
As of such date, the Fund’s investment management fees became a monthly fee at the annual rate of the value of the Fund’s average daily net assets as set forth below:
| • | 0.750% up to and including $200 million; |
| • | 0.735% over $200 million, up to and including $700 million; |
| • | 0.700% over $700 million, up to and including $1.2 billion; |
| • | 0.675% over $1.2 billion, up to and including $5 billion; |
| • | 0.645% over $5 billion, up to and including $10 billion; |
| • | 0.625% over $10 billion, up to and including $15 billion; |
| • | 0.605% over $15 billion, up to and including $20 billion; |
| • | 0.585% in excess of $20 billion. |
Please keep this supplement with your prospectus for future reference.
| MS-8 |
FRANKLIN TEMPLETON VARIABLE INSURANCE PRODUCTS TRUST
Financial Highlights
Franklin Mutual Shares VIP Fund
| Six Months Ended (unaudited) |
Year Ended December 31, | |||||||||||||||||||||||
| 2013 | 2012 | 2011 | 2010 | 2009 | ||||||||||||||||||||
| Class 1 | ||||||||||||||||||||||||
| Per share operating performance (for a share outstanding throughout the period) |
||||||||||||||||||||||||
| Net asset value, beginning of period |
$21.92 | $17.45 | $15.57 | $16.14 | $14.75 | $11.92 | ||||||||||||||||||
|
|
|
|||||||||||||||||||||||
| Income from investment operationsa: | ||||||||||||||||||||||||
| Net investment incomeb |
0.46 | c | 0.42 | 0.35 | 0.38 | d | 0.40 | e | 0.23 | f | ||||||||||||||
| Net realized and unrealized gains (losses) |
1.33 | 4.52 | 1.92 | (0.53 | ) | 1.27 | 2.89 | |||||||||||||||||
|
|
|
|||||||||||||||||||||||
| Total from investment operations |
1.79 | 4.94 | 2.27 | (0.15 | ) | 1.67 | 3.12 | |||||||||||||||||
|
|
|
|||||||||||||||||||||||
| Less distributions from net investment income |
— | (0.47 | ) | (0.39 | ) | (0.42 | ) | (0.28 | ) | (0.29 | ) | |||||||||||||
|
|
|
|||||||||||||||||||||||
| Net asset value, end of period |
$23.71 | $21.92 | $17.45 | $15.57 | $16.14 | $14.75 | ||||||||||||||||||
|
|
|
|||||||||||||||||||||||
| Total returng |
8.17% | 28.53% | 14.61% | (0.79)% | 11.47% | 26.35% | ||||||||||||||||||
| Ratios to average net assetsh | ||||||||||||||||||||||||
| Expensesi |
0.72% | j | 0.71% | j | 0.71% | 0.73% | j | 0.74% | j | 0.78% | j | |||||||||||||
| Expenses incurred in connection with securities sold short |
0.01% | —% | k | —% | k | —% | k | 0.02% | 0.06% | |||||||||||||||
| Net investment income |
4.19% | c | 2.08% | 2.06% | 2.28% | d | 2.66% | e | 1.85% | f | ||||||||||||||
| Supplemental data | ||||||||||||||||||||||||
| Net assets, end of period (000’s) |
$644,295 | $552,163 | $449,343 | $1,170,781 | $1,301,520 | $767,553 | ||||||||||||||||||
| Portfolio turnover rate |
11.56% | 24.05% | 34.07% | l | 41.02% | 32.05% | 49.33% | |||||||||||||||||
aThe amount shown for a share outstanding throughout the period may not correlate with the Statement of Operations for the period due to the timing of sales and repurchases of the Fund shares in relation to income earned and/or fluctuating fair value of the investments of the Fund.
bBased on average daily shares outstanding.
cNet investment income per share includes approximately $0.23 per share received in the form of special dividends paid in connection with certain Fund’s holdings. Excluding these amounts, the ratio of net investment income to average net assets would have been 2.11%.
dNet investment income per share includes approximately $0.02 per share related to interest income received that had previously been deemed uncollectible. Excluding this amount, the ratio of net investment income to average net assets would have been 2.14%.
eNet investment income per share includes approximately $0.11 per share received in the form of a special dividend paid in connection with a corporate real estate investment trust (REIT) conversion. Excluding this non-recurring amount, the ratio of the net investment income to average net assets would have been 1.93%.
fNet investment income per share includes approximately $(0.03) per share related to an adjustment for uncollectible interest. Excluding the effect of this adjustment, the ratio of net investment income to average net assets would have been 2.08%.
gTotal return does not include fees, charges or expenses imposed by the variable annuity and life insurance contracts for which the Franklin Templeton Variable Insurance Products Trust serves as an underlying investment vehicle. Total return is not annualized for periods less than one year.
hRatios are annualized for periods less than one year.
iIncludes dividend or interest expense on securities sold short and security borrowing fees, if any. See below for the ratios of such expenses to average net assets for the periods presented. See Note 1(d).
jBenefit of expense reduction rounds to less than 0.01%.
kRounds to less than 0.01%.
lExcludes the value of portfolio securities delivered as a result of a redemption in-kind.
| The accompanying notes are an integral part of these financial statements. | Semiannual Report | MS-9 |
FRANKLIN TEMPLETON VARIABLE INSURANCE PRODUCTS TRUST
FINANCIAL HIGHLIGHTS
Franklin Mutual Shares VIP Fund (continued)
| Six Months Ended (unaudited) |
Year Ended December 31, | |||||||||||||||||||||||
| 2013 | 2012 | 2011 | 2010 | 2009 | ||||||||||||||||||||
| Class 2 | ||||||||||||||||||||||||
| Per share operating performance (for a share outstanding throughout the period) |
||||||||||||||||||||||||
| Net asset value, beginning of period |
$21.63 | $17.23 | $15.38 | $15.95 | $14.58 | $11.78 | ||||||||||||||||||
|
|
|
|||||||||||||||||||||||
| Income from investment operationsa: | ||||||||||||||||||||||||
| Net investment incomeb |
0.43 | c | 0.36 | 0.30 | 0.32 | d | 0.36 | e | 0.20 | f | ||||||||||||||
| Net realized and unrealized gains (losses) |
1.31 | 4.46 | 1.90 | (0.51 | ) | 1.25 | 2.85 | |||||||||||||||||
|
|
|
|||||||||||||||||||||||
| Total from investment operations |
1.74 | 4.82 | 2.20 | (0.19 | ) | 1.61 | 3.05 | |||||||||||||||||
|
|
|
|||||||||||||||||||||||
| Less distributions from net investment income |
— | (0.42 | ) | (0.35 | ) | (0.38 | ) | (0.24 | ) | (0.25 | ) | |||||||||||||
|
|
|
|||||||||||||||||||||||
| Net asset value, end of period |
$23.37 | $21.63 | $17.23 | $15.38 | $15.95 | $14.58 | ||||||||||||||||||
|
|
|
|||||||||||||||||||||||
| Total returng |
8.04% | 28.26% | 14.24% | (1.04)% | 11.19% | 26.05% | ||||||||||||||||||
| Ratios to average net assetsh | ||||||||||||||||||||||||
| Expensesi |
0.97%j | 0.96% | j | 0.96% | 0.98% | j | 0.99% | j | 1.03% | j | ||||||||||||||
| Expenses incurred in connection with securities sold short |
0.01% | —% | k | —% | k | —% | k | 0.02% | 0.06% | |||||||||||||||
| Net investment income |
3.94% | c | 1.83% | 1.81% | 2.03% | d | 2.41% | e | 1.60% | f | ||||||||||||||
| Supplemental data | ||||||||||||||||||||||||
| Net assets, end of period (000’s) |
$4,587,477 | $4,558,547 | $4,069,803 | $3,913,220 | $4,188,821 | $3,953,435 | ||||||||||||||||||
| Portfolio turnover rate |
11.56% | 24.05% | 34.07% | l | 41.02% | 32.05% | 49.33% | |||||||||||||||||
aThe amount shown for a share outstanding throughout the period may not correlate with the Statement of Operations for the period due to the timing of sales and repurchases of the Fund shares in relation to income earned and/or fluctuating fair value of the investments of the Fund.
bBased on average daily shares outstanding.
cNet investment income per share includes approximately $0.23 per share received in the form of special dividends paid in connection with certain Fund’s holdings. Excluding these amounts, the ratio of net investment income to average net assets would have been 1.86%.
dNet investment income per share includes approximately $0.02 per share related to interest income received that had previously been deemed uncollectible. Excluding this amount, the ratio of net investment income to average net assets would have been 1.89%.
eNet investment income per share includes approximately $0.11 per share received in the form of a special dividend paid in connection with a corporate REIT conversion. Excluding this non-recurring amount, the ratio of the net investment income to average net assets would have been 1.68%.
fNet investment income per share includes approximately $(0.03) per share related to an adjustment for uncollectible interest. Excluding the effect of this adjustment, the ratio of net investment income to average net assets would have been 1.83%.
gTotal return does not include fees, charges or expenses imposed by the variable annuity and life insurance contracts for which the Franklin Templeton Variable Insurance Products Trust serves as an underlying investment vehicle. Total return is not annualized for periods less than one year.
hRatios are annualized for periods less than one year.
iIncludes dividend or interest expense on securities sold short and security borrowing fees, if any. See below for the ratios of such expenses to average net assets for the periods presented. See Note 1(d).
jBenefit of expense reduction rounds to less than 0.01%.
kRounds to less than 0.01%.
lExcludes the value of portfolio securities delivered as a result of a redemption in-kind.
| MS-10 | Semiannual Report | The accompanying notes are an integral part of these financial statements. |
FRANKLIN TEMPLETON VARIABLE INSURANCE PRODUCTS TRUST
FINANCIAL HIGHLIGHTS
Franklin Mutual Shares VIP Fund (continued)
| Six Months Ended (unaudited) |
Year Ended December 31, | |||||||||||||||||||||||
| 2013 | 2012 | 2011 | 2010 | 2009 | ||||||||||||||||||||
| Class 4 | ||||||||||||||||||||||||
| Per share operating performance (for a share outstanding throughout the period) |
||||||||||||||||||||||||
| Net asset value, beginning of period |
$21.74 | $17.31 | $15.45 | $16.03 | $14.66 | $11.88 | ||||||||||||||||||
|
|
|
|||||||||||||||||||||||
| Income from investment operationsa: | ||||||||||||||||||||||||
| Net investment incomeb |
0.42 | c | 0.34 | 0.28 | 0.30 | d | 0.35 | e | 0.19 | f | ||||||||||||||
| Net realized and unrealized gains (losses) |
1.31 | 4.49 | 1.91 | (0.51 | ) | 1.26 | 2.87 | |||||||||||||||||
|
|
|
|||||||||||||||||||||||
| Total from investment operations |
1.73 | 4.83 | 2.19 | (0.21 | ) | 1.61 | 3.06 | |||||||||||||||||
|
|
|
|||||||||||||||||||||||
| Less distributions from net investment income |
— | (0.40 | ) | (0.33 | ) | (0.37 | ) | (0.24 | ) | (0.28 | ) | |||||||||||||
|
|
|
|||||||||||||||||||||||
| Net asset value, end of period |
$23.47 | $21.74 | $17.31 | $15.45 | $16.03 | $14.66 | ||||||||||||||||||
|
|
|
|||||||||||||||||||||||
| Total returng |
7.96% | 28.05% | 14.20% | (1.12)% | 11.06% | 25.94% | ||||||||||||||||||
| Ratios to average net assetsh | ||||||||||||||||||||||||
| Expensesi |
1.07% | j | 1.06% | j | 1.06% | 1.08% | j | 1.09% | j | 1.13%j | ||||||||||||||
| Expenses incurred in connection with securities sold short |
0.01% | —% | k | —% | k | —% | k | 0.02% | 0.06% | |||||||||||||||
| Net investment income |
3.84% | c | 1.73% | 1.71% | 1.93% | d | 2.31% | e | 1.50% | f | ||||||||||||||
| Supplemental data | ||||||||||||||||||||||||
| Net assets, end of period (000’s) |
$183,991 | $188,153 | $165,015 | $162,049 | $167,274 | $141,446 | ||||||||||||||||||
| Portfolio turnover rate |
11.56% | 24.05% | 34.07% | l | 41.02% | 32.05% | 49.33% | |||||||||||||||||
aThe amount shown for a share outstanding throughout the period may not correlate with the Statement of Operations for the period due to the timing of sales and repurchases of the Fund shares in relation to income earned and/or fluctuating fair value of the investments of the Fund.
bBased on average daily shares outstanding.
cNet investment income per share includes approximately $0.23 per share received in the form of special dividends paid in connection with certain Fund’s holdings. Excluding these amounts, the ratio of net investment income to average net assets would have been 1.76%.
dNet investment income per share includes approximately $0.02 per share related to interest income received that had previously been deemed uncollectible. Excluding this amount, the ratio of net investment income to average net assets would have been 1.79%.
eNet investment income per share includes approximately $0.11 per share received in the form of a special dividend paid in connection with a corporate REIT conversion. Excluding this non-recurring amount, the ratio of the net investment income to average net assets would have been 1.58%.
fNet investment income per share includes approximately $(0.03) per share related to an adjustment for uncollectible interest. Excluding the effect of this adjustment, the ratio of net investment income to average net assets would have been 1.73%.
gTotal return does not include fees, charges or expenses imposed by the variable annuity and life insurance contracts for which the Franklin Templeton Variable Insurance Products Trust serves as an underlying investment vehicle. Total return is not annualized for periods less than one year.
hRatios are annualized for periods less than one year.
iIncludes dividend or interest expense on securities sold short and security borrowing fees, if any. See below for the ratios of such expenses to average net assets for the periods presented. See Note 1(d).
jBenefit of expense reduction rounds to less than 0.01%.
kRounds to less than 0.01%.
lExcludes the value of portfolio securities delivered as a result of a redemption in-kind.
| The accompanying notes are an integral part of these financial statements. | Semiannual Report | MS-11 |
FRANKLIN TEMPLETON VARIABLE INSURANCE PRODUCTS TRUST
Statement of Investments, June 30, 2014 (unaudited)
| Franklin Mutual Shares VIP Fund | ||||||||||||||
| Country | Shares | Value | ||||||||||||
| Common Stocks and Other Equity Interests 85.8% |
||||||||||||||
| Aerospace & Defense 1.5% |
||||||||||||||
| a | B/E Aerospace Inc. |
United States | 371,022 | $ | 34,315,825 | |||||||||
| Huntington Ingalls Industries Inc. |
United States | 487,068 | 46,071,762 | |||||||||||
|
|
|
|||||||||||||
| 80,387,587 | ||||||||||||||
|
|
|
|||||||||||||
| Auto Components 0.3% |
||||||||||||||
| a,b | International Automotive Components Group Brazil LLC |
Brazil | 1,730,515 | 275,965 | ||||||||||
| a,b,c | International Automotive Components Group North America, LLC |
United States | 15,382,424 | 14,194,593 | ||||||||||
|
|
|
|||||||||||||
| 14,470,558 | ||||||||||||||
|
|
|
|||||||||||||
| Automobiles 1.2% |
||||||||||||||
| General Motors Co. |
United States | 1,769,500 | 64,232,850 | |||||||||||
|
|
|
|||||||||||||
| Banks 7.1% |
||||||||||||||
| CIT Group Inc. |
United States | 717,853 | 32,848,953 | |||||||||||
| Citigroup Inc. |
United States | 1,063,709 | 50,100,694 | |||||||||||
| Columbia Banking System Inc. |
United States | 163,162 | 4,292,792 | |||||||||||
| a,d | FCB Financial Holdings Inc., A, 144A |
United States | 493,723 | 8,393,291 | ||||||||||
| Guaranty Bancorp |
United States | 209,583 | 2,913,204 | |||||||||||
| JPMorgan Chase & Co. |
United States | 1,129,560 | 65,085,247 | |||||||||||
| KB Financial Group Inc. |
South Korea | 809,531 | 28,157,600 | |||||||||||
| PNC Financial Services Group Inc. |
United States | 1,099,079 | 97,872,985 | |||||||||||
| Societe Generale SA |
France | 214,711 | 11,248,346 | |||||||||||
| State Bank Financial Corp. |
United States | 352,200 | 5,955,702 | |||||||||||
| SunTrust Banks Inc. |
United States | 1,082,994 | 43,384,740 | |||||||||||
| Wells Fargo & Co. |
United States | 708,330 | 37,229,825 | |||||||||||
|
|
|
|||||||||||||
| 387,483,379 | ||||||||||||||
|
|
|
|||||||||||||
| Beverages 1.5% |
||||||||||||||
| Coca-Cola Enterprises Inc. |
United States | 522,207 | 24,951,050 | |||||||||||
| PepsiCo Inc. |
United States | 621,282 | 55,505,334 | |||||||||||
|
|
|
|||||||||||||
| 80,456,384 | ||||||||||||||
|
|
|
|||||||||||||
| Capital Markets 1.1% |
||||||||||||||
| Credit Suisse Group AG |
Switzerland | 1,629,282 | 46,590,282 | |||||||||||
| Morgan Stanley |
United States | 364,390 | 11,780,729 | |||||||||||
|
|
|
|||||||||||||
| 58,371,011 | ||||||||||||||
|
|
|
|||||||||||||
| Chemicals 0.0% |
||||||||||||||
| a,e,f | Dow Corning Corp., Contingent Distribution |
United States | 100,000 | — | ||||||||||
|
|
|
|||||||||||||
| Communications Equipment 1.2% |
||||||||||||||
| Cisco Systems Inc. |
United States | 2,600,090 | 64,612,237 | |||||||||||
|
|
|
|||||||||||||
| Consumer Finance 0.4% |
||||||||||||||
| a | Ally Financial Inc. |
United States | 1,050,600 | 25,119,846 | ||||||||||
|
|
|
|||||||||||||
| Containers & Packaging 0.9% |
||||||||||||||
| MeadWestvaco Corp. |
United States | 1,125,526 | 49,815,781 | |||||||||||
|
|
|
|||||||||||||
| Diversified Consumer Services 0.2% |
||||||||||||||
| a | Cengage Learning Holdings II LP |
United States | 289,744 | 10,213,476 | ||||||||||
|
|
|
|||||||||||||
| Diversified Financial Services 0.6% |
||||||||||||||
| a | ING Groep NV, IDR |
Netherlands | 2,453,476 | 34,472,703 | ||||||||||
|
|
|
|||||||||||||
| Diversified Telecommunication Services 0.5% |
||||||||||||||
| a,e,f | Global Crossing Holdings Ltd., Contingent Distribution |
United States | 9,005,048 | — | ||||||||||
| a | Koninklijke KPN NV |
Netherlands | 7,517,400 | 27,394,204 | ||||||||||
|
|
|
|||||||||||||
| 27,394,204 | ||||||||||||||
|
|
|
|||||||||||||
| MS-12 | Semiannual Report |
FRANKLIN TEMPLETON VARIABLE INSURANCE PRODUCTS TRUST
STATEMENT OF INVESTMENTS (UNAUDITED)
Franklin Mutual Shares VIP Fund (continued)
| Country | Shares | Value | ||||||||||||
| Common Stocks and Other Equity Interests (continued) |
|
|||||||||||||
| Electric Utilities 0.4% |
||||||||||||||
| Entergy Corp. |
United States | 257,180 | $ | 21,111,906 | ||||||||||
|
|
|
|||||||||||||
| Energy Equipment & Services 2.3% |
||||||||||||||
| Baker Hughes Inc. |
United States | 808,658 | 60,204,588 | |||||||||||
| Ensco PLC, A |
United States | 364,874 | 20,276,048 | |||||||||||
| Transocean Ltd. |
United States | 1,011,287 | 45,538,254 | |||||||||||
|
|
|
|||||||||||||
| 126,018,890 | ||||||||||||||
|
|
|
|||||||||||||
| Food & Staples Retailing 4.0% |
||||||||||||||
| CVS Caremark Corp. |
United States | 539,003 | 40,624,656 | |||||||||||
| The Kroger Co. |
United States | 1,507,502 | 74,515,824 | |||||||||||
| Tesco PLC |
United Kingdom | 10,650,840 | 51,797,491 | |||||||||||
| Walgreen Co. |
United States | 698,015 | 51,743,852 | |||||||||||
|
|
|
|||||||||||||
| 218,681,823 | ||||||||||||||
|
|
|
|||||||||||||
| Health Care Equipment & Supplies 3.1% |
||||||||||||||
| Medtronic Inc. |
United States | 2,233,842 | 142,429,766 | |||||||||||
| Stryker Corp. |
United States | 298,778 | 25,192,961 | |||||||||||
|
|
|
|||||||||||||
| 167,622,727 | ||||||||||||||
|
|
|
|||||||||||||
| Health Care Providers & Services 1.9% |
||||||||||||||
| Cigna Corp. |
United States | 1,107,554 | 101,861,741 | |||||||||||
|
|
|
|||||||||||||
| Independent Power & Renewable Electricity Producers 0.9% |
||||||||||||||
| NRG Energy Inc. |
United States | 1,388,884 | 51,666,485 | |||||||||||
|
|
|
|||||||||||||
| Insurance 7.8% |
||||||||||||||
| ACE Ltd. |
United States | 762,875 | 79,110,138 | |||||||||||
| a | Alleghany Corp. |
United States | 124,988 | 54,759,743 | ||||||||||
| The Allstate Corp. |
United States | 725,690 | 42,612,517 | |||||||||||
| American International Group Inc. |
United States | 1,647,106 | 89,899,045 | |||||||||||
| MetLife Inc. |
United States | 921,593 | 51,203,707 | |||||||||||
| a,b | Olympus Re Holdings Ltd. |
United States | 16,280 | — | ||||||||||
| White Mountains Insurance Group Ltd. |
United States | 114,635 | 69,748,519 | |||||||||||
| Zurich Insurance Group AG |
Switzerland | 111,270 | 33,537,206 | |||||||||||
|
|
|
|||||||||||||
| 420,870,875 | ||||||||||||||
|
|
|
|||||||||||||
| IT Services 1.4% |
||||||||||||||
| Xerox Corp. |
United States | 6,041,544 | 75,156,807 | |||||||||||
|
|
|
|||||||||||||
| Machinery 1.5% |
||||||||||||||
| Caterpillar Inc. |
United States | 337,816 | 36,710,465 | |||||||||||
| CNH Industrial NV (EUR Traded) |
United Kingdom | 1,444,736 | 14,838,702 | |||||||||||
| CNH Industrial NV, special voting (EUR Traded) |
United Kingdom | 1,844,814 | 18,947,853 | |||||||||||
| Federal Signal Corp. |
United States | 757,221 | 11,093,287 | |||||||||||
|
|
|
|||||||||||||
| 81,590,307 | ||||||||||||||
|
|
|
|||||||||||||
| Marine 1.5% |
||||||||||||||
| A.P. Moeller-Maersk AS, B |
Denmark | 32,450 | 80,636,295 | |||||||||||
|
|
|
|||||||||||||
| Media 7.6% |
||||||||||||||
| CBS Corp., B |
United States | 958,571 | 59,565,602 | |||||||||||
| Comcast Corp., Special A |
United States | 278,448 | 14,849,632 | |||||||||||
| a | DIRECTV |
United States | 641,479 | 54,532,130 | ||||||||||
| Reed Elsevier PLC |
United Kingdom | 4,610,810 | 74,166,173 | |||||||||||
| Time Warner Cable Inc. |
United States | 560,096 | 82,502,141 | |||||||||||
| Semiannual Report | MS-13 |
FRANKLIN TEMPLETON VARIABLE INSURANCE PRODUCTS TRUST
STATEMENT OF INVESTMENTS (UNAUDITED)
Franklin Mutual Shares VIP Fund (continued)
| Country | Shares | Value | ||||||||||||
| Common Stocks and Other Equity Interests (continued) |
|
|||||||||||||
| Media (continued) |
||||||||||||||
| a | Tribune Co., A |
United States | 205,018 | $ | 17,436,781 | |||||||||
| a | Tribune Co., B |
United States | 185,976 | 15,817,259 | ||||||||||
| Twenty-First Century Fox Inc., B |
United States | 2,702,579 | 92,509,279 | |||||||||||
|
|
|
|||||||||||||
| 411,378,997 | ||||||||||||||
|
|
|
|||||||||||||
| Metals & Mining 2.7% |
||||||||||||||
| Anglo American PLC |
United Kingdom | 1,378,690 | 33,736,766 | |||||||||||
| Freeport-McMoRan Copper & Gold Inc., B |
United States | 1,917,216 | 69,978,384 | |||||||||||
| a | ThyssenKrupp AG |
Germany | 1,430,635 | 41,711,006 | ||||||||||
|
|
|
|||||||||||||
| 145,426,156 | ||||||||||||||
|
|
|
|||||||||||||
| Multiline Retail 0.7% |
||||||||||||||
| Kohl’s Corp. |
United States | 685,800 | 36,127,944 | |||||||||||
|
|
|
|||||||||||||
| Oil, Gas & Consumable Fuels 8.8% |
||||||||||||||
| Apache Corp. |
United States | 904,610 | 91,021,858 | |||||||||||
| BG Group PLC |
United Kingdom | 1,980,660 | 41,857,924 | |||||||||||
| BP PLC |
United Kingdom | 5,114,242 | 45,061,429 | |||||||||||
| CONSOL Energy Inc. |
United States | 839,405 | 38,671,388 | |||||||||||
| Marathon Oil Corp. |
United States | 1,859,308 | 74,223,576 | |||||||||||
| Murphy Oil Corp. |
United States | 502,750 | 33,422,820 | |||||||||||
| Petroleo Brasileiro SA, ADR |
Brazil | 1,541,270 | 22,548,780 | |||||||||||
| Royal Dutch Shell PLC, A |
United Kingdom | 2,350,491 | 97,338,923 | |||||||||||
| g | Talisman Energy Inc. (CAD Traded) |
Canada | 202,643 | 2,143,385 | ||||||||||
| Talisman Energy Inc. (USD Traded) |
Canada | 3,047,937 | 32,308,132 | |||||||||||
|
|
|
|||||||||||||
| 478,598,215 | ||||||||||||||
|
|
|
|||||||||||||
| Paper & Forest Products 1.3% |
||||||||||||||
| International Paper Co. |
United States | 1,398,676 | 70,591,178 | |||||||||||
|
|
|
|||||||||||||
| Personal Products 0.7% |
||||||||||||||
| Avon Products Inc. |
United States | 2,664,426 | 38,927,264 | |||||||||||
|
|
|
|||||||||||||
| Pharmaceuticals 7.3% |
||||||||||||||
| AstraZeneca PLC |
United Kingdom | 598,110 | 44,424,405 | |||||||||||
| AstraZeneca PLC, ADR |
United Kingdom | 246,630 | 18,327,075 | |||||||||||
| Eli Lilly & Co. |
United States | 779,532 | 48,463,504 | |||||||||||
| a | Hospira Inc. |
United States | 835,339 | 42,911,364 | ||||||||||
| Merck & Co. Inc. |
United States | 2,362,728 | 136,683,815 | |||||||||||
| Teva Pharmaceutical Industries Ltd., ADR |
Israel | 1,990,576 | 104,345,994 | |||||||||||
|
|
|
|||||||||||||
| 395,156,157 | ||||||||||||||
|
|
|
|||||||||||||
| Real Estate Investment Trusts (REITs) 0.3% |
||||||||||||||
| Alexander’s Inc. |
United States | 40,126 | 14,825,353 | |||||||||||
|
|
|
|||||||||||||
| Real Estate Management & Development 0.3% |
||||||||||||||
| f | Canary Wharf Group PLC |
United Kingdom | 1,535,898 | 11,679,350 | ||||||||||
| a | Forestar Group Inc. |
United States | 185,159 | 3,534,685 | ||||||||||
|
|
|
|||||||||||||
| 15,214,035 | ||||||||||||||
|
|
|
|||||||||||||
| Semiconductors & Semiconductor Equipment 0.7% |
||||||||||||||
| Samsung Electronics Co. Ltd. |
South Korea | 28,252 | 36,906,269 | |||||||||||
|
|
|
|||||||||||||
| Software 4.1% |
||||||||||||||
| Microsoft Corp. |
United States | 3,479,007 | 145,074,592 | |||||||||||
| Symantec Corp. |
United States | 3,304,335 | 75,669,271 | |||||||||||
|
|
|
|||||||||||||
| 220,743,863 | ||||||||||||||
|
|
|
|||||||||||||
| MS-14 | Semiannual Report |
FRANKLIN TEMPLETON VARIABLE INSURANCE PRODUCTS TRUST
STATEMENT OF INVESTMENTS (UNAUDITED)
Franklin Mutual Shares VIP Fund (continued)
| Country | Shares | Value | ||||||||||||
| Common Stocks and Other Equity Interests (continued) |
|
|||||||||||||
| Technology Hardware, Storage & Peripherals 3.4% |
||||||||||||||
| Apple Inc. |
United States | 1,483,090 | $ | 137,823,554 | ||||||||||
| Hewlett-Packard Co. |
United States | 1,342,537 | 45,216,646 | |||||||||||
|
|
|
|||||||||||||
| 183,040,200 | ||||||||||||||
|
|
|
|||||||||||||
| Tobacco 5.4% |
||||||||||||||
| Altria Group Inc. |
United States | 1,312,068 | 55,028,132 | |||||||||||
| British American Tobacco PLC |
United Kingdom | 1,569,507 | 93,410,055 | |||||||||||
| Imperial Tobacco Group PLC |
United Kingdom | 1,211,827 | 54,537,743 | |||||||||||
| Lorillard Inc. |
United States | 1,057,573 | 64,480,226 | |||||||||||
| Philip Morris International Inc. |
United States | 315,520 | 26,601,491 | |||||||||||
|
|
|
|||||||||||||
| 294,057,647 | ||||||||||||||
|
|
|
|||||||||||||
| Wireless Telecommunication Services 1.2% |
||||||||||||||
| Vodafone Group PLC |
United Kingdom | 19,137,764 | 63,859,660 | |||||||||||
|
|
|
|||||||||||||
| Total Common Stocks and Other Equity Interests |
4,647,100,810 | |||||||||||||
|
|
|
|||||||||||||
| Preferred Stocks (Cost $38,376,811) 0.7% |
||||||||||||||
| Automobiles 0.7% |
||||||||||||||
| Volkswagen AG, pfd. |
Germany | 147,089 | 38,634,470 | |||||||||||
|
|
|
|||||||||||||
| Principal Amount* | ||||||||||||||
| Corporate Bonds, Notes and Senior Floating Rate Interests 4.8% |
||||||||||||||
| d | American Airlines Inc., senior secured note, 144A, 7.50%, 3/15/16 |
United States | 27,778,000 | 28,906,481 | ||||||||||
| Avaya Inc., |
||||||||||||||
| d senior note, 144A, 10.50%, 3/01/21 |
United States | 14,061,000 | 13,041,578 | |||||||||||
| d senior secured note, 144A, 7.00%, 4/01/19 |
United States | 12,923,000 | 12,987,615 | |||||||||||
| h,i Tranche B-3 Term Loan, 4.727%, 10/26/17 |
United States | 19,579,590 | 19,219,462 | |||||||||||
| h,i 1.Tranche B-6 Term Loan, 6.50%, 3/31/18 |
United States | 4,775,102 | 4,787,875 | |||||||||||
| h,i | Caesars Entertainment Operating Co. Inc., Senior Tranche Term Loan, |
|||||||||||||
| B5, first lien, 4.402%, 1/28/18 |
United States | 3,440,000 | 3,183,913 | |||||||||||
| B6, first lien, 5.402%, 1/28/18 |
United States | 16,401,000 | 15,340,528 | |||||||||||
| h,i | Cengage Learning Acquisitions Inc., First Lien Exit Term Loan, 7.00%, 3/31/20 |
United States | 1,834,403 | 1,860,581 | ||||||||||
| Clear Channel Communications Inc., |
||||||||||||||
| senior secured note, first lien, 9.00%, 12/15/19 |
United States | 26,449,000 | 28,300,430 | |||||||||||
| h,i Tranche B Term Loan, 3.80%, 1/29/16 |
United States | 537,126 | 533,935 | |||||||||||
| h,i Tranche C Term Loan, 3.80%, 1/29/16 |
United States | 61,187 | 60,636 | |||||||||||
| h,i Tranche D Term Loan, 6.90%, 1/30/19 |
United States | 34,746,619 | 34,664,096 | |||||||||||
| h,i Tranche E Term Loan, 7.65%, 7/30/19 |
United States | 11,168,253 | 11,215,562 | |||||||||||
| First Data Corp., |
||||||||||||||
| senior bond, 12.625%, 1/15/21 |
United States | 3,679,000 | 4,538,966 | |||||||||||
| senior note, 11.75%, 8/15/21 |
United States | 15,674,000 | 18,652,060 | |||||||||||
| d,j | First Data Holdings Inc., 144A, PIK, 14.50%, 9/24/19 |
United States | 10,091,571 | 10,898,897 | ||||||||||
| h,i | Harrah’s Operating Co. Inc., Senior Tranche Term Loan, first lien, 9.75%, 3/01/17 |
United States | 1,817,000 | 1,795,992 | ||||||||||
| h,i | JC Penney Corp. Inc., Term Loan, 6.00%, 5/22/18 |
United States | 26,324,459 | 26,627,664 | ||||||||||
| NGPL PipeCo LLC, |
||||||||||||||
| d secured note, 144A, 7.119%, 12/15/17 |
United States | 9,756,000 | 9,951,120 | |||||||||||
| d senior secured note, 144A, 9.625%, 6/01/19 |
United States | 14,481,000 | 15,929,100 | |||||||||||
| Semiannual Report | MS-15 |
FRANKLIN TEMPLETON VARIABLE INSURANCE PRODUCTS TRUST
STATEMENT OF INVESTMENTS (UNAUDITED)
Franklin Mutual Shares VIP Fund (continued)
| Country | Principal Amount* | Value | ||||||||||||
| Corporate Bonds, Notes and Senior Floating Rate Interests (continued) |
||||||||||||||
| h,i Term Loan B, 6.75%, 9/15/17 |
United States | 826,939 | $ | 824,613 | ||||||||||
|
|
|
|||||||||||||
| Total Corporate Bonds, Notes and Senior Floating Rate Interests (Cost $243,924,713) |
263,321,104 | |||||||||||||
|
|
|
|||||||||||||
| Corporate Notes and Senior Floating Rate Interests in Reorganization 2.1% |
||||||||||||||
| b,k | Broadband Ventures III LLC, secured promissory note, 5.00%, 2/01/12 |
United States | 1,754 | — | ||||||||||
| h,i | Texas Competitive Electric Holdings Co. LLC, Extended Term Loan, 4.651%, 10/10/17 |
United States | 90,618,405 | 75,213,276 | ||||||||||
| d,k | Texas Competitive Electric Holdings Co. LLC/Texas Competitive Electric Holdings Finance Inc., senior secured note, 144A, 11.50%, 10/01/20 |
United States | 39,308,000 | 36,065,090 | ||||||||||
|
|
|
|||||||||||||
| Total Corporate Notes and Senior Floating Rate Interests in Reorganization (Cost $116,326,796) |
111,278,366 | |||||||||||||
|
|
|
|||||||||||||
| Shares | ||||||||||||||
| Companies in Liquidation 1.2% |
||||||||||||||
| a | Adelphia Recovery Trust |
United States | 29,283,354 | 292,834 | ||||||||||
| a,e | Adelphia Recovery Trust, Arahova Contingent Value Vehicle, Contingent Distribution |
United States | 1,955,453 | 23,465 | ||||||||||
| a,b,c,l | CB FIM Coinvestors LLC |
United States | 6,400,507 | — | ||||||||||
| a,e,f | Century Communications Corp., Contingent Distribution |
United States | 5,487,000 | — | ||||||||||
| a,b | FIM Coinvestor Holdings I, LLC |
United States | 8,006,950 | — | ||||||||||
| a,m | Lehman Brothers Holdings Inc., Bankruptcy Claim |
United States | 144,058,799 | 66,086,974 | ||||||||||
| a,e,f | Tribune Litigation Trust, Contingent Distribution |
United States | 393,761 | — | ||||||||||
| a,e,f | Tropicana Litigation Trust, Contingent Distribution |
United States | 18,305,000 | — | ||||||||||
| Principal Amount* | ||||||||||||||
| f,k | Peregrine Investments Holdings Ltd., 6.70%, 1/15/98 |
Hong Kong | 5,000,000 | JPY | — | |||||||||
| f,k | PIV Investment Finance (Cayman) Ltd., 4.50%, 12/01/00 |
Hong Kong | 12,200,000 | — | ||||||||||
|
|
|
|||||||||||||
| Total Companies in Liquidation |
66,403,273 | |||||||||||||
|
|
|
|||||||||||||
| Municipal Bonds (Cost $14,653,163) 0.3% |
||||||||||||||
| Puerto Rico Commonwealth GO, Refunding, Series A, 8.00%, 7/01/35 |
United States | 15,709,000 | 13,838,686 | |||||||||||
|
|
|
|||||||||||||
| Total Investments before Short Term Investments |
5,140,576,709 | |||||||||||||
|
|
|
|||||||||||||
| Short Term Investments 4.9% |
||||||||||||||
| U.S. Government and Agency Securities 4.9% |
||||||||||||||
| n | FHLB, 7/01/14 |
United States | 12,500,000 | 12,500,000 | ||||||||||
| n,o | U.S. Treasury Bills, 7/17/14 - 12/26/14 |
United States | 254,100,000 | 254,074,467 | ||||||||||
|
|
|
|||||||||||||
| Total U.S. Government and Agency Securities |
266,574,467 | |||||||||||||
|
|
|
|||||||||||||
| Total Investments before Money Market Funds |
5,407,151,176 | |||||||||||||
|
|
|
|||||||||||||
| MS-16 | Semiannual Report |
FRANKLIN TEMPLETON VARIABLE INSURANCE PRODUCTS TRUST
STATEMENT OF INVESTMENTS (UNAUDITED)
Franklin Mutual Shares VIP Fund (continued)
| Country | Shares | Value | ||||||||||||
| p | Investments from Cash Collateral Received for Loaned Securities (Cost $546,198) 0.0%† |
|||||||||||||
| Money Market Funds 0.0%† |
||||||||||||||
| q | BNY Mellon Overnight Government Fund, 0.082% |
United States | 546,198 | $ | 546,198 | |||||||||
|
|
|
|||||||||||||
| Total Investments (Cost $3,985,453,575) 99.8% |
5,407,697,374 | |||||||||||||
| Securities Sold Short (0.5)% |
(29,487,482 | ) | ||||||||||||
| Other Assets, less Liabilities 0.7% |
37,552,219 | |||||||||||||
|
|
|
|||||||||||||
| Net Assets 100.0% |
$ | 5,415,762,111 | ||||||||||||
|
|
|
|||||||||||||
| r | Securities Sold Short (Proceeds $29,277,284) (0.5)% |
|||||||||||||
| Common Stocks (0.5)% |
||||||||||||||
| Diversified Telecommunication Services (0.5)% |
||||||||||||||
| AT&T Inc. |
United States | 833,922 | $ | (29,487,482 | ) | |||||||||
|
|
|
|||||||||||||
†Rounds to less than 0.1% of net assets.
*The principal amount is stated in U.S. dollars unless otherwise indicated.
aNon-income producing.
bSee Note 8 regarding restricted securities.
cAt June 30, 2014, pursuant to the Fund’s policies and the requirements of applicable securities law, the Fund may be restricted from trading these securities for a limited or extended period of time due to ownership limits and/or potential possession of material non-public information.
dSecurity was purchased pursuant to Rule 144A under the Securities Act of 1933 and may be sold in transactions exempt from registration only to qualified institutional buyers or in a public offering registered under the Securities Act of 1933. These securities have been deemed liquid under guidelines approved by the Trust’s Board of Trustees. At June 30, 2014, the aggregate value of these securities was $136,173,172, representing 2.51% of net assets.
eContingent distributions represent the right to receive additional distributions, if any, during the reorganization of the underlying company. Shares represent total underlying principal of debt securities.
fSecurity has been deemed illiquid because it may not be able to be sold within seven days. At June 30, 2014, the aggregate value of these securities was $11,679,350, representing 0.22% of net assets.
gA portion or all of the security is on loan at June 30, 2014. See Note 1(e).
hSee Note 1(f) regarding senior floating rate interests.
iThe coupon rate shown represents the rate at period end.
jIncome may be received in additional securities and/or cash.
kSee Note 7 regarding credit risk and defaulted securities.
lSee Note 10 regarding holdings of 5% voting securities.
mBankruptcy claims represent the right to receive distributions, if any, during the liquidation of the underlying pool of assets. Shares represent amount of allowed unsecured claims.
nThe security is traded on a discount basis with no stated coupon rate.
oSecurity or a portion of the security has been pledged as collateral for securities sold short, open futures and forward contracts. At June 30, 2014, the aggregate value of these securities and/or cash pledged as collateral was $43,260,625, representing 0.80% of net assets.
pSee Note 1(e) regarding securities on loan.
qThe rate shown is the annualized seven-day yield at period end.
rSee Note 1(d) regarding securities sold short.
| Semiannual Report | MS-17 |
FRANKLIN TEMPLETON VARIABLE INSURANCE PRODUCTS TRUST
STATEMENT OF INVESTMENTS (UNAUDITED)
Franklin Mutual Shares VIP Fund (continued)
At June 30, 2014, the Fund had the following futures contracts outstanding. See Note 1(c).
Futures Contracts
| Description | Type | Number of Contracts |
Notional Value |
Expiration Date |
Unrealized Appreciation |
Unrealized Depreciation |
||||||||||||||||||
| Currency Contracts | ||||||||||||||||||||||||
| CHF/USD |
Short | 18 | $ | 2,539,575 | 9/15/14 | $ | — | $ | (19,839 | ) | ||||||||||||||
| EUR/USD |
Short | 491 | 84,071,475 | 9/15/14 | — | (908,724 | ) | |||||||||||||||||
| GBP/USD |
Short | 1,030 | 110,049,063 | 9/15/14 | — | (2,039,401 | ) | |||||||||||||||||
|
|
|
|||||||||||||||||||||||
| Net unrealized appreciation (depreciation) |
|
$ | (2,967,964 | ) | ||||||||||||||||||||
|
|
|
|||||||||||||||||||||||
At June 30, 2014, the Fund had the following forward exchange contracts outstanding. See Note 1(c).
Forward Exchange Contracts
| Currency | Counterpartya | Type | Quantity | Contract Amount |
Settlement Date |
Unrealized Appreciation |
Unrealized Depreciation |
|||||||||||||||||||||
| Euro |
BOFA | Buy | 24,293,214 | $ | 33,498,897 | 7/17/14 | $ | 1,390 | $ | (229,641 | ) | |||||||||||||||||
| Euro |
BOFA | Sell | 25,795,816 | 35,080,373 | 7/17/14 | 146 | (248,299 | ) | ||||||||||||||||||||
| Euro |
BZWS | Buy | 17,805,254 | 24,580,550 | 7/17/14 | 671 | (196,128 | ) | ||||||||||||||||||||
| Euro |
BZWS | Sell | 329,993 | 448,113 | 7/17/14 | — | (3,828 | ) | ||||||||||||||||||||
| Euro |
BONY | Buy | 296,301 | 405,280 | 7/17/14 | 634 | (116 | ) | ||||||||||||||||||||
| Euro |
HSBC | Buy | 3,664,789 | 5,033,436 | 7/17/14 | 368 | (14,712 | ) | ||||||||||||||||||||
| Euro |
HSBC | Sell | 3,671,658 | 4,998,612 | 7/17/14 | 464 | (30,353 | ) | ||||||||||||||||||||
| Euro |
SCBT | Buy | 2,800,912 | 3,866,494 | 7/17/14 | 736 | (31,255 | ) | ||||||||||||||||||||
| Euro |
SCBT | Sell | 20,545,611 | 27,942,031 | 7/17/14 | — | (196,104 | ) | ||||||||||||||||||||
| Euro |
SSBT | Buy | 1,753,952 | 2,420,744 | 7/17/14 | 591 | (19,219 | ) | ||||||||||||||||||||
| Euro |
SSBT | Sell | 271,344 | 371,489 | 7/17/14 | — | (129 | ) | ||||||||||||||||||||
| British Pound |
BOFA | Buy | 1,050,215 | 1,745,882 | 7/21/14 | 50,928 | — | |||||||||||||||||||||
| British Pound |
BOFA | Sell | 18,318,525 | 29,886,674 | 7/21/14 | — | (1,454,454 | ) | ||||||||||||||||||||
| British Pound |
BZWS | Buy | 1,277,326 | 2,121,131 | 7/21/14 | 64,243 | — | |||||||||||||||||||||
| British Pound |
BZWS | Sell | 41,328,694 | 68,092,989 | 7/21/14 | — | (2,616,192 | ) | ||||||||||||||||||||
| British Pound |
FBCO | Buy | 183,618 | 307,245 | 7/21/14 | 6,906 | — | |||||||||||||||||||||
| British Pound |
HSBC | Buy | 1,703,102 | 2,832,880 | 7/21/14 | 80,954 | — | |||||||||||||||||||||
| British Pound |
HSBC | Sell | 5,171,604 | 8,486,603 | 7/21/14 | — | (361,485 | ) | ||||||||||||||||||||
| British Pound |
SSBT | Buy | 1,798,084 | 2,989,863 | 7/21/14 | 86,475 | — | |||||||||||||||||||||
| South Korean Won |
BOFA | Buy | 7,094,380,532 | 6,810,277 | 8/12/14 | 188,235 | — | |||||||||||||||||||||
| South Korean Won |
BOFA | Sell | 16,483,765,392 | 15,375,614 | 8/12/14 | — | (885,402 | ) | ||||||||||||||||||||
| South Korean Won |
FBCO | Buy | 2,719,133,817 | 2,600,728 | 8/12/14 | 81,661 | — | |||||||||||||||||||||
| South Korean Won |
FBCO | Sell | 32,361,290,513 | 30,138,394 | 8/12/14 | — | (1,785,591 | ) | ||||||||||||||||||||
| South Korean Won |
HSBC | Buy | 4,374,620,932 | 4,179,047 | 8/12/14 | 136,459 | — | |||||||||||||||||||||
| South Korean Won |
HSBC | Sell | 31,079,325,326 | 28,969,601 | 8/12/14 | — | (1,689,742 | ) | ||||||||||||||||||||
| Swiss Franc |
BOFA | Sell | 5,420,377 | 6,115,341 | 8/12/14 | 50,120 | (9,009 | ) | ||||||||||||||||||||
| Swiss Franc |
BZWS | Sell | 2,795,770 | 3,179,349 | 8/12/14 | 30,133 | (4,436 | ) | ||||||||||||||||||||
| Swiss Franc |
BONY | Sell | 103,406 | 117,031 | 8/12/14 | 388 | — | |||||||||||||||||||||
| Swiss Franc |
FBCO | Buy | 450,000 | 503,253 | 8/12/14 | 4,351 | — | |||||||||||||||||||||
| Swiss Franc |
DBAB | Buy | 496,400 | 555,750 | 8/12/14 | 4,193 | — | |||||||||||||||||||||
| Swiss Franc |
HSBC | Sell | 71,818 | 81,947 | 8/12/14 | 935 | — | |||||||||||||||||||||
| Swiss Franc |
SSBT | Buy | 175,230 | 196,088 | 8/12/14 | 1,573 | — | |||||||||||||||||||||
| Swiss Franc |
SSBT | Sell | 2,836,400 | 3,207,835 | 8/12/14 | 13,746 | (5,394 | ) | ||||||||||||||||||||
| British Pound |
BOFA | Buy | 6,616,425 | 11,190,205 | 8/19/14 | 127,451 | (286 | ) | ||||||||||||||||||||
| British Pound |
BOFA | Sell | 17,123,596 | 28,709,472 | 8/19/14 | — | (580,375 | ) | ||||||||||||||||||||
| British Pound |
BZWS | Buy | 4,700,602 | 7,926,962 | 8/19/14 | 113,399 | — | |||||||||||||||||||||
| British Pound |
BZWS | Sell | 29,137,504 | 48,778,891 | 8/19/14 | — | (1,060,700 | ) | ||||||||||||||||||||
| British Pound |
FBCO | Buy | 2,234,682 | 3,810,479 | 8/19/14 | 12,135 | (199 | ) | ||||||||||||||||||||
| British Pound |
DBAB | Buy | 3,259,956 | 5,541,372 | 8/19/14 | 34,770 | — | |||||||||||||||||||||
| British Pound |
HSBC | Buy | 1,421,799 | 2,386,708 | 8/19/14 | 45,274 | — | |||||||||||||||||||||
| British Pound |
HSBC | Sell | 23,317,794 | 39,049,496 | 8/19/14 | — | (835,503 | ) | ||||||||||||||||||||
| British Pound |
SCBT | Buy | 420,327 | 706,685 | 8/19/14 | 12,282 | — | |||||||||||||||||||||
| British Pound |
SSBT | Buy | 3,732,384 | 6,300,637 | 8/19/14 | 83,592 | — | |||||||||||||||||||||
| British Pound |
SSBT | Sell | 212,187 | 357,527 | 8/19/14 | — | (5,418 | ) | ||||||||||||||||||||
| MS-18 | Semiannual Report |
FRANKLIN TEMPLETON VARIABLE INSURANCE PRODUCTS TRUST
STATEMENT OF INVESTMENTS (UNAUDITED)
Franklin Mutual Shares VIP Fund (continued)
Forward Exchange Contracts (continued)
| Currency | Counterpartya | Type | Quantity | Contract Amount |
Settlement Date |
Unrealized Appreciation |
Unrealized Depreciation |
|||||||||||||||||||||
| Euro |
BOFA | Buy | 7,689,652 | $ | 10,503,918 | 8/29/14 | $ | 44,348 | $ | (15,450 | ) | |||||||||||||||||
| Euro |
BOFA | Sell | 14,170,121 | 19,386,568 | 8/29/14 | — | (22,800 | ) | ||||||||||||||||||||
| Euro |
BZWS | Buy | 6,398,135 | 8,751,462 | 8/29/14 | 21,608 | (9,296 | ) | ||||||||||||||||||||
| Euro |
BZWS | Sell | 14,170,257 | 19,372,725 | 8/29/14 | — | (36,828 | ) | ||||||||||||||||||||
| Euro |
BONY | Buy | 1,822,736 | 2,494,589 | 8/29/14 | 3,033 | (950 | ) | ||||||||||||||||||||
| Euro |
HSBC | Buy | 4,535,135 | 6,193,355 | 8/29/14 | 19,540 | (943 | ) | ||||||||||||||||||||
| Euro |
SCBT | Buy | 1,818,018 | 2,486,905 | 8/29/14 | 3,497 | (192 | ) | ||||||||||||||||||||
| Euro |
SSBT | Buy | 4,442,719 | 6,096,787 | 8/29/14 | 3,684 | (15,106 | ) | ||||||||||||||||||||
| Euro |
BOFA | Buy | 4,006,052 | 5,433,361 | 10/16/14 | 55,057 | — | |||||||||||||||||||||
| Euro |
BZWS | Buy | 4,081,483 | 5,552,648 | 10/16/14 | 39,111 | — | |||||||||||||||||||||
| Euro |
DBAB | Buy | 1,398,466 | 1,903,954 | 10/16/14 | 11,988 | — | |||||||||||||||||||||
| Euro |
HSBC | Buy | 3,336,676 | 4,539,122 | 10/16/14 | 32,228 | — | |||||||||||||||||||||
| Euro |
SCBT | Sell | 14,900,000 | 20,324,643 | 10/16/14 | — | (88,824 | ) | ||||||||||||||||||||
| Euro |
SSBT | Buy | 1,193,430 | 1,626,702 | 10/16/14 | 8,335 | — | |||||||||||||||||||||
| British Pound |
BOFA | Sell | 24,093,987 | 40,424,891 | 10/22/14 | — | (761,703 | ) | ||||||||||||||||||||
| British Pound |
HSBC | Buy | 437,133 | 744,363 | 10/22/14 | 2,878 | — | |||||||||||||||||||||
| British Pound |
SSBT | Buy | 119,309 | 202,728 | 10/22/14 | 1,220 | — | |||||||||||||||||||||
| British Pound |
SSBT | Sell | 28,173,363 | 47,254,697 | 10/22/14 | — | (905,239 | ) | ||||||||||||||||||||
| Euro |
BOFA | Sell | 28,623,774 | 39,233,003 | 11/17/14 | 47,860 | (36,019 | ) | ||||||||||||||||||||
| Euro |
BZWS | Sell | 34,758,953 | 47,673,691 | 11/17/14 | 66,315 | (20,392 | ) | ||||||||||||||||||||
| Euro |
DBAB | Sell | 1,696,915 | 2,317,392 | 11/17/14 | — | (7,772 | ) | ||||||||||||||||||||
| Euro |
HSBC | Sell | 7,325,122 | 10,011,929 | 11/17/14 | 6,921 | (32,096 | ) | ||||||||||||||||||||
| Euro |
SCBT | Sell | 370,000 | 504,003 | 11/17/14 | — | (2,982 | ) | ||||||||||||||||||||
| Euro |
SSBT | Sell | 64,103 | 87,417 | 11/17/14 | — | (419 | ) | ||||||||||||||||||||
| British Pound |
BOFA | Sell | 16,031,607 | 26,949,131 | 11/21/14 | — | (445,870 | ) | ||||||||||||||||||||
| British Pound |
SSBT | Sell | 14,211,118 | 23,888,889 | 11/21/14 | — | (395,239 | ) | ||||||||||||||||||||
|
|
|
|||||||||||||||||||||||||||
| Unrealized appreciation (depreciation) |
|
1,602,826 | (15,062,090 | ) | ||||||||||||||||||||||||
|
|
|
|||||||||||||||||||||||||||
| Net unrealized appreciation (depreciation) |
|
$ | (13,459,264 | ) | ||||||||||||||||||||||||
|
|
|
|||||||||||||||||||||||||||
aMay be comprised of multiple contracts using the same currency and settlement date.
See Abbreviations on page MS-34.
| The accompanying notes are an integral part of these financial statements. | Semiannual Report | MS-19 |
FRANKLIN TEMPLETON VARIABLE INSURANCE PRODUCTS TRUST
Financial Statements
Statement of Assets and Liabilities
June 30, 2014 (unaudited)
| Franklin Mutual Shares VIP Fund |
||||
| Assets: | ||||
| Investments in securities: |
||||
| Cost - Unaffiliated issuers |
$ | 3,985,453,575 | ||
|
|
|
|||
| Value - Unaffiliated issuers (includes securities loaned in the amount of $520,470) |
$ | 5,407,697,374 | ||
| Cash |
1,039,814 | |||
| Foreign currency, at value (cost $7,079,447) |
7,099,780 | |||
| Receivables: |
||||
| Investment securities sold |
15,045,070 | |||
| Capital shares sold |
3,681,836 | |||
| Dividends and interest |
12,826,651 | |||
| Due from brokers |
30,120,744 | |||
| Unrealized appreciation on forward exchange contracts |
1,602,826 | |||
| Other assets |
2,366 | |||
|
|
|
|||
| Total assets |
5,479,116,461 | |||
|
|
|
|||
| Liabilities: | ||||
| Payables: |
||||
| Capital shares redeemed |
11,347,544 | |||
| Management fees |
3,046,384 | |||
| Distribution fees |
2,018,770 | |||
| Variation margin |
854,539 | |||
| Securities sold short, at value (proceeds $29,277,284) |
29,487,482 | |||
| Payable upon return of securities loaned |
546,198 | |||
| Unrealized depreciation on forward exchange contracts |
15,062,090 | |||
| Accrued expenses and other liabilities |
991,343 | |||
|
|
|
|||
| Total liabilities |
63,354,350 | |||
|
|
|
|||
| Net assets, at value |
$ | 5,415,762,111 | ||
|
|
|
|||
| Net assets consist of: | ||||
| Paid-in capital |
$ | 3,594,818,545 | ||
| Undistributed net investment income |
194,669,467 | |||
| Net unrealized appreciation (depreciation) |
1,405,720,985 | |||
| Accumulated net realized gain (loss) |
220,553,114 | |||
|
|
|
|||
| Net assets, at value |
$ | 5,415,762,111 | ||
|
|
|
|||
| MS-20 | Semiannual Report | The accompanying notes are an integral part of these financial statements. |
FRANKLIN TEMPLETON VARIABLE INSURANCE PRODUCTS TRUST
FINANCIAL STATEMENTS
Statement of Assets and Liabilities (continued)
June 30, 2014 (unaudited)
| Franklin Mutual Shares VIP Fund |
||||
| Class 1: | ||||
| Net assets, at value |
$ | 644,294,501 | ||
|
|
|
|||
| Shares outstanding |
27,169,570 | |||
|
|
|
|||
| Net asset value and maximum offering price per share |
$ | 23.71 | ||
|
|
|
|||
| Class 2: | ||||
| Net assets, at value |
$ | 4,587,476,501 | ||
|
|
|
|||
| Shares outstanding |
196,269,945 | |||
|
|
|
|||
| Net asset value and maximum offering price per share |
$ | 23.37 | ||
|
|
|
|||
| Class 4: | ||||
| Net assets, at value |
$ | 183,991,109 | ||
|
|
|
|||
| Shares outstanding |
7,838,291 | |||
|
|
|
|||
| Net asset value and maximum offering price per share |
$ | 23.47 | ||
|
|
|
|||
| The accompanying notes are an integral part of these financial statements. | Semiannual Report | MS-21 |
FRANKLIN TEMPLETON VARIABLE INSURANCE PRODUCTS TRUST
FINANCIAL STATEMENTS
Statement of Operations
for the six months ended June 30, 2014 (unaudited)
| Franklin Mutual Shares VIP Fund |
||||
| Investment income: | ||||
| Dividends |
$ | 111,530,278 | ||
| Interest |
16,663,268 | |||
| Income from securities loaned |
13,790 | |||
|
|
|
|||
| Total investment income |
128,207,336 | |||
|
|
|
|||
| Expenses: | ||||
| Management fees (Note 3a) |
16,411,148 | |||
| Administrative fees (Note 3b) |
1,475,520 | |||
| Distribution fees: (Note 3c) |
||||
| Class 2 |
5,574,088 | |||
| Class 4 |
322,295 | |||
| Custodian fees (Note 4) |
72,696 | |||
| Reports to shareholders |
395,433 | |||
| Professional fees |
78,364 | |||
| Trustees’ fees and expenses |
9,852 | |||
| Dividends on securities sold short |
255,185 | |||
| Other |
44,047 | |||
|
|
|
|||
| Total expenses |
24,638,628 | |||
| Expense reductions (Note 4) |
(103 | ) | ||
|
|
|
|||
| Net expenses |
24,638,525 | |||
|
|
|
|||
| Net investment income |
103,568,811 | |||
|
|
|
|||
| Realized and unrealized gains (losses): | ||||
| Net realized gain (loss) from: |
||||
| Investments |
225,067,178 | |||
| Foreign currency transactions |
(26,682,349 | ) | ||
| Futures contracts |
(1,296,510 | ) | ||
| Securities sold short |
226,144 | |||
|
|
|
|||
| Net realized gain (loss) |
197,314,463 | |||
|
|
|
|||
| Net change in unrealized appreciation (depreciation) on: |
||||
| Investments |
98,646,945 | |||
| Translation of other assets and liabilities denominated in foreign currencies |
11,798,892 | |||
|
|
|
|||
| Net change in unrealized appreciation (depreciation) |
110,445,837 | |||
|
|
|
|||
| Net realized and unrealized gain (loss) |
307,760,300 | |||
|
|
|
|||
| Net increase (decrease) in net assets resulting from operations |
$ | 411,329,111 | ||
|
|
|
|||
| MS-22 | Semiannual Report | The accompanying notes are an integral part of these financial statements. |
FRANKLIN TEMPLETON VARIABLE INSURANCE PRODUCTS TRUST
FINANCIAL STATEMENTS
Statements of Changes in Net Assets
| Franklin Mutual Shares VIP Fund | ||||||||
| Six Months Ended June 30, 2014 (unaudited) |
Year Ended December 31, 2013 |
|||||||
| Increase (decrease) in net assets: | ||||||||
| Operations: |
||||||||
| Net investment income |
$ | 103,568,811 | $ | 93,933,333 | ||||
| Net realized gain (loss) from investments, written options, foreign currency transactions, futures contracts and securities sold short |
197,314,463 | 369,009,836 | ||||||
| Net change in unrealized appreciation (depreciation) on investments and translation of other assets and liabilities denominated in foreign currencies |
110,445,837 | 786,825,157 | ||||||
|
|
|
|||||||
| Net increase (decrease) in net assets resulting from operations |
411,329,111 | 1,249,768,326 | ||||||
|
|
|
|||||||
| Distributions to shareholders from: |
||||||||
| Net investment income: |
||||||||
| Class 1 |
— | (11,380,461 | ) | |||||
| Class 2 |
— | (90,294,700 | ) | |||||
| Class 4 |
— | (3,535,676 | ) | |||||
|
|
|
|||||||
| Total distributions to shareholders |
— | (105,210,837 | ) | |||||
|
|
|
|||||||
| Capital share transactions: (Note 2) |
||||||||
| Class 1 |
44,486,222 | (9,960,888 | ) | |||||
| Class 2 |
(320,351,870 | ) | (502,396,967 | ) | ||||
| Class 4 |
(18,564,034 | ) | (17,497,568 | ) | ||||
|
|
|
|||||||
| Total capital share transactions |
(294,429,682 | ) | (529,855,423 | ) | ||||
|
|
|
|||||||
| Net increase (decrease) in net assets |
116,899,429 | 614,702,066 | ||||||
| Net assets: | ||||||||
| Beginning of period |
5,298,862,682 | 4,684,160,616 | ||||||
|
|
|
|||||||
| End of period |
$ | 5,415,762,111 | $ | 5,298,862,682 | ||||
|
|
|
|||||||
| Undistributed net investment income included in net assets: | ||||||||
| End of period |
$ | 194,669,467 | $ | 91,100,656 | ||||
|
|
|
|||||||
| The accompanying notes are an integral part of these financial statements. | Semiannual Report | MS-23 |
FRANKLIN TEMPLETON VARIABLE INSURANCE PRODUCTS TRUST
Notes to Financial Statements (unaudited)
Franklin Mutual Shares VIP Fund
| MS-24 | Semiannual Report |
FRANKLIN TEMPLETON VARIABLE INSURANCE PRODUCTS TRUST
NOTES TO FINANCIAL STATEMENTS (UNAUDITED)
Franklin Mutual Shares VIP Fund (continued)
| Semiannual Report | MS-25 |
FRANKLIN TEMPLETON VARIABLE INSURANCE PRODUCTS TRUST
NOTES TO FINANCIAL STATEMENTS (UNAUDITED)
Franklin Mutual Shares VIP Fund (continued)
1. Organization and Significant Accounting Policies (continued)
c. Derivative Financial Instruments (continued)
Realized gain and loss and unrealized appreciation and depreciation on these contracts for the period are included in the Statement of Operations.
Derivative counterparty credit risk is managed through a formal evaluation of the creditworthiness of all potential counterparties. The Fund attempts to reduce its exposure to counterparty credit risk on OTC derivatives, whenever possible, by entering into International Swaps and Derivatives Association (ISDA) master agreements with certain counterparties. These agreements contain various provisions, including but not limited to collateral requirements, events of default, or early termination. Termination events applicable to the counterparty include certain deteriorations in the credit quality of the counterparty. Termination events applicable to the Fund include failure of the Fund to maintain certain net asset levels and/or limit the decline in net assets over various periods of time. In the event of default or early termination, the ISDA master agreement gives the non-defaulting party the right to net and close-out all transactions traded, whether or not arising under the ISDA agreement, to one net amount payable by one counterparty to the other. However, absent an event of default or early termination, OTC derivative assets and liabilities are presented gross and not offset in the Statement of Assets and Liabilities. Early termination by the counterparty may result in an immediate payment by the Fund of any net liability owed to that counterparty under the ISDA agreement. At June 30, 2014, the Fund had OTC derivatives in a net liability position of $12,358,485 and the aggregate value of collateral pledged for such contracts was $9,677,237.
Collateral requirements differ by type of derivative. Collateral or initial margin requirements are set by the broker or exchange clearing house for exchange traded and centrally cleared derivatives. Initial margin deposited is held at the exchange and can be in the form of cash and/or securities. For OTC derivatives traded under an ISDA master agreement, posting of collateral is required by either the fund or the applicable counterparty if the total net exposure of all OTC derivatives with the applicable counterparty exceeds the minimum transfer amount, which typically ranges from $100,000 to $250,000, and can vary depending on the counterparty and the type of the agreement. Generally, collateral is determined at the close of fund business each day and any additional collateral required
due to changes in derivative values may be delivered by the fund or the counterparty within a few business days. Collateral pledged and/or received by the fund for OTC derivatives, if any, is held in segregated accounts with the fund’s custodian/counterparty broker and can be in the form of cash and/or securities. Unrestricted cash may be invested according to the Fund’s investment objectives.
The Fund entered into exchange traded futures contracts primarily to manage exposure to certain foreign currencies. A futures contract is an agreement between the Fund and a counterparty to buy or sell an asset for a specified price on a future date. Required initial margins are pledged by the Fund, and the daily change in fair value is accounted for as a variation margin payable or receivable on the Statement of Assets and Liabilities.
The Fund entered into OTC forward exchange contracts primarily to manage exposure to certain foreign currencies. A forward exchange contract is an agreement between the Fund and a counterparty to buy or sell a foreign currency at a specific exchange rate on a future date.
The Fund purchased or wrote exchange traded option contracts primarily to manage exposure to equity price risk. An option is a contract entitling the holder to purchase or sell a specific amount of shares or units of an asset or notional amount of a swap (swaption), at a specified price. Options purchased are recorded as an asset while options written are recorded as a liability. Upon exercise of an option, the acquisition cost or sales proceeds of the underlying investment is adjusted by any premium received or paid. Upon expiration of an option, any premium received or paid is recorded as a realized gain or loss. Upon closing an option other than through expiration or exercise, the difference between the premium and the cost to close the position is recorded as a realized gain or loss.
See Note 9 regarding other derivative information.
d. Securities Sold Short
The Fund is engaged in selling securities short, which obligates the Fund to replace a borrowed security with the same security at current fair value. The Fund incurs a loss if the price of the security increases between the date of the short sale and the date on which the Fund replaces the borrowed security. The Fund realizes a gain if the price of the security declines between those dates. Gains are limited to the price at which the Fund sold the security short, while losses are potentially unlimited in size.
| MS-26 | Semiannual Report |
FRANKLIN TEMPLETON VARIABLE INSURANCE PRODUCTS TRUST
NOTES TO FINANCIAL STATEMENTS (UNAUDITED)
Franklin Mutual Shares VIP Fund (continued)
| Semiannual Report | MS-27 |
FRANKLIN TEMPLETON VARIABLE INSURANCE PRODUCTS TRUST
NOTES TO FINANCIAL STATEMENTS (UNAUDITED)
Franklin Mutual Shares VIP Fund (continued)
1. Organization and Significant Accounting Policies (continued)
h. Security Transactions, Investment Income, Expenses and Distributions (continued)
Common expenses incurred by the Trust are allocated among the funds based on the ratio of net assets of each fund to the combined net assets of the Trust. Fund specific expenses are charged directly to the fund that incurred the expense.
Realized and unrealized gains and losses and net investment income, not including class specific expenses, are allocated daily to each class of shares based upon the relative proportion of net assets of each class. Differences in per share distributions, by class, are generally due to differences in class specific expenses.
i. Accounting Estimates
The preparation of financial statements in accordance with U.S. GAAP requires management to make estimates and assumptions
that affect the reported amounts of assets and liabilities at the date of the financial statements and the amounts of income and expenses during the reporting period. Actual results could differ from those estimates.
j. Guarantees and Indemnifications
Under the Trust’s organizational documents, its officers and trustees are indemnified by the Trust against certain liabilities arising out of the performance of their duties to the Trust. Additionally, in the normal course of business, the Trust, on behalf of the Fund, enters into contracts with service providers that contain general indemnification clauses. The Trust’s maximum exposure under these arrangements is unknown as this would involve future claims that may be made against the Trust that have not yet occurred. Currently, the Trust expects the risk of loss to be remote.
2. Shares of Beneficial Interest
At June 30, 2014, there were an unlimited number of shares authorized (without par value). Transactions in the Fund’s shares were as follows:
| Six Months Ended June 30, 2014 |
Year Ended December 31, 2013 |
|||||||||||||||||
| Shares | Amount | Shares | Amount | |||||||||||||||
| Class 1 Shares: | ||||||||||||||||||
| Shares sold |
2,656,114 | $ | 59,761,419 | 1,271,063 | $ | 25,943,160 | ||||||||||||
| Shares issued in reinvestment of distributions |
— | — | 565,348 | 11,380,461 | ||||||||||||||
| Shares redeemed |
(676,467 | ) | (15,275,197 | ) | (2,402,608 | ) | (47,284,509 | ) | ||||||||||
|
|
|
|||||||||||||||||
| Net increase (decrease) |
1,979,647 | $ | 44,486,222 | (566,197 | ) | $ | (9,960,888 | ) | ||||||||||
|
|
|
|||||||||||||||||
| Class 2 Shares: | ||||||||||||||||||
| Shares sold |
1,841,049 | $ | 40,446,500 | 9,115,759 | $ | 176,951,746 | ||||||||||||
| Shares issued in reinvestment of distributions |
— | — | 4,541,987 | 90,294,700 | ||||||||||||||
| Shares redeemed |
(16,302,299 | ) | (360,798,370 | ) | (39,198,203 | ) | (769,643,413 | ) | ||||||||||
|
|
|
|||||||||||||||||
| Net increase (decrease) |
(14,461,250 | ) | $ | (320,351,870 | ) | (25,540,457 | ) | $ | (502,396,967 | ) | ||||||||
|
|
|
|||||||||||||||||
| Class 4 Shares: | ||||||||||||||||||
| Shares sold |
112,314 | $ | 2,485,376 | 622,201 | $ | 12,228,440 | ||||||||||||
| Shares issued on reinvestment of distributions |
— | — | 176,961 | 3,535,676 | ||||||||||||||
| Shares redeemed |
(930,517 | ) | (21,049,410 | ) | (1,677,249 | ) | (33,261,684 | ) | ||||||||||
|
|
|
|||||||||||||||||
| Net increase (decrease) |
(818,203 | ) | $ | (18,564,034 | ) | (878,087 | ) | $ | (17,497,568 | ) | ||||||||
|
|
|
|||||||||||||||||
| MS-28 | Semiannual Report |
FRANKLIN TEMPLETON VARIABLE INSURANCE PRODUCTS TRUST
NOTES TO FINANCIAL STATEMENTS (UNAUDITED)
Franklin Mutual Shares VIP Fund (continued)
3. Transactions With Affiliates
Franklin Resources, Inc. is the holding company for various subsidiaries that together are referred to as Franklin Templeton Investments. Certain officers and trustees of the Fund are also officers and/or directors of the following subsidiaries:
| Subsidiary | Affiliation | |
| Franklin Mutual Advisers, LLC (Franklin Mutual) | Investment manager | |
| Franklin Templeton Services, LLC (FT Services) | Administrative manager | |
| Franklin Templeton Distributors, Inc. (Distributors) | Principal underwriter | |
| Franklin Templeton Investor Services, LLC (Investor Services) | Transfer agent |
a. Management Fees
The Fund pays an investment management fee to Franklin Mutual based on the average daily net assets of the Fund as follows:
| Annualized Fee Rate | Net Assets | |
| 0.750% | Up to and including $200 million | |
| 0.735% | Over $200 million, up to and including $700 million | |
| 0.700% | Over $700 million, up to and including $1.2 billion | |
| 0.675% | Over $1.2 billion, up to and including $5 billion | |
| 0.645% | Over $5 billion, up to and including $10 billion | |
| 0.625% | Over $10 billion, up to and including $15 billion | |
| 0.605% | Over $15 billion, up to and including $20 billion | |
| 0.585% | In excess of $20 billion |
Effective May 1, 2014, the Fund combined its investment management and administration agreements as approved by the Board. The fees paid under the combined agreement do not exceed the aggregate fees that were paid under the separate agreements.
Prior to May 1, 2014, the Fund paid fees to Franklin Mutual based on the average daily net assets of the Fund as follows:
| Annualized Fee Rate | Net Assets | |
| 0.600% | Up to and including $5 billion | |
| 0.570% | Over $5 billion, up to and including $10 billion | |
| 0.550% | Over $10 billion, up to and including $15 billion | |
| 0.530% | Over $15 billion, up to and including $20 billion | |
| 0.510% | In excess of $20 billion |
b. Administrative Fees
Effective May 1, 2014, under an agreement with Franklin Mutual, FT Services provides administrative services to the Fund. The fee is paid by Franklin Mutual based on the Fund’s average daily net assets, and is not an additional expense of the Fund.
Prior to May 1, 2014, the Fund paid fees to FT Services based on the average daily net assets of the Fund as follows:
| Annualized Fee Rate | Net Assets | |
| 0.150% | Up to and including $200 million | |
| 0.135% | Over $200 million, up to and including $700 million | |
| 0.100% | Over $700 million, up to and including $1.2 billion | |
| 0.075% | In excess of $1.2 billion |
| Semiannual Report | MS-29 |
FRANKLIN TEMPLETON VARIABLE INSURANCE PRODUCTS TRUST
NOTES TO FINANCIAL STATEMENTS (UNAUDITED)
Franklin Mutual Shares VIP Fund (continued)
3. Transactions With Affiliates (continued)
c. Distribution Fees
The Board has adopted distribution plans for Class 2 and Class 4 shares pursuant to Rule 12b-1 under the 1940 Act. Under the Fund’s compensation distribution plans, the Fund pays Distributors for costs incurred in connection with the servicing, sale and distribution of the Fund’s shares up to 0.35% per year of its average daily net assets. Some distribution fees are not charged on shares held by affiliates. The Board has agreed to limit the current rate to 0.25% per year for Class 2. The plan year, for purposes of monitoring compliance with the maximum annual plan rates, is February 1 through January 31.
d. Transfer Agent Fees
Investor Services, under terms of an agreement, performs shareholder servicing for the Fund and is not paid by the Fund for the services.
e. Other Affiliated Transactions
At June 30, 2014, Franklin Templeton Variable Insurance Products Trust – Franklin Founding Funds Allocation VIP Fund owned 8.19% of the Fund’s outstanding shares.
4. Expense Offset Arrangement
The Fund has entered into an arrangement with its custodian whereby credits realized as a result of uninvested cash balances are used to reduce a portion of the Fund’s custodian expenses. During the period ended June 30, 2014, the custodian fees were reduced as noted in the Statement of Operations.
5. Income Taxes
At June 30, 2014, the cost of investments and net unrealized appreciation (depreciation) for income tax purposes were as follows:
| Cost of investments |
$4,016,321,905 | |
|
| ||
| Unrealized appreciation |
$1,510,093,857 | |
| Unrealized depreciation |
(118,718,388) | |
|
| ||
| Net unrealized appreciation (depreciation) |
$1,391,375,469 | |
|
| ||
Differences between income and/or capital gains as determined on a book basis and a tax basis are primarily due to differing treatments of foreign currency transactions, bond discounts and premiums, and wash sales.
6. Investment Transactions
Purchases and sales of investments (excluding short term securities and securities sold short) for the period ended June 30, 2014, aggregated $573,601,822 and $817,139,691, respectively.
7. Credit Risk and Defaulted Securities
The Fund may purchase the pre-default or defaulted debt of distressed companies. Distressed companies are financially troubled and are about to be or are already involved in financial restructuring or bankruptcy. Risks associated with purchasing these securities include the possibility that the bankruptcy or other restructuring process takes longer than expected, or that distributions in restructuring are less than anticipated, either or both of which may result in unfavorable consequences to the Fund. If it becomes probable that the income on debt securities, including those of distressed companies, will not be collected, the Fund discontinues accruing income and recognizes an adjustment for uncollectible interest.
| MS-30 | Semiannual Report |
FRANKLIN TEMPLETON VARIABLE INSURANCE PRODUCTS TRUST
NOTES TO FINANCIAL STATEMENTS (UNAUDITED)
Franklin Mutual Shares VIP Fund (continued)
At June 30, 2014, the aggregate value of distressed company securities for which interest recognition has been discontinued was $36,065,090, representing 0.67% of the Fund’s net assets. For information as to specific securities, see the accompanying Statement of Investments.
8. Restricted Securities
The Fund invests in securities that are restricted under the Securities Act of 1933 (1933 Act) or which are subject to legal, contractual, or other agreed upon restrictions on resale. Restricted securities are often purchased in private placement transactions, and cannot be sold without prior registration unless the sale is pursuant to an exemption under the 1933 Act. Disposal of these securities may require greater effort and expense, and prompt sale at an acceptable price may be difficult. The Fund may have registration rights for restricted securities. The issuer generally incurs all registration costs.
At June 30, 2014, the Fund held investments in restricted securities, excluding certain securities exempt from registration under the 1933 Act deemed to be liquid, as follows:
| Principal Amount/ Shares |
Issuer | Acquisition Dates |
Cost | Value | ||||||||||||
| 1,754 | Broadband Ventures III LLC, secured promissory note, 5.00%, 2/01/12 |
7/01/10 - 11/30/12 | $ | 1,754 | $ | — | ||||||||||
| 6,400,507 | CB FIM Coinvestors LLC |
1/15/09 - 6/02/09 | — | — | ||||||||||||
| 8,006,950 | FIM Coinvestor Holdings I, LLC |
11/20/06 - 6/02/09 | — | — | ||||||||||||
| 1,730,515 | International Automotive Components Group Brazil LLC |
4/13/06 - 12/26/08 | 1,149,241 | 275,965 | ||||||||||||
| 15,382,424 | International Automotive Components Group North America, LLC |
1/12/06 - 3/18/13 | 12,591,586 | 14,194,593 | ||||||||||||
| 16,280 | Olympus Re Holdings Ltd. |
12/19/01 | 1,525,128 | — | ||||||||||||
|
|
|
|||||||||||||||
| Total Restricted Securities (Value is 0.27% of Net Assets) |
$ | 15,267,709 | $ | 14,470,558 | ||||||||||||
|
|
|
|||||||||||||||
9. Other Derivative Information
At June 30, 2014, the Fund’s investments in derivative contracts are reflected on the Statement of Assets and Liabilities as follows:
| Asset Derivatives | Liability Derivatives | |||||||||
| Derivative Contracts Not Accounted for as Hedging Instruments |
Statement of Assets and Liabilities Location |
Fair Value Amount |
Statement of Assets and Liabilities Location |
Fair Value Amount |
||||||
| Foreign exchange contracts |
Unrealized appreciation on forward exchange contracts | $1,602,826 | Unrealized depreciation on forward exchange contracts / Net assets consist of – net unrealized appreciation (depreciation) | $ | 18,030,054 | a | ||||
aIncludes cumulative appreciation (depreciation) of futures contracts as reported in the Statement of Investments. Only current day’s variation margin is separately reported within the Statement of Assets and Liabilities.
For the period ended June 30, 2014, the effect of derivative contracts on the Fund’s Statement of Operations was as follows:
| Derivative Contracts Not Accounted for as Hedging Instruments |
Statement of Operations Locations | Realized Gain (Loss) for the Period |
Change in Unrealized Appreciation (Depreciation) for the Period |
|||||||
| Foreign exchange contracts |
Net realized gain (loss) from foreign currency transactions and futures contracts / Net change in unrealized appreciation (depreciation) on translation of other assets and liabilities denominated in foreign currencies | $ | (28,314,448 | ) | $ | 11,779,806 | ||||
| Semiannual Report | MS-31 |
FRANKLIN TEMPLETON VARIABLE INSURANCE PRODUCTS TRUST
NOTES TO FINANCIAL STATEMENTS (UNAUDITED)
Franklin Mutual Shares VIP Fund (continued)
9. Other Derivative Information (continued)
For the period ended June 30, 2014, the average month end fair value of derivatives represented 0.26% of average month end net assets. The average month end number of open derivative contracts for the period was 210.
See Note 1(c) regarding derivative financial instruments.
10. Holdings of 5% Voting Securities of Portfolio Companies
The 1940 Act defines “affiliated companies” to include investments in portfolio companies in which a fund owns 5% or more of the outstanding voting securities. Investments in “affiliated companies” for the Fund for the period ended June 30, 2014, were as shown below.
| Name of Issuer | Number of Shares Held at Beginning of Period |
Gross Additions |
Gross Reductions |
Number of Shares Held at End of Period |
Value at End of Period |
Investment Income |
Realized Capital Gain (Loss) |
|||||||||||||||||||||
| Non-Controlled Affiliates | ||||||||||||||||||||||||||||
| CB FIM Coinvestors LLC |
6,400,507 | — | — | 6,400,507 | $ | — | $ | — | $ | — | ||||||||||||||||||
|
|
|
|||||||||||||||||||||||||||
11. Credit Facility
The Fund, together with other U.S. registered and foreign investment funds (collectively, Borrowers), managed by Franklin Templeton Investments, are borrowers in a joint syndicated senior unsecured credit facility totaling $1.5 billion (Global Credit Facility) which matures on February 13, 2015. This Global Credit Facility provides a source of funds to the Borrowers for temporary and emergency purposes, including the ability to meet future unanticipated or unusually large redemption requests.
Under the terms of the Global Credit Facility, the Fund shall, in addition to interest charged on any borrowings made by the Fund and other costs incurred by the Fund, pay its share of fees and expenses incurred in connection with the implementation and maintenance of the Global Credit Facility, based upon its relative share of the aggregate net assets of all of the Borrowers, including an annual commitment fee of 0.07% based upon the unused portion of the Global Credit Facility. These fees are reflected in other expenses on the Statement of Operations. During the period ended June 30, 2014, the Fund did not use the Global Credit Facility.
12. Fair Value Measurements
The Fund follows a fair value hierarchy that distinguishes between market data obtained from independent sources (observable inputs) and the Fund’s own market assumptions (unobservable inputs). These inputs are used in determining the value of the Fund’s financial instruments and are summarized in the following fair value hierarchy:
| • | Level 1 – quoted prices in active markets for identical financial instruments |
| • | Level 2 – other significant observable inputs (including quoted prices for similar financial instruments, interest rates, prepayment speed, credit risk, etc.) |
| • | Level 3 – significant unobservable inputs (including the Fund’s own assumptions in determining the fair value of financial instruments) |
The input levels are not necessarily an indication of the risk or liquidity associated with financial instruments at that level.
For movements between the levels within the fair value hierarchy, the Fund has adopted a policy of recognizing the transfers as of the date of the underlying event which caused the movement.
| MS-32 | Semiannual Report |
FRANKLIN TEMPLETON VARIABLE INSURANCE PRODUCTS TRUST
NOTES TO FINANCIAL STATEMENTS (UNAUDITED)
Franklin Mutual Shares VIP Fund (continued)
A summary of inputs used as of June 30, 2014, in valuing the Fund’s assets and liabilities carried at fair value, is as follows:
| Level 1 | Level 2 | Level 3 | Total | |||||||||||||
| Assets: | ||||||||||||||||
| Investments in Securities |
||||||||||||||||
| Equity Investments:a |
||||||||||||||||
| Auto Components |
$ | — | $ | — | $ | 14,470,558 | $ | 14,470,558 | ||||||||
| Banks |
379,090,088 | — | 8,393,291 | 387,483,379 | ||||||||||||
| Machinery |
62,642,454 | 18,947,853 | — | 81,590,307 | ||||||||||||
| Real Estate Management & Development |
3,534,685 | — | 11,679,350 | 15,214,035 | ||||||||||||
| Other Equity Investmentsb |
4,186,977,001 | — | — | c | 4,186,977,001 | |||||||||||
| Corporate Bonds, Notes and Senior Floating Rate Interests |
— | 263,321,104 | — | 263,321,104 | ||||||||||||
| Corporate Notes and Senior Floating Rate Interests in Reorganization |
— | 111,278,366 | — | c | 111,278,366 | |||||||||||
| Companies in Liquidation |
292,834 | 66,110,439 | — | c | 66,403,273 | |||||||||||
| Municipal Bonds |
— | 13,838,686 | — | 13,838,686 | ||||||||||||
| Short Term Investments |
254,074,467 | 13,046,198 | — | 267,120,665 | ||||||||||||
|
|
|
|||||||||||||||
| Total Investments in Securities |
$ | 4,886,611,529 | $ | 486,542,646 | $ | 34,543,199 | $ | 5,407,697,374 | ||||||||
|
|
|
|||||||||||||||
| Other Financial Instruments |
||||||||||||||||
| Forward Exchange Contracts |
$ | — | $ | 1,602,826 | $ | — | $ | 1,602,826 | ||||||||
|
|
|
|||||||||||||||
| Liabilities: | ||||||||||||||||
| Other Financial Instruments |
||||||||||||||||
| Securities Sold Short |
$ | 29,487,482 | $ | — | $ | — | $ | 29,487,482 | ||||||||
| Futures Contracts |
2,967,964 | 2,967,964 | ||||||||||||||
| Forward Exchange Contracts |
— | 15,062,090 | — | 15,062,090 | ||||||||||||
|
|
|
|||||||||||||||
| Total Other Financial Instruments |
$ | 32,455,446 | $ | 15,062,090 | $ | — | $ | 47,517,536 | ||||||||
|
|
|
|||||||||||||||
aIncludes common and preferred stocks as well as other equity investments.
bFor detailed categories, see the accompanying Statement of Investments.
cIncludes securities determined to have no value at June 30, 2014.
A reconciliation of assets in which Level 3 inputs are used in determining fair value is presented when there are significant Level 3 financial instruments at the end of the period.
13. New Accounting Pronouncements
In June 2014, the Financial Accounting Standards Board issued Accounting Standards Update (ASU) No. 2014-11, Transfers and Servicing (Topic 860), Repurchase-to-Maturity Transactions, Repurchase Financings, and Disclosures. The ASU changes the accounting for certain repurchase agreements and expands disclosure requirements related to repurchase agreements, securities lending, repurchase-to-maturity and similar transactions. The ASU is effective for interim and annual reporting periods beginning after December 15, 2014. Management is currently evaluating the impact, if any, of applying the provision.
| Semiannual Report | MS-33 |
FRANKLIN TEMPLETON VARIABLE INSURANCE PRODUCTS TRUST
NOTES TO FINANCIAL STATEMENTS (UNAUDITED)
Franklin Mutual Shares VIP Fund (continued)
14. Subsequent Events
The Fund has evaluated subsequent events through the issuance of the financial statements and determined that no events have occurred that require disclosure.
Abbreviations
| Counterparty | Currency | Selected Portfolio | ||||||||
| BOFA | Bank of America Corp. | CAD | Canadian Dollar | ADR | American Depositary Receipt | |||||
| BONY | Bank of New York Mellon | CHF | Swiss Franc | FHLB | Federal Home Loan Bank | |||||
| BZWS | Barclays Bank PLC | EUR | Euro | GO | General Obligation | |||||
| DBAB | Deutsche Bank AG | GBP | British Pound | IDR | International Depositary Receipt | |||||
| FBCO | Credit Suisse Group AG | JPY | Japanese Yen | PIK | Payment-In-Kind | |||||
| HSBC | HSBC Bank USA, N.A. | USD | United States Dollar | |||||||
| SCBT | Standard Chartered Bank | |||||||||
| SSBT | State Street Bank and Trust Co. | |||||||||
| MS-34 | Semiannual Report |
Franklin Rising Dividends VIP Fund
(Formerly, Franklin Rising Dividends Securities Fund)
This semiannual report for Franklin Rising Dividends VIP Fund covers the period ended June 30, 2014.
Class 2 Performance Summary as of June 30, 2014
Franklin Rising Dividends VIP Fund – Class 2 delivered a +4.23% total return* for the six-month period ended June 30, 2014.
*The Fund has a fee waiver associated with its investments in a Franklin Templeton money fund, contractually guaranteed through at least its current fiscal year-end. Fund investment results reflect the fee waiver, to the extent applicable; without this reduction, the results would have been lower.
Performance reflects the Fund’s Class 2 operating expenses, but does not include any contract fees, expenses or sales charges. If they had been included, performance would be lower. These charges and deductions, particularly for variable life policies, can have a significant effect on contract values and insurance benefits. See the contract prospectus for a complete description of these expenses, including sales charges.
Performance data represent past performance, which does not guarantee future results. Investment return and principal value will fluctuate, and you may have a gain or loss when you sell your shares. Current performance may differ from figures shown.
| Semiannual Report | FRD-1 |
FRANKLIN RISING DIVIDENDS VIP FUND
Fund Goal and Main Investments: Franklin Rising Dividends VIP Fund seeks long-term capital appreciation, with preservation of capital as an important consideration. Under normal market conditions, the Fund invests at least 80% of its net assets in equity securities of companies that have paid rising dividends.
Fund Risks: All investments involve risks, including possible loss of principal. Value securities may not increase in price as anticipated or may decline further in value. While smaller and midsized companies may offer substantial opportunities for capital growth, they also involve heightened risks and should be considered speculative. Historically, smaller- and midsized-company securities have been more volatile in price than larger company securities, especially over the short term. The Fund is actively managed but there is no guarantee that the manager’s investment decisions will produce the desired results. The Fund’s prospectus also includes a description of the main investment risks.
Performance Overview
You can find the Fund’s six-month total return in the Performance Summary. In comparison, the Standard & Poor’s® 500 Index (S&P 500®) rose 7.14% for the same period.1 Please note the Fund employs a bottom-up stock selection process, and the managers invest in securities without regard to benchmark comparisons.
Economic and Market Overview
The U.S. economy showed some signs of recovery during the six-month period ended June 30, 2014, despite a first-quarter contraction in gross domestic product. Manufacturing activity expanded, and the unemployment rate declined to 6.1% in June 2014 from 6.7% in December 2013.2 Except for a sharp increase in March, retail sales rose at a modest pace that missed consensus expectations. The housing market had some weather-related weakness early in 2014, but home sales picked up in the spring and home prices were higher than a year ago.
The Federal Reserve Board (Fed) began reducing bond purchases by $10 billion a month in January 2014, based on earlier largely positive economic and employment data. Although economic data in early 2014 were soft, Fed Chair Janet Yellen
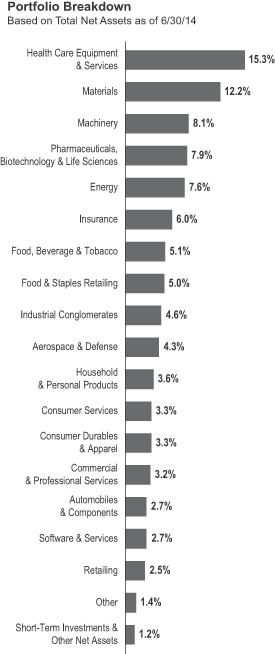
1. Source: © 2014 Morningstar. One cannot invest directly in an index, and an index is not representative of the Fund’s portfolio. Please see Index Descriptions following the Fund Summaries.
2. Source: Bureau of Labor Statistics.
| FRD-2 | Semiannual Report |
FRANKLIN RISING DIVIDENDS VIP FUND
3. Please see Index Descriptions following the Fund Summaries.
| Semiannual Report | FRD-3 |
FRANKLIN RISING DIVIDENDS VIP FUND
| FRD-4 | Semiannual Report |
FRANKLIN RISING DIVIDENDS VIP FUND
Class 2 Fund Expenses
| Class 2 | Beginning Account Value 1/1/14 |
Ending Account Value 6/30/14 |
Fund-Level Expenses 1/1/14–6/30/14 |
|||||||||
| Actual | $1,000 | $1,042.30 | $4.39 | |||||||||
| Hypothetical (5% return before expenses) | $1,000 | $1,020.48 | $4.34 | |||||||||
*Expenses are calculated using the most recent six-month annualized expense ratio, net of expense waivers, for the Fund’s Class 2 shares (0.87%), which does not include any ongoing expenses of the Contract for which the Fund is an investment option, multiplied by the average account value over the period, multiplied by 181/365 to reflect the one-half year period.
| Semiannual Report | FRD-5 |
FRANKLIN TEMPLETON VARIABLE INSURANCE PRODUCTS TRUST
Financial Highlights
Franklin Rising Dividends VIP Fund
|
Six Months Ended (unaudited) |
Year Ended December 31, | |||||||||||||||||||||||
| 2013 | 2012 | 2011 | 2010 | 2009 | ||||||||||||||||||||
| Class 1 | ||||||||||||||||||||||||
| Per share operating performance (for a share outstanding throughout the period) |
||||||||||||||||||||||||
| Net asset value, beginning of period |
$28.14 | $22.03 | $20.01 | $19.15 | $16.13 | $13.96 | ||||||||||||||||||
|
|
|
|||||||||||||||||||||||
| Income from investment operationsa: | ||||||||||||||||||||||||
| Net investment incomeb |
0.21 | 0.40 | 0.41 | 0.36 | 0.32 | 0.14 | c | |||||||||||||||||
| Net realized and unrealized gains (losses) |
1.00 | 6.16 | 2.00 | 0.83 | 3.01 | 2.28 | ||||||||||||||||||
|
|
|
|||||||||||||||||||||||
| Total from investment operations |
1.21 | 6.56 | 2.41 | 1.19 | 3.33 | 2.42 | ||||||||||||||||||
|
|
|
|||||||||||||||||||||||
| Less distributions from: | ||||||||||||||||||||||||
| Net investment income |
(0.44 | ) | (0.45 | ) | (0.39 | ) | (0.33 | ) | (0.31 | ) | (0.25 | ) | ||||||||||||
| Net realized gains |
(0.55 | ) | — | — | — | — | — | |||||||||||||||||
|
|
|
|||||||||||||||||||||||
| Total distributions |
(0.99 | ) | (0.45 | ) | (0.39 | ) | (0.33 | ) | (0.31 | ) | (0.25 | ) | ||||||||||||
|
|
|
|||||||||||||||||||||||
| Net asset value, end of period |
$28.36 | $28.14 | $22.03 | $20.01 | $19.15 | $16.13 | ||||||||||||||||||
|
|
|
|||||||||||||||||||||||
| Total returnd |
4.33% | 30.05% | 12.18% | 6.29% | 20.94% | 17.67% | ||||||||||||||||||
| Ratios to average net assetse | ||||||||||||||||||||||||
| Expenses |
0.62% | f | 0.61% | 0.63% | 0.63% | 0.64% | 0.65% | g | ||||||||||||||||
| Net investment income |
1.51% | 1.59% | 1.96% | 1.87% | 1.88% | 0.99% | c | |||||||||||||||||
| Supplemental data | ||||||||||||||||||||||||
| Net assets, end of period (000’s) |
$163,713 | $168,380 | $141,455 | $140,297 | $148,544 | $139,816 | ||||||||||||||||||
| Portfolio turnover rate |
0.06% | 0.07% | 11.19% | 12.76% | 8.97% | 16.99% | ||||||||||||||||||
aThe amount shown for a share outstanding throughout the period may not correlate with the Statement of Operations for the period due to the timing of sales and repurchases of the Fund shares in relation to income earned and/or fluctuating fair value of the investments of the Fund.
bBased on average daily shares outstanding.
cNet investment income per share includes approximately $(0.15) per share as a return of capital adjustment to a previously recorded special dividend received by the Fund. Excluding this non-recurring amount, the ratio of net investment income to average net assets would have been 2.07%.
dTotal return does not include fees, charges or expenses imposed by the variable annuity and life insurance contracts for which the Franklin Templeton Variable Insurance Products Trust serves as an underlying investment vehicle. Total return is not annualized for periods less than one year.
eRatios are annualized for periods less than one year.
fBenefit of waiver and payment by affiliate rounds to less than 0.01%.
gBenefit of expense reduction rounds to less than 0.01%.
| FRD-6 | Semiannual Report | The accompanying notes are an integral part of these financial statements. |
FRANKLIN TEMPLETON VARIABLE INSURANCE PRODUCTS TRUST
FINANCIAL HIGHLIGHTS
Franklin Rising Dividends VIP Fund (continued)
| Six Months Ended (unaudited) |
Year Ended December 31, | |||||||||||||||||||||||
| 2013 | 2012 | 2011 | 2010 | 2009 | ||||||||||||||||||||
| Class 2 | ||||||||||||||||||||||||
| Per share operating performance (for a share outstanding throughout the period) |
||||||||||||||||||||||||
| Net asset value, beginning of period |
$27.62 | $21.64 | $19.65 | $18.82 | $15.86 | $13.72 | ||||||||||||||||||
|
|
|
|||||||||||||||||||||||
| Income from investment operationsa: | ||||||||||||||||||||||||
| Net investment incomeb |
0.17 | 0.33 | 0.35 | 0.31 | 0.28 | 0.10 | c | |||||||||||||||||
| Net realized and unrealized gains (losses) |
0.99 | 6.04 | 1.98 | 0.81 | 2.95 | 2.24 | ||||||||||||||||||
|
|
|
|||||||||||||||||||||||
| Total from investment operations |
1.16 | 6.37 | 2.33 | 1.12 | 3.23 | 2.34 | ||||||||||||||||||
|
|
|
|||||||||||||||||||||||
| Less distributions from: | ||||||||||||||||||||||||
| Net investment income |
(0.37 | ) | (0.39 | ) | (0.34 | ) | (0.29 | ) | (0.27 | ) | (0.20 | ) | ||||||||||||
| Net realized gains |
(0.55 | ) | — | — | — | — | — | |||||||||||||||||
|
|
|
|||||||||||||||||||||||
| Total distributions |
(0.92 | ) | (0.39 | ) | (0.34 | ) | (0.29 | ) | (0.27 | ) | (0.20 | ) | ||||||||||||
|
|
|
|||||||||||||||||||||||
| Net asset value, end of period |
$27.86 | $27.62 | $21.64 | $19.65 | $18.82 | $15.86 | ||||||||||||||||||
|
|
|
|||||||||||||||||||||||
| Total returnd |
4.23% | 29.69% | 11.96% | 6.00% | 20.64% | 17.34% | ||||||||||||||||||
| Ratios to average net assetse | ||||||||||||||||||||||||
| Expenses |
0.87% | f | 0.86% | 0.88% | 0.88% | 0.89% | 0.90% | g | ||||||||||||||||
| Net investment income |
1.26% | 1.34% | 1.71% | 1.62% | 1.63% | 0.74% | c | |||||||||||||||||
| Supplemental data | ||||||||||||||||||||||||
| Net assets, end of period (000’s) |
$1,720,335 | $1,752,012 | $1,550,084 | $1,523,396 | $1,572,732 | $1,371,351 | ||||||||||||||||||
| Portfolio turnover rate |
0.06% | 0.07% | 11.19% | 12.76% | 8.97% | 16.99% | ||||||||||||||||||
aThe amount shown for a share outstanding throughout the period may not correlate with the Statement of Operations for the period due to the timing of sales and repurchases of the Fund shares in relation to income earned and/or fluctuating fair value of the investments of the Fund.
bBased on average daily shares outstanding.
cNet investment income per share includes approximately $(0.15) per share as a return of capital adjustment to a previously recorded special dividend received by the Fund. Excluding this non-recurring amount, the ratio of net investment income to average net assets would have been 1.82%.
dTotal return does not include fees, charges or expenses imposed by the variable annuity and life insurance contracts for which the Franklin Templeton Variable Insurance Products Trust serves as an underlying investment vehicle. Total return is not annualized for periods less than one year.
eRatios are annualized for periods less than one year.
fBenefit of waiver and payment by affiliate rounds to less than 0.01%.
gBenefit of expense reduction rounds to less than 0.01%.
| The accompanying notes are an integral part of these financial statements. | Semiannual Report | FRD-7 |
FRANKLIN TEMPLETON VARIABLE INSURANCE PRODUCTS TRUST
FINANCIAL HIGHLIGHTS
Franklin Rising Dividends VIP Fund (continued)
| Six Months Ended (unaudited) |
Year Ended December 31, | |||||||||||||||||||||||
| 2013 | 2012 | 2011 | 2010 | 2009 | ||||||||||||||||||||
| Class 4 | ||||||||||||||||||||||||
| Per share operating performance (for a share outstanding throughout the period) |
||||||||||||||||||||||||
| Net asset value, beginning of period |
$27.76 | $21.78 | $19.83 | $19.04 | $16.09 | $13.92 | ||||||||||||||||||
|
|
|
|||||||||||||||||||||||
| Income from investment operationsa: | ||||||||||||||||||||||||
| Net investment incomeb |
0.16 | 0.32 | 0.35 | 0.31 | 0.32 | 0.13 | c | |||||||||||||||||
| Net realized and unrealized gains (losses) |
0.99 | 6.07 | 1.96 | 0.80 | 2.94 | 2.24 | ||||||||||||||||||
|
|
|
|||||||||||||||||||||||
| Total from investment operations |
1.15 | 6.39 | 2.31 | 1.11 | 3.26 | 2.37 | ||||||||||||||||||
|
|
|
|||||||||||||||||||||||
| Less distributions from: | ||||||||||||||||||||||||
| Net investment income |
(0.37 | ) | (0.41 | ) | (0.36 | ) | (0.32 | ) | (0.31 | ) | (0.20 | ) | ||||||||||||
| Net realized gains |
(0.55 | ) | — | — | — | — | — | |||||||||||||||||
|
|
|
|||||||||||||||||||||||
| Total distributions |
(0.92 | ) | (0.41 | ) | (0.36 | ) | (0.32 | ) | (0.31 | ) | (0.20 | ) | ||||||||||||
|
|
|
|||||||||||||||||||||||
| Net asset value, end of period |
$27.99 | $27.76 | $21.78 | $19.83 | $19.04 | $16.09 | ||||||||||||||||||
|
|
|
|||||||||||||||||||||||
| Total returnd |
4.15% | 29.57% | 11.78% | 5.89% | 20.62% | 17.22% | ||||||||||||||||||
| Ratios to average net assetse | ||||||||||||||||||||||||
| Expenses |
0.97% | f | 0.96% | 0.98% | 0.98% | 0.99% | 1.00% | g | ||||||||||||||||
| Net investment income |
1.16% | 1.24% | 1.61% | 1.52% | 1.53% | 0.64% | c | |||||||||||||||||
| Supplemental data | ||||||||||||||||||||||||
| Net assets, end of period (000’s) |
$12,897 | $12,028 | $6,432 | $3,020 | $1,007 | $15 | ||||||||||||||||||
| Portfolio turnover rate |
0.06% | 0.07% | 11.19% | 12.76% | 8.97% | 16.99% | ||||||||||||||||||
aThe amount shown for a share outstanding throughout the period may not correlate with the Statement of Operations for the period due to the timing of sales and repurchases of the Fund shares in relation to income earned and/or fluctuating fair value of the investments of the Fund.
bBased on average daily shares outstanding.
cNet investment income per share includes approximately $(0.15) per share as a return of capital adjustment to a previously recorded special dividend received by the Fund. Excluding this non-recurring amount, the ratio of net investment income to average net assets would have been 1.72%.
dTotal return does not include fees, charges or expenses imposed by the variable annuity and life insurance contracts for which the Franklin Templeton Variable Insurance Products Trust serves as an underlying investment vehicle. Total return is not annualized for periods less than one year.
eRatios are annualized for periods less than one year.
fBenefit of waiver and payment by affiliate rounds to less than 0.01%.
gBenefit of expense reduction rounds to less than 0.01%.
| FRD-8 | Semiannual Report | The accompanying notes are an integral part of these financial statements. |
FRANKLIN TEMPLETON VARIABLE INSURANCE PRODUCTS TRUST
Statement of Investments, June 30, 2014 (unaudited)
| Franklin Rising Dividends VIP Fund | ||||||||||
| Shares | Value | |||||||||
| Common Stocks 98.8% |
||||||||||
| Aerospace & Defense 4.3% |
||||||||||
| General Dynamics Corp. |
38,000 | $ | 4,428,900 | |||||||
| Honeywell International Inc. |
2,500 | 232,375 | ||||||||
| United Technologies Corp. |
658,900 | 76,070,005 | ||||||||
|
|
|
|||||||||
| 80,731,280 | ||||||||||
|
|
|
|||||||||
| Automobiles & Components 2.7% |
||||||||||
| Johnson Controls Inc. |
1,040,500 | 51,952,165 | ||||||||
|
|
|
|||||||||
| Commercial & Professional Services 3.2% |
||||||||||
| ABM Industries Inc. |
919,288 | 24,802,390 | ||||||||
| Brady Corp., A |
733,579 | 21,912,005 | ||||||||
| Cintas Corp. |
225,700 | 14,340,978 | ||||||||
|
|
|
|||||||||
| 61,055,373 | ||||||||||
|
|
|
|||||||||
| Consumer Durables & Apparel 3.3% |
||||||||||
| Leggett & Platt Inc. |
471,800 | 16,173,304 | ||||||||
| NIKE Inc., B |
548,500 | 42,536,175 | ||||||||
| Superior Uniform Group Inc. |
227,967 | 3,695,345 | ||||||||
|
|
|
|||||||||
| 62,404,824 | ||||||||||
|
|
|
|||||||||
| Consumer Services 3.3% |
||||||||||
| Hillenbrand Inc. |
1,091,300 | 35,598,206 | ||||||||
| Matthews International Corp., A |
39,000 | 1,621,230 | ||||||||
| McDonald’s Corp. |
254,345 | 25,622,715 | ||||||||
|
|
|
|||||||||
| 62,842,151 | ||||||||||
|
|
|
|||||||||
| Diversified Financials 0.4% |
||||||||||
| State Street Corp. |
110,500 | 7,432,230 | ||||||||
|
|
|
|||||||||
| Energy 7.6% |
||||||||||
| Chevron Corp. |
597,700 | 78,029,735 | ||||||||
| Exxon Mobil Corp. |
330,500 | 33,274,740 | ||||||||
| Occidental Petroleum Corp. |
312,190 | 32,040,060 | ||||||||
| Schlumberger Ltd. |
2,000 | 235,900 | ||||||||
|
|
|
|||||||||
| 143,580,435 | ||||||||||
|
|
|
|||||||||
| Food & Staples Retailing 5.0% |
||||||||||
| CVS Caremark Corp. |
2,500 | 188,425 | ||||||||
| Wal-Mart Stores Inc. |
728,800 | 54,711,016 | ||||||||
| Walgreen Co. |
531,300 | 39,385,269 | ||||||||
|
|
|
|||||||||
| 94,284,710 | ||||||||||
|
|
|
|||||||||
| Food, Beverage & Tobacco 5.1% |
||||||||||
| Archer-Daniels-Midland Co. |
713,000 | 31,450,430 | ||||||||
| Bunge Ltd. |
5,000 | 378,200 | ||||||||
| McCormick & Co. Inc. |
441,000 | 31,571,190 | ||||||||
| PepsiCo Inc. |
363,900 | 32,510,826 | ||||||||
|
|
|
|||||||||
| 95,910,646 | ||||||||||
|
|
|
|||||||||
| Health Care Equipment & Services 15.3% |
||||||||||
| Abbott Laboratories |
681,800 | 27,885,620 | ||||||||
| Becton, Dickinson and Co. |
565,143 | 66,856,417 | ||||||||
| DENTSPLY International Inc. |
4,000 | 189,400 | ||||||||
| Hill-Rom Holdings Inc. |
22,279 | 924,801 | ||||||||
| Medtronic Inc. |
730,000 | 46,544,800 | ||||||||
| Stryker Corp. |
630,400 | 53,155,328 | ||||||||
| Semiannual Report | FRD-9 |
FRANKLIN TEMPLETON VARIABLE INSURANCE PRODUCTS TRUST
STATEMENT OF INVESTMENTS (UNAUDITED)
Franklin Rising Dividends VIP Fund (continued)
| Shares | Value | |||||||||
| Common Stocks (continued) |
||||||||||
| Health Care Equipment & Services (continued) |
||||||||||
| Teleflex Inc. |
471,753 | $ | 49,817,117 | |||||||
| West Pharmaceutical Services Inc. |
1,086,534 | 45,830,004 | ||||||||
|
|
|
|||||||||
| 291,203,487 | ||||||||||
|
|
|
|||||||||
| Household & Personal Products 3.6% |
||||||||||
| Colgate-Palmolive Co. |
191,000 | 13,022,380 | ||||||||
| The Procter & Gamble Co. |
707,600 | 55,610,284 | ||||||||
|
|
|
|||||||||
| 68,632,664 | ||||||||||
|
|
|
|||||||||
| Industrial Conglomerates 4.6% |
||||||||||
| Carlisle Cos. Inc. |
96,261 | 8,338,128 | ||||||||
| Roper Industries Inc. |
541,850 | 79,115,518 | ||||||||
|
|
|
|||||||||
| 87,453,646 | ||||||||||
|
|
|
|||||||||
| Insurance 6.0% |
||||||||||
| Aflac Inc. |
276,200 | 17,193,450 | ||||||||
| Arthur J. Gallagher & Co. |
744,000 | 34,670,400 | ||||||||
| The Chubb Corp. |
45,000 | 4,147,650 | ||||||||
| Erie Indemnity Co., A |
526,085 | 39,593,157 | ||||||||
| Mercury General Corp. |
18,148 | 853,682 | ||||||||
| Old Republic International Corp. |
678,708 | 11,225,830 | ||||||||
| RLI Corp. |
124,142 | 5,683,221 | ||||||||
|
|
|
|||||||||
| 113,367,390 | ||||||||||
|
|
|
|||||||||
| Machinery 8.1% |
||||||||||
| Donaldson Co. Inc. |
350,068 | 14,814,878 | ||||||||
| Dover Corp. |
865,000 | 78,671,750 | ||||||||
| Pentair PLC (United Kingdom) |
844,000 | 60,869,280 | ||||||||
|
|
|
|||||||||
| 154,355,908 | ||||||||||
|
|
|
|||||||||
| Materials 12.2% |
||||||||||
| Air Products and Chemicals Inc. |
451,800 | 58,110,516 | ||||||||
| Albemarle Corp. |
694,700 | 49,671,050 | ||||||||
| Bemis Co. Inc. |
323,300 | 13,145,378 | ||||||||
| Ecolab Inc. |
66,000 | 7,348,440 | ||||||||
| Nucor Corp. |
499,002 | 24,575,849 | ||||||||
| Praxair Inc. |
593,460 | 78,835,226 | ||||||||
|
|
|
|||||||||
| 231,686,459 | ||||||||||
|
|
|
|||||||||
| Media 0.4% |
||||||||||
| John Wiley & Sons Inc., A |
116,500 | 7,058,735 | ||||||||
|
|
|
|||||||||
| Pharmaceuticals, Biotechnology & Life Sciences 7.9% |
||||||||||
| AbbVie Inc. |
472,300 | 26,656,612 | ||||||||
| Johnson & Johnson |
726,100 | 75,964,582 | ||||||||
| Perrigo Co. PLC |
1,500 | 218,640 | ||||||||
| Pfizer Inc. |
1,570,100 | 46,600,568 | ||||||||
|
|
|
|||||||||
| 149,440,402 | ||||||||||
|
|
|
|||||||||
| Retailing 2.5% |
||||||||||
| Family Dollar Stores Inc. |
706,835 | 46,750,067 | ||||||||
| Ross Stores Inc. |
3,000 | 198,390 | ||||||||
| Target Corp. |
3,000 | 173,850 | ||||||||
|
|
|
|||||||||
| 47,122,307 | ||||||||||
|
|
|
|||||||||
| FRD-10 | Semiannual Report |
FRANKLIN TEMPLETON VARIABLE INSURANCE PRODUCTS TRUST
STATEMENT OF INVESTMENTS (UNAUDITED)
Franklin Rising Dividends VIP Fund (continued)
| Shares | Value | |||||||||
| Common Stocks (continued) |
||||||||||
| Semiconductors & Semiconductor Equipment 0.0%† |
||||||||||
| Texas Instruments Inc. |
4,500 | $ | 215,055 | |||||||
|
|
|
|||||||||
| Software & Services 2.7% |
||||||||||
| Accenture PLC, A |
2,500 | 202,100 | ||||||||
| International Business Machines Corp. |
280,200 | 50,791,854 | ||||||||
| Microsoft Corp. |
5,000 | 208,500 | ||||||||
|
|
|
|||||||||
| 51,202,454 | ||||||||||
|
|
|
|||||||||
| Technology Hardware & Equipment 0.6% |
||||||||||
| a | Knowles Corp. |
358,300 | 11,014,142 | |||||||
| QUALCOMM Inc. |
3,000 | 237,600 | ||||||||
|
|
|
|||||||||
| 11,251,742 | ||||||||||
|
|
|
|||||||||
| Trading Companies & Distributors 0.0%† |
||||||||||
| W.W. Grainger Inc. |
1,000 | 254,270 | ||||||||
|
|
|
|||||||||
| Transportation 0.0%† |
||||||||||
| United Parcel Service Inc., B |
2,000 | 205,320 | ||||||||
|
|
|
|||||||||
| Total Common Stocks (Cost $934,699,024) |
1,873,643,653 | |||||||||
|
|
|
|||||||||
| Short Term Investments (Cost $24,746,100) 1.3% |
||||||||||
| Money Market Funds 1.3% |
||||||||||
| a,b | Institutional Fiduciary Trust Money Market Portfolio |
24,746,100 | 24,746,100 | |||||||
|
|
|
|||||||||
| Total Investments (Cost $959,445,124) 100.1% |
1,898,389,753 | |||||||||
| Other Assets, less Liabilities (0.1)% |
(1,444,991 | ) | ||||||||
|
|
|
|||||||||
| Net Assets 100.0% |
$ | 1,896,944,762 | ||||||||
|
|
|
|||||||||
†Rounds to less than 0.1% of net assets.
aNon-income producing.
bSee Note 3(e) regarding investments in the Institutional Fiduciary Trust Money Market Portfolio.
| The accompanying notes are an integral part of these financial statements. | Semiannual Report | FRD-11 |
FRANKLIN TEMPLETON VARIABLE INSURANCE PRODUCTS TRUST
Financial Statements
Statement of Assets and Liabilities
June 30, 2014 (unaudited)
| Franklin Rising Dividends VIP Fund |
||||
| Assets: | ||||
| Investments in securities: |
||||
| Cost - Unaffiliated issuers |
$ | 934,699,024 | ||
| Cost - Sweep Money Fund (Note 3e) |
24,746,100 | |||
|
|
|
|||
| Total cost of investments |
$ | 959,445,124 | ||
|
|
|
|||
| Value - Unaffiliated issuers |
$ | 1,873,643,653 | ||
| Value - Sweep Money Fund (Note 3e) |
24,746,100 | |||
|
|
|
|||
| Total value of investments |
1,898,389,753 | |||
| Receivables: |
||||
| Investment securities sold |
1,689,332 | |||
| Capital shares sold |
494,498 | |||
| Dividends |
1,972,521 | |||
| Other assets |
849 | |||
|
|
|
|||
| Total assets |
1,902,546,953 | |||
|
|
|
|||
| Liabilities: | ||||
| Payables: |
||||
| Capital shares redeemed |
3,704,883 | |||
| Management fees |
932,340 | |||
| Distribution fees |
723,165 | |||
| Accrued expenses and other liabilities |
241,803 | |||
|
|
|
|||
| Total liabilities |
5,602,191 | |||
|
|
|
|||
| Net assets, at value |
$ | 1,896,944,762 | ||
|
|
|
|||
| Net assets consist of: | ||||
| Paid-in capital |
$ | 913,919,832 | ||
| Undistributed net investment income |
11,930,991 | |||
| Net unrealized appreciation (depreciation) |
938,944,629 | |||
| Accumulated net realized gain (loss) |
32,149,310 | |||
|
|
|
|||
| Net assets, at value |
$ | 1,896,944,762 | ||
|
|
|
|||
| FRD-12 | Semiannual Report | The accompanying notes are an integral part of these financial statements. |
FRANKLIN TEMPLETON VARIABLE INSURANCE PRODUCTS TRUST
FINANCIAL STATEMENTS
Statement of Assets and Liabilities (continued)
June 30, 2014 (unaudited)
| Franklin Rising Dividends VIP Fund |
||||
| Class 1: | ||||
| Net assets, at value |
$ | 163,713,031 | ||
|
|
|
|||
| Shares outstanding |
5,772,442 | |||
|
|
|
|||
| Net asset value and maximum offering price per share |
$ | 28.36 | ||
|
|
|
|||
| Class 2: | ||||
| Net assets, at value |
$ | 1,720,335,000 | ||
|
|
|
|||
| Shares outstanding |
61,759,139 | |||
|
|
|
|||
| Net asset value and maximum offering price per share |
$ | 27.86 | ||
|
|
|
|||
| Class 4: | ||||
| Net assets, at value |
$ | 12,896,731 | ||
|
|
|
|||
| Shares outstanding |
460,705 | |||
|
|
|
|||
| Net asset value and maximum offering price per share |
$ | 27.99 | ||
|
|
|
|||
| The accompanying notes are an integral part of these financial statements. | Semiannual Report | FRD-13 |
FRANKLIN TEMPLETON VARIABLE INSURANCE PRODUCTS TRUST
FINANCIAL STATEMENTS
Statement of Operations
for the six months ended June 30, 2014 (unaudited)
| Franklin Rising Dividends VIP Fund |
||||
| Investment income: | ||||
| Dividends |
$ | 19,812,718 | ||
|
|
|
|||
| Expenses: | ||||
| Management fees (Note 3a) |
5,590,885 | |||
| Distribution fees: (Note 3c) |
||||
| Class 2 |
2,112,027 | |||
| Class 4 |
21,458 | |||
| Custodian fees (Note 4) |
8,065 | |||
| Reports to shareholders |
103,154 | |||
| Professional fees |
29,398 | |||
| Trustees’ fees and expenses |
3,770 | |||
| Other |
15,821 | |||
|
|
|
|||
| Total expenses |
7,884,578 | |||
| Expenses waived/paid by affiliates (Note 3e) |
(8,417 | ) | ||
|
|
|
|||
| Net expenses |
7,876,161 | |||
|
|
|
|||
| Net investment income |
11,936,557 | |||
|
|
|
|||
| Realized and unrealized gains (losses): | ||||
| Net realized gain (loss) from investments |
33,737,525 | |||
| Net change in unrealized appreciation (depreciation) on investments |
31,373,978 | |||
|
|
|
|||
| Net realized and unrealized gain (loss) |
65,111,503 | |||
|
|
|
|||
| Net increase (decrease) in net assets resulting from operations |
$ | 77,048,060 | ||
|
|
|
|||
| FRD-14 | Semiannual Report | The accompanying notes are an integral part of these financial statements. |
FRANKLIN TEMPLETON VARIABLE INSURANCE PRODUCTS TRUST
FINANCIAL STATEMENTS
Statements of Changes in Net Assets
| Franklin Rising Dividends VIP Fund | ||||||||
| Six Months Ended June 30, 2014 (unaudited) |
Year Ended December 31, 2013 |
|||||||
| Increase (decrease) in net assets: | ||||||||
| Operations: |
||||||||
| Net investment income |
$ | 11,936,557 | $ | 25,051,212 | ||||
| Net realized gain (loss) from investments |
33,737,525 | 109,495,187 | ||||||
| Net change in unrealized appreciation (depreciation) on investments |
31,373,978 | 341,536,473 | ||||||
|
|
|
|||||||
| Net increase (decrease) in net assets resulting from operations |
77,048,060 | 476,082,872 | ||||||
|
|
|
|||||||
| Distributions to shareholders from: |
||||||||
| Net investment income: |
||||||||
| Class 1 |
(2,478,710 | ) | (2,772,388 | ) | ||||
| Class 2 |
(22,406,447 | ) | (26,490,890 | ) | ||||
| Class 4 |
(165,391 | ) | (163,605 | ) | ||||
| Net realized gains: |
||||||||
| Class 1 |
(3,072,165 | ) | — | |||||
| Class 2 |
(32,971,551 | ) | — | |||||
| Class 4 |
(247,432 | ) | — | |||||
|
|
|
|||||||
| Total distributions to shareholders |
(61,341,696 | ) | (29,426,883 | ) | ||||
|
|
|
|||||||
| Capital share transactions: (Note 2) |
||||||||
| Class 1 |
(5,961,538 | ) | (11,198,645 | ) | ||||
| Class 2 |
(45,965,433 | ) | (204,341,308 | ) | ||||
| Class 4 |
746,249 | 3,331,799 | ||||||
|
|
|
|||||||
| Total capital share transactions |
(51,180,722 | ) | (212,208,154 | ) | ||||
|
|
|
|||||||
| Net increase (decrease) in net assets |
(35,474,358 | ) | 234,447,835 | |||||
| Net assets: | ||||||||
| Beginning of period |
1,932,419,120 | 1,697,971,285 | ||||||
|
|
|
|||||||
| End of period |
$ | 1,896,944,762 | $ | 1,932,419,120 | ||||
|
|
|
|||||||
| Undistributed net investment income included in net assets: |
||||||||
| End of period |
$ | 11,930,991 | $ | 25,044,982 | ||||
|
|
|
|||||||
| The accompanying notes are an integral part of these financial statements. | Semiannual Report | FRD-15 |
FRANKLIN TEMPLETON VARIABLE INSURANCE PRODUCTS TRUST
Notes to Financial Statements (unaudited)
Franklin Rising Dividends VIP Fund
| FRD-16 | Semiannual Report |
FRANKLIN TEMPLETON VARIABLE INSURANCE PRODUCTS TRUST
NOTES TO FINANCIAL STATEMENTS (UNAUDITED)
2. Shares of Beneficial Interest
At June 30, 2014, there were an unlimited number of shares authorized (without par value). Transactions in the Fund’s shares were as follows:
| Six Months Ended June 30, 2014 |
Year Ended December 31, 2013 |
|||||||||||||||||
| Shares | Amount | Shares | Amount | |||||||||||||||
| Class 1 Shares: | ||||||||||||||||||
| Shares sold |
93,873 | $ | 2,592,211 | 425,367 | $ | 10,754,937 | ||||||||||||
| Shares issued in reinvestment of distributions |
197,681 | 5,550,875 | 111,610 | 2,772,388 | ||||||||||||||
| Shares redeemed |
(502,550 | ) | (14,104,624 | ) | (973,756 | ) | (24,725,970 | ) | ||||||||||
|
|
|
|||||||||||||||||
| Net increase (decrease) |
(210,996 | ) | $ | (5,961,538 | ) | (436,779 | ) | $ | (11,198,645 | ) | ||||||||
|
|
|
|||||||||||||||||
| Class 2 Shares: | ||||||||||||||||||
| Shares sold |
2,265,357 | $ | 62,334,563 | 6,187,499 | $ | 153,726,999 | ||||||||||||
| Shares issued in reinvestment of distributions |
2,007,904 | 55,377,998 | 1,085,247 | 26,490,890 | ||||||||||||||
| Shares redeemed |
(5,939,960 | ) | (163,677,994 | ) | (15,483,753 | ) | (384,559,197 | ) | ||||||||||
|
|
|
|||||||||||||||||
| Net increase (decrease) |
(1,666,699 | ) | $ | (45,965,433 | ) | (8,211,007 | ) | $ | (204,341,308 | ) | ||||||||
|
|
|
|||||||||||||||||
| Semiannual Report | FRD-17 |
Franklin Rising Dividends VIP Fund (continued)
FRANKLIN TEMPLETON VARIABLE INSURANCE PRODUCTS TRUST
NOTES TO FINANCIAL STATEMENTS (UNAUDITED)
Franklin Rising Dividends VIP Fund (continued)
2. Shares of Beneficial Interest (continued)
| Six Months Ended June 30, 2014 |
Year Ended December 31, 2013 |
|||||||||||||||||
| Shares | Amount | Shares | Amount | |||||||||||||||
| Class 4 Shares: | ||||||||||||||||||
| Shares sold |
46,868 | $ | 1,289,017 | 216,130 | $ | 5,332,125 | ||||||||||||
| Shares issued on reinvestment of distributions |
14,893 | 412,823 | 6,664 | 163,605 | ||||||||||||||
| Shares redeemed |
(34,285 | ) | (955,591 | ) | (84,878 | ) | (2,163,931 | ) | ||||||||||
|
|
|
|||||||||||||||||
| Net increase (decrease) |
27,476 | $ | 746,249 | 137,916 | $ | 3,331,799 | ||||||||||||
|
|
|
|||||||||||||||||
3. Transactions With Affiliates
Franklin Resources, Inc. is the holding company for various subsidiaries that together are referred to as Franklin Templeton Investments. Certain officers and trustees of the Fund are also officers and/or directors of the following subsidiaries:
| Subsidiary | Affiliation | |
| Franklin Advisory Services, LLC (Advisory Services) | Investment manager | |
| Franklin Templeton Services, LLC (FT Services) | Administrative manager | |
| Franklin Templeton Distributors, Inc. (Distributors) | Principal underwriter | |
| Franklin Templeton Investor Services, LLC (Investor Services) | Transfer agent |
a. Management Fees
The Fund pays an investment management fee to Advisory Services based on the average daily net assets of the Fund as follows:
| Annualized Fee Rate | Net Assets | |
| 0.750% | Up to and including $500 million | |
| 0.625% | Over $500 million, up to and including $1 billion | |
| 0.500% | In excess of $1 billion |
b. Administrative Fees
Under an agreement with Advisory Services, FT Services provides administrative services to the Fund. The fee is paid by Advisory Services based on the Fund’s average daily net assets, and is not an additional expense of the Fund.
c. Distribution Fees
The Board has adopted distribution plans for Class 2 and Class 4 shares pursuant to Rule 12b-1 under the 1940 Act. Under the Fund’s compensation distribution plans, the Fund pays Distributors for costs incurred in connection with the servicing, sale and distribution of the Fund’s shares up to 0.35% per year of its average daily net assets. Some distribution fees are not charged on shares held by affiliates. The Board has agreed to limit the current rate to 0.25% per year for Class 2. The plan year, for purposes of monitoring compliance with the maximum annual plan rates, is February 1 through January 31.
d. Transfer Agent Fees
Investor Services, under terms of an agreement, performs shareholder servicing for the Fund and is not paid by the Fund for the services.
| FRD-18 | Semiannual Report |
FRANKLIN TEMPLETON VARIABLE INSURANCE PRODUCTS TRUST
NOTES TO FINANCIAL STATEMENTS (UNAUDITED)
Franklin Rising Dividends VIP Fund (continued)
e. Investment in Institutional Fiduciary Trust Money Market Portfolio
The Fund invests in the Institutional Fiduciary Trust Money Market Portfolio (Sweep Money Fund), an affiliated open-end management investment company. Management fees paid by the Fund are waived on assets invested in the Sweep Money Fund, in an amount not to exceed the management and administrative fees paid directly or indirectly by the Sweep Money Fund, as noted on the Statement of Operations. Prior to January 1, 2014, the waiver was accounted for as a reduction to management fees.
4. Expense Offset Arrangement
The Fund has entered into an arrangement with its custodian whereby credits realized as a result of uninvested cash balances are used to reduce a portion of the Fund’s custodian expenses. During the period ended June 30, 2014, there were no credits earned.
5. Income Taxes
At June 30, 2014, the cost of investments and net unrealized appreciation (depreciation) for income tax purposes were as follows:
| Cost of investments |
$ | 961,031,794 | ||
|
|
|
|||
| Unrealized appreciation |
$ | 937,395,566 | ||
| Unrealized depreciation |
(37,607) | |||
|
|
|
|||
| Net unrealized appreciation (depreciation) |
$ | 937,357,959 | ||
|
|
|
|||
Differences between income and/or capital gains as determined on a book basis and a tax basis are primarily due to differing treatment of wash sales.
6. Investment Transactions
Purchases and sales of investments (excluding short term securities) for the period ended June 30, 2014, aggregated $1,143,295 and $93,437,788, respectively.
7. Credit Facility
The Fund, together with other U.S. registered and foreign investment funds (collectively, Borrowers), managed by Franklin Templeton Investments, are borrowers in a joint syndicated senior unsecured credit facility totaling $1.5 billion (Global Credit Facility) which matures on February 13, 2015. This Global Credit Facility provides a source of funds to the Borrowers for temporary and emergency purposes, including the ability to meet future unanticipated or unusually large redemption requests.
Under the terms of the Global Credit Facility, the Fund shall, in addition to interest charged on any borrowings made by the Fund and other costs incurred by the Fund, pay its share of fees and expenses incurred in connection with the implementation and maintenance of the Global Credit Facility, based upon its relative share of the aggregate net assets of all of the Borrowers, including an annual commitment fee of 0.07% based upon the unused portion of the Global Credit Facility. These fees are reflected in other expenses on the Statement of Operations. During the period ended June 30, 2014, the Fund did not use the Global Credit Facility
8. Fair Value Measurements
The Fund follows a fair value hierarchy that distinguishes between market data obtained from independent sources (observable inputs) and the Fund’s own market assumptions (unobservable inputs). These inputs are used in determining the value of the Fund’s financial instruments and are summarized in the following fair value hierarchy:
| • | Level 1 – quoted prices in active markets for identical financial instruments |
| • | Level 2 – other significant observable inputs (including quoted prices for similar financial instruments, interest rates, prepayment speed, credit risk, etc.) |
| Semiannual Report | FRD-19 |
FRANKLIN TEMPLETON VARIABLE INSURANCE PRODUCTS TRUST
NOTES TO FINANCIAL STATEMENTS (UNAUDITED)
Franklin Rising Dividends VIP Fund (continued)
| • | Level 3 – significant unobservable inputs (including the Fund’s own assumptions in determining the fair value of financial instruments) |
The input levels are not necessarily an indication of the risk or liquidity associated with financial instruments at that level.
For movements between the levels within the fair value hierarchy, the Fund has adopted a policy of recognizing the transfers as of the date of the underlying event which caused the movement.
At June 30, 2014, all of the Fund’s investments in financial instruments carried at fair value were valued using Level 1 inputs. For detailed categories, see the accompanying Statement of Investments.
9. New Accounting Pronouncements
In June 2014, the Financial Accounting Standards Board issued Accounting Standards Update (ASU) No. 2014-11, Transfers and Servicing (Topic 860), Repurchase-to-Maturity Transactions, Repurchase Financings, and Disclosures. The ASU changes the accounting for certain repurchase agreements and expands disclosure requirements related to repurchase agreements, securities lending, repurchase-to-maturity and similar transactions. The ASU is effective for interim and annual reporting periods beginning after December 15, 2014. Management is currently evaluating the impact, if any, of applying this provision.
10. Subsequent Events
The Fund has evaluated subsequent events through the issuance of the financial statements and determined that no events have occurred that require disclosure.
| FRD-20 | Semiannual Report |
Franklin Small Cap Value VIP Fund
(Formerly, Franklin Small Cap Value Securities Fund)
This semiannual report for Franklin Small Cap Value VIP Fund covers the period ended June 30, 2014.
Class 2 Performance Summary as of June 30, 2014
Franklin Small Cap Value VIP Fund – Class 2 delivered a +4.54% total return* for the six-month period ended June 30, 2014.
*The Fund has a fee waiver associated with its investments in a Franklin Templeton money fund, contractually guaranteed through at least its current fiscal year-end. Fund investment results reflect the fee waiver, to the extent applicable; without this reduction, the results would have been lower.
Performance reflects the Fund’s Class 2 operating expenses, but does not include any contract fees, expenses or sales charges. If they had been included, performance would be lower. These charges and deductions, particularly for variable life policies, can have a significant effect on contract values and insurance benefits. See the contract prospectus for a complete description of these expenses, including sales charges.
Performance data represent past performance, which does not guarantee future results. Investment return and principal value will fluctuate, and you may have a gain or loss when you sell your shares. Current performance may differ from figures shown.
| Semiannual Report | FSV-1 |
FRANKLIN SMALL CAP VALUE VIP FUND
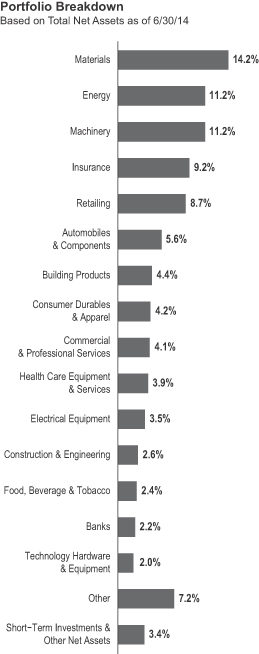
1. Source: © 2014 Morningstar. One cannot invest directly in an index, and an index is not representative of the Fund’s portfolio. Please see Index Descriptions following the Fund Summaries.
2. Source: Bureau of Labor Statistics.
| FSV-2 | Semiannual Report |
FRANKLIN SMALL CAP VALUE VIP FUND
allocations. Protective Life was the subject of a takeover offer from Dai-ichi Life Insurance at a 34% premium to the company’s unaffected share price on May 30, 2014. Unit Corp., an onshore oil and gas exploration, production and services company, was helped by an increase in natural gas prices because of the cold winter and improved demand for land-based drilling rigs to support the North American energy revolution.
Detractors from absolute Fund performance included La-Z-Boy, GameStop and Gentex. La-Z-Boy, a furniture retailer, had weaker-than-expected sales as severe winter weather seemingly hurt results, and management indicated that sales were likely to remain soft during the usually slow summer season. GameStop, a video game retailer, reported weaker-than-expected new software sales and lowered guidance as the industry shifted its focus to new video game consoles developed by Microsoft and Sony. Gentex experienced earnings-multiple compression as its earnings growth rate, although strong, was expected to slow from 2013 levels.
3. Please see Index Descriptions following the Fund Summaries.
| Semiannual Report | FSV-3 |
FRANKLIN SMALL CAP VALUE VIP FUND
| FSV-4 | Semiannual Report |
FRANKLIN SMALL CAP VALUE VIP FUND
Class 2 Fund Expenses
| Class 2 | Beginning Account Value 1/1/14 |
Ending Account Value 6/30/14 |
Fund-Level Expenses 1/1/14–6/30/14 |
|||||||||
| Actual |
$1,000 | $1,045.40 | $4.41 | |||||||||
| Hypothetical (5% return before expenses) | $1,000 | $1,020.48 | $4.36 | |||||||||
*Expenses are calculated using the most recent six-month annualized expense ratio, net of expense waivers, for the Fund’s Class 2 shares (0.87%), which does not include any ongoing expenses of the Contract for which the Fund is an investment option, multiplied by the average account value over the period, multiplied by 181/365 to reflect the one-half year period.
| Semiannual Report | FSV-5 |
SUPPLEMENT DATED MAY 1, 2014
TO THE PROSPECTUSES DATED MAY 1, 2014
OF
FRANKLIN SMALL CAP VALUE VIP FUND
(A series of Franklin Templeton Variable Insurance Products Trust)
The prospectus is amended as follows:
I. The “Fund Summaries – Portfolio Managers” section on page FSV-S4 is revised to read as follows:
Portfolio Managers
STEVEN B. RAINERI Portfolio Manager of Advisory Services and portfolio manager of the Fund since 2012.
DONALD G. TAYLOR, CPA Chief Investment Officer of Advisory Services and portfolio manager of the Fund since inception (1998).
BRUCE C. BAUGHMAN, CPA Senior Vice President of Advisory Services and portfolio manager of the Fund since inception (1998).
WILLIAM J. LIPPMAN President of Advisory Services and portfolio manager of the Fund since inception (1998).
II. The “Fund Details – Management” section disclosure concerning the portfolio management team beginning on page FSV-D4 is revised to read as follows:
The Fund is managed by a team of dedicated professionals focused on investments of small cap value companies. The portfolio managers of the team are as follows:
| STEVEN B. RAINERI Portfolio Manager of Advisory Services |
Mr. Raineri has been a co-lead portfolio manager of the Fund since 2012. He joined Franklin Templeton Investments in 2005. | |
| DONALD G. TAYLOR, CPA Chief Investment Officer of Advisory Services |
Mr. Taylor has been a portfolio manager of the Fund since its inception (1998). He joined Franklin Templeton Investments in 1996. | |
| BRUCE C. BAUGHMAN, CPA Senior Vice President of Advisory Services |
Mr. Baughman has been a portfolio manager of the Fund since its inception (1998). He joined Franklin Templeton Investments in 1988. | |
| WILLIAM J. LIPPMAN President of Advisory Services |
Mr. Lippman has been the lead portfolio manager of the Fund since its inception and became a co-lead in 2007. He joined Franklin Templeton Investments in 1988. | |
Please keep this supplement with your prospectus for future reference.
| FSV-6 |
SUPPLEMENT DATED AUGUST 1, 2014
TO THE PROSPECTUS DATED MAY 1, 2014
OF
FRANKLIN SMALL CAP VALUE VIP FUND
(a series of Franklin Templeton Variable Insurance Products Trust)
The prospectus is amended as follows:
I. The “Fund Summary – Annual Fund Operating Expenses” table beginning on page FSV-S1 in the Fund’s Class 1 prospectus is replaced with the following:
Annual Fund Operating Expenses
(expenses that you pay each year as a percentage of the value of your investment)
| Class 1 | ||||
| Management fees1 | 0.61% | |||
| Distribution and service (12b-1) fees | None | |||
| Other expenses1 | 0.02% | |||
| Total annual Fund operating expenses | 0.63% | |||
| 1. | Management fees and other expenses have been restated to reflect current fiscal year fees and expenses as a result of the bundling of the Fund’s investment management agreement with its fund administration agreement effective May 1, 2014. Such combined investment management fees are described further under “Management” in the Fund’s prospectus. Total annual fund operating expenses are not affected by such bundling. |
II. The “Fund Summary – Annual Fund Operating Expenses” table beginning on page FSV-S1 in the Fund’s Class 2 prospectus is replaced with the following:
Annual Fund Operating Expenses
(expenses that you pay each year as a percentage of the value of your investment)
| Class 2 | ||||
| Management fees1 | 0.61% | |||
| Distribution and service (12b-1) fees | 0.25% | |||
| Other expenses1 | 0.02% | |||
| Total annual Fund operating expenses | 0.88% | |||
| 1. | Management fees and other expenses have been restated to reflect current fiscal year fees and expenses as a result of the bundling of the Fund’s investment management agreement with its fund administration agreement effective May 1, 2014. Such combined investment management fees are described further under “Management” in the Fund’s prospectus. Total annual fund operating expenses are not affected by such bundling. |
III. The “Fund Summary – Annual Fund Operating Expenses” table beginning on page FSV-S1 in the Fund’s Class 4 prospectus is replaced with the following:
Annual Fund Operating Expenses
(expenses that you pay each year as a percentage of the value of your investment)
| Class 4 | ||||
| Management fees1 | 0.61% | |||
| Distribution and service (12b-1) fees | 0.35% | |||
| Other expenses1 | 0.02% | |||
| Total annual Fund operating expenses | 0.98% | |||
| FSV-7 |
| 1. | Management fees and other expenses have been restated to reflect current fiscal year fees and expenses as a result of the bundling of the Fund’s investment management agreement with its fund administration agreement effective May 1, 2014. Such combined investment management fees are described further under “Management” in the Fund’s prospectus. Total annual fund operating expenses are not affected by such bundling. |
IV. The following is added as the second to last paragraph in the “Fund Details – Management” section of each Class’ prospectus beginning on page FSV-D4:
Effective May 1, 2014, the Fund’s investment management agreement was bundled with its fund administration agreement, including the fees payable to the Fund’s administrator thereunder, as approved by the board of trustees. The fee payable to the administrator under the Fund’s administration agreement, prior to May 1, 2014, was a monthly fee under the following fee schedule of the Fund’s average daily net assets:
| • | 0.150% up to and including $200 million; |
| • | 0.135% over $200 million, up to and including $700 million; |
| • | 0.100% over $700 million, up to and including $1.2 billion; |
| • | 0.075% in excess of $1.2 billion. |
As of such date, the Fund’s investment management fees became a monthly fee at the annual rate of the value of the Fund’s average daily net assets as set forth below:
| • | 0.750% up to and including $200 million; |
| • | 0.635% over $200 million, up to and including $700 million; |
| • | 0.600% over $700 million, up to and including $1.2 billion; |
| • | 0.575% over $1.2 billion, up to and including $1.3 billion; |
| • | 0.475% in excess of $1.3 billion. |
Please keep this supplement with your prospectus for future reference.
| FSV-8 |
FRANKLIN TEMPLETON VARIABLE INSURANCE PRODUCTS TRUST
Financial Highlights
Franklin Small Cap Value VIP Fund
| Six Months Ended (unaudited) |
Year Ended December 31, | |||||||||||||||||||||||
| 2013 | 2012 | 2011 | 2010 | 2009 | ||||||||||||||||||||
| Class 1 | ||||||||||||||||||||||||
| Per share operating performance (for a share outstanding throughout the period) |
||||||||||||||||||||||||
| Net asset value, beginning of period |
$24.54 | $18.58 | $15.82 | $16.55 | $13.00 | $10.73 | ||||||||||||||||||
|
|
|
|||||||||||||||||||||||
| Income from investment operationsa: | ||||||||||||||||||||||||
| Net investment incomeb |
0.09 | 0.19 | 0.29 | c | 0.16 | 0.14 | 0.15 | |||||||||||||||||
| Net realized and unrealized gains (losses) |
1.03 | 6.45 | 2.64 | (0.74 | ) | 3.54 | 2.86 | |||||||||||||||||
|
|
|
|||||||||||||||||||||||
| Total from investment operations |
1.12 | 6.64 | 2.93 | (0.58 | ) | 3.68 | 3.01 | |||||||||||||||||
|
|
|
|||||||||||||||||||||||
| Less distributions from: | ||||||||||||||||||||||||
| Net investment income |
(0.20 | ) | (0.32 | ) | (0.17 | ) | (0.15 | ) | (0.13 | ) | (0.22 | ) | ||||||||||||
| Net realized gains |
(1.78 | ) | (0.36 | ) | — | — | — | (0.52 | ) | |||||||||||||||
|
|
|
|||||||||||||||||||||||
| Total distributions |
(1.98 | ) | (0.68 | ) | (0.17 | ) | (0.15 | ) | (0.13 | ) | (0.74 | ) | ||||||||||||
|
|
|
|||||||||||||||||||||||
| Net asset value, end of period |
$23.68 | $24.54 | $18.58 | $15.82 | $16.55 | $13.00 | ||||||||||||||||||
|
|
|
|||||||||||||||||||||||
| Total returnd |
4.73% | 36.50% | 18.75% | (3.53)% | 28.49% | 29.54% | ||||||||||||||||||
| Ratios to average net assetse | ||||||||||||||||||||||||
| Expenses |
0.62% | f,g | 0.63% | 0.67% | 0.66% | 0.67% | 0.68% | f | ||||||||||||||||
| Net investment income |
0.72% | 0.90% | 1.70% | c | 1.02% | 0.98% | 1.29% | |||||||||||||||||
| Supplemental data | ||||||||||||||||||||||||
| Net assets, end of period (000’s) |
$61,774 | $62,408 | $40,133 | $39,374 | $47,300 | $42,428 | ||||||||||||||||||
| Portfolio turnover rate |
9.81% | 10.44% | 5.84% | 14.39% | 15.92% | 6.68% | ||||||||||||||||||
aThe amount shown for a share outstanding throughout the period may not correlate with the Statement of Operations for the period due to the timing of sales and repurchases of the Fund shares in relation to income earned and/or fluctuating fair value of the investments of the Fund.
bBased on average daily shares outstanding.
cNet investment income per share includes approximately $0.10 per share received in the form of special dividends. Excluding these amounts, the ratio of net investment income to average net assets would have been 1.10%.
dTotal return does not include fees, charges or expenses imposed by the variable annuity and life insurance contracts for which the Franklin Templeton Variable Insurance Products Trust serves as an underlying investment vehicle. Total return is not annualized for periods less than one year.
eRatios are annualized for periods less than one year.
fBenefit of expense reduction rounds to less than 0.01%.
gBenefit of waiver and payment by affiliate rounds to less than 0.01%.
| The accompanying notes are an integral part of these financial statements. | Semiannual Report | FSV-9 |
FRANKLIN TEMPLETON VARIABLE INSURANCE PRODUCTS TRUST
FINANCIAL HIGHLIGHTS
Franklin Small Cap Value VIP Fund (continued)
| Six Months Ended (unaudited) |
Year Ended December 31, | |||||||||||||||||||||||
| 2013 | 2012 | 2011 | 2010 | 2009 | ||||||||||||||||||||
| Class 2 | ||||||||||||||||||||||||
| Per share operating performance (for a share outstanding throughout the period) |
||||||||||||||||||||||||
| Net asset value, beginning of period |
$24.07 | $18.23 | $15.53 | $16.25 | $12.77 | $10.55 | ||||||||||||||||||
|
|
|
|||||||||||||||||||||||
| Income from investment operationsa: | ||||||||||||||||||||||||
| Net investment incomeb |
0.06 | 0.14 | 0.24 | c | 0.12 | 0.10 | 0.12 | |||||||||||||||||
| Net realized and unrealized gains (losses) |
1.00 | 6.34 | 2.59 | (0.73 | ) | 3.48 | 2.81 | |||||||||||||||||
|
|
|
|||||||||||||||||||||||
| Total from investment operations |
1.06 | 6.48 | 2.83 | (0.61 | ) | 3.58 | 2.93 | |||||||||||||||||
|
|
|
|||||||||||||||||||||||
| Less distributions from: | ||||||||||||||||||||||||
| Net investment income |
(0.15 | ) | (0.28 | ) | (0.13 | ) | (0.11 | ) | (0.10 | ) | (0.19 | ) | ||||||||||||
| Net realized gains |
(1.78 | ) | (0.36 | ) | — | — | — | (0.52 | ) | |||||||||||||||
|
|
|
|||||||||||||||||||||||
| Total distributions |
(1.93 | ) | (0.64 | ) | (0.13 | ) | (0.11 | ) | (0.10 | ) | (0.71 | ) | ||||||||||||
|
|
|
|||||||||||||||||||||||
| Net asset value, end of period |
$23.20 | $24.07 | $18.23 | $15.53 | $16.25 | $12.77 | ||||||||||||||||||
|
|
|
|||||||||||||||||||||||
| Total returnd |
4.54% | 36.24% | 18.39% | (3.76)% | 28.22% | 29.16% | ||||||||||||||||||
| Ratios to average net assetse | ||||||||||||||||||||||||
| Expenses |
0.87% | f,g | 0.88% | 0.92% | 0.91% | 0.92% | 0.93% | f | ||||||||||||||||
| Net investment income |
0.47% | 0.65% | 1.45% | c | 0.77% | 0.73% | 1.04% | |||||||||||||||||
| Supplemental data | ||||||||||||||||||||||||
| Net assets, end of period (000’s) |
$1,590,037 | $1,606,802 | $1,286,573 | $1,211,168 | $1,362,292 | $1,109,855 | ||||||||||||||||||
| Portfolio turnover rate |
9.81% | 10.44% | 5.84% | 14.39% | 15.92% | 6.68% | ||||||||||||||||||
aThe amount shown for a share outstanding throughout the period may not correlate with the Statement of Operations for the period due to the timing of sales and repurchases of the Fund shares in relation to income earned and/or fluctuating fair value of the investments of the Fund.
bBased on average daily shares outstanding.
cNet investment income per share includes approximately $0.10 per share received in the form of special dividends. Excluding these amounts, the ratio of net investment income to average net assets would have been 0.85%
dTotal return does not include fees, charges or expenses imposed by the variable annuity and life insurance contracts for which the Franklin Templeton Variable Insurance Products Trust serves as an underlying investment vehicle. Total return is not annualized for periods less than one year.
eRatios are annualized for periods less than one year.
fBenefit of expense reduction rounds to less than 0.01%.
gBenefit of waiver and payment by affiliate rounds to less than 0.01%.
| FSV-10 | Semiannual Report | The accompanying notes are an integral part of these financial statements. |
FRANKLIN TEMPLETON VARIABLE INSURANCE PRODUCTS TRUST
FINANCIAL HIGHLIGHTS
Franklin Small Cap Value VIP Fund (continued)
| Six Months Ended (unaudited) |
Year Ended December 31, | |||||||||||||||||||||||
| 2013 | 2012 | 2011 | 2010 | 2009 | ||||||||||||||||||||
| Class 4 | ||||||||||||||||||||||||
| Per share operating performance (for a share outstanding throughout the period) |
||||||||||||||||||||||||
| Net asset value, beginning of period |
$24.37 | $18.44 | $15.71 | $16.44 | $12.92 | $10.70 | ||||||||||||||||||
|
|
|
|||||||||||||||||||||||
| Income from investment operationsa: | ||||||||||||||||||||||||
| Net investment incomeb |
0.04 | 0.12 | 0.22 | c | 0.11 | 0.09 | 0.11 | |||||||||||||||||
| Net realized and unrealized gains (losses) |
1.03 | 6.42 | 2.63 | (0.75 | ) | 3.53 | 2.84 | |||||||||||||||||
|
|
|
|||||||||||||||||||||||
| Total from investment operations |
1.07 | 6.54 | 2.85 | (0.64 | ) | 3.62 | 2.95 | |||||||||||||||||
|
|
|
|||||||||||||||||||||||
| Less distributions from: | ||||||||||||||||||||||||
| Net investment income |
(0.12 | ) | (0.25 | ) | (0.12 | ) | (0.09 | ) | (0.10 | ) | (0.21 | ) | ||||||||||||
| Net realized gains |
(1.78 | ) | (0.36 | ) | — | — | — | (0.52 | ) | |||||||||||||||
|
|
|
|||||||||||||||||||||||
| Total distributions |
(1.90 | ) | (0.61 | ) | (0.12 | ) | (0.09 | ) | (0.10 | ) | (0.73 | ) | ||||||||||||
|
|
|
|||||||||||||||||||||||
| Net asset value, end of period |
$23.54 | $24.37 | $18.44 | $15.71 | $16.44 | $12.92 | ||||||||||||||||||
|
|
|
|||||||||||||||||||||||
| Total returnd |
4.52% | 36.12% | 18.27% | (3.87)% | 28.14% | 29.04% | ||||||||||||||||||
| Ratios to average net assetse | ||||||||||||||||||||||||
| Expenses |
0.97% | f,g | 0.98% | 1.02% | 1.01% | 1.02% | 1.03% | f | ||||||||||||||||
| Net investment income |
0.37% | 0.55% | 1.35% | c | 0.67% | 0.63% | 0.94% | |||||||||||||||||
| Supplemental data | ||||||||||||||||||||||||
| Net assets, end of period (000’s) |
$33,628 | $35,936 | $32,424 | $34,284 | $39,075 | $28,599 | ||||||||||||||||||
| Portfolio turnover rate |
9.81% | 10.44% | 5.84% | 14.39% | 15.92% | 6.68% | ||||||||||||||||||
aThe amount shown for a share outstanding throughout the period may not correlate with the Statement of Operations for the period due to the timing of sales and repurchases of the Fund shares in relation to income earned and/or fluctuating fair value of the investments of the Fund.
bBased on average daily shares outstanding.
cNet investment income per share includes approximately $0.10 per share received in the form of special dividends. Excluding these amounts, the ratio of net investment income to average net assets would have been 0.75%.
dTotal return does not include fees, charges or expenses imposed by the variable annuity and life insurance contracts for which the Franklin Templeton Variable Insurance Products Trust serves as an underlying investment vehicle. Total return is not annualized for periods less than one year.
eRatios are annualized for periods less than one year.
fBenefit of expense reduction rounds to less than 0.01%.
gBenefit of waiver and payment by affiliate rounds to less than 0.01%.
| The accompanying notes are an integral part of these financial statements. | Semiannual Report | FSV-11 |
FRANKLIN TEMPLETON VARIABLE INSURANCE PRODUCTS TRUST
Statement of Investments, June 30, 2014 (unaudited)
| Franklin Small Cap Value VIP Fund | ||||||||||
| Shares | Value | |||||||||
| Common Stocks 96.6% |
||||||||||
| Aerospace & Defense 1.6% |
||||||||||
| AAR Corp. |
983,300 | $ | 27,099,748 | |||||||
|
|
|
|||||||||
| Automobiles & Components 5.6% |
||||||||||
| Autoliv Inc. |
161,300 | 17,191,354 | ||||||||
| Drew Industries Inc. |
220,000 | 11,002,200 | ||||||||
| Gentex Corp. |
715,900 | 20,825,531 | ||||||||
| Thor Industries Inc. |
680,900 | 38,722,783 | ||||||||
| a | Winnebago Industries Inc. |
300,600 | 7,569,108 | |||||||
|
|
|
|||||||||
| 95,310,976 | ||||||||||
|
|
|
|||||||||
| Banks 2.2% |
||||||||||
| Chemical Financial Corp. |
398,954 | 11,202,628 | ||||||||
| OFG Bancorp. |
602,000 | 11,082,820 | ||||||||
| Peoples Bancorp Inc. |
158,000 | 4,179,100 | ||||||||
| TrustCo Bank Corp. NY |
1,690,000 | 11,289,200 | ||||||||
|
|
|
|||||||||
| 37,753,748 | ||||||||||
|
|
|
|||||||||
| Building Products 4.4% |
||||||||||
| Apogee Enterprises Inc. |
610,000 | 21,264,600 | ||||||||
| a | Gibraltar Industries Inc. |
842,300 | 13,064,073 | |||||||
| Simpson Manufacturing Co. Inc. |
433,400 | 15,758,424 | ||||||||
| Universal Forest Products Inc. |
504,700 | 24,361,869 | ||||||||
|
|
|
|||||||||
| 74,448,966 | ||||||||||
|
|
|
|||||||||
| Commercial & Professional Services 4.1% |
||||||||||
| Brady Corp., A |
350,500 | 10,469,435 | ||||||||
| a | Civeo Corp. |
606,600 | 15,183,198 | |||||||
| Insperity Inc. |
263,100 | 8,682,300 | ||||||||
| McGrath RentCorp |
396,918 | 14,586,737 | ||||||||
| MSA Safety Inc. |
358,300 | 20,595,084 | ||||||||
|
|
|
|||||||||
| 69,516,754 | ||||||||||
|
|
|
|||||||||
| Construction & Engineering 2.6% |
||||||||||
| EMCOR Group Inc. |
367,400 | 16,360,322 | ||||||||
| Granite Construction Inc. |
775,000 | 27,884,500 | ||||||||
|
|
|
|||||||||
| 44,244,822 | ||||||||||
|
|
|
|||||||||
| Consumer Durables & Apparel 4.2% |
||||||||||
| Brunswick Corp. |
445,000 | 18,747,850 | ||||||||
| Hooker Furniture Corp. |
445,000 | 7,182,300 | ||||||||
| La-Z-Boy Inc. |
1,188,900 | 27,546,813 | ||||||||
| M.D.C. Holdings Inc. |
213,800 | 6,476,002 | ||||||||
| a | M/I Homes Inc. |
435,900 | 10,579,293 | |||||||
|
|
|
|||||||||
| 70,532,258 | ||||||||||
|
|
|
|||||||||
| Consumer Services 1.1% |
||||||||||
| Hillenbrand Inc. |
545,200 | 17,784,424 | ||||||||
|
|
|
|||||||||
| Electrical Equipment 3.5% |
||||||||||
| EnerSys |
24,100 | 1,657,839 | ||||||||
| Franklin Electric Co. Inc. |
389,264 | 15,699,017 | ||||||||
| Powell Industries Inc. |
195,000 | 12,749,100 | ||||||||
| Regal-Beloit Corp. |
374,700 | 29,436,432 | ||||||||
|
|
|
|||||||||
| 59,542,388 | ||||||||||
|
|
|
|||||||||
| FSV-12 | Semiannual Report |
FRANKLIN TEMPLETON VARIABLE INSURANCE PRODUCTS TRUST
STATEMENT OF INVESTMENTS (UNAUDITED)
Franklin Small Cap Value VIP Fund (continued)
| Shares | Value | |||||||||
| Common Stocks (continued) |
||||||||||
| Energy 11.2% |
||||||||||
| a | Atwood Oceanics Inc. |
500,000 | $ | 26,240,000 | ||||||
| Bristow Group Inc. |
400,000 | 32,248,000 | ||||||||
| Energen Corp. |
220,000 | 19,553,600 | ||||||||
| a | Helix Energy Solutions Group Inc. |
794,400 | 20,900,664 | |||||||
| a | Oil States International Inc. |
224,300 | 14,375,387 | |||||||
| Rowan Cos. PLC |
529,000 | 16,890,970 | ||||||||
| Tidewater Inc. |
415,000 | 23,302,250 | ||||||||
| a | Unit Corp. |
515,000 | 35,447,450 | |||||||
|
|
|
|||||||||
| 188,958,321 | ||||||||||
|
|
|
|||||||||
| Food, Beverage & Tobacco 2.4% |
||||||||||
| GrainCorp Ltd. (Australia) |
1,725,000 | 13,669,142 | ||||||||
| Maple Leaf Foods Inc. (Canada) |
1,412,700 | 26,308,052 | ||||||||
|
|
|
|||||||||
| 39,977,194 | ||||||||||
|
|
|
|||||||||
| Health Care Equipment & Services 3.9% |
||||||||||
| Hill-Rom Holdings Inc. |
344,000 | 14,279,440 | ||||||||
| STERIS Corp. |
530,000 | 28,344,400 | ||||||||
| Teleflex Inc. |
218,497 | 23,073,283 | ||||||||
|
|
|
|||||||||
| 65,697,123 | ||||||||||
|
|
|
|||||||||
| Industrial Conglomerates 1.6% |
||||||||||
| Carlisle Cos. Inc. |
308,900 | 26,756,918 | ||||||||
|
|
|
|||||||||
| Insurance 9.2% |
||||||||||
| Arthur J. Gallagher & Co. |
168,200 | 7,838,120 | ||||||||
| Aspen Insurance Holdings Ltd. |
407,800 | 18,522,276 | ||||||||
| Assurant Inc. |
51,800 | 3,395,490 | ||||||||
| The Hanover Insurance Group Inc. |
345,000 | 21,786,750 | ||||||||
| HCC Insurance Holdings Inc. |
188,200 | 9,210,508 | ||||||||
| Montpelier Re Holdings Ltd. |
455,000 | 14,537,250 | ||||||||
| Old Republic International Corp. |
1,296,900 | 21,450,726 | ||||||||
| Protective Life Corp. |
241,500 | 16,743,195 | ||||||||
| StanCorp Financial Group Inc. |
467,400 | 29,913,600 | ||||||||
| Validus Holdings Ltd. |
317,800 | 12,152,672 | ||||||||
|
|
|
|||||||||
| 155,550,587 | ||||||||||
|
|
|
|||||||||
| Machinery 11.2% |
||||||||||
| Astec Industries Inc. |
488,100 | 21,417,828 | ||||||||
| Briggs & Stratton Corp. |
601,800 | 12,312,828 | ||||||||
| a | EnPro Industries Inc. |
245,000 | 17,924,200 | |||||||
| Kennametal Inc. |
452,100 | 20,923,188 | ||||||||
| Lincoln Electric Holdings Inc. |
347,800 | 24,304,264 | ||||||||
| b | Lindsay Corp. |
165,900 | 14,013,573 | |||||||
| Mueller Industries Inc. |
685,200 | 20,151,732 | ||||||||
| Trinity Industries Inc. |
640,400 | 27,998,288 | ||||||||
| a | Wabash National Corp. |
1,705,000 | 24,296,250 | |||||||
| Watts Water Technologies Inc., A |
78,200 | 4,827,286 | ||||||||
|
|
|
|||||||||
| 188,169,437 | ||||||||||
|
|
|
|||||||||
| Materials 14.2% |
||||||||||
| A. Schulman Inc. |
511,966 | 19,813,084 | ||||||||
| AptarGroup Inc. |
65,000 | 4,355,650 | ||||||||
| Axiall Corp. |
268,200 | 12,677,814 | ||||||||
| Semiannual Report | FSV-13 |
FRANKLIN TEMPLETON VARIABLE INSURANCE PRODUCTS TRUST
STATEMENT OF INVESTMENTS (UNAUDITED)
Franklin Small Cap Value VIP Fund (continued)
| Shares | Value | |||||||||
| Common Stocks (continued) |
||||||||||
| Materials (continued) |
||||||||||
| Cabot Corp. |
522,400 | $ | 30,293,976 | |||||||
| Carpenter Technology Corp. |
356,600 | 22,554,950 | ||||||||
| H.B. Fuller Co. |
584,700 | 28,124,070 | ||||||||
| Minerals Technologies Inc. |
186,900 | 12,256,902 | ||||||||
| Reliance Steel & Aluminum Co. |
379,600 | 27,980,316 | ||||||||
| RPM International Inc. |
620,000 | 28,631,600 | ||||||||
| Sensient Technologies Corp. |
482,800 | 26,901,616 | ||||||||
| Steel Dynamics Inc. |
1,024,300 | 18,386,185 | ||||||||
| Stepan Co. |
135,000 | 7,136,100 | ||||||||
|
|
|
|||||||||
| 239,112,263 | ||||||||||
|
|
|
|||||||||
| Retailing 8.7% |
||||||||||
| Brown Shoe Co. Inc. |
800,000 | 22,888,000 | ||||||||
| The Cato Corp., A |
438,600 | 13,552,740 | ||||||||
| GameStop Corp., A |
218,100 | 8,826,507 | ||||||||
| a | Genesco Inc. |
261,908 | 21,510,504 | |||||||
| Group 1 Automotive Inc. |
425,400 | 35,865,474 | ||||||||
| The Men’s Wearhouse Inc. |
430,100 | 23,999,580 | ||||||||
| a | The Pep Boys - Manny, Moe & Jack |
1,173,600 | 13,449,456 | |||||||
| a | West Marine Inc. |
610,700 | 6,265,782 | |||||||
|
|
|
|||||||||
| 146,358,043 | ||||||||||
|
|
|
|||||||||
| Semiconductors & Semiconductor Equipment 0.5% |
||||||||||
| Cohu Inc. |
736,000 | 7,875,200 | ||||||||
|
|
|
|||||||||
| Technology Hardware & Equipment 2.0% |
||||||||||
| a | Ingram Micro Inc., A |
507,100 | 14,812,391 | |||||||
| a | Multi-Fineline Electronix Inc. |
180,400 | 1,991,616 | |||||||
| a | Rofin-Sinar Technologies Inc. |
674,900 | 16,224,596 | |||||||
|
|
|
|||||||||
| 33,028,603 | ||||||||||
|
|
|
|||||||||
| Trading Companies & Distributors 0.6% |
||||||||||
| Applied Industrial Technologies Inc. |
205,200 | 10,409,796 | ||||||||
|
|
|
|||||||||
| Transportation 1.8% |
||||||||||
| a | Genesee & Wyoming Inc. |
191,200 | 20,076,000 | |||||||
| SkyWest Inc. |
851,000 | 10,399,220 | ||||||||
|
|
|
|||||||||
| 30,475,220 | ||||||||||
|
|
|
|||||||||
| Total Common Stocks (Cost $958,887,070) |
1,628,602,789 | |||||||||
|
|
|
|||||||||
| Short Term Investments 4.0% |
||||||||||
| Money Market Funds (Cost $54,880,539) 3.3% |
||||||||||
| a,c | Institutional Fiduciary Trust Money Market Portfolio |
54,880,539 | 54,880,539 | |||||||
|
|
|
|||||||||
| Principal Amount | ||||||||||
| d | Investments from Cash Collateral Received for Loaned Securities 0.7% |
|||||||||
| e | Repurchase Agreements 0.7% |
|||||||||
| Barclays Capital Inc., 0.07%, 7/01/14 (Maturity Value $2,970,427) |
$ | 2,970,421 | 2,970,421 | |||||||
| Collateralized by U.S. Treasury Bonds, 3.375% - 3.75%, 11/15/43 - 5/15/44; U.S. Treasury Notes, 1.625% - 2.25%, 5/31/15 - 4/30/21; and U.S. Treasury Strips, 11/15/17 - 5/15/44 (valued at $3,029,830) |
||||||||||
| FSV-14 | Semiannual Report |
FRANKLIN TEMPLETON VARIABLE INSURANCE PRODUCTS TRUST
STATEMENT OF INVESTMENTS (UNAUDITED)
Franklin Small Cap Value VIP Fund (continued)
| Principal Amount | Value | |||||||||
| d | Investments from Cash Collateral Received for Loaned Securities (continued) |
|
||||||||
| e | Repurchase Agreements (continued) |
|||||||||
| Citigroup Global Markets Inc., 0.06%, 7/01/14 (Maturity Value $2,970,426) |
$ | 2,970,421 | $ | 2,970,421 | ||||||
| Collateralized by U.S. Treasury Bonds, 4.375%, 5/14/40; U.S. Treasury Bonds, Index Linked, 0.625% - 2.375%, 1/15/25 - 2/15/44; U.S. Treasury Notes, 0.25% - 4.50%, 12/31/14 - 11/15/23; U.S. Treasury Notes, Index Linked, 0.125% - 1.25%, 7/15/20 -1/15/23; and U.S. Treasury Strips, 8/15/15 - 11/15/39 (valued at $3,029,830) |
||||||||||
| Deutsche Bank Securities Inc., 0.05%, 7/01/14 (Maturity Value $2,970,425) |
2,970,421 | 2,970,421 | ||||||||
| Collateralized by fU.S. Treasury Bills, 7/03/14 - 4/30/15; U.S. Treasury Bonds, 2.75% - 11.25%, 2/15/15 - 5/15/44; U.S. Treasury Bonds, Index Linked, 0.625% - 2.375%, 1/15/25 - 2/15/43; U.S. Treasury Notes, 0.085% - 4.875%, 7/15/14 - 5/15/24; U.S. Treasury Notes, Index Linked, 0.125% - 1.625%, 1/15/15 - 4/15/18; and U.S. Treasury Strips, 11/15/27 - 5/15/35 (valued at $3,029,829) |
||||||||||
| HSBC Securities (USA) Inc., 0.07%, 7/01/14 (Maturity Value $2,970,427) |
2,970,421 | 2,970,421 | ||||||||
| Collateralized by fU.S. Treasury Bills, 7/10/14 - 6/25/15; U.S. Treasury Bonds, 2.75% -6.375%, 8/15/27 - 8/15/42; and U.S. Treasury Notes, 0.50% - 2.375%, 6/30/16 - 12/31/20 (valued at $3,029,838) |
||||||||||
| Merrill Lynch, Pierce, Fenner & Smith Inc., 0.06%, 7/01/14 (Maturity Value $625,268) |
625,267 | 625,267 | ||||||||
| Collateralized by U.S. Treasury Bonds, 3.75% - 8.00%, 11/15/21 - 11/15/43; and U.S. Treasury Notes, 0.25%, 8/15/15 (valued at $637,773) |
||||||||||
|
|
|
|||||||||
| Total Repurchase Agreements (Cost $12,506,951) |
12,506,951 | |||||||||
|
|
|
|||||||||
| Total Investments (Cost $1,026,274,560) 100.6% |
1,695,990,279 | |||||||||
| Other Assets, less Liabilities (0.6)% |
(10,550,631 | ) | ||||||||
|
|
|
|||||||||
| Net Assets 100.0% |
$ | 1,685,439,648 | ||||||||
|
|
|
|||||||||
aNon-income producing.
bA portion or all of the security is on loan at June 30, 2014. See Note 1(d).
cSee Note 3(e) regarding investments in the Institutional Fiduciary Trust Money Market Portfolio.
dSee Note 1(d) regarding securities on loan.
eSee Note 1(c) regarding repurchase agreements.
fThe security is traded on a discount basis with no stated coupon rate.
| The accompanying notes are an integral part of these financial statements. | Semiannual Report | FSV-15 |
FRANKLIN TEMPLETON VARIABLE INSURANCE PRODUCTS TRUST
Financial Statements
Statement of Assets and Liabilities
June 30, 2014 (unaudited)
| Franklin Small Cap Value VIP Fund |
||||
| Assets: | ||||
| Investments in securities: |
||||
| Cost - Unaffiliated issuers |
$ | 958,887,070 | ||
| Cost - Sweep Money Fund (Note 3e) |
54,880,539 | |||
| Cost - Repurchase agreements |
12,506,951 | |||
|
|
|
|||
| Total cost of investments |
$ | 1,026,274,560 | ||
|
|
|
|||
| Value - Unaffiliated issuers |
$ | 1,628,602,789 | ||
| Value - Sweep Money Fund (Note 3e) |
54,880,539 | |||
| Value - Repurchase agreements |
12,506,951 | |||
|
|
|
|||
| Total value of investments (includes securities loaned in the amount of $12,248,150) |
1,695,990,279 | |||
| Receivables: |
||||
| Investment securities sold |
6,463,335 | |||
| Capital shares sold |
268,516 | |||
| Dividends |
870,656 | |||
| Other assets |
742 | |||
|
|
|
|||
| Total assets |
1,703,593,528 | |||
|
|
|
|||
| Liabilities: | ||||
| Payables: |
||||
| Investment securities purchased |
2,189,088 | |||
| Capital shares redeemed |
1,657,737 | |||
| Management fees |
812,933 | |||
| Distribution fees |
667,190 | |||
| Payable upon return of securities loaned |
12,506,951 | |||
| Accrued expenses and other liabilities |
319,981 | |||
|
|
|
|||
| Total liabilities |
18,153,880 | |||
|
|
|
|||
| Net assets, at value |
$ | 1,685,439,648 | ||
|
|
|
|||
| Net assets consist of: | ||||
| Paid-in capital |
$ | 898,360,491 | ||
| Undistributed net investment income |
3,356,222 | |||
| Net unrealized appreciation (depreciation) |
669,715,719 | |||
| Accumulated net realized gain (loss) |
114,007,216 | |||
|
|
|
|||
| Net assets, at value |
$ | 1,685,439,648 | ||
|
|
|
|||
| FSV-16 | Semiannual Report | The accompanying notes are an integral part of these financial statements. |
FRANKLIN TEMPLETON VARIABLE INSURANCE PRODUCTS TRUST
FINANCIAL STATEMENTS
Statement of Asset and Liabilities (continued)
June 30, 2014 (unaudited)
| Franklin Small Cap Value VIP Fund |
||||
| Class 1: | ||||
| Net assets, at value |
$ | 61,774,035 | ||
|
|
|
|||
| Shares outstanding |
2,609,141 | |||
|
|
|
|||
| Net asset value and maximum offering price per share |
$ | 23.68 | ||
|
|
|
|||
| Class 2: | ||||
| Net assets, at value |
$ | 1,590,037,444 | ||
|
|
|
|||
| Shares outstanding |
68,524,093 | |||
|
|
|
|||
| Net asset value and maximum offering price per share |
$ | 23.20 | ||
|
|
|
|||
| Class 4: | ||||
| Net assets, at value |
$ | 33,628,169 | ||
|
|
|
|||
| Shares outstanding |
1,428,637 | |||
|
|
|
|||
| Net asset value and maximum offering price per share |
$ | 23.54 | ||
|
|
|
|||
| The accompanying notes are an integral part of these financial statements. | Semiannual Report | FSV-17 |
FRANKLIN TEMPLETON VARIABLE INSURANCE PRODUCTS TRUST
FINANCIAL STATEMENTS
Statement of Operations
for the six months ended June 30, 2014 (unaudited)
| Franklin Small Cap Value VIP Fund |
||||
| Investment income: | ||||
| Dividends |
$ | 10,679,127 | ||
| Income from securities loaned |
313,618 | |||
|
|
|
|||
| Total investment income |
10,992,745 | |||
|
|
|
|||
| Expenses: | ||||
| Management fees (Note 3a) |
4,312,254 | |||
| Administrative fees (Note 3b) |
596,175 | |||
| Distribution fees: (Note 3c) |
||||
| Class 2 |
1,924,580 | |||
| Class 4 |
58,826 | |||
| Custodian fees (Note 4) |
7,143 | |||
| Reports to shareholders |
150,040 | |||
| Professional fees |
26,945 | |||
| Trustees’ fees and expenses |
3,106 | |||
| Other |
14,458 | |||
|
|
|
|||
| Total expenses |
7,093,527 | |||
| Expense reductions (Note 4) |
(177 | ) | ||
| Expenses waived/paid by affiliates (Note 3e) |
(22,603 | ) | ||
|
|
|
|||
| Net expenses |
7,070,747 | |||
|
|
|
|||
| Net investment income |
3,921,998 | |||
|
|
|
|||
| Realized and unrealized gains (losses): | ||||
| Net realized gain (loss) from: |
||||
| Investments |
114,227,196 | |||
| Foreign currency transactions |
(129,239 | ) | ||
|
|
|
|||
| Net realized gain (loss) |
114,097,957 | |||
|
|
|
|||
| Net change in unrealized appreciation (depreciation) on investments |
(44,760,712 | ) | ||
|
|
|
|||
| Net realized and unrealized gain (loss) |
69,337,245 | |||
|
|
|
|||
| Net increase (decrease) in net assets resulting from operations |
$ | 73,259,243 | ||
|
|
|
|||
| FSV-18 | Semiannual Report | The accompanying notes are an integral part of these financial statements. |
FRANKLIN TEMPLETON VARIABLE INSURANCE PRODUCTS TRUST
FINANCIAL STATEMENTS
Statements of Changes in Net Assets
| Franklin Small Cap Value VIP Fund | ||||||||
| Six Months Ended June 30, 2014 (unaudited) |
Year Ended December 31, 2013 |
|||||||
| Increase (decrease) in net assets: | ||||||||
| Operations: |
||||||||
| Net investment income |
$ | 3,921,998 | $ | 10,009,153 | ||||
| Net realized gain (loss) from investments and foreign currency transactions |
114,097,957 | 119,472,862 | ||||||
| Net change in unrealized appreciation (depreciation) on investments |
(44,760,712 | ) | 344,133,096 | |||||
|
|
|
|||||||
| Net increase (decrease) in net assets resulting from operations |
73,259,243 | 473,615,111 | ||||||
|
|
|
|||||||
| Distributions to shareholders from: |
||||||||
| Net investment income: |
||||||||
| Class 1 |
(493,372 | ) | (615,112 | ) | ||||
| Class 2 |
(9,349,846 | ) | (18,772,536 | ) | ||||
| Class 4 |
(160,210 | ) | (406,547 | ) | ||||
| Net realized gains: |
||||||||
| Class 1 |
(4,292,308 | ) | (681,161 | ) | ||||
| Class 2 |
(112,743,662 | ) | (24,226,581 | ) | ||||
| Class 4 |
(2,435,910 | ) | (585,151 | ) | ||||
|
|
|
|||||||
| Total distributions to shareholders |
(129,475,308 | ) | (45,287,088 | ) | ||||
|
|
|
|||||||
| Capital share transactions: (Note 2) |
||||||||
| Class 1 |
1,412,963 | 7,328,882 | ||||||
| Class 2 |
36,274,317 | (83,608,654 | ) | |||||
| Class 4 |
(1,177,350 | ) | (6,031,999 | ) | ||||
|
|
|
|||||||
| Total capital share transactions |
36,509,930 | (82,311,771 | ) | |||||
|
|
|
|||||||
| Net increase (decrease) in net assets |
(19,706,135 | ) | 346,016,252 | |||||
| Net assets: | ||||||||
| Beginning of period |
1,705,145,783 | 1,359,129,531 | ||||||
|
|
|
|||||||
| End of period |
$ | 1,685,439,648 | $ | 1,705,145,783 | ||||
|
|
|
|||||||
| Undistributed net investment income included in net assets: |
||||||||
| End of period |
$ | 3,356,222 | $ | 9,437,652 | ||||
|
|
|
|||||||
| The accompanying notes are an integral part of these financial statements. | Semiannual Report | FSV-19 |
FRANKLIN TEMPLETON VARIABLE INSURANCE PRODUCTS TRUST
Notes to Financial Statements (unaudited)
Franklin Small Cap Value VIP Fund
| FSV-20 | Semiannual Report |
FRANKLIN TEMPLETON VARIABLE INSURANCE PRODUCTS TRUST
NOTES TO FINANCIAL STATEMENTS (UNAUDITED)
Franklin Small Cap Value VIP Fund (continued)
| Semiannual Report | FSV-21 |
FRANKLIN TEMPLETON VARIABLE INSURANCE PRODUCTS TRUST
NOTES TO FINANCIAL STATEMENTS (UNAUDITED)
Franklin Small Cap Value VIP Fund (continued)
1. Organization and Significant Accounting Policies (continued)
d. Securities Lending (continued)
with respect to the collateral investment, securities loaned, and the risk that the agent may default on its obligations to the Fund. The securities lending agent has agreed to indemnify the Fund in the event of default by a third party borrower.
e. Income and Deferred Taxes
It is the Fund’s policy to qualify as a regulated investment company under the Internal Revenue Code. The Fund intends to distribute to shareholders substantially all of its taxable income and net realized gains to relieve it from federal income and if applicable, excise taxes. As a result, no provision for U.S. federal income taxes is required.
The Fund may be subject to foreign taxation related to income received, capital gains on the sale of securities and certain foreign currency transactions in the foreign jurisdictions in which it invests. Foreign taxes, if any, are recorded based on the tax regulations and rates that exist in the foreign markets in which the Fund invests. When a capital gain tax is determined to apply the Fund records an estimated deferred tax liability in an amount that would be payable if the securities were disposed of on the valuation date.
The Fund recognizes the tax benefits of uncertain tax positions only when the position is “more likely than not” to be sustained upon examination by the tax authorities based on the technical merits of the tax position. As of June 30, 2014, and for all open tax years, the Fund has determined that no liability for unrecognized tax benefits is required in the Fund’s financial statements related to uncertain tax positions taken on a tax return (or expected to be taken on future tax returns). Open tax years are those that remain subject to examination and are based on each tax jurisdiction statute of limitation.
f. Security Transactions, Investment Income, Expenses and Distributions
Security transactions are accounted for on trade date. Realized gains and losses on security transactions are determined on a specific identification basis. Estimated expenses are accrued daily. Dividend income recorded on the ex-dividend date except
that certain dividends from foreign securities are recognized as soon as the Fund is notified of the ex-dividend date. Distributions to shareholders are recorded on the ex-dividend date and are determined according to income tax regulations (tax basis). Distributable earnings determined on a tax basis may differ from earnings recorded in accordance with accounting principles generally accepted in the United States of America. These differences may be permanent or temporary. Permanent differences are reclassified among capital accounts to reflect their tax character. These reclassifications have no impact on net assets or the results of operations. Temporary differences are not reclassified, as they may reverse in subsequent periods.
Common expenses incurred by the Trust are allocated among the funds based on the ratio of net assets of each fund to the combined net assets of the Trust. Fund specific expenses are charged directly to the fund that incurred the expense.
Realized and unrealized gains and losses and net investment income, not including class specific expenses, are allocated daily to each class of shares based upon the relative proportion of net assets of each class. Differences in per share distributions, by class, are generally due to differences in class specific expenses.
g. Accounting Estimates
The preparation of financial statements in accordance with U.S. GAAP requires management to make estimates and assumptions that affect the reported amounts of assets and liabilities at the date of the financial statements and the amounts of income and expenses during the reporting period. Actual results could differ from those estimates.
h. Guarantees and Indemnifications
Under the Trust’s organizational documents, its officers and trustees are indemnified by the Trust against certain liabilities arising out of the performance of their duties to the Trust. Additionally, in the normal course of business, the Trust, on behalf of the Fund, enters into contracts with service providers that contain general indemnification clauses. The Trust’s maximum exposure under these arrangements is unknown as this would involve future claims that may be made against the Trust that have not yet occurred. Currently, the Trust expects the risk of loss to be remote.
| FSV-22 | Semiannual Report |
FRANKLIN TEMPLETON VARIABLE INSURANCE PRODUCTS TRUST
NOTES TO FINANCIAL STATEMENTS (UNAUDITED)
Franklin Small Cap Value VIP Fund (continued)
2. Shares of Beneficial Interest
At June 30, 2014, there were an unlimited number of shares authorized (without par value). Transactions in the Fund’s shares were as follows:
| Six Months Ended June 30, 2014 |
Year Ended December 31, 2013 |
|||||||||||||||||
| Shares | Amount | Shares | Amount | |||||||||||||||
| Class 1 Shares: | ||||||||||||||||||
| Shares sold | 62,421 | $ | 1,504,950 | 854,519 | $ | 17,437,814 | ||||||||||||
| Shares issued in reinvestment of distributions | 206,102 | 4,785,680 | 64,172 | 1,296,273 | ||||||||||||||
| Shares redeemed | (202,214 | ) | (4,877,667 | ) | (536,406 | ) | (11,405,205 | ) | ||||||||||
|
|
|
|||||||||||||||||
| Net increase (decrease) |
66,309 | $ | 1,412,963 | 382,285 | $ | 7,328,882 | ||||||||||||
|
|
|
|||||||||||||||||
| Class 2 Shares: | ||||||||||||||||||
| Shares sold |
1,986,661 | $ | 46,908,812 | 6,730,565 | $ | 138,529,743 | ||||||||||||
| Shares issued in reinvestment of distributions | 5,364,390 | 122,093,507 | 2,167,294 | 42,999,117 | ||||||||||||||
| Shares redeemed | (5,593,601 | ) | (132,728,002 | ) | (12,704,970 | ) | (265,137,514 | ) | ||||||||||
|
|
|
|||||||||||||||||
| Net increase (decrease) |
1,757,450 | $ | 36,274,317 | (3,807,111 | ) | $ | (83,608,654 | ) | ||||||||||
|
|
|
|||||||||||||||||
| Class 4 Shares: | ||||||||||||||||||
| Shares sold |
44,169 | $ | 1,068,555 | 205,689 | $ | 4,293,023 | ||||||||||||
| Shares issued on reinvestment of distributions | 112,435 | 2,596,120 | 49,338 | 991,698 | ||||||||||||||
| Shares redeemed | (202,696 | ) | (4,842,025 | ) | (538,222 | ) | (11,316,720 | ) | ||||||||||
|
|
|
|||||||||||||||||
| Net increase (decrease) |
(46,092 | ) | $ | (1,177,350 | ) | (283,195 | ) | $ | (6,031,999 | ) | ||||||||
|
|
|
|||||||||||||||||
3. Transactions With Affiliates
Franklin Resources, Inc. is the holding company for various subsidiaries that together are referred to as Franklin Templeton Investments. Certain officers and trustees of the Fund are also officers and/or directors of the following subsidiaries:
| Subsidiary | Affiliation | |
| Franklin Advisory Services, LLC (Advisory Services) | Investment manager | |
| Franklin Templeton Services, LLC (FT Services) | Administrative manager | |
| Franklin Templeton Distributors, Inc. (Distributors) | Principal underwriter | |
| Franklin Templeton Investor Services, LLC (Investor Services) | Transfer agent |
a. Management Fees
The Fund pays an investment management fee to Advisory Services based on the average daily net assets of the Fund as follows:
| Annualized Fee Rate | Net Assets | |
| 0.750% | Up to and including $200 million | |
| 0.635% | Over $200 million, up to and including $700 million | |
| 0.600% | Over $700 million, up to and including $1.2 billion | |
| 0.575% | Over $1.2 billion, up to and including $1.3 billion | |
| 0.475% | In excess of $1.3 billion |
| Semiannual Report | FSV-23 |
FRANKLIN TEMPLETON VARIABLE INSURANCE PRODUCTS TRUST
NOTES TO FINANCIAL STATEMENTS (UNAUDITED)
Franklin Small Cap Value VIP Fund (continued)
3. Transactions With Affiliates (continued)
a. Management Fees (continued)
Effective May 1, 2014, the Fund combined its investment management and administration agreements as approved by the Board. The fees paid under the combined agreement do not exceed the aggregate fees that were paid under the separate agreements.
Prior to May 1, 2014, the Fund paid fees to Advisory Services based on the average daily net assets of the Fund as follows:
| Annualized Fee Rate | Net Assets | |
| 0.600% | Up to and including $200 million | |
| 0.500% | Over $200 million, up to and including $1.3 billion | |
| 0.400% | In excess of $1.3 billion |
b. Administrative Fees
Effective May 1, 2014, under an agreement with Advisory Services, FT Services provides administrative services to the Fund. The fee is paid by Advisory Services based on the Fund’s average daily net assets, and is not an additional expense of the Fund.
Prior to May 1, 2014, the Fund paid administrative fees to FT Services based on the average daily net assets of the Fund as follows:
| Annualized Fee Rate | Net Assets | |
| 0.150% | Up to and including $200 million | |
| 0.135% | Over $200 million, up to and including $700 million | |
| 0.100% | Over $700 million, up to and including $1.2 billion | |
| 0.075% | In excess of $1.2 billion |
c. Distribution Fees
The Board has adopted distribution plans for Class 2 and Class 4 shares pursuant to Rule 12b-1 under the 1940 Act. Under the Fund’s compensation distribution plans, the Fund pays Distributors for costs incurred in connection with the servicing, sale and distribution of the Fund’s shares up to 0.35% per year of its average daily net assets of each class. Some distribution fees are not charged on shares held by affiliates. The Board has agreed to limit the current rate to 0.25% per year for Class 2. The plan year, for purposes of monitoring compliance with the maximum annual plan rates, is February 1 through January 31.
d. Transfer Agent Fees
Investor Services, under terms of an agreement, performs shareholder servicing for the Fund and is not paid by the Fund for the services.
e. Investment in Institutional Fiduciary Trust Money Market Portfolio
The Fund invests in the Institutional Fiduciary Trust Money Market Portfolio (Sweep Money Fund), an affiliated open-end management investment company. Management fees paid by the Fund are waived on assets invested in the Sweep Money Fund, in an amount not to exceed the management and administrative fees paid directly or indirectly by the Sweep Money Fund, as noted on the Statement of Operations. Prior to January 1, 2014, the waiver was accounted for as a reduction to management fees.
4. Expense Offset Arrangement
The Fund has entered into an arrangement with its custodian whereby credits realized as a result of uninvested cash balances are used to reduce a portion of the Fund’s custodian expenses. During the period ended June 30, 2014, the custodian fees were reduced as noted in the Statement of Operations.
| FSV-24 | Semiannual Report |
FRANKLIN TEMPLETON VARIABLE INSURANCE PRODUCTS TRUST
NOTES TO FINANCIAL STATEMENTS (UNAUDITED)
Franklin Small Cap Value VIP Fund (continued)
5. Income Taxes
At June 30, 2014, the cost of investments and net unrealized appreciation (depreciation) for income tax purposes were as follows:
| Cost of investments |
$1,029,321,550 | |
|
| ||
| Unrealized appreciation |
$ 697,820,603 | |
| Unrealized depreciation |
(31,151,874) | |
|
| ||
| Net unrealized appreciation (depreciation) |
$ 666,668,729 | |
|
| ||
Differences between income and/or capital gains as determined on a book basis and a tax basis are primarily due to differing treatment of passive foreign investment company shares.
6. Investment Transactions
Purchases and sales of investments (excluding short term securities) for the period ended June 30, 2014, aggregated $156,775,859 and $236,227,735, respectively.
7. Credit Facility
The Fund, together with other U.S. registered and foreign investment funds (collectively, Borrowers), managed by Franklin Templeton Investments, are borrowers in a joint syndicated senior unsecured credit facility totaling $1.5 billion (Global Credit Facility) which matures on February 13, 2015. This Global Credit Facility provides a source of funds to the Borrowers for temporary and emergency purposes, including the ability to meet future unanticipated or unusually large redemption requests.
Under the terms of the Global Credit Facility, the Fund shall, in addition to interest charged on any borrowings made by the Fund and other costs incurred by the Fund, pay its share of fees and expenses incurred in connection with the implementation and maintenance of the Global Credit Facility, based upon its relative share of the aggregate net assets of all of the Borrowers, including an annual commitment fee of 0.07% based upon the unused portion of the Global Credit Facility. These fees are reflected in other expenses on the Statement of Operations. During the period ended June 30, 2014, the Fund did not use the Global Credit Facility.
8. Fair Value Measurements
The Fund follows a fair value hierarchy that distinguishes between market data obtained from independent sources (observable inputs) and the Fund’s own market assumptions (unobservable inputs). These inputs are used in determining the value of the Fund’s financial instruments and are summarized in the following fair value hierarchy:
| • | Level 1 – quoted prices in active markets for identical financial instruments |
| • | Level 2 – other significant observable inputs (including quoted prices for similar financial instruments, interest rates, prepayment speed, credit risk, etc.) |
| • | Level 3 – significant unobservable inputs (including the Fund’s own assumptions in determining the fair value of financial instruments) |
The input levels are not necessarily an indication of the risk or liquidity associated with financial instruments at that level.
For movements between the levels within the fair value hierarchy, the Fund has adopted a policy of recognizing the transfers as of the date of the underlying event which caused the movement.
| Semiannual Report | FSV-25 |
FRANKLIN TEMPLETON VARIABLE INSURANCE PRODUCTS TRUST
NOTES TO FINANCIAL STATEMENTS (UNAUDITED)
Franklin Small Cap Value VIP Fund (continued)
8. Fair Value Measurements (continued)
A summary of inputs used as of June 30, 2014, in valuing the Fund’s assets carried at fair value, is as follows:
| Level 1 | Level 2 | Level 3 | Total | |||||||||||||
| Assets: | ||||||||||||||||
| Investments in Securities: |
||||||||||||||||
| Equity Investmentsa |
$ | 1,628,602,789 | $ | — | $ | — | $ | 1,628,602,789 | ||||||||
| Short Term Investments |
54,880,539 | 12,506,951 | — | 67,387,490 | ||||||||||||
|
|
|
|||||||||||||||
| Total Investments in Securities |
$ | 1,683,483,328 | $ | 12,506,951 | $ | — | $ | 1,695,990,279 | ||||||||
|
|
|
|||||||||||||||
aFor detailed categories, see the accompanying Statement of Investments.
9. New Accounting Pronouncements
In June 2014, the Financial Accounting Standards Board issued Accounting Standards Update (ASU) No. 2014-11, Transfers and Servicing (Topic 860), Repurchase-to-Maturity Transactions, Repurchase Financings, and Disclosures. The ASU changes the accounting for certain repurchase agreements and expands disclosure requirements related to repurchase agreements, securities lending, repurchase-to-maturity and similar transactions. The ASU is effective for interim and annual reporting periods beginning after December 15, 2014. Management is currently evaluating the impact, if any, of applying this provision.
10. Subsequent Events
The Fund has evaluated subsequent events through the issuance of the financial statements and determined that no events have occurred that require disclosure.
| FSV-26 | Semiannual Report |
Franklin Small-Mid Cap Growth VIP Fund
(Formerly, Franklin Small-Mid Cap Growth Securities Fund)
This semiannual report for Franklin Small-Mid Cap Growth VIP Fund covers the
period ended June 30, 2014.
Class 2 Performance Summary as of June 30, 2014
Franklin Small-Mid Cap Growth VIP Fund – Class 2 delivered a +5.37% total return* for the six-month period ended June 30, 2014.
*The Fund has a fee waiver associated with its investments in a Franklin Templeton money fund, contractually guaranteed through at least its current fiscal year-end. Fund investment results reflect the fee waiver, to the extent applicable; without this reduction, the results would have been lower.
Performance reflects the Fund’s Class 2 operating expenses, but does not include any contract fees, expenses or sales charges. If they had been included, performance would be lower. These charges and deductions, particularly for variable life policies, can have a significant effect on contract values and insurance benefits. See the contract prospectus for a complete description of these expenses, including sales charges.
Performance data represent past performance, which does not guarantee future results. Investment return and principal value will fluctuate, and you may have a gain or loss when you sell your shares. Current performance may differ from figures shown.
| Semiannual Report | FSC-1 |
FRANKLIN SMALL-MID CAP GROWTH VIP FUND
1. Please see Index Descriptions following the Fund Summaries.
2. Source: © 2014 Morningstar. One cannot invest directly in an index, and an index is not representative of the Fund’s portfolio. Please see Index Descriptions following the Fund Summaries.
3. Source: Bureau of Labor Statistics.
| FSC-2 | Semiannual Report |
FRANKLIN SMALL-MID CAP GROWTH VIP FUND
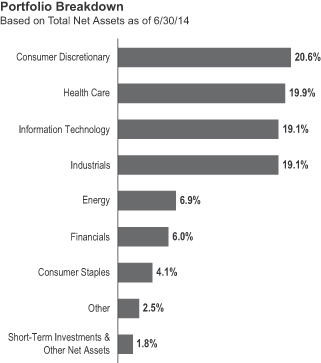
equipment manufacturer Manitowoc and equipment rental company United Rentals. Under Armour reported better-than-expected quarterly earnings, resulting from its customers’ increasing health consciousness and the rising popularity of sportswear for women. The company raised its full-year 2014 guidance, supported by broad-based strength in its apparel and footwear segments and solid growth in international markets. Manitowoc reported solid quarterly earnings, resulting from new product introductions, cost control measures and its foodservice division’s performance. Manitowoc’s stock price surged near period-end following news that an activist investment firm sought to break up the company, which indicated it would review the potential long-term benefits of separating its crane and foodservice businesses. United Rentals continued to deliver stronger-than-expected quarterly earnings, driven by growth in equipment rentals and sales.
In contrast, key detractors from the Fund’s relative performance included stock selection in the consumer staples, consumer discretionary and health care sectors. In consumer staples, Whole Foods Market hurt relative results as heightened competition in the organic food market led the natural and organic foods retailer
| Semiannual Report | FSC-3 |
FRANKLIN SMALL-MID CAP GROWTH VIP FUND
Thank you for your participation in Franklin Small-Mid Cap Growth VIP Fund. We look forward to serving your future investment needs.
The foregoing information reflects our analysis, opinions and portfolio holdings as of June 30, 2014, the end of the reporting period. The way we implement our main investment strategies and the resulting portfolio holdings may change depending on factors such as market and economic conditions. These opinions may not be relied upon as investment advice or an offer for a particular security. The information is not a complete analysis of every aspect of any market, country, industry, security or the Fund. Statements of fact are from sources considered reliable, but the investment manager makes no representation or warranty as to their completeness or accuracy. Although historical performance is no guarantee of future results, these insights may help you understand our investment management philosophy.
| FSC-4 | Semiannual Report |
FRANKLIN SMALL-MID CAP GROWTH VIP FUND
Class 2 Fund Expenses
| Class 2 | Beginning Account Value 1/1/14 |
Ending Account Value 6/30/14 |
Fund-Level Expenses 1/1/14–6/30/14 |
|||||||||
| Actual | $1,000 | $1,053.70 | $5.35 | |||||||||
| Hypothetical (5% return before expenses) | $1,000 | $1,019.59 | $5.26 | |||||||||
*Expenses are calculated using the most recent six-month annualized expense ratio, net of expense waivers, for the Fund’s Class 2 shares (1.05%), which does not include any ongoing expenses of the Contract for which the Fund is an investment option, multiplied by the average account value over the period, multiplied by 181/365 to reflect the one-half year period.
| Semiannual Report | FSC-5 |
FRANKLIN TEMPLETON VARIABLE INSURANCE PRODUCTS TRUST
Financial Highlights
Franklin Small-Mid Cap Growth VIP Fund
| Six Months Ended (unaudited) |
Year Ended December 31, | |||||||||||||||||||||||
| 2013 | 2012 | 2011 | 2010 | 2009 | ||||||||||||||||||||
| Class 1 | ||||||||||||||||||||||||
| Per share operating performance (for a share outstanding throughout the period) |
||||||||||||||||||||||||
| Net asset value, beginning of period |
$28.38 | $21.87 | $21.19 | $22.21 | $17.36 | $12.06 | ||||||||||||||||||
|
|
|
|||||||||||||||||||||||
| Income from investment operationsa: | ||||||||||||||||||||||||
| Net investment income (loss)b |
(0.04 | ) | (0.09 | ) | (0.01 | )c | (0.05 | ) | (0.01 | ) | (0.10 | )d | ||||||||||||
| Net realized and unrealized gains (losses) |
1.49 | 8.19 | 2.27 | (0.97 | ) | 4.86 | 5.40 | |||||||||||||||||
|
|
|
|||||||||||||||||||||||
| Total from investment operations |
1.45 | 8.10 | 2.26 | (1.02 | ) | 4.85 | 5.30 | |||||||||||||||||
|
|
|
|||||||||||||||||||||||
| Less distributions from net realized gains |
(5.40 | ) | (1.59 | ) | (1.58 | ) | — | — | — | |||||||||||||||
|
|
|
|||||||||||||||||||||||
| Net asset value, end of period |
$24.43 | $28.38 | $21.87 | $21.19 | $22.21 | $17.36 | ||||||||||||||||||
|
|
|
|||||||||||||||||||||||
| Total returne |
5.53% | 38.50% | 11.12% | (4.59)% | 27.94% | 43.95% | ||||||||||||||||||
| Ratios to average net assetsf | ||||||||||||||||||||||||
| Expenses |
0.80% | g | 0.80% | h | 0.80% | 0.79% | 0.79% | 0.80% | h | |||||||||||||||
| Net investment income (loss) |
(0.32)% | (0.35)% | (0.03)% | c | (0.21)% | (0.07)% | (0.72)% | d | ||||||||||||||||
| Supplemental data | ||||||||||||||||||||||||
| Net assets, end of period (000’s) |
$100,425 | $98,020 | $75,977 | $76,384 | $89,826 | $79,670 | ||||||||||||||||||
| Portfolio turnover rate |
25.05% | 42.77% | 41.44% | 45.00% | 46.69% | 63.93% | ||||||||||||||||||
aThe amount shown for a share outstanding throughout the period may not correlate with the Statement of Operations for the period due to the timing of sales and repurchases of the Fund shares in relation to income earned and/or fluctuating fair value of the investments of the Fund.
bBased on average daily shares outstanding.
cNet investment income per share includes approximately $0.03 per share received in the form of special dividends. Excluding these amounts, the ratio of net investment income to average net assets would have been (0.16)%.
dNet investment income per share includes approximately $(0.06) per share as a return of capital adjustment to a previously recorded special dividend received by the Fund. Excluding this non-recurring amount, the ratio of net investment income to average net assets would have been (0.22)%.
eTotal return does not include fees, charges or expenses imposed by the variable annuity and life insurance contracts for which the Franklin Templeton Variable Insurance Products Trust serves as an underlying investment vehicle. Total return is not annualized for periods less than one year.
fRatios are annualized for periods less than one year.
gBenefit of waiver and payment by affiliate rounds to less than 0.01%.
hBenefit of expense reduction rounds to less than 0.01%.
| FSC-6 | Semiannual Report | The accompanying notes are an integral part of these financial statements. |
FRANKLIN TEMPLETON VARIABLE INSURANCE PRODUCTS TRUST
FINANCIAL HIGHLIGHTS
Franklin Small-Mid Cap Growth VIP Fund (continued)
| Six Months Ended (unaudited) |
Year Ended December 31, | |||||||||||||||||||||||
| 2013 | 2012 | 2011 | 2010 | 2009 | ||||||||||||||||||||
| Class 2 | ||||||||||||||||||||||||
| Per share operating performance (for a share outstanding throughout the period) |
||||||||||||||||||||||||
| Net asset value, beginning of period |
$27.16 | $21.04 | $20.49 | $21.54 | $16.87 | $11.75 | ||||||||||||||||||
|
|
|
|||||||||||||||||||||||
| Income from investment operationsa: | ||||||||||||||||||||||||
| Net investment income (loss)b |
(0.08 | ) | (0.14 | ) | (0.06 | )c | (0.10 | ) | (0.06 | ) | (0.13 | )d | ||||||||||||
| Net realized and unrealized gains (losses) |
1.42 | 7.85 | 2.19 | (0.95 | ) | 4.73 | 5.25 | |||||||||||||||||
|
|
|
|||||||||||||||||||||||
| Total from investment operations |
1.34 | 7.71 | 2.13 | (1.05 | ) | 4.67 | 5.12 | |||||||||||||||||
|
|
|
|||||||||||||||||||||||
| Less distributions from net realized gains |
(5.40 | ) | (1.59 | ) | (1.58 | ) | — | — | — | |||||||||||||||
|
|
|
|||||||||||||||||||||||
| Net asset value, end of period |
$23.10 | $27.16 | $21.04 | $20.49 | $21.54 | $16.87 | ||||||||||||||||||
|
|
|
|||||||||||||||||||||||
| Total returne |
5.37% | 38.15% | 10.85% | (4.87)% | 27.68% | 43.57% | ||||||||||||||||||
| Ratios to average net assetsf | ||||||||||||||||||||||||
| Expenses |
1.05% | g | 1.05% | h | 1.05% | 1.04% | 1.04% | 1.05% | h | |||||||||||||||
| Net investment income (loss) |
(0.57)% | (0.60)% | (0.28)% | c | (0.46)% | (0.32)% | (0.92)% | d | ||||||||||||||||
| Supplemental data | ||||||||||||||||||||||||
| Net assets, end of period (000’s) |
$630,357 | $660,806 | $670,193 | $717,086 | $939,481 | $813,480 | ||||||||||||||||||
| Portfolio turnover rate |
25.05% | 42.77% | 41.44% | 45.00% | 46.69% | 63.93% | ||||||||||||||||||
aThe amount shown for a share outstanding throughout the period may not correlate with the Statement of Operations for the period due to the timing of sales and repurchases of the Fund shares in relation to income earned and/or fluctuating fair value of the investments of the Fund.
bBased on average daily shares outstanding.
cNet investment income per share includes approximately $0.03 per share received in the form of special dividends. Excluding these amounts, the ratio of net investment income to average net assets would have been (0.41)%.
dNet investment income per share includes approximately $(0.06) per share as a return of capital adjustment to a previously recorded special dividend received by the Fund. Excluding this non-recurring amount, the ratio of net investment income to average net assets would have been (0.47)%.
eTotal return does not include fees, charges or expenses imposed by the variable annuity and life insurance contracts for which the Franklin Templeton Variable Insurance Products Trust serves as an underlying investment vehicle. Total return is not annualized for periods less than one year.
fRatios are annualized for periods less than one year.
gBenefit of waiver and payment by affiliate rounds to less than 0.01%.
hBenefit of expense reduction rounds to less than 0.01%.
| The accompanying notes are an integral part of these financial statements. | Semiannual Report | FSC-7 |
FRANKLIN TEMPLETON VARIABLE INSURANCE PRODUCTS TRUST
FINANCIAL HIGHLIGHTS
Franklin Small-Mid Cap Growth VIP Fund (continued)
| Six Months Ended (unaudited) |
Year Ended December 31, | |||||||||||||||||||||||
| 2013 | 2012 | 2011 | 2010 | 2009 | ||||||||||||||||||||
| Class 4 | ||||||||||||||||||||||||
| Per share operating performance (for a share outstanding throughout the period) |
||||||||||||||||||||||||
| Net asset value, beginning of period |
$27.72 | $21.47 | $20.90 | $21.98 | $17.24 | $12.02 | ||||||||||||||||||
|
|
|
|||||||||||||||||||||||
| Income from investment operationsa: | ||||||||||||||||||||||||
| Net investment income (loss)b |
(0.09 | ) | (0.17 | ) | (0.09 | )c | (0.12 | ) | (0.07 | ) | (0.15 | )d | ||||||||||||
| Net realized and unrealized gains (losses) |
1.44 | 8.01 | 2.24 | (0.96 | ) | 4.81 | 5.37 | |||||||||||||||||
|
|
|
|||||||||||||||||||||||
| Total from investment operations |
1.35 | 7.84 | 2.15 | (1.08 | ) | 4.74 | 5.22 | |||||||||||||||||
|
|
|
|||||||||||||||||||||||
| Less distributions from net realized gains |
(5.40 | ) | (1.59 | ) | (1.58 | ) | — | — | — | |||||||||||||||
|
|
|
|||||||||||||||||||||||
| Net asset value, end of period |
$23.67 | $27.72 | $21.47 | $20.90 | $21.98 | $17.24 | ||||||||||||||||||
|
|
|
|||||||||||||||||||||||
| Total returne |
5.30% | 37.99% | 10.79% | (4.91)% | 27.49% | 43.43% | ||||||||||||||||||
| Ratios to average net assetsf | ||||||||||||||||||||||||
| Expenses |
1.15% | g | 1.15% | h | 1.15% | 1.14% | 1.14% | 1.15% | h | |||||||||||||||
| Net investment income (loss) |
(0.67)% | (0.70)% | (0.38)% | c | (0.56)% | (0.42)% | (1.07)% | d | ||||||||||||||||
| Supplemental data | ||||||||||||||||||||||||
| Net assets, end of period (000’s) |
$18,390 | $19,132 | $12,000 | $12,664 | $15,413 | $11,029 | ||||||||||||||||||
| Portfolio turnover rate |
25.05% | 42.77% | 41.44% | 45.00% | 46.69% | 63.93% | ||||||||||||||||||
aThe amount shown for a share outstanding throughout the period may not correlate with the Statement of Operations for the period due to the timing of sales and repurchases of the Fund shares in relation to income earned and/or fluctuating fair value of the investments of the Fund.
bBased on average daily shares outstanding.
cNet investment income per share includes approximately $0.03 per share received in the form of special dividends. Excluding these amounts, the ratio of net investment income to average net assets would have been (0.51)%.
dNet investment income per share includes approximately $(0.06) per share as a return of capital adjustment to a previously recorded special dividend received by the Fund. Excluding this non-recurring amount, the ratio of net investment income to average net assets would have been (0.57)%.
eTotal return does not include fees, charges or expenses imposed by the variable annuity and life insurance contracts for which the Franklin Templeton Variable Insurance Products Trust serves as an underlying investment vehicle. Total return is not annualized for periods less than one year.
fRatios are annualized for periods less than one year.
gBenefit of waiver and payment by affiliate rounds to less than 0.01%.
hBenefit of expense reduction rounds to less than 0.01%.
| FSC-8 | Semiannual Report | The accompanying notes are an integral part of these financial statements. |
FRANKLIN TEMPLETON VARIABLE INSURANCE PRODUCTS TRUST
Statement of Investments, June 30, 2014 (unaudited)
| Franklin Small-Mid Cap Growth VIP Fund | ||||||||||
| Shares | Value | |||||||||
| Common Stocks 98.2% |
||||||||||
| Consumer Discretionary 20.6% |
||||||||||
| a | AMC Networks Inc., A |
41,800 | $ | 2,570,282 | ||||||
| BorgWarner Inc. |
108,000 | 7,040,520 | ||||||||
| a | BRP Inc. (Canada) |
118,400 | 2,919,893 | |||||||
| a | Buffalo Wild Wings Inc. |
33,500 | 5,551,285 | |||||||
| a | Charter Communications Inc., A |
26,900 | 4,260,422 | |||||||
| a | Chipotle Mexican Grill Inc. |
11,600 | 6,873,116 | |||||||
| Dick’s Sporting Goods Inc. |
149,000 | 6,937,440 | ||||||||
| GNC Holdings Inc., A |
43,700 | 1,490,170 | ||||||||
| a | Grand Canyon Education Inc. |
103,300 | 4,748,701 | |||||||
| Harman International Industries Inc. |
44,200 | 4,748,406 | ||||||||
| a | HomeAway Inc. |
116,300 | 4,049,566 | |||||||
| a,b | Imax Corp. (Canada) |
136,800 | 3,896,064 | |||||||
| a | Jarden Corp. |
127,900 | 7,590,865 | |||||||
| a | Kate Spade & Co. |
75,200 | 2,868,128 | |||||||
| KB Home |
416,800 | 7,785,824 | ||||||||
| a | Liberty Media Corp., A |
46,100 | 6,300,948 | |||||||
| a | Liberty Ventures, A |
62,400 | 4,605,120 | |||||||
| Marriott International Inc., A |
77,900 | 4,993,390 | ||||||||
| a | Michael Kors Holdings Ltd. |
36,100 | 3,200,265 | |||||||
| a | Netflix Inc. |
16,300 | 7,181,780 | |||||||
| a | Norwegian Cruise Line Holdings Ltd. |
155,600 | 4,932,520 | |||||||
| The Ryland Group Inc. |
100,300 | 3,955,832 | ||||||||
| a | Shutterfly Inc. |
88,700 | 3,819,422 | |||||||
| Starwood Hotels & Resorts Worldwide Inc. |
79,200 | 6,400,944 | ||||||||
| a | Tenneco Inc. |
130,000 | 8,541,000 | |||||||
| Tractor Supply Co. |
69,500 | 4,197,800 | ||||||||
| a | Under Armour Inc., A |
127,876 | 7,607,343 | |||||||
| Wolverine World Wide Inc. |
273,100 | 7,116,986 | ||||||||
| Wynn Resorts Ltd. |
40,700 | 8,447,692 | ||||||||
|
|
|
|||||||||
| 154,631,724 | ||||||||||
|
|
|
|||||||||
| Consumer Staples 4.1% |
||||||||||
| a | Boston Beer Inc., A |
22,700 | 5,073,904 | |||||||
| Mead Johnson Nutrition Co., A |
102,400 | 9,540,608 | ||||||||
| a | Monster Beverage Corp. |
74,300 | 5,277,529 | |||||||
| a | TreeHouse Foods Inc. |
79,200 | 6,341,544 | |||||||
| Whole Foods Market Inc. |
116,900 | 4,515,847 | ||||||||
|
|
|
|||||||||
| 30,749,432 | ||||||||||
|
|
|
|||||||||
| Energy 6.9% |
||||||||||
| Cabot Oil & Gas Corp., A |
193,300 | 6,599,262 | ||||||||
| a | Cameron International Corp. |
39,700 | 2,688,087 | |||||||
| a | Concho Resources Inc. |
67,300 | 9,724,850 | |||||||
| a | Diamondback Energy Inc. |
67,100 | 5,958,480 | |||||||
| a | Eclipse Resources Corp. |
84,400 | 2,120,972 | |||||||
| a | Memorial Resource Development Corp. |
81,900 | 1,995,084 | |||||||
| a | Oasis Petroleum Inc. |
195,400 | 10,920,906 | |||||||
| Oceaneering International Inc. |
41,100 | 3,211,143 | ||||||||
| a | Rex Energy Corp. |
193,300 | 3,423,343 | |||||||
| Superior Energy Services Inc. |
131,900 | 4,766,866 | ||||||||
|
|
|
|||||||||
| 51,408,993 | ||||||||||
|
|
|
|||||||||
| Semiannual Report | FSC-9 |
FRANKLIN TEMPLETON VARIABLE INSURANCE PRODUCTS TRUST
STATEMENT OF INVESTMENTS (UNAUDITED)
Franklin Small-Mid Cap Growth VIP Fund (continued)
| Shares | Value | |||||||||
| Common Stocks (continued) |
||||||||||
| Financials 6.0% |
||||||||||
| a | Affiliated Managers Group Inc. |
48,400 | $ | 9,941,360 | ||||||
| Brown & Brown Inc. |
129,800 | 3,986,158 | ||||||||
| Intercontinental Exchange Inc. |
43,808 | 8,275,331 | ||||||||
| Jones Lang LaSalle Inc. |
26,600 | 3,361,974 | ||||||||
| Lazard Ltd., A |
107,400 | 5,537,544 | ||||||||
| a | Signature Bank |
68,500 | 8,643,330 | |||||||
| T. Rowe Price Group Inc. |
62,100 | 5,241,861 | ||||||||
|
|
|
|||||||||
| 44,987,558 | ||||||||||
|
|
|
|||||||||
| Health Care 19.9% |
||||||||||
| a | Actavis PLC |
40,600 | 9,055,830 | |||||||
| Agilent Technologies Inc. |
95,000 | 5,456,800 | ||||||||
| a | Alexion Pharmaceuticals Inc. |
36,100 | 5,640,625 | |||||||
| a | Alnylam Pharmaceuticals Inc. |
51,100 | 3,227,987 | |||||||
| a | BioMarin Pharmaceutical Inc. |
28,100 | 1,748,101 | |||||||
| a | CareFusion Corp. |
105,900 | 4,696,665 | |||||||
| a | Catamaran Corp. |
121,300 | 5,356,608 | |||||||
| a | Celldex Therapeutics Inc. |
209,800 | 3,423,936 | |||||||
| a | Cerner Corp. |
102,800 | 5,302,424 | |||||||
| The Cooper Cos. Inc. |
54,800 | 7,427,044 | ||||||||
| a | DaVita HealthCare Partners Inc. |
105,700 | 7,644,224 | |||||||
| DENTSPLY International Inc. |
112,500 | 5,326,875 | ||||||||
| a | DexCom Inc. |
54,400 | 2,157,504 | |||||||
| a | Edwards Lifesciences Corp. |
35,200 | 3,021,568 | |||||||
| a | Envision Healthcare Holdings Inc. |
144,200 | 5,178,222 | |||||||
| a | HCA Holdings Inc. |
148,300 | 8,361,154 | |||||||
| a | HeartWare International Inc. |
30,806 | 2,726,331 | |||||||
| a | HMS Holdings Corp. |
129,300 | 2,639,013 | |||||||
| a | Illumina Inc. |
30,100 | 5,374,054 | |||||||
| a | Incyte Corp. |
57,500 | 3,245,300 | |||||||
| a | Insulet Corp. |
51,000 | 2,023,170 | |||||||
| a | Karyopharm Therapeutics Inc. |
66,213 | 3,082,215 | |||||||
| a | Medivation Inc. |
51,546 | 3,973,166 | |||||||
| a | Mettler-Toledo International Inc. |
29,700 | 7,519,446 | |||||||
| Perrigo Co. PLC |
57,885 | 8,437,317 | ||||||||
| a | Puma Biotechnology Inc. |
14,100 | 930,600 | |||||||
| a | Quintiles Transnational Holdings Inc. |
140,300 | 7,476,587 | |||||||
| a | Sagent Pharmaceuticals Inc. |
154,800 | 4,003,128 | |||||||
| St. Jude Medical Inc. |
74,700 | 5,172,975 | ||||||||
| a | Tandem Diabetes Care Inc. |
87,968 | 1,430,360 | |||||||
| a | Vertex Pharmaceuticals Inc. |
26,100 | 2,471,148 | |||||||
| Zoetis Inc. |
173,100 | 5,585,937 | ||||||||
|
|
|
|||||||||
| 149,116,314 | ||||||||||
|
|
|
|||||||||
| Industrials 19.1% |
||||||||||
| Acuity Brands Inc. |
39,500 | 5,460,875 | ||||||||
| a | The Advisory Board Co. |
81,300 | 4,211,340 | |||||||
| Allegiant Travel Co. |
53,612 | 6,313,885 | ||||||||
| AMETEK Inc. |
195,500 | 10,220,740 | ||||||||
| a | Colfax Corp. |
104,300 | 7,774,522 | |||||||
| a | DigitalGlobe Inc. |
170,100 | 4,728,780 | |||||||
| Flowserve Corp. |
111,000 | 8,252,850 | ||||||||
| FSC-10 | Semiannual Report |
FRANKLIN TEMPLETON VARIABLE INSURANCE PRODUCTS TRUST
STATEMENT OF INVESTMENTS (UNAUDITED)
Franklin Small-Mid Cap Growth VIP Fund (continued)
| Shares | Value | |||||||||
| Common Stocks (continued) |
||||||||||
| Industrials (continued) |
||||||||||
| a | Genesee & Wyoming Inc. |
56,700 | $ | 5,953,500 | ||||||
| a | Hexcel Corp. |
134,000 | 5,480,600 | |||||||
| a | IHS Inc., A |
68,200 | 9,252,694 | |||||||
| Interface Inc. |
142,400 | 2,682,816 | ||||||||
| J.B. Hunt Transport Services Inc. |
63,100 | 4,655,518 | ||||||||
| a | Jacobs Engineering Group Inc. |
74,200 | 3,953,376 | |||||||
| Kansas City Southern |
37,700 | 4,053,127 | ||||||||
| The Manitowoc Co. Inc. |
187,000 | 6,144,820 | ||||||||
| a | Proto Labs Inc. |
36,400 | 2,981,888 | |||||||
| Robert Half International Inc. |
149,200 | 7,122,808 | ||||||||
| Rockwell Automation Inc. |
31,700 | 3,967,572 | ||||||||
| Roper Industries Inc. |
84,770 | 12,377,268 | ||||||||
| a | Spirit Airlines Inc. |
94,200 | 5,957,208 | |||||||
| Towers Watson & Co. |
23,100 | 2,407,713 | ||||||||
| a | United Rentals Inc. |
76,900 | 8,053,737 | |||||||
| a | Verisk Analytics Inc., A |
51,300 | 3,079,026 | |||||||
| W.W. Grainger Inc. |
12,600 | 3,203,802 | ||||||||
| a | WABCO Holdings Inc. |
43,200 | 4,614,624 | |||||||
|
|
|
|||||||||
| 142,905,089 | ||||||||||
|
|
|
|||||||||
| Information Technology 19.1% |
||||||||||
| a | Alliance Data Systems Corp. |
22,500 | 6,328,125 | |||||||
| a | ANSYS Inc. |
91,500 | 6,937,530 | |||||||
| Applied Materials Inc. |
346,400 | 7,811,320 | ||||||||
| Avago Technologies Ltd. (Singapore) |
111,300 | 8,021,391 | ||||||||
| a | Bottomline Technologies Inc. |
112,500 | 3,366,000 | |||||||
| a | Cognex Corp. |
180,100 | 6,915,840 | |||||||
| a | Demandware Inc. |
52,500 | 3,641,925 | |||||||
| a | Electronic Arts Inc. |
125,000 | 4,483,750 | |||||||
| a | Equinix Inc. |
25,000 | 5,252,250 | |||||||
| a | FleetCor Technologies Inc. |
58,100 | 7,657,580 | |||||||
| a | Global Eagle Entertainment Inc. |
233,700 | 2,897,880 | |||||||
| Intersil Corp., A |
544,900 | 8,146,255 | ||||||||
| a | JDS Uniphase Corp. |
316,400 | 3,945,508 | |||||||
| Lam Research Corp. |
57,700 | 3,899,366 | ||||||||
| a | LinkedIn Corp., A |
39,100 | 6,704,477 | |||||||
| Maxim Integrated Products Inc. |
146,600 | 4,956,546 | ||||||||
| a | NetSuite Inc. |
33,400 | 2,901,792 | |||||||
| a | NXP Semiconductors NV (Netherlands) |
156,200 | 10,337,316 | |||||||
| a | Pandora Media Inc. |
71,000 | 2,094,500 | |||||||
| a | Red Hat Inc. |
56,100 | 3,100,647 | |||||||
| a | Semtech Corp. |
94,700 | 2,476,405 | |||||||
| a | ServiceNow Inc. |
34,700 | 2,150,012 | |||||||
| a,b | Stratasys Ltd. |
22,004 | 2,500,315 | |||||||
| a | Trimble Navigation Ltd. |
210,400 | 7,774,280 | |||||||
| a | Twitter Inc. |
55,600 | 2,277,932 | |||||||
| a | ViaSat Inc. |
101,900 | 5,906,124 | |||||||
| a | Workday Inc. |
19,600 | 1,761,256 | |||||||
| Xilinx Inc. |
76,100 | 3,600,291 | ||||||||
| a | Yelp Inc. |
66,300 | 5,083,884 | |||||||
|
|
|
|||||||||
| 142,930,497 | ||||||||||
|
|
|
|||||||||
| Semiannual Report | FSC-11 |
FRANKLIN TEMPLETON VARIABLE INSURANCE PRODUCTS TRUST
STATEMENT OF INVESTMENTS (UNAUDITED)
Franklin Small-Mid Cap Growth VIP Fund (continued)
| Shares | Value | |||||||||
| Common Stocks (continued) |
||||||||||
| Materials 1.9% |
||||||||||
| Cytec Industries Inc. |
52,900 | $ | 5,576,718 | |||||||
| H.B. Fuller Co. |
79,013 | 3,800,525 | ||||||||
| Martin Marietta Materials Inc. |
36,400 | 4,806,620 | ||||||||
|
|
|
|||||||||
| 14,183,863 | ||||||||||
|
|
|
|||||||||
| Utilities 0.6% |
||||||||||
| a | Calpine Corp. |
191,000 | 4,547,710 | |||||||
|
|
|
|||||||||
| Total Common Stocks (Cost $471,135,034) |
735,461,180 | |||||||||
|
|
|
|||||||||
| Short Term Investments 3.1% |
||||||||||
| Money Market Funds (Cost $19,150,716) 2.5% |
||||||||||
| a,c | Institutional Fiduciary Trust Money Market Portfolio |
19,150,716 | 19,150,716 | |||||||
|
|
|
|||||||||
| d | Investments from Cash Collateral Received for Loaned Securities |
|||||||||
| Money Market Funds 0.6% |
||||||||||
| e | BNY Mellon Overnight Government Fund, 0.082% |
4,321,503 | 4,321,503 | |||||||
|
|
|
|||||||||
| Total Investments (Cost $494,607,253) 101.3% |
758,933,399 | |||||||||
| Other Assets, less Liabilities (1.3)% |
(9,761,998 | ) | ||||||||
|
|
|
|||||||||
| Net Assets 100.0% |
$ | 749,171,401 | ||||||||
|
|
|
|||||||||
aNon-income producing.
bA portion or all of the security is on loan at June 30, 2014. See Note 1(c).
cSee Note 3(e) regarding investments in the Institutional Fiduciary Trust Money Market Portfolio.
dSee Note 1(c) regarding securities on loan.
eThe rate shown is the annualized seven-day yield at period end.
| FSC-12 | Semiannual Report | The accompanying notes are an integral part of these financial statements. |
FRANKLIN TEMPLETON VARIABLE INSURANCE PRODUCTS TRUST
Financial Statements
Statement of Assets and Liabilities
June 30, 2014 (unaudited)
| Franklin Small-Mid Cap Growth VIP Fund |
||||
| Assets: | ||||
| Investments in securities: |
||||
| Cost - Unaffiliated issuers |
$ | 475,456,537 | ||
| Cost - Sweep Money Fund (Note 3e) |
19,150,716 | |||
|
|
|
|||
| Total cost of investments |
$ | 494,607,253 | ||
|
|
|
|||
| Value - Unaffiliated issuers |
$ | 739,782,683 | ||
| Value - Sweep Money Fund (Note 3e) |
19,150,716 | |||
|
|
|
|||
| Total value of investments (includes securities loaned in the amount of $4,301,966) |
758,933,399 | |||
| Receivables: |
||||
| Investment securities sold |
2,521,723 | |||
| Capital shares sold |
53,985 | |||
| Dividends and interest |
140,936 | |||
| Other assets |
353 | |||
|
|
|
|||
| Total assets |
761,650,396 | |||
|
|
|
|||
| Liabilities: | ||||
| Payables: |
||||
| Investment securities purchased |
6,065,467 | |||
| Capital shares redeemed |
1,137,750 | |||
| Management fees |
459,462 | |||
| Distribution fees |
267,264 | |||
| Payable upon return of securities loaned |
4,321,503 | |||
| Accrued expenses and other liabilities |
227,549 | |||
|
|
|
|||
| Total liabilities |
12,478,995 | |||
|
|
|
|||
| Net assets, at value |
$ | 749,171,401 | ||
|
|
|
|||
| Net assets consist of: | ||||
| Paid-in capital |
$ | 389,571,414 | ||
| Undistributed net investment income (loss) |
(1,988,255 | ) | ||
| Net unrealized appreciation (depreciation) |
264,326,146 | |||
| Accumulated net realized gain (loss) |
97,262,096 | |||
|
|
|
|||
| Net assets, at value |
$ | 749,171,401 | ||
|
|
|
|||
| The accompanying notes are an integral part of these financial statements. | Semiannual Report | FSC-13 |
FRANKLIN TEMPLETON VARIABLE INSURANCE PRODUCTS TRUST
FINANCIAL STATEMENTS
Statement of Assets and Liabilities (continued)
June 30, 2014 (unaudited)
| Franklin Small-Mid Cap Growth VIP Fund |
||||
| Class 1: | ||||
| Net assets, at value |
$ | 100,424,646 | ||
|
|
|
|||
| Shares outstanding |
4,111,516 | |||
|
|
|
|||
| Net asset value and maximum offering price per share |
$ | 24.43 | ||
|
|
|
|||
| Class 2: | ||||
| Net assets, at value |
$ | 630,356,534 | ||
|
|
|
|||
| Shares outstanding |
27,292,576 | |||
|
|
|
|||
| Net asset value and maximum offering price per share |
$ | 23.10 | ||
|
|
|
|||
| Class 4: | ||||
| Net assets, at value |
$ | 18,390,221 | ||
|
|
|
|||
| Shares outstanding |
776,889 | |||
|
|
|
|||
| Net asset value and maximum offering price per share |
$ | 23.67 | ||
|
|
|
|||
| FSC-14 | Semiannual Report | The accompanying notes are an integral part of these financial statements. |
FRANKLIN TEMPLETON VARIABLE INSURANCE PRODUCTS TRUST
FINANCIAL STATEMENTS
Statement of Operations
for the six months ended June 30, 2014 (unaudited)
| Franklin Small-Mid Cap Growth VIP Fund |
||||
| Investment income: | ||||
| Dividends |
$ | 1,799,989 | ||
| Income from securities loaned |
18,389 | |||
|
|
|
|||
| Total investment income |
1,818,378 | |||
|
|
|
|||
| Expenses: | ||||
| Management fees (Note 3a) |
2,851,950 | |||
| Distribution fees: (Note 3c) |
||||
| Class 2 |
786,304 | |||
| Class 4 |
32,520 | |||
| Custodian fees (Note 4) |
3,475 | |||
| Reports to shareholders |
106,043 | |||
| Professional fees |
22,121 | |||
| Trustees’ fees and expenses |
1,531 | |||
| Other |
9,157 | |||
|
|
|
|||
| Total expenses |
3,813,101 | |||
| Expenses waived/paid by affiliates (Note 3e) |
(3,806 | ) | ||
|
|
|
|||
| Net expenses |
3,809,295 | |||
|
|
|
|||
| Net investment income (loss) |
(1,990,917 | ) | ||
|
|
|
|||
| Realized and unrealized gains (losses): | ||||
| Net realized gain (loss) from: |
||||
| Investments |
97,768,125 | |||
| Foreign currency transactions |
(4,711 | ) | ||
|
|
|
|||
| Net realized gain (loss) |
97,763,414 | |||
|
|
|
|||
| Net change in unrealized appreciation (depreciation) on investments |
(57,175,326 | ) | ||
|
|
|
|||
| Net realized and unrealized gain (loss) |
40,588,088 | |||
|
|
|
|||
| Net increase (decrease) in net assets resulting from operations |
$ | 38,597,171 | ||
|
|
|
|||
| The accompanying notes are an integral part of these financial statements. | Semiannual Report | FSC-15 |
FRANKLIN TEMPLETON VARIABLE INSURANCE PRODUCTS TRUST
FINANCIAL STATEMENTS
Statements of Changes in Net Assets
| Franklin Small-Mid Cap Growth VIP Fund | ||||||||
| Six Months Ended June 30, 2014 (unaudited) |
Year Ended December 31, 2013 |
|||||||
| Increase (decrease) in net assets: | ||||||||
| Operations: |
||||||||
| Net investment income (loss) |
$ | (1,990,917 | ) | $ | (4,372,919 | ) | ||
| Net realized gain (loss) from investments and foreign currency transactions |
97,763,414 | 148,360,735 | ||||||
| Net change in unrealized appreciation (depreciation) on investments |
(57,175,326 | ) | 103,931,403 | |||||
|
|
|
|||||||
| Net increase (decrease) in net assets resulting from operations |
38,597,171 | 247,919,219 | ||||||
|
|
|
|||||||
| Distributions to shareholders from: |
||||||||
| Net realized gains: |
||||||||
| Class 1 |
(18,164,400 | ) | (5,305,025 | ) | ||||
| Class 2 |
(120,447,127 | ) | (39,304,696 | ) | ||||
| Class 4 |
(3,536,394 | ) | (836,392 | ) | ||||
|
|
|
|||||||
| Total distributions to shareholders |
(142,147,921 | ) | (45,446,113 | ) | ||||
|
|
|
|||||||
| Capital share transactions: (Note 2) |
||||||||
| Class 1 |
15,347,680 | (739,844 | ) | |||||
| Class 2 |
57,572,256 | (185,107,692 | ) | |||||
| Class 4 |
1,843,731 | 3,163,185 | ||||||
|
|
|
|||||||
| Total capital share transactions |
74,763,667 | (182,684,351 | ) | |||||
|
|
|
|||||||
| Net increase (decrease) in net assets |
(28,787,083 | ) | 19,788,755 | |||||
| Net assets: | ||||||||
| Beginning of period |
777,958,484 | 758,169,729 | ||||||
|
|
|
|||||||
| End of period |
$ | 749,171,401 | $ | 777,958,484 | ||||
|
|
|
|||||||
| Undistributed net investment income (loss) included in net assets: |
||||||||
| End of period |
$ | (1,988,255 | ) | $ | 2,662 | |||
|
|
|
|||||||
| FSC-16 | Semiannual Report | The accompanying notes are an integral part of these financial statements. |
FRANKLIN TEMPLETON VARIABLE INSURANCE PRODUCTS TRUST
Notes to Financial Statements (unaudited)
Franklin Small-Mid Cap Growth VIP Fund
| Semiannual Report | FSC-17 |
FRANKLIN TEMPLETON VARIABLE INSURANCE PRODUCTS TRUST
NOTES TO FINANCIAL STATEMENTS (UNAUDITED)
Franklin Small-Mid Cap Growth VIP Fund (continued)
1. Organization and Significant Accounting Policies (continued)
a. Financial Instrument Valuation (continued)
Fund. As a result, differences may arise between the value of the Fund’s portfolio securities as determined at the foreign market close and the latest indications of value at the close of the NYSE. In order to minimize the potential for these differences, the VLOC monitors price movements following the close of trading in foreign stock markets through a series of country specific market proxies (such as baskets of American Depositary Receipts, futures contracts and exchange traded funds). These price movements are measured against established trigger thresholds for each specific market proxy to assist in determining if an event has occurred that may call into question the reliability of the values of the foreign securities held by the Fund. If such an event occurs, the securities may be valued using fair value procedures, which may include the use of independent pricing services.
Also, when the last day of the reporting period is a non-business day, certain foreign markets may be open on those days that the NYSE is closed, which could result in differences between the value of the Fund’s portfolio securities on the last business day and the last calendar day of the reporting period. Any significant security valuation changes due to an open foreign market are adjusted and reflected by the Fund for financial reporting purposes.
b. Foreign Currency Translation
Portfolio securities and other assets and liabilities denominated in foreign currencies are translated into U.S. dollars based on the exchange rate of such currencies against U.S. dollars on the date of valuation. The Fund may enter into foreign currency exchange contracts to facilitate transactions denominated in a foreign currency. Purchases and sales of securities, income and expense items denominated in foreign currencies are translated into U.S. dollars at the exchange rate in effect on the transaction date. Portfolio securities and assets and liabilities denominated in foreign currencies contain risks that those currencies will decline in value relative to the U.S. dollar. Occasionally, events may impact the availability or reliability of foreign exchange rates used to convert the U.S. dollar equivalent value. If such an event occurs, the foreign exchange rate will be valued at fair value using procedures established and approved by the Board.
The Fund does not separately report the effect of changes in foreign exchange rates from changes in market prices on securities held. Such changes are included in net realized and unrealized gain or loss from investments on the Statement of Operations.
Realized foreign exchange gains or losses arise from sales of foreign currencies, currency gains or losses realized between the trade and settlement dates on securities transactions and the difference between the recorded amounts of dividends, interest, and foreign withholding taxes and the U.S. dollar equivalent of the amounts actually received or paid. Net unrealized foreign exchange gains and losses arise from changes in foreign exchange rates on foreign denominated assets and liabilities other than investments in securities held at the end of the reporting period.
c. Securities Lending
The Fund participates in an agency based securities lending program. The Fund receives cash collateral against the loaned securities in an amount equal to at least 102% of the fair value of the loaned securities. Collateral is maintained over the life of the loan in an amount not less than 100% of the fair value of loaned securities, as determined at the close of fund business each day; any additional collateral required due to changes in security values is delivered to the Fund on the next business day. The collateral is invested in a non-registered money fund as indicated on the Statement of Investments. The Fund receives income from the investment of cash collateral, in addition to lending fees and rebates paid by the borrower. The Fund bears the market risk with respect to the collateral investment, securities loaned, and the risk that the agent may default on its obligations to the Fund. The securities lending agent has agreed to indemnify the Fund in the event of default by a third party borrower.
d. Income and Deferred Taxes
It is the Fund’s policy to qualify as a regulated investment company under the Internal Revenue Code. The Fund intends to distribute to shareholders substantially all of its taxable income and net realized gains to relieve it from federal income and if applicable, excise taxes. As a result, no provision for U.S. federal income taxes is required.
The Fund may be subject to foreign taxation related to income received, capital gains on the sale of securities and certain for-
| FSC-18 | Semiannual Report |
FRANKLIN TEMPLETON VARIABLE INSURANCE PRODUCTS TRUST
NOTES TO FINANCIAL STATEMENTS (UNAUDITED)
Franklin Small-Mid Cap Growth VIP Fund (continued)
| Semiannual Report | FSC-19 |
FRANKLIN TEMPLETON VARIABLE INSURANCE PRODUCTS TRUST
NOTES TO FINANCIAL STATEMENTS (UNAUDITED)
Franklin Small-Mid Cap Growth VIP Fund (continued)
2. Shares of Beneficial Interest
At June 30, 2014, there were an unlimited number of shares authorized (without par value). Transactions in the Fund’s shares were as follows:
| Six Months Ended June 30, 2014 |
Year Ended December 31, 2013 |
|||||||||||||||||
| Shares | Amount | Shares | Amount | |||||||||||||||
| Class 1 Shares: | ||||||||||||||||||
| Shares sold |
138,957 | $ | 3,929,222 | 208,707 | $ | 5,257,737 | ||||||||||||
| Shares issued in reinvestment of distributions |
759,699 | 18,164,400 | 224,030 | 5,305,025 | ||||||||||||||
| Shares redeemed |
(240,456 | ) | (6,745,942 | ) | (452,875 | ) | (11,302,606 | ) | ||||||||||
|
|
|
|||||||||||||||||
| Net increase (decrease) |
658,200 | $ | 15,347,680 | (20,138 | ) | $ | (739,844 | ) | ||||||||||
|
|
|
|||||||||||||||||
| Class 2 Shares: | ||||||||||||||||||
| Shares sold |
387,852 | $ | 10,529,480 | 1,537,143 | $ | 36,852,173 | ||||||||||||
| Shares issued in reinvestment of distributions |
5,327,162 | 120,447,127 | 1,732,248 | 39,304,696 | ||||||||||||||
| Shares redeemed |
(2,752,692 | ) | (73,404,351 | ) | (10,791,872 | ) | (261,264,561 | ) | ||||||||||
|
|
|
|||||||||||||||||
| Net increase (decrease) |
2,962,322 | $ | 57,572,256 | (7,522,481 | ) | $ | (185,107,692 | ) | ||||||||||
|
|
|
|||||||||||||||||
| Class 4 Shares: | ||||||||||||||||||
| Shares sold |
31,151 | $ | 882,799 | 272,840 | $ | 6,706,822 | ||||||||||||
| Shares issued on reinvestment of distributions |
152,628 | 3,536,394 | 36,098 | 836,392 | ||||||||||||||
| Shares redeemed |
(97,102 | ) | (2,575,462 | ) | (177,757 | ) | (4,380,029 | ) | ||||||||||
|
|
|
|||||||||||||||||
| Net increase (decrease) |
86,677 | $ | 1,843,731 | 131,181 | $ | 3,163,185 | ||||||||||||
|
|
|
|||||||||||||||||
3. Transactions With Affiliates
Franklin Resources, Inc. is the holding company for various subsidiaries that together are referred to as Franklin Templeton Investments. Certain officers and trustees of the Fund are also officers and/or directors of the following subsidiaries:
| Subsidiary | Affiliation | |
| Franklin Advisers, Inc. (Advisers) | Investment manager | |
| Franklin Templeton Services, LLC (FT Services) | Administrative manager | |
| Franklin Templeton Distributors, Inc. (Distributors) | Principal underwriter | |
| Franklin Templeton Investor Services, LLC (Investor Services) | Transfer agent |
| FSC-20 | Semiannual Report |
FRANKLIN TEMPLETON VARIABLE INSURANCE PRODUCTS TRUST
NOTES TO FINANCIAL STATEMENTS (UNAUDITED)
Franklin Small-Mid Cap Growth VIP Fund (continued)
a. Management Fees
The Fund pays an investment management fee to Advisers based on the average daily net assets of the Fund as follows:
| Annualized Fee Rate | Net Assets | |
| 0.800% | Up to and including $500 million | |
| 0.700% | Over $500 million, up to and including $1 billion | |
| 0.650% | Over $1 billion, up to and including $1.5 billion | |
| 0.600% | Over $1.5 billion, up to and including $6.5 billion | |
| 0.575% | Over $6.5 billion, up to and including $11.5 billion | |
| 0.550% | Over $11.5 billion, up to and including $16.5 billion | |
| 0.540% | Over $16.5 billion, up to and including $19 billion | |
| 0.530% | Over $19 billion, up to and including $21.5 billion | |
| 0.520% | In excess of $21.5 billion |
b. Administrative Fees
Under an agreement with Advisers, FT Services provides administrative services to the Fund. The fee is paid by Advisers based on the Fund’s average daily net assets, and is not an additional expense of the Fund.
c. Distribution Fees
The Board has adopted distribution plans for Class 2 and Class 4 shares pursuant to Rule 12b-1 under the 1940 Act. Under the Fund’s compensation distribution plans, the Fund pays Distributors for costs incurred in connection with the servicing, sale and distribution of the Fund’s shares up to 0.35% per year of its average daily net assets of each class. Some distribution fees are not charged on shares held by affiliates. The Board has agreed to limit the current rate to 0.25% per year for Class 2. The plan year, for purposes of monitoring compliance with the maximum annual plan rates, is February 1 through January 31.
d. Transfer Agent Fees
Investor Services, under terms of an agreement, performs shareholder servicing for the Fund and is not paid by the Fund for the services.
e. Investment in Institutional Fiduciary Trust Money Market Portfolio
The Fund invests in the Institutional Fiduciary Trust Money Market Portfolio (Sweep Money Fund), an affiliated open-end management investment company. Management fees paid by the Fund are waived on assets invested in the Sweep Money Fund, in an amount not to exceed the management and administrative fees paid directly or indirectly by the Sweep Money Fund, as noted on the Statement of Operations. Prior to January 1, 2014, the waiver was accounted for as a reduction to management fees.
4. Expense Offset Arrangement
The Fund has entered into an arrangement with its custodian whereby credits realized as a result of uninvested cash balances are used to reduce a portion of the Fund’s custodian expenses. During the period ended June 30, 2014, there were no credits earned.
| Semiannual Report | FSC-21 |
FRANKLIN TEMPLETON VARIABLE INSURANCE PRODUCTS TRUST
NOTES TO FINANCIAL STATEMENTS (UNAUDITED)
Franklin Small-Mid Cap Growth VIP Fund (continued)
5. Income Taxes
At June 30, 2014, the cost of investments and net unrealized appreciation (depreciation) for income tax purposes were as follows:
| Cost of investments |
$495,150,218 | |
|
| ||
| Unrealized appreciation |
$271,126,675 | |
| Unrealized depreciation |
(7,343,494) | |
|
| ||
| Net unrealized appreciation (depreciation) |
$263,783,181 | |
|
| ||
Differences between income and/or capital gains as determined on a book basis and a tax basis are primarily due to differing treatments of wash sales.
6. Investment Transactions
Purchases and sales of investments (excluding short term securities) for the period ended June 30, 2014, aggregated $187,105,896 and $261,171,372, respectively.
7. Credit Facility
The Fund, together with other U.S. registered and foreign investment funds (collectively, Borrowers), managed by Franklin Templeton Investments, are borrowers in a joint syndicated senior unsecured credit facility totaling $1.5 billion (Global Credit Facility) which matures on February 13, 2015. This Global Credit Facility provides a source of funds to the Borrowers for temporary and emergency purposes, including the ability to meet future unanticipated or unusually large redemption requests.
Under the terms of the Global Credit Facility, the Fund shall, in addition to interest charged on any borrowings made by the Fund and other costs incurred by the Fund, pay its share of fees and expenses incurred in connection with the implementation and maintenance of the Global Credit Facility, based upon its relative share of the aggregate net assets of all of the Borrowers, including an annual commitment fee of 0.07% based upon the unused portion of the Global Credit Facility. These fees are reflected in other expenses on the Statement of Operations. During the period ended June 30, 2014, the Fund did not use the Global Credit Facility.
8. Fair Value Measurements
The Fund follows a fair value hierarchy that distinguishes between market data obtained from independent sources (observable inputs) and the Fund’s own market assumptions (unobservable inputs). These inputs are used in determining the value of the Fund’s financial instruments and are summarized in the following fair value hierarchy:
| • | Level 1 – quoted prices in active markets for identical financial instruments |
| • | Level 2 – other significant observable inputs (including quoted prices for similar financial instruments, interest rates, prepayment speed, credit risk, etc.) |
| • | Level 3 – significant unobservable inputs (including the Fund’s own assumptions in determining the fair value of financial instruments) |
The input levels are not necessarily an indication of the risk or liquidity associated with financial instruments at that level.
For movements between the levels within the fair value hierarchy, the Fund has adopted a policy of recognizing the transfers as of the date of the underlying event which caused the movement.
| FSC-22 | Semiannual Report |
FRANKLIN TEMPLETON VARIABLE INSURANCE PRODUCTS TRUST
NOTES TO FINANCIAL STATEMENTS (UNAUDITED)
Franklin Small-Mid Cap Growth VIP Fund (continued)
A summary of inputs used as of June 30, 2014, in valuing the Fund’s assets carried at fair value, is as follows:
| Level 1 | Level 2 | Level 3 | Total | |||||||||||||
| Assets: | ||||||||||||||||
| Investments in Securities: |
||||||||||||||||
| Equity Investmentsa |
$ | 735,461,180 | $ | — | $ | — | $ | 735,461,180 | ||||||||
| Short Term Investments |
19,150,716 | 4,321,503 | — | 23,472,219 | ||||||||||||
|
|
|
|||||||||||||||
| Total Investments in Securities |
$ | 754,611,896 | $ | 4,321,503 | $ | — | $ | 758,933,399 | ||||||||
|
|
|
|||||||||||||||
aFor detailed categories, see the accompanying Statement of Investments.
9. New Accounting Pronouncements
In June 2014, the Financial Accounting Standards Board issued Accounting Standards Update (ASU) No. 2014-11, Transfers and Servicing (Topic 860), Repurchase-to-Maturity Transactions, Repurchase Financings, and Disclosures. The ASU changes the accounting for certain repurchase agreements and expands disclosure requirements related to repurchase agreements, securities lending, repurchase-to-maturity and similar transactions. The ASU is effective for interim and annual reporting periods beginning after December 15, 2014. Management is currently evaluating the impact, if any, of applying this provision.
10. Subsequent Events
The Fund has evaluated subsequent events through the issuance of the financial statements and determined that no events have occurred that require disclosure.
| Semiannual Report | FSC-23 |
Franklin Strategic Income VIP Fund
(Formerly, Franklin Strategic Income Securities Fund)
This semiannual report for Franklin Strategic Income VIP Fund covers the period ended June 30, 2014.
Class 2 Performance Summary as of June 30, 2014
Franklin Strategic Income VIP Fund – Class 2 delivered a +4.15% total return* for the six-month period ended June 30, 2014.
*The Fund has a fee waiver associated with its investments in a Franklin Templeton money fund, contractually guaranteed through at least its current fiscal year-end. Fund investment results reflect the fee waiver, to the extent applicable; without this reduction, the results would have been lower.
Performance reflects the Fund’s Class 2 operating expenses, but does not include any contract fees, expenses or sales charges. If they had been included, performance would be lower. These charges and deductions, particularly for variable life policies, can have a significant effect on contract values and insurance benefits. See the contract prospectus for a complete description of these expenses, including sales charges.
Performance data represent past performance, which does not guarantee future results. Investment return and principal value will fluctuate, and you may have a gain or loss when you sell your shares. Current performance may differ from figures shown.
| Semiannual Report | FSI-1 |
FRANKLIN STRATEGIC INCOME VIP FUND
1. Source: © 2014 Morningstar.
2. Source: Lipper, a Thomson Reuters Company.
One cannot invest directly in an index, and an index is not representative of the Fund’s portfolio. Please see Index Descriptions following the Fund Summaries.
3. Source: Bureau of Labor Statistics.
| FSI-2 | Semiannual Report |
FRANKLIN STRATEGIC INCOME VIP FUND
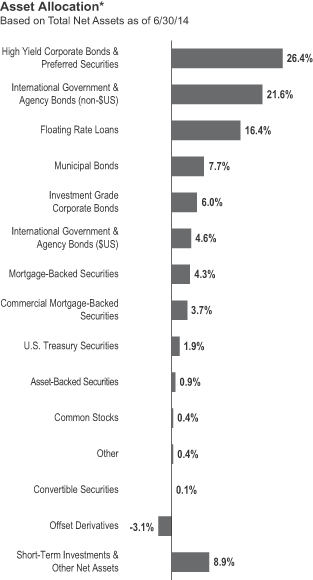
income market. Relative to the Fund’s benchmarks, exposure to high yield and longer duration municipal securities added to performance, while the Fund’s generally shorter duration positioning detracted from relative returns.
| Semiannual Report | FSI-3 |
FRANKLIN STRATEGIC INCOME VIP FUND
| FSI-4 | Semiannual Report |
FRANKLIN STRATEGIC INCOME VIP FUND
Class 2 Fund Expenses
| Class 2 | Beginning Account Value 1/1/14 |
Ending Account Value 6/30/14 |
Fund-Level Expenses 1/1/14–6/30/14 |
|||||||||
| Actual | $1,000 | $1,041.50 | $4.60 | |||||||||
| Hypothetical (5% return before expenses) | $1,000 | $1,020.48 | $4.36 | |||||||||
*Expenses are calculated using the most recent six-month annualized expense ratio, net of expense waivers, for the Fund’s Class 2 shares (0.87%), which does not include any ongoing expenses of the Contract for which the Fund is an investment option, multiplied by the average account value over the period, multiplied by 181/365 to reflect the one-half year period.
| Semiannual Report | FSI-5 |
FRANKLIN TEMPLETON VARIABLE INSURANCE PRODUCTS TRUST
Financial Highlights
Franklin Strategic Income VIP Fund
| Six Months Ended (unaudited) |
Year Ended December 31, | |||||||||||||||||||||||
| 2013 | 2012 | 2011 | 2010 | 2009 | ||||||||||||||||||||
| Class 1 | ||||||||||||||||||||||||
| Per share operating performance (for a share outstanding throughout the period) |
||||||||||||||||||||||||
| Net asset value, beginning of period |
$12.64 | $13.17 | $12.55 | $12.99 | $12.28 | $10.58 | ||||||||||||||||||
|
|
|
|||||||||||||||||||||||
| Income from investment operationsa: | ||||||||||||||||||||||||
| Net investment incomeb |
0.28 | 0.59 | 0.65 | 0.69 | 0.72 | 0.70 | ||||||||||||||||||
| Net realized and unrealized gains (losses) |
0.26 | (0.15 | ) | 0.92 | (0.32 | ) | 0.61 | 1.95 | ||||||||||||||||
|
|
|
|||||||||||||||||||||||
| Total from investment operations |
0.54 | 0.44 | 1.57 | 0.37 | 1.33 | 2.65 | ||||||||||||||||||
|
|
|
|||||||||||||||||||||||
| Less distributions from: | ||||||||||||||||||||||||
| Net investment income and net foreign currency gains |
(0.78 | ) | (0.80 | ) | (0.93 | ) | (0.81 | ) | (0.62 | ) | (0.95 | ) | ||||||||||||
| Net realized gains |
(0.25 | ) | (0.17 | ) | (0.02 | ) | — | — | — | |||||||||||||||
|
|
|
|||||||||||||||||||||||
| Total distributions |
(1.03 | ) | (0.97 | ) | (0.95 | ) | (0.81 | ) | (0.62 | ) | (0.95 | ) | ||||||||||||
|
|
|
|||||||||||||||||||||||
| Net asset value, end of period |
$12.15 | $12.64 | $13.17 | $12.55 | $12.99 | $12.28 | ||||||||||||||||||
|
|
|
|||||||||||||||||||||||
| Total returnc |
4.27% | 3.52% | 13.12% | 2.78% | 11.21% | 26.11% | ||||||||||||||||||
| Ratios to average net assetsd | ||||||||||||||||||||||||
| Expenses |
0.62% | e,f | 0.60% | e | 0.58% | 0.60% | e | 0.59% | e | 0.58% | e | |||||||||||||
| Net investment income |
4.37% | 4.58% | 5.04% | 5.36% | 5.71% | 6.13% | ||||||||||||||||||
| Supplemental data | ||||||||||||||||||||||||
| Net assets, end of period (000’s) |
$656,691 | $705,493 | $1,019,537 | $1,043,690 | $1,195,149 | $1,173,313 | ||||||||||||||||||
| Portfolio turnover rate |
24.60% | 48.06% | 49.98% | 55.65% | 56.46% | 56.19% | ||||||||||||||||||
| Portfolio turnover rate excluding mortgage dollar rollsg |
24.60% | 47.01% | 48.75% | 55.65% | 56.46% | 56.19% | ||||||||||||||||||
aThe amount shown for a share outstanding throughout the period may not correlate with the Statement of Operations for the period due to the timing of sales and repurchases of the Fund shares in relation to income earned and/or fluctuating fair value of the investments of the Fund.
bBased on average daily shares outstanding.
cTotal return does not include fees, charges or expenses imposed by the variable annuity and life insurance contracts for which the Franklin Templeton Variable Insurance Products Trust serves as an underlying investment vehicle. Total return is not annualized for periods less than one year.
dRatios are annualized for periods less than one year.
eBenefit of expense reduction rounds to less than 0.01%.
fBenefit of waiver and payments by affiliates rounds to less than 0.01%.
gSee Note 1(h) regarding mortgage dollar rolls.
| FSI-6 | Semiannual Report | The accompanying notes are an integral part of these financial statements. |
FRANKLIN TEMPLETON VARIABLE INSURANCE PRODUCTS TRUST
FINANCIAL HIGHLIGHTS
Franklin Strategic Income VIP Fund (continued)
| Six Months Ended (unaudited) |
Year Ended December 31, | |||||||||||||||||||||||
| 2013 | 2012 | 2011 | 2010 | 2009 | ||||||||||||||||||||
| Class 2 | ||||||||||||||||||||||||
| Per share operating performance (for a share outstanding throughout the period) |
||||||||||||||||||||||||
| Net asset value, beginning of period |
$12.30 | $12.84 | $12.27 | $12.72 | $12.05 | $10.41 | ||||||||||||||||||
|
|
|
|||||||||||||||||||||||
| Income from investment operationsa: | ||||||||||||||||||||||||
| Net investment incomeb |
0.25 | 0.54 | 0.60 | 0.64 | 0.68 | 0.66 | ||||||||||||||||||
| Net realized and unrealized gains (losses) |
0.26 | (0.13 | ) | 0.89 | (0.30 | ) | 0.59 | 1.91 | ||||||||||||||||
|
|
|
|||||||||||||||||||||||
| Total from investment operations |
0.51 | 0.41 | 1.49 | 0.34 | 1.27 | 2.57 | ||||||||||||||||||
|
|
|
|||||||||||||||||||||||
| Less distributions from: | ||||||||||||||||||||||||
| Net investment income and net foreign currency gains |
(0.75 | ) | (0.78 | ) | (0.90 | ) | (0.79 | ) | (0.60 | ) | (0.93 | ) | ||||||||||||
| Net realized gains |
(0.25 | ) | (0.17 | ) | (0.02 | ) | — | — | — | |||||||||||||||
|
|
|
|||||||||||||||||||||||
| Total distributions |
(1.00 | ) | (0.95 | ) | (0.92 | ) | (0.79 | ) | (0.60 | ) | (0.93 | ) | ||||||||||||
|
|
|
|||||||||||||||||||||||
| Net asset value, end of period |
$11.81 | $12.30 | $12.84 | $12.27 | $12.72 | $12.05 | ||||||||||||||||||
|
|
|
|||||||||||||||||||||||
| Total returnc |
4.15% | 3.32% | 12.75% | 2.57% | 10.91% | 25.75% | ||||||||||||||||||
| Ratios to average net assetsd | ||||||||||||||||||||||||
| Expenses |
0.87% | e,f | 0.85% | e | 0.83% | 0.85% | e | 0.84% | e | 0.83% | e | |||||||||||||
| Net investment income |
4.12% | 4.33% | 4.79% | 5.11% | 5.46% | 5.88% | ||||||||||||||||||
| Supplemental data | ||||||||||||||||||||||||
| Net assets, end of period (000’s) |
$193,514 | $175,307 | $158,451 | $123,749 | $101,347 | $68,240 | ||||||||||||||||||
| Portfolio turnover rate |
24.60% | 48.06% | 49.98% | 55.65% | 56.46% | 56.19% | ||||||||||||||||||
| Portfolio turnover rate excluding mortgage dollar rollsg |
24.60% | 47.01% | 48.75% | 55.65% | 56.46% | 56.19% | ||||||||||||||||||
aThe amount shown for a share outstanding throughout the period may not correlate with the Statement of Operations for the period due to the timing of sales and repurchases of the Fund shares in relation to income earned and/or fluctuating fair value of the investments of the Fund.
bBased on average daily shares outstanding.
cTotal return does not include fees, charges or expenses imposed by the variable annuity and life insurance contracts for which the Franklin Templeton Variable Insurance Products Trust serves as an underlying investment vehicle. Total return is not annualized for periods less than one year.
dRatios are annualized for periods less than one year.
eBenefit of expense reduction rounds to less than 0.01%.
fBenefit of waiver and payments by affiliates rounds to less than 0.01%.
gSee Note 1(h) regarding mortgage dollar rolls.
| The accompanying notes are an integral part of these financial statements. | Semiannual Report | FSI-7 |
FRANKLIN TEMPLETON VARIABLE INSURANCE PRODUCTS TRUST
FINANCIAL HIGHLIGHTS
Franklin Strategic Income VIP Fund (continued)
| Six Months Ended (unaudited) |
Year Ended December 31, | |||||||||||||||||||||||
| 2013 | 2012 | 2011 | 2010 | 2009 | ||||||||||||||||||||
| Class 4 | ||||||||||||||||||||||||
| Per share operating performance (for a share outstanding throughout the period) |
||||||||||||||||||||||||
| Net asset value, beginning of period |
$12.51 | $13.04 | $12.44 | $12.88 | $12.20 | $10.54 | ||||||||||||||||||
|
|
|
|||||||||||||||||||||||
| Income from investment operationsa: | ||||||||||||||||||||||||
| Net investment incomeb |
0.25 | 0.54 | 0.60 | 0.64 | 0.67 | 0.66 | ||||||||||||||||||
| Net realized and unrealized gains (losses) |
0.26 | (0.14 | ) | 0.91 | (0.31 | ) | 0.60 | 1.94 | ||||||||||||||||
|
|
|
|||||||||||||||||||||||
| Total from investment operations |
0.51 | 0.40 | 1.51 | 0.33 | 1.27 | 2.60 | ||||||||||||||||||
|
|
|
|||||||||||||||||||||||
| Less distributions from: | ||||||||||||||||||||||||
| Net investment income and net foreign currency gains |
(0.72 | ) | (0.76 | ) | (0.89 | ) | (0.77 | ) | (0.59 | ) | (0.94 | ) | ||||||||||||
| Net realized gains |
(0.25 | ) | (0.17 | ) | (0.02 | ) | — | — | — | |||||||||||||||
|
|
|
|||||||||||||||||||||||
| Total distributions |
(0.97 | ) | (0.93 | ) | (0.91 | ) | (0.77 | ) | (0.59 | ) | (0.94 | ) | ||||||||||||
|
|
|
|||||||||||||||||||||||
| Net asset value, end of period |
$12.05 | $12.51 | $13.04 | $12.44 | $12.88 | $12.20 | ||||||||||||||||||
|
|
|
|||||||||||||||||||||||
| Total returnc |
4.09% | 3.17% | 12.67% | 2.46% | 10.88% | 25.52% | ||||||||||||||||||
| Ratios to average net assetsd | ||||||||||||||||||||||||
| Expenses |
0.97% | e,f | 0.95% | e | 0.93% | 0.95% | e | 0.94% | e | 0.93% | e | |||||||||||||
| Net investment income |
4.02% | 4.23% | 4.69% | 5.01% | 5.36% | 5.78% | ||||||||||||||||||
| Supplemental data | ||||||||||||||||||||||||
| Net assets, end of period (000’s) |
$132,122 | $134,970 | $196,479 | $188,786 | $188,178 | $162,074 | ||||||||||||||||||
| Portfolio turnover rate |
24.60% | 48.06% | 49.98% | 55.65% | 56.46% | 56.19% | ||||||||||||||||||
| Portfolio turnover rate excluding mortgage dollar rollsg |
24.60% | 47.01% | 48.75% | 55.65% | 56.46% | 56.19% | ||||||||||||||||||
aThe amount shown for a share outstanding throughout the period may not correlate with the Statement of Operations for the period due to the timing of sales and repurchases of the Fund shares in relation to income earned and/or fluctuating fair value of the investments of the Fund.
bBased on average daily shares outstanding.
cTotal return does not include fees, charges or expenses imposed by the variable annuity and life insurance contracts for which the Franklin Templeton Variable Insurance Products Trust serves as an underlying investment vehicle. Total return is not annualized for periods less than one year.
dRatios are annualized for periods less than one year.
eBenefit of expense reduction rounds to less than 0.01%.
fBenefit of waiver and payments by affiliates rounds to less than 0.01%.
gSee Note 1(h) regarding mortgage dollar rolls.
| FSI-8 | Semiannual Report | The accompanying notes are an integral part of these financial statements. |
FRANKLIN TEMPLETON VARIABLE INSURANCE PRODUCTS TRUST
Statement of Investments, June 30, 2014 (unaudited)
| Franklin Strategic Income VIP Fund | ||||||||||||||
| Country | Shares | Value | ||||||||||||
| Common Stocks 0.4% |
||||||||||||||
| Consumer Services 0.3% |
||||||||||||||
| a,b,c | Turtle Bay Resort |
United States | 1,901,449 | $ | 2,852,173 | |||||||||
|
|
|
|||||||||||||
| Materials 0.1% |
||||||||||||||
| NewPage Holdings Inc. |
United States | 5,000 | 415,000 | |||||||||||
|
|
|
|||||||||||||
| Transportation 0.0%† |
||||||||||||||
| a | CEVA Holdings LLC |
United Kingdom | 224 | 246,708 | ||||||||||
|
|
|
|||||||||||||
| Total Common Stocks (Cost $3,434,985) |
3,513,881 | |||||||||||||
|
|
|
|||||||||||||
| Convertible Preferred Stocks 0.1% |
||||||||||||||
| Transportation 0.1% |
||||||||||||||
| a | CEVA Holdings LLC, cvt. pfd., A-1 |
United Kingdom | 6 | 8,700 | ||||||||||
| a | CEVA Holdings LLC, cvt. pfd., A-2 |
United Kingdom | 486 | 534,061 | ||||||||||
|
|
|
|||||||||||||
| Total Convertible Preferred Stocks (Cost $731,856) |
542,761 | |||||||||||||
|
|
|
|||||||||||||
| Preferred Stocks (Cost $625,000) 0.1% |
||||||||||||||
| Diversified Financials 0.1% |
||||||||||||||
| GMAC Capital Trust I, 8.125%, pfd. |
United States | 25,000 | 682,500 | |||||||||||
|
|
|
|||||||||||||
| Principal Amount* | ||||||||||||||
| Corporate Bonds 36.2% |
||||||||||||||
| Automobiles & Components 0.7% |
||||||||||||||
| d | Avis Budget Finance PLC, senior note, 144A, 6.00%, 3/01/21 |
United States | 1,400,000 | EUR | 2,045,445 | |||||||||
| d | General Motors Co., senior bond, 144A, 4.875%, 10/02/23 |
United States | 2,400,000 | 2,538,000 | ||||||||||
| The Goodyear Tire & Rubber Co., senior note, 6.50%, 3/01/21 |
United States | 2,000,000 | 2,180,000 | |||||||||||
|
|
|
|||||||||||||
| 6,763,445 | ||||||||||||||
|
|
|
|||||||||||||
| Banks 2.8% |
||||||||||||||
| Bank of America Corp., |
||||||||||||||
| ejunior sub. bond, M, 8.125% to 5/15/18, FRN thereafter, Perpetual |
United States | 2,500,000 | 2,825,995 | |||||||||||
| senior note, 5.65%, 5/01/18 |
United States | 1,500,000 | 1,701,137 | |||||||||||
| CIT Group Inc., senior note, |
||||||||||||||
| 5.375%, 5/15/20 |
United States | 1,000,000 | 1,077,187 | |||||||||||
| 5.00%, 8/15/22 |
United States | 2,500,000 | 2,596,875 | |||||||||||
| Citigroup Inc., |
||||||||||||||
| ejunior sub. bond, M, 6.30% to 5/15/24, FRN thereafter, Perpetual |
United States | 700,000 | 716,181 | |||||||||||
| senior note, 3.875%, 10/25/23 |
United States | 3,000,000 | 3,077,043 | |||||||||||
| sub. bond, 5.50%, 9/13/25 |
United States | 1,500,000 | 1,675,737 | |||||||||||
| sub. note, 4.05%, 7/30/22 |
United States | 300,000 | 307,724 | |||||||||||
| JPMorgan Chase & Co., |
||||||||||||||
| ejunior sub. bond, 5.00% to 7/30/19, FRN thereafter, Perpetual |
United States | 200,000 | 199,840 | |||||||||||
| ejunior sub. bond, 6.00% to 8/01/23, FRN thereafter, Perpetual |
United States | 1,500,000 | 1,537,500 | |||||||||||
| senior note, 4.25%, 10/15/20 |
United States | 2,000,000 | 2,172,280 | |||||||||||
| sub. note, 3.375%, 5/01/23 |
United States | 1,000,000 | 982,841 | |||||||||||
| Regions Bank, sub. note, 7.50%, 5/15/18 |
United States | 1,000,000 | 1,190,089 | |||||||||||
| Royal Bank of Scotland Group PLC, sub. note, 6.125%, 12/15/22 |
United Kingdom | 1,000,000 | 1,095,625 | |||||||||||
| The Royal Bank of Scotland PLC, sub. note, 6.934%, 4/09/18 |
United Kingdom | 1,500,000 | EUR | 2,384,127 | ||||||||||
| e | Wells Fargo & Co., S, junior sub. bond, 5.90% to 6/15/14, FRN thereafter, Perpetual |
United States | 3,500,000 | 3,714,375 | ||||||||||
|
|
|
|||||||||||||
| 27,254,556 | ||||||||||||||
|
|
|
|||||||||||||
| Semiannual Report | FSI-9 |
FRANKLIN TEMPLETON VARIABLE INSURANCE PRODUCTS TRUST
STATEMENT OF INVESTMENTS (UNAUDITED)
Franklin Strategic Income VIP Fund (continued)
| Country | Principal Amount* | Value | ||||||||||||
| Corporate Bonds (continued) |
||||||||||||||
| Capital Goods 0.8% |
||||||||||||||
| d | Abengoa Finance SAU, senior note, 144A, |
|||||||||||||
| 8.875%, 11/01/17 |
Spain | 2,000,000 | $ | 2,263,750 | ||||||||||
| 7.75%, 2/01/20 |
Spain | 200,000 | 223,125 | |||||||||||
| d | KM Germany Holdings GmbH, secured note, 144A, 8.75%, 12/15/20 |
Germany | 1,500,000 | EUR | 2,314,798 | |||||||||
| Navistar International Corp., senior note, 8.25%, 11/01/21 |
United States | 1,500,000 | 1,571,250 | |||||||||||
| Terex Corp., senior note, 6.00%, 5/15/21 |
United States | 1,000,000 | 1,082,500 | |||||||||||
| d | TransDigm Inc., |
|||||||||||||
| senior sub. bond, 144A, 6.50%, 7/15/24 |
United States | 500,000 | 521,250 | |||||||||||
| senior sub. note, 144A, 6.00%, 7/15/22 |
United States | 400,000 | 411,500 | |||||||||||
|
|
|
|||||||||||||
| 8,388,173 | ||||||||||||||
|
|
|
|||||||||||||
| Consumer Durables & Apparel 0.8% |
||||||||||||||
| d | Financiere Gaillon 8 SAS, senior note, 144A, 7.00%, 9/30/19 |
France | 1,200,000 | EUR | 1,673,125 | |||||||||
| KB Home, senior note, |
||||||||||||||
| 4.75%, 5/15/19 |
United States | 1,000,000 | 1,010,000 | |||||||||||
| 7.00%, 12/15/21 |
United States | 1,600,000 | 1,748,000 | |||||||||||
| M/I Homes Inc., senior note, 8.625%, 11/15/18 |
United States | 800,000 | 856,000 | |||||||||||
| Toll Brothers Finance Corp., senior bond, 5.625%, 1/15/24 |
United States | 1,100,000 | 1,177,000 | |||||||||||
| Visant Corp., senior note, 10.00%, 10/01/17 |
United States | 1,400,000 | 1,312,500 | |||||||||||
|
|
|
|||||||||||||
| 7,776,625 | ||||||||||||||
|
|
|
|||||||||||||
| Consumer Services 1.0% |
||||||||||||||
| Caesars Entertainment Operating Co. Inc., senior secured note, 11.25%, 6/01/17 |
United States | 3,000,000 | 2,760,000 | |||||||||||
| d,f | Financiere Quick SAS, 144A, FRN, 7.825%, 10/15/19 |
France | 1,600,000 | EUR | 2,209,394 | |||||||||
| d,g | Fontainebleau Las Vegas, senior secured note, first lien, 144A, 11.00%, 6/15/15 |
United States | 2,500,000 | 15,625 | ||||||||||
| MGM Resorts International, senior note, |
||||||||||||||
| 6.625%, 7/15/15 |
United States | 3,000,000 | 3,157,500 | |||||||||||
| 6.75%, 10/01/20 |
United States | 200,000 | 223,750 | |||||||||||
| 6.625%, 12/15/21 |
United States | 500,000 | 556,875 | |||||||||||
| Pinnacle Entertainment Inc., senior note, 6.375%, 8/01/21 |
United States | 700,000 | 742,000 | |||||||||||
|
|
|
|||||||||||||
| 9,665,144 | ||||||||||||||
|
|
|
|||||||||||||
| Diversified Financials 2.6% |
||||||||||||||
| Ally Financial Inc., senior note, 7.50%, 9/15/20 |
United States | 3,000,000 | 3,626,250 | |||||||||||
| Deutsche Bank AG, sub. bond, 4.296% to 5/24/23, FRN thereafter, 5/24/28 |
Germany | 4,000,000 | 3,939,000 | |||||||||||
| E*TRADE Financial Corp., senior note, 6.375%, 11/15/19 |
United States | 1,400,000 | 1,522,500 | |||||||||||
| General Electric Capital Corp., |
||||||||||||||
| senior note, A, 8.50%, 4/06/18 |
United States | 29,000,000 | MXN | 2,530,385 | ||||||||||
| sub. note, 5.30%, 2/11/21 |
United States | 500,000 | 569,131 | |||||||||||
| General Motors Financial Co. Inc., senior note, 3.25%, 5/15/18 |
United States | 900,000 | 913,500 | |||||||||||
| GMAC Inc., sub. note, 8.00%, 12/31/18 |
United States | 500,000 | 596,250 | |||||||||||
| d | KKR Group Finance Co., senior note, 144A, 6.375%, 9/29/20 |
United States | 2,500,000 | 2,951,462 | ||||||||||
| Morgan Stanley, senior note, |
||||||||||||||
| 6.00%, 4/28/15 |
United States | 1,000,000 | 1,046,686 | |||||||||||
| 5.50%, 7/24/20 |
United States | 1,500,000 | 1,725,723 | |||||||||||
| d | Neuberger Berman Group LLC/Finance Corp., senior note, 144A, |
|||||||||||||
| 5.625%, 3/15/20 |
United States | 600,000 | 637,500 | |||||||||||
| 5.875%, 3/15/22 |
United States | 1,400,000 | 1,501,500 | |||||||||||
| FSI-10 | Semiannual Report |
FRANKLIN TEMPLETON VARIABLE INSURANCE PRODUCTS TRUST
STATEMENT OF INVESTMENTS (UNAUDITED)
Franklin Strategic Income VIP Fund (continued)
| Country | Principal Amount* | Value | ||||||||||||
| Corporate Bonds (continued) |
||||||||||||||
| Diversified Financials (continued) |
||||||||||||||
| SLM Corp., senior note, |
||||||||||||||
| 8.45%, 6/15/18 |
United States | 1,800,000 | $ | 2,131,875 | ||||||||||
| 5.50%, 1/15/19 |
United States | 1,500,000 | 1,597,500 | |||||||||||
|
|
|
|||||||||||||
| 25,289,262 | ||||||||||||||
|
|
|
|||||||||||||
| Energy 8.1% |
||||||||||||||
| Access Midstream Partner LP/ACMP Finance Corp., senior note, |
||||||||||||||
| 5.875%, 4/15/21 |
United States | 1,500,000 | 1,612,500 | |||||||||||
| 6.125%, 7/15/22 |
United States | 600,000 | 666,000 | |||||||||||
| CGG SA, senior note, |
||||||||||||||
| 7.75%, 5/15/17 |
France | 159,000 | 161,783 | |||||||||||
| 6.50%, 6/01/21 |
France | 2,000,000 | 1,995,000 | |||||||||||
| d 144A, 6.875%, 1/15/22 |
France | 700,000 | 701,750 | |||||||||||
| CHC Helicopter SA, |
||||||||||||||
| senior note, 9.375%, 6/01/21 |
Canada | 400,000 | 429,000 | |||||||||||
| senior secured note, first lien, 9.25%, 10/15/20 |
Canada | 2,250,000 | 2,463,750 | |||||||||||
| Chesapeake Energy Corp., senior note, |
||||||||||||||
| 6.625%, 8/15/20 |
United States | 1,500,000 | 1,732,500 | |||||||||||
| 6.125%, 2/15/21 |
United States | 1,500,000 | 1,687,500 | |||||||||||
| 5.75%, 3/15/23 |
United States | 1,000,000 | 1,116,200 | |||||||||||
| Clayton Williams Energy Inc., senior note, 7.75%, 4/01/19 |
United States | 1,500,000 | 1,597,500 | |||||||||||
| d | CONSOL Energy Inc., senior note, 144A, 5.875%, 4/15/22 |
United States | 1,900,000 | 1,995,000 | ||||||||||
| El Paso Corp., senior bond, 6.50%, 9/15/20 |
United States | 1,500,000 | 1,668,750 | |||||||||||
| Energy Transfer Equity LP, senior note, 7.50%, 10/15/20 |
United States | 3,500,000 | 4,060,000 | |||||||||||
| Energy Transfer Partners LP, senior note, 5.20%, 2/01/22 |
United States | 1,000,000 | 1,107,819 | |||||||||||
| Energy XXI Gulf Coast Inc., senior note, |
||||||||||||||
| 9.25%, 12/15/17 |
United States | 2,000,000 | 2,140,000 | |||||||||||
| d 144A, 6.875%, 3/15/24 |
United States | 1,000,000 | 1,022,500 | |||||||||||
| d | EnQuest PLC, senior note, 144A, 7.00%, 4/15/22 |
United Kingdom | 900,000 | 934,313 | ||||||||||
| Enterprise Products Operating LLC, junior sub. note, 7.034% to 1/15/18, FRN thereafter, 1/15/68 |
United States | 1,500,000 | 1,713,457 | |||||||||||
| d | Expro Finance Luxembourg, senior secured note, 144A, 8.50%, 12/15/16 |
United Kingdom | 2,000,000 | 2,091,250 | ||||||||||
| d,h | Gaz Capital SA, (OJSC Gazprom), loan participation, |
|||||||||||||
| senior bond, 144A, 6.51%, 3/07/22 |
Russia | 500,000 | 544,250 | |||||||||||
| senior note, 144A, 5.092%, 11/29/15 |
Russia | 1,500,000 | 1,571,572 | |||||||||||
| senior note, 144A, 3.85%, 2/06/20 |
Russia | 1,000,000 | 975,335 | |||||||||||
| Halcon Resources Corp., senior note, |
||||||||||||||
| 9.75%, 7/15/20 |
United States | 200,000 | 219,250 | |||||||||||
| 8.875%, 5/15/21 |
United States | 2,000,000 | 2,160,000 | |||||||||||
| 9.25%, 2/15/22 |
United States | 800,000 | 878,000 | |||||||||||
| d | Kinder Morgan Finance Co. LLC, senior secured note, 144A, 6.00%, 1/15/18 |
United States | 2,000,000 | 2,195,000 | ||||||||||
| Linn Energy LLC/Finance Corp., senior note, |
||||||||||||||
| 8.625%, 4/15/20 |
United States | 2,000,000 | 2,170,000 | |||||||||||
| 7.75%, 2/01/21 |
United States | 1,500,000 | 1,625,625 | |||||||||||
| d | LUKOIL International Finance BV, senior note, 144A, 4.563%, 4/24/23 |
Russia | 3,000,000 | 2,911,005 | ||||||||||
| Martin Midstream Partners LP/Martin Midstream Finance Corp., senior note, 7.25%, 2/15/21 |
United States | 1,800,000 | 1,917,000 | |||||||||||
| Midstates Petroleum Co. Inc./LLC, senior note, 9.25%, 6/01/21 |
United States | 1,500,000 | 1,657,500 | |||||||||||
| d | Oasis Petroleum Inc., senior note, 144A, 6.875%, 3/15/22 |
United States | 1,300,000 | 1,423,500 | ||||||||||
| Semiannual Report | FSI-11 |
FRANKLIN TEMPLETON VARIABLE INSURANCE PRODUCTS TRUST
STATEMENT OF INVESTMENTS (UNAUDITED)
Franklin Strategic Income VIP Fund (continued)
| Country | Principal Amount* | Value | ||||||||||||
| Corporate Bonds (continued) |
||||||||||||||
| Energy (continued) |
||||||||||||||
| Offshore Group Investment Ltd., |
||||||||||||||
| senior bond, first lien, 7.125%, 4/01/23 |
United States | 700,000 | $ | 715,750 | ||||||||||
| senior secured note, first lien, 7.50%, 11/01/19 |
United States | 2,000,000 | 2,118,750 | |||||||||||
| Peabody Energy Corp., senior note, |
||||||||||||||
| 6.50%, 9/15/20 |
United States | 2,500,000 | 2,531,250 | |||||||||||
| 6.25%, 11/15/21 |
United States | 1,500,000 | 1,501,875 | |||||||||||
| Penn Virginia Corp., senior note, 8.50%, 5/01/20 |
United States | 1,000,000 | 1,122,500 | |||||||||||
| Penn Virginia Resource Partners LP/Finance Corp., senior note, 8.375%, 6/01/20 |
United States | 1,426,000 | 1,620,292 | |||||||||||
| Penn Virginia Resource Partners LP/Penn Virginia Resource Finance Corp., senior note, 6.50%, 5/15/21 |
United States | 400,000 | 438,000 | |||||||||||
| Plains Exploration & Production Co., senior note, |
||||||||||||||
| 6.125%, 6/15/19 |
United States | 600,000 | 666,000 | |||||||||||
| 6.875%, 2/15/23 |
United States | 1,000,000 | 1,175,000 | |||||||||||
| QR Energy LP/QRE Finance, senior note, 9.25%, 8/01/20 |
United States | 2,000,000 | 2,195,000 | |||||||||||
| Quicksilver Resources Inc., |
||||||||||||||
| d,f secured note, second lien, 144A, FRN, 7.00%, 6/21/19 |
United States | 1,800,000 | 1,764,000 | |||||||||||
| senior note, 9.125%, 8/15/19 |
United States | 500,000 | 466,250 | |||||||||||
| Regency Energy Partners LP/Regency Energy Finance Corp., senior note, 5.875%, 3/01/22 |
United States | 200,000 | 217,750 | |||||||||||
| Sabine Pass Liquefaction LLC, |
||||||||||||||
| first lien, 5.625%, 2/01/21 |
United States | 2,500,000 | 2,656,250 | |||||||||||
| first lien, 5.625%, 4/15/23 |
United States | 900,000 | 940,500 | |||||||||||
| d senior secured note, first lien, 144A, 5.75%, 5/15/24 |
United States | 300,000 | 313,125 | |||||||||||
| d | Samson Investment Co., senior note, 144A, 9.75%, 2/15/20 |
United States | 2,500,000 | 2,646,875 | ||||||||||
| d | Sanchez Energy Corp., senior note, 144A, |
|||||||||||||
| 7.75%, 6/15/21 |
United States | 1,700,000 | 1,853,000 | |||||||||||
| 6.125%, 1/15/23 |
United States | 500,000 | 517,500 | |||||||||||
| W&T Offshore Inc., senior note, 8.50%, 6/15/19 |
United States | 2,500,000 | 2,712,500 | |||||||||||
|
|
|
|||||||||||||
| 79,316,776 | ||||||||||||||
|
|
|
|||||||||||||
| Food & Staples Retailing 0.2% |
||||||||||||||
| d | Cencosud SA, senior note, 144A, 4.875%, 1/20/23 |
Chile | 2,500,000 | 2,525,500 | ||||||||||
|
|
|
|||||||||||||
| Food, Beverage & Tobacco 1.2% |
||||||||||||||
| d | Boparan Finance PLC, senior note, 144A, 9.75%, 4/30/18 |
United Kingdom | 200,000 | EUR | 294,945 | |||||||||
| Constellation Brands Inc., senior note, 4.25%, 5/01/23 |
United States | 1,000,000 | 1,003,750 | |||||||||||
| Del Monte Corp., senior note, 7.625%, 2/15/19 |
United States | 1,736,000 | 1,811,256 | |||||||||||
| d | JBS USA LLC/Finance Inc., senior note, 144A, |
|||||||||||||
| 8.25%, 2/01/20 |
United States | 2,400,000 | 2,616,000 | |||||||||||
| 7.25%, 6/01/21 |
United States | 300,000 | 323,250 | |||||||||||
| Kraft Foods Group Inc., senior bond, 3.50%, 6/06/22 |
United States | 2,500,000 | 2,570,065 | |||||||||||
| d | Post Holdings Inc., senior note, 144A, |
|||||||||||||
| 6.75%, 12/01/21 |
United States | 1,600,000 | 1,702,000 | |||||||||||
| 6.00%, 12/15/22 |
United States | 400,000 | 409,000 | |||||||||||
| d | Smithfield Foods Inc., senior note, 144A, 5.875%, 8/01/21 |
United States | 600,000 | 637,875 | ||||||||||
|
|
|
|||||||||||||
| 11,368,141 | ||||||||||||||
|
|
|
|||||||||||||
| Health Care Equipment & Services 1.5% |
||||||||||||||
| Alere Inc., senior sub. note, 6.50%, 6/15/20 |
United States | 800,000 | 844,000 | |||||||||||
| d | Cegedim SA, senior note, 144A, 6.75%, 4/01/20 |
France | 900,000 | EUR | 1,348,052 | |||||||||
| CHS/Community Health Systems Inc., |
||||||||||||||
| senior note, 8.00%, 11/15/19 |
United States | 1,500,000 | 1,646,250 | |||||||||||
| d senior note, 144A, 6.875%, 2/01/22 |
United States | 400,000 | 426,000 | |||||||||||
| senior secured note, 5.125%, 8/15/18 |
United States | 600,000 | 630,750 | |||||||||||
| FSI-12 | Semiannual Report |
FRANKLIN TEMPLETON VARIABLE INSURANCE PRODUCTS TRUST
STATEMENT OF INVESTMENTS (UNAUDITED)
Franklin Strategic Income VIP Fund (continued)
| Country | Principal Amount* | Value | ||||||||||||
| Corporate Bonds (continued) |
||||||||||||||
| Health Care Equipment & Services (continued) |
||||||||||||||
| DaVita HealthCare Partners Inc., |
||||||||||||||
| senior bond, 5.125%, 7/15/24 |
United States | 500,000 | $ | 504,063 | ||||||||||
| senior note, 5.75%, 8/15/22 |
United States | 1,500,000 | 1,608,750 | |||||||||||
| HCA Inc., |
||||||||||||||
| senior note, 7.50%, 2/15/22 |
United States | 1,500,000 | 1,734,375 | |||||||||||
| senior note, 5.875%, 5/01/23 |
United States | 1,500,000 | 1,573,125 | |||||||||||
| senior secured note, 5.875%, 3/15/22 |
United States | 1,400,000 | 1,522,500 | |||||||||||
| Tenet Healthcare Corp., senior note, |
||||||||||||||
| 8.125%, 4/01/22 |
United States | 1,700,000 | 1,972,000 | |||||||||||
| d 144A, 5.00%, 3/01/19 |
United States | 500,000 | 508,125 | |||||||||||
|
|
|
|||||||||||||
| 14,317,990 | ||||||||||||||
|
|
|
|||||||||||||
| Insurance 0.6% |
||||||||||||||
| MetLife Inc., junior sub. note, 6.40% to 12/15/36, FRN thereafter, 12/15/66 |
United States | 2,500,000 | 2,806,250 | |||||||||||
| d | Mitsui Sumitomo Insurance Co. Ltd., junior sub. note, 144A, 7.00% to 3/15/22, FRN thereafter, 3/15/72 |
Japan | 2,500,000 | 2,982,788 | ||||||||||
|
|
|
|||||||||||||
| 5,789,038 | ||||||||||||||
|
|
|
|||||||||||||
| Materials 4.5% |
||||||||||||||
| ArcelorMittal, senior note, |
||||||||||||||
| 6.00%, 3/01/21 |
Luxembourg | 3,500,000 | 3,788,662 | |||||||||||
| 6.75%, 2/25/22 |
Luxembourg | 500,000 | 561,513 | |||||||||||
| d | Ardagh Packaging Finance PLC, senior note, 144A, 9.125%, 10/15/20 |
Luxembourg | 900,000 | 1,000,125 | ||||||||||
| d | Ardagh Packaging Finance PLC/Ardagh MP Holdings USA Inc., |
|||||||||||||
| senior note, 144A, 6.25%, 1/31/19 |
Luxembourg | 200,000 | 205,500 | |||||||||||
| senior note, 144A, 7.00%, 11/15/20 |
Luxembourg | 105,882 | 109,985 | |||||||||||
| senior note, 144A, 6.75%, 1/31/21 |
Luxembourg | 200,000 | 207,750 | |||||||||||
| i senior note, 144A, 6.00%, 6/30/21 |
Luxembourg | 1,300,000 | 1,299,188 | |||||||||||
| senior secured note, first lien, 144A, 7.375%, 10/15/17 |
Luxembourg | 600,000 | 634,125 | |||||||||||
| d | Barminco Finance Pty. Ltd., senior note, 144A, 9.00%, 6/01/18 |
Australia | 1,500,000 | 1,473,750 | ||||||||||
| d | Cemex Finance LLC, senior secured note, 144A, 6.00%, 4/01/24 |
Mexico | 1,000,000 | 1,044,375 | ||||||||||
| d | Cemex SAB de CV, |
|||||||||||||
| secured note, 144A, 5.875%, 3/25/19 |
Mexico | 1,000,000 | 1,046,250 | |||||||||||
| senior secured note, 144A, 9.00%, 1/11/18 |
Mexico | 2,000,000 | 2,157,500 | |||||||||||
| d | Faenza GmbH, senior note, 144A, 8.25%, 8/15/21 |
Germany | 900,000 | EUR | 1,375,013 | |||||||||
| d | First Quantum Minerals Ltd., senior note, 144A, |
|||||||||||||
| 6.75%, 2/15/20 |
Canada | 1,725,000 | 1,785,375 | |||||||||||
| 7.00%, 2/15/21 |
Canada | 1,725,000 | 1,783,219 | |||||||||||
| d | FMG Resources (August 2006) Pty. Ltd., senior note, 144A, |
|||||||||||||
| 6.875%, 2/01/18 |
Australia | 2,500,000 | 2,631,250 | |||||||||||
| 8.25%, 11/01/19 |
Australia | 1,000,000 | 1,092,500 | |||||||||||
| d | Glencore Funding LLC, |
|||||||||||||
| 144A, 4.625%, 4/29/24 |
Switzerland | 500,000 | 517,500 | |||||||||||
| senior note, 144A, 4.125%, 5/30/23 |
Switzerland | 1,000,000 | 1,005,665 | |||||||||||
| d | Ineos Finance PLC, senior secured note, 144A, |
|||||||||||||
| 8.375%, 2/15/19 |
Switzerland | 200,000 | 219,500 | |||||||||||
| 7.50%, 5/01/20 |
Switzerland | 300,000 | 327,750 | |||||||||||
| d | Ineos Group Holdings SA, senior note, 144A, |
|||||||||||||
| 6.125%, 8/15/18 |
Switzerland | 700,000 | 727,125 | |||||||||||
| 6.50%, 8/15/18 |
Switzerland | 700,000 | EUR | 1,001,753 | ||||||||||
| 5.75%, 2/15/19 |
Switzerland | 300,000 | EUR | 425,471 | ||||||||||
| Semiannual Report | FSI-13 |
FRANKLIN TEMPLETON VARIABLE INSURANCE PRODUCTS TRUST
STATEMENT OF INVESTMENTS (UNAUDITED)
Franklin Strategic Income VIP Fund (continued)
| Country | Principal Amount* | Value | ||||||||||||
| Corporate Bonds (continued) |
||||||||||||||
| Materials (continued) |
||||||||||||||
| d | Kerling PLC, senior secured note, 144A, 10.625%, 2/01/17 |
United Kingdom | 1,000,000 | EUR | $ | 1,456,773 | ||||||||
| Novelis Inc., senior note, |
||||||||||||||
| 8.375%, 12/15/17 |
Canada | 500,000 | 533,625 | |||||||||||
| 8.75%, 12/15/20 |
Canada | 1,600,000 | 1,784,000 | |||||||||||
| d | Orion Engineered Carbons Bondco GmbH, senior secured bond, 144A, 10.00%, 6/15/18 |
Germany | 2,000,000 | EUR | 2,958,012 | |||||||||
| d,j | Orion Engineered Carbons Finance & Co. SCA, senior note, 144A, PIK, 9.25%, 8/01/19 |
Germany | 200,000 | 209,100 | ||||||||||
| Reynolds Group Issuer Inc./LLC/SA, |
||||||||||||||
| first lien, 5.75%, 10/15/20 |
United States | 900,000 | 954,000 | |||||||||||
| senior note, 8.50%, 5/15/18 |
United States | 1,500,000 | 1,571,250 | |||||||||||
| senior note, 8.25%, 2/15/21 |
United States | 1,000,000 | 1,092,500 | |||||||||||
| senior secured note, 7.125%, 4/15/19 |
United States | 1,000,000 | 1,050,000 | |||||||||||
| d | Sealed Air Corp., senior note, 144A, |
|||||||||||||
| 8.125%, 9/15/19 |
United States | 1,000,000 | 1,106,250 | |||||||||||
| 8.375%, 9/15/21 |
United States | 800,000 | 920,000 | |||||||||||
| d | U.S. Coatings Acquisition Inc./Flash Dutch 2 BV, 144A, 5.75%, 2/01/21 |
United States | 1,000,000 | EUR | 1,467,879 | |||||||||
| d | Xstrata Finance Canada Ltd., senior note, 144A, 4.95%, 11/15/21 |
Canada | 2,500,000 | 2,700,087 | ||||||||||
|
|
|
|||||||||||||
| 44,224,320 | ||||||||||||||
|
|
|
|||||||||||||
| Media 3.4% |
||||||||||||||
| CCO Holdings LLC/CCO Holdings Capital Corp., senior bond, 5.25%, 9/30/22 |
United States | 1,400,000 | 1,428,000 | |||||||||||
| Clear Channel Communications Inc., senior secured bond, first lien, 9.00%, 3/01/21 |
United States | 2,500,000 | 2,684,375 | |||||||||||
| Clear Channel Worldwide Holdings Inc., |
||||||||||||||
| senior note, 6.50%, 11/15/22 |
United States | 1,000,000 | 1,082,500 | |||||||||||
| senior sub. note, 7.625%, 3/15/20 |
United States | 200,000 | 215,000 | |||||||||||
| senior sub. note, 7.625%, 3/15/20 |
United States | 500,000 | 541,875 | |||||||||||
| CSC Holdings LLC, senior note, 6.75%, 11/15/21 |
United States | 3,000,000 | 3,311,250 | |||||||||||
| DISH DBS Corp., senior note, |
||||||||||||||
| 7.125%, 2/01/16 |
United States | 2,500,000 | 2,709,375 | |||||||||||
| 6.75%, 6/01/21 |
United States | 500,000 | 571,250 | |||||||||||
| 5.875%, 7/15/22 |
United States | 500,000 | 543,750 | |||||||||||
| d | Gannett Co. Inc., |
|||||||||||||
| senior bond, 144A, 6.375%, 10/15/23 |
United States | 1,900,000 | 2,033,000 | |||||||||||
| senior note, 144A, 5.125%, 7/15/20 |
United States | 1,000,000 | 1,031,250 | |||||||||||
| d,i | Nielsen Finance LLC/Co., senior note, 144A, 5.00%, 4/15/22 |
United States | 1,700,000 | 1,718,063 | ||||||||||
| d | Sirius XM Radio Inc., senior bond, 144A, 6.00%, 7/15/24 |
United States | 1,700,000 | 1,772,250 | ||||||||||
| Time Warner Inc., 7.625%, 4/15/31 |
United States | 1,500,000 | 2,064,007 | |||||||||||
| d | Unitymedia Hessen GmbH & Co.KG/Unitymedia NRW GmbH, senior secured note, 144A, 5.625%, 4/15/23 |
Germany | 800,000 | EUR | 1,196,401 | |||||||||
| d | Univision Communications Inc., |
|||||||||||||
| senior secured bond, 144A, 6.75%, 9/15/22 |
United States | 436,000 | 484,505 | |||||||||||
| senior secured note, 144A, 7.875%, 11/01/20 |
United States | 2,000,000 | 2,210,000 | |||||||||||
| d | UPC Holding BV, senior note, 144A, 6.375%, 9/15/22 |
Netherlands | 500,000 | EUR | 748,490 | |||||||||
| d | UPCB Finance II Ltd., senior secured note, 144A, 6.375%, 7/01/20 |
Netherlands | 2,000,000 | EUR | 2,914,737 | |||||||||
| d | Videotron Ltd., senior bond, 144A, 5.375%, 6/15/24 |
Canada | 800,000 | 822,000 | ||||||||||
| d | Virgin Media Secured Finance PLC, senior secured bond, first lien, 144A, 5.50%, 1/15/25 |
United Kingdom | 1,900,000 | 1,973,625 | ||||||||||
| d | VTR Finance BV, senior secured note, 144A, 6.875%, 1/15/24 |
Chile | 900,000 | 968,247 | ||||||||||
|
|
|
|||||||||||||
| 33,023,950 | ||||||||||||||
|
|
|
|||||||||||||
| FSI-14 | Semiannual Report |
FRANKLIN TEMPLETON VARIABLE INSURANCE PRODUCTS TRUST
STATEMENT OF INVESTMENTS (UNAUDITED)
Franklin Strategic Income VIP Fund (continued)
| Country | Principal Amount* | Value | ||||||||||||
| Corporate Bonds (continued) |
||||||||||||||
| Pharmaceuticals, Biotechnology & Life Sciences 0.8% |
||||||||||||||
| d | Grifols Worldwide Operations Ltd., senior note, 144A, 5.25%, 4/01/22 |
United States | 700,000 | $ | 728,000 | |||||||||
| c,d,j | Jaguar Holding Co. I, senior note, 144A, PIK, 9.375%, 10/15/17 |
United States | 1,500,000 | 1,560,000 | ||||||||||
| d | Valeant Pharmaceuticals International Inc., senior note, 144A, 7.50%, 7/15/21 |
United States | 1,200,000 | 1,333,500 | ||||||||||
| d | VPI Escrow Corp., senior note, 144A, 6.375%, 10/15/20 |
United States | 2,400,000 | 2,559,000 | ||||||||||
| Zoetis Inc., senior bond, 3.25%, 2/01/23 |
United States | 2,000,000 | 1,981,008 | |||||||||||
|
|
|
|||||||||||||
| 8,161,508 | ||||||||||||||
|
|
|
|||||||||||||
| Real Estate 0.1% |
||||||||||||||
| Crown Castle International Corp., senior bond, 5.25%, 1/15/23 |
United States | 500,000 | 523,750 | |||||||||||
|
|
|
|||||||||||||
| Retailing 0.5% |
||||||||||||||
| d | Edcon Pty. Ltd., secured note, 144A, 9.50%, 3/01/18 |
South Africa | 1,800,000 | EUR | 2,492,519 | |||||||||
| d | New Look Bondco I PLC, 144A, 8.75%, 5/14/18 |
United Kingdom | 1,300,000 | GBP | 2,389,078 | |||||||||
|
|
|
|||||||||||||
| 4,881,597 | ||||||||||||||
|
|
|
|||||||||||||
| Software & Services 1.1% |
||||||||||||||
| d | BMC Software Finance Inc., senior note, 144A, 8.125%, 7/15/21 |
United States | 2,000,000 | 2,067,500 | ||||||||||
| Equinix Inc., senior bond, 5.375%, 4/01/23 |
United States | 2,500,000 | 2,568,750 | |||||||||||
| First Data Corp., |
||||||||||||||
| senior bond, 12.625%, 1/15/21 |
United States | 300,000 | 370,125 | |||||||||||
| d senior secured bond, 144A, 8.25%, 1/15/21 |
United States | 4,000,000 | 4,400,000 | |||||||||||
| Sterling International Inc., senior note, 11.00%, 10/01/19 |
United States | 1,100,000 | 1,185,250 | |||||||||||
|
|
|
|||||||||||||
| 10,591,625 | ||||||||||||||
|
|
|
|||||||||||||
| Technology Hardware & Equipment 0.2% |
||||||||||||||
| d | Alcatel-Lucent USA Inc., senior note, 144A, 6.75%, 11/15/20 |
France | 2,000,000 | 2,140,000 | ||||||||||
| d,j | CommScope Holdings Co. Inc., senior note, 144A, PIK, 6.625%, 6/01/20 |
United States | 200,000 | 214,500 | ||||||||||
|
|
|
|||||||||||||
| 2,354,500 | ||||||||||||||
|
|
|
|||||||||||||
| Telecommunication Services 3.5% |
||||||||||||||
| CenturyLink Inc., |
||||||||||||||
| senior bond, 6.75%, 12/01/23 |
United States | 200,000 | 219,500 | |||||||||||
| senior note, 6.00%, 4/01/17 |
United States | 1,000,000 | 1,108,750 | |||||||||||
| senior note, 6.45%, 6/15/21 |
United States | 1,000,000 | 1,090,000 | |||||||||||
| d | Digicel Group Ltd., senior note, 144A, 8.25%, 9/30/20 |
Bermuda | 2,000,000 | 2,205,000 | ||||||||||
| d | Digicel Ltd., senior note, 144A, 6.00%, 4/15/21 |
Bermuda | 800,000 | 828,500 | ||||||||||
| d | eAccess Ltd., senior note, 144A, 8.25%, 4/01/18 |
Japan | 1,400,000 | 1,518,125 | ||||||||||
| Frontier Communications Corp., |
||||||||||||||
| senior bond, 7.625%, 4/15/24 |
United States | 600,000 | 648,750 | |||||||||||
| senior note, 8.50%, 4/15/20 |
United States | 2,000,000 | 2,370,000 | |||||||||||
| senior note, 8.75%, 4/15/22 |
United States | 1,000,000 | 1,165,000 | |||||||||||
| senior note, 7.875%, 1/15/27 |
United States | 400,000 | 415,500 | |||||||||||
| Intelsat Jackson Holdings SA, |
||||||||||||||
| senior bond, 6.625%, 12/15/22 |
Luxembourg | 1,600,000 | 1,674,000 | |||||||||||
| senior note, 7.25%, 10/15/20 |
Luxembourg | 1,000,000 | 1,080,000 | |||||||||||
| senior note, 7.50%, 4/01/21 |
Luxembourg | 1,000,000 | 1,100,000 | |||||||||||
| d | Millicom International Cellular SA, senior note, 144A, 6.625%, 10/15/21 |
Luxembourg | 1,300,000 | 1,412,125 | ||||||||||
| d,j | Mobile Challenger Intermediate Group SA, secured note, 144A, PIK, 8.75%, 3/15/19 |
Switzerland | 600,000 | EUR | 846,320 | |||||||||
| Semiannual Report | FSI-15 |
FRANKLIN TEMPLETON VARIABLE INSURANCE PRODUCTS TRUST
STATEMENT OF INVESTMENTS (UNAUDITED)
Franklin Strategic Income VIP Fund (continued)
| Country | Principal Amount* | Value | ||||||||||||
| Corporate Bonds (continued) |
||||||||||||||
| Telecommunication Services (continued) |
||||||||||||||
| d | Play Finance 1 SA, senior note, 144A, 6.50%, 8/01/19 |
Poland | 500,000 | EUR | $ | 736,935 | ||||||||
| d | Play Finance 2 SA, senior secured note, 144A, 5.25%, 2/01/19 |
Poland | 800,000 | EUR | 1,152,748 | |||||||||
| d | Sprint Corp., senior note, 144A, 7.875%, 9/15/23 |
United States | 500,000 | 557,500 | ||||||||||
| Sprint Nextel Corp., senior note, |
||||||||||||||
| 8.375%, 8/15/17 |
United States | 2,000,000 | 2,342,500 | |||||||||||
| 6.00%, 11/15/22 |
United States | 500,000 | 512,500 | |||||||||||
| d 144A, 9.00%, 11/15/18 |
United States | 1,500,000 | 1,822,500 | |||||||||||
| d 144A, 7.00%, 3/01/20 |
United States | 800,000 | 924,000 | |||||||||||
| T-Mobile USA Inc., |
||||||||||||||
| senior bond, 6.50%, 1/15/24 |
United States | 300,000 | 321,375 | |||||||||||
| senior note, 6.542%, 4/28/20 |
United States | 1,400,000 | 1,517,250 | |||||||||||
| senior note, 6.125%, 1/15/22 |
United States | 200,000 | 213,000 | |||||||||||
| Verizon Communications Inc., senior note, 5.15%, 9/15/23 |
United States | 3,000,000 | 3,361,719 | |||||||||||
| d | Wind Acquisition Finance SA, senior secured note, 144A, |
|||||||||||||
| i 4.00%, 7/15/20 |
Italy | 600,000 | EUR | 822,184 | ||||||||||
| 7.00%, 4/23/21 |
Italy | 2,000,000 | EUR | 2,949,740 | ||||||||||
|
|
|
|||||||||||||
| 34,915,521 | ||||||||||||||
|
|
|
|||||||||||||
| Transportation 0.7% |
||||||||||||||
| d | Florida East Coast Holdings Corp., |
|||||||||||||
| secured note, first lien, 144A, 6.75%, 5/01/19 |
United States | 900,000 | 952,875 | |||||||||||
| senior note, 144A, 9.75%, 5/01/20 |
United States | 400,000 | 424,500 | |||||||||||
| Hertz Corp., senior note, |
||||||||||||||
| 6.75%, 4/15/19 |
United States | 1,500,000 | 1,597,500 | |||||||||||
| 6.25%, 10/15/22 |
United States | 1,500,000 | 1,595,625 | |||||||||||
| d | Stena AB, senior bond, 144A, 7.00%, 2/01/24 |
Sweden | 900,000 | 960,750 | ||||||||||
| d | Stena International SA, secured bond, 144A, 5.75%, 3/01/24 |
Sweden | 1,100,000 | 1,119,250 | ||||||||||
|
|
|
|||||||||||||
| 6,650,500 | ||||||||||||||
|
|
|
|||||||||||||
| Utilities 1.1% |
||||||||||||||
| d | Calpine Corp., |
|||||||||||||
| senior secured bond, first lien, 144A, 5.875%, 1/15/24 |
United States | 600,000 | 636,000 | |||||||||||
| senior secured note, 144A, 7.875%, 7/31/20 |
United States | 454,000 | 494,860 | |||||||||||
| senior secured note, 144A, 7.50%, 2/15/21 |
United States | 1,492,000 | 1,620,685 | |||||||||||
| senior secured note, first lien, 144A, 6.00%, 1/15/22 |
United States | 100,000 | 108,250 | |||||||||||
| d,e | EDF SA, |
|||||||||||||
| junior sub. bond, 144A, 5.625% to 1/22/24, FRN thereafter, Perpetual |
France | 500,000 | 523,295 | |||||||||||
| sub. note, 144A, 5.25% to 1/29/23, FRN thereafter, Perpetual |
France | 3,000,000 | 3,063,450 | |||||||||||
| d | InterGen NV, secured bond, 144A, 7.00%, 6/30/23 |
Netherlands | 2,000,000 | 2,080,000 | ||||||||||
| d,g | Texas Competitive Electric Holdings Co. LLC/Texas Competitive Electric Holdings Finance Inc., senior secured note, 144A, 11.50%, 10/01/20 |
United States | 3,000,000 | 2,752,500 | ||||||||||
|
|
|
|||||||||||||
| 11,279,040 | ||||||||||||||
|
|
|
|||||||||||||
| Total Corporate Bonds (Cost $329,953,928) |
355,060,961 | |||||||||||||
|
|
|
|||||||||||||
| f,k | Senior Floating Rate Interests 16.3% |
|||||||||||||
| Automobiles & Components 0.6% |
||||||||||||||
| i | August LuxUK Holding Co., |
|||||||||||||
| First Lien Term Loan, 6.25%, 4/27/18 |
Luxembourg | 519,132 | 526,270 | |||||||||||
| Lux Second Lien, 11.25%, 4/27/19 |
Luxembourg | 114,872 | 116,021 | |||||||||||
| FSI-16 | Semiannual Report |
FRANKLIN TEMPLETON VARIABLE INSURANCE PRODUCTS TRUST
STATEMENT OF INVESTMENTS (UNAUDITED)
Franklin Strategic Income VIP Fund (continued)
| Country | Principal Amount* | Value | ||||||||||||
| f,k | Senior Floating Rate Interests (continued) |
|||||||||||||
| Automobiles & Components (continued) |
||||||||||||||
| i | August U.S. Holding Co. Inc., |
|||||||||||||
| First Term Loan, 6.25%, 4/27/18 |
United States | 156,162 | $ | 158,309 | ||||||||||
| U.S. Second Lien, 11.50%, 4/27/19 |
United States | 37,613 | 37,989 | |||||||||||
| FRAM Group Holdings Inc. (Autoparts Holdings), |
||||||||||||||
| Second Lien Term Loan, 10.50%, 1/29/18 |
United States | 2,083,899 | 1,979,704 | |||||||||||
| Term Loan, 6.50%, 7/29/17 |
United States | 1,303,518 | 1,306,776 | |||||||||||
| i | Gates Global LLC, Term Loan B, 5.50%, 7/20/21 |
United States | 383,269 | 382,520 | ||||||||||
| i | Grede Holdings LLC, Initial Term Loan, 6.00%, 6/02/21 |
United States | 590,600 | 593,430 | ||||||||||
| i | Henniges Automotive Holdings Inc., Term Loans, 7.25%, 6/12/21 |
United States | 458,822 | 464,557 | ||||||||||
|
|
|
|||||||||||||
| 5,565,576 | ||||||||||||||
|
|
|
|||||||||||||
| Capital Goods 1.0% |
||||||||||||||
| i | Alfred Fueling Systems Inc. (Wayne Fueling), |
|||||||||||||
| Second Lien Term Loan, 9.75%, 6/18/22 |
United States | 621,400 | 623,989 | |||||||||||
| Term Loan B, 6.00%, 6/18/21 |
United States | 436,400 | 438,400 | |||||||||||
| Doncasters U.S. Finance LLC, Term B Loans, 4.50%, 4/09/20 |
United States | 273,010 | 274,034 | |||||||||||
| l | Erickson Inc., Purchase Price Notes, 6.00%, 11/02/20 |
United States | 190,406 | 170,002 | ||||||||||
| Husky Injection Molding Systems Ltd., Term Loan, 5.50%, 6/30/21 |
United States | 108,500 | 109,178 | |||||||||||
| Quikrete Holdings Inc., First Lien Initial Loan, 4.00%, 9/26/20 |
United States | 1,421,949 | 1,425,949 | |||||||||||
| Sensus USA Inc., Second Lien Term Loan, 8.50%, 5/09/18 |
United States | 2,582,186 | 2,596,710 | |||||||||||
| Signode Industrial Group U.S. Inc., Initial Term B Loan, 4.00%, 5/01/21 |
United States | 1,007,000 | 1,004,902 | |||||||||||
| TransDigm Inc., |
||||||||||||||
| Tranche C Term Loan, 3.75%, 2/28/20 |
United States | 670,490 | 668,773 | |||||||||||
| Tranche D Term Loan, 3.75%, 6/04/21 |
United States | 688,600 | 686,276 | |||||||||||
| Wesco Distribution Inc., Tranche B-1 Loan, 3.75%, 12/12/19 |
United States | 1,311,607 | 1,314,394 | |||||||||||
| i | WireCo Worldgroup Inc., Term Loan, 7.00%, 2/15/17 |
United States | 48,976 | 49,435 | ||||||||||
|
|
|
|||||||||||||
| 9,362,042 | ||||||||||||||
|
|
|
|||||||||||||
| Commercial & Professional Services 0.8% |
||||||||||||||
| i | AlixPartners LLP, Second Lien 2013 Recapitalization Term Loan, 9.00%, 7/10/21 |
United States | 374,569 | 380,812 | ||||||||||
| Altegrity Inc., Tranche D Term Loan, 7.75%, 2/21/15 |
United States | 2,846,512 | 2,835,837 | |||||||||||
| EnergySolutions LLC, Term Advance, 6.75%, 5/29/20 |
United States | 336,100 | 341,141 | |||||||||||
| Interactive Data Corp., Term Loan, 4.75%, 5/02/21 |
United States | 4,239,620 | 4,281,355 | |||||||||||
|
|
|
|||||||||||||
| 7,839,145 | ||||||||||||||
|
|
|
|||||||||||||
| Consumer Durables & Apparel 0.3% |
||||||||||||||
| i | Visant Corp. (Jostens), New Loan, 5.25%, 12/22/16 |
United States | 2,757,913 | 2,748,434 | ||||||||||
|
|
|
|||||||||||||
| Consumer Services 1.2% |
||||||||||||||
| i | 24 Hour Fitness Worldwide Inc., Term Loan, 4.75%, 5/30/21 |
United States | 1,651,572 | 1,663,616 | ||||||||||
| i | Caesars Entertainment Resort Properties LLC, Term B Loans, 7.00%, 10/11/20 |
United States | 2,504,370 | 2,521,414 | ||||||||||
| Diamond Resorts Corp., Term Loans, 5.50%, 5/09/21 |
United States | 345,900 | 348,062 | |||||||||||
| Fitness International LLC, Term Loan B, 6.75%, 6/30/20 |
United States | 1,431,700 | 1,428,718 | |||||||||||
| TGI Friday’s Inc., Term Loan B, 6.50%, 6/24/20 |
United States | 173,500 | 173,934 | |||||||||||
| c,j | Turtle Bay Holdings LLC, Term Loan B, PIK, 3.00%, 6/30/16 |
United States | 6,326,938 | 6,026,408 | ||||||||||
|
|
|
|||||||||||||
| 12,162,152 | ||||||||||||||
|
|
|
|||||||||||||
| Diversified Financials 0.5% |
||||||||||||||
| Guggenheim Partners Investment Management Holdings LLC, Initial Term Loan, 4.25%, 7/22/20 |
United States | 544,353 | 546,848 | |||||||||||
| Trans Union LLC, 2014 Replacement Term Loan, 4.00%, 4/09/21 |
United States | 4,180,612 | 4,187,928 | |||||||||||
|
|
|
|||||||||||||
| 4,734,776 | ||||||||||||||
|
|
|
|||||||||||||
| Semiannual Report | FSI-17 |
FRANKLIN TEMPLETON VARIABLE INSURANCE PRODUCTS TRUST
STATEMENT OF INVESTMENTS (UNAUDITED)
Franklin Strategic Income VIP Fund (continued)
| Country | Principal Amount* | Value | ||||||||||||
| f,k | Senior Floating Rate Interests (continued) |
|||||||||||||
| Energy 0.1% |
||||||||||||||
| Bowie Resource Holdings LLC, 2nd Lien Initial Term Loan, 11.75%, 2/16/21 |
United States | 285,714 | $ | 292,857 | ||||||||||
| McJunkin Red Man Corp., 2013 Term Loan, 5.00%, 11/11/19 |
United States | 727,457 | 733,186 | |||||||||||
| i | Utex Industries Inc., First Lien Initial Term Loan, 5.00%, 5/22/21 |
United States | 368,856 | 372,775 | ||||||||||
|
|
|
|||||||||||||
| 1,398,818 | ||||||||||||||
|
|
|
|||||||||||||
| Food & Staples Retailing 0.2% |
||||||||||||||
| AdvancePierre Foods Inc., Second Lien Term Loan, 9.50%, 10/10/17 |
United States | 1,805,558 | 1,753,648 | |||||||||||
|
|
|
|||||||||||||
| Food, Beverage & Tobacco 0.2% |
||||||||||||||
| Big Heart Pet Brands (Del Monte Pet), Initial Term Loans, 3.50%, 2/24/20 |
United States | 1,673,454 | 1,665,086 | |||||||||||
| CSM Bakery Supplies LLC (U.S. Acquisition), Second Lien Term Loan, 8.50%, 7/03/21 |
United States | 128,913 | 131,653 | |||||||||||
| Post Holdings Inc., Series A Incremental Term Loan, 3.75%, 6/02/21 |
United States | 313,400 | 316,314 | |||||||||||
|
|
|
|||||||||||||
| 2,113,053 | ||||||||||||||
|
|
|
|||||||||||||
| Health Care Equipment & Services 2.0% |
||||||||||||||
| Carestream Health Inc., Second Lien Loan, 9.50%, 12/07/19 |
United States | 641,944 | 656,923 | |||||||||||
| CDRH Merger Sub II Inc. (Healogics, Inc.), Initial Term Loan, 6.50%, 7/01/21 |
United States | 135,800 | 134,442 | |||||||||||
| Community Health Systems Inc., 2021 Term D Loan, 4.25%, 1/27/21 |
United States | 4,127,114 | 4,157,745 | |||||||||||
| Connolly LLC, |
||||||||||||||
| 2nd Lien Initial Term Loan, 8.00%, 5/14/22 |
United States | 423,200 | 431,135 | |||||||||||
| i Initial Term Loan, 5.00%, 5/14/21 |
United States | 1,775,865 | 1,801,393 | |||||||||||
| i | DaVita HealthCare Partners Inc., Tranche B Term Loan, 5.00%, 6/24/21 |
United States | 3,390,833 | 3,411,117 | ||||||||||
| Dialysis Newco Inc., |
||||||||||||||
| Second Lien Term Loan B, 7.75%, 10/22/21 |
United States | 267,300 | 269,305 | |||||||||||
| Term Loan B, 4.75%, 4/23/21 |
United States | 469,633 | 471,394 | |||||||||||
| i | Millennium Laboratories LLC, Tranche B Term Loan, 5.25%, 4/16/21 |
United States | 4,101,400 | 4,144,087 | ||||||||||
| Surgery Centers Holdings Inc., Incremental Second Lien Term Loan, 9.75%, 4/10/20 |
United States | 8,339 | 8,381 | |||||||||||
| Truven Health Analytics Inc., New Tranche B Term Loan, 4.50%, 6/06/19 |
United States | 1,118,625 | 1,109,536 | |||||||||||
| U.S. Renal Care Inc., Tranche B-2 Term Loan, 4.25%, 7/03/19 |
United States | 2,927,246 | 2,940,969 | |||||||||||
|
|
|
|||||||||||||
| 19,536,427 | ||||||||||||||
|
|
|
|||||||||||||
| Household & Personal Products 0.7% |
||||||||||||||
| FGI Operating Co. LLC (Freedom Group), Term B Loans, 5.50%, 4/19/19 |
United States | 3,500,837 | 3,535,845 | |||||||||||
| i | Sun Products Corp., Tranche B Term Loan, 5.50%, 3/23/20 |
United States | 3,535,804 | 3,478,347 | ||||||||||
|
|
|
|||||||||||||
| 7,014,192 | ||||||||||||||
|
|
|
|||||||||||||
| Materials 3.0% |
||||||||||||||
| Arysta Lifescience SPC LLC, |
||||||||||||||
| Initial Term Loan, 4.50%, 5/29/20 |
United States | 3,471,366 | 3,495,190 | |||||||||||
| Second Lien Initial Term Loan, 8.25%, 11/30/20 |
United States | 2,864,234 | 2,932,259 | |||||||||||
| Atkore International Inc., Second Lien Initial Term Loan, 7.75%, 10/09/21 |
United States | 219,800 | 221,723 | |||||||||||
| Axalta Coating Systems U.S. Holdings Inc., 2014 Specified Refinancing Term, 4.00%, 2/01/20 |
United States | 1,659,762 | 1,662,759 | |||||||||||
| FSI-18 | Semiannual Report |
FRANKLIN TEMPLETON VARIABLE INSURANCE PRODUCTS TRUST
STATEMENT OF INVESTMENTS (UNAUDITED)
Franklin Strategic Income VIP Fund (continued)
| Country | Principal Amount* | Value | ||||||||||||
| f,k | Senior Floating Rate Interests (continued) |
|||||||||||||
| Materials (continued) |
||||||||||||||
| i | AZ Chem US Inc., First Lien Initial Term Loan, 5.75%, 6/12/21 |
United States | 1,582,980 | $ | 1,599,470 | |||||||||
| Caraustar Industries Inc., Initial Term Loan, 7.50%, 5/01/19 |
United States | 341,297 | 346,523 | |||||||||||
| CD&R Millennium US Acquico LLC, |
||||||||||||||
| Second Lien Term Loan, 9.50%, 7/15/22 |
United States | 585,000 | 579,150 | |||||||||||
| USD First Lien Term Loan, 5.75%, 7/15/21 |
United States | 202,700 | 201,687 | |||||||||||
| Cyanco Intermediate Corp., Initial Term Loan, 5.50%, 5/01/20 |
United States | 1,976,331 | 1,981,272 | |||||||||||
| i | Exopack Holdings SA, USD Term Loan, 5.25%, 5/08/19 |
Luxembourg | 2,974,684 | 3,025,813 | ||||||||||
| FMG America Finance Inc. (Fortescue Metals Group), Loans, 3.75%, 6/30/19 |
United States | 2,151,776 | 2,156,258 | |||||||||||
| HII Holding Corp. (Houghton International), Second Lien Term Loan, 9.50%, 12/20/20 |
United States | 475,175 | 487,648 | |||||||||||
| MacDermid Holdings LLC, First Lien Tranche B Term Loan, 4.00%, 6/07/20 |
United States | 2,098,063 | 2,102,259 | |||||||||||
| OCI Beaumont LLC, Term B-3 Loan, 5.00%, 8/20/19 |
United States | 1,069,550 | 1,086,930 | |||||||||||
| Oxbow Carbon LLC, |
||||||||||||||
| First Lien Tranche B Term Loan, 4.25%, 7/19/19 |
United States | 1,265,464 | 1,269,155 | |||||||||||
| i Second Lien Initial Term Loan, 9.25%, 1/19/20 |
United States | 311,538 | 319,716 | |||||||||||
| OXEA GmbH, Second Lien Term Loan, 8.25%, 7/15/20 |
Luxembourg | 838,599 | 850,130 | |||||||||||
| Prescrix Inc., 2nd Lien Term Loan, 8.00%, 5/02/22 |
United States | 663,243 | 667,389 | |||||||||||
| Reynolds Group Holdings Inc., U.S. Term Loan, 4.00%, 12/01/18 |
United States | 2,766,634 | 2,773,725 | |||||||||||
| Tronox Pigments (Netherlands) BV, Term Loan, 4.00%, 3/19/20 |
Netherlands | 986,076 | 988,079 | |||||||||||
| i | Walter Energy Inc., B Term Loan, 7.25%, 4/01/18 |
United States | 789,251 | 764,939 | ||||||||||
|
|
|
|||||||||||||
| 29,512,074 | ||||||||||||||
|
|
|
|||||||||||||
| Media 1.3% |
||||||||||||||
| Cengage Learning Acquisitions Inc., First Lien Exit Term Loan, 7.00%, 3/31/20 |
United States | 3,188,859 | 3,234,367 | |||||||||||
| Cumulus Media Holdings Inc., Term Loans, 4.25%, 12/23/20 |
United States | 480,977 | 483,322 | |||||||||||
| i | Gray Television Inc., Term Loan B, 5.25%, 6/13/21 |
United States | 46,747 | 47,049 | ||||||||||
| NEP/NCP Holdco Inc., Second Lien Term Loan, 9.50%, 7/22/20 |
United States | 678,796 | 698,736 | |||||||||||
| i | Radio One Inc., Term Loan, 7.50%, 3/31/16 |
United States | 631,685 | 643,529 | ||||||||||
| William Morris Endeavor Entertainment LLC, |
||||||||||||||
| i Term Loans First Lien, 5.25%, 3/21/21 |
United States | 5,095,882 | 5,142,066 | |||||||||||
| Term Loans Second Lien, 8.25%, 3/21/22 |
United States | 2,310,400 | 2,349,388 | |||||||||||
| Zuffa LLC, Initial Term Loan, 3.75%, 2/25/20 |
United States | 381,285 | 382,715 | |||||||||||
|
|
|
|||||||||||||
| 12,981,172 | ||||||||||||||
|
|
|
|||||||||||||
| Pharmaceuticals, Biotechnology & Life Sciences 0.2% |
||||||||||||||
| i | Akorn Inc., Loans, 5.75%, 4/17/21 |
United States | 199,500 | 200,664 | ||||||||||
| Valeant Pharmaceuticals International Inc., Series E-1 Tranche B Term Loan, 3.75%, 8/05/20 |
Canada | 1,764,074 | 1,764,736 | |||||||||||
|
|
|
|||||||||||||
| 1,965,400 | ||||||||||||||
|
|
|
|||||||||||||
| Real Estate 0.0%† |
||||||||||||||
| i | RHP Hotel Properties LP, Tranche B Term Loan, 5.25%, 1/15/21 |
United States | 169,400 | 170,424 | ||||||||||
|
|
|
|||||||||||||
| Retailing 2.3% |
||||||||||||||
| BJ’s Wholesale Club Inc., |
||||||||||||||
| 2013 (Nov) Replacement Loans, 4.50%, 9/26/19 |
United States | 4,260,244 | 4,272,484 | |||||||||||
| Second Lien 2013 (Nov) Replacment Loans, 8.50%, 3/26/20 |
United States | 1,790,788 | 1,840,407 | |||||||||||
| Evergreen AcqCo. 1 LP (Savers), Term Loan, 5.00%, 7/09/19 |
United States | 2,609,625 | 2,612,073 | |||||||||||
| Harbor Freight Tools USA Inc., Loans, 4.75%, 7/26/19 |
United States | 1,072,279 | 1,082,197 | |||||||||||
| i | JC Penney Corp. Inc., Term Loan, 6.25%, 6/20/19 |
United States | 1,664,286 | 1,669,071 | ||||||||||
| Semiannual Report | FSI-19 |
FRANKLIN TEMPLETON VARIABLE INSURANCE PRODUCTS TRUST
STATEMENT OF INVESTMENTS (UNAUDITED)
Franklin Strategic Income VIP Fund (continued)
| Country | Principal Amount* | Value | ||||||||||||
| f,k | Senior Floating Rate Interests (continued) |
|||||||||||||
| Retailing (continued) |
||||||||||||||
| The Men’s Wearhouse Inc., Tranche B Term Loan, 4.50%, 6/18/21 |
United States | 1,569,100 | $ | 1,576,741 | ||||||||||
| Party City Holdings Inc., 2014 Replacement Term Loan, 4.00%, 7/27/19 |
United States | 1,409,195 | 1,402,904 | |||||||||||
| i | Sears Roebuck Acceptance Corp., Term Loan, 5.50%, 6/30/18 |
United States | 4,891,708 | 4,954,165 | ||||||||||
| i | Sungard Availability Services Capital Inc., Tranche B Term Loan, 6.00%, 3/31/19 |
United States | 3,263,109 | 3,243,736 | ||||||||||
|
|
|
|||||||||||||
| 22,653,778 | ||||||||||||||
|
|
|
|||||||||||||
| Semiconductors & Semiconductor Equipment 0.1% |
||||||||||||||
| M/A-COM Technology Solutions Holdings Inc., Initial Term Loan, 4.50%, 5/07/21 |
United States | 523,600 | 527,867 | |||||||||||
|
|
|
|||||||||||||
| Software & Services 1.1% |
||||||||||||||
| i | BMC Software Finance Inc., Initial U.S. Term Loans, 5.00%, 9/10/20 |
United States | 4,583,124 | 4,581,694 | ||||||||||
| MoneyGram International Inc., Term Loan, 4.25%, 3/28/20 |
United States | 4,085,759 | 4,035,197 | |||||||||||
| Vertafore Inc., Second Lien Term Loan, 9.75%, 10/27/17 |
United States | 2,015,657 | 2,056,601 | |||||||||||
|
|
|
|||||||||||||
| 10,673,492 | ||||||||||||||
|
|
|
|||||||||||||
| Technology Hardware & Equipment 0.4% |
||||||||||||||
| Alcatel-Lucent USA Inc., US Term Loan C (TLC), 4.50%, 1/30/19 |
France | 1,498,356 | 1,501,790 | |||||||||||
| Dell International LLC, Term B Loan, 4.50%, 4/29/20 |
United States | 1,312,865 | 1,320,847 | |||||||||||
| Presidio Inc., Term Loan, 5.00%, 3/31/17 |
United States | 804,628 | 811,794 | |||||||||||
|
|
|
|||||||||||||
| 3,634,431 | ||||||||||||||
|
|
|
|||||||||||||
| Telecommunication Services 0.1% |
||||||||||||||
| Intelsat Jackson Holdings SA, Tranche B-2 Term Loan, 3.75%, 6/30/19 |
Luxembourg | 1,485,191 | 1,489,600 | |||||||||||
|
|
|
|||||||||||||
| Transportation 0.2% |
||||||||||||||
| i | Global Tip Finance BV/Finance America LLC, Facility C Commitment, 7.00%, 10/16/20 |
United States | 2,424,189 | 2,439,340 | ||||||||||
|
|
|
|||||||||||||
| Total Senior Floating Rate Interests (Cost $158,881,528) |
160,275,841 | |||||||||||||
|
|
|
|||||||||||||
| Foreign Government and Agency Securities 19.2% |
||||||||||||||
| Government of Canada, |
||||||||||||||
| 2.25%, 8/01/14 |
Canada | 701,000 | CAD | 658,057 | ||||||||||
| 1.00%, 11/01/14 |
Canada | 591,000 | CAD | 554,164 | ||||||||||
| 2.00%, 12/01/14 |
Canada | 1,420,000 | CAD | 1,337,246 | ||||||||||
| 1.00%, 5/01/15 |
Canada | 5,080,000 | CAD | 4,764,087 | ||||||||||
| Government of Hungary, |
||||||||||||||
| 5.50%, 2/12/16 |
Hungary | 1,864,700,000 | HUF | 8,675,831 | ||||||||||
| 5.50%, 12/22/16 |
Hungary | 46,690,000 | HUF | 220,657 | ||||||||||
| 6.50%, 6/24/19 |
Hungary | 206,000,000 | HUF | 1,040,919 | ||||||||||
| 7.50%, 11/12/20 |
Hungary | 313,570,000 | HUF | 1,676,632 | ||||||||||
| 5.375%, 2/21/23 |
Hungary | 1,020,000 | 1,098,081 | |||||||||||
| A, 6.75%, 11/24/17 |
Hungary | 104,470,000 | HUF | 519,368 | ||||||||||
| A, 5.50%, 12/20/18 |
Hungary | 34,100,000 | HUF | 165,074 | ||||||||||
| A, 7.00%, 6/24/22 |
Hungary | 930,000 | HUF | 4,919 | ||||||||||
| A, 6.00%, 11/24/23 |
Hungary | 1,270,000 | HUF | 6,369 | ||||||||||
| senior note, 6.25%, 1/29/20 |
Hungary | 4,597,000 | 5,208,976 | |||||||||||
| senior note, 6.375%, 3/29/21 |
Hungary | 1,550,000 | 1,772,812 | |||||||||||
| FSI-20 | Semiannual Report |
FRANKLIN TEMPLETON VARIABLE INSURANCE PRODUCTS TRUST
STATEMENT OF INVESTMENTS (UNAUDITED)
Franklin Strategic Income VIP Fund (continued)
| Country | Principal Amount* | Value | ||||||||||||
| Foreign Government and Agency Securities (continued) |
|
|||||||||||||
| Government of Indonesia, |
||||||||||||||
| FR26, 11.00%, 10/15/14 |
Indonesia | 1,800,000,000 | IDR | $ | 153,869 | |||||||||
| FR34, 12.80%, 6/15/21 |
Indonesia | 17,235,000,000 | IDR | 1,822,724 | ||||||||||
| Government of Ireland, |
||||||||||||||
| 5.00%, 10/18/20 |
Ireland | 3,000,000 | EUR | 5,015,473 | ||||||||||
| senior bond, 5.40%, 3/13/25 |
Ireland | 2,883,710 | EUR | 5,008,323 | ||||||||||
| Government of Malaysia, |
||||||||||||||
| 3.434%, 8/15/14 |
Malaysia | 6,410,000 | MYR | 1,997,461 | ||||||||||
| 3.741%, 2/27/15 |
Malaysia | 12,310,000 | MYR | 3,850,182 | ||||||||||
| 3.835%, 8/12/15 |
Malaysia | 4,675,000 | MYR | 1,465,979 | ||||||||||
| 4.72%, 9/30/15 |
Malaysia | 10,268,000 | MYR | 3,255,317 | ||||||||||
| 3.197%, 10/15/15 |
Malaysia | 4,730,000 | MYR | 1,472,178 | ||||||||||
| senior bond, 3.814%, 2/15/17 |
Malaysia | 2,500,000 | MYR | 784,880 | ||||||||||
| senior bond, 4.24%, 2/07/18 |
Malaysia | 600,000 | MYR | 190,931 | ||||||||||
| senior note, 3.172%, 7/15/16 |
Malaysia | 17,100,000 | MYR | 5,305,207 | ||||||||||
| Government of Mexico, |
||||||||||||||
| 9.50%, 12/18/14 |
Mexico | 679,620 | m MXN | 5,393,726 | ||||||||||
| 6.00%, 6/18/15 |
Mexico | 18,020 | m MXN | 142,737 | ||||||||||
| 8.00%, 12/17/15 |
Mexico | 573,560 | m MXN | 4,724,262 | ||||||||||
| 6.25%, 6/16/16 |
Mexico | 199,310 | m MXN | 1,620,875 | ||||||||||
| 7.25%, 12/15/16 |
Mexico | 790,330 | m MXN | 6,611,785 | ||||||||||
| Government of Poland, |
||||||||||||||
| 5.50%, 4/25/15 |
Poland | 7,018,000 | PLN | 2,368,685 | ||||||||||
| 6.25%, 10/24/15 |
Poland | 9,134,000 | PLN | 3,155,962 | ||||||||||
| 4.75%, 10/25/16 |
Poland | 37,000,000 | PLN | 12,794,158 | ||||||||||
| f FRN, 2.72%, 1/25/17 |
Poland | 1,660,000 | PLN | 546,459 | ||||||||||
| f FRN, 2.72%, 1/25/21 |
Poland | 1,683,000 | PLN | 546,479 | ||||||||||
| Strip, 7/25/14 |
Poland | 295,000 | PLN | 97,018 | ||||||||||
| Strip, 7/25/15 |
Poland | 2,052,000 | PLN | 659,264 | ||||||||||
| Strip, 1/25/16 |
Poland | 1,066,000 | PLN | 338,174 | ||||||||||
| d | Government of Russia, senior bond, 144A, 7.50%, 3/31/30 |
Russia | 1,439,185 | 1,671,074 | ||||||||||
| d | Government of Serbia, senior note, 144A, |
|||||||||||||
| 4.875%, 2/25/20 |
Serbia | 4,410,000 | 4,487,175 | |||||||||||
| 7.25%, 9/28/21 |
Serbia | 1,820,000 | 2,084,828 | |||||||||||
| Government of Singapore, senior note, 1.125%, 4/01/16 |
Singapore | 6,750,000 | SGD | 5,486,670 | ||||||||||
| Government of Sri Lanka, |
||||||||||||||
| A, 11.75%, 3/15/15 |
Sri Lanka | 1,160,000 | LKR | 9,193 | ||||||||||
| A, 6.50%, 7/15/15 |
Sri Lanka | 28,980,000 | LKR | 221,239 | ||||||||||
| A, 11.00%, 8/01/15 |
Sri Lanka | 116,400,000 | LKR | 929,159 | ||||||||||
| A, 6.40%, 8/01/16 |
Sri Lanka | 19,500,000 | LKR | 147,038 | ||||||||||
| A, 8.00%, 11/15/18 |
Sri Lanka | 70,220,000 | LKR | 529,677 | ||||||||||
| A, 9.00%, 5/01/21 |
Sri Lanka | 73,580,000 | LKR | 555,301 | ||||||||||
| B, 6.40%, 10/01/16 |
Sri Lanka | 16,000,000 | LKR | 120,313 | ||||||||||
| B, 8.50%, 7/15/18 |
Sri Lanka | 15,280,000 | LKR | 117,989 | ||||||||||
| C, 8.50%, 4/01/18 |
Sri Lanka | 8,070,000 | LKR | 62,472 | ||||||||||
| D, 8.50%, 6/01/18 |
Sri Lanka | 54,050,000 | LKR | 417,839 | ||||||||||
| Government of Sweden, 4.50%, 8/12/15 |
Sweden | 13,000,000 | SEK | 2,034,583 | ||||||||||
| Government of the Philippines, senior note, 1.625%, 4/25/16 |
Philippines | 120,000,000 | PHP | 2,724,266 | ||||||||||
| d | Government of Ukraine, |
|||||||||||||
| 144A, 7.75%, 9/23/20 |
Ukraine | 3,850,000 | 3,690,860 | |||||||||||
| senior bond, 144A, 7.80%, 11/28/22 |
Ukraine | 2,790,000 | 2,650,500 | |||||||||||
| senior note, 144A, 7.95%, 2/23/21 |
Ukraine | 2,120,000 | 2,032,550 | |||||||||||
| senior note, 144A, 7.50%, 4/17/23 |
Ukraine | 1,000,000 | 945,540 | |||||||||||
| Semiannual Report | FSI-21 |
FRANKLIN TEMPLETON VARIABLE INSURANCE PRODUCTS TRUST
STATEMENT OF INVESTMENTS (UNAUDITED)
Franklin Strategic Income VIP Fund (continued)
| Country | Principal Amount* | Value | ||||||||||||
| Foreign Government and Agency Securities (continued) |
||||||||||||||
| n | Government of Uruguay, senior bond, Index Linked, 4.375%, 12/15/28 |
Uruguay | 185,558,941 | UYU | $ | 9,068,133 | ||||||||
| Korea Monetary Stabilization Bond, |
||||||||||||||
| senior bond, 2.47%, 4/02/15 |
South Korea | 4,622,600,000 | KRW | 4,563,972 | ||||||||||
| senior bond, 2.80%, 8/02/15 |
South Korea | 1,324,510,000 | KRW | 1,311,527 | ||||||||||
| senior bond, 2.81%, 10/02/15 |
South Korea | 6,000,000,000 | KRW | 5,943,148 | ||||||||||
| senior note, 2.82%, 8/02/14 |
South Korea | 509,400,000 | KRW | 503,470 | ||||||||||
| senior note, 2.78%, 10/02/14 |
South Korea | 2,030,900,000 | KRW | 2,007,868 | ||||||||||
| senior note, 2.84%, 12/02/14 |
South Korea | 841,710,000 | KRW | 832,627 | ||||||||||
| senior note, 2.74%, 2/02/15 |
South Korea | 117,220,000 | KRW | 115,930 | ||||||||||
| senior note, 2.76%, 6/02/15 |
South Korea | 5,045,300,000 | KRW | 4,992,773 | ||||||||||
| Korea Treasury Bond, senior note, |
||||||||||||||
| 3.25%, 12/10/14 |
South Korea | 1,261,950,000 | KRW | 1,250,586 | ||||||||||
| 3.25%, 6/10/15 |
South Korea | 210,800,000 | KRW | 209,567 | ||||||||||
| 2.75%, 12/10/15 |
South Korea | 4,897,900,000 | KRW | 4,849,739 | ||||||||||
| 3.00%, 12/10/16 |
South Korea | 5,500,000,000 | KRW | 5,477,489 | ||||||||||
| Nota Do Tesouro Nacional, |
||||||||||||||
| 10.00%, 1/01/17 Brazil |
Brazil | 6,200 | o BRL | 2,716,688 | ||||||||||
| n Index Linked, 6.00%, 5/15/15 |
Brazil | 1,390 | o BRL | 1,557,928 | ||||||||||
| n Index Linked, 6.00%, 8/15/16 |
Brazil | 1,604 | o BRL | 1,803,832 | ||||||||||
| n Index Linked, 6.00%, 8/15/18 |
Brazil | 6,525 | o BRL | 7,327,097 | ||||||||||
| Uruguay Notas del Tesoro, |
||||||||||||||
| 10.50%, 3/21/15 |
Uruguay | 1,700,000 | UYU | 71,783 | ||||||||||
| 10.25%, 8/22/15 |
Uruguay | 59,720,000 | UYU | 2,488,241 | ||||||||||
| 9.50%, 1/27/16 |
Uruguay | 9,220,000 | UYU | 367,917 | ||||||||||
| p 18, Index Linked, 2.25%, 8/23/17 |
Uruguay | 25,238,789 | UYU | 1,012,739 | ||||||||||
| Uruguay Treasury Bill, Strip, |
||||||||||||||
| 7/02/15 |
Uruguay | 510,000 | UYU | 19,274 | ||||||||||
| 8/20/15 |
Uruguay | 65,364,000 | UYU | 2,427,398 | ||||||||||
|
|
|
|||||||||||||
| Total Foreign Government and Agency Securities (Cost $183,533,057) |
188,863,292 | |||||||||||||
|
|
|
|||||||||||||
| U.S. Government and Agency Securities 1.9% |
||||||||||||||
| U.S. Treasury Bond, |
||||||||||||||
| 4.50%, 2/15/16 |
United States | 3,000,000 | 3,204,375 | |||||||||||
| 7.875%, 2/15/21 |
United States | 900,000 | 1,230,574 | |||||||||||
| U.S. Treasury Note, |
||||||||||||||
| 4.625%, 2/15/17 |
United States | 600,000 | 661,289 | |||||||||||
| 4.75%, 8/15/17 |
United States | 2,900,000 | 3,241,884 | |||||||||||
| 3.75%, 11/15/18 |
United States | 7,000,000 | 7,699,727 | |||||||||||
| p Index Linked, 0.125%, 4/15/16 |
United States | 2,470,015 | 2,535,915 | |||||||||||
|
|
|
|||||||||||||
| Total U.S. Government and Agency Securities (Cost $17,856,201) |
18,573,764 | |||||||||||||
|
|
|
|||||||||||||
| Asset-Backed Securities and Commercial Mortgage-Backed Securities 5.2% |
||||||||||||||
| Banks 3.6% |
||||||||||||||
| Banc of America Commercial Mortgage Trust, 2006-4, AJ, 5.695%, 7/10/46 |
United States | 1,807,000 | 1,895,683 | |||||||||||
| Bear Stearns Commercial Mortgage Securities Inc., |
||||||||||||||
| f 2006-PW11, AJ, FRN, 5.44%, 3/11/39 |
United States | 1,000,000 | 1,046,130 | |||||||||||
| f 2006-PW12, AJ, FRN, 5.751%, 9/11/38 |
United States | 1,440,000 | 1,518,662 | |||||||||||
| FSI-22 | Semiannual Report |
FRANKLIN TEMPLETON VARIABLE INSURANCE PRODUCTS TRUST
STATEMENT OF INVESTMENTS (UNAUDITED)
Franklin Strategic Income VIP Fund (continued)
| Country | Principal Amount* | Value | ||||||||||||
| Asset-Backed Securities and Commercial Mortgage-Backed Securities (continued) |
||||||||||||||
| Banks (continued) |
||||||||||||||
| 2006-PW13, AJ, 5.611%, 9/11/41 |
United States | 5,100,000 | $ | 5,342,663 | ||||||||||
| f 2007-PW16, AM, FRN, 5.706%, 6/11/40 |
United States | 520,000 | 577,746 | |||||||||||
| Citigroup Commercial Mortgage Trust, |
||||||||||||||
| 2006-C5, AJ, 5.482%, 10/15/49 |
United States | 2,520,000 | 2,557,229 | |||||||||||
| f 2007-C6, AM, FRN, 5.706%, 6/10/17 |
United States | 4,900,000 | 5,408,542 | |||||||||||
| f | Citigroup/Deutsche Bank Commercial Mortgage Trust, 2006-CD3, AJ, FRN, 5.688%, 10/15/48 |
United States | 2,700,000 | 2,641,148 | ||||||||||
| Countrywide Asset-Backed Certificates, 2005-11, AF4, 5.21%, 3/25/34 |
United States | 1,275,000 | 1,053,558 | |||||||||||
| Greenwich Capital Commercial Funding Corp., |
||||||||||||||
| f 2006-GG7, AJ, FRN, 5.82%, 7/10/38 |
United States | 2,560,000 | 2,683,957 | |||||||||||
| 2007-GG9, AM, 5.475%, 3/10/39 |
United States | 1,030,000 | 1,111,186 | |||||||||||
| JPMorgan Chase Commercial Mortgage Securities Corp., |
||||||||||||||
| 2006-CB17, AM, 5.464%, 12/12/43 |
United States | 760,000 | 805,305 | |||||||||||
| f 2006-LDP7, AJ, FRN, 5.873%, 4/15/45 |
United States | 1,680,000 | 1,726,699 | |||||||||||
| f | LB-UBS Commercial Mortgage Trust, 2006-C4, AM, FRN, 5.857%, 6/15/38 |
United States | 1,550,000 | 1,683,619 | ||||||||||
| f | Morgan Stanley Capital I Trust, |
|||||||||||||
| 2006-HQ8, AJ, FRN, 5.497%, 3/12/44 |
United States | 200,000 | 204,817 | |||||||||||
| 2007-IQ16, AM, FRN, 6.099%, 12/12/49 |
United States | 510,000 | 576,051 | |||||||||||
| 2007-IQ16, AMA, FRN, 6.094%, 12/12/49 |
United States | 2,050,000 | 2,296,946 | |||||||||||
| Wells Fargo Mortgage Backed Securities Trust, |
||||||||||||||
| f 04-W, A9, FRN, 2.762%, 11/25/34 |
United States | 1,320,775 | 1,367,917 | |||||||||||
| 2007-3, 3A1, 5.50%, 4/25/37 |
United States | 461,294 | 478,712 | |||||||||||
|
|
|
|||||||||||||
| 34,976,570 | ||||||||||||||
|
|
|
|||||||||||||
| Diversified Financials 1.6% |
||||||||||||||
| d,f | ARES CLO Funds, 2007-12A, B, 144A, FRN, 1.227%, 11/25/20 |
United States | 1,380,000 | 1,350,247 | ||||||||||
| d,f | Atrium CDO Corp., 10A, C, 144A, FRN, 2.829%, 7/16/25 |
United States | 1,400,000 | 1,370,838 | ||||||||||
| d,f | Catamaran CLO Ltd., 2013-1A, C, 144A, FRN, 2.828%, 1/27/25 |
Cayman Islands | 1,130,000 | 1,094,529 | ||||||||||
| d,f | Cent CDO Ltd., 2007-15A, A2B, 144A, FRN, 0.571%, 3/11/21 |
United States | 1,251,000 | 1,180,556 | ||||||||||
| d,f | Cent CLO LP, 2013-17A, D, 144A, FRN, 3.225%, 1/30/25 |
Cayman Islands | 784,314 | 782,942 | ||||||||||
| d,f | CIFC Funding Ltd., 2007-3A, A1J, 144A, FRN, 0.628%, 7/26/21 |
United States | 960,000 | 917,789 | ||||||||||
| d,f | ColumbusNova CLO Ltd., 2007-2A, A2, 144A, FRN, 1.227%, 10/15/21 |
United States | 860,000 | 837,313 | ||||||||||
| d,f | CT CDO IV Ltd., 2006-4A, A1, 144A, FRN, 0.463%, 10/20/43 |
United States | 1,629,470 | 1,598,274 | ||||||||||
| d | G-Force LLC, 2005-RRA, C, 144A, 5.20%, 8/22/36 |
United States | 2,000,000 | 1,859,450 | ||||||||||
| d,f | ING Investment Management CLO Ltd., |
|||||||||||||
| 2013-1A, B, 144A, FRN, 3.127%, 4/15/24 |
Cayman Islands | 270,000 | 269,600 | |||||||||||
| 2013-1A, C, 144A, FRN, 3.727%, 4/15/24 |
Cayman Islands | 440,000 | 421,084 | |||||||||||
| 2013-2A, B, 144A, FRN, 2.909%, 4/25/25 |
United States | 1,080,000 | 1,065,237 | |||||||||||
| d,f | Newcastle CDO Ltd., 2004-5A, 1, 144A, FRN, 0.571%, 12/24/39 |
United States | 734,499 | 706,401 | ||||||||||
| Residential Asset Securities Corp., 2004-KS1, AI4, 4.213%, 4/25/32 |
United States | 49,941 | 49,924 | |||||||||||
| f,q | Talisman 6 Finance, Reg S, FRN, 0.507%, 10/22/16 |
Germany | 2,050,674 | EUR | 2,741,598 | |||||||||
|
|
|
|||||||||||||
| 16,245,782 | ||||||||||||||
|
|
|
|||||||||||||
| Total Asset-Backed Securities and Commercial Mortgage-Backed Securities (Cost $48,197,301) |
51,222,352 | |||||||||||||
|
|
|
|||||||||||||
| Mortgage-Backed Securities 3.5% |
||||||||||||||
| f | Federal Home Loan Mortgage Corp. (FHLMC) Adjustable Rate 0.0%† |
|
||||||||||||
| FHLMC, 2.348%, 1/01/33 |
United States | 61,216 | 63,844 | |||||||||||
|
|
|
|||||||||||||
| Semiannual Report | FSI-23 |
FRANKLIN TEMPLETON VARIABLE INSURANCE PRODUCTS TRUST
STATEMENT OF INVESTMENTS (UNAUDITED)
Franklin Strategic Income VIP Fund (continued)
| Country | Principal Amount* | Value | ||||||||||||
| Mortgage-Backed Securities (continued) |
||||||||||||||
| Federal Home Loan Mortgage Corp. (FHLMC) Fixed Rate 0.6% |
||||||||||||||
| FHLMC Gold 15 Year, 4.50%, 10/01/18 - 6/01/19 |
United States | 428,262 | $ | 454,365 | ||||||||||
| FHLMC Gold 15 Year, 5.00%, 12/01/17 - 9/01/19 |
United States | 618,556 | 656,893 | |||||||||||
| FHLMC Gold 15 Year, 5.50%, 7/01/17 - 7/01/19 |
United States | 108,844 | 116,083 | |||||||||||
| FHLMC Gold 15 Year, 6.00%, 5/01/17 |
United States | 4,969 | 5,174 | |||||||||||
| FHLMC Gold 15 Year, 6.50%, 5/01/16 |
United States | 635 | 655 | |||||||||||
| FHLMC Gold 30 Year, 3.00%, 11/01/42 |
United States | 2,635,673 | 2,603,896 | |||||||||||
| FHLMC Gold 30 Year, 3.50%, 4/01/42 |
United States | 154,702 | 159,270 | |||||||||||
| FHLMC Gold 30 Year, 5.00%, 4/01/34 - 8/01/35 |
United States | 428,341 | 474,479 | |||||||||||
| FHLMC Gold 30 Year, 5.50%, 3/01/33 - 1/01/35 |
United States | 399,844 | 448,433 | |||||||||||
| FHLMC Gold 30 Year, 6.00%, 4/01/33 - 2/01/36 |
United States | 346,555 | 391,276 | |||||||||||
| FHLMC Gold 30 Year, 6.50%, 12/01/23 - 6/01/36 |
United States | 83,440 | 94,255 | |||||||||||
| FHLMC Gold 30 Year, 7.00%, 9/01/21 - 4/01/30 |
United States | 35,061 | 39,590 | |||||||||||
| FHLMC Gold 30 Year, 7.50%, 3/01/30 - 7/01/31 |
United States | 1,341 | 1,424 | |||||||||||
|
|
|
|||||||||||||
| 5,445,793 | ||||||||||||||
|
|
|
|||||||||||||
| f | Federal National Mortgage Association (FNMA) Adjustable Rate 0.0%† |
|
||||||||||||
| FNMA, 2.31% - 2.33%, 4/01/20 - 12/01/34 |
United States | 239,721 | 253,313 | |||||||||||
|
|
|
|||||||||||||
| Federal National Mortgage Association (FNMA) Fixed Rate 2.6% |
||||||||||||||
| FNMA 15 Year, 2.50%, 7/01/22 - 6/01/27 |
United States | 652,311 | 664,653 | |||||||||||
| FNMA 15 Year, 3.00%, 10/01/27 |
United States | 6,272,401 | 6,525,510 | |||||||||||
| FNMA 15 Year, 3.50%, 1/01/26 |
United States | 370,672 | 393,430 | |||||||||||
| FNMA 15 Year, 4.50%, 6/01/19 - 3/01/20 |
United States | 144,319 | 153,362 | |||||||||||
| FNMA 15 Year, 5.00%, 10/01/17 - 6/01/18 |
United States | 118,351 | 125,595 | |||||||||||
| FNMA 15 Year, 5.50%, 9/01/14 - 11/01/18 |
United States | 701,934 | 746,085 | |||||||||||
| FNMA 15 Year, 6.00%, 4/01/16 - 7/01/16 |
United States | 1,153 | 1,162 | |||||||||||
| FNMA 30 Year, 3.00%, 12/01/42 - 5/01/43 |
United States | 4,699,638 | 4,649,639 | |||||||||||
| FNMA 30 Year, 3.50%, 5/01/43 |
United States | 2,851,449 | 2,940,691 | |||||||||||
| FNMA 30 Year, 4.00%, 2/01/41 |
United States | 8,383,825 | 8,912,666 | |||||||||||
| FNMA 30 Year, 5.00%, 4/01/30 |
United States | 147,259 | 164,042 | |||||||||||
| FNMA 30 Year, 6.50%, 6/01/28 - 10/01/37 |
United States | 479,892 | 541,648 | |||||||||||
|
|
|
|||||||||||||
| 25,818,483 | ||||||||||||||
|
|
|
|||||||||||||
| Government National Mortgage Association (GNMA) Fixed Rate 0.3% |
|
|||||||||||||
| GNMA I SF 30 Year, 5.00%, 11/15/33 - 7/15/34 |
United States | 480,767 | 533,300 | |||||||||||
| GNMA I SF 30 Year, 5.50%, 12/15/32 - 6/15/36 |
United States | 659,209 | 738,769 | |||||||||||
| GNMA I SF 30 Year, 6.50%, 2/15/32 |
United States | 2,200 | 2,512 | |||||||||||
| GNMA I SF 30 Year, 7.00%, 10/15/28 - 6/15/32 |
United States | 36,878 | 39,157 | |||||||||||
| GNMA I SF 30 Year, 7.50%, 9/15/30 |
United States | 1,663 | 1,923 | |||||||||||
| GNMA II SF 30 Year, 3.50%, 5/20/42 |
United States | 1,361,412 | 1,421,290 | |||||||||||
| GNMA II SF 30 Year, 5.00%, 9/20/33 - 11/20/33 |
United States | 143,153 | 158,935 | |||||||||||
| GNMA II SF 30 Year, 6.00%, 11/20/34 |
United States | 167,282 | 193,330 | |||||||||||
| GNMA II SF 30 Year, 6.50%, 4/20/31 - 2/20/34 |
United States | 75,056 | 86,669 | |||||||||||
| GNMA II SF 30 Year, 7.50%, 1/20/28 - 4/20/32 |
United States | 18,420 | 21,575 | |||||||||||
|
|
|
|||||||||||||
| 3,197,460 | ||||||||||||||
|
|
|
|||||||||||||
| Total Mortgage-Backed Securities (Cost $34,515,473) |
34,778,893 | |||||||||||||
|
|
|
|||||||||||||
| Municipal Bonds 6.0% |
||||||||||||||
| Arkansas State GO, Four-Lane Highway Construction and Improvement Bonds, 3.25%, 6/15/22 |
United States | 1,300,000 | 1,370,330 | |||||||||||
| FSI-24 | Semiannual Report |
FRANKLIN TEMPLETON VARIABLE INSURANCE PRODUCTS TRUST
STATEMENT OF INVESTMENTS (UNAUDITED)
Franklin Strategic Income VIP Fund (continued)
| Country | Principal Amount* | Value | ||||||||||||
| Municipal Bonds (continued) |
||||||||||||||
| California State GO, Various Purpose, |
||||||||||||||
| 6.00%, 4/01/38 |
United States | 2,500,000 | $ | 2,951,625 | ||||||||||
| 6.00%, 11/01/39 |
United States | 160,000 | 192,186 | |||||||||||
| 5.25%, 11/01/40 |
United States | 560,000 | 631,075 | |||||||||||
| Refunding, 5.25%, 3/01/38 |
United States | 1,500,000 | 1,632,720 | |||||||||||
| Refunding, 5.00%, 4/01/38 |
United States | 3,000,000 | 3,255,750 | |||||||||||
| Refunding, NATL Insured, 4.50%, 12/01/32 |
United States | 300,000 | 311,772 | |||||||||||
| Refunding, Series 1, AGMC Insured, 4.75%, 9/01/31 |
United States | 290,000 | 301,507 | |||||||||||
| Colorado State ISD, GO, Mitchell and Scurry Counties, School Building, PSF Guarantee, 5.00%, 8/15/43 |
United States | 300,000 | 333,369 | |||||||||||
| Evansville Local Public Improvement Bond Bank Revenue, Sewage Works Project, Series A, 5.00%, 7/01/36 |
United States | 675,000 | 743,580 | |||||||||||
| Florida Hurricane Catastrophe Fund Finance Corp. Revenue, Series A, 2.995%, 7/01/20 |
United States | 4,700,000 | 4,687,592 | |||||||||||
| Hawaii State GO, Series EH, 5.00%, 8/01/30 |
United States | 700,000 | 809,914 | |||||||||||
| Illinois State GO, |
||||||||||||||
| 5.877%, 3/01/19 |
United States | 3,000,000 | 3,382,590 | |||||||||||
| Build America Bonds, 7.35%, 7/01/35 |
United States | 1,000,000 | 1,211,830 | |||||||||||
| Kansas State Development Finance Authority Revenue, Wichita State University Union Corp. Student Housing Project, Refunding, Series F-1, |
||||||||||||||
| 5.25%, 6/01/38 |
United States | 820,000 | 891,127 | |||||||||||
| 5.25%, 6/01/42 |
United States | 800,000 | 867,368 | |||||||||||
| 5.00%, 6/01/46 |
United States | 1,000,000 | 1,054,270 | |||||||||||
| Marco Island Utility System Revenue, Refunding, 4.625%, |
||||||||||||||
| 10/01/30 |
United States | 350,000 | 381,430 | |||||||||||
| 10/01/31 |
United States | 325,000 | 352,313 | |||||||||||
| Massachusetts State GO, Consolidated Loan of 2014, Series A, 4.50%, 12/01/43 |
United States | 2,300,000 | 2,427,397 | |||||||||||
| Metropolitan Boston Transit Parking Corp. Systemwide Parking Revenue, senior lien, 5.00%, 7/01/41 |
United States | 500,000 | 541,335 | |||||||||||
| Minnesota State GO, Various Purpose, Refunding, Series F, 4.00%, 10/01/24 |
United States | 2,650,000 | 2,985,516 | |||||||||||
| Mississippi State GO, Series B, 5.00%, 12/01/31 |
United States | 780,000 | 902,218 | |||||||||||
| Nassau County GO, General Improvement Bonds, Series B, 5.00%, |
||||||||||||||
| 4/01/39 |
United States | 1,500,000 | 1,610,820 | |||||||||||
| 4/01/43 |
United States | 1,600,000 | 1,713,328 | |||||||||||
| New Jersey EDA Revenue, School Facilities Construction, Refunding, Series NN, 5.00%, 3/01/30 |
United States | 700,000 | 765,247 | |||||||||||
| New York City HDC Revenue, Series B1, 5.00%, 7/01/33 |
United States | 500,000 | 547,745 | |||||||||||
| New York City Municipal Water Finance Authority Water and Sewer System Revenue, Second General Resolution, Fiscal 2014, Refunding, Series BB, 5.00%, 6/15/46 |
United States | 2,430,000 | 2,659,076 | |||||||||||
| New York GO, Sub. Series G-1, 5.00%, 4/01/27 |
United States | 1,750,000 | 1,994,090 | |||||||||||
| New York State Urban Development Corp. Revenue, State Personal Income Tax, General Purpose, Series C, 5.00%, 3/15/29 |
United States | 1,500,000 | 1,718,265 | |||||||||||
| Puerto Rico Electric Power Authority Power Revenue, |
||||||||||||||
| Series A, 6.75%, 7/01/36 |
United States | 3,465,000 | 1,602,562 | |||||||||||
| Series XX, 5.25%, 7/01/40 |
United States | 165,000 | 72,643 | |||||||||||
| Puerto Rico Sales Tax FICO Sales Tax Revenue, |
||||||||||||||
| Capital Appreciation, Series A, zero cpn., 8/01/25 |
United States | 320,000 | 144,246 | |||||||||||
| first subordinate, Series A, 5.75%, 8/01/37 |
United States | 1,000,000 | 816,750 | |||||||||||
| Semiannual Report | FSI-25 |
FRANKLIN TEMPLETON VARIABLE INSURANCE PRODUCTS TRUST
STATEMENT OF INVESTMENTS (UNAUDITED)
Franklin Strategic Income VIP Fund (continued)
| Country | Principal Amount* | Value | ||||||||||||
| Municipal Bonds (continued) |
||||||||||||||
| Puerto Rico Sales Tax FICO Sales Tax Revenue, (continued) |
||||||||||||||
| first subordinate, Series A, 6.50%, 8/01/44 |
United States | 2,500,000 | $ | 2,173,725 | ||||||||||
| Refunding, Series A, NATL RE, FGIC Insured, zero cpn., 8/01/45 |
United States | 3,700,000 | 502,275 | |||||||||||
| Refunding, Series B, 6.05%, 8/01/37 |
United States | 915,000 | 798,768 | |||||||||||
| Refunding, Series B, 6.05%, 8/01/38 |
United States | 1,120,000 | 969,741 | |||||||||||
| Red River Education Financing Corp. Education Revenue, Higher Education, Texas Christian University, 5.00%, 3/15/43 |
United States | 625,000 | 678,638 | |||||||||||
| South Carolina State Public Service Authority Revenue, Refunding, Series B, 5.00%, 12/01/38 |
United States | 1,000,000 | 1,085,100 | |||||||||||
| University of California Revenues, General, Series AK, 5.00%, 5/15/48 |
United States | 4,320,000 | 5,250,614 | |||||||||||
| Washington State GO, Various Purpose, |
||||||||||||||
| Refunding, Series R-C, 5.00%, 7/01/24 |
United States | 900,000 | 1,084,257 | |||||||||||
| Series D, 5.00%, 2/01/23 |
United States | 775,000 | 922,111 | |||||||||||
|
|
|
|||||||||||||
| Total Municipal Bonds (Cost $56,978,650) |
59,328,815 | |||||||||||||
|
|
|
|||||||||||||
| Shares | ||||||||||||||
| Escrows and Litigation Trusts 0.0% |
||||||||||||||
| Aerospace & Defense 0.0% |
||||||||||||||
| a,l | Comfort Co. Inc., Escrow Account |
United States | 13,427 | — | ||||||||||
| a,l | NewPage Corp., Litigation Trust |
United States | 2,500,000 | — | ||||||||||
|
|
|
|||||||||||||
| Total Escrows and Litigation Trusts (Cost $ —) |
— | |||||||||||||
|
|
|
|||||||||||||
| Total Investments before Short Term Investments |
872,843,060 | |||||||||||||
|
|
|
|||||||||||||
| Principal Amount* | ||||||||||||||
| Short Term Investments 10.6% |
||||||||||||||
| Foreign Government and Agency Securities 0.8% |
||||||||||||||
| r | Bank of Negara Monetary Notes, 7/08/14 - 11/06/14 |
Malaysia | 9,365,000 | MYR | 2,911,269 | |||||||||
| Government of Singapore, senior note, 3.625%, 7/01/14 |
Singapore | 600,000 | SGD | 481,290 | ||||||||||
| r | Philippine Treasury Bills, 7/02/14 - 11/05/14 |
Philippines | 212,265,000 | PHP | 4,856,403 | |||||||||
| r | Uruguay Treasury Bill, 8/29/14 |
Uruguay | 7,578,000 | UYU | 324,607 | |||||||||
|
|
|
|||||||||||||
| Total Foreign Government and Agency Securities (Cost $8,547,631) |
8,573,569 | |||||||||||||
|
|
|
|||||||||||||
| Total Investments before Money Market Funds (Cost $843,255,610) |
881,416,629 | |||||||||||||
|
|
|
|||||||||||||
| FSI-26 | Semiannual Report |
FRANKLIN TEMPLETON VARIABLE INSURANCE PRODUCTS TRUST
STATEMENT OF INVESTMENTS (UNAUDITED)
Franklin Strategic Income VIP Fund (continued)
| Country | Shares | Value | ||||||||||||
| Money Market Funds (Cost $96,249,322) 9.8% |
||||||||||||||
| a,s | Institutional Fiduciary Trust Money Market Portfolio |
United States | 96,249,322 | $ | 96,249,322 | |||||||||
|
|
|
|||||||||||||
| Total Investments (Cost $939,504,932) 99.5% |
977,665,951 | |||||||||||||
| Other Assets, less Liabilities 0.5% |
4,660,867 | |||||||||||||
|
|
|
|||||||||||||
| Net Assets 100.0% |
$ | 982,326,818 | ||||||||||||
|
|
|
|||||||||||||
†Rounds to less than 0.1% of net assets.
*The principal amount is stated in U.S. dollars unless otherwise indicated.
aNon-income producing.
bThe security is owned by FT Holdings Corporation III, a wholly-owned subsidiary of the Fund. See Note 1(g).
cAt June 30, 2014, pursuant to the Fund’s policies and the requirements of applicable securities law, the Fund may be restricted from trading these securities for a limited or extended period of time due to ownership limits and/or potential possession of material non-public information.
dSecurity was purchased pursuant to Rule 144A under the Securities Act of 1933 and may be sold in transactions exempt from registration only to qualified institutional buyers or in a public offering registered under the Securities Act of 1933. These securities have been deemed liquid under guidelines approved by the Trust’s Board of Trustees. At June 30, 2014, the aggregate value of these securities was $188,714,298, representing 19.21% of net assets.
ePerpetual security with no stated maturity date.
fThe coupon rate shown represents the rate at period end.
gSee Note 7 regarding defaulted securities.
hSee Note 1(f) regarding loan participation notes.
iA portion or all of the security purchased on a when-issued or delayed delivery basis.
jIncome may be received in additional securities and/or cash.
kSee Note 1(i) regarding senior floating rate interests.
lSecurity has been deemed illiquid because it may not be able to be sold within seven days. At June 30, 2014, the aggregate value of these securities was $170,002, representing 0.02% of net assets.
mPrincipal amount is stated in 100 Mexican Peso Units.
nPrincipal amount of security is adjusted for inflation. See Note 1(k).
oPrincipal amount is stated in 1,000 Brazilian Real Units.
pRedemption price at maturity is adjusted for inflation. See Note 1(k).
qSecurity was purchased pursuant to Regulation S under the Securities Act of 1933, which exempts from registration securities offered and sold outside of the United States. Such a security cannot be sold in the United States without either an effective registration statement filed pursuant to the Securities Act of 1933, or pursuant to an exemption from registration. This security has been deemed liquid under guidelines approved by the Trust’s Board of Trustees. At June 30, 2014, the value of this security was $2,741,598, representing 0.28% of net assets.
rThe security is traded on a discount basis with no stated coupon rate.
sSee Note 3(e) regarding investments in the Institutional Fiduciary Trust Money Market Portfolio.
| Semiannual Report | FSI-27 |
FRANKLIN TEMPLETON VARIABLE INSURANCE PRODUCTS TRUST
STATEMENT OF INVESTMENTS (UNAUDITED)
Franklin Strategic Income VIP Fund (continued)
At June 30, 2014, the Fund had the following forward exchange contracts outstanding. See Note 1(d).
Forward Exchange Contracts
| Currency | Counterpartya | Type | Quantity | Contract Amount |
Settlement Date |
Unrealized Appreciation |
Unrealized Depreciation |
|||||||||||||||||||||
| Japanese Yen |
DBAB | Buy | 97,929,000 | $ | 960,371 | 7/01/14 | $ | 6,312 | $ | — | ||||||||||||||||||
| Japanese Yen |
DBAB | Sell | 97,929,000 | 1,000,000 | 7/01/14 | 33,317 | — | |||||||||||||||||||||
| British Pound |
DBAB | Buy | 297,656 | 506,760 | 7/09/14 | 2,551 | — | |||||||||||||||||||||
| British Pound |
DBAB | Sell | 297,656 | 444,222 | 7/09/14 | — | (65,089 | ) | ||||||||||||||||||||
| Euro |
DBAB | Buy | 312,984 | 425,513 | 7/10/14 | 3,121 | — | |||||||||||||||||||||
| Euro |
DBAB | Sell | 312,984 | 404,094 | 7/10/14 | — | (24,540 | ) | ||||||||||||||||||||
| Euro |
DBAB | Sell | 190,862 | 252,893 | 7/25/14 | — | (8,510 | ) | ||||||||||||||||||||
| Euro |
BZWS | Sell | 1,993,000 | 2,639,529 | 7/28/14 | — | (90,096 | ) | ||||||||||||||||||||
| Euro |
CITI | Sell | 648,569 | 858,916 | 7/28/14 | — | (29,368 | ) | ||||||||||||||||||||
| British Pound |
DBAB | Sell | 169,385 | 257,905 | 7/30/14 | — | (31,873 | ) | ||||||||||||||||||||
| Euro |
DBAB | Buy | 656,385 | 899,717 | 8/01/14 | 2,178 | (2,894 | ) | ||||||||||||||||||||
| Euro |
DBAB | Sell | 900,000 | 1,191,825 | 8/01/14 | — | (40,838 | ) | ||||||||||||||||||||
| Euro |
JPHQ | Sell | 667,276 | 882,608 | 8/06/14 | — | (31,324 | ) | ||||||||||||||||||||
| Euro |
CITI | Sell | 317,220 | 422,315 | 8/08/14 | — | (12,167 | ) | ||||||||||||||||||||
| Chilean Peso |
BZWS | Buy | 743,650,000 | 1,382,121 | 8/11/14 | — | (43,383 | ) | ||||||||||||||||||||
| Euro |
CITI | Sell | 92,411 | 123,136 | 8/11/14 | — | (3,436 | ) | ||||||||||||||||||||
| Chilean Peso |
JPHQ | Buy | 1,141,336,600 | 2,148,196 | 8/20/14 | — | (95,407 | ) | ||||||||||||||||||||
| Japanese Yen |
HSBC | Sell | 65,957,000 | 679,969 | 8/20/14 | 28,645 | — | |||||||||||||||||||||
| Japanese Yen |
JPHQ | Sell | 47,983,000 | 493,588 | 8/20/14 | 19,758 | — | |||||||||||||||||||||
| Euro |
JPHQ | Sell | 3,500,000 | 4,678,783 | 8/21/14 | — | (115,190 | ) | ||||||||||||||||||||
| Japanese Yen |
BZWS | Sell | 15,895,000 | 163,934 | 8/22/14 | 6,969 | — | |||||||||||||||||||||
| Euro |
BZWS | Sell | 704,462 | 944,395 | 8/25/14 | — | (20,523 | ) | ||||||||||||||||||||
| Japanese Yen |
CITI | Sell | 31,757,000 | 326,915 | 8/25/14 | 13,305 | — | |||||||||||||||||||||
| Japanese Yen |
HSBC | Sell | 31,524,000 | 323,685 | 8/25/14 | 12,376 | — | |||||||||||||||||||||
| Euro |
DBAB | Sell | 527,245 | 704,399 | 8/26/14 | — | (17,782 | ) | ||||||||||||||||||||
| Japanese Yen |
BZWS | Sell | 44,152,000 | 449,156 | 8/26/14 | 13,139 | — | |||||||||||||||||||||
| Japanese Yen |
JPHQ | Sell | 31,689,000 | 322,365 | 8/26/14 | 9,425 | — | |||||||||||||||||||||
| Euro |
JPHQ | Sell | 211,135 | 281,762 | 8/27/14 | — | (7,436 | ) | ||||||||||||||||||||
| Japanese Yen |
DBAB | Sell | 27,184,000 | 275,420 | 8/27/14 | 6,967 | — | |||||||||||||||||||||
| Japanese Yen |
HSBC | Sell | 50,145,000 | 508,122 | 8/27/14 | 12,918 | — | |||||||||||||||||||||
| Japanese Yen |
JPHQ | Sell | 15,991,000 | 162,242 | 8/27/14 | 4,324 | — | |||||||||||||||||||||
| Singapore Dollar |
DBAB | Buy | 940,000 | 735,352 | 8/27/14 | 18,682 | — | |||||||||||||||||||||
| Euro |
DBAB | Sell | 1,174,984 | 1,568,731 | 8/28/14 | — | (40,685 | ) | ||||||||||||||||||||
| Japanese Yen |
JPHQ | Sell | 15,743,000 | 162,024 | 8/29/14 | 6,553 | — | |||||||||||||||||||||
| Euro |
BZWS | Sell | 178,354 | 238,281 | 9/19/14 | — | (6,040 | ) | ||||||||||||||||||||
| Euro |
UBSW | Sell | 2,137,312 | 2,856,732 | 9/22/14 | — | (71,137 | ) | ||||||||||||||||||||
| Euro |
DBAB | Sell | 275,651 | 374,008 | 9/23/14 | — | (3,603 | ) | ||||||||||||||||||||
| Euro |
BZWS | Sell | 469,210 | 635,198 | 9/24/14 | — | (7,571 | ) | ||||||||||||||||||||
| Euro |
DBAB | Sell | 1,550,000 | 2,093,074 | 9/30/14 | — | (30,321 | ) | ||||||||||||||||||||
| Euro |
JPHQ | Sell | 2,850,000 | 3,886,730 | 10/07/14 | — | (17,700 | ) | ||||||||||||||||||||
| Euro |
DBAB | Sell | 185,654 | 251,914 | 10/08/14 | — | (2,429 | ) | ||||||||||||||||||||
| Euro |
BZWS | Sell | 2,749,000 | 3,718,627 | 10/14/14 | — | (47,555 | ) | ||||||||||||||||||||
| Euro |
DBAB | Sell | 121,043 | 163,672 | 10/15/14 | — | (2,160 | ) | ||||||||||||||||||||
| Euro |
DBAB | Sell | 587,951 | 795,880 | 10/17/14 | — | (9,635 | ) | ||||||||||||||||||||
| Malaysian Ringgit |
JPHQ | Buy | 763,000 | 235,851 | 10/20/14 | 316 | — | |||||||||||||||||||||
| Chilean Peso |
CITI | Buy | 377,668,000 | 724,891 | 10/24/14 | — | (49,916 | ) | ||||||||||||||||||||
| Japanese Yen |
JPHQ | Sell | 270,990,000 | 2,763,554 | 10/24/14 | 86,144 | — | |||||||||||||||||||||
| Malaysian Ringgit |
DBAB | Buy | 6,892,000 | 2,140,040 | 10/24/14 | — | (7,321 | ) | ||||||||||||||||||||
| Malaysian Ringgit |
HSBC | Buy | 6,809,796 | 2,103,087 | 10/24/14 | 4,194 | — | |||||||||||||||||||||
| Euro |
BZWS | Sell | 217,715 | 299,754 | 10/27/14 | 1,463 | — | |||||||||||||||||||||
| Euro |
GSCO | Sell | 369,000 | 509,146 | 10/29/14 | 3,575 | — | |||||||||||||||||||||
| Euro |
DBAB | Sell | 243,767 | 329,122 | 10/30/14 | — | (4,868 | ) | ||||||||||||||||||||
| Euro |
DBAB | Sell | 744,524 | 1,028,195 | 10/31/14 | 8,104 | — | |||||||||||||||||||||
| Euro |
BZWS | Sell | 529,706 | 716,374 | 11/05/14 | — | (9,405 | ) | ||||||||||||||||||||
| Japanese Yen |
JPHQ | Sell | 360,360,000 | 3,678,695 | 11/05/14 | 117,894 | — | |||||||||||||||||||||
| Euro |
DBAB | Sell | 740,000 | 997,705 | 11/07/14 | — | (16,219 | ) | ||||||||||||||||||||
| Japanese Yen |
DBAB | Sell | 245,702,500 | 2,500,000 | 11/07/14 | 72,110 | — | |||||||||||||||||||||
| Euro |
JPHQ | Sell | 473,670 | 631,611 | 11/12/14 | — | (17,412 | ) | ||||||||||||||||||||
| Euro |
DBAB | Sell | 800,000 | 1,076,736 | 11/14/14 | — | (19,433 | ) | ||||||||||||||||||||
| FSI-28 | Semiannual Report |
FRANKLIN TEMPLETON VARIABLE INSURANCE PRODUCTS TRUST
STATEMENT OF INVESTMENTS (UNAUDITED)
Franklin Strategic Income VIP Fund (continued)
Forward Exchange Contracts (continued)
| Currency | Counterpartya | Type | Quantity | Contract Amount |
Settlement Date |
Unrealized Appreciation |
Unrealized Depreciation |
|||||||||||||||||||||
| Japanese Yen |
MSCO | Sell | 12,500,000 | $ | 125,800 | 11/14/14 | $ | 2,274 | $ | — | ||||||||||||||||||
| Euro |
DBAB | Sell | 227,970 | 306,442 | 11/17/14 | — | (5,930 | ) | ||||||||||||||||||||
| Euro |
DBAB | Sell | 63,419 | 85,419 | 11/19/14 | — | (1,480 | ) | ||||||||||||||||||||
| Malaysian Ringgit |
DBAB | Buy | 623,200 | 191,242 | 11/19/14 | 1,305 | — | |||||||||||||||||||||
| Euro |
JPHQ | Sell | 1,702,433 | 2,304,430 | 11/20/14 | — | (28,327 | ) | ||||||||||||||||||||
| Malaysian Ringgit |
HSBC | Buy | 376,000 | 115,479 | 11/20/14 | 685 | — | |||||||||||||||||||||
| Euro |
DBAB | Sell | 1,245,000 | 1,688,936 | 12/04/14 | — | (17,132 | ) | ||||||||||||||||||||
| Euro |
DBAB | Buy | 2,872,000 | 4,001,414 | 12/09/14 | — | (65,720 | ) | ||||||||||||||||||||
| Euro |
DBAB | Sell | 3,400,000 | 4,645,114 | 12/09/14 | — | (14,134 | ) | ||||||||||||||||||||
| Euro |
DBAB | Buy | 548,290 | 745,307 | 12/11/14 | 6,058 | — | |||||||||||||||||||||
| Euro |
DBAB | Sell | 800,000 | 1,097,800 | 12/11/14 | 1,496 | — | |||||||||||||||||||||
| Euro |
DBAB | Sell | 1,200,000 | 1,652,520 | 12/12/14 | 8,057 | — | |||||||||||||||||||||
| Japanese Yen |
JPHQ | Sell | 187,760,000 | 1,833,764 | 12/12/14 | — | (22,188 | ) | ||||||||||||||||||||
| Euro |
CITI | Sell | 3,868,000 | 5,309,874 | 12/17/14 | 9,102 | — | |||||||||||||||||||||
| Euro |
DBAB | Sell | 486,875 | 667,993 | 12/17/14 | 771 | — | |||||||||||||||||||||
| Euro |
DBAB | Sell | 501,617 | 689,772 | 12/18/14 | 2,345 | — | |||||||||||||||||||||
| Chilean Peso |
BZWS | Buy | 477,650,000 | 823,534 | 1/09/15 | 24,189 | — | |||||||||||||||||||||
| Chilean Peso |
DBAB | Buy | 140,000,000 | 241,421 | 1/09/15 | 7,048 | — | |||||||||||||||||||||
| Euro |
BZWS | Sell | 4,116,197 | 5,626,760 | 1/09/15 | 5,983 | (20,774 | ) | ||||||||||||||||||||
| Euro |
DBAB | Buy | 5,250,258 | 7,234,053 | 1/09/15 | 8,068 | (46,255 | ) | ||||||||||||||||||||
| Euro |
DBAB | Sell | 7,328,957 | 9,971,255 | 1/09/15 | — | (73,621 | ) | ||||||||||||||||||||
| Euro |
JPHQ | Sell | 7,574,544 | 10,313,425 | 1/09/15 | 3,754 | (71,800 | ) | ||||||||||||||||||||
| Indian Rupee |
DBAB | Buy | 307,316,000 | 4,589,980 | 1/09/15 | 356,372 | — | |||||||||||||||||||||
| Indian Rupee |
HSBC | Buy | 144,338,000 | 2,139,801 | 1/09/15 | 183,367 | — | |||||||||||||||||||||
| Indian Rupee |
JPHQ | Buy | 23,701,000 | 356,835 | 1/09/15 | 24,640 | — | |||||||||||||||||||||
| Japanese Yen |
BZWS | Sell | 136,513,000 | 1,336,671 | 1/09/15 | — | (13,068 | ) | ||||||||||||||||||||
| Japanese Yen |
CITI | Sell | 127,820,000 | 1,250,365 | 1/09/15 | — | (13,425 | ) | ||||||||||||||||||||
| Japanese Yen |
DBAB | Sell | 987,554,000 | 9,622,124 | 1/09/15 | — | (142,079 | ) | ||||||||||||||||||||
| Japanese Yen |
GSCO | Sell | 42,760,000 | 417,639 | 1/09/15 | — | (5,140 | ) | ||||||||||||||||||||
| Japanese Yen |
HSBC | Sell | 247,910,000 | 2,397,324 | 1/09/15 | 903 | (54,729 | ) | ||||||||||||||||||||
| Japanese Yen |
JPHQ | Sell | 149,719,000 | 1,472,570 | 1/09/15 | 1,104 | (8,845 | ) | ||||||||||||||||||||
| Singapore Dollar |
DBAB | Buy | 1,663,000 | 1,319,773 | 1/09/15 | 14,452 | — | |||||||||||||||||||||
| Euro |
DBAB | Sell | 3,561,422 | 4,905,641 | 2/09/15 | 23,645 | — | |||||||||||||||||||||
| Euro |
JPHQ | Sell | 1,889,700 | 2,614,801 | 2/09/15 | 24,401 | — | |||||||||||||||||||||
| Indian Rupee |
CITI | Buy | 4,537,000 | 68,123 | 2/09/15 | 4,456 | — | |||||||||||||||||||||
| Japanese Yen |
DBAB | Sell | 257,790,000 | 2,516,252 | 2/09/15 | — | (33,290 | ) | ||||||||||||||||||||
| Japanese Yen |
HSBC | Sell | 85,800,000 | 837,049 | 2/09/15 | — | (11,513 | ) | ||||||||||||||||||||
| Japanese Yen |
JPHQ | Sell | 181,500,000 | 1,771,692 | 2/09/15 | — | (23,342 | ) | ||||||||||||||||||||
| Singapore Dollar |
DBAB | Buy | 973,400 | 768,575 | 2/09/15 | 12,426 | — | |||||||||||||||||||||
| Singapore Dollar |
JPHQ | Buy | 694,000 | 548,088 | 2/09/15 | 8,738 | — | |||||||||||||||||||||
| Swedish Krona |
DBAB | Buy | 91,336,000 | 14,011,490 | 2/09/15 | — | (367,342 | ) | ||||||||||||||||||||
| British Pound |
DBAB | Sell | 380,363 | 643,957 | 3/09/15 | — | (4,955 | ) | ||||||||||||||||||||
| Chilean Peso |
DBAB | Buy | 314,000,000 | 543,629 | 3/09/15 | 10,750 | — | |||||||||||||||||||||
| Chilean Peso |
JPHQ | Buy | 234,301,000 | 408,546 | 3/09/15 | 5,121 | — | |||||||||||||||||||||
| Chilean Peso |
MSCO | Buy | 220,380,000 | 389,861 | 3/09/15 | 1,081 | (1,853 | ) | ||||||||||||||||||||
| Euro |
BZWS | Sell | 132,570 | 182,984 | 3/09/15 | 1,230 | — | |||||||||||||||||||||
| Euro |
DBAB | Buy | 693,250 | 960,637 | 3/09/15 | — | (10,188 | ) | ||||||||||||||||||||
| Euro |
DBAB | Sell | 14,178,711 | 19,458,828 | 3/09/15 | 79,734 | (59,973 | ) | ||||||||||||||||||||
| Euro |
HSBC | Sell | 142,717 | 196,450 | 3/09/15 | 784 | — | |||||||||||||||||||||
| Euro |
JPHQ | Sell | 2,118,679 | 2,926,091 | 3/09/15 | 21,374 | — | |||||||||||||||||||||
| Japanese Yen |
DBAB | Sell | 780,622,000 | 7,656,519 | 3/09/15 | 183 | (65,942 | ) | ||||||||||||||||||||
| Japanese Yen |
HSBC | Sell | 80,270,000 | 785,267 | 3/09/15 | — | (8,801 | ) | ||||||||||||||||||||
| Japanese Yen |
JPHQ | Sell | 235,580,000 | 2,304,140 | 3/09/15 | — | (26,327 | ) | ||||||||||||||||||||
| Singapore Dollar |
DBAB | Buy | 7,316,140 | 5,840,520 | 3/09/15 | 29,821 | — | |||||||||||||||||||||
| Singapore Dollar |
HSBC | Buy | 837,000 | 669,900 | 3/09/15 | 1,694 | — | |||||||||||||||||||||
| Singapore Dollar |
JPHQ | Buy | 4,945,200 | 3,938,045 | 3/09/15 | 29,896 | — | |||||||||||||||||||||
|
|
|
|||||||||||||||||||||||||||
| Unrealized appreciation (depreciation) |
|
1,411,647 | (2,221,439 | ) | ||||||||||||||||||||||||
|
|
|
|||||||||||||||||||||||||||
| Net unrealized appreciation (depreciation) |
|
$ | (809,792 | ) | ||||||||||||||||||||||||
|
|
|
|||||||||||||||||||||||||||
aMay be comprised of multiple contracts using the same currency and settlement date.
| Semiannual Report | FSI-29 |
FRANKLIN TEMPLETON VARIABLE INSURANCE PRODUCTS TRUST
STATEMENT OF INVESTMENTS (UNAUDITED)
Franklin Strategic Income VIP Fund (continued)
At June 30, 2014, the Fund had the following credit default swap contracts outstanding. See Note 1(d).
Credit Default Swap Contracts
| Description | Counterparty / Exchange |
Notional Amounta |
Periodic Payment Rate |
Expiration Date |
Upfront Premiums Paid (Received) |
Unrealized Appreciation |
Unrealized Depreciation |
Market Value |
Ratingb | |||||||||||||||||||||||||
| OTC Swaps | ||||||||||||||||||||||||||||||||||
| Contracts to Sell Protectionc | ||||||||||||||||||||||||||||||||||
| Single Name | ||||||||||||||||||||||||||||||||||
| People’s Republic of China |
BZWS | 1,500,000 | 1.00 | % | 3/20/19 | $ | 2,682 | $ | 19,805 | $ — | $ | 22,487 | AA- | |||||||||||||||||||||
| People’s Republic of China |
JPHQ | 7,500,000 | 1.00 | % | 3/20/19 | 19,549 | 92,886 | — | 112,435 | AA- | ||||||||||||||||||||||||
| Republic of Brazil |
FBCO | 3,000,000 | 1.00 | % | 3/20/19 | (137,892 | ) | 96,325 | — | (41,567 | ) | BBB- | ||||||||||||||||||||||
| Traded Index | ||||||||||||||||||||||||||||||||||
| CMBX.NA.AJ.2 |
FBCO | 2,730,154 | 1.09 | % | 3/15/49 | (381,238 | ) | 179,722 | — | (201,516 | ) | Non Investment Grade | ||||||||||||||||||||||
| MCDX.NA.21 |
CITI | 16,000,000 | 1.00 | % | 12/20/18 | (268,039 | ) | 232,529 | — | (35,510 | ) | Non Investment Grade | ||||||||||||||||||||||
|
|
|
|||||||||||||||||||||||||||||||||
| Net unrealized appreciation (depreciation) |
|
$ | 621,267 | |||||||||||||||||||||||||||||||
|
|
|
|||||||||||||||||||||||||||||||||
aIn U.S. dollars unless otherwise indicated. For contracts to sell protection, the notional amount is equal to the maximum potential amount of the future payments and no recourse provisions have been entered into in association with the contracts.
bBased on Standard and Poor’s (S&P) Rating for single name swaps and internal ratings for index swaps. Internal ratings based on mapping into equivalent ratings from external vendors.
cThe fund enters contracts to sell protection to create a long credit position. Performance triggers include default, bankruptcy or restructuring for single name swaps and failure to pay or bankruptcy of the underlying securities for traded index swaps.
See Note 9 regarding other derivative information.
See Abbreviations on page FSI-47.
| FSI-30 | Semiannual Report | The accompanying notes are an integral part of these financial statements. |
FRANKLIN TEMPLETON VARIABLE INSURANCE PRODUCTS TRUST
Financial Statements
Statement of Assets and Liabilities
June 30, 2014 (unaudited)
| Franklin Strategic Income VIP Fund |
||||
| Assets: | ||||
| Investments in securities: |
||||
| Cost - Unaffiliated issuers |
$ | 843,255,610 | ||
| Cost - Sweep Money Fund (Note 3e) |
96,249,322 | |||
|
|
|
|||
| Total cost of investments |
$ | 939,504,932 | ||
|
|
|
|||
| Value - Unaffiliated issuers |
$ | 881,416,629 | ||
| Value - Sweep Money Fund (Note 3e) |
96,249,322 | |||
|
|
|
|||
| Total value of investments |
977,665,951 | |||
| Cash |
847,920 | |||
| Restricted cash (Note 1e) |
56,000 | |||
| Foreign currency, at value (cost $9,368,585) |
9,381,912 | |||
| Receivables: |
||||
| Investment securities sold |
13,191,188 | |||
| Capital shares sold |
282,729 | |||
| Dividends and interest |
10,283,361 | |||
| Due from brokers |
1,170,000 | |||
| OTC swaps (premiums paid $24,165) |
22,231 | |||
| Unrealized appreciation on forward exchange contracts |
1,411,647 | |||
| Unrealized appreciation on OTC swap contracts |
621,267 | |||
| Other assets |
469 | |||
|
|
|
|||
| Total assets |
1,014,934,675 | |||
|
|
|
|||
| Liabilities: | ||||
| Payables: |
||||
| Investment securities purchased |
26,636,164 | |||
| Capital shares redeemed |
1,975,612 | |||
| Management fees |
458,279 | |||
| Distribution fees |
158,966 | |||
| Due to brokers |
56,000 | |||
| OTC Swaps (premiums received $852,539) |
787,169 | |||
| Unrealized depreciation on forward exchange contracts |
2,221,439 | |||
| Unrealized depreciation on unfunded loan commitments (Note 8) |
16,846 | |||
| Deferred tax |
24,637 | |||
| Accrued expenses and other liabilities |
272,745 | |||
|
|
|
|||
| Total liabilities |
32,607,857 | |||
|
|
|
|||
| Net assets, at value |
$ | 982,326,818 | ||
|
|
|
|||
| Net assets consist of: | ||||
| Paid-in capital |
$ | 920,364,886 | ||
| Undistributed net investment income |
13,623,331 | |||
| Net unrealized appreciation (depreciation) |
37,950,556 | |||
| Accumulated net realized gain (loss) |
10,388,045 | |||
|
|
|
|||
| Net assets, at value |
$ | 982,326,818 | ||
|
|
|
|||
| The accompanying notes are an integral part of these financial statements. | Semiannual Report | FSI-31 |
FRANKLIN TEMPLETON VARIABLE INSURANCE PRODUCTS TRUST
FINANCIAL STATEMENTS
Statement of Assets and Liabilities (continued)
June 30, 2014 (unaudited)
| Franklin Strategic Income VIP Fund |
||||
| Class 1: | ||||
| Net assets, at value |
$ | 656,691,116 | ||
|
|
|
|||
| Shares outstanding |
54,038,177 | |||
|
|
|
|||
| Net asset value and maximum offering price per share |
$ | 12.15 | ||
|
|
|
|||
| Class 2: | ||||
| Net assets, at value |
$ | 193,514,185 | ||
|
|
|
|||
| Shares outstanding |
16,387,877 | |||
|
|
|
|||
| Net asset value and maximum offering price per share |
$ | 11.81 | ||
|
|
|
|||
| Class 4: | ||||
| Net assets, at value |
$ | 132,121,517 | ||
|
|
|
|||
| Shares outstanding |
10,961,211 | |||
|
|
|
|||
| Net asset value and maximum offering price per share |
$ | 12.05 | ||
|
|
|
|||
| FSI-32 | Semiannual Report | The accompanying notes are an integral part of these financial statements. |
FRANKLIN TEMPLETON VARIABLE INSURANCE PRODUCTS TRUST
FINANCIAL STATEMENTS
Statement of Operations
for the six months ended June 30, 2014 (unaudited)
| Franklin Strategic Income VIP Fund |
||||
| Investment income: | ||||
| Dividends |
$ | 28,941 | ||
| Interest |
24,727,901 | |||
|
|
|
|||
| Total investment income |
24,756,842 | |||
|
|
|
|||
| Expenses: | ||||
| Management fees (Note 3a) |
2,851,686 | |||
| Distribution fees: (Note 3c) |
||||
| Class 2 |
228,359 | |||
| Class 4 |
235,691 | |||
| Custodian fees (Note 4) |
66,736 | |||
| Reports to shareholders |
94,326 | |||
| Registration and filing fees |
126 | |||
| Professional fees |
41,524 | |||
| Trustees’ fees and expenses |
2,558 | |||
| Other |
39,011 | |||
|
|
|
|||
| Total expenses |
3,560,017 | |||
| Expense reductions (Note 4) |
(613 | ) | ||
| Expenses waived/paid by affiliates (Note 3e) |
(35,336 | ) | ||
|
|
|
|||
| Net expenses |
3,524,068 | |||
|
|
|
|||
| Net investment income |
21,232,774 | |||
|
|
|
|||
| Realized and unrealized gains (losses): | ||||
| Net realized gain (loss) from: |
||||
| Investments |
10,777,634 | |||
| Foreign currency transactions |
(491,481 | ) | ||
| Swap contracts |
356,710 | |||
|
|
|
|||
| Net realized gain (loss) |
10,642,863 | |||
|
|
|
|||
| Net change in unrealized appreciation (depreciation) on: |
||||
| Investments |
9,765,603 | |||
| Translation of other assets and liabilities denominated in foreign currencies |
(274,353 | ) | ||
| Change in deferred taxes on unrealized appreciation |
(13,508 | ) | ||
|
|
|
|||
| Net change in unrealized appreciation (depreciation) |
9,477,742 | |||
|
|
|
|||
| Net realized and unrealized gain (loss) |
20,120,605 | |||
|
|
|
|||
| Net increase (decrease) in net assets resulting from operations |
$ | 41,353,379 | ||
|
|
|
|||
| The accompanying notes are an integral part of these financial statements. | Semiannual Report | FSI-33 |
FRANKLIN TEMPLETON VARIABLE INSURANCE PRODUCTS TRUST
FINANCIAL STATEMENTS
Statements of Changes in Net Assets
| Franklin Strategic Income VIP Fund | ||||||||
| Six Months Ended June 30, 2014 (unaudited) |
Year Ended December 31, 2013 |
|||||||
| Increase (decrease) in net assets: | ||||||||
| Operations: |
||||||||
| Net investment income |
$ | 21,232,774 | $ | 54,238,182 | ||||
| Net realized gain (loss) from investments, foreign currency transactions and swap contracts |
10,642,863 | 22,020,933 | ||||||
| Net change in unrealized appreciation (depreciation) on investments, translation of other assets and liabilities denominated in foreign currencies and deferred taxes |
9,477,742 | (37,991,817 | ) | |||||
|
|
|
|||||||
| Net increase (decrease) in net assets resulting from operations |
41,353,379 | 38,267,298 | ||||||
|
|
|
|||||||
| Distributions to shareholders from: |
||||||||
| Net investment income and net foreign currency gains: |
||||||||
| Class 1 |
(39,220,893 | ) | (54,987,119 | ) | ||||
| Class 2 |
(11,269,863 | ) | (10,246,664 | ) | ||||
| Class 4 |
(7,512,342 | ) | (10,775,092 | ) | ||||
| Net realized gains: |
||||||||
| Class 1 |
(12,517,628 | ) | (11,433,439 | ) | ||||
| Class 2 |
(3,732,579 | ) | (2,203,428 | ) | ||||
| Class 4 |
(2,588,163 | ) | (2,384,488 | ) | ||||
|
|
|
|||||||
| Total distributions to shareholders |
(76,841,468 | ) | (92,030,230 | ) | ||||
|
|
|
|||||||
| Capital share transactions: (Note 2) |
||||||||
| Class 1 |
(25,486,396 | ) | (275,817,937 | ) | ||||
| Class 2 |
25,715,487 | 23,867,593 | ||||||
| Class 4 |
1,815,697 | (52,983,286 | ) | |||||
|
|
|
|||||||
| Total capital share transactions |
2,044,788 | (304,933,630 | ) | |||||
|
|
|
|||||||
| Net increase (decrease) in net assets |
(33,443,301 | ) | (358,696,562 | ) | ||||
| Net assets: | ||||||||
| Beginning of period |
1,015,770,119 | 1,374,466,681 | ||||||
|
|
|
|||||||
| End of period |
$ | 982,326,818 | $ | 1,015,770,119 | ||||
|
|
|
|||||||
| Undistributed net investment income included in net assets: | ||||||||
| End of period |
$ | 13,623,331 | $ | 50,393,655 | ||||
|
|
|
|||||||
| FSI-34 | Semiannual Report | The accompanying notes are an integral part of these financial statements. |
FRANKLIN TEMPLETON VARIABLE INSURANCE PRODUCTS TRUST
Notes to Financial Statements (unaudited)
Franklin Strategic Income VIP Fund
| Semiannual Report | FSI-35 |
FRANKLIN TEMPLETON VARIABLE INSURANCE PRODUCTS TRUST
NOTES TO FINANCIAL STATEMENTS (UNAUDITED)
Franklin Strategic Income VIP Fund (continued)
1. Organization and Significant Accounting Policies (continued)
a. Financial Instrument Valuation (continued)
regular basis to review such financial instruments and considers a number of factors, including significant unobservable valuation inputs, when arriving at fair value. The VLOC primarily employs a market-based approach which may use related or comparable assets or liabilities, recent transactions, market multiples, book values, and other relevant information for the investment to determine the fair value of the investment. An income-based valuation approach may also be used in which the anticipated future cash flows of the investment are discounted to calculate fair value. Discounts may also be applied due to the nature or duration of any restrictions on the disposition of the investments. Due to the inherent uncertainty of valuations of such investments, the fair values may differ significantly from the values that would have been used had an active market existed. The VLOC employs various methods for calibrating these valuation approaches including a regular review of key inputs and assumptions, transactional back-testing or disposition analysis, and reviews of any related market activity.
Trading in securities on foreign securities stock exchanges and OTC markets may be completed before the daily NYSE close. In addition, trading in certain foreign markets may not take place on every NYSE business day. Occasionally, events occur between the time at which trading in a foreign security is completed and the close of the NYSE that might call into question the reliability of the value of a portfolio security held by the Fund. As a result, differences may arise between the value of the Fund’s portfolio securities as determined at the foreign market close and the latest indications of value at the close of the NYSE. In order to minimize the potential for these differences, the VLOC monitors price movements following the close of trading in foreign stock markets through a series of country specific market proxies (such as baskets of American Depositary Receipts, futures contracts and exchange traded funds). These price movements are measured against established trigger thresholds for each specific market proxy to assist in determining if an event has occurred that may call into question the reliability of the values of the foreign securities held by the Fund. If such an event occurs, the securities may be valued using fair value procedures, which may include the use of independent pricing services.
Also, when the last day of the reporting period is a non-business day, certain foreign markets may be open on those days that the NYSE is closed, which could result in differences between the value of the Fund’s portfolio securities on the last business day and the last calendar day of the reporting period. Any significant security valuation changes due to an open foreign market are adjusted and reflected by the Fund for financial reporting purposes.
b. Foreign Currency Translation
Portfolio securities and other assets and liabilities denominated in foreign currencies are translated into U.S. dollars based on the exchange rate of such currencies against U.S. dollars on the date of valuation. The Fund may enter into foreign currency exchange contracts to facilitate transactions denominated in a foreign currency. Purchases and sales of securities, income and expense items denominated in foreign currencies are translated into U.S. dollars at the exchange rate in effect on the transaction date. Portfolio securities and assets and liabilities denominated in foreign currencies contain risks that those currencies will decline in value relative to the U.S. dollar. Occasionally, events may impact the availability or reliability of foreign exchange rates used to convert the U.S. dollar equivalent value. If such an event occurs, the foreign exchange rate will be valued at fair value using procedures established and approved by the Board.
The Fund does not separately report the effect of changes in foreign exchange rates from changes in market prices on securities held. Such changes are included in net realized and unrealized gain or loss from investments on the Statement of Operations.
Realized foreign exchange gains or losses arise from sales of foreign currencies, currency gains or losses realized between the trade and settlement dates on securities transactions and the difference between the recorded amounts of dividends, interest, and foreign withholding taxes and the U.S. dollar equivalent of the amounts actually received or paid. Net unrealized foreign exchange gains and losses arise from changes in foreign exchange rates on foreign denominated assets and liabilities other than investments in securities held at the end of the reporting period.
c. Securities Purchased on a When-Issued and Delayed Delivery Basis
The Fund purchases securities on a when-issued and delayed delivery basis, with payment and delivery scheduled for a future date. These transactions are subject to market fluctuations and
| FSI-36 | Semiannual Report |
FRANKLIN TEMPLETON VARIABLE INSURANCE PRODUCTS TRUST
NOTES TO FINANCIAL STATEMENTS (UNAUDITED)
Franklin Strategic Income VIP Fund (continued)
| Semiannual Report | FSI-37 |
FRANKLIN TEMPLETON VARIABLE INSURANCE PRODUCTS TRUST
NOTES TO FINANCIAL STATEMENTS (UNAUDITED)
Franklin Strategic Income VIP Fund (continued)
1. Organization and Significant Accounting Policies (continued)
d. Derivative Financial Instruments (continued)
as an unrealized appreciation or depreciation until the payments are made, at which time they are realized. Payments received or paid to initiate a credit default swap contract are reflected on the Statement of Assets and Liabilities and represent compensating factors between stated terms of the credit default swap agreement and prevailing market conditions (credit spreads and other relevant factors). These upfront payments are amortized over the term of the contract as a realized gain or loss on the Statement of Operations.
See Note 9 regarding other derivative information.
e. Restricted Cash
At June 30, 2014, the Fund received restricted cash in connection with investments in certain derivative securities. Restricted cash is held in a segregated account with the Fund’s custodian and is reflected in the Statement of Assets and Liabilities.
f. Loan Participation Notes
The Fund invests in loan participation notes (“Participations”). Participations are loans originally issued to a borrower by one or more financial institutions (the “Lender”) and subsequently sold to other investors, such as the Fund. Participations typically result in the Fund having a contractual relationship only with the Lender and not with the borrower. The Fund has the right to receive from the Lender any payments of principal, interest and fees which the Lender received from the borrower. The Fund generally has no rights to either enforce compliance by the borrower with the terms of the loan agreement or to any collateral relating to the original loan. As a result, the Fund assumes the credit risk of both the borrower and the Lender that is selling the Participation. The Participations may also involve interest rate risk and liquidity risk, including the potential default or insolvency of the borrower and/or the Lender.
g. FT Holdings Corporation III (FT Subsidiary)
The Fund invests in certain financial instruments through its investment in the FT Subsidiary. The FT Subsidiary is a Delaware Corporation, is a wholly-owned subsidiary of the Fund, and is able to invest in certain financial instruments consistent with the investment objective of the Fund. At June 30, 2014, the FT Subsidiary’s investment, Turtle Bay Resort, as well as any
other assets and liabilities of the FT Subsidiary are reflected in the Fund’s Statement of Investments and Statement of Assets and Liabilities. The financial statements have been consolidated and include the accounts of the Fund and the FT Subsidiary. All intercompany transactions and balances have been eliminated.
h. Mortgage Dollar Rolls
The Fund enters into mortgage dollar rolls, typically on a to-be-announced basis. Mortgage dollar rolls are agreements between the Fund and a financial institution to simultaneously sell and repurchase mortgage-backed securities at a future date. Gains or losses are realized on the initial sale, and the difference between the repurchase price and the sale price is recorded as an unrealized gain or loss to the Fund upon entering into the mortgage dollar roll. In addition, the Fund may invest the cash proceeds that are received from the initial sale. During the period between the sale and repurchase, the Fund is not entitled to principal and interest paid on the mortgage backed securities. The risks of mortgage dollar roll transactions include the potential inability of the counterparty to fulfill its obligations.
i. Senior Floating Rate Interests
The Fund invests in senior secured corporate loans that pay interest at rates which are periodically reset by reference to a base lending rate plus a spread. These base lending rates are generally the prime rate offered by a designated U.S. bank or the London InterBank Offered Rate (LIBOR). Senior secured corporate loans often require prepayment of principal from excess cash flows or at the discretion of the borrower. As a result, actual maturity may be substantially less than the stated maturity. Senior secured corporate loans in which the Fund invests are generally readily marketable, but may be subject to certain restrictions on resale.
j. Income and Deferred Taxes
It is the Fund’s policy to qualify as a regulated investment company under the Internal Revenue Code. The Fund intends to distribute to shareholders substantially all of its taxable income and net realized gains to relieve it from federal income and if applicable, excise taxes. As a result, no provision for U.S. federal income taxes is required.
The Fund may be subject to foreign taxation related to income received, capital gains on the sale of securities and certain foreign currency transactions in the foreign jurisdictions in which it invests. Foreign taxes, if any, are recorded based on the
| FSI-38 | Semiannual Report |
FRANKLIN TEMPLETON VARIABLE INSURANCE PRODUCTS TRUST
NOTES TO FINANCIAL STATEMENTS (UNAUDITED)
Franklin Strategic Income VIP Fund (continued)
| Semiannual Report | FSI-39 |
FRANKLIN TEMPLETON VARIABLE INSURANCE PRODUCTS TRUST
NOTES TO FINANCIAL STATEMENTS (UNAUDITED)
Franklin Strategic Income VIP Fund (continued)
2. Shares of Beneficial Interest
At June 30, 2014, there were an unlimited number of shares authorized (without par value). Transactions in the Fund’s shares were as follows:
| Six Months Ended June 30, 2014 |
Year Ended December 31, 2013 |
|||||||||||||||||
| Shares | Amount | Shares | Amount | |||||||||||||||
| Class 1 Shares: | ||||||||||||||||||
| Shares sold |
394,638 | $ | 5,020,821 | 782,903 | $ | 10,091,023 | ||||||||||||
| Shares issued in reinvestment of distributions |
4,268,855 | 51,738,520 | 5,373,832 | 66,420,558 | ||||||||||||||
| Shares redeemed |
(6,429,009 | ) | (82,245,737 | ) | (27,765,536 | ) | (352,329,518 | ) | ||||||||||
|
|
|
|||||||||||||||||
| Net increase (decrease) |
(1,765,516 | ) | $ | (25,486,396 | ) | (21,608,801 | ) | $ | (275,817,937 | ) | ||||||||
|
|
|
|||||||||||||||||
| Class 2 Shares: | ||||||||||||||||||
| Shares sold |
2,516,497 | $ | 31,336,075 | 4,461,765 | $ | 56,022,684 | ||||||||||||
| Shares issued in reinvestment of distributions |
1,273,552 | 15,002,442 | 1,034,061 | 12,450,092 | ||||||||||||||
| Shares redeemed |
(1,654,459 | ) | (20,623,030 | ) | (3,579,730 | ) | (44,605,183 | ) | ||||||||||
|
|
|
|||||||||||||||||
| Net increase (decrease) |
2,135,590 | $ | 25,715,487 | 1,916,096 | $ | 23,867,593 | ||||||||||||
|
|
|
|||||||||||||||||
| Class 4 Shares: | ||||||||||||||||||
| Shares sold |
396,814 | $ | 4,985,004 | 930,235 | $ | 11,782,444 | ||||||||||||
| Shares issued on reinvestment of distributions |
839,610 | 10,100,506 | 1,074,251 | 13,159,580 | ||||||||||||||
| Shares redeemed |
(1,061,217 | ) | (13,269,813 | ) | (6,283,838 | ) | (77,925,310 | ) | ||||||||||
|
|
|
|||||||||||||||||
| Net increase (decrease) |
175,207 | $ | 1,815,697 | (4,279,352 | ) | $ | (52,983,286 | ) | ||||||||||
|
|
|
|||||||||||||||||
3. Transactions With Affiliates
Franklin Resources, Inc. is the holding company for various subsidiaries that together are referred to as Franklin Templeton Investments. Certain officers and trustees of the Fund are also officers and/or directors of the following subsidiaries:
| Subsidiary | Affiliation | |
| Franklin Advisers, Inc. (Advisers) | Investment manager | |
| Franklin Templeton Services, LLC (FT Services) | Administrative manager | |
| Franklin Templeton Distributors, Inc. (Distributors) | Principal underwriter | |
| Franklin Templeton Investor Services, LLC (Investor Services) | Transfer agent |
a. Management Fees
The Fund pays an investment management fee to Advisers based on the average daily net assets of the Fund as follows:
| Annualized Fee Rate | Net Assets | |
| 0.625% | Up to and including $500 million | |
| 0.525% | Over $500 million, up to and including $1 billion | |
| 0.480% | Over $1 billion, up to and including $1.5 billion | |
| 0.435% | Over $1.5 billion, up to and including $6.5 billion | |
| 0.415% | Over $6.5 billion, up to and including $11.5 billion | |
| 0.400% | Over $11.5 billion, up to and including $16.5 billion |
| FSI-40 | Semiannual Report |
FRANKLIN TEMPLETON VARIABLE INSURANCE PRODUCTS TRUST
NOTES TO FINANCIAL STATEMENTS (UNAUDITED)
Franklin Strategic Income VIP Fund (continued)
| Annualized Fee Rate | Net Assets | |
| 0.390% | Over $16.5 billion, up to and including $19 billion | |
| 0.380% | Over $19 billion, up to and including $21.5 billion | |
| 0.370% | In excess of $21.5 billion |
b. Administrative Fees
Under an agreement with Advisers, FT Services provides administrative services to the Fund. The fee is paid by Advisers based on the Fund’s average daily net assets, and is not an additional expense of the Fund.
c. Distribution Fees
The Board has adopted distribution plans for Class 2 and Class 4 shares pursuant to Rule 12b-1 under the 1940 Act. Under the Fund’s compensation distribution plans, the Fund pays Distributors for costs incurred in connection with the servicing, sale and distribution of the Fund’s shares up to 0.25%, and 0.35% per year of its average daily net assets of Class 2 and Class 4, respectively. Some distribution fees are not charged on shares held by affiliates. The plan year, for purposes of monitoring compliance with the maximum annual plan rates, is February 1 through January 31.
d. Transfer Agent Fees
Investor Services, under terms of an agreement, performs shareholder servicing for the Fund and is not paid by the Fund for the services.
e. Investment in Institutional Fiduciary Trust Money Market Portfolio
The Fund invests in the Institutional Fiduciary Trust Money Market Portfolio (Sweep Money Fund), an affiliated open-end management investment company. Management fees paid by the Fund are waived on assets invested in the Sweep Money Fund, in an amount not to exceed the management and administrative fees paid directly or indirectly by the Sweep Money Fund, as noted on the Statement of Operations. Prior to January 1, 2014, the waiver was accounted for as a reduction to management fees.
4. Expense Offset Arrangement
The Fund has entered into an arrangement with its custodian whereby credits realized as a result of uninvested cash balances are used to reduce a portion of the Fund’s custodian expenses. During the period ended June 30, 2014, the custodian fees were reduced as noted in the Statement of Operations.
5. Income Taxes
At June 30, 2014, the cost of investments and net unrealized appreciation (depreciation) for income tax purposes were as follows:
| Cost of investments |
$941,852,209 | |
|
| ||
| Unrealized appreciation |
$ 46,765,434 | |
| Unrealized depreciation |
(10,951,692) | |
|
| ||
| Net unrealized appreciation (depreciation) |
$ 35,813,742 | |
|
| ||
Differences between income and/or capital gains as determined on a book basis and a tax basis are primarily due to differing treatments of paydown losses, bond discounts and premiums and tax straddles.
| Semiannual Report | FSI-41 |
FRANKLIN TEMPLETON VARIABLE INSURANCE PRODUCTS TRUST
NOTES TO FINANCIAL STATEMENTS (UNAUDITED)
Franklin Strategic Income VIP Fund (continued)
6. Investment Transactions
Purchases and sales of investments (excluding short term securities) for the period ended June 30, 2014, aggregated $217,446,022 and $248,015,193, respectively.
7. Credit Risk and Defaulted Securities
At June 30, 2014, the Fund had 53.75% of its portfolio invested in high yield, senior secured floating rate notes, or other securities rated below investment grade. These securities may be more sensitive to economic conditions causing greater price volatility and are potentially subject to a greater risk of loss due to default than higher rated securities.
The Fund held defaulted securities and/or other securities for which the income has been deemed uncollectible. At June 30, 2014, the aggregate value of these securities was $2,768,125, representing 0.28% of the Fund’s net assets. The Fund discontinues accruing income on securities for which income has been deemed uncollectible and provides an estimate for losses on interest receivable. The securities have been identified on the accompanying Statement of Investments.
8. Unfunded Loan Commitments
The Fund enters into certain credit agreements, all or a portion of which may be unfunded. The Fund is obligated to fund these loan commitments at the borrowers’ discretion. Funded portions of credit agreements are presented on the Statement of Investments.
At June 30, 2014, unfunded commitments were as follows:
| Borrower | Unfunded Commitment | |
| Patriot Coal Corp., L/C Facility, 6.50%, 12/18/18 |
$174,859 | |
|
|
Unfunded loan commitments and funded portions of credit agreements are marked to market daily and any unrealized appreciation or depreciation is included in the Statement of Assets and Liabilities and the Statement of Operations.
9. Other Derivative Information
At June 30, 2014, the Fund’s investments in derivative contracts are reflected on the Statement of Assets and Liabilities as follows:
| Asset Derivatives | Liability Derivatives | |||||||||||
| Derivative Contracts Not Accounted for as Hedging Instruments |
Statement of Assets and Liabilities Location |
Fair Value Amount |
Statement of Assets and Liabilities Location |
Fair Value Amount |
||||||||
| Foreign exchange contracts |
Unrealized appreciation on forward exchange contracts |
$ | 1,411,647 | Unrealized depreciation on forward exchange contracts |
$ |
2,221,439 |
| |||||
| Credit contracts |
Unrealized appreciation on OTC swap contracts |
621,267 | Unrealized depreciation on OTC swap contracts |
— | ||||||||
| FSI-42 | Semiannual Report |
FRANKLIN TEMPLETON VARIABLE INSURANCE PRODUCTS TRUST
NOTES TO FINANCIAL STATEMENTS (UNAUDITED)
Franklin Strategic Income VIP Fund (continued)
For the period ended June 30, 2014, the effect of derivative contracts on the Fund’s Statement of Operations was as follows:
| Derivative Contracts Not Accounted for as Hedging Instruments |
Statement of Operations Locations | Realized Gain (Loss) for the Period |
Change in Unrealized Appreciation (Depreciation) for the Period | |||
| Foreign exchange contracts |
Net realized gain (loss) from foreign currency transactions / Net change in unrealized appreciation (depreciation) on translation of other assets and liabilities denominated in foreign currencies |
$(649,796) | $(199,908) | |||
| Credit contracts |
Net realized gain (loss) from swap contracts / Net change in unrealized appreciation (depreciation) on investments |
356,710 | 373,967 |
At June 30, 2014, the Fund’s OTC derivative assets and liabilities, are as follows:
| Gross and Net Amounts of Assets and Liabilities Presented in the Statement of Assets and Liabilities |
||||||||
| Assetsa | Liabilitiesa | |||||||
| Derivatives | ||||||||
| Forward exchange contracts |
$ | 1,411,647 | $ | 2,221,439 | ||||
| Swap Contracts |
643,498 | 787,169 | ||||||
|
|
|
|||||||
| Total |
$ | 2,055,145 | $ | 3,008,608 | ||||
|
|
|
|||||||
aAbsent an event of default or early termination, OTC derivative assets and liabilities are presented gross and not offset in the Statement of Assets & Liabilities.
At June 30, 2014, the Fund’s OTC derivative assets which may be offset against the Fund’s OTC derivative liabilities and collateral received from the counterparty, is as follows:
| Amounts Not Offset in the Statement of Assets & Liabilities |
||||||||||||||||||||
| Gross and Net Amounts of Assets Presented in the Statement of Assets & Liabilities |
Financial Instruments Available for Offset |
Financial Instruments Collateral Receiveda,b |
Cash Collateral Receivedb |
Net Amount (Not less than zero) |
||||||||||||||||
| Counterparty | ||||||||||||||||||||
| BZWS |
$ | 75,460 | $ | (75,460 | ) | $ | — | $ | — | $ | — | |||||||||
| CITI |
259,392 | (259,392 | ) | — | — | — | ||||||||||||||
| DBAB |
715,873 | (715,873 | ) | — | — | — | ||||||||||||||
| FBCO |
276,047 | (276,047 | ) | — | — | — | ||||||||||||||
| GSCO |
3,575 | (3,575 | ) | — | — | — | ||||||||||||||
| HSBC |
245,566 | (75,043 | ) | (112,303 | ) | — | 58,220 | |||||||||||||
| Semiannual Report | FSI-43 |
FRANKLIN TEMPLETON VARIABLE INSURANCE PRODUCTS TRUST
NOTES TO FINANCIAL STATEMENTS (UNAUDITED)
Franklin Strategic Income VIP Fund (continued)
9. Other Derivative Information (continued)
| Amounts Not Offset in the Statement of Assets & Liabilities |
||||||||||||||||||||
| Gross and Net Amounts of Assets Presented in the Statement of Assets & Liabilities |
Financial Instruments Available for Offset |
Financial Instruments Collateral Receiveda,b |
Cash Collateral Receivedb |
Net Amount (Not less than zero) |
||||||||||||||||
| JPHQ |
$ | 475,877 | $ | (465,298 | ) | $ | (10,579 | ) | $ | — | $ | — | ||||||||
| MSCO |
3,355 | (1,853 | ) | — | (1,502 | ) | — | |||||||||||||
| UBSW |
— | — | — | — | — | |||||||||||||||
|
|
|
|||||||||||||||||||
| Total |
$ | 2,055,145 | $ | (1,872,541 | ) | $ | (122,882 | ) | $ | (1,502 | ) | $ | 58,220 | |||||||
|
|
|
|||||||||||||||||||
aAt June 30, 2014, the Fund received United Kingdom Treasury Bonds and Notes and U.S. Treasury Bonds and Notes as collateral for derivatives.
bIn some instances, the collateral amounts disclosed in the table above were adjusted due to the requirement to limit collateral amounts to avoid the effect of overcollateralization. Actual collateral received and/or pledged may be more than the amount disclosed herein.
At June 30, 2014, the Fund’s OTC derivative liabilities which may be offset against the Fund’s OTC derivative assets and collateral pledged to the counterparty, is as follows:
| Amounts Not Offset in the Statement of Assets & Liabilities |
||||||||||||||||||||
| Gross and Net Amounts of Liabilities Presented in the Statement of Assets & Liabilities |
Financial Instruments Available for Offset |
Financial Instruments Collateral Pledged |
Cash Collateral Pledgeda |
Net Amount (Not less than zero) |
||||||||||||||||
| Counterparty | ||||||||||||||||||||
| BZWS |
$ | 258,415 | $ | (75,460 | ) | $ | — | $ | — | $ | 182,955 | |||||||||
| CITI |
376,351 | (259,392 | ) | — | — | 116,959 | ||||||||||||||
| DBAB |
1,236,241 | (715,873 | ) | — | (350,000 | ) | 170,368 | |||||||||||||
| FBCO |
519,130 | (276,047 | ) | — | (243,083 | ) | — | |||||||||||||
| GSCO |
5,140 | (3,575 | ) | — | — | 1,565 | ||||||||||||||
| HSBC |
75,043 | (75,043 | ) | — | — | — | ||||||||||||||
| JPHQ |
465,298 | (465,298 | ) | — | — | — | ||||||||||||||
| MSCO |
1,853 | (1,853 | ) | — | — | — | ||||||||||||||
| UBSW |
71,137 | — | — | (71,137 | ) | — | ||||||||||||||
|
|
|
|||||||||||||||||||
| Total |
$ | 3,008,608 | $ | (1,872,541 | ) | $ | — | $ | (664,220 | ) | $ | 471,847 | ||||||||
|
|
|
|||||||||||||||||||
aIn some instances, the collateral amounts disclosed in the table above were adjusted due to the requirement to limit collateral amounts to avoid the effect of overcollateralization. Actual collateral received and/or pledged may be more than the amount disclosed herein.
For the period ended June 30, 2014, the average month end fair value of derivatives represented 0.62% of average month end net assets. The average month end number of open derivative contracts for the period was 206.
See Note 1(d) regarding derivative financial instruments.
| FSI-44 | Semiannual Report |
FRANKLIN TEMPLETON VARIABLE INSURANCE PRODUCTS TRUST
NOTES TO FINANCIAL STATEMENTS (UNAUDITED)
Franklin Strategic Income VIP Fund (continued)
10. Credit Facility
The Fund, together with other U.S. registered and foreign investment funds (collectively, Borrowers), managed by Franklin Templeton Investments, are borrowers in a joint syndicated senior unsecured credit facility totaling $1.5 billion (Global Credit Facility) which matures on February 13, 2015. This Global Credit Facility provides a source of funds to the Borrowers for temporary and emergency purposes, including the ability to meet future unanticipated or unusually large redemption requests.
Under the terms of the Global Credit Facility, the Fund shall, in addition to interest charged on any borrowings made by the Fund and other costs incurred by the Fund, pay its share of fees and expenses incurred in connection with the implementation and maintenance of the Global Credit Facility, based upon its relative share of the aggregate net assets of all of the Borrowers, including an annual commitment fee of 0.07% based upon the unused portion of the Global Credit Facility. These fees are reflected in other expenses on the Statement of Operations. During the period ended June 30, 2014, the Fund did not use the Global Credit Facility.
11. Fair Value Measurements
The Fund follows a fair value hierarchy that distinguishes between market data obtained from independent sources (observable inputs) and the Fund’s own market assumptions (unobservable inputs). These inputs are used in determining the value of the Fund’s financial instruments and are summarized in the following fair value hierarchy:
| • | Level 1 – quoted prices in active markets for identical financial instruments |
| • | Level 2 – other significant observable inputs (including quoted prices for similar financial instruments, interest rates, prepayment speed, credit risk, etc.) |
| • | Level 3 – significant unobservable inputs (including the Fund’s own assumptions in determining the fair value of financial instruments) |
The input levels are not necessarily an indication of the risk or liquidity associated with financial instruments at that level.
For movements between the levels within the fair value hierarchy, the Fund has adopted a policy of recognizing the transfers as of the date of the underlying event which caused the movement.
A summary of inputs used as of June 30, 2014, in valuing the Fund’s assets and liabilities carried at fair value, is as follows:
| Level 1 | Level 2 | Level 3 | Total | |||||||||||||
| Assets: | ||||||||||||||||
| Investments in Securities: |
||||||||||||||||
| Equity Investments:a |
||||||||||||||||
| Consumer Services |
$ | — | $ | 2,852,173 | $ | $ | 2,852,173 | |||||||||
| Materials |
— | 415,000 | — | 415,000 | ||||||||||||
| Transportation |
— | 789,469 | — | 789,469 | ||||||||||||
| Other Equity Investmentsb |
682,500 | — | — | 682,500 | ||||||||||||
| Corporate Bonds |
— | 355,045,336 | 15,625 | 355,060,961 | ||||||||||||
| Senior Floating Rate Interests |
— | 160,105,839 | 170,002 | 160,275,841 | ||||||||||||
| Foreign Government and Agency Securities |
— | 188,863,292 | — | 188,863,292 | ||||||||||||
| U.S. Government and Agency Securities |
— | 18,573,764 | — | 18,573,764 | ||||||||||||
| Asset-Backed Securities and Commercial Mortgage-Backed Securities |
— | 51,222,352 | — | 51,222,352 | ||||||||||||
| Mortgage-Backed Securities |
— | 34,778,893 | — | 34,778,893 | ||||||||||||
| Semiannual Report | FSI-45 |
FRANKLIN TEMPLETON VARIABLE INSURANCE PRODUCTS TRUST
NOTES TO FINANCIAL STATEMENTS (UNAUDITED)
Franklin Strategic Income VIP Fund (continued)
11. Fair Value Measurements (continued)
| Level 1 | Level 2 | Level 3 | Total | |||||||||||||
| Assets: (continued) | ||||||||||||||||
| Investments in Securities: (continued) |
||||||||||||||||
| Municipal Bonds |
$ | — | $ | 59,328,815 | $ | — | $ | 59,328,815 | ||||||||
| Escrows and Litigation Trusts |
— | — | — | c | — | |||||||||||
| Short Term Investments |
96,249,322 | 8,573,569 | — | 104,822,891 | ||||||||||||
|
|
|
|||||||||||||||
| Total Investments in Securities |
$ | 96,931,822 | $ | 880,548,502 | $ | 185,627 | $ | 977,665,951 | ||||||||
|
|
|
|||||||||||||||
| Other Financial Instruments |
||||||||||||||||
| Forward Exchange Contracts |
$ | — | $ | 1,411,647 | $ | — | $ | 1,411,647 | ||||||||
| Swap Contracts |
— | 621,267 | — | 621,267 | ||||||||||||
|
|
|
|||||||||||||||
| Total Other Financial Instruments |
$ | — | $ | 2,032,914 | $ | — | $ | 2,032,914 | ||||||||
|
|
|
|||||||||||||||
| Liabilities: | ||||||||||||||||
| Other Financial Instruments |
||||||||||||||||
| Forward Exchange Contracts |
$ | — | $ | 2,221,439 | $ | — | $ | 2,221,439 | ||||||||
| Unfunded Loan Commitments |
— | 16,846 | — | 16,846 | ||||||||||||
|
|
|
|||||||||||||||
| Total Other Financial Instruments |
$ | — | $ | 2,238,285 | $ | — | $ | 2,238,285 | ||||||||
|
|
|
|||||||||||||||
aIncludes common, preferred and convertible preferred stocks.
bFor detailed categories, see the accompanying Statement of Investments.
cIncludes securities determined to have no value at June 30, 2014.
A reconciliation of assets in which Level 3 inputs are used in determining fair value is presented when there are significant Level 3 financial instruments at the end of the period.
12. New Accounting Pronouncements
In June 2014, the Financial Accounting Standards Board issued Accounting Standards Update (ASU) No. 2014-11, Transfers and Servicing (Topic 860), Repurchase-to-Maturity Transactions, Repurchase Financings, and Disclosures. The ASU changes the accounting for certain repurchase agreements and expands disclosure requirements related to repurchase agreements, securities lending, repurchase-to-maturity and similar transactions. The ASU is effective for interim and annual reporting periods beginning after December 15, 2014. Management is currently evaluating the impact, if any, of applying this provision.
13. Subsequent Events
The Fund has evaluated subsequent events through the issuance of the financial statements and determined that no events have occurred that require disclosure.
| FSI-46 | Semiannual Report |
FRANKLIN TEMPLETON VARIABLE INSURANCE PRODUCTS TRUST
NOTES TO FINANCIAL STATEMENTS (UNAUDITED)
Franklin Strategic Income VIP Fund (continued)
Abbreviations
| Counterparty | Currency | Selected Portfolio | ||||||||
| BZWS | Barclays Bank PLC | BRL | Brazilian Real | AGMC | Assured Guaranty Municipal Corp. | |||||
| CITI | Citigroup, Inc. | CAD | Canadian Dollar | CDO | Collateralized Debt Obligation | |||||
| DBAB | Deutsche Bank AG | EUR | Euro | CLO | Collateralized Loan Obligation | |||||
| FBCO | Credit Suisse Group AG | GBP | British Pound | EDA | Economic Development Authority | |||||
| GSCO | The Goldman Sachs Group, Inc. | HUF | Hungarian Forint | FGIC | Financial Guaranty Insurance Co. | |||||
| HSBC | HSBC Bank USA, N.A. | IDR | Indonesian Rupiah | FICO | Financing Corp. | |||||
| JPHQ | JP Morgan Chase & Co. | KRW | South Korean Won | FRN | Floating Rate Note | |||||
| MSCO | Morgan Stanley | LKR | Sri Lankan Rupee | GO | General Obligation | |||||
| UBSW | UBS AG | MXN | Mexican Peso | HDC | Housing Development Corp. | |||||
| MYR | Malaysian Ringgit | ISD | Independent School District | |||||||
| PHP | Philippine Peso | NATL | National Public Financial Guarantee Corp. | |||||||
| PLN | Polish Zloty | NATL RE | National Public Financial Guarantee Corp. | |||||||
| SEK | Swedish Krona | Reinsured | ||||||||
| SGD |
Singapore Dollar |
PIK | Payment-In-Kind | |||||||
| UYU |
Uruguayan Peso |
PSF | Permanent School Fund | |||||||
| Semiannual Report | FSI-47 |
Franklin U.S. Government Securities VIP Fund
(Formerly, Franklin U.S. Government Fund)
This semiannual report for Franklin U.S. Government Securities VIP Fund covers the period ended June 30, 2014.
Class 2 Performance Summary as of June 30, 2014
Franklin U.S. Government Securities VIP Fund – Class 2 delivered a +2.41% total return for the six-month
period ended June 30, 2014.
Performance reflects the Fund’s Class 2 operating expenses, but does not include any contract fees, expenses or sales charges. If they had been included, performance would be lower. These charges and deductions, particularly for variable life policies, can have a significant effect on contract values and insurance benefits. See the contract prospectus for a complete description of these expenses, including sales charges.
Performance data represent past performance, which does not guarantee future results. Investment return and principal value will fluctuate, and you may have a gain or loss when you sell your shares. Current performance may differ from figures shown.
| Semiannual Report | FUS-1 |
FRANKLIN U.S. GOVERNMENT SECURITIES VIP FUND
Fund Goal and Main Investments: Franklin U.S. Government Securities VIP Fund seeks income. Under normal market conditions, the Fund invests at least 80% of its net assets in U.S. government securities.
Fund Risks: All investments involve risks, including possible loss of principal. The Fund’s share price and yield will be affected by interest rate movements and mortgage prepayments. Bond prices generally move in the opposite direction of interest rates. Thus, as prices of bonds in the Fund adjust to a rise in interest rates, the Fund’s share price may decline. Changes in the financial strength of a bond issuer or in a bond’s credit rating may affect its value. The Fund is actively managed but there is no guarantee that the manager’s investment decisions will produce the desired results. The Fund’s prospectus also includes a description of the main investment risks.
Performance Overview
You can find the Fund’s six-month total return in the Performance Summary. In comparison, the Fund’s primary benchmark, the Barclays U.S. Government Index: Intermediate Component, delivered a +1.55% total return.1 The Fund’s secondary benchmark, the Lipper VIP General U.S. Government Funds Classification Average, produced a +3.95% total return.2 Funds in the Lipper average may allocate as much as 35% of their investments in asset types other than U.S. government and agency mortgage-backed securities.
Economic and Market Overview
The U.S. economy continued to show signs of recovery during the six-month period ended June 30, 2014. Economic activity increased toward period-end after severe weather conditions and a slowdown in health care spending led to a contraction in the first quarter of 2014. Manufacturing activity expanded during the period under review, despite a slowdown in January. Except for a sharp rebound in March, retail sales rose at a modest pace that missed consensus expectations. The housing market had some weather-related weakness early in 2014, but home sales picked up in the spring and home prices were higher than a year ago. The unemployment rate declined to 6.1% in June 2014 from 6.7% in December 2013.3 Inflation, as measured by the Consumer Price Index, picked up toward the end of the period.
The Federal Reserve Board (Fed) began reducing bond purchases by $10 billion a month in January 2014, based on earlier largely positive economic and employment data. Although economic data in early 2014 were soft, Fed Chair Janet Yellen kept the pace of asset-purchase tapering intact in the March meeting while adopting a more qualitative approach to rate-hike guidance. In June, the Fed lowered projections for near- and long-term economic growth even as it maintained the pace of tapering and remained committed to keeping interest rates low for a considerable amount of time after the asset-purchase program ends.
The 10-year Treasury yield declined from 3.04% at the beginning of the period to 2.53% on June 30, 2014, as investors shifted to less risky assets given subdued economic data, the crises in Ukraine and Iraq, growth concerns about emerging markets and lower Treasury issuance.
Investment Strategy
Using our straightforward investment approach, we seek to produce current income with a high degree of credit safety from a conservatively managed portfolio of U.S. government securities. Analyzing securities using proprietary and nonproprietary research, we seek to identify attractive investment opportunities.
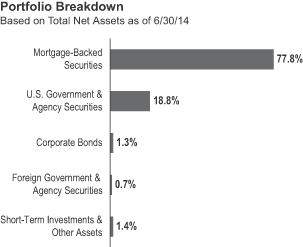
The dollar value, number of shares or principal amount, and names of all portfolio holdings are listed in the Fund’s Statement of Investments.
1. © 2014 Morningstar.
2. Source: Lipper, a Thomson Reuters Company.
One cannot invest directly in an index, and an index is not representative of the Fund’s portfolio. Please see Index Descriptions following the Fund Summaries.
3. Source: Bureau of Labor Statistics.
| FUS-2 | Semiannual Report |
FRANKLIN U.S. GOVERNMENT SECURITIES VIP FUND
4. Securities owned by the Fund, but not shares of the Fund, are guaranteed by the U.S. government, its agencies or instrumentalities as to timely payment of principal and interest. The Fund’s yield and share price are not guaranteed and will vary with market conditions.
| Semiannual Report | FUS-3 |
FRANKLIN U.S. GOVERNMENT SECURITIES VIP FUND
Class 2 Fund Expenses
| Class 2 | Beginning Account Value 1/1/14 |
Ending Account Value 6/30/14 |
Fund-Level
Expenses 1/1/14–6/30/14 |
|||||||||
| Actual | $1,000 | $1,024.10 | $3.71 | |||||||||
| Hypothetical (5% return before expenses) | $1,000 | $1,021.12 | $3.71 | |||||||||
*Expenses are calculated using the most recent six-month annualized expense ratio for the Fund’s Class 2 shares (0.74%), which does not include any ongoing expenses of the Contract for which the Fund is an investment option, multiplied by the average account value over the period, multiplied by 181/365 to reflect the one-half year period.
| FUS-4 | Semiannual Report |
SUPPLEMENT DATED AUGUST 4, 2014
TO THE STATEMENT OF ADDITIONAL INFORMATION DATED MAY 1, 2014
OF
FRANKLIN U.S. GOVERNMENT SECURITIES VIP FUND
(Series of Franklin Templeton Variable Insurance Products Trust)
The Statement of Additional Information is amended as follows:
I. In the section entitled “Glossary of Investments, Techniques, Strategies and Their Risks – Borrowing-Segregation of Assets,” on page 15, the first paragraph is revised as follows:
Segregation of assets. Consistent with SEC staff guidance, financial instruments that involve the Fund’s obligation to make future payments to third parties will not be viewed as creating any senior security provided that the Fund covers its obligations as described below. Those financial instruments can include, among others, (i) securities purchased or sold on a when-issued, delayed delivery, or to-be-announced basis, (ii) futures contracts, (iii) forward currency contracts, (iv) swaps, (v) written options, (vi) unfunded commitments, (vii) securities sold short, and (viii) reverse repurchase agreements. Consistent with SEC staff guidance, the Fund will consider its obligations involving such a financial instrument as “covered” when the Fund (1) maintains an offsetting financial position, or (2) segregates liquid assets (constituting cash, cash equivalents or other liquid portfolio securities) equal to the Fund’s exposures relating to the financial instrument, as determined on a daily basis. Dedicated Fund compliance policies and procedures, which the Fund’s board has approved, govern the kinds of transactions that can be deemed to be offsetting positions for purposes of (1) above, and the amounts of assets that need to be segregated for purposes of (2) above (Asset Segregation Policies). In the case of forward currency contracts, the Fund may offset the contracts for purposes of (1) above when the counterparties, terms and amounts match; otherwise an appropriate amount of assets will be segregated consistent with (2) above. Segregated assets for purposes of (2) above are not required to be physically segregated from other Fund assets, but are segregated through appropriate notation on the books of the Fund or the Fund’s custodian.
II. In the section entitled “Glossary of Investments, Techniques, Strategies and Their Risks – Mortgage-backed securities – Overview,” on page 46, the third paragraph is revised as follows:
Mortgage-backed securities are based on different types of mortgages, including those on commercial real estate or residential properties. The primary issuers or guarantors of mortgage-backed securities have historically been the Government National Mortgage Association (GNMA, or “Ginnie Mae”), the Federal National Mortgage Association (FNMA, or “Fannie Mae”) and the Federal Home Loan Mortgage Corporation (FHLMC, or “Freddie Mac”). Other issuers of mortgage-backed securities include commercial banks and other private lenders. Trading in mortgage-backed securities guaranteed by a governmental agency, instrumentality or sponsored enterprise may frequently take place in the to-be-announced (TBA) forward market. See “When-issued, delayed delivery and to-be-announced transactions” below.
III. In the section entitled “Glossary of Investments, Techniques, Strategies and Their Risks – Mortgage-backed securities – Guarantees,” on page 47 is revised as follows:
Guarantees. The existence of a guarantee or other form of credit support on a mortgage-backed security usually increases the price that the Fund pays or receives for the security.
| FUS-5 |
There is always the risk that the guarantor will default on its obligations. When the guarantor is the U.S. government, there is minimal risk of guarantor default. However, the risk remains if the credit support or guarantee is provided by a private party or a U.S. government agency or sponsored enterprise. Even if the guarantor meets its obligations, there can be no assurance that the type of guarantee or credit support provided will be effective at reducing losses or delays to investors, given the nature of the default. A guarantee only assures timely payment of interest and principal, not a particular rate of return on the Fund’s investment or protection against prepayment or other risks. The market price and yield of the mortgage-backed security at any given time are not guaranteed and likely to fluctuate.
IV. In the section entitled “Glossary of Investments, Techniques, Strategies and Their Risks – When-issued, delayed delivery and to-be-announced transactions,” beginning on page 57, the first, second and fourth paragraph is revised as follows:
When-issued, delayed delivery and to-be-announced (TBA) transactions are arrangements under which the parties agree on the sale of securities with payment for and delivery of the security scheduled for a future time. The securities may have been authorized but not yet issued, or, in the TBA market for U.S. Government agency mortgage-backed securities, the parties agree on a price, volume, and basic characteristics of securities to be delivered on the settlement date, rather than particular securities. In addition to buying securities on a when-issued, delayed delivery or TBA basis, the Fund may also sell these securities on a TBA basis to close out an existing TBA position before the settlement date, to take advantage of an expected decline in value of the securities, or for hedging purposes.
Entering into a when-issued, delayed delivery or TBA transaction may be viewed as a form of leverage and will result in associated risks for the Fund. To mitigate these risks, when the Fund enters into this type of transaction, it will segregate liquid assets as set forth in “Segregation of assets” under “Borrowing.” However, the Fund does not consider the purchase and/or sale of securities on a when-issued, delayed delivery or TBA basis to be a borrowing for purposes of the Fund’s fundamental restrictions or other limitations on borrowing.
The Fund also relies on the counterparty to complete the transaction. The counterparty’s failure to do so may cause the Fund to miss a price or yield considered advantageous to the Fund. Although their price typically reflects accrued interest, securities purchased on a when-issued or delayed delivery basis do not generally earn interest until their scheduled delivery date. Purchases or sales of debt securities on a when-issued or delayed delivery basis are also subject to the risk that the market value or the yield at delivery may be more or less than the market price or yield available when the transaction was entered into, or that the Fund is unable to purchase securities for delivery at the settlement date with the characteristics agreed upon at the time of the transaction.
Please keep this supplement with your statement of additional information for future reference.
| FUS-6 |
FRANKLIN TEMPLETON VARIABLE INSURANCE PRODUCTS TRUST
Financial Highlights
Franklin U.S. Government Securities VIP Fund
| Six Months Ended June 30, 2014 (unaudited) |
Year Ended December 31, | |||||||||||||||||||||||
| 2013 | 2012 | 2011 | 2010 | 2009 | ||||||||||||||||||||
| Class 1 | ||||||||||||||||||||||||
| Per share operating performance (for a share outstanding throughout the period) |
||||||||||||||||||||||||
| Net asset value, beginning of period |
$12.91 | $13.57 | $13.67 | $13.34 | $13.08 | $13.19 | ||||||||||||||||||
|
|
|
|||||||||||||||||||||||
| Income from investment operationsa: | ||||||||||||||||||||||||
| Net investment incomeb |
0.13 | 0.24 | 0.32 | 0.42 | 0.47 | 0.52 | ||||||||||||||||||
| Net realized and unrealized gains (losses) |
0.19 | (0.51 | ) | (0.03 | ) | 0.36 | 0.25 | (0.09 | ) | |||||||||||||||
|
|
|
|||||||||||||||||||||||
| Total from investment operations |
0.32 | (0.27 | ) | 0.29 | 0.78 | 0.72 | 0.43 | |||||||||||||||||
|
|
|
|||||||||||||||||||||||
| Less distributions from net investment income |
(0.37 | ) | (0.39 | ) | (0.39 | ) | (0.45 | ) | (0.46 | ) | (0.54 | ) | ||||||||||||
|
|
|
|||||||||||||||||||||||
| Net asset value, end of period |
$12.86 | $12.91 | $13.57 | $13.67 | $13.34 | $13.08 | ||||||||||||||||||
|
|
|
|||||||||||||||||||||||
| Total returnc |
2.52% | (1.99)% | 2.12% | 5.96% | 5.56% | 3.34% | ||||||||||||||||||
| Ratios to average net assetsd | ||||||||||||||||||||||||
| Expenses |
0.49% | 0.49% | e | 0.50% | 0.51% | 0.52% | 0.53% | |||||||||||||||||
| Net investment income |
1.96% | 1.84% | 2.36% | 3.11% | 3.51% | 3.96% | ||||||||||||||||||
| Supplemental data | ||||||||||||||||||||||||
| Net assets, end of period (000’s) |
$96,918 | $99,947 | $126,536 | $136,628 | $157,551 | $162,524 | ||||||||||||||||||
| Portfolio turnover rate |
15.58% | 69.47% | 45.89% | 37.89% | 51.04% | 27.51% | ||||||||||||||||||
| Portfolio turnover rate excluding mortgage dollar rollsf |
15.58% | 67.80% | 45.89% | 37.89% | 51.04% | 27.51% | ||||||||||||||||||
aThe amount shown for a share outstanding throughout the period may not correlate with the Statement of Operations for the period due to the timing of sales and repurchases of the Fund shares in relation to income earned and/or fluctuating fair value of the investments of the Fund.
bBased on average daily shares outstanding.
cTotal return does not include fees, charges or expenses imposed by the variable annuity and life insurance contracts for which the Franklin Templeton Variable Insurance Products Trust serves as an underlying investment vehicle. Total return is not annualized for periods less than one year.
dRatios are annualized for periods less than one year.
eBenefit of expense reduction rounds to less than 0.01%.
fSee Note 1(c) regarding mortgage dollar rolls.
| The accompanying notes are an integral part of these financial statements. | Semiannual Report | FUS-7 |
FRANKLIN TEMPLETON VARIABLE INSURANCE PRODUCTS TRUST
FINANCIAL HIGHLIGHTS
Franklin U.S. Government Securities VIP Fund (continued)
| Six Months Ended June 30, 2014 (unaudited) |
Year Ended December 31, | |||||||||||||||||||||||
| 2013 | 2012 | 2011 | 2010 | 2009 | ||||||||||||||||||||
| Class 2 | ||||||||||||||||||||||||
| Per share operating performance (for a share outstanding throughout the period) |
||||||||||||||||||||||||
| Net asset value, beginning of period |
$12.65 | $13.31 | $13.42 | $13.11 | $12.87 | $12.99 | ||||||||||||||||||
|
|
|
|||||||||||||||||||||||
| Income from investment operationsa: | ||||||||||||||||||||||||
| Net investment incomeb |
0.11 | 0.21 | 0.28 | 0.38 | 0.43 | 0.48 | ||||||||||||||||||
| Net realized and unrealized gains (losses) |
0.19 | (0.50 | ) | (0.03 | ) | 0.35 | 0.24 | (0.09 | ) | |||||||||||||||
|
|
|
|||||||||||||||||||||||
| Total from investment operations |
0.30 | (0.29 | ) | 0.25 | 0.73 | 0.67 | 0.39 | |||||||||||||||||
|
|
|
|||||||||||||||||||||||
| Less distributions from net investment income |
(0.34 | ) | (0.37 | ) | (0.36 | ) | (0.42 | ) | (0.43 | ) | (0.51 | ) | ||||||||||||
|
|
|
|||||||||||||||||||||||
| Net asset value, end of period |
$12.61 | $12.65 | $13.31 | $13.42 | $13.11 | $12.87 | ||||||||||||||||||
|
|
|
|||||||||||||||||||||||
| Total returnc |
2.41% | (2.24)% | 1.89% | 5.68% | 5.28% | 3.09% | ||||||||||||||||||
| Ratios to average net assetsd | ||||||||||||||||||||||||
| Expenses |
0.74% | 0.74% | e | 0.75% | 0.76% | 0.77% | 0.78% | |||||||||||||||||
| Net investment income |
1.71% | 1.59% | 2.11% | 2.86% | 3.26% | 3.71% | ||||||||||||||||||
| Supplemental data | ||||||||||||||||||||||||
| Net assets, end of period (000’s) |
$1,324,486 | $1,267,994 | $1,206,089 | $894,699 | $703,997 | $557,809 | ||||||||||||||||||
| Portfolio turnover rate |
15.58% | 69.47% | 45.89% | 37.89% | 51.04% | 27.51% | ||||||||||||||||||
| Portfolio turnover rate excluding mortgage dollar rollsf |
15.58% | 67.80% | 45.89% | 37.89% | 51.04% | 27.51% | ||||||||||||||||||
aThe amount shown for a share outstanding throughout the period may not correlate with the Statement of Operations for the period due to the timing of sales and repurchases of the Fund shares in relation to income earned and/or fluctuating fair value of the investments of the Fund.
bBased on average daily shares outstanding.
cTotal return does not include fees, charges or expenses imposed by the variable annuity and life insurance contracts for which the Franklin Templeton Variable Insurance Products Trust serves as an underlying investment vehicle. Total return is not annualized for periods less than one year.
dRatios are annualized for periods less than one year.
eBenefit of expense reduction rounds to less than 0.01%.
fSee Note 1(c) regarding mortgage dollar rolls.
| FUS-8 | Semiannual Report | The accompanying notes are an integral part of these financial statements. |
FRANKLIN TEMPLETON VARIABLE INSURANCE PRODUCTS TRUST
Statement of Investments, June 30, 2014 (unaudited)
| Franklin U.S. Government Securities VIP Fund | ||||||||||
| Principal Amount | Value | |||||||||
| Corporate Bonds 1.3% |
||||||||||
| New Valley Generation IV, secured bond, 4.687%, 1/15/22 |
$ | 2,962,730 | $ | 3,244,240 | ||||||
| Private Export Funding Corp., |
||||||||||
| secured bond, 2.80%, 5/15/22 |
9,000,000 | 9,185,436 | ||||||||
| senior secured note, 3.05%, 10/15/14 |
6,500,000 | 6,554,366 | ||||||||
|
|
|
|||||||||
| Total Corporate Bonds (Cost $19,251,980) |
18,984,042 | |||||||||
|
|
|
|||||||||
| Foreign Government and Agency Securities 0.7% |
||||||||||
| Government of Tunisia, 1.686%, 7/16/19 |
7,000,000 | 6,952,456 | ||||||||
| International Bank for Reconstruction and Development, |
||||||||||
| 2, zero cpn., 2/15/16 |
1,868,000 | 1,850,155 | ||||||||
| Principal Strip, 7/15/17 |
1,761,000 | 1,688,491 | ||||||||
|
|
|
|||||||||
| Total Foreign Government and Agency Securities (Cost $10,624,594) |
10,491,102 | |||||||||
|
|
|
|||||||||
| Mortgage-Backed Securities 77.8% |
||||||||||
| a | Federal Home Loan Mortgage Corp. (FHLMC) Adjustable Rate 7.5% |
|||||||||
| FHLMC, 1.607% - 2.261%, 10/01/16 - 5/01/43 |
5,771,095 | 5,994,223 | ||||||||
| FHLMC, 2.264%, 6/01/37 |
13,531,362 | 14,345,654 | ||||||||
| FHLMC, 2.305%, 6/01/36 |
13,932,204 | 14,886,411 | ||||||||
| FHLMC, 2.265% - 2.365%, 2/01/19 - 7/01/41 |
13,113,223 | 13,924,429 | ||||||||
| FHLMC, 2.366% - 2.40%, 10/01/22 - 9/01/38 |
12,284,818 | 13,078,124 | ||||||||
| FHLMC, 2.40% - 2.445%, 3/01/24 - 10/01/38 |
12,069,574 | 12,851,908 | ||||||||
| FHLMC, 2.75%, 4/01/40 |
15,417,935 | 16,390,769 | ||||||||
| FHLMC, 2.445% - 5.307%, 12/01/18 - 8/01/41 |
13,129,431 | 13,959,214 | ||||||||
| FHLMC, 5.318% - 6.137%, 8/01/24 - 11/01/39 |
1,220,307 | 1,291,997 | ||||||||
|
|
|
|||||||||
| 106,722,729 | ||||||||||
|
|
|
|||||||||
| Federal Home Loan Mortgage Corp. (FHLMC) Fixed Rate 3.9% |
||||||||||
| FHLMC Gold 15 Year, 4.50%, 3/01/25 - 4/01/25 |
3,651,812 | 3,934,230 | ||||||||
| FHLMC Gold 30 Year, 3.00%, 5/01/43 |
688,642 | 680,333 | ||||||||
| FHLMC Gold 30 Year, 3.50%, 3/01/32 - 5/01/43 |
8,489,476 | 8,873,276 | ||||||||
| FHLMC Gold 30 Year, 4.00%, 9/01/40 - 12/01/41 |
13,922,744 | 14,773,925 | ||||||||
| FHLMC Gold 30 Year, 4.50%, 5/01/40 - 7/01/41 |
7,341,123 | 7,953,087 | ||||||||
| FHLMC Gold 30 Year, 5.00%, 9/01/33 - 4/01/40 |
9,571,623 | 10,603,196 | ||||||||
| FHLMC Gold 30 Year, 5.50%, 7/01/33 - 5/01/38 |
3,466,187 | 3,883,871 | ||||||||
| FHLMC Gold 30 Year, 6.00%, 1/01/24 - 8/01/35 |
2,299,381 | 2,607,470 | ||||||||
| FHLMC Gold 30 Year, 6.50%, 12/01/23 - 5/01/35 |
871,120 | 982,843 | ||||||||
| FHLMC Gold 30 Year, 7.00%, 4/01/24 - 10/01/32 |
408,964 | 454,559 | ||||||||
| FHLMC Gold 30 Year, 7.50%, 12/01/22 - 5/01/24 |
5,998 | 6,404 | ||||||||
| FHLMC Gold 30 Year, 8.00%, 7/01/21 - 5/01/22 |
9,837 | 11,040 | ||||||||
| FHLMC Gold 30 Year, 8.50%, 10/01/21 - 7/01/31 |
659,758 | 767,987 | ||||||||
| FHLMC PC 30 Year, 8.00%, 1/01/17 - 5/01/17 |
3,058 | 3,068 | ||||||||
| FHLMC PC 30 Year, 8.50%, 9/01/20 |
562 | 613 | ||||||||
|
|
|
|||||||||
| 55,535,902 | ||||||||||
|
|
|
|||||||||
| a | Federal National Mortgage Association (FNMA) Adjustable Rate 13.9% |
|||||||||
| FNMA, 1.08% - 1.996%, 4/01/16 - 10/01/44 |
13,225,193 | 13,808,881 | ||||||||
| FNMA, 1.998% - 2.07%, 8/01/29 - 10/01/37 |
10,041,784 | 10,582,822 | ||||||||
| FNMA, 2.073% - 2.156%, 11/01/17 - 1/01/40 |
12,698,000 | 13,292,033 | ||||||||
| FNMA, 2.225%, 8/01/36 |
14,281,448 | 15,177,743 | ||||||||
| FNMA, 2.256%, 10/01/35 |
13,909,063 | 14,778,054 | ||||||||
| FNMA, 2.158% - 2.257%, 1/01/17 - 8/01/37 |
11,662,030 | 12,375,332 | ||||||||
| FNMA, 2.258% - 2.304%, 8/01/26 - 8/01/39 |
13,196,355 | 14,013,023 | ||||||||
| FNMA, 2.260% - 2.311%, 9/01/23 - 4/01/40 |
13,248,209 | 14,102,340 | ||||||||
| Semiannual Report | FUS-9 |
FRANKLIN TEMPLETON VARIABLE INSURANCE PRODUCTS TRUST
STATEMENT OF INVESTMENTS (UNAUDITED)
Franklin U.S. Government Securities VIP Fund (continued)
| Principal Amount | Value | |||||||||
| Mortgage-Backed Securities (continued) |
||||||||||
| a | Federal National Mortgage Association (FNMA) Adjustable Rate (continued) |
|||||||||
| FNMA, 2.301% - 2.322%, 11/01/33 - 7/01/38 |
$ | 13,029,593 | $ | 13,794,368 | ||||||
| FNMA, 2.323% - 2.375%, 6/01/21 - 12/01/40 |
13,199,575 | 14,005,879 | ||||||||
| FNMA, 2.484%, 9/01/37 |
37,848,356 | 40,456,814 | ||||||||
| FNMA, 2.375% - 2.621%, 9/01/18 - 3/01/47 |
13,322,170 | 14,002,908 | ||||||||
| FNMA, 2.625% - 7.210%, 8/01/18 - 11/01/47 |
6,043,297 | 6,341,794 | ||||||||
|
|
|
|||||||||
| 196,731,991 | ||||||||||
|
|
|
|||||||||
| Federal National Mortgage Association (FNMA) Fixed Rate 6.6% |
||||||||||
| FNMA 15 Year, 5.50%, 6/01/16 - 1/01/25 |
3,648,144 | 4,000,302 | ||||||||
| FNMA 15 Year, 6.00%, 8/01/17 - 9/01/17 |
184,039 | 191,331 | ||||||||
| FNMA 30 Year, 3.00%, 12/01/42 |
348,080 | 344,377 | ||||||||
| FNMA 30 Year, 4.00%, 1/01/41 - 8/01/41 |
16,980,886 | 18,052,020 | ||||||||
| FNMA 30 Year, 4.50%, 8/01/40 - 6/01/41 |
17,234,228 | 18,680,282 | ||||||||
| FNMA 30 Year, 4.50%, 12/01/43 |
20,658,749 | 22,414,153 | ||||||||
| FNMA 30 Year, 5.00%, 3/01/34 - 7/01/41 |
13,348,893 | 14,848,163 | ||||||||
| FNMA 30 Year, 5.50%, 12/01/32 - 8/01/35 |
3,847,220 | 4,316,164 | ||||||||
| FNMA 30 Year, 6.00%, 1/01/24 - 8/01/38 |
6,626,039 | 7,471,637 | ||||||||
| FNMA 30 Year, 6.50%, 1/01/24 - 9/01/36 |
1,108,152 | 1,251,378 | ||||||||
| FNMA 30 Year, 7.50%, 4/01/23 - 8/01/25 |
37,584 | 40,428 | ||||||||
| FNMA 30 Year, 8.00%, 3/01/22 - 2/01/25 |
134,208 | 141,596 | ||||||||
| FNMA 30 Year, 8.50%, 3/01/20 - 6/01/21 |
1,335 | 1,464 | ||||||||
| FNMA 30 Year, 9.00%, 10/01/26 |
186,502 | 215,523 | ||||||||
| FNMA GL 30 Year, 8.00%, 8/01/19 |
17,657 | 17,726 | ||||||||
| FNMA PL 30 Year, 5.50%, 4/01/34 |
1,946,835 | 2,191,306 | ||||||||
|
|
|
|||||||||
| 94,177,850 | ||||||||||
|
|
|
|||||||||
| Government National Mortgage Association (GNMA) Fixed Rate 45.9% |
||||||||||
| GNMA I SF 30 Year, 3.00%, 7/15/42 |
773,106 | 780,697 | ||||||||
| GNMA I SF 30 Year, 4.50%, 1/15/39 - 6/15/41 |
41,386,468 | 45,219,437 | ||||||||
| GNMA I SF 30 Year, 5.00%, 6/15/30 - 9/15/40 |
56,167,771 | 62,117,608 | ||||||||
| GNMA I SF 30 Year, 5.50%, 11/15/28 - 10/15/39 |
13,632,962 | 15,317,333 | ||||||||
| GNMA I SF 30 Year, 6.00%, 11/15/23 - 11/15/38 |
7,248,853 | 8,224,900 | ||||||||
| GNMA I SF 30 Year, 6.50%, 5/15/23 - 9/15/38 |
3,398,070 | 3,880,314 | ||||||||
| GNMA I SF 30 Year, 7.00%, 3/15/22 - 1/15/32 |
950,382 | 1,015,183 | ||||||||
| GNMA I SF 30 Year, 7.50%, 2/15/17 - 8/15/33 |
938,450 | 1,085,741 | ||||||||
| GNMA I SF 30 Year, 8.00%, 3/15/17 - 5/15/24 |
277,184 | 292,095 | ||||||||
| GNMA I SF 30 Year, 8.50%, 6/15/22 - 12/15/24 |
104,272 | 111,032 | ||||||||
| GNMA I SF 30 Year, 9.00%, 6/15/16 - 5/15/20 |
20,542 | 20,681 | ||||||||
| GNMA I SF 30 Year, 9.50%, 7/15/16 - 12/15/20 |
83,349 | 86,665 | ||||||||
| GNMA I SF 30 Year, 10.00%, 11/15/17 - 8/15/21 |
45,507 | 47,970 | ||||||||
| GNMA II SF 30 Year, 3.00%, 12/20/42 |
376,691 | 381,461 | ||||||||
| GNMA II SF 30 Year, 3.50%, 8/20/42 |
16,240,906 | 16,954,113 | ||||||||
| GNMA II SF 30 Year, 3.50%, 9/20/42 |
45,491,098 | 47,489,431 | ||||||||
| GNMA II SF 30 Year, 3.50%, 10/20/42 |
14,030,542 | 14,646,713 | ||||||||
| GNMA II SF 30 Year, 3.50%, 11/20/42 |
27,869,532 | 29,093,617 | ||||||||
| GNMA II SF 30 Year, 3.50%, 12/20/42 |
20,345,880 | 21,240,761 | ||||||||
| GNMA II SF 30 Year, 3.50%, 1/20/43 |
34,427,680 | 35,942,284 | ||||||||
| GNMA II SF 30 Year, 3.50%, 4/20/43 |
16,735,077 | 17,469,128 | ||||||||
| GNMA II SF 30 Year, 3.50%, 5/20/43 |
28,643,932 | 29,893,259 | ||||||||
| GNMA II SF 30 Year, 3.50%, 12/20/40 - 6/20/43 |
31,676,727 | 33,063,894 | ||||||||
| GNMA II SF 30 Year, 3.50%, 5/20/44 |
24,942,673 | 26,031,715 | ||||||||
| GNMA II SF 30 Year, 4.00%, 11/20/41 |
17,713,288 | 18,993,860 | ||||||||
| FUS-10 | Semiannual Report |
FRANKLIN TEMPLETON VARIABLE INSURANCE PRODUCTS TRUST
STATEMENT OF INVESTMENTS (UNAUDITED)
Franklin U.S. Government Securities VIP Fund (continued)
| Principal Amount | Value | |||||||||
| Mortgage-Backed Securities (continued) |
||||||||||
| Government National Mortgage Association (GNMA) Fixed Rate (continued) |
||||||||||
| GNMA II SF 30 Year, 4.00%, 11/20/39 - 2/20/44 |
$ | 37,964,456 | $ | 40,736,890 | ||||||
| GNMA II SF 30 Year, 4.00%, 2/20/44 |
19,675,698 | 21,098,141 | ||||||||
| GNMA II SF 30 Year, 4.00%, 6/20/44 |
25,649,000 | 27,503,280 | ||||||||
| GNMA II SF 30 Year, 4.50%, 9/20/41 |
14,869,682 | 16,271,775 | ||||||||
| GNMA II SF 30 Year, 4.50%, 10/20/39 - 2/20/44 |
61,280,765 | 67,090,798 | ||||||||
| GNMA II SF 30 Year, 5.00%, 9/20/33 - 10/20/42 |
25,740,364 | 28,575,748 | ||||||||
| GNMA II SF 30 Year, 5.50%, 5/20/34 - 6/20/38 |
11,470,278 | 12,872,865 | ||||||||
| GNMA II SF 30 Year, 6.00%, 11/20/23 - 7/20/39 |
7,052,850 | 8,020,566 | ||||||||
| GNMA II SF 30 Year, 6.50%, 12/20/27 - 4/20/34 |
904,548 | 1,040,168 | ||||||||
| GNMA II SF 30 Year, 7.00%, 5/20/32 |
15,125 | 17,805 | ||||||||
| GNMA II SF 30 Year, 7.50%, 11/20/17 - 5/20/33 |
185,165 | 211,840 | ||||||||
| GNMA II SF 30 Year, 8.00%, 7/20/16 - 8/20/26 |
17,880 | 20,030 | ||||||||
| GNMA II SF 30 Year, 9.50%, 4/20/25 |
2,689 | 2,704 | ||||||||
|
|
|
|||||||||
| 652,862,502 | ||||||||||
|
|
|
|||||||||
| Total Mortgage-Backed Securities (Cost $1,092,369,029) |
1,106,030,974 | |||||||||
|
|
|
|||||||||
| U.S. Government and Agency Securities 18.8% |
||||||||||
| AID-Israel, |
||||||||||
| 7-Z, U.S. Government Guaranteed, Strip, 8/15/22 |
5,619,000 | 4,482,967 | ||||||||
| U.S. Government Guaranteed, Strip, 5/01/17 |
5,000,000 | 4,845,650 | ||||||||
| Federal Agricultural Mortgage Corp., |
||||||||||
| 1.41%, 3/06/20 |
10,000,000 | 9,653,060 | ||||||||
| 2.66%, 4/12/22 |
7,000,000 | 7,126,420 | ||||||||
| 4.30%, 5/13/19 |
1,010,000 | 1,125,635 | ||||||||
| b | Federal Agricultural Mortgage Corp. Guaranteed Trust 07-1, 144A, 5.125%, 4/19/17 |
13,000,000 | 14,476,098 | |||||||
| FFCB, 1.50%, 11/16/15 |
10,000,000 | 10,162,220 | ||||||||
| FHLB, |
||||||||||
| 4.75%, 12/16/16 |
17,000,000 | 18,689,086 | ||||||||
| 5.25%, 6/05/17 |
9,000,000 | 10,141,929 | ||||||||
| FICO, |
||||||||||
| 1P, Strip, 5/11/18 |
10,000,000 | 9,456,810 | ||||||||
| 12, Strip, 6/06/18 |
4,627,000 | 4,359,013 | ||||||||
| 13P, Strip, 12/27/18 |
2,500,000 | 2,318,343 | ||||||||
| 15, Strip, 3/07/16 |
15,000,000 | 14,853,345 | ||||||||
| 15P, Strip, 3/07/19 |
1,798,000 | 1,656,264 | ||||||||
| 16, Strip, 4/05/17 |
12,367,000 | 12,022,765 | ||||||||
| A-P, Strip, 2/08/18 |
1,000,000 | 951,700 | ||||||||
| B-P, Strip, 4/06/18 |
1,405,000 | 1,331,873 | ||||||||
| E-P, Strip, 11/02/18 |
1,296,000 | 1,207,983 | ||||||||
| Strip, 9/26/19 |
7,605,000 | 6,873,178 | ||||||||
| FNMA, senior note, 5.375%, 6/12/17 |
17,800,000 | 20,112,950 | ||||||||
| Overseas Private Investment Corp., |
||||||||||
| A, Strip, 2/19/18 |
800,000 | 801,217 | ||||||||
| Strip, 11/18/16 |
2,650,000 | 2,658,416 | ||||||||
| SBA, |
||||||||||
| a FRN, 3.125%, 3/25/18 |
282,846 | 284,539 | ||||||||
| PC, 1995-20L, 1, 6.45%, 12/01/15 |
63,518 | 65,809 | ||||||||
| PC, 1996-20L, 1, 6.70%, 12/01/16 |
117,271 | 122,001 | ||||||||
| PC, 1997-20G, 1, 6.85%, 7/01/17 |
135,856 | 141,775 | ||||||||
| PC, 1998-20I, 1, 6.00%, 9/01/18 |
455,175 | 479,702 | ||||||||
| Semiannual Report | FUS-11 |
FRANKLIN TEMPLETON VARIABLE INSURANCE PRODUCTS TRUST
STATEMENT OF INVESTMENTS (UNAUDITED)
Franklin U.S. Government Securities VIP Fund (continued)
| Principal Amount | Value | |||||||||
| U.S. Government and Agency Securities (continued) |
||||||||||
| TVA, |
||||||||||
| 1.875%, 8/15/22 |
$ | 6,000,000 | $ | 5,692,710 | ||||||
| 5.88%, 4/01/36 |
5,000,000 | 6,479,750 | ||||||||
| Strip, 11/01/18 |
2,644,000 | 2,437,559 | ||||||||
| Strip, 6/15/19 |
5,973,000 | 5,416,000 | ||||||||
| Strip, 6/15/20 |
6,138,000 | 5,364,311 | ||||||||
| U.S. Treasury Note, |
||||||||||
| 0.875%, 11/30/16 |
2,500,000 | 2,515,332 | ||||||||
| 1.25%, 1/31/19 |
10,000,000 | 9,886,720 | ||||||||
| 1.75%, 10/31/18 |
3,000,000 | 3,042,657 | ||||||||
| 2.375%, 8/31/14 |
8,000,000 | 8,030,936 | ||||||||
| 2.375%, 9/30/14 |
17,000,000 | 17,098,277 | ||||||||
| 2.375%, 10/31/14 |
7,000,000 | 7,053,592 | ||||||||
| 2.50%, 4/30/15 |
6,950,000 | 7,089,139 | ||||||||
| 4.25%, 8/15/15 |
20,000,000 | 20,917,180 | ||||||||
| Ukraine Government Aid Bonds, 1.844%, 5/16/19 |
5,000,000 | 5,006,860 | ||||||||
|
|
|
|||||||||
| Total U.S. Government and Agency Securities (Cost $262,919,065) |
266,431,771 | |||||||||
|
|
|
|||||||||
| Total Investments before Short Term Investments |
1,401,937,889 | |||||||||
|
|
|
|||||||||
| Short Term Investments (Cost $14,100,650) 1.0% |
||||||||||
| Repurchase Agreements 1.0% |
||||||||||
| c | Joint Repurchase Agreement, 0.064%, 7/01/14 (Maturity Value $14,100,675) BNP Paribas Securities Corp. (Maturity Value $2,848,054) |
14,100,650 | 14,100,650 | |||||||
| Collateralized by U.S. Government Agency Securities, 0.00% - 6.21%, 1/16/15 - 5/04/37; d U.S. Government Agency Discount Notes, 12/24/14 - 1/30/15; U.S. Government Agency Securities, Strips, 5/15/30; U.S. Treasury Bonds, 7.50% - 8.875%, 11/15/16 - 2/15/19; U.S. Treasury Notes, 0.25% - 4.50%, 7/15/15 - 4/30/18; and U.S. Treasury Notes, Index Linked, 1.375%, 7/15/18 (valued at $14,385,065) |
||||||||||
|
|
|
|||||||||
| Total Investments (Cost $1,399,265,318) 99.6% |
1,416,038,539 | |||||||||
| Other Assets, less Liabilities 0.4% |
5,365,359 | |||||||||
|
|
|
|||||||||
| Net Assets 100.0% |
$ | 1,421,403,898 | ||||||||
|
|
|
|||||||||
See Abbreviations on page FUS-21.
aThe coupon rate shown represents the rate at period end.
bSecurity was purchased pursuant to Rule 144A under the Securities Act of 1933 and may be sold in transactions exempt from registration only to qualified institutional buyers or in a public offering registered under the Securities Act of 1933. This security has been deemed liquid under guidelines approved by the Trust’s Board of Trustees. At June 30, 2014, the value of this security was $14,476,098, representing 1.02% of net assets.
cSee Note 1(b) regarding joint repurchase agreement.
dThe security is traded on a discount basis with no stated coupon rate.
| FUS-12 | Semiannual Report | The accompanying notes are an integral part of these financial statements. |
FRANKLIN TEMPLETON VARIABLE INSURANCE PRODUCTS TRUST
Financial Statements
Statement of Assets and Liabilities
June 30, 2014 (unaudited)
| Franklin U.S. Government Securities VIP Fund |
||||
| Assets: | ||||
| Investments in securities: |
||||
| Cost - Unaffiliated issuers |
$ | 1,385,164,668 | ||
| Cost - Repurchase agreements |
14,100,650 | |||
|
|
|
|||
| Total cost of investments |
$ | 1,399,265,318 | ||
|
|
|
|||
| Value - Unaffiliated issuers |
$ | 1,401,937,889 | ||
| Value - Repurchase agreements |
14,100,650 | |||
|
|
|
|||
| Total value of investments |
1,416,038,539 | |||
| Receivables: |
||||
| Investment securities sold |
1,211,462 | |||
| Capital shares sold |
1,112,509 | |||
| Interest |
4,536,322 | |||
| Other assets |
644 | |||
|
|
|
|||
| Total assets |
1,422,899,476 | |||
|
|
|
|||
| Liabilities: | ||||
| Payables: |
||||
| Capital shares redeemed |
215,859 | |||
| Management fees |
542,424 | |||
| Distribution fees |
549,374 | |||
| Reports to shareholders |
175,511 | |||
| Accrued expenses and other liabilities |
12,410 | |||
|
|
|
|||
| Total liabilities |
1,495,578 | |||
|
|
|
|||
| Net assets, at value |
$ | 1,421,403,898 | ||
|
|
|
|||
| Net assets consist of: | ||||
| Paid-in capital |
$ | 1,427,809,715 | ||
| Undistributed net investment income |
7,497,244 | |||
| Net unrealized appreciation (depreciation) |
16,773,221 | |||
| Accumulated net realized gain (loss) |
(30,676,282 | ) | ||
|
|
|
|||
| Net assets, at value |
$ | 1,421,403,898 | ||
|
|
|
|||
| Class 1: | ||||
| Net assets, at value |
$ | 96,918,075 | ||
|
|
|
|||
| Shares outstanding |
7,537,115 | |||
|
|
|
|||
| Net asset value and maximum offering price per share |
$ | 12.86 | ||
|
|
|
|||
| Class 2: | ||||
| Net assets, at value |
$ | 1,324,485,823 | ||
|
|
|
|||
| Shares outstanding |
105,059,530 | |||
|
|
|
|||
| Net asset value and maximum offering price per share |
$ | 12.61 | ||
|
|
|
|||
| The accompanying notes are an integral part of these financial statements. | Semiannual Report | FUS-13 |
FRANKLIN TEMPLETON VARIABLE INSURANCE PRODUCTS TRUST
FINANCIAL STATEMENTS
Statement of Operations
for the six months ended June 30, 2014 (unaudited)
| Franklin U.S. Government Securities VIP Fund |
||||
| Investment income: | ||||
| Interest |
$ | 21,540,074 | ||
| Paydown gain (loss) |
(4,596,922 | ) | ||
|
|
|
|||
| Total investment income |
16,943,152 | |||
|
|
|
|||
| Expenses: | ||||
| Management fees (Note 3a) |
3,237,144 | |||
| Distribution fees - Class 2 (Note 3c) |
1,608,936 | |||
| Custodian fees (Note 4) |
5,716 | |||
| Reports to shareholders |
99,666 | |||
| Professional fees |
24,596 | |||
| Trustees’ fees and expenses |
2,838 | |||
| Other |
26,077 | |||
|
|
|
|||
| Total expenses |
5,004,973 | |||
|
|
|
|||
| Net investment income |
11,938,179 | |||
|
|
|
|||
| Realized and unrealized gains (losses): | ||||
| Net realized gain (loss) from investments |
(446,340 | ) | ||
| Net change in unrealized appreciation (depreciation) on investments |
21,807,179 | |||
|
|
|
|||
| Net realized and unrealized gain (loss) |
21,360,839 | |||
|
|
|
|||
| Net increase (decrease) in net assets resulting from operations |
$ | 33,299,018 | ||
|
|
|
|||
| FUS-14 | Semiannual Report | The accompanying notes are an integral part of these financial statements. |
FRANKLIN TEMPLETON VARIABLE INSURANCE PRODUCTS TRUST
FINANCIAL STATEMENTS
Statements of Changes in Net Assets
| Franklin U.S. Government Securities VIP Fund |
||||||||
| Six Months Ended June 30, 2014 (unaudited) |
Year Ended December 31, 2013 |
|||||||
| Increase (decrease) in net assets: | ||||||||
| Operations: |
||||||||
| Net investment income |
$ | 11,938,179 | $ | 22,010,219 | ||||
| Net realized gain (loss) from investments |
(446,340 | ) | (4,159,151 | ) | ||||
| Net change in unrealized appreciation (depreciation) on investments |
21,807,179 | (49,606,935 | ) | |||||
|
|
|
|||||||
| Net increase (decrease) in net assets resulting from operations |
33,299,018 | (31,755,867 | ) | |||||
|
|
|
|||||||
| Distributions to shareholders from: |
||||||||
| Net investment income: |
||||||||
| Class 1 |
(2,743,382 | ) | (3,416,984 | ) | ||||
| Class 2 |
(35,038,168 | ) | (35,241,458 | ) | ||||
|
|
|
|||||||
| Total distributions to shareholders |
(37,781,550 | ) | (38,658,442 | ) | ||||
|
|
|
|||||||
| Capital share transactions: (Note 2) |
||||||||
| Class 1 |
(2,750,753 | ) | (20,692,170 | ) | ||||
| Class 2 |
60,695,568 | 126,422,957 | ||||||
|
|
|
|||||||
| Total capital share transactions |
57,944,815 | 105,730,787 | ||||||
|
|
|
|||||||
| Net increase (decrease) in net assets |
53,462,283 | 35,316,478 | ||||||
| Net assets: | ||||||||
| Beginning of period |
1,367,941,615 | 1,332,625,137 | ||||||
|
|
|
|||||||
| End of period |
$ | 1,421,403,898 | $ | 1,367,941,615 | ||||
|
|
|
|||||||
| Undistributed net investment income included in net assets: | ||||||||
| End of period |
$ | 7,497,244 | $ | 33,340,615 | ||||
|
|
|
|||||||
| The accompanying notes are an integral part of these financial statements. | Semiannual Report | FUS-15 |
FRANKLIN TEMPLETON VARIABLE INSURANCE PRODUCTS TRUST
Notes to Financial Statements (unaudited)
Franklin U.S. Government Securities VIP Fund
| FUS-16 | Semiannual Report |
FRANKLIN TEMPLETON VARIABLE INSURANCE PRODUCTS TRUST
NOTES TO FINANCIAL STATEMENTS (UNAUDITED)
Franklin U.S. Government Securities VIP Fund (continued)
| Semiannual Report | FUS-17 |
FRANKLIN TEMPLETON VARIABLE INSURANCE PRODUCTS TRUST
NOTES TO FINANCIAL STATEMENTS (UNAUDITED)
Franklin U.S. Government Securities VIP Fund (continued)
1. Organization and Significant Accounting Policies (continued)
g. Guarantees and Indemnifications
Under the Trust’s organizational documents, its officers and trustees are indemnified by the Trust against certain liabilities arising out of the performance of their duties to the Trust.
Additionally, in the normal course of business, the Trust, on behalf of the Fund, enters into contracts with service providers that contain general indemnification clauses. The Trust’s maximum exposure under these arrangements is unknown as this would involve future claims that may be made against the Trust that have not yet occurred. Currently, the Trust expects the risk of loss to be remote.
2. Shares of Beneficial Interest
At June 30, 2014, there were an unlimited number of shares authorized (without par value). Transactions in the Fund’s shares were as follows:
| Six Months Ended June 30, 2014 |
Year Ended December 31, 2013 |
|||||||||||||||||
| Shares | Amount | Shares | Amount | |||||||||||||||
| Class 1 Shares: | ||||||||||||||||||
| Shares sold |
118,088 | $ | 1,547,128 | 543,938 | $ | 7,320,837 | ||||||||||||
| Shares issued in reinvestment of distributions |
214,159 | 2,743,382 | 262,643 | 3,416,984 | ||||||||||||||
| Shares redeemed |
(539,252 | ) | (7,041,263 | ) | (2,385,700 | ) | (31,429,991 | ) | ||||||||||
|
|
|
|||||||||||||||||
| Net increase (decrease) |
(207,005 | ) | $ | (2,750,753 | ) | (1,579,119 | ) | $ | (20,692,170 | ) | ||||||||
|
|
|
|||||||||||||||||
| Class 2 Shares: | ||||||||||||||||||
| Shares sold |
5,954,911 | $ | 76,194,386 | 21,495,475 | $ | 278,880,113 | ||||||||||||
| Shares issued in reinvestment of distributions |
2,789,663 | 35,038,168 | 2,759,707 | 35,241,458 | ||||||||||||||
| Shares redeemed |
(3,949,875 | ) | (50,536,986 | ) | (14,590,310 | ) | (187,698,614 | ) | ||||||||||
|
|
|
|||||||||||||||||
| Net increase (decrease) |
4,794,699 | $ | 60,695,568 | 9,664,872 | $ | 126,422,957 | ||||||||||||
|
|
|
|||||||||||||||||
3. Transactions With Affiliates
Franklin Resources, Inc. is the holding company for various subsidiaries that together are referred to as Franklin Templeton Investments. Certain officers and trustees of the Fund are also officers and/or directors of the following subsidiaries:
| Subsidiary | Affiliation | |
| Franklin Advisers, Inc. (Advisers) | Investment manager | |
| Franklin Templeton Services, LLC (FT Services) | Administrative manager | |
| Franklin Templeton Distributors, Inc. (Distributors) | Principal underwriter | |
| Franklin Templeton Investor Services, LLC (Investor Services) | Transfer agent |
| FUS-18 | Semiannual Report |
FRANKLIN TEMPLETON VARIABLE INSURANCE PRODUCTS TRUST
NOTES TO FINANCIAL STATEMENTS (UNAUDITED)
Franklin U.S. Government Securities VIP Fund (continued)
a. Management Fees
The Fund pays an investment management fee to Advisers based on the average daily net assets of the Fund as follows:
| Annualized Fee Rate | Net Assets | |
| 0.625% | Up to and including $100 million | |
| 0.500% | Over $100 million, up to and including $250 million | |
| 0.450% | Over $250 million, up to and including $7.5 billion | |
| 0.440% | Over $7.5 billion, up to and including $10 billion | |
| 0.430% | Over $10 billion, up to and including $12.5 billion | |
| 0.420% | Over $12.5 billion, up to and including $15 billion | |
| 0.400% | In excess of $15 billion |
b. Administrative Fees
Under an agreement with Advisers, FT Services provides administrative services to the Fund. The fee is paid by Advisers based on the Fund’s average daily net assets, and is not an additional expense of the Fund.
c. Distribution Fees
The Board has adopted a distribution plan for Class 2 shares pursuant to Rule 12b-1 under the 1940 Act. Under the Fund’s compensation distribution plan, the Fund pays Distributors for costs incurred in connection with the servicing, sale and distribution of the Fund’s shares up to 0.35% per year of its average daily net assets. Some distribution fees are not charged on shares held by affiliates. The Board has agreed to limit the current rate to 0.25% per year for Class 2. The plan year, for purposes of monitoring compliance with the maximum annual plan rate, is February 1 through January 31.
d. Transfer Agent Fees
Investor Services, under terms of an agreement, performs shareholder servicing for the Fund and is not paid by the Fund for the services.
4. Expense Offset Arrangement
The Fund has entered into an arrangement with its custodian whereby credits realized as a result of uninvested cash balances are used to reduce a portion of the Fund’s custodian expenses. During the period ended June 30, 2014, there were no credits earned.
5. Income Taxes
For tax purposes, capital losses may be carried over to offset future capital gains. Capital loss carryforwards with no expiration, if any, must be fully utilized before those losses with expiration dates.
| Semiannual Report | FUS-19 |
FRANKLIN TEMPLETON VARIABLE INSURANCE PRODUCTS TRUST
NOTES TO FINANCIAL STATEMENTS (UNAUDITED)
Franklin U.S. Government Securities VIP Fund (continued)
5. Income Taxes (continued)
At December 31, 2013, capital loss carryforwards were as follows:
| Capital loss carryforwards expiring in: |
||
| 2014 |
$ 1,618,397 | |
| 2015 |
2,329,071 | |
| 2016 |
841,479 | |
| 2017 |
401,851 | |
| 2018 |
426,637 | |
| Capital loss carryforwards not subject to expiration: |
||
| Short term |
15,192,272 | |
| Long term |
9,310,380 | |
|
| ||
| Total capital loss carryforwards |
$30,120,087 | |
|
| ||
At June 30, 2014, the cost of investments and net unrealized appreciation (depreciation) for income tax purposes were as follows:
| Cost of investments |
$ | 1,404,952,567 | ||
|
|
|
|||
| Unrealized appreciation |
$ | 25,560,269 | ||
| Unrealized depreciation |
(14,474,297 | ) | ||
|
|
|
|||
| Net unrealized appreciation (depreciation) |
$ | 11,085,972 | ||
|
|
|
|||
Differences between income and/or capital gains as determined on a book basis and a tax basis are primarily due to differing treatments of paydown losses and bond discounts and premiums.
6. Investment Transactions
Purchases and sales of investments (excluding short term securities) for the period ended June 30, 2014, aggregated $284,903,753 and $212,515,683, respectively.
7. Credit Facility
The Fund, together with other U.S. registered and foreign investment funds (collectively, Borrowers), managed by Franklin Templeton Investments, are borrowers in a joint syndicated senior unsecured credit facility totaling $1.5 billion (Global Credit Facility) which matures on February 13, 2015. This Global Credit Facility provides a source of funds to the Borrowers for temporary and emergency purposes, including the ability to meet future unanticipated or unusually large redemption requests.
Under the terms of the Global Credit Facility, the Fund shall, in addition to interest charged on any borrowings made by the Fund and other costs incurred by the Fund, pay its share of fees and expenses incurred in connection with the implementation and maintenance of the Global Credit Facility, based upon its relative share of the aggregate net assets of all of the Borrowers, including an annual commitment fee of 0.07% based upon the unused portion of the Global Credit Facility. These fees are reflected in other expenses on the Statement of Operations. During the period ended June 30, 2014, the Fund did not use the Global Credit Facility.
| FUS-20 | Semiannual Report |
FRANKLIN TEMPLETON VARIABLE INSURANCE PRODUCTS TRUST
NOTES TO FINANCIAL STATEMENTS (UNAUDITED)
Franklin U.S. Government Securities VIP Fund (continued)
8. Fair Value Measurements
The Fund follows a fair value hierarchy that distinguishes between market data obtained from independent sources (observable inputs) and the Fund’s own market assumptions (unobservable inputs). These inputs are used in determining the value of the Fund’s financial instruments and are summarized in the following fair value hierarchy:
| • | Level 1 – quoted prices in active markets for identical financial instruments |
| • | Level 2 – other significant observable inputs (including quoted prices for similar financial instruments, interest rates, prepayment speed, credit risk, etc.) |
| • | Level 3 – significant unobservable inputs (including the Fund’s own assumptions in determining the fair value of financial instruments) |
The input levels are not necessarily an indication of the risk or liquidity associated with financial instruments at that level.
For movements between the levels within the fair value hierarchy, the Fund has adopted a policy of recognizing the transfers as of the date of the underlying event which caused the movement.
At June 30, 2014, all of the Fund’s investments in financial instruments carried at fair value were valued using Level 2 inputs. For detailed categories, see the accompanying Statement of Investments.
9. New Accounting Pronouncements
In June 2014, the Financial Accounting Standards Board issued Accounting Standards Update (ASU) No. 2014-11, Transfers and Servicing (Topic 860), Repurchase-to-Maturity Transactions, Repurchase Financings, and Disclosures. The ASU changes the accounting for certain repurchase agreements and expands disclosure requirements related to repurchase agreements, securities lending, repurchase-to-maturity and similar transactions. The ASU is effective for interim and annual reporting periods beginning after December 15, 2014. Management is currently evaluating the impact, if any, of applying this provision.
10. Subsequent Events
The Fund has evaluated subsequent events through the issuance of the financial statements and determined that no events have occurred that require disclosure.
Abbreviations
| Selected Portfolio | ||
| FFCB | Federal Farm Credit Bank | |
| FHLB | Federal Home Loan Bank | |
| FICO | Financing Corp. | |
| FRN | Floating Rate Note | |
| GL | Government Loan | |
| PC | Participation Certificate | |
| PL | Project Loan | |
| SBA | Small Business Administration | |
| SF | Single Family | |
| TVA | Tennessee Valley Authority | |
| Semiannual Report | FUS-21 |
Templeton Developing Markets VIP Fund
(Formerly, Templeton Developing Markets Securities Fund)
This semiannual report for Templeton Developing Markets VIP Fund covers the period ended June 30, 2014.
Class 2 Performance Summary as of June 30, 2014
Templeton Developing Markets VIP Fund – Class 2 delivered a +0.77% total return* for the six-month period ended June 30, 2014.
*The Fund has a fee waiver associated with its investments in a Franklin Templeton money fund, contractually guaranteed through at least its current fiscal year-end. Fund investment results reflect the fee waiver, to the extent applicable; without this reduction, the results would have been lower.
Performance reflects the Fund’s Class 2 operating expenses, but does not include any contract fees, expenses or sales charges. If they had been included, performance would be lower. These charges and deductions, particularly for variable life policies, can have a significant effect on contract values and insurance benefits. See the contract prospectus for a complete description of these expenses, including sales charges.
Performance data represent past performance, which does not guarantee future results. Investment return and principal value will fluctuate, and you may have a gain or loss when you sell your shares. Current performance may differ from figures shown.
| Semiannual Report | TD-1 |
TEMPLETON DEVELOPING MARKETS VIP FUND
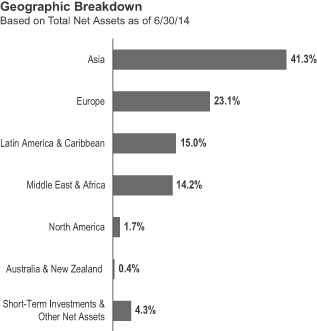
traction. Retail sales continued to grow as household income increased. Domestic demand accounted for a greater portion of gross domestic product, indicating stable progress in policymakers’ efforts to make China’s economy more consumer driven. Other economies that showed signs of moderation included those of Russia, Brazil and Turkey, while several economies, including those of Qatar, Taiwan and Poland, showed signs of improvement.
After a weak start to the year, emerging market stocks advanced in the second half of the period, supported by better U.S. economic data, the European Central Bank’s further monetary easing, an apparent cooling of tensions between Russia and Ukraine, and China’s improving manufacturing sector. Certain emerging markets such as India and Indonesia were buoyed by investors’ expectations for economic reforms after elections. Several emerging market central banks, including those of Brazil, India, South Africa and Russia, raised interest rates in response to rising inflation and weakening currencies, while several central banks, including those of Chile, Mexico, Romania and Thailand, lowered interest rates to promote economic growth. After raising interest rates early in the year to support the Turkish lira, Turkey’s central bank began easing monetary policy toward period-end to boost economic growth. The
1. Source: © 2014 Morningstar. One cannot invest directly in an index, and an index is not representative of the Fund’s portfolio. Please see Index Descriptions following the Fund Summaries.
| TD-2 | Semiannual Report |
TEMPLETON DEVELOPING MARKETS VIP FUND
recovery could potentially support future earnings growth. Investor positioning prior to the UAE’s inclusion in the MSCI EM Index in June led to strong buying of Emaar’s shares, contributing to further price increases.
Brilliance China Automotive has a joint venture with BMW for the production and sale of BMW 3-series and 5-series sedans and X1 compact sport utility vehicles in China. The company appears to us to be well positioned to fulfill China’s expanding middle class’s fast-growing demand for affordable luxury vehicles. The resilient sales growth of luxury cars in China contributed to Brilliance’s strong first-quarter sales volume, with BMW cars taking an increasing market share. Continued positive car-sales data and news of an extension to 2028 of the joint venture agreement between Brilliance and BMW also boosted Brilliance’s share price.
Tata Consultancy Services, in our view, is a well-managed and attractively valued service provider in the growing IT outsourcing industry. In addition to benefiting from the Indian equity market’s strong performance, its shares were supported by the IT outsourcing industry’s growth during the period. We believe that India has a major competitive advantage in providing outsourcing services because of the country’s available technological expertise and relatively low labor costs. Tata Consultancy’s shares made solid gains in June as the company reaffirmed its revenue and margin outlook and as earnings results from a U.S. peer suggested ongoing strength in key markets.
In contrast, key detractors from the Fund’s absolute performance included SJM Holdings, MGM China Holdings and Luk Fook Holdings (International). We closed the Fund’s positions
| Semiannual Report | TD-3 |
TEMPLETON DEVELOPING MARKETS VIP FUND
some purchases in other emerging market countries, including Turkey, Indonesia and Taiwan. Additionally, we made some purchases in certain developed market countries, such as Austria and Belgium, where we identified companies that have significant emerging market operations, giving them the potential to benefit from emerging market countries’ stronger personal income and consumer demand growth. In sector terms, we increased investments largely in materials, energy, IT and financials.3 Key purchases included new positions in Brilliance China Automotive Holdings; Siam Commercial Bank, one of
Thailand’s biggest banks; and Naspers, a South Africa-based multinational media group that engages in Internet, pay television and print media businesses.
Conversely, we reduced the Fund’s investments largely in Hong Kong, the UAE and Brazil as we focused on opportunities we considered to be more attractively valued within our investment
2. “China H” denotes shares of China-incorporated, Hong Kong Stock Exchange-listed companies with most businesses in China. “Red Chip” denotes shares of Hong Kong Stock Exchange-listed companies substantially owned by Chinese mainland state entities, with significant exposure to China.
3. The materials sector comprises chemicals, construction materials, and metals and mining in the SOI. The energy sector comprises oil, gas and consumable fuels in the SOI. The IT sector comprises Internet software and services, IT services, and semiconductors and semiconductor equipment in the SOI. The financials sector comprises banks, diversified financial services, and real estate management and development in the SOI.
| TD-4 | Semiannual Report |
TEMPLETON DEVELOPING MARKETS VIP FUND
4. The consumer staples sector comprises beverages, food products, food staples and retailing, personal products and tobacco in the SOI. The consumer discretionary sector comprises automobiles; media; hotels, restaurants and leisure; specialty retail; and textiles, apparel and luxury goods in the SOI.
| Semiannual Report | TD-5 |
TEMPLETON DEVELOPING MARKETS VIP FUND
Class 2 Fund Expenses
| Class 2 | Beginning Account Value 1/1/14 |
Ending Account Value 6/30/14 |
Fund-Level Expenses 1/1/14–6/30/14 |
|||||||||
| Actual | $1,000 | $1,007.70 | $8.06 | |||||||||
| Hypothetical (5% return before expenses) | $1,000 | $1,016.76 | $8.10 | |||||||||
*Expenses are calculated using the most recent six-month annualized expense ratio, net of expense waivers, for the Fund’s Class 2 shares (1.62%), which does not include any ongoing expenses of the Contract for which the Fund is an investment option, multiplied by the average account value over the period, multiplied by 181/365 to reflect the one-half year period.
| TD-6 | Semiannual Report |
SUPPLEMENT DATED AUGUST 1, 2014
TO THE PROSPECTUS DATED MAY 1, 2014
OF
TEMPLETON DEVELOPING MARKETS VIP FUND
(a series of Franklin Templeton Variable Insurance Products Trust)
The prospectus is amended as follows:
I. The “Fund Summary – Annual Fund Operating Expenses” table beginning on page TD-S1 in the Fund’s Class 1 prospectus is replaced with the following:
Annual Fund Operating Expenses
(expenses that you pay each year as a percentage of the value of your investment)
| Class 1 | ||||
| Management fees1 | 1.24% | |||
| Distribution and service (12b-1) fees | None | |||
| Other expenses1 | 0.11% | |||
| Total annual Fund operating expenses | 1.35% | |||
| 1. | Management fees and other expenses have been restated to reflect current fiscal year fees and expenses as a result of the bundling of the Fund’s investment management agreement with its fund administration agreement effective May 1, 2014. Such combined investment management fees are described further under “Management” in the Fund’s prospectus. Total annual fund operating expenses are not affected by such bundling. |
II. The “Fund Summary – Annual Fund Operating Expenses” table beginning on page TD-S1 in the Fund’s Class 2 prospectus is replaced with the following:
Annual Fund Operating Expenses
(expenses that you pay each year as a percentage of the value of your investment)
| Class 2 | ||||
| Management fees1 | 1.24% | |||
| Distribution and service (12b-1) fees | 0.25% | |||
| Other expenses1 | 0.11% | |||
| Total annual Fund operating expenses | 1.60% | |||
| 1. | Management fees and other expenses have been restated to reflect current fiscal year fees and expenses as a result of the bundling of the Fund’s investment management agreement with its fund administration agreement effective May 1, 2014. Such combined investment management fees are described further under “Management” in the Fund’s prospectus. Total annual fund operating expenses are not affected by such bundling. |
III. The “Fund Summary – Annual Fund Operating Expenses” table beginning on page TD-S1 in the Fund’s Class 4 prospectus is replaced with the following:
Annual Fund Operating Expenses
(expenses that you pay each year as a percentage of the value of your investment)
| Class 4 | ||||
| Management fees1 | 1.24% | |||
| Distribution and service (12b-1) fees | 0.35% | |||
| Other expenses1 | 0.11% | |||
| Total annual Fund operating expenses | 1.70% | |||
| TD-7 |
| 1. | Management fees and other expenses have been restated to reflect current fiscal year fees and expenses as a result of the bundling of the Fund’s investment management agreement with its fund administration agreement effective May 1, 2014. Such combined investment management fees are described further under “Management” in the Fund’s prospectus. Total annual fund operating expenses are not affected by such bundling. |
IV. The following is added as the second to last paragraph in the “Fund Details – Management” section of each Class’ prospectus beginning on page TD-D7:
Effective May 1, 2014, the Fund’s investment management agreement was bundled with its fund administration agreement, including the fees payable to the Fund’s administrator thereunder, as approved by the board of trustees. The fee payable to the administrator under the Fund’s administration agreement, prior to May 1, 2014, was a monthly fee under the following fee schedule of the Fund’s average daily net assets:
| • | 0.150% up to and including $200 million; |
| • | 0.135% over $200 million, up to and including $700 million; |
| • | 0.100% over $700 million, up to and including $1.2 billion; |
| • | 0.075% in excess of $1.2 billion. |
As of such date, the Fund’s investment management fees became a monthly fee at the annual rate of the value of the Fund’s average daily net assets as set forth below:
| • | 1.250% up to and including $200 million; |
| • | 1.235% over $200 million, up to and including $700 million; |
| • | 1.200% over $700 million, up to and including $1 billion; |
| • | 1.150% over $1 billion, up to and including $1.2 billion; |
| • | 1.125% over $1.2 billion, up to and including $5 billion; |
| • | 1.075% over $5 billion, up to and including $10 billion; |
| • | 1.025% over $10 billion, up to and including $15 billion; |
| • | 0.975% over $15 billion, up to and including $20 billion; |
| • | 0.925% in excess of $20 billion. |
Please keep this supplement with your prospectus for future reference.
| TD-8 |
FRANKLIN TEMPLETON VARIABLE INSURANCE PRODUCTS TRUST
Financial Highlights
Templeton Developing Markets VIP Fund
| Six Months Ended (unaudited) |
Year Ended December 31, | |||||||||||||||||||||||
| 2013 | 2012 | 2011 | 2010 | 2009 | ||||||||||||||||||||
| Class 1 | ||||||||||||||||||||||||
| Per share operating performance (for a share outstanding throughout the period) |
||||||||||||||||||||||||
| Net asset value, beginning of period |
$10.26 | $10.58 | $ 9.50 | $11.40 | $ 9.86 | $6.11 | ||||||||||||||||||
|
|
|
|||||||||||||||||||||||
| Income from investment operationsa: | ||||||||||||||||||||||||
| Net investment incomeb |
0.11 | 0.13 | 0.19 | 0.17 | 0.09 | 0.12 | ||||||||||||||||||
| Net realized and unrealized gains (losses) |
(0.02 | ) | (0.22 | ) | 1.06 | (1.94 | ) | 1.63 | 4.02 | |||||||||||||||
|
|
|
|||||||||||||||||||||||
| Total from investment operations |
0.09 | (0.09 | ) | 1.25 | (1.77 | ) | 1.72 | 4.14 | ||||||||||||||||
|
|
|
|||||||||||||||||||||||
| Less distributions from: | ||||||||||||||||||||||||
| Net investment income |
(0.17 | ) | (0.23 | ) | (0.17 | ) | (0.13 | ) | (0.18 | ) | (0.36 | ) | ||||||||||||
| Net realized gains |
— | — | — | — | — | (0.03 | ) | |||||||||||||||||
|
|
|
|||||||||||||||||||||||
| Total distributions |
(0.17 | ) | (0.23 | ) | (0.17 | ) | (0.13 | ) | (0.18 | ) | (0.39 | ) | ||||||||||||
|
|
|
|||||||||||||||||||||||
| Redemption feesc |
— | — | — | — | — | — | ||||||||||||||||||
|
|
|
|||||||||||||||||||||||
| Net asset value, end of period |
$10.18 | $10.26 | $10.58 | $ 9.50 | $11.40 | $9.86 | ||||||||||||||||||
|
|
|
|||||||||||||||||||||||
| Total returnd |
0.93% | (0.73)% | 13.40% | (15.67)% | 17.83% | 73.32% | ||||||||||||||||||
| Ratios to average net assetse | ||||||||||||||||||||||||
| Expenses before waiver and payments by affiliates |
1.38% | 1.35% | 1.35% | 1.40% | 1.49% | 1.45% | ||||||||||||||||||
| Expenses net of waiver and payments by affiliates |
1.37% | 1.35% | 1.35% | 1.40% | 1.49% | f | 1.45% | f | ||||||||||||||||
| Net investment income |
2.17% | 1.25% | 1.93% | 1.57% | 0.87% | 1.64% | ||||||||||||||||||
| Supplemental data | ||||||||||||||||||||||||
| Net assets, end of period (000’s) |
$135,486 | $145,707 | $203,568 | $232,544 | $347,242 | $325,927 | ||||||||||||||||||
| Portfolio turnover rate |
61.52% | 44.59% | 24.45% | 14.90% | 24.41% | 56.58% | g | |||||||||||||||||
aThe amount shown for a share outstanding throughout the period may not correlate with the Statement of Operations for the period due to the timing of sales and repurchases of the Fund shares in relation to income earned and/or fluctuating fair value of the investments of the Fund.
bBased on average daily shares outstanding.
cAmount rounds to less than $0.01 per share.
dTotal return does not include fees, charges or expenses imposed by the variable annuity and life insurance contracts for which the Franklin Templeton Variable Insurance Products Trust serves as an underlying investment vehicle. Total return is not annualized for periods less than one year.
eRatios are annualized for periods less than one year.
fBenefit of expense reduction rounds to less than 0.01%.
gExcludes the value of portfolio securities delivered as a result of a redemption in-kind.
| The accompanying notes are an integral part of these financial statements. | Semiannual Report | TD-9 |
FRANKLIN TEMPLETON VARIABLE INSURANCE PRODUCTS TRUST
FINANCIAL HIGHLIGHTS
Templeton Developing Markets VIP Fund (continued)
| Six Months Ended (unaudited) |
Year Ended December 31, | |||||||||||||||||||||||
| 2013 | 2012 | 2011 | 2010 | 2009 | ||||||||||||||||||||
| Class 2 | ||||||||||||||||||||||||
| Per share operating performance (for a share outstanding throughout the period) |
||||||||||||||||||||||||
| Net asset value, beginning of period |
$10.19 | $10.50 | $ 9.42 | $11.30 | $ 9.78 | $6.04 | ||||||||||||||||||
|
|
|
|||||||||||||||||||||||
| Income from investment operationsa: | ||||||||||||||||||||||||
| Net investment incomeb |
0.09 | 0.10 | 0.17 | 0.14 | 0.06 | 0.11 | ||||||||||||||||||
| Net realized and unrealized gains (losses) |
(0.02 | ) | (0.21 | ) | 1.05 | (1.92 | ) | 1.62 | 3.98 | |||||||||||||||
|
|
|
|||||||||||||||||||||||
| Total from investment operations |
0.07 | (0.11 | ) | 1.22 | (1.78 | ) | 1.68 | 4.09 | ||||||||||||||||
|
|
|
|||||||||||||||||||||||
| Less distributions from: | ||||||||||||||||||||||||
| Net investment income |
(0.15 | ) | (0.20 | ) | (0.14 | ) | (0.10 | ) | (0.16 | ) | (0.32 | ) | ||||||||||||
| Net realized gains |
— | — | — | — | — | (0.03 | ) | |||||||||||||||||
|
|
|
|||||||||||||||||||||||
| Total distributions |
(0.15 | ) | (0.20 | ) | (0.14 | ) | (0.10 | ) | (0.16 | ) | (0.35 | ) | ||||||||||||
|
|
|
|||||||||||||||||||||||
| Redemption feesc |
— | — | — | — | — | — | ||||||||||||||||||
|
|
|
|||||||||||||||||||||||
| Net asset value, end of period |
$10.11 | $10.19 | $10.50 | $ 9.42 | $11.30 | $9.78 | ||||||||||||||||||
|
|
|
|||||||||||||||||||||||
| Total returnd |
0.77% | (0.92)% | 13.16% | (15.86)% | 17.58% | 72.59% | ||||||||||||||||||
| Ratios to average net assetse | ||||||||||||||||||||||||
| Expenses before waiver and payments by affiliates |
1.63% | 1.60% | 1.60% | 1.65% | 1.74% | 1.70% | ||||||||||||||||||
| Expenses net of waiver and payments by affiliates |
1.62% | 1.60% | 1.60% | 1.65% | 1.74% | f | 1.70% | f | ||||||||||||||||
| Net investment income |
1.92% | 1.00% | 1.68% | 1.32% | 0.62% | 1.39% | ||||||||||||||||||
| Supplemental data | ||||||||||||||||||||||||
| Net assets, end of period (000’s) |
$301,279 | $274,683 | $291,638 | $295,223 | $392,546 | $435,947 | ||||||||||||||||||
| Portfolio turnover rate |
61.52% | 44.59% | 24.45% | 14.90% | 24.41% | 56.58% | g | |||||||||||||||||
aThe amount shown for a share outstanding throughout the period may not correlate with the Statement of Operations for the period due to the timing of sales and repurchases of the Fund shares in relation to income earned and/or fluctuating fair value of the investments of the Fund.
bBased on average daily shares outstanding.
cAmount rounds to less than $0.01 per share.
dTotal return does not include fees, charges or expenses imposed by the variable annuity and life insurance contracts for which the Franklin Templeton Variable Insurance Products Trust serves as an underlying investment vehicle. Total return is not annualized for periods less than one year.
eRatios are annualized for periods less than one year.
fBenefit of expense reduction rounds to less than 0.01%.
gExcludes the value of portfolio securities delivered as a result of a redemption in-kind.
| TD-10 | Semiannual Report | The accompanying notes are an integral part of these financial statements. |
FRANKLIN TEMPLETON VARIABLE INSURANCE PRODUCTS TRUST
FINANCIAL HIGHLIGHTS
Templeton Developing Markets VIP Fund (continued)
| Six Months Ended (unaudited) |
Year Ended December 31, | |||||||||||||||||||||||
| 2013 | 2012 | 2011 | 2010 | 2009 | ||||||||||||||||||||
| Class 4 | ||||||||||||||||||||||||
| Per share operating performance (for a share outstanding throughout the period) |
||||||||||||||||||||||||
| Net asset value, beginning of period |
$10.20 | $10.50 | $ 9.42 | $11.30 | $ 9.80 | $6.09 | ||||||||||||||||||
|
|
|
|||||||||||||||||||||||
| Income from investment operationsa: | ||||||||||||||||||||||||
| Net investment incomeb |
0.09 | 0.10 | 0.16 | 0.13 | 0.05 | 0.09 | ||||||||||||||||||
| Net realized and unrealized gains (losses) |
(0.02 | ) | (0.21 | ) | 1.04 | (1.91 | ) | 1.61 | 4.00 | |||||||||||||||
|
|
|
|||||||||||||||||||||||
| Total from investment operations |
0.07 | (0.11 | ) | 1.20 | (1.78 | ) | 1.66 | 4.09 | ||||||||||||||||
|
|
|
|||||||||||||||||||||||
| Less distributions from: | ||||||||||||||||||||||||
| Net investment income |
(0.13 | ) | (0.19 | ) | (0.12 | ) | (0.10 | ) | (0.16 | ) | (0.35 | ) | ||||||||||||
| Net realized gains |
— | — | — | — | — | (0.03 | ) | |||||||||||||||||
|
|
|
|||||||||||||||||||||||
| Total distributions |
(0.13 | ) | (0.19 | ) | (0.12 | ) | (0.10 | ) | (0.16 | ) | (0.38 | ) | ||||||||||||
|
|
|
|||||||||||||||||||||||
| Redemption feesc |
— | — | — | — | — | — | ||||||||||||||||||
|
|
|
|||||||||||||||||||||||
| Net asset value, end of period |
$10.14 | $10.20 | $10.50 | $ 9.42 | $11.30 | $9.80 | ||||||||||||||||||
|
|
|
|||||||||||||||||||||||
| Total returnd |
0.65% | (1.07)% | 13.06% | (15.88)% | 17.41% | 72.45% | ||||||||||||||||||
| Ratios to average net assetse | ||||||||||||||||||||||||
| Expenses before waiver and payments by affiliates |
1.73% | 1.70% | 1.70% | 1.75% | 1.84% | 1.80% | ||||||||||||||||||
| Expenses net of waiver and payments by affiliates |
1.72% | 1.70% | 1.70% | 1.75% | 1.84% | f | 1.80% | f | ||||||||||||||||
| Net investment income |
1.82% | 0.90% | 1.58% | 1.22% | 0.52% | 1.29% | ||||||||||||||||||
| Supplemental data | ||||||||||||||||||||||||
| Net assets, end of period (000’s) |
$13,980 | $15,225 | $23,341 | $24,380 | $37,198 | $26,362 | ||||||||||||||||||
| Portfolio turnover rate |
61.52% | 44.59% | 24.45% | 14.90% | 24.41% | 56.58% | g | |||||||||||||||||
aThe amount shown for a share outstanding throughout the period may not correlate with the Statement of Operations for the period due to the timing of sales and repurchases of the Fund shares in relation to income earned and/or fluctuating fair value of the investments of the Fund.
bBased on average daily shares outstanding.
cAmount rounds to less than $0.01 per share.
dTotal return does not include fees, charges or expenses imposed by the variable annuity and life insurance contracts for which the Franklin Templeton Variable Insurance Products Trust serves as an underlying investment vehicle. Total return is not annualized for periods less than one year.
eRatios are annualized for periods less than one year.
fBenefit of expense reduction rounds to less than 0.01%.
gExcludes the value of portfolio securities delivered as a result of a redemption in-kind.
| The accompanying notes are an integral part of these financial statements. | Semiannual Report | TD-11 |
FRANKLIN TEMPLETON VARIABLE INSURANCE PRODUCTS TRUST
Statement of Investments, June 30, 2014 (unaudited)
| Templeton Developing Markets VIP Fund | ||||||||||||||
| Industry | Shares | Value | ||||||||||||
| Common Stocks 90.9% |
||||||||||||||
| Argentina 0.1% |
||||||||||||||
| a | Grupo Clarin SA, B, GDR, Reg S |
Media | 70,355 | $ | 513,592 | |||||||||
|
|
|
|||||||||||||
| Australia 0.4% |
||||||||||||||
| BHP Billiton Ltd. |
Metals & Mining | 56,757 | 1,922,148 | |||||||||||
|
|
|
|||||||||||||
| Austria 0.1% |
||||||||||||||
| OMV AG |
Oil, Gas & Consumable Fuels | 13,000 | 587,494 | |||||||||||
|
|
|
|||||||||||||
| Belgium 3.1% |
||||||||||||||
| Anheuser-Busch InBev NV |
Beverages | 120,577 | 13,853,917 | |||||||||||
|
|
|
|||||||||||||
| Brazil 10.4% |
||||||||||||||
| Ambev SA |
Beverages | 1,856,450 | 13,237,259 | |||||||||||
| Itau Unibanco Holding SA, ADR |
Banks | 1,090,710 | 15,684,410 | |||||||||||
| M Dias Branco SA |
Food Products | 149,700 | 6,618,565 | |||||||||||
| Souza Cruz SA |
Tobacco | 1,098,228 | 11,313,947 | |||||||||||
|
|
|
|||||||||||||
| 46,854,181 | ||||||||||||||
|
|
|
|||||||||||||
| Chile 0.6% |
||||||||||||||
| Sociedad Quimica Y Minera de Chile SA Soquimich, ADR |
Chemicals | 94,287 | 2,763,552 | |||||||||||
|
|
|
|||||||||||||
| China 13.9% |
||||||||||||||
| b | Aluminum Corp. of China Ltd., H |
Metals & Mining | 1,324,000 | 474,904 | ||||||||||
| Angang Steel Co. Ltd., H |
Metals & Mining | 3,772,000 | 2,428,540 | |||||||||||
| Brilliance China Automotive Holdings Ltd. |
Automobiles | 9,805,700 | 18,345,083 | |||||||||||
| China Construction Bank Corp., H |
Banks | 6,283,300 | 4,750,710 | |||||||||||
| China Mobile Ltd. |
|
Wireless Telecommunication Services |
|
542,000 | 5,258,843 | |||||||||
| b | China Shipping Development Co. Ltd., H |
Marine | 6,101,100 | 3,565,984 | ||||||||||
| Industrial and Commercial Bank of China Ltd., H |
Banks | 7,018,300 | 4,437,119 | |||||||||||
| NetEase Inc., ADR |
Internet Software & Services | 36,003 | 2,821,195 | |||||||||||
| PetroChina Co. Ltd., H |
Oil, Gas & Consumable Fuels | 6,136,600 | 7,743,544 | |||||||||||
| Tencent Holdings Ltd. |
Internet Software & Services | 827,000 | 12,644,363 | |||||||||||
|
|
|
|||||||||||||
| 62,470,285 | ||||||||||||||
|
|
|
|||||||||||||
| Greece 0.3% |
||||||||||||||
| b | National Bank of Greece SA |
Banks | 312,080 | 1,141,099 | ||||||||||
|
|
|
|||||||||||||
| Hong Kong 0.6% |
||||||||||||||
| Dairy Farm International Holdings Ltd. |
Food & Staples Retailing | 187,433 | 1,998,036 | |||||||||||
| Giordano International Ltd. |
Specialty Retail | 1,358,200 | 800,853 | |||||||||||
| b | Summit Ascent Holdings Ltd. |
Trading Companies & Distributors | 50,400 | 38,757 | ||||||||||
|
|
|
|||||||||||||
| 2,837,646 | ||||||||||||||
|
|
|
|||||||||||||
| India 6.6% |
||||||||||||||
| Dr. Reddy’s Laboratories Ltd. |
Pharmaceuticals | 68,010 | 2,961,312 | |||||||||||
| Tata Consultancy Services Ltd. |
IT Services | 438,340 | 17,658,037 | |||||||||||
| Tata Motors Ltd. |
Automobiles | 1,285,800 | 9,230,314 | |||||||||||
|
|
|
|||||||||||||
| 29,849,663 | ||||||||||||||
|
|
|
|||||||||||||
| Indonesia 2.5% |
||||||||||||||
| Astra International Tbk PT |
Automobiles | 11,424,700 | 7,010,940 | |||||||||||
| Bank Danamon Indonesia Tbk PT |
Banks | 3,377,400 | 1,180,879 | |||||||||||
| Semen Indonesia (Persero) Tbk PT |
Construction Materials | 2,531,000 | 3,218,459 | |||||||||||
|
|
|
|||||||||||||
| 11,410,278 | ||||||||||||||
|
|
|
|||||||||||||
| TD-12 | Semiannual Report |
FRANKLIN TEMPLETON VARIABLE INSURANCE PRODUCTS TRUST
STATEMENTS OF INVESTMENTS (UNAUDITED)
Templeton Developing Markets VIP Fund (continued)
| Industry | Shares | Value | ||||||||||||
| Common Stocks (continued) |
||||||||||||||
| Kenya 0.7% |
||||||||||||||
| Equity Bank Ltd. |
Banks | 2,662,201 | $ | 1,428,350 | ||||||||||
| Kenya Commercial Bank Ltd. |
Banks | 3,217,000 | 1,872,911 | |||||||||||
|
|
|
|||||||||||||
| 3,301,261 | ||||||||||||||
|
|
|
|||||||||||||
| Luxembourg 0.0%† |
||||||||||||||
| a | O’Key Group SA, GDR, Reg S |
Food & Staples Retailing | 600 | 5,511 | ||||||||||
|
|
|
|||||||||||||
| Nigeria 0.4% |
||||||||||||||
| Nigerian Breweries PLC |
Beverages | 1,467,239 | 1,548,727 | |||||||||||
|
|
|
|||||||||||||
| Pakistan 0.6% |
||||||||||||||
| United Bank Ltd. |
Banks | 1,465,400 | 2,506,605 | |||||||||||
|
|
|
|||||||||||||
| Peru 0.4% |
||||||||||||||
| Compania de Minas Buenaventura SA, ADR |
Metals & Mining | 153,850 | 1,816,968 | |||||||||||
|
|
|
|||||||||||||
| Philippines 0.9% |
||||||||||||||
| Ayala Corp. |
Diversified Financial Services | 193,800 | 2,876,458 | |||||||||||
| b | Bloomberry Resorts Corp. |
Hotels, Restaurants & Leisure | 1,112,200 | 274,321 | ||||||||||
| b | Melco Crown Philippines Resorts Corp. |
Hotels, Restaurants & Leisure | 2,837,100 | 745,288 | ||||||||||
|
|
|
|||||||||||||
| 3,896,067 | ||||||||||||||
|
|
|
|||||||||||||
| Qatar 3.2% |
||||||||||||||
| Industries Qatar QSC |
Industrial Conglomerates | 312,223 | 14,493,679 | |||||||||||
|
|
|
|||||||||||||
| Romania 0.2% |
||||||||||||||
| c | Societatea Nationala de Gaze Naturale ROMGAZ SA, 144A |
Oil, Gas & Consumable Fuels | 85,800 | 929,871 | ||||||||||
|
|
|
|||||||||||||
| Russia 7.4% |
||||||||||||||
| Gazprom OAO, ADR |
Oil, Gas & Consumable Fuels | 509,300 | 4,438,549 | |||||||||||
| d | LUKOIL Holdings, ADR |
Oil, Gas & Consumable Fuels | 29,958 | 1,788,792 | ||||||||||
| d | LUKOIL Holdings, ADR (London Stock Exchange) |
Oil, Gas & Consumable Fuels | 38,918 | 2,323,794 | ||||||||||
| a,b | Mail.ru Group Ltd., GDR, Reg S |
Internet Software & Services | 68,025 | 2,397,881 | ||||||||||
| Mining and Metallurgical Co. Norilsk Nickel OJSC, ADR |
Metals & Mining | 540,000 | 10,697,400 | |||||||||||
| b | Yandex NV, A |
Internet Software & Services | 331,568 | 11,817,084 | ||||||||||
|
|
|
|||||||||||||
| 33,463,500 | ||||||||||||||
|
|
|
|||||||||||||
| South Africa 8.9% |
||||||||||||||
| MTN Group Ltd. |
|
Wireless Telecommunication Services |
|
176,100 | 3,708,248 | |||||||||
| Naspers Ltd., N |
Media | 118,190 | 13,911,242 | |||||||||||
| Remgro Ltd. |
Diversified Financial Services | 1,032,124 | 22,317,244 | |||||||||||
|
|
|
|||||||||||||
| 39,936,734 | ||||||||||||||
|
|
|
|||||||||||||
| South Korea 3.5% |
||||||||||||||
| Grand Korea Leisure Co. Ltd. |
Hotels, Restaurants & Leisure | 170,220 | 6,997,186 | |||||||||||
| Hyundai Development Co. |
Construction & Engineering | 57,780 | 1,835,600 | |||||||||||
| Samsung Electronics Co. Ltd. |
|
Semiconductors & Semiconductor Equipment |
|
3,858 | 5,039,798 | |||||||||
| SK Innovation Co. Ltd. |
Oil, Gas & Consumable Fuels | 17,532 | 1,957,624 | |||||||||||
|
|
|
|||||||||||||
| 15,830,208 | ||||||||||||||
|
|
|
|||||||||||||
| Sweden 0.5% |
||||||||||||||
| e | Oriflame Cosmetics SA, SDR |
Personal Products | 92,706 | 2,160,471 | ||||||||||
|
|
|
|||||||||||||
| Switzerland 3.4% |
||||||||||||||
| Compagnie Financiere Richemont SA |
|
Textiles, Apparel & Luxury Goods |
|
143,641 | 15,071,089 | |||||||||
|
|
|
|||||||||||||
| Semiannual Report | TD-13 |
FRANKLIN TEMPLETON VARIABLE INSURANCE PRODUCTS TRUST
STATEMENTS OF INVESTMENTS (UNAUDITED)
Templeton Developing Markets VIP Fund (continued)
| Industry | Shares | Value | ||||||||||||
| Common Stocks (continued) |
||||||||||||||
| Taiwan 3.6% |
||||||||||||||
| Novatek Microelectronics Corp. Ltd. |
|
Semiconductors & Semiconductor Equipment |
|
252,000 | $ | 1,240,071 | ||||||||
| Taiwan Semiconductor Manufacturing Co. Ltd. |
|
Semiconductors & Semiconductor Equipment |
|
3,505,000 | 14,842,497 | |||||||||
|
|
|
|||||||||||||
| 16,082,568 | ||||||||||||||
|
|
|
|||||||||||||
| Thailand 9.0% |
||||||||||||||
| Kasikornbank PCL, fgn. |
Banks | 705,800 | 4,460,203 | |||||||||||
| Land and Houses PCL, fgn. |
|
Real Estate Management & Development |
|
9,006,200 | 2,734,620 | |||||||||
| PTT Exploration and Production PCL, fgn. |
Oil, Gas & Consumable Fuels | 609,700 | 3,148,112 | |||||||||||
| PTT PCL, fgn. |
Oil, Gas & Consumable Fuels | 593,300 | 5,815,949 | |||||||||||
| Quality Houses PCL, fgn. |
|
Real Estate Management & Development |
|
20,757,100 | 2,265,109 | |||||||||
| Siam Commercial Bank PCL, fgn. |
Banks | 2,869,800 | 14,906,329 | |||||||||||
| Thai Beverage PCL, fgn. |
Beverages | 14,863,200 | 7,391,958 | |||||||||||
|
|
|
|||||||||||||
| 40,722,280 | ||||||||||||||
|
|
|
|||||||||||||
| Turkey 2.9% |
||||||||||||||
| Akbank TAS |
Banks | 1,260,000 | 4,631,654 | |||||||||||
| Tupras-Turkiye Petrol Rafinerileri AS |
Oil, Gas & Consumable Fuels | 91,900 | 2,142,252 | |||||||||||
| Turkiye Garanti Bankasi AS |
Banks | 1,636,500 | 6,401,748 | |||||||||||
|
|
|
|||||||||||||
| 13,175,654 | ||||||||||||||
|
|
|
|||||||||||||
| United Arab Emirates 0.4% |
||||||||||||||
| Emaar Properties PJSC |
|
Real Estate Management & Development |
|
793,238 | 1,816,361 | |||||||||
|
|
|
|||||||||||||
| United Kingdom 4.5% |
||||||||||||||
| Unilever PLC |
Food Products | 450,037 | 20,415,440 | |||||||||||
|
|
|
|||||||||||||
| United States 1.7% |
||||||||||||||
| Avon Products Inc. |
Personal Products | 537,046 | 7,846,242 | |||||||||||
|
|
|
|||||||||||||
| Vietnam 0.1% |
||||||||||||||
| DHG Pharmaceutical JSC |
Pharmaceuticals | 54,400 | 249,939 | |||||||||||
|
|
|
|||||||||||||
| Total Common Stocks (Cost $334,685,369) |
409,473,030 | |||||||||||||
|
|
|
|||||||||||||
| f | Participatory Notes (Cost $2,030,659) 0.6% |
|||||||||||||
| Saudi Arabia 0.6% |
||||||||||||||
| c | HSBC Bank PLC, Etihad Etisalat Co., 144A, 12/05/14 |
|
Wireless Telecommunication Services |
|
129,805 | 2,838,024 | ||||||||
|
|
|
|||||||||||||
| Preferred Stocks 4.2% |
||||||||||||||
| Brazil 2.6% |
||||||||||||||
| Petroleo Brasileiro SA, ADR, pfd. |
Oil, Gas & Consumable Fuels | 454,600 | 7,109,944 | |||||||||||
| Vale SA, ADR, pfd., A |
Metals & Mining | 391,400 | 4,657,660 | |||||||||||
|
|
|
|||||||||||||
| 11,767,604 | ||||||||||||||
|
|
|
|||||||||||||
| Chile 0.9% |
||||||||||||||
| Embotelladora Andina SA, pfd., A |
Beverages | 1,374,417 | 4,218,458 | |||||||||||
|
|
|
|||||||||||||
| TD-14 | Semiannual Report |
FRANKLIN TEMPLETON VARIABLE INSURANCE PRODUCTS TRUST
STATEMENTS OF INVESTMENTS (UNAUDITED)
Templeton Developing Markets VIP Fund (continued)
| Industry | Shares | Value | ||||||||||
| Preferred Stocks (continued) |
||||||||||||
| Russia 0.7% |
||||||||||||
| Sberbank of Russia, pfd. |
Banks | 1,538,200 | $ | 3,123,212 | ||||||||
|
|
|
|||||||||||
| Total Preferred Stocks (Cost $18,100,263) |
19,109,274 | |||||||||||
|
|
|
|||||||||||
| Total Investments before Short Term Investments |
431,420,328 | |||||||||||
|
|
|
|||||||||||
| Short Term Investments 5.2% |
||||||||||||
| Money Market Funds (Cost $22,475,010) 5.0% |
||||||||||||
| United States 5.0% |
||||||||||||
| b,g | Institutional Fiduciary Trust Money Market Portfolio |
22,475,010 | 22,475,010 | |||||||||
|
|
|
|||||||||||
| h | Investments from Cash Collateral Received for Loaned Securities (Cost $1,128,696) 0.2% |
|||||||||||
| Money Market Funds 0.2% |
||||||||||||
| United States 0.2% |
||||||||||||
| i | BNY Mellon Overnight Government Fund, 0.082% |
1,128,696 | 1,128,696 | |||||||||
|
|
|
|||||||||||
| Total Investments (Cost $378,419,997) 100.9% |
455,024,034 | |||||||||||
| Other Assets, less Liabilities (0.9)% |
(4,279,758 | ) | ||||||||||
|
|
|
|||||||||||
| Net Assets 100.0% |
$ | 450,744,276 | ||||||||||
|
|
|
|||||||||||
See Abbreviations on page TD-27.
†Rounds to less than 0.1% of net assets.
aSecurity was purchased pursuant to Regulation S under the Securities Act of 1933, which exempts from registration securities offered and sold outside of the United States. Such a security cannot be sold in the United States without either an effective registration statement filed pursuant to the Securities Act of 1933, or pursuant to an exemption from registration. These securities have been deemed liquid under guidelines approved by the Trust’s Board of Trustees. At June 30, 2014, the aggregate value of these securities was $2,916,984, representing 0.65% of net assets.
bNon-income producing.
cSecurity was purchased pursuant to Rule 144A under the Securities Act of 1933 and may be sold in transactions exempt from registration only to qualified institutional buyers or in a public offering registered under the Securities Act of 1933. These securities have been deemed liquid under guidelines approved by the Trust’s Board of Trustees. At June 30, 2014, the aggregate value of these securities was $3,767,895, representing 0.84% of net assets.
dAt June 30, 2014, pursuant to the Fund’s policies and the requirements of applicable securities law, the Fund may be restricted from trading these securities for a limited or extended period of time due to ownership limits and/or potential possession of material non-public information.
eA portion or all of the security is on loan at June 30, 2014. See Note 1(d).
fSee Note 1(c) regarding Participatory Notes.
gSee Note 3(e) regarding investments in the Institutional Fiduciary Trust Money Market Portfolio.
hSee Note 1(d) regarding securities on loan.
iThe rate shown is the annualized seven-day yield at period end.
| The accompanying notes are an integral part of these financial statements. | Semiannual Report | TD-15 |
FRANKLIN TEMPLETON VARIABLE INSURANCE PRODUCTS TRUST
Financial Statements
Statement of Assets and Liabilities
June 30, 2014 (unaudited)
| Templeton Developing Markets VIP Fund |
||||
| Assets: | ||||
| Investments in securities: |
||||
| Cost - Unaffiliated issuers |
$ | 355,944,987 | ||
| Cost - Sweep Money Fund (Note 3e) |
22,475,010 | |||
|
|
|
|||
| Total cost of investments |
$ | 378,419,997 | ||
|
|
|
|||
| Value - Unaffiliated issuers |
$ | 432,549,024 | ||
| Value - Sweep Money Fund (Note 3e) |
22,475,010 | |||
|
|
|
|||
| Total value of investments (Includes securities loaned in the amount of $1,080,236) |
455,024,034 | |||
| Cash |
107,481 | |||
| Foreign currency, at value (cost $17,472) |
17,472 | |||
| Receivables: |
||||
| Investment securities sold |
1,384,670 | |||
| Capital shares sold |
63,398 | |||
| Dividends |
1,134,916 | |||
| Foreign tax |
25,537 | |||
| Other assets |
201 | |||
|
|
|
|||
| Total assets |
457,757,709 | |||
|
|
|
|||
| Liabilities: | ||||
| Payables: |
||||
| Investment securities purchased |
4,473,528 | |||
| Capital shares redeemed |
451,991 | |||
| Management fees |
456,460 | |||
| Distribution fees |
133,506 | |||
| Trustees’ fees and expenses |
102 | |||
| Payable upon return of securities loaned |
1,128,696 | |||
| Deferred tax |
15,134 | |||
| Accrued expenses and other liabilities |
354,016 | |||
|
|
|
|||
| Total liabilities |
7,013,433 | |||
|
|
|
|||
| Net assets, at value |
$ | 450,744,276 | ||
|
|
|
|||
| Net assets consist of: | ||||
| Paid-in capital |
$ | 348,211,368 | ||
| Distributions in excess of net investment income |
(2,913,174 | ) | ||
| Net unrealized appreciation (depreciation) |
76,541,780 | |||
| Accumulated net realized gain (loss) |
28,904,302 | |||
|
|
|
|||
| Net assets, at value |
$ | 450,744,276 | ||
|
|
|
|||
| TD-16 | Semiannual Report | The accompanying notes are an integral part of these financial statements. |
FRANKLIN TEMPLETON VARIABLE INSURANCE PRODUCTS TRUST
FINANCIAL STATEMENTS
Statement of Assets and Liabilities (continued)
June 30, 2014 (unaudited)
| Templeton Developing Markets VIP Fund |
||||
| Class 1: | ||||
| Net assets, at value |
$ | 135,485,746 | ||
|
|
|
|||
| Shares outstanding |
13,309,893 | |||
|
|
|
|||
| Net asset value and maximum offering price per share |
$ | 10.18 | ||
|
|
|
|||
| Class 2: | ||||
| Net assets, at value |
$ | 301,278,598 | ||
|
|
|
|||
| Shares outstanding |
29,786,460 | |||
|
|
|
|||
| Net asset value and maximum offering price per share |
$ | 10.11 | ||
|
|
|
|||
| Class 4: | ||||
| Net assets, at value |
$ | 13,979,932 | ||
|
|
|
|||
| Shares outstanding |
1,378,402 | |||
|
|
|
|||
| Net asset value and maximum offering price per share |
$ | 10.14 | ||
|
|
|
|||
| The accompanying notes are an integral part of these financial statements. | Semiannual Report | TD-17 |
FRANKLIN TEMPLETON VARIABLE INSURANCE PRODUCTS TRUST
FINANCIAL STATEMENTS
Statement of Operations
for the six months ended June 30, 2014 (unaudited)
| Templeton Developing Markets VIP Fund |
||||
| Investment income: | ||||
| Dividends (net of foreign taxes of $477,114) |
$ | 7,819,279 | ||
| Income from securities loaned |
29,839 | |||
|
|
|
|||
| Total investment income |
7,849,118 | |||
|
|
|
|||
| Expenses: | ||||
| Management fees (Note 3a) |
2,544,970 | |||
| Administrative fees (Note 3b) |
207,590 | |||
| Distribution fees: (Note 3c) |
||||
| Class 2 |
339,802 | |||
| Class 3 |
27,045 | |||
| Class 4 |
24,750 | |||
| Custodian fees (Note 4) |
149,935 | |||
| Reports to shareholders |
97,631 | |||
| Professional fees |
34,679 | |||
| Trustees’ fees and expenses |
1,074 | |||
| Other |
11,251 | |||
|
|
|
|||
| Total expenses |
3,438,727 | |||
| Expenses waived/paid by affiliates (Note 3e) |
(9,804 | ) | ||
|
|
|
|||
| Net expenses |
3,428,923 | |||
|
|
|
|||
| Net investment income |
4,420,195 | |||
|
|
|
|||
| Realized and unrealized gains (losses): | ||||
| Net realized gain (loss) from: |
||||
| Investments |
55,794,187 | |||
| Foreign currency transactions |
64,531 | |||
|
|
|
|||
| Net realized gain (loss) |
55,858,718 | |||
|
|
|
|||
| Net change in unrealized appreciation (depreciation) on: |
||||
| Investments |
(57,238,411 | ) | ||
| Translation of other assets and liabilities denominated in foreign currencies |
(24,412 | ) | ||
| Change in deferred taxes on unrealized appreciation |
(15,134 | ) | ||
|
|
|
|||
| Net change in unrealized appreciation (depreciation) |
(57,277,957 | ) | ||
|
|
|
|||
| Net realized and unrealized gain (loss) |
(1,419,239 | ) | ||
|
|
|
|||
| Net increase (decrease) in net assets resulting from operations |
$ | 3,000,956 | ||
|
|
|
|||
| TD-18 | Semiannual Report | The accompanying notes are an integral part of these financial statements. |
FRANKLIN TEMPLETON VARIABLE INSURANCE PRODUCTS TRUST
FINANCIAL STATEMENTS
Statements of Changes in Net Assets
| Templeton Developing Markets VIP Fund |
||||||||
| Six Months Ended June 30, 2014 (unaudited) |
Year Ended December 31, 2013 |
|||||||
| Increase (decrease) in net assets: | ||||||||
| Operations: |
||||||||
| Net investment income |
$ | 4,420,195 | $ | 5,556,147 | ||||
| Net realized gain (loss) from investments and foreign currency transactions |
55,858,718 | 67,962,625 | ||||||
| Net change in unrealized appreciation (depreciation) on investments, translation of other assets and liabilities denominated in foreign currencies and deferred taxes |
(57,277,957 | ) | (79,189,158 | ) | ||||
|
|
|
|||||||
| Net increase (decrease) in net assets resulting from operations |
3,000,956 | (5,670,386 | ) | |||||
|
|
|
|||||||
| Distributions to shareholders from: |
||||||||
| Net investment income: |
||||||||
| Class 1 |
(2,319,775 | ) | (3,816,779 | ) | ||||
| Class 2 |
(4,358,800 | ) | (5,449,449 | ) | ||||
| Class 3 |
— | (777,644 | ) | |||||
| Class 4 |
(173,399 | ) | (373,848 | ) | ||||
|
|
|
|||||||
| Total distributions to shareholders |
(6,851,974 | ) | (10,417,720 | ) | ||||
|
|
|
|||||||
| Capital share transactions: (Note 2) |
||||||||
| Class 1 |
(8,793,874 | ) | (52,075,044 | ) | ||||
| Class 2 |
27,936,429 | (8,867,643 | ) | |||||
| Class 3 |
(33,674,042 | ) | (12,240,084 | ) | ||||
| Class 4 |
(1,138,997 | ) | (7,287,727 | ) | ||||
|
|
|
|||||||
| Total capital share transactions |
(15,670,484 | ) | (80,470,498 | ) | ||||
|
|
|
|||||||
| Redemption fees |
68 | 1,204 | ||||||
|
|
|
|||||||
| Net increase (decrease) in net assets |
(19,521,434 | ) | (96,557,400 | ) | ||||
|
|
|
|||||||
| Net assets: | ||||||||
| Beginning of period |
470,265,710 | 566,823,110 | ||||||
|
|
|
|||||||
| End of period |
$ | 450,744,276 | $ | 470,265,710 | ||||
|
|
|
|||||||
| Distributions in excess of net investment income included in net assets: |
||||||||
| End of period |
$ | (2,913,174 | ) | $ | (481,395 | ) | ||
|
|
|
|||||||
| The accompanying notes are an integral part of these financial statements. | Semiannual Report | TD-19 |
FRANKLIN TEMPLETON VARIABLE INSURANCE PRODUCTS TRUST
Notes to Financial Statements (unaudited)
Templeton Developing Markets VIP Fund
| TD-20 | Semiannual Report |
FRANKLIN TEMPLETON VARIABLE INSURANCE PRODUCTS TRUST
NOTES TO FINANCIAL STATEMENTS (UNAUDITED)
Templeton Developing Markets VIP Fund (continued)
| Semiannual Report | TD-21 |
FRANKLIN TEMPLETON VARIABLE INSURANCE PRODUCTS TRUST
NOTES TO FINANCIAL STATEMENTS (UNAUDITED)
Templeton Developing Markets VIP Fund (continued)
1. Organization and Significant Accounting Policies (continued)
e. Income and Deferred Taxes
It is the Fund’s policy to qualify as a regulated investment company under the Internal Revenue Code. The Fund intends to distribute to shareholders substantially all of its taxable income and net realized gains to relieve it from federal income and if applicable, excise taxes. As a result, no provision for U.S. federal income taxes is required.
The Fund may be subject to foreign taxation related to income received, capital gains on the sale of securities and certain foreign currency transactions in the foreign jurisdictions in which it invests. Foreign taxes, if any, are recorded based on the tax regulations and rates that exist in the foreign markets in which the Fund invests. When a capital gain tax is determined to apply the Fund records an estimated deferred tax liability in an amount that would be payable if the securities were disposed of on the valuation date.
The Fund recognizes the tax benefits of uncertain tax positions only when the position is “more likely than not” to be sustained upon examination by the tax authorities based on the technical merits of the tax position. As of June 30, 2014, and for all open tax years, the Fund has determined that no liability for unrecognized tax benefits is required in the Fund’s financial statements related to uncertain tax positions taken on a tax return (or expected to be taken on future tax returns). Open tax years are those that remain subject to examination and are based on each tax jurisdiction statute of limitation.
f. Security Transactions, Investment Income, Expenses and Distributions
Security transactions are accounted for on trade date. Realized gains and losses on security transactions are determined on a specific identification basis. Estimated expenses are accrued daily. Dividend income is recorded on the ex-dividend date except that certain dividends from foreign securities are recognized as soon as the Fund is notified of the ex-dividend date. Distributions to shareholders are recorded on the ex-dividend date and are determined according to income tax regulations (tax basis). Distributable earnings determined on a tax basis may differ from earnings recorded in accordance with accounting principles generally accepted in the United States of America. These differences may be permanent or temporary. Permanent
differences are reclassified among capital accounts to reflect their tax character. These reclassifications have no impact on net assets or the results of operations. Temporary differences are not reclassified, as they may reverse in subsequent periods.
Common expenses incurred by the Trust are allocated among the funds based on the ratio of net assets of each fund to the combined net assets of the Trust. Fund specific expenses are charged directly to the fund that incurred the expense.
Realized and unrealized gains and losses and net investment income, not including class specific expenses, are allocated daily to each class of shares based upon the relative proportion of net assets of each class. Differences in per share distributions, by class, are generally due to differences in class specific expenses.
g. Accounting Estimates
The preparation of financial statements in accordance with U.S. GAAP requires management to make estimates and assumptions that affect the reported amounts of assets and liabilities at the date of the financial statements and the amounts of income and expenses during the reporting period. Actual results could differ from those estimates.
h. Redemption Fees
Redemptions and exchanges of interests in an insurance company subaccount that invested in Class 3 shares of the Fund were subject to a 1.0% short term trading fee if the interest in the subaccount had been held for less than 60 days. Such fees were retained by the Fund and accounted for as an addition to paid-in capital, allocated to each class of shares based upon the relative proportion of net assets of each class.
i. Guarantees and Indemnifications
Under the Trust’s organizational documents, its officers and trustees are indemnified by the Trust against certain liabilities arising out of the performance of their duties to the Trust. Additionally, in the normal course of business, the Trust, on behalf of the Fund, enters into contracts with service providers that contain general indemnification clauses. The Trust’s maximum exposure under these arrangements is unknown as this would involve future claims that may be made against the Trust that have not yet occurred. Currently, the Trust expects the risk of loss to be remote.
| TD-22 | Semiannual Report |
FRANKLIN TEMPLETON VARIABLE INSURANCE PRODUCTS TRUST
NOTES TO FINANCIAL STATEMENTS (UNAUDITED)
Templeton Developing Markets VIP Fund (continued)
2. Shares of Beneficial Interest
At June 30, 2014, there were an unlimited number of shares authorized (without par value). Transactions in the Fund’s shares were as follows:
| Six Months Ended June 30, 2014 |
Year Ended December 31, 2013 |
|||||||||||||||||
| Shares | Amount | Shares | Amount | |||||||||||||||
| Class 1 Shares: | ||||||||||||||||||
| Shares sold | 745,405 | $ | 7,471,902 | 1,118,729 | $ | 11,636,774 | ||||||||||||
| Shares issued in reinvestment of distributions | 229,681 | 2,319,775 | 392,673 | 3,816,779 | ||||||||||||||
| Shares redeemed | (1,861,045 | ) | (18,585,551 | ) | (6,552,381 | ) | (67,528,597 | ) | ||||||||||
|
|
|
|||||||||||||||||
| Net increase (decrease) |
(885,959 | ) | $ | (8,793,874 | ) | (5,040,979 | ) | $ | (52,075,044 | ) | ||||||||
|
|
|
|||||||||||||||||
| Class 2 Shares: | ||||||||||||||||||
| Shares sold | 5,902,160 | $ | 58,483,619 | 5,110,513 | $ | 51,867,557 | ||||||||||||
| Shares issued in reinvestment of distributions | 434,143 | 4,358,800 | 564,125 | 5,449,449 | ||||||||||||||
| Shares redeemed | (3,516,666 | ) | (34,905,990 | ) | (6,483,017 | ) | (66,184,649 | ) | ||||||||||
|
|
|
|||||||||||||||||
| Net increase (decrease) |
2,819,637 | $ | 27,936,429 | (808,379 | ) | $ | (8,867,643 | ) | ||||||||||
|
|
|
|||||||||||||||||
| Class 3 Sharesa: | ||||||||||||||||||
| Shares sold | 171,371 | $ | 1,697,483 | 410,783 | $ | 4,328,836 | ||||||||||||
| Shares issued in reinvestment of distributions | — | — | 81,005 | 777,644 | ||||||||||||||
| Shares redeemed | (3,593,907 | ) | (35,371,525 | ) | (1,696,602 | ) | (17,346,564 | ) | ||||||||||
|
|
|
|||||||||||||||||
| Net increase (decrease) |
(3,422,536 | ) | $ | (33,674,042 | ) | (1,204,814 | ) | $ | (12,240,084 | ) | ||||||||
|
|
|
|||||||||||||||||
| Class 4 Shares: | ||||||||||||||||||
| Shares sold | 37,229 | $ | 367,546 | 206,201 | $ | 2,099,934 | ||||||||||||
| Shares issued on reinvestment of distributions | 17,219 | 173,399 | 38,661 | 373,848 | ||||||||||||||
| Shares redeemed | (169,287 | ) | (1,679,942 | ) | (973,500 | ) | (9,761,509 | ) | ||||||||||
|
|
|
|||||||||||||||||
| Net increase (decrease) |
(114,839 | ) | $ | (1,138,997 | ) | (728,638 | ) | $ | (7,287,727 | ) | ||||||||
|
|
|
|||||||||||||||||
aEffective May 1, 2014, all Class 3 shares were converted to Class 2.
3. Transactions With Affiliates
Franklin Resources, Inc. is the holding company for various subsidiaries that together are referred to as Franklin Templeton Investments. Certain officers and trustees of the Fund are also officers and/or directors of the following subsidiaries:
| Subsidiary | Affiliation | |
| Templeton Asset Management Ltd. (TAML) | Investment manager | |
| Franklin Templeton Services, LLC (FT Services) | Administrative manager | |
| Franklin Templeton Distributors, Inc. (Distributors) | Principal underwriter | |
| Franklin Templeton Investor Services, LLC (Investor Services) | Transfer agent |
| Semiannual Report | TD-23 |
FRANKLIN TEMPLETON VARIABLE INSURANCE PRODUCTS TRUST
NOTES TO FINANCIAL STATEMENTS (UNAUDITED)
Templeton Developing Markets VIP Fund (continued)
3. Transactions With Affiliates (continued)
a. Management Fees
The Fund pays an investment management fee to TAML based on the average daily net assets of the Fund as follows:
| Annualized Fee Rate | Net Assets | |
| 1.250% | Up to and including $200 million | |
| 1.235% | Over $200 million, up to and including $700 million | |
| 1.200% | Over $700 million, up to and including $1 billion | |
| 1.150% | Over $1 billion, up to and including $1.2 billion | |
| 1.125% | Over $1.2 billion, up to and including $5 billion | |
| 1.075% | Over $5 billion, up to and including $10 billion | |
| 1.025% | Over $10 billion, up to and including $15 billion | |
| 0.975% | Over $15 billion, up to and including $20 billion | |
| 0.925% | In excess of $20 billion |
Effective May 1, 2014, the Fund combined its investment management and administration agreements as approved by the Board. The fees paid under the combined agreement do not exceed the aggregate fees that were paid under the separate agreements.
Prior to May 1, 2014, the Fund paid fees to TAML based on the average daily net assets of the Fund as follows:
| Annualized Fee Rate | Net Assets | |
| 1.100% | Up to and including $1 billion | |
| 1.050% | Over $1 billion, up to and including $5 billion | |
| 1.000% | Over $5 billion, up to and including $10 billion | |
| 0.950% | Over $10 billion, up to and including $15 billion | |
| 0.900% | Over $15 billion, up to and including $20 billion | |
| 0.850% | In excess of $20 billion |
b. Administrative Fees
Effective, May 1, 2014, under an agreement with TAML, FT Services provides administrative services to the Fund. The fee is paid by TAML based on the Fund’s average daily net assets, and is not an additional expense of the Fund.
Prior to May 1, 2014, the Fund paid administrative fees to FT Services based on the average daily net assets of the Fund as follows:
| Annualized Fee Rate | Net Assets | |
| 0.150% | Up to and including $200 million | |
| 0.135% | Over $200 million, up to and including $700 million | |
| 0.100% | Over $700 million, up to and including $1.2 billion | |
| 0.075% | In excess of $1.2 billion |
c. Distribution Fees
The Board has adopted distribution plans for Class 2, Class 3, and Class 4 shares pursuant to Rule 12b-1 under the 1940 Act. Under the Fund’s compensation distribution plans, the Fund pays Distributors for costs incurred in connection with the servicing, sale and distribution of the Fund’s shares up to 0.25%, 0.35%, and 0.35% per year of its average daily net assets of Class 2, Class 3, and
| TD-24 | Semiannual Report |
FRANKLIN TEMPLETON VARIABLE INSURANCE PRODUCTS TRUST
NOTES TO FINANCIAL STATEMENTS (UNAUDITED)
Templeton Developing Markets VIP Fund (continued)
Class 4, respectively. Some distribution fees are not charged on shares held by affiliates. The Board has agreed to limit the current rate to 0.25% per year for Class 3. The plan year, for purposes of monitoring compliance with the maximum annual plan rates, is February 1 through January 31.
d. Transfer Agent Fees
Investor Services, under terms of an agreement, performs shareholder servicing for the Fund and is not paid by the Fund for the services.
e. Investment in Institutional Fiduciary Trust Money Market Portfolio
The Fund invests in the Institutional Fiduciary Trust Money Market Portfolio (Sweep Money Fund), an affiliated open-end management investment company. Management fees paid by the Fund are waived on assets invested in the Sweep Money Fund, in an amount not to exceed the management and administrative fees paid directly or indirectly by the Sweep Money Fund, as noted on the Statement of Operations. Prior to January 1, 2014, the waiver was accounted for as a reduction to management fees.
4. Expense Offset Arrangement
The Fund has entered into an arrangement with its custodian whereby credits realized as a result of uninvested cash balances are used to reduce a portion of the Fund’s custodian expenses. During the period ended June 30, 2014, there were no credits earned.
5. Income Taxes
For tax purposes, capital losses may be carried over to offset future capital gains. Capital loss carryforwards with no expiration, if any, must be fully utilized before those losses with expiration dates.
At December 31, 2013, the Fund had capital loss carryforwards of $21,512,788 expiring in 2017.
At June 30, 2014, the cost of investments and net unrealized appreciation (depreciation) for income tax purposes were as follows:
| Cost of investments |
$391,637,946 | |
|
| ||
| Unrealized appreciation |
$ 70,234,167 | |
| Unrealized depreciation |
(6,848,079) | |
|
| ||
| Net unrealized appreciation (depreciation) |
$ 63,386,088 | |
|
| ||
Differences between income and/or capital gains as determined on a book basis and a tax basis are primarily due to differing treatments of foreign currency transactions, passive foreign investment company shares, corporate actions and wash sales.
6. Investment Transactions
Purchases and sales of investments (excluding short term securities) for the period ended June 30, 2014, aggregated $261,157,894 and $285,458,370, respectively.
7. Concentration of Risk
Investing in foreign securities may include certain risks and considerations not typically associated with investing in U.S. securities, such as fluctuating currency values and changing local and regional economic, political and social conditions, which may result in greater market volatility. In addition, certain foreign securities may not be as liquid as U.S. securities.
| Semiannual Report | TD-25 |
FRANKLIN TEMPLETON VARIABLE INSURANCE PRODUCTS TRUST
NOTES TO FINANCIAL STATEMENTS (UNAUDITED)
Templeton Developing Markets VIP Fund (continued)
8. Credit Facility.
The Fund, together with other U.S. registered and foreign investment funds (collectively, Borrowers), managed by Franklin Templeton Investments, are borrowers in a joint syndicated senior unsecured credit facility totaling $1.5 billion (Global Credit Facility) which matures on February 13, 2015. This Global Credit Facility provides a source of funds to the Borrowers for temporary and emergency purposes, including the ability to meet future unanticipated or unusually large redemption requests.
Under the terms of the Global Credit Facility, the Fund shall, in addition to interest charged on any borrowings made by the Fund and other costs incurred by the Fund, pay its share of fees and expenses incurred in connection with the implementation and maintenance of the Global Credit Facility, based upon its relative share of the aggregate net assets of all of the Borrowers, including an annual commitment fee of 0.07% based upon the unused portion of the Global Credit Facility. These fees are reflected in other expenses on the Statement of Operations. During the period ended June 30, 2014, the Fund did not use the Global Credit Facility.
9. Fair Value Measurements
The Fund follows a fair value hierarchy that distinguishes between market data obtained from independent sources (observable inputs) and the Fund’s own market assumptions (unobservable inputs). These inputs are used in determining the value of the Fund’s financial instruments and are summarized in the following fair value hierarchy:
| • | Level 1 – quoted prices in active markets for identical financial instruments |
| • | Level 2 – other significant observable inputs (including quoted prices for similar financial instruments, interest rates, prepayment speed, credit risk, etc.) |
| • | Level 3 – significant unobservable inputs (including the Fund’s own assumptions in determining the fair value of financial instruments) |
The input levels are not necessarily an indication of the risk or liquidity associated with financial instruments at that level.
For movements between the levels within the fair value hierarchy, the Fund has adopted a policy of recognizing the transfers as of the date of the underlying event which caused the movement.
A summary of inputs used as of June 30, 2014, in valuing the Fund’s assets carried at fair value, is as follows:
| Level 1 | Level 2 | Level 3 | Total | |||||||||||||
| Assets: | ||||||||||||||||
| Investments in Securities: |
||||||||||||||||
| Equity Investments:a |
||||||||||||||||
| Russia |
$ | 19,661,971 | $ | 16,924,741 | $ | — | $ | 36,586,712 | ||||||||
| All Other Equity Investmentsb |
391,995,592 | — | — | 391,995,592 | ||||||||||||
| Participatory Notes |
— | 2,838,024 | — | 2,838,024 | ||||||||||||
| Short Term Investments |
22,475,010 | 1,128,696 | — | 23,603,706 | ||||||||||||
|
|
|
|||||||||||||||
| Total Investments in Securities |
$ | 434,132,573 | $ | 20,891,461 | $ | — | $ | 455,024,034 | ||||||||
|
|
|
|||||||||||||||
aIncludes common and preferred stocks.
bFor detailed categories, see the accompanying Statement of Investments.
| TD-26 | Semiannual Report |
FRANKLIN TEMPLETON VARIABLE INSURANCE PRODUCTS TRUST
NOTES TO FINANCIAL STATEMENTS (UNAUDITED)
Templeton Developing Markets VIP Fund (continued)
10. New Accounting Pronouncements
In June 2014, the Financial Accounting Standards Board issued Accounting Standards Update (ASU) No. 2014-11, Transfers and Servicing (Topic 860), Repurchase-to-Maturity Transactions, Repurchase Financings, and Disclosures. The ASU changes the accounting for certain repurchase agreements and expands disclosure requirements related to repurchase agreements, securities lending, repurchase-to-maturity and similar transactions. The ASU is effective for interim and annual reporting periods beginning after December 15, 2014. Management is currently evaluating the impact, if any, of applying this provision.
11. Subsequent Events
The Fund has evaluated subsequent events through the issuance of the financial statements and determined that no events have occurred that require disclosure.
Abbreviations
| Selected Portfolio | ||
| ADR | American Depositary Receipt | |
| GDR | Global Depositary Receipt | |
| SDR | Swedish Depositary Receipt | |
| Semiannual Report | TD-27 |
FRANKLIN TEMPLETON VARIABLE INSURANCE PRODUCTS TRUST
TAX INFORMATION (UNAUDITED)
Templeton Developing Markets VIP Fund
At December 31, 2013, more than 50% of the Fund’s total assets were invested in securities of foreign issuers. In most instances, foreign taxes were withheld from income paid to the Fund on these investments. As shown in the table below, the Fund hereby reports to shareholders the foreign source income and foreign taxes paid, pursuant to Section 853 of the Internal Revenue Code. This written statement will allow shareholders of record on June 12, 2014, to treat their proportionate share of foreign taxes paid by the Fund as having been paid directly by them. The shareholder shall consider these amounts as foreign taxes paid in the tax year in which they receive the Fund distribution.
The following table provides a detailed analysis of foreign tax paid, and foreign source income as reported by the Fund, to Class 1, Class 2, and Class 4 shareholders of record.
| Class | Foreign Tax Paid Per Share |
Foreign Source Income Per Share |
||||||
| Class 1 | $0.0221 | $0.2041 | ||||||
| Class 2 | $0.0221 | $0.1809 | ||||||
| Class 4 | $0.0221 | $0.1564 | ||||||
Foreign Tax Paid Per Share (Column 1) is the amount per share available to you, as a tax credit (assuming you held your shares in the Fund for a minimum of 16 days during the 31-day period beginning 15 days before the ex-dividend date of the Fund’s dis-tribution to which the foreign taxes relate), or, as a tax deduction.
Foreign Source Income Per Share (Column 2) is the amount per share of income dividends attributable to foreign securities held by the Fund, plus any foreign taxes withheld on these dividends.
| TD-28 | Semiannual Report |
Templeton Foreign VIP Fund
(Formerly, Templeton Foreign Securities Fund)
This semiannual report for Templeton Foreign VIP Fund covers the period ended June 30, 2014.
Class 2 Performance Summary as of June 30, 2014
Templeton Foreign VIP Fund – Class 2 delivered a +3.22% total return* for the six-month period ended June 30, 2014.
*The Fund has a fee waiver associated with its investments in a Franklin Templeton money fund, contractually guaranteed through at least its current fiscal year-end. Fund investment results reflect the fee waiver, to the extent applicable; without this reduction, the results would have been lower.
Performance reflects the Fund’s Class 2 operating expenses, but does not include any contract fees, expenses or sales charges. If they had been included, performance would be lower. These charges and deductions, particularly for variable life policies, can have a significant effect on contract values and insurance benefits. See the contract prospectus for a complete description of these expenses, including sales charges.
Performance data represent past performance, which does not guarantee future results. Investment return and principal value will fluctuate, and you may have a gain or loss when you sell your shares. Current performance may differ from figures shown.
| Semiannual Report | TF-1 |
TEMPLETON FOREIGN VIP FUND
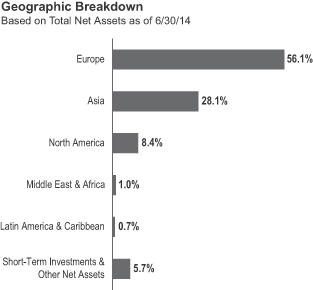
2014. The U.S. Federal Reserve Board (Fed) began reducing bond purchases by $10 billion a month in January 2014, based on earlier largely positive economic and employment data. The Fed continued reducing asset purchases during the period.
Outside the U.S., the U.K. economy grew relatively well in the first half of 2014, supported by the services and manufacturing sectors. In the second quarter, a preliminary estimate registered expansion at precrisis levels. The Japanese economy grew strongly during the first quarter of 2014 as consumption rose ahead of a sales tax increase in April. The Bank of Japan kept its monetary policy unchanged as it maintained an upbeat inflation forecast and reiterated that the economy continued to recover moderately, despite challenges resulting from the sales tax increase. Japan’s growth weakened, however, in the second quarter. The Japanese government proposed a reduction in corporate taxes as part of its economic reforms in an effort to avoid deflation and facilitate growth. Although out of recession, the eurozone experienced deflationary risks and weak employment trends. The region’s first-quarter economic growth was softer than what many observers had expected. In the second quarter, concerns arose about the potential negative impacts to growth from the crisis in Ukraine and tension in the Middle East. Toward period-end, the European Central Bank reduced its main interest rate and, for the first time, set a negative deposit rate.
1. Source: © 2014 Morningstar. One cannot invest directly in an index, and an index is not representative of the Fund’s portfolio. Please see Index Descriptions following the Fund Summaries.
| TF-2 | Semiannual Report |
TEMPLETON FOREIGN VIP FUND
Statoil rallied after it reported better-than-expected first-quarter earnings because of higher gas prices resulting from a severe winter in the U.S. Investor sentiment toward oil exploration and production companies improved as crude oil prices rose following geopolitical tension in Ukraine and Iraq. Stock selection and an underweighting in the consumer discretionary sector, especially in automobiles, also aided relative results.4 Stock selection and an underweighting in industrials, particularly in aerospace and defense, added to relative returns.5 Select positions in the financials sector, including U.K. insurer Aviva and Italian bank UniCredit, aided returns.6 Aviva reported strong earnings in 2013, reflecting its efforts in reducing costs and selling underperforming businesses. Aviva also reported strong new business growth during the first quarter of 2014. Other individual contributors included Flextronics International3 (Singapore) and Teva Pharmaceuticals3 (Israel).
2. The energy sector comprises energy equipment and services; and oil, gas and consumable fuels in the SOI.
3. Not part of the index.
4. The consumer discretionary sector comprises auto components, automobiles, household durables, leisure products, multiline retail and specialty retail in the SOI.
5. The industrials sector comprises aerospace and defense, airlines, building products, construction and engineering, electrical equipment, industrial conglomerates, and trading companies and distributors in the SOI.
6. The financials sector comprises banks, capital markets, diversified financial services, insurance, and real estate management and development in the SOI.
| Semiannual Report | TF-3 |
TEMPLETON FOREIGN VIP FUND
7. The health care sector comprises health care equipment and supplies, health care providers and services, life sciences tools and services, and pharmaceuticals in the SOI.
8. The consumer staples sector comprises beverages and food and staples retailing in the SOI.
9. Sold by period-end.
| TF-4 | Semiannual Report |
TEMPLETON FOREIGN VIP FUND
Class 2 Fund Expenses
| Class 2 | Beginning Account Value 1/1/14 |
Ending Account Value 6/30/14 |
Fund-Level
Expenses 1/1/14–6/30/14 |
|||||||||
| Actual | $1,000 | $1,032.20 | $5.14 | |||||||||
| Hypothetical (5% return before expenses) | $1,000 | $1,019.74 | $5.11 | |||||||||
*Expenses are calculated using the most recent six-month annualized expense ratio, net of expense waivers, for the Fund’s Class 2 shares (1.02%), which does not include any ongoing expenses of the Contract for which the Fund is an investment option, multiplied by the average account value over the period, multiplied by 181/365 to reflect the one-half year period.
| Semiannual Report | TF-5 |
SUPPLEMENT DATED AUGUST 1, 2014
TO THE PROSPECTUS DATED MAY 1, 2014
OF
TEMPLETON FOREIGN VIP FUND
(a series of Franklin Templeton Variable Insurance Products Trust)
The prospectus is amended as follows:
I. The “Fund Summary – Annual Fund Operating Expenses” table beginning on page TF-S1 in the Fund’s Class 1 prospectus is replaced with the following:
Annual Fund Operating Expenses
(expenses that you pay each year as a percentage of the value of your investment)
| Class 1 | ||||
| Management fees1 | 0.74% | |||
| Distribution and service (12b-1) fees | None | |||
| Other expenses1 | 0.04% | |||
| Total annual Fund operating expenses | 0.78% | |||
| 1. | Management fees and other expenses have been restated to reflect current fiscal year fees and expenses as a result of the bundling of the Fund’s investment management agreement with its fund administration agreement effective May 1, 2014. Such combined investment management fees are described further under “Management” in the Fund’s prospectus. Total annual fund operating expenses are not affected by such bundling. |
II. The “Fund Summary – Annual Fund Operating Expenses” table beginning on page TF-S1 in the Fund’s Class 2 prospectus is replaced with the following:
Annual Fund Operating Expenses
(expenses that you pay each year as a percentage of the value of your investment)
| Class 2 | ||||
| Management fees1 | 0.74% | |||
| Distribution and service (12b-1) fees | 0.25% | |||
| Other expenses1 | 0.04% | |||
| Total annual Fund operating expenses | 1.03% | |||
| 1. | Management fees and other expenses have been restated to reflect current fiscal year fees and expenses as a result of the bundling of the Fund’s investment management agreement with its fund administration agreement effective May 1, 2014. Such combined investment management fees are described further under “Management” in the Fund’s prospectus. Total annual fund operating expenses are not affected by such bundling. |
III. The “Fund Summary – Annual Fund Operating Expenses” table beginning on page TF-S1 in the Fund’s Class 4 prospectus is replaced with the following:
Annual Fund Operating Expenses
(expenses that you pay each year as a percentage of the value of your investment)
| Class 4 | ||||
| Management fees1 | 0.74% | |||
| Distribution and service (12b-1) fees | 0.35% | |||
| Other expenses1 | 0.04% | |||
| Total annual Fund operating expenses | 1.13% | |||
| TF-6 |
| 1. | Management fees and other expenses have been restated to reflect current fiscal year fees and expenses as a result of the bundling of the Fund’s investment management agreement with its fund administration agreement effective May 1, 2014. Such combined investment management fees are described further under “Management” in the Fund’s prospectus. Total annual fund operating expenses are not affected by such bundling. |
IV. The following is added as the second to last paragraph in the “Fund Details – Management” section of each Class’ prospectus beginning on page TF-D8:
Effective May 1, 2014, the Fund’s investment management agreement was bundled with its fund administration agreement, including the fees payable to the Fund’s administrator thereunder, as approved by the board of trustees. The fee payable to the administrator under the Fund’s administration agreement, prior to May 1, 2014, was a monthly fee under the following fee schedule of the Fund’s average daily net assets:
| • | 0.150% up to and including $200 million; |
| • | 0.135% over $200 million, up to and including $700 million; |
| • | 0.100% over $700 million, up to and including $1.2 billion; |
| • | 0.075% in excess of $1.2 billion. |
As of such date, the Fund’s investment management fees became a monthly fee at the annual rate of the value of the Fund’s average daily net assets as set forth below:
| • | 0.900% up to and including $200 million; |
| • | 0.810% over $200 million, up to and including $700 million; |
| • | 0.775% over $700 million, up to and including $1.2 billion; |
| • | 0.750% over $1.2 billion, up to and including $1.3 billion; |
| • | 0.675% over $1.3 billion, up to and including $10 billion; |
| • | 0.655% over $10 billion, up to and including $15 billion; |
| • | 0.635% over $15 billion, up to and including $20 billion; |
| • | 0.615% in excess of $20 billion. |
Please keep this supplement with your prospectus for future reference.
| TF-7 |
FRANKLIN TEMPLETON VARIABLE INSURANCE PRODUCTS TRUST
Financial Highlights
Templeton Foreign VIP Fund
| Six Months Ended June 30, 2014 (unaudited) |
Year Ended December 31, | |||||||||||||||||||||||
| 2013 | 2012 | 2011 | 2010 | 2009 | ||||||||||||||||||||
| Class 1 | ||||||||||||||||||||||||
| Per share operating performance (for a share outstanding throughout the period) |
||||||||||||||||||||||||
| Net asset value, beginning of period |
$17.56 | $14.63 | $12.78 | $14.54 | $13.68 | $10.95 | ||||||||||||||||||
|
|
|
|||||||||||||||||||||||
| Income from investment operationsa: | ||||||||||||||||||||||||
| Net investment incomeb |
0.45 | c | 0.34 | 0.38 | 0.42 | 0.28 | 0.25 | |||||||||||||||||
| Net realized and unrealized gains (losses) |
0.14 | 3.00 | 1.91 | (1.90 | ) | 0.86 | 3.39 | |||||||||||||||||
|
|
|
|||||||||||||||||||||||
| Total from investment operations |
0.59 | 3.34 | 2.29 | (1.48 | ) | 1.14 | 3.64 | |||||||||||||||||
|
|
|
|||||||||||||||||||||||
| Less distributions from: | ||||||||||||||||||||||||
| Net investment income |
(0.36 | ) | (0.41 | ) | (0.44 | ) | (0.28 | ) | (0.28 | ) | (0.43 | ) | ||||||||||||
| Net realized gains |
— | — | — | — | — | (0.48 | ) | |||||||||||||||||
|
|
|
|||||||||||||||||||||||
| Total distributions |
(0.36 | ) | (0.41 | ) | (0.44 | ) | (0.28 | ) | (0.28 | ) | (0.91 | ) | ||||||||||||
|
|
|
|||||||||||||||||||||||
| Redemption feesd |
— | — | — | — | — | — | ||||||||||||||||||
|
|
|
|||||||||||||||||||||||
| Net asset value, end of period |
$17.79 | $17.56 | $14.63 | $12.78 | $14.54 | $13.68 | ||||||||||||||||||
|
|
|
|||||||||||||||||||||||
| Total returne |
3.35% | 23.27% | 18.60% | (10.44)% | 8.67% | 37.34% | ||||||||||||||||||
| Ratios to average net assetsf | ||||||||||||||||||||||||
| Expenses before waiver and payments by affiliates |
0.78% | 0.78% | 0.79% | 0.79% | 0.78% | 0.78% | ||||||||||||||||||
| Expenses net of waiver and payments by affiliates |
0.77% | 0.78% | 0.79% | 0.79% | g | 0.78% | g | 0.78% | g | |||||||||||||||
| Net investment income |
5.18% | c | 2.16% | 2.84% | 2.92% | 2.10% | 2.28% | |||||||||||||||||
| Supplemental data | ||||||||||||||||||||||||
| Net assets, end of period (000’s) |
$296,523 | $298,468 | $265,924 | $254,292 | $321,282 | $318,173 | ||||||||||||||||||
| Portfolio turnover rate |
9.16% | 23.61% | 12.53% | 21.09% | 19.16% | 22.50% | ||||||||||||||||||
aThe amount shown for a share outstanding throughout the period may not correlate with the Statement of Operations for the period due to the timing of sales and repurchases of the Fund shares in relation to income earned and/or fluctuating fair value of the investments of the Fund.
bBased on average daily shares outstanding.
cNet investment income per share includes approximately $0.17 per share received in the form of a special dividend paid in connection with certain Fund holdings. Excluding this amount, the ratio of net investment income to average net assets would have been 3.24%.
dAmount rounds to less than $0.01 per share.
eTotal return does not include fees, charges or expenses imposed by the variable annuity and life insurance contracts for which the Franklin Templeton Variable Insurance Products Trust serves as an underlying investment vehicle. Total return is not annualized for periods less than one year.
fRatios are annualized for periods less than one year.
gBenefit of expense reduction rounds to less than 0.01%.
| TF-8 | Semiannual Report | The accompanying notes are an integral part of these financial statements. |
FRANKLIN TEMPLETON VARIABLE INSURANCE PRODUCTS TRUST
FINANCIAL HIGHLIGHTS
Templeton Foreign VIP Fund (continued)
| Six Months Ended June 30, 2014 (unaudited) |
Year Ended December 31, | |||||||||||||||||||||||
| 2013 | 2012 | 2011 | 2010 | 2009 | ||||||||||||||||||||
| Class 2 | ||||||||||||||||||||||||
| Per share operating performance (for a share outstanding throughout the period) |
||||||||||||||||||||||||
| Net asset value, beginning of period |
$17.24 | $14.37 | $12.56 | $14.29 | $13.45 | $10.76 | ||||||||||||||||||
|
|
|
|||||||||||||||||||||||
| Income from investment operationsa: | ||||||||||||||||||||||||
| Net investment incomeb |
0.42 | c | 0.30 | 0.34 | 0.37 | 0.25 | 0.22 | |||||||||||||||||
| Net realized and unrealized gains (losses) |
0.14 | 2.94 | 1.87 | (1.86 | ) | 0.84 | 3.34 | |||||||||||||||||
|
|
|
|||||||||||||||||||||||
| Total from investment operations |
0.56 | 3.24 | 2.21 | (1.49 | ) | 1.09 | 3.56 | |||||||||||||||||
|
|
|
|||||||||||||||||||||||
| Less distributions from: | ||||||||||||||||||||||||
| Net investment income |
(0.32 | ) | (0.37 | ) | (0.40 | ) | (0.24 | ) | (0.25 | ) | (0.39 | ) | ||||||||||||
| Net realized gains |
— | — | — | — | — | (0.48 | ) | |||||||||||||||||
|
|
|
|||||||||||||||||||||||
| Total distributions |
(0.32 | ) | (0.37 | ) | (0.40 | ) | (0.24 | ) | (0.25 | ) | (0.87 | ) | ||||||||||||
|
|
|
|||||||||||||||||||||||
| Redemption feesd |
— | — | — | — | — | — | ||||||||||||||||||
|
|
|
|||||||||||||||||||||||
| Net asset value, end of period |
$17.48 | $17.24 | $14.37 | $12.56 | $14.29 | $13.45 | ||||||||||||||||||
|
|
|
|||||||||||||||||||||||
| Total returne |
3.22% | 22.97% | 18.23% | (10.63)% | 8.41% | 37.04% | ||||||||||||||||||
| Ratios to average net assetsf | ||||||||||||||||||||||||
| Expenses before waiver and payments by affiliates |
1.03% | 1.03% | 1.04% | 1.04% | 1.03% | 1.03% | ||||||||||||||||||
| Expenses net of waiver and payments by affiliates |
1.02% | 1.03% | 1.04% | 1.04% | g | 1.03% | g | 1.03% | g | |||||||||||||||
| Net investment income |
4.93% | c | 1.91% | 2.59% | 2.67% | 1.85% | 2.03% | |||||||||||||||||
| Supplemental data | ||||||||||||||||||||||||
| Net assets, end of period (000’s) |
$1,928,297 | $1,873,586 | $1,744,231 | $1,679,412 | $2,090,757 | $2,010,268 | ||||||||||||||||||
| Portfolio turnover rate |
9.16% | 23.61% | 12.53% | 21.09% | 19.16% | 22.50% | ||||||||||||||||||
aThe amount shown for a share outstanding throughout the period may not correlate with the Statement of Operations for the period due to the timing of sales and repurchases of the Fund shares in relation to income earned and/or fluctuating fair value of the investments of the Fund.
bBased on average daily shares outstanding.
cNet investment income per share includes approximately $0.17 per share received in the form of a special dividend paid in connection with certain Fund holdings. Excluding this amount, the ratio of net investment income to average net assets would have been 2.99%.
dAmount rounds to less than $0.01 per share.
eTotal return does not include fees, charges or expenses imposed by the variable annuity and life insurance contracts for which the Franklin Templeton Variable Insurance Products Trust serves as an underlying investment vehicle. Total return is not annualized for periods less than one year.
fRatios are annualized for periods less than one year.
gBenefit of expense reduction rounds to less than 0.01%.
| The accompanying notes are an integral part of these financial statements. | Semiannual Report | TF-9 |
FRANKLIN TEMPLETON VARIABLE INSURANCE PRODUCTS TRUST
FINANCIAL HIGHLIGHTS
Templeton Foreign VIP Fund (continued)
| Six Months Ended June 30, 2014 (unaudited) |
Year Ended December 31, | |||||||||||||||||||||||
| 2013 | 2012 | 2011 | 2010 | 2009 | ||||||||||||||||||||
| Class 4 | ||||||||||||||||||||||||
| Per share operating performance (for a share outstanding throughout the period) |
||||||||||||||||||||||||
| Net asset value, beginning of period |
$17.37 | $14.48 | $12.66 | $14.43 | $13.59 | $10.91 | ||||||||||||||||||
|
|
|
|||||||||||||||||||||||
| Income from investment operationsa: | ||||||||||||||||||||||||
| Net investment incomeb |
0.42 | c | 0.28 | 0.33 | 0.36 | 0.17 | 0.21 | |||||||||||||||||
| Net realized and unrealized gains (losses) |
0.13 | 2.97 | 1.89 | (1.88 | ) | 0.92 | 3.37 | |||||||||||||||||
|
|
|
|||||||||||||||||||||||
| Total from investment operations |
0.55 | 3.25 | 2.22 | (1.52 | ) | 1.09 | 3.58 | |||||||||||||||||
|
|
|
|||||||||||||||||||||||
| Less distributions from: | ||||||||||||||||||||||||
| Net investment income |
(0.31 | ) | (0.36 | ) | (0.40 | ) | (0.25 | ) | (0.25 | ) | (0.42 | ) | ||||||||||||
| Net realized gains |
— | — | — | — | — | (0.48 | ) | |||||||||||||||||
|
|
|
|||||||||||||||||||||||
| Total distributions |
(0.31 | ) | (0.36 | ) | (0.40 | ) | (0.25 | ) | (0.25 | ) | (0.90 | ) | ||||||||||||
|
|
|
|||||||||||||||||||||||
| Redemption feesd |
— | — | — | — | — | — | ||||||||||||||||||
|
|
|
|||||||||||||||||||||||
| Net asset value, end of period |
$17.61 | $17.37 | $14.48 | $12.66 | $14.43 | $13.59 | ||||||||||||||||||
|
|
|
|||||||||||||||||||||||
| Total returne |
3.13% | 22.86% | 18.14% | (10.74)% | 8.38% | 36.84% | ||||||||||||||||||
| Ratios to average net assetsf | ||||||||||||||||||||||||
| Expenses before waiver and payments by affiliates |
1.13% | 1.13% | 1.14% | 1.14% | 1.13% | 1.13% | ||||||||||||||||||
| Expenses net of waiver and payments by affiliates |
1.12% | 1.13% | 1.14% | 1.14% | g | 1.13% | g | 1.13% | g | |||||||||||||||
| Net investment income |
4.83% | c | 1.81% | 2.49% | 2.57% | 1.75% | 1.93% | |||||||||||||||||
| Supplemental data | ||||||||||||||||||||||||
| Net assets, end of period (000’s) |
$535,078 | $513,098 | $416,277 | $353,346 | $305,505 | $48,501 | ||||||||||||||||||
| Portfolio turnover rate |
9.16% | 23.61% | 12.53% | 21.09% | 19.16% | 22.50% | ||||||||||||||||||
aThe amount shown for a share outstanding throughout the period may not correlate with the Statement of Operations for the period due to the timing of sales and repurchases of the Fund shares in relation to income earned and/or fluctuating fair value of the investments of the Fund.
bBased on average daily shares outstanding.
cNet investment income per share includes approximately $0.17 per share received in the form of a special dividend paid in connection with certain Fund holdings. Excluding this amount, the ratio of net investment income to average net assets would have been 2.89%.
dAmount rounds to less than $0.01 per share.
eTotal return does not include fees, charges or expenses imposed by the variable annuity and life insurance contracts for which the Franklin Templeton Variable Insurance Products Trust serves as an underlying investment vehicle. Total return is not annualized for periods less than one year.
fRatios are annualized for periods less than one year.
gBenefit of expense reduction rounds to less than 0.01%.
| TF-10 | Semiannual Report | The accompanying notes are an integral part of these financial statements. |
FRANKLIN TEMPLETON VARIABLE INSURANCE PRODUCTS TRUST
Statement of Investments, June 30, 2014 (unaudited)
| Templeton Foreign VIP Fund | ||||||||||||||
| Country | Shares | Value | ||||||||||||
| Common Stocks 94.0% |
||||||||||||||
| Aerospace & Defense 0.9% |
||||||||||||||
| BAE Systems PLC |
United Kingdom | 3,443,320 | $ | 25,507,375 | ||||||||||
|
|
|
|||||||||||||
| Airlines 0.7% |
||||||||||||||
| Deutsche Lufthansa AG |
Germany | 859,340 | 18,452,586 | |||||||||||
|
|
|
|||||||||||||
| Auto Components 2.0% |
||||||||||||||
| Cie Generale des Etablissements Michelin, B |
France | 222,570 | 26,596,715 | |||||||||||
| Hyundai Mobis |
South Korea | 100,634 | 28,241,162 | |||||||||||
|
|
|
|||||||||||||
| 54,837,877 | ||||||||||||||
|
|
|
|||||||||||||
| Automobiles 2.4% |
||||||||||||||
| Hyundai Motor Co. |
South Korea | 38,742 | 8,785,859 | |||||||||||
| Nissan Motor Co. Ltd. |
Japan | 2,952,600 | 28,008,969 | |||||||||||
| Toyota Motor Corp., ADR |
Japan | 240,755 | 28,808,743 | |||||||||||
|
|
|
|||||||||||||
| 65,603,571 | ||||||||||||||
|
|
|
|||||||||||||
| Banks 12.9% |
||||||||||||||
| Bangkok Bank PCL, fgn. |
Thailand | 1,247,500 | 7,441,161 | |||||||||||
| Barclays PLC |
United Kingdom | 2,778,290 | 10,116,959 | |||||||||||
| BNP Paribas SA |
France | 1,058,470 | 71,816,551 | |||||||||||
| DBS Group Holdings Ltd. |
Singapore | 2,174,520 | 29,216,869 | |||||||||||
| Hana Financial Group Inc. |
South Korea | 1,562,861 | 57,912,339 | |||||||||||
| HSBC Holdings PLC |
United Kingdom | 4,015,600 | 40,723,592 | |||||||||||
| KB Financial Group Inc., ADR |
South Korea | 1,189,645 | 41,352,060 | |||||||||||
| Societe Generale SA |
France | 391,870 | 20,529,406 | |||||||||||
| UniCredit SpA |
Italy | 6,991,743 | 58,550,159 | |||||||||||
| United Overseas Bank Ltd. |
Singapore | 985,000 | 17,793,446 | |||||||||||
|
|
|
|||||||||||||
| 355,452,542 | ||||||||||||||
|
|
|
|||||||||||||
| Beverages 0.5% |
||||||||||||||
| Suntory Beverage & Food Ltd. |
Japan | 377,600 | 14,816,248 | |||||||||||
|
|
|
|||||||||||||
| Building Products 0.6% |
||||||||||||||
| Compagnie de Saint-Gobain |
France | 296,890 | 16,752,964 | |||||||||||
|
|
|
|||||||||||||
| Capital Markets 2.3% |
||||||||||||||
| Credit Suisse Group AG |
Switzerland | 1,874,638 | 53,606,382 | |||||||||||
| GAM Holding Ltd. |
Switzerland | 505,110 | 9,625,482 | |||||||||||
|
|
|
|||||||||||||
| 63,231,864 | ||||||||||||||
|
|
|
|||||||||||||
| Chemicals 1.1% |
||||||||||||||
| Akzo Nobel NV |
Netherlands | 407,380 | 30,544,286 | |||||||||||
|
|
|
|||||||||||||
| Communications Equipment 0.4% |
||||||||||||||
| Ericsson, B, ADR |
Sweden | 997,972 | 12,055,502 | |||||||||||
|
|
|
|||||||||||||
| Construction & Engineering 0.8% |
||||||||||||||
| Carillion PLC |
United Kingdom | 3,750,730 | 21,250,824 | |||||||||||
|
|
|
|||||||||||||
| Construction Materials 0.6% |
||||||||||||||
| CRH PLC |
Ireland | 659,820 | 16,933,285 | |||||||||||
|
|
|
|||||||||||||
| Containers & Packaging 0.8% |
||||||||||||||
| Rexam PLC |
United Kingdom | 2,417,032 | 22,127,736 | |||||||||||
|
|
|
|||||||||||||
| Diversified Financial Services 3.9% |
||||||||||||||
| BM&F BOVESPA SA |
Brazil | 2,189,700 | 11,482,241 | |||||||||||
| Deutsche Boerse AG |
Germany | 279,400 | 21,687,146 | |||||||||||
| Semiannual Report | TF-11 |
FRANKLIN TEMPLETON VARIABLE INSURANCE PRODUCTS TRUST
STATEMENT OF INVESTMENTS (UNAUDITED)
Templeton Foreign VIP Fund (continued)
| Country | Shares | Value | ||||||||||||
| Common Stocks (continued) |
||||||||||||||
| Diversified Financial Services (continued) |
||||||||||||||
| a | ING Groep NV, IDR |
Netherlands | 2,462,644 | $ | 34,601,518 | |||||||||
| Voya Financial Inc. |
United States | 1,076,240 | 39,110,561 | |||||||||||
|
|
|
|||||||||||||
| 106,881,466 | ||||||||||||||
|
|
|
|||||||||||||
| Diversified Telecommunication Services 4.5% |
||||||||||||||
| China Telecom Corp. Ltd., H |
China | 47,482,357 | 23,280,320 | |||||||||||
| Orange SA |
France | 25,570 | 403,569 | |||||||||||
| Singapore Telecommunications Ltd. |
Singapore | 9,394,000 | 29,011,270 | |||||||||||
| b | Telefonica SA, ADR |
Spain | 2,270,951 | 38,969,519 | ||||||||||
| Telenor ASA |
Norway | 1,103,354 | 25,134,701 | |||||||||||
| Vivendi SA |
France | 245,395 | 6,005,324 | |||||||||||
|
|
|
|||||||||||||
| 122,804,703 | ||||||||||||||
|
|
|
|||||||||||||
| Electrical Equipment 0.3% |
||||||||||||||
| Shanghai Electric Group Co. Ltd., H |
China | 23,792,000 | 9,577,643 | |||||||||||
|
|
|
|||||||||||||
| Electronic Equipment, Instruments & Components 1.8% |
||||||||||||||
| a | Flextronics International Ltd. |
Singapore | 2,385,970 | 26,412,688 | ||||||||||
| Kingboard Chemical Holdings Ltd. |
Hong Kong | 11,646,000 | 24,011,906 | |||||||||||
|
|
|
|||||||||||||
| 50,424,594 | ||||||||||||||
|
|
|
|||||||||||||
| Energy Equipment & Services 4.6% |
||||||||||||||
| Aker Solutions ASA |
Norway | 1,617,940 | 28,124,322 | |||||||||||
| Ensign Energy Services Inc. |
Canada | 1,965,300 | 30,535,910 | |||||||||||
| Fugro NV, IDR |
Netherlands | 225,252 | 12,898,729 | |||||||||||
| a | Saipem SpA |
Italy | 297,027 | 8,013,243 | ||||||||||
| Technip SA |
France | 76,090 | 8,324,653 | |||||||||||
| Trican Well Service Ltd. |
Canada | 2,373,000 | 38,339,153 | |||||||||||
|
|
|
|||||||||||||
| 126,236,010 | ||||||||||||||
|
|
|
|||||||||||||
| Food & Staples Retailing 2.9% |
||||||||||||||
| a | Metro AG |
Germany | 489,650 | 21,343,643 | ||||||||||
| Tesco PLC |
United Kingdom | 12,226,930 | 59,462,381 | |||||||||||
|
|
|
|||||||||||||
| 80,806,024 | ||||||||||||||
|
|
|
|||||||||||||
| Health Care Equipment & Supplies 0.9% |
||||||||||||||
| Getinge AB, B |
Sweden | 417,870 | 10,982,918 | |||||||||||
| Nobel Biocare Holding AG |
Switzerland | 974,135 | 14,499,162 | |||||||||||
|
|
|
|||||||||||||
| 25,482,080 | ||||||||||||||
|
|
|
|||||||||||||
| Health Care Providers & Services 0.8% |
||||||||||||||
| Shanghai Pharmaceuticals Holding Co. Ltd., H |
China | 6,434,800 | 13,383,607 | |||||||||||
| Sinopharm Group Co. |
China | 3,102,800 | 8,607,268 | |||||||||||
|
|
|
|||||||||||||
| 21,990,875 | ||||||||||||||
|
|
|
|||||||||||||
| Household Durables 0.4% |
||||||||||||||
| Nikon Corp. |
Japan | 647,800 | 10,199,309 | |||||||||||
|
|
|
|||||||||||||
| Industrial Conglomerates 2.2% |
||||||||||||||
| Hutchison Whampoa Ltd. |
Hong Kong | 2,096,239 | 28,642,429 | |||||||||||
| Siemens AG |
Germany | 233,124 | 30,791,821 | |||||||||||
|
|
|
|||||||||||||
| 59,434,250 | ||||||||||||||
|
|
|
|||||||||||||
| Insurance 7.5% |
||||||||||||||
| ACE Ltd. |
United States | 307,649 | 31,903,201 | |||||||||||
| Aegon NV |
Netherlands | 4,446,700 | 38,814,683 | |||||||||||
| TF-12 | Semiannual Report |
FRANKLIN TEMPLETON VARIABLE INSURANCE PRODUCTS TRUST
STATEMENT OF INVESTMENTS (UNAUDITED)
Templeton Foreign VIP Fund (continued)
| Country | Shares | Value | ||||||||||||
| Common Stocks (continued) |
||||||||||||||
| Insurance (continued) |
||||||||||||||
| AIA Group Ltd. |
Hong Kong | 4,133,000 | $ | 20,797,115 | ||||||||||
| Aviva PLC |
United Kingdom | 3,200,110 | 27,955,126 | |||||||||||
| AXA SA |
France | 2,056,508 | 49,158,250 | |||||||||||
| China Life Insurance Co. Ltd., H |
China | 4,286,000 | 11,225,903 | |||||||||||
| Muenchener Rueckversicherungs-Gesellschaft AG |
Germany | 68,060 | 15,089,851 | |||||||||||
| Swiss Re AG |
Switzerland | 130,190 | 11,582,557 | |||||||||||
|
|
|
|||||||||||||
| 206,526,686 | ||||||||||||||
|
|
|
|||||||||||||
| Leisure Products 0.8% |
||||||||||||||
| Bandai Namco Holdings Inc. |
Japan | 977,800 | 22,894,641 | |||||||||||
|
|
|
|||||||||||||
| Life Sciences Tools & Services 0.7% |
||||||||||||||
| Lonza Group AG |
Switzerland | 121,930 | 13,267,458 | |||||||||||
| a | QIAGEN NV |
Netherlands | 197,121 | 4,778,068 | ||||||||||
|
|
|
|||||||||||||
| 18,045,526 | ||||||||||||||
|
|
|
|||||||||||||
| Metals & Mining 3.1% |
||||||||||||||
| HudBay Minerals Inc. |
Canada | 2,891,000 | 26,756,219 | |||||||||||
| Mining and Metallurgical Co. Norilsk Nickel OJSC, ADR |
Russia | 926,924 | 18,362,364 | |||||||||||
| POSCO |
South Korea | 136,907 | 41,126,214 | |||||||||||
|
|
|
|||||||||||||
| 86,244,797 | ||||||||||||||
|
|
|
|||||||||||||
| Multiline Retail 1.1% |
||||||||||||||
| Marks & Spencer Group PLC |
United Kingdom | 4,066,900 | 29,590,857 | |||||||||||
|
|
|
|||||||||||||
| Oil, Gas & Consumable Fuels 13.3% |
||||||||||||||
| BP PLC |
United Kingdom | 5,946,135 | 52,391,212 | |||||||||||
| China Shenhua Energy Co. Ltd., H |
China | 8,462,000 | 24,456,490 | |||||||||||
| Dragon Oil PLC |
Turkmenistan | 731,930 | 7,683,957 | |||||||||||
| Eni SpA |
Italy | 1,319,747 | 36,110,402 | |||||||||||
| Kunlun Energy Co. Ltd. |
China | 7,280,000 | 12,004,258 | |||||||||||
| LUKOIL Holdings, ADR |
Russia | 160,535 | 9,585,545 | |||||||||||
| Royal Dutch Shell PLC, A |
United Kingdom | 16,803 | 695,398 | |||||||||||
| Royal Dutch Shell PLC, B |
United Kingdom | 1,094,263 | 47,608,387 | |||||||||||
| Statoil ASA |
Norway | 1,314,870 | 40,394,865 | |||||||||||
| Suncor Energy Inc. |
Canada | 901,700 | 38,470,955 | |||||||||||
| Talisman Energy Inc. |
Canada | 2,554,600 | 27,020,383 | |||||||||||
| Total SA, B |
France | 979,926 | 70,828,627 | |||||||||||
|
|
|
|||||||||||||
| 367,250,479 | ||||||||||||||
|
|
|
|||||||||||||
| Pharmaceuticals 9.7% |
||||||||||||||
| Bayer AG |
Germany | 194,750 | 27,510,143 | |||||||||||
| GlaxoSmithKline PLC |
United Kingdom | 2,772,585 | 74,203,162 | |||||||||||
| Novartis AG |
Switzerland | 328,730 | 29,764,920 | |||||||||||
| Roche Holding AG |
Switzerland | 179,480 | 53,529,300 | |||||||||||
| Sanofi |
France | 513,135 | 54,516,450 | |||||||||||
| Teva Pharmaceutical Industries Ltd., ADR |
Israel | 520,107 | 27,264,009 | |||||||||||
|
|
|
|||||||||||||
| 266,787,984 | ||||||||||||||
|
|
|
|||||||||||||
| Real Estate Management & Development 0.0%† |
||||||||||||||
| Cheung Kong (Holdings) Ltd. |
Hong Kong | 922 | 16,345 | |||||||||||
|
|
|
|||||||||||||
| Semiconductors & Semiconductor Equipment 3.6% |
||||||||||||||
| Infineon Technologies AG |
Germany | 1,103,225 | 13,792,197 | |||||||||||
| Samsung Electronics Co. Ltd. |
South Korea | 53,022 | 69,263,917 | |||||||||||
| Taiwan Semiconductor Manufacturing Co. Ltd. |
Taiwan | 4,151,526 | 17,580,318 | |||||||||||
|
|
|
|||||||||||||
| 100,636,432 | ||||||||||||||
|
|
|
|||||||||||||
| Semiannual Report | TF-13 |
FRANKLIN TEMPLETON VARIABLE INSURANCE PRODUCTS TRUST
STATEMENT OF INVESTMENTS (UNAUDITED)
Templeton Foreign VIP Fund (continued)
| Country | Shares | Value | ||||||||||||
| Common Stocks (continued) |
||||||||||||||
| Software 0.7% |
||||||||||||||
| Capcom Co. Ltd. |
Japan | 1,211,400 | $ | 20,531,798 | ||||||||||
|
|
|
|||||||||||||
| Specialty Retail 1.1% |
||||||||||||||
| Kingfisher PLC |
United Kingdom | 5,160,616 | 31,702,739 | |||||||||||
|
|
|
|||||||||||||
| Technology Hardware, Storage & Peripherals 0.4% |
||||||||||||||
| CANON Inc. |
Japan | 349,700 | 11,377,634 | |||||||||||
|
|
|
|||||||||||||
| Trading Companies & Distributors 2.1% |
||||||||||||||
| ITOCHU Corp. |
Japan | 3,753,600 | 48,205,257 | |||||||||||
| Noble Group Ltd. |
Hong Kong | 8,267,000 | 9,084,980 | |||||||||||
|
|
|
|||||||||||||
| 57,290,237 | ||||||||||||||
|
|
|
|||||||||||||
| Wireless Telecommunication Services 1.6% |
||||||||||||||
| China Mobile Ltd. |
China | 2,340,000 | 22,704,230 | |||||||||||
| Vodafone Group PLC, ADR |
United Kingdom | 671,535 | 22,422,554 | |||||||||||
|
|
|
|||||||||||||
| 45,126,784 | ||||||||||||||
|
|
|
|||||||||||||
| Total Common Stocks (Cost $1,965,280,829) |
2,595,426,553 | |||||||||||||
|
|
|
|||||||||||||
| Preferred Stocks (Cost $11,136,802) 0.3% |
||||||||||||||
| Oil, Gas & Consumable Fuels 0.3% |
||||||||||||||
| Petroleo Brasileiro SA, ADR, pfd. |
Brazil | 517,880 | 8,099,643 | |||||||||||
|
|
|
|||||||||||||
| Total Investments before Short Term Investments |
2,603,526,196 | |||||||||||||
|
|
|
|||||||||||||
| Short Term Investments 3.3% |
||||||||||||||
| Money Market Funds (Cost $88,693,589) 3.3% |
||||||||||||||
| a,c | Institutional Fiduciary Trust Money Market Portfolio |
United States | 88,693,589 | 88,693,589 | ||||||||||
|
|
|
|||||||||||||
| d | Investments from Cash Collateral Received for Loaned |
|||||||||||||
| Money Market Funds 0.0%† |
||||||||||||||
| e | BNY Mellon Overnight Government Fund, 0.082% |
United States | 175,000 | 175,000 | ||||||||||
|
|
|
|||||||||||||
| Total Investments (Cost $2,065,286,220) 97.6% |
2,692,394,785 | |||||||||||||
| Other Assets, less Liabilities 2.4% |
67,503,762 | |||||||||||||
|
|
|
|||||||||||||
| Net Assets 100.0% |
$ | 2,759,898,547 | ||||||||||||
|
|
|
|||||||||||||
See Abbreviations on page TF-25.
†Rounds to less than 0.1% of net assets.
aNon-income producing.
bA portion or all of the security is on loan at June 30, 2014. See Note 1(c).
cSee Note 3(e) regarding investments in the Institutional Fiduciary Trust Money Market Portfolio.
dSee Note 1(c) regarding securities on loan.
eThe rate shown is the annualized seven-day yield at period end.
| TF-14 | Semiannual Report | The accompanying notes are an integral part of these financial statements. |
FRANKLIN TEMPLETON VARIABLE INSURANCE PRODUCTS TRUST
Financial Statements
Statement of Assets and Liabilities
June 30, 2014 (unaudited)
| Templeton Foreign VIP Fund |
||||
| Assets: | ||||
| Investments in securities: |
||||
| Cost - Unaffiliated issuers |
$ | 1,976,592,631 | ||
| Cost - Sweep Money Fund (Note 3e) |
88,693,589 | |||
|
|
|
|||
| Total cost of investments |
$ | 2,065,286,220 | ||
|
|
|
|||
| Value - Unaffiliated issuers |
$ | 2,603,701,196 | ||
| Value - Sweep Money Fund (Note 3e) |
88,693,589 | |||
|
|
|
|||
| Total value of investments (includes securities loaned in the amount $188,760) |
2,692,394,785 | |||
| Cash |
1,033,838 | |||
| Receivables: |
||||
| Investment securities sold |
59,340,898 | |||
| Capital shares sold |
4,368,268 | |||
| Dividends |
9,420,950 | |||
| Other assets |
1,227 | |||
|
|
|
|||
| Total assets |
2,766,559,966 | |||
|
|
|
|||
| Liabilities: | ||||
| Payables: |
||||
| Investment securities purchased |
854,232 | |||
| Capital shares redeemed |
2,087,479 | |||
| Management fees |
1,673,742 | |||
| Distribution fees |
1,123,503 | |||
| Reports to shareholders |
521,744 | |||
| Payable upon return of securities loaned |
175,000 | |||
| Accrued expenses and other liabilities |
225,719 | |||
|
|
|
|||
| Total liabilities |
6,661,419 | |||
|
|
|
|||
| Net assets, at value |
$ | 2,759,898,547 | ||
|
|
|
|||
| Net assets consist of: | ||||
| Paid-in capital |
$ | 2,090,303,838 | ||
| Undistributed net investment income |
66,405,969 | |||
| Net unrealized appreciation (depreciation) |
627,330,445 | |||
| Accumulated net realized gain (loss) |
(24,141,705 | ) | ||
|
|
|
|||
| Net assets, at value |
$ | 2,759,898,547 | ||
|
|
|
|||
| The accompanying notes are an integral part of these financial statements. | Semiannual Report | TF-15 |
FRANKLIN TEMPLETON VARIABLE INSURANCE PRODUCTS TRUST
FINANCIAL STATEMENTS
Statement of Assets and Liabilities (continued)
June 30, 2014 (unaudited)
| Templeton Foreign VIP Fund |
||||
| Class 1: | ||||
| Net assets, at value |
$ | 296,523,166 | ||
|
|
|
|||
| Shares outstanding |
16,670,268 | |||
|
|
|
|||
| Net asset value and maximum offering price per share |
$ | 17.79 | ||
|
|
|
|||
| Class 2: | ||||
| Net assets, at value |
$ | 1,928,297,158 | ||
|
|
|
|||
| Shares outstanding |
110,319,871 | |||
|
|
|
|||
| Net asset value and maximum offering price per share |
$ | 17.48 | ||
|
|
|
|||
| Class 4: | ||||
| Net assets, at value |
$ | 535,078,223 | ||
|
|
|
|||
| Shares outstanding |
30,385,375 | |||
|
|
|
|||
| Net asset value and maximum offering price per share |
$ | 17.61 | ||
|
|
|
|||
| TF-16 | Semiannual Report | The accompanying notes are an integral part of these financial statements. |
FRANKLIN TEMPLETON VARIABLE INSURANCE PRODUCTS TRUST
FINANCIAL STATEMENTS
Statement of Operations
for the six months ended June 30, 2014 (unaudited)
| Templeton Foreign VIP Fund |
||||
| Investment income: | ||||
| Dividends (net of foreign taxes of $5,540,795) |
$ | 79,172,850 | ||
| Income from securities loaned |
1,581,816 | |||
|
|
|
|||
| Total investment income |
80,754,666 | |||
|
|
|
|||
| Expenses: | ||||
| Management fees (Note 3a) |
9,145,575 | |||
| Administrative fees (Note 3b) |
859,943 | |||
| Distribution fees: (Note 3c) |
||||
| Class 2 |
2,312,099 | |||
| Class 3 |
75,571 | |||
| Class 4 |
897,703 | |||
| Custodian fees (Note 4) |
201,159 | |||
| Reports to shareholders |
233,252 | |||
| Registration and filing fees |
298 | |||
| Professional fees |
47,828 | |||
| Trustees’ fees and expenses |
5,365 | |||
| Other |
30,063 | |||
|
|
|
|||
| Total expenses |
13,808,856 | |||
| Expenses waived/paid by affiliates (Note 3e) |
(35,078 | ) | ||
|
|
|
|||
| Net expenses |
13,773,778 | |||
|
|
|
|||
| Net investment income |
66,980,888 | |||
|
|
|
|||
| Realized and unrealized gains (losses): | ||||
| Net realized gain (loss) from: |
||||
| Investments |
44,052,202 | |||
| Foreign currency transactions |
(258,117 | ) | ||
|
|
|
|||
| Net realized gain (loss) |
43,794,085 | |||
|
|
|
|||
| Net change in unrealized appreciation (depreciation) on: |
||||
| Investments |
(24,744,270 | ) | ||
| Translation of other assets and liabilities denominated in foreign currencies |
137,909 | |||
|
|
|
|||
| Net change in unrealized appreciation (depreciation) |
(24,606,361 | ) | ||
|
|
|
|||
| Net realized and unrealized gain (loss) |
19,187,724 | |||
|
|
|
|||
| Net increase (decrease) in net assets resulting from operations |
$ | 86,168,612 | ||
|
|
|
|||
| The accompanying notes are an integral part of these financial statements. | Semiannual Report | TF-17 |
FRANKLIN TEMPLETON VARIABLE INSURANCE PRODUCTS TRUST
FINANCIAL STATEMENTS
Statements of Changes in Net Assets
| Templeton Foreign VIP Fund | ||||||||
| Six Months June 30, 2014 |
Year Ended December 31, 2013 |
|||||||
| Increase (decrease) in net assets: | ||||||||
| Operations: |
||||||||
| Net investment income |
$ | 66,980,888 | $ | 50,200,298 | ||||
| Net realized gain (loss) from investments and foreign currency transactions |
43,794,085 | 40,523,982 | ||||||
| Net change in unrealized appreciation (depreciation) on investments and translation of other assets and liabilities denominated in foreign currencies |
(24,606,361 | ) | 454,985,363 | |||||
|
|
|
|||||||
| Net increase (decrease) in net assets resulting from operations |
86,168,612 | 545,709,643 | ||||||
|
|
|
|||||||
| Distributions to shareholders from: |
||||||||
| Net investment income: |
||||||||
| Class 1 |
(5,893,509 | ) | (7,042,374 | ) | ||||
| Class 2 |
(34,594,703 | ) | (42,339,120 | ) | ||||
| Class 3 |
— | (2,189,476 | ) | |||||
| Class 4 |
(9,091,879 | ) | (10,745,373 | ) | ||||
|
|
|
|||||||
| Total distributions to shareholders |
(49,580,091 | ) | (62,316,343 | ) | ||||
|
|
|
|||||||
| Capital share transactions: (Note 2) |
||||||||
| Class 1 |
(5,604,179 | ) | (18,682,478 | ) | ||||
| Class 2 |
30,610,794 | (199,579,456 | ) | |||||
| Class 3 |
(96,991,462 | ) | (13,135,502 | ) | ||||
| Class 4 |
14,733,712 | 10,467,967 | ||||||
|
|
|
|||||||
| Total capital share transactions |
(57,251,135 | ) | (220,929,469 | ) | ||||
|
|
|
|||||||
| Redemption fees |
3,115 | 19,703 | ||||||
|
|
|
|||||||
| Net increase (decrease) in net assets |
(20,659,499 | ) | 262,483,534 | |||||
| Net assets: | ||||||||
| Beginning of period |
2,780,558,046 | 2,518,074,512 | ||||||
|
|
|
|||||||
| End of period |
$ | 2,759,898,547 | $ | 2,780,558,046 | ||||
|
|
|
|||||||
| Undistributed net investment income included in net assets: | ||||||||
| End of period |
$ | 66,405,969 | $ | 49,005,172 | ||||
|
|
|
|||||||
| TF-18 | Semiannual Report | The accompanying notes are an integral part of these financial statements. |
FRANKLIN TEMPLETON VARIABLE INSURANCE PRODUCTS TRUST
Notes to Financial Statements (unaudited)
Templeton Foreign VIP Fund
| Semiannual Report | TF-19 |
FRANKLIN TEMPLETON VARIABLE INSURANCE PRODUCTS TRUST
NOTES TO FINANCIAL STATEMENTS (UNAUDITED)
Templeton Foreign VIP Fund (continued)
1. Organization and Significant Accounting Policies (continued)
a. Financial Instrument Valuation (continued)
minimize the potential for these differences, the VLOC monitors price movements following the close of trading in foreign stock markets through a series of country specific market proxies (such as baskets of American Depositary Receipts, futures contracts and exchange traded funds). These price movements are measured against established trigger thresholds for each specific market proxy to assist in determining if an event has occurred that may call into question the reliability of the values of the foreign securities held by the Fund. If such an event occurs, the securities may be valued using fair value procedures, which may include the use of independent pricing services.
Also, when the last day of the reporting period is a non-business day, certain foreign markets may be open on those days that the NYSE is closed, which could result in differences between the value of the Fund’s portfolio securities on the last business day and the last calendar day of the reporting period. Any significant security valuation changes due to an open foreign market are adjusted and reflected by the Fund for financial reporting purposes.
b. Foreign Currency Translation
Portfolio securities and other assets and liabilities denominated in foreign currencies are translated into U.S. dollars based on the exchange rate of such currencies against U.S. dollars on the date of valuation. The Fund may enter into foreign currency exchange contracts to facilitate transactions denominated in a foreign currency. Purchases and sales of securities, income and expense items denominated in foreign currencies are translated into U.S. dollars at the exchange rate in effect on the transaction date. Portfolio securities and assets and liabilities denominated in foreign currencies contain risks that those currencies will decline in value relative to the U.S. dollar. Occasionally, events may impact the availability or reliability of foreign exchange rates used to convert the U.S. dollar equivalent value. If such an event occurs, the foreign exchange rate will be valued at fair value using procedures established and approved by the Board.
The Fund does not separately report the effect of changes in foreign exchange rates from changes in market prices on securities held. Such changes are included in net realized and unrealized gain or loss from investments on the Statement of Operations.
Realized foreign exchange gains or losses arise from sales of foreign currencies, currency gains or losses realized between the trade and settlement dates on securities transactions and the difference between the recorded amounts of dividends, interest, and foreign withholding taxes and the U.S. dollar equivalent of the amounts actually received or paid. Net unrealized foreign exchange gains and losses arise from changes in foreign exchange rates on foreign denominated assets and liabilities other than investments in securities held at the end of the reporting period.
c. Securities Lending
The Fund participates in an agency based securities lending program. The Fund receives cash collateral against the loaned securities in an amount equal to at least 102% of the fair value of the loaned securities. Collateral is maintained over the life of the loan in an amount not less than 100% of the fair value of loaned securities, as determined at the close of fund business each day; any additional collateral required due to changes in security values is delivered to the Fund on the next business day. The collateral is invested in a non-registered money fund as indicated on the Statement of Investments. The Fund receives income from the investment of cash collateral, in addition to lending fees and rebates paid by the borrower. The Fund bears the market risk with respect to the collateral investment, securities loaned, and the risk that the agent may default on its obligations to the Fund. The securities lending agent has agreed to indemnify the Fund in the event of default by a third party borrower.
d. Income and Deferred Taxes
It is the Fund’s policy to qualify as a regulated investment company under the Internal Revenue Code. The Fund intends to distribute to shareholders substantially all of its taxable income and net realized gains to relieve it from federal income and if applicable, excise taxes. As a result, no provision for U.S. federal income taxes is required.
The Fund may be subject to foreign taxation related to income received, capital gains on the sale of securities and certain foreign currency transactions in the foreign jurisdictions in which it invests. Foreign taxes, if any, are recorded based on the tax regulations and rates that exist in the foreign markets in which the Fund invests. When a capital gain tax is determined to apply the Fund records an estimated deferred tax liability in an amount that would be payable if the securities were disposed of on the valuation date.
| TF-20 | Semiannual Report |
FRANKLIN TEMPLETON VARIABLE INSURANCE PRODUCTS TRUST
NOTES TO FINANCIAL STATEMENTS (UNAUDITED)
Templeton Foreign VIP Fund (continued)
2. Shares of Beneficial Interest
At June 30, 2014, there were an unlimited number of shares authorized (without par value). Transactions in the Fund’s shares were as follows:
| Six Months Ended June 30, 2014 |
Year Ended December 31, 2013 |
|||||||||||||||||
| Shares | Amount | Shares | Amount | |||||||||||||||
| Class 1 Shares: | ||||||||||||||||||
| Shares sold |
270,390 | $ | 4,708,316 | 496,052 | $ | 7,884,222 | ||||||||||||
| Shares issued in reinvestment of distributions |
329,615 | 5,893,509 | 468,554 | 7,042,374 | ||||||||||||||
| Shares redeemed |
(925,352 | ) | (16,206,004 | ) | (2,142,399 | ) | (33,609,074 | ) | ||||||||||
|
|
|
|||||||||||||||||
| Net increase (decrease) |
(325,347 | ) | $ | (5,604,179 | ) | (1,177,793 | ) | $ | (18,682,478 | ) | ||||||||
|
|
|
|||||||||||||||||
| Semiannual Report | TF-21 |
FRANKLIN TEMPLETON VARIABLE INSURANCE PRODUCTS TRUST
NOTES TO FINANCIAL STATEMENTS (UNAUDITED)
Templeton Foreign VIP Fund (continued)
2. Shares of Beneficial Interest (continued)
| Six Months Ended June 30, 2014 |
Year Ended December 31, 2013 |
|||||||||||||||||
| Shares | Amount | Shares | Amount | |||||||||||||||
| Class 2 Shares: | ||||||||||||||||||
| Shares sold |
9,956,026 | $ | 173,281,368 | 9,932,214 | $ | 152,564,880 | ||||||||||||
| Shares issued in reinvestment of distributions |
1,967,844 | 34,594,703 | 2,864,622 | 42,339,120 | ||||||||||||||
| Shares redeemed |
(10,260,663 | ) | (177,265,277 | ) | (25,480,434 | ) | (394,483,456 | ) | ||||||||||
|
|
|
|||||||||||||||||
| Net increase (decrease) |
1,663,207 | $ | 30,610,794 | (12,683,598 | ) | $ | (199,579,456 | ) | ||||||||||
|
|
|
|||||||||||||||||
| Class 3 Sharesa: | ||||||||||||||||||
| Shares sold |
149,791 | $ | 2,553,688 | 558,566 | $ | 8,455,794 | ||||||||||||
| Shares issued in reinvestment of distributions |
— | — | 148,742 | 2,189,476 | ||||||||||||||
| Shares redeemed |
(5,703,761 | ) | (99,545,150 | ) | (1,552,340 | ) | (23,780,772 | ) | ||||||||||
|
|
|
|||||||||||||||||
| Net increase (decrease) |
(5,553,970 | ) | $ | (96,991,462 | ) | (845,032 | ) | $ | (13,135,502 | ) | ||||||||
|
|
|
|||||||||||||||||
| Class 4 Shares: | ||||||||||||||||||
| Shares sold |
2,127,882 | $ | 36,966,762 | 5,690,758 | $ | 88,119,947 | ||||||||||||
| Shares issued on reinvestment of distributions |
513,375 | 9,091,879 | 721,650 | 10,745,373 | ||||||||||||||
| Shares redeemed |
(1,800,270 | ) | (31,324,929 | ) | (5,613,738 | ) | (88,397,353 | ) | ||||||||||
|
|
|
|||||||||||||||||
| Net increase (decrease) |
840,987 | $ | 14,733,712 | 798,670 | $ | 10,467,967 | ||||||||||||
|
|
|
|||||||||||||||||
aEffective May 1, 2014, all Class 3 Shares were converted to Class 2.
3. Transactions With Affiliates
Franklin Resources, Inc. is the holding company for various subsidiaries that together are referred to as Franklin Templeton Investments. Certain officers and trustees of the Fund are also officers and/or directors of the following subsidiaries:
| Subsidiary | Affiliation | |
| Templeton Investment Counsel, LLC (TIC) | Investment manager | |
| Franklin Templeton Services, LLC (FT Services) | Administrative manager | |
| Franklin Templeton Distributors, Inc. (Distributors) | Principal underwriter | |
| Franklin Templeton Investor Services, LLC (Investor Services) | Transfer agent |
a. Management Fees
The Fund pays an investment management fee to TIC based on the average daily net assets of the Fund as follows:
| Annualized Fee Rate | Net Assets | |
| 0.900% | Up to and including $200 million | |
| 0.810% | Over $200 million, up to and including $700 million | |
| 0.775% | Over $700 million, up to and including $1.2 billion | |
| 0.750% | Over $1.2 billion, up to and including $1.3 billion | |
| 0.675% | Over $1.3 billion, up to and including $10 billion | |
| 0.655% | Over $10 billion, up to and including $15 billion | |
| 0.635% | Over $15 billion, up to and including $20 billion | |
| 0.615% | In excess of $20 billion |
| TF-22 | Semiannual Report |
FRANKLIN TEMPLETON VARIABLE INSURANCE PRODUCTS TRUST
NOTES TO FINANCIAL STATEMENTS (UNAUDITED)
Templeton Foreign VIP Fund (continued)
Effective May 1, 2014, the Fund combined its investment management and administration agreements as approved by the Board. The fees paid under the combined agreement do not exceed the aggregate fees that were paid under the separate agreements.
Prior to May 1, 2014, the Fund paid fees to TIC based on the average daily net assets of the Fund as follows:
| Annualized Fee Rate | Net Assets | |
| 0.750% | Up to and including $200 million | |
| 0.675% | Over $200 million, up to and including $1.3 billion | |
| 0.600% | Over $1.3 billion, up to and including $10 billion | |
| 0.580% | Over $10 billion, up to and including $15 billion | |
| 0.560% | Over $15 billion, up to and including $20 billion | |
| 0.540% | In excess of $20 billion |
b. Administrative Fees
Effective May 1, 2014, under an agreement with TIC, FT Services provides administrative services to the Fund. The fee is paid by TIC based on the Fund’s average daily net assets, and is not an additional expense of the Fund.
Prior to May 1, 2014, the Fund paid fees to FT Services based on the average daily net assets of the Fund as follows:
| Annualized Fee Rate | Net Assets | |
| 0.150% | Up to and including $200 million | |
| 0.135% | Over $200 million, up to and including $700 million | |
| 0.100% | Over $700 million, up to and including $1.2 billion | |
| 0.075% | In excess of $1.2 billion |
c. Distribution Fees
The Board has adopted distribution plans for Class 2, Class 3, and Class 4 shares pursuant to Rule 12b-1 under the 1940 Act. Under the Fund’s compensation distribution plans, the Fund pays Distributors for costs incurred in connection with the servicing, sale and distribution of the Fund’s shares up to 0.25%, 0.35%, and 0.35% per year of its average daily net assets of Class 2, Class 3, and Class 4, respectively. Some distribution fees are not charged on shares held by affiliates. The Board has agreed to limit the current rate to 0.25% per year for Class 3. The plan year, for purposes of monitoring compliance with the maximum annual plan rates, is February 1 through January 31.
d. Transfer Agent Fees
Investor Services, under terms of an agreement, performs shareholder servicing for the Fund and is not paid by the Fund for the services.
e. Investment in Institutional Fiduciary Trust Money Market Portfolio
The Fund invests in the Institutional Fiduciary Trust Money Market Portfolio (Sweep Money Fund), an affiliated open-end management investment company. Management fees paid by the Fund are waived on assets invested in the Sweep Money Fund, in an amount not to exceed the management and administrative fees paid directly or indirectly by the Sweep Money Fund, as noted on the Statement of Operations. Prior to January 1, 2014, the waiver was accounted for as a reduction to management fees.
| Semiannual Report | TF-23 |
FRANKLIN TEMPLETON VARIABLE INSURANCE PRODUCTS TRUST
NOTES TO FINANCIAL STATEMENTS (UNAUDITED)
Templeton Foreign VIP Fund (continued)
4. Expense Offset Arrangement
The Fund has entered into an arrangement with its custodian whereby credits realized as a result of uninvested cash balances are used to reduce a portion of the Fund’s custodian expenses. During the period ended June 30, 2014, there were no credits earned.
5. Income Taxes
For tax purposes, capital losses may be carried over to offset future capital gains. Capital loss carryforwards with no expiration, if any, must be fully utilized before those losses with expiration dates. At December 31, 2013, the Fund had capital loss carryforwards of $59,815,020 expiring in 2017.
At June 30, 2014, the cost of investments and net unrealized appreciation (depreciation) for income tax purposes were as follows:
| Cost of investments |
$2,074,098,065 | |
|
| ||
| Unrealized appreciation |
$ 682,164,336 | |
| Unrealized depreciation |
(63,867,616) | |
|
| ||
| Net unrealized appreciation (depreciation) |
$ 618,296,720 | |
|
| ||
Differences between income and/or capital gains as determined on a book basis and a tax basis are primarily due to differing treatments of foreign currency transactions and wash sales.
6. Investment Transactions
Purchases and sales of investments (excluding short term securities) for the period ended June 30, 2014, aggregated $242,207,618 and $392,812,257, respectively.
7. Concentration of Risk
Investing in foreign securities may include certain risks and considerations not typically associated with investing in U.S. securities, such as fluctuating currency values and changing local and regional economic, political and social conditions, which may result in greater market volatility. In addition, certain foreign securities may not be as liquid as U.S. securities.
8. Credit Facility
The Fund, together with other U.S. registered and foreign investment funds (collectively, Borrowers), managed by Franklin Templeton Investments, are borrowers in a joint syndicated senior unsecured credit facility totaling $1.5 billion (Global Credit Facility) which matures on February 13, 2015. This Global Credit Facility provides a source of funds to the Borrowers for temporary and emergency purposes, including the ability to meet future unanticipated or unusually large redemption requests.
Under the terms of the Global Credit Facility, the Fund shall, in addition to interest charged on any borrowings made by the Fund and other costs incurred by the Fund, pay its share of fees and expenses incurred in connection with the implementation and maintenance of the Global Credit Facility, based upon its relative share of the aggregate net assets of all of the Borrowers, including an annual commitment fee of 0.07% based upon the unused portion of the Global Credit Facility. These fees are reflected in other expenses on the Statement of Operations. During the period ended June 30, 2014, the Fund did not use the Global Credit Facility.
| TF-24 | Semiannual Report |
FRANKLIN TEMPLETON VARIABLE INSURANCE PRODUCTS TRUST
NOTES TO FINANCIAL STATEMENTS (UNAUDITED)
Templeton Foreign VIP Fund (continued)
9. Fair Value Measurements
The Fund follows a fair value hierarchy that distinguishes between market data obtained from independent sources (observable inputs) and the Fund’s own market assumptions (unobservable inputs). These inputs are used in determining the value of the Fund’s financial instruments and are summarized in the following fair value hierarchy:
| • | Level 1 – quoted prices in active markets for identical financial instruments |
| • | Level 2 – other significant observable inputs (including quoted prices for similar financial instruments, interest rates, prepayment speed, credit risk, etc.) |
| • | Level 3 – significant unobservable inputs (including the Fund’s own assumptions in determining the fair value of financial instruments) |
The input levels are not necessarily an indication of the risk or liquidity associated with financial instruments at that level.
For movements between the levels within the fair value hierarchy, the Fund has adopted a policy of recognizing the transfers as of the date of the underlying event which caused the movement.
A summary of inputs used as of June 30, 2014, in valuing the Fund’s assets carried at fair value, is as follows:
| Level 1 | Level 2 | Level 3 | Total | |||||||||||||
| Assets: | ||||||||||||||||
| Investments in Securities: |
||||||||||||||||
| Equity Investmentsa,b |
$ | 2,603,526,196 | $ | — | $ | — | $ | 2,603,526,196 | ||||||||
| Short Term Investments |
88,693,589 | 175,000 | — | 88,868,589 | ||||||||||||
|
|
|
|||||||||||||||
| Total Investments in Securities |
$ | 2,692,219,785 | $ | 175,000 | $ | — | $ | 2,692,394,785 | ||||||||
|
|
|
|||||||||||||||
aIncludes common and preferred stocks.
bFor detailed categories, see the accompanying Statement of Investments.
10. New Accounting Pronouncements
In June 2014, the Financial Accounting Standards Board issued Accounting Standards Update (ASU) No. 2014-11, Transfers and Servicing (Topic 860), Repurchase-to-Maturity Transactions, Repurchase Financings, and Disclosures. The ASU changes the accounting for certain repurchase agreements and expands disclosure requirements related to repurchase agreements, securities lending, repurchase-to-maturity and similar transactions. The ASU is effective for interim and annual reporting periods beginning after December 15, 2014. Management is currently evaluating the impact, if any, of applying this provision.
11. Subsequent Events
The Fund has evaluated subsequent events through the issuance of the financial statements and determined that no events have occurred that require disclosure.
Abbreviations
| Selected Portfolio | ||
| ADR | American Depositary Receipt | |
| IDR | International Depositary Receipt | |
| Semiannual Report | TF-25 |
FRANKLIN TEMPLETON VARIABLE INSURANCE PRODUCTS TRUST
TAX INFORMATION (UNAUDITED)
Templeton Foreign VIP Fund
At December 31, 2013, more than 50% of the Fund’s total assets were invested in securities of foreign issuers. In most instances, foreign taxes were withheld from income paid to the Fund on these investments. As shown in the table below, the Fund hereby reports to shareholders the foreign source income and foreign taxes paid, pursuant to Section 853 of the Internal Revenue Code. This written statement will allow shareholders of record on June 12, 2014, to treat their proportionate share of foreign taxes paid by the Fund as having been paid directly by them. The shareholder shall consider these amounts as foreign taxes paid in the tax year in which they receive the Fund distribution.
The following table provides a detailed analysis of foreign tax paid and foreign source income as reported by the Fund, to Class 1, Class 2, and Class 4 shareholders of record.
| Class | Foreign Tax Paid Per Share |
Foreign Source Income Per Share | ||
| Class 1 | $0.0298 | $0.3847 | ||
| Class 2 | $0.0298 | $0.3447 | ||
| Class 4 | $0.0298 | $0.3313 |
Foreign Tax Paid Per Share (Column 1) is the amount per share available to you, as a tax credit (assuming you held your shares in the Fund for a minimum of 16 days during the 31-day period beginning 15 days before the ex-dividend date of the Fund’s distribution to which the foreign taxes relate), or, as a tax deduction.
Foreign Source Income Per Share (Column 2) is the amount per share of income dividends attributable to foreign securities held by the Fund, plus any foreign taxes withheld on these dividends.
| TF-26 | Semiannual Report |
Templeton Global Bond VIP Fund
(Formerly, Templeton Global Bond Securities Fund)
This semiannual report for Templeton Global Bond VIP Fund covers the period ended June 30, 2014.
Class 2 Performance Summary as of June 30, 2014
Templeton Global Bond VIP Fund – Class 2 delivered a +3.19% total return for the six-month period ended June 30, 2014.
Performance reflects the Fund’s Class 2 operating expenses, but does not include any contract fees, expenses or sales charges. If they had been included, performance would be lower. These charges and deductions, particularly for variable life policies, can have a significant effect on contract values and insurance benefits. See the contract prospectus for a complete description of these expenses, including sales charges.
Performance data represent past performance, which does not guarantee future results. Investment return and principal value will fluctuate, and you may have a gain or loss when you sell your shares. Current performance may differ from figures shown.
| Semiannual Report | TGB-1 |
TEMPLETON GLOBAL BOND VIP FUND
Fund Goal and Main Investments: Templeton Global Bond VIP Fund seeks high current income, consistent with preservation of capital, with capital appreciation as a secondary consideration. Under normal market conditions, the Fund invests at least 80% of its net assets in bonds, which include debt securities of any maturity, such as bonds, notes, bills and debentures.
Fund Risks: All investments involve risks, including possible loss of principal. Currency rates may fluctuate significantly over short periods of time, and can reduce returns. Derivatives, including currency management strategies, involve costs and can create economic leverage in the portfolio that may result in significant volatility and cause the Fund to participate in losses (as well as enable gains) on an amount that exceeds the Fund’s initial investment. The Fund may not achieve the anticipated benefits and may realize losses when a counterparty fails to perform as promised. Foreign securities involve special risks, including currency fluctuations and economic and political uncertainties. Investments in emerging markets involve heightened risks related to the same factors, in addition to those associated with these markets’ smaller size and lesser liquidity. Investments in lower rated bonds include higher risk of default and loss of principal. Changes in interest rates will affect the value of the Fund’s portfolio and its share price and yield. Bond prices generally move in the opposite direction of interest rates. As prices of bonds in the Fund adjust to a rise in interest rates, the Fund’s share price may decline. The Fund is also nondiversified, which involves the risk of greater price fluctuation than a more diversified portfolio. Changes in the financial strength of a bond issuer or in a bond’s credit rating may affect its value. The Fund is actively managed but there is no guarantee that the manager’s investment decisions will produce the desired results. The Fund’s prospectus also includes a description of the main investment risks.
Performance Overview
You can find the Fund’s six-month total return in the Performance Summary. For comparison, the Fund’s benchmarks, the J.P. Morgan (JPM) Global Government Bond Index (GGBI) and the Citigroup World Government Bond Index, generated +5.05% and +5.00% total returns for the same period.1
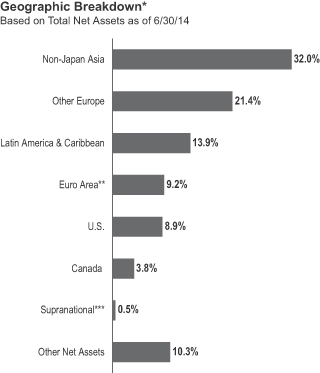
*Weightings may be negative or may not total 100% due to rounding, use of any derivatives, unsettled trades or other factors
**The Fund’s euro area investments were in Ireland and Slovenia.
***The Fund’s supranational investment was denominated in the Mexican peso.
Economic and Market Overview
The global economic recovery was mixed during the period under review. The recovery in emerging markets moderated from fairly strong levels. Although some developed economies, such as those of Australia and some Scandinavian countries, also enjoyed relatively strong recoveries, the G-3 (U.S., eurozone and Japan) continued to experience growth that was slow by the standards of previous recoveries. As fears eased surrounding the issues of European sovereign debt, the possibility of another U.S. recession and a potential Chinese “hard landing,” financial market performance was positive. Improving sentiment, relatively strong fundamentals and continued provision of global liquidity supported risk assets as equity markets performed well. Policymakers in the largest developed economies adjusted their unprecedented efforts to supply liquidity. The European Central Bank (ECB) took the unusual step of
1. Source: © 2014 Morningstar. One cannot invest directly in an index, and an index is not representative of the Fund’s portfolio. Please see Index Descriptions following the Fund Summaries.
| TGB-2 | Semiannual Report |
TEMPLETON GLOBAL BOND VIP FUND
| Semiannual Report | TGB-3 |
TEMPLETON GLOBAL BOND VIP FUND
| TGB-4 | Semiannual Report |
TEMPLETON GLOBAL BOND VIP FUND
Class 2 Fund Expenses
| Class 2 | Beginning Account Value 1/1/14 |
Ending Account Value 6/30/14 |
Fund-Level Expenses 1/1/14–6/30/14 |
|||||||||
| Actual | $1,000 | $1,031.90 | $3.83 | |||||||||
| Hypothetical (5% return before expenses) | $1,000 | $1,021.03 | $3.81 | |||||||||
*Expenses are calculated using the most recent six-month annualized expense ratio for the Fund’s Class 2 shares (0.76%), which does not include any ongoing expenses of the Contract for which the Fund is an investment option, multiplied by the average account value over the period, multiplied by 181/365 to reflect the one-half year period.
| Semiannual Report | TGB-5 |
FRANKLIN TEMPLETON VARIABLE INSURANCE PRODUCTS TRUST
Financial Highlights
Templeton Global Bond VIP Fund
| Six Months Ended June 30, 2014 (unaudited) |
Year Ended December 31, | |||||||||||||||||||||||
| 2013 | 2012 | 2011 | 2010 | 2009 | ||||||||||||||||||||
| Class 1 | ||||||||||||||||||||||||
| Per share operating performance (for a share outstanding throughout the period) |
||||||||||||||||||||||||
| Net asset value, beginning of period |
$19.15 | $20.01 | $18.61 | $19.94 | $17.72 | $17.42 | ||||||||||||||||||
|
|
|
|||||||||||||||||||||||
| Income from investment operationsa: | ||||||||||||||||||||||||
| Net investment incomeb |
0.30 | 0.64 | 0.72 | 0.87 | 1.00 | 0.99 | ||||||||||||||||||
| Net realized and unrealized gains (losses) |
0.34 | (0.30 | ) | 1.99 | (0.92 | ) | 1.58 | 2.01 | ||||||||||||||||
|
|
|
|||||||||||||||||||||||
| Total from investment operations |
0.64 | 0.34 | 2.71 | (0.05 | ) | 2.58 | 3.00 | |||||||||||||||||
|
|
|
|||||||||||||||||||||||
| Less distributions from: | ||||||||||||||||||||||||
| Net investment income and net foreign currency gains |
(1.01 | ) | (0.96 | ) | (1.28 | ) | (1.15 | ) | (0.31 | ) | (2.70 | ) | ||||||||||||
| Net realized gains |
— | (0.24 | ) | (0.03 | ) | (0.13 | ) | (0.05 | ) | — | ||||||||||||||
|
|
|
|||||||||||||||||||||||
| Total distributions |
(1.01 | ) | (1.20 | ) | (1.31 | ) | (1.28 | ) | (0.36 | ) | (2.70 | ) | ||||||||||||
|
|
|
|||||||||||||||||||||||
| Redemption feesc |
— | — | — | — | — | — | ||||||||||||||||||
|
|
|
|||||||||||||||||||||||
| Net asset value, end of period |
$18.78 | $19.15 | $20.01 | $18.61 | $19.94 | $17.72 | ||||||||||||||||||
|
|
|
|||||||||||||||||||||||
| Total returnd |
3.33% | 1.89% | 15.31% | (0.61)% | 14.71% | 18.98% | ||||||||||||||||||
| Ratios to average net assetse | ||||||||||||||||||||||||
| Expensesf |
0.51% | 0.51% | 0.55% | 0.56% | 0.55% | 0.54% | ||||||||||||||||||
| Net investment income |
3.17% | 3.26% | 3.71% | 4.40% | 5.27% | 5.73% | ||||||||||||||||||
| Supplemental data | ||||||||||||||||||||||||
| Net assets, end of period (000’s) |
$314,705 | $280,963 | $307,142 | $269,819 | $272,232 | $195,662 | ||||||||||||||||||
| Portfolio turnover rate |
18.58% | 34.39% | 43.26% | 34.18% | 8.77% | 20.84% | ||||||||||||||||||
aThe amount shown for a share outstanding throughout the period may not correlate with the Statement of Operations for the period due to the timing of sales and repurchases of the Fund shares in relation to income earned and/or fluctuating fair value of the investments of the Fund.
bBased on average daily shares outstanding.
cAmount rounds to less than $0.01 per share.
dTotal return does not include fees, charges or expenses imposed by the variable annuity and life insurance contracts for which the Franklin Templeton Variable Insurance Products Trust serves as an underlying investment vehicle. Total return is not annualized for periods less than one year.
eRatios are annualized for periods less than one year.
fBenefit of expense reduction rounds to less than 0.01%.
| TGB-6 | Semiannual Report | The accompanying notes are an integral part of these financial statements. |
FRANKLIN TEMPLETON VARIABLE INSURANCE PRODUCTS TRUST
FINANCIAL HIGHLIGHTS
Templeton Global Bond VIP Fund (continued)
| Six Months Ended (unaudited) |
Year Ended December 31, | |||||||||||||||||||||||
| 2013 | 2012 | 2011 | 2010 | 2009 | ||||||||||||||||||||
| Class 2 | ||||||||||||||||||||||||
| Per share operating performance (for a share outstanding throughout the period) |
||||||||||||||||||||||||
| Net asset value, beginning of period |
$18.60 | $19.47 | $18.15 | $19.49 | $17.34 | $17.10 | ||||||||||||||||||
|
|
|
|||||||||||||||||||||||
| Income from investment operationsa: | ||||||||||||||||||||||||
| Net investment incomeb |
0.27 | 0.57 | 0.65 | 0.79 | 0.93 | 0.93 | ||||||||||||||||||
| Net realized and unrealized gains (losses) |
0.32 | (0.27 | ) | 1.94 | (0.89 | ) | 1.54 | 1.98 | ||||||||||||||||
|
|
|
|||||||||||||||||||||||
| Total from investment operations |
0.59 | 0.30 | 2.59 | (0.10 | ) | 2.47 | 2.91 | |||||||||||||||||
|
|
|
|||||||||||||||||||||||
| Less distributions from: | ||||||||||||||||||||||||
| Net investment income and net foreign currency gains |
(0.96 | ) | (0.93 | ) | (1.24 | ) | (1.11 | ) | (0.27 | ) | (2.67 | ) | ||||||||||||
| Net realized gains |
— | (0.24 | ) | (0.03 | ) | (0.13 | ) | (0.05 | ) | — | ||||||||||||||
|
|
|
|||||||||||||||||||||||
| Total distributions |
(0.96 | ) | (1.17 | ) | (1.27 | ) | (1.24 | ) | (0.32 | ) | (2.67 | ) | ||||||||||||
|
|
|
|||||||||||||||||||||||
| Redemption feesc |
— | — | — | — | — | — | ||||||||||||||||||
|
|
|
|||||||||||||||||||||||
| Net asset value, end of period |
$18.23 | $18.60 | $19.47 | $18.15 | $19.49 | $17.34 | ||||||||||||||||||
|
|
|
|||||||||||||||||||||||
| Total returnd |
3.19% | 1.63% | 15.07% | (0.87)% | 14.45% | 18.68% | ||||||||||||||||||
| Ratios to average net assetse | ||||||||||||||||||||||||
| Expensesf |
0.76% | 0.76% | 0.80% | 0.81% | 0.80% | 0.79% | ||||||||||||||||||
| Net investment income |
2.92% | 3.01% | 3.46% | 4.15% | 5.02% | 5.48% | ||||||||||||||||||
| Supplemental data | ||||||||||||||||||||||||
| Net assets, end of period (000’s) |
$3,137,403 | $2,826,039 | $2,418,229 | $1,812,814 | $1,490,794 | $1,262,783 | ||||||||||||||||||
| Portfolio turnover rate |
18.58% | 34.39% | 43.26% | 34.18% | 8.77% | 20.84% | ||||||||||||||||||
aThe amount shown for a share outstanding throughout the period may not correlate with the Statement of Operations for the period due to the timing of sales and repurchases of the Fund shares in relation to income earned and/or fluctuating fair value of the investments of the Fund.
bBased on average daily shares outstanding.
cAmount rounds to less than $0.01 per share.
dTotal return does not include fees, charges or expenses imposed by the variable annuity and life insurance contracts for which the Franklin Templeton Variable Insurance Products Trust serves as an underlying investment vehicle. Total return is not annualized for periods less than one year.
eRatios are annualized for periods less than one year.
fBenefit of expense reduction rounds to less than 0.01%.
| The accompanying notes are an integral part of these financial statements. | Semiannual Report | TGB-7 |
FRANKLIN TEMPLETON VARIABLE INSURANCE PRODUCTS TRUST
FINANCIAL HIGHLIGHTS
Templeton Global Bond VIP Fund (continued)
| Six Months Ended June 30, 2014 (unaudited) |
Year Ended December 31, | |||||||||||||||||||||||
| 2013 | 2012 | 2011 | 2010 | 2009 | ||||||||||||||||||||
| Class 4 | ||||||||||||||||||||||||
| Per share operating performance (for a share outstanding throughout the period) |
||||||||||||||||||||||||
| Net asset value, beginning of period |
$18.97 | $19.82 | $18.44 | $19.78 | $17.61 | $17.37 | ||||||||||||||||||
|
|
|
|||||||||||||||||||||||
| Income from investment operationsa: | ||||||||||||||||||||||||
| Net investment incomeb |
0.27 | 0.56 | 0.64 | 0.79 | 0.93 | 0.93 | ||||||||||||||||||
| Net realized and unrealized gains (losses) |
0.31 | (0.28 | ) | 1.98 | (0.91 | ) | 1.56 | 2.00 | ||||||||||||||||
|
|
|
|||||||||||||||||||||||
| Total from investment operations |
0.58 | 0.28 | 2.62 | (0.12 | ) | 2.49 | 2.93 | |||||||||||||||||
|
|
|
|||||||||||||||||||||||
| Less distributions from: | ||||||||||||||||||||||||
| Net investment income and net foreign currency gains |
(0.92 | ) | (0.89 | ) | (1.21 | ) | (1.09 | ) | (0.27 | ) | (2.69 | ) | ||||||||||||
| Net realized gains |
— | (0.24 | ) | (0.03 | ) | (0.13 | ) | (0.05 | ) | — | ||||||||||||||
|
|
|
|||||||||||||||||||||||
| Total distributions |
(0.92 | ) | (1.13 | ) | (1.24 | ) | (1.22 | ) | (0.32 | ) | (2.69 | ) | ||||||||||||
|
|
|
|||||||||||||||||||||||
| Redemption feesc |
— | — | — | — | — | — | ||||||||||||||||||
|
|
|
|||||||||||||||||||||||
| Net asset value, end of period |
$18.63 | $18.97 | $19.82 | $18.44 | $19.78 | $17.61 | ||||||||||||||||||
|
|
|
|||||||||||||||||||||||
| Total returnd |
3.08% | 1.54% | 14.97% | (0.96)% | 14.28% | 18.58% | ||||||||||||||||||
| Ratios to average net assetse | ||||||||||||||||||||||||
| Expensesf |
0.86% | 0.86% | 0.90% | 0.91% | 0.90% | 0.89% | ||||||||||||||||||
| Net investment income |
2.82% | 2.91% | 3.36% | 4.05% | 4.92% | 5.38% | ||||||||||||||||||
| Supplemental data | ||||||||||||||||||||||||
| Net assets, end of period (000’s) |
$116,993 | $118,145 | $163,241 | $151,695 | $150,891 | $108,910 | ||||||||||||||||||
| Portfolio turnover rate |
18.58% | 34.39% | 43.26% | 34.18% | 8.77% | 20.84% | ||||||||||||||||||
aThe amount shown for a share outstanding throughout the period may not correlate with the Statement of Operations for the period due to the timing of sales and repurchases of the Fund shares in relation to income earned and/or fluctuating fair value of the investments of the Fund.
bBased on average daily shares outstanding.
cAmount rounds to less than $0.01 per share.
dTotal return does not include fees, charges or expenses imposed by the variable annuity and life insurance contracts for which the Franklin Templeton Variable Insurance Products Trust serves as an underlying investment vehicle. Total return is not annualized for periods less than one year.
eRatios are annualized for periods less than one year.
fBenefit of expense reduction rounds to less than 0.01%.
| TGB-8 | Semiannual Report | The accompanying notes are an integral part of these financial statements. |
FRANKLIN TEMPLETON VARIABLE INSURANCE PRODUCTS TRUST
Statement of Investments, June 30, 2014 (unaudited)
| Templeton Global Bond VIP Fund | ||||||||||
| Principal Amount* | Value | |||||||||
| Foreign Government and Agency Securities 64.5% |
||||||||||
| Brazil 4.7% |
||||||||||
| Letra Tesouro Nacional, Strip, |
||||||||||
| 1/01/15 |
3,971 | a BRL | $ | 1,702,766 | ||||||
| 1/01/16 |
26,160 | a BRL | 10,071,585 | |||||||
| 1/01/17 |
46,660 | a BRL | 16,016,735 | |||||||
| 1/01/18 |
28,770 | a BRL | 8,780,326 | |||||||
| Nota Do Tesouro Nacional, |
||||||||||
| 10.00%, 1/01/17 |
22,490 | a BRL | 9,854,568 | |||||||
| 10.00%, 1/01/21 |
9,240 | a BRL | 3,836,307 | |||||||
| 10.00%, 1/01/23 |
26,700 | a BRL | 10,870,763 | |||||||
| b Index Linked, 6.00%, 5/15/15 |
30,226 | a BRL | 33,877,643 | |||||||
| b Index Linked, 6.00%, 8/15/16 |
14,388 | a BRL | 16,180,512 | |||||||
| b Index Linked, 6.00%, 5/15/17 |
202 | a BRL | 227,913 | |||||||
| b Index Linked, 6.00%, 8/15/18 |
15,665 | a BRL | 17,590,648 | |||||||
| b Index Linked, 6.00%, 8/15/22 |
14,400 | a BRL | 16,046,254 | |||||||
| b Index Linked, 6.00%, 5/15/45 |
10,825 | a BRL | 11,740,325 | |||||||
| senior note, 10.00%, 1/01/19 |
21,390 | a BRL | 9,112,338 | |||||||
|
|
|
|||||||||
| 165,908,683 | ||||||||||
|
|
|
|||||||||
| Canada 3.2% |
||||||||||
| Government of Canada, |
||||||||||
| 2.25%, 8/01/14 |
35,099,000 | CAD | 32,948,859 | |||||||
| 1.00%, 11/01/14 |
20,887,000 | CAD | 19,585,149 | |||||||
| 2.00%, 12/01/14 |
17,861,000 | CAD | 16,820,106 | |||||||
| 1.00%, 2/01/15 |
48,972,000 | CAD | 45,929,303 | |||||||
|
|
|
|||||||||
| 115,283,417 | ||||||||||
|
|
|
|||||||||
| Hungary 4.7% |
||||||||||
| Government of Hungary, |
||||||||||
| 7.75%, 8/24/15 |
672,690,000 | HUF | 3,159,979 | |||||||
| 5.50%, 2/12/16 |
436,800,000 | HUF | 2,032,286 | |||||||
| 5.50%, 12/22/16 |
258,730,000 | HUF | 1,222,761 | |||||||
| 4.125%, 2/19/18 |
14,310,000 | 14,927,119 | ||||||||
| 4.00%, 4/25/18 |
609,130,000 | HUF | 2,781,366 | |||||||
| 6.50%, 6/24/19 |
1,037,370,000 | HUF | 5,241,835 | |||||||
| 7.50%, 11/12/20 |
317,540,000 | HUF | 1,697,859 | |||||||
| 5.375%, 2/21/23 |
26,430,000 | 28,453,216 | ||||||||
| A, 8.00%, 2/12/15 |
280,000,000 | HUF | 1,281,842 | |||||||
| A, 6.75%, 11/24/17 |
2,394,300,000 | HUF | 11,903,159 | |||||||
| A, 5.50%, 12/20/18 |
446,060,000 | HUF | 2,159,323 | |||||||
| A, 7.00%, 6/24/22 |
1,272,650,000 | HUF | 6,730,864 | |||||||
| A, 6.00%, 11/24/23 |
613,400,000 | HUF | 3,076,100 | |||||||
| B, 6.75%, 2/24/17 |
597,480,000 | HUF | 2,916,107 | |||||||
| B, 5.50%, 6/24/25 |
2,583,860,000 | HUF | 12,542,547 | |||||||
| D, 6.75%, 8/22/14 |
923,770,000 | HUF | 4,109,561 | |||||||
| senior note, 6.25%, 1/29/20 |
6,420,000 | 7,274,662 | ||||||||
| senior note, 6.375%, 3/29/21 |
14,820,000 | 16,950,375 | ||||||||
| c senior note, Reg S, 3.50%, 7/18/16 |
1,055,000 | EUR | 1,498,046 | |||||||
| c senior note, Reg S, 4.375%, 7/04/17 |
7,480,000 | EUR | 10,995,869 | |||||||
| c senior note, Reg S, 5.75%, 6/11/18 |
14,475,000 | EUR | 22,498,864 | |||||||
| c senior note, Reg S, 3.875%, 2/24/20 |
3,120,000 | EUR | 4,560,983 | |||||||
|
|
|
|||||||||
| 168,014,723 | ||||||||||
|
|
|
|||||||||
| Semiannual Report | TGB-9 |
FRANKLIN TEMPLETON VARIABLE INSURANCE PRODUCTS TRUST
STATEMENT OF INVESTMENTS (UNAUDITED)
| Templeton Global Bond VIP Fund (continued) | ||||||||||
| Principal Amount* | Value | |||||||||
| Foreign Government and Agency Securities (continued) |
||||||||||
| Iceland 0.2% |
||||||||||
| d | Government of Iceland, 144A, 5.875%, 5/11/22 |
7,660,000 | $ | 8,461,696 | ||||||
|
|
|
|||||||||
| Indonesia 2.4% |
||||||||||
| Government of Indonesia, |
||||||||||
| FR31, 11.00%, 11/15/20 |
170,808,000,000 | IDR | 16,578,898 | |||||||
| FR34, 12.80%, 6/15/21 |
208,649,000,000 | IDR | 22,066,113 | |||||||
| FR35, 12.90%, 6/15/22 |
67,421,000,000 | IDR | 7,216,548 | |||||||
| FR36, 11.50%, 9/15/19 |
31,754,000,000 | IDR | 3,087,959 | |||||||
| FR39, 11.75%, 8/15/23 |
5,491,000,000 | IDR | 567,396 | |||||||
| FR40, 11.00%, 9/15/25 |
46,856,000,000 | IDR | 4,672,101 | |||||||
| FR43, 10.25%, 7/15/22 |
69,179,000,000 | IDR | 6,512,103 | |||||||
| FR44, 10.00%, 9/15/24 |
4,454,000,000 | IDR | 419,382 | |||||||
| FR46, 9.50%, 7/15/23 |
226,780,000,000 | IDR | 20,553,003 | |||||||
| FR48, 9.00%, 9/15/18 |
16,920,000,000 | IDR | 1,493,520 | |||||||
| senior bond, FR53, 8.25%, 7/15/21 |
11,270,000,000 | IDR | 958,658 | |||||||
| Indonesia Retail Bond, senior note, 8.50%, 10/15/16 |
3,358,000,000 | IDR | 289,006 | |||||||
|
|
|
|||||||||
| 84,414,687 | ||||||||||
|
|
|
|||||||||
| Ireland 8.8% |
||||||||||
| Government of Ireland, |
||||||||||
| 5.50%, 10/18/17 |
20,708,700 | EUR | 33,013,043 | |||||||
| 5.90%, 10/18/19 |
20,597,000 | EUR | 35,373,847 | |||||||
| 4.50%, 4/18/20 |
19,512,000 | EUR | 31,640,657 | |||||||
| 5.00%, 10/18/20 |
58,588,000 | EUR | 97,948,852 | |||||||
| senior bond, 4.50%, 10/18/18 |
8,090,000 | EUR | 12,869,635 | |||||||
| senior bond, 4.40%, 6/18/19 |
20,943,000 | EUR | 33,547,165 | |||||||
| senior bond, 5.40%, 3/13/25 |
40,422,910 | EUR | 70,205,047 | |||||||
|
|
|
|||||||||
| 314,598,246 | ||||||||||
|
|
|
|||||||||
| Lithuania 1.1% |
||||||||||
| d | Government of Lithuania, 144A, |
|||||||||
| 6.75%, 1/15/15 |
19,480,000 | 20,111,249 | ||||||||
| 7.375%, 2/11/20 |
12,690,000 | 15,566,442 | ||||||||
| 6.125%, 3/09/21 |
3,240,000 | 3,797,086 | ||||||||
|
|
|
|||||||||
| 39,474,777 | ||||||||||
|
|
|
|||||||||
| Malaysia 3.1% |
||||||||||
| Government of Malaysia, |
||||||||||
| 3.434%, 8/15/14 |
59,260,000 | MYR | 18,466,383 | |||||||
| 3.741%, 2/27/15 |
80,530,000 | MYR | 25,187,256 | |||||||
| 3.835%, 8/12/15 |
54,190,000 | MYR | 16,992,810 | |||||||
| 4.72%, 9/30/15 |
42,200,000 | MYR | 13,378,885 | |||||||
| 3.197%, 10/15/15 |
51,120,000 | MYR | 15,910,722 | |||||||
| senior bond, 3.814%, 2/15/17 |
18,885,000 | MYR | 5,928,984 | |||||||
| senior bond, 4.24%, 2/07/18 |
44,360,000 | MYR | 14,116,178 | |||||||
|
|
|
|||||||||
| 109,981,218 | ||||||||||
|
|
|
|||||||||
| Mexico 4.4% |
||||||||||
| Government of Mexico, |
||||||||||
| 9.50%, 12/18/14 |
5,221,200 | e MXN | 41,437,453 | |||||||
| 6.00%, 6/18/15 |
775,800 | e MXN | 6,145,120 | |||||||
| 8.00%, 12/17/15 |
5,566,550 | e MXN | 45,850,201 | |||||||
| 6.25%, 6/16/16 |
733,810 | e MXN | 5,967,660 | |||||||
| 7.25%, 12/15/16 |
250,000 | e MXN | 2,091,463 | |||||||
| 7.75%, 12/14/17 |
4,473,000 | e MXN | 38,594,167 | |||||||
| TGB-10 | Semiannual Report |
FRANKLIN TEMPLETON VARIABLE INSURANCE PRODUCTS TRUST
STATEMENT OF INVESTMENTS (UNAUDITED)
| Templeton Global Bond VIP Fund (continued) | ||||||||||
| Principal Amount* | Value | |||||||||
| Foreign Government and Agency Securities (continued) |
||||||||||
| Mexico (continued) |
||||||||||
| f | Mexican Udibonos, Index Linked, |
|||||||||
| 4.50%, 12/18/14 |
225,369 | g MXN | $ | 1,783,575 | ||||||
| 5.00%, 6/16/16 |
577,352 | g MXN | 4,886,129 | |||||||
| 3.50%, 12/14/17 |
578,841 | g MXN | 4,896,269 | |||||||
| 4.00%, 6/13/19 |
397,302 | g MXN | 3,460,719 | |||||||
| 2.50%, 12/10/20 |
312,895 | g MXN | 2,523,729 | |||||||
|
|
|
|||||||||
| 157,636,485 | ||||||||||
|
|
|
|||||||||
| Peru 0.1% |
||||||||||
| Government of Peru, senior bond, 7.84%, 8/12/20 |
11,090,000 | PEN | 4,560,613 | |||||||
|
|
|
|||||||||
| Philippines 0.3% |
||||||||||
| Government of the Philippines, |
||||||||||
| senior bond, 7.00%, 1/27/16 |
53,190,000 | PHP | 1,292,515 | |||||||
| senior bond, 9.125%, 9/04/16 |
31,840,000 | PHP | 812,990 | |||||||
| senior note, 1.625%, 4/25/16 |
349,310,000 | PHP | 7,930,112 | |||||||
|
|
|
|||||||||
| 10,035,617 | ||||||||||
|
|
|
|||||||||
| Poland 7.4% |
||||||||||
| Government of Poland, |
||||||||||
| 6.25%, 10/24/15 |
34,630,000 | PLN | 11,965,289 | |||||||
| 5.00%, 4/25/16 |
61,000,000 | PLN | 20,988,813 | |||||||
| 4.75%, 10/25/16 |
340,685,000 | PLN | 117,804,802 | |||||||
| 5.75%, 9/23/22 |
48,750,000 | PLN | 18,775,878 | |||||||
| h FRN, 2.72%, 1/25/17 |
59,279,000 | PLN | 19,514,184 | |||||||
| h FRN, 2.72%, 1/25/21 |
60,135,000 | PLN | 19,526,151 | |||||||
| Strip, 1/25/16 |
177,077,000 | PLN | 56,175,267 | |||||||
|
|
|
|||||||||
| 264,750,384 | ||||||||||
|
|
|
|||||||||
| Russia 1.6% |
||||||||||
| d | Government of Russia, senior bond, 144A, 7.50%, 3/31/30 |
48,523,345 | 56,341,669 | |||||||
|
|
|
|||||||||
| Serbia 0.7% |
||||||||||
| d | Government of Serbia, senior note, 144A, |
|||||||||
| 5.25%, 11/21/17 |
4,590,000 | 4,802,287 | ||||||||
| 4.875%, 2/25/20 |
8,800,000 | 8,954,000 | ||||||||
| 7.25%, 9/28/21 |
9,670,000 | 11,077,082 | ||||||||
|
|
|
|||||||||
| 24,833,369 | ||||||||||
|
|
|
|||||||||
| Singapore 0.7% |
||||||||||
| Government of Singapore, senior note, |
||||||||||
| 3.625%, 7/01/14 |
21,650,000 | SGD | 17,366,542 | |||||||
| 1.125%, 4/01/16 |
11,000,000 | SGD | 8,941,240 | |||||||
|
|
|
|||||||||
| 26,307,782 | ||||||||||
|
|
|
|||||||||
| Slovenia 0.4% |
||||||||||
| d | Government of Slovenia, senior note, 144A, |
|||||||||
| 5.50%, 10/26/22 |
8,140,000 | 8,969,629 | ||||||||
| 5.85%, 5/10/23 |
5,030,000 | 5,678,115 | ||||||||
|
|
|
|||||||||
| 14,647,744 | ||||||||||
|
|
|
|||||||||
| South Korea 13.5% |
||||||||||
| The Export-Import Bank of Korea, senior note, 4.625%, 2/20/17 |
230,000 | EUR | 345,868 | |||||||
| Korea Monetary Stabilization Bond, |
||||||||||
| senior bond, 2.47%, 4/02/15 |
22,461,930,000 | KRW | 22,177,050 | |||||||
| senior bond, 2.80%, 8/02/15 |
68,737,030,000 | KRW | 68,063,242 | |||||||
| Semiannual Report | TGB-11 |
FRANKLIN TEMPLETON VARIABLE INSURANCE PRODUCTS TRUST
STATEMENT OF INVESTMENTS (UNAUDITED)
| Templeton Global Bond VIP Fund (continued) | ||||||||||
| Principal Amount* | Value | |||||||||
| Foreign Government and Agency Securities (continued) |
||||||||||
| South Korea (continued) |
||||||||||
| senior bond, 2.81%, 10/02/15 |
2,932,000,000 | KRW | $ | 2,904,218 | ||||||
| senior note, 2.82%, 8/02/14 |
31,785,420,000 | KRW | 31,415,428 | |||||||
| senior note, 2.78%, 10/02/14 |
13,357,000,000 | KRW | 13,205,519 | |||||||
| senior note, 2.84%, 12/02/14 |
22,065,270,000 | KRW | 21,827,153 | |||||||
| senior note, 2.74%, 2/02/15 |
47,745,950,000 | KRW | 47,220,463 | |||||||
| senior note, 2.76%, 6/02/15 |
51,516,200,000 | KRW | 50,979,860 | |||||||
| senior note, 2.90%, 12/02/15 |
54,164,800,000 | KRW | 53,728,432 | |||||||
| senior note, 2.78%, 2/02/16 |
20,416,550,000 | KRW | 20,220,737 | |||||||
| senior note, 2.80%, 4/02/16 |
34,476,970,000 | KRW | 34,160,988 | |||||||
| senior note, 2.79%, 6/02/16 |
10,523,000,000 | KRW | 10,427,430 | |||||||
| Korea Treasury Bond, |
||||||||||
| senior bond, 4.00%, 3/10/16 |
1,283,100,000 | KRW | 1,296,409 | |||||||
| senior bond, 5.00%, 9/10/16 |
2,806,000,000 | KRW | 2,909,467 | |||||||
| senior note, 3.25%, 12/10/14 |
13,830,700,000 | KRW | 13,706,156 | |||||||
| senior note, 4.50%, 3/10/15 |
641,500,000 | KRW | 642,106 | |||||||
| senior note, 3.25%, 6/10/15 |
4,668,800,000 | KRW | 4,641,498 | |||||||
| senior note, 4.00%, 9/10/15 |
3,390,100,000 | KRW | 3,404,307 | |||||||
| senior note, 2.75%, 12/10/15 |
32,942,000,000 | KRW | 32,618,081 | |||||||
| senior note, 2.75%, 6/10/16 |
18,308,100,000 | KRW | 18,128,148 | |||||||
| senior note, 3.00%, 12/10/16 |
26,530,400,000 | KRW | 26,421,814 | |||||||
|
|
|
|||||||||
| 480,444,374 | ||||||||||
|
|
|
|||||||||
| Sri Lanka 1.2% |
||||||||||
| Government of Sri Lanka, |
||||||||||
| 8.25%, 3/01/17 |
41,710,000 | LKR | 325,132 | |||||||
| 10.60%, 7/01/19 |
20,000,000 | LKR | 165,096 | |||||||
| 11.20%, 7/01/22 |
69,990,000 | LKR | 579,020 | |||||||
| A, 11.25%, 7/15/14 |
773,000,000 | LKR | 5,941,587 | |||||||
| A, 11.75%, 3/15/15 |
8,520,000 | LKR | 67,520 | |||||||
| A, 6.50%, 7/15/15 |
239,920,000 | LKR | 1,831,593 | |||||||
| A, 11.00%, 8/01/15 |
1,349,700,000 | LKR | 10,773,936 | |||||||
| A, 8.50%, 11/01/15 |
144,870,000 | LKR | 1,130,848 | |||||||
| A, 6.40%, 8/01/16 |
109,200,000 | LKR | 823,414 | |||||||
| A, 5.80%, 1/15/17 |
112,300,000 | LKR | 827,642 | |||||||
| A, 7.50%, 8/15/18 |
25,990,000 | LKR | 193,922 | |||||||
| A, 8.00%, 11/15/18 |
512,300,000 | LKR | 3,864,332 | |||||||
| A, 9.00%, 5/01/21 |
861,720,000 | LKR | 6,503,316 | |||||||
| B, 6.40%, 10/01/16 |
119,100,000 | LKR | 895,578 | |||||||
| B, 8.50%, 7/15/18 |
146,350,000 | LKR | 1,130,087 | |||||||
| C, 8.50%, 4/01/18 |
444,930,000 | LKR | 3,444,303 | |||||||
| D, 8.50%, 6/01/18 |
633,000,000 | LKR | 4,893,468 | |||||||
|
|
|
|||||||||
| 43,390,794 | ||||||||||
|
|
|
|||||||||
| i | Supranational 0.5% |
|||||||||
| Inter-American Development Bank, senior note, 7.50%, 12/05/24 |
200,000,000 | MXN | 17,992,679 | |||||||
|
|
|
|||||||||
| Sweden 1.5% |
||||||||||
| Government of Sweden, 4.50%, 8/12/15 |
342,110,000 | SEK | 53,542,409 | |||||||
|
|
|
|||||||||
| Ukraine 3.6% |
||||||||||
| d | Financing of Infrastructure Projects State Enterprise, 144A, |
|||||||||
| 8.375%, 11/03/17 |
1,100,000 | 1,050,500 | ||||||||
| 7.40%, 4/20/18 |
840,000 | 803,775 | ||||||||
| TGB-12 | Semiannual Report |
FRANKLIN TEMPLETON VARIABLE INSURANCE PRODUCTS TRUST
STATEMENT OF INVESTMENTS (UNAUDITED)
| Templeton Global Bond VIP Fund (continued) | ||||||||||
| Principal Amount* | Value | |||||||||
| Foreign Government and Agency Securities (continued) |
||||||||||
| Ukraine (continued) |
||||||||||
| d | Government of Ukraine, |
|||||||||
| 144A, 9.25%, 7/24/17 |
46,270,000 | $ | 46,964,050 | |||||||
| 144A, 7.75%, 9/23/20 |
17,227,000 | 16,514,922 | ||||||||
| senior bond, 144A, 6.58%, 11/21/16 |
12,541,000 | 12,073,221 | ||||||||
| senior bond, 144A, 7.80%, 11/28/22 |
10,110,000 | 9,604,500 | ||||||||
| senior note, 144A, 4.95%, 10/13/15 |
290,000 | EUR | 377,383 | |||||||
| senior note, 144A, 6.25%, 6/17/16 |
8,760,000 | 8,442,450 | ||||||||
| senior note, 144A, 7.95%, 2/23/21 |
24,098,000 | 23,103,957 | ||||||||
| senior note, 144A, 7.50%, 4/17/23 |
8,160,000 | 7,715,606 | ||||||||
|
|
|
|||||||||
| 126,650,364 | ||||||||||
|
|
|
|||||||||
| Vietnam 0.4% |
||||||||||
| d | Government of Vietnam, 144A, 6.75%, 1/29/20 |
13,110,000 | 14,901,613 | |||||||
|
|
|
|||||||||
| Total Foreign Government and Agency Securities |
2,302,173,343 | |||||||||
|
|
|
|||||||||
| Short Term Investments 25.2% |
||||||||||
| Foreign Government and Agency Securities 16.3% |
||||||||||
| Canada 0.6% |
||||||||||
| j | Canada Treasury Bills, 7/31/14 - 9/11/14 |
23,550,000 | CAD | 22,053,785 | ||||||
|
|
|
|||||||||
| Malaysia 5.0% |
||||||||||
| j | Bank of Negara Monetary Notes, 7/03/14 - 6/16/15 |
583,025,000 | MYR | 178,759,314 | ||||||
|
|
|
|||||||||
| Mexico 4.7% |
||||||||||
| j | Mexico Treasury Bills, |
|||||||||
| 7/10/14 |
3,744,700 | k MXN | 2,883,591 | |||||||
| 10/16/14 |
48,848,680 | k MXN | 37,318,336 | |||||||
| 12/11/14 |
61,630,770 | k MXN | 46,852,968 | |||||||
| 4/01/15 |
108,012,900 | k MXN | 81,327,017 | |||||||
|
|
|
|||||||||
| 168,381,912 | ||||||||||
|
|
|
|||||||||
| Philippines 0.6% |
||||||||||
| j | Philippine Treasury Bills, 7/02/14 - 4/08/15 |
967,255,000 | PHP | 22,115,981 | ||||||
|
|
|
|||||||||
| Singapore 3.7% |
||||||||||
| j | Monetary Authority of Singapore Treasury Bills, |
|||||||||
| 8/01/14 |
56,381,000 | SGD | 45,217,368 | |||||||
| 7/11/14 - 11/25/14 |
108,930,000 | SGD | 87,339,460 | |||||||
|
|
|
|||||||||
| 132,556,828 | ||||||||||
|
|
|
|||||||||
| South Korea 1.1% |
||||||||||
| Korea Monetary Stabilization Bond, |
||||||||||
| senior bond, 2.72%, 9/09/14 |
14,437,000,000 | KRW | 14,269,705 | |||||||
| senior note, 2.66%, 6/09/15 |
24,216,850,000 | KRW | 23,943,333 | |||||||
|
|
|
|||||||||
| 38,213,038 | ||||||||||
|
|
|
|||||||||
| Sweden 0.6% |
||||||||||
| j | Sweden Treasury Bills, 8/20/14 - 9/17/14 |
144,410,000 | SEK | 21,596,461 | ||||||
|
|
|
|||||||||
| Total Foreign Government and Agency Securities |
583,677,319 | |||||||||
|
|
|
|||||||||
| Total Investments before Repurchase Agreements |
2,885,850,662 | |||||||||
|
|
|
|||||||||
| Semiannual Report | TGB-13 |
FRANKLIN TEMPLETON VARIABLE INSURANCE PRODUCTS TRUST
STATEMENT OF INVESTMENTS (UNAUDITED)
| Templeton Global Bond VIP Fund (continued) | ||||||||||
| Principal Amount* | Value | |||||||||
| Repurchase Agreements (Cost $316,336,298) 8.9% |
||||||||||
| United States 8.9% |
||||||||||
| l | Joint Repurchase Agreement, 0.064%, 7/01/14 (Maturity Value $316,336,864) BNP Paribas Securities Corp. (Maturity Value $63,893,720) |
316,336,298 | $ | 316,336,298 | ||||||
| Collateralized by U.S. Government Agency Securities, 0.00% - 6.21%, 1/16/15 - 5/04/37; jU.S. Government Agency Discount Notes, 12/24/14 - 1/30/15; U.S. Government Agency Securities, Strips, 5/15/30; U.S. Treasury Bonds, 7.50% - 8.875%, 11/15/16 - 2/15/19; U.S. Treasury Notes, 0.25% - 4.50%, 7/15/15 - 4/30/18; and U.S. Treasury Notes, Index Linked, 1.375%, 7/15/18 (valued at $322,716,913) |
||||||||||
|
|
|
|||||||||
| Total Investments (Cost $3,033,799,743) 89.7% |
3,202,186,960 | |||||||||
| Other Assets, less Liabilities 10.3% |
366,914,800 | |||||||||
|
|
|
|||||||||
| Net Assets 100.0% |
$ | 3,569,101,760 | ||||||||
|
|
|
|||||||||
*The principal amount is stated in U.S. dollars unless otherwise indicated.
aPrincipal amount is stated in 1,000 Brazilian Real Units.
bRedemption price at maturity is adjusted for inflation. See Note 1(g).
cSecurity was purchased pursuant to Regulation S under the Securities Act of 1933, which exempts from registration securities offered and sold outside of the United States. Such a security cannot be sold in the United States without either an effective registration statement filed pursuant to the Securities Act of 1933, or pursuant to an exemption from registration. These securities have been deemed liquid under guidelines approved by the Trust’s Board of Trustees. At June 30, 2014, the aggregate value of these securities was $39,553,762, representing 1.11% of net assets.
dSecurity was purchased pursuant to Rule 144A under the Securities Act of 1933 and may be sold in transactions exempt from registration only to qualified institutional buyers or in a public offering registered under the Securities Act of 1933. These securities have been deemed liquid under guidelines approved by the Trust’s Board of Trustees. At June 30, 2014, the aggregate value of these securities was $285,311,232, representing 7.99% of net assets.
ePrincipal amount is stated in 100 Mexican Peso Units.
fPrincipal amount of security is adjusted for inflation. See Note 1(g).
gPrincipal amount is stated in Unidad de Inversion Units.
hThe coupon rate shown represents the rate at period end.
iA supranational organization is an entity formed by two or more central governments through international treaties.
jThe security is traded on a discount basis with no stated coupon rate.
kPrincipal amount is stated in 10 Mexican Peso Units.
l See Note 1(c) regarding joint repurchase agreement.
| TGB-14 | Semiannual Report |
FRANKLIN TEMPLETON VARIABLE INSURANCE PRODUCTS TRUST
STATEMENT OF INVESTMENTS (UNAUDITED)
Templeton Global Bond VIP Fund (continued)
At June 30, 2014, the Fund had the following forward exchange contracts outstanding. See Note 1(d).
Forward Exchange Contracts
| Currency | Counterpartya | Type | Quantity | Contract Amount* |
Settlement Date |
Unrealized Appreciation |
Unrealized Depreciation |
|||||||||||||||||||||||||
| Indian Rupee |
HSBC | Buy | 120,016,750 | 2,026,163 | 7/03/14 | $ | — | $ | (28,913 | ) | ||||||||||||||||||||||
| Indian Rupee |
HSBC | Buy | 251,448,000 | 4,110,004 | 7/07/14 | 71,573 | — | |||||||||||||||||||||||||
| Swedish Krona |
DBAB | Buy | 136,332,733 | 15,345,873 | EUR | 7/09/14 | — | (612,867 | ) | |||||||||||||||||||||||
| Mexican Peso |
CITI | Buy | 105,786,172 | 7,970,207 | 7/10/14 | 175,650 | — | |||||||||||||||||||||||||
| Malaysian Ringgit |
DBAB | Buy | 18,006,622 | 5,550,404 | 7/14/14 | 53,316 | — | |||||||||||||||||||||||||
| Indian Rupee |
DBAB | Buy | 239,338,000 | 3,897,918 | 7/15/14 | 76,806 | — | |||||||||||||||||||||||||
| Malaysian Ringgit |
DBAB | Buy | 13,610,000 | 4,232,360 | 7/15/14 | 2,898 | — | |||||||||||||||||||||||||
| Euro |
BZWS | Sell | 2,243,000 | 2,932,498 | 7/16/14 | — | (139,378 | ) | ||||||||||||||||||||||||
| Euro |
MSCO | Sell | 9,679,000 | 12,627,320 | 7/16/14 | — | (628,450 | ) | ||||||||||||||||||||||||
| Euro |
UBSW | Sell | 17,930,000 | 23,415,056 | 7/16/14 | — | (1,140,783 | ) | ||||||||||||||||||||||||
| Indian Rupee |
DBAB | Buy | 383,041,000 | 6,231,653 | 7/17/14 | 127,387 | — | |||||||||||||||||||||||||
| Euro |
BZWS | Sell | 3,518,000 | 4,627,050 | 7/18/14 | — | (191,029 | ) | ||||||||||||||||||||||||
| Malaysian Ringgit |
DBAB | Buy | 2,637,000 | 815,651 | 7/18/14 | 4,822 | — | |||||||||||||||||||||||||
| Malaysian Ringgit |
DBAB | Buy | 11,455,000 | 2,704,841 | EUR | 7/18/14 | — | (140,321 | ) | |||||||||||||||||||||||
| Indian Rupee |
JPHQ | Buy | 226,092,000 | 3,683,102 | 7/21/14 | 67,781 | — | |||||||||||||||||||||||||
| Euro |
DBAB | Sell | 1,935,000 | 2,538,372 | 7/22/14 | — | (111,752 | ) | ||||||||||||||||||||||||
| Euro |
MSCO | Sell | 12,182,000 | 15,957,689 | 7/22/14 | — | (726,446 | ) | ||||||||||||||||||||||||
| Indian Rupee |
DBAB | Buy | 79,271,000 | 1,285,302 | 7/22/14 | 29,585 | — | |||||||||||||||||||||||||
| Indian Rupee |
JPHQ | Buy | 152,363,000 | 2,476,018 | 7/22/14 | 51,263 | — | |||||||||||||||||||||||||
| Malaysian Ringgit |
DBAB | Buy | 4,160,000 | 1,280,867 | 7/22/14 | 13,202 | — | |||||||||||||||||||||||||
| Malaysian Ringgit |
DBAB | Buy | 12,933,000 | 3,029,870 | EUR | 7/22/14 | — | (126,504 | ) | |||||||||||||||||||||||
| Euro |
DBAB | Sell | 1,759,000 | 2,311,361 | 7/23/14 | — | (97,727 | ) | ||||||||||||||||||||||||
| Japanese Yen |
CITI | Sell | 913,412,000 | 9,181,286 | 7/24/14 | 163,057 | — | |||||||||||||||||||||||||
| Japanese Yen |
JPHQ | Sell | 1,407,000,000 | 14,122,252 | 7/24/14 | 230,769 | — | |||||||||||||||||||||||||
| Singapore Dollar |
JPHQ | Buy | 5,740,000 | 4,493,010 | 7/24/14 | 111,352 | — | |||||||||||||||||||||||||
| Euro |
DBAB | Sell | 4,715,000 | 6,236,219 | 7/25/14 | — | (221,395 | ) | ||||||||||||||||||||||||
| Euro |
GSCO | Sell | 4,711,000 | 6,236,704 | 7/25/14 | — | (215,432 | ) | ||||||||||||||||||||||||
| Japanese Yen |
JPHQ | Sell | 490,100,000 | 4,944,262 | 7/25/14 | 105,405 | — | |||||||||||||||||||||||||
| Malaysian Ringgit |
DBAB | Buy | 5,058,000 | 1,570,466 | 7/25/14 | 2,703 | — | |||||||||||||||||||||||||
| Malaysian Ringgit |
DBAB | Buy | 16,628,000 | 3,903,470 | EUR | 7/25/14 | — | (174,413 | ) | |||||||||||||||||||||||
| Chilean Peso |
DBAB | Buy | 1,967,720,000 | 3,551,200 | 7/28/14 | — | (3,730 | ) | ||||||||||||||||||||||||
| Euro |
CITI | Sell | 1,935,410 | 2,563,112 | 7/28/14 | — | (87,638 | ) | ||||||||||||||||||||||||
| Japanese Yen |
BZWS | Sell | 1,079,470,000 | 10,875,395 | 7/29/14 | 217,219 | — | |||||||||||||||||||||||||
| Chilean Peso |
DBAB | Buy | 635,690,000 | 1,131,725 | 7/30/14 | 14,055 | — | |||||||||||||||||||||||||
| Chilean Peso |
JPHQ | Buy | 675,370,000 | 1,209,907 | 7/30/14 | 7,393 | — | |||||||||||||||||||||||||
| Indian Rupee |
HSBC | Buy | 531,272,000 | 8,522,675 | 7/30/14 | 277,590 | — | |||||||||||||||||||||||||
| Malaysian Ringgit |
JPHQ | Buy | 5,318,000 | 1,632,139 | 7/30/14 | 21,468 | — | |||||||||||||||||||||||||
| Malaysian Ringgit |
JPHQ | Buy | 16,628,000 | 3,857,826 | EUR | 7/30/14 | — | (113,347 | ) | |||||||||||||||||||||||
| Chilean Peso |
MSCO | Buy | 1,963,430,000 | 3,690,311 | 7/31/14 | — | (151,747 | ) | ||||||||||||||||||||||||
| Euro |
JPHQ | Sell | 11,263,000 | 14,973,201 | 7/31/14 | — | (452,845 | ) | ||||||||||||||||||||||||
| Indian Rupee |
DBAB | Buy | 233,568,494 | 3,783,766 | 7/31/14 | 84,564 | — | |||||||||||||||||||||||||
| Indian Rupee |
JPHQ | Buy | 60,607,000 | 1,018,656 | 7/31/14 | — | (14,891 | ) | ||||||||||||||||||||||||
| Malaysian Ringgit |
HSBC | Buy | 3,005,000 | 916,354 | 7/31/14 | 17,988 | — | |||||||||||||||||||||||||
| Malaysian Ringgit |
JPHQ | Buy | 11,703,000 | 3,466,939 | 7/31/14 | 171,865 | — | |||||||||||||||||||||||||
| Chilean Peso |
DBAB | Buy | 1,271,380,000 | 2,278,949 | 8/01/14 | 12,145 | — | |||||||||||||||||||||||||
| Euro |
GSCO | Sell | 11,263,000 | 14,951,745 | 8/01/14 | — | (474,347 | ) | ||||||||||||||||||||||||
| Euro |
BZWS | Sell | 282,898 | 375,646 | 8/04/14 | — | (11,822 | ) | ||||||||||||||||||||||||
| Euro |
HSBC | Sell | 11,263,000 | 14,928,318 | 8/04/14 | — | (497,911 | ) | ||||||||||||||||||||||||
| Euro |
BZWS | Sell | 7,003,000 | 9,287,659 | 8/05/14 | — | (303,942 | ) | ||||||||||||||||||||||||
| Euro |
JPHQ | Sell | 5,724,900 | 7,572,342 | 8/06/14 | — | (268,743 | ) | ||||||||||||||||||||||||
| Indian Rupee |
JPHQ | Buy | 21,500,000 | 350,877 | 8/06/14 | 4,861 | — | |||||||||||||||||||||||||
| Malaysian Ringgit |
HSBC | Buy | 21,208,085 | 6,274,923 | 8/06/14 | 317,240 | — | |||||||||||||||||||||||||
| Malaysian Ringgit |
JPHQ | Buy | 1,100,000 | 331,655 | 8/06/14 | 10,261 | — | |||||||||||||||||||||||||
| Indian Rupee |
CITI | Buy | 34,491,000 | 565,171 | 8/07/14 | 5,424 | — | |||||||||||||||||||||||||
| Indian Rupee |
DBAB | Buy | 217,594,000 | 3,562,297 | 8/07/14 | 37,432 | — | |||||||||||||||||||||||||
| Semiannual Report | TGB-15 |
FRANKLIN TEMPLETON VARIABLE INSURANCE PRODUCTS TRUST
STATEMENT OF INVESTMENTS (UNAUDITED)
Templeton Global Bond VIP Fund (continued)
Forward Exchange Contracts (continued)
| Currency | Counterpartya | Type | Quantity | Contract Amount* |
Settlement Date |
Unrealized Appreciation |
Unrealized Depreciation |
|||||||||||||||||||||||||
| Malaysian Ringgit |
HSBC | Buy | 1,320,000 | 393,619 | 8/07/14 | $ | 16,659 | $ | — | |||||||||||||||||||||||
| Singapore Dollar |
DBAB | Buy | 6,207,000 | 4,893,490 | 8/07/14 | 85,500 | — | |||||||||||||||||||||||||
| Singapore Dollar |
HSBC | Buy | 6,206,000 | 4,894,322 | 8/07/14 | 83,866 | — | |||||||||||||||||||||||||
| Euro |
CITI | Sell | 1,210,637 | 1,611,721 | 8/08/14 | — | (46,433 | ) | ||||||||||||||||||||||||
| Euro |
CITI | Sell | 351,512 | 468,384 | 8/11/14 | — | (13,070 | ) | ||||||||||||||||||||||||
| Euro |
DBAB | Sell | 4,845,000 | 6,460,081 | 8/11/14 | — | (175,951 | ) | ||||||||||||||||||||||||
| Euro |
JPHQ | Sell | 6,343,900 | 8,447,664 | 8/11/14 | — | (241,360 | ) | ||||||||||||||||||||||||
| Malaysian Ringgit |
HSBC | Buy | 2,230,000 | 666,250 | 8/11/14 | 26,727 | — | |||||||||||||||||||||||||
| Chilean Peso |
DBAB | Buy | 1,145,000,000 | 2,028,523 | 8/12/14 | 32,526 | — | |||||||||||||||||||||||||
| Euro |
GSCO | Sell | 30,376,000 | 40,668,604 | 8/12/14 | — | (936,495 | ) | ||||||||||||||||||||||||
| Indian Rupee |
DBAB | Buy | 39,609,000 | 649,740 | 8/12/14 | 5,001 | — | |||||||||||||||||||||||||
| Indian Rupee |
HSBC | Buy | 42,784,000 | 701,822 | 8/12/14 | 5,402 | — | |||||||||||||||||||||||||
| Malaysian Ringgit |
HSBC | Buy | 6,100,000 | 1,853,146 | 8/12/14 | 42,343 | — | |||||||||||||||||||||||||
| Singapore Dollar |
BZWS | Buy | 1,717,028 | 1,351,778 | 8/12/14 | 25,551 | — | |||||||||||||||||||||||||
| Singapore Dollar |
DBAB | Buy | 12,363,000 | 9,768,489 | 8/12/14 | 148,600 | — | |||||||||||||||||||||||||
| South Korean Won |
HSBC | Buy | 11,980,000,000 | 1,018,568,902 | JPY | 8/12/14 | 1,760,301 | — | ||||||||||||||||||||||||
| Indian Rupee |
HSBC | Buy | 108,000,000 | 1,770,666 | 8/13/14 | 14,301 | — | |||||||||||||||||||||||||
| Euro |
MSCO | Sell | 1,962,500 | 2,604,218 | 8/15/14 | — | (83,784 | ) | ||||||||||||||||||||||||
| Chilean Peso |
DBAB | Buy | 2,188,820,000 | 3,887,089 | 8/18/14 | 50,485 | — | |||||||||||||||||||||||||
| Singapore Dollar |
BZWS | Buy | 4,886,000 | 3,847,244 | 8/18/14 | 72,113 | — | |||||||||||||||||||||||||
| Euro |
BZWS | Sell | 7,066,000 | 9,363,510 | 8/19/14 | — | (314,779 | ) | ||||||||||||||||||||||||
| Indian Rupee |
DBAB | Buy | 108,614,000 | 1,799,601 | 8/19/14 | — | (6,205 | ) | ||||||||||||||||||||||||
| Indian Rupee |
JPHQ | Buy | 358,075,000 | 5,936,798 | 8/19/14 | — | (24,392 | ) | ||||||||||||||||||||||||
| Japanese Yen |
DBAB | Sell | 838,612,000 | 8,543,578 | 8/19/14 | 262,362 | — | |||||||||||||||||||||||||
| Polish Zloty |
DBAB | Buy | 59,155,000 | 13,693,287 | EUR | 8/19/14 | 660,415 | — | ||||||||||||||||||||||||
| Singapore Dollar |
DBAB | Buy | 3,667,000 | 2,892,412 | 8/19/14 | 49,112 | — | |||||||||||||||||||||||||
| Singapore Dollar |
HSBC | Buy | 3,667,000 | 2,892,868 | 8/19/14 | 48,656 | — | |||||||||||||||||||||||||
| Chilean Peso |
JPHQ | Buy | 1,055,800,000 | 1,893,302 | 8/20/14 | 5,643 | — | |||||||||||||||||||||||||
| Chilean Peso |
MSCO | Buy | 981,300,000 | 1,843,960 | 8/20/14 | — | (79,009 | ) | ||||||||||||||||||||||||
| Euro |
DBAB | Sell | 3,964,000 | 5,294,081 | 8/20/14 | — | (135,420 | ) | ||||||||||||||||||||||||
| Euro |
JPHQ | Sell | 7,851,000 | 10,489,250 | 8/20/14 | — | (264,284 | ) | ||||||||||||||||||||||||
| Japanese Yen |
HSBC | Sell | 1,621,372,000 | 16,715,175 | 8/20/14 | 704,171 | — | |||||||||||||||||||||||||
| Japanese Yen |
JPHQ | Sell | 1,135,828,000 | 11,683,964 | 8/20/14 | 467,693 | — | |||||||||||||||||||||||||
| Indian Rupee |
DBAB | Buy | 98,937,000 | 1,668,527 | 8/21/14 | — | (35,437 | ) | ||||||||||||||||||||||||
| Japanese Yen |
BZWS | Sell | 376,247,000 | 3,880,435 | 8/22/14 | 164,957 | — | |||||||||||||||||||||||||
| Euro |
BZWS | Sell | 2,680,925 | 3,594,021 | 8/25/14 | — | (78,103 | ) | ||||||||||||||||||||||||
| Japanese Yen |
CITI | Sell | 751,731,000 | 7,738,515 | 8/25/14 | 314,948 | — | |||||||||||||||||||||||||
| Japanese Yen |
DBAB | Sell | 371,821,000 | 3,825,870 | 8/25/14 | 154,027 | — | |||||||||||||||||||||||||
| Japanese Yen |
HSBC | Sell | 746,218,000 | 7,662,084 | 8/25/14 | 292,959 | — | |||||||||||||||||||||||||
| Japanese Yen |
BZWS | Sell | 1,085,075,000 | 11,038,403 | 8/26/14 | 322,893 | — | |||||||||||||||||||||||||
| Japanese Yen |
JPHQ | Sell | 750,133,000 | 7,630,942 | 8/26/14 | 223,106 | — | |||||||||||||||||||||||||
| Malaysian Ringgit |
HSBC | Buy | 1,223,000 | 363,124 | 8/26/14 | 16,631 | — | |||||||||||||||||||||||||
| Swedish Krona |
UBSW | Buy | 30,000,000 | 3,417,246 | EUR | 8/26/14 | — | (193,249 | ) | |||||||||||||||||||||||
| Chilean Peso |
DBAB | Buy | 1,435,490,000 | 2,547,001 | 8/27/14 | 33,018 | — | |||||||||||||||||||||||||
| Euro |
CITI | Sell | 6,136,805 | 8,203,374 | 8/27/14 | — | (202,397 | ) | ||||||||||||||||||||||||
| Euro |
HSBC | Sell | 18,537,726 | 24,780,677 | 8/27/14 | — | (611,020 | ) | ||||||||||||||||||||||||
| Euro |
JPHQ | Sell | 14,996,625 | 20,054,025 | 8/27/14 | — | (487,315 | ) | ||||||||||||||||||||||||
| Indian Rupee |
DBAB | Buy | 130,201,000 | 2,196,169 | 8/27/14 | — | (49,079 | ) | ||||||||||||||||||||||||
| Japanese Yen |
DBAB | Sell | 685,950,000 | 6,949,848 | 8/27/14 | 175,798 | — | |||||||||||||||||||||||||
| Japanese Yen |
HSBC | Sell | 1,247,125,000 | 12,637,176 | 8/27/14 | 321,283 | — | |||||||||||||||||||||||||
| Japanese Yen |
JPHQ | Sell | 751,903,000 | 7,628,692 | 8/27/14 | 203,328 | — | |||||||||||||||||||||||||
| Malaysian Ringgit |
JPHQ | Buy | 8,340,000 | 2,483,399 | 8/27/14 | 106,127 | — | |||||||||||||||||||||||||
| Singapore Dollar |
DBAB | Buy | 15,499,000 | 12,204,702 | 8/27/14 | 228,032 | — | |||||||||||||||||||||||||
| Chilean Peso |
JPHQ | Buy | 593,800,000 | 1,052,650 | 8/28/14 | 14,484 | — | |||||||||||||||||||||||||
| Indian Rupee |
DBAB | Buy | 233,568,494 | 3,904,848 | 8/28/14 | — | (53,781 | ) | ||||||||||||||||||||||||
| Indian Rupee |
HSBC | Buy | 148,257,000 | 2,478,095 | 8/28/14 | — | (33,640 | ) | ||||||||||||||||||||||||
| TGB-16 | Semiannual Report |
FRANKLIN TEMPLETON VARIABLE INSURANCE PRODUCTS TRUST
STATEMENT OF INVESTMENTS (UNAUDITED)
Templeton Global Bond VIP Fund (continued)
Forward Exchange Contracts (continued)
| Currency | Counterpartya | Type | Quantity | Contract Amount* |
Settlement Date |
Unrealized Appreciation |
Unrealized Depreciation |
|||||||||||||||||||||||||
| Indian Rupee |
JPHQ | Buy | 60,607,000 | 1,013,715 | 8/28/14 | $ | — | $ | (14,430 | ) | ||||||||||||||||||||||
| Euro |
DBAB | Sell | 1,058,312 | 1,413,270 | 8/29/14 | — | (36,341 | ) | ||||||||||||||||||||||||
| Japanese Yen |
JPHQ | Sell | 372,662,000 | 3,835,372 | 8/29/14 | 155,127 | — | |||||||||||||||||||||||||
| Euro |
DBAB | Sell | 1,732,000 | 2,293,688 | 9/03/14 | — | (78,752 | ) | ||||||||||||||||||||||||
| Indian Rupee |
CITI | Buy | 34,827,000 | 582,260 | 9/03/14 | — | (8,630 | ) | ||||||||||||||||||||||||
| Indian Rupee |
DBAB | Buy | 211,714,000 | 3,541,937 | 9/03/14 | — | (54,829 | ) | ||||||||||||||||||||||||
| Indian Rupee |
HSBC | Buy | 120,016,750 | 2,007,019 | 9/03/14 | — | (30,242 | ) | ||||||||||||||||||||||||
| Chilean Peso |
DBAB | Buy | 2,582,200,000 | 4,533,263 | 9/05/14 | 103,504 | — | |||||||||||||||||||||||||
| Euro |
DBAB | Sell | 8,105,300 | 10,696,483 | 9/05/14 | — | (406,003 | ) | ||||||||||||||||||||||||
| Chilean Peso |
DBAB | Buy | 1,320,220,000 | 2,316,988 | 9/08/14 | 52,961 | — | |||||||||||||||||||||||||
| Indian Rupee |
DBAB | Buy | 40,529,000 | 674,053 | 9/09/14 | — | (7,209 | ) | ||||||||||||||||||||||||
| Mexican Peso |
HSBC | Buy | 135,500,950 | 10,157,493 | 9/10/14 | 232,227 | — | |||||||||||||||||||||||||
| Swedish Krona |
DBAB | Buy | 41,300,000 | 4,559,405 | EUR | 9/10/14 | — | (68,591 | ) | |||||||||||||||||||||||
| Swedish Krona |
MSCO | Buy | 13,064,000 | 1,437,037 | EUR | 9/11/14 | — | (14,610 | ) | |||||||||||||||||||||||
| Swedish Krona |
MSCO | Buy | 42,305,800 | 4,657,203 | EUR | 9/12/14 | — | (52,289 | ) | |||||||||||||||||||||||
| Singapore Dollar |
HSBC | Buy | 10,521,600 | 8,293,867 | 9/15/14 | 146,290 | — | |||||||||||||||||||||||||
| Swedish Krona |
BZWS | Buy | 24,372,000 | 2,689,354 | EUR | 9/15/14 | — | (39,003 | ) | |||||||||||||||||||||||
| Swedish Krona |
MSCO | Buy | 28,654,000 | 3,162,945 | EUR | 9/15/14 | — | (47,347 | ) | |||||||||||||||||||||||
| Swedish Krona |
MSCO | Buy | 21,328,100 | 2,350,385 | EUR | 9/16/14 | — | (29,945 | ) | |||||||||||||||||||||||
| Chilean Peso |
DBAB | Buy | 2,600,220,000 | 4,463,897 | 9/17/14 | 199,533 | — | |||||||||||||||||||||||||
| Japanese Yen |
BZWS | Sell | 285,057,504 | 2,895,749 | 9/18/14 | 80,245 | — | |||||||||||||||||||||||||
| Euro |
BZWS | Sell | 678,250 | 906,142 | 9/19/14 | — | (22,969 | ) | ||||||||||||||||||||||||
| Singapore Dollar |
HSBC | Buy | 9,120,000 | 7,203,791 | 9/19/14 | 112,059 | — | |||||||||||||||||||||||||
| Euro |
DBAB | Sell | 8,070,000 | 10,949,537 | 9/23/14 | — | (105,470 | ) | ||||||||||||||||||||||||
| Hungarian Forint |
JPHQ | Buy | 1,156,013,000 | 3,813,337 | EUR | 9/23/14 | — | (128,354 | ) | |||||||||||||||||||||||
| Indian Rupee |
JPHQ | Buy | 139,661,000 | 2,293,762 | 9/23/14 | — | (1,482 | ) | ||||||||||||||||||||||||
| Euro |
BZWS | Sell | 1,647,381 | 2,230,159 | 9/24/14 | — | (26,581 | ) | ||||||||||||||||||||||||
| Hungarian Forint |
JPHQ | Buy | 925,405,000 | 3,021,829 | EUR | 9/25/14 | — | (60,863 | ) | |||||||||||||||||||||||
| Philippine Peso |
JPHQ | Buy | 123,740,000 | 2,819,064 | 9/25/14 | 15,564 | — | |||||||||||||||||||||||||
| Euro |
CITI | Sell | 1,532,964 | 2,110,324 | 9/26/14 | 10,305 | — | |||||||||||||||||||||||||
| Euro |
DBAB | Sell | 3,753,000 | 5,064,392 | 9/26/14 | — | (76,871 | ) | ||||||||||||||||||||||||
| Indian Rupee |
DBAB | Buy | 130,201,000 | 2,136,194 | 9/26/14 | — | (304 | ) | ||||||||||||||||||||||||
| Malaysian Ringgit |
DBAB | Buy | 11,080,500 | 3,390,087 | 9/26/14 | 44,520 | — | |||||||||||||||||||||||||
| Malaysian Ringgit |
HSBC | Buy | 11,490,000 | 3,513,224 | 9/26/14 | 48,315 | — | |||||||||||||||||||||||||
| South Korean Won |
HSBC | Buy | 9,530,000,000 | 8,719,122 | 9/26/14 | 665,264 | — | |||||||||||||||||||||||||
| Euro |
BZWS | Sell | 6,085,000 | 8,220,531 | 9/29/14 | — | (115,467 | ) | ||||||||||||||||||||||||
| Japanese Yen |
JPHQ | Sell | 285,510,329 | 2,905,810 | 9/29/14 | 85,606 | — | |||||||||||||||||||||||||
| Chilean Peso |
DBAB | Buy | 1,252,750,000 | 2,393,028 | 9/30/14 | — | (149,171 | ) | ||||||||||||||||||||||||
| Euro |
DBAB | Sell | 14,880,000 | 20,093,506 | 9/30/14 | — | (291,081 | ) | ||||||||||||||||||||||||
| Euro |
GSCO | Sell | 4,020,000 | 5,424,226 | 9/30/14 | — | (82,900 | ) | ||||||||||||||||||||||||
| Euro |
HSBC | Sell | 5,430,000 | 7,340,763 | 9/30/14 | — | (97,968 | ) | ||||||||||||||||||||||||
| Indian Rupee |
DBAB | Buy | 258,518,494 | 4,237,536 | 9/30/14 | 333 | — | |||||||||||||||||||||||||
| Japanese Yen |
JPHQ | Sell | 172,207,000 | 1,746,477 | 9/30/14 | 45,441 | — | |||||||||||||||||||||||||
| Swedish Krona |
UBSW | Buy | 302,991,000 | 32,894,831 | EUR | 10/01/14 | 244,321 | — | ||||||||||||||||||||||||
| Swedish Krona |
DBAB | Buy | 445,104,500 | 69,296,379 | 10/03/14 | — | (2,738,064 | ) | ||||||||||||||||||||||||
| Chilean Peso |
DBAB | Buy | 1,330,940,000 | 2,372,442 | 10/06/14 | 10,155 | — | |||||||||||||||||||||||||
| Euro |
JPHQ | Sell | 6,370,000 | 8,687,183 | 10/07/14 | — | (39,560 | ) | ||||||||||||||||||||||||
| Mexican Peso |
HSBC | Buy | 377,048,070 | 27,679,754 | 10/07/14 | 1,178,554 | — | |||||||||||||||||||||||||
| Euro |
DBAB | Sell | 12,680,000 | 17,224,258 | 10/09/14 | — | (147,188 | ) | ||||||||||||||||||||||||
| Chilean Peso |
MSCO | Buy | 2,645,530,000 | 4,751,738 | 10/10/14 | — | (17,545 | ) | ||||||||||||||||||||||||
| Mexican Peso |
DBAB | Buy | 259,112,000 | 19,136,780 | 10/14/14 | 685,623 | — | |||||||||||||||||||||||||
| Japanese Yen |
JPHQ | Sell | 652,895,000 | 6,282,004 | 10/17/14 | — | (168,240 | ) | ||||||||||||||||||||||||
| Chilean Peso |
CITI | Buy | 921,291,798 | 1,770,693 | 10/20/14 | — | (123,542 | ) | ||||||||||||||||||||||||
| Euro |
HSBC | Sell | 12,569,000 | 17,069,079 | 10/20/14 | — | (151,158 | ) | ||||||||||||||||||||||||
| Japanese Yen |
JPHQ | Sell | 1,233,160,000 | 12,562,755 | 10/20/14 | 379,464 | — | |||||||||||||||||||||||||
| Malaysian Ringgit |
JPHQ | Buy | 8,104,000 | 2,505,023 | 10/20/14 | 3,351 | — | |||||||||||||||||||||||||
| Semiannual Report | TGB-17 |
FRANKLIN TEMPLETON VARIABLE INSURANCE PRODUCTS TRUST
STATEMENT OF INVESTMENTS (UNAUDITED)
Templeton Global Bond VIP Fund (continued)
Forward Exchange Contracts (continued)
| Currency | Counterpartya | Type | Quantity | Contract Amount* |
Settlement Date |
Unrealized Appreciation |
Unrealized Depreciation |
|||||||||||||||||||||||||
| Japanese Yen |
BZWS | Sell | 735,200,000 | 7,538,966 | 10/22/14 | $ | 275,249 | $ | — | |||||||||||||||||||||||
| Malaysian Ringgit |
HSBC | Buy | 14,613,000 | 4,556,311 | 10/22/14 | — | (33,796 | ) | ||||||||||||||||||||||||
| Chilean Peso |
CITI | Buy | 2,420,966,000 | 4,646,768 | 10/24/14 | — | (319,974 | ) | ||||||||||||||||||||||||
| Euro |
DBAB | Sell | 4,545,000 | 6,276,600 | 10/24/14 | 49,581 | — | |||||||||||||||||||||||||
| Malaysian Ringgit |
DBAB | Buy | 10,811,000 | 3,356,932 | 10/24/14 | — | (11,484 | ) | ||||||||||||||||||||||||
| Malaysian Ringgit |
HSBC | Buy | 7,209,825 | 2,226,629 | 10/24/14 | 4,440 | — | |||||||||||||||||||||||||
| Chilean Peso |
BZWS | Buy | 199,342,000 | 381,370 | 10/27/14 | — | (25,200 | ) | ||||||||||||||||||||||||
| Euro |
BZWS | Sell | 5,604,306 | 7,749,142 | 10/27/14 | 70,684 | — | |||||||||||||||||||||||||
| Chilean Peso |
DBAB | Buy | 398,486,000 | 758,732 | 10/29/14 | — | (46,876 | ) | ||||||||||||||||||||||||
| Euro |
DBAB | Sell | 3,319,244 | 4,583,909 | 10/31/14 | 36,131 | — | |||||||||||||||||||||||||
| Malaysian Ringgit |
JPHQ | Buy | 7,468,000 | 2,335,210 | 10/31/14 | — | (25,221 | ) | ||||||||||||||||||||||||
| Swedish Krona |
BZWS | Buy | 122,773,200 | 13,531,560 | EUR | 10/31/14 | — | (185,159 | ) | |||||||||||||||||||||||
| Euro |
DBAB | Sell | 224,556 | 309,000 | 11/03/14 | 1,326 | — | |||||||||||||||||||||||||
| Euro |
BZWS | Sell | 1,581,109 | 2,138,292 | 11/05/14 | — | (28,074 | ) | ||||||||||||||||||||||||
| Japanese Yen |
CITI | Sell | 341,992,119 | 3,478,711 | 11/10/14 | 99,247 | — | |||||||||||||||||||||||||
| Euro |
JPHQ | Sell | 8,969,211 | 11,959,905 | 11/12/14 | — | (329,701 | ) | ||||||||||||||||||||||||
| Japanese Yen |
HSBC | Sell | 413,563,000 | 4,194,351 | 11/12/14 | 107,567 | — | |||||||||||||||||||||||||
| Japanese Yen |
JPHQ | Sell | 335,950,000 | 3,397,209 | 11/13/14 | 77,357 | — | |||||||||||||||||||||||||
| Japanese Yen |
MSCO | Sell | 300,000,000 | 3,019,202 | 11/14/14 | 54,579 | — | |||||||||||||||||||||||||
| Euro |
DBAB | Sell | 10,778,730 | 14,488,984 | 11/17/14 | — | (280,358 | ) | ||||||||||||||||||||||||
| Euro |
MSCO | Sell | 1,962,500 | 2,641,103 | 11/17/14 | — | (47,974 | ) | ||||||||||||||||||||||||
| Japanese Yen |
CITI | Sell | 429,663,000 | 4,339,154 | 11/17/14 | 93,070 | — | |||||||||||||||||||||||||
| Japanese Yen |
SCNY | Sell | 340,600,700 | 3,436,315 | 11/17/14 | 70,377 | — | |||||||||||||||||||||||||
| Euro |
DBAB | Sell | 3,953,398 | 5,324,831 | 11/19/14 | — | (92,283 | ) | ||||||||||||||||||||||||
| Japanese Yen |
CITI | Sell | 986,239,000 | 9,872,460 | 11/19/14 | 125,908 | — | |||||||||||||||||||||||||
| Japanese Yen |
DBAB | Sell | 796,770,000 | 7,970,888 | 11/19/14 | 96,772 | — | |||||||||||||||||||||||||
| Malaysian Ringgit |
DBAB | Buy | 7,197,960 | 2,208,844 | 11/19/14 | 15,075 | — | |||||||||||||||||||||||||
| Euro |
DBAB | Sell | 3,887,000 | 5,260,471 | 11/20/14 | — | (65,686 | ) | ||||||||||||||||||||||||
| Euro |
JPHQ | Sell | 15,309,581 | 20,722,858 | 11/20/14 | — | (255,079 | ) | ||||||||||||||||||||||||
| Japanese Yen |
CITI | Sell | 1,107,834,000 | 11,116,135 | 11/20/14 | 167,811 | — | |||||||||||||||||||||||||
| Japanese Yen |
HSBC | Sell | 207,909,000 | 2,085,116 | 11/20/14 | 30,426 | — | |||||||||||||||||||||||||
| Japanese Yen |
JPHQ | Sell | 715,709,000 | 7,176,440 | 11/20/14 | 103,346 | — | |||||||||||||||||||||||||
| Malaysian Ringgit |
HSBC | Buy | 4,326,000 | 1,328,624 | 11/20/14 | 7,879 | — | |||||||||||||||||||||||||
| Chilean Peso |
DBAB | Buy | 2,094,920,000 | 3,681,111 | 11/28/14 | 51,036 | — | |||||||||||||||||||||||||
| Euro |
DBAB | Sell | 837,570 | 1,134,907 | 11/28/14 | — | (12,814 | ) | ||||||||||||||||||||||||
| Singapore Dollar |
DBAB | Buy | 2,980,000 | 2,373,027 | 11/28/14 | 17,677 | — | |||||||||||||||||||||||||
| Chilean Peso |
DBAB | Buy | 790,050,000 | 1,385,810 | 12/01/14 | 21,298 | — | |||||||||||||||||||||||||
| Euro |
DBAB | Sell | 5,440,000 | 7,369,350 | 12/04/14 | — | (85,277 | ) | ||||||||||||||||||||||||
| Euro |
HSBC | Sell | 2,155,292 | 2,941,973 | 12/09/14 | — | (11,568 | ) | ||||||||||||||||||||||||
| Euro |
SCNY | Sell | 2,400,751 | 3,279,738 | 12/09/14 | — | (10,172 | ) | ||||||||||||||||||||||||
| Euro |
JPHQ | Sell | 5,095,000 | 7,027,712 | 12/15/14 | 45,502 | — | |||||||||||||||||||||||||
| Mexican Peso |
CITI | Buy | 95,083,400 | 7,164,750 | 12/16/14 | 78,436 | — | |||||||||||||||||||||||||
| Malaysian Ringgit |
JPHQ | Buy | 13,361,013 | 4,058,384 | 12/17/14 | 62,771 | — | |||||||||||||||||||||||||
| Mexican Peso |
CITI | Buy | 45,585,080 | 3,424,103 | 12/18/14 | 47,973 | — | |||||||||||||||||||||||||
| Malaysian Ringgit |
JPHQ | Buy | 14,772,000 | 4,472,704 | 12/19/14 | 83,118 | — | |||||||||||||||||||||||||
| Singapore Dollar |
JPHQ | Buy | 5,686,000 | 4,540,808 | 12/19/14 | 20,915 | — | |||||||||||||||||||||||||
| Japanese Yen |
DBAB | Sell | 1,453,310,000 | 14,169,165 | 12/22/14 | — | (197,738 | ) | ||||||||||||||||||||||||
| Japanese Yen |
HSBC | Sell | 1,455,540,000 | 14,169,149 | 12/22/14 | — | (219,799 | ) | ||||||||||||||||||||||||
| Singapore Dollar |
HSBC | Buy | 6,864,000 | 5,478,053 | 12/22/14 | 28,771 | — | |||||||||||||||||||||||||
| Singapore Dollar |
DBAB | Buy | 8,589,700 | 6,876,106 | 12/23/14 | 15,215 | — | |||||||||||||||||||||||||
| Japanese Yen |
BZWS | Sell | 696,650,000 | 6,718,260 | 12/26/14 | — | (168,834 | ) | ||||||||||||||||||||||||
| Japanese Yen |
CITI | Sell | 1,086,780,000 | 10,480,503 | 12/26/14 | — | (263,423 | ) | ||||||||||||||||||||||||
| Philippine Peso |
JPHQ | Buy | 17,950,000 | 408,381 | 12/29/14 | 2,551 | — | |||||||||||||||||||||||||
| Euro |
DBAB | Sell | 2,285,618 | 3,117,423 | 1/07/15 | — | (15,152 | ) | ||||||||||||||||||||||||
| Japanese Yen |
DBAB | Sell | 770,370,000 | 7,397,446 | 1/07/15 | — | (219,266 | ) | ||||||||||||||||||||||||
| Japanese Yen |
GSCO | Sell | 329,010,000 | 3,172,373 | 1/08/15 | — | (80,605 | ) | ||||||||||||||||||||||||
| TGB-18 | Semiannual Report |
FRANKLIN TEMPLETON VARIABLE INSURANCE PRODUCTS TRUST
STATEMENT OF INVESTMENTS (UNAUDITED)
Templeton Global Bond VIP Fund (continued)
Forward Exchange Contracts (continued)
| Currency | Counterpartya | Type | Quantity | Contract Amount* |
Settlement Date |
Unrealized Appreciation |
Unrealized Depreciation |
|||||||||||||||||||||||||
| Malaysian Ringgit |
DBAB | Buy | 8,862,500 | 2,641,344 | 1/08/15 | $ | 88,615 | $ | — | |||||||||||||||||||||||
| Malaysian Ringgit |
JPHQ | Buy | 5,661,200 | 1,689,507 | 1/08/15 | 54,340 | — | |||||||||||||||||||||||||
| Malaysian Ringgit |
JPHQ | Buy | 3,044,000 | 909,091 | 1/09/15 | 28,510 | — | |||||||||||||||||||||||||
| Chilean Peso |
MSCO | Buy | 2,254,600,000 | 4,087,753 | 1/12/15 | — | (87,398 | ) | ||||||||||||||||||||||||
| Euro |
CITI | Sell | 5,040,000 | 6,851,628 | 1/12/15 | — | (56,174 | ) | ||||||||||||||||||||||||
| Malaysian Ringgit |
JPHQ | Buy | 912,000 | 272,646 | 1/12/15 | 8,213 | — | |||||||||||||||||||||||||
| Mexican Peso |
CITI | Buy | 109,357,558 | 8,148,849 | 1/12/15 | 166,401 | — | |||||||||||||||||||||||||
| Euro |
SCNY | Sell | 15,572,000 | 21,162,504 | 1/13/15 | — | (180,524 | ) | ||||||||||||||||||||||||
| Japanese Yen |
CITI | Sell | 138,680,000 | 1,325,939 | 1/13/15 | — | (45,275 | ) | ||||||||||||||||||||||||
| Euro |
DBAB | Sell | 9,460,000 | 12,915,265 | 1/14/15 | — | (50,707 | ) | ||||||||||||||||||||||||
| Euro |
JPHQ | Sell | 937,000 | 1,280,879 | 1/14/15 | — | (3,383 | ) | ||||||||||||||||||||||||
| Japanese Yen |
SCNY | Sell | 415,980,000 | 3,981,432 | 1/14/15 | — | (131,654 | ) | ||||||||||||||||||||||||
| Japanese Yen |
BZWS | Sell | 1,089,820,000 | 10,508,959 | 1/15/15 | — | (266,951 | ) | ||||||||||||||||||||||||
| Japanese Yen |
HSBC | Sell | 536,380,000 | 5,157,500 | 1/15/15 | — | (146,112 | ) | ||||||||||||||||||||||||
| Japanese Yen |
JPHQ | Sell | 708,450,000 | 6,830,771 | 1/15/15 | — | (174,233 | ) | ||||||||||||||||||||||||
| Malaysian Ringgit |
JPHQ | Buy | 1,700,000 | 509,975 | 1/15/15 | 13,460 | — | |||||||||||||||||||||||||
| Euro |
DBAB | Sell | 4,856,000 | 6,643,979 | 1/16/15 | — | (11,774 | ) | ||||||||||||||||||||||||
| Japanese Yen |
DBAB | Sell | 858,140,000 | 8,301,876 | 1/16/15 | — | (183,307 | ) | ||||||||||||||||||||||||
| Japanese Yen |
SCNY | Sell | 707,660,000 | 6,849,041 | 1/16/15 | — | (148,214 | ) | ||||||||||||||||||||||||
| Malaysian Ringgit |
JPHQ | Buy | 1,856,000 | 559,221 | 1/16/15 | 12,211 | — | |||||||||||||||||||||||||
| Japanese Yen |
JPHQ | Sell | 652,895,000 | 6,288,781 | 1/20/15 | — | (167,195 | ) | ||||||||||||||||||||||||
| Euro |
BZWS | Sell | 2,638,000 | 3,595,594 | 1/21/15 | — | (20,210 | ) | ||||||||||||||||||||||||
| Euro |
JPHQ | Sell | 300,000 | 407,663 | 1/22/15 | — | (3,538 | ) | ||||||||||||||||||||||||
| Chilean Peso |
DBAB | Buy | 2,227,910,000 | 4,025,131 | 1/23/15 | — | (75,986 | ) | ||||||||||||||||||||||||
| Chilean Peso |
DBAB | Buy | 3,160,140,000 | 5,597,626 | 1/26/15 | 2,480 | — | |||||||||||||||||||||||||
| Japanese Yen |
GSCO | Sell | 944,420,000 | 9,135,865 | 1/27/15 | — | (203,361 | ) | ||||||||||||||||||||||||
| Japanese Yen |
DBAB | Sell | 897,860,782 | 8,793,935 | 1/28/15 | — | (84,953 | ) | ||||||||||||||||||||||||
| Japanese Yen |
HSBC | Sell | 1,162,462,488 | 11,359,272 | 1/28/15 | — | (136,245 | ) | ||||||||||||||||||||||||
| Euro |
CITI | Sell | 4,998,400 | 6,833,688 | 1/29/15 | — | (17,717 | ) | ||||||||||||||||||||||||
| Euro |
DBAB | Sell | 71,313,000 | 97,501,346 | 1/30/15 | — | (249,289 | ) | ||||||||||||||||||||||||
| Chilean Peso |
DBAB | Buy | 1,186,400,000 | 2,093,155 | 2/04/15 | 7,598 | — | |||||||||||||||||||||||||
| Malaysian Ringgit |
JPHQ | Buy | 9,715,000 | 2,870,948 | 2/04/15 | 116,668 | — | |||||||||||||||||||||||||
| Japanese Yen |
JPHQ | Sell | 1,719,500,000 | 17,030,047 | 2/06/15 | 24,655 | — | |||||||||||||||||||||||||
| Japanese Yen |
SCNY | Sell | 1,720,000,000 | 17,030,125 | 2/06/15 | 19,787 | — | |||||||||||||||||||||||||
| Euro |
DBAB | Sell | 1,738,000 | 2,350,993 | 2/09/15 | — | (31,457 | ) | ||||||||||||||||||||||||
| Euro |
GSCO | Sell | 2,045,000 | 2,850,198 | 2/09/15 | 46,913 | — | |||||||||||||||||||||||||
| Japanese Yen |
BZWS | Sell | 1,720,220,000 | 17,030,111 | 2/09/15 | 17,142 | — | |||||||||||||||||||||||||
| Japanese Yen |
JPHQ | Sell | 1,723,960,000 | 17,030,113 | 2/09/15 | — | (19,845 | ) | ||||||||||||||||||||||||
| Chilean Peso |
BZWS | Buy | 1,142,900,000 | 1,966,110 | 2/10/15 | 56,542 | — | |||||||||||||||||||||||||
| Euro |
BZWS | Sell | 4,929,000 | 6,705,658 | 2/10/15 | — | (51,049 | ) | ||||||||||||||||||||||||
| Euro |
CITI | Sell | 6,572,000 | 8,937,066 | 2/10/15 | — | (71,877 | ) | ||||||||||||||||||||||||
| Euro |
HSBC | Sell | 1,800,000 | 2,448,198 | 2/10/15 | — | (19,254 | ) | ||||||||||||||||||||||||
| Japanese Yen |
CITI | Sell | 366,860,000 | 3,613,387 | 2/10/15 | — | (14,889 | ) | ||||||||||||||||||||||||
| Polish Zloty |
DBAB | Buy | 17,528,000 | 4,100,597 | EUR | 2/10/15 | 76,845 | — | ||||||||||||||||||||||||
| South Korean Won |
HSBC | Buy | 21,363,430,000 | 19,556,417 | 2/10/15 | 1,362,640 | — | |||||||||||||||||||||||||
| Euro |
BZWS | Sell | 1,412,000 | 1,919,896 | 2/11/15 | — | (15,693 | ) | ||||||||||||||||||||||||
| Polish Zloty |
BZWS | Buy | 17,528,000 | 4,098,200 | EUR | 2/11/15 | 79,828 | — | ||||||||||||||||||||||||
| Chilean Peso |
MSCO | Buy | 2,590,220,000 | 4,500,035 | 2/12/15 | 83,209 | — | |||||||||||||||||||||||||
| Japanese Yen |
GSCO | Sell | 394,373,000 | 3,862,539 | 2/12/15 | — | (37,912 | ) | ||||||||||||||||||||||||
| Japanese Yen |
HSBC | Sell | 1,035,240,000 | 10,157,129 | 2/12/15 | — | (81,664 | ) | ||||||||||||||||||||||||
| Japanese Yen |
JPHQ | Sell | 1,034,700,000 | 10,163,748 | 2/12/15 | — | (69,705 | ) | ||||||||||||||||||||||||
| Euro |
SCNY | Sell | 657,000 | 898,921 | 2/13/15 | — | (1,714 | ) | ||||||||||||||||||||||||
| Japanese Yen |
CITI | Sell | 1,371,360,000 | 13,455,259 | 2/13/15 | — | (107,970 | ) | ||||||||||||||||||||||||
| Japanese Yen |
JPHQ | Sell | 686,710,000 | 6,722,960 | 2/13/15 | — | (68,842 | ) | ||||||||||||||||||||||||
| Malaysian Ringgit |
DBAB | Buy | 97,443,480 | 28,620,284 | 2/13/15 | 1,329,642 | — | |||||||||||||||||||||||||
| Chilean Peso |
CITI | Buy | 2,285,090,000 | 3,997,009 | 2/17/15 | 44,537 | — | |||||||||||||||||||||||||
| Semiannual Report | TGB-19 |
FRANKLIN TEMPLETON VARIABLE INSURANCE PRODUCTS TRUST
STATEMENT OF INVESTMENTS (UNAUDITED)
Templeton Global Bond VIP Fund (continued)
Forward Exchange Contracts (continued)
| Currency | Counterpartya | Type | Quantity | Contract Amount* |
Settlement Date |
Unrealized Appreciation |
Unrealized Depreciation |
|||||||||||||||||||||||||
| Chilean Peso |
DBAB | Buy | 964,250,000 | 1,678,124 | 2/17/15 | $ | 27,306 | $ | — | |||||||||||||||||||||||
| Japanese Yen |
CITI | Sell | 684,870,000 | 6,711,780 | 2/17/15 | — | (62,066 | ) | ||||||||||||||||||||||||
| Polish Zloty |
DBAB | Buy | 17,528,000 | 4,116,487 | EUR | 2/17/15 | 52,943 | — | ||||||||||||||||||||||||
| Japanese Yen |
GSCO | Sell | 810,877,280 | 7,987,562 | 2/18/15 | — | (32,655 | ) | ||||||||||||||||||||||||
| Japanese Yen |
JPHQ | Sell | 831,970,000 | 8,193,278 | 2/18/15 | — | (35,563 | ) | ||||||||||||||||||||||||
| Singapore Dollar |
HSBC | Buy | 3,667,000 | 2,901,108 | 2/18/15 | 41,130 | — | |||||||||||||||||||||||||
| Euro |
JPHQ | Sell | 3,942,000 | 5,406,118 | 2/19/15 | 2,139 | — | |||||||||||||||||||||||||
| Malaysian Ringgit |
HSBC | Buy | 4,899,000 | 1,458,904 | 2/19/15 | 46,285 | — | |||||||||||||||||||||||||
| Euro |
BZWS | Sell | 6,280,000 | 8,629,160 | 2/20/15 | 20,035 | — | |||||||||||||||||||||||||
| Chilean Peso |
MSCO | Buy | 1,273,240,000 | 2,229,062 | 2/23/15 | 21,672 | — | |||||||||||||||||||||||||
| Euro |
DBAB | Sell | 11,070,000 | 15,216,822 | 2/23/15 | 40,941 | — | |||||||||||||||||||||||||
| Euro |
GSCO | Sell | 2,038,000 | 2,804,594 | 2/23/15 | 10,696 | — | |||||||||||||||||||||||||
| Hungarian Forint |
DBAB | Buy | 18,260,690,000 | 57,055,741 | EUR | 2/23/15 | 1,866,300 | — | ||||||||||||||||||||||||
| Chilean Peso |
JPHQ | Buy | 1,792,000,000 | 3,139,453 | 2/24/15 | 28,023 | — | |||||||||||||||||||||||||
| Japanese Yen |
HSBC | Sell | 385,460,000 | 3,778,205 | 2/24/15 | — | (34,504 | ) | ||||||||||||||||||||||||
| Chilean Peso |
MSCO | Buy | 1,559,200,000 | 2,719,456 | 2/25/15 | 36,288 | — | |||||||||||||||||||||||||
| Euro |
DBAB | Sell | 1,530,900 | 2,104,222 | 2/25/15 | 5,486 | — | |||||||||||||||||||||||||
| Japanese Yen |
BZWS | Sell | 343,460,000 | 3,353,283 | 2/25/15 | — | (44,020 | ) | ||||||||||||||||||||||||
| Japanese Yen |
JPHQ | Sell | 385,700,000 | 3,764,359 | 2/25/15 | — | (50,757 | ) | ||||||||||||||||||||||||
| Chilean Peso |
DBAB | Buy | 1,455,470,000 | 2,533,896 | 2/26/15 | 38,287 | — | |||||||||||||||||||||||||
| Euro |
BZWS | Sell | 13,673,773 | 18,783,180 | 2/26/15 | 37,483 | — | |||||||||||||||||||||||||
| Euro |
SCNY | Sell | 13,581,483 | 18,651,450 | 2/26/15 | 32,276 | — | |||||||||||||||||||||||||
| Japanese Yen |
BZWS | Sell | 1,576,550,000 | 15,416,019 | 2/26/15 | — | (178,421 | ) | ||||||||||||||||||||||||
| Japanese Yen |
SCNY | Sell | 937,086,000 | 9,171,113 | 2/26/15 | — | (98,070 | ) | ||||||||||||||||||||||||
| Euro |
BOFA | Sell | 2,694,506 | 3,684,198 | 2/27/15 | — | (9,783 | ) | ||||||||||||||||||||||||
| Euro |
DBAB | Sell | 2,579,651 | 3,535,928 | 2/27/15 | — | (595 | ) | ||||||||||||||||||||||||
| Japanese Yen |
DBAB | Sell | 229,660,000 | 2,253,115 | 2/27/15 | — | (18,587 | ) | ||||||||||||||||||||||||
| Malaysian Ringgit |
HSBC | Buy | 2,087,700 | 625,397 | 2/27/15 | 15,723 | — | |||||||||||||||||||||||||
| Chilean Peso |
DBAB | Buy | 1,253,970,000 | 2,164,256 | 3/03/15 | 50,847 | — | |||||||||||||||||||||||||
| Japanese Yen |
JPHQ | Sell | 848,300,000 | 8,330,768 | 3/03/15 | — | (60,564 | ) | ||||||||||||||||||||||||
| Japanese Yen |
HSBC | Sell | 400,800,000 | 3,927,487 | 3/04/15 | — | (37,238 | ) | ||||||||||||||||||||||||
| Euro |
DBAB | Sell | 1,536,000 | 2,117,606 | 3/05/15 | 11,789 | — | |||||||||||||||||||||||||
| Euro |
BZWS | Sell | 7,226,276 | 9,927,286 | 3/09/15 | 20,035 | — | |||||||||||||||||||||||||
| Euro |
GSCO | Sell | 21,480,000 | 29,508,580 | 3/09/15 | 59,420 | — | |||||||||||||||||||||||||
| Euro |
HSBC | Sell | 1,844,000 | 2,535,057 | 3/09/15 | 6,927 | — | |||||||||||||||||||||||||
| Japanese Yen |
BZWS | Sell | 1,712,605,900 | 16,747,810 | 3/09/15 | — | (194,091 | ) | ||||||||||||||||||||||||
| Euro |
CITI | Sell | 31,404,613 | 43,464,770 | 3/10/15 | 408,699 | — | |||||||||||||||||||||||||
| Euro |
MSCO | Sell | 5,225,000 | 7,236,494 | 3/10/15 | 72,962 | — | |||||||||||||||||||||||||
| Singapore Dollar |
CITI | Buy | 21,075,381 | 16,688,084 | 3/11/15 | 222,484 | — | |||||||||||||||||||||||||
| Chilean Peso |
DBAB | Buy | 1,284,460,000 | 2,183,008 | 3/13/15 | 83,953 | — | |||||||||||||||||||||||||
| Mexican Peso |
CITI | Buy | 30,688,400 | 2,312,964 | 3/13/15 | 10,927 | — | |||||||||||||||||||||||||
| Euro |
JPHQ | Sell | 541,000 | 749,734 | 3/16/15 | 7,993 | — | |||||||||||||||||||||||||
| Euro |
BZWS | Sell | 1,161,439 | 1,619,627 | 3/17/15 | 27,222 | — | |||||||||||||||||||||||||
| Euro |
CITI | Sell | 861,168 | 1,201,588 | 3/17/15 | 20,873 | — | |||||||||||||||||||||||||
| Japanese Yen |
CITI | Sell | 286,112,008 | 2,796,192 | 3/17/15 | — | (34,364 | ) | ||||||||||||||||||||||||
| Mexican Peso |
CITI | Buy | 25,894,900 | 1,896,854 | 3/17/15 | 63,511 | — | |||||||||||||||||||||||||
| Hungarian Forint |
DBAB | Buy | 2,348,675,000 | 7,360,310 | EUR | 3/19/15 | 200,979 | — | ||||||||||||||||||||||||
| Hungarian Forint |
JPHQ | Buy | 703,907,450 | 2,206,261 | EUR | 3/19/15 | 59,760 | — | ||||||||||||||||||||||||
| Japanese Yen |
CITI | Sell | 1,866,452,000 | 18,386,154 | 3/19/15 | — | (79,314 | ) | ||||||||||||||||||||||||
| Japanese Yen |
MSCO | Sell | 575,230,000 | 5,697,039 | 3/19/15 | 6,086 | — | |||||||||||||||||||||||||
| Chilean Peso |
JPHQ | Buy | 1,065,000,000 | 1,806,616 | 3/20/15 | 71,857 | — | |||||||||||||||||||||||||
| Hungarian Forint |
JPHQ | Buy | 2,348,992,000 | 7,387,464 | EUR | 3/20/15 | 164,759 | — | ||||||||||||||||||||||||
| Euro |
BZWS | Sell | 744,197 | 1,036,294 | 3/23/15 | 15,921 | — | |||||||||||||||||||||||||
| Japanese Yen |
DBAB | Sell | 725,287,000 | 7,102,579 | 3/24/15 | — | (73,261 | ) | ||||||||||||||||||||||||
| Mexican Peso |
CITI | Buy | 75,637,200 | 5,533,080 | 3/24/15 | 190,273 | — | |||||||||||||||||||||||||
| Japanese Yen |
BZWS | Sell | 983,714,840 | 9,632,663 | 3/25/15 | — | (100,096 | ) | ||||||||||||||||||||||||
| TGB-20 | Semiannual Report |
FRANKLIN TEMPLETON VARIABLE INSURANCE PRODUCTS TRUST
STATEMENT OF INVESTMENTS (UNAUDITED)
Templeton Global Bond VIP Fund (continued)
Forward Exchange Contracts (continued)
| Currency | Counterpartya | Type | Quantity | Contract Amount* |
Settlement Date |
Unrealized Appreciation |
Unrealized Depreciation |
|||||||||||||||||||||||
| Euro |
DBAB | Sell | 2,736,000 | $ | 3,767,882 | 3/26/15 | $ | 16,477 | $ | — | ||||||||||||||||||||
| Malaysian Ringgit |
DBAB | Buy | 8,012,500 | 2,379,008 | 3/26/15 | 77,532 | — | |||||||||||||||||||||||
| Malaysian Ringgit |
HSBC | Buy | 7,634,000 | 2,265,685 | 3/26/15 | 74,811 | — | |||||||||||||||||||||||
| Euro |
BZWS | Sell | 6,085,000 | 8,403,385 | 3/27/15 | 60,029 | — | |||||||||||||||||||||||
| Malaysian Ringgit |
HSBC | Buy | 7,790,000 | 2,319,971 | 3/31/15 | 67,667 | — | |||||||||||||||||||||||
| Euro |
DBAB | Sell | 6,200,000 | 8,552,466 | 4/07/15 | 50,732 | — | |||||||||||||||||||||||
| Euro |
HSBC | Sell | 8,692,000 | 11,983,443 | 4/10/15 | 64,294 | — | |||||||||||||||||||||||
| Malaysian Ringgit |
HSBC | Buy | 4,010,000 | 1,204,023 | 4/10/15 | 24,349 | — | |||||||||||||||||||||||
| Euro |
DBAB | Sell | 7,243,000 | 9,997,296 | 4/13/15 | 64,906 | — | |||||||||||||||||||||||
| Euro |
SCNY | Sell | 4,346,000 | 6,007,172 | 4/13/15 | 47,464 | — | |||||||||||||||||||||||
| Euro |
JPHQ | Sell | 3,907,000 | 5,415,297 | 4/14/15 | 57,554 | — | |||||||||||||||||||||||
| Japanese Yen |
CITI | Sell | 261,800,000 | 2,586,279 | 4/15/15 | — | (4,646 | ) | ||||||||||||||||||||||
| Chilean Peso |
MSCO | Buy | 2,370,410,000 | 4,180,617 | 4/16/15 | — | (10,134 | ) | ||||||||||||||||||||||
| Euro |
HSBC | Sell | 6,919,000 | 9,607,793 | 4/16/15 | 119,495 | — | |||||||||||||||||||||||
| Malaysian Ringgit |
DBAB | Buy | 16,369,588 | 4,942,508 | 4/16/15 | 70,244 | — | |||||||||||||||||||||||
| Japanese Yen |
BZWS | Sell | 700,840,000 | 6,897,488 | 4/17/15 | — | (38,618 | ) | ||||||||||||||||||||||
| Japanese Yen |
JPHQ | Sell | 421,090,000 | 4,129,831 | 4/21/15 | — | (37,855 | ) | ||||||||||||||||||||||
| Malaysian Ringgit |
JPHQ | Buy | 15,728,213 | 4,756,756 | 4/21/15 | 58,233 | — | |||||||||||||||||||||||
| Japanese Yen |
JPHQ | Sell | 496,560,000 | 4,870,981 | 4/22/15 | — | (43,727 | ) | ||||||||||||||||||||||
| Chilean Peso |
JPHQ | Buy | 1,501,938,000 | 2,597,385 | 4/28/15 | 42,111 | — | |||||||||||||||||||||||
| Euro |
BZWS | Sell | 6,575,679 | 9,116,916 | 4/30/15 | 98,487 | — | |||||||||||||||||||||||
| Euro |
SCNY | Sell | 11,263,000 | 15,586,415 | 4/30/15 | 139,407 | — | |||||||||||||||||||||||
| Euro |
BZWS | Sell | 7,026,829 | 9,738,201 | 5/05/15 | 100,668 | — | |||||||||||||||||||||||
| Euro |
BZWS | Sell | 1,259,000 | 1,747,228 | 5/07/15 | 20,441 | — | |||||||||||||||||||||||
| Euro |
GSCO | Sell | 2,990,000 | 4,150,539 | 5/07/15 | 49,592 | — | |||||||||||||||||||||||
| Chilean Peso |
MSCO | Buy | 1,150,200,000 | 1,963,134 | 5/11/15 | 55,735 | — | |||||||||||||||||||||||
| Japanese Yen |
CITI | Sell | 366,861,000 | 3,622,531 | 5/12/15 | — | (9,454 | ) | ||||||||||||||||||||||
| Euro |
CITI | Sell | 5,658,426 | 7,795,614 | 5/13/15 | 34,429 | — | |||||||||||||||||||||||
| Euro |
GSCO | Sell | 2,279,000 | 3,140,210 | 5/13/15 | 14,298 | — | |||||||||||||||||||||||
| Euro |
SCNY | Sell | 629,000 | 865,237 | 5/13/15 | 2,491 | — | |||||||||||||||||||||||
| Japanese Yen |
GSCO | Sell | 490,555,000 | 4,832,578 | 5/13/15 | — | (24,064 | ) | ||||||||||||||||||||||
| Japanese Yen |
SCNY | Sell | 366,681,000 | 3,615,470 | 5/13/15 | — | (14,782 | ) | ||||||||||||||||||||||
| Euro |
GSCO | Sell | 3,095,000 | 4,263,177 | 5/14/15 | 17,995 | — | |||||||||||||||||||||||
| Japanese Yen |
CITI | Sell | 366,680,000 | 3,607,315 | 5/14/15 | — | (22,975 | ) | ||||||||||||||||||||||
| Euro |
BZWS | Sell | 8,551,980 | 11,739,474 | 5/18/15 | 9,008 | — | |||||||||||||||||||||||
| Japanese Yen |
BOFA | Sell | 1,105,661,700 | 10,890,000 | 5/18/15 | — | (57,117 | ) | ||||||||||||||||||||||
| Japanese Yen |
BOFA | Sell | 1,102,846,375 | 10,895,000 | 5/19/15 | — | (24,389 | ) | ||||||||||||||||||||||
| Japanese Yen |
BZWS | Sell | 1,105,842,500 | 10,895,000 | 5/19/15 | — | (54,054 | ) | ||||||||||||||||||||||
| Japanese Yen |
CITI | Sell | 1,104,534,000 | 10,895,000 | 5/19/15 | — | (41,099 | ) | ||||||||||||||||||||||
| Japanese Yen |
HSBC | Sell | 1,106,730,400 | 10,895,000 | 5/19/15 | — | (62,846 | ) | ||||||||||||||||||||||
| Singapore Dollar |
DBAB | Buy | 11,645,100 | 9,320,927 | 5/19/15 | 24,731 | — | |||||||||||||||||||||||
| Euro |
GSCO | Sell | 4,454,000 | 6,114,496 | 5/21/15 | 4,956 | — | |||||||||||||||||||||||
| Chilean Peso |
MSCO | Buy | 420,740,000 | 740,218 | 5/22/15 | — | (2,489 | ) | ||||||||||||||||||||||
| Euro |
BZWS | Sell | 11,375,532 | 15,597,276 | 5/22/15 | — | (6,627 | ) | ||||||||||||||||||||||
| Malaysian Ringgit |
HSBC | Buy | 298,500 | 90,870 | 5/22/15 | 352 | — | |||||||||||||||||||||||
| Euro |
JPHQ | Sell | 4,730,771 | 6,467,059 | 5/26/15 | — | (22,370 | ) | ||||||||||||||||||||||
| Malaysian Ringgit |
HSBC | Buy | 1,229,300 | 374,615 | 5/28/15 | 934 | — | |||||||||||||||||||||||
| Euro |
BZWS | Sell | 2,836,669 | 3,862,153 | 5/29/15 | — | (29,130 | ) | ||||||||||||||||||||||
| Singapore Dollar |
BZWS | Buy | 21,427,761 | 17,077,995 | 5/29/15 | 119,175 | — | |||||||||||||||||||||||
| Singapore Dollar |
DBAB | Buy | 2,980,000 | 2,374,029 | 5/29/15 | 17,615 | — | |||||||||||||||||||||||
| Euro |
GSCO | Sell | 463,000 | 629,997 | 6/01/15 | — | (5,151 | ) | ||||||||||||||||||||||
| Chilean Peso |
BZWS | Buy | 3,010,700,000 | 5,297,730 | 6/04/15 | — | (25,220 | ) | ||||||||||||||||||||||
| Chilean Peso |
MSCO | Buy | 662,100,000 | 1,160,053 | 6/05/15 | — | (655 | ) | ||||||||||||||||||||||
| Euro |
BZWS | Sell | 7,895,591 | 10,753,400 | 6/05/15 | — | (78,173 | ) | ||||||||||||||||||||||
| Mexican Peso |
CITI | Buy | 78,317,430 | 5,880,658 | 6/08/15 | 15,795 | — | |||||||||||||||||||||||
| Euro |
GSCO | Sell | 2,033,100 | 2,772,843 | 6/09/15 | — | (16,350 | ) | ||||||||||||||||||||||
| Semiannual Report | TGB-21 |
FRANKLIN TEMPLETON VARIABLE INSURANCE PRODUCTS TRUST
STATEMENT OF INVESTMENTS (UNAUDITED)
Templeton Global Bond VIP Fund (continued)
Forward Exchange Contracts (continued)
| Currency | Counterpartya | Type | Quantity | Contract Amount* |
Settlement Date |
Unrealized Appreciation |
Unrealized Depreciation |
|||||||||||||||||||||||||
| Japanese Yen |
CITI | Sell | 1,370,500,000 | 13,418,909 | 6/09/15 | $ | — | $ | (154,371 | ) | ||||||||||||||||||||||
| Japanese Yen |
HSBC | Sell | 2,052,400,000 | 20,093,398 | 6/09/15 | — | (233,343 | ) | ||||||||||||||||||||||||
| Mexican Peso |
CITI | Buy | 78,230,000 | 5,898,586 | 6/09/15 | — | (9,103 | ) | ||||||||||||||||||||||||
| Japanese Yen |
BZWS | Sell | 1,689,110,000 | 16,542,468 | 6/10/15 | — | (186,515 | ) | ||||||||||||||||||||||||
| Japanese Yen |
CITI | Sell | 2,595,800,000 | 25,383,818 | 6/10/15 | — | (325,042 | ) | ||||||||||||||||||||||||
| Japanese Yen |
HSBC | Sell | 1,798,900,000 | 17,624,266 | 6/10/15 | — | (192,079 | ) | ||||||||||||||||||||||||
| Japanese Yen |
DBAB | Sell | 595,700,000 | 5,832,191 | 6/11/15 | — | (67,714 | ) | ||||||||||||||||||||||||
| Japanese Yen |
JPHQ | Sell | 1,666,680,000 | 16,314,089 | 6/11/15 | — | (192,967 | ) | ||||||||||||||||||||||||
| Polish Zloty |
CITI | Buy | 5,990,000 | 1,431,781 | EUR | 6/11/15 | — | (28,151 | ) | |||||||||||||||||||||||
| Euro |
GSCO | Sell | 8,105,300 | 10,996,461 | 6/12/15 | — | (123,382 | ) | ||||||||||||||||||||||||
| Mexican Peso |
CITI | Buy | 159,085,880 | 11,896,940 | 6/12/15 | 77,347 | — | |||||||||||||||||||||||||
| Polish Zloty |
DBAB | Buy | 30,704,000 | 7,330,373 | EUR | 6/12/15 | — | (132,820 | ) | |||||||||||||||||||||||
| Euro |
DBAB | Sell | 8,383,000 | 11,362,067 | 6/15/15 | — | (139,016 | ) | ||||||||||||||||||||||||
| Mexican Peso |
CITI | Buy | 68,370,400 | 5,118,694 | 6/15/15 | 26,483 | — | |||||||||||||||||||||||||
| Japanese Yen |
CITI | Sell | 310,702,000 | 3,054,123 | 6/17/15 | — | (23,366 | ) | ||||||||||||||||||||||||
| Japanese Yen |
JPHQ | Sell | 702,800,000 | 6,909,128 | 6/17/15 | — | (52,072 | ) | ||||||||||||||||||||||||
| Euro |
BZWS | Sell | 1,124,367 | 1,529,617 | 6/22/15 | — | (13,043 | ) | ||||||||||||||||||||||||
| Japanese Yen |
DBAB | Sell | 1,455,820,000 | 14,296,573 | 6/22/15 | — | (124,226 | ) | ||||||||||||||||||||||||
| Malaysian Ringgit |
HSBC | Buy | 36,880,000 | 11,168,312 | 6/22/15 | 82,633 | — | |||||||||||||||||||||||||
| Mexican Peso |
CITI | Buy | 61,535,000 | 4,596,280 | 6/22/15 | 32,368 | — | |||||||||||||||||||||||||
| Philippine Peso |
JPHQ | Buy | 251,010,000 | 5,697,263 | 6/25/15 | 35,522 | — | |||||||||||||||||||||||||
| South Korean Won |
DBAB | Buy | 21,440,000,000 | 20,706,973 | 6/29/15 | 181,758 | — | |||||||||||||||||||||||||
| Polish Zloty |
CITI | Buy | 135,806,000 | 43,573,652 | 6/30/15 | 283,500 | — | |||||||||||||||||||||||||
|
|
|
|||||||||||||||||||||||||||||||
| Unrealized appreciation (depreciation) |
|
26,169,086 | (26,275,243 | ) | ||||||||||||||||||||||||||||
|
|
|
|||||||||||||||||||||||||||||||
| Net unrealized appreciation (depreciation) |
|
$ | (106,157 | ) | ||||||||||||||||||||||||||||
|
|
|
|||||||||||||||||||||||||||||||
aMay be comprised of multiple contracts using the same currency and settlement date.
*In U.S. dollars unless otherwise indicated.
At June 30, 2014, the Fund had the following interest rate swap contracts outstanding. See Note 1(d).
Interest Rate Swap Contracts
| Description | Counterparty/ Exchange |
Expiration Date |
Notional Amount |
Unrealized Appreciation |
Unrealized Depreciation |
|||||||||||||||
| Centrally Cleared Swaps | ||||||||||||||||||||
| Receive Floating rate 3-month USD BBA LIBOR Pay Fixed rate 2.775% |
DBAB | 10/4/23 | $ | 13,090,000 | $ | — | $ | (346,044 | ) | |||||||||||
| Receive Floating rate 3-month USD BBA LIBOR Pay Fixed rate 2.795% |
DBAB | 10/4/23 | 13,090,000 | — | (368,968 | ) | ||||||||||||||
| Receive Floating rate 3-month USD BBA LIBOR Pay Fixed rate 2.765% |
HSBC | 10/7/23 | 13,090,000 | — | (329,894 | ) | ||||||||||||||
| Receive Floating rate 3-month USD BBA LIBOR Pay Fixed rate 3.668% |
DBAB | 10/4/43 | 6,370,000 | — | (480,809 | ) | ||||||||||||||
| Receive Floating rate 3-month USD BBA LIBOR Pay Fixed rate 3.687% |
DBAB | 10/4/43 | 6,370,000 | — | (504,390 | ) | ||||||||||||||
| Receive Floating rate 3-month USD BBA LIBOR Pay Fixed rate 3.675% |
HSBC | 10/7/43 | 6,370,000 | — | (487,920 | ) | ||||||||||||||
|
|
|
|||||||||||||||||||
| Centrally Cleared Swaps unrealized appreciation (depreciation) |
|
— | (2,518,025 | ) | ||||||||||||||||
|
|
|
|||||||||||||||||||
| OTC Swaps | ||||||||||||||||||||
| Receive Floating rate 3-month USD BBA LIBOR Pay Fixed rate 3.558% |
JPHQ | 3/4/21 | $ | 3,240,000 | $ | — | $ | (334,109 | ) | |||||||||||
| Receive Floating rate 3-month USD BBA LIBOR Pay Fixed rate 3.523% |
DBAB | 3/28/21 | 14,630,000 | — | (1,442,766 | ) | ||||||||||||||
| TGB-22 | Semiannual Report |
FRANKLIN TEMPLETON VARIABLE INSURANCE PRODUCTS TRUST
STATEMENT OF INVESTMENTS (UNAUDITED)
Templeton Global Bond VIP Fund (continued)
Interest Rate Swap Contracts (continued)
| Description | Counterparty/ Exchange |
Expiration Date |
Notional Amount |
Unrealized Appreciation |
Unrealized Depreciation |
|||||||||||||||
| Receive Floating rate 3-month USD BBA LIBOR Pay Fixed rate 4.347% |
CITI | 2/25/41 | $ | 7,460,000 | $ | — | $ | (1,556,877 | ) | |||||||||||
| Receive Floating rate 3-month USD BBA LIBOR Pay Fixed rate 4.349% |
JPHQ | 2/25/41 | 7,460,000 | — | (1,560,637 | ) | ||||||||||||||
| Receive Floating rate 3-month USD BBA LIBOR Pay Fixed rate 4.320% |
JPHQ | 2/28/41 | 5,600,000 | — | (1,146,436 | ) | ||||||||||||||
| Receive Floating rate 3-month USD BBA LIBOR Pay Fixed rate 4.299% |
JPHQ | 3/1/41 | 1,870,000 | — | (371,892 | ) | ||||||||||||||
|
|
|
|||||||||||||||||||
| OTC Swaps unrealized appreciation (depreciation) |
|
— | (6,412,717 | ) | ||||||||||||||||
|
|
|
|||||||||||||||||||
| Total Interest Rate Swaps unrealized appreciation (depreciation) |
|
— | (8,930,742 | ) | ||||||||||||||||
|
|
|
|||||||||||||||||||
| Net unrealized appreciation (depreciation) |
|
$ | (8,930,742 | ) | ||||||||||||||||
|
|
|
|||||||||||||||||||
See Abbreviations on page TGB-37.
| The accompanying notes are an integral part of these financial statements. | Semiannual Report | TGB-23 |
FRANKLIN TEMPLETON VARIABLE INSURANCE PRODUCTS TRUST
Financial Statements
Statement of Assets and Liabilities
June 30, 2014 (unaudited)
| Templeton Global Bond VIP Fund |
||||
| Assets: | ||||
| Investments in securities: |
||||
| Cost - Unaffiliated issuers |
$ | 2,717,463,445 | ||
| Cost - Repurchase agreements |
316,336,298 | |||
|
|
|
|||
| Total cost of investments |
$ | 3,033,799,743 | ||
|
|
|
|||
| Value - Unaffiliated issuers |
$ | 2,885,850,662 | ||
| Value - Repurchase agreements |
316,336,298 | |||
|
|
|
|||
| Total value of investments |
3,202,186,960 | |||
| Cash |
295,748,898 | |||
| Restricted cash (Note 1e) |
4,160,000 | |||
| Foreign currency, at value (cost $20,661,415) |
20,782,477 | |||
| Receivables: |
||||
| Investment securities sold |
11,479,755 | |||
| Capital shares sold |
7,307,574 | |||
| Interest |
36,068,916 | |||
| Due from brokers |
9,689,309 | |||
| Unrealized appreciation on forward exchange contracts |
26,169,086 | |||
| Other assets |
1,549 | |||
|
|
|
|||
| Total assets |
3,613,594,524 | |||
|
|
|
|||
| Liabilities: | ||||
| Payables: |
||||
| Capital shares redeemed |
1,727,492 | |||
| Management fees |
1,324,328 | |||
| Distribution fees |
1,359,836 | |||
| Variation margin |
191,903 | |||
| Due to Brokers |
4,160,000 | |||
| Unrealized depreciation on forward exchange contracts |
26,275,243 | |||
| Unrealized depreciation on OTC swap contracts |
6,412,717 | |||
| Deferred tax |
1,782,818 | |||
| Accrued expenses and other liabilities |
1,258,427 | |||
|
|
|
|||
| Total liabilities |
44,492,764 | |||
|
|
|
|||
| Net assets, at value |
$ | 3,569,101,760 | ||
|
|
|
|||
| Net assets consist of: | ||||
| Paid-in capital |
$ | 3,428,853,008 | ||
| Distributions in excess of net investment income |
(22,970,846 | ) | ||
| Net unrealized appreciation (depreciation) |
157,801,357 | |||
| Accumulated net realized gain (loss) |
5,418,241 | |||
|
|
|
|||
| Net assets, at value |
$ | 3,569,101,760 | ||
|
|
|
|||
| TGB-24 | Semiannual Report | The accompanying notes are an integral part of these financial statements. |
FRANKLIN TEMPLETON VARIABLE INSURANCE PRODUCTS TRUST
FINANCIAL STATEMENTS
Statement of Assets and Liabilities (continued)
June 30, 2014 (unaudited)
| Templeton Global Bond VIP Fund |
||||
| Class 1: | ||||
| Net assets, at value |
$ | 314,705,377 | ||
|
|
|
|||
| Shares outstanding |
16,758,260 | |||
|
|
|
|||
| Net asset value and maximum offering price per share |
$ | 18.78 | ||
|
|
|
|||
| Class 2: | ||||
| Net assets, at value |
$ | 3,137,403,256 | ||
|
|
|
|||
| Shares outstanding |
172,133,980 | |||
|
|
|
|||
| Net asset value and maximum offering price per share |
$ | 18.23 | ||
|
|
|
|||
| Class 4: | ||||
| Net assets, at value |
$ | 116,993,127 | ||
|
|
|
|||
| Shares outstanding |
6,278,192 | |||
|
|
|
|||
| Net asset value and maximum offering price per share |
$ | 18.63 | ||
|
|
|
|||
| The accompanying notes are an integral part of these financial statements. | Semiannual Report | TGB-25 |
FRANKLIN TEMPLETON VARIABLE INSURANCE PRODUCTS TRUST
FINANCIAL STATEMENTS
Statement of Operations
for the six months ended June 30, 2014 (unaudited)
| Templeton Global Bond VIP Fund |
||||
| Investment income: | ||||
| Interest (net of foreign taxes $1,449,591) |
$ | 62,608,345 | ||
|
|
|
|||
| Expenses: | ||||
| Management fees (Note 3a) |
7,778,963 | |||
| Distribution fees: (Note 3c) |
||||
| Class 2 |
3,599,193 | |||
| Class 3 |
156,081 | |||
| Class 4 |
205,066 | |||
| Custodian fees (Note 4) |
593,634 | |||
| Reports to shareholders |
248,636 | |||
| Professional fees |
48,632 | |||
| Trustees’ fees and expenses |
6,846 | |||
| Other |
31,085 | |||
|
|
|
|||
| Total expenses |
12,668,136 | |||
| Expense reductions (Note 4) |
(2,593 | ) | ||
|
|
|
|||
| Net expenses |
12,665,543 | |||
|
|
|
|||
| Net investment income |
49,942,802 | |||
|
|
|
|||
| Realized and unrealized gains (losses): | ||||
| Net realized gain (loss) from: |
||||
| Investments |
3,326,708 | |||
| Foreign currency transactions |
8,488,773 | |||
| Swap contracts |
(2,061,842 | ) | ||
|
|
|
|||
| Net realized gain (loss) |
9,753,639 | |||
|
|
|
|||
| Net change in unrealized appreciation (depreciation) on: |
||||
| Investments |
71,024,415 | |||
| Translation of other assets and liabilities denominated in foreign currencies |
(22,152,346 | ) | ||
| Change in deferred taxes on unrealized appreciation |
(122,498 | ) | ||
|
|
|
|||
| Net change in unrealized appreciation (depreciation) |
48,749,571 | |||
|
|
|
|||
| Net realized and unrealized gain (loss) |
58,503,210 | |||
|
|
|
|||
| Net increase (decrease) in net assets resulting from operations |
$ | 108,446,012 | ||
|
|
|
|||
| TGB-26 | Semiannual Report | The accompanying notes are an integral part of these financial statements. |
FRANKLIN TEMPLETON VARIABLE INSURANCE PRODUCTS TRUST
FINANCIAL STATEMENTS
Statements of Changes in Net Assets
| Templeton Global Bond VIP Fund | ||||||||
| Six Months Ended June 30, 2014 (unaudited) |
Year Ended December 31, 2013 |
|||||||
| Increase (decrease) in net assets: | ||||||||
| Operations: |
||||||||
| Net investment income |
$ | 49,942,802 | $ | 100,648,197 | ||||
| Net realized gain (loss) from investments, foreign currency transactions and swap contracts |
9,753,639 | 47,113,794 | ||||||
| Net change in unrealized appreciation (depreciation) on investments, translation of other assets and liabilities denominated in foreign currencies and deferred taxes |
48,749,571 | (98,508,111 | ) | |||||
|
|
|
|||||||
| Net increase (decrease) in net assets resulting from operations |
108,446,012 | 49,253,880 | ||||||
|
|
|
|||||||
| Distributions to shareholders from: |
||||||||
| Net investment income and net foreign currency gains: |
||||||||
| Class 1 |
(15,858,865 | ) | (14,463,879 | ) | ||||
| Class 2 |
(156,385,457 | ) | (128,696,606 | ) | ||||
| Class 3 |
— | (9,351,774 | ) | |||||
| Class 4 |
(5,645,270 | ) | (7,129,387 | ) | ||||
| Net realized gains: |
||||||||
| Class 1 |
— | (3,587,066 | ) | |||||
| Class 2 |
— | (33,227,731 | ) | |||||
| Class 3 |
— | (2,438,218 | ) | |||||
| Class 4 |
— | (1,906,223 | ) | |||||
|
|
|
|||||||
| Total distributions to shareholders |
(177,889,592 | ) | (200,800,884 | ) | ||||
|
|
|
|||||||
| Capital share transactions: (Note 2) |
||||||||
| Class 1 |
40,004,185 | (13,273,114 | ) | |||||
| Class 2 |
374,327,544 | 529,969,403 | ||||||
| Class 3 |
(195,888,546 | ) | 4,794,164 | |||||
| Class 4 |
831,948 | (37,369,362 | ) | |||||
|
|
|
|||||||
| Total capital share transactions |
219,275,131 | 484,121,091 | ||||||
|
|
|
|||||||
| Redemption fees |
1,163 | 7,288 | ||||||
|
|
|
|||||||
| Net increase (decrease) in net assets |
149,832,714 | 332,581,375 | ||||||
| Net assets: | ||||||||
| Beginning of period |
3,419,269,046 | 3,086,687,671 | ||||||
|
|
|
|||||||
| End of period |
$ | 3,569,101,760 | $ | 3,419,269,046 | ||||
|
|
|
|||||||
| Undistributed net investment income (distributions in excess of net investment income) included in net assets: |
||||||||
| End of period |
$ | (22,970,846 | ) | $ | 104,975,944 | |||
|
|
|
|||||||
| The accompanying notes are an integral part of these financial statements. | Semiannual Report | TGB-27 |
FRANKLIN TEMPLETON VARIABLE INSURANCE PRODUCTS TRUST
Notes to Financial Statements (unaudited)
Templeton Global Bond VIP Fund
| TGB-28 | Semiannual Report |
FRANKLIN TEMPLETON VARIABLE INSURANCE PRODUCTS TRUST
NOTES TO FINANCIAL STATEMENTS (UNAUDITED)
Templeton Global Bond VIP Fund (continued)
| Semiannual Report | TGB-29 |
FRANKLIN TEMPLETON VARIABLE INSURANCE PRODUCTS TRUST
NOTES TO FINANCIAL STATEMENTS (UNAUDITED)
Templeton Global Bond VIP Fund (continued)
1. Organization and Significant Accounting Policies (continued)
d. Derivative Financial Instruments (continued)
assets over various periods of time. In the event of default or early termination, the ISDA master agreement gives the non-defaulting party the right to net and close-out all transactions traded, whether or not arising under the ISDA agreement, to one net amount payable by one counterparty to the other. However, absent an event of default or early termination, OTC derivative assets and liabilities are presented gross and not offset in the Statement of Assets and Liabilities. Early termination by the counterparty may result in an immediate payment by the Fund of any net liability owed to that counterparty under the ISDA agreement.
Collateral requirements differ by type of derivative. Collateral or initial margin requirements are set by the broker or exchange clearing house for exchange traded and centrally cleared derivatives. Initial margin deposited is held at the exchange and can be in the form of cash and/or securities. For OTC derivatives traded under an ISDA master agreement, posting of collateral is required by either the fund or the applicable counterparty if the total net exposure of all OTC derivatives with the applicable counterparty exceeds the minimum transfer amount, which typically ranges from $100,000 to $250,000, and can vary depending on the counterparty and the type of the agreement. Generally, collateral is determined at the close of fund business each day and any additional collateral required due to changes in derivative values may be delivered by the fund or the counterparty within a few business days. Collateral pledged and/or received by the fund for OTC derivatives, if any, is held in segregated accounts with the fund’s custodian/counterparty broker and can be in the form of cash and/or securities. Unrestricted cash may be invested according to the Fund’s investment objectives.
The Fund entered into OTC forward exchange contracts primarily to manage and/or gain exposure to certain foreign currencies. A forward exchange contract is an agreement between the Fund and a counterparty to buy or sell a foreign currency at a specific exchange rate on a future date.
The Fund entered into interest rate swap contracts primarily to manage interest rate risk. An interest rate swap is an agreement between the Fund and a counterparty to exchange cash flows
based on the difference between two interest rates, applied to a notional amount. These agreements may be privately negotiated in the over-the-counter market (“OTC interest rate swaps”) or may be executed on a registered exchange (“centrally cleared interest rate swaps”). For centrally cleared interest rate swaps, required initial margins are pledged by the Fund, and the daily change in fair value is accounted for as a variation margin payable or receivable on the Statement of Assets and Liabilities. Over the term of the contract, contractually required payments to be paid and to be received are accrued daily and recorded as unrealized depreciation and appreciation until the payments are made, at which time they are realized.
See Note 9 regarding other derivative information.
e. Restricted Cash
At June 30, 2014, the Fund received restricted cash in connection with investments in certain derivative securities. Restricted cash is held in a segregated account with the Fund’s counterparty broker and is reflected in the Statement of Assets and Liabilities.
f. Income and Deferred Taxes
It is the Fund’s policy to qualify as a regulated investment company under the Internal Revenue Code. The Fund intends to distribute to shareholders substantially all of its taxable income and net realized gains to relieve it from federal income and if applicable, excise taxes. As a result, no provision for U.S. federal income taxes is required.
The Fund may be subject to foreign taxation related to income received, capital gains on the sale of securities and certain foreign currency transactions in the foreign jurisdictions in which it invests. Foreign taxes, if any, are recorded based on the tax regulations and rates that exist in the foreign markets in which the Fund invests. When a capital gain tax is determined to apply the Fund records an estimated deferred tax liability in an amount that would be payable if the securities were disposed of on the valuation date.
The Fund recognizes the tax benefits of uncertain tax positions only when the position is “more likely than not” to be sustained upon examination by the tax authorities based on the technical merits of the tax position. As of June 30, 2014, and for all open tax years, the Fund has determined that no liability for unrecognized tax benefits is required in the Fund’s financial statements
| TGB-30 | Semiannual Report |
FRANKLIN TEMPLETON VARIABLE INSURANCE PRODUCTS TRUST
NOTES TO FINANCIAL STATEMENTS (UNAUDITED)
Templeton Global Bond VIP Fund (continued)
| Semiannual Report | TGB-31 |
FRANKLIN TEMPLETON VARIABLE INSURANCE PRODUCTS TRUST
NOTES TO FINANCIAL STATEMENTS (UNAUDITED)
Templeton Global Bond VIP Fund (continued)
2. Shares of Beneficial Interest
At June 30, 2014, there were an unlimited number of shares authorized (without par value). Transactions in the Fund’s shares were as follows:
| Six Months Ended June 30, 2014 |
Year Ended December 31, 2013 |
|||||||||||||||||
| Shares | Amount | Shares | Amount | |||||||||||||||
| Class 1 Shares: | ||||||||||||||||||
| Shares sold |
2,388,211 | $ | 45,987,259 | 1,918,229 | $ | 37,822,305 | ||||||||||||
| Shares issued in reinvestment of distributions |
844,006 | 15,858,865 | 962,717 | 18,050,945 | ||||||||||||||
| Shares redeemed |
(1,142,034 | ) | (21,841,939 | ) | (3,563,965 | ) | (69,146,364 | ) | ||||||||||
|
|
|
|||||||||||||||||
| Net increase (decrease) |
2,090,183 | $ | 40,004,185 | (683,019 | ) | $ | (13,273,114 | ) | ||||||||||
|
|
|
|||||||||||||||||
| Class 2 Shares: | ||||||||||||||||||
| Shares sold |
21,979,032 | $ | 410,865,499 | 34,876,621 | $ | 667,964,958 | ||||||||||||
| Shares issued in reinvestment of distributions |
8,573,764 | 156,385,457 | 8,877,431 | 161,924,337 | ||||||||||||||
| Shares redeemed |
(10,359,769 | ) | (192,923,412 | ) | (16,008,448 | ) | (299,919,892 | ) | ||||||||||
|
|
|
|||||||||||||||||
| Net increase (decrease) |
20,193,027 | $ | 374,327,544 | 27,745,604 | $ | 529,969,403 | ||||||||||||
|
|
|
|||||||||||||||||
| Class 3 Sharesa: | ||||||||||||||||||
| Shares sold |
167,296 | $ | 3,090,707 | 1,022,231 | $ | 19,570,327 | ||||||||||||
| Shares issued in reinvestment of distributions |
— | — | 646,027 | 11,789,991 | ||||||||||||||
| Shares redeemed |
(10,595,103 | ) | (198,979,253 | ) | (1,409,425 | ) | (26,566,154 | ) | ||||||||||
|
|
|
|||||||||||||||||
| Net increase (decrease) |
(10,427,807 | ) | $ | (195,888,546 | ) | 258,833 | $ | 4,794,164 | ||||||||||
|
|
|
|||||||||||||||||
| Class 4 Shares: | ||||||||||||||||||
| Shares sold |
307,102 | $ | 5,804,634 | 892,452 | $ | 17,199,730 | ||||||||||||
| Shares issued on reinvestment of distributions |
302,695 | 5,645,270 | 485,524 | 9,035,611 | ||||||||||||||
| Shares redeemed |
(560,738 | ) | (10,617,956 | ) | (3,385,215 | ) | (63,604,703 | ) | ||||||||||
|
|
|
|||||||||||||||||
| Net increase (decrease) |
49,059 | $ | 831,948 | (2,007,239 | ) | $ | (37,369,362 | ) | ||||||||||
|
|
|
|||||||||||||||||
aEffective May 1, 2014, all Class 3 shares were converted to Class 2.
3. Transactions With Affiliates
Franklin Resources, Inc. is the holding company for various subsidiaries that together are referred to as Franklin Templeton Investments. Certain officers and trustees of the Fund are also officers and/or directors of the following subsidiaries:
| Subsidiary | Affiliation | |
| Franklin Advisers, Inc. (Advisers) | Investment manager | |
| Franklin Templeton Services, LLC (FT Services) | Administrative manager | |
| Franklin Templeton Distributors, Inc. (Distributors) | Principal underwriter | |
| Franklin Templeton Investor Services, LLC (Investor Services) | Transfer agent |
| TGB-32 | Semiannual Report |
FRANKLIN TEMPLETON VARIABLE INSURANCE PRODUCTS TRUST
NOTES TO FINANCIAL STATEMENTS (UNAUDITED)
Templeton Global Bond VIP Fund (continued)
a. Management Fees
The Fund pays an investment management fee to Advisers based on the average daily net assets of the Fund as follows:
| Annualized Fee Rate | Net Assets | |
| 0.625% | Up to and including $100 million | |
| 0.500% | Over $100 million, up to and including $250 million | |
| 0.450% | Over $250 million, up to and including $7.5 billion | |
| 0.440% | Over $7.5 billion, up to and including $10 billion | |
| 0.430% | Over $10 billion, up to and including $12.5 billion | |
| 0.420% | Over $12.5 billion, up to and including $15 billion | |
| 0.400% | In excess of $15 billion |
b. Administrative Fees
Under an agreement with Advisers, FT Services provides administrative services to the Fund. The fee is paid by Advisers based on the Fund’s average daily net assets, and is not an additional expense of the Fund.
c. Distribution Fees.
The Board has adopted distribution plans for Class 2, Class 3, and Class 4 shares pursuant to Rule 12b-1 under the 1940 Act. Under the Fund’s compensation distribution plans, the Fund pays Distributors for costs incurred in connection with the servicing, sale and distribution of the Fund’s shares up to 0.25%, 0.35%, and 0.35% per year of its average daily net assets of Class 2, Class 3, and Class 4, respectively. Some distribution fees are not charged on shares held by affiliates. The Board has agreed to limit the current rate to 0.25% per year for Class 3. The plan year, for purposes of monitoring compliance with the maximum annual plan rates, is February 1 through January 31.
d. Transfer Agent Fees
Investor Services, under terms of an agreement, performs shareholder servicing for the Fund and is not paid by the Fund for the services.
4. Expense Offset Arrangement
The Fund has entered into an arrangement with its custodian whereby credits realized as a result of uninvested cash balances are used to reduce a portion of the Fund’s custodian expenses. During the period ended June 30, 2014, the custodian fees were reduced as noted in the Statement of Operations.
5. Income Taxes
For tax purposes, capital losses may be carried over to offset future capital gains. At December 31, 2013, the Fund had long-term capital loss carryforwards of $4,268,308.
At June 30, 2014, the cost of investments and net unrealized appreciation (depreciation) for income tax purposes were as follows:
| Cost of investments |
$ | 3,050,563,904 | ||
|
|
|
|||
| Unrealized appreciation |
$ | 188,957,445 | ||
| Unrealized depreciation |
(37,334,389 | ) | ||
|
|
|
|||
| Net unrealized appreciation (depreciation) |
$ | 151,623,056 | ||
|
|
|
|||
| Semiannual Report | TGB-33 |
FRANKLIN TEMPLETON VARIABLE INSURANCE PRODUCTS TRUST
NOTES TO FINANCIAL STATEMENTS (UNAUDITED)
Templeton Global Bond VIP Fund (continued)
5. Income Taxes (continued)
Differences between income and/or capital gains as determined on a book basis and a tax basis are primarily due to differing treatments of foreign currency transactions, bond discounts and premiums, and tax straddles.
6. Investment Transactions
Purchases and sales of investments (excluding short term securities) for the period ended June 30, 2014, aggregated $434,725,701 and $513,101,247, respectively.
7. Credit Risk
At June 30, 2014, the Fund had 12.87% of its portfolio invested in high yield or other securities rated below investment grade. These securities may be more sensitive to economic conditions causing greater price volatility and are potentially subject to a greater risk of loss due to default than higher rated securities.
8. Concentration of Risk.
Investing in foreign securities may include certain risks and considerations not typically associated with investing in U.S. securities, such as fluctuating currency values and changing local and regional economic, political and social conditions, which may result in greater market volatility. In addition, certain foreign securities may not be as liquid as U.S. securities.
9. Other Derivative Information
At June 30, 2014, the Fund’s investments in derivative contracts are reflected on the Statement of Assets and Liabilities as follows:
| Asset Derivatives | Liability Derivatives | |||||||||||
| Derivative Contracts Not Accounted for as Hedging Instruments |
Statement of Assets and Liabilities Location |
Fair Value Amount |
Statement of Assets and Liabilities Location |
Fair Value Amount |
||||||||
| Interest rate contracts |
Net assets consist of—net unrealized appreciation (depreciation) |
$ | — | Variation margin /Unrealized depreciation on swap contracts / Net assets consist of—net unrealized appreciation |
$ | 8,930,742 | ||||||
| Foreign exchange contracts |
Unrealized appreciation on forward exchange contracts |
26,169,086 | Unrealized depreciation on forward exchange contracts |
26,275,243 | ||||||||
a Includes cumulative appreciation (depreciation) of centrally cleared swaps as reported in the Statement of Investments. Only current day’s variation margin is separately reported within the Statement of Assets and Liabilities.
For the period ended June 30, 2014, the effect of derivative contracts on the Fund’s Statement of Operations was as follows:
| Derivative Contracts Not Accounted for as Hedging Instruments |
Statement of Operations Locations |
Realized Gain (Loss) for the Period |
Change in Unrealized Appreciation (Depreciation) for the Period |
|||||||
| Interest rate contracts |
Net realized gain (loss) from swap contracts / Net change in unrealized appreciation (depreciation) on investments |
$ | (2,061,842 | ) | $ | (6,803,271 | ) | |||
| Foreign exchange contracts |
Net realized gain (loss) from foreign currency transactions / Net change in unrealized appreciation (depreciation) on translation of other assets and liabilities denominated in foreign currencies |
7,481,025 | (21,876,711 | ) | ||||||
| TGB-34 | Semiannual Report |
FRANKLIN TEMPLETON VARIABLE INSURANCE PRODUCTS TRUST
NOTES TO FINANCIAL STATEMENTS (UNAUDITED)
Templeton Global Bond VIP Fund (continued)
At June 30, 2014, the Fund’s OTC derivative assets and liabilities, are as follows:
| Gross and Net Amounts of Assets and Liabilities Presented in the Statement of Assets and Liabilities |
||||||||
| Assetsa | Liabilitiesa | |||||||
| Derivatives | ||||||||
| Forward Exchange Contracts |
$ | 26,169,086 | $ | 26,275,243 | ||||
| Swap Contracts |
— | 6,412,717 | ||||||
|
|
|
|||||||
| Total |
$ | 26,169,086 | $ | 32,687,960 | ||||
|
|
|
|||||||
aAbsent an event of default or early termination, OTC derivative assets and liabilities are presented gross and not offset in the Statement of Assets and Liabilities.
At June 30, 2014, the Fund’s OTC derivative assets which may be offset against the Fund’s OTC derivative liabilities and collateral received from the counterparty, is as follows:
| Amounts Not Offset in the Statement of Assets & Liabilities |
||||||||||||||||||||
| Gross and Net Amounts of Assets Presented in the Statement of Assets & Liabilities |
Financial Instruments Available for Offset |
Financial Instruments Collateral Receiveda,b |
Cash Collateral Receivedb |
Net Amount (Not less than zero) |
||||||||||||||||
| Counterparty | ||||||||||||||||||||
| BOFA |
$ | — | $ | — | $ | — | $ | — | $ | — | ||||||||||
| BZWS |
1,910,927 | (1,910,927 | ) | — | — | — | ||||||||||||||
| CITI |
2,879,456 | (2,879,456 | ) | — | — | — | ||||||||||||||
| DBAB |
8,132,537 | (8,132,537 | ) | — | — | — | ||||||||||||||
| GSCO |
203,870 | (203,870 | ) | — | — | — | ||||||||||||||
| HSBC |
8,486,722 | (2,659,300 | ) | (5,827,422 | ) | — | — | |||||||||||||
| JPHQ |
3,668,920 | (3,668,920 | ) | — | — | — | ||||||||||||||
| MSCO |
330,531 | (330,531 | ) | — | — | — | ||||||||||||||
| SCNY |
311,802 | (311,802 | ) | — | — | — | ||||||||||||||
| UBSW |
244,321 | (244,321 | ) | — | — | — | ||||||||||||||
|
|
|
|||||||||||||||||||
| Total |
$ | 26,169,086 | $ | (20,341,664 | ) | $ | (5,827,422 | ) | $ | — | $ | — | ||||||||
|
|
|
|||||||||||||||||||
aAt June 30, 2014, the Fund received United Kingdom Treasury Bonds and U.S. Treasury Bonds as collateral for derivatives.
bIn some instances, the collateral amounts disclosed in the table above were adjusted due to the requirement to limit the collateral amounts to avoid the effect of overcollateralization. Actual collateral received and/or pledged may be more than the amounts disclosed herein.
| Semiannual Report | TGB-35 |
FRANKLIN TEMPLETON VARIABLE INSURANCE PRODUCTS TRUST
NOTES TO FINANCIAL STATEMENTS (UNAUDITED)
Templeton Global Bond VIP Fund (continued)
9. Other Derivative Information (continued)
At June 30, 2014, the Fund’s OTC derivative liabilities which may be offset against the Fund’s OTC derivative assets and collateral pledged to the counterparty, is as follows:
| Amounts Not Offset in the Statement of Assets & Liabilities |
||||||||||||||||||||
| Gross and Net Amounts of Liabilities Presented in the Statement of Assets & Liabilities |
Financial Instruments Available for Offset |
Financial Instruments Collateral Pledged |
Cash Collateral Pledgeda |
Net Amount (Not less than zero) |
||||||||||||||||
| Counterparty | ||||||||||||||||||||
| BOFA |
$ | 91,289 | $ | — | $ | — | $ | — | $ | 91,289 | ||||||||||
| BZWS |
2,952,251 | (1,910,927 | ) | — | — | 1,041,324 | ||||||||||||||
| CITI |
3,729,837 | (2,879,456 | ) | — | — | 850,381 | ||||||||||||||
| DBAB |
9,817,848 | (8,132,537 | ) | — | — | 1,685,311 | ||||||||||||||
| GSCO |
2,232,654 | (203,870 | ) | — | (1,190,000 | ) | 838,784 | |||||||||||||
| HSBC |
2,659,300 | (2,659,300 | ) | — | — | — | ||||||||||||||
| JPHQ |
7,305,797 | (3,668,920 | ) | — | (740,000 | ) | 2,896,877 | |||||||||||||
| MSCO |
1,979,822 | (330,531 | ) | — | (1,649,291 | ) | — | |||||||||||||
| SCNY |
585,130 | (311,802 | ) | — | — | 273,328 | ||||||||||||||
| UBSW |
1,334,032 | (244,321 | ) | — | (1,089,711 | ) | — | |||||||||||||
|
|
|
|||||||||||||||||||
| Total |
$ | 32,687,960 | $ | (20,341,664 | ) | $ | — | $ | (4,669,002 | ) | $ | 7,677,294 | ||||||||
|
|
|
|||||||||||||||||||
aIn some instances, the collateral amounts disclosed in the table above were adjusted due to the requirement to limit the collateral amounts to avoid the effect of overcollateralization. Actual collateral received and/or pledged may be more than the amounts disclosed herein.
For the period ended June 30, 2014, the average month end fair value of derivatives represented 2.43% of average month end net assets. The average month end number of open derivative contracts for the period was 475.
See Note 1(d) regarding derivative financial instruments.
10. Credit Facility
The Fund, together with other U.S. registered and foreign investment funds (collectively, Borrowers), managed by Franklin Templeton Investments, are borrowers in a joint syndicated senior unsecured credit facility totaling $1.5 billion (Global Credit Facility) which matures on February 13, 2015. This Global Credit Facility provides a source of funds to the Borrowers for temporary and emergency purposes, including the ability to meet future unanticipated or unusually large redemption requests.
Under the terms of the Global Credit Facility, the Fund shall, in addition to interest charged on any borrowings made by the Fund and other costs incurred by the Fund, pay its share of fees and expenses incurred in connection with the implementation and maintenance of the Global Credit Facility, based upon its relative share of the aggregate net assets of all of the Borrowers, including an annual commitment fee of 0.07% based upon the unused portion of the Global Credit Facility. These fees are reflected in other expenses on the Statement of Operations. During the period ended June 30, 2014, the Fund did not use the Global Credit Facility.
11. Fair Value Measurements
The Fund follows a fair value hierarchy that distinguishes between market data obtained from independent sources (observable inputs) and the Fund’s own market assumptions (unobservable inputs). These inputs are used in determining the value of the Fund’s financial instruments and are summarized in the following fair value hierarchy:
| • | Level 1 – quoted prices in active markets for identical financial instruments |
| • | Level 2 – other significant observable inputs (including quoted prices for similar financial instruments, interest rates, prepayment speed, credit risk, etc.) |
| • | Level 3 – significant unobservable inputs (including the Fund’s own assumptions in determining the fair value of financial instruments) |
| TGB-36 | Semiannual Report |
FRANKLIN TEMPLETON VARIABLE INSURANCE PRODUCTS TRUST
NOTES TO FINANCIAL STATEMENTS (UNAUDITED)
Templeton Global Bond VIP Fund (continued)
The input levels are not necessarily an indication of the risk or liquidity associated with financial instruments at that level.
For movements between the levels within the fair value hierarchy, the Fund has adopted a policy of recognizing the transfers as of the date of the underlying event which caused the movement.
At June 30, 2014, all of the Fund’s investments in financial instruments carried at fair value were valued using Level 2 inputs.
12. New Accounting Pronouncements
In June 2014, the Financial Accounting Standards Board issued Accounting Standards Update (ASU) No. 2014-11, Transfers and Servicing (Topic 860), Repurchase-to-Maturity Transactions, Repurchase Financings, and Disclosures. The ASU changes the accounting for certain repurchase agreements and expands disclosure requirements related to repurchase agreements, securities lending, repurchase-to-maturity and similar transactions. The ASU is effective for interim and annual reporting periods beginning after December 15, 2014. Management is currently evaluating the impact, if any, of applying this provision.
13. Subsequent Events
The Fund has evaluated subsequent events through the issuance of the financial statements and determined that no events have occurred that require disclosure.
Abbreviations
| Counterparty | Currency | Selected Portfolio | ||||||||
| BOFA | Bank of America N.A. | BRL | Brazilian Real | FRN | Floating Rate Note | |||||
| BZWS | Barclays Bank PLC | CAD | Canadian Dollar | |||||||
| CITI | Citigroup, Inc. | EUR | Euro | |||||||
| DBAB | Deutsche Bank AG | HUF | Hungarian Forint | |||||||
| GSCO | Goldman Sachs Bank | IDR | Indonesian Rupiah | |||||||
| HSBC | HSBC Bank USA N.A. | JPY | Japanese Yen | |||||||
| JPHQ | JP Morgan Chase & Co. | KRW | South Korean Won | |||||||
| MSCO | Morgan Stanley | LKR | Sri Lankan Rupee | |||||||
| SCNY | Standard Chartered Bank | MXN | Mexican Peso | |||||||
| UBSW | UBS AG | MYR | Malaysian Ringgit | |||||||
| PEN | Peruvian Nuevo Sol | |||||||||
| PHP | Philippine Peso | |||||||||
| PLN | Polish Zloty | |||||||||
| SEK | Swedish Krona | |||||||||
| SGD | Singapore Dollar | |||||||||
| Semiannual Report | TGB-37 |
FRANKLIN TEMPLETON VARIABLE INSURANCE PRODUCTS TRUST
TAX INFORMATION (UNAUDITED)
Templeton Global Bond VIP Fund
At December 31, 2013, more than 50% of the Fund’s total assets were invested in securities of foreign issuers. In most instances, foreign taxes were withheld from income paid to the Fund on these investments. As shown in the table below, the Fund hereby reports to shareholders the foreign source income and foreign taxes paid, pursuant to Section 853 of the Internal Revenue Code (Code). This written statement will allow shareholders of record on June 12, 2014, to treat their proportionate share of foreign taxes paid by the Fund as having been paid directly by them. The shareholder shall consider these amounts as foreign taxes paid in the tax year in which they receive the Fund distribution.
The following table provides a detailed analysis of foreign tax paid and foreign source income as reported by the Fund, to Class 1, Class 2, and Class 4 shareholders of record.
| Class | Foreign Tax Paid Per Share |
Foreign Source Income Per Share | ||
| Class 1 | $0.0152 | $0.7142 | ||
| Class 2 | $0.0152 | $0.6850 | ||
| Class 4 | $0.0152 | $0.6557 |
Foreign Tax Paid Per Share (Column 1) is the amount per share available to you, as a tax credit (assuming you held your shares in the Fund for a minimum of 16 days during the 31-day period beginning 15 days before the ex-dividend date of the Fund’s distribution to which the foreign taxes relate), or, as a tax deduction.
Foreign Source Income Per Share (Column 2) is the amount per share of income dividends attributable to foreign securities held by the Fund, plus any foreign taxes withheld on these dividends.
| TGB-38 | Semiannual Report |
Templeton Growth VIP Fund
(Formerly, Templeton Growth Securities Fund)
This semiannual report for Templeton Growth VIP Fund covers the period ended June 30, 2014.
Class 2 Performance Summary as of June 30, 2014
Templeton Growth VIP Fund – Class 2 delivered a +5.03% total return for the six-month period ended June 30, 2014.
Performance reflects the Fund’s Class 2 operating expenses, but does not include any contract fees, expenses or sales charges. If they had been included, performance would be lower. These charges and deductions, particularly for variable life policies, can have a significant effect on contract values and insurance benefits. See the contract prospectus for a complete description of these expenses, including sales charges.
Performance data represent past performance, which does not guarantee future results. Investment return and principal value will fluctuate, and you may have a gain or loss when you sell your shares. Current performance may differ from figures shown.
| Semiannual Report | TG-1 |
TEMPLETON GROWTH VIP FUND
Fund Goal and Main Investments: Templeton Growth VIP Fund seeks long-term capital growth. Under normal market conditions, the Fund invests predominantly in equity securities of companies located anywhere in the world, including emerging markets.
Fund Risks: All investments involve risks, including possible loss of principal. Special risks are associated with foreign investing, including currency fluctuations, economic instability and political developments; investments in emerging markets involve heightened risks related to the same factors. To the extent the Fund focuses on particular countries, regions, industries, sectors or types of investments from time to time, it may be subject to greater risks of adverse developments in such areas of focus than a fund that invests in a wider variety of countries, regions, industries, sectors or investments. The Fund is actively managed but there is no guarantee that the manager’s investment decisions will produce the desired results. The Fund’s prospectus also includes a description of the main investment risks.
Performance Overview
You can find the Fund’s six-month total return in the Performance Summary. For comparison, the Fund’s benchmarks, the MSCI All Country World Index (ACWI) and the MSCI World Index, produced total returns of +6.50% and +6.52% for the period under review.1
Economic and Market Overview
The global economy grew moderately during the six months under review as many developed markets continued to recover and many emerging markets recorded continued growth. Major developed market central banks reaffirmed their accommodative monetary policies in an effort to support ongoing recovery. Several emerging market central banks cut interest rates to boost economic growth, while others raised rates to control inflation and currency depreciation.
U.S. economic growth and employment trends were generally encouraging during the period, despite severe weather across many states that limited economic activity in the first quarter of 2014. The U.S. Federal Reserve Board (Fed) began reducing bond purchases by $10 billion a month in January 2014, based on earlier largely positive economic and employment data. The Fed continued reducing asset purchases during the period. In this
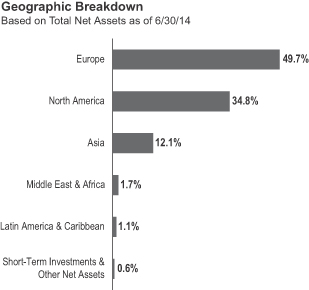
environment, defensive sectors, such as health care and utilities, and sectors benefiting from rising oil prices, including energy, led market returns, while more cyclical sectors, such as financials and consumer discretionary, lagged the broader market.
Outside the U.S., the U.K. economy grew relatively well in the first half of 2014, supported by the services and manufacturing sectors. In the second quarter, a preliminary estimate registered expansion at percrisis levels. The Japanese economy grew strongly during the first quarter of 2014 as consumption rose ahead of a sales tax increase in April. The Bank of Japan kept its monetary policy unchanged as it maintained an upbeat inflation forecast and reiterated that the economy continued to recover moderately, despite challenges resulting from the sales tax increase. Japan’s growth weakened, however, in the second quarter. The Japanese government proposed a reduction in corporate taxes as part of its economic reforms in an effort to avoid deflation and facilitate growth. Although out of recession, the eurozone experienced deflationary risks and weak employment trends. The region’s first-quarter economic growth was softer than what many observers had expected. In the second quarter, concerns arose about the potential negative impacts to growth from the crisis in Ukraine and tension in the Middle East. Toward period-end, the European Central Bank (ECB) reduced its main interest rate and, for the first time, set a negative deposit rate.
1. Source: © 2014 Morningstar. One cannot invest directly in an index, and an index is not representative of the Fund’s portfolio. Please see Index Descriptions following the Fund Summaries.
| TG-2 | Semiannual Report |
TEMPLETON GROWTH VIP FUND
| Semiannual Report | TG-3 |
2. The industrials sector comprises aerospace and defense, air freight and logistics, airlines, commercial services and supplies, construction and engineering, electrical equipment, industrial conglomerates, machinery and professional services in the SOI.
TEMPLETON GROWTH VIP FUND
Encouragingly, an underweighted position in energy, where we found new bargains, also contributed to relative and absolute performance during the period.5 U.S. oilfield services firms Halliburton and Baker Hughes were among the key overweighted energy stocks, with share prices rallying as pessimism surrounding margins and supply faded amid improvements in the U.S. pressure pumping market. With oil prices rising above the estimated marginal cost of supply and U.S. pumping activity near all-time highs, our thesis on these highly cyclical stocks appeared to be maturing. We remained favorable toward oil services stocks given the strong demand for their expertise and technology as major and state-owned oil companies attempted to extract hydrocarbons from increasingly challenging locations. Among oil services and integrated oil firms, we found opportunities attractive to us in Europe, where energy stocks traded at their lowest cyclically adjusted earnings multiples in 30 years. We were encouraged to see many major oil companies
3. The financials sector comprises banks, capital markets, diversified financial services and insurance in the SOI.
4. The consumer discretionary sector comprises auto components, automobiles, media, multiline retail and specialty retail in the SOI.
5. The energy sector comprises energy equipment and services; and oil, gas and consumable fuels in the SOI.
| TG-4 | Semiannual Report |
TEMPLETON GROWTH VIP FUND
6. The information technology sector comprises communications equipment; electronic equipment, instruments and components; semiconductors and semiconductor equipment; and software in the SOI.
7. The telecommunication services sector comprises diversified telecommunication services and wireless telecommunication services in the SOI.
8. Not part of the index.
9. The health care sector comprises biotechnology, life sciences tools and services, and pharmaceuticals in the SOI.
| Semiannual Report | TG-5 |
TEMPLETON GROWTH VIP FUND
Class 2 Fund Expenses
| Class 2 | Beginning Account Value 1/1/14 |
Ending Account Value 6/30/14 |
Fund-Level
Expenses 1/1/14–6/30/14 |
|||||||||
| Actual | $1,000 | $1,050.30 | $5.29 | |||||||||
| Hypothetical (5% return before expenses) | $1,000 | $1,019.64 | $5.21 | |||||||||
*Expenses are calculated using the most recent six-month annualized expense ratio for the Fund’s Class 2 shares (1.04%), which does not include any ongoing expenses of the Contract for which the Fund is an investment option, multiplied by the average account value over the period, multiplied by 181/365 to reflect the one-half year period.
| TG-6 | Semiannual Report |
FRANKLIN TEMPLETON VARIABLE INSURANCE PRODUCTS TRUST
Financial Highlights
Templeton Growth VIP Fund
| Six Months Ended June 30, 2014 (unaudited) |
Year Ended December 31, | |||||||||||||||||||||||
| 2013 | 2012 | 2011 | 2010 | 2009 | ||||||||||||||||||||
| Class 1 | ||||||||||||||||||||||||
| Per share operating performance (for a share outstanding throughout the period) |
||||||||||||||||||||||||
| Net asset value, beginning of period |
$15.47 | $12.16 | $10.27 | $11.19 | $10.56 | $ 8.34 | ||||||||||||||||||
|
|
|
|||||||||||||||||||||||
| Income from investment operationsa: | ||||||||||||||||||||||||
| Net investment incomeb |
0.29 | c | 0.22 | 0.27 | 0.25 | 0.17 | 0.17 | |||||||||||||||||
| Net realized and unrealized gains (losses) |
0.52 | 3.49 | 1.88 | (0.99 | ) | 0.62 | 2.36 | |||||||||||||||||
|
|
|
|||||||||||||||||||||||
| Total from investment operations |
0.81 | 3.71 | 2.15 | (0.74 | ) | 0.79 | 2.53 | |||||||||||||||||
|
|
|
|||||||||||||||||||||||
| Less distributions from net investment income |
(0.25 | ) | (0.40 | ) | (0.26 | ) | (0.18 | ) | (0.16 | ) | (0.31 | ) | ||||||||||||
|
|
|
|||||||||||||||||||||||
| Net asset value, end of period |
$16.03 | $15.47 | $12.16 | $10.27 | $11.19 | $10.56 | ||||||||||||||||||
|
|
|
|||||||||||||||||||||||
| Total returnd |
5.21% | 31.05% | 21.40% | (6.80)% | 7.74% | 31.33% | ||||||||||||||||||
| Ratios to average net assetse | ||||||||||||||||||||||||
| Expenses |
0.79% | 0.78% | f | 0.78% | f | 0.78% | f | 0.77% | f | 0.79% | f | |||||||||||||
| Net investment income |
3.64% | c | 1.62% | 2.31% | 2.22% | 1.71% | 2.00% | |||||||||||||||||
| Supplemental data | ||||||||||||||||||||||||
| Net assets, end of period (000’s) |
$622,810 | $588,409 | $476,954 | $1,200,682 | $1,348,622 | $824,575 | ||||||||||||||||||
| Portfolio turnover rate |
10.30% | 11.60% | 18.73% | g | 42.13% | g | 9.61% | 14.95% | ||||||||||||||||
aThe amount shown for a share outstanding throughout the period may not correlate with the Statement of Operations for the period due to the timing of sales and repurchases of the Fund shares in relation to income earned and/or fluctuating fair value of the investments of the Fund.
bBased on average daily shares outstanding.
cNet investment income per share includes approximately $0.09 per share received in the form of special dividends. Excluding these amounts, the ratio of net investment income to average net assets would have been 2.52%.
dTotal return does not include fees, charges or expenses imposed by the variable annuity and life insurance contracts for which the Franklin Templeton Variable Insurance Products Trust serves as an underlying investment vehicle. Total return is not annualized for periods less than one year.
eRatios are annualized for periods less than one year.
fBenefit of expense reduction rounds to less than 0.01%.
gExcludes the value of portfolio securities delivered as a result of a redemption in-kind.
| The accompanying notes are an integral part of these financial statements. | Semiannual Report | TG-7 |
FRANKLIN TEMPLETON VARIABLE INSURANCE PRODUCTS TRUST
FINANCIAL HIGHLIGHTS
Templeton Growth VIP Fund (continued)
| Six Months Ended June 30, 2014 (unaudited) |
Year Ended December 31, | |||||||||||||||||||||||
| 2013 | 2012 | 2011 | 2010 | 2009 | ||||||||||||||||||||
| Class 2 | ||||||||||||||||||||||||
| Per share operating performance (for a share outstanding throughout the period) |
||||||||||||||||||||||||
| Net asset value, beginning of period |
$15.23 | $11.97 | $10.11 | $11.01 | $10.40 | $ 8.20 | ||||||||||||||||||
|
|
|
|||||||||||||||||||||||
| Income from investment operationsa: | ||||||||||||||||||||||||
| Net investment incomeb |
0.26 | c | 0.19 | 0.21 | 0.21 | 0.15 | 0.16 | |||||||||||||||||
| Net realized and unrealized gains (losses) |
0.51 | 3.44 | 1.88 | (0.96 | ) | 0.60 | 2.32 | |||||||||||||||||
|
|
|
|||||||||||||||||||||||
| Total from investment operations |
0.77 | 3.63 | 2.09 | (0.75 | ) | 0.75 | 2.48 | |||||||||||||||||
|
|
|
|||||||||||||||||||||||
| Less distributions from net investment income |
(0.21 | ) | (0.37 | ) | (0.23 | ) | (0.15 | ) | (0.14 | ) | (0.28 | ) | ||||||||||||
|
|
|
|||||||||||||||||||||||
| Net asset value, end of period |
$15.79 | $15.23 | $11.97 | $10.11 | $11.01 | $10.40 | ||||||||||||||||||
|
|
|
|||||||||||||||||||||||
| Total returnd |
5.03% | 30.82% | 21.07% | (6.97)% | 7.39% | 31.10% | ||||||||||||||||||
| Ratios to average net assetse | ||||||||||||||||||||||||
| Expenses |
1.04% | 1.03% | f | 1.03% | f | 1.03% | f | 1.02% | f | 1.04% | f | |||||||||||||
| Net investment income |
3.39% | c | 1.37% | 2.06% | 1.97% | 1.46% | 1.75% | |||||||||||||||||
| Supplemental data | ||||||||||||||||||||||||
| Net assets, end of period (000’s) |
$1,399,118 | $1,450,304 | $1,352,554 | $1,254,193 | $1,626,885 | $1,718,894 | ||||||||||||||||||
| Portfolio turnover rate |
10.30% | 11.60% | 18.73% | g | 42.13% | g | 9.61% | 14.95% | ||||||||||||||||
aThe amount shown for a share outstanding throughout the period may not correlate with the Statement of Operations for the period due to the timing of sales and repurchases of the Fund shares in relation to income earned and/or fluctuating fair value of the investments of the Fund.
bBased on average daily shares outstanding.
cNet investment income per share includes approximately $0.09 per share received in the form of special dividends. Excluding these amounts, the ratio of net investment income to average net assets would have been 2.27%.
dTotal return does not include fees, charges or expenses imposed by the variable annuity and life insurance contracts for which the Franklin Templeton Variable Insurance Products Trust serves as an underlying investment vehicle. Total return is not annualized for periods less than one year.
eRatios are annualized for periods less than one year.
fBenefit of expense reduction rounds to less than 0.01%.
gExcludes the value of portfolio securities delivered as a result of a redemption in-kind.
| TG-8 | Semiannual Report | The accompanying notes are an integral part of these financial statements. |
FRANKLIN TEMPLETON VARIABLE INSURANCE PRODUCTS TRUST
FINANCIAL HIGHLIGHTS
Templeton Growth VIP Fund (continued)
| Six Months Ended June 30, 2014 (unaudited) |
Year Ended December 31, | |||||||||||||||||||||||
| 2013 | 2012 | 2011 | 2010 | 2009 | ||||||||||||||||||||
| Class 4 | ||||||||||||||||||||||||
| Per share operating performance (for a share outstanding throughout the period) |
||||||||||||||||||||||||
| Net asset value, beginning of period |
$15.35 | $12.07 | $10.19 | $11.11 | $10.50 | $ 8.31 | ||||||||||||||||||
|
|
|
|||||||||||||||||||||||
| Income from investment operationsa: | ||||||||||||||||||||||||
| Net investment incomeb |
0.25 | c | 0.17 | 0.20 | 0.20 | 0.14 | 0.14 | |||||||||||||||||
| Net realized and unrealized gains (losses) |
0.51 | 3.47 | 1.90 | (0.98 | ) | 0.61 | 2.36 | |||||||||||||||||
|
|
|
|||||||||||||||||||||||
| Total from investment operations |
0.76 | 3.64 | 2.10 | (0.78 | ) | 0.75 | 2.50 | |||||||||||||||||
|
|
|
|||||||||||||||||||||||
| Less distributions from net investment income |
(0.19 | ) | (0.36 | ) | (0.22 | ) | (0.14 | ) | (0.14 | ) | (0.31 | ) | ||||||||||||
|
|
|
|||||||||||||||||||||||
| Net asset value, end of period |
$15.92 | $15.35 | $12.07 | $10.19 | $11.11 | $10.50 | ||||||||||||||||||
|
|
|
|||||||||||||||||||||||
| Total returnd |
4.97% | 30.64% | 21.02% | (7.14)% | 7.31% | 30.98% | ||||||||||||||||||
| Ratios to average net assetse | ||||||||||||||||||||||||
| Expenses |
1.14% | 1.13% | f | 1.13% | f | 1.13% | f | 1.12% | f | 1.14% | f | |||||||||||||
| Net investment income |
3.29% | c | 1.27% | 1.96% | 1.87% | 1.36% | 1.65% | |||||||||||||||||
| Supplemental data | ||||||||||||||||||||||||
| Net assets, end of period (000’s) |
$71,165 | $72,683 | $67,158 | $56,170 | $60,569 | $56,218 | ||||||||||||||||||
| Portfolio turnover rate |
10.30% | 11.60% | 18.73% | g | 42.13% | g | 9.61% | 14.95% | ||||||||||||||||
aThe amount shown for a share outstanding throughout the period may not correlate with the Statement of Operations for the period due to the timing of sales and repurchases of the Fund shares in relation to income earned and/or fluctuating fair value of the investments of the Fund.
bBased on average daily shares outstanding.
cNet investment income per share includes approximately $0.09 per share received in the form of special dividends. Excluding these amounts, the ratio of net investment income to average net assets would have been 2.17%.
dTotal return does not include fees, charges or expenses imposed by the variable annuity and life insurance contracts for which the Franklin Templeton Variable Insurance Products Trust serves as an underlying investment vehicle. Total return is not annualized for periods less than one year.
eRatios are annualized for periods less than one year.
fBenefit of expense reduction rounds to less than 0.01%.
gExcludes the value of portfolio securities delivered as a result of a redemption in-kind.
| The accompanying notes are an integral part of these financial statements. | Semiannual Report | TG-9 |
FRANKLIN TEMPLETON VARIABLE INSURANCE PRODUCTS TRUST
Statement of Investments, June 30, 2014 (unaudited)
| Templeton Growth VIP Fund | ||||||||||||||
| Country | Shares | Value | ||||||||||||
| Common Stocks 98.3% |
||||||||||||||
| Aerospace & Defense 0.6% |
||||||||||||||
| BAE Systems PLC |
United Kingdom | 1,730,147 | $ | 12,816,557 | ||||||||||
|
|
|
|||||||||||||
| Air Freight & Logistics 2.0% |
||||||||||||||
| FedEx Corp. |
United States | 100,270 | 15,178,873 | |||||||||||
| TNT Express NV |
Netherlands | 646,272 | 5,850,095 | |||||||||||
| a | TNT Express NV, 144A |
Netherlands | 441,000 | 3,991,960 | ||||||||||
| United Parcel Service Inc., B |
United States | 160,030 | 16,428,680 | |||||||||||
|
|
|
|||||||||||||
| 41,449,608 | ||||||||||||||
|
|
|
|||||||||||||
| Airlines 2.5% |
||||||||||||||
| Deutsche Lufthansa AG |
Germany | 1,609,064 | 34,551,391 | |||||||||||
| b | International Consolidated Airlines Group SA |
United Kingdom | 2,633,247 | 16,694,776 | ||||||||||
|
|
|
|||||||||||||
| 51,246,167 | ||||||||||||||
|
|
|
|||||||||||||
| Auto Components 1.5% |
||||||||||||||
| Cie Generale des Etablissements Michelin, B |
France | 259,469 | 31,006,079 | |||||||||||
|
|
|
|||||||||||||
| Automobiles 2.5% |
||||||||||||||
| Mazda Motor Corp. |
Japan | 2,351,180 | 11,024,239 | |||||||||||
| Nissan Motor Co. Ltd. |
Japan | 2,342,720 | 22,223,522 | |||||||||||
| Toyota Motor Corp. |
Japan | 312,490 | 18,766,982 | |||||||||||
|
|
|
|||||||||||||
| 52,014,743 | ||||||||||||||
|
|
|
|||||||||||||
| Banks 12.2% |
||||||||||||||
| Bangkok Bank PCL, fgn. |
Thailand | 913,600 | 5,435,413 | |||||||||||
| BNP Paribas SA |
France | 401,637 | 27,250,828 | |||||||||||
| Citigroup Inc. |
United States | 770,990 | 36,313,629 | |||||||||||
| b | Commerzbank AG |
Germany | 547,840 | 8,612,749 | ||||||||||
| Credit Agricole SA |
France | 1,640,346 | 23,137,629 | |||||||||||
| DBS Group Holdings Ltd. |
Singapore | 932,690 | 12,531,631 | |||||||||||
| HSBC Holdings PLC |
United Kingdom | 2,567,864 | 26,041,599 | |||||||||||
| ICICI Bank Ltd., ADR |
India | 261,909 | 13,069,259 | |||||||||||
| Intesa Sanpaolo SpA |
Italy | 3,054,444 | 9,436,641 | |||||||||||
| JPMorgan Chase & Co. |
United States | 440,760 | 25,396,591 | |||||||||||
| KB Financial Group Inc. |
South Korea | 657,984 | 22,886,400 | |||||||||||
| SunTrust Banks Inc. |
United States | 478,520 | 19,169,511 | |||||||||||
| UniCredit SpA |
Italy | 3,118,881 | 26,118,090 | |||||||||||
|
|
|
|||||||||||||
| 255,399,970 | ||||||||||||||
|
|
|
|||||||||||||
| Biotechnology 1.5% |
||||||||||||||
| Amgen Inc. |
United States | 272,230 | 32,223,865 | |||||||||||
|
|
|
|||||||||||||
| Capital Markets 2.8% |
||||||||||||||
| Credit Suisse Group AG |
Switzerland | 1,026,980 | 29,367,100 | |||||||||||
| Morgan Stanley |
United States | 886,050 | 28,645,997 | |||||||||||
|
|
|
|||||||||||||
| 58,013,097 | ||||||||||||||
|
|
|
|||||||||||||
| Chemicals 1.4% |
||||||||||||||
| Akzo Nobel NV |
Netherlands | 397,282 | 29,787,165 | |||||||||||
|
|
|
|||||||||||||
| Commercial Services & Supplies 0.7% |
||||||||||||||
| Serco Group PLC |
United Kingdom | 2,417,267 | 15,118,643 | |||||||||||
|
|
|
|||||||||||||
| Communications Equipment 2.6% |
||||||||||||||
| Brocade Communications Systems Inc. |
United States | 298,490 | 2,746,108 | |||||||||||
| Cisco Systems Inc. |
United States | 1,040,800 | 25,863,880 | |||||||||||
| TG-10 | Semiannual Report |
FRANKLIN TEMPLETON VARIABLE INSURANCE PRODUCTS TRUST
STATEMENT OF INVESTMENTS (UNAUDITED)
Templeton Growth VIP Fund (continued)
| Country | Shares | Value | ||||||||||||
| Common Stocks (continued) |
||||||||||||||
| Communications Equipment (continued) |
||||||||||||||
| Ericsson, B |
Sweden | 2,161,202 | $ | 26,121,007 | ||||||||||
|
|
|
|||||||||||||
| 54,730,995 | ||||||||||||||
|
|
|
|||||||||||||
| Construction & Engineering 0.7% |
||||||||||||||
| c | FLSmidth & Co. AS |
Denmark | 250,000 | 13,967,455 | ||||||||||
|
|
|
|||||||||||||
| Construction Materials 1.6% |
||||||||||||||
| CRH PLC |
Ireland | 1,277,393 | 32,782,365 | |||||||||||
|
|
|
|||||||||||||
| Diversified Financial Services 1.1% |
||||||||||||||
| b | ING Groep NV, IDR |
Netherlands | 1,617,386 | 22,725,173 | ||||||||||
|
|
|
|||||||||||||
| Diversified Telecommunication Services 4.1% |
||||||||||||||
| China Telecom Corp. Ltd., ADR |
China | 179,195 | 8,771,595 | |||||||||||
| Singapore Telecommunications Ltd. |
Singapore | 7,063,710 | 21,814,690 | |||||||||||
| Telefonica SA |
Spain | 1,682,480 | 28,846,983 | |||||||||||
| Verizon Communications Inc. |
United States | 158,750 | 7,778,750 | |||||||||||
| Vivendi SA |
France | 739,654 | 18,100,865 | |||||||||||
|
|
|
|||||||||||||
| 85,312,883 | ||||||||||||||
|
|
|
|||||||||||||
| Electrical Equipment 0.7% |
||||||||||||||
| Alstom SA |
France | 299,697 | 10,927,433 | |||||||||||
| Dongfang Electric Corp. Ltd., H |
China | 2,016,600 | 3,465,749 | |||||||||||
|
|
|
|||||||||||||
| 14,393,182 | ||||||||||||||
|
|
|
|||||||||||||
| Electronic Equipment, Instruments & Components 0.4% |
||||||||||||||
| b | Flextronics International Ltd. |
Singapore | 691,118 | 7,650,676 | ||||||||||
|
|
|
|||||||||||||
| Energy Equipment & Services 4.1% |
||||||||||||||
| Baker Hughes Inc. |
United States | 358,770 | 26,710,427 | |||||||||||
| Fugro NV, IDR |
Netherlands | 339,969 | 19,467,831 | |||||||||||
| Halliburton Co. |
United States | 225,414 | 16,006,648 | |||||||||||
| Noble Corp. PLC |
United States | 698,190 | 23,431,257 | |||||||||||
|
|
|
|||||||||||||
| 85,616,163 | ||||||||||||||
|
|
|
|||||||||||||
| Food & Staples Retailing 2.5% |
||||||||||||||
| CVS Caremark Corp. |
United States | 330,420 | 24,903,755 | |||||||||||
| b | Metro AG |
Germany | 156,280 | 6,812,181 | ||||||||||
| Tesco PLC |
United Kingdom | 4,054,493 | 19,717,935 | |||||||||||
|
|
|
|||||||||||||
| 51,433,871 | ||||||||||||||
|
|
|
|||||||||||||
| Health Care Equipment & Supplies 2.4% |
||||||||||||||
| Getinge AB, B |
Sweden | 712,770 | 18,733,803 | |||||||||||
| Medtronic Inc. |
United States | 497,540 | 31,723,151 | |||||||||||
|
|
|
|||||||||||||
| 50,456,954 | ||||||||||||||
|
|
|
|||||||||||||
| Industrial Conglomerates 2.0% |
||||||||||||||
| Koninklijke Philips NV |
Netherlands | 459,718 | 14,590,071 | |||||||||||
| Siemens AG |
Germany | 201,712 | 26,642,816 | |||||||||||
|
|
|
|||||||||||||
| 41,232,887 | ||||||||||||||
|
|
|
|||||||||||||
| Insurance 6.1% |
||||||||||||||
| American International Group Inc. |
United States | 569,370 | 31,076,215 | |||||||||||
| Aviva PLC |
United Kingdom | 3,361,950 | 29,368,907 | |||||||||||
| AXA SA |
France | 1,091,068 | 26,080,615 | |||||||||||
| Muenchener Rueckversicherungs-Gesellschaft AG |
Germany | 78,511 | 17,406,983 | |||||||||||
| Semiannual Report | TG-11 |
FRANKLIN TEMPLETON VARIABLE INSURANCE PRODUCTS TRUST
STATEMENT OF INVESTMENTS (UNAUDITED)
Templeton Growth VIP Fund (continued)
| Country | Shares | Value | ||||||||||||
| Common Stocks (continued) |
||||||||||||||
| Insurance (continued) |
||||||||||||||
| Swiss Re AG |
Switzerland | 270,006 | $ | 24,021,507 | ||||||||||
|
|
|
|||||||||||||
| 127,954,227 | ||||||||||||||
|
|
|
|||||||||||||
| Life Sciences Tools & Services 0.4% |
||||||||||||||
| b | QIAGEN NV |
Netherlands | 357,300 | 8,660,689 | ||||||||||
|
|
|
|||||||||||||
| Machinery 1.3% |
||||||||||||||
| b | Navistar International Corp. |
United States | 725,430 | 27,189,116 | ||||||||||
|
|
|
|||||||||||||
| Media 4.2% |
||||||||||||||
| Comcast Corp., Special A |
United States | 648,892 | 34,605,410 | |||||||||||
| b | News Corp., A |
United States | 319,435 | 5,730,664 | ||||||||||
| Twenty-First Century Fox Inc., A |
United States | 641,182 | 22,537,547 | |||||||||||
| The Walt Disney Co. |
United States | 296,070 | 25,385,042 | |||||||||||
|
|
|
|||||||||||||
| 88,258,663 | ||||||||||||||
|
|
|
|||||||||||||
| Metals & Mining 2.0% |
||||||||||||||
| Mining and Metallurgical Co. Norilsk Nickel OJSC, ADR |
Russia | 1,077,050 | 21,336,360 | |||||||||||
| POSCO |
South Korea | 63,730 | 19,144,190 | |||||||||||
| POSCO, ADR |
South Korea | 27,740 | 2,064,966 | |||||||||||
|
|
|
|||||||||||||
| 42,545,516 | ||||||||||||||
|
|
|
|||||||||||||
| Multiline Retail 0.5% |
||||||||||||||
| Target Corp. |
United States | 191,680 | 11,107,856 | |||||||||||
|
|
|
|||||||||||||
| Oil, Gas & Consumable Fuels 10.8% |
||||||||||||||
| BP PLC |
United Kingdom | 2,807,128 | 24,733,518 | |||||||||||
| Chevron Corp. |
United States | 137,470 | 17,946,709 | |||||||||||
| China Shenhua Energy Co. Ltd., H |
China | 5,271,520 | 15,235,509 | |||||||||||
| Eni SpA |
Italy | 776,759 | 21,253,376 | |||||||||||
| Galp Energia SGPS SA, B |
Portugal | 1,575,520 | 28,868,631 | |||||||||||
| Kunlun Energy Co. Ltd. |
China | 9,057,840 | 14,935,803 | |||||||||||
| LUKOIL Holdings, ADR (London Stock Exchange) |
Russia | 203,010 | 12,121,727 | |||||||||||
| Royal Dutch Shell PLC, B |
United Kingdom | 299,573 | 13,033,601 | |||||||||||
| Talisman Energy Inc. |
Canada | 3,158,600 | 33,408,981 | |||||||||||
| Total SA, B |
France | 618,659 | 44,716,405 | |||||||||||
|
|
|
|||||||||||||
| 226,254,260 | ||||||||||||||
|
|
|
|||||||||||||
| Pharmaceuticals 11.8% |
||||||||||||||
| b | Forest Laboratories Inc. |
United States | 232,470 | 23,014,530 | ||||||||||
| GlaxoSmithKline PLC |
United Kingdom | 1,165,640 | 31,196,220 | |||||||||||
| Merck & Co. Inc. |
United States | 558,641 | 32,317,382 | |||||||||||
| Merck KGaA |
Germany | 229,554 | 19,927,452 | |||||||||||
| Pfizer Inc. |
United States | 1,111,443 | 32,987,628 | |||||||||||
| Roche Holding AG |
Switzerland | 128,303 | 38,265,934 | |||||||||||
| Sanofi |
France | 308,607 | 32,787,002 | |||||||||||
| Teva Pharmaceutical Industries Ltd., ADR |
Israel | 686,230 | 35,972,177 | |||||||||||
|
|
|
|||||||||||||
| 246,468,325 | ||||||||||||||
|
|
|
|||||||||||||
| Professional Services 0.3% |
||||||||||||||
| Hays PLC |
United Kingdom | 2,280 | 5,700 | |||||||||||
| Randstad Holding NV |
Netherlands | 125,110 | 6,783,029 | |||||||||||
|
|
|
|||||||||||||
| 6,788,729 | ||||||||||||||
|
|
|
|||||||||||||
| TG-12 | Semiannual Report |
FRANKLIN TEMPLETON VARIABLE INSURANCE PRODUCTS TRUST
STATEMENT OF INVESTMENTS (UNAUDITED)
Templeton Growth VIP Fund (continued)
| Country | Shares | Value | ||||||||||||
| Common Stocks (continued) |
||||||||||||||
| Semiconductors & Semiconductor Equipment 2.5% |
||||||||||||||
| Samsung Electronics Co. Ltd. |
South Korea | 40,730 | $ | 53,206,581 | ||||||||||
|
|
|
|||||||||||||
| Software 2.6% |
||||||||||||||
| Microsoft Corp. |
United States | 1,177,169 | 49,087,948 | |||||||||||
| SAP AG |
Germany | 80,912 | 6,249,398 | |||||||||||
|
|
|
|||||||||||||
| 55,337,346 | ||||||||||||||
|
|
|
|||||||||||||
| Specialty Retail 1.5% |
||||||||||||||
| Best Buy Co. Inc. |
United States | 355,360 | 11,019,714 | |||||||||||
| Kingfisher PLC |
United Kingdom | 3,350,261 | 20,581,351 | |||||||||||
|
|
|
|||||||||||||
| 31,601,065 | ||||||||||||||
|
|
|
|||||||||||||
| Technology Hardware, Storage & Peripherals 1.7% |
||||||||||||||
| Hewlett-Packard Co. |
United States | 1,036,700 | 34,916,056 | |||||||||||
|
|
|
|||||||||||||
| Wireless Telecommunication Services 2.7% |
||||||||||||||
| Mobile TeleSystems, ADR |
Russia | 812,930 | 16,047,238 | |||||||||||
| b | Sprint Corp. |
United States | 539,599 | 4,602,780 | ||||||||||
| b | Turkcell Iletisim Hizmetleri AS, ADR |
Turkey | 1,647,543 | 25,701,671 | ||||||||||
| Vodafone Group PLC |
United Kingdom | 3,292,417 | 10,986,269 | |||||||||||
|
|
|
|||||||||||||
| 57,337,958 | ||||||||||||||
|
|
|
|||||||||||||
| Total Common Stocks (Cost $1,494,680,547) |
2,057,004,885 | |||||||||||||
|
|
|
|||||||||||||
| Preferred Stocks (Cost $27,756,720) 1.1% |
||||||||||||||
| Oil, Gas & Consumable Fuels 1.1% |
||||||||||||||
| Petroleo Brasileiro SA, ADR, pfd. |
Brazil | 1,528,452 | 23,904,989 | |||||||||||
|
|
|
|||||||||||||
| Total Investments before Short Term Investments |
2,080,909,874 | |||||||||||||
|
|
|
|||||||||||||
| Principal Amount* | ||||||||||||||
| Short Term Investments 0.6% |
||||||||||||||
| Time Deposits 0.5% |
||||||||||||||
| Royal Bank of Canada, 0.05%, 7/01/14 |
Canada | 10,000,000 | 10,000,000 | |||||||||||
|
|
|
|||||||||||||
| Total Investments before Money Market Funds |
2,090,909,874 | |||||||||||||
|
|
|
|||||||||||||
| Semiannual Report | TG-13 |
FRANKLIN TEMPLETON VARIABLE INSURANCE PRODUCTS TRUST
STATEMENT OF INVESTMENTS (UNAUDITED)
| Country | Shares | Value | ||||||||||||
| d | Investments from Cash Collateral Received for Loaned Securities (Cost $1,727,113) 0.1% |
|||||||||||||
| Money Market Funds 0.1% |
||||||||||||||
| e | BNY Mellon Overnight Government Fund, 0.082% |
United States | 1,727,113 | $ | 1,727,113 | |||||||||
|
|
|
|||||||||||||
| Total Investments (Cost $1,534,164,380) 100.0% |
2,092,636,987 | |||||||||||||
| Other Assets, less Liabilities 0.0%† |
456,273 | |||||||||||||
|
|
|
|||||||||||||
| Net Assets 100.0% |
$ | 2,093,093,260 | ||||||||||||
|
|
|
|||||||||||||
See Abbreviations on page TG-25.
†Rounds to less than 0.1% of net assets.
*The principal amount is stated in U.S. dollars unless otherwise indicated.
aSecurity was purchased pursuant to Rule 144A under the Securities Act of 1933 and may be sold in transactions exempt from registration only to qualified institutional buyers or in a public offering registered under the Securities Act of 1933. This security has been deemed liquid under guidelines approved by the Trust’s Board of Trustees. At June 30, 2014, the value of this security was $3,991,960, representing 0.19% of net assets.
bNon-income producing.
cA portion or all of the security is on loan at June 30, 2014. See Note 1(c).
dSee Note 1(c) regarding securities on loan.
eThe rate shown is the annualized seven-day yield at period end.
| TG-14 | Semiannual Report | The accompanying notes are an integral part of these financial statements. |
FRANKLIN TEMPLETON VARIABLE INSURANCE PRODUCTS TRUST
Financial Statements
Statement of Assets and Liabilities
June 30, 2014 (unaudited)
| Templeton Growth VIP Fund |
||||
| Assets: | ||||
| Investments in securities: |
||||
| Cost |
$ | 1,534,164,380 | ||
|
|
|
|||
| Value (Includes securities loaned in the amount of $1,656,540) |
$ | 2,092,636,987 | ||
| Cash |
719,190 | |||
| Receivables: |
||||
| Investment securities sold |
4,241,749 | |||
| Capital shares sold |
72,704 | |||
| Dividends and interest |
4,396,361 | |||
| Other assets |
936 | |||
|
|
|
|||
| Total assets |
2,102,067,927 | |||
|
|
|
|||
| Liabilities: | ||||
| Payables: |
||||
| Investment securities purchased |
3,121,836 | |||
| Capital shares redeemed |
1,646,752 | |||
| Management fees |
1,305,821 | |||
| Distribution fees |
633,853 | |||
| Payable upon return of securities loaned |
1,727,113 | |||
| Accrued expenses and other liabilities |
539,292 | |||
|
|
|
|||
| Total liabilities |
8,974,667 | |||
|
|
|
|||
| Net assets, at value |
$ | 2,093,093,260 | ||
|
|
|
|||
| Net assets consist of: | ||||
| Paid-in capital |
$ | 1,637,246,382 | ||
| Undistributed net investment income |
33,705,772 | |||
| Net unrealized appreciation (depreciation) |
558,522,565 | |||
| Accumulated net realized gain (loss) |
(136,381,459 | ) | ||
|
|
|
|||
| Net assets, at value |
$ | 2,093,093,260 | ||
|
|
|
|||
| The accompanying notes are an integral part of these financial statements. | Semiannual Report | TG-15 |
FRANKLIN TEMPLETON VARIABLE INSURANCE PRODUCTS TRUST
FINANCIAL STATEMENTS
Statement of Assets and Liabilities (continued)
June 30, 2014 (unaudited)
| Templeton Growth VIP Fund |
||||
| Class 1: | ||||
| Net assets, at value |
$ | 622,810,174 | ||
|
|
|
|||
| Shares outstanding |
38,864,374 | |||
|
|
|
|||
| Net asset value and maximum offering price per share |
$ | 16.03 | ||
|
|
|
|||
| Class 2: | ||||
| Net assets, at value |
$ | 1,399,118,487 | ||
|
|
|
|||
| Shares outstanding |
88,622,433 | |||
|
|
|
|||
| Net asset value and maximum offering price per share |
$ | 15.79 | ||
|
|
|
|||
| Class 4: | ||||
| Net assets, at value |
$ | 71,164,599 | ||
|
|
|
|||
| Shares outstanding |
4,469,164 | |||
|
|
|
|||
| Net asset value and maximum offering price per share |
$ | 15.92 | ||
|
|
|
|||
| TG-16 | Semiannual Report | The accompanying notes are an integral part of these financial statements. |
FRANKLIN TEMPLETON VARIABLE INSURANCE PRODUCTS TRUST
FINANCIAL STATEMENTS
Statement of Operations
for the six months ended June 30, 2014 (unaudited)
| Templeton Growth VIP Fund |
||||
| Investment income: | ||||
| Dividends (net of foreign taxes of $3,207,528) |
$ | 44,916,134 | ||
| Interest |
6,465 | |||
| Income from securities loaned |
927,931 | |||
|
|
|
|||
| Total investment income |
45,850,530 | |||
|
|
|
|||
| Expenses: | ||||
| Management fees (Note 3a) |
7,795,739 | |||
| Distribution fees: (Note 3c) |
||||
| Class 2 |
1,756,036 | |||
| Class 4 |
125,247 | |||
| Custodian fees (Note 4) |
119,832 | |||
| Reports to shareholders |
168,065 | |||
| Professional fees |
45,335 | |||
| Trustees’ fees and expenses |
4,057 | |||
| Other |
28,772 | |||
|
|
|
|||
| Total expenses |
10,043,083 | |||
|
|
|
|||
| Net investment income |
35,807,447 | |||
|
|
|
|||
| Realized and unrealized gains (losses): | ||||
| Net realized gain (loss) from: |
||||
| Investments: |
||||
| Unaffiliated issuers |
56,981,531 | |||
| Non-controlled affiliated issuers (Note 8) |
773,990 | |||
| Foreign currency transactions |
(42,714 | ) | ||
|
|
|
|||
| Net realized gain (loss) |
57,712,807 | |||
|
|
|
|||
| Net change in unrealized appreciation (depreciation) on: |
||||
| Investments |
9,288,662 | |||
| Translation of other assets and liabilities denominated in foreign currencies |
2,443 | |||
|
|
|
|||
| Net change in unrealized appreciation (depreciation) |
9,291,105 | |||
|
|
|
|||
| Net realized and unrealized gain (loss) |
67,003,912 | |||
|
|
|
|||
| Net increase (decrease) in net assets resulting from operations |
$ | 102,811,359 | ||
|
|
|
|||
| The accompanying notes are an integral part of these financial statements. | Semiannual Report | TG-17 |
FRANKLIN TEMPLETON VARIABLE INSURANCE PRODUCTS TRUST
FINANCIAL STATEMENTS
Statements of Changes in Net Assets
| Templeton Growth VIP Fund | ||||||||
| Six Months Ended June 30, 2014 (unaudited) |
Year Ended December 31, 2013 |
|||||||
| Increase (decrease) in net assets: | ||||||||
| Operations: |
||||||||
| Net investment income |
$ | 35,807,447 | $ | 28,850,993 | ||||
| Net realized gain (loss) from investments and foreign currency transactions |
57,712,807 | 98,725,339 | ||||||
| Net change in unrealized appreciation (depreciation) on investments and translation of other assets and liabilities denominated in foreign currencies |
9,291,105 | 412,375,570 | ||||||
|
|
|
|||||||
| Net increase (decrease) in net assets resulting from operations |
102,811,359 | 539,951,902 | ||||||
|
|
|
|||||||
| Distributions to shareholders from: |
||||||||
| Net investment income: |
||||||||
| Class 1 |
(9,482,577 | ) | (15,214,157 | ) | ||||
| Class 2 |
(18,300,865 | ) | (38,639,867 | ) | ||||
| Class 4 |
(885,005 | ) | (1,946,523 | ) | ||||
|
|
|
|||||||
| Total distributions to shareholders |
(28,668,447 | ) | (55,800,547 | ) | ||||
|
|
|
|||||||
| Capital share transactions: (Note 2) |
||||||||
| Class 1 |
13,625,810 | (17,266,459 | ) | |||||
| Class 2 |
(101,891,617 | ) | (240,507,877 | ) | ||||
| Class 4 |
(4,179,503 | ) | (11,647,677 | ) | ||||
|
|
|
|||||||
| Total capital share transactions |
(92,445,310 | ) | (269,422,013 | ) | ||||
|
|
|
|||||||
| Net increase (decrease) in net assets |
(18,302,398 | ) | 214,729,342 | |||||
| Net assets: | ||||||||
| Beginning of period |
2,111,395,658 | 1,896,666,316 | ||||||
|
|
|
|||||||
| End of period |
$ | 2,093,093,260 | $ | 2,111,395,658 | ||||
|
|
|
|||||||
| Undistributed net investment income included in net assets: | ||||||||
| End of period |
$ | 33,705,772 | $ | 26,566,772 | ||||
|
|
|
|||||||
| TG-18 | Semiannual Report | The accompanying notes are an integral part of these financial statements. |
FRANKLIN TEMPLETON VARIABLE INSURANCE PRODUCTS TRUST
Notes to Financial Statements (unaudited)
Templeton Growth VIP Fund
| Semiannual Report | TG-19 |
FRANKLIN TEMPLETON VARIABLE INSURANCE PRODUCTS TRUST
NOTES TO FINANCIAL STATEMENTS (UNAUDITED)
Templeton Growth VIP Fund (continued)
1. Organization and Significant Accounting Policies (continued)
a. Financial Instrument Valuation (continued)
market close and the latest indications of value at the close of the NYSE. In order to minimize the potential for these differences, the VLOC monitors price movements following the close of trading in foreign stock markets through a series of country specific market proxies (such as baskets of American Depositary Receipts, futures contracts and exchange traded funds). These price movements are measured against established trigger thresholds for each specific market proxy to assist in determining if an event has occurred that may call into question the reliability of the values of the foreign securities held by the Fund. If such an event occurs, the securities may be valued using fair value procedures, which may include the use of independent pricing services.
Also, when the last day of the reporting period is a non-business day, certain foreign markets may be open on those days that the NYSE is closed, which could result in differences between the value of the Fund’s portfolio securities on the last business day and the last calendar day of the reporting period. Any significant security valuation changes due to an open foreign market are adjusted and reflected by the Fund for financial reporting purposes.
b. Foreign Currency Translation
Portfolio securities and other assets and liabilities denominated in foreign currencies are translated into U.S. dollars based on the exchange rate of such currencies against U.S. dollars on the date of valuation. The Fund may enter into foreign currency exchange contracts to facilitate transactions denominated in a foreign currency. Purchases and sales of securities, income and expense items denominated in foreign currencies are translated into U.S. dollars at the exchange rate in effect on the transaction date. Portfolio securities and assets and liabilities denominated in foreign currencies contain risks that those currencies will decline in value relative to the U.S. dollar. Occasionally, events may impact the availability or reliability of foreign exchange rates used to convert the U.S. dollar equivalent value. If such an event occurs, the foreign exchange rate will be valued at fair value using procedures established and approved by the Board.
The Fund does not separately report the effect of changes in foreign exchange rates from changes in market prices on securities held. Such changes are included in net realized and unrealized gain or loss from investments on the Statement of Operations.
Realized foreign exchange gains or losses arise from sales of foreign currencies, currency gains or losses realized between the trade and settlement dates on securities transactions and the difference between the recorded amounts of dividends, interest, and foreign withholding taxes and the U.S. dollar equivalent of the amounts actually received or paid. Net unrealized foreign exchange gains and losses arise from changes in foreign exchange rates on foreign denominated assets and liabilities other than investments in securities held at the end of the reporting period.
c. Securities Lending
The Fund participates in an agency based securities lending program. The Fund receives cash collateral against the loaned securities in an amount equal to at least 102% of the fair value of the loaned securities. Collateral is maintained over the life of the loan in an amount not less than 100% of the fair value of loaned securities, as determined at the close of fund business each day; any additional collateral required due to changes in security values is delivered to the Fund on the next business day. The collateral is invested in a non-registered money fund as indicated on the Statement of Investments. The Fund receives income from the investment of cash collateral, in addition to lending fees and rebates paid by the borrower. The Fund bears the market risk with respect to the collateral investment, securities loaned, and the risk that the agent may default on its obligations to the Fund. The securities lending agent has agreed to indemnify the Fund in the event of default by a third party borrower.
d. Income and Deferred Taxes
It is the Fund’s policy to qualify as a regulated investment company under the Internal Revenue Code. The Fund intends to distribute to shareholders substantially all of its taxable income and net realized gains to relieve it from federal income and if applicable, excise taxes. As a result, no provision for U.S. federal income taxes is required.
The Fund may be subject to foreign taxation related to income received, capital gains on the sale of securities and certain foreign currency transactions in the foreign jurisdictions in which it invests. Foreign taxes, if any, are recorded based on the tax regulations and rates that exist in the foreign markets in which the Fund invests. When a capital gain tax is determined to apply the Fund records an estimated deferred tax liability in an amount that would be payable if the securities were disposed of on the valuation date.
| TG-20 | Semiannual Report |
FRANKLIN TEMPLETON VARIABLE INSURANCE PRODUCTS TRUST
NOTES TO FINANCIAL STATEMENTS (UNAUDITED)
Templeton Growth VIP Fund (continued)
2. Shares of Beneficial Interest
At June 30, 2014, there were an unlimited number of shares authorized (without par value). Transactions in the Fund’s shares were as follows:
| Six Months Ended June 30, 2014 |
Year Ended December 31, 2013 |
|||||||||||||||||
| Shares | Amount | Shares | Amount | |||||||||||||||
| Class 1 Shares: | ||||||||||||||||||
| Shares sold |
1,171,010 | $ | 18,626,956 | 896,927 | $ | 12,053,666 | ||||||||||||
| Shares issued in reinvestment of distributions |
589,713 | 9,482,577 | 1,149,106 | 15,214,157 | ||||||||||||||
| Shares redeemed |
(923,380 | ) | (14,483,723 | ) | (3,250,296 | ) | (44,534,282 | ) | ||||||||||
|
|
|
|||||||||||||||||
| Net increase (decrease) |
837,343 | $ | 13,625,810 | (1,204,263 | ) | $ | (17,266,459 | ) | ||||||||||
|
|
|
|||||||||||||||||
| Semiannual Report | TG-21 |
FRANKLIN TEMPLETON VARIABLE INSURANCE PRODUCTS TRUST
NOTES TO FINANCIAL STATEMENTS (UNAUDITED)
Templeton Growth VIP Fund (continued)
2. Shares of Beneficial Interest (continued)
| Six Months Ended June 30, 2014 |
Year Ended December 31, 2013 |
|||||||||||||||||
| Shares | Amount | Shares | Amount | |||||||||||||||
| Class 2 Shares: | ||||||||||||||||||
| Shares sold |
1,267,922 | $ | 19,613,913 | 7,540,783 | $ | 101,234,976 | ||||||||||||
| Shares issued in reinvestment of distributions |
1,155,358 | 18,300,865 | 2,963,180 | 38,639,867 | ||||||||||||||
| Shares redeemed |
(9,038,415 | ) | (139,806,395 | ) | (28,236,625 | ) | (380,382,720 | ) | ||||||||||
|
|
|
|||||||||||||||||
| Net increase (decrease) |
(6,615,135 | ) | $ | (101,891,617 | ) | (17,732,662 | ) | $ | (240,507,877 | ) | ||||||||
|
|
|
|||||||||||||||||
| Class 4 Shares: | ||||||||||||||||||
| Shares sold |
189,752 | $ | 2,968,440 | 683,745 | $ | 9,107,528 | ||||||||||||
| Shares issued on reinvestment of distributions |
55,382 | 885,005 | 147,912 | 1,946,523 | ||||||||||||||
| Shares redeemed |
(510,473 | ) | (8,032,948 | ) | (1,660,931 | ) | (22,701,728 | ) | ||||||||||
|
|
|
|||||||||||||||||
| Net increase (decrease) |
(265,339 | ) | $ | (4,179,503 | ) | (829,274 | ) | $ | (11,647,677 | ) | ||||||||
|
|
|
|||||||||||||||||
3. Transactions With Affiliates
Franklin Resources, Inc. is the holding company for various subsidiaries that together are referred to as Franklin Templeton Investments. Certain officers and trustees of the Fund are also officers and/or directors of the following subsidiaries:
| Subsidiary | Affiliation | |
| Templeton Global Advisors Limited (TGAL) | Investment manager | |
| Franklin Templeton Services, LLC (FT Services) | Administrative manager | |
| Franklin Templeton Distributors, Inc. (Distributors) | Principal underwriter | |
| Franklin Templeton Investor Services, LLC (Investor Services) | Transfer agent |
a. Management Fees
The Fund pays an investment management fee to TGAL based on the average daily net assets of the Fund as follows:
| Annualized Fee Rate | Net Assets | |
| 1.000% | Up to and including $100 million | |
| 0.900% | Over $100 million, up to and including $250 million | |
| 0.800% | Over $250 million, up to and including $500 million | |
| 0.750% | Over $500 million, up to and including $1 billion | |
| 0.700% | Over $1 billion, up to and including $5 billion | |
| 0.675% | Over $5 billion, up to and including $10 billion | |
| 0.655% | Over $10 billion, up to and including $15 billion | |
| 0.635% | Over $15 billion, up to and including $20 billion | |
| 0.615% | In excess of $20 billion |
b. Administrative Fees
Under an agreement with TGAL, FT Services provides administrative services to the Fund. The fee is paid by TGAL based on the Fund’s average daily net assets, and is not an additional expense of the Fund.
| TG-22 | Semiannual Report |
FRANKLIN TEMPLETON VARIABLE INSURANCE PRODUCTS TRUST
NOTES TO FINANCIAL STATEMENTS (UNAUDITED)
Templeton Growth VIP Fund (continued)
c. Distribution Fees
The Board has adopted distribution plans for Class 2 and Class 4 shares pursuant to Rule 12b-1 under the 1940 Act. Under the Fund’s compensation distribution plans, the Fund pays Distributors for costs incurred in connection with the servicing, sale and distribution of the Fund’s shares up to 0.35% per year of its average daily net assets of each class. Some distribution fees are not charged on shares held by affiliates. The Board has agreed to limit the current rate to 0.25% per year for Class 2. The plan year, for purposes of monitoring compliance with the maximum annual plan rates, is February 1 through January 31.
d. Transfer Agent Fees
Investor Services, under terms of an agreement, performs shareholder servicing for the Fund and is not paid by the Fund for the services.
e. Other Affiliated Transactions
At June 30, 2014, Franklin Templeton Variable Insurance Products Trust – Franklin Founding Funds Allocation VIP Fund owned 20.96% of the Fund’s outstanding shares. Investment activities of this investment company could have a material impact on the Fund.
4. Expense Offset Arrangement
The Fund has entered into an arrangement with its custodian whereby credits realized as a result of uninvested cash balances are used to reduce a portion of the Fund’s custodian expenses. During the period ended June 30, 2014, there were no credits earned.
5. Income Taxes
For tax purposes, capital losses may be carried over to offset future capital gains. Capital loss carryforwards with no expiration, if any, must be fully utilized before those losses with expiration dates.
At December 31, 2013, capital loss carryforwards were as follows:
| Capital loss carryforwards expiring in: |
||
| 2017 |
$117,602,940 | |
| 2018 |
55,299,629 | |
|
| ||
| $172,902,569 | ||
|
|
At June 30, 2014, the cost of investments and net unrealized appreciation (depreciation) for income tax purposes were as follows:
| Cost of investments |
$1,552,912,581 | |
|
| ||
| Unrealized appreciation |
$ 595,730,718 | |
| Unrealized depreciation |
(56,006,312) | |
|
| ||
| Net unrealized appreciation (depreciation) |
$ 539,724,406 | |
|
| ||
Differences between income and/or capital gains as determined on a book basis and a tax basis are primarily due to differing treatments of foreign currency transactions and wash sales.
6. Investment Transactions
Purchases and sales of investments (excluding short term securities) for the period ended June 30, 2014, aggregated $211,038,453 and $267,687,369, respectively.
| Semiannual Report | TG-23 |
FRANKLIN TEMPLETON VARIABLE INSURANCE PRODUCTS TRUST
NOTES TO FINANCIAL STATEMENTS (UNAUDITED)
Templeton Growth VIP Fund (continued)
7. Concentration of Risk
Investing in foreign securities may include certain risks and considerations not typically associated with investing in U.S. securities, such as fluctuating currency values and changing local and regional economic, political and social conditions, which may result in greater market volatility. In addition, certain foreign securities may not be as liquid as U.S. securities.
8. Holdings of 5% Voting Securities of Portfolio Companies
The 1940 Act defines “affiliated companies” to include investments in portfolio companies in which a fund owns 5% or more of the outstanding voting securities. Investments in “affiliated companies” for the Fund for the period ended June 30, 2014, were as shown below.
| Name of Issuer | Number of Shares Held at Beginning of Period |
Gross Additions |
Gross Reductions |
Number of Shares Held at End of Period |
Value at End of Period |
Investment Income |
Realized Capital Gain (Loss) |
|||||||||||||||||||||
| Non-Controlled Affiliates | ||||||||||||||||||||||||||||
| Templeton China Opportunities Fund Ltd., Reg D |
1,195,196 | — | (1,195,196 | ) | — | $ | —* | $ | — | $ | 773,990 | |||||||||||||||||
|
|
|
|||||||||||||||||||||||||||
| Total Affiliated Securities (Value is -% of Net Assets) |
|
|||||||||||||||||||||||||||
*As of June 30, 2014, no longer an affiliate.
9. Credit Facility
The Fund, together with other U.S. registered and foreign investment funds (collectively, Borrowers), managed by Franklin Templeton Investments, are borrowers in a joint syndicated senior unsecured credit facility totaling $1.5 billion (Global Credit Facility) which matures on February 13, 2015. This Global Credit Facility provides a source of funds to the Borrowers for temporary and emergency purposes, including the ability to meet future unanticipated or unusually large redemption requests.
Under the terms of the Global Credit Facility, the Fund shall, in addition to interest charged on any borrowings made by the Fund and other costs incurred by the Fund, pay its share of fees and expenses incurred in connection with the implementation and maintenance of the Global Credit Facility, based upon its relative share of the aggregate net assets of all of the Borrowers, including an annual commitment fee of 0.07% based upon the unused portion of the Global Credit Facility. These fees are reflected in other expenses on the Statement of Operations. During the period ended June 30, 2014, the Fund did not use the Global Credit Facility.
10. Fair Value Measurements
The Fund follows a fair value hierarchy that distinguishes between market data obtained from independent sources (observable inputs) and the Fund’s own market assumptions (unobservable inputs). These inputs are used in determining the value of the Fund’s financial instruments and are summarized in the following fair value hierarchy:
| • | Level 1 – quoted prices in active markets for identical financial instruments |
| • | Level 2 – other significant observable inputs (including quoted prices for similar financial instruments, interest rates, prepayment speed, credit risk, etc.) |
| • | Level 3 – significant unobservable inputs (including the Fund’s own assumptions in determining the fair value of financial instruments) |
The input levels are not necessarily an indication of the risk or liquidity associated with financial instruments at that level.
| TG-24 | Semiannual Report |
FRANKLIN TEMPLETON VARIABLE INSURANCE PRODUCTS TRUST
NOTES TO FINANCIAL STATEMENTS (UNAUDITED)
Templeton Growth VIP Fund (continued)
For movements between the levels within the fair value hierarchy, the Fund has adopted a policy of recognizing the transfers as of the date of the underlying event which caused the movement.
A summary of inputs used as of June 30, 2014, in valuing the Fund’s assets carried at fair value, is as follows:
| Level 1 | Level 2 | Level 3 | Total | |||||||||||||
| Assets: | ||||||||||||||||
| Investments in Securities: |
||||||||||||||||
| Equity Investmentsa,b |
$ | 2,080,909,874 | $ | — | $ | — | $ | 2,080,909,874 | ||||||||
| Short Term investments |
— | 11,727,113 | — | 11,727,113 | ||||||||||||
|
|
|
|||||||||||||||
| Total Investments in Securities |
$ | 2,080,909,874 | $ | 11,727,113 | $ | — | $ | 2,092,636,987 | ||||||||
|
|
|
|||||||||||||||
aIncludes common and preferred stocks.
bFor detailed categories, see the accompanying Statement of Investments.
11. New Accounting Pronouncements
In June 2014, the Financial Accounting Standards Board issued Accounting Standards Update (ASU) No. 2014-11, Transfers and Servicing (Topic 860), Repurchase-to-Maturity Transactions, Repurchase Financings, and Disclosures. The ASU changes the accounting for certain repurchase agreements and expands disclosure requirements related to repurchase agreements, securities lending, repurchase-to-maturity and similar transactions. The ASU is effective for interim and annual reporting periods beginning after December 15, 2014. Management is currently evaluating the impact, if any, of applying this provision.
12. Subsequent Events
The Fund has evaluated subsequent events through the issuance of the financial statements and determined that no events have occurred that require disclosure.
Abbreviations
| Selected Portfolio | ||
| ADR | American Depositary Receipt | |
| IDR | International Depositary Receipt | |
| Semiannual Report | TG-25 |
FRANKLIN TEMPLETON VARIABLE INSURANCE PRODUCTS TRUST
TAX INFORMATION (UNAUDITED)
Templeton Growth VIP Fund
At December 31, 2013 more than 50% of the Fund’s total assets were invested in securities of foreign issuers. In most instances, foreign taxes were withheld from income paid to the Fund on these investments. As shown in the table below, the Fund hereby reports to shareholders the foreign source income and foreign taxes paid, pursuant to Section 853 of the Internal Revenue Code (Code). This written statement will allow shareholders of record on June 12, 2014, to treat their proportionate share of foreign taxes paid by the Fund as having been paid directly by them. The shareholder shall consider these amounts as foreign taxes paid in the tax year in which they receive the Fund distribution.
The following table provides a detailed analysis of foreign tax paid and foreign source income as reported by the Fund, to Class 1, Class 2, and Class 4 shareholders of record.
| Class | Foreign Tax Paid Per Share |
Foreign Source Income Per Share | ||
| Class 1 | $0.0152 | $0.2047 | ||
| Class 2 | $0.0152 | $0.1740 | ||
| Class 4 | $0.0152 | $0.1628 |
Foreign Tax Paid Per Share (Column 1) is the amount per share available to you, as a tax credit (assuming you held your shares in the Fund for a minimum of 16 days during the 31-day period beginning 15 days before the ex-dividend date of the Fund’s distribution to which the foreign taxes relate), or, as a tax deduction.
Foreign Source Income Per Share (Column 2) is the amount per share of income dividends attributable to foreign securities held by the Fund, plus any foreign taxes withheld on these dividends.
| TG-26 | Semiannual Report |
FRANKLIN MANAGED VOLATILITY GLOBAL ALLOCATION VIP FUND
| Semiannual Report | FMV-1 |
FRANKLIN MANAGED VOLATILITY GLOBAL ALLOCATION VIP FUND
| Portfolio Breakdown* | ||||
| Based on Total Net Assets | ||||
| 6/30/14 | ||||
| % of Total Net Assets |
||||
| Exchange Traded Funds | 52.2% | |||
| Foreign Equity | 30.8% | |||
| Domestic Equity | 21.4% | |||
| Bonds | 35.8% | |||
| Foreign Government & Agency Securities | 25.4% | |||
| U.S. Government & Agency Securities | 10.4% | |||
| Stocks** | 4.8% | |||
| Banks | 0.8% | |||
| Consumer Durables & Apparel | 0.7% | |||
| Automobiles & Components | 0.7% | |||
| Software & Services | 0.6% | |||
| Food, Beverage & Tobacco | 0.5% | |||
| Energy | 0.3% | |||
| Transportation | 0.3% | |||
| Materials | 0.3% | |||
| Semiconductors & Semiconductor Equipment | 0.2% | |||
| Household & Personal Products | 0.2% | |||
| Food & Staples Retailing | 0.1% | |||
| Telecommunication Services | 0.1% | |||
| Commodities | 4.4% | |||
| Exchange Traded Notes | 4.4% | |||
| Short-Term Investments & Other Net Assets | 2.8% | |||
*Portfolio Breakdown figures are stated as a percentage of total and may not equal 100% or may be negative due to rounding, use of any derivatives, unsettled trades or other factors.
**Includes common and preferred shares.
| FMV-2 | Semiannual Report |
FRANKLIN MANAGED VOLATILITY GLOBAL ALLOCATION VIP FUND
Class 2 Fund Expenses
| Semiannual Report | FMV-3 |
FRANKLIN MANAGED VOLATILITY GLOBAL ALLOCATION VIP FUND
| Class 2 | Beginning Account Value 1/1/14 |
Ending Account Value 6/30/14 |
Fund-Level Expenses Incurred During Period* 1/1/14–6/30/14 |
|||||||||
| Actual | $1,000 | $1,056.20 | $5.51 | |||||||||
| Hypothetical (5% return before expenses) | $1,000 | $1,019.44 | $5.41 | |||||||||
*Expenses are calculated using the most recent six-month annualized
expense ratio, net of expense waivers, for the Fund’s Class 2 shares (1.08%), which does not include any ongoing expenses of the Contract for which the Fund is an investment option, multiplied by the average account value over the period, multiplied by 181/365 to reflect the one-half year period.
| FMV-4 | Semiannual Report |
FRANKLIN MANAGED VOLATILITY GLOBAL ALLOCATION VIP FUND
Class 5 Fund Expenses
| Semiannual Report | FMV-5 |
FRANKLIN MANAGED VOLATILITY GLOBAL ALLOCATION VIP FUND
Hypothetical Example for Comparison with Other Mutual Funds
Information in the second line (Hypothetical) of the table can help you compare ongoing expenses of the Fund with those of other mutual funds offered through the Contract. This information may not be used to estimate the actual ending account balance or expenses you incurred during the period. The hypothetical “Ending Account Value” is based on the Fund’s actual expense ratio and an assumed 5% annual rate of return before expenses, which does not represent the Fund’s actual return. The figure under the heading “Fund-Level Expenses Incurred During Period” shows the hypothetical expenses your account would have incurred under this scenario. You can compare this figure with the 5% hypothetical examples that appear in shareholder reports of other funds offered through a Contract.
| Class 5 | Beginning Account Value 1/1/14 |
Ending Account Value 6/30/14 |
Fund-Level Expenses 1/1/14–6/30/14 |
|||||||||
| Actual | $1,000 | $1,056.20 | $4.74 | |||||||||
| Hypothetical (5% return before expenses) | $1,000 | $1,020.18 | $4.66 | |||||||||
*Expenses are calculated using the most recent six-month annualized expense ratio, net of expense waivers, for the Fund’s Class 5 shares (0.93%), which does not include any ongoing expenses of the Contract for which the Fund is an investment option, multiplied by the average account value over the period, multiplied by 181/365 to reflect the one-half year period.
| FMV-6 | Semiannual Report |
FRANKLIN TEMPLETON VARIABLE INSURANCE PRODUCTS TRUST
Consolidated Financial Highlights
Franklin Managed Volatility Global Allocation VIP Fund
| Six Months Ended June 30, 2014 (unaudited) |
Period Ended December 31, |
|||||||
| Class 2 | ||||||||
| Per share operating performance (for a share outstanding throughout the period) |
||||||||
| Net asset value, beginning of period |
$10.07 | $10.00 | ||||||
|
|
|
|||||||
| Income from investment operationsb: | ||||||||
| Net investment incomec |
0.07 | 0.09 | ||||||
| Net realized and unrealized gains (losses) |
0.50 | 0.17 | ||||||
|
|
|
|||||||
| Total from investment operations |
0.57 | 0.26 | ||||||
|
|
|
|||||||
| Less distributions from net investment income |
(0.01 | ) | (0.19 | ) | ||||
|
|
|
|||||||
| Net asset value, end of period |
$10.63 | $10.07 | ||||||
|
|
|
|||||||
| Total returnd |
5.62% | 2.56% | ||||||
| Ratios to average net assetse | ||||||||
| Expenses before waiver and payments by affiliatesf |
1.84% | 2.97% | ||||||
| Expenses net of waiver and payments by affiliatesf,g |
1.08% | 1.08% | ||||||
| Net investment income |
1.41% | 1.21% | ||||||
| Supplemental data | ||||||||
| Net assets, end of period (000’s) |
$10,625 | $10,065 | ||||||
| Portfolio turnover rate |
3.93% | 8.12% | ||||||
aFor the period April 1, 2013 (commencement of operations) to December 31, 2013.
bThe amount shown for a share outstanding throughout the period may not correlate with the Consolidated Statement of Operations for the period due to the timing of sales and repurchases of the Fund shares in relation to income earned and/or fluctuating market value of the investments of the Fund.
cBased on average daily shares outstanding.
dTotal return does not include fees, charges or expenses imposed by the variable annuity and life insurance contracts for which the Franklin Templeton Variable Insurance Products Trust serves as an underlying investment vehicle. Total return is not annualized for periods less than one year.
eRatios are annualized for periods less than one year.
fDoes not include expenses of the exchange traded funds in which the Fund invests. The weighted average indirect expenses of the exchange traded funds was 0.09% for the period ended June 30, 2014.
gBenefit of expense reduction rounds to less than 0.01%.
| The accompanying notes are an integral part of these consolidated financial statements. | Semiannual Report | FMV-7 |
FRANKLIN TEMPLETON VARIABLE INSURANCE PRODUCTS TRUST
CONSOLIDATED FINANCIAL HIGHLIGHTS
Franklin Managed Volatility Global Allocation VIP Fund (continued)
| Six Months Ended June 30, 2014 (unaudited) |
Period Ended December 31, 2013a |
|||||||
| Class 5 | ||||||||
| Per share operating performance (for a share outstanding throughout the period) |
||||||||
| Net asset value, beginning of period |
$10.07 | $10.00 | ||||||
|
|
|
|||||||
| Income from investment operationsb: | ||||||||
| Net investment incomec |
0.08 | 0.10 | ||||||
| Net realized and unrealized gains (losses) |
0.49 | 0.17 | ||||||
|
|
|
|||||||
| Total from investment operations |
0.57 | 0.27 | ||||||
|
|
|
|||||||
| Less distributions from net investment income |
(0.01 | ) | (0.20 | ) | ||||
|
|
|
|||||||
| Net asset value, end of period |
$10.63 | $10.07 | ||||||
|
|
|
|||||||
| Total returnd |
5.62% | 2.68% | ||||||
| Ratios to average net assetse | ||||||||
| Expenses before waiver and payments by affiliatesf |
1.69% | 2.82% | ||||||
| Expenses net of waiver and payments by affiliatesf,g |
0.93% | 0.93% | ||||||
| Net investment income |
1.56% | 1.36% | ||||||
| Supplemental data | ||||||||
| Net assets, end of period (000’s) |
$10,633 | $10,065 | ||||||
| Portfolio turnover rate |
3.93% | 8.12% | ||||||
aFor the period April 1, 2013 (commencement of operations) to December 31, 2013.
bThe amount shown for a share outstanding throughout the period may not correlate with the Consolidated Statement of Operations for the period due to the timing of sales and repurchases of the Fund shares in relation to income earned and/or fluctuating market value of the investments of the Fund.
cBased on average daily shares outstanding.
dTotal return does not include fees, charges or expenses imposed by the variable annuity and life insurance contracts for which the Franklin Templeton Variable Insurance Products Trust serves as an underlying investment vehicle. Total return is not annualized for periods less than one year.
eRatios are annualized for periods less than one year.
fDoes not include expenses of the exchange traded funds in which the Fund invests. The weighted average indirect expenses of the exchange traded funds was 0.09% for the period ended June 30, 2014.
gBenefit of expense reduction rounds to less than 0.01%.
| FMV-8 | Semiannual Report | The accompanying notes are an integral part of these consolidated financial statements. |
FRANKLIN TEMPLETON VARIABLE INSURANCE PRODUCTS TRUST
Consolidated Statement of Investments, June 30, 2014 (unaudited)
| Franklin Managed Volatility Global Allocation VIP Fund | ||||||||||||||
| Country | Shares/Units | Value | ||||||||||||
| Common Stocks 4.4% |
||||||||||||||
| Automobiles & Components 0.7% |
||||||||||||||
| Astra International Tbk PT |
Indonesia | 74,000 | $ | 45,411 | ||||||||||
| Brilliance China Automotive Holdings Ltd. |
China | 52,000 | 97,285 | |||||||||||
|
|
|
|||||||||||||
| 142,696 | ||||||||||||||
|
|
|
|||||||||||||
| Banks 0.6% |
||||||||||||||
| ICICI Bank Ltd., ADR |
India | 1,500 | 74,850 | |||||||||||
| a | National Bank of Greece SA |
Greece | 861 | 3,148 | ||||||||||
| Sberbank of Russia, ADR |
Russia | 4,615 | 46,750 | |||||||||||
|
|
|
|||||||||||||
| 124,748 | ||||||||||||||
|
|
|
|||||||||||||
| Capital Goods 0.0%† |
||||||||||||||
| Samsung Heavy Industries Co. Ltd. |
South Korea | 10 | 267 | |||||||||||
|
|
|
|||||||||||||
| Consumer Durables & Apparel 0.7% |
||||||||||||||
| Compagnie Financiere Richemont SA |
Switzerland | 727 | 76,278 | |||||||||||
| Fila Korea Ltd. |
South Korea | 480 | 45,581 | |||||||||||
| LF Corp. |
South Korea | 1,087 | 29,699 | |||||||||||
|
|
|
|||||||||||||
| 151,558 | ||||||||||||||
|
|
|
|||||||||||||
| Energy 0.3% |
||||||||||||||
| Gazprom OAO, ADR |
Russia | 1,200 | 10,458 | |||||||||||
| b | LUKOIL Holdings, ADR |
Russia | 900 | 53,739 | ||||||||||
| SK Innovation Co. Ltd. |
South Korea | 38 | 4,243 | |||||||||||
|
|
|
|||||||||||||
| 68,440 | ||||||||||||||
|
|
|
|||||||||||||
| Food & Staples Retailing 0.1% |
||||||||||||||
| Bizim Toptan Satis Magazalari AS |
Turkey | 3,016 | 26,827 | |||||||||||
|
|
|
|||||||||||||
| Food, Beverage & Tobacco 0.5% |
||||||||||||||
| Eastern Tobacco |
Egypt | 2,100 | 44,059 | |||||||||||
| Pinar Sut Mamulleri Sanayii AS |
Turkey | 4,260 | 36,183 | |||||||||||
| Thai Beverage PCL |
Thailand | 61,000 | 30,337 | |||||||||||
|
|
|
|||||||||||||
| 110,579 | ||||||||||||||
|
|
|
|||||||||||||
| Household & Personal Products 0.2% |
||||||||||||||
| Avon Products Inc. |
United States | 2,927 | 42,764 | |||||||||||
|
|
|
|||||||||||||
| Materials 0.1% |
||||||||||||||
| Compania de Minas Buenaventura SA, ADR |
Peru | 1,200 | 14,172 | |||||||||||
| Semen Indonesia (Persero) Tbk PT |
Indonesia | 1,500 | 1,907 | |||||||||||
|
|
|
|||||||||||||
| 16,079 | ||||||||||||||
|
|
|
|||||||||||||
| Retailing 0.0%† |
||||||||||||||
| Luk Fook Holdings (International) Ltd. |
Hong Kong | 2,000 | 5,858 | |||||||||||
|
|
|
|||||||||||||
| Semiconductors & Semiconductor Equipment 0.2% |
||||||||||||||
| Taiwan Semiconductor Manufacturing Co. Ltd. |
Taiwan | 11,000 | 46,581 | |||||||||||
|
|
|
|||||||||||||
| Software & Services 0.6% |
||||||||||||||
| a,c | Mail.ru Group Ltd., GDR, Reg S |
Russia | 558 | 19,670 | ||||||||||
| Travelsky Technology Ltd., H |
China | 90,000 | 82,795 | |||||||||||
| a | Yandex NV, A |
Russia | 636 | 22,667 | ||||||||||
|
|
|
|||||||||||||
| 125,132 | ||||||||||||||
|
|
|
|||||||||||||
| Telecommunication Services 0.1% |
||||||||||||||
| China Unicom (Hong Kong) Ltd. |
China | 12,000 | 18,580 | |||||||||||
|
|
|
|||||||||||||
| Transportation 0.3% |
||||||||||||||
| COSCO Pacific Ltd. |
China | 44,308 | 61,513 | |||||||||||
|
|
|
|||||||||||||
| Total Common Stocks (Cost $877,421) |
941,622 | |||||||||||||
|
|
|
|||||||||||||
| d | Exchange Traded Funds 52.2% |
|||||||||||||
| Domestic Equity 21.4% |
||||||||||||||
| iShares MSCI USA Minimum Volatility Index ETF |
United States | 122,000 | 4,540,840 | |||||||||||
|
|
|
|||||||||||||
| Foreign Equity 30.8% |
||||||||||||||
| iShares MSCI EAFE Minimum Volatility Index ETF |
United States | 100,100 | 6,544,538 | |||||||||||
|
|
|
|||||||||||||
| Total Exchange Traded Funds (Cost $9,892,641) |
11,085,378 | |||||||||||||
|
|
|
|||||||||||||
| Semiannual Report | FMV-9 |
FRANKLIN TEMPLETON VARIABLE INSURANCE PRODUCTS TRUST
CONSOLIDATED STATEMENT OF INVESTMENTS (UNAUDITED)
Franklin Managed Volatility Global Allocation VIP Fund (continued)
| Country | Shares/Units | Value | ||||||||||||
| e | Exchange Traded Notes (Cost $927,123) 4.4% |
|||||||||||||
| Diversified Financials 4.4% |
||||||||||||||
| a,f,g | iPATH Dow Jones-UBS Commodity Index Total Return ETN, 6/12/36 |
United States | 23,800 | 938,672 | ||||||||||
|
|
|
|||||||||||||
| Preferred Stocks 0.4% |
||||||||||||||
| Banks 0.2% |
||||||||||||||
| Banco Bradesco SA, ADR, pfd. |
Brazil | 3,500 | 50,820 | |||||||||||
|
|
|
|||||||||||||
| Materials 0.2% |
||||||||||||||
| Vale SA, ADR, pfd., A |
Brazil | 3,500 | 41,650 | |||||||||||
|
|
|
|||||||||||||
| Total Preferred Stocks (Cost $115,822) |
92,470 | |||||||||||||
|
|
|
|||||||||||||
| Principal Amount* | ||||||||||||||
| Foreign Government and Agency Securities 25.4% |
||||||||||||||
| Development Bank of Japan, |
||||||||||||||
| 1.70%, 9/20/22 |
Japan | 10,000,000 | JPY | 108,573 | ||||||||||
| senior bond, 2.30%, 3/19/26 |
Japan | 10,000,000 | JPY | 115,702 | ||||||||||
| France Treasury Note, 1.75%, 2/25/17 |
France | 200,000 | EUR | 285,629 | ||||||||||
| Government of Canada, 2.75%, 6/01/22 |
Canada | 160,000 | CAD | 158,365 | ||||||||||
| c | Government of Finland, senior bond, Reg S, 4.375%, 7/04/19 |
Finland | 150,000 | EUR | 244,659 | |||||||||
| Government of France, 3.25%, 4/25/16 |
France | 150,000 | EUR | 217,242 | ||||||||||
| Government of Ireland, 5.50%, 10/18/17 |
Ireland | 150,000 | EUR | 239,124 | ||||||||||
| Government of Japan, senior bond, |
||||||||||||||
| 0.40%, 6/20/16 |
Japan | 35,000,000 | JPY | 347,678 | ||||||||||
| 1.20%, 6/20/21 |
Japan | 30,000,000 | JPY | 314,748 | ||||||||||
| 1.90%, 6/20/31 |
Japan | 15,000,000 | JPY | 164,885 | ||||||||||
| 2.20%, 3/20/41 |
Japan | 15,000,000 | JPY | 166,738 | ||||||||||
| Government of Malaysia, 3.197%, 10/15/15 |
Malaysia | 500,000 | MYR | 155,621 | ||||||||||
| Government of Mexico, 8.00%, 12/07/23 |
Mexico | 15,000 | h MXN | 135,453 | ||||||||||
| c | Government of Netherlands, Reg S, 1.75%, 7/15/23 |
Netherlands | 200,000 | EUR | 283,798 | |||||||||
| Government of Poland, |
||||||||||||||
| 5.75%, 9/23/22 |
Poland | 300,000 | PLN | 115,544 | ||||||||||
| 4.00%, 10/25/23 |
Poland | 300,000 | PLN | 103,117 | ||||||||||
| Government of Singapore, senior note, 1.375%, 10/01/14 |
Singapore | 200,000 | SGD | 160,894 | ||||||||||
| Government of Spain, 5.75%, 7/30/32 |
Spain | 150,000 | EUR | 267,982 | ||||||||||
| Italy Treasury Bond, |
||||||||||||||
| c | Reg S, 3.50%, 3/01/30 |
Italy | 150,000 | EUR | 209,629 | |||||||||
| senior bond, 4.25%, 9/01/19 |
Italy | 150,000 | EUR | 234,073 | ||||||||||
| senior bond, 5.50%, 9/01/22 |
Italy | 150,000 | EUR | 252,273 | ||||||||||
| c | senior bond, Reg S, 4.75%, 9/01/44 |
Italy | 200,000 | EUR | 312,684 | |||||||||
| Queensland Treasury Corp., |
||||||||||||||
| senior bond, 5.75%, 7/22/24 |
Australia | 150,000 | AUD | 162,126 | ||||||||||
| senior note, 6.00%, 7/21/22 |
Australia | 150,000 | AUD | 163,454 | ||||||||||
| c | U.K. Treasury Note, Reg S, 4.00%, 3/07/22 |
United Kingdom | 250,000 | GBP | 475,158 | |||||||||
|
|
|
|||||||||||||
| Total Foreign Government and Agency Securities |
5,395,149 | |||||||||||||
|
|
|
|||||||||||||
| U.S. Government and Agency Securities 10.4% |
||||||||||||||
| U.S. Treasury Bond, 4.25%, 5/15/39 |
United States | 100,000 | 117,234 | |||||||||||
| U.S. Treasury Note, |
||||||||||||||
| 2.375%, 8/31/14 |
United States | 100,000 | 100,387 | |||||||||||
| 0.25%, 9/30/14 |
United States | 350,000 | 350,185 | |||||||||||
| 0.25%, 1/15/15 |
United States | 400,000 | 400,398 | |||||||||||
| 4.625%, 11/15/16 |
United States | 300,000 | 328,465 | |||||||||||
| 4.00%, 8/15/18 |
United States | 300,000 | 332,449 | |||||||||||
| 2.00%, 11/15/21 |
United States | 300,000 | 296,192 | |||||||||||
| 1.75%, 5/15/22 |
United States | 300,000 | 288,703 | |||||||||||
|
|
|
|||||||||||||
| Total U.S. Government and Agency Securities |
2,214,013 | |||||||||||||
|
|
|
|||||||||||||
| Total Investments before Short Term Investments |
20,667,304 | |||||||||||||
|
|
|
|||||||||||||
| Shares | ||||||||||||||
| Short Term Investments (Cost $262,320) 1.3% |
||||||||||||||
| Money Market Funds 1.3% |
United States | 262,320 | 262,320 | |||||||||||
|
|
|
|||||||||||||
| a,i | Institutional Fiduciary Trust Money Market Portfolio |
|||||||||||||
| FMV-10 | Semiannual Report |
FRANKLIN TEMPLETON VARIABLE INSURANCE PRODUCTS TRUST
CONSOLIDATED STATEMENT OF INVESTMENTS (UNAUDITED)
Franklin Managed Volatility Global Allocation VIP Fund (continued)
| Total Investments (Cost $19,602,548) 98.5% |
20,929,624 | |||||||||
| Other Assets, less Liabilities 1.5% |
328,659 | |||||||||
|
|
|
|||||||||
| Net Assets 100.0% |
$ | 21,258,283 | ||||||||
|
|
|
†Rounds to less than 0.1% of net assets.
*The principal amount is stated in U.S. dollars unless otherwise indicated.
aNon-income producing.
bAt June 30, 2014, pursuant to the Fund’s policies and the requirements of applicable securities law, the Fund may be restricted from trading this security for a limited or extended period of time due to ownership limits and/or potential possession of material non-public information.
cSecurity was purchased pursuant to Regulation S under the Securities Act of 1933, which exempts from registration securities offered and sold outside of the United States. Such a security cannot be sold in the United States without either an effective registration statement filed pursuant to the Securities Act of 1933, or pursuant to an exemption from registration. These securities have been deemed liquid under guidelines approved by the Trust’s Board of Trustees. At June 30, 2014, the aggregate value of these securities was $1,545,598, representing 7.27% of net assets.
dSee Note 1(d) regarding exchange traded funds.
eSee Note 1(e) regarding exchange traded notes.
fThe security is owned by MVGAF Holdings Corp., a wholly-owned subsidiary of the Fund. See Note 1(f).
gSecurity does not guarantee any return of principal at maturity, upon redemption or otherwise. Cash payment at maturity or upon early redemption is based on the performance of the indicated index less an investor fee.
hPrincipal amount is stated in 100 Mexican Peso Units.
iSee Note 3(e) regarding investments in the Institutional Fiduciary Trust Money Market Portfolio.
At June 30, 2014, the fund had the following forward exchange contracts outstanding. See Note 1(c).
| Forward Exchange Contracts | ||||||||||||||||||||||||||||
| Currency | Counterpartya | Type | Quantity | Contract Amount |
Settlement Date |
Unrealized Appreciation |
Unrealized Depreciation |
|||||||||||||||||||||
| Euro |
BZWS | Sell | 300,000 | $ | 406,536 | 9/08/14 | $ | — | $ | (4,404 | ) | |||||||||||||||||
| Australian Dollar |
BZWS | Sell | 330,000 | 304,435 | 9/10/14 | — | (5,244 | ) | ||||||||||||||||||||
| British Pound |
BZWS | Sell | 20,000 | 33,490 | 9/10/14 | — | (713 | ) | ||||||||||||||||||||
|
|
|
|||||||||||||||||||||||||||
| Net unrealized appreciation (depreciation) |
|
$ | (10,361 | ) | ||||||||||||||||||||||||
|
|
|
|||||||||||||||||||||||||||
aMay be comprised of multiple contracts using the same currency and settlement date.
See Abbreviations on page 25.
| The accompanying notes are an integral part of these financial statements. | Semiannual Report | FMV-11 |
FRANKLIN TEMPLETON VARIABLE INSURANCE PRODUCTS TRUST
Consolidated Financial Statements
Consolidated Statement of Assets and Liabilities
June 30, 2014 (unaudited)
| Franklin Managed Allocation VIP Fund |
||||
| Assets: | ||||
| Investments in securities: |
||||
| Cost - Unaffiliated issuers |
$ | 19,340,228 | ||
| Cost - Sweep Money Fund (Note 3e) |
262,320 | |||
|
|
|
|||
| Total cost of investments |
$ | 19,602,548 | ||
|
|
|
|||
| Value - Unaffiliated issuers |
$ | 20,667,304 | ||
| Value - Sweep Money Fund (Note 3e) |
262,320 | |||
|
|
|
|||
| Total value of investments |
20,929,624 | |||
| Cash |
132,815 | |||
| Receivables: |
||||
| Dividends and interest |
246,940 | |||
| Affiliates |
7,016 | |||
| Other assets |
9 | |||
|
|
|
|||
| Total assets |
21,316,404 | |||
|
|
|
|||
| Liabilities: | ||||
| Payables: |
||||
| Investment securities purchased |
15,278 | |||
| Management fees |
884 | |||
| Distribution fees |
6,142 | |||
| Professional fees |
22,285 | |||
| Unrealized depreciation on forward exchange contracts |
10,361 | |||
| Accrued expenses and other liabilities |
3,171 | |||
|
|
|
|||
| Total liabilities |
58,121 | |||
|
|
|
|||
| Net assets, at value |
$ | 21,258,283 | ||
|
|
|
|||
| Net assets consist of: | ||||
| Paid-in capital |
$ | 19,887,306 | ||
| Undistributed net investment income |
98,601 | |||
| Net unrealized appreciation (depreciation) |
1,317,090 | |||
| Accumulated net realized gain (loss) |
(44,714 | ) | ||
|
|
|
|||
| Net assets, at value |
$ | 21,258,283 | ||
|
|
|
|||
| Class 2: | ||||
| Net assets, at value |
$ | 10,625,153 | ||
|
|
|
|||
| Shares outstanding |
1,000,000 | |||
|
|
|
|||
| Net asset value and maximum offering price per share |
$ | 10.63 | ||
|
|
|
|||
| Class 5 | ||||
| Net assets, at value |
$ | 10,633,130 | ||
|
|
|
|||
| Shares outstanding |
1,000,000 | |||
|
|
|
|||
| Net asset value and maximum offering price per share |
$ | 10.63 | ||
|
|
|
|||
| FMV-12 | Semiannual Report | The accompanying notes are an integral part of these consolidated financial statements. | |||
FRANKLIN TEMPLETON VARIABLE INSURANCE PRODUCTS TRUST
CONSOLIDATED FINANCIAL STATEMENTS
Consolidated Statement of Operations
for the six months ended June 30, 2014 (unaudited)
|
Franklin Managed VIP Fund |
||||
| Investment income: | ||||
| Dividends |
$ | 10,632 | ||
| Dividends - Exchange traded funds |
182,544 | |||
| Interest |
60,255 | |||
|
|
|
|||
| Total investment income |
253,431 | |||
|
|
|
|||
| Expenses: | ||||
| Management fees (Note 3a) |
101,713 | |||
| Distribution fees: (Note 3c) |
||||
| Class 2 |
12,712 | |||
| Class 5 |
5,087 | |||
| Custodian fees (Note 4) |
369 | |||
| Reports to shareholders |
1,342 | |||
| Registration and filing fees |
2,107 | |||
| Professional fees |
29,123 | |||
| Amortization of offering costs |
51,188 | |||
| Other |
2,043 | |||
|
|
|
|||
| Total expenses |
205,684 | |||
| Expense reductions (Note 4) |
(29 | ) | ||
| Expenses waived/paid by affiliates (Note 3f) |
(103,434 | ) | ||
|
|
|
|||
| Net expenses |
102,221 | |||
|
|
|
|||
| Net investment income |
151,210 | |||
|
|
|
|||
| Realized and unrealized gains (losses): | ||||
| Net realized gain (loss) from: |
||||
| Investments |
81,336 | |||
| Foreign currency transactions |
(10,670 | ) | ||
|
|
|
|||
| Net realized gain (loss) |
70,666 | |||
|
|
|
|||
| Net change in unrealized appreciation (depreciation) on: |
||||
| Investments |
930,158 | |||
| Translation of other assets and liabilities denominated in foreign currencies |
(13,110 | ) | ||
|
|
|
|||
| Net change in unrealized appreciation (depreciation) |
917,048 | |||
|
|
|
|||
| Net realized and unrealized gain (loss) |
987,714 | |||
|
|
|
|||
| Net increase (decrease) in net assets resulting from operations |
$ | 1,138,924 | ||
|
|
|
|||
| The accompanying notes are an integral part of these consolidated financial statements. | Semiannual Report | FMV-13 |
FRANKLIN TEMPLETON VARIABLE INSURANCE PRODUCTS TRUST
CONSOLIDATED FINANCIAL STATEMENTS
Consolidated Statements of Changes in Net Assets
| Franklin Managed Volatility Global Allocation VIP Fund |
||||||||
| Six Months Ended June 30, 2014 (unaudited) |
Period Ended December 31, 2013a |
|||||||
| Increase (decrease) in net assets: | ||||||||
| Operations: |
||||||||
| Net investment income |
$ | 151,210 | $ | 194,538 | ||||
| Net realized gain (loss) from investments, foreign currency transactions and futures contracts |
70,666 | (79,821 | ) | |||||
| Net change in unrealized appreciation (depreciation) on investments and translation of other assets and liabilities denominated in foreign currencies |
917,048 | 400,042 | ||||||
|
|
|
|||||||
| Net increase (decrease) in net assets resulting from operations |
1,138,924 | 514,759 | ||||||
|
|
|
|||||||
| Distributions to shareholders from: |
||||||||
| Net investment income: |
||||||||
| Class 2 |
(5,700 | ) | (186,300 | ) | ||||
| Class 5 |
(5,700 | ) | (197,700 | ) | ||||
|
|
|
|||||||
| Total distributions to shareholders |
(11,400 | ) | (384,000 | ) | ||||
|
|
|
|||||||
| Capital share transactions: (Note 2) |
||||||||
| Class 2 |
— | 10,000,000 | ||||||
| Class 5 |
— | 10,000,000 | ||||||
|
|
|
|||||||
| Total capital share transactions |
— | 20,000,000 | ||||||
|
|
|
|||||||
| Net increase (decrease) in net assets |
1,127,524 | 20,130,759 | ||||||
| Net assets: | ||||||||
| Beginning of period |
20,130,759 | — | ||||||
|
|
|
|||||||
| End of period |
$ | 21,258,283 | $ | 20,130,759 | ||||
|
|
|
|||||||
| Undistributed net investment income (distributions in excess of net investment income) included in net assets: |
||||||||
| End of period |
$ | 98,601 | $ | (41,209 | ) | |||
|
|
|
|||||||
aFor the period April 1, 2013 (commencement of operations) to December 31, 2013.
| FMV-14 | Semiannual Report | The accompanying notes are an integral part of these consolidated financial statements. | |||
FRANKLIN TEMPLETON VARIABLE INSURANCE PRODUCTS TRUST
Notes to Consolidated Financial Statements (unaudited)
Franklin Managed Volatility Global Allocation VIP Fund
| Semiannual Report | FMV-15 |
FRANKLIN TEMPLETON VARIABLE INSURANCE PRODUCTS TRUST
NOTES TO CONSOLIDATED FINANCIAL STATEMENTS (UNAUDITED)
Franklin Managed Volatility Global Allocation VIP Fund (continued)
| FMV-16 | Semiannual Report |
FRANKLIN TEMPLETON VARIABLE INSURANCE PRODUCTS TRUST
NOTES TO CONSOLIDATED FINANCIAL STATEMENTS (UNAUDITED)
Franklin Managed Volatility Global Allocation VIP Fund (continued)
| Semiannual Report | FMV-17 |
FRANKLIN TEMPLETON VARIABLE INSURANCE PRODUCTS TRUST
NOTES TO CONSOLIDATED FINANCIAL STATEMENTS (UNAUDITED)
Franklin Managed Volatility Global Allocation VIP Fund (continued)
| FMV-18 | Semiannual Report |
FRANKLIN TEMPLETON VARIABLE INSURANCE PRODUCTS TRUST
NOTES TO CONSOLIDATED FINANCIAL STATEMENTS (UNAUDITED)
Franklin Managed Volatility Global Allocation VIP Fund (continued)
| Semiannual Report | FMV-19 |
FRANKLIN TEMPLETON VARIABLE INSURANCE PRODUCTS TRUST
NOTES TO CONSOLIDATED FINANCIAL STATEMENTS (UNAUDITED)
Franklin Managed Volatility Global Allocation VIP Fund (continued)
2. Shares of Beneficial Interest
At June 30, 2014, there were an unlimited number of shares authorized (without par value). Transactions in the Fund’s shares were as follows:
| Six Months Ended June 30, 2014 |
Period Ended December 31, 2013a |
|||||||||||||||||
| Shares | Amount | Shares | Amount | |||||||||||||||
| Class 2 Shares: | ||||||||||||||||||
| Shares sold |
— | $ | — | 1,000,000 | $ | 10,000,000 | ||||||||||||
|
|
|
|||||||||||||||||
| Class 5 Shares: | ||||||||||||||||||
| Shares sold |
— | $ | — | 1,000,000 | $ | 10,000,000 | ||||||||||||
|
|
|
|||||||||||||||||
aFor the period April 1, 2013 (commencement of operations) to December 31, 2013.
3. Transactions with Affiliates
Franklin Resources, Inc. is the holding company for various subsidiaries that together are referred to as Franklin Templeton Investments. Certain officers and trustees of the Fund are also officers and/or directors of the following subsidiaries:
| Subsidiary | Affiliation | |
| Franklin Advisers, Inc. (Advisers) | Investment manager | |
| Franklin Alternative Strategies Advisors, LLC (FASA) | Investment manager | |
| Franklin Templeton Investment Management Limited (FTIML) | Investment manager | |
| Templeton Asset Management Ltd. (TAML) | Investment manager | |
| Franklin Templeton Services, LLC (FT Services) | Administrative manager | |
| Franklin Templeton Distributors, Inc. (Distributors) | Principal underwriter | |
| Franklin Templeton Investor Services, LLC (Investor Services) | Transfer agent |
Effective April 1, 2014, the Fund’s investment manager is FASA. Prior to April 1, 2014, Advisers was the Fund’s investment manager.
a. Management Fees
Effective April 1, 2014, the Fund and the MVGAF Subsidiary pay an investment management fee to FASA based on the average daily net assets of the Fund and the MVGAF Subsidiary as follows:
| Annualized Fee Rate | Net Assets | |
| 1.000% | Up to and including $1 billion | |
| 0.980% | Over $1 billion, up to and including $5 billion | |
| 0.960% | Over $5 billion, up to and including $10 billion | |
| 0.940% | Over $10 billion, up to and including $15 billion | |
| 0.920% | Over $15 billion, up to and including $20 billion | |
| 0.900% | In excess of $20 billion |
Prior to April 1, 2014, the Fund and the MVGAF Subsidiary paid the investment management fee to Advisers.
Management fees paid by the Fund are reduced on assets invested in the MVGAF Subsidiary, in an amount not to exceed the management fees paid by MVGAF Subsidiary.
| FMV-20 | Semiannual Report |
FRANKLIN TEMPLETON VARIABLE INSURANCE PRODUCTS TRUST
NOTES TO CONSOLIDATED FINANCIAL STATEMENTS (UNAUDITED)
Franklin Managed Volatility Global Allocation VIP Fund (continued)
Under a subadvisory agreement, Advisers, FTIML and TAML, affiliates of FASA, provide subadvisory services to the Fund. The subadvisory fee is paid by FASA based on the Fund’s average daily net assets, and is not an additional expense of the Fund.
b. Administrative Fees
Effective April 1, 2014, under an agreement with FASA, FT Services provides administrative services to the Fund and the MVGAF Subsidiary. The fees are paid by FASA based on the Fund and the MVGAF Subsidiary’s average daily net assets, and are not additional expenses of the Fund and the MVGAF Subsidiary. Prior to April 1, 2014, the fees were paid by Advisers.
c. Distribution Fees
The Board has adopted distribution plans for Class 2 and Class 5 shares pursuant to Rule 12b-1 under the 1940 Act. Under the Fund’s compensation distribution plans, the Fund pays Distributors for costs incurred in connection with the servicing, sale and distribution of the Fund’s shares up to 0.35% and 0.10% per year of its average daily net assets of Class 2 and Class 5, respectively. Some distribution fees are not charged on shares held by affiliates. The Board has agreed to limit the current rate to 0.25% per year for Class 2. The plan year, for purposes of monitoring compliance with the maximum annual plan rates, is February 1 through January 31.
d. Transfer Agent Fees
Investor Services, under terms of an agreement, performs shareholder servicing for the Fund and is not paid by the Fund for the services.
e. Investment in Institutional Fiduciary Trust Money Market Portfolio
The Fund invests in the Institutional Fiduciary Trust Money Market Portfolio (Sweep Money Fund), an affiliated open-end management investment company. Management fees paid by the Fund are waived on assets invested in the Sweep Money Fund, in an amount not to exceed the management and administrative fees paid directly or indirectly by the Sweep Money Fund, as noted on the Consolidated Statement of Operations. Prior to January 1, 2014, the waiver was accounted for as a reduction to management fees.
f. Waiver and Expense Reimbursements
FASA has contractually agreed in advance to waive or limit its fees and to assume as its own expense certain expenses otherwise payable by the Fund so that the expenses (excluding distribution fees, and acquired fund fees and expenses), for each class of the Fund do not exceed 0.83% based on the average net assets of each class (other than certain non-routine expenses or costs, including those relating to litigation, indemnification, reorganizations, and liquidations) until April 30, 2015.
g. Other Affiliated Transactions
At June 30, 2014, Advisers owned 100% of the Fund’s outstanding shares. Investment activities of this shareholder could have a material impact on the Fund.
4. Expense Offset Arrangement
The Fund and the MVGAF Subsidiary have entered into an arrangement with their custodian whereby credits realized as a result of uninvested cash balances are used to reduce a portion of the Fund’s and the MVGAF Subsidiary’s custodian expenses. During the period ended June 30, 2014, the custodian fees were reduced as noted in the Consolidated Statement of Operations.
| Semiannual Report | FMV-21 |
FRANKLIN TEMPLETON VARIABLE INSURANCE PRODUCTS TRUST
NOTES TO CONSOLIDATED FINANCIAL STATEMENTS (UNAUDITED)
Franklin Managed Volatility Global Allocation VIP Fund (continued)
5. Income Taxes
For tax purposes, capital losses may be carried over to offset future capital gains, if any.
At December 31, 2013, the Fund had capital loss carryforwards as follows:
| Capital loss carryforwards: |
||||
| Short term |
$ | 44,055 | ||
| Long term |
71,325 | |||
|
|
|
|||
| Total capital loss carryforwards |
$ | 115,380 | ||
|
|
|
|||
At June 30, 2014, the cost of investments and net unrealized appreciation (depreciation) for income tax purposes were as follows:
| Cost of investments |
$ | 19,677,534 | ||
|
|
|
|||
| Unrealized appreciation |
$ | 1,579,494 | ||
| Unrealized depreciation |
(327,404 | ) | ||
|
|
|
|||
| Net unrealized appreciation (depreciation) |
$ | 1,252,090 | ||
|
|
|
|||
Differences between income and/or capital gains as determined on a book basis and a tax basis are primarily due to differing treatments of foreign currency transactions, bond discounts and premiums, and offering costs.
6. Investment Transactions
Purchases and sales of investments (excluding short term securities) for the period ended June 30, 2014, aggregated $1,013,821 and $775,854, respectively.
7. Concentration of Risk
Investing in foreign securities may include certain risks and considerations not typically associated with investing in U.S. securities, such as fluctuating currency values and changing local and regional economic, political and social conditions, which may result in greater market volatility. In addition, certain foreign securities may not be as liquid as U.S. securities.
| FMV-22 | Semiannual Report |
FRANKLIN TEMPLETON VARIABLE INSURANCE PRODUCTS TRUST
NOTES TO CONSOLIDATED FINANCIAL STATEMENTS (UNAUDITED)
Franklin Managed Volatility Global Allocation VIP Fund (continued)
8. Other Derivative Information
At June 30, 2014, the Fund’s investments in derivative contracts are reflected on the Consolidated Statement of Assets and Liabilities as follows:
| Asset Derivatives | Liability Derivatives | |||||||||||
| Derivative Contracts Not Accounted for as Hedging Instruments |
Consolidated Statement of Assets and Liabilities Location |
Fair Value Amount |
Consolidated Statement of Assets and Liabilities Location |
Fair Value Amount |
||||||||
| Foreign exchange contracts |
Unrealized appreciation on forward exchange contracts | $ | — | Unrealized depreciation on forward exchange contracts | $ | 10,361 | ||||||
For the period ended June 30, 2014, the effect of derivative contracts on the Fund’s Consolidated Statement of Operations was as follows:
| Derivative Contracts Not Accounted for as Hedging Instruments |
Consolidated Statement of Operations Locations |
Realized Gain (Loss) for the Period |
Change in Unrealized Appreciation (Depreciation) for the Period |
|||||||
| Foreign exchange contracts |
Net realized gain (loss) from foreign currency transactions / Net change in unrealized appreciation (depreciation) on translation of other assets and liabilities denominated in foreign currencies | $ | (12,880 | ) | $ | (12,910 | ) | |||
For the period ended June 30, 2014, the average month end fair value of derivatives represented 0.05% of average month end net assets. The average month end number of open derivative contracts for the period was 2.
See Note 1(c) regarding derivative financial instruments.
9. Credit Facility
The Fund, together with other U.S. registered and foreign investment funds (collectively, Borrowers), managed by Franklin Templeton Investments, are borrowers in a joint syndicated senior unsecured credit facility totaling $1.5 billion (Global Credit Facility) which matures on February 13, 2015. This Global Credit Facility provides a source of funds to the Borrowers for temporary and emergency purposes, including the ability to meet future unanticipated or unusually large redemption requests.
Under the terms of the Global Credit Facility, the Fund shall, in addition to interest charged on any borrowings made by the Fund and other costs incurred by the Fund, pay its share of fees and expenses incurred in connection with the implementation and maintenance of the Global Credit Facility, based upon its relative share of the aggregate net assets of all of the Borrowers, including an annual commitment fee of 0.07% based upon the unused portion of the Global Credit Facility. These fees are reflected in other expenses on the Consolidated Statement of Operations. During the period ended June 30, 2014, the Fund did not use the Global Credit Facility.
10. Fair Value Measurements
The Fund follows a fair value hierarchy that distinguishes between market data obtained from independent sources (observable inputs) and the Fund’s own market assumptions (unobservable inputs). These inputs are used in determining the value of the Fund’s financial instruments and are summarized in the following fair value hierarchy:
| • | Level 1 – quoted prices in active markets for identical financial instruments |
| Semiannual Report | FMV-23 |
FRANKLIN TEMPLETON VARIABLE INSURANCE PRODUCTS TRUST
NOTES TO CONSOLIDATED FINANCIAL STATEMENTS (UNAUDITED)
Franklin Managed Volatility Global Allocation VIP Fund (continued)
10. Fair Value Measurements (continued)
| • | Level 2 – other significant observable inputs (including quoted prices for similar financial instruments, interest rates, prepayment speed, credit risk, etc.) |
| • | Level 3 – significant unobservable inputs (including the Fund’s own assumptions in determining the fair value of financial instruments) |
The input levels are not necessarily an indication of the risk or liquidity associated with financial instruments at that level.
For movements between the levels within the fair value hierarchy, the Fund has adopted a policy of recognizing the transfers as of the date of the underlying event which caused the movement.
A summary of inputs used as of June 30, 2014, in valuing the Fund’s assets and liabilities carried at fair value, is as follows:
| Level 1 | Level 2 | Level 3 | Total | |||||||||||||
| Assets: | ||||||||||||||||
| Investments in Securities: |
||||||||||||||||
| Equity Investments:a |
||||||||||||||||
| Energy |
$ | 4,243 | $ | 64,197 | $ | — | $ | 68,440 | ||||||||
| Other Equity Investmentsb |
965,652 | — | — | 965,652 | ||||||||||||
| Exchange Traded Funds |
11,085,378 | — | — | 11,085,378 | ||||||||||||
| Exchange Traded Notes |
938,672 | — | — | 938,672 | ||||||||||||
| Foreign Government and Agency Securities |
— | 5,395,149 | — | 5,395,149 | ||||||||||||
| U.S. Government and Agency Securities |
— | 2,214,013 | — | 2,214,013 | ||||||||||||
| Short Term Investments |
262,320 | — | — | 262,320 | ||||||||||||
|
|
|
|||||||||||||||
| Total Investments in Securities |
$ | 13,256,265 | $ | 7,673,359 | $ | — | $ | 20,929,624 | ||||||||
|
|
|
|||||||||||||||
| Liabilities: | ||||||||||||||||
| Other Financial Instruments |
||||||||||||||||
| Forward Exchange Contracts |
$ | — | $ | 10,361 | $ | — | $ | 10,361 | ||||||||
|
|
|
|||||||||||||||
aIncludes common and preferred stocks as well as other equity investments.
bFor detailed categories, see the accompanying Consolidated Statement of Investments.
11. New Accounting Pronouncements
In June 2014, the Financial Accounting Standards Board (FASB) issued Accounting Standards Update (ASU) No. 2014-11, Transfers and Servicing (Topic 860), Repurchase-to-Maturity Transactions, Repurchase Financings, and Disclosures. The ASU changes the accounting for certain repurchase agreements and expands disclosure requirements related to repurchase agreements, securities lending, repurchase-to-maturity and similar transactions. The ASU is effective for interim and annual reporting periods beginning after December 15, 2014. Management is currently evaluating the impact, if any, of applying this provision.
12. Subsequent Events
The Fund has evaluated subsequent events through the issuance of the financial statements and determined that no events have occurred that require disclosure.
| FMV-24 | Semiannual Report |
FRANKLIN TEMPLETON VARIABLE INSURANCE PRODUCTS TRUST
NOTES TO CONSOLIDATED FINANCIAL STATEMENTS (UNAUDITED)
Franklin Managed Volatility Global Allocation VIP Fund (continued)
Abbreviations
| Counterparty | Currency | Selected Portfolio | ||||||||
| BZWS | - Barclays Bank PLC | AUD | - Australian Dollar | ADR | - American Depositary Receipt | |||||
| CAD | - Canadian Dollar | ETF | - Exchange Traded Fund | |||||||
| EUR | - Euro | ETN | - Exchange Traded Note | |||||||
| GBP | - British Pound | GDR | - Global Depositary Receipt | |||||||
| JPY | - Japanese Yen | |||||||||
| MXN | - Mexican Peso | |||||||||
| MYR | - Malaysian Ringgit | |||||||||
| PLN | - Polish Zloty | |||||||||
| SGD | - Singapore Dollar | |||||||||
| Semiannual Report | FMV-25 |
FRANKLIN TEMPLETON VARIABLE INSURANCE PRODUCTS TRUST
INDEX DESCRIPTIONS
| Semiannual Report | I-1 |
FRANKLIN TEMPLETON VARIABLE INSURANCE PRODUCTS TRUST
INDEX DESCRIPTIONS
| I-2 | Semiannual Report |
FRANKLIN TEMPLETON VARIABLE INSURANCE PRODUCTS TRUST
INDEX DESCRIPTIONS
| Semiannual Report | I-3 |
FRANKLIN TEMPLETON VARIABLE INSURANCE PRODUCTS TRUST
SHAREHOLDER INFORMATION
Board Review of Investment Management Agreement
At a meeting held April 15, 2014, the Board of Trustees (Board), including a majority of non-interested or independent Trustees, approved renewal of the investment management agreement for each of the separate funds within the Trust (Fund(s)). In reaching this decision, the Board took into account information furnished throughout the year at regular Board meetings, as well as information prepared specifically in connection with the annual renewal review process. Information furnished and discussed throughout the year included investment performance reports and related financial information for each Fund, along with periodic reports on expenses, shareholder services, legal and compliance matters, pricing, brokerage commissions and execution and other services provided by the Investment Manager (Manager) and its affiliates. Information furnished specifically in connection with the renewal process included reports prepared by Lipper, Inc. (Lipper), an independent organization, as well as additional material, including a Fund profitability analysis prepared by management. The Lipper reports compared a Fund’s investment performance and expenses with those of other mutual funds deemed comparable to the Fund as selected by Lipper. No Lipper reports, however, were furnished with respect to the newly formed Franklin Managed Volatility Global Allocation VIP Fund in view of its short period of operation and absence of third-party shareholders. The Fund profitability analysis discussed the profitability to Franklin Templeton Investments from its overall U.S. fund operations, as well as on an individual fund-by-fund basis. Additional material accompanying such profitability analysis included information on a fund-by-fund basis listing portfolio managers and other accounts they manage, as well as information on management fees charged by the Manager and its affiliates to U.S. mutual funds and other accounts, including management’s explanation of differences where relevant. Such material also included a memorandum prepared by management describing project initiatives and capital investments relating to the services provided to the Funds by the Franklin Templeton Investments organization, as well as a memorandum relating to economies of scale.
In considering such materials, the independent Trustees received assistance and advice from and met separately with independent counsel. While the investment management agreements for all Funds were considered at the same Board meeting, the Board dealt with each Fund separately. In approving continuance of the investment management agreement for each Fund, the Board, including a majority of independent Trustees, determined that the existing management fee structure was fair and reasonable and that continuance of the investment management agreement was in the best interests of each Fund and its shareholders. While attention was given to all
information furnished, the following discusses some primary factors relevant to the Board’s decision.
Nature, Extent and Quality of Service. The Board was satisfied with the nature and quality of the overall services provided by the Manager and its affiliates to the Funds and their shareholders. In addition to investment performance and expenses discussed later, the Board’s opinion was based, in part, upon periodic reports furnished them showing that the investment policies and restrictions for each Fund were consistently complied with as well as other reports periodically furnished the Board covering matters such as the compliance of portfolio managers and other management personnel with the code of ethics adopted throughout the Franklin Templeton fund complex, the adherence to fair value pricing procedures established by the Board, and the accuracy of net asset value calculations. Favorable consideration was given to management’s continual efforts and expenditures in establishing back-up systems and recovery procedures to function in the event of a natural disaster, it being noted that such systems and procedures had functioned well during the Florida hurricanes and blackouts experienced in previous years, and that those operations in the New York/New Jersey area ran smoothly during the period of the 2012 Hurricane Sandy. Among other factors taken into account by the Board were the Manager’s best execution trading policies, including a favorable report by an independent portfolio trading analytical firm, which also covered FOREX transactions. Consideration was also given to the experience of each Fund’s portfolio management team, the number of accounts managed and general method of compensation. In this latter respect, the Board noted that a primary factor in management’s determination of a portfolio manager’s bonus compensation was the relative investment performance of the funds he or she managed and that a portion of such bonus was required to be invested in a predesignated list of funds within such person’s fund management area so as to be aligned with the interests of shareholders. Particular attention was given to management’s conservative approach and diligent risk management procedures, including continual monitoring of counterparty credit risk and attention given to derivatives and other complex instruments, including expanded collateralization requirements. The Board also took into account, among other things, management’s efforts in establishing a global credit facility for the benefit of the Funds and other accounts managed by Franklin Templeton Investments to provide a source of cash for temporary and emergency purposes or to meet unusual redemption requests as well as the strong financial position of the Manager’s parent company and its commitment to the mutual fund business as evidenced by its subsidization of money market funds.
| Semiannual Report | SI-1 |
FRANKLIN TEMPLETON VARIABLE INSURANCE PRODUCTS TRUST
SHAREHOLDER INFORMATION
| SI-2 | Semiannual Report |
FRANKLIN TEMPLETON VARIABLE INSURANCE PRODUCTS TRUST
SHAREHOLDER INFORMATION
| Semiannual Report | SI-3 |
FRANKLIN TEMPLETON VARIABLE INSURANCE PRODUCTS TRUST
SHAREHOLDER INFORMATION
| SI-4 | Semiannual Report |
FRANKLIN TEMPLETON VARIABLE INSURANCE PRODUCTS TRUST
SHAREHOLDER INFORMATION
| Semiannual Report | SI-5 |
FRANKLIN TEMPLETON VARIABLE INSURANCE PRODUCTS TRUST
SHAREHOLDER INFORMATION
| SI-6 | Semiannual Report |
FRANKLIN TEMPLETON VARIABLE INSURANCE PRODUCTS TRUST
SHAREHOLDER INFORMATION
| Semiannual Report | SI-7 |

Franklin Templeton Variable Insurance Products Trust (FTVIP) shares are not offered to the public; they are offered and sold only to:
(1) insurance company separate accounts (Separate Account) to serve as the underlying investment vehicle for variable contracts;
(2) certain qualified plans; and (3) other mutual funds (funds of funds).
Authorized for distribution to investors in Separate Accounts only when accompanied or preceded by the current prospectus for the applicable contract, which includes the Separate Account and the FTVIP prospectuses. Investors should carefully consider a fund’s investment goals, risks, charges and expenses before investing. The prospectus contains this and other information; please read it carefully before investing.
To help ensure we provide you with quality service, all calls to and from our service areas are monitored and/or recorded.
| ©2014 Franklin Templeton Investments. All rights reserved. | VIP2 S 08/14 |
| Item 2. | Code of Ethics. |
| (a) | The Registrant has adopted a code of ethics that applies to its principal executive officers and principal financial and accounting officer. |
| (c) | N/A |
| (d) | N/A |
| (f) | Pursuant to Item 12(a)(1), the Registrant is attaching as an exhibit a copy of its code of ethics that applies to its principal executive officers and principal financial and accounting officer. |
| Item 3. | Audit Committee Financial Expert. |
| (a)(1) | The Registrant has an audit committee financial expert serving on its audit committee. |
| (2) | The audit committee financial expert is John B. Wilson and he is “independent” as defined under the relevant Securities and Exchange Commission Rules and Releases. |
| Item 4. | Principal Accountant Fees and Services. N/A |
| Item 5. | Audit Committee of Listed Registrants. N/A |
| Item 6. | Schedule of Investments. N/A |
| Item 7. | Disclosure of Proxy Voting Policies and Procedures for Closed-End Management Investment Companies. N/A |
| Item 8. | Portfolio Managers of Closed-End Management Investment Companies. N/A |
| Item 9. | Purchases of Equity Securities by Closed-End Management Investment Company and Affiliated Purchasers. N/A |
| Item 10. | Submission of Matters to a Vote of Security Holders. |
There have been no changes to the procedures by which shareholders may recommend nominees to the Registrant’s Board of Trustees that would require disclosure herein.
| Item 11. | Controls and Procedures. |
(a) Evaluation of Disclosure Controls and Procedures. The Registrant maintains disclosure controls and procedures that are designed to ensure that information required to be disclosed in the Registrant’s filings under the Securities Exchange Act of 1934 and the Investment Company Act of 1940 is recorded, processed, summarized and reported within the periods specified in the rules and forms of the Securities and Exchange Commission. Such information is accumulated and communicated to the Registrant’s management, including its principal executive officer and principal financial officer, as appropriate, to allow timely decisions regarding required disclosure. The Registrant’s management, including the principal executive officer and the principal financial officer, recognizes that any set of controls and procedures, no matter how well designed and operated, can provide only reasonable assurance of achieving the desired control objectives.
Within 90 days prior to the filing date of this Shareholder Report on Form N-CSR, the Registrant had carried out an evaluation, under the supervision and with the participation of the Registrant’s management, including the Registrant’s principal executive officer and the Registrant’s principal financial officer, of the effectiveness of the design and operation of the Registrant’s disclosure controls and procedures. Based on such evaluation, the Registrant’s principal executive officer and principal financial officer concluded that the Registrant’s disclosure controls and procedures are effective.
(b) Changes in Internal Controls. There have been no changes in the Registrant’s internal controls or in other factors that could materially affect the internal controls over financial reporting subsequent to the date of their evaluation in connection with the preparation of this Shareholder Report on Form N-CSR.
| Item 12. | Exhibits. |
(a)(1) Code of Ethics
(a)(2) Certifications pursuant to Section 302 of the Sarbanes-Oxley Act of 2002 of Laura F. Fergerson, Chief Executive Officer – Finance and Administration, and Gaston Gardey, Chief Financial Officer and Chief Accounting Officer
(b) Certifications pursuant to Section 906 of the Sarbanes-Oxley Act of 2002 of Laura F. Fergerson, Chief Executive Officer – Finance and Administration, and Gaston Gardey, Chief Financial Officer and Chief Accounting Officer
SIGNATURES
Pursuant to the requirements of the Securities Exchange Act of 1934 and the Investment Company Act of 1940, the registrant has duly caused this report to be signed on its behalf by the undersigned, thereunto duly authorized.
Franklin Templeton Variable Insurance Products Trust
| By | /s/ LAURA F. FERGERSON | |
| Laura F. Fergerson | ||
| Chief Executive Officer – | ||
| Finance and Administration | ||
| Date August 27, 2014 | ||
Pursuant to the requirements of the Securities Exchange Act of 1934 and the Investment Company Act of 1940, this report has been signed below by the following persons on behalf of the registrant and in the capacities and on the dates indicated.
| By | /s/ LAURA F. FERGERSON | |
| Laura F. Fergerson | ||
| Chief Executive Officer – | ||
| Finance and Administration | ||
| Date August 27, 2014 | ||
| By | /s/ GASTON GARDEY | |
| Gaston Gardey | ||
| Chief Financial Officer and | ||
| Chief Accounting Officer | ||
| Date August 27, 2014 | ||