Exhibit 99.1
|
|
Cowen and Company Global Metals, Mining and Materials Conference November 12, 2013 |
|
|
Forward-Looking & Non-GAAP Statements 1 Except for historical information contained herein, the statements in this document are forward-looking and made pursuant to the safe harbor provisions of the Private Securities Litigation Reform Act of 1995 and may involve a number of risks and uncertainties. Forward-looking statements are based on information available to management at the time, and they involve judgments and estimates. Forward-looking statements include expressions such as "believe," "anticipate," "expect," "estimate," "intend," "may," "plan," "predict," "will," and similar terms and expressions. These forward-looking statements are made based on expectations and beliefs concerning future events affecting us and are subject to various risks, uncertainties and factors relating to our operations and business environment, all of which are difficult to predict and many of which are beyond our control, which could cause our actual results to differ materially from those matters expressed in or implied by these forward-looking statements. The following factors are among those that may cause actual results to differ materially from our forward-looking statements: unfavorable economic, financial and business conditions; the global economic crisis; market conditions beyond our control; prolonged decline in the price of coal; decline in global coal or steel demand; prolonged or dramatic shortages or difficulties in coal production; our customer's refusal to honor or renew contracts; our ability to collect payments from our customers; inherent risks in coal mining such as weather patterns and conditions affecting production, geological conditions, equipment failure and other operational risks associated with mining; title defects preventing us from (or resulting in additional costs for) mining our mineral interests; concentration of our mining operations in limited number of areas; a significant reduction of, or loss of purchases by, our largest customers; unavailability of cost-effective transportation for our coal; availability, performance and costs of railroad, barge, truck and other transportation; disruptions or delays at the port facilities we use; risks associated with our reclamation and mine closure obligations, including failure to obtain or renew surety bonds; significant increase in competitive pressures and foreign currency fluctuations; significant cost increases and delays in the delivery of raw materials, mining equipment and purchased components; availability of adequate skilled employees and other labor relations matters; inaccuracies in our estimates of our coal reserves; estimates concerning economically recoverable coal reserves; greater than anticipated costs incurred for compliance with environmental liabilities or limitations on our abilities to produce or sell coal; our ability to attract and retain key personnel; future regulations that increase our costs or limit our ability to produce coal; new laws and regulations to reduce greenhouse gas emissions that impact the demand for our coal reserves; adverse rulings in current or future litigation; inability to access needed capital; events beyond our control that may result in an event of default under one or more of our debt instruments; availability of licenses, permits, and other authorizations that may be subject to challenges; risks associated with our reclamation and mine closure obligations; failure to meet project development and expansion targets; risks associated with operating in foreign jurisdictions; risks related to our indebtedness and our ability to generate cash for our financial obligations; downgrade in our credit rating; our ability to identify suitable acquisition candidates to promote growth; our ability to integrate acquisitions successfully; our exposure to indemnification obligations; volatility in the price of our common stock; our ability to pay regular dividends to stockholders; costs related to our post-retirement benefit obligations and workers' compensation obligations; our exposure to litigation; and other risks and uncertainties including those described in our filings with the SEC. Forward-looking statements made by us in this document, or elsewhere, speak only as of the date on which the statements were made. You are advised to read the risk factors in our most recently filed Annual Report on Form 10-K and subsequent filings with the SEC, which are available on our website at www.walterenergy.com and on the SEC's website at www.sec.gov. New risks and uncertainties arise from time to time, and it is impossible for us to predict these events or how they may affect us or our anticipated results. We have no duty to, and do not intend to, update or revise the forward-looking statements in this document, except as may be required by law. In light of these risks and uncertainties, readers should keep in mind that any forward-looking statement made in this document may not occur. All data presented herein is as of the date of this document unless otherwise noted. We use a number of different financial measures in assessing the overall performance of our business, including measures calculated in accordance with United States generally accepted accounting principles (“GAAP”) and non-GAAP numbers. EBITDA from Continuing Operations, EBITDA, Adjusted EBITDA and Adjusted Net Income (Loss) are financial measures that are calculated in conformity with GAAP and should be considered supplemental to, and not as a substitute or superior to, financial measures calculated in conformity with GAAP. We believe that EBITDA from Continuing Operations, EBITDA, Adjusted EBITDA and Adjusted Net Income (Loss) are useful measures as some investors and analysts use EBITDA from Continuing Operations, EBITDA, Adjusted EBITDA and Adjusted Net Income (Loss) to compare us against other companies and to help analyze our ability to satisfy principal and interest obligations and capital expenditure needs. EBITDA from Continuing Operations, EBITDA, Adjusted EBITDA and Adjusted Net Income (Loss) may not be comparable to similarly titled measures used by other companies. A reconciliation of these non-GAAP measures is included in the Appendix hereto. |
|
|
Agenda Walter Overview Met Coal Market Update Business Update Appendix 2 |
|
|
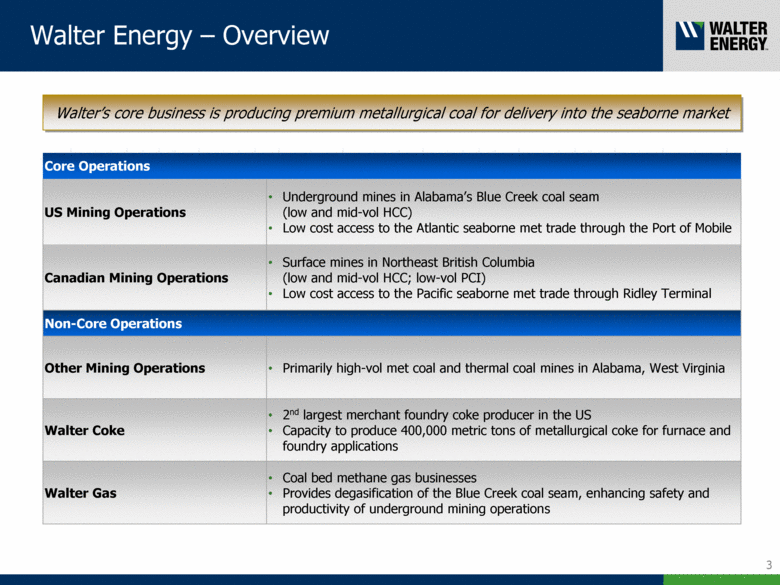
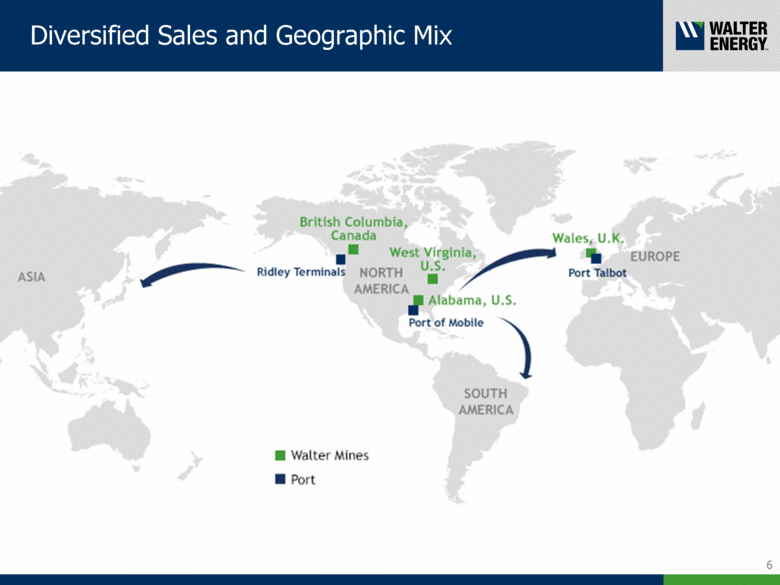
Walter’s core business is producing premium metallurgical coal for delivery into the seaborne market Walter Energy – Overview 3 Core Operations US Mining Operations Underground mines in Alabama’s Blue Creek coal seam (low and mid-vol HCC) Low cost access to the Atlantic seaborne met trade through the Port of Mobile Canadian Mining Operations Surface mines in Northeast British Columbia (low and mid-vol HCC; low-vol PCI) Low cost access to the Pacific seaborne met trade through Ridley Terminal Non-Core Operations Other Mining Operations Primarily high-vol met coal and thermal coal mines in Alabama, West Virginia Walter Coke 2nd largest merchant foundry coke producer in the US Capacity to produce 400,000 metric tons of metallurgical coke for furnace and foundry applications Walter Gas Coal bed methane gas businesses Provides degasification of the Blue Creek coal seam, enhancing safety and productivity of underground mining operations |
|
|
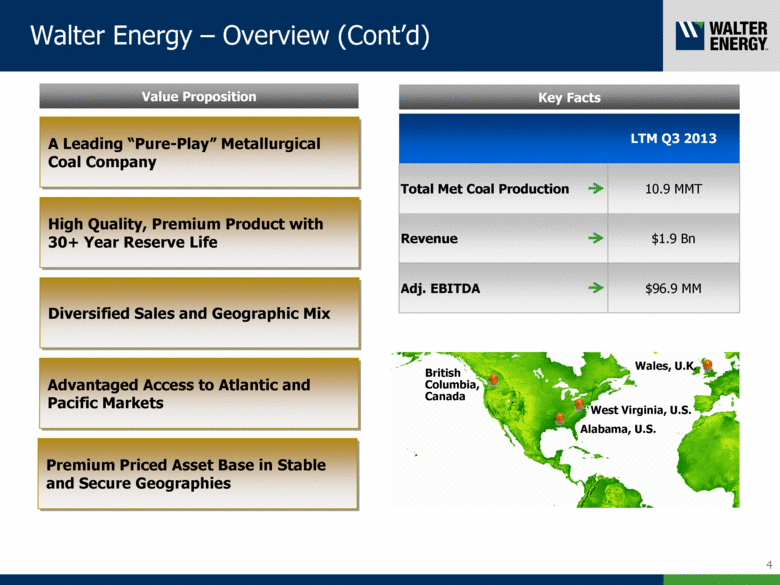
Walter Energy – Overview (Cont’d) 4 Value Proposition A Leading “Pure-Play” Metallurgical Coal Company High Quality, Premium Product with 30+ Year Reserve Life Diversified Sales and Geographic Mix Advantaged Access to Atlantic and Pacific Markets Premium Priced Asset Base in Stable and Secure Geographies Key Facts LTM Q3 2013 Total Met Coal Production 10.9 MMT Revenue $1.9 Bn Adj. EBITDA $96.9 MM Wales, U.K. West Virginia, U.S. Alabama, U.S. British Columbia, Canada |
|
|
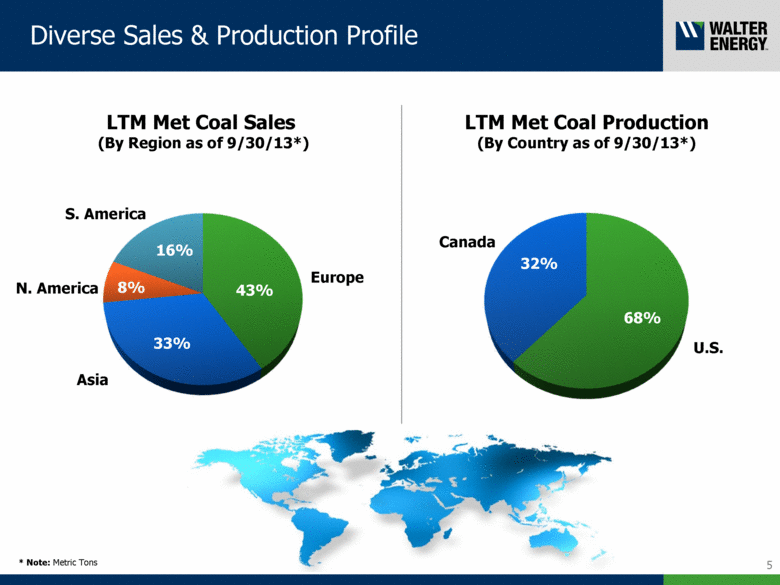
Diverse Sales & Production Profile 5 LTM Met Coal Sales (By Region as of 9/30/13*) Europe Asia S. America N. America 68% 32% 43% 16% 8% 33% Canada U.S. LTM Met Coal Production (By Country as of 9/30/13*) * Note: Metric Tons |
|
|
Diversified Sales and Geographic Mix 6 |
|
|
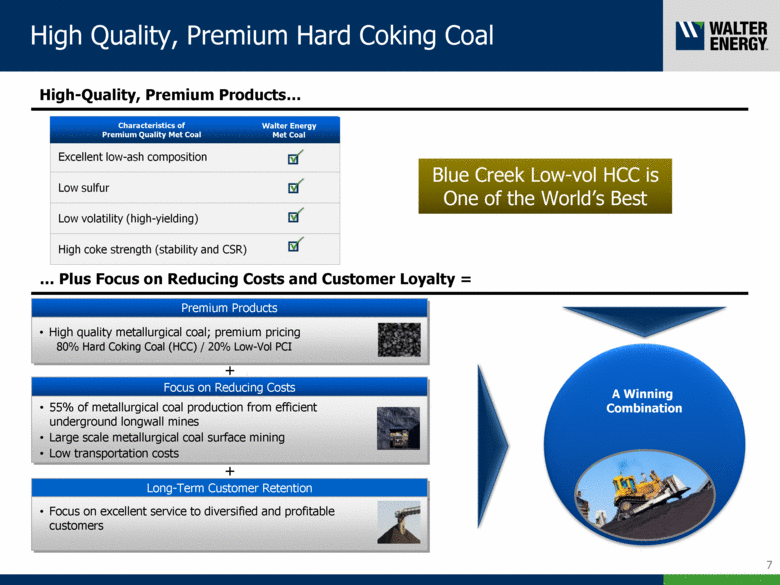
High Quality, Premium Hard Coking Coal 7 Blue Creek Low-vol HCC is One of the World’s Best Plus Focus on Reducing Costs and Customer Loyalty = Premium Products High quality metallurgical coal; premium pricing 80% Hard Coking Coal (HCC) / 20% Low-Vol PCI + Focus on Reducing Costs 55% of metallurgical coal production from efficient underground longwall mines Large scale metallurgical coal surface mining Low transportation costs Long-Term Customer Retention Focus on excellent service to diversified and profitable customers A Winning Combination + High-Quality, Premium Products Characteristics of Premium Quality Met Coal Walter Energy Met Coal |
|
|
Agenda Walter Overview Met Coal Market Update Business Update Appendix 8 |
|
|
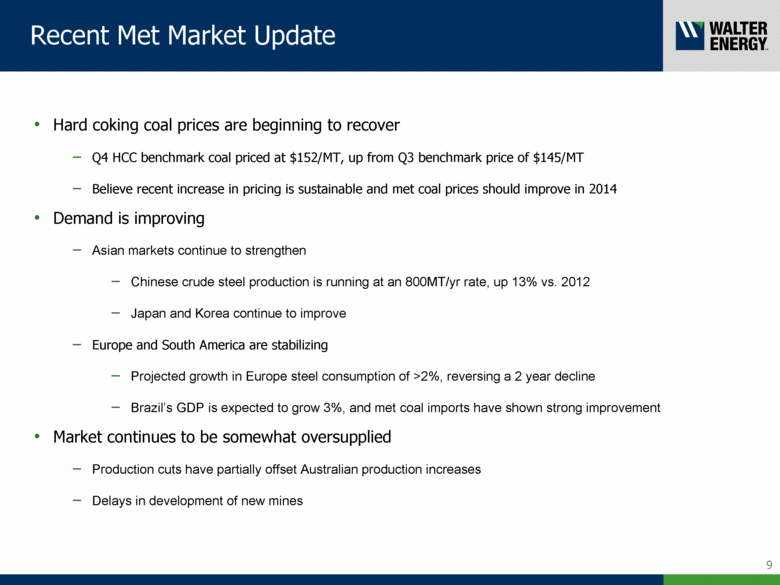
9 Recent Met Market Update Hard coking coal prices are beginning to recover Q4 HCC benchmark coal priced at $152/MT, up from Q3 benchmark price of $145/MT Believe recent increase in pricing is sustainable and met coal prices should improve in 2014 Demand is improving Asian markets continue to strengthen Chinese crude steel production is running at an 800MT/yr rate, up 13% vs. 2012 Japan and Korea continue to improve Europe and South America are stabilizing Projected growth in Europe steel consumption of >2%, reversing a 2 year decline Brazil’s GDP is expected to grow 3%, and met coal imports have shown strong improvement Market continues to be somewhat oversupplied Production cuts have partially offset Australian production increases Delays in development of new mines |
|
|
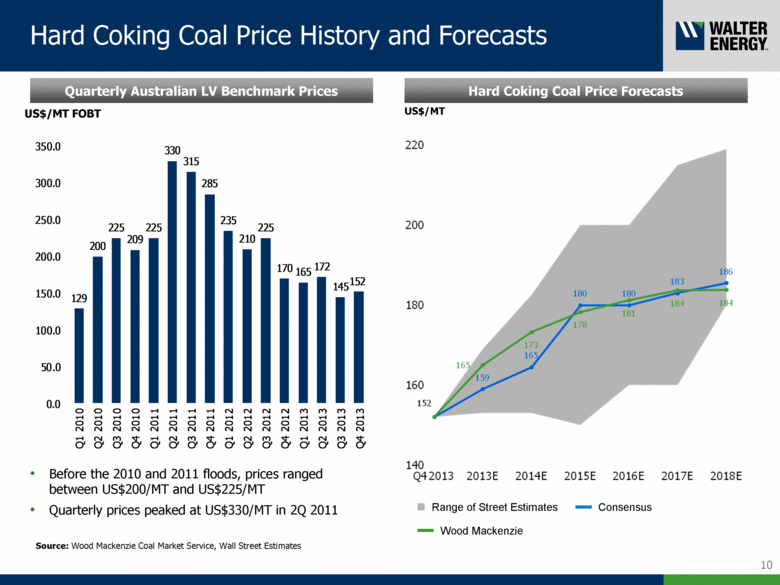
Hard Coking Coal Price History and Forecasts 10 0 47 95 0 98 214 63 156 53 121 121 121 152 52 9 35 91 110 82 71 0 181 181 181 Quarterly Australian LV Benchmark Prices Before the 2010 and 2011 floods, prices ranged between US$200/MT and US$225/MT Quarterly prices peaked at US$330/MT in 2Q 2011 Source: Wood Mackenzie Coal Market Service, Wall Street Estimates US$/MT FOBT Hard Coking Coal Price Forecasts Range of Street Estimates Consensus Wood Mackenzie US$/MT 129 200 225 209 225 330 315 285 235 210 225 170 165 172 145 152 0.0 50.0 100.0 150.0 200.0 250.0 300.0 350.0 Q1 2010 Q2 2010 Q3 2010 Q4 2010 Q1 2011 Q2 2011 Q3 2011 Q4 2011 Q1 2012 Q2 2012 Q3 2012 Q4 2012 Q1 2013 Q2 2013 Q3 2013 Q4 2013 |
|
|
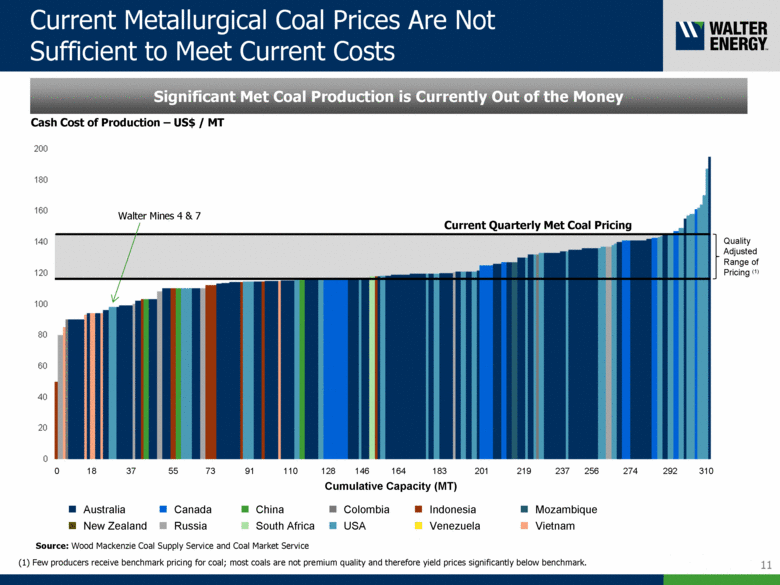
Current Metallurgical Coal Prices Are Not Sufficient to Meet Current Costs 11 Significant Met Coal Production is Currently Out of the Money Source: Wood Mackenzie Coal Supply Service and Coal Market Service Cash Cost of Production – US$ / MT China Indonesia Australia Mozambique Canada New Zealand Russia South Africa USA Venezuela Vietnam Cumulative Capacity (MT) 0 18 37 55 73 146 219 256 274 310 91 110 128 164 183 201 237 292 Current Quarterly Met Coal Pricing Walter Mines 4 & 7 Quality Adjusted Range of Pricing (1) (1) Few producers receive benchmark pricing for coal; most coals are not premium quality and therefore yield prices significantly below benchmark. 0 47 95 0 98 214 63 156 53 121 121 121 152 52 9 35 91 110 82 71 0 181 181 181 |
|
|
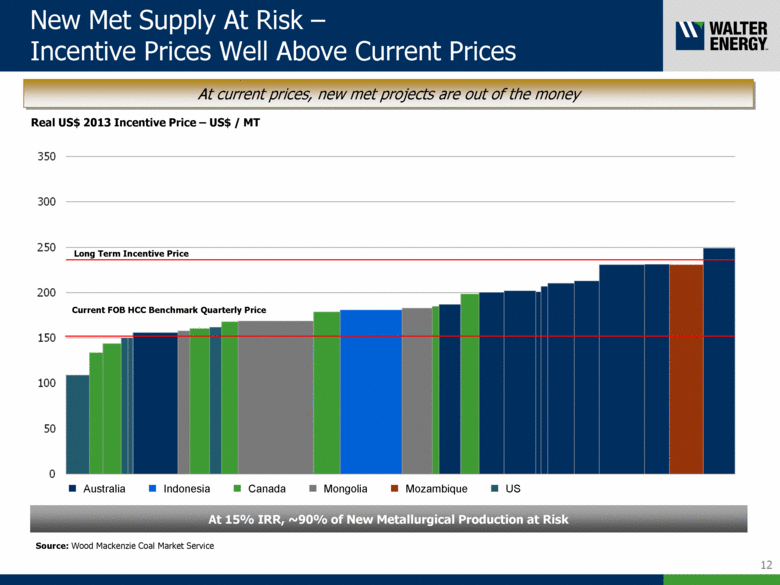
New Met Supply At Risk – Incentive Prices Well Above Current Prices 12 Real US$ 2013 Incentive Price – US$ / MT 0 47 95 0 98 214 63 156 53 121 121 121 152 52 9 35 91 110 82 71 0 181 181 181 At 15% IRR, ~90% of New Metallurgical Production at Risk Source: Wood Mackenzie Coal Market Service Canada US Australia Mozambique Indonesia Long Term Incentive Price Current FOB HCC Benchmark Quarterly Price At current prices, new met projects are out of the money |
|
|
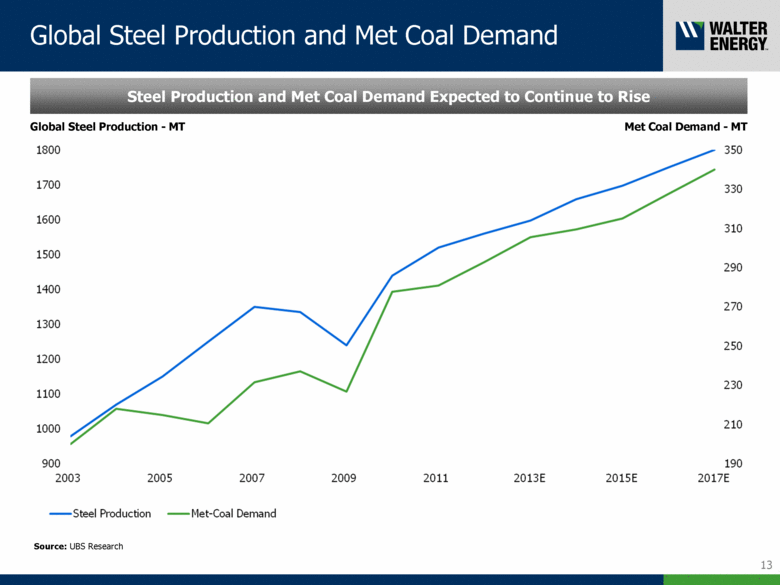
Global Steel Production and Met Coal Demand 13 Steel Production and Met Coal Demand Expected to Continue to Rise 0 47 95 0 98 214 63 156 53 121 121 121 152 52 9 35 91 110 82 71 0 181 181 181 Source: UBS Research Global Steel Production - MT Met Coal Demand - MT |
|
|
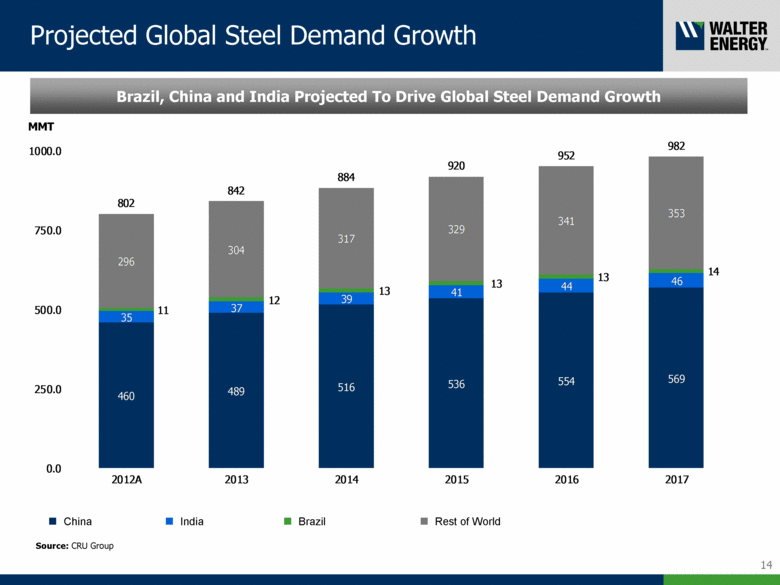
Projected Global Steel Demand Growth 14 Brazil, China and India Projected To Drive Global Steel Demand Growth MMT 0 47 95 0 98 214 63 156 53 121 121 121 152 52 9 35 91 110 82 71 0 181 181 181 Source: CRU Group China India Brazil Rest of World 460 489 516 536 554 569 35 37 39 41 44 46 11 12 13 13 13 14 296 304 317 329 341 353 802 842 884 920 952 982 0.0 250.0 500.0 750.0 1000.0 2012A 2013 2014 2015 2016 2017 |
|
|
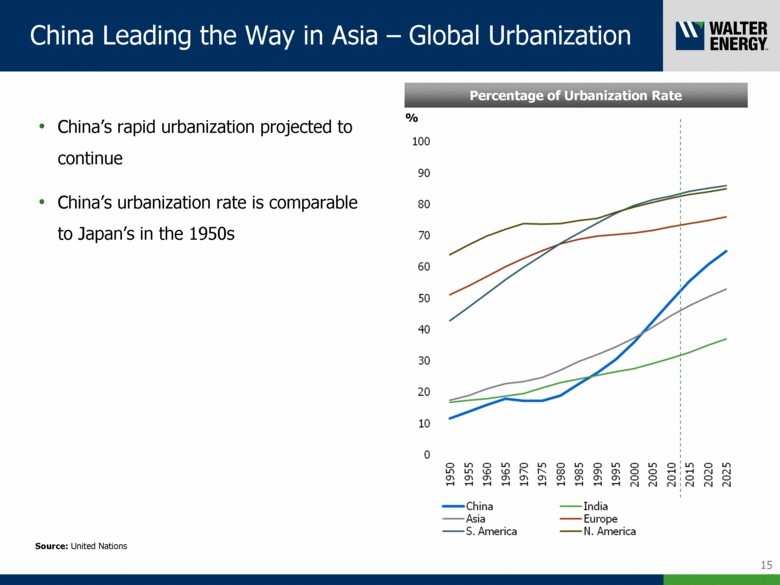
15 China Leading the Way in Asia – Global Urbanization China’s rapid urbanization projected to continue China’s urbanization rate is comparable to Japan’s in the 1950s Source: United Nations Percentage of Urbanization Rate % |
|
|
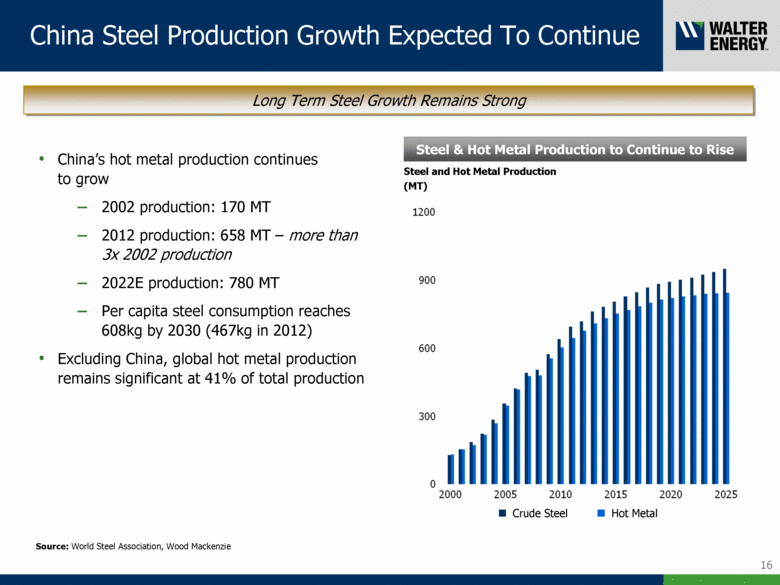
16 China Steel Production Growth Expected To Continue Steel & Hot Metal Production to Continue to Rise Steel and Hot Metal Production (MT) Hot Metal Long Term Steel Growth Remains Strong China’s hot metal production continues to grow 2002 production: 170 MT 2012 production: 658 MT – more than 3x 2002 production 2022E production: 780 MT Per capita steel consumption reaches 608kg by 2030 (467kg in 2012) Excluding China, global hot metal production remains significant at 41% of total production Source: World Steel Association, Wood Mackenzie |
|
|
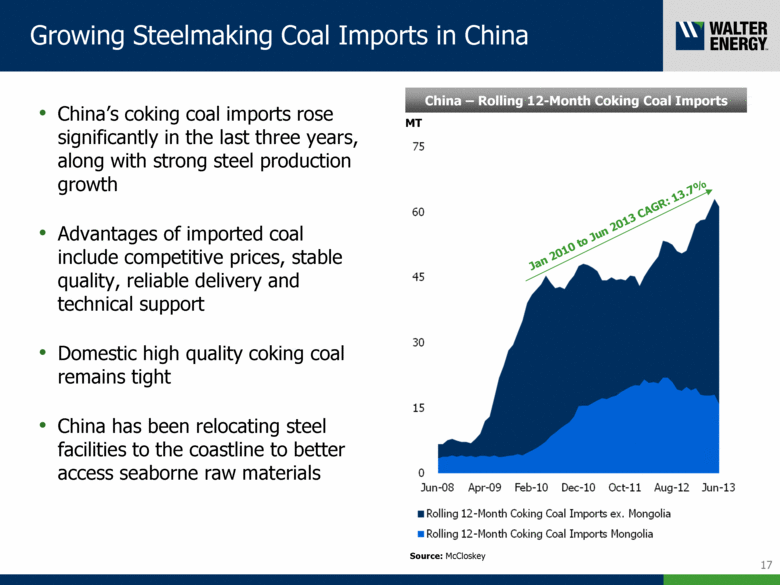
17 Growing Steelmaking Coal Imports in China China’s coking coal imports rose significantly in the last three years, along with strong steel production growth Advantages of imported coal include competitive prices, stable quality, reliable delivery and technical support Domestic high quality coking coal remains tight China has been relocating steel facilities to the coastline to better access seaborne raw materials China – Rolling 12-Month Coking Coal Imports Source: McCloskey MT Jan 2010 to Jun 2013 CAGR: 13.7% |
|
|
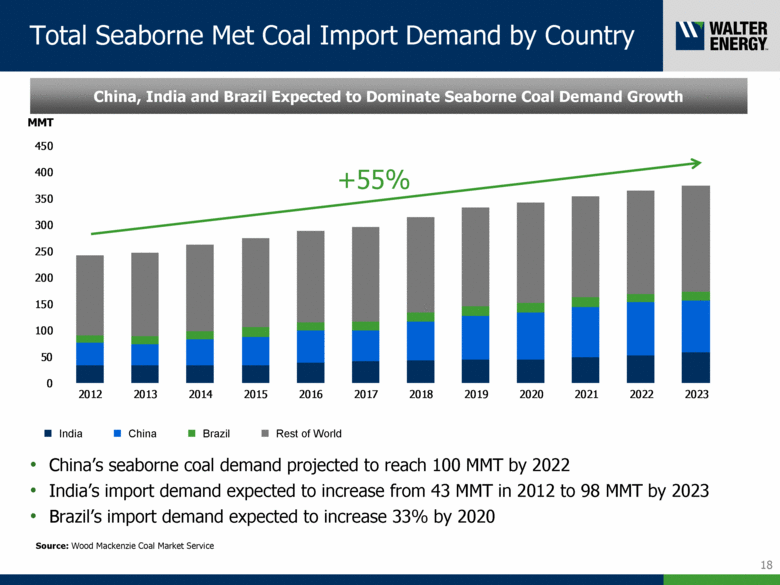
Total Seaborne Met Coal Import Demand by Country 18 0 47 95 0 98 214 63 156 53 121 121 121 152 52 9 35 91 110 82 71 0 181 181 181 China, India and Brazil Expected to Dominate Seaborne Coal Demand Growth China’s seaborne coal demand projected to reach 100 MMT by 2022 India’s import demand expected to increase from 43 MMT in 2012 to 98 MMT by 2023 Brazil’s import demand expected to increase 33% by 2020 Source: Wood Mackenzie Coal Market Service MMT India China Brazil Rest of World +55% 0 50 100 150 200 250 300 350 400 450 2012 2013 2014 2015 2016 2017 2018 2019 2020 2021 2022 2023 |
|
|
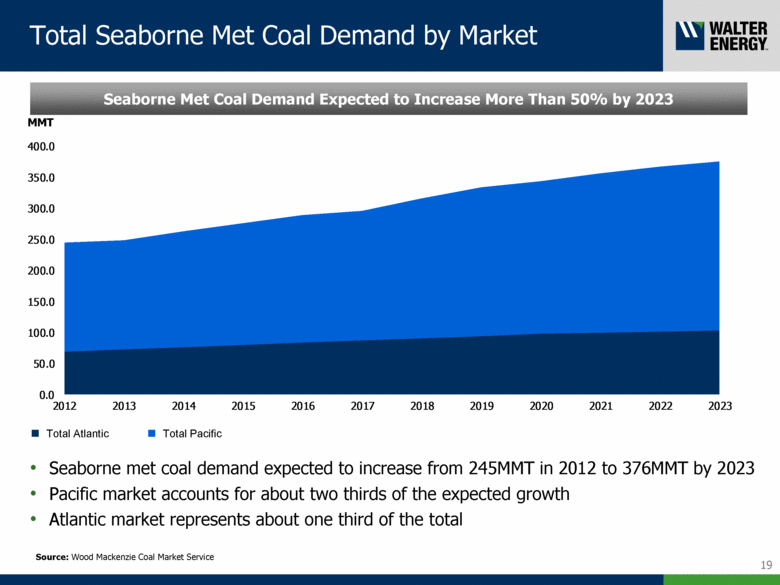
Total Seaborne Met Coal Demand by Market Total Atlantic 19 0 47 95 0 98 214 63 156 53 121 121 121 152 52 9 35 91 110 82 71 0 181 181 181 Seaborne Met Coal Demand Expected to Increase More Than 50% by 2023 Seaborne met coal demand expected to increase from 245MMT in 2012 to 376MMT by 2023 Pacific market accounts for about two thirds of the expected growth Atlantic market represents about one third of the total Source: Wood Mackenzie Coal Market Service MMT Total Pacific 0.0 50.0 100.0 150.0 200.0 250.0 300.0 350.0 400.0 2012 2013 2014 2015 2016 2017 2018 2019 2020 2021 2022 2023 |
|
|
Agenda Walter Overview Met Coal Market Update Business Update Appendix 20 |
|
|
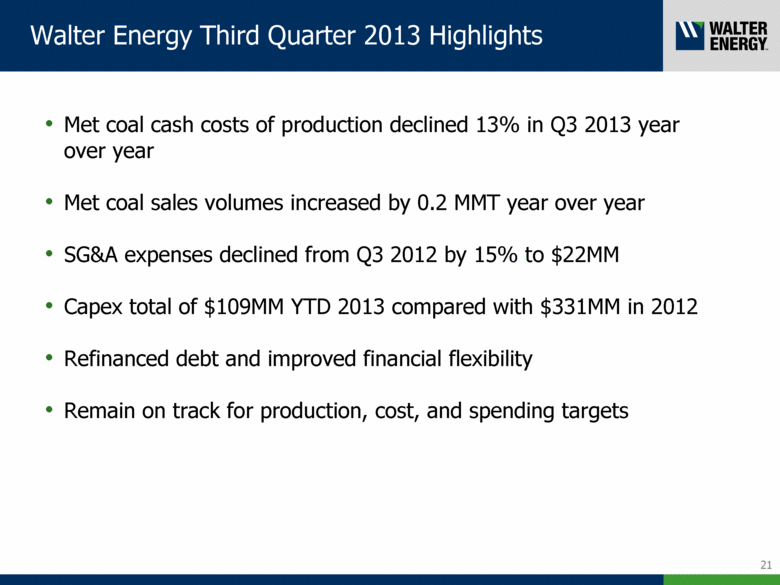
21 Walter Energy Third Quarter 2013 Highlights Met coal cash costs of production declined 13% in Q3 2013 year over year Met coal sales volumes increased by 0.2 MMT year over year SG&A expenses declined from Q3 2012 by 15% to $22MM Capex total of $109MM YTD 2013 compared with $331MM in 2012 Refinanced debt and improved financial flexibility Remain on track for production, cost, and spending targets |
|
|
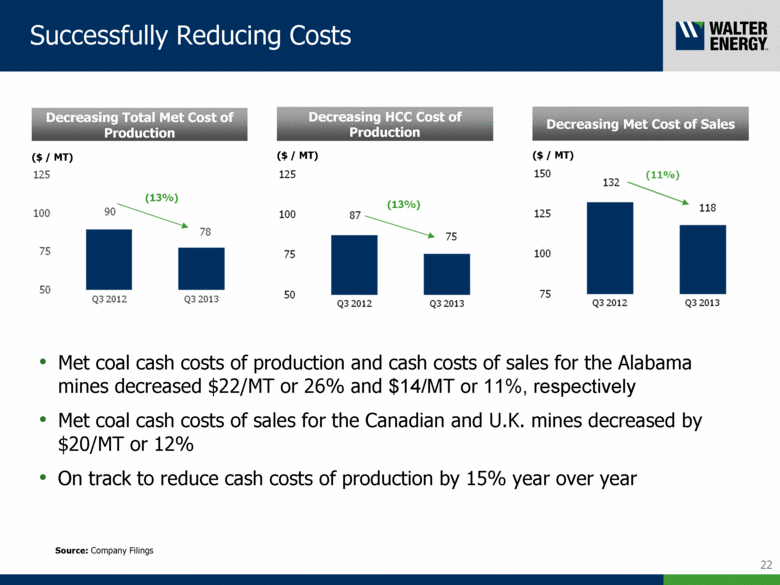
Decreasing HCC Cost of Production Decreasing Total Met Cost of Production 22 ($ / MT) (13%) ($ / MT) (13%) Successfully Reducing Costs Met coal cash costs of production and cash costs of sales for the Alabama mines decreased $22/MT or 26% and $14/MT or 11%, respectively Met coal cash costs of sales for the Canadian and U.K. mines decreased by $20/MT or 12% On track to reduce cash costs of production by 15% year over year Decreasing Met Cost of Sales ($ / MT) (11%) Source: Company Filings |
|
|
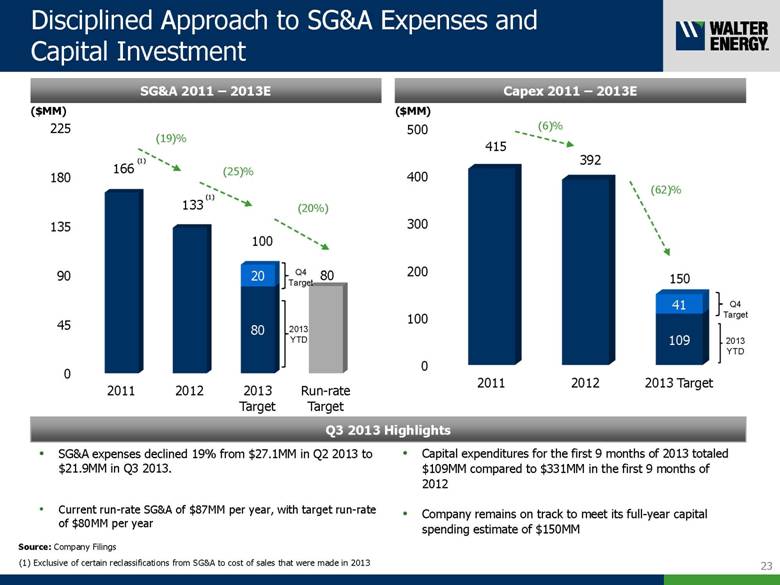
2013 YTD Disciplined Approach to SG&A Expenses and Capital Investment 23 Q3 2013 Highlights SG&A 2011 – 2013E ($MM) SG&A expenses declined 19% from $27.1MM in Q2 2013 to $21.9MM in Q3 2013. Current run-rate SG&A of $87MM per year, with target run-rate of $80MM per year (19)% (25)% Capex 2011 – 2013E ($MM) (62)% (6)% Capital expenditures for the first 9 months of 2013 totaled $109MM compared to $331MM in the first 9 months of 2012 Company remains on track to meet its full-year capital spending estimate of $150MM 2013 YTD (20%) Q4 Target Q4 Target (1) (1) Exclusive of certain reclassifications from SG&A to cost of sales that were made in 2013 (1) Source: Company Filings |
|
|
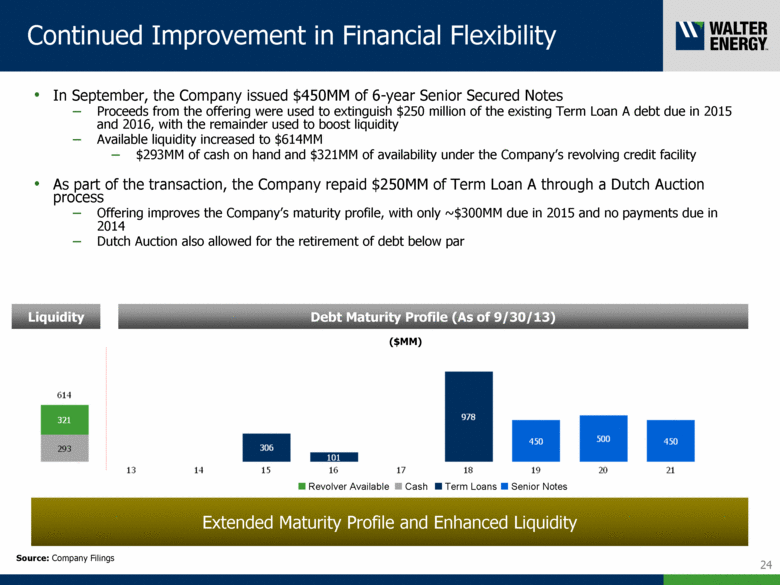
Cash Term Loans Senior Notes Debt Maturity Profile (As of 9/30/13) 24 Continued Improvement in Financial Flexibility ($MM) In September, the Company issued $450MM of 6-year Senior Secured Notes Proceeds from the offering were used to extinguish $250 million of the existing Term Loan A debt due in 2015 and 2016, with the remainder used to boost liquidity Available liquidity increased to $614MM $293MM of cash on hand and $321MM of availability under the Company’s revolving credit facility As part of the transaction, the Company repaid $250MM of Term Loan A through a Dutch Auction process Offering improves the Company’s maturity profile, with only ~$300MM due in 2015 and no payments due in 2014 Dutch Auction also allowed for the retirement of debt below par Extended Maturity Profile and Enhanced Liquidity Liquidity Revolver Available Source: Company Filings |
|
|
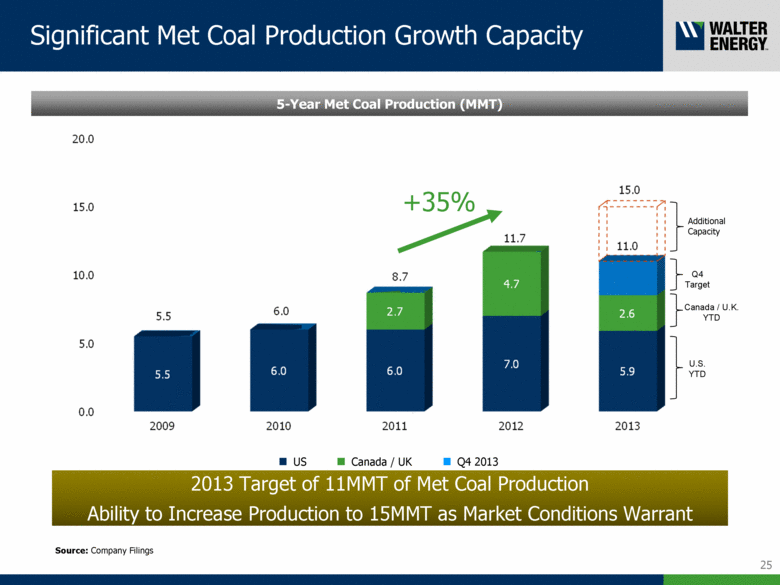
Significant Met Coal Production Growth Capacity 25 Canada / UK Q4 2013 Source: Company Filings 2013 Target of 11MMT of Met Coal Production Ability to Increase Production to 15MMT as Market Conditions Warrant 5-Year Met Coal Production (MMT) +35% U.S. YTD Canada / U.K. YTD Q4 Target Additional Capacity US |
|
|
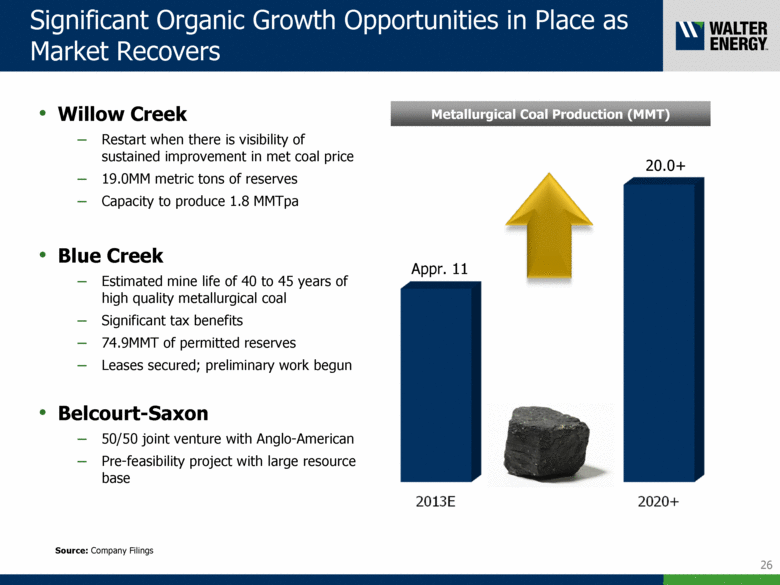
26 Appr. 11 Significant Organic Growth Opportunities in Place as Market Recovers 20.0+ Willow Creek Restart when there is visibility of sustained improvement in met coal price 19.0MM metric tons of reserves Capacity to produce 1.8 MMTpa Blue Creek Estimated mine life of 40 to 45 years of high quality metallurgical coal Significant tax benefits 74.9MMT of permitted reserves Leases secured; preliminary work begun Belcourt-Saxon 50/50 joint venture with Anglo-American Pre-feasibility project with large resource base Metallurgical Coal Production (MMT) Source: Company Filings |
|
|
27 Q4 Outlook Expect met coal sales to meet or exceed Q3 sales Higher benchmark price coupled with higher volumes expected to increase Revenue and EBITDA Productivity enhancements expected to drive continued declines in cash costs of production Remain on track for production, cost, and spending targets On track to produce 11.0MMT of met coal in 2013 On track to reduce cash costs of production by 15% year over year On track to meet capex target of $150MM for 2013 On track to reach annualized run-rate of $80MM SG&A by year-end |
|
|
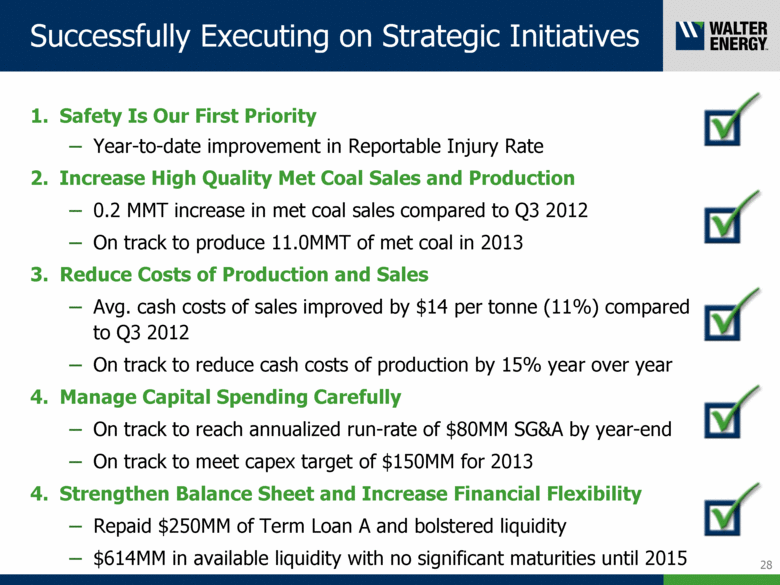
Successfully Executing on Strategic Initiatives Safety Is Our First Priority Year-to-date improvement in Reportable Injury Rate Increase High Quality Met Coal Sales and Production 0.2 MMT increase in met coal sales compared to Q3 2012 On track to produce 11.0MMT of met coal in 2013 Reduce Costs of Production and Sales Avg. cash costs of sales improved by $14 per tonne (11%) compared to Q3 2012 On track to reduce cash costs of production by 15% year over year Manage Capital Spending Carefully On track to reach annualized run-rate of $80MM SG&A by year-end On track to meet capex target of $150MM for 2013 Strengthen Balance Sheet and Increase Financial Flexibility Repaid $250MM of Term Loan A and bolstered liquidity $614MM in available liquidity with no significant maturities until 2015 28 |
|
|
Agenda Walter Overview Met Coal Market Update Business Update Appendix 29 |
|
|
- Appendix - |
|
|
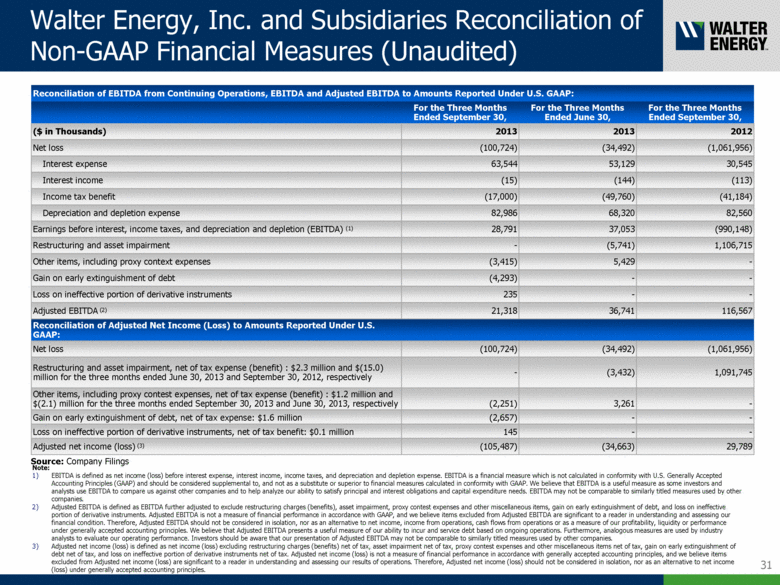
Walter Energy, Inc. and Subsidiaries Reconciliation of Non-GAAP Financial Measures (Unaudited) Reconciliation of EBITDA from Continuing Operations, EBITDA and Adjusted EBITDA to Amounts Reported Under U.S. GAAP: For the Three Months Ended September 30, For the Three Months Ended June 30, For the Three Months Ended September 30, ($ in Thousands) 2013 2013 2012 Net loss (100,724) (34,492) (1,061,956) Interest expense 63,544 53,129 30,545 Interest income (15) (144) (113) Income tax benefit (17,000) (49,760) (41,184) Depreciation and depletion expense 82,986 68,320 82,560 Earnings before interest, income taxes, and depreciation and depletion (EBITDA) (1) 28,791 37,053 (990,148) Restructuring and asset impairment - (5,741) 1,106,715 Other items, including proxy context expenses (3,415) 5,429 - Gain on early extinguishment of debt (4,293) - - Loss on ineffective portion of derivative instruments 235 - - Adjusted EBITDA (2) 21,318 36,741 116,567 Reconciliation of Adjusted Net Income (Loss) to Amounts Reported Under U.S. GAAP: Net loss (100,724) (34,492) (1,061,956) Restructuring and asset impairment, net of tax expense (benefit) : $2.3 million and $(15.0) million for the three months ended June 30, 2013 and September 30, 2012, respectively - (3,432) 1,091,745 Other items, including proxy contest expenses, net of tax expense (benefit) : $1.2 million and $(2.1) million for the three months ended September 30, 2013 and June 30, 2013, respectively (2,251) 3,261 - Gain on early extinguishment of debt, net of tax expense: $1.6 million (2,657) - - Loss on ineffective portion of derivative instruments, net of tax benefit: $0.1 million 145 - - Adjusted net income (loss) (3) (105,487) (34,663) 29,789 Note: EBITDA is defined as net income (loss) before interest expense, interest income, income taxes, and depreciation and depletion expense. EBITDA is a financial measure which is not calculated in conformity with U.S. Generally Accepted Accounting Principles (GAAP) and should be considered supplemental to, and not as a substitute or superior to financial measures calculated in conformity with GAAP. We believe that EBITDA is a useful measure as some investors and analysts use EBITDA to compare us against other companies and to help analyze our ability to satisfy principal and interest obligations and capital expenditure needs. EBITDA may not be comparable to similarly titled measures used by other companies. Adjusted EBITDA is defined as EBITDA further adjusted to exclude restructuring charges (benefits), asset impairment, proxy contest expenses and other miscellaneous items, gain on early extinguishment of debt, and loss on ineffective portion of derivative instruments. Adjusted EBITDA is not a measure of financial performance in accordance with GAAP, and we believe items excluded from Adjusted EBITDA are significant to a reader in understanding and assessing our financial condition. Therefore, Adjusted EBITDA should not be considered in isolation, nor as an alternative to net income, income from operations, cash flows from operations or as a measure of our profitability, liquidity or performance under generally accepted accounting principles. We believe that Adjusted EBITDA presents a useful measure of our ability to incur and service debt based on ongoing operations. Furthermore, analogous measures are used by industry analysts to evaluate our operating performance. Investors should be aware that our presentation of Adjusted EBITDA may not be comparable to similarly titled measures used by other companies. Adjusted net income (loss) is defined as net income (loss) excluding restructuring charges (benefits) net of tax, asset impairment net of tax, proxy contest expenses and other miscellaneous items net of tax, gain on early extinguishment of debt net of tax, and loss on ineffective portion of derivative instruments net of tax. Adjusted net income (loss) is not a measure of financial performance in accordance with generally accepted accounting principles, and we believe items excluded from Adjusted net income (loss) are significant to a reader in understanding and assessing our results of operations. Therefore, Adjusted net income (loss) should not be considered in isolation, nor as an alternative to net income (loss) under generally accepted accounting principles. 31 Source: Company Filings |
