SEI Institutional International Trust
UNITED STATES
SECURITIES AND EXCHANGE COMMISSION
Washington, D.C. 20549
FORM N-CSR
CERTIFIED SHAREHOLDER REPORT OF REGISTERED
MANAGEMENT INVESTMENT COMPANIES
Investment Company Act file number
811-05601
SEI Institutional International Trust
(Exact name of registrant as specified in charter)
SEI
Investments
One Freedom Valley Drive
Oaks, PA 19456
(Address of principal executive offices) (Zip code)
CT Corporation
155 Federal Street
Boston, MA 02110
(Name and address of agent for service)
Registrant’s telephone number, including area code: 1-800-342-5734
Date of
fiscal year end: September 30, 2012
Date of reporting period: September 30, 2012
| Item 1. |
Reports to Stockholders. |

September 30, 2012
ANNUAL REPORT
SEI Institutional International Trust
International Equity Fund
Emerging Markets Equity Fund
International Fixed Income
Fund
Emerging Markets Debt
Fund

TABLE OF CONTENTS
The Trust files its complete schedule of portfolio holdings with the Securities and Exchange Commission for the first and
third quarters of each fiscal year on Form N-Q within sixty days after the end of the period. The Trust’s Form N-Q is available on the Commission’s website at http://www.sec.gov, and may be reviewed and copied at the Commission’s
Public Reference Room in Washington, DC. Information on the operation of the Public Reference Room may be obtained by calling 1-800-SEC-0330.
A
description of the policies and procedures that the Trust uses to determine how to vote proxies relating to portfolio securities, as well as information relating to how a Fund voted proxies relating to portfolio securities during the most recent
12-month period ended June 30, is available (i) without charge, upon request, by calling 1-800-DIAL-SEI; and (ii) on the Commission’s website at http://www.sec.gov.
MANAGEMENT’S DISCUSSION AND ANALYSIS OF FUND PERFORMANCE
SEI INSTITUTIONAL INTERNATIONAL TRUST — SEPTEMBER 30, 2012
International Equity Fund
I. Objective
The International Equity Fund (the “Fund”) seeks to provide long-term capital appreciation.
II. Multi-Manager Approach Statement
The Fund uses a
multi-manager approach, relying on a number of sub-advisors with differing investment approaches to manage portions of the Fund’s portfolio, under the general supervision of SEI Investments Management Corporation (SIMC). The Fund utilized the
following sub-advisers as of September 30, 2012: Acadian Asset Management LLC, Causeway Capital Management LLC, del Rey Global Investors LLC, INTECH Investment Management LLC, Neuberger Berman Management LLC, Schroder Investment Management North
America, Inc. and Tradewinds Global Investors LLC. For the year ended September 30, 2012, there were no new managers added to the Fund; Quantitative Management Associates LLC was terminated during the period.
III. Market Commentary
For the year ended September
30, 2012, we saw strong equity returns on the heels of relatively positive economic data combined with significant central bank intervention worldwide. The greatest concern continued to be the eurozone sovereign debt saga, with the focus shifting
from Greece and other peripheral countries to questions regarding the financial strength of larger national economies such as Germany and France, which may eventually have to backstop the debts of their weaker neighbors. Entering 2012, eurozone debt
fears waned temporarily, bringing strong equity market results in January and February despite the fact that yield spreads between stronger governments and troubled governments remained quite high (wide spreads may be an indication of stress and
risk aversion in credit markets). While there were releases of improved economic data throughout the period, fears persisted regarding the prospects of a hard landing for China and other emerging markets’ domestic economies, as well as concerns
regarding the potential for a double-dip recession in the U.S. However, global equity markets rallied in the third quarter of 2012, due, we believe, to central banks around the world signaling that they will take the necessary measures to stimulate
economic growth. Performance was strong across developed markets with the exception of Japan, which continues to struggle due largely to the impact of its strong currency on its predominately export-driven economy. Financials also rebounded
significantly during the period in response to increasing central bank intervention aimed at stabilizing financial markets.
IV. Return vs.
Benchmark
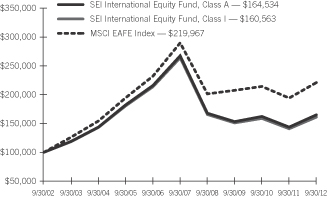
For year ended September 30, 2012, the Fund’s Class A shares outperformed the MSCI EAFE Index (the “Index”), returning
14.76% (Class A) versus the Index return of 13.75%.
V. Fund Attribution
At the sector level, Fund outperformance came mainly from stock selection. Selection in Industrials drove positive results as did selection in Energy and Telecommunications. In contrast, selection in
Consumer Discretionary and Consumer Staples detracted slightly from performance. Regionally, outperformance came mainly through stock selection, while regional allocation had little impact. Stock selection in Europe was the greatest contributor to
Fund outperformance, particularly within Switzerland and the Netherlands. The greatest detractor from performance was Australia, where stock selection and the underweight allocation both dragged on results.
Some of the managers within the Fund used derivatives for currency hedging (futures and forwards) during the period, though these instruments did not have a
meaningful impact on Fund performance.
International Equity Fund:
AVERAGE ANNUAL TOTAL RETURN1
|
|
|
|
|
|
|
|
|
|
|
|
|
|
|
|
|
|
|
|
|
| |
|
One Year
Return |
|
|
Annualized
3 Year
Return |
|
|
Annualized
5 Year
Return |
|
|
Annualized
10 Year
Return |
|
|
Annualized
Inception
to Date |
|
| Class A |
|
|
14.76% |
|
|
|
2.50% |
|
|
|
(9.13)% |
|
|
|
5.11% |
|
|
|
2.84% |
|
| Class I |
|
|
14.37% |
|
|
|
2.22% |
|
|
|
(9.34)% |
|
|
|
4.85% |
|
|
|
2.03% |
|
| MSCI EAFE Index |
|
|
13.75% |
|
|
|
2.12% |
|
|
|
(5.24)% |
|
|
|
8.20% |
|
|
|
3.85% |
|
Comparison of Change in the Value of a $100,000 Investment in the International Equity Fund, Class A and Class I, versus
the MSCI EAFE Index
| |
1 |
|
For the year ended September 30, 2012. Past performance is no indication of future performance. Class I Shares were offered beginning on
January 4, 2002. Class A Shares were offered beginning December 20, 1989. Class I Shares performance for the period prior to January 4, 2002 is performance derived from the performance of the Class A Shares. The performance
of Class I Shares may be lower than the performance of Class A Shares because of different distribution fees paid by Class I shareholders. Returns shown do not reflect the deduction of taxes that a shareholder would pay on fund distributions or
the redemption of fund shares. The returns for certain periods reflect fee waivers and/or reimbursements in effect for that period; absent fee waivers and reimbursements, performance would have been lower.
|
|
|
|
|
|
| SEI Institutional International Trust / Annual Report / September 30, 2012 |
|
|
1` |
|
MANAGEMENT’S DISCUSSION AND ANALYSIS OF FUND PERFORMANCE
SEI INSTITUTIONAL INTERNATIONAL TRUST — SEPTEMBER 30, 2012
Emerging Markets Equity Fund
I. Objective
The Emerging Markets Equity Fund (the “Fund”) seeks capital appreciation.
II. Multi-Manager
Approach Statement
The Fund uses a multi-manager approach, relying on a number of sub-advisors with differing investment approaches to manage
portions of the Fund’s portfolio, under the general supervision of SEI Investments Management Corporation (SIMC). The Fund utilized the following sub-advisers as of September 30, 2012: Delaware Management Company, JO Hambro Capital Management
Limited, Kleinwort Benson Investors International, Lazard Asset Management LLC, Neuberger Berman Management LLC, PanAgora Asset Management, Inc., and The Boston Company Asset Management LLC. For the year ended September 30, 2012, Kleinwort Benson
Investors International was added to the Fund; Artisan Partners Limited Partnership was terminated during the period.
III. Market Commentary
For the year ended September 30, 2012, emerging markets outperformed developed markets driven largely by a renewed appetite for risk that was
interspersed throughout the period. The greatest concern worldwide continued to be the eurozone sovereign debt saga, with the focus shifting from the fate of Greece and other peripheral nations, to questions regarding the financial strength of the
larger nations such as Germany and France, as it was assumed that they would ultimately have to step in and finance the debts of their weaker neighbors. Entering 2012, the euro debt fears waned temporarily, bringing strong results in January and
February, despite the fact that spreads on European sovereign debt remained extremely high. While there were releases of improved economic data throughout the period, fears persisted regarding the prospects of a hard landing for China’s and
other emerging markets’ economies, along with the worldwide concern regarding the potential for a double-dip recession in the U.S. However, equity markets around the world rallied in the third quarter of 2012, as central banks around the globe
continued to signal that they would take whatever measures they deem necessary to stimulate economic growth. Of these measures, the one that created the most positive market reaction was the European Central Bank’s (ECB) announcement to provide
liquidity to the market through unlimited purchases of short-duration bonds, and the ECB president’s pledge to “do whatever it takes” to preserve the euro currency union. Within emerging markets, the larger economies of Brazil and
India struggled, as the sustainability of growth in those nations came into question. In contrast, Mexico and Korea delivered strong performance through the choppy market environment.
IV. Return vs. Benchmark
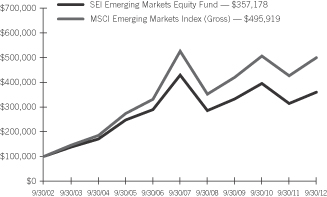
For year ended September 30, 2012, the Fund underperformed the MSCI Emerging Markets Index (Gross) (the “Index”), returning 14.21% versus the Index return of 17.33%.
V. Fund Attribution
Stock selection in Information
Technology and Financials detracted most from performance. In contrast, an underweight to Materials contributed positively, as did stock selection in Industrials. From a regional standpoint, both stock selection and portfolio allocation detracted
from performance. Stock selection in Brazil was strong during the period, but weak selection in China and South Africa detracted from results.
Emerging Markets Equity Fund:
AVERAGE ANNUAL TOTAL RETURN1
|
|
|
|
|
|
|
|
|
|
|
|
|
|
|
|
|
|
|
|
|
| |
|
One Year
Return |
|
|
Annualized
3 Year
Return |
|
|
Annualized
5 Year
Return |
|
|
Annualized
10 Year
Return |
|
|
Annualized
Inception
to Date |
|
| Class A |
|
|
14.21% |
|
|
|
2.64% |
|
|
|
(3.44)% |
|
|
|
13.58% |
|
|
|
4.99% |
|
MSCI Emerging Markets Index
(Gross) |
|
|
17.33% |
|
|
|
5.96% |
|
|
|
(0.98)% |
|
|
|
17.37% |
|
|
|
7.08% |
|
Comparison of Change in the Value of a $100,000 Investment in the
Emerging Markets Equity Fund, Class A, versus the MSCI Emerging Markets Index (Gross)
| |
1 |
|
For the year ended September 30, 2012. Past performance is no indication of future performance. Class A Shares were offered beginning
January 17, 1995. Returns shown do not reflect the deduction of taxes that a shareholder would pay on fund distributions or the redemption of fund shares. The returns for certain periods reflect fee waivers and/or reimbursements in effect for
that period; absent fee waivers and reimbursements, performance would have been lower. |
|
|
|
| 2 |
|
SEI Institutional International Trust / Annual Report / September 30, 2012 |
MANAGEMENT’S DISCUSSION AND ANALYSIS OF FUND PERFORMANCE
SEI INSTITUTIONAL INTERNATIONAL TRUST — SEPTEMBER 30, 2012
International Fixed Income Fund
I. Objective
The International Fixed Income Fund (the “Fund”) seeks to provide capital appreciation and current income.
II. Multi-Manager Approach Statement
The Fund uses a multi-manager approach, relying on a number of
sub-advisors with differing investment approaches to manage portions of the Fund’s portfolio, under the general supervision of SEI Investments Management Corporation (SIMC). The Fund utilized the following sub-advisers as of September 30,
2012: AllianceBernstein L.P., Wellington Management Company, LLP and Fidelity International Investment Advisors (UK) Limited. For the year ended September 30, 2012, no manager changes were made.
Market Commentary
For the year ended
September 30, 2012, markets experienced another roller coaster ride, flipping from “risk-on” to “risk-off” quite frequently. The new European Central Bank (ECB) President Mario Draghi has been extremely active all
year-round. At the beginning of his mandate the ECB cut rates in December 2011 and followed suit with two rounds of long term refinancing operations (LTRO). The LTROs have been perceived as a game changer in Europe in terms of: 1) backstopping bank
funding for long periods; 2) pushing all short-end rates and spreads lower; and 3) reviving demand for government bonds. The broader collateral eligibility that came along the second LTRO gave the opportunity to small financial entities to access
the operation: a total of 800 banks borrowed 530 billion euro. The ECB’s efforts were reinforced by the Euro area finance ministers with an extension of EFSF/ ESM firewalls. The deal ensures
€500 billion of lending capacity beyond the funds already committed will be available from the middle of 2012. On the Greek subject
the new government took some measures including public and private sector wage cuts, reduction in the number of civil service employees, tax reform, pension reform and a host of other reforms in order to achieve a consolidation of 1.5% of gross
domestic product (GDP) in 2012 and an additional 5% of GDP through 2015. By the end of the first quarter a second-round bailout was agreed with even more structural reforms in order to pay the March 20th bond maturity. In addition the PSI
negotiations went throughout: EU172bn of bonds tenders in swap
with consents from 85% of holders. The International Swaps and Derivatives Association (ISDA) voted that a Greek credit event occurred which triggered CDS contracts.
The second quarter saw the reversal of the first quarter in the form of renewed markets skepticism about two main worried: the stability of the euro area and
the momentum in global growth / demand. Market anxiety about Spain flared up again. At the beginning of the period Spain was in the spotlight as confidence disappeared due to the large fiscal slippage in 2011 (2.5% of GDP). The Spanish government
announced its fiscal consolidation plan for 2012, with measures worth EUR27.3bn for the central government budget. But the weak banking system came into light with the Bankia bailout which was much larger than estimated just two weeks prior and was
placed on the country’s balance sheet despite the country moving back into recession in the first quarter. By the end of the quarter the decision to provide funds for Spanish bank recapitalization failed to stabilize markets.
At the beginning of the third quarter the ECB cut its main refinancing rate by 25bp to 0.75% as well as marginal deposit and lending rates. The deposit rate
is now at zero. During the last ECB meeting of the quarter President Draghi introduced a new policy approach that seeks to navigate the current difficult path in a judicious manner and is called Outright Monetary Transactions (OMT). More precisely,
any country requesting ECB action will first be required to have signed up for either a full EFSF/ESM program (such as Greece, Ireland, Portugal) or at minimum to have set up a precautionary program. Precautionary programs are akin to the IMF’s
precautionary credit line. The market reaction was strong and positive as investors realized that it was a step towards fiscal union.
The
substantially stimulating monetary policy applied in Europe was used throughout the world: the US, Japan, the UK and China all loosened their monetary policy to fight the economic slowdown and the lack of political leadership.
On the market front the major treasury markets (U.S., Europe and UK) are lower than a year ago. Spreads on government debt within the eurozone tightened
significantly, especially since the LTRO announcement. On the corporate-bond side, spreads tightened, especially in the US, as companies deleveraged their balance sheets and are still sitting on a pile of cash to stomach a potentially global
downturn.
|
|
|
|
|
| SEI Institutional International Trust / Annual Report / September 30, 2012 |
|
|
3 |
|
MANAGEMENT’S DISCUSSION AND ANALYSIS OF FUND PERFORMANCE
SEI INSTITUTIONAL INTERNATIONAL TRUST — SEPTEMBER 30, 2012
International Fixed Income Fund (Concluded)
III. Return vs. Benchmark
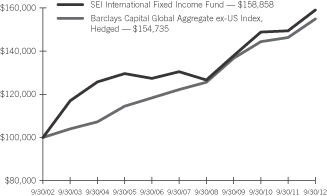
For year ended September 30, 2012, the Fund outperformed the Barclays Capital Global Aggregate ex-USD Index, Hedged (the “Index”) returning 6.34% versus the Index return of 5.86%.
IV. Fund Attribution
The fund kept a short duration
positioning throughout the year which overall was marginally positive. The main contributor to performance was the asset allocation call through an overweight stance to the corporate, especially financials, and securitized sectors and an underweight
stance to the sovereign sector. Another positive driver of performance was the security selection within the corporate and securitized sub-sectors. The country selection was positive as the fund successfully managed to adjust the exposure of the
so-called peripheral countries according to the market environment. Treasury futures, currency forwards, options and swaps were used to efficiently assist in managing the Fund’s duration, currency and yield-curve exposures.
International Fixed Income Fund:
AVERAGE ANNUAL TOTAL RETURN1
|
|
|
|
|
|
|
|
|
|
|
|
|
|
|
|
|
|
|
|
|
| |
|
One Year
Return |
|
|
Annualized
3 Year
Return |
|
|
Annualized
5 Year
Return |
|
|
Annualized
10 Year
Return |
|
|
Annualized
Inception
to Date |
|
| Class A |
|
|
6.34% |
|
|
|
4.85% |
|
|
|
4.03% |
|
|
|
4.74% |
|
|
|
4.63% |
|
| Barclays Capital Global Aggregate ex-US Index, Hedged |
|
|
5.86% |
|
|
|
4.22% |
|
|
|
4.84% |
|
|
|
4.46% |
|
|
|
6.17% |
|
Comparison of Change in the Value of a $100,000 Investment in the International Fixed Income Fund, Class A, versus the
Barclays Capital Global Aggregate ex-US Index, Hedged
| |
1 |
|
For the year ended September 30, 2012. Past performance is no indication of future performance. Class A Shares were offered beginning
September 1, 1993. Returns shown do not reflect the deduction of taxes that a shareholder would pay on fund distributions or the redemption of fund shares. The returns for certain periods reflect fee waivers and/or reimbursements in effect for
that period; absent fee waivers and reimbursements, performance would have been lower. |
|
|
|
| 4 |
|
SEI Institutional International Trust / Annual Report / September 30, 2012 |
MANAGEMENT’S DISCUSSION AND ANALYSIS OF FUND PERFORMANCE
SEI INSTITUTIONAL INTERNATIONAL TRUST — SEPTEMBER 30, 2012
Emerging Markets Debt Fund
I. Objective
The Emerging Markets Debt Fund (the “Fund”) seeks to maximize total return.
II.
Multi-Manager Approach Statement
The Fund uses a multi-manager approach, relying on a number of sub-advisors with differing investment approaches
to manage portions of the Fund’s portfolio, under the general supervision of SEI Investments Management Corp. (SIMC). The Fund utilized the following sub-advisers as of September 30, 2012: Ashmore Investment Management Limited, ING Investment
Management Advisors, B.V. and Stone Harbor Investment Partners LP. For the year ended September 30, 2012, no manager changes were made.
III.
Market Commentary
For the year ended September 30, 2012, emerging markets debt (EMD) posted a return of 18.52% (as measured by a blended
benchmark) during a roller-coaster market that saw increasing asset prices despite persistent volatility. EMD began the period with a stretch of volatility caused by resolution of the U.S. debt ceiling crisis and deepening concerns over financial
stresses in Europe. Investor risk appetite returned on news of an improving outlook in Europe, positive developments in China, a temporary respite from the U.S. government’s fiscal challenges, and relatively attractive valuations that resulted
from a mid-2011 selloff across global markets.
Emerging markets local-currency debt posted positive absolute returns, but failed to keep pace
with the strong dollar market during the period. Local currency assets were severely impaired in September 2011, coming off another period of volatility, causing investors to return to external-debt sectors. After additional volatility in the second
quarter of 2012, the European Central Bank and U.S. Federal Reserve provided more support to financial markets, enacting measures designed to minimize the likelihood of extremely severe market events in the short term. Central bank policies in
emerging markets also began to ease as inflation risks took a backseat to fears of a global slowdown.
The accommodative tone from policymakers caused a surge in appetite for external emerging market debt assets.
This resulted in asset-class inflows of approximately $60 billion — $25 billion more than projected at the start of 2012 — with another quarter left in calendar year 2012. These positive technicals put upward pressure on EMD asset prices
and boosted returns, despite liquidity challenges and supply imbalances. New issuance, which usually helps absorb investor inflows, was largely completed at the start of 2012 and thus unavailable to offset a sharp decline in yields. Though sovereign
financing remained quiet, very strong issuance in new corporate deals helped pick up the slack. Investors are still becoming acquainted with the growing EMD corporate sector.
Growth expectations in emerging markets declined during the period, yet remain significantly higher than in the developed world. Economic fundamentals continued to improve despite fiscal pressures in a few
countries, giving way to more credit-rating upgrades—a trend that is expected to continue. The strong technical environment has clearly supported asset prices, but we believe it is ultimately the positive underlying long-term fundamentals that
are supporting investors’ increasing comfort with the emerging markets debt asset class.
IV. Return vs. Benchmark
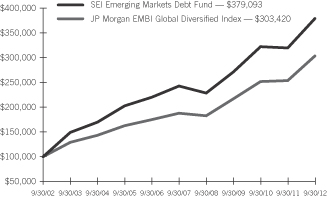
From September 30, 2011 through June 30, 2012, the Fund’s benchmark was the JP Morgan EMBI Global Diversified Index. During that period, the Fund
outperformed the benchmark, returning 13.11% versus 12.11%.
From June 30, 2012 through September 30, 2012, the Fund’s benchmark was 50% JP
Morgan EMBI Global Diversified Index and 50% JP Morgan GBI-EM Global Diversified Index. During that period, the Fund outperformed the benchmark, returning 6.16% versus 5.72%.
For the year ended September 30, 2012, the Fund returned 18.48% versus a linked return of 18.52% for the two benchmarks used during the period.
|
|
|
|
|
| SEI Institutional International Trust / Annual Report / September 30, 2012 |
|
|
5 |
|
MANAGEMENT’S DISCUSSION AND ANALYSIS OF FUND PERFORMANCE
SEI INSTITUTIONAL INTERNATIONAL TRUST — SEPTEMBER 30, 2012
Emerging Markets Debt Fund (Concluded)
V. Fund Attribution
Adding to the Fund’s relative return for the period was an overweight to local-currency debt (particularly in Mexico and Brazil), security selection in quasi-sovereign debt, an underweight to Lebanon
and security selection in Venezuela.
At the country level, security selection in Mexico was the largest contributor to relative return as the
country’s debt benefited from a high correlation to U.S. Treasuries, which rallied. Mexico’s currency, the peso, also rallied on favorable economic growth expectations for continued reforms under the new administration. Local-currency debt
in Brazil was also a strong contributor to performance, with the majority of returns derived from local rates rather than changes in the exchange rate (the Brazilian government currently manages the U.S. dollar-exchange rate of its currency, the
real). Bond yields fell and prices rose as Brazil’s central bank slashed interest rates after it became apparent that global growth was slowing. An underweight in Lebanon, one of the benchmark’s worst performers, was beneficial.
Demographics and high levels of debt resulted in unattractive fundamentals there. Security selection in Venezuela’s Energy sector helped returns thanks to supportive oil prices. Bonds in Venezuela also posted a rally during the year on
expectations of a potential regime change which would have been viewed as market friendly.
Detracting from relative returns was a broader
allocation to corporate debt, which performed well but lagged dollar debt during the year. An overweight to Argentina detracted in the Fund’s fiscal year but benefited returns in the third quarter of 2012. An underweight to Peru and an
overweight to local-currency debt in India also detracted from returns. Currency forwards and swap contracts were used in the Fund for the year ended September 30, 2012 as a way to either hedge particular positions or gain exposure to additional
areas of the market. These tools, which allow for more efficient portfolio management, had a marginally positive impact on Fund performance.
Emerging Markets Debt Fund
AVERAGE ANNUAL TOTAL RETURN1
|
|
|
|
|
|
|
|
|
|
|
|
|
|
|
|
|
|
|
|
|
| |
|
One Year
Return |
|
|
Annualized
3 Year
Return |
|
|
Annualized
5 Year
Return |
|
|
Annualized
10 Year
Return |
|
|
Annualized
Inception
to Date |
|
| Class A |
|
|
18.48% |
|
|
|
11.80% |
|
|
|
9.34% |
|
|
|
14.25% |
|
|
|
10.77% |
|
| JP Morgan EMBI Global Diversified Index |
|
|
19.55% |
|
|
|
11.83% |
|
|
|
10.07% |
|
|
|
11.74% |
|
|
|
10.04% |
|
| 50/50 Blended Benchmark consisting of the J.P. Morgan EMBI Global Diversified Index and the J.P. Morgan GBI-EM Global Diversified
Index |
|
|
16.18% |
|
|
|
10.72% |
|
|
|
9.50% |
|
|
|
N/A |
|
|
|
N/A |
|
Comparison of Change in the Value of a $100,000 Investment in the Emerging Markets Debt Fund, Class A, versus the JP Morgan
EMBI Global Diversified Index
| |
1 |
|
For the year ended September 30, 2012. Past performance is no indication of future performance. Class A Shares were offered beginning
June 26, 1997. Returns shown do not reflect the deduction of taxes that a shareholder would pay on fund distributions or the redemption of fund shares. The returns for certain periods reflect fee waivers and/or reimbursements in effect for that
period; absent fee waivers and reimbursements, performance would have been lower. |
|
|
|
| 6 |
|
SEI Institutional International Trust / Annual Report / September 30, 2012 |
SUMMARY SCHEDULE OF INVESTMENTS
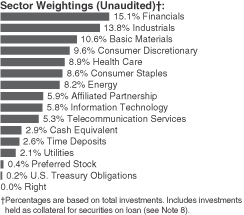
International Equity Fund
September 30, 2012
|
|
|
|
|
|
|
|
|
|
|
|
|
| Description |
|
Percentage of
Net Assets (%) |
|
|
Shares |
|
|
Market Value
($ Thousands) |
|
|
|
|
|
|
|
|
|
|
|
|
|
|
|
|
| COMMON STOCK — 93.8% |
|
|
|
|
|
|
|
| Argentina — 0.0% |
|
|
|
|
|
| Other Securities |
|
|
0.0 |
% |
|
|
|
|
|
$ |
42 |
|
|
|
|
|
|
|
|
|
|
|
|
|
|
|
|
| Australia — 3.1% |
|
|
|
|
|
| Australia & New Zealand Banking Group |
|
|
0.6 |
|
|
|
407,583 |
|
|
|
10,490 |
|
| Newcrest Mining |
|
|
0.5 |
|
|
|
330,170 |
|
|
|
10,005 |
|
| Other Securities |
|
|
2.0 |
|
|
|
|
|
|
|
35,728 |
|
|
|
|
|
|
|
|
|
|
|
|
|
|
|
|
|
|
|
|
|
|
|
|
|
56,223 |
|
|
|
|
|
|
|
|
|
|
|
|
|
|
|
|
| Austria — 0.0% |
|
|
|
|
|
| Other Securities |
|
|
0.0 |
|
|
|
|
|
|
|
651 |
|
|
|
|
|
|
|
|
|
|
|
|
|
|
|
|
| Belgium — 1.7% |
|
|
|
|
|
| Anheuser-Busch InBev |
|
|
0.9 |
|
|
|
197,567 |
|
|
|
16,819 |
|
| Other Securities |
|
|
0.8 |
|
|
|
|
|
|
|
15,226 |
|
|
|
|
|
|
|
|
|
|
|
|
|
|
|
|
|
|
|
|
|
|
|
|
|
32,045 |
|
|
|
|
|
|
|
|
|
|
|
|
|
|
|
|
| Bosnia and Herzegovina — 0.1% |
|
|
|
|
|
| Other Securities |
|
|
0.1 |
|
|
|
|
|
|
|
2,288 |
|
|
|
|
|
|
|
|
|
|
|
|
|
|
|
|
| Brazil — 0.4% |
|
|
|
|
|
| Other Securities |
|
|
0.4 |
|
|
|
|
|
|
|
6,729 |
|
|
|
|
|
|
|
|
|
|
|
|
|
|
|
|
| Canada — 3.5% |
|
|
|
|
|
| Barrick Gold |
|
|
0.5 |
|
|
|
225,222 |
|
|
|
9,405 |
|
| Other Securities |
|
|
3.0 |
|
|
|
|
|
|
|
54,514 |
|
|
|
|
|
|
|
|
|
|
|
|
|
|
|
|
|
|
|
|
|
|
|
|
|
63,919 |
|
|
|
|
|
|
|
|
|
|
|
|
|
|
|
|
| Chile — 0.2% |
|
|
|
|
|
| Other Securities |
|
|
0.2 |
|
|
|
|
|
|
|
4,407 |
|
|
|
|
|
|
|
|
|
|
|
|
|
|
|
|
| China — 0.4% |
|
|
|
|
|
| Other Securities |
|
|
0.4 |
|
|
|
|
|
|
|
7,249 |
|
|
|
|
|
|
|
|
|
|
|
|
|
|
|
|
|
|
|
|
|
|
|
|
|
|
|
| Description |
|
Percentage of
Net Assets (%) |
|
|
Shares |
|
|
Market Value
($ Thousands) |
|
|
|
|
|
|
|
|
|
|
|
|
|
|
|
|
| Colombia — 0.1% |
|
|
|
|
|
| Other Securities |
|
|
0.1 |
% |
|
|
|
|
|
$ |
2,622 |
|
|
|
|
|
|
|
|
|
|
|
|
|
|
|
|
| Czech Republic — 0.1% |
|
|
|
|
|
| Other Securities |
|
|
0.1 |
|
|
|
|
|
|
|
2,161 |
|
|
|
|
|
|
|
|
|
|
|
|
|
|
|
|
| Denmark — 1.2% |
|
|
|
|
|
| Novo Nordisk, Cl B |
|
|
0.6 |
|
|
|
62,554 |
|
|
|
9,894 |
|
| Other Securities |
|
|
0.6 |
|
|
|
|
|
|
|
12,013 |
|
|
|
|
|
|
|
|
|
|
|
|
|
|
|
|
|
|
|
|
|
|
|
|
|
21,907 |
|
|
|
|
|
|
|
|
|
|
|
|
|
|
|
|
| Finland — 0.3% |
|
|
|
|
|
| Other Securities |
|
|
0.3 |
|
|
|
|
|
|
|
6,212 |
|
|
|
|
|
|
|
|
|
|
|
|
|
|
|
|
| France — 8.8% |
|
|
|
|
|
| BNP Paribas (A) |
|
|
0.6 |
|
|
|
207,576 |
|
|
|
9,875 |
|
| Sanofi |
|
|
1.6 |
|
|
|
353,602 |
|
|
|
30,183 |
|
| Schneider Electric |
|
|
0.8 |
|
|
|
238,540 |
|
|
|
14,134 |
|
| Total |
|
|
0.5 |
|
|
|
194,192 |
|
|
|
9,643 |
|
| Other Securities |
|
|
5.3 |
|
|
|
|
|
|
|
98,741 |
|
|
|
|
|
|
|
|
|
|
|
|
|
|
|
|
|
|
|
|
|
|
|
|
|
162,576 |
|
|
|
|
|
|
|
|
|
|
|
|
|
|
|
|
| Germany — 8.4% |
|
|
|
|
|
| Bayer |
|
|
0.5 |
|
|
|
108,656 |
|
|
|
9,342 |
|
| Daimler |
|
|
0.5 |
|
|
|
189,074 |
|
|
|
9,162 |
|
| Deutsche Boerse (A) |
|
|
0.6 |
|
|
|
205,895 |
|
|
|
11,407 |
|
| Linde (A) |
|
|
0.8 |
|
|
|
88,407 |
|
|
|
15,241 |
|
| Muenchener Rueckversicherungs |
|
|
0.5 |
|
|
|
55,307 |
|
|
|
8,645 |
|
| Siemens |
|
|
0.9 |
|
|
|
158,522 |
|
|
|
15,828 |
|
| Other Securities |
|
|
4.6 |
|
|
|
|
|
|
|
85,837 |
|
|
|
|
|
|
|
|
|
|
|
|
|
|
|
|
|
|
|
|
|
|
|
|
|
155,462 |
|
|
|
|
|
|
|
|
|
|
|
|
|
|
|
|
| Hong Kong — 3.0% |
|
|
|
|
|
| Other Securities |
|
|
3.0 |
|
|
|
|
|
|
|
55,811 |
|
|
|
|
|
|
|
|
|
|
|
|
|
|
|
|
| India — 0.3% |
|
|
|
|
|
| Other Securities |
|
|
0.3 |
|
|
|
|
|
|
|
6,238 |
|
|
|
|
|
|
|
|
|
|
|
|
|
|
|
|
|
|
| Indonesia — 0.1% |
|
|
|
|
|
|
|
|
|
|
|
|
| Other Securities |
|
|
0.1 |
|
|
|
|
|
|
|
2,052 |
|
|
|
|
|
|
|
|
|
|
|
|
|
|
|
|
| Ireland — 1.1% |
|
|
|
|
|
| Experian |
|
|
0.5 |
|
|
|
541,123 |
|
|
|
8,992 |
|
| Other Securities |
|
|
0.6 |
|
|
|
|
|
|
|
11,933 |
|
|
|
|
|
|
|
|
|
|
|
|
|
|
|
|
|
|
|
|
|
|
|
|
|
20,925 |
|
|
|
|
|
|
|
|
|
|
|
|
|
|
|
|
| Israel — 0.8% |
|
|
|
|
|
| Check Point Software Technologies* |
|
|
0.5 |
|
|
|
185,968 |
|
|
|
8,956 |
|
| Other Securities |
|
|
0.3 |
|
|
|
|
|
|
|
6,075 |
|
|
|
|
|
|
|
|
|
|
|
|
|
|
|
|
|
|
|
|
|
|
|
|
|
15,031 |
|
|
|
|
|
|
|
|
|
|
|
|
|
|
|
|
|
|
|
| SEI Institutional International Trust / Annual Report / September 30, 2012 |
|
|
7 |
|
SUMMARY SCHEDULE OF INVESTMENTS
International Equity Fund (Continued)
September 30, 2012
|
|
|
|
|
|
|
|
|
|
|
|
|
| Description |
|
Percentage of
Net Assets (%) |
|
|
Shares |
|
|
Market Value
($ Thousands) |
|
|
|
|
|
|
|
|
|
|
|
|
|
|
|
|
| Italy — 0.9% |
|
|
|
|
|
| Other Securities |
|
|
0.9 |
% |
|
|
|
|
|
$ |
16,753 |
|
|
|
|
|
|
|
|
|
|
|
|
|
|
|
|
| Japan — 16.0% |
|
|
|
|
|
| Chugai Pharmaceutical |
|
|
0.0 |
|
|
|
10,400 |
|
|
|
219 |
|
| Fanuc |
|
|
0.8 |
|
|
|
85,700 |
|
|
|
13,857 |
|
| Honda Motor (A) |
|
|
0.7 |
|
|
|
387,000 |
|
|
|
11,923 |
|
| JGC |
|
|
0.6 |
|
|
|
309,200 |
|
|
|
10,353 |
|
| Jupiter Telecommunications |
|
|
0.5 |
|
|
|
8,833 |
|
|
|
8,992 |
|
| KDDI |
|
|
0.5 |
|
|
|
110,600 |
|
|
|
8,615 |
|
| Mabuchi Motor (A) |
|
|
0.5 |
|
|
|
178,500 |
|
|
|
8,191 |
|
| Nippon Telegraph & Telephone |
|
|
0.6 |
|
|
|
222,200 |
|
|
|
10,624 |
|
| Seven & I Holdings |
|
|
0.8 |
|
|
|
444,200 |
|
|
|
13,686 |
|
| Toyota Motor |
|
|
0.7 |
|
|
|
331,200 |
|
|
|
12,941 |
|
| Other Securities |
|
|
10.6 |
|
|
|
|
|
|
|
195,952 |
|
|
|
|
|
|
|
|
|
|
|
|
|
|
|
|
|
|
|
|
|
|
|
|
|
295,353 |
|
|
|
|
|
|
|
|
|
|
|
|
|
|
|
|
| Malta — 0.0% |
|
|
|
|
|
| Other Securities |
|
|
0.0 |
|
|
|
|
|
|
|
— |
|
|
|
|
|
|
|
|
|
|
|
|
|
|
|
|
| Mexico — 0.3% |
|
|
|
|
|
| Other Securities |
|
|
0.3 |
|
|
|
|
|
|
|
5,204 |
|
|
|
|
|
|
|
|
|
|
|
|
|
|
|
|
| Netherlands — 4.7% |
|
|
|
|
|
| Akzo Nobel |
|
|
0.8 |
|
|
|
267,747 |
|
|
|
15,153 |
|
| Reed Elsevier |
|
|
0.6 |
|
|
|
869,613 |
|
|
|
11,641 |
|
| Other Securities |
|
|
3.3 |
|
|
|
|
|
|
|
59,079 |
|
|
|
|
|
|
|
|
|
|
|
|
|
|
|
|
|
|
|
|
|
|
|
|
|
85,873 |
|
|
|
|
|
|
|
|
|
|
|
|
|
|
|
|
| New Zealand — 0.1% |
|
|
|
|
|
| Other Securities |
|
|
0.1 |
|
|
|
|
|
|
|
2,584 |
|
|
|
|
|
|
|
|
|
|
|
|
|
|
|
|
| Norway — 1.3% |
|
|
|
|
|
| DNB |
|
|
0.6 |
|
|
|
920,593 |
|
|
|
11,297 |
|
| Other Securities |
|
|
0.7 |
|
|
|
|
|
|
|
11,887 |
|
|
|
|
|
|
|
|
|
|
|
|
|
|
|
|
|
|
|
|
|
|
|
|
|
23,184 |
|
|
|
|
|
|
|
|
|
|
|
|
|
|
|
|
| Poland — 0.1% |
|
|
|
|
|
| Other Securities |
|
|
0.1 |
|
|
|
|
|
|
|
1,791 |
|
|
|
|
|
|
|
|
|
|
|
|
|
|
|
|
| Portugal — 0.0% |
|
|
|
|
|
| Other Securities |
|
|
0.0 |
|
|
|
|
|
|
|
179 |
|
|
|
|
|
|
|
|
|
|
|
|
|
|
|
|
| Russia — 0.8% |
|
|
|
|
|
| Sberbank of Russia ADR |
|
|
0.5 |
|
|
|
752,179 |
|
|
|
8,763 |
|
| Other Securities |
|
|
0.3 |
|
|
|
|
|
|
|
4,973 |
|
|
|
|
|
|
|
|
|
|
|
|
|
|
|
|
|
|
|
|
|
|
|
|
|
13,736 |
|
|
|
|
|
|
|
|
|
|
|
|
|
|
|
|
| Singapore — 1.4% |
|
|
|
|
|
| Other Securities |
|
|
1.4 |
|
|
|
|
|
|
|
25,906 |
|
|
|
|
|
|
|
|
|
|
|
|
|
|
|
|
| South Africa — 0.6% |
|
|
|
|
|
| Other Securities |
|
|
0.6 |
|
|
|
|
|
|
|
11,301 |
|
|
|
|
|
|
|
|
|
|
|
|
|
|
|
|
|
|
|
|
|
|
|
|
|
|
|
| Description |
|
Percentage of
Net Assets (%) |
|
|
Shares |
|
|
Market Value
($ Thousands) |
|
|
|
|
|
|
|
|
|
|
|
|
|
|
|
|
| South Korea — 2.8% |
|
|
|
|
|
| KT&G |
|
|
0.6 |
% |
|
|
137,854 |
|
|
$ |
10,506 |
|
| Samsung Electronics |
|
|
0.9 |
|
|
|
13,366 |
|
|
|
16,187 |
|
| Other Securities |
|
|
1.3 |
|
|
|
|
|
|
|
24,540 |
|
|
|
|
|
|
|
|
|
|
|
|
|
|
|
|
|
|
|
|
|
|
|
|
|
51,233 |
|
|
|
|
|
|
|
|
|
|
|
|
|
|
|
|
| Spain — 1.0% |
|
|
|
|
|
| Other Securities |
|
|
1.0 |
|
|
|
|
|
|
|
19,119 |
|
|
|
|
|
|
|
|
|
|
|
|
|
|
|
|
|
|
| Sweden — 2.1% |
|
|
|
|
|
|
|
|
|
|
|
|
| Other Securities |
|
|
2.1 |
|
|
|
|
|
|
|
39,292 |
|
|
|
|
|
|
|
|
|
|
|
|
|
|
|
|
| Switzerland — 8.5% |
|
|
|
|
|
| Givaudan |
|
|
0.7 |
|
|
|
14,019 |
|
|
|
13,314 |
|
| Nestle |
|
|
1.2 |
|
|
|
337,630 |
|
|
|
21,304 |
|
| Novartis |
|
|
1.1 |
|
|
|
341,225 |
|
|
|
20,895 |
|
| Roche Holding |
|
|
1.8 |
|
|
|
175,867 |
|
|
|
32,879 |
|
| SGS |
|
|
0.5 |
|
|
|
4,654 |
|
|
|
9,568 |
|
| Sulzer |
|
|
0.4 |
|
|
|
56,389 |
|
|
|
8,220 |
|
| Zurich Insurance Group |
|
|
0.6 |
|
|
|
47,073 |
|
|
|
11,731 |
|
| Other Securities |
|
|
2.2 |
|
|
|
|
|
|
|
38,248 |
|
|
|
|
|
|
|
|
|
|
|
|
|
|
|
|
|
|
|
|
|
|
|
|
|
156,159 |
|
|
|
|
|
|
|
|
|
|
|
|
|
|
|
|
| Taiwan — 0.1% |
|
|
|
|
|
| Other Securities |
|
|
0.1 |
|
|
|
|
|
|
|
1,418 |
|
|
|
|
|
|
|
|
|
|
|
|
|
|
|
|
| Thailand — 0.1% |
|
|
|
|
|
| Other Securities |
|
|
0.1 |
|
|
|
|
|
|
|
1,630 |
|
|
|
|
|
|
|
|
|
|
|
|
|
|
|
|
| United Kingdom — 18.4% |
|
|
|
|
|
| BG Group |
|
|
0.9 |
|
|
|
779,002 |
|
|
|
15,724 |
|
| BHP Billiton |
|
|
0.7 |
|
|
|
405,901 |
|
|
|
12,617 |
|
| British American Tobacco |
|
|
0.6 |
|
|
|
229,719 |
|
|
|
11,794 |
|
| Diageo |
|
|
0.4 |
|
|
|
291,195 |
|
|
|
8,180 |
|
| HSBC Holdings |
|
|
0.4 |
|
|
|
874,000 |
|
|
|
8,223 |
|
| Petrofac |
|
|
0.6 |
|
|
|
394,859 |
|
|
|
10,170 |
|
| Rolls-Royce Holdings |
|
|
0.5 |
|
|
|
606,526 |
|
|
|
8,257 |
|
| Shire |
|
|
0.5 |
|
|
|
305,490 |
|
|
|
8,949 |
|
| Tesco |
|
|
0.9 |
|
|
|
3,215,538 |
|
|
|
17,239 |
|
| Vodafone Group |
|
|
1.0 |
|
|
|
6,631,151 |
|
|
|
18,819 |
|
| Other Securities |
|
|
11.9 |
|
|
|
|
|
|
|
219,738 |
|
|
|
|
|
|
|
|
|
|
|
|
|
|
|
|
|
|
|
|
|
|
|
|
|
339,710 |
|
|
|
|
|
|
|
|
|
|
|
|
|
|
|
|
| United States — 1.0% |
|
|
|
|
|
| Other Securities |
|
|
1.0 |
|
|
|
|
|
|
|
17,419 |
|
|
|
|
|
|
|
|
|
|
|
|
|
|
| Total Common Stock (Cost $1,711,127) ($ Thousands) |
|
|
|
1,732,394 |
|
|
|
|
|
|
|
|
|
|
|
|
|
|
|
|
|
| 8 |
|
SEI Institutional International Trust / Annual Report / September 30, 2012 |
|
|
|
|
|
|
|
|
|
|
|
|
|
| Description |
|
Percentage of
Net Assets (%) |
|
|
Shares |
|
|
Market Value
($ Thousands) |
|
|
|
|
|
|
|
|
|
|
|
|
|
|
|
| PREFERRED STOCK — 0.4% |
|
|
| Brazil — 0.1% |
|
| Other Securities |
|
|
0.1 |
% |
|
|
|
|
|
$ |
1,383 |
|
|
|
|
|
|
|
|
|
|
|
|
|
|
|
| Germany — 0.3% |
|
| Other Securities |
|
|
0.3 |
|
|
|
|
|
|
|
6,421 |
|
|
|
|
|
|
|
|
|
|
|
|
|
|
| Total Preferred Stock
(Cost $7,335) ($ Thousands) |
|
|
|
7,804 |
|
|
|
|
|
|
|
|
|
|
|
|
|
|
|
| U.S. TREASURY OBLIGATIONS — 0.3% |
|
| Other Securities |
|
|
0.3 |
|
|
|
|
|
|
|
4,399 |
|
|
|
|
|
|
|
|
|
|
|
|
|
|
| Total U.S. Treasury Obligations
(Cost $4,399) ($ Thousands) |
|
|
|
4,399 |
|
|
|
|
|
|
|
|
|
|
|
|
|
|
|
| RIGHTS — 0.0% |
|
|
| France — 0.0% |
|
| Other Securities |
|
|
0.0 |
|
|
|
|
|
|
|
41 |
|
|
|
|
|
|
|
|
|
|
|
|
|
|
| Total Rights
(Cost $—) ($ Thousands) |
|
|
|
41 |
|
|
|
|
|
|
|
|
|
|
|
|
|
|
|
| AFFILIATED PARTNERSHIP — 6.3% |
|
| SEI Liquidity Fund, L.P. 0.150%**† (B) |
|
|
6.3 |
|
|
|
118,692,866 |
|
|
|
116,607 |
|
|
|
|
|
|
|
|
|
|
|
|
|
|
| Total Affiliated Partnership
(Cost $118,693) ($ Thousands) |
|
|
|
116,607 |
|
|
|
|
|
|
|
|
|
|
|
|
|
|
|
| CASH EQUIVALENT — 3.1% |
|
| SEI Daily Income Trust, Prime Obligation Fund, CI A 0.070%**† |
|
|
3.1 |
|
|
|
57,461,405 |
|
|
|
57,461 |
|
|
|
|
|
|
|
|
|
|
|
|
|
|
| Total Cash Equivalent
(Cost $57,461) ($ Thousands) |
|
|
|
57,461 |
|
|
|
|
|
|
|
|
|
|
|
|
|
|
|
|
|
|
|
|
|
|
|
|
|
|
|
|
|
| Description |
|
Percentage of
Net Assets (%) |
|
Face Amount (1)
(thousands) |
|
|
Market Value
($ Thousands) |
|
|
|
|
|
|
|
|
|
|
|
|
|
|
|
|
|
|
| TIME DEPOSITS — 2.7% |
|
|
|
|
|
|
|
| United States — 2.7% |
|
|
|
|
|
| Brown Brothers Harriman |
|
|
|
|
|
|
|
|
|
|
|
|
| 4.150%, 10/01/2012 |
|
|
|
|
ZAR |
|
|
|
14 |
|
|
$ |
2 |
|
| 2.580%, 10/01/2012 |
|
|
|
|
AUD |
|
|
|
309 |
|
|
|
321 |
|
| 1.550%, 10/01/2012 |
|
|
|
|
NZD |
|
|
|
137 |
|
|
|
114 |
|
| 0.550%, 10/01/2012 |
|
|
|
|
NOK |
|
|
|
715 |
|
|
|
125 |
|
| 0.400%, 10/01/2012 |
|
|
|
|
SEK |
|
|
|
10 |
|
|
|
2 |
|
| 0.185%, 10/01/2012 |
|
|
|
|
CAD |
|
|
|
6 |
|
|
|
6 |
|
| 0.054%, 10/01/2012 |
|
|
|
|
GBP |
|
|
|
598 |
|
|
|
965 |
|
| 0.030%, 10/01/2012 |
|
|
|
|
|
|
|
|
46,735 |
|
|
|
46,735 |
|
| 0.010%, 10/01/2012 |
|
|
|
|
JPY |
|
|
|
30,165 |
|
|
|
388 |
|
| 0.010%, 10/01/2012 |
|
|
|
|
SGD |
|
|
|
140 |
|
|
|
114 |
|
| 0.005%, 10/01/2012 |
|
|
|
|
HKD |
|
|
|
1,747 |
|
|
|
225 |
|
| 0.005%, 10/01/2012 |
|
|
|
|
CHF |
|
|
|
1,060 |
|
|
|
1,128 |
|
| (0.014)%, 10/01/2012 |
|
|
|
|
EUR |
|
|
|
288 |
|
|
|
370 |
|
| (0.200)%, 10/01/2012 |
|
|
|
|
DKK |
|
|
|
852 |
|
|
|
147 |
|
|
|
|
|
|
|
|
|
|
|
|
|
|
|
|
| Total Time Deposits
(Cost $50,642) ($ Thousands) |
|
|
|
50,642 |
|
|
|
|
|
|
|
|
|
|
|
|
|
|
|
|
| Total Investments — 106.6%
(Cost $1,949,657) ($ Thousands)†† |
|
|
$ |
1,969,348 |
|
|
|
|
|
|
|
|
|
|
|
|
|
|
|
|
A list of the open futures contracts held by the Fund at September 30, 2012, is as follows:
|
|
|
|
|
|
|
|
|
|
|
|
|
| Type of
Contract |
|
Number of
Contracts
Long |
|
|
Expiration
Date |
|
|
Unrealized
Appreciation
(Depreciation)
($ Thousands) |
|
| DJ Euro Stoxx 50 Index |
|
|
585 |
|
|
|
Dec-2012 |
|
|
$ |
(930 |
) |
| FTSE 100 Index |
|
|
198 |
|
|
|
Dec-2012 |
|
|
|
(327 |
) |
| Hang Seng Index |
|
|
25 |
|
|
|
Oct-2012 |
|
|
|
30 |
|
| SPI 200 Index |
|
|
57 |
|
|
|
Dec-2012 |
|
|
|
(28 |
) |
| Topix Index |
|
|
155 |
|
|
|
Dec-2012 |
|
|
|
235 |
|
|
|
|
|
|
|
|
|
|
|
|
|
|
|
|
|
|
|
|
|
|
|
|
$ |
(1,020 |
) |
|
|
|
|
|
|
|
|
|
|
|
|
|
For the year ended September 30, 2012, the total amount of all open futures contracts, as presented in the table above,
are representative of the volume of activity for this derivative type during the year.
A list of the open forward foreign currency contracts held
by the Fund at September 30, 2012, is as follows:
|
|
|
|
|
|
|
|
|
|
|
|
|
|
|
|
|
|
|
|
|
| Settlement
Date |
|
Currency
to
Deliver
(Thousands) |
|
|
Currency
to
Receive (Thousands) |
|
|
Unrealized
Depreciation
($ Thousands) |
|
| 11/02/2012 |
|
|
EUR |
|
|
|
11,621 |
|
|
|
USD |
|
|
|
14,562 |
|
|
$ |
(391 |
) |
|
|
|
|
|
|
|
|
|
|
|
|
|
|
|
|
|
|
|
|
|
|
|
|
|
|
| SEI Institutional International Trust / Annual Report / September 30, 2012 |
|
|
9 |
|
SUMMARY SCHEDULE OF INVESTMENTS
International Equity Fund (Concluded)
September 30, 2012
A list of the counterparties for the open forward foreign currency contracts held by the Fund at
September 30, 2012, is as follows:
|
|
|
|
|
|
|
|
|
|
|
|
|
|
|
|
|
| Counterparty |
|
Settlement
Date |
|
|
Currency
to Deliver ($ Thousands) |
|
|
Currency
to Receive ($ Thousands) |
|
|
Unrealized
Appreciation
(Depreciation)
($ Thousands) |
|
| State Street |
|
|
11/02/2012 |
|
|
|
(14,953 |
) |
|
|
14,562 |
|
|
$ |
(391 |
) |
|
|
|
|
|
|
|
|
|
|
|
|
|
|
|
|
|
For the year ended September 30, 2012, the total amount of all open forward foreign currency contracts, as presented in
the table above, are representative of the volume of activity for this derivative type during the year.
Percentages are based on a Net Assets of
$1,848,122 ($ Thousands).
| * |
|
Non-income producing security |
| ** |
|
Rate shown is the 7-day effective yield as of September 30, 2012. |
| † |
|
Investment in Affiliated security (See Note 4). |
| (1) |
|
In U.S. Dollars unless otherwise indicated. |
| (A) |
|
This security or a partial position of this security is on loan at September 30, 2012. The total market value of such securities at September 30, 2012 was
$111,744 ($ Thousands) (See Note 8). |
| (B) |
|
This security was purchased with cash collateral held from securities on loan (see Note 8). The total value of such securities on loan at September 30, 2012 was
$116,607 ($ Thousands). |
| †† |
|
The Summary Schedule of Investments does not reflect the complete portfolio holdings. It includes the Fund’s 50 largest holdings and each investment of any issuer
that exceeds 1% of the Fund’s net assets. “Other Securities” represent all issues not required to be disclosed under the rules adopted by the U.S. Securities and Exchange Commission (“SEC”). In certain instances, securities
for which footnotes listed above may otherwise apply are included in the Other Securities caption. The complete schedule of portfolio holdings is available (i) without charge, upon request, by calling (800) 342-5734; and (ii) on the
SEC’s website at http://www.sec.gov. |
AUD — Australian Dollar
CAD — Canadian Dollar
CHF — Swiss Franc
Cl — Class
DJ — Dow Jones
DKK — Danish Krone
EUR — Euro
FTSE — Financial Times and the London Stock Exchange
GBP — British Pound Sterling
HKD — Hong Kong Dollar
JPY — Japanese Yen
L.P. — Limited
Partnership
NOK — Norwegian Krone
NZD — New Zealand Dollar
SEK — Swedish
Krone
SGD — Singapore Dollar
SPI
— Share Price Index
USD — U.S. Dollar
ZAR — South African Rand
The following is a summary of the inputs used as of September 30, 2012, in valuing the Fund’s
investments and other financial instruments carried at value ($ Thousands):
|
|
|
|
|
|
|
|
|
|
|
|
|
|
|
|
|
| Investments in Securities |
|
Level 1 |
|
|
Level 2 |
|
|
Level 3(1) |
|
|
Total |
|
| Common Stock |
|
$ |
1,726,328 |
|
|
$ |
5,712 |
|
|
$ |
354 |
|
|
$ |
1,732,394 |
|
| Preferred Stock |
|
|
7,804 |
|
|
|
— |
|
|
|
— |
|
|
|
7,804 |
|
| U.S. Treasury Obligations |
|
|
— |
|
|
|
4,399 |
|
|
|
— |
|
|
|
4,399 |
|
| Rights |
|
|
41 |
|
|
|
— |
|
|
|
— |
|
|
|
41 |
|
| Affiliated Partnership |
|
|
— |
|
|
|
116,607 |
|
|
|
— |
|
|
|
116,607 |
|
| Cash Equivalent |
|
|
57,461 |
|
|
|
— |
|
|
|
— |
|
|
|
57,461 |
|
| Time Deposits |
|
|
— |
|
|
|
50,642 |
|
|
|
— |
|
|
|
50,642 |
|
|
|
|
|
|
|
|
|
|
|
|
|
|
|
|
|
|
| Total Investments in Securities |
|
$ |
1,791,634 |
|
|
$ |
177,360 |
|
|
$ |
354 |
|
|
$ |
1,969,348 |
|
|
|
|
|
|
|
|
|
|
|
|
|
|
|
|
|
|
| Other Financial Instruments |
|
Level 1 |
|
|
Level 2 |
|
|
Level 3 |
|
|
Total |
|
| Futures Contracts* |
|
$ |
(1,020 |
) |
|
$ |
— |
|
|
$ |
— |
|
|
$ |
(1,020 |
) |
| Forwards Contracts* |
|
|
— |
|
|
|
(391 |
) |
|
|
— |
|
|
|
(391 |
) |
|
|
|
|
|
|
|
|
|
|
|
|
|
|
|
|
|
| Total Other Financial Instruments |
|
$ |
(1,020 |
) |
|
$ |
(391 |
) |
|
$ |
— |
|
|
$ |
(1,411 |
) |
|
|
|
|
|
|
|
|
|
|
|
|
|
|
|
|
|
| (1) |
|
A reconciliation of Level 3 instruments is presented when the Fund has a significant amount of Level 3 investments at the beginning and/or end of the
period in relation to net assets. |
| * |
|
Futures and forwards contracts are valued at the unrealized depreciation on the instrument. |
For the year ended September 30, 2012, there were transfers between Level 1 and Level 2 assets and liabilities. The primary reason for changes in the classifications between Levels 1 and 2 occurs
when foreign equity securities are fair valued using other observable market-based inputs in place of the closing exchange price due to events occurring after the close of the exchange or market on which the investment is principally traded (see
Note 2).
For the year ended September 30, 2012, there were transfers from Level 2 into Level 3 assets and liabilities for certain
securities. The primary reason for changes in the classifications between Level 2 and Level 3 occurs when trading of securities are halted on the primary exchange on which they are traded.
Amounts designated as “—” are $O or have been rounded to $O.
The accompanying notes are
an integral part of the financial statements.
|
|
|
| 10 |
|
SEI Institutional International Trust / Annual Report / September 30, 2012 |
SUMMARY SCHEDULE OF INVESTMENTS
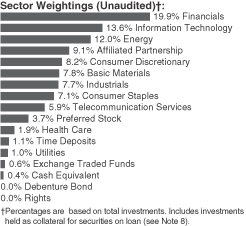
Emerging Markets Equity Fund
September 30, 2012
|
|
|
|
|
|
|
|
|
|
|
|
|
|
|
| Description |
|
Percentage of
Net Assets (%) |
|
|
Shares |
|
|
Market Value
($ Thousands) |
|
|
|
|
|
|
|
|
|
|
|
|
|
|
|
|
|
|
| COMMON STOCK — 93.6% |
|
|
|
|
|
|
|
| Argentina — 0.2% |
|
|
|
|
|
| Other Securities |
|
|
0.2 |
% |
|
|
|
|
|
|
|
$ |
2,067 |
|
|
|
|
|
|
|
|
|
|
|
|
|
|
|
|
|
|
| Austria — 0.2% |
|
|
|
|
|
| Other Securities |
|
|
0.2 |
|
|
|
|
|
|
|
|
|
1,546 |
|
|
|
|
|
|
|
|
|
|
|
|
|
|
|
|
|
|
| Brazil — 9.3% |
|
|
|
|
|
| Gerdau ADR (A) |
|
|
0.6 |
|
|
|
|
|
550,665 |
|
|
|
5,237 |
|
| Petroleo Brasileiro ADR |
|
|
1.1 |
|
|
|
|
|
413,765 |
|
|
|
9,492 |
|
| Petroleo Brasileiro |
|
|
0.1 |
|
|
|
|
|
80,722 |
|
|
|
923 |
|
| Totvs |
|
|
0.5 |
|
|
|
|
|
215,292 |
|
|
|
4,456 |
|
| Vale |
|
|
0.1 |
|
|
|
|
|
58,092 |
|
|
|
1,038 |
|
| Vale ADR, Cl B |
|
|
0.6 |
|
|
|
|
|
300,325 |
|
|
|
5,376 |
|
| Other Securities |
|
|
6.3 |
|
|
|
|
|
|
|
|
|
57,050 |
|
|
|
|
|
|
|
|
|
|
|
|
|
|
|
|
|
|
|
|
|
|
|
|
|
|
|
|
|
83,572 |
|
|
|
|
|
|
|
|
|
|
|
|
|
|
|
|
|
|
| Canada — 1.3% |
|
|
|
|
|
| Pacific Rubiales Energy (A) |
|
|
0.5 |
|
|
|
|
|
196,676 |
|
|
|
4,695 |
|
| Other Securities |
|
|
0.8 |
|
|
|
|
|
|
|
|
|
7,192 |
|
|
|
|
|
|
|
|
|
|
|
|
|
|
|
|
|
|
|
|
|
|
|
|
|
|
|
|
|
11,887 |
|
|
|
|
|
|
|
|
|
|
|
|
|
|
|
|
|
|
|
|
|
| Chile — 0.5% |
|
|
|
|
|
|
|
|
|
|
|
|
|
|
| Other Securities |
|
|
0.5 |
|
|
|
|
|
|
|
|
|
3,999 |
|
|
|
|
|
|
|
|
|
|
|
|
|
|
|
|
|
|
|
|
|
| China — 11.5% |
|
|
|
|
|
|
|
|
|
|
|
|
|
|
| AAC Technologies Holdings (A) |
|
|
0.6 |
|
|
|
|
|
1,498,180 |
|
|
|
5,411 |
|
| Agricultural Bank of China, Cl H (A) |
|
|
0.5 |
|
|
|
|
|
12,488,732 |
|
|
|
4,865 |
|
| Baidu ADR* (A) |
|
|
0.4 |
|
|
|
|
|
32,500 |
|
|
|
3,797 |
|
| Beijing Capital International Airport, Cl H |
|
|
0.1 |
|
|
|
|
|
1,094,000 |
|
|
|
734 |
|
| China Coal Energy, Cl H |
|
|
0.1 |
|
|
|
|
|
1,206,000 |
|
|
|
1,101 |
|
| China Communications Services, Cl H |
|
|
0.1 |
|
|
|
|
|
810,000 |
|
|
|
469 |
|
|
|
|
|
|
|
|
|
|
|
|
|
|
|
|
| Description |
|
Percentage of
Net Assets (%) |
|
|
Shares |
|
|
Market Value
($ Thousands) |
|
|
|
|
|
|
|
|
|
|
|
|
|
|
|
|
| China Construction Bank, Cl H |
|
|
0.9 |
% |
|
|
|
|
11,602,800 |
|
|
$ |
8,051 |
|
| China Life Insurance, Cl H |
|
|
0.2 |
|
|
|
|
|
602,000 |
|
|
|
1,739 |
|
| China Petroleum & Chemical ADR (A) |
|
|
0.2 |
|
|
|
|
|
20,200 |
|
|
|
1,867 |
|
| China Railway Construction, Cl H |
|
|
0.0 |
|
|
|
|
|
232,500 |
|
|
|
208 |
|
| China Railway Group, Cl H |
|
|
0.1 |
|
|
|
|
|
1,655,000 |
|
|
|
724 |
|
| Dongfeng Motor Group, Cl H |
|
|
0.0 |
|
|
|
|
|
268,000 |
|
|
|
313 |
|
| Foxconn International Holdings* (A) |
|
|
0.1 |
|
|
|
|
|
3,333,000 |
|
|
|
1,096 |
|
| Industrial & Commercial Bank of China, Cl H |
|
|
1.0 |
|
|
|
|
|
14,800,419 |
|
|
|
8,743 |
|
| PetroChina ADR (A) |
|
|
0.4 |
|
|
|
|
|
27,766 |
|
|
|
3,586 |
|
| PetroChina, Cl H |
|
|
0.4 |
|
|
|
|
|
2,794,119 |
|
|
|
3,661 |
|
| Tencent Holdings |
|
|
0.4 |
|
|
|
|
|
109,547 |
|
|
|
3,733 |
|
| Zhejiang Expressway, Cl H |
|
|
0.1 |
|
|
|
|
|
1,012,000 |
|
|
|
705 |
|
| Other Securities |
|
|
5.9 |
|
|
|
|
|
|
|
|
|
52,892 |
|
|
|
|
|
|
|
|
|
|
|
|
|
|
|
|
|
|
|
|
|
|
|
|
|
|
|
|
|
103,695 |
|
|
|
|
|
|
|
|
|
|
|
|
|
|
|
|
|
|
|
|
|
| Colombia — 0.9% |
|
|
|
|
|
|
|
|
|
|
|
|
|
|
| Bancolombia ADR, Cl R (A) |
|
|
0.4 |
|
|
|
|
|
63,000 |
|
|
|
3,762 |
|
| Other Securities |
|
|
0.5 |
|
|
|
|
|
|
|
|
|
4,519 |
|
|
|
|
|
|
|
|
|
|
|
|
|
|
|
|
|
|
|
|
|
|
|
|
|
|
|
|
|
8,281 |
|
|
|
|
|
|
|
|
|
|
|
|
|
|
|
|
|
|
|
|
|
| Cyprus — 0.5% |
|
|
|
|
|
|
|
|
|
|
|
|
|
|
| Other Securities |
|
|
0.5 |
|
|
|
|
|
|
|
|
|
4,627 |
|
|
|
|
|
|
|
|
|
|
|
|
|
|
|
|
|
|
|
|
|
| Czech Republic — 0.3% |
|
|
|
|
|
|
|
|
|
|
|
|
|
|
| Other Securities |
|
|
0.3 |
|
|
|
|
|
|
|
|
|
2,713 |
|
|
|
|
|
|
|
|
|
|
|
|
|
|
|
|
|
|
|
|
|
| Denmark — 0.1% |
|
|
|
|
|
|
|
|
|
|
|
|
|
|
| Other Securities |
|
|
0.1 |
|
|
|
|
|
|
|
|
|
699 |
|
|
|
|
|
|
|
|
|
|
|
|
|
|
|
|
|
|
|
|
|
| Egypt — 0.1% |
|
|
|
|
|
|
|
|
|
|
|
|
|
|
| Other Securities |
|
|
0.1 |
|
|
|
|
|
|
|
|
|
565 |
|
|
|
|
|
|
|
|
|
|
|
|
|
|
|
|
|
|
|
|
|
| Guernsey — 0.0% |
|
|
|
|
|
|
|
|
|
|
|
|
|
|
| Other Securities |
|
|
0.0 |
|
|
|
|
|
|
|
|
|
357 |
|
|
|
|
|
|
|
|
|
|
|
|
|
|
|
|
|
|
|
|
|
| Hong Kong — 5.8% |
|
|
|
|
|
|
|
|
|
|
|
|
|
|
| China Mengniu Dairy (A) |
|
|
0.4 |
|
|
|
|
|
1,240,815 |
|
|
|
3,713 |
|
| China Mobile |
|
|
1.1 |
|
|
|
|
|
906,645 |
|
|
|
10,051 |
|
| China Mobile ADR (A) |
|
|
0.2 |
|
|
|
|
|
39,540 |
|
|
|
2,189 |
|
| China Resources Enterprise (A) |
|
|
0.1 |
|
|
|
|
|
386,000 |
|
|
|
1,289 |
|
| China State Construction International Holdings (A) |
|
|
0.5 |
|
|
|
|
|
3,631,784 |
|
|
|
4,272 |
|
| China Unicom Hong Kong ADR (A) |
|
|
0.3 |
|
|
|
|
|
145,490 |
|
|
|
2,373 |
|
| CNOOC ADR |
|
|
0.2 |
|
|
|
|
|
9,710 |
|
|
|
1,969 |
|
| CNOOC |
|
|
0.4 |
|
|
|
|
|
1,643,407 |
|
|
|
3,370 |
|
| Cosco International Holdings |
|
|
0.0 |
|
|
|
|
|
208,805 |
|
|
|
82 |
|
| Dah Chong Hong Holdings |
|
|
0.1 |
|
|
|
|
|
743,400 |
|
|
|
677 |
|
|
|
|
|
|
| SEI Institutional International Trust / Annual Report / September 30, 2012 |
|
|
11 |
|
SUMMARY SCHEDULE OF INVESTMENTS
Emerging Markets Equity Fund (Continued)
September 30, 2012
|
|
|
|
|
|
|
|
|
|
|
|
|
|
|
| Description |
|
Percentage of
Net Assets (%) |
|
|
Shares |
|
|
Market Value
($ Thousands) |
|
|
|
|
|
|
|
|
|
|
|
|
|
|
|
|
| Vinda International Holdings (A) |
|
|
0.4 |
% |
|
|
|
|
2,628,460 |
|
|
$ |
3,621 |
|
| Other Securities |
|
|
2.1 |
|
|
|
|
|
|
|
|
|
18,958 |
|
|
|
|
|
|
|
|
|
|
|
|
|
|
|
|
|
|
|
|
|
|
|
|
|
|
|
|
|
52,564 |
|
|
|
|
|
|
|
|
|
|
|
|
|
|
|
|
|
|
|
|
|
| Hungary — 0.0% |
|
|
|
|
|
|
|
|
|
|
|
|
|
|
| Other Securities |
|
|
0.0 |
|
|
|
|
|
|
|
|
|
367 |
|
|
|
|
|
|
|
|
|
|
|
|
|
|
|
|
|
|
|
|
|
| India — 7.0% |
|
|
|
|
|
|
|
|
|
|
|
|
|
|
| Cairn India* |
|
|
0.8 |
|
|
|
|
|
1,163,614 |
|
|
|
7,303 |
|
| ICICI Bank ADR (A) |
|
|
0.7 |
|
|
|
|
|
165,744 |
|
|
|
6,653 |
|
| Reliance Industries GDR (B) |
|
|
0.7 |
|
|
|
|
|
190,252 |
|
|
|
5,989 |
|
| Other Securities |
|
|
4.8 |
|
|
|
|
|
|
|
|
|
42,898 |
|
|
|
|
|
|
|
|
|
|
|
|
|
|
|
|
|
|
|
|
|
|
|
|
|
|
|
|
|
62,843 |
|
|
|
|
|
|
|
|
|
|
|
|
|
|
|
|
|
|
|
|
|
| Indonesia — 2.4% |
|
|
|
|
|
|
|
|
|
|
|
|
|
|
| Bank Rakyat Indonesia Persero |
|
|
0.5 |
|
|
|
|
|
5,983,451 |
|
|
|
4,658 |
|
| Other Securities |
|
|
1.9 |
|
|
|
|
|
|
|
|
|
17,101 |
|
|
|
|
|
|
|
|
|
|
|
|
|
|
|
|
|
|
|
|
|
|
|
|
|
|
|
|
|
21,759 |
|
|
|
|
|
|
|
|
|
|
|
|
|
|
|
|
|
|
|
|
|
| Ireland — 0.1% |
|
|
|
|
|
|
|
|
|
|
|
|
|
|
| Other Securities |
|
|
0.1 |
|
|
|
|
|
|
|
|
|
1,284 |
|
|
|
|
|
|
|
|
|
|
|
|
|
|
|
|
|
|
|
|
|
| Israel — 0.4% |
|
|
|
|
|
|
|
|
|
|
|
|
|
|
| Other Securities |
|
|
0.4 |
|
|
|
|
|
|
|
|
|
3,259 |
|
|
|
|
|
|
|
|
|
|
|
|
|
|
|
|
|
|
|
|
|
| Macau — 0.3% |
|
|
|
|
|
|
|
|
|
|
|
|
|
|
| Other Securities |
|
|
0.3 |
|
|
|
|
|
|
|
|
|
2,664 |
|
|
|
|
|
|
|
|
|
|
|
|
|
|
|
|
|
|
|
|
|
| Malaysia — 1.8% |
|
|
|
|
|
|
|
|
|
|
|
|
|
|
| Other Securities |
|
|
1.8 |
|
|
|
|
|
|
|
|
|
16,293 |
|
|
|
|
|
|
|
|
|
|
|
|
|
|
|
|
|
|
|
|
|
| Mexico — 5.0% |
|
|
|
|
|
|
|
|
|
|
|
|
|
|
| Genomma Lab Internacional, Cl B* (A) |
|
|
0.7 |
|
|
|
|
|
3,040,501 |
|
|
|
5,891 |
|
| Grupo Financiero Banorte, Cl O |
|
|
0.5 |
|
|
|
|
|
825,351 |
|
|
|
4,670 |
|
| Grupo Televisa ADR |
|
|
0.7 |
|
|
|
|
|
258,043 |
|
|
|
6,067 |
|
| Other Securities |
|
|
3.1 |
|
|
|
|
|
|
|
|
|
27,987 |
|
|
|
|
|
|
|
|
|
|
|
|
|
|
|
|
|
|
|
|
|
|
|
|
|
|
|
|
|
44,615 |
|
|
|
|
|
|
|
|
|
|
|
|
|
|
|
|
|
|
|
|
|
| Netherlands — 0.4% |
|
|
|
|
|
|
|
|
|
|
|
|
|
|
| Other Securities |
|
|
0.4 |
|
|
|
|
|
|
|
|
|
3,099 |
|
|
|
|
|
|
|
|
|
|
|
|
|
|
|
|
|
|
|
|
|
| Peru — 0.6% |
|
|
|
|
|
|
|
|
|
|
|
|
|
|
| Credicorp |
|
|
0.5 |
|
|
|
|
|
36,900 |
|
|
|
4,623 |
|
| Other Securities |
|
|
0.1 |
|
|
|
|
|
|
|
|
|
268 |
|
|
|
|
|
|
|
|
|
|
|
|
|
|
|
|
|
|
|
|
|
|
|
|
|
|
|
|
|
4,891 |
|
|
|
|
|
|
|
|
|
|
|
|
|
|
|
|
|
|
|
|
|
| Philippines — 0.7% |
|
|
|
|
|
|
|
|
|
|
|
|
|
|
| Other Securities |
|
|
0.7 |
|
|
|
|
|
|
|
|
|
6,009 |
|
|
|
|
|
|
|
|
|
|
|
|
|
|
|
|
|
|
|
|
|
|
|
|
|
|
|
|
|
|
|
| Description |
|
Percentage of
Net Assets (%) |
|
|
Shares |
|
|
Market Value
($ Thousands) |
|
|
|
|
|
|
|
|
|
|
|
|
|
|
|
|
|
|
|
|
|
| Poland — 0.9% |
|
|
|
|
|
|
|
|
|
|
|
|
|
|
| Other Securities |
|
|
0.9 |
% |
|
|
|
|
|
|
|
$ |
8,478 |
|
|
|
|
|
|
|
|
|
|
|
|
|
|
|
|
|
|
|
|
|
| Russia — 7.2% |
|
|
|
|
|
|
|
|
|
|
|
|
|
|
| Gazprom ADR (A) |
|
|
1.0 |
|
|
|
|
|
913,965 |
|
|
|
9,222 |
|
| Gazprom Neft JSC ADR |
|
|
0.0 |
|
|
|
|
|
11,637 |
|
|
|
286 |
|
| Lukoil ADR |
|
|
1.0 |
|
|
|
|
|
141,281 |
|
|
|
8,694 |
|
| Rosneft GDR |
|
|
0.0 |
|
|
|
|
|
27,110 |
|
|
|
182 |
|
| Rosneft Oil GDR |
|
|
0.5 |
|
|
|
|
|
647,645 |
|
|
|
4,353 |
|
| Sberbank of Russia ADR (A) |
|
|
1.5 |
|
|
|
|
|
1,097,060 |
|
|
|
12,845 |
|
| Uralkali GDR |
|
|
0.4 |
|
|
|
|
|
87,400 |
|
|
|
3,616 |
|
| VTB Bank GDR |
|
|
0.2 |
|
|
|
|
|
636,355 |
|
|
|
2,119 |
|
| Other Securities |
|
|
2.6 |
|
|
|
|
|
|
|
|
|
23,568 |
|
|
|
|
|
|
|
|
|
|
|
|
|
|
|
|
|
|
|
|
|
|
|
|
|
|
|
|
|
64,885 |
|
|
|
|
|
|
|
|
|
|
|
|
|
|
|
|
|
|
|
|
|
| Singapore — 0.0% |
|
|
|
|
|
|
|
|
|
|
|
|
|
|
| Other Securities |
|
|
0.0 |
|
|
|
|
|
|
|
|
|
305 |
|
|
|
|
|
|
|
|
|
|
|
|
|
|
|
|
|
|
|
|
|
| South Africa — 5.4% |
|
|
|
|
|
|
|
|
|
|
|
|
|
|
| MTN Group |
|
|
0.6 |
|
|
|
|
|
268,069 |
|
|
|
5,205 |
|
| Standard Bank Group |
|
|
0.6 |
|
|
|
|
|
456,800 |
|
|
|
5,848 |
|
| Other Securities |
|
|
4.2 |
|
|
|
|
|
|
|
|
|
37,770 |
|
|
|
|
|
|
|
|
|
|
|
|
|
|
|
|
|
|
|
|
|
|
|
|
|
|
|
|
|
48,823 |
|
|
|
|
|
|
|
|
|
|
|
|
|
|
|
|
|
|
|
|
|
| South Korea — 14.7% |
|
|
|
|
|
|
|
|
|
|
|
|
|
|
| Hyundai Motor |
|
|
0.7 |
|
|
|
|
|
27,260 |
|
|
|
6,181 |
|
| KB Financial Group ADR (A) |
|
|
0.4 |
|
|
|
|
|
103,265 |
|
|
|
3,644 |
|
| KCC |
|
|
0.4 |
|
|
|
|
|
14,732 |
|
|
|
3,864 |
|
| Kia Motors |
|
|
0.5 |
|
|
|
|
|
72,671 |
|
|
|
4,538 |
|
| Korea Zinc |
|
|
0.5 |
|
|
|
|
|
10,526 |
|
|
|
4,626 |
|
| Samsung Electronics |
|
|
3.7 |
|
|
|
|
|
27,482 |
|
|
|
33,282 |
|
| SK Telecom ADR (A) |
|
|
0.5 |
|
|
|
|
|
325,994 |
|
|
|
4,740 |
|
| Sung Kwang Bend |
|
|
0.4 |
|
|
|
|
|
161,697 |
|
|
|
3,834 |
|
| Other Securities |
|
|
7.6 |
|
|
|
|
|
|
|
|
|
67,649 |
|
|
|
|
|
|
|
|
|
|
|
|
|
|
|
|
|
|
|
|
|
|
|
|
|
|
|
|
|
132,358 |
|
|
|
|
|
|
|
|
|
|
|
|
|
|
|
|
|
|
|
|
|
| Taiwan — 7.7% |
|
|
|
|
|
|
|
|
|
|
|
|
|
|
| Hon Hai Precision Industry |
|
|
1.1 |
|
|
|
|
|
3,258,159 |
|
|
|
10,226 |
|
| Taiwan Semiconductor Manufacturing |
|
|
0.6 |
|
|
|
|
|
1,812,219 |
|
|
|
5,552 |
|
| Taiwan Semiconductor Manufacturing ADR |
|
|
0.6 |
|
|
|
|
|
363,089 |
|
|
|
5,744 |
|
| Other Securities |
|
|
5.4 |
|
|
|
|
|
|
|
|
|
48,057 |
|
|
|
|
|
|
|
|
|
|
|
|
|
|
|
|
|
|
|
|
|
|
|
|
|
|
|
|
|
69,579 |
|
|
|
|
|
|
|
|
|
|
|
|
|
|
|
|
|
|
|
|
|
| Thailand — 2.6% |
|
|
|
|
|
|
|
|
|
|
|
|
|
|
| Other Securities |
|
|
2.6 |
|
|
|
|
|
|
|
|
|
23,551 |
|
|
|
|
|
|
|
|
|
|
|
|
|
|
|
|
|
|
|
|
|
| Turkey — 2.1% |
|
|
|
|
|
|
|
|
|
|
|
|
|
|
| Other Securities |
|
|
2.1 |
|
|
|
|
|
|
|
|
|
18,700 |
|
|
|
|
|
|
|
|
|
|
|
|
|
|
|
|
|
|
|
| 12 |
|
SEI Institutional International Trust / Annual Report / September 30, 2012 |
|
|
|
|
|
|
|
|
|
|
|
|
|
|
|
| Description |
|
Percentage of
Net Assets (%) |
|
|
Shares |
|
|
Market Value
($ Thousands) |
|
|
|
|
|
|
|
|
|
|
|
|
|
|
|
|
|
|
|
|
|
| United Arab Emirates — 0.2% |
|
|
|
|
|
|
|
|
|
|
|
|
|
|
| Other Securities |
|
|
0.2 |
% |
|
|
|
|
|
|
|
$ |
1,773 |
|
|
|
|
|
|
|
|
|
|
|
|
|
|
|
|
|
|
|
|
|
| United Kingdom — 1.5% |
|
|
|
|
|
|
|
|
|
|
|
|
|
|
| Other Securities |
|
|
1.5 |
|
|
|
|
|
|
|
|
|
13,516 |
|
|
|
|
|
|
|
|
|
|
|
|
|
|
|
|
|
|
|
|
|
| United States — 1.9% |
|
|
|
|
|
|
|
|
|
|
|
|
|
|
| Yahoo!* |
|
|
0.5 |
|
|
|
|
|
264,900 |
|
|
|
4,232 |
|
| Other Securities |
|
|
1.4 |
|
|
|
|
|
|
|
|
|
12,582 |
|
|
|
|
|
|
|
|
|
|
|
|
|
|
|
|
|
|
|
|
|
|
|
|
|
|
|
|
|
16,814 |
|
|
|
|
|
|
|
|
|
|
|
|
|
|
|
|
| Total Common Stock
(Cost $806,414) ($ Thousands) |
|
|
|
|
|
|
|
|
|
|
|
|
842,437 |
|
|
|
|
|
|
|
|
|
|
|
|
|
|
|
|
|
|
|
| PREFERRED STOCK — 4.0% |
|
|
|
|
|
|
|
|
|
|
|
|
|
| Brazil — 4.0% |
|
|
|
|
|
|
|
|
|
|
|
|
|
|
| Cia Brasileira de Distribuicao Grupo Pao de Acucar ADR (A) |
|
|
0.4 |
|
|
|
|
|
84,960 |
|
|
|
3,833 |
|
| Cia de Bebidas das Americas ADR (A) |
|
|
0.4 |
|
|
|
|
|
96,492 |
|
|
|
3,693 |
|
| Cia Vale do Rio Doce ADR, Cl B |
|
|
0.0 |
|
|
|
|
|
1,393 |
|
|
|
24 |
|
| Petroleo Brasileiro, Cl Preference |
|
|
0.3 |
|
|
|
|
|
214,816 |
|
|
|
2,367 |
|
| Petroleo Brasileiro ADR, Cl A (A) |
|
|
0.9 |
|
|
|
|
|
362,457 |
|
|
|
7,999 |
|
| Vale ADR, Cl B (A) |
|
|
0.4 |
|
|
|
|
|
202,297 |
|
|
|
3,512 |
|
| Other Securities |
|
|
1.6 |
|
|
|
|
|
|
|
|
|
14,727 |
|
|
|
|
|
|
|
|
|
|
|
|
|
|
|
|
| Total Preferred Stock
(Cost $35,746) ($ Thousands) |
|
|
|
|
|
|
|
|
|
|
|
|
36,155 |
|
|
|
|
|
|
|
|
|
|
|
|
|
|
|
|
|
|
| EXCHANGE TRADED FUNDS — 0.7% |
|
|
|
|
|
|
|
|
| United States — 0.6% |
|
|
|
|
|
|
|
|
| iShares MSCI Emerging Markets Index Fund |
|
|
0.6 |
|
|
|
|
|
124,063 |
|
|
|
5,126 |
|
|
|
|
|
|
|
|
|
|
|
|
|
|
|
|
|
|
|
|
|
| Hong Kong — 0.1% |
|
|
|
|
|
|
|
|
|
|
|
|
|
|
| Other Securities |
|
|
0.1 |
|
|
|
|
|
|
|
|
|
1,112 |
|
|
|
|
|
|
|
|
|
|
|
|
|
|
|
|
| Total Exchange Traded Funds
(Cost $6,173) ($ Thousands) |
|
|
|
|
|
|
|
|
|
|
|
|
6,238 |
|
|
|
|
|
|
|
|
|
|
|
|
|
|
|
|
|
|
|
| DEBENTURE BOND — 0.0% |
|
|
|
|
|
|
|
|
|
|
|
|
|
| Brazil — 0.0% |
|
|
|
|
|
|
|
|
|
|
|
|
|
|
| Vale, Ser 1997
0.000%, 09/30/49 (B) |
|
|
0.0 |
|
|
|
|
|
8 |
|
|
|
— |
|
|
|
|
|
|
|
|
|
|
|
|
|
|
|
|
| Total Debenture Bond
(Cost $—) ($ Thousands) |
|
|
|
|
|
|
|
|
|
|
|
|
— |
|
|
|
|
|
|
|
|
|
|
|
|
|
|
|
|
|
|
|
|
|
|
|
|
|
|
|
|
|
|
|
|
|
| Description |
|
Percentage of
Net Assets (%) |
|
|
Shares/
Face Amount (1)
(Thousands) |
|
|
Market Value
($ Thousands) |
|
|
|
|
|
|
|
|
|
|
|
|
|
|
|
|
|
|
|
|
|
|
| RIGHTS — 0.0% |
|
|
|
|
|
|
|
|
|
|
|
|
|
|
|
|
|
|
| Thailand — 0.0% |
|
|
|
|
|
|
|
|
|
|
|
|
|
|
|
|
| Other Securities |
|
|
0.0 |
% |
|
|
|
|
|
|
|
|
|
$ |
268 |
|
|
|
|
|
|
|
|
|
|
|
|
|
|
|
|
|
|
| Total Rights
(Cost $0) ($ Thousands) |
|
|
|
|
|
|
|
|
|
|
|
268 |
|
|
|
|
|
|
|
|
|
|
|
|
|
|
|
|
|
|
|
|
| AFFILIATED PARTNERSHIP — 10.0% |
|
|
|
|
|
| SEI Liquidity Fund, L.P. 0.150%**† (D) |
|
|
10.0 |
|
|
|
|
|
|
|
91,070,119 |
|
|
|
89,808 |
|
|
|
|
|
|
|
|
|
|
|
|
|
|
|
|
|
|
| Total Affiliated Partnership
(Cost $91,070) ($ Thousands) |
|
|
|
|
|
|
|
|
|
|
|
|
|
|
89,808 |
|
|
|
|
|
|
|
|
|
|
|
|
|
|
|
|
|
|
|
|
|
| CASH EQUIVALENT — 0.5% |
|
|
|
|
|
|
|
|
|
| SEI Daily Income Trust, Prime Obligation Fund, Cl A 0.070%**† |
|
|
0.5 |
|
|
|
|
|
|
|
4,231,824 |
|
|
|
4,232 |
|
|
|
|
|
|
|
|
|
|
|
|
|
|
|
|
|
|
| Total Cash Equivalent
(Cost $4,232) ($ Thousands) |
|
|
|
|
|
|
|
|
|
|
|
|
|
|
4,232 |
|
|
|
|
|
|
|
|
|
|
|
|
|
|
|
|
|
|
|
|
|
| TIME DEPOSITS — 1.2% |
|
|
|
|
|
|
|
|
|
|
|
|
|
|
| United States — 1.2% |
|
|
|
|
|
|
|
|
|
|
|
|
|
|
|
|
| Brown Brothers Harriman |
|
|
|
|
|
|
|
|
|
|
|
|
|
|
|
|
| 4.150%, 10/01/2012 |
|
|
|
|
|
|
ZAR |
|
|
|
842 |
|
|
|
102 |
|
| 0.550%, 10/01/2012 |
|
|
|
|
|
|
NOK |
|
|
|
— |
|
|
|
— |
|
| 0.400%, 10/01/2012 |
|
|
|
|
|
|
SEK |
|
|
|
— |
|
|
|
— |
|
| 0.185%, 10/01/2012 |
|
|
|
|
|
|
CAD |
|
|
|
— |
|
|
|
— |
|
| 0.054%, 10/01/2012 |
|
|
|
|
|
|
GBP |
|
|
|
5 |
|
|
|
9 |
|
| 0.030%, 10/01/2012 |
|
|
|
|
|
|
|
|
|
|
9,836 |
|
|
|
9,836 |
|
| 0.010%, 10/01/2012 |
|
|
|
|
|
|
SGD |
|
|
|
7 |
|
|
|
5 |
|
| 0.005%, 10/01/2012 |
|
|
|
|
|
|
HKD |
|
|
|
3,253 |
|
|
|
420 |
|
| 0.005%, 10/01/2012 |
|
|
|
|
|
|
CHF |
|
|
|
— |
|
|
|
— |
|
| (0.014)%, 10/01/2012 |
|
|
|
|
|
|
EUR |
|
|
|
1 |
|
|
|
1 |
|
| (0.200)%, 10/01/2012 |
|
|
|
|
|
|
DKK |
|
|
|
3 |
|
|
|
— |
|
|
|
|
|
|
|
|
|
|
|
|
|
|
|
|
|
|
| Total Time Deposits
(Cost $10,373) ($ Thousands) |
|
|
|
|
|
|
|
|
|
|
|
|
|
|
10,373 |
|
|
|
|
|
|
|
|
|
|
|
|
|
|
|
|
|
|
| Total Investments — 110.0%
(Cost $954,008) ($ Thousands)†† |
|
|
|
|
|
|
$ |
989,511 |
|
|
|
|
|
|
|
|
|
|
|
|
|
|
|
|
|
|
Percentages are based on a Net Assets of $899,730 ($ Thousands).
| * |
|
Non-income producing security |
| ** |
|
Rate shown is the 7-day effective yield as of September 30, 2012. |
| † |
|
Investment in Affiliated security (See Note 4). |
| (1) |
|
In U.S. Dollars unless otherwise indicated. |
| (A) |
|
This security or a partial position of this security is on loan at September 30, 2012. The total market value of securities on loan at September 30,
2012 was $87,300 ($ Thousands) (See Note 8). |
| (B) |
|
Securities sold within terms of a private placement memorandum, exempt from registration under Section 144A of the Securities Act of 1933, as amended, and may be sold only
to dealers in that program or other “accredited investors.” These securities have been determined to be liquid under guidelines established by the Board of Trustees. |
| (C) |
|
Variable Rate Security — The rate reported on the Summary Schedule of Investments is the rate in effect as of September 30, 2012.
|
|
|
|
|
|
| SEI Institutional International Trust / Annual Report / September 30, 2012 |
|
|
13 |
|
SUMMARY SCHEDULE OF INVESTMENTS
Emerging Markets Equity Fund (Concluded)
September 30, 2012
| (D) |
|
This security was purchased with cash collateral held from securities on loan (see Note 8). The total value of such securities at September 30, 2012 was $89,808
($ Thousands). |
| †† |
|
The Summary Schedule of Investments does not reflect the complete portfolio holdings. It includes the Fund’s 50 largest holdings and each investment of any issuer
that exceeds 1% of the Fund’s net assets. “Other Securities” represent all issues not required to be disclosed under the rules adopted by the U.S. Securities and Exchange Commission (“SEC”). In certain instances,
securities for which footnotes listed above may otherwise apply are included in the Other Securities caption. The complete schedule of portfolio holdings is available (i) without charge, upon request, by calling (800) 342-5734; and
(ii) on the SEC’s website at http://www.sec.gov. |
ADR — American Depositary Receipt
CAD — Canadian Dollar
CHF — Swiss Franc
Cl — Class
DKK — Danish Krone
EUR — Euro
GBP — British
Pound Sterling
GDR — Global Depositary Receipt
HKD — Hong Kong Dollar
L.P. — Limited Partnership
MSCI — Morgan Stanley Capital International
NOK
— Norwegian Krone
SEK — Swedish Krona
Ser — Series
SGD — Singapore Dollar
ZAR — South African Rand
The following is a summary of the inputs used as of September 30,
2012, in valuing the Fund’s investments carried at value ($ Thousands):
|
|
|
|
|
|
|
|
|
|
|
|
|
|
|
|
|
| Investments in Securities |
|
Level 1 |
|
|
Level 2 |
|
|
Level 3 (1) |
|
|
Total |
|
| Common Stock |
|
$ |
834,741 |
|
|
$ |
5,894 |
|
|
$ |
1,802 |
|
|
$ |
842,437 |
|
| Preferred Stock |
|
|
36,155 |
|
|
|
— |
|
|
|
— |
|
|
|
36,155 |
|
| Exchange Traded Funds |
|
|
6,238 |
|
|
|
— |
|
|
|
— |
|
|
|
6,238 |
|
| Rights |
|
|
268 |
|
|
|
— |
|
|
|
— |
|
|
|
268 |
|
| Debenture Bond |
|
|
— |
|
|
|
— |
|
|
|
— |
|
|
|
— |
|
| Time Deposits |
|
|
— |
|
|
|
10,373 |
|
|
|
— |
|
|
|
10,373 |
|
| Affiliated Partnership |
|
|
— |
|
|
|
89,808 |
|
|
|
— |
|
|
|
89,808 |
|
| Cash Equivalent |
|
|
4,232 |
|
|
|
— |
|
|
|
— |
|
|
|
4,232 |
|
|
|
|
|
|
|
|
|
|
|
|
|
|
|
|
|
|
| Total Investments in Securities |
|
$ |
881,634 |
|
|
$ |
106,075 |
|
|
$ |
1,802 |
|
|
$ |
989,511 |
|
|
|
|
|
|
|
|
|
|
|
|
|
|
|
|
|
|
| (1) |
|
A reconciliation of Level 3 instruments is presented when the Fund has a significant amount of Level 3 investments at the beginning and/or end of the
period in relation to net assets. |
For the year ended September 30, 2012, there were transfers between Level 1 and Level 2
assets and liabilities. The primary reason for changes in the classifications between Level 1 and Level 2 occurs when foreign equity securities are fair valued using other observable market-based inputs in place of the closing exchange price due to
events occurring after the close of the exchange or market on which the investment is principally traded (See Note 2).
For the year ended
September 30, 2012, there were transfers between Level 2 and Level 3 assets and liabilities. The transfer was due to a change in the availability of observable inputs used to determine fair value.
Amounts designated as “—” are $O or have been rounded to $O.
The accompanying notes are an integral part of the financial statements.
|
|
|
| 14 |
|
SEI Institutional International Trust / Annual Report / September 30, 2012 |
SUMMARY SCHEDULE OF INVESTMENTS
International Fixed Income Fund
September 30, 2012
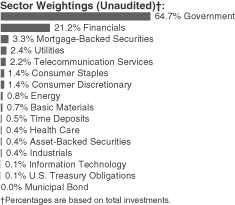
|
|
|
|
|
|
|
|
|
|
|
|
|
|
|
| Description |
|
Percentage of
Net Assets (%) |
|
|
Face Amount (1)
(Thousands) |
|
|
Market Value
($ Thousands) |
|
|
|
|
|
|
|
|
|
|
|
|
|
|
|
|
|
|
|
|
| GLOBAL BONDS — 92.6% |
|
|
|
|
|
|
|
|
|
|
|
|
|
|
|
|
| Australia — 1.8% |
|
|
|
|
|
|
|
|
|
|
|
|
|
|
| Government of Australia,
Ser 124 |
|
|
|
|
|
|
|
|
|
|
|
|
|
|
| 5.750%, 05/15/2021 |
|
|
0.5 |
% |
|
|
|
|
1,900 |
|
|
$ |
2,415 |
|
| Other Securities |
|
|
1.3 |
|
|
|
|
|
|
|
|
|
6,597 |
|
|
|
|
|
|
|
|
|
|
|
|
|
|
|
|
|
|
|
|
|
|
|
|
|
|
|
|
|
9,012 |
|
|
|
|
|
|
|
|
|
|
|
|
|
|
|
|
|
|
|
|
|
| Austria — 1.2% |
|
|
|
|
|
|
|
|
|
|
|
|
|
|
| Republic of Austria |
|
|
|
|
|
|
|
|
|
|
|
|
|
|
| 4.300%, 09/15/2017 |
|
|
0.4 |
|
|
|
|
|
1,420 |
|
|
|
2,132 |
|
| 3.900%, 07/15/2020 |
|
|
0.0 |
|
|
|
|
|
75 |
|
|
|
112 |
|
| 3.650%, 04/20/2022 |
|
|
0.1 |
|
|
|
|
|
290 |
|
|
|
429 |
|
| 3.200%, 02/20/2017 |
|
|
0.1 |
|
|
|
|
|
300 |
|
|
|
427 |
|
| 1.950%, 06/18/2019 |
|
|
0.5 |
|
|
|
|
|
1,900 |
|
|
|
2,538 |
|
| Republic of Austria, Ser 97-6 |
|
|
|
|
|
|
|
|
|
|
|
|
|
|
| 6.250%, 07/15/2027 |
|
|
0.1 |
|
|
|
|
|
225 |
|
|
|
423 |
|
|
|
|
|
|
|
|
|
|
|
|
|
|
|
|
|
|
|
|
|
|
|
|
|
|
|
|
|
6,061 |
|
|
|
|
|
|
|
|
|
|
|
|
|
|
|
|
|
|
|
|
|
| Belgium — 3.8% |
|
|
|
|
|
|
|
|
|
|
|
|
|
|
| Kingdom of Belgium, Ser 44 |
|
|
|
|
|
|
|
|
|
|
|
|
|
|
| 5.000%, 03/28/2035 |
|
|
0.2 |
|
|
|
|
|
500 |
|
|
|
816 |
|
| Kingdom of Belgium, Ser 47 |
|
|
|
|
|
|
|
|
|
|
|
|
|
|
| 3.250%, 09/28/2016 |
|
|
2.1 |
|
|
|
|
|
7,325 |
|
|
|
10,276 |
|
| Kingdom of Belgium, Ser 48 |
|
|
|
|
|
|
|
|
|
|
|
|
|
|
| 4.000%, 03/28/2022 |
|
|
0.2 |
|
|
|
|
|
725 |
|
|
|
1,058 |
|
| Kingdom of Belgium, Ser 49 |
|
|
|
|
|
|
|
|
|
|
|
|
|
|
| 4.000%, 03/28/2017 |
|
|
0.1 |
|
|
|
|
|
230 |
|
|
|
333 |
|
| Kingdom of Belgium, Ser 50 |
|
|
|
|
|
|
|
|
|
|
|
|
|
|
| 4.000%, 03/28/2013 |
|
|
0.8 |
|
|
|
|
|
3,200 |
|
|
|
4,194 |
|
| Kingdom of Belgium, Ser 58 |
|
|
|
|
|
|
|
|
|
|
|
|
|
|
| 3.750%, 09/28/2020 |
|
|
0.1 |
|
|
|
|
|
231 |
|
|
|
332 |
|
| Kingdom of Belgium, Ser 65 |
|
|
|
|
|
|
|
|
|
|
|
|
|
|
| 4.250%, 09/28/2022 |
|
|
0.0 |
|
|
|
|
|
125 |
|
|
|
185 |
|
| Other Securities |
|
|
0.3 |
|
|
|
|
|
|
|
|
|
1,396 |
|
|
|
|
|
|
|
|
|
|
|
|
|
|
|
|
|
|
|
|
|
|
|
|
|
|
|
|
|
18,590 |
|
|
|
|
|
|
|
|
|
|
|
|
|
|
|
|
|
|
|
|
|
|
|
|
|
|
|
|
|
|
|
|
|
| Description |
|
Percentage of
Net Assets (%) |
|
|
Face Amount (1)
(Thousands) |
|
|
Market Value
($ Thousands) |
|
|
|
|
|
|
|
|
|
|
|
|
|
|
|
|
|
|
|
|
|
|
|
| Brazil — 0.3% |
|
|
|
|
|
|
|
|
|
|
|
|
|
|
|
|
| Other Securities |
|
|
0.3 |
% |
|
|
|
|
|
|
|
|
|
$ |
1,318 |
|
|
|
|
|
|
|
|
|
|
|
|
|
|
|
|
|
|
|
|
|
|
|
| Canada — 4.7% |
|
|
|
|
|
|
|
|
|
|
|
|
|
|
|
|
| Government of Canada |
|
|
|
|
|
|
|
|
|
|
|
|
|
|
|
|
| 5.750%, 06/01/2033 |
|
|
0.4 |
|
|
|
|
|
|
|
1,300 |
|
|
|
2,074 |
|
| 5.000%, 06/01/2037 |
|
|
0.4 |
|
|
|
|
|
|
|
1,300 |
|
|
|
1,975 |
|
| 4.250%, 06/01/2018 |
|
|
0.2 |
|
|
|
|
|
|
|
715 |
|
|
|
841 |
|
| 3.500%, 06/01/2020 |
|
|
0.9 |
|
|
|
|
|
|
|
3,795 |
|
|
|
4,396 |
|
| 2.750%, 06/01/2022 |
|
|
0.4 |
|
|
|
|
|
|
|
1,800 |
|
|
|
1,993 |
|
| 2.250%, 08/01/2014 |
|
|
0.2 |
|
|
|
|
|
|
|
1,000 |
|
|
|
1,038 |
|
| 2.000%, 06/01/2016 |
|
|
0.3 |
|
|
|
|
|
|
|
1,425 |
|
|
|
1,489 |
|
| 1.500%, 03/01/2017 |
|
|
0.0 |
|
|
|
|
|
|
|
255 |
|
|
|
262 |
|
| 1.500%, 09/01/2017 |
|
|
0.2 |
|
|
|
|
|
|
|
825 |
|
|
|
846 |
|
| Other Securities |
|
|
1.7 |
|
|
|
|
|
|
|
|
|
|
|
8,177 |
|
|
|
|
|
|
|
|
|
|
|
|
|
|
|
|
|
|
|
|
|
|
|
|
|
|
|
|
|
|
|
|
|
23,091 |
|
|
|
|
|
|
|
|
|
|
|
|
|
|
|
|
|
|
|
|
|
|
|
| China — 0.1% |
|
|
|
|
|
|
|
|
|
|
|
|
|
|
|
|
| Other Securities |
|
|
0.1 |
|
|
|
|
|
|
|
|
|
|
|
335 |
|
|
|
|
|
|
|
|
|
|
|
|
|
|
|
|
|
|
|
|
|
|
|
| Czech Republic — 0.1% |
|
|
|
|
|
|
|
|
|
|
|
|
|
|
|
|
| Other Securities |
|
|
0.1 |
|
|
|
|
|
|
|
|
|
|
|
462 |
|
|
|
|
|
|
|
|
|
|
|
|
|
|
|
|
|
|
|
|
|
|
|
| Denmark — 1.7% |
|
|
|
|
|
|
|
|
|
|
|
|
|
|
|
|
| DONG Energy MTN |
|
|
|
|
|
|
|
|
|
|
|
|
|
|
|
|
| 6.500%, 05/07/2019 |
|
|
0.1 |
|
|
|
EUR |
|
|
|
245 |
|
|
|
397 |
|
| Kingdom of Denmark |
|
|
|
|
|
|
|
|
|
|
|
|
|
|
|
|
| 4.500%, 11/15/2039 |
|
|
0.1 |
|
|
|
|
|
|
|
1,300 |
|
|
|
336 |
|
| 4.000%, 11/15/2017 |
|
|
0.4 |
|
|
|
|
|
|
|
8,915 |
|
|
|
1,807 |
|
| 3.125%, 03/17/2014 |
|
|
0.1 |
|
|
|
EUR |
|
|
|
500 |
|
|
|
671 |
|
| 3.000%, 11/15/2021 |
|
|
0.9 |
|
|
|
|
|
|
|
21,800 |
|
|
|
4,329 |
|
| Other Securities |
|
|
0.2 |
|
|
|
|
|
|
|
|
|
|
|
1,098 |
|
|
|
|
|
|
|
|
|
|
|
|
|
|
|
|
|
|
|
|
|
|
|
|
|
|
|
|
|
|
|
|
|
8,638 |
|
|
|
|
|
|
|
|
|
|
|
|
|
|
|
|
|
|
|
|
|
|
|
| Finland — 1.2% |
|
|
|
|
|
|
|
|
|
|
|
|
|
|
|
|
| Government of Finland |
|
|
|
|
|
|
|
|
|
|
|
|
|
|
|
|
| 3.375%, 04/15/2020 |
|
|
0.8 |
|
|
|
|
|
|
|
2,550 |
|
|
|
3,755 |
|
| Other Securities |
|
|
0.4 |
|
|
|
|
|
|
|
|
|
|
|
1,940 |
|
|
|
|
|
|
|
|
|
|
|
|
|
|
|
|
|
|
|
|
|
|
|
|
|
|
|
|
|
|
|
|
|
5,695 |
|
|
|
|
|
|
|
|
|
|
|
|
|
|
|
|
|
|
|
|
|
|
|
| France — 5.7% |
|
|
|
|
|
|
|
|
|
|
|
|
|
|
|
|
| EDF MTN |
|
|
|
|
|
|
|
|
|
|
|
|
|
|
|
|
| 6.500%, 01/26/2019 (A) |
|
|
0.1 |
|
|
|
USD |
|
|
|
250 |
|
|
|
306 |
|
| 5.500%, 10/17/2041 |
|
|
0.0 |
|
|
|
GBP |
|
|
|
100 |
|
|
|
178 |
|
| 4.125%, 03/25/2027 |
|
|
0.0 |
|
|
|
|
|
|
|
100 |
|
|
|
139 |
|
| 4.000%, 11/12/2025 |
|
|
0.0 |
|
|
|
|
|
|
|
150 |
|
|
|
206 |
|
| French Treasury Note |
|
|
|
|
|
|
|
|
|
|
|
|
|
|
|
|
| 1.000%, 07/25/2017 |
|
|
0.1 |
|
|
|
|
|
|
|
235 |
|
|
|
304 |
|
| 0.750%, 09/25/2014 |
|
|
0.2 |
|
|
|
|
|
|
|
800 |
|
|
|
1,041 |
|
| Government of France |
|
|
|
|
|
|
|
|
|
|
|
|
|
|
|
|
| 5.000%, 10/25/2016 |
|
|
0.5 |
|
|
|
|
|
|
|
1,760 |
|
|
|
2,656 |
|
| 4.750%, 04/25/2035 |
|
|
0.3 |
|
|
|
|
|
|
|
815 |
|
|
|
1,331 |
|
| 4.500%, 04/25/2041 |
|
|
0.3 |
|
|
|
|
|
|
|
1,060 |
|
|
|
1,701 |
|
|
|
|
|
|
| SEI Institutional International Trust / Annual Report / September 30, 2012 |
|
|
15 |
|
SUMMARY SCHEDULE OF INVESTMENTS
International Fixed Income Fund (Continued)
September 30, 2012
|
|
|
|
|
|
|
|
|
|
|
|
|
|
|
|
|
| Description |
|
Percentage of
Net Assets (%) |
|
|
Face Amount (1)
(Thousands) |
|
|
Market Value
($ Thousands) |
|
|
|
|
|
|
|
|
|
|
|
|
|
|
|
|
|
|
| 3.250%, 10/25/2021 |
|
|
0.1 |
% |
|
|
|
|
|
|
350 |
|
|
$ |
494 |
|
| 3.000%, 10/25/2015 |
|
|
1.1 |
|
|
|
|
|
|
|
3,850 |
|
|
|
5,343 |
|
| 3.000%, 04/25/2022 |
|
|
0.1 |
|
|
|
|
|
|
|
555 |
|
|
|
764 |
|
| Other Securities |
|
|
2.9 |
|
|
|
|
|
|
|
|
|
|
|
13,534 |
|
|
|
|
|
|
|
|
|
|
|
|
|
|
|
|
|
|
|
|
|
|
|
|
|
|
|
|
|
|
|
|
|
27,997 |
|
|
|
|
|
|
|
|
|
|
|
|
|
|
|
|
|
|
|
|
|
|
|
| Germany — 11.9% |
|
|
|
|
|
|
|
|
|
|
|
|
|
|
|
|
| Bundesobligation |
|
|
|
|
|
|
|
|
|
|
|
|
|
|
|
|
| 1.250%, 10/14/2016 |
|
|
0.7 |
|
|
|
|
|
|
|
2,470 |
|
|
|
3,301 |
|
| 0.500%, 04/07/2017 |
|
|
0.3 |
|
|
|
|
|
|
|
1,150 |
|
|
|
1,486 |
|
| Bundesobligation Inflation Linked Bond |
|
|
|
|
|
|
|
|
|
|
|
|
|
|
|
|
| 2.250%, 04/15/2013 |
|
|
5.1 |
|
|
|
|
|
|
|
19,144 |
|
|
|
25,089 |
|
| Bundesobligation, Ser 159 |
|
|
|
|
|
|
|
|
|
|
|
|
|
|
|
|
| 2.000%, 02/26/2016 |
|
|
0.0 |
|
|
|
|
|
|
|
95 |
|
|
|
130 |
|
| Bundesrepublik Deutschland |
|
|
|
|
|
|
|
|
|
|
|
|
|
|
|
|
| 3.250%, 07/04/2021 |
|
|
0.6 |
|
|
|
|
|
|
|
1,850 |
|
|
|
2,779 |
|
| 3.000%, 07/04/2020 |
|
|
0.1 |
|
|
|
|
|
|
|
295 |
|
|
|
434 |
|
| 2.500%, 01/04/2021 |
|
|
0.1 |
|
|
|
|
|
|
|
437 |
|
|
|
622 |
|
| 2.250%, 09/04/2020 |
|
|
0.0 |
|
|
|
|
|
|
|
120 |
|
|
|
168 |
|
| 2.000%, 01/04/2022 |
|
|
1.7 |
|
|
|
|
|
|
|
6,000 |
|
|
|
8,172 |
|
| 1.750%, 07/04/2022 |
|
|
0.1 |
|
|
|
|
|
|
|
250 |
|
|
|
332 |
|
| Bundesrepublik Deutschland, Ser 00 |
|
|
|
|
|
|
|
|
|
|
|
|
|
|
|
|
| 5.500%, 01/04/2031 |
|
|
0.1 |
|
|
|
|
|
|
|
340 |
|
|
|
660 |
|
| Bundesrepublik Deutschland, Ser 03 |
|
|
|
|
|
|
|
|
|
|
|
|
|
|
|
|
| 4.750%, 07/04/2034 |
|
|
0.2 |
|
|
|
|
|
|
|
460 |
|
|
|
853 |
|
| Bundesrepublik Deutschland, Ser 07 |
|
|
|
|
|
|
|
|
|
|
|
|
|
|
|
|
| 4.250%, 07/04/2039 |
|
|
0.4 |
|
|
|
|
|
|
|
1,185 |
|
|
|
2,152 |
|
| 4.000%, 01/04/2018 |
|
|
0.0 |
|
|
|
|
|
|
|
25 |
|
|
|
38 |
|
| Bundesrepublik Deutschland, Ser 08 |
|
|
|
|
|
|
|
|
|
|
|
|
|
|
|
|
| 4.750%, 07/04/2040 |
|
|
0.0 |
|
|
|
|
|
|
|
25 |
|
|
|
49 |
|
| 4.250%, 07/04/2018 |
|
|
0.0 |
|
|
|
|
|
|
|
125 |
|
|
|
193 |
|
| KFW MTN |
|
|
|
|
|
|
|
|
|
|
|
|
|
|
|
|
| 4.375%, 07/04/2018 |
|
|
0.3 |
|
|
|
|
|
|
|
915 |
|
|
|
1,395 |
|
| 0.875%, 11/15/2013 |
|
|
0.4 |
|
|
|
|
|
|
|
1,625 |
|
|
|
2,109 |
|
| Kreditanstalt fuer Wiederaufbau |
|
|
|
|
|
|
|
|
|
|
|
|
|
|
|
|
| 4.750%, 08/12/2015 |
|
|
0.2 |
|
|
|
SEK |
|
|
|
6,000 |
|
|
|
996 |
|
| 4.375%, 10/11/2013 |
|
|
0.3 |
|
|
|
|
|
|
|
1,050 |
|
|
|
1,410 |
|
| 3.875%, 01/21/2019 |
|
|
0.2 |
|
|
|
|
|
|
|
575 |
|
|
|
861 |
|
| 3.375%, 08/30/2017 |
|
|
0.1 |
|
|
|
CHF |
|
|
|
370 |
|
|
|
454 |
|
| Landwirtschaftliche Rentenbank MTN |
|
|
|
|
|
|
|
|
|
|
|
|
|
|
|
|
| 3.750%, 02/11/2016 |
|
|
0.0 |
|
|
|
|
|
|
|
173 |
|
|
|
247 |
|
| Other Securities |
|
|
1.0 |
|
|
|
|
|
|
|
|
|
|
|
4,811 |
|
|
|
|
|
|
|
|
|
|
|
|
|
|
|
|
|
|
|
|
|
|
|
|
|
|
|
|
|
|
58,741 |
|
|
|
|
|
|
|
|
|
|
|
|
|
|
|
|
|
|
|
|
|
|
|
| Indonesia — 0.1% |
|
|
|
|
|
|
|
|
|
|
|
|
|
|
|
|
| Other Securities |
|
|
0.1 |
|
|
|
|
|
|
|
|
|
|
|
412 |
|
|
|
|
|
|
|
|
|
|
|
|
|
|
|
|
|
|
|
|
|
|
|
|
|
|
|
|
|
|
|
|
|
| Description |
|
Percentage of
Net Assets (%) |
|
|
Face Amount (1)
(Thousands) |
|
|
Market Value
($ Thousands) |
|
|
|
|
|
|
|
|
|
|
|
|
|
|
|
|
|
|
|
|
|
| Ireland — 0.5% |
|
|
|
|
|
|
|
|
|
|
|
|
|
|
| Other Securities |
|
|
0.5 |
% |
|
|
|
|
|
|
|
$ |
2,377 |
|
|
|
|
|
|
|
|
|
|
|
|
|
|
|
|
|
|
|
|
|
| Italy — 4.9% |
|
|
|
|
|
|
|
|
|
|
|
|
|
|
| Edison MTN |
|
|
|
|
|
|
|
|
|
|
|
|
|
|
| 3.875%, 11/10/2017 |
|
|
0.2 |
|
|
|
|
|
600 |
|
|
|
826 |
|
| Italy Buoni Poliennali Del Tesoro |
|
|
|
|
|
|
|
|
|
|
|
|
|
|
| 6.500%, 11/01/2027 |
|
|
0.1 |
|
|
|
|
|
500 |
|
|
|
693 |
|
| 6.000%, 05/01/2031 |
|
|
0.1 |
|
|
|
|
|
500 |
|
|
|
661 |
|
| 5.500%, 09/01/2022 |
|
|
0.0 |
|
|
|
|
|
130 |
|
|
|
173 |
|
| 5.000%, 09/01/2040 |
|
|
0.4 |
|
|
|
|
|
1,755 |
|
|
|
2,023 |
|
| 5.000%, 03/01/2022 |
|
|
0.4 |
|
|
|
|
|
1,500 |
|
|
|
1,938 |
|
| 4.750%, 05/01/2017 |
|
|
0.6 |
|
|
|
|
|
2,105 |
|
|
|
2,799 |
|
| 4.750%, 09/01/2021 |
|
|
0.9 |
|
|
|
|
|
3,250 |
|
|
|
4,165 |
|
| 4.500%, 03/01/2019 |
|
|
0.1 |
|
|
|
|
|
400 |
|
|
|
519 |
|
| 4.250%, 10/15/2012 |
|
|
0.2 |
|
|
|
|
|
585 |
|
|
|
753 |
|
| 4.250%, 02/01/2015 |
|
|
0.6 |
|
|
|
|
|
2,325 |
|
|
|
3,099 |
|
| 3.750%, 03/01/2021 |
|
|
0.1 |
|
|
|
|
|
255 |
|
|
|
307 |
|
| 3.500%, 06/01/2014 |
|
|
0.3 |
|
|
|
|
|
1,150 |
|
|
|
1,507 |
|
| Italy Buoni Poliennali Del Tesoro Inflation Linked Bond |
|
|
|
|
|
|
|
|
|
|
|
|
|
|
| 2.100%, 09/15/2021 |
|
|
0.3 |
|
|
|
|
|
1,430 |
|
|
|
1,620 |
|
| 2.100%, 09/15/2016 |
|
|
0.2 |
|
|
|
|
|
733 |
|
|
|
930 |
|
| Other Securities |
|
|
1.0 |
|
|
|
|
|
|
|
|
|
1,914 |
|
|
|
|
|
|
|
|
|
|
|
|
|
|
|
|
|
|
|
|
|
|
|
|
|
|
23,927 |
|
|
|
|
|
|
|
|
|
|
|
|
|
|
|
|
|
|
|
|
|
| Japan — 22.2% |
|
|
|
|
|
|
|
|
|
|
|
|
|
|
| Government of Japan 5 Year Bond, Ser 79 |
|
|
|
|
|
|
|
|
|
|
|
|
|
|
| 0.700%, 12/20/2013 |
|
|
1.2 |
|
|
|
|
|
447,300 |
|
|
|
5,791 |
|
| Government of Japan 5 Year Bond, Ser 95 |
|
|
|
|
|
|
|
|
|
|
|
|
|
|
| 0.600%, 03/20/2016 |
|
|
0.8 |
|
|
|
|
|
313,950 |
|
|
|
4,102 |
|
| Government of Japan 10 Year Bond, Ser 275 |
|
|
|
|
|
|
|
|
|
|
|
|
|
|
| 1.400%, 12/20/2015 |
|
|
1.7 |
|
|
|
|
|
626,600 |
|
|
|
8,385 |
|
| Government of Japan 10 Year Bond, Ser 284 |
|
|
|
|
|
|
|
|
|
|
|
|
|
|
| 1.700%, 12/20/2016 |
|
|
0.3 |
|
|
|
|
|
100,000 |
|
|
|
1,369 |
|
| Government of Japan 10 Year Bond, Ser 288 |
|
|
|
|
|
|
|
|
|
|
|
|
|
|
| 1.700%, 09/20/2017 |
|
|
3.6 |
|
|
|
|
|
1,277,950 |
|
|
|
17,646 |
|
| Government of Japan 10 Year Bond, Ser 298 |
|
|
|
|
|
|
|
|
|
|
|
|
|
|
| 1.300%, 12/20/2018 |
|
|
0.9 |
|
|
|
|
|
321,150 |
|
|
|
4,377 |
|
| Government of Japan 10 Year Bond, Ser 301 |
|
|
|
|
|
|
|
|
|
|
|
|
|
|
| 1.500%, 06/20/2019 |
|
|
0.7 |
|
|
|
|
|
235,300 |
|
|
|
3,248 |
|
| Government of Japan 10 Year Bond, Ser 303 |
|
|
|
|
|
|
|
|
|
|
|
|
|
|
| 1.400%, 09/20/2019 |
|
|
0.2 |
|
|
|
|
|
74,050 |
|
|
|
1,016 |
|
| Government of Japan 10 Year Bond, Ser 308 |
|
|
|
|
|
|
|
|
|
|
|
|
|
|
| 1.300%, 06/20/2020 |
|
|
2.8 |
|
|
|
|
|
1,016,000 |
|
|
|
13,849 |
|
|
|
|
| 16 |
|
SEI Institutional International Trust / Annual Report / September 30, 2012 |
|
|
|
|
|
|
|
|
|
|
|
|
|
|
|
| Description |
|
Percentage of
Net Assets (%) |
|
|
Face Amount (1)
(Thousands) |
|
|
Market Value
($ Thousands) |
|
|
|
|
|
|
|
|
|
|
|
|
|
|
|
|
| Government of Japan 10 Year Bond, Ser 316 |
|
|
|
|
|
|
|
|
|
|
|
|
|
|
| 1.100%, 06/20/2021 |
|
|
0.4 |
% |
|
|
|
|
165,550 |
|
|
$ |
2,212 |
|
| Government of Japan 10 Year Bond, Ser 318 |
|
|
|
|
|
|
|
|
|
|
|
|
|
|
| 1.000%, 09/20/2021 |
|
|
0.6 |
|
|
|
|
|
225,000 |
|
|
|
2,979 |
|
| Government of Japan 10 Year Bond, Ser 321 |
|
|
|
|
|
|
|
|
|
|
|
|
|
|
| 1.000%, 03/20/2022 |
|
|
0.0 |
|
|
|
|
|
12,000 |
|
|
|
158 |
|
| Government of Japan 20 Year Bond, Ser 48 |
|
|
|
|
|
|
|
|
|
|
|
|
|
|
| 2.500%, 12/21/2020 |
|
|
1.9 |
|
|
|
|
|
629,450 |
|
|
|
9,340 |
|
| Government of Japan 20 Year Bond, Ser 55 |
|
|
|
|
|
|
|
|
|
|
|
|
|
|
| 2.000%, 03/21/2022 |
|
|
0.8 |
|
|
|
|
|
257,000 |
|
|
|
3,691 |
|
| Government of Japan 20 Year Bond, Ser 99 |
|
|
|
|
|
|
|
|
|
|
|
|
|
|
| 2.100%, 12/20/2027 |
|
|
1.6 |
|
|
|
|
|
538,250 |
|
|
|
7,638 |
|
| Government of Japan 20 Year Bond, Ser 106 |
|
|
|
|
|
|
|
|
|
|
|
|
|
|
| 2.200%, 09/20/2028 |
|
|
0.2 |
|
|
|
|
|
67,150 |
|
|
|
962 |
|
| Government of Japan 20 Year Bond, Ser 109 |
|
|
|
|
|
|
|
|
|
|
|
|
|
|
| 1.900%, 03/20/2029 |
|
|
0.1 |
|
|
|
|
|
39,000 |
|
|
|
535 |
|
| Government of Japan 20 Year Bond, Ser 112 |
|
|
|
|
|
|
|
|
|
|
|
|
|
|
| 2.100%, 06/20/2029 |
|
|
2.6 |
|
|
|
|
|
910,000 |
|
|
|
12,789 |
|
| Government of Japan 20 Year Bond, Ser 128 |
|
|
|
|
|
|
|
|
|
|
|
|
|
|
| 1.900%, 06/20/2031 |
|
|
0.0 |
|
|
|
|
|
15,000 |
|
|
|
202 |
|
| Government of Japan 30 Year Bond, Ser 29 |
|
|
|
|
|
|
|
|
|
|
|
|
|
|
| 2.400%, 09/20/2038 |
|
|
0.3 |
|
|
|
|
|
103,250 |
|
|
|
1,489 |
|
| Government of Japan 30 Year Bond, Ser 30 |
|
|
|
|
|
|
|
|
|
|
|
|
|
|
| 2.300%, 03/20/2039 |
|
|
0.8 |
|
|
|
|
|
294,150 |
|
|
|
4,158 |
|
| Government of Japan 30 Year Bond, Ser 33 |
|
|
|
|
|
|
|
|
|
|
|
|
|
|
| 2.000%, 09/20/2040 |
|
|
0.5 |
|
|
|
|
|
167,000 |
|
|
|
2,212 |
|
| Government of Japan 30 Year Bond, Ser 34 |
|
|
|
|
|
|
|
|
|
|
|
|
|
|
| 2.200%, 03/20/2041 |
|
|
0.1 |
|
|
|
|
|
30,000 |
|
|
|
414 |
|
| Government of Japan 30 Year Bond, Ser 36 |
|
|
|
|
|
|
|
|
|
|
|
|
|
|
| 2.000%, 03/20/2042 |
|
|
0.0 |
|
|
|
|
|
10,000 |
|
|
|
132 |
|
| Other Securities |
|
|
0.1 |
|
|
|
|
|
|
|
|
|
759 |
|
|
|
|
|
|
|
|
|
|
|
|
|
|
|
|
|
|
|
|
|
|
|
|
|
|
109,453 |
|
|
|
|
|
|
|
|
|
|
|
|
|
|
|
|
|
|
|
|
|
| Jersey — 0.1% |
|
|
|
|
|
|
|
|
|
|
|
|
|
|
| Other Securities |
|
|
0.1 |
|
|
|
|
|
|
|
|
|
715 |
|
|
|
|
|
|
|
|
|
|
|
|
|
|
|
|
|
|
|
|
|
| Malaysia — 0.2% |
|
|
|
|
|
|
|
|
|
|
|
|
|
|
| Other Securities |
|
|
0.2 |
|
|
|
|
|
|
|
|
|
820 |
|
|
|
|
|
|
|
|
|
|
|
|
|
|
|
|
|
|
|
|
|
|
|
|
|
|
|
|
|
|
|
|
|
| Description |
|
Percentage of
Net Assets (%) |
|
|
Face Amount (1)
(Thousands) |
|
|
Market Value
($ Thousands) |
|
|
|
|
|
|
|
|
|
|
|
|
|
|
|
|
|
|
|
|
|
|
|
| Mexico — 1.1% |
|
|
|
|
|
|
|
|
|
|
|
|
|
|
|
|
| Mexican Bonos, Ser M10 |
|
|
|
|
|
|
|
|
|
|
|
|
|
|
|
|
| 7.750%, 12/14/2017 |
|
|
0.4 |
% |
|
|
|
|
|
|
24,085 |
|
|
$ |
2,108 |
|
| Mexican Bonos, Ser MI10 |
|
|
|
|
|
|
|
|
|
|
|
|
|
|
|
|
| 9.000%, 12/20/2012 |
|
|
0.6 |
|
|
|
|
|
|
|
40,000 |
|
|
|
3,141 |
|
| Other Securities |
|
|
0.1 |
|
|
|
|
|
|
|
|
|
|
|
295 |
|
|
|
|
|
|
|
|
|
|
|
|
|
|
|
|
|
|
|
|
|
|
|
|
|
|
|
|
|
|
5,544 |
|
|
|
|
|
|
|
|
|
|
|
|
|
|
|
|
|
|
|
|
|
|
|
| Netherlands — 4.3% |
|
|
|
|
|
|
|
|
|
|
|
|
|
|
|
|
| ABN Amro Bank MTN |
|
|
|
|
|
|
|
|
|
|
|
|
|
|
|
|
| 4.875%, 01/16/2019 |
|
|
0.1 |
|
|
|
GBP |
|
|
|
200 |
|
|
|
352 |
|
| 3.750%, 07/15/2014 |
|
|
0.2 |
|
|
|
|
|
|
|
750 |
|
|
|
1,022 |
|
| Kingdom of Netherlands |
|
|
|
|
|
|
|
|
|
|
|
|
|
|
|
|
| 4.500%, 07/15/2017 |
|
|
0.2 |
|
|
|
|
|
|
|
500 |
|
|
|
758 |
|
| 4.000%, 07/15/2018 |
|
|
0.1 |
|
|
|
|
|
|
|
185 |
|
|
|
278 |
|
| 4.000%, 01/15/2037 |
|
|
0.1 |
|
|
|
|
|
|
|
300 |
|
|
|
499 |
|
| 3.500%, 07/15/2020 |
|
|
0.1 |
|
|
|
|
|
|
|
485 |
|
|
|
721 |
|
| 2.250%, 07/15/2022 |
|
|
1.2 |
|
|
|
|
|
|
|
4,305 |
|
|
|
5,804 |
|
| Other Securities |
|
|
2.3 |
|
|
|
|
|
|
|
|
|
|
|
11,545 |
|
|
|
|
|
|
|
|
|
|
|
|
|
|
|
|
|
|
|
|
|
|
|
|
|
|
|
|
|
|
20,979 |
|
|
|
|
|
|
|
|
|
|
|
|
|
|
|
|
|
|
|
|
|
|
|
| New Zealand — 0.3% |
|
|
|
|
|
|
|
|
|
|
|
|
|
|
|
|
| Other Securities |
|
|
0.3 |
|
|
|
|
|
|
|
|
|
|
|
1,612 |
|
|
|
|
|
|
|
|
|
|
|
|
|
|
|
|
|
|
|
|
|
|
|
| Norway — 0.4% |
|
|
|
|
|
|
|
|
|
|
|
|
|
|
|
|
| Other Securities |
|
|
0.4 |
|
|
|
|
|
|
|
|
|
|
|
2,224 |
|
|
|
|
|
|
|
|
|
|
|
|
|
|
|
|
|
|
|
|
|
|
|
| Poland — 0.3% |
|
|
|
|
|
|
|
|
|
|
|
|
|
|
|
|
| Other Securities |
|
|
0.3 |
|
|
|
|
|
|
|
|
|
|
|
1,871 |
|
|
|
|
|
|
|
|
|
|
|
|
|
|
|
|
|
|
|
|
|
|
|
| Qatar — 0.1% |
|
|
|
|
|
|
|
|
|
|
|
|
|
|
|
|
| Other Securities |
|
|
0.1 |
|
|
|
|
|
|
|
|
|
|
|
441 |
|
|
|
|
|
|
|
|
|
|
|
|
|
|
|
|
|
|
|
|
|
|
|
| Russia — 0.3% |
|
|
|
|
|
|
|
|
|
|
|
|
|
|
|
|
| Other Securities |
|
|
0.3 |
|
|
|
|
|
|
|
|
|
|
|
1,329 |
|
|
|
|
|
|
|
|
|
|
|
|
|
|
|
|
|
|
|
|
|
|
|
| Singapore — 0.8% |
|
|
|
|
|
|
|
|
|
|
|
|
|
|
|
|
| Government of Singapore |
|
|
|
|
|
|
|
|
|
|
|
|
|
|
|
|
| 3.125%, 09/01/2022 |
|
|
0.5 |
|
|
|
|
|
|
|
2,805 |
|
|
|
2,635 |
|
| Other Securities |
|
|
0.3 |
|
|
|
|
|
|
|
|
|
|
|
1,353 |
|
|
|
|
|
|
|
|
|
|
|
|
|
|
|
|
|
|
|
|
|
|
|
|
|
|
|
|
|
|
|
|
|
3,988 |
|
|
|
|
|
|
|
|
|
|
|
|
|
|
|
|
|
|
|
|
|
|
|
| South Africa — 0.7% |
|
|
|
|
|
|
|
|
|
|
|
|
|
|
|
|
| Republic of South Africa, Ser R203 |
|
|
|
|
|
|
|
|
|
|
|
|
|
|
|
|
| 8.250%, 09/15/2017 |
|
|
0.7 |
|
|
|
|
|
|
|
24,405 |
|
|
|
3,259 |
|
|
|
|
|
|
|
|
|
|
|
|
|
|
|
|
|
|
|
|
|
|
|
| South Korea — 0.6% |
|
|
|
|
|
|
|
|
|
|
|
|
|
|
|
|
| Other Securities |
|
|
0.6 |
|
|
|
|
|
|
|
|
|
|
|
2,832 |
|
|
|
|
|
|
|
|
|
|
|
|
|
|
|
|
|
|
|
|
|
|
|
| Spain — 2.1% |
|
|
|
|
|
|
|
|
|
|
|
|
|
|
|
|
| Banco Santander |
|
|
|
|
|
|
|
|
|
|
|
|
|
|
|
|
| 4.625%, 01/20/2016 |
|
|
0.1 |
|
|
|
|
|
|
|
300 |
|
|
|
399 |
|
|
|
|
|
|
| SEI Institutional International Trust / Annual Report / September 30, 2012 |
|
|
17 |
|
SUMMARY SCHEDULE OF INVESTMENTS
International Fixed Income Fund (Continued)
September 30, 2012
|
|
|
|
|
|
|
|
|
|
|
|
|
|
|
|
|
| Description |
|
Percentage of
Net Assets (%) |
|
|
Face Amount (1)
(Thousands) |
|
|
Market Value
($ Thousands) |
|
|
|
|
|
|
|
|
|
|
|
|
|
|
|
|
|
|
| Government of Spain |
|
|
|
|
|
|
|
|
|
|
|
|
|
|
|
|
| 5.850%, 01/31/2022 |
|
|
0.0 |
% |
|
|
|
|
|
|
150 |
|
|
$ |
191 |
|
| 5.500%, 04/30/2021 |
|
|
0.5 |
|
|
|
|
|
|
|
1,770 |
|
|
|
2,212 |
|
| 4.750%, 07/30/2014 |
|
|
0.3 |
|
|
|
|
|
|
|
925 |
|
|
|
1,217 |
|
| 4.700%, 07/30/2041 |
|
|
0.2 |
|
|
|
|
|
|
|
995 |
|
|
|
962 |
|
| 4.600%, 07/30/2019 |
|
|
0.0 |
|
|
|
|
|
|
|
155 |
|
|
|
190 |
|
| 4.200%, 01/31/2037 |
|
|
0.0 |
|
|
|
|
|
|
|
190 |
|
|
|
172 |
|
| 4.000%, 04/30/2020 |
|
|
0.1 |
|
|
|
|
|
|
|
285 |
|
|
|
331 |
|
| 3.800%, 01/31/2017 |
|
|
0.1 |
|
|
|
|
|
|
|
420 |
|
|
|
519 |
|
| 3.300%, 10/31/2014 |
|
|
0.1 |
|
|
|
|
|
|
|
475 |
|
|
|
608 |
|
| Instituto de Credito Oficial MTN |
|
|
|
|
|
|
|
|
|
|
|
|
|
|
|
|
| 2.375%, 03/04/2013 (A) |
|
|
0.0 |
|
|
|
USD |
|
|
|
200 |
|
|
|
199 |
|
| Santander International Debt SAU MTN |
|
|
|
|
|
|
|
|
|
|
|
|
|
| 4.625%, 03/21/2016 |
|
|
0.2 |
|
|
|
|
|
|
|
700 |
|
|
|
898 |
|
| Santander Issuances, Ser 24 |
|
|
|
|
|
|
|
|
|
|
|
|
|
|
|
|
| 7.300%, 07/27/2019 (B) |
|
|
0.1 |
|
|
|
GBP |
|
|
|
400 |
|
|
|
602 |
|
| Other Securities |
|
|
0.4 |
|
|
|
|
|
|
|
|
|
|
|
2,261 |
|
|
|
|
|
|
|
|
|
|
|
|
|
|
|
|
|
|
|
|
|
|
|
|
|
|
|
|
|
|
10,761 |
|
|
|
|
|
|
|
|
|
|
|
|
|
|
|
|
|
|
|
|
|
|
|
| Supra-National — 0.3% |
|
|
|
|
|
|
|
|
|
|
|
|
|
|
|
|
| Other Securities |
|
|
0.3 |
|
|
|
|
|
|
|
|
|
|
|
1,363 |
|
|
|
|
|
|
|
|
|
|
|
|
|
|
|
|
|
|
|
|
|
|
|
| Sweden — 1.6% |
|
|
|
|
|
|
|
|
|
|
|
|
|
|
|
|
| Other Securities |
|
|
1.6 |
|
|
|
|
|
|
|
|
|
|
|
7,749 |
|
|
|
|
|
|
|
|
|
|
|
|
|
|
|
|
|
|
|
|
|
|
|
| Switzerland — 1.1% |
|
|
|
|
|
|
|
|
|
|
|
|
|
|
|
|
| Other Securities |
|
|
1.1 |
|
|
|
|
|
|
|
|
|
|
|
5,317 |
|
|
|
|
|
|
|
|
|
|
|
|
|
|
|
|
|
|
|
|
|
|
|
| Turkey — 0.3% |
|
|
|
|
|
|
|
|
|
|
|
|
|
|
|
|
| Other Securities |
|
|
0.3 |
|
|
|
|
|
|
|
|
|
|
|
1,594 |
|
|
|
|
|
|
|
|
|
|
|
|
|
|
|
|
|
|
|
|
|
|
|
| United Arab Emirates — 0.1% |
|
|
|
|
|
|
|
|
|
|
|
|
|
|
|
|
| Other Securities |
|
|
0.1 |
|
|
|
|
|
|
|
|
|
|
|
384 |
|
|
|
|
|
|
|
|
|
|
|
|
|
|
|
|
|
|
|
|
|
|
|
| United Kingdom — 11.9% |
|
|
|
|
|
|
|
|
|
|
|
|
|
|
|
|
| Abbey National Treasury Services MTN |
|
|
|
|
|
|
|
|
|
|
|
|
|
| 5.500%, 06/18/2014 |
|
|
0.3 |
|
|
|
|
|
|
|
775 |
|
|
|
1,309 |
|
| 5.250%, 02/16/2029 |
|
|
0.2 |
|
|
|
|
|
|
|
450 |
|
|
|
877 |
|
| 5.125%, 04/14/2021 |
|
|
0.1 |
|
|
|
|
|
|
|
300 |
|
|
|
571 |
|
| 4.250%, 04/12/2021 |
|
|
0.1 |
|
|
|
EUR |
|
|
|
350 |
|
|
|
517 |
|
| 3.625%, 09/08/2016 |
|
|
0.1 |
|
|
|
EUR |
|
|
|
300 |
|
|
|
421 |
|
| 3.375%, 06/08/2015 |
|
|
0.1 |
|
|
|
EUR |
|
|
|
500 |
|
|
|
685 |
|
| Direct Line Insurance Group |
|
|
|
|
|
|
|
|
|
|
|
|
|
|
|
|
| 9.250%, 04/27/2042 (B) |
|
|
0.0 |
|
|
|
|
|
|
|
100 |
|
|
|
180 |
|
| Eastern Power Networks MTN |
|
|
|
|
|
|
|
|
|
|
|
|
|
|
|
|
| 6.000%, 11/12/2036 |
|
|
0.1 |
|
|
|
|
|
|
|
160 |
|
|
|
323 |
|
| Royal Bank of Scotland |
|
|
|
|
|
|
|
|
|
|
|
|
|
|
|
|
| 5.750%, 05/21/2014 |
|
|
0.2 |
|
|
|
EUR |
|
|
|
600 |
|
|
|
828 |
|
| 5.125%, 01/13/2024 |
|
|
0.2 |
|
|
|
|
|
|
|
400 |
|
|
|
779 |
|
| United Kingdom Gilt |
|
|
|
|
|
|
|
|
|
|
|
|
|
|
|
|
| 5.000%, 03/07/2025 |
|
|
0.0 |
|
|
|
|
|
|
|
100 |
|
|
|
216 |
|
| 4.500%, 12/07/2042 |
|
|
0.8 |
|
|
|
|
|
|
|
1,890 |
|
|
|
3,915 |
|
| 4.250%, 06/07/2032 |
|
|
0.1 |
|
|
|
|
|
|
|
265 |
|
|
|
535 |
|
| 4.250%, 12/07/2049 |
|
|
0.0 |
|
|
|
|
|
|
|
25 |
|
|
|
50 |
|
|
|
|
|
|
|
|
|
|
|
|
|
|
|
|
|
|
| Description |
|
Percentage of
Net Assets (%) |
|
|
Face Amount (1)
(Thousands) |
|
|
Market Value
($ Thousands) |
|
|
|
|
|
|
|
|
|
|
|
|
|
|
|
|
|
|
| 4.250%, 12/07/2055 |
|
|
0.1 |
% |
|
|
|
|
|
|
175 |
|
|
$ |
354 |
|
| 1.000%, 09/07/2017 |
|
|
0.7 |
|
|
|
|
|
|
|
2,200 |
|
|
|
3,600 |
|
| United Kingdom Treasury |
|
|
|
|
|
|
|
|
|
|
|
|
|
|
|
|
| 4.750%, 12/07/2030 |
|
|
0.5 |
|
|
|
|
|
|
|
1,250 |
|
|
|
2,687 |
|
| 4.750%, 12/07/2038 |
|
|
0.4 |
|
|
|
|
|
|
|
956 |
|
|
|
2,053 |
|
| 4.250%, 03/07/2036 |
|
|
0.2 |
|
|
|
|
|
|
|
550 |
|
|
|
1,097 |
|
| 4.250%, 09/07/2039 |
|
|
0.4 |
|
|
|
|
|
|
|
885 |
|
|
|
1,759 |
|
| 4.250%, 12/07/2040 |
|
|
0.1 |
|
|
|
|
|
|
|
285 |
|
|
|
565 |
|
| 4.000%, 09/07/2016 |
|
|
0.1 |
|
|
|
|
|
|
|
250 |
|
|
|
460 |
|
| 4.000%, 03/07/2022 |
|
|
0.6 |
|
|
|
|
|
|
|
1,490 |
|
|
|
2,929 |
|
| 2.250%, 03/07/2014 |
|
|
0.3 |
|
|
|
|
|
|
|
795 |
|
|
|
1,321 |
|
| 2.000%, 01/22/2016 |
|
|
0.2 |
|
|
|
|
|
|
|
533 |
|
|
|
907 |
|
| 1.750%, 01/22/2017 |
|
|
0.6 |
|
|
|
|
|
|
|
1,670 |
|
|
|
2,834 |
|
| United Kingdom Treasury, Ser 2002 |
|
|
|
|
|
|
|
|
|
|
|
|
|
|
|
|
| 5.000%, 09/07/2014 |
|
|
0.1 |
|
|
|
|
|
|
|
200 |
|
|
|
353 |
|
| Other Securities |
|
|
5.3 |
|
|
|
|
|
|
|
|
|
|
|
26,354 |
|
|
|
|
|
|
|
|
|
|
|
|
|
|
|
|
|
|
|
|
|
|
|
|
|
|
|
|
|
|
|
|
|
58,479 |
|
|
|
|
|
|
|
|
|
|
|
|
|
|
|
|
|
|
|
|
|
|
|
| United States — 5.8% |
|
|
|
|
|
|
|
|
|
|
|
|
|
|
|
|
| Bank of America MTN |
|
|
|
|
|
|
|
|
|
|
|
|
|
|
|
|
| 5.650%, 05/01/2018 |
|
|
0.1 |
|
|
|
|
|
|
|
350 |
|
|
|
399 |
|
| Bank of America, Ser E MTN |
|
|
|
|
|
|
|
|
|
|
|
|
|
|
|
|
| 5.125%, 09/26/2014 |
|
|
0.5 |
|
|
|
EUR |
|
|
|
1,700 |
|
|
|
2,332 |
|
| Citigroup |
|
|
|
|
|
|
|
|
|
|
|
|
|
|
|
|
| 5.875%, 01/30/2042 |
|
|
0.0 |
|
|
|
|
|
|
|
75 |
|
|
|
90 |
|
| 4.500%, 01/14/2022 |
|
|
0.0 |
|
|
|
|
|
|
|
60 |
|
|
|
66 |
|
| 4.450%, 01/10/2017 |
|
|
0.1 |
|
|
|
|
|
|
|
550 |
|
|
|
604 |
|
| 4.250%, 02/25/2030 (B) |
|
|
0.3 |
|
|
|
EUR |
|
|
|
1,400 |
|
|
|
1,471 |
|
| 4.000%, 11/26/2015 |
|
|
0.1 |
|
|
|
EUR |
|
|
|
230 |
|
|
|
317 |
|
| JPMorgan Chase |
|
|
|
|
|
|
|
|
|
|
|
|
|
|
|
|
| 4.500%, 01/24/2022 |
|
|
0.0 |
|
|
|
|
|
|
|
200 |
|
|
|
222 |
|
| 2.750%, 08/24/2022 |
|
|
0.1 |
|
|
|
EUR |
|
|
|
300 |
|
|
|
386 |
|
| 0.921%, 10/12/2015 (B) |
|
|
0.1 |
|
|
|
EUR |
|
|
|
350 |
|
|
|
430 |
|
| JPMorgan Chase Bank |
|
|
|
|
|
|
|
|
|
|
|
|
|
|
|
|
| 0.877%, 05/31/2017 (B) |
|
|
0.3 |
|
|
|
EUR |
|
|
|
1,250 |
|
|
|
1,528 |
|
| Merrill Lynch MTN |
|
|
|
|
|
|
|
|
|
|
|
|
|
|
|
|
| 0.805%, 09/14/2018 (B) |
|
|
0.1 |
|
|
|
EUR |
|
|
|
375 |
|
|
|
405 |
|
| US Bank MTN |
|
|
|
|
|
|
|
|
|
|
|
|
|
|
|
|
| 0.817%, 02/28/2017 (B) |
|
|
0.4 |
|
|
|
EUR |
|
|
|
1,700 |
|
|
|
2,165 |
|
| Other Securities |
|
|
3.7 |
|
|
|
|
|
|
|
|
|
|
|
17,901 |
|
|
|
|
|
|
|
|
|
|
|
|
|
|
|
|
|
|
|
|
|
|
|
|
|
|
|
|
|
|
|
|
|
28,316 |
|
|
|
|
|
|
|
|
|
|
|
|
|
|
|
|
|
|
| Total Global Bonds
(Cost $431,445) ($ Thousands) |
|
|
|
|
|
|
|
455,686 |
|
|
|
|
|
|
|
|
|
|
|
|
|
|
|
|
|
|
|
|
| MORTGAGE-BACKED SECURITIES — 3.3% |
|
|
|
|
|
|
|
| Non-Agency Mortgage-Backed Obligation — 3.3% |
|
|
|
|
|
| Bear Stearns Adjustable Rate Mortgage Trust, Ser 2004-6, Cl 3A |
|
|
|
|
|
|
|
|
|
|
|
|
|
|
|
|
| 5.452%, 09/25/2034 (B) |
|
|
0.0 |
|
|
|
|
|
|
|
191 |
|
|
|
187 |
|
| Bear Stearns Commercial Mortgage Securities, Ser 2004-PWR6, Cl A6 |
|
|
|
|
|
|
|
|
|
|
|
|
|
|
|
|
| 4.825%, 11/11/2041 |
|
|
0.1 |
|
|
|
|
|
|
|
575 |
|
|
|
620 |
|
|
|
|
| 18 |
|
SEI Institutional International Trust / Annual Report / September 30, 2012 |
|
|
|
|
|
|
|
|
|
|
|
|
|
|
|
| Description |
|
Percentage of
Net Assets (%) |
|
|
Face Amount (1)
(Thousands) |
|
|
Market Value
($ Thousands) |
|
|
|
|
|
|
|
|
|
|
|
|
|
|
|
|
| Bear Stearns Commercial Mortgage Securities, Ser 2005-T18, Cl A4 |
|
|
|
|
|
|
|
|
|
|
|
|
|
|
| 4.933%, 02/13/2042 (B) |
|
|
0.0 |
% |
|
|
|
|
135 |
|
|
$ |
148 |
|
| Bear Stearns Commercial Mortgage Securities, Ser 2006-PW11, Cl A4 |
|
|
|
|
|
|
|
|
|
|
|
|
|
|
| 5.621%, 03/11/2039 (B) |
|
|
0.1 |
|
|
|
|
|
450 |
|
|
|
511 |
|
| Bear Stearns Commercial Mortgage Securities, Ser 2006-T24, Cl A4 |
|
|
|
|
|
|
|
|
|
|
|
|
|
|
| 5.537%, 10/12/2041 |
|
|
0.1 |
|
|
|
|
|
400 |
|
|
|
464 |
|
| Bear Stearns Commercial Mortgage Securities, Ser 2007-PW16, Cl A4 |
|
|
|
|
|
|
|
|
|
|
|
|
|
|
| 5.906%, 06/11/2040 (B) |
|
|
0.1 |
|
|
|
|
|
241 |
|
|
|
284 |
|
| Bear Stearns Commercial Mortgage Securities, Ser 2007-PW17, Cl A4 |
|
|
|
|
|
|
|
|
|
|
|
|
|
|
| 5.694%, 06/11/2050 (B) |
|
|
0.1 |
|
|
|
|
|
190 |
|
|
|
223 |
|
| Citigroup Commercial Mortgage Trust, Ser 2007-C6, Cl A4 |
|
|
|
|
|
|
|
|
|
|
|
|
|
|
| 5.888%, 12/10/2049 (B) |
|
|
0.3 |
|
|
|
|
|
1,140 |
|
|
|
1,341 |
|
| Citigroup Commercial Mortgage Trust, Ser 2008-C7, Cl A4 |
|
|
|
|
|
|
|
|
|
|
|
|
|
|
| 6.262%, 12/10/2049 (B) |
|
|
0.1 |
|
|
|
|
|
405 |
|
|
|
484 |
|
| Citigroup Mortgage Loan Trust, Ser 2005-2, Cl 1A4 |
|
|
|
|
|
|
|
|
|
|
|
|
|
|
| 2.746%, 05/25/2035 (B) |
|
|
0.2 |
|
|
|
|
|
897 |
|
|
|
867 |
|
| Citigroup, Ser 2007-CD4, Cl A4 |
|
|
|
|
|
|
|
|
|
|
|
|
|
|
| 5.322%, 12/11/2049 |
|
|
0.1 |
|
|
|
|
|
325 |
|
|
|
370 |
|
| Fosse Master Issuer, Ser 2011-1X, Cl A3 |
|
|
|
|
|
|
|
|
|
|
|
|
|
|
| 2.208%, 10/18/2054 (B) |
|
|
0.1 |
|
|
|
|
|
285 |
|
|
|
466 |
|
| JPMorgan Chase Commercial Mortgage Securities, Ser 2007-CB18, Cl A4 |
|
|
|
|
|
|
|
|
|
|
|
|
|
|
| 5.440%, 06/12/2047 |
|
|
0.2 |
|
|
|
|
|
880 |
|
|
|
1,014 |
|
| JPMorgan Mortgage Trust,
Ser 2004-A5, Cl 3A1 |
|
|
|
|
|
|
|
|
|
|
|
|
|
|
| 5.008%, 12/25/2034 (B) |
|
|
0.1 |
|
|
|
|
|
233 |
|
|
|
237 |
|
| Merrill Lynch Mortgage Trust, Ser 2005-LC1, Cl A4 |
|
|
|
|
|
|
|
|
|
|
|
|
|
|
| 5.291%, 01/12/2044 (B) |
|
|
0.1 |
|
|
|
|
|
370 |
|
|
|
414 |
|
| Merrill Lynch, Ser 2007-7, Cl A4 |
|
|
|
|
|
|
|
|
|
|
|
|
|
|
| 5.810%, 06/12/2050 (B) |
|
|
0.1 |
|
|
|
|
|
285 |
|
|
|
319 |
|
| Other Securities |
|
|
1.7 |
|
|
|
|
|
|
|
|
|
8,369 |
|
|
|
|
|
|
|
|
|
|
|
|
|
|
|
|
| Total Mortgage-Backed Securities (Cost $15,731) ($ Thousands) |
|
|
|
|
|
|
|
|
|
|
|
|
16,318 |
|
|
|
|
|
|
|
|
|
|
|
|
|
|
|
|
|
|
|
|
| CORPORATE OBLIGATIONS — 2.3% |
|
|
|
|
|
|
|
|
|
|
|
|
|
|
|
|
| United States — 2.3% |
|
|
|
|
|
|
|
|
|
|
|
|
|
|
| Bank of America MTN |
|
|
|
|
|
|
|
|
|
|
|
|
|
|
| 5.000%, 05/13/2021 |
|
|
0.0 |
|
|
|
|
|
175 |
|
|
|
192 |
|
| Other Securities |
|
|
2.3 |
|
|
|
|
|
|
|
|
|
11,014 |
|
|
|
|
|
|
|
|
|
|
|
|
|
|
|
|
| Total Corporate Obligations (Cost $10,279) ($ Thousands) |
|
|
|
|
|
|
|
|
|
|
|
|
11,206 |
|
|
|
|
|
|
|
|
|
|
|
|
|
|
|
|
|
|
|
|
|
|
|
|
|
|
|
|
|
|
|
|
|
| Description |
|
Percentage of
Net Assets (%) |
|
|
Face Amount (1)
(Thousands) |
|
|
Market Value
($ Thousands) |
|
|
|
|
|
|
|
|
|
|
|
|
|
|
|
|
|
|
|
|
|
| ASSET-BACKED SECURITIES — 0.4% |
|
|
|
|
|
|
|
|
|
|
|
|
|
|
| Automotive — 0.4% |
|
|
|
|
|
|
|
|
|
|
|
|
|
|
|
|
| Bank of America Auto Trust, Ser 2012-1, Cl A2 |
|
|
|
|
|
|
|
|
|
|
|
|
|
|
|
|
| 0.590%, 11/17/2014 |
|
|
0.2 |
% |
|
|
|
|
|
|
900 |
|
|
$ |
901 |
|
| Other Securities |
|
|
0.2 |
|
|
|
|
|
|
|
|
|
|
|
914 |
|
|
|
|
|
|
|
|
|
|
|
|
|
|
|
|
|
|
|
|
|
|
|
|
|
|
|
|
|
|
|
|
|
1,815 |
|
|
|
|
|
|
|
|
|
|
|
|
|
|
|
|
|
|
|
|
|
|
| Other Asset-Backed Securities — 0.0% |
|
|
|
|
|
|
|
|
|
|
|
|
|
| Santander Consumer Finance, Ser 2007-1, Cl A |
|
|
|
|
|
|
|
|
|
|
|
|
|
|
|
|
| 0.394%, 09/20/2022 (C) |
|
|
0.0 |
|
|
|
|
|
|
|
31 |
|
|
|
39 |
|
| Other Securities |
|
|
0.0 |
|
|
|
|
|
|
|
|
|
|
|
2 |
|
|
|
|
|
|
|
|
|
|
|
|
|
|
|
|
|
|
|
|
|
|
|
|
|
|
|
|
|
|
|
|
|
41 |
|
|
|
|
|
|
|
|
|
|
|
|
|
|
|
|
|
|
| Total Asset-Backed Securities (Cost $1,857) ($ Thousands) |
|
|
|
|
|
|
|
|
|
|
|
|
|
|
1,856 |
|
|
|
|
|
|
|
|
|
|
|
|
|
|
|
|
|
|
|
|
|
| U.S. TREASURY OBLIGATIONS — 0.1% |
|
|
|
|
|
|
|
|
|
| Other Securities |
|
|
0.1 |
|
|
|
|
|
|
|
|
|
|
|
486 |
|
|
|
|
|
|
|
|
|
|
|
|
|
|
|
|
|
|
| Total U.S. Treasury Obligations (Cost $408) ($ Thousands) |
|
|
|
|
|
|
|
|
|
|
|
|
|
|
486 |
|
|
|
|
|
|
|
|
|
|
|
|
|
|
|
|
|
|
|
|
|
|
| MUNICIPAL BOND — 0.0% |
|
|
|
|
|
|
|
|
|
|
|
|
|
| Other Securities |
|
|
0.0 |
|
|
|
|
|
|
|
|
|
|
|
51 |
|
|
|
|
|
|
|
|
|
|
|
|
|
|
|
|
|
|
| Total Municipal Bonds |
|
|
|
|
|
|
|
|
|
|
|
|
|
|
|
|
| (Cost $45) ($ Thousands) |
|
|
|
|
|
|
|
|
|
|
|
|
|
|
51 |
|
|
|
|
|
|
|
|
|
|
|
|
|
|
|
|
|
|
|
|
|
|
|
| TIME DEPOSITS — 0.5% |
|
|
|
|
|
|
|
|
|
|
|
|
|
|
|
|
|
|
|
|
|
| United States — 0.5% |
|
|
|
|
|
|
|
|
|
|
|
|
|
|
|
|
| Brown Brothers Harriman |
|
|
|
|
|
|
|
|
|
|
|
|
|
|
|
|
| 4.150%, 10/01/2012 |
|
|
|
|
|
|
ZAR |
|
|
|
— |
|
|
|
— |
|
| 2.580%, 10/01/2012 |
|
|
|
|
|
|
AUD |
|
|
|
4 |
|
|
|
4 |
|
| 1.550%, 10/01/2012 |
|
|
|
|
|
|
NZD |
|
|
|
22 |
|
|
|
19 |
|
| 0.550%, 10/01/2012 |
|
|
|
|
|
|
NOK |
|
|
|
125 |
|
|
|
22 |
|
| 0.400%, 10/01/2012 |
|
|
|
|
|
|
SEK |
|
|
|
106 |
|
|
|
16 |
|
| 0.185%, 10/01/2012 |
|
|
|
|
|
|
CAD |
|
|
|
22 |
|
|
|
23 |
|
| 0.054%, 10/01/2012 |
|
|
|
|
|
|
GBP |
|
|
|
40 |
|
|
|
64 |
|
| 0.030%, 10/01/2012 |
|
|
|
|
|
|
|
|
|
|
1,525 |
|
|
|
1,525 |
|
| 0.010%, 10/01/2012 |
|
|
|
|
|
|
JPY |
|
|
|
5,139 |
|
|
|
66 |
|
| 0.010%, 10/01/2012 |
|
|
|
|
|
|
SGD |
|
|
|
60 |
|
|
|
49 |
|
| 0.005%, 10/01/2012 |
|
|
|
|
|
|
HKD |
|
|
|
2 |
|
|
|
— |
|
| 0.005%, 10/01/2012 |
|
|
|
|
|
|
CHF |
|
|
|
— |
|
|
|
— |
|
| (0.014)%, 10/01/2012 |
|
|
|
|
|
|
EUR |
|
|
|
533 |
|
|
|
686 |
|
| (0.200)%, 10/01/2012 |
|
|
|
|
|
|
DKK |
|
|
|
1 |
|
|
|
— |
|
|
|
|
|
|
|
|
|
|
|
|
|
|
|
|
|
|
| Total Time Deposits
(Cost $2,474) ($ Thousands) |
|
|
|
2,474 |
|
|
|
|
|
|
|
|
|
|
|
|
|
|
|
|
|
|
| Total Investments — 99.2%
(Cost $462,239) ($ Thousands)†† |
|
|
|
|
|
|
$ |
488,077 |
|
|
|
|
|
|
|
|
|
|
|
|
|
|
|
|
|
|
|
|
|
|
|
| SEI Institutional International Trust / Annual Report / September 30, 2012 |
|
|
19 |
|
SUMMARY SCHEDULE OF INVESTMENTS
International Fixed Income Fund (Continued)
September 30, 2012
A list of the open futures contracts held by the Fund at September 30, 2012, is as follows:
|
|
|
|
|
|
|
|
|
|
|
|
|
| Type of
Contract |
|
Number of
Contracts
Long (Short) |
|
|
Expiration
Date |
|
|
Unrealized
Appreciation
(Depreciation)
($ Thousands) |
|
| Australian 3-Year Bond |
|
|
64 |
|
|
|
Dec-2012 |
|
|
$ |
36 |
|
| Canadian 10-Year Bond |
|
|
15 |
|
|
|
Dec-2012 |
|
|
|
8 |
|
| Euro-Bobl |
|
|
41 |
|
|
|
Dec-2012 |
|
|
|
(8 |
) |
| Euro-Oat |
|
|
6 |
|
|
|
Dec-2012 |
|
|
|
8 |
|
| Euro-Bund |
|
|
60 |
|
|
|
Dec-2012 |
|
|
|
8 |
|
| Euro-Buxl 30 Year Bond |
|
|
4 |
|
|
|
Dec-2012 |
|
|
|
(8 |
) |
| Euro-Schatz |
|
|
18 |
|
|
|
Dec-2012 |
|
|
|
(3 |
) |
| Japanese 10-Year Bond |
|
|
6 |
|
|
|
Dec-2012 |
|
|
|
23 |
|
| Japanese 10-Year Bond |
|
|
(5 |
) |
|
|
Dec-2012 |
|
|
|
(3 |
) |
| Long Gilt 10-Year Bond |
|
|
5 |
|
|
|
Dec-2012 |
|
|
|
4 |
|
| U.S. 10-Year Treasury Note |
|
|
(180 |
) |
|
|
Dec-2012 |
|
|
|
(117 |
) |
| U.S. 2-Year Treasury Note |
|
|
(35 |
) |
|
|
Dec-2012 |
|
|
|
(3 |
) |
| U.S. 5-Year Treasury Note |
|
|
(112 |
) |
|
|
Dec-2012 |
|
|
|
(51 |
) |
| U.S. Long Treasury Bond |
|
|
(19 |
) |
|
|
Dec-2012 |
|
|
|
(25 |
) |
| U.S. Ultra Long Treasury Bond |
|
|
(6 |
) |
|
|
Dec-2012 |
|
|
|
8 |
|
|
|
|
|
|
|
|
|
|
|
|
|
|
|
|
|
|
|
|
|
|
|
|
$ |
(123 |
) |
|
|
|
|
|
|
|
|
|
|
|
|
|
For the year ended September 30, 2012, the total amount of all open futures contracts, as presented in the table above,
are representative of the volume of activity for this derivative type during the period.
A list of the open forward foreign currency contracts
held by the Fund at September 30, 2012, is as follows:
|
|
|
|
|
|
|
|
|
|
|
|
|
|
|
|
|
|
|
|
|
| Maturity Date |
|
Currency
to Deliver
(Thousands) |
|
|
Currency
to Receive
(Thousands) |
|
|
Unrealized
Appreciation
(Depreciation)
($ Thousands) |
|
| 10/04/2012 |
|
|
USD |
|
|
|
90 |
|
|
|
ZAR |
|
|
|
734 |
|
|
$ |
(1 |
) |
| 10/04/2012-10/31/2012 |
|
|
USD |
|
|
|
11,997 |
|
|
|
EUR |
|
|
|
9,256 |
|
|
|
(88 |
) |
| 10/04/2012-10/31/2012 |
|
|
USD |
|
|
|
550 |
|
|
|
JPY |
|
|
|
42,952 |
|
|
|
2 |
|
| 10/04/2012-10/31/2012 |
|
|
ZAR |
|
|
|
27,825 |
|
|
|
USD |
|
|
|
3,345 |
|
|
|
(24 |
) |
| 10/04/2012-11/05/2012 |
|
|
AUD |
|
|
|
9,778 |
|
|
|
USD |
|
|
|
10,143 |
|
|
|
(1 |
) |
| 10/04/2012-11/05/2012 |
|
|
CZK |
|
|
|
136,603 |
|
|
|
USD |
|
|
|
6,949 |
|
|
|
(28 |
) |
| 10/04/2012-11/05/2012 |
|
|
EUR |
|
|
|
240,666 |
|
|
|
USD |
|
|
|
308,731 |
|
|
|
(916 |
) |
| 10/04/2012-11/05/2012 |
|
|
GBP |
|
|
|
51,645 |
|
|
|
USD |
|
|
|
83,194 |
|
|
|
(189 |
) |
| 10/04/2012-11/05/2012 |
|
|
USD |
|
|
|
3,810 |
|
|
|
CZK |
|
|
|
73,466 |
|
|
|
(57 |
) |
| 10/04/2012-11/05/2012 |
|
|
USD |
|
|
|
1,629 |
|
|
|
KRW |
|
|
|
1,818,495 |
|
|
|
7 |
|
| 10/04/2012-11/08/2012 |
|
|
DKK |
|
|
|
61,005 |
|
|
|
USD |
|
|
|
10,467 |
|
|
|
(67 |
) |
| 10/04/2012-11/08/2012 |
|
|
SEK |
|
|
|
38,726 |
|
|
|
USD |
|
|
|
5,902 |
|
|
|
(1 |
) |
| 10/04/2012-11/09/2012 |
|
|
CAD |
|
|
|
26,922 |
|
|
|
USD |
|
|
|
27,450 |
|
|
|
100 |
|
| 10/04/2012-11/16/2012 |
|
|
JPY |
|
|
|
11,742,909 |
|
|
|
USD |
|
|
|
150,588 |
|
|
|
(415 |
) |
| 10/04/2012-12/27/2012 |
|
|
MXP |
|
|
|
77,267 |
|
|
|
USD |
|
|
|
5,778 |
|
|
|
(203 |
) |
|
|
|
|
|
|
|
|
|
|
|
|
|
|
|
|
|
|
|
|
|
| Maturity Date |
|
Currency
to Deliver
(Thousands) |
|
|
Currency
to Receive
(Thousands) |
|
|
Unrealized
Appreciation
(Depreciation)
($ Thousands) |
|
| 10/05/2012-10/31/2012 |
|
|
SGD |
|
|
|
4,364 |
|
|
|
USD |
|
|
|
3,527 |
|
|
$ |
(30 |
) |
| 10/11/2012 |
|
|
TRY |
|
|
|
2,878 |
|
|
|
USD |
|
|
|
1,599 |
|
|
|
(2 |
) |
| 10/11/2012-10/31/2012 |
|
|
NZD |
|
|
|
2,049 |
|
|
|
USD |
|
|
|
1,683 |
|
|
|
(17 |
) |
| 10/18/2012-10/31/2012 |
|
|
USD |
|
|
|
2,033 |
|
|
|
MXP |
|
|
|
26,046 |
|
|
|
(12 |
) |
| 10/31/2012 |
|
|
CHF |
|
|
|
1,625 |
|
|
|
USD |
|
|
|
1,735 |
|
|
|
5 |
|
| 10/31/2012 |
|
|
KRW |
|
|
|
2,558,461 |
|
|
|
USD |
|
|
|
2,277 |
|
|
|
(24 |
) |
| 10/31/2012 |
|
|
MYR |
|
|
|
1,001 |
|
|
|
USD |
|
|
|
325 |
|
|
|
(2 |
) |
| 10/31/2012 |
|
|
NOK |
|
|
|
1,247 |
|
|
|
USD |
|
|
|
218 |
|
|
|
— |
|
| 10/31/2012 |
|
|
PLN |
|
|
|
3,745 |
|
|
|
USD |
|
|
|
1,170 |
|
|
|
5 |
|
| 10/31/2012 |
|
|
USD |
|
|
|
721 |
|
|
|
AUD |
|
|
|
698 |
|
|
|
2 |
|
| 10/31/2012 |
|
|
USD |
|
|
|
738 |
|
|
|
CAD |
|
|
|
723 |
|
|
|
(4 |
) |
| 10/31/2012 |
|
|
USD |
|
|
|
559 |
|
|
|
NOK |
|
|
|
3,200 |
|
|
|
(1 |
) |
| 10/31/2012 |
|
|
USD |
|
|
|
744 |
|
|
|
NZD |
|
|
|
907 |
|
|
|
8 |
|
| 10/31/2012 |
|
|
USD |
|
|
|
161 |
|
|
|
SEK |
|
|
|
1,060 |
|
|
|
1 |
|
|
|
|
|
|
|
|
|
|
|
|
|
|
|
|
|
|
|
|
|
|
|
|
|
|
|
|
|
|
|
|
|
|
|
|
|
|
|
|
$ |
(1,952 |
) |
|
|
|
|
|
|
|
|
|
|
|
|
|
|
|
|
|
|
|
|
|
A list of the counterparties for the open forward foreign currency contracts held by the Fund at September 30, 2012, is as
follows:
|
|
|
|
|
|
|
|
|
|
|
|
|
|
|
|
|
| Counterparty |
|
Settlement Date |
|
|
Currency to
Deliver
($ Thousands) |
|
|
Currency to
Receive
($ Thousands) |
|
|
Unrealized
Appreciation
(Depreciation)
($ Thousands) |
|
| Bank of America |
|
|
10/04/2012-10/31/2012 |
|
|
|
(2,274 |
) |
|
|
2,269 |
|
|
$ |
(5 |
) |
| Bank of Montreal |
|
|
10/31/2012 |
|
|
|
(163 |
) |
|
|
163 |
|
|
|
— |
|
| Barclays PLC |
|
|
10/04/2012-11/08/2012 |
|
|
|
(22,541 |
) |
|
|
22,639 |
|
|
|
98 |
|
| BNP Paribas |
|
|
10/04/2012-11/05/2012 |
|
|
|
(95,932 |
) |
|
|
96,734 |
|
|
|
802 |
|
| Brown Brothers Harriman |
|
|
10/04/2012 |
|
|
|
(3,898 |
) |
|
|
3,913 |
|
|
|
15 |
|
| Citigroup |
|
|
10/04/2012-11/09/2012 |
|
|
|
(18,910 |
) |
|
|
18,990 |
|
|
|
80 |
|
| Credit Suisse First Boston |
|
|
10/18/2012-10/31/2012 |
|
|
|
(38,895 |
) |
|
|
38,775 |
|
|
|
(120 |
) |
| Deutsche Bank |
|
|
10/04/2012-11/05/2012 |
|
|
|
(17,295 |
) |
|
|
17,089 |
|
|
|
(206 |
) |
| Goldman Sachs |
|
|
10/31/2012 |
|
|
|
(1,298 |
) |
|
|
1,309 |
|
|
|
11 |
|
| HSBC |
|
|
10/04/2012-11/16/2012 |
|
|
|
(179,222 |
) |
|
|
179,297 |
|
|
|
75 |
|
| JPMorgan Chase Bank |
|
|
10/04/2012-10/31/2012 |
|
|
|
(11,072 |
) |
|
|
11,049 |
|
|
|
(23 |
) |
| Morgan Stanley |
|
|
10/04/2012-10/31/2012 |
|
|
|
(5,182 |
) |
|
|
5,111 |
|
|
|
(71 |
) |
| National Australia Bank |
|
|
10/04/2012-10/11/2012 |
|
|
|
(1,752 |
) |
|
|
1,759 |
|
|
|
7 |
|
| Royal Bank of Canada |
|
|
10/31/2012-11/09/2012 |
|
|
|
(10,481 |
) |
|
|
10,522 |
|
|
|
41 |
|
| Royal Bank of Scotland |
|
|
10/04/2012-12/27/2012 |
|
|
|
(6,595 |
) |
|
|
6,395 |
|
|
|
(200 |
) |
| Societe Generale |
|
|
10/4/2012 |
|
|
|
(2,012 |
) |
|
|
2,056 |
|
|
|
44 |
|
| Standard New York, Inc. |
|
|
10/5/2012 |
|
|
|
(2,417 |
) |
|
|
2,388 |
|
|
|
(29 |
) |
| State Street |
|
|
10/04/2012-11/05/2012 |
|
|
|
(173,947 |
) |
|
|
171,364 |
|
|
|
(2,583 |
) |
| UBS |
|
|
10/04/2012-10/31/2012 |
|
|
|
(56,820 |
) |
|
|
56,932 |
|
|
|
112 |
|
|
|
|
|
|
|
|
|
|
|
|
|
|
|
|
|
|
|
|
|
|
|
|
|
|
|
|
|
|
|
|
$ |
(1,952 |
) |
|
|
|
|
|
|
|
|
|
|
|
|
|
|
|
|
|
A list of outstanding swap agreements held by the Fund at September 30, 2012, is as follows:
|
|
|
|
|
|
|
|
|
|
|
|
|
|
|
|
|
|
|
| Interest Rate Swaps |
|
| Counterparty |
|
Fund Pays |
|
Fund Receives |
|
Termination
Date |
|
Currency |
|
|
Notional
Amount
(Thousands) |
|
|
Net Unrealized
Appreciation
(Depreciation)
($ Thousands) |
|
| Citigroup |
|
3.79% |
|
6-Month GBP LIBOR |
|
05/19/2019 |
|
|
GBP |
|
|
|
2,500 |
|
|
$ |
(684 |
) |
| Deutsche Bank |
|
1.93% |
|
6-Month EURIBOR |
|
04/03/2019 |
|
|
EUR |
|
|
|
4,200 |
|
|
|
(259 |
) |
| UBS |
|
1.07% |
|
6-Month EURIBOR Flat |
|
09/11/2017 |
|
|
DEM |
|
|
|
2,000 |
|
|
|
(17 |
) |
| UBS |
|
2.66% |
|
6-Month GBP LIBOR |
|
09/05/2032 |
|
|
GBP |
|
|
|
1,000 |
|
|
|
15 |
|
| Deutsche Bank |
|
6-Month EURIBOR |
|
4.17% |
|
03/28/2013 |
|
|
EUR |
|
|
|
7,000 |
|
|
|
361 |
|
| Deutsche Bank |
|
6-Month EURIBOR Flat |
|
1.77% |
|
09/07/2022 |
|
|
DEM |
|
|
|
5,250 |
|
|
|
23 |
|
| JPMorgan |
|
6-Month JPY LIBOR |
|
2.22% |
|
03/30/2027 |
|
|
JPY |
|
|
|
750,000 |
|
|
|
1,348 |
|
| Royal Bank of Scotland |
|
6-Month EURIBOR |
|
3.14% |
|
08/04/2021 |
|
|
EUR |
|
|
|
1,450 |
|
|
|
248 |
|
| JPMorgan |
|
6-Month EURIBOR |
|
4.38% |
|
01/07/2013 |
|
|
EUR |
|
|
|
5,400 |
|
|
|
278 |
|
| USB |
|
3-Month Canadian Bankers Acceptance Rate |
|
2.56% |
|
04/24/2022 |
|
|
CAD |
|
|
|
2,000 |
|
|
|
91 |
|
|
|
|
|
|
|
|
|
|
|
|
|
|
|
|
|
|
|
|
|
|
|
|
|
|
|
|
|
|
|
|
|
|
|
|
$ |
1,404 |
|
|
|
|
|
|
|
|
|
|
|
|
|
|
|
|
|
|
|
|
|
|
|
| 20 |
|
SEI Institutional International Trust / Annual Report / September 30, 2012 |
| Percentages |
|
are based on a Net Assets of $491,793 ($ Thousands). |
| (1) |
|
In local currency unless otherwise indicated. |
| (A) |
|
Securities sold within terms of a private placement memorandum, exempt from registration under Section 144A of the Securities Act of 1933, as amended, and may be sold
only to dealers in that program or other “accredited investors.” These securities have been determined to be liquid under guidelines established by the Board of Trustees. |
| (B) |
|
Variable Rate Security — The rate reported on the Summary Schedule of Investments is the rate in effect as of September 30, 2012.
|
| (C) |
|
Securities considered illiquid. The total market value of such securities as of September 30, 2012 was $1,411 ($ Thousands) and
represented 0.3% of Net Assets. |
| †† |
|
The Summary Schedule of Investments does not reflect the complete portfolio holdings. It includes the Fund’s 50 largest holdings and each investment of any issuer
that exceeds 1% of the Fund’s net assets. “Other Securities” represent all issues not required to be disclosed under the rules adopted by the U.S. Securities and Exchange Commission (“SEC”). In certain instances,
securities for which footnotes listed above may otherwise apply are included in the Other Securities caption. The complete schedule of portfolio holdings is available (i) without charge, upon request, by calling (800) 342-5734; and
(ii) on the SEC’s website at http://www.sec.gov. |
AUD
— Australian Dollar
CAD — Canadian Dollar
CHF — Swiss Franc
CZK — Czech Koruna
Cl — Class
DEM — German Mark
DKK — Danish Krone
EUR — Euro
EURIBOR — Euro London Interbank Offered Rate
GBP — British Pound Sterling
HKD — Hong Kong Dollar
JPY — Japanese Yen
KRW — Korean Won
LIBOR — London
Interbank Offered Rate
MTN — Medium Term Note
MXP — Mexican Peso
MYR — Malaysian Ringgit
NOK — Norwegian Krone
NZD — New Zealand
Dollar
PLC — Public Limited Company
PLN — Polish Zlotty
SEK — Swedish Krone
Ser — Series
SGD — Singapore
Dollar
TRY — Turkish Lira
USD —
U.S. Dollar
ZAR — South African Rand
The following is a summary of the inputs used as of September 30, 2012, in valuing the Fund’s
investments and other financial instruments carried at value ($ Thousands):
|
|
|
|
|
|
|
|
|
|
|
|
|
|
|
|
|
| Investments in Securities |
|
Level 1 |
|
|
Level 2 |
|
|
Level 3 |
|
|
Total |
|
| Global Bonds |
|
$ |
— |
|
|
$ |
455,686 |
|
|
$ |
— |
|
|
$ |
455,686 |
|
| Mortgage-Backed Securities |
|
|
— |
|
|
|
16,318 |
|
|
|
— |
|
|
|
16,318 |
|
| Corporate Obligations |
|
|
— |
|
|
|
11,206 |
|
|
|
— |
|
|
|
11,206 |
|
| Asset-Backed Securities |
|
|
— |
|
|
|
1,856 |
|
|
|
— |
|
|
|
1,856 |
|
| U.S. Treasury Obligations |
|
|
— |
|
|
|
486 |
|
|
|
— |
|
|
|
486 |
|
| Municipal Bond |
|
|
— |
|
|
|
51 |
|
|
|
— |
|
|
|
51 |
|
| Time Deposits |
|
|
— |
|
|
|
2,474 |
|
|
|
— |
|
|
|
2,474 |
|
|
|
|
|
|
|
|
|
|
|
|
|
|
|
|
|
|
| Total Investments in Securities |
|
$ |
— |
|
|
$ |
488,077 |
|
|
$ |
— |
|
|
$ |
488,077 |
|
|
|
|
|
|
|
|
|
|
|
|
|
|
|
|
|
|
|
|
|
|
|
|
|
|
|
|
|
|
|
|
|
|
|
| Other Financial Instruments |
|
Level 1 |
|
|
Level 2 |
|
|
Level 3 |
|
|
Total |
|
| Futures Contracts* |
|
$ |
(123 |
) |
|
$ |
— |
|
|
$ |
— |
|
|
$ |
(123 |
) |
| Forwards Contracts* |
|
|
— |
|
|
|
(1,952 |
) |
|
|
— |
|
|
|
(1,952 |
) |
| Interest Rate Swaps* |
|
|
— |
|
|
|
1,404 |
|
|
|
— |
|
|
|
1,404 |
|
|
|
|
|
|
|
|
|
|
|
|
|
|
|
|
|
|
| Total Other Financial Instruments |
|
$ |
(123 |
) |
|
$ |
(548 |
) |
|
$ |
— |
|
|
$ |
(671 |
) |
|
|
|
|
|
|
|
|
|
|
|
|
|
|
|
|
|
| * |
|
Futures, forwards, and swap contracts are valued at the net unrealized appreciation/(depreciation) on the instrument. |
For the year ended September 30, 2012, there were no transfers between Level 1 and Level 2 assets and liabilities.
For the year ended September 30, 2012, there were no transfers between Level 2 and Level 3 assets and liabilities.
Amounts designated as “—” are $0 or have been rounded to $0.
The accompanying notes are an integral part of the financial statements.
|
|
|
|
|
| SEI Institutional International Trust / Annual Report / September 30, 2012 |
|
|
21 |
|
SUMMARY SCHEDULE OF INVESTMENTS
Emerging Markets Debt Fund
September 30, 2012
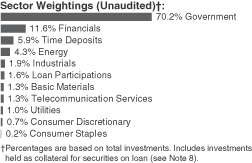
|
|
|
|
|
|
|
|
|
|
|
|
|
|
|
|
|
| Description |
|
Percentage of
Net Assets (%) |
|
|
Face Amount (1)
(Thousands) |
|
|
Market Value
($ Thousands) |
|
|
|
|
|
|
|
|
|
|
|
|
|
|
|
|
|
|
|
|
|
|
|
| GLOBAL BONDS — 86.0% |
|
|
|
|
|
|
|
|
|
|
|
|
|
|
|
|
|
|
|
|
|
| Angola — 0.1% |
|
|
|
|
|
|
|
|
|
|
|
|
|
|
|
|
| Other Securities |
|
|
0.1 |
% |
|
|
|
|
|
|
|
|
|
$ |
851 |
|
|
|
|
|
|
|
|
|
|
|
|
|
|
|
|
|
|
|
|
|
|
|
| Argentina — 1.9% |
|
|
|
|
|
|
|
|
|
|
|
|
|
|
|
|
| Republic of Argentina |
|
|
|
|
|
|
|
|
|
|
|
|
|
|
|
|
| 8.750%, 06/02/2017 |
|
|
0.0 |
|
|
|
|
|
|
|
320 |
|
|
|
312 |
|
| 8.280%, 12/31/2033 |
|
|
0.1 |
|
|
|
|
|
|
|
1,891 |
|
|
|
1,484 |
|
| 8.280%, 12/31/2033 |
|
|
0.0 |
|
|
|
|
|
|
|
351 |
|
|
|
262 |
|
| 7.820%, 12/31/2033 |
|
|
0.1 |
|
|
|
EUR |
|
|
|
1,685 |
|
|
|
1,409 |
|
| 7.820%, 12/31/2033 |
|
|
0.0 |
|
|
|
EUR |
|
|
|
275 |
|
|
|
230 |
|
| 7.820%, 12/31/2033 |
|
|
0.7 |
|
|
|
EUR |
|
|
|
9,497 |
|
|
|
7,960 |
|
| 7.000%, 10/03/2015 |
|
|
0.2 |
|
|
|
|
|
|
|
1,765 |
|
|
|
1,610 |
|
| 4.191%, 12/15/2035 (A) |
|
|
0.1 |
|
|
|
EUR |
|
|
|
7,500 |
|
|
|
1,158 |
|
| 2.500%, 03/31/2019 (B) |
|
|
0.1 |
|
|
|
|
|
|
|
1,800 |
|
|
|
663 |
|
| 1.180%, 12/31/2038 (A) (B) |
|
|
0.0 |
|
|
|
ARS |
|
|
|
2 |
|
|
|
— |
|
| 0.044%, 12/15/2035 (A) |
|
|
0.1 |
|
|
|
|
|
|
|
4,360 |
|
|
|
569 |
|
| 0.000%, 12/15/2035 (A) |
|
|
0.0 |
|
|
|
ARS |
|
|
|
2 |
|
|
|
— |
|
| Other Securities |
|
|
0.5 |
|
|
|
|
|
|
|
|
|
|
|
6,635 |
|
|
|
|
|
|
|
|
|
|
|
|
|
|
|
|
|
|
|
|
|
|
|
|
|
|
|
|
|
|
|
|
|
22,292 |
|
|
|
|
|
|
|
|
|
|
|
|
|
|
|
|
|
|
|
|
|
|
|
| Azerbaijan — 0.1% |
|
|
|
|
|
|
|
|
|
|
|
|
|
|
|
|
| Other Securities |
|
|
0.1 |
|
|
|
|
|
|
|
|
|
|
|
703 |
|
|
|
|
|
|
|
|
|
|
|
|
|
|
|
|
|
|
|
|
|
|
|
| Barbados — 0.1% |
|
|
|
|
|
|
|
|
|
|
|
|
|
|
|
|
| Other Securities |
|
|
0.1 |
|
|
|
|
|
|
|
|
|
|
|
1,332 |
|
|
|
|
|
|
|
|
|
|
|
|
|
|
|
|
|
|
|
|
|
|
|
| Belarus — 0.2% |
|
|
|
|
|
|
|
|
|
|
|
|
|
|
|
|
| Other Securities |
|
|
0.2 |
|
|
|
|
|
|
|
|
|
|
|
2,225 |
|
|
|
|
|
|
|
|
|
|
|
|
|
|
|
|
|
|
|
|
|
|
|
| Bermuda — 0.1% |
|
|
|
|
|
|
|
|
|
|
|
|
|
|
|
|
| Other Securities |
|
|
0.1 |
|
|
|
|
|
|
|
|
|
|
|
861 |
|
|
|
|
|
|
|
|
|
|
|
|
|
|
|
|
|
|
|
|
|
|
|
| Bosnia and Herzegovina — 0.1% |
|
|
|
|
|
|
|
|
|
|
|
|
|
|
|
|
| Other Securities |
|
|
0.1 |
|
|
|
|
|
|
|
|
|
|
|
910 |
|
|
|
|
|
|
|
|
|
|
|
|
|
|
|
|
|
|
|
|
|
|
|
| Brazil — 7.0% |
|
|
|
|
|
|
|
|
|
|
|
|
|
|
|
|
| Banco Nacional de Desenvolvimento Economico e Social |
|
|
|
|
|
|
|
|
|
|
|
|
|
|
|
|
| 6.500%, 06/10/2019 (C) |
|
|
0.1 |
|
|
|
|
|
|
|
660 |
|
|
|
813 |
|
| 5.500%, 07/12/2020 (C) |
|
|
0.1 |
|
|
|
|
|
|
|
400 |
|
|
|
474 |
|
|
|
|
|
|
|
|
|
|
|
|
|
|
|
|
|
|
| Description |
|
Percentage of
Net Assets (%) |
|
|
Face Amount (1)
(Thousands) |
|
|
Market Value
($ Thousands) |
|
|
|
|
|
|
|
|
|
|
|
|
|
|
|
|
|
|
| Barclays, CLN (Nota Do Tesouro Nacional) |
|
|
|
|
|
|
|
|
|
|
|
|
|
|
|
|
| 6.000%, 05/15/2015 |
|
|
0.1 |
% |
|
|
BRL |
|
|
|
850 |
|
|
$ |
997 |
|
| Barclays, CLN (Nota Do Tesouro Nacional, Serie F) |
|
|
|
|
|
|
|
|
|
|
|
|
|
|
|
|
| 10.000%, 01/01/2017 |
|
|
0.4 |
|
|
|
BRL |
|
|
|
9,890 |
|
|
|
5,027 |
|
| 10.000%, 01/01/2021 |
|
|
0.3 |
|
|
|
BRL |
|
|
|
6,770 |
|
|
|
3,390 |
|
| Brazil Letras do Tesouro Nacional |
|
|
|
|
|
|
|
|
|
|
|
|
|
|
|
|
| 8.260%, 01/01/2015 (D) |
|
|
0.4 |
|
|
|
BRL |
|
|
|
10,800 |
|
|
|
4,435 |
|
| Brazil Notas do Tesouro Nacional, Serie B |
|
|
|
|
|
|
|
|
|
|
|
|
|
|
|
|
| 13.054%, 05/15/2015 |
|
|
0.9 |
|
|
|
BRL |
|
|
|
8,660 |
|
|
|
10,157 |
|
| 10.674%, 08/15/2020 |
|
|
0.5 |
|
|
|
BRL |
|
|
|
4,560 |
|
|
|
5,712 |
|
| 6.000%, 08/15/2016 |
|
|
0.3 |
|
|
|
BRL |
|
|
|
2,540 |
|
|
|
3,021 |
|
| Brazil Notas do Tesouro Nacional, Serie F |
|
|
|
|
|
|
|
|
|
|
|
|
|
|
|
|
| 10.000%, 01/01/2014 |
|
|
0.1 |
|
|
|
BRL |
|
|
|
1,490 |
|
|
|
752 |
|
| 10.000%, 01/01/2021 |
|
|
0.1 |
|
|
|
BRL |
|
|
|
3,100 |
|
|
|
1,552 |
|
| Citigroup Funding, CLN (Federal Republic of Brazil) MTN |
|
|
|
|
|
|
|
|
|
|
|
|
|
|
|
|
| 6.000%, 08/16/2018 |
|
|
0.5 |
|
|
|
|
|
|
|
5,154 |
|
|
|
5,136 |
|
| Deutsche Bank, CLN (Nota Do Tesouro Nacional) MTN |
|
|
|
|
|
|
|
|
|
|
|
|
|
|
|
|
| 10.000%, 01/06/2021 |
|
|
0.2 |
|
|
|
|
|
|
|
2,500 |
|
|
|
2,614 |
|
| Federal Republic of Brazil |
|
|
|
|
|
|
|
|
|
|
|
|
|
|
|
|
| 11.000%, 08/17/2040 |
|
|
0.0 |
|
|
|
|
|
|
|
150 |
|
|
|
192 |
|
| 10.250%, 01/10/2028 |
|
|
0.0 |
|
|
|
BRL |
|
|
|
290 |
|
|
|
187 |
|
| 10.125%, 05/15/2027 |
|
|
0.4 |
|
|
|
|
|
|
|
2,827 |
|
|
|
5,113 |
|
| 8.875%, 04/15/2024 |
|
|
0.1 |
|
|
|
|
|
|
|
360 |
|
|
|
582 |
|
| 8.500%, 01/05/2024 |
|
|
0.5 |
|
|
|
BRL |
|
|
|
8,920 |
|
|
|
5,175 |
|
| 8.250%, 01/20/2034 |
|
|
0.1 |
|
|
|
|
|
|
|
900 |
|
|
|
1,487 |
|
| 7.125%, 01/20/2037 |
|
|
0.4 |
|
|
|
|
|
|
|
3,021 |
|
|
|
4,554 |
|
| 5.875%, 01/15/2019 |
|
|
0.0 |
|
|
|
|
|
|
|
260 |
|
|
|
324 |
|
| 5.625%, 01/07/2041 |
|
|
0.1 |
|
|
|
|
|
|
|
1,150 |
|
|
|
1,472 |
|
| 4.875%, 01/22/2021 |
|
|
0.1 |
|
|
|
|
|
|
|
460 |
|
|
|
550 |
|
| 2.625%, 01/05/2023 |
|
|
0.0 |
|
|
|
|
|
|
|
400 |
|
|
|
400 |
|
| JPMorgan, CLN (Nota Do Tesouro Nacional) |
|
|
|
|
|
|
|
|
|
|
|
|
|
|
|
|
| 10.000%, 01/01/2023 |
|
|
0.1 |
|
|
|
BRL |
|
|
|
1,800 |
|
|
|
897 |
|
| 6.000%, 05/15/2015 |
|
|
0.4 |
|
|
|
BRL |
|
|
|
3,705 |
|
|
|
4,346 |
|
| Vale |
|
|
|
|
|
|
|
|
|
|
|
|
|
|
|
|
| 5.625%, 09/11/2042 |
|
|
0.0 |
|
|
|
|
|
|
|
340 |
|
|
|
346 |
|
| Other Securities |
|
|
0.8 |
|
|
|
|
|
|
|
|
|
|
|
11,834 |
|
|
|
|
|
|
|
|
|
|
|
|
|
|
|
|
|
|
|
|
|
|
|
|
|
|
|
|
|
|
|
|
|
81,539 |
|
|
|
|
|
|
|
|
|
|
|
|
|
|
|
|
|
|
|
|
|
|
|
| Canada — 0.0% |
|
|
|
|
|
|
|
|
|
|
|
|
|
|
|
|
| PTTEP Canada International Finance MTN |
|
|
|
|
|
|
|
|
|
|
|
|
|
|
|
|
| 5.692%, 04/05/2021 |
|
|
0.0 |
|
|
|
|
|
|
|
200 |
|
|
|
231 |
|
|
|
|
|
|
|
|
|
|
|
|
|
|
|
|
|
|
|
|
|
|
|
| Chile — 0.8% |
|
|
|
|
|
|
|
|
|
|
|
|
|
|
|
|
| Other Securities |
|
|
0.8 |
|
|
|
|
|
|
|
|
|
|
|
8,866 |
|
|
|
|
|
|
|
|
|
|
|
|
|
|
|
|
|
|
|
|
|
| 22 |
|
SEI Institutional International Trust / Annual Report / September 30, 2012 |
|
|
|
|
|
|
|
|
|
|
|
|
|
|
|
|
|
| Description |
|
Percentage of
Net Assets (%) |
|
|
Face
Amount (1)
(Thousands) |
|
|
Market
Value
($ Thousands) |
|
|
|
|
|
|
|
|
|
|
|
|
|
|
|
|
|
|
|
| China — 1.1% |
|
| Tencent Holdings |
|
|
|
|
|
|
|
|
|
|
|
|
|
|
|
|
| 3.375%, 03/05/2018 |
|
|
0.0 |
% |
|
|
|
|
|
|
217 |
|
|
$ |
219 |
|
| Other Securities |
|
|
1.1 |
|
|
|
|
|
|
|
|
|
|
|
12,045 |
|
|
|
|
|
|
|
|
|
|
|
|
|
|
|
|
|
|
|
|
|
|
|
|
|
|
|
|
|
|
|
|
|
12,264 |
|
|
|
|
|
|
|
|
|
|
|
|
|
|
|
|
|
|
|
| Colombia — 4.2% |
|
| Bogota Distrito Capital |
|
|
|
|
|
|
|
|
|
|
|
|
|
|
|
|
| 9.750%, 07/26/2028 (C) |
|
|
0.6 |
|
|
|
COP |
|
|
|
9,020,000 |
|
|
|
7,380 |
|
| Citigroup Funding, CLN (Republic of Columbia) MTN |
|
|
|
|
|
|
|
|
|
|
|
|
|
|
|
|
| 11.000%, 07/27/2020 |
|
|
0.6 |
|
|
|
COP |
|
|
|
8,830,000 |
|
|
|
6,355 |
|
| Ecopetrol |
|
|
|
|
|
|
|
|
|
|
|
|
|
|
|
|
| 7.625%, 07/23/2019 (C) |
|
|
0.0 |
|
|
|
|
|
|
|
220 |
|
|
|
281 |
|
| Republic of Colombia |
|
|
|
|
|
|
|
|
|
|
|
|
|
|
|
|
| 12.000%, 10/22/2015 |
|
|
0.3 |
|
|
|
COP |
|
|
|
4,279,000 |
|
|
|
2,926 |
|
| 11.750%, 02/25/2020 |
|
|
0.2 |
|
|
|
|
|
|
|
1,552 |
|
|
|
2,526 |
|
| 10.375%, 01/28/2033 |
|
|
0.0 |
|
|
|
|
|
|
|
140 |
|
|
|
256 |
|
| 9.850%, 06/28/2027 |
|
|
0.2 |
|
|
|
COP |
|
|
|
2,670,000 |
|
|
|
2,247 |
|
| 9.850%, 06/28/2027 |
|
|
0.2 |
|
|
|
COP |
|
|
|
2,550,000 |
|
|
|
2,146 |
|
| 8.125%, 05/21/2024 |
|
|
0.2 |
|
|
|
|
|
|
|
1,310 |
|
|
|
1,955 |
|
| 7.750%, 04/14/2021 |
|
|
0.3 |
|
|
|
COP |
|
|
|
5,668,000 |
|
|
|
3,875 |
|
| 7.375%, 01/27/2017 |
|
|
0.1 |
|
|
|
|
|
|
|
445 |
|
|
|
553 |
|
| 7.375%, 03/18/2019 |
|
|
0.2 |
|
|
|
|
|
|
|
1,760 |
|
|
|
2,327 |
|
| 7.375%, 09/18/2037 |
|
|
0.7 |
|
|
|
|
|
|
|
5,379 |
|
|
|
8,257 |
|
| 6.125%, 01/18/2041 |
|
|
0.2 |
|
|
|
|
|
|
|
1,195 |
|
|
|
1,619 |
|
| 4.375%, 07/12/2021 |
|
|
0.1 |
|
|
|
|
|
|
|
450 |
|
|
|
518 |
|
| 4.375%, 03/21/2023 |
|
|
0.1 |
|
|
|
COP |
|
|
|
2,176,000 |
|
|
|
1,187 |
|
| Titulos de Tesoreria |
|
|
|
|
|
|
|
|
|
|
|
|
|
|
|
|
| 7.000%, 02/25/2015 |
|
|
0.1 |
|
|
|
COP |
|
|
|
570,000 |
|
|
|
714 |
|
| Other Securities |
|
|
0.1 |
|
|
|
|
|
|
|
|
|
|
|
3,905 |
|
|
|
|
|
|
|
|
|
|
|
|
|
|
|
|
|
|
|
|
|
|
|
|
|
|
|
|
|
|
|
|
|
49,027 |
|
|
|
|
|
|
|
|
|
|
|
|
|
|
|
|
|
|
|
| Croatia — 1.0% |
|
| Other Securities |
|
|
1.0 |
|
|
|
|
|
|
|
|
|
|
|
11,415 |
|
|
|
|
|
|
|
|
|
|
|
|
|
|
|
|
|
|
|
| Czech Republic — 0.1% |
|
| Other Securities |
|
|
0.1 |
|
|
|
|
|
|
|
|
|
|
|
937 |
|
|
|
|
|
|
|
|
|
|
|
|
|
|
|
|
|
|
|
| Dominican Republic — 0.2% |
|
| Other Securities |
|
|
0.2 |
|
|
|
|
|
|
|
|
|
|
|
2,038 |
|
|
|
|
|
|
|
|
|
|
|
|
|
|
|
|
|
|
|
| Ecuador — 0.0% |
|
| Other Securities |
|
|
0.0 |
|
|
|
|
|
|
|
|
|
|
|
248 |
|
|
|
|
|
|
|
|
|
|
|
|
|
|
|
|
|
|
|
| Egypt — 0.1% |
|
| Other Securities |
|
|
0.1 |
|
|
|
|
|
|
|
|
|
|
|
767 |
|
|
|
|
|
|
|
|
|
|
|
|
|
|
|
|
|
|
|
| El Salvador — 0.3% |
|
| Other Securities |
|
|
0.3 |
|
|
|
|
|
|
|
|
|
|
|
3,159 |
|
|
|
|
|
|
|
|
|
|
|
|
|
|
|
|
|
|
|
| Georgia — 0.1% |
|
| Other Securities |
|
|
0.1 |
|
|
|
|
|
|
|
|
|
|
|
834 |
|
|
|
|
|
|
|
|
|
|
|
|
|
|
|
|
|
|
|
|
|
|
|
|
|
|
|
|
|
|
|
|
|
|
|
| Description |
|
Percentage of
Net Assets (%) |
|
|
Face
Amount (1)
(Thousands) |
|
|
Market
Value
($ Thousands) |
|
|
|
|
|
|
|
|
|
|
|
|
|
|
|
|
|
|
|
|
|
|
|
| Ghana — 0.1% |
|
|
|
|
|
|
|
|
|
|
|
|
|
|
|
|
| Other Securities |
|
|
0.1 |
% |
|
|
|
|
|
|
|
|
|
$ |
1,352 |
|
|
|
|
|
|
|
|
|
|
|
|
|
|
|
|
|
|
|
|
|
|
|
| Hong Kong — 0.3% |
|
|
|
|
|
|
|
|
|
|
|
|
|
|
|
|
| Other Securities |
|
|
0.3 |
|
|
|
|
|
|
|
|
|
|
|
3,243 |
|
|
|
|
|
|
|
|
|
|
|
|
|
|
|
|
|
|
|
|
|
|
|
| Hungary — 3.3% |
|
|
|
|
|
|
|
|
|
|
|
|
|
|
|
|
| Republic of Hungary Treasury Bills |
|
|
|
|
|
|
|
|
|
|
|
|
|
|
|
|
| 0.000%,
01/02/2013 (D) |
|
|
0.2 |
|
|
|
HUF |
|
|
|
570,200 |
|
|
|
2,532 |
|
| Republic of Hungary |
|
|
|
|
|
|
|
|
|
|
|
|
|
|
|
|
| 8.000%, 02/12/2015 |
|
|
0.4 |
|
|
|
HUF |
|
|
|
1,069,000 |
|
|
|
4,957 |
|
| 7.750%, 08/24/2015 |
|
|
1.0 |
|
|
|
HUF |
|
|
|
2,463,850 |
|
|
|
11,367 |
|
| 7.000%, 06/24/2022 |
|
|
0.3 |
|
|
|
HUF |
|
|
|
768,730 |
|
|
|
3,402 |
|
| 6.000%, 01/11/2019 |
|
|
0.1 |
|
|
|
EUR |
|
|
|
612 |
|
|
|
783 |
|
| 5.750%, 06/11/2018 |
|
|
0.2 |
|
|
|
EUR |
|
|
|
2,018 |
|
|
|
2,565 |
|
| 5.500%, 05/06/2014 |
|
|
0.0 |
|
|
|
GBP |
|
|
|
66 |
|
|
|
106 |
|
| 5.000%, 03/30/2016 |
|
|
0.0 |
|
|
|
GBP |
|
|
|
227 |
|
|
|
339 |
|
| 3.500%, 07/18/2016 |
|
|
0.2 |
|
|
|
EUR |
|
|
|
1,637 |
|
|
|
1,967 |
|
| Other Securities |
|
|
0.9 |
|
|
|
|
|
|
|
|
|
|
|
11,187 |
|
|
|
|
|
|
|
|
|
|
|
|
|
|
|
|
|
|
|
|
|
|
|
|
|
|
|
|
|
|
|
|
|
39,205 |
|
|
|
|
|
|
|
|
|
|
|
|
|
|
|
|
|
|
|
|
|
|
|
| India — 0.1% |
|
|
|
|
|
|
|
|
|
|
|
|
|
|
|
|
| Other Securities |
|
|
0.1 |
|
|
|
|
|
|
|
|
|
|
|
1,301 |
|
|
|
|
|
|
|
|
|
|
|
|
|
|
|
|
|
|
|
|
|
|
|
| Indonesia — 4.7% |
|
|
|
|
|
|
|
|
|
|
|
|
|
|
|
|
| Deutsche Bank, CLN (Republic of Indonesia) |
|
|
|
|
|
|
|
|
|
|
|
|
|
|
|
|
| 7.000%, 05/15/2022 |
|
|
0.1 |
|
|
|
IDR |
|
|
|
4,600,000 |
|
|
|
515 |
|
| Indosat Palapa |
|
|
|
|
|
|
|
|
|
|
|
|
|
|
|
|
| 7.375%,
07/29/2020 (C) |
|
|
0.0 |
|
|
|
|
|
|
|
352 |
|
|
|
400 |
|
| JPMorgan, CLN (Republic of Indonesia) |
|
|
|
|
|
|
|
|
|
|
|
|
|
|
|
|
| 7.000%, 05/15/2022 |
|
|
1.2 |
|
|
|
IDR |
|
|
|
122,400,000 |
|
|
|
13,715 |
|
| Majapahit Holding |
|
|
|
|
|
|
|
|
|
|
|
|
|
|
|
|
| 8.000%, 08/07/2019 |
|
|
0.0 |
|
|
|
|
|
|
|
370 |
|
|
|
467 |
|
| 7.875%,
06/29/2037 (C) (E) |
|
|
0.0 |
|
|
|
|
|
|
|
205 |
|
|
|
266 |
|
| 7.750%, 10/17/2016 |
|
|
0.0 |
|
|
|
|
|
|
|
370 |
|
|
|
438 |
|
| 7.750%, 01/20/2020 |
|
|
0.0 |
|
|
|
|
|
|
|
30 |
|
|
|
38 |
|
| 7.750%, 01/20/2020 (C) |
|
|
0.0 |
|
|
|
|
|
|
|
250 |
|
|
|
314 |
|
| Pertamina Persero |
|
|
|
|
|
|
|
|
|
|
|
|
|
|
|
|
| 6.500%, 05/27/2041 (C) |
|
|
0.0 |
|
|
|
|
|
|
|
380 |
|
|
|
435 |
|
| 6.000%, 05/03/2042 (C) |
|
|
0.1 |
|
|
|
|
|
|
|
935 |
|
|
|
1,014 |
|
| 5.250%, 05/23/2021 (C) |
|
|
0.1 |
|
|
|
|
|
|
|
500 |
|
|
|
552 |
|
| 4.875%, 05/03/2022 (C) |
|
|
0.0 |
|
|
|
|
|
|
|
220 |
|
|
|
237 |
|
| Perusahaan Listrik Negara |
|
|
|
|
|
|
|
|
|
|
|
|
|
|
|
|
| 5.500%, 11/22/2021 (C) |
|
|
0.0 |
|
|
|
|
|
|
|
310 |
|
|
|
347 |
|
| Republic of Indonesia |
|
|
|
|
|
|
|
|
|
|
|
|
|
|
|
|
| 11.625%, 03/04/2019 |
|
|
0.1 |
|
|
|
|
|
|
|
628 |
|
|
|
959 |
|
| 11.625%, 03/04/2019 (C) |
|
|
0.2 |
|
|
|
|
|
|
|
1,195 |
|
|
|
1,825 |
|
| 11.625%, 03/04/2019 |
|
|
0.2 |
|
|
|
|
|
|
|
1,786 |
|
|
|
2,728 |
|
| 11.000%, 10/15/2014 |
|
|
0.1 |
|
|
|
IDR |
|
|
|
5,200,000 |
|
|
|
603 |
|
| 10.375%, 05/04/2014 |
|
|
0.0 |
|
|
|
|
|
|
|
190 |
|
|
|
216 |
|
| 8.500%, 10/12/2035 |
|
|
0.1 |
|
|
|
|
|
|
|
401 |
|
|
|
636 |
|
|
|
|
|
|
| SEI Institutional International Trust / Annual Report / September 30, 2012 |
|
|
23 |
|
SUMMARY SCHEDULE OF INVESTMENTS
Emerging Markets Debt Fund (Continued)
September 30, 2012
|
|
|
|
|
|
|
|
|
|
|
|
|
|
|
|
|
| Description |
|
Percentage of
Net Assets (%) |
|
|
Face Amount (1)
(Thousands) |
|
|
Market Value
($ Thousands) |
|
|
|
|
|
|
|
|
|
|
|
|
|
|
|
|
|
|
| 8.500%, 10/12/2035 |
|
|
0.3 |
% |
|
|
|
|
|
|
2,010 |
|
|
$ |
3,186 |
|
| 8.250%, 06/15/2032 |
|
|
0.7 |
|
|
|
IDR |
|
|
|
65,922,000 |
|
|
|
8,008 |
|
| 7.500%, 01/15/2016 |
|
|
0.1 |
|
|
|
|
|
|
|
500 |
|
|
|
588 |
|
| 7.750%, 01/17/2038 |
|
|
0.6 |
|
|
|
|
|
|
|
4,482 |
|
|
|
6,678 |
|
| 7.750%, 01/17/2038 |
|
|
0.0 |
|
|
|
|
|
|
|
100 |
|
|
|
149 |
|
| 7.000%, 05/15/2022 |
|
|
0.2 |
|
|
|
IDR |
|
|
|
17,800,000 |
|
|
|
1,995 |
|
| 6.875%, 01/17/2018 |
|
|
0.1 |
|
|
|
|
|
|
|
910 |
|
|
|
1,115 |
|
| 6.750%, 03/10/2014 |
|
|
0.0 |
|
|
|
|
|
|
|
160 |
|
|
|
171 |
|
| 6.625%, 05/15/2033 |
|
|
0.0 |
|
|
|
IDR |
|
|
|
3,214,000 |
|
|
|
332 |
|
| 6.625%, 02/17/2037 |
|
|
0.0 |
|
|
|
|
|
|
|
110 |
|
|
|
146 |
|
| 6.625%, 02/17/2037 |
|
|
0.0 |
|
|
|
|
|
|
|
70 |
|
|
|
93 |
|
| 6.250%, 04/15/2017 |
|
|
0.2 |
|
|
|
IDR |
|
|
|
16,000,000 |
|
|
|
1,717 |
|
| 5.875%, 03/13/2020 (C) |
|
|
0.1 |
|
|
|
|
|
|
|
764 |
|
|
|
921 |
|
| 5.625%, 05/15/2023 |
|
|
0.0 |
|
|
|
IDR |
|
|
|
3,900,000 |
|
|
|
394 |
|
| 5.250%, 01/17/2042 |
|
|
0.0 |
|
|
|
|
|
|
|
337 |
|
|
|
383 |
|
| 4.875%, 05/05/2021 (C) |
|
|
0.1 |
|
|
|
|
|
|
|
850 |
|
|
|
973 |
|
| Other Securities |
|
|
0.1 |
|
|
|
|
|
|
|
|
|
|
|
2,382 |
|
|
|
|
|
|
|
|
|
|
|
|
|
|
|
|
|
|
|
|
|
|
|
|
|
|
|
|
|
|
|
|
|
54,936 |
|
|
|
|
|
|
|
|
|
|
|
|
|
|
|
|
|
|
|
|
|
|
|
| Iraq — 0.6% |
|
|
|
|
|
|
|
|
|
|
|
|
|
|
|
|
| Republic of Iraq |
|
|
|
|
|
|
|
|
|
|
|
|
|
|
|
|
| 5.800%, 01/15/2028 |
|
|
0.6 |
|
|
|
|
|
|
|
7,453 |
|
|
|
6,838 |
|
| Other Securities |
|
|
0.0 |
|
|
|
|
|
|
|
|
|
|
|
500 |
|
|
|
|
|
|
|
|
|
|
|
|
|
|
|
|
|
|
|
|
|
|
|
|
|
|
|
|
|
|
|
|
|
7,338 |
|
|
|
|
|
|
|
|
|
|
|
|
|
|
|
|
|
|
|
|
|
|
|
| Israel — 0.2% |
|
|
|
|
|
|
|
|
|
|
|
|
|
|
|
|
| Other Securities |
|
|
0.2 |
|
|
|
|
|
|
|
|
|
|
|
2,631 |
|
|
|
|
|
|
|
|
|
|
|
|
|
|
|
|
|
|
|
|
|
|
|
| Ivory Coast — 0.4% |
|
|
|
|
|
|
|
|
|
|
|
|
|
|
|
|
| Other Securities |
|
|
0.4 |
|
|
|
|
|
|
|
|
|
|
|
4,801 |
|
|
|
|
|
|
|
|
|
|
|
|
|
|
|
|
|
|
|
|
|
|
|
| Jamaica — 0.2% |
|
|
|
|
|
|
|
|
|
|
|
|
|
|
|
|
| Other Securities |
|
|
0.2 |
|
|
|
|
|
|
|
|
|
|
|
1,959 |
|
|
|
|
|
|
|
|
|
|
|
|
|
|
|
|
|
|
|
|
|
|
|
| Jordan — 0.1% |
|
|
|
|
|
|
|
|
|
|
|
|
|
|
|
|
| Other Securities |
|
|
0.1 |
|
|
|
|
|
|
|
|
|
|
|
694 |
|
|
|
|
|
|
|
|
|
|
|
|
|
|
|
|
|
|
|
|
|
|
|
| Kazakhstan — 1.8% |
|
|
|
|
|
|
|
|
|
|
|
|
|
|
|
|
| BTA Bank |
|
|
|
|
|
|
|
|
|
|
|
|
|
|
|
|
| 10.750%, 07/01/2018 (C) (F) |
|
|
0.0 |
|
|
|
|
|
|
|
1,202 |
|
|
|
222 |
|
| 10.750%, 07/01/2018 (F) |
|
|
0.1 |
|
|
|
|
|
|
|
3,634 |
|
|
|
672 |
|
| 0.000%, 07/01/2020 (C) (F) |
|
|
0.0 |
|
|
|
|
|
|
|
2,492 |
|
|
|
156 |
|
| Development Bank of Kazakhstan |
|
|
|
|
|
|
|
|
|
|
|
|
|
|
|
|
| 5.500%, 12/20/2015 (C) |
|
|
0.0 |
|
|
|
|
|
|
|
450 |
|
|
|
488 |
|
| Kazakhstan Temir Zholy Finance BV |
|
|
|
|
|
|
|
|
|
|
|
|
|
|
|
|
| 6.950%, 07/10/2042 (C) |
|
|
0.0 |
|
|
|
|
|
|
|
200 |
|
|
|
243 |
|
| Kazatomprom Natsionalnaya Atomnaya Kompaniya |
|
|
|
|
|
|
|
|
|
|
|
|
|
|
|
|
| 6.250%, 05/20/2015 |
|
|
0.0 |
|
|
|
|
|
|
|
100 |
|
|
|
109 |
|
| KazMunayGas National |
|
|
|
|
|
|
|
|
|
|
|
|
|
|
|
|
| 11.750%, 01/23/2015 |
|
|
0.3 |
|
|
|
|
|
|
|
2,624 |
|
|
|
3,166 |
|
|
|
|
|
|
|
|
|
|
|
|
|
|
|
|
|
|
| Description |
|
Percentage of
Net Assets(%) |
|
|
Face Amount (1)
(Thousands) |
|
|
Market Value
($ Thousands) |
|
|
|
|
|
|
|
|
|
|
|
|
|
|
|
|
|
|
| 11.750%, 01/23/2015 (C) |
|
|
0.0 |
% |
|
|
|
|
|
|
410 |
|
|
$ |
495 |
|
| 9.125%, 07/02/2018 |
|
|
0.0 |
|
|
|
|
|
|
|
329 |
|
|
|
426 |
|
| 9.125%, 07/02/2018 (C) |
|
|
0.2 |
|
|
|
|
|
|
|
2,010 |
|
|
|
2,601 |
|
| 8.375%, 07/02/2013 |
|
|
0.1 |
|
|
|
|
|
|
|
690 |
|
|
|
723 |
|
| 7.000%, 05/05/2020 (C) |
|
|
0.2 |
|
|
|
|
|
|
|
1,436 |
|
|
|
1,763 |
|
| 6.375%, 04/09/2021 (C) |
|
|
0.3 |
|
|
|
|
|
|
|
2,569 |
|
|
|
3,084 |
|
| 6.375%, 04/09/2021 |
|
|
0.1 |
|
|
|
|
|
|
|
912 |
|
|
|
1,095 |
|
| Republic of Kazakhstan |
|
|
|
|
|
|
|
|
|
|
|
|
|
|
|
|
| 6.375%, 10/06/2020 (C) |
|
|
0.1 |
|
|
|
EUR |
|
|
|
600 |
|
|
|
719 |
|
| Other Securities |
|
|
0.4 |
|
|
|
|
|
|
|
|
|
|
|
4,822 |
|
|
|
|
|
|
|
|
|
|
|
|
|
|
|
|
|
|
|
|
|
|
|
|
|
|
|
|
|
|
|
|
|
20,784 |
|
|
|
|
|
|
|
|
|
|
|
|
|
|
|
|
|
|
|
|
|
|
|
| Kuwait — 0.1% |
|
|
|
|
|
|
|
|
|
|
|
|
|
|
|
|
| Other Securities |
|
|
0.1 |
|
|
|
|
|
|
|
|
|
|
|
817 |
|
|
|
|
|
|
|
|
|
|
|
|
|
|
|
|
|
|
|
|
|
|
|
| Latvia — 0.0% |
|
|
|
|
|
|
|
|
|
|
|
|
|
|
|
|
| Other Securities |
|
|
0.0 |
|
|
|
|
|
|
|
|
|
|
|
551 |
|
|
|
|
|
|
|
|
|
|
|
|
|
|
|
|
|
|
|
|
|
|
|
| Lithuania — 1.3% |
|
|
|
|
|
|
|
|
|
|
|
|
|
|
|
|
| Republic of Lithuania |
|
|
|
|
|
|
|
|
|
|
|
|
|
|
|
|
| 7.375%, 02/11/2020 (C) |
|
|
0.1 |
|
|
|
|
|
|
|
1,100 |
|
|
|
1,397 |
|
| 7.375%, 02/11/2020 |
|
|
0.0 |
|
|
|
|
|
|
|
90 |
|
|
|
114 |
|
| 6.625%, 02/01/2022 (C) |
|
|
0.1 |
|
|
|
|
|
|
|
1,000 |
|
|
|
1,240 |
|
| 6.625%, 02/01/2022 |
|
|
0.1 |
|
|
|
|
|
|
|
1,000 |
|
|
|
1,240 |
|
| 6.125%, 03/09/2021 |
|
|
0.6 |
|
|
|
|
|
|
|
5,738 |
|
|
|
6,843 |
|
| 6.125%, 03/09/2021 (C) |
|
|
0.2 |
|
|
|
|
|
|
|
1,989 |
|
|
|
2,372 |
|
| 5.125%, 09/14/2017 (C) |
|
|
0.1 |
|
|
|
|
|
|
|
785 |
|
|
|
875 |
|
| 4.850%, 02/07/2018 |
|
|
0.1 |
|
|
|
EUR |
|
|
|
650 |
|
|
|
905 |
|
|
|
|
|
|
|
|
|
|
|
|
|
|
|
|
|
|
|
|
|
|
|
|
|
|
|
|
|
|
|
|
|
14,986 |
|
|
|
|
|
|
|
|
|
|
|
|
|
|
|
|
|
|
|
|
|
|
|
| Malaysia — 4.2% |
|
|
|
|
|
|
|
|
|
|
|
|
|
|
|
|
| Malaysia Government Bond |
|
|
|
|
|
|
|
|
|
|
|
|
|
|
|
|
| 4.392%, 04/15/2026 |
|
|
0.2 |
|
|
|
MYR |
|
|
|
8,100 |
|
|
|
2,841 |
|
| 4.262%, 09/15/2016 |
|
|
0.8 |
|
|
|
MYR |
|
|
|
27,100 |
|
|
|
9,198 |
|
| 4.160%, 07/15/2021 |
|
|
0.4 |
|
|
|
MYR |
|
|
|
13,410 |
|
|
|
4,568 |
|
| 4.012%, 09/15/2017 |
|
|
0.9 |
|
|
|
MYR |
|
|
|
29,800 |
|
|
|
10,052 |
|
| 3.892%, 03/15/2027 |
|
|
0.1 |
|
|
|
MYR |
|
|
|
1,719 |
|
|
|
571 |
|
| 3.580%, 09/28/2018 |
|
|
0.2 |
|
|
|
MYR |
|
|
|
6,750 |
|
|
|
2,229 |
|
| 3.418%, 08/15/2022 |
|
|
0.2 |
|
|
|
MYR |
|
|
|
7,700 |
|
|
|
2,491 |
|
| 3.314%, 10/31/2017 |
|
|
0.1 |
|
|
|
MYR |
|
|
|
2,040 |
|
|
|
667 |
|
| 3.197%, 10/15/2015 |
|
|
0.7 |
|
|
|
MYR |
|
|
|
26,550 |
|
|
|
8,681 |
|
| Petronas Capital |
|
|
|
|
|
|
|
|
|
|
|
|
|
|
|
|
| 7.875%, 05/22/2022 |
|
|
0.3 |
|
|
|
|
|
|
|
2,148 |
|
|
|
3,066 |
|
| Wakala Global Sukuk |
|
|
|
|
|
|
|
|
|
|
|
|
|
|
|
|
| 4.646%, 07/06/2021 (C) |
|
|
0.0 |
|
|
|
|
|
|
|
390 |
|
|
|
450 |
|
| Other Securities |
|
|
0.3 |
|
|
|
|
|
|
|
|
|
|
|
3,788 |
|
|
|
|
|
|
|
|
|
|
|
|
|
|
|
|
|
|
|
|
|
|
|
|
|
|
|
|
|
|
|
|
|
48,602 |
|
|
|
|
|
|
|
|
|
|
|
|
|
|
|
|
|
|
|
|
|
|
|
| Mexico — 9.1% |
|
|
|
|
|
|
|
|
|
|
|
|
|
|
|
|
| Comision Federal de Electricidad |
|
|
|
|
|
|
|
|
|
|
|
|
|
|
|
|
| 5.750%, 02/14/2042 (C) |
|
|
0.1 |
|
|
|
|
|
|
|
500 |
|
|
|
556 |
|
| 4.875%, 05/26/2021 (C) |
|
|
0.0 |
|
|
|
|
|
|
|
200 |
|
|
|
223 |
|
|
|
|
| 24 |
|
SEI Institutional International Trust / Annual Report / September 30, 2012 |
|
|
|
|
|
|
|
|
|
|
|
|
|
|
|
|
|
| Description |
|
Percentage of
Net Assets(%) |
|
|
Face Amount (1)
(Thousands) |
|
|
Market Value
($ Thousands) |
|
|
|
|
|
|
|
|
|
|
|
|
|
|
|
|
|
|
| Deutsche Bank, CLN (Urbi Desarrollos Urbanos) |
|
|
|
|
|
|
|
|
|
|
|
|
|
|
|
|
| 10.468%, 12/22/2012 |
|
|
0.0 |
% |
|
|
|
|
|
|
240 |
|
|
$ |
211 |
|
| Mexican Bonos |
|
|
|
|
|
|
|
|
|
|
|
|
|
|
|
|
| 8.000%, 06/11/2020 |
|
|
0.0 |
|
|
|
MXP |
|
|
|
2,400 |
|
|
|
220 |
|
| 7.500%, 06/03/2027 |
|
|
0.7 |
|
|
|
MXP |
|
|
|
83,123 |
|
|
|
7,470 |
|
| 6.500%, 06/09/2022 |
|
|
0.7 |
|
|
|
MXP |
|
|
|
103,539 |
|
|
|
8,758 |
|
| 6.250%, 06/16/2016 |
|
|
0.1 |
|
|
|
MXP |
|
|
|
19,480 |
|
|
|
1,586 |
|
| 6.000%, 06/18/2015 |
|
|
0.3 |
|
|
|
MXP |
|
|
|
47,840 |
|
|
|
3,843 |
|
| 5.000%, 06/15/2017 |
|
|
0.1 |
|
|
|
MXP |
|
|
|
14,948 |
|
|
|
1,163 |
|
| 4.750%, 03/08/2044 |
|
|
0.3 |
|
|
|
|
|
|
|
2,744 |
|
|
|
3,053 |
|
| 3.625%, 03/15/2022 |
|
|
0.0 |
|
|
|
|
|
|
|
300 |
|
|
|
327 |
|
| Mexican Bonos, Ser M |
|
|
|
|
|
|
|
|
|
|
|
|
|
|
|
|
| 6.500%, 06/10/2021 |
|
|
0.8 |
|
|
|
MXP |
|
|
|
109,352 |
|
|
|
9,263 |
|
| Mexican Bonos, Ser M10 |
|
|
|
|
|
|
|
|
|
|
|
|
|
|
|
|
| 8.500%, 12/13/2018 |
|
|
0.3 |
|
|
|
MXP |
|
|
|
34,500 |
|
|
|
3,165 |
|
| 8.000%, 12/17/2015 |
|
|
0.2 |
|
|
|
MXP |
|
|
|
24,227 |
|
|
|
2,060 |
|
| 7.750%, 12/14/2017 |
|
|
0.3 |
|
|
|
MXP |
|
|
|
34,900 |
|
|
|
3,055 |
|
| Mexican Bonos, Ser M20 |
|
|
|
|
|
|
|
|
|
|
|
|
|
|
|
|
| 10.000%, 12/05/2024 |
|
|
0.1 |
|
|
|
MXP |
|
|
|
14,500 |
|
|
|
1,586 |
|
| 8.500%, 05/31/2029 |
|
|
0.1 |
|
|
|
MXP |
|
|
|
16,000 |
|
|
|
1,560 |
|
| 7.750%, 05/29/2031 |
|
|
0.2 |
|
|
|
MXP |
|
|
|
27,780 |
|
|
|
2,504 |
|
| Mexican Bonos, Ser M30 |
|
|
|
|
|
|
|
|
|
|
|
|
|
|
|
|
| 10.000%, 11/20/2036 |
|
|
0.3 |
|
|
|
MXP |
|
|
|
32,600 |
|
|
|
3,625 |
|
| 8.500%, 11/18/2038 |
|
|
0.6 |
|
|
|
MXP |
|
|
|
66,900 |
|
|
|
6,503 |
|
| Mexican Udibonos |
|
|
|
|
|
|
|
|
|
|
|
|
|
|
|
|
| 5.000%, 06/16/2016 |
|
|
0.0 |
|
|
|
MXP |
|
|
|
260 |
|
|
|
113 |
|
| 2.500%, 12/10/2020 |
|
|
0.7 |
|
|
|
MXP |
|
|
|
19,040 |
|
|
|
7,892 |
|
| Mexichem |
|
|
|
|
|
|
|
|
|
|
|
|
|
|
|
|
| 6.750%, 09/19/2042 |
|
|
0.0 |
|
|
|
|
|
|
|
200 |
|
|
|
208 |
|
| 4.875%, 09/19/2022 |
|
|
0.0 |
|
|
|
|
|
|
|
200 |
|
|
|
203 |
|
| Mexico Cetes |
|
|
|
|
|
|
|
|
|
|
|
|
|
|
|
|
| 4.390%, 12/13/2012 (D) |
|
|
0.3 |
|
|
|
MXP |
|
|
|
410,000 |
|
|
|
3,160 |
|
| Pemex Finance |
|
|
|
|
|
|
|
|
|
|
|
|
|
|
|
|
| 9.150%, 11/15/2018 |
|
|
0.2 |
|
|
|
|
|
|
|
1,595 |
|
|
|
1,998 |
|
| Pemex Project Funding Master Trust |
|
|
|
|
|
|
|
|
|
|
|
|
|
|
|
|
| 6.625%, 06/15/2035 |
|
|
0.1 |
|
|
|
|
|
|
|
1,244 |
|
|
|
1,561 |
|
| 5.750%, 03/01/2018 |
|
|
0.1 |
|
|
|
|
|
|
|
1,255 |
|
|
|
1,470 |
|
| Petroleos Mexicanos |
|
|
|
|
|
|
|
|
|
|
|
|
|
|
|
|
| 8.000%, 05/03/2019 |
|
|
0.1 |
|
|
|
|
|
|
|
360 |
|
|
|
471 |
|
| 6.500%, 06/02/2041 |
|
|
0.0 |
|
|
|
|
|
|
|
20 |
|
|
|
25 |
|
| 6.500%, 06/02/2041 (C) |
|
|
0.0 |
|
|
|
|
|
|
|
140 |
|
|
|
174 |
|
| 6.500%, 06/02/2041 (C) |
|
|
0.1 |
|
|
|
|
|
|
|
442 |
|
|
|
551 |
|
| 6.000%, 03/05/2020 (C) |
|
|
0.0 |
|
|
|
|
|
|
|
60 |
|
|
|
72 |
|
| 6.000%, 03/05/2020 |
|
|
0.0 |
|
|
|
|
|
|
|
130 |
|
|
|
155 |
|
| 5.500%, 06/27/2044 (C) |
|
|
0.0 |
|
|
|
|
|
|
|
150 |
|
|
|
165 |
|
| United Mexican States MTN |
|
|
|
|
|
|
|
|
|
|
|
|
|
|
|
|
| 8.300%, 08/15/2031 |
|
|
0.2 |
|
|
|
|
|
|
|
1,400 |
|
|
|
2,247 |
|
| 6.050%, 01/11/2040 |
|
|
0.2 |
|
|
|
|
|
|
|
2,016 |
|
|
|
2,696 |
|
| 5.950%, 03/19/2019 |
|
|
0.0 |
|
|
|
|
|
|
|
370 |
|
|
|
459 |
|
| 5.750%, 10/12/2110 |
|
|
0.7 |
|
|
|
|
|
|
|
6,964 |
|
|
|
8,322 |
|
| 5.625%, 01/15/2017 |
|
|
0.0 |
|
|
|
|
|
|
|
402 |
|
|
|
470 |
|
| 5.125%, 01/15/2020 |
|
|
0.1 |
|
|
|
|
|
|
|
920 |
|
|
|
1,099 |
|
|
|
|
|
|
|
|
|
|
|
|
|
|
|
|
|
|
| Description |
|
Percentage of
Net Assets(%) |
|
|
Face Amount (1)
(Thousands) |
|
|
Market Value
($ Thousands) |
|
|
|
|
|
|
|
|
|
|
|
|
|
|
|
|
|
|
| United Mexican States, Ser A MTN |
|
|
|
|
|
|
|
|
|
|
|
|
|
|
|
|
| 6.750%, 09/27/2034 |
|
|
0.1 |
% |
|
|
|
|
|
|
640 |
|
|
$ |
911 |
|
| Other Securities |
|
|
1.0 |
|
|
|
|
|
|
|
|
|
|
|
11,533 |
|
|
|
|
|
|
|
|
|
|
|
|
|
|
|
|
|
|
|
|
|
|
|
|
|
|
|
|
|
|
|
|
|
106,686 |
|
|
|
|
|
|
|
|
|
|
|
|
|
|
|
|
|
|
|
|
|
|
|
| Mongolia — 0.1% |
|
|
|
|
|
|
|
|
|
|
|
|
|
|
|
|
| Other Securities |
|
|
0.1 |
|
|
|
|
|
|
|
|
|
|
|
1,124 |
|
|
|
|
|
|
|
|
|
|
|
|
|
|
|
|
|
|
|
|
|
|
|
| Morocco — 0.0% |
|
|
|
|
|
|
|
|
|
|
|
|
|
|
|
|
| Other Securities |
|
|
0.0 |
|
|
|
|
|
|
|
|
|
|
|
323 |
|
|
|
|
|
|
|
|
|
|
|
|
|
|
|
|
|
|
|
|
|
|
|
| Nigeria — 0.3% |
|
|
|
|
|
|
|
|
|
|
|
|
|
|
|
|
| Other Securities |
|
|
0.3 |
|
|
|
|
|
|
|
|
|
|
|
3,911 |
|
|
|
|
|
|
|
|
|
|
|
|
|
|
|
|
|
|
|
|
|
|
|
| Oman — 0.0% |
|
|
|
|
|
|
|
|
|
|
|
|
|
|
|
|
| Other Securities |
|
|
0.0 |
|
|
|
|
|
|
|
|
|
|
|
113 |
|
|
|
|
|
|
|
|
|
|
|
|
|
|
|
|
|
|
|
|
|
|
|
| Pakistan — 0.1% |
|
|
|
|
|
|
|
|
|
|
|
|
|
|
|
|
| Other Securities |
|
|
0.1 |
|
|
|
|
|
|
|
|
|
|
|
852 |
|
|
|
|
|
|
|
|
|
|
|
|
|
|
|
|
|
|
|
|
|
|
|
| Panama — 1.0% |
|
|
|
|
|
|
|
|
|
|
|
|
|
|
|
|
| ENA Norte Trust |
|
|
|
|
|
|
|
|
|
|
|
|
|
|
|
|
| 4.950%, 04/25/2023 |
|
|
0.0 |
|
|
|
|
|
|
|
250 |
|
|
|
250 |
|
| Other Securities |
|
|
1.0 |
|
|
|
|
|
|
|
|
|
|
|
10,858 |
|
|
|
|
|
|
|
|
|
|
|
|
|
|
|
|
|
|
|
|
|
|
|
|
|
|
|
|
|
|
|
|
|
11,108 |
|
|
|
|
|
|
|
|
|
|
|
|
|
|
|
|
|
|
|
|
|
|
|
| Peru — 1.6% |
|
|
|
|
|
|
|
|
|
|
|
|
|
|
|
|
| CFG Investment |
|
|
|
|
|
|
|
|
|
|
|
|
|
|
|
|
| 9.750%, 07/30/2019 |
|
|
0.0 |
|
|
|
|
|
|
|
450 |
|
|
|
355 |
|
| Corp Azucarera del Peru |
|
|
|
|
|
|
|
|
|
|
|
|
|
|
|
|
| 6.375%, 08/02/2022 |
|
|
0.0 |
|
|
|
|
|
|
|
121 |
|
|
|
128 |
|
| Republic of Peru |
|
|
|
|
|
|
|
|
|
|
|
|
|
|
|
|
| 8.750%, 11/21/2033 |
|
|
0.5 |
|
|
|
|
|
|
|
3,391 |
|
|
|
5,909 |
|
| 8.600%, 08/12/2017 |
|
|
0.1 |
|
|
|
PEI |
|
|
|
2,110 |
|
|
|
996 |
|
| 8.375%, 05/03/2016 |
|
|
0.1 |
|
|
|
|
|
|
|
340 |
|
|
|
423 |
|
| 8.200%, 08/12/2026 |
|
|
0.2 |
|
|
|
PEI |
|
|
|
4,950 |
|
|
|
2,569 |
|
| 7.840%, 08/12/2020 |
|
|
0.1 |
|
|
|
PEI |
|
|
|
3,150 |
|
|
|
1,503 |
|
| 7.840%, 08/12/2020 |
|
|
0.1 |
|
|
|
PEI |
|
|
|
2,820 |
|
|
|
1,345 |
|
| 7.350%, 07/21/2025 |
|
|
0.2 |
|
|
|
|
|
|
|
1,160 |
|
|
|
1,699 |
|
| 7.125%, 03/30/2019 |
|
|
0.0 |
|
|
|
|
|
|
|
140 |
|
|
|
185 |
|
| 6.950%, 08/12/2031 |
|
|
0.1 |
|
|
|
PEI |
|
|
|
1,400 |
|
|
|
644 |
|
| Other Securities |
|
|
0.2 |
|
|
|
|
|
|
|
|
|
|
|
3,169 |
|
|
|
|
|
|
|
|
|
|
|
|
|
|
|
|
|
|
|
|
|
|
|
|
|
|
|
|
|
|
|
|
|
18,925 |
|
|
|
|
|
|
|
|
|
|
|
|
|
|
|
|
|
|
|
|
|
|
|
| Philippines — 2.0% |
|
|
|
|
|
|
|
|
|
|
|
|
|
|
|
|
| Development Bank of Philippines |
|
|
|
|
|
|
|
|
|
|
|
|
|
|
|
|
| 5.500%, 03/25/2021 |
|
|
0.0 |
|
|
|
|
|
|
|
330 |
|
|
|
369 |
|
| Republic of Philippines |
|
|
|
|
|
|
|
|
|
|
|
|
|
|
|
|
| 10.625%, 03/16/2025 |
|
|
0.2 |
|
|
|
|
|
|
|
1,440 |
|
|
|
2,523 |
|
| 9.500%, 02/02/2030 |
|
|
0.4 |
|
|
|
|
|
|
|
2,849 |
|
|
|
4,925 |
|
| 8.375%, 06/17/2019 |
|
|
0.0 |
|
|
|
|
|
|
|
320 |
|
|
|
442 |
|
| 7.750%, 01/14/2031 |
|
|
0.6 |
|
|
|
|
|
|
|
4,868 |
|
|
|
7,448 |
|
| 7.500%, 09/25/2024 |
|
|
0.0 |
|
|
|
|
|
|
|
290 |
|
|
|
412 |
|
|
|
|
|
|
| SEI Institutional International Trust / Annual Report / September 30, 2012 |
|
|
25 |
|
SUMMARY SCHEDULE OF INVESTMENTS
Emerging Markets Debt Fund (Continued)
September 30, 2012
|
|
|
|
|
|
|
|
|
|
|
|
|
|
|
|
|
| Description |
|
Percentage of
Net Assets(%) |
|
|
Face Amount (1)
(Thousands) |
|
|
Market Value
($ Thousands) |
|
|
|
|
|
|
|
|
|
|
|
|
|
|
|
|
|
|
| 6.375%, 10/23/2034 |
|
|
0.1 |
% |
|
|
|
|
|
|
530 |
|
|
$ |
730 |
|
| 6.250%, 01/14/2036 |
|
|
0.2 |
|
|
|
PHP |
|
|
|
73,000 |
|
|
|
1,945 |
|
| 5.500%, 03/30/2026 |
|
|
0.1 |
|
|
|
|
|
|
|
540 |
|
|
|
677 |
|
| 4.950%, 01/15/2021 |
|
|
0.0 |
|
|
|
PHP |
|
|
|
15,000 |
|
|
|
379 |
|
| 4.000%, 01/15/2021 |
|
|
0.1 |
|
|
|
|
|
|
|
1,016 |
|
|
|
1,135 |
|
| Other Securities |
|
|
0.3 |
|
|
|
|
|
|
|
|
|
|
|
2,553 |
|
|
|
|
|
|
|
|
|
|
|
|
|
|
|
|
|
|
|
|
|
|
|
|
|
|
|
|
|
|
|
|
|
23,538 |
|
|
|
|
|
|
|
|
|
|
|
|
|
|
|
|
|
|
|
|
|
|
|
| Poland — 5.9% |
|
|
|
|
|
|
|
|
|
|
|
|
|
|
|
|
| Republic of Poland |
|
|
|
|
|
|
|
|
|
|
|
|
|
|
|
|
| 6.375%, 07/15/2019 |
|
|
0.7 |
|
|
|
|
|
|
|
6,510 |
|
|
|
8,040 |
|
| 6.250%, 10/24/2015 |
|
|
0.1 |
|
|
|
|
|
|
|
3,080 |
|
|
|
1,020 |
|
| 5.750%, 04/25/2014 |
|
|
0.0 |
|
|
|
|
|
|
|
980 |
|
|
|
314 |
|
| 5.125%, 04/21/2021 |
|
|
0.1 |
|
|
|
|
|
|
|
1,000 |
|
|
|
1,165 |
|
| 5.000%, 04/25/2016 |
|
|
0.3 |
|
|
|
|
|
|
|
11,500 |
|
|
|
3,689 |
|
| 5.000%, 03/23/2022 |
|
|
0.4 |
|
|
|
|
|
|
|
3,465 |
|
|
|
4,019 |
|
| 4.750%, 10/25/2016 |
|
|
0.1 |
|
|
|
PLN |
|
|
|
5,100 |
|
|
|
1,626 |
|
| 4.750%, 04/25/2017 |
|
|
0.5 |
|
|
|
PLN |
|
|
|
19,646 |
|
|
|
6,274 |
|
| 4.060%, 07/25/2014 (D) |
|
|
0.4 |
|
|
|
PLN |
|
|
|
14,090 |
|
|
|
4,094 |
|
| 4.000%, 03/23/2021 |
|
|
0.1 |
|
|
|
EUR |
|
|
|
736 |
|
|
|
1,032 |
|
| 3.000%, 03/17/2023 |
|
|
0.1 |
|
|
|
|
|
|
|
700 |
|
|
|
688 |
|
| Republic of Poland, Ser 0114 |
|
|
|
|
|
|
|
|
|
|
|
|
|
|
|
|
| 4.530%, 01/25/2014 (D) |
|
|
0.6 |
|
|
|
PLN |
|
|
|
24,410 |
|
|
|
7,227 |
|
| Republic of Poland, Ser 0415 |
|
|
|
|
|
|
|
|
|
|
|
|
|
|
|
|
| 5.500%, 04/25/2015 |
|
|
0.7 |
|
|
|
PLN |
|
|
|
23,970 |
|
|
|
7,733 |
|
| Republic of Poland, Ser 0922 |
|
|
|
|
|
|
|
|
|
|
|
|
|
|
|
|
| 5.750%, 09/23/2022 |
|
|
0.6 |
|
|
|
PLN |
|
|
|
21,450 |
|
|
|
7,255 |
|
| Republic of Poland, Ser 1019 |
|
|
|
|
|
|
|
|
|
|
|
|
|
|
|
|
| 5.500%, 10/25/2019 |
|
|
0.2 |
|
|
|
PLN |
|
|
|
7,500 |
|
|
|
2,490 |
|
| Republic of Poland, Ser 1021 |
|
|
|
|
|
|
|
|
|
|
|
|
|
|
|
|
| 5.750%, 10/25/2021 |
|
|
0.5 |
|
|
|
PLN |
|
|
|
17,920 |
|
|
|
6,021 |
|
| Republic of Poland, Ser CPI |
|
|
|
|
|
|
|
|
|
|
|
|
|
|
|
|
| 3.000%, 08/24/2016 |
|
|
0.3 |
|
|
|
PLN |
|
|
|
12,134 |
|
|
|
3,954 |
|
| Other Securities |
|
|
0.2 |
|
|
|
|
|
|
|
|
|
|
|
2,824 |
|
|
|
|
|
|
|
|
|
|
|
|
|
|
|
|
|
|
|
|
|
|
|
|
|
|
|
|
|
|
|
|
|
69,465 |
|
|
|
|
|
|
|
|
|
|
|
|
|
|
|
|
|
|
|
|
|
|
|
| Qatar — 1.1% |
|
|
|
|
|
|
|
|
|
|
|
|
|
|
|
|
| Qtel International Finance |
|
|
|
|
|
|
|
|
|
|
|
|
|
|
|
|
| 7.875%, 06/10/2019 |
|
|
0.1 |
|
|
|
|
|
|
|
770 |
|
|
|
993 |
|
| 5.000%, 10/19/2025 (C) |
|
|
0.0 |
|
|
|
|
|
|
|
200 |
|
|
|
223 |
|
| 4.750%, 02/16/2021 (C) |
|
|
0.1 |
|
|
|
|
|
|
|
457 |
|
|
|
507 |
|
| 4.750%, 02/16/2021 |
|
|
0.0 |
|
|
|
|
|
|
|
250 |
|
|
|
277 |
|
| Ras Laffan Liquefied Natural Gas II |
|
|
|
|
|
|
|
|
|
|
|
|
|
|
|
|
| 5.298%, 09/30/2020 |
|
|
0.0 |
|
|
|
|
|
|
|
420 |
|
|
|
472 |
|
| Ras Laffan Liquefied Natural Gas III |
|
|
|
|
|
|
|
|
|
|
|
|
|
|
|
|
| 5.832%, 09/30/2016 |
|
|
0.0 |
|
|
|
|
|
|
|
178 |
|
|
|
194 |
|
| State of Qatar |
|
|
|
|
|
|
|
|
|
|
|
|
|
|
|
|
| 9.750%, 06/15/2030 |
|
|
0.2 |
|
|
|
|
|
|
|
1,025 |
|
|
|
1,809 |
|
| 6.550%, 04/09/2019 |
|
|
0.2 |
|
|
|
|
|
|
|
1,533 |
|
|
|
1,911 |
|
| 6.400%, 01/20/2040 |
|
|
0.0 |
|
|
|
|
|
|
|
220 |
|
|
|
300 |
|
| 6.400%, 01/20/2040 (C) |
|
|
0.1 |
|
|
|
|
|
|
|
377 |
|
|
|
515 |
|
|
|
|
|
|
|
|
|
|
|
|
|
|
|
|
|
|
| Description |
|
Percentage of
Net Assets(%) |
|
|
Face Amount (1)
(Thousands) |
|
|
Market Value
($ Thousands) |
|
|
|
|
|
|
|
|
|
|
|
|
|
|
|
|
|
|
| 5.750%, 01/20/2042 (C) |
|
|
0.1 |
% |
|
|
|
|
|
|
750 |
|
|
$ |
954 |
|
| 5.250%, 01/20/2020 |
|
|
0.1 |
|
|
|
|
|
|
|
1,182 |
|
|
|
1,398 |
|
| 5.250%, 01/20/2020 (C) |
|
|
0.2 |
|
|
|
|
|
|
|
2,300 |
|
|
|
2,720 |
|
| Other Securities |
|
|
0.0 |
|
|
|
|
|
|
|
|
|
|
|
311 |
|
|
|
|
|
|
|
|
|
|
|
|
|
|
|
|
|
|
|
|
|
|
|
|
|
|
|
|
|
|
|
|
|
12,584 |
|
|
|
|
|
|
|
|
|
|
|
|
|
|
|
|
|
|
|
|
|
|
|
| Romania — 0.4% |
|
|
|
|
|
|
|
|
|
|
|
|
|
|
|
|
| Other Securities |
|
|
0.4 |
|
|
|
|
|
|
|
|
|
|
|
4,910 |
|
|
|
|
|
|
|
|
|
|
|
|
|
|
|
|
|
|
|
|
|
|
|
| Russia — 6.0% |
|
|
|
|
|
|
|
|
|
|
|
|
|
|
|
|
| Credit Suisse, CLN (Russian Government Bond) |
|
|
|
|
|
|
|
|
|
|
|
|
|
|
|
|
| 7.600%, 04/14/2021 |
|
|
0.7 |
|
|
|
RUB |
|
|
|
238,700 |
|
|
|
7,635 |
|
| 7.500%, 03/15/2018 |
|
|
0.2 |
|
|
|
RUB |
|
|
|
81,500 |
|
|
|
2,623 |
|
| Gazprom Neft OAO Via GPN Capital |
|
|
|
|
|
|
|
|
|
|
|
|
|
|
|
|
| 4.375%, 09/19/2022 (C) |
|
|
0.1 |
|
|
|
|
|
|
|
550 |
|
|
|
547 |
|
| Gazprom OAO Via Gaz Capital |
|
|
|
|
|
|
|
|
|
|
|
|
|
|
|
|
| 4.950%, 07/19/2022 (C) |
|
|
0.1 |
|
|
|
|
|
|
|
877 |
|
|
|
919 |
|
| Russian Agricultural Bank Via RSHB Capital |
|
|
|
|
|
|
|
|
|
|
|
|
|
|
|
|
| 5.298%, 12/27/2017 (C) |
|
|
0.0 |
|
|
|
|
|
|
|
415 |
|
|
|
439 |
|
| Russian Foreign Bond –Eurobond |
|
|
|
|
|
|
|
|
|
|
|
|
|
|
|
|
| 12.750%, 06/24/2028 |
|
|
0.2 |
|
|
|
|
|
|
|
930 |
|
|
|
1,802 |
|
| 11.000%, 07/24/2018 |
|
|
0.0 |
|
|
|
|
|
|
|
292 |
|
|
|
427 |
|
| 7.850%, 03/10/2018 |
|
|
0.8 |
|
|
|
RUB |
|
|
|
270,000 |
|
|
|
9,281 |
|
| 7.500%, 03/31/2030 |
|
|
1.6 |
|
|
|
|
|
|
|
15,114 |
|
|
|
19,082 |
|
| 5.625%, 04/04/2042 (C) |
|
|
0.1 |
|
|
|
|
|
|
|
800 |
|
|
|
960 |
|
| 5.000%, 04/29/2020 (C) |
|
|
0.1 |
|
|
|
|
|
|
|
900 |
|
|
|
1,033 |
|
| 3.250%, 04/04/2017 (C) |
|
|
0.1 |
|
|
|
|
|
|
|
1,200 |
|
|
|
1,263 |
|
| Sberbank of Russia Via SB Capital |
|
|
|
|
|
|
|
|
|
|
|
|
|
|
|
|
| 6.125%, 02/07/2022 |
|
|
0.0 |
|
|
|
|
|
|
|
250 |
|
|
|
276 |
|
| SCF Capital |
|
|
|
|
|
|
|
|
|
|
|
|
|
|
|
|
| 5.375%, 10/27/2017 (C) |
|
|
0.1 |
|
|
|
|
|
|
|
1,010 |
|
|
|
1,016 |
|
| VEB-Leasing Via VEB Leasing Investment |
|
|
|
|
|
|
|
|
|
|
|
|
|
|
|
|
| 5.125%, 05/27/2016 |
|
|
0.0 |
|
|
|
|
|
|
|
320 |
|
|
|
332 |
|
| Vnesheconombank Via VEB Finance |
|
|
|
|
|
|
|
|
|
|
|
|
|
|
|
|
| 6.902%, 07/09/2020 (C) |
|
|
0.1 |
|
|
|
|
|
|
|
785 |
|
|
|
926 |
|
| 6.902%, 07/09/2020 |
|
|
0.1 |
|
|
|
|
|
|
|
1,240 |
|
|
|
1,463 |
|
| 6.800%, 11/22/2025 |
|
|
0.0 |
|
|
|
|
|
|
|
450 |
|
|
|
529 |
|
| 6.800%, 11/22/2025 (C) |
|
|
0.0 |
|
|
|
|
|
|
|
150 |
|
|
|
176 |
|
| 6.025%, 07/05/2022 (C) |
|
|
0.1 |
|
|
|
|
|
|
|
750 |
|
|
|
835 |
|
| 5.450%, 11/22/2017 (C) |
|
|
0.0 |
|
|
|
|
|
|
|
300 |
|
|
|
326 |
|
| VTB Bank Via VTB Capital |
|
|
|
|
|
|
|
|
|
|
|
|
|
|
|
|
| 6.875%, 05/29/2018 |
|
|
0.0 |
|
|
|
|
|
|
|
300 |
|
|
|
323 |
|
| 6.551%, 10/13/2020 (C) |
|
|
0.1 |
|
|
|
|
|
|
|
860 |
|
|
|
908 |
|
| 6.315%, 02/22/2018 |
|
|
0.1 |
|
|
|
|
|
|
|
762 |
|
|
|
806 |
|
| 6.250%, 06/30/2035 |
|
|
0.0 |
|
|
|
|
|
|
|
357 |
|
|
|
379 |
|
|
|
|
| 26 |
|
SEI Institutional International Trust / Annual Report / September 30, 2012 |
|
|
|
|
|
|
|
|
|
|
|
|
|
|
|
|
|
| Description |
|
Percentage of
Net Assets(%) |
|
|
Face Amount (1)
(Thousands) |
|
|
Market Value
($ Thousands) |
|
|
|
|
|
|
|
|
|
|
|
|
|
|
|
|
|
|
| 6.000%, 04/12/2017 (C) |
|
|
0.1 |
% |
|
|
|
|
|
|
1,400 |
|
|
$ |
1,463 |
|
| Other Securities |
|
|
1.2 |
|
|
|
|
|
|
|
|
|
|
|
13,915 |
|
|
|
|
|
|
|
|
|
|
|
|
|
|
|
|
|
|
|
|
|
|
|
|
|
|
|
|
|
|
|
|
|
69,684 |
|
|
|
|
|
|
|
|
|
|
|
|
|
|
|
|
|
|
|
|
|
|
|
| Saudi Arabia — 0.1% |
|
|
|
|
|
|
|
|
|
|
|
|
|
|
|
|
| Other Securities |
|
|
0.1 |
|
|
|
|
|
|
|
|
|
|
|
1,061 |
|
|
|
|
|
|
|
|
|
|
|
|
|
|
|
|
|
|
|
|
|
|
|
| Senegal — 0.1% |
|
|
|
|
|
|
|
|
|
|
|
|
|
|
|
|
| Other Securities |
|
|
0.1 |
|
|
|
|
|
|
|
|
|
|
|
1,150 |
|
|
|
|
|
|
|
|
|
|
|
|
|
|
|
|
|
|
|
|
|
|
|
| Serbia — 0.1% |
|
|
|
|
|
|
|
|
|
|
|
|
|
|
|
|
| Other Securities |
|
|
0.1 |
|
|
|
|
|
|
|
|
|
|
|
1,322 |
|
|
|
|
|
|
|
|
|
|
|
|
|
|
|
|
|
|
|
|
|
|
|
| Singapore — 0.2% |
|
|
|
|
|
|
|
|
|
|
|
|
|
|
|
|
| Other Securities |
|
|
0.2 |
|
|
|
|
|
|
|
|
|
|
|
2,276 |
|
|
|
|
|
|
|
|
|
|
|
|
|
|
|
|
|
|
|
|
|
|
|
| Slovak Republic — 0.1% |
|
|
|
|
|
|
|
|
|
|
|
|
|
|
|
|
| Other Securities |
|
|
0.1 |
|
|
|
|
|
|
|
|
|
|
|
1,359 |
|
|
|
|
|
|
|
|
|
|
|
|
|
|
|
|
|
|
|
|
|
|
|
| South Africa — 7.4% |
|
|
|
|
|
|
|
|
|
|
|
|
|
|
|
|
| Eskom Holdings |
|
|
|
|
|
|
|
|
|
|
|
|
|
|
|
|
| 5.750%, 01/26/2021 (C) |
|
|
0.1 |
|
|
|
|
|
|
|
600 |
|
|
|
684 |
|
| Republic of South Africa |
|
|
|
|
|
|
|
|
|
|
|
|
|
|
|
|
| 13.500%, 09/15/2015 |
|
|
0.7 |
|
|
|
ZAR |
|
|
|
51,580 |
|
|
|
7,616 |
|
| 10.500%, 12/21/2026 |
|
|
1.0 |
|
|
|
ZAR |
|
|
|
75,065 |
|
|
|
11,540 |
|
| 8.500%, 06/23/2017 |
|
|
0.1 |
|
|
|
|
|
|
|
860 |
|
|
|
1,045 |
|
| 8.000%, 12/21/2018 |
|
|
1.3 |
|
|
|
ZAR |
|
|
|
117,120 |
|
|
|
15,529 |
|
| 7.750%, 02/28/2023 |
|
|
0.3 |
|
|
|
ZAR |
|
|
|
30,193 |
|
|
|
3,860 |
|
| 7.250%, 01/15/2020 |
|
|
0.7 |
|
|
|
ZAR |
|
|
|
63,000 |
|
|
|
7,986 |
|
| 7.000%, 02/28/2031 |
|
|
0.2 |
|
|
|
ZAR |
|
|
|
18,400 |
|
|
|
2,037 |
|
| 6.875%, 05/27/2019 |
|
|
0.3 |
|
|
|
|
|
|
|
2,847 |
|
|
|
3,584 |
|
| 6.750%, 03/31/2021 |
|
|
1.4 |
|
|
|
ZAR |
|
|
|
135,540 |
|
|
|
16,617 |
|
| 6.500%, 02/28/2041 |
|
|
0.1 |
|
|
|
ZAR |
|
|
|
9,200 |
|
|
|
913 |
|
| 6.250%, 03/08/2041 |
|
|
0.0 |
|
|
|
|
|
|
|
279 |
|
|
|
368 |
|
| 5.875%, 05/30/2022 |
|
|
0.1 |
|
|
|
|
|
|
|
670 |
|
|
|
825 |
|
| 5.500%, 03/09/2020 |
|
|
0.3 |
|
|
|
|
|
|
|
2,697 |
|
|
|
3,203 |
|
| 4.665%, 01/17/2024 |
|
|
0.2 |
|
|
|
|
|
|
|
1,500 |
|
|
|
1,684 |
|
| Republic of South Africa, Ser R203 |
|
|
|
|
|
|
|
|
|
|
|
|
|
|
|
|
| 8.250%, 09/15/2017 |
|
|
0.4 |
|
|
|
ZAR |
|
|
|
31,600 |
|
|
|
4,219 |
|
| Transnet MTN |
|
|
|
|
|
|
|
|
|
|
|
|
|
|
|
|
| 4.500%, 02/10/2016 (C) |
|
|
0.0 |
|
|
|
|
|
|
|
280 |
|
|
|
297 |
|
| Transnet SOC |
|
|
|
|
|
|
|
|
|
|
|
|
|
|
|
|
| 4.000%, 07/26/2022 (C) |
|
|
0.1 |
|
|
|
|
|
|
|
1,119 |
|
|
|
1,137 |
|
| Other Securities |
|
|
0.3 |
|
|
|
|
|
|
|
|
|
|
|
2,968 |
|
|
|
|
|
|
|
|
|
|
|
|
|
|
|
|
|
|
|
|
|
|
|
|
|
|
|
|
|
|
|
|
|
86,112 |
|
|
|
|
|
|
|
|
|
|
|
|
|
|
|
|
|
|
|
|
|
|
|
| South Korea — 0.1% |
|
|
|
|
|
|
|
|
|
|
|
|
|
|
|
|
| Other Securities |
|
|
0.1 |
|
|
|
|
|
|
|
|
|
|
|
1,695 |
|
|
|
|
|
|
|
|
|
|
|
|
|
|
|
|
|
|
|
|
|
|
|
| Sri Lanka — 0.1% |
|
|
|
|
|
|
|
|
|
|
|
|
|
|
|
|
| Other Securities |
|
|
0.1 |
|
|
|
|
|
|
|
|
|
|
|
1,676 |
|
|
|
|
|
|
|
|
|
|
|
|
|
|
|
|
|
|
|
|
|
|
|
|
|
|
|
|
|
|
|
|
|
|
|
| Description |
|
Percentage of
Net Assets(%) |
|
|
Face Amount (1)
(Thousands) |
|
|
Market Value
($ Thousands) |
|
|
|
|
|
|
|
|
|
|
|
|
|
|
|
|
|
|
|
|
|
|
|
| Supra-National — 0.1% |
|
|
|
|
|
|
|
|
|
|
|
|
|
|
|
|
| Other Securities |
|
|
0.1 |
% |
|
|
|
|
|
|
|
|
|
$ |
1,407 |
|
|
|
|
|
|
|
|
|
|
|
|
|
|
|
|
|
|
|
|
|
|
|
| Thailand — 2.9% |
|
|
|
|
|
|
|
|
|
|
|
|
|
|
|
|
| Thailand Government Bond |
|
|
|
|
|
|
|
|
|
|
|
|
|
|
|
|
| 3.775%, 06/25/2032 |
|
|
0.1 |
|
|
|
THB |
|
|
|
29,000 |
|
|
|
909 |
|
| 3.650%, 12/17/2021 |
|
|
0.3 |
|
|
|
THB |
|
|
|
98,980 |
|
|
|
3,235 |
|
| 3.625%, 05/22/2015 |
|
|
1.0 |
|
|
|
THB |
|
|
|
354,070 |
|
|
|
11,614 |
|
| 3.625%, 06/16/2023 |
|
|
0.1 |
|
|
|
THB |
|
|
|
49,409 |
|
|
|
1,595 |
|
| 3.580%, 12/17/2027 |
|
|
0.2 |
|
|
|
THB |
|
|
|
62,656 |
|
|
|
1,978 |
|
| 3.450%, 03/08/2019 |
|
|
0.1 |
|
|
|
THB |
|
|
|
44,700 |
|
|
|
1,443 |
|
| 3.250%, 06/16/2017 |
|
|
0.5 |
|
|
|
THB |
|
|
|
168,940 |
|
|
|
5,455 |
|
| 2.800%, 10/10/2017 |
|
|
0.3 |
|
|
|
THB |
|
|
|
103,000 |
|
|
|
3,252 |
|
| 1.200%, 07/14/2021 |
|
|
0.3 |
|
|
|
THB |
|
|
|
117,298 |
|
|
|
3,859 |
|
| Other Securities |
|
|
0.0 |
|
|
|
|
|
|
|
|
|
|
|
741 |
|
|
|
|
|
|
|
|
|
|
|
|
|
|
|
|
|
|
|
|
|
|
|
|
|
|
|
|
|
|
|
|
|
34,081 |
|
|
|
|
|
|
|
|
|
|
|
|
|
|
|
|
|
|
|
|
|
|
|
| Trinidad & Tobago — 0.1% |
|
|
|
|
|
|
|
|
|
|
|
|
|
|
|
|
| Other Securities |
|
|
0.1 |
|
|
|
|
|
|
|
|
|
|
|
1,583 |
|
|
|
|
|
|
|
|
|
|
|
|
|
|
|
|
|
|
|
|
|
|
|
| Turkey — 6.1% |
|
|
|
|
|
|
|
|
|
|
|
|
|
|
|
|
| Export Credit Bank of Turkey |
|
|
|
|
|
|
|
|
|
|
|
|
|
|
|
|
| 5.875%, 04/24/2019 (C) |
|
|
0.0 |
|
|
|
|
|
|
|
200 |
|
|
|
220 |
|
| 5.375%, 11/04/2016 (C) |
|
|
0.0 |
|
|
|
|
|
|
|
390 |
|
|
|
418 |
|
| Republic of Turkey |
|
|
|
|
|
|
|
|
|
|
|
|
|
|
|
|
| 11.875%, 01/15/2030 |
|
|
0.1 |
|
|
|
|
|
|
|
460 |
|
|
|
863 |
|
| 10.500%, 01/15/2020 |
|
|
0.2 |
|
|
|
TRY |
|
|
|
4,200 |
|
|
|
2,643 |
|
| 9.018%, 07/17/2013 (D) |
|
|
0.6 |
|
|
|
TRY |
|
|
|
13,503 |
|
|
|
7,112 |
|
| 9.000%, 03/05/2014 |
|
|
0.1 |
|
|
|
TRY |
|
|
|
960 |
|
|
|
545 |
|
| 9.000%, 05/21/2014 |
|
|
0.4 |
|
|
|
TRY |
|
|
|
6,892 |
|
|
|
4,343 |
|
| 9.000%, 01/27/2016 |
|
|
0.1 |
|
|
|
TRY |
|
|
|
2,590 |
|
|
|
1,502 |
|
| 9.000%, 03/08/2017 |
|
|
0.6 |
|
|
|
TRY |
|
|
|
11,900 |
|
|
|
6,959 |
|
| 8.000%, 02/14/2034 |
|
|
0.2 |
|
|
|
|
|
|
|
1,370 |
|
|
|
1,932 |
|
| 7.500%, 07/14/2017 |
|
|
0.0 |
|
|
|
|
|
|
|
410 |
|
|
|
492 |
|
| 7.500%, 11/07/2019 |
|
|
0.4 |
|
|
|
|
|
|
|
3,400 |
|
|
|
4,272 |
|
| 7.375%, 02/05/2025 |
|
|
0.1 |
|
|
|
|
|
|
|
1,170 |
|
|
|
1,518 |
|
| 7.250%, 03/15/2015 |
|
|
0.0 |
|
|
|
|
|
|
|
410 |
|
|
|
454 |
|
| 7.250%, 03/05/2038 |
|
|
0.0 |
|
|
|
|
|
|
|
250 |
|
|
|
332 |
|
| 7.000%, 09/26/2016 |
|
|
0.0 |
|
|
|
|
|
|
|
360 |
|
|
|
417 |
|
| 7.000%, 03/11/2019 |
|
|
0.0 |
|
|
|
|
|
|
|
240 |
|
|
|
291 |
|
| 7.000%, 06/05/2020 |
|
|
0.1 |
|
|
|
|
|
|
|
460 |
|
|
|
566 |
|
| 6.875%, 03/17/2036 |
|
|
0.1 |
|
|
|
|
|
|
|
913 |
|
|
|
1,158 |
|
| 6.780%, 05/15/2013 (D) |
|
|
0.2 |
|
|
|
TRY |
|
|
|
4,600 |
|
|
|
2,453 |
|
| 6.750%, 04/03/2018 |
|
|
0.3 |
|
|
|
|
|
|
|
2,814 |
|
|
|
3,310 |
|
| 6.750%, 05/30/2040 |
|
|
0.0 |
|
|
|
|
|
|
|
375 |
|
|
|
473 |
|
| 6.580%, 03/20/2013 (D) |
|
|
0.2 |
|
|
|
TRY |
|
|
|
3,653 |
|
|
|
1,970 |
|
| 6.250%, 09/26/2022 |
|
|
0.1 |
|
|
|
|
|
|
|
740 |
|
|
|
886 |
|
| 6.070%, 02/20/2013 (D) |
|
|
0.3 |
|
|
|
TRY |
|
|
|
6,200 |
|
|
|
3,364 |
|
| 6.000%, 01/14/2041 |
|
|
0.1 |
|
|
|
|
|
|
|
1,002 |
|
|
|
1,156 |
|
| 5.625%, 03/30/2021 |
|
|
0.0 |
|
|
|
|
|
|
|
190 |
|
|
|
217 |
|
| 5.125%, 03/25/2022 |
|
|
0.2 |
|
|
|
|
|
|
|
1,709 |
|
|
|
1,882 |
|
| 4.500%, 02/11/2015 |
|
|
0.3 |
|
|
|
TRY |
|
|
|
5,750 |
|
|
|
3,461 |
|
|
|
|
|
|
| SEI Institutional International Trust / Annual Report / September 30, 2012 |
|
|
27 |
|
SUMMARY SCHEDULE OF INVESTMENTS
Emerging Markets Debt Fund (Continued)
September 30, 2012
|
|
|
|
|
|
|
|
|
|
|
|
|
|
|
|
|
| Description |
|
Percentage of
Net Assets(%) |
|
|
Face Amount (1)
(Thousands) |
|
|
Market Value
($ Thousands) |
|
|
|
|
|
|
|
|
|
|
|
|
|
|
|
|
|
|
| 4.000%, 04/29/2015 |
|
|
0.5 |
% |
|
|
TRY |
|
|
|
10,219 |
|
|
$ |
6,124 |
|
| 4.000%, 04/01/2020 |
|
|
0.2 |
|
|
|
TRY |
|
|
|
3,149 |
|
|
|
1,952 |
|
| 3.000%, 02/23/2022 |
|
|
0.3 |
|
|
|
TRY |
|
|
|
5,283 |
|
|
|
3,109 |
|
| Other Securities |
|
|
0.4 |
|
|
|
|
|
|
|
|
|
|
|
4,744 |
|
|
|
|
|
|
|
|
|
|
|
|
|
|
|
|
|
|
|
|
|
|
|
|
|
|
|
|
|
|
|
|
|
71,138 |
|
|
|
|
|
|
|
|
|
|
|
|
|
|
|
|
|
|
|
|
|
|
|
| Ukraine — 1.6% |
|
|
|
|
|
|
|
|
|
|
|
|
|
|
|
|
| Financing of Infrastrucural Projects State Enterprise |
|
|
|
|
|
|
|
|
|
|
|
|
|
|
|
|
| 8.375%, 11/03/2017 (C) |
|
|
0.1 |
|
|
|
|
|
|
|
550 |
|
|
|
506 |
|
| Government of Ukraine |
|
|
|
|
|
|
|
|
|
|
|
|
|
|
|
|
| 9.250%, 07/24/2017 (C) |
|
|
0.1 |
|
|
|
|
|
|
|
1,100 |
|
|
|
1,156 |
|
| 9.250%, 07/24/2017 |
|
|
0.1 |
|
|
|
|
|
|
|
950 |
|
|
|
996 |
|
| 7.950%, 02/23/2021 (C) |
|
|
0.0 |
|
|
|
|
|
|
|
250 |
|
|
|
249 |
|
| 7.750%, 09/23/2020 |
|
|
0.0 |
|
|
|
|
|
|
|
250 |
|
|
|
247 |
|
| 7.650%, 06/11/2013 |
|
|
0.1 |
|
|
|
|
|
|
|
441 |
|
|
|
444 |
|
| 6.875%, 09/23/2015 (C) |
|
|
0.0 |
|
|
|
|
|
|
|
350 |
|
|
|
346 |
|
| 6.580%, 11/21/2016 (C) |
|
|
0.0 |
|
|
|
|
|
|
|
230 |
|
|
|
221 |
|
| 6.250%, 06/17/2016 |
|
|
0.0 |
|
|
|
|
|
|
|
200 |
|
|
|
192 |
|
| 6.250%, 06/17/2016 (C) |
|
|
0.1 |
|
|
|
|
|
|
|
600 |
|
|
|
576 |
|
| National Naftogaz of Ukraine |
|
|
|
|
|
|
|
|
|
|
|
|
|
|
|
|
| 9.500%, 09/30/2014 |
|
|
0.2 |
|
|
|
|
|
|
|
2,130 |
|
|
|
2,165 |
|
| Oschadbank Via SSB No. 1 |
|
|
|
|
|
|
|
|
|
|
|
|
|
|
|
|
| 8.250%, 03/10/2016 |
|
|
0.1 |
|
|
|
|
|
|
|
430 |
|
|
|
411 |
|
| The EXIM of Ukraine Via Credit Suisse First Boston International |
|
|
|
|
|
|
|
|
|
|
|
|
|
|
|
|
| 6.800%, 10/04/2012 |
|
|
0.0 |
|
|
|
|
|
|
|
320 |
|
|
|
320 |
|
| Ukreximbank Via Biz Finance |
|
|
|
|
|
|
|
|
|
|
|
|
|
|
|
|
| 8.375%, 04/27/2015 |
|
|
0.4 |
|
|
|
|
|
|
|
5,083 |
|
|
|
4,905 |
|
| Other Securities |
|
|
0.4 |
|
|
|
|
|
|
|
|
|
|
|
5,619 |
|
|
|
|
|
|
|
|
|
|
|
|
|
|
|
|
|
|
|
|
|
|
|
|
|
|
|
|
|
|
|
|
|
18,353 |
|
|
|
|
|
|
|
|
|
|
|
|
|
|
|
|
|
|
|
|
|
|
|
| United Arab Emirates — 1.2% |
|
|
|
|
|
|
|
|
|
|
|
|
|
|
|
|
| Dubai World |
|
|
|
|
|
|
|
|
|
|
|
|
|
|
|
|
| 1.000%, 09/30/2015 |
|
|
0.1 |
|
|
|
|
|
|
|
1,200 |
|
|
|
600 |
|
| 1.000%, 09/30/2018 |
|
|
0.1 |
|
|
|
|
|
|
|
1,015 |
|
|
|
467 |
|
| Other Securities |
|
|
1.0 |
|
|
|
|
|
|
|
|
|
|
|
12,696 |
|
|
|
|
|
|
|
|
|
|
|
|
|
|
|
|
|
|
|
|
|
|
|
|
|
|
|
|
|
|
|
|
|
13,763 |
|
|
|
|
|
|
|
|
|
|
|
|
|
|
|
|
|
|
|
|
|
|
|
| Uruguay — 0.7% |
|
|
|
|
|
|
|
|
|
|
|
|
|
|
|
|
| Other Securities |
|
|
0.7 |
|
|
|
|
|
|
|
|
|
|
|
7,761 |
|
|
|
|
|
|
|
|
|
|
|
|
|
|
|
|
|
|
|
|
|
|
|
| Venezuela — 2.5% |
|
|
|
|
|
|
|
|
|
|
|
|
|
|
|
|
| Petroleos de Venezuela |
|
|
|
|
|
|
|
|
|
|
|
|
|
|
|
|
| 5.500%, 04/12/2037 |
|
|
0.0 |
|
|
|
|
|
|
|
550 |
|
|
|
333 |
|
| 5.375%, 04/12/2027 |
|
|
0.1 |
|
|
|
|
|
|
|
1,391 |
|
|
|
859 |
|
| 5.250%, 04/12/2017 |
|
|
0.0 |
|
|
|
|
|
|
|
430 |
|
|
|
340 |
|
| 5.000%, 10/28/2015 |
|
|
0.0 |
|
|
|
|
|
|
|
560 |
|
|
|
475 |
|
| 4.900%, 10/28/2014 |
|
|
0.8 |
|
|
|
|
|
|
|
10,110 |
|
|
|
9,130 |
|
| Republic of Venezuela |
|
|
|
|
|
|
|
|
|
|
|
|
|
|
|
|
| 13.625%, 08/15/2018 |
|
|
0.2 |
|
|
|
|
|
|
|
2,100 |
|
|
|
2,258 |
|
| 13.625%, 08/15/2018 |
|
|
0.0 |
|
|
|
|
|
|
|
144 |
|
|
|
149 |
|
|
|
|
|
|
|
|
|
|
|
|
|
|
|
|
|
|
| Description |
|
Percentage of
Net Assets(%) |
|
|
Face Amount (1)
(Thousands) |
|
|
Market Value
($ Thousands) |
|
|
|
|
|
|
|
|
|
|
|
|
|
|
|
|
|
|
| 10.750%, 09/19/2013 |
|
|
0.0 |
% |
|
|
|
|
|
|
210 |
|
|
$ |
215 |
|
| 9.375%, 01/13/2034 |
|
|
0.1 |
|
|
|
|
|
|
|
980 |
|
|
|
870 |
|
| 9.250%, 09/15/2027 |
|
|
0.1 |
|
|
|
|
|
|
|
620 |
|
|
|
559 |
|
| 9.250%, 05/07/2028 |
|
|
0.0 |
|
|
|
|
|
|
|
530 |
|
|
|
466 |
|
| 9.000%, 05/07/2023 |
|
|
0.1 |
|
|
|
|
|
|
|
590 |
|
|
|
519 |
|
| 8.500%, 10/08/2014 |
|
|
0.0 |
|
|
|
|
|
|
|
456 |
|
|
|
458 |
|
| 8.250%, 10/13/2024 |
|
|
0.0 |
|
|
|
|
|
|
|
490 |
|
|
|
407 |
|
| 7.750%, 10/13/2019 |
|
|
0.0 |
|
|
|
|
|
|
|
540 |
|
|
|
466 |
|
| 7.650%, 04/21/2025 |
|
|
0.1 |
|
|
|
|
|
|
|
610 |
|
|
|
477 |
|
| 7.000%, 03/31/2038 |
|
|
0.0 |
|
|
|
|
|
|
|
40 |
|
|
|
29 |
|
| 6.000%, 12/09/2020 |
|
|
0.1 |
|
|
|
|
|
|
|
847 |
|
|
|
638 |
|
| Other Securities |
|
|
0.9 |
|
|
|
|
|
|
|
|
|
|
|
10,363 |
|
|
|
|
|
|
|
|
|
|
|
|
|
|
|
|
|
|
|
|
|
|
|
|
|
|
|
|
|
|
|
|
|
29,011 |
|
|
|
|
|
|
|
|
|
|
|
|
|
|
|
|
|
|
|
|
|
|
|
| Vietnam — 0.1% |
|
|
|
|
|
|
|
|
|
|
|
|
|
|
|
|
| Other Securities |
|
|
0.1 |
|
|
|
|
|
|
|
|
|
|
|
1,350 |
|
|
|
|
|
|
|
|
|
|
|
|
|
|
|
|
|
|
|
|
|
|
|
| Zambia — 0.0% |
|
|
|
|
|
|
|
|
|
|
|
|
|
|
|
|
| Other Securities |
|
|
0.0 |
|
|
|
|
|
|
|
|
|
|
|
452 |
|
|
|
|
|
|
|
|
|
|
|
|
|
|
|
|
|
|
| Total Global Bonds (Cost $924,701) ($ Thousands) |
|
|
|
|
|
|
|
|
|
|
|
|
|
|
1,002,472 |
|
|
|
|
|
|
|
|
|
|
|
|
|
|
|
|
|
|
|
|
|
| LOAN PARTICIPATIONS — 1.4% |
|
|
|
|
|
|
|
|
|
| Other Securities |
|
|
1.4 |
|
|
|
|
|
|
|
|
|
|
|
16,874 |
|
|
|
|
|
|
|
|
|
|
|
|
|
|
|
|
|
|
| Total Loan Participations (Cost $20,316) ($ Thousands) |
|
|
|
|
|
|
|
|
|
|
|
|
|
|
16,874 |
|
|
|
|
|
|
|
|
|
|
|
|
|
|
|
|
|
|
|
|
|
| CONVERTIBLE BONDS — 0.3% |
|
|
|
|
|
|
|
|
|
| Other Securities |
|
|
0.3 |
|
|
|
|
|
|
|
|
|
|
|
2,918 |
|
|
|
|
|
|
|
|
|
|
|
|
|
|
|
|
|
|
| Total Convertible Bonds (Cost $2,902) ($ Thousands) |
|
|
|
|
|
|
|
|
|
|
|
|
|
|
2,918 |
|
|
|
|
|
|
|
|
|
|
|
|
|
|
|
|
|
|
|
|
|
| TIME DEPOSITS — 5.5% |
|
|
|
|
|
|
|
|
|
|
|
|
| United States — 5.5% |
|
|
|
|
|
|
|
|
|
| Brown Brothers Harriman |
|
|
|
|
|
|
|
|
|
|
|
|
|
|
|
|
| 4.150%, 10/01/2012 |
|
|
|
|
|
|
ZAR |
|
|
|
2,928 |
|
|
|
355 |
|
| 0.030%, 10/01/2012 |
|
|
|
|
|
|
|
|
|
|
59,115 |
|
|
|
59,115 |
|
| 0.010%, 10/01/2012 |
|
|
|
|
|
|
SGD |
|
|
|
— |
|
|
|
— |
|
| (0.014)%, 10/01/2012 |
|
|
|
|
|
|
EUR |
|
|
|
3,642 |
|
|
|
4,685 |
|
|
|
|
|
|
|
|
|
|
|
|
|
|
|
|
|
|
| Total Time Deposits (Cost $64,155) ($ Thousands) |
|
|
|
|
|
|
|
|
|
|
|
64,155 |
|
|
|
|
|
|
|
|
|
|
|
|
|
|
|
|
|
|
| Total Investments — 93.2% (Cost $1,012,074) ($ Thousands)†† |
|
|
|
|
|
|
|
|
|
|
$ |
1,086,419 |
|
|
|
|
|
|
|
|
|
|
|
|
|
|
|
|
|
|
|
|
|
| 28 |
|
SEI Institutional International Trust / Annual Report / September 30, 2012 |
A list of the open futures contracts held by the Fund at September 30, 2012, is as follows:
|
|
|
|
|
|
|
|
|
|
|
|
|
Type of
Contract |
|
Number of
Contracts
Long (Short) |
|
|
Expiration
Date |
|
|
Unrealized
Appreciation
(Depreciation)
($ Thousands) |
|
| Euro-Bund |
|
|
(7 |
) |
|
|
Dec-2012 |
|
|
$ |
(3 |
) |
| Euro-Buxl 30 Year Bond |
|
|
(8 |
) |
|
|
Dec-2012 |
|
|
|
1 |
|
| U.S. 10-Year Treasury Note |
|
|
40 |
|
|
|
Dec-2012 |
|
|
|
23 |
|
|
|
|
|
|
|
|
|
|
|
|
|
|
|
|
|
|
|
|
|
|
|
|
$ |
21 |
|
|
|
|
|
|
|
|
|
|
|
|
|
|
For the year ended September 30, 2012, the total amount of all open futures contracts, as presented in the table above,
are representative of the volume of activity for this derivative type during the period.
A list of the open forward foreign currency contracts
held by the Fund at September 30, 2012, is as follows:
|
|
|
|
|
|
|
|
|
|
|
|
|
|
|
|
|
|
|
|
|
| Maturity Date |
|
Currency
to Deliver (Thousands) |
|
|
Currency
to Receive (Thousands) |
|
|
Unrealized
Appreciation
(Depreciation)
($ Thousands) |
|
| 10/01/2012-11/21/2012 |
|
|
MYR |
|
|
|
33,971 |
|
|
|
USD |
|
|
|
11,033 |
|
|
$ |
(73 |
) |
| 10/01/2012-12/19/2012 |
|
|
USD |
|
|
|
38,705 |
|
|
|
MYR |
|
|
|
120,702 |
|
|
|
690 |
|
| 10/02/2012-10/30/2012 |
|
|
USD |
|
|
|
15,077 |
|
|
|
IDR |
|
|
|
144,460,789 |
|
|
|
4 |
|
| 10/02/2012-12/19/2012 |
|
|
IDR |
|
|
|
121,799,424 |
|
|
|
USD |
|
|
|
12,746 |
|
|
|
40 |
|
| 10/02/2012-12/21/2012 |
|
|
USD |
|
|
|
24,073 |
|
|
|
BRL |
|
|
|
49,294 |
|
|
|
154 |
|
| 10/02/2012-01/03/2013 |
|
|
BRL |
|
|
|
30,961 |
|
|
|
USD |
|
|
|
14,965 |
|
|
|
(250 |
) |
| 10/03/2012-10/31/2012 |
|
|
EUR |
|
|
|
32,221 |
|
|
|
USD |
|
|
|
41,406 |
|
|
|
(49 |
) |
| 10/03/2012-11/05/2012 |
|
|
USD |
|
|
|
6,912 |
|
|
|
EUR |
|
|
|
5,413 |
|
|
|
52 |
|
| 10/04/2012-12/19/2012 |
|
|
USD |
|
|
|
32,099 |
|
|
|
RUB |
|
|
|
1,029,252 |
|
|
|
708 |
|
| 10/04/2012-12/20/2012 |
|
|
RUB |
|
|
|
630,325 |
|
|
|
USD |
|
|
|
20,117 |
|
|
|
40 |
|
| 10/08/2012-11/23/2012 |
|
|
EUR |
|
|
|
10,795 |
|
|
|
PLN |
|
|
|
45,489 |
|
|
|
293 |
|
| 10/09/2012-01/15/2013 |
|
|
USD |
|
|
|
12,158 |
|
|
|
INR |
|
|
|
670,353 |
|
|
|
396 |
|
| 10/10/2012-10/22/2012 |
|
|
USD |
|
|
|
10,745 |
|
|
|
THB |
|
|
|
337,843 |
|
|
|
220 |
|
| 10/10/2012-12/19/2012 |
|
|
THB |
|
|
|
257,358 |
|
|
|
USD |
|
|
|
8,299 |
|
|
|
(50 |
) |
| 10/12/2012-11/30/2012 |
|
|
USD |
|
|
|
20,202 |
|
|
|
TRY |
|
|
|
36,756 |
|
|
|
186 |
|
| 10/16/2012-11/30/2012 |
|
|
USD |
|
|
|
34,898 |
|
|
|
MXP |
|
|
|
458,234 |
|
|
|
654 |
|
| 10/16/2012-12/05/2012 |
|
|
PHP |
|
|
|
123,231 |
|
|
|
USD |
|
|
|
2,960 |
|
|
|
7 |
|
| 10/16/2012-12/05/2012 |
|
|
USD |
|
|
|
4,661 |
|
|
|
PHP |
|
|
|
195,187 |
|
|
|
17 |
|
| 10/18/2012-11/23/2012 |
|
|
USD |
|
|
|
10,719 |
|
|
|
KRW |
|
|
|
12,011,706 |
|
|
|
87 |
|
| 10/19/2012 |
|
|
PLN |
|
|
|
5,280 |
|
|
|
EUR |
|
|
|
1,252 |
|
|
|
(34 |
) |
| 10/19/2012-11/13/2012 |
|
|
USD |
|
|
|
3,260 |
|
|
|
COP |
|
|
|
5,899,070 |
|
|
|
1 |
|
| 10/19/2012-11/16/2012 |
|
|
COP |
|
|
|
10,053,926 |
|
|
|
USD |
|
|
|
5,515 |
|
|
|
(53 |
) |
| 10/19/2012-11/20/2012 |
|
|
USD |
|
|
|
5,027 |
|
|
|
PEI |
|
|
|
13,182 |
|
|
|
43 |
|
| 10/19/2012-11/26/2012 |
|
|
PEI |
|
|
|
3,315 |
|
|
|
USD |
|
|
|
1,241 |
|
|
|
(33 |
) |
| 10/19/2012-11/30/2012 |
|
|
MXP |
|
|
|
210,570 |
|
|
|
USD |
|
|
|
15,903 |
|
|
|
(434 |
) |
| 10/19/2012-12/3/2012 |
|
|
CNY |
|
|
|
33,301 |
|
|
|
USD |
|
|
|
5,228 |
|
|
|
(46 |
) |
| 10/19/2012-7/25/2013 |
|
|
USD |
|
|
|
4,126 |
|
|
|
CNY |
|
|
|
26,301 |
|
|
|
35 |
|
| 10/24/2012-11/26/2012 |
|
|
USD |
|
|
|
6,181 |
|
|
|
CLP |
|
|
|
2,981,474 |
|
|
|
57 |
|
| 10/25/2012-12/18/2012 |
|
|
USD |
|
|
|
1,298 |
|
|
|
RON |
|
|
|
4,519 |
|
|
|
(23 |
) |
|
|
|
|
|
|
|
|
|
|
|
|
|
|
|
|
|
|
|
|
|
| Maturity Date |
|
Currency
to Deliver (Thousands) |
|
|
Currency
to Receive (Thousands) |
|
|
Unrealized
Appreciation
(Depreciation)
($ Thousands) |
|
| 10/26/2012 |
|
|
TWD |
|
|
|
174,028 |
|
|
|
USD |
|
|
|
5,933 |
|
|
$ |
(9 |
) |
| 10/31/2012 |
|
|
EUR |
|
|
|
2,076 |
|
|
|
CZK |
|
|
|
50,690 |
|
|
|
(82 |
) |
| 10/31/2012 |
|
|
GBP |
|
|
|
517 |
|
|
|
USD |
|
|
|
828 |
|
|
|
(7 |
) |
| 10/31/2012 |
|
|
PLN |
|
|
|
638 |
|
|
|
USD |
|
|
|
200 |
|
|
|
2 |
|
| 10/31/2012 |
|
|
USD |
|
|
|
1,720 |
|
|
|
CZK |
|
|
|
33,712 |
|
|
|
2 |
|
| 10/31/2012-11/19/2012 |
|
|
CZK |
|
|
|
99,725 |
|
|
|
EUR |
|
|
|
4,031 |
|
|
|
92 |
|
| 10/31/2012-11/28/2012 |
|
|
USD |
|
|
|
4,873 |
|
|
|
ZAR |
|
|
|
41,205 |
|
|
|
88 |
|
| 10/31/2012-11/28/2012 |
|
|
ZAR |
|
|
|
81,007 |
|
|
|
USD |
|
|
|
9,768 |
|
|
|
2 |
|
| 10/31/2012-11/30/2012 |
|
|
HUF |
|
|
|
1,288,066 |
|
|
|
USD |
|
|
|
5,783 |
|
|
|
(1 |
) |
| 10/31/2012-11/30/2012 |
|
|
USD |
|
|
|
6,270 |
|
|
|
HUF |
|
|
|
1,402,781 |
|
|
|
23 |
|
| 10/31/2012-12/10/2012 |
|
|
USD |
|
|
|
15,357 |
|
|
|
PLN |
|
|
|
50,396 |
|
|
|
280 |
|
| 11/09/2012 |
|
|
INR |
|
|
|
71,607 |
|
|
|
USD |
|
|
|
1,318 |
|
|
|
(29 |
) |
| 11/13/2012 |
|
|
TRY |
|
|
|
19,714 |
|
|
|
USD |
|
|
|
10,799 |
|
|
|
(119 |
) |
| 11/13/2012-11/28/2012 |
|
|
ILS |
|
|
|
10,440 |
|
|
|
USD |
|
|
|
2,599 |
|
|
|
(57 |
) |
| 11/16/2012-11/26/2012 |
|
|
CLP |
|
|
|
2,599,293 |
|
|
|
USD |
|
|
|
5,392 |
|
|
|
(43 |
) |
| 11/21/2012-12/18/2012 |
|
|
HUF |
|
|
|
1,191,594 |
|
|
|
EUR |
|
|
|
4,194 |
|
|
|
61 |
|
| 11/23/2012 |
|
|
KRW |
|
|
|
2,740,000 |
|
|
|
USD |
|
|
|
2,400 |
|
|
|
(65 |
) |
| 11/28/2012 |
|
|
USD |
|
|
|
2,624 |
|
|
|
ILS |
|
|
|
10,281 |
|
|
|
(9 |
) |
| 11/30/2012 |
|
|
CZK |
|
|
|
34,203 |
|
|
|
USD |
|
|
|
1,771 |
|
|
|
23 |
|
| 07/17/2013-07/17/2015 |
|
|
CNH |
|
|
|
151,802 |
|
|
|
USD |
|
|
|
23,050 |
|
|
|
(33 |
) |
| 07/17/2013-07/17/2015 |
|
|
USD |
|
|
|
23,050 |
|
|
|
CNH |
|
|
|
150,599 |
|
|
|
99 |
|
|
|
|
|
|
|
|
|
|
|
|
|
|
|
|
|
|
|
|
|
|
|
|
|
|
|
|
|
|
|
|
|
|
|
|
|
|
|
|
$ |
2,857 |
|
|
|
|
|
|
|
|
|
|
|
|
|
|
|
|
|
|
|
|
|
|
A list of the counterparties for the open forward foreign currency contracts held by the Fund at September 30, 2012, is as
follows:
|
|
|
|
|
|
|
|
|
|
|
|
|
|
|
|
|
| Counterparty |
|
Settlement Date |
|
|
Currency to
Deliver
($ Thousands) |
|
|
Currency to
Receive
($ Thousands) |
|
|
Unrealized
Appreciation
(Depreciation)
($ Thousands) |
|
| Bank of America |
|
|
10/16/2012-12/10/2012 |
|
|
|
(12,332 |
) |
|
|
12,449 |
|
|
$ |
117 |
|
| Barclays PLC |
|
|
10/01/2012-07/25/2013 |
|
|
|
(139,808 |
) |
|
|
140,630 |
|
|
|
822 |
|
| Citigroup |
|
|
10/01/2012-12/19/2012 |
|
|
|
(139,087 |
) |
|
|
139,808 |
|
|
|
721 |
|
| Deutsche Bank |
|
|
10/02/2012-12/18/2012 |
|
|
|
(56,548 |
) |
|
|
56,964 |
|
|
|
416 |
|
| Goldman Sachs |
|
|
10/31/2012-11/30/2012 |
|
|
|
(10,510 |
) |
|
|
10,417 |
|
|
|
(93 |
) |
| HSBC |
|
|
10/02/2012-07/17/2015 |
|
|
|
(65,020 |
) |
|
|
65,160 |
|
|
|
140 |
|
| JPMorgan Chase Bank |
|
|
10/02/2012-01/03/2013 |
|
|
|
(56,437 |
) |
|
|
56,614 |
|
|
|
177 |
|
| Standard New York |
|
|
10/02/2012-11/21/2012 |
|
|
|
(6,080 |
) |
|
|
6,164 |
|
|
|
84 |
|
| UBS |
|
|
10/02/2012-01/15/2013 |
|
|
|
(37,339 |
) |
|
|
37,812 |
|
|
|
473 |
|
|
|
|
|
|
|
|
|
|
|
|
|
|
|
|
|
|
|
|
|
|
|
|
|
|
|
|
|
|
|
|
$ |
2,857 |
|
|
|
|
|
|
|
|
|
|
|
|
|
|
|
|
|
|
|
|
|
|
|
| SEI Institutional International Trust / Annual Report / September 30, 2012 |
|
|
29 |
|
SUMMARY SCHEDULE OF INVESTMENTS
Emerging Markets Debt Fund (Concluded)
September 30, 2012
A
list of outstanding swap agreements held by the Fund at September 30, 2012, is as follows:
|
|
|
|
|
|
|
|
|
|
|
|
|
|
|
|
|
|
|
| Interest Rate
Swaps |
|
| Counterparty |
|
Fund Pays |
|
Fund Receives |
|
Termination Date |
|
Currency |
|
|
Notional
Amount
(Thousands) |
|
|
Net Unrealized
Appreciation
(Depreciation)
($ Thousands) |
|
| Barclays Bank PLC |
|
Singapore Swap Offer Rate Fixing 6 Month |
|
2.77% |
|
06/14/2032 |
|
|
SGD |
|
|
|
2,220 |
|
|
$ |
19 |
|
| Barclays Bank PLC |
|
1.86% |
|
Singapore Swap Offer Rate Fixing 6 Month |
|
06/14/2022 |
|
|
SGD |
|
|
|
3,830 |
|
|
|
(26 |
) |
| Barclays Bank PLC |
|
Brazil Interbank Deposit Rate |
|
9.04% |
|
01/02/2017 |
|
|
BRL |
|
|
|
3,525 |
|
|
|
7 |
|
| HSBC |
|
Brazil Interbank Deposit Rate |
|
9.14% |
|
01/04/2017 |
|
|
BRL |
|
|
|
2,162 |
|
|
|
6 |
|
|
|
|
|
|
|
|
|
|
|
|
|
|
|
|
|
|
|
|
|
|
|
|
|
|
|
|
|
|
|
|
|
|
|
|
$ |
6 |
|
|
|
|
|
|
|
|
|
|
|
|
|
|
|
|
|
|
|
|
|
|
|
|
|
|
|
|
|
|
|
|
|
|
|
|
|
|
|
|
|
|
|
| Total Return
Swaps |
|
| Counterparty |
|
Reference Entity/Obligation |
|
Fund Pays |
|
Fund Receives |
|
Termination Date |
|
|
Currency |
|
|
Notional
Amount
(Thousands) |
|
|
Net
Unrealized
Appreciation
(Depreciation)
($ Thousands) |
|
| HSBC |
|
Republic of Indonesia, 10.50%, 8/15/30 |
|
Cash Deposit Of Notional Amount |
|
Price Return |
|
|
08/15/2030 |
|
|
|
IDR |
|
|
|
29,500,000 |
|
|
$ |
(15 |
) |
| HSBC |
|
Republic of Indonesia, 11.50%, 9/15/19 |
|
Cash Deposit Of Notional Amount |
|
Price Return |
|
|
09/15/2019 |
|
|
|
IDR |
|
|
|
68,500,000 |
|
|
|
(245 |
) |
| HSBC |
|
Republic of Indonesia, 11.50%, 9/15/19 |
|
Cash Deposit Of Notional Amount |
|
Price Return |
|
|
09/15/2019 |
|
|
|
IDR |
|
|
|
4,500,000 |
|
|
|
(15 |
) |
| HSBC |
|
Republic of Indonesia, 8.25%, 6/15/32 |
|
Cash Deposit Of Notional Amount |
|
Price Return |
|
|
06/15/2032 |
|
|
|
IDR |
|
|
|
18,100,000 |
|
|
|
(9 |
) |
| HSBC |
|
Republic of Indonesia, 8.375%, 9/15/26 |
|
Cash Deposit Of Notional Amount |
|
Price Return |
|
|
09/15/2026 |
|
|
|
IDR |
|
|
|
18,900,000 |
|
|
|
(4 |
) |
| HSBC |
|
Russia Government Bond – Ofz, 7.6%, 7//22 |
|
Cash Deposit Of Notional Amount |
|
Price Return |
|
|
07/22/2022 |
|
|
|
RUB |
|
|
|
38,800 |
|
|
|
61 |
|
| HSBC |
|
Russia Government Bond – Ofz, 6.9%, 8/3/16 |
|
Cash Deposit Of Notional Amount |
|
Price Return |
|
|
08/05/2016 |
|
|
|
RUB |
|
|
|
46,300 |
|
|
|
85 |
|
| HSBC |
|
Russia Government Bond – Ofz, 6.9%, 8/3/16 |
|
Cash Deposit Of Notional Amount |
|
Price Return |
|
|
08/05/2016 |
|
|
|
RUB |
|
|
|
356,000 |
|
|
|
539 |
|
| HSBC |
|
Russia Government Bond – Ofz, 7.1%, 3/13/14 |
|
Cash Deposit Of Notional Amount |
|
Price Return |
|
|
03/17/2014 |
|
|
|
RUB |
|
|
|
14,900 |
|
|
|
22 |
|
| HSBC |
|
Russia Government Bond – Ofz, 7.1%, 3/13/14 |
|
Cash Deposit Of Notional Amount |
|
Price Return |
|
|
03/17/2014 |
|
|
|
RUB |
|
|
|
207,000 |
|
|
|
233 |
|
| HSBC |
|
Russia Government Bond – Ofz, 7.4%, 4/19/17 |
|
Cash Deposit Of Notional Amount |
|
Price Return |
|
|
04/21/2017 |
|
|
|
RUB |
|
|
|
20,700 |
|
|
|
29 |
|
| HSBC |
|
Russia Government Bond – Ofz, 7.4%, 4/19/17 |
|
Cash Deposit Of Notional Amount |
|
Price Return |
|
|
04/21/2017 |
|
|
|
RUB |
|
|
|
36,700 |
|
|
|
54 |
|
| HSBC |
|
Russia Government Bond – Ofz, 7.4%, 6/14/17 |
|
Cash Deposit Of Notional Amount |
|
Price Return |
|
|
06/16/2017 |
|
|
|
RUB |
|
|
|
45,700 |
|
|
|
45 |
|
| HSBC |
|
Russia Government Bond – Ofz, 7.4%, 6/14/17 |
|
Cash Deposit Of Notional Amount |
|
Price Return |
|
|
06/16/2017 |
|
|
|
RUB |
|
|
|
54,000 |
|
|
|
56 |
|
| HSBC |
|
Russia Government Bond – Ofz, 7.5%, 2/27/19 |
|
Cash Deposit Of Notional Amount |
|
Price Return |
|
|
03/01/2019 |
|
|
|
RUB |
|
|
|
20,700 |
|
|
|
11 |
|
| HSBC |
|
Russia Government Bond – Ofz, 7.5%, 2/27/19 |
|
Cash Deposit Of Notional Amount |
|
Price Return |
|
|
03/01/2019 |
|
|
|
RUB |
|
|
|
23,670 |
|
|
|
29 |
|
| HSBC |
|
Russia Government Bond – Ofz, 7.5%, 2/27/19 |
|
Cash Deposit Of Notional Amount |
|
Price Return |
|
|
03/01/2019 |
|
|
|
RUB |
|
|
|
183,000 |
|
|
|
426 |
|
| HSBC |
|
Russia Government Bond – Ofz, 7.5%, 3/15/18 |
|
Cash Deposit Of Notional Amount |
|
Price Return |
|
|
03/19/2018 |
|
|
|
RUB |
|
|
|
4,500 |
|
|
|
2 |
|
| HSBC |
|
Russia Government Bond – Ofz, 7.5%, 3/15/18 |
|
Cash Deposit Of Notional Amount |
|
Price Return |
|
|
03/19/2018 |
|
|
|
RUB |
|
|
|
21,600 |
|
|
|
12 |
|
| HSBC |
|
Russia Government Bond – Ofz, 7.6%, 4/14/21 |
|
Cash Deposit Of Notional Amount |
|
Price Return |
|
|
04/16/2021 |
|
|
|
RUB |
|
|
|
19,000 |
|
|
|
41 |
|
| HSBC |
|
Russia Government Bond – Ofz, 7.6%, 4/14/21 |
|
Cash Deposit Of Notional Amount |
|
Price Return |
|
|
04/16/2021 |
|
|
|
RUB |
|
|
|
87,000 |
|
|
|
166 |
|
| HSBC |
|
Russia Government Bond – Ofz, 8.15%, 2/3/27 |
|
Cash Deposit Of Notional Amount |
|
Price Return |
|
|
02/05/2017 |
|
|
|
RUB |
|
|
|
36,000 |
|
|
|
52 |
|
| HSBC |
|
Russia Government Bond – Ofz, 8.15%, 2/3/27 |
|
Cash Deposit Of Notional Amount |
|
Price Return |
|
|
02/05/2017 |
|
|
|
RUB |
|
|
|
37,400 |
|
|
|
60 |
|
|
|
|
|
|
|
|
|
|
|
|
|
|
|
|
|
|
|
|
|
|
|
|
|
|
|
|
|
|
|
|
|
|
|
|
|
|
|
|
|
|
|
|
$ |
1,635 |
|
|
|
|
|
|
|
|
|
|
|
|
|
|
|
|
|
|
|
|
|
|
|
|
|
|
|
| 30 |
|
SEI Institutional International Trust / Annual Report / September 30, 2012 |
Percentages are based on a Net Assets of $1,165,102 ($ Thousands).
| (1) |
|
In U.S. Dollars unless otherwise indicated. |
| (A) |
|
Variable Rate Security — The rate reported on the Summary Schedule of Investments is the rate in effect as of September 30, 2012.
|
| (B) |
|
Step Bonds — The rate reflected on the Summary Schedule of Investments is the effective yield on September 30, 2012. The coupon on a step bond changes
on a specified date. |
| (C) |
|
Securities sold within terms of a private placement memorandum, exempt from registration under Section 144A of the Securities Act of 1933, as amended, and may be sold
only to dealers in that program or other “accredited investors.” These securities have been determined to be liquid under guidelines established by the Board of Trustees. |
| (D) |
|
Zero coupon security. The rate reported on the Summary Schedule of Investments is the effective yield at time of purchase. |
| (E) |
|
Securities considered illiquid. The total market value of such securities as of September 30, 2012 was $27,387 ($ Thousands) and
represented 2.4% of Net Assets. |
| (F) |
|
Security in default on interest payments. |
| †† |
|
The Summary Schedule of Investments does not reflect the complete portfolio holdings. It includes the Fund’s 50 largest holdings and each investment of any issuer
that exceeds 1% of the Fund’s net assets. “Other Securities” represent all issues not required to be disclosed under the rules adopted by the U.S. Securities and Exchange Commission (“SEC”). In certain instances,
securities for which footnotes listed above may otherwise apply are included in the Other Securities caption. The complete schedule of portfolio holdings is available (i) without charge, upon request, by calling (800) 342-5734; and
(ii) on the SEC’s website at http://www.sec.gov. |
ARS — Argentine Peso
BRL — Brazilian Real
BUBOR — Budapest
Interbank Offered Rate
CLN — Credit Linked Note
CLP — Chilean Peso
CNH — Chinese Yuen (Offshore)
CNY — Chinese Renminbi
COP — Colombian Peso
CZK — Czech Koruna
EUR — Euro
GBP — British Pound Sterling
HUF — Hungarian Forint
IDR — Indonesia
Rupiah
ILS — Israeli Shekel
INR
— India Rupee
KRW — Korean Won
MTN — Medium Term Note
MXP — Mexican Peso
MYR — Malaysian Ringgit
PEI —
Peruvian Inca
PHP — Philippine Peso
PLC — Public Limited Company
PLN — Polish
Zlotty
RON — Romanian Leu
RUB —
Russian Ruble
Ser — Series
SGD
— Singapore Dollar
THB — Thailand Baht
TRY — Turkish Lira
TWD — Taiwanese Dollar
USD — U.S. Dollar
ZAR — South African
Rand
The following is a summary of the inputs used as of September 30, 2012, in valuing the Fund’s
investments and other financial instruments carried at value ($ Thousands):
|
|
|
|
|
|
|
|
|
|
|
|
|
|
|
|
|
| Investments in Securities |
|
Level 1 |
|
|
Level 2 |
|
|
Level 3 (1) |
|
|
Total |
|
| Global Bonds |
|
$ |
— |
|
|
$ |
1,002,378 |
|
|
$ |
94 |
|
|
$ |
1,002,472 |
|
| Convertible Bonds |
|
|
— |
|
|
|
2,918 |
|
|
|
— |
|
|
|
2,918 |
|
| Time Deposits |
|
|
— |
|
|
|
64,155 |
|
|
|
— |
|
|
|
64,155 |
|
| Loan Participations |
|
|
— |
|
|
|
— |
|
|
|
16,874 |
|
|
|
16,874 |
|
|
|
|
|
|
|
|
|
|
|
|
|
|
|
|
|
|
| Total Investments in Securities |
|
$ |
— |
|
|
$ |
1,069,451 |
|
|
$ |
16,968 |
|
|
$ |
1,086,419 |
|
|
|
|
|
|
|
|
|
|
|
|
|
|
|
|
|
|
| Other Financial Instruments |
|
Level 1 |
|
|
Level 2 |
|
|
Level 3 |
|
|
Total |
|
| Futures Contracts * |
|
$ |
21 |
|
|
$ |
— |
|
|
$ |
— |
|
|
$ |
21 |
|
| Forwards Contracts * |
|
|
— |
|
|
|
2,857 |
|
|
|
— |
|
|
|
2,857 |
|
| Total Return Swaps * |
|
|
— |
|
|
|
1,635 |
|
|
|
— |
|
|
|
1,635 |
|
| Interest Rate Swaps * |
|
|
— |
|
|
|
6 |
|
|
|
— |
|
|
|
6 |
|
|
|
|
|
|
|
|
|
|
|
|
|
|
|
|
|
|
| Total Other Financial Instruments |
|
$ |
21 |
|
|
$ |
4,498 |
|
|
$ |
— |
|
|
$ |
4,519 |
|
|
|
|
|
|
|
|
|
|
|
|
|
|
|
|
|
|
| * |
|
Futures and forwards contracts and swaps are valued at the unrealized appreciation on the instrument. |
The following is a reconciliation of the investments in which significant unobservable inputs (Level 3) were used in determining value ($ Thousands):
|
|
|
|
|
|
|
|
|
| |
|
Global
Bonds |
|
|
Loan
Participations |
|
| Beginning balance as of October 1, 2011 |
|
$ |
— |
|
|
$ |
18,404 |
|
| Accrued discounts/premiums |
|
|
— |
|
|
|
69 |
|
| Realized gain/(loss) |
|
|
— |
|
|
|
4 |
|
| Change in unrealized appreciation/(depreciation) |
|
|
94 |
|
|
|
426 |
|
| Purchases |
|
|
— |
|
|
|
568 |
|
| Sales |
|
|
— |
|
|
|
(2,597 |
) |
| Transfer into Level 3 |
|
|
— |
|
|
|
— |
|
| Transfer out of Level 3 |
|
|
— |
|
|
|
— |
|
|
|
|
|
|
|
|
|
|
| Ending balance as of September 30, 2012 |
|
$ |
94 |
|
|
$ |
16,874 |
|
|
|
|
|
|
|
|
|
|
| (1) |
|
Of the $16,968 ($ Thousands) in Level 3 securities as of September 30, 2012, $7,648 ($ Thousands) or 0.6% are not valued via third party pricing vendors
and broker quotes. If significant, the disclosure of the unobservable inputs and the interrelationships and sensitivity between these inputs are required for those Level 3 securities that are not valued by third party pricing vendors or broker
quotes. |
For the year ended September 30, 2012, there have been no significant transfers between Level 1 and Level 2
assets and liabilities.
For the year ended September 30, 2012, there have been no significant transfers between Level 2 and Level 3 assets
and liabilities.
Amounts designated as “—” are $O or have been rounded to $O.
The accompanying notes are an integral part of the financial statements.
|
|
|
|
|
| SEI Institutional International Trust / Annual Report / September 30, 2012 |
|
|
31 |
|
Statements of Assets and Liabilities ($ Thousands)
September 30, 2012
|
|
|
|
|
|
|
|
|
|
|
|
|
|
|
|
|
| |
|
International
Equity Fund |
|
|
Emerging Markets
Equity Fund |
|
|
International Fixed
Income Fund |
|
|
Emerging Markets
Debt Fund |
|
| ASSETS: |
|
|
|
|
|
|
|
|
|
|
|
|
|
|
|
|
| Investments, at value (Cost $1,773,503, $858,706, $462,239 and $1,012,074, respectively)(1) |
|
$ |
1,795,280 |
|
|
$ |
895,471 |
|
|
$ |
488,077 |
|
|
$ |
1,086,419 |
|
| Affiliated investments, at value (Cost $176,154, $95,302, $0 and $0, respectively) |
|
|
174,068 |
|
|
|
94,040 |
|
|
|
— |
|
|
|
— |
|
| Cash |
|
|
— |
|
|
|
— |
|
|
|
— |
|
|
|
245 |
|
| Foreign currency, at value (Cost $0, $7,793, $0 and $3,175, respectively) |
|
|
— |
|
|
|
7,820 |
|
|
|
— |
|
|
|
3,180 |
|
| Cash pledged as collateral for forward foreign currency contracts, futures contracts or swap contracts |
|
|
— |
|
|
|
— |
|
|
|
937 |
|
|
|
477 |
|
| Receivable for investment securities sold |
|
|
12,849 |
|
|
|
5,125 |
|
|
|
9,003 |
|
|
|
4,575 |
|
| Unrealized gain on forward foreign currency contracts |
|
|
— |
|
|
|
— |
|
|
|
130 |
|
|
|
4,356 |
|
| Receivable for fund shares sold |
|
|
1,218 |
|
|
|
475 |
|
|
|
700 |
|
|
|
2,150 |
|
| Dividends and interest receivable |
|
|
5,113 |
|
|
|
1,048 |
|
|
|
4,964 |
|
|
|
16,164 |
|
| Variation margin receivable |
|
|
12 |
|
|
|
— |
|
|
|
44 |
|
|
|
— |
|
| Foreign tax reclaim receivable |
|
|
2,573 |
|
|
|
41 |
|
|
|
— |
|
|
|
— |
|
| Unrealized gain on foreign spot currency contracts |
|
|
8 |
|
|
|
— |
|
|
|
18 |
|
|
|
— |
|
| Swap contracts, at value (Premiums paid $0, $0, $0 and $57,906, respectively) |
|
|
— |
|
|
|
— |
|
|
|
7,407 |
|
|
|
61,922 |
|
| Receivable for swap contracts closed |
|
|
— |
|
|
|
— |
|
|
|
— |
|
|
|
24 |
|
| Total Assets |
|
|
1,991,121 |
|
|
|
1,004,020 |
|
|
|
511,280 |
|
|
|
1,179,512 |
|
| LIABILITIES: |
|
|
|
|
|
|
|
|
|
|
|
|
|
|
|
|
| Payable for investment securities purchased |
|
|
17,827 |
|
|
|
5,920 |
|
|
|
9,780 |
|
|
|
7,552 |
|
| Payable upon return of securities loaned |
|
|
118,693 |
|
|
|
91,070 |
|
|
|
— |
|
|
|
— |
|
| Payable to custodian |
|
|
578 |
|
|
|
4,001 |
|
|
|
409 |
|
|
|
— |
|
| Payable for foreign currency ($111, $0, $131 and $0, respectively) |
|
|
115 |
|
|
|
— |
|
|
|
131 |
|
|
|
— |
|
| Unrealized loss on forward foreign currency contracts |
|
|
391 |
|
|
|
— |
|
|
|
2,082 |
|
|
|
1,499 |
|
| Swap contracts, at value (Premiums received $0, $0, $0 and $0, respectively) |
|
|
— |
|
|
|
— |
|
|
|
6,003 |
|
|
|
2,375 |
|
| Payable for swap contracts closed |
|
|
— |
|
|
|
— |
|
|
|
— |
|
|
|
13 |
|
| Payable for securities lending collateral |
|
|
— |
|
|
|
— |
|
|
|
— |
|
|
|
243 |
|
| Payable for fund shares redeemed |
|
|
2,523 |
|
|
|
1,413 |
|
|
|
602 |
|
|
|
1,369 |
|
| Variation margin payable |
|
|
736 |
|
|
|
— |
|
|
|
7 |
|
|
|
7 |
|
| Unrealized loss on foreign spot currency contracts |
|
|
11 |
|
|
|
— |
|
|
|
2 |
|
|
|
— |
|
| Investment advisory fees payable |
|
|
775 |
|
|
|
696 |
|
|
|
121 |
|
|
|
363 |
|
| Administration fees payable |
|
|
690 |
|
|
|
473 |
|
|
|
241 |
|
|
|
613 |
|
| Shareholder servicing fees payable |
|
|
386 |
|
|
|
182 |
|
|
|
37 |
|
|
|
236 |
|
| Trustees’ fees |
|
|
1 |
|
|
|
— |
|
|
|
— |
|
|
|
1 |
|
| Chief compliance officer fees payable |
|
|
2 |
|
|
|
1 |
|
|
|
1 |
|
|
|
1 |
|
| Administration servicing fees payable |
|
|
4 |
|
|
|
— |
|
|
|
— |
|
|
|
— |
|
| Other accrued expenses |
|
|
267 |
|
|
|
239 |
|
|
|
71 |
|
|
|
138 |
|
| Accrued foreign capital gains tax on appreciated securities |
|
|
— |
|
|
|
295 |
|
|
|
— |
|
|
|
— |
|
| Total Liabilities |
|
|
142,999 |
|
|
|
104,290 |
|
|
|
19,487 |
|
|
|
14,410 |
|
| Net Assets |
|
$ |
1,848,122 |
|
|
$ |
899,730 |
|
|
$ |
491,793 |
|
|
$ |
1,165,102 |
|
| NET ASSETS: |
|
|
|
|
|
|
|
|
|
|
|
|
|
|
|
|
| Paid in Capital (unlimited authorization — no par value) |
|
$ |
2,861,623 |
|
|
$ |
973,543 |
|
|
$ |
499,037 |
|
|
$ |
1,034,287 |
|
| Undistributed (distributions in excess of) net investment income |
|
|
29,231 |
|
|
|
3,390 |
|
|
|
(15,636 |
) |
|
|
8,863 |
|
| Accumulated net realized gain (loss) on investments, futures contracts, option contracts, foreign currency contracts and swap
contracts |
|
|
(1,061,086 |
) |
|
|
(112,457 |
) |
|
|
(16,015 |
) |
|
|
42,955 |
|
| Net unrealized appreciation on investments and option contracts |
|
|
19,691 |
|
|
|
35,503 |
|
|
|
25,838 |
|
|
|
74,345 |
|
| Net unrealized appreciation (depreciation) on futures contracts |
|
|
(1,020 |
) |
|
|
— |
|
|
|
(123 |
) |
|
|
21 |
|
| Net unrealized appreciation on swap contracts |
|
|
— |
|
|
|
— |
|
|
|
1,404 |
|
|
|
1,641 |
|
| Net unrealized appreciation (depreciation) on forward foreign currency contracts, foreign currencies and translation of other assets
and liabilities denominated in foreign currencies |
|
|
(317 |
) |
|
|
46 |
|
|
|
(2,712 |
) |
|
|
2,990 |
|
| Accumulated foreign capital gains tax on appreciated securities |
|
|
— |
|
|
|
(295 |
) |
|
|
— |
|
|
|
— |
|
| Net Assets |
|
$ |
1,848,122 |
|
|
$ |
899,730 |
|
|
$ |
491,793 |
|
|
$ |
1,165,102 |
|
| Net Asset Value, Offering and Redemption Price Per Share — Class A($1,842,851,384
÷ 225,042,679 shares, $899,729,692 ÷ 87,797,789 shares, $491,792,970 ÷ 45,472,189 shares, $1,165,101,681 ÷ 96,521,107 shares, respectively.) |
|
|
$8.19 |
|
|
|
$10.25 |
|
|
|
$10.82 |
|
|
|
$12.07 |
|
| Net Asset Value, Offering and Redemption Price Per Share — Class I ($5,270,600 ÷
644,509 shares) |
|
|
$8.18 |
|
|
|
N/A |
|
|
|
N/A |
|
|
|
N/A |
|
| (1) |
|
Included in “Investments, at value” is the market value of securities on loan in the amounts of $111,744, $87,300, $0 and $0, ($ Thousands), respectively.
|
N/A — Not applicable. Share classes currently not offered.
Amounts designated as “—” are $0 or have been rounded to $0.
The accompanying notes are
an integral part of the financial statements.
|
|
|
| 32 |
|
SEI Institutional International Trust / Annual Report / September 30, 2012 |
Statements of Operations ($
Thousands)
For the year ended September 30, 2012
|
|
|
|
|
|
|
|
|
|
|
|
|
|
|
|
|
| |
|
International
Equity Fund |
|
|
Emerging Markets
Equity Fund |
|
|
International Fixed
Income Fund |
|
|
Emerging Markets
Debt Fund |
|
| Investment Income: |
|
|
|
|
|
|
|
|
|
|
|
|
|
|
|
|
| Dividends |
|
$ |
54,932 |
|
|
$ |
22,185 |
|
|
$ |
— |
|
|
$ |
— |
|
| Dividends from Affiliated
Investments(1)(2) |
|
|
25 |
|
|
|
4 |
|
|
|
— |
|
|
|
— |
|
| Interest |
|
|
54 |
|
|
|
1 |
|
|
|
12,803 |
|
|
|
62,625 |
|
| Security Lending Income — Net(2) |
|
|
1,933 |
|
|
|
579 |
|
|
|
— |
|
|
|
12 |
|
| Less: Foreign Taxes Withheld |
|
|
(4,693 |
) |
|
|
(2,103 |
) |
|
|
9 |
|
|
|
(94 |
) |
| Total Investment Income |
|
|
52,251 |
|
|
|
20,666 |
|
|
|
12,812 |
|
|
|
62,543 |
|
| Expenses: |
|
|
|
|
|
|
|
|
|
|
|
|
|
|
|
|
| Investment Advisory Fees |
|
|
8,759 |
|
|
|
8,831 |
|
|
|
1,462 |
|
|
|
8,564 |
|
| Administration Fees |
|
|
7,805 |
|
|
|
5,467 |
|
|
|
2,925 |
|
|
|
6,549 |
|
| Shareholder Servicing Fees — Class A |
|
|
4,323 |
|
|
|
2,103 |
|
|
|
1,219 |
|
|
|
2,519 |
|
| Shareholder Servicing Fees — Class I |
|
|
14 |
|
|
|
— |
|
|
|
— |
|
|
|
— |
|
| Administrative Servicing Fees — Class I |
|
|
14 |
|
|
|
— |
|
|
|
— |
|
|
|
— |
|
| Trustees’ Fees |
|
|
35 |
|
|
|
17 |
|
|
|
10 |
|
|
|
20 |
|
| Chief Compliance Officer Fees |
|
|
8 |
|
|
|
4 |
|
|
|
2 |
|
|
|
5 |
|
| Custodian/Wire Agent Fees |
|
|
334 |
|
|
|
496 |
|
|
|
66 |
|
|
|
93 |
|
| Printing Fees |
|
|
231 |
|
|
|
112 |
|
|
|
68 |
|
|
|
147 |
|
| Overdraft Fees |
|
|
30 |
|
|
|
36 |
|
|
|
6 |
|
|
|
13 |
|
| Professional Fees |
|
|
158 |
|
|
|
194 |
|
|
|
45 |
|
|
|
120 |
|
| Registration Fees |
|
|
50 |
|
|
|
24 |
|
|
|
13 |
|
|
|
25 |
|
| Other Expenses |
|
|
147 |
|
|
|
86 |
|
|
|
56 |
|
|
|
64 |
|
| Total Expenses |
|
|
21,908 |
|
|
|
17,370 |
|
|
|
5,872 |
|
|
|
18,119 |
|
| Less: |
|
|
|
|
|
|
|
|
|
|
|
|
|
|
|
|
| Waiver of Investment Advisory Fees |
|
|
— |
|
|
|
(832 |
) |
|
|
— |
|
|
|
(4,377 |
) |
| Waiver of Shareholder Servicing Fees — Class A |
|
|
— |
|
|
|
— |
|
|
|
(888 |
) |
|
|
— |
|
| Net Expenses |
|
|
21,908 |
|
|
|
16,538 |
|
|
|
4,984 |
|
|
|
13,742 |
|
| Net Investment Income |
|
|
30,343 |
|
|
|
4,128 |
|
|
|
7,828 |
|
|
|
48,801 |
|
| Net Realized and Unrealized Gain (Loss) on Investments, Affiliated Investments, Futures Contracts, Swap Contracts and Foreign
Currency Transactions: |
|
|
|
|
|
|
|
|
|
|
|
|
|
|
|
|
| Net Realized Gain (Loss) from: |
|
|
|
|
|
|
|
|
|
|
|
|
|
|
|
|
| Investments |
|
|
(48,483 |
) |
|
|
(70,342 |
) |
|
|
6,293 |
|
|
|
51,146 |
|
| Affiliated Investments |
|
|
— |
|
|
|
— |
|
|
|
— |
|
|
|
(243 |
) |
| Futures Contracts |
|
|
8,354 |
|
|
|
— |
|
|
|
182 |
|
|
|
(2,673 |
) |
| Swap Contracts |
|
|
— |
|
|
|
— |
|
|
|
(944 |
) |
|
|
339 |
|
| Foreign Currency Transactions |
|
|
371 |
|
|
|
(1,087 |
) |
|
|
16,653 |
|
|
|
(810 |
) |
| Net Change in Unrealized Appreciation (Depreciation) on: |
|
|
|
|
|
|
|
|
|
|
|
|
|
|
|
|
| Investments |
|
|
242,252 |
|
|
|
170,444 |
|
|
|
14,772 |
|
|
|
68,002 |
|
| Affiliated Investments |
|
|
(339 |
) |
|
|
(352 |
) |
|
|
— |
|
|
|
267 |
|
| Futures Contracts |
|
|
(1,696 |
) |
|
|
— |
|
|
|
247 |
|
|
|
(121 |
) |
| Swap Contracts |
|
|
— |
|
|
|
— |
|
|
|
214 |
|
|
|
1,564 |
|
| Foreign Capital Gains Tax on Appreciated Securities |
|
|
— |
|
|
|
(292 |
) |
|
|
— |
|
|
|
— |
|
| Foreign Currency Transactions |
|
|
(362 |
) |
|
|
184 |
|
|
|
(15,591 |
) |
|
|
2,058 |
|
| Net Realized and Unrealized Gain on Investments, Written Options, Futures Contracts, Swap
Contracts and Foreign Currency Transactions |
|
|
200,097 |
|
|
|
98,555 |
|
|
|
21,826 |
|
|
|
119,529 |
|
| Net Increase in Net Assets Resulting from Operations |
|
$ |
230,440 |
|
|
$ |
102,683 |
|
|
$ |
29,654 |
|
|
$ |
168,330 |
|
| (1) |
|
Income is from the investment of collateral in an affiliated security. |
| (2) |
|
See Note 4 in Notes to Financial Statements. |
Amounts
designated as “—” are $0 or have been rounded to $0.
The accompanying notes are an integral part of the financial statements.
|
|
|
|
|
| SEI Institutional International Trust / Annual Report / September 30, 2012 |
|
|
33 |
|
Statements of Changes in Net Assets ($ Thousands)
For the years ended September 30,
|
|
|
|
|
|
|
|
|
|
|
|
|
|
|
|
|
| |
|
International
Equity Fund |
|
|
Emerging Markets
Equity Fund |
|
| |
|
2012 |
|
|
2011 |
|
|
2012 |
|
|
2011 |
|
| Operations: |
|
|
|
|
|
|
|
|
|
|
|
|
|
|
|
|
| Net Investment Income |
|
$ |
30,343 |
|
|
$ |
36,457 |
|
|
$ |
4,128 |
|
|
$ |
4,092 |
|
| Net Realized Gain (Loss) from Investments, Affiliated Investments, Futures Contracts, and Swap Contracts |
|
|
(40,129 |
) |
|
|
175,855 |
|
|
|
(70,342 |
) |
|
|
128,870 |
|
| Net Realized Gain (Loss) on Forward Foreign Currency Contracts and Foreign Currency Transactions |
|
|
371 |
|
|
|
(3,283 |
) |
|
|
(1,087 |
) |
|
|
(1,199 |
) |
| Net Change in Unrealized Appreciation (Depreciation) on Investments, Affiliated Investments, Futures Contracts, and Swap
Contracts |
|
|
240,217 |
|
|
|
(405,494 |
) |
|
|
170,092 |
|
|
|
(311,142 |
) |
| Net Change in Unrealized Appreciation (Depreciation) on Foreign Capital Tax Gains on Appreciated Securities |
|
|
— |
|
|
|
— |
|
|
|
(292 |
) |
|
|
319 |
|
| Net Change in Unrealized Appreciation (Depreciation) on Forward Foreign Currency Contracts,
Foreign Currencies, and Translation of Other Assets and Liabilities Denominated in Foreign Currencies |
|
|
(362 |
) |
|
|
(198 |
) |
|
|
184 |
|
|
|
(218 |
) |
| Net Increase (Decrease) in Net Assets Resulting from Operations |
|
|
230,440 |
|
|
|
(196,663 |
) |
|
|
102,683 |
|
|
|
(179,278 |
) |
| Dividends from: |
|
|
|
|
|
|
|
|
|
|
|
|
|
|
|
|
| Net Investment Income: |
|
|
|
|
|
|
|
|
|
|
|
|
|
|
|
|
| Class A |
|
|
(34,665 |
) |
|
|
(27,359 |
) |
|
|
(2,183 |
) |
|
|
(8,167 |
) |
| Class I |
|
|
(96 |
) |
|
|
(106 |
) |
|
|
— |
|
|
|
— |
|
| Total Dividends |
|
|
(34,761 |
) |
|
|
(27,465 |
) |
|
|
(2,183 |
) |
|
|
(8,167 |
) |
| Capital Share Transactions: |
|
|
|
|
|
|
|
|
|
|
|
|
|
|
|
|
| Class A: |
|
|
|
|
|
|
|
|
|
|
|
|
|
|
|
|
| Proceeds from Shares Issued |
|
|
568,731 |
(1) |
|
|
534,221 |
|
|
|
298,296 |
|
|
|
267,635 |
|
| Reinvestment of Dividends & Distributions |
|
|
32,156 |
|
|
|
25,959 |
|
|
|
2,014 |
|
|
|
7,653 |
|
| Cost of Shares Redeemed |
|
|
(519,994 |
) |
|
|
(667,954 |
) |
|
|
(196,578 |
) |
|
|
(327,928 |
) |
| Increase (Decrease) in Net Assets Derived from Class A Transactions |
|
|
80,893 |
|
|
|
(107,774 |
) |
|
|
103,732 |
|
|
|
(52,640 |
) |
| Class I: |
|
|
|
|
|
|
|
|
|
|
|
|
|
|
|
|
| Proceeds from Shares Issued |
|
|
1,307 |
(1) |
|
|
1,445 |
|
|
|
— |
|
|
|
— |
|
| Reinvestment of Dividends & Distributions |
|
|
67 |
|
|
|
78 |
|
|
|
— |
|
|
|
— |
|
| Cost of Shares Redeemed |
|
|
(1,982 |
) |
|
|
(4,124 |
) |
|
|
— |
|
|
|
— |
|
| Decrease in Net Assets Derived from Class I Transactions |
|
|
(608 |
) |
|
|
(2,601 |
) |
|
|
— |
|
|
|
— |
|
| Increase (Decrease) in Net Assets Derived from Capital Share Transactions |
|
|
80,285 |
|
|
|
(110,375 |
) |
|
|
103,732 |
|
|
|
(52,640 |
) |
| Net Increase (Decrease) in Net Assets |
|
|
275,964 |
|
|
|
(334,503 |
) |
|
|
204,232 |
|
|
|
(240,085 |
) |
| Net Assets: |
|
|
|
|
|
|
|
|
|
|
|
|
|
|
|
|
| Beginning of Year |
|
|
1,572,158 |
|
|
|
1,906,661 |
|
|
|
695,498 |
|
|
|
935,583 |
|
| End of Year |
|
$ |
1,848,122 |
|
|
$ |
1,572,158 |
|
|
$ |
899,730 |
|
|
$ |
695,498 |
|
| Undistributed Net Investment Income Included in Net Assets at End of Year
|
|
$ |
29,231 |
|
|
$ |
32,544 |
|
|
$ |
3,390 |
|
|
$ |
1,998 |
|
| Share Transactions: |
|
|
|
|
|
|
|
|
|
|
|
|
|
|
|
|
| Class A: |
|
|
|
|
|
|
|
|
|
|
|
|
|
|
|
|
| Shares Issued |
|
|
72,568 |
|
|
|
60,845 |
|
|
|
30,168 |
|
|
|
22,954 |
|
| Reinvestment of Distributions |
|
|
4,334 |
|
|
|
2,973 |
|
|
|
215 |
|
|
|
643 |
|
| Shares Redeemed |
|
|
(66,704 |
) |
|
|
(76,626 |
) |
|
|
(19,866 |
) |
|
|
(28,393 |
) |
| Total Class A Transactions |
|
|
10,198 |
|
|
|
(12,808 |
) |
|
|
10,517 |
|
|
|
(4,796 |
) |
| Class I: |
|
|
|
|
|
|
|
|
|
|
|
|
|
|
|
|
| Shares Issued |
|
|
166 |
|
|
|
165 |
|
|
|
— |
|
|
|
— |
|
| Reinvestment of Distributions |
|
|
9 |
|
|
|
9 |
|
|
|
— |
|
|
|
— |
|
| Shares Redeemed |
|
|
(254 |
) |
|
|
(466 |
) |
|
|
— |
|
|
|
— |
|
| Total Class I Transactions |
|
|
(79 |
) |
|
|
(292 |
) |
|
|
— |
|
|
|
— |
|
| Net Increase (Decrease) in Shares Outstanding from Share Transactions |
|
|
10,119 |
|
|
|
(13,100 |
) |
|
|
10,517 |
|
|
|
(4,796 |
) |
(1) See Note 10 in Notes to Financial Statements.
Amounts designated as “—” are $0 or have been rounded to $0.
The accompanying notes are
an integral part of the financial statements.
|
|
|
| 34 |
|
SEI Institutional International Trust / Annual Report / September 30, 2012 |
Statements of Changes in Net Assets ($ Thousands)
(Continued)
For the years ended September 30,
|
|
|
|
|
|
|
|
|
|
|
|
|
|
|
|
|
| |
|
International Fixed
Income Fund |
|
|
Emerging Markets
Debt Fund |
|
| |
|
2012 |
|
|
2011 |
|
|
2012 |
|
|
2011 |
|
| Operations: |
|
|
|
|
|
|
|
|
|
|
|
|
|
|
|
|
| Net Investment Income |
|
$ |
7,828 |
|
|
$ |
11,662 |
|
|
$ |
48,801 |
|
|
$ |
50,403 |
|
| Net Realized Gain (Loss) from Investments, Affiliated Investments, Futures Contracts, and Swap Contracts |
|
|
5,531 |
|
|
|
3,682 |
|
|
|
48,569 |
|
|
|
32,145 |
|
| Net Realized Gain (Loss) on Forward Foreign Currency Contracts and Foreign Currency Transactions |
|
|
16,653 |
|
|
|
(25,271 |
) |
|
|
(810 |
) |
|
|
1,855 |
|
| Net Change in Unrealized Appreciation (Depreciation) on Investments, Affiliated Investments, Futures Contracts, and Swap
Contracts |
|
|
15,233 |
|
|
|
(20,547 |
) |
|
|
69,712 |
|
|
|
(93,220 |
) |
| Net Change in Unrealized Appreciation (Depreciation) on Forward Foreign Currency Contracts,
Foreign Currencies, and Translation of Other Assets and Liabilities Denominated in Foreign Currencies |
|
|
(15,591 |
) |
|
|
31,787 |
|
|
|
2,058 |
|
|
|
1,547 |
|
| Net Increase (Decrease) in Net Assets Resulting from Operations |
|
|
29,654 |
|
|
|
1,313 |
|
|
|
168,330 |
|
|
|
(7,270 |
) |
| Dividends and Distributions from: |
|
|
|
|
|
|
|
|
|
|
|
|
|
|
|
|
| Net Investment Income: |
|
|
|
|
|
|
|
|
|
|
|
|
|
|
|
|
| Class A |
|
|
(12,225 |
) |
|
|
(22,700 |
) |
|
|
(53,538 |
) |
|
|
(25,140 |
) |
| Net Realized Gains: |
|
|
|
|
|
|
|
|
|
|
|
|
|
|
|
|
| Class A |
|
|
— |
|
|
|
(490 |
) |
|
|
(2,001 |
) |
|
|
— |
|
| Total Dividends and Distributions |
|
|
(12,225 |
) |
|
|
(23,190 |
) |
|
|
(55,539 |
) |
|
|
(25,140 |
) |
| Capital Share Transactions: |
|
|
|
|
|
|
|
|
|
|
|
|
|
|
|
|
| Class A: |
|
|
|
|
|
|
|
|
|
|
|
|
|
|
|
|
| Proceeds from Shares Issued |
|
|
92,376 |
|
|
|
124,990 |
|
|
|
446,482 |
|
|
|
399,472 |
|
| Reinvestment of Dividends & Distributions |
|
|
11,251 |
|
|
|
21,936 |
|
|
|
49,190 |
|
|
|
22,662 |
|
| Cost of Shares Redeemed |
|
|
(118,192 |
) |
|
|
(141,201 |
) |
|
|
(319,757 |
) |
|
|
(445,193 |
) |
| Increase (Decrease) in Net Assets Derived from Capital Share Transactions |
|
|
(14,565 |
) |
|
|
5,725 |
|
|
|
175,915 |
|
|
|
(23,059 |
) |
| Net Increase (Decrease) in Net Assets |
|
|
2,864 |
|
|
|
(16,152 |
) |
|
|
288,706 |
|
|
|
(55,469 |
) |
| Net Assets: |
|
|
|
|
|
|
|
|
|
|
|
|
|
|
|
|
| Beginning of Year |
|
|
488,929 |
|
|
|
505,081 |
|
|
|
876,396 |
|
|
|
931,865 |
|
| End of Year |
|
$ |
491,793 |
|
|
$ |
488,929 |
|
|
$ |
1,165,102 |
|
|
$ |
876,396 |
|
| Undistributed (Distributions in excess of) Net Investment Income Included in Net Assets
at End of Year |
|
$ |
(15,636 |
) |
|
$ |
(30,912 |
) |
|
$ |
8,863 |
|
|
$ |
15,008 |
|
| Share Transactions: |
|
|
|
|
|
|
|
|
|
|
|
|
|
|
|
|
| Class A: |
|
|
|
|
|
|
|
|
|
|
|
|
|
|
|
|
| Shares Issued |
|
|
8,800 |
|
|
|
12,022 |
|
|
|
39,221 |
|
|
|
35,467 |
|
| Reinvestment of Distributions |
|
|
1,098 |
|
|
|
2,157 |
|
|
|
4,465 |
|
|
|
2,016 |
|
| Shares Redeemed |
|
|
(11,260 |
) |
|
|
(13,579 |
) |
|
|
(28,264 |
) |
|
|
(39,651 |
) |
| Total Class A Transactions |
|
|
(1,362 |
) |
|
|
600 |
|
|
|
15,422 |
|
|
|
(2,168 |
) |
Amounts designated as “—” are either $0 or have been rounded to $0.
The accompanying notes are an integral part of the financial statements.
|
|
|
|
|
| SEI Institutional International Trust / Annual Report / September 30, 2012 |
|
|
35 |
|
Financial Highlights
For the years ended September 30,
For a Share Outstanding Throughout Each Year
|
|
|
|
|
|
|
|
|
|
|
|
|
|
|
|
|
|
|
|
|
|
|
|
|
|
|
|
|
|
|
|
|
|
|
|
|
|
|
|
|
|
|
|
|
|
|
|
|
|
|
|
|
|
|
|
|
|
|
|
|
| |
|
Net Asset
Value,
Beginning
of Year |
|
|
Net
Investment
Income
(Loss)(1) |
|
|
Net
Realized
and
Unrealized
Gains
(Losses)
on
Securities(1) |
|
|
Total from
Operations |
|
|
Dividends
from Net
Investment
Income |
|
|
Distributions
from
Realized
Capital
Gains |
|
|
Total
Dividends
and
Distributions
and Return
of
Capital |
|
|
Net Asset
Value,
End of
Year |
|
|
Total
Return† |
|
|
Net Assets
End of Year
($ Thousands) |
|
|
Ratio of
Expenses
to Average
Net Assets* |
|
|
Ratio of
Expenses
to Average
Net
Assets
(Excluding
Fees Paid
Indirectly)** |
|
|
Ratio of
Expenses
to Average
Net
Assets
(Excluding
Waivers and
Fees Paid
Indirectly)** |
|
|
Ratio of
Net
Investment
Income
(Loss) to
Average
Net
Assets |
|
|
Portfolio
Turnover
Rate |
|
| International Equity Fund |
|
| Class A |
|
|
|
|
|
|
|
|
|
|
|
|
|
|
|
|
|
|
|
|
|
|
|
|
|
|
|
|
|
|
|
|
|
|
|
|
|
|
|
|
|
|
|
|
|
|
|
|
|
| 2012 |
|
$ |
7.29 |
|
|
$ |
0.14 |
|
|
$ |
0.92 |
|
|
$ |
1.06 |
|
|
$ |
(0.16 |
) |
|
$ |
— |
|
|
$ |
(0.16 |
) |
|
$ |
8.19 |
|
|
|
14.76 |
% |
|
$ |
1,842,851 |
|
|
|
1.26 |
%(3) |
|
|
1.26 |
%(3) |
|
|
1.26 |
%(3) |
|
|
1.75 |
% |
|
|
56 |
% |
| 2011 |
|
|
8.34 |
|
|
|
0.16 |
|
|
|
(1.08 |
) |
|
|
(0.92 |
) |
|
|
(0.13 |
) |
|
|
— |
|
|
|
(0.13 |
) |
|
|
7.29 |
|
|
|
(11.34 |
) |
|
|
1,566,893 |
|
|
|
1.27 |
(3) |
|
|
1.27 |
(3) |
|
|
1.27 |
(3) |
|
|
1.88 |
|
|
|
98 |
|
| 2010 |
|
|
7.88 |
|
|
|
0.10 |
|
|
|
0.36 |
|
|
|
0.46 |
|
|
|
— |
|
|
|
— |
|
|
|
— |
|
|
|
8.34 |
|
|
|
5.84 |
|
|
|
1,898,206 |
|
|
|
1.27 |
(3) |
|
|
1.27 |
(3) |
|
|
1.28 |
|
|
|
1.26 |
|
|
|
144 |
|
| 2009 |
|
|
8.85 |
|
|
|
0.13 |
|
|
|
(0.94 |
) |
|
|
(0.81 |
) |
|
|
(0.16 |
) |
|
|
— |
|
|
|
(0.16 |
) |
|
|
7.88 |
|
|
|
(8.73 |
) |
|
|
2,053,411 |
|
|
|
1.28 |
(2)(3) |
|
|
1.28 |
(2)(3) |
|
|
1.29 |
|
|
|
2.01 |
|
|
|
154 |
|
| 2008 |
|
|
16.18 |
|
|
|
0.27 |
|
|
|
(5.52 |
) |
|
|
(5.25 |
) |
|
|
(0.34 |
) |
|
|
(1.74 |
) |
|
|
(2.08 |
) |
|
|
8.85 |
|
|
|
(36.96 |
) |
|
|
2,329,504 |
|
|
|
1.25 |
(2)(3) |
|
|
1.26 |
(2)(3) |
|
|
1.26 |
(2) |
|
|
2.15 |
|
|
|
218 |
|
| Class I |
|
|
|
|
|
|
|
|
|
|
|
|
|
|
|
|
|
|
|
|
|
|
|
|
|
|
|
|
|
|
|
|
|
|
|
|
|
|
|
|
|
|
|
|
|
|
|
|
|
| 2012 |
|
$ |
7.28 |
|
|
$ |
0.12 |
|
|
$ |
0.91 |
|
|
$ |
1.03 |
|
|
$ |
(0.13 |
) |
|
$ |
— |
|
|
$ |
(0.13 |
) |
|
$ |
8.18 |
|
|
|
14.37 |
% |
|
$ |
5,271 |
|
|
|
1.51 |
%(3) |
|
|
1.51 |
%(3) |
|
|
1.51 |
%(3) |
|
|
1.48 |
% |
|
|
56 |
% |
| 2011 |
|
|
8.32 |
|
|
|
0.13 |
|
|
|
(1.06 |
) |
|
|
(0.93 |
) |
|
|
(0.11 |
) |
|
|
— |
|
|
|
(0.11 |
) |
|
|
7.28 |
|
|
|
(11.44 |
) |
|
|
5,265 |
|
|
|
1.52 |
(3) |
|
|
1.52 |
(3) |
|
|
1.52 |
|
|
|
1.54 |
|
|
|
98 |
|
| 2010 |
|
|
7.89 |
|
|
|
0.08 |
|
|
|
0.35 |
|
|
|
0.43 |
|
|
|
— |
|
|
|
— |
|
|
|
— |
|
|
|
8.32 |
|
|
|
5.45 |
|
|
|
8,455 |
|
|
|
1.52 |
(3) |
|
|
1.52 |
(3) |
|
|
1.53 |
|
|
|
1.00 |
|
|
|
144 |
|
| 2009 |
|
|
8.82 |
|
|
|
0.13 |
|
|
|
(0.94 |
) |
|
|
(0.81 |
) |
|
|
(0.12 |
) |
|
|
— |
|
|
|
(0.12 |
) |
|
|
7.89 |
|
|
|
(8.80 |
) |
|
|
8,397 |
|
|
|
1.53 |
(2)(3) |
|
|
1.53 |
(2)(3) |
|
|
1.54 |
|
|
|
1.97 |
|
|
|
154 |
|
| 2008 |
|
|
16.13 |
|
|
|
0.22 |
|
|
|
(5.49 |
) |
|
|
(5.27 |
) |
|
|
(0.30 |
) |
|
|
(1.74 |
) |
|
|
(2.04 |
) |
|
|
8.82 |
|
|
|
(37.14 |
) |
|
|
6,538 |
|
|
|
1.50 |
(2)(3) |
|
|
1.51 |
(2)(3) |
|
|
1.51 |
(2) |
|
|
1.72 |
|
|
|
218 |
|
| Emerging Markets Equity Fund |
|
| Class A |
|
|
|
|
|
|
|
|
|
|
|
|
|
|
|
|
|
|
|
|
|
|
|
|
|
|
|
|
|
|
|
|
|
|
|
|
|
|
|
|
|
|
|
|
|
|
|
|
|
| 2012 |
|
$ |
9.00 |
|
|
$ |
0.05 |
|
|
$ |
1.23 |
|
|
$ |
1.28 |
|
|
$ |
(0.03 |
) |
|
$ |
— |
|
|
$ |
(0.03 |
) |
|
$ |
10.25 |
|
|
|
14.21 |
% |
|
$ |
899,730 |
|
|
|
1.97 |
%(4) |
|
|
1.97 |
%(4) |
|
|
2.07 |
% |
|
|
0.49 |
% |
|
|
93 |
% |
| 2011 |
|
|
11.40 |
|
|
|
0.05 |
|
|
|
(2.35 |
) |
|
|
(2.30 |
) |
|
|
(0.10 |
) |
|
|
— |
|
|
|
(0.10 |
) |
|
|
9.00 |
|
|
|
(20.38 |
) |
|
|
695,498 |
|
|
|
1.96 |
(4) |
|
|
1.96 |
(4) |
|
|
2.09 |
|
|
|
0.44 |
|
|
|
98 |
|
| 2010 |
|
|
9.64 |
|
|
|
0.04 |
|
|
|
1.78 |
|
|
|
1.82 |
|
|
|
(0.06 |
) |
|
|
— |
|
|
|
(0.06 |
) |
|
|
11.40 |
|
|
|
18.93 |
|
|
|
935,583 |
|
|
|
1.96 |
(4) |
|
|
1.96 |
(4) |
|
|
2.09 |
|
|
|
0.38 |
|
|
|
81 |
|
| 2009 |
|
|
11.43 |
|
|
|
0.08 |
|
|
|
0.18 |
|
|
|
0.26 |
|
|
|
(0.10 |
) |
|
|
(1.95 |
) |
|
|
(2.05 |
) |
|
|
9.64 |
|
|
|
16.40 |
|
|
|
916,780 |
|
|
|
1.97 |
(4) |
|
|
1.97 |
(4) |
|
|
2.11 |
|
|
|
1.08 |
|
|
|
80 |
|
| 2008 |
|
|
21.49 |
|
|
|
0.14 |
|
|
|
(5.64 |
) |
|
|
(5.50 |
) |
|
|
(0.08 |
) |
|
|
(4.48 |
) |
|
|
(4.56 |
) |
|
|
11.43 |
|
|
|
(33.33 |
) |
|
|
965,730 |
|
|
|
1.99 |
(4) |
|
|
1.99 |
(4) |
|
|
2.08 |
|
|
|
0.85 |
|
|
|
94 |
|
| International Fixed Income Fund |
|
| Class A |
|
|
|
|
|
|
|
|
|
|
|
|
|
|
|
|
|
|
|
|
|
|
|
|
|
|
|
|
|
|
|
|
|
|
|
|
|
|
|
|
|
|
|
|
|
|
|
|
|
| 2012 |
|
$ |
10.44 |
|
|
$ |
0.17 |
|
|
$ |
0.48 |
|
|
$ |
0.65 |
|
|
$ |
(0.27 |
) |
|
$ |
— |
|
|
$ |
(0.27 |
) |
|
$ |
10.82 |
|
|
|
6.34 |
% |
|
$ |
491,793 |
|
|
|
1.02 |
%(5) |
|
|
1.02 |
%(5) |
|
|
1.21 |
% |
|
|
1.60 |
% |
|
|
103 |
% |
| 2011 |
|
|
10.92 |
|
|
|
0.25 |
|
|
|
(0.22 |
) |
|
|
0.03 |
|
|
|
(0.51 |
)(9) |
|
|
— |
|
|
|
(0.51 |
) |
|
|
10.44 |
|
|
|
0.41 |
|
|
|
488,929 |
|
|
|
1.02 |
(5) |
|
|
1.02 |
(5) |
|
|
1.21 |
|
|
|
2.40 |
|
|
|
119 |
|
| 2010 |
|
|
10.21 |
|
|
|
0.24 |
|
|
|
0.57 |
|
|
|
0.81 |
|
|
|
(0.10 |
)(8) |
|
|
— |
|
|
|
(0.10 |
) |
|
|
10.92 |
|
|
|
7.97 |
|
|
|
505,081 |
|
|
|
1.07 |
(7) |
|
|
1.07 |
(7) |
|
|
1.21 |
|
|
|
2.33 |
|
|
|
135 |
|
| 2009 |
|
|
10.46 |
|
|
|
0.28 |
|
|
|
0.53 |
|
|
|
0.81 |
|
|
|
(1.06 |
) |
|
|
— |
|
|
|
(1.06 |
) |
|
|
10.21 |
|
|
|
8.85 |
|
|
|
538,159 |
|
|
|
1.02 |
(5) |
|
|
1.02 |
(5) |
|
|
1.06 |
|
|
|
2.86 |
|
|
|
170 |
|
| 2008 |
|
|
10.91 |
|
|
|
0.37 |
|
|
|
(0.68 |
) |
|
|
(0.31 |
) |
|
|
(0.14 |
) |
|
|
— |
|
|
|
(0.14 |
) |
|
|
10.46 |
|
|
|
(2.89 |
) |
|
|
703,324 |
|
|
|
1.02 |
(5) |
|
|
1.02 |
(5) |
|
|
1.04 |
|
|
|
3.45 |
|
|
|
147 |
|
| Emerging Markets Debt Fund |
|
| Class A |
|
|
|
|
|
|
|
|
|
|
|
|
|
|
|
|
|
|
|
|
|
|
|
|
|
|
|
|
|
|
|
|
|
|
|
|
|
|
|
|
|
|
|
|
|
|
|
|
|
| 2012 |
|
$ |
10.81 |
|
|
$ |
0.55 |
|
|
$ |
1.36 |
|
|
$ |
1.91 |
|
|
$ |
(0.63 |
) |
|
$ |
(0.02 |
) |
|
$ |
(0.65 |
) |
|
$ |
12.07 |
|
|
|
18.48 |
% |
|
$ |
1,165,102 |
|
|
|
1.36 |
%(6) |
|
|
1.36 |
%(6) |
|
|
1.80 |
% |
|
|
4.85 |
% |
|
|
102 |
% |
| 2011 |
|
|
11.19 |
|
|
|
0.63 |
|
|
|
(0.70 |
) |
|
|
(0.07 |
) |
|
|
(0.31 |
) |
|
|
— |
|
|
|
(0.31 |
) |
|
|
10.81 |
|
|
|
(0.71 |
) |
|
|
876,396 |
|
|
|
1.36 |
(6) |
|
|
1.36 |
(6) |
|
|
1.80 |
|
|
|
5.58 |
|
|
|
59 |
|
| 2010 |
|
|
10.24 |
|
|
|
0.67 |
|
|
|
1.14 |
|
|
|
1.81 |
|
|
|
(0.86 |
) |
|
|
— |
|
|
|
(0.86 |
) |
|
|
11.19 |
|
|
|
18.78 |
|
|
|
931,865 |
|
|
|
1.36 |
(6) |
|
|
1.36 |
(6) |
|
|
1.79 |
|
|
|
6.41 |
|
|
|
70 |
|
| 2009 |
|
|
9.43 |
|
|
|
0.71 |
|
|
|
0.85 |
|
|
|
1.56 |
|
|
|
(0.75 |
) |
|
|
— |
|
|
|
(0.75 |
) |
|
|
10.24 |
|
|
|
18.62 |
|
|
|
790,597 |
|
|
|
1.37 |
(6) |
|
|
1.37 |
(6) |
|
|
1.81 |
|
|
|
8.47 |
|
|
|
73 |
|
| 2008 |
|
|
11.04 |
|
|
|
0.62 |
|
|
|
(1.18 |
) |
|
|
(0.56 |
) |
|
|
(0.74 |
) |
|
|
(0.31 |
) |
|
|
(1.05 |
) |
|
|
9.43 |
|
|
|
(5.71 |
) |
|
|
877,354 |
|
|
|
1.37 |
(6) |
|
|
1.37 |
(6) |
|
|
1.79 |
|
|
|
5.94 |
|
|
|
83 |
|
| * |
|
Includes Fees Paid Indirectly, if applicable. See Note 4 in Notes to Financial Statements. |
| ** |
|
See Note 4 in Notes to Financial Statements. |
| † |
|
Returns do not reflect the deduction of taxes that a shareholder would pay on fund distributions or the redemption of fund shares. |
| (1) |
|
Per share net investment income/(loss) and net realized and unrealized gains/(losses) calculated using average shares. |
| (2) |
|
The expense ratio includes interest expense on reverse repurchase agreements. Had this expense been excluded, the ratios for Class A and I shares would have been 1.28% and
1.53%, respectively, for 2009 and 2008. |
| (3) |
|
The expense ratio includes overdraft fees. Had this expense been excluded, the ratios for Class A and I shares would have been 1.26% and 1.51%, respectively for 2012,
1.27% and 1.52%, respectively for 2011 and 2010, 1.28% and 1.53%, respectively for 2009 and 1.25% and 1.50%, respectively for 2008. |
| (4) |
|
The expense ratio includes overdraft fees. Had this expense been excluded, the ratios would have been 1.96% for 2012, 2011, 2010, 2009 and 2008. |
| (5) |
|
The expense ratio includes overdraft fees. Had this expense been excluded, the ratios would have been 1.02%, 1.02%, 1.01% and 1.02% for 2012, 2011, 2009 and 2008,
respectively. |
| (6) |
|
The expense ratio includes overdraft fees. Had this expense been excluded, the ratios would have been 1.36% for 2012, 2011, 2010, 2009 and 2008. |
| (7) |
|
The expense ratio includes proxy and overdraft fees. Had these expenses been excluded, the ratio would have been 1.01% for 2010. |
| (8) |
|
Includes return of capital of less than $0.01. |
| (9) |
|
Includes a return of capital of $0.01 per share. |
Amounts designated as “—” are either $0 or have been rounded to $0.
The accompanying notes are an integral part of the financial statements.
|
|
|
| 36 |
|
SEI Institutional International Trust / Annual Report / September 30, 2012 |
Notes to Financial Statements
September 30, 2012
1. ORGANIZATION
SEI Institutional International Trust (the “Trust”) was organized as a Massachusetts business trust under a Declaration of Trust dated June 30, 1988. The operations of the Trust commenced on
December 20, 1989.
The Trust is registered under the Investment Company Act of 1940, as amended, as an open-end investment company with four
funds: International Equity Fund, Emerging Markets Equity Fund, International Fixed Income Fund and Emerging Markets Debt Fund (together the “Funds”). The Trust’s prospectuses provide a description of each Fund’s investment
objective, and strategies. The Trust is registered to offer Class A shares of each of the Funds, Class G shares of the International Equity, Emerging Markets Equity and Emerging Markets Debt Funds, and Class I shares of the International Equity
Fund.
As of September 30, 2012, the Class G shares had not yet commenced operations.
2. SIGNIFICANT ACCOUNTING POLICIES
The following is a summary of significant accounting policies
consistently followed by the Funds.
Use of Estimates — The preparation of financial statements, in conformity with U.S. generally
accepted accounting principles (“GAAP”), requires management to make estimates and assumptions that affect the reported amounts of assets and liabilities and disclosure of contingent assets and liabilities as of the date of the financial
statements, and the reported amounts of increases and decreases in net assets from operations during the reporting period. Actual results could differ from those estimates.
Security Valuation — Securities listed on a securities exchange, market or automated quotation system for which quotations are readily available are valued at the last quoted sale price on the
primary exchange or market (foreign or domestic) on which they are traded, or, if there is no such reported sale, at the most recent quoted bid price. Debt securities are priced based upon valuations provided by independent, third-party pricing
agents, if available. Such values generally reflect the last reported sales price if the security is actively traded. The third-party pricing agents may also value debt securities at an evaluated bid price by employing methodologies that utilize
actual market transactions, broker-supplied valuations, or other methodologies designed to identify the market value for such securities. Debt obligations with remaining maturities of sixty days or less may be valued at their amortized cost, which
approximates market value. The prices for foreign securities are reported in local currency and converted to U.S. dollars using currency exchange rates. Prices for most securities held in the Funds are provided daily by recognized independent
pricing agents. SEI Investments Management Corporation (“SIMC”) or a sub-adviser, as applicable, reasonably believes that prices provided by independent pricing agents are reliable. However, there can be no assurance that such pricing
service’s prices
will be reliable. SIMC or a sub-adviser, as applicable, continuously monitors the reliability of prices
obtained from any pricing service and will notify the Funds’ administrator if it believes that a particular pricing service is no longer a reliable source of prices. The Funds’ administrator, in turn, will notify the Trust’s Fair
Value Committee if it receives such notification from SIMC or a sub-adviser, as applicable, or if the Funds’ administrator reasonably believes that a particular pricing service is no longer a reliable source for prices. If a security price
cannot be obtained from an independent, third-party pricing agent, the Funds seek to obtain a bid price from at least one independent broker.
Securities for which market prices are not “readily available” are determined to be unreliable or can not be valued using methodologies described
above are valued in accordance with Fair Value Procedures established by the Trust’s Board of Trustees (the “Board”). The Trust’s Fair Value Procedures are implemented through a Fair Value Committee (the “Committee”)
designated by the Board. The Committee is currently composed of two members of the Board of Trustees, as well as representatives from SIMC and its affiliates. The Committee provides regular reports to the Board concerning investments for which
market prices are not readily available or may be unreliable. Some of the more common reasons that may necessitate that a security be valued using Fair Value Procedures include: the security’s trading has been halted or suspended; the security
has been de-listed from a national exchange; the security’s primary trading market is temporarily closed at a time when, under normal conditions, it would be open; or the security’s primary pricing source is not able or willing to provide
a price. When a security is valued in accordance with the Fair Value Procedures, the Committee will determine the value after taking into consideration relevant information reasonably available to the Committee. Examples of factors the Committee may
consider are: (i) the facts giving rise to the need to fair value; (ii) the last trade price; (iii) the performance of the market or the issuer’s industry; (iv) the liquidity of the security; (v) the size of the holding in a Fund; or (vi) any
other appropriate information. The determination of a security’s fair value price often involves the consideration of a number of subjective factors and is therefore subject to the unavoidable risk that the value assigned to a security may be
higher or lower than the security’s value would be if a reliable market quotation for the security was readily available.
For securities
that principally trade on a foreign market or exchange, a significant gap in time can exist between the time of a particular security’s last trade and the time at which a Fund calculates its net asset value. The closing prices of such
securities may no longer reflect their market value at the time the Fund calculates net asset value if an event that could materially affect the value of those securities (a “Significant Event”) has occurred between the time of the
security’s last close and the time that the Fund calculates net asset value. A Significant Event may relate to a single issuer or to an entire market sector. If the adviser or sub-adviser of a Fund becomes aware of a
|
|
|
|
|
| SEI Institutional International Trust / Annual Report / September 30, 2012 |
|
|
37 |
|
Notes to Financial Statements (Continued)
September 30, 2012
Significant Event that has occurred with respect to a security or group of securities after the closing of the exchange or market on which the security or securities principally trade, but before
the time at which the Fund calculates net asset value, it may request that a Committee meeting be called. In addition, the Fund’s administrator monitors price movements among certain selected indices, securities and/or baskets of securities
that may be an indicator that the closing prices received earlier from foreign exchanges or markets may not reflect market value at the time the Fund calculates net asset value. If price movements in a monitored index or security exceed levels
established by the administrator, the administrator notifies the adviser or sub-adviser for any Fund holding the relevant securities that such limits have been exceeded. In such event, the adviser or sub-adviser makes the determination whether a
Committee Meeting should be called based on the information provided.
The International Equity Fund and Emerging Markets Equity Fund also use a
third-party fair valuation vendor. The vendor provides a fair value for foreign securities held by these Funds based on certain factors and methodologies (involving, generally, tracking valuation correlations between the U.S. market and each
non-U.S. security). Values from the fair value vendor are applied in the event that there is a movement in the U.S. market that exceeds a specific threshold that has been established by the Committee. The Committee has also established a
“confidence interval” which is used to determine the level of historical correlation between the value of a specific foreign security and movements in the U.S. market before a particular security will be fair valued when the threshold is
exceeded. In the event that the threshold established by the Committee is exceeded on a specific day, the International Equity Fund and Emerging Markets Equity Fund will value the non-U.S. securities in their portfolios that exceed the applicable
“confidence interval” based upon the adjusted prices provided by the fair valuation vendor.
In accordance with GAAP, fair value is
defined as the price that the Fund would receive upon selling an investment in a timely transaction to an independent buyer in the principal or most advantageous market of the investment. A three-tier hierarchy has been established to maximize the
use of the observable market data and minimize the use of unobservable inputs and to establish classification of the fair value measurements for disclosure purposes. Inputs refer broadly to the assumptions that market participants would use in
pricing an asset. Inputs may be observable or unobservable. Observable inputs are inputs that reflect the assumptions market participants would use in pricing the asset or liability developed based on market data obtained from sources independent of
the reporting entity. Unobservable inputs are inputs that reflect the reporting entity’s own assumptions about the assumptions market participants would use in pricing the asset or liability developed based on the best information
available in the circumstances.
The three-tier hierarchy of inputs is summarized in the three broad Levels listed below:
Level 1 — quoted prices in active markets for identical investments
Level 2 — other significant observable inputs (including quoted prices for similar investments, interest rates, prepayment speeds, credit risks, etc.)
Level 3 — significant unobservable inputs (including the Fund’s own assumptions in determining the fair value of investments)
Investments are classified within the level of the lowest significant input considered in determining fair value. Investments classified within Level 3 whose
fair value measurement considers several inputs may include Level 1 or Level 2 inputs as components of the overall fair value measurement.
In May
2011, the Financial Accounting Standards Board (“FASB”) issued Accounting Standards Update (“ASU”) No. 2011-04 “Amendments to Achieve Common Fair Value Measurement and Disclosure Requirements in U.S. GAAP and International
Financial Reporting Standards (“IFRS”)”. ASU 2011-04 includes common requirements for measurement of and disclosure about fair value between U.S. GAAP and IFRS. ASU 2011-04 will require reporting entities to disclose the following
information for fair value measurements categorized within Level 3 of the fair value hierarchy: quantitative information about the unobservable inputs used in the fair value measurement, the valuation processes used by the reporting entity, and a
narrative description of the sensitivity of the fair value measurement to changes in unobservable inputs and the interrelationships between those unobservable inputs. In addition, ASU 2011-04 will require reporting entities to make disclosures about
amounts and reasons for all transfers in and out of Level 1 and Level 2 fair value measurements. The new and revised disclosures are effective for interim and annual reporting periods beginning after December 15, 2011. The adoption of ASU No.
2011-04 did not materially affect the Funds’ financial condition or results of operations.
The valuation techniques used by the Funds to
measure fair value during the year ended September 30, 2012 maximized the use of observable inputs and minimized the use of unobservable inputs.
For the year ended September 30, 2012, there have been no significant changes to the inputs or the Trust’s fair valuation methodologies.
Security Transactions and Investment Income — Security transactions are recorded on the trade date. Cost used in determining net realized capital
gains and losses on the sale of securities is determined on the basis of specific identification. Dividend income and expense is recognized on the ex-dividend date, and interest income or expense is recognized using the accrual basis of accounting.
Distributions received on securities that represent a return of capital or capital gain are recorded as a reduction of cost of investments and/
|
|
|
| 38 |
|
SEI Institutional International Trust / Annual Report / September 30, 2012 |
or as a realized gain. The Trust estimates the components of distributions received that may be considered nontaxable distributions or capital gain distributions.
Amortization and accretion is calculated using the scientific interest method, which approximates the effective interest method over the holding period of
the security, which is not materially different from the effective interest method. Amortization of premiums and discounts is included in interest income.
Expenses — Expenses that are directly related to one of the Funds are charged directly to that Fund. Other operating expenses of the Trust are prorated to the Funds on the basis of relative daily
net assets.
Classes — Class-specific expenses are borne by that class. Income, non-class specific expenses, and realized and
unrealized gains/losses are allocated to the respective classes on the basis of relative daily net assets.
Foreign Currency Translation
— The books and records of the Funds investing in international securities are maintained in U.S. dollars on the following basis:
(i)
market value of investment securities, assets and liabilities at the current rate of exchange; and
(ii) purchases and sales of investment
securities, income and expenses at the relevant rates of exchange prevailing on the respective dates of such transactions.
The Funds do not
isolate that portion of gains and losses on investments in equity securities that is due to changes in the foreign exchange rates from that which is due to changes in market prices of equity securities.
The Funds report certain foreign-currency-related transactions as components of realized gains for financial reporting purposes, whereas such components are
treated as ordinary income for Federal income tax purposes.
Forward Foreign Currency Contracts — To the extent consistent with its
Investment Objective and Strategies, a Fund may enter into forward foreign currency contracts as hedges against either specific transactions, fund positions, speculative purposes or anticipated fund positions. All commitments are
“marked-to-market” daily at the applicable foreign exchange rate, and any resulting unrealized gains or losses are recorded currently. The Fund realizes gains and losses at the time forward contracts are extinguished. Unrealized gains or
losses on outstanding positions in forward foreign currency contracts held at the close of the year are recognized as ordinary income or loss for federal income tax purposes. The Fund could be exposed to risk if the counterparties to the contracts
are unable to meet the terms of the contract and from unanticipated movements in the value of a foreign currency relative to the U.S. dollar.
Finally, the risk exists that losses could exceed amounts disclosed on the Statement of Assets and Liabilities. Refer to each Fund’s Summary
Schedule of Investments for details regarding open forward foreign currency contracts as of September 30, 2012, if applicable.
Futures Contracts — To the extent consistent with its Investment Objective and Strategies, the Funds may purchase futures contracts to gain exposure to market changes, which may be more efficient
or cost effective than actually buying the securities. To the extent consistent with its Investment Objective and Strategies, a Fund may utilize futures contracts for tactical hedging purposes as well as to enhance the Funds’ returns. In
addition, the International Fixed Income Fund and the Emerging Markets Debt Fund may utilize futures contracts to efficiently assist in managing the Funds’ duration and yield curve exposure. Upon entering into such a contract, a Fund is
required to deposit and maintain as collateral such initial margin as required by the exchange on which the contract is held. The contracts are marked to market daily and the resulting changes in value are accounted for as unrealized gains and
losses. Variation margin payments are paid or received, depending upon whether unrealized losses or gains are incurred. When the contract is closed, the Funds record a realized gain or loss equal to the difference between the proceeds from (or cost
of) the closing transaction and the amount invested in the contract.
Risks of entering into futures contracts include the possibility that there
will be an imperfect price correlation between the futures and the underlying securities. Second, it is possible that a lack of liquidity for futures contracts could exist in the secondary market, resulting in an inability to close a position prior
to its maturity date. Third, the futures contract involves the risk that a Fund could lose more than the original margin deposit required to initiate a futures transaction.
Finally, the risk exists that losses could exceed amounts disclosed on the Statement of Assets and Liabilities. Refer to each Fund’s Summary Schedule of Investments for details regarding open futures
contracts as of September 30, 2012, if applicable.
Swap Agreements — To the extent consistent with its Investment Objective and
Strategies, a Fund may invest in swap contracts as an efficient means to take and manage risk in the portfolio, including interest rate risk, credit risk and overall yield sensitivity. A swap agreement is a two-party contract under which an
agreement is made to exchange returns from predetermined investments or instruments, including a particular interest rate, foreign currency, or “basket” of securities representing a particular index. Interest rate swaps involve the
exchange by a Fund with another party of their respective commitments to pay or receive interest (e.g., an exchange of floating rate payments for fixed rate payments) with respect to a notional amount of principal. Credit default swaps involve the
periodic payment by a Fund or counterparty of interest based on a specified rate multiplied by a notional amount assigned to an underlying debt instrument or group of debt instruments in exchange for the assumption of credit risk on the same
instruments. In the event of a credit event, usually in the form of a credit rating downgrade, the party receiving periodic payments (i.e. floating rate payer) must pay the other party (i.e. fixed
|
|
|
|
|
| SEI Institutional International Trust / Annual Report / September 30, 2012 |
|
|
39 |
|
Notes to Financial Statements (Continued)
September 30, 2012
rate payer) an amount equal to the outstanding principal of the downgraded debt instrument. Total return swaps allow an investor to benefit from the cash flow without ever actually owning the
underlying security. The receiver must pay any decline in value to the payer at the end of the total return swap. However, the investor does not need to make a payment if there is no decline in price. Payments can be made on various indices, bonds
(i.e. mortgage backed securities, bank debt and corporate), loans or commodities. The value of a total return swap is equal to the change in value of the underlying asset versus the accrued income payment based on LIBOR (London Interbank Offered
Rate) or some other form of index on the notional amount. Interest rate swaps involve the exchange by a Fund with another party of their respective commitments to pay or receive interest (e.g., an exchange of floating rate payments for fixed rate
payments) with respect to a notional amount of principal to manage a Fund’s exposure to interest rates. Payments received or made are recorded as realized gains or losses. A Fund could be exposed to credit or market risk due to unfavorable
changes in the fluctuation of interest rates or if the counterparty defaults on its obligation to perform. Risk of loss may exceed amounts recognized on the statement of assets and liabilities. In connection with swap agreements, securities/cash may
be set aside as collateral by the Fund’s custodian. A Fund may enter into swap agreements in order to, among other things, change the maturity or duration of the investment portfolio; protect a Fund’s value from changes in interest rates;
or expose a Fund to a different security or market.
Swaps are marked-to-market daily based upon quotations from market makers and the resulting
changes in market values, if any, are recorded as unrealized gains or losses in the Statement of Operations. Net payments of interest are recorded as realized gains or losses.
Entering into swap agreements involves, to varying degrees, elements of credit and market risk in excess of the amounts recognized on the Summary Schedule of Investments or the Statement of Assets and
Liabilities. Such risks involve the possibility that there will be no liquid market for these agreements, that the counterparty to the agreement may default on its obligation to perform and that there may be unfavorable changes in the fluctuation of
interest rates. Risks also arise from potential losses from adverse market movements.
Counterparty risk may be mitigated by having a master
netting arrangement between a Fund and the counterparty and by having the counterparty post collateral to cover a Fund’s exposure to the counterparty. Refer to each Fund’s Summary Schedule of Investments for details regarding open swap
contracts as of September 30, 2012, if applicable.
Delayed Delivery Transactions — A Fund may purchase or sell securities on a
when-issued or delayed delivery basis. These transactions involve a commitment by the Fund to purchase or sell securities for a predetermined price or yield, with payment and delivery taking place beyond the customary settlement period. When delayed
delivery purchases are outstanding, the Fund will set aside liquid assets in an
amount sufficient to meet the purchase price. When purchasing a security on a delayed delivery basis, the Fund assumes the rights and risks of ownership of the security, including the risk
of price and yield fluctuations, and takes such fluctuations into account when determining its net asset value. The Fund may dispose of or renegotiate a delayed delivery transaction after it is entered into, and may sell when-issued securities
before they are delivered, which may result in a capital gain or loss. When the Fund has sold a security on a delayed delivery basis, the Fund does not participate in future gains and losses with respect to the security.
Loan Participations and Brady Bonds — To the extent consistent with its Investment Objective and Strategies, a Fund may invest in U.S.
dollar-denominated fixed- and floating-rate loans (“Loans”) arranged through private negotiations between a foreign sovereign entity and one or more financial institutions (“Lenders”). The Fund invests in such Loans in the form
of participations in Loans (“Participations”) or assignments of all or a portion of Loans from third parties. Participations typically result in a Fund having a contractual relationship only with the Lenders, not with the sovereign
borrowers. This Fund has the right to receive payments of principal, interest and any fees to which it is entitled from the Lender selling the Participation and only upon receipt by the Lender of the payments from the borrower. In connection with
purchasing Participations, the Fund generally has no right to enforce compliance by the borrower with the terms of the loan agreement relating to the Loan, nor any rights of set-off against the borrower, and the Fund will not benefit directly from
any collateral supporting the Loan in which it has purchased the Participation. As a result, the Fund assumes the credit risk of both the borrower and the Lender that is selling the Participation.
Certain debt obligations, customarily referred to as “Brady Bonds,” are created through the exchange of existing commercial bank loans to foreign
entities for new obligations in connection with debt restructuring under a plan introduced by former U.S. Secretary of the Treasury Nicholas F. Brady. Brady Bonds have only been issued since 1989, and, accordingly, do not have a long payment
history. They are issued by governments that may have previously defaulted on the loans being restructured by the Brady Bonds, so they are subject to the risk of default by the issuer. They may be fully or partially collateralized or
uncollateralized and issued in various currencies.
Illiquid Securities — A security is considered illiquid if it cannot be sold or
disposed of in the ordinary course of business within seven days or less for its approximate carrying value on the books of the Funds. Valuations of illiquid securities may differ significantly from the values that would have been used had an active
market value for these securities existed.
Dividends and Distributions to Shareholders — The International Equity, Emerging Markets
Equity and International Fixed Income Funds will distribute substantially all of their net investment income and all net realized capital gains, if any, at least annually.
|
|
|
| 40 |
|
SEI Institutional International Trust / Annual Report / September 30, 2012 |
The Emerging Markets Debt Fund will distribute substantially all of its net investment income, if any, at least quarterly and all net realized gains, if any, at least annually. All dividends and
distributions are recorded on ex-dividend date.
Investments in Real Estate Investment Trusts (“REITs”) — Dividend income is
recorded based on the income included in distributions received from the REIT investments using published REIT reclassifications including some management estimates when actual amounts are not available. Distributions received in excess of this
estimated amount are recorded as a reduction of the cost of investments or reclassified to capital gains. The actual amounts of income, return of capital, and capital gains are only determined by each REIT after its fiscal year-end, and may differ
from the estimated amounts.
Redemption Fees — The Funds charge a redemption fee based on a redemption, or a series of
redemptions from a single identifiable source that in the aggregate exceed a specific dollar threshold within any thirty day period, as presented below:
|
|
|
|
|
|
|
|
|
| |
|
Dollar
Threshold
($ Thousands) |
|
|
Redemption
Fee |
|
| International Equity Fund |
|
$ |
50,000 |
|
|
|
0.75 |
% |
| Emerging Markets Equity Fund |
|
|
25,000 |
|
|
|
1.25 |
|
| International Fixed Income Fund |
|
|
25,000 |
|
|
|
1.00 |
|
| Emerging Markets Debt Fund |
|
|
25,000 |
|
|
|
1.00 |
|
For the year ended September 30, 2012, the Funds did not charge any redemption fees. Such fees, if any, are retained by the
Funds for the benefit of the remaining shareholders.
3. DERIVATIVE TRANSACTIONS
The following tables include only Funds that had exposure to more than one type of risk on derivatives held throughout the year. For Funds that held derivatives throughout the year with only one type of risk
exposure, additional information can be found on the Summary Schedules of Investments and the Statements of Operations. The fair value of derivative instruments as of September 30, 2012 was as follows:
|
|
|
|
|
|
|
|
|
|
|
|
|
| |
|
Asset Derivatives |
|
|
Liability Derivatives |
|
| |
|
Year ended September 30, 2012
($ Thousands) |
|
|
Year ended September 30, 2012
($ Thousands) |
|
| Contract Type |
|
Statements of Assets & Liabilities Location |
|
Fair Value |
|
|
Statements of Assets & Liabilities Location |
|
Fair Value |
|
|
|
|
|
|
| International Equity |
|
|
|
|
|
|
|
|
|
|
|
|
| Foreign exchange contracts |
|
Unrealized gain on forward foreign currency contracts |
|
$ |
— |
|
|
Unrealized loss on forward foreign currency contracts |
|
$ |
391 |
|
| Equity contracts |
|
Net Assets — Unrealized appreciation on futures contracts |
|
|
265 |
* |
|
Net Assets — Unrealized depreciation on futures contracts |
|
|
1,285 |
* |
|
|
|
|
|
|
|
|
|
|
|
|
|
| Total Derivatives not accounted for as hedging instruments |
|
$ |
265 |
|
|
|
|
$ |
1,676 |
|
|
|
|
|
|
|
|
|
|
|
|
|
|
|
|
|
|
|
| International Fixed Income Fund |
|
|
|
|
|
|
|
|
|
|
|
|
| Interest rate contracts |
|
Net Assets — Unrealized appreciation on futures contracts |
|
$ |
95 |
* |
|
Net Assets — Unrealized depreciation on futures contracts |
|
$ |
218 |
* |
| Interest rate contracts |
|
Net Assets — Unrealized appreciation on swap contracts |
|
|
2,364 |
† |
|
Net Assets — Unrealized depreciation on swap contracts |
|
|
960 |
† |
| Foreign exchange contracts |
|
Unrealized gain on forward foreign currency contracts |
|
|
130 |
|
|
Unrealized loss on forward foreign currency contracts |
|
|
2,082 |
|
|
|
|
|
|
|
|
|
|
|
|
|
|
| Total Derivatives not accounted for as hedging instruments |
|
$ |
2,589 |
|
|
|
|
$ |
3,260 |
|
|
|
|
|
|
|
|
|
|
|
|
|
|
|
|
|
|
|
| Emerging Markets Debt Fund |
|
|
|
|
|
|
|
|
|
|
|
|
| Interest rate contracts |
|
Net Assets — Unrealized appreciation on futures contracts |
|
$ |
24 |
* |
|
Net Assets — Unrealized depreciation on futures contracts |
|
$ |
3 |
* |
| Foreign exchange contracts |
|
Unrealized gain on forward foreign currency contracts |
|
|
4,356 |
|
|
Unrealized loss on forward foreign currency contracts |
|
|
1,499 |
|
| Equity contracts |
|
Net Assets — Unrealized appreciation on swap contracts |
|
|
1,923 |
† |
|
Net Assets — Unrealized depreciation of swap contracts |
|
|
288 |
† |
| Interest rate contracts |
|
Net Assets — Unrealized appreciation on swap contracts |
|
|
32 |
† |
|
Net Assets — Unrealized depreciation on swap contracts |
|
|
26 |
† |
|
|
|
|
|
|
|
|
|
|
|
|
|
| Total Derivatives not accounted for as hedging instruments |
|
$ |
6,335 |
|
|
|
|
$ |
1,816 |
|
|
|
|
|
|
|
|
|
|
|
|
|
|
| * |
|
Includes cumulative appreciation/(depreciation) on futures contracts as reported in the Summary Schedules of Investments. Only current day’s variation margin is
reported within the Statements of Assets & Liabilities. |
| † |
|
Includes cumulative appreciation/(depreciation) on swap contracts as reported in the Summary Schedules of Investments. Market Value is reported within the Statements of
Assets & Liabilities for swap contracts that have paid premiums. |
|
|
|
|
|
| SEI Institutional International Trust / Annual Report / September 30, 2012 |
|
|
41 |
|
Notes to Financial Statements (Continued)
September 30, 2012
The effect of derivative instruments on the Statements of Operations for the
year ended September 30, 2012 is as follows:
Amount of Realized Gain or (Loss) on Derivatives Recognized in Income ($ Thousands):
|
|
|
|
|
|
|
|
|
|
|
|
|
|
|
|
|
| Derivatives Not Accounted for as Hedging Instruments |
|
Futures |
|
|
Forward
Currency
Contracts |
|
|
Swaps |
|
|
Total |
|
|
|
|
|
|
| International Equity |
|
|
|
|
|
|
|
|
|
|
|
|
|
|
|
|
| Equity contracts |
|
$ |
8,354 |
|
|
$ |
— |
|
|
$ |
— |
|
|
$ |
8,354 |
|
| Foreign exchange contracts |
|
|
— |
|
|
|
1,425 |
|
|
|
— |
|
|
|
1,425 |
|
| Total |
|
$ |
8,354 |
|
|
$ |
1,425 |
|
|
$ |
— |
|
|
$ |
9,779 |
|
|
|
|
|
|
| International Fixed Income Fund |
|
|
|
|
|
|
|
|
|
|
|
|
|
|
|
|
| Interest rate contracts |
|
$ |
182 |
|
|
$ |
— |
|
|
$ |
(47 |
) |
|
$ |
135 |
|
| Foreign exchange contracts |
|
|
— |
|
|
|
20,693 |
|
|
|
— |
|
|
|
20,693 |
|
| Credit contracts |
|
|
— |
|
|
|
— |
|
|
|
(897 |
) |
|
|
(897 |
) |
| Total |
|
$ |
182 |
|
|
$ |
20,693 |
|
|
$ |
(944 |
) |
|
$ |
19,931 |
|
|
|
|
|
|
| Emerging Markets Debt Fund |
|
|
|
|
|
|
|
|
|
|
|
|
|
|
|
|
| Interest rate contracts |
|
$ |
(2,673 |
) |
|
$ |
— |
|
|
$ |
9 |
|
|
$ |
(2,664 |
) |
| Equity contracts |
|
|
— |
|
|
|
— |
|
|
|
330 |
|
|
|
330 |
|
| Foreign exchange contracts |
|
|
— |
|
|
|
875 |
|
|
|
— |
|
|
|
875 |
|
| Total |
|
$ |
(2,673 |
) |
|
$ |
875 |
|
|
$ |
339 |
|
|
$ |
(1,459 |
) |
Change in Unrealized Appreciation or (Depreciation) on Derivatives Recognized in Income ($ Thousands):
|
|
|
|
|
|
|
|
|
|
|
|
|
|
|
|
|
| Derivatives Not Accounted for as Hedging Instruments |
|
Futures |
|
|
Forward
Currency
Contracts |
|
|
Swaps |
|
|
Total |
|
|
|
|
|
|
| International Equity |
|
|
|
|
|
|
|
|
|
|
|
|
|
|
|
|
| Equity contracts |
|
$ |
(1,696 |
) |
|
$ |
— |
|
|
$ |
— |
|
|
$ |
(1,696 |
) |
| Foreign exchange contracts |
|
|
— |
|
|
|
(391 |
) |
|
|
— |
|
|
|
(391 |
) |
| Total |
|
$ |
(1,696 |
) |
|
$ |
(391 |
) |
|
$ |
— |
|
|
$ |
(2,087 |
) |
|
|
|
|
|
| International Fixed Income Fund |
|
|
|
|
|
|
|
|
|
|
|
|
|
|
|
|
| Interest rate contracts |
|
$ |
247 |
|
|
$ |
— |
|
|
$ |
214 |
|
|
$ |
461 |
|
| Foreign exchange contracts |
|
|
— |
|
|
|
(15,926 |
) |
|
|
— |
|
|
|
(15,926 |
) |
| Total |
|
$ |
247 |
|
|
$ |
(15,926 |
) |
|
$ |
214 |
|
|
$ |
(15,465 |
) |
|
|
|
|
|
| Emerging Markets Debt Fund |
|
|
|
|
|
|
|
|
|
|
|
|
|
|
|
|
| Interest rate contracts |
|
$ |
(121 |
) |
|
$ |
— |
|
|
$ |
6 |
|
|
$ |
(115 |
) |
| Foreign exchange contracts |
|
|
— |
|
|
|
1,716 |
|
|
|
— |
|
|
|
1,716
|
|
| Equity contracts |
|
|
— |
|
|
|
— |
|
|
|
1,558 |
|
|
|
1,558 |
|
| Total |
|
$ |
(121 |
) |
|
$ |
1,716 |
|
|
$ |
1,564 |
|
|
$ |
3,159 |
|
Certain Funds are party to International Swap Dealers Association, Inc. Master Agreements (“ISDA Master
Agreements”). These agreements are with select counterparties and they govern transactions, including certain over-the counter derivative and foreign exchange contracts, entered into by the Trust on behalf of a Fund and the counterparty.
The ISDA Master Agreements maintain provisions for general obligations, representations, agreements, collateral, and events of default or
termination. The occurrence of a specified event of termination may give a counterparty the right to terminate all of its contracts and affect settlement of all outstanding transactions under the applicable ISDA Master Agreement.
4. INVESTMENT ADVISORY, ADMINISTRATION AND DISTRIBUTION AGREEMENTS, INVESTMENT SUB-ADVISORY AGREEMENTS AND OTHER TRANSACTIONS WITH AFFILIATES
Investment Advisory, Administration and Distribution Agreements — SIMC serves as investment adviser (the “Adviser”) to
each Fund. In connection with serving as Adviser, SIMC is entitled to a fee, which is calculated daily and paid monthly, based on the average daily net assets of each fund.
The Trust and SEI Investments Global Funds Services (the “Administrator”) are parties to an amended and restated Administration and Transfer Agency
Agreement dated December 10, 2003 under which the Administrator provides administrative and transfer agency services to the Funds for annual fees, based on the average daily net assets of each fund.
SEI Investments Distribution Co. (the “Distributor”), a wholly owned subsidiary of SEI Investments Company (“SEI”), serves as each
Fund’s Distributor under an amended and restated Distribution Agreement dated September 16, 2002. The Trust has adopted plans under which firms, including the Distributor, that provide shareholder and administrative services may receive
compensation therefrom. Such plans provide fees payable to the Distributor, calculated as a percentage of the average daily net assets attributable to each
|
|
|
| 42 |
|
SEI Institutional International Trust / Annual Report / September 30, 2012 |
particular class of each respective fund. Under both the shareholder servicing plan and Administrative Service Plan, the Distributor may retain as profit any difference between the fee it
receives and the amount it pays to third parties.
The Adviser, Administrator and/or Distributor have voluntarily agreed to waive a portion of
their fees in order to keep total direct operating expenses (exclusive of interest from borrowings, brokerage commissions, taxes, Trustees fees and extraordinary expenses not incurred in the ordinary course of the Funds’ business) at a
specified level. The voluntary waivers by the Funds’ Adviser, Administrator and/or
Distrib-
utor are limited to the Funds’ direct operating expenses and, therefore, do not apply to indirect expenses incurred by the Funds, such as acquired fund fees and expenses (AFFE). The waivers
are voluntarily and the Funds’ Adviser, Administrator and/or Distributor may discontinue all or part of any of these waivers at any time. Prior to February 1, 2012, the Adviser had contractually agreed to waive fees or reimburse expenses
for the International Fixed Income Fund until the later of (i) two years after the effective date of the Expense Limitation Agreement, or (ii) January 31, 2012.
The following is a summary of annual fees payable to the Adviser, Administrator and Distributor and the
voluntary expense limitations for each fund:
|
|
|
|
|
|
|
|
|
|
|
|
|
|
|
|
|
|
|
|
|
| |
|
Advisory
Fee |
|
|
Administration
Fee |
|
|
Shareholder
Servicing
Fee |
|
|
Administrative
Servicing Fee |
|
|
Voluntary
Expense
Limitations |
|
| International Equity Fund |
|
|
|
|
|
|
|
|
|
|
|
|
|
|
|
|
|
|
|
|
| Class A |
|
|
0.505 |
% |
|
|
0.45 |
% |
|
|
0.25 |
% |
|
|
— |
|
|
|
1.27 |
% |
| Class I |
|
|
0.505 |
% |
|
|
0.45 |
% |
|
|
0.25 |
% |
|
|
0.25 |
% |
|
|
1.52 |
% |
| Emerging Markets Equity Fund |
|
|
|
|
|
|
|
|
|
|
|
|
|
|
|
|
|
|
|
|
| Class A |
|
|
1.050 |
% |
|
|
0.65 |
% |
|
|
0.25 |
% |
|
|
— |
|
|
|
1.96 |
% |
| International Fixed Income Fund |
|
|
|
|
|
|
|
|
|
|
|
|
|
|
|
|
|
|
|
|
| Class A |
|
|
0.300 |
% |
|
|
0.60 |
% |
|
|
0.25 |
% |
|
|
— |
|
|
|
1.02 |
%* |
| Emerging Markets Debt Fund |
|
|
|
|
|
|
|
|
|
|
|
|
|
|
|
|
|
|
|
|
| Class A |
|
|
0.850 |
% |
|
|
0.65 |
% |
|
|
0.25 |
% |
|
|
— |
|
|
|
1.36 |
% |
* Prior to February 1, 2012 the expense limitation was contractual.
For the year ended September 30, 2012, the Distributor retained 100% of both shareholder servicing fees
and administrative servicing fees, less the waiver.
Investment Sub-Advisory Agreements — As of September 30, 2012,
SIMC has entered into Investment Sub-Advisory Agreements with the following parties:
|
| Investment Sub-Adviser |
| International Equity Fund |
| Acadian Asset Management LLC |
| Causeway Capital Management LLC |
| del Rey Global Investors LLC |
| INTECH Investment Management LLC |
| Neuberger Berman Management LLC |
| Schroder Investment Management North America, Inc. |
| Tradewinds Global Investors LLC |
| Emerging Markets Equity Fund |
| Delaware Management Company |
| JO Hambro Capital Management Limited |
| Kleinwort Benson Investors International |
| Lazard Asset Management LLC |
| Neuberger Berman Management LLC |
| PanAgora Asset Management, Inc. |
| The Boston Company Asset Management LLC |
| International Fixed Income Fund |
| AllianceBernstein L.P. |
| Fidelity International Investment Advisors (UK) Limited (delegates to Fidelity International Investment
Advisors) |
| Wellington Management Company, LLP |
|
| Investment Sub-Adviser |
| Emerging Markets Debt Fund |
| Ashmore Investment Management Limited |
| ING Investment Management Advisors, B.V. |
| Stone Harbor Investment Partners LP |
Under the investment sub-advisory agreements, each sub-adviser receives an annual fee, paid by SIMC.
Brokerage Commissions Paid to Affiliates — The Distribution Agreement between the Distributor and the Trust provides that the Distributor may
receive compensation on fund transactions effected for the Trust in accordance with the rules of the Securities and Exchange Commission (“SEC”). Accordingly, it is expected that fund transactions may result in brokerage commissions being
paid to the Distributor. The SEC rules require that such commissions not exceed usual and customary commissions. For the year ended September 30, 2012, the Distributor received no brokerage commissions.
Fees Paid Indirectly — The Funds may direct certain fund trades to the Distributor who pays a portion of the Fund’s expenses.
Accordingly, the expenses reduced, which were used to pay third party expenses, and the effect on the Fund’s expense ratio, as a percentage of the Fund’s average daily net assets for the year ended September 30, 2012, can be found on
the Statement of Operations and Financial Highlights, respectively. During the year ended September 30, 2012, the Funds did not report any such fees.
|
|
|
|
|
| SEI Institutional International Trust / Annual Report / September 30, 2012 |
|
|
43 |
|
Notes to Financial Statements (Continued)
September 30, 2012
Investment in Affiliated Securities — The Funds may invest excess cash in the SEI Daily
Income Trust Prime Obligation Fund, an affiliated money market fund. Additionally, the Funds may invest cash collateral from the securities lending program in the SEI Liquidity Fund L.P., also an affiliated fund.
Payment to Affiliates — Certain Officers and Trustees of the Trust are also Officers and/or Trustees of the Administrator, Adviser and/or
the Distributor.
The Trust pays each unaffiliated Trustee an annual fee for attendance at quarterly, interim, and committee meetings. The
Administrator or the Distributor pays compensation of Officers and affiliated Trustees.
A portion of the services provided by the Chief
Compliance Officer (“CCO”) and his staff, whom are employees of the Administrator, are paid for by the Trust as incurred. The services include regulatory oversight of the Trust’s Adviser, sub-advisers and service providers as required
by SEC regulations. The CCO’s services have been approved by and are reviewed annually by the Board.
Interfund Lending —
The SEC has granted an exemption that permits the Trust to participate in an interfund lending program (“the Program”) with existing or future investment companies registered under the 1940 Act that are advised by SIMC (the “SEI
Funds”). The Program allows the SEI Funds to lend money to and borrow money from each other for temporary or emergency purposes. Participation in the Program is voluntary for both borrowing and lending funds. Interfund loans may be made only
when the rate of interest to be charged is more favorable to the lending fund than an investment in overnight repurchase agreements (“Repo Rate”), and more favorable to the borrowing fund than the rate of interest that would be charged by
a bank for short-term borrowings (“Bank Loan Rate”). The Bank Loan Rate will be determined using a formula approved by the SEI Funds’ board of trustees. The interest rate imposed on interfund loans is the average of the Repo Rate and
the Bank Loan Rate. For the year ended September 30, 2012, the Trust had not participated in the Program.
5. INVESTMENT TRANSACTIONS
The cost of security purchases and the proceeds from the sale of securities, other than temporary cash investments and futures, during the year
ended September 30, 2012, were as follows:
|
|
|
|
|
|
|
|
|
| |
|
Purchases
($ Thousands) |
|
|
Sales and Maturities
($ Thousands) |
|
| International Equity Fund |
|
|
|
|
|
|
|
|
| US Government |
|
$ |
— |
|
|
$ |
— |
|
| Other |
|
|
969,262 |
|
|
|
926,585 |
|
| Emerging Markets Equity Fund |
|
|
|
|
|
|
|
|
| US Government |
|
|
— |
|
|
|
— |
|
| Other |
|
|
857,518 |
|
|
|
751,674 |
|
| International Fixed Income Fund |
|
|
|
|
|
|
|
|
| US Government |
|
|
962 |
|
|
|
915 |
|
| Other |
|
|
446,817 |
|
|
|
452,900 |
|
| Emerging Markets Debt Fund |
|
|
|
|
|
|
|
|
| US Government |
|
|
— |
|
|
|
— |
|
| Other |
|
|
961,838 |
|
|
|
896,544 |
|
Included in the realized gain on investments for the International Equity and Emerging Markets Equity funds
was $786 and $1,319 ($ Thousands), respectively, received from AXA Rosenberg Investment Management, a former investment sub-adviser to the funds, as a result of a settlement with the Securities and Exchange Commission related to a coding error
in its quantitative investment process. The settlement proceeds represented 0.05% and 0.19% of the funds’ average net assets, respectively, for the year ended September 30, 2011.
6. FEDERAL TAX INFORMATION:
It is each Fund’s intention to continue to qualify as a regulated
investment company under Subchapter M of the Internal Revenue Code and distribute all of its taxable income (including net capital gains). Accordingly, no provision for Federal income taxes is required.
The Funds may be subject to taxes imposed by countries in which they invest with respect to their investments in issuers existing or operating in such
countries. Such taxes are generally based on income earned. The Funds accrue such taxes when the related income is earned.
Dividends from net
investment income and distributions from net realized capital gains are determined in accordance with U.S. Federal income tax regulations, which may differ from those amounts determined under GAAP. These differences, which may result in distribution
reclassifications, are primarily due to paydown reclassifications, foreign currency transactions, net investment losses, investment in partnerships, swaps and passive foreign investment companies. These book/tax differences are either temporary or
permanent in nature. To the extent these differences are permanent, they are charged or credited to paid-in capital, undistributed net investment income or accumulated net realized gain, as appropriate, in the period that the differences arise.
Accordingly, the following permanent differences, primarily attributable to different treatment for gains and losses on paydowns of mortgage and
asset-backed securities for tax purposes, investments in swaps, investments in passive foreign investment companies, investments in partnerships, distribution reclassification, REIT income reclassification, distributions in excess of net investment
income and foreign currency transactions have been reclassified to/from the following accounts as of September 30, 2012:
|
|
|
|
|
|
|
|
|
|
|
|
|
| |
|
Paid-in
Capital
($ Thousands) |
|
|
Undistributed
Net
Investment
Income/(Loss)
($ Thousands) |
|
|
Accumulated
Realized Gain/
(Loss)
($ Thousands) |
|
| International Equity Fund |
|
$ |
— |
|
|
$ |
1,105 |
|
|
$ |
(1,105 |
) |
| Emerging Markets Equity Fund |
|
|
— |
|
|
|
(553 |
) |
|
|
553 |
|
| International Fixed Income Fund |
|
|
(1,462 |
) |
|
|
19,673 |
|
|
|
(18,211 |
) |
| Emerging Markets Debt Fund |
|
|
— |
|
|
|
(1,408 |
) |
|
|
1,408 |
|
|
|
|
| 44 |
|
SEI Institutional International Trust / Annual Report / September 30, 2012 |
The tax character of dividends and distributions declared during the last two years were as follows:
|
|
|
|
|
|
|
|
|
|
|
|
|
|
|
|
|
|
|
|
|
| |
|
|
|
|
Ordinary
Income
($ Thousands) |
|
|
Long-Term
Capital Gain
($ Thousands) |
|
|
Return of
Capital
($ Thousands) |
|
|
Totals
($ Thousands) |
|
| International Equity Fund |
|
|
2012 |
|
|
$ |
34,761 |
|
|
$ |
— |
|
|
$ |
— |
|
|
$ |
34,761 |
|
|
|
|
2011 |
|
|
|
27,465 |
|
|
|
— |
|
|
|
— |
|
|
|
27,465 |
|
| Emerging Markets Equity Fund |
|
|
2012 |
|
|
|
2,183 |
|
|
|
— |
|
|
|
— |
|
|
|
2,183 |
|
|
|
|
2011 |
|
|
|
8,167 |
|
|
|
— |
|
|
|
— |
|
|
|
8,167 |
|
| International Fixed Income Fund |
|
|
2012 |
|
|
|
12,225 |
|
|
|
— |
|
|
|
— |
|
|
|
12,225 |
|
|
|
|
2011 |
|
|
|
22,700 |
|
|
|
— |
|
|
|
490 |
|
|
|
23,190 |
|
| Emerging Markets Debt Fund |
|
|
2012 |
|
|
|
53,538 |
|
|
|
2,001 |
|
|
|
— |
|
|
|
55,539 |
|
|
|
|
2011 |
|
|
|
25,140 |
|
|
|
— |
|
|
|
— |
|
|
|
25,140 |
|
As of September 30, 2012, the components of Distributable Earnings (Accumulated Losses) were as follows:
|
|
|
|
|
|
|
|
|
|
|
|
|
|
|
|
|
| |
|
Undistributed
Ordinary
Income
($ Thousands) |
|
|
Undistributed
Long-Term
Capital Gain
($ Thousands) |
|
|
Capital
Loss
Carryforwards
($ Thousands) |
|
|
Post
October
Gains (Losses)
($ Thousands) |
|
| International Equity Fund |
|
$ |
29,975 |
|
|
$ |
— |
|
|
$ |
(1,005,442 |
) |
|
$ |
(38,847 |
) |
| Emerging Markets Equity Fund |
|
|
5,483 |
|
|
|
— |
|
|
|
(26,674 |
) |
|
|
(53,694 |
) |
| International Fixed Income Fund |
|
|
— |
|
|
|
— |
|
|
|
(16,081 |
) |
|
|
— |
|
| Emerging Markets Debt Fund |
|
|
36,708 |
|
|
|
37,028 |
|
|
|
— |
|
|
|
— |
|
|
|
|
|
|
|
|
|
|
|
|
|
|
|
|
|
|
| |
|
Post October
Currency
Losses
($ Thousands) |
|
|
Unrealized
Appreciation
($ Thousands) |
|
|
Other
Temporary
Differences
($ Thousands) |
|
|
Total
Accumulated
Gains (Losses)
($ Thousands) |
|
| International Equity Fund |
|
$ |
— |
|
|
$ |
18 |
|
|
$ |
795 |
|
|
$ |
(1,013,501 |
) |
| Emerging Markets Equity Fund |
|
|
— |
|
|
|
1,072 |
|
|
|
— |
|
|
|
(73,813 |
) |
| International Fixed Income Fund |
|
|
— |
|
|
|
24,367 |
|
|
|
(15,530 |
) |
|
|
(7,244 |
) |
| Emerging Markets Debt Fund |
|
|
— |
|
|
|
76,423 |
|
|
|
(19,344 |
) |
|
|
130,815 |
|
Post-October losses represent losses realized on investment transactions from November 1, 2011 through September 30, 2012,
that, in accordance with Federal income tax regulations, the Funds defer and treat as having arisen in the following fiscal year. For Federal income tax purposes, capital carryforwards may be carried forward and applied against future capital gains
as follows:
|
|
|
|
|
|
|
|
|
|
|
|
|
| |
|
Expires 2017
($ Thousands) |
|
|
Expires 2018
($ Thousands) |
|
|
Total Capital
Loss
Carryforward
09/30/12
($ Thousands) |
|
| International Equity Fund |
|
$ |
306,282 |
|
|
$ |
690,357 |
|
|
$ |
996,639 |
|
| Emerging Markets Equity Fund |
|
|
— |
|
|
|
19,246 |
|
|
|
19,246 |
|
| International Fixed Income Fund |
|
|
— |
|
|
|
16,081 |
|
|
|
16,081 |
|
Under the recently enacted Regulated Investment Company Modernization Act of 2010, Funds will be permitted to carry forward
capital losses incurred in taxable years beginning after December 22, 2010
for an unlimited period. However, any losses incurred during those future taxable years will be required to be utilized prior to the losses incurred in pre-enactment taxable years. As a result of
this ordering rule, pre-enactment capital loss carryforwards may be more likely to expire unused. Additionally, post-enactment capital losses that are carried forward will retain their character as either short-term or long-term capital losses
rather than being considered all short-term as under previous law. Losses carried forward under these new provisions are as follows:
|
|
|
|
|
|
|
|
|
|
|
|
|
| |
|
Short-Term Loss |
|
|
Long-Term Loss |
|
|
Total * |
|
| International Equity Fund |
|
$ |
6,750 |
|
|
$ |
2,053 |
|
|
$ |
8,803 |
|
| Emerging Markets Equity Fund |
|
|
6,697 |
|
|
|
731 |
|
|
|
7,428 |
|
| * |
|
This table should be used in conjunction with the capital loss carryforwards table. |
During the year ended September 30, 2012, the following Funds utilized capital loss carryforwards to offset capital gains:
|
|
|
|
|
| |
|
Amount utilized
($ Thousands) |
|
| International Fixed Income Fund |
|
$ |
4,547 |
|
| Emerging Markets Debt Fund |
|
|
749 |
|
For Federal income tax purposes, the cost of securities owned at September 30, 2012, and the net realized gains or losses on
securities sold for the period were not materially different from amounts reported for financial reporting purposes. These differences are primarily due to investments in partnerships, passive foreign investment companies, defaulted bonds and wash
sales which cannot be used for Federal income tax purposes in the current year and have been deferred for use in future years. The aggregate gross unrealized appreciation and depreciation on total investments held by the Funds at September 30, 2012,
was as follows:
|
|
|
|
|
|
|
|
|
|
|
|
|
|
|
|
|
| |
|
Federal Tax Cost
($ Thousands) |
|
|
Aggregate
Gross
Unrealized
Appreciation
($ Thousands) |
|
|
Aggregate
Gross
Unrealized
Depreciation
($ Thousands) |
|
|
Net
Unrealized
Appreciation
($ Thousands) |
|
| International Equity Fund |
|
$ |
1,967,993 |
|
|
$ |
160,093 |
|
|
$ |
(158,738 |
) |
|
$ |
1,355 |
|
| Emerging Markets Equity Fund |
|
|
988,190 |
|
|
|
106,471 |
|
|
|
(105,150 |
) |
|
|
1,321 |
|
| International Fixed Income Fund |
|
|
462,279 |
|
|
|
31,197 |
|
|
|
(5,399 |
) |
|
|
25,798 |
|
| Emerging Markets Debt Fund |
|
|
1,014,648 |
|
|
|
94,246 |
|
|
|
(22,475 |
) |
|
|
71,771 |
|
Management has analyzed the Funds’ tax positions taken on federal income tax returns for all open tax years and has
concluded that as of September 30, 2012, no provision for income tax would be required in the Funds’ financial statements. The Funds’ federal and state income and federal excise tax returns for tax years for which the applicable statutes
of limitations have not expired are subject to examination by the Internal Revenue Service and state departments of revenue.
7.
CONCENTRATION/RISKS
Each Fund invests in securities of foreign issuers in various countries. These investments may involve certain considerations
and risks not
|
|
|
|
|
| SEI Institutional International Trust / Annual Report / September 30, 2012 |
|
|
45 |
|
Notes to Financial Statements (Concluded)
September 30, 2012
typically associated with investments in the United States, as a result of, among other factors, the possibility of future political and economic developments and the level of governmental
supervision and regulation of securities markets in the respective countries. The market values of the International Fixed Income and Emerging Markets Debt Funds’ investments will change in response to interest rate changes and other factors.
During periods of falling interest rates, the values of fixed income securities generally rise. Conversely, during periods of rising interest rates, the values of such securities generally decline. Changes by recognized rating agencies in the
ratings of any fixed income security and in the ability of an issuer to make payments of interest and principal may also affect the value of these investments. Also, the ability of the issuers of debt securities held by the International Fixed
Income Fund and Emerging Markets Debt Fund to meet their obligations may be affected by economic and political developments in a specific country, industry or region.
Certain securities held by the Funds are valued on the basis of a price provided by a principal market maker. The prices provided by the principal market makers are estimates that may differ from the value
that would be realized if the securities were sold. At September 30, 2012, the total value of these securities represented approximately 2% of the net assets of the Emerging Markets Debt Fund.
In the normal course of business, the Funds enter into contracts that provide general indemnifications by the Fund to the counterparty to the contract. The Funds’ maximum exposure under these
arrangements is dependent on future claims that may be made against the Funds and, therefore, cannot be established; however, Management believes that based on experience, the risk of loss from such claims is considered remote.
8. SECURITIES LENDING
A Fund may lend portfolio
securities to brokers, dealers and other financial organizations that meet capital and other credit requirements or other criteria established by the Trust’s Board of Trustees. These loans may not exceed 33 1/3% of the total asset value of a
Fund (including the loan collateral). No Fund will lend portfolio securities to its Adviser, sub-adviser or their affiliates unless it has applied for and received specific authority to do so from the SEC. Loans of portfolio securities will be fully
collateralized by cash. Collateral will be maintained in an amount equal to at least 100% of the current market value of the loaned securities by marking to market daily, although the borrower will be required to deliver collateral between 102% and
105% of the market value of borrowed securities for domestic and
foreign securities, respectively. However, due to market fluctuations during the day, the value of securities loaned on a particular day may, during the course of the day, exceed the value of
collateral. On each business day, the amount of collateral is adjusted based on the prior
day’s market fluctuations and the current
day’s lending activity. Income from lending activity is determined by the amount of interest earned on collateral, less any amounts payable to the borrowers of the securities and the lending agent. Lending securities involves certain
risks, including the risk that a Fund may be delayed or prevented from recovering the collateral if the borrower fails to return the securities.
Cash collateral received in connection with securities lending is invested in short-term investments by the lending agent. These investments may
include the SEI Liquidity Fund L.P., and the Fund bears all of the gains and losses on such investment. There is no guarantee that these investments will not lose value.
9. NEW ACCOUNTING PRONOUNCEMENT
In December 2011, the FASB issued a further update to the guidance
“Balance Sheet — Disclosures about Offsetting Assets and Liabilities”. The amendments to this standard require an entity to disclose information about offsetting and related arrangements to enable users of its financial
statements to understand the effect of those arrangements on its financial position. The amended guidance is effective for interim and annual reporting periods beginning after January 1, 2013. At this time, management is evaluating the implications
of this update and its impact on the financial statements has not been determined.
10. LITIGATION SETTLEMENT
During the year ended September 30, 2012, the International Equity Fund received reimbursements to Class A of $3,740 ($ Thousands) and to Class I of $12 ($
Thousands). These amounts received by the International Equity Fund were related to the Bank of America Fair Value Market Timing Litigation and are included in the Statement of Changes. The reimbursements did not have a significant impact on the
International Equity Fund’s performance for the year ended September 30, 2012.
11. SUBSEQUENT EVENTS
Management has evaluated the need for disclosures and/or adjustments resulting from subsequent events. Based on this evaluation, no disclosures and/or
adjustments were required to the financial statements as of September 30, 2012.
|
|
|
| 46 |
|
SEI Institutional International Trust / Annual Report / September 30, 2012 |
Report of Independent Registered Public Accounting Firm
To the Board of Trustees and Shareholders
SEI Institutional International Trust:
We have
audited the accompanying statements of assets and liabilities of SEI Institutional International Trust comprised of the International Equity Fund, Emerging Markets Equity Fund, International Fixed Income Fund and Emerging Markets Debt Fund
(collectively, the “Funds”), including the summary schedules of investments, as of September 30, 2012, and the related statements of operations for the year then ended, the statements of changes in net assets for each of the years in the
two-year period then ended, and the financial highlights for each of the years in the five-year period then ended. These financial statements and financial highlights are the responsibility of the Funds’ management. Our responsibility is to
express an opinion on these financial statements and financial highlights based on our audits.
We conducted our audits in accordance with the
standards of the Public Company Accounting Oversight Board (United States). Those standards require that we plan and perform the audit to obtain reasonable assurance about whether the financial statements and financial highlights are free of
material misstatement. An audit includes examining, on a test basis, evidence supporting the amounts and disclosures in the financial statements. Our procedures included confirmation of securities owned as of September 30, 2012, by correspondence
with the custodian and brokers, or other appropriate auditing procedures. An audit also includes assessing the accounting principles used and significant estimates made by management, as well as evaluating the overall financial statement
presentation. We believe that our audits provide a reasonable basis for our opinion.
In our opinion, the financial statements and financial
highlights referred to above present fairly, in all material respects, the financial position of each of the funds comprising SEI Institutional International Trust as of September 30, 2012, the results of their operations for the year then ended,
the changes in their net assets for each of the years in the two-year period then ended, and the financial highlights for each of the years in the five-year period then ended, in conformity with U.S. generally accepted accounting principles.

Philadelphia, Pennsylvania
November 29, 2012
|
|
|
|
|
| SEI Institutional International Trust / Annual Report / September 30, 2012 |
|
|
47 |
|
Trustees and Officers of the Trust (Unaudited)
The following chart lists Trustees and Officers as of September 30, 2012.
Set forth below are the
names, ages, addresses, position with the Fund, term of office and length of time served, the principal occupations during the past five years, number of portfolios in fund complex overseen by the directors, and other directorships outside the fund
complex of each of the persons currently serving as Directors and Officers of the Fund. The Fund’s Statement of Additional Information (“SAI”) includes additional information about the Directors and Officers. The SAI may be obtained
without charge by calling 1-800-342-5734.
|
|
|
|
|
|
|
|
|
|
|
Name,
Age and
Address |
|
Position(s)
Held with
Trusts |
|
Term of
Office and
Length of
Time Served1 |
|
Principal Occupation(s)
During Past Five Years |
|
Number of
Portfolios in
Fund Complex
Overseen
by Trustee2 |
|
Other Directorships
Held by Trustee |
| INTERESTED DIRECTORS |
|
|
|
|
|
|
|
|
Robert A. Nesher
One Freedom
Valley Drive,
Oaks, PA 19456
65 yrs. old |
|
Chairman of the Board of Trustees* |
|
since 1982 |
|
Currently performs various services on behalf of SEI for which Mr. Nesher is compensated. |
|
96 |
|
Trustee of The Advisors’ Inner Circle Fund, The Advisors’ Inner Circle Fund II, Bishop Street Funds, Director of SEI Global Master
Fund, plc, SEI Global Assets Fund, plc, SEI Global Investments Fund, plc, SEI Investments Global, Limited, SEI Investments — Global Fund Services, Limited, SEI Investments (Europe), Limited, SEI Global Nominee Ltd., and SEI Structured Credit
Fund, L.P. |
William M. Doran
One Freedom
Valley Drive
Oaks, PA 19456
71 yrs. old |
|
Trustee* |
|
since 1982 |
|
Self-employed Consultant since 2003. Partner, Morgan, Lewis & Bockius LLP (law firm) from 1976 to 2003, counsel to the Trust, SEI, SIMC, the
Administrator and the Distributor. Secretary of SEI since 1978. |
|
96 |
|
Trustee of The Advisors’ Inner Circle Fund, The Advisors’ Inner Circle Fund II, Bishop Street Funds, Director of SEI since 1974.
Director of the Distributor since 2003. Director of SEI Investments — Global Fund Services, Limited, SEI Investments Global, Limited, SEI Investments (Europe), Limited, SEI Global Nominee, Ltd, SEI Investments (Asia), Limited, and SEI Asset
Korea Co., Ltd. |
| TRUSTEES |
|
|
|
|
|
|
|
|
|
|
George J. Sullivan Jr.
One Freedom
Valley Drive,
Oaks, PA 19456
69 yrs. old |
|
Trustee |
|
since 1996 |
|
Retired since January 2012. Self-employed Consultant, Newfound Consultants, Inc. since April 1997-December 2011. |
|
96 |
|
Trustee of The Advisors’ Inner Circle Fund, The Advisors’ Inner Circle Fund II, Bishop Street Funds, State Street Navigator Securities
Lending Trust, Director of SEI Structured Credit Fund L.P. and member of the independent review committee for SEI’s Canadian-registered mutual funds. |
Rosemarie B. Greco
One Freedom
Valley Drive,
Oaks, PA 19456
65 yrs. old |
|
Trustee |
|
since 1999 |
|
Director, Governor’s Office of Health Care Reform, Commonwealth of Pennsylvania from 2003 to 2008. |
|
96 |
|
Director, Sunoco, Inc.; Director, Exelon Corporation; Trustee, Pennsylvania Real Estate Investment Trust. |
| |
*Messrs. |
Nesher and Doran are Trustees who may be deemed as “interested” persons of the Trust as that term is defined in the 1940 Act by virtue of their affiliation
with SIMC and the Trust’s Distributor. |
| |
1Each |
Trustee shall hold office during the lifetime of the Trust until the election and qualification of his of her successor, or until he or she sooner
dies, resigns or is removed in accordance with the Trust’s Declaration of Trust. |
| |
2The |
Fund Complex includes the following Trusts: SEI Asset Allocation Trust, SEI Daily Income Trust, SEI Institutional Investments Trust, Adviser Managed
Trust, SEI Institutional International Trust, SEI Institutional Managed Trust, SEI Liquid Asset Trust, SEI Tax Exempt Trust, SEI Alpha Strategy Portfolios, LP. and New Covenant Funds. |
|
|
|
| 48 |
|
SEI Institutional International Trust / Annual Report / September 30, 2012 |
|
|
|
|
|
|
|
|
|
|
|
Name,
Age and
Address |
|
Position(s)
Held with
Trusts |
|
Term of
Office and
Length of
Time Served1 |
|
Principal Occupation(s)
During Past Five Years |
|
Number of
Portfolios in
Fund Complex
Overseen
by Trustee2 |
|
Other Directorships
Held by Trustee |
| TRUSTEES (continued) |
|
|
|
|
|
|
|
|
Nina Lesavoy
One Freedom
Valley Drive,
Oaks, PA 19456
54 yrs. old |
|
Trustee |
|
since 2003 |
|
Founder and Managing Director, Avec Capital, since 2008. Managing Director, Cue Capital from March 2002 to March 2008 |
|
96 |
|
Director of SEI Structured Credit Fund, L.P. |
James M. Williams
One Freedom
Valley Drive,
Oaks, PA 19456
64 yrs. old |
|
Trustee |
|
since 2004 |
|
Vice President and Chief Investment Officer, J. Paul Getty Trust, Non-Profit Foundation for Visual Arts, since December 2002. |
|
96 |
|
Trustee/Director of Ariel Mutual Funds and SEI Structured Credit Fund, L.P. |
Mitchell A. Johnson
One Freedom
Valley Drive,
Oaks, PA 19456
70 yrs. old |
|
Trustee |
|
since 2007 |
|
Private Investor since 1994. |
|
96 |
|
Trustee of The Advisors’ Inner Circle Fund, The Advisors’ Inner Circle Fund II and Bishop Street Funds. |
Hubert L. Harris, Jr.
One Freedom
Valley Drive,
Oaks, PA 19456
68 yrs. old |
|
Trustee |
|
since 2008 |
|
Retired since December 2005. Chief Executive Officer and Chair of the Board of Directors, AMVESCAP Retirement, Inc., 1997-December 2005. Chief
Executive Officer, INVESCO North America, September 2003-December 2005. |
|
96 |
|
Director of Colonial BancGroup, Inc. and St. Joseph’s Translational Research Institute, Chair of the Board of Trustees, Georgia Tech
Foundation, Inc. (nonprofit corporation); Board of Councilors of the Carter Center. |
| OFFICERS |
|
|
|
|
|
|
|
|
|
|
Robert A. Nesher
One Freedom
Valley Drive,
Oaks, PA 19456
65 yrs. Old |
|
President and CEO |
|
since 2005 |
|
Currently performs various services on behalf of SEI for which Mr. Nesher is compensated. |
|
N/A |
|
N/A |
Peter A. Rodriguez
One Freedom
Valley Drive,
Oaks, PA 19456
50 yrs. old |
|
Controller and Chief Financial Officer |
|
since 2011 |
|
Director, Fund Accounting, SEI Investments Global Funds Services (March 2011, September 2002 to March 2005 and 1997- 2002); Director, Mutual
Fund Trading, SEI Private Trust Company (May 2009 to February 2011); Director, Asset Data Services, Global Wealth Services (June 2006 to April 2009); Director, Portfolio Accounting, SEI Investments Global Fund Services (March 2005 to June
2006) |
|
N/A |
|
N/A |
Russell Emery
One Freedom
Valley Drive,
Oaks, PA 19456
49 yrs. old |
|
Chief Compliance Officer |
|
since 2006 |
|
Chief Compliance Officer of SEI Institutional Managed Trust, SEI Daily Income Trust, SEI Institutional International Trust, SEI Asset Allocation
Trust, SEI Liquid Asset Trust, SEI Tax Exempt Trust, SEI Institutional Investments Trust, The Advisors’ Inner Circle Fund, The Advisors’ Inner Circle Fund II, and Bishop Street Funds, since March 2006. Chief Compliance Officer of SEI
Structured Credit Fund, LP and SEI Alpha Strategy Portfolios, LP since June 2007. Chief Compliance Officer of Adviser Managed Trust since December 2010. Chief Compliance Officer of New Covenant Funds since February 2012. |
|
N/A |
|
N/A |
|
|
|
|
|
| SEI Institutional International Trust / Annual Report / September 30, 2012 |
|
|
49 |
|
TRUSTEES AND OFFICERS OF THE TRUST (Unaudited)
|
|
|
|
|
|
|
|
|
|
|
Name,
Age and
Address |
|
Position(s)
Held with
Trusts |
|
Term of
Office and
Length of
Time Served1 |
|
Principal Occupation(s)
During Past Five Years |
|
Number of
Portfolios in
Fund Complex
Overseen
by Trustee2 |
|
Other Directorships
Held by Trustee |
| OFFICERS (continued) |
|
|
|
|
|
|
|
|
Timothy D. Barto
One Freedom
Valley Drive,
Oaks, PA 19456
44 yrs. old |
|
Vice President and Secretary |
|
since 2002 |
|
General Counsel, Vice President and Secretary of SIMC and the Administrator since 2004. Vice President and Assistant Secretary of SEI since
2001. Vice President of SIMC and the Administrator since 1999. |
|
N/A |
|
N/A |
Aaron Buser
One Freedom
Valley Drive,
Oaks, PA 19456
41 yrs. old |
|
Vice President and Assistant Secretary |
|
since 2008 |
|
Vice President and Assistant Secretary of SIMC since 2007. Associate at Stark & Stark (2004-2007). |
|
N/A |
|
N/A |
David F. McCann
One Freedom
Valley Drive,
Oaks, PA 19456
36 yrs. old |
|
Vice President and Assistant Secretary |
|
since 2009 |
|
Vice President and Assistant Secretary of SIMC since 2008. Attorney, Drinker, Bidder & Reath LLP (law firm), May 2005-October
2008. |
|
N/A |
|
N/A |
Stephen G. MacRae
One Freedom
Valley Drive,
Oaks, PA 19456
44 yrs. old |
|
Vice President |
|
since 2012 |
|
Director of Global Investment Product Management since 2004. |
|
N/A |
|
N/A |
Keri E. Rohn
One Freedom
Valley Drive,
Oaks, PA 19456
31 yrs. old |
|
Privacy Officer and Anti-Money Laundering Compliance Officer |
|
since 2009 |
|
Compliance Officer of SEI Investments Company since June 2003. |
|
N/A |
|
N/A |
| |
1Each |
trustee shall hold office during the lifetime of this Trust until the election and qualification of his or her successor, or until he or she sooner
dies, resigns or is removed in accordance with the Trust’s Declaration of Trust. |
| |
2The |
Fund Complex includes the following Trusts: SEI Asset Allocation Trust, SEI Daily Income Trust, SEI Institutional Investments Trust, Adviser Managed
Trust, SEI Institutional International Trust, SEI Institutional Managed Trust, SEI Liquid Asset Trust, SEI Tax Exempt Trust, SEI Alpha Strategy Portfolios, L.P. and New Covenant Funds. |
|
|
|
| 50 |
|
SEI Institutional International Trust / Annual Report / September 30, 2012 |
Disclosure of Fund Expenses
(Unaudited)
All mutual funds have operating expenses. As a shareholder of a fund, your investment is affected by these ongoing costs, which include (among others) costs
for portfolio management, administrative services, and shareholder reports like this one. It is important for you to understand the impact of these costs on your investment returns.
Operating expenses such as these are deducted from the fund’s gross income and directly reduce your final investment return. These expenses are expressed as a percentage of the fund’s average net
assets; this percentage is known as the fund’s expense ratio.
The following examples use the expense ratio and are intended to help you
understand the ongoing costs (in dollars) of investing in your fund and to compare these costs with those of other mutual funds. The examples are based on an investment of $1,000 made at the beginning of the period shown and held for the entire
period.
The table on this page illustrates your fund’s costs in two ways:
Actual fund return. This section helps you to estimate the actual expenses after fee waivers that your Fund incurred over the period. The “Expenses Paid During Period” column shows the
actual dollar expense cost incurred by a $1,000 investment in the Fund, and the “Ending Account Value” number is derived from deducting that expense cost from the Fund’s gross investment return.
You can use this information, together with the actual amount you invested in the Fund, to estimate the expenses you paid over that period. Simply divide
your actual account value by $1,000 to arrive at a ratio (for example, an $8,600 account value divided by $1,000 = 8.6), then multiply that ratio by the number shown for your Fund under “Expenses Paid During Period.”
Hypothetical 5% return. This section helps you compare your Fund’s costs with those of other mutual funds. It assumes that the fund had an annual
5% return before expenses during the year, but that the expense ratio (Column 3) for the period is unchanged. This example is useful in making comparisons because the Securities and Exchange Commission requires all mutual funds to make this 5%
calculation. You can assess your Fund’s comparative cost by comparing the hypothetical result for your Fund in the “Expense Paid During Period” column with those that appear in the same charts in the shareholder reports for other
funds.
NOTE: Because the return is set at 5% for comparison purposes — NOT your Fund’s actual return — the account values
shown may not apply to your specific investment.
|
|
|
|
|
|
|
|
|
|
|
|
|
|
|
|
|
| |
|
Beginning
Account
Value
4/1/12 |
|
|
Ending
Account
Value
9/30/12 |
|
|
Annualized
Expense
Ratios |
|
|
Expenses
Paid
During
Period* |
|
| International Equity Fund |
|
|
|
|
|
|
|
|
|
|
|
|
|
| Actual Fund Return |
|
|
|
|
|
|
|
|
|
|
|
|
|
|
|
|
| Class A |
|
$ |
1,000.00 |
|
|
$ |
993.90 |
|
|
|
1.26 |
% |
|
$ |
6.28 |
|
| Class I |
|
|
1,000.00 |
|
|
|
992.70 |
|
|
|
1.51 |
|
|
|
7.52 |
|
| Hypothetical 5% Return |
|
|
|
|
|
|
|
|
|
|
|
|
|
| Class A |
|
$ |
1,000.00 |
|
|
$ |
1,018.77 |
|
|
|
1.26 |
% |
|
$ |
6.36 |
|
| Class I |
|
|
1,000.00 |
|
|
|
1,017.52 |
|
|
|
1.51 |
|
|
|
7.62 |
|
| Emerging Markets Equity
Fund |
|
|
|
|
|
|
|
|
|
|
|
|
|
| Actual Fund Return |
|
|
|
|
|
|
|
|
|
|
|
|
|
|
|
|
| Class A |
|
$ |
1,000.00 |
|
|
$ |
965.20 |
|
|
|
1.97 |
% |
|
$ |
9.68 |
|
| Hypothetical 5% Return |
|
|
|
|
|
|
|
|
|
|
|
|
|
| Class A |
|
$ |
1,000.00 |
|
|
$ |
1,015.21 |
|
|
|
1.97 |
% |
|
$ |
9.93 |
|
|
|
|
|
|
|
|
|
|
|
|
|
|
|
|
|
|
| |
|
Beginning
Account
Value
4/1/12 |
|
|
Ending
Account
Value
9/30/12 |
|
|
Annualized
Expense
Ratios |
|
|
Expenses
Paid
During
Period* |
|
| International Fixed Income
Fund |
|
|
|
|
|
|
|
|
|
|
|
|
|
| Actual Fund Return |
|
|
|
|
|
|
|
|
|
|
|
|
|
|
|
|
| Class A |
|
$ |
1,000.00 |
|
|
$ |
1,033.40 |
|
|
|
1.02 |
% |
|
$ |
5.22 |
|
| Hypothetical 5% Return |
|
|
|
|
|
|
|
|
|
|
|
|
|
| Class A |
|
$ |
1,000.00 |
|
|
$ |
1,019.94 |
|
|
|
1.02 |
% |
|
$ |
5.18 |
|
| Emerging Markets Debt Fund |
|
|
|
|
|
|
|
|
|
|
|
|
|
| Actual Fund Return |
|
|
|
|
|
|
|
|
|
|
|
|
|
|
|
|
| Class A |
|
$ |
1,000.00 |
|
|
$ |
1,072.00 |
|
|
|
1.36 |
% |
|
$ |
7.09 |
|
| Hypothetical 5% Return |
|
|
|
|
|
|
|
|
|
|
|
|
|
| Class A |
|
$ |
1,000.00 |
|
|
$ |
1,018.23 |
|
|
|
1.36 |
% |
|
$ |
6.90 |
|
| * |
|
Expenses are equal to the Fund’s annualized expense ratio multiplied by the average account value over the period, multiplied by 183/365 (to reflect the one-half year
period shown). |
|
|
|
|
|
| SEI Institutional International Trust / Annual Report / September 30, 2012 |
|
|
51 |
|
Board of Trustees Considerations in Approving the Funds’ Investment Advisory
and Sub-Advisory Agreements (Unaudited)
SEI Institutional International Trust (the “Trust”) and SEI Investments Management Corporation (“SIMC”) have entered into an investment
advisory agreement (the “Advisory Agreement”). Pursuant to the Advisory Agreement, SIMC oversees the investment advisory services provided to the series of the Trust (the “Funds”) and may manage the cash portion of the
Funds’ assets. Pursuant to separate sub-advisory agreements (the “Sub-Advisory Agreements” and, together with the Advisory Agreement, the “Investment Advisory Agreements”) with SIMC, and under the supervision of SIMC and the
Trust’s Board of Trustees (the “Board”), the sub-advisers (each, a “Sub-Adviser” and collectively, the “Sub-Advisers”) are responsible for the day-to-day investment management of all or a discrete portion of the
assets of the Funds. The Sub-Advisers are also responsible for managing their employees who provide services to these Funds. The Sub-Advisers are selected based primarily upon the research and recommendations of SIMC, which evaluates quantitatively
and qualitatively the Sub-Advisers’ skills and investment results in managing assets for specific asset classes, investment styles and strategies.
The Investment Company Act of 1940, as amended (the “1940 Act”) requires that the initial approval of, as well as the continuation of, the Funds’ Investment Advisory Agreements must be
specifically approved: (i) by the vote of the Board or by a vote of the shareholders of the Funds; and (ii) by the vote of a majority of the Trustees who are not parties to the Investment Advisory Agreements or “interested persons” of any
party (the “Independent Trustees”), cast in person at a meeting called for the purpose of voting on such approval(s). In connection with their consideration of such approval(s), the Funds’ Trustees must request and evaluate, and SIMC
and the Sub-Advisers are required to furnish, such information as may be reasonably necessary to evaluate the terms of the Investment Advisory Agreements. In addition, the Securities and Exchange Commission takes the position that, as part of their
fiduciary duties with respect to a mutual fund’s fees, mutual fund boards are required to evaluate the material factors applicable to a decision to approve an Investment Advisory Agreement.
Consistent with these responsibilities, the Trust’s Board calls and holds meetings each year that are dedicated to considering whether to renew the
Investment Advisory Agreements between the Trust and SIMC and SIMC and the Sub-Advisers with respect to the Funds of the Trust. In preparation for these meetings, the Board requests and reviews a wide variety of materials provided by SIMC and the
Sub-Advisers, including information about SIMC’s and the Sub-Advisers’ affiliates, personnel and operations. The Board also receives extensive data from third parties. This information is provided in addition to the detailed information
about the Funds that the Board reviews during the course of each year, including information that relates to Fund operations and Fund performance. The Trustees also receive a memorandum from Fund counsel and independent counsel to the Independent
Trustees regarding the responsibilities of Trustees in connection with their consideration of whether to approve the Trust’s Investment Advisory Agreements. Finally, the Independent Trustees receive advice from independent counsel to the
Independent Trustees, meet in executive sessions outside the presence of Fund management and participate in question and answer sessions with representatives of SIMC and the Sub-Advisers.
Specifically, during the course of the Trust’s fiscal year, the Board requested and received written materials from SIMC and the Sub-Advisers regarding: (i) the quality of SIMC’s and the
Sub-Advisers’ investment management and other services; (ii) SIMC’s and the Sub-Advisers’ investment management personnel; (iii) SIMC’s and the Sub-Advisers’ operations and financial condition; (iv) SIMC’s and the
Sub-Advisers’ brokerage practices (including any soft dollar arrangements) and investment strategies; (v) the level of the advisory fees that SIMC and the Sub-Advisers charge the Funds compared with the fees each charge to comparable mutual
funds; (vi) the Funds’ overall fees and operating expenses compared with similar mutual funds; (vii) the level of SIMC’s and the Sub-Advisers’ profitability from their Fund-related operations; (viii) SIMC’s and the
Sub-Advisers’ compliance systems; (ix) SIMC’s and the Sub-Advisers’ policies on and compliance procedures for personal securities transactions; (x) SIMC’s and the Sub-Advisers’ reputation, expertise and resources in domestic
and/or international financial markets; and (xi) the Funds’ performance compared with similar mutual funds.
|
|
|
| 52 |
|
SEI Institutional International Trust / Annual Report / September 30, 2012 |
At the June 27, 2012 and September 19, 2012 meetings of the Board of Trustees, the Trustees, including a
majority of the Independent Trustees, approved the Investment Advisory Agreements and approved the selection of SIMC and the Sub-Advisers to act in their respective capacities for the Funds. The Board’s approval was based on its consideration
and evaluation of a variety of specific factors discussed at the meeting and at prior meetings, including:
| • |
|
the nature, extent and quality of the services provided to the Funds under the Investment Advisory Agreements, including the resources of SIMC and the
Sub-Advisers and their affiliates dedicated to the Funds; |
| • |
|
the Funds’ investment performance and how it compared to that of other comparable mutual funds; |
| • |
|
the Funds’ expenses under each Investment Advisory Agreement and how those expenses compared to those of other comparable mutual funds;
|
| • |
|
the profitability of SIMC and the Sub-Advisers and their affiliates with respect to the Funds, including both direct and indirect benefits accruing to
SIMC and the Sub-Advisers and their affiliates; and |
| • |
|
the extent to which economies of scale would be realized as the Funds grow and whether fee levels in the Investment Advisory Agreements reflect those
economies of scale for the benefit of Fund investors. |
Nature, Extent and Quality of Services. The Board considered the
nature, extent and quality of the services provided by SIMC and the Sub-Advisers to the Funds and the resources of SIMC and the Sub-Advisers and their affiliates dedicated to the Funds. In this regard, the Trustees evaluated, among other things,
SIMC’s and each Sub-Adviser’s personnel, experience, track record and compliance program. The Trustees found the level of SIMC’s and each Sub-Adviser’s professional staff and culture of compliance satisfactory. Following
evaluation, the Board concluded that, within the context of its full deliberations, the nature, extent and quality of services provided by SIMC and the Sub-Advisers to the Funds and the resources of SIMC and the Sub-Advisers and their affiliates
dedicated to the Funds supported renewal of the Investment Advisory Agreements.
Fund Performance. The Board of Trustees
considered Fund performance in determining whether to renew the Investment Advisory Agreements. Specifically, the Trustees considered the Funds’ performance relative to their peer groups and appropriate indices/benchmarks in light of total
return, yield and market trends. As part of this review, the Trustees considered the composition of each peer group and selection criteria. In evaluating performance, the Trustees considered both market risk and shareholder risk expectations for the
Funds. The Trustees found Fund performance satisfactory, and, where performance was below the benchmark, the Trustees were satisfied that appropriate steps were being taken. Following evaluation, the Board concluded that, within the context of its
full deliberations, the performance of the Funds supported renewal of the Investment Advisory Agreements.
Fund Expenses. With respect to
the Funds’ expenses under the Investment Advisory Agreements, the Trustees considered the rate of compensation called for by the Investment Advisory Agreements and the Funds’ net operating expense ratio in comparison to those of other
comparable mutual funds. The Trustees also considered information about average expense ratios of comparable mutual funds in the Funds’ respective peer groups. The Trustees further considered the fact that the comparative fee analysis either
showed that the various fees were below average or that there was a reasonable basis for the fee level. Finally, the Trustees considered the effects of SIMC’s voluntary waiver of management and other fees and the Sub-Advisers’ fees to
prevent total Fund expenses from exceeding a specified cap and concluded that SIMC and the Sub-Advisers, through waivers, have maintained the Funds’ net operating expenses at competitive levels for their respective distribution channels.
Following evaluation, the Board concluded that, within the context of its full deliberations, the expenses of the Funds are reasonable and supported renewal of the Investment Advisory Agreements.
|
|
|
|
|
| SEI Institutional International Trust / Annual Report / September 30, 2012 |
|
|
53 |
|
Board of Trustees Considerations in Approving the Funds’ Investment Advisory and Sub-Advisory Agreements
(Unaudited) (Concluded)
Profitability. With regard to profitability, the Trustees considered all compensation flowing to SIMC and the Sub-Advisers and their affiliates,
directly or indirectly. The Trustees considered whether the varied levels of compensation and profitability under the Investment Advisory Agreements and other service agreements were reasonable and justified in light of the quality of all services
rendered to the Funds by SIMC and the Sub-Advisers and their affiliates. The Trustees found that profitability was reasonable and that the margin was not increasing despite growth in assets. When considering the profitability of the Sub-Advisers,
the Board took into account the fact that the Sub-Advisers are compensated by SIMC and not by the Funds directly, and such compensation with respect to any Sub-Adviser reflects an arms-length negotiation between the Sub-Adviser and SIMC. Based on
this evaluation, the Board concluded that, within the context of its full deliberations, the profitability of each of SIMC and the Sub-Advisers is reasonable and supported renewal of the Investment Advisory Agreements.
Economies of Scale. The Trustees considered the existence of any economies of scale and whether those were passed along to the Funds’
shareholders through a graduated investment advisory fee schedule or other means, including any fee waivers by SIMC and its affiliates. Based on this evaluation, the Board concluded that, within the context of its full deliberations, the Funds
obtain reasonable benefit from economies of scale.
Based on the Trustees’ deliberation and their evaluation of the information described
above, the Board, including all of the Independent Trustees, unanimously approved the continuation of the Investment Advisory Agreements and concluded that the compensation under the Investment Advisory Agreements is fair and reasonable in light of
such services and expenses and such other matters as the Trustees considered to be relevant in the exercise of their reasonable judgment. In the course of their deliberations, the Trustees did not identify any particular information that was
all-important or controlling.
|
|
|
| 54 |
|
SEI Institutional International Trust / Annual Report / September 30, 2012 |
Notice to Shareholders
(Unaudited)
For shareholders that do not have a September 30, 2012 taxable year end, this notice is for informational purposes only. For shareholders with a
September 30, 2012 taxable year end, please consult your tax advisor as to the pertinence of this notice.
For the fiscal year ended
September 30, 2012 the Funds of the SEI Institutional International Trust are designating the following items with regard to distributions paid during the year:
|
|
|
|
|
|
|
|
|
|
|
|
|
|
|
|
|
|
|
|
|
|
|
|
|
|
|
|
|
|
|
|
|
|
|
|
|
| Fund |
|
(A)
Return of
Capital |
|
|
(B)
Long-Term
Capital Gain
Distributions
(Tax
Basis) |
|
|
(C)
Ordinary
Income
Distributions
(Tax Basis) |
|
|
(D)
Total |
|
|
(E)
Dividends
Received
Deductions (1) |
|
|
(F)
Qualifying
Dividend Income
(15% Tax Rate
for QDI)
(2) |
|
|
(G)
U.S. Government
Interest (3) |
|
|
(H)
Interest
Related
Dividends (4) |
|
|
(I)
Short-Term
Capital Gain
Dividends (5) |
|
| International Equity |
|
|
0.00 |
% |
|
|
0.00 |
% |
|
|
100.00 |
% |
|
|
100.00 |
% |
|
|
0.00 |
% |
|
|
100.00 |
% |
|
|
0.00 |
% |
|
|
0.03 |
% |
|
|
0.00 |
% |
| Emerging Markets Equity |
|
|
0.00 |
% |
|
|
0.00 |
% |
|
|
100.00 |
% |
|
|
100.00 |
% |
|
|
0.00 |
% |
|
|
100.00 |
% |
|
|
0.00 |
% |
|
|
0.01 |
% |
|
|
0.00 |
% |
| International Fixed Income |
|
|
0.00 |
% |
|
|
0.00 |
% |
|
|
100.00 |
% |
|
|
100.00 |
% |
|
|
0.00 |
% |
|
|
0.00 |
% |
|
|
0.07 |
% |
|
|
0.10 |
% |
|
|
0.00 |
% |
| Emerging Markets Debt |
|
|
0.00 |
% |
|
|
3.60 |
% |
|
|
96.40 |
% |
|
|
100.00 |
% |
|
|
0.00 |
% |
|
|
0.00 |
% |
|
|
0.00 |
% |
|
|
0.00 |
% |
|
|
0.00 |
% |
The Funds intend to pass through foreign tax credit to shareholders. For the fiscal year ended September 30, 2012, the
amount of foreign source income and foreign tax credit are as follows:
|
|
|
|
|
|
|
|
|
| Fund |
|
Foreign
Source
Income |
|
|
Foreign
Tax Credit
Pass
Through |
|
| International Equity |
|
$ |
32,578,354 |
|
|
$ |
2,589,995 |
|
| Emerging Markets Equity |
|
|
6,762,434 |
|
|
|
1,912,645 |
|
| (1) |
“Dividends Received Deduction” represent dividends which qualify for the corporate dividends received deduction. |
| (2) |
“Qualifying Dividend Income” represent qualifying dividends as created by the Jobs and Growth Tax Relief Reconciliation Act of 2003. It is the intention of the
Fund to designate the max amount permitted by law. |
| (3) |
“U.S. Government Interest” represent the amount of interest that was derived from direct U.S. Government obligations and distributed during the fiscal year.
Generally, interest from direct U.S. Government obligations is exempt from state income tax. However, for shareholders who are residents of California, Connecticut or New York, the statutory threshold requirements were not satisfied to permit
exemption of these amounts from state income. |
| (4) |
“Interest Related Dividends” represent qualifying interest that is exempt from U.S. withholding tax when paid to foreign investors as created by the American
Jobs Creation Act of 2004. |
| (5) |
“Short-Term Capital Gain Dividends” represent qualifying short-term capital gain that is exempt from U.S. withholding tax when paid to foreign investors as
created by the American Jobs Creation Act of 2004. |
Items (A), (B), (C) and (D) are based on the percentage of
each fund’s total distribution.
Items (E) and (F) are based on the percentage of “Ordinary Income Distributions.”
Item (F) is based on the percentage of gross income of each Fund.
Item (H) is based on the percentage of net investment income distributions.
Item (I) is based
on the percentage of short-term capital gains distributions.
Please consult your tax adviser for proper treatment of this information. This
notification should be kept with your permanent tax records.
|
|
|
|
|
| SEI Institutional International Trust / Annual Report / September 30, 2012 |
|
|
55 |
|
SEI INSTITUTIONAL INTERNATIONAL TRUST ANNUAL REPORT SEPTEMBER 30, 2012
Robert A. Nesher, Chairman
Trustees
William M. Doran
George J. Sullivan, Jr.
Rosemarie B. Greco
Nina Lesavoy
James M. Williams
Mitchell A. Johnson
Hubert L. Harris, Jr.
Officers
Robert A. Nesher
President and Chief Executive Officer
Peter A. Rodriguez
Controller and Chief Financial Officer
Russell
Emery
Chief Compliance Officer
Timothy D. Barto
Vice President, Secretary
Aaron Buser
Vice President,
Assistant Secretary
David F. McCann
Vice President, Assistant Secretary
Stephen G.
MacRae
Vice President
Keri E. Rohn
Anti-Money Laundering Compliance Officer
Privacy Officer
Investment Adviser
SEI Investments Management Corporation
Administrator
SEI Investments Global Funds Services
Distributor
SEI Investments Distribution Co.
Legal Counsel
Morgan, Lewis & Bockius
LLP
Independent Registered Public Accounting Firm
KMPG LLP
This report and the financial statements contained herein are submitted for the general
information of the shareholders of the Trust and must be preceded or accompanied by a current prospectus. Shares of the SEI Funds are not deposits or obligations of, or guaranteed or endorsed by, any bank. The shares are not federally insured by the
Federal Deposit Insurance Corporation (FDIC), the Federal Reserve Board, or any other government agency. Investment in the shares involves risk, including the possible loss of principal.
For more information call
1 800 DIAL SEI
(1 800 342 5734)

SEI-F-018 (9/12)
The Registrant has
adopted a code of ethics that applies to the Registrant’s principal executive officer, principal financial officer, comptroller or principal accounting officer, and any person who performs a similar function.
| Item 3. |
Audit Committee Financial Expert. |
(a)(1)
The Registrant’s Board of Trustees has determined that the Registrant has at least two audit committee financial experts serving on the audit committee.
(a) (2) The audit committee financial experts are George J. Sullivan, Jr. and Hubert L. Harris, Jr. Messrs. Sullivan and Harris are independent as defined in Form N-CSR Item 3 (a) (2).
| Item 4. |
Principal Accountant Fees and Services. |
Fees billed by KPMG LLP (“KPMG”) related to the Registrant.
KPMG billed the Registrant aggregate fees for services rendered to the Registrant for the fiscal years 2012 and 2011 as follows:
|
|
|
|
|
|
|
|
|
|
|
|
|
|
|
|
|
|
|
|
|
|
|
|
|
|
|
| |
|
|
|
Fiscal 2012 |
|
|
Fiscal 2011 |
|
| |
|
|
|
All fees and
services to
the
Registrant that
were pre-
approved |
|
|
All fees and
services to
service
affiliates that
were pre-
approved |
|
|
All other fees
and services
to
service
affiliates that
did not
require
pre-approval |
|
|
All fees and
services to
the
Registrant that
were pre-
approved |
|
|
All fees and
services to
service
affiliates that
were pre-
approved |
|
|
All other fees
and services
to
service
affiliates that
did not
require
pre-approval |
|
| (a) |
|
Audit Fees(1) |
|
$ |
190,100 |
|
|
|
N/A |
|
|
|
N/A |
|
|
$ |
178,500 |
|
|
|
N/A |
|
|
|
N/A |
|
| (b) |
|
Audit-Related Fees |
|
$ |
20,000 |
(3) |
|
$ |
0 |
|
|
$ |
0 |
|
|
$ |
25,000 |
(3) |
|
$ |
0 |
|
|
$ |
0 |
|
| (c) |
|
Tax Fees |
|
$ |
0 |
|
|
$ |
5,000 |
|
|
|
N/A |
|
|
$ |
0 |
|
|
$ |
0 |
|
|
|
N/A |
|
| (d) |
|
All Other Fees |
|
$ |
0 |
|
|
$ |
236,000 |
|
|
$ |
0 |
|
|
$ |
0 |
|
|
$ |
234,500 |
|
|
$ |
0 |
|
Notes:
| (1) |
Audit fees include amounts related to the audit of the Registrant’s annual financial statements and services normally provided by the accountant in connection with
statutory and regulatory filings. |
| (2) |
See Item 4(g) for a description of the services comprising the fees disclosed under this category. |
| (3) |
Audit-related fees include amounts related to attestation reporting over compliance with an exemptive order under the federal securities laws. |
(e)(1) The Registrant’s Audit Committee has adopted and the Board of Trustees has ratified an Audit and Non-Audit Services Pre-Approval Policy (the
“Policy”), which sets forth the procedures and the conditions
pursuant to which services proposed to be performed by the independent auditor of the Registrant may be pre-approved.
The Policy provides that all requests or applications for proposed services to be provided by the independent auditor must be submitted to the Registrant’s Chief Financial Officer (“CFO”)
and must include a detailed description of the services proposed to be rendered. The CFO will determine whether such services: (1) require specific pre-approval; (2) are included within the list of services that have received the general
pre-approval of the Audit Committee pursuant to the Policy; or (3) have been previously pre-approved in connection with the independent auditor’s annual engagement letter for the applicable year or otherwise. In any instance where services
require pre-approval, the Audit Committee will consider whether such services are consistent with SEC’s rules and whether the provision of such services would impair the auditor’s independence.
Requests or applications to provide services that require specific pre-approval by the Audit Committee will be submitted to the Audit Committee by the
CFO. The Audit Committee will be informed by the CFO on a quarterly basis of all services rendered by the independent auditor. The Audit Committee has delegated specific pre-approval authority to either the Audit Committee Chair or financial
experts, provided that the estimated fee for any such proposed pre-approved service does not exceed $100,000 and any pre-approval decisions are reported to the Audit Committee at its next regularly scheduled meeting.
Services that have received the general pre-approval of the Audit Committee are identified and described in the Policy. In addition, the Policy sets
forth a maximum fee per engagement with respect to each identified service that has received general pre-approval.
All services to be
provided by the independent auditor shall be provided pursuant to a signed written engagement letter with the Registrant, the investment advisor or applicable control affiliate (except that matters as to which an engagement letter would be
impractical because of timing issues or because the matter is small may not be the subject of an engagement letter) that sets forth both the services to be provided by the independent auditor and the total fees to be paid to the independent auditor
for those services.
In addition, the Audit Committee has determined to take additional measures on an annual basis to meet its responsibility
to oversee the work of the independent auditor and to assure the auditor’s independence from the Registrant, such as reviewing a formal written statement from the independent auditor delineating all relationships between the independent auditor
and the Registrant, and discussing with the independent auditor its methods and procedures for ensuring independence.
(e)(2) Percentage of
fees billed applicable to non-audit services pursuant to waiver of pre-approval requirement were as follows:
|
|
|
|
|
|
|
|
|
| |
|
Fiscal 2012 |
|
|
Fiscal 2011 |
|
| Audit-Related Fees |
|
|
0 |
% |
|
|
0 |
% |
| Tax Fees |
|
|
0 |
% |
|
|
0 |
% |
| All Other Fees |
|
|
0 |
% |
|
|
0 |
% |
(g)(1) The aggregate non-audit
fees and services billed by KPMG for the fiscal years 2012 and 2011 were $236,000 and $234,500, respectively. Non-audit fees consist of SSAE No.16 review of fund accounting and administration operations, attestation report in accordance with Rule
17Ad-13, and agreed upon procedures report over certain internal controls related to compliance with federal securities laws and regulations and tax consulting services for various service affiliates of the Registrant.
(h) During the past fiscal year, Registrant’s principal accountant provided certain non-audit services
to Registrant’s investment adviser or to entities controlling, controlled by, or under common control with Registrant’s investment adviser that provide ongoing services to Registrant that were not subject to pre-approval pursuant to
paragraph (c)(7)(ii) of Rule 2-01 of Regulation S-X. The Audit Committee of Registrant’s Board of Trustees reviewed and considered these non-audit services provided by Registrant’s principal accountant to Registrant’s affiliates,
including whether the provision of these non-audit services is compatible with maintaining the principal accountant’s independence.
| Item 5. |
Audit Committee of Listed Registrants. |
Not applicable.
| Item 6. |
Schedule of Investments |
The Schedules of
Investments in securities of unaffiliated issuers as of the close of the reporting period for the International Equity Fund, Emerging Markets Equity Fund, International Fixed Income Fund, and Emerging Markets Debt Fund are listed below.
Schedule of Investments
International Equity Fund
September 30, 2012
|
|
|
|
|
|
|
|
|
| Description |
|
Shares |
|
|
Market Value
($ Thousands) |
|
|
|
|
|
|
|
|
|
|
| COMMON STOCK — 93.8% |
|
|
|
|
|
|
|
|
|
|
|
| Argentina — 0.0% |
|
|
|
|
|
|
|
|
| Tenaris |
|
|
2,059 |
|
|
$ |
42 |
|
|
|
|
|
|
|
|
|
|
|
|
|
| Australia — 3.1% |
|
|
|
|
|
|
|
|
| ALS |
|
|
85,776 |
|
|
|
766 |
|
| Alumina |
|
|
1,118,227 |
|
|
|
988 |
|
| Amcor |
|
|
386,803 |
|
|
|
3,121 |
|
| AMP |
|
|
16,846 |
|
|
|
76 |
|
| APA Group (A) |
|
|
148,993 |
|
|
|
734 |
|
| Atlas Iron * |
|
|
2,273,801 |
|
|
|
3,334 |
|
| Australia & New Zealand Banking Group |
|
|
407,583 |
|
|
|
10,490 |
|
| Australian Stock Exchange |
|
|
6,115 |
|
|
|
188 |
|
| Beach Energy |
|
|
389,254 |
|
|
|
512 |
|
| BHP Billiton (USD) ADR (A) |
|
|
43,900 |
|
|
|
3,012 |
|
| Boral |
|
|
37,541 |
|
|
|
150 |
|
| Brambles |
|
|
128,646 |
|
|
|
939 |
|
| Caltex Australia |
|
|
98,796 |
|
|
|
1,698 |
|
| Centro Retail Australia (B) |
|
|
26,036 |
|
|
|
57 |
|
| CFS Retail Property Trust Group (B) |
|
|
34,385 |
|
|
|
69 |
|
| Coca-Cola Amatil |
|
|
11,072 |
|
|
|
156 |
|
| Commonwealth Bank of Australia |
|
|
21,044 |
|
|
|
1,220 |
|
| Credit Group |
|
|
6,790 |
|
|
|
45 |
|
| Crown |
|
|
17,653 |
|
|
|
167 |
|
| CSL |
|
|
96,080 |
|
|
|
4,596 |
|
| Dexus Property Group (B) |
|
|
890,282 |
|
|
|
880 |
|
| Echo Entertainment Group |
|
|
23,844 |
|
|
|
95 |
|
| Fortescue Metals Group (A) |
|
|
29,671 |
|
|
|
108 |
|
| Goodman Group (B) |
|
|
225,718 |
|
|
|
930 |
|
| GPT Group (B) |
|
|
17,180 |
|
|
|
61 |
|
| Iluka Resources |
|
|
309,448 |
|
|
|
3,195 |
|
| Leighton Holdings |
|
|
15,451 |
|
|
|
267 |
|
| Macquarie Group |
|
|
23,382 |
|
|
|
692 |
|
| Newcrest Mining |
|
|
330,170 |
|
|
|
10,005 |
|
| Orica |
|
|
1,042 |
|
|
|
27 |
|
| Ramsay Health Care |
|
|
4,996 |
|
|
|
125 |
|
| Roc Oil * |
|
|
155,859 |
|
|
|
59 |
|
| Santos |
|
|
48,384 |
|
|
|
572 |
|
| Sims Metal Management |
|
|
3,984 |
|
|
|
40 |
|
| Sonic Healthcare |
|
|
4,827 |
|
|
|
68 |
|
| Stockland (B) |
|
|
11,664 |
|
|
|
41 |
|
| Suncorp Group |
|
|
33,368 |
|
|
|
321 |
|
| Tatts Group |
|
|
297,431 |
|
|
|
838 |
|
| Telstra |
|
|
560,363 |
|
|
|
2,284 |
|
| Toll Holdings |
|
|
129,438 |
|
|
|
594 |
|
| Transurban Group |
|
|
155,478 |
|
|
|
970 |
|
| Wesfarmers |
|
|
26,894 |
|
|
|
958 |
|
| Westfield Group (B) |
|
|
52,378 |
|
|
|
553 |
|
| Westfield Retail Trust (B) |
|
|
48,979 |
|
|
|
147 |
|
| Westpac Banking |
|
|
220 |
|
|
|
6 |
|
| WorleyParsons |
|
|
2,351 |
|
|
|
69 |
|
|
|
|
|
|
|
|
|
|
|
|
|
|
|
|
|
56,223 |
|
|
|
|
|
|
|
|
|
|
|
|
|
| Austria — 0.0% |
|
|
|
|
|
|
|
|
| Andritz |
|
|
5,398 |
|
|
|
306 |
|
| Oesterreichische Post |
|
|
4,748 |
|
|
|
170 |
|
| Raiffeisen International Bank Holding |
|
|
4,820 |
|
|
|
175 |
|
|
|
|
|
|
|
|
|
|
|
|
|
|
|
|
|
651 |
|
|
|
|
|
|
|
|
|
|
|
|
|
|
|
|
|
|
|
| Description |
|
Shares |
|
|
Market Value
($ Thousands) |
|
|
|
|
|
|
|
|
|
|
|
|
|
| Belgium — 1.7% |
|
|
|
|
|
|
|
|
| Ageas |
|
|
71,318 |
|
|
$ |
1,712 |
|
| Anheuser-Busch InBev |
|
|
197,567 |
|
|
|
16,819 |
|
| Belgacom |
|
|
239,617 |
|
|
|
7,321 |
|
| Colruyt (A) |
|
|
105,151 |
|
|
|
4,585 |
|
| KBC Groep |
|
|
21,585 |
|
|
|
518 |
|
| Solvay |
|
|
1,114 |
|
|
|
129 |
|
| UCB |
|
|
2,810 |
|
|
|
155 |
|
| Umicore |
|
|
15,401 |
|
|
|
806 |
|
|
|
|
|
|
|
|
|
|
|
|
|
|
|
|
|
32,045 |
|
|
|
|
|
|
|
|
|
|
|
|
|
| Bosnia and Herzegovina — 0.1% |
|
|
|
|
|
|
|
|
| Axis Capital Holdings |
|
|
65,521 |
|
|
|
2,288 |
|
|
|
|
|
|
|
|
|
|
|
|
|
| Brazil — 0.4% |
|
|
|
|
|
|
|
|
| Centrais Eletricas Brasileiras |
|
|
163,400 |
|
|
|
973 |
|
| Centrais Eletricas Brasileiras ADR |
|
|
204,827 |
|
|
|
1,215 |
|
| Cia Energetica de Minas Gerais ADR |
|
|
30,145 |
|
|
|
365 |
|
| Petroleo Brasileiro ADR |
|
|
182,027 |
|
|
|
4,176 |
|
|
|
|
|
|
|
|
|
|
|
|
|
|
|
|
|
6,729 |
|
|
|
|
|
|
|
|
|
|
|
|
|
| Canada — 3.5% |
|
|
|
|
|
|
|
|
| Agrium |
|
|
26,300 |
|
|
|
2,726 |
|
| Bank of Nova Scotia (A) |
|
|
52,400 |
|
|
|
2,871 |
|
| Barrick Gold |
|
|
225,222 |
|
|
|
9,405 |
|
| Cameco |
|
|
155,934 |
|
|
|
3,033 |
|
| Cenovus Energy |
|
|
78,540 |
|
|
|
2,739 |
|
| Cott * |
|
|
7,100 |
|
|
|
56 |
|
| Goldcorp |
|
|
120,100 |
|
|
|
5,510 |
|
| Horizon North Logistics |
|
|
23,300 |
|
|
|
189 |
|
| Kinross Gold |
|
|
616,016 |
|
|
|
6,290 |
|
| Magna International, Cl A |
|
|
62,800 |
|
|
|
2,715 |
|
| New Gold * |
|
|
464,100 |
|
|
|
5,684 |
|
| Nexen |
|
|
57,900 |
|
|
|
1,467 |
|
| Onex |
|
|
11,606 |
|
|
|
458 |
|
| Silver Wheaton |
|
|
117,700 |
|
|
|
4,675 |
|
| Sino-Forest, Cl A *(C) |
|
|
76,000 |
|
|
|
8 |
|
| Suncor Energy |
|
|
314,047 |
|
|
|
10,320 |
|
| Talisman Energy |
|
|
154,187 |
|
|
|
2,054 |
|
| Toronto-Dominion Bank |
|
|
44,636 |
|
|
|
3,719 |
|
|
|
|
|
|
|
|
|
|
|
|
|
|
|
|
|
63,919 |
|
|
|
|
|
|
|
|
|
|
|
|
|
| Chile — 0.2% |
|
|
|
|
|
|
|
|
| Sociedad Quimica y Minera de Chile ADR |
|
|
71,500 |
|
|
|
4,407 |
|
|
|
|
|
|
|
|
|
|
|
|
|
| China — 0.4% |
|
|
|
|
|
|
|
|
| Huaneng Power International, Cl H |
|
|
3,902,000 |
|
|
|
2,969 |
|
| Industrial & Commercial Bank of China, Cl H |
|
|
7,245,000 |
|
|
|
4,280 |
|
|
|
|
|
|
|
|
|
|
|
|
|
|
|
|
|
7,249 |
|
|
|
|
|
|
|
|
|
|
|
|
|
| Colombia — 0.1% |
|
|
|
|
|
|
|
|
| Ecopetrol ADR |
|
|
44,500 |
|
|
|
2,622 |
|
|
|
|
|
|
|
|
|
|
|
|
|
| Czech Republic — 0.1% |
|
|
|
|
|
|
|
|
| Komercni Banka (D) |
|
|
10,900 |
|
|
|
2,161 |
|
|
|
|
|
|
|
|
|
|
|
|
|
| Denmark — 1.2% |
|
|
|
|
|
|
|
|
| AP Moeller - Maersk, Cl B |
|
|
267 |
|
|
|
1,913 |
|
| AP Moeller - Maersk, Cl A |
|
|
10 |
|
|
|
68 |
|
| Carlsberg, Cl B |
|
|
2,362 |
|
|
|
209 |
|
|
|
|
| 1 |
|
SEI Institutional International Trust / Annual Report / September 30, 2012 |
Schedule of Investments
International Equity Fund
September 30, 2012
|
|
|
|
|
|
|
|
|
| Description |
|
Shares |
|
|
Market Value
($ Thousands) |
|
|
|
|
|
|
|
|
|
|
| Coloplast, Cl B |
|
|
1,627 |
|
|
$ |
339 |
|
| Jyske Bank * |
|
|
112,431 |
|
|
|
3,345 |
|
| Novo Nordisk, Cl B |
|
|
62,554 |
|
|
|
9,894 |
|
| Tryg |
|
|
87,138 |
|
|
|
5,668 |
|
| William Demant Holding * |
|
|
5,246 |
|
|
|
471 |
|
|
|
|
|
|
|
|
|
|
|
|
|
|
|
|
|
21,907 |
|
|
|
|
|
|
|
|
|
|
|
|
|
| Finland — 0.3% |
|
|
|
|
|
|
|
|
| Elisa, Cl A |
|
|
10,216 |
|
|
|
231 |
|
| Kone, Cl B |
|
|
610 |
|
|
|
42 |
|
| Metso |
|
|
18,695 |
|
|
|
669 |
|
| Nokian Renkaat |
|
|
16,012 |
|
|
|
652 |
|
| Stora Enso, Cl R |
|
|
601,458 |
|
|
|
3,741 |
|
| Wartsila, Cl B |
|
|
25,299 |
|
|
|
877 |
|
|
|
|
|
|
|
|
|
|
|
|
|
|
|
|
|
6,212 |
|
|
|
|
|
|
|
|
|
|
|
|
|
| France — 8.8% |
|
|
|
|
|
|
|
|
| Accor |
|
|
5,851 |
|
|
|
195 |
|
| Air Liquide (A) |
|
|
28,877 |
|
|
|
3,583 |
|
| Alcatel-Lucent *(A) |
|
|
2,943,893 |
|
|
|
3,253 |
|
| Alstom |
|
|
35,938 |
|
|
|
1,262 |
|
| Areva |
|
|
79,082 |
|
|
|
1,450 |
|
| Arkema |
|
|
64,580 |
|
|
|
6,053 |
|
| AtoS |
|
|
4,951 |
|
|
|
346 |
|
| AXA (A) |
|
|
334,595 |
|
|
|
4,989 |
|
| BNP Paribas (A) |
|
|
207,576 |
|
|
|
9,875 |
|
| Bureau Veritas |
|
|
993 |
|
|
|
102 |
|
| Carrefour (A) |
|
|
149,982 |
|
|
|
3,114 |
|
| Christian Dior |
|
|
2,735 |
|
|
|
367 |
|
| Cie Generale des Etablissements-Michelin,
Cl B |
|
|
66,812 |
|
|
|
5,240 |
|
| Cie Generale d’Optique Essilor International |
|
|
78,167 |
|
|
|
7,328 |
|
| Compagnie Generale de
Geophysique-Veritas *(A) |
|
|
24,987 |
|
|
|
788 |
|
| Danone |
|
|
251 |
|
|
|
15 |
|
| Dassault Systemes |
|
|
483 |
|
|
|
51 |
|
| Electricite de France (A) |
|
|
99,095 |
|
|
|
2,079 |
|
| Eurazeo |
|
|
1,155 |
|
|
|
53 |
|
| Eutelsat Communications |
|
|
117,109 |
|
|
|
3,769 |
|
| Fonciere Des Regions (B) |
|
|
2,242 |
|
|
|
169 |
|
| Iliad |
|
|
2,753 |
|
|
|
449 |
|
| Lafarge |
|
|
1,037 |
|
|
|
56 |
|
| Lagardere SCA |
|
|
1,577 |
|
|
|
43 |
|
| Legrand (A)(E) |
|
|
182,420 |
|
|
|
6,883 |
|
| L’Oreal |
|
|
45,865 |
|
|
|
5,680 |
|
| LVMH Moet Hennessy Louis Vuitton |
|
|
39,838 |
|
|
|
5,996 |
|
| Nexity |
|
|
5,300 |
|
|
|
153 |
|
| Pernod-Ricard |
|
|
28,375 |
|
|
|
3,187 |
|
| PPR |
|
|
31 |
|
|
|
5 |
|
| Publicis Groupe |
|
|
4,834 |
|
|
|
271 |
|
| Remy Cointreau |
|
|
4,058 |
|
|
|
467 |
|
| Renault (A) |
|
|
51,741 |
|
|
|
2,431 |
|
| Rexel |
|
|
271,110 |
|
|
|
5,462 |
|
| Safran |
|
|
165,847 |
|
|
|
5,971 |
|
| Sanofi |
|
|
353,602 |
|
|
|
30,183 |
|
| Schneider Electric |
|
|
238,540 |
|
|
|
14,134 |
|
| Societe BIC |
|
|
874 |
|
|
|
106 |
|
| Sodexo |
|
|
77,542 |
|
|
|
5,845 |
|
| Technip |
|
|
61,762 |
|
|
|
6,874 |
|
| Thales (A) |
|
|
57,530 |
|
|
|
1,978 |
|
| Total |
|
|
194,192 |
|
|
|
9,643 |
|
| Veolia Environnement |
|
|
13,090 |
|
|
|
141 |
|
|
|
|
|
|
|
|
|
|
| Description |
|
Shares |
|
|
Market Value
($ Thousands) |
|
|
|
|
|
|
|
|
|
|
| Vinci |
|
|
648 |
|
|
$ |
28 |
|
| Vivendi |
|
|
66,494 |
|
|
|
1,298 |
|
| Wendel |
|
|
6,885 |
|
|
|
582 |
|
| Zodiac Aerospace |
|
|
6,430 |
|
|
|
629 |
|
|
|
|
|
|
|
|
|
|
|
|
|
|
|
|
|
162,576 |
|
|
|
|
|
|
|
|
|
|
|
|
|
| Germany — 8.4% |
|
|
|
|
|
|
|
|
| Adidas |
|
|
5,068 |
|
|
|
416 |
|
| Allianz |
|
|
17,552 |
|
|
|
2,091 |
|
| BASF |
|
|
85,318 |
|
|
|
7,206 |
|
| Bayer |
|
|
108,656 |
|
|
|
9,342 |
|
| Bayerische Motoren Werke |
|
|
21,776 |
|
|
|
1,594 |
|
| Beiersdorf |
|
|
3,293 |
|
|
|
242 |
|
| Brenntag |
|
|
46,416 |
|
|
|
5,948 |
|
| Celesio |
|
|
4,397 |
|
|
|
78 |
|
| Continental |
|
|
43,852 |
|
|
|
4,299 |
|
| Daimler |
|
|
189,074 |
|
|
|
9,162 |
|
| Deutsche Bank |
|
|
37,161 |
|
|
|
1,470 |
|
| Deutsche Boerse (A) |
|
|
205,895 |
|
|
|
11,407 |
|
| Deutsche Lufthansa |
|
|
118,404 |
|
|
|
1,607 |
|
| Deutsche Post |
|
|
356,756 |
|
|
|
6,976 |
|
| Deutsche Telekom |
|
|
326,073 |
|
|
|
4,017 |
|
| E.ON |
|
|
98,739 |
|
|
|
2,346 |
|
| Fresenius |
|
|
483 |
|
|
|
56 |
|
| Fresenius Medical Care |
|
|
97,122 |
|
|
|
7,130 |
|
| GEA Group |
|
|
187,253 |
|
|
|
5,672 |
|
| Gerresheimer |
|
|
2,466 |
|
|
|
129 |
|
| Hannover Rueckversicherung |
|
|
9,300 |
|
|
|
595 |
|
| HeidelbergCement |
|
|
24,890 |
|
|
|
1,305 |
|
| Henkel |
|
|
11,160 |
|
|
|
729 |
|
| Hugo Boss |
|
|
1,724 |
|
|
|
152 |
|
| Infineon Technologies |
|
|
1,064,754 |
|
|
|
6,764 |
|
| Kabel Deutschland Holding *(A) |
|
|
38,349 |
|
|
|
2,739 |
|
| Lanxess |
|
|
10,830 |
|
|
|
899 |
|
| Linde (A) |
|
|
88,407 |
|
|
|
15,241 |
|
| MAN |
|
|
7,922 |
|
|
|
726 |
|
| Merck |
|
|
10,747 |
|
|
|
1,327 |
|
| Muenchener Rueckversicherungs |
|
|
55,307 |
|
|
|
8,645 |
|
| RWE |
|
|
2,644 |
|
|
|
118 |
|
| SAP |
|
|
104,943 |
|
|
|
7,440 |
|
| SAP ADR (A) |
|
|
69,900 |
|
|
|
4,986 |
|
| Siemens |
|
|
158,522 |
|
|
|
15,828 |
|
| Suedzucker |
|
|
31,798 |
|
|
|
1,127 |
|
| Symrise |
|
|
166,749 |
|
|
|
5,653 |
|
|
|
|
|
|
|
|
|
|
|
|
|
|
|
|
|
155,462 |
|
|
|
|
|
|
|
|
|
|
|
|
|
| Hong Kong — 3.0% |
|
|
|
|
|
|
|
|
| AIA Group |
|
|
1,836,200 |
|
|
|
6,844 |
|
| ASM Pacific Technology (A) |
|
|
49,500 |
|
|
|
586 |
|
| BOC Hong Kong Holdings |
|
|
197,500 |
|
|
|
628 |
|
| Chaoda Modern Agriculture *(C) |
|
|
2,440,000 |
|
|
|
346 |
|
| China Merchants Holdings International |
|
|
400,000 |
|
|
|
1,233 |
|
| China Mobile |
|
|
517,000 |
|
|
|
5,731 |
|
| China Mobile ADR |
|
|
85,100 |
|
|
|
4,711 |
|
| CLP Holdings |
|
|
151,000 |
|
|
|
1,283 |
|
| CNOOC |
|
|
2,557,000 |
|
|
|
5,244 |
|
| First Pacific (A) |
|
|
678,000 |
|
|
|
737 |
|
| Galaxy Entertainment Group * |
|
|
249,000 |
|
|
|
835 |
|
| Hang Lung Group (A) |
|
|
20,000 |
|
|
|
127 |
|
| Hang Seng Bank |
|
|
3,100 |
|
|
|
48 |
|
| Hong Kong & China Gas |
|
|
38,600 |
|
|
|
98 |
|
| Hongkong Land Holdings (A) |
|
|
125,000 |
|
|
|
751 |
|
|
|
|
| 2 |
|
SEI Institutional International Trust / Annual Report / September 30, 2012 |
Schedule of Investments
International Equity Fund
September 30, 2012
|
|
|
|
|
|
|
|
|
| Description |
|
Shares |
|
|
Market Value
($ Thousands) |
|
|
|
|
|
|
|
|
|
|
| Hutchison Telecommunications Hong Kong Holdings |
|
|
802,000 |
|
|
$ |
355 |
|
| Hutchison Whampoa |
|
|
189,500 |
|
|
|
1,838 |
|
| Hysan Development |
|
|
111,000 |
|
|
|
505 |
|
| Jardine Strategic Holdings |
|
|
221,610 |
|
|
|
7,517 |
|
| Kerry Properties |
|
|
29,000 |
|
|
|
147 |
|
| Li & Fung (A) |
|
|
810,000 |
|
|
|
1,256 |
|
| MGM China Holdings |
|
|
180,000 |
|
|
|
312 |
|
| New World Development |
|
|
1,100,000 |
|
|
|
1,705 |
|
| Orient Overseas International |
|
|
16,000 |
|
|
|
88 |
|
| RCG Holdings * |
|
|
16,196 |
|
|
|
— |
|
| Shangri-La Asia |
|
|
122,000 |
|
|
|
237 |
|
| SJM Holdings |
|
|
59,000 |
|
|
|
128 |
|
| Sun Hung Kai Properties |
|
|
386,000 |
|
|
|
5,656 |
|
| Swire Pacific, Cl A |
|
|
9,500 |
|
|
|
116 |
|
| Wheelock |
|
|
70,000 |
|
|
|
302 |
|
| Wing Hang Bank |
|
|
16,500 |
|
|
|
155 |
|
| Yue Yuen Industrial Holdings (A) |
|
|
1,869,000 |
|
|
|
6,292 |
|
|
|
|
|
|
|
|
|
|
|
|
|
|
|
|
|
55,811 |
|
|
|
|
|
|
|
|
|
|
|
|
|
| India — 0.3% |
|
|
|
|
|
|
|
|
| Idea Cellular * |
|
|
3,857,257 |
|
|
|
6,238 |
|
|
|
|
|
|
|
|
|
|
|
|
|
| Indonesia — 0.1% |
|
|
|
|
|
|
|
|
| Bank Mandiri |
|
|
2,291,200 |
|
|
|
1,963 |
|
| Telekomunikasi Indonesia ADR |
|
|
2,286 |
|
|
|
89 |
|
|
|
|
|
|
|
|
|
|
|
|
|
|
|
|
|
2,052 |
|
|
|
|
|
|
|
|
|
|
|
|
|
| Ireland — 1.1% |
|
|
|
|
|
|
|
|
| CRH |
|
|
89,657 |
|
|
|
1,730 |
|
| Elan * |
|
|
137,679 |
|
|
|
1,486 |
|
| Experian |
|
|
541,123 |
|
|
|
8,992 |
|
| James Hardie Industries |
|
|
98,311 |
|
|
|
889 |
|
| Kerry Group, Cl A |
|
|
17,614 |
|
|
|
903 |
|
| Ryanair Holdings ADR * |
|
|
132,700 |
|
|
|
4,280 |
|
| Smurfit Kappa Group |
|
|
261,595 |
|
|
|
2,645 |
|
|
|
|
|
|
|
|
|
|
|
|
|
|
|
|
|
20,925 |
|
|
|
|
|
|
|
|
|
|
|
|
|
| Israel — 0.8% |
|
|
|
|
|
|
|
|
| Bezeq Israeli Telecommunication (D) |
|
|
2,408,029 |
|
|
|
2,810 |
|
| Check Point Software Technologies * |
|
|
185,968 |
|
|
|
8,956 |
|
| Mellanox Technologies *(D) |
|
|
2,579 |
|
|
|
267 |
|
| NICE Systems *(D) |
|
|
10,303 |
|
|
|
342 |
|
| Teva Pharmaceutical Industries (D) |
|
|
3,217 |
|
|
|
133 |
|
| Teva Pharmaceutical Industries ADR |
|
|
60,932 |
|
|
|
2,523 |
|
|
|
|
|
|
|
|
|
|
|
|
|
|
|
|
|
15,031 |
|
|
|
|
|
|
|
|
|
|
|
|
|
| Italy — 0.9% |
|
|
|
|
|
|
|
|
| Enel |
|
|
372,509 |
|
|
|
1,319 |
|
| Eni |
|
|
40,748 |
|
|
|
892 |
|
| ERG |
|
|
93,152 |
|
|
|
673 |
|
| Exor |
|
|
32,479 |
|
|
|
818 |
|
| Fiat Industrial |
|
|
86,357 |
|
|
|
845 |
|
| Intesa Sanpaolo |
|
|
1,145,666 |
|
|
|
1,744 |
|
| Luxottica Group |
|
|
19,568 |
|
|
|
693 |
|
| Pirelli & C (A) |
|
|
37,159 |
|
|
|
401 |
|
| Prysmian |
|
|
2,808 |
|
|
|
50 |
|
| Saipem |
|
|
2,901 |
|
|
|
139 |
|
| Snam Rete Gas |
|
|
902,841 |
|
|
|
4,007 |
|
| Telecom Italia RNC |
|
|
5,833,246 |
|
|
|
5,114 |
|
| Unione di Banche Italiane |
|
|
15,658 |
|
|
|
58 |
|
|
|
|
|
|
|
|
|
|
|
|
|
|
|
|
|
16,753 |
|
|
|
|
|
|
|
|
|
|
|
|
|
|
|
|
|
|
|
| Description |
|
Shares |
|
|
Market Value
($ Thousands) |
|
|
|
|
|
|
|
|
|
|
|
|
|
| Japan — 16.0% |
|
|
|
|
|
|
|
|
| Advantest (A) |
|
|
33,200 |
|
|
$ |
433 |
|
| Aeon Credit Service |
|
|
6,600 |
|
|
|
143 |
|
| Aisin Seiki |
|
|
7,800 |
|
|
|
223 |
|
| Ajinomoto |
|
|
3,000 |
|
|
|
47 |
|
| Alfresa Holdings |
|
|
16,900 |
|
|
|
837 |
|
| Alpen |
|
|
14,700 |
|
|
|
277 |
|
| AOKI Holdings |
|
|
3,800 |
|
|
|
83 |
|
| Aoyama Trading |
|
|
5,300 |
|
|
|
102 |
|
| Arc Land Sakamoto |
|
|
12,800 |
|
|
|
191 |
|
| Arnest One |
|
|
37,800 |
|
|
|
585 |
|
| Astellas Pharma |
|
|
144,700 |
|
|
|
7,375 |
|
| Autobacs Seven (A) |
|
|
2,500 |
|
|
|
114 |
|
| Bank of Yokohama |
|
|
40,000 |
|
|
|
191 |
|
| Belluna |
|
|
6,800 |
|
|
|
55 |
|
| Best Bridal |
|
|
65 |
|
|
|
75 |
|
| Calsonic Kansei (A) |
|
|
199,000 |
|
|
|
770 |
|
| Canon |
|
|
1,500 |
|
|
|
48 |
|
| Casio Computer (A) |
|
|
30,500 |
|
|
|
217 |
|
| Central Glass |
|
|
31,000 |
|
|
|
92 |
|
| Central Japan Railway |
|
|
34,700 |
|
|
|
3,060 |
|
| Chiyoda |
|
|
34,200 |
|
|
|
584 |
|
| Chugai Pharmaceutical |
|
|
10,400 |
|
|
|
219 |
|
| Chugoku Electric Power |
|
|
18,800 |
|
|
|
251 |
|
| Citizen Holdings |
|
|
57,000 |
|
|
|
291 |
|
| Coca-Cola West (A) |
|
|
172,500 |
|
|
|
2,869 |
|
| Cocokara fine |
|
|
1,600 |
|
|
|
56 |
|
| Cosmo Oil |
|
|
22,000 |
|
|
|
41 |
|
| Credit Saison |
|
|
21,200 |
|
|
|
514 |
|
| Dai Nippon Printing (A) |
|
|
750,600 |
|
|
|
5,248 |
|
| Daicel |
|
|
225,000 |
|
|
|
1,353 |
|
| Daido Steel |
|
|
4,000 |
|
|
|
19 |
|
| Daihatsu Motor |
|
|
37,800 |
|
|
|
633 |
|
| Dai-ichi Life Insurance |
|
|
454 |
|
|
|
517 |
|
| Daiichi Sankyo |
|
|
74,200 |
|
|
|
1,230 |
|
| Daiichikosho |
|
|
4,600 |
|
|
|
111 |
|
| Daikyo |
|
|
175,000 |
|
|
|
443 |
|
| Dainippon Sumitomo Pharma |
|
|
101,500 |
|
|
|
1,119 |
|
| Daito Trust Construction (A) |
|
|
29,700 |
|
|
|
2,997 |
|
| Daiwa House Industry |
|
|
202,000 |
|
|
|
2,942 |
|
| Denso |
|
|
2,800 |
|
|
|
88 |
|
| Doutor Nichires Holdings |
|
|
6,200 |
|
|
|
78 |
|
| Dydo Drinco |
|
|
4,400 |
|
|
|
201 |
|
| EDION (A) |
|
|
78,900 |
|
|
|
350 |
|
| Eisai |
|
|
600 |
|
|
|
27 |
|
| Faith |
|
|
340 |
|
|
|
37 |
|
| FamilyMart |
|
|
4,800 |
|
|
|
237 |
|
| Fanuc |
|
|
85,700 |
|
|
|
13,857 |
|
| Fast Retailing |
|
|
4,000 |
|
|
|
933 |
|
| Fuji Film Holdings |
|
|
312,600 |
|
|
|
5,256 |
|
| Fuji Heavy Industries |
|
|
110,000 |
|
|
|
916 |
|
| Fuji Soft |
|
|
4,100 |
|
|
|
86 |
|
| Fujishoji |
|
|
42 |
|
|
|
57 |
|
| Fujitsu |
|
|
182,000 |
|
|
|
685 |
|
| Fukuoka Financial Group |
|
|
61,000 |
|
|
|
249 |
|
| Geo Holdings (A) |
|
|
200 |
|
|
|
230 |
|
| GMO internet |
|
|
8,200 |
|
|
|
56 |
|
| Goldcrest |
|
|
1,640 |
|
|
|
25 |
|
| Gulliver International |
|
|
2,250 |
|
|
|
65 |
|
| Hachijuni Bank |
|
|
231,000 |
|
|
|
1,286 |
|
| Hakuhodo DY Holdings |
|
|
3,740 |
|
|
|
253 |
|
| Hankyu Hanshin Holdings |
|
|
51,000 |
|
|
|
277 |
|
|
|
|
| 3 |
|
SEI Institutional International Trust / Annual Report / September 30, 2012 |
Schedule of Investments
International Equity Fund
September 30, 2012
|
|
|
|
|
|
|
|
|
| Description |
|
Shares |
|
|
Market Value
($ Thousands) |
|
|
|
|
|
|
|
|
|
|
| Hino Motors |
|
|
361,000 |
|
|
$ |
2,371 |
|
| HIS |
|
|
12,100 |
|
|
|
382 |
|
| Hisamitsu Pharmaceutical |
|
|
900 |
|
|
|
50 |
|
| Hitachi (A) |
|
|
655,700 |
|
|
|
3,658 |
|
| Hitachi Chemical |
|
|
1,100 |
|
|
|
15 |
|
| Hitachi Construction Machinery |
|
|
17,900 |
|
|
|
291 |
|
| Hitachi High-Technologies |
|
|
12,400 |
|
|
|
300 |
|
| Hokkaido Electric Power |
|
|
4,000 |
|
|
|
33 |
|
| Hokuriku Electric Power |
|
|
3,800 |
|
|
|
46 |
|
| Honda Motor (A) |
|
|
387,000 |
|
|
|
11,923 |
|
| IHI |
|
|
304,000 |
|
|
|
680 |
|
| Iida Home Max |
|
|
30,600 |
|
|
|
286 |
|
| Inpex |
|
|
67 |
|
|
|
401 |
|
| Isetan Mitsukoshi Holdings |
|
|
34,600 |
|
|
|
362 |
|
| Isuzu Motors |
|
|
179,000 |
|
|
|
867 |
|
| IT Holdings |
|
|
56,400 |
|
|
|
735 |
|
| Itochu |
|
|
57,000 |
|
|
|
580 |
|
| Itochu-Shokuhin |
|
|
1,900 |
|
|
|
71 |
|
| J Front Retailing |
|
|
83,000 |
|
|
|
467 |
|
| J Trust |
|
|
9,200 |
|
|
|
108 |
|
| Japan Petroleum Exploration |
|
|
2,400 |
|
|
|
97 |
|
| Japan Prime Realty Investment, Cl A (B) |
|
|
131 |
|
|
|
396 |
|
| Japan Real Estate Investment, Cl A (B) |
|
|
4 |
|
|
|
40 |
|
| Japan Retail Fund Investment, Cl A (B) |
|
|
37 |
|
|
|
66 |
|
| Japan Steel Works |
|
|
239,000 |
|
|
|
1,336 |
|
| Japan Tobacco |
|
|
35,200 |
|
|
|
1,060 |
|
| JFE Holdings |
|
|
6,164 |
|
|
|
82 |
|
| JGC |
|
|
309,200 |
|
|
|
10,353 |
|
| Joyo Bank |
|
|
10,000 |
|
|
|
49 |
|
| JSR |
|
|
3,200 |
|
|
|
53 |
|
| Jupiter Telecommunications |
|
|
8,833 |
|
|
|
8,992 |
|
| JVC Kenwood |
|
|
78,200 |
|
|
|
281 |
|
| Kamei |
|
|
5,000 |
|
|
|
49 |
|
| Kanamoto |
|
|
5,000 |
|
|
|
58 |
|
| Kanematsu * |
|
|
158,000 |
|
|
|
185 |
|
| Kanematsu Electronics |
|
|
6,100 |
|
|
|
68 |
|
| Kansai Paint |
|
|
411,300 |
|
|
|
4,573 |
|
| Kao |
|
|
105,200 |
|
|
|
3,110 |
|
| Kasumi |
|
|
12,600 |
|
|
|
84 |
|
| KDDI |
|
|
110,600 |
|
|
|
8,615 |
|
| Keio |
|
|
63,000 |
|
|
|
477 |
|
| Keisei Electric Railway |
|
|
53,000 |
|
|
|
480 |
|
| Keyence |
|
|
11,100 |
|
|
|
2,853 |
|
| Kinki Sharyo (A) |
|
|
37,000 |
|
|
|
120 |
|
| Kintetsu (A) |
|
|
11,000 |
|
|
|
43 |
|
| Kita-Nippon Bank |
|
|
1,700 |
|
|
|
50 |
|
| Koito Manufacturing |
|
|
1,000 |
|
|
|
12 |
|
| Komatsu |
|
|
63,700 |
|
|
|
1,258 |
|
| Konaka (A) |
|
|
7,700 |
|
|
|
71 |
|
| Konica Minolta Holdings |
|
|
36,500 |
|
|
|
282 |
|
| Kubota |
|
|
73,000 |
|
|
|
741 |
|
| KYORIN Holdings |
|
|
6,000 |
|
|
|
148 |
|
| Lawson |
|
|
6,500 |
|
|
|
501 |
|
| Mabuchi Motor (A) |
|
|
178,500 |
|
|
|
8,191 |
|
| Makita |
|
|
72,400 |
|
|
|
2,820 |
|
| Marubeni (A) |
|
|
203,000 |
|
|
|
1,299 |
|
| Medipal Holdings |
|
|
34,600 |
|
|
|
478 |
|
| Megane TOP |
|
|
14,700 |
|
|
|
170 |
|
| Misawa Homes (A) |
|
|
24,600 |
|
|
|
374 |
|
|
|
|
|
|
|
|
|
|
| Description |
|
Shares |
|
|
Market Value
($ Thousands) |
|
|
|
|
|
|
|
|
|
|
| Mitsubishi Gas Chemical |
|
|
11,000 |
|
|
$ |
55 |
|
| Mitsubishi Heavy Industries |
|
|
112,000 |
|
|
|
487 |
|
| Mitsubishi Materials |
|
|
180,000 |
|
|
|
569 |
|
| Mitsubishi UFJ Financial Group |
|
|
351,400 |
|
|
|
1,653 |
|
| Mitsubishi UFJ Lease & Finance |
|
|
4,480 |
|
|
|
189 |
|
| Mitsui Fudosan |
|
|
10,000 |
|
|
|
201 |
|
| Mitsui Home |
|
|
8,000 |
|
|
|
42 |
|
| Mizuho Financial Group |
|
|
288,800 |
|
|
|
471 |
|
| MS&AD Insurance Group Holdings |
|
|
268,900 |
|
|
|
4,669 |
|
| Namco Bandai Holdings |
|
|
500 |
|
|
|
9 |
|
| NEC |
|
|
64,000 |
|
|
|
102 |
|
| NEC Fielding |
|
|
9,800 |
|
|
|
120 |
|
| NEC Mobiling |
|
|
1,200 |
|
|
|
47 |
|
| NEC Networks & System Integration |
|
|
17,900 |
|
|
|
301 |
|
| NET One Systems |
|
|
23,400 |
|
|
|
296 |
|
| NHK Spring |
|
|
36,700 |
|
|
|
316 |
|
| Nichii Gakkan |
|
|
9,500 |
|
|
|
92 |
|
| Nichireki |
|
|
8,000 |
|
|
|
41 |
|
| Nidec |
|
|
700 |
|
|
|
51 |
|
| Nihon Unisys |
|
|
17,700 |
|
|
|
128 |
|
| Nikon |
|
|
28,100 |
|
|
|
776 |
|
| Nintendo |
|
|
35,500 |
|
|
|
4,513 |
|
| Nippo |
|
|
35,000 |
|
|
|
407 |
|
| Nippon Densetsu Kogyo |
|
|
5,000 |
|
|
|
49 |
|
| Nippon Road |
|
|
9,000 |
|
|
|
32 |
|
| Nippon Shinyaku |
|
|
6,000 |
|
|
|
77 |
|
| Nippon Synthetic Chemical Industry |
|
|
7,000 |
|
|
|
46 |
|
| Nippon Telegraph & Telephone |
|
|
222,200 |
|
|
|
10,624 |
|
| Nippon Telegraph & Telephone ADR |
|
|
155,603 |
|
|
|
3,689 |
|
| Nippon Yusen |
|
|
80,000 |
|
|
|
142 |
|
| Nishimatsu Construction |
|
|
78,000 |
|
|
|
120 |
|
| Nissan Motor |
|
|
39,200 |
|
|
|
335 |
|
| Nissan Tokyo Sales Holdings *(A) |
|
|
42,000 |
|
|
|
187 |
|
| Nisshin Fudosan |
|
|
13,200 |
|
|
|
77 |
|
| NOK |
|
|
27,200 |
|
|
|
437 |
|
| Nomura Holdings |
|
|
71,300 |
|
|
|
256 |
|
| Nomura Real Estate Holdings |
|
|
55,400 |
|
|
|
977 |
|
| Nomura Real Estate Office Fund, Cl A (B) |
|
|
18 |
|
|
|
113 |
|
| North Pacific Bank * |
|
|
412,300 |
|
|
|
1,180 |
|
| NTT Data |
|
|
139 |
|
|
|
438 |
|
| Nuflare Technology |
|
|
11 |
|
|
|
97 |
|
| Oita Bank |
|
|
16,000 |
|
|
|
53 |
|
| Ono Pharmaceutical |
|
|
1,800 |
|
|
|
111 |
|
| Oracle Japan |
|
|
4,200 |
|
|
|
217 |
|
| Otsuka |
|
|
5,500 |
|
|
|
495 |
|
| Otsuka Holdings |
|
|
86,400 |
|
|
|
2,688 |
|
| Panasonic |
|
|
204,900 |
|
|
|
1,359 |
|
| Relo Holdings |
|
|
1,400 |
|
|
|
49 |
|
| Resorttrust |
|
|
4,500 |
|
|
|
84 |
|
| Riken |
|
|
9,000 |
|
|
|
33 |
|
| Rohm |
|
|
60,200 |
|
|
|
2,034 |
|
| San-In Godo Bank |
|
|
15,000 |
|
|
|
110 |
|
| Sankyo |
|
|
91,000 |
|
|
|
4,252 |
|
| SBI Holdings |
|
|
5,320 |
|
|
|
34 |
|
| Secom |
|
|
65,300 |
|
|
|
3,416 |
|
| Sega Sammy Holdings |
|
|
117,400 |
|
|
|
2,235 |
|
| Seino Holdings |
|
|
76,000 |
|
|
|
484 |
|
| Sekisui Chemical |
|
|
610,000 |
|
|
|
4,932 |
|
|
|
|
| 4 |
|
SEI Institutional International Trust / Annual Report / September 30, 2012 |
Schedule of Investments
International Equity Fund
September 30, 2012
|
|
|
|
|
|
|
|
|
| Description |
|
Shares |
|
|
Market Value
($ Thousands) |
|
|
|
|
|
|
|
|
|
|
| Sekisui House |
|
|
216,000 |
|
|
$ |
2,152 |
|
| Sekisui Jushi |
|
|
5,000 |
|
|
|
52 |
|
| Seven & I Holdings |
|
|
444,200 |
|
|
|
13,686 |
|
| Shikoku Electric Power |
|
|
34,100 |
|
|
|
386 |
|
| Shimamura |
|
|
2,400 |
|
|
|
280 |
|
| Shimano |
|
|
7,600 |
|
|
|
555 |
|
| Shin-Etsu Chemical |
|
|
89,800 |
|
|
|
5,067 |
|
| Ship Healthcare Holdings |
|
|
5,900 |
|
|
|
189 |
|
| Shiseido |
|
|
362,600 |
|
|
|
4,992 |
|
| Showa |
|
|
34,000 |
|
|
|
301 |
|
| Showa Denko KK |
|
|
148,000 |
|
|
|
236 |
|
| SKY Perfect JSAT Holdings |
|
|
96 |
|
|
|
43 |
|
| SMC |
|
|
29,100 |
|
|
|
4,705 |
|
| Softbank |
|
|
120,700 |
|
|
|
4,902 |
|
| Sojitz |
|
|
370,700 |
|
|
|
481 |
|
| Sony Financial Holdings |
|
|
396,800 |
|
|
|
6,824 |
|
| Stanley Electric |
|
|
16,400 |
|
|
|
244 |
|
| Sumitomo |
|
|
56,100 |
|
|
|
759 |
|
| Sumitomo Electric Industries |
|
|
23,400 |
|
|
|
248 |
|
| Sumitomo Forestry |
|
|
8,900 |
|
|
|
79 |
|
| Sumitomo Mitsui Financial Group |
|
|
222,600 |
|
|
|
6,981 |
|
| Sumitomo Mitsui Trust Holdings |
|
|
1,272,220 |
|
|
|
3,794 |
|
| Sumitomo Precision Products |
|
|
29,000 |
|
|
|
120 |
|
| Sumitomo Real Estate Sales |
|
|
1,090 |
|
|
|
55 |
|
| Sumitomo Realty & Development |
|
|
10,000 |
|
|
|
266 |
|
| Suruga Bank |
|
|
6,000 |
|
|
|
68 |
|
| Suzuken |
|
|
39,100 |
|
|
|
1,304 |
|
| Suzuki Motor |
|
|
37,300 |
|
|
|
726 |
|
| Sysmex |
|
|
4,400 |
|
|
|
212 |
|
| T&D Holdings |
|
|
32,500 |
|
|
|
353 |
|
| Taiheiyo Cement |
|
|
59,000 |
|
|
|
127 |
|
| Taisho Pharmaceutical Holdings |
|
|
500 |
|
|
|
41 |
|
| Takashimaya |
|
|
9,000 |
|
|
|
62 |
|
| TDK |
|
|
7,800 |
|
|
|
291 |
|
| Tobu Railway |
|
|
172,000 |
|
|
|
929 |
|
| Toho |
|
|
3,700 |
|
|
|
68 |
|
| Toho Holdings |
|
|
32,500 |
|
|
|
668 |
|
| Tokai |
|
|
2,800 |
|
|
|
72 |
|
| Tokyo Electron |
|
|
93,200 |
|
|
|
3,983 |
|
| Tokyu Land |
|
|
86,000 |
|
|
|
462 |
|
| Toppan Forms |
|
|
16,800 |
|
|
|
163 |
|
| Topre |
|
|
4,100 |
|
|
|
35 |
|
| Toshiba TEC |
|
|
96,000 |
|
|
|
427 |
|
| Totetsu Kogyo |
|
|
9,000 |
|
|
|
115 |
|
| Toyoda Gosei |
|
|
19,100 |
|
|
|
384 |
|
| Toyota Motor |
|
|
331,200 |
|
|
|
12,941 |
|
| Toyota Motor ADR |
|
|
25,066 |
|
|
|
1,968 |
|
| Toyota Tsusho |
|
|
97,600 |
|
|
|
2,094 |
|
| TS Tech |
|
|
7,100 |
|
|
|
114 |
|
| Unicharm (A) |
|
|
10,100 |
|
|
|
582 |
|
| Unipres |
|
|
10,600 |
|
|
|
236 |
|
| USS |
|
|
4,270 |
|
|
|
453 |
|
| VT Holdings |
|
|
4,300 |
|
|
|
37 |
|
| Wacoal Holdings |
|
|
175,704 |
|
|
|
2,123 |
|
| Warabeya Nichiyo |
|
|
13,300 |
|
|
|
231 |
|
| Watabe Wedding |
|
|
6,395 |
|
|
|
55 |
|
| Yakult Honsha |
|
|
6,500 |
|
|
|
309 |
|
| Yamato Kogyo (A) |
|
|
2,500 |
|
|
|
74 |
|
| Yamazen |
|
|
7,600 |
|
|
|
49 |
|
| Yaskawa Electric (A) |
|
|
568,000 |
|
|
|
3,818 |
|
| Yellow Hat |
|
|
12,500 |
|
|
|
174 |
|
| Yuasa Trading |
|
|
38,000 |
|
|
|
66 |
|
|
|
|
|
|
|
|
|
|
| Description |
|
Shares |
|
|
Market Value
($ Thousands) |
|
|
|
|
|
|
|
|
|
|
|
|
|
|
|
|
$ |
295,353 |
|
|
|
|
|
|
|
|
|
|
|
|
|
| Malta — 0.0% |
|
|
|
|
|
|
|
|
| BGP Holdings *(C) |
|
|
198,683 |
|
|
|
— |
|
|
|
|
|
|
|
|
|
|
|
|
|
| Mexico — 0.3% |
|
|
|
|
|
|
|
|
| Grupo Financiero Santander Mexico ADR * |
|
|
372,538 |
|
|
|
5,104 |
|
| Industrias, Cl B * |
|
|
16,800 |
|
|
|
100 |
|
|
|
|
|
|
|
|
|
|
|
|
|
|
|
|
|
5,204 |
|
|
|
|
|
|
|
|
|
|
|
|
|
| Netherlands — 4.7% |
|
|
|
|
|
|
|
|
| Aegon |
|
|
19,059 |
|
|
|
99 |
|
| Akzo Nobel |
|
|
267,747 |
|
|
|
15,153 |
|
| ASML Holding |
|
|
31,862 |
|
|
|
1,705 |
|
| Boskalis Westminster |
|
|
5,482 |
|
|
|
198 |
|
| DE Master Blenders 1753 * |
|
|
7,800 |
|
|
|
94 |
|
| European Aeronautic Defence and Space |
|
|
126,776 |
|
|
|
4,023 |
|
| Fugro |
|
|
2,212 |
|
|
|
151 |
|
| Gemalto |
|
|
14,719 |
|
|
|
1,296 |
|
| Heineken |
|
|
24,693 |
|
|
|
1,474 |
|
| ING Groep * |
|
|
758,940 |
|
|
|
6,004 |
|
| Koninklijke Ahold |
|
|
627,734 |
|
|
|
7,871 |
|
| Koninklijke DSM |
|
|
2,920 |
|
|
|
146 |
|
| Koninklijke Vopak |
|
|
12,357 |
|
|
|
869 |
|
| PostNL |
|
|
881,986 |
|
|
|
3,075 |
|
| QIAGEN * |
|
|
6,088 |
|
|
|
112 |
|
| Randstad Holding |
|
|
1,865 |
|
|
|
62 |
|
| Reed Elsevier |
|
|
869,613 |
|
|
|
11,641 |
|
| Royal Dutch Shell, Cl A |
|
|
251,816 |
|
|
|
8,713 |
|
| Royal Dutch Shell, Cl B |
|
|
173,193 |
|
|
|
6,147 |
|
| Royal Imtech |
|
|
136,176 |
|
|
|
3,598 |
|
| Unilever (A) |
|
|
211,207 |
|
|
|
7,480 |
|
| Wolters Kluwer |
|
|
316,745 |
|
|
|
5,962 |
|
|
|
|
|
|
|
|
|
|
|
|
|
|
|
|
|
85,873 |
|
|
|
|
|
|
|
|
|
|
|
|
|
| New Zealand — 0.1% |
|
|
|
|
|
|
|
|
| Chorus |
|
|
108,845 |
|
|
|
294 |
|
| Telecom of New Zealand |
|
|
1,158,145 |
|
|
|
2,290 |
|
|
|
|
|
|
|
|
|
|
|
|
|
|
|
|
|
2,584 |
|
|
|
|
|
|
|
|
|
|
|
|
|
| Norway — 1.3% |
|
|
|
|
|
|
|
|
| Aker Solutions |
|
|
2,672 |
|
|
|
51 |
|
| DNB |
|
|
920,593 |
|
|
|
11,297 |
|
| Marine Harvest * |
|
|
1,918,283 |
|
|
|
1,551 |
|
| Orkla |
|
|
92,652 |
|
|
|
704 |
|
| Seadrill |
|
|
54,455 |
|
|
|
2,128 |
|
| Statoil |
|
|
287,117 |
|
|
|
7,418 |
|
| Telenor |
|
|
1,820 |
|
|
|
35 |
|
|
|
|
|
|
|
|
|
|
|
|
|
|
|
|
|
23,184 |
|
|
|
|
|
|
|
|
|
|
|
|
|
| Poland — 0.1% |
|
|
|
|
|
|
|
|
| KGHM Polska Miedz (A) |
|
|
37,620 |
|
|
|
1,791 |
|
|
|
|
|
|
|
|
|
|
|
|
|
| Portugal — 0.0% |
|
|
|
|
|
|
|
|
| Jeronimo Martins (A) |
|
|
10,704 |
|
|
|
179 |
|
|
|
|
|
|
|
|
|
|
|
|
|
| Russia — 0.8% |
|
|
|
|
|
|
|
|
| Gazprom ADR |
|
|
242,597 |
|
|
|
2,448 |
|
| NovaTek GDR |
|
|
20,703 |
|
|
|
2,449 |
|
| Sberbank of Russia ADR |
|
|
752,179 |
|
|
|
8,763 |
|
| Surgutneftegas ADR |
|
|
8,414 |
|
|
|
76 |
|
|
|
|
|
|
|
|
|
|
|
|
|
|
|
|
|
13,736 |
|
|
|
|
|
|
|
|
|
|
|
|
|
| 5 |
|
SEI Institutional International Trust / Annual Report / September 30, 2012 |
Schedule of Investments
International Equity Fund
September 30, 2012
|
|
|
|
|
|
|
|
|
| Description |
|
Shares |
|
|
Market Value
($ Thousands) |
|
|
|
|
|
|
|
|
|
|
| Singapore — 1.4% |
|
|
|
|
|
|
|
|
| Bukit Sembawang Estates |
|
|
10,000 |
|
|
$ |
43 |
|
| CapitaLand |
|
|
103,000 |
|
|
|
267 |
|
| ComfortDelgro |
|
|
38,000 |
|
|
|
53 |
|
| DBS Group Holdings (A) |
|
|
332,000 |
|
|
|
3,895 |
|
| Fraser and Neave (A) |
|
|
150,000 |
|
|
|
1,086 |
|
| Jardine Cycle & Carriage (A) |
|
|
9,000 |
|
|
|
353 |
|
| Keppel (A) |
|
|
172,110 |
|
|
|
1,599 |
|
| Keppel Land |
|
|
125,000 |
|
|
|
362 |
|
| Oversea-Chinese Banking (A) |
|
|
153,000 |
|
|
|
1,165 |
|
| SembCorp Industries (A) |
|
|
562,600 |
|
|
|
2,600 |
|
| SembCorp Marine (A) |
|
|
1,153,000 |
|
|
|
4,671 |
|
| Singapore Airlines |
|
|
512,000 |
|
|
|
4,483 |
|
| Singapore Land |
|
|
23,000 |
|
|
|
133 |
|
| Singapore Press Holdings (A) |
|
|
18,400 |
|
|
|
61 |
|
| Singapore Technologies Engineering (A) |
|
|
53,000 |
|
|
|
153 |
|
| Singapore Telecommunications |
|
|
29,000 |
|
|
|
76 |
|
| Transpac Industrial Holdings |
|
|
48,000 |
|
|
|
68 |
|
| United Overseas Bank |
|
|
263,000 |
|
|
|
4,213 |
|
| UOL Group |
|
|
53,000 |
|
|
|
247 |
|
| Wilmar International (A) |
|
|
14,000 |
|
|
|
37 |
|
| Yangzijiang Shipbuilding Holdings (A) |
|
|
427,000 |
|
|
|
341 |
|
|
|
|
|
|
|
|
|
|
|
|
|
|
|
|
|
25,906 |
|
|
|
|
|
|
|
|
|
|
|
|
|
| South Africa — 0.6% |
|
|
|
|
|
|
|
|
| AngloGold Ashanti ADR |
|
|
94,946 |
|
|
|
3,328 |
|
| Gold Fields |
|
|
445,972 |
|
|
|
5,770 |
|
| Impala Platinum Holdings |
|
|
123,886 |
|
|
|
2,087 |
|
| Liberty Holdings |
|
|
9,672 |
|
|
|
116 |
|
|
|
|
|
|
|
|
|
|
|
|
|
|
|
|
|
11,301 |
|
|
|
|
|
|
|
|
|
|
|
|
|
| South Korea — 2.8% |
|
|
|
|
|
|
|
|
| Hana Financial Group |
|
|
16,860 |
|
|
|
516 |
|
| Hyundai Mobis |
|
|
18,391 |
|
|
|
5,138 |
|
| Hyundai Motor |
|
|
5,303 |
|
|
|
1,202 |
|
| Kia Motors |
|
|
18,767 |
|
|
|
1,172 |
|
| Korea Electric Power ADR |
|
|
205,475 |
|
|
|
2,552 |
|
| KT ADR |
|
|
340,100 |
|
|
|
5,319 |
|
| KT&G |
|
|
137,854 |
|
|
|
10,506 |
|
| LG Display |
|
|
42,450 |
|
|
|
1,083 |
|
| Samsung Electronics |
|
|
13,366 |
|
|
|
16,187 |
|
| Shinhan Financial Group |
|
|
93,150 |
|
|
|
3,181 |
|
| SK Telecom ADR |
|
|
301,044 |
|
|
|
4,377 |
|
|
|
|
|
|
|
|
|
|
|
|
|
|
|
|
|
51,233 |
|
|
|
|
|
|
|
|
|
|
|
|
|
| Spain — 1.0% |
|
|
|
|
|
|
|
|
| Abertis Infraestructuras |
|
|
20,089 |
|
|
|
296 |
|
| Amadeus IT Holding, Cl A |
|
|
7,675 |
|
|
|
179 |
|
| Banco Popular Espanol (A) |
|
|
417,341 |
|
|
|
913 |
|
| Distribuidora Internacional de Alimentacion |
|
|
94,301 |
|
|
|
521 |
|
| Enagas |
|
|
273,304 |
|
|
|
5,397 |
|
| Endesa |
|
|
8,158 |
|
|
|
157 |
|
| Ferrovial (A) |
|
|
4,641 |
|
|
|
61 |
|
| Grifols *(A) |
|
|
23,575 |
|
|
|
780 |
|
| Inditex |
|
|
1,209 |
|
|
|
150 |
|
| Indra Sistemas (A) |
|
|
424,772 |
|
|
|
4,120 |
|
| Red Electrica |
|
|
32,676 |
|
|
|
1,551 |
|
| Tecnicas Reunidas (A) |
|
|
107,286 |
|
|
|
4,994 |
|
|
|
|
|
|
|
|
|
|
|
|
|
|
|
|
|
19,119 |
|
|
|
|
|
|
|
|
|
|
|
|
|
| Sweden — 2.1% |
|
|
|
|
|
|
|
|
| Alfa Laval |
|
|
2,952 |
|
|
|
54 |
|
|
|
|
|
|
|
|
|
|
| Description |
|
Shares |
|
|
Market Value
($ Thousands) |
|
|
|
|
|
|
|
|
|
|
| Assa Abloy, Cl B |
|
|
33,045 |
|
|
$ |
1,074 |
|
| Atlas Copco, Cl A |
|
|
42,475 |
|
|
|
993 |
|
| Atlas Copco, Cl B |
|
|
44,271 |
|
|
|
928 |
|
| Boliden |
|
|
8,744 |
|
|
|
146 |
|
| Electrolux, Ser B |
|
|
67,994 |
|
|
|
1,680 |
|
| Elekta, Cl B |
|
|
398,140 |
|
|
|
5,268 |
|
| Getinge, Cl B |
|
|
4,628 |
|
|
|
140 |
|
| Hennes & Mauritz, Cl B |
|
|
5,674 |
|
|
|
197 |
|
| Hexagon, Cl B |
|
|
32,954 |
|
|
|
708 |
|
| Husqvarna, Cl B |
|
|
25,468 |
|
|
|
130 |
|
| Industrivarden, Cl C |
|
|
16,573 |
|
|
|
238 |
|
| Investor, Cl B |
|
|
2,859 |
|
|
|
63 |
|
| Lundin Petroleum * |
|
|
929 |
|
|
|
23 |
|
| Millicom International Cellular |
|
|
558 |
|
|
|
52 |
|
| Nordea Bank |
|
|
442,824 |
|
|
|
4,387 |
|
| Sandvik |
|
|
450,787 |
|
|
|
6,129 |
|
| Scania, Cl B |
|
|
19,351 |
|
|
|
356 |
|
| Skandinaviska Enskilda Banken, Cl A |
|
|
453,068 |
|
|
|
3,800 |
|
| Skanska, Cl B |
|
|
14,886 |
|
|
|
241 |
|
| Svenska Cellulosa, Cl B |
|
|
5,678 |
|
|
|
106 |
|
| Svenska Handelsbanken, Cl A |
|
|
18,156 |
|
|
|
681 |
|
| Swedbank, Cl A |
|
|
75,866 |
|
|
|
1,428 |
|
| Swedish Match |
|
|
23,971 |
|
|
|
971 |
|
| Telefonaktiebolaget LM Ericsson ADR (A) |
|
|
220,274 |
|
|
|
2,011 |
|
| Telefonaktiebolaget LM Ericsson, Cl B |
|
|
799,138 |
|
|
|
7,295 |
|
| Volvo, Cl B |
|
|
13,771 |
|
|
|
193 |
|
|
|
|
|
|
|
|
|
|
|
|
|
|
|
|
|
39,292 |
|
|
|
|
|
|
|
|
|
|
|
|
|
| Switzerland — 8.5% |
|
|
|
|
|
|
|
|
| Compagnie Financiere Richemont |
|
|
36,683 |
|
|
|
2,202 |
|
| Credit Suisse Group |
|
|
379,890 |
|
|
|
8,056 |
|
| Georg Fischer |
|
|
1,400 |
|
|
|
495 |
|
| Givaudan |
|
|
14,019 |
|
|
|
13,314 |
|
| Helvetia Holding |
|
|
415 |
|
|
|
145 |
|
| Julius Baer Group |
|
|
139,231 |
|
|
|
4,859 |
|
| Lindt & Spruengli |
|
|
1 |
|
|
|
36 |
|
| Lindt & Spruengli Participating Certificate |
|
|
10 |
|
|
|
32 |
|
| Nestle |
|
|
337,630 |
|
|
|
21,304 |
|
| Novartis |
|
|
341,225 |
|
|
|
20,895 |
|
| OC Oerlikon |
|
|
157,324 |
|
|
|
1,513 |
|
| Partners Group Holding |
|
|
14,000 |
|
|
|
2,915 |
|
| Roche Holding |
|
|
175,867 |
|
|
|
32,879 |
|
| Schweiter Technologies |
|
|
76 |
|
|
|
36 |
|
| SGS |
|
|
4,654 |
|
|
|
9,568 |
|
| Sika |
|
|
2,302 |
|
|
|
4,698 |
|
| Sonova Holding |
|
|
1,789 |
|
|
|
181 |
|
| Sulzer |
|
|
56,389 |
|
|
|
8,220 |
|
| Swatch Group |
|
|
951 |
|
|
|
380 |
|
| Swiss Life Holding |
|
|
9,320 |
|
|
|
1,110 |
|
| Swiss Prime Site |
|
|
501 |
|
|
|
41 |
|
| Swiss Re |
|
|
13,955 |
|
|
|
898 |
|
| Syngenta |
|
|
2,971 |
|
|
|
1,111 |
|
| UBS |
|
|
271,853 |
|
|
|
3,311 |
|
| UBS Foreign |
|
|
367,651 |
|
|
|
4,479 |
|
| Weatherford International * |
|
|
137,978 |
|
|
|
1,750 |
|
| Zurich Insurance Group |
|
|
47,073 |
|
|
|
11,731 |
|
|
|
|
|
|
|
|
|
|
|
|
|
|
|
|
|
156,159 |
|
|
|
|
|
|
|
|
|
|
|
|
|
| Taiwan — 0.1% |
|
|
|
|
|
|
|
|
| United Microelectronics ADR (A) |
|
|
691,541 |
|
|
|
1,418 |
|
|
|
|
| 6 |
|
SEI Institutional International Trust / Annual Report / September 30, 2012 |
Schedule of Investments
International Equity Fund
September 30, 2012
|
|
|
|
|
|
|
|
|
| Description |
|
Shares |
|
|
Market Value
($ Thousands) |
|
|
|
|
|
|
|
|
|
|
| Thailand — 0.1% |
|
|
|
|
|
|
|
|
| Advanced Info Service |
|
|
39,500 |
|
|
$ |
274 |
|
| Total Access Communication |
|
|
451,200 |
|
|
|
1,356 |
|
|
|
|
|
|
|
|
|
|
|
|
|
|
|
|
|
1,630 |
|
|
|
|
|
|
|
|
|
|
|
|
|
| United Kingdom — 18.4% |
|
|
|
|
|
|
|
|
| Aberdeen Asset Management |
|
|
166,469 |
|
|
|
836 |
|
| Acergy |
|
|
230,475 |
|
|
|
5,322 |
|
| Admiral Group |
|
|
8,442 |
|
|
|
144 |
|
| Afren * |
|
|
1,099,100 |
|
|
|
2,487 |
|
| Aggreko |
|
|
41,105 |
|
|
|
1,535 |
|
| AMEC |
|
|
435,491 |
|
|
|
8,059 |
|
| Amlin |
|
|
974,112 |
|
|
|
6,347 |
|
| Associated British Foods |
|
|
41,244 |
|
|
|
858 |
|
| AstraZeneca |
|
|
153,203 |
|
|
|
7,310 |
|
| Aviva |
|
|
1,016,319 |
|
|
|
5,230 |
|
| Babcock International Group |
|
|
79,796 |
|
|
|
1,194 |
|
| BAE Systems |
|
|
943,014 |
|
|
|
4,951 |
|
| Balfour Beatty |
|
|
1,134,671 |
|
|
|
5,565 |
|
| Barclays |
|
|
2,174,725 |
|
|
|
7,545 |
|
| Barratt Developments * |
|
|
52,363 |
|
|
|
143 |
|
| BG Group |
|
|
779,002 |
|
|
|
15,724 |
|
| BHP Billiton |
|
|
405,901 |
|
|
|
12,617 |
|
| BP ADR |
|
|
54,757 |
|
|
|
2,320 |
|
| BP |
|
|
945,430 |
|
|
|
6,664 |
|
| British American Tobacco |
|
|
229,719 |
|
|
|
11,794 |
|
| British Sky Broadcasting Group |
|
|
11,741 |
|
|
|
141 |
|
| BT Group, Cl A |
|
|
1,404,157 |
|
|
|
5,231 |
|
| Bunzl |
|
|
397,833 |
|
|
|
7,124 |
|
| Burberry Group |
|
|
22,344 |
|
|
|
361 |
|
| Cairn Energy (A) |
|
|
642,651 |
|
|
|
2,855 |
|
| Capita |
|
|
420,414 |
|
|
|
5,258 |
|
| Centrica |
|
|
1,131,885 |
|
|
|
5,991 |
|
| Cobham |
|
|
29,101 |
|
|
|
104 |
|
| Compass Group |
|
|
87,647 |
|
|
|
967 |
|
| Croda International |
|
|
13,403 |
|
|
|
525 |
|
| Davis Service Group |
|
|
44,500 |
|
|
|
392 |
|
| Debenhams |
|
|
78,364 |
|
|
|
130 |
|
| Diageo |
|
|
291,195 |
|
|
|
8,180 |
|
| EnQuest * |
|
|
80,776 |
|
|
|
150 |
|
| Eurasian Natural Resources |
|
|
435,354 |
|
|
|
2,170 |
|
| G4S |
|
|
163,525 |
|
|
|
702 |
|
| GlaxoSmithKline |
|
|
189,305 |
|
|
|
4,364 |
|
| Hammerson (B) |
|
|
17,563 |
|
|
|
128 |
|
| Home Retail Group |
|
|
4,113,765 |
|
|
|
5,919 |
|
| HSBC Holdings |
|
|
1,731,904 |
|
|
|
16,165 |
|
| ICAP |
|
|
722,600 |
|
|
|
3,747 |
|
| IMI |
|
|
23,690 |
|
|
|
344 |
|
| Imperial Tobacco Group |
|
|
143,340 |
|
|
|
5,305 |
|
| Informa |
|
|
722,603 |
|
|
|
4,699 |
|
| InterContinental Hotels Group |
|
|
62,036 |
|
|
|
1,623 |
|
| Intermediate Capital Group |
|
|
39,223 |
|
|
|
189 |
|
| Intertek Group |
|
|
30,983 |
|
|
|
1,371 |
|
| ITV |
|
|
936,436 |
|
|
|
1,337 |
|
| Johnson Matthey |
|
|
40,414 |
|
|
|
1,575 |
|
| Kazakhmys |
|
|
111,185 |
|
|
|
1,243 |
|
| Kingfisher |
|
|
1,400,715 |
|
|
|
5,976 |
|
| Land Securities Group (B) |
|
|
15,745 |
|
|
|
194 |
|
| Legal & General Group |
|
|
492,213 |
|
|
|
1,048 |
|
| Lloyds Banking Group * |
|
|
2,724,841 |
|
|
|
1,709 |
|
| London Stock Exchange Group |
|
|
20,328 |
|
|
|
310 |
|
| Marks & Spencer Group |
|
|
17,433 |
|
|
|
100 |
|
|
|
|
|
|
|
|
|
|
| Description |
|
Shares |
|
|
Market Value
($ Thousands) |
|
|
|
|
|
|
|
|
|
|
| Meggitt |
|
|
57,097 |
|
|
$ |
364 |
|
| Melrose |
|
|
104,704 |
|
|
|
409 |
|
| Michael Page International |
|
|
481,352 |
|
|
|
2,766 |
|
| Micro Focus International |
|
|
28,756 |
|
|
|
274 |
|
| Mondi |
|
|
49,096 |
|
|
|
499 |
|
| National Grid |
|
|
22,482 |
|
|
|
248 |
|
| Next |
|
|
16,695 |
|
|
|
930 |
|
| Old Mutual |
|
|
341,665 |
|
|
|
937 |
|
| Pearson |
|
|
43,393 |
|
|
|
848 |
|
| Persimmon (A) |
|
|
20,741 |
|
|
|
254 |
|
| Petrofac |
|
|
394,859 |
|
|
|
10,170 |
|
| Polyus Gold International * |
|
|
493,318 |
|
|
|
1,727 |
|
| Premier Oil *(A) |
|
|
782,626 |
|
|
|
4,536 |
|
| Prudential |
|
|
576,074 |
|
|
|
7,456 |
|
| QinetiQ Group (A) |
|
|
261,900 |
|
|
|
801 |
|
| Reckitt Benckiser Group |
|
|
747 |
|
|
|
43 |
|
| Reed Elsevier |
|
|
304,769 |
|
|
|
2,913 |
|
| Rexam |
|
|
834,692 |
|
|
|
5,862 |
|
| Rio Tinto |
|
|
136,462 |
|
|
|
6,357 |
|
| Rolls-Royce Holdings |
|
|
606,526 |
|
|
|
8,257 |
|
| Royal Bank of Scotland Group * |
|
|
42,333 |
|
|
|
176 |
|
| SABMiller |
|
|
37,495 |
|
|
|
1,647 |
|
| Sage Group |
|
|
841,761 |
|
|
|
4,260 |
|
| Severn Trent |
|
|
28,277 |
|
|
|
767 |
|
| Shire |
|
|
305,490 |
|
|
|
8,949 |
|
| Smiths Group |
|
|
2,900 |
|
|
|
49 |
|
| SSE |
|
|
1,399 |
|
|
|
31 |
|
| Standard Chartered |
|
|
4,815 |
|
|
|
109 |
|
| Standard Life |
|
|
123,050 |
|
|
|
542 |
|
| Tate & Lyle |
|
|
50,619 |
|
|
|
544 |
|
| Taylor Wimpey |
|
|
179,659 |
|
|
|
158 |
|
| Tesco |
|
|
3,215,538 |
|
|
|
17,239 |
|
| Tullow Oil |
|
|
233,575 |
|
|
|
5,167 |
|
| Unilever |
|
|
149,420 |
|
|
|
5,434 |
|
| United Utilities Group |
|
|
472,750 |
|
|
|
5,466 |
|
| Vodafone Group |
|
|
6,631,151 |
|
|
|
18,819 |
|
| Whitbread |
|
|
11,315 |
|
|
|
414 |
|
| William Hill (A) |
|
|
209,849 |
|
|
|
1,074 |
|
| Willis Group Holdings |
|
|
139,700 |
|
|
|
5,158 |
|
| Wolseley |
|
|
50,863 |
|
|
|
2,170 |
|
| WPP (A) |
|
|
118,782 |
|
|
|
1,614 |
|
|
|
|
|
|
|
|
|
|
|
|
|
|
|
|
|
339,710 |
|
|
|
|
|
|
|
|
|
|
|
|
|
| United States — 1.0% |
|
|
|
|
|
|
|
|
| Alon USA Energy |
|
|
12,029 |
|
|
|
165 |
|
| American International Group * |
|
|
8,142 |
|
|
|
267 |
|
| Apple |
|
|
121 |
|
|
|
81 |
|
| Autoliv |
|
|
43,900 |
|
|
|
2,720 |
|
| Calamos Asset Management, Cl A |
|
|
12,204 |
|
|
|
142 |
|
| Cambrex * |
|
|
14,189 |
|
|
|
166 |
|
| CF Industries Holdings |
|
|
4,882 |
|
|
|
1,085 |
|
| ConocoPhillips |
|
|
33,651 |
|
|
|
1,924 |
|
| Delek US Holdings |
|
|
3,208 |
|
|
|
82 |
|
| Eli Lilly |
|
|
12,784 |
|
|
|
606 |
|
| GenCorp * |
|
|
4,013 |
|
|
|
38 |
|
| John B Sanfilippo & Son * |
|
|
2,229 |
|
|
|
29 |
|
| Lydall * |
|
|
2,757 |
|
|
|
39 |
|
| Magnachip Semiconductor * |
|
|
7,654 |
|
|
|
90 |
|
| Manpower |
|
|
38,467 |
|
|
|
1,416 |
|
| Marcus |
|
|
6,186 |
|
|
|
69 |
|
| Movado Group |
|
|
1,241 |
|
|
|
42 |
|
| Myers Industries |
|
|
6,159 |
|
|
|
96 |
|
| Newmont Mining |
|
|
94,700 |
|
|
|
5,304 |
|
|
|
|
| 7 |
|
SEI Institutional International Trust / Annual Report / September 30, 2012 |
Schedule of Investments
International Equity Fund
September 30, 2012
|
|
|
|
|
|
|
|
|
| Description |
|
Shares/Face Amount
($Thousands) |
|
|
Market Value
($ Thousands) |
|
|
|
|
|
|
|
|
|
|
| PDL BioPharma |
|
|
43,451 |
|
|
$ |
334 |
|
| Phillips 66 |
|
|
43,583 |
|
|
|
2,021 |
|
| Standex International |
|
|
1,518 |
|
|
|
67 |
|
| Taser International * |
|
|
6,745 |
|
|
|
41 |
|
| Tesoro |
|
|
5,369 |
|
|
|
225 |
|
| Town Sports International
Holdings * |
|
|
4,210 |
|
|
|
52 |
|
| Unisys *(C) |
|
|
13,413 |
|
|
|
279 |
|
| Western Refining |
|
|
1,475 |
|
|
|
39 |
|
|
|
|
|
|
|
|
|
|
|
|
|
|
|
|
|
17,419 |
|
|
|
|
|
|
|
|
|
|
| Total Common Stock
(Cost $1,711,127) ($ Thousands) |
|
|
|
1,732,394 |
|
|
|
|
|
|
|
|
|
|
|
|
|
| PREFERRED STOCK — 0.4% |
|
|
|
|
|
|
|
|
|
|
|
| Brazil — 0.1% |
|
|
|
|
|
|
|
|
| Centrais Eletricas Brasileiras |
|
|
153,300 |
|
|
|
1,383 |
|
|
|
|
|
|
|
|
|
|
|
|
|
| Germany — 0.3% |
|
|
|
|
|
|
|
|
| Bayerische Motoren Werke |
|
|
1,912 |
|
|
|
98 |
|
| Draegerwerk |
|
|
2,624 |
|
|
|
260 |
|
| Henkel |
|
|
26,883 |
|
|
|
2,141 |
|
| ProSiebenSat.1 Media |
|
|
24,899 |
|
|
|
628 |
|
| RWE |
|
|
3,675 |
|
|
|
147 |
|
| Volkswagen (A) |
|
|
17,232 |
|
|
|
3,147 |
|
|
|
|
|
|
|
|
|
|
|
|
|
|
|
|
|
6,421 |
|
|
|
|
|
|
|
|
|
|
| Total Preferred Stock
(Cost $7,335) ($ Thousands) |
|
|
|
|
|
|
7,804 |
|
|
|
|
|
|
|
|
|
|
|
| U.S. TREASURY OBLIGATIONS (F)(G)— 0.3% |
|
| U.S. Treasury Bills |
|
|
|
|
|
|
|
|
| 2.386%, 01/31/2013 |
|
$ |
4,130 |
|
|
|
4,129 |
|
| 0.071%, 11/15/2012 |
|
|
270 |
|
|
|
270 |
|
|
|
|
|
|
|
|
|
|
| Total U.S. Treasury Obligations
(Cost $4,399) ($ Thousands) |
|
|
|
|
|
|
4,399 |
|
|
|
|
|
|
|
|
|
|
|
|
|
| |
|
Number Of Rights |
|
|
|
|
| RIGHTS — 0.0% |
|
|
|
|
|
|
|
|
|
|
|
| France — 0.0% |
|
|
|
|
|
|
|
|
| Cie Generale,
Expires 10/12/2012 |
|
|
25 |
|
|
|
41 |
|
|
|
|
|
|
|
|
|
|
| Total Rights
(Cost $0) ($ Thousands) |
|
|
|
|
|
|
41 |
|
|
|
|
|
|
|
|
|
|
|
|
| AFFILIATED PARTNERSHIP — 6.3% |
|
|
|
|
|
|
|
|
| United States — 6.3% |
|
|
|
|
|
|
|
|
| SEI Liquidity Fund, L.P. |
|
|
|
|
|
|
|
|
| 0.150%†**(H) |
|
|
118,692.866 |
|
|
|
116,607 |
|
|
|
|
|
|
|
|
|
|
| Total Affiliated Partnership
(Cost $118,693) ($ Thousands) |
|
|
|
116,607 |
|
|
|
|
|
|
|
|
|
|
|
|
|
| CASH EQUIVALENT — 3.1% |
|
|
|
|
|
|
|
|
| SEI Daily Income Trust, Prime Obligation Fund,
Cl A 0.070%†** |
|
|
57,461,405 |
|
|
|
57,461 |
|
|
|
|
|
|
|
|
|
|
| Total Cash Equivalent
(Cost $57,461) ($ Thousands) |
|
|
|
|
|
|
57,461 |
|
|
|
|
|
|
|
|
|
|
|
|
|
|
|
|
|
|
|
| Description |
|
Shares/Face Amount
(1) (Thousands) |
|
|
Market Value
($Thousands) |
|
|
|
|
|
|
|
|
|
|
| TIME DEPOSITS — 2.7% |
|
|
|
|
|
|
|
|
|
|
|
| United States — 2.7% |
|
|
|
|
|
|
|
|
| Brown Brothers Harriman |
|
|
|
|
|
|
|
|
| 4.150%, 10/01/2012 |
|
ZAR |
14 |
|
|
$ |
2 |
|
| 2.580%, 10/01/2012 |
|
AUD |
309 |
|
|
|
321 |
|
| 1.550%, 10/01/2012 |
|
NZD |
137 |
|
|
|
114 |
|
| 0.550%, 10/01/2012 |
|
NOK |
715 |
|
|
|
125 |
|
| 0.400%, 10/01/2012 |
|
SEK |
10 |
|
|
|
2 |
|
| 0.185%, 10/01/2012 |
|
CAD |
6 |
|
|
|
6 |
|
| 0.054%, 10/01/2012 |
|
GBP |
598 |
|
|
|
965 |
|
| 0.030%, 10/01/2012 |
|
|
46,735 |
|
|
|
46,735 |
|
| 0.010%, 10/01/2012 |
|
JPY |
30,165 |
|
|
|
388 |
|
| 0.010%, 10/01/2012 |
|
SGD |
140 |
|
|
|
114 |
|
| 0.005%, 10/01/2012 |
|
HKD |
1,747 |
|
|
|
225 |
|
| 0.005%, 10/01/2012 |
|
CHF |
1,060 |
|
|
|
1,128 |
|
| (0.014)%, 10/01/2012 |
|
EUR |
288 |
|
|
|
370 |
|
| (0.200)%, 10/01/2012 |
|
DKK |
852 |
|
|
|
147 |
|
|
|
|
|
|
|
|
|
|
| Total Time Deposits
(Cost $50,642) ($ Thousands) |
|
|
|
|
|
|
50,642 |
|
|
|
|
|
|
|
|
|
|
| Total Investments — 106.6%
(Cost $1,949,657) ($ Thousands) |
|
|
|
|
|
$ |
1,969,348 |
|
|
|
|
|
|
|
|
|
|
A list of the open futures contracts held by the Fund at September 30, 2012, is as follows:
|
|
|
|
|
|
|
|
|
|
|
|
|
| Type of Contract |
|
Number of
Contracts
Long |
|
|
Expiration
Date |
|
|
Unrealized
Appreciation
(Depreciation)
($ Thousands) |
|
| DJ Euro Stoxx 50 Index |
|
|
585 |
|
|
|
Dec-2012 |
|
|
$ |
(930 |
) |
| FTSE 100 Index |
|
|
198 |
|
|
|
Dec-2012 |
|
|
|
(327 |
) |
| Hang Seng Index |
|
|
25 |
|
|
|
Oct-2012 |
|
|
|
30 |
|
| SPI 200 Index |
|
|
57 |
|
|
|
Dec-2012 |
|
|
|
(28 |
) |
| Topix Index |
|
|
155 |
|
|
|
Dec-2012 |
|
|
|
235 |
|
|
|
|
|
|
|
|
|
|
|
|
|
|
|
|
|
|
|
|
|
|
|
|
$ |
(1,020 |
) |
|
|
|
|
|
|
|
|
|
|
|
|
|
For the year ended September 30, 2012, the total amount of all open futures contracts, as presented in the table above,
are representative of the volume of activity for this derivative type during the year.
A list of the counterparties for the open forward foreign
currency contracts held by the Fund at September 30, 2012, is as follows:
|
|
|
|
|
|
|
|
|
|
|
|
|
|
|
|
|
| Counterparty |
|
Settlement
Date |
|
|
Currency
to
Deliver ($ Thousands) |
|
|
Currency
to
Receive ($ Thousands) |
|
|
Unrealized
(Depreciation)
($ Thousands) |
|
| State Street |
|
|
11/02/2012 |
|
|
|
(14,953 |
) |
|
|
14,562 |
|
|
$ |
(391 |
) |
|
|
|
|
|
|
|
|
|
|
|
|
|
|
|
|
|
For the year ended September 30, 2012, the total amount of all open forward foreign currency contracts, as presented in
the table above, are representative of the volume of activity for this derivative type during the year.
Percentages are based on a Net Assets of
$1,848,122 ($ Thousands).
| * |
|
Non-income producing security. |
| ** |
|
Rate shown is the 7-day effective yield as of September 30, 2012. |
| † |
|
Investment in Affiliated Security (See Note 4).
|
|
|
|
| 8 |
|
SEI Institutional International Trust / Annual Report / September 30, 2012 |
Schedule of Investments
International Equity Fund
September 30, 2012
| (1) |
|
In U.S. Dollars unless otherwise indicated. |
| (A) |
|
This security or a partial position of this security is on loan at September 30, 2012. The total market value of securities on loan at September 30,
2012 was $111,744 ($ Thousands) (See Note 8). |
| (B) |
|
Real Estate Investment Trust. |
| (C) |
|
Securities considered illiquid. The total market value of such securities as of September 30, 2012 was $633 ($ Thousands) and represented 0.0% of
Net Assets. |
| (D) |
|
Security fair valued using methods determined in good faith by the Valuation Committee of the Board of Trustees. The total market value of such securities as
of September 30, 2012 was $5,713 ($ Thousands) and represented 0.3% of Net Assets. |
| (E) |
|
Securities sold within terms of a private placement memorandum, exempt from registration under Section 144A of the Securities Act of 1933, as amended, and may be sold
only to dealers in that program or other “accredited investors.” These securities have been determined to be liquid under guidelines established by the Board of Trustees. |
| (F) |
|
The rate reported is the effective yield at time of purchase. |
| (G) |
|
Security, or portion thereof, has been pledged as collateral on open futures contracts. |
| (H) |
|
This security was purchased with cash collateral held from securities on loan (see Note 8). The total value of such securities as of September 30, 2012 was
$116,607 ($ Thousands). |
|
| ADR — American Depositary Receipt |
| AUD — Australian Dollar |
| CAD — Canadian Dollar |
| CHF — Swiss Franc |
| Cl — Class |
| DJ — Dow Jones |
| DKK — Danish Krone |
| EUR — Euro |
| FTSE — Financial Times and the London Stock Exchange |
| GBP — British Pound Sterling |
| GDR — Global Depositary Receipt |
| HKD — Hong Kong Dollar |
| JPY — Japanese Yen |
| L.P. — Limited Partnership |
| NOK — Norwegian Krone |
| NZD — New Zealand Dollar |
| SEK — Swedish Krone |
| SGD — Singapore Dollar |
| Ser — Series |
| SPI — Share Price Index |
USD — U.S. Dollar
ZAR — South African Rand
The following is a summary of the inputs used as of September 30,
2012, in valuing the Fund’s investments and other financial instruments carried at value ($ Thousands):
|
|
|
|
|
|
|
|
|
|
|
|
|
|
|
|
|
| Investments in Securities |
|
Level 1 |
|
|
Level 2 |
|
|
Level 3(1) |
|
|
Total |
|
| Common Stock |
|
$ |
1,726,328 |
|
|
$ |
5,712 |
|
|
$ |
354 |
|
|
$ |
1,732,394 |
|
| Preferred Stock |
|
|
7,804 |
|
|
|
— |
|
|
|
— |
|
|
|
7,804 |
|
| U.S. Treasury Obligations |
|
|
— |
|
|
|
4,399 |
|
|
|
— |
|
|
|
4,399 |
|
| Rights |
|
|
41 |
|
|
|
— |
|
|
|
— |
|
|
|
41 |
|
| Affiliated Partnership |
|
|
— |
|
|
|
116,607 |
|
|
|
— |
|
|
|
116,607 |
|
| Cash Equivalent |
|
|
57,461 |
|
|
|
— |
|
|
|
— |
|
|
|
57,461 |
|
| Time Deposits |
|
|
— |
|
|
|
50,642 |
|
|
|
— |
|
|
|
50,642 |
|
|
|
|
|
|
|
|
|
|
|
|
|
|
|
|
|
|
| Total Investments in Securities |
|
$ |
1,791,634 |
|
|
$ |
177,360 |
|
|
$ |
354 |
|
|
$ |
1,969,348 |
|
|
|
|
|
|
|
|
|
|
|
|
|
|
|
|
|
|
|
|
|
|
|
|
|
|
|
|
|
|
|
|
|
|
|
| Other Financial Instruments |
|
Level 1 |
|
|
Level 2 |
|
|
Level 3 |
|
|
Total |
|
| Futures Contracts * |
|
$ |
(1,020 |
) |
|
$ |
— |
|
|
$ |
— |
|
|
$ |
(1,020 |
) |
| Forwards Contracts * |
|
|
— |
|
|
|
(391 |
) |
|
|
— |
|
|
|
(391 |
) |
|
|
|
|
|
|
|
|
|
|
|
|
|
|
|
|
|
| Total Other Financial Instruments |
|
$ |
(1,020 |
) |
|
$ |
(391 |
) |
|
$ |
— |
|
|
$ |
(1,411 |
) |
|
|
|
|
|
|
|
|
|
|
|
|
|
|
|
|
|
(1) A reconciliation of Level 3 investments is presented when the Fund has a significant amount of Level 3 investments at
the beginning and/or end of the period in relation to net assets.
*Futures and Forwards contracts are valued at the unrealized depreciation on
the instrument.
For the year ended September 30, 2012, there were transfers between Level 1 and Level 2 assets and liabilities. The primary
reason for changes in the classifications between Levels 1 and 2 occurs when foreign equity securities are fair valued using other observable market-based inputs in place of the closing exchange price due to events occurring after the close of the
exchange or market on which the investment is principally traded.
For the year ended September 30, 2012, there were transfers from Level 2
into Level 3 assets and liabilities for certain securities. The transfer was due to a change in the availability of observable inputs used to determine fair value.
Amounts designated as “—” are $O or have been rounded to $O.
The accompanying notes are
an integral part of the financial statements.
|
|
|
| 9 |
|
SEI Institutional International Trust / Annual Report / September 30, 2012 |
Schedule of Investments
Emerging Markets Equity Fund
September 30, 2012
|
|
|
|
|
|
|
|
|
| Description |
|
Shares |
|
|
Market Value
($ Thousands) |
|
|
|
|
|
|
|
|
|
|
| COMMON STOCK — 93.6% |
|
|
|
|
|
|
|
|
|
|
|
| Argentina — 0.2% |
|
|
|
|
|
|
|
|
| Tenaris ADR (A) |
|
|
34,504 |
|
|
$ |
1,407 |
|
| YPF ADR |
|
|
50,800 |
|
|
|
660 |
|
|
|
|
|
|
|
|
|
|
|
|
|
|
|
|
|
2,067 |
|
|
|
|
|
|
|
|
|
|
|
|
|
| Austria — 0.2% |
|
|
|
|
|
|
|
|
| Erste Group Bank |
|
|
30,880 |
|
|
|
690 |
|
| IMMOFINANZ * |
|
|
235,666 |
|
|
|
856 |
|
|
|
|
|
|
|
|
|
|
|
|
|
|
|
|
|
1,546 |
|
|
|
|
|
|
|
|
|
|
|
|
|
| Brazil — 9.3% |
|
|
|
|
|
|
|
|
| All America Latina Logistica |
|
|
165,664 |
|
|
|
680 |
|
| B2W Cia Global Do Varejo * |
|
|
47,600 |
|
|
|
250 |
|
| Banco Bradesco ADR (A) |
|
|
218,681 |
|
|
|
3,514 |
|
| Banco do Brasil |
|
|
218,080 |
|
|
|
2,666 |
|
| Banco Santander Brasil |
|
|
177,511 |
|
|
|
1,301 |
|
| Banco Santander Brasil ADR |
|
|
462,475 |
|
|
|
3,408 |
|
| BM&FBovespa |
|
|
587,384 |
|
|
|
3,535 |
|
| BR Malls Participacoes |
|
|
126,300 |
|
|
|
1,738 |
|
| Brasil Insurance Participacoes e Administracao |
|
|
222,000 |
|
|
|
2,094 |
|
| Braskem ADR (A) |
|
|
83,310 |
|
|
|
1,176 |
|
| BRF - Brasil Foods ADR (A) |
|
|
158,820 |
|
|
|
2,748 |
|
| Centrais Eletricas Brasileiras |
|
|
128,580 |
|
|
|
766 |
|
| CETIP - Mercados Organizados |
|
|
56,000 |
|
|
|
732 |
|
| Cia Hering |
|
|
89,197 |
|
|
|
1,992 |
|
| Cosan, Cl A |
|
|
18,312 |
|
|
|
290 |
|
| Cosan Industria e Comercio |
|
|
80,889 |
|
|
|
1,474 |
|
| Cyrela Brazil Realty Empreendimentos e Participacoes |
|
|
266,667 |
|
|
|
2,279 |
|
| Diagnosticos da America |
|
|
80,300 |
|
|
|
480 |
|
| EDP - Energias do Brasil |
|
|
121,900 |
|
|
|
764 |
|
| Embraer ADR (A) |
|
|
38,717 |
|
|
|
1,031 |
|
| Estacio Participacoes |
|
|
57,258 |
|
|
|
957 |
|
| Even Construtora e Incorporadora |
|
|
408,339 |
|
|
|
1,574 |
|
| Fibria Celulose * |
|
|
41,000 |
|
|
|
372 |
|
| Fibria Celulose ADR *(A) |
|
|
260,175 |
|
|
|
2,430 |
|
| Gerdau ADR (A) |
|
|
550,665 |
|
|
|
5,237 |
|
| Gol Linhas Aereas Inteligentes ADR *(A) |
|
|
191,645 |
|
|
|
1,100 |
|
| Helbor Empreendimentos |
|
|
73,649 |
|
|
|
387 |
|
| Hypermarcas * |
|
|
219,760 |
|
|
|
1,597 |
|
| JBS * |
|
|
246,600 |
|
|
|
808 |
|
| Kroton Educacional * |
|
|
94,279 |
|
|
|
1,618 |
|
| Localiza Rent a Car |
|
|
62,212 |
|
|
|
1,077 |
|
| M Dias Branco |
|
|
53,121 |
|
|
|
1,739 |
|
| Magnesita Refratarios |
|
|
158,400 |
|
|
|
589 |
|
| MRV Engenharia e Participacoes |
|
|
355,832 |
|
|
|
2,106 |
|
| Obrascon Huarte Lain Brasil |
|
|
87,816 |
|
|
|
799 |
|
| Oi ADR (A) |
|
|
194,224 |
|
|
|
798 |
|
| Petroleo Brasileiro |
|
|
80,722 |
|
|
|
923 |
|
| Petroleo Brasileiro ADR |
|
|
413,765 |
|
|
|
9,492 |
|
| Porto Seguro |
|
|
101,170 |
|
|
|
1,017 |
|
| Qualicorp * |
|
|
160,600 |
|
|
|
1,544 |
|
| Santos Brasil Participacoes |
|
|
71,520 |
|
|
|
1,015 |
|
| Sul America |
|
|
121,794 |
|
|
|
898 |
|
| Telefonica Brasil ADR (A) |
|
|
78,502 |
|
|
|
1,707 |
|
| Totvs |
|
|
215,292 |
|
|
|
4,456 |
|
| Vale |
|
|
58,092 |
|
|
|
1,038 |
|
| Vale ADR, Cl B |
|
|
300,325 |
|
|
|
5,376 |
|
|
|
|
|
|
|
|
|
|
| Description |
|
Shares |
|
|
Market Value
($ Thousands) |
|
|
|
|
|
|
|
|
|
|
|
|
|
|
|
|
$ |
83,572 |
|
|
|
|
|
|
|
|
|
|
|
|
|
| Canada — 1.3% |
|
|
|
|
|
|
|
|
| Africa Oil * |
|
|
154,340 |
|
|
|
1,520 |
|
| Alamos Gold |
|
|
95,100 |
|
|
|
1,847 |
|
| B2Gold * |
|
|
142,367 |
|
|
|
570 |
|
| First Majestic Silver * |
|
|
50,600 |
|
|
|
1,174 |
|
| Pacific Rubiales Energy (A) |
|
|
196,676 |
|
|
|
4,695 |
|
| Yamana Gold |
|
|
108,904 |
|
|
|
2,081 |
|
|
|
|
|
|
|
|
|
|
|
|
|
|
|
|
|
11,887 |
|
|
|
|
|
|
|
|
|
|
|
|
|
| Chile — 0.5% |
|
|
|
|
|
|
|
|
| Banco Santander Chile ADR (A) |
|
|
8,802 |
|
|
|
644 |
|
| Cia Cervecerias Unidas ADR |
|
|
4,804 |
|
|
|
343 |
|
| Enersis ADR |
|
|
44,117 |
|
|
|
723 |
|
| Latam Airlines Group ADR (A) |
|
|
29,103 |
|
|
|
736 |
|
| Sociedad Quimica y Minera de Chile ADR |
|
|
25,194 |
|
|
|
1,553 |
|
|
|
|
|
|
|
|
|
|
|
|
|
|
|
|
|
3,999 |
|
|
|
|
|
|
|
|
|
|
|
|
|
| China — 11.5% |
|
|
|
|
|
|
|
|
| AAC Technologies Holdings (A) |
|
|
1,498,180 |
|
|
|
5,411 |
|
| Agricultural Bank of China, Cl H (A) |
|
|
12,488,732 |
|
|
|
4,865 |
|
| Anhui Conch Cement, Cl H |
|
|
227,000 |
|
|
|
707 |
|
| Asia Cement China Holdings |
|
|
300,500 |
|
|
|
127 |
|
| Baidu ADR *(A) |
|
|
32,500 |
|
|
|
3,797 |
|
| Bank of China, Cl H |
|
|
7,628,105 |
|
|
|
2,902 |
|
| Bank of Communications, Cl H (A) |
|
|
3,630,347 |
|
|
|
2,463 |
|
| Beijing Capital International Airport, Cl H |
|
|
1,094,000 |
|
|
|
734 |
|
| BYD Electronic International |
|
|
2,340,000 |
|
|
|
498 |
|
| China Coal Energy, Cl H |
|
|
1,206,000 |
|
|
|
1,101 |
|
| China Communications Services, Cl H |
|
|
810,000 |
|
|
|
469 |
|
| China Construction Bank, Cl H |
|
|
11,602,800 |
|
|
|
8,051 |
|
| China Dongxiang Group |
|
|
984,000 |
|
|
|
105 |
|
| China Liansu Group Holdings (A) |
|
|
2,191,700 |
|
|
|
1,142 |
|
| China Life Insurance, Cl H |
|
|
602,000 |
|
|
|
1,739 |
|
| China Merchants Bank, Cl H |
|
|
1,581,576 |
|
|
|
2,664 |
|
| China National Materials (A) |
|
|
6,831,438 |
|
|
|
1,921 |
|
| China Petroleum & Chemical, Cl H |
|
|
2,324,646 |
|
|
|
2,171 |
|
| China Petroleum & Chemical ADR (A) |
|
|
20,200 |
|
|
|
1,867 |
|
| China Railway Construction, Cl H |
|
|
232,500 |
|
|
|
208 |
|
| China Railway Group, Cl H |
|
|
1,655,000 |
|
|
|
724 |
|
| China Telecom, Cl H |
|
|
3,100,000 |
|
|
|
1,791 |
|
| China Vanke, Cl B |
|
|
1,322,800 |
|
|
|
1,663 |
|
| China Zhongwang Holdings |
|
|
483,005 |
|
|
|
186 |
|
| Chongqing Rural Commercial Bank, Cl H |
|
|
2,226,612 |
|
|
|
879 |
|
| Daphne International Holdings (A) |
|
|
2,383,000 |
|
|
|
2,391 |
|
| Dongfeng Motor Group, Cl H |
|
|
268,000 |
|
|
|
313 |
|
| First Tractor, Cl H |
|
|
2,987,900 |
|
|
|
2,301 |
|
| Foxconn International Holdings *(A) |
|
|
3,333,000 |
|
|
|
1,096 |
|
| Giant Interactive Group ADR (A) |
|
|
168,628 |
|
|
|
875 |
|
| Golden Eagle Retail Group (A) |
|
|
450,500 |
|
|
|
884 |
|
| Great Wall Motor, Cl H (A) |
|
|
693,679 |
|
|
|
1,830 |
|
| Guangzhou Automobile Group, Cl H |
|
|
1,682,415 |
|
|
|
1,104 |
|
| Harbin Electric, Cl H (A) |
|
|
536,682 |
|
|
|
413 |
|
| Hidili Industry International Development (A) |
|
|
3,895,366 |
|
|
|
934 |
|
|
|
|
| 1 |
|
SEI Institutional International Trust / Annual Report / September 30, 2012 |
Schedule of Investments
Emerging Markets Equity Fund
September 30, 2012
|
|
|
|
|
|
|
|
|
| Description |
|
Shares |
|
|
Market Value
($ Thousands) |
|
|
|
|
|
|
|
|
|
|
| Huaneng Power International, Cl H (A) |
|
|
3,460,800 |
|
|
$ |
2,634 |
|
| Industrial & Commercial Bank of China, Cl H |
|
|
14,800,419 |
|
|
|
8,743 |
|
| Inner Mongolia Yitai Coal, Cl B |
|
|
41,922 |
|
|
|
226 |
|
| Lianhua Supermarket Holdings, Cl H |
|
|
1,014,000 |
|
|
|
806 |
|
| NetEase ADR * |
|
|
25,479 |
|
|
|
1,430 |
|
| PetroChina, Cl H |
|
|
2,794,119 |
|
|
|
3,661 |
|
| PetroChina ADR (A) |
|
|
27,766 |
|
|
|
3,586 |
|
| PICC Property & Casualty, Cl H |
|
|
1,658,000 |
|
|
|
2,036 |
|
| Ping An Insurance Group, Cl H |
|
|
345,500 |
|
|
|
2,611 |
|
| Prince Frog International Holdings (A) |
|
|
5,611,100 |
|
|
|
1,809 |
|
| SINA * |
|
|
29,700 |
|
|
|
1,921 |
|
| Sinotrans, Cl H |
|
|
3,405,000 |
|
|
|
444 |
|
| Soho China (A) |
|
|
1,148,028 |
|
|
|
711 |
|
| Sohu.com * |
|
|
41,800 |
|
|
|
1,759 |
|
| Tencent Holdings |
|
|
109,547 |
|
|
|
3,733 |
|
| Tingyi Cayman Islands Holding (A) |
|
|
668,000 |
|
|
|
2,012 |
|
| Travelsky Technology, Cl H |
|
|
362,880 |
|
|
|
193 |
|
| Tsingtao Brewery, Cl H (A) |
|
|
256,000 |
|
|
|
1,413 |
|
| Weiqiao Textile, Cl H |
|
|
1,054,400 |
|
|
|
385 |
|
| Zhejiang Expressway, Cl H |
|
|
1,012,000 |
|
|
|
705 |
|
| Zoomlion Heavy Industry Science and Technology (A) |
|
|
2,245,260 |
|
|
|
2,551 |
|
|
|
|
|
|
|
|
|
|
|
|
|
|
|
|
|
103,695 |
|
|
|
|
|
|
|
|
|
|
|
|
|
| Colombia — 0.9% |
|
|
|
|
|
|
|
|
| Almacenes Exito |
|
|
42,561 |
|
|
|
697 |
|
| Bancolombia ADR, Cl R (A) |
|
|
63,000 |
|
|
|
3,762 |
|
| Ecopetrol ADR (A) |
|
|
35,500 |
|
|
|
2,092 |
|
| Ecopetrol |
|
|
587,903 |
|
|
|
1,730 |
|
|
|
|
|
|
|
|
|
|
|
|
|
|
|
|
|
8,281 |
|
|
|
|
|
|
|
|
|
|
|
|
|
| Cyprus — 0.5% |
|
|
|
|
|
|
|
|
| Eurasia Drilling GDR (B) |
|
|
140,201 |
|
|
|
4,627 |
|
|
|
|
|
|
|
|
|
|
|
|
|
| Czech Republic — 0.3% |
|
|
|
|
|
|
|
|
| CEZ |
|
|
17,261 |
|
|
|
643 |
|
| Komercni Banka (C) |
|
|
10,440 |
|
|
|
2,070 |
|
|
|
|
|
|
|
|
|
|
|
|
|
|
|
|
|
2,713 |
|
|
|
|
|
|
|
|
|
|
|
|
|
| Denmark — 0.1% |
|
|
|
|
|
|
|
|
| Carlsberg, Cl B |
|
|
7,876 |
|
|
|
699 |
|
|
|
|
|
|
|
|
|
|
|
|
|
| Egypt — 0.1% |
|
|
|
|
|
|
|
|
| Commercial International Bank Egypt (C) |
|
|
98,456 |
|
|
|
565 |
|
|
|
|
|
|
|
|
|
|
|
|
|
| Guernsey — 0.0% |
|
|
|
|
|
|
|
|
| Etalon Group GDR *(B)(D) |
|
|
56,800 |
|
|
|
357 |
|
|
|
|
|
|
|
|
|
|
|
|
|
| Hong Kong — 5.8% |
|
|
|
|
|
|
|
|
| Chaoda Modern Agriculture *(D) |
|
|
2,056,181 |
|
|
|
292 |
|
| China Everbright International (A) |
|
|
1,384,300 |
|
|
|
732 |
|
| China High Precision Automation Group |
|
|
1,385,624 |
|
|
|
222 |
|
| China Mengniu Dairy (A) |
|
|
1,240,815 |
|
|
|
3,713 |
|
| China Mobile |
|
|
906,645 |
|
|
|
10,051 |
|
| China Mobile ADR (A) |
|
|
39,540 |
|
|
|
2,189 |
|
| China Power International Development |
|
|
2,184,200 |
|
|
|
597 |
|
|
|
|
|
|
|
|
|
|
| Description |
|
Shares |
|
|
Market Value
($ Thousands) |
|
|
|
|
|
|
|
|
|
|
| China Resources Enterprise (A) |
|
|
386,000 |
|
|
$ |
1,289 |
|
| China Resources Gas Group (A) |
|
|
590,500 |
|
|
|
1,206 |
|
| China State Construction International
Holdings (A) |
|
|
3,631,784 |
|
|
|
4,272 |
|
| China Unicom Hong Kong ADR (A) |
|
|
145,490 |
|
|
|
2,373 |
|
| CNOOC ADR |
|
|
9,710 |
|
|
|
1,969 |
|
| CNOOC |
|
|
1,643,407 |
|
|
|
3,370 |
|
| Cosco International Holdings |
|
|
208,805 |
|
|
|
82 |
|
| COSCO Pacific |
|
|
580,996 |
|
|
|
812 |
|
| Dah Chong Hong Holdings |
|
|
743,400 |
|
|
|
677 |
|
| Global Bio-Chemical Technology Group |
|
|
4,393,300 |
|
|
|
465 |
|
| Haier Electronics Group * |
|
|
1,649,700 |
|
|
|
1,913 |
|
| Hengdeli Holdings (A) |
|
|
6,072,000 |
|
|
|
1,762 |
|
| KWG Property Holding |
|
|
3,054,467 |
|
|
|
1,694 |
|
| Lenovo Group |
|
|
1,820,613 |
|
|
|
1,508 |
|
| Minth Group |
|
|
428,000 |
|
|
|
452 |
|
| NWS Holdings |
|
|
489,224 |
|
|
|
786 |
|
| Shanghai Industrial Holdings |
|
|
341,000 |
|
|
|
1,014 |
|
| Sino Biopharmaceutical (A) |
|
|
1,952,000 |
|
|
|
720 |
|
| SJM Holdings |
|
|
1,057,405 |
|
|
|
2,299 |
|
| Skyworth Digital Holdings (A) |
|
|
284,000 |
|
|
|
135 |
|
| Sunny Optical Technology Group |
|
|
1,250,000 |
|
|
|
693 |
|
| TPV Technology |
|
|
407,890 |
|
|
|
89 |
|
| Vinda International Holdings (A) |
|
|
2,628,460 |
|
|
|
3,621 |
|
| Xinyi Glass Holdings |
|
|
3,086,944 |
|
|
|
1,437 |
|
| Yuexiu Real Estate Investment (E) |
|
|
266,538 |
|
|
|
130 |
|
|
|
|
|
|
|
|
|
|
|
|
|
|
|
|
|
52,564 |
|
|
|
|
|
|
|
|
|
|
|
|
|
| Hungary — 0.0% |
|
|
|
|
|
|
|
|
| EGIS Pharmaceuticals |
|
|
1,778 |
|
|
|
141 |
|
| Richter Gedeon |
|
|
1,288 |
|
|
|
226 |
|
|
|
|
|
|
|
|
|
|
|
|
|
|
|
|
|
367 |
|
|
|
|
|
|
|
|
|
|
|
|
|
| India — 7.0% |
|
|
|
|
|
|
|
|
| Asian Paints |
|
|
19,025 |
|
|
|
1,419 |
|
| Axis Bank |
|
|
48,301 |
|
|
|
1,040 |
|
| Bajaj Holdings and Investment |
|
|
12,648 |
|
|
|
191 |
|
| Ballarpur Industries |
|
|
894,389 |
|
|
|
336 |
|
| Bank of Baroda |
|
|
47,330 |
|
|
|
716 |
|
| Bank of India |
|
|
49,860 |
|
|
|
294 |
|
| Bharat Heavy Electricals |
|
|
163,280 |
|
|
|
765 |
|
| Cairn India * |
|
|
1,163,614 |
|
|
|
7,303 |
|
| Chambal Fertilizers & Chemicals |
|
|
428,234 |
|
|
|
600 |
|
| Corporation Bank |
|
|
14,494 |
|
|
|
115 |
|
| Cummins India |
|
|
147,080 |
|
|
|
1,409 |
|
| Glenmark Pharmaceuticals |
|
|
227,154 |
|
|
|
1,813 |
|
| Godrej Consumer Products |
|
|
117,570 |
|
|
|
1,491 |
|
| Grasim Industries |
|
|
25,316 |
|
|
|
1,591 |
|
| Havells India |
|
|
69,082 |
|
|
|
818 |
|
| HCL Technologies |
|
|
180,774 |
|
|
|
1,979 |
|
| HDFC Bank ADR (A) |
|
|
37,700 |
|
|
|
1,417 |
|
| Hexaware Technologies |
|
|
162,156 |
|
|
|
374 |
|
| Hindustan Petroleum |
|
|
69,680 |
|
|
|
407 |
|
| ICICI Bank ADR (A) |
|
|
165,744 |
|
|
|
6,653 |
|
| India Cements |
|
|
527,110 |
|
|
|
948 |
|
| Indiabulls Financial Services |
|
|
218,840 |
|
|
|
888 |
|
| Indian Bank |
|
|
146,669 |
|
|
|
538 |
|
| Jubilant Life Sciences |
|
|
169,946 |
|
|
|
682 |
|
| Mahindra & Mahindra GDR |
|
|
142,083 |
|
|
|
2,329 |
|
| McLeod Russel India |
|
|
20,755 |
|
|
|
127 |
|
| NMDC |
|
|
138,920 |
|
|
|
511 |
|
| Oil & Natural Gas |
|
|
162,136 |
|
|
|
863 |
|
| Oil India |
|
|
19,676 |
|
|
|
184 |
|
|
|
|
| 2 |
|
SEI Institutional International Trust / Annual Report / September 30, 2012 |
Schedule of Investments
Emerging Markets Equity Fund
September 30, 2012
|
|
|
|
|
|
|
|
|
| Description |
|
Shares |
|
|
Market Value
($ Thousands) |
|
|
|
|
|
|
|
|
|
|
| Oriental Bank of Commerce |
|
|
173,340 |
|
|
$ |
992 |
|
| Petronet LNG |
|
|
362,300 |
|
|
|
1,085 |
|
| Reliance Industries GDR (B) |
|
|
190,252 |
|
|
|
5,989 |
|
| Reliance Industries |
|
|
201,750 |
|
|
|
3,202 |
|
| Rolta India |
|
|
365,340 |
|
|
|
503 |
|
| Rural Electrification |
|
|
669,186 |
|
|
|
2,769 |
|
| Shriram Transport Finance |
|
|
227,998 |
|
|
|
2,679 |
|
| State Bank of India GDR (B) |
|
|
8,510 |
|
|
|
723 |
|
| State Bank of India |
|
|
60,384 |
|
|
|
2,565 |
|
| Steel Authority of India |
|
|
335,380 |
|
|
|
543 |
|
| Sterlite Industries India |
|
|
304,470 |
|
|
|
575 |
|
| Sterlite Industries India ADR (A) |
|
|
45,590 |
|
|
|
346 |
|
| Syndicate Bank |
|
|
219,373 |
|
|
|
452 |
|
| Tata Chemicals |
|
|
100,421 |
|
|
|
611 |
|
| UCO Bank |
|
|
227,884 |
|
|
|
332 |
|
| Yes Bank |
|
|
231,420 |
|
|
|
1,676 |
|
|
|
|
|
|
|
|
|
|
|
|
|
|
|
|
|
62,843 |
|
|
|
|
|
|
|
|
|
|
|
|
|
| Indonesia — 2.4% |
|
|
|
|
|
|
|
|
| AKR Corporindo |
|
|
644,922 |
|
|
|
286 |
|
| Aneka Tambang |
|
|
3,608,894 |
|
|
|
509 |
|
| Astra Agro Lestari |
|
|
331,399 |
|
|
|
760 |
|
| Bank Bukopin |
|
|
3,373,948 |
|
|
|
226 |
|
| Bank Mandiri |
|
|
1,493,200 |
|
|
|
1,279 |
|
| Bank Negara Indonesia Persero |
|
|
1,536,000 |
|
|
|
630 |
|
| Bank Rakyat Indonesia Persero |
|
|
5,983,451 |
|
|
|
4,658 |
|
| Holcim Indonesia |
|
|
560,662 |
|
|
|
167 |
|
| Indo Tambangraya Megah |
|
|
99,500 |
|
|
|
438 |
|
| Indocement Tunggal Prakarsa |
|
|
290,270 |
|
|
|
617 |
|
| Indofood CBP Sukses Makmur |
|
|
347,434 |
|
|
|
231 |
|
| Indosat |
|
|
1,030,500 |
|
|
|
582 |
|
| Japfa Comfeed Indonesia |
|
|
527,131 |
|
|
|
259 |
|
| Kalbe Farma |
|
|
949,293 |
|
|
|
466 |
|
| Medco Energi Internasional |
|
|
1,716,000 |
|
|
|
307 |
|
| Perusahaan Perkebunan London Sumatra Indonesia |
|
|
3,083,411 |
|
|
|
789 |
|
| Sampoerna Agro |
|
|
282,000 |
|
|
|
85 |
|
| Semen Gresik Persero |
|
|
1,173,700 |
|
|
|
1,772 |
|
| Tambang Batubara Bukit Asam |
|
|
971,000 |
|
|
|
1,644 |
|
| Telekomunikasi Indonesia |
|
|
2,291,616 |
|
|
|
2,263 |
|
| United Tractors |
|
|
1,068,071 |
|
|
|
2,310 |
|
| XL Axiata |
|
|
2,131,000 |
|
|
|
1,481 |
|
|
|
|
|
|
|
|
|
|
|
|
|
|
|
|
|
21,759 |
|
|
|
|
|
|
|
|
|
|
|
|
|
| Ireland — 0.1% |
|
|
|
|
|
|
|
|
| Kenmare Resources * |
|
|
2,023,611 |
|
|
|
1,284 |
|
|
|
|
|
|
|
|
|
|
|
|
|
| Israel — 0.4% |
|
|
|
|
|
|
|
|
| Israel Chemicals (C) |
|
|
268,657 |
|
|
|
3,259 |
|
|
|
|
|
|
|
|
|
|
|
|
|
| Macau — 0.3% |
|
|
|
|
|
|
|
|
| Sands China (A) |
|
|
713,500 |
|
|
|
2,664 |
|
|
|
|
|
|
|
|
|
|
|
|
|
| Malaysia — 1.8% |
|
|
|
|
|
|
|
|
| Affin Holdings |
|
|
96,100 |
|
|
|
106 |
|
| Axiata Group |
|
|
1,179,736 |
|
|
|
2,509 |
|
| Berjaya Sports Toto |
|
|
289,360 |
|
|
|
410 |
|
| British American Tobacco Malaysia |
|
|
34,351 |
|
|
|
679 |
|
| Digi.Com |
|
|
428,901 |
|
|
|
741 |
|
| DRB-Hicom |
|
|
967,872 |
|
|
|
738 |
|
| Genting |
|
|
207,300 |
|
|
|
591 |
|
| Genting Malaysia |
|
|
710,156 |
|
|
|
813 |
|
|
|
|
|
|
|
|
|
|
| Description |
|
Shares |
|
|
Market Value
($ Thousands) |
|
|
|
|
|
|
|
|
|
|
| Hong Leong Financial Group |
|
|
84,800 |
|
|
$ |
329 |
|
| KLCC Property Holdings |
|
|
106,600 |
|
|
|
203 |
|
| Kulim Malaysia |
|
|
273,500 |
|
|
|
441 |
|
| Lafarge Malayan Cement |
|
|
51,587 |
|
|
|
150 |
|
| Malaysia Building Society |
|
|
501,327 |
|
|
|
395 |
|
| Media Prima |
|
|
151,347 |
|
|
|
116 |
|
| Parkson Holdings |
|
|
336,718 |
|
|
|
531 |
|
| Public Bank |
|
|
485,500 |
|
|
|
2,284 |
|
| Telekom Malaysia |
|
|
281,476 |
|
|
|
570 |
|
| Tenaga Nasional |
|
|
90,525 |
|
|
|
202 |
|
| Top Glove |
|
|
1,039,428 |
|
|
|
1,666 |
|
| Tradewinds Malaysia |
|
|
35,682 |
|
|
|
84 |
|
| UEM Land Holdings * |
|
|
2,460,100 |
|
|
|
1,352 |
|
| UMW Holdings |
|
|
422,783 |
|
|
|
1,383 |
|
|
|
|
|
|
|
|
|
|
|
|
|
|
|
|
|
16,293 |
|
|
|
|
|
|
|
|
|
|
|
|
|
| Mexico — 5.0% |
|
|
|
|
|
|
|
|
| Alfa, Cl A |
|
|
1,695,520 |
|
|
|
3,160 |
|
| America Movil ADR, Ser L (A) |
|
|
117,355 |
|
|
|
2,985 |
|
| America Movil, Ser L |
|
|
1,608,374 |
|
|
|
2,051 |
|
| Cemex ADR *(A) |
|
|
301,658 |
|
|
|
2,513 |
|
| Consorcio ARA * |
|
|
781,500 |
|
|
|
245 |
|
| Desarrolladora Homex ADR *(A) |
|
|
51,150 |
|
|
|
698 |
|
| Desarrolladora Homex * |
|
|
121,300 |
|
|
|
277 |
|
| Empresas ICA ADR * |
|
|
142,080 |
|
|
|
1,100 |
|
| Fomento Economico Mexicano ADR |
|
|
29,055 |
|
|
|
2,672 |
|
| Genomma Lab Internacional, Cl B *(A) |
|
|
3,040,501 |
|
|
|
5,891 |
|
| GEO * |
|
|
2,294,130 |
|
|
|
2,819 |
|
| Gruma, Cl B * |
|
|
620,132 |
|
|
|
1,756 |
|
| Grupo Financiero Banorte, Cl O |
|
|
825,351 |
|
|
|
4,670 |
|
| Grupo Financiero Santander Mexico ADR * |
|
|
124,878 |
|
|
|
1,711 |
|
| Grupo Herdez |
|
|
32,875 |
|
|
|
85 |
|
| Grupo Mexico, Ser B |
|
|
354,191 |
|
|
|
1,172 |
|
| Grupo Televisa ADR |
|
|
258,043 |
|
|
|
6,067 |
|
| Industrias, Cl B * |
|
|
44,233 |
|
|
|
264 |
|
| Industrias Penoles |
|
|
14,915 |
|
|
|
737 |
|
| Kimberly-Clark de Mexico, Cl A |
|
|
943,400 |
|
|
|
2,255 |
|
| Wal-Mart de Mexico, Ser V |
|
|
527,618 |
|
|
|
1,487 |
|
|
|
|
|
|
|
|
|
|
|
|
|
|
|
|
|
44,615 |
|
|
|
|
|
|
|
|
|
|
|
|
|
| Netherlands — 0.4% |
|
|
|
|
|
|
|
|
| VimpelCom ADR |
|
|
94,280 |
|
|
|
1,122 |
|
| Yandex, Cl A * |
|
|
82,000 |
|
|
|
1,977 |
|
|
|
|
|
|
|
|
|
|
|
|
|
|
|
|
|
3,099 |
|
|
|
|
|
|
|
|
|
|
|
|
|
| Peru — 0.6% |
|
|
|
|
|
|
|
|
| Credicorp |
|
|
36,900 |
|
|
|
4,623 |
|
| Intercorp Financial Services, Ser INC |
|
|
8,266 |
|
|
|
268 |
|
|
|
|
|
|
|
|
|
|
|
|
|
|
|
|
|
4,891 |
|
|
|
|
|
|
|
|
|
|
|
|
|
| Philippines — 0.7% |
|
|
|
|
|
|
|
|
| Alliance Global Group |
|
|
2,157,288 |
|
|
|
760 |
|
| BDO Unibank * |
|
|
668,853 |
|
|
|
1,040 |
|
| International Container Terminal Services |
|
|
1,045,644 |
|
|
|
1,765 |
|
| Manila Electric |
|
|
3,990 |
|
|
|
24 |
|
| Megaworld |
|
|
7,326,000 |
|
|
|
392 |
|
| Nickel Asia |
|
|
214,350 |
|
|
|
90 |
|
| Rizal Commercial Banking |
|
|
66,500 |
|
|
|
73 |
|
| SM Investments |
|
|
77,903 |
|
|
|
1,363 |
|
|
|
|
| 3 |
|
SEI Institutional International Trust / Annual Report / September 30, 2012 |
Schedule of Investments
Emerging Markets Equity Fund
September 30, 2012
|
|
|
|
|
|
|
|
|
| Description |
|
Shares |
|
|
Market Value
($ Thousands) |
|
|
|
|
|
|
|
|
|
|
| Universal Robina |
|
|
300,934 |
|
|
$ |
502 |
|
|
|
|
|
|
|
|
|
|
|
|
|
|
|
|
|
6,009 |
|
|
|
|
|
|
|
|
|
|
|
|
|
| Poland — 0.9% |
|
|
|
|
|
|
|
|
| Asseco Poland |
|
|
41,369 |
|
|
|
577 |
|
| Bank Pekao |
|
|
11,040 |
|
|
|
544 |
|
| KGHM Polska Miedz (A) |
|
|
43,152 |
|
|
|
2,054 |
|
| PGE |
|
|
192,356 |
|
|
|
1,111 |
|
| Polish Oil & Gas |
|
|
379,560 |
|
|
|
482 |
|
| Polski Koncern Naftowy Orlen * |
|
|
98,921 |
|
|
|
1,405 |
|
| Powszechna Kasa Oszczednosci Bank Polski |
|
|
207,449 |
|
|
|
2,305 |
|
|
|
|
|
|
|
|
|
|
|
|
|
|
|
|
|
8,478 |
|
|
|
|
|
|
|
|
|
|
|
|
|
| Russia — 7.2% |
|
|
|
|
|
|
|
|
| Alliance Oil *(A) |
|
|
157,214 |
|
|
|
1,244 |
|
| Gazprom ADR (A) |
|
|
913,965 |
|
|
|
9,222 |
|
| Gazprom Neft JSC ADR |
|
|
11,637 |
|
|
|
286 |
|
| Globaltrans Investment GDR (B) |
|
|
263,660 |
|
|
|
5,478 |
|
| Lukoil ADR |
|
|
141,281 |
|
|
|
8,694 |
|
| Magnit GDR |
|
|
97,811 |
|
|
|
3,325 |
|
| Mail.ru Group GDR (A) |
|
|
27,299 |
|
|
|
911 |
|
| MMC Norilsk Nickel ADR |
|
|
37,470 |
|
|
|
598 |
|
| Mobile Telesystems ADR |
|
|
139,135 |
|
|
|
2,438 |
|
| NovaTek GDR |
|
|
25,605 |
|
|
|
3,029 |
|
| Pharmstandard GDR * |
|
|
57,650 |
|
|
|
819 |
|
| Rosneft GDR |
|
|
27,110 |
|
|
|
182 |
|
| Rosneft Oil GDR |
|
|
647,645 |
|
|
|
4,353 |
|
| Sberbank of Russia ADR (A) |
|
|
1,097,060 |
|
|
|
12,845 |
|
| Severstal GDR |
|
|
47,025 |
|
|
|
588 |
|
| Surgutneftegas ADR |
|
|
38,455 |
|
|
|
350 |
|
| Tatneft ADR |
|
|
9,018 |
|
|
|
374 |
|
| TMK GDR |
|
|
129,055 |
|
|
|
1,963 |
|
| Uralkali GDR |
|
|
87,400 |
|
|
|
3,616 |
|
| VTB Bank GDR |
|
|
636,355 |
|
|
|
2,119 |
|
| X5 Retail Group GDR * |
|
|
116,667 |
|
|
|
2,451 |
|
|
|
|
|
|
|
|
|
|
|
|
|
|
|
|
|
64,885 |
|
|
|
|
|
|
|
|
|
|
|
|
|
| Singapore — 0.0% |
|
|
|
|
|
|
|
|
| China Yuchai International |
|
|
23,951 |
|
|
|
305 |
|
|
|
|
|
|
|
|
|
|
|
|
|
| South Africa — 5.4% |
|
|
|
|
|
|
|
|
| Adcock Ingram Holdings |
|
|
58,170 |
|
|
|
419 |
|
| African Bank Investments |
|
|
253,978 |
|
|
|
1,017 |
|
| Anglo American Platinum (A) |
|
|
46,697 |
|
|
|
2,422 |
|
| AngloGold Ashanti |
|
|
24,574 |
|
|
|
871 |
|
| ArcelorMittal South Africa |
|
|
145,522 |
|
|
|
723 |
|
| AVI |
|
|
109,700 |
|
|
|
795 |
|
| Barloworld |
|
|
296,334 |
|
|
|
2,582 |
|
| Bidvest Group |
|
|
89,428 |
|
|
|
2,233 |
|
| Exxaro Resources |
|
|
136,544 |
|
|
|
2,663 |
|
| FirstRand |
|
|
315,725 |
|
|
|
1,067 |
|
| Gold Fields |
|
|
89,580 |
|
|
|
1,159 |
|
| Impala Platinum Holdings |
|
|
45,655 |
|
|
|
769 |
|
| Imperial Holdings |
|
|
73,073 |
|
|
|
1,661 |
|
| JD Group |
|
|
153,600 |
|
|
|
866 |
|
| Liberty Holdings |
|
|
87,400 |
|
|
|
1,051 |
|
| Life Healthcare Group Holdings |
|
|
494,925 |
|
|
|
1,904 |
|
| Mondi |
|
|
76,006 |
|
|
|
779 |
|
| MTN Group |
|
|
268,069 |
|
|
|
5,205 |
|
| Murray & Roberts Holdings |
|
|
385,669 |
|
|
|
1,033 |
|
| Naspers, Cl N |
|
|
42,464 |
|
|
|
2,650 |
|
| Netcare |
|
|
214,447 |
|
|
|
465 |
|
| Remgro |
|
|
64,565 |
|
|
|
1,137 |
|
|
|
|
|
|
|
|
|
|
| Description |
|
Shares |
|
|
Market Value
($ Thousands) |
|
|
|
|
|
|
|
|
|
|
| RMB Holdings |
|
|
40,853 |
|
|
$ |
183 |
|
| Sanlam |
|
|
266,337 |
|
|
|
1,213 |
|
| Sappi |
|
|
40,682 |
|
|
|
117 |
|
| Sasol ADR (A) |
|
|
36,375 |
|
|
|
1,622 |
|
| Sasol |
|
|
35,112 |
|
|
|
1,584 |
|
| Shoprite Holdings |
|
|
103,820 |
|
|
|
2,118 |
|
| Standard Bank Group |
|
|
456,800 |
|
|
|
5,848 |
|
| Telkom |
|
|
213,890 |
|
|
|
456 |
|
| Vodacom Group |
|
|
125,556 |
|
|
|
1,554 |
|
| Woolworths Holdings |
|
|
89,174 |
|
|
|
657 |
|
|
|
|
|
|
|
|
|
|
|
|
|
|
|
|
|
48,823 |
|
|
|
|
|
|
|
|
|
|
|
|
|
| South Korea — 14.7% |
|
|
|
|
|
|
|
|
| AMOREPACIFIC Group |
|
|
1,221 |
|
|
|
542 |
|
| Bioland |
|
|
38,881 |
|
|
|
628 |
|
| BS Financial Group |
|
|
195,748 |
|
|
|
2,113 |
|
| Daelim Industrial |
|
|
8,666 |
|
|
|
740 |
|
| Daesang |
|
|
24,441 |
|
|
|
517 |
|
| Daewoo Shipbuilding & Marine Engineering |
|
|
31,740 |
|
|
|
741 |
|
| Daishin Securities |
|
|
40,932 |
|
|
|
325 |
|
| Daou Technology |
|
|
122,153 |
|
|
|
1,918 |
|
| Doosan |
|
|
1,255 |
|
|
|
155 |
|
| Gamevil * |
|
|
13,659 |
|
|
|
1,288 |
|
| Genic * |
|
|
6,231 |
|
|
|
363 |
|
| Grand Korea Leisure |
|
|
34,184 |
|
|
|
903 |
|
| GS Home Shopping |
|
|
2,692 |
|
|
|
268 |
|
| Hankook Tire |
|
|
34,400 |
|
|
|
1,288 |
|
| Hite Jinro |
|
|
54,259 |
|
|
|
1,191 |
|
| Hyundai Development |
|
|
36,980 |
|
|
|
740 |
|
| Hyundai Marine & Fire Insurance |
|
|
39,803 |
|
|
|
1,239 |
|
| Hyundai Mobis |
|
|
8,750 |
|
|
|
2,444 |
|
| Hyundai Motor |
|
|
27,260 |
|
|
|
6,181 |
|
| Hyundai Wia |
|
|
12,665 |
|
|
|
2,137 |
|
| Industrial Bank of Korea |
|
|
55,200 |
|
|
|
608 |
|
| KB Financial Group |
|
|
57,694 |
|
|
|
2,061 |
|
| KB Financial Group ADR (A) |
|
|
103,265 |
|
|
|
3,644 |
|
| KCC |
|
|
14,732 |
|
|
|
3,864 |
|
| Kia Motors |
|
|
72,671 |
|
|
|
4,538 |
|
| Korea Electric Power * |
|
|
77,030 |
|
|
|
1,934 |
|
| Korea Electric Power ADR |
|
|
31,820 |
|
|
|
395 |
|
| Korea Exchange Bank |
|
|
147,610 |
|
|
|
1,128 |
|
| Korea Zinc |
|
|
10,526 |
|
|
|
4,626 |
|
| KT |
|
|
13,830 |
|
|
|
438 |
|
| KT ADR (A) |
|
|
201,720 |
|
|
|
3,155 |
|
| KT&G |
|
|
26,805 |
|
|
|
2,043 |
|
| LG Chem |
|
|
11,493 |
|
|
|
3,428 |
|
| LG Display ADR (A) |
|
|
101,140 |
|
|
|
1,271 |
|
| LG Display |
|
|
74,310 |
|
|
|
1,895 |
|
| LG Electronics |
|
|
23,284 |
|
|
|
1,446 |
|
| Lotte Chilsung Beverage |
|
|
1,623 |
|
|
|
2,014 |
|
| Lotte Confectionery |
|
|
1,343 |
|
|
|
1,875 |
|
| Mando |
|
|
18,449 |
|
|
|
2,556 |
|
| Mirae Asset Securities |
|
|
35,190 |
|
|
|
1,072 |
|
| NHN |
|
|
8,585 |
|
|
|
2,244 |
|
| Nong Shim |
|
|
4,732 |
|
|
|
1,130 |
|
| POSCO |
|
|
4,549 |
|
|
|
1,496 |
|
| POSCO ADR (A) |
|
|
3,000 |
|
|
|
245 |
|
| Samsung Electronics |
|
|
27,482 |
|
|
|
33,282 |
|
| Samsung Fire & Marine Insurance |
|
|
5,009 |
|
|
|
1,077 |
|
| Samsung Heavy Industries |
|
|
28,785 |
|
|
|
976 |
|
| Samsung Life Insurance |
|
|
17,949 |
|
|
|
1,552 |
|
| Seah Besteel |
|
|
9,504 |
|
|
|
326 |
|
|
|
|
| 4 |
|
SEI Institutional International Trust / Annual Report / September 30, 2012 |
Schedule of Investments
Emerging Markets Equity Fund
September 30, 2012
|
|
|
|
|
|
|
|
|
| Description |
|
Shares |
|
|
Market Value
($ Thousands) |
|
|
|
|
|
|
|
|
|
|
| Shinhan Financial Group |
|
|
68,874 |
|
|
$ |
2,352 |
|
| Shinsegae |
|
|
7,005 |
|
|
|
1,324 |
|
| Silicon Works |
|
|
78,951 |
|
|
|
2,085 |
|
| SK Holdings |
|
|
14,402 |
|
|
|
2,015 |
|
| SK Telecom |
|
|
10,201 |
|
|
|
1,349 |
|
| SK Telecom ADR (A) |
|
|
325,994 |
|
|
|
4,740 |
|
| Sung Kwang Bend |
|
|
161,697 |
|
|
|
3,834 |
|
| Taekwang Industrial |
|
|
109 |
|
|
|
93 |
|
| Tongyang Life Insurance |
|
|
32,458 |
|
|
|
293 |
|
| Woongjin Coway |
|
|
57,050 |
|
|
|
1,578 |
|
| Youngone |
|
|
4,540 |
|
|
|
150 |
|
| Yuhan |
|
|
3,667 |
|
|
|
505 |
|
|
|
|
|
|
|
|
|
|
|
|
|
|
|
|
|
132,358 |
|
|
|
|
|
|
|
|
|
|
|
|
|
| Taiwan — 7.7% |
|
|
|
|
|
|
|
|
| Asustek Computer |
|
|
157,740 |
|
|
|
1,714 |
|
| AU Optronics |
|
|
502,000 |
|
|
|
182 |
|
| AU Optronics ADR |
|
|
144,290 |
|
|
|
502 |
|
| Catcher Technology |
|
|
453,000 |
|
|
|
2,133 |
|
| Chailease Holding |
|
|
984,000 |
|
|
|
1,856 |
|
| Chicony Electronics |
|
|
151,438 |
|
|
|
356 |
|
| China Steel Chemical |
|
|
168,800 |
|
|
|
746 |
|
| Chinatrust Financial Holding |
|
|
1,353,809 |
|
|
|
817 |
|
| Chunghwa Telecom |
|
|
481,056 |
|
|
|
1,541 |
|
| Compal Electronics |
|
|
526,000 |
|
|
|
473 |
|
| CTCI |
|
|
187,000 |
|
|
|
427 |
|
| Elan Microelectronics |
|
|
902,000 |
|
|
|
1,594 |
|
| Evergreen Marine Taiwan |
|
|
1,351,996 |
|
|
|
713 |
|
| Farglory Land Development |
|
|
196,043 |
|
|
|
366 |
|
| Formosa Taffeta |
|
|
88,000 |
|
|
|
84 |
|
| Hon Hai Precision Industry |
|
|
3,258,159 |
|
|
|
10,226 |
|
| Huaku Development |
|
|
176,196 |
|
|
|
426 |
|
| ILI Technology |
|
|
124,000 |
|
|
|
431 |
|
| Lite-On Technology |
|
|
951,478 |
|
|
|
1,229 |
|
| MediaTek |
|
|
242,924 |
|
|
|
2,565 |
|
| Merida Industry |
|
|
367,750 |
|
|
|
1,355 |
|
| MStar Semiconductor |
|
|
99,000 |
|
|
|
795 |
|
| Nan Ya Printed Circuit Board |
|
|
590,049 |
|
|
|
963 |
|
| Novatek Microelectronics |
|
|
106,000 |
|
|
|
383 |
|
| Pegatron * |
|
|
992,738 |
|
|
|
1,292 |
|
| Phison Electronics |
|
|
192,000 |
|
|
|
1,549 |
|
| Pou Chen |
|
|
1,059,000 |
|
|
|
1,084 |
|
| Powertech Technology |
|
|
411,500 |
|
|
|
790 |
|
| President Chain Store |
|
|
125,652 |
|
|
|
673 |
|
| Radiant Opto-Electronics |
|
|
281,272 |
|
|
|
1,219 |
|
| Realtek Semiconductor |
|
|
484,380 |
|
|
|
960 |
|
| Siliconware Precision Industries |
|
|
707,000 |
|
|
|
787 |
|
| Siliconware Precision Industries ADR (A) |
|
|
9,590 |
|
|
|
53 |
|
| Simplo Technology |
|
|
273,094 |
|
|
|
1,635 |
|
| SinoPac Financial Holdings |
|
|
2,863,727 |
|
|
|
1,207 |
|
| Synnex Technology International |
|
|
670,783 |
|
|
|
1,519 |
|
| Taishin Financial Holding |
|
|
5,390,431 |
|
|
|
2,078 |
|
| Taiwan Fertilizer |
|
|
789,000 |
|
|
|
2,140 |
|
| Taiwan Semiconductor Manufacturing |
|
|
1,812,219 |
|
|
|
5,552 |
|
| Taiwan Semiconductor Manufacturing ADR |
|
|
363,089 |
|
|
|
5,744 |
|
| Tatung * |
|
|
1,036,428 |
|
|
|
267 |
|
| Teco Electric and Machinery |
|
|
1,679,000 |
|
|
|
1,163 |
|
| Transcend Information |
|
|
230,640 |
|
|
|
624 |
|
| U-Ming Marine Transport |
|
|
188,926 |
|
|
|
302 |
|
|
|
|
|
|
|
|
|
|
| Description |
|
Shares |
|
|
Market Value
($ Thousands) |
|
|
|
|
|
|
|
|
|
|
| Uni-President Enterprises |
|
|
863,680 |
|
|
$ |
1,532 |
|
| United Microelectronics |
|
|
4,805,293 |
|
|
|
2,000 |
|
| United Microelectronics ADR (A) |
|
|
835,510 |
|
|
|
1,713 |
|
| Yageo |
|
|
566,489 |
|
|
|
172 |
|
| Young Fast Optoelectronics |
|
|
224,723 |
|
|
|
542 |
|
| Yuanta Financial Holding |
|
|
2,103,399 |
|
|
|
1,105 |
|
|
|
|
|
|
|
|
|
|
|
|
|
|
|
|
|
69,579 |
|
|
|
|
|
|
|
|
|
|
|
|
|
| Thailand — 2.6% |
|
|
|
|
|
|
|
|
| Airports of Thailand |
|
|
672,400 |
|
|
|
1,737 |
|
| Bangkok Bank |
|
|
385,700 |
|
|
|
2,431 |
|
| Bangkok Bank Foreign (A) |
|
|
371,900 |
|
|
|
2,429 |
|
| Bangkok Bank NVDR |
|
|
363,071 |
|
|
|
2,288 |
|
| CP ALL |
|
|
606,982 |
|
|
|
700 |
|
| CP Seven Eleven PCL |
|
|
831,722 |
|
|
|
959 |
|
| Electricity Generating |
|
|
40,800 |
|
|
|
172 |
|
| Kasikornbank NVDR |
|
|
435,600 |
|
|
|
2,583 |
|
| Kiatnakin Bank |
|
|
287,544 |
|
|
|
432 |
|
| Krung Thai Bank |
|
|
2,938,600 |
|
|
|
1,747 |
|
| Krung Thai Bank NVDR |
|
|
2,837,982 |
|
|
|
1,687 |
|
| Land and Houses |
|
|
5,849,700 |
|
|
|
1,729 |
|
| PTT |
|
|
283,050 |
|
|
|
3,026 |
|
| Siam Cement NVDR |
|
|
72,000 |
|
|
|
816 |
|
| Siam Makro |
|
|
41,788 |
|
|
|
539 |
|
| Thai Beverage |
|
|
835,068 |
|
|
|
276 |
|
|
|
|
|
|
|
|
|
|
|
|
|
|
|
|
|
23,551 |
|
|
|
|
|
|
|
|
|
|
|
|
|
| Turkey — 2.1% |
|
|
|
|
|
|
|
|
| Anadolu Efes Biracilik Ve Malt Sanayii |
|
|
80,900 |
|
|
|
1,203 |
|
| Aselsan Elektronik Sanayi Ve Ticaret |
|
|
508,810 |
|
|
|
1,842 |
|
| Asya Katilim Bankasi * |
|
|
421,730 |
|
|
|
465 |
|
| EIS Eczacibasi Ilac ve Sinai ve Finansal Yatirimlar Sanayi ve Ticaret |
|
|
158,566 |
|
|
|
164 |
|
| Eregli Demir ve Celik Fabrikalari |
|
|
401,351 |
|
|
|
494 |
|
| Ford Otomotiv Sanayi |
|
|
166,682 |
|
|
|
1,727 |
|
| Koza Altin Isletmeleri |
|
|
55,998 |
|
|
|
1,204 |
|
| Tekfen Holding |
|
|
463,325 |
|
|
|
1,682 |
|
| Tofas Turk Otomobil Fabrikasi |
|
|
121,104 |
|
|
|
612 |
|
| Tupras Turkiye Petrol Rafinerileri |
|
|
30,037 |
|
|
|
686 |
|
| Turkcell Iletisim Hizmetleri * |
|
|
395,987 |
|
|
|
2,415 |
|
| Turkcell Iletisim Hizmetleri ADR * |
|
|
83,435 |
|
|
|
1,263 |
|
| Turkiye Garanti Bankasi |
|
|
490,840 |
|
|
|
2,050 |
|
| Turkiye Sise ve Cam Fabrikalari |
|
|
718,028 |
|
|
|
996 |
|
| Ulker Biskuvi Sanayi |
|
|
73,714 |
|
|
|
313 |
|
| Yapi ve Kredi Bankasi |
|
|
664,463 |
|
|
|
1,584 |
|
|
|
|
|
|
|
|
|
|
|
|
|
|
|
|
|
18,700 |
|
|
|
|
|
|
|
|
|
|
|
|
|
| United Arab Emirates — 0.2% |
|
|
|
|
|
|
|
|
| Dragon Oil |
|
|
181,498 |
|
|
|
1,773 |
|
|
|
|
|
|
|
|
|
|
|
|
|
| United Kingdom — 1.5% |
|
|
|
|
|
|
|
|
| Afren * |
|
|
744,370 |
|
|
|
1,684 |
|
| African Barrick Gold (A) |
|
|
95,430 |
|
|
|
686 |
|
| Anglo American ADR |
|
|
72,740 |
|
|
|
1,066 |
|
| BG Group |
|
|
62,381 |
|
|
|
1,259 |
|
| Hikma Pharmaceuticals (A) |
|
|
103,686 |
|
|
|
1,216 |
|
| JKX Oil & Gas |
|
|
164,060 |
|
|
|
209 |
|
| Old Mutual |
|
|
509,925 |
|
|
|
1,399 |
|
| Petrofac |
|
|
58,035 |
|
|
|
1,495 |
|
| SABMiller |
|
|
42,900 |
|
|
|
1,881 |
|
|
|
|
| 5 |
|
SEI Institutional International Trust / Annual Report / September 30, 2012 |
Schedule of Investments
Emerging Markets Equity Fund
September 30, 2012
|
|
|
|
|
|
|
|
|
| Description |
|
Shares |
|
|
Market Value
($ Thousands) |
|
|
|
|
|
|
|
|
|
|
| Tullow Oil |
|
|
118,471 |
|
|
$ |
2,621 |
|
|
|
|
|
|
|
|
|
|
|
|
|
|
|
|
|
13,516 |
|
|
|
|
|
|
|
|
|
|
|
|
|
| United States — 1.9% |
|
|
|
|
|
|
|
|
| Avon Products |
|
|
212,100 |
|
|
|
3,383 |
|
| Cognizant Technology Solutions, Cl A * |
|
|
28,200 |
|
|
|
1,971 |
|
| EPAM Systems * |
|
|
50,462 |
|
|
|
956 |
|
| First Cash Financial Services * |
|
|
43,900 |
|
|
|
2,020 |
|
| Freeport-McMoRan Copper & Gold |
|
|
50,000 |
|
|
|
1,979 |
|
| Samsonite International (A) |
|
|
1,184,352 |
|
|
|
2,273 |
|
| Yahoo! * |
|
|
264,900 |
|
|
|
4,232 |
|
|
|
|
|
|
|
|
|
|
|
|
|
|
|
|
|
16,814 |
|
|
|
|
|
|
|
|
|
|
| Total Common Stock
(Cost $806,414) ($ Thousands) |
|
|
|
|
|
|
842,437 |
|
|
|
|
|
|
|
|
|
|
|
|
|
| PREFERRED STOCK — 4.0% |
|
|
|
|
|
|
|
|
|
|
|
| Brazil — 4.0% |
|
|
|
|
|
|
|
|
| Banco do Estado do Rio Grande do Sul |
|
|
234,456 |
|
|
|
2,044 |
|
| Bradespar, Cl Preference |
|
|
38,439 |
|
|
|
529 |
|
| Centrais Eletricas Brasileiras ADR, Cl B |
|
|
60,831 |
|
|
|
549 |
|
| Cia Brasileira de Distribuicao Grupo Pao de Acucar, Cl Preference |
|
|
4 |
|
|
|
— |
|
| Cia Brasileira de Distribuicao Grupo Pao de Acucar ADR (A) |
|
|
84,960 |
|
|
|
3,833 |
|
| Cia de Bebidas das Americas ADR (A) |
|
|
96,492 |
|
|
|
3,693 |
|
| Cia Energetica de Minas Gerais |
|
|
81,100 |
|
|
|
983 |
|
| Cia Vale do Rio Doce ADR, Cl B |
|
|
1,393 |
|
|
|
24 |
|
| Itau Unibanco Holding |
|
|
75,427 |
|
|
|
1,141 |
|
| Itau Unibanco Holding ADR |
|
|
227,292 |
|
|
|
3,473 |
|
| Klabin |
|
|
156,914 |
|
|
|
818 |
|
| Marcopolo |
|
|
359,300 |
|
|
|
2,077 |
|
| Petroleo Brasileiro, Cl Preference |
|
|
214,816 |
|
|
|
2,367 |
|
| Petroleo Brasileiro ADR, Cl A (A) |
|
|
362,457 |
|
|
|
7,999 |
|
| Randon Participacoes |
|
|
149,747 |
|
|
|
860 |
|
| Vale ADR, Cl B (A) |
|
|
202,297 |
|
|
|
3,512 |
|
| Vale, Cl A |
|
|
129,714 |
|
|
|
2,253 |
|
|
|
|
|
|
|
|
|
|
| Total Preferred Stock
(Cost $35,746) ($ Thousands) |
|
|
|
|
|
|
36,155 |
|
|
|
|
|
|
|
|
|
|
|
|
| EXCHANGE TRADED FUNDS — 0.7% |
|
|
|
|
|
|
|
|
| Hong Kong — 0.1% |
|
|
|
|
|
|
|
|
| iShares FTSE A50 China Index Fund |
|
|
884,800 |
|
|
|
1,112 |
|
|
|
|
|
|
|
|
|
|
|
|
|
| United States — 0.6% |
|
|
|
|
|
|
|
|
| iShares MSCI Emerging Markets Index Fund |
|
|
124,063 |
|
|
|
5,126 |
|
|
|
|
|
|
|
|
|
|
| Total Exchange Traded Funds
(Cost $6,173) ($ Thousands) |
|
|
|
|
|
|
6,238 |
|
|
|
|
|
|
|
|
|
|
|
|
|
|
|
|
|
|
|
| Description |
|
Shares/Face Amount (1)
(Thousands) |
|
|
Market Value
($ Thousands) |
|
|
|
|
|
|
|
|
|
|
| |
|
Number Of Rights |
|
|
|
|
| RIGHTS — 0.0% |
|
|
|
|
|
|
|
|
|
|
|
| Thailand — 0.0% |
|
|
|
|
|
|
|
|
| Krung Thai Bank,
Expires 10/11/2012 |
|
|
735 |
|
|
$ |
136 |
|
| Krung Thai Bank NVDR,
Expires 10/11/2012 |
|
|
709 |
|
|
|
132 |
|
|
|
|
|
|
|
|
|
|
| Total Rights
(Cost $0) ($ Thousands) |
|
|
|
|
|
|
268 |
|
|
|
|
|
|
|
|
|
|
|
|
|
| DEBENTURE BOND — 0.0% |
|
|
|
|
|
|
|
|
|
|
|
| Brazil — 0.0% |
|
|
|
|
|
|
|
|
| Vale, Ser 1997 |
|
|
|
|
|
|
|
|
| 0.000%, 09/30/2049 (F) |
|
|
8 |
|
|
|
— |
|
|
|
|
|
|
|
|
|
|
| Total Debenture Bond
(Cost $—) ($ Thousands) |
|
|
|
|
|
|
— |
|
|
|
|
|
|
|
|
|
|
|
|
| AFFILIATED PARTNERSHIP — 10.0% |
|
|
|
|
|
|
|
|
| United States — 10.0% |
|
|
|
|
|
|
|
|
| SEI Liquidity Fund, L.P., Cl A |
|
|
|
|
|
|
|
|
| 0.150%†**(G) |
|
|
91,070,119 |
|
|
|
89,808 |
|
|
|
|
|
|
|
|
|
|
| Total Affiliated Partnership
(Cost $91,070) ($ Thousands) |
|
|
|
|
|
|
89,808 |
|
|
|
|
|
|
|
|
|
|
|
|
|
| CASH EQUIVALENT — 0.5% |
|
|
|
|
|
|
|
|
| SEI Daily Income Trust, Prime Obligation Fund |
|
|
|
|
|
|
|
|
| 0.070%†** |
|
|
4,231,824 |
|
|
|
4,232 |
|
|
|
|
|
|
|
|
|
|
| Total Cash Equivalent
(Cost $4,232) ($ Thousands) |
|
|
|
|
|
|
4,232 |
|
|
|
|
|
|
|
|
|
|
|
|
|
| TIME DEPOSITS — 1.2% |
|
|
|
|
|
|
|
|
|
|
|
| United States — 1.2% |
|
|
|
|
|
|
|
|
| Brown Brothers Harriman |
|
|
|
|
|
|
|
|
| 4.150%, 10/01/2012 |
|
ZAR |
842 |
|
|
|
102 |
|
| 0.550%, 10/01/2012 |
|
NOK |
— |
|
|
|
— |
|
| 0.400%, 10/01/2012 |
|
SEK |
— |
|
|
|
— |
|
| 0.185%, 10/01/2012 |
|
CAD |
— |
|
|
|
— |
|
| 0.054%, 10/01/2012 |
|
GBP |
5 |
|
|
|
9 |
|
| 0.030%, 10/01/2012 |
|
|
9,836 |
|
|
|
9,836 |
|
| 0.010%, 10/01/2012 |
|
SGD |
7 |
|
|
|
5 |
|
| 0.005%, 10/01/2012 |
|
HKD |
3,253 |
|
|
|
420 |
|
| 0.005%, 10/01/2012 |
|
CHF |
— |
|
|
|
— |
|
| (0.014)%, 10/01/2012 |
|
EUR |
1 |
|
|
|
1 |
|
| (0.200)%, 10/01/2012 |
|
DKK |
3 |
|
|
|
— |
|
|
|
|
|
|
|
|
|
|
| Total Time Deposits
(Cost $10,373) ($ Thousands) |
|
|
|
|
|
|
10,373 |
|
|
|
|
|
|
|
|
|
|
| Total Investments — 110.0% ,
(Cost $954,008) ($ Thousands) |
|
|
|
|
|
$ |
989,511 |
|
|
|
|
|
|
|
|
|
|
Percentages are based on a Net Assets of $899,730 ($ Thousands).
| * |
|
Non-income producing security. |
| ** |
|
Rate shown is the 7-day effective yield as of September 30, 2012. |
| † |
|
Investment in Affiliated Security (See Note 4). |
| (1) |
|
In U.S. Dollars unless otherwise indicated.
|
|
|
|
| 6 |
|
SEI Institutional International Trust / Annual Report / September 30, 2012 |
Schedule of Investments
Emerging Markets Equity Fund
September 30, 2012
| (A) |
|
This security or a partial position of this security is on loan at September 30, 2012. The total market value of securities on loan at September
30,2012 was $87,300
($ Thousands) (See Note 8). |
| (B) |
|
Securities sold within terms of a private placement memorandum, exempt from registration under Section 144A of the Securities Act of 1933, as amended, and may be sold
only to dealers in that program or other “accredited investors.” These securities have been determined to be liquid under guidelines established by the Board of Trustees. |
| (C) |
|
Security fair valued using methods determined in good faith by the Valuation Committee of the Board of Trustees. The total market value of such securities as
of September 30, 2012 was $5,894 ($ Thousands) and represented 0.7% of Net Assets. |
| (D) |
|
Securities considered illiquid. The total market value of such securities as of September 30, 2012 was $649 ($ Thousands) and
represented 0.1% of Net Assets. |
| (E) |
|
Real Estate Investment Trust. |
| (F) |
|
Variable Rate Security - The rate reported on the Schedule of Investments is the rate in effect as of September 30, 2012. |
| (G) |
|
This security was purchased with cash collateral held from securities on loan (see Note 8). The total value of such securities as of September 30,
2012 was $89,808 ($ Thousands). |
|
| ADR — American Depositary Receipt |
| CAD — Canadian Dollar |
| CHF — Swiss Franc |
| Cl — Class |
| DKK — Danish Krone |
| EUR — Euro |
| FTSE — Financial Times and the London Stock Exchange |
| GBP — British Pound Sterling |
| GDR — Global Depositary Receipt |
| HKD — Hong Kong Dollar |
| L.P. — Limited Partnership |
MSCI — Morgan Stanley Capital International
|
| NOK — Norwegian Krone |
| NVDR — Non-Voting Depositary Receipt |
| SEK — Swedish Krona |
| Ser — Series |
| SGD — Singapore Dollar |
| ZAR — South African Rand |
The following is a summary of the inputs used as of September 30, 2012, in valuing the Fund’s investments and
other financial instruments carried at value ($ Thousands):
|
|
|
|
|
|
|
|
|
|
|
|
|
|
|
|
|
| Investments in Securities |
|
Level 1 |
|
|
Level 2 |
|
|
Level 3(1) |
|
|
Total |
|
| Common Stock |
|
$ |
834,741 |
|
|
$ |
5,894 |
|
|
$ |
1,802 |
|
|
$ |
842,437 |
|
| Preferred Stock |
|
|
36,155 |
|
|
|
— |
|
|
|
— |
|
|
|
36,155 |
|
| Exchange Traded Funds |
|
|
6,238 |
|
|
|
— |
|
|
|
— |
|
|
|
6,238 |
|
| Rights |
|
|
268 |
|
|
|
— |
|
|
|
— |
|
|
|
268 |
|
| Debenture Bond |
|
|
— |
|
|
|
— |
|
|
|
— |
|
|
|
— |
|
| Time Deposits |
|
|
— |
|
|
|
10,373 |
|
|
|
— |
|
|
|
10,373 |
|
| Affiliated Partnership |
|
|
— |
|
|
|
89,808 |
|
|
|
— |
|
|
|
89,808 |
|
| Cash Equivalent |
|
|
4,232 |
|
|
|
— |
|
|
|
— |
|
|
|
4,232 |
|
|
|
|
|
|
|
|
|
|
|
|
|
|
|
|
|
|
| Total Investments in Securities |
|
$ |
881,634 |
|
|
$ |
106,075 |
|
|
$ |
1,802 |
|
|
$ |
989,511 |
|
|
|
|
|
|
|
|
|
|
|
|
|
|
|
|
|
|
(1) A reconciliation of Level 3 investments is presented when the Fund has a significant amount of Level 3 investments at
the beginning and/or end of the period in relation to net assets.
For the year ended September 30, 2012, there were transfers between Level
1 and Level 2 assets and liabilities. The primary reason for changes in the classifications between Level 1 and Level 2 occurs when foreign equity securities are fair valued using other observable market-based inputs in place of the closing exchange
price due to events occurring after the close of the exchange or market on which the investment is principally traded (See Note 2).
For the year
ended September 30, 2012, there were transfers between Level 2 and Level 3 assets and liabilities. The transfer was due to a change in the availability of observable inputs used to determine fair value.
Amounts designated as “—” are $O or have been rounded to $O.
The accompanying notes are an integral part of the financial statements.
|
|
|
| 7 |
|
SEI Institutional International Trust / Annual Report / September 30, 2012 |
Schedule of Investments
International Fixed Income Fund
September 30, 2012
|
|
|
|
|
|
|
|
|
| Description |
|
Face Amount(1)
(Thousands) |
|
|
Market Value
($ Thousands) |
|
|
|
|
|
|
|
|
|
|
| GLOBAL BONDS — 92.6% |
|
|
|
|
|
|
|
|
|
|
|
| Australia — 1.8% |
|
|
|
|
|
|
|
|
| Australia & New Zealand Banking Group MTN |
|
|
|
|
|
|
|
|
| 3.625%, 07/18/2022 |
|
|
300 |
|
|
$ |
435 |
|
| Commonwealth Bank of Australia MTN |
|
|
|
|
|
|
|
|
| 3.000%, 05/03/2022 |
|
|
230 |
|
|
|
320 |
|
| 2.625%, 01/12/2017 |
|
|
245 |
|
|
|
337 |
|
| Government of Australia |
|
|
|
|
|
|
|
|
| 6.000%, 02/15/2017 |
|
|
750 |
|
|
|
894 |
|
| 5.750%, 07/15/2022 |
|
|
700 |
|
|
|
903 |
|
| Government of Australia, Ser 124 |
|
|
|
|
|
|
|
|
| 5.750%, 05/15/2021 |
|
|
1,900 |
|
|
|
2,415 |
|
| Government of Australia, Ser 20CI |
|
|
|
|
|
|
|
|
| 6.076%, 08/20/2020 |
|
|
200 |
|
|
|
406 |
|
| National Australia Bank MTN |
|
|
|
|
|
|
|
|
| 2.625%, 01/13/2017 |
|
|
410 |
|
|
|
563 |
|
| New South Wales Treasury, Ser 13 |
|
|
|
|
|
|
|
|
| 5.250%, 05/01/2013 |
|
|
980 |
|
|
|
1,035 |
|
| Queensland Treasury, Ser 17 |
|
|
|
|
|
|
|
|
| 6.000%, 09/14/2017 |
|
|
780 |
|
|
|
914 |
|
| Suncorp-Metway |
|
|
|
|
|
|
|
|
| 5.125%, 10/27/2014 |
|
GBP |
235 |
|
|
|
398 |
|
| Westpac Banking MTN |
|
|
|
|
|
|
|
|
| 5.625%, 04/29/2018 (A) |
|
GBP |
240 |
|
|
|
392 |
|
|
|
|
|
|
|
|
|
|
|
|
|
|
|
|
|
9,012 |
|
|
|
|
|
|
|
|
|
|
|
|
|
| Austria — 1.2% |
|
|
|
|
|
|
|
|
| Republic of Austria |
|
|
|
|
|
|
|
|
| 4.300%, 09/15/2017 |
|
|
1,420 |
|
|
|
2,132 |
|
| 3.900%, 07/15/2020 |
|
|
75 |
|
|
|
112 |
|
| 3.650%, 04/20/2022 |
|
|
290 |
|
|
|
429 |
|
| 3.200%, 02/20/2017 |
|
|
300 |
|
|
|
427 |
|
| 1.950%, 06/18/2019 |
|
|
1,900 |
|
|
|
2,538 |
|
| Republic of Austria, Ser 97-6 |
|
|
|
|
|
|
|
|
| 6.250%, 07/15/2027 |
|
|
225 |
|
|
|
423 |
|
|
|
|
|
|
|
|
|
|
|
|
|
|
|
|
|
6,061 |
|
|
|
|
|
|
|
|
|
|
|
|
|
| Belgium — 3.8% |
|
|
|
|
|
|
|
|
| Anheuser-Busch InBev MTN |
|
|
|
|
|
|
|
|
| 8.625%, 01/30/2017 |
|
|
200 |
|
|
|
337 |
|
| 2.875%, 09/25/2024 |
|
|
650 |
|
|
|
846 |
|
| Fortis Bank |
|
|
|
|
|
|
|
|
| 4.625%, 10/24/2049 (A) |
|
|
200 |
|
|
|
213 |
|
| Kingdom of Belgium, Ser 44 |
|
|
|
|
|
|
|
|
| 5.000%, 03/28/2035 |
|
|
500 |
|
|
|
816 |
|
| Kingdom of Belgium, Ser 47 |
|
|
|
|
|
|
|
|
| 3.250%, 09/28/2016 |
|
|
7,325 |
|
|
|
10,276 |
|
| Kingdom of Belgium, Ser 48 |
|
|
|
|
|
|
|
|
| 4.000%, 03/28/2022 |
|
|
725 |
|
|
|
1,058 |
|
| Kingdom of Belgium, Ser 49 |
|
|
|
|
|
|
|
|
| 4.000%, 03/28/2017 |
|
|
230 |
|
|
|
333 |
|
| Kingdom of Belgium, Ser 50 |
|
|
|
|
|
|
|
|
| 4.000%, 03/28/2013 |
|
|
3,200 |
|
|
|
4,194 |
|
| Kingdom of Belgium, Ser 58 |
|
|
|
|
|
|
|
|
| 3.750%, 09/28/2020 |
|
|
231 |
|
|
|
332 |
|
| Kingdom of Belgium, Ser 65 |
|
|
|
|
|
|
|
|
| 4.250%, 09/28/2022 |
|
|
125 |
|
|
|
185 |
|
|
|
|
|
|
|
|
|
|
|
|
|
|
|
|
|
18,590 |
|
|
|
|
|
|
|
|
|
|
|
|
|
|
|
|
|
|
|
| Description |
|
Face Amount(1)
(Thousands) |
|
|
Market Value
($ Thousands) |
|
|
|
|
|
|
|
|
|
|
|
|
|
| Brazil — 0.3% |
|
|
|
|
|
|
|
|
| Centrais Eletricas Brasileiras |
|
|
|
|
|
|
|
|
| 6.875%, 07/30/2019 |
|
USD |
150 |
|
|
$ |
179 |
|
| Embraer |
|
|
|
|
|
|
|
|
| 5.150%, 06/15/2022 |
|
USD |
106 |
|
|
|
114 |
|
| Globo Comunicacao e Participacoes |
|
|
|
|
|
|
|
|
| 5.307%, 05/11/2017 (B)(C) |
|
USD |
380 |
|
|
|
413 |
|
| Petrobras International Finance |
|
|
|
|
|
|
|
|
| 5.375%, 01/27/2021 |
|
USD |
250 |
|
|
|
282 |
|
| Vale Overseas |
|
|
|
|
|
|
|
|
| 4.375%, 01/11/2022 |
|
USD |
314 |
|
|
|
330 |
|
|
|
|
|
|
|
|
|
|
|
|
|
|
|
|
|
1,318 |
|
|
|
|
|
|
|
|
|
|
|
|
|
| Canada — 4.6% |
|
|
|
|
|
|
|
|
| Bell Canada MTN |
|
|
|
|
|
|
|
|
| 5.000%, 02/15/2017 |
|
|
270 |
|
|
|
304 |
|
| Canada Housing Trust No. 1 |
|
|
|
|
|
|
|
|
| 4.100%, 12/15/2018 |
|
|
1,390 |
|
|
|
1,602 |
|
| 2.050%, 06/15/2017 |
|
|
2,470 |
|
|
|
2,561 |
|
| CDP Financial |
|
|
|
|
|
|
|
|
| 4.400%, 11/25/2019 (B) |
|
USD |
850 |
|
|
|
977 |
|
| Government of Canada |
|
|
|
|
|
|
|
|
| 5.750%, 06/01/2033 |
|
|
1,300 |
|
|
|
2,074 |
|
| 5.000%, 06/01/2037 |
|
|
1,300 |
|
|
|
1,975 |
|
| 4.250%, 06/01/2018 |
|
|
715 |
|
|
|
841 |
|
| 3.500%, 06/01/2020 |
|
|
3,795 |
|
|
|
4,396 |
|
| 2.750%, 06/01/2022 |
|
|
1,800 |
|
|
|
1,993 |
|
| 2.250%, 08/01/2014 |
|
|
1,000 |
|
|
|
1,038 |
|
| 2.000%, 06/01/2016 |
|
|
1,425 |
|
|
|
1,489 |
|
| 1.500%, 03/01/2017 |
|
|
255 |
|
|
|
262 |
|
| 1.500%, 09/01/2017 |
|
|
825 |
|
|
|
846 |
|
| Nexen |
|
|
|
|
|
|
|
|
| 6.200%, 07/30/2019 |
|
USD |
125 |
|
|
|
151 |
|
| Province of British Columbia |
|
|
|
|
|
|
|
|
| 3.250%, 12/18/2021 |
|
|
1,150 |
|
|
|
1,243 |
|
| Royal Bank of Canada, Ser 2 MTN |
|
|
|
|
|
|
|
|
| 4.625%, 01/22/2018 |
|
EUR |
252 |
|
|
|
381 |
|
| Teck Resources |
|
|
|
|
|
|
|
|
| 2.500%, 02/01/2018 |
|
USD |
89 |
|
|
|
89 |
|
| Toronto-Dominion Bank |
|
|
|
|
|
|
|
|
| 2.200%, 07/29/2015 (B) |
|
USD |
540 |
|
|
|
565 |
|
| TransCanada PipeLines |
|
|
|
|
|
|
|
|
| 2.500%, 08/01/2022 |
|
USD |
300 |
|
|
|
304 |
|
|
|
|
|
|
|
|
|
|
|
|
|
|
|
|
|
23,091 |
|
|
|
|
|
|
|
|
|
|
|
|
|
| China — 0.1% |
|
|
|
|
|
|
|
|
| Talent Yield Investments |
|
|
|
|
|
|
|
|
| 4.500%, 04/25/2022 (B) |
|
USD |
310 |
|
|
|
335 |
|
|
|
|
|
|
|
|
|
|
|
|
|
| Czech Republic — 0.1% |
|
|
|
|
|
|
|
|
| Government of Czech Republic, Ser 51 |
|
|
|
|
|
|
|
|
| 4.000%, 04/11/2017 |
|
|
8,050 |
|
|
|
462 |
|
|
|
|
|
|
|
|
|
|
|
|
|
| Denmark — 1.8% |
|
|
|
|
|
|
|
|
| Danske Bank |
|
|
|
|
|
|
|
|
| 5.375%, 09/29/2021 (A) |
|
GBP |
170 |
|
|
|
246 |
|
| 3.500%, 04/16/2018 |
|
EUR |
155 |
|
|
|
220 |
|
| DONG Energy MTN |
|
|
|
|
|
|
|
|
| 6.500%, 05/07/2019 |
|
EUR |
245 |
|
|
|
397 |
|
| FIH Erhvervsbank |
|
|
|
|
|
|
|
|
| 2.000%, 06/12/2013 (B) |
|
USD |
625 |
|
|
|
632 |
|
|
|
|
| 1 |
|
SEI Institutional International Trust / Annual Report / September 30, 2012 |
Schedule of Investments
International Fixed Income Fund
September 30, 2012
|
|
|
|
|
|
|
|
|
| Description |
|
Face Amount(1)
(Thousands) |
|
|
Market Value
($ Thousands) |
|
|
|
|
|
|
|
|
|
|
| Kingdom of Denmark |
|
|
|
|
|
|
|
|
| 4.500%, 11/15/2039 |
|
|
1,300 |
|
|
$ |
336 |
|
| 4.000%, 11/15/2017 |
|
|
8,915 |
|
|
|
1,807 |
|
| 3.125%, 03/17/2014 |
|
EUR |
500 |
|
|
|
671 |
|
| 3.000%, 11/15/2021 |
|
|
21,800 |
|
|
|
4,329 |
|
|
|
|
|
|
|
|
|
|
|
|
|
|
|
|
|
8,638 |
|
|
|
|
|
|
|
|
|
|
|
|
|
| Finland — 1.2% |
|
|
|
|
|
|
|
|
| Elisa MTN |
|
|
|
|
|
|
|
|
| 2.250%, 10/04/2019 (D) |
|
|
300 |
|
|
|
384 |
|
| Fortum MTN |
|
|
|
|
|
|
|
|
| 2.250%, 09/06/2022 |
|
|
350 |
|
|
|
444 |
|
| Government of Finland |
|
|
|
|
|
|
|
|
| 4.375%, 07/04/2019 |
|
|
400 |
|
|
|
622 |
|
| 3.375%, 04/15/2020 |
|
|
2,550 |
|
|
|
3,755 |
|
| Nordea Bank Finland MTN |
|
|
|
|
|
|
|
|
| 2.375%, 07/17/2017 |
|
|
190 |
|
|
|
260 |
|
| 2.250%, 05/03/2019 |
|
|
170 |
|
|
|
230 |
|
|
|
|
|
|
|
|
|
|
|
|
|
|
|
|
|
5,695 |
|
|
|
|
|
|
|
|
|
|
|
|
|
| France — 5.7% |
|
|
|
|
|
|
|
|
| Arkema |
|
|
|
|
|
|
|
|
| 3.850%, 04/30/2020 |
|
|
200 |
|
|
|
275 |
|
| AXA MTN |
|
|
|
|
|
|
|
|
| 5.250%, 04/16/2040 (A) |
|
|
600 |
|
|
|
707 |
|
| BNP Paribas MTN |
|
|
|
|
|
|
|
|
| 4.730%, 04/12/2049 (A) |
|
|
300 |
|
|
|
328 |
|
| 2.500%, 08/23/2019 |
|
|
350 |
|
|
|
455 |
|
| 2.375%, 09/14/2017 |
|
USD |
445 |
|
|
|
447 |
|
| BPCE SFH MTN |
|
|
|
|
|
|
|
|
| 3.625%, 05/12/2016 |
|
|
100 |
|
|
|
140 |
|
| 2.750%, 02/16/2017 |
|
|
300 |
|
|
|
411 |
|
| Caisse de Refinancement de l’Habitat MTN |
|
|
|
|
|
|
|
|
| 4.500%, 10/25/2017 |
|
|
540 |
|
|
|
805 |
|
| 2.600%, 04/26/2016 |
|
|
65 |
|
|
|
89 |
|
| Cie de Financement Foncier MTN |
|
|
|
|
|
|
|
|
| 4.625%, 09/23/2017 |
|
|
95 |
|
|
|
141 |
|
| 4.625%, 09/23/2017 |
|
|
575 |
|
|
|
853 |
|
| 4.250%, 01/19/2022 |
|
|
300 |
|
|
|
443 |
|
| 4.125%, 10/25/2017 |
|
|
220 |
|
|
|
319 |
|
| 2.500%, 09/16/2015 (B) |
|
USD |
800 |
|
|
|
827 |
|
| Cie de St-Gobain MTN |
|
|
|
|
|
|
|
|
| 6.000%, 05/20/2013 |
|
|
50 |
|
|
|
66 |
|
| Credit Agricole Home Loan SFH MTN |
|
|
|
|
|
|
|
|
| 3.500%, 07/21/2014 |
|
|
200 |
|
|
|
271 |
|
| 3.500%, 06/14/2018 |
|
|
200 |
|
|
|
285 |
|
| 2.875%, 09/09/2016 |
|
|
300 |
|
|
|
413 |
|
| Credit Logement |
|
|
|
|
|
|
|
|
| 1.402%, 03/29/2049 (A)(E) |
|
|
350 |
|
|
|
243 |
|
| 0.852%, 12/15/2049 (A)(E) |
|
|
42 |
|
|
|
32 |
|
| Dexia Credit Local MTN |
|
|
|
|
|
|
|
|
| 2.625%, 01/21/2014 |
|
|
300 |
|
|
|
393 |
|
| 0.927%, 04/29/2014 (A) |
|
USD |
410 |
|
|
|
400 |
|
| Dexia Municipal Agency MTN |
|
|
|
|
|
|
|
|
| 4.500%, 04/27/2015 |
|
|
380 |
|
|
|
522 |
|
| 3.750%, 05/18/2016 |
|
|
225 |
|
|
|
307 |
|
| EDF MTN |
|
|
|
|
|
|
|
|
| 6.500%, 01/26/2019 (B) |
|
USD |
250 |
|
|
|
306 |
|
| 5.500%, 10/17/2041 |
|
GBP |
100 |
|
|
|
178 |
|
| 4.125%, 03/25/2027 |
|
|
100 |
|
|
|
139 |
|
| 4.000%, 11/12/2025 |
|
|
150 |
|
|
|
206 |
|
|
|
|
|
|
|
|
|
|
| Description |
|
Face Amount(1)
(Thousands) |
|
|
Market Value
($ Thousands) |
|
|
|
|
|
|
|
|
|
|
| Eutelsat |
|
|
|
|
|
|
|
|
| 5.000%, 01/14/2019 |
|
|
200 |
|
|
$ |
295 |
|
| French Treasury Note |
|
|
|
|
|
|
|
|
| 1.000%, 07/25/2017 |
|
|
235 |
|
|
|
304 |
|
| 0.750%, 09/25/2014 |
|
|
800 |
|
|
|
1,041 |
|
| Government of France |
|
|
|
|
|
|
|
|
| 5.000%, 10/25/2016 |
|
|
1,760 |
|
|
|
2,656 |
|
| 4.750%, 04/25/2035 |
|
|
815 |
|
|
|
1,331 |
|
| 4.500%, 04/25/2041 |
|
|
1,060 |
|
|
|
1,701 |
|
| 3.250%, 10/25/2021 |
|
|
350 |
|
|
|
494 |
|
| 3.000%, 10/25/2015 |
|
|
3,850 |
|
|
|
5,343 |
|
| 3.000%, 04/25/2022 |
|
|
555 |
|
|
|
764 |
|
| HSBC France MTN |
|
|
|
|
|
|
|
|
| 4.875%, 01/15/2014 |
|
|
250 |
|
|
|
339 |
|
| Iliand |
|
|
|
|
|
|
|
|
| 4.875%, 06/01/2016 |
|
|
300 |
|
|
|
413 |
|
| RCI Banque |
|
|
|
|
|
|
|
|
| 3.400%, 04/11/2014 (B) |
|
USD |
250 |
|
|
|
253 |
|
| Societe Financement de l’Economie Francaise |
|
|
|
|
|
|
|
|
| 3.375%, 05/05/2014 (B) |
|
USD |
905 |
|
|
|
946 |
|
| Societe Generale SCF MTN |
|
|
|
|
|
|
|
|
| 4.000%, 07/07/2016 |
|
|
650 |
|
|
|
928 |
|
| Societe Generale SFH MTN |
|
|
|
|
|
|
|
|
| 3.250%, 06/06/2016 |
|
|
400 |
|
|
|
556 |
|
| Societe Generale MTN |
|
|
|
|
|
|
|
|
| 5.750%, 04/20/2016 (B) |
|
USD |
111 |
|
|
|
115 |
|
| 3.875%, 12/17/2015 |
|
GBP |
100 |
|
|
|
168 |
|
| Vivendi MTN |
|
|
|
|
|
|
|
|
| 7.750%, 01/23/2014 |
|
|
250 |
|
|
|
349 |
|
|
|
|
|
|
|
|
|
|
|
|
|
|
|
|
|
27,997 |
|
|
|
|
|
|
|
|
|
|
|
|
|
| Germany — 11.9% |
|
|
|
|
|
|
|
|
| Bundesobligation |
|
|
|
|
|
|
|
|
| 1.250%, 10/14/2016 |
|
|
2,470 |
|
|
|
3,301 |
|
| 0.500%, 04/07/2017 |
|
|
1,150 |
|
|
|
1,486 |
|
| Bundesobligation Inflation Linked Bond |
|
|
|
|
|
|
|
|
| 2.250%, 04/15/2013 |
|
|
19,144 |
|
|
|
25,089 |
|
| Bundesobligation, Ser 159 |
|
|
|
|
|
|
|
|
| 2.000%, 02/26/2016 |
|
|
95 |
|
|
|
130 |
|
| Bundesrepublik Deutschland |
|
|
|
|
|
|
|
|
| 3.250%, 07/04/2021 |
|
|
1,850 |
|
|
|
2,779 |
|
| 3.000%, 07/04/2020 |
|
|
295 |
|
|
|
434 |
|
| 2.500%, 01/04/2021 |
|
|
437 |
|
|
|
622 |
|
| 2.250%, 09/04/2020 |
|
|
120 |
|
|
|
168 |
|
| 2.000%, 01/04/2022 |
|
|
6,000 |
|
|
|
8,172 |
|
| 1.750%, 07/04/2022 |
|
|
250 |
|
|
|
332 |
|
| Bundesrepublik Deutschland, Ser 00 |
|
|
|
|
|
|
|
|
| 5.500%, 01/04/2031 |
|
|
340 |
|
|
|
660 |
|
| Bundesrepublik Deutschland, Ser 03 |
|
|
|
|
|
|
|
|
| 4.750%, 07/04/2034 |
|
|
460 |
|
|
|
853 |
|
| Bundesrepublik Deutschland, Ser 07 |
|
|
|
|
|
|
|
|
| 4.250%, 07/04/2039 |
|
|
1,185 |
|
|
|
2,152 |
|
| 4.000%, 01/04/2018 |
|
|
25 |
|
|
|
38 |
|
| Bundesrepublik Deutschland, Ser 08 |
|
|
|
|
|
|
|
|
| 4.750%, 07/04/2040 |
|
|
25 |
|
|
|
49 |
|
| 4.250%, 07/04/2018 |
|
|
125 |
|
|
|
193 |
|
|
|
|
| 2 |
|
SEI Institutional International Trust / Annual Report / September 30, 2012 |
Schedule of Investments
International Fixed Income Fund
September 30, 2012
|
|
|
|
|
|
|
|
|
| Description |
|
Face Amount(1)
(Thousands) |
|
|
Market Value
($ Thousands) |
|
|
|
|
|
|
|
|
|
|
| Deutsche Bank MTN |
|
|
|
|
|
|
|
|
| 1.543%, 12/15/2015 (A) |
|
GBP |
280 |
|
|
$ |
416 |
|
| Deutsche Postbank MTN |
|
|
|
|
|
|
|
|
| 3.750%, 02/12/2014 |
|
|
800 |
|
|
|
1,078 |
|
| FMS Wertmanagement |
|
|
|
|
|
|
|
|
| 1.000%, 07/18/2017 |
|
|
1,000 |
|
|
|
1,290 |
|
| Hypothekenbank Frankfurt MTN |
|
|
|
|
|
|
|
|
| 2.875%, 01/19/2016 |
|
|
160 |
|
|
|
220 |
|
| K+S |
|
|
|
|
|
|
|
|
| 5.000%, 09/24/2014 |
|
|
350 |
|
|
|
485 |
|
| KFW MTN |
|
|
|
|
|
|
|
|
| 4.375%, 07/04/2018 |
|
|
915 |
|
|
|
1,395 |
|
| 0.875%, 11/15/2013 |
|
|
1,625 |
|
|
|
2,109 |
|
| Kreditanstalt fuer Wiederaufbau |
|
|
|
|
|
|
|
|
| 4.750%, 08/12/2015 |
|
SEK |
6,000 |
|
|
|
996 |
|
| 4.375%, 10/11/2013 |
|
|
1,050 |
|
|
|
1,410 |
|
| 3.875%, 01/21/2019 |
|
|
575 |
|
|
|
861 |
|
| 3.375%, 08/30/2017 |
|
CHF |
370 |
|
|
|
454 |
|
| Landwirtschaftliche Rentenbank MTN |
|
|
|
|
|
|
|
|
| 3.750%, 02/11/2016 |
|
|
173 |
|
|
|
247 |
|
| Muenchener Rueckversicherungs MTN |
|
|
|
|
|
|
|
|
| 6.250%, 05/26/2042 (A) |
|
|
200 |
|
|
|
281 |
|
| RWE |
|
|
|
|
|
|
|
|
| 7.000%, 10/12/2072 (A) |
|
USD |
224 |
|
|
|
233 |
|
| Volkswagen International Finance |
|
|
|
|
|
|
|
|
| 1.625%, 08/12/2013 (B) |
|
USD |
800 |
|
|
|
808 |
|
|
|
|
|
|
|
|
|
|
|
|
|
|
|
|
|
58,741 |
|
|
|
|
|
|
|
|
|
|
|
|
|
| Indonesia — 0.1% |
|
|
|
|
|
|
|
|
| Pertamina Persero |
|
|
|
|
|
|
|
|
| 6.000%, 05/03/2042 (B) |
|
|
380 |
|
|
|
412 |
|
|
|
|
|
|
|
|
|
|
|
|
|
| Ireland — 0.5% |
|
|
|
|
|
|
|
|
| Bank of Ireland MTN |
|
|
|
|
|
|
|
|
| 4.625%, 04/08/2013 |
|
|
195 |
|
|
|
248 |
|
| GE Capital UK Funding MTN |
|
|
|
|
|
|
|
|
| 4.375%, 07/31/2019 |
|
GBP |
810 |
|
|
|
1,421 |
|
| Governor & of the Bank of Ireland MTN |
|
|
|
|
|
|
|
|
| 4.000%, 01/28/2015 |
|
|
250 |
|
|
|
319 |
|
| Guaranteed Funding, Ser 2009-1 |
|
|
|
|
|
|
|
|
| 2.319%, 02/11/2013 |
|
|
300 |
|
|
|
389 |
|
|
|
|
|
|
|
|
|
|
|
|
|
|
|
|
|
2,377 |
|
|
|
|
|
|
|
|
|
|
|
|
|
| Italy — 4.9% |
|
|
|
|
|
|
|
|
| Edison MTN |
|
|
|
|
|
|
|
|
| 3.875%, 11/10/2017 |
|
|
600 |
|
|
|
826 |
|
| Enel Finance International MTN |
|
|
|
|
|
|
|
|
| 4.875%, 03/11/2020 |
|
|
100 |
|
|
|
131 |
|
| 3.875%, 10/07/2014 (B) |
|
USD |
350 |
|
|
|
360 |
|
| Intesa Sanpaolo MTN |
|
|
|
|
|
|
|
|
| 6.375%, 11/12/2017 (A) |
|
GBP |
300 |
|
|
|
470 |
|
| 4.875%, 07/10/2015 |
|
|
300 |
|
|
|
399 |
|
|
|
|
|
|
|
|
|
|
| Description |
|
Face Amount(1)
(Thousands) |
|
|
Market Value
($ Thousands) |
|
|
|
|
|
|
|
|
|
|
| Italy Buoni Poliennali Del Tesoro |
|
|
|
|
|
|
|
|
| 6.500%, 11/01/2027 |
|
|
500 |
|
|
$ |
693 |
|
| 6.000%, 05/01/2031 |
|
|
500 |
|
|
|
661 |
|
| 5.500%, 09/01/2022 |
|
|
130 |
|
|
|
173 |
|
| 5.000%, 09/01/2040 |
|
|
1,755 |
|
|
|
2,023 |
|
| 5.000%, 03/01/2022 |
|
|
1,500 |
|
|
|
1,938 |
|
| 4.750%, 09/01/2021 |
|
|
3,250 |
|
|
|
4,165 |
|
| 4.750%, 05/01/2017 |
|
|
2,105 |
|
|
|
2,799 |
|
| 4.500%, 03/01/2019 |
|
|
400 |
|
|
|
519 |
|
| 4.250%, 10/15/2012 |
|
|
585 |
|
|
|
753 |
|
| 4.250%, 02/01/2015 |
|
|
2,325 |
|
|
|
3,099 |
|
| 3.750%, 03/01/2021 |
|
|
255 |
|
|
|
307 |
|
| 3.500%, 06/01/2014 |
|
|
1,150 |
|
|
|
1,507 |
|
| Italy Buoni Poliennali Del Tesoro Inflation Linked Bond |
|
|
|
|
|
|
|
|
| 2.100%, 09/15/2021 |
|
|
1,430 |
|
|
|
1,620 |
|
| 2.100%, 09/15/2016 |
|
|
733 |
|
|
|
930 |
|
| UniCredit MTN |
|
|
|
|
|
|
|
|
| 6.375%, 10/16/2018 (A) |
|
USD |
100 |
|
|
|
143 |
|
| 4.875%, 03/07/2017 |
|
|
110 |
|
|
|
144 |
|
| Unione di Banche Italiane MTN |
|
|
|
|
|
|
|
|
| 4.500%, 02/22/2016 |
|
|
200 |
|
|
|
267 |
|
|
|
|
|
|
|
|
|
|
|
|
|
|
|
|
|
23,927 |
|
|
|
|
|
|
|
|
|
|
|
|
|
| Japan — 22.2% |
|
|
|
|
|
|
|
|
| Government of Japan 5 Year Bond, Ser 79 |
|
|
|
|
|
|
|
|
| 0.700%, 12/20/2013 |
|
|
447,300 |
|
|
|
5,791 |
|
| Government of Japan 5 Year Bond, Ser 95 |
|
|
|
|
|
|
|
|
| 0.600%, 03/20/2016 |
|
|
313,950 |
|
|
|
4,102 |
|
| Government of Japan 10 Year Bond, Ser 275 |
|
|
|
|
|
|
|
|
| 1.400%, 12/20/2015 |
|
|
626,600 |
|
|
|
8,385 |
|
| Government of Japan 10 Year Bond, Ser 284 |
|
|
|
|
|
|
|
|
| 1.700%, 12/20/2016 |
|
|
100,000 |
|
|
|
1,369 |
|
| Government of Japan 10 Year Bond, Ser 288 |
|
|
|
|
|
|
|
|
| 1.700%, 09/20/2017 |
|
|
1,277,950 |
|
|
|
17,646 |
|
| Government of Japan 10 Year Bond, Ser 298 |
|
|
|
|
|
|
|
|
| 1.300%, 12/20/2018 |
|
|
321,150 |
|
|
|
4,377 |
|
| Government of Japan 10 Year Bond, Ser 301 |
|
|
|
|
|
|
|
|
| 1.500%, 06/20/2019 |
|
|
235,300 |
|
|
|
3,248 |
|
| Government of Japan 10 Year Bond, Ser 303 |
|
|
|
|
|
|
|
|
| 1.400%, 09/20/2019 |
|
|
74,050 |
|
|
|
1,016 |
|
| Government of Japan 10 Year Bond, Ser 308 |
|
|
|
|
|
|
|
|
| 1.300%, 06/20/2020 |
|
|
1,016,000 |
|
|
|
13,849 |
|
| Government of Japan 10 Year Bond, Ser 316 |
|
|
|
|
|
|
|
|
| 1.100%, 06/20/2021 |
|
|
165,550 |
|
|
|
2,212 |
|
| Government of Japan 10 Year Bond, Ser 318 |
|
|
|
|
|
|
|
|
| 1.000%, 09/20/2021 |
|
|
225,000 |
|
|
|
2,979 |
|
| Government of Japan 10 Year Bond, Ser 321 |
|
|
|
|
|
|
|
|
| 1.000%, 03/20/2022 |
|
|
12,000 |
|
|
|
158 |
|
|
|
|
| 3 |
|
SEI Institutional International Trust / Annual Report / September 30, 2012 |
Schedule of Investments
International Fixed Income Fund
September 30, 2012
|
|
|
|
|
|
|
|
|
| Description |
|
Face Amount(1)
(Thousands) |
|
|
Market Value
($ Thousands) |
|
|
|
|
|
|
|
|
|
|
| Government of Japan 20 Year Bond, Ser 106 |
|
|
|
|
|
|
|
|
| 2.200%, 09/20/2028 |
|
|
67,150 |
|
|
$ |
962 |
|
| Government of Japan 20 Year Bond, Ser 109 |
|
|
|
|
|
|
|
|
| 1.900%, 03/20/2029 |
|
|
39,000 |
|
|
|
535 |
|
| Government of Japan 20 Year Bond, Ser 112 |
|
|
|
|
|
|
|
|
| 2.100%, 06/20/2029 |
|
|
910,000 |
|
|
|
12,789 |
|
| Government of Japan 20 Year Bond, Ser 128 |
|
|
|
|
|
|
|
|
| 1.900%, 06/20/2031 |
|
|
15,000 |
|
|
|
202 |
|
| Government of Japan 20 Year Bond, Ser 48 |
|
|
|
|
|
|
|
|
| 2.500%, 12/21/2020 |
|
|
629,450 |
|
|
|
9,340 |
|
| Government of Japan 20 Year Bond, Ser 55 |
|
|
|
|
|
|
|
|
| 2.000%, 03/21/2022 |
|
|
257,000 |
|
|
|
3,691 |
|
| Government of Japan 20 Year Bond, Ser 99 |
|
|
|
|
|
|
|
|
| 2.100%, 12/20/2027 |
|
|
538,250 |
|
|
|
7,638 |
|
| Government of Japan 30 Year Bond, Ser 29 |
|
|
|
|
|
|
|
|
| 2.400%, 09/20/2038 |
|
|
103,250 |
|
|
|
1,489 |
|
| Government of Japan 30 Year Bond, Ser 30 |
|
|
|
|
|
|
|
|
| 2.300%, 03/20/2039 |
|
|
294,150 |
|
|
|
4,158 |
|
| Government of Japan 30 Year Bond, Ser 33 |
|
|
|
|
|
|
|
|
| 2.000%, 09/20/2040 |
|
|
167,000 |
|
|
|
2,212 |
|
| Government of Japan 30 Year Bond, Ser 34 |
|
|
|
|
|
|
|
|
| 2.200%, 03/20/2041 |
|
|
30,000 |
|
|
|
414 |
|
| Government of Japan 30 Year Bond, Ser 36 |
|
|
|
|
|
|
|
|
| 2.000%, 03/20/2042 |
|
|
10,000 |
|
|
|
132 |
|
| Japan Finance Organization for Municipalities |
|
|
|
|
|
|
|
|
| 4.500%, 05/27/2014 |
|
EUR |
450 |
|
|
|
615 |
|
| ORIX |
|
|
|
|
|
|
|
|
| 4.710%, 04/27/2015 |
|
USD |
135 |
|
|
|
144 |
|
|
|
|
|
|
|
|
|
|
|
|
|
|
|
|
|
109,453 |
|
|
|
|
|
|
|
|
|
|
|
|
|
| Jersey — 0.1% |
|
|
|
|
|
|
|
|
| BAA Funding MTN |
|
|
|
|
|
|
|
|
| 7.125%, 02/14/2024 |
|
|
150 |
|
|
|
281 |
|
| Gatwick Funding MTN |
|
|
|
|
|
|
|
|
| 5.750%, 01/23/2037 |
|
|
250 |
|
|
|
434 |
|
|
|
|
|
|
|
|
|
|
|
|
|
|
|
|
|
715 |
|
|
|
|
|
|
|
|
|
|
|
|
|
| Malaysia — 0.2% |
|
|
|
|
|
|
|
|
| Government of Malaysia |
|
|
|
|
|
|
|
|
| 5.734%, 07/30/2019 |
|
|
900 |
|
|
|
335 |
|
| Petronas Capital |
|
|
|
|
|
|
|
|
| 5.250%, 08/12/2019 (B) |
|
USD |
410 |
|
|
|
485 |
|
|
|
|
|
|
|
|
|
|
|
|
|
|
|
|
|
820 |
|
|
|
|
|
|
|
|
|
|
|
|
|
| Mexico — 1.1% |
|
|
|
|
|
|
|
|
| America Movil |
|
|
|
|
|
|
|
|
| 3.000%, 07/12/2021 |
|
EUR |
225 |
|
|
|
295 |
|
| Mexican Bonos, Ser M10 |
|
|
|
|
|
|
|
|
| 7.750%, 12/14/2017 |
|
|
24,085 |
|
|
|
2,108 |
|
|
|
|
|
|
|
|
|
|
| Description |
|
Face Amount(1)
(Thousands) |
|
|
Market Value
($ Thousands) |
|
|
|
|
|
|
|
|
|
|
| Mexican Bonos, Ser MI10 |
|
|
|
|
|
|
|
|
| 9.000%, 12/20/2012 |
|
|
40,000 |
|
|
$ |
3,141 |
|
|
|
|
|
|
|
|
|
|
|
|
|
|
|
|
|
5,544 |
|
|
|
|
|
|
|
|
|
|
|
|
|
| Netherlands — 4.3% |
|
|
|
|
|
|
|
|
| ABN Amro Bank MTN |
|
|
|
|
|
|
|
|
| 4.875%, 01/16/2019 |
|
GBP |
200 |
|
|
|
352 |
|
| 3.750%, 07/15/2014 |
|
|
750 |
|
|
|
1,022 |
|
| Akzo Nobel MTN |
|
|
|
|
|
|
|
|
| 8.000%, 04/06/2016 |
|
GBP |
205 |
|
|
|
396 |
|
| Alliander MTN |
|
|
|
|
|
|
|
|
| 2.875%, 06/14/2024 |
|
|
200 |
|
|
|
265 |
|
| Allianz Finance II MTN |
|
|
|
|
|
|
|
|
| 3.500%, 02/14/2022 |
|
|
300 |
|
|
|
419 |
|
| BMW Finance MTN |
|
|
|
|
|
|
|
|
| 3.375%, 12/14/2018 |
|
GBP |
250 |
|
|
|
429 |
|
| Cooperatieve Centrale Raiffeisen-Boerenleenbank MTN |
|
|
|
|
|
|
|
|
| 4.125%, 01/12/2021 |
|
|
230 |
|
|
|
331 |
|
| 4.000%, 01/11/2022 |
|
|
125 |
|
|
|
178 |
|
| Daimler International Finance BV MTN |
|
|
|
|
|
|
|
|
| 7.875%, 01/16/2014 |
|
|
575 |
|
|
|
807 |
|
| Deutsche Telekom International Finance MTN |
|
|
|
|
|
|
|
|
| 6.500%, 04/08/2022 |
|
GBP |
90 |
|
|
|
183 |
|
| Diageo Capital MTN |
|
|
|
|
|
|
|
|
| 5.500%, 07/01/2013 |
|
|
550 |
|
|
|
734 |
|
| E.ON International Finance |
|
|
|
|
|
|
|
|
| 5.800%, 04/30/2018 (B) |
|
USD |
150 |
|
|
|
181 |
|
| EDP Finance BV MTN |
|
|
|
|
|
|
|
|
| 5.750%, 09/21/2017 |
|
|
200 |
|
|
|
254 |
|
| Hit Finance |
|
|
|
|
|
|
|
|
| 5.750%, 03/09/2018 |
|
|
300 |
|
|
|
401 |
|
| ING Bank MTN |
|
|
|
|
|
|
|
|
| 3.375%, 03/23/2017 |
|
|
125 |
|
|
|
177 |
|
| 3.375%, 03/03/2014 |
|
|
500 |
|
|
|
671 |
|
| 1.109%, 05/23/2016 (A) |
|
USD |
450 |
|
|
|
419 |
|
| ING Verzekeringen |
|
|
|
|
|
|
|
|
| 2.088%, 06/21/2021 (A) |
|
|
860 |
|
|
|
1,062 |
|
| Kingdom of Netherlands |
|
|
|
|
|
|
|
|
| 4.500%, 07/15/2017 |
|
|
500 |
|
|
|
758 |
|
| 4.000%, 07/15/2018 |
|
|
185 |
|
|
|
278 |
|
| 4.000%, 01/15/2037 |
|
|
300 |
|
|
|
499 |
|
| 3.500%, 07/15/2020 |
|
|
485 |
|
|
|
721 |
|
| 2.250%, 07/15/2022 |
|
|
4,305 |
|
|
|
5,804 |
|
| Koninklijke KPN |
|
|
|
|
|
|
|
|
| 3.250%, 02/01/2021 |
|
|
200 |
|
|
|
261 |
|
| LeasePlan MTN |
|
|
|
|
|
|
|
|
| 3.250%, 05/22/2014 |
|
|
1,040 |
|
|
|
1,402 |
|
| Linde Finance MTN |
|
|
|
|
|
|
|
|
| 3.875%, 06/01/2021 |
|
|
450 |
|
|
|
663 |
|
| LyondellBasell Industries |
|
|
|
|
|
|
|
|
| 5.750%, 04/15/2024 |
|
USD |
230 |
|
|
|
262 |
|
| NIBC Bank MTN |
|
|
|
|
|
|
|
|
| 3.500%, 04/07/2014 |
|
|
97 |
|
|
|
131 |
|
| Petrobras Global Finance BV |
|
|
|
|
|
|
|
|
| 4.250%, 10/02/2023 (D) |
|
|
153 |
|
|
|
198 |
|
| RWE Finance MTN |
|
|
|
|
|
|
|
|
| 5.000%, 02/10/2015 |
|
|
500 |
|
|
|
704 |
|
| SNS Bank MTN |
|
|
|
|
|
|
|
|
| 3.500%, 03/10/2014 |
|
|
500 |
|
|
|
672 |
|
|
|
|
| 4 |
|
SEI Institutional International Trust / Annual Report / September 30, 2012 |
Schedule of Investments
International Fixed Income Fund
September 30, 2012
|
|
|
|
|
|
|
|
|
| Description |
|
Face Amount(1)
(Thousands) |
|
|
Market Value
($ Thousands) |
|
|
|
|
|
|
|
|
|
|
| UPCB Finance |
|
|
|
|
|
|
|
|
| 7.625%, 01/15/2020 |
|
|
250 |
|
|
$ |
345 |
|
|
|
|
|
|
|
|
|
|
|
|
|
|
|
|
|
20,979 |
|
|
|
|
|
|
|
|
|
|
|
|
|
| New Zealand — 0.3% |
|
|
|
|
|
|
|
|
| Government of New Zealand |
|
|
|
|
|
|
|
|
| 5.500%, 04/15/2023 |
|
|
1,650 |
|
|
|
1,612 |
|
|
|
|
|
|
|
|
|
|
|
|
|
| Norway — 0.4% |
|
|
|
|
|
|
|
|
| DnB Bank MTN |
|
|
|
|
|
|
|
|
| 4.750%, 03/08/2022 |
|
EUR |
120 |
|
|
|
163 |
|
| DnB Boligkreditt MTN |
|
|
|
|
|
|
|
|
| 2.750%, 04/20/2015 |
|
EUR |
625 |
|
|
|
849 |
|
| 2.375%, 04/11/2017 |
|
EUR |
224 |
|
|
|
306 |
|
| Eksportfinans |
|
|
|
|
|
|
|
|
| 2.375%, 05/25/2016 |
|
USD |
200 |
|
|
|
185 |
|
| 2.000%, 09/15/2015 |
|
USD |
20 |
|
|
|
19 |
|
| Government of Norway |
|
|
|
|
|
|
|
|
| 4.500%, 05/22/2019 |
|
|
1,150 |
|
|
|
235 |
|
| Sparebank 1 Boligkreditt MTN |
|
|
|
|
|
|
|
|
| 2.375%, 11/22/2016 |
|
EUR |
170 |
|
|
|
232 |
|
| Yara International |
|
|
|
|
|
|
|
|
| 7.875%, 06/11/2019 (B) |
|
USD |
185 |
|
|
|
235 |
|
|
|
|
|
|
|
|
|
|
|
|
|
|
|
|
|
2,224 |
|
|
|
|
|
|
|
|
|
|
|
|
|
| Poland — 0.3% |
|
|
|
|
|
|
|
|
| Republic of Poland |
|
|
|
|
|
|
|
|
| 5.125%, 04/21/2021 |
|
|
135 |
|
|
|
157 |
|
| 5.000%, 03/23/2022 |
|
|
380 |
|
|
|
441 |
|
| 5.000%, 04/25/2016 |
|
|
3,700 |
|
|
|
1,187 |
|
| Republic of Poland, Ser E MTN |
|
|
|
|
|
|
|
|
| 4.200%, 04/15/2020 |
|
EUR |
60 |
|
|
|
86 |
|
|
|
|
|
|
|
|
|
|
|
|
|
|
|
|
|
1,871 |
|
|
|
|
|
|
|
|
|
|
|
|
|
| Qatar — 0.1% |
|
|
|
|
|
|
|
|
| State of Qatar |
|
|
|
|
|
|
|
|
| 4.500%, 01/20/2022 (B) |
|
USD |
390 |
|
|
|
441 |
|
|
|
|
|
|
|
|
|
|
|
|
|
| Russia — 0.3% |
|
|
|
|
|
|
|
|
| Gazprom Via Gaz Capital MTN |
|
|
|
|
|
|
|
|
| 6.580%, 10/31/2013 |
|
GBP |
240 |
|
|
|
404 |
|
| 3.755%, 03/15/2017 |
|
|
400 |
|
|
|
530 |
|
| Russian Agricultural Bank Via RSHB Capital |
|
|
|
|
|
|
|
|
| 7.750%, 05/29/2018 (B) |
|
USD |
335 |
|
|
|
395 |
|
|
|
|
|
|
|
|
|
|
|
|
|
|
|
|
|
1,329 |
|
|
|
|
|
|
|
|
|
|
|
|
|
| Singapore — 0.8% |
|
|
|
|
|
|
|
|
| Government of Singapore |
|
|
|
|
|
|
|
|
| 4.000%, 09/01/2018 |
|
|
495 |
|
|
|
482 |
|
| 3.125%, 09/01/2022 |
|
|
2,805 |
|
|
|
2,635 |
|
| 2.375%, 04/01/2017 |
|
|
425 |
|
|
|
376 |
|
| Temasek Financial I |
|
|
|
|
|
|
|
|
| 2.375%, 01/23/2023 (B) |
|
USD |
495 |
|
|
|
495 |
|
|
|
|
|
|
|
|
|
|
|
|
|
|
|
|
|
3,988 |
|
|
|
|
|
|
|
|
|
|
|
|
|
| South Africa — 0.7% |
|
|
|
|
|
|
|
|
| Republic of South Africa, Ser R203 |
|
|
|
|
|
|
|
|
| 8.250%, 09/15/2017 |
|
|
24,405 |
|
|
|
3,259 |
|
|
|
|
|
|
|
|
|
|
|
|
|
| South Korea — 0.6% |
|
|
|
|
|
|
|
|
| Korea National Oil |
|
|
|
|
|
|
|
|
| 3.125%, 04/03/2017 (B) |
|
USD |
540 |
|
|
|
567 |
|
|
|
|
|
|
|
|
|
|
| Description |
|
Face Amount(1)
(Thousands) |
|
|
Market Value
($ Thousands) |
|
|
|
|
|
|
|
|
|
|
| Korea Treasury Bond |
|
|
|
|
|
|
|
|
| 4.250%, 06/10/2021 |
|
|
1,009,870 |
|
|
$ |
994 |
|
| 3.500%, 09/10/2016 |
|
|
1,380,800 |
|
|
|
1,271 |
|
|
|
|
|
|
|
|
|
|
|
|
|
|
|
|
|
2,832 |
|
|
|
|
|
|
|
|
|
|
|
|
|
| Spain — 2.1% |
|
|
|
|
|
|
|
|
| Banco Bilbao Vizcaya Argentaria |
|
|
|
|
|
|
|
|
| 4.375%, 10/20/2019 (A) |
|
|
100 |
|
|
|
108 |
|
| 4.125%, 01/13/2014 |
|
|
150 |
|
|
|
196 |
|
| Banco Santander |
|
|
|
|
|
|
|
|
| 4.625%, 01/20/2016 |
|
|
300 |
|
|
|
399 |
|
| Bankia MTN |
|
|
|
|
|
|
|
|
| 5.750%, 06/29/2016 |
|
|
400 |
|
|
|
480 |
|
| 4.250%, 05/25/2018 |
|
|
150 |
|
|
|
161 |
|
| CaixaBank |
|
|
|
|
|
|
|
|
| 5.125%, 04/27/2016 |
|
|
200 |
|
|
|
261 |
|
| Government of Spain |
|
|
|
|
|
|
|
|
| 5.850%, 01/31/2022 |
|
|
150 |
|
|
|
191 |
|
| 5.500%, 04/30/2021 |
|
|
1,770 |
|
|
|
2,212 |
|
| 4.750%, 07/30/2014 |
|
|
925 |
|
|
|
1,217 |
|
| 4.700%, 07/30/2041 |
|
|
995 |
|
|
|
962 |
|
| 4.600%, 07/30/2019 |
|
|
155 |
|
|
|
190 |
|
| 4.200%, 01/31/2037 |
|
|
190 |
|
|
|
172 |
|
| 4.000%, 04/30/2020 |
|
|
285 |
|
|
|
331 |
|
| 3.800%, 01/31/2017 |
|
|
420 |
|
|
|
519 |
|
| 3.300%, 10/31/2014 |
|
|
475 |
|
|
|
608 |
|
| Instituto de Credito Oficial MTN |
|
|
|
|
|
|
|
|
| 2.375%, 03/04/2013 (B) |
|
USD |
200 |
|
|
|
199 |
|
| Santander International Debt SAU MTN |
|
|
|
|
|
|
|
|
| 4.625%, 03/21/2016 |
|
|
700 |
|
|
|
898 |
|
| Santander Issuances, Ser 24 |
|
|
|
|
|
|
|
|
| 7.300%, 07/27/2019 (A) |
|
GBP |
400 |
|
|
|
602 |
|
| Telefonica Emisiones MTN |
|
|
|
|
|
|
|
|
| 5.811%, 09/05/2017 |
|
|
300 |
|
|
|
406 |
|
| 5.597%, 03/12/2020 |
|
GBP |
100 |
|
|
|
159 |
|
| 4.375%, 02/02/2016 |
|
|
375 |
|
|
|
490 |
|
|
|
|
|
|
|
|
|
|
|
|
|
|
|
|
|
10,761 |
|
|
|
|
|
|
|
|
|
|
|
|
|
| Supra-National — 0.3% |
|
|
|
|
|
|
|
|
| European Investment Bank MTN |
|
|
|
|
|
|
|
|
| 2.750%, 09/15/2021 |
|
|
1,000 |
|
|
|
1,363 |
|
|
|
|
|
|
|
|
|
|
|
|
|
| Sweden — 1.6% |
|
|
|
|
|
|
|
|
| Akzo Nobel Sweden Finance MTN |
|
|
|
|
|
|
|
|
| 2.625%, 07/27/2022 |
|
EUR |
150 |
|
|
|
191 |
|
| Kingdom of Sweden, Ser 1041 |
|
|
|
|
|
|
|
|
| 6.750%, 05/05/2014 |
|
|
5,970 |
|
|
|
997 |
|
| Kingdom of Sweden, Ser 1049 |
|
|
|
|
|
|
|
|
| 4.500%, 08/12/2015 |
|
|
5,050 |
|
|
|
850 |
|
| Kingdom of Sweden, Ser 1051 |
|
|
|
|
|
|
|
|
| 3.750%, 08/12/2017 |
|
|
5,295 |
|
|
|
913 |
|
| Kommuninvest I Sverige, Ser 1508 MTN |
|
|
|
|
|
|
|
|
| 2.750%, 08/12/2015 |
|
|
5,300 |
|
|
|
836 |
|
| Nordea Bank MTN |
|
|
|
|
|
|
|
|
| 4.500%, 05/12/2014 |
|
EUR |
100 |
|
|
|
137 |
|
| 4.000%, 03/29/2021 |
|
EUR |
255 |
|
|
|
334 |
|
| Skandinaviska Enskilda Banken MTN |
|
|
|
|
|
|
|
|
| 4.000%, 09/12/2022 (A) |
|
EUR |
190 |
|
|
|
247 |
|
| Stadshypotek MTN |
|
|
|
|
|
|
|
|
| 3.750%, 12/12/2013 |
|
EUR |
350 |
|
|
|
469 |
|
|
|
|
| 5 |
|
SEI Institutional International Trust / Annual Report / September 30, 2012 |
Schedule of Investments
International Fixed Income Fund
September 30, 2012
|
|
|
|
|
|
|
|
|
| Description |
|
Face Amount(1)
(Thousands) |
|
|
Market Value
($ Thousands) |
|
|
|
|
|
|
|
|
|
|
| Svenska Handelsbanken MTN |
|
|
|
|
|
|
|
|
| 2.875%, 04/04/2017 |
|
USD |
250 |
|
|
$ |
263 |
|
| 0.670%, 10/19/2017 (A) |
|
EUR |
500 |
|
|
|
642 |
|
| Swedbank Hypotek |
|
|
|
|
|
|
|
|
| 3.625%, 10/05/2016 |
|
EUR |
250 |
|
|
|
356 |
|
| Swedbank |
|
|
|
|
|
|
|
|
| 7.375%, 06/26/2018 (A) |
|
EUR |
150 |
|
|
|
200 |
|
| 3.375%, 05/27/2014 |
|
EUR |
500 |
|
|
|
676 |
|
| Telefonaktiebolaget LM Ericsson |
|
|
|
|
|
|
|
|
| 4.125%, 05/15/2022 |
|
USD |
465 |
|
|
|
479 |
|
| Volvo Treasury |
|
|
|
|
|
|
|
|
| 5.950%, 04/01/2015 (B) |
|
USD |
145 |
|
|
|
159 |
|
|
|
|
|
|
|
|
|
|
|
|
|
|
|
|
|
7,749 |
|
|
|
|
|
|
|
|
|
|
|
|
|
| Switzerland — 1.1% |
|
|
|
|
|
|
|
|
| Credit Suisse MTN |
|
|
|
|
|
|
|
|
| 4.750%, 08/05/2019 |
|
EUR |
400 |
|
|
|
601 |
|
| 2.875%, 09/24/2015 |
|
EUR |
220 |
|
|
|
297 |
|
| Glencore Finance Europe MTN |
|
|
|
|
|
|
|
|
| 7.125%, 04/23/2015 |
|
EUR |
300 |
|
|
|
435 |
|
| 5.250%, 03/22/2017 |
|
EUR |
300 |
|
|
|
423 |
|
| 4.125%, 04/03/2018 |
|
EUR |
300 |
|
|
|
407 |
|
| Government of Switzerland |
|
|
|
|
|
|
|
|
| 2.000%, 04/28/2021 |
|
|
1,070 |
|
|
|
1,290 |
|
| Novartis Finance MTN |
|
|
|
|
|
|
|
|
| 4.250%, 06/15/2016 |
|
EUR |
375 |
|
|
|
543 |
|
| UBS |
|
|
|
|
|
|
|
|
| 6.625%, 04/11/2018 |
|
GBP |
150 |
|
|
|
291 |
|
| 6.375%, 07/20/2016 |
|
GBP |
160 |
|
|
|
296 |
|
| 5.875%, 12/20/2017 |
|
USD |
425 |
|
|
|
503 |
|
| 4.280%, 04/29/2049 (A) |
|
EUR |
200 |
|
|
|
231 |
|
|
|
|
|
|
|
|
|
|
|
|
|
|
|
|
|
5,317 |
|
|
|
|
|
|
|
|
|
|
|
|
|
| Turkey — 0.3% |
|
|
|
|
|
|
|
|
| Republic of Turkey |
|
|
|
|
|
|
|
|
| 9.000%, 01/27/2016 |
|
TRY |
2,750 |
|
|
|
1,594 |
|
|
|
|
|
|
|
|
|
|
|
|
|
| United Arab Emirates — 0.1% |
|
|
|
|
|
|
|
|
| IPIC GMTN MTN |
|
|
|
|
|
|
|
|
| 6.875%, 03/14/2026 |
|
|
100 |
|
|
|
197 |
|
| 5.875%, 03/14/2021 |
|
|
125 |
|
|
|
187 |
|
|
|
|
|
|
|
|
|
|
|
|
|
|
|
|
|
384 |
|
|
|
|
|
|
|
|
|
|
|
|
|
| United Kingdom — 11.9% |
|
|
|
|
|
|
|
|
| Abbey National Treasury Services MTN |
|
|
|
|
|
|
|
|
| 5.500%, 06/18/2014 |
|
|
775 |
|
|
|
1,309 |
|
| 5.250%, 02/16/2029 |
|
|
450 |
|
|
|
877 |
|
| 5.125%, 04/14/2021 |
|
|
300 |
|
|
|
571 |
|
| 4.250%, 04/12/2021 |
|
EUR |
350 |
|
|
|
517 |
|
| 3.625%, 09/08/2016 |
|
EUR |
300 |
|
|
|
421 |
|
| 3.375%, 06/08/2015 |
|
EUR |
500 |
|
|
|
685 |
|
| Anglian Water Services Financing, Ser A5 MTN |
|
|
|
|
|
|
|
|
| 6.293%, 07/30/2030 |
|
|
500 |
|
|
|
1,067 |
|
| Aviva MTN |
|
|
|
|
|
|
|
|
| 6.875%, 05/22/2038 (A) |
|
EUR |
195 |
|
|
|
243 |
|
| Bank of Scotland MTN |
|
|
|
|
|
|
|
|
| 4.750%, 06/08/2022 |
|
EUR |
290 |
|
|
|
450 |
|
| 4.625%, 06/08/2017 |
|
EUR |
275 |
|
|
|
407 |
|
|
|
|
|
|
|
|
|
|
| Description |
|
Face Amount(1)
(Thousands) |
|
|
Market Value
($ Thousands) |
|
|
|
|
|
|
|
|
|
|
| Barclays Bank MTN |
|
|
|
|
|
|
|
|
| 6.750%, 01/16/2023 (A) |
|
|
350 |
|
|
$ |
579 |
|
| 5.000%, 09/22/2016 |
|
USD |
125 |
|
|
|
139 |
|
| 4.875%, 12/29/2049 (A) |
|
EUR |
200 |
|
|
|
175 |
|
| 4.500%, 03/04/2019 (A) |
|
EUR |
125 |
|
|
|
154 |
|
| 4.250%, 01/12/2022 |
|
|
400 |
|
|
|
735 |
|
| 4.000%, 01/20/2017 |
|
EUR |
200 |
|
|
|
284 |
|
| BAT International Finance MTN |
|
|
|
|
|
|
|
|
| 7.250%, 03/12/2024 |
|
|
250 |
|
|
|
546 |
|
| 5.375%, 06/29/2017 |
|
EUR |
425 |
|
|
|
644 |
|
| Bishopsgate Asset Finance |
|
|
|
|
|
|
|
|
| 4.808%, 08/14/2044 |
|
|
194 |
|
|
|
313 |
|
| BP Capital Markets MTN |
|
|
|
|
|
|
|
|
| 3.830%, 10/06/2017 |
|
EUR |
350 |
|
|
|
501 |
|
| 2.994%, 02/18/2019 |
|
EUR |
300 |
|
|
|
411 |
|
| British American Tobacco Holdings MTN |
|
|
|
|
|
|
|
|
| 4.000%, 07/07/2020 |
|
|
100 |
|
|
|
145 |
|
| British Telecommunications |
|
|
|
|
|
|
|
|
| 8.750%, 12/07/2016 |
|
|
165 |
|
|
|
334 |
|
| 5.750%, 12/07/2028 |
|
|
411 |
|
|
|
791 |
|
| Centrica MTN |
|
|
|
|
|
|
|
|
| 4.375%, 03/13/2029 |
|
|
300 |
|
|
|
528 |
|
| 4.250%, 09/12/2044 |
|
|
200 |
|
|
|
315 |
|
| Coventry Building Society MTN |
|
|
|
|
|
|
|
|
| 4.625%, 04/19/2018 |
|
|
230 |
|
|
|
424 |
|
| Direct Line Insurance Group |
|
|
|
|
|
|
|
|
| 9.250%, 04/27/2042 (A) |
|
|
100 |
|
|
|
180 |
|
| Eastern Power Networks MTN |
|
|
|
|
|
|
|
|
| 6.000%, 11/12/2036 |
|
|
160 |
|
|
|
323 |
|
| 4.750%, 09/30/2021 |
|
|
100 |
|
|
|
182 |
|
| ENW Finance MTN |
|
|
|
|
|
|
|
|
| 6.125%, 07/21/2021 |
|
|
350 |
|
|
|
687 |
|
| Experian Finance MTN |
|
|
|
|
|
|
|
|
| 4.750%, 11/23/2018 |
|
|
300 |
|
|
|
545 |
|
| FCE Bank MTN |
|
|
|
|
|
|
|
|
| 5.125%, 11/16/2015 |
|
|
200 |
|
|
|
344 |
|
| 4.825%, 02/15/2017 |
|
|
200 |
|
|
|
342 |
|
| First Hydro Finance |
|
|
|
|
|
|
|
|
| 9.000%, 07/31/2021 |
|
|
220 |
|
|
|
419 |
|
| Great Rolling Stock MTN |
|
|
|
|
|
|
|
|
| 6.250%, 07/27/2020 |
|
|
300 |
|
|
|
576 |
|
| HSBC Bank |
|
|
|
|
|
|
|
|
| 3.100%, 05/24/2016 (B) |
|
USD |
261 |
|
|
|
275 |
|
| HSBC Holdings MTN |
|
|
|
|
|
|
|
|
| 9.875%, 04/08/2018 (A) |
|
|
80 |
|
|
|
134 |
|
| 6.500%, 05/20/2024 |
|
|
250 |
|
|
|
519 |
|
| 4.000%, 03/30/2022 |
|
USD |
145 |
|
|
|
156 |
|
| Imperial Tobacco Finance MTN |
|
|
|
|
|
|
|
|
| 8.375%, 02/17/2016 |
|
EUR |
75 |
|
|
|
118 |
|
| 7.750%, 06/24/2019 |
|
|
600 |
|
|
|
1,250 |
|
| 7.250%, 09/15/2014 |
|
EUR |
150 |
|
|
|
216 |
|
| Legal & General Group MTN |
|
|
|
|
|
|
|
|
| 4.000%, 06/08/2025 (A) |
|
EUR |
200 |
|
|
|
247 |
|
| Lloyds TSB Bank |
|
|
|
|
|
|
|
|
| 4.200%, 03/28/2017 |
|
USD |
380 |
|
|
|
419 |
|
| Marks & Spencer MTN |
|
|
|
|
|
|
|
|
| 6.125%, 12/02/2019 |
|
|
100 |
|
|
|
181 |
|
| Mondi Finance MTN |
|
|
|
|
|
|
|
|
| 3.375%, 09/28/2020 |
|
EUR |
250 |
|
|
|
321 |
|
| Motability Operations Group MTN |
|
|
|
|
|
|
|
|
| 3.750%, 11/29/2017 |
|
EUR |
300 |
|
|
|
424 |
|
|
|
|
| 6 |
|
SEI Institutional International Trust / Annual Report / September 30, 2012 |
Schedule of Investments
International Fixed Income Fund
September 30, 2012
|
|
|
|
|
|
|
|
|
| Description |
|
Face Amount(1)
(Thousands) |
|
|
Market Value
($ Thousands) |
|
|
|
|
|
|
|
|
|
|
| National Westminster Bank |
|
|
|
|
|
|
|
|
| 6.500%, 09/07/2021 |
|
|
220 |
|
|
$ |
358 |
|
| Nationwide Building Society |
|
|
|
|
|
|
|
|
| 3.125%, 10/13/2016 |
|
EUR |
175 |
|
|
|
245 |
|
| Network Rail Infrastructure Finance MTN |
|
|
|
|
|
|
|
|
| 4.400%, 03/06/2016 |
|
CAD |
690 |
|
|
|
752 |
|
| Northern Rock |
|
|
|
|
|
|
|
|
| 5.625%, 06/22/2017 (B) |
|
USD |
1,750 |
|
|
|
1,966 |
|
| Northumbrian Water Finance |
|
|
|
|
|
|
|
|
| 6.000%, 10/11/2017 |
|
|
500 |
|
|
|
956 |
|
| Rolls-Royce |
|
|
|
|
|
|
|
|
| 6.750%, 04/30/2019 |
|
|
100 |
|
|
|
205 |
|
| Royal Bank of Scotland |
|
|
|
|
|
|
|
|
| 5.750%, 05/21/2014 |
|
EUR |
600 |
|
|
|
828 |
|
| 5.125%, 01/13/2024 |
|
|
400 |
|
|
|
779 |
|
| Severn Trent Utilities Finance |
|
|
|
|
|
|
|
|
| 6.250%, 06/07/2029 |
|
|
350 |
|
|
|
743 |
|
| SP Manweb MTN |
|
|
|
|
|
|
|
|
| 4.875%, 09/20/2027 |
|
|
300 |
|
|
|
499 |
|
| SSE MTN |
|
|
|
|
|
|
|
|
| 5.750%, 02/05/2014 |
|
|
245 |
|
|
|
419 |
|
| Tesco |
|
|
|
|
|
|
|
|
| 6.052%, 10/13/2039 |
|
|
339 |
|
|
|
640 |
|
| Thames Water Utilities Cayman Finance MTN |
|
|
|
|
|
|
|
|
| 6.125%, 02/04/2013 |
|
EUR |
200 |
|
|
|
262 |
|
| United Kingdom Gilt |
|
|
|
|
|
|
|
|
| 5.000%, 03/07/2025 |
|
|
100 |
|
|
|
216 |
|
| 4.500%, 12/07/2042 |
|
|
1,890 |
|
|
|
3,915 |
|
| 4.250%, 12/07/2049 |
|
|
25 |
|
|
|
50 |
|
| 4.250%, 12/07/2055 |
|
|
175 |
|
|
|
354 |
|
| 4.250%, 06/07/2032 |
|
|
265 |
|
|
|
535 |
|
| 1.000%, 09/07/2017 |
|
|
2,200 |
|
|
|
3,600 |
|
| United Kingdom Treasury |
|
|
|
|
|
|
|
|
| 4.750%, 12/07/2030 |
|
|
1,250 |
|
|
|
2,687 |
|
| 4.750%, 12/07/2038 |
|
|
956 |
|
|
|
2,053 |
|
| 4.250%, 09/07/2039 |
|
|
885 |
|
|
|
1,759 |
|
| 4.250%, 12/07/2040 |
|
|
285 |
|
|
|
565 |
|
| 4.250%, 03/07/2036 |
|
|
550 |
|
|
|
1,097 |
|
| 4.000%, 03/07/2022 |
|
|
1,490 |
|
|
|
2,929 |
|
| 4.000%, 09/07/2016 |
|
|
250 |
|
|
|
460 |
|
| 2.250%, 03/07/2014 |
|
|
795 |
|
|
|
1,321 |
|
| 2.000%, 01/22/2016 |
|
|
533 |
|
|
|
907 |
|
| 1.750%, 01/22/2017 |
|
|
1,670 |
|
|
|
2,834 |
|
| United Kingdom Treasury, Ser 2002 |
|
|
|
|
|
|
|
|
| 5.000%, 09/07/2014 |
|
|
200 |
|
|
|
353 |
|
| Virgin Media Secured Finance |
|
|
|
|
|
|
|
|
| 7.000%, 01/15/2018 |
|
|
180 |
|
|
|
315 |
|
| Wales & West Utilities Finance MTN |
|
|
|
|
|
|
|
|
| 6.750%, 12/17/2036 (A) |
|
|
200 |
|
|
|
380 |
|
| Western Power Distribution South West |
|
|
|
|
|
|
|
|
| 5.750%, 03/23/2040 |
|
|
200 |
|
|
|
381 |
|
| Westfield UK & Europe Finance MTN |
|
|
|
|
|
|
|
|
| 4.250%, 07/11/2022 |
|
|
300 |
|
|
|
503 |
|
| William Hill |
|
|
|
|
|
|
|
|
| 7.125%, 11/11/2016 |
|
|
100 |
|
|
|
176 |
|
|
|
|
|
|
|
|
|
|
| Description |
|
Face Amount(1)
(Thousands) |
|
|
Market Value
($ Thousands) |
|
|
|
|
|
|
|
|
|
|
| WPP MTN |
|
|
|
|
|
|
|
|
| 6.625%, 05/12/2016 |
|
EUR |
225 |
|
|
$ |
341 |
|
| Yorkshire Power Finance |
|
|
|
|
|
|
|
|
| 7.250%, 08/04/2028 |
|
|
208 |
|
|
|
457 |
|
| Yorkshire Water Services Bradford Finance |
|
|
|
|
|
|
|
|
| 6.375%, 08/19/2039 |
|
|
100 |
|
|
|
216 |
|
|
|
|
|
|
|
|
|
|
|
|
|
|
|
|
|
58,479 |
|
|
|
|
|
|
|
|
|
|
|
|
|
| United States — 5.8% |
|
|
|
|
|
|
|
|
| Alcoa |
|
|
|
|
|
|
|
|
| 5.400%, 04/15/2021 |
|
|
215 |
|
|
|
226 |
|
| Altria Group |
|
|
|
|
|
|
|
|
| 4.750%, 05/05/2021 |
|
|
180 |
|
|
|
206 |
|
| 4.250%, 08/09/2042 |
|
|
265 |
|
|
|
263 |
|
| American International Group |
|
|
|
|
|
|
|
|
| 8.175%, 05/15/2058 (A) |
|
|
240 |
|
|
|
294 |
|
| 6.765%, 11/15/2017 |
|
GBP |
150 |
|
|
|
278 |
|
| AT&T |
|
|
|
|
|
|
|
|
| 5.875%, 04/28/2017 |
|
GBP |
200 |
|
|
|
379 |
|
| 4.875%, 06/01/2044 |
|
GBP |
200 |
|
|
|
346 |
|
| 4.450%, 05/15/2021 |
|
|
525 |
|
|
|
618 |
|
| Bank of America MTN |
|
|
|
|
|
|
|
|
| 5.650%, 05/01/2018 |
|
|
350 |
|
|
|
399 |
|
| Bank of America, Ser E MTN |
|
|
|
|
|
|
|
|
| 5.125%, 09/26/2014 |
|
EUR |
1,700 |
|
|
|
2,332 |
|
| Bristol-Myers Squibb |
|
|
|
|
|
|
|
|
| 2.000%, 08/01/2022 |
|
|
670 |
|
|
|
651 |
|
| CCO Holdings |
|
|
|
|
|
|
|
|
| 8.125%, 04/30/2020 |
|
|
90 |
|
|
|
102 |
|
| Cellco Partnership |
|
|
|
|
|
|
|
|
| 7.375%, 11/15/2013 |
|
|
725 |
|
|
|
779 |
|
| Citigroup |
|
|
|
|
|
|
|
|
| 5.875%, 01/30/2042 |
|
|
75 |
|
|
|
90 |
|
| 4.500%, 01/14/2022 |
|
|
60 |
|
|
|
66 |
|
| 4.450%, 01/10/2017 |
|
|
550 |
|
|
|
604 |
|
| 4.250%, 02/25/2030 (A) |
|
EUR |
1,400 |
|
|
|
1,471 |
|
| 4.000%, 11/26/2015 |
|
EUR |
230 |
|
|
|
317 |
|
| Comcast Cable Communications Holdings |
|
|
|
|
|
|
|
|
| 8.375%, 03/15/2013 |
|
|
750 |
|
|
|
777 |
|
| DIRECTV Holdings |
|
|
|
|
|
|
|
|
| 4.375%, 09/14/2029 |
|
GBP |
300 |
|
|
|
486 |
|
| 3.800%, 03/15/2022 |
|
|
310 |
|
|
|
319 |
|
| Eastman Chemical |
|
|
|
|
|
|
|
|
| 3.600%, 08/15/2022 |
|
|
109 |
|
|
|
115 |
|
| 2.400%, 06/01/2017 |
|
|
53 |
|
|
|
55 |
|
| General Electric Capital MTN |
|
|
|
|
|
|
|
|
| 5.500%, 01/08/2020 |
|
|
305 |
|
|
|
361 |
|
| 5.300%, 02/11/2021 |
|
|
205 |
|
|
|
235 |
|
| 4.625%, 01/07/2021 |
|
|
750 |
|
|
|
838 |
|
| 3.150%, 09/07/2022 |
|
|
45 |
|
|
|
45 |
|
| Goldman Sachs Group |
|
|
|
|
|
|
|
|
| 6.375%, 05/02/2018 |
|
EUR |
400 |
|
|
|
600 |
|
| 5.250%, 07/27/2021 |
|
|
110 |
|
|
|
121 |
|
| 4.375%, 03/16/2017 |
|
EUR |
350 |
|
|
|
480 |
|
| 0.675%, 02/04/2013 (A) |
|
EUR |
450 |
|
|
|
579 |
|
| Ingersoll-Rand Global Holding |
|
|
|
|
|
|
|
|
| 9.500%, 04/15/2014 |
|
|
213 |
|
|
|
240 |
|
| JPMorgan Chase |
|
|
|
|
|
|
|
|
| 4.500%, 01/24/2022 |
|
|
200 |
|
|
|
222 |
|
| 2.750%, 08/24/2022 |
|
EUR |
300 |
|
|
|
386 |
|
| 0.921%, 10/12/2015 (A) |
|
EUR |
350 |
|
|
|
430 |
|
|
|
|
| 7 |
|
SEI Institutional International Trust / Annual Report / September 30, 2012 |
Schedule of Investments
International Fixed Income Fund
September 30, 2012
|
|
|
|
|
|
|
|
|
| Description |
|
Face Amount (1)
(Thousands) |
|
|
Market Value
($ Thousands) |
|
|
|
|
|
|
|
|
|
|
| JPMorgan Chase Bank |
|
|
|
|
|
|
|
|
| 0.877%, 05/31/2017 (A) |
|
EUR |
1,250 |
|
|
$ |
1,528 |
|
| Merrill Lynch MTN |
|
|
|
|
|
|
|
|
| 0.805%, 09/14/2018 (A) |
|
EUR |
375 |
|
|
|
405 |
|
| Metropolitan Life Global Funding I MTN |
|
|
|
|
|
|
|
|
| 4.625%, 05/16/2017 |
|
EUR |
200 |
|
|
|
290 |
|
| Mondelez International |
|
|
|
|
|
|
|
|
| 7.000%, 08/11/2037 |
|
|
200 |
|
|
|
276 |
|
| 5.375%, 02/10/2020 |
|
|
400 |
|
|
|
483 |
|
| 2.625%, 05/08/2013 |
|
|
625 |
|
|
|
632 |
|
| Morgan Stanley MTN |
|
|
|
|
|
|
|
|
| 5.625%, 09/23/2019 |
|
|
175 |
|
|
|
191 |
|
| 5.375%, 08/10/2020 |
|
EUR |
150 |
|
|
|
207 |
|
| 3.750%, 09/21/2017 |
|
EUR |
350 |
|
|
|
459 |
|
| Nabors Industries |
|
|
|
|
|
|
|
|
| 9.250%, 01/15/2019 |
|
|
221 |
|
|
|
289 |
|
| NBCUniversal Media |
|
|
|
|
|
|
|
|
| 4.375%, 04/01/2021 |
|
|
375 |
|
|
|
425 |
|
| News America |
|
|
|
|
|
|
|
|
| 4.500%, 02/15/2021 |
|
|
210 |
|
|
|
237 |
|
| Noble Holding International |
|
|
|
|
|
|
|
|
| 4.900%, 08/01/2020 |
|
|
25 |
|
|
|
28 |
|
| Omnicom Group |
|
|
|
|
|
|
|
|
| 3.625%, 05/01/2022 |
|
|
130 |
|
|
|
137 |
|
| Owens Corning |
|
|
|
|
|
|
|
|
| 6.500%, 12/01/2016 |
|
|
145 |
|
|
|
163 |
|
| Philip Morris International |
|
|
|
|
|
|
|
|
| 2.900%, 11/15/2021 |
|
|
325 |
|
|
|
339 |
|
| 2.875%, 05/30/2024 |
|
EUR |
100 |
|
|
|
132 |
|
| 2.125%, 05/30/2019 |
|
EUR |
100 |
|
|
|
131 |
|
| PNC Funding |
|
|
|
|
|
|
|
|
| 5.125%, 02/08/2020 |
|
|
300 |
|
|
|
355 |
|
| 3.300%, 03/08/2022 |
|
|
150 |
|
|
|
161 |
|
| Proctor and Gamble |
|
|
|
|
|
|
|
|
| 2.000%, 08/16/2022 |
|
EUR |
200 |
|
|
|
254 |
|
| Rabobank Capital Funding Trust IV |
|
|
|
|
|
|
|
|
| 5.556%, 12/31/2019 (A) |
|
GBP |
153 |
|
|
|
222 |
|
| Republic Services |
|
|
|
|
|
|
|
|
| 4.750%, 05/15/2023 |
|
|
155 |
|
|
|
178 |
|
| Ryder System MTN |
|
|
|
|
|
|
|
|
| 5.850%, 11/01/2016 |
|
|
116 |
|
|
|
133 |
|
| Time Warner Cable |
|
|
|
|
|
|
|
|
| 6.200%, 07/01/2013 |
|
|
750 |
|
|
|
782 |
|
| 5.850%, 05/01/2017 |
|
|
286 |
|
|
|
341 |
|
| Transocean |
|
|
|
|
|
|
|
|
| 2.500%, 10/15/2017 |
|
|
173 |
|
|
|
174 |
|
| United Technologies |
|
|
|
|
|
|
|
|
| 1.800%, 06/01/2017 |
|
|
201 |
|
|
|
208 |
|
| US Bank MTN |
|
|
|
|
|
|
|
|
| 0.817%, 02/28/2017 (A) |
|
EUR |
1,700 |
|
|
|
2,165 |
|
| WellPoint |
|
|
|
|
|
|
|
|
| 4.650%, 01/15/2043 |
|
|
110 |
|
|
|
112 |
|
| 3.300%, 01/15/2023 |
|
|
204 |
|
|
|
206 |
|
| Wells Fargo MTN |
|
|
|
|
|
|
|
|
| 4.600%, 04/01/2021 |
|
|
75 |
|
|
|
87 |
|
| 3.500%, 03/08/2022 |
|
|
335 |
|
|
|
357 |
|
| 2.625%, 08/16/2022 |
|
EUR |
400 |
|
|
|
519 |
|
|
|
|
|
|
|
|
|
|
|
|
|
|
|
|
|
28,316 |
|
|
|
|
|
|
|
|
|
|
| Total Global Bonds
(Cost $431,445) ($ Thousands) |
|
|
|
|
|
|
455,686 |
|
|
|
|
|
|
|
|
|
|
|
|
|
|
|
|
|
|
|
| Description |
|
Face Amount (1)
(Thousands) |
|
|
Market Value
($ Thousands) |
|
|
|
|
|
|
|
|
|
|
| MORTGAGE-BACKED SECURITIES — 3.3% |
|
|
|
|
|
|
|
| Non-Agency Mortgage-Backed Obligation — 3.3% |
|
|
|
|
|
| Bear Stearns Adjustable Rate Mortgage Trust, Ser 2004-6, Cl 3A |
|
|
|
|
|
|
|
|
| 5.452%, 09/25/2034 (A) |
|
|
191 |
|
|
$ |
187 |
|
| Bear Stearns Commercial Mortgage Securities, Ser 2004-PWR6, Cl A6 |
|
|
|
|
|
|
|
|
| 4.825%, 11/11/2041 |
|
|
575 |
|
|
|
620 |
|
| Bear Stearns Commercial Mortgage Securities, Ser 2005-T18, Cl A4 |
|
|
|
|
|
|
|
|
| 4.933%, 02/13/2042 (A) |
|
|
135 |
|
|
|
148 |
|
| Bear Stearns Commercial Mortgage Securities, Ser 2006-PW11, Cl A4 |
|
|
|
|
|
|
|
|
| 5.621%, 03/11/2039 (A) |
|
|
450 |
|
|
|
511 |
|
| Bear Stearns Commercial Mortgage Securities, Ser 2006-T24, Cl A4 |
|
|
|
|
|
|
|
|
| 5.537%, 10/12/2041 |
|
|
400 |
|
|
|
464 |
|
| Bear Stearns Commercial Mortgage Securities, Ser 2007-PW16, Cl A4 |
|
|
|
|
|
|
|
|
| 5.906%, 06/11/2040 (A) |
|
|
241 |
|
|
|
284 |
|
| Bear Stearns Commercial Mortgage Securities, Ser 2007-PW17, Cl A4 |
|
|
|
|
|
|
|
|
| 5.694%, 06/11/2050 (A) |
|
|
190 |
|
|
|
223 |
|
| Canary Wharf Finance, Ser II, Cl C2 |
|
|
|
|
|
|
|
|
| 1.325%, 10/22/2037 (A)(E) |
|
|
200 |
|
|
|
200 |
|
| Citigroup Commercial Mortgage Trust, Ser 2007-C6, Cl A4 |
|
|
|
|
|
|
|
|
| 5.888%, 12/10/2049 (A) |
|
|
1,140 |
|
|
|
1,341 |
|
| Citigroup Commercial Mortgage Trust, Ser 2008-C7, Cl A4 |
|
|
|
|
|
|
|
|
| 6.262%, 12/10/2049 (A) |
|
|
405 |
|
|
|
484 |
|
| Citigroup Mortgage Loan Trust, Ser 2005-2, Cl 1A4 |
|
|
|
|
|
|
|
|
| 2.746%, 05/25/2035 (A) |
|
|
897 |
|
|
|
867 |
|
| Citigroup, Ser 2007-CD4, Cl A4 |
|
|
|
|
|
|
|
|
| 5.322%, 12/11/2049 |
|
|
325 |
|
|
|
370 |
|
| Commercial Mortgage Pass-Through Certificates Series 2008-C1, Ser 2008-C1, Cl A3 |
|
|
|
|
|
|
|
|
| 6.407%, 02/15/2041 (A) |
|
|
85 |
|
|
|
99 |
|
| Credit Suisse Mortgage Capital Certificates, Ser 2006-C5, Cl A3 |
|
|
|
|
|
|
|
|
| 5.311%, 12/15/2039 |
|
|
1,215 |
|
|
|
1,382 |
|
| CW Capital Cobalt, Ser 2006-C1, Cl A4 |
|
|
|
|
|
|
|
|
| 5.223%, 08/15/2048 |
|
|
140 |
|
|
|
157 |
|
| Eddystone Finance, Ser 2006-1, Cl A2 |
|
|
|
|
|
|
|
|
| 1.003%, 04/19/2021 (A)(E) |
|
|
150 |
|
|
|
215 |
|
| FHLMC, Ser K501-X1A, IO |
|
|
|
|
|
|
|
|
| 1.756%, 08/25/2016 (E) |
|
|
333 |
|
|
|
17 |
|
|
|
|
| 8 |
|
SEI Institutional International Trust / Annual Report / September 30, 2012 |
Schedule of Investments
International Fixed Income Fund
September 30, 2012
|
|
|
|
|
|
|
|
|
| Description |
|
Face Amount (1)
(Thousands) |
|
|
Market Value
($ Thousands) |
|
|
|
|
|
|
|
|
|
|
| Fosse Master Issuer, Ser 2011-1X, Cl A3 |
|
|
|
|
|
|
|
|
| 2.208%, 10/18/2054 (A) |
|
|
285 |
|
|
$ |
466 |
|
| Granite Master Issuer, Ser 2005-1, Cl A5 |
|
|
|
|
|
|
|
|
| 0.299%, 12/20/2054 (A)(E) |
|
|
177 |
|
|
|
223 |
|
| Granite Master Issuer, Ser 2006-2, Cl A5 |
|
|
|
|
|
|
|
|
| 0.319%, 12/20/2054 (A)(E) |
|
|
349 |
|
|
|
440 |
|
| Greenwich Capital Commercial Funding, Ser 2007-GG9, Cl A4 |
|
|
|
|
|
|
|
|
| 5.444%, 03/10/2039 |
|
|
250 |
|
|
|
285 |
|
| GS Mortgage Securities II, Ser 2012-ALOH |
|
|
|
|
|
|
|
|
| 3.551%, 04/10/2034 (B) |
|
|
181 |
|
|
|
195 |
|
| GS Mortgage Securities II, Ser 2012-GCJ7, Cl A4 |
|
|
|
|
|
|
|
|
| 3.377%, 05/10/2045 |
|
|
60 |
|
|
|
65 |
|
| GSR Mortgage Loan Trust, Ser 2005-AR1, Cl 4A1 |
|
|
|
|
|
|
|
|
| 5.069%, 01/25/2035 (A) |
|
|
261 |
|
|
|
260 |
|
| JPMorgan Chase Commercial Mortgage Securities, Ser 2004-CB9, Cl A4 |
|
|
|
|
|
|
|
|
| 5.777%, 06/12/2041 (A) |
|
|
110 |
|
|
|
119 |
|
| JPMorgan Chase Commercial Mortgage Securities, Ser 2005-CB13, Cl A4 |
|
|
|
|
|
|
|
|
| 5.467%, 01/12/2043 (A) |
|
|
75 |
|
|
|
83 |
|
| JPMorgan Chase Commercial Mortgage Securities, Ser 2007-CB18, Cl A4 |
|
|
|
|
|
|
|
|
| 5.440%, 06/12/2047 |
|
|
880 |
|
|
|
1,014 |
|
| JPMorgan Chase Commercial Mortgage Securities, Ser 2007-CB19, Cl A4 |
|
|
|
|
|
|
|
|
| 5.920%, 02/12/2049 (A) |
|
|
250 |
|
|
|
294 |
|
| JPMorgan Chase Commercial Mortgage Securities, Ser 2012-WLDN, Cl A |
|
|
|
|
|
|
|
|
| 3.905%, 05/05/2030 (B) |
|
|
100 |
|
|
|
109 |
|
| JPMorgan Chase Commercial Mortgage Securities, Ser LDP9, Cl A3 |
|
|
|
|
|
|
|
|
| 5.336%, 05/15/2047 |
|
|
190 |
|
|
|
217 |
|
| JPMorgan Mortgage Trust, Ser 2004-A5, Cl 3A1 |
|
|
|
|
|
|
|
|
| 5.008%, 12/25/2034 (A) |
|
|
233 |
|
|
|
237 |
|
| LB-UBS Commercial Mortgage Trust, Ser 2006-C7, Cl A3 |
|
|
|
|
|
|
|
|
| 5.347%, 11/15/2038 |
|
|
250 |
|
|
|
289 |
|
| LB-UBS Commercial Mortgage Trust, Ser 2008-C1, Cl A2 |
|
|
|
|
|
|
|
|
| 6.157%, 04/15/2041 (A) |
|
|
11 |
|
|
|
13 |
|
| LB-UBS Commercial Mortgage Trust, Ser C2, Cl A3 |
|
|
|
|
|
|
|
|
| 5.430%, 02/15/2040 |
|
|
465 |
|
|
|
532 |
|
| Merrill Lynch Mortgage Trust, Ser 2005-LC1, Cl A4 |
|
|
|
|
|
|
|
|
| 5.291%, 01/12/2044 (A) |
|
|
370 |
|
|
|
414 |
|
| Merrill Lynch, Ser 2007-7, Cl A4 |
|
|
|
|
|
|
|
|
| 5.810%, 06/12/2050 (A) |
|
|
285 |
|
|
|
319 |
|
|
|
|
|
|
|
|
|
|
| Description |
|
Face Amount (1)
(Thousands) |
|
|
Market Value
($ Thousands) |
|
|
|
|
|
|
|
|
|
|
| Morgan Stanley Capital I Trust 2005-TOP19, Ser 2005-T19, Cl A4A |
|
|
|
|
|
|
|
|
| 4.890%, 06/12/2047 |
|
|
75 |
|
|
$ |
83 |
|
| Silverstone Master Issuer, Ser 2009-1, Cl A2 |
|
|
|
|
|
|
|
|
| 2.225%, 01/21/2055 (A) |
|
|
300 |
|
|
|
495 |
|
| Storm, Ser 2006-1, Cl A2 |
|
|
|
|
|
|
|
|
| 0.568%, 04/22/2048 (A) |
|
|
1,048 |
|
|
|
1,348 |
|
| Storm, Ser 2011-4, Cl A1 |
|
|
|
|
|
|
|
|
| 1.658%, 10/22/2053 (A) |
|
|
717 |
|
|
|
931 |
|
| UBS-Barclays Commercial Mortgage Trust, Ser 2012-C2, Cl A4 |
|
|
|
|
|
|
|
|
| 3.525%, 05/10/2063 |
|
|
170 |
|
|
|
184 |
|
| UBS-Barclays Commercial Mortgage Trust, Ser 2012-C3, Cl D |
|
|
|
|
|
|
|
|
| 4.958%, 08/10/2049 (A)(B) |
|
|
115 |
|
|
|
98 |
|
| Wells Fargo Commercial Mortgage Trust, Ser LC5, Cl D |
|
|
|
|
|
|
|
|
| 4.780%, 10/15/2045 (A)(B) |
|
|
41 |
|
|
|
36 |
|
|
|
|
|
|
|
|
|
|
| Total Mortgage-Backed Securities
(Cost $15,731) ($ Thousands) |
|
|
|
|
|
|
16,318 |
|
|
|
|
|
|
|
|
|
|
|
|
|
| CORPORATE OBLIGATIONS — 2.3% |
|
|
|
|
|
|
|
|
|
|
|
| United States — 2.3% |
|
|
|
|
|
|
|
|
| American Express Bank |
|
|
|
|
|
|
|
|
| 5.550%, 10/17/2012 |
|
|
530 |
|
|
|
531 |
|
| American Express Credit MTN |
|
|
|
|
|
|
|
|
| 2.750%, 09/15/2015 |
|
|
400 |
|
|
|
421 |
|
| Anadarko Petroleum |
|
|
|
|
|
|
|
|
| 6.375%, 09/15/2017 |
|
|
330 |
|
|
|
398 |
|
| Ball |
|
|
|
|
|
|
|
|
| 5.000%, 03/15/2022 |
|
|
230 |
|
|
|
241 |
|
| Bank of America MTN |
|
|
|
|
|
|
|
|
| 5.000%, 05/13/2021 |
|
|
175 |
|
|
|
192 |
|
| BE Aerospace |
|
|
|
|
|
|
|
|
| 5.250%, 04/01/2022 |
|
|
230 |
|
|
|
239 |
|
| CBS |
|
|
|
|
|
|
|
|
| 4.300%, 02/15/2021 |
|
|
300 |
|
|
|
334 |
|
| CIGNA |
|
|
|
|
|
|
|
|
| 5.125%, 06/15/2020 |
|
|
154 |
|
|
|
178 |
|
| Cimarex Energy |
|
|
|
|
|
|
|
|
| 5.875%, 05/01/2022 |
|
|
116 |
|
|
|
122 |
|
| CMS Energy |
|
|
|
|
|
|
|
|
| 5.050%, 03/15/2022 |
|
|
140 |
|
|
|
154 |
|
| CNA Financial |
|
|
|
|
|
|
|
|
| 7.250%, 11/15/2023 |
|
|
110 |
|
|
|
136 |
|
| 6.500%, 08/15/2016 |
|
|
40 |
|
|
|
46 |
|
| COX Communications |
|
|
|
|
|
|
|
|
| 7.125%, 10/01/2012 |
|
|
750 |
|
|
|
750 |
|
| CVS Caremark |
|
|
|
|
|
|
|
|
| 6.600%, 03/15/2019 |
|
|
375 |
|
|
|
479 |
|
| Daimler Finance North America |
|
|
|
|
|
|
|
|
| 1.788%, 07/11/2013 (A)(B) |
|
|
400 |
|
|
|
403 |
|
| DIRECTV Holdings |
|
|
|
|
|
|
|
|
| 4.600%, 02/15/2021 |
|
|
300 |
|
|
|
328 |
|
| Duke Realty |
|
|
|
|
|
|
|
|
| 6.750%, 03/15/2020 (F) |
|
|
140 |
|
|
|
168 |
|
| Enterprise Products Operating |
|
|
|
|
|
|
|
|
| 5.950%, 02/01/2041 |
|
|
100 |
|
|
|
118 |
|
|
|
|
| 9 |
|
SEI Institutional International Trust / Annual Report / September 30, 2012 |
Schedule of Investments
International Fixed Income Fund
September 30, 2012
|
|
|
|
|
|
|
|
|
| Description |
|
Face Amount (1)
(Thousands) |
|
|
Market Value
($ Thousands) |
|
|
|
|
|
|
|
|
|
|
| EQT |
|
|
|
|
|
|
|
|
| 8.125%, 06/01/2019 |
|
|
285 |
|
|
$ |
345 |
|
| General Electric Capital MTN |
|
|
|
|
|
|
|
|
| 2.375%, 06/30/2015 |
|
|
150 |
|
|
|
156 |
|
| Goldman Sachs Group |
|
|
|
|
|
|
|
|
| 6.000%, 06/15/2020 |
|
|
45 |
|
|
|
52 |
|
| Hartford Financial Services Group |
|
|
|
|
|
|
|
|
| 5.125%, 04/15/2022 |
|
|
385 |
|
|
|
433 |
|
| Humana |
|
|
|
|
|
|
|
|
| 7.200%, 06/15/2018 |
|
|
280 |
|
|
|
339 |
|
| Laboratory Corp of America Holdings |
|
|
|
|
|
|
|
|
| 3.750%, 08/23/2022 |
|
|
50 |
|
|
|
52 |
|
| 2.200%, 08/23/2017 |
|
|
93 |
|
|
|
95 |
|
| Lincoln National |
|
|
|
|
|
|
|
|
| 8.750%, 07/01/2019 |
|
|
128 |
|
|
|
168 |
|
| Lorillard Tobacco |
|
|
|
|
|
|
|
|
| 6.875%, 05/01/2020 |
|
|
375 |
|
|
|
460 |
|
| McGraw-Hill |
|
|
|
|
|
|
|
|
| 5.900%, 11/15/2017 |
|
|
325 |
|
|
|
382 |
|
| Morgan Stanley |
|
|
|
|
|
|
|
|
| 3.450%, 11/02/2015 |
|
|
125 |
|
|
|
128 |
|
| Motorola Solutions |
|
|
|
|
|
|
|
|
| 7.500%, 05/15/2025 |
|
|
85 |
|
|
|
106 |
|
| Nisource Finance |
|
|
|
|
|
|
|
|
| 6.800%, 01/15/2019 |
|
|
235 |
|
|
|
284 |
|
| Nissan Motor |
|
|
|
|
|
|
|
|
| 3.250%, 01/30/2013 (B) |
|
|
430 |
|
|
|
433 |
|
| Prudential Financial MTN |
|
|
|
|
|
|
|
|
| 6.100%, 06/15/2017 |
|
|
125 |
|
|
|
147 |
|
| Ryder System MTN |
|
|
|
|
|
|
|
|
| 7.200%, 09/01/2015 |
|
|
108 |
|
|
|
125 |
|
| SABMiller Holdings |
|
|
|
|
|
|
|
|
| 3.750%, 01/15/2022 (B) |
|
|
400 |
|
|
|
434 |
|
| SLM MTN |
|
|
|
|
|
|
|
|
| 5.050%, 11/14/2014 |
|
|
155 |
|
|
|
164 |
|
| Time Warner |
|
|
|
|
|
|
|
|
| 4.875%, 03/15/2020 |
|
|
150 |
|
|
|
173 |
|
| Time Warner Cable |
|
|
|
|
|
|
|
|
| 7.500%, 04/01/2014 |
|
|
385 |
|
|
|
423 |
|
| Union Electric |
|
|
|
|
|
|
|
|
| 6.700%, 02/01/2019 |
|
|
45 |
|
|
|
58 |
|
| Viacom |
|
|
|
|
|
|
|
|
| 6.125%, 10/05/2017 |
|
|
325 |
|
|
|
391 |
|
| Wachovia Capital Trust III |
|
|
|
|
|
|
|
|
| 5.570%, 12/31/2049 (A) |
|
|
385 |
|
|
|
381 |
|
| Wynn Las Vegas |
|
|
|
|
|
|
|
|
| 5.375%, 03/15/2022 (B) |
|
|
235 |
|
|
|
239 |
|
|
|
|
|
|
|
|
|
|
| Total Corporate Obligations
(Cost $10,279) ($ Thousands) |
|
|
|
|
|
|
11,206 |
|
|
|
|
|
|
|
|
|
|
|
|
|
| ASSET-BACKED SECURITIES — 0.4% |
|
|
|
|
|
|
|
|
|
|
|
| Automotive — 0.4% |
|
|
|
|
|
|
|
|
| Auto Compartiment, Ser 2007-1, Cl A |
|
|
|
|
|
|
|
|
| 0.413%, 02/25/2019 (A) |
|
|
86 |
|
|
|
111 |
|
| Bank of America Auto Trust 2012-1, Ser 2012-1, Cl A2 |
|
|
|
|
|
|
|
|
| 0.590%, 11/17/2014 |
|
|
900 |
|
|
|
901 |
|
|
|
|
|
|
|
|
|
|
| Description |
|
Face Amount (1)
(Thousands) |
|
|
Market Value
($ Thousands) |
|
|
|
|
|
|
|
|
|
|
| Ford Credit Floorplan Master Owner Trust, Ser 2010-1 |
|
|
|
|
|
|
|
|
| 1.871%, 12/15/2014 (A)(B) |
|
|
800 |
|
|
$ |
803 |
|
|
|
|
|
|
|
|
|
|
|
|
|
|
|
|
|
1,815 |
|
|
|
|
|
|
|
|
|
|
|
|
|
| Other Asset-Backed Securities — 0.0% |
|
|
|
|
|
|
|
|
| Lambda Finance, Ser 2005-1X, Cl A2 |
|
|
|
|
|
|
|
|
| 0.589%, 11/15/2029 (A)(E) |
|
|
2 |
|
|
|
2 |
|
| Santander Consumer Finance, Ser 2007-1, Cl A |
|
|
|
|
|
|
|
|
| 0.394%, 09/20/2022 (E) |
|
|
31 |
|
|
|
39 |
|
|
|
|
|
|
|
|
|
|
|
|
|
|
|
|
|
41 |
|
|
|
|
|
|
|
|
|
|
| Total Asset-Backed Securities
(Cost $1,857) ($ Thousands) |
|
|
|
|
|
|
1,856 |
|
|
|
|
|
|
|
|
|
|
|
|
| U.S. TREASURY OBLIGATIONS — 0.1% |
|
|
|
|
|
| U.S. Treasury Bonds |
|
|
|
|
|
|
|
|
| 4.375%, 11/15/2039 |
|
$ |
20 |
|
|
|
26 |
|
| 4.375%, 05/15/2041 |
|
|
205 |
|
|
|
272 |
|
| 3.875%, 08/15/2040 |
|
|
5 |
|
|
|
6 |
|
| U.S. Treasury Notes |
|
|
|
|
|
|
|
|
| 2.000%, 02/15/2022 |
|
|
175 |
|
|
|
182 |
|
|
|
|
|
|
|
|
|
|
| Total U.S. Treasury Obligations
(Cost $408) ($ Thousands) |
|
|
|
|
|
|
486 |
|
|
|
|
|
|
|
|
|
|
|
|
|
| MUNICIPAL BOND — 0.0% |
|
|
|
|
|
|
|
|
| State of Illinois, GO |
|
|
|
|
|
|
|
|
| 5.877%, 03/01/19 |
|
|
45 |
|
|
|
51 |
|
|
|
|
|
|
|
|
|
|
| Total Municipal Bond
(Cost $45) ($ Thousands) |
|
|
|
|
|
|
51 |
|
|
|
|
|
|
|
|
|
|
|
|
|
| TIME DEPOSITS — 0.5% |
|
|
|
|
|
|
|
|
|
|
|
| United States — 0.5% |
|
|
|
|
|
|
|
|
| Brown Brothers Harriman |
|
|
|
|
|
|
|
|
| 4.150%, 10/01/2012 |
|
ZAR |
— |
|
|
|
— |
|
| 2.580%, 10/01/2012 |
|
AUD |
4 |
|
|
|
4 |
|
| 1.550%, 10/01/2012 |
|
NZD |
22 |
|
|
|
19 |
|
| 0.550%, 10/01/2012 |
|
NOK |
125 |
|
|
|
22 |
|
| 0.400%, 10/01/2012 |
|
SEK |
106 |
|
|
|
16 |
|
| 0.185%, 10/01/2012 |
|
CAD |
22 |
|
|
|
23 |
|
| 0.054%, 10/01/2012 |
|
GBP |
40 |
|
|
|
64 |
|
| 0.030%, 10/01/2012 |
|
|
1,525 |
|
|
|
1,525 |
|
| 0.010%, 10/01/2012 |
|
JPY |
5,139 |
|
|
|
66 |
|
| 0.010%, 10/01/2012 |
|
SGD |
60 |
|
|
|
49 |
|
| 0.005%, 10/01/2012 |
|
HKD |
2 |
|
|
|
— |
|
| 0.005%, 10/01/2012 |
|
CHF |
— |
|
|
|
— |
|
| (0.014)%, 10/01/2012 |
|
EUR |
533 |
|
|
|
686 |
|
| (0.200)%, 10/01/2012 |
|
DKK |
1 |
|
|
|
— |
|
|
|
|
|
|
|
|
|
|
| Total Time Deposits
(Cost $2,474) ($ Thousands) |
|
|
|
|
|
|
2,474 |
|
|
|
|
|
|
|
|
|
|
| Total Investments — 99.2%
(Cost $462,239) ($ Thousands) |
|
|
|
|
|
$ |
488,077 |
|
|
|
|
|
|
|
|
|
|
|
|
|
| 10 |
|
SEI Institutional International Trust / Annual Report / September 30, 2012 |
Schedule of Investments
International Fixed Income Fund
September 30, 2012
A list of the open futures contracts held by the Fund at September 30, 2012, is as follows:
|
|
|
|
|
|
|
|
|
|
|
|
|
| Type of Contract |
|
Number of
Contracts
Long (Short) |
|
|
Expiration
Date |
|
|
Unrealized
Appreciation
(Depreciation)
($ Thousands) |
|
| Australian 3-Year Bond |
|
|
64 |
|
|
|
Dec-2012 |
|
|
$ |
36 |
|
| Canadian 10-Year Bond |
|
|
15 |
|
|
|
Dec-2012 |
|
|
|
8 |
|
| Euro-Bobl |
|
|
41 |
|
|
|
Dec-2012 |
|
|
|
(8 |
) |
| Euro-Oat |
|
|
6 |
|
|
|
Dec-2012 |
|
|
|
8 |
|
| Euro-Bund |
|
|
60 |
|
|
|
Dec-2012 |
|
|
|
8 |
|
| Euro-Buxl 30 Year Bond |
|
|
4 |
|
|
|
Dec-2012 |
|
|
|
(8 |
) |
| Euro-Schatz |
|
|
18 |
|
|
|
Dec-2012 |
|
|
|
(3 |
) |
| Japanese 10-Year Bond |
|
|
6 |
|
|
|
Dec-2012 |
|
|
|
23 |
|
| Japanese 10-Year Bond |
|
|
(5 |
) |
|
|
Dec-2012 |
|
|
|
(3 |
) |
| Long Gilt 10-Year Bond |
|
|
5 |
|
|
|
Dec-2012 |
|
|
|
4 |
|
| U.S. 10-Year Treasury Note |
|
|
(180 |
) |
|
|
Dec-2012 |
|
|
|
(117 |
) |
| U.S. 2-Year Treasury Note |
|
|
(35 |
) |
|
|
Dec-2012 |
|
|
|
(3 |
) |
| U.S. 5-Year Treasury Note |
|
|
(112 |
) |
|
|
Dec-2012 |
|
|
|
(51 |
) |
| U.S. Long Treasury Bond |
|
|
(19 |
) |
|
|
Dec-2012 |
|
|
|
(25 |
) |
| U.S. Ultra Long Treasury Bond |
|
|
(6 |
) |
|
|
Dec-2012 |
|
|
|
8 |
|
|
|
|
|
|
|
|
|
|
|
|
|
|
|
|
|
|
|
|
|
|
|
|
$ |
(123 |
) |
|
|
|
|
|
|
|
|
|
|
|
|
|
For the year ended September 30, 2012, the total amount of all open futures contracts, as presented in the table above,
are representative of the volume of activity for this derivative type during the year.
A list of the open forward foreign currency contracts
held by the Fund at September 30, 2012, is as follows:
|
|
|
|
|
|
|
|
|
|
|
|
|
| Maturity Date |
|
Currency
to Deliver (Thousands) |
|
|
Currency
to Receive (Thousands) |
|
|
Unrealized
Appreciation (Depreciation)
($ Thousands) |
|
| 10/04/2012 |
|
USD |
90 |
|
|
ZAR |
734 |
|
|
$ |
(1 |
) |
| 10/04/2012-10/31/2012 |
|
USD |
11,997 |
|
|
EUR |
9,256 |
|
|
|
(88 |
) |
| 10/04/2012-10/31/2012 |
|
USD |
550 |
|
|
JPY |
42,952 |
|
|
|
2 |
|
| 10/04/2012-10/31/2012 |
|
ZAR |
27,825 |
|
|
USD |
3,345 |
|
|
|
(24 |
) |
| 10/04/2012-11/05/2012 |
|
AUD |
9,778 |
|
|
USD |
10,143 |
|
|
|
(1 |
) |
| 10/04/2012-11/05/2012 |
|
CZK |
136,603 |
|
|
USD |
6,949 |
|
|
|
(28 |
) |
| 10/04/2012-11/05/2012 |
|
EUR |
240,666 |
|
|
USD |
308,731 |
|
|
|
(916 |
) |
| 10/04/2012-11/05/2012 |
|
GBP |
51,645 |
|
|
USD |
83,194 |
|
|
|
(189 |
) |
| 10/04/2012-11/05/2012 |
|
USD |
3,810 |
|
|
CZK |
73,466 |
|
|
|
(57 |
) |
| 10/04/2012-11/05/2012 |
|
USD |
1,629 |
|
|
KRW |
1,818,495 |
|
|
|
7 |
|
| 10/04/2012-11/08/2012 |
|
DKK |
61,005 |
|
|
USD |
10,467 |
|
|
|
(67 |
) |
| 10/04/2012-11/08/2012 |
|
SEK |
38,726 |
|
|
USD |
5,902 |
|
|
|
(1 |
) |
| 10/04/2012-11/09/2012 |
|
CAD |
26,922 |
|
|
USD |
27,450 |
|
|
|
100 |
|
| 10/04/2012-11/16/2012 |
|
JPY |
11,742,909 |
|
|
USD |
150,588 |
|
|
|
(415 |
) |
| 10/04/2012-12/27/2012 |
|
MXP |
77,267 |
|
|
USD |
5,778 |
|
|
|
(203 |
) |
| 10/05/2012-10/31/2012 |
|
SGD |
4,364 |
|
|
USD |
3,527 |
|
|
|
(30 |
) |
| 10/11/2012 |
|
TRY |
2,878 |
|
|
USD |
1,599 |
|
|
|
(2 |
) |
| 10/11/2012-10/31/2012 |
|
NZD |
2,049 |
|
|
USD |
1,683 |
|
|
|
(17 |
) |
| 10/18/2012-10/31/2012 |
|
USD |
2,033 |
|
|
MXP |
26,046 |
|
|
|
(12 |
) |
| 10/31/2012 |
|
CHF |
1,625 |
|
|
USD |
1,735 |
|
|
|
5 |
|
| 10/31/2012 |
|
KRW |
2,558,461 |
|
|
USD |
2,277 |
|
|
|
(24 |
) |
| 10/31/2012 |
|
MYR |
1,001 |
|
|
USD |
325 |
|
|
|
(2 |
) |
| 10/31/2012 |
|
NOK |
1,247 |
|
|
USD |
218 |
|
|
|
— |
|
| 10/31/2012 |
|
PLN |
3,745 |
|
|
USD |
1,170 |
|
|
|
5 |
|
| 10/31/2012 |
|
USD |
721 |
|
|
AUD |
698 |
|
|
|
2 |
|
| 10/31/2012 |
|
USD |
738 |
|
|
CAD |
723 |
|
|
|
(4 |
) |
| 10/31/2012 |
|
USD |
559 |
|
|
NOK |
3,200 |
|
|
|
(1 |
) |
| 10/31/2012 |
|
USD |
744 |
|
|
NZD |
907 |
|
|
|
8 |
|
| 10/31/2012 |
|
USD |
161 |
|
|
SEK |
1,060 |
|
|
|
1 |
|
|
|
|
|
|
|
|
|
|
|
|
|
|
|
|
|
|
|
|
|
|
|
|
$ |
(1,952 |
) |
|
|
|
|
|
|
|
|
|
|
|
|
|
A list of the counterparties for the open forward foreign currency contracts held by the Fund at
September 30, 2012, is as follows:
|
|
|
|
|
|
|
|
|
|
|
|
|
|
|
|
|
| Counterparty |
|
Settlement Date |
|
|
Currencyto
Deliver
($ Thousands) |
|
|
Currency
to Receive
($ Thousands) |
|
|
Unrealized
Appreciation
(Depreciation)
($ Thousands) |
|
| Bank of America |
|
|
10/04/2012-10/31/2012 |
|
|
|
(2,274 |
) |
|
|
2,269 |
|
|
$ |
(5 |
) |
| Bank of Montreal |
|
|
10/31/2012 |
|
|
|
(163 |
) |
|
|
163 |
|
|
|
— |
|
| Barclays PLC |
|
|
10/04/2012-11/08/2012 |
|
|
|
(22,541 |
) |
|
|
22,639 |
|
|
|
98 |
|
| BNP Paribas |
|
|
10/04/2012-11/05/2012 |
|
|
|
(95,932 |
) |
|
|
96,734 |
|
|
|
802 |
|
| Brown Brothers Harriman |
|
|
10/04/2012 |
|
|
|
(3,898 |
) |
|
|
3,913 |
|
|
|
15 |
|
| Citigroup |
|
|
10/04/2012-11/09/2012 |
|
|
|
(18,910 |
) |
|
|
18,990 |
|
|
|
80 |
|
| Credit Suisse First Boston |
|
|
10/18/2012-10/31/2012 |
|
|
|
(38,895 |
) |
|
|
38,775 |
|
|
|
(120 |
) |
| Deutsche Bank |
|
|
10/04/2012-11/05/2012 |
|
|
|
(17,295 |
) |
|
|
17,089 |
|
|
|
(206 |
) |
| Goldman Sachs |
|
|
10/31/2012 |
|
|
|
(1,298 |
) |
|
|
1,309 |
|
|
|
11 |
|
| HSBC |
|
|
10/04/2012-11/16/2012 |
|
|
|
(179,222 |
) |
|
|
179,297 |
|
|
|
75 |
|
| JPMorgan Chase Bank |
|
|
10/04/2012-10/31/2012 |
|
|
|
(11,072 |
) |
|
|
11,049 |
|
|
|
(23 |
) |
| Morgan Stanley |
|
|
10/04/2012-10/31/2012 |
|
|
|
(5,182 |
) |
|
|
5,111 |
|
|
|
(71 |
) |
| National Australia Bank |
|
|
10/04/2012-10/11/2012 |
|
|
|
(1,752 |
) |
|
|
1,759 |
|
|
|
7 |
|
| Royal Bank of Canada |
|
|
10/31/2012-11/09/2012 |
|
|
|
(10,481 |
) |
|
|
10,522 |
|
|
|
41 |
|
| Royal Bank of Scotland |
|
|
10/04/2012-12/27/2012 |
|
|
|
(6,595 |
) |
|
|
6,395 |
|
|
|
(200 |
) |
| Societe Generale |
|
|
10/4/2012 |
|
|
|
(2,012 |
) |
|
|
2,056 |
|
|
|
44 |
|
| Standard New York, Inc. |
|
|
10/5/2012 |
|
|
|
(2,417 |
) |
|
|
2,388 |
|
|
|
(29 |
) |
| State Street |
|
|
10/04/2012-11/05/2012 |
|
|
|
(173,947 |
) |
|
|
171,364 |
|
|
|
(2,583 |
) |
| UBS |
|
|
10/04/2012-10/31/2012 |
|
|
|
(56,820 |
) |
|
|
56,932 |
|
|
|
112 |
|
|
|
|
|
|
|
|
|
|
|
|
|
|
|
|
|
|
|
|
|
|
|
|
|
|
|
|
|
|
|
|
$ |
(1,952 |
) |
|
|
|
|
|
|
|
|
|
|
|
|
|
|
|
|
|
For the year ended September 30, 2012, the total amount of all open forward foreign currency contracts, as presented in
the table above are representative of the volume of activity for this derivative type during the period.
|
|
|
| 11 |
|
SEI Institutional International Trust / Annual Report / September 30, 2012 |
Schedule of Investments
International Fixed Income Fund
September 30, 2012
A list of the open swap agreements held by the Fund at September 30, 2012,
is as follows:
|
|
|
|
|
|
|
|
|
|
|
|
|
|
|
|
|
|
|
|
|
| Interest Rate Swaps |
|
| Counterparty |
|
Fund Pays |
|
Fund Receives |
|
Termination
Date |
|
|
Currency |
|
|
Notional
Amount
(Thousands) |
|
|
Net Unrealized
Appreciation
(Depreciation)
($Thousands) |
|
| Citigroup |
|
3.79% |
|
6-Month GBP LIBOR |
|
|
05/19/2019 |
|
|
|
GBP |
|
|
|
2,500 |
|
|
$ |
(684 |
) |
| Deutsche Bank |
|
1.93% |
|
6-Month EURIBOR |
|
|
04/03/2019 |
|
|
|
EUR |
|
|
|
4,200 |
|
|
|
(259 |
) |
| UBS |
|
1.07% |
|
6-Month EURIBOR Flat |
|
|
09/11/2017 |
|
|
|
DEM |
|
|
|
2,000 |
|
|
|
(17 |
) |
| UBS |
|
2.66% |
|
6-Month GBP LIBOR |
|
|
09/05/2032 |
|
|
|
GBP |
|
|
|
1,000 |
|
|
|
15 |
|
| Deutsche Bank |
|
6-Month EURIBOR |
|
4.17% |
|
|
03/28/2013 |
|
|
|
EUR |
|
|
|
7,000 |
|
|
|
361 |
|
| Deutsche Bank |
|
6-Month EURIBOR Flat |
|
1.77% |
|
|
09/07/2022 |
|
|
|
DEM |
|
|
|
5,250 |
|
|
|
23 |
|
| JPMorgan |
|
6-Month JPY LIBOR |
|
2.22% |
|
|
03/30/2027 |
|
|
|
JPY |
|
|
|
750,000 |
|
|
|
1,348 |
|
| Royal Bank of Scotland |
|
6-Month EURIBOR |
|
3.14% |
|
|
08/04/2021 |
|
|
|
EUR |
|
|
|
1,450 |
|
|
|
248 |
|
| JPMorgan |
|
6-Month EURIBOR |
|
4.38% |
|
|
01/07/2013 |
|
|
|
EUR |
|
|
|
5,400 |
|
|
|
278 |
|
| USB |
|
3-Month Canadian Bankers Acceptance Rate |
|
2.56% |
|
|
04/24/2022 |
|
|
|
CAD |
|
|
|
2,000 |
|
|
|
91 |
|
|
|
|
|
|
|
|
|
|
|
|
|
|
|
|
|
|
|
|
|
|
|
|
|
|
|
|
|
|
|
|
|
|
|
|
|
|
|
|
$ |
1,404 |
|
|
|
|
|
|
|
|
|
|
|
|
|
|
|
|
|
|
|
|
|
|
For the year ended September 30, 2012, the total amount of all swap agreements, as presented in the table above, are
representative of the volume of activity for this derivative type during the period.
Percentages are based on a Net Assets of $491,793 ($ Thousands).
| (1) |
|
In local currency unless otherwise indicated. |
| (A) |
|
Variable Rate Security - The rate reported on the Schedule of Investments is the rate in effect as of September 30, 2012. |
| (B) |
|
Securities sold within terms of a private placement memorandum, exempt from registration under Section 144A of the Securities Act of 1933, as amended, and may be sold
only to dealers in that program or other “accredited investors.” These securities have been determined to be liquid under guidelines established by the Board of Trustees. |
| (C) |
|
Step Bonds - The rate reflected on the Schedule of Investments is the effective yield on September 30, 2012. The coupon on a step bond changes on a specified date.
|
| (D) |
|
Security is when-issued. |
| (E) |
|
Securities considered illiquid. The total market value of such securities as of September 30, 2012 was $1,411 ($ Thousands) and
represented 0.3% of Net Assets. |
| (F) |
|
Real Estate Investment Trust. |
AUD — Australian
Dollar
CAD — Canadian Dollar
CHF
— Swiss Franc
CZK — Czech Koruna
Cl — Class
DKK — Danish Krone
EUR — Euro
EURIBOR — Euro London Interbank
Offered Rate
FHLMC — Federal Home Loan Mortgage Corporation
GBP — British Pound Sterling
HKD— Hong Kong Dollar
JPY — Japanese Yen
KRW — Korean Won
LIBOR — London Interbank Offered Rate
MTN — Medium Term Note
MXP — Mexican Peso
MYR — Malaysian Ringgit
NOK —
Norwegian Krone
NZD — New Zealand Dollar
PLC — Public Limited Company
PLN — Polish Zlotty
SEK — Swedish Krone
Ser — Series
SGD — Singapore Dollar
TRY —
Turkish Lira
USD — U.S. Dollar
ZAR— South African Rand
The following is a summary of the inputs used as of September 30, 2012, in valuing the Fund’s
investments and other financial instruments carried at value ($ Thousands):
|
|
|
|
|
|
|
|
|
|
|
|
|
|
|
|
|
| Investments in Securities |
|
Level 1 |
|
|
Level 2 |
|
|
Level 3 |
|
|
Total |
|
| Global Bonds |
|
$ |
— |
|
|
$ |
455,686 |
|
|
$ |
— |
|
|
$ |
455,686 |
|
| Mortgage-Backed Securities |
|
|
— |
|
|
|
16,318 |
|
|
|
— |
|
|
|
16,318 |
|
| Corporate Obligations |
|
|
— |
|
|
|
11,206 |
|
|
|
— |
|
|
|
11,206 |
|
| Asset-Backed Securities |
|
|
— |
|
|
|
1,856 |
|
|
|
— |
|
|
|
1,856 |
|
| U.S. Treasury Obligations |
|
|
— |
|
|
|
486 |
|
|
|
— |
|
|
|
486 |
|
| Municipal Bond |
|
|
— |
|
|
|
51 |
|
|
|
— |
|
|
|
51 |
|
| Time Deposits |
|
|
— |
|
|
|
2,474 |
|
|
|
— |
|
|
|
2,474 |
|
|
|
|
|
|
|
|
|
|
|
|
|
|
|
|
|
|
| Total Investments in Securities |
|
$ |
— |
|
|
$ |
488,077 |
|
|
$ |
— |
|
|
$ |
488,077 |
|
|
|
|
|
|
|
|
|
|
|
|
|
|
|
|
|
|
|
|
|
|
|
|
|
|
|
|
|
|
|
|
|
|
|
| Other Financial Instruments |
|
Level 1 |
|
|
Level 2 |
|
|
Level 3 |
|
|
Total |
|
| Futures Contracts * |
|
$ |
(123 |
) |
|
$ |
— |
|
|
$ |
— |
|
|
$ |
(123 |
) |
| Forwards Contracts * |
|
|
— |
|
|
|
(1,952 |
) |
|
|
— |
|
|
|
(1,952 |
) |
| Interest Rate Swaps * |
|
|
— |
|
|
|
1,404 |
|
|
|
— |
|
|
|
1,404 |
|
|
|
|
|
|
|
|
|
|
|
|
|
|
|
|
|
|
| Total Other Financial Instruments |
|
$ |
(123 |
) |
|
$ |
(548 |
) |
|
$ |
— |
|
|
$ |
(671 |
) |
|
|
|
|
|
|
|
|
|
|
|
|
|
|
|
|
|
| * |
|
Futures contracts, forwards contracts, and swap contracts are valued at the net unrealized appreciation/(depreciation). |
For the year ended September 30, 2012, there were no transfers between Level 1 and Level 2 assets and liabilities.
For the year ended September 30, 2012, there were no transfers between Level 2 and Level 3 assets and liabilities.
Amounts designated as “—” are $O or have been rounded to $O.
The accompanying notes are an integral part of the financial statements.
|
|
|
| 12 |
|
SEI Institutional International Trust / Annual Report / September 30, 2012 |
Schedule of Investments
Emerging Markets Debt Fund
September 30, 2012
|
|
|
|
|
|
|
|
|
| Description |
|
Face Amount(1)
(Thousands) |
|
|
Market
Value ($ Thousands) |
|
|
|
|
|
|
|
|
|
|
|
|
|
| GLOBAL BONDS — 86.0% |
|
|
|
|
|
|
|
|
|
|
|
| Angola — 0.1% |
|
|
|
|
|
|
|
|
| Republic of Angola Via Northern Lights III |
|
|
|
|
|
|
|
|
| 7.000%, 08/16/2019 |
|
|
775 |
|
|
$ |
851 |
|
|
|
|
|
|
|
|
|
|
|
|
|
| Argentina — 1.9% |
|
|
|
|
|
|
|
|
| Capex |
|
|
|
|
|
|
|
|
| 10.000%, 03/10/2018 (A) |
|
|
488 |
|
|
|
366 |
|
| City of Buenos Aires Argentina |
|
|
|
|
|
|
|
|
| 9.950%, 03/01/2017 (A) |
|
|
1,754 |
|
|
|
1,570 |
|
|
|
|
|
|
|
|
|
|
| Deutsche Bank, CLN (Cablevision) MTN |
|
|
|
|
|
|
|
|
| 9.375%, 02/13/2018 (A)(B) |
|
|
1,732 |
|
|
|
1,299 |
|
| Empresa Distribuidora Y Comercializadora Norte |
|
|
|
|
|
|
|
|
| 9.750%, 10/25/2022 (A) |
|
|
606 |
|
|
|
303 |
|
| Province of Buenos Aires |
|
|
|
|
|
|
|
|
| 9.625%, 04/18/2028 (B) |
|
|
595 |
|
|
|
422 |
|
| 9.625%, 04/18/2028 (A)(B) |
|
|
1,605 |
|
|
|
1,140 |
|
| 9.375%, 09/14/2018 (B) |
|
|
470 |
|
|
|
343 |
|
| Province of Medoza |
|
|
|
|
|
|
|
|
| 5.500%, 09/04/2018 (B) |
|
|
266 |
|
|
|
205 |
|
| Province of Neuquen |
|
|
|
|
|
|
|
|
| 8.656%, 10/18/2014 (A)(B) |
|
|
84 |
|
|
|
86 |
|
| Republic of Argentina |
|
|
|
|
|
|
|
|
| 8.750%, 06/02/2017 |
|
|
320 |
|
|
|
312 |
|
| 8.280%, 12/31/2033 |
|
|
1,891 |
|
|
|
1,484 |
|
| 8.280%, 12/31/2033 |
|
|
351 |
|
|
|
262 |
|
| 7.820%, 12/31/2033 |
|
EUR |
1,685 |
|
|
|
1,409 |
|
| 7.820%, 12/31/2033 |
|
EUR |
275 |
|
|
|
230 |
|
| 7.820%, 12/31/2033 |
|
EUR |
9,497 |
|
|
|
7,960 |
|
| 7.000%, 10/03/2015 |
|
|
1,765 |
|
|
|
1,610 |
|
| 4.191%, 12/15/2035 (C) |
|
EUR |
7,500 |
|
|
|
1,158 |
|
| 2.500%, 03/31/2019 (D) |
|
|
1,800 |
|
|
|
663 |
|
| 1.180%, 12/31/2038 (C)(D) |
|
ARS |
2 |
|
|
|
— |
|
| 0.044%, 12/15/2035 (C) |
|
|
4,360 |
|
|
|
569 |
|
| 0.000%, 12/15/2035 (C) |
|
ARS |
2 |
|
|
|
— |
|
| Transportadora Gas del Norte |
|
|
|
|
|
|
|
|
| 3.500%, 08/22/2019 (A)(D) |
|
|
173 |
|
|
|
— |
|
| 3.500%, 08/22/2019 (A)(D) |
|
|
318 |
|
|
|
— |
|
| 0.000%, 08/22/2019 (A)(E) |
|
|
125 |
|
|
|
72 |
|
| 0.000%, 08/22/2019 (A)(E) |
|
|
38 |
|
|
|
22 |
|
| WPE International Cooperatief |
|
|
|
|
|
|
|
|
| 10.375%, 09/30/2020 (A) |
|
|
950 |
|
|
|
807 |
|
|
|
|
|
|
|
|
|
|
|
|
|
|
|
|
|
22,292 |
|
|
|
|
|
|
|
|
|
|
|
|
|
| Azerbaijan — 0.1% |
|
|
|
|
|
|
|
|
| State Oil of the Azerbaijan Republic |
|
|
|
|
|
|
|
|
| 5.450%, 02/09/2017 |
|
|
657 |
|
|
|
703 |
|
|
|
|
|
|
|
|
|
|
|
|
|
|
|
|
|
|
|
| Description |
|
Face Amount(1)
(Thousands) |
|
|
Market
Value ($ Thousands) |
|
|
|
|
|
|
|
|
|
|
|
|
|
| Barbados — 0.1% |
|
|
|
|
|
|
|
|
| Columbus International |
|
|
|
|
|
|
|
|
| 11.500%, 11/20/2014 (A) |
|
|
1,200 |
|
|
$ |
1,332 |
|
|
|
|
|
|
|
|
|
|
|
|
|
| Belarus — 0.2% |
|
|
|
|
|
|
|
|
| Republic of Belarus |
|
|
|
|
|
|
|
|
| 8.950%, 01/26/2018 |
|
|
1,230 |
|
|
|
1,207 |
|
| 8.750%, 08/03/2015 |
|
|
1,030 |
|
|
|
1,018 |
|
|
|
|
|
|
|
|
|
|
|
|
|
|
|
|
|
2,225 |
|
|
|
|
|
|
|
|
|
|
|
|
|
| Bermuda — 0.1% |
|
|
|
|
|
|
|
|
| Bermuda Government International Bond |
|
|
|
|
|
|
|
|
| 4.138%, 01/03/2023 (A) |
|
|
820 |
|
|
|
861 |
|
|
|
|
|
|
|
|
|
|
|
|
|
| Bosnia and Herzegovina — 0.1% |
|
|
|
|
|
|
|
|
| Republic of Bosnia & Herzegovina |
|
|
|
|
|
|
|
|
| 0.000%, 12/11/2017 (B)(C) |
|
DEM |
1,821 |
|
|
|
910 |
|
|
|
|
|
|
|
|
|
|
|
|
|
| Brazil — 7.0% |
|
|
|
|
|
|
|
|
| Banco Cruzeiro do Sul |
|
|
|
|
|
|
|
|
| 8.875%, 09/22/2020 (F) |
|
|
384 |
|
|
|
— |
|
| 8.875%, 09/22/2020 (F) |
|
|
1,144 |
|
|
|
1 |
|
| Banco Nacional de Desenvolvimento Economico e Social |
|
|
|
|
|
|
|
|
| 6.500%, 06/10/2019 (A) |
|
|
660 |
|
|
|
813 |
|
| 5.500%, 07/12/2020 (A) |
|
|
400 |
|
|
|
474 |
|
| Barclays, CLN (Nota Do Tesouro Nacional) |
|
|
|
|
|
|
|
|
| 6.000%, 05/15/2015 |
|
BRL |
850 |
|
|
|
997 |
|
| Barclays, CLN (Nota Do Tesouro Nacional, Serie F) |
|
|
|
|
|
|
|
|
| 10.000%, 01/01/2017 |
|
BRL |
9,890 |
|
|
|
5,027 |
|
| 10.000%, 01/01/2021 |
|
BRL |
6,770 |
|
|
|
3,390 |
|
| BM&FBovespa |
|
|
|
|
|
|
|
|
| 5.500%, 07/16/2020 |
|
|
300 |
|
|
|
341 |
|
| BR Malls International Finance |
|
|
|
|
|
|
|
|
| 8.500%, 12/31/2049 (A) |
|
|
145 |
|
|
|
158 |
|
| BR Properties |
|
|
|
|
|
|
|
|
| 9.000%, 12/31/2049 (A) |
|
|
241 |
|
|
|
260 |
|
| Braskem Finance |
|
|
|
|
|
|
|
|
| 7.375%, 10/04/2049 |
|
|
200 |
|
|
|
210 |
|
| Brazil Letras do Tesouro Nacional |
|
|
|
|
|
|
|
|
| 0.000%, 01/01/2015 (E) |
|
BRL |
10,800 |
|
|
|
4,435 |
|
| Brazil Notas do Tesouro Nacional, Ser B |
|
|
|
|
|
|
|
|
| 13.054%, 05/15/2015 |
|
BRL |
8,660 |
|
|
|
10,157 |
|
| 10.674%, 08/15/2020 |
|
BRL |
4,560 |
|
|
|
5,712 |
|
| Brazil Notas do Tesouro Nacional, Serie B |
|
|
|
|
|
|
|
|
| 6.000%, 08/15/2016 |
|
BRL |
2,540 |
|
|
|
3,021 |
|
| Brazil Notas do Tesouro Nacional, Serie F |
|
|
|
|
|
|
|
|
| 10.000%, 01/01/2014 |
|
BRL |
1,490 |
|
|
|
752 |
|
| 10.000%, 01/01/2021 |
|
BRL |
3,100 |
|
|
|
1,552 |
|
|
|
|
| 1 |
|
SEI Institutional International Trust / Annual Report / September 30, 2012 |
Schedule of Investments
Emerging Markets Debt Fund
September 30, 2012
|
|
|
|
|
|
|
|
|
| Description |
|
Face Amount(1)
(Thousands) |
|
|
Market Value
($ Thousands) |
|
|
|
|
|
|
|
|
|
|
| Cia Energetica de Sao Paulo MTN |
|
|
|
|
|
|
|
|
| 9.750%, 01/15/2015 |
|
|
630 |
|
|
$ |
452 |
|
| Citigroup Funding, CLN (Federal Republic of Brazil) MTN |
|
|
|
|
|
|
|
|
| 6.000%, 08/16/2018 |
|
|
5,154 |
|
|
|
5,136 |
|
| Deutsche Bank, CLN (Nota Do Tesouro Nacional) MTN |
|
|
|
|
|
|
|
|
| 10.000%, 01/06/2021 |
|
|
2,500 |
|
|
|
2,614 |
|
| Federal Republic of Brazil |
|
|
|
|
|
|
|
|
| 11.000%, 08/17/2040 |
|
|
150 |
|
|
|
192 |
|
| 10.250%, 01/10/2028 |
|
BRL |
290 |
|
|
|
187 |
|
| 10.125%, 05/15/2027 |
|
|
2,827 |
|
|
|
5,113 |
|
| 8.875%, 04/15/2024 |
|
|
360 |
|
|
|
582 |
|
| 8.500%, 01/05/2024 |
|
BRL |
8,920 |
|
|
|
5,175 |
|
| 8.250%, 01/20/2034 |
|
|
900 |
|
|
|
1,487 |
|
| 7.125%, 01/20/2037 |
|
|
3,021 |
|
|
|
4,554 |
|
| 5.875%, 01/15/2019 |
|
|
260 |
|
|
|
324 |
|
| 5.625%, 01/07/2041 |
|
|
1,150 |
|
|
|
1,472 |
|
| 4.875%, 01/22/2021 |
|
|
460 |
|
|
|
550 |
|
| 2.625%, 01/05/2023 |
|
|
400 |
|
|
|
400 |
|
| Fibria Overseas Finance |
|
|
|
|
|
|
|
|
| 6.750%, 03/03/2021 |
|
|
700 |
|
|
|
747 |
|
| General Shopping Finance |
|
|
|
|
|
|
|
|
| 10.000%, 12/31/2049 (A) |
|
|
294 |
|
|
|
300 |
|
| Globo Comunicacao e Participacoes |
|
|
|
|
|
|
|
|
| 6.250%, 07/20/2015 (D) |
|
|
147 |
|
|
|
159 |
|
| Hypermarcas |
|
|
|
|
|
|
|
|
| 6.500%, 04/20/2021 (A) |
|
|
224 |
|
|
|
235 |
|
| Itau Unibanco Holding |
|
|
|
|
|
|
|
|
| 5.650%, 03/19/2022 (A) |
|
|
200 |
|
|
|
209 |
|
| JBS Finance II |
|
|
|
|
|
|
|
|
| 8.250%, 01/29/2018 |
|
|
300 |
|
|
|
306 |
|
| 8.250%, 01/29/2018 (A) |
|
|
1,320 |
|
|
|
1,346 |
|
| JPMorgan, CLN (Nota Do Tesouro Nacional) |
|
|
|
|
|
|
|
|
| 10.000%, 01/01/2023 |
|
BRL |
1,800 |
|
|
|
897 |
|
| 6.000%, 05/15/2015 |
|
BRL |
3,705 |
|
|
|
4,346 |
|
| Marfrig Holding Europe |
|
|
|
|
|
|
|
|
| 8.375%, 05/09/2018 |
|
|
1,200 |
|
|
|
978 |
|
| Minerva Luxembourg |
|
|
|
|
|
|
|
|
| 12.250%, 02/10/2022 (A) |
|
|
1,000 |
|
|
|
1,154 |
|
| Minerva Overseas II |
|
|
|
|
|
|
|
|
| 10.875%, 11/15/2019 |
|
|
110 |
|
|
|
122 |
|
| Morgan Stanley |
|
|
|
|
|
|
|
|
| 10.090%, 05/03/2017 |
|
BRL |
2,600 |
|
|
|
1,380 |
|
| Odebrecht Drilling Norbe VIII/IX |
|
|
|
|
|
|
|
|
| 6.350%, 06/30/2021 |
|
|
25 |
|
|
|
28 |
|
| 6.350%, 06/30/2021 |
|
|
116 |
|
|
|
131 |
|
| OGX Austria GmbH |
|
|
|
|
|
|
|
|
| 8.375%, 04/01/2022 (A) |
|
|
400 |
|
|
|
348 |
|
| OGX Petroleo e Gas Participacoes |
|
|
|
|
|
|
|
|
| 8.500%, 06/01/2018 (A) |
|
|
508 |
|
|
|
457 |
|
| OSX 3 Leasing |
|
|
|
|
|
|
|
|
| 9.250%, 03/20/2015 |
|
|
200 |
|
|
|
207 |
|
|
|
|
|
|
|
|
|
|
| Description |
|
Face Amount(1)
(Thousands) |
|
|
Market Value
($ Thousands) |
|
|
|
|
|
|
|
|
|
|
| Petrobras International Finance |
|
|
|
|
|
|
|
|
| 5.375%, 01/27/2021 |
|
|
20 |
|
|
$ |
23 |
|
| QGOG Atlantic/Alaskan Rigs |
|
|
|
|
|
|
|
|
| 5.250%, 07/30/2018 (A) |
|
|
290 |
|
|
|
302 |
|
| Schahin II Finance |
|
|
|
|
|
|
|
|
| 5.875%, 09/25/2022 (A) |
|
|
590 |
|
|
|
618 |
|
| Telemar Norte Leste |
|
|
|
|
|
|
|
|
| 5.500%, 10/23/2020 (A) |
|
|
200 |
|
|
|
210 |
|
| Vale |
|
|
|
|
|
|
|
|
| 5.625%, 09/11/2042 |
|
|
340 |
|
|
|
346 |
|
| Vale Overseas |
|
|
|
|
|
|
|
|
| 8.250%, 01/17/2034 |
|
|
230 |
|
|
|
298 |
|
| 6.875%, 11/21/2036 |
|
|
250 |
|
|
|
289 |
|
| Voto-Votorantim Overseas Trading Operations |
|
|
|
|
|
|
|
|
| 6.625%, 09/25/2019 (A) |
|
|
490 |
|
|
|
565 |
|
|
|
|
|
|
|
|
|
|
|
|
|
|
|
|
|
81,539 |
|
|
|
|
|
|
|
|
|
|
|
|
|
| Canada — 0.0% |
|
|
|
|
|
|
|
|
| PTTEP Canada International Finance MTN |
|
|
|
|
|
|
|
|
| 5.692%, 04/05/2021 |
|
|
200 |
|
|
|
231 |
|
|
|
|
|
|
|
|
|
|
|
|
|
| Chile — 0.8% |
|
|
|
|
|
|
|
|
| Banco del Estado de Chile |
|
|
|
|
|
|
|
|
| 4.125%, 10/07/2020 |
|
|
130 |
|
|
|
141 |
|
| 3.875%, 02/08/2022 (A) |
|
|
230 |
|
|
|
244 |
|
| BancoEstado |
|
|
|
|
|
|
|
|
| 4.125%, 10/07/2020 (A) |
|
|
270 |
|
|
|
293 |
|
| Empresa Nacional del Petroleo |
|
|
|
|
|
|
|
|
| 6.250%, 07/08/2019 |
|
|
50 |
|
|
|
58 |
|
| 6.250%, 07/08/2019 (A) |
|
|
100 |
|
|
|
115 |
|
| 5.250%, 08/10/2020 (A) |
|
|
240 |
|
|
|
262 |
|
| Inversiones Alsacia |
|
|
|
|
|
|
|
|
| 8.000%, 08/18/2018 (A) |
|
|
966 |
|
|
|
991 |
|
| Nacional del Cobre de Chile |
|
|
|
|
|
|
|
|
| 7.500%, 01/15/2019 |
|
|
170 |
|
|
|
220 |
|
| 6.150%, 10/24/2036 |
|
|
1,530 |
|
|
|
1,961 |
|
| 4.250%, 07/17/2042 (A) |
|
|
654 |
|
|
|
647 |
|
| 3.875%, 11/03/2021 (A) |
|
|
410 |
|
|
|
446 |
|
| 3.750%, 11/04/2020 (A) |
|
|
290 |
|
|
|
313 |
|
| 3.750%, 11/04/2020 |
|
|
110 |
|
|
|
119 |
|
| 3.000%, 07/17/2022 (A) |
|
|
721 |
|
|
|
727 |
|
| Republic of Chile |
|
|
|
|
|
|
|
|
| 5.500%, 08/05/2020 |
|
CLP |
140,000 |
|
|
|
313 |
|
| 5.500%, 08/05/2020 |
|
CLP |
500,000 |
|
|
|
1,113 |
|
| 3.250%, 09/14/2021 |
|
|
556 |
|
|
|
602 |
|
| Telefonica Moviles Chile |
|
|
|
|
|
|
|
|
| 2.875%, 11/09/2015 |
|
|
300 |
|
|
|
301 |
|
|
|
|
|
|
|
|
|
|
|
|
|
|
|
|
|
8,866 |
|
|
|
|
|
|
|
|
|
|
|
|
|
| China — 1.1% |
|
|
|
|
|
|
|
|
| Agile Property Holdings |
|
|
|
|
|
|
|
|
| 8.875%, 04/28/2017 |
|
|
400 |
|
|
|
403 |
|
| Central China Real Estate |
|
|
|
|
|
|
|
|
| 12.250%, 10/20/2015 |
|
|
300 |
|
|
|
325 |
|
| China Oriental Group |
|
|
|
|
|
|
|
|
| 8.000%, 08/18/2015 (A) |
|
|
950 |
|
|
|
921 |
|
| 7.000%, 11/17/2017 |
|
|
200 |
|
|
|
172 |
|
| China Overseas Finance Cayman II |
|
|
|
|
|
|
|
|
| 5.500%, 11/10/2020 |
|
|
100 |
|
|
|
110 |
|
|
|
|
| 2 |
|
SEI Institutional International Trust / Annual Report / September 30, 2012 |
Schedule of Investments
Emerging Markets Debt Fund
September 30, 2012
|
|
|
|
|
|
|
|
|
| Description |
|
Face
Amount(1) (Thousands) |
|
|
Market
Value ($ Thousands) |
|
|
|
|
|
|
|
|
|
|
| China Shanshui Cement Group |
|
|
|
|
|
|
|
|
| 10.500%, 04/27/2017 (A) |
|
|
650 |
|
|
$ |
682 |
|
| CNPC HK Overseas Capital |
|
|
|
|
|
|
|
|
| 5.950%, 04/28/2041 |
|
|
400 |
|
|
|
511 |
|
| Country Garden Holdings |
|
|
|
|
|
|
|
|
| 11.250%, 04/22/2017 |
|
|
700 |
|
|
|
763 |
|
| Evergrande Real Estate Group |
|
|
|
|
|
|
|
|
| 13.000%, 01/27/2015 |
|
|
400 |
|
|
|
405 |
|
| 13.000%, 01/27/2015 (A) |
|
|
600 |
|
|
|
607 |
|
| 9.250%, 01/19/2016 |
|
CNY |
5,000 |
|
|
|
702 |
|
| 7.500%, 01/19/2014 |
|
CNY |
3,000 |
|
|
|
450 |
|
| Franshion Development |
|
|
|
|
|
|
|
|
| 6.750%, 04/15/2021 (A) |
|
|
320 |
|
|
|
329 |
|
| Hidili Industry International Development |
|
|
|
|
|
|
|
|
| 8.625%, 11/04/2015 |
|
|
800 |
|
|
|
628 |
|
| Mega Advance Investments |
|
|
|
|
|
|
|
|
| 5.000%, 05/12/2021 (A) |
|
|
406 |
|
|
|
453 |
|
| Sinochem Offshore Capital |
|
|
|
|
|
|
|
|
| 1.800%, 01/18/2014 |
|
CNY |
2,000 |
|
|
|
310 |
|
| Sinochem Overseas Capital |
|
|
|
|
|
|
|
|
| 6.300%, 11/12/2040 |
|
|
150 |
|
|
|
174 |
|
| 4.500%, 11/12/2020 (A) |
|
|
2,072 |
|
|
|
2,204 |
|
| 4.500%, 11/12/2020 |
|
|
327 |
|
|
|
348 |
|
| Sinopec Group Overseas Development 2012 |
|
|
|
|
|
| 4.875%, 05/17/2042 (A) |
|
|
700 |
|
|
|
784 |
|
| 3.900%, 05/17/2022 (A) |
|
|
300 |
|
|
|
321 |
|
| Tencent Holdings |
|
|
|
|
|
|
|
|
| 4.625%, 12/12/2016 |
|
|
250 |
|
|
|
266 |
|
| 3.375%, 03/05/2018 |
|
|
217 |
|
|
|
219 |
|
| West China Cement |
|
|
|
|
|
|
|
|
| 7.500%, 01/25/2016 (A) |
|
|
200 |
|
|
|
177 |
|
|
|
|
|
|
|
|
|
|
|
|
|
|
|
|
|
12,264 |
|
|
|
|
|
|
|
|
|
|
|
|
|
| Colombia — 4.2% |
|
|
|
|
|
|
|
|
| Bancolombia |
|
|
|
|
|
|
|
|
| 5.950%, 06/03/2021 |
|
|
300 |
|
|
|
337 |
|
| 5.950%, 06/03/2021 (A) |
|
|
398 |
|
|
|
448 |
|
| 5.125%, 09/11/2022 |
|
|
175 |
|
|
|
177 |
|
| Bogota Distrito Capital |
|
|
|
|
|
|
|
|
| 9.750%, 07/26/2028 |
|
COP |
375,000 |
|
|
|
307 |
|
| 9.750%, 07/26/2028 (A) |
|
COP |
9,020,000 |
|
|
|
7,380 |
|
| Citigroup Funding, CLN (Republic of Columbia) MTN |
|
|
|
|
|
|
|
|
| 11.000%, 07/27/2020 |
|
COP |
8,830,000 |
|
|
|
6,355 |
|
| Colombia Telecomunicaciones ESP |
|
|
|
|
|
| 5.375%, 09/27/2022 (A) |
|
|
310 |
|
|
|
315 |
|
| Ecopetrol |
|
|
|
|
|
|
|
|
| 7.625%, 07/23/2019 (A) |
|
|
220 |
|
|
|
281 |
|
| Emgesa ESP |
|
|
|
|
|
|
|
|
| 8.750%, 01/25/2021 |
|
COP |
870,000 |
|
|
|
546 |
|
| Empresa de Energia de Bogota |
|
|
|
|
|
|
|
|
| 6.125%, 11/10/2021 |
|
|
300 |
|
|
|
330 |
|
| Empresas Publicas de Medellin ESP |
|
|
|
|
|
| 8.375%, 02/01/2021 |
|
COP |
310,000 |
|
|
|
193 |
|
| Grupo Aval |
|
|
|
|
|
|
|
|
| 5.250%, 02/01/2017 (A) |
|
|
200 |
|
|
|
212 |
|
|
|
|
|
|
|
|
|
|
| Description |
|
Face
Amount(1) (Thousands) |
|
|
Market
Value ($ Thousands) |
|
|
|
|
|
|
|
|
|
|
| 4.750%, 09/26/2022 (A) |
|
|
222 |
|
|
$ |
219 |
|
| Gruposura Finance |
|
|
|
|
|
|
|
|
| 5.700%, 05/18/2021 (A) |
|
|
410 |
|
|
|
447 |
|
| Republic of Colombia |
|
|
|
|
|
|
|
|
| 12.000%, 10/22/2015 |
|
COP |
4,279,000 |
|
|
|
2,926 |
|
| 11.750%, 02/25/2020 |
|
|
1,552 |
|
|
|
2,526 |
|
| 10.375%, 01/28/2033 |
|
|
140 |
|
|
|
256 |
|
| 9.850%, 06/28/2027 |
|
COP |
2,670,000 |
|
|
|
2,247 |
|
| 9.850%, 06/28/2027 |
|
COP |
2,550,000 |
|
|
|
2,146 |
|
| 8.125%, 05/21/2024 |
|
|
1,310 |
|
|
|
1,955 |
|
| 7.750%, 04/14/2021 |
|
COP |
5,668,000 |
|
|
|
3,875 |
|
| 7.375%, 01/27/2017 |
|
|
445 |
|
|
|
553 |
|
| 7.375%, 03/18/2019 |
|
|
1,760 |
|
|
|
2,327 |
|
| 7.375%, 09/18/2037 |
|
|
5,379 |
|
|
|
8,257 |
|
| 6.125%, 01/18/2041 |
|
|
1,195 |
|
|
|
1,619 |
|
| 4.375%, 07/12/2021 |
|
|
450 |
|
|
|
518 |
|
| 4.375%, 03/21/2023 |
|
COP |
2,176,000 |
|
|
|
1,187 |
|
| Titulos de Tesoreria |
|
|
|
|
|
|
|
|
| 7.000%, 02/25/2015 |
|
COP |
570,000 |
|
|
|
714 |
|
| Transportadora de Gas Internacional ESP |
|
|
|
|
|
| 5.700%, 03/20/2022 (A) |
|
|
350 |
|
|
|
374 |
|
|
|
|
|
|
|
|
|
|
|
|
|
|
|
|
|
49,027 |
|
|
|
|
|
|
|
|
|
|
|
|
|
| Croatia — 1.0% |
|
|
|
|
|
|
|
|
| Agrokor |
|
|
|
|
|
|
|
|
| 9.125%, 02/01/2020 |
|
|
130 |
|
|
|
167 |
|
| 8.875%, 02/01/2020 |
|
|
200 |
|
|
|
200 |
|
| Government of Croatia |
|
|
|
|
|
|
|
|
| 6.750%, 11/05/2019 |
|
|
2,473 |
|
|
|
2,788 |
|
| 6.625%, 07/14/2020 (A) |
|
|
1,988 |
|
|
|
2,229 |
|
| 6.625%, 07/14/2020 |
|
|
600 |
|
|
|
673 |
|
| 6.375%, 03/24/2021 |
|
|
810 |
|
|
|
898 |
|
| 6.375%, 03/24/2021 (A) |
|
|
1,551 |
|
|
|
1,720 |
|
| 6.250%, 04/27/2017 (A) |
|
|
1,212 |
|
|
|
1,312 |
|
| 5.875%, 07/09/2018 |
|
EUR |
150 |
|
|
|
208 |
|
| Zagrebacki Holding |
|
|
|
|
|
|
|
|
| 5.500%, 07/10/2017 |
|
EUR |
1,100 |
|
|
|
1,220 |
|
|
|
|
|
|
|
|
|
|
|
|
|
|
|
|
|
11,415 |
|
|
|
|
|
|
|
|
|
|
|
|
|
| Czech Republic — 0.1% |
|
|
|
|
|
|
|
|
| Central European Media Enterprises |
|
|
|
|
|
| 11.625%, 09/15/2016 (A) |
|
EUR |
700 |
|
|
|
937 |
|
|
|
|
|
|
|
|
|
|
|
|
|
| Dominican Republic — 0.2% |
|
|
|
|
|
|
|
|
| Cap Cana |
|
|
|
|
|
|
|
|
| 10.000%, 04/30/2016 (F) |
|
|
982 |
|
|
|
147 |
|
| 10.000%, 04/30/2016 (F) |
|
|
844 |
|
|
|
211 |
|
| Dominican Republic |
|
|
|
|
|
|
|
|
| 7.500%, 05/06/2021 (A) |
|
|
1,490 |
|
|
|
1,680 |
|
|
|
|
|
|
|
|
|
|
|
|
|
|
|
|
|
2,038 |
|
|
|
|
|
|
|
|
|
|
|
|
|
| Ecuador — 0.0% |
|
|
|
|
|
|
|
|
| Republic of Ecuador |
|
|
|
|
|
|
|
|
| 9.375%, 12/15/2015 |
|
|
240 |
|
|
|
248 |
|
|
|
|
|
|
|
|
|
|
|
|
|
| Egypt — 0.1% |
|
|
|
|
|
|
|
|
| Government of Egypt |
|
|
|
|
|
|
|
|
| 6.875%, 04/30/2040 |
|
|
240 |
|
|
|
236 |
|
| 5.750%, 04/29/2020 (A) |
|
|
100 |
|
|
|
100 |
|
| 5.750%, 04/29/2020 |
|
|
150 |
|
|
|
151 |
|
|
|
|
| 3 |
|
SEI Institutional International Trust / Annual Report / September 30, 2012 |
Schedule of Investments
Emerging Markets Debt Fund
September 30, 2012
|
|
|
|
|
|
|
|
|
| Description |
|
Face
Amount(1) (Thousands) |
|
|
Market Value
($ Thousands) |
|
|
|
|
|
|
|
|
|
|
| Nile Finance |
|
|
|
|
|
|
|
|
| 5.250%, 08/05/2015 |
|
|
280 |
|
|
$ |
280 |
|
|
|
|
|
|
|
|
|
|
|
|
|
|
|
|
|
767 |
|
|
|
|
|
|
|
|
|
|
|
|
|
| El Salvador — 0.3% |
|
|
|
|
|
|
|
|
| Republic of El Salvador |
|
|
|
|
|
|
|
|
| 8.250%, 04/10/2032 |
|
|
110 |
|
|
|
131 |
|
| 7.750%, 01/24/2023 |
|
|
332 |
|
|
|
388 |
|
| 7.650%, 06/15/2035 |
|
|
1,337 |
|
|
|
1,494 |
|
| 7.625%, 02/01/2041 (A) |
|
|
380 |
|
|
|
424 |
|
| 7.375%, 12/01/2019 |
|
|
170 |
|
|
|
195 |
|
| Telemovil Finance |
|
|
|
|
|
|
|
|
| 8.000%, 10/01/2017 (A) |
|
|
500 |
|
|
|
527 |
|
|
|
|
|
|
|
|
|
|
|
|
|
|
|
|
|
3,159 |
|
|
|
|
|
|
|
|
|
|
|
|
|
| Georgia — 0.1% |
|
|
|
|
|
|
|
|
| JSC Georgian Railway |
|
|
|
|
|
|
|
|
| 7.750%, 07/11/2022 (A) |
|
|
390 |
|
|
|
445 |
|
| Republic of Georgia |
|
|
|
|
|
|
|
|
| 6.875%, 04/12/2021 (A) |
|
|
340 |
|
|
|
389 |
|
|
|
|
|
|
|
|
|
|
|
|
|
|
|
|
|
834 |
|
|
|
|
|
|
|
|
|
|
|
|
|
| Ghana — 0.1% |
|
|
|
|
|
|
|
|
| Republic of Ghana |
|
|
|
|
|
|
|
|
| 8.500%, 10/04/2017 (A) |
|
|
300 |
|
|
|
352 |
|
| 8.500%, 10/04/2017 |
|
|
851 |
|
|
|
1,000 |
|
|
|
|
|
|
|
|
|
|
|
|
|
|
|
|
|
1,352 |
|
|
|
|
|
|
|
|
|
|
|
|
|
| Hong Kong — 0.3% |
|
|
|
|
|
|
|
|
| Bank of China Hong Kong |
|
|
|
|
|
|
|
|
| 5.550%, 02/11/2020 (A) |
|
|
870 |
|
|
|
975 |
|
| Fosun International |
|
|
|
|
|
|
|
|
| 7.500%, 05/12/2016 |
|
|
400 |
|
|
|
392 |
|
| Hutchison Whampoa International |
|
|
|
|
|
|
|
|
| 6.000%, 12/31/2049 (C) |
|
|
260 |
|
|
|
269 |
|
| Hutchison Whampoa International 11 |
|
|
|
|
|
| 4.625%, 01/13/2022 (A) |
|
|
400 |
|
|
|
438 |
|
| Industrial & Commercial Bank of China Asia MTN |
|
|
|
|
|
|
|
|
| 5.125%, 11/30/2020 |
|
|
260 |
|
|
|
285 |
|
| PCCW-HKT Capital No. 4 |
|
|
|
|
|
|
|
|
| 4.250%, 02/24/2016 |
|
|
301 |
|
|
|
320 |
|
| Swire Pacific Financing MTN |
|
|
|
|
|
|
|
|
| 4.500%, 02/28/2022 |
|
|
250 |
|
|
|
273 |
|
| Yancoal International Resources Development |
|
|
|
|
|
|
|
|
| 5.730%, 05/16/2022 (A) |
|
|
281 |
|
|
|
291 |
|
|
|
|
|
|
|
|
|
|
|
|
|
|
|
|
|
3,243 |
|
|
|
|
|
|
|
|
|
|
|
|
|
| Hungary — 3.3% |
|
|
|
|
|
|
|
|
| Republic of Hungary Treasury Bills |
|
|
|
|
|
|
|
|
| 0.000%, 01/02/2013 (E)(G) |
|
HUF |
570,200 |
|
|
|
2,532 |
|
| Republic of Hungary |
|
|
|
|
|
|
|
|
| 8.000%, 02/12/2015 |
|
HUF |
1,069,000 |
|
|
|
4,957 |
|
| 7.750%, 08/24/2015 |
|
HUF |
2,463,850 |
|
|
|
11,367 |
|
| 7.625%, 03/29/2041 |
|
|
810 |
|
|
|
915 |
|
| 7.000%, 06/24/2022 |
|
HUF |
768,730 |
|
|
|
3,402 |
|
| 6.750%, 11/24/2017 |
|
HUF |
1,011,200 |
|
|
|
4,540 |
|
| 6.750%, 02/24/2017 |
|
HUF |
902,000 |
|
|
|
4,056 |
|
| 6.375%, 03/29/2021 |
|
|
832 |
|
|
|
906 |
|
| 6.250%, 01/29/2020 |
|
|
710 |
|
|
|
770 |
|
| 6.000%, 01/11/2019 |
|
EUR |
612 |
|
|
|
783 |
|
| 5.750%, 06/11/2018 |
|
EUR |
2,018 |
|
|
|
2,565 |
|
| 5.500%, 05/06/2014 |
|
GBP |
66 |
|
|
|
106 |
|
|
|
|
|
|
|
|
|
|
| Description |
|
Face Amount(1)
(Thousands) |
|
|
Market Value
($ Thousands) |
|
|
|
|
|
|
|
|
|
|
| 5.000%, 03/30/2016 |
|
GBP |
227 |
|
|
$ |
339 |
|
| 3.500%, 07/18/2016 |
|
EUR |
1,637 |
|
|
|
1,967 |
|
|
|
|
|
|
|
|
|
|
|
|
|
|
|
|
|
39,205 |
|
|
|
|
|
|
|
|
|
|
|
|
|
| India — 0.1% |
|
|
|
|
|
|
|
|
| ICICI Bank |
|
|
|
|
|
|
|
|
| 5.750%, 11/16/2020 (A) |
|
|
128 |
|
|
|
136 |
|
| Reliance Holdings USA |
|
|
|
|
|
|
|
|
| 6.250%, 10/19/2040 |
|
|
800 |
|
|
|
898 |
|
| 5.400%, 02/14/2022 (A) |
|
|
250 |
|
|
|
267 |
|
|
|
|
|
|
|
|
|
|
|
|
|
|
|
|
|
1,301 |
|
|
|
|
|
|
|
|
|
|
|
|
|
| Indonesia — 4.7% |
|
|
|
|
|
|
|
|
| Adaro Indonesia MTN |
|
|
|
|
|
|
|
|
| 7.625%, 10/22/2019 (A) |
|
|
455 |
|
|
|
500 |
|
| Bakrie Telecom |
|
|
|
|
|
|
|
|
| 11.500%, 05/07/2015 |
|
|
484 |
|
|
|
218 |
|
| Berau Capital Resources |
|
|
|
|
|
|
|
|
| 12.500%, 07/08/2015 |
|
|
954 |
|
|
|
1,011 |
|
| Deutsche Bank, CLN (Republic of Indonesia) |
|
|
|
|
|
|
|
|
| 7.000%, 05/15/2022 |
|
IDR |
4,600,000 |
|
|
|
515 |
|
| Indosat Palapa |
|
|
|
|
|
|
|
|
| 7.375%, 07/29/2020 (A) |
|
|
352 |
|
|
|
400 |
|
| JPMorgan, CLN (Republic of Indonesia) |
|
|
|
|
|
|
|
|
| 7.000%, 05/15/2022 |
|
IDR |
122,400,000 |
|
|
|
13,715 |
|
| Majapahit Holding |
|
|
|
|
|
|
|
|
| 8.000%, 08/07/2019 |
|
|
370 |
|
|
|
467 |
|
| 7.875%, 06/29/2037 (A)(B) |
|
|
205 |
|
|
|
266 |
|
| 7.750%, 01/20/2020 |
|
|
30 |
|
|
|
38 |
|
| 7.750%, 10/17/2016 |
|
|
370 |
|
|
|
438 |
|
| 7.750%, 01/20/2020 (A) |
|
|
250 |
|
|
|
314 |
|
| Pertamina Persero |
|
|
|
|
|
|
|
|
| 6.500%, 05/27/2041 (A) |
|
|
380 |
|
|
|
435 |
|
| 6.000%, 05/03/2042 (A) |
|
|
935 |
|
|
|
1,014 |
|
| 5.250%, 05/23/2021 (A) |
|
|
500 |
|
|
|
552 |
|
| 4.875%, 05/03/2022 (A) |
|
|
220 |
|
|
|
237 |
|
| Perusahaan Listrik Negara |
|
|
|
|
|
|
|
|
| 5.500%, 11/22/2021 (A) |
|
|
310 |
|
|
|
347 |
|
| Republic of Indonesia |
|
|
|
|
|
|
|
|
| 11.625%, 03/04/2019 |
|
|
628 |
|
|
|
959 |
|
| 11.625%, 03/04/2019 |
|
|
1,786 |
|
|
|
2,728 |
|
| 11.625%, 03/04/2019 (A) |
|
|
1,195 |
|
|
|
1,825 |
|
| 11.000%, 10/15/2014 |
|
IDR |
5,200,000 |
|
|
|
603 |
|
| 10.375%, 05/04/2014 |
|
|
190 |
|
|
|
216 |
|
| 8.500%, 10/12/2035 |
|
|
2,010 |
|
|
|
3,186 |
|
| 8.500%, 10/12/2035 |
|
|
401 |
|
|
|
636 |
|
| 8.250%, 06/15/2032 |
|
IDR |
65,922,000 |
|
|
|
8,008 |
|
| 7.750%, 01/17/2038 |
|
|
4,482 |
|
|
|
6,678 |
|
| 7.750%, 01/17/2038 |
|
|
100 |
|
|
|
149 |
|
| 7.500%, 01/15/2016 |
|
|
500 |
|
|
|
588 |
|
| 7.000%, 05/15/2022 |
|
IDR |
17,800,000 |
|
|
|
1,995 |
|
| 6.875%, 01/17/2018 |
|
|
910 |
|
|
|
1,115 |
|
| 6.750%, 03/10/2014 |
|
|
160 |
|
|
|
171 |
|
| 6.625%, 02/17/2037 |
|
|
70 |
|
|
|
93 |
|
| 6.625%, 05/15/2033 |
|
IDR |
3,214,000 |
|
|
|
332 |
|
| 6.625%, 02/17/2037 |
|
|
110 |
|
|
|
146 |
|
| 6.250%, 04/15/2017 |
|
IDR |
16,000,000 |
|
|
|
1,717 |
|
| 5.875%, 03/13/2020 (A) |
|
|
764 |
|
|
|
921 |
|
| 5.625%, 05/15/2023 |
|
IDR |
3,900,000 |
|
|
|
394 |
|
| 5.250%, 01/17/2042 |
|
|
337 |
|
|
|
383 |
|
|
|
|
| 4 |
|
SEI Institutional International Trust / Annual Report / September 30, 2012 |
Schedule of Investments
Emerging Markets Debt Fund
September 30, 2012
|
|
|
|
|
|
|
|
|
| Description |
|
Face Amount(1)
(Thousands) |
|
|
Market Value
($ Thousands) |
|
|
|
|
|
|
|
|
|
|
| 4.875%, 05/05/2021 (A) |
|
|
850 |
|
|
$ |
973 |
|
| Sable International Finance |
|
|
|
|
|
|
|
|
| 8.750%, 02/01/2020 (A) |
|
|
200 |
|
|
|
223 |
|
| Star Energy Geothermal Wayang Windu |
|
|
|
|
|
|
|
|
| 11.500%, 02/12/2015 (A) |
|
|
400 |
|
|
|
430 |
|
|
|
|
|
|
|
|
|
|
|
|
|
|
|
|
|
54,936 |
|
|
|
|
|
|
|
|
|
|
|
|
|
| Iraq — 0.6% |
|
|
|
|
|
|
|
|
| Republic of Iraq |
|
|
|
|
|
|
|
|
| 5.800%, 01/15/2028 (A) |
|
|
545 |
|
|
|
500 |
|
| 5.800%, 01/15/2028 |
|
|
7,453 |
|
|
|
6,838 |
|
|
|
|
|
|
|
|
|
|
|
|
|
|
|
|
|
7,338 |
|
|
|
|
|
|
|
|
|
|
|
|
|
| Israel — 0.2% |
|
|
|
|
|
|
|
|
| Israel Government Bond - Fixed |
|
|
|
|
|
|
|
|
| 5.500%, 01/31/2022 |
|
ILS |
9,100 |
|
|
|
2,631 |
|
|
|
|
|
|
|
|
|
|
|
|
|
| Ivory Coast — 0.4% |
|
|
|
|
|
|
|
|
| Government of Ivory Coast |
|
|
|
|
|
|
|
|
| 3.750%, 12/31/2032 (F) |
|
|
5,583 |
|
|
|
4,801 |
|
|
|
|
|
|
|
|
|
|
|
|
|
| Jamaica — 0.2% |
|
|
|
|
|
|
|
|
| Digicel Group |
|
|
|
|
|
|
|
|
| 10.500%, 04/15/2018 |
|
|
160 |
|
|
|
174 |
|
| 8.250%, 09/30/2020 (A) |
|
|
1,700 |
|
|
|
1,785 |
|
|
|
|
|
|
|
|
|
|
|
|
|
|
|
|
|
1,959 |
|
|
|
|
|
|
|
|
|
|
|
|
|
| Jordan — 0.1% |
|
|
|
|
|
|
|
|
| Kingdom of Jordan |
|
|
|
|
|
|
|
|
| 3.875%, 11/12/2015 |
|
|
710 |
|
|
|
694 |
|
|
|
|
|
|
|
|
|
|
|
|
|
| Kazakhstan — 1.8% |
|
|
|
|
|
|
|
|
| ATF Bank JSC |
|
|
|
|
|
|
|
|
| 9.000%, 05/11/2016 |
|
|
300 |
|
|
|
296 |
|
| BTA Bank |
|
|
|
|
|
|
|
|
| 10.750%, 07/01/2018 (A)(F) |
|
|
1,202 |
|
|
|
222 |
|
| 10.750%, 07/01/2018 (F) |
|
|
3,634 |
|
|
|
672 |
|
| 0.000%, 07/01/2020 (A)(F) |
|
|
2,492 |
|
|
|
156 |
|
| Development Bank of Kazakhstan |
|
|
|
|
|
|
|
|
| 5.500%, 12/20/2015 (A) |
|
|
450 |
|
|
|
488 |
|
| Halyk Savings Bank of Kazakhstan |
|
|
|
|
|
|
|
|
| 7.250%, 01/28/2021 (A) |
|
|
700 |
|
|
|
725 |
|
| Kazakhstan Temir Zholy Finance BV |
|
|
|
|
|
|
|
|
| 6.950%, 07/10/2042 (A) |
|
|
200 |
|
|
|
243 |
|
| Kazatomprom Natsionalnaya Atomnaya Kompaniya |
|
|
|
|
|
|
|
|
| 6.250%, 05/20/2015 |
|
|
100 |
|
|
|
109 |
|
| 6.250%, 05/20/2015 (A) |
|
|
923 |
|
|
|
1,006 |
|
| Kazkommertsbank Via Citigroup Global Markets |
|
|
|
|
|
|
|
|
| 8.700%, 04/07/2014 (C)(D) |
|
|
1,100 |
|
|
|
1,013 |
|
| KazMunayGas National |
|
|
|
|
|
|
|
|
| 11.750%, 01/23/2015 (A) |
|
|
410 |
|
|
|
495 |
|
| 11.750%, 01/23/2015 |
|
|
2,624 |
|
|
|
3,166 |
|
| 9.125%, 07/02/2018 |
|
|
329 |
|
|
|
426 |
|
|
|
|
|
|
|
|
|
|
| Description |
|
Face Amount(1)
(Thousands) |
|
|
Market Value
($ Thousands) |
|
|
|
|
|
|
|
|
|
|
| 9.125%, 07/02/2018 (A) |
|
|
2,010 |
|
|
$ |
2,601 |
|
| 8.375%, 07/02/2013 |
|
|
690 |
|
|
|
723 |
|
| 7.000%, 05/05/2020 (A) |
|
|
1,436 |
|
|
|
1,763 |
|
| 6.375%, 04/09/2021 |
|
|
912 |
|
|
|
1,095 |
|
| 6.375%, 04/09/2021 (A) |
|
|
2,569 |
|
|
|
3,084 |
|
| Republic of Kazakhstan |
|
|
|
|
|
|
|
|
| 6.375%, 10/06/2020 (A) |
|
|
600 |
|
|
|
719 |
|
| Tengizchevroil Finance |
|
|
|
|
|
|
|
|
| 6.124%, 11/15/2014 |
|
|
179 |
|
|
|
187 |
|
| Zhaikmunai LLP |
|
|
|
|
|
|
|
|
| 10.500%, 10/19/2015 |
|
|
150 |
|
|
|
160 |
|
| 10.500%, 10/19/2015 (A) |
|
|
1,349 |
|
|
|
1,435 |
|
|
|
|
|
|
|
|
|
|
|
|
|
|
|
|
|
20,784 |
|
|
|
|
|
|
|
|
|
|
|
|
|
| Kuwait — 0.1% |
|
|
|
|
|
|
|
|
| Kuwait Projects MTN |
|
|
|
|
|
|
|
|
| 9.375%, 07/15/2020 |
|
|
200 |
|
|
|
237 |
|
| 8.875%, 10/17/2016 |
|
|
500 |
|
|
|
580 |
|
|
|
|
|
|
|
|
|
|
|
|
|
|
|
|
|
817 |
|
|
|
|
|
|
|
|
|
|
|
|
|
| Latvia — 0.0% |
|
|
|
|
|
|
|
|
| Republic of Latvia |
|
|
|
|
|
|
|
|
| 5.250%, 06/16/2021 (A) |
|
|
490 |
|
|
|
551 |
|
|
|
|
|
|
|
|
|
|
|
|
|
| Lithuania — 1.3% |
|
|
|
|
|
|
|
|
| Republic of Lithuania |
|
|
|
|
|
|
|
|
| 7.375%, 02/11/2020 |
|
|
90 |
|
|
|
114 |
|
| 7.375%, 02/11/2020 (A) |
|
|
1,100 |
|
|
|
1,397 |
|
| 6.625%, 02/01/2022 |
|
|
1,000 |
|
|
|
1,240 |
|
| 6.625%, 02/01/2022 (A) |
|
|
1,000 |
|
|
|
1,240 |
|
| 6.125%, 03/09/2021 |
|
|
5,738 |
|
|
|
6,843 |
|
| 6.125%, 03/09/2021 (A) |
|
|
1,989 |
|
|
|
2,372 |
|
| 5.125%, 09/14/2017 (A) |
|
|
785 |
|
|
|
875 |
|
| 4.850%, 02/07/2018 |
|
EUR |
650 |
|
|
|
905 |
|
|
|
|
|
|
|
|
|
|
|
|
|
|
|
|
|
14,986 |
|
|
|
|
|
|
|
|
|
|
|
|
|
| Malaysia — 4.2% |
|
|
|
|
|
|
|
|
| Axiata SPV1 Labuan |
|
|
|
|
|
|
|
|
| 5.375%, 04/28/2020 |
|
|
250 |
|
|
|
280 |
|
| IOI Investment L MTN |
|
|
|
|
|
|
|
|
| 4.375%, 06/27/2022 |
|
|
200 |
|
|
|
206 |
|
| Malaysia Government Bond |
|
|
|
|
|
|
|
|
| 4.392%, 04/15/2026 |
|
MYR |
8,100 |
|
|
|
2,841 |
|
| 4.262%, 09/15/2016 |
|
MYR |
27,100 |
|
|
|
9,198 |
|
| 4.160%, 07/15/2021 |
|
MYR |
13,410 |
|
|
|
4,568 |
|
| 4.012%, 09/15/2017 |
|
MYR |
29,800 |
|
|
|
10,052 |
|
| 3.892%, 03/15/2027 |
|
MYR |
1,719 |
|
|
|
571 |
|
| 3.580%, 09/28/2018 |
|
MYR |
6,750 |
|
|
|
2,229 |
|
| 3.418%, 08/15/2022 |
|
MYR |
7,700 |
|
|
|
2,491 |
|
| 3.314%, 10/31/2017 |
|
MYR |
2,040 |
|
|
|
667 |
|
| 3.197%, 10/15/2015 |
|
MYR |
26,550 |
|
|
|
8,681 |
|
| Petronas Capital |
|
|
|
|
|
|
|
|
| 7.875%, 05/22/2022 |
|
|
2,148 |
|
|
|
3,066 |
|
| 5.250%, 08/12/2019 (A) |
|
|
2,790 |
|
|
|
3,302 |
|
| Wakala Global Sukuk |
|
|
|
|
|
|
|
|
| 4.646%, 07/06/2021 (A) |
|
|
390 |
|
|
|
450 |
|
|
|
|
|
|
|
|
|
|
|
|
|
|
|
|
|
48,602 |
|
|
|
|
|
|
|
|
|
|
|
|
|
| Mexico — 9.1% |
|
|
|
|
|
|
|
|
| America Movil |
|
|
|
|
|
|
|
|
| 3.125%, 07/16/2022 |
|
|
200 |
|
|
|
206 |
|
| Axtel |
|
|
|
|
|
|
|
|
| 9.000%, 09/22/2019 |
|
|
219 |
|
|
|
136 |
|
|
|
|
| 5 |
|
SEI Institutional International Trust / Annual Report / September 30, 2012 |
Schedule of Investments
Emerging Markets Debt Fund
September 30, 2012
|
|
|
|
|
|
|
|
|
| Description |
|
Face Amount(1)
(Thousands) |
|
|
Market Value
($ Thousands) |
|
|
|
|
|
|
|
|
|
|
| Bank of New York Mellon Institucion de Banca Multiple |
|
|
|
|
|
|
|
|
| 9.625%, 05/02/2021 (A) |
|
|
1,374 |
|
|
$ |
1,264 |
|
| BBVA Bancomer |
|
|
|
|
|
|
|
|
| 6.750%, 09/30/2022 (A) |
|
|
500 |
|
|
|
546 |
|
| 6.008%, 05/17/2022 (C) |
|
|
550 |
|
|
|
546 |
|
| Cemex |
|
|
|
|
|
|
|
|
| 9.250%, 05/12/2020 |
|
|
200 |
|
|
|
200 |
|
| 9.000%, 01/11/2018 (A) |
|
|
306 |
|
|
|
306 |
|
| 9.000%, 01/11/2018 |
|
|
200 |
|
|
|
200 |
|
| Cemex Espana |
|
|
|
|
|
|
|
|
| 9.250%, 05/12/2020 (A) |
|
|
1,400 |
|
|
|
1,397 |
|
| Comision Federal de Electricidad |
|
|
|
|
|
|
|
|
| 5.750%, 02/14/2042 (A) |
|
|
500 |
|
|
|
556 |
|
| 4.875%, 05/26/2021 (A) |
|
|
200 |
|
|
|
223 |
|
| Desarrolladora Homex |
|
|
|
|
|
|
|
|
| 9.750%, 03/25/2020 (A) |
|
|
700 |
|
|
|
714 |
|
| Deutsche Bank, CLN (Urbi Desarrollos Urbanos) |
|
|
|
|
|
|
|
|
| 10.468%, 12/22/2012 |
|
|
240 |
|
|
|
211 |
|
| GEO |
|
|
|
|
|
|
|
|
| 9.250%, 06/30/2020 |
|
|
306 |
|
|
|
315 |
|
| 8.875%, 03/27/2022 (A) |
|
|
200 |
|
|
|
204 |
|
| Grupo Bimbo |
|
|
|
|
|
|
|
|
| 4.500%, 01/25/2022 (A) |
|
|
200 |
|
|
|
216 |
|
| Grupo Senda |
|
|
|
|
|
|
|
|
| 10.500%, 10/03/2015 |
|
|
2,965 |
|
|
|
3,069 |
|
| Grupo Televisa |
|
|
|
|
|
|
|
|
| 6.000%, 05/15/2018 |
|
|
145 |
|
|
|
172 |
|
| Mexican Bonos |
|
|
|
|
|
|
|
|
| 8.000%, 06/11/2020 |
|
MXP |
2,400 |
|
|
|
220 |
|
| 7.500%, 06/03/2027 |
|
MXP |
83,123 |
|
|
|
7,470 |
|
| 6.500%, 06/09/2022 |
|
MXP |
103,539 |
|
|
|
8,758 |
|
| 6.250%, 06/16/2016 |
|
MXP |
19,480 |
|
|
|
1,586 |
|
| 6.000%, 06/18/2015 |
|
MXP |
47,840 |
|
|
|
3,843 |
|
| 5.000%, 06/15/2017 |
|
MXP |
14,948 |
|
|
|
1,163 |
|
| 4.750%, 03/08/2044 |
|
|
2,744 |
|
|
|
3,053 |
|
| 3.625%, 03/15/2022 |
|
|
300 |
|
|
|
327 |
|
| Mexican Bonos, Ser M |
|
|
|
|
|
|
|
|
| 6.500%, 06/10/2021 |
|
MXP |
109,352 |
|
|
|
9,263 |
|
| Mexican Bonos, Ser M10 |
|
|
|
|
|
|
|
|
| 8.500%, 12/13/2018 |
|
MXP |
34,500 |
|
|
|
3,165 |
|
| 8.000%, 12/17/2015 |
|
MXP |
24,227 |
|
|
|
2,060 |
|
| 7.750%, 12/14/2017 |
|
MXP |
34,900 |
|
|
|
3,055 |
|
| Mexican Bonos, Ser M20 |
|
|
|
|
|
|
|
|
| 10.000%, 12/05/2024 |
|
MXP |
14,500 |
|
|
|
1,586 |
|
| 8.500%, 05/31/2029 |
|
MXP |
16,000 |
|
|
|
1,560 |
|
| 7.750%, 05/29/2031 |
|
MXP |
27,780 |
|
|
|
2,504 |
|
| Mexican Bonos, Ser M30 |
|
|
|
|
|
|
|
|
| 10.000%, 11/20/2036 |
|
MXP |
32,600 |
|
|
|
3,625 |
|
| 8.500%, 11/18/2038 |
|
MXP |
66,900 |
|
|
|
6,503 |
|
| Mexican Udibonos |
|
|
|
|
|
|
|
|
| 5.000%, 06/16/2016 |
|
MXP |
260 |
|
|
|
113 |
|
| 2.500%, 12/10/2020 |
|
MXP |
19,040 |
|
|
|
7,892 |
|
| Mexichem |
|
|
|
|
|
|
|
|
| 6.750%, 09/19/2042 |
|
|
200 |
|
|
|
208 |
|
| 4.875%, 09/19/2022 |
|
|
200 |
|
|
|
203 |
|
| Mexico Cetes |
|
|
|
|
|
|
|
|
| 4.390%, 12/13/2012 (E) |
|
MXP |
410,000 |
|
|
|
3,160 |
|
|
|
|
|
|
|
|
|
|
| Description |
|
Face Amount(1)
(Thousands) |
|
|
Market Value
($ Thousands) |
|
|
|
|
|
|
|
|
|
|
| NII Capital |
|
|
|
|
|
|
|
|
| 10.000%, 08/15/2016 |
|
|
359 |
|
|
$ |
354 |
|
| 7.625%, 04/01/2021 |
|
|
516 |
|
|
|
410 |
|
| Oceanografia |
|
|
|
|
|
|
|
|
| 11.250%, 07/15/2015 |
|
|
1,079 |
|
|
|
750 |
|
| Pemex Finance |
|
|
|
|
|
|
|
|
| 9.150%, 11/15/2018 |
|
|
1,595 |
|
|
|
1,998 |
|
| Pemex Project Funding Master Trust |
|
|
|
|
|
|
|
|
| 6.625%, 06/15/2035 |
|
|
1,244 |
|
|
|
1,561 |
|
| 5.750%, 03/01/2018 |
|
|
1,255 |
|
|
|
1,470 |
|
| Petroleos Mexicanos |
|
|
|
|
|
|
|
|
| 8.000%, 05/03/2019 |
|
|
360 |
|
|
|
471 |
|
| 6.500%, 06/02/2041 |
|
|
20 |
|
|
|
25 |
|
| 6.500%, 06/02/2041 (A) |
|
|
140 |
|
|
|
174 |
|
| 6.500%, 06/02/2041 (A) |
|
|
442 |
|
|
|
551 |
|
| 6.000%, 03/05/2020 (A) |
|
|
60 |
|
|
|
72 |
|
| 6.000%, 03/05/2020 |
|
|
130 |
|
|
|
155 |
|
| 5.500%, 06/27/2044 (A) |
|
|
150 |
|
|
|
165 |
|
| United Mexican States MTN |
|
|
|
|
|
|
|
|
| 8.300%, 08/15/2031 |
|
|
1,400 |
|
|
|
2,247 |
|
| 6.050%, 01/11/2040 |
|
|
2,016 |
|
|
|
2,696 |
|
| 5.950%, 03/19/2019 |
|
|
370 |
|
|
|
459 |
|
| 5.750%, 10/12/2110 |
|
|
6,964 |
|
|
|
8,322 |
|
| 5.625%, 01/15/2017 |
|
|
402 |
|
|
|
470 |
|
| 5.125%, 01/15/2020 |
|
|
920 |
|
|
|
1,099 |
|
| United Mexican States, Ser A MTN |
|
|
|
|
|
|
|
|
| 6.750%, 09/27/2034 |
|
|
640 |
|
|
|
911 |
|
| Urbi Desarrollos Urbanos |
|
|
|
|
|
|
|
|
| 9.750%, 02/03/2022 (A) |
|
|
600 |
|
|
|
528 |
|
|
|
|
|
|
|
|
|
|
|
|
|
|
|
|
|
106,686 |
|
|
|
|
|
|
|
|
|
|
|
|
|
| Mongolia — 0.1% |
|
|
|
|
|
|
|
|
| Development Bank of Mongolia |
|
|
|
|
|
|
|
|
| 5.750%, 03/21/2017 |
|
|
420 |
|
|
|
438 |
|
| Mongolian Mining MTN |
|
|
|
|
|
|
|
|
| 8.875%, 03/29/2017 (A) |
|
|
677 |
|
|
|
686 |
|
|
|
|
|
|
|
|
|
|
|
|
|
|
|
|
|
1,124 |
|
|
|
|
|
|
|
|
|
|
|
|
|
| Morocco — 0.0% |
|
|
|
|
|
|
|
|
| Kingdom of Morocco |
|
|
|
|
|
|
|
|
| 4.500%, 10/05/2020 |
|
EUR |
250 |
|
|
|
323 |
|
|
|
|
|
|
|
|
|
|
|
|
|
| Nigeria — 0.3% |
|
|
|
|
|
|
|
|
| Afren |
|
|
|
|
|
|
|
|
| 11.500%, 02/01/2016 (A) |
|
|
877 |
|
|
|
1,000 |
|
| 10.250%, 04/08/2019 (A) |
|
|
500 |
|
|
|
567 |
|
| Nigeria Government Bond |
|
|
|
|
|
|
|
|
| 16.000%, 06/29/2019 |
|
NGN |
169,000 |
|
|
|
1,203 |
|
| Republic of Nigeria |
|
|
|
|
|
|
|
|
| 6.750%, 01/28/2021 (A) |
|
|
550 |
|
|
|
621 |
|
| UBS |
|
|
|
|
|
|
|
|
| 7.396%, 08/29/2010 (A)(B)(C) |
|
|
750 |
|
|
|
520 |
|
|
|
|
|
|
|
|
|
|
|
|
|
|
|
|
|
3,911 |
|
|
|
|
|
|
|
|
|
|
|
|
|
| Oman — 0.0% |
|
|
|
|
|
|
|
|
| Blue City Investments |
|
|
|
|
|
|
|
|
| 13.750%, 11/07/2013 (A)(B)(F) |
|
|
2,250 |
|
|
|
113 |
|
|
|
|
|
|
|
|
|
|
|
|
|
| 6 |
|
SEI Institutional International Trust / Annual Report / September 30, 2012 |
Schedule of Investments
Emerging Markets Debt Fund
September 30, 2012
|
|
|
|
|
|
|
|
|
| Description |
|
Face Amount(1)
(Thousands) |
|
|
Market Value
($ Thousands) |
|
|
|
|
|
|
|
|
|
|
| Pakistan — 0.1% |
|
|
|
|
|
|
|
|
| Republic of Pakistan |
|
|
|
|
|
|
|
|
| 7.125%, 03/31/2016 |
|
|
390 |
|
|
$ |
348 |
|
| 6.875%, 06/01/2017 |
|
|
600 |
|
|
|
504 |
|
|
|
|
|
|
|
|
|
|
|
|
|
|
|
|
|
852 |
|
|
|
|
|
|
|
|
|
|
|
|
|
| Panama — 1.0% |
|
|
|
|
|
|
|
|
| ENA Norte Trust |
|
|
|
|
|
|
|
|
| 4.950%, 04/25/2023 (G) |
|
|
250 |
|
|
|
250 |
|
| Republic of Panama |
|
|
|
|
|
|
|
|
| 9.375%, 01/16/2023 |
|
|
560 |
|
|
|
813 |
|
| 9.375%, 04/01/2029 |
|
|
1,712 |
|
|
|
2,915 |
|
| 8.875%, 09/30/2027 |
|
|
1,350 |
|
|
|
2,187 |
|
| 8.125%, 04/28/2034 |
|
|
1,954 |
|
|
|
2,784 |
|
| 7.250%, 03/15/2015 |
|
|
350 |
|
|
|
401 |
|
| 7.125%, 01/29/2026 |
|
|
100 |
|
|
|
142 |
|
| 6.700%, 01/26/2036 |
|
|
1,150 |
|
|
|
1,616 |
|
|
|
|
|
|
|
|
|
|
|
|
|
|
|
|
|
11,108 |
|
|
|
|
|
|
|
|
|
|
|
|
|
| Peru — 1.6% |
|
|
|
|
|
|
|
|
| Banco de Credito del Peru |
|
|
|
|
|
|
|
|
| 5.375%, 09/16/2020 |
|
|
10 |
|
|
|
11 |
|
| 5.375%, 09/16/2020 (A) |
|
|
302 |
|
|
|
325 |
|
| BBVA Banco Continental |
|
|
|
|
|
|
|
|
| 5.000%, 08/26/2022 (A) |
|
|
184 |
|
|
|
189 |
|
| CFG Investment |
|
|
|
|
|
|
|
|
| 9.750%, 07/30/2019 |
|
|
450 |
|
|
|
355 |
|
| Corp Azucarera del Peru |
|
|
|
|
|
|
|
|
| 6.375%, 08/02/2022 |
|
|
121 |
|
|
|
128 |
|
| Inkia Energy |
|
|
|
|
|
|
|
|
| 8.375%, 04/04/2021 (A) |
|
|
200 |
|
|
|
218 |
|
| Interoceanica IV Finance |
|
|
|
|
|
|
|
|
| 3.926%, 11/30/2025 (A)(B)(E) |
|
|
857 |
|
|
|
540 |
|
| 3.196%, 11/30/2018 (A)(B)(E) |
|
|
331 |
|
|
|
285 |
|
| Peru Enhanced Pass-Through Finance |
|
|
|
|
|
|
|
|
| 4.194%, 06/02/2025 (A)(E) |
|
|
1,000 |
|
|
|
645 |
|
| 3.288%, 05/31/2018 (B)(E) |
|
|
161 |
|
|
|
147 |
|
| 3.121%, 05/31/2018 (A)(B)(E) |
|
|
436 |
|
|
|
397 |
|
| Republic of Peru |
|
|
|
|
|
|
|
|
| 8.750%, 11/21/2033 |
|
|
3,391 |
|
|
|
5,909 |
|
| 8.600%, 08/12/2017 |
|
PEI |
2,110 |
|
|
|
996 |
|
| 8.375%, 05/03/2016 |
|
|
340 |
|
|
|
423 |
|
| 8.200%, 08/12/2026 |
|
PEI |
4,950 |
|
|
|
2,569 |
|
| 7.840%, 08/12/2020 |
|
PEI |
2,820 |
|
|
|
1,345 |
|
| 7.840%, 08/12/2020 |
|
PEI |
3,150 |
|
|
|
1,503 |
|
| 7.350%, 07/21/2025 |
|
|
1,160 |
|
|
|
1,699 |
|
| 7.125%, 03/30/2019 |
|
|
140 |
|
|
|
185 |
|
| 6.950%, 08/12/2031 |
|
PEI |
1,400 |
|
|
|
644 |
|
| Southern Copper |
|
|
|
|
|
|
|
|
| 6.750%, 04/16/2040 |
|
|
186 |
|
|
|
214 |
|
| Volcan Cia Minera |
|
|
|
|
|
|
|
|
| 5.375%, 02/02/2022 (A) |
|
|
183 |
|
|
|
198 |
|
|
|
|
|
|
|
|
|
|
|
|
|
|
|
|
|
18,925 |
|
|
|
|
|
|
|
|
|
|
|
|
|
| Philippines — 2.0% |
|
|
|
|
|
|
|
|
| Development Bank of Philippines |
|
|
|
|
|
|
|
|
| 5.500%, 03/25/2021 |
|
|
330 |
|
|
|
369 |
|
|
|
|
|
|
|
|
|
|
| Description |
|
Face Amount(1)
(Thousands) |
|
|
Market Value
($ Thousands) |
|
|
|
|
|
|
|
|
|
|
| National Power |
|
|
|
|
|
|
|
|
| 9.625%, 05/15/2028 (B) |
|
|
1,100 |
|
|
$ |
1,694 |
|
| Power Sector Assets & Liabilities Management |
|
|
|
|
|
|
|
|
| 7.390%, 12/02/2024 (A) |
|
|
620 |
|
|
|
859 |
|
| Republic of Philippines |
|
|
|
|
|
|
|
|
| 10.625%, 03/16/2025 |
|
|
1,440 |
|
|
|
2,523 |
|
| 9.500%, 02/02/2030 |
|
|
2,849 |
|
|
|
4,925 |
|
| 8.375%, 06/17/2019 |
|
|
320 |
|
|
|
442 |
|
| 7.750%, 01/14/2031 |
|
|
4,868 |
|
|
|
7,448 |
|
| 7.500%, 09/25/2024 |
|
|
290 |
|
|
|
412 |
|
| 6.375%, 10/23/2034 |
|
|
530 |
|
|
|
730 |
|
| 6.250%, 01/14/2036 |
|
PHP |
73,000 |
|
|
|
1,945 |
|
| 5.500%, 03/30/2026 |
|
|
540 |
|
|
|
677 |
|
| 4.950%, 01/15/2021 |
|
PHP |
15,000 |
|
|
|
379 |
|
| 4.000%, 01/15/2021 |
|
|
1,016 |
|
|
|
1,135 |
|
|
|
|
|
|
|
|
|
|
|
|
|
|
|
|
|
23,538 |
|
|
|
|
|
|
|
|
|
|
|
|
|
| Poland — 5.9% |
|
|
|
|
|
|
|
|
| CEDC Finance International |
|
|
|
|
|
|
|
|
| 8.875%, 12/01/2016 |
|
EUR |
400 |
|
|
|
351 |
|
| Eileme 2 |
|
|
|
|
|
|
|
|
| 11.625%, 01/31/2020 (A) |
|
|
1,000 |
|
|
|
1,120 |
|
| Polish Television Holding |
|
|
|
|
|
|
|
|
| 11.000%, 11/15/2014 (A)(D) |
|
EUR |
600 |
|
|
|
803 |
|
| Republic of Poland |
|
|
|
|
|
|
|
|
| 6.375%, 07/15/2019 |
|
|
6,510 |
|
|
|
8,040 |
|
| 6.250%, 10/24/2015 |
|
PLN |
3,080 |
|
|
|
1,020 |
|
| 5.750%, 04/25/2014 |
|
|
980 |
|
|
|
314 |
|
| 5.125%, 04/21/2021 |
|
|
1,000 |
|
|
|
1,165 |
|
| 5.000%, 04/25/2016 |
|
|
11,500 |
|
|
|
3,689 |
|
| 5.000%, 03/23/2022 |
|
|
3,465 |
|
|
|
4,019 |
|
| 4.750%, 04/25/2017 |
|
PLN |
19,646 |
|
|
|
6,274 |
|
| 4.750%, 10/25/2016 |
|
PLN |
5,100 |
|
|
|
1,626 |
|
| 4.000%, 03/23/2021 |
|
EUR |
736 |
|
|
|
1,032 |
|
| 3.000%, 03/17/2023 |
|
|
700 |
|
|
|
688 |
|
| 0.000%, 07/25/2014 (E) |
|
PLN |
14,090 |
|
|
|
4,094 |
|
| Republic of Poland, Ser 0114 |
|
|
|
|
|
|
|
|
| 4.530%, 01/25/2014 (E) |
|
PLN |
24,410 |
|
|
|
7,227 |
|
| Republic of Poland, Ser 0415 |
|
|
|
|
|
|
|
|
| 5.500%, 04/25/2015 |
|
PLN |
23,970 |
|
|
|
7,733 |
|
| Republic of Poland, Ser 0922 |
|
|
|
|
|
|
|
|
| 5.750%, 09/23/2022 |
|
PLN |
21,450 |
|
|
|
7,255 |
|
| Republic of Poland, Ser 1019 |
|
|
|
|
|
|
|
|
| 5.500%, 10/25/2019 |
|
PLN |
7,500 |
|
|
|
2,490 |
|
| Republic of Poland, Ser 1021 |
|
|
|
|
|
|
|
|
| 5.750%, 10/25/2021 |
|
PLN |
17,920 |
|
|
|
6,021 |
|
| Republic of Poland, Ser CPI |
|
|
|
|
|
|
|
|
| 3.000%, 08/24/2016 |
|
PLN |
9,570 |
|
|
|
3,954 |
|
| TVN Finance II |
|
|
|
|
|
|
|
|
| 10.750%, 11/15/2017 |
|
EUR |
200 |
|
|
|
275 |
|
| 10.750%, 11/15/2017 (A) |
|
EUR |
200 |
|
|
|
275 |
|
|
|
|
|
|
|
|
|
|
|
|
|
|
|
|
|
69,465 |
|
|
|
|
|
|
|
|
|
|
|
|
|
| Qatar — 1.1% |
|
|
|
|
|
|
|
|
| Doha Finance MTN |
|
|
|
|
|
|
|
|
| 3.500%, 03/14/2017 |
|
|
300 |
|
|
|
311 |
|
| Qtel International Finance |
|
|
|
|
|
|
|
|
| 7.875%, 06/10/2019 |
|
|
770 |
|
|
|
993 |
|
| 5.000%, 10/19/2025 (A) |
|
|
200 |
|
|
|
223 |
|
| 4.750%, 02/16/2021 (A) |
|
|
457 |
|
|
|
507 |
|
|
|
|
| 7 |
|
SEI Institutional International Trust / Annual Report / September 30, 2012 |
Schedule of Investments
Emerging Markets Debt Fund
September 30, 2012
|
|
|
|
|
|
|
|
|
| Description |
|
Face
Amount(1) (Thousands) |
|
|
Market Value
($ Thousands) |
|
|
|
|
|
|
|
|
|
|
| 4.750%, 02/16/2021 |
|
|
250 |
|
|
$ |
277 |
|
| Ras Laffan Liquefied Natural Gas II |
|
|
|
|
|
| 5.298%, 09/30/2020 |
|
|
420 |
|
|
|
472 |
|
| Ras Laffan Liquefied Natural Gas III |
|
|
|
|
|
| 5.832%, 09/30/2016 |
|
|
178 |
|
|
|
194 |
|
| State of Qatar |
|
|
|
|
|
|
|
|
| 9.750%, 06/15/2030 |
|
|
1,025 |
|
|
|
1,809 |
|
| 6.550%, 04/09/2019 |
|
|
1,533 |
|
|
|
1,911 |
|
| 6.400%, 01/20/2040 |
|
|
220 |
|
|
|
300 |
|
| 6.400%, 01/20/2040 (A) |
|
|
377 |
|
|
|
515 |
|
| 5.750%, 01/20/2042 (A) |
|
|
750 |
|
|
|
954 |
|
| 5.250%, 01/20/2020 |
|
|
1,182 |
|
|
|
1,398 |
|
| 5.250%, 01/20/2020 (A) |
|
|
2,300 |
|
|
|
2,720 |
|
|
|
|
|
|
|
|
|
|
|
|
|
|
|
|
|
12,584 |
|
|
|
|
|
|
|
|
|
|
|
|
|
| Romania — 0.4% |
|
|
|
|
|
|
|
|
| Government of Romania MTN |
|
|
|
|
|
|
|
|
| 6.750%, 02/07/2022 (A) |
|
|
350 |
|
|
|
394 |
|
| 6.750%, 02/07/2022 |
|
|
2,204 |
|
|
|
2,479 |
|
| 6.500%, 06/18/2018 |
|
EUR |
1,050 |
|
|
|
1,462 |
|
| 6.000%, 10/19/2013 |
|
RON |
2,030 |
|
|
|
575 |
|
|
|
|
|
|
|
|
|
|
|
|
|
|
|
|
|
4,910 |
|
|
|
|
|
|
|
|
|
|
|
|
|
| Russia — 6.0% |
|
|
|
|
|
|
|
|
| Alfa Bank Via Alfa Bond Issuance |
|
|
|
|
|
| 7.750%, 04/28/2021 (A) |
|
|
750 |
|
|
|
794 |
|
| 7.500%, 09/26/2019 (A) |
|
|
1,065 |
|
|
|
1,073 |
|
| Bank of Moscow via BOM Capital |
|
|
|
|
|
| 6.699%, 03/11/2015 |
|
|
600 |
|
|
|
639 |
|
| Credit Suisse, CLN (Russian Government Bond) |
|
|
|
|
|
|
|
|
| 7.600%, 04/14/2021 |
|
RUB |
238,700 |
|
|
|
7,635 |
|
| 7.500%, 03/15/2018 |
|
RUB |
81,500 |
|
|
|
2,623 |
|
| Evraz Group |
|
|
|
|
|
|
|
|
| 9.500%, 04/24/2018 |
|
|
500 |
|
|
|
563 |
|
| 6.750%, 04/27/2018 (A) |
|
|
250 |
|
|
|
248 |
|
| 6.750%, 04/27/2018 |
|
|
800 |
|
|
|
794 |
|
| Gazprom Neft OAO Via GPN Capital |
|
|
|
|
|
| 4.375%, 09/19/2022 (A) |
|
|
550 |
|
|
|
547 |
|
| Gazprom OAO Via Gaz Capital |
|
|
|
|
|
|
|
|
| 4.950%, 07/19/2022 (A) |
|
|
877 |
|
|
|
919 |
|
| Lukoil International Finance |
|
|
|
|
|
|
|
|
| 6.656%, 06/07/2022 |
|
|
300 |
|
|
|
360 |
|
| Metalloinvest Finance |
|
|
|
|
|
|
|
|
| 6.500%, 07/21/2016 |
|
|
500 |
|
|
|
509 |
|
| MTS International Funding |
|
|
|
|
|
|
|
|
| 8.625%, 06/22/2020 (A) |
|
|
1,400 |
|
|
|
1,703 |
|
| Novatek Finance |
|
|
|
|
|
|
|
|
| 5.326%, 02/03/2016 |
|
|
200 |
|
|
|
213 |
|
| Novatek OAO via Novatek Finance |
|
|
|
|
|
|
|
|
| 6.604%, 02/03/2021 (A) |
|
|
363 |
|
|
|
424 |
|
| Russian Agricultural Bank Via RSHB Capital |
|
|
|
|
|
|
|
|
| 5.298%, 12/27/2017 (A) |
|
|
415 |
|
|
|
439 |
|
| Russian Foreign Bond - Eurobond |
|
|
|
|
|
| 12.750%, 06/24/2028 |
|
|
930 |
|
|
|
1,802 |
|
| 11.000%, 07/24/2018 |
|
|
292 |
|
|
|
427 |
|
|
|
|
|
|
|
|
|
|
| Description |
|
Face
Amount(1) (Thousands) |
|
|
Market Value
($ Thousands) |
|
|
|
|
|
|
|
|
|
|
| 7.850%, 03/10/2018 |
|
RUB |
270,000 |
|
|
$ |
9,281 |
|
| 7.500%, 03/31/2030 |
|
|
15,114 |
|
|
|
19,082 |
|
| 5.625%, 04/04/2042 (A) |
|
|
800 |
|
|
|
960 |
|
| 5.000%, 04/29/2020 (A) |
|
|
900 |
|
|
|
1,033 |
|
| 3.250%, 04/04/2017 (A) |
|
|
1,200 |
|
|
|
1,263 |
|
| Sberbank of Russia Via SB Capital |
|
|
|
|
|
|
|
|
| 6.125%, 02/07/2022 |
|
|
250 |
|
|
|
276 |
|
| 6.125%, 02/07/2022 (A) |
|
|
260 |
|
|
|
287 |
|
| SCF Capital |
|
|
|
|
|
|
|
|
| 5.375%, 10/27/2017 (A) |
|
|
1,010 |
|
|
|
1,016 |
|
| Severstal Via Steel Capital |
|
|
|
|
|
|
|
|
| 6.700%, 10/25/2017 |
|
|
501 |
|
|
|
536 |
|
| 6.250%, 07/26/2016 |
|
|
600 |
|
|
|
627 |
|
| Sinek Capital Via Edel Capital |
|
|
|
|
|
|
|
|
| 7.700%, 08/03/2015 |
|
|
500 |
|
|
|
511 |
|
| Teorema Holding |
|
|
|
|
|
|
|
|
| 11.000%, 10/27/2009 (F) |
|
|
3,400 |
|
|
|
340 |
|
| TMK Capital |
|
|
|
|
|
|
|
|
| 7.750%, 01/27/2018 |
|
|
1,100 |
|
|
|
1,122 |
|
| VEB-Leasing Via VEB Leasing Investment |
|
|
|
|
|
|
|
|
| 5.125%, 05/27/2016 |
|
|
320 |
|
|
|
332 |
|
| Vimpel Communications Via VIP Finance Ireland |
|
|
|
|
|
|
|
|
| 9.125%, 04/30/2018 |
|
|
550 |
|
|
|
630 |
|
| 9.125%, 04/30/2018 (A)(B) |
|
|
600 |
|
|
|
687 |
|
| 7.748%, 02/02/2021 (A) |
|
|
1,150 |
|
|
|
1,229 |
|
| VimpelCom Holdings |
|
|
|
|
|
|
|
|
| 7.504%, 03/01/2022 (A) |
|
|
400 |
|
|
|
420 |
|
| 6.255%, 03/01/2017 |
|
|
200 |
|
|
|
206 |
|
| Vnesheconombank Via VEB Finance |
|
|
|
|
|
|
|
|
| 6.902%, 07/09/2020 (A) |
|
|
785 |
|
|
|
926 |
|
| 6.902%, 07/09/2020 |
|
|
1,240 |
|
|
|
1,463 |
|
| 6.800%, 11/22/2025 |
|
|
450 |
|
|
|
529 |
|
| 6.800%, 11/22/2025 (A) |
|
|
150 |
|
|
|
176 |
|
| 6.025%, 07/05/2022 (A) |
|
|
750 |
|
|
|
835 |
|
| 5.450%, 11/22/2017 (A) |
|
|
300 |
|
|
|
326 |
|
| VTB Bank Via VTB Capital |
|
|
|
|
|
|
|
|
| 6.875%, 05/29/2018 |
|
|
300 |
|
|
|
323 |
|
| 6.551%, 10/13/2020 (A) |
|
|
860 |
|
|
|
908 |
|
| 6.315%, 02/22/2018 |
|
|
762 |
|
|
|
806 |
|
| 6.250%, 06/30/2035 |
|
|
357 |
|
|
|
379 |
|
| 6.000%, 04/12/2017 (A) |
|
|
1,400 |
|
|
|
1,463 |
|
|
|
|
|
|
|
|
|
|
|
|
|
|
|
|
|
69,684 |
|
|
|
|
|
|
|
|
|
|
|
|
|
| Saudi Arabia — 0.1% |
|
|
|
|
|
|
|
|
| Dar Al-Arkan International Sukuk |
|
|
|
|
|
|
|
|
| 10.750%, 02/18/2015 (A) |
|
|
600 |
|
|
|
640 |
|
| Saudi Electricity Global Sukuk |
|
|
|
|
|
|
|
|
| 4.211%, 04/03/2022 |
|
|
200 |
|
|
|
215 |
|
| 2.665%, 04/03/2017 |
|
|
200 |
|
|
|
206 |
|
|
|
|
|
|
|
|
|
|
|
|
|
|
|
|
|
1,061 |
|
|
|
|
|
|
|
|
|
|
|
|
|
| Senegal — 0.1% |
|
|
|
|
|
|
|
|
| Republic of Senegal |
|
|
|
|
|
|
|
|
| 8.750%, 05/13/2021 (A) |
|
|
950 |
|
|
|
1,150 |
|
|
|
|
|
|
|
|
|
|
|
|
|
| 8 |
|
SEI Institutional International Trust / Annual Report / September 30, 2012 |
Schedule of Investments
Emerging Markets Debt Fund
September 30, 2012
|
|
|
|
|
|
|
|
|
| Description |
|
Face
Amount(1) (Thousands) |
|
|
Market Value
($ Thousands) |
|
|
|
|
|
|
|
|
|
|
| Serbia — 0.1% |
|
|
|
|
|
|
|
|
| Republic of Serbia |
|
|
|
|
|
|
|
|
| 7.250%, 09/28/2021 (A) |
|
|
450 |
|
|
$ |
476 |
|
| 7.250%, 09/28/2021 |
|
|
800 |
|
|
|
846 |
|
|
|
|
|
|
|
|
|
|
|
|
|
|
|
|
|
1,322 |
|
|
|
|
|
|
|
|
|
|
|
|
|
| Singapore — 0.2% |
|
|
|
|
|
|
|
|
| DBS Bank |
|
|
|
|
|
|
|
|
| 3.625%, 09/21/2022 (C) |
|
|
200 |
|
|
|
205 |
|
| MMI International |
|
|
|
|
|
|
|
|
| 8.000%, 03/01/2017 |
|
|
250 |
|
|
|
260 |
|
| Oversea-Chinese Banking |
|
|
|
|
|
|
|
|
| 3.150%, 03/11/2023 (A)(C) |
|
|
208 |
|
|
|
209 |
|
| PSA International MTN |
|
|
|
|
|
|
|
|
| 3.875%, 02/11/2021 |
|
|
100 |
|
|
|
109 |
|
| Sea Product |
|
|
|
|
|
|
|
|
| 4.743%, 05/14/2010 (B) |
|
|
1,451 |
|
|
|
1,291 |
|
| Yanlord Land Group |
|
|
|
|
|
|
|
|
| 9.500%, 05/04/2017 |
|
|
200 |
|
|
|
202 |
|
|
|
|
|
|
|
|
|
|
|
|
|
|
|
|
|
2,276 |
|
|
|
|
|
|
|
|
|
|
|
|
|
| Slovak Republic — 0.1% |
|
|
|
|
|
|
|
|
| Slovakia Government International Bond |
|
|
|
|
|
| 4.375%, 05/21/2022 (A) |
|
|
1,292 |
|
|
|
1,359 |
|
|
|
|
|
|
|
|
|
|
|
|
|
| South Africa — 7.4% |
|
|
|
|
|
|
|
|
| African Bank MTN |
|
|
|
|
|
|
|
|
| 8.125%, 02/24/2017 |
|
|
400 |
|
|
|
430 |
|
| AngloGold Ashanti Holdings |
|
|
|
|
|
|
|
|
| 5.125%, 08/01/2022 |
|
|
205 |
|
|
|
209 |
|
| Edcon Proprietary |
|
|
|
|
|
|
|
|
| 3.502%, 06/15/2014 (C) |
|
EUR |
1,100 |
|
|
|
1,316 |
|
| Eskom Holdings |
|
|
|
|
|
|
|
|
| 5.750%, 01/26/2021 (A) |
|
|
600 |
|
|
|
684 |
|
| Gold Fields Orogen Holdings |
|
|
|
|
|
|
|
|
| 4.875%, 10/07/2020 |
|
|
324 |
|
|
|
330 |
|
| Myriad International Holding |
|
|
|
|
|
|
|
|
| 6.375%, 07/28/2017 |
|
|
320 |
|
|
|
362 |
|
| Republic of South Africa |
|
|
|
|
|
|
|
|
| 13.500%, 09/15/2015 |
|
ZAR |
51,580 |
|
|
|
7,616 |
|
| 10.500%, 12/21/2026 |
|
ZAR |
75,065 |
|
|
|
11,540 |
|
| 8.500%, 06/23/2017 |
|
|
860 |
|
|
|
1,045 |
|
| 8.000%, 12/21/2018 |
|
ZAR |
117,120 |
|
|
|
15,529 |
|
| 7.750%, 02/28/2023 |
|
ZAR |
30,193 |
|
|
|
3,860 |
|
| 7.250%, 01/15/2020 |
|
ZAR |
63,000 |
|
|
|
7,986 |
|
| 7.000%, 02/28/2031 |
|
ZAR |
18,400 |
|
|
|
2,037 |
|
| 6.875%, 05/27/2019 |
|
|
2,847 |
|
|
|
3,584 |
|
| 6.750%, 03/31/2021 |
|
ZAR |
135,540 |
|
|
|
16,617 |
|
| 6.500%, 02/28/2041 |
|
ZAR |
9,200 |
|
|
|
913 |
|
| 6.250%, 03/08/2041 |
|
|
279 |
|
|
|
368 |
|
| 5.875%, 05/30/2022 |
|
|
670 |
|
|
|
825 |
|
| 5.500%, 03/09/2020 |
|
|
2,697 |
|
|
|
3,203 |
|
| 4.665%, 01/17/2024 |
|
|
1,500 |
|
|
|
1,684 |
|
| Republic of South Africa, Ser R203 |
|
|
|
|
|
|
|
|
| 8.250%, 09/15/2017 |
|
ZAR |
31,600 |
|
|
|
4,219 |
|
| Sappi Papier Holding |
|
|
|
|
|
|
|
|
| 8.375%, 06/15/2019 (A) |
|
|
300 |
|
|
|
321 |
|
| Transnet MTN |
|
|
|
|
|
|
|
|
| 4.500%, 02/10/2016 (A) |
|
|
280 |
|
|
|
297 |
|
|
|
|
|
|
|
|
|
|
| Description |
|
Face Amount(1)
(Thousands) |
|
|
Market Value
($ Thousands) |
|
|
|
|
|
|
|
|
|
|
| Transnet SOC |
|
|
|
|
|
|
|
|
| 4.000%, 07/26/2022 (A) |
|
|
1,119 |
|
|
$ |
1,137 |
|
|
|
|
|
|
|
|
|
|
|
|
|
|
|
|
|
86,112 |
|
|
|
|
|
|
|
|
|
|
|
|
|
| South Korea — 0.1% |
|
|
|
|
|
|
|
|
| Industrial Bank of Korea |
|
|
|
|
|
|
|
|
| 2.375%, 07/17/2017 (A) |
|
|
200 |
|
|
|
203 |
|
| Korea East-West Power |
|
|
|
|
|
|
|
|
| 2.500%, 07/16/2017 (A) |
|
|
202 |
|
|
|
206 |
|
| Korea Electric Power |
|
|
|
|
|
|
|
|
| 3.000%, 10/05/2015 (A) |
|
|
100 |
|
|
|
104 |
|
| Korea Hydro & Nuclear Power |
|
|
|
|
|
|
|
|
| 4.750%, 07/13/2021 |
|
|
200 |
|
|
|
227 |
|
| 3.000%, 09/19/2022 (A) |
|
|
280 |
|
|
|
278 |
|
| Korea Western Power MTN |
|
|
|
|
|
|
|
|
| 3.125%, 05/10/2017 (A) |
|
|
441 |
|
|
|
462 |
|
| KT |
|
|
|
|
|
|
|
|
| 3.875%, 01/20/2017 |
|
|
200 |
|
|
|
215 |
|
|
|
|
|
|
|
|
|
|
|
|
|
|
|
|
|
1,695 |
|
|
|
|
|
|
|
|
|
|
|
|
|
| Sri Lanka — 0.1% |
|
|
|
|
|
|
|
|
| Bank of Ceylon |
|
|
|
|
|
|
|
|
| 6.875%, 05/03/2017 (A) |
|
|
320 |
|
|
|
341 |
|
| Republic of Sri Lanka |
|
|
|
|
|
|
|
|
| 7.400%, 01/22/2015 (A) |
|
|
150 |
|
|
|
163 |
|
| 6.250%, 10/04/2020 (A) |
|
|
480 |
|
|
|
522 |
|
| 6.250%, 07/27/2021 (A) |
|
|
400 |
|
|
|
435 |
|
| 5.875%, 07/25/2022 (A) |
|
|
200 |
|
|
|
215 |
|
|
|
|
|
|
|
|
|
|
|
|
|
|
|
|
|
1,676 |
|
|
|
|
|
|
|
|
|
|
|
|
|
| Supra-National — 0.1% |
|
|
|
|
|
|
|
|
| Andina de Fomento |
|
|
|
|
|
|
|
|
| 4.375%, 06/15/2022 |
|
|
764 |
|
|
|
828 |
|
| Inter-American Development Bank MTN |
|
|
|
|
|
| 16.400%, 08/20/2015 (E) |
|
IDR |
6,610,000 |
|
|
|
579 |
|
|
|
|
|
|
|
|
|
|
|
|
|
|
|
|
|
1,407 |
|
|
|
|
|
|
|
|
|
|
|
|
|
| Thailand — 2.9% |
|
|
|
|
|
|
|
|
| Bangkok Bank |
|
|
|
|
|
|
|
|
| 3.875%, 09/27/2022 (A) |
|
|
338 |
|
|
|
338 |
|
| 2.750%, 03/27/2018 (A) |
|
|
201 |
|
|
|
201 |
|
| PTT Global Chemical |
|
|
|
|
|
|
|
|
| 4.250%, 09/19/2022 (A) |
|
|
200 |
|
|
|
202 |
|
| Thailand Government Bond |
|
|
|
|
|
|
|
|
| 3.775%, 06/25/2032 |
|
THB |
29,000 |
|
|
|
909 |
|
| 3.650%, 12/17/2021 |
|
THB |
98,980 |
|
|
|
3,235 |
|
| 3.625%, 05/22/2015 |
|
THB |
354,070 |
|
|
|
11,614 |
|
| 3.625%, 06/16/2023 |
|
THB |
49,409 |
|
|
|
1,595 |
|
| 3.580%, 12/17/2027 |
|
THB |
62,656 |
|
|
|
1,978 |
|
| 3.450%, 03/08/2019 |
|
THB |
44,700 |
|
|
|
1,443 |
|
| 3.250%, 06/16/2017 |
|
THB |
168,940 |
|
|
|
5,455 |
|
| 2.800%, 10/10/2017 |
|
THB |
103,000 |
|
|
|
3,252 |
|
| 1.200%, 07/14/2021 |
|
THB |
113,600 |
|
|
|
3,859 |
|
|
|
|
|
|
|
|
|
|
|
|
|
|
|
|
|
34,081 |
|
|
|
|
|
|
|
|
|
|
|
|
|
| Trinidad & Tobago — 0.1% |
|
|
|
|
|
|
|
|
| Petroleum of Trinidad & Tobago |
|
|
|
|
|
|
|
|
| 9.750%, 08/14/2019 (A)(B) |
|
|
1,090 |
|
|
|
1,401 |
|
| 6.000%, 05/08/2022 (B) |
|
|
171 |
|
|
|
182 |
|
|
|
|
|
|
|
|
|
|
|
|
|
|
|
|
|
1,583 |
|
|
|
|
|
|
|
|
|
|
|
|
|
| Turkey — 6.1% |
|
|
|
|
|
|
|
|
| Export Credit Bank of Turkey |
|
|
|
|
|
|
|
|
| 5.875%, 04/24/2019 (A) |
|
|
200 |
|
|
|
220 |
|
|
|
|
| 9 |
|
SEI Institutional International Trust / Annual Report / September 30, 2012 |
Schedule of Investments
Emerging Markets Debt Fund
September 30, 2012
|
|
|
|
|
|
|
|
|
| Description |
|
Face Amount(1)
(Thousands) |
|
|
Market Value
($ Thousands) |
|
|
|
|
|
|
|
|
|
|
| 5.375%, 11/04/2016 (A) |
|
|
390 |
|
|
$ |
418 |
|
| Republic of Turkey |
|
|
|
|
|
|
|
|
| 11.875%, 01/15/2030 |
|
|
460 |
|
|
|
863 |
|
| 10.500%, 01/15/2020 |
|
TRY |
4,200 |
|
|
|
2,643 |
|
| 10.000%, 12/04/2013 |
|
TRY |
1,200 |
|
|
|
688 |
|
| 9.500%, 01/12/2022 |
|
TRY |
5,750 |
|
|
|
3,473 |
|
| 9.018%, 07/17/2013 (E) |
|
TRY |
13,503 |
|
|
|
7,112 |
|
| 9.000%, 03/05/2014 |
|
TRY |
960 |
|
|
|
545 |
|
| 9.000%, 05/21/2014 |
|
TRY |
5,460 |
|
|
|
4,343 |
|
| 9.000%, 01/27/2016 |
|
TRY |
2,590 |
|
|
|
1,502 |
|
| 9.000%, 03/08/2017 |
|
TRY |
11,900 |
|
|
|
6,959 |
|
| 8.000%, 02/14/2034 |
|
|
1,370 |
|
|
|
1,932 |
|
| 7.500%, 11/07/2019 |
|
|
3,400 |
|
|
|
4,272 |
|
| 7.500%, 07/14/2017 |
|
|
410 |
|
|
|
492 |
|
| 7.375%, 02/05/2025 |
|
|
1,170 |
|
|
|
1,518 |
|
| 7.250%, 03/05/2038 |
|
|
250 |
|
|
|
332 |
|
| 7.250%, 03/15/2015 |
|
|
410 |
|
|
|
454 |
|
| 7.000%, 03/11/2019 |
|
|
240 |
|
|
|
291 |
|
| 7.000%, 09/26/2016 |
|
|
360 |
|
|
|
417 |
|
| 7.000%, 06/05/2020 |
|
|
460 |
|
|
|
566 |
|
| 6.875%, 03/17/2036 |
|
|
913 |
|
|
|
1,158 |
|
| 6.780%, 05/15/2013 (E) |
|
TRY |
4,600 |
|
|
|
2,453 |
|
| 6.750%, 05/30/2040 |
|
|
375 |
|
|
|
473 |
|
| 6.750%, 04/03/2018 |
|
|
2,814 |
|
|
|
3,310 |
|
| 6.580%, 03/20/2013 (E) |
|
TRY |
3,653 |
|
|
|
1,970 |
|
| 6.250%, 09/26/2022 |
|
|
740 |
|
|
|
886 |
|
| 6.070%, 02/20/2013 (E) |
|
TRY |
6,200 |
|
|
|
3,364 |
|
| 6.000%, 01/14/2041 |
|
|
1,002 |
|
|
|
1,156 |
|
| 5.625%, 03/30/2021 |
|
|
190 |
|
|
|
217 |
|
| 5.125%, 03/25/2022 |
|
|
1,709 |
|
|
|
1,882 |
|
| 4.500%, 02/11/2015 |
|
TRY |
4,800 |
|
|
|
3,461 |
|
| 4.000%, 04/29/2015 |
|
TRY |
8,840 |
|
|
|
6,124 |
|
| 4.000%, 04/01/2020 |
|
TRY |
2,700 |
|
|
|
1,952 |
|
| 3.000%, 02/23/2022 |
|
TRY |
5,200 |
|
|
|
3,109 |
|
| Turkiye Garanti Bankasi |
|
|
|
|
|
|
|
|
| 5.250%, 09/13/2022 (A) |
|
|
200 |
|
|
|
201 |
|
| 4.000%, 09/13/2017 (A) |
|
|
270 |
|
|
|
270 |
|
| Yuksel Insaat |
|
|
|
|
|
|
|
|
| 9.500%, 11/10/2015 |
|
|
146 |
|
|
|
112 |
|
|
|
|
|
|
|
|
|
|
|
|
|
|
|
|
|
71,138 |
|
|
|
|
|
|
|
|
|
|
|
|
|
| Ukraine — 1.6% |
|
|
|
|
|
|
|
|
| DTEK Finance |
|
|
|
|
|
|
|
|
| 9.500%, 04/28/2015 (A) |
|
|
320 |
|
|
|
320 |
|
| 9.500%, 04/28/2015 |
|
|
550 |
|
|
|
550 |
|
| Ferrexpo Finance |
|
|
|
|
|
|
|
|
| 7.875%, 04/07/2016 (A) |
|
|
238 |
|
|
|
225 |
|
| 7.875%, 04/07/2016 |
|
|
1,200 |
|
|
|
1,134 |
|
| Financing of Infrastrucural Projects State Enterprise |
|
|
|
|
|
|
|
|
| 8.375%, 11/03/2017 (A) |
|
|
550 |
|
|
|
506 |
|
| Government of Ukraine |
|
|
|
|
|
|
|
|
| 9.250%, 07/24/2017 |
|
|
950 |
|
|
|
996 |
|
| 9.250%, 07/24/2017 (A) |
|
|
1,100 |
|
|
|
1,156 |
|
| 7.950%, 02/23/2021 (A) |
|
|
250 |
|
|
|
249 |
|
| 7.750%, 09/23/2020 |
|
|
250 |
|
|
|
247 |
|
| 7.650%, 06/11/2013 |
|
|
441 |
|
|
|
444 |
|
| 6.875%, 09/23/2015 (A) |
|
|
350 |
|
|
|
346 |
|
| 6.580%, 11/21/2016 (A) |
|
|
230 |
|
|
|
221 |
|
| 6.250%, 06/17/2016 |
|
|
200 |
|
|
|
192 |
|
| 6.250%, 06/17/2016 (A) |
|
|
600 |
|
|
|
576 |
|
| Metinvest |
|
|
|
|
|
|
|
|
| 10.250%, 05/20/2015 |
|
|
400 |
|
|
|
404 |
|
|
|
|
|
|
|
|
|
|
| Description |
|
Face Amount(1)
(Thousands) |
|
|
Market Value
($ Thousands) |
|
|
|
|
|
|
|
|
|
|
| 8.750%, 02/14/2018 (A) |
|
|
369 |
|
|
$ |
352 |
|
| 8.750%, 02/14/2018 |
|
|
929 |
|
|
|
885 |
|
| MHP |
|
|
|
|
|
|
|
|
| 10.250%, 04/29/2015 (A) |
|
|
1,428 |
|
|
|
1,449 |
|
| Mriya Agro Holding |
|
|
|
|
|
|
|
|
| 10.950%, 03/30/2016 (A) |
|
|
316 |
|
|
|
300 |
|
| National Naftogaz of Ukraine |
|
|
|
|
|
|
|
|
| 9.500%, 09/30/2014 |
|
|
2,130 |
|
|
|
2,165 |
|
| Oschadbank Via SSB No. 1 |
|
|
|
|
|
|
|
|
| 8.250%, 03/10/2016 |
|
|
430 |
|
|
|
411 |
|
| The EXIM of Ukraine Via Credit Suisse First Boston International |
|
|
|
|
|
|
|
|
| 6.800%, 10/04/2012 |
|
|
320 |
|
|
|
320 |
|
| Ukreximbank Via Biz Finance |
|
|
|
|
|
|
|
|
| 8.375%, 04/27/2015 |
|
|
5,083 |
|
|
|
4,905 |
|
|
|
|
|
|
|
|
|
|
|
|
|
|
|
|
|
18,353 |
|
|
|
|
|
|
|
|
|
|
|
|
|
| United Arab Emirates — 1.2% |
|
|
|
|
|
|
|
|
| Atlantic Finance |
|
|
|
|
|
|
|
|
| 10.750%, 05/27/2014 (D) |
|
|
983 |
|
|
|
1,080 |
|
| Dolphin Energy |
|
|
|
|
|
|
|
|
| 5.888%, 06/15/2019 |
|
|
137 |
|
|
|
155 |
|
| 5.888%, 06/15/2019 (A) |
|
|
384 |
|
|
|
435 |
|
| DP World MTN |
|
|
|
|
|
|
|
|
| 6.850%, 07/02/2037 |
|
|
1,500 |
|
|
|
1,616 |
|
| DP World Sukuk |
|
|
|
|
|
|
|
|
| 6.250%, 07/02/2017 |
|
|
100 |
|
|
|
109 |
|
| Dubai DOF Sukuk MTN |
|
|
|
|
|
|
|
|
| 6.396%, 11/03/2014 |
|
|
340 |
|
|
|
364 |
|
| Dubai Electricity & Water Authority |
|
|
|
|
|
| 8.500%, 04/22/2015 |
|
|
958 |
|
|
|
1,078 |
|
| 7.375%, 10/21/2020 |
|
|
120 |
|
|
|
140 |
|
| 7.375%, 10/21/2020 (A) |
|
|
1,676 |
|
|
|
1,959 |
|
| Dubai Holding Commercial Operations MTN |
|
|
|
|
|
|
|
|
| 6.000%, 02/01/2017 |
|
GBP |
250 |
|
|
|
372 |
|
| 4.750%, 01/30/2014 |
|
EUR |
1,550 |
|
|
|
1,904 |
|
| Dubai World |
|
|
|
|
|
|
|
|
| 1.000%, 09/30/2018 |
|
|
1,015 |
|
|
|
467 |
|
| 1.000%, 09/30/2015 |
|
|
1,200 |
|
|
|
600 |
|
| Emirate of Dubai MTN |
|
|
|
|
|
|
|
|
| 7.750%, 10/05/2020 |
|
|
410 |
|
|
|
487 |
|
| 6.700%, 10/05/2015 |
|
|
130 |
|
|
|
143 |
|
| Emirates Airline |
|
|
|
|
|
|
|
|
| 5.125%, 06/08/2016 |
|
|
300 |
|
|
|
311 |
|
| IPIC GMTN |
|
|
|
|
|
|
|
|
| 5.500%, 03/01/2022 |
|
|
200 |
|
|
|
224 |
|
| 5.500%, 03/01/2022 (A) |
|
|
363 |
|
|
|
407 |
|
| 3.750%, 03/01/2017 (A) |
|
|
400 |
|
|
|
421 |
|
| MAF Global Securities MTN |
|
|
|
|
|
|
|
|
| 5.250%, 07/05/2019 |
|
|
500 |
|
|
|
517 |
|
| MAF Sukuk MTN |
|
|
|
|
|
|
|
|
| 5.850%, 02/07/2017 |
|
|
200 |
|
|
|
215 |
|
| Pyrus |
|
|
|
|
|
|
|
|
| 7.500%, 12/20/2015 |
|
|
700 |
|
|
|
759 |
|
|
|
|
|
|
|
|
|
|
|
|
|
|
|
|
|
13,763 |
|
|
|
|
|
|
|
|
|
|
|
|
|
| 10 |
|
SEI Institutional International Trust / Annual Report / September 30, 2012 |
Schedule of Investments
Emerging Markets Debt Fund
September 30, 2012
|
|
|
|
|
|
|
|
|
| Description |
|
Face Amount (1)
(Thousands) |
|
|
Market Value
($ Thousands) |
|
|
|
|
|
|
|
|
|
|
| Uruguay — 0.7% |
|
|
|
|
|
|
|
|
| Republic of Uruguay |
|
|
|
|
|
|
|
|
| 9.250%, 05/17/2017 |
|
|
218 |
|
|
$ |
289 |
|
| 8.000%, 11/18/2022 |
|
|
2,471 |
|
|
|
3,593 |
|
| 7.625%, 03/21/2036 |
|
|
1,344 |
|
|
|
2,093 |
|
| 6.875%, 09/28/2025 |
|
|
317 |
|
|
|
431 |
|
| Republic of Uruguay PIK |
|
|
|
|
|
|
|
|
| 7.875%, 01/15/2033 |
|
|
869 |
|
|
|
1,355 |
|
|
|
|
|
|
|
|
|
|
|
|
|
|
|
|
|
7,761 |
|
|
|
|
|
|
|
|
|
|
|
|
|
| Venezuela — 2.5% |
|
|
|
|
|
|
|
|
| Petroleos de Venezuela |
|
|
|
|
|
|
|
|
| 12.750%, 02/17/2022 |
|
|
280 |
|
|
|
286 |
|
| 8.500%, 11/02/2017 |
|
|
500 |
|
|
|
452 |
|
| 8.500%, 11/02/2017 |
|
|
900 |
|
|
|
815 |
|
| 5.500%, 04/12/2037 |
|
|
550 |
|
|
|
333 |
|
| 5.375%, 04/12/2027 |
|
|
1,391 |
|
|
|
859 |
|
| 5.250%, 04/12/2017 |
|
|
430 |
|
|
|
340 |
|
| 5.000%, 10/28/2015 |
|
|
560 |
|
|
|
475 |
|
| 4.900%, 10/28/2014 |
|
|
10,110 |
|
|
|
9,130 |
|
| Republic of Venezuela |
|
|
|
|
|
|
|
|
| 13.625%, 08/15/2018 |
|
|
144 |
|
|
|
149 |
|
| 13.625%, 08/15/2018 |
|
|
2,100 |
|
|
|
2,258 |
|
| 12.750%, 08/23/2022 |
|
|
4,042 |
|
|
|
4,295 |
|
| 11.950%, 08/05/2031 |
|
|
1,510 |
|
|
|
1,536 |
|
| 11.750%, 10/21/2026 |
|
|
2,964 |
|
|
|
2,979 |
|
| 10.750%, 09/19/2013 |
|
|
210 |
|
|
|
215 |
|
| 9.375%, 01/13/2034 |
|
|
980 |
|
|
|
870 |
|
| 9.250%, 05/07/2028 |
|
|
530 |
|
|
|
466 |
|
| 9.250%, 09/15/2027 |
|
|
620 |
|
|
|
559 |
|
| 9.000%, 05/07/2023 |
|
|
590 |
|
|
|
519 |
|
| 8.500%, 10/08/2014 |
|
|
456 |
|
|
|
458 |
|
| 8.250%, 10/13/2024 |
|
|
490 |
|
|
|
407 |
|
| 7.750%, 10/13/2019 |
|
|
540 |
|
|
|
466 |
|
| 7.650%, 04/21/2025 |
|
|
610 |
|
|
|
477 |
|
| 7.000%, 03/31/2038 |
|
|
40 |
|
|
|
29 |
|
| 6.000%, 12/09/2020 |
|
|
847 |
|
|
|
638 |
|
|
|
|
|
|
|
|
|
|
|
|
|
|
|
|
|
29,011 |
|
|
|
|
|
|
|
|
|
|
|
|
|
| Vietnam — 0.1% |
|
|
|
|
|
|
|
|
| Republic of Vietnam |
|
|
|
|
|
|
|
|
| 6.875%, 01/15/2016 |
|
|
360 |
|
|
|
392 |
|
| 6.750%, 01/29/2020 |
|
|
560 |
|
|
|
622 |
|
| Vietnam Joint Stock Commercial Bank for Industry and Trade |
|
|
|
|
|
|
|
|
| 8.000%, 05/17/2017 (A) |
|
|
350 |
|
|
|
336 |
|
|
|
|
|
|
|
|
|
|
|
|
|
|
|
|
|
1,350 |
|
|
|
|
|
|
|
|
|
|
|
|
|
| Zambia — 0.0% |
|
|
|
|
|
|
|
|
| Zambia Government International Bond |
|
|
|
|
|
|
|
|
| 5.375%, 09/20/2022 (A) |
|
|
450 |
|
|
|
452 |
|
|
|
|
|
|
|
|
|
|
| Total Global Bonds
(Cost $924,701) ($ Thousands) |
|
|
|
|
|
|
1,002,472 |
|
|
|
|
|
|
|
|
|
|
|
| LOAN PARTICIPATIONS — 1.4% |
|
|
|
|
| Angola — 0.1% |
|
|
|
|
|
|
|
|
| Republic of Angola |
|
|
|
|
|
|
|
|
| 3.667%, 04/30/2016 |
|
EUR |
867 |
|
|
|
1,040 |
|
|
|
|
|
|
|
|
|
|
|
|
|
|
|
|
|
|
|
| Description |
|
Face Amount (1)
(Thousands) |
|
|
Market Value
($ Thousands) |
|
|
|
|
|
|
|
|
|
|
|
|
|
| Brazil — 0.0% |
|
|
|
|
|
|
|
|
| Virgolino de Oliveira |
|
|
|
|
|
|
|
|
| 5.551%, 11/03/2015 |
|
|
382 |
|
|
$ |
375 |
|
|
|
|
|
|
|
|
|
|
|
|
|
| Indonesia — 0.2% |
|
|
|
|
|
|
|
|
| PT Bumi |
|
|
|
|
|
|
|
|
| 15.000%, 01/18/2013 (B) |
|
|
252 |
|
|
|
113 |
|
| 15.000%, 01/18/2013 (B) |
|
|
316 |
|
|
|
142 |
|
| 11.243%, 08/07/2013 (B) |
|
|
1,743 |
|
|
|
1,621 |
|
|
|
|
|
|
|
|
|
|
|
|
|
|
|
|
|
1,876 |
|
|
|
|
|
|
|
|
|
|
|
|
|
| Mexico — 0.5% |
|
|
|
|
|
|
|
|
| Altos Hornos Promissory Note (Counterparty: Deustche Bank) |
|
|
|
|
|
|
|
|
| 0.000%, 12/31/2049 (B)(F) |
|
|
4,500 |
|
|
|
1,665 |
|
| Altos Hornos Promissory Note No. 5 |
|
|
|
|
|
|
|
|
| 0.000%, 04/29/1999 (B)(F) |
|
|
2,500 |
|
|
|
925 |
|
| Altos Hornos Promissory Note No. 6 |
|
|
|
|
|
|
|
|
| 0.000%, 04/29/1999 (B)(F) |
|
|
2,500 |
|
|
|
925 |
|
| Altos Hornos Tranche A (Counterparty: Bank of America) |
|
|
|
|
|
|
|
|
| 0.000%, 04/11/2004 (B)(F) |
|
|
6,540 |
|
|
|
2,420 |
|
|
|
|
|
|
|
|
|
|
|
|
|
|
|
|
|
5,935 |
|
|
|
|
|
|
|
|
|
|
|
|
|
| Singapore — 0.6% |
|
|
|
|
|
|
|
|
| Ashmore Cayman SPC, No. 1 PIK |
|
|
|
|
|
|
|
|
| 0.000%, 08/31/2011 (B)(F) |
|
|
9,161 |
|
|
|
4,727 |
|
| Morton Bay |
|
|
|
|
|
|
|
|
| 6.220%, 12/30/2009 (B) |
|
|
3,158 |
|
|
|
2,921 |
|
|
|
|
|
|
|
|
|
|
|
|
|
|
|
|
|
7,648 |
|
|
|
|
|
|
|
|
|
|
| Total Loan Participations (Cost $20,316) ($ Thousands) |
|
|
|
|
|
|
16,874 |
|
|
|
|
|
|
|
|
|
|
|
|
|
| CONVERTIBLE BONDS — 0.3% |
|
|
|
|
|
|
|
|
| Dana Gas Sukuk CV to 19.076 Variable Shares |
|
|
|
|
|
|
|
|
| 7.500%, 10/31/12 |
|
|
850 |
|
|
|
646 |
|
| Firstsource CV to 42,549.14 Shares |
|
|
|
|
|
|
|
|
| 5.580%, 12/04/12 (E) |
|
|
1,800 |
|
|
|
1,890 |
|
| Suzlon Energy CV to 533.2762 Shares |
|
|
|
|
|
|
|
|
| 2.446%, 07/25/14 (E) |
|
|
450 |
|
|
|
382 |
|
|
|
|
|
|
|
|
|
|
| Total Convertible Bonds
(Cost $2,902) ($ Thousands) |
|
|
|
|
|
|
2,918 |
|
|
|
|
|
|
|
|
|
|
|
|
|
| 11 |
|
SEI Institutional International Trust / Annual Report / September 30, 2012 |
Schedule of Investments
Emerging Markets Debt Fund
September 30, 2012
|
|
|
|
|
|
|
|
|
| Description |
|
Face
Amount(1) (Thousands) |
|
|
Market Value
($ Thousands) |
|
|
|
|
|
|
|
|
|
|
| TIME DEPOSITS — 5.5% |
|
|
|
|
|
|
|
|
|
|
|
| United States — 5.5% |
|
|
|
|
|
|
|
|
| Brown Brothers Harriman |
|
|
|
|
|
|
|
|
| 4.150%, 10/01/2012 |
|
ZAR |
2,928 |
|
|
$ |
355 |
|
| 0.030%, 10/01/2012 |
|
|
59,115 |
|
|
|
59,115 |
|
| 0.010%, 10/01/2012 |
|
SGD |
— |
|
|
|
— |
|
| (0.014)%, 10/01/2012 |
|
EUR |
3,642 |
|
|
|
4,685 |
|
|
|
|
|
|
|
|
|
|
| Total Time Deposits
(Cost $64,155) ($ Thousands) |
|
|
|
|
|
|
64,155 |
|
|
|
|
|
|
|
|
|
|
| Total Investments — 93.2%
(Cost $1,012,074) ($ Thousands) |
|
|
|
|
|
$ |
1,086,419 |
|
|
|
|
|
|
|
|
|
|
A list of the open futures contracts held by the Fund at September 30, 2012, is as follows:
|
|
|
|
|
|
|
|
|
|
|
|
|
| Type of Contract |
|
Number of
Contracts
Long (Short) |
|
|
Expiration
Date |
|
|
Unrealized
Appreciation
(Depreciation)
($ Thousands) |
|
| Euro-Bund |
|
|
(7 |
) |
|
|
Dec-2012 |
|
|
$ |
(3 |
) |
| Euro-Buxl 30 Year Bond |
|
|
(8 |
) |
|
|
Dec-2012 |
|
|
|
1 |
|
| U.S. 10-Year Treasury Note |
|
|
40 |
|
|
|
Dec-2012 |
|
|
|
23 |
|
|
|
|
|
|
|
|
|
|
|
|
|
|
|
|
|
|
|
|
|
|
|
|
$ |
21 |
|
|
|
|
|
|
|
|
|
|
|
|
|
|
For the year ended September 30, 2012, the total amount of all open futures contracts, as presented in the table above,
are representative of the volume of activity for this derivative type during the year.
A list of the open forward foreign currency contracts held by the Fund at September 30, 2012, is as
follows:
|
|
|
|
|
|
|
|
|
|
|
|
|
| Maturity Date |
|
Currency to
Deliver (Thousands) |
|
|
Currency to
Receive (Thousands) |
|
|
Unrealized
Appreciation
(Depreciation)
($ Thousands) |
|
| 10/01/2012-11/21/2012 |
|
MYR |
33,971 |
|
|
USD |
11,033 |
|
|
$ |
(73 |
) |
| 10/01/2012-12/19/2012 |
|
USD |
38,705 |
|
|
MYR |
120,702 |
|
|
|
690 |
|
| 10/02/2012-10/30/2012 |
|
USD |
15,077 |
|
|
IDR |
144,460,789 |
|
|
|
4 |
|
| 10/02/2012-12/19/2012 |
|
IDR |
121,799,424 |
|
|
USD |
12,746 |
|
|
|
40 |
|
| 10/02/2012-12/21/2012 |
|
USD |
24,073 |
|
|
BRL |
49,294 |
|
|
|
154 |
|
| 10/02/2012-01/03/2013 |
|
BRL |
30,961 |
|
|
USD |
14,964 |
|
|
|
(250 |
) |
| 10/03/2012-10/31/2012 |
|
EUR |
32,221 |
|
|
USD |
41,406 |
|
|
|
(49 |
) |
| 10/03/2012-11/05/2012 |
|
USD |
6,912 |
|
|
EUR |
5,413 |
|
|
|
52 |
|
| 10/04/2012-12/19/2012 |
|
USD |
32,099 |
|
|
RUB |
1,029,252 |
|
|
|
708 |
|
| 10/04/2012-12/20/2012 |
|
RUB |
630,325 |
|
|
USD |
20,117 |
|
|
|
40 |
|
| 10/08/2012-11/23/2012 |
|
EUR |
10,795 |
|
|
PLN |
45,489 |
|
|
|
293 |
|
| 10/09/2012-01/15/2013 |
|
USD |
12,158 |
|
|
INR |
670,353 |
|
|
|
396 |
|
| 10/10/2012-10/22/2012 |
|
USD |
10,745 |
|
|
THB |
337,843 |
|
|
|
220 |
|
| 10/10/2012-12/19/2012 |
|
THB |
257,358 |
|
|
USD |
8,299 |
|
|
|
(50 |
) |
| 10/12/2012-11/30/2012 |
|
USD |
20,202 |
|
|
TRY |
36,756 |
|
|
|
186 |
|
| 10/16/2012-11/30/2012 |
|
USD |
34,898 |
|
|
MXP |
458,234 |
|
|
|
654 |
|
| 10/16/2012-12/05/2012 |
|
PHP |
123,231 |
|
|
USD |
2,960 |
|
|
|
7 |
|
| 10/16/2012-12/05/2012 |
|
USD |
4,661 |
|
|
PHP |
195,187 |
|
|
|
17 |
|
| 10/18/2012-11/23/2012 |
|
USD |
10,719 |
|
|
KRW |
12,011,706 |
|
|
|
87 |
|
| 10/19/2012 |
|
PLN |
5,280 |
|
|
EUR |
1,252 |
|
|
|
(34 |
) |
| 10/19/2012-11/13/2012 |
|
USD |
3,260 |
|
|
COP |
5,899,070 |
|
|
|
1 |
|
| 10/19/2012-11/16/2012 |
|
COP |
10,053,926 |
|
|
USD |
5,515 |
|
|
|
(53 |
) |
| 10/19/2012-11/20/2012 |
|
USD |
5,027 |
|
|
PEI |
13,182 |
|
|
|
43 |
|
| 10/19/2012-11/26/2012 |
|
PEI |
3,315 |
|
|
USD |
1,241 |
|
|
|
(33 |
) |
| 10/19/2012-11/30/2012 |
|
MXP |
210,570 |
|
|
USD |
15,903 |
|
|
|
(434 |
) |
| 10/19/2012-12/3/2012 |
|
CNY |
33,301 |
|
|
USD |
5,228 |
|
|
|
(46 |
) |
| 10/19/2012-7/25/2013 |
|
USD |
4,126 |
|
|
CNY |
26,301 |
|
|
|
35 |
|
| 10/24/2012-11/26/2012 |
|
USD |
6,181 |
|
|
CLP |
2,981,474 |
|
|
|
57 |
|
| 10/25/2012-12/18/2012 |
|
USD |
1,298 |
|
|
RON |
4,519 |
|
|
|
(23 |
) |
| 10/26/2012 |
|
TWD |
174,028 |
|
|
USD |
5,933 |
|
|
|
(9 |
) |
| 10/31/2012 |
|
EUR |
2,076 |
|
|
CZK |
50,690 |
|
|
|
(82 |
) |
| 10/31/2012 |
|
GBP |
517 |
|
|
USD |
828 |
|
|
|
(7 |
) |
| 10/31/2012 |
|
PLN |
638 |
|
|
USD |
200 |
|
|
|
2 |
|
| 10/31/2012 |
|
USD |
1,720 |
|
|
CZK |
33,712 |
|
|
|
2 |
|
| 10/31/2012-11/19/2012 |
|
CZK |
99,725 |
|
|
EUR |
4,031 |
|
|
|
92 |
|
| 10/31/2012-11/28/2012 |
|
USD |
4,873 |
|
|
ZAR |
41,205 |
|
|
|
88 |
|
| 10/31/2012-11/28/2012 |
|
ZAR |
81,007 |
|
|
USD |
9,768 |
|
|
|
2 |
|
| 10/31/2012-11/30/2012 |
|
HUF |
1,288,066 |
|
|
USD |
5,783 |
|
|
|
(1 |
) |
| 10/31/2012-11/30/2012 |
|
USD |
6,270 |
|
|
HUF |
1,402,781 |
|
|
|
23 |
|
| 10/31/2012-12/10/2012 |
|
USD |
15,357 |
|
|
PLN |
50,396 |
|
|
|
280 |
|
| 11/09/2012 |
|
INR |
71,607 |
|
|
USD |
1,318 |
|
|
|
(29 |
) |
| 11/13/2012 |
|
TRY |
19,714 |
|
|
USD |
10,799 |
|
|
|
(119 |
) |
| 11/13/2012-11/28/2012 |
|
ILS |
10,440 |
|
|
USD |
2,599 |
|
|
|
(57 |
) |
| 11/16/2012-11/26/2012 |
|
CLP |
2,599,293 |
|
|
USD |
5,392 |
|
|
|
(43 |
) |
| 11/21/2012-12/18/2012 |
|
HUF |
1,191,594 |
|
|
EUR |
4,194 |
|
|
|
61 |
|
| 11/23/2012 |
|
KRW |
2,740,000 |
|
|
USD |
2,400 |
|
|
|
(65 |
) |
| 11/28/2012 |
|
USD |
2,624 |
|
|
ILS |
10,281 |
|
|
|
(9 |
) |
| 11/30/2012 |
|
CZK |
34,203 |
|
|
USD |
1,771 |
|
|
|
23 |
|
| 07/17/2013-07/17/2015 |
|
CNH |
151,802 |
|
|
USD |
23,050 |
|
|
|
(33 |
) |
| 07/17/2013-07/17/2015 |
|
USD |
23,050 |
|
|
CNH |
150,599 |
|
|
|
99 |
|
|
|
|
|
|
|
|
|
|
|
|
|
|
|
|
|
|
|
|
|
|
|
|
$ |
2,857 |
|
|
|
|
|
|
|
|
|
|
|
|
|
|
A list of the counterparties for the open forward foreign currency contracts held by the Fund at September 30, 2012, is
as follows:
|
|
|
|
|
|
|
|
|
|
|
|
|
|
|
|
|
| Counterparty |
|
Settlement Date |
|
|
Currency
to
Deliver ($ Thousands) |
|
|
Currency
to Receive ($ Thousands) |
|
|
Unrealized
Appreciation (Depreciation)
($ Thousands) |
|
| Bank of America |
|
|
10/16/2012-12/10/2012 |
|
|
|
(12,332 |
) |
|
|
12,449 |
|
|
$ |
117 |
|
| Barclays PLC |
|
|
10/01/2012-07/25/2013 |
|
|
|
(139,808 |
) |
|
|
140,630 |
|
|
|
822 |
|
| Citigroup |
|
|
10/01/2012-12/19/2012 |
|
|
|
(139,087 |
) |
|
|
139,808 |
|
|
|
721 |
|
| Deutsche Bank |
|
|
10/02/2012-12/18/2012 |
|
|
|
(56,548 |
) |
|
|
56,964 |
|
|
|
416 |
|
| Goldman Sachs |
|
|
10/31/2012-11/30/2012 |
|
|
|
(10,510 |
) |
|
|
10,417 |
|
|
|
(93 |
) |
| HSBC |
|
|
10/02/2012-07/17/2015 |
|
|
|
(65,020 |
) |
|
|
65,160 |
|
|
|
140 |
|
| JPMorgan Chase Bank |
|
|
10/02/2012-01/03/2013 |
|
|
|
(56,437 |
) |
|
|
56,614 |
|
|
|
177 |
|
| Standard New York |
|
|
10/02/2012-11/21/2012 |
|
|
|
(6,080 |
) |
|
|
6,164 |
|
|
|
84 |
|
| UBS |
|
|
10/02/2012-01/15/2013 |
|
|
|
(37,339 |
) |
|
|
37,812 |
|
|
|
473 |
|
|
|
|
|
|
|
|
|
|
|
|
|
|
|
|
|
|
|
|
|
|
|
|
|
|
|
|
|
|
|
|
$ |
2,857 |
|
|
|
|
|
|
|
|
|
|
|
|
|
|
|
|
|
|
For the year ended September 30, 2012, the total amount of all open forward foreign currency contracts, as presented in
the table above, are representative of the volume of activity for this derivative type during the period.
|
|
|
| 12 |
|
SEI Institutional International Trust / Annual Report / September 30, 2012 |
Schedule of Investments
Emerging Markets Debt Fund
September 30, 2012
A list of the open swap agreements held by the fund at September 30, 2012, is as follows:
|
|
|
|
|
|
|
|
|
|
|
|
|
|
|
|
|
|
|
|
|
| Interest Rate Swaps |
|
| Counterparty |
|
Fund Pays |
|
Fund Receives |
|
Termination
Date |
|
|
Currency |
|
|
Notional
Amount
(Thousands) |
|
|
Net Unrealized
Appreciation
(Depreciation)
($Thousands) |
|
| Barclays Bank PLC |
|
Singapore Swap Offer Rate Fixing 6 Month |
|
2.77% |
|
|
06/14/2032 |
|
|
|
SGD |
|
|
|
2,220 |
|
|
$ |
19 |
|
| Barclays Bank PLC |
|
1.86% |
|
Singapore Swap Offer Rate Fixing 6 Month |
|
|
06/14/2022 |
|
|
|
SGD |
|
|
|
3,830 |
|
|
|
(26 |
) |
| Barclays Bank PLC |
|
Brazil Interbank Deposit Rate |
|
9.04% |
|
|
01/02/2017 |
|
|
|
BRL |
|
|
|
3,525 |
|
|
|
7 |
|
| HSBC |
|
Brazil Interbank Deposit Rate |
|
9.14% |
|
|
01/04/2017 |
|
|
|
BRL |
|
|
|
2,162 |
|
|
|
6 |
|
|
|
|
|
|
|
|
|
|
|
|
|
|
|
|
|
|
|
|
|
|
|
|
|
|
|
|
|
|
|
|
|
|
|
|
|
|
|
|
$ |
6 |
|
|
|
|
|
|
|
|
|
|
|
|
|
|
|
|
|
|
|
|
|
|
|
|
|
|
|
|
|
|
|
|
|
|
|
|
|
|
|
|
|
|
|
|
|
| Total Return Swaps |
|
| Counterparty |
|
Reference Entity/Obligation |
|
Fund Pays |
|
Fund
Receives |
|
|
Termination
Date |
|
Currency |
|
|
Notional
Amount
(Thousands) |
|
|
Net Unrealized
Appreciation
(Depreciation)
($Thousands) |
|
| HSBC |
|
Republic of Indonesia, 10.50%, 8/15/30 |
|
Cash Deposit Of Notional Amount |
|
|
Price Return |
|
|
08/15/2030 |
|
|
IDR |
|
|
|
29,500,000 |
|
|
$ |
(15 |
) |
| HSBC |
|
Republic of Indonesia, 11.50%, 9/15/19 |
|
Cash Deposit Of Notional Amount |
|
|
Price Return |
|
|
09/15/2019 |
|
|
IDR |
|
|
|
68,500,000 |
|
|
|
(245 |
) |
| HSBC |
|
Republic of Indonesia, 11.50%, 9/15/19 |
|
Cash Deposit Of Notional Amount |
|
|
Price Return |
|
|
09/15/2019 |
|
|
IDR |
|
|
|
4,500,000 |
|
|
|
(15 |
) |
| HSBC |
|
Republic of Indonesia, 8.25%, 6/15/32 |
|
Cash Deposit Of Notional Amount |
|
|
Price Return |
|
|
06/15/2032 |
|
|
IDR |
|
|
|
18,100,000 |
|
|
|
(9 |
) |
| HSBC |
|
Republic of Indonesia, 8.375%, 9/15/26 |
|
Cash Deposit Of Notional Amount |
|
|
Price Return |
|
|
09/15/2026 |
|
|
IDR |
|
|
|
18,900,000 |
|
|
|
(4 |
) |
| HSBC |
|
Russia Government Bond - Ofz , 7.6%, 7//22 |
|
Cash Deposit Of Notional Amount |
|
|
Price Return |
|
|
07/22/2022 |
|
|
RUB |
|
|
|
38,800 |
|
|
|
61 |
|
| HSBC |
|
Russia Government Bond - Ofz , 6.9%, 8/3/16 |
|
Cash Deposit Of Notional Amount |
|
|
Price Return |
|
|
08/05/2016 |
|
|
RUB |
|
|
|
46,300 |
|
|
|
85 |
|
| HSBC |
|
Russia Government Bond - Ofz , 6.9%, 8/3/16 |
|
Cash Deposit Of Notional Amount |
|
|
Price Return |
|
|
08/05/2016 |
|
|
RUB |
|
|
|
356,000 |
|
|
|
539 |
|
| HSBC |
|
Russia Government Bond - Ofz , 7.1%, 3/13/14 |
|
Cash Deposit Of Notional Amount |
|
|
Price Return |
|
|
03/17/2014 |
|
|
RUB |
|
|
|
14,900 |
|
|
|
22 |
|
| HSBC |
|
Russia Government Bond - Ofz , 7.1%, 3/13/14 |
|
Cash Deposit Of Notional Amount |
|
|
Price Return |
|
|
03/17/2014 |
|
|
RUB |
|
|
|
207,000 |
|
|
|
233 |
|
| HSBC |
|
Russia Government Bond - Ofz , 7.4%, 4/19/17 |
|
Cash Deposit Of Notional Amount |
|
|
Price Return |
|
|
04/21/2017 |
|
|
RUB |
|
|
|
20,700 |
|
|
|
29 |
|
| HSBC |
|
Russia Government Bond - Ofz , 7.4%, 4/19/17 |
|
Cash Deposit Of Notional Amount |
|
|
Price Return |
|
|
04/21/2017 |
|
|
RUB |
|
|
|
36,700 |
|
|
|
54 |
|
| HSBC |
|
Russia Government Bond - Ofz , 7.4%, 6/14/17 |
|
Cash Deposit Of Notional Amount |
|
|
Price Return |
|
|
06/16/2017 |
|
|
RUB |
|
|
|
45,700 |
|
|
|
45 |
|
| HSBC |
|
Russia Government Bond - Ofz , 7.4%, 6/14/17 |
|
Cash Deposit Of Notional Amount |
|
|
Price Return |
|
|
06/16/2017 |
|
|
RUB |
|
|
|
54,000 |
|
|
|
56 |
|
| HSBC |
|
Russia Government Bond - Ofz , 7.5%, 2/27/19 |
|
Cash Deposit Of Notional Amount |
|
|
Price Return |
|
|
03/01/2019 |
|
|
RUB |
|
|
|
20,700 |
|
|
|
11 |
|
| HSBC |
|
Russia Government Bond - Ofz , 7.5%, 2/27/19 |
|
Cash Deposit Of Notional Amount |
|
|
Price Return |
|
|
03/01/2019 |
|
|
RUB |
|
|
|
23,670 |
|
|
|
29 |
|
| HSBC |
|
Russia Government Bond - Ofz , 7.5%, 2/27/19 |
|
Cash Deposit Of Notional Amount |
|
|
Price Return |
|
|
03/01/2019 |
|
|
RUB |
|
|
|
183,000 |
|
|
|
426 |
|
| HSBC |
|
Russia Government Bond - Ofz , 7.5%, 3/15/18 |
|
Cash Deposit Of Notional Amount |
|
|
Price Return |
|
|
03/19/2018 |
|
|
RUB |
|
|
|
4,500 |
|
|
|
2 |
|
| HSBC |
|
Russia Government Bond - Ofz , 7.5%, 3/15/18 |
|
Cash Deposit Of Notional Amount |
|
|
Price Return |
|
|
03/19/2018 |
|
|
RUB |
|
|
|
21,600 |
|
|
|
12 |
|
| HSBC |
|
Russia Government Bond - Ofz , 7.6%, 4/14/21 |
|
Cash Deposit Of Notional Amount |
|
|
Price Return |
|
|
04/16/2021 |
|
|
RUB |
|
|
|
19,000 |
|
|
|
41 |
|
| HSBC |
|
Russia Government Bond - Ofz , 7.6%, 4/14/21 |
|
Cash Deposit Of Notional Amount |
|
|
Price Return |
|
|
04/16/2021 |
|
|
RUB |
|
|
|
87,000 |
|
|
|
166 |
|
| HSBC |
|
Russia Government Bond - Ofz, 8.15%, 2/3/27 |
|
Cash Deposit Of Notional Amount |
|
|
Price Return |
|
|
02/05/2017 |
|
|
RUB |
|
|
|
36,000 |
|
|
|
52 |
|
| HSBC |
|
Russia Government Bond - Ofz, 8.15%, 2/3/27 |
|
Cash Deposit Of Notional Amount |
|
|
Price Return |
|
|
02/05/2017 |
|
|
RUB |
|
|
|
37,400 |
|
|
|
60 |
|
|
|
|
|
|
|
|
|
|
|
|
|
|
|
|
|
|
|
|
|
|
|
|
|
|
|
|
|
|
|
|
|
|
|
|
|
|
|
|
|
|
|
|
$ |
1,635 |
|
|
|
|
|
|
|
|
|
|
|
|
|
|
|
|
|
|
|
|
|
|
|
|
For the year ended September 30, 2012, the total number of all open swap agreements, as presented in the table above,
are representative of the volume of activity for this derivative type during the period.
| Percentages |
|
are based on a Net Assets of $1,165,102 ($ Thousands). |
| (1) |
|
In U.S. Dollars unless otherwise indicated. |
| (A) |
|
Securities sold within terms of a private placement memorandum, exempt from registration under Section 144A of the Securities Act of 1933, as amended, and may be sold
only to dealers in that program or other "accredited investors." These securities have been determined to be liquid under guidelines established by the Board of Trustees. |
| (B) |
|
Securities considered illiquid. The total market value of such securities as of September 30, 2012 was $27,387 ($ Thousands) and
represented 2.4% of Net Assets. |
| (C) |
|
Variable Rate Security - The rate reported on the Schedule of Investments is the rate in effect as of September 30, 2012. |
| (D) |
|
Step Bonds - The rate reflected on the Schedule of Investments is the effective yield on September 30, 2012. The coupon on a step bond changes on a specified date.
|
| (E) |
|
Zero coupon security. The rate reported on the Schedule of Investments is the effective yield at time of purchase. |
| (F) |
|
Security in default on interest payments. |
| (G) |
|
Security is when-issued.
|
ARS — Argentine Peso
BRL — Brazilian Real
BUBOR — Budapest Interbank Offered Rate
CLN — Credit Linked Note
CLP — Chilean Peso
CNH — Chinese Yuen (Offshore)
CNY
— Chinese Renminbi
COP — Colombian Peso
CZK — Czech Koruna
DEM — German Mark
EUR — Euro
GBP — British Pound Sterling
HUF — Hungarian Forint
IDR — Indonesia
Rupiah
ILS — Israeli Shekel
INR
— India Rupee
KRW — Korean Won
MTN — Medium Term Note
MXP — Mexican Peso
MYR — Malaysian Ringgit
NGN —
Nigerian Naira
PEI — Peruvian Inca
PHP — Philippine Peso
PIK — Payment-in-Kind
PLC — Public Limited Company
PLN
— Polish Zlotty
RON — Romanian Leu
RUB — Russian Ruble
Ser — Series
SGD — Singapore Dollar
|
|
|
| 13 |
|
SEI Institutional International Trust / Annual Report / September 30, 2012 |
Schedule of Investments
Emerging Markets Debt Fund
September 30, 2012
SPC — Segregated Portfolio Company
THB — Thai Baht
TRY — Turkish Lira
USD — U.S. Dollar
ZAR — South African Rand
The following is a summary of the inputs used as of September 30, 2012, in valuing the Fund’s investments and other financial instruments carried
at value ($ Thousands):
|
|
|
|
|
|
|
|
|
|
|
|
|
|
|
|
|
| Investments in Securities |
|
Level 1 |
|
|
Level 2 |
|
|
Level 3 (1) |
|
|
Total |
|
| Global Bonds |
|
$ |
— |
|
|
$ |
1,002,378 |
|
|
$ |
94 |
|
|
$ |
1,002,472 |
|
| Convertible Bonds |
|
|
— |
|
|
|
2,918 |
|
|
|
— |
|
|
|
2,918 |
|
| Loan Participations |
|
|
— |
|
|
|
— |
|
|
|
16,874 |
|
|
|
16,874 |
|
| Time Deposits |
|
|
— |
|
|
|
64,155 |
|
|
|
— |
|
|
|
64,155 |
|
|
|
|
|
|
|
|
|
|
|
|
|
|
|
|
|
|
| Total Investments in Securities |
|
$ |
— |
|
|
$ |
1,069,451 |
|
|
$ |
16,968 |
|
|
$ |
1,086,419 |
|
|
|
|
|
|
|
|
|
|
|
|
|
|
|
|
|
|
|
|
|
|
|
|
|
|
|
|
|
|
|
|
|
|
|
| Other Financial Instruments |
|
Level 1 |
|
|
Level 2 |
|
|
Level 3 |
|
|
Total |
|
| Futures Contracts * |
|
$ |
21 |
|
|
$ |
— |
|
|
$ |
— |
|
|
$ |
21 |
|
| Forwards Contracts* |
|
|
— |
|
|
|
2,857 |
|
|
|
— |
|
|
|
2,857 |
|
| Total Return Swaps * |
|
|
— |
|
|
|
1,635 |
|
|
|
— |
|
|
|
1,635 |
|
| Interest Rate Swaps * |
|
|
— |
|
|
|
6 |
|
|
|
— |
|
|
|
6 |
|
|
|
|
|
|
|
|
|
|
|
|
|
|
|
|
|
|
| Total Other Financial Instruments |
|
$ |
21 |
|
|
$ |
4,498 |
|
|
$ |
— |
|
|
$ |
4,519 |
|
|
|
|
|
|
|
|
|
|
|
|
|
|
|
|
|
|
| * |
|
Futures and forwards contracts and swaps are valued at the unrealized appreciation on the instrument. |
|
|
|
|
|
|
|
|
|
| |
|
Global Bonds |
|
|
Loan
Participations |
|
| Beginning balance as of October 1, 2011 |
|
$ |
— |
|
|
$ |
18,404 |
|
| Accrued discounts/premiums |
|
|
— |
|
|
|
69 |
|
| Realized gains/(loss) |
|
|
— |
|
|
|
4 |
|
| Change in unrealized appreciation/(depreciation) |
|
|
94 |
|
|
|
426 |
|
| Purchases |
|
|
— |
|
|
|
568 |
|
| Sales |
|
|
— |
|
|
|
(2,597 |
) |
| Transfer into Level 3 |
|
|
— |
|
|
|
— |
|
| Transfer out of Level 3 |
|
|
— |
|
|
|
— |
|
|
|
|
|
|
|
|
|
|
| Ending balance as of September 30, 2012 |
|
$ |
94 |
|
|
$ |
16,874 |
|
|
|
|
|
|
|
|
|
|
| (1) |
|
Of the $16,968 ($
Thousands) in Level 3 securities as of September 30, 2012, $7,648 ($ Thousands) or 0.6% are not valued via third party pricing vendors and broker quotes. If significant, the disclosure of the unobservable inputs and the interrelationships and
sensitivity between these inputs are required for those Level 3 securities that are no valued by third party pricing vendors or broker quotes. |
For the year ended September 30, 2012, there were no transfers between Level 1 and Level 2 assets and liabilities.
For the year ended September 30, 2012, there were no transfers between Level 2 and Level 3 assets and liabilities.
Amounts designated as “—” are $O or have been rounded to $O.
The accompanying notes are
an integral part of the financial statements.
|
|
|
| 14 |
|
SEI Institutional International Trust / Annual Report / September 30, 2012 |
Report of Independent Registered Public Accounting Firm
To the Board of Trustees and Shareholders
SEI
Institutional International Trust:
We have audited, in accordance with the standards of the Public Company Accounting Oversight Board (United
States), the financial statements of SEI Institutional International Trust, comprising the International Equity Fund, Emerging Markets Equity Fund, International Fixed Income Fund and the Emerging Markets Debt Fund (collectively, the
“Funds”), as of and for the year ended September 30, 2012, and have issued our unqualified report thereon dated November 29, 2012 (which report and financial statements are included in Item 1 of this Certified Shareholder
Report on Form N-CSR). Our audits included an audit of the Funds’ schedules of investments in securities (the “Schedules”) as of September 30, 2012 appearing in Item 6 of this Form N-CSR. These Schedules are the
responsibility of the Funds’ management. Our responsibility is to express an opinion on these Schedules based on our audits.
In our
opinion, the Schedules referred to above, when read in conjunction with the financial statements of the Funds referred to above, present fairly, in all material respects, the information set forth therein.
Philadelphia, Pennsylvania
November 29, 2012
| Item 7. |
Disclosure of Proxy Voting Policies and Procedures for Closed-End Management Investment Companies. |
Not applicable.
| Item 8. |
Portfolio Managers of Closed-End Management Investment Companies |
Not applicable.
| Item 9. |
Purchases of Equity Securities by Closed-End Management Company and Affiliated Purchasers. |
Not applicable.
| Item 10. |
Submission of Matters to a Vote of Security Holders. |
The Registrant has a standing Governance Committee (the “Committee”) currently consisting of the Independent Trustees. The Committee is responsible for evaluating and recommending nominees for
election to the Registrant’s Board of Trustees (the “Board”). Pursuant to the Committee’s Charter, adopted on June 18, 2004, as amended, the Committee will review all shareholder recommendations for nominations to fill
vacancies on the Board if such recommendations are submitted in writing and addressed to the Committee at the Registrant’s office.
| Item 11. |
Controls and Procedures. |
(a) The
Registrant’s principal executive and principal financial officers, or persons performing similar functions, have concluded that the Registrant’s disclosure controls and procedures (as defined in Rule 30a-3(c) under the Investment Company
Act of 1940 (the “1940 Act”)) are effective, based on the evaluation of these controls and procedures required by Rule 30a-3(b) under the 1940 Act and Rules 13a-15(b) or 15d-15(b) under the Securities Exchange Act of 1934 as of a date
within 90 days of the filing date of this report.
(b) There were no changes in the Registrant’s internal control over financial
reporting (as defined in Rule 30a-3(d) under the 1940 Act) that occurred during the second fiscal quarter of the period covered by this report that have materially affected, or are reasonably likely to materially affect, the Registrants internal
control over financial reporting.
(a)(1) Code of Ethics attached
hereto.
(a)(2) A separate certification for the principal executive officer and the principal financial officer of the Registrant as required
by Rule 30a-2(a) under the Investment Company Act of 1940, as amended (17 CFR 270.30a-2(a)), are filed herewith.
(b) Officer certifications
as required by Rule 30a-2(b) under the Investment Company Act 1940, as amended (17 CFR 270.30a-2(b)) also accompany this filing as exhibits.
SIGNATURES
Pursuant to the requirements of the Securities Exchange Act of 1934 and the Investment Company Act of 1940, the Registrant has duly caused this report to be signed on its behalf by the undersigned,
thereunto duly authorized.
|
|
|
| SEI Institutional International Trust |
|
|
| By: |
|
/S/ ROBERT A.
NESHER |
|
|
Robert A. Nesher President & CEO |
|
| Date: December 5, 2012 |
Pursuant to the requirements of the Securities Exchange Act of 1934 and the Investment Company Act of 1940, this report
has been signed below by the following persons on behalf of the Registrant and in the capacities and on the dates indicated.
|
|
|
| By: |
|
/S/ ROBERT A.
NESHER |
|
|
Robert A. Nesher President & CEO |
|
| Date: December 5, 2012 |
|
|
| By: |
|
/S/ PETER A.
RODRIGUEZ |
|
|
Peter A. Rodriguez Controller & CFO |
|
| Date: December 5, 2012 |