| Label |
Element |
Value |
| Risk Return [Abstract] |
rr_RiskReturnAbstract |
|
|
| ProspectusDate |
rr_ProspectusDate |
Jan. 31,
2012 |
|
|
SIT EMERGING MARKETS DEBT FUND (Second Prospectus Summary) | SIT EMERGING MARKETS DEBT FUND
|
|
|
|
| Risk Return [Abstract] |
rr_RiskReturnAbstract |
|
|
| Risk/Return, Heading |
rr_RiskReturnHeading |
EMERGING MARKETS DEBT FUND |
|
| Investment Objective, Heading |
rr_ObjectiveHeading |
Investment Goal |
|
| investment Objective, Primary |
rr_ObjectivePrimaryTextBlock |
Maximize total return. |
|
| Expense, Heading |
rr_ExpenseHeading |
Fees and Expenses |
|
| Expense, Narrative |
rr_ExpenseNarrativeTextBlock |
The following tables describe the fees and expenses that you may pay if you buy
and hold Fund shares. |
|
| Shareholder Fees, Caption |
rr_ShareholderFeesCaption |
SHAREHOLDER FEES (fees paid directly from your investment) |
|
| Operating Expenses, Caption |
rr_OperatingExpensesCaption |
ANNUAL FUND OPERATING EXPENSES (expenses that you pay each year as a percentage of the value of your investment) |
|
| Portfolio Turnover, Heading |
rr_PortfolioTurnoverHeading |
PORTFOLIO TURNOVER |
|
| Portfolio Turnover |
rr_PortfolioTurnoverTextBlock |
The Fund pays transaction costs, such as commissions, when it buys and sells
securities (or "turns over" its portfolio). A higher portfolio turnover rate may
indicate higher transaction costs and may result in higher taxes when Fund
shares are held in a taxable account. These costs, which are not reflected in
annual Fund operating expenses or in the Example, affect the Fund's performance.
During the most recent fiscal year, the Fund's portfolio turnover rate was 59%
of the average value of its portfolio. |
|
| Portfolio Turnover, Rate |
rr_PortfolioTurnoverRate |
59.00% |
|
| Expense Example, Heading |
rr_ExpenseExampleHeading |
EXAMPLE |
|
| Expense Example, Narrative |
rr_ExpenseExampleNarrativeTextBlock |
This Example is intended to help you compare the cost of investing in the Fund
with the cost of investing in other mutual funds. The Example assumes that you
invest $10,000 in the Fund for the time periods indicated and then redeem all of
your shares at the end of those periods. The Example also assumes that your
investment has a 5% return each year and that the Fund's operating expenses
remain the same. |
|
| Expense Example, By Year, Caption |
rr_ExpenseExampleByYearCaption |
Although your actual costs may be higher or lower, based on these assumptions your costs would be: |
|
| Investment Strategy, Heading |
rr_StrategyHeading |
Principal Investment Strategies |
|
| Investment Strategy, Narrative |
rr_StrategyNarrativeTextBlock |
Under normal circumstances, the Emerging Markets Debt Fund will invest at least
80% of its net assets (plus the amount of any borrowings for investment
purposes) in fixed income securities of emerging market issuers. The Fund will
invest in debt securities of government, government-related and corporate
issuers in emerging market countries, as well as entities organized to
restructure the outstanding debt of such issuers. The Fund uses a multi-manager
approach, relying upon a number of Sub-Advisers with differing investment
philosophies to manage portions of the Fund's portfolio under the general
supervision of SIMC. The Sub-Advisers will spread the Fund's holdings across a
number of countries and industries to limit its exposure to a single emerging
market economy and may not invest more than 25% of its assets in any single
country. There are no restrictions on the Fund's average portfolio maturity or
on the maturity of any specific security. There is no minimum rating standard
for the Fund's securities, and the Fund's securities will generally be in the
lower or lowest rating categories (including those below the fourth highest
rating category by a Nationally Recognized Statistical Rating Organization,
commonly referred to as junk bonds).
The Sub-Advisers may seek to enhance the Fund's return by actively managing the
Fund's foreign currency exposure. In managing the Fund's currency exposure, the
Sub-Advisers buy and sell currencies (i.e., take long or short positions) using
futures and foreign currency forward contracts. The Fund may take long and short
positions in foreign currencies in excess of the value of the Fund's assets
denominated in a particular currency or when the Fund does not own assets
denominated in that currency. The Fund may also engage in currency transactions
in an attempt to take advantage of certain inefficiencies in the currency
exchange market, to increase its exposure to a foreign currency or to shift
exposure to foreign currency fluctuations from one currency to another. In
managing the Fund's currency exposure for foreign securities, the Sub-Advisers
may buy and sell currencies for hedging or for speculative purposes.
The Fund may purchase shares of ETFs to gain exposure to a particular portion of
the market while awaiting an opportunity to purchase securities directly. |
|
| Risk, Heading |
rr_RiskHeading |
Principal Risks |
|
| Risk, Narrative |
rr_RiskNarrativeTextBlock |
Below Investment Grade Securities Risk -- Fixed income securities rated below
investment grade (junk bonds) involve greater risks of default or downgrade and
are more volatile than investment grade securities because the prospect for
repayment of principal and interest of many of these securities is speculative.
Corporate Fixed Income Securities Risk -- Corporate fixed income securities
respond to economic developments, especially changes in interest rates, as well
as perceptions of the creditworthiness and business prospects of individual
issuers.
Credit Risk -- The risk that the issuer of a security or the counterparty to a
contract will default or otherwise become unable to honor a financial
obligation.
Currency Risk -- As a result of the Fund's investments in securities or other
investments denominated in, and/or receiving revenues in, foreign currencies and
the Fund's active management of its currency exposures, the Fund will be subject
to currency risk. Currency risk is the risk that foreign currencies will decline
in value relative to the U.S. dollar or, in the case of hedging positions, that
the U.S. dollar will decline in value relative to the currency hedged. In either
event, the dollar value of an investment in the Fund would be adversely affected.
Due to the Fund's active positions in currencies, it will be subject to the risk that
currency exchange rates may fluctuate in response to, among other things, changes
in interest rates, intervention (or failure to intervene) by U.S. or foreign governments,
central banks or supranational entities, or by the imposition of currency controls or
other political developments in the United States or abroad.
Derivatives Risk -- The Fund's use of futures and forward contracts is subject to
market risk, leverage risk, correlation risk and liquidity risk. Leverage risk
and liquidity risk are described below. Market risk is the risk that the market
value of an investment may move up and down, sometimes rapidly and
unpredictably. Correlation risk is the risk that changes in the value of the
derivative may not correlate perfectly with the underlying asset, rate or index.
The Fund's use of over-the-counter forward contracts is also subject to credit
risk and valuation risk. Valuation risk is the risk that the derivative may be
difficult to value and/or valued incorrectly. Credit risk is described above.
Each of the above risks could cause the Fund to lose more than the principal
amount invested in a derivative instrument.
Exchange-Traded Funds (ETFs) Risk -- The risks of owning shares of an ETF
generally reflect the risks of owning the underlying securities the ETF is
designed to track, although lack of liquidity in an ETF could result in its
value being more volatile than the underlying portfolio securities.
Extension Risk -- The risk that rising interest rates may extend the duration of
a fixed income security, typically reducing the security's value.
Fixed Income Market Risk -- The prices of the Fund's fixed income securities
respond to economic developments, particularly interest rate changes, as well as
to perceptions about the creditworthiness of individual issuers, including
governments and their agencies. In the case of foreign securities, price
fluctuations will reflect international economic and political events, as well
as changes in currency valuations relative to the U.S. dollar.
Foreign Investment/Emerging Markets Risk -- The risk that non-U.S. securities may
be subject to additional risks due to, among other things, political, social and
economic developments abroad, currency movements and different legal, regulatory
and tax environments. These additional risks may be heightened with respect to
emerging market countries since political turmoil and rapid changes in economic
conditions are more likely to occur in these countries.
Foreign Sovereign Debt Securities Risk -- The risks that (i) the governmental
entity that controls the repayment of sovereign debt may not be willing or able
to repay the principal and/or interest when it becomes due, due to factors such
as debt service burden, political constraints, cash flow problems and other
national economic factors; (ii) governments may default on their debt
securities, which may require holders of such securities to participate in debt
rescheduling or additional lending to defaulting governments; and (iii) there is
no bankruptcy proceeding by which defaulted sovereign debt may be collected in
whole or in part.
Interest Rate Risk -- The risk that the Fund's yield will decline due to falling
interest rates. A rise in interest rates typically causes a fall in the value of
fixed income securities in which the Fund invests, while a fall in interest
rates typically causes a rise in the value of such securities.
Investment Style Risk -- The risk that emerging market debt securities may
underperform other segments of the fixed income markets or the fixed income
markets as a whole.
Leverage Risk -- The use of leverage can amplify the effects of market volatility
on the Fund's share price and may also cause the Fund to liquidate portfolio
positions when it would not be advantageous to do so in order to satisfy its
obligations.
Liquidity Risk -- The risk that certain securities may be difficult or impossible
to sell at the time and the price that the Fund would like. The Fund may have to
lower the price, sell other securities instead or forego an investment
opportunity, any of which could have a negative effect on Fund management or
performance.
Non-Diversified Risk -- The Fund is non-diversified, which means that it may
invest in the securities of relatively few issuers. As a result, the Fund may be
more susceptible to a single adverse economic or political occurrence affecting
one or more of these issuers, and may experience increased volatility due to its
investments in those securities.
Portfolio Turnover Risk -- Due to its investment strategy, the Fund may buy and
sell securities frequently. This may result in higher transaction costs and
additional capital gains tax liabilities.
Prepayment Risk -- The risk that with declining interest rates, fixed income
securities with stated interest rates may have the principal paid earlier than
expected, requiring the Fund to invest the proceeds at generally lower interest
rates.
Loss of money is a risk of investing in the Fund. |
|
| Risk, Lose Money |
rr_RiskLoseMoney |
Loss of money is a risk of investing in the Fund. |
|
| Risk, Nondiversified Status |
rr_RiskNondiversifiedStatus |
The Fund is non-diversified, which means that it may invest in the securities of relatively few issuers. As a result, the Fund may be more susceptible to a single adverse economic or political occurrence affecting one or more of these issuers, and may experience increased volatility due to its investments in those securities. |
|
| Bar Chart and Performance Table, Heading |
rr_BarChartAndPerformanceTableHeading |
Performance Information |
|
| Performance, Narrative |
rr_PerformanceNarrativeTextBlock |
As of January 31, 2012, Class G Shares of the Fund had not commenced operations
and did not have a performance history.
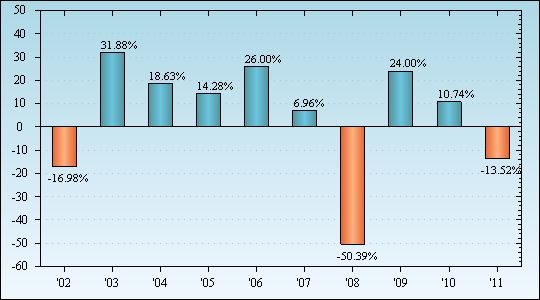
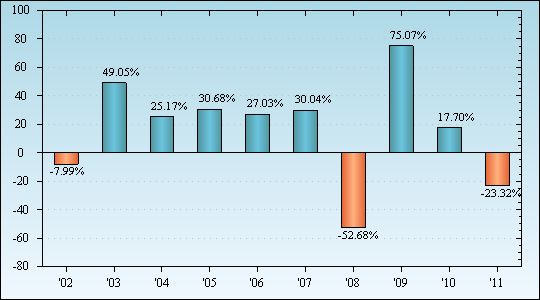
The bar chart and the performance table below provide some indication of the
risks of investing in the Fund by showing changes in the Fund's performance from
year to year for the past ten calendar years and by showing how the Fund's
average annual returns for 1, 5 and 10 years, and since the Fund's inception,
compared with those of a broad measure of market performance. Since Class G
Shares are invested in the same portfolio of securities, returns for Class G
Shares will be substantially similar to those of Class A Shares, shown here, and
will differ only to the extent that Class G Shares have higher expenses. The
Fund's past performance (before and after taxes) is not necessarily an
indication of how the Fund will perform in the future. |
|
| Performance, Information Illustrates Variability of Returns |
rr_PerformanceInformationIllustratesVariabilityOfReturns |
The bar chart and the performance table below provide some indication of the risks of investing in the Fund by showing changes in the Fund's performance from year to year for the past ten calendar years and by showing how the Fund's average annual returns for 1, 5 and 10 years, and since the Fund's inception, compared with those of a broad measure of market performance. |
|
| Performance, Past Does Not Indicate Future |
rr_PerformancePastDoesNotIndicateFuture |
The Fund's past performance (before and after taxes) is not necessarily an indication of how the Fund will perform in the future. |
|
| Bar Chart, Closing |
rr_BarChartClosingTextBlock |
Best Quarter: 17.55% (12/31/2002)
Worst Quarter: -13.19% (12/31/2008) |
|
| Performance Table, Heading |
rr_PerformanceTableHeading |
Average Annual Total Returns (for the periods ended December 31, 2011) |
|
| Index No Deduction for Fees, Expenses, Taxes |
rr_IndexNoDeductionForFeesExpensesTaxes |
reflects no deduction for fees, expenses, or taxes |
|
| Performance Table, Uses Highest Federal Rate |
rr_PerformanceTableUsesHighestFederalRate |
After-tax returns are calculated using the historical highest individual federal marginal income tax rates and do not reflect the impact of state and local taxes. |
|
| Performance Table, Not Relevant to Tax Deferred |
rr_PerformanceTableNotRelevantToTaxDeferred |
Your actual after-tax returns will depend on your tax situation and may differ from those shown. After-tax returns shown are not relevant to investors who hold their Fund shares through tax-deferred arrangements, such as 401(k) plans or individual retirement accounts. |
|
| Performance Table, Narrative |
rr_PerformanceTableNarrativeTextBlock |
After-tax returns are calculated using the historical highest individual federal
marginal income tax rates and do not reflect the impact of state and local
taxes. Your actual after-tax returns will depend on your tax situation and may
differ from those shown. After-tax returns shown are not relevant to investors
who hold their Fund shares through tax-deferred arrangements, such as 401(k)
plans or individual retirement accounts. |
|
|
SIT EMERGING MARKETS DEBT FUND (Second Prospectus Summary) | SIT EMERGING MARKETS DEBT FUND | J.P. Morgan EMBI Global Diversified Index Return
|
|
|
|
| Risk Return [Abstract] |
rr_RiskReturnAbstract |
|
|
| Average Annual Returns, Label |
rr_AverageAnnualReturnLabel |
J.P. Morgan EMBI Global Diversified Index Return (reflects no deduction for fees, expenses, or taxes) |
|
| Average Annual Returns, 1 Year |
rr_AverageAnnualReturnYear01 |
7.35% |
|
| Average Annual Returns, 5 Years |
rr_AverageAnnualReturnYear05 |
7.87% |
|
| Average Annual Returns, 10 Years |
rr_AverageAnnualReturnYear10 |
10.62% |
|
| Average Annual Returns, Since Inception |
rr_AverageAnnualReturnSinceInception |
9.59% |
|
| Average Annual Returns, Inception Date |
rr_AverageAnnualReturnInceptionDate |
Jun. 26,
1997 |
[1] |
|
SIT EMERGING MARKETS DEBT FUND (Second Prospectus Summary) | SIT EMERGING MARKETS DEBT FUND | CLASS G
|
|
|
|
| Risk Return [Abstract] |
rr_RiskReturnAbstract |
|
|
| Redemption Fee (applies to a redemption, or series of redemptions, from a single identifiable source that, in the aggregate, exceeds $25 million within any thirty (30) day period) |
rr_RedemptionFeeOverRedemption |
(1.00%) |
|
| Management Fees |
rr_ManagementFeesOverAssets |
0.85% |
|
| Distribution (12b-1) Fees |
rr_DistributionAndService12b1FeesOverAssets |
0.25% |
|
| Other Expenses |
rr_OtherExpensesOverAssets |
0.95% |
|
| Total Annual Fund Operating Expenses |
rr_ExpensesOverAssets |
2.05% |
|
| Expense Example, With Redemption, 1 Year |
rr_ExpenseExampleYear01 |
208 |
|
| Expense Example, With Redemption, 3 Years |
rr_ExpenseExampleYear03 |
643 |
|
| Expense Example, With Redemption, 5 Years |
rr_ExpenseExampleYear05 |
1,103 |
|
| Expense Example, With Redemption, 10 Years |
rr_ExpenseExampleYear10 |
2,379 |
|
| Annual Return 2002 |
rr_AnnualReturn2002 |
10.61% |
|
| Annual Return 2003 |
rr_AnnualReturn2003 |
34.65% |
|
| Annual Return 2004 |
rr_AnnualReturn2004 |
14.49% |
|
| Annual Return 2005 |
rr_AnnualReturn2005 |
14.06% |
|
| Annual Return 2006 |
rr_AnnualReturn2006 |
12.43% |
|
| Annual Return 2007 |
rr_AnnualReturn2007 |
6.42% |
|
| Annual Return 2008 |
rr_AnnualReturn2008 |
(19.72%) |
|
| Annual Return 2009 |
rr_AnnualReturn2009 |
40.53% |
|
| Annual Return 2010 |
rr_AnnualReturn2010 |
14.47% |
|
| Annual Return 2011 |
rr_AnnualReturn2011 |
4.74% |
|
| Highest Quarterly Return, Label |
rr_HighestQuarterlyReturnLabel |
Best Quarter: |
|
| Highest Quarterly Return, Date |
rr_BarChartHighestQuarterlyReturnDate |
Dec. 31,
2002 |
|
| Highest Quarterly Return |
rr_BarChartHighestQuarterlyReturn |
17.55% |
|
| Lowest Quarterly Return, Label |
rr_LowestQuarterlyReturnLabel |
Worst Quarter: |
|
| Lowest Quarterly Return, Date |
rr_BarChartLowestQuarterlyReturnDate |
Dec. 31,
2008 |
|
| Lowest Quarterly Return |
rr_BarChartLowestQuarterlyReturn |
(13.19%) |
|
| Average Annual Returns, Label |
rr_AverageAnnualReturnLabel |
Class A Shares Return Before Taxes |
|
| Average Annual Returns, 1 Year |
rr_AverageAnnualReturnYear01 |
4.74% |
|
| Average Annual Returns, 5 Years |
rr_AverageAnnualReturnYear05 |
7.56% |
|
| Average Annual Returns, 10 Years |
rr_AverageAnnualReturnYear10 |
12.15% |
|
| Average Annual Returns, Since Inception |
rr_AverageAnnualReturnSinceInception |
10.40% |
|
| Average Annual Returns, Inception Date |
rr_AverageAnnualReturnInceptionDate |
Jun. 26,
1997 |
|
|
SIT EMERGING MARKETS DEBT FUND (Second Prospectus Summary) | SIT EMERGING MARKETS DEBT FUND | CLASS G | After Taxes on Distributions
|
|
|
|
| Risk Return [Abstract] |
rr_RiskReturnAbstract |
|
|
| Average Annual Returns, Label |
rr_AverageAnnualReturnLabel |
Class A Shares Return After Taxes on Distributions |
|
| Average Annual Returns, 1 Year |
rr_AverageAnnualReturnYear01 |
2.52% |
|
| Average Annual Returns, 5 Years |
rr_AverageAnnualReturnYear05 |
4.96% |
|
| Average Annual Returns, 10 Years |
rr_AverageAnnualReturnYear10 |
8.98% |
|
| Average Annual Returns, Since Inception |
rr_AverageAnnualReturnSinceInception |
7.03% |
|
| Average Annual Returns, Inception Date |
rr_AverageAnnualReturnInceptionDate |
Jun. 26,
1997 |
|
|
SIT EMERGING MARKETS DEBT FUND (Second Prospectus Summary) | SIT EMERGING MARKETS DEBT FUND | CLASS G | After Taxes on Distributions and Sales
|
|
|
|
| Risk Return [Abstract] |
rr_RiskReturnAbstract |
|
|
| Average Annual Returns, Label |
rr_AverageAnnualReturnLabel |
Class A Shares Return After Taxes on Distributions and Sale of Fund Shares |
|
| Average Annual Returns, 1 Year |
rr_AverageAnnualReturnYear01 |
3.10% |
|
| Average Annual Returns, 5 Years |
rr_AverageAnnualReturnYear05 |
4.90% |
|
| Average Annual Returns, 10 Years |
rr_AverageAnnualReturnYear10 |
8.76% |
|
| Average Annual Returns, Since Inception |
rr_AverageAnnualReturnSinceInception |
6.93% |
|
| Average Annual Returns, Inception Date |
rr_AverageAnnualReturnInceptionDate |
Jun. 26,
1997 |
|
|
|
|