Presentation Materials for Investors November 2019 Exhibit 99.1
Disclaimer • This presentation includes certain “forward - looking statements” within the meaning of The U.S. Private Securities Litigation Reform Act of 1995. • These statements are based on current expectations and currently available information. • Actual results may differ materially from these expectations due to certain risks, uncertainties and other important factors, including the risk factors set forth in the most recent annual and periodic reports of Toyota Motor Corporation and Toyota Motor Credit Corporation. • We do not undertake to update the forward - looking statements to reflect actual results or changes in the factors affecting the forward - looking statements. • This presentation does not constitute an offer to sell or a solicitation of an offer to purchase any securities. Any offer or sale of securities will be made only by means of a prospectus and related documentation. • Investors and others should note that we announce material financial information using the investor relations section of our corporate website ( http://www.toyotafinancial.com ) and SEC filings. We use these channels, press releases, as well as social media to communicate with our investors, customers and the general public about our company, our services and other issues. While not all of the information that we post on social media is of a material nature, some information could be material. Therefore, we encourage investors, the media, and others interested in our company to review the information we post on the Toyota Motor Credit Corporation Twitter Feed ( http://www.twitter.com/toyotafinancial ). We may update our social media channels from time to time on the investor relations section of our corporate website. 2

Disclaimer • This presentation includes certain “forward - looking statements” within the meaning of The U.S. Private Securities Litigation Reform Act of 1995. These statements are based on current expectations and currently available information. • • Actual results may differ materially from these expectations due to certain risks, uncertainties and other important factors, including the risk factors set forth in the most recent annual and periodic reports of Toyota Motor Corporation and Toyota Motor Credit Corporation (“TMCC”). • We do not undertake to update the forward - looking statements to reflect actual results or changes in the factors affecting the forward - looking statements. • This presentation does not constitute or form part of and should not be construed as, an offer to sell or issue or the solicitation of an offer to purchase or subscribe for securities of TMCC in any jurisdiction or an inducement to enter into investment activity in any jurisdiction. Neither this presentation nor any part thereof, nor the fact of its distribution, shall form the basis of, or be relied on in connection with, any contract or commitment or investment decision whatsoever. Any offer or sale of securities by TMCC will be made only by means of a prospectus and related documentation. • Investors and prospective investors in securities of TMCC are required to make their own independent investigation and appraisal of the business and financial condition of TMCC and the nature of its securities. This presentation does not constitute a recommendation regarding securities of TMCC. Any prospective purchaser of securities in TMCC is recommended to seek its own independent financial advice. • This presentation and its contents are directed only at and may only be communicated to (a) persons in member states of the European Economic Area who are “qualified investors” within the meaning of Article 2(e) of the Prospectus Regulation (EU) 2017/1129, and (b) in the United Kingdom to such “qualified investors” who are (i) persons who have professional experience in matters relating to investments falling within Article 19(5) of the Financial Services and Markets Act 2000 (Financial Promotion) Order 2005 (the “Order”), or (ii) high net worth entities and other persons to whom it may lawfully be communicated, falling within Article 49(2)(a) to (d) of the Order, or (iii) other persons to whom it may otherwise lawfully be communicated (all such persons in (a) through (b) are collectively referred to as “Relevant Persons”). This presentation must not be acted or relied on by persons who are not Relevant Persons. Any investment or investment activity to which this presentation relates is available only to Relevant Persons and will be engaged in only with Relevant Persons. • This presentation is an advertisement and not a prospectus and investors should not subscribe for or purchase any securities of TMCC referred to in this presentation or otherwise except on the basis of information in the Euro Medium Term Note Programme base prospectus of Toyota Motor Finance (Netherlands) B.V., Toyota Credit Canada Inc., Toyota Finance Australia Limited and Toyota Motor Credit Corporation dated 13 September 2019 as supplemented from time to time (together, the “Prospectus”) together with the applicable final terms which are or will be, as applicable, available on the website of the London Stock Exchange plc at www.londonstockexchange.com/exchange/news/market - news/marketnewshome.html. Investors should read the Prospectus before making an investment decision in order to fully understand the potential risks and rewards associated with the decision to invest in any securities of Toyota Motor Credit Corporation issued under the Euro Medium Term Note Programme. Approval of the Prospectus by the • Central Bank of Ireland should not be understood as an endorsement of securities issued under the Euro Medium Term Note Programme. Investors and others should note that we announce material financial information using the investor relations section of our corporate website ( http://www.toyotafinancial.com ) and SEC filings. We use these channels, press releases, as well as social media to communicate with our investors, customers and the general public about our company, our services and other issues. While not all of the information that we post on social media is of a material nature, some information could be material. Therefore, we encourage investors, the media, and others interested in our company to review the information we post on the Toyota Motor Credit Corporation Twitter Feed ( http://www.twitter.com/toyotafinancial ). We may update our social media channels from time to time on the investor relations section of our corporate website. 3

4 Toyota’s Global Businesses Markets vehicles in over 190 countries/regions. 50 overseas manufacturing companies in 27 countries/regions.A UTOMOT I VE Design, Manufacturing, Distribution Consumer Financing Dealer Support & Financing Banking Securities Services Ancillary Products & Services OTHER BUSINESSES Housing Marine Telecommunications e - Business Intelligent Transport Services Biotechnology & Afforestation
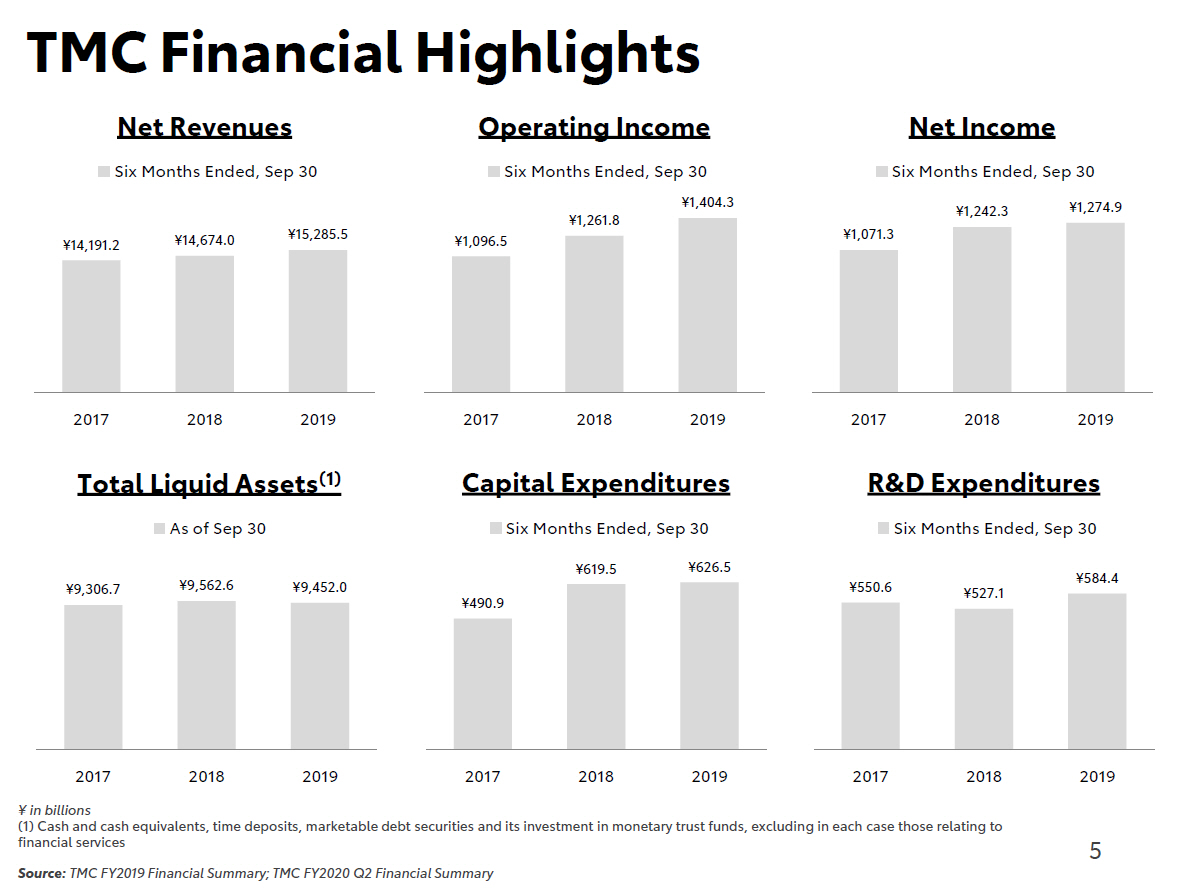
5 TMC Financial Highlights ¥ 14,191.2 ¥ 14,674. 0 ¥ 15, 285.5 Net Revenues Six Months Ended, Sep 30 ¥1,096.5 ¥ 1,261.8 Operating Income Six Months Ended, Sep 30 ¥ 1,404.3 ¥ 1,071.3 ¥1,242.3 ¥1,274.9 Net Income Six Months Ended, Sep 30 ¥9,306. 7¥9,562.6 ¥9,452.0 2017 2018 2019 Total Liquid Assets (1) As of Sep 30 ¥490.9 ¥619.5 ¥626.5 2017 2018 2019 Capital Expenditures Six Months Ended, Sep 30 ¥550.6 ¥527.1 ¥ 584.4 2017 2018 2019 2017 2018 2019 2017 2018 ¥ in billions (1) Cash and cash equivalents, time deposits, marketable debt securities and its investment in monetary trust funds, excluding in each case those relating to financial services Source: TMC FY2019 Financial Summary; TMC FY2020 Q2 Financial Summary 20 1 9 20 1 7 20 1 8 20 1 9 R&D Expenditures Six Months Ended, Sep 30
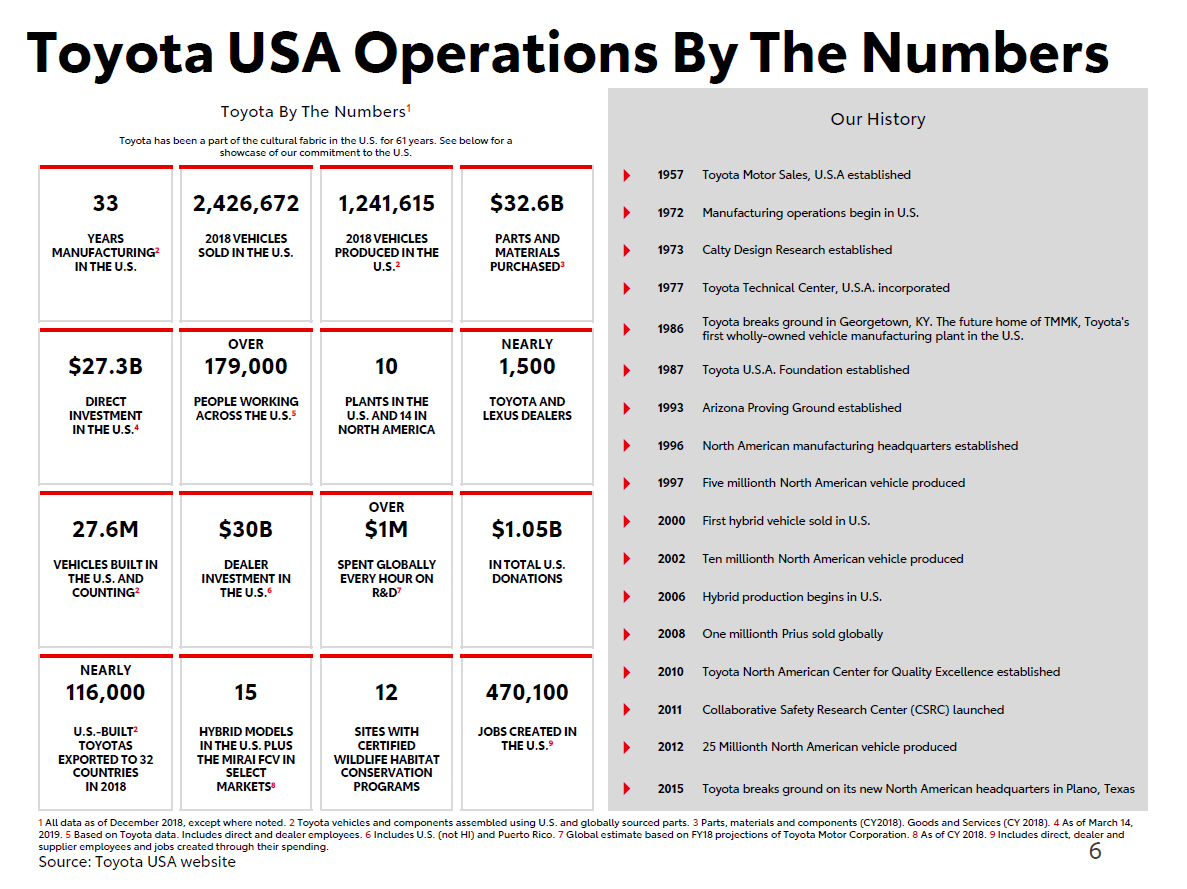
6 Toyota USA Operations By The Numbers Toyota By The Numbers 1 Toyota has been a part of the cultural fabric in the U.S. for 61 years. See below for a showcase of our commitment to the U.S. 33 YEARS MANUFACTURING 2 IN THE U.S. 2,426,672 2018 VEHICLES SOLD IN THE U.S. 1,241,615 2018 VEHICLES PRODUCED IN THE U.S. 2 $ 32.6 B PARTS AND MATERIALS PU R C H A S E D 3 $27.3B DIRECT I N V E S TME N T IN THE U.S. 4 OVER 179,000 PEOPLE WORKING ACROSS THE U.S. 5 10 PLANTS IN THE U.S. AND 14 IN NORTH AMERICA NEARLY 1,500 TOYOTA AND LEXUS DEALERS 27.6M VEHICLES BUILT IN THE U.S. AND COUNTING 2 $30B DEALER INVESTMENT IN THE U.S. 6 OVER $1M SPENT GLOBALLY EVERY HOUR ON R&D 7 $1.05B IN TOTAL U.S. DONATIONS NEARLY 116,000 U.S. - BUILT 2 TOYOTAS EXPORTED TO 32 COUNTRIES IN 2018 15 HYBRID MODELS IN THE U.S. PLUS THE MIRAI FCV IN SELECT MARKETS 8 12 SITES WITH CERTIFIED WILDLIFE HABITAT CONSERVATION PROGRAMS 470,100 JOBS CREATED IN THE U.S. 9 Our History 1957 Toyota Motor Sales, U.S.A established 1972 Manufacturing operations begin in U.S. 1973 Calty Design Research established 1977 Toyota Technical Center, U.S.A. incorporated 1986 Toyota breaks ground in Georgetown, KY. The future home of TMMK, Toyota's first wholly - owned vehicle manufacturing plant in the U.S. 1987 Toyota U.S.A. Foundation established 1993 Arizona Proving Ground established 1996 North American manufacturing headquarters established 1997 Five millionth North American vehicle produced 2000 First hybrid vehicle sold in U.S. 2002 Ten millionth North American vehicle produced 2006 Hybrid production begins in U.S. 2008 One millionth Prius sold globally 2010 Toyota North American Center for Quality Excellence established 2011 Collaborative Safety Research Center (CSRC) launched 2012 25 Millionth North American vehicle produced 2015 Toyota breaks ground on its new North American headquarters in Plano, Texas 1 All data as of December 2018, except where noted. 2 Toyota vehicles and components assembled using U.S. and globally sourced parts. 3 Parts, materials and components (CY2018). Goods and Services (CY 2018). 4 As of March 14, 2019. 5 Based on Toyota data. Includes direct and dealer employees. 6 Includes U.S. (not HI) and Puerto Rico. 7 Global estimate based on FY18 projections of Toyota Motor Corporation. 8 As of CY 2018. 9 Includes direct, dealer and supplier employees and jobs created through their spending. Source: Toyota USA website
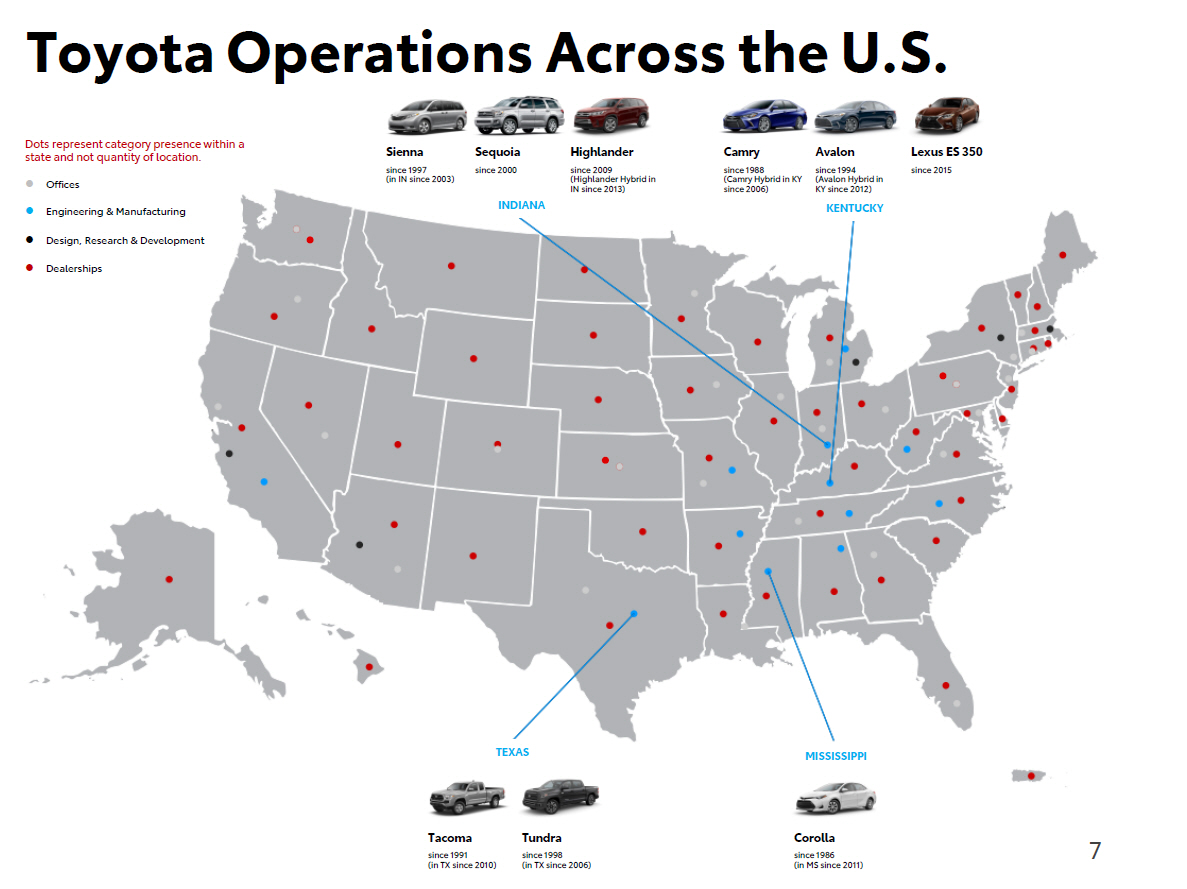
7 Toyota Operations Across the U.S. Dots represent category presence within a state and not quantity of location. Offices Engineering & Manufacturing Design, Research & Development Dealerships INDIANA Sienna s inc e 1 997 (in IN since 2003) Sequoia s inc e 2000 Highlander since 2009 (Highlander Hybrid in IN since 2013) KE N T U C K Y Camry s inc e 1 988 (Camry Hybrid in KY s inc e 200 6 ) Avalon since 1994 (Avalon Hybrid in KY since 2012) Lexus ES 350 s inc e 20 1 5 TEXAS Tacoma s inc e 1 99 1 (in TX since 2010) Tundra s inc e 1 998 (in TX since 2006) MISSISSIPPI Corolla since 1 986 (in MS since 2011)
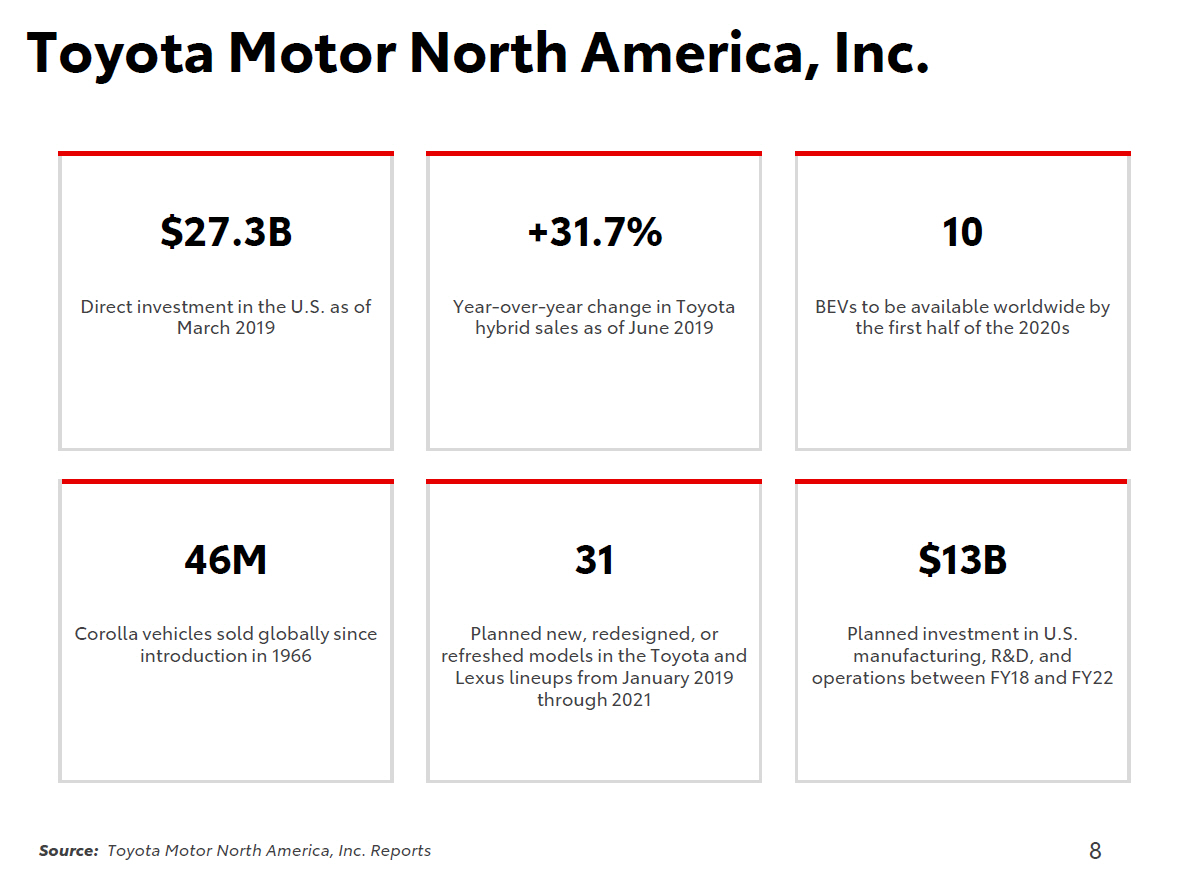
8 Toyota Motor North America, Inc. $27.3B Direct investment in the U.S. as of March 2019 +31.7% Year - over - year change in Toyota hybrid sales as of June 2019 10 BEVs to be available worldwide by the first half of the 2020s 46M Corolla vehicles sold globally since introduction in 1966 31 Planned new, redesigned, or refreshed models in the Toyota and Lexus lineups from January 2019 through 2021 $13B Planned investment in U.S. manufacturing, R&D, and operations between FY18 and FY22 Source: Toyota Motor North America, Inc. Reports
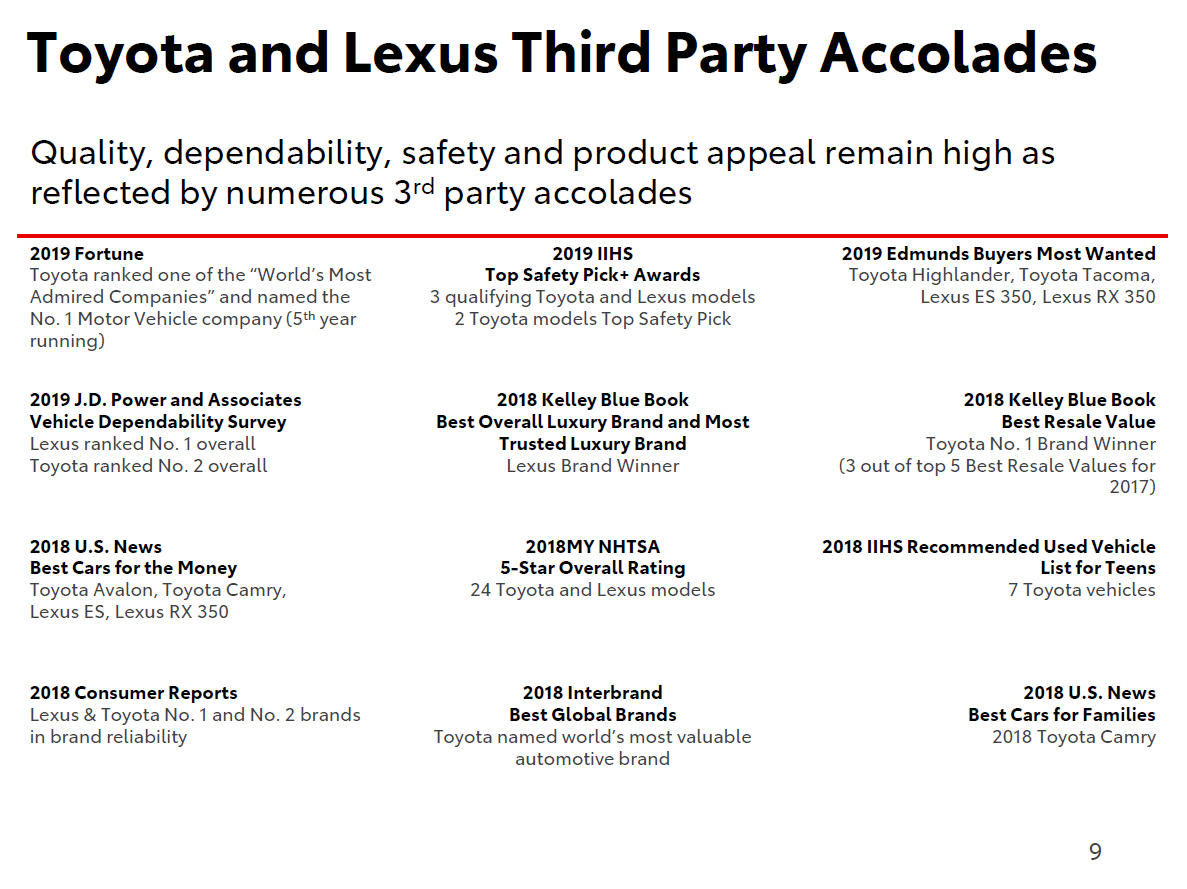
9 Toyota and Lexus Third Party Accolades Quality, dependability, safety and product appeal remain high as reflected by numerous 3 rd party accolades 2019 Fortune Toyota ranked one of the “World’s Most Admired Companies” and named the No. 1 Motor Vehicle company (5 th year running) 2019 IIHS Top Safety Pick+ Awards 3 qualifying Toyota and Lexus models 2 Toyota models Top Safety Pick 2019 Edmunds Buyers Most Wanted Toyota Highlander, Toyota Tacoma, Lexus ES 350, Lexus RX 350 2019 J.D. Power and Associates Vehicle Dependability Survey Lexus ranked No. 1 overall Toyota ranked No. 2 overall 2018 Kelley Blue Book Best Overall Luxury Brand and Most Trusted Luxury Brand Lexus Brand Winner 2018 Kelley Blue Book Best Resale Value Toyota No. 1 Brand Winner (3 out of top 5 Best Resale Values for 2017) 2018 U.S. News Best Cars for the Money Toyota Avalon, Toyota Camry, Lexus ES, Lexus RX 350 2018MY NHTSA 5 - Star Overall Rating 24 Toyota and Lexus models 2018 IIHS Recommended Used Vehicle List for Teens 7 Toyota vehicles 2018 Consumer Reports Lexus & Toyota No. 1 and No. 2 brands in brand reliability 2018 Interbrand Best Global Brands Toyota named world’s most valuable automotive brand 2018 U.S. News Best Cars for Families 2018 Toyota Camry

10 Toyota and Lexus Vehicle Highlights RAV4 Corolla Supra ES NX Hybrid RX

Next Generation Technology MaaS e - Palette Autonomous TRI - P4 Fuel Cell Mirai / Tri - Gen / Project Portal 2.0 11

12 Toyota Financial Services

13 TFS Group Global Presence EUROPE/AFRICA REGION CHINA REGION ASIA/PACIFIC REGION AMERICAS OCEANIA REGION Finland Sweden Norway Netherlands Denmark G e r m a n y Ireland UK France Pol a n d Czech S lo v a k i a Hungary Po r t u g a l S p a i n I t a l y Kazakhstan China Ko r e a JAPAN REGION Japan India Thailand R u ss i a Ph i l i pp i n e s Vietnam Malaysia Indonesia South Africa Australia New Zealand Argentina Br az i l Venezuela M e xi co Puerto Rico Canada U. S.A.Taiwan TOYOTA FINANCIAL SERVICES GLOBAL REGIONS

14 Toyota Motor Credit Corporation (TMCC) Toyota Motor Corporation (TMC) Toyota Financial Services Corporation (TFSC) Toyota Motor Credit Corporation (TMCC) • Over 4.5 million active finance contracts (1) • AA - (2) /Aa3 (2) rated captive finance company by S&P/Moody’s • Credit support agreement structure with TFSC/TMC (3) (1) As of September 2019. Source : Company Reports (2) Outlook stable (3) The Credit Support Agreements do not apply to securitization transactions

15 TMCC Products and Services ■ Dealer Financing • Wholesale • Real Estate • Working Capital • Revolving Credit Lines ■ Consumer Financing • Retail • Lease ■ Insurance Products • Service Agreements • Prepaid Maintenance • Guaranteed Auto Protection • Excess Wear & Use • Tire & Wheel • Key Replacement Protection Source : TMCC September 30, 2019 10 - Q. Reflects Operating Lease and Retail Financing revenues; Dealer Financing revenues; and Insurance earned premiums and contract revenues for the six months ended September 30, 2019. 87% 6% 7% $6.44B FYTD 2020 Revenue
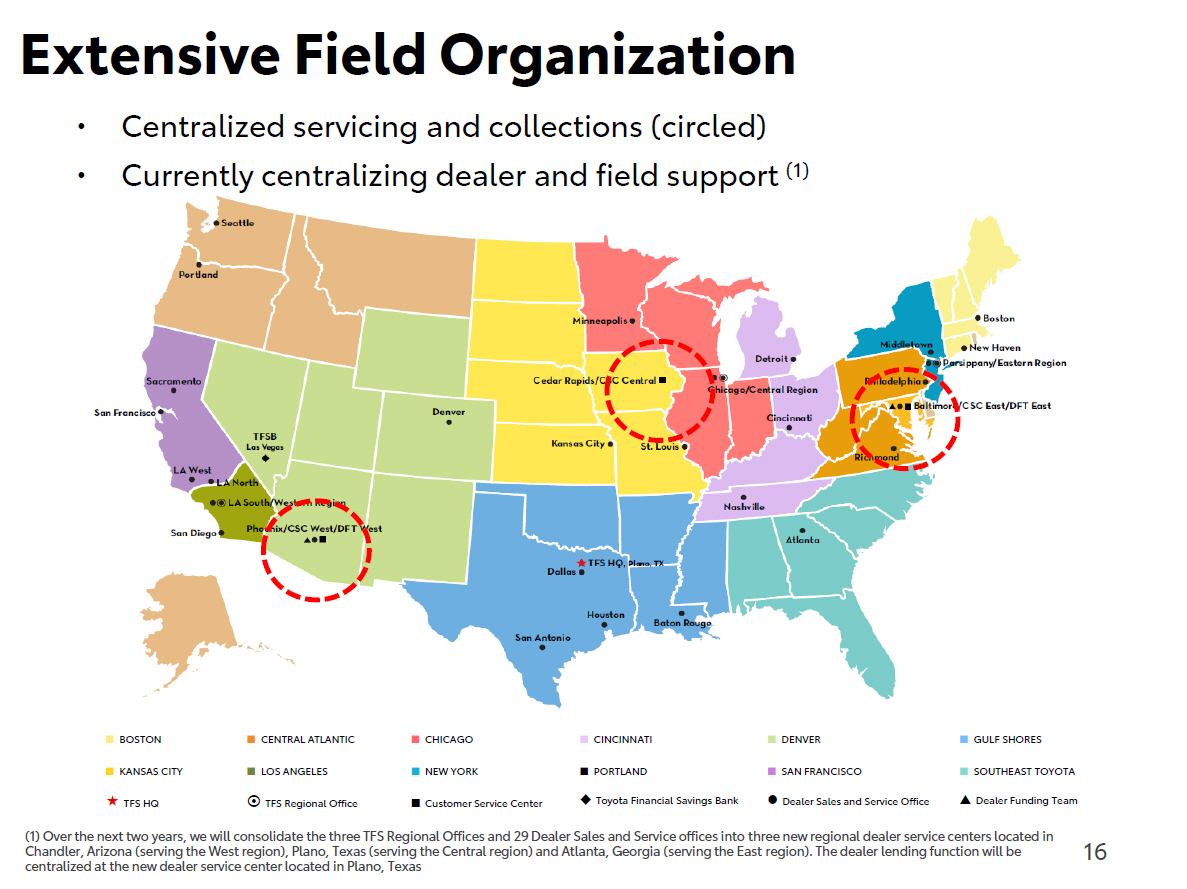
16 Extensive Field Organization • Centralized servicing and collections (circled) • Currently centralizing dealer and field support (1) ■ BOSTON ■ CENTRAL ATLANTIC ■ CHICAGO ■ CINCINNATI ■ DENVER ■ GULF SHORES ■ KANSAS CITY ■ LOS ANGELES ■ NEW YORK ■ PORTLAND ■ SAN FRANCISCO ■ SOUTHEAST TOYOTA TFS HQ TFS Regional Office ■ Customer Service Center Toyota Financial Savings Bank Dealer Sales and Service Office Dealer Funding Team (1) Over the next two years, we will consolidate the three TFS Regional Offices and 29 Dealer Sales and Service offices into three new regional dealer service centers located in Chandler, Arizona (serving the West region), Plano, Texas (serving the Central region) and Atlanta, Georgia (serving the East region). The dealer lending function will be centralized at the new dealer service center located in Plano, Texas
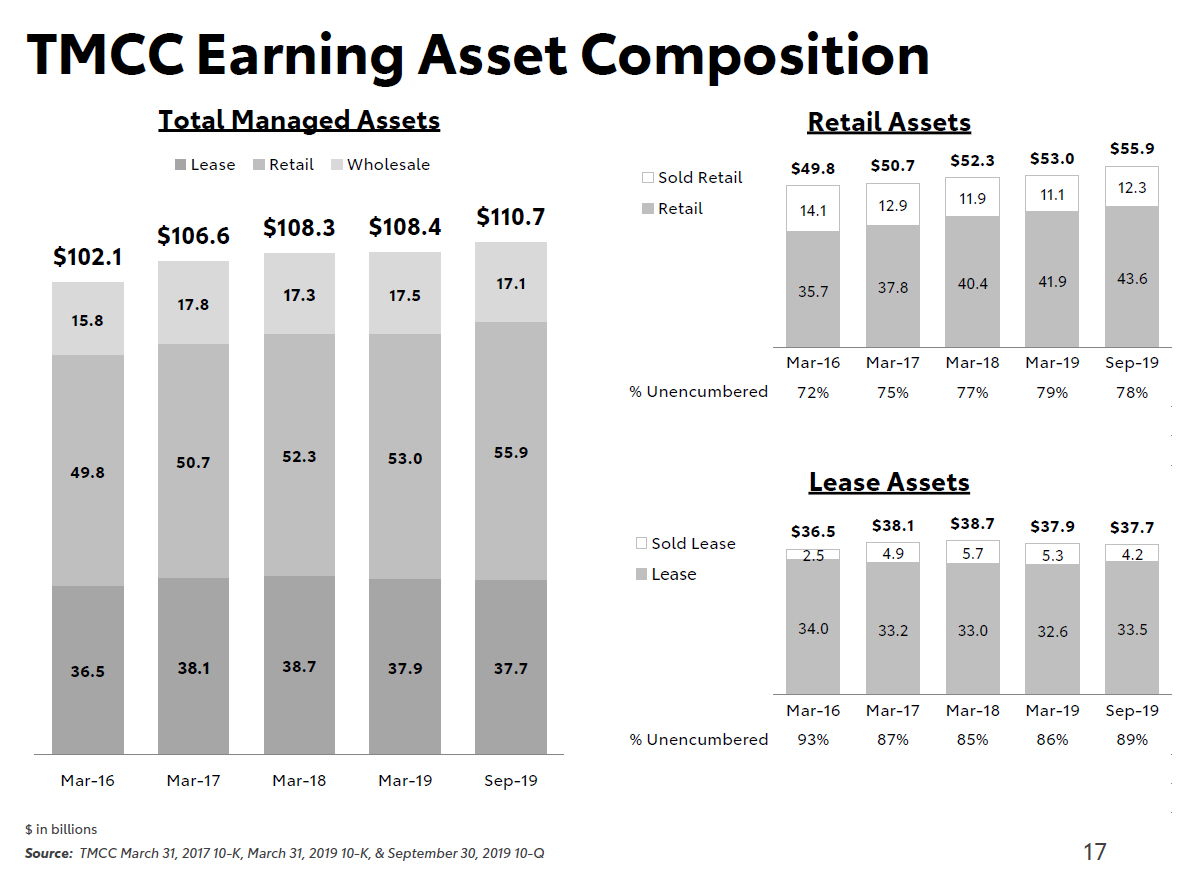
36.5 38.1 38.7 37.9 37.7 49.8 50.7 52.3 53.0 55.9 15.8 17.8 17.1 $ 1 02.1 $106.6 $108.3 $108.4 17.3 17.5 $1 1 0.7 Total Managed Assets Lease Retail Wholesale 12.3 14.1 12.9 11.9 11.1 41.9 43.6 40.4 35.7 37.8 $49.8 $50.7 $52.3 $53.0 $55.9% Unencumbered Mar - 16 72% Mar - 17 75% Mar - 18 77% Mar - 19 79% S e p - 19 78% Total $49.800 $50.700 $52.300 $53.000 $55.900 Sold Retail $14.1 $12.9 $11.9 $11.1 $12.3 Retail $35.7 $37.8 $40.4 $41.9 $43.6 Retail Assets Sold Retail Retail 34.0 33.2 33.0 32.6 33.5 2.5 4.9 5.7 5.3 4.2 $36.5 $38.1 $38.7 $37.9 $37.7% Unencumbered Ma r - 1 6 93% Ma r - 1 7 87% Ma r - 1 8 85% Ma r - 1 9 86% S e p - 1 9 89% Total $36.500 $38.100 $38.700 $37.900 $37.700 Sold Lease $2.5 $4.9 $5.7 $5.3 $4.2 Lea s e $ 3 4.0 $ 3 3.2 $ 3 3.0 $ 3 2.6 $ 3 3.5 Lease Assets Sold Lease Lease TMCC Earning Asset Composition 17 Mar - 16 Mar - 17 Mar - 18 Mar - 19 Sep - 19 $ in billions Source: TMCC March 31, 2017 10 - K, March 31, 2019 10 - K, & September 30, 2019 10 - Q

18 TMCC Financial Performance operating leases (investments in operating leases before allowance for credit losses) (3) Net Credit Losses : results are annualized Source: TMCC September 30, 2018 10 - Q and September 30, 2019 10 - Q $ 5,245 $ 5,726 $5, 98 1 Total Financing Revenues Six Months Ended, Sep 30 $1, 526 $1, 460 $ 2,1 39 Net Revenues Six Months Ended, Sep 30 $282 $286 $818 Net Income Six Months Ended, Sep 30 0.36% 0.36% 2017 2018 2019 60+ Days Delinquent (1) As of Sep 30 0.36% 0.60% 0.54% 0.53% As of Sep 30 2017 2018 2019 Allowance for Credit Losses (1)(2) 0.3 1% 0.27% 2017 2018 2019 2017 2018 2019 2017 2018 2019 $ in millions (1) 60+ Days Delinquent, Allowance for Credit Losses, and Net Credit Losses : percentage of gross earning assets (2) Allowance for Credit Losses : the quotient of allowance for credit losses divided by the sum of gross finance receivables (finance receivables before allowance for credit losses) plus gross investments in 20 1 7 20 1 8 20 1 9 Net Credit Losses (1)(3) Six Months Ended, Sep 30 0.37%
19 TMCC Funding Programs

20 TMCC Funding Program Objectives Highly Liquid and Well Diversified P - 1 | A - 1+ Direct Issue Commercial Paper Program $20.5B Committed Bank Credit Facilities $4.4B Average Liquidity Portfolio Balance for FY20 $70B + Readily Salable Retail Loans and Leases EUR NZD JPY USD GBP AUD Global Issuance Capacity Intercompany Lending Infrastructure Investor Focused Long - Term Perspective Best - in - Class Execution Responsive Flexible Innovative Diversity and Inclusion N o ve m b er 2 0 17 Toyota Motor Credit Corporation € 600mn 0.00% Green Notes due 2021 Green Bonds € 600mn 0.625% Notes due 2024 Source : TMCC September 30, 2019 10 - Q and Company Reports

21 Commercial Paper Program Highlights P – 1 | A – 1 + Moody’s S&P Highest Short - Term Ratings TCCI TFA TMCC TMFNL TCPR Five Distinct Programs $15.0B | $5.5B Multi - Party Bilateral Backed by $20.5B of Committed Bank Credit $26.8B Average Outstanding Balance TMCC and TCPR during FY2020 700+ Investors State and Local, Corporates, Pension Funds, Asset Managers, Financial Institutions DOCP <GO> Rates Posted Daily on Bloomberg Source : TMCC September 30, 2019 10 - Q and Company Reports

ABS, 47% MTN, 20% Uridashi, 4% Other, 8% $9.6B Term Debt Funded Q2 FY2020 $5.1B Unsecured $3.5B Public ABS* $1.0B Private ABS 22 TMCC Q1 FY20 Funding Overview Global, 21% (1) Net of retained (2) Funding from asset - backed loans and ABCP Conduits Figures may not add up to 100% due to rounding Source: Company Reports as of September 30, 2019

23 Diversification in Debt Offerings TMCC Long Term Debt Outstanding $ in millions Source: Company Reports as of September 30, 2019 Global MTN, $26,764 EMTN / Eurobonds, $17,274 Public / Private ABS, $12,863 MTN, $6,863 By Deal Type Other, $4,300 USD, 55,264 EUR, 7,047 AUD, 3,870 GBP, 1,399 Other, 485 By Currency

24 Funding Flexibility And Responsiveness 45% 37% 49% 83% 58% 37% 44% 5 1% 38% 17% 5% 11% 12% 13% 0% FY16 FY17 FY18 (1) Unsecured U.S. MTN issuances, excluding Structured Notes and Retail Notes Percentages may not add to 100% due to rounding Source: Company Reports as of September 30, 2019 FY19 FYTD20 Diversification Across the USD Curve (1) <=2yrs 3 - 5yrs 7 - 10yrs

TMCC Retail Loan Collateral & ABS Transactions 25

26 Credit Decisioning & Collections Disciplined Underwriting Consistent and conservative underwriting standards designed to limit delinquencies and credit losses • Key mission is to support Toyota and Lexus brand and vehicle sales • Continued focus on prime originations • Proprietary credit scores that leverage TMCC’s extensive origination history • Regular statistical validations of predictive power Servicing Optimization Optimization of collections strategy and staff supports loss mitigation while enabling portfolio growth • Emphasis on early intervention • Reinforcement of strong compliance management system • Focus on analytics and technology to prioritize high risk accounts and manage loss severities

27 Cumulative Net Losses by Vintage 1.0% 0.5% 0.0% 1.5% 2.0% 2.5% 3.0% 3.5% 4.0% 1 5 9 1 3 1 7 21 25 29 Source: Company Reports as of September 30, 2019 33 37 41 45 49 53 57 61 65 69 73 2007 2008 2009 20 1 0 2011 20 1 5 20 1 2 20 1 6 20 1 3 20 1 7 20 1 4 20 1 8 2015 2007 2008

28 Retail Managed Portfolio Performance Source: Company Reports as of September 30, 2019 $ 5 3 $ 5 3 $ 5 1 $ 5 0 $ 5 0 $ 4 9 $ 4 7 $ 4 5 $ 4 5 $53 Sep 2018 $56 Sep 2019 3.1 0 3.1 6 3.1 8 3.1 6 3.2 1 3.22 3.1 6 3.1 2 3.1 9 F Y 1 9 F Y 1 1 F Y 1 2 F Y 1 3 F Y 1 4 F Y 1 5 F Y 1 6 F Y 1 7 F Y 1 8 Receivables Principal Balance ($B) Contracts Outstanding (#M) 3.13 Sep 2018 3.13 Sep 2019 2.5% 2.0% 1.5% 1.0% 0.5% 0.0% F Y 1 6 F Y 1 7 F Y 1 8 F Y 1 9 F Y 1 4 F Y 1 5 F Y 1 1 F Y 1 2 F Y 1 3 0.55% 0.5 6% Sep 2018 Sep 2019 0.56% Sep 2018 0.5 4% Sep 2019 0.46% 0.4 4% Sep 2018 Sep 2019% 60+D Past Due Gross Charge Offs Net Losses FY11 FY12 FY13 FY14 FY15 FY16 FY17 FY18 FY19 Performance by Principal Balance Outstanding 2.5% 2.0% 1.5% 1.0% 0.5% 0.0% F Y 1 8 F Y 1 9 F Y 1 5 F Y 1 6 F Y 1 7 F Y 1 1 F Y 1 2 F Y 1 3 F Y 1 4 0.62% Sep 2018 0.64% Sep 2019 1.14% Sep 2018 1.10% Sep 2019% 60+D Past Due% Repossessed Performance by Contracts Outstanding
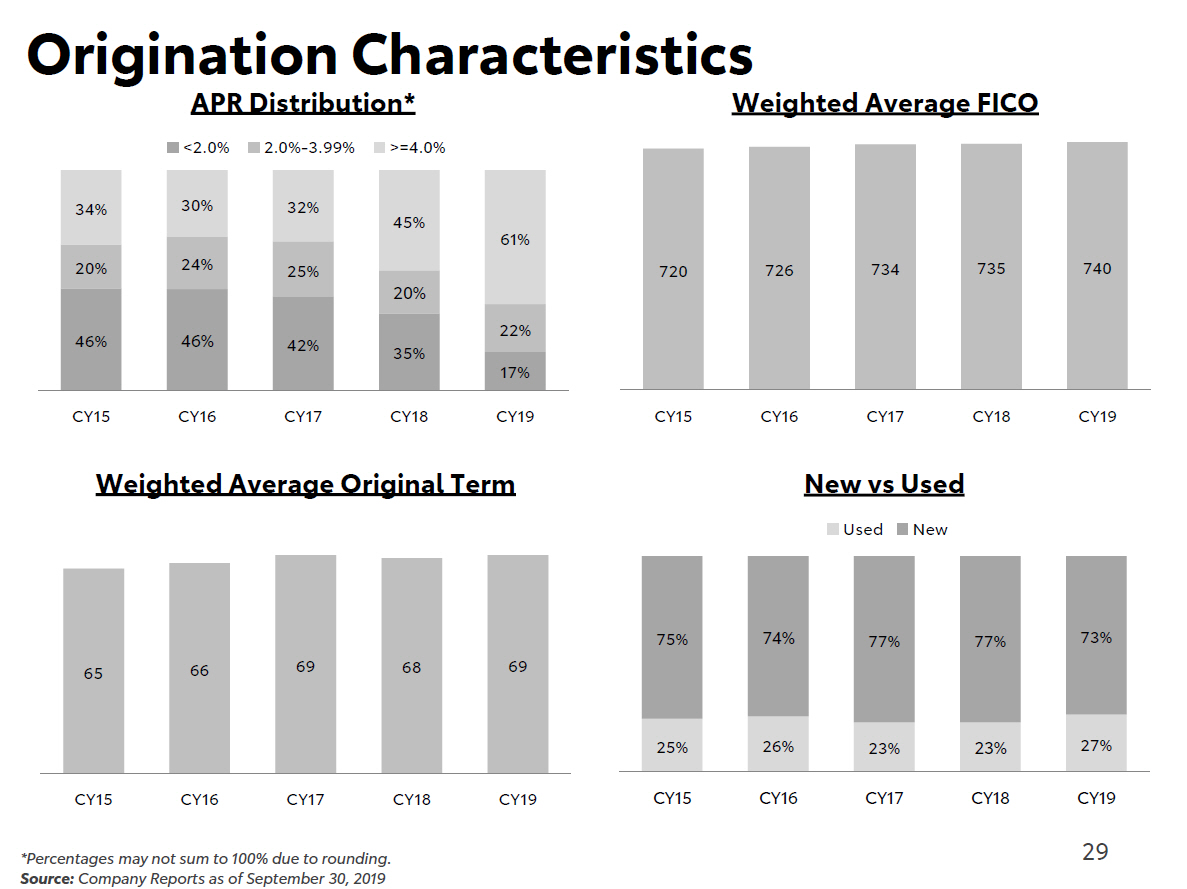
29 Origination Characteristics *Percentages may not sum to 100% due to rounding. Source: Company Reports as of September 30, 2019 46% 46% 42% 35% 1 7% 20% 24% 20% 22% 34% 30% 32% 45% 6 1% C Y 1 5 C Y 1 6 C Y 1 7 C Y 1 8 APR Distribution* <2.0% 2.0% - 3.99% >=4.0% 25% 720 726 734 735 740 C Y 1 9 C Y 1 5 C Y 1 6 C Y 1 7 C Y 1 8 C Y 1 9 Weighted Average FICO Weighted Average Original Term 65 66 69 68 69 75% 74% 77% 77% 73% 25% 26% 23% 23% 27% CY15 CY16 CY17 CY18 CY19 CY15 CY16 CY17 CY18 CY19 New vs Used Used New
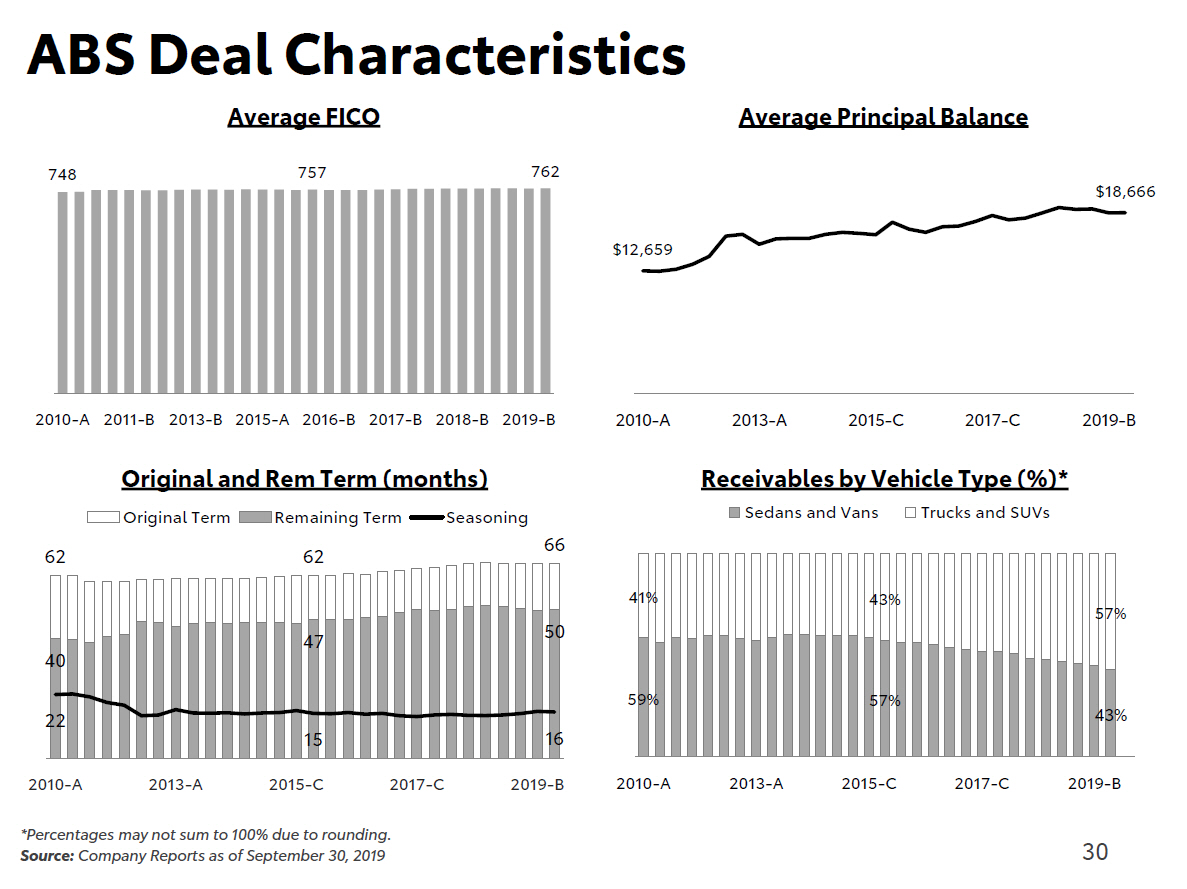
30 ABS Deal Characteristics *Percentages may not sum to 100% due to rounding. Source: Company Reports as of September 30, 2019 748 757 762 2010 - A 2011 - B 2013 - B 2015 - A 2016 - B 2017 - B 2018 - B 2019 - B Average FICO $12,659 $18,666 2 0 1 0 - A 2019 - B Average Principal Balance 62 66 40 47 50 16 22 15 20 1 0 - A 20 1 3 - A 20 1 5 - C 20 1 7 - C 20 1 9 - B Original and Rem Term (months) Original Term Re m ai n i n g T e rm S e aso n i n g 62 59% 57% 4 1% 43% 57% 2010 - A 2013 - A 20 1 5 - C 20 1 7 - C 43% 2019 - B 2013 - A 2015 - C 2017 - C Receivables by Vehicle Type (%)* Sedans and Vans Trucks and SUVs

31 TAOT Cumulative Net Losses Source: Company Reports as of November 15, 2019 payment date 0.0% 0.1% 0.2% 0.3% 0.4% 0.5% 0.6% 1 5 9 1 3 1 7 21 25 29 33 37 41 45 49 TAOT 2010 - A TAOT 2010 - B TAOT 2010 - C TAOT 2011 - A TAOT 2011 - B TAOT 2012 - A TAOT 2012 - B 0.1% 0.0% 0.2% 0.3% 0.4% 0.6% 0.5% 2010, 2011, 2012 Series 2013, 2014, 2015 Series TAOT 2013 - A TAOT 2013 - B TAOT 2014 - A TAOT 2014 - B TAOT 2014 - C TAOT 2015 - A TAOT 2015 - B TAOT 2015 - C 0.0% 0.1% 0.2% 0.3% 0.4% 0.5% 0.6% 1 5 9 1 3 1 7 21 25 29 33 37 41 45 49 2016 and 2017 Series TAOT 2016 - A TAOT 2016 - B TAOT 2016 - C TAOT 2016 - D TAOT 2017 - A TAOT 2017 - B TAOT 2017 - C TAOT 2017 - D 0.0% 0.1% 0.2% 0.4% 0.3% 0.5% 0.6% 1 5 9 1 3 1 7 21 25 29 33 37 41 45 49 1 5 9 1 3 1 7 21 25 29 33 37 41 45 49 2018 and 2019 Series TAOT 2018 - A TAOT 2018 - B TAOT 2018 - C TAOT 2018 - D TAOT 2019 - A TAOT 2019 - B

32 Appendix

TMC Consolidated Financials Summary Source : TMC FY2019 Financial Summary; FY2020 Q2 Financial Summary Consolidated Income Statement Fiscal Year Ended March 31, Six Months Ended (JPY billions) 2018 2019 September 30, 2019 Net Revenues 29,379.5 30,225.6 15,285.5 Operating Income 2,399.8 2,467.5 1,404.3 Net Income 2,493.9 1,882.8 1,274.9 Consolidated Balance Sheet Fiscal Year Ended March 31, Six Months Ended (JPY billions) 2018 2019 September 30, 2019 Current assets 1 8,1 52.6 1 8,879.2 18,976.9 Noncurrent finance receivables, net 9,48 1.6 1 0,28 1.1 10,396.2 Investment & other assets 1 2,406.3 1 2,09 1.1 12,271.5 Property, plant & equipment, net 1 0,267.6 1 0,685.4 10,595.4 Total Assets 50,308 .2 5 1,936 .9 52,240.0 Liabilities 30,386.1 3 1,37 1.7 31,237.7 Shareholders' equity 1 9,922.0 20,565.2 21,002.3 Total Liabilities & Shareholders' Equity 50,308 .2 5 1,936 .9 52,240.0 Numbers may not sum to total due to rounding. 33
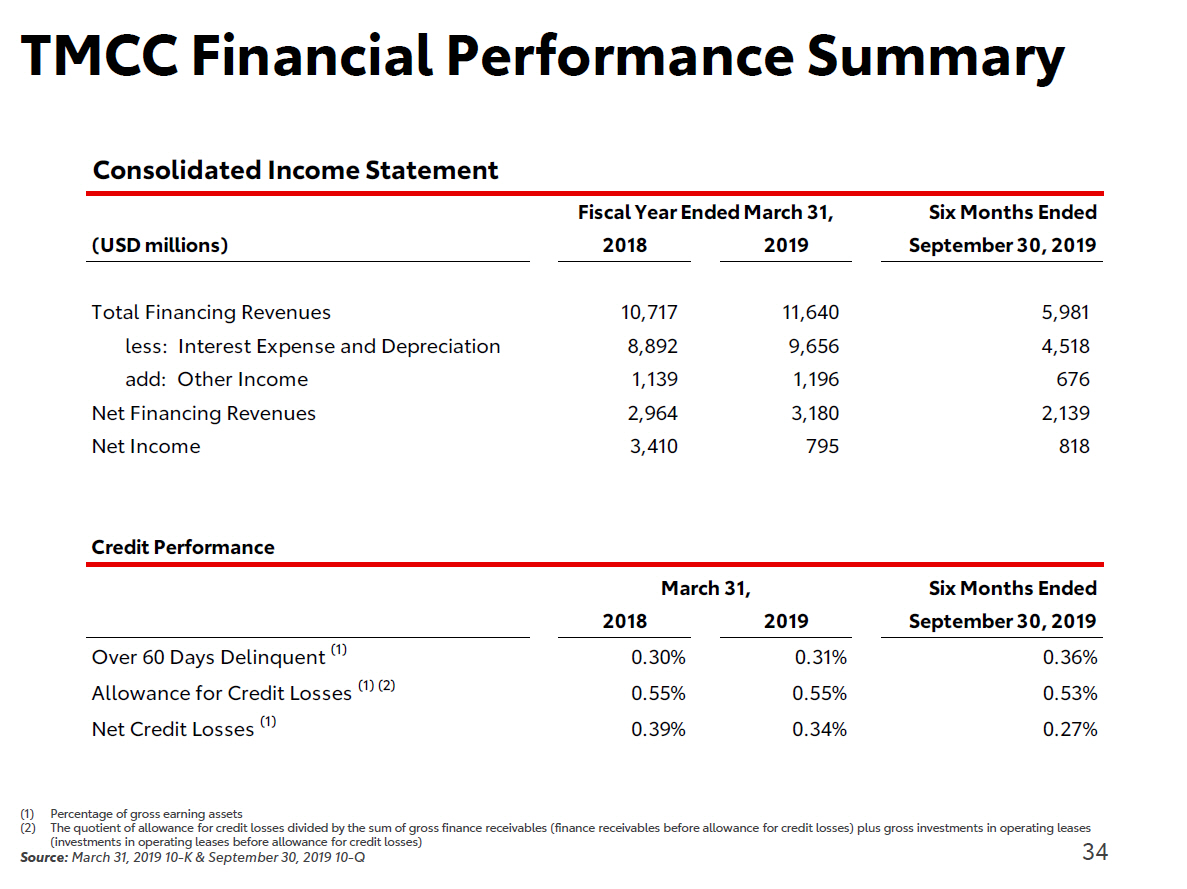
34 TMCC Financial Performance Summary (1) Percentage of gross earning assets (2) The quotient of allowance for credit losses divided by the sum of gross finance receivables (finance receivables before allowance for credit losses) plus gross investments in operating leases (investments in operating leases before allowance for credit losses) Sour ce: March 31, 2019 10 - K & September 30, 2019 10 - Q Consolidated Income Statement ( U S D m i ll i o n s ) 20 1 8 20 1 9 Six Months Ended September 30, 2019 Fiscal Year Ended March 31, Total Financing Revenues 10,717 11,640 5,98 1 less: Interest Expense and Depreciation 8,892 9,656 4,5 1 8 add: Other Income 1,139 1,196 676 Net Financing Revenues 2,964 3,180 2,1 3 9 Net Income 3,410 795 8 1 8 Credit Performance March 31, Six Months Ended 2018 2019 September 30, 2019 Over 60 Days Delinquent (1) 0.30% 0.3 1% 0.36% Allowance for Credit Losses (1) (2) 0.55% 0.55% 0.53% Net Credit Losses (1) 0.39% 0.34% 0.27%

35 Credit Support Agreements TFSC Credit Support Agreement Securities (1) issued by TMCC (and various other TFSC subsidiaries) have the benefit of a credit support agreement with TFSC • TFSC will own 100% of TMCC • TFSC will cause TMCC to maintain a tangible net worth of at least $100,000 as long as covered securities are outstanding • If TMCC determines it will be unable to meet its payment obligations on any securities, TFSC will make sufficient funds available to TMCC to ensure that all such payment obligations are paid as due • Agreement cannot be terminated until (1) repayment of all outstanding securities or (2) each rating agency requested by Toyota to provide a rating has confirmed no change in rating of all such securities TMC Credit Support Agreement TFSC in turn has the benefit of a credit support agreement with TMC • Same key features as TFSC/TMCC credit support agreement • TMC will cause TFSC to maintain a tangible net worth of at least JPY10mm as long as covered securities are outstanding TFSC’s and/or TMC's credit support obligations will rank pari passu with all other senior unsecured debt obligations (1) “Securities” defined as outstanding bonds, debentures, notes and other investment securities and commercial paper, but does not include asset - backed securities issued by TMCC’s securitization trusts.
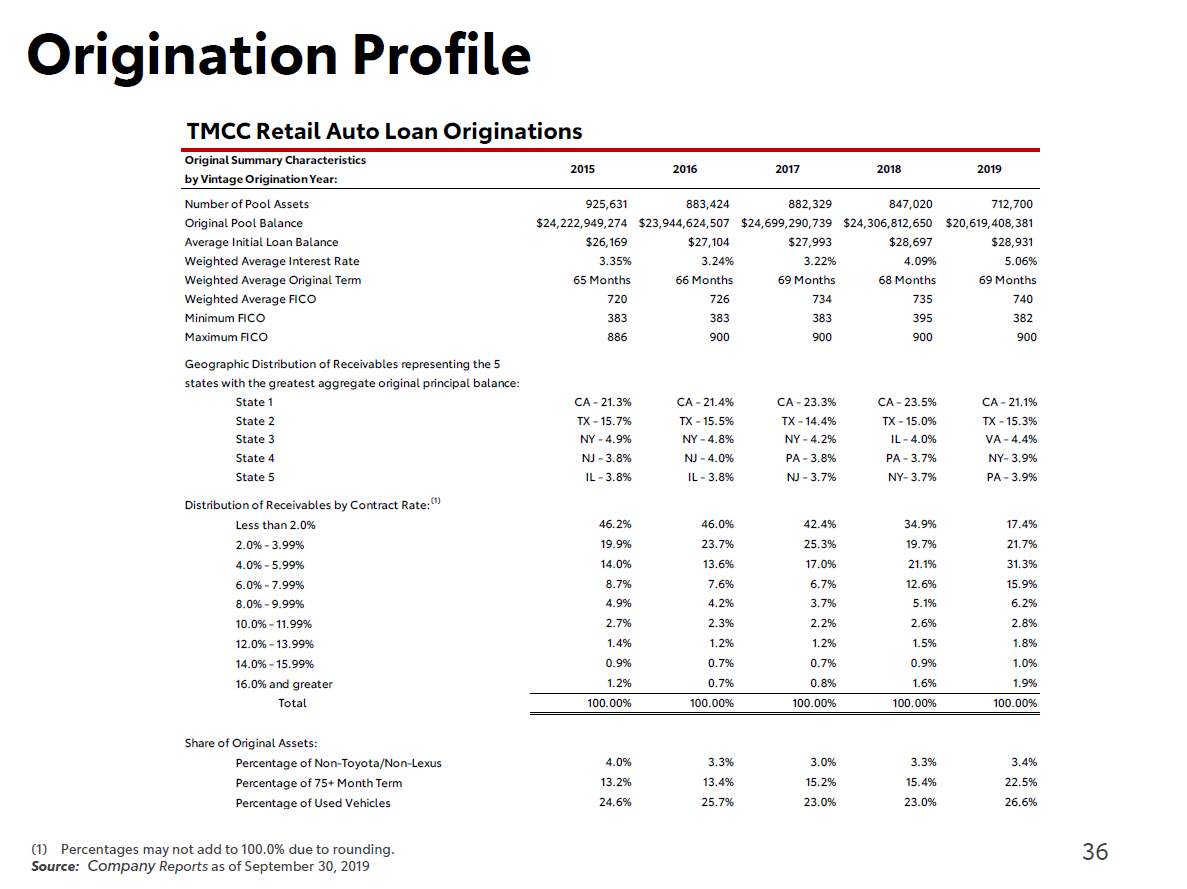
36 Origination Profile (1) Percentages may not add to 100.0% due to rounding. Source: Company Reports as of September 30, 2019 TMCC Retail Auto Loan Originations Original Summary Characteristics 20 1 5 20 1 6 20 1 7 20 1 8 20 1 9 by Vintage Origination Year: Number of Pool Assets 9 2 5,6 3 1 8 8 3,4 2 4 8 8 2,3 2 9 8 4 7,0 2 0 7 1 2,7 0 0 Original Pool Balance $ 2 4,2 2 2,9 4 9,2 7 4 $23,944,624,507 $ 2 4,6 9 9,2 9 0,7 3 9 $ 2 4,3 0 6,8 1 2,6 5 0 $ 2 0,6 1 9,4 0 8,3 8 1 Average Initial Loan Balance $ 2 6,1 69 $ 2 7,1 04 $ 2 7,9 9 3 $ 2 8,6 9 7 $ 2 8,9 3 1 Weighted Average Interest Rate 3.3 5% 3.2 4% 3.2 2% 4.0 9% 5.0 6% Weighted Average Original Term 65 Months 66 Months 69 Months 68 Months 69 Months Weighted Average FICO 720 726 734 735 740 Minimum FICO 383 383 383 395 382 Maximum FICO 886 900 900 900 900 Geographic Distribution of Receivables representing the 5 states with the greatest aggregate original principal balance: State 1 CA - 21.3% CA - 21.4% CA - 23.3% CA - 23.5% CA - 21.1% State 2 TX - 15.7% TX - 15.5% TX - 14.4% TX - 15.0% TX - 15.3% State 3 NY - 4.9% NY - 4.8% NY - 4.2% IL - 4.0% VA - 4.4% State 4 NJ - 3.8% NJ - 4.0% PA - 3.8% PA - 3.7% NY - 3.9% State 5 IL - 3.8% IL - 3.8% NJ - 3.7% NY - 3.7% PA - 3.9% Distribution of Receivables by Contract Rate: (1) Less than 2.0% 4 6.2% 4 6.0% 4 2.4% 3 4.9% 1 7.4% 2.0% - 3.99% 1 9.9% 2 3.7% 2 5.3% 1 9.7% 2 1.7% 4.0% - 5.99% 1 4.0% 1 3.6% 1 7.0% 2 1.1% 3 1.3% 6.0% - 7.99% 8.7% 7.6% 6.7% 1 2.6% 1 5.9% 8.0% - 9.99% 4.9% 4.2% 3.7% 5.1% 6.2% 10.0% - 11.99% 2.7% 2.3% 2.2% 2.6% 2.8% 12.0% - 13.99% 1.4% 1.2% 1.2% 1.5% 1.8% 14.0% - 15.99% 0.9% 0.7% 0.7% 0.9% 1.0% 16.0% and greater 1.2% 0.7% 0.8% 1.6% 1.9% Total 1 0 0.0 0% 1 0 0.0 0% 1 0 0.0 0% 1 0 0.0 0% 1 0 0.0 0% Share of Original Assets: Percentage of Non - Toyota/Non - Lexus 4.0% 3.3% 3.0% 3.3% 3.4% Percentage of 75+ Month Term 1 3.2% 1 3.4% 1 5.2% 1 5.4% 2 2.5% Percentage of Used Vehicles 2 4.6% 2 5.7% 2 3.0% 2 3.0% 2 6.6%

37 Managed Portfolio Performance (1) The historical delinquency data reported in this table includes all retail vehicle installment sales contracts purchased by TMCC, excluding those purchased by a subsidiary of TMCC operating in Puerto Rico. Includes contracts that have been sold but are still being serviced by TMCC. (2) Number of contracts outstanding at end of period. (3) The period of delinquency is based on the number of days payments are contractually past due. A payment is deemed to be past due if less than 90% of such payment is made. Source: Company Reports TMCC Retail Loan Delinquency Experience (1) At March 31, At September 30, 2019 2018 2019 2018 2017 2016 2015 Outstanding Contracts (2) 3,134,492 3,1 25,64 2 3,097,46 4 3,158,375 3,1 8 1,1 4 3 3,1 63,1 8 9 3,209,87 2 Number of Accounts Past Due in the following categories 30 - 59 days 42,387 42,29 8 38,49 8 37,04 4 36,39 6 35,79 5 3 1,1 3 0 60 - 89 days 11,310 11,1 7 6 9,57 6 9,46 4 8,0 1 8 7,82 2 6,56 9 Over 89 days 8,734 8,24 0 8,24 0 8,06 3 7,63 3 6,77 6 5,6 1 6 Delinquencies as a Percentage of Contracts Outstanding (3) 30 - 59 days 1.35% 1.35% 1.24% 1.1 7% 1.1 4% 1.1 3% 0.97% 60 - 89 days 0.36% 0.36% 0.3 1% 0.30% 0.25% 0.25% 0.20% Over 89 days 0.28% 0.26% 0.27% 0.26% 0.24% 0.2 1% 0.1 7%

38 Performance – Retail Loan (1) The net loss and repossession data reported in this table includes all retail installment sales contracts purchased by TMCC, excluding those purchased by a subsidiary of TMCC operating in Puerto Rico. Includes contracts that have been sold but are still being serviced by TMCC. (2) Principal Balance Outstanding includes payoff amount for simple interest contracts and net principal amount for actuarial contracts. Actuarial contracts do not comprise any of the Receivables. (3) Average of the principal balance or number of contracts outstanding as of the beginning and end of the indicated periods. (4) Includes bankruptcy - related repossessions but excludes bankruptcies. (5) Amount charged - off is the net remaining principal balance, including earned but not yet received finance charges, repossession expenses and unpaid extension fees, less any proceeds from the liquidation of the related vehicle. Also includes dealer reserve charge - offs. (6) Includes all recoveries from post - disposition monies received on previously charged - off contracts including any proceeds from the liquidation of the related vehicle after the related charge - off. Also includes recoveries for dealer reserve charge - offs and chargebacks. (7) Annualized = [Result] Divide By [Number of Periods] Multiply By [12] Source : Company Reports Number of Repossessions as a Percent of Net Losses as a Percentage of Average Principal Balance Outstanding 0.45% (7) 0.46% (7) 0.52% 0.58% 0.69% 0.55% 0.42% For the Month Ended September 30, For the Fiscal Years Ended March 31, TMCC Managed Portfolio Net Loss and Reposession Experience (dollars in thousands) (1) 20 1 9 2018 2019 2018 2017 2016 2015 Principal Balance Outstanding (2) $55,862,043 $53,292,90 1 $53,236,38 0 $52,760,04 1 $50,759,34 1 $49,7 1 6,9 1 4 $49,645,35 4 Average Principal Balance Outstanding (3) $54,549,212 $53,026,47 1 $52,998,2 1 1 $5 1,759,69 1 $50,238,1 2 7 $49,68 1,1 3 4 $49,203,25 9 Number of Contracts Outstanding $3,134,492 Average Number of $3,1 25,64 2 $3,097,46 4 $3,1 58,37 5 $3,1 8 1,1 4 3 $3,1 63,1 8 9 $3,209,87 2 Contracts Outstanding (3) 3,115,978 3,142,009 3,1 27,92 0 3,1 69,75 9 3,1 72,1 6 6 3,1 86,53 1 3,2 1 5,25 7 Number of Repossessions (4) 17,191 17,809 35,69 4 38,58 0 45,88 3 37,74 1 34,78 0 the Number of Contracts Outstanding 1.10% (7) Number of Repossessions as a Percent of 1.14% (7) 1.1 5% 1.22% 1.44% 1.1 9% 1.08% the Average Number of Contracts Outstanding 1.10% (7) 1.13% (7) 1.1 4% 1.22% 1.45% 1.1 8% 1.08% Gross Charge - Offs (5)(8) $149,935 $147,925 $323,96 2 $351,634 $395,109 $322,814 $267,835 Recoveries (6) $27,283 $26,096 $48,87 1 $49,567 $49,474 $47,966 $59,931 Net Losses Net Losses as a Percentage of Principal Balance Outstanding $122,652 0.44% (7) $121,829 0.46% (7) $275,091 0.52% $302,06 7 0.57% $345,63 5 0.68% $274,84 8 0.55% $207,90 4 0.42%

39 ABS Deal Comparison (1) Percentages may not add to 100.00% due to rounding Source: Company Reports TAOT 2018 - B TAOT 2018 - C TAOT 2018 - D TAOT 2019 - A TAOT 2019 - A TAOT 2019 - B TAOT 2019 - C 94,82 9 1 09,46 7 73,1 2 5 1 0 1,38 0 1 0 1,38 0 1 02,32 4 72,04 5 $1,767,851,358.52 $2,101,423,565.52 $1,390,010,109.85 $1,930,929,363.46 $1,930,929,363.46 $1,907,216,811.97 $1,344,769,909.63 $ 1 8,642.5 2 2.1 5% 66 51 761 620 900 $ 1 9,1 96.8 7 2.1 4% 66 52 761 620 900 $ 1 9,008.6 9 2.1 3% 66 51 762 620 900 $ 1 9,046.4 5 2.32% 66 51 762 620 900 $ 1 9,046.4 5 2.32% 66 51 762 620 900 $ 1 8,639.0 0 2.56% 66 50 761 620 900 $ 1 8,665.6 9 2.74% 66 50 762 620 900 CA - 24.5% TX - 14.7% IL - 4.6% PA - 4.3% NJ - 4.0% CA - 24.7% TX - 15.7% IL - 4.4% PA - 4.2% NJ - 3.8% CA - 23.5% TX - 15.4% IL - 4.3% PA - 4.1% VA - 3.8% CA - 23.9% TX - 15.3% IL - 4.6% PA - 4.0% VA - 3.8% CA - 23.9% TX - 15.3% IL - 4.6% PA - 4.0% VA - 3.8% CA - 24.7% TX - 14.6% IL - 4.7% PA - 4.0% VA - 3.7% CA – 24.8% TX – 14.8% IL – 4.8% PA – 4.0% VA – 3.6% Original Summary Characteristics by Prior Securitization: Number of Pool Assets Original Pool Balance Average Principal Balance Weighted Average Interest Rate Weighted Average Original Term Weighted Average Remaining Term Weighted Average FICO Minimum FICO Maximum FICO Geographic Distribution of Receivables representing the 5 states with the greatest aggregate original principal balance: State 1 State 2 State 3 State 4 State 5 Distribution of Receivables by Contract Rate: (1) Distribution of Receivables by Vehicle Type: (1) Less than 2.0% 57.27% 58.86% 60.89% 57.4 1% 57.41% 52.99% 50.7 1% 2.0% - 3.99% 26.44% 24.84% 23.29% 24.22% 24.22% 25.69% 24.8 1% 4.0% - 5.99% 1 0.46% 1 0.68% 1 0.3 1% 11.70% 11.70% 1 3.35% 1 5.33% 6.0% - 7.99% 3.1 7% 3.09% 3.06% 3.84% 3.84% 4.67% 5.74% 8.0% - 9.99% 1.67% 1.55% 1.43% 1.67% 1.67% 1.88% 1.93% 10.0% - 11.99% 0.76% 0.74% 0.73% 0.77% 0.77% 0.96% 0.99% 12.0% - 13.99% 0.2 1% 0.2 1% 0.23% 0.30% 0.30% 0.32% 0.36% 14.0% - 15.99% 0.02% 0.03% 0.05% 0.05% 0.05% 0.11% 0.1 2% 16.0% and greater 0.0 1% 0.00% 0.0 1% 0.0 1% 0.01% 0.02% 0.03% Total 1 00.00% 1 00.00% 1 00.00% 1 00.00% 100.00% 1 00.00% 1 00.00% Passenger Cars 42.06% 4 1.45% 40.79% 40.19% 40.19% 39.1 0% 37.82% Minivans 6.44% 6.34% 5.88% 5.79% 5.79% 5.55% 5.3 1% Light Duty Trucks 1 2.64% 1 3.38% 1 4.82% 16.00% 16.00% 1 6.57% 1 7.29% SUVs 38.86% 38.84% 38.50% 38.03% 38.03% 38.78% 39.58% Total 1 00.00% 1 00.00% 1 00.00% 100.00% 100.00% 1 00.00% 1 00.00% Distribution of Receivables by Make: (1) Toyota and Scion 87.20% 87.72% 88.92% 89.45% 89.45% 89.02% 87.87% Lexus 1 2.80% 1 2.28% 11.08% 10.55% 10.55% 1 0.98% 1 2.1 3% Total 1 00.00% 1 00.00% 1 00.00% 100.00% 100.00% 1 00.00% 1 00.00% Share of Original Assets: Percentage with Original Scheduled Payments > 60 months 54.1 0% 56.39% 56.1 7% 55.51% 55.51% 55.07% 55.30% Percentage of Used Vehicles 1 9.98% 1 9.1 4% 1 7.97% 17.64% 17.64% 1 8.24% 1 8.97%

40