Exhibit 99.1
Presentation Materials for Investors September 2015

2 Disclaimer • This presentation includes certain “forward - looking statements” within the meaning of The U.S. Private Securities Litigation Reform Act of 1995. • These statements are based on current expectations and currently available information. • Actual results may differ materially from these expectations due to certain risks, uncertainties and other important factors, including the risk factors set forth in the most recent annual and periodic reports of Toyota Motor Corporation and Toyota Motor Credit Corporation. • We do not undertake to update the forward - looking statements to reflect actual results or changes in the factors affecting the forward - looking statements. • This presentation does not constitute an offer to sell or a solicitation of an offer to purchase any securities. Any offer or sa le of securities will be made only by means of a prospectus and related documentation. • Investors and others should note that we announce material financial information using the investor relations section of our corporate website ( http://www.toyotafinancial.com ) and SEC filings. We use these channels, press releases, as well as social media to communicate with our investors, customers and the general public about our company, our services and other issues. While not all of the information that we post on social media is of a material nature, some information could be material. Therefore, we encourage investors, the media, and others interested in our company to review the information we post on the Toyota Motor Credit Corporation Twitter Feed ( http://www.twitter.com/toyotafinancial ). We may update our social media channels from time to time on the investor relations section of our corporate website.

3 Disclaimer • This presentation includes certain “forward - looking statements” within the meaning of The U.S. Private Securities Litigation Ref orm Act of 1995. • These statements are based on current expectations and currently available information. • Actual results may differ materially from these expectations due to certain risks, uncertainties and other important factors, in cluding the risk factors set forth in the most recent annual and periodic reports of Toyota Motor Corporation and Toyota Motor Credit Corporation. • We do not undertake to update the forward - looking statements to reflect actual results or changes in the factors affecting the f orward - looking statements. • This presentation does not constitute or form part of and should not be construed as, an offer to sell or issue or the solici tat ion of an offer to purchase or subscribe for securities of TMCC in any jurisdiction or an inducement to enter into investment activity in any jurisdiction. Neither this presentation nor any pa rt thereof, nor the fact of its distribution, shall form the basis of, or be relied on in connection with, any contract or commitment or investment decision whatsoever. Any offer or sale of securiti es by TMCC will be made only by means of a prospectus and related documentation. • Investors and prospective investors in securities of TMCC are required to make their own independent investigation and apprai sal of the business and financial condition of TMCC and the nature of its securities. This presentation does not constitute a recommendation regarding securities of TMCC. Any prospectiv e p urchaser of securities in TMCC is recommended to seek its own independent financial advice. • This presentation is made to and directed only at ( i ) persons outside the United Kingdom, or (ii) qualified investors or investment professionals falling within Article 19(5) and A rticle 49(2)(a) to (d) of the Financial Services and Markets Act 2000 (Financial Promotion) Order 2005 (the “Order”), or (iii) high net worth individuals, and other persons to whom it may lawfully be communicated, falling within Article 49(2)(a) to (d) of the Order, and (iv) persons who are “qualified investors” within t he meaning of Article 2(1)(e) of the Prospectus Directive (Directive 2003/71/EC) as amended (such persons collectively being referred to as “Relevant Persons”). This presentation must not be act ed or relied on by persons who are not Relevant Persons. Any investment or investment activity to which this presentation relates is available only to Relevant Persons and will be engage d i n only with Relevant Persons. • This presentation is an advertisement and not a prospectus and investors should not subscribe for or purchase any securities of TMCC referred to in this presentation or otherwise except on the basis of information in the base prospectus of Toyota Motor Finance (Netherlands) B.V., Toyota Credit Canada Inc., Toyota Fi nance Australia Limited and Toyota Motor Credit Corporation dated 11 September 2015 as supplemented from time to time together with the applicable final terms which are or w ill be, as applicable, available on the website of the London Stock Exchange plc at www.londonstockexchange.com/exchange/news/market - news/market - news - home.html. • Investors and others should note that we announce material financial information using the investor relations section of our cor porate website ( http://www.toyotafinancial.com ) and SEC filings. We use these channels, press releases, as well as social media to communicate with our investors, customers and the gen eral public about our company, our services and other issues. While not all of the information that we post on social media is of a material nature, some information could be material. Th ere fore, we encourage investors, the media, and others interested in our company to review the information we post on the Toyota Motor Credit Corporation Twitter Feed ( http://www.twitter.com/toyotafinancial ). We may update our social media channels from time to time on the investor relations section of our corporate website .
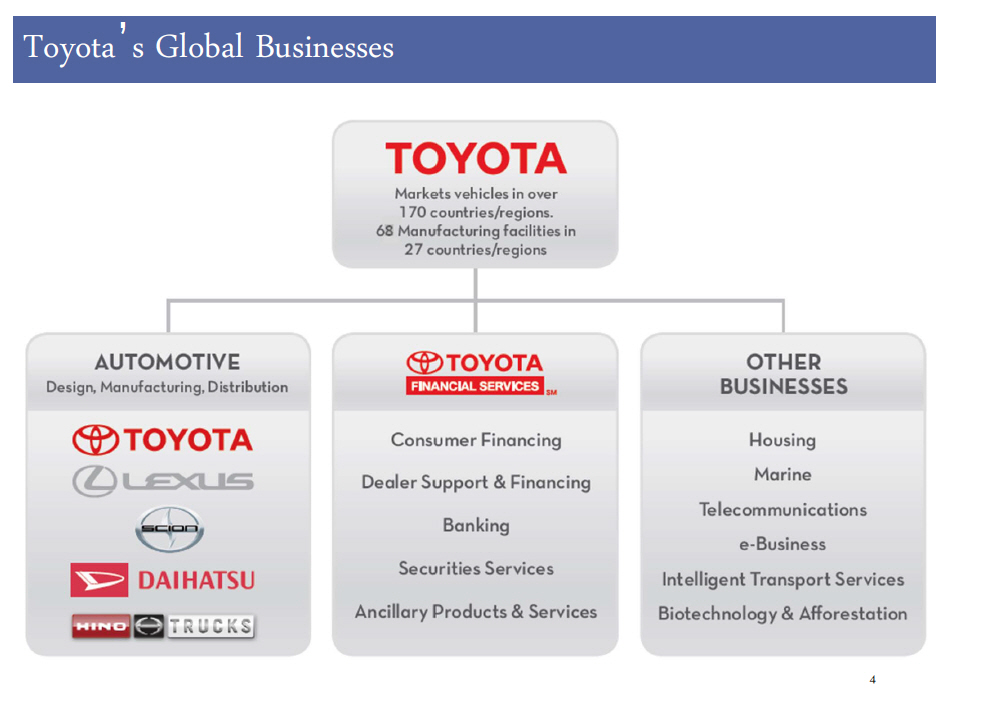
4 Toyota ’ s Global Businesses

5 TMC Consolidated Financial Results Source : TMC FY2014, FY2015 20 - F, June 30, 2015 6 - K Three Months Ended June 30, (JPY billions) 2014 2015 2015 Net Revenues 25,691.9 27,234.5 6,987.6 Operating Income 2,292.1 2,750.6 756.0 Net Income 1,823.1 2,173.3 646.4 Fiscal Year Ended March 31,
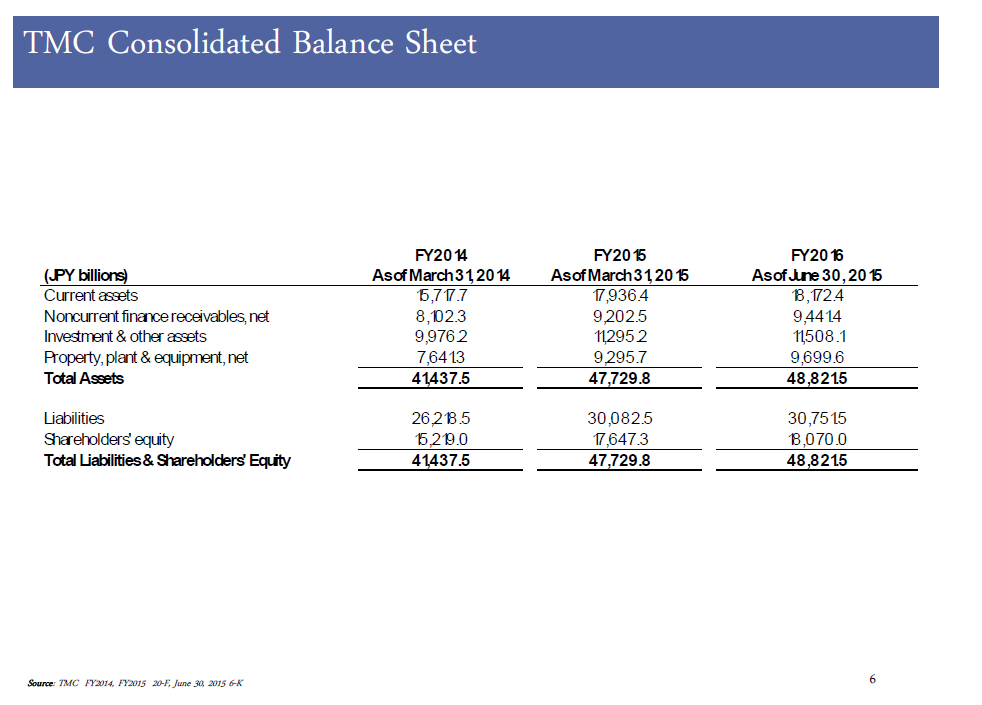
6 TMC Consolidated Balance Sheet Source : TMC FY2014, FY2015 20 - F, June 30, 2015 6 - K FY2014 FY2015 FY2016 (JPY billions) As of March 31, 2014 As of March 31, 2015 As of June 30, 2015 Current assets 15,717.7 17,936.4 18,172.4 Noncurrent finance receivables, net 8,102.3 9,202.5 9,441.4 Investment & other assets 9,976.2 11,295.2 11,508.1 Property, plant & equipment, net 7,641.3 9,295.7 9,699.6 Total Assets 41,437.5 47,729.8 48,821.5 Liabilities 26,218.5 30,082.5 30,751.5 Shareholders' equity 15,219.0 17,647.3 18,070.0 Total Liabilities & Shareholders' Equity 41,437.5 47,729.8 48,821.5

Toyota Across the United States 7 Operations Overview
8 • TMS sold 2.37 million vehicles in 2014; the highest sales volume since 2007 and up 6.2% from 2013 – Toyota division is the #1 US retail brand in 2015 (1) – Camry was the best - selling passenger car in America for the 13 th consecutive year • Industry - leading investment in next - generation technologies in power - train, safety and production – TMS has one of the most fuel - efficient line - ups of any full - line OEM – Over 2.4 million hybrids sold in the US (2) and over 8.0 million worldwide (3) – 13 hybrid models (4) and 1 plug - in model across the TMS line - up – Mirai is Toyota’s first mass - produced hydrogen fuel cell vehicle • For 2015, TMS will launch 12 new or refreshed models. Recent and upcoming vehicle launches: Toyota Motor Sales, USA (1) As of June 2015 (2) As of November 2014 (3) As of August 2015 (4) Includes cars and light trucks - Mirai (FCV) - Scion iM - Scion iA - Prius - Lexus R X - Lexus GS Source: TMS Reports - Tacoma - Avalon - RAV4
9 Toyota Motor Sales, USA (2) • Qu ality, dependability , safety and product appeal remain high as reflected by numerous 3 rd party accolades 2015 Forbes Toyota ranked No. 1 most valuable automotive brand 2015 U.S. News Best Cars for the Money Camry Hybrid, Highlander Hybrid, RX350 2015 Fortune Magazine Toyota ranked 24 th in world’s most admired company list 2015 U.S. News Best Cars for Families Highlander, Highlander Hybrid, RX350 2015 NHSTA 5 - Star Crash Test Rating RAV4, Scion FR - S and tC 2015 Kelley Blue Book’s Best Mid - Size Pickup Truck Tacoma Kelley Blue Book’s Top 10 Best Resale Value of 2015 Tacoma, Tundra, 4Runner 2015 Fast Company Toyota ranked among World’s 50 Most Innovative Companies 2015 Consumer Reports Greatest Likelihood of Turning Over 200K Miles Toyota Prius, Camry, Corolla, Sienna, and Highlander 2015 J.D. Power and Associates Customer Service Index Lexus ranked 2 nd overall 2015 Kelley Blue Book 10 Best Green Cars Toyota Prius and Camry Hybrid 2015 Newsweek Toyota ranked No. 2 among automakers as one of the world’s greenest companies
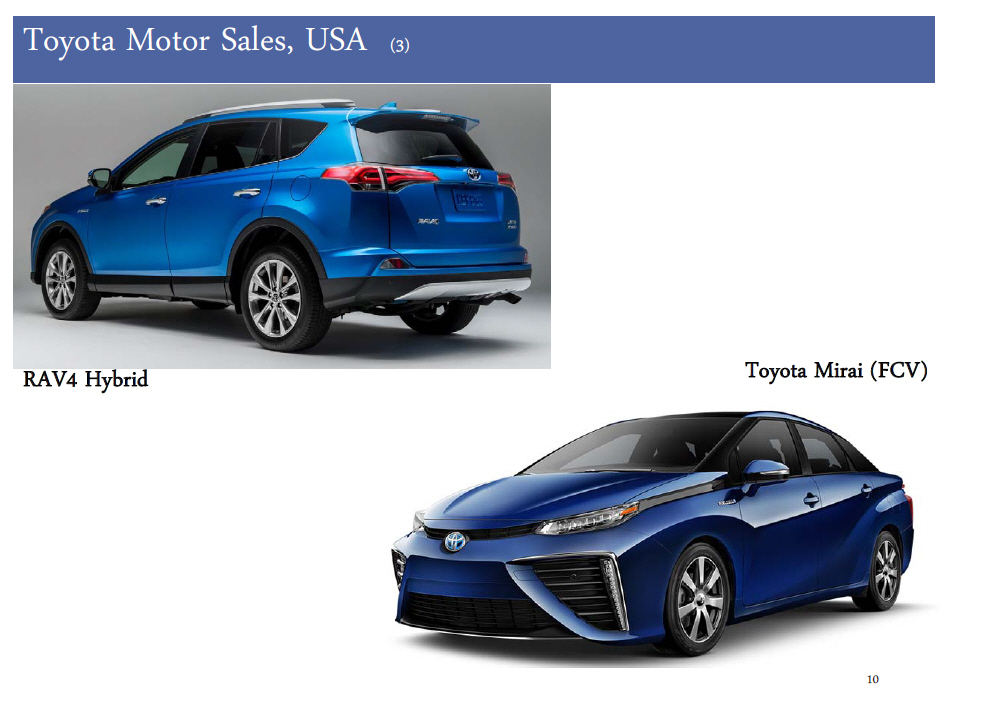
10 Toyota Motor Sales, USA (3) RAV4 Hybrid Toyota Mirai (FCV)
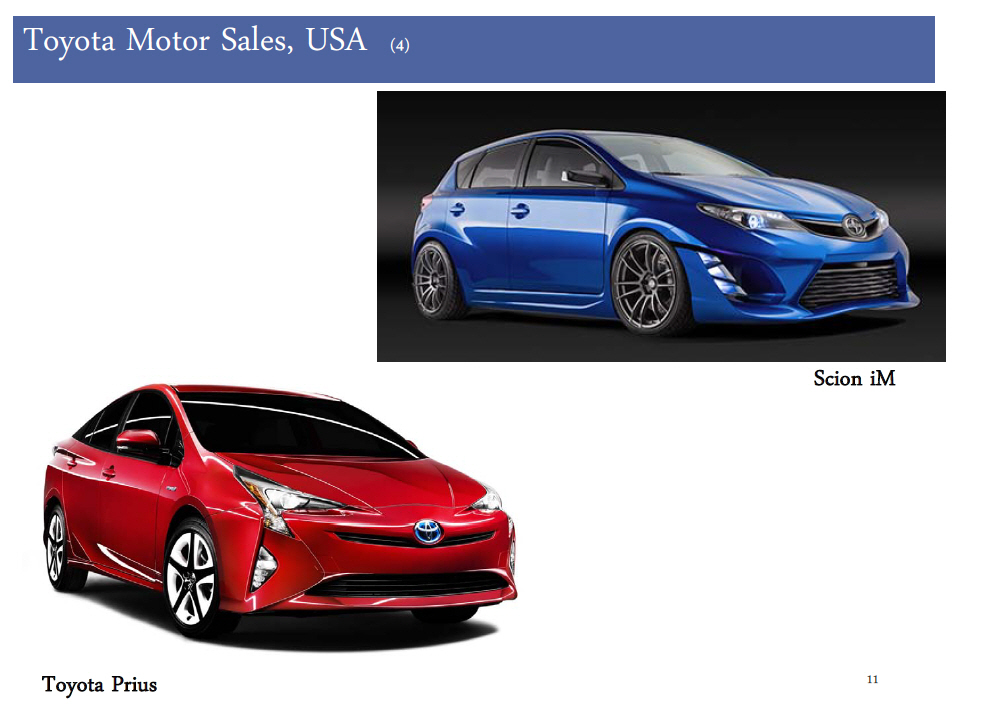
11 Toyota Motor Sales, USA (4) Toyota Prius Scion iM
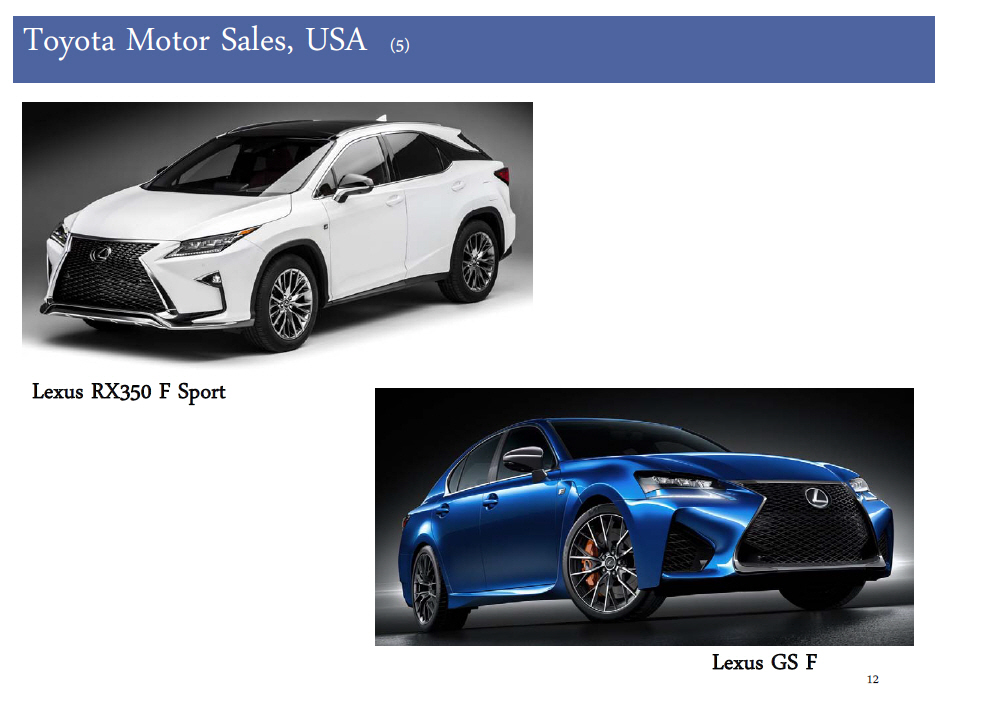
12 Toyota Motor Sales, USA (5) Lexus GS F Lexus RX350 F Sport

13 Toyota Financial Services
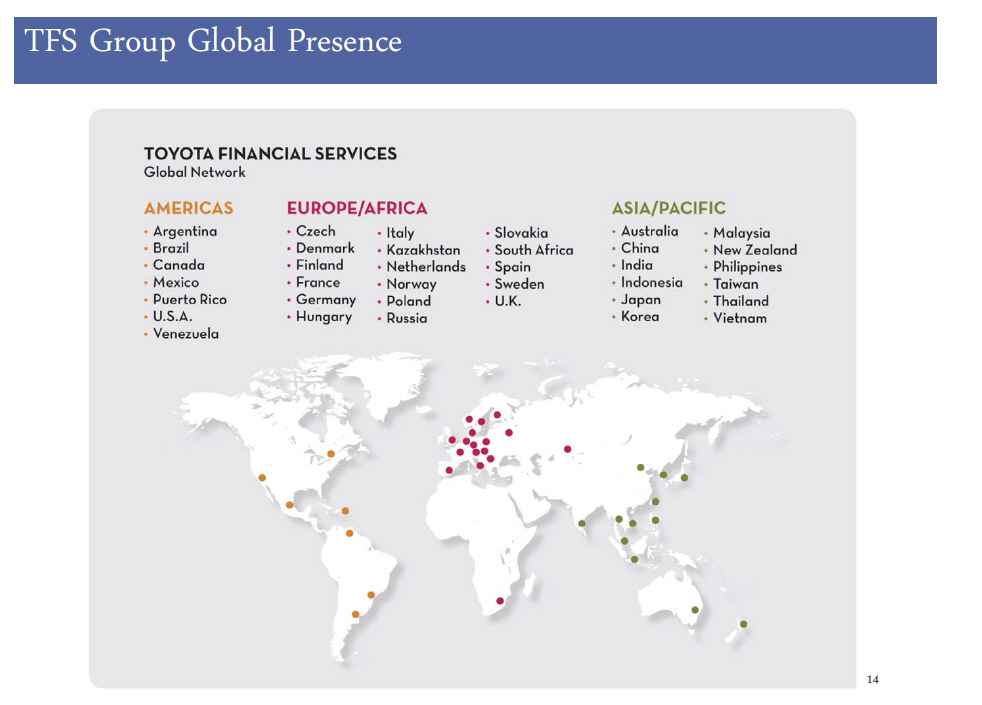
14 TFS Group Global Presence
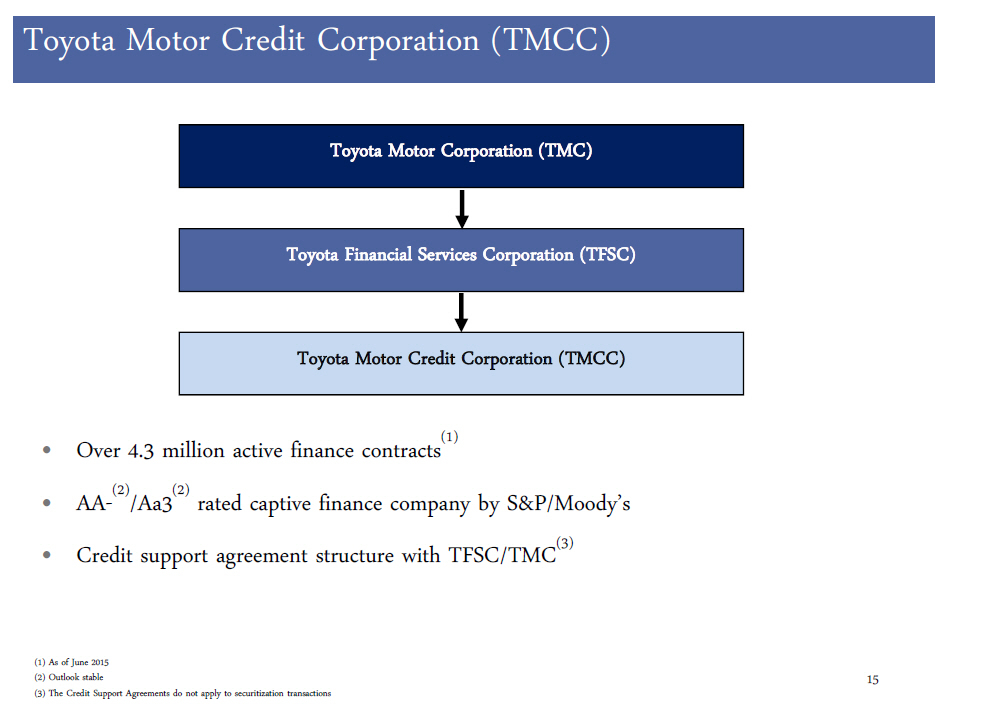
15 • Over 4.3 million active finance contracts (1) • AA - (2) /Aa3 (2) rated captive finance company by S&P/Moody’s • Credit support agreement structure with TFSC/TMC (3) Toyota Financial Services Corporation (TFSC) Toyota Motor Credit Corporation (TMCC) Toyota Motor Credit Corporation (TMCC) Toyota Motor Corporation (TMC) (1) As of June 2015 (2) Outlook stable (3) The Credit Support Agreements do not apply to securitization transactions

16 Credit Support Agreements • Securities* issued by TMCC (and various other TFSC subsidiaries) have the benefit of a credit support agreement with TFSC – TFSC will own 100% of TMCC – TFSC will cause TMCC to maintain a tangible net worth of at least $100,000 as long as covered securities are outstanding – If TMCC determines it will be unable to meet its payment obligations on any securities, TFSC will make sufficient funds avail abl e to TMCC to ensure that all such payment obligations are paid as due – Agreement cannot be terminated until (1) repayment of all outstanding securities or (2) each rating agency requested by Toyot a t o provide a rating has confirmed no change in rating of all such securities • TFSC in turn has the benefit of a credit support agreement with TMC – Same key features as TFSC/TMCC credit support agreement – TMC will cause TFSC to maintain a tangible net worth of at least JPY10mm as long as covered securities are outstanding • TFSC’s and/or TMC's credit support obligations will rank pari passu with all other senior unsecured debt obligations * “Securities” defined as outstanding bonds, debentures, notes and other investment securities and commercial paper, but does not include as set - backed securities issued by TMCC’s securitization trusts.
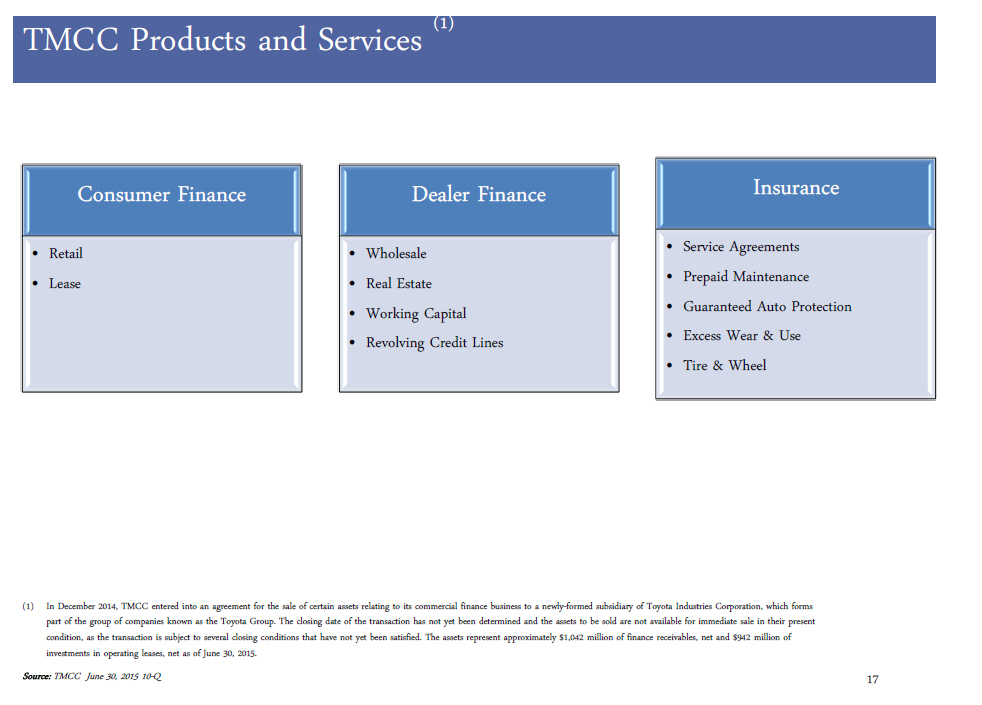
17 TMCC Products and Services (1) Consumer Finance • Retail • Lease Dealer Finance • Wholesale • Real Estate • Working Capital • Revolving Credit Lines Insurance • Service Agreements • Prepaid Maintenance • Guaranteed Auto Protection • Excess Wear & Use • Tire & Wheel (1) In December 2014, TMCC entered into an agreement for the sale of certain assets relating to its commercial finance business t o a newly - formed subsidiary of Toyota Industries Corporation, which forms part of the group of companies known as the Toyota Group. The closing date of the transaction has not yet been determined and th e assets to be sold are not available for immediate sale in their present condition, as the transaction is subject to several closing conditions that have not yet been satisfied. The assets represent ap proximately $1,042 million of finance receivables, net and $942 million of investments in operating leases, net as of June 30, 2015. Source: TMCC June 30, 2015 10 - Q

18 Extensive Field Organization • Decentralized dealer and field support • Centralized servicing and collections (circled)
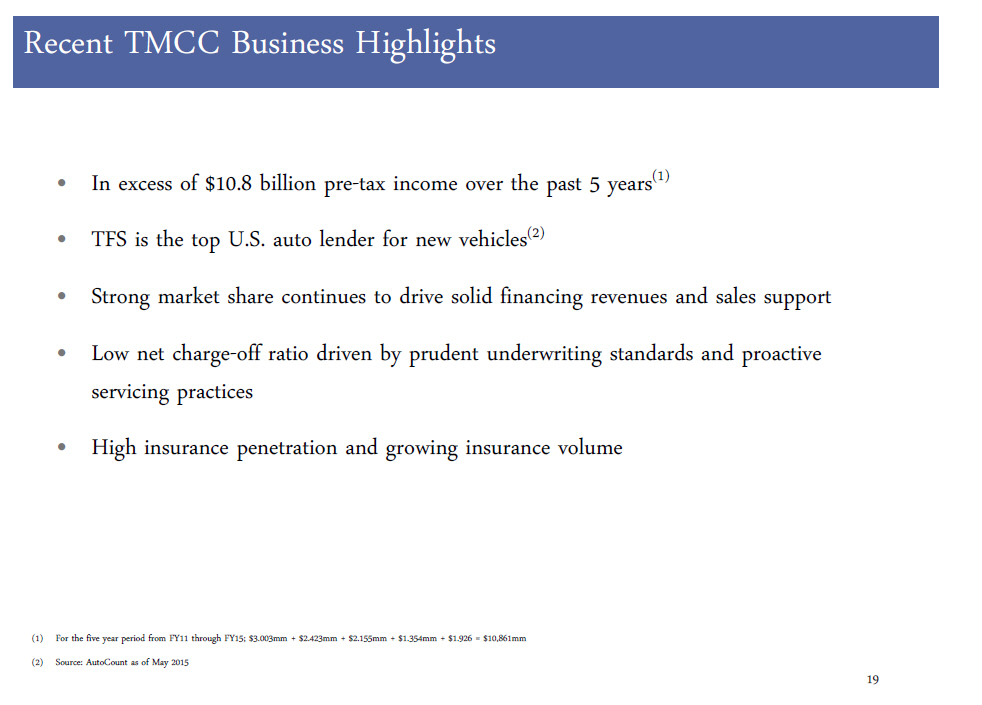
Recent TMCC Business Highlights • In excess of $10.8 billion pre - tax income over the past 5 years (1) • TFS is the top U.S. auto lender for new vehicles (2) • Strong market share continues to drive solid financing revenues and sales support • Low net charge - off ratio driven by prudent underwriting standards and proactive servicing practices • High insurance penetration and growing insurance volume 19 (1) For the five year period from FY11 through FY15; $3.003mm + $2.423mm + $2.155mm + $1.354mm + $1.926 = $10,861mm (2) Source: AutoCount as of May 2015

20 TMCC Earning Asset Composition Managed Assets (USD billions) Source: TMCC March 31, 2012 10 - K, March 31, 2013 10 - K , March 31, 2014 10 - K , March 31, 2015 10 - K & June 30, 2015 10 - Q 19.0 20.2 24.9 30.2 32.0 34.6 39.9 39.6 38.4 37.5 10.5 8.0 9.7 12.7 14.1 12.7 14.9 15.8 15.6 15.6 $76.8 $83.0 $89.9 $ 97.0 $99.2 Mar-12 Mar-13 Mar-14 Mar-15 Jun-15 Lease Retail Sold (ABS) Wholesale & Other Totals may not add up due to rounding

21 TMCC Financial Performance - Select Data Source: TMCC March 31, 2015 10 - K & TMCC June 30, 2015 10 - Q Three Months Ended June 30, (USD millions) 2012 2013 2014 2015 2015 Total Financing Revenues 7,429 7,244 7,397 8,310 2,255 add: Other Income 717 744 702 832 212 less: Interest Expense 4,639 4,508 5,352 5,593 1,868 and Depreciation Net Financing Revenues 3,507 3,480 2,747 3,549 599 and Other Revenues Net Income 1,486 1,331 857 1,197 135 Fiscal Year Ended March 31,

22 TMCC Financial Performance - Select Data (1) Percentage of gross earning assets (2) The quotient of allowance for credit losses divided by the sum of gross finance receivables (net finance receivables less all owa nce for credit losses) plus gross investments in operating leases (net investments in operating leases less allowance for credit losses ) (3) Percentage of average gross earning assets annualized Note: All percentage figures calculated were based on a 120 - day charge - off policy Source: TMCC March 31, 2015 10 - K & June 30, 2015 10 - Q Three Months Ended June 30, (USD millions) 2012 2013 2014 2015 2015 Over 60 Days Delinquent (1) 0.18% 0.19% 0.18% 0.21% 0.27% Allowance for Credit Losses (1) (2) 0.80% 0.63% 0.50% 0.50% 0.47% Net Credit Losses (3) 0.21% 0.27% 0.28% 0.29% 0.25% Fiscal Year Ended March 31,
23 TMCC Funding Programs
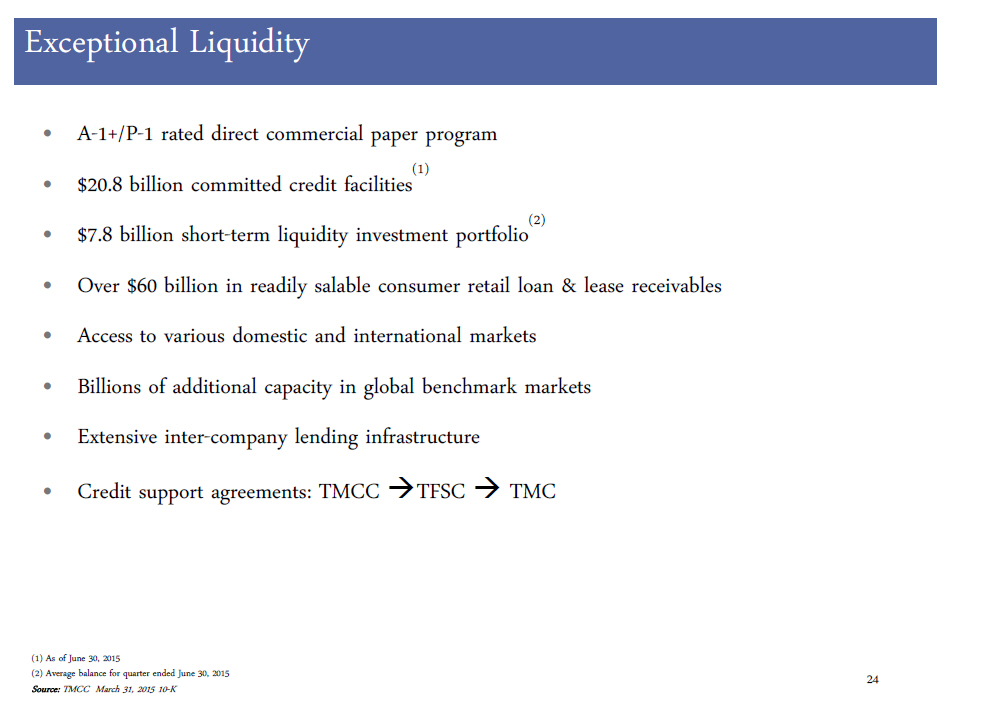
24 • A - 1+/P - 1 rated direct commercial paper program • $20.8 billion committed credit facilities (1) • $7.8 billion short - term liquidity investment portfolio (2) • Over $60 billion in readily salable consumer retail loan & lease receivables • Access to various domestic and international markets • Billions of additional capacity in global benchmark markets • Extensive inter - company lending infrastructure • Credit support agreements: TMCC TFSC TMC Exceptional Liquidity (1) As of June 30, 2015 (2) Average balance for quarter ended June 30, 2015 Source : TMCC March 31, 2015 10 - K
25 • TMCC is committed to: – Maintaining funding diversity and exceptional liquidity – Issuing into strong demand with attractive deals – Identifying & developing new markets and investor relationships – Responding quickly to opportunities with best - in - class execution – Managing our business and stakeholder relationships with a long - term view TMCC Funding Program Objectives
New Funding Vehicles 26 • Auto industry’s first ever Green Bond ABS • Diversity and Inclusion (D&I) bond syndicates led by diversity firms • Competitive, innovative and socially responsible
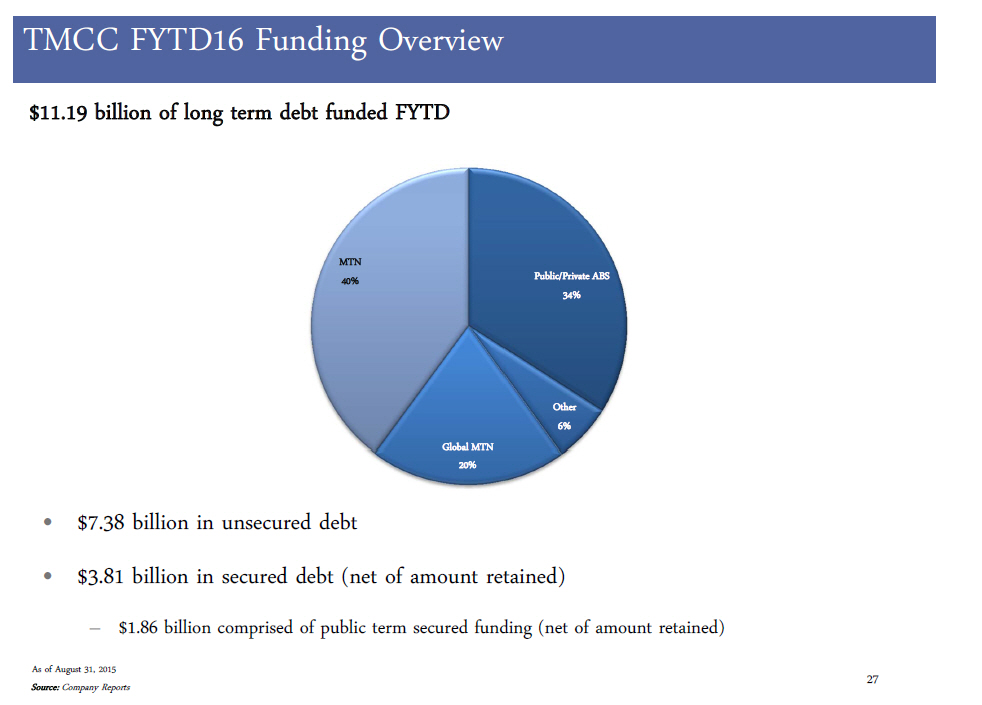
27 • $7.38 billion in unsecured debt • $3.81 billion in secured debt (net of amount retained ) – $1.86 billion comprised of public term secured funding (net of amount retained) TMCC FYTD16 Funding Overview Source : Company Reports $11.19 billion of long term debt funded FYTD As of August 31, 2015 Public/Private ABS 34% Other 6% Global MTN 20% MTN 40%
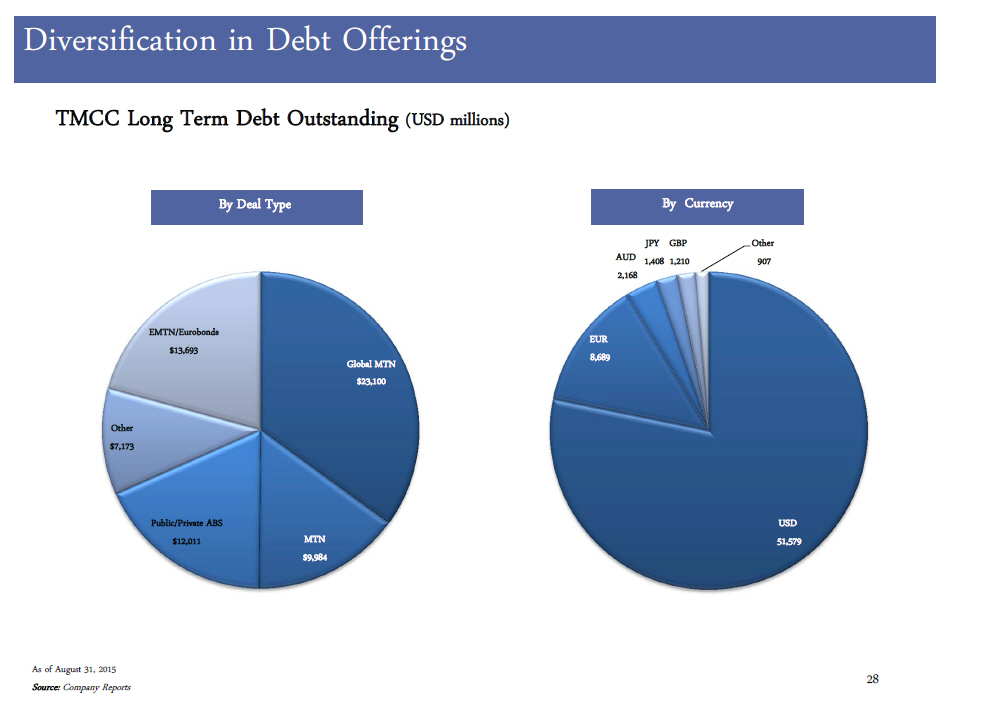
28 TMCC Long Term Debt Outstanding (USD millions) Diversification in Debt Offerings As of August 31, 2015 Source: Company Reports By Deal Type By Currency Global MTN $23,100 MTN $9,984 Public/Private ABS $12,011 Other $7,173 EMTN/Eurobonds $13,693 USD 51,579 EUR 8,689 AUD 2,168 JPY 1,408 GBP 1,210 Other 907
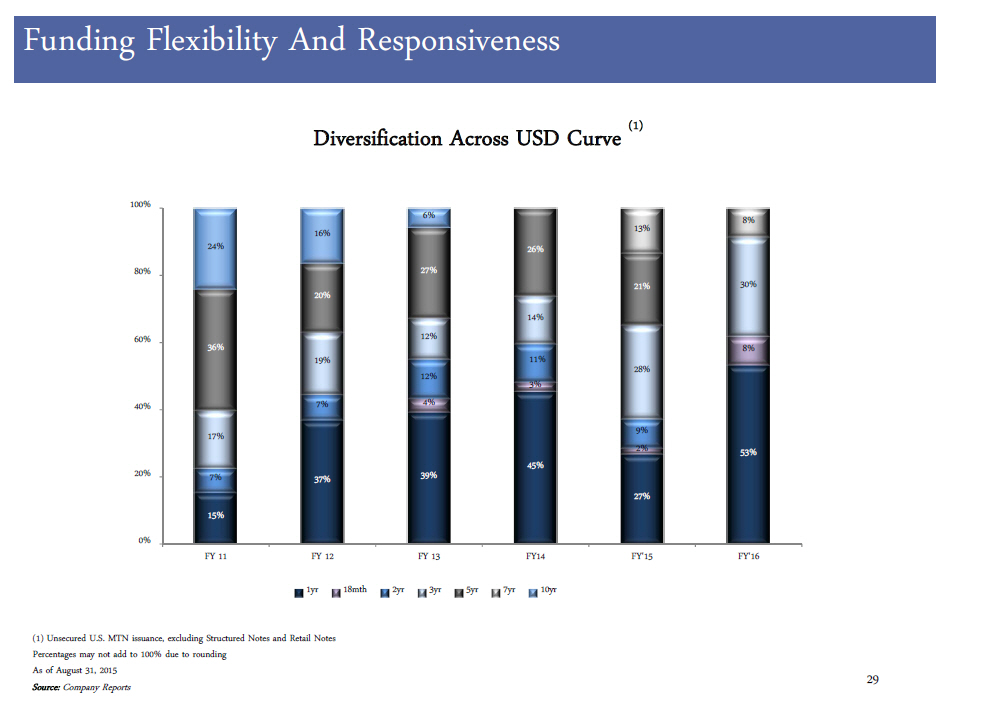
29 Funding Flexibility And Responsiveness Source: Company Reports Diversification Across USD Curve (1 ) (1) Unsecured U.S. MTN issuance, excluding Structured Notes and Retail Notes Percentages may not add to 100% due to rounding As of August 31, 2015 15% 37% 39% 45% 27% 53% 4% 3% 2% 8% 7% 7% 12% 11% 9% 17% 19% 12% 14% 28% 30% 36% 20% 27% 26% 21% 13% 8% 24% 16% 6% 0% 20% 40% 60% 80% 100% FY 11 FY 12 FY 13 FY14 FY'15 FY'16 1yr 18mth 2yr 3yr 5yr 7yr 10yr
30 Key Investment Highlights • Financial strength supported by strong credit ratings • Transparent business model with exceptional liquidity • Rational funding programs with long - term perspective – Diversification in bond offerings – Focus on proactively meeting needs of market – Strong emphasis placed on flexibility and responsiveness • Industry - leading in: – Liquidity management framework – Balance sheet strength – Business model resiliency

31 TMCC Retail Loan Collateral & ABS Transactions

32 • Recent consistent, conservative underwriting standards have produced low levels of delinquencies and credit losses – Identification & minimization of least desirable segments – Ongoing focus on Toyota and Lexus business • Optimization of collections strategy and staff supports loss mitigation while enabling portfolio growth – Emphasis on early intervention – Reinforcement of strong compliance management system Credit Decisioning & Collections 32 0.0% 1.0% 2.0% 3.0% FY2009 FY2010 FY2011 FY2012 FY2013 FY2014 FY2015 Delinquency Credit loss (2) (1) Delinquency is 30+ day delinquencies as a percentage of retail receivables outstanding (2) Credit loss is annual net credit loss as a percentage of retail receivables outstanding (1)
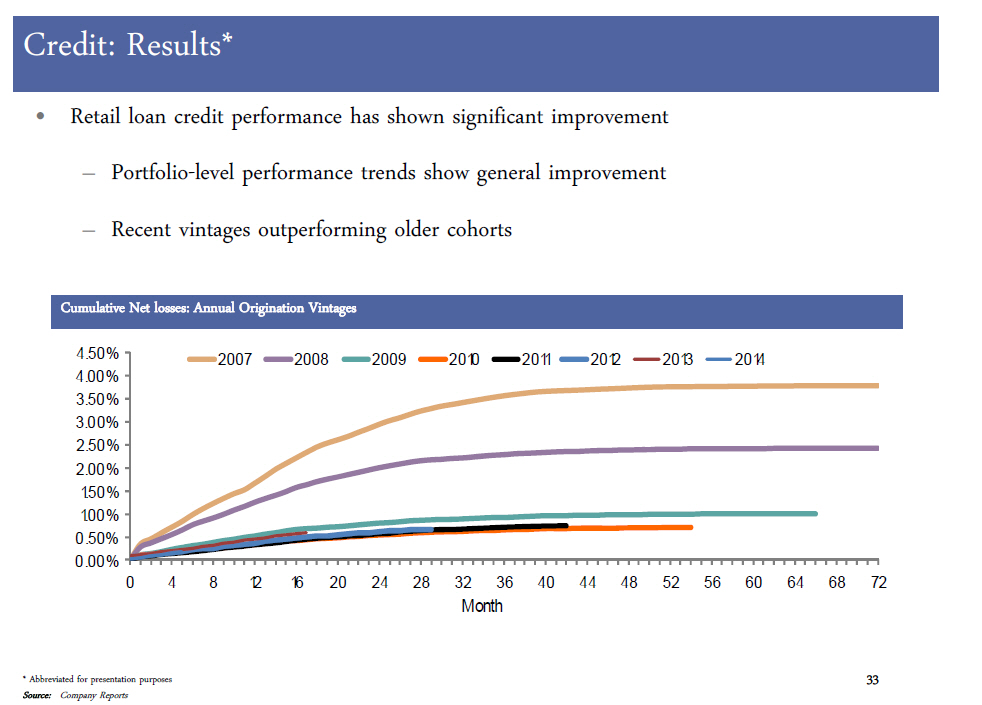
Credit: Results* • Retail loan credit performance has shown significant improvement – Portfolio - level performance trends show general improvement – Recent vintages outperforming older cohorts Cumulative Net losses: Annual Origination Vintages 0.00% 0.50% 1.00% 1.50% 2.00% 2.50% 3.00% 3.50% 4.00% 4.50% 0 4 8 12 16 20 24 28 32 36 40 44 48 52 56 60 64 68 72 Month 2007 2008 2009 2010 2011 2012 2013 2014 * Abbreviated for presentation purposes Source: Company Reports 33 33
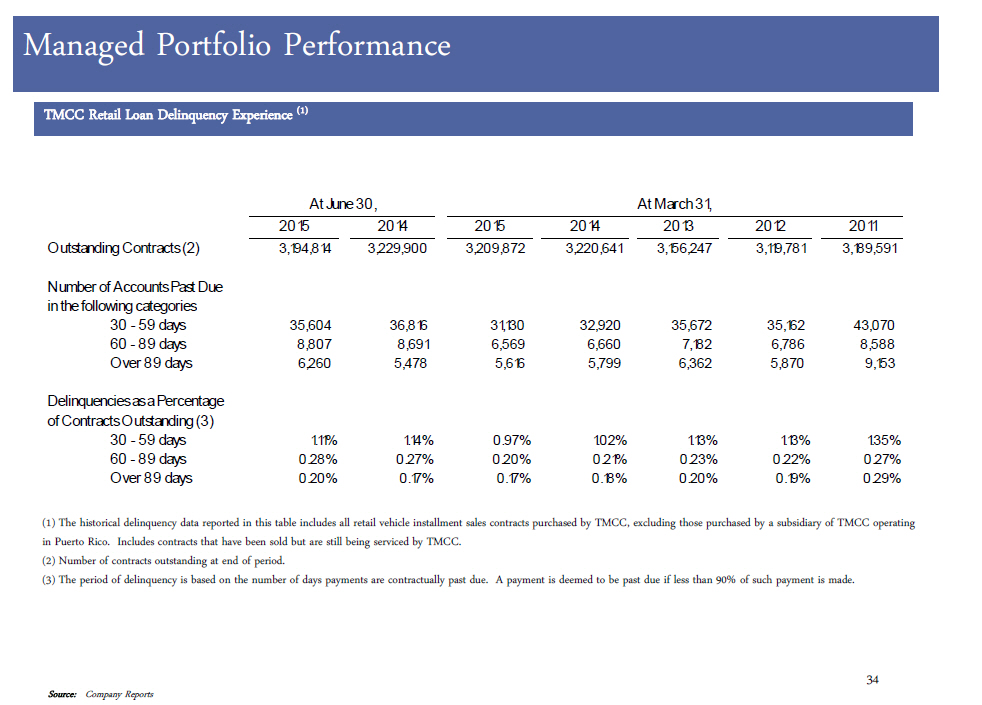
34 TMCC Retail Loan Delinquency Experience (1) (1) The historical delinquency data reported in this table includes all retail vehicle installment sales contracts purchased by TMCC, excluding those purchased by a subsidiary of TMCC operating in Puerto Rico. Includes contracts that have been sold but are still being serviced by TMCC. (2) Number of contracts outstanding at end of period. (3) The period of delinquency is based on the number of days payments are contractually past due. A payment is deemed to be pas t due if less than 90% of such payment is made. Managed Portfolio Performance Source: Company Reports 2015 2014 2015 2014 2013 2012 2011 Outstanding Contracts (2) 3,194,814 3,229,900 3,209,872 3,220,641 3,156,247 3,119,781 3,189,591 Number of Accounts Past Due in the following categories 30 - 59 days 35,604 36,816 31,130 32,920 35,672 35,162 43,070 60 - 89 days 8,807 8,691 6,569 6,660 7,182 6,786 8,588 Over 89 days 6,260 5,478 5,616 5,799 6,362 5,870 9,153 Delinquencies as a Percentage of Contracts Outstanding (3) 30 - 59 days 1.11% 1.14% 0.97% 1.02% 1.13% 1.13% 1.35% 60 - 89 days 0.28% 0.27% 0.20% 0.21% 0.23% 0.22% 0.27% Over 89 days 0.20% 0.17% 0.17% 0.18% 0.20% 0.19% 0.29% At March 31, At June 30,

Performance – Retail Loan TMCC Managed Portfolio Net Loss and Repossession Experience (dollars in thousands) (1) 35 Source : Company Reports (1) The net loss and repossession data reported in this table includes all retail installment sales contracts purchased by T MCC , excluding those purchased by a subsidiary of TMCC operating in Puerto Rico. Includes contracts that have been sold but are still being serviced by TMCC. (2) Principal Balance Outstanding includes payoff amount for simple interest contracts and net principal amount for actuaria l c ontracts. Actuarial contracts do not comprise any of the Receivables. (3) Average of the principal balance or number of contracts outstanding as of the beginning and end of the indicated periods . (4) Includes bankruptcy - related repossessions but excludes bankruptcies. (5) Amount charged - off is the net remaining principal balance, including earned but not yet received finance charges, repossess ion expenses and unpaid extension fees, less any proceeds from the liquidation of the related vehicle. Also includes dealer reserve charge - offs. (6) Includes all recoveries from post - disposition monies received on previously charged - off contracts including any proceeds from the liquidation of the related vehicle after the related charge - off. Also includes recoveries for dealer reserve charge - offs and chargebacks. (7) Annualized. 2015 2014 2015 2014 2013 2012 2011 Principal Balance Outstanding (2) $50,097,931 $49,100,982 $49,645,354 $48,761,164 $46,932,720 $44,648,020 $45,053,303 Average Principal Balance Outstanding (3) $49,871,643 $48,931,073 $49,203,259 $47,846,942 $45,790,370 $44,850,661 $44,144,021 Number of Contracts Outstanding 3,194,814 3,229,900 3,209,872 3,220,641 3,156,247 3,119,781 3,189,591 Average Number of Contracts Outstanding (3) 3,202,343 3,225,271 3,215,257 3,188,444 3,138,014 3,154,686 3,141,743 Number of Repossessions (4) 7,012 7,476 34,780 34,923 34,353 42,937 64,710 Number of Repossessions as a Percent of the Average Number of Contracts Outstanding 0.88% (7) 0.93%(7) 1.08% 1.10% 1.09% 1.36% 2.06% Gross Charge-Offs (5) $58,771 $49,645 $267,835 $257,586 $244,432 $240,736 $447,159 Recoveries (6) $14,434 $16,106 $59,931 $62,714 $69,088 $78,593 $98,105 Net Losses $44,337 $33,539 $207,904 $194,872 $175,344 $162,143 $349,054 Net Losses as a Percentage of Average Principal Balance Outstanding 0.36%(7) 0.27%(7) 0.42% 0.41% 0.38% 0.36% 0.79% For the Fiscal Years EndedJune 30, For the Three Months Ended
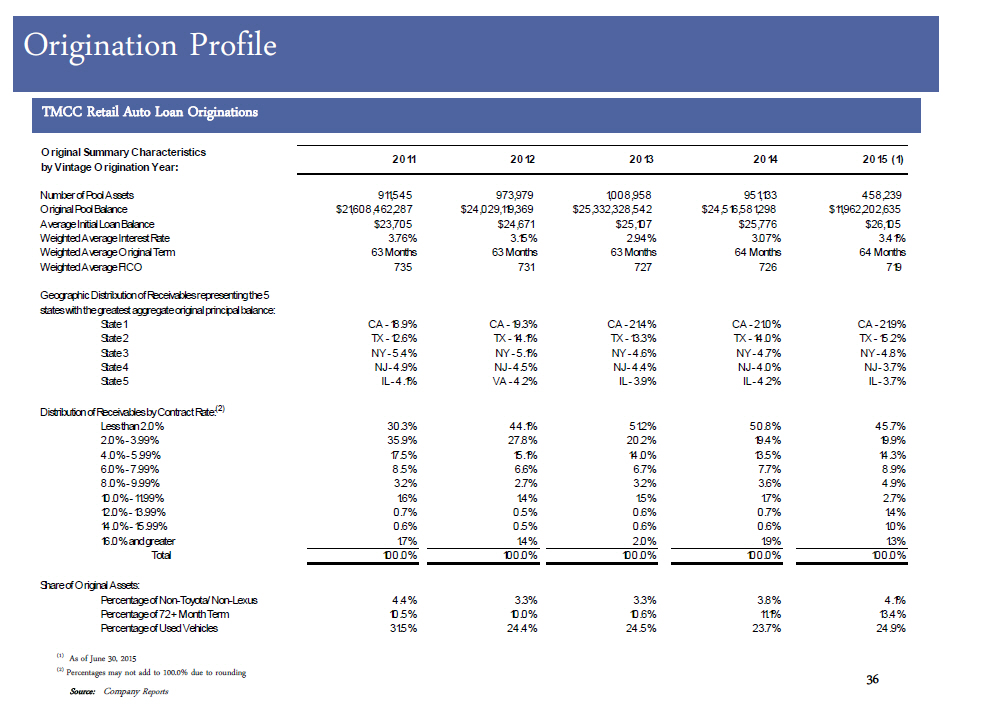
36 TMCC Retail Auto Loan Originations (1) As of June 30, 2015 (2) Percentages may not add to 100.0% due to rounding Origination Profile 36 Source: Company Reports Original Summary Characteristics by Vintage Origination Year: 2011 2012 2013 2014 2015 (1) Number of Pool Assets 911,545 973,979 1,008,958 951,133 458,239 Original Pool Balance $21,608,462,287 $24,029,119,369 $25,332,328,542 $24,516,581,298 $11,962,202,635 Average Initial Loan Balance $23,705 $24,671 $25,107 $25,776 $26,105 Weighted Average Interest Rate 3.76% 3.15% 2.94% 3.07% 3.41% Weighted Average Original Term 63 Months 63 Months 63 Months 64 Months 64 Months Weighted Average FICO 735 731 727 726 719 Geographic Distribution of Receivables representing the 5 states with the greatest aggregate original principal balance: State 1 CA - 18.9% CA - 19.3% CA - 21.4% CA - 21.0% CA - 21.9% State 2 TX - 12.6% TX - 14.1% TX - 13.3% TX - 14.0% TX - 15.2% State 3 NY - 5.4% NY - 5.1% NY - 4.6% NY - 4.7% NY - 4.8% State 4 NJ - 4.9% NJ - 4.5% NJ - 4.4% NJ - 4.0% NJ - 3.7% State 5 IL - 4.1% VA - 4.2% IL - 3.9% IL - 4.2% IL - 3.7% Distribution of Receivables by Contract Rate: (2) Less than 2.0% 30.3% 44.1% 51.2% 50.8% 45.7% 2.0% - 3.99% 35.9% 27.8% 20.2% 19.4% 19.9% 4.0% - 5.99% 17.5% 15.1% 14.0% 13.5% 14.3% 6.0% - 7.99% 8.5% 6.6% 6.7% 7.7% 8.9% 8.0% - 9.99% 3.2% 2.7% 3.2% 3.6% 4.9% 10.0% - 11.99% 1.6% 1.4% 1.5% 1.7% 2.7% 12.0% - 13.99% 0.7% 0.5% 0.6% 0.7% 1.4% 14.0% - 15.99% 0.6% 0.5% 0.6% 0.6% 1.0% 16.0% and greater 1.7% 1.4% 2.0% 1.9% 1.3% Total 100.0% 100.0% 100.0% 100.0% 100.0% Share of Original Assets: Percentage of Non-Toyota/Non-Lexus 4.4% 3.3% 3.3% 3.8% 4.1% Percentage of 72+ Month Term 10.5% 10.0% 10.6% 11.1% 13.4% Percentage of Used Vehicles 31.5% 24.4% 24.5% 23.7% 24.9%
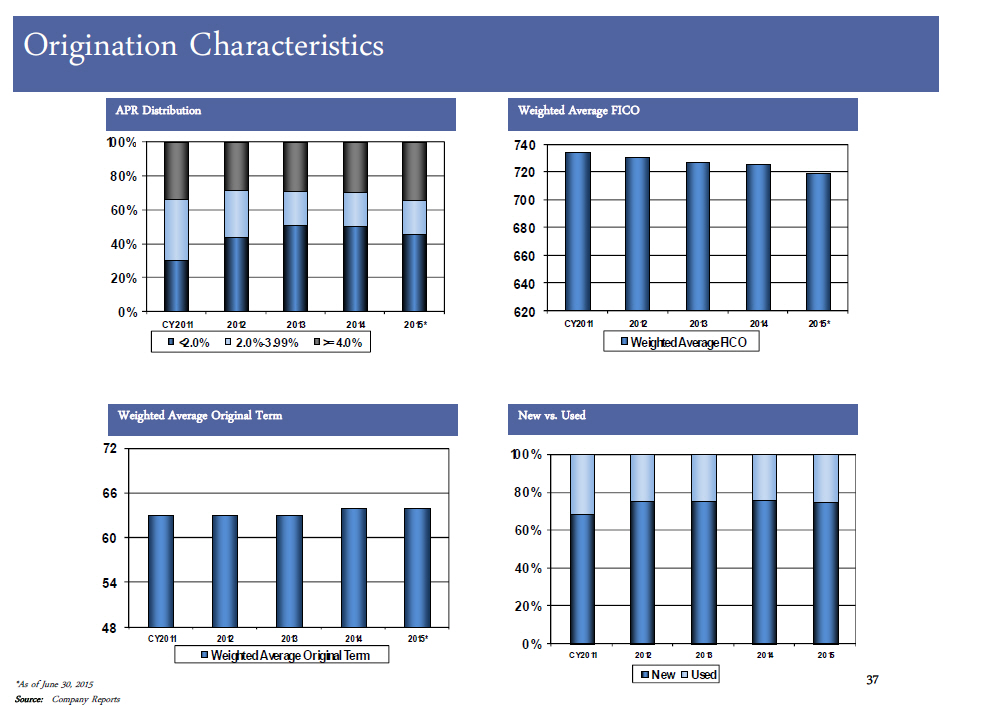
Origination Characteristics Weighted Average FICO 48 54 60 66 72 CY2011 2012 2013 2014 2015* Weighted Average Original Term Weighted Average Original Term APR Distribution New vs. Used 0% 20% 40% 60% 80% 100% CY2011 2012 2013 2014 2015 New Used 37 37 *As of June 30, 2015 Source : Company Reports 620 640 660 680 700 720 740 CY2011 2012 2013 2014 2015* Weighted Average FICO 0% 20% 40% 60% 80% 100% CY2011 2012 2013 2014 2015* <2.0% 2.0%-3.99% >= 4.0%

ABS Deal Comparison Toyota Auto Owner Trust (TAOT ) (*) * Abbreviated for presentation purposes (1) Percentages may not add to 100.00% due to rounding 38 Source: Company Reports
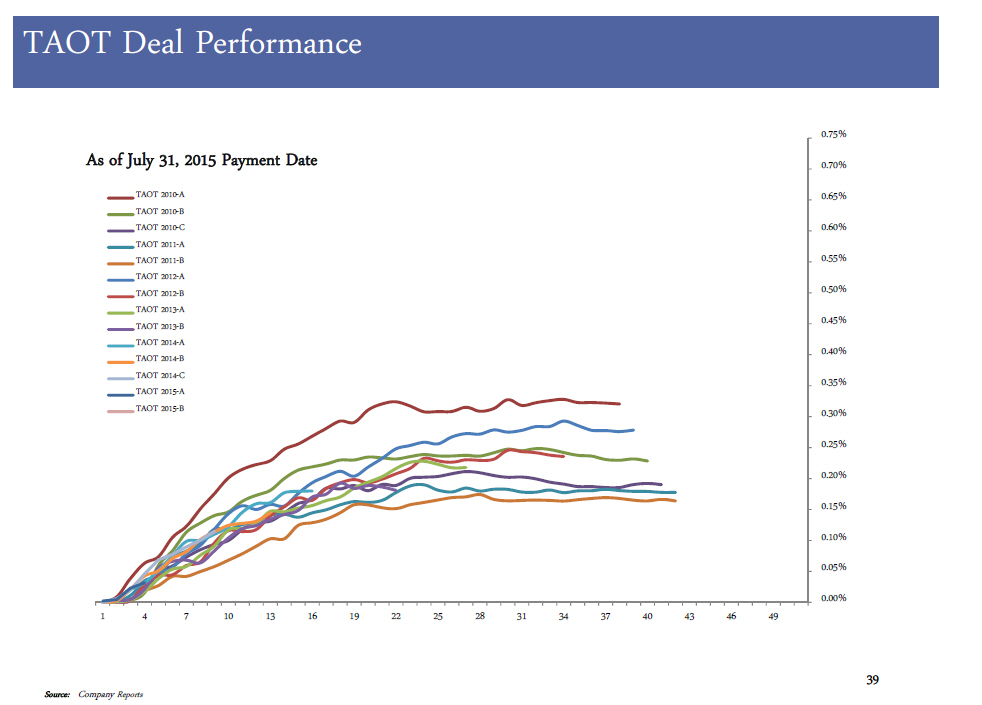
TAOT Deal Performance 39 39 Source: Company Reports 0.00% 0.05% 0.10% 0.15% 0.20% 0.25% 0.30% 0.35% 0.40% 0.45% 0.50% 0.55% 0.60% 0.65% 0.70% 0.75% 1 4 7 10 13 16 19 22 25 28 31 34 37 40 43 46 49 As of July 31, 2015 Payment Date TAOT 2010-A TAOT 2010-B TAOT 2010-C TAOT 2011-A TAOT 2011-B TAOT 2012-A TAOT 2012-B TAOT 2013-A TAOT 2013-B TAOT 2014-A TAOT 2014-B TAOT 2014-C TAOT 2015-A TAOT 2015-B

40 Sales & Trading Update
Commercial Paper Programs Highlights • A - 1+/P - 1 Direct Commercial Paper Programs – 3 distinct USD commercial paper programs (TMCC, TCPR, TCCI) – $15.0 billion multi - party committed credit facilities – $5.8 billion bilateral committed credit facilities – $ 26.4 billion USCP combined average outstanding for TMCC and TCPR – Over 600 diverse institutional investors • State and local municipalities • Large corporations • Pension and retirement funds • Financial institutions • Money managers and mutual fund companies – Rates are posted daily on Bloomberg DOCP screen Source : TMCC June 30, 2015 10 - Q 41