Exhibit 99.1
Presentation Materials for Investors
June 2014
1
|
 |
Disclaimer
[] This presentation includes certain "forward-looking statements" within the
meaning of The U.S. Private Securities Litigation Reform Act of 1995.
[] These statements are based on current expectations and currently available
information.
[] Actual results may differ materially from these expectations due to certain
risks, uncertainties and other important factors, including the risk factors
set forth in the most recent annual and periodic reports of Toyota Motor
Corporation and Toyota Motor Credit Corporation.
[] We do not undertake to update the forward-looking statements to reflect
actual results or changes in the factors affecting the forward-looking
statements.
[] This presentation does not constitute an offer to sell or a solicitation of
an offer to purchase any securities. Any offer or sale of securities will be
made only by means of a prospectus and related documentation.
[] Investors and others should note that we announce material financial
information using the investor relations section of our corporate website
(http://www. toyotafinancial. com) and SEC filings. We use these channels,
press releases, as well as social media to communicate with our investors,
customers and the general public about our company, our services and other
issues. While not all of the information that we post on social media is of a
material nature, some information could be material. Therefore, we encourage
investors, the media, and others interested in our company to review the
information we post on the Toyota Motor Credit Corporation Twitter Feed
(http://www. twitter.com/toyotafinancial) . We may update our social media
channels from time to time on the investor relations section of our corporate
website.
2
|
 |
Disclaimer
[] This presentation includes certain "forward-looking statements" within the
meaning of The U.S. Private Securities Litigation Reform Act of 1995.
[] These statements are based on current expectations and currently available
information.
[] Actual results may differ materially from these expectations due to certain
risks, uncertainties and other important factors, including the risk factors
set forth in the most recent annual and periodic reports of Toyota Motor
Corporation and Toyota Motor Credit Corporation.
[] We do not undertake to update the forward-looking statements to reflect
actual results or changes in the factors affecting the forward-looking
statements.
[] This presentation does not constitute or form part of and should not be
construed as, an offer to sell or issue or the solicitation of an offer to
purchase or subscribe for securities of TMCC in any jurisdiction or an
inducement to enter into investment activity in any jurisdiction. Neither this
presentation nor any part thereof, nor the fact of its distribution, shall form
the basis of, or be relied on in connection with, any contract or commitment or
investment decision whatsoever. Any offer or sale of securities by TMCC will be
made only by means of a prospectus and related documentation.
[] Investors and prospective investors in securities of TMCC are required to
make their own independent investigation and appraisal of the business and
financial condition of TMCC and the nature of its securities. This presentation
does not constitute a recommendation regarding securities of TMCC. Any
prospective purchaser of securities in TMCC is recommended to seek its own
independent financial advice.
[] This presentation is made to and directed only at (i) persons outside the
United Kingdom, or (ii) qualified investors or investment professionals falling
within Article 19(5) and Article 49(2)(a) to (d) of the Financial Services and
Markets Act 2000 (Financial Promotion) Order 2005 (the "Order"), or (iii) high
net worth individuals, and other persons to whom it may lawfully be
communicated, falling within Article 49(2)(a) to (d) of the Order, and (iv)
persons who are "qualified investors" within the meaning of Article 2(1)(e) of
the Prospectus Directive (Directive 2003/71/EC) as amended (such persons
collectively being referred to as "Relevant Persons"). This presentation must
not be acted or relied on by persons who are not Relevant Persons. Any
investment or investment activity to which this presentation relates is
available only to Relevant Persons and will be engaged in only with Relevant
Persons.
[] This presentation is an advertisement and not a prospectus and investors
should not subscribe for or purchase any securities of TMCC referred to in this
presentation or otherwise except on the basis of information in the base
prospectus of Toyota Motor Finance (Netherlands) B.V., Toyota Credit Canada
Inc., Toyota Finance Australia Limited and Toyota Motor Credit Corporation
dated 13 September 2013 as supplemented from time to time together with the
applicable final terms which are or will be, as applicable, available on the
website of the London Stock Exchange plc at www.londonstockexchange.
com/exchange/news/market -news/market -news-home.html.
[] Investors and others should note that we announce material financial
information using the investor relations section of our corporate website
(http://www. toyotafinancial. com) and SEC filings. We use these channels,
press releases, as well as social media to communicate with our investors,
customers and the general public about our company, our services and other
issues. While not all of the information that we post on social media is of a
material nature, some information could be material. Therefore, we encourage
investors, the media, and others interested in our company to review the
information we post on the Toyota Motor Credit Corporation Twitter Feed
(http://www. twitter.com/toyotafinancial) . We may update our social media
channels from time to time on the investor relations section of our corporate
website.
3
|
 |
Toyota's Global Businesses
4
|
 |
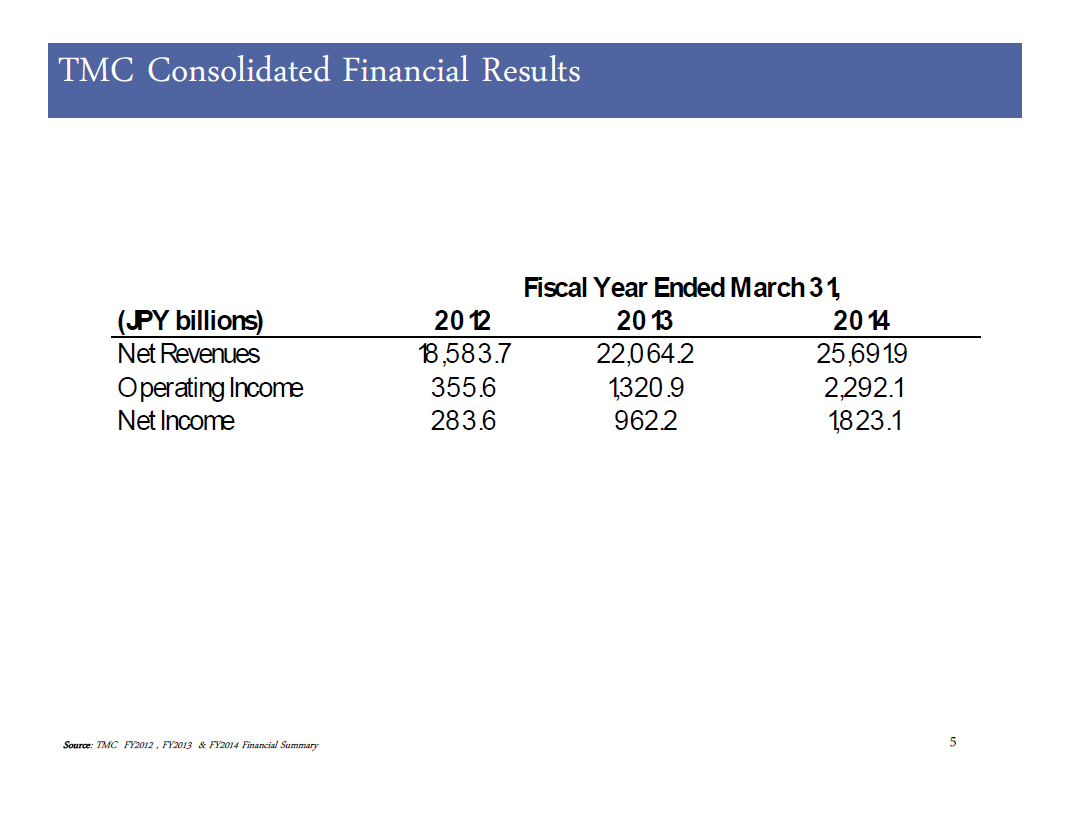
TMC Consolidated Financial Results
Fiscal Year Ended March 31,
(JPY billions) 2012 2013 2014
================ ======== ======================== =========
Net Revenues 18,583.7 22,064.2 25,691.9
Operating Income 355.6 1,320.9 2,292.1
Net Income 283.6 962.2 1,823.1
Source: TMC FY2012 , FY2013 & FY2014 Financial Summary
5
|
 |
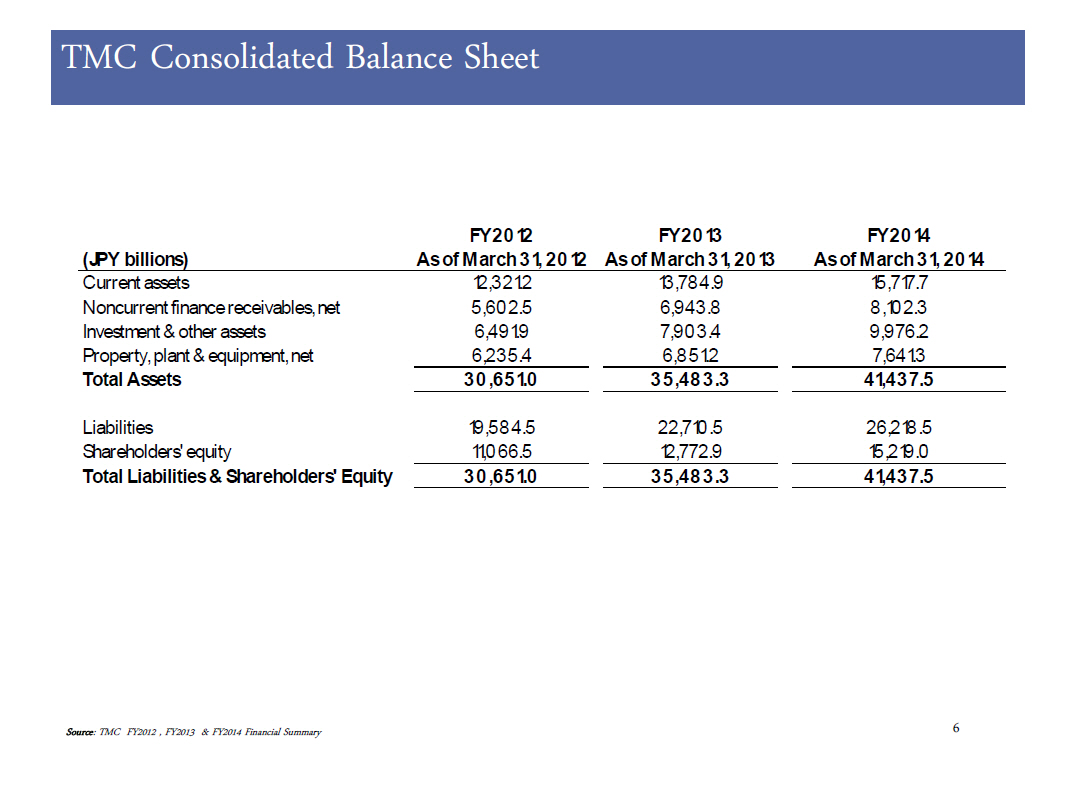
TMC Consolidated Balance Sheet
FY2012 FY2013 FY2014
(JPY billions) Asof March 31, 2012 Asof March 31, 2013 Asof March 31, 2014
======================================= =================== ===================
Current assets 12,321.2 13,784.9 15,717.7
Noncurrent finance receivables, net 5,602.5 6,943.8 8,102.3
Investment & other assets 6,491.9 7,903.4 9,976.2
Property, plant & equipment, net 6,235.4 6,851.2 7,641.3
=================== =================== ===================
Total Assets 30,651.0 35,483.3 41,437.5
=================== =================== ===================
Liabilities 19,584.5 22,710.5 26,218.5
Shareholders' equity 11,066.5 12,772.9 15,219.0
=================== =================== ===================
Total Liabilities &
Shareholders' Equity 30,651.0 35,483.3 41,437.5
=================== =================== ===================
Source: TMC FY2012 , FY2013 & FY2014 Financial Summary
6
|
 |
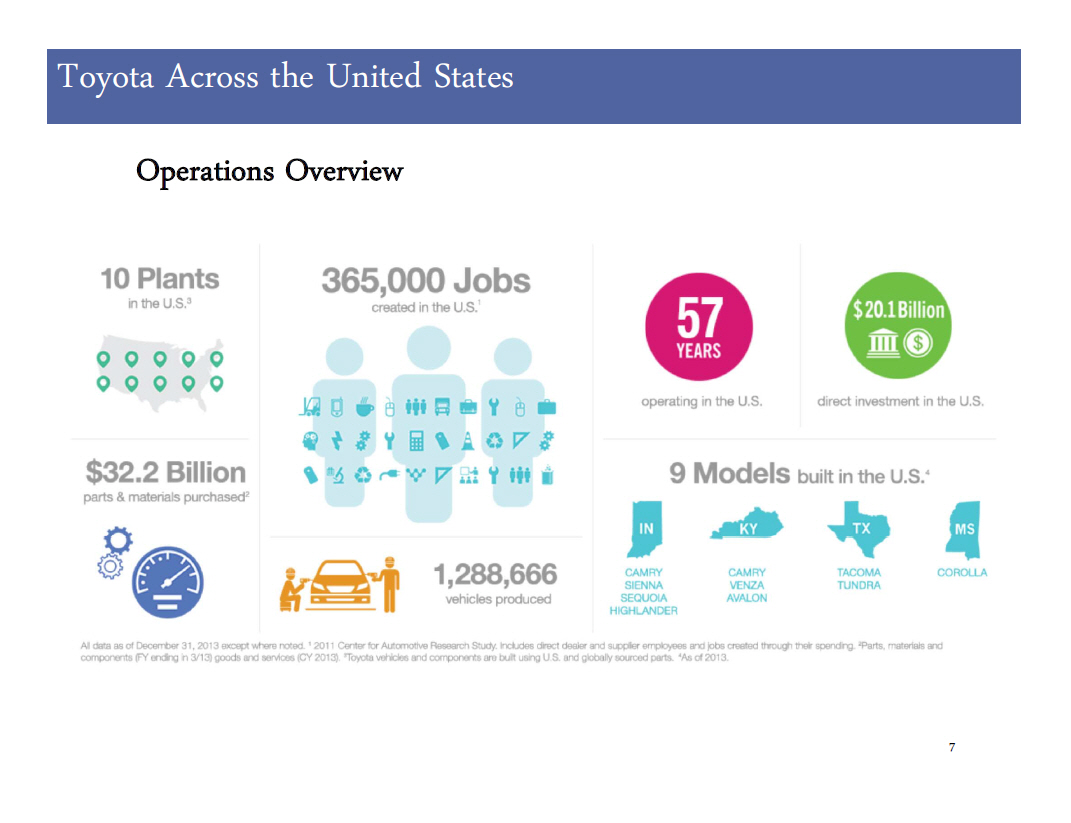
Toyota Across the United States
Operations Overview
7
|
 |
Toyota's Next Chapter
[] Recently announced consolidation of Toyota headquarters functions
[] Will move to a single location in Plano, Texas during 2016 - 2018
[] Unified manufacturing and sales leadership HQ will enable us to:
-- Improve collaboration and break down operational siloes
-- Respond to changes in the market faster and improve our competitive
advantage
-- Better align manufacturing operations with sales, marketing and other
functions
-- Ultimately build better vehicles for our customers
8
|
 |
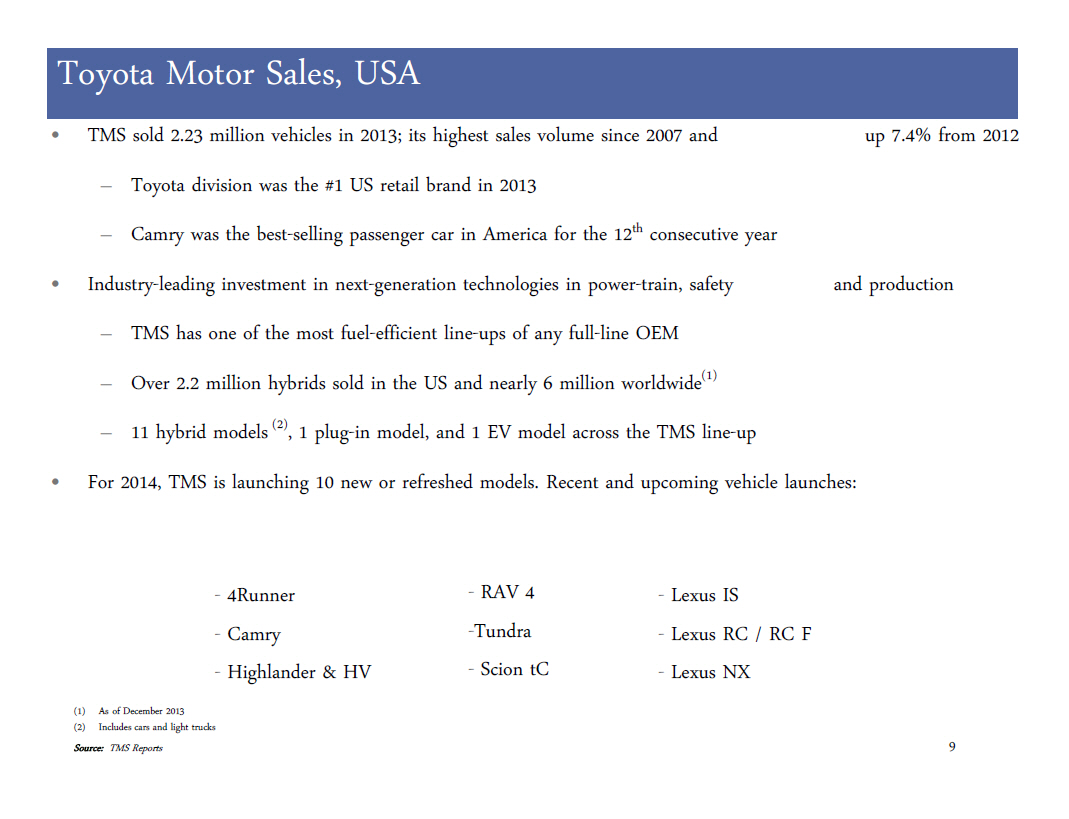
Toyota Motor Sales, USA
[] TMS sold 2.23 million vehicles in 2013; its highest sales volume since 2007
and up 7.4% from 2012
-- Toyota division was the #1 US retail brand in 2013
-- Camry was the best-selling passenger car in America for the 12(th)
consecutive year
[] Industry-leading investment in next-generation technologies in power-train,
safety and production
-- TMS has one of the most fuel-efficient line-ups of any full-line OEM
-- Over 2.2 million hybrids sold in the US and nearly 6 million worldwide(1)
-- 11 hybrid models (2), 1 plug-in model, and 1 EV model across the TMS
line-up
[] For 2014, TMS is launching 10 new or refreshed models. Recent and upcoming
vehicle launches:
- 4Runner - RAV 4 - Lexus IS
- Camry -Tundra - Lexus RC / RC F
- Highlander & HV - Scion tC - Lexus NX
(1) As of December 2013
(2) Includes cars and light trucks
Source: TMS Reports
9
|
 |
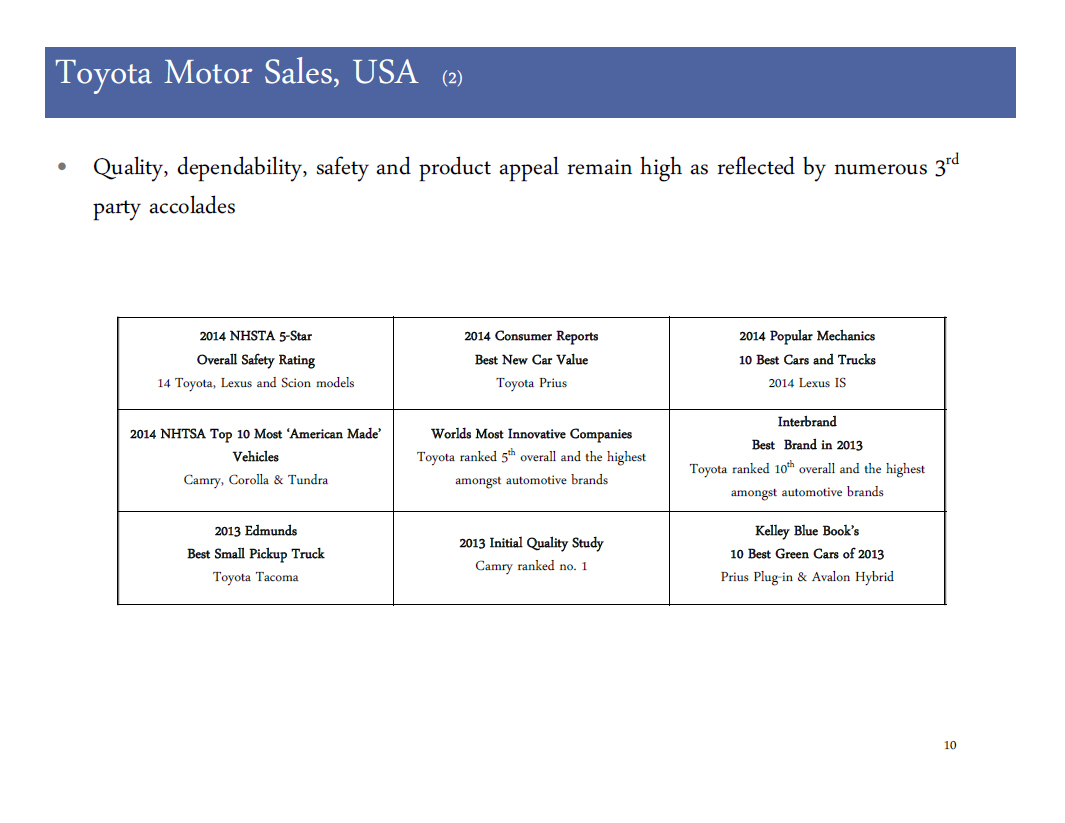
Toyota Motor Sales, USA (2)
[] Quality, dependability, safety and product appeal remain high as reflected
by numerous 3(rd) party accolades
10
2014 NHSTA 5-Star
Overall Safety Rating
14 Toyota, Lexus and Scion models
2014 NHTSA Top 10 Most 'American Made'
Vehicles
Camry, Corolla & Tundra
2013 Edmunds
Best Small Pickup Truck
Toyota Tacoma
2014 Consumer Reports
Best New Car Value
Toyota Prius
Worlds Most Innovative Companies
Toyota ranked 5(th) overall and the highest
amongst automotive brands
2013 Initial Quality Study
Camry ranked no. 1
2014 Popular Mechanics
10 Best Cars and Trucks
2014 Lexus IS
Interbrand
Best Brand in 2013
Toyota ranked 10(th) overall and the highest
amongst automotive brands
Kelley Blue Book's
10 Best Green Cars of 2013
Prius Plug-in & Avalon Hybrid
10
|
 |
Toyota Motor Sales, USA (3)
11
|
 |
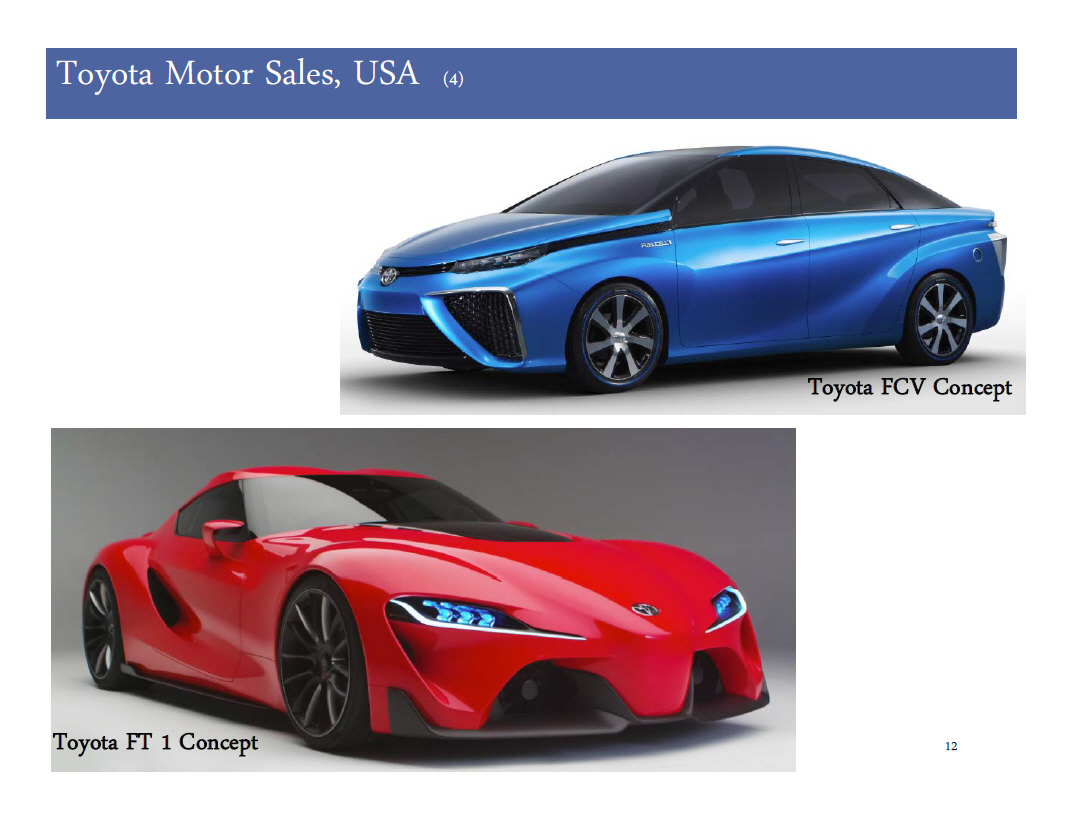
Toyota Motor Sales, USA (4)
12
|
 |
Toyota Motor Sales, USA (5)
13
|
 |
Toyota
Financial
Services
14
|
 |
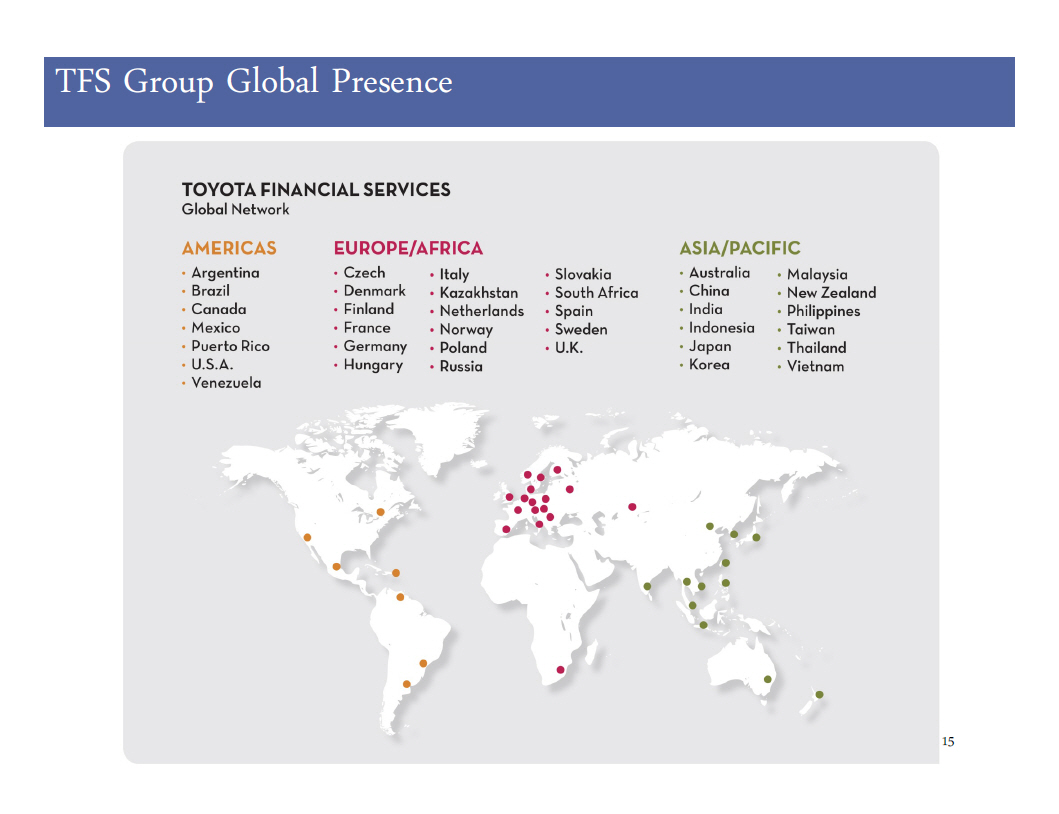
TFS Group Global Presence
15
|
 |
Toyota Motor Credit Corporation (TMCC)
Toyota Motor Corporation (TMC)
Toyota Financial Services Corporation (TFSC)
Toyota Motor Credit Corporation (TMCC)
(1)
[] Over 4.1 million active finance contracts (2) (2)
[] AA- /Aa3 rated captive finance company by S&P / Moody's (3)
[] Credit support agreement structure with TFSC/TMC
(1) As of March 31, 2014
(2) Outlook stable
(3) The Credit Support Agreements do not apply to securitization transactions
16
|
 |
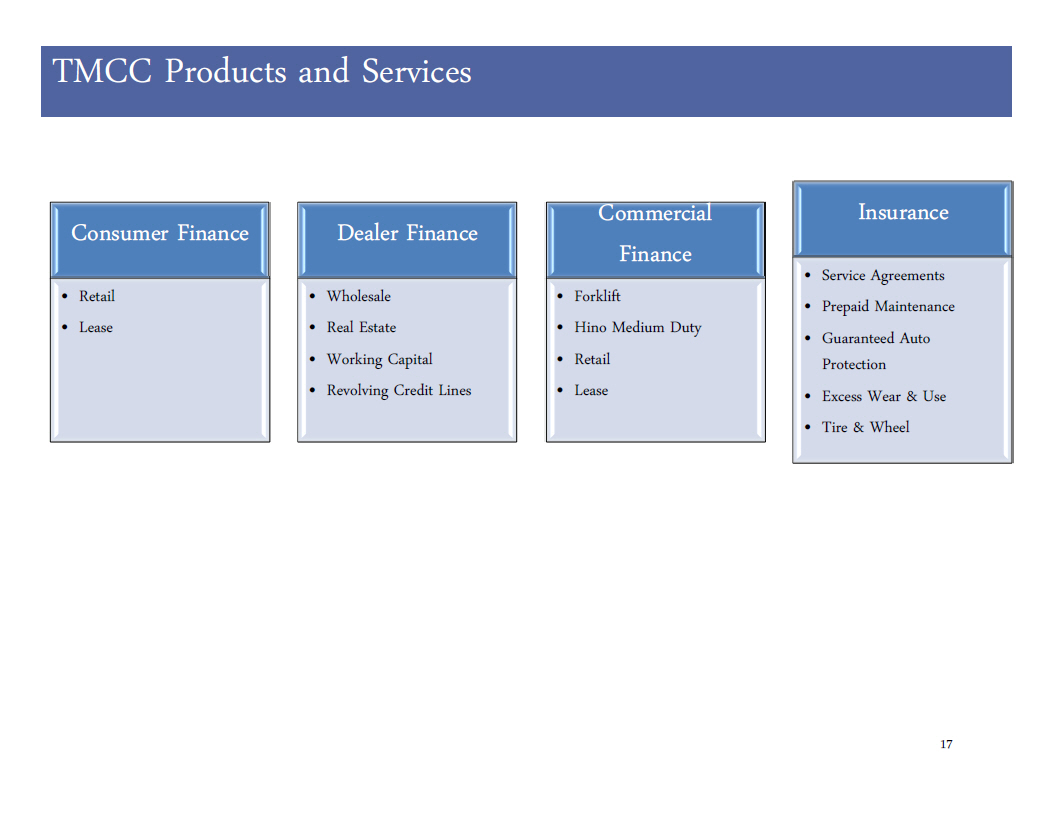
TMCC Products and Services
17
[] Retail
[] Lease
[] Wholesale
[] Real Estate
[]Working Capital
[] Revolving Credit Lines
[]Forklift
[] Hino Medium Duty
[]Retail
[]Lease
[] Service Agreements
[] Prepaid Maintenance
[] Guaranteed Auto
Protection
[] Excess Wear & Use
[] Tire & Wheel
17
|
 |
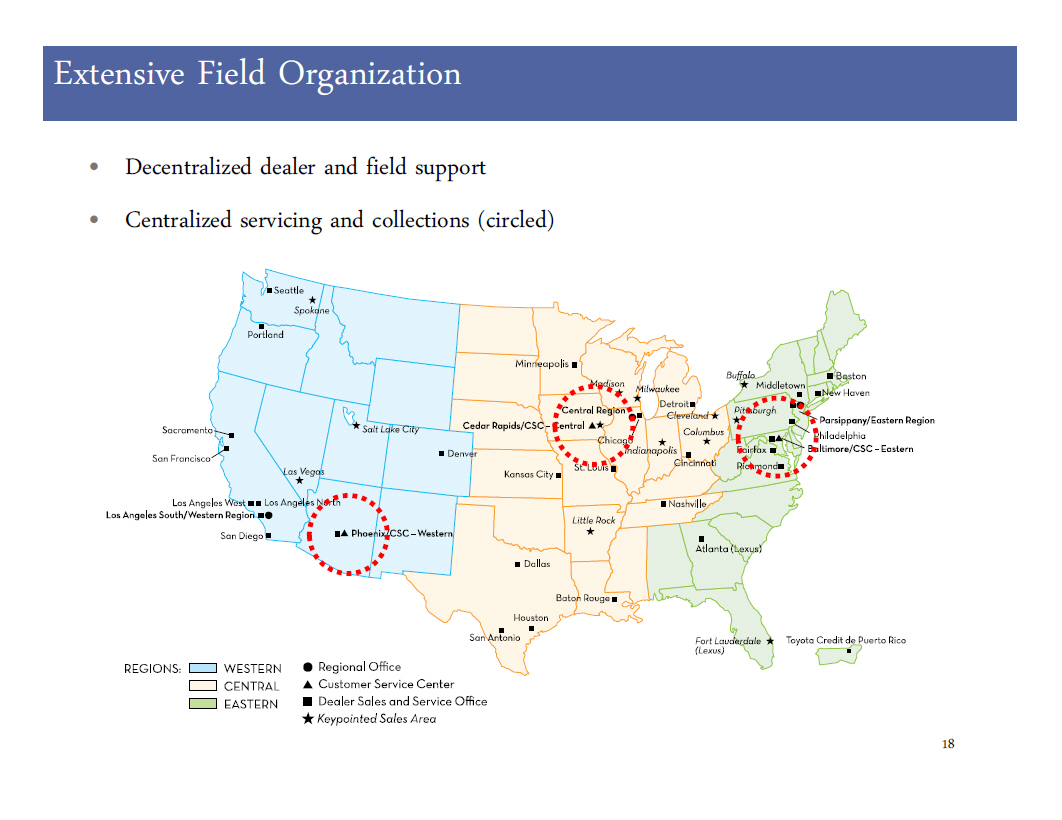
Extensive Field Organization
[] Decentralized dealer and field support
[] Centralized servicing and collections (circled)
18
|
 |
Recent TMCC Business Highlights
[] In excess of $10.6 billion income before income taxes over the past 5
years(1)
[] Continuing the trend in 2014, TFS is the top U. S. auto lender in all new
vehicles(2)
[] Strong market share continues to drive solid financing revenues and sales
support
[] Low net charge-off ratio driven by prudent underwriting standards and
proactive servicing practices
[] High insurance penetration and growing insurance volume
(1) For the four year period from FY10 through FY14
(2) Source: AutoCount as of December 31, 2013
19
|
 |
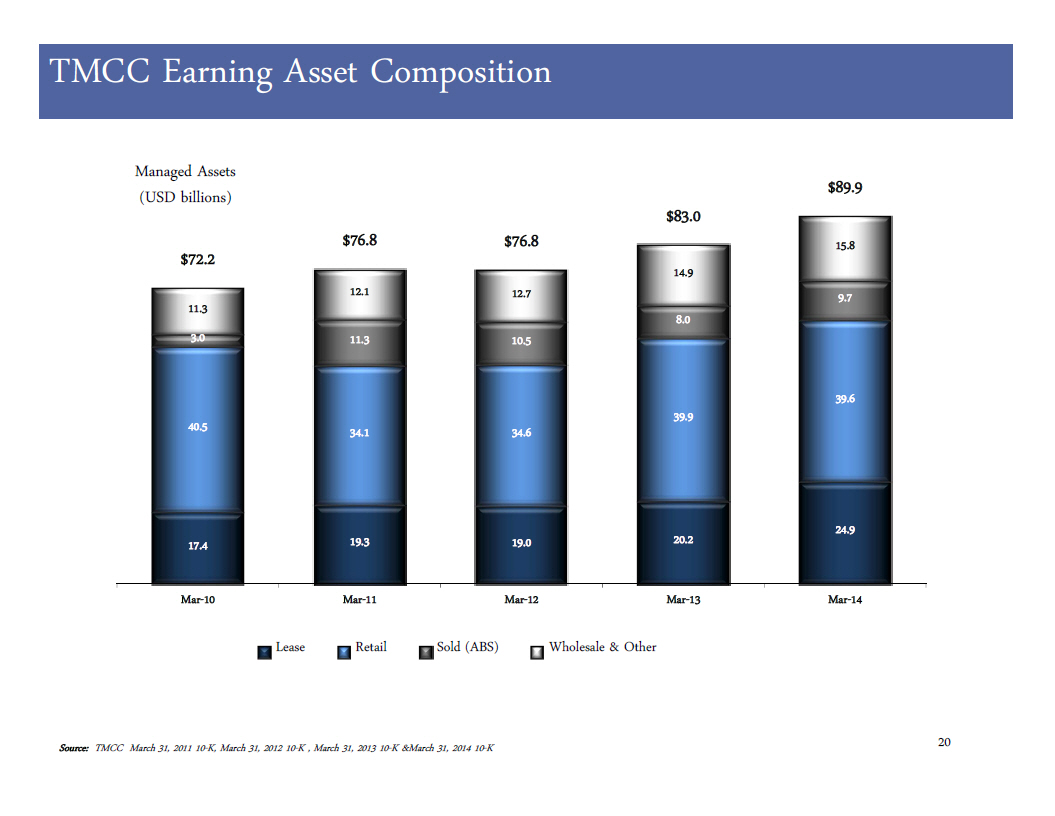
TMCC Earning Asset Composition
24.9
17.4 19.3 19.0 20.2
------ ----- -------- ---------- ------ ----------------- ------ ------
Mar-10 Mar-11 Mar-12 Mar-13 Mar-14
Lease Retail Sold (ABS) Wholesale & Other
Source: TMCC March 31, 2011 10-K, March 31, 2012 10-K , March 31, 2013 10-K
&March 31, 2014 10-K
20
|
 |
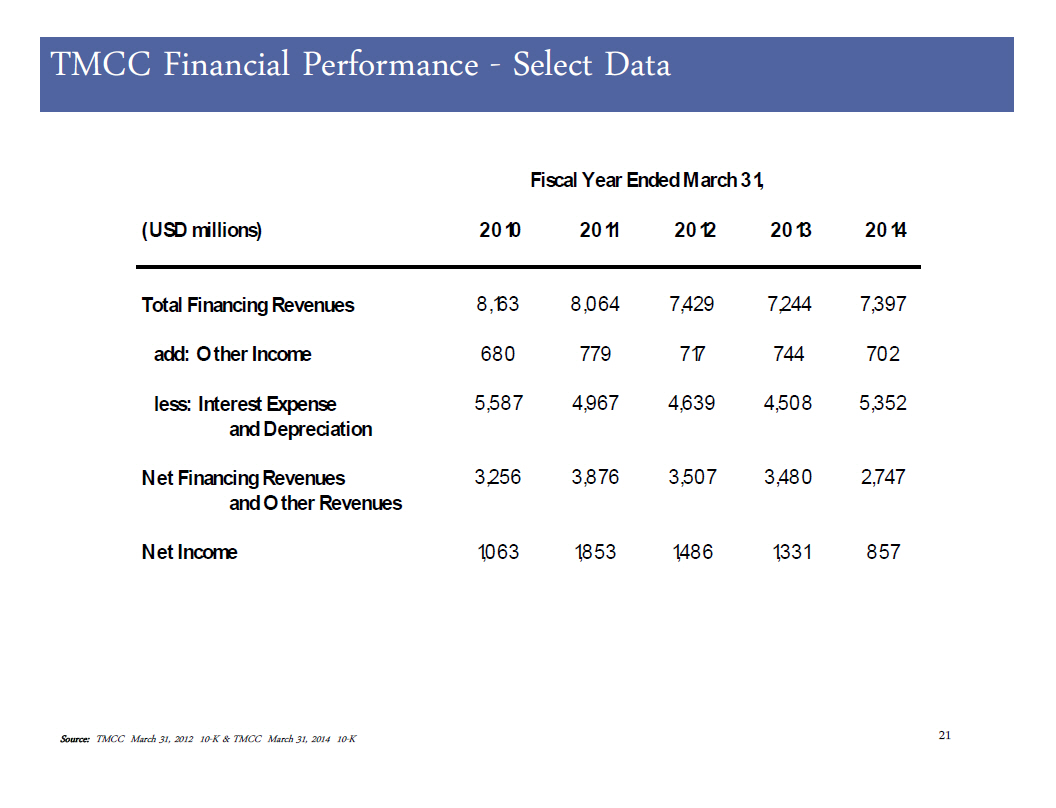
TMCC Financial Performance - Select Data
Fiscal Year Ended March 31,
Source: TMCC March 31, 2012 10-K & TMCC March 31, 2014 10-K
21
(USD millions) 2010 2011
------------------------------------ ----- -----
Total Financing Revenues 8,163 8,064
add: Other Income 680 779
less: Interest Expense 5,587 4,967
and Depreciation
Net Financing Revenues 3,256 3,876
and Other Revenues
Net Income 1,063 1,853
2012 2013 2014
----- ------ -----
7,429 7,244 7,397
717 744 702
4,639 4,508 5,352
3,507 3,480 2,747
1,486 1,331 857
21
|
 |
TMCC Financial Performance - Select Data
(1) Percentage of gross earning assets
(2) The quotient of allowance for credit losses divided by the sum of gross
finance receivables (net finance receivables less allowance for credit losses)
plus gross investments in operating leases (net investments in operating leases
less allowance for credit losses)
Note: All percentage figures calculated were
based on a 120-day charge-off policy
Source: TMCC March 31, 2014 10-K 22
Fiscal Year Ended March 31,
(USD millions) 2010 2011
------------------------------------ ----- ------
Over 60 Days Delinquent (1) 0.45% 0.26%
Allowance for Credit Losses(1) (2) 2.31% 1.13%
Net Credit Losses 1.03% 0 .52%
2012 2013 2014
----- ----- ------
0.18% 0.19% 0 .18%
0.80% 0.63% 0.50%
.
0 .21% 0.27% 0.28%
22
|
 |
TMCC
Funding
Programs
23
|
 |
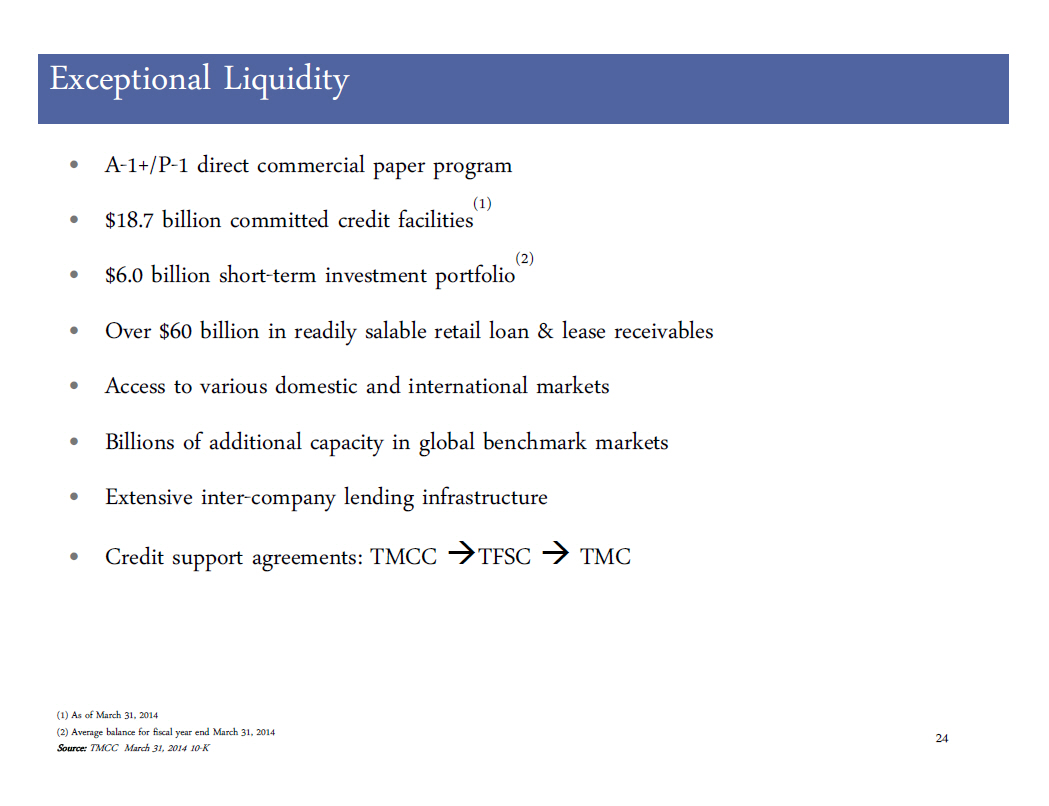
Exceptional Liquidity
[] A-1+/P-1 direct commercial paper program (1) [] $18.7 billion committed
credit facilities (2) [] $6.0 billion short-term investment portfolio
[] Over $60 billion in readily salable retail loan & lease receivables
[] Access to various domestic and international markets
[] Billions of additional capacity in global benchmark markets
[] Extensive inter-company lending infrastructure
[] Credit support agreements: TMCC []TFSC [] TMC
(1) As of March 31, 2014
(2) Average balance for fiscal year end March 31, 2014 24
Source: TMCC March 31, 2014 10-K
24
|
 |
TMCC Funding Program Objectives
[] TMCC is committed to:
-- Maintaining funding diversity and exceptional liquidity
-- Issuing into strong demand with attractive deals
-- Identifying & developing new markets and investor relationships
-- Responding quickly to opportunities with best-in-class execution
25
|
 |
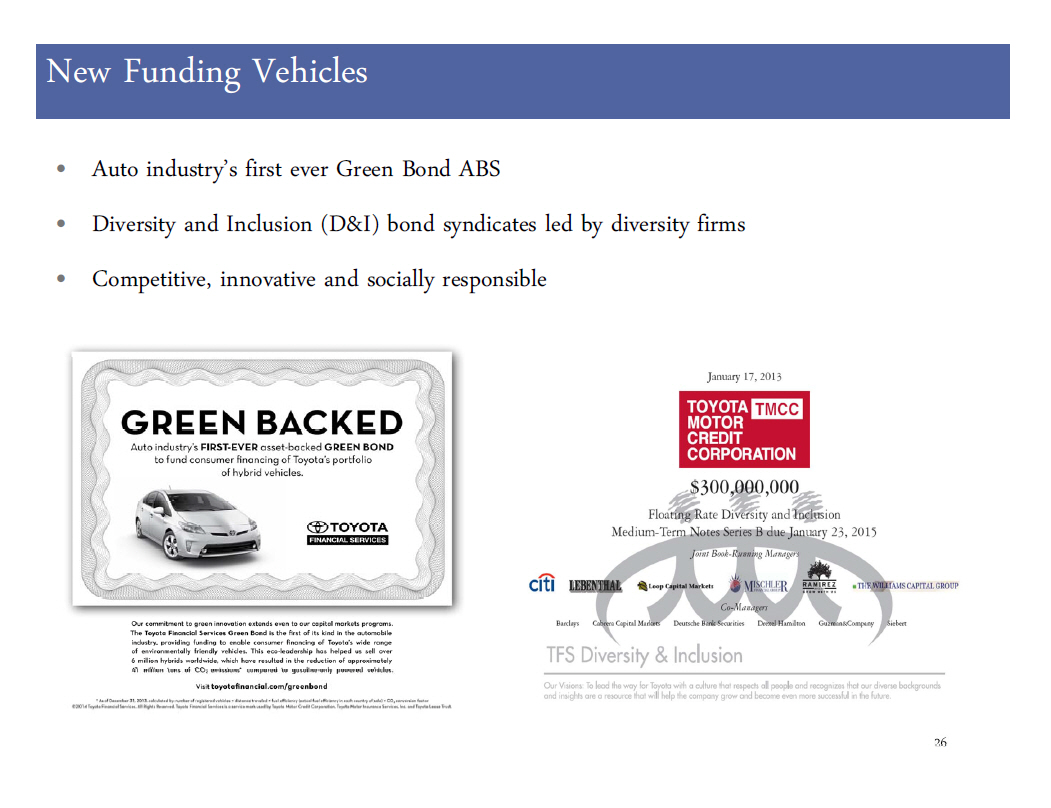
New Funding Vehicles
[] Auto industry's first ever Green Bond ABS
[] Diversity and Inclusion (D&I) bond syndicates led by diversity firms
[] Competitive, innovative and socially responsible
26
|
 |
TMCC FY14 Funding Overview
$19.9 billion of long term debt funded in FY2014
Other
3%
EMTN
13%
Global MTN
21%
MTN
35%
Public /
Private ABS
28%
[] $14.3 billion in unsecured debt
[] $5.6 billion in secured debt (net of amount retained)
-- $2.5 billion comprised of public term secured funding (net of amount
retained)
As of March 31, 2014
27
Source: Company Reports
27
|
 |
Diversification in Debt Offerings
TMCC Long Term Debt Outstanding (USD millions)
By Deal Type
By Currency
Uridashi
$2,457
28
|
 |
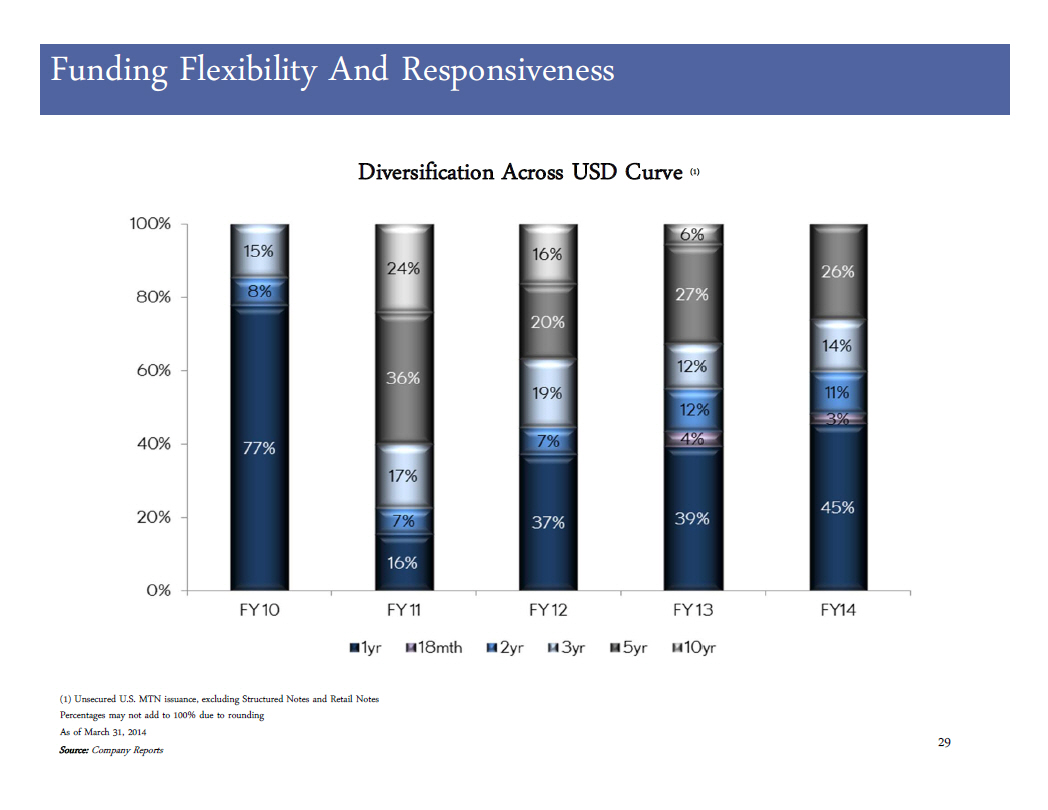
Funding Flexibility And Responsiveness
Diversification Across USD Curve (1)
(1) Unsecured U.S. MTN issuance, excluding Structured Notes and Retail Notes
Percentages may not add to 100% due to rounding
As of March 31, 2014
Source: Company Reports
29
|
 |
Key Investment Highlights
[] Financial strength supported by strong credit ratings
[] Transparent business model with exceptional liquidity
[] Rational funding programs with long term perspective
-- Diversification in bond offerings
-- Focus on proactively meeting needs of market
-- Strong emphasis placed on flexibility and responsiveness
[] Industry-leading in:
-- Liquidity management framework
-- Balance sheet strength
-- Business model resiliency
30
|
 |
TMCC Retail Loan Collateral & ABS
Transactions
31
|
 |
Credit Decisioning & Collections
[] Recent consistent, conservative underwriting standards have produced low
levels of delinquencies and credit losses
-- Identification & minimization of least desirable segments
-- Ongoing focus on Toyota and Lexus business
[] Optimization of collections strategy and staff supports loss mitigation
while enabling portfolio growth
-- Emphasis on early intervention
-- Reinforcement of strong compliance management system
(1) Delinquency is 30+ day delinquencies as a percentage of receivables
outstanding
(2) Credit loss is annual net credit loss as a percentage of receivables
outstanding
32
|
 |
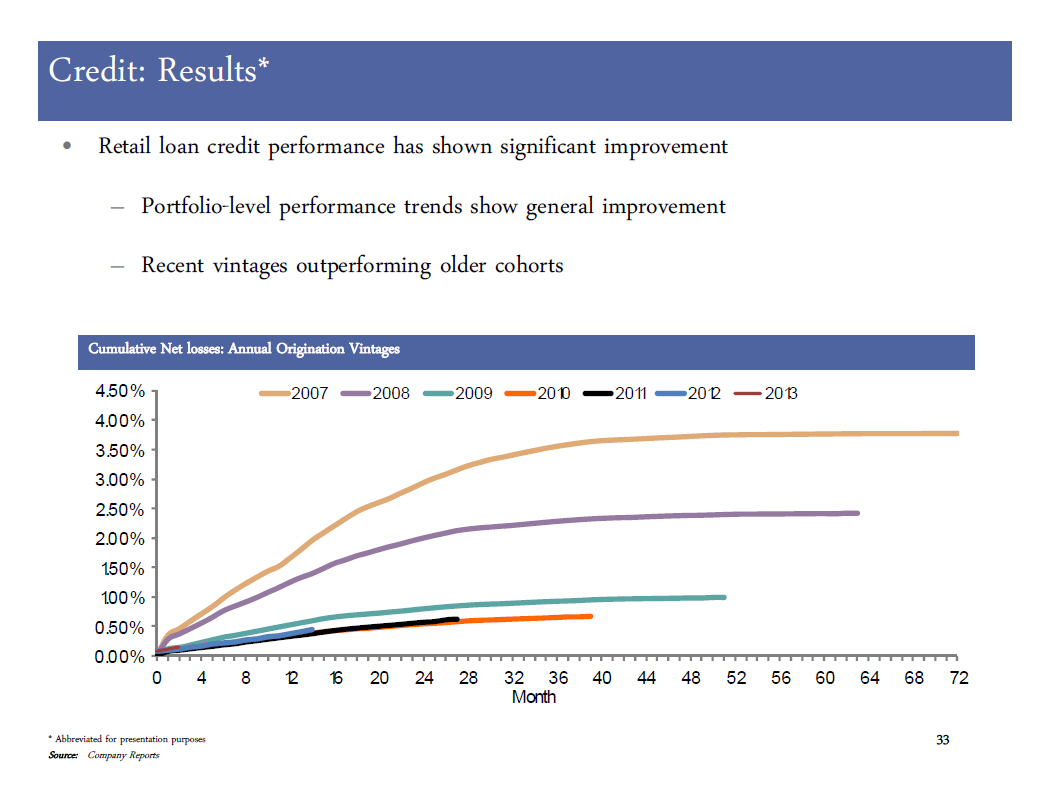
Credit: Results*
[] Retail loan credit performance has shown significant improvement
-- Portfolio-level performance trends show general improvement
-- Recent vintages outperforming older cohorts
0 4 8 12 16 20 24 28 32 36 40 44 48 52 56 60 64 68 72
Month
* Abbreviated for presentation purposes 33
Source: Company Reports
33
|
 |
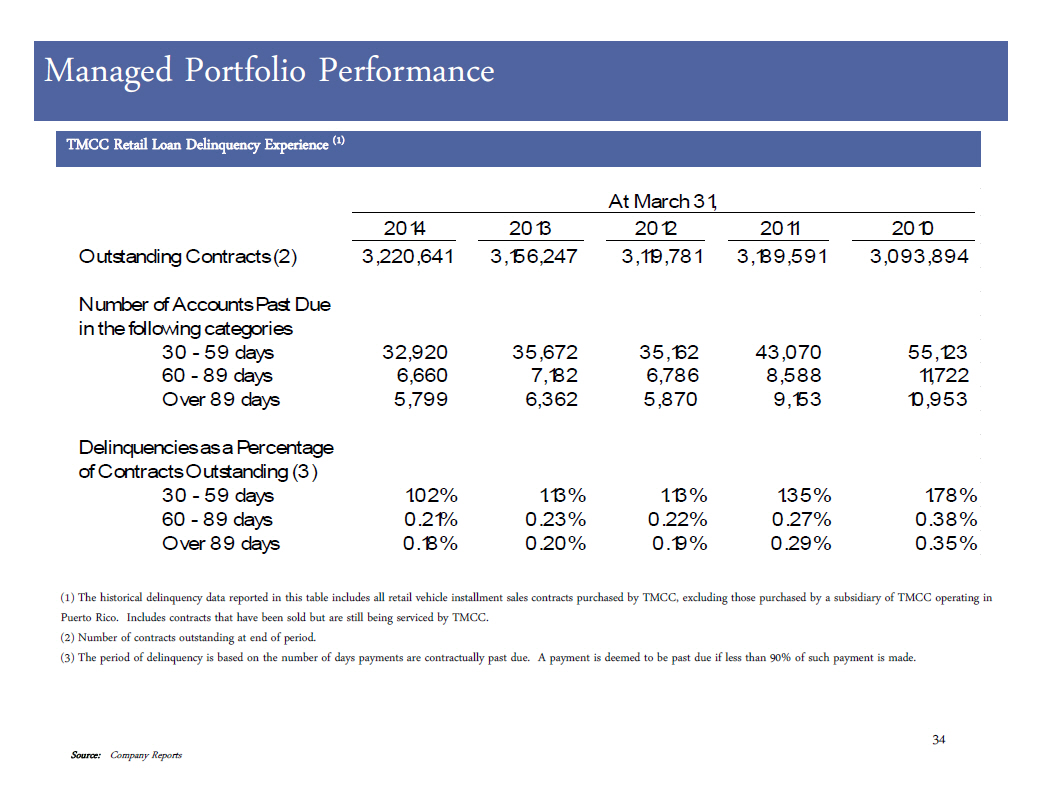
(1) The historical delinquency data reported in this table includes all retail
vehicle installment sales contracts purchased by TMCC, excluding those
purchased by a subsidiary of TMCC operating in Puerto Rico. Includes contracts
that have been sold but are still being serviced by TMCC.
(2) Number of contracts outstanding at end of period.
(3) The period of delinquency is based on the number of days payments are
contractually past due. A payment is deemed to be past due if less than 90% of
such payment is made.
34
Source: Company Reports
Managed Portfolio Performance
TMCC Retail Loan Delinquency Experience (1)
2014 2013
------------- ---------------
Outstanding Contracts(2) 3,220,641 3,156,247
Number of AccountsPast Due
in the following categories
30 - 59 days 32,920 35,672
60 - 89 days 6,660 7,182
Over 89 days 5,799 6,362
Delinquenciesasa Percentage
of ContractsOutstanding (3)
30 - 59 days 1.02% 1.13%
60 - 89 days 0 .21% 0.23%
Over 89 days 0.18% 0.20%
At March 31,
2012 2011 2010
------------ ------------- ----------------
3,119,781 3,189,591 3,093,894
35,162 43,070 55,123
6,786 8,588 11,722
5,870 9,153 10,953
1.13% 1.35% 1.78%
0.22% 0.27% 0.38%
0.19% 0.29% 0.35%
34
|
 |
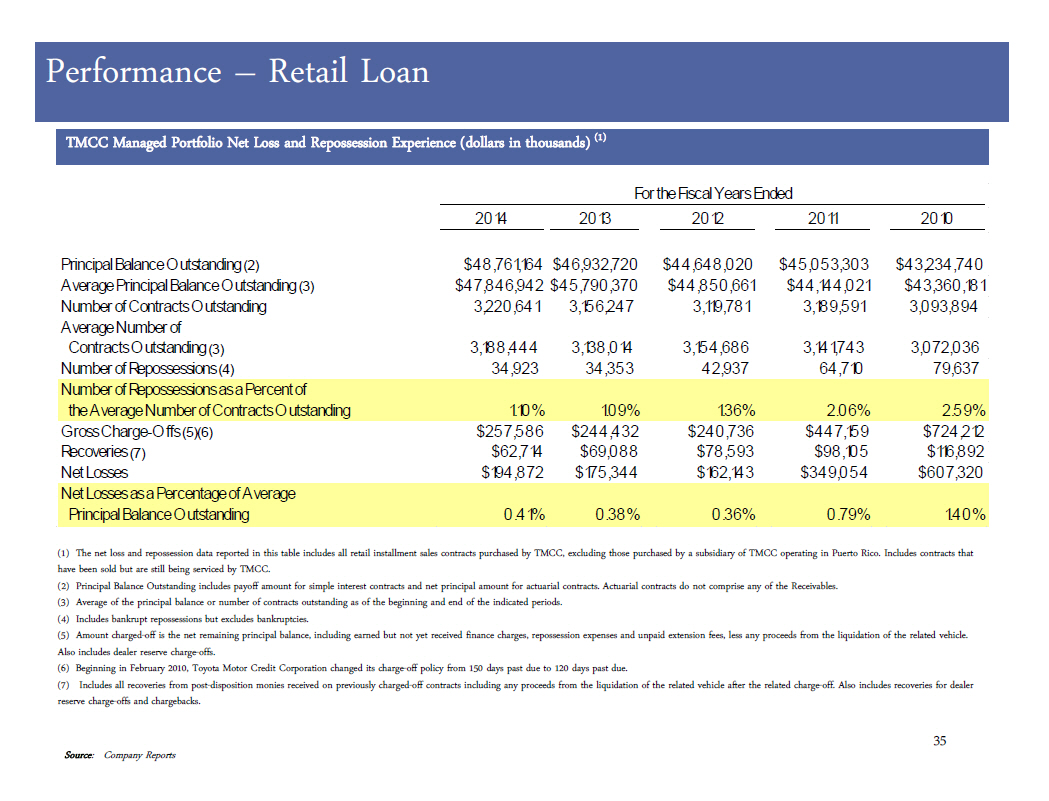
(1) The net loss and repossession data reported in this table includes all
retail installment sales contracts purchased by TMCC, excluding those purchased
by a subsidiary of TMCC operating in Puerto Rico. Includes contracts that have
been sold but are still being serviced by TMCC.
(2) Principal Balance Outstanding includes payoff amount for simple interest
contracts and net principal amount for actuarial contracts. Actuarial contracts
do not comprise any of the Receivables.
(3) Average of the principal balance or number of contracts outstanding as of
the beginning and end of the indicated periods.
(4) Includes bankrupt repossessions but excludes bankruptcies.
(5) Amount charged-off is the net remaining principal balance, including earned
but not yet received finance charges, repossession expenses and unpaid
extension fees, less any proceeds from the liquidation of the related vehicle.
Also includes dealer reserve charge-offs.
(6) Beginning in February 2010, Toyota Motor Credit Corporation changed its
charge-off policy from 150 days past due to 120 days past due.
(7) Includes all recoveries from post-disposition monies received on previously
charged-off contracts including any proceeds from the liquidation of the
related vehicle after the related charge-off. Also includes recoveries for
dealer
reserve charge-offs and chargebacks.
35
Source: Company Reports
Performance -- Retail Loan
TMCC Managed Portfolio Net Loss and Repossession Experience (dollars in
thousands) (1)
For the Fiscal Years Ended
2014 2013
---------------- --------------
Principal Balance Outstanding(2) $48,761,164 $46,932,720
Average Principal BalanceOutstanding (3) $47,846,942 $45,790,370
Number ofContracts Outstanding 3,220,641 3,156,247
Average Number of
Contracts Outstanding(3) 3,188,444 3,138,014
Number ofRepossessions(4) 34,923 34,353
Number ofRepossessions as aPercentof
the Average Number of Contracts Outstanding 1.10% 1.09%
Gross Charge-Offs(5)(6) $257,586 $244,432
Recoveries(7) $62,714 $69,088
Net Losses $194,872 $175,344
Net Losses as aPercentageof Average
Principal Balance Outstanding 0.41% 0.38%
2012 2011 2010
---------------- -------------- ---------------
$44,648,020 $45,053,303 $43,234,740
$44,850,661 $44,144,021 $43,360,181
3,119,781 3,189,591 3,093,894
3,154,686 3,141,743 3,072,036
42,937 64,710 79,637
1.36% 2.06% 2.59%
$240,736 $447,159 $724,212
$78,593 $98,105 $116,892
$162,143 $349,054 $607,320
0.36% 0.79% 1.40%
35
|
 |
Source: Company Reports
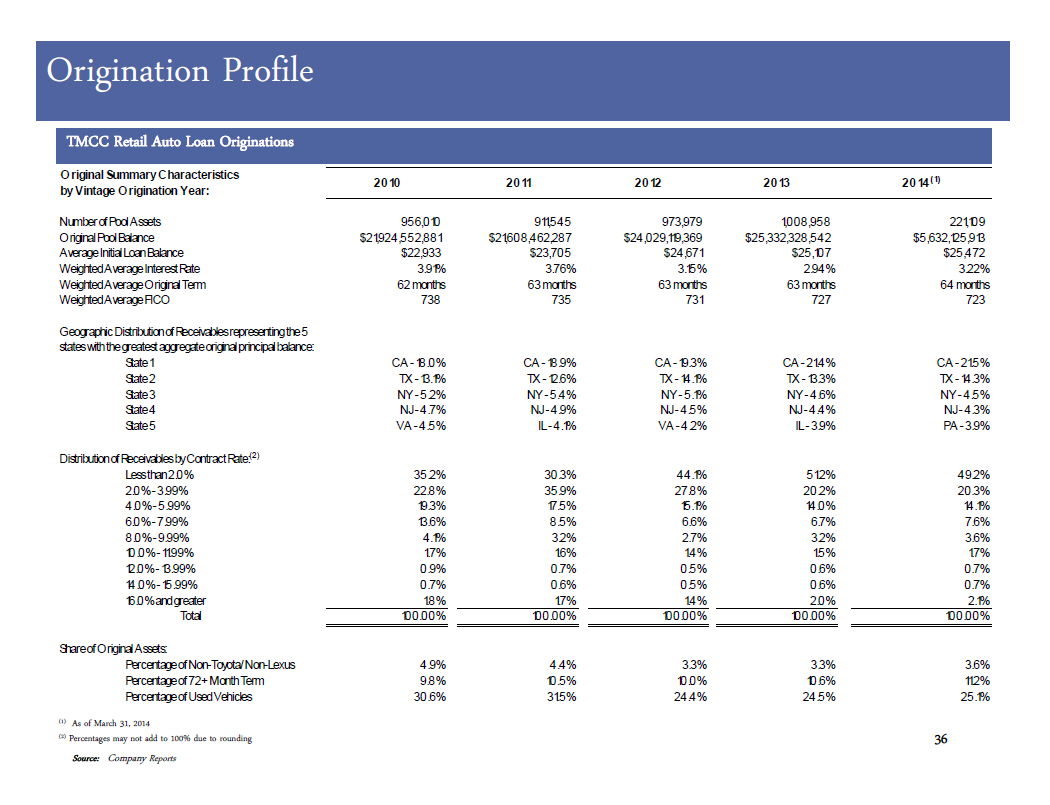
Origination Profile
TMCC Retail Auto Loan Originations
O riginal SummaryCharacteristics 2010 2011
by Vintage O rigination Year:
========== ====== ===================
Number of Pool Assets 956,010 911,545
Original Pool Balance $21,924,552,881 $21,608,462,287
Average Initial LoanBalance $22,933 $23,705
Weighted Average Interest Rate 3.91% 3.76%
Weighted Average Original Term 62 months 63 months
Weighted Average FICO 738 735
Geographic Distribution of Receivablesrepresenting the 5
states withthe greatest aggregate original principal balance:
State 1 CA 18.0% CA - 18.9%
State 2 TX 13.1% TX 12.6%
State 3 NY - 5.2% NY - 5.4%
State 4 NJ - 4.7% NJ- 4.9%
State 5 VA - 4.5% IL - 4.1%
Distribution of Receivablesby Contract Rate:(2)
Less than2.0% 35.2% 30.3%
2.0% - 3.99% 22.8% 35.9%
4.0% - 5.99% 19.3% 17.5%
6.0% - 7.99% 13.6% 8.5%
8.0% - 9.99% 4.1% 3.2%
10.0% - 11.99% 1.7% 1.6%
12.0% -13.99% 0.9% 0.7%
14.0% - 15.99% 0.7% 0.6%
16.0% andgreater 1.8% 1.7%
========== ====== ===================
Total 100.00% 100.00%
================= ===================
Share of Original Assets:
Percentage ofNon-Toyota/Non-Lexus 4.9% 4.4%
Percentage of72+ Month Term 9.8% 10.5%
Percentage ofUsed Vehicles 30.6% 31.5%
2012 2013 2014 (1)
================= =================== =================
973,979 1,008,958 221,109
$24,029,119,369 $25,332,328,542 $5,632,125,913
$24,671 $25,107 $25,472
3.15% 2.94% 3.22%
63 months 63 months 64 months
731 727 723
CA - 19.3% CA - 21.4% CA - 21.5%
TX - 14.1% TX -13.3% TX - 14.3%
NY - 5.1% NY - 4.6% NY - 4.5%
NJ - 4.5% NJ - 4.4% NJ- 4.3%
VA - 4.2% IL - 3.9% PA - 3.9%
44.1% 51.2% 49.2%
27.8% 20.2% 20.3%
15.1% 14.0% 14.1%
6.6% 6.7% 7.6%
2.7% 3.2% 3.6%
1.4% 1.5% 1.7%
0.5% 0.6% 0.7%
0.5% 0.6% 0.7%
1.4% 2.0% 2.1%
================= =================== =================
100.00% 100.00% 100.00%
================= =================== =================
3.3% 3.3% 3.6%
10.0% 10.6% 11.2%
24.4% 24.5% 25.1%
36
|
 |
Origination Characteristics
Weighted Average Original Term
*As of March 31, 2014
Source: Company Reports
Weighted Average FICO
Weighted Average FICO
New vs. Used
37
|
 |
(1) Abbreviated for presentation purposes
38
Source: Company Reports
ABS Deal Comparison
(1)
Toyota Auto Owner Trust (TAOT)
O riginal Summary Characteristicsby TAO T 2012-A TAO T 2012-B
Prior Securitization:
====================== ===========
Number of Pool Assets 95,915 62,985
Original Pool Balance $1,558,792,743 $1,034,333,678
Average Principal Balance $16,252 $16,422
Weighted Average Interest Rate 2.89% 2.85%
Weighted Average Original Term 61 61
Weighted Average FICO 754 754
GeographicDistribution of Receivables
representing the 5 states with the greatest
State 1 CA - 19.8% CA - 21.4%
State 2 TX 12.4% TX 13.3%
State 3 IL - 4.5% NJ - 4.7%
State 4 VA - 4.5% IL - 4.5%
State 5 MD - 4.1% NY - 4.5%
Share of Original Assets:
Percentage of Non-Toyota/Non- 0.0% 0.0%
Percentage of 72+ Month Term 0.0% 0.0%
Percentage of Used Vehicles 27.3% 26.3%
TAO T 2013-A TAO T 2013-B TAO T 2014-A
====================== ===================== ======================
84,513 66,096 115,093
$1,301,545,574 $1,054,454,801 $1,845,073,346
$15,401 $15,953 $16,031
2.56% 2.24% 2.10%
61 61 61
756 757 757
CA - 20.0% CA - 21.3% CA - 22.6%
TX 13.3% TX 13.4% TX 13.4%
VA - 4.3% IL - 4.2% IL - 4.6%
IL - 4.3% VA - 4.1% PA - 4.3%
NJ - 4.2% PA - 4.0% NJ - 4.2%
0.0% 0.0% 0.0%
0.0% 0.0% 0.0%
22.7% 21.8% 21.4%
38
|
 |
TAOT Deal Performance
As of April 15, 2014 Payment Date
Source: Company Reports
1 2 3 4 5 6 7 8
91011121314151617181920212223242526272829303132333435363738394041
TAOT 2010-A
TAOT 2010-B
TAOT 2010-C
TAOT 2011-A
TAOT 2011-B
TAOT 2012-A
TAOT 2012-B
TAOT 2013-A
TAOT 2013-B
TAOT 2014-A
39
|
 |
Sales
& Trading
Update
40
|
 |
Commercial Paper Programs Highlights
[] A-1+/P-1 Direct Commercial Paper Programs
-- 3 distinct USD commercial paper programs (TMCC, TCPR, TCCI) -- $13.0
billion multi-party committed credit facilities -- $5.7 billion bilateral
committed credit facilities -- $25.9 billion USCP combined average
outstanding for TMCC and TCPR
-- Over 600 diverse institutional investors
[] State and local municipalities
[] Large corporations
[] Pension and retirement funds
[] Financial institutions
[] Money managers and mutual fund companies
-- Rates are posted daily on Bloomberg DOCP screen
Source: TMCC March 31, 2014 10-K
41
|
 |
TOYOTA
FINANCIAL SERVICES
42
|
 |
|
|

