Filed Pursuant to Rule 433
Registration No. 333-158385
November 1, 2011
FREE WRITING PROSPECTUS
(To Prospectus dated April 2, 2009,
Prospectus Supplement dated April 9, 2009,
Product Supplement dated April 9, 2009,
Underlying Supplement no. 3 dated October 22, 2010, and
Underlying Supplement no. 4 dated October 22, 2010)
HSBC USA Inc.
Buffered Accelerated Market Participation
SecuritiesTM (“AMPS”)
|
}
|
AMPSTM linked to an equally weighted basket consisting of the S&P 500® Index, the Russell 2000® Index and the iShares® MSCI EAFE Index Fund
|
|
}
|
3-year maturity
|
|
}
|
1.5x exposure to any positive return in the reference asset, subject to a maximum return
|
|
}
|
Protection from the first 20% of any losses in the reference asset, subject to the credit risk of HSBC USA Inc.
|
The Buffered Accelerated Market Participation SecuritiesTM (“AMPS” or, each a “security” and collectively the “securities”) offered hereunder are not deposit liabilities or other obligations of a bank and are not insured by the Federal Deposit Insurance Corporation or any other governmental agency of the United States or any other jurisdiction and include investment risks including possible loss of the Principal Amount invested due to the credit risk of HSBC USA Inc. The AMPS will not be listed on any U.S. securities exchange or automated quotation system.
Neither the U.S. Securities and Exchange Commission (the “SEC”) nor any state securities commission has approved or disapproved of the securities or passed upon the accuracy or the adequacy of this document, the accompanying prospectus, prospectus supplement, product supplement, underlying supplement no. 3 or underlying supplement no. 4. Any representation to the contrary is a criminal offense. We have appointed HSBC Securities (USA) Inc., an affiliate of ours, as the agent for the sale of the securities. HSBC Securities (USA) Inc. will purchase the securities from us for distribution to other registered broker dealers or will offer the securities directly to investors. In addition, HSBC Securities (USA) Inc. or another of its affiliates or agents may use the pricing supplement to which this free writing prospectus relates in market-making transactions in any securities after their initial sale. Unless we or our agent informs you otherwise in the confirmation of sale, the pricing supplement to which this free writing prospectus relates is being used in a market-making transaction. See “Supplemental Plan of Distribution (Conflicts of Interest)” on page FWP-16 of this free writing prospectus.
Investment in the securities involves certain risks. You should refer to “Risk Factors” beginning on page FWP-8 of this document, page PS-4 of the accompanying product supplement, page S-3 of the accompanying prospectus supplement, page US3-1 of the accompanying underlying supplement no. 3, and page US4-2 of the accompanying underlying supplement no. 4.
|
Price to Public
|
Fees and Commissions1
|
Proceeds to Issuer
|
|
|
Per security
|
$1,000
|
||
|
Total
|
1HSBC USA Inc. or one of our affiliates may pay varying discounts and commissions of up to 2.15% per $1,000 Principal Amount of securities in connection with the distribution of the securities, which may consist of selling concessions of up to 2.15%. See “Supplemental Plan of Distribution (Conflicts of Interest)” on page FWP-16 of this free writing prospectus.
HSBC USA Inc.
Buffered Accelerated Market Participation SecuritiesTM (AMPS)
Linked to an equally weighted basket of consisting of SPX, RTY and EFA
This FWP relates to a single offering of AMPSTM by HSBC USA Inc. linked to the performance of the Reference Asset as indicated below.
|
Reference Asset
|
Reference Asset Components
|
Component
Weighting
|
Maximum Cap1
|
CUSIP
|
|
SPX/RTY/EFA Basket
|
S&P 500® Index (“SPX”)
Russell 2000® Index (“RTY”)
iShares® MSCI EAFE Index Fund (“EFA”)
|
1/3
1/3
1/3
|
37.00% to 41.00%
|
4042K1SE4
|
|
1Expected range. The actual Maximum Cap will be determined on the Pricing Date.
|
||||
Indicative Terms*
|
Principal Amount
|
$1,000 per security
|
|
Term
|
3 years
|
|
Upside
Participation Rate
|
150% (1.5x) exposure to any positive Reference Return, subject to the Maximum Cap
|
|
Buffer Value
|
-20%
|
|
Payment at
Maturity
per security
|
If the underlying Reference Return is greater than zero, you will receive the lesser of:
a) $1,000 + ($1,000 × Reference Return × Upside Participation Rate); and
b) $1,000 + ($1,000 × Maximum Cap).
If the Reference Return is less than or equal to zero but greater than or equal to the Buffer Value:
$1,000 (zero return).
If the Reference Return is less than the Buffer Value:
$1,000 + [$1,000 × (Reference Return + 20%)]
For example, if the Reference Return is less than the Buffer Value, you will lose 1% of the Principal Amount of your securities for every 1% decline in the Final Value as compared to the Initial Value. If the Reference Return is less than the Buffer Value you could lose 80% of your initial investment.
|
|
Reference Return
|
Final Value – Initial Value
Initial Value
|
|
Initial Value
|
See page FWP-5
|
|
Final Value
|
See page FWP-5
|
|
Pricing Date
|
November 18, 2011
|
|
Trade Date
|
November 18, 2011
|
|
Original Issue Date
|
November 28, 2011
|
|
Final Valuation Date
|
November 18, 2014
|
|
Maturity Date
|
November 25, 2014
|
* As more fully described beginning on page FWP-4.
The AMPSTM
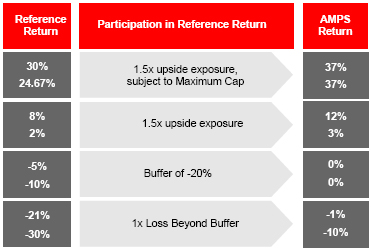
For investors who believe the Reference Asset will appreciate over the term of the AMPS, the AMPS provide an opportunity for accelerated returns (subject to the Maximum Cap). If the Reference Return is below the Buffer Value, then the AMPS provide 1:1 exposure to any potential decline in the Reference Asset beyond -20%
If the Reference Asset appreciates over the term of the securities, you will realize 150% (1.5x) of the Reference Asset appreciation up to the Maximum Cap. Should the Reference Asset decline, you will lose 1% of your investment for every 1% decline in the Reference Asset beyond the -20% Buffer Value. You could lose up to 80% of your initial investment.
|
The offering period for the AMPS is through November 18, 2011
|

FWP-2
|
Payoff Example
|
||
|
The table at right shows the hypothetical payout profile of an investment in the securities reflecting the 150% (1.5x) Upside Participation Rate and a hypothetical Maximum Cap of 37.00%. The actual Maximum Cap will be determined on the Pricing Date and will not be less than 37.00% or greater than 41.00%.
|
 |
Information about the Reference Asset
|
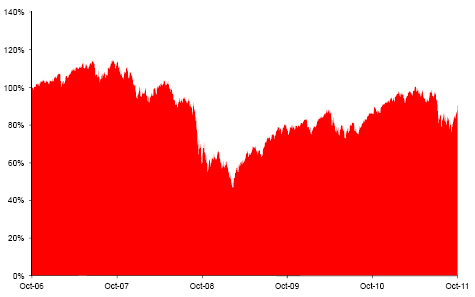
The following graph illustrates the hypothetical daily historical performance of the SPX/RTY/EFA Basket from October 28, 2006 through October 28, 2011 based on information from Bloomberg Professional® service, if the level of the Basket was made to equal 100 on October 28, 2006. The hypothetical historical performance reflects the performance the Basket would have exhibited based on (i) the actual historical performance of the Reference Asset Components and (ii) the assumption that no adjustment to the Official Closing Value occurred from October 28, 2006 through October 28, 2011 for any Reference Asset Component. Neither the hypothetical historical performance of the Basket nor the actual historical performance of the Reference Asset Components should be taken as indications of future performance.
We cannot give you assurance that the performance of the Basket will result in the return of your initial investment. You may lose up to 80% of your investment.
|

FWP-3
|
HSBC USA Inc.
Buffered Accelerated Market Participation SecuritiesTM (AMPS)
|
Linked to an equally weighted basket consisting of the S&P 500® Index, the Russell 2000® Index and the iShares® MSCI EAFE Index Fund
All references to “Enhanced Market Participation Notes” in the accompanying product supplement shall refer to these Buffered Accelerated Market Participation Securities. The offering of securities will have the terms described in this free writing prospectus and the accompanying underlying supplement no. 3, underlying supplement no. 4, product supplement, prospectus supplement and prospectus. If the terms of the securities offered hereby are inconsistent with those described in the accompanying underlying supplement no. 3, underlying supplement no. 4, product supplement, prospectus supplement or prospectus, the terms described in this free writing prospectus shall control. You should be willing to forgo interest and dividend payments during the term of the securities and, if the Reference Return is negative, lose up to 80% of your principal.
This free writing prospectus relates to a single offering of securities linked to the performance of an equally weighted basket (the “Reference Asset”). The purchaser of a security will acquire a senior unsecured debt security of HSBC USA Inc. linked to the Reference Asset as described below. The following key terms relate to the offering of securities:
|
Issuer:
|
HSBC USA Inc.
|
|
Issuer Rating:
|
AA- (S&P), A1 (Moody’s), AA (Fitch)†
|
|
Principal Amount:
|
$1,000 per security
|
|
Reference Asset:
|
The underlying basket consisting of two indices and one index fund (each, a “Reference Asset Component”), as indicated below
|
|
Reference Asset
|
Reference Asset Components
|
Upside Participation
Rate
|
Maximum Cap1
|
CUSIP/ISIN
|
|
SPX/RTY/EFA Basket:
|
S&P 500® Index (“SPX”)
Russell 2000® Index (“RTY”)
iShares® MSCI EAFE Index Fund (“EFA”)
|
150%
|
37.00% to 41.00%
|
4042K1SE4 /
|
|
|
1Expected range. The actual Maximum Cap will be determined on the Pricing Date.
|
|||||||||
|
Trade Date:
|
November 18, 2011
|
||||||||
|
Pricing Date:
|
November 18, 2011
|
||||||||
|
Original Issue Date:
|
November 28, 2011
|
||||||||
|
Final Valuation Date:
|
November 18, 2014, subject to adjustment as described below under the caption “Final Valuation Date and Maturity Date.”
|
||||||||
|
Maturity Date:
|
5 business days after the Final Valuation Date, which is expected to be November 25, 2014. The Maturity Date is subject to adjustment as described below under the caption “Final Valuation Date and Maturity Date.”
|
||||||||
|
Payment at Maturity:
|
On the Maturity Date, for each security, we will pay you the Final Settlement Value.
|
||||||||
|
Component Weighting:
|
With respect to the SPX, 1/3, with respect to the RTY, 1/3 and with respect to the EFA, 1/3.
|
||||||||
|
Final Settlement Value:
|
If the Reference Return is greater than zero, you will receive a cash payment on the Maturity Date, per $1,000 Principal Amount of securities, equal to the lesser of:
(a) $1,000 + ($1,000 × Reference Return × Upside Participation Rate); and
(b) $1,000 + ($1,000 × Maximum Cap).
If the Reference Return is less than or equal to zero but greater than or equal to the Buffer Value, you will receive $1,000 per $1,000 Principal Amount of securities (zero return).
If the Reference Return is less than the Buffer Value, you will receive a cash payment on the Maturity Date, per $1,000 Principal Amount of securities, calculated as follows:
$1,000 + [$1,000 × (Reference Return + 20%)].
Under these circumstances, you will lose 1% of the Principal Amount of your securities for each percentage point that the Reference Return is below the Buffer Value. For example, because the buffer protects the first 20% of loss, if the Reference Return is -30%, you will suffer a 10% loss and receive 90% of the Principal Amount. If the Reference Return is less than the Buffer Value, you may lose up to 80% of your investment.
|
FWP-4
|
Reference Return:
|
The quotient, expressed as a percentage, calculated as follows:
|
|
Final Value – Initial Value
Initial Value
|
|
|
Buffer Value:
|
-20%
|
|
Initial Value:
|
Set equal to 100 on the Pricing Date.
|
|
Final Value:
|
The Closing Value on the Final Valuation Date.
|
|
Closing Value:
|
On any scheduled trading day, the Reference Asset Closing Value will be calculated as follows:
100 × [1 + (sum of the Reference Asset Component Return multiplied by the respective Component Weighting for each Reference Asset Component)]
Each of the Reference Asset Component Returns set forth in the formula above refers to the return for the Reference Asset Component, which reflects the performance of the Reference Asset Component, expressed as the percentage change from the Initial Component Value of that Reference Asset Component to the Final Component Value of that Reference Asset Component.
|
|
Initial Component Value:
|
With respect to each Reference Asset Component, the Official Closing Value (as defined below) of the respective Reference Asset Component as determined by the calculation agent on the Pricing Date.
|
|
Final Component Value:
|
With respect to each Reference Asset Component, the Official Closing Value of the respective Reference Asset Component on the Final Valuation Date.
|
|
Official Closing Value:
|
With respect to each Reference Asset Component, the Official Closing Value on any scheduled trading day will be determined by the calculation agent based upon the closing level of such index or closing price of such index fund, as applicable, displayed on the relevant Bloomberg Professional® service page (with respect to the SPX, “SPX <INDEX>”, with respect to the RTY, “RTY <INDEX>” and with respect to the EFA, “EFA UP <EQUITY>”) and with respect to the EFA, adjusted by the calculation agent as described under “Additional Terms of the Notes—Antidiluton and Reorganization Adjustments” in the accompanying underlying supplement no. 4 or, for each Reference Asset Component, any successor page on Bloomberg Professional® service or any successor service, as applicable.
|
|
Form of securities:
|
Book-Entry
|
|
Listing:
|
The securities will not be listed on any U.S. securities exchange or quotation system.
|
† A credit rating reflects the creditworthiness of HSBC USA Inc. and is not a recommendation to buy, sell or hold securities, and it may be subject to revision or withdrawal at any time by the assigning rating organization. The securities themselves have not been independently rated. Each rating should be evaluated independently of any other rating.
FWP-5
GENERAL
This free writing prospectus relates to a single security offering linked to the Reference Asset identified on the cover page. The purchaser of a security will acquire a senior unsecured debt security of HSBC USA Inc. linked to the Reference Asset. We reserve the right to withdraw, cancel or modify the offering and to reject orders in whole or in part. Although the offering of securities relates to the Reference Asset identified on the cover page, you should not construe that fact as a recommendation as to the merits of acquiring an investment linked to such Reference Asset or any component security included in such Reference Asset or as to the suitability of an investment in the securities.
You should read this document together with the prospectus dated April 2, 2009, the prospectus supplement dated April 9, 2009, the product supplement dated April 9, 2009, underlying supplement no. 3 dated October 22, 2010 and underlying supplement no. 4 dated October 22, 2010. All references to “Enhanced Market Participation Notes” in the accompanying product supplement shall refer to these Buffered Accelerated Market Participation Securities. If the terms of the securities offered hereby are inconsistent with those described in the accompanying underlying supplement no. 3, underlying supplement no. 4, product supplement, prospectus supplement or prospectus, the terms described in this free writing prospectus shall control. You should carefully consider, among other things, the matters set forth in “Risk Factors” beginning on page FWP-8 of this free writing prospectus, page US3-1 of the underlying supplement no. 3, page US4-2 of the underlying supplement no. 4, page PS-4 of the product supplement and page S-3 of the prospectus supplement as the securities involve risks not associated with conventional debt securities. We urge you to consult your investment, legal, tax, accounting and other advisors before you invest in the securities. As used herein, references to the “Issuer”, “HSBC”, “we”, “us” and “our” are to HSBC USA Inc.
HSBC has filed a registration statement (including a prospectus, a prospectus supplement, a product supplement and underlying supplements) with the SEC for the offering to which this free writing prospectus relates. Before you invest, you should read the prospectus, prospectus supplement, product supplement, underlying supplement no. 3 and underlying supplement no. 4 in that registration statement and other documents HSBC has filed with the SEC for more complete information about HSBC and this offering. You may get these documents for free by visiting EDGAR on the SEC’s web site at www.sec.gov. Alternatively, HSBC Securities (USA) Inc. or any dealer participating in this offering will arrange to send you the prospectus, prospectus supplement, product supplement and underlying supplements if you request them by calling toll-free 1-866-811-8049.
You may also obtain:
|
}
|
The underlying supplement no. 3 at: http://www.sec.gov/Archives/edgar/data/83246/000114420410055205/v198039_424b2.htm
|
|
}
|
The underlying supplement no. 4 at: http://www.sec.gov/Archives/edgar/data/83246/000114420410055207/v199610_424b2.htm
|
|
}
|
The product supplement at: http://www.sec.gov/Archives/edgar/data/83246/000114420409019791/v145840_424b2.htm
|
|
}
|
The prospectus supplement at: http://www.sec.gov/Archives/edgar/data/83246/000114420409019785/v145824_424b2.htm
|
|
}
|
We are using this free writing prospectus to solicit from you an offer to purchase the securities. You may revoke your offer to purchase the securities at any time prior to the time at which we accept your offer by notifying HSBC Securities (USA) Inc. We reserve the right to change the terms of, or reject any offer to purchase, the securities prior to their issuance. In the event of any material changes to the terms of the securities, we will notify you.
PAYMENT AT MATURITY
On the Maturity Date, for each security you hold, we will pay you the Final Settlement Value, which is an amount in cash, as described below:
If the Reference Return is greater than zero, you will receive a cash payment on the Maturity Date, per $1,000 Principal Amount of securities, equal to the lesser of:
(a) $1,000 + ($1,000 × Reference Return × Upside Participation Rate); and
(b) $1,000 + ($1,000 × Maximum Cap).
If the Reference Return is less than or equal to zero but greater than or equal to the Buffer Value, you will receive $1,000 per $1,000 Principal Amount of securities (zero return).
If the Reference Return is less than the Buffer Value, you will receive a cash payment on the Maturity Date, per $1,000 Principal Amount of securities, calculated as follows:
$1,000 + [$1,000 × (Reference Return + 20%)].
FWP-6
Under these circumstances, you will lose 1% of the Principal Amount of your securities for each percentage point that the Reference Return is below the Buffer Value. For example, because the buffer protects the first 20% loss, subject to the credit risk of HSBC, if the Reference Return is -30%, you will suffer a 10% loss and receive 90% of the Principal Amount. You should be aware that if the Reference Return is less than the Buffer Value, you may lose up to 80% of your investment.
Interest
The securities will not pay periodic interest.
Calculation Agent
We or one of our affiliates will act as calculation agent with respect to the securities.
Trustee
Notwithstanding anything contained in the accompanying prospectus supplement or product supplement to the contrary, the securities will be issued under the senior indenture dated March 31, 2009, between HSBC USA Inc., as Issuer, and Wells Fargo Bank, National Association, as trustee. Such indenture has substantially the same terms as the indenture described in the accompanying prospectus supplement.
Paying Agent
Notwithstanding anything contained in the accompanying prospectus supplement or product supplement to the contrary, HSBC Bank USA, N.A. will act as paying agent with respect to the securities pursuant to a Paying Agent and Securities Registrar Agreement dated June 1, 2009, between HSBC USA Inc. and HSBC Bank USA, N.A.
Reference Issuer and Reference Sponsor
With respect to EFA, iShares, Inc. is the reference issuer. With respect to SPX, Standard and Poor’s Financial Services LLC, a subsidiary of The McGraw-Hill Companies, Inc. is the reference sponsor. With respect to RTY, Russell Investment Group is the reference sponsor.
INVESTOR SUITABILITY
The securities may be suitable for you if:
|
}
|
You seek an investment with an enhanced return linked to the potential positive performance of the Reference Asset up to the Maximum Cap and you believe the value of such Reference Asset will increase over the term of the securities.
|
|
}
|
You are willing to invest in the securities based on the Maximum Cap indicated herein, which may limit your return at maturity.
|
|
}
|
You are willing to make an investment that is exposed to the negative Reference Return on a 1-to-1 basis for each percentage point that the Reference Return is below -20%.
|
|
}
|
You do not prefer the lower risk, and therefore accept the potentially lower returns, of conventional debt securities with comparable maturities issued by HSBC or another issuer with a similar credit rating.
|
|
}
|
You are willing to forego dividends or other distributions paid to holders of stocks comprising the Reference Asset Components, or the Reference Asset Components themselves, as applicable.
|
|
}
|
You do not seek current income from your investment.
|
|
}
|
You do not seek an investment for which there is an active secondary market.
|
|
}
|
You are willing to hold the securities to maturity.
|
|
}
|
You are comfortable with the creditworthiness of HSBC, as issuer of the securities.
|
The securities may not be suitable for you if:
|
}
|
You believe the Reference Return will be negative on the Final Valuation Date or that the Reference Return will not be sufficiently positive to provide you with your desired return.
|
|
}
|
You are unwilling to invest in the securities based on the Maximum Cap indicated herein, which may limit your return at maturity.
|
|
}
|
You are unwilling to make an investment that is exposed to the negative Reference Return on a 1-to-1 basis for each percentage point that the Reference Return is below -20%.
|
|
}
|
You seek an investment that provides a full return of principal.
|
|
}
|
You prefer the lower risk, and therefore accept the potentially lower returns, of conventional debt securities with comparable maturities issued by HSBC or another issuer with a similar credit rating.
|
|
}
|
You prefer to receive the dividends or other distributions paid on any stocks comprising the Reference Asset Components, or the Reference Asset Components themselves, as applicable.
|
|
}
|
You seek current income from your investment.
|
|
}
|
You seek an investment for which there will be an active secondary market.
|
|
}
|
You are unable or unwilling to hold the securities to maturity
|
|
}
|
You are not willing or are unable to assume the credit risk associated with HSBC, as issuer of the securities.
|
FWP-7
RISK FACTORS
We urge you to read the section “Risk Factors” beginning on page S-3 in the accompanying prospectus supplement, page PS-4 of the accompanying product supplement, page US3-1 of underlying supplement no. 3 and page US4-2 of underlying supplement no. 4. Investing in the securities is not equivalent to investing directly in any of the stocks comprising the Reference Asset Components or the Reference Asset Components themselves, as applicable. You should understand the risks of investing in the securities and should reach an investment decision only after careful consideration, with your advisors, of the suitability of the securities in light of your particular financial circumstances and the information set forth in this free writing prospectus and the accompanying underlying supplement no. 3, underlying supplement no. 4, product supplement, prospectus supplement and prospectus.
In addition to the risks discussed below, you should review “Risk Factors” in the accompanying underlying supplement no. 3, the accompanying underlying supplement no. 4, the accompanying product supplement and the accompanying prospectus supplement, including the explanation of risks relating to the securities described in the following sections:
|
}
|
“— Risks Relating to All Note Issuances” in the prospectus supplement;
|
|
}
|
“— Additional Risks Relating to Notes with an Equity Security or Equity Index as the Reference Asset” in the prospectus supplement;
|
|
}
|
“— Additional Risks Relating to Certain Notes with More than One Instrument Comprising the Reference Asset” in the prospectus supplement;
|
|
}
|
“— Additional Risks Relating to Notes Linked to the Performance of Exchange-Traded Funds” in the product supplement;
|
|
}
|
“— There are Risks Associated with Small Capitalization Stocks” in underlying supplement no. 3;
|
|
}
|
“— Securities Prices Generally are Subject to Political, Economic, Financial, and Social Factors that Apply to the Markets in which they Trade and to a Lesser Extent, Foreign Markets” in underlying supplement no. 4; and
|
|
}
|
“— The Notes are Subject to Currency Exchange Risk” in underlying supplement no. 4.
|
You will be subject to significant risks not associated with conventional fixed-rate or floating-rate debt securities.
Your investment in the securities may result in a loss.
You will be exposed to the decline in the Final Value from the Initial Value beyond the Buffer Value of -20%. Accordingly, if the Reference Return is less than -20%, your Payment at Maturity will be less than the Principal Amount of your securities. You may lose up to 80% of your investment at maturity if the Reference Return is negative.
The appreciation on the securities is limited by the Maximum Cap.
You will not participate in any appreciation in the value of the Reference Asset (as magnified by the Upside Participation Rate) beyond the Maximum Cap. The Maximum Cap (to be determined on the Pricing Date) will not be less than 37.00% or greater than 41.00%. You will not receive a return on the securities greater than the Maximum Cap.
Credit risk of HSBC USA Inc.
The securities are senior unsecured debt obligations of the issuer, HSBC, and are not, either directly or indirectly, an obligation of any third party. As further described in the accompanying prospectus supplement and prospectus, the Notes will rank on par with all of the other unsecured and unsubordinated debt obligations of HSBC, except such obligations as may be preferred by operation of law. Any payment to be made on the securities, including any return of principal at maturity, depends on the ability of HSBC to satisfy its obligations as they come due. As a result, the actual and perceived creditworthiness of HSBC may affect the market value of the securities and, in the event HSBC were to default on its obligations, you may not receive the amounts owed to you under the terms of the securities.
The securities will not bear interest.
As a holder of the securities, you will not receive periodic interest payments.
No interest or dividend payments or voting rights.
As a holder of the securities, you will not receive interest payments, and you will not have voting rights or rights to receive cash dividends or other distributions or other rights that holders of the stocks comprising the Reference Asset Components or the Reference Asset Components themselves would have.
FWP-8
Changes in the values of the Reference Asset Components may offset each other.
Movements in the values of the Reference Asset Components may not correlate with each other. At a time when the value of one of the Reference Asset Components increases, the values of the other Reference Asset Components may not increase as much or may even decline. Therefore, in calculating the Final Value and therefore the Reference Return and Final Settlement Value, increases in the value of one or more of the Reference Asset Components may be moderated, or more than offset, by lesser increases or declines in the values of the other Reference Asset Components. As a result, the Final Settlement Value may be adversely affected even if the value of some of the Reference Asset Components increase during the term of the securities.
An index fund and its underlying index are different.
The performance of an index fund may not exactly replicate the performance of the respective underlying index, because such index fund will reflect transaction costs and fees that are not included in the calculation of the respective underlying index. It is also possible that an index fund may not fully replicate or may in certain circumstances diverge significantly from the performance of the respective underlying index due to the temporary unavailability of certain securities in the secondary market, the performance of any derivative instruments contained in such fund or due to other circumstances. An index fund may use futures contracts, options, swap agreements, currency forwards and repurchase agreements in seeking performance that corresponds to the respective underlying index and in managing cash flows.
The Reference Asset is subject to management risk.
The index fund included in the Reference Asset is not managed according to traditional methods of ‘‘active’’ investment management, which involve the buying and selling of securities based on economic, financial and market analysis and investment judgment. Instead, the index fund, utilizing a ‘‘passive’’ or indexing investment approach, attempts to approximate the investment performance of its underlying index by investing in a portfolio of securities that generally replicate the underlying index. Therefore, unless a specific security is removed from the underlying index, the index fund generally would not sell a security because the security’s issuer was in financial trouble. In addition, the index fund is subject to the risk that the investment strategy of the index fund’s investment advisor may not produce the intended results.
There is limited anti-dilution protection.
For certain events affecting shares of an index fund, such as stock splits or extraordinary dividends, the calculation agent may make adjustments to the relevant Final Component Value, which may affect your Final Settlement Value. However, the calculation agent is not required to make an adjustment for every corporate action which affects the shares of the relevant Reference Asset Component. If an event occurs that does not require the calculation agent to adjust the amount of the shares of the relevant Reference Asset Component, the market price of the securities and the Final Settlement Value may be materially and adversely affected.
The securities are not insured by any governmental agency of the United States or any other jurisdiction.
The securities are not deposit liabilities or other obligations of a bank and are not insured by the Federal Deposit Insurance Corporation or any other governmental agency or program of the United States or any other jurisdiction. An investment in the securities is subject to the credit risk of HSBC, and in the event that HSBC is unable to pay its obligations as they become due, you may not receive the full Payment at Maturity of the securities.
Certain built-in costs are likely to adversely affect the value of the securities prior to maturity.
While the Payment at Maturity described in this free writing prospectus is based on the full Principal Amount of your securities, the original issue price of the securities includes the placement agent’s commission and the estimated cost of HSBC hedging its obligations under the securities. As a result, the price, if any, at which HSBC Securities (USA) Inc. will be willing to purchase securities from you in secondary market transactions, if at all, will likely be lower than the original issue price, and any sale prior to the Maturity Date could result in a substantial loss to you. The securities are not designed to be short-term trading instruments. Accordingly, you should be able and willing to hold your securities to maturity.
The securities lack liquidity.
The securities will not be listed on any securities exchange. HSBC Securities (USA) Inc. is not required to offer to purchase the securities in the secondary market, if any exists. Even if there is a secondary market, it may not provide enough liquidity to allow you to trade or sell the securities easily. Because other dealers are not likely to make a secondary market for the securities, the price at which you may be able to trade your securities is likely to depend on the price, if any, at which HSBC Securities (USA) Inc. is willing to buy the securities.
FWP-9
Potential conflicts.
HSBC and its affiliates play a variety of roles in connection with the issuance of the securities, including acting as calculation agent and hedging our obligations under the securities. In performing these duties, the economic interests of the calculation agent and other affiliates of ours are potentially adverse to your interests as an investor in the securities. We will not have any obligation to consider your interests as a holder of the securities in taking any action that might affect the value of your securities.
Uncertain tax treatment.
For a discussion of the U.S. federal income tax consequences of your investment in a security, please see the discussion under “U.S. Federal Income Tax Considerations” herein, the discussion under “Certain U.S. Federal Income Tax Considerations” in the accompanying product supplement and the discussion under “Certain U.S. Federal Income Tax Considerations” in the accompanying prospectus supplement.
FWP-10
ILLUSTRATIVE EXAMPLES
The following table and examples are provided for illustrative purposes only and are hypothetical. They do not purport to be representative of every possible scenario concerning increases or decreases in the value of the Reference Asset relative to its Initial Value. We cannot predict the Final Value of the Reference Asset. The assumptions we have made in connection with the illustrations set forth below may not reflect actual events. You should not take this illustration or these examples as an indication or assurance of the expected performance of the Reference Asset to which your securities are linked or the return on your securities. With respect to the securities, the Final Settlement Value may be less than the amount that you would have received from a conventional debt security with the same stated maturity, including those issued by HSBC. The numbers appearing in the table below and following examples have been rounded for ease of analysis.
The table below illustrates the Payment at Maturity on a $1,000 investment in the securities for a hypothetical range of performance for the Reference Return from -100% to +100%. The following results are based solely on the assumptions outlined below. The “Hypothetical Return on the Security” as used below is the number, expressed as a percentage, that results from comparing the Payment at Maturity per $1,000 Principal Amount of securities to $1,000. The potential returns described here assume that your securities are held to maturity. You should consider carefully whether the securities are suitable to your investment goals. The following table and examples assume the following:
|
}
|
Principal Amount:
|
$1,000
|
|
}
|
Upside Participation Rate:
|
150%
|
|
}
|
Hypothetical Maximum Cap:
|
37.00% (The actual Maximum Cap will be determined on the Pricing Date and will not be less than 37.00% or greater than 41.00%)
|
|
Hypothetical
Reference Return
|
Hypothetical Payment
at Maturity
|
Hypothetical Return on
the Security
|
|
100.00%
|
$1,370.00
|
37.00%
|
|
80.00%
|
$1,370.00
|
37.00%
|
|
60.00%
|
$1,370.00
|
37.00%
|
|
40.00%
|
$1,370.00
|
37.00%
|
|
24.67%
|
$1,370.00
|
37.00%
|
|
20.00%
|
$1,300.00
|
30.00%
|
|
15.00%
|
$1,225.00
|
22.50%
|
|
10.00%
|
$1,150.00
|
15.00%
|
|
5.00%
|
$1,075.00
|
7.50%
|
|
2.00%
|
$1,030.00
|
3.00%
|
|
1.00%
|
$1,015.00
|
1.50%
|
|
0.00%
|
$1,000.00
|
0.00%
|
|
-1.00%
|
$1,000.00
|
0.00%
|
|
-2.00%
|
$1,000.00
|
0.00%
|
|
-5.00%
|
$1,000.00
|
0.00%
|
|
-10.00%
|
$1,000.00
|
0.00%
|
|
-15.00%
|
$1,000.00
|
0.00%
|
|
-20.00%
|
$1,000.00
|
0.00%
|
|
-30.00%
|
$900.00
|
-10.00%
|
|
-40.00%
|
$800.00
|
-20.00%
|
|
-60.00%
|
$600.00
|
-40.00%
|
|
-80.00%
|
$400.00
|
-60.00%
|
|
-100.00%
|
$200.00
|
-80.00%
|
The following examples indicate how the Final Settlement Value would be calculated with respect to a hypothetical $1,000 investment in the securities.
Example 1: The Reference Return is 5.00%.
|
Reference Return:
|
5.00%
|
|
Final Settlement Value:
|
$1,075.00
|
Because the Reference Return is positive, and such Reference Return multiplied by the Upside Participation Rate is less than the hypothetical Maximum Cap, the Final Settlement Value would be $1,075.00 per $1,000 Principal Amount of securities, calculated as follows:
FWP-11
$1,000 + ($1,000 × Reference Return × Upside Participation Rate)
= $1,000 + ($1,000 × 5.00% × 150%)
= $1,075.00
Example 1 shows that you will receive the return of your principal investment plus a return equal to the Reference Return multiplied by 150% when such Reference Return is positive and if such amount is equal to or less than the Maximum Cap.
Example 2: The Reference Return is 30.00%.
|
Reference Return:
|
30.00%
|
|
Final Settlement Value:
|
$1,370.00
|
Because the Reference Return is positive, and such Reference Return multiplied by the Upside Participation Rate is greater than the hypothetical Maximum Cap, the Final Settlement Value would be $1,370.00 per $1,000 Principal Amount of securities, calculated as follows:
$1,000 + ($1,000 × Maximum Cap)
= $1,000 + ($1,000 × 37.00%)
= $1,370.00
Example 2 shows that you will receive the return of your principal investment plus a return equal to the Maximum Cap when the Reference Return is positive and such Reference Return multiplied by 150% exceeds the Maximum Cap.
Example 3: The Reference Return is -5.00%.
|
Reference Return:
|
-5.00%
|
|
Final Settlement Value:
|
$1,000.00
|
Because the Reference Return is less than zero but greater than the Buffer Value, the Final Settlement Value would be $1,000.00 per $1,000 Principal Amount of securities (a zero return).
Example 3 shows that you will receive the return of your principal investment where the value of the Reference Asset declines by no more than 20% over the term of the securities.
Example 4: The Reference Return is -30%.
|
Reference Return:
|
-30.00%
|
|
|
Final Settlement Value:
|
$900.00
|
|
Here, the Reference Return is -30.00%. Because the Reference Return is less than the Buffer Value of -20%, the Final Settlement Value would be $900.00 per $1,000 Principal Amount of securities, calculated as follows:
$1,000 + [$1,000 × (Reference Return + 20%)]
= $1,000 + [$1,000 × (-30.00% + 20%)]
= $900.00
Example 4 shows that you are exposed on a 1-to-1 basis to declines in the value of the Reference Asset beyond the Buffer Amount of -20%. YOU MAY LOSE UP TO 80% OF THE PRINCIPAL AMOUNT OF YOUR SECURITIES.
FWP-12
|
INFORMATION RELATING TO THE REFERENCE ASSET
|
The S&P 500® Index
|
Description of the SPX
The SPX is a capitalization-weighted index of 500 U.S. stocks. It is designed to measure performance of the broad domestic economy through changes in the aggregate market value of 500 stocks representing all major industries.
The top 5 industry groups by market capitalization as of October 28, 2011 were: Information Technology, Financials, Energy, Health Care and Consumer Staples.
For more information about the SPX, see “The S&P 500Ò Index” on page US3-4 of the accompanying underlying supplement no. 3.
|
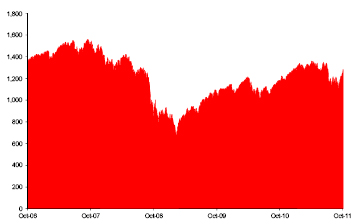
Historical Performance of the SPX
The following graph sets forth the historical performance of the SPX based on the daily historical closing levels from October 30, 2006 through October 28, 2011. The closing level for the SPX on October 28, 2011 was 1,285.09. We obtained the closing levels below from Bloomberg Professional® service. We make no representation or warranty as to the accuracy or completeness of the information obtained from Bloomberg Professional® service.
 |
|
The historical levels of the SPX should not be taken as an indication of future performance, and no assurance can be given as to the Official Closing Value of the SPX on the Final Valuation Date.
|
The Russell 2000® Index
|
Description of the RTY
RTY is designed to track the performance of the small capitalization segment of the United States equity market. All 2,000 stocks are traded on the New York Stock Exchange or NASDAQ, and RTY consists of the smallest 2,000 companies included in the Russell 3000® Index. The Russell 3000® Index is composed of the 3,000 largest United States companies as determined by market capitalization and represents approximately 98% of the United States equity market.
The top 5 industry groups by market capitalization as of September 30, 2011 were: Financial Services, Technology, Consumer Discretionary, Producer Durables and Health Care.
For more information about the RTY, see “The Russell 2000Ò Index” on page US3-8 of the accompanying underlying supplement no. 3.
|
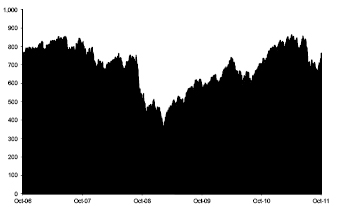
Historical Performance of the RTY
The following graph sets forth the historical performance of the RTY based on the daily historical closing levels from October 30, 2006 through October 28, 2011. The closing level for the RTY on October 28, 2011 was 761.00. We obtained the closing levels below from Bloomberg Professional® service. We make no representation or warranty as to the accuracy or completeness of the information obtained from Bloomberg Professional® service.
 |
|
The historical levels of the RTY should not be taken as an indication of future performance, and no assurance can be given as to the Official Closing Value of the RTY on the Final Valuation Date.
|
FWP-13
The iSharesÒ MSCI EAFE Index Fund
|
Description of the EFA
The EFA seeks investment results that correspond generally to the price and yield performance, before fees and expenses, of publicly traded securities in the European, Australasian, and Far Eastern markets, as measured by the MSCI EAFE® Index, which is the Underlying Index of the EFA. As of October 28, 2011, the MSCI EAFEÒ Index consisted of the following 22 component country indices: Australia, Austria, Belgium, Denmark, Finland, France, Germany, Greece, Hong Kong, Ireland, Israel, Italy, Japan, Netherlands, New Zealand, Norway, Portugal, Singapore, Spain, Sweden, Switzerland, and the United Kingdom.
For more information about the EFA, see “The iSharesÒ MSCI EAFE Index Fund” on page US4-25 of the accompanying underlying supplement no. 4.
|
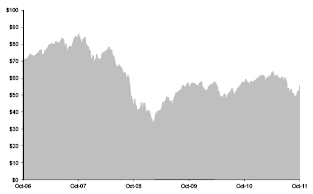
Historical Performance of the EFA
The following graph sets forth the historical performance of the EFA based on the daily historical closing prices from October 30, 2006 through October 28, 2011. The closing price for the EFA on October 28, 2011 was $55.20. We obtained the closing prices below from Bloomberg Professional® service. We make no representation or warranty as to the accuracy or completeness of the information obtained from Bloomberg Professional® service.
 |
|
The historical prices of the EFA should not be taken as an indication of future performance, and no assurance can be given as to the Official Closing Value of the EFA on the Final Valuation Date.
|
|
Quarter Begin
|
Quarter End
|
Quarterly High
|
Quarterly Low
|
Quarterly Close
|
|
1/3/2006
|
3/31/2006
|
$65.52
|
$60.25
|
$64.99
|
|
4/3/2006
|
6/30/2006
|
$70.65
|
$59.40
|
$65.35
|
|
7/3/2006
|
9/29/2006
|
$68.52
|
$60.94
|
$67.78
|
|
10/2/2006
|
12/29/2006
|
$74.66
|
$67.61
|
$73.26
|
|
1/3/2007
|
3/30/2007
|
$77.18
|
$70.95
|
$76.27
|
|
4/2/2007
|
6/29/2007
|
$81.79
|
$76.05
|
$80.63
|
|
7/2/2007
|
9/28/2007
|
$85.50
|
$67.99
|
$82.56
|
|
10/1/2007
|
12/31/2007
|
$86.49
|
$78.00
|
$78.50
|
|
1/2/2008
|
3/31/2008
|
$79.22
|
$65.63
|
$71.90
|
|
4/1/2008
|
6/30/2008
|
$78.76
|
$68.06
|
$68.70
|
|
7/1/2008
|
9/30/2008
|
$68.39
|
$52.36
|
$56.30
|
|
10/1/2008
|
12/31/2008
|
$56.42
|
$35.53
|
$44.87
|
|
1/2/2009
|
3/31/2009
|
$45.61
|
$31.56
|
$37.59
|
|
4/1/2009
|
6/30/2009
|
$49.18
|
$37.28
|
$45.81
|
|
7/1/2009
|
9/30/2009
|
$56.31
|
$43.49
|
$54.70
|
|
10/1/2009
|
12/31/2009
|
$57.66
|
$52.42
|
$55.30
|
|
1/4/2010
|
3/31/2010
|
$58.00
|
$49.94
|
$56.00
|
|
4/1/2010
|
6/30/2010
|
$58.08
|
$45.86
|
$46.51
|
|
7/1/2010
|
9/30/2010
|
$55.81
|
$46.45
|
$54.92
|
|
10/1/2010
|
12/31/2010
|
$59.50
|
$53.85
|
$58.23
|
|
1/3/2011
|
3/31/2011
|
$61.98
|
$54.69
|
$60.09
|
|
4/1/2011
|
6/30/2011
|
$64.35
|
$56.71
|
$60.14
|
|
7/1/2011
|
9/30/2011
|
$60.86
|
$46.09
|
$47.75
|
|
10/3/2011*
|
10/28/2011*
|
$55.86
|
$45.46
|
$55.20
|
*As of the date of this term sheet available information for the fourth calendar quarter of 2011 includes data for the period from October 3, 2011 through October 28, 2011. Accordingly, the “Quarterly High,” “Quarterly Low” and “Quarterly Close” data indicated are for this shortened period only and do not reflect complete data for the fourth calendar quarter of 2011.
FWP-14
The SPX/RTY/EFA Basket
The following graph illustrates the hypothetical daily historical performance of the SPX/RTY/EFA Basket from October 30, 2006 through October 28, 2011 based on information from Bloomberg Professional® service, if the level of the Basket was made to equal 100 on October 30, 2006. The hypothetical historical performance reflects the performance the Basket would have exhibited based on (i) the actual historical performance of the Reference Asset Components and (ii) the assumption that no adjustment to the Official Closing Value occurred from October 30, 2006 through October 28, 2011 for any Reference Asset Component. Neither the hypothetical historical performance of the Basket nor the actual historical performance of the Reference Asset Components should be taken as indications of future performance.
We cannot give you assurance that the performance of the Basket will result in the return of your initial investment. You may lose up to 80% of your investment.
FINAL VALUATION DATE AND MATURITY DATE
If the Final Valuation Date is not a scheduled trading day for any Reference Asset Component, then the Final Valuation Date for such Reference Asset Component will be the next succeeding day that is a scheduled trading day (as defined in the relevant underlying supplement with respect to each Reference Asset Component) for such Reference Asset Component. For each Reference Asset Component, the calculation agent will determine whether a market disruption event (as defined in the relevant underlying supplement with respect to each Reference Asset Component) exists on the Final Valuation Date with respect to such Reference Asset Component independent from other Reference Asset Components; therefore a market disruption event may exist for certain Reference Asset Components and not exist for other Reference Asset Components. If a market disruption event exists for a Reference Asset Component on the Final Valuation Date, then the Final Valuation Date for such Reference Asset Component will be the next scheduled trading day for which there is no market disruption event for such Reference Asset Component. If such market disruption event continues for five consecutive scheduled trading days, then that fifth scheduled trading day will nonetheless be the Final Valuation Date for such Reference Asset Component, and the Final Component Value with respect to such Reference Asset Component will be determined (1) with respect to a Reference Asset Component that is an index, by means of the formula for and method of calculating such index which applied just prior to the market disruption event, using the relevant exchange’s traded or quoted price of each stock or other security included in such index (or if an event giving rise to a market disruption event has occurred with respect to a stock or other security in such index and is continuing on that fifth scheduled trading day, the calculation agent’s good faith estimate of the value for that stock or other security), or (2) with respect to a Reference Asset Component that is an index fund, by the calculation agent, in its sole discretion, using its estimate of the exchange traded prices for such index fund that would have prevailed but for that market disruption event. For the avoidance of doubt, if no market disruption event exists with respect to a Reference Asset Component on the originally scheduled Final Valuation Date, the determination of such Reference Asset Component’s Final Component Value will be made on the originally scheduled Final Valuation Date, irrespective of the existence of a market disruption event with respect to any other Reference Asset Component. If the Final Valuation Date for any Reference Asset Component is postponed, then the Maturity Date will also be postponed to the fifth business day following the latest of such postponed Final Valuation Dates.
FWP-15
EVENTS OF DEFAULT AND ACCELERATION
If the securities have become immediately due and payable following an Event of Default (as defined in the accompanying prospectus) with respect to the securities, the calculation agent will determine the accelerated Payment at Maturity due and payable in the same general manner as described in “Payment at Maturity” in this free writing prospectus. In such a case, the third scheduled trading day for all of the Reference Asset Components immediately preceding the date of acceleration will be used as the Final Valuation Date for purposes of determining the accelerated Reference Asset Component Return for each Reference Asset Component. If a market disruption event exists with respect to a Reference Asset Component on that scheduled trading day, then the accelerated Final Valuation Date will be postponed for up to five scheduled trading days (in the same general manner used for postponing the originally scheduled Final Valuation Date). The accelerated Maturity Date will be the fifth business day following such accelerated postponed Final Valuation Date.
For more information, see “Description of Debt Securities — Events of Default” in the accompanying prospectus.
SUPPLEMENTAL PLAN OF DISTRIBUTION (CONFLICTS OF INTEREST)
We have appointed HSBC Securities (USA) Inc., an affiliate of HSBC, as the agent for the sale of the securities. Pursuant to the terms of a distribution agreement, HSBC Securities (USA) Inc. will purchase the securities from HSBC for distribution to other registered broker dealers or will offer the securities directly to investors. HSBC Securities (USA) Inc. proposes to offer the securities at the offering price set forth on the cover page of this free writing prospectus and will receive underwriting discounts and commissions of up to 2.15%, or $21.50, per $1,000 Principal Amount of securities. HSBC Securities (USA) Inc. may allow selling concessions on sales of such securities by other brokers or dealers of up to 2.15%, or $21.50 per $1,000 Principal Amount of securities.
An affiliate of HSBC has paid or may pay in the future an amount to broker dealers in connection with the costs of the continuing implementation of systems to support these securities.
In addition, HSBC Securities (USA) Inc. or another of its affiliates or agents may use the pricing supplement to which this free writing prospectus relates in market-making transactions after the initial sale of the securities, but is under no obligation to do so and may discontinue any market-making activities at any time without notice.
See “Supplemental Plan of Distribution” on page S-52 in the prospectus supplement. All references to NASD Rule 2720 in the prospectus supplement shall be to FINRA Rule 5121.
We expect that delivery of the securities will be made against payment for the securities on or about the Original Issue Date set forth on page FWP-2 of this document, which is expected to be the fifth business day following the Trade Date of the securities. Under Rule 15c6-1 under the Securities Exchange Act of 1934, as amended, trades in the secondary market generally are required to settle in three business days, unless the parties to that trade expressly agree otherwise. Accordingly, purchasers who wish to trade securities on the Trade Date and the following business day thereafter will be required to specify an alternate settlement cycle at the time of any such trade to prevent a failed settlement and should consult their own advisors.
U.S. FEDERAL INCOME TAX CONSIDERATIONS
There is no direct legal authority as to the proper tax treatment of the securities, and therefore significant aspects of the tax treatment of the securities are uncertain as to both the timing and character of any inclusion in income in respect of the securities. Under one approach, a security should be treated as a pre-paid forward or other executory contract with respect to the Reference Asset. We intend to treat the securities consistent with this approach. Pursuant to the terms of the securities, you agree to treat the securities under this approach for all U.S. federal income tax purposes. Notwithstanding any disclosure in the accompanying product supplement to the contrary, our special U.S. tax counsel in this transaction is Sidley Austin llp. Subject to the limitations described therein, and based on certain factual representations received from us, in the opinion of our special U.S. tax counsel, Sidley Austin llp, it is reasonable to treat a security as a pre-paid forward or other executory contract with respect to the Reference Asset. Pursuant to this approach and subject to the discussion below regarding “constructive ownership transactions,” we do not intend to report any income or gain with respect to the securities prior to their maturity or an earlier sale or exchange and we intend to treat any gain or loss upon maturity or an earlier sale or exchange as long-term capital gain or loss, provided that you have held the security for more than one year at such time for U.S. federal income tax purposes.
Despite the foregoing, U.S. holders (as defined under “Certain U.S. Federal Income Tax Considerations” in the accompanying prospectus supplement) should be aware that the Internal Revenue Code of 1986, as amended (the “Code”) contains a provision, Section 1260 of the Code, which sets forth rules which are applicable to what it refers to as “constructive ownership transactions.” Due to the manner in which it is drafted, the precise applicability of Section 1260 of the Code to any particular transaction is often uncertain. In general, a “constructive ownership transaction” includes a contract under which an investor will receive payment equal to or credit for the future value of any equity interest in a regulated investment company (such as shares of the EFA). Under the “constructive ownership”
FWP-16
rules, if an investment in the securities is treated as a “constructive ownership transaction,” any long-term capital gain recognized by a U.S. holder in respect of a security will be recharacterized as ordinary income to the extent such gain exceeds the amount of “net underlying long-term capital gain” (as defined in Section 1260 of the Code) of the U.S. holder (the “Excess Gain”). In addition, an interest charge will also apply to any deemed underpayment of tax in respect of any Excess Gain to the extent such gain would have resulted in gross income inclusion for the U.S. holder in taxable years prior to the taxable year of the sale, exchange or maturity of the security (assuming such income accrued at a constant rate equal to the applicable federal rate as of the date of sale, exchange or maturity of the security).
Although the matter is not clear, there exists a risk that an investment in the securities will be treated as a “constructive ownership transaction.” If such treatment applies, it is not entirely clear to what extent any long-term capital gain recognized by a U.S. holder in respect of a security will be recharacterized as ordinary income. Accordingly, U.S. holders should consult their tax advisors regarding the potential application of the “constructive ownership” rules.
We will not attempt to ascertain whether the issuer of any stock included in, or owned by, one or more of the Reference Asset Components would be treated as either a “passive foreign investment company” (“PFIC”) or a United States real property holding corporation (“USRPHC”), both as defined for U.S. federal income tax purposes. In the event that the issuer of any stock included in, or owned by, one or more of the Reference Asset Components were treated as a PFIC or USRPHC, certain adverse U.S. federal income tax consequences might apply. You should refer to information filed with the SEC and other authorities by the issuers of stock included in, or owned by, the Reference Asset Components and consult your tax advisor regarding the possible consequences to you in the event that one or more issuers of stock included in, or owned by, one or more of the Reference Asset Components is or becomes a PFIC or USRPHC.
For a discussion of the U.S. federal income tax consequences of your investment in a security, please see the discussion under “Certain U.S. Federal Income Tax Considerations” in the accompanying product supplement and the discussion under “Certain U.S. Federal Income Tax Considerations” in the accompanying prospectus supplement.
FWP-17
|
TABLE OF CONTENTS
|
You should only rely on the information contained in this free writing prospectus, any accompanying underlying supplement, product supplement, prospectus supplement and prospectus. We have not authorized anyone to provide you with information or to make any representation to you that is not contained in this free writing prospectus, any accompanying underlying supplement, product supplement, prospectus supplement and prospectus. If anyone provides you with different or inconsistent information, you should not rely on it. This free writing prospectus, any accompanying underlying supplement, product supplement, prospectus supplement and prospectus are not an offer to sell these securities, and these documents are not soliciting an offer to buy these securities, in any jurisdiction where the offer or sale is not permitted. You should not, under any circumstances, assume that the information in this free writing prospectus, any accompanying underlying supplement, product supplement, prospectus supplement and prospectus is correct on any date after their respective dates.
HSBC USA Inc.
$ Buffered Accelerated Market
Participation Securities
November 1, 2011
FREE WRITING PROSPECTUS
|
||
|
Free Writing Prospectus
|
|||
|
General
|
FWP-6
|
||
|
Payment at Maturity
|
FWP-6
|
||
|
Investor Suitability
|
FWP-7
|
||
|
Risk Factors
|
FWP-8
|
||
|
Illustrative Examples
|
FWP-11
|
||
|
Information Relating to the Reference Asset
|
FWP-13
|
||
|
Final Valuation Date and Maturity Date
|
FWP-15
|
||
|
Events of Default and Acceleration
|
FWP-16
|
||
|
Supplemental Plan of Distribution (Conflicts of Interest)
|
FWP-16
|
||
|
U.S. Federal Income Tax Considerations
|
FWP-16
|
||
|
Underlying Supplement no. 3
|
|||
|
Risk Factors
|
US3-1
|
||
|
The S&P 500® Index
|
US3-4
|
||
|
The Russell 2000® Index
|
US3-8
|
||
|
The Dow Jones Industrial AverageSM
|
US3-11
|
||
|
The Hang Seng China Enterprises Index®
|
US3-13
|
||
|
The Hang Seng® Index
|
US3-15
|
||
|
The Korea Stock Price Index 200
|
US3-17
|
||
|
MSCI Indices
|
US3-20
|
||
|
The Dow Jones EURO STOXX 50® Index
|
US3-24
|
||
|
The PHLX Housing SectorSM Index
|
US3-26
|
||
|
The TOPIX® Index
|
US3-30
|
||
|
The NASDAQ-100 Index®
|
US3-33
|
||
|
S&P BRIC 40 Index
|
US3-37
|
||
|
The Nikkei 225 Index
|
US3-40
|
||
|
The FTSE™ 100 Index
|
US3-42
|
||
|
Other Components
|
US3-44
|
||
|
Additional Terms of the Notes
|
US3-44
|
||
|
Underlying Supplement no. 4
|
|||
|
Risk Factors
|
US4-2
|
||
|
The SPDR® Dow Jones Industrial AverageSM ETF Trust
|
US4-9
|
||
|
The POWERSHARES QQQ TRUSTSM, SERIES 1
|
US4-12
|
||
|
The iShares® MSCI Mexico Investable Market Index Fund
|
US4-16
|
||
|
The iShares® MSCI Brazil Index Fund
|
US4-19
|
||
|
The iShares® MSCI Emerging Markets Index Fund
|
US4-22
|
||
|
The iShares® MSCI EAFE Index Fund
|
US4-25
|
||
|
The SPDR Trust Series 1
|
US4-27
|
||
|
The Market Vectors Gold Miners ETF
|
US4-31
|
||
|
The Oil Service HOLDRSSM Trust
|
US4-34
|
||
|
The iShares® Dow Jones U.S. Real Estate Index Fund
|
US4-36
|
||
|
The iShares® FTSE/Xinhua China 25 Index Fund
|
US4-39
|
||
|
The iShares® S&P Latin America 40 Index Fund
|
US4-43
|
||
|
The Financial Select Sector SPDR® Fund
|
US4-46
|
||
|
The Semiconductor HOLDRSSM Trust
|
US4-49
|
||
|
The iShares® Dow Jones Transportation Average Index Fund
|
US4-51
|
||
|
The Energy Select SPDR® Fund
|
US4-53
|
||
|
The Health Care Select SPDR® Fund
|
US4-56
|
||
|
Other Components
|
US4-59
|
||
|
Additional Terms of the Notes
|
US4-59
|
||
|
Product Supplement
|
|||
|
Notice to Investors
|
PS-1
|
||
|
Product Supplement Summary
|
PS-1
|
||
|
Risk Factors
|
PS-4
|
||
|
Pricing Supplement Overview
|
PS-7
|
||
|
Valuation of the Notes
|
PS-7
|
||
|
Hypothetical Examples
|
PS-10
|
||
|
Specific Terms of the Notes
|
PS-19
|
||
|
Certain U.S. Federal Income Tax Considerations
|
PS-24
|
||
|
Events of Default and Acceleration
|
PS-25
|
||
|
Information Regarding the Reference Asset and Reference Issuers
|
PS-25
|
||
|
Certain ERISA Considerations
|
PS-25
|
||
|
Validity of the Notes
|
PS-25
|
||
|
Prospectus Supplement
|
|||
|
Risk Factors
|
S-3
|
||
|
Pricing Supplement
|
S-16
|
||
|
Description of Notes
|
S-16
|
||
|
Sponsors or Issuers and Reference Asset
|
S-37
|
||
|
Use of Proceeds and Hedging
|
S-37
|
||
|
Certain ERISA
|
S-38
|
||
|
Certain U.S. Federal Income Tax Considerations
|
S-39
|
||
|
Supplemental Plan of Distribution
|
S-52
|
||
|
Prospectus
|
|||
|
About this Prospectus
|
2
|
||
|
Special Note Regarding Forward-Looking Statements
|
2
|
||
|
HSBC USA Inc.
|
3
|
||
|
Use of Proceeds
|
3
|
||
|
Description of Debt Securities
|
4
|
||
|
Description of Preferred Stock
|
16
|
||
|
Description of Warrants
|
22
|
||
|
Description of Purchase Contracts
|
26
|
||
|
Description of Units
|
29
|
||
|
Book-Entry Procedures
|
32
|
||
|
Limitations on Issuances in Bearer Form
|
36
|
||
|
Certain U.S. Federal Income Tax Considerations Relating to Debt Securities
|
37
|
||
|
Plan of Distribution
|
52
|
||
|
Notice to Canadian Investors
|
54
|
||
|
Certain ERISA Matters
|
58
|
||
|
Where You Can Find More Information
|
59
|
||
|
Legal Opinions
|
59
|
||
|
Experts
|
59
|
||