                                United States
                      Securities and Exchange Commission
                            Washington, D.C. 20549

                              Amended Form N-CSR
  Certified Shareholder Report of Registered Management Investment Companies


                                  811-05536

                     (Investment Company Act File Number)


                                Hibernia Funds
       ---------------------------------------------------------------

              (Exact Name of Registrant as Specified in Charter)


                             5800 Corporate Drive
                     Pittsburgh, Pennsylvania 15237-7010


                                (412) 288-1900
                       (Registrant's Telephone Number)


                                  Gail C. Jones
                            Federated Investors Tower
                               1001 Liberty Avenue
                       Pittsburgh, Pennsylvania 15222-3779
                     (Name and Address of Agent for Service)
                (Notices should be sent to the Agent for Service)


                       Date of Fiscal Year End: 8/31/04


             Date of Reporting Period: Fiscal year ended 8/31/04
                                       -------------------------


Item 1.     Reports to Stockholders
ANNUAL REPORT
AUGUST 31, 2004
MANAGEMENT’S DISCUSSION OF FUND PERFORMANCE
FINANCIAL HIGHLIGHTS SHAREHOLDER EXPENSE EXAMPLE
PORTFOLIO OF INVESTMENTS SUMMARY TABLES
FINANCIAL STATEMENTS
REPORT OF ERNST & YOUNG LLP, INDEPENDENT REGISTERED PUBLIC ACCOUNTANTS
BOARD OF TRUSTEES AND TRUST OFFICERS VOTING PROXIES ON FUND PORTFOLIO SECURITIES
QUARTERLY PORTFOLIO SCHEDULE
[Logo of Hibernia Funds]
Hibernia Capital Appreciation Fund
Class A Shares
Class B Shares
Hibernia Louisiana Municipal Income Fund
Class A Shares
Class B Shares
Hibernia Mid Cap Equity Fund
Class A Shares
Class B Shares
Hibernia Total Return Bond Fund
Hibernia U.S. Government Income Fund
Hibernia Cash Reserve Fund
Class A Shares
Class B Shares
Hibernia U.S. Treasury Money Market Fund
Not FDIC Insured • May Lose Value • No Bank Guarantee
Management Discussion of Fund Performance
Hibernia Capital Appreciation Fund
Annual Report/12-month period from September 1, 2003 through August 31, 2004
HIBERNIA CAPITAL APPRECIATION FUND
During the fund's fiscal year, U.S. equity markets experienced a great deal of volatility. All of the gain reported for the year was generated in the first five months. The remainder of the fiscal year was a period of volatility as equity investors grappled with indecision and attempted to gain an understanding of the unclear state of the U.S. economy.
The fundamental picture actually became much more clear as the year progressed. Corporate revenue and profit growth exceeded expectations, corporate capital expenditures finally began to come on strong, and the consumer sector showed considerable resilience. Indeed, corporate profits increased by 20%. Capital expenditures grew at an annualized rate of about 12% led by tech-spending, which was up over 14% from 12 months prior. Consumer spending continued to increase, albeit at a slower pace. Furthermore, the housing sector showed no signs of slowing: Building Permits, Housing Starts, New Home Sales, and Existing Home Sales all continued to expand.
In this strong economic environment, domestic equity performance was good. The S&P 500 Index was up over 11% for the 12 months ended August 31, 2004 while the S&P 400 Mid Cap Index was up over 12%.1
PERFORMANCE
The Hibernia Capital Appreciation Fund's Class A Shares produced a total return of 9.87%2 , based on net asset value for the 12 month period ended August 31, 2004.
Fund performance was very strong in the first five months of the fiscal year, which is the period during which all of the full-year gains were generated. During that period, as well as throughout the remainder of the fiscal year, value stocks outperformed growth stocks. The portfolio was not dominated by any particular themes throughout the reporting period as the risk-control process of portfolio strategy was tightly implemented. Individual stock performance was the main driver of returns.
STRATEGY
Portfolio strategy continued to emphasize security selection and risk-control. Broad diversification across industry groups and economic sectors was a key part of this risk control, as well as minimization of exposures to other benchmark characteristics (i.e., growth vs. value, capitalization, etc.).3
1 The S&P 500 is an unmanaged capitalization-weighted index of 500 stocks designed to measure performance of the broad domestic economy through changes in the aggregate market value of 500 stocks representing all major industries. The S&P 400 Mid Cap Index is an unmanaged capitalization-weighted index of common stocks representing all major industries in the mid-range of the U.S. stock market. Investments cannot be made in an index.
2 Performance data quoted represents past performance which is no guarantee of future results. Investment return and principal value will fluctuate so that an investor's shares, when redeemed, may be worth more or less than their original cost. Mutual fund performance changes over time and current performance may be lower or higher than what is stated. Current to the most recent month end performance is available on the Hibernia Funds website at http://www.Hiberniafunds.com. Total return for Class A Shares, based on offering price, was 4.92%, for the reporting period. The maximum sales charge is 4.50%. Total returns for Class B Shares was 9.08% based on net asset value and 3.58% based on redemption value for the reporting period. The maximum contingent deferred sales charge is 5.50% for Class B Shares.
3 Diversification does not assure a profit nor protect against loss.
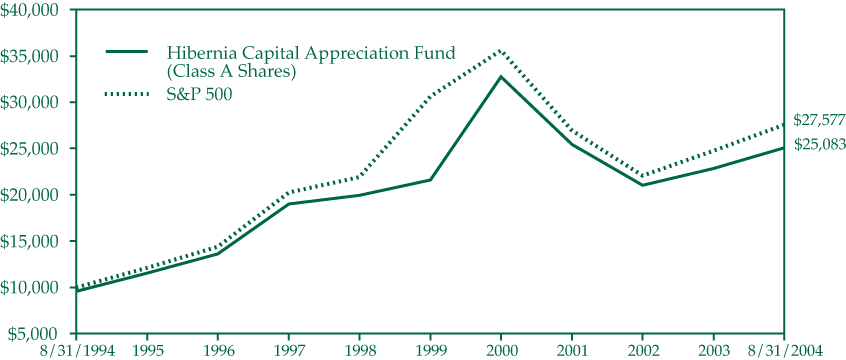
Hibernia Capital Appreciation Fund--Class A Shares
Growth of a $10,000 Investment
The graph below illustrates the hypothetical investment of $10,0001 in the Hibernia Capital Appreciation Fund--Class A Shares (the "Fund") from August 31, 1994 to August 31, 2004, compared to the Standard and Poor's 500 Index ("S&P 500").2
AVERAGE ANNUAL TOTAL RETURNS3 FOR THE
PERIOD ENDED AUGUST 31, 2004
| 1 Year |
4.92% |
|
| 5 Years |
(2.81)% |
|
| 10 Years |
9.63% |
Performance data quoted represents past performance, which is no guarantee of future results. Returns shown do not reflect the deduction of taxes that a shareholder would pay on Fund distributions or the redemption of Fund shares. Investment return and principal value will fluctuate so that an investor's shares, when redeemed, may be worth more or less than their original cost. Mutual fund performance changes over time and current performance may be lower or higher than what is stated. Mutual funds are not obligations of or guaranteed by any bank and are not federally insured.
1 Represents a hypothetical investment of $10,000 in the Fund after deducting the original maximum sales charge of 4.50% ($10,000 investment minus $450 sales charge = $9,550). For the period from October 31, 1993 to August 31, 1996, the sales charge was reduced to 3.00%. Effective September 1, 1996, the maximum sales charge changed to 4.50%. The Fund's performance assumes the reinvestment of all dividends and distributions. The S&P 500 has been adjusted to reflect reinvestment of dividends on securities in the index.
2 The S&P 500 is not adjusted to reflect sales charges, expenses, or other fees that the Securities and Exchange Commission ("SEC") requires to be reflected in the Fund's performance. The index is unmanaged.
3 Total return quoted reflects the current 4.50% sales charge.
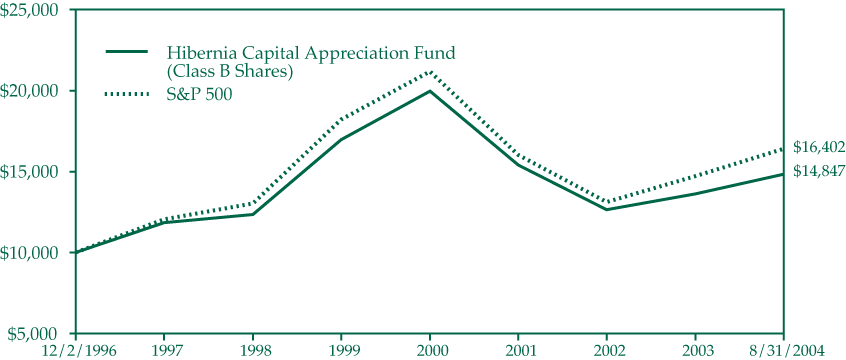
Hibernia Capital Appreciation Fund--Class B Shares
Growth of a $10,000 Investment
The graph below illustrates the hypothetical investment of $10,0001 in the Hibernia Capital Appreciation Fund--Class B Shares (the "Fund") from December 2, 1996 (start of performance) to August 31, 2004, compared to the Standard and Poor's 500 Index ("S&P 500").2
AVERAGE ANNUAL TOTAL RETURNS3 FOR THE
PERIOD ENDED AUGUST 31, 2004
| 1 Year |
3.58% |
|
| 5 Years |
(2.94)% |
|
| Start of Performance (12/2/96) |
5.23% |
Performance data quoted represents past performance, which is no guarantee of future results. Returns shown do not reflect the deduction of taxes that a shareholder would pay on Fund distributions or the redemption of Fund shares. Investment return and principal value will fluctuate so that an investor's shares, when redeemed, may be worth more or less than their original cost. Mutual fund performance changes over time and current performance may be lower or higher than what is stated. Mutual funds are not obligations of or guaranteed by any bank and are not federally insured.
1 Represents a hypothetical investment of $10,000 in the Fund. The ending value of the Fund does not reflect a contingent deferred sales charge on any redemption over seven years from the purchase date. The maximum contingent deferred sales charge is 5.50% on any redemption less than one year from the purchase date. The Fund's performance assumes the reinvestment of all dividends and distributions. The S&P 500 has been adjusted to reflect reinvestment of dividends on securities in the index.
2 The S&P 500 is not adjusted to reflect sales charges, expenses, or other fees that the SEC requires to be reflected in the Fund's performance. The index is unmanaged.
3 Total return quoted reflects all applicable contingent deferred sales charges.
Hibernia Louisiana Municipal Income Fund
Annual Report/12-month period from September 1, 2003 through August 31, 2004
HIBERNIA LOUISIANA MUNICIPAL INCOME FUND
The fund ended the 2004 fiscal year with a positive total return of 5.88% for Class A Shares, based on net asset value.1 The primary factor providing the positive return in the fund was the tax exempt interest income generated by the portfolio. Yields on tax exempt bonds dropped more than those on taxable rates during the 12 months ended August 31, 2004. "AAA" tax exempt 10-year bond yields declined over 50 basis points for the reporting period. The decline in tax exempt interest rates and the corresponding rise in bond prices during the reporting period were significant components of the total return of the fund accounting for over 1.25 percentage points. The decline in interest rates was in spite of an improving U.S. economy, growing federal deficit, a declining U.S. dollar, rising oil prices and higher commodity prices. The fund took an increasingly defensive posture during the reporting period in an effort to protect shareholder value while still providing the tax exempt income required by the fund's investment objective. The fund's effective maturity was reduced from 10 years to 6 years over the course of the 12 month reporting period.
The fund did not invest in derivative securities during the reporting period.
1 Performance data quoted represents past performance which is no guarantee of future results. Investment return and principal value will fluctuate so that an investor's shares, when redeemed, may be worth more or less than their original cost. Mutual fund performance changes over time and current performance may be lower or higher than what is stated. Current to the most recent month end performance is available on the Hibernia Funds website at http://www.Hiberniafunds.com. Total return for Class A Shares, based on offering price, was 2.68%, for the reporting period. The maximum sales charge is 3.00%. Total return for Class B Shares was 5.08% based on net asset value and (0.42)% based on redemption value for the reporting period. The maximum contingent deferred sales charge is 5.50% for Class B Shares.
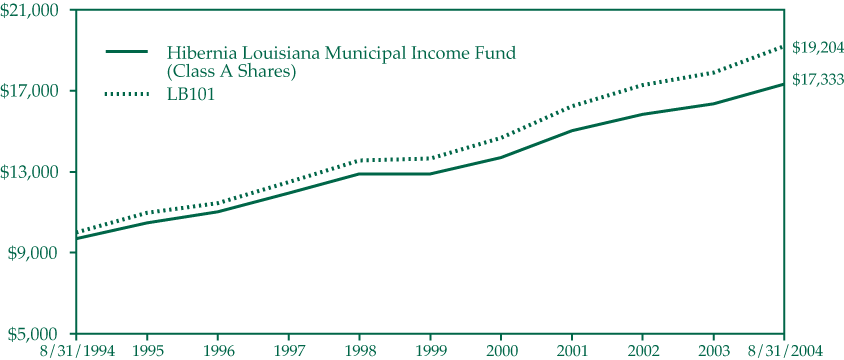
Hibernia Louisiana Municipal Income Fund--Class A Shares
Growth of a $10,000 Investment
The graph below illustrates the hypothetical investment of $10,0001 in the Hibernia Louisiana Municipal Income Fund--Class A Shares (the "Fund") from August 31, 1994 to August 31, 2004, compared to the Lehman Brothers Ten Year Insured Bond Index ("LB10I").2
AVERAGE ANNUAL TOTAL RETURNS3 FOR THE
PERIOD ENDED AUGUST 31, 2004
|
1 Year |
2.68% | |
|
5 Years |
5.44% | |
|
10 Years |
5.65% |
Performance data quoted represents past performance, which is no guarantee of future results. Returns shown do not reflect the deduction of taxes that a shareholder would pay on Fund distributions or the redemption of Fund shares. Investment return and principal value will fluctuate so that an investor's shares, when redeemed, may be worth more or less than original cost. Mutual fund performance changes over time and current performance may be lower or higher than what is stated. Mutual funds are not obligations of or guaranteed by any bank and are not federally insured.
1 Represents a hypothetical investment of $10,000 in the Fund after deducting the maximum sales charge of 3.00% ($10,000 investment minus $300 sales charge = $9,700). The Fund's performance assumes the reinvestment of all dividends and distributions. The LB101 has been adjusted to reflect reinvestment of income on securities in the index.
2 The LB10I is not adjusted to reflect sales charges, expenses, or other fees that the SEC requires to be reflected in the Fund's performance. The index is unmanaged.
3 Total return quoted reflects the current 3.00% sales charge.
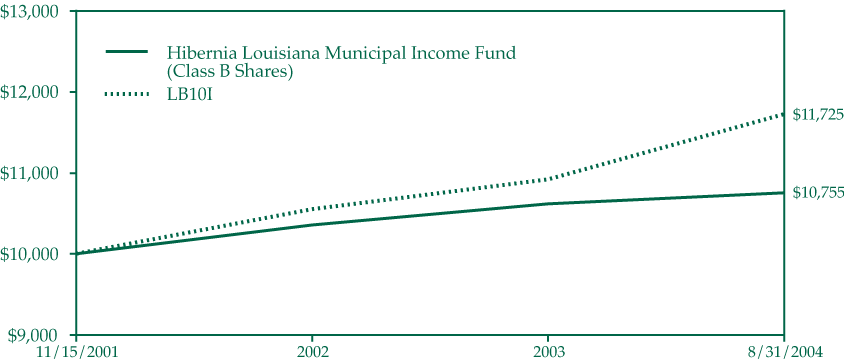
Hibernia Louisiana Municipal Income Fund--Class B Shares
Growth of a $10,000 Investment
The graph below illustrates the hypothetical investment of $10,0001 in the Hibernia Louisiana Municipal Income Fund--Class B Shares (the "Fund") from November 15, 2001 (start of performance) to August 31, 2004, compared to the Lehman Brothers Ten Year Insured Bond Index ("LB10I").2
AVERAGE ANNUAL TOTAL RETURNS3 FOR THE
PERIOD ENDED AUGUST 31, 2004
|
1 Year |
(0.42)% | |
|
Start of Performance (11/15/01) |
2.64% |
Performance data quoted represents past performance, which is no guarantee of future results. Returns shown do not reflect the deduction of taxes that a shareholder would pay on Fund distributions or the redemption of Fund shares. Investment return and principal value will fluctuate so that an investor's shares, when redeemed, may be worth more or less than original cost. Mutual fund performance changes over time and current performance may be lower or higher than what is stated. Mutual funds are not obligations of or guaranteed by any bank and are not federally insured.
1 Represents a hypothetical investment of $10,000 in the Fund. The ending value of the Fund reflects a 4.50% contingent deferred sales charge on any redemption less than three years from the purchase date. The maximum contingent deferred sales charge is 5.50% on any redemption less than one year from the purchase date. The Fund's performance assumes the reinvestment of all dividends and distributions. The LB10I has been adjusted to reflect reinvestment of income on securities in the index.
2 The LB10I is not adjusted to reflect sales charges, expenses, or other fees that the SEC requires to be reflected in the Fund's performance. The index is unmanaged.
3 Total return quoted reflects all applicable contingent deferred sales charges.
Hibernia Mid Cap Equity Fund
Annual Report/12-month period from September 1, 2003 through August 31, 2004
HIBERNIA MID CAP EQUITY FUND
During the fund's fiscal year, U.S. equity markets experienced a great deal of volatility. All of the gain reported for the year was generated in the first five months. The remainder of the fiscal year was a period of volatility as equity investors grappled with indecision and attempted to gain an understanding of the unclear state of the U.S. economy.
The fundamental picture actually became much more clear as the year progressed. Corporate revenue and profit growth exceeded expectations, corporate capital expenditures finally began to come on strong, and the consumer sector showed considerable resilience. Indeed, corporate profits increased by 20%. Capital expenditures grew at a annualized rate of about 12% led by tech-spending, which was up over 14% from 12 months prior. Consumer spending continued to increase, albeit at a slower pace. Furthermore, the housing sector showed no signs of slowing: Building Permits, Housing Starts, New Home Sales, and Existing Home Sales all continued to expand.
In this strong economic environment, domestic equity performance was good. The S&P 500 Index was up over 11% for the 12 months ended August 31, 2004 while the S&P 400 Mid Cap Index was up over 12%.1 Value stocks outperformed growth stocks and smaller capitalization stocks outperformed larger capitalization stocks during the reporting period.
PERFORMANCE
The Hibernia Mid Cap Equity Fund's Class A Shares produced a total return of 12.01%,2 based on net asset value for the 12 month period ended August 31, 2004.
Fund performance was very strong in the first six months of the fiscal year, and then pulled back sharply as the U.S. equity markets overall experienced a pull-back. During the fiscal year, mid-cap value stocks vastly outperformed mid-cap growth stocks. Portfolio management throughout the fiscal year emphasized bringing the portfolio's average market capitalization more in line with the benchmark as part of the overall risk-control process, focusing on security selection.
STRATEGY
In the beginning of the fiscal year, average market capitalization was biased to larger stocks in the mid-cap universe. This bias has been reduced throughout the year.
Portfolio Strategy continued to emphasize security selection and risk-control. Broad diversification across industry groups and economic sectors was a key part of this risk control, as well as minimization of exposures to other benchmark characteristics (i.e., growth vs. value, capitalization, etc.).3
1 The S&P 500 is an unmanaged capitalization-weighted index of 500 stocks designed to measure performance of the broad domestic economy through changes in the aggregate market value of 500 stocks representing all major industries. The S&P 400 Mid Cap Index is an unmanaged capitalization-weighted index of common stocks representing all major industries in the mid-range of the U.S. stock market. Investments cannot be made in an index.
2 Performance data quoted represents past performance which is no guarantee of future results. Investment return and principal value will fluctuate so that an investor's shares, when redeemed, may be worth more or less than their original cost. Mutual fund performance changes over time and current performance may be lower or higher than what is stated. Current to the most recent month end performance is available on the Hibernia Funds website at http://www.Hiberniafunds.com. Total return for Class A Shares, based on offering price, was 6.97%, for the reporting period. The maximum sales charge is 4.50%. Total return for Class B Shares was 11.19% based on net asset value and 5.69% based on redemption value for the reporting period. The maximum contingent deferred sales charge is 5.50% for Class B Shares.
3 Diversification does not assure a profit nor protect against loss.
Hibernia Mid Cap Equity Fund--Class A Shares
Growth of a $10,000 Investment
The graph below illustrates the hypothetical investment of $10,0001 in the Hibernia Mid Cap Equity Fund--Class A Shares (the "Fund") from August 31, 19942 to August 31, 2004, compared to the Standard & Poor's 400 Mid Cap Index ("S&P 400").3
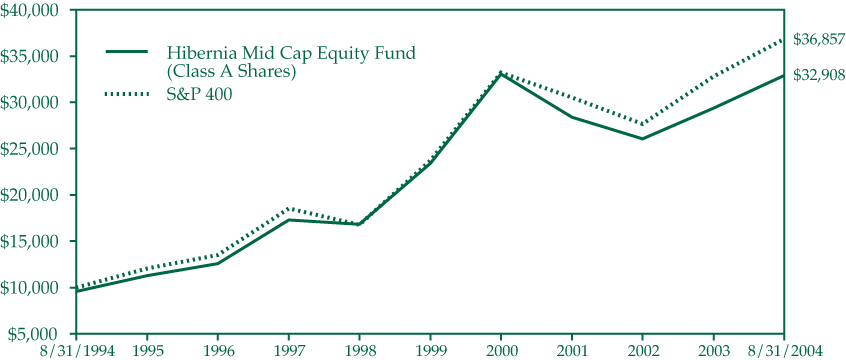
AVERAGE ANNUAL TOTAL RETURNS4 FOR THE
PERIOD ENDED AUGUST 31, 2004
|
1 Year |
6.97% | |
|
5 Years |
6.03% | |
|
10 Years |
12.64% |
Performance data quoted represents past performance, which is no guarantee of future results. Returns shown do not reflect the deduction of taxes that a shareholder would pay on Fund distributions or the redemption of Fund shares. Investment return and principal value will fluctuate so that an investor's shares, when redeemed, may be worth more or less than original cost. Mutual fund performance changes over time and current performance may be lower or higher than what is stated. Mutual funds are not obligations of or guaranteed by any bank and are not federally insured.
1 Represents a hypothetical investment of $10,000 in the Fund after deducting the original maximum sales charge of 4.50% ($10,000 investment minus $450 sales charge = $9,550), which was effective on July 13, 1998. The Fund's performance assumes the reinvestment of all dividends and distributions. The S&P 400 has been adjusted to reflect reinvestment of dividends on securities in the index.
2 Hibernia Mid Cap Equity Fund -- Class A Shares is the successor to a common trust fund. The quoted performance data includes performance of the common trust fund for the period from 8/31/93 to 7/12/98 when the Fund first commenced operation, as adjusted to reflect the Fund's anticipated expenses. The common trust fund was not registered under the Investment Company Act of 1940 ("1940 Act") and, therefore, was not subject to certain investment restrictions imposed by the 1940 Act. If the common trust fund had been registered under the 1940 Act, the performance may have been adversely affected.
3 The S&P 400 is not adjusted to reflect sales charges, expenses or other fees that the SEC requires to be reflected in the Fund's performance. The index is unmanaged.
4 Total returns quoted reflect the current 4.50% sales charge.
Hibernia Mid Cap Equity Fund--Class B Shares
Growth of a $10,000 Investment
The graph below illustrates the hypothetical investment of $10,0001 in the Hibernia Mid Cap Equity Fund--Class B Shares (the "Fund") from July 13, 1998 (start of performance) to August 31, 2004, compared to the Standard & Poor's 400 Mid Cap Index ("S&P 400").2

AVERAGE ANNUAL TOTAL RETURNS3 FOR THE
PERIOD ENDED AUGUST 31, 2004
|
1 Year |
5.69% | |
|
5 Years |
5.88% | |
|
Start of Performance (7/13/98) |
7.11% |
Performance data quoted represents past performance, which is no guarantee of future results. Returns shown do not reflect the deduction of taxes that a shareholder would pay on Fund distributions or the redemption of Fund shares. Investment return and principal value will fluctuate so that an investor's shares, when redeemed, may be worth more or less than original cost. Mutual fund performance changes over time and current performance may be lower or higher than what is stated. Mutual funds are not obligations of or guaranteed by any bank and are not federally insured.
1 Represents a hypothetical investment of $10,000 in the Fund. The ending value of the Fund reflects a 1.00% contingent deferred sales charge on any redemption less than seven years from the purchase date. The maximum contingent deferred sales charge is 5.50% on any redemption less than one year from the purchase date. The Fund's performance assumes the reinvestment of all dividends and distributions. The S&P 400 has been adjusted to reflect reinvestment of dividends on securities in the index.
2 The S&P 400 is not adjusted to reflect sales charges, expenses or other fees that the SEC requires to be reflected in the Fund's performance. The index is unmanaged.
3 Total returns quoted reflect all applicable contingent deferred sales charges.
Hibernia Total Return Bond Fund
Annual Report/12-month period from September 1, 2003 through August 31, 2004
HIBERNIA TOTAL RETURN BOND FUND
The fund ended its 2004 fiscal year with a positive total return of 3.72%, based on net asset value.1 The primary factor providing the positive return in the fund was interest income generated by the portfolio. A slight overall decline in interest rates and the corresponding rise in bond prices during the reporting period also benefited performance. The general decline in interest rates was in spite of an improving U.S. economy, growing federal deficit, a declining U.S. dollar, rising oil prices and higher commodity prices. Given these inflationary economic factors, the fund maintained a defensive posture throughout its fiscal year. The defensive posture manifested in two primary ways. First, the overall duration2 of the fund was held roughly at 85% of the market index as evidenced by the Lehman Brothers Aggregate Bond Index.3 This practice reduced the volatility of the fund, but also dampened yield and price appreciation. Second, the fund focused on higher quality securities in the corporate sector. This bias toward quality lowered the credit risk of the portfolio but also lowered yield and price appreciation.
Other factors playing a lesser role in the positive performance of the fund were an overweighting in agency notes and corporate bonds and underweighting in U.S. Treasury securities and mortgage bonds.
The fund did not invest in derivative securities during the reporting period.
1 Performance data quoted represents past performance which is no guarantee of future results. Investment return and principal value will fluctuate, so that an investor's shares, when redeemed, may be worth more or less than their original cost. Mutual fund performance changes over time and current performance may be lower or higher than what is stated. Current to the most recent month end performance is available on the Hibernia Funds website at http://www.Hiberniafunds.com. Total return, based on offering price, was 0.59%, for the reporting period. The maximum sales charge is 3.00%.
2 Duration is a measure of a security's price sensitivity to changes in interest rates. Securities with longer durations are more sensitive to changes in interest rates than securities of shorter durations.
3 The Lehman Brothers Aggregate Bond Index is an unmanaged index that tracks investment grade corporate and government bonds. Investments cannot be made in an index.
Hibernia Total Return Bond Fund
Growth of a $10,000 Investment
The graph below illustrates the hypothetical investment of $10,0001 in the Hibernia Total Return Bond Fund (the "Fund") from August 31, 1994 to August 31, 2004, compared to the Citigroup Broad Investment-Grade Bond Index ("CBIGBI")2,3 and the Lehman Brothers Aggregate Bond Index ("LBAB").2,3
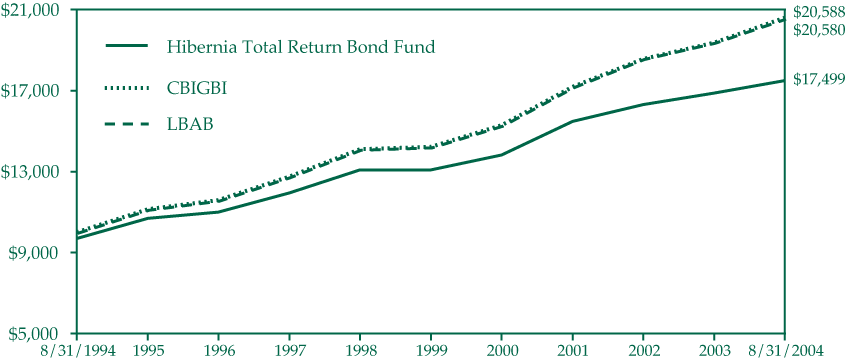
AVERAGE ANNUAL TOTAL RETURNS4
FOR THE
PERIOD ENDED AUGUST 31, 2004
|
1 Year |
0.59% | |
|
5 Years |
5.33% | |
|
10 Years |
5.75% |
Performance data quoted represents past performance, which is no guarantee of future results. Returns shown do not reflect the deduction of taxes that a shareholder would pay on Fund distributions or the redemption of Fund shares. Investment return and principal value will fluctuate so that an investor's shares, when redeemed, may be worth more or less than original cost. Mutual fund performance changes over time and current performance may be lower or higher than what is stated. Mutual funds are not obligations of or guaranteed by any bank and are not federally insured.
1 Represents a hypothetical investment of $10,000 in the Fund after deducting the maximum sales charge of 3.00% ($10,000 investment minus $300 sales charge = $9,700). The Fund's performance assumes the reinvestment of all dividends and distributions. The CBIGBI and LBAB have been adjusted to reflect reinvestment of income on securities in the index.
2 The CBIGBI and LBAB are not adjusted to reflect sales charges, expenses or other fees that the SEC requires to be reflected in the Fund's performance. The indexes are unmanaged.
3 The Fund's Adviser has elected to change the benchmark index from CBIGBI to LBAB because it is more reflective of the Fund's current investment strategy.
4 Total returns quoted reflect the current 3.00% sales charge.
Hibernia U.S. Government Income Fund
Annual Report/12-month period from September 1, 2003 through August 31, 2004
HIBERNIA U.S. GOVERNMENT INCOME FUND
The fund ended its 2004 fiscal year with a positive total return of 4.08%, based on net asset value.1 The primary factor providing the positive return in the fund was the interest income generated by the portfolio. A slight overall decline in interest rates and the corresponding rise in bond prices during the reporting period also benefited performance. The general decline in interest rates was in spite of an improving U.S. economy, growing federal deficit, a declining U.S. dollar, rising oil prices and higher commodity prices. The fund took a neutral to slightly defensive posture during its fiscal year in an effort to protect shareholder value while still providing the taxable income required by the fund's investment objective. During the fiscal year, the target duration2 of the fund was held at or below the intermediate term bond market level as represented by the Lehman Brothers Intermediate Term Aggregate Index.3 In keeping with the high quality of the fund, Treasury, agency notes and bonds accounted for over 65% of the fund's portfolio. Mortgage securities were utilized to a lesser degree comprising 20% of the portfolio while corporate bonds comprised roughly 15%. The focus within the corporate sector was primarily on "A" rated or above securities.
The fund did not invest in derivative securities during the reporting period.
1 Performance data quoted represents past performance which is no guarantee of future results. Investment return and principal value will fluctuate, so that an investor's shares, when redeemed, may be worth more or less than their original cost. Mutual fund performance changes over time and current performance may be lower or higher than what is stated. Current to the most recent month end performance is available on the Hibernia Funds website at http://www.Hiberniafunds.com. Total return, based on offering price, was 0.94%, for the reporting period. The maximum sales charge is 3.00%.
2 Duration is a measure of a security's price sensitivity to changes in interest rates. Securities with longer durations are more sensitive to changes in interest rates than securities of shorter durations.
3 Lehman Brothers Intermediate Term Aggregate Index is an unmanaged index that tracks investment grade corporate and government bonds with maturities between one and ten years. Investments cannot be made in an index.
Hibernia U.S. Government Income Fund
Growth of a $10,000 Investment
The graph below illustrates the hypothetical investment of $10,0001 in the Hibernia U.S. Government Income Fund (the "Fund") from August 31, 1994 to August 31, 2004, compared to the Citigroup Medium Term Broad Index ("CMTBI")2,3 and the Lehman Brothers Intermediate Term Aggregate Index ("LBIA").2,3
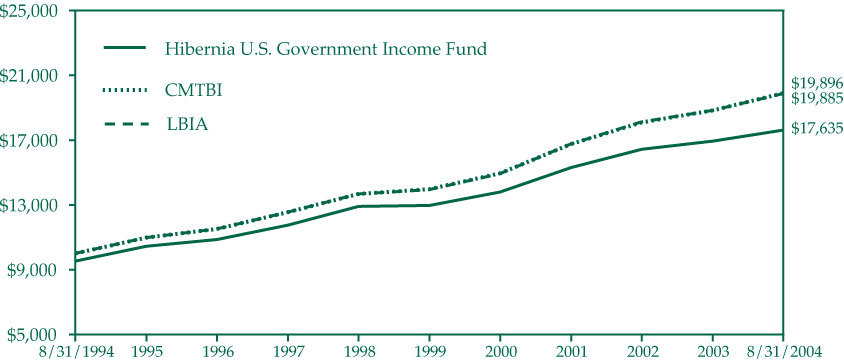
AVERAGE ANNUAL TOTAL RETURNS4 FOR THE
PERIOD ENDED AUGUST 31, 2004
|
1 Year |
0.94% | |
|
5 Years |
5.70% | |
|
10 Years |
6.00% |
Performance data quoted represents past performance, which is no guarantee of future results. Returns shown do not reflect the deduction of taxes that a shareholder would pay on Fund distributions or the redemption of Fund shares. Investment return and principal value will fluctuate so that an investor's shares, when redeemed, may be worth more or less than original cost. Mutual fund performance changes over time and current performance may be lower or higher than what is stated. Mutual funds are not obligations of or guaranteed by any bank and are not federally insured.
1 Represents a hypothetical investment of $10,000 in the Fund after deducting the original maximum sales charge of 3.00% ($10,000 investment minus $300 sales charge = $9,700). The Fund's performance assumes the reinvestment of all dividends and distributions. The CMTBI and LBIA have been adjusted to reflect reinvestment of income on securities in the index.
2 The CMTBI and LBIA are not adjusted to reflect sales charges, expenses or other fees that the SEC requires to be reflected in the Fund's performance. The indexes are unmanaged.
3 The Fund's Adviser has elected to change the benchmark index from CMTBI to LBIA because it is more reflective of the Fund's current investment strategy.
4 Total returns quoted reflect the current 3.00% sales charge.
Financial Highlights
Hibernia Funds
August 31, 2004
(For a share outstanding throughout each period)
|
Year Ended |
Net Asset |
Net |
Net Realized |
Total from |
Distributions |
Distributions |
||||||
|---|---|---|---|---|---|---|---|---|---|---|---|---|
|
Capital Appreciation Fund--Class A Shares |
||||||||||||
|
2000 |
$26.07 |
(0.01) |
4.50 |
4.49 |
-- |
(3.15) |
||||||
|
2001 |
$27.41 |
0.02 |
(6.07) |
(6.05) |
-- |
(0.52) |
||||||
|
2002 |
$20.84 |
0.04 |
(3.44) |
(3.40) |
(0.02) |
(0.92) |
||||||
|
2003 |
$16.50 |
0.08(3) |
1.31 |
1.39 |
(0.07) |
-- |
||||||
|
2004 |
$17.82 |
0.08(3) |
1.62 |
1.70 |
(0.07) |
(1.14) |
||||||
|
Capital Appreciation Fund--Class B Shares |
||||||||||||
|
2000 |
$25.70 |
(0.18) |
4.39 |
4.21 |
-- |
(3.15) |
||||||
|
2001 |
$26.76 |
(0.18) |
(5.87) |
(6.05) |
-- |
(0.52) |
||||||
|
2002 |
$20.19 |
(0.11) |
(3.31) |
(3.42) |
-- |
(0.92) |
||||||
|
2003 |
$15.85 |
(0.04)(3) |
1.25 |
1.21 |
-- |
-- |
||||||
|
2004 |
$17.06 |
(0.06)(3) |
1.56 |
1.50 |
-- |
(1.14) |
||||||
|
Louisiana Municipal Income Fund--Class A Shares |
||||||||||||
|
2000 |
$10.85 |
0.56 |
0.09 |
0.65 |
(0.55) |
(0.10) |
||||||
|
2001 |
$10.85 |
0.53(3) |
0.50 |
1.03 |
(0.53) |
(0.02) |
||||||
|
2002 |
$11.33 |
0.51(4) |
0.07(4) |
0.58 |
(0.51) |
(0.00)(5) |
||||||
|
2003 |
$11.40 |
0.50 |
(0.12) |
0.38 |
(0.50) |
(0.07) |
||||||
|
2004 |
$11.21 |
0.48 |
0.17 |
0.65 |
(0.47) |
(0.03) |
||||||
|
Louisiana Municipal Income Fund--Class B Shares |
||||||||||||
|
2002(6) |
$11.36 |
0.34(4) |
0.05(4) |
0.39 |
(0.35) |
(0.00)(5) |
||||||
|
2003 |
$11.40 |
0.40 |
(0.12) |
0.28 |
(0.40) |
(0.07) |
||||||
|
2004 |
$11.21 |
0.38 |
0.19 |
0.57 |
(0.38) |
(0.03) |
||||||
|
Mid Cap Equity Fund--Class A Shares |
||||||||||||
|
2000 |
$11.35 |
(0.05) |
4.71 |
4.66 |
-- |
-- |
||||||
|
2001 |
$16.01 |
(0.03) |
(2.12) |
(2.15) |
-- |
(1.29) |
||||||
|
2002 |
$12.57 |
(0.02) |
(1.01) |
(1.03) |
-- |
(0.08) |
||||||
|
2003 |
$11.46 |
(0.05)(3) |
1.51 |
1.46 |
-- |
-- |
||||||
|
2004 |
$12.92 |
(0.02)(3) |
1.56 |
1.54 |
-- |
(0.07) |
||||||
|
Mid Cap Equity Fund--Class B Shares |
||||||||||||
|
2000 |
$11.29 |
(0.11) |
4.63 |
4.52 |
-- |
-- |
||||||
|
2001 |
$15.81 |
(0.11) |
(2.13) |
(2.24) |
-- |
(1.29) |
||||||
|
2002 |
$12.28 |
0.18 |
(1.26) |
(1.08) |
-- |
(0.08) |
||||||
|
2003 |
$11.12 |
(0.14)(3) |
1.46 |
1.32 |
-- |
-- |
||||||
|
2004 |
$12.44 |
(0.12)(3) |
1.50 |
1.38 |
-- |
(0.07) |
||||||
|
Total Return Bond Fund |
||||||||||||
|
2000 |
$9.68 |
0.59 |
(0.07) |
0.52 |
(0.58) |
-- |
||||||
|
2001 |
$9.62 |
0.57 |
0.56 |
1.13 |
(0.59) |
-- |
||||||
|
2002 |
$10.16 |
0.52(3)(8) |
--(8) |
0.52 |
(0.53) |
-- |
||||||
|
2003 |
$10.15 |
0.45(3) |
(0.11) |
0.34 |
(0.51) |
-- |
||||||
|
2004 |
$9.98 |
0.41(3) |
(0.05) |
0.36 |
(0.45) |
-- |
||||||
(1) Based on net asset value, which does not reflect the sales charge, redemption fee or contingent deferred sales charge, if applicable. Total returns for periods less than one year are not annualized.
(2) This voluntary expense decrease is reflected in both the expense and net investment income ratios.
(3) Based on average shares outstanding.
(4) Effective September 1, 2001 the Hibernia Louisiana Municipal Income Fund adopted the provisions of the American Institute of Certified Public Accountants (AICPA) Audit and Accounting Guide for Investment companies and began accreting short and long term discounts on debt securities. For the period ended August 31, 2002 this change had no effect on net investment income per share or net realized and unrealized gain per share, but increased the ratio of net investment income to average net assets from 4.58% to 4.59% for Class A Shares and increased the ratio of net investment income to average net assets from 3.75% to 3.76% for Class B Shares. Per share, ratios and supplemental data for periods prior to September 1, 2001 have not been restated to reflect this change in presentation.
(See Notes which are an integral part of the Financial Statements)
|
|
|
|
Ratio to Average Net Assets |
|
|
|||||||||
|---|---|---|---|---|---|---|---|---|---|---|---|---|---|---|
|
Total |
Net |
Total |
Expenses |
Net |
Expense |
Net Assets, End |
Portfolio |
|||||||
|
|
|
|
|
|
|
|
|
|||||||
|
(3.15) |
$27.41 |
18.55% |
1.20% |
(0.04)% |
-- |
$380,073 |
8% |
|||||||
|
(0.52) |
$20.84 |
(22.37)% |
1.21% |
0.07% |
-- |
$265,817 |
2% |
|||||||
|
(0.94) |
$16.50 |
(17.18)% |
1.23% |
0.18% |
-- |
$217,744 |
3% |
|||||||
|
(0.07) |
$17.82 |
8.46% |
1.27% |
0.48% |
-- |
$234,905 |
29% |
|||||||
|
(1.21) |
$18.31 |
9.87% |
1.25% |
0.41% |
-- |
$239,871 |
22% |
|||||||
|
|
|
|
|
|
|
|
|
|||||||
|
(3.15) |
$26.76 |
17.65% |
1.95% |
(0.79)% |
-- |
$21,159 |
8% |
|||||||
|
(0.52) |
$20.19 |
(22.93)% |
1.96% |
(0.68)% |
-- |
$15,245 |
2% |
|||||||
|
(0.92) |
$15.85 |
(17.83)% |
1.98% |
(0.57)% |
-- |
$11,849 |
3% |
|||||||
|
-- |
$17.06 |
7.63% |
2.02% |
(0.27)% |
-- |
$11,865 |
29% |
|||||||
|
(1.14) |
$17.42 |
9.08% |
2.00% |
(0.34)% |
-- |
$11.981 |
22% |
|||||||
|
|
|
|
|
|
|
|
|
|||||||
|
(0.65) |
$10.85 |
6.23% |
0.67% |
5.20% |
0.33% |
$93,684 |
12% |
|||||||
|
(0.55) |
$11.33 |
9.79% |
0.66% |
4.83% |
0.33% |
$98,822 |
9% |
|||||||
|
(0.51) |
$11.40 |
5.32% |
0.71% |
4.59%(4) |
0.33% |
$84,361 |
10% |
|||||||
|
(0.57) |
$11.21 |
3.33% |
0.74% |
4.36% |
0.33% |
$81,468 |
9% |
|||||||
|
(0.50) |
$11.36 |
5.88% |
0.75% |
4.20% |
0.33% |
$78,288 |
11% |
|||||||
|
|
|
|
|
|
|
|
|
|||||||
|
(0.35) |
$11.40 |
3.60% |
1.59%(7) |
3.76%(4)(7) |
0.23%(8) |
$2,824 |
10% |
|||||||
|
(0.47) |
$11.21 |
2.47% |
1.59% |
3.51% |
0.23% |
$4,127 |
9% |
|||||||
|
(0.41) |
$11.37 |
5.08% |
1.60% |
3.35% |
0.23% |
$3,569 |
11% |
|||||||
|
|
|
|
|
|
|
|
|
|||||||
|
-- |
$16.01 |
41.06% |
1.72% |
(0.35)% |
0.23% |
$26,171 |
32% |
|||||||
|
(1.29) |
$12.57 |
(14.05)% |
1.58% |
(0.21)% |
0.15% |
$36,985 |
20% |
|||||||
|
(0.08) |
$11.46 |
(8.27)% |
1.57% |
(0.51)% |
-- |
$42,545 |
12% |
|||||||
|
-- |
$12.92 |
12.74% |
1.55% |
(0.48)% |
-- |
$59,735 |
25% |
|||||||
|
(0.07) |
$14.39 |
12.01% |
1.45% |
(0.14)% |
-- |
$74,783 |
51% |
|||||||
|
|
|
|
|
|
|
|
|
|||||||
|
-- |
$15.81 |
40.04% |
2.47% |
(1.10)% |
0.23% |
$4,090 |
32% |
|||||||
|
(1.29) |
$12.28 |
(14.86)% |
2.33% |
(0.94)% |
0.15% |
$3,548 |
20% |
|||||||
|
(0.08) |
$11.12 |
(8.87)% |
2.32% |
(1.26)% |
-- |
$3,450 |
12% |
|||||||
|
-- |
$12.44 |
11.87% |
2.30% |
(1.23)% |
-- |
$3,795 |
25% |
|||||||
|
(0.07) |
$13.75 |
11.19% |
2.20% |
(0.89)% |
-- |
$4,321 |
51% |
|||||||
|
|
|
|
|
|
|
|
|
|||||||
|
(0.58) |
$9.62 |
5.53% |
0.98% |
6.04% |
0.30% |
$77,909 |
11% |
|||||||
|
(0.59) |
$10.16 |
12.08% |
0.97% |
5.79% |
0.30% |
$71,060 |
8% |
|||||||
|
(0.53) |
$10.15 |
5.39% |
1.01% |
5.18%(8) |
0.30% |
$47,428 |
0% |
|||||||
|
(0.51) |
$9.98 |
3.38% |
1.01% |
4.38% |
0.40% |
$48,563 |
20% |
|||||||
|
(0.45) |
$9.89 |
3.72% |
1.01% |
4.08% |
0.40% |
$51,957 |
22% |
|||||||
(5) Represents less than $0.01.
(6) Reflects operations for the period from November 15, 2001(date of initial public offering) to August 31, 2002.
(7) Computed on an annualized basis.
(8) Effective September 1, 2001, the Total Return Bond Fund adopted the provisions of the AICPA Audit and Accounting Guide for Investment Companies and began accreting discount/amortizing premiums on long term debt securities. The effect of this change for the fiscal year ended August 31, 2002 was to decrease net investment income per share by $0.01, increase net realized and unrealized gain/loss per share by $0.01, and decrease the ratio of net investment income to average net assets from 5.34% to 5.18%. Per share, ratios and supplemental data for the periods prior to September 1, 2001 have not been restated to reflect this change in presentation.
Financial Highlights (continued)
Hibernia Funds
August 31, 2004
(For a share outstanding throughout each period)
|
Year Ended |
Net Asset Value, |
Net Investment |
Net Realized and |
Total from |
Distributions from |
|||||
|---|---|---|---|---|---|---|---|---|---|---|
|
U.S. Government Income Fund |
||||||||||
|
2000 |
$9.81 |
0.58 |
0.03 |
0.61 |
(0.57) |
|||||
|
2001 |
$9.85 |
0.59 |
0.46 |
1.05 |
(0.60) |
|||||
|
2002 |
$10.30 |
0.61(3) |
0.13(3) |
0.74 |
(0.56) |
|||||
|
2003 |
$10.48 |
0.42(4) |
(0.11) |
0.31 |
(0.49) |
|||||
|
2004 |
$10.30 |
0.38(4) |
0.03 |
0.41 |
(0.41) |
|||||
|
Cash Reserve Fund--Class A Shares |
||||||||||
|
2000 |
$1.00 |
0.05 |
-- |
0.05 |
(0.05) |
|||||
|
2001 |
$1.00 |
0.05 |
-- |
0.05 |
(0.05) |
|||||
|
2002 |
$1.00 |
0.01 |
(0.00)(5) |
0.01 |
(0.01) |
|||||
|
2003 |
$1.00 |
0.01 |
0.00(5) |
0.01 |
(0.01) |
|||||
|
2004 |
$1.00 |
0.005 |
0.000(6) |
0.005 |
(0.005) |
|||||
|
Cash Reserve Fund--Class B Shares |
||||||||||
|
2000 |
$1.00 |
0.04 |
-- |
0.04 |
(0.04) |
|||||
|
2001 |
$1.00 |
0.04 |
-- |
0.04 |
(0.04) |
|||||
|
2002 |
$1.00 |
0.01 |
(0.00)(5) |
0.01 |
(0.01) |
|||||
|
2003 |
$1.00 |
0.01 |
0.00(5) |
0.01 |
(0.01) |
|||||
|
2004 |
$1.00 |
0.003 |
0.001 |
0.004 |
(0.004) |
|||||
|
U.S. Treasury Money Market Fund |
||||||||||
|
2000 |
$1.00 |
0.05 |
-- |
0.05 |
(0.05) |
|||||
|
2001 |
$1.00 |
0.05 |
-- |
0.05 |
(0.05) |
|||||
|
2002 |
$1.00 |
0.01 |
-- |
0.01 |
(0.01) |
|||||
|
2003 |
$1.00 |
0.01 |
-- |
0.01 |
(0.01) |
|||||
|
2004 |
$1.00 |
0.003 |
-- |
0.003 |
(0.003) |
|||||
(1) Based on net asset value, which does not reflect the sales charge, redemption fee or contingent deferred sales charge, if applicable. Total returns for periods less than one year are not annualized.
(2) This voluntary expense decrease is reflected in both the expense and net investment income ratios.
(3) Effective September 1, 2001, the U.S. Government Income Fund adopted the provisions of the AICPA Audit and Accounting Guide for Investment Companies and began accreting discount/amortizing premiums on long term debt securities. The effect of this change for the fiscal year ended August 31, 2002 was to decrease net investment income per share by $0.05, increase net realized and unrealized gain/loss per share by $0.05, and decrease the ratio of net investment income to average net assets from 5.41% to 4.87%. Per share, ratios and supplemental data for the periods prior to September 1, 2001 have not been restated to reflect this change in presentation.
(See Notes which are an integral part of the Financial Statements)
|
|
|
Ratio to Average Net Assets |
|
|
||||||||
|---|---|---|---|---|---|---|---|---|---|---|---|---|
|
Net Asset |
Total |
Expenses |
Net |
Expense |
Net Assets, |
Portfolio |
||||||
|
|
|
|
|
|
|
|
||||||
|
$9.85 |
6.47% |
0.68% |
5.96% |
0.31% |
$85,724 |
15% |
||||||
|
$10.30 |
10.95% |
0.68% |
5.83% |
0.31% |
$85,017 |
27% |
||||||
|
$10.48 |
7.39% |
0.69% |
4.87%(3) |
0.31% |
$85,093 |
39% |
||||||
|
$10.30 |
3.01% |
0.70% |
3.97% |
0.31% |
$89,573 |
31% |
||||||
|
$10.30 |
4.08% |
0.70% |
3.71% |
0.31% |
$82,231 |
29% |
||||||
|
|
|
|
|
|
|
|
||||||
|
$1.00 |
5.10% |
0.94% |
5.03% |
-- |
$232,410 |
-- |
||||||
|
$1.00 |
4.66% |
0.90% |
4.47% |
-- |
$244,254 |
-- |
||||||
|
$1.00 |
1.27% |
0.84% |
1.28% |
0.06% |
$212,320 |
-- |
||||||
|
$1.00 |
0.80% |
0.53% |
0.81% |
0.40% |
$182,575 |
-- |
||||||
|
$1.00 |
0.55% |
0.56% |
0.55% |
0.40% |
$166,616 |
-- |
||||||
|
|
|
|
|
|
|
|
||||||
|
$1.00 |
4.31% |
1.69% |
4.27% |
-- |
$189 |
-- |
||||||
|
$1.00 |
3.88% |
1.65% |
3.34% |
-- |
$509 |
-- |
||||||
|
$1.00 |
0.84% |
1.30% |
0.81% |
0.35% |
$696 |
-- |
||||||
|
$1.00 |
0.57% |
0.89% |
0.45% |
0.79% |
$677 |
-- |
||||||
|
$1.00 |
0.40% |
0.71% |
0.39% |
1.00% |
$417 |
-- |
||||||
|
|
|
|
|
|
|
|
||||||
|
$1.00 |
5.15% |
0.63% |
4.99% |
-- |
$198,457 |
-- |
||||||
|
$1.00 |
4.68% |
0.64% |
4.56% |
-- |
$210,102 |
-- |
||||||
|
$1.00 |
1.38% |
0.62% |
1.37% |
-- |
$193,535 |
-- |
||||||
|
$1.00 |
0.62% |
0.65% |
0.61% |
-- |
$221,334 |
-- |
||||||
|
$1.00 |
0.34% |
0.66% |
0.34% |
-- |
$152,264 |
-- |
||||||
(4) Based on average shares outstanding.
(5) Represents less than $0.01.
(6) Represents less than $0.001.
Shareholder Expense Example
As a shareholder of a Fund, you incur ongoing costs, including management fees, distribution (12b-1) fees (Class A Shares, Class B Shares and Shares), shareholder services fees (Class B Shares) and other Fund expenses. This Example is intended to help you to understand your ongoing costs (in dollars) of investing in the Funds and to compare these costs with the ongoing costs of investing in other mutual funds. It is based on an investment of $1,000 invested at the beginning of the period and held for the entire period from March 1, 2004 to August 31, 2004.
Actual Expenses
The first section of the table below provides information about actual account values and actual expenses. You may use the information in this section, together with the amount you invested, to estimate the expenses that you incurred over the period. Simply divide your account value by $1,000 (for example, an $8,600 account value divided by $1,000 = 8.6), then multiply the result by the number in the first section under the heading entitled "Expenses Paid During Period" to estimate the expenses attributable to your investment during this period.
Hypothetical Example for Comparison Purposes
The second section of the table below provides information about hypothetical account values and hypothetical expenses based on the Funds' actual expense ratios and an assumed rate of return of 5% per year before expenses, which is not the Funds' actual return. Thus, you should not use the hypothetical account values and expenses to estimate the actual ending account balance or your expenses for the period. Rather, these figures are provided to enable you to compare the ongoing costs of investing in the Funds and other funds. To do so, compare this 5% hypothetical example with the 5% hypothetical examples that appear in the shareholder reports of the other funds.
Please note that the expenses shown in the table are meant to highlight your ongoing costs only. Therefore, the second section of the table is useful in comparing ongoing costs only, and will not help you determine the relative total costs of owning different funds.
|
|
Beginning |
Ending |
Expenses Paid |
|||
|---|---|---|---|---|---|---|
|
Hibernia Capital Appreciation Fund |
|
|
|
|||
|
Actual |
|
|
|
|||
|
Class A Shares |
$1,000 |
$ 974.50 |
$ 6.25 |
|||
|
Class B Shares |
$1,000 |
$ 970.50 |
$ 9.96 |
|||
|
Hypothetical (assuming a 5% return before expenses) |
|
|
|
|||
|
Class A Shares |
$1,000 |
$ 1,018.80 |
$ 6.39 |
|||
|
Class B Shares |
$1,000 |
$ 1,015.03 |
$ 10.18 |
|||
|
Hibernia Louisiana Municipal Income Fund |
|
|
|
|||
|
Actual |
|
|
|
|||
|
Class A Shares |
$1,000 |
$ 1,001.10 |
$ 3.77 |
|||
|
Class B Shares |
$1,000 |
$ 996.80 |
$ 8.03 |
|||
|
Hypothetical (assuming a 5% return before expenses) |
|
|
|
|||
|
Class A Shares |
$1,000 |
$ 1,021.37 |
$ 3.81 |
|||
|
Class B Shares |
$1,000 |
$ 1,017.09 |
$ 8.11 |
|||
|
Hibernia Mid Cap Equity Fund |
|
|
|
|||
|
Actual |
|
|
|
|||
|
Class A Shares |
$1,000 |
$ 961.30 |
$ 7.00 |
|||
|
Class B Shares |
$1,000 |
$ 957.50 |
$ 10.68 |
|||
|
Hypothetical (assuming a 5% return before expenses) |
|
|
|
|||
|
Class A Shares |
$1,000 |
$ 1,018.00 |
$ 7.20 |
|||
|
Class B Shares |
$1,000 |
$ 1,014.23 |
$ 10.99 |
|||
|
Hibernia Total Return Bond Fund |
|
|
|
|||
|
Actual |
$1,000 |
$ 1,003.70 |
$ 5.09 |
|||
|
Hypothetical (assuming a 5% return before expenses) |
$1,000 |
$ 1,020.06 |
$ 5.13 |
|||
|
Hibernia U.S. Government Income Fund |
|
|
|
|||
|
Actual |
$1,000 |
$ 1,003.80 |
$ 3.58 |
|||
|
Hypothetical (assuming a 5% return before expenses) |
$1,000 |
$ 1,021.57 |
$ 3.61 |
|||
|
Hibernia Cash Reserve Fund |
|
|
|
|||
|
Actual |
|
|
|
|||
|
Class A Shares |
$1,000 |
$1,002.90 |
$ 2.87 |
|||
|
Class B Shares |
$1,000 |
$1,002.20 |
$ 3.62 |
|||
|
Hypothetical (assuming a 5% return before expenses) |
|
|
|
|||
|
Class A Shares |
$1,000 |
$1,022.27 |
$ 2.90 |
|||
|
Class B Shares |
$1,000 |
$1,021.52 |
$ 3.66 |
|||
|
Hibernia U.S. Treasury Money Market Fund |
|
|
|
|||
|
Actual |
$1,000 |
$1,001.90 |
$ 3.42 |
|||
|
Hypothetical (assuming a 5% return before expenses) |
$1,000 |
$1,021.72 |
$ 3.46 |
(1) Expenses are equal to the Funds' Class A Shares and Class B Shares annualized expense ratios multiplied by the average account value over the period, multiplied by 184/366 (to reflect the one-half year period).
The annualized expense ratios were as follows:
|
Capital Appreciation Fund |
|
|
|
Class A Shares |
1.26% |
|
|
Class B Shares |
2.01% |
|
|
Louisiana Municipal Income Fund |
|
|
|
Class A Shares |
0.75% |
|
|
Class B Shares |
1.60% |
|
|
Mid Cap Equity Fund |
|
|
|
Class A Shares |
1.42% |
|
|
Class B Shares |
2.17% |
|
|
Total Return Bond Fund |
1.01% |
|
|
U.S. Government Income Fund |
0.71% |
|
|
Cash Reserve Fund |
|
|
|
Class A Shares |
0.57% |
|
|
Class B Shares |
0.72% |
|
|
U.S. Treasury Money Market Fund |
0.68% |
Portfolio of Investments Summary Tables
CAPITAL APPRECIATION FUND SUMMARY TABLE
At August 31, 2004, the fund's portfolio composition(1) was as follows:
|
EQUITIES |
Percentage |
|
|---|---|---|
|
Finance |
21.9% |
|
|
Health Technology |
10.4% |
|
|
Technology Services |
8.3% |
|
|
Consumer Non-Durables |
8.3% |
|
|
Producer Manufacturing |
8.2% |
|
|
Electronic Technology |
6.9% |
|
|
Retail Trade |
6.9% |
|
|
Energy Minerals |
6.2% |
|
|
Consumer Services |
5.2% |
|
|
Communications |
3.8% |
|
|
Utilities |
3.0% |
|
|
Transportation |
1.9% |
|
|
Health Services |
1.6% |
|
|
Process Industries |
1.5% |
|
|
Commercial Services |
1.4% |
|
|
Non-Energy Minerals |
1.4% |
|
|
Distribution Services |
1.2% |
|
|
Consumer Durables |
0.9% |
|
|
Industrial Services |
0.8% |
|
|
TOTAL EQUITIES PORTFOLIO VALUE |
99.8% |
|
|
Other Securities(3) |
1.2% |
|
|
TOTAL PORTFOLIO VALUE |
100% |
(1) See the fund's prospectus for a more complete description of these types of investments.
(2) Percentages are based on total investments, which may differ from total net assets.
(3) Investment represents shares held in a money market mutual fund.
Portfolio of Investments
Hibernia Funds
August 31, 2004
CAPITAL APPRECIATION FUND
|
Shares |
|
Value |
||
|---|---|---|---|---|
|
|
COMMON STOCKS--99.6% |
|
||
|
|
Commercial Services--1.3% |
|
||
|
33,000 |
McGraw-Hill Cos., Inc. |
$ 2,499,090 |
||
|
13,000 |
Omnicom Group, Inc. |
894,530 |
||
|
|
||||
|
|
Total |
3,393,620 |
||
|
|
||||
|
|
Communications--3.7% |
|
||
|
115,200 |
BellSouth Corp. |
3,082,752 |
||
|
62,800 |
(1) NEXTEL Communications, Inc., Class A |
1,456,332 |
||
|
124,600 |
Verizon Communications, Inc. |
4,890,550 |
||
|
|
||||
|
|
Total |
9,429,634 |
||
|
|
||||
|
|
Consumer Durables--0.9% |
|
||
|
84,563 |
Ford Motor Co. |
1,193,184 |
||
|
25,400 |
General Motors Corp. |
1,049,274 |
||
|
|
||||
|
|
Total |
2,242,458 |
||
|
|
||||
|
|
Consumer Non-Durables--8.3% |
|
||
|
54,000 |
Altria Group, Inc. |
2,643,300 |
||
|
51,620 |
Anheuser-Busch Cos., Inc. |
2,725,536 |
||
|
23,500 |
(1) Coach, Inc. |
990,525 |
||
|
20,000 |
Coca-Cola Co. |
894,200 |
||
|
34,900 |
Kimberly-Clark Corp. |
2,327,830 |
||
|
127,000 |
PepsiCo, Inc. |
6,350,000 |
||
|
90,282 |
Procter & Gamble Co. |
5,053,084 |
||
|
|
||||
|
|
Total |
20,984,475 |
||
|
|
||||
|
|
Consumer Services--5.2% |
|
||
|
184,000 |
Cendant Corp. |
3,979,920 |
||
|
127,600 |
(1) Fox Entertainment Group, Inc., Class A |
3,463,064 |
||
|
38,700 |
Walt Disney Co. |
868,815 |
||
|
117,400 |
Yum! Brands, Inc. |
4,661,954 |
||
|
|
||||
|
|
Total |
12,973,753 |
||
|
|
||||
|
|
Distribution Services--1.2% |
|
||
|
98,100 |
McKesson HBOC, Inc. |
3,036,195 |
||
|
|
||||
|
|
Electronic Technology--6.9% |
|
||
|
224,720 |
(1) Cisco Systems, Inc. |
4,215,747 |
||
|
107,900 |
(1) Dell, Inc. |
3,759,236 |
||
|
85,386 |
Hewlett-Packard Co. |
1,527,556 |
||
|
201,432 |
Intel Corp. |
4,288,487 |
||
|
157,000 |
(1) National Semiconductor Corp. |
2,092,810 |
||
|
30,000 |
Scientific-Atlanta, Inc. |
$ 817,200 |
||
|
35,000 |
Texas Instruments, Inc. |
683,900 |
||
|
|
||||
|
|
Total |
17,384,936 |
||
|
|
||||
|
|
Energy Minerals--6.2% |
|
||
|
9,800 |
Anadarko Petroleum Corp. |
580,356 |
||
|
35,300 |
Apache Corp. |
1,577,557 |
||
|
20,000 |
ChevronTexaco Corp. |
1,950,000 |
||
|
54,500 |
ConocoPhillips |
4,056,435 |
||
|
120,410 |
Exxon Mobil Corp. |
5,550,901 |
||
|
51,600 |
Marathon Oil Corp. |
1,871,532 |
||
|
|
||||
|
|
Total |
15,586,781 |
||
|
|
||||
|
|
Finance--21.9% |
|
||
|
55,000 |
Allstate Corp. |
2,596,550 |
||
|
72,050 |
Ambac Financial Group, Inc. |
5,439,775 |
||
|
52,395 |
American Express Co. |
2,620,798 |
||
|
155,000 |
Bank of America Corp. |
6,971,900 |
||
|
24,000 |
Bear Stearns Cos., Inc. |
2,110,080 |
||
|
114,800 |
Citigroup, Inc. |
5,347,384 |
||
|
129,600 |
Countrywide Financial Corp. |
4,607,280 |
||
|
29,400 |
Equity Office Properties Trust |
839,664 |
||
|
42,200 |
Golden West Financial Corp. |
4,567,306 |
||
|
27,500 |
Goldman Sachs Group, Inc. |
2,465,375 |
||
|
109,900 |
J.P. Morgan Chase & Co. |
4,349,842 |
||
|
39,200 |
MetLife, Inc. |
1,460,200 |
||
|
37,300 |
SouthTrust Corp. |
1,542,355 |
||
|
206,100 |
UNUMProvident Corp. |
3,334,698 |
||
|
54,000 |
Wachovia Corp. |
2,533,140 |
||
|
48,780 |
Washington Mutual Bank FA |
1,894,127 |
||
|
40,400 |
Wells Fargo & Co. |
2,373,500 |
||
|
|
||||
|
|
Total |
55,053,974 |
||
|
|
||||
|
|
Health Services--1.6% |
|
||
|
49,100 |
IMS Health, Inc. |
1,145,503 |
||
|
4,653 |
(1) Medco Health Solutions, Inc. |
145,313 |
||
|
40,200 |
UnitedHealth Group, Inc. |
2,658,426 |
||
|
|
||||
|
|
Total |
3,949,242 |
||
|
|
||||
|
|
Health Technology--10.4% |
|
||
|
48,800 |
(1) Amgen, Inc. |
2,893,352 |
||
|
129,800 |
Johnson & Johnson |
7,541,380 |
||
|
19,680 |
Lilly (Eli) & Co. |
1,248,696 |
||
|
38,715 |
Merck & Co., Inc. |
1,741,013 |
||
|
|
COMMON STOCKS--continued |
|
||
|
49,100 |
Mylan Laboratories, Inc. |
$ 855,322 |
||
|
244,000 |
Pfizer, Inc. |
7,971,480 |
||
|
53,912 |
(1) Zimmer Holdings, Inc. |
3,843,926 |
||
|
|
||||
|
|
Total |
26,095,169 |
||
|
|
||||
|
|
Industrial Services--0.8% |
|
||
|
33,900 |
Schlumberger Ltd. |
2,095,020 |
||
|
|
||||
|
|
Non-Energy Minerals--1.4% |
|
||
|
110,702 |
Alcoa, Inc. |
3,584,531 |
||
|
|
||||
|
|
Process Industries--1.5% |
|
||
|
51,000 |
Air Products & Chemicals, Inc. |
2,671,380 |
||
|
19,600 |
Sigma-Aldrich Corp. |
1,122,884 |
||
|
|
||||
|
|
Total |
3,794,264 |
||
|
|
||||
|
|
Producer Manufacturing--8.2% |
|
||
|
58,400 |
3M Co. |
4,809,824 |
||
|
14,700 |
Caterpillar, Inc. |
1,068,690 |
||
|
151,500 |
General Electric Co. |
4,967,685 |
||
|
26,550 |
Graco, Inc. |
828,360 |
||
|
32,400 |
Molex, Inc. |
935,388 |
||
|
29,400 |
PACCAR, Inc. |
1,769,586 |
||
|
68,700 |
Tyco International Ltd. |
2,151,684 |
||
|
43,200 |
United Technologies Corp. |
4,056,912 |
||
|
|
||||
|
|
Total |
20,588,129 |
||
|
|
||||
|
|
Retail Trade--6.9% |
|
||
|
94,000 |
Home Depot, Inc. |
3,436,640 |
||
|
73,600 |
SUPERVALU, Inc. |
1,940,096 |
||
|
55,900 |
Sherwin-Williams Co. |
2,308,670 |
||
|
337,500 |
TJX Cos., Inc. |
7,141,500 |
||
|
50,000 |
Wal-Mart Stores, Inc. |
2,633,500 |
||
|
|
||||
|
|
Total |
17,460,406 |
||
|
|
||||
|
|
Technology Services--8.3% |
|
||
|
35,000 |
(1) Computer Sciences Corp. |
1,622,250 |
||
|
90,300 |
Electronic Data Systems Corp. |
1,735,566 |
||
|
50,000 |
IBM Corp. |
4,234,500 |
||
|
343,400 |
Microsoft Corp. |
9,374,820 |
||
|
79,900 |
(1) Symantec Corp. |
3,832,004 |
||
|
|
||||
|
|
Total |
20,799,140 |
||
|
|
||||
|
|
Transportation--1.9% |
|
||
|
33,400 |
Burlington Northern Santa Fe Corp. |
1,195,720 |
||
|
44,200 |
FedEx Corp. |
3,623,958 |
||
|
|
||||
|
|
Total |
4,819,678 |
||
|
|
||||
|
|
Utilities--3.0% |
|
||
|
33,400 |
Constellation Energy Group |
$ 1,372,740 |
||
|
54,700 |
DTE Energy Co. |
2,260,204 |
||
|
77,200 |
Exelon Corp. |
2,844,820 |
||
|
24,500 |
Questar Corp. |
996,660 |
||
|
|
||||
|
|
Total |
7,474,424 |
||
|
|
||||
|
|
TOTAL COMMON STOCKS |
250,745,829 |
||
|
|
||||
|
|
MUTUAL FUND--0.2% |
|
||
|
615,000 |
Fidelity Institutional Cash Treasury Money Market Fund (at net asset value) |
615,000 |
||
|
|
||||
|
|
TOTAL INVESTMENTS--99.8% |
251,360,829 |
||
|
|
||||
|
|
OTHER ASSETS AND LIABILITIES--NET--0.2% |
491,222 |
||
|
|
||||
|
|
TOTAL NET ASSETS--100% |
$ 251,852,051 |
||
|
|
||||
(See Notes to Portfolio of Investments)
Portfolio of Investments Summary Tables
LOUISIANA MUNICIPAL INCOME FUND
At August 31, 2004, the fund's portfolio composition(1) was as follows:
|
|
Percentage |
|
|---|---|---|
|
Special Revenue |
38.0% |
|
|
General Obligation |
20.8% |
|
|
Utilities |
16.8% |
|
|
Sales Tax |
10.6% |
|
|
Mortgage |
7.5% |
|
|
Hospitals |
4.6% |
|
|
Transportation |
1.7% |
|
|
TOTAL |
100% |
At August 31, 2004, the fund's credit quality ratings composition(3) was as follows:
|
S&P Long-Term Ratings as |
|
|
Moody's Long-Term Ratings as |
|||||
|
AAA |
|
93.8 |
% |
|
Aaa |
|
82.8 |
% |
|
AA |
|
1.8 |
% |
|
Not Rated by Moody's |
|
17.2 |
% |
|
Not Rated by S&P |
|
4.4 |
% |
|
|
|
|
|
|
TOTAL |
|
100 |
% |
|
TOTAL |
|
100 |
% |
(1) See the fund's prospectus for a more complete description of these types of investments.
(2) Percentages are based on total investments, which may differ from total net assets.
(3) These tables depict the long-term credit quality ratings assigned to the fund's portfolio holdings by Standard & Poor's and Moody's Investors Service, each of which is a Nationally Recognized Statistical Ratings Organization (NRSRO). These credit-quality ratings are shown without regard to gradations within a given rating category, For example, securities rated "A-" have been included in the "A" rated category. Holdings that are rated only by a different NRSRO than the one identified have been included in the "Not rated by..." category. Rated securities that have been pre-refunded, but not rated again by the NRSRO, also have been included in the "Not rated by..." category. The tables also reflect both the fund's direct holdings and the fund's pro-rata share of holdings in other investment companies managed by the fund's adviser (or its affiliates), although the shares of those other investment companies held by the fund might not be rated.) Rated securities include a security with an obligor and/or credit enhancer that has received a rating from an NRSRO with respect to a class of debt obligations that is comparable in priority and security with the security held by the fund. Credit quality ratings are an assessment of the risk that a security will default in payment and do not address other risks presented by the security. Please see the description of credit quality ratings in the fund's Statement of Additional Information.
Each table depicts the long-term credit quality ratings as assigned only by the NRSRO identified in the table. Of the portfolio's total investments, all securities have received a rating by an NRSRO.
LOUISIANA MUNICIPAL INCOME FUND
|
Principal |
|
Credit |
Value |
|||
|---|---|---|---|---|---|---|
|
|
(2) LONG-TERM MUNICIPALS--98.0% |
|
|
|||
|
|
Guam--1.4% |
|
|
|||
|
$ 1,020,000 |
Guam Airport Authority Revenue Bonds, (Series A), 5.25%, 10/1/2014 |
AAA |
$ 1,142,502 |
|||
|
|
Louisiana--96.6% |
|
|
|||
|
1,000,000 |
Bossier City, LA,, Revenue Bonds, 5.00% (FGIC INS), 12/1/2019 |
AAA |
1,063,440 |
|||
|
500,000 |
Bossier City, LA, Refunding Revenue Bonds, 5.20% (FGIC INS)/(Original Issue Yield: 5.35%), 11/1/2014 |
AAA |
542,955 |
|||
|
1,000,000 |
Calcasieu Parish, LA, IDB, Sales Tax, 5.50% (FSA LOC), 11/1/2019 |
AAA |
1,103,640 |
|||
|
50,000 |
East Baton Rouge, LA, Mortgage Finance Authority, Refunding Revenue Bonds, 4.80% (GNMA COL Home Mortgage Program COL), 10/1/2004 |
Aaa |
50,139 |
|||
|
245,000 |
East Baton Rouge, LA, Mortgage Finance Authority, SFM Purchasing Revenue Bonds (Series B), 5.40% (FNMA COL), 10/1/2025 |
Aaa |
246,852 |
|||
|
70,000 |
East Baton Rouge, LA, Mortgage Finance Authority, SFM Refunding Revenue Bonds (Series C), 7.00%, 4/1/2032 |
Aaa |
70,085 |
|||
|
750,000 |
East Baton Rouge Parish, LA, Refunding Revenue Bonds, 5.00% (FGIC LOC)/(Original Issue Yield: 4.72%), 2/1/2013 |
AAA |
818,197 |
|||
|
1,500,000 |
East Baton Rouge Parish, LA, Refunding Revenue Bonds, 5.40% (FGIC INS)/(Original Issue Yield: 5.85%), 2/1/2018 |
AAA |
1,588,110 |
|||
|
$ 1,250,000 |
East Baton Rouge Parish, LA, Sales & Use Tax Revenue Bonds (Series ST), 5.90% (FGIC INS), 2/1/2017 |
AAA |
$ 1,292,150 |
|||
|
270,000 |
Ernest N Morial-New Orleans, LA, Exhibit Hall Authority (Series C), 5.50% (MBIA Insurance Corp. LOC)/(Original Issue Yield: 5.58%), 7/15/2006 (@101) |
AAA |
288,724 |
|||
|
730,000 |
Ernest N. Morial-New Orleans, LA, Exhibit Hall Authority (Series C), 5.50% (MBIA Insurance Corp. LOC)/(Original Issue Yield: 5.58%), 7/15/2018 |
AAA |
787,823 |
|||
|
200,000 |
Ernest N. Morial-New Orleans, LA, Exhibit Hall Authority, Special Tax, 5.60% (MBIA Insurance Corp. LOC)/(Original Issue Yield: 5.65%), 7/15/2025 |
AAA |
212,210 |
|||
|
125,000 |
Ernest N. Morial-New Orleans, LA, Exhibit Hall Authority, Special Tax, 5.60% (MBIA Insurance Corp. LOC)/(Original Issue Yield: 5.65%), 7/15/2025 |
AAA |
134,444 |
|||
|
875,000 |
Ernest N. Morial-New Orleans, LA, Exhibit Hall Authority, Special tax, 5.60% (MBIA Insurance Corp. LOC)/(Original Issue Yield: 5.65%), 7/15/2025 |
AAA |
945,910 |
|||
|
1,300,000 |
Harahan, LA, Refunding Bonds, 6.10%, 6/1/2024 |
AA |
1,451,632 |
|||
|
1,650,000 |
Jefferson Parish, LA, Home Mortgage Authority, Refunding Revenue Bonds (Series A), 6.15% (FNMA and GNMA COL), 6/1/2028 |
AAA |
1,756,738 |
|||
|
|
(2) LONG-TERM MUNICIPALS--continued |
|
|
|||
|
|
Louisiana--continued |
|
|
|||
|
$ 500,000 |
Jefferson Parish, LA, Home Mortgage Authority, Revenue Bonds, 5.85% (FNMA COL)/(GNMA LOC), 12/1/2028 |
AAA |
$ 518,130 |
|||
|
1,000,000 |
Jefferson Parish, LA, Hospital Service District No. 2, Refunding Revenue Bonds, 5.75% (MBIA Insurance Corp. INS)/(Original Issue Yield: 6.05%), 7/1/2016 |
AAA |
1,012,710 |
|||
|
1,000,000 |
Jefferson Parish, LA, School Board, GO UT, 5.10% accrual (FSA INS)/(Original Issue Yield: 5.10%), 3/1/2010 |
AAA |
832,190 |
|||
|
680,000 |
Jefferson, LA, Sales Tax District Special Sales Tax Revenue (Series B), 5.75% (AMBAC LOC)/(Original Issue Yield: 5.20%), 12/1/2014 |
AAA |
790,996 |
|||
|
500,000 |
Lafayette Parish, LA, School Board, Refunding Revenue Bonds, 4.50% (FGIC LOC)/(Original Issue Yield: 4.85%), 4/1/2008 (@101.5) |
AAA |
523,745 |
|||
|
1,500,000 |
Lafayette, LA, Public Improvement Sales Tax (Series A), 5.625% (FGIC LOC)/(Original Issue Yield: 5.69%), 3/1/2025 |
AAA |
1,645,335 |
|||
|
1,305,000 |
Lafayette, LA, Public Power Authority (Series A), 5.00% (AMBAC LOC)/(Original Issue Yield: 2.47%), 11/1/2008 |
AAA |
1,434,273 |
|||
|
25,000 |
Louisiana HFA, SFM Revenue Bonds (Series A-2), 6.55%, 12/1/2026 |
Aaa |
25,294 |
|||
|
$ 1,000,000 |
Louisiana Local Government Environmental Facilities Community Development Authority (Series A), Revenue Bonds, 5.20% (Original Issue Yield: 5.30%), 6/1/2031 |
Aaa |
$ 1,035,620 |
|||
|
1,835,000 |
Louisiana Local Government Environmental Facilities Community Development Authority, 5.50% (MBIA Global Funding LLC LOC), 12/1/2012 |
AAA |
2,104,837 |
|||
|
1,500,000 |
Louisiana Local Government Environmental Facilities Community Development Authority, Refunding Revenue Bonds, 5.00% (MBIA Insurance Corp. LOC), 12/1/2032 |
AAA |
1,522,785 |
|||
|
1,500,000 |
Louisiana Local Government Environmental Facilities Community Development Authority, Revenue Bonds, 5.25% (AMBAC LOC), 12/1/2018 |
AAA |
1,685,535 |
|||
|
215,000 |
Louisiana PFA, Hospital Refunding Revenue Bonds, 5.00% (Louisiana Health System Corporate Project)/(FSA LOC)/(Original Issue Yield: 5.10%), 10/1/2013 |
AAA |
234,498 |
|||
|
1,000,000 |
Louisiana PFA, Hospital Revenue Bonds, 5.00% (Franciscan Missionaries of Our Lady Health System)/(MBIA Insurance Corp. INS)/(Original Issue Yield: 5.24%), 7/1/2019 |
AAA |
1,042,410 |
|||
|
|
(2) LONG-TERM MUNICIPALS--continued |
|
|
|||
|
|
Louisiana--continued |
|
|
|||
|
$ 1,045,000 |
Louisiana PFA (Series A), Refunding Revenue Bonds, 5.125% (Tulane University, LA)/(Original Issue Yield: 5.25%), 7/1/2027 |
AAA |
$ 1,079,913 |
|||
|
1,000,000 |
Louisiana PFA (Series A-2), 5.125% (Original Issue Yield: 5.24%), 11/15/2017 |
AAA |
1,079,730 |
|||
|
750,000 |
Louisiana PFA, 4.50%, 10/15/2010 |
AAA |
811,425 |
|||
|
2,045,000 |
Louisiana PFA, Multifamily Housing Revenue Bonds (Series A), 7.50% (FHLMC COL), 6/1/2021 |
AAA |
2,128,007 |
|||
|
1,000,000 |
Louisiana PFA, Revenue Bonds, 5.00% (FSA LOC)/(Original Issue Yield: 5.38%), 8/1/2017 |
AAA |
1,076,130 |
|||
|
1,500,000 |
Louisiana PFA, Revenue Bonds, 5.25% (Xavier University of LA Project)/(MBIA Insurance Corp. LOC), 9/1/2027 |
AAA |
1,569,060 |
|||
|
750,000 |
Louisiana PFA, Revenue Bonds, 6.00% (General Health, Inc.)/(MBIA Insurance Corp. INS)/(Original Issue Yield: 6.15%), 11/1/2012 |
AAA |
755,378 |
|||
|
500,000 |
Louisiana PFA, Revenue Bonds, 5.10% (Tulane University, LA)/(MBIA Insurance Corp. INS)/(Original Issue Yield: 5.27%), 11/15/2021 |
AAA |
531,000 |
|||
|
1,890,000 |
Louisiana PFA, Refunding Revenue Bonds (Series A), 6.75% (Bethany Home Project)/(FHA LOC), 8/1/2025 |
AAA |
1,900,905 |
|||
|
$1,000,000 |
Louisiana PFA, Refunding Revenue Bonds, 5.45% (AMBAC INS)/(Original Issue Yield: 5.45%), 2/1/2013 |
Aaa |
$ 1,016,230 |
|||
|
2,445,000 |
Louisiana Stadium and Expo District (Series B), 4.75% (FGIC LOC)/(Original Issue Yield: 5.03%), 7/1/2021 |
AAA |
2,511,602 |
|||
|
1,500,000 |
Louisiana Stadium and Expo District, Revenue Bonds, 5.75% (FGIC INS)/(Original Issue Yield: 5.85%), 7/1/2026 |
AAA |
1,610,640 |
|||
|
1,000,000 |
Louisiana State Office Facilities, Refunding Revenue Bonds, 4.70% (MBIA Insurance Corp. LOC)/(Original Issue Yield: 4.79%), 11/1/2022 |
AAA |
1,015,810 |
|||
|
1,000,000 |
Louisiana State Office Facilities, Refunding Revenue Bonds, 4.75% (MBIA Insurance Corp. LOC)/(Original Issue Yield: 4.88%), 11/1/2023 |
AAA |
1,012,180 |
|||
|
500,000 |
Louisiana State Office Facilities, Revenue Bonds, 5.375% (MBIA Insurance Corp. LOC)/(Original Issue Yield: 5.43%), 3/1/2019 |
AAA |
547,745 |
|||
|
1,250,000 |
Louisiana State University and Agricultural and Mechanical College, University & College Improvement Refunding Revenue Bonds, 5.00% (University of New Orleans Project)/(AMBAC LOC), 10/1/2030 |
AAA |
1,267,288 |
|||
|
1,500,000 |
Louisiana State (Series A), 5.00% (FGIC LOC)/(Original Issue Yield: 5.23%), 11/15/2015 |
AAA |
1,624,890 |
|||
|
|
(2) LONG-TERM MUNICIPALS--continued |
|
|
|||
|
|
Louisiana--continued |
|
|
|||
|
$ 1,000,000 |
Louisiana State (Series A), 5.00% (FGIC LOC)/(Original Issue Yield: 5.42%), 11/15/2019 |
AAA |
$ 1,063,910 |
|||
|
1,000,000 |
Louisiana State, GO UT (Series B), 5.00% (FSA INS)/(Original Issue Yield: 5.17%), 4/15/2018 |
AAA |
1,067,110 |
|||
|
1,370,000 |
Monroe, LA, Sales & Use Tax, Revenue Bonds (Series A), 4.70% (FGIC LOC), 7/1/2021 |
AAA |
1,411,607 |
|||
|
250,000 |
New Orleans, LA, Aviation Board, Refunding Revenue Bonds, 6.00% (FSA LOC)/(Original Issue Yield: 6.16%), 9/1/2019 |
AAA |
253,353 |
|||
|
990,000 |
New Orleans, LA, Home Mortgage Authority, Special Obligation Revenue Bonds, 6.25% (United States Treasury COL)/(Original Issue Yield: 6.518%), 1/15/2011 |
Aaa |
1,146,450 |
|||
|
100,000 |
New Orleans, LA, Housing Development Corp., Multifamily Housing Revenue Bonds, 7.375% (Southwood Patio)/(FNMA COL)/(Original Issue Yield: 7.50%), 8/1/2005 |
AAA |
100,407 |
|||
|
2,000,000 |
New Orleans, LA, GO UT, 5.125% (MBIA Insurance Corp. LOC)/(Original Issue Yield: 5.29%), 9/1/2012 (@100) |
AAA |
2,124,180 |
|||
|
1,900,000 |
New Orleans, LA, GO Refunding Bonds, 6.20% (AMBAC INS)/(Original Issue Yield: 6.30%), 10/1/2021 |
AAA |
2,004,006 |
|||
|
$4,750,000 |
(8) New Orleans, LA, GO UT Capital Appreciation Bonds, (AMBAC INS)/(Original Issue Yield: 7.10%), 9/1/2013 |
AAA |
$ 3,289,850 |
|||
|
980,000 |
New Orleans, LA, GO UT Refunding Bonds, 5.875% (AMBAC INS)/(Original Issue Yield: 6.00%), 10/1/2011 |
AAA |
1,033,616 |
|||
|
1,145,000 |
Orleans, LA, Levee District, Refunding Revenue Bonds (Series A), 5.95% (FSA INS)/(Original Issue Yield: 6.039%), 11/1/2014 |
AAA |
1,238,203 |
|||
|
790,000 |
Ouachita Parish, LA, East Ouachita Parish School District, GO UT, 5.75% (FGIC LOC)/(Original Issue Yield: 5.78%), 3/1/2020 |
AAA |
883,678 |
|||
|
780,000 |
Ouachita Parish, LA, East Ouachita Parish School District, GO UT, 5.75% (FGIC LOC)/(Original Issue Yield: 5.81%), 3/1/2021 |
AAA |
872,492 |
|||
|
1,020,000 |
Ouachita Parish, LA, East Ouachita Parish School District, GO UT, 5.75% (FGIC LOC)/(Original Issue Yield: 5.85%), 3/1/2024 |
AAA |
1,134,617 |
|||
|
1,000,000 |
Rapides Parish, LA, Consolidated School District No. 62, GO UT (Series A), 5.00% (Original Issue Yield: 5.00%), 3/1/2018 |
AAA |
1,064,400 |
|||
|
2,500,000 |
Rapides Parish, LA, Industrial Development, Refunding Revenue Bonds, 5.875% (AMBAC LOC)/(Original Issue Yield: 5.95%), 9/1/2029 |
AAA |
2,793,500 |
|||
|
1,000,000 |
Shreveport, LA, GO UT Public Improvement Bonds, 5.00%, 3/1/2017 |
AAA |
1,064,400 |
|||
|
|
(2) LONG-TERM MUNICIPALS--continued |
|
|
|||
|
|
Louisiana--continued |
|
|
|||
|
$ 870,000 |
Shreveport, LA, GO UT (Series A), 4.00% (Original Issue Yield: 4.03%), 11/1/2012 |
AAA |
$ 900,798 |
|||
|
750,000 |
Shreveport, LA, Revenue Bonds (Series A), 5.375% (FSA INS), 1/1/2028 |
AAA |
767,903 |
|||
|
500,000 |
Shreveport, LA, Revenue Bonds (Series B), 5.375% (FSA INS), 1/1/2024 |
AAA |
522,365 |
|||
|
1,315,000 |
Shreveport, LA, Water & Sewer (Series C), 4.00% (FGIC LOC)/(Original Issue Yield: 3.80%), 6/1/2014 |
AAA |
1,354,700 |
|||
|
500,000 |
St. Charles Parish, LA, Environmental Improvement Revenue Bonds, 5.95% (LA Power & Light Co.)/(FSA INS)/ (Original Issue Yield: 5.986%), 12/1/2023 |
AAA |
511,435 |
|||
|
1,000,000 |
St. Charles Parish, LA, Solid Waste Disposal Revenue Bonds, 7.00% (LA Power & Light Co.)/(AMBAC INS)/(Original Issue Yield: 7.04%), 12/1/2022 |
AAA |
1,012,930 |
|||
|
400,000 |
St. Tammany Parish, LA, Hospital Service District No. 2, Hospital Refunding Revenue Bonds, 6.125% (Connie Lee INS)/Original Issue Yield: 6.315%), 10/1/2011 |
AAA |
409,464 |
|||
|
1,000,000 |
St. Tammany Parish, LA, Hospital Service District No. 2, Revenue Bonds, 6.25% (Connie Lee LOC)/(Original Issue Yield: 6.40%), 10/1/2014 |
AAA |
1,023,760 |
|||
|
Principal |
|
Credit |
Value |
|||
|
$ 500,000 |
St. Tammany Parish, LA, Wide School District No. 12, GO UT, 5.375% (FSA INS), 3/1/2013 |
AAA |
$ 527,400 |
|||
|
625,000 |
State Colleges & Universities, LA, Recreational Facility Improvements, 5.50% (University of Southwestern, LA Cajundome)/(MBIA Insurance Corp. LOC)/(Original Issue Yield: 5.499%), 9/1/2017 |
AAA |
689,856 |
|||
|
500,000 |
State Colleges & Universities, LA, Revenue Bonds, 5.65% (University of Southwestern, LA Cajundome)/(MBIA Insurance Corp. INS), 9/1/2026 |
AAA |
545,875 |
|||
|
|
||||||
|
|
Total |
|
79,111,605 |
|||
|
|
||||||
|
|
TOTAL LONG-TERM MUNICIPALS (Identified Cost $74,747,647) |
|
80,254,107 |
|||
|
|
||||||
|
|
MUTUAL FUND--0.8% |
|
|
|||
|
665,993 |
(4) Tax-Free Obligations Fund, IS Shares (at net asset value) |
AAA |
665,993 |
|||
|
|
||||||
|
|
TOTAL INVESTMENTS--98.8% (identified Cost $75,413,640) |
|
80,920,100 |
|||
|
|
||||||
|
|
OTHER ASSETS AND LIABILITIES--NET--1.2% |
|
937,090 |
|||
|
|
||||||
|
|
TOTAL NET ASSETS--100% |
|
$ 81,857,190 |
|||
|
|
||||||
(See Notes to Portfolio of Investments)
Portfolio of Investments Summary Tables
MID CAP EQUITY FUND
At August 31, 2004, the fund's portfolio composition(1) was as follows:
|
EQUITIES |
Percentage |
|---|---|
|
Finance |
20.0% |
|
Electronic Technology |
8.4% |
|
Commercial Services |
7.2% |
|
Retail Trade |
6.5% |
|
Consumer Non-Durables |
6.2% |
|
Utilities |
5.7% |
|
Health Technology |
5.5% |
|
Consumer Durables |
5.4% |
|
Consumer Services |
5.2% |
|
Industrial Services |
4.7% |
|
Producer Manufacturing |
4.7% |
|
Health Services |
4.2% |
|
Non-Energy Minerals |
3.3% |
|
Process Industries |
3.0% |
|
Energy Minerals |
2.8% |
|
Technology Services |
2.5% |
|
Transportation |
2.4% |
|
Communications |
1.0% |
|
Distribution Services |
0.8% |
|
TOTAL EQUITIES PORTFOLIO VALUE |
99.5% |
|
Other Securities(3) |
0.5% |
|
TOTAL PORTFOLIO VALUE |
100% |
(1) See the fund's prospectus for a more complete description of these types of investments.
(2) Percentages are based on total investments, which may differ from total net assets.
(3) Investment represents shares held in a money market mutual fund.
MID-CAP EQUITY FUND
|
Shares |
|
Value |
||
|---|---|---|---|---|
|
|
COMMON STOCKS--99.4% |
|
||
|
|
Commercial Services--7.1% |
|
||
|
22,300 |
Banta Corp. |
$ 863,233 |
||
|
44,800 |
Brinks Co. (The) |
1,290,240 |
||
|
56,000 |
(1) Copart, Inc. |
1,216,320 |
||
|
13,490 |
(1) Dun & Bradstreet Corp. |
743,839 |
||
|
39,100 |
Ikon Office Solutions, Inc. |
441,048 |
||
|
33,500 |
SEI Investments, Co. |
1,094,780 |
||
|
|
||||
|
|
Total |
5,649,460 |
||
|
|
||||
|
|
Communications--1.0% |
|
||
|
5,980 |
CenturyTel, Inc. |
192,496 |
||
|
7,420 |
Telephone and Data System, Inc. |
572,082 |
||
|
|
||||
|
|
Total |
764,578 |
||
|
|
||||
|
|
Consumer Durables--5.4% |
|
||
|
78,300 |
(1) Activision, Inc. |
1,126,737 |
||
|
11,200 |
Centex Corp. |
512,624 |
||
|
15,575 |
D. R. Horton, Inc. |
481,890 |
||
|
11,580 |
Lennar Corp., Class A |
530,364 |
||
|
4,330 |
(1) Mohawk Industries, Inc. |
333,064 |
||
|
27,900 |
Polaris Industries, Inc., Class A |
1,315,764 |
||
|
|
||||
|
|
Total |
4,300,443 |
||
|
|
||||
|
|
Consumer Non-Durables--6.1% |
|
||
|
33,500 |
(1) American Greetings Corp., Class A |
806,345 |
||
|
22,250 |
Blyth Industries, Inc. |
667,722 |
||
|
21,880 |
(1) Coach, Inc. |
922,242 |
||
|
5,210 |
(1) Constellation Brands, Inc., Class A |
191,572 |
||
|
10,600 |
(1) Dean Foods Co. |
392,942 |
||
|
15,290 |
Hormel Foods Corp. |
408,243 |
||
|
58,000 |
PepsiAmericas, Inc. |
1,150,720 |
||
|
19,360 |
Tyson Foods, Inc., Class A |
319,053 |
||
|
|
||||
|
|
Total |
4,858,839 |
||
|
|
||||
|
|
Consumer Services--5.2% |
|
||
|
14,945 |
(1) Apollo Group, Inc., Class A |
1,165,680 |
||
|
7,710 |
(1) Education Management Corp. |
224,053 |
||
|
37,180 |
Gtech Holdings Corp. |
873,730 |
||
|
10,680 |
(1) Pixar, Inc. |
830,050 |
||
|
31,460 |
Ruby Tuesday, Inc. |
850,993 |
||
|
7,420 |
(1) Westwood One, Inc. |
166,505 |
||
|
|
||||
|
|
Total |
4,111,011 |
||
|
|
||||
|
|
Distribution Services--0.8% |
|
||
|
16,760 |
(1) Avnet, Inc. |
266,149 |
||
|
5,980 |
CDW Corp. |
349,830 |
||
|
|
||||
|
|
Total |
615,979 |
||
|
|
||||
|
|
Electronic Technology--8.4% |
|
||
|
15,800 |
(1) Altera Corp. |
$ 298,936 |
||
|
111,800 |
(1) Atmel Corp. |
390,182 |
||
|
33,500 |
(1) Cree, Inc. |
837,835 |
||
|
12,530 |
Harris Corp. |
603,445 |
||
|
11,080 |
Imation Corp. |
381,484 |
||
|
16,760 |
(1) Jabil Circuit, Inc. |
345,759 |
||
|
32,280 |
(1) MEMC Electronic Materials |
258,240 |
||
|
18,880 |
Microchip Technology, Inc. |
498,243 |
||
|
21,300 |
Plantronics, Inc. |
827,505 |
||
|
7,100 |
Precision Castparts Corp. |
391,139 |
||
|
6,460 |
(1) Silicon Laboratories, Inc. |
211,823 |
||
|
26,690 |
(1) Storage Technology Corp. |
647,233 |
||
|
20,100 |
(1) United Defense Industries, Inc. |
768,423 |
||
|
16,900 |
(1) Vishay Intertechnology, Inc. |
215,475 |
||
|
|
||||
|
|
Total |
6,675,722 |
||
|
|
||||
|
|
Energy Minerals--2.9% |
|
||
|
16,800 |
(1) Newfield Exploration Co. |
929,880 |
||
|
20,100 |
Valero Energy Corp. |
1,327,203 |
||
|
|
||||
|
|
Total |
2,257,083 |
||
|
|
||||
|
|
Finance--20.0% |
|
||
|
48,100 |
(1) AmeriTrade Holding Corp. |
547,859 |
||
|
33,600 |
American Capital Strategies Ltd. |
1,048,320 |
||
|
16,823 |
Amsouth Bancorporation |
438,239 |
||
|
15,900 |
Astoria Financial Corp. |
577,806 |
||
|
8,480 |
City National Corp. |
559,510 |
||
|
12,910 |
Downey Financial Corp. |
695,462 |
||
|
9,150 |
Everest Re Group Ltd. |
641,964 |
||
|
26,898 |
Fidelity National Financial, Inc. |
1,012,710 |
||
|
25,430 |
First American Financial Corp. |
736,707 |
||
|
15,230 |
First Horizon National Corp. |
692,508 |
||
|
32,940 |
Greenpoint Financial Corp. |
1,451,007 |
||
|
17,730 |
HRPT Properties Trust |
191,129 |
||
|
18,110 |
Hospitality Properties Trust |
759,715 |
||
|
32,280 |
IndyMac Bancorp, Inc. |
1,113,660 |
||
|
23,710 |
North Fork Bancorp, Inc. |
994,397 |
||
|
13,340 |
Old Republic International Corp. |
314,157 |
||
|
21,780 |
PMI Group, Inc. |
904,523 |
||
|
17,630 |
Radian Group, Inc. |
781,009 |
||
|
17,174 |
Rayonier, Inc. |
796,358 |
||
|
22,300 |
Ryder Systems, Inc. |
976,963 |
||
|
9,050 |
TCF Financial Corp. |
575,671 |
||
|
|
||||
|
|
Total |
15,809,674 |
||
|
|
||||
|
|
COMMON STOCKS--continued |
|
||
|
|
Health Services--4.2% |
|
||
|
52,900 |
(1) Humana, Inc. |
$ 1,005,100 |
||
|
20,100 |
(1) PacifiCare Health Systems, Inc. |
655,461 |
||
|
14,500 |
(1) Triad Hospitals, Inc. |
460,955 |
||
|
9,440 |
Universal Health Services, Inc., Class B |
425,272 |
||
|
22,300 |
(1) WellChoice, Inc. |
794,995 |
||
|
|
||||
|
|
Total |
3,341,783 |
||
|
|
||||
|
|
Health Technology--5.5% |
|
||
|
9,260 |
Hillenbrand Industries, Inc. |
520,968 |
||
|
17,900 |
(1) Invitrogen Corp. |
886,050 |
||
|
19,220 |
Mylan Laboratories, Inc. |
334,812 |
||
|
44,800 |
Perrigo Co. |
879,872 |
||
|
47,600 |
(1) VISX, Inc. |
965,328 |
||
|
23,600 |
(1) Varian Medical Systems, Inc. |
782,340 |
||
|
|
||||
|
|
Total |
4,369,370 |
||
|
|
||||
|
|
Industrial Services--4.7% |
|
||
|
16,750 |
BJ Services Co. |
804,837 |
||
|
11,200 |
(1) FMC Technologies, Inc. |
344,064 |
||
|
10,110 |
Granite Construction, Inc. |
230,508 |
||
|
22,530 |
Helmerich & Payne, Inc. |
582,626 |
||
|
6,450 |
(1) Nabors Industries Ltd. |
284,445 |
||
|
5,500 |
(1) Weatherford International Ltd. |
254,870 |
||
|
42,300 |
Western Gas Resources, Inc. |
1,181,016 |
||
|
|
||||
|
|
Total |
3,682,366 |
||
|
|
||||
|
|
Non-Energy Minerals--3.3% |
|
||
|
11,200 |
Georgia-Pacific Corp. |
380,576 |
||
|
25,700 |
Lafarge North America, Inc. |
1,151,617 |
||
|
10,600 |
Nucor Corp. |
829,874 |
||
|
4,510 |
Vulcan Materials Co. |
214,992 |
||
|
|
||||
|
|
Total |
2,577,059 |
||
|
|
||||
|
|
Process Industries--3.0% |
|
||
|
4,820 |
Air Products & Chemicals, Inc. |
252,471 |
||
|
18,400 |
Albemarle Corp. |
611,984 |
||
|
14,500 |
Cabot Corp. |
577,680 |
||
|
20,040 |
Cytec Industries, Inc. |
966,730 |
||
|
|
||||
|
|
Total |
2,408,865 |
||
|
|
||||
|
|
Producer Manufacturing--4.7% |
|
||
|
29,760 |
AMETEK, Inc. |
849,648 |
||
|
11,200 |
Cummins, Inc. |
753,648 |
||
|
8,670 |
(1) Energizer Holdings, Inc. |
358,418 |
||
|
3,180 |
Ingersoll-Rand Co., Class A |
206,732 |
||
|
9,260 |
Johnson Controls, Inc. |
$ 521,338 |
||
|
13,400 |
Lear Corp. |
721,992 |
||
|
9,450 |
SPX Corp. |
344,831 |
||
|
|
||||
|
|
Total |
3,756,607 |
||
|
|
||||
|
|
Retail Trade--6.5% |
|
||
|
31,110 |
Abercrombie & Fitch Co., Class A |
871,080 |
||
|
42,300 |
(1) Barnes & Noble, Inc. |
1,461,888 |
||
|
67,100 |
Claire's Stores, Inc. |
1,633,214 |
||
|
39,490 |
Ross Stores, Inc. |
835,213 |
||
|
16,370 |
Ruddick Corp. |
312,176 |
||
|
|
||||
|
|
Total |
5,113,571 |
||
|
|
||||
|
|
Technology Services--2.5% |
|
||
|
9,440 |
(1) Affiliated Computer Services, Inc., Class A |
512,875 |
||
|
11,200 |
(1) BMC Software, Inc. |
167,664 |
||
|
16,860 |
(1) Intuit, Inc. |
713,009 |
||
|
25,430 |
(1) SunGard Data Systems, Inc. |
584,890 |
||
|
|
||||
|
|
Total |
1,978,438 |
||
|
|
||||
|
|
Transportation--2.4% |
|
||
|
8,480 |
CNF Transportation, Inc. |
347,850 |
||
|
8,570 |
Expeditors International Washington, Inc. |
418,044 |
||
|
7,330 |
Overseas Shipholding Group, Inc. |
315,190 |
||
|
27,900 |
Tidewater, Inc. |
814,122 |
||
|
|
||||
|
|
Total |
1,895,206 |
||
|
|
||||
|
|
Utilities--5.7% |
|
||
|
20,810 |
Energy East Corp. |
507,140 |
||
|
52,900 |
MDU Resources Group, Inc. |
1,342,073 |
||
|
11,134 |
NSTAR |
543,339 |
||
|
27,900 |
National Fuel Gas Co. |
747,162 |
||
|
18,175 |
PNM Resources, Inc. |
388,400 |
||
|
23,280 |
Questar Corp. |
947,030 |
||
|
|
||||
|
|
Total |
4,475,144 |
||
|
|
||||
|
|
TOTAL COMMON STOCKS (identified cost $69,031,232) |
78,641,198 |
||
|
|
||||
|
|
MUTUAL FUND--0.5% |
|
||
|
418,000 |
Fidelity Institutional Cash Treasury Money Market Fund (at net asset value) |
$ 418,000 |
||
|
|
||||
|
|
TOTAL INVESTMENTS--99.9% (identified cost $69,449,232) |
79,059,198 |
||
|
|
||||
|
|
OTHER ASSETS AND LIABILITIES--NET--0.1% |
44,558 |
||
|
|
||||
|
|
TOTAL NET ASSETS--100% |
$ 79,103,756 |
||
|
|
||||
(See Notes to Portfolio of Investments)
Portfolio of Investments Summary Tables
TOTAL RETURN BOND FUND
At August 31, 2004, the fund's portfolio composition(1) was as follows:
|
|
Percentage |
|
|---|---|---|
|
Corporate Bonds |
32.6% |
|
|
Mortgage Backed Securities |
19.5% |
|
|
U.S. Treasury |
19.0% |
|
|
Government Agencies |
17.3% |
|
|
Municipals |
8.1% |
|
|
Repurchase Agreement |
3.3% |
|
|
Other Securities(3) |
0.2% |
|
|
TOTAL |
100% |
At August 31, 2004, the fund's credit quality ratings composition(4) was as follows:
|
S&P Long-Term Ratings as |
|
|
Moody's Long-Term Ratings as |
|||||
|
AAA |
|
61.4 |
% |
|
AAA |
|
34.5 |
% |
|
AA |
|
3.2 |
% |
|
Aaa |
|
27.9 |
% |
|
A |
|
21.3 |
% |
|
Aa |
|
9.3 |
% |
|
BBB |
|
8.1 |
% |
|
A |
|
18.1 |
% |
|
Not Rated by S&P |
|
6.0 |
% |
|
Baa |
|
5.2 |
% |
|
|
|
|
|
|
Not Rated by Moody's |
|
5.0 |
% |
|
TOTAL |
|
100 |
% |
|
TOTAL |
|
100 |
% |
(1) See the fund's prospectus for a more complete description of these types of investments.
(2) Percentages are based on total investments, which may differ from total net assets.
(3) Investment represents shares held in a money market mutual fund.
(4) These tables depict the long-term credit quality ratings assigned to the fund's portfolio holdings by Standard & Poor's and Moody's Investors Service, each of which is a Nationally Recognized Statistical Ratings Organization (NRSRO). These credit-quality ratings are shown without regard to gradations within a given rating category, For example, securities rated "A-" have been included in the "A" rated category. Holdings that are rated only by a different NRSRO than the one identified have been included in the "Not rated by..." category. Rated securities that have been pre-refunded, but not rated again by the NRSRO, also have been included in the "Not rated by..." category. Rated securities include a security with an obligor and/or credit enhancer that has received a rating from an NRSRO with respect to a class of debt obligations that is comparable in priority and security with the security held by the fund. Credit quality ratings are an assessment of the risk that a security will default in payment and do not address other risks presented by the security. Please see the description of credit quality ratings in the fund's Statement of Additional Information.
Each table depicts the long-term credit quality ratings as assigned only by the NRSRO identified in the table. Of the portfolio's total investments, all securities have received a rating by an NRSRO.
TOTAL RETURN BOND FUND
|
Principal |
|
Value |
||
|---|---|---|---|---|
|
|
CORPORATE BONDS--32.3% |
|
||
|
|
Consumer Durables--5.1% |
|
||
|
$ 1,500,000 |
Ford Motor Co., Note, 7.25%, 10/1/2008 |
$ 1,635,255 |
||
|
1,000,000 |
General Motors Corp., Bond, 6.25%, 5/1/2005 |
1,020,190 |
||
|
|
||||
|
|
Total |
2,655,445 |
||
|
|
||||
|
|
Consumer Non-Durables--2.9% |
|
||
|
1,500,000 |
Nabisco, Inc., Note, 6.375%, 2/1/2035 |
1,531,170 |
||
|
|
||||
|
|
Finance--15.0% |
|
||
|
1,000,000 |
Aflac, Inc., 6.50%, 4/15/2009 |
1,102,550 |
||
|
500,000 |
Boeing Capital Corp., Sr. Note, Series MTN, 5.40%, 11/30/2009 |
532,005 |
||
|
750,000 |
CIT Group, Inc., Deb., 5.875%, 10/15/2008 |
807,615 |
||
|
1,000,000 |
J.P. Morgan Chase & Co., Note, 5.25%, 5/1/2015 |
1,012,440 |
||
|
1,000,000 |
Lehman Brothers, Inc., Bond, 6.50%, 4/15/2008 |
1,098,130 |
||
|
1,500,000 |
Old Republic International Corp., Deb., 7.00%, 6/15/2007 |
1,643,115 |
||
|
1,500,000 |
Swiss Bank Corp. New York, Sub. Note, 7.25%, 9/1/2006 |
1,625,025 |
||
|
|
||||
|
|
Total |
7,820,880 |
||
|
|
||||
|
|
Process Industries--1.1% |
|
||
|
550,000 |
Lubrizol Corp., 5.875%, 12/1/2008 |
546,447 |
||
|
|
||||
|
|
Retail Trade--3.1% |
|
||
|
1,000,000 |
Dayton-Hudson Corp., Note, 7.50%, 7/15/2006 |
1,087,330 |
||
|
500,000 |
Target Corp., Note, 5.375%, 6/15/2009 |
532,955 |
||
|
|
||||
|
|
Total |
1,620,285 |
||
|
|
||||
|
|
Technology Services--2.1% |
|
||
|
1,000,000 |
First Data Corp., Note, 5.80%, 12/15/2008 |
1,085,730 |
||
|
|
||||
|
|
Utilities--3.0% |
|
||
|
1,500,000 |
Progress Energy Carolinas, Inc., 1st Mtg. Note, 5.125%, 9/15/2013 |
1,534,830 |
||
|
|
||||
|
|
TOTAL CORPORATE BONDS |
16,794,787 |
||
|
|
||||
|
|
GOVERNMENT AGENCIES--17.2% |
|
||
|
|
Federal Home Loan Bank--1.1% |
|
||
|
$ 550,000 |
7.01%, 6/14/2006 |
$ 593,159 |
||
|
|
||||
|
|
Federal Home Loan Mortgage Corporation--4.6% |
|
||
|
2,000,000 |
Unsecd. Note, 6.75%, 9/15/2029 |
2,360,180 |
||
|
|
||||
|
|
Federal National Mortgage Association--11.5% |
|
||
|
800,000 |
Bond, 6.625%, 11/15/2030 |
932,008 |
||
|
1,500,000 |
Note, 6.00%, 12/15/2005 |
1,571,655 |
||
|
2,200,000 |
Unsecd. Note, 7.00%, 7/15/2005 |
2,292,664 |
||
|
1,000,000 |
Unsecd. Note, 7.125%, 6/15/2010 |
1,165,450 |
||
|
|
||||
|
|
Total |
5,961,777 |
||
|
|
||||
|
|
TOTAL GOVERNMENT AGENCIES (identified cost $8,165,659) |
8,915,116 |
||
|
|
||||
|
|
MORTGAGE BACKED SECURITIES--19.4% |
|
||
|
|
(5) Federal Home Loan Mortgage Corporation 15-Year--5.3% |
|
||
|
852,092 |
Pool E98632, 5.00%, 8/1/2018 |
868,870 |
||
|
1,850,340 |
Pool G11536, 4.50%, 4/1/2014 |
1,875,782 |
||
|
|
||||
|
|
Total |
2,744,652 |
||
|
|
||||
|
|
Federal Home Loan Mortgage Corporation 30-Year--4.0% |
|
||
|
1,992,484 |
Pool G08003, 6.00%, 7/1/2034 |
2,063,456 |
||
|
|
||||
|
|
Federal National Mortgage Association 20-Year--2.3% |
|
||
|
1,144,796 |
Pool 254739, 6.00%, 4/1/2023 |
1,192,374 |
||
|
|
||||
|
|
(5) Federal National Mortgage Association--0.0% |
|
||
|
2,658 |
Pool 76204, 11.00%, 6/1/2019 |
2,981 |
||
|
3,248 |
Pool 85131, 11.00%, 5/1/2017 |
3,678 |
||
|
|
||||
|
|
Total |
6,659 |
||
|
|
||||
|
|
(5) Government National Mortgage Association 15-Year--0.5% |
|
||
|
275,889 |
Pool 420153, 7.00%, 9/15/2010 |
295,373 |
||
|
|
||||
|
|
MORTGAGE BACKED SECURITIES--continued |
|
||
|
|
(5) Government National Mortgage Association 30-Year--7.3% |
|
||
|
$ 17,039 |
Pool 147875, 10.00%, 3/15/2016 |
$ 19,168 |
||
|
45,914 |
Pool 168511, 8.00%, 7/15/2016 |
50,344 |
||
|
2,528 |
Pool 174673, 8.00%, 8/15/2016 |
2,761 |
||
|
9,466 |
Pool 177145, 8.00%, 1/15/2017 |
10,406 |
||
|
397 |
Pool 188080, 8.00%, 9/15/2018 |
435 |
||
|
7,814 |
Pool 212660, 8.00%, 4/15/2017 |
8,534 |
||
|
23,800 |
Pool 216950, 8.00%, 6/15/2017 |
26,165 |
||
|
9,818 |
Pool 217533, 8.00%, 5/15/2017 |
10,723 |
||
|
5,862 |
Pool 225725, 10.00%, 9/15/2020 |
6,622 |
||
|
3,366 |
Pool 227430, 9.00%, 8/15/2019 |
3,793 |
||
|
2,618 |
Pool 253449, 10.00%, 10/15/2018 |
2,964 |
||
|
10,908 |
Pool 279619, 10.00%, 9/15/2019 |
12,367 |
||
|
6,139 |
Pool 287853, 9.00%, 4/15/2020 |
6,935 |
||
|
3,734 |
Pool 288967, 9.00%, 4/15/2020 |
4,204 |
||
|
6,247 |
Pool 289082, 9.00%, 4/15/2020 |
6,995 |
||
|
8,426 |
Pool 291100, 9.00%, 5/15/2020 |
9,492 |
||
|
31,999 |
Pool 302101, 7.00%, 6/15/2024 |
34,359 |
||
|
50,584 |
Pool 345031, 7.00%, 10/15/2023 |
54,456 |
||
|
58,239 |
Pool 345090, 7.00%, 11/15/2023 |
62,534 |
||
|
34,904 |
Pool 360772, 7.00%, 2/15/2024 |
37,577 |
||
|
36,501 |
Pool 404653, 7.00%, 9/15/2025 |
39,148 |
||
|
45,901 |
Pool 408884, 7.00%, 9/15/2025 |
49,185 |
||
|
26,703 |
Pool 410108, 7.00%, 9/15/2025 |
28,614 |
||
|
16,858 |
Pool 410786, 7.00%, 9/15/2025 |
18,064 |
||
|
130,158 |
Pool 415427, 7.50%, 8/15/2025 |
140,774 |
||
|
22,933 |
Pool 415865, 7.00%, 9/15/2025 |
24,575 |
||
|
95,346 |
Pool 418781, 7.00%, 9/15/2025 |
102,259 |
||
|
102,717 |
Pool 420157, 7.00%, 10/15/2025 |
110,452 |
||
|
335,441 |
Pool 532641, 7.00%, 12/15/2030 |
358,398 |
||
|
1,997,661 |
Pool 615486, 5.50%, 7/15/2034 |
2,036,995 |
||
|
464,701 |
Pool 780717, 7.00%, 2/15/2028 |
498,392 |
||
|
|
||||
|
|
Total |
3,777,690 |
||
|
|
||||
|
|
TOTAL MORTGAGE BACKED SECURITIES (identified cost $9,944,769) |
10,080,204 |
||
|
|
||||
|
Principal |
|
Value |
||
|
|
MUNICIPALS--8.0% |
|
||
|
$ 1,175,000 |
Liberal, KS, GO UT (Series 2), 6.50% Bonds (FSA INS), 12/1/2010 |
$ 1,285,027 |
||
|
2,000,000 |
New Orleans, LA Aviation Board, Revenue Bonds, 7.10% Bonds (AMBAC INS), 10/1/2027 |
2,113,120 |
||
|
360,000 |
Vail, CO Sales Tax Revenue, Refunding Revenue Bonds, 6.00% Bonds (MBIA Insurance Corp. LOC), 12/1/2006 |
384,890 |
||
|
350,000 |
Vail, CO Sales Tax Revenue, Refunding Revenue Bonds, 6.05% Bonds (MBIA Insurance Corp. LOC), 12/1/2007 |
381,070 |
||
|
|
||||
|
|
TOTAL MUNICIPALS |
4,164,107 |
||
|
|
||||
|
|
U.S. TREASURY--18.9% |
|
||
|
|
U.S. Treasury Bonds--6.3% |
|
||
|
1,300,000 |
12.50%, 8/15/2014 |
1,839,097 |
||
|
1,250,000 |
6.125%, 11/15/2027 |
1,441,012 |
||
|
|
||||
|
|
Total |
3,280,109 |
||
|
|
||||
|
|
U.S. Treasury Notes--12.6% |
|
||
|
2,000,000 |
4.00%, 2/15/2014 |
1,982,820 |
||
|
4,500,000 |
5.875%, 11/15/2004 |
4,536,720 |
||
|
|
||||
|
|
Total |
6,519,540 |
||
|
|
||||
|
|
TOTAL U.S. TREASURY |
9,799,649 |
||
|
|
||||
|
|
MUTUAL FUND--0.2% |
|
||
|
116,000 |
Fidelity Institutional Cash Treasury Money Market Fund (at net asset value) |
116,000 |
||
|
|
||||
|
Principal |
|
Value |
||
|
|
REPURCHASE |
|
||
|
$ 1,700,000 |
Repurchase agreement with Merrill Lynch, Pierce, Fenner and Smith, 1.53%, dated 8/31/2004 to be repurchased at $1,700,072 on 9/1/2004, collateralized by a U.S. Treasury Obligation with maturity of 9/30/2004, collateral market value $1,735,050 (at amortized cost) |
$ 1,700,000 |
||
|
|
||||
|
|
TOTAL INVESTMENTS--99.3% |
51,569,863 |
||
|
|
||||
|
|
OTHER ASSETS AND LIABILITIES--NET--0.7% |
387,286 |
||
|
|
||||
|
|
TOTAL NET ASSETS--100% |
$ 51,957,149 |
||
|
|
||||
(See Notes to Portfolio of Investments)
Portfolio of Investments Summary Tables
U.S. GOVERNMENT INCOME FUND
At August 31, 2004, the fund's portfolio composition(1) was as follows:
|
|
Percentage |
|
|---|---|---|
|
U.S. Treasury Securities |
37.3% |
|
|
U.S. Government Agency Securities |
29.3% |
|
|
U.S. Government Agency Mortgage Backed Securities |
17.6% |
|
|
Corporate Bonds |
15.2% |
|
|
Other Securities(3) |
0.6% |
|
|
TOTAL |
100% |
(1) See the fund's prospectus for a more complete description of these types of investments.
(2) Percentages are based on total investments, which may differ from total net assets.
(3) Investment represents shares held in a money market mutual fund.
U.S. GOVERNMENT INCOME FUND
|
Principal |
|
Value |
||
|---|---|---|---|---|
|
|
LONG-TERM OBLIGATIONS--98.8% |
|
||
|
|
Corporate Bonds--15.1% |
|
||
|
$ 2,000,000 |
Boeing Capital Corp., 6.350%, 11/15/2007 |
$ 2,191,560 |
||
|
2,000,000 |
Computer Sciences Corp., 7.375%, 6/15/2011 |
2,326,500 |
||
|
1,500,000 |
GE Global Insurance, 7.500%, 6/15/2010 |
1,728,810 |
||
|
2,500,000 |
General Electric Capital Corp., 2.850%, 1/30/2006 |
2,517,475 |
||
|
1,000,000 |
Ingersoll-Rand Co., 6.250%, 5/15/2006 |
1,055,710 |
||
|
1,000,000 |
J.P. Morgan & Co., Inc., 6.000%, 1/15/2009 |
1,085,600 |
||
|
1,000,000 |
J.P. Morgan Chase & Co., 5.250%, 5/1/2015 |
1,012,440 |
||
|
500,000 |
Wal-Mart Stores, Inc., 4.150%, 6/15/2005 |
507,455 |
||
|
|
||||
|
|
TOTAL CORPORATE BONDS |
12,425,550 |
||
|
|
||||
|
|
GOVERNMENT AGENCIES--29.1% |
|
||
|
|
Federal Farm Credit System--2.5% |
|
||
|
2,000,000 |
4.450%, 8/27/2010 |
2,055,920 |
||
|
|
||||
|
|
Federal Home Loan Bank--6.2% |
|
||
|
2,000,000 |
4.125%, 4/28/2009 |
2,011,840 |
||
|
2,000,000 |
5.980%, 6/18/2008 |
2,189,840 |
||
|
850,000 |
7.010%, 6/14/2006 |
916,699 |
||
|
|
||||
|
|
Total |
5,118,379 |
||
|
|
||||
|
|
Federal Home Loan Mortgage Corporation--5.5% |
|
||
|
3,000,000 |
2.500%, 12/4/2006 |
2,980,920 |
||
|
1,500,000 |
5.825%, 2/9/2006 |
1,574,145 |
||
|
|
||||
|
|
Total |
4,555,065 |
||
|
|
||||
|
|
Federal National Mortgage Association--14.9% |
|
||
|
2,100,000 |
Floating Rate Note, 3.250%, 12/6/2004 |
2,096,976 |
||
|
2,500,000 |
1.000%, 5/19/2008 |
2,472,475 |
||
|
3,000,000 |
2.500%, 6/15/2006 |
2,997,480 |
||
|
2,000,000 |
3.250%, 2/15/2009 |
1,976,320 |
||
|
1,000,000 |
5.750%, 6/15/2005 |
1,028,830 |
||
|
1,000,000 |
6.000%, 5/15/2008 |
1,093,470 |
||
|
465,000 |
6.460%, 6/29/2012 |
530,500 |
||
|
|
||||
|
|
Total |
12,196,051 |
||
|
|
||||
|
|
TOTAL GOVERNMENT AGENCIES |
23,925,415 |
||
|
|
||||
|
Principal |
|
Value |
||
|
|
MORTGAGE BACKED SECURITIES--17.5% |
|
||
|
|
(5) Federal Home Loan Mortgage Corporation 15-Year--4.5% |
|
||
|
$ 3,700,681 |
4.500%, 4/1/2014 |
$ 3,751,565 |
||
|
304 |
9.500%, 10/1/2004 |
306 |
||
|
|
||||
|
|
Total |
3,751,871 |
||
|
|
||||
|
|
(5) Federal Home Loan Mortgage Corporation 30-Year--1.7% |
|
||
|
157,321 |
6.000%, 11/1/2006 |
161,028 |
||
|
996,242 |
6.000%, 7/1/2034 |
1,031,728 |
||
|
98,957 |
8.750%, 2/1/2017 |
108,621 |
||
|
5,498 |
9.000%, 6/1/2016 |
6,042 |
||
|
162 |
9.000%, 9/1/2016 |
178 |
||
|
800 |
9.000%, 10/1/2016 |
883 |
||
|
8,225 |
9.000%, 1/1/2017 |
9,074 |
||
|
11,738 |
9.500%, 10/1/2019 |
13,131 |
||
|
33,832 |
10.000%, 5/1/2014 |
37,553 |
||
|
20,246 |
10.000%, 6/1/2018 |
22,720 |
||
|
|
||||
|
|
Total |
1,390,958 |
||
|
|
||||
|
|
(5) Federal National Mortgage Association 15-Year--0.1% |
|
||
|
66,080 |
7.000%, 8/1/2012 |
70,603 |
||
|
|
||||
|
|
Federal National Mortgage Association 20-Year--1.4% |
|
||
|
1,144,796 |
6.000%, 4/1/2023 |
1,192,374 |
||
|
|
||||
|
|
(5) Federal National Mortgage Association 30-Year--1.2% |
|
||
|
247,439 |
5.000%, 4/1/2009 |
253,548 |
||
|
61,386 |
6.500%, 1/1/2008 |
63,305 |
||
|
242,077 |
7.000%, 12/1/2031 |
257,057 |
||
|
356,621 |
7.500%, 7/1/2031 |
380,803 |
||
|
16,922 |
9.500%, 8/1/2020 |
18,963 |
||
|
|
||||
|
|
Total |
973,676 |
||
|
|
||||
|
|
(5) Government National Mortgage Association 15-Year--2.5% |
|
||
|
681,603 |
6.000%, 3/20/2017 |
720,154 |
||
|
105,427 |
6.500%, 2/15/2017 |
112,708 |
||
|
11,008 |
7.000%, 11/15/2009 |
11,764 |
||
|
1,052,896 |
7.000%, 12/15/2008 |
1,117,060 |
||
|
58,421 |
7.000%, 9/15/2010 |
62,547 |
||
|
|
||||
|
|
Total |
2,024,233 |
||
|
|
||||
|
Principal |
|
Value |
||
|
|
MORTGAGE BACKED SECURITIES--continued |
|
||
|
|
Government National Mortgage Association 30-Year--6.1% |
|
||
|
$ 1,997,661 |
5.500%, 7/15/2034 |
$ 2,036,995 |
||
|
149,495 |
6.500%, 4/15/2029 |
158,091 |
||
|
381,962 |
7.000%, 9/15/2023 |
410,132 |
||
|
395,964 |
7.000%, 6/20/2030 |
421,947 |
||
|
163,934 |
7.000%, 2/15/2032 |
175,101 |
||
|
277,394 |
7.000%, 3/15/2032 |
296,204 |
||
|
64,728 |
7.500%, 10/15/2022 |
70,331 |
||
|
106,643 |
7.500%, 3/15/2026 |
115,340 |
||
|
157,471 |
7.500%, 9/15/2026 |
170,314 |
||
|
92,579 |
7.500%, 11/20/2029 |
99,551 |
||
|
118,903 |
7.500%, 12/20/2029 |
127,858 |
||
|
85,511 |
7.500%, 12/20/2030 |
91,898 |
||
|
123,000 |
8.000%, 1/15/2022 |
135,532 |
||
|
111,658 |
8.000%, 4/15/2022 |
123,034 |
||
|
89,507 |
8.000%, 8/15/2022 |
98,626 |
||
|
32,580 |
8.000%, 11/15/2022 |
36,041 |
||
|
88,313 |
8.000%, 10/15/2029 |
96,482 |
||
|
72,700 |
8.000%, 2/20/2030 |
79,152 |
||
|
93,500 |
8.000%, 3/20/2030 |
101,798 |
||
|
66,966 |
8.000%, 1/20/2030 |
72,909 |
||
|
18,876 |
8.500%, 2/20/2025 |
20,746 |
||
|
31,862 |
9.000%, 2/15/2020 |
35,895 |
||
|
19,870 |
9.500%, 6/15/2020 |
22,428 |
||
|
|
||||
|
|
Total |
4,996,405 |
||
|
|
||||
|
|
TOTAL MORTGAGE BACKED SECURITIES |
14,400,120 |
||
|
|
||||
|
|
U.S. TREASURY--37.1% |
|
||
|
|
Treasury Inflation-Indexed Note--13.7% |
|
||
|
4,696,360 |
3.625%, 1/15/2008 |
5,162,333 |
||
|
4,615,280 |
3.875%, 4/15/2029 |
6,094,339 |
||
|
|
||||
|
|
Total |
11,256,672 |
||
|
|
||||
|
Principal |
|
Value |
||
|
|
U.S. Treasury Bonds--9.3% |
|
||
|
$ 1,500,000 |
6.000%, 2/15/2026 |
$ 1,698,045 |
||
|
1,500,000 |
7.250%, 5/15/2016 |
1,886,250 |
||
|
1,000,000 |
7.250%, 8/15/2022 |
1,281,560 |
||
|
500,000 |
7.875%, 2/15/2021 |
673,985 |
||
|
300,000 |
8.500%, 2/15/2020 |
423,798 |
||
|
500,000 |
8.750%, 5/15/2020 |
721,955 |
||
|
900,000 |
10.375%, 11/15/2009 |
916,173 |
||
|
|
||||
|
|
Total |
7,601,766 |
||
|
|
||||
|
|
U.S. Treasury Notes--14.1% |
|
||
|
4,500,000 |
5.625%, 2/15/2006 |
4,724,280 |
||
|
1,000,000 |
6.125%, 8/15/2007 |
1,095,310 |
||
|
1,500,000 |
6.250%, 2/15/2007 |
1,631,010 |
||
|
1,000,000 |
6.500%, 5/15/2005 |
1,031,950 |
||
|
1,000,000 |
7.000%, 7/15/2006 |
1,084,380 |
||
|
2,000,000 |
7.500%, 2/15/2005 |
2,052,660 |
||
|
|
||||
|
|
Total |
11,619,590 |
||
|
|
||||
|
|
TOTAL U.S. TREASURY |
30,478,028 |
||
|
|
||||
|
|
TOTAL LONG-TERM OBLIGATIONS (identified cost $77,586,737) |
81,229,113 |
||
|
|
||||
|
|
MUTUAL FUND--0.6% |
|
||
|
495,000 |
Fidelity Institutional Cash Treasury Money Market Fund (at net asset value) |
495,000 |
||
|
|
||||
|
|
TOTAL INVESTMENTS--99.4% (identified cost $78,081,737) |
81,724,113 |
||
|
|
||||
|
|
OTHER ASSETS AND LIABILITIES--NET--0.6% |
507,153 |
||
|
|
||||
|
|
TOTAL NET ASSETS--100% |
$ 82,231,266 |
||
|
|
||||
(See Notes to Portfolio of Investments)
Portfolio of Investments Summary Tables
CASH RESERVE FUND
At August 31, 2004, the fund's portfolio composition(1) was as follows:
|
|
Percentage |
|
|---|---|---|
|
Commercial Paper |
77.6% |
|
|
U.S. Government Agency Securities |
14.3% |
|
|
Repurchase Agreement |
7.5% |
|
|
Other Securities(3) |
0.6% |
|
|
TOTAL |
100% |
(1) See the fund's prospectus for a more complete description of these types of investments.
(2) Percentages are based on total investments, which may differ from total net assets.
(3) Investment represents shares held in a money market mutual fund.
CASH RESERVE FUND
|
Principal |
|
Value |
||
|---|---|---|---|---|
|
|
(6) COMMERCIAL PAPER--78.1% |
|
||
|
|
Agricultural Operations--3.1% |
|
||
|
$ 5,177,000 |
(9)(10)Cargill, Inc., 1.373% - 1.501%, 9/7/2004 - 9/8/2004 |
$ 5,175,680 |
||
|
|
||||
|
|
Consumer Durables--3.6% |
|
||
|
6,000,000 |
Toyota Motor Credit Corp., 1.522%, 9/21/2004 |
5,994,934 |
||
|
|
||||
|
|
Consumer Non-Durables--3.5% |
|
||
|
6,000,000 |
(9)(10)Colgate-Palmolive Co., 1.502%, 9/23/2004 |
5,994,500 |
||
|
|
||||
|
|
Consumer Services--3.6% |
|
||
|
6,000,000 |
(9)(10)Knight-Ridder, Inc., 1.481%, 9/1/2004 |
6,000,000 |
||
|
|
||||
|
|
Energy Minerals--3.6% |
|
||
|
6,000,000 |
ChevronTexaco Corp., 1.482%, 9/23/2004 |
5,994,573 |
||
|
|
||||
|
|
Finance--46.3% |
|
||
|
6,000,000 |
American Express Co., 1.502%, 9/13/2004 |
5,997,000 |
||
|
6,000,000 |
American General Investment Corp., (Guaranteed by American General Corp.), 1.373%, 9/8/2004 |
5,998,402 |
||
|
6,000,000 |
(9)(10)Beta Finance, Inc., 1.647%, 11/15/2004 |
5,979,500 |
||
|
6,400,000 |
(9)(10)CIESCO LP, 1.553% - 1.573%, 10/5/2004 - 10/8/2004 |
6,390,182 |
||
|
6,000,000 |
CIT Group, Inc., 1.454% - 1.454%, 9/22/2004 |
5,994,925 |
||
|
6,000,000 |
Citicorp, 1.502%, 9/24/2004 |
5,994,250 |
||
|
6,000,000 |
(9)(10)CRC Funding LLC, 1.604%, 10/14/2004 |
5,988,533 |
||
|
6,000,000 |
General Electric Capital Corp., 1.382%, 9/2/2004 |
5,999,770 |
||
|
6,000,000 |
(9)(10)GOVCO, Inc., 1.506%, 10/8/2004 |
5,990,750 |
||
|
6,000,000 |
Household Finance Corp., 1.502%, 9/22/2004 |
5,994,750 |
||
|
5,000,000 |
(9)(10)Jupiter Securitization Corp., 1.520%, 9/2/2004 |
4,999,789 |
||
|
6,000,000 |
Prudential Funding Corp., 1.502%, 9/24/2004 |
5,994,250 |
||
|
6,000,000 |
(9)(10)Variable Funding Capital Corp., 1.434%, 9/21/2004 |
5,995,233 |
||
|
|
||||
|
|
Total |
77,317,334 |
||
|
|
||||
|
Principal |
|
Value |
||
|
|
Health Technology--3.6% |
|
||
|
$ 6,000,000 |
(9)(10)Abbott Laboratories, 1.353% - 1.493%, 9/16/2004 - 9/28/2004 |
$ 5,995,515 |
||
|
|
||||
|
|
Process Industries--3.6% |
|
||
|
6,000,000 |
Du Pont (E.I.) de Nemours & Co., 1.481% - 1.492%, 9/3/2004 - 9/22/2004 |
5,996,359 |
||
|
|
||||
|
|
Retail Trade--7.2% |
|
||
|
6,000,000 |
Seven Eleven, Inc., 1.522%, 9/15/2004 |
5,996,453 |
||
|
6,000,000 |
(9)(10)Wal-Mart Stores, Inc., 1.343% - 1.482%, 9/8/2004 - 9/21/2004 |
5,996,190 |
||
|
|
||||
|
|
Total |
11,992,643 |
||
|
|
||||
|
|
TOTAL COMMERCIAL PAPER |
130,461,538 |
||
|
|
||||
|
|
(7) GOVERNMENT AGENCIES--14.3% |
|
||
|
|
Finance--14.3% |
|
||
|
1,000,000 |
Federal Home Loan Bank System, 1.265%, 3/15/2005 |
1,000,000 |
||
|
1,000,000 |
Federal Home Loan Bank System, 1.300%, 4/27/2005 |
1,000,000 |
||
|
1,000,000 |
Federal Home Loan Bank System, 1.350%, 4/29/2005 |
1,000,000 |
||
|
2,000,000 |
Federal Home Loan Bank System, 1.450%, 3/11/2005 |
2,000,000 |
||
|
5,000,000 |
Federal Home Loan Bank System, 1.500%, 9/22/2004 |
4,995,625 |
||
|
2,000,000 |
Federal Home Loan Bank System, 1.500%, 5/4/2005 |
2,000,000 |
||
|
1,000,000 |
Federal Home Loan Bank System, 1.580%, 5/10/2005 |
1,000,000 |
||
|
1,000,000 |
FNMA, 1.270%, 4/25/2005 |
1,000,000 |
||
|
5,000,000 |
FNMA, 1.5000%, 9/22/2004 |
4,995,625 |
||
|
5,000,000 |
FNMA, 1.500%, 9/29/2004 |
4,994,167 |
||
|
|
||||
|
|
TOTAL |
23,985,417 |
||
|
|
||||
|
|
MUTUAL FUND--0.6% |
|
||
|
935,000 |
Fidelity Institutional Cash Treasury Money Market Fund |
935,000 |
||
|
|
||||
|
Principal |
|
Value |
||
|
|
REPURCHASE AGREEMENT--7.6% |
|
||
|
$12,707,000 |
Repurchase agreement with Morgan Stanley & Co., Inc., 1.53%, dated 8/31/2004 to be repurchased at $12,707,540 on 9/1/2004, collateralized by a U.S. Treasury Obligation with maturity of 11/15/2004, collateral market value $12,962,362 |
$ 12,707,000 |
||
|
|
||||
|
|
TOTAL INVESTMENTS--100.6% (at amortized cost) |
168,088,955 |
||
|
|
||||
|
|
OTHER ASSETS AND LIABILITIES--NET--(0.6)% |
(1,056,096) |
||
|
|
||||
|
|
TOTAL NET ASSETS--100% |
$ 167,032,859 |
||
|
|
||||
(See Notes to Portfolio of Investments)
Portfolio of Investments Summary Tables
U.S. TREASURY MONEY MARKET FUND
At August 31, 2004, the fund's portfolio composition(1) was as follows:
|
|
Percentage |
|
|---|---|---|
|
U. S. Treasury Securities |
56.1% |
|
|
Repurchase Agreements |
41.2% |
|
|
Other Securities(3) |
2.7% |
|
|
TOTAL |
100% |
(1) See the fund's prospectus for a more complete description of these types of investments.
(2) Percentages are based on total investments, which may differ from total net assets.
(3) Investment represents shares held in a money market mutual fund.
U.S. TREASURY MONEY MARKET FUND
|
Principal |
|
Value |
||
|---|---|---|---|---|
|
|
(7) U.S. TREASURY--56.1% |
|
||
|
|
U.S. Treasury Bills--56.1% |
|
||
|
$ 5,000,000 |
0.975%, 9/16/2004 |
$ 4,997,969 |
||
|
15,000,000 |
1.010% - 1.355%, 9/30/2004 |
14,985,343 |
||
|
4,700,000 |
1.185%, 9/9/2004 |
4,698,762 |
||
|
5,000,000 |
1.335%, 10/21/2004 |
4,990,729 |
||
|
2,000,000 |
1.350%, 9/2/2004 |
1,999,925 |
||
|
12,000,000 |
1.390% - 1.450%, 11/18/2004 |
11,963,004 |
||
|
5,000,000 |
1.425%, 11/4/2004 |
4,987,333 |
||
|
5,000,000 |
1.445%, 11/12/2004 |
4,985,550 |
||
|
5,000,000 |
1.488%, 12/2/2004 |
4,980,987 |
||
|
2,000,000 |
1.500%, 12/30/2004 |
1,990,000 |
||
|
20,000,000 |
1.515%, 11/26/2004 |
19,927,617 |
||
|
5,000,000 |
1.650%, 1/20/2005 |
4,967,687 |
||
|
|
||||
|
|
TOTAL U.S. TREASURY |
85,474,906 |
||
|
|
||||
|
|
MUTUAL FUND--2.7% |
|
||
|
4,102,000 |
Fidelity Institutional Cash Treasury Money Market Fund |
4,102,000 |
||
|
|
||||
|
Principal |
|
Value |
||
|
|
REPURCHASE AGREEMENTS--41.2% |
|
||
|
$ 31,000,000 |
Repurchase agreement with Merrill Lynch, Pierce, Fenner and Smith, 1.530%, dated 8/31/2004 to be repurchased at $31,001,318 on 9/1/2004, collateralized by a U.S. Treasury Obligation with maturity of 5/15/2005, collateral market value $31,621,600 |
$ 31,000,000 |
||
|
31,753,000 |
Repurchase agreement with Morgan Stanley & Co., Inc., 1.530%, dated 8/31/2004 to be repurchased at $31,754,350 on 9/1/2004, collateralized by a U.S. Treasury Obligation with maturity of 5/15/2018, collateral market value $32,462,102 |
31,753,000 |
||
|
|
||||
|
|
TOTAL REPURCHASE AGREEMENTS |
62,753,000 |
||
|
|
||||
|
|
TOTAL INVESTMENTS--100% (at amortized cost) |
152,329,906 |
||
|
|
||||
|
|
OTHER ASSETS AND LIABILITIES--NET--0.0% |
(65,410) |
||
|
|
||||
|
|
TOTAL NET ASSETS--100% |
$ 152,264,496 |
||
|
|
||||
(See Notes to Portfolio of Investments)
Notes to Portfolios of Investments
Hibernia Funds
August 31, 2004
|
(1) |
Non-income producing. |
|
|
(2) |
Securities that are subject to the federal alternative minimum tax (AMT) represent 6.3% of the Hibernia Louisiana Municipal Income Fund's portfolio calculated based upon total portfolio market value (percentage is unaudited). |
|
|
(3) |
Please refer to the Appendix of the Statement of Additional Information for an explanation of the credit ratings. Current credit ratings are unaudited. |
|
|
(4) |
Affiliated company. |
|
|
(5) |
Because of monthly principal payments, the average lives of certain government securities are less than the indicated periods. |
|
|
(6) |
Rate shown represents yield to maturity. |
|
|
(7) |
These issues show the rate of discount at time of purchase. |
|
|
(8) |
Denotes a zero coupon bond with effective rate at time of purchase. |
|
|
(9) |
Denotes a restricted security, including securities purchased under Rule 144A of the Securities Act of 1933. These securities unless registered under the Act or exempted from registration, may only be sold to qualified institutional investors. At August 31, 2004, these securities amounted to $64,505,872 which represents 38.6% of total net assets. |
|
|
(10) |
Denotes a restricted security, including securities purchased under Rule 144A that have been deemed liquid by criteria approved by the fund's Board of Trustees. At August 31, 2004, these securities amounted to $64,505,872 which represents 38.6% of total net assets. |
The following abbreviations are used in these portfolios:
|
AMBAC |
--American Municipal Bond Assurance Corporation |
|
COL |
--Collateralized |
|
FGIC |
--Financial Guaranty Insurance Corporation |
|
FHA |
--Federal Housing Administration |
|
FHLMC |
--Federal Home Loan Mortgage Corporation |
|
FNMA |
--Federal National Mortgage Association |
|
FSA |
--Financial Security Assurance |
|
GNMA |
--Government National Mortgage Association |
|
GO |
--General Obligation |
|
HFA |
--Housing Finance Authority |
|
IDB |
--Industrial Development Bond |
|
INS |
--Insured |
|
LOC |
--Letter of Credit |
|
MTN |
--Medium Term Note |
|
PFA |
--Public Facility Authority |
|
SFM |
--Single Family Mortgage |
|
UT |
--Unlimited Tax |
Percentages listed on Hibernia Capital Appreciation Fund and Hibernia Mid Cap Equity Fund's Portfolio of Investments beneath the heading "Common Stocks," represent the percentage of the respective portfolio invested in the identified economic sectors.
|
|
For Federal Tax Purposes |
|||
|
Hibernia Funds |
Cost of Investments |
Total Net Assets* |
||
|
Capital Appreciation Fund |
$177,176,354 |
$ 251,852,051 |
||
|
Louisiana Municipal Income Fund |
75,350,562 |
81,857,190 |
||
|
Mid Cap Equity Fund |
69,449,876 |
79,103,756 |
||
|
Total Return Bond Fund |
49,831,215 |
51,957,149 |
||
|
U.S. Government Income Fund |
78,833,200 |
82,231,266 |
||
|
Cash Reserve Fund |
168,088,955 |
167,032,859 |
||
|
U.S. Treasury Money Market Fund |
152,329,906 |
152,264,496 |
||
* The categories of investments are shown as a percentage of total net assets at August 31, 2004.
Statements of Assets and Liabilities
Hibernia Funds
August 31, 2004
|
|
Capital |
Louisiana Municipal |
Mid Cap |
|||
|---|---|---|---|---|---|---|
|
Assets: |
|
|
|
|||
|
Investments in repurchase agreements |
$ -- |
$ -- |
$ -- |
|||
|
Investments in securities |
251,360,829 |
80,920,100(a) |
79,059,198 |
|||
|
|
|
|
||||
|
Total investments in securities, at value |
251,360,829 |
80,920,100 |
79,059,198 |
|||
|
Cash |
233 |
-- |
636 |
|||
|
Income receivable |
493,909 |
1,167,704 |
86,100 |
|||
|
Receivable for shares sold |
184,361 |
-- |
39,541 |
|||
|
|
|
|
||||
|
Total assets |
252,039,332 |
82,087,804 |
79,185,475 |
|||
|
|
|
|
||||
|
Liabilities: |
|
|
|
|||
|
Payable for shares redeemed |
107,383 |
27,145 |
36,420 |
|||
|
Income distribution payable |
-- |
170,680 |
-- |
|||
|
Payable for transfer and dividend disbursing agent fees |
16,927 |
6,383 |
16,646 |
|||
|
Payable for portfolio accounting fees (Note 5) |
8,486 |
10,913 |
14,603 |
|||
|
Payable for distribution services fee (Note 5) |
52,441 |
11,889 |
2,638 |
|||
|
Payable for shareholder services fee (Note 5) |
1,012 |
1,041 |
7,078 |
|||
|
Accrued expenses |
1,032 |
2,563 |
4,334 |
|||
|
|
|
|
||||
|
Total liabilities |
187,281 |
230,614 |
81,719 |
|||
|
|
|
|
||||
|
Net Assets Consist of: |
|
|
|
|||
|
Paid in capital |
169,519,641 |
76,159,652 |
65,300,671 |
|||
|
Net unrealized appreciation of investments |
74,184,475 |
5,506,460 |
9,609,966 |
|||
|
Accumulated net realized gain (loss) on investments |
7,814,892 |
166,966 |
4,193,119 |
|||
|
Undistributed (distributions in excess of) net |
333,043 |
24,112 |
-- |
|||
|
|
|
|
||||
|
Total Net Assets |
$ 251,852,051 |
$ 81,857,190 |
$ 79,103,756 |
|||
|
|
|
|
||||
|
Net Assets: |
$ 239,870,895(b) |
$ 78,288,064(b) |
$ 74,783,069(b) |
|||
|
|
|
|
||||
|
|
$ 11,981,156(c) |
$ 3,569,126(c) |
$ 4,320,687(c) |
|||
|
|
|
|
||||
|
Shares Outstanding, No Par Value, Unlimited Shares Authorized: |
13,099,546(b) |
6,891,206(b) |
5,197,852(b) |
|||
|
|
|
|
||||
|
|
687,774(c) |
313,967(c) |
314,226(c) |
|||
|
|
|
|
||||
|
Total Shares Outstanding |
13,787,320 |
7,205,173 |
5,512,078 |
|||
|
|
|
|
||||
|
Net Asset Value Per Share |
$ 18.31(b) |
$ 11.36(b) |
$ 14.39(b) |
|||
|
|
|
|
||||
|
|
$ 17.42(c) |
$ 11.37(c) |
$ 13.75(c) |
|||
|
|
|
|
||||
|
Offering Price Per Share* |
$ 19.17(b)*** |
$ 11.71(b)**** |
$ 15.07(b)*** |
|||
|
|
|
|
||||
|
|
$ 17.42(c) |
$ 11.37(c) |
$ 13.75(c) |
|||
|
|
|
|
||||
|
Redemption Proceeds Per Share** |
$ 18.31(b) |
$ 11.36(b) |
$ 14.39(b) |
|||
|
|
|
|
||||
|
|
$ 16.46c)***** |
$ 10.74(c)***** |
$ 12.99(c)***** |
|||
|
|
|
|
||||
|
Investments, at identified cost |
$ 177,176,354 |
$ 75,413,640 |
$ 69,449,232 |
|||
|
|
|
|
(a) Including $665,993 of investments in affiliated issuer.
(b) Represents Class A Shares.
(c) Represents Class B Shares.
* See "What Do Shares Cost" in the Prospectus.
** See "How to Redeem and Exchange Shares" in the Prospectus.
*** Computation of Offering Price: 100/95.50 of net asset value.
**** Computation of Offering Price: 100/97 of net asset value.
***** Computation of Redemption Proceeds: 94.50/100 of net asset value.
(See Notes which are an integral part of the Financial Statements)
|
Total Return |
U.S. Government |
Cash |
U.S. Treasury |
|||
|---|---|---|---|---|---|---|
|
|
|
|
|
|||
|
$ 1,700,000 |
$ -- |
$ 12,707,000 |
$ 62,753,000 |
|||
|
49,869,863 |
81,724,113 |
155,381,955 |
89,576,906 |
|||
|
|
|
|
|
|||
|
51,569,863 |
81,724,113 |
168,088,955 |
152,329,906 |
|||
|
934 |
326 |
337 |
970 |
|||
|
699,619 |
625,785 |
43,881 |
7,030 |
|||
|
55,318 |
147,445 |
138,543 |
232,380 |
|||
|
|
|
|
|
|||
|
52,325,734 |
82,497,669 |
168,271,716 |
152,570,286 |
|||
|
|
|
|
|
|||
|
|
|
|
|
|||
|
281,790 |
47,934 |
1,106,880 |
228,948 |
|||
|
36,716 |
199,385 |
73,172 |
63,753 |
|||
|
11,011 |
2,978 |
23,445 |
2,222 |
|||
|
7,635 |
1,446 |
11,761 |
8,401 |
|||
|
29,395 |
10,605 |
18,496 |
-- |
|||
|
-- |
-- |
-- |
-- |
|||
|
2,038 |
4,055 |
5,103 |
2,466 |
|||
|
|
|
|
|
|||
|
368,585 |
266,403 |
1,238,857 |
305,790 |
|||
|
|
|
|
|
|||
|
|
|
|
|
|||
|
52,347,299 |
80,875,752 |
167,081,882 |
152,264,677 |
|||
|
2,289,721 |
3,642,376 |
-- |
-- |
|||
|
(2,730,046) |
(2,535,432) |
(48,629) |
-- |
|||
|
50,175 |
248,570 |
(394) |
(181) |
|||
|
|
|
|
|
|||
|
$ 51,957,149 |
$ 82,231,266 |
$ 167,032,859 |
$ 152,264,496 |
|||
|
|
|
|
|
|||
|
$ 51,957,149 |
$ 82,231,266 |
$ 166,615,813(b) |
$ 152,264,496 |
|||
|
|
|
|
|
|||
|
-- |
-- |
$ 417,046(c) |
-- |
|||
|
|
|
|
|
|||
|
5,254,962 |
7,986,263 |
166,663,677(b) |
152,264,686 |
|||
|
|
|
|
|
|||
|
-- |
-- |
418,205(c) |
-- |
|||
|
|
|
|
|
|||
|
5,254,962 |
7,986,263 |
167,081,882 |
152,264,686 |
|||
|
|
|
|
|
|||
|
$ 9.89 |
$ 10.30 |
$ 1.00(b) |
$ 1.00 |
|||
|
|
|
|
|
|||
|
$ -- |
$ -- |
$ 1.00(c) |
$ -- |
|||
|
|
|
|
|
|||
|
$ 10.20**** |
$ 10.62**** |
$ 1.00(b) |
$ 1.00 |
|||
|
|
|
|
|
|||
|
$ -- |
$ -- |
$ 1.00(c) |
$ -- |
|||
|
|
|
|
|
|||
|
$ 9.89 |
$ 10.30 |
$ 1.00(b) |
$ 1.00 |
|||
|
|
|
|
|
|||
|
$ -- |
$ -- |
$ 0.95(c)***** |
$ -- |
|||
|
|
|
|
|
|||
|
$ 49,280,142 |
$ 78,081,737 |
$ 168,088,955 |
$ 152,329,906 |
|||
|
|
|
|
|
Statements of Operations
Hibernia Funds
August 31, 2004
|
|
Capital |
Louisiana Municipal |
Mid Cap |
|||
|---|---|---|---|---|---|---|
|
Investment Income: |
|
|
|
|||
|
Dividends |
$ 4,279,732(a) |
$ 8,446(b) |
$ 920,488 |
|||
|
Interest |
14,226 |
4,225,522 |
9,334 |
|||
|
|
|
|
||||
|
Total income |
4,293,958 |
4,233,968 |
929,822 |
|||
|
|
|
|
||||
|
Expenses: |
|
|
|
|||
|
Investment adviser fee (Note 5) |
1,935,752 |
385,181 |
530,979 |
|||
|
Administrative personnel and services fee (Note 5) |
301,873 |
100,084 |
82,839 |
|||
|
Custodian fees (Note 5) |
56,620 |
21,399 |
17,700 |
|||
|
Transfer and dividend disbursing agent fees and expenses (Note 5) |
91,841 |
51,651 |
76,263 |
|||
|
Directors'/Trustees' fees |
17,099 |
7,263 |
4,259 |
|||
|
Auditing fees |
22,880 |
15,888 |
14,872 |
|||
|
Legal fees |
12,242 |
12,398 |
12,130 |
|||
|
Portfolio accounting fees (Note 5) |
76,444 |
66,363 |
65,031 |
|||
|
Distribution services fee (Note 5) |
707,546(c) |
234,522(d) |
198,930(e) |
|||
|
Shareholder services fee (Note 5) |
31,148(g) |
10,266(g) |
10,968(g) |
|||
|
Share registration costs |
30,152 |
27,298 |
23,203 |
|||
|
Printing and postage |
18,488 |
6,182 |
6,727 |
|||
|
Insurance premiums |
14,523 |
9,261 |
8,655 |
|||
|
Miscellaneous |
4,835 |
5,206 |
7,394 |
|||
|
|
|
|
||||
|
Total expenses |
3,321,443 |
952,962 |
1,059,950 |
|||
|
|
|
|
||||
|
Waivers (Note 5): |
|
|
|
|||
|
Waiver of investment adviser fee |
-- |
(196,870) |
-- |
|||
|
Waiver of distribution services fee |
-- |
(81,490)(h) |
-- |
|||
|
|
|
|
||||
|
Total waivers |
-- |
(278,360) |
-- |
|||
|
|
|
|
||||
|
Net expenses |
3,321,443 |
674,602 |
1,059,950 |
|||
|
|
|
|
||||
|
Net investment income (loss) |
972,515 |
3,559,366 |
(130,128) |
|||
|
|
|
|
||||
|
Realized and Unrealized Gain (Loss) on Investments: |
|
|
|
|||
|
Net realized gain (loss) on investments |
8,945,443 |
157,576 |
5,009,487 |
|||
|
Net change in unrealized appreciation/depreciation of investments |
14,180,860 |
1,128,372 |
2,075,941 |
|||
|
|
|
|
||||
|
Net realized and unrealized gain (loss) on investments |
23,126,303 |
1,285,948 |
7,085,428 |
|||
|
|
|
|
||||
|
Change in net assets resulting from operations |
$ 24,098,818 |
$ 4,845,314 |
$ 6,955,300 |
|||
|
|
|
|
(a) Net of foreign taxes withheld of $11,659.
(b) Received from affiliated issuer.
(c) Represents distribution services fee of $614,103 and $93,443, for Class A Shares and Class B Shares, respectively.
(d) Represents distribution services fee of $203,724 and $30,798, for Class A Shares and Class B Shares, respectively.
(e) Represents distribution services fee of $166,025 and $32,905, for Class A Shares and Class B Shares, respectively.
(f) Represents distribution services fee of $428,777 and $3,888 for Class A Shares and Class B Shares, respectively.
(g) Represents shareholder services fee for Class B Shares.
(h) Represents distribution services fee waiver for Class A Shares.
(i) Represents distribution services fee waiver of $257,266 and $3,888 for Class A Shares and Class B Shares, respectively.
(See Notes which are an integral part of the Financial Statements)
|
Total Return |
U.S. Government |
Cash |
U.S. Treasury |
|||
|---|---|---|---|---|---|---|
|
|
|
|
|
|||
|
$ -- |
$ -- |
$ -- |
$ -- |
|||
|
2,637,993 |
3,856,077 |
1,897,316 |
1,689,798 |
|||
|
|
|
|
|
|||
|
2,637,993 |
3,856,077 |
1,897,316 |
1,689,798 |
|||
|
|
|
|
|
|||
|
|
|
|
|
|||
|
362,720 |
392,970 |
688,116 |
676,112 |
|||
|
60,620 |
102,106 |
201,139 |
197,390 |
|||
|
15,154 |
21,832 |
39,406 |
38,806 |
|||
|
46,740 |
32,581 |
114,679 |
58,247 |
|||
|
3,974 |
7,534 |
18,283 |
17,203 |
|||
|
14,347 |
16,044 |
21,559 |
22,297 |
|||
|
12,558 |
12,558 |
14,203 |
13,949 |
|||
|
50,700 |
43,205 |
61,363 |
47,828 |
|||
|
129,543 |
218,317 |
432,665(f) |
-- |
|||
|
-- |
-- |
1,296(g) |
-- |
|||
|
16,524 |
16,993 |
27,543 |
15,228 |
|||
|
3,836 |
4,466 |
10,810 |
16,995 |
|||
|
8,228 |
9,339 |
13,674 |
13,665 |
|||
|
7,667 |
6,794 |
5,767 |
1,511 |
|||
|
|
|
|
|
|||
|
732,611 |
884,739 |
1,650,503 |
1,119,231 |
|||
|
|
|
|
|
|||
|
|
|
|
|
|||
|
(207,269) |
(183,386) |
(430,073) |
-- |
|||
|
-- |
(87,327) |
(261,154)(i) |
-- |
|||
|
|
|
|
|
|||
|
(207,269) |
(270,713) |
(691,227) |
-- |
|||
|
|
|
|
|
|||
|
525,342 |
614,026 |
959,276 |
1,119,231 |
|||
|
|
|
|
|
|||
|
2,112,651 |
3,242,051 |
938,040 |
570,567 |
|||
|
|
|
|
|
|||
|
|
|
|
|
|||
|
199,634 |
(90,843) |
188 |
-- |
|||
|
(439,021) |
334,289 |
-- |
-- |
|||
|
|
|
|
|
|||
|
(239,387) |
243,446 |
188 |
-- |
|||
|
|
|
|
|
|||
|
$ 1,873,264 |
$ 3,485,497 |
$ 938,228 |
$ 570,567 |
|||
|
|
|
|
|
Statements of Changes in Net Assets
Hibernia Funds
August 31, 2004
|
|
Capital |
Louisiana Municipal |
||||||
|---|---|---|---|---|---|---|---|---|
|
|
Year Ended |
Year Ended |
Year Ended |
Year Ended |
||||
|
Increase (Decrease) in Net Assets: |
|
|
|
|
||||
|
Operations: |
|
|
|
|
||||
|
Net investment income (loss) |
$ 972,515 |
$ 990,849 |
$ 3,559,366 |
$ 3,839,317 |
||||
|
Net realized gain (loss) on investments |
8,945,443 |
15,490,759 |
157,576 |
174,785 |
||||
|
Net change in unrealized appreciation/depreciation on investments |
14,180,860 |
2,302,262 |
1,128,372 |
(1,210,531) |
||||
|
|
|
|
|
|||||
|
Change in net assets resulting from operations |
24,098,818 |
18,783,870 |
4,845,314 |
2,803,571 |
||||
|
|
|
|
|
|||||
|
Distributions to Shareholders: |
|
|
|
|
||||
|
Distributions from net investment income |
(1,004,129)(a) |
(881,464)(a) |
(3,510,149)(c) |
(3,827,363)(e) |
||||
|
Distributions from net realized gain on investments |
(15,667,151)(b) |
-- |
(211,682)(d) |
(540,234)(f) |
||||
|
|
|
|
|
|||||
|
Change in net assets from distributions to shareholders |
(16,671,280) |
(881,464) |
(3,721,831) |
(4,367,597) |
||||
|
|
|
|
|
|||||
|
Share Transactions: |
|
|
|
|
||||
|
Proceeds from sale of shares |
23,450,979 |
35,894,157 |
5,743,016 |
13,888,866 |
||||
|
Net asset value of shares issued to shareholders in payment of distributions declared |
13,081,716 |
326,238 |
1,452,869 |
1,793,212 |
||||
|
Cost of shares redeemed |
(38,878,745) |
(36,945,664) |
(12,057,422) |
(15,708,137) |
||||
|
|
|
|
|
|||||
|
Change in net assets from share transactions |
(2,346,050) |
(725,269) |
(4,861,537) |
(26,059) |
||||
|
|
|
|
|
|||||
|
Change in net assets |
5,081,488 |
17,177,137 |
(3,738,054) |
(1,590,085) |
||||
|
Net Assets: |
|
|
|
|
||||
|
Beginning of period |
246,770,563 |
229,593,426 |
85,595,244 |
87,185,329 |
||||
|
|
|
|
|
|||||
|
End of period |
$ 251,852,051 |
$246,770,563 |
$ 81,857,190 |
$ 85,595,244 |
||||
|
|
|
|
|
|||||
|
Undistributed (distributions in excess of) net investment income included in net assets at end of period |
$ 333,043 |
$ 364,657 |
$ 24,112 |
$ (31,365) |
||||
|
|
|
|
|
|||||
(a) Represents income distributions for Class A Shares.
(b) Represents gain distributions of $14,881,321 and $785,830 for Class A Shares and Class B Shares, respectively.
(c) Represents income distributions of $3,374,188 and $135,961 for Class A Shares and Class B Shares, respectively.
(d) Represents gain distributions of $201,401 and $10,281 for Class A Shares and Class B Shares, respectively.
(e) Represents income distributions of $3,696,273 and $131,090 for Class A Shares and Class B Shares, respectively.
(f) Represents gain distributions of $520,530 and $19,704 for Class A Shares and Class B Shares, respectively.
(g) Represents gain distributions of $314,775 and $21,087 for Class A Shares and Class B Shares, respectively.
(See Notes which are an integral part of the Financial Statements)
|
Mid Cap |
Total Return |
U.S. Government |
||||||||
|---|---|---|---|---|---|---|---|---|---|---|
|
Year Ended |
Year Ended |
Year Ended |
Year Ended |
Year Ended |
Year Ended |
|||||
|
|
|
|
|
|
|
|||||
|
|
|
|
|
|
|
|||||
|
$ (130,128) |
$ (271,388) |
$ 2,112,651 |
$ 2,104,931 |
$ 3,242,051 |
$ 3,558,065 |
|||||
|
5,009,487 |
528,822 |
199,634 |
91,618 |
(90,843) |
264,479 |
|||||
|
2,075,941 |
7,078,054 |
(439,021) |
(614,776) |
334,289 |
(1,282,435) |
|||||
|
|
|
|
|
|
|
|||||
|
6,955,300 |
7,335,488 |
1,873,264 |
1,581,773 |
3,485,497 |
2,540,109 |
|||||
|
|
|
|
|
|
|
|||||
|
|
|
|
|
|
|
|||||
|
-- |
-- |
(2,352,147) |
(2,404,027) |
(3,483,285) |
(4,153,568) |
|||||
|
(335,862)(g) |
-- |
-- |
-- |
-- |
-- |
|||||
|
|
|
|
|
|
|
|||||
|
(335,862) |
-- |
(2,352,147) |
(2,404,027) |
(3,483,285) |
(4,153,568) |
|||||
|
|
|
|
|
|
|
|||||
|
|
|
|
|
|
|
|||||
|
25,871,292 |
16,958,084 |
10,422,642 |
7,285,506 |
9,788,237 |
16,253,444 |
|||||
|
319,175 |
-- |
1,991,623 |
2,089,993 |
1,076,052 |
1,324,332 |
|||||
|
(17,235,363) |
(6,759,403) |
(8,541,313) |
(7,417,882) |
(18,208,485) |
(11,484,124) |
|||||
|
|
|
|
|
|
|
|||||
|
8,955,104 |
10,198,681 |
3,872,952 |
1,957,617 |
(7,344,196) |
6,093,652 |
|||||
|
|
|
|
|
|
|
|||||
|
15,574,542 |
17,534,169 |
3,394,069 |
1,135,363 |
(7,341,984) |
4,480,193 |
|||||
|
|
|
|
|
|
|
|||||
|
63,529,214 |
45,995,045 |
48,563,080 |
47,427,717 |
89,573,250 |
85,093,057 |
|||||
|
|
|
|
|
|
|
|||||
|
$ 79,103,756 |
$ 63,529,214 |
$ 51,957,149 |
$ 48,563,080 |
$ 82,231,266 |
$ 89,573,250 |
|||||
|
|
|
|
|
|
|
|||||
|
$ -- |
$ -- |
$ 50,175 |
$ 16,343 |
$ 248,570 |
$ 36,446 |
|||||
|
|
|
|
|
|
|
|||||
Statements of Changes in Net Assets (continued)
Hibernia Funds
August 31, 2004
|
|
Cash Reserve |
U.S. Treasury |
||||||
|---|---|---|---|---|---|---|---|---|
|
|
Year Ended |
Year Ended |
Year Ended |
Year Ended |
||||
|
Increase (Decrease) in Net Assets |
|
|
|
|
||||
|
Operations: |
|
|
|
|
||||
|
Net investment income |
$ 938,040 |
$ 1,657,843 |
$ 570,567 |
$ 1,173,528 |
||||
|
Net realized gain (loss) on investments |
188 |
(3,311) |
--- |
--- |
||||
|
|
|
|
|
|||||
|
Change in net assets resulting from operations |
938,228 |
1,654,532 |
570,567 |
1,173,528 |
||||
|
|
|
|
|
|||||
|
Distributions to Shareholders: |
|
|
|
|
||||
|
Distributions from net investment income |
(938,533)(a) |
(1,663,528)(b) |
(570,153) |
(1,173,759) |
||||
|
|
|
|
|
|||||
|
Share Transactions: |
|
|
|
|
||||
|
Proceeds from sale of shares |
287,135,245 |
327,590,041 |
1,909,988,046 |
720,769,448 |
||||
|
Net asset value of shares issued to shareholders in payment of distributions declared |
370,059 |
599,918 |
134,843 |
306,250 |
||||
|
Cost of shares redeemed |
(303,724,419) |
(357,943,914) |
(1,979,193,244) |
(693,275,644) |
||||
|
|
|
|
|
|||||
|
Change in net assets from share transactions |
(16,219,115) |
(29,753,955) |
(69,070,355) |
27,800,054 |
||||
|
|
|
|
|
|||||
|
Change in net assets |
(16,219,420) |
(29,762,951) |
(69,069,941) |
27,799,823 |
||||
|
Net Assets: |
|
|
|
|
||||
|
Beginning of period |
183,252,279 |
213,015,230 |
221,334,437 |
193,534,614 |
||||
|
|
|
|
|
|||||
|
End of period |
$167,032,859 |
$ 183,252,279 |
$ 152,264,496 |
$ 221,334,437 |
||||
|
|
|
|
|
|||||
|
Undistributed (distributions in excess of) net investment income included in net assets at end of period |
$ (394) |
$ 99 |
$ (181) |
$ (595) |
||||
|
|
|
|
|
|||||
(a) Represents income distributions of $936,513 and $2,020 for Class A Shares and Class B Shares, respectively.
(b) Represents income distributions of $1,659,423 and $4,105 for Class A Shares and Class B Shares, respectively.
(See Notes which are an integral part of the Financial Statements)
Combined Notes to Financial Statements
Hibernia Funds
August 31, 2004
(1) ORGANIZATION
Hibernia Funds (the "Trust") is registered under the Investment Company Act of 1940, as amended (the "Act"), as an open-end management investment company. The Trust consists of seven portfolios (individually referred to as the "Fund", or collectively as the "Funds") which are presented herein:
|
Portfolio Name |
Diversification |
Investment Objective |
||
|
Hibernia Capital Appreciation Fund |
diversified |
provide growth of capital and income |
||
|
Hibernia Louisiana Municipal Income Fund |
non-diversified |
provide current income which is generally exempt from |
||
|
Hibernia Mid Cap Equity Fund |
diversified |
total return |
||
|
Hibernia Total Return Bond Fund |
diversified |
maximize total return |
||
|
Hibernia U.S. Government Income Fund |
diversified |
provide current income |
||
|
Hibernia Cash Reserve Fund |
diversified |
provide current income consistent with stability of principal |
||
|
Hibernia U.S. Treasury Money Market Fund |
diversified |
provide current income consistent with stability of principal and liquidity |
The assets of each portfolio are segregated and a shareholder's interest is limited to the portfolio in which shares are held. Capital Appreciation Fund, Louisiana Municipal Income Fund, Mid Cap Equity Fund and Cash Reserve Fund offer two classes of shares: Class A Shares and Class B Shares.
(2) SIGNIFICANT ACCOUNTING POLICIES
The following is a summary of significant accounting policies consistently followed by the Funds in the preparation of their financial statements. These policies are in conformity with generally accepted accounting principles ("GAAP") in the United States of America.
Investment Valuations--Municipal bonds are valued by an independent pricing service, taking into consideration yield, liquidity, risk, credit quality, coupon, maturity, type of issue and any other factors or market data the pricing service deems relevant. U.S. government securities, listed corporate bonds, and other fixed income and asset-backed securities are generally valued at the mean of the latest bid and asked price as furnished by an independent pricing service. Listed equity securities are valued at the last sale price or official closing price reported on a national securities exchange. If unavailable, the security is generally valued at the mean between the last closing bid and asked prices. Cash Reserve Fund and U.S. Treasury Money Market Fund use the amortized cost method to value portfolio securities in accordance with Rule 2a-7 under the Act. For Capital Appreciation Fund, Louisiana Municipal Income Fund, Mid Cap Equity Fund, Total Return Bond Fund and U.S. Government Income Fund, short-term securities are valued at the prices provided by an independent pricing service. However, short-term securities purchased with remaining maturities of 60 days or less may be valued at amortized cost, which approximates fair market value. Securities for which no quotations are readily available are valued at fair value as determined in accordance with procedures established by and under general supervision of the Board of Trustees (the "Trustees"). Investments in other open-end regulated investment companies are valued at net asset value.
Repurchase Agreements--It is the policy of the Funds to require the custodian bank to take possession, to have legally segregated in the Federal Reserve Book Entry System, or to have segregated within the custodian bank's vault, all securities held as collateral under repurchase agreement transactions. Additionally, procedures have been established by the Funds to monitor, on a daily basis, the market value of each repurchase agreement's collateral to ensure that the value of collateral at least equals the repurchase price to be paid under the repurchase agreement.
The Funds will only enter into repurchase agreements with banks and other recognized financial institutions, such as broker/ealers, which are deemed by the Funds' adviser to be creditworthy pursuant to the guidelines and/or standards reviewed or established by the Trustees. The Funds, along with other affiliated investment companies, may utilize a joint trading account for the purpose of entering into one or more repurchase agreements.
Investment Income, Expenses and Distributions--Interest income and expenses are accrued daily. Dividend income and distributions to shareholders are recorded on the ex-dividend date. Non-cash dividends included in dividend income, if any, are recorded at fair value. Investment income, realized and unrealized gains and losses, and certain fund-level expenses are allocated to each class based on relative average daily net assets, except that each class bears certain expenses unique to that class such as distribution and service fees. Dividends are declared separately for each class. No class has preferential dividend rights; differences in per share dividend rates are generally due to differences in separate class expenses.
Premium and Discount Amortization/Paydown Gains and Losses--All premiums and discounts are amortized/accreted for financial statement purposes. Gains and losses realized on principal payment of mortgage-backed securities (paydown gains and losses) are classified as part of investment income.
Federal Taxes--It is the Funds' policy to comply with the Subchapter M provision of the Internal Revenue Code (the "Code") and to distribute to shareholders each year substantially all of their income. Accordingly, no provision for federal tax is necessary.
Withholding taxes on foreign interest, dividends and capital gains has been provided for in accordance with the applicable country's rules and rates.
When-Issued and Delayed Delivery Transactions--The Funds may engage in when-issued or delayed delivery transactions. The Funds record when-issued securities on the trade date and maintain security positions such that sufficient liquid assets will be available to make payment for the securities purchased. Securities purchased on a when-issued or delayed delivery basis are marked to market daily and begin earning interest on the settlement date. Losses may occur on these transactions due to changes in market conditions or the failure of counterparties to perform under the contract.
Use of Estimates--The preparation of financial statements in conformity with GAAP requires management to make estimates and assumptions that affect the amounts of assets, liabilities, expenses and revenues reported in the financial statements. Actual results could differ from those estimated.
Other--Investment transactions are accounted for on a trade date basis. Realized gains and losses from investment transactions are recorded on an identified cost basis.
(3) SHARES OF BENEFICIAL INTEREST
The following tables summarize share activity:
EQUITY AND INCOME FUNDS
|
|
Capital Appreciation Fund |
|||||||
|---|---|---|---|---|---|---|---|---|
|
|
Year Ended |
Year Ended |
||||||
|
Class A Shares |
Shares |
Dollars |
Shares |
Dollars |
||||
|
Shares sold |
1,228,494 |
$ 22,586,640 |
2,107,437 |
$ 34,764,538 |
||||
|
Shares issued to shareholders in payment of distributions declared |
701,667 |
12,314,274 |
20,213 |
326,238 |
||||
|
Shares redeemed |
(2,012,927) |
(37,066,876) |
(2,139,768) |
(35,022,703) |
||||
|
|
|
|
|
|||||
|
Net change resulting from Class A |
(82,766) |
$ (2,165,962) |
(12,118) |
$ 68,073 |
||||
|
|
|
|
|
|||||
|
|
Capital Appreciation Fund |
|||||||
|---|---|---|---|---|---|---|---|---|
|
|
Year Ended |
Year Ended |
||||||
|
Class B Shares |
Shares |
Dollars |
Shares |
Dollars |
||||
|
Shares sold |
49,264 |
$ 864,339 |
71,932 |
$ 1,129,619 |
||||
|
Shares issued to shareholders in payment of distributions declared |
45,927 |
767,442 |
-- |
-- |
||||
|
Shares redeemed |
(102,803) |
(1,811,869) |
(123,930) |
(1,922,961) |
||||
|
|
|
|
|
|||||
|
Net change resulting from Class B |
(7,612) |
$ (180,088) |
(51,998) |
$ (793,342) |
||||
|
|
|
|
|
|||||
|
Net change resulting from Fund |
(90,378) |
$ (2,346,050) |
(64,116) |
$ (725,269) |
||||
|
|
|
|
|
|||||
|
|
Louisiana Municipal Income Fund |
|||||||
|---|---|---|---|---|---|---|---|---|
|
|
Year Ended |
Year Ended |
||||||
|
Class A Shares |
Shares |
Dollars |
Shares |
Dollars |
||||
|
Shares sold |
472,447 |
$ 5,372,221 |
1,030,960 |
$ 11,871,838 |
||||
|
Shares issued to shareholders in payment of distributions declared |
119,837 |
1,361,079 |
148,357 |
1,689,721 |
||||
|
Shares redeemed |
(969,932) |
(10,986,254) |
(1,309,069) |
(14,962,703) |
||||
|
|
|
|
|
|||||
|
Net change resulting from Class A |
(377,648) |
$ (4,252,954) |
(129,752) |
$ (1,401,144) |
||||
|
|
|
|
|
|||||
|
|
Louisiana Municipal Income Fund |
|||||||
|---|---|---|---|---|---|---|---|---|
|
|
Year Ended |
Year Ended |
||||||
|
Class B Shares |
Shares |
Dollars |
Shares |
Dollars |
||||
|
Shares sold |
32,536 |
$ 370,795 |
176,584 |
$ 2,017,028 |
||||
|
Shares issued to shareholders in payment of distributions declared |
8,078 |
91,790 |
9,079 |
103,491 |
||||
|
Shares redeemed |
(94,863) |
(1,071,168) |
(65,233) |
(745,434) |
||||
|
|
|
|
|
|||||
|
Net change resulting from Class B |
(54,249) |
$ (608,583) |
120,430 |
$ 1,375,085 |
||||
|
|
|
|
|
|||||
|
Net change resulting from Fund |
(431,897) |
$ (4,861,537) |
(9,322) |
$ (26,059) |
||||
|
|
|
|
|
|||||
|
|
Mid Cap Equity Fund |
|||||||
|---|---|---|---|---|---|---|---|---|
|
|
Year Ended |
Year Ended |
||||||
|
Class A Shares |
Shares |
Dollars |
Shares |
Dollars |
||||
|
Shares sold |
1,713,132 |
$ 25,142,095 |
1,438,616 |
$ 16,335,457 |
||||
|
Shares issued to shareholders in payment of distributions declared |
22,026 |
300,002 |
-- |
-- |
||||
|
Shares redeemed |
(1,161,466) |
(16,640,166) |
(528,498) |
(6,090,301) |
||||
|
|
|
|
|
|||||
|
Net change resulting from Class A |
573,692 |
$ 8,801,931 |
910,118 |
$ 10,245,156 |
||||
|
|
|
|
|
|||||
|
|
Mid Cap Equity Fund |
|||||||
|---|---|---|---|---|---|---|---|---|
|
|
Year Ended |
Year Ended |
||||||
|
Class B Shares |
Shares |
Dollars |
Shares |
Dollars |
||||
|
Shares sold |
51,655 |
$ 729,197 |
56,823 |
$ 622,627 |
||||
|
Shares issued to shareholders in payment of distributions declared |
1,464 |
19,173 |
-- |
-- |
||||
|
Shares redeemed |
(43,905) |
(595,197) |
(62,151) |
(669,102) |
||||
|
|
|
|
|
|||||
|
Net change resulting from Class B |
9,214 |
$ (153,173) |
(5,328) |
$ (46,475) |
||||
|
|
|
|
|
|||||
|
Net change resulting from Fund |
582,906 |
$ 8,955,104 |
904,790 |
$ 10,198,681 |
||||
|
|
|
|
|
|||||
|
|
Total Return Bond Fund |
|||||||
|---|---|---|---|---|---|---|---|---|
|
|
Year Ended |
Year Ended |
||||||
|
|
Shares |
Dollars |
Shares |
Dollars |
||||
|
Shares sold |
1,051,018 |
$ 10,422,642 |
716,373 |
$ 7,285,506 |
||||
|
Shares issued to shareholders in payment of distributions declared |
200,348 |
1,991,623 |
205,542 |
2,089,993 |
||||
|
Shares redeemed |
(863,084) |
(8,541,313) |
(727,008) |
(7,417,882) |
||||
|
|
|
|
|
|||||
|
Net change resulting from Fund |
388,282 |
$ 3,872,952 |
194,907 |
$ 1,957,617 |
||||
|
|
|
|
|
|||||
|
|
U.S. Government Income Fund |
|||||||
|---|---|---|---|---|---|---|---|---|
|
|
Year Ended |
Year Ended |
||||||
|
|
Shares |
Dollars |
Shares |
Dollars |
||||
|
Shares sold |
950,641 |
$ 9,788,237 |
1,544,848 |
$ 16,253,444 |
||||
|
Shares issued to shareholders in payment of distributions declared |
104,299 |
1,076,052 |
126,328 |
1,324,332 |
||||
|
Shares redeemed |
(1,765,729) |
(18,208,485) |
(1,092,294) |
(11,484,124) |
||||
|
|
|
|
|
|||||
|
Net change resulting from Fund |
(710,789) |
$ (7,344,196) |
578,882 |
$ 6,093,652 |
||||
|
|
|
|
|
|||||
MONEY MARKET FUNDS
|
|
Cash Reserve Fund |
|||||||
|---|---|---|---|---|---|---|---|---|
|
|
Year Ended |
Year Ended |
||||||
|
Class A Shares |
Shares |
Dollars |
Shares |
Dollars |
||||
|
Shares sold |
287,007,608 |
$ 287,007,608 |
327,318,475 |
$ 327,318,475 |
||||
|
Shares issued to shareholders in payment of distributions declared |
368,094 |
368,094 |
595,940 |
595,940 |
||||
|
Shares redeemed |
(303,334,896) |
(303,334,896) |
(357,650,686) |
(357,650,686) |
||||
|
|
|
|
|
|||||
|
Net change resulting from Class A |
(15,959,194) |
$ (15,959,194) |
(29,736,271) |
$ (29,736,271) |
||||
|
|
|
|
|
|||||
|
|
Cash Reserve Fund |
|||||||
|---|---|---|---|---|---|---|---|---|
|
|
Year Ended |
Year Ended |
||||||
|
Class B Shares |
Shares |
Dollars |
Shares |
Dollars |
||||
|
Shares sold |
127,637 |
$ 127,637 |
271,566 |
$ 271,566 |
||||
|
Shares issued to shareholders in payment of distributions declared |
1,965 |
1,965 |
3,978 |
3,978 |
||||
|
Shares redeemed |
(389,523) |
(389,523) |
(293,228) |
(293,228) |
||||
|
|
|
|
|
|||||
|
Net change resulting from Class B |
(259,921) |
$ (259,921) |
(17,684) |
$ (17,684) |
||||
|
|
|
|
|
|||||
|
Net change resulting from Fund |
(16,219,115) |
$ (16,219,115) |
(29,753,955) |
$ (29,753,955) |
||||
|
|
|
|
|
|||||
|
|
U.S. Treasury Money Market Fund |
|||||||
|---|---|---|---|---|---|---|---|---|
|
|
Year Ended |
Year Ended |
||||||
|
|
Shares |
Dollars |
Shares |
Dollars |
||||
|
Shares sold |
1,909,988,046 |
$ 1,909,988,046 |
720,769,448 |
$ 720,769,448 |
||||
|
Shares issued to shareholders in payment of distributions declared |
134,843 |
134,843 |
306,250 |
306,250 |
||||
|
Shares redeemed |
(1,979,193,244) |
(1,979,193,244) |
(693,275,644) |
(693,275,644) |
||||
|
|
|
|
|
|||||
|
Net change resulting from Fund |
(69,070,355) |
$ (69,070,355) |
27,800,054 |
$ 27,800,054 |
||||
|
|
|
|
|
|||||
(4) FEDERAL TAX INFORMATION
The timing and character of income and capital gain distributions are determined in accordance with income tax regulations, which may differ from GAAP. These differences are due in part to differing treatments for dividend redesignations, net operating losses, expiration of capital loss carryforwards, and discount accretion/premium amortization on debt securities.
For the year ended August 31, 2004, permanent differences identified and reclassified
among the components of net assets were
as follows:
|
Fund |
Paid-In |
Undistributed |
Accumulated |
|||
|---|---|---|---|---|---|---|
|
Louisiana Municipal Income Fund |
$ -- |
$ 6,260 |
$ (6,260) |
|||
|
Mid Cap Equity Fund |
(130,128) |
130,128 |
-- |
|||
|
Total Return Bond Fund |
-- |
273,328 |
(273,328) |
|||
|
U.S. Government Income Fund |
(1,298,006) |
453,358 |
844,648 |
Net investment income, net realized gains (losses), and net assets were not affected by this reclassification.
The tax character of distributions as reported on the Statements of Changes in Net Assets for the years ended August 31, 2004 and 2003 were as follows:
|
|
2004 |
2003 |
||||||||||
|---|---|---|---|---|---|---|---|---|---|---|---|---|
|
Fund |
Tax-Exempt |
Ordinary |
Long-Term |
Tax-Exempt |
Ordinary |
Long-Term |
||||||
|
Capital Appreciation Fund |
$ -- |
$ 1,349,529 |
$ 15,321,751 |
$ -- |
$ 881,464 |
$ -- |
||||||
|
Louisiana Municipal Income Fund |
3,509,984 |
165 |
211,682 |
3,827,233 |
265 |
540,099 |
||||||
|
Mid Cap Equity Fund |
-- |
-- |
335,862 |
-- |
-- |
-- |
||||||
|
Total Return Bond Fund |
-- |
2,352,147 |
-- |
-- |
2,404,027 |
-- |
||||||
|
U.S. Government Income Fund |
-- |
3,483,285 |
-- |
-- |
4,153,568 |
-- |
||||||
|
Cash Reserve Fund |
-- |
938,533 |
-- |
-- |
1,663,528 |
-- |
||||||
|
U.S. Treasury Money Market Fund |
-- |
570,153 |
-- |
-- |
1,173,759 |
-- |
||||||
* For tax purposes short-term capital gain distributions are considered ordinary income.
As of August 31, 2004, the components of distributable earnings on a tax basis were as follows:
|
Fund |
Undistributed |
Undistributed |
Undistributed |
Net |
Capital Loss |
|||||
|---|---|---|---|---|---|---|---|---|---|---|
|
Capital Appreciation Fund |
$ -- |
$ 333,043 |
$ 7,814,892 |
$ 74,184,475 |
$ -- |
|||||
|
Louisiana Municipal Income Fund |
294,589 |
461 |
103,889 |
5,569,538 |
-- |
|||||
|
Mid Cap Equity Fund |
-- |
-- |
4,193,763 |
9,609,322 |
-- |
|||||
|
Total Return Bond Fund |
-- |
238,392 |
-- |
1,738,648 |
2,178,973 |
|||||
|
U.S. Government Income Fund |
-- |
537,375 |
-- |
2,890,913 |
1,436,394 |
|||||
|
Cash Reserve Fund |
-- |
72,778 |
-- |
-- |
48,629 |
|||||
|
U.S. Treasury Money Market Fund |
-- |
63,572 |
-- |
-- |
-- |
For federal income tax purposes, the following amounts apply as of August 31, 2004:
|
Fund |
Cost of |
Unrealized |
Unrealized |
Net Unrealized |
||||
|---|---|---|---|---|---|---|---|---|
|
Capital Appreciation Fund |
$ 177,176,354 |
$ 77,831,193 |
$ (3,646,718) |
$ 74,184,475 |
||||
|
Louisiana Municipal Income Fund |
75,350,562 |
5,575,724 |
(6,186) |
5,569,538 |
||||
|
Mid Cap Equity Fund |
69,449,876 |
12,199,255 |
(2,589,933) |
9,609,322 |
||||
|
Total Return Bond Fund |
49,831,215 |
2,220,891 |
(482,243) |
1,738,648 |
||||
|
U.S. Government Income Fund |
78,833,200 |
3,293,658 |
(402,745) |
2,890,913 |
||||
|
Cash Reserve Fund |
168,088,955 |
-- |
-- |
-- |
||||
|
U.S. Treasury Money Market Fund |
152,329,906 |
-- |
-- |
-- |
* At amortized cost.
The difference between book-basis and tax-basis unrealized appreciation/depreciation is due in part to differing treatments for tax deferral of losses on wash sales and accretion/premium amortization of debt securities.
At August 31, 2004, Total Return Bond Fund, U.S. Government Income Fund and Cash Reserve Fund had capital loss carryforwards, as noted below, which will reduce the Fund's taxable income arising from future net realized gain on investments, if any, to the extent permitted by the Code, and thus will reduce the amount of the distributions to shareholders which would otherwise be necessary to relieve the Fund of any liability for federal tax. Pursuant to the Code, such capital loss carryforwards will expire as follows:
|
|
Expiration Year |
|
||||||||||||
|---|---|---|---|---|---|---|---|---|---|---|---|---|---|---|
|
Fund |
2005 |
2008 |
2009 |
2010 |
2011 |
2012 |
Total |
|||||||
|
Total Return Bond Fund |
$ -- |
$ -- |
$ 100,003 |
$ 152,412 |
$ 1,926,558 |
$ -- |
$ 2,178,973 |
|||||||
|
U.S. Government Income Fund |
553,828 |
77,409 |
402,687 |
99,291 |
122,693 |
180,486 |
1,436,394 |
|||||||
|
Cash Reserve Fund |
-- |
-- |
-- |
931 |
44,663 |
3,035 |
48,629 |
|||||||
Under current tax regulations, capital losses realized after October 31 may be deferred and treated as occurring on the first day of the following fiscal year. As of August 31, 2004, for federal income tax purposes, the U.S. Government Income Fund had post October losses of $347,576 which were deferred to September 1, 2004.
(5) INVESTMENT ADVISER FEE AND OTHER TRANSACTIONS WITH AFFILIATES
Investment Adviser Fee--Hibernia Asset Management, a separately identifiable division of Hibernia National Bank, the Funds' investment adviser (the "Adviser") receives for its services an annual investment adviser fee based on a percentage of each Fund's average daily net assets as follows:
|
Fund |
Annual |
|
|---|---|---|
|
Capital Appreciation Fund |
0.75% |
|
|
Louisiana Municipal Income Fund |
0.45% |
|
|
Mid Cap Equity Fund |
0.75% |
|
|
Total Return Bond Fund |
0.70% |
|
|
U.S. Government Income Fund |
0.45% |
|
|
Cash Reserve Fund |
0.40% |
|
|
U.S. Treasury Money Market Fund |
0.40% |
The Adviser may voluntarily choose to waive any portion of its fee. The Adviser can modify or terminate this voluntary waiver at any time at its sole discretion.
Administrative Fee--Federated Administrative Services ("FAS") provides the Funds with certain administrative personnel and services. The fee paid to FAS is based on the level of average aggregate daily net assets of the Trust for the reporting period. FAS may voluntarily choose to waive any portion of its fee. FAS can modify or terminate this voluntary waiver at any time at its sole discretion.
|
Maximum |
Average Aggregate Daily Net Assets of |
|
|
0.150% |
on the first $250 million |
|
|
0.125% |
on the next $250 million |
|
|
0.100% |
on the next $250 million |
|
|
0.075% |
on assets in excess of $750 million |
Distribution Services Fee--The Funds have adopted a Distribution Plan (the "Plan") pursuant to Rule 12b-1 under the Act. Under the terms of the Plan, the Funds will reimburse Edgewood Services, Inc. ("Edgewood"), the distributor, from the net assets of the Funds to finance activities intended to result in the sale of each Fund's shares. The Plan provides that the Funds, except for Class B Shares of the Capital Appreciation Fund, Louisiana Municipal Income Fund, Mid Cap Equity Fund and Cash Reserve Fund, may incur distribution expenses up to 0.25% of the average daily net assets of the Funds, annually, to reimburse Edgewood. Class B Shares of the Capital Appreciation Fund, Louisiana Municipal Income Fund, Mid Cap Equity Fund and Cash Reserve Fund may incur distribution expenses of up to 0.75% of average daily net assets of the Class B Shares, annually, to reimburse Edgewood. Edgewood may voluntarily choose to waive any portion of its fee. Edgewood can modify or terminate this voluntary waiver at any time at its sole discretion. For the year ended August 31, 2004, the U.S. Treasury Money Market Fund did not incur distribution services fees.
Sales Charges--For the year ended August 31, 2004, Edgewood did not retain sales charges from the sale of Class A shares.
See "What Do Shares Cost?" in the Prospectus.
Shareholder Services Fee--Under the terms of a Shareholder Services Agreement with Federated Shareholder Services Company ("FSSC"), Class B Shares of Capital Appreciation Fund, Louisiana Municipal Income Fund, Mid Cap Equity Fund and Cash Reserve Fund will pay FSSC up to 0.25% of their average daily net assets for the reporting period. The fee paid to FSSC is used to finance certain services for shareholders and to maintain shareholder accounts. FSSC may voluntarily choose to waive any portion of its fee. FSSC can modify or terminate this voluntary waiver at any time at its sole discretion.
Transfer and Dividend Disbursing Agent Fees and Expenses--Prior to July 1, 2004, Federated Services Company ("FServ"), through its subsidiary, FSSC served as transfer and dividend disbursing agent for the Funds. The fee paid to FSSC was based on the size, type and number of accounts and transactions made by shareholders. The fee paid to FSSC during the reporting period, after voluntary waiver, if applicable, was as follows:
|
Fund |
FSSC |
|
|---|---|---|
|
Capital Appreciation Fund |
$ 75,123 |
|
|
Louisiana Municipal Income Fund |
$ 43,717 |
|
|
Mid Cap Equity Fund |
$ 61,141 |
|
|
Total Return Bond Fund |
$ 38,428 |
|
|
U.S. Government Income Fund |
$ 27,812 |
|
|
Cash Reserve Fund |
$ 91,465 |
|
|
U.S. Treasury Money Market Fund |
$ 49,061 |
Portfolio Accounting Fees--FServ maintains the Funds' accounting records for which it receives a fee. The fee is based on the level of each Fund's average daily net assets for the reporting period, plus out-of-pocket expenses. FServ may voluntarily choose to waive any portion of its fee. FServ can modify or terminate this voluntary waiver at any time at its sole discretion.
Custodian Fees--Hibernia National Bank is the Funds' custodian for which it receives a fee. The fee is based on the level of each Fund's average daily net assets for the reporting period, plus out-of-pocket expenses.
Other Affiliated Parties and Transactions--Pursuant to an exemptive order issued by the Securities and Exchange Commission, the Funds may invest in certain affiliated money market funds which are distributed by an affiliate of Edgewood, the Funds' distributor. Income distributions earned by the Fund are recorded as income in the accompanying financial statements as follows:
|
Fund |
Affiliated |
Income from |
||
|
Louisiana Municipal Income Fund |
Tax-Free Obligations Fund |
$8,446 |
General--Certain of the Officers and Trustees of the Trust are Officers and Directors or Trustees of the above companies.
(6) INVESTMENT TRANSACTIONS
Purchases and sales of investments, excluding long-term U.S. government securities and short-term obligations (and in-kind contributions), for the year ended August 31, 2004 were as follows:
|
Fund |
Purchases |
Sales |
||
|---|---|---|---|---|
|
Capital Appreciation Fund |
$ 56,742,239 |
$ 71,204,834 |
||
|
Louisiana Municipal Income Fund |
9,024,819 |
13,308,834 |
||
|
Mid Cap Equity Fund |
47,694,484 |
35,713,596 |
||
|
Total Return Bond Fund |
2,556,969 |
8,026,119 |
||
|
U.S. Government Income Fund |
1,027,869 |
13,374,425 |
(7) CONCENTRATION OF CREDIT RISK
Since Louisiana Municipal Income Fund invests a substantial portion of its assets in issuers located in one state, it will be more susceptible to factors adversely affecting issuers of that state than would be a comparable tax-exempt mutual fund that invests nationally. In order to reduce the credit risk associated with such factors, at August 31, 2004, 80.5% of the securities in the portfolio of investments were backed by letters of credit or bond insurance of various financial institutions and financial guaranty assurance agencies. The largest percentage of investments insured by or supported (backed) by a letter of credit from any one institution or agency was 24.6% of total investments.
(8) FEDERAL TAX INFORMATION (UNAUDITED)
For the year ended August 31, 2004, the amount of long-term capital gain designated by the Funds was as follows:
|
Fund Name |
|
|
|---|---|---|
|
Capital Appreciation Fund |
$ 15,321,751 |
|
|
Louisiana Municipal Income Fund |
$ 211,682 |
|
|
Mid Cap Equity Fund |
$ 335,862 |
Of the ordinary income (including short-term capital gain) distributions made by the Funds during the year ended August 31, 2004, the following percentages qualify for the dividend received deduction available to corporate shareholders:
|
Fund Name |
|
|
|---|---|---|
|
Capital Appreciation Fund |
94.33% |
For the fiscal year ended August 31, 2004, the following percentages of total ordinary dividends paid by the Funds are qualifying dividends which may be subject to a maximum tax rate of 15% as provided for by the Jobs and Growth Tax Relief Act of 2003. Complete information is reported in conjunction with the reporting of your distributions on Form 1099-DIV. The percentages were as follows:
|
Fund Name |
|
|
|---|---|---|
|
Capital Appreciation Fund |
100.00% |
At August 31, 2004, the following percentages present the portion of distributions from net investment income which are exempt from federal income tax, other than alternative minimum tax:
|
Fund Name |
|
|
|---|---|---|
|
Louisiana Municipal Income Fund |
100.00% |
Report of Ernst & Young LLP, Independent Registered Public Accountants
To the Shareholders and Board of Trustees of
Hibernia Funds
We have audited the accompanying statements of assets and liabilities, including the portfolios of investments, of Hibernia Capital Appreciation Fund, Hibernia Louisiana Municipal Income Fund, Hibernia Mid Cap Equity Fund, Hibernia Total Return Bond Fund, Hibernia U.S. Government Income Fund, Hibernia Cash Reserve Fund and Hibernia U.S. Treasury Money Market Fund (the seven portfolios constituting the Hibernia Funds) (the "Trust") as of August 31, 2004, and the related statements of operations for the year then ended, the statements of changes in net assets for each of the two years in the period then ended, and the financial highlights for each of the periods indicated therein. These financial statements and financial highlights are the responsibility of the Trust's management. Our responsibility is to express an opinion on these financial statements and financial highlights based on our audits.
We conducted our audits in accordance with the standards of the Public Company Accounting Oversight Board (United States). Those standards require that we plan and perform the audit to obtain reasonable assurance about whether the financial statements and financial highlights are free of material misstatement. An audit includes examining, on a test basis, evidence supporting the amounts and disclosures in the financial statements. Our procedures included confirmation of securities owned as of August 31, 2004, by correspondence with the custodian and brokers, or by other appropriate auditing procedures where replies from brokers were not received. An audit also includes assessing the accounting principles used and significant estimates made by management, as well as evaluating the overall financial statement presentation. We believe that our audits provide a reasonable basis for our opinion.
In our opinion, the financial statements and financial highlights referred to above present fairly, in all material respects, the financial position of each of the respective portfolios constituting the Hibernia Funds at August 31, 2004, the results of their operations for the year then ended, the changes in their net assets for each of the two years in the period then ended, and the financial highlights for each of the periods indicated therein, in conformity with U.S. generally accepted accounting principles.
/s/ Ernst & Young LLP
Boston, Massachusetts
October 8, 2004
Board of Trustees and Trust Officers
The following tables give information about each Board member and the senior officers of the Funds. The tables separately list Board members who are "interested persons" of the Fund (i.e., "Interested" Board members) and those who are not (i.e., "Independent" Board members). The Hibernia Fund Complex consists of seven investment company portfolios. Unless otherwise noted, each Officer is elected annually. Unless otherwise noted, each Board member oversees all portfolios in the Hibernia Fund Complex and serves for an indefinite term. The Funds' Statement of Additional Information includes additional information about the Funds Trustees and is available, without charge and upon request, by calling 1-800-999-0426.
INTERESTED TRUSTEES BACKGROUND
|
Name |
Principal Occupation(s) for Past Five Years, Other Directorships Held and Previous Position(s) |
|
|---|---|---|
|
Edward C. Gonzales* |
Principal Occupation: Employee, Federated Investors, Inc. Previous Positions: President, Executive Vice President and Treasurer
of some of the Funds in the |
* Mr. Gonzales is deemed an interested Trustee due to the positions that he holds with Federated Investors, Inc., the parent company of the Funds' distributor.
INDEPENDENT TRUSTEES BACKGROUND
|
Name |
Principal Occupation(s) for Past Five Years, Other Directorships Held and Previous Position(s) |
|
|---|---|---|
|
Arthur Rhew Dooley, Jr. |
Principal Occupation: Chairman, Dooley Tackaberry, Inc. (distributors
and fabricators of fire Other Directorships Held: Director, Loop Cold Storage Company; UTM.D. Anderson Cancer Center Board of Visitors. |
|
|
Teri G. Fontenot |
Principal Occupation: President and Chief Executive Officer of Woman's Hospital, Baton Rouge, LA. Other Directorships Held: Immediate Past Chair of Louisiana Hospital
Association; Federal Reserve |
Board of Trustees and Trust Officers
INDEPENDENT TRUSTEES BACKGROUND (CONT.)
|
Name |
Principal Occupation(s) for Past Five Years, Other Directorships Held and Previous Position(s) |
|
|---|---|---|
|
Joe N. Averett, Jr. |
Principal Occupation: Retired. Other Directorships Held: Sci-Port Discovery Center, Immediate
Past Chair and Current Director; |
|
|
Ernest E. Howard, III |
Principal Occupation: Retired. Previous Positions: President and Chief Executive Officer of
FM Properties, predecessor to |
OFFICERS
|
Name |
Principal Occupation(s) for Past Five Years and Previous Position(s) |
|
|---|---|---|
|
Charles L. Davis, Jr. |
Principal Occupations: Vice President, Managing Director of Mutual
Fund Previous Positions: President, Federated Clearing Services and
Director; Business |
|
|
Donald P. Lee |
Principal Occupation: Director, Private Client Group Risk Management, Hibernia National Bank. Previous Positions: Corporate Counsel, Hibernia National Bank
2002 - 2003; General Counsel and |
|
|
Richard J. Thomas |
Principal Occupations: Principal Financial Officer and Treasurer
of the Federated Investors Fund Previous Positions: Vice President, Federated Administrative
Services; held various management |
|
|
Timothy S. Johnson |
Principal Occupation: Counsel, Reed Smith LLP. Previous Positions: Vice President and Corporate Counsel, Federated
Services Company; Secretary, |
Mutual funds are not bank deposits, or obligations, are not guaranteed by any bank, and are not insured or guaranteed by the U.S. government, the Federal Deposit Insurance Corporation, the Federal Reserve Board, or any other government agency. Investment in mutual funds involves investment risk, including the possible loss of principal. An investment in Hibernia Cash Reserve Fund and Hibernia U.S. Treasury Money Market Fund is neither insured nor guaranteed by the Federal Deposit Insurance Corporation or any other government agency. Although the Money Market Funds seek to preserve the value of your investment at $1.00 per share, it is possible to lose money by investing in these Funds.
This report is authorized for distribution to prospective investors only when preceded or accompanied by the Funds' prospectus, which contains facts concerning their objectives and policies, management fees, expenses and other information.
VOTING PROXIES ON FUND PORTFOLIO SECURITIES
A description of the policies and procedures that the Funds use to determine how to vote proxies relating to securities held in the Fund's portfolio is available, without change and upon request, by calling 1-800-562-9007 Ext. 3-3326. A report of how the Funds voted any such proxies during the most recent 12-month period ended June 30 is available through the Hibernia Funds website. Go to http://www.Hiberniafunds.com; select Proxy Voting Record; then select a Fund. This report on "Form N-PX" is also available from the EDGAR database on the SEC's Internet site at http://www.sec.gov.
QUARTERLY PORTFOLIO SCHEDULE
The Fund files with the SEC a complete schedule of its portfolio holdings, as of the close of the first and third quarters of its fiscal year, on "Form N-Q." These filings are available on the SEC's website at http://www.sec.gov; and may be reviewed and copied at the SEC's Public Reference Room in Washington, DC. (Call 1-800-SEC-0330 for information on the operation of the Public Reference Room).
Edgewood Services, Inc., Distributor of the Funds
G01262-01 (10/04)
Item 2.     Code of Ethics

(a) As of the end of the period covered by this report, the registrant has
adopted a code of ethics (the "Section 406 Standards for Investment Companies
- Ethical Standards for Principal Executive and Financial Officers") that
applies to the registrant's Principal Executive Officer and Principal
Financial Officer; the registrant's Principal Financial Officer also serves
as the Principal Accounting Officer.

(c) Not Applicable

(d) Not Applicable

(e) Not Applicable

(f)(3) The registrant hereby undertakes to provide any person, without charge,
upon request, a copy of the code of ethics.  To request a copy of the code of
ethics, contact the registrant at 1-800-999-0426, and ask for a copy of the
Section 406 Standards for Investment Companies - Ethical Standards for
Principal Executive and Financial Officers.


Item 3.     Audit Committee Financial Expert

The registrant's Board has determined that each member of the Board's Audit
Committee is an "audit committee financial expert," and that each such member
is "independent," for purposes of this Item.  The Audit Committee consists of
the following Board members:  Joe N. Averett, Jr., Arthur Rhew Dooley, Jr.,
Teri G. Fontenot, and Ernest E. Howard III.


Item 4.     Principal Accountant Fees and Services

            (a)   Audit Fees billed to the registrant for the two most recent
fiscal years:

                  Fiscal year ended 2004 - $132,000

                  Fiscal year ended 2003 - $126,000


(b)         Audit-Related Fees billed to the registrant for the two most
recent fiscal years:

                  Fiscal year ended 2004 - $0

                  Fiscal year ended 2003 - $0

      Amount requiring approval of the registrant's audit committee pursuant
      to paragraph (c)(7)(ii) of Rule 2-01 of Regulation S-X, $0 and $0
      respectively.


(c)          Tax Fees billed to the registrant for the two most recent fiscal
years:

                  Fiscal year ended 2004 - $0

                  Fiscal year ended 2003 - $0

      Amount requiring approval of the registrant's audit committee pursuant
      to paragraph (c)(7)(ii) of Rule 2-01 of Regulation S-X, $0 and $0
      respectively.


(d)         All Other Fees billed to the registrant for the two most recent
fiscal years:

                  Fiscal year ended 2004 - $0

                  Fiscal year ended 2003 - $0

      Amount requiring approval of the registrant's audit committee pursuant
      to paragraph (c)(7)(ii) of Rule 2-01 of Regulation S-X, $0 and $0
      respectively.


(e)(1)      Audit Committee Policies regarding Pre-approval of Services.

            The Audit Committee is required to pre-approve audit and
non-audit services performed by the independent auditor in order to assure
that the provision of such services do not impair the auditor's
independence.  Unless a type of service to be provided by the independent
auditor has received general pre-approval, it will require specific
pre-approval by the Audit Committee.  Any proposed services exceeding
pre-approved cost levels will require specific pre-approval by the Audit
Committee.

            Certain services have the general pre-approval of the Audit
Committee.  The term of the general pre-approval is 12 months from the date
of pre-approval, unless the Audit Committee specifically provides for a
different period.  The Audit Committee will annually review the services that
may be provided by the independent auditor without obtaining specific
pre-approval from the Audit Committee and may grant general pre-approval for
such services.  The Audit Committee will revise the list of general
pre-approved services from time to time, based on subsequent determinations.
The Audit Committee will not delegate its responsibilities to pre-approve
services performed by the independent auditor to management.

            The Audit Committee has delegated pre-approval authority to its
Chairman.  The Chairman will report any pre-approval decisions to the Audit
Committee at its next scheduled meeting.  The Committee will designate
another member with such pre-approval authority when the Chairman is
unavailable.


AUDIT SERVICES

      The annual Audit services engagement terms and fees will be subject to
the specific pre-approval of the Audit Committee.  The Audit Committee must
approve any changes in terms, conditions and fees resulting from changes in
audit scope, registered investment company (RIC) structure or other matters.

      In addition to the annual Audit services engagement specifically
approved by the Audit Committee, the Audit Committee may grant general
pre-approval for other Audit Services, which are those services that only the
independent auditor reasonably can provide.  The Audit Committee has
pre-approved certain Audit services, all other Audit services must be
specifically pre-approved by the Audit Committee.


AUDIT-RELATED SERVICES

      Audit-related services are assurance and related services that are
reasonably related to the performance of the audit or review of the Company's
financial statements or that are traditionally performed by the independent
auditor.  The Audit Committee believes that the provision of Audit-related
services does not impair the independence of the auditor, and has
pre-approved certain Audit-related services, all other Audit-related services
must be specifically pre-approved by the Audit Committee.


TAX SERVICES

      The Audit Committee believes that the independent auditor can provide
Tax services to the Company such as tax compliance, tax planning and tax
advice without impairing the auditor's independence.  However, the Audit
Committee will not permit the retention of the independent auditor in
connection with a transaction initially recommended by the independent
auditor, the purpose of which may be tax avoidance and the tax treatment of
which may not be supported in the Internal Revenue Code and related
regulations.  The Audit Committee has pre-approved certain Tax services, all
Tax services involving large and complex transactions must be specifically
pre-approved by the Audit Committee.


ALL OTHER SERVICES

      With respect to the provision of services other than audit, review or
attest services the pre-approval requirement is waived if:


(1)  The aggregate amount of all such services provided constitutes no more than
     five percent of the total amount of revenues  paid by the  registrant,  the
     registrant's adviser (not including any sub-adviser whose role is primarily
     portfolio  management  and is  subcontracted  with or  overseen  by another
     investment  adviser),  and any entity controlling,  controlled by, or under
     common control with the investment  adviser that provides  ongoing services
     to the  registrant  to its  accountant  during the fiscal year in which the
     services are provided;

(2)  Such  services  were not  recognized by the  registrant,  the  registrant's
     adviser (not including any  sub-adviser  whose role is primarily  portfolio
     management  and is  subcontracted  with or overseen  by another  investment
     adviser),  and any  entity  controlling,  controlled  by,  or under  common
     control with the investment  adviser that provides  ongoing services to the
     registrant at the time of the engagement to be non-audit services; and

(3)  Such services are promptly  brought to the attention of the Audit Committee
     of the  issuer and  approved  prior to the  completion  of the audit by the
     Audit  Committee or by one or more members of the Audit  Committee  who are
     members of the board of directors to whom authority to grant such approvals
     has been delegated by the Audit Committee.


      The Audit Committee may grant general pre-approval to those permissible
non-audit services classified as All Other services that it believes are
routine and recurring services, and would not impair the independence of the
auditor.


      The SEC's rules and relevant guidance should be consulted to determine
the precise definitions of prohibited non-audit services and the
applicability of exceptions to certain of the prohibitions.


PRE-APPROVAL FEE LEVELS

      Pre-approval fee levels for all services to be provided by the
independent auditor will be established annually by the Audit Committee.  Any
proposed services exceeding these levels will require specific pre-approval
by the Audit Committee.


PROCEDURES

      Requests or applications to provide services that require specific
approval by the Audit Committee will be submitted to the Audit Committee by
both the independent auditor and the Principal Accounting Officer and/or
Internal Auditor, and must include a joint statement as to whether, in their
view, the request or application is consistent with the SEC's rules on
auditor independence.


(e)(2)      Percentage of services identified in items 4(b) through 4(d) that
were approved by the registrants audit committee pursuant to paragraph
(c)(7)(i)(C) of Rule 2-01 of Regulation S-X:

                  4(b)

                  Fiscal year ended 2004 - 0%

                  Fiscal year ended 2003 - 0%

            Percentage of services provided to the registrants investment
            adviser and any entity controlling, controlled by, or under
            common control with the investment adviser that provides ongoing
            services to the registrant that were approved by the registrants
            audit committee pursuant to paragraph (c)(7)(i)(C) of Rule 2-01
            of Regulation S-X, 0% and 0% respectively.


            4(c)

            Fiscal year ended 2004 - 0%

                  Fiscal year ended 2003 - 0%

            Percentage of services provided to the registrants investment
            adviser and any entity controlling, controlled by, or under
            common control with the investment adviser that provides ongoing
            services to the registrant that were approved by the registrants
            audit committee pursuant to paragraph (c)(7)(i)(C) of Rule 2-01
            of Regulation S-X, 0% and 0% respectively.


            4(d)

            Fiscal year ended 2004 - 0%

                  Fiscal year ended 2003 - 0%

            Percentage of services provided to the registrants investment
            adviser and any entity controlling, controlled by, or under
            common control with the investment adviser that provides ongoing
            services to the registrant that were approved by the registrants
            audit committee pursuant to paragraph (c)(7)(i)(C) of Rule 2-01
            of Regulation S-X, 0% and 0% respectively.


(f)   NA


(g)   Non-Audit Fees billed to the registrant, the registrant's investment
      adviser, and certain entities controlling, controlled by or under
      common control with the investment adviser:
                  Fiscal year ended 2004 - $0

                  Fiscal year ended 2003 - $0


(h)         The registrant's Audit Committee has considered that the
provision of non-audit services that were rendered to the registrant's
adviser (not including any sub-adviser whose role is primarily portfolio
management and is subcontracted with or overseen by another investment
adviser), and any entity controlling, controlled by, or under common control
with the investment adviser that provides ongoing services to the registrant
that were not pre-approved pursuant to paragraph (c)(7)(ii) of Rule 2-01 of
Regulation S-X is compatible with maintaining the principal accountant's
independence.

Item 5.     Audit Committee of Listed Registrants

            Not Applicable

Item 6.     Schedule of Investments

            Not Applicable

Item 7.     Disclosure of Proxy Voting Policies and Procedures for Closed-End
            Management Investment Companies

            Not Applicable

Item 8.     Portfolio Managers of Closed-End Management Investment Companies

            Not Applicable


Item 9.     Purchases of Equity Securities by Closed-End Management
            Investment Company and Affiliated Purchasers

            Not Applicable

Item 10.     Submission of Matters to a Vote of Security Holders

            Not Applicable

Item 11.    Controls and Procedures

(a) The registrant's President and Treasurer have concluded that the
registrant's disclosure controls and procedures (as defined in rule 30a-3(c)
under the Act) are effective in design and operation and are sufficient to
form the basis of the certifications required by Rule 30a-(2) under the Act,
based on their evaluation of these disclosure controls and procedures within
90 days of the filing date of this report on Form N-CSR.

(b) There were no changes in the registrant's internal control over financial
reporting (as defined in rule 30a-3(d) under the Act) during the last fiscal
quarter that have materially affected, or are reasonably likely to materially
affect, the registrant's internal control over financial reporting.

Item 12.    Exhibits


SIGNATURES

Pursuant to the requirements of the Securities Exchange Act of 1934 and the
Investment Company Act of 1940, the registrant has duly caused this report to
be signed on its behalf by the undersigned, thereunto duly authorized.

Registrant  Hibernia Funds


By          /s/Richard N. Paddock
            Richard N. Paddock
            Richard N. Paddock, Principal Financial Officer

Date        March 1, 2006


Pursuant to the requirements of the Securities Exchange Act of 1934 and the
Investment Company Act of 1940, this report has been signed below by the
following persons on behalf of the registrant and in the capacities and on
the dates indicated.


By          /s/Charles L. Davis
            Charles L. Davis, Jr.
            Charles L. Davis, Jr., Principal Executive Officer

Date        March 1, 2006


By          /s/Richard N. Paddock
            Richard N. Paddock
            Richard N. Paddock, Principal Financial Officer

Date        March 1, 2006