2Q 2013 Exhibit 99.1

|
| | | | | |
333 North Central Avenue Phoenix, AZ 85004 | Financial Contacts: | | | | Media Contact: |
| Kathleen L. Quirk (602) 366-8016 | | David P. Joint (504) 582-4203 | | Eric E. Kinneberg (602) 366-7994 |
Freeport-McMoRan Copper & Gold Inc.
Reports Second-Quarter and Six-Month 2013 Results
| |
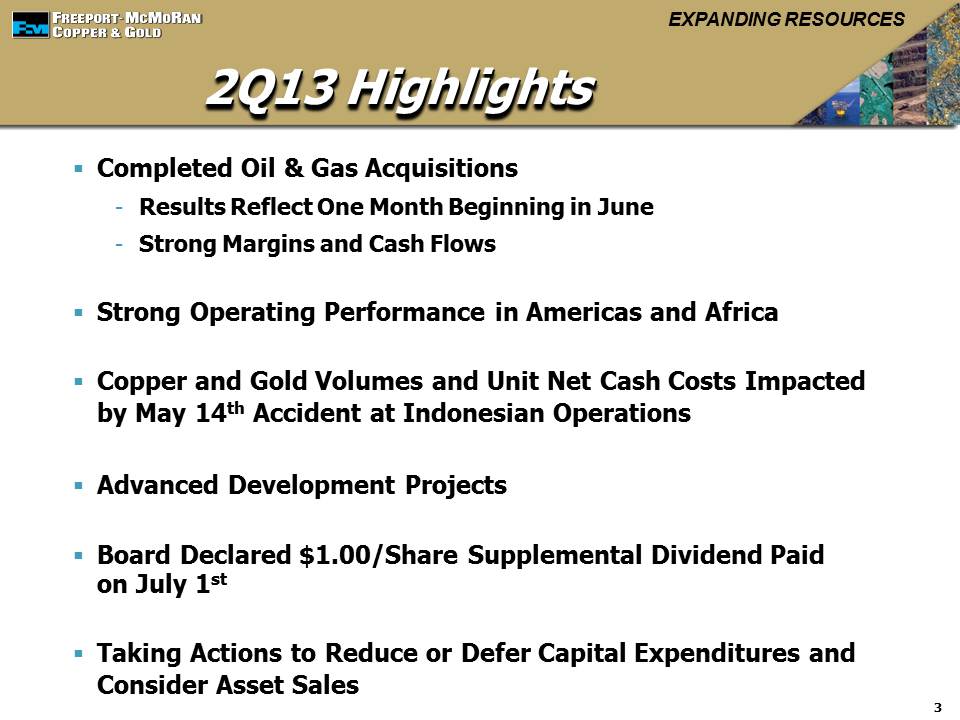
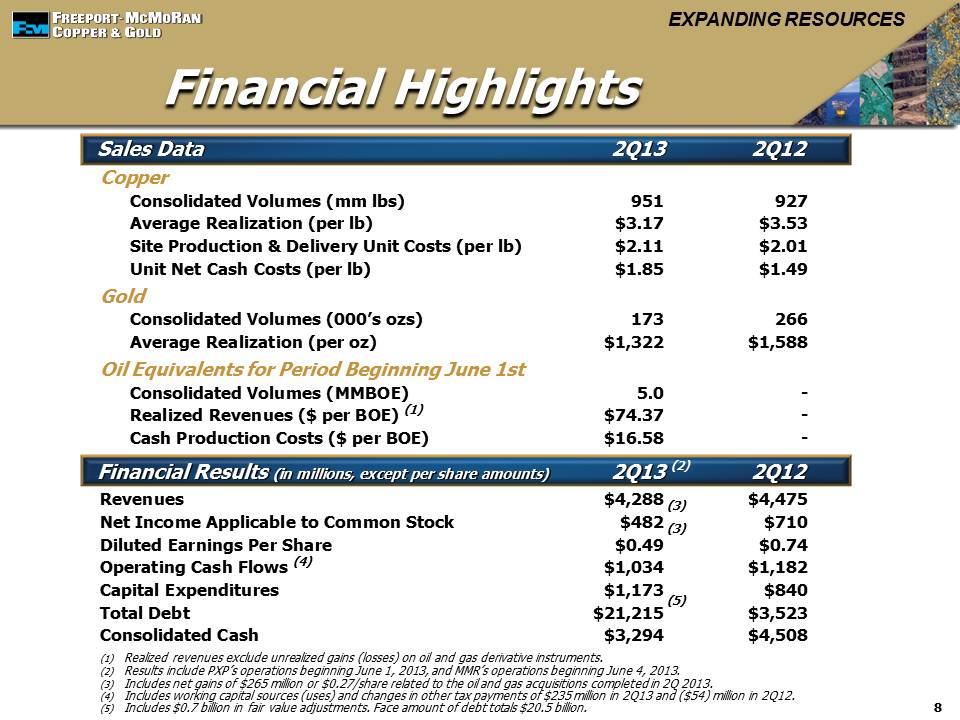
▪ | During second-quarter 2013, FCX completed its $19 billion acquisitions of Plains Exploration & Production Company (PXP) and McMoRan Exploration Co. (MMR), creating a premier U.S.-based natural resource company. FCX's second-quarter 2013 financial results include PXP's operations beginning June 1, 2013, and MMR's operations beginning June 4, 2013. |
| |
▪ | Net income attributable to common stock totaled $482 million, $0.49 per share for second-quarter 2013, compared with net income of $710 million, $0.74 per share, for second-quarter 2012. Net income attributable to common stock for the first six months of 2013 totaled $1.1 billion, $1.17 per share, compared with $1.5 billion, $1.55 per share, for the first six months of 2012. |
| |
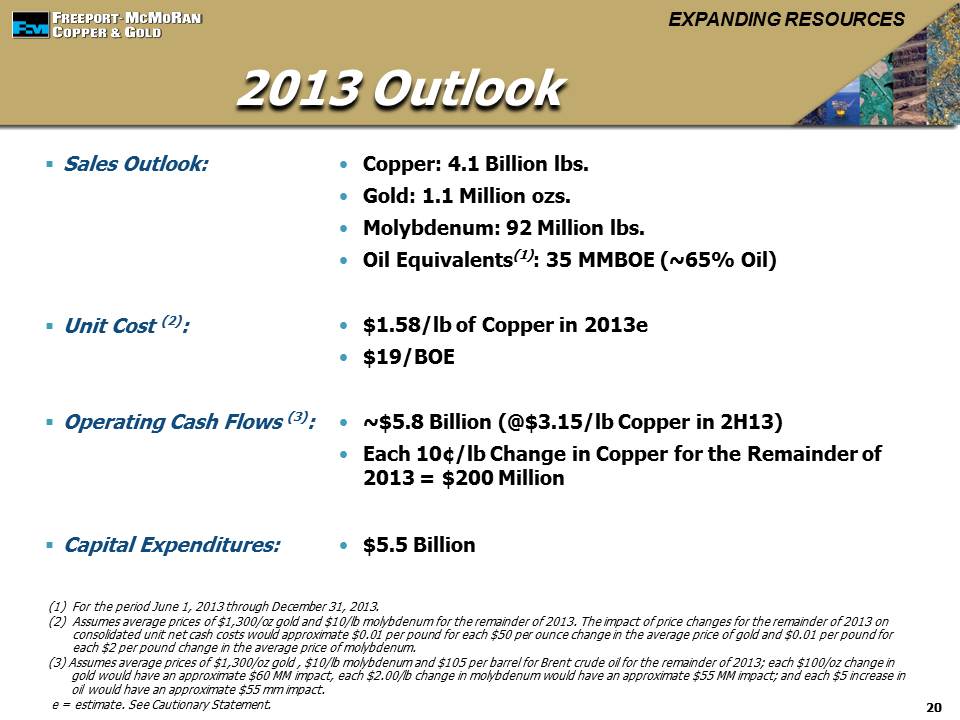
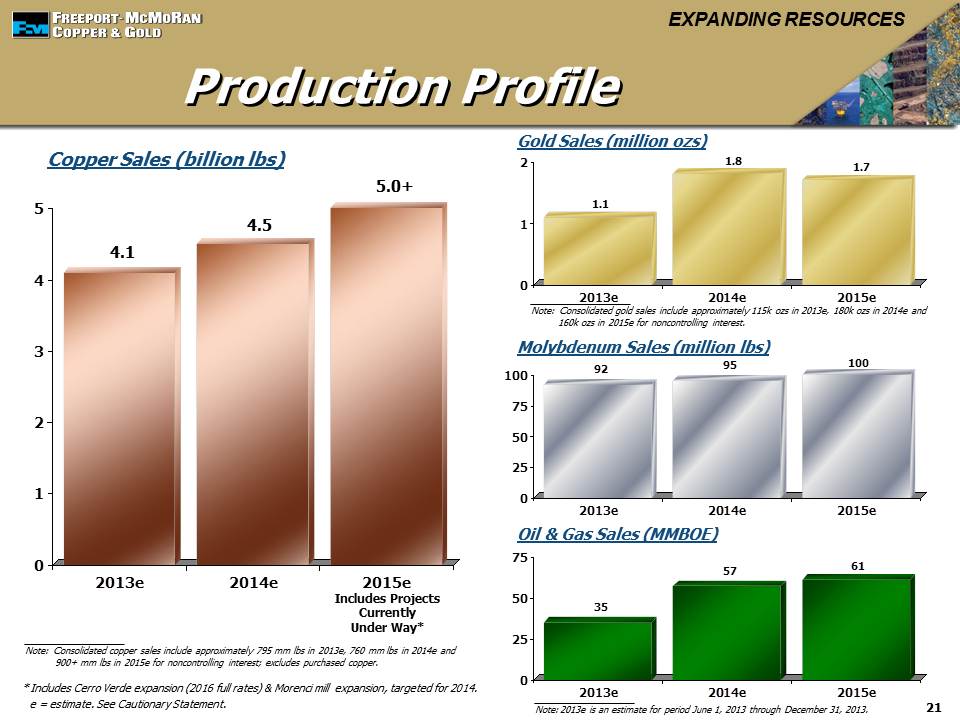
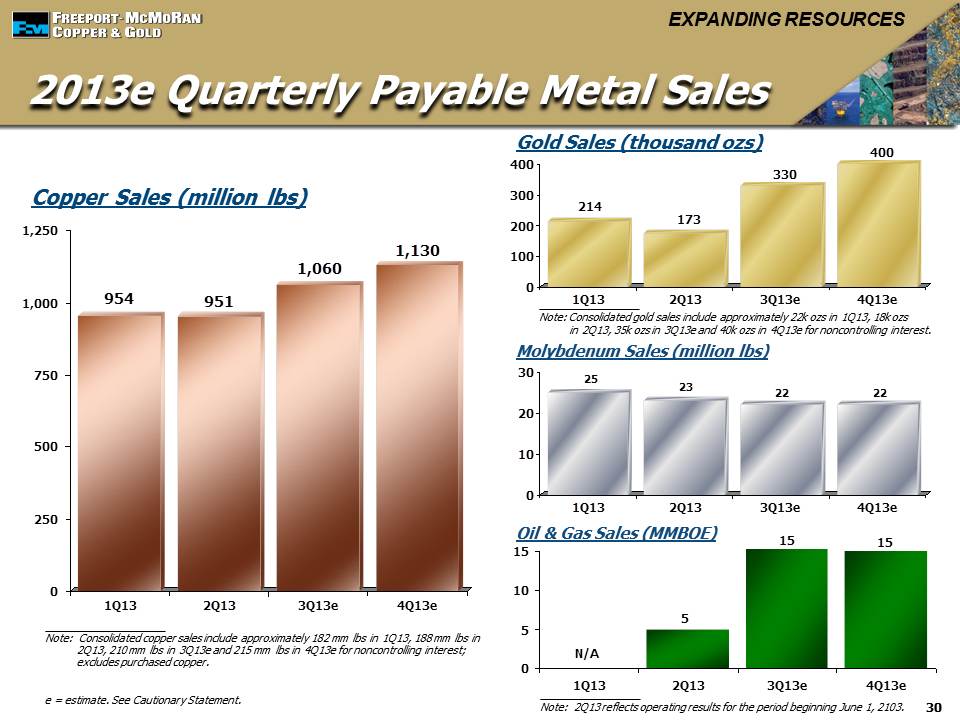
▪ | Consolidated sales for second-quarter 2013 totaled 951 million pounds of copper, 173 thousand ounces of gold, 23 million pounds of molybdenum and 5.0 million barrels of oil equivalents (MMBOE), reflecting results from Freeport-McMoRan Oil & Gas (FM O&G) beginning June 1, 2013. For the year 2013, sales are expected to approximate 4.1 billion pounds of copper, 1.1 million ounces of gold, 92 million pounds of molybdenum and 35 MMBOE (reflecting results for FM O&G beginning June 1, 2013). |
| |
▪ | Operating cash flows totaled $1.0 billion (including $235 million in working capital sources and changes in other tax payments) for second-quarter 2013 and $1.9 billion (net of $195 million in working capital uses and changes in other tax payments) for the first six months of 2013. Based on current sales volume and cost estimates and assuming average prices of $3.15 per pound for copper, $1,300 per ounce for gold, $10 per pound of molybdenum and $105 per barrel for Brent crude oil for the second half of 2013, operating cash flows for the year 2013 are expected to approximate $5.8 billion (net of $30 million of net working capital uses and other tax payments). |
| |
▪ | Capital expenditures totaled $1.2 billion for second-quarter 2013 and $2.0 billion for the first six months of 2013. Capital expenditures are expected to approximate $5.5 billion for the year 2013, including $2.3 billion for major projects at mining operations and $1.5 billion for oil and gas operations for the period beginning June 1, 2013. |
| |
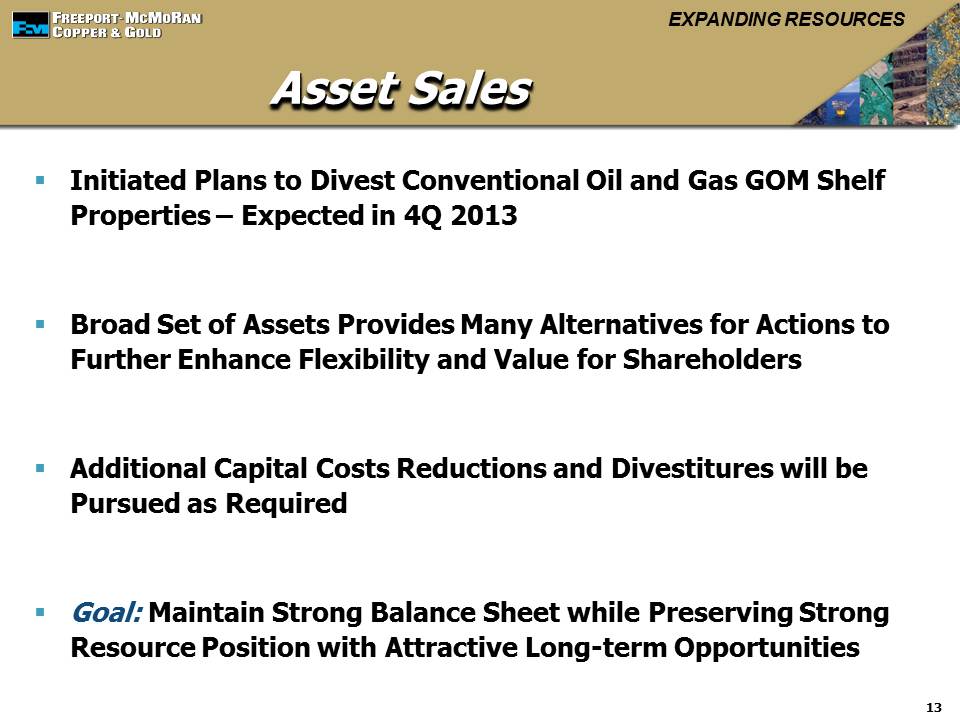
▪ | During second-quarter 2013, FCX took actions to reduce or defer capital expenditures and other costs, and initiated efforts to identify potential asset sales to reduce debt and maintain financial strength and flexibility in response to recent declines in metals prices. As a first step, FCX has reduced budgeted future capital expenditures, exploration and other costs by a total of $1.9 billion in 2013 and 2014. FCX has also initiated a process to divest certain oil and gas properties from its conventional Gulf of Mexico (GOM) Shelf properties. FCX has a broad set of natural resource assets which provide many alternatives for future actions to enhance FCX's financial flexibility and value for shareholders. Additional capital cost reductions and divestitures will be pursued as required to maintain a strong balance sheet while preserving a strong resource position and portfolio of assets with attractive long-term growth prospects. |
| |
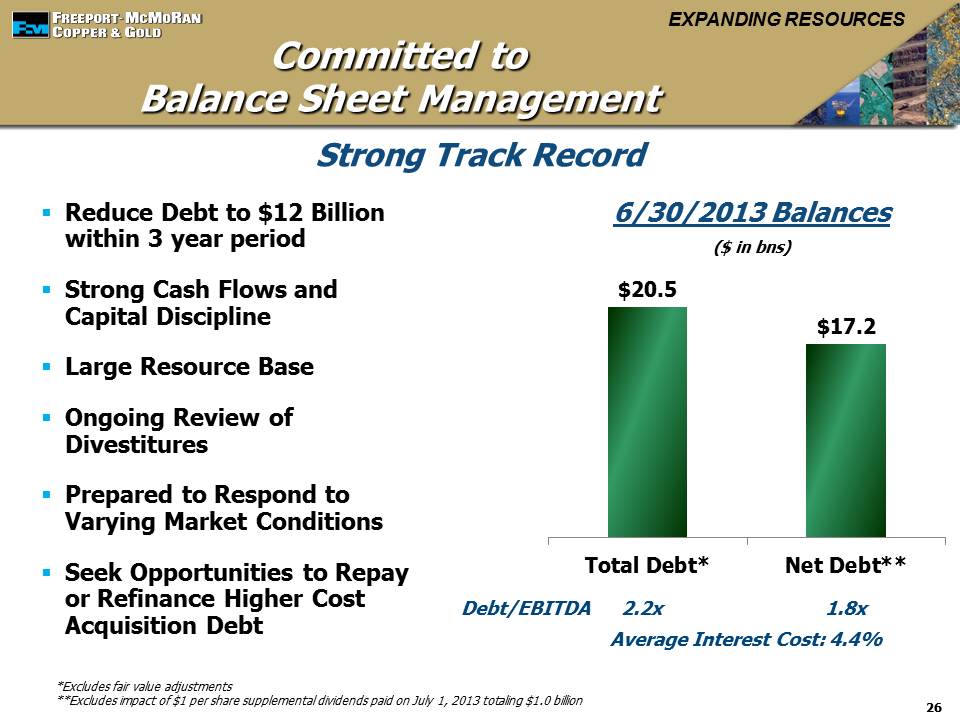
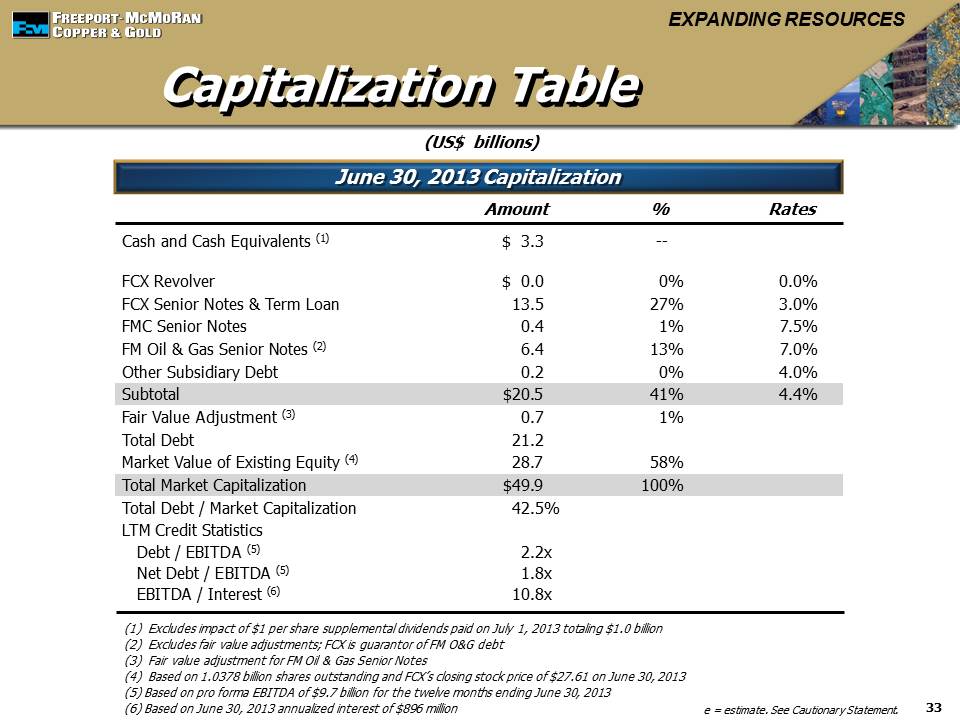
▪ | At June 30, 2013, consolidated cash totaled $3.3 billion and consolidated debt totaled $21.2 billion, including $0.7 billion of fair value adjustments to the stated value of assumed debt. |
| |
▪ | On May 31, 2013, FCX's Board of Directors declared a supplemental common stock dividend of $1.00 per share, which was paid on July 1, 2013. This supplemental dividend, which totaled $1.0 billion, is in addition to FCX's regular quarterly dividend of $0.3125 per share and is the eleventh supplemental dividend paid by FCX since 2004, which have totaled $3.0 billion. |
Freeport-McMoRan Copper & Gold 1
PHOENIX, AZ, July 23, 2013 - Freeport-McMoRan Copper & Gold Inc. (NYSE: FCX) reported net income attributable to common stock of $482 million, $0.49 per share, for second-quarter 2013 and $1.1 billion, $1.17 per share, for the first six months of 2013, compared with $710 million, $0.74 per share, for second-quarter 2012 and $1.5 billion, $1.55 per share, for the first six months of 2012. FCX's results for the second quarter and first six months of 2013 include the results of its wholly owned subsidiary Freeport-McMoRan Oil & Gas (FM O&G), following the acquisitions of PXP on May 31, 2013, and of MMR on June 3, 2013. Results for second-quarter 2013 also included net gains of $265 million to net income attributable to common stock, $0.27 per share, related to the acquisitions, as more fully described below.
James R. Moffett, Chairman of the Board; Richard C. Adkerson, Vice Chairman, President and Chief Executive Officer; and James C. Flores, Vice Chairman and President and Chief Executive Officer of FM O&G, said, "We are pleased to report our initial quarterly results following the second-quarter 2013 oil and gas acquisitions. As an organization, we are focused on strong execution of our business plans, which provide exposure to a significant, geographically diverse natural resource base, with an established and successful operating history and with multi-faceted and financially attractive growth opportunities. We are committed to our business plan of reducing debt and maintaining a strong balance sheet, while investing in financially attractive projects and providing cash returns to shareholders. We are taking measures to execute prudent capital management in an uncertain global economic environment and are committed to pursuing additional divestitures and capital cost reductions as required to maintain a strong balance sheet while preserving a strong resource position and a portfolio of assets with attractive long-term growth prospects."
SUMMARY FINANCIAL DATA |
| | | | | | | | | | | | | | | | | |
| | Three Months Ended | | Six Months Ended | |
| | June 30, | | June 30, | |
| | 2013 | a | 2012 | | 2013 | a | 2012 | |
| | (in millions, except per share amounts) | |
Revenuesb | | $ | 4,288 |
| | $ | 4,475 |
| | $ | 8,871 |
| | $ | 9,080 |
| |
Operating income | | $ | 639 |
| c | $ | 1,311 |
| | $ | 1,994 |
| c | $ | 3,045 |
| |
Net income attributable to common stockd | | $ | 482 |
| c,e | $ | 710 |
| | $ | 1,130 |
| c,e,f | $ | 1,474 |
| f |
Diluted net income per share of common stock | | $ | 0.49 |
| c,e | $ | 0.74 |
| | $ | 1.17 |
| c,e,f | $ | 1.55 |
| f |
Diluted weighted-average common shares outstanding | | 984 |
| | 953 |
| | 968 |
| | 954 |
| |
Operating cash flowsg | | $ | 1,034 |
| | $ | 1,182 |
| | $ | 1,865 |
| | $ | 1,983 |
| |
Capital expenditures | | $ | 1,173 |
| | $ | 840 |
| | $ | 1,978 |
| | $ | 1,547 |
| |
At June 30: | | | | | | | | | |
Cash and cash equivalents | | $ | 3,294 |
| | $ | 4,508 |
| | $ | 3,294 |
| | $ | 4,508 |
| |
Total debt, including current portion | | $ | 21,215 |
| | $ | 3,523 |
| | $ | 21,215 |
| | $ | 3,523 |
| |
| | | | | | | | | |
| |
a. | Includes the results of FM O&G beginning June 1, 2013. Results of the oil and gas operations for June 2013 included revenues of $336 million and operating income of $64 million. |
| |
b. | Includes (unfavorable) favorable adjustments to provisionally priced concentrate and cathode copper sales recognized in prior periods totaling $(117) million ($(55) million to net income attributable to common stock or $(0.06) per share) in second-quarter 2013, $(75) million ($(31) million to net income attributable to common stock or $(0.03) per share) in second-quarter 2012, $(26) million ($(12) million to net income attributable to common stock or $(0.01) per share) for the first six months of 2013 and $101 million ($43 million to net income attributable to common stock or $0.05 per share) for the first six months of 2012. The 2013 periods also reflect (unfavorable) adjustments of $(35) million ($(27) million to net income attributable to common stock or (0.03) per share) related to oil and gas derivative instruments that were assumed in connection with FCX's acquisition of PXP. For further discussion, refer to the supplemental schedule "Derivative Instruments" on page IX, which is available on FCX's website, "www.fcx.com." |
| |
c. | Includes charges of $61 million ($46 million to net income attributable to common stock or $0.05 per share) for second-quarter 2013 and $75 million ($57 million to net income attributable to common stock or $0.06 per share) for the first six months of 2013 for transaction and related costs principally associated with the acquisitions of PXP and MMR. |
| |
d. | FCX defers recognizing profits on intercompany sales until final sales to third parties occur. Refer to the "Consolidated Statements of Income" on page V for a summary of net impacts from changes in these deferrals. |
Freeport-McMoRan Copper & Gold 2
| |
e. | The second quarter and first six months of 2013 include gains associated with the acquisitions of PXP and MMR, including (i) $128 million to net income attributable to common stock, $0.13 per share, primarily related to FCX's preferred stock investment in and the subsequent acquisition of MMR, and (ii) $183 million to net income attributable to common stock, $0.19 per share, associated with net reductions in FCX's deferred tax liabilities and deferred tax asset valuation allowances. |
| |
f. | Includes losses on early extinguishment of debt totaling $39 million to net income attributable to common stock, $0.04 per share, for the first six months of 2013 related to the termination of the acquisition bridge loan facilities and $149 million to net income attributable to common stock, $0.16 per share, for the first six months of 2012 associated with the redemption of FCX's remaining 8.375% senior notes. |
| |
g. | Includes net working capital sources (uses) and changes in other tax payments of $235 million for second-quarter 2013, $(54) million for second-quarter 2012, $(195) million for the first six months of 2013 and $(774) million for the first six months of 2012. |
ACQUISITIONS OF PXP AND MMR
FCX completed the acquisition of PXP on May 31, 2013, and the acquisition of MMR on June 3, 2013. PXP per-share consideration was equivalent to 0.6531 shares of FCX common stock and $25.00 in cash, resulting in FCX issuing 91 million shares of its common stock and paying $3.8 billion in cash (including $0.4 billion for the special dividend paid to PXP stockholders on May 31, 2013). MMR per-share consideration consisted of $14.75 in cash ($1.7 billion in cash, net of FCX's and PXP's interests in MMR) and 1.15 units of a royalty trust, which holds a five percent overriding royalty interest in future production from MMR's ultra-deep exploration prospects that existed at the acquisition date.
In accordance with the acquisition method of accounting, the purchase price from FCX's oil and gas acquisitions has been allocated on a preliminary basis to the assets acquired and liabilities assumed based on initial estimates of their fair values on the respective acquisition dates, with the excess of purchase price over the estimated fair value of the net assets acquired recorded as goodwill.
Following is a summary of FM O&G's preliminary acquisition-date balance sheet (in billions):
|
| | | | | |
| | Preliminary | |
| | Acquisition-Date | |
| | Fair Valuea | |
Current assets | | $ | 1.1 |
| |
Oil and natural gas propertiesb: | | | |
Subject to depletion | | 12.2 |
| |
Not subject to depletion | | 11.4 |
| |
Property, plant and equipment | | 0.3 |
| |
Other assets | | 0.4 |
| |
Goodwill | | 1.8 |
| |
Total assets | | $ | 27.2 |
| |
| | | |
Current liabilities | | $ | 1.1 |
| |
Assumed debt (current and long-term) | | 11.2 |
| c |
Other liabilities (primarily asset retirement obligations) | | 1.0 |
| |
Deferred income taxesd | | 3.9 |
| |
Redeemable noncontrolling interest | | 1.1 |
| |
Equity (FCX's investment in FM O&G) | | 8.9 |
| |
Total liabilities and equity | | $ | 27.2 |
| |
| | | |
| |
a. | The final valuation of assets acquired and liabilities assumed is not complete and carrying amounts initially assigned to the assets and liabilities may change as the fair value analysis is completed. |
| |
b. | FCX's oil and gas operations will follow the full cost method of accounting whereby all costs associated with oil and gas acquisition, exploration and development activities are capitalized. Capitalized costs, along with estimated future costs to develop proved reserves, are amortized to expense under the unit-of-production method using estimates of proved oil and natural gas reserves. The costs of unproved oil and gas properties are excluded from amortization until the properties are evaluated, at which time the related costs are subject to amortization. Under the full cost accounting rules, FCX will conduct a "ceiling test" each quarter to review the carrying value of its oil and gas properties for impairment. |
Freeport-McMoRan Copper & Gold 3
| |
c. | Includes $0.8 billion of fair value adjustments to the stated value of the assumed debt. Following the acquisitions, FCX repaid $4.1 billion of the assumed debt primarily related to PXP's amended credit facility with proceeds from a $4.0 billion bank term loan. |
| |
d. | Deferred income taxes have been recognized based on the estimated fair value adjustments to net assets using a 38 percent tax rate, which reflected the 35 percent federal statutory rate and a 3 percent weighted-average of the applicable statutory state tax rates, net of federal benefit. |
SUMMARY OPERATING DATA
|
| | | | | | | | | | | | | | | | | |
| | Three Months Ended | | Six Months Ended | |
| | June 30, | | June 30, | |
| | 2013 | | 2012 | | 2013 | | 2012 | |
Copper (millions of recoverable pounds) | | | | | | | | | |
Production | | 909 |
| | 887 |
| | 1,889 |
| | 1,720 |
| |
Sales, excluding purchases | | 951 |
| | 927 |
| | 1,905 |
| | 1,754 |
| |
Average realized price per pound | | $ | 3.17 |
| | $ | 3.53 |
| | $ | 3.29 |
| | $ | 3.61 |
| |
Site production and delivery costs per pounda | | $ | 2.11 |
| | $ | 2.01 |
| | $ | 2.02 |
| | $ | 1.98 |
| |
Unit net cash costs per pounda | | $ | 1.85 |
| | $ | 1.49 |
| | $ | 1.71 |
| | $ | 1.38 |
| |
Gold (thousands of recoverable ounces) | | | | | | | | | |
Production | | 151 |
| | 251 |
| | 386 |
| | 503 |
| |
Sales, excluding purchases | | 173 |
| | 266 |
| | 387 |
| | 554 |
| |
Average realized price per ounce | | $ | 1,322 |
| | $ | 1,588 |
| | $ | 1,434 |
| | $ | 1,639 |
| |
Molybdenum (millions of recoverable pounds) | | | | | | | | | |
Production | | 24 |
| | 20 |
| | 46 |
| | 41 |
| |
Sales, excluding purchases | | 23 |
| | 20 |
| | 48 |
| | 41 |
| |
Average realized price per pound | | $ | 12.35 |
| | $ | 15.44 |
| | $ | 12.56 |
| | $ | 15.39 |
| |
Oil Equivalentsb | | | | | | | | | |
Sales volumes: | | | | | | | | | |
MMBOE | | 5.0 |
| | | | 5.0 |
| | | |
MBOE per day | | 169 |
| | | | 169 |
| | | |
Cash operating margin per BOE: | | | | | | | | | |
Realized revenues per BOE | | $ | 74.37 |
| c | | | $ | 74.37 |
| c | | |
Cash production costs per BOE | | 16.58 |
| c | | | 16.58 |
| c | | |
Cash operating margin per BOE | | $ | 57.79 |
| | | | $ | 57.79 |
| | | |
| |
a. | Reflects per pound weighted-average site production and delivery costs and unit net cash costs (net of by-product credits) for all copper mines, excluding net noncash and other costs. For reconciliations of per pound unit costs by operating division to production and delivery costs applicable to sales reported in FCX's consolidated financial statements, refer to the supplemental schedule, "Product Revenues and Production Costs," beginning on page XIII, which is available on FCX's website, "www.fcx.com." |
| |
b. | Reflects the operating results of FM O&G for the period beginning June 1, 2013. |
| |
c. | Cash operating margin for FCX's oil and gas operations reflects realized revenues less cash production costs. Realized revenues exclude unrealized gains (losses) on derivative instruments (average realized price excluding both realized and unrealized gains (losses) on derivative instruments was $74.03 per BOE) and cash production costs exclude accretion and other costs. For reconciliations of realized revenues and cash production costs per BOE to revenues and production and delivery costs reported in FCX's consolidated financial statements, refer to the supplemental schedule “Product Revenues and Production Costs” beginning on page XIII, which is available on FCX's website, “www.fcx.com.” |
Freeport-McMoRan Copper & Gold 4
Consolidated Sales Volumes
Second-quarter 2013 consolidated copper sales of 951 million pounds were lower than the April 2013 estimate of 1.0 billion pounds, but higher than second-quarter 2012 sales of 927 million pounds, reflecting increased sales from the Americas and Africa, partly offset by reduced volumes from Indonesia. Second-quarter 2013 consolidated gold sales of 173 thousand ounces were lower than the April 2013 estimate of 295 thousand ounces and second-quarter 2012 sales of 266 thousand ounces. Compared with the April 2013 estimates, lower copper and gold sales volumes primarily reflected lower production from Indonesia as a result of the temporary suspension of operations in mid-May following a tragic accident. Second-quarter 2013 consolidated molybdenum sales of 23 million pounds approximated the April 2013 estimate and were higher than second-quarter 2012 sales of 20 million pounds primarily because of stronger sales in the metallurgical and chemical sectors.
Second-quarter 2013 sales from FCX's recently acquired oil and gas operations totaled 5.0 MMBOE for the period from June 1, 2013 through June 30, 2013, including 3.4 million barrels of (MMBbls) of crude oil, 7.7 billion cubic feet (Bcf) of natural gas and 0.3 MMBbls of natural gas liquids (NGLs).
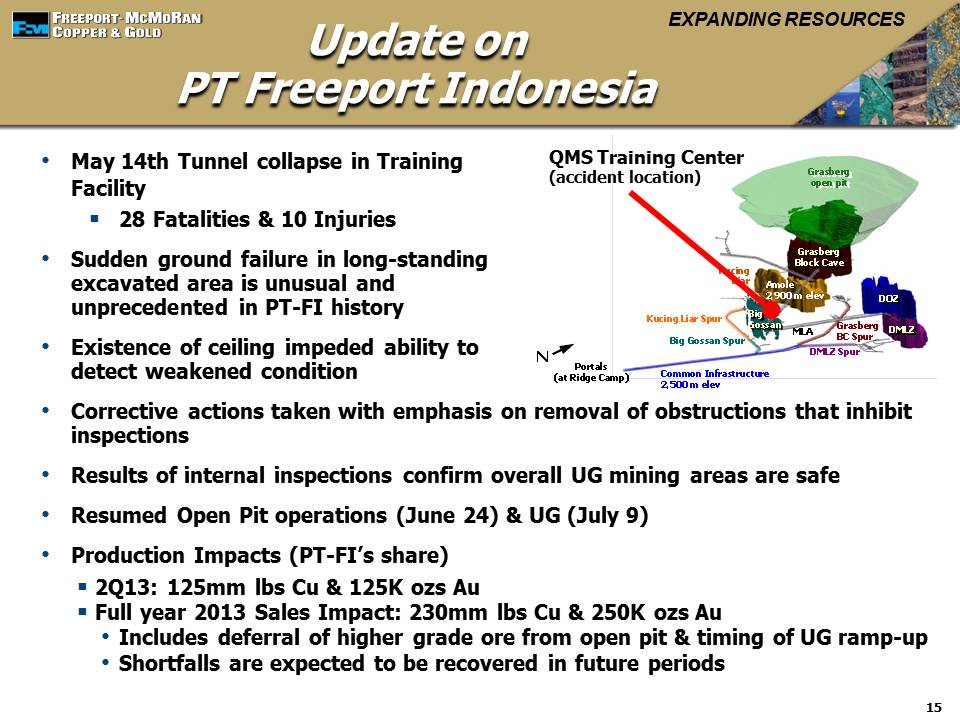
On May 14, 2013, a tragic accident, which resulted in 28 fatalities and 10 injuries, occurred at PT Freeport Indonesia when the rock structure above an underground ceiling for a training facility collapsed in an unprecedented and unexpected event. While the accident occurred outside the area of mining operations, PT Freeport Indonesia temporarily suspended mining and processing activities at the Grasberg complex in respect for the deceased and injured workers and their families, and to conduct inspections of its facilities in coordination with Indonesian government authorities. The temporary suspension of mining and processing activities at PT Freeport Indonesia, which have subsequently resumed, resulted in an estimated production impact of approximately 125 million pounds of copper and 125 thousand ounces of gold for second-quarter 2013.
Consolidated sales for the year 2013 are expected to approximate 4.1 billion pounds of copper, 1.1 million ounces of gold, 92 million pounds of molybdenum and 35 MMBOE, including 1.1 billion pounds of copper, 330 thousand ounces of gold, 22 million pounds of molybdenum and 15 MMBOE for third-quarter 2013. Projected 2013 sales volumes of copper and gold are approximately 210 million pounds and 260 thousand ounces lower than April 2013 estimates primarily reflecting the impact of the temporary production suspension at PT Freeport Indonesia in second-quarter 2013, impacts of achieving a full ramp-up in underground production and the timing of accessing higher grade material in the Grasberg open pit. The shortfalls are expected to be recovered in future periods.
Consolidated Unit Costs
Mining Unit Net Cash Costs. Consolidated average unit net cash costs (net of by-product credits) for FCX's mining operations of $1.85 per pound of copper in second-quarter 2013 were higher than unit net cash costs of $1.49 per pound in second-quarter 2012 primarily reflecting lower copper and gold volumes in Indonesia, anticipated higher mining rates in North America and the impact of lower gold prices in net by-product credits.
Assuming average prices of $1,300 per ounce of gold and $10 per pound of molybdenum for the second half of 2013 and achievement of current sales volume and cost estimates, consolidated unit net cash costs (net of by-product credits) for FCX's copper mining operations are expected to average approximately $1.58 per pound of copper for the year 2013. Projected unit net cash costs for 2013 are higher than previous estimates primarily because of the impact of lower copper and gold volumes from Indonesia. The impact of price changes for the second half of 2013 on consolidated unit net cash costs would approximate $0.01 per pound for each $50 per ounce change in the average price of gold and $0.01 per pound for each $2 per pound change in the average price of molybdenum. Quarterly unit net cash costs vary with fluctuations in sales volumes and average realized prices (primarily gold and molybdenum prices). Unit net cash costs are expected to decline during the second half of 2013 and in 2014 as FCX gains access to higher grade ore in Indonesia.
Oil and Gas Cash Production Costs per BOE. Cash production costs for oil and gas operations were $16.58 per BOE in June 2013. Based on current sales volume and cost estimates for the second half of 2013, cash production costs per BOE are expected to approximate $19 per BOE in the second half of 2013.
Freeport-McMoRan Copper & Gold 5
MINING OPERATIONS
North America Copper Mines. FCX operates seven open-pit copper mines in North America - Morenci, Bagdad, Safford, Sierrita and Miami in Arizona, and Chino and Tyrone in New Mexico. All of the North America mining operations are wholly owned, except for Morenci. FCX records its 85 percent joint venture interest in Morenci using the proportionate consolidation method. In addition to copper, the Sierrita, Bagdad, Morenci and Chino mines also produce molybdenum concentrates, which are sold to FCX's molybdenum sales company at market-based pricing.
Operating and Development Activities. FCX has increased production from its North America copper mines in recent years and continues to evaluate a number of opportunities to invest in additional production capacity at its North America copper mines in response to positive exploration results in recent years. Future investments will be undertaken based on the results of economic and technical feasibility studies and taking into consideration market conditions.
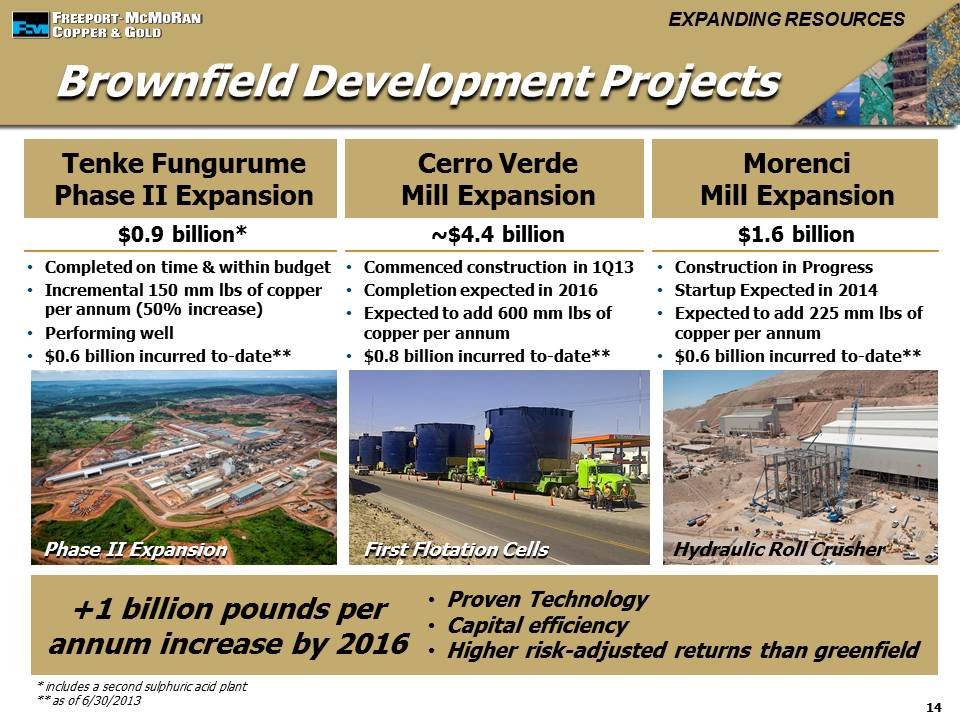
At Morenci, FCX is expanding mining and milling capacity to process additional sulfide ores identified through exploratory drilling. The project is targeting incremental annual production of approximately 225 million pounds of copper in 2014 (an approximate 40 percent increase from 2012) through an increase in milling rates from 50,000 metric tons of ore per day to approximately 115,000 metric tons of ore per day and mining rates from 700,000 short tons per day to 900,000 short tons per day. The targeted increase in mining rates has been achieved and construction activities for the new mill and related facilities are in progress. At June 30, 2013, approximately $0.6 billion has been incurred for this project, with approximately $1.0 billion remaining to be incurred. Cost estimates for the project are approximately 15 percent higher than previous estimates resulting from increased equipment and material costs and higher labor costs.
During second-quarter 2013, FCX took actions to reduce near-term capital expenditures and other costs (refer to "Capital Expenditures" on page14 for further discussion).
Operating Data. Following is summary consolidated operating data for the North America copper mines for the second quarters and first six months of 2013 and 2012: |
| | | | | | | | | | | | | | | | | |
| | Three Months Ended | | Six Months Ended | |
| | June 30, | | June 30, | |
| | 2013 | | 2012 | | 2013 | | 2012 | |
Copper (millions of recoverable pounds) | | | | | | | | | |
Production | | 349 |
| | 331 |
| | 692 |
| | 668 |
| |
Sales | | 372 |
| | 361 |
| | 725 |
| | 699 |
| |
Average realized price per pound | | $ | 3.25 |
| | $ | 3.57 |
| | $ | 3.41 |
| | $ | 3.68 |
| |
| | | | | | | | | |
Molybdenum (millions of recoverable pounds) | | | | | | | | | |
Productiona | | 9 |
| | 9 |
| | 17 |
| | 19 |
| |
| | | | | | | | | |
Unit net cash costs per pound of copperb: | | | | | | | | | |
Site production and delivery, excluding adjustments | | $ | 2.09 |
| | $ | 1.88 |
| | $ | 2.04 |
| | $ | 1.84 |
| |
By-product credits | | (0.25 | ) | | (0.36 | ) | | (0.26 | ) | | (0.39 | ) | |
Treatment charges | | 0.08 |
| | 0.10 |
| | 0.11 |
| | 0.12 |
| |
Unit net cash costs | | $ | 1.92 |
| | $ | 1.62 |
| | $ | 1.89 |
| | $ | 1.57 |
| |
| | | | | | | | | |
| |
a. | Refer to summary operating data on page 4 for FCX's consolidated molybdenum sales, which includes sales of molybdenum produced at the North America copper mines. |
| |
b. | For a reconciliation of unit net cash costs per pound to production and delivery costs applicable to sales reported in FCX's consolidated financial statements, refer to the supplemental schedule, "Product Revenues and Production Costs," beginning on page XIII, which is available on FCX's website, "www.fcx.com." |
North America's consolidated copper sales volumes of 372 million pounds in second-quarter 2013 were higher than second-quarter 2012 sales of 361 million pounds, primarily reflecting increased production at the Chino mine. Sales from the North America copper mines are expected to approximate 1.5 billion pounds of copper for the year 2013, compared with 1.35 billion pounds in 2012, primarily reflecting higher production at Morenci and Chino.
Freeport-McMoRan Copper & Gold 6
As anticipated, average unit net cash costs (net of by-product credits) for the North America copper mines of $1.92 per pound of copper in second-quarter 2013 were higher than unit net cash costs of $1.62 per pound in second-quarter 2012, primarily reflecting higher mining rates and lower molybdenum credits. Average unit net cash costs (net of by-product credits) for the North America copper mines are expected to approximate $1.87 per pound of copper for the year 2013, based on current sales volume and cost estimates and assuming an average molybdenum price of $10 per pound for the second half of 2013. North America's average projected unit net cash costs would change by approximately $0.015 per pound for each $2 per pound change in the average price of molybdenum for the second half of 2013.
South America Mining. FCX operates four copper mines in South America - Cerro Verde in Peru and El Abra, Candelaria and Ojos del Salado in Chile. FCX owns a 53.56 percent interest in Cerro Verde, a 51 percent interest in El Abra, and an 80 percent interest in both the Candelaria and Ojos del Salado mining complexes. All operations in South America are consolidated in FCX's financial statements. South America mining includes open-pit and underground mining. In addition to copper, the Candelaria and Ojos del Salado mines produce gold and silver, and the Cerro Verde mine produces molybdenum concentrates which are sold to FCX's molybdenum sales company at market-based pricing.
Development Activities. FCX has commenced initial construction activities associated with a large-scale expansion at Cerro Verde. The project will expand the concentrator facilities from 120,000 metric tons of ore per day to 360,000 metric tons of ore per day and provide incremental annual production of approximately 600 million pounds of copper and 15 million pounds of molybdenum beginning in 2016. At June 30, 2013, approximately $0.8 billion has been incurred for this project, with approximately $3.6 billion remaining to be incurred.
FCX continues to evaluate a potential large-scale milling operation at El Abra to process additional sulfide material and to achieve higher recoveries. Exploration results at El Abra indicate the potential for a significant sulfide resource. Future long-term investments will require evaluation and the completion of feasibility studies and will be dependent on overall market conditions.
During second-quarter 2013, FCX took actions to reduce near-term capital expenditures and other costs (refer to "Capital Expenditures" on page 14 for further discussion).
Operating Data. Following is summary consolidated operating data for the South America mining operations for the second quarters and first six months of 2013 and 2012: |
| | | | | | | | | | | | | | | | | |
| | Three Months Ended | | Six Months Ended | |
| | June 30, | | June 30, | |
| | 2013 | | 2012 | | 2013 | | 2012 | |
Copper (millions of recoverable pounds) | | | | | | | | | |
Production | | 299 |
| | 304 |
| | 597 |
| | 597 |
| |
Sales | | 315 |
| | 301 |
| | 600 |
| | 587 |
| |
Average realized price per pound | | $ | 3.13 |
| | $ | 3.51 |
| | $ | 3.22 |
| | $ | 3.56 |
| |
| | | | | | | | | |
Gold (thousands of recoverable ounces) | | | | | | | | | |
Production | | 19 |
| | 18 |
| | 40 |
| | 37 |
| |
Sales | | 21 |
| | 16 |
| | 42 |
| | 35 |
| |
Average realized price per ounce | | $ | 1,317 |
| | $ | 1,596 |
| | $ | 1,449 |
| | $ | 1,630 |
| |
| | | | | | | | | |
Molybdenum (millions of recoverable pounds) | | | | | | | | | |
Productiona | | 2 |
| | 2 |
| | 4 |
| | 4 |
| |
| | | | | | | | | |
Unit net cash costs per pound of copperb: | | | | | | | | | |
Site production and delivery, excluding adjustments | | $ | 1.62 |
| | $ | 1.56 |
| | $ | 1.62 |
| | $ | 1.55 |
| |
By-product credits | | (0.24 | ) | | (0.23 | ) | | (0.26 | ) | | (0.26 | ) | |
Treatment charges | | 0.16 |
| | 0.16 |
| | 0.17 |
| | 0.16 |
| |
Unit net cash costs | | $ | 1.54 |
| | $ | 1.49 |
| | $ | 1.53 |
| | $ | 1.45 |
| |
| | | | | | | | | |
Freeport-McMoRan Copper & Gold 7
| |
a. | Refer to summary operating data on page 4 for FCX's consolidated molybdenum sales, which includes sales of molybdenum produced at Cerro Verde. |
| |
b. | For a reconciliation of unit net cash costs per pound to production and delivery costs applicable to sales reported in FCX's consolidated financial statements, refer to the supplemental schedule, "Product Revenues and Production Costs," beginning on page XIII, which is available on FCX's website, "www.fcx.com." |
South America's consolidated copper sales volumes of 315 million pounds in second-quarter 2013 were higher than second-quarter 2012 sales of 301 million pounds primarily related to timing of shipments. Sales from South America mining are expected to approximate 1.3 billion pounds of copper for the year 2013, compared with sales of 1.25 billion pounds of copper in 2012, primarily reflecting higher grade ore at Candelaria.
Average unit net cash costs (net of by-product credits) for South America mining of $1.54 per pound of copper in second-quarter 2013 were higher than unit net cash costs of $1.49 per pound in second-quarter 2012 primarily reflecting higher mining costs. Average unit net cash costs (net of by-product credits) for South America mining are expected to approximate $1.42 per pound of copper for the year 2013, based on current sales volume and cost estimates and assuming average prices of $1,300 per ounce of gold and $10 per pound of molybdenum for the second half of 2013.
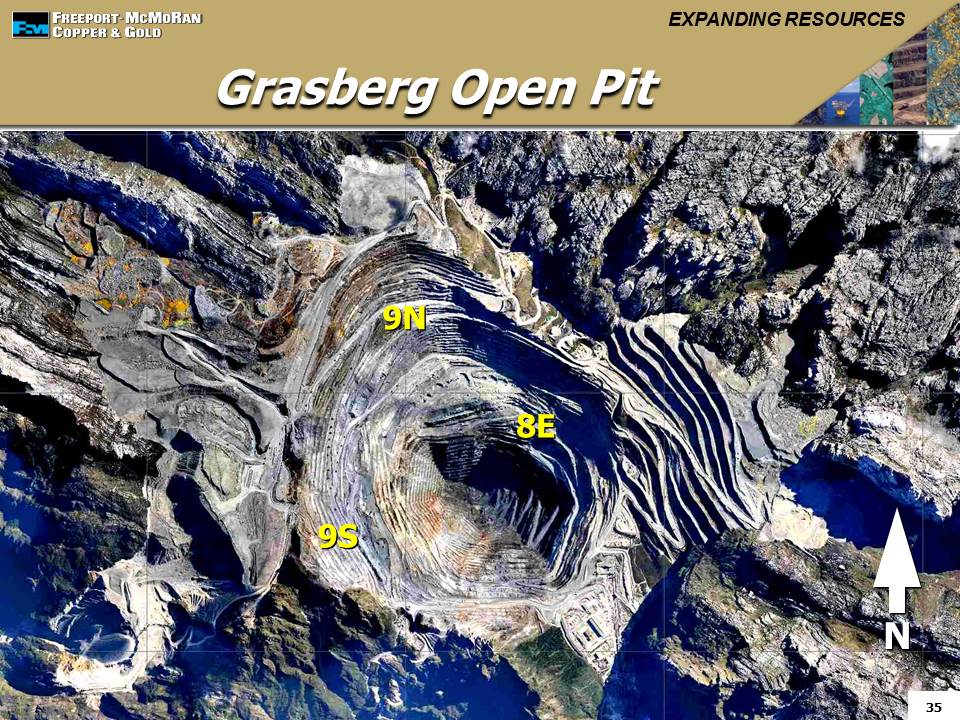
Indonesia Mining. Through its 90.64 percent owned and consolidated subsidiary PT Freeport Indonesia, FCX's assets include one of the world's largest copper and gold deposits at the Grasberg minerals district in Papua, Indonesia. PT Freeport Indonesia produces copper concentrates, which contain significant quantities of gold and silver.
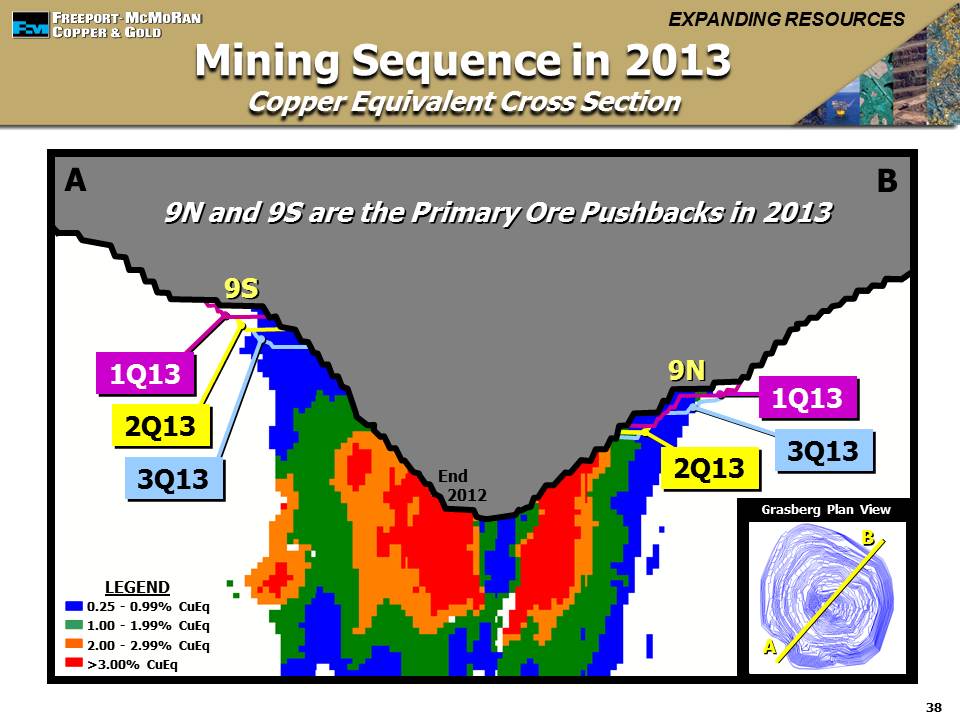
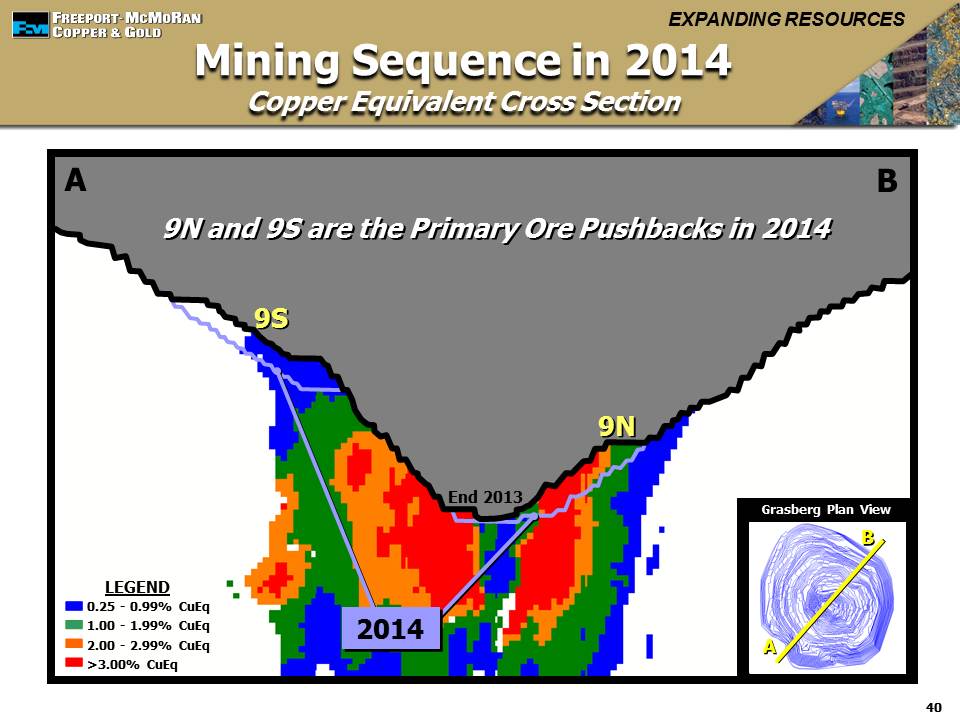
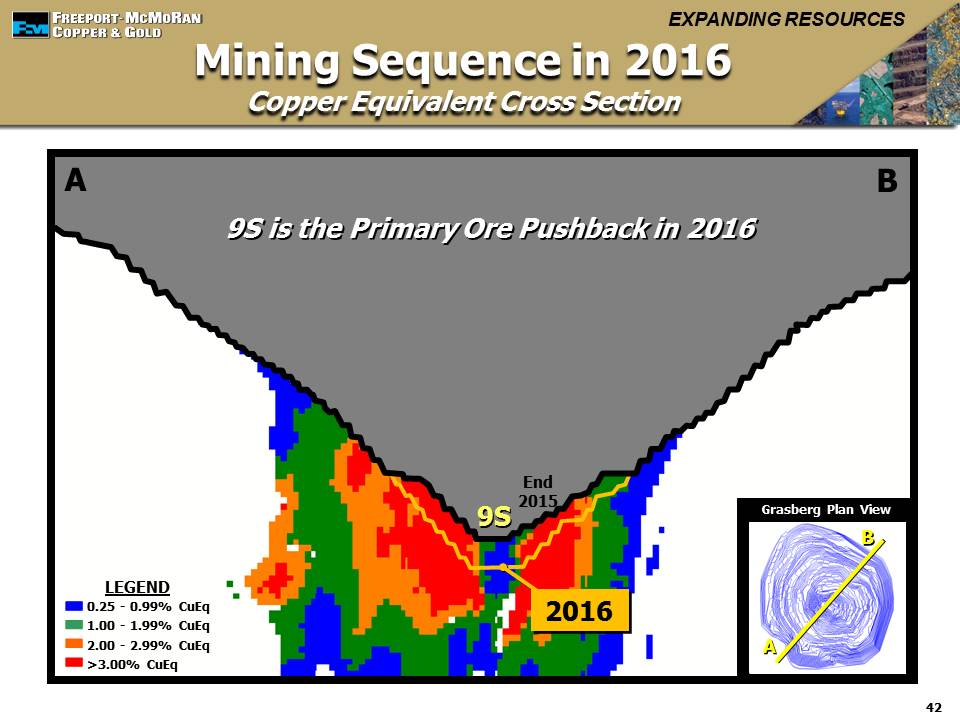
Development Activities. FCX has several projects in progress in the Grasberg minerals district, primarily related to the development of large-scale, high-grade underground ore bodies. In aggregate, these underground ore bodies are expected to ramp up over several years to produce approximately 240,000 metric tons of ore per day following the currently anticipated transition from the Grasberg open pit in 2017. Development of the Grasberg Block Cave and Deep Mill Level Zone (DMLZ) is advancing according to schedule, which would enable the DMLZ to commence production in 2015 and the Grasberg Block Cave mine to commence production in 2017. Over the next five years, estimated aggregate capital spending on these projects is currently expected to average $760 million per year ($600 million per year net to PT Freeport Indonesia).
During second-quarter 2013, FCX took actions to reduce near-term capital expenditures and other costs (refer to "Capital Expenditures" on page 14 for further discussion).
Operating Data. Following is summary consolidated operating data for the Indonesia mining operations for the second quarters and first six months of 2013 and 2012: |
| | | | | | | | | | | | | | | | | |
| | Three Months Ended | | Six Months Ended | |
| | June 30, | | June 30, | |
| | 2013 | | 2012 | | 2013 | | 2012 | |
Copper (millions of recoverable pounds) | | | | | | | | | |
Production | | 139 |
| | 173 |
| | 358 |
| | 296 |
| |
Sales | | 158 |
| | 183 |
| | 356 |
| | 317 |
| |
Average realized price per pound | | $ | 3.08 |
| | $ | 3.49 |
| | $ | 3.20 |
| | $ | 3.56 |
| |
| | | | | | | | | |
Gold (thousands of recoverable ounces) | | | | | | | | | |
Production | | 131 |
| | 230 |
| | 343 |
| | 459 |
| |
Sales | | 151 |
| | 247 |
| | 342 |
| | 513 |
| |
Average realized price per ounce | | $ | 1,321 |
| | $ | 1,587 |
| | $ | 1,431 |
| | $ | 1,639 |
| |
| | | | | | | | | |
Unit net cash costs per pound of coppera: | | | | | | | | | |
Site production and delivery, excluding adjustments | | $ | 3.55 |
| | $ | 3.23 |
| | $ | 3.03 |
| | $ | 3.35 |
| |
Gold and silver credits | | (1.20 | ) | | (2.20 | ) | | (1.44 | ) | | (2.75 | ) | |
Treatment charges | | 0.23 |
| | 0.21 |
| | 0.23 |
| | 0.20 |
| |
Royalty on metals | | 0.13 |
| | 0.13 |
| | 0.13 |
| | 0.13 |
| |
Unit net cash costs | | $ | 2.71 |
| | $ | 1.37 |
| | $ | 1.95 |
| | $ | 0.93 |
| |
| | | | | | | | | |
Freeport-McMoRan Copper & Gold 8
| |
a. | For a reconciliation of unit net cash costs per pound to production and delivery costs applicable to sales reported in FCX's consolidated financial statements, refer to the supplemental schedule, "Product Revenues and Production Costs," beginning on page XIII, which is available on FCX's website, "www.fcx.com." |
Indonesia's second-quarter 2013 copper sales of 158 million pounds and gold sales of 151 thousand ounces were lower than second-quarter 2012 copper sales of 183 million pounds and gold sales of 247 thousand ounces resulting primarily from a suspension of activities following the accident described below.
On May 14, 2013, a tragic accident, which resulted in 28 fatalities and 10 injuries, occurred at PT Freeport Indonesia when the rock structure above an underground ceiling for a training facility collapsed in an unprecedented and unexpected event. While the accident occurred outside the area of mining operations, PT Freeport Indonesia temporarily suspended mining and processing activities at the Grasberg complex in respect for the deceased and injured workers and their families, and to conduct inspections of its facilities in coordination with Indonesian government authorities. The temporary suspension of mining and processing activities at PT Freeport Indonesia, which has subsequently resumed, resulted in an estimated production impact of approximately 125 million pounds of copper and 125 thousand ounces of gold for second-quarter 2013.
Following approval from Indonesia's Department of Energy and Mineral Resources, PT Freeport Indonesia resumed open pit mining and concentrating activities at its Grasberg operations on June 24, 2013, and resumed underground operations on July 9, 2013. PT Freeport Indonesia has conducted safety inspections throughout its operations, which focused on ground control installation and monitoring. For the period from July 10 to July 19, 2013, mill rates averaged approximately 200,000 metric tons of ore per day. Productivity in the open-pit operations continues to improve and the Deep Ore Zone (DOZ) mine is being ramped up. Current DOZ rates approximate 40,000 metric tons of ore per day and are expected to reach 80,000 metric tons of ore per day by mid-2014.
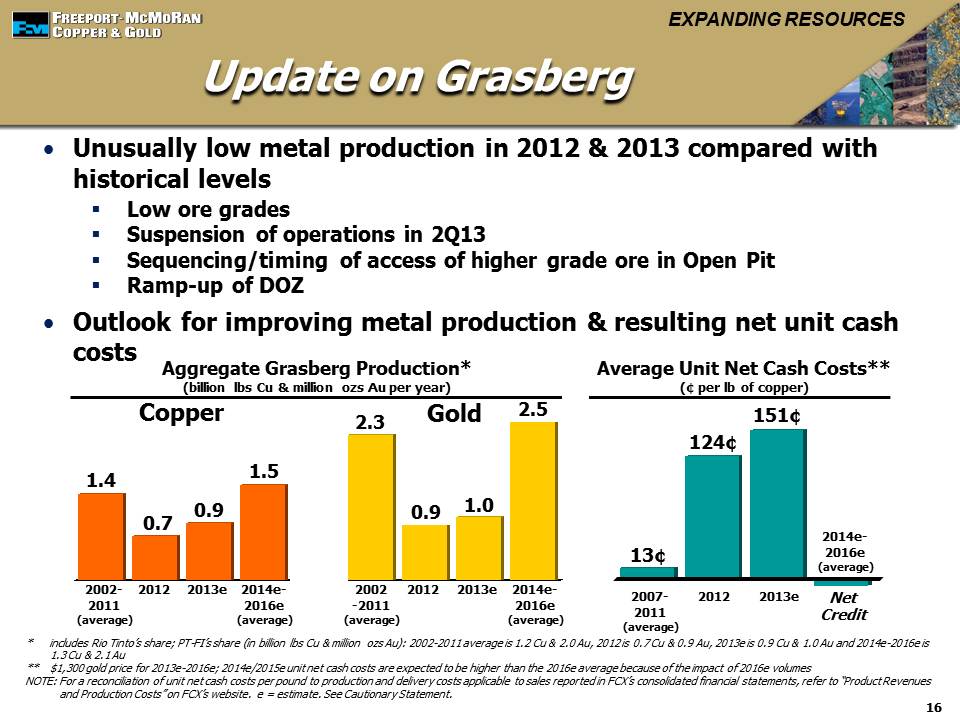
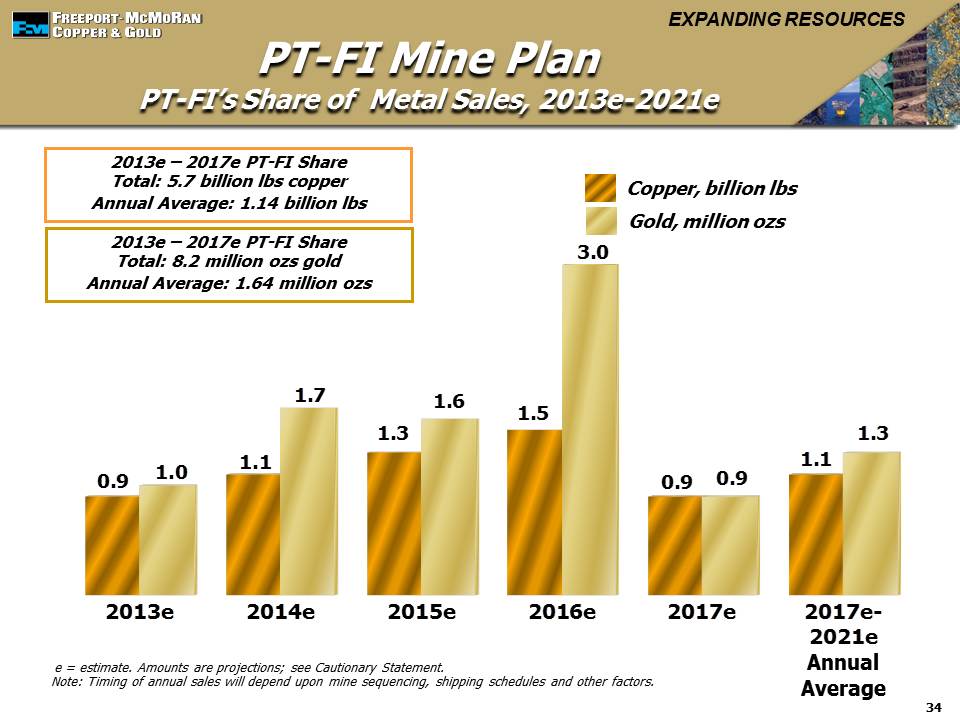
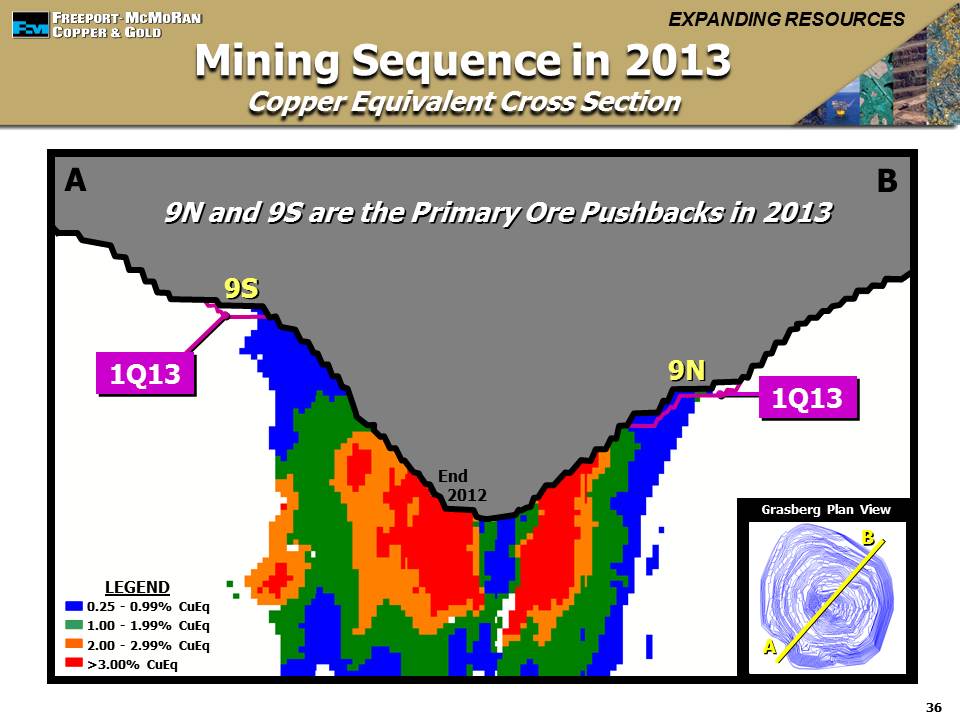
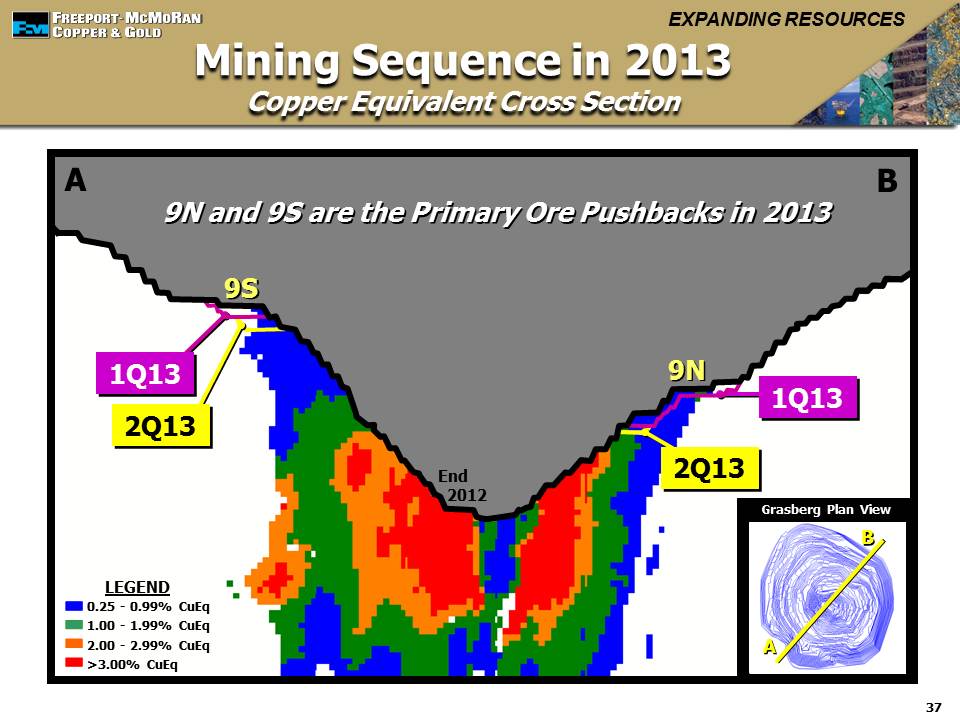
At the Grasberg mine, the sequencing of mining areas with varying ore grades causes fluctuations in the timing of ore production resulting in varying quarterly and annual sales of copper and gold. Sales from Indonesia mining are expected to approximate 0.9 billion pounds of copper and 1.0 million ounces of gold for the year 2013, compared with 0.7 billion pounds of copper and 0.9 million ounces of gold for the year 2012. Projected 2013 sales volumes of copper and gold are approximately 230 million pounds and 250 thousand ounces lower than April 2013 estimates primarily reflecting the impact of the temporary production suspension in second-quarter 2013, impacts of achieving a full ramp-up in underground production and the timing of accessing higher grade material in the open pit. Sales from Indonesia mining are expected to increase in 2014 through 2016 as PT Freeport Indonesia gains access to higher ore grades.
A significant portion of PT Freeport Indonesia's costs are fixed and unit costs vary depending on production volumes. Indonesia's unit net cash costs (including gold and silver credits) of $2.71 per pound of copper in second-quarter 2013 were significantly higher than unit net cash costs of $1.37 per pound in second-quarter 2012 primarily reflecting the impact of the temporary production suspension in second-quarter 2013.
Unit net cash costs (net of gold and silver credits) for Indonesia mining are expected to approximate $1.51 per pound of copper for the year 2013, based on current sales volume and cost estimates and assuming an average gold price of $1,300 per ounce for the second half of 2013. Indonesia mining's projected unit net cash costs would change by approximately $0.04 per pound for each $50 per ounce change in the average price of gold for the second half of 2013. Because of the fixed nature of a large portion of Indonesia's costs, unit costs vary from quarter to quarter depending on copper and gold sales volumes. Indonesia mining's unit net cash costs are expected to decline during the second half of 2013 as it gains access to higher grade ore.
PT Freeport Indonesia has commenced discussions with union officials regarding its bi-annual labor agreement which is scheduled for renewal in September 2013.
Africa Mining. Through its 56 percent owned and consolidated subsidiary Tenke Fungurume Mining S.A.R.L. (TFM), FCX operates the Tenke Fungurume (Tenke) minerals district in the Katanga province of the Democratic Republic of Congo (DRC). In addition to copper, the Tenke mine produces cobalt hydroxide.
Operating and Development Activities. TFM has completed its second phase expansion project, which included optimizing the current plant and increasing mine, mill and processing capacity. The expanded mill has a design capacity of 14,000 metric tons of ore per day, enabling an increase in Tenke's copper production by 150 million pounds to over 430 million pounds per year. The expanded mill facility is performing well, with second-
Freeport-McMoRan Copper & Gold 9
quarter 2013 average throughput rates of 15,000 metric tons per day. The addition of a second sulphuric acid plant is expected to be completed in 2015.
Refer to "Capital Expenditures" on page 14 for further discussion of FCX's initiatives to reduce near-term capital expenditures and other costs.
FCX continues to engage in drilling activities, exploration analyses and metallurgical testing to evaluate the potential of the highly prospective minerals district at Tenke. These analyses are being incorporated in future plans to evaluate opportunities for expansion. Future expansions are subject to a number of factors, including economic and market conditions, and the business and investment climate in the DRC.
Operating Data. Following is summary consolidated operating data for the Africa mining operations for the second quarters and first six months of 2013 and 2012: |
| | | | | | | | | | | | | | | | | |
| | Three Months Ended | | Six Months Ended | |
| | June 30, | | June 30, | |
| | 2013 | | 2012 | | 2013 | | 2012 | |
Copper (millions of recoverable pounds) | | | | | | | | | |
Production | | 122 |
| | 79 |
| | 242 |
| | 159 |
| |
Sales | | 106 |
| | 82 |
| | 224 |
| | 151 |
| |
Average realized price per pounda | | $ | 3.10 |
| | $ | 3.45 |
| | $ | 3.22 |
| | $ | 3.54 |
| |
| | | | | | | | | |
Cobalt (millions of contained pounds) | | | | | | | | | |
Production | | 5 |
| | 6 |
| | 11 |
| | 12 |
| |
Sales | | 5 |
| | 6 |
| | 11 |
| | 11 |
| |
Average realized price per pound | | $ | 8.48 |
| | $ | 8.24 |
| | $ | 7.99 |
| | $ | 8.40 |
| |
| | | | | | | | | |
Unit net cash costs per pound of copperb: | | | | | | | | | |
Site production and delivery, excluding adjustments | | $ | 1.47 |
| | $ | 1.48 |
| | $ | 1.43 |
| | $ | 1.49 |
| |
Cobalt creditsc | | (0.30 | ) | | (0.33 | ) | | (0.26 | ) | | (0.34 | ) | |
Royalty on metals | | 0.06 |
| | 0.07 |
| | 0.06 |
| | 0.08 |
| |
Unit net cash costs | | $ | 1.23 |
| | $ | 1.22 |
| | $ | 1.23 |
| | $ | 1.23 |
| |
| | | | | | | | | |
| |
a. | Includes point-of-sale transportation costs as negotiated in customer contracts. |
| |
b. | For a reconciliation of unit net cash costs per pound to production and delivery costs applicable to sales reported in FCX's consolidated financial statements, refer to the supplemental schedule, "Product Revenues and Production Costs," beginning on page XIII, which is available on FCX's website, "www.fcx.com." |
| |
c. | Net of cobalt downstream processing and freight costs. |
Africa's copper sales of 106 million pounds in second-quarter 2013 were higher than second-quarter 2012 copper sales of 82 million pounds, primarily reflecting higher mining and milling rates principally related to the ramp up of the expansion project and higher ore grades. Africa mining's sales are expected to approximate 450 million pounds of copper and 24 million pounds of cobalt for the year 2013, compared with 336 million pounds of copper and 25 million pounds of cobalt for the year 2012.
Africa mining's unit net cash costs (net of cobalt credits) of $1.23 per pound of copper in second-quarter 2013 were slightly higher than unit net cash costs of $1.22 per pound in second-quarter 2012. Unit net cash costs (net of cobalt credits) for Africa mining are expected to approximate $1.24 per pound of copper for the year 2013, based on current sales volume and cost estimates and assuming an average cobalt price of $12 per pound for the second half of 2013. Africa mining's projected unit net cash costs would change by approximately $0.035 per pound for each $2 per pound change in the average price of cobalt for the second half of 2013.
Freeport-McMoRan Copper & Gold 10
Molybdenum Mines. FCX has two wholly owned molybdenum mines in North America - the Henderson underground mine and the Climax open-pit mine, both in Colorado. The Henderson and Climax mines produce high-purity, chemical-grade molybdenum concentrates, which are typically further processed into value-added molybdenum chemical products.
Operating Data. Following is summary consolidated operating data for the molybdenum mines for the second quarters and first six months of 2013 and 2012: |
| | | | | | | | | | | | | | | | | |
| | Three Months Ended | | Six Months Ended | |
| | June 30, | | June 30, | |
| | 2013 | | 2012 | | 2013 | | 2012 | |
Molybdenum production (millions of recoverable pounds)a | | 13 |
| | 9 |
| | 25 |
| | 18 |
| |
| | | | | | | | | |
Unit net cash cost per pound of molybdenumb | | $ | 6.79 |
| | $ | 6.83 |
| | $ | 7.05 |
| | $ | 6.85 |
| |
| | | | | | | | | |
| |
a. | Refer to summary operating data on page 4 for FCX's consolidated molybdenum sales, which includes sales of molybdenum produced at the molybdenum mines, and from the North and South America copper mines. |
| |
b. | Unit net cash costs per pound of molybdenum for the 2013 periods reflect the results of the Henderson and Climax mines, and the 2012 periods reflect the results of only the Henderson mine as startup activities were still underway for the Climax mine. For a reconciliation of unit net cash costs per pound to production and delivery costs applicable to sales reported in FCX's consolidated financial statements, refer to the supplemental schedule, "Product Revenues and Production Costs," beginning on page XIII, which is available on FCX's website, "www.fcx.com." |
Average unit net cash costs for the molybdenum mines of $6.79 per pound of molybdenum in second-quarter 2013 were lower than Henderson's unit net cash costs of $6.83 per pound in second-quarter 2012. Based on current sales volume and cost estimates, unit net cash costs for the molybdenum mines are expected to average approximately $7.10 per pound of molybdenum for the year 2013.
Mining Exploration Activities. FCX is actively conducting exploration activities near its existing mines with a focus on opportunities to expand reserves that will support the development of additional future production capacity in the large minerals districts where it currently operates. Exploration results indicate opportunities for significant future potential reserve additions in North and South America and in the Tenke Fungurume minerals district. The drilling data in North America continue to indicate the potential for expanded sulfide production.
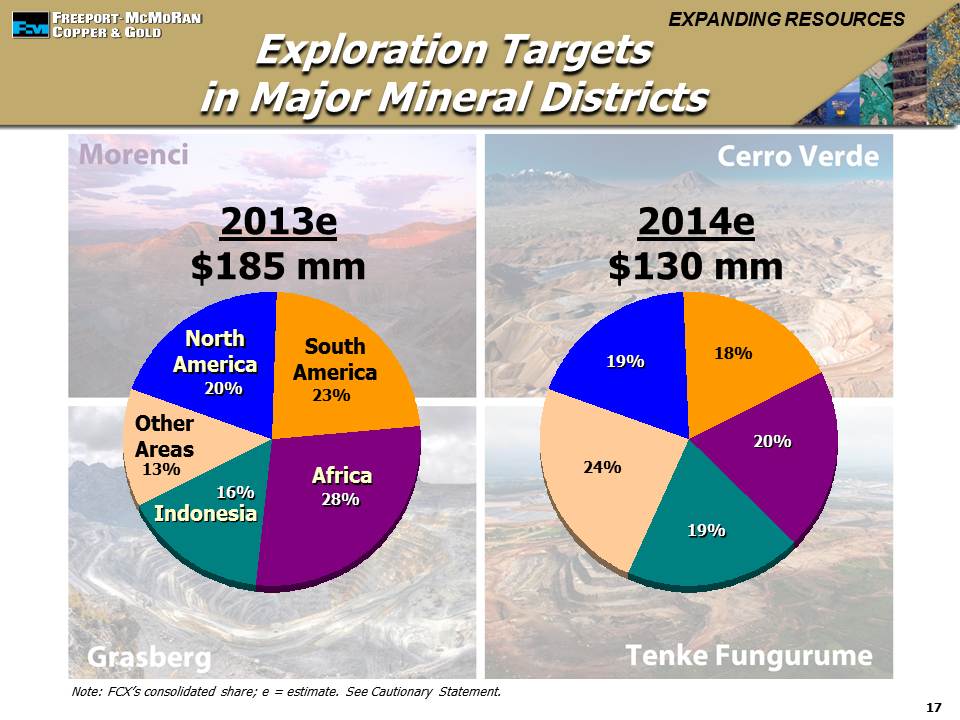
Exploration spending associated with mining operations is expected to approximate $185 million for the year 2013, compared to $251 million in 2012. Exploration activities will continue to focus primarily on the potential for future reserve additions in FCX's existing minerals districts. Projected exploration spending for 2013 is approximately 20 percent lower than previous estimates as a result of ongoing efforts to reduce capital spending and other operating costs.
Freeport-McMoRan Copper & Gold 11
OIL & GAS OPERATIONS
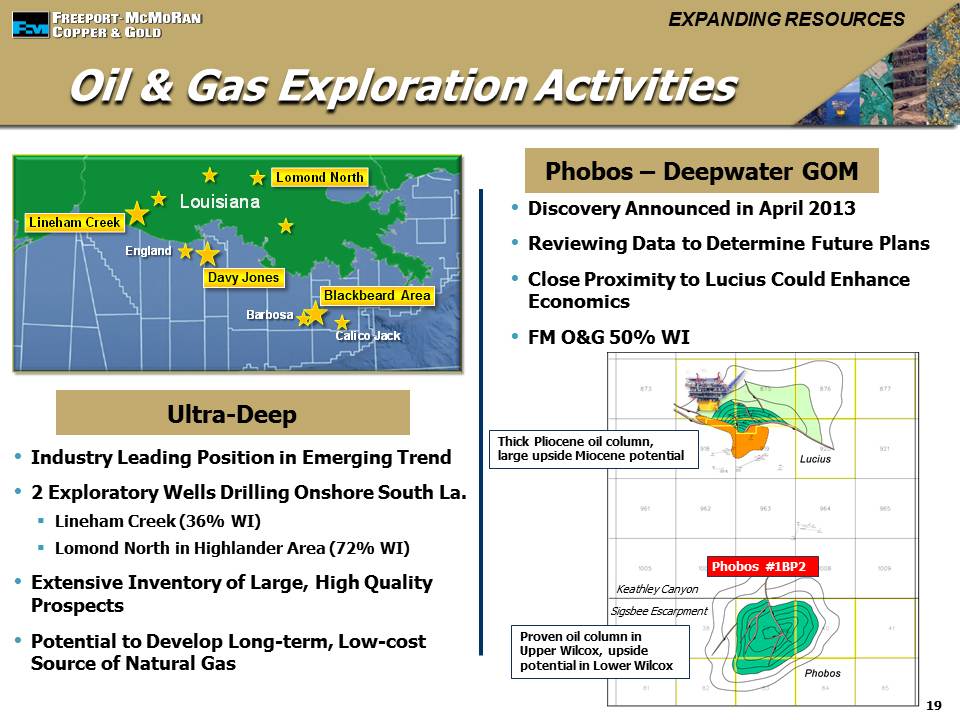
FCX's recently acquired oil and gas business (FM O&G) provides exposure to energy markets with positive fundamentals, strong margins and cash flows and a large resource base with financially attractive exploration and development investment opportunities. The portfolio of assets includes significant oil production facilities and growth potential in the Deepwater Gulf of Mexico (GOM), strong oil production from the onshore Eagle Ford trend in Texas, established oil production facilities onshore and offshore California, large onshore resources in the Haynesville natural gas trend in Louisiana, and an industry leading position in the emerging shallow water, ultra-deep gas trend on the Shelf of the GOM and onshore in South Louisiana. Excluding the impact of derivative instruments, approximately 90 percent of FM O&G's revenues are from oil and NGLs.
Financial and Operating Data. The following table reflects the summary financial and operating results of FCX's oil and gas operations for June 2013:
|
| | | | | |
Financial Summary (in millions): | | | |
Realized revenues |
| $ | 372 |
| a |
Cash production costs |
| 83 |
| a |
Cash operating margin | | $ | 289 |
| |
Capital expenditures |
| $ | 190 |
| |
Sales Volumes: | | | |
Oil (MMBbls) | | 3.4 |
| |
Natural gas (Bcf) | | 7.7 |
| |
NGLs (MMBbls) | | 0.3 |
| |
MMBOE | | 5.0 |
| |
Average Realizations: | | | |
Oil (per barrel) | | $ | 97.42 |
| a |
Natural gas (per MMbtu) | | $ | 3.86 |
| a |
NGLs (per barrel) | | $ | 35.18 |
| a |
Cash Operating Margin per BOE: | | | |
Realized revenues per BOE | | $ | 74.37 |
| a |
Cash production costs per BOE | | 16.58 |
| a |
Cash operating margin per BOE | | $ | 57.79 |
| |
| | | |
| |
a. | Cash operating margin for FCX's oil and gas operations reflects realized revenues less cash production costs. Average realized revenues exclude unrealized gains (losses) on derivative instruments (average realized prices excluding both realized and unrealized gains (losses) on derivative instruments were $97.05 per barrel for oil, $3.81 per MMbtu for natural gas, $35.18 per barrel for NGLs and $74.03 per BOE) and cash production costs exclude accretion and other costs. For reconciliations of average realized prices and cash production costs per BOE to revenues and production and delivery costs reported in FCX's consolidated financial statements, refer to the supplemental schedule “Product Revenues and Production Costs” beginning on page XIII, which is available on FCX's website, “www.fcx.com.” |
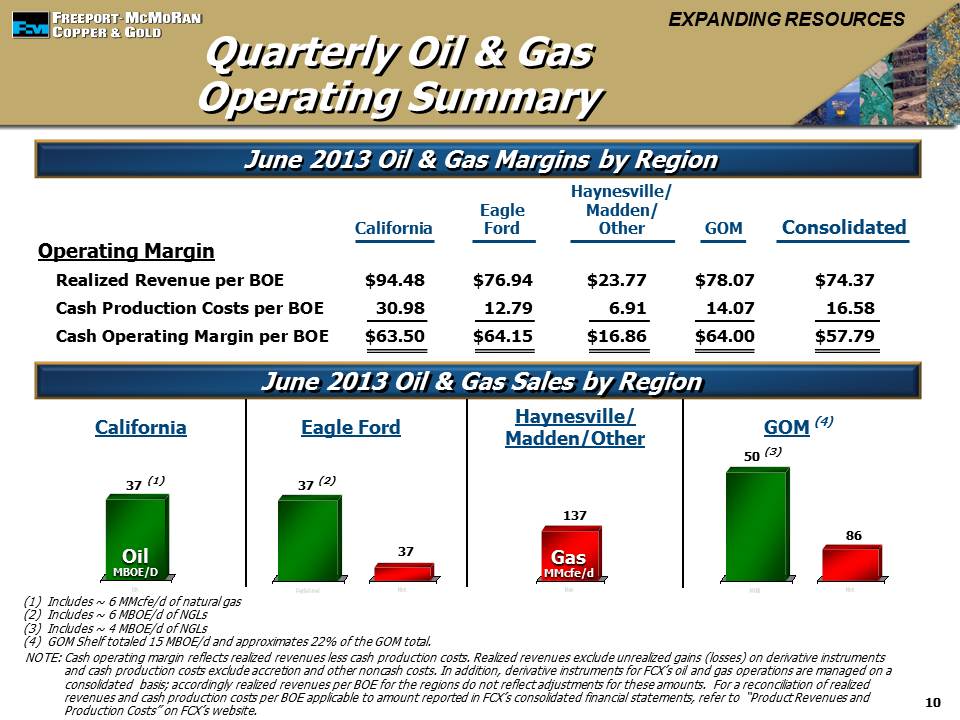
Realized revenues for FCX's oil and gas operations totaled $372 million ($74.37 per BOE) and cash production costs totaled $83 million ($16.58 per BOE) in June 2013.
During June 2013, Brent crude oil prices averaged $103.38 per barrel. FM O&G's average realized price for crude oil in June 2013 was $97.42 per barrel, or 94 percent of Brent. Excluding the impact of derivative instruments, the June 2013 average realized price for crude oil was $97.05 per barrel.
The New York Mercantile Exchange (NYMEX) gas price for the June 2013 contract was $4.15 per million British thermal units (MMBtu). FM O&G's average realized price for natural gas in June 2013 was $3.86 per MMBtu, or 93 percent of NYMEX. Excluding the impact of derivative instruments, the June 2013 average realized price for natural gas was $3.81 per MMBtu.
Freeport-McMoRan Copper & Gold 12
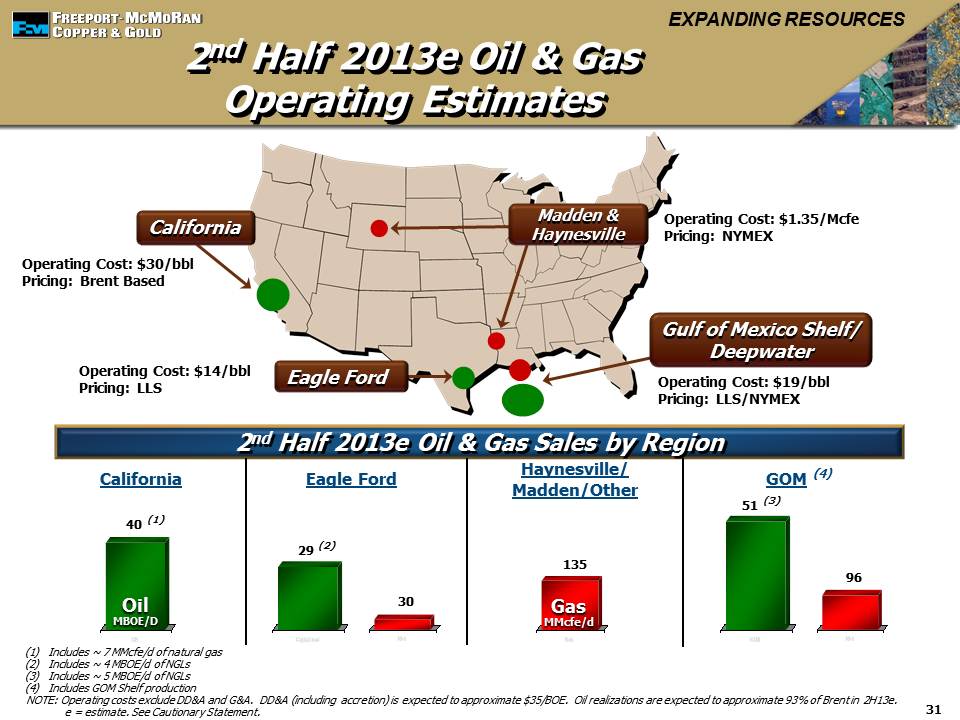
The following table presents sales volumes per day by region for FCX's oil and gas operations:
|
| |
Sales Volumes (MBOE per day): | |
GOMa | 64 |
Eagle Ford | 43 |
California | 37 |
Haynesville/Madden/Other | 25 |
Total oil and gas operations | 169 |
| |
| |
a. | Includes sales from properties on the Shelf and in the Deepwater GOM. Production from the GOM Shelf totaled 15 MBOE per day in June 2013, approximating 22 percent of the GOM total. |
Daily sales volumes averaged 169 MBOE in June 2013, including 114 MBbls of crude oil per day, 263 MMcf of natural gas per day and 11 MBbls of NGLs per day. For the second half of 2013, sales volumes from FCX's oil and gas operations are expected to average 163 MBOE per day, comprised of 67 percent oil, 27 percent natural gas and 6 percent NGLs.
Based on current sales volume and cost estimates for the second half of 2013, cash production costs are expected to approximate $19 per BOE for the year 2013 (reflecting results beginning June 1, 2013).
Exploration, Operating and Development Activities. FCX's oil and gas business has significant proved, probable and possible reserves, and a large resource position with financially attractive organic growth opportunities. The portfolio includes a broad range of relatively low-risk development opportunities and high-potential exploration prospects. The business will be managed to reinvest its cash flows in projects with attractive rates of returns and risk profiles.
Capital expenditures for FM O&G totaled $190 million during June 2013, including $77 million in Eagle Ford, $52 million in GOM (including GOM Shelf), $30 million in California and $18 million in the Ultra-deep Trend. Oil and gas capital expenditures are expected to approximate $1.3 billion for the second half of 2013, including approximately $0.4 billion in the Deepwater GOM, $0.4 billion in Eagle Ford and $0.2 billion in the Ultra-deep Trend. Capital expenditures for FM O&G are expected to be funded by its operating cash flows. In addition, FM O&G is undertaking a plan to divest of certain of its Shelf oil and gas properties and may consider potential additional sales or partnering arrangements, depending on market conditions.
Gulf of Mexico. Multiple development and exploration opportunities have been identified in the Deepwater GOM that are expected to benefit from tieback opportunities to available production capacity at the FM O&G operated large-scale Holstein, Marlin and Horn Mountain deepwater production platforms. FM O&G has contracted three drill ships to drill and evaluate deepwater prospects, two of which are currently under construction. Delivery of the drill ships are expected mid-2014 and early 2015.
At the Lucius development in Keathley Canyon (in which FM O&G has a 23.33 percent working interest) five of the six planned wells have been drilled with the sixth well currently in progress. In December 2011, the operator and its working interest partners sanctioned development of Lucius, a subsea development consisting of a truss spar hull located in 7,200 feet of water with a topside capacity of 80 MBbls of oil per day and 450 MMcf of gas per day. First production is anticipated in the second half of 2014.
In April 2013, the operator of the Phobos prospect (in which FM O&G has a 50 percent working interest) announced that the Phobos-1 well encountered approximately 250 net feet of high quality oil pay in Lower Tertiary reservoirs. The Phobos discovery is located in approximately 8,500 feet of water, approximately 11 miles south of the Lucius development. Phobos' close proximity to Lucius could enhance the economics of this project. The operator and partners are incorporating the data from the Phobos-1 well to determine future plans.
Freeport-McMoRan Copper & Gold 13
Eagle Ford. FCX has an attractive position in an oil and NGLs rich section of the Eagle Ford shale play, located in South Texas. Production from the field has grown significantly in recent years and totaled 43 MBOE per day in June 2013. At June 30, 2013, FM O&G had six drilling rigs operating. As part of its capital reduction initiatives, FCX expects to reduce drilling activity at Eagle Ford over the next several quarters. FCX's Eagle Ford acreage position provides flexibility to manage its drilling program to meet capital spending and cash flow objectives.
California. FCX's development plans are principally focused on maintaining stable production levels in its long established producing fields principally onshore California.
Haynesville. FCX has rights to a substantial natural gas resource, estimated to exceed five trillion cubic feet (Tcf), located in the Haynesville shale play in North Louisiana. Drilling activities in recent years have been significantly reduced as a result of low natural gas prices. The field is currently being operated to maximize cash flows in a low natural gas price environment. FM O&G has flexibility to manage its drilling program and large resource to benefit from potentially higher future natural gas prices.
Ultra-deep Trend. FCX has a leading industry position in the emerging ultra-deep trend with a significant onshore and offshore lease acreage position with high quality prospects and the potential to develop a significant long-term, low-cost source of natural gas. Data from seven wells drilled to date indicate the presence of geologic formations that are analogous to productive formations in the Deepwater GOM and onshore in the Gulf Coast region. The near-term focus is on further defining the trend onshore. FM O&G currently has two onshore ultra-deep exploration prospects in-progress, including Lineham Creek (in which FM O&G has a 36 percent working interest) and Lomond North in the Highlander area (in which FM O&G has a 72 percent working interest).
CASH FLOWS, CASH, DEBT and FINANCIAL OUTLOOK
Operating Cash Flows. FCX generated operating cash flows of $1.0 billion (including $235 million in working capital sources and changes in other tax payments) for second-quarter 2013 and $1.9 billion (net of $195 million in working capital uses and changes in other tax payments) for the first six months of 2013.
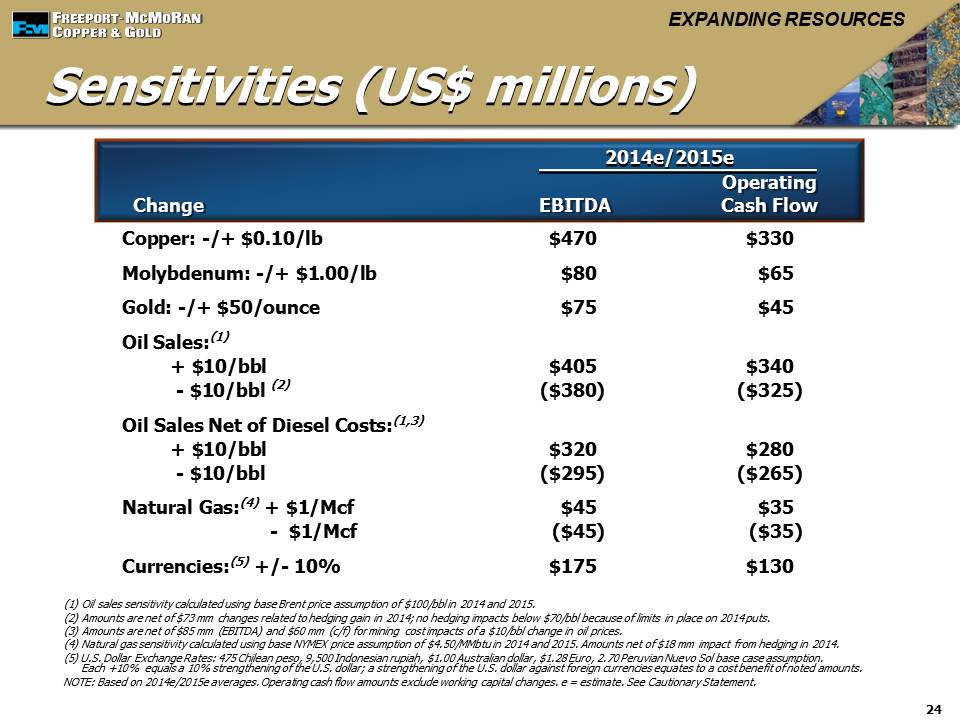
Based on current sales volume and cost estimates and assuming average prices of $3.15 per pound of copper, $1,300 per ounce of gold, $10 per pound of molybdenum, and $105 per barrel of Brent crude oil for the second half of 2013, FCX's consolidated operating cash flows are estimated to approximate $5.8 billion (net of $30 million in net working capital uses and changes in other tax payments) for the year 2013. The impact of price changes during the second half of 2013 on operating cash flows would approximate $200 million for each $0.10 per pound change in the average price of copper, $30 million for each $50 per ounce change in the average price of gold, $55 million for each $2 per pound change in the average price of molybdenum and $55 million for each $5 per barrel increase in the price of Brent crude oil.
Capital Expenditures. Capital expenditures totaled $1.2 billion for second-quarter 2013 and $2.0 billion for the first six months of 2013. Capital expenditures for the second quarter and first six months of 2013 included $190 million for oil and gas operations for the period beginning June 1, 2013.
Capital expenditures are currently expected to approximate $5.5 billion for the year 2013, including $2.3 billion for major projects at mining operations and $1.5 billion for oil and gas operations (for the period beginning June 1, 2013). Major projects at FCX's mines for the year 2013 primarily include the expansions at Cerro Verde and Morenci and underground development activities at Grasberg. Capital expenditures for FCX's oil & gas operations are expected to be funded by its operating cash flows.
During second-quarter 2013, FCX took actions to reduce or defer capital expenditures and other costs, and initiated efforts to identify potential asset sales to reduce debt and maintain financial strength and flexibility in response to recent declines in metals prices. As a first step, FCX has reduced its budgeted future capital expenditures, exploration and other costs by a total of $1.9 billion in 2013 and 2014, including $1.0 billion in reductions and deferrals of mining capital projects, $0.4 billion in reduced oil and gas investments and $0.5 billion in reduced minerals exploration, research and other costs. Capital spending plans remain under review and will be revised as market conditions warrant.
FCX has also initiated a process to divest certain oil and gas properties from its conventional GOM Shelf properties. FCX has a broad set of natural resource assets which provide many alternatives for future actions to enhance FCX's financial flexibility and value for shareholders. Additional capital cost reductions and divestitures will
Freeport-McMoRan Copper & Gold 14
be pursued as required to maintain a strong balance sheet while preserving a strong resource position and portfolio of assets with attractive long-term growth prospects.
Cash. Following is a summary of cash available to the parent company, net of noncontrolling interests' share, taxes and other costs at June 30, 2013 (in billions):
|
| | | | |
Cash at domestic companies | $ | 1.3 |
| |
Cash at international operations | 2.0 |
| |
Total consolidated cash and cash equivalents | 3.3 |
| |
Less: Noncontrolling interests' share | (0.8 | ) | |
Cash, net of noncontrolling interests' share | 2.5 |
| |
Less: Withholding taxes and other | (0.1 | ) | |
Net cash available | $ | 2.4 |
| |
| | |
Debt. Following is a summary of total debt and related weighted-average interest rates at June 30, 2013:
|
| | | | | | |
| | | Weighted- | |
| June 30, 2013 | | Average | |
| (in billions) | | Interest Rate | |
Acquisition-related debt | $ | 10.5 |
| a | 3.1% | |
Assumed debt of PXP and MMR | 7.1 |
| b | 7.0% | |
FCX's previously existing debt | 3.6 |
| | 3.5% | |
| $ | 21.2 |
| | 4.4% | |
| | | | |
a. FCX used the proceeds from the issuance of $6.5 billion of senior notes and a $4.0 billion bank term loan to finance the acquisitions of PXP and MMR and repay certain PXP debt.
b. Following the acquisitions of PXP and MMR, FCX repaid $4.1 billion of the $11.2 billion of debt assumed in the transactions.
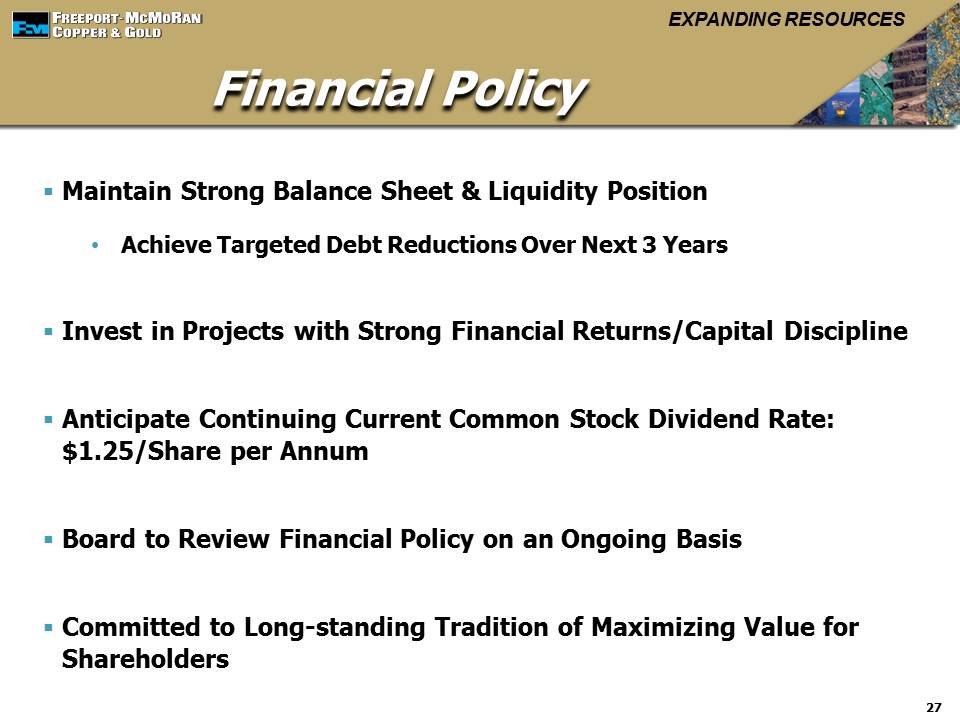
FCX has established a plan to reduce debt and is targeting reductions that will reduce total debt to $12 billion over the next three years.
Upon closing of the PXP acquisition, FCX replaced its revolving credit facility that was scheduled to expire in March 2016 with a new $3.0 billion senior unsecured revolving credit facility, which is available through May 2018. At June 30, 2013, FCX had no borrowings outstanding and $46 million of letters of credit issued under its revolving credit facility, resulting in availability of approximately $3.0 billion.
FINANCIAL POLICY
FCX has a long-standing tradition of seeking to build shareholder value through investing in projects with attractive rates of return and returning cash to shareholders through common stock dividends and share purchases. FCX paid common stock dividends of $595 million in the first six months of 2013.
On May 31, 2013, FCX's Board of Directors (the Board) declared a supplemental common stock dividend of $1.00 per share, which was paid on July 1, 2013. Based on 1.04 billion common shares outstanding, the supplemental dividend payment totaled $1.0 billion. This supplemental dividend, which is in addition to FCX's regular quarterly dividend, is the eleventh supplemental dividend paid by FCX since 2004. FCX's current annual dividend rate for its common stock is $1.25 per share. On June 27, 2013, the Board declared a regular quarterly dividend of $0.3125 per share, which will be paid on August 1, 2013.
FCX intends to continue to maintain a strong financial position, with a focus on debt reduction while continuing to invest in attractive growth projects and providing cash returns to shareholders. The Board will continue to review FCX's financial policy on an ongoing basis.
Freeport-McMoRan Copper & Gold 15
WEBCAST INFORMATION
A conference call with securities analysts to discuss FCX's second-quarter 2013 results is scheduled for today at 10:00 a.m. Eastern Time. The conference call will be broadcast on the Internet along with slides. Interested parties may listen to the conference call live and view the slides by accessing "www.fcx.com." A replay of the webcast will be available through Friday, August 23, 2013.
-----------------------------------------------------------------------------------------------------------
FCX is a premier U.S.-based natural resource company with an industry leading global portfolio of mineral assets, significant oil and gas resources and a growing production profile. FCX is the world's largest publicly traded copper producer.
FCX's portfolio of assets includes the Grasberg minerals district in Indonesia, one of the world's largest copper and gold deposits; significant mining operations in the Americas, including the large-scale Morenci minerals district in North America and the Cerro Verde and El Abra operations in South America; the Tenke Fungurume minerals district in the DRC; and significant oil and natural gas assets in North America, including reserves in the Deepwater GOM, onshore and offshore California and in the Eagle Ford and Haynesville shale plays, and an industry leading position in the emerging shallow water, ultra-deep gas trend on the Shelf of the GOM and onshore in South Louisiana. Additional information about FCX is available on FCX's website at "www.fcx.com."
Cautionary Statement and Regulation G Disclosure: This press release contains forward-looking statements in which FCX discusses its potential future performance. Forward-looking statements are all statements other than statements of historical facts, such as projections or expectations relating to ore grades and milling rates, production and sales volumes, unit net cash costs, operating cash flows, capital expenditures, exploration efforts and results, development and production activities and costs, liquidity, tax rates, the impact of copper, gold, molybdenum, cobalt, oil and gas price changes, the impact of derivative positions, the impact of deferred intercompany profits on earnings, reserve estimates, future dividend payments and potential share purchases. The words “anticipates,” “may,” “can,” “plans,” “believes,” “estimates,” “expects,” “projects,” “intends,” “likely,” “will,” “should,” “to be,” and any similar expressions are intended to identify those assertions as forward-looking statements. The declaration of dividends is at the discretion of FCX's Board and will depend on FCX's financial results, cash requirements, future prospects, and other factors deemed relevant by the Board.
FCX cautions readers that forward-looking statements are not guarantees of future performance and its actual results may differ materially from those anticipated, projected or assumed in the forward-looking statements. Important factors that can cause FCX's actual results to differ materially from those anticipated in the forward-looking statements include demand for, and prices of, copper, gold, molybdenum, cobalt, oil and gas, mine sequencing, production rates, drilling results, the outcome of ongoing discussions with the Indonesian government, the potential effects of violence in Indonesia, the resolution of administrative disputes in the Democratic Republic of Congo, labor relations, the ability to retain current or future lease acreage rights, unanticipated hazards for which we have limited or no insurance coverage, failure of third party partners to fulfill their capital and other commitments, adverse conditions that could lead to structural or mechanical failures or increased costs, changes in reserve estimates, currency translation risks, risks associated with the integration of recently acquired oil and gas operations, industry risks, regulatory changes, political risks, weather- and climate-related risks, environmental risks, litigation results, and other factors described in more detail under the heading “Risk Factors” in FCX's Annual Report on Form 10-K for the year ended December 31, 2012, filed with the U.S. Securities and Exchange Commission (SEC) as updated by FCX's subsequent filings with the SEC.
Investors are cautioned that many of the assumptions on which FCX's forward-looking statements are based are likely to change after its forward-looking statements are made, including for example commodity prices, which FCX cannot control, and production volumes and costs, some aspects of which FCX may or may not be able to control. Further, FCX may make changes to its business plans that could or will affect its results. FCX cautions investors that it does not intend to update forward-looking statements more frequently than quarterly notwithstanding any changes in FCX's assumptions, changes in business plans, actual experience or other changes, and FCX undertakes no obligation to update any forward-looking statements.
This press release also contains certain financial measures such as unit net cash costs per pound of copper and per pound of molybdenum, oil and gas product revenues, cash production costs and realizations, which are not recognized under generally accepted accounting principles in the U.S. As required by SEC Regulation G, reconciliations of these measures to amounts reported in FCX's consolidated financial statements are in the supplemental schedules of this press release, which are also available on FCX's website, "www.fcx.com."
Freeport-McMoRan Copper & Gold 16
|
| | | | | | | | | | | | | | | |
FREEPORT-McMoRan COPPER & GOLD INC. | |
SELECTED MINING OPERATING DATA | |
| | | | | | | | | |
| Three Months Ended June 30, | | |
| Production | | Sales | | |
COPPER (millions of recoverable pounds) | 2013 | | 2012 | | 2013 | | 2012 | | |
(FCX's net interest in %) | | | | | | | | | |
North America | | | | | | | | | |
Morenci (85%)a | 136 |
| | 129 |
| | 147 |
| | 141 |
| | |
Bagdad (100%) | 52 |
| | 48 |
| | 54 |
| | 52 |
| | |
Safford (100%) | 42 |
| | 46 |
| | 43 |
| | 50 |
| | |
Sierrita (100%) | 39 |
| | 39 |
| | 42 |
| | 45 |
| | |
Miami (100%) | 14 |
| | 17 |
| | 15 |
| | 19 |
| | |
Chino (100%) | 40 |
| | 31 |
| | 44 |
| | 32 |
| | |
Tyrone (100%) | 24 |
| | 20 |
| | 25 |
| | 21 |
| | |
Other (100%) | 2 |
| | 1 |
| | 2 |
| | 1 |
| | |
Total North America | 349 |
| | 331 |
| | 372 |
| | 361 |
| | |
| | | | | | | | | |
South America | | | | | | | | | |
Cerro Verde (53.56%) | 136 |
| | 151 |
| | 139 |
| | 149 |
| | |
El Abra (51%) | 84 |
| | 82 |
| | 93 |
| | 87 |
| | |
Candelaria/Ojos del Salado (80%) | 79 |
| | 71 |
| | 83 |
| | 65 |
| | |
Total South America | 299 |
| | 304 |
| | 315 |
| | 301 |
| | |
| | | | | | | | | |
Indonesia | | | | | | | | | |
Grasberg (90.64%)b | 139 |
| | 173 |
| | 158 |
| | 183 |
| | |
| | | | | | | | | |
Africa | | | | | | | | | |
Tenke Fungurume (56%) | 122 |
| | 79 |
| | 106 |
| | 82 |
| | |
| | | | | | | | | |
Consolidated | 909 |
| | 887 |
| | 951 |
| | 927 |
| | |
Less noncontrolling interests | 187 |
| | 175 |
| | 188 |
| | 178 |
| | |
Net | 722 |
| | 712 |
| | 763 |
| | 749 |
| | |
| | | | | | | | | |
Consolidated sales from mines | | | | | 951 |
| | 927 |
| | |
Purchased copper | | | | | 54 |
| | 25 |
| | |
Total copper sales, including purchases | | | | | 1,005 |
| | 952 |
| | |
| | | | | | | | | |
Average realized price per pound | | | | | $ | 3.17 |
| | $ | 3.53 |
| | |
| | | | | | | | | |
GOLD (thousands of recoverable ounces) | | | | | | | | | |
(FCX's net interest in %) | | | | | | | | | |
North America (100%) | 1 |
| | 3 |
| | 1 |
| | 3 |
| | |
South America (80%) | 19 |
| | 18 |
| | 21 |
| | 16 |
| | |
Indonesia (90.64%)b | 131 |
| | 230 |
| | 151 |
| | 247 |
| | |
Consolidated | 151 |
| | 251 |
| | 173 |
| | 266 |
| | |
Less noncontrolling interests | 16 |
| | 25 |
| | 18 |
| | 27 |
| | |
Net | 135 |
| | 226 |
| | 155 |
| | 239 |
| | |
| | | | | | | | | |
Average realized price per ounce | | | | | $ | 1,322 |
| | $ | 1,588 |
| | |
| | | | | | | | | |
MOLYBDENUM (millions of recoverable pounds) | | | | | | | | | |
(FCX's net interest in %) | | | | | | | | | |
Henderson (100%) | 8 |
| | 8 |
| | N/A |
| | N/A |
| | |
Climax (100%) | 5 |
| | 1 |
| | N/A |
| | N/A |
| | |
North America copper mines (100%)a | 9 |
| | 9 |
| | N/A |
| | N/A |
| | |
Cerro Verde (53.56%) | 2 |
| | 2 |
| | N/A |
| | N/A |
| | |
Consolidated | 24 |
| | 20 |
| | 23 |
| | 20 |
| | |
Less noncontrolling interests | 1 |
| | 1 |
| | 1 |
| | 1 |
| | |
Net | 23 |
| | 19 |
| | 22 |
| | 19 |
| | |
| | | | | | | | | |
Average realized price per pound | | | | | $ | 12.35 |
| | $ | 15.44 |
| | |
| | | | | | | | | |
COBALT (millions of contained pounds) | | | | | | | | | |
(FCX's net interest in %) | | | | | | | | | |
Consolidated - Tenke Fungurume (56%) | 5 |
| | 6 |
| | 5 |
| | 6 |
| | |
Less noncontrolling interests | 2 |
| | 2 |
| | 2 |
| | 3 |
| | |
Net | 3 |
| | 4 |
| | 3 |
| | 3 |
| | |
| | | | | | | | | |
Average realized price per pound | | | | | $ | 8.48 |
| | $ | 8.24 |
| | |
| | | | | | | | | |
a. Amounts are net of Morenci's 15 percent joint venture partner's interest. |
b. Amounts are net of Grasberg's joint venture partner's interest, which varies in accordance with the terms of the joint venture agreement. |
|
| | | | | | | | | | | | | | | |
FREEPORT-McMoRan COPPER & GOLD INC. | |
SELECTED MINING OPERATING DATA (continued) | |
| | | | | | | | | |
| Six Months Ended June 30, | | |
| Production | | Sales | | |
COPPER (millions of recoverable pounds) | 2013 | | 2012 | | 2013 | | 2012 | | |
(FCX's net interest in %) | | | | | | | | | |
North America | | | | | | | | | |
Morenci (85%)a | 274 |
| | 259 |
| | 288 |
| | 273 |
| | |
Bagdad (100%) | 101 |
| | 96 |
| | 105 |
| | 101 |
| | |
Safford (100%) | 73 |
| | 92 |
| | 80 |
| | 95 |
| | |
Sierrita (100%) | 83 |
| | 82 |
| | 85 |
| | 89 |
| | |
Miami (100%) | 28 |
| | 37 |
| | 29 |
| | 39 |
| | |
Chino (100%) | 83 |
| | 60 |
| | 87 |
| | 59 |
| | |
Tyrone (100%) | 47 |
| | 40 |
| | 48 |
| | 41 |
| | |
Other (100%) | 3 |
| | 2 |
| | 3 |
| | 2 |
| | |
Total North America | 692 |
| | 668 |
| | 725 |
| | 699 |
| | |
| | | | | | | | | |
South America | | | | | | | | | |
Cerro Verde (53.56%) | 258 |
| | 290 |
| | 258 |
| | 285 |
| | |
El Abra (51%) | 174 |
| | 164 |
| | 172 |
| | 166 |
| | |
Candelaria/Ojos del Salado (80%) | 165 |
| | 143 |
| | 170 |
| | 136 |
| | |
Total South America | 597 |
| | 597 |
| | 600 |
| | 587 |
| | |
| | | | | | | | | |
Indonesia | | | | | | | | | |
Grasberg (90.64%)b | 358 |
| | 296 |
| | 356 |
| | 317 |
| | |
| | | | | | | | | |
Africa | | | | | | | | | |
Tenke Fungurume (56%) | 242 |
| | 159 |
| | 224 |
| | 151 |
| | |
| | | | | | | | | |
Consolidated | 1,889 |
| | 1,720 |
| | 1,905 |
| | 1,754 |
| | |
Less noncontrolling interests | 378 |
| | 340 |
| | 370 |
| | 336 |
| | |
Net | 1,511 |
| | 1,380 |
| | 1,535 |
| | 1,418 |
| | |
| | | | | | | | | |
Consolidated sales from mines | | | | | 1,905 |
| | 1,754 |
| | |
Purchased copper | | | | | 103 |
| | 52 |
| | |
Total copper sales, including purchases | | | | | 2,008 |
| | 1,806 |
| | |
| | | | | | | | | |
Average realized price per pound | | | | | $ | 3.29 |
| | $ | 3.61 |
| | |
| | | | | | | | | |
GOLD (thousands of recoverable ounces) | | | | | | | | | |
(FCX's net interest in %) | | | | | | | | | |
North America (100%) | 3 |
| | 7 |
| | 3 |
| | 6 |
| | |
South America (80%) | 40 |
| | 37 |
| | 42 |
| | 35 |
| | |
Indonesia (90.64%)b | 343 |
| | 459 |
| | 342 |
| | 513 |
| | |
Consolidated | 386 |
| | 503 |
| | 387 |
| | 554 |
| | |
Less noncontrolling interests | 40 |
| | 50 |
| | 40 |
| | 55 |
| | |
Net | 346 |
| | 453 |
| | 347 |
| | 499 |
| | |
| | | | | | | | | |
Average realized price per ounce | | | | | $ | 1,434 |
| | $ | 1,639 |
| | |
| | | | | | | | | |
MOLYBDENUM (millions of recoverable pounds) | | | | | | | | | |
(FCX's net interest in %) | | | | | | | | | |
Henderson (100%) | 15 |
| | 17 |
| | N/A |
| | N/A |
| | |
Climax (100%) | 10 |
| | 1 |
| | N/A |
| | N/A |
| | |
North America copper mines (100%)a | 17 |
| | 19 |
| | N/A |
| | N/A |
| | |
Cerro Verde (53.56%) | 4 |
| | 4 |
| | N/A |
| | N/A |
| | |
Consolidated | 46 |
| | 41 |
| | 48 |
| | 41 |
| | |
Less noncontrolling interests | 2 |
| | 2 |
| | 2 |
| | 2 |
| | |
Net | 44 |
| | 39 |
| | 46 |
| | 39 |
| | |
| | | | | | | | | |
Average realized price per pound | | | | | $ | 12.56 |
| | $ | 15.39 |
| | |
| | | | | | | | | |
COBALT (millions of contained pounds) | | | | | | | | | |
(FCX's net interest in %) | | | | | | | | | |
Consolidated - Tenke Fungurume (56%) | 11 |
| | 12 |
| | 11 |
| | 11 |
| | |
Less noncontrolling interests | 5 |
| | 5 |
| | 5 |
| | 5 |
| | |
Net | 6 |
| | 7 |
| | 6 |
| | 6 |
| | |
| | | | | | | | | |
Average realized price per pound | | | | | $ | 7.99 |
| | $ | 8.40 |
| | |
| | | | | | | | | |
a. Amounts are net of Morenci's 15 percent joint venture partner's interest. |
b. Amounts are net of Grasberg's joint venture partner's interest, which varies in accordance with the terms of the joint venture agreement. |
|
| | | | | | | | | | | | |
FREEPORT-McMoRan COPPER & GOLD INC. | | | |
SELECTED MINING OPERATING DATA (continued) | | | |
| | | | | | | | |
| Three Months Ended | | Six Months Ended | |
| June 30, | | June 30, | |
| 2013 | | 2012 | | 2013 | | 2012 | |
100% North America Copper Mines | | | | | | | | |
Solution Extraction/Electrowinning (SX/EW) Operations | | | | | | | | |
Leach ore placed in stockpiles (metric tons per day) | 1,053,000 |
| | 948,600 |
| | 1,026,700 |
| | 990,800 |
| |
Average copper ore grade (percent) | 0.22 |
| | 0.21 |
| | 0.22 |
| | 0.22 |
| |
Copper production (millions of recoverable pounds) | 226 |
| | 210 |
| | 435 |
| | 428 |
| |
| | | | | | | | |
Mill Operations | | | | | | | | |
Ore milled (metric tons per day) | 240,900 |
| | 228,300 |
| | 245,700 |
| | 232,200 |
| |
Average ore grades (percent): | | | | | | | | |
Copper | 0.38 |
| | 0.37 |
| | 0.39 |
| | 0.37 |
| |
Molybdenum | 0.03 |
| | 0.03 |
| | 0.03 |
| | 0.03 |
| |
Copper recovery rate (percent) | 82.4 |
| | 85.3 |
| | 83.4 |
| | 82.6 |
| |
Production (millions of recoverable pounds): | | | | | | | | |
Copper | 148 |
| | 144 |
| | 306 |
| | 286 |
| |
Molybdenum | 9 |
| | 9 |
| | 17 |
| | 19 |
| |
| | | | | | | | |
100% South America Mining | | | | | | | | |
SX/EW Operations | | | | | | | | |
Leach ore placed in stockpiles (metric tons per day) | 279,100 |
| | 242,700 |
| | 271,000 |
| | 219,500 |
| |
Average copper ore grade (percent) | 0.50 |
| | 0.54 |
| | 0.50 |
| | 0.55 |
| |
Copper production (millions of recoverable pounds) | 110 |
| | 113 |
| | 219 |
| | 231 |
| |
| | | | | | | | |
Mill Operations | | | | | | | | |
Ore milled (metric tons per day) | 194,600 |
| | 192,600 |
| | 191,600 |
| | 189,300 |
| |
Average ore grades: | | | | | | | | |
Copper (percent) | 0.56 |
| | 0.58 |
| | 0.57 |
| | 0.57 |
| |
Gold (grams per metric ton) | 0.09 |
| | 0.08 |
| | 0.10 |
| | 0.09 |
| |
Molybdenum (percent) | 0.02 |
| | 0.02 |
| | 0.02 |
| | 0.02 |
| |
Copper recovery rate (percent) | 89.8 |
| | 88.6 |
| | 90.3 |
| | 88.9 |
| |
Production (recoverable): | | | | | | | | |
Copper (millions of pounds) | 189 |
| | 191 |
| | 378 |
| | 366 |
| |
Gold (thousands of ounces) | 19 |
| | 18 |
| | 40 |
| | 37 |
| |
Molybdenum (millions of pounds) | 2 |
| | 2 |
| | 4 |
| | 4 |
| |
| | | | | | | | |
100% Indonesia Mining | | | | | | | | |
Ore milled (metric tons per day)a | | | | | | | | |
Grasberg open pit | 81,800 |
| | 132,800 |
| | 109,500 |
| | 106,600 |
| |
DOZ underground mine | 31,100 |
| | 45,400 |
| | 44,900 |
| | 39,300 |
| |
Big Gossan underground mine | 1,400 |
| | 1,300 |
| | 2,200 |
| | 1,200 |
| |
Total | 114,300 |
| | 179,500 |
| | 156,600 |
| | 147,100 |
| |
Average ore grades: | | | | | | | | |
Copper (percent) | 0.73 |
| | 0.57 |
| | 0.69 |
| | 0.59 |
| |
Gold (grams per metric ton) | 0.53 |
| | 0.58 |
| | 0.53 |
| | 0.68 |
| |
Recovery rates (percent): | | | | | | | | |
Copper | 89.0 |
| | 88.9 |
| | 88.7 |
| | 89.2 |
| |
Gold | 75.4 |
| | 76.2 |
| | 73.1 |
| | 79.0 |
| |
Production (recoverable): | | | | | | | | |
Copper (millions of pounds) | 139 |
| | 173 |
| | 358 |
| | 296 |
| |
Gold (thousands of ounces) | 131 |
| | 230 |
| | 343 |
| | 459 |
| |
| | | | | | | | |
100% Africa Mining | | | | | | | | |
Ore milled (metric tons per day) | 15,000 |
| | 12,900 |
| | 14,800 |
| | 12,500 |
| |
Average ore grades (percent): | | | | | | | | |
Copper | 4.59 |
| | 3.45 |
| | 4.52 |
| | 3.53 |
| |
Cobalt | 0.31 |
| | 0.36 |
| | 0.32 |
| | 0.37 |
| |
Copper recovery rate (percent) | 89.9 |
| | 90.6 |
| | 91.7 |
| | 90.9 |
| |
Production (millions of pounds): | | | | | | | | |
Copper (recoverable) | 122 |
| | 79 |
| | 242 |
| | 159 |
| |
Cobalt (contained) | 5 |
| | 6 |
| | 11 |
| | 12 |
| |
| | | | | | | | |
100% Molybdenum Minesb | | | | | | | | |
Ore milled (metric tons per day) | 39,000 |
| | 22,000 |
| | 37,400 |
| | 20,900 |
| |
Average molybdenum ore grade (percent) | 0.19 |
| | 0.22 |
| | 0.19 |
| | 0.24 |
| |
Molybdenum production (millions of recoverable pounds) | 13 |
| | 8 |
| | 25 |
| | 17 |
| |
a. Amounts represent the approximate average daily throughput processed at PT Freeport Indonesia's mill facilities from each producing mine.
b. The 2013 periods reflect the results of the Henderson and Climax mines; the 2012 periods reflect the results of only the Henderson mine, as startup activities were still underway for the Climax mine.
|
| | | | | | | | | | | |
FREEPORT-McMoRan COPPER & GOLD INC. | | | | | |
SELECTED OIL AND GAS OPERATING DATA | | | | | |
| | | | | | | | |
| June 1, 2013 to June 30, 2013 | | | |
| Sales Volumes (in MMBbls, Bcf and MMBOE)a | | Sales per Day (in MBbls, MMcf and MBOE)a | | | | | |
FCX CONSOLIDATED OIL AND GAS OPERATIONS | | | | | | | | |
Oil (barrels) | 3.4 |
| | 114 |
| | | | | |
Natural gas (cubic feet) | 7.7 |
| | 263 |
| | | | | |
Natural gas liquids (NGLs, in barrels) | 0.3 |
| | 11 |
| | | | | |
Barrels of oil equivalents (BOE) | 5.0 |
| | 169 |
| | | | | |
Cash operating margin per BOE: | | | | | | | | |
Realized revenue per BOE | $ | 74.37 |
| b | | | | | | |
Cash production costs per BOE | $ | 16.58 |
| b | | | | | | |
Cash operating margin per BOE | $ | 57.79 |
| | | | | | | |
Depreciation, depletion and amortization per BOE | $ | 33.82 |
| | | | | | | |
Capital expenditures (in millions) | $ | 190 |
| | | | | | | |
| | | | | | | | |
GULF OF MEXICO (GOM)c | | | | | | | | |
Oil (barrels) | 1.4 |
| | 46 |
| | | | | |
Natural gas (cubic feet) | 2.4 |
| | 86 |
| | | | | |
NGLs (barrels) | 0.1 |
| | 4 |
| | | | | |
BOE | 1.9 |
| | 64 |
| | | | | |
Average realized price per BOE | $ | 78.07 |
| b | | | | | | |
Cash production costs per BOE | $ | 14.07 |
| b | | | | | | |
Capital expenditures (in millions) | $ | 70 |
| | | | | | | |
| | | | | | | | |
EAGLE FORD | | | | | | | | |
Oil (barrels) | 0.9 |
| | 31 |
| | | | | |
Natural gas (cubic feet) | 1.1 |
| | 37 |
| | | | | |
NGLs (barrels) | 0.2 |
| | 6 |
| | | | | |
BOE | 1.3 |
| | 43 |
| | | | | |
Average realized price per BOE | $ | 76.94 |
| b | | | | | | |
Cash production costs per BOE | $ | 12.79 |
| b | | | | | | |
Capital expenditures (in millions) | $ | 77 |
| | | | | | | |
| | | | | | | | |
CALIFORNIA | | | | | | | | |
Oil (barrels) | 1.1 |
| | 36 |
| | | | | |
Natural gas (cubic feet) | 0.2 |
| | 6 |
| | | | | |
BOE | 1.1 |
| | 37 |
| | | | | |
Average realized price per BOE | $ | 94.48 |
| b | | | | | | |
Cash production costs per BOE | $ | 30.98 |
| b | | | | | | |
Capital expenditures (in millions) | $ | 30 |
| | | | | | | |
| | | | | | | | |
HAYNESVILLE/MADDEN/OTHER | | | | | | | | |
Oil (barrels) | — |
| | 1 |
| | | | | |
Natural gas (cubic feet) | 4.0 |
| | 134 |
| | | | | |
NGLs (barrels) | — |
| | 1 |
| | | | | |
BOE | 0.7 |
| | 25 |
| | | | | |
Average realized price per BOE | $ | 23.77 |
| b | | | | | | |
Cash production costs per BOE | $ | 6.91 |
| b | | | | | | |
Capital expenditures (in millions) | $ | 13 |
| | | | | | | |
| | | | | | | | |
| |
a. | MMBbls = million barrels; MBbls = thousand barrels; Bcf = billion cubic feet; MMcf = million cubic feet; MMBOE = million BOE; MBOE = thousand BOE |
| |
b. | Cash operating margin for FCX's oil and gas operations reflects realized revenues less cash production costs. Average realized revenues exclude unrealized gains (losses) on derivative instruments and cash production costs exclude accretion and other costs. In addition, derivative instruments for FCX's oil and gas operations are managed on a consolidated basis; accordingly, average realized price per BOE by region does not reflect adjustments for derivative instruments. For reconciliations of average realized prices and cash production costs per BOE to revenues and production and delivery costs reported in FCX's consolidated financial statements, refer to the supplemental schedule “Product Revenues and Production Costs” beginning on page XIII, which is available on FCX's website, “www.fcx.com.” |
| |
c. | Includes properties on the Shelf and in the Deepwater GOM. |
|
| | | | | | | | | | | | | | | | |
FREEPORT-McMoRan COPPER & GOLD INC. |
CONSOLIDATED STATEMENTS OF INCOME (Unaudited) |
| | | | | | | | |
| Three Months Ended | | Six Months Ended | |
| June 30, | | June 30, | |
| 2013 | | 2012 | | 2013 | | 2012 | |
| (In Millions, Except Per Share Amounts) | |
Revenues | $ | 4,288 |
| a | $ | 4,475 |
| a | $ | 8,871 |
| a | $ | 9,080 |
| a |
Cost of sales: | | | | | | | | |
Production and delivery | 2,853 |
| | 2,622 |
| | 5,572 |
| | 5,050 |
| |
Depreciation, depletion and amortization | 530 |
| | 291 |
| | 859 |
| | 558 |
| |
Total cost of sales | 3,383 |
| | 2,913 |
| | 6,431 |
| | 5,608 |
| |
Selling, general and administrative expenses | 186 |
| b | 97 |
| | 299 |
| b | 201 |
| |
Mining exploration and research expenses | 64 |
| | 73 |
| | 116 |
| | 135 |
| |
Environmental obligations and shutdown costs | 16 |
| | 81 |
| | 31 |
| | 91 |
| |
Total costs and expenses | 3,649 |
| | 3,164 |
| | 6,877 |
| | 6,035 |
| |
Operating income | 639 |
| | 1,311 |
| | 1,994 |
| | 3,045 |
| |
Interest expense, net | (132 | ) | c | (43 | ) | c | (189 | ) | c | (106 | ) | c |
Losses on early extinguishment of debt | — |
| | — |
| | (45 | ) | | (168 | ) | |
Gain on investment in McMoRan Exploration Co. (MMR) | 128 |
| d | — |
| | 128 |
| d | — |
| |
Other income, net | 13 |
| | 51 |
| | 10 |
| | 38 |
| |
Income before income taxes and equity in affiliated | | | | | | | | |
companies' net earnings (losses) | 648 |
| | 1,319 |
| | 1,898 |
| | 2,809 |
| |
Provision for income taxes | (40 | ) | d | (422 | ) | | (468 | ) | d | (913 | ) | |
Equity in affiliated companies' net earnings (losses) | 2 |
| | (3 | ) | | 4 |
| | (1 | ) | |
Net income | 610 |
| | 894 |
| | 1,434 |
| | 1,895 |
| |
Net income attributable to noncontrolling interests | (128 | ) | | (184 | ) | | (304 | ) | | (421 | ) | |
Net income attributable to FCX common stock | $ | 482 |
| e | $ | 710 |
| e | $ | 1,130 |
| e | $ | 1,474 |
| e |
| | | | | | | | |
Net income per share attributable to FCX common stock: | | | | | | | | |
Basic | $ | 0.49 |
| | $ | 0.75 |
| | $ | 1.17 |
| | $ | 1.55 |
| |
Diluted | $ | 0.49 |
| | $ | 0.74 |
| | $ | 1.17 |
| | $ | 1.55 |
| |
| | | | | | | | |
Weighted-average common shares outstanding: | | | | | | | | |
Basic | 980 |
| | 949 |
| | 965 |
| | 949 |
| |
Diluted | 984 |
| | 953 |
| | 968 |
| | 954 |
| |
| | | | | | | | |
Dividends declared per share of common stock | $ | 1.3125 |
| | $ | 0.3125 |
| | $ | 1.625 |
| | $ | 0.625 |
| |
| | | | | | | | |
| |
a. | Includes (unfavorable) favorable adjustments to provisionally priced copper sales recognized in the prior periods totaling $(117) million ($(55) million to net income attributable to common stock) in second-quarter 2013, $(75) million ($(31) million to net income attributable to common stock) in second-quarter 2012, $(26) million ($(12) million to net income attributable to common stock) for the first six months of 2013 and $101 million ($43 million to net income attributable to common stock) for the first six months of 2012. The 2013 periods also reflect (unfavorable) adjustments of $(35) million ($(27) million to net income attributable to common stock) related to oil and gas derivative instruments that were acquired in connection with FCX's acquisition of Plains Exploration & Company (PXP). For further discussion refer to the supplemental schedule, "Derivative Instruments" on page IX. |
| |
b. | Includes charges of $61 million ($46 million to net income attributable to common stock) for second-quarter 2013 and $75 million ($57 million to net income attributable to common stock) for the first six months of 2013 for transaction and related costs principally associated with the acquisitions of PXP and MMR. |
| |
c. | Consolidated interest expense, excluding capitalized interest, totaled $167 million in second-quarter 2013 and $55 million in second-quarter 2012, $242 million for the first six months of 2013 and $154 million for the first six months of 2012. Higher interest expense in the 2013 periods primarily reflected additional expense associated with acquisition-related debt. |
| |
d. | Includes gains associated with the acquisitions of PXP and MMR, including (i) $128 million to net income attributable to common stock primarily related to FCX's preferred stock investment in and the subsequent acquisition of MMR, and (ii) $183 million to net income attributable to common stock associated with net reductions in FCX's deferred tax liabilities and deferred tax asset valuation allowances resulting from the acquisitions. |
| |
e. | FCX defers recognizing profits on intercompany sales until final sales to third parties occur. Changes in these deferrals attributable to variability in intercompany volumes resulted in net additions (reductions) to net income attributable to common stock of $2 million in second-quarter 2013, $17 million in second-quarter 2012, $27 million for the first six months of 2013 and $(35) million for the first six months of 2012. For further discussion refer to the supplemental schedule, "Deferred Profits" on page X. |
|
| | | | | | | | |
FREEPORT-McMoRan COPPER & GOLD INC. |
CONDENSED CONSOLIDATED BALANCE SHEETS (Unaudited) |
| | | | |
| June 30, | | December 31, | |
| 2013 | | 2012 | |
| (In Millions) | |
ASSETS | | | | |
Current assets: | | | | |
Cash and cash equivalents | $ | 3,294 |
| | $ | 3,705 |
| |
Trade accounts receivable | 1,244 |
| | 927 |
| |
Other accounts receivable | 635 |
| | 702 |
| |
Inventories: |
| | | |
Mill and leach stockpiles | 1,713 |
| | 1,672 |
| |
Materials and supplies, net | 1,725 |
| | 1,504 |
| |
Product | 1,508 |
| | 1,400 |
| |
Other current assets | 458 |
| | 387 |
| |
Total current assets | 10,577 |
| | 10,297 |
| |
Property, plant, equipment and development costs, net | 46,254 |
| | 20,999 |
| |
Long-term mill and leach stockpiles | 2,192 |
| | 1,955 |
| |
Goodwill | 1,811 |
| | — |
| |
Other assets | 2,269 |
| | 2,189 |
| |
Total assets | $ | 63,103 |
| | $ | 35,440 |
| |
| | | | |
LIABILITIES AND EQUITY | | | | |
Current liabilities: | | | | |
Accounts payable and accrued liabilities | $ | 3,771 |
| | $ | 2,708 |
| |
Dividends payable | 1,368 |
| a | 299 |
| |
Current portion of reclamation and environmental obligations | 284 |
| | 241 |
| |
Accrued income taxes | 114 |
| | 93 |
| |
Current portion of debt | 73 |
| | 2 |
| |
Total current liabilities | 5,610 |
| | 3,343 |
| |
Long-term debt, less current portion | 21,142 |
| | 3,525 |
| |
Deferred income taxes | 6,786 |
| | 3,490 |
| |
Reclamation and environmental obligations, less current portion | 3,106 |
| | 2,127 |
| |
Other liabilities | 1,731 |
| | 1,644 |
| |
Total liabilities | 38,375 |
| | 14,129 |
| |
| | | | |
Redeemable noncontrolling interest | 861 |
| | — |
| |
| | | | |
Equity: | | | | |
FCX stockholders' equity: | | | | |
Common stock | 117 |
| | 107 |
| |
Capital in excess of par value | 22,072 |
| | 19,119 |
| |
Retained earnings | 1,865 |
| | 2,399 |
| |
Accumulated other comprehensive loss | (495 | ) | | (506 | ) | |
Common stock held in treasury | (3,681 | ) | | (3,576 | ) | |
Total FCX stockholders' equity | 19,878 |
| | 17,543 |
| |
Noncontrolling interests | 3,989 |
| | 3,768 |
| |
Total equity | 23,867 |
| | 21,311 |
| |
Total liabilities and equity | $ | 63,103 |
| | $ | 35,440 |
| |
| | | | |
a. Includes $1.0 billion for the $1.00 per share supplemental dividend paid on July 1, 2013.
|
| | | | | | | | | |
FREEPORT-McMoRan COPPER & GOLD INC. |
CONSOLIDATED STATEMENTS OF CASH FLOWS (Unaudited) |
| | | |
| | Six Months Ended | |
| | June 30, | |
| | 2013 | | 2012 | |
| | (In Millions) | |
Cash flow from operating activities: | | | | | |
Net income | | $ | 1,434 |
| | $ | 1,895 |
| |
Adjustments to reconcile net income to net cash provided by operating activities: | | | | | |
Depreciation, depletion and amortization | | 859 |
| | 558 |
| |
Gain on investment in MMR | | (128 | ) | | — |
| |
Stock-based compensation | | 65 |
| | 54 |
| |
Pension plan contributions | | (42 | ) | | (75 | ) | |
Net charges for reclamation and environmental obligations, including accretion | | 73 |
| | 112 |
| |
Payments of reclamation and environmental obligations | | (91 | ) | | (98 | ) | |
Losses on early extinguishment of debt | | 45 |
| | 168 |
| |
Deferred income taxes | | 43 |
| | 288 |
| |
Increase in long-term mill and leach stockpiles | | (236 | ) | | (162 | ) | |
Other, net | | 38 |
| | 17 |
| |
(Increases) decreases in working capital and other tax payments, excluding amounts acquired from PXP and MMR: | | | | |
| |
Accounts receivable | | 350 |
| | (182 | ) | |
Inventories | | (160 | ) | | (160 | ) | |
Other current assets | | 58 |
| | (11 | ) | |
Accounts payable and accrued liabilities | | (371 | ) | | (117 | ) | |
Accrued income taxes and other tax payments | | (72 | ) | | (304 | ) | |
Net cash provided by operating activities | | 1,865 |
| | 1,983 |
| |
| | | | | |
Cash flow from investing activities: | | | | | |
Capital expenditures: | | | | | |
North America copper mines | | (543 | ) | | (296 | ) | |
South America | | (470 | ) | | (392 | ) | |
Indonesia | | (511 | ) | | (387 | ) | |
Africa | | (103 | ) | | (297 | ) | |
Molybdenum mines | | (82 | ) | | (148 | ) | |
Oil & gas operations | | (190 | ) | | — |
| |
Other | | (79 | ) | | (27 | ) | |
Acquisition of PXP, net of cash acquired | | (3,465 | ) | | — |
| |
Acquisition of MMR, net of cash acquired | | (1,628 | ) | | — |
| |
Acquisition of cobalt chemical business, net of cash acquired | | (321 | ) | | — |
| |
Other, net | | (264 | ) | | (4 | ) | |
Net cash used in investing activities | | (7,656 | ) | | (1,551 | ) | |
| | | | | |
Cash flow from financing activities: | | | | | |
Proceeds from debt | | 11,021 |
| | 3,016 |
| |
Repayments of debt | | (4,541 | ) | | (3,171 | ) | |
Redemption of MMR preferred stock | | (202 | ) | | — |
| |
Cash dividends and distributions paid: | | | | | |
Common stock | | (595 | ) | | (535 | ) | |
Noncontrolling interests | | (90 | ) | | (38 | ) | |
Debt financing costs | | (111 | ) | | (22 | ) | |
Other, net | | (102 | ) | | 4 |
| |
Net cash provided by (used in) financing activities | | 5,380 |
| | (746 | ) | |
| | | | | |
Net decrease in cash and cash equivalents | | (411 | ) | | (314 | ) | |
Cash and cash equivalents at beginning of year | | 3,705 |
| | 4,822 |
| |
Cash and cash equivalents at end of period | | $ | 3,294 |
| | $ | 4,508 |
| |
| | | | | |
FREEPORT-McMoRan COPPER & GOLD INC.
PROVISION FOR INCOME TAXES
Following are summaries of the approximate amounts in the calculation of FCX's consolidated provision for income taxes for the second quarters and first six months of 2013 and 2012 (in millions, except percentages):
|
| | | | | | | | | | | | | | | | | | | | |
| Three Months Ended June 30, | |
| 2013 | | 2012 | |
| | | | | Income Tax | | | | | | Income Tax | |
| Income | | Effective | | (Provision) | | | | Effective | | (Provision) | |
| (Loss)a | | Tax Rate | | Benefit | | Incomea | | Tax Rate | | Benefit | |
U.S. | $ | 253 |
| | 35% | | $ | (89 | ) | | $ | 454 |
| | 24% | | $ | (110 | ) | |
South America | 341 |
| | 37% | | (127 | ) | | 445 |
| | 34% | | (151 | ) | |
Indonesia | (66 | ) | | 6% | | 4 |
| b | 292 |
| | 43% | | (126 | ) | |
Africa | 67 |
| | 33% | | (22 | ) | | 79 |
| | 28% | | (22 | ) | |
Eliminations and other | 53 |
| | N/A | | (8 | ) | | 49 |
| | N/A | | (8 | ) | |
Annualized rate adjustmentc | — |
| | N/A | | 19 |
| | — |
| | N/A | | (5 | ) | |
| 648 |
| | 34% | | (223 | ) | | 1,319 |
| | 32% | | (422 | ) | |
Acquisition related adjustmentsd | — |
| | N/A | | 183 |
| | — |
| | N/A | | — |
| |
Consolidated FCX | $ | 648 |
| | 6% | | $ | (40 | ) | | $ | 1,319 |
| | 32% | | $ | (422 | ) | |
| | | | | | | | | | | | |
| Six Months Ended June 30, | |
| 2013 | | 2012 | |
| | | | | Income Tax | | | | | | Income Tax | |
| Income | | Effective | | (Provision) | | | | Effective | | (Provision) | |
| (Loss)a | | Tax Rate | | Benefit | | Incomea | | Tax Rate | | Benefit | |
U.S. | $ | 578 |
| | 28% | | $ | (160 | ) | | $ | 793 |
| | 24% | | $ | (193 | ) | |
South America | 784 |
| | 35% | | (278 | ) | | 1,136 |
| | 34% | | (391 | ) | |
Indonesia | 213 |
| | 54% | | (116 | ) | | 643 |
| | 43% | | (276 | ) | |
Africa | 210 |
| | 31% | | (66 | ) | | 168 |
| | 31% | | (51 | ) | |
Eliminations and other | 113 |
| | N/A | | (18 | ) | | 69 |
| | N/A | | 1 |
| |
Annualized rate adjustmentc | — |
| | N/A | | (13 | ) | | — |
| | N/A | | (3 | ) | |
| 1,898 |
| | 34% | e | (651 | ) | | 2,809 |
| | 33% | | (913 | ) | |
Acquisition related adjustmentsd | — |
| | N/A | | 183 |
| | — |
| | N/A | | — |
| |
Consolidated FCX | $ | 1,898 |
| | 25% | | $ | (468 | ) | | $ | 2,809 |
| | 33% | | $ | (913 | ) | |
| |
a. | Represents income by geographic location before income taxes and equity in affiliated companies' net earnings (losses). |
| |
b. | Includes an $18 million charge in second-quarter 2013 to reflect increases in tax reserves related to prior periods. |
| |
c. | In accordance with applicable accounting rules, FCX adjusts its interim provision for income taxes equal to its estimated annualized tax rate. |
| |
d. | Reflects net reductions in FCX's deferred tax liabilities and deferred tax asset valuation allowances resulting from FCX's acquisitions. |
| |
e. | FCX's consolidated effective income tax rate is a function of the combined effective tax rates for the jurisdictions in which it operates. Accordingly, variations in the relative proportions of jurisdictional income result in fluctuations to FCX's consolidated effective income tax rate. Assuming average prices of $3.15 per pound for copper, $1,300 per ounce for gold, $10 per pound for molybdenum and Brent crude oil of $105 per barrel for the second half of 2013 and achievement of current sales volume and cost estimates, FCX estimates its annual consolidated effective tax rate, excluding the impact of the acquisition related adjustments, for the year 2013 will approximate 34 percent. |
FREEPORT-McMoRan COPPER & GOLD INC.
DERIVATIVE INSTRUMENTS
Provisional Pricing. For the first six months of 2013, 45 percent of FCX's mined copper was sold in concentrate, 29 percent as cathode and 26 percent as rod from North America operations. Under the long-established structure of sales agreements prevalent in the industry, copper contained in concentrates and cathodes is provisionally priced at the time of shipment. The provisional prices are finalized in a contractually specified future month (generally one to four months from the shipment date) primarily based on quoted monthly average spot copper prices on the London Metal Exchange (LME). Because a significant portion of FCX's copper concentrate and cathode sales in any quarterly period usually remain subject to final pricing, the quarter-end forward price is a major determinant of recorded revenues and the average recorded copper price for the period. LME spot copper prices averaged $3.24 per pound during second-quarter 2013, compared to FCX's average realized price of $3.17 per pound.
Following are the (unfavorable) favorable impacts of net adjustments to prior periods' provisionally priced copper sales for the second quarters and first six months of 2013 and 2012 (in millions, except per share amounts): |
| | | | | | | | | | | | | | | |
| Three Months Ended | | Six Months Ended |
| June 30, | | June 30, |
| 2013 | | 2012 | | 2013 | | 2012 |
Revenues | $ | (117 | ) | | $ | (75 | ) | | $ | (26 | ) | | $ | 101 |
|
Net income attributable to FCX common stock | $ | (55 | ) | | $ | (31 | ) | | $ | (12 | ) | | $ | 43 |
|
Net income per share of FCX common stock | $ | (0.06 | ) | | $ | (0.03 | ) | | $ | (0.01 | ) | | $ | 0.05 |
|
At June 30, 2013, FCX had provisionally priced copper sales at its copper mining operations, primarily South America and Indonesia, totaling 306 million pounds of copper (net of intercompany sales and noncontrolling interests) recorded at an average of $3.06 per pound, subject to final pricing over the next several months. FCX estimates that each $0.05 change in the price realized from the June 30, 2013, provisional price recorded would have an approximate $21 million effect on its 2013 consolidated revenues ($11 million to net income attributable to common stock). The LME spot copper price closed at $3.16 per pound on July 22, 2013.
Oil and Gas. FCX's oil and gas operations uses various derivative instruments to manage its exposure to commodity price risk related to sales of oil and gas production. These instruments do not qualify for hedge accounting and mark-to-market price fluctuations are reflected in revenues each period. A variety of derivative instruments, including swaps, put and call options, and various combinations of these instruments are in place to protect oil and gas cash flows through 2015.
Following are the unfavorable impacts of net adjustments to oil and gas derivative contracts for second-quarter 2013 (reflecting the period beginning June 1, 2013).
|
| | | |
Revenuesa | $ | (35 | ) |
Net income attributable to FCX common stock | $ | (27 | ) |
Net income per share of FCX common stock | $ | (0.03 | ) |
a. Includes unrealized losses of $36 million, partly offset by realized gains of $1 million. Unrealized losses reflect a net decrease in the fair value of the derivatives primarily related to an increase in forward Brent crude oil prices during June 2013.
As of June 30, 2013, the fair value of the oil and gas derivative contracts totaled $443 million. Offsetting the fair value is $478 million in deferred premiums and interest to be settled in future periods.
Following presents the estimated impact of a 10 percent change in Brent and NYMEX forward prices on the fair values of outstanding oil and gas derivative instruments, compared with forward prices used to determine the June 30, 2013, fair values:
|
| | | | | | | | |
| | 10% Increase (in millions) | | 10% Decrease (in millions) |
Crude oil puts | | $ | (148 | ) | | $ | 224 |
|
Crude oil collars | | (15 | ) | | 30 |
|
Crude oil swaps | | (74 | ) | | 74 |
|
Natural gas swaps | | (20 | ) | | 20 |
|
| | $ | (257 | ) | | $ | 348 |
|
| | | | |
FREEPORT-McMoRan COPPER & GOLD INC.
DEFERRED PROFITS
FCX defers recognizing profits on sales from its mining operations to Atlantic Copper and on 25 percent of Indonesia mining's sales to PT Smelting (PT Freeport Indonesia's 25 percent-owned Indonesian smelting unit) until final sales to third parties occur. Changes in these deferrals attributable to variability in intercompany volumes resulted in net additions (reductions) to net income attributable to common stock totaling $2 million in second-quarter 2013, $17 million in second-quarter 2012, $27 million for the first six months of 2013, and $(35) million for the first six months of 2012. FCX's net deferred profits on its inventories at Atlantic Copper and PT Smelting to be recognized in future periods' net income attributable to common stock totaled $31 million at June 30, 2013. Quarterly variations in ore grades, the timing of intercompany shipments and changes in product prices will result in variability in FCX's net deferred profits and quarterly earnings.
BUSINESS SEGMENTS
Subsequent to the acquisitions of PXP and MMR, FCX has organized its operations into six primary divisions – North America copper mines, South America mining, Indonesia mining, Africa mining, Molybdenum mines and Oil & Gas operations. Notwithstanding this structure, FCX internally reports information on a mine-by-mine basis for its mining operations. Therefore, FCX concluded that its operating segments include individual mines or operations relative to its mining operations. For oil and gas operations, operating segments are determined on a country-by-country basis and all of FCX's oil and gas operations are in the United States. Operating segments that meet certain thresholds are reportable segments, which are separately disclosed in the following table.
Intersegment Sales. Intersegment sales between FCX’s mining operations are based on similar arms-length transactions with third parties at the time of the sale. Intersegment sales may not be reflective of the actual prices ultimately realized because of a variety of factors, including additional processing, timing of sales to unaffiliated customers and transportation premiums.
Allocations. FCX allocates certain operating costs, expenses and capital expenditures to its operating divisions and individual segments. However, not all costs and expenses applicable to a mine or operation are allocated. U.S. federal and state income taxes are recorded and managed at the corporate level, whereas foreign income taxes are recorded and managed at the applicable country. In addition, most exploration and research activities are managed at the corporate level, and those costs along with some selling, general and administrative costs are not allocated to the operating divisions or segments. Accordingly, the following segment information reflects management determinations that may not be indicative of what the actual financial performance of each operating division or segment would be if it was an independent entity.
FREEPORT-McMoRan COPPER & GOLD INC.
BUSINESS SEGMENTS (continued)
|
| | | | | | | | | | | | | | | | | | | | | | | | | | | | | | | | | | | | | | | | | | | | | | | | | | | | | | | | | | | | | | | |
(In millions) | Mining Operations | | | | | | |
| North America Copper Mines | | South America | | Indonesia | | Africa | | | | | | | | | | | | | | | | |
| | | | | | | | | | | | | | | | | | | | | Atlantic | | Other | | | | | | Corporate, | | |
| | | | | | | | | | | | | | | | | Molyb- | | | | Copper | | Mining | | | | | | Other | | |
| | | Other | | | | Cerro | | Other | | | | | | | | denum | | Rod & | | Smelting | | & Elimi- | | Total | | Oil & Gas | | & Elimi- | | FCX |
| Morenci | | Mines | | Total | | Verde | | Mines | | Total | | Grasberg | | Tenke | | Mines | | Refining | | & Refining | | nations | | Mining | | Operations | | nations | | Total |
Three Months Ended June 30, 2013 | | | | | | | | | | | | | | | | | | | | | | | | | | | | | | | |
Revenues: | | | | | | | | | | | | | | | | | | | | | | | | | | | | | | | |
Unaffiliated customers | $ | 38 |
| | $ | 76 |
| | $ | 114 |
| | $ | 311 |
| | $ | 453 |
| | $ | 764 |
| | $ | 471 |
| a | $ | 355 |
| | $ | — |
| | $ | 1,265 |
| | $ | 583 |
| | $ | 399 |
| b | $ | 3,951 |
| | $ | 336 |
| c | $ | 1 |
| | $ | 4,288 |
|
Intersegment | 444 |
| | 751 |
| | 1,195 |
| | 86 |
| | 101 |
| | 187 |
| | 120 |
| | 10 |
| | 144 |
| | 7 |
| | 4 |
| | (1,667 | ) | | — |
| | — |
| | — |
| | — |
|
Production and delivery | 301 |
| | 552 |
| | 853 |
| | 189 |
| | 327 |
| | 516 |
| | 563 |
| | 185 |
| | 78 |
| | 1,262 |
| | 575 |
| | (1,273 | ) | | 2,759 |
| | 89 |
| | 5 |
| | 2,853 |
|
Depreciation, depletion and amortization | 37 |
| | 71 |
| | 108 |
| | 37 |
| | 49 |
| | 86 |
| | 58 |
| | 57 |
| | 21 |
| | 2 |
| | 12 |
| | 14 |
| | 358 |
| | 169 |
| | 3 |
| | 530 |
|
Selling, general and administrative expenses | 1 |
| | 1 |
| | 2 |
| | 2 |
| | — |
| | 2 |
| | 27 |
| | 3 |
| | — |
| | — |
| | 4 |
| | 9 |
| | 47 |
| | 14 |
| | 125 |
| | 186 |
|
Mining exploration and research expenses | — |
| | 1 |
| | 1 |
| | — |
| | — |
| | — |
| | — |
| | — |
| | — |
| | — |
| | — |
| | 60 |
| | 61 |
| | — |
| | 3 |
| | 64 |
|
Environmental obligations and shutdown costs | — |
| | (2 | ) | | (2 | ) | | — |
| | — |
| | — |
| | — |
| | — |
| | — |
| | — |
| | — |
| | 18 |
| | 16 |
| | — |
| | — |
| | 16 |
|
Operating income (loss) | 143 |
| | 204 |
| | 347 |
| | 169 |
| | 178 |
| | 347 |
| | (57 | ) | | 120 |
| | 45 |
| | 8 |
| | (4 | ) | | (96 | ) | | 710 |
| | 64 |
| | (135 | ) | | 639 |
|
| | | | | | | | | | | | | | | | | | | | | | | | | | | | | | | |
Interest expense, net | 2 |
| | 1 |
| | 3 |
| | 2 |
| | — |
| | 2 |
| | 10 |
| | 2 |
| | — |
| | — |
| | 4 |
| | 20 |
| | 41 |
| | 26 |
| | 65 |
| | 132 |
|
Provision for (benefit from) income taxes | — |
| | — |
| | — |
| | 59 |
| | 68 |
| | 127 |
| | (4 | ) | | 22 |
| | — |
| | — |
| | — |
| | — |
| | 145 |
| | — |
| | (105 | ) | d | 40 |
|
Total assets at June 30, 2013 | 2,730 |
| | 5,768 |
| | 8,498 |
| | 6,089 |
| | 4,110 |
| | 10,199 |
| | 7,095 |
| | 4,887 |
| | 2,061 |
| | 287 |
| | 934 |
| | 1,100 |
| | 35,061 |
| | 26,533 |
| | 1,509 |
| | 63,103 |
|
Capital expenditures | 204 |
| | 82 |
| | 286 |
| | 208 |
| | 36 |
| | 244 |
| | 320 |
| | 46 |
| | 42 |
| | 1 |
| | 11 |
| | 23 |
| | 973 |
| | 190 |
| | 10 |
| | 1,173 |
|
| | | | | | | | | | | | | | | | | | | | | | | | | | | | | | | |
Three Months Ended June 30, 2012 | | | | | | | | | | | | | | | | | | | | | | | | | | | | | | | |
Revenues: | | | | | | | | | | | | | | | | | | | | | | | | | | | | | | | |
Unaffiliated customers | $ | 105 |
| | $ | (5 | ) | | $ | 100 |
| | $ | 332 |
| | $ | 546 |
| | $ | 878 |
| | $ | 875 |
| a | $ | 317 |
| | $ | — |
| | $ | 1,283 |
| | $ | 686 |
| | $ | 334 |
| b | $ | 4,473 |
| | $ | — |
| | $ | 2 |
| | $ | 4,475 |
|
Intersegment | 405 |
| | 923 |
| | 1,328 |
| | 151 |
| | (13 | ) | | 138 |
| | 81 |
| | 5 |
| | 134 |
| | 7 |
| | 9 |
| | (1,702 | ) | | — |
| | — |
| | — |
| | — |
|
Production and delivery | 279 |
| | 483 |
| | 762 |
| | 185 |
| | 305 |
| | 490 |
| | 586 |
| | 152 |
| | 78 |
| | 1,281 |
| | 669 |
| | (1,397 | ) | | 2,621 |
| | — |
| | 1 |
| | 2,622 |
|
Depreciation, depletion and amortization | 33 |
| | 60 |
| | 93 |
| | 33 |
| | 39 |
| | 72 |
| | 53 |
| | 40 |
| | 13 |
| | 3 |
| | 10 |
| | 5 |
| | 289 |
| | — |
| | 2 |
| | 291 |
|
Selling, general and administrative expenses | 1 |
| | — |
| | 1 |
| | — |
| | 1 |
| | 1 |
| | 27 |
| | 1 |
| | — |
| | — |
| | 5 |
| | 4 |
| | 39 |
| | — |
| | 58 |
| | 97 |
|
Mining exploration and research expenses | — |
| | — |
| | — |
| | — |
| | — |
| | — |
| | — |
| | — |
| | — |
| | — |
| | — |
| | 73 |
| | 73 |
| | — |
| | — |
| | 73 |
|
Environmental obligations and shutdown costs | — |
| | — |
| | — |
| | — |
| | — |
| | — |
| | — |
| | — |
| | — |
| | — |
| | — |
| | 81 |
| | 81 |
| | — |
| | — |
| | 81 |
|
Operating income (loss) | 197 |
| | 375 |
| | 572 |
| | 265 |
| | 188 |
| | 453 |
| | 290 |
| | 129 |
| | 43 |
| | 6 |
| | 11 |
| | (134 | ) | | 1,370 |
| | — |
| | (59 | ) | | 1,311 |
|
| | | | | | | | | | | | | | | | | | | | | | | | | | | | | | | |
Interest expense, net | — |
| | — |
| | — |
| | — |
| | — |
| | — |
| | 3 |
| | — |
| | — |
| | — |
| | 3 |
| | 21 |
| | 27 |
| | — |
| | 16 |
| | 43 |
|
Provision for income taxes | — |
| | — |
| | — |
| | 96 |
| | 55 |
| | 151 |
| | 126 |
| | 22 |
| | — |
| | — |
| | — |
| | — |
| | 299 |
| | — |
| | 123 |
| | 422 |
|
Total assets at June 30, 2012 | 2,135 |
| | 5,231 |
| | 7,366 |
| | 5,472 |
| | 4,081 |
| | 9,553 |
| | 5,883 |
| | 4,318 |
| | 1,933 |
| | 327 |
| | 990 |
| | 864 |
| | 31,234 |
| | — |
| | 2,455 |
| | 33,689 |
|
Capital expenditures | 52 |
| | 102 |
| | 154 |
| | 116 |
| | 124 |
| | 240 |
| | 205 |
| | 170 |
| | 55 |
| | — |
| | 4 |
| | 12 |
| | 840 |
| | — |
| | — |
| | 840 |
|
a. Includes PT Freeport Indonesia's sales to PT Smelting totaling $291 million in second-quarter 2013 and $368 million in second-quarter 2012.
b. Includes revenues from FCX's molybdenum sales company, which includes sales of molybdenum produced by the molybdenum mines and by certain of the North and South America copper mines.
c. Includes unfavorable adjustments of $35 million related to oil and gas derivative instruments that were assumed in connection with FCX's acquisition of PXP. For further discussion, refer to the supplemental schedule "Derivative Instruments" on page IX.
d. Includes $183 million related to net reductions in FCX's deferred tax liabilities and deferred tax asset valuation allowances resulting from second-quarter 2013 oil and gas acquisitions.
FREEPORT-McMoRan COPPER & GOLD INC.
BUSINESS SEGMENTS (continued)
|
| | | | | | | | | | | | | | | | | | | | | | | | | | | | | | | | | | | | | | | | | | | | | | | | | | | | | | | | | | | | | | | |
| | | | | | | | | | | | | | | | | | | | | | | | | | | | | | | |
(In millions) | Mining Operations | | | | | | |
| North America Copper Mines | | South America | | Indonesia | | Africa | | | | | | | | | | | | | | | | |
| | | | | | | | | | | | | | | | | | | | | Atlantic | | Other | | | | | | Corporate, | | |
| | | | | | | | | | | | | | | | | Molyb- | | | | Copper | | Mining | | | | | | Other | | |
| | | Other | | | | Cerro | | Other | | | | | | | | denum | | Rod & | | Smelting | | & Elimi- | | Total | | Oil & Gas | | & Elimi- | | FCX |
| Morenci | | Mines | | Total | | Verde | | Mines | | Total | | Grasberg | | Tenke | | Mines | | Refining | | & Refining | | nations | | Mining | | Operations | | nations | | Total |
Six Months Ended June 30, 2013 | | | | | | | | | | | | | | | | | | | | | | | | | | | | | | | |
Revenues: | | | | | | | | | | | | | | | | | | | | | | | | | | | | | | | |
Unaffiliated customers | $ | 118 |
| | $ | 121 |
| | $ | 239 |
| | $ | 601 |
| | $ | 1,013 |
| | $ | 1,614 |
| | $ | 1,335 |
| a | $ | 793 |
| | $ | — |
| | $ | 2,595 |
| | $ | 1,216 |
| | $ | 740 |
| b | $ | 8,532 |
| | $ | 336 |
| c | $ | 3 |
| | $ | 8,871 |
|
Intersegment | 880 |
| | 1,575 |
| | 2,455 |
| | 195 |
| | 156 |
| | 351 |
| | 187 |
| | 10 |
| | 287 |
| | 14 |
| | 10 |
| | (3,314 | ) | | — |
| | — |
| | — |
| | — |
|
Production and delivery | 598 |
| | 1,054 |
| | 1,652 |
| | 360 |
| | 631 |
| | 991 |
| | 1,126 |
| | 370 |
| | 158 |
| | 2,590 |
| | 1,203 |
| | (2,615 | ) | | 5,475 |
| | 89 |
| | 8 |
| | 5,572 |
|
Depreciation, depletion and amortization | 70 |
| | 140 |
| | 210 |
| | 70 |
| | 87 |
| | 157 |
| | 113 |
| | 115 |
| | 41 |
| | 5 |
| | 22 |
| | 22 |
| | 685 |
| | 169 |
| | 5 |
| | 859 |
|
Selling, general and administrative expenses | 1 |
| | 2 |
| | 3 |
| | 2 |
| | 1 |
| | 3 |
| | 53 |
| | 6 |
| | — |
| | — |
| | 9 |
| | 18 |
| | 92 |
| | 14 |
| | 193 |
| | 299 |
|
Mining exploration and research expenses | — |
| | 1 |
| | 1 |
| | — |
| | — |
| | — |
| | — |
| | — |
| | — |
| | — |
| | — |
| | 109 |
| | 110 |
| | — |
| | 6 |
| | 116 |
|
Environmental obligations and shutdown costs | — |
| | (6 | ) | | (6 | ) | | — |
| | — |
| | — |
| | — |
| | — |
| | — |
| | — |
| | — |
| | 37 |
| | 31 |
| | — |
| | — |
| | 31 |
|
Operating income (loss) | 329 |
| | 505 |
| | 834 |
| | 364 |
| | 450 |
| | 814 |
| | 230 |
| | 312 |
| | 88 |
| | 14 |
| | (8 | ) | | (145 | ) | | 2,139 |
| | 64 |
| | (209 | ) | | 1,994 |
|
| | | | | | | | | | | | | | | | | | | | | | | | | | | | | | | |
Interest expense, net | 3 |
| | 1 |
| | 4 |
| | 2 |
| | — |
| | 2 |
| | 12 |
| | 2 |
| | — |
| | — |
| | 8 |
| | 40 |
| | 68 |
| | 26 |
| | 95 |
| | 189 |
|
Provision for income taxes | — |
| | — |
| | — |
| | 123 |
| | 155 |
| | 278 |
| | 116 |
| | 66 |
| | — |
| | — |
| | — |
| | — |
| | 460 |
| | — |
| | 8 |
| d | 468 |
|
Capital expenditures | 357 |
| | 186 |
| | 543 |
| | 372 |
| | 98 |
| | 470 |
| | 511 |
| | 103 |
| | 82 |
| | 2 |
| | 19 |
| | 40 |
| | 1,770 |
| | 190 |
| | 18 |
| | 1,978 |
|
| | | | | | | | | | | | | | | | | | | | | | | | | | | | | | | |
Six Months Ended June 30, 2012 | | | | | | | | | | | | | | | | | | | | | | | | | | | | | | | |
Revenues: | | | | | | | | | | | | | | | | | | | | | | | | | | | | | | | |
Unaffiliated customers | $ | 118 |
| | $ | 11 |
| | $ | 129 |
| | $ | 781 |
| | $ | 1,072 |
| | $ | 1,853 |
| | $ | 1,828 |
| a | $ | 620 |
| | $ | — |
| | $ | 2,581 |
| | $ | 1,390 |
| | $ | 675 |
| b | $ | 9,076 |
| | $ | — |
| | $ | 4 |
| | $ | 9,080 |
|
Intersegment | 918 |
| | 1,835 |
| | 2,753 |
| | 278 |
| | 139 |
| | 417 |
| | 78 |
| | 7 |
| | 260 |
| | 13 |
| | 17 |
| | (3,545 | ) | | — |
| | — |
| | — |
| | — |
|
Production and delivery | 535 |
| | 912 |
| | 1,447 |
| | 378 |
| | 575 |
| | 953 |
| | 1,101 |
| | 284 |
| | 149 |
| | 2,578 |
| | 1,364 |
| | (2,826 | ) | | 5,050 |
| | — |
| | — |
| | 5,050 |
|
Depreciation, depletion and amortization | 64 |
| | 122 |
| | 186 |
| | 63 |
| | 71 |
| | 134 |
| | 99 |
| | 72 |
| | 23 |
| | 5 |
| | 20 |
| | 15 |
| | 554 |
| | — |
| | 4 |
| | 558 |
|
Selling, general and administrative expenses | 1 |
| | 1 |
| | 2 |
| | 1 |
| | 2 |
| | 3 |
| | 60 |
| | 3 |
| | — |
| | — |
| | 10 |
| | 8 |
| | 86 |
| | — |
| | 115 |
| | 201 |
|
Mining exploration and research expenses | — |
| | — |
| | — |
| | — |
| | — |
| | — |
| | — |
| | — |
| | — |
| | — |
| | — |
| | 135 |
| | 135 |
| | — |
| | — |
| | 135 |
|
Environmental obligations and shutdown costs | — |
| | — |
| | — |
| | — |
| | — |
| | — |
| | — |
| | — |
| | — |
| | — |
| | — |
| | 91 |
| | 91 |
| | | | — |
| | 91 |
|
Operating income (loss) | 436 |
| | 811 |
| | 1,247 |
| | 617 |
| | 563 |
| | 1,180 |
| | 646 |
| | 268 |
| | 88 |
| | 11 |
| | 13 |
| | (293 | ) | | 3,160 |
| | — |
| | (115 | ) | | 3,045 |
|
| | | | | | | | | | | | | | | | | | | | | | | | | | | | | | | |
Interest expense, net | — |
| | — |
| | — |
| | 5 |
| | — |
| | 5 |
| | 3 |
| | — |
| | — |
| | — |
| | 6 |
| | 42 |
| | 56 |
| | — |
| | 50 |
| | 106 |
|
Provision for income taxes | — |
| | — |
| | — |
| | 219 |
| | 172 |
| | 391 |
| | 276 |
| | 51 |
| | — |
| | — |
| | — |
| | — |
| | 718 |
| | — |
| | 195 |
| | 913 |
|
Capital expenditures | 96 |
| | 200 |
| | 296 |
| | 185 |
| | 207 |
| | 392 |
| | 387 |
| | 297 |
| | 148 |
| | 3 |
| | 7 |
| | 26 |
| | 1,556 |
| | — |
| | (9 | ) | | 1,547 |
|
| |
a. | Includes PT Freeport Indonesia’s sales to PT Smelting totaling $721 million for the first six months of 2013 and $957 million for the first six months of 2012. |
| |
b. | Includes revenues from FCX's molybdenum sales company, which includes sales of molybdenum produced by the molybdenum mines and by certain of the North and South America copper mines. |
| |
c. | Includes unfavorable adjustments of $35 million related to oil and gas derivative instruments that were assumed in connection with FCX's acquisition of PXP. For further discussion, refer to the supplemental schedule "Derivative Instruments" on page IX. |
| |
d. | Includes $183 million related to net reductions in FCX's deferred tax liabilities and deferred tax asset valuation allowances resulting from second-quarter 2013 oil and gas acquisitions. |
FREEPORT-McMoRan COPPER & GOLD INC.
PRODUCT REVENUES AND PRODUCTION COSTS
Mining Product Revenues and Unit Net Cash Costs. Unit net cash costs per pound of copper and molybdenum are measures intended to provide investors with information about the cash-generating capacity of FCX's mining operations expressed on a basis relating to the primary metal product for the respective operations. FCX uses this measure for the same purpose and for monitoring operating performance by its mining operations. This information differs from measures of performance determined in accordance with U.S. generally accepted accounting principles (GAAP) and should not be considered in isolation or as a substitute for measures of performance determined in accordance with U.S. GAAP. This measure is presented by other metals mining companies, although FCX's measures may not be comparable to similarly titled measures reported by other companies.
FCX presents gross profit per pound of copper in the following tables using both a “by-product” method and a “co-product” method. FCX uses the by-product method in its presentation of gross profit per pound of copper because (i) the majority of its revenues are copper revenues, (ii) it mines ore, which contains copper, gold, molybdenum and other metals, (iii) it is not possible to specifically assign all of FCX's costs to revenues from the copper, gold, molybdenum and other metals it produces, (iv) it is the method used to compare mining operations in certain industry publications and (v) it is the method used by FCX's management and Board of Directors to monitor operations. In the co-product method presentations, shared costs are allocated to the different products based on their relative revenue values, which will vary to the extent FCX's metals sales volumes and realized prices change.
FCX shows revenue adjustments for prior period open sales as separate line items. Because these adjustments do not result from current period sales, FCX has reflected these separately from revenues on current period sales. Noncash and other costs consist of items such as stock-based compensation costs, start-up costs, write-offs of equipment and/or unusual charges. They are removed from site production and delivery costs in the calculation of unit net cash costs. As discussed above, gold, molybdenum and other metal revenues at copper mines are reflected as credits against site production and delivery costs in the by-product method. The following schedules are presentations under both the by-product and co-product methods together with reconciliations to amounts reported in FCX's consolidated financial statements.
Oil & Gas Product Revenues and Cash Production Costs per Unit. Realized revenues and cash production costs per unit are measures intended to provide investors with information about the cash operating margin of FCX's oil and gas operations expressed on a basis relating to each product sold. FCX uses this measure for the same purpose and for monitoring operating performance by its oil and gas operations. This information differs from measures of performance determined in accordance with U.S. GAAP and should not be considered in isolation or as a substitute for measures of performance determined in accordance with U.S. GAAP. FCX's measures may not be comparable to similarly titled measures reported by other companies.
Because gains and losses on derivative instruments do not result from sales, FCX has reflected these separately and as adjustments to revenues. Additionally, accretion and other costs are removed from site production and delivery costs in the calculation of cash production costs per BOE. The following schedules include calculations of oil and gas product revenues and cash production costs together with a reconciliation to amounts reported in FCX's consolidated financial statements.
|
| | | | | | | | | | | | | | | | | | | | | |
FREEPORT-McMoRan COPPER & GOLD INC. |
PRODUCT REVENUES AND PRODUCTION COSTS (continued) |
|
North America Copper Mines Product Revenues and Production Costs and Unit Net Cash Costs |
| | | | | |
Three Months Ended June 30, 2013 | | | | | |
| | By-Product | | Co-Product Method | |
(In Millions) | | Method | | Copper | | Molybdenuma | | Otherb | | Total | |
Revenues, excluding adjustments | | $ | 1,205 |
| | $ | 1,205 |
| | $ | 98 |
| | $ | 26 |
| | $ | 1,329 |
| |
| | | | | | | | | | | |
Site production and delivery, before net noncash | | | | | | | | | | | |
and other costs shown below | | 774 |
| | 745 |
| | 41 |
| | 18 |
| | 804 |
| |
By-product creditsa | | (94 | ) | | — |
| | — |
| | — |
| | — |
| |
Treatment charges | | 31 |
| | 30 |
| | — |
| | 1 |
| | 31 |
| |
Net cash costs | | 711 |
| | 775 |
| | 41 |
| | 19 |
| | 835 |
| |
Depreciation, depletion and amortization | | 105 |
| | 101 |
| | 3 |
| | 1 |
| | 105 |
| |
Noncash and other costs, net | | 29 |
| | 29 |
| | — |
| | — |
| | 29 |
| |
Total costs | | 845 |
| | 905 |
| | 44 |
| | 20 |
| | 969 |
| |
Revenue adjustments, primarily for pricing | | | | | | | | | | | |
on prior period open sales | | (14 | ) | | (14 | ) | | — |
| | — |
| | (14 | ) | |
Gross profit | | $ | 346 |
| | $ | 286 |
| | $ | 54 |
| | $ | 6 |
| | $ | 346 |
| |
| | | | | | | | | | | |
Copper sales (millions of recoverable pounds) | | 370 |
| | 370 |
| | | | | | | |
Molybdenum sales (millions of recoverable pounds)a | | | | | | 9 |
| | | | | |
| | | | | | | | | | | |
Gross profit per pound of copper and molybdenum: | | | | | | | |
| | | | | | | | | | | |
Revenues, excluding adjustments | | $ | 3.25 |
| | $ | 3.25 |
| | $ | 11.17 |
| | | | | |
| | | | | | | | | | | |
Site production and delivery, before net noncash | | | | | | | | | | | |
and other costs shown below | | 2.09 |
| | 2.01 |
| | 4.63 |
| | | | | |
By-product creditsa | | (0.25 | ) | | — |
| | — |
| | | | | |
Treatment charges | | 0.08 |
| | 0.08 |
| | — |
| | | | | |
Unit net cash costs | | 1.92 |
| | 2.09 |
| | 4.63 |
| | | | | |
Depreciation, depletion and amortization | | 0.28 |
| | 0.27 |
| | 0.30 |
| | | | | |
Noncash and other costs, net | | 0.08 |
| | 0.08 |
| | 0.04 |
| | | | | |
Total unit costs | | 2.28 |
| | 2.44 |
| | 4.97 |
| | | | | |
Revenue adjustments, primarily for pricing | | | | | | | | | | | |
on prior period open sales | | (0.04 | ) | | (0.04 | ) | | — |
| | | | | |
Gross profit per pound | | $ | 0.93 |
| | $ | 0.77 |
| | $ | 6.20 |
| | | | | |
| | | | | | | | | | | |
Reconciliation to Amounts Reported | | | | | | Depreciation, | | | | | |
| | | | Production | | Depletion and | | | | | |
(In Millions) | | Revenues | | and Delivery | | Amortization | | | | | |
Totals presented above | | $ | 1,329 |
| | $ | 804 |
| | $ | 105 |
| | | | | |
Treatment charges | | — |
| | 31 |
| | — |
| | | | | |
Net noncash and other costs | | — |
| | 29 |
| | — |
| | | | | |
Revenue adjustments, primarily for pricing | | | | | | | | | | | |
on prior period open sales | | (14 | ) | | — |
| | — |
| | | | | |
Eliminations and other | | (6 | ) | | (11 | ) | | 3 |
| | | | | |
North America copper mines | | 1,309 |
| | 853 |
| | 108 |
| | | | | |
Other mining & eliminationsc | | 2,642 |
| | 1,906 |
| | 250 |
| | | | | |
Total mining | | 3,951 |
| | 2,759 |
| | 358 |
| | | | | |
Oil & gas operations | | 336 |
| | 89 |
| | 169 |
| | | | | |
Corporate, other & eliminations | | 1 |
| | 5 |
| | 3 |
| | | | | |
As reported in FCX’s consolidated financial statements | | $ | 4,288 |
| | $ | 2,853 |
| | $ | 530 |
| | | | | |
| | | | | | | | | | | |
a. Reflects sales of molybdenum produced by certain of the North America copper mines to FCX's molybdenum sales company at market-based pricing. |
|
b. Includes gold and silver product revenues and production costs. |
|
c. Represents the combined total for all other mining operations and the related eliminations, as presented in the supplemental schedule, “Business Segments” on page XI. |
|
| | | | | | | | | | | | | | | | | | | | | |
FREEPORT-McMoRan COPPER & GOLD INC. |
PRODUCT REVENUES AND PRODUCTION COSTS (continued) |
|
North America Copper Mines Product Revenues and Production Costs and Unit Net Cash Costs |
| | | | | |
Three Months Ended June 30, 2012 | | | | | |
| | By-Product | | Co-Product Method | |
(In Millions) | | Method | | Copper | | Molybdenuma | | Otherb | | Total | |
Revenues, excluding adjustments | | $ | 1,286 |
| | $ | 1,286 |
| | $ | 121 |
| | $ | 21 |
| | $ | 1,428 |
| |
| | | | | | | | | | | |
Site production and delivery, before net noncash | | | | | | | | | | | |
and other costs shown below | | 676 |
| | 614 |
| | 62 |
| | 12 |
| | 688 |
| |
By-product creditsa | | (130 | ) | | — |
| | — |
| | — |
| | — |
| |
Treatment charges | | 38 |
| | 37 |
| | — |
| | 1 |
| | 38 |
| |
Net cash costs | | 584 |
| | 651 |
| | 62 |
| | 13 |
| | 726 |
| |
Depreciation, depletion and amortization | | 90 |
| | 84 |
| | 5 |
| | 1 |
| | 90 |
| |
Noncash and other costs, net | | 38 |
| | 37 |
| | 1 |
| | — |
| | 38 |
| |
Total costs | | 712 |
| | 772 |
| | 68 |
| | 14 |
| | 854 |
| |
Revenue adjustments, primarily for pricing | | | | | | | | | | | |
on prior period open sales | | (8 | ) | | (8 | ) | | — |
| | — |
| | (8 | ) | |
Gross profit | | $ | 566 |
| | $ | 506 |
| | $ | 53 |
| | $ | 7 |
| | $ | 566 |
| |
| | | | | | | | | | | |
Copper sales (millions of recoverable pounds) | | 360 |
| | 360 |
| | | | | | | |
Molybdenum sales (millions of recoverable pounds)a | | | | | 9 |
| | | | | |
| | | | | | | | | | | |
Gross profit per pound of copper and molybdenum: | | | | | | | |
| | | | | | | | | | | |
Revenues, excluding adjustments | | $ | 3.57 |
| | $ | 3.57 |
| | $ | 13.53 |
| | | | | |
| | | | | | | | | | | |
Site production and delivery, before net noncash | | | | | | | | | | | |
and other costs shown below | | 1.88 |
| | 1.71 |
| | 7.00 |
| | | | | |
By-product creditsa | | (0.36 | ) | | — |
| | — |
| | | | | |
Treatment charges | | 0.10 |
| | 0.10 |
| | — |
| | | | | |
Unit net cash costs | | 1.62 |
| | 1.81 |
| | 7.00 |
| | | | | |
Depreciation, depletion and amortization | | 0.25 |
| | 0.23 |
| | 0.57 |
| | | | | |
Noncash and other costs, net | | 0.11 |
| | 0.10 |
| | 0.07 |
| | | | | |
Total unit costs | | 1.98 |
| | 2.14 |
| | 7.64 |
| | | | | |
Revenue adjustments, primarily for pricing | | | | | | | | | | | |
on prior period open sales | | (0.02 | ) | | (0.02 | ) | | — |
| | | | | |
Gross profit per pound | | $ | 1.57 |
| | $ | 1.41 |
| | $ | 5.89 |
| | | | | |
| | | | | | | | | | | |
Reconciliation to Amounts Reported | | | | | | Depreciation, | | | | | |
| | | | Production | | Depletion and | | | | | |
(In Millions) | | Revenues | | and Delivery | | Amortization | | | | | |
Totals presented above | | $ | 1,428 |
| | $ | 688 |
| | $ | 90 |
| | | | | |
Treatment charges | | — |
| | 38 |
| | — |
| | | | | |
Net noncash and other costs | | — |
| | 38 |
| | — |
| | | | | |
Revenue adjustments, primarily for pricing | | | | | | | | | | | |
on prior period open sales | | (8 | ) | | — |
| | — |
| | | | | |
Eliminations and other | | 8 |
| | (2 | ) | | 3 |
| | | | | |
North America copper mines | | 1,428 |
| | 762 |
| | 93 |
| | | | | |
Other mining & eliminationsc | | 3,045 |
| | 1,859 |
| | 196 |
| | | | | |
Total mining | | 4,473 |
| | 2,621 |
| | 289 |
| | | | | |
Oil & gas operations | | — |
| | — |
| | — |
| | | | | |
Corporate, other & eliminations | | 2 |
| | 1 |
| | 2 |
| | | | | |
As reported in FCX’s consolidated financial statements | | $ | 4,475 |
| | $ | 2,622 |
| | $ | 291 |
| | | | | |
| | | | | | | | | | | |
a. Reflects sales of molybdenum produced by certain of the North America copper mines to FCX's molybdenum sales company at market-based pricing. |
|
b. Includes gold and silver product revenues and production costs. |
|
c. Represents the combined total for all other mining operations and the related eliminations, as presented in the supplemental schedule, “Business Segments” on page XI. |
|
| | | | | | | | | | | | | | | | | | | | | |
| | | | | | | | | | | |
FREEPORT-McMoRan COPPER & GOLD INC. |
PRODUCT REVENUES AND PRODUCTION COSTS (continued) |
|
North America Copper Mines Product Revenues and Production Costs and Unit Net Cash Costs |
| | | | | |
Six Months Ended June 30, 2013 | | | | | |
| | By-Product | | Co-Product Method | |
(In Millions) | | Method | | Copper | | Molybdenuma | | Otherb | | Total | |
Revenues, excluding adjustments | | $ | 2,463 |
| | $ | 2,463 |
| | $ | 191 |
| | $ | 53 |
| | $ | 2,707 |
| |
| | | | | | | | | | | |
Site production and delivery, before net noncash | | | | | | | | | | | |
and other costs shown below | | 1,477 |
| | 1,430 |
| | 66 |
| | 38 |
| | 1,534 |
| |
By-product creditsa | | (187 | ) | | — |
| | — |
| | — |
| | — |
| |
Treatment charges | | 76 |
| | 74 |
| | — |
| | 2 |
| | 76 |
| |
Net cash costs | | 1,366 |
| | 1,504 |
| | 66 |
| | 40 |
| | 1,610 |
| |
Depreciation, depletion and amortization | | 204 |
| | 197 |
| | 4 |
| | 3 |
| | 204 |
| |
Noncash and other costs, net | | 60 |
| | 59 |
| | 1 |
| | — |
| | 60 |
| |
Total costs | | 1,630 |
| | 1,760 |
| | 71 |
| | 43 |
| | 1,874 |
| |
Revenue adjustments, primarily for pricing | | | | | | | | | | | |
on prior period open sales | | (4 | ) | | (4 | ) | | — |
| | — |
| | (4 | ) | |
Gross profit | | $ | 829 |
| | $ | 699 |
| | $ | 120 |
| | $ | 10 |
| | $ | 829 |
| |
| | | | | | | | | | | |
Copper sales (millions of recoverable pounds) | | 722 |
| | 722 |
| | | | | | | |
Molybdenum sales (millions of recoverable pounds)a | | | | | | 17 |
| | | | | |
| | | | | | | | | | | |
Gross profit per pound of copper and molybdenum: | | | | | | | | | | | |
| | | | | | | | | | | |
Revenues, excluding adjustments | | $ | 3.41 |
| | $ | 3.41 |
| | $ | 11.45 |
| | | | | |
| | | | | | | | | | | |
Site production and delivery, before net noncash | | | | | | | | | | | |
and other costs shown below | | 2.04 |
| | 1.98 |
| | 3.98 |
| | | | | |
By-product creditsa | | (0.26 | ) | | — |
| | — |
| | | | | |
Treatment charges | | 0.11 |
| | 0.10 |
| | — |
| | | | | |
Unit net cash costs | | 1.89 |
| | 2.08 |
| | 3.98 |
| | | | | |
Depreciation, depletion and amortization | | 0.28 |
| | 0.27 |
| | 0.26 |
| | | | | |
Noncash and other costs, net | | 0.08 |
| | 0.08 |
| | 0.04 |
| | | | | |
Total unit costs | | 2.25 |
| | 2.43 |
| | 4.28 |
| | | | | |
Revenue adjustments, primarily for pricing | | | | | | | | | | | |
on prior period open sales | | (0.01 | ) | | (0.01 | ) | | — |
| | | | | |
Gross profit per pound | | $ | 1.15 |
| | $ | 0.97 |
| | $ | 7.17 |
| | | | | |
| | | | | | | | | | | |
Reconciliation to Amounts Reported | | | | | | Depreciation, | | | | | |
| | | | Production | | Depletion and | | | | | |
(In Millions) | | Revenues | | and Delivery | | Amortization | | | | | |
Totals presented above | | $ | 2,707 |
| | $ | 1,534 |
| | $ | 204 |
| | | | | |
Treatment charges | | — |
| | 76 |
| | — |
| | | | | |
Net noncash and other costs | | — |
| | 60 |
| | — |
| | | | | |
Revenue adjustments, primarily for pricing | | | | | | | | | | | |
on prior period open sales | | (4 | ) | | — |
| | — |
| | | | | |
Eliminations and other | | (9 | ) | | (18 | ) | | 6 |
| | | | | |
North America copper mines | | 2,694 |
| | 1,652 |
| | 210 |
| | | | | |
Other mining & eliminationsc | | 5,838 |
| | 3,823 |
| | 475 |
| | | | | |
Total mining | | 8,532 |
| | 5,475 |
| | 685 |
| | | | | |
Oil & gas operations | | 336 |
| | 89 |
| | 169 |
| | | | | |
Corporate, other & eliminations | | 3 |
| | 8 |
| | 5 |
| | | | | |
As reported in FCX’s consolidated financial statements | | $ | 8,871 |
| | $ | 5,572 |
| | $ | 859 |
| | | | | |
| | | | | | | | | | | |
a. Reflects sales of molybdenum produced by certain of the North America copper mines to FCX's molybdenum sales company at market-based pricing. |
| | | | | | | | | | | |
b. Includes gold and silver product revenues and production costs. |
|
c. Represents the combined total for all other mining operations and the related eliminations, as presented in the supplemental schedule, “Business Segments” on page XII. |
|
| | | | | | | | | | | | | | | | | | | | | |
| | | | | | | | | | | |
FREEPORT-McMoRan COPPER & GOLD INC. |
PRODUCT REVENUES AND PRODUCTION COSTS (continued) |
|
North America Copper Mines Product Revenues and Production Costs and Unit Net Cash Costs |
| | | | | |
Six Months Ended June 30, 2012 | | | | | |
| | By-Product | | Co-Product Method | |
(In Millions) | | Method | | Copper | | Molybdenuma | | Otherb | | Total | |
Revenues, excluding adjustments | | $ | 2,566 |
| | $ | 2,566 |
| | $ | 257 |
| | $ | 42 |
| | $ | 2,865 |
| |
| | | | | | | | | | | |
Site production and delivery, before net noncash | | | | | | | | | | | |
and other costs shown below | | 1,283 |
| | 1,198 |
| | 91 |
| | 24 |
| | 1,313 |
| |
By-product creditsa | | (269 | ) | | — |
| | — |
| | — |
| | — |
| |
Treatment charges | | 79 |
| | 76 |
| | — |
| | 3 |
| | 79 |
| |
Net cash costs | | 1,093 |
| | 1,274 |
| | 91 |
| | 27 |
| | 1,392 |
| |
Depreciation, depletion and amortization | | 179 |
| | 169 |
| | 7 |
| | 3 |
| | 179 |
| |
Noncash and other costs, net | | 59 |
| | 58 |
| | 1 |
| | — |
| | 59 |
| |
Total costs | | 1,331 |
| | 1,501 |
| | 99 |
| | 30 |
| | 1,630 |
| |
Revenue adjustments, primarily for pricing | | | | | | | | | | | |
on prior period open sales | | 7 |
| | 7 |
| | — |
| | — |
| | 7 |
| |
Gross profit | | $ | 1,242 |
| | $ | 1,072 |
| | $ | 158 |
| | $ | 12 |
| | $ | 1,242 |
| |
| | | | | | | | | | | |
Copper sales (millions of recoverable pounds) | | 697 |
| | 697 |
| | | | | | | |
Molybdenum sales (millions of recoverable pounds)a | | | | | | 19 |
| | | | | |
| | | | | | | | | | | |
Gross profit per pound of copper and molybdenum: | | | | | | | |
| | | | | | | | | | | |
Revenues, excluding adjustments | | $ | 3.68 |
| | $ | 3.68 |
| | $ | 13.83 |
| | | | | |
| | | | | | | | | | | |
Site production and delivery, before net noncash | | | | | | | | | | | |
and other costs shown below | | 1.84 |
| | 1.72 |
| | 4.92 |
| | | | | |
By-product creditsa | | (0.39 | ) | | — |
| | — |
| | | | | |
Treatment charges | | 0.12 |
| | 0.11 |
| | — |
| | | | | |
Unit net cash costs | | 1.57 |
| | 1.83 |
| | 4.92 |
| | | | | |
Depreciation, depletion and amortization | | 0.26 |
| | 0.24 |
| | 0.37 |
| | | | | |
Noncash and other costs, net | | 0.08 |
| | 0.08 |
| | 0.04 |
| | | | | |
Total unit costs | | 1.91 |
| | 2.15 |
| | 5.33 |
| | | | | |
Revenue adjustments, primarily for pricing | | | | | | | | | | | |
on prior period open sales | | 0.01 |
| | 0.01 |
| | — |
| | | | | |
Gross profit per pound | | $ | 1.78 |
| | $ | 1.54 |
| | $ | 8.50 |
| | | | | |
| | | | | | | | | | | |
Reconciliation to Amounts Reported | | | | | | Depreciation, | | | | | |
| | | | Production | | Depletion and | | | | | |
(In Millions) | | Revenues | | and Delivery | | Amortization | | | | | |
Totals presented above | | $ | 2,865 |
| | $ | 1,313 |
| | $ | 179 |
| | | | | |
Treatment charges | | — |
| | 79 |
| | — |
| | | | | |
Net noncash and other costs | | — |
| | 59 |
| | — |
| | | | | |
Revenue adjustments, primarily for pricing | | | | | | | | | | | |
on prior period open sales | | 7 |
| | — |
| | — |
| | | | | |
Eliminations and other | | 10 |
| | (4 | ) | | 7 |
| | | | | |
North America copper mines | | 2,882 |
| | 1,447 |
| | 186 |
| | | | | |
Other mining & eliminationsc | | 6,194 |
| | 3,603 |
| | 368 |
| | | | | |
Total mining | | 9,076 |
| | 5,050 |
| | 554 |
| | | | | |
Oil & gas operations | | — |
| | — |
| | — |
| | | | | |
Corporate, other & eliminations | | 4 |
| | — |
| | 4 |
| | | | | |
As reported in FCX’s consolidated financial statements | | $ | 9,080 |
| | $ | 5,050 |
| | $ | 558 |
| | | | | |
| | | | | | | | | | | |
a. Reflects sales of molybdenum produced by certain of the North America copper mines to FCX's molybdenum sales company at market-based pricing. |
| | | | | | | | | | | |
b. Includes gold and silver product revenues and production costs. |
|
c. Represents the combined total for all other mining operations and the related eliminations, as presented in the supplemental schedule, “Business Segments” on page XII. |
|
| | | | | | | | | | | | | | | | | |
FREEPORT-McMoRan COPPER & GOLD INC. |
PRODUCT REVENUES AND PRODUCTION COSTS (continued) |
|
South America Mining Product Revenues and Production Costs and Unit Net Cash Costs |
| | | | | |
Three Months Ended June 30, 2013 | | | | | |
| | By-Product | | Co-Product Method | |
(In Millions) | | Method | | Copper | | Other | | Total | |
Revenues, excluding adjustments | | $ | 986 |
| | $ | 986 |
| | $ | 80 |
| a | $ | 1,066 |
| |
| | | | | | | | | |
Site production and delivery, before net noncash | | | | | | | | | |
and other costs shown below | | 511 |
| | 472 |
| | 45 |
| | 517 |
| |
By-product credits | | (74 | ) | | — |
| | — |
| | — |
| |
Treatment charges | | 49 |
| | 49 |
| | — |
| | 49 |
| |
Net cash costs | | 486 |
| | 521 |
| | 45 |
| | 566 |
| |
Depreciation, depletion and amortization | | 86 |
| | 80 |
| | 6 |
| | 86 |
| |
Noncash and other costs, net | | 7 |
| | (1 | ) | | 8 |
| | 7 |
| |
Total costs | | 579 |
| | 600 |
| | 59 |
| | 659 |
| |
Revenue adjustments, primarily for pricing | | | | | | | | | |
on prior period open sales | | (65 | ) | | (65 | ) | | — |
| | (65 | ) | |
Gross profit | | $ | 342 |
| | $ | 321 |
| | $ | 21 |
| | $ | 342 |
| |
| | | | | | | | | |
Copper sales (millions of recoverable pounds) | | 315 |
| | 315 |
| | | | | |
| | | | | | | | | |
Gross profit per pound of copper: | | | | | |
| | | | | | | | | |
Revenues, excluding adjustments | | $ | 3.13 |
| | $ | 3.13 |
| | | | | |
| | | | | | | | | |
Site production and delivery, before net noncash | | | | | | | | | |
and other costs shown below | | 1.62 |
| | 1.50 |
| | | | | |
By-product credits | | (0.24 | ) | | — |
| | | | | |
Treatment charges | | 0.16 |
| | 0.16 |
| | | | | |
Unit net cash costs | | 1.54 |
| | 1.66 |
| | | | | |
Depreciation, depletion and amortization | | 0.27 |
| | 0.25 |
| | | | | |
Noncash and other costs, net | | 0.02 |
| | (0.01 | ) | | | | | |
Total unit costs | | 1.83 |
| | 1.90 |
| | | | | |
Revenue adjustments, primarily for pricing | | | | | | | | | |
on prior period open sales | | (0.21 | ) | | (0.21 | ) | | | | | |
Gross profit per pound | | $ | 1.09 |
| | $ | 1.02 |
| | | | | |
| | | | | | | | | |
Reconciliation to Amounts Reported | | | | | | Depreciation, | | | |
| | | | Production | | Depletion and | | | |
(In Millions) | | Revenues | | and Delivery | | Amortization | | | |
Totals presented above | | $ | 1,066 |
| | $ | 517 |
| | $ | 86 |
| | | |
Treatment charges | | (49 | ) | | — |
| | — |
| | | |
Net noncash and other costs | | — |
| | 7 |
| | — |
| | | |
Revenue adjustments, primarily for pricing | | | | | | | | | |
on prior period open sales | | (65 | ) | | — |
| | — |
| | | |
Eliminations and other | | (1 | ) | | (8 | ) | | — |
| | | |
South America mining | | 951 |
| | 516 |
| | 86 |
| | | |
Other mining & eliminationsb | | 3,000 |
| | 2,243 |
| | 272 |
| | | |
Total mining | | 3,951 |
| | 2,759 |
| | 358 |
| | | |
Oil & gas operations | | 336 |
| | 89 |
| | 169 |
| | | |
Corporate, other & eliminations | | 1 |
| | 5 |
| | 3 |
| | | |
As reported in FCX’s consolidated financial statements | | $ | 4,288 |
| | $ | 2,853 |
| | $ | 530 |
| | | |
| | | | | | | | | |
| |
a. | Includes gold sales of 21 thousand ounces ($1,317 per ounce average realized price) and silver sales of 809 thousand ounces ($20.40 per ounce average realized price). Also reflects sales of molybdenum produced by Cerro Verde to FCX's molybdenum sales company at market-based pricing. |
| |
b. | Represents the combined total for all other mining operations and the related eliminations, as presented in the supplemental schedule, “Business Segments” on page XI. |
|
| | | | | | | | | | | | | | | | | |
FREEPORT-McMoRan COPPER & GOLD INC. |
PRODUCT REVENUES AND PRODUCTION COSTS (continued) |
|
South America Mining Product Revenues and Production Costs and Unit Net Cash Costs |
| | | | | |
Three Months Ended June 30, 2012 | | | | | |
| | By-Product | | Co-Product Method | |
(In Millions) | | Method | | Copper | | Other | | Total | |
Revenues, excluding adjustments | | $ | 1,057 |
| | $ | 1,057 |
| | $ | 75 |
| a | $ | 1,132 |
| |
| | | | | | | | | |
Site production and delivery, before net noncash | | | | | | | | | |
and other costs shown below | | 469 |
| | 438 |
| | 37 |
| | 475 |
| |
By-product credits | | (69 | ) | | — |
| | — |
| | — |
| |
Treatment charges | | 47 |
| | 47 |
| | — |
| | 47 |
| |
Net cash costs | | 447 |
| | 485 |
| | 37 |
| | 522 |
| |
Depreciation, depletion and amortization | | 71 |
| | 68 |
| | 3 |
| | 71 |
| |
Noncash and other costs, net | | 22 |
| | 14 |
| | 8 |
| | 22 |
| |
Total costs | | 540 |
| | 567 |
| | 48 |
| | 615 |
| |
Revenue adjustments, primarily for pricing | | | | | | | | | |
on prior period open sales | | (68 | ) | | (68 | ) | | — |
| | (68 | ) | |
Gross profit | | $ | 449 |
| | $ | 422 |
| | $ | 27 |
| | $ | 449 |
| |
| | | | | | | | | |
Copper sales (millions of recoverable pounds) | | 301 |
| | 301 |
| | | | | |
| | | | | | | | | |
Gross profit per pound of copper: | | | | | |
| | | | | | | | | |
Revenues, excluding adjustments | | $ | 3.51 |
| | $ | 3.51 |
| | | | | |
| | | | | | | | | |
Site production and delivery, before net noncash | | | | | | | | | |
and other costs shown below | | 1.56 |
| | 1.45 |
| | | | | |
By-product credits | | (0.23 | ) | | — |
| | | | | |
Treatment charges | | 0.16 |
| | 0.16 |
| | | | | |
Unit net cash costs | | 1.49 |
| | 1.61 |
| | | | | |
Depreciation, depletion and amortization | | 0.24 |
| | 0.23 |
| | | | | |
Noncash and other costs, net | | 0.07 |
| | 0.05 |
| | | | | |
Total unit costs | | 1.80 |
| | 1.89 |
| | | | | |
Revenue adjustments, primarily for pricing | | | | | | | | | |
on prior period open sales | | (0.22 | ) | | (0.22 | ) | | | | | |
Gross profit per pound | | $ | 1.49 |
| | $ | 1.40 |
| | | | | |
| | | | | | | | | |
Reconciliation to Amounts Reported | | | | | | Depreciation, | | | |
| | | | Production | | Depletion and | | | |
(In Millions) | | Revenues | | and Delivery | | Amortization | | | |
Totals presented above | | $ | 1,132 |
| | $ | 475 |
| | $ | 71 |
| | | |
Treatment charges | | (47 | ) | | — |
| | — |
| | | |
Net noncash and other costs | | — |
| | 22 |
| | — |
| | | |
Revenue adjustments, primarily for pricing | | | | | | | | | |
on prior period open sales | | (68 | ) | | — |
| | — |
| | | |
Eliminations and other | | (1 | ) | | (7 | ) | | 1 |
| | | |
South America mining | | 1,016 |
| | 490 |
| | 72 |
| | | |
Other mining & eliminationsb | | 3,457 |
| | 2,131 |
| | 217 |
| | | |
Total mining | | 4,473 |
| | 2,621 |
| | 289 |
| | | |
Oil & gas operations | | — |
| | — |
| | — |
| | | |
Corporate, other & eliminations | | 2 |
| | 1 |
| | 2 |
| | | |
As reported in FCX’s consolidated financial statements | | $ | 4,475 |
| | $ | 2,622 |
| | $ | 291 |
| | | |
| | | | | | | | | |
| |
a. | Includes gold sales of 16 thousand ounces ($1,596 per ounce average realized price) and silver sales of 712 thousand ounces ($28.36 per ounce average realized price). Also reflects sales of molybdenum produced by Cerro Verde to FCX's molybdenum sales company at market-based pricing. |
| |
b. | Represents the combined total for all other mining operations and the related eliminations, as presented in the supplemental schedule, “Business Segments” on page XI. |
|
| | | | | | | | | | | | | | | | | |
| | | | | | | | | |
FREEPORT-McMoRan COPPER & GOLD INC. |
PRODUCT REVENUES AND PRODUCTION COSTS (continued) |
|
South America Mining Product Revenues and Production Costs and Unit Net Cash Costs |
| | | | | |
Six Months Ended June 30, 2013 | | | | | |
| | By-Product | | Co-Product Method | |
(In Millions) | | Method | | Copper | | Other | | Total | |
Revenues, excluding adjustments | | $ | 1,929 |
| | $ | 1,929 |
| | $ | 166 |
| a | $ | 2,095 |
| |
| | | | | | | | | |
Site production and delivery, before net noncash | | | | | | | | | |
and other costs shown below | | 973 |
| | 897 |
| | 86 |
| | 983 |
| |
By-product credits | | (156 | ) | | — |
| | — |
| | — |
| |
Treatment charges | | 99 |
| | 99 |
| | — |
| | 99 |
| |
Net cash costs | | 916 |
| | 996 |
| | 86 |
| | 1,082 |
| |
Depreciation, depletion and amortization | | 156 |
| | 147 |
| | 9 |
| | 156 |
| |
Noncash and other costs, net | | 22 |
| | 6 |
| | 16 |
| | 22 |
| |
Total costs | | 1,094 |
| | 1,149 |
| | 111 |
| | 1,260 |
| |
Revenue adjustments, primarily for pricing | | | | | | | | | |
on prior period open sales | | (29 | ) | | (29 | ) | | — |
| | (29 | ) | |
Gross profit | | $ | 806 |
| | $ | 751 |
| | $ | 55 |
| | $ | 806 |
| |
| | | | | | | | | |
Copper sales (millions of recoverable pounds) | | 600 |
| | 600 |
| | | | | |
| | | | | | | | | |
Gross profit per pound of copper: | | | | | |
| | | | | | | | | |
Revenues, excluding adjustments | | $ | 3.22 |
| | $ | 3.22 |
| | | | | |
| | | | | | | | | |
Site production and delivery, before net noncash | | | | | | | | | |
and other costs shown below | | 1.62 |
| | 1.50 |
| | | | | |
By-product credits | | (0.26 | ) | | 0.16 |
| | | | | |
Treatment charges | | 0.17 |
| | — |
| | | | | |
Unit net cash costs | | 1.53 |
| | 1.66 |
| | | | | |
Depreciation, depletion and amortization | | 0.26 |
| | 0.25 |
| | | | | |
Noncash and other costs, net | | 0.04 |
| | 0.01 |
| | | | | |
Total unit costs | | 1.83 |
| | 1.92 |
| | | | | |
Revenue adjustments, primarily for pricing | | | | | | | | | |
on prior period open sales | | (0.05 | ) | | (0.05 | ) | | | | | |
Gross profit per pound | | $ | 1.34 |
| | $ | 1.25 |
| | | | | |
| | | | | | | | | |
Reconciliation to Amounts Reported | | | | | | Depreciation, | | | |
| | | | Production | | Depletion and | | | |
(In Millions) | | Revenues | | and Delivery | | Amortization | | | |
Totals presented above | | 2,095 |
| | 983 |
| | 156 |
| | | |
Treatment charges | | (99 | ) | | — |
| | — |
| | | |
Net noncash and other costs | | — |
| | 22 |
| | — |
| | | |
Revenue adjustments, primarily for pricing | | | | | | | | | |
on prior period open sales | | (29 | ) | | — |
| | — |
| | | |
Eliminations and other | | (2 | ) | | (14 | ) | | 1 |
| | | |
South America mining | | 1,965 |
| | 991 |
| | 157 |
| | | |
Other mining & eliminationsb | | 6,567 |
| | 4,484 |
| | 528 |
| | | |
Total mining | | 8,532 |
| | 5,475 |
| | 685 |
| | | |
Oil & gas operations | | 336 |
| | 89 |
| | 169 |
| | | |
Corporate, other & eliminations | | 3 |
| | 8 |
| | 5 |
| | | |
As reported in FCX’s consolidated financial statements | | $ | 8,871 |
| | $ | 5,572 |
| | $ | 859 |
| | | |
| | | | | | | | | |
| |
a. | Includes gold sales of 42 thousand ounces ($1,449 per ounce average realized price) and silver sales of 1.8 million ounces ($25.93 per ounce average realized price). Also reflects sales of molybdenum produced by Cerro Verde to FCX's molybdenum sales company at market-based pricing. |
| |
b. | Represents the combined total for all other mining operations and the related eliminations, as presented in the supplemental schedule, “Business Segments” on page XII. |
|
| | | | | | | | | | | | | | | | | |
| | | | | | | | | |
FREEPORT-McMoRan COPPER & GOLD INC. |
PRODUCT REVENUES AND PRODUCTION COSTS (continued) |
|
South America Mining Product Revenues and Production Costs and Unit Net Cash Costs |
| | | | | |
Six Months Ended June 30, 2012 | | | | | |
| | By-Product | | Co-Product Method | |
(In Millions) | | Method | | Copper | | Other | | Total | |
Revenues, excluding adjustments | | $ | 2,094 |
| | $ | 2,094 |
| | $ | 164 |
| a | $ | 2,258 |
| |
| | | | | | | | | |
Site production and delivery, before net noncash | | | | | | | | | |
and other costs shown below | | 908 |
| | 842 |
| | 77 |
| | 919 |
| |
By-product credits | | (153 | ) | | — |
| | — |
| | — |
| |
Treatment charges | | 95 |
| | 95 |
| | — |
| | 95 |
| |
Net cash costs | | 850 |
| | 937 |
| | 77 |
| | 1,014 |
| |
Depreciation, depletion and amortization | | 134 |
| | 127 |
| | 7 |
| | 134 |
| |
Noncash and other costs, net | | 42 |
| | 27 |
| | 15 |
| | 42 |
| |
Total costs | | 1,026 |
| | 1,091 |
| | 99 |
| | 1,190 |
| |
Revenue adjustments, primarily for pricing | | | | | | | | | |
on prior period open sales | | 104 |
| | 104 |
| | — |
| | 104 |
| |
Gross profit | | $ | 1,172 |
| | $ | 1,107 |
| | $ | 65 |
| | $ | 1,172 |
| |
| | | | | | | | | |
Copper sales (millions of recoverable pounds) | | 587 |
| | 587 |
| | | | | |
| | | | | | | | | |
Gross profit per pound of copper: | | | | | |
| | | | | | | | | |
Revenues, excluding adjustments | | $ | 3.56 |
| | $ | 3.56 |
| | | | | |
| | | | | | | | | |
Site production and delivery, before net noncash | | | | | | | | | |
and other costs shown below | | 1.55 |
| | 1.43 |
| | | | | |
By-product credits | | (0.26 | ) | | — |
| | | | | |
Treatment charges | | 0.16 |
| | 0.16 |
| | | | | |
Unit net cash costs | | 1.45 |
| | 1.59 |
| | | | | |
Depreciation, depletion and amortization | | 0.22 |
| | 0.22 |
| | | | | |
Noncash and other costs, net | | 0.07 |
| | 0.05 |
| | | | | |
Total unit costs | | 1.74 |
| | 1.86 |
| | | | | |
Revenue adjustments, primarily for pricing | | | | | | | | | |
on prior period open sales | | 0.18 |
| | 0.18 |
| | | | | |
Gross profit per pound | | $ | 2.00 |
| | $ | 1.88 |
| | | | | |
| | | | | | | | | |
Reconciliation to Amounts Reported | | | | | | Depreciation, | | | |
| | | | Production | | Depletion and | | | |
(In Millions) | | Revenues | | and Delivery | | Amortization | | | |
Totals presented above | | $ | 2,258 |
| | $ | 919 |
| | $ | 134 |
| | | |
Treatment charges | | (95 | ) | | — |
| | — |
| | | |
Net noncash and other costs | | — |
| | 42 |
| | — |
| | | |
Revenue adjustments, primarily for pricing | | | | | | | | | |
on prior period open sales | | 104 |
| | — |
| | — |
| | | |
Eliminations and other | | 3 |
| | (8 | ) | | — |
| | | |
South America mining | | 2,270 |
| | 953 |
| | 134 |
| | | |
Other mining & eliminationsb | | 6,806 |
| | 4,097 |
| | 420 |
| | | |
Total mining | | 9,076 |
| | 5,050 |
| | 554 |
| | | |
Oil & gas operations | | — |
| | — |
| | — |
| | | |
Corporate, other & eliminations | | 4 |
| | — |
| | 4 |
| | | |
As reported in FCX’s consolidated financial statements | | $ | 9,080 |
| | $ | 5,050 |
| | $ | 558 |
| | | |
| | | | | | | | | |
| |
a. | Includes gold sales of 35 thousand ounces ($1,630 per ounce average realized price) and silver sales of 1.4 million ounces ($29.33 per ounce average realized price). Also reflects sales of molybdenum produced by Cerro Verde to FCX's molybdenum sales company at market-based pricing. |
| |
b. | Represents the combined total for all other mining operations and the related eliminations, as presented in the supplemental schedule, “Business Segments” on page XII. |
|
| | | | | | | | | | | | | | | | | | | | | |
FREEPORT-McMoRan COPPER & GOLD INC. |
PRODUCT REVENUES AND PRODUCTION COSTS (continued) |
|
Indonesia Mining Product Revenues and Production Costs and Unit Net Cash Costs |
| | | | | |
Three Months Ended June 30, 2013 | | | | | |
| | By-Product | | Co-Product Method | |
(In Millions) | | Method | | Copper | | Gold | | Silver | | Total | |
Revenues, excluding adjustments | | $ | 487 |
| | $ | 487 |
| | $ | 199 |
| | $ | 9 |
| a | $ | 695 |
| |
| | | | | | | | | | | |
Site production and delivery, before net noncash | | | | | | | | | | | |
and other costs shown below | | 561 |
| | 393 |
| | 161 |
| | 7 |
| | 561 |
| |
Gold and silver credits | | (190 | ) | | — |
| | — |
| | — |
| | — |
| |
Treatment charges | | 36 |
| | 25 |
| | 10 |
| | 1 |
| | 36 |
| |
Royalty on metals | | 21 |
| | 15 |
| | 6 |
| | — |
| | 21 |
| |
Net cash costs | | 428 |
| | 433 |
| | 177 |
| | 8 |
| | 618 |
| |
Depreciation and amortization | | 58 |
| | 41 |
| | 16 |
| | 1 |
| | 58 |
| |
Noncash and other costs, net | | 35 |
| | 25 |
| | 10 |
| | — |
| | 35 |
| |
Total costs | | 521 |
| | 499 |
| | 203 |
| | 9 |
| | 711 |
| |
Revenue adjustments, primarily for pricing on | | | | | | | | | | | |
prior period open sales | | (29 | ) | | (29 | ) | | (17 | ) | | (1 | ) | | (47 | ) | |
PT Smelting intercompany profit | | 33 |
| | 23 |
| | 10 |
| | — |
| | 33 |
| |
Gross profit | | $ | (30 | ) | | $ | (18 | ) | | $ | (11 | ) | | $ | (1 | ) | | $ | (30 | ) | |
| | | | | | | | | | | |
Copper sales (millions of recoverable pounds) | | 158 |
| | 158 |
| | | | | | | |
Gold sales (thousands of recoverable ounces) | | | | | | 151 |
| | | | | |
| | | | | | | | | | | |
Gross profit per pound of copper/per ounce of gold: | | | | | | | |
| | | | | | | | | | | |
Revenues, excluding adjustments | | $ | 3.08 |
| | $ | 3.08 |
| | $ | 1,321 |
| | | | | |
| | | | | | | | | | | |
Site production and delivery, before net noncash | | | | | | | | | | | |
and other costs shown below | | 3.55 |
| | 2.49 |
| | 1,066 |
| | | | | |
Gold and silver credits | | (1.20 | ) | | — |
| | — |
| | | | | |
Treatment charges | | 0.23 |
| | 0.16 |
| | 69 |
| | | | | |
Royalty on metals | | 0.13 |
| | 0.09 |
| | 39 |
| | | | | |
Unit net cash costs | | 2.71 |
| | 2.74 |
| | 1,174 |
| | | | | |
Depreciation and amortization | | 0.37 |
| | 0.26 |
| | 111 |
| | | | | |
Noncash and other costs, net | | 0.22 |
| | 0.15 |
| | 67 |
| | | | | |
Total unit costs | | 3.30 |
| | 3.15 |
| | 1,352 |
| | | | | |
Revenue adjustments, primarily for pricing on | | | | | | | | | | | |
prior period open sales | | (0.18 | ) | | (0.18 | ) | | (110 | ) | | | | | |
PT Smelting intercompany profit | | 0.21 |
| | 0.14 |
| | 62 |
| | | | | |
Gross profit per pound/ounce | | $ | (0.19 | ) | | $ | (0.11 | ) | | $ | (79 | ) | | | | | |
| | | | | | | | | | | |
Reconciliation to Amounts Reported | | | | | | Depreciation, | | | | | |
| | | | Production | | Depletion and | | | | | |
(In Millions) | | Revenues | | and Delivery | | Amortization | | | | | |
Totals presented above | | $ | 695 |
| | $ | 561 |
| | $ | 58 |
| | | | | |
Treatment charges | | (36 | ) | | — |
| | — |
| | | | | |
Royalty on metals | | (21 | ) | | — |
| | — |
| | | | | |
Net noncash and other costs | | — |
| | 35 |
| | — |
| | | | | |
Revenue adjustments, primarily for pricing on | | | | | | | | | | | |
prior period open sales | | (47 | ) | | — |
| | — |
| | | | | |
PT Smelting intercompany profit | | — |
| | (33 | ) | | — |
| | | | | |
Indonesia mining | | 591 |
| | 563 |
| | 58 |
| | | | | |
Other mining & eliminationsb | | 3,360 |
| | 2,196 |
| | 300 |
| | | | | |
Total mining | | 3,951 |
| | 2,759 |
| | 358 |
| | | | | |
Oil & gas operations | | 336 |
| | 89 |
| | 169 |
| | | | | |
Corporate, other & eliminations | | 1 |
| | 5 |
| | 3 |
| | | | | |
As reported in FCX’s consolidated financial statements | | $ | 4,288 |
| | $ | 2,853 |
| | $ | 530 |
| | | | | |
| | | | | | | | | | | |
a. Includes silver sales of 452 thousand ounces ($20.04 per ounce average realized price).
b. Represents the combined total for all other mining operations and the related eliminations, as presented in the supplemental schedule, “Business Segments” on page XI.
|
| | | | | | | | | | | | | | | | | | | | | |
FREEPORT-McMoRan COPPER & GOLD INC. |
PRODUCT REVENUES AND PRODUCTION COSTS (continued) |
|
Indonesia Mining Product Revenues and Production Costs and Unit Net Cash Costs |
| | | | | |
Three Months Ended June 30, 2012 | | | | | |
| | By-Product | | Co-Product Method | |
(In Millions) | | Method | | Copper | | Gold | | Silver | | Total | |
Revenues, excluding adjustments | | $ | 637 |
| | $ | 637 |
| | $ | 391 |
| | $ | 13 |
| a | $ | 1,041 |
| |
| | | | | | | | | | | |
Site production and delivery, before net noncash | | | | | | | | | | | |
and other costs shown below | | 589 |
| | 361 |
| | 221 |
| | 7 |
| | 589 |
| |
Gold and silver credits | | (402 | ) | | — |
| | — |
| | — |
| | — |
| |
Treatment charges | | 38 |
| | 23 |
| | 14 |
| | 1 |
| | 38 |
| |
Royalty on metals | | 25 |
| | 15 |
| | 10 |
| | — |
| | 25 |
| |
Net cash costs | | 250 |
| | 399 |
| | 245 |
| | 8 |
| | 652 |
| |
Depreciation and amortization | | 53 |
| | 32 |
| | 20 |
| | 1 |
| | 53 |
| |
Noncash and other costs, net | | 5 |
| | 3 |
| | 2 |
| | — |
| | 5 |
| |
Total costs | | 308 |
| | 434 |
| | 267 |
| | 9 |
| | 710 |
| |
Revenue adjustments, primarily for pricing on | | | | | | | | | | | |
prior period open sales | | (20 | ) | | (20 | ) | | (2 | ) | | — |
| | (22 | ) | |
PT Smelting intercompany profit | | 8 |
| | 5 |
| | 3 |
| | — |
| | 8 |
| |
Gross profit | | $ | 317 |
| | $ | 188 |
| | $ | 125 |
| | $ | 4 |
| | $ | 317 |
| |
| | | | | | | | | | | |
Copper sales (millions of recoverable pounds) | | 183 |
| | 183 |
| | | | | | | |
Gold sales (thousands of recoverable ounces) | | | | | | 247 | | | | | |
| | | | | | | | | | | |
Gross profit per pound of copper/per ounce of gold: | | | | | | | |
| | | | | | | | | | | |
Revenues, excluding adjustments | | $ | 3.49 |
| | $ | 3.49 |
| | $ | 1,587 |
| | | | | |
| | | | | | | | | | | |
Site production and delivery, before net noncash | | | | | | | | | | | |
and other costs shown below | | 3.23 |
| | 1.97 |
| | 898 |
| | | | | |
Gold and silver credits | | (2.20 | ) | | — |
| | — |
| | | | | |
Treatment charges | | 0.21 |
| | 0.13 |
| | 58 |
| | | | | |
Royalty on metals | | 0.13 |
| | 0.08 |
| | 37 |
| | | | | |
Unit net cash costs | | 1.37 |
| | 2.18 |
| | 993 |
| | | | | |
Depreciation and amortization | | 0.29 |
| | 0.18 |
| | 80 |
| | | | | |
Noncash and other costs, net | | 0.03 |
| | 0.02 |
| | 8 |
| | | | | |
Total unit costs | | 1.69 |
| | 2.38 |
| | 1,081 |
| | | | | |
Revenue adjustments, primarily for pricing on | | | | | | | | | | | |
prior period open sales | | (0.11 | ) | | (0.11 | ) | | (9 | ) | | | | | |
PT Smelting intercompany profit | | 0.05 |
| | 0.03 |
| | 13 |
| | | | | |
Gross profit per pound/ounce | | $ | 1.74 |
| | $ | 1.03 |
| | $ | 510 |
| | | | | |
| | | | | | | | | | | |
Reconciliation to Amounts Reported | | | | | | Depreciation, | | | | | |
| | | | Production | | Depletion and | | | | | |
(In Millions) | | Revenues | | and Delivery | | Amortization | | | | | |
Totals presented above | | $ | 1,041 |
| | $ | 589 |
| | $ | 53 |
| | | | | |
Treatment charges | | (38 | ) | | — |
| | — |
| | | | | |
Royalty on metals | | (25 | ) | | — |
| | — |
| | | | | |
Net noncash and other costs | | — |
| | 5 |
| | — |
| | | | | |
Revenue adjustments, primarily for pricing on | | | | | | | | | | | |
prior period open sales | | (22 | ) | | — |
| | — |
| | | | | |
PT Smelting intercompany profit | | — |
| | (8 | ) | | — |
| | | | | |
Indonesia mining | | 956 |
| | 586 |
| | 53 |
| | | | | |
Other mining & eliminationsb | | 3,517 |
| | 2,035 |
| | 236 |
| | | | | |
Total mining | | 4,473 |
| | 2,621 |
| | 289 |
| | | | | |
Oil & gas operations | | — |
| | — |
| | — |
| | | | | |
Corporate, other & eliminations | | 2 |
| | 1 |
| | 2 |
| | | | | |
As reported in FCX’s consolidated financial statements | | $ | 4,475 |
| | $ | 2,622 |
| | $ | 291 |
| | | | | |
a. Includes silver sales of 476 thousand ounces ($27.23 per ounce average realized price).
b. Represents the combined total for all other mining operations and the related eliminations, as presented in the supplemental schedule, “Business Segments” on page XI.
|
| | | | | | | | | | | | | | | | | | | | | |
| | | | | | | | | | | |
FREEPORT-McMoRan COPPER & GOLD INC. |
PRODUCT REVENUES AND PRODUCTION COSTS (continued) |
|
Indonesia Mining Product Revenues and Production Costs and Unit Net Cash Costs |
| | | | | |
Six Months Ended June 30, 2013 | | | | | |
| | By-Product | | Co-Product Method | |
(In Millions) | | Method | | Copper | | Gold | | Silver | | Total | |
Revenues, excluding adjustments | | $ | 1,137 |
| | $ | 1,137 |
| | $ | 490 |
| | $ | 24 |
| a | $ | 1,651 |
| |
| | | | | | | | | | | |
Site production and delivery, before net noncash | | | | | | | | | | | |
and other costs shown below | | 1,077 |
| | 742 |
| | 319 |
| | 16 |
| | 1,077 |
| |
Gold and silver credits | | (512 | ) | | — |
| | — |
| | — |
| | — |
| |
Treatment charges | | 81 |
| | 56 |
| | 24 |
| | 1 |
| | 81 |
| |
Royalty on metals | | 47 |
| | 33 |
| | 14 |
| | — |
| | 47 |
| |
Net cash costs | | 693 |
| | 831 |
| | 357 |
| | 17 |
| | 1,205 |
| |
Depreciation and amortization | | 113 |
| | 78 |
| | 33 |
| | 2 |
| | 113 |
| |
Noncash and other costs, net | | 87 |
| | 60 |
| | 26 |
| | 1 |
| | 87 |
| |
Total costs | | 893 |
| | 969 |
| | 416 |
| | 20 |
| | 1,405 |
| |
Revenue adjustments, primarily for pricing on | | | | | | | | | | | |
prior period open sales | | 1 |
| | 1 |
| | (2 | ) | | — |
| | (1 | ) | |
PT Smelting intercompany profit | | 38 |
| | 26 |
| | 11 |
| | 1 |
| | 38 |
| |
Gross profit | | $ | 283 |
| | $ | 195 |
| | $ | 83 |
| | $ | 5 |
| | $ | 283 |
| |
| | | | | | | | | | | |
Copper sales (millions of recoverable pounds) | | 356 |
| | 356 |
| | | | | | | |
Gold sales (thousands of recoverable ounces) | | | | | | 342 |
| | | | | |
| | | | | | | | | | | |
Gross profit per pound of copper/per ounce of gold: | | | | | | | |
| | | | | | | | | | | |
Revenues, excluding adjustments | | $ | 3.20 |
| | $ | 3.20 |
| | $ | 1,431 |
| | | | | |
| | | | | | | | | | | |
Site production and delivery, before net noncash | | | | | | | | | | | |
and other costs shown below | | 3.03 |
| | 2.08 |
| | 934 |
| | | | | |
Gold and silver credits | | (1.44 | ) | | — |
| | — |
| | | | | |
Treatment charges | | 0.23 |
| | 0.16 |
| | 70 |
| | | | | |
Royalty on metals | | 0.13 |
| | 0.09 |
| | 41 |
| | | | | |
Unit net cash costs | | 1.95 |
| | 2.33 |
| | 1,045 |
| | | | | |
Depreciation and amortization | | 0.32 |
| | 0.22 |
| | 98 |
| | | | | |
Noncash and other costs, net | | 0.24 |
| | 0.17 |
| | 76 |
| | | | | |
Total unit costs | | 2.51 |
| | 2.72 |
| | 1,219 |
| | | | | |
Revenue adjustments, primarily for pricing on | | | | | | | | | | | |
prior period open sales | | — |
| | — |
| | (4 | ) | | | | | |
PT Smelting intercompany profit | | 0.10 |
| | 0.07 |
| | 33 |
| | | | | |
Gross profit per pound/ounce | | $ | 0.79 |
| | $ | 0.55 |
| | $ | 241 |
| | | | | |
| | | | | | | | | | | |
Reconciliation to Amounts Reported | | | | | | Depreciation, | | | | | |
| | | | Production | | Depletion and | | | | | |
(In Millions) | | Revenues | | and Delivery | | Amortization | | | | | |
Totals presented above | | $ | 1,651 |
| | $ | 1,077 |
| | $ | 113 |
| | | | | |
Treatment charges | | (81 | ) | | — |
| | — |
| | | | | |
Royalty on metals | | (47 | ) | | — |
| | — |
| | | | | |
Net noncash and other costs | | — |
| | 87 |
| | — |
| | | | | |
Revenue adjustments, primarily for pricing on | | | | | | | | | | | |
prior period open sales | | (1 | ) | | — |
| | — |
| | | | | |
PT Smelting intercompany profit | | — |
| | (38 | ) | | — |
| | | | | |
Indonesia mining | | 1,522 |
| | 1,126 |
| | 113 |
| | | | | |
Other mining & eliminationsb | | 7,010 |
| | 4,349 |
| | 572 |
| | | | | |
Total mining | | 8,532 |
| | 5,475 |
| | 685 |
| | | | | |
Oil & gas operations | | 336 |
| | 89 |
| | 169 |
| | | | | |
Corporate, other & eliminations | | 3 |
| | 8 |
| | 5 |
| | | | | |
As reported in FCX’s consolidated financial statements | | $ | 8,871 |
| | $ | 5,572 |
| | $ | 859 |
| | | | | |
| | | | | | | | | | | |
a. Includes silver sales of 1.0 million ounces ($23.19 per ounce average realized price).
b. Represents the combined total for all other mining operations and the related eliminations, as presented in the supplemental schedule, “Business Segments” on page XII.
|
| | | | | | | | | | | | | | | | | | | | | |
| | | | | | | | | | | |
FREEPORT-McMoRan COPPER & GOLD INC. |
PRODUCT REVENUES AND PRODUCTION COSTS (continued) |
|
Indonesia Mining Product Revenues and Production Costs and Unit Net Cash Costs |
| | | | | |
Six Months Ended June 30, 2012 | | | | | |
| | By-Product | | Co-Product Method | |
(In Millions) | | Method | | Copper | | Gold | | Silver | | Total | |
Revenues, excluding adjustments | | $ | 1,128 |
| | $ | 1,128 |
| | $ | 841 |
| | $ | 27 |
| a | $ | 1,996 |
| |
| | | | | | | | | | | |
Site production and delivery, before net noncash | | | | | | | | | | | |
and other costs shown below | | 1,059 |
| | 598 |
| | 446 |
| | 15 |
| | 1,059 |
| |
Gold and silver credits | | (871 | ) | | — |
| | — |
| | — |
| | — |
| |
Treatment charges | | 63 |
| | 36 |
| | 26 |
| | 1 |
| | 63 |
| |
Royalty on metals | | 43 |
| | 24 |
| | 18 |
| | 1 |
| | 43 |
| |
Net cash costs | | 294 |
| | 658 |
| | 490 |
| | 17 |
| | 1,165 |
| |
Depreciation and amortization | | 99 |
| | 56 |
| | 42 |
| | 1 |
| | 99 |
| |
Noncash and other costs, net | | 30 |
| | 17 |
| | 13 |
| | — |
| | 30 |
| |
Total costs | | 423 |
| | 731 |
| | 545 |
| | 18 |
| | 1,294 |
| |
Revenue adjustments, primarily for pricing on | | | | | | | | | | | |
prior period open sales | | 13 |
| | 13 |
| | 3 |
| | — |
| | 16 |
| |
PT Smelting intercompany loss | | (12 | ) | | (7 | ) | | (5 | ) | | — |
| | (12 | ) | |
Gross profit | | $ | 706 |
| | $ | 403 |
| | $ | 294 |
| | $ | 9 |
| | $ | 706 |
| |
| | | | | | | | | | | |
Copper sales (millions of recoverable pounds) | | 317 |
| | 317 |
| | | | | | | |
Gold sales (thousands of recoverable ounces) | | | | | | 513 |
| | | | | |
| | | | | | | | | | | |
Gross profit per pound of copper/per ounce of gold: | | | | | | | |
| | | | | | | | | | | |
Revenues, excluding adjustments | | $ | 3.56 |
| | $ | 3.56 |
| | $ | 1,639 |
| | | | | |
| | | | | | | | | | | |
Site production and delivery, before net noncash | | | | | | | | | | | |
and other costs shown below | | 3.35 |
| | 1.89 |
| | 869 |
| | | | | |
Gold and silver credits | | (2.75 | ) | | — |
| | — |
| | | | | |
Treatment charges | | 0.20 |
| | 0.11 |
| | 52 |
| | | | | |
Royalty on metals | | 0.13 |
| | 0.08 |
| | 35 |
| | | | | |
Unit net cash costs | | 0.93 |
| | 2.08 |
| | 956 |
| | | | | |
Depreciation and amortization | | 0.31 |
| | 0.18 |
| | 81 |
| | | | | |
Noncash and other costs, net | | 0.09 |
| | 0.05 |
| | 25 |
| | | | | |
Total unit costs | | 1.33 |
| | 2.31 |
| | 1,062 |
| | | | | |
Revenue adjustments, primarily for pricing on | | | | | | | | | | | |
prior period open sales | | 0.04 |
| | 0.04 |
| | 5 |
| | | | | |
PT Smelting intercompany loss | | (0.04 | ) | | (0.02 | ) | | (10 | ) | | | | | |
Gross profit per pound/ounce | | $ | 2.23 |
| | $ | 1.27 |
| | $ | 572 |
| | | | | |
| | | | | | | | | | | |
Reconciliation to Amounts Reported | | | | | | Depreciation, | | | | | |
| | | | Production | | Depletion and | | | | | |
(In Millions) | | Revenues | | and Delivery | | Amortization | | | | | |
Totals presented above | | $ | 1,996 |
| | $ | 1,059 |
| | $ | 99 |
| | | | | |
Treatment charges | | (63 | ) | | — |
| | — |
| | | | | |
Royalty on metals | | (43 | ) | | — |
| | — |
| | | | | |
Net noncash and other costs | | — |
| | 30 |
| | — |
| | | | | |
Revenue adjustments, primarily for pricing on | | | | | | | | | | | |
prior period open sales | | 16 |
| | — |
| | — |
| | | | | |
PT Smelting intercompany loss | | — |
| | 12 |
| | — |
| | | | | |
Indonesia mining | | 1,906 |
| | 1,101 |
| | 99 |
| | | | | |
Other mining & eliminationsb | | 7,170 |
| | 3,949 |
| | 455 |
| | | | | |
Total mining | | 9,076 |
| | 5,050 |
| | 554 |
| | | | | |
Oil & gas operations | | — |
| | — |
| | — |
| | | | | |
Corporate, other & eliminations | | 4 |
| | — |
| | 4 |
| | | | | |
As reported in FCX’s consolidated financial statements | | $ | 9,080 |
| | $ | 5,050 |
| | $ | 558 |
| | | | | |
| | | | | | | | | | | |
a. Includes silver sales of 925 thousand ounces ($29.84 per ounce average realized price).
b. Represents the combined total for all other mining operations and the related eliminations, as presented in the supplemental schedule, “Business Segments” on page XII.
|
| | | | | | | | | | | | | | | | | |
FREEPORT-McMoRan COPPER & GOLD INC. |
PRODUCT REVENUES AND PRODUCTION COSTS (continued) |
|
Africa Mining Product Revenues and Production Costs and Unit Net Cash Costs |
| | | | | |
Three Months Ended June 30, 2013 | | | | | |
| | By-Product | | Co-Product Method | |
(In Millions) | | Method | | Copper | | Cobalt | | Total | |
Revenues, excluding adjustmentsa | | $ | 330 |
| | $ | 330 |
| | $ | 47 |
| | $ | 377 |
| |
| | | | | | | | | |
Site production and delivery, before net noncash | | | | | | | | | |
and other costs shown below | | 156 |
| | 146 |
| | 27 |
| | 173 |
| |
Cobalt creditsb | | (31 | ) | | — |
| | — |
| | — |
| |
Royalty on metals | | 6 |
| | 5 |
| | 1 |
| | 6 |
| |
Net cash costs | | 131 |
| | 151 |
| | 28 |
| | 179 |
| |
Depreciation, depletion and amortization | | 57 |
| | 52 |
| | 5 |
| | 57 |
| |
Noncash and other costs, net | | 12 |
| | 11 |
| | 1 |
| | 12 |
| |
Total costs | | 200 |
| | 214 |
| | 34 |
| | 248 |
| |
Revenue adjustments, primarily for pricing | | | | | | | | | |
on prior period open sales | | (7 | ) | | (8 | ) | | 2 |
| | (6 | ) | |
Gross profit | | $ | 123 |
| | $ | 108 |
| | $ | 15 |
| | $ | 123 |
| |
| | | | | | | | | |
Copper sales (millions of recoverable pounds) | | 106 |
| | 106 |
| | | | | |
Cobalt sales (millions of contained pounds) | | | | | | 5 |
| | | |
| | | | | | | | | |
Gross profit per pound of copper/cobalt: | | | | | |
| | | | | | | | | |
Revenues, excluding adjustmentsa | | $ | 3.10 |
| | $ | 3.10 |
| | $ | 8.48 |
| | | |
| | | | | | | | | |
Site production and delivery, before net noncash | | | | | | | | | |
and other costs shown below | | 1.47 |
| | 1.37 |
| | 4.92 |
| | | |
Cobalt creditsb | | (0.30 | ) | | — |
| | — |
| | | |
Royalty on metals | | 0.06 |
| | 0.05 |
| | 0.15 |
| | | |
Unit net cash costs | | 1.23 |
| | 1.42 |
| | 5.07 |
| | | |
Depreciation, depletion and amortization | | 0.53 |
| | 0.49 |
| | 0.80 |
| | | |
Noncash and other costs, net | | 0.11 |
| | 0.10 |
| | 0.17 |
| | | |
Total unit costs | | 1.87 |
| | 2.01 |
| | 6.04 |
| | | |
Revenue adjustments, primarily for pricing | | | | | | | | | |
on prior period open sales | | (0.07 | ) | | (0.07 | ) | | 0.27 |
| | | |
Gross profit per pound | | $ | 1.16 |
| | $ | 1.02 |
| | $ | 2.71 |
| | | |
| | | | | | | | | |
Reconciliation to Amounts Reported | | | | | | Depreciation, | | | |
| | | | Production | | Depletion and | | | |
(In Millions) | | Revenues | | and Delivery | | Amortization | | | |
Totals presented above | | $ | 377 |
| | $ | 173 |
| | $ | 57 |
| | | |
Royalty on metals | | (6 | ) | | — |
| | — |
| | | |
Net noncash and other costs | | — |
| | 12 |
| | — |
| | | |
Revenue adjustments, primarily for pricing | | | | | | | | | |
on prior period open sales | | (6 | ) | | — |
| | — |
| | | |
Africa mining | | 365 |
| | 185 |
| | 57 |
| | | |
Other mining & eliminationsc | | 3,586 |
| | 2,574 |
| | 301 |
| | | |
Total mining | | 3,951 |
| | 2,759 |
| | 358 |
| | | |
Oil & gas operations | | 336 |
| | 89 |
| | 169 |
| | | |
Corporate, other & eliminations | | 1 |
| | 5 |
| | 3 |
| | | |
As reported in FCX’s consolidated financial statements | | $ | 4,288 |
| | $ | 2,853 |
| | $ | 530 |
| | | |
| | | | | | | | | |
a. Includes point-of-sale transportation costs as negotiated in customer contracts. |
|
b. Net of cobalt downstream processing and freight costs. |
|
c. Represents the combined total for all other mining operations and the related eliminations, as presented in the supplemental schedule, “Business Segments” on page XI. |
|
| | | | | | | | | | | | | | | | | |
FREEPORT-McMoRan COPPER & GOLD INC. |
PRODUCT REVENUES AND PRODUCTION COSTS (continued) |
|
Africa Mining Product Revenues and Production Costs and Unit Net Cash Costs |
| | | | | |
Three Months Ended June 30, 2012 | | | | | |
| | By-Product | | Co-Product Method | |
(In Millions) | | Method | | Copper | | Cobalt | | Total | |
Revenues, excluding adjustmentsa | | $ | 284 |
| | $ | 284 |
| | $ | 49 |
| | $ | 333 |
| |
| | | | | | | | | |
Site production and delivery, before net noncash | | | | | | | | | |
and other costs shown below | | 121 |
| | 114 |
| | 30 |
| | 144 |
| |
Cobalt creditsb | | (27 | ) | | — |
| | — |
| | — |
| |
Royalty on metals | | 6 |
| | 5 |
| | 1 |
| | 6 |
| |
Net cash costs | | 100 |
| | 119 |
| | 31 |
| | 150 |
| |
Depreciation, depletion and amortization | | 40 |
| | 35 |
| | 5 |
| | 40 |
| |
Noncash and other costs, net | | 8 |
| | 7 |
| | 1 |
| | 8 |
| |
Total costs | | 148 |
| | 161 |
| | 37 |
| | 198 |
| |
Revenue adjustments, primarily for pricing | | | | | | | | | |
on prior period open sales | | (6 | ) | | (6 | ) | | 1 |
| | (5 | ) | |
Gross profit | | $ | 130 |
| | $ | 117 |
| | $ | 13 |
| | $ | 130 |
| |
| | | | | | | | | |
Copper sales (millions of recoverable pounds) | | 82 |
| | 82 |
| | | | | |
Cobalt sales (millions of contained pounds) | | | | | | 6 |
| | | |
| | | | | | | | | |
Gross profit per pound of copper/cobalt: | | | | | |
| | | | | | | | | |
Revenues, excluding adjustmentsa | | $ | 3.45 |
| | $ | 3.45 |
| | $ | 8.24 |
| | | |
| | | | | | | | | |
Site production and delivery, before net noncash | | | | | | | | | |
and other costs shown below | | 1.48 |
| | 1.39 |
| | 5.09 |
| | | |
Cobalt creditsb | | (0.33 | ) | | — |
| | — |
| | | |
Royalty on metals | | 0.07 |
| | 0.06 |
| | 0.13 |
| | | |
Unit net cash costs | | 1.22 |
| | 1.45 |
| | 5.22 |
| | | |
Depreciation, depletion and amortization | | 0.49 |
| | 0.43 |
| | 0.75 |
| | | |
Noncash and other costs, net | | 0.09 |
| | 0.08 |
| | 0.14 |
| | | |
Total unit costs | | 1.80 |
| | 1.96 |
| | 6.11 |
| | | |
Revenue adjustments, primarily for pricing | | | | | | | | | |
on prior period open sales | | (0.07 | ) | | (0.07 | ) | | 0.12 |
| | | |
Gross profit per pound | | $ | 1.58 |
| | $ | 1.42 |
| | $ | 2.25 |
| | | |
| | | | | | | | | |
Reconciliation to Amounts Reported | | | | | | Depreciation, | | | |
| | | | Production | | Depletion and | | | |
(In Millions) | | Revenues | | and Delivery | | Amortization | | | |
Totals presented above | | $ | 333 |
| | $ | 144 |
| | $ | 40 |
| | | |
Royalty on metals | | (6 | ) | | — |
| | — |
| | | |
Net noncash and other costs | | — |
| | 8 |
| | — |
| | | |
Revenue adjustments, primarily for pricing | | | | | | | | | |
on prior period open sales | | (5 | ) | | — |
| | — |
| | | |
Africa mining | | 322 |
| | 152 |
| | 40 |
| | | |
Other mining & eliminationsc | | 4,151 |
| | 2,469 |
| | 249 |
| | | |
Total mining | | 4,473 |
| | 2,621 |
| | 289 |
| | | |
Oil & gas operations | | — |
| | — |
| | — |
| | | |
Corporate, other & eliminations | | 2 |
| | 1 |
| | 2 |
| | | |
As reported in FCX’s consolidated financial statements | | $ | 4,475 |
| | $ | 2,622 |
| | $ | 291 |
| | | |
| | | | | | | | | |
a. Includes point-of-sale transportation costs as negotiated in customer contracts. |
|
b. Net of cobalt downstream processing and freight costs. |
|
c. Represents the combined total for all other mining operations and the related eliminations, as presented in the supplemental schedule, “Business Segments” on page XI. |
|
| | | | | | | | | | | | | | | | | |
| | | | | | | | | |
FREEPORT-McMoRan COPPER & GOLD INC. |
PRODUCT REVENUES AND PRODUCTION COSTS (continued) |
|
Africa Mining Product Revenues and Production Costs and Unit Net Cash Costs |
| | | | | |
Six Months Ended June 30, 2013 | | | | | |
| | By-Product | | Co-Product Method | |
(In Millions) | | Method | | Copper | | Cobalt | | Total | |
Revenues, excluding adjustmentsa | | $ | 724 |
| | $ | 724 |
| | $ | 89 |
| | $ | 813 |
| |
| | | | | | | | | |
Site production and delivery, before net noncash | | | | | | | | | |
and other costs shown below | | 321 |
| | 303 |
| | 51 |
| | 354 |
| |
Cobalt creditsb | | (58 | ) | | — |
| | — |
| | — |
| |
Royalty on metals | | 14 |
| | 13 |
| | 1 |
| | 14 |
| |
Net cash costs | | 277 |
| | 316 |
| | 52 |
| | 368 |
| |
Depreciation, depletion and amortization | | 115 |
| | 107 |
| | 8 |
| | 115 |
| |
Noncash and other costs, net | | 16 |
| | 15 |
| | 1 |
| | 16 |
| |
Total costs | | 408 |
| | 438 |
| | 61 |
| | 499 |
| |
Revenue adjustments, primarily for pricing | | | | | | | | | |
on prior period open sales | | 2 |
| | 2 |
| | 2 |
| | 4 |
| |
Gross profit | | $ | 318 |
| | $ | 288 |
| | $ | 30 |
| | $ | 318 |
| |
| | | | | | | | | |
Copper sales (millions of recoverable pounds) | | 224 |
| | 224 |
| | | | | |
Cobalt sales (millions of contained pounds) | | | | | | 11 |
| | | |
| | | | | | | | | |
Gross profit per pound of copper/cobalt: | | | | | |
| | | | | | | | | |
Revenues, excluding adjustmentsa | | $ | 3.22 |
| | $ | 3.22 |
| | $ | 7.99 |
| | | |
| | | | | | | | | |
Site production and delivery, before net noncash | | | | | | | | | |
and other costs shown below | | 1.43 |
| | 1.35 |
| | 4.54 |
| | | |
Cobalt creditsb | | (0.26 | ) | | — |
| | — |
| | | |
Royalty on metals | | 0.06 |
| | 0.06 |
| | 0.14 |
| | | |
Unit net cash costs | | 1.23 |
| | 1.41 |
| | 4.68 |
| | | |
Depreciation, depletion and amortization | | 0.51 |
| | 0.47 |
| | 0.75 |
| | | |
Noncash and other costs, net | | 0.08 |
| | 0.07 |
| | 0.11 |
| | | |
Total unit costs | | 1.82 |
| | 1.95 |
| | 5.54 |
| | | |
Revenue adjustments, primarily for pricing | | | | | | | | | |
on prior period open sales | | 0.01 |
| | 0.01 |
| | 0.21 |
| | | |
Gross profit per pound | | $ | 1.41 |
| | $ | 1.28 |
| | $ | 2.66 |
| | | |
| | | | | | | | | |
Reconciliation to Amounts Reported | | | | | | Depreciation, | | | |
| | | | Production | | Depletion and | | | |
(In Millions) | | Revenues | | and Delivery | | Amortization | | | |
Totals presented above | | 813 |
| | 354 |
| | 115 |
| | | |
Royalty on metals | | (14 | ) | | — |
| | — |
| | | |
Net noncash and other costs | | — |
| | 16 |
| | — |
| | | |
Revenue adjustments, primarily for pricing | | | | | | | | | |
on prior period open sales | | 4 |
| | — |
| | — |
| | | |
Africa mining | | 803 |
| | 370 |
| | 115 |
| | | |
Other mining & eliminationsc | | 7,729 |
| | 5,105 |
| | 570 |
| | | |
Total mining | | 8,532 |
| | 5,475 |
| | 685 |
| | | |
Oil & gas operations | | 336 |
| | 89 |
| | 169 |
| | | |
Corporate, other & eliminations | | 3 |
| | 8 |
| | 5 |
| | | |
As reported in FCX’s consolidated financial statements | | $ | 8,871 |
| | $ | 5,572 |
| | $ | 859 |
| | | |
| | | | | | | | | |
a. Includes point-of-sale transportation costs as negotiated in customer contracts. |
|
b. Net of cobalt downstream processing and freight costs. |
|
c. Represents the combined total for all other mining operations and the related eliminations, as presented in the supplemental schedule, “Business Segments” on page XII. |
|
| | | | | | | | | | | | | | | | | |
| | | | | | | | | |
FREEPORT-McMoRan COPPER & GOLD INC. |
PRODUCT REVENUES AND PRODUCTION COSTS (continued) |
|
Africa Mining Product Revenues and Production Costs and Unit Net Cash Costs |
| | | | | |
Six Months Ended June 30, 2012 | | | | | |
| | By-Product | | Co-Product Method | |
(In Millions) | | Method | | Copper | | Cobalt | | Total | |
Revenues, excluding adjustmentsa | | $ | 536 |
| | $ | 536 |
| | $ | 92 |
| | $ | 628 |
| |
| | | | | | | | | |
Site production and delivery, before net noncash | | | | | | | | | |
and other costs shown below | | 224 |
| | 213 |
| | 56 |
| | 269 |
| |
Cobalt creditsb | | (50 | ) | | — |
| | — |
| | — |
| |
Royalty on metals | | 12 |
| | 11 |
| | 1 |
| | 12 |
| |
Net cash costs | | 186 |
| | 224 |
| | 57 |
| | 281 |
| |
Depreciation, depletion and amortization | | 72 |
| | 64 |
| | 8 |
| | 72 |
| |
Noncash and other costs, net | | 15 |
| | 13 |
| | 2 |
| | 15 |
| |
Total costs | | 273 |
| | 301 |
| | 67 |
| | 368 |
| |
Revenue adjustments, primarily for pricing | | | | | | | | | |
on prior period open sales | | 8 |
| | 8 |
| | 3 |
| | 11 |
| |
Gross profit | | $ | 271 |
| | $ | 243 |
| | $ | 28 |
| | $ | 271 |
| |
| | | | | | | | | |
Copper sales (millions of recoverable pounds) | | 151 |
| | 151 |
| | | | | |
Cobalt sales (millions of contained pounds) | | | | | | 11 |
| | | |
| | | | | | | | | |
Gross profit per pound of copper/cobalt: | | | | | |
| | | | | | | | | |
Revenues, excluding adjustmentsa | | $ | 3.54 |
| | $ | 3.54 |
| | $ | 8.40 |
| | | |
| | | | | | | | | |
Site production and delivery, before net noncash | | | | | | | | | |
and other costs shown below | | 1.49 |
| | 1.41 |
| | 5.11 |
| | | |
Cobalt creditsb | | (0.34 | ) | | — |
| | — |
| | | |
Royalty on metals | | 0.08 |
| | 0.07 |
| | 0.13 |
| | | |
Unit net cash costs | | 1.23 |
| | 1.48 |
| | 5.24 |
| | | |
Depreciation, depletion and amortization | | 0.48 |
| | 0.42 |
| | 0.71 |
| | | |
Noncash and other costs, net | | 0.10 |
| | 0.09 |
| | 0.14 |
| | | |
Total unit costs | | 1.81 |
| | 1.99 |
| | 6.09 |
| | | |
Revenue adjustments, primarily for pricing | | | | | | | | | |
on prior period open sales | | 0.06 |
| | 0.06 |
| | 0.22 |
| | | |
Gross profit per pound | | $ | 1.79 |
| | $ | 1.61 |
| | $ | 2.53 |
| | | |
| | | | | | | | | |
Reconciliation to Amounts Reported | | | | | | Depreciation, | | | |
| | | | Production | | Depletion and | | | |
(In Millions) | | Revenues | | and Delivery | | Amortization | | | |
Totals presented above | | $ | 628 |
| | $ | 269 |
| | $ | 72 |
| | | |
Royalty on metals | | (12 | ) | | — |
| | — |
| | | |
Net noncash and other costs | | — |
| | 15 |
| | — |
| | | |
Revenue adjustments, primarily for pricing | | | | | | | | | |
on prior period open sales | | 11 |
| | — |
| | — |
| | | |
Africa mining | | 627 |
| | 284 |
| | 72 |
| | | |
Other mining & eliminationsc | | 8,449 |
| | 4,766 |
| | 482 |
| | | |
Total mining | | 9,076 |
| | 5,050 |
| | 554 |
| | | |
Oil & gas operations | | — |
| | — |
| | — |
| | | |
Corporate, other & eliminations | | 4 |
| | — |
| | 4 |
| | | |
As reported in FCX’s consolidated financial statements | | $ | 9,080 |
| | $ | 5,050 |
| | $ | 558 |
| | | |
| | | | | | | | | |
a. Includes point-of-sale transportation costs as negotiated in customer contracts. |
|
b. Net of cobalt downstream processing and freight costs. |
|
c. Represents the combined total for all other mining operations and the related eliminations, as presented in the supplemental schedule, “Business Segments” on page XII. |
|
| | | | | | | | | | | | | | | |
FREEPORT-McMoRan COPPER & GOLD INC. |
PRODUCT REVENUES AND PRODUCTION COSTS (continued) |
|
Molybdenum Mines Product Revenues and Production Costs and Unit Net Cash Costs |
| | | | | | | | | |
| Three Months Ended June 30, | | | | | | |
(In Millions) | 2013a | | 2012a | | | | | | |
| | | | | | | | | |
Revenues, excluding adjustmentsb | $ | 156 |
| | $ | 130 |
| | | | | | |
| | | | | | | | | |
Site production and delivery, before net noncash | | | | | | | | | |
and other costs shown below | 76 |
| | 51 |
| | | | | | |
Treatment charges and other | 12 |
| | 8 |
| | | | | | |
Net cash costs | 88 |
| | 59 |
| | | | | | |
Depreciation, depletion and amortization | 21 |
| | 8 |
| | | | | | |
Noncash and other costs, net | 2 |
| | 2 |
| | | | | | |
Total costs | 111 |
| | 69 |
| | | | | | |
Gross profit | $ | 45 |
| | $ | 61 |
| | | | | | |
| | | | | | | | | |
Molybdenum production (millions of recoverable pounds)b | 13 |
| | 8 |
| | | | | | |
| | | | | | | | | |
Gross profit per pound of molybdenum: | | | | | | |
| | | | | | | | | |
Revenues, excluding adjustmentsb | $ | 12.13 |
| | $ | 15.11 |
| | | | | | |
| | | | | | | | | |
Site production and delivery, before net noncash | | | | | | | | | |
and other costs shown below | 5.84 |
| | 5.95 |
| | | | | | |
Treatment charges and other | 0.95 |
| | 0.88 |
| | | | | | |
Unit net cash costs | 6.79 |
| | 6.83 |
| | | | | | |
Depreciation, depletion and amortization | 1.65 |
| | 0.95 |
| | | | | | |
Noncash and other costs, net | 0.18 |
| | 0.25 |
| | | | | | |
Total unit costs | 8.62 |
| | 8.03 |
| | | | | | |
Gross profit per pound | $ | 3.51 |
| | $ | 7.08 |
| | | | | | |
| | | | | | | | | |
Reconciliation to Amounts Reported | | | | | | | | | |
(In Millions) | | | | | Depreciation, | | | | |
| | | Production | | Depletion and | | | | |
Three Months Ended June 30, 2013 | Revenues | | and Delivery | | Amortization | | | | |
Totals presented above | $ | 156 |
| | $ | 76 |
| | $ | 21 |
| | | | |
Treatment charges and other | (12 | ) | | — |
| | — |
| | | | |
Net noncash and other costs | — |
| | 2 |
| | — |
| | | | |
Molybdenum mines | 144 |
| | 78 |
| | 21 |
| | | | |
Other mining & eliminationsc | 3,807 |
| | 2,681 |
| | 337 |
| | | | |
Total mining | 3,951 |
| | 2,759 |
| | 358 |
| | | | |
Oil & gas operations | 336 |
| | 89 |
| | 169 |
| | | | |
Corporate, other & eliminations | 1 |
| | 5 |
| | 3 |
| | | | |
As reported in FCX’s consolidated financial statements | $ | 4,288 |
| | $ | 2,853 |
| | $ | 530 |
| | | | |
| | | | | | | | | |
Three Months Ended June 30, 2012 | | | | | | | | | |
Totals presented above | $ | 130 |
| | $ | 51 |
| | $ | 8 |
| | | | |
Treatment charges and other | (8 | ) | | — |
| | — |
| | | | |
Net noncash and other costs | — |
| | 2 |
| | — |
| | | | |
Henderson mine | 122 |
| | 53 |
| | 8 |
| | | | |
Climax mine | 12 |
| | 25 |
| | 5 |
| | | | |
Molybdenum mines | 134 |
| | 78 |
| | 13 |
| | | | |
Other mining & eliminationsc | 4,339 |
| | 2,543 |
| | 276 |
| | | | |
Total mining | 4,473 |
| | 2,621 |
| | 289 |
| | | | |
Oil & gas operations | — |
| | — |
| | — |
| | | | |
Corporate, other & eliminations | 2 |
| | 1 |
| | 2 |
| | | | |
As reported in FCX’s consolidated financial statements | $ | 4,475 |
| | $ | 2,622 |
| | $ | 291 |
| | | | |
| | | | | | | | | |
a. Second-quarter 2013 includes the results of the Henderson and Climax mines; second-quarter 2012 reflects the results of only the Henderson mine as start-up activities were still underway at the Climax mine. |
|
b. Reflects sales of the molybdenum mines' production to FCX's molybdenum sales company at market-based pricing. On a consolidated basis, realizations are based on the actual contract terms for sales to third parties; as a result, FCX's consolidated average realized price per pound of molybdenum will differ from the amounts reported in this table. |
|
c. Represents the combined total for all other mining operations and the related eliminations, as presented in the supplemental schedule, “Business Segments” on page XI. Also includes amounts associated with FCX's molybdenum sales company, which includes sales of molybdenum produced by the molybdenum mines and by certain of the North and South America copper mines. |
|
|
| | | | | | | | | | | | | | | |
| | | | | | | | | |
FREEPORT-McMoRan COPPER & GOLD INC. |
PRODUCT REVENUES AND PRODUCTION COSTS (continued) |
| | | | | | | | | |
Molybdenum Mines Product Revenues and Production Costs and Unit Net Cash Costs |
| | | | | | | | | |
| Six Months Ended June 30, | | | | | | |
(In Millions) | 2013a | | 2012a | | | | | | |
| | | | | | | | | |
Revenues, excluding adjustmentsb | $ | 311 |
| | $ | 264 |
| | | | | | |
| | | | | | | | | |
Site production and delivery, before net noncash | | | | | | | | | |
and other costs shown below | 154 |
| | 105 |
| | | | | | |
Treatment charges and other | 24 |
| | 15 |
| | | | | | |
Net cash costs | 178 |
| | 120 |
| | | | | | |
Depreciation, depletion and amortization | 41 |
| | 16 |
| | | | | | |
Noncash and other costs, net | 4 |
| | 1 |
| | | | | | |
Total costs | 223 |
| | 137 |
| | | | | | |
Gross profit | $ | 88 |
| | $ | 127 |
| | | | | | |
| | | | | | | | | |
Molybdenum sales (millions of recoverable pounds)b | 25 |
| | 17 |
| | | | | | |
| | | | | | | | | |
Gross profit per pound of molybdenum: | | | | | | |
| | | | | | | | | |
Revenues, excluding adjustmentsb | $ | 12.33 |
| | $ | 15.07 |
| | | | | | |
| | | | | | | | | |
Site production and delivery, before net noncash | | | | | | | | | |
and other costs shown below | 6.10 |
| | 5.98 |
| | | | | | |
Treatment charges and other | 0.95 |
| | 0.87 |
| | | | | | |
Unit net cash costs | 7.05 |
| | 6.85 |
| | | | | | |
Depreciation, depletion and amortization | 1.64 |
| | 0.93 |
| | | | | | |
Noncash and other costs, net | 0.16 |
| | 0.06 |
| | | | | | |
Total unit costs | 8.85 |
| | 7.84 |
| | | | | | |
Gross profit per pound | $ | 3.48 |
| | $ | 7.23 |
| | | | | | |
| | | | | | | | | |
Reconciliation to Amounts Reported | | | | | | | | | |
(In Millions) | | | | | Depreciation, | | | | |
| | | Production | | Depletion and | | | | |
Six Months Ended June 30, 2013 | Revenues | | and Delivery | | Amortization | | | | |
Totals presented above | $ | 311 |
| | $ | 154 |
| | $ | 41 |
| | | | |
Treatment charges and other | (24 | ) | | — |
| | — |
| | | | |
Net noncash and other costs | — |
| | 4 |
| | — |
| | | | |
Molybdenum mines | 287 |
| | 158 |
| | 41 |
| | | | |
Other mining & eliminations | 8,245 |
| | 5,317 |
| | 644 |
| | | | |
Total mining | 8,532 |
| | 5,475 |
| | 685 |
| | | | |
Oil & gas operations | 336 |
| | 89 |
| | 169 |
| | | | |
Corporate, other & eliminationsc | 3 |
| | 8 |
| | 5 |
| | | | |
As reported in FCX’s consolidated financial statements | $ | 8,871 |
| | $ | 5,572 |
| | $ | 859 |
| | | | |
| | | | | | | | | |
Six Months Ended June 30, 2012 | | | | | | | | | |
Totals presented above | $ | 264 |
| | $ | 105 |
| | $ | 16 |
| | | | |
Treatment charges and other | (15 | ) | | — |
| | — |
| | | | |
Net noncash and other costs | — |
| | 1 |
| | — |
| | | | |
Henderson mine | 249 |
| | 106 |
| | 16 |
| | | | |
Climax mine | 11 |
| | 43 |
| | 7 |
| | | | |
Molybdenum mines | 260 |
| | 149 |
| | 23 |
| | | | |
Other mining & eliminationsc | 8,816 |
| | 4,901 |
| | 531 |
| | | | |
Total mining | 9,076 |
| | 5,050 |
| | 554 |
| | | | |
Oil & gas operations | — |
| | — |
| | — |
| | | | |
Corporate, other & eliminations | 4 |
| | — |
| | 4 |
| | | | |
As reported in FCX’s consolidated financial statements | $ | 9,080 |
| | $ | 5,050 |
| | $ | 558 |
| | | | |
| | | | | | | | | |
a. The 2013 period includes the results of the Henderson and Climax mines; the 2012 period reflects the results of only the Henderson mine as start-up activities were still underway at the Climax mine. |
|
b. Reflects sales of the molybdenum mines' production to FCX's molybdenum sales company at market-based pricing. On a consolidated basis, realizations are based on the actual contract terms for sales to third parties; as a result, FCX's consolidated average realized price per pound of molybdenum will differ from the amounts reported in this table. |
|
c. Represents the combined total for all other mining operations and the related eliminations, as presented in the supplemental schedule, “Business Segments” on page XII. Also includes amounts associated with FCX's molybdenum sales company, which includes sales of molybdenum produced by the molybdenum mines and by certain of the North and South America copper mines. |
| | | | | | | | | |
|
| | | | | | | | | | | | | | | | | | | | |
FREEPORT-McMoRan COPPER & GOLD INC. | |
PRODUCT REVENUES AND PRODUCTION COSTS (continued) | |
| |
Oil & Gas Product Revenues and Cash Production Costs and Realizations | |
| | | | | | |
June 1, 2013, to June 30, 2013 | | | | | | | | | | |
| | | | | | Natural | | | | |
| | | | Natural | | Gas Liquids | | Total | | |
(In Millions) | | Oil | | Gas | | (NGLs) | | Oil & Gas | | |
Oil and gas revenues before derivatives | | $ | 330 |
| | $ | 30 |
| | $ | 11 |
| | $ | 371 |
| | |
Realized gains on derivative instruments | | 1 |
| | — |
| | — |
| | 1 |
| | |
Realized revenues | | 331 |
| | 30 |
| | 11 |
| | 372 |
| | |
Unrealized (losses) gains on derivative instruments | | (55 | ) | | 19 |
| | — |
| | (36 | ) | | |
Oil and gas revenues | | $ | 276 |
| | $ | 49 |
| | $ | 11 |
| | $ | 336 |
| | |
| | | | | | | | | | |
Oil (MMBbls) | | 3.4 |
| | | | | | | | |
Gas (Bcf) | | | | 7.7 |
| | | | | | |
NGLs (MMBbls) | | | | | | 0.3 |
| | | | |
Oil Equivalents (MMBOE) | | | | | | | | 5.0 |
| | |
| | | | | | | | | | |
| | Oil | | Natural Gas | | NGLs | | | | |
| | (per MBbls) | | (per MMcf) | | (per MBbls) | | Per BOE | | |
Oil and gas revenues before derivatives | | $ | 97.05 |
| | $ | 3.81 |
| | $ | 35.18 |
| | $ | 74.03 |
| | |
Realized gains on derivative instruments | | 0.37 |
| | 0.05 |
| | — |
| | 0.34 |
| | |
Realized revenues | | 97.42 |
| | 3.86 |
| | 35.18 |
| | 74.37 |
| | |
Unrealized (losses) gains on derivative instruments | | (16.12 | ) | | 2.38 |
| | — |
| | (7.27 | ) | | |
Oil and gas revenues | | $ | 81.30 |
| | $ | 6.24 |
| | $ | 35.18 |
| | $ | 67.10 |
| | |
| | | | | | | | | | |
| | | | | | | | | | |
| | | | | | | | | | |
Average Realized Price and Cash Production Cost per BOE by Region | |
| | | | | | | | | | |
| | MMBOE | | Revenues
(in millions) | | Average Realized Price per BOEa | | Production and Delivery (in millions) | | Cash Production Costs per BOE |
Gulf of Mexico | | 1.9 |
| | $ | 149 |
| | $ | 78.07 |
| | $ | 27 |
| | $ | 14.07 |
|
Eagle Ford | | 1.3 |
| | 99 |
| | 76.94 |
| | 16 |
| | 12.79 |
|
California | | 1.1 |
| | 107 |
| | 94.48 |
| | 35 |
| | 30.98 |
|
Haynesville/Madden/Other | | 0.7 |
| | 16 |
| | 23.77 |
| | 5 |
| | 6.91 |
|
| | 5.0 |
| | 371 |
| | | | 83 |
| | 16.58 |
|
Net losses on derivative instruments | | | | (35 | ) | a | | | — |
| | |
Accretion and other costs | | | | — |
| | | | 6 |
| | |
Oil and gas operations | | | | 336 |
| | | | 89 |
| | |
Total mining | | | | 3,951 |
| | | | 2,759 |
| | |
Corporate, other & eliminations | | | | 1 |
| | | | 5 |
| | |
As reported in FCX’s consolidated financial statements | | $ | 4,288 |
| | | | $ | 2,853 |
| | |
| | | | | | | | | | |
a. Derivative instruments for FCX's oil and gas operations are managed on a consolidated basis; accordingly, average realized price per BOE by region does not reflect adjustments for derivative instruments. |