Wilmington Funds
UNITED STATES
SECURITIES AND EXCHANGE COMMISSION
Washington, D.C. 20549
FORM
N-CSR
CERTIFIED SHAREHOLDER REPORT OF REGISTERED MANAGEMENT
INVESTMENT COMPANIES
Investment Company Act file number 811-05514
Wilmington
Funds
(Exact name of registrant as specified in charter)
Wilmington Trust Investment Advisors, Inc.
111 South Calvert Street, 26th Floor
Baltimore, Maryland
21202
(Address of principal executive offices) (Zip code)
Mary Ellen Reilly
Wilmington
Trust Investment Advisors, Inc.
Rodney Square North
1100 North Market Street
Wilmington, DE
19890-0001
(Name and address of agent for service)
Registrant’s telephone number, including area code: 410-986-5600
Date of fiscal year end: April 30
Date of reporting period: April 30, 2015
Form N-CSR is to be used by management investment companies to file reports with the Commission not later than 10 days after the transmission
to stockholders of any report that is required to be transmitted to stockholders under Rule 30e-1 under the Investment Company Act of 1940 (17 CFR 270.30e-1). The Commission may use the information provided on Form N-CSR in its regulatory,
disclosure review, inspection, and policymaking roles.
A registrant is required to disclose the information specified by Form N-CSR, and
the Commission will make this information public. A registrant is not required to respond to the collection of information contained in Form N-CSR unless the Form displays a currently valid Office of Management and Budget (“OMB”) control
number. Please direct comments concerning the accuracy of the information collection burden estimate and any suggestions for reducing the burden to Secretary, Securities and Exchange Commission, 100 F Street, NE, Washington, DC 20549. The OMB has
reviewed this collection of information under the clearance requirements of 44 U.S.C. § 3507.
Item 1. Reports to Stockholders.
The Report to Shareholders is attached herewith.

|
|
|
|
|
Wilmington Prime Money Market Fund (“Prime Money Market Fund”) |
|
|
|
|
Wilmington U.S. Government Money Market Fund (“U.S. Government Money Market Fund”) |
|
|
|
|
Wilmington U.S. Treasury Money Market Fund (“U.S. Treasury Money Market Fund”) |
|
|
|
|
Wilmington Tax-Exempt Money Market Fund (“Tax-Exempt Money Market Fund”) |

[This Page Intentionally Left Blank]
Dear Investor:
I am pleased to present the Annual Report of the Wilmington Funds (the “Trust”), covering the
Trust’s fiscal year of May 1, 2014, through April 30, 2015. Inside you will find a comprehensive review of the Funds’ holdings and financial statements.
The Economy and Financial Markets in Review
Wilmington Funds Management Corporation, the investment advisor to the Trust, and Wilmington Trust Investment
Advisors, Inc., the sub-advisor to the Trust, have provided the following review of the economy, bond markets, and stock markets for the Trust’s fiscal year.
The Economy
Economic reports painted an ambiguous picture of the U.S economy. The gross domestic product (GDP) expanded at
a very strong annualized rate in the 2nd and 3rd quarters of 2014 (+4.6% and +5.0%, respectively), but cooled off in the 4th quarter of 2014, recording a more modest 2.2% increase and posting a 0.7% decline in the 1st quarter of 2015.i
ihttp://www.bea.org/index.htm
The headwinds responsible for this slowdown in economic growth were manifold. A dock worker strike at West
Coast ports, a strong U.S. dollar (and its concomitant drag on exports), sliding oil prices, and an unusually harsh winter all conspired to sap the building economic momentum.
Despite the uneven GDP performance, the employment situation steadily improved. Unemployment, which stood at
6.3% in May 2014, fell by nearly a full percentage point to 5.4% by April 2015, placing it in the range of what the Federal Reserve (the “Fed”) has come to view as “full
employment.”ii
iihttp://data.bls.gov/timeseries/LNS14000000
While the
unemployment picture brightened, the labor force participation rate remained unchanged at 62.8%.iii This rate is at a historical low and has shown little sign of bouncing back to pre-recession
levels.
iiihttp://data.bls.gov/timeseries/LNS11300000
Oil prices went on a wild ride, with West Texas Intermediate (WTI) crude falling nearly 60% in value, from its
$107.95 per barrel peak in June 2014 to a low of $43.39 on March 17th. Prices staged a partial recovery, rising to $59.62 by the end of April 2015.iv
ivhttp://www.eia.gov/dnav/pet/hist/LeafHandler.ashx?n=PET&s=RWTC&F=D
Though it might seem that declining oil prices would be a boost to the economy given their positive
impact on corporate earnings and consumer spending, the short-term effect was negative as oil-related companies ratcheted back their spending on capital goods. The expected boost from consumer spending was muted as individuals chose to reduce debt
with the savings accrued from lower gas prices, or adopt a wait-and-see attitude over whether lower prices would persist.
The Bond
Markets
The bond market weathered the end of quantitative easing1 and performed well amid the persistent uncertainty of a hike in short-term rates by the Fed. While the path of the 10-year Treasury rate was a bit erratic, the direction was generally lower. The
yield on the 10-year note, which was 2.65% at the start of the Trust’s fiscal year, fell to 2.03% by April 30, 2015, after spending a substantial amount of time under 2% during the first quarter of 2015.v
vhttp://www.treasury.gov/resource-center/data-chart-center/interest-rates/Pages/TextView.aspx?data=yieldYear&year=2015
The Barclays U.S. Aggregate Index2 returned 4.46% for the
12-month period ended April 30, 2015, powered by an increase of 15.06% in the Barclays U.S. Long Government Bond Index3.
Municipal bonds also turned in a good year, with the S&P Municipal Bond Intermediate Index4 gaining 3.94%.
The Barclays U.S. Corporate High Yield
Bond Index5, which returned a paltry 2.58%, was hampered by oil-related high yield bonds, which suffered as oil prices sagged.
Investors will be awaiting Fed interest rate policy actions in the latter half of 2015. The Fed has signaled
that it wishes to begin the process of normalizing monetary policy yet how the capital markets will react remains an open question.
|
| PRESIDENT’S MESSAGE / April 30, 2015 (unaudited) |
For the 12-month reporting period May 1, 2014 through
April 30, 2015, certain Barclays’ indices performed as follows6:
|
|
|
|
|
|
|
|
|
|
|
|
|
Barclays
U.S. Aggregate
Bond Index |
|
Barclays
U.S. Treasury
Bond Index7 |
|
Barclays
U.S. Mortgage-
Backed
Securities
Index8 |
|
Barclays
U.S. Credit
Bond Index9 |
|
Barclays
Municipal Bond
Index10 |
|
|
|
|
|
4.46% |
|
4.23% |
|
4.61% |
|
4.87% |
|
4.80% |
|
|
|
|
The Stock Markets
The current bull market in stocks entered its seventh year. Though economic growth and corporate earnings
deserve their fair share of the credit for this extended stock rally, the Federal Reserve policies of quantitative easing and low rates have provided substantial support to stock prices during this time.
With the end to quantitative easing in the 4th quarter of 2014, the markets remained fixated on when the Fed
might raise short-term rates. The mixed signals that each new economic report sent about the underlying strength of the economy was enough for the Fed to postpone a rate hike into the 2nd half of 2015, helping the markets record solid gains during
the Trust’s fiscal year period.
Through the period May 1, 2014 to April 30, 2015, the
S&P 500 index11 jumped 12.98%, the S&P MidCap 400 Index12 rose 12.28% and the S&P SmallCap 600 Index13 turned in a gain of 9.24%.
While smaller-cap stocks
underperformed for the full 12-month period, they raced ahead of large-cap stocks in the latter part of the period, aided, in part, by a lower exposure to foreign markets, which has become challenging to large companies because of the strengthening
U.S. dollar.
Growth stocks proved to be far better performers than value stocks, as evidenced by the
return gap between the S&P 500 Growth Index14 (+16.32%) and the S&P 500 Value Index15 (+9.43%). This return disparity was also
evident in the mid-cap and small-cap sectors which, while not as wide, were on the order of 400 basis points (4.0%).
The U.S. markets were driven by the healthcare (+25.12%), information technology (+20.53%) and consumer
discretionary (+19.84%) sectors. The only sector to lose ground was energy, which declined 9.84%. Real estate also enjoyed a strong year, as reflected in the +13.22% return in the FTSE NAREIT Equity REITs Index16.
International stocks trailed U.S. markets, with the
MSCI EAFE (Net) Index17 netting a small gain of 1.66%. Overseas markets were hampered by weak economic growth and a tight credit environment. However, following the implementation by the European
Central Bank (ECB) and the Bank of Japan (BOJ) of their own forms of quantitative easing, economic growth and investor enthusiasm for stocks picked up. In the three-month period, ending April 30, 2015, the MSCI EAFE Index turned positive,
gaining 8.63%.
For the 12-month reporting period May 1, 2014 through April 30, 2015, certain
stock market indices performed as follows:
|
|
|
|
|
|
|
|
|
|
|
|
|
S&P 500
Index |
|
Dow Jones
Industrial Average18 |
|
NASDAQ
Composite Index19 |
|
MSCI All Country
World ex-US (Net)
Index20 |
|
|
|
|
|
|
|
12.98% |
|
10.11% |
|
21.52% |
|
2.63% |
|
|
|
|
|
|
I want to thank you for your continued trust in allowing us to help you
reach your important financial goals. We understand the profound responsibility you have placed with us in managing your investments. We work hard every day to ensure that we continue to deserve your confidence.
Sincerely,

Christopher D. Randall
President
May 29, 2015
For more complete information, please download the Trust’s prospectus, which is available on
www.wilmingtonfunds.com, or call 1-800-836-2211 for a copy. You should consider the Funds’ investment objectives, risks, charges, and expenses carefully before you invest. Information about these and other important subjects is in the
Trust’s prospectus, which you should read carefully before investing.
|
| April 30, 2015 (unaudited) / PRESIDENT’S MESSAGE |
Past performance is no guarantee of future results. The index
performance quoted is for illustrative purposes only and is not representative of any specific investment. Diversification does not ensure a profit nor protect against loss.
All investments involve risk, including the possible loss of principal. Equity Securities are subject to
price fluctuation and possible loss of principal. Small- and mid-cap stocks involve greater risks and volatility than large-cap stocks. International investments are subject to special risks, including currency fluctuations, social, economic, and
political uncertainties, which could increase volatility. These risks are magnified in emerging markets.
High yield, lower-rated securities generally entail greater market, credit and liquidity risks than
investment grade securities and may include higher volatility and higher risk of default.
An
investment in money market funds is neither insured nor guaranteed by the Federal Deposit Insurance Corporation or any other government agency. Although money market funds seek to preserve the value of your investment at $1.00 per share, it is
possible to lose money by investing in these funds.
| |
1. |
Quantitative Easing (QE) is a government monetary policy occasionally used to increase the money supply by buying government securities or other securities from the market. Quantitative Easing increases the money supply
by flooding the financial institutions with capital, in an effort to promote increased lending and liquidity loss. |
|
| |
2. |
Barclays U.S. Aggregate Bond Index is a widely used benchmark index for the domestic investment-grade bond market composed of securities from the Barclays Government/Corporate Bond Index, Mortgage-Backed Securities
Index and Asset-Backed Securities Index. The index typically includes fixed income securities with overall intermediate- to long-term average maturities. The index is unmanaged and investments cannot be made directly in an index. |
|
| |
3. |
Barclays U.S. Long Government Bond Index tracks the market for U.S. dollar-denominated, fixed rate, nominal U.S. Treasuries (with the exception of Federal Reserve holdings of U.S. Treasuries) and U.S. agency debentures
(with the exception of those U.S. agency debentures held in the Federal Reserve SOMA account). To be included in this index, securities must have at least 10 years to final maturity. |
|
| |
4. |
S&P Municipal Bond Intermediate Index is a broad, market value-weighted index that seeks to measure the performance of the U.S. municipal bond market. |
|
| |
5. |
Barclays U.S. Corporate High Yield Bond Index measures the USD-denominated, high yield, fixed-rate corporate bond market. Securities are classified as high yield if the middle rating of Moody’s, Fitch, and S&P
is Ba1/BB+/BB+ or below. Bonds from issuers with an emerging markets country of risk, based on Barclays EM country definition, are excluded. The U.S. Corporate High Yield Bond Index is a component of the U.S. Universal and Global High Yield Indices.
|
|
| |
6. |
Bond prices are sensitive to changes in interest rates and a rise in interest rates can cause a decline in their prices. |
|
| |
7. |
Barclays U.S. Treasury Bond Index is a market capitalization weighted index that includes all publicly issued, U.S. Treasury securities that have a remaining maturity of at least one year, are rated investment-grade,
and have $250 million or more of outstanding face value. The index is unmanaged and investments cannot be made directly in an index. |
|
| |
8. |
Barclays U.S. Mortgage Backed Securities Index is composed of all securities mortgage pools by GNMA, FNMA and the FHLMC, including GNMA graduated Payment Mortgages. The index is unmanaged and investments cannot be made
directly in an index. |
|
| |
9. |
Barclays U.S. Credit Bond Index tracks the performance of domestic investment-grade corporate bonds and is composed of all publicly issued, fixed-rate, nonconvertible, investment-grade corporate debt. The index is
unmanaged and investments cannot be made directly in an index. |
|
| |
10. |
Barclays Municipal Bond Index tracks the performance of long-term, tax-exempt, investment-grade bond market. To be included in the index, bonds must have an outstanding par balance of at least $7 million and be issued
as part of a transaction of at least $75 million. The index is unmanaged and investments cannot be made directly in an index. |
|
| |
11. |
The S&P 500 Index is a capitalization-weighted index of 500 stocks designed to measure performance of the broad domestic economy through changes in the aggregate market value of 500 stocks representing all major
industries. The index is unmanaged and investments cannot be made directly in an index. |
|
| |
12. |
The S&P MidCap 400 Index measures the mid cap segment of the U.S. equity market. To be included in the index, a stock must have a total market capitalization that ranges from roughly $750 million to $3.3 billion.
|
|
| |
13. |
The S&P SmallCap 600 Index measures the small cap segment of the U.S. equity market. The index is designed to be an investable portfolio of companies that meet specific inclusion criteria to ensure that they are
liquid and financially viable. The index is unmanaged and investments cannot be made directly in an index. |
|
| |
14. |
The S&P 500 Growth Index measures growth stocks using three factors: sales growth, the ratio of earnings change to price, and momentum. S&P Style Indices divide the complete market capitalization of each parent
index into growth and value segments. Constituents are drawn from the S&P 500 Index. The index is unmanaged and investments cannot be made directly in an index. |
|
| |
15. |
The S&P 500 Value Index measures value stocks using three factors: the ratios of book value, earnings, and sales to price. S&P Style Indices divide the complete market capitalization of each parent index into
growth and value segments. Constituents are drawn from the S&P 500 Index. The index is unmanaged and investments cannot be made directly in an index. |
|
| |
16. |
FTSE NAREIT Equity REITs Index is a free-float adjusted, market capitalization-weighted index of U.S. Equity REITs. Constituents of the Index include all tax-qualified REITs with more than 50 percent of total assets in
qualifying real estate assets other than mortgages secured by real property. |
|
| |
17. |
MSCI EAFE (Net) Index is a free float-adjusted market capitalization index that is designed to measure equity market performance of developed markets, excluding the U.S. & Canada. The index consisted of the
following 22 developed market country indices: Australia, Austria, Belgium, Denmark, Finland, France, Germany, Greece, Hong Kong, Ireland, Israel, Italy, Japan, Netherlands, New Zealand, Norway, Portugal, Singapore, Spain, Sweden, Switzerland and
the United Kingdom. The index is unmanaged and investments cannot be made directly in an index. |
|
| |
18. |
Dow Jones Industrial Average (“DJIA”) represents share prices of selected blue chip industrial corporations as well as public utility and transportation companies. The DJIA indicates daily changes in the
average prices of stocks in any of its categories. It also reports total sales for each group of industries. Because it represents the top corporations of America, the DJIA’s average movements are leading economic indicators for the stock
market as a whole. The average is unmanaged and investments cannot be made directly in an average. |
|
| |
19. |
NASDAQ Composite Index measures all NASDAQ domestic and non-U.S. based common stocks listed on the NASDAQ Stock Market. The index is unmanaged and investments cannot be made directly in an index. |
|
| |
20. |
MSCI All Country World ex-US (Net) Index is a free float-adjusted market capitalization weighted index that is designed to measure the equity market performance of developed and emerging markets excluding the U.S.
market. The index consists of 44 countries indices comprising 23 developed and 21 emerging market country indices. The index is unmanaged and investments cannot be made directly in an index. |
|
|
| PRESIDENT’S MESSAGE / April 30, 2015 (unaudited) |
WILMINGTON MONEY MARKET FUNDS
Management’s Discussion of Fund Performance
The bond market rebounded during the past fiscal year as intermediate and
long-term interest rates moved lower in response to plummeting energy prices, a Federal Reserve (the “Fed”) that remains accommodative and a European Central Bank that implemented its own quantitative easing program. Shorter term interest
rates moved slightly higher as the market began to expect the Fed to start tightening monetary policy later this year.
Economic growth for the 12-month period ended March 31, 2015 improved to 3% as measured by the GDP (gross domestic
product). The consumer continued to pull their weight as evidenced by another year of strong auto sales. What was remarkable about this growth rate was that it included the two best consecutive quarters of economic growth since 2003. GDP for the 2nd and 3rd quarters of 2014 was 4.6% and 5.0%, respectively. Once again, the 1st quarter of
2015 was negatively impacted by harsh winter weather as GDP decreased by 0.7%. We anticipate economic growth will pick up for the remainder of 2015 as the weather improves. The labor market continued to improve as companies fired fewer employees,
initial jobless claims have fallen to a 15-year low and the unemployment rate has declined to 5.4%. Over the past several months, we have seen the manufacturing sector weaken as the stronger dollar has led to exported manufactured goods to be less
competitive. The Institute for Supply Managements (ISM) surveys has weakened and industrial production has been shrinking.
Oil prices fell from a high of $107 per barrel to a low of $43.39 per barrel over the course of the fiscal year. The catalyst
for the sharp decline was increased supply from U.S. oil producers and weaker demand as China and European economic growth slowed. The sharp decline of energy prices caused the Consumer Price Index (CPI) to fall -0.2% in the fiscal year. The less
volatile core CPI, which excludes food and energy, increased by 1.8% this fiscal year. Wage growth also remains anemic, increasing at only a 2.2% annualized rate over the past year as there continues to be slack in the jobs market.
The yield curve flattened over the fiscal year as long-term interest rates moved lower in response to weaker inflation and in
response to European sovereign yields declining to all-time low yields and in some maturities fell to negative yields. The catalyst for the decline of European yields was the ECB’s implementation of a quantitative easing program which is
similar to what the Fed had initiated several years ago to stimulate economic growth and fears of deflation in the Eurozone. The low European yields acted as a “magnet” to pull U.S. treasury yields lower. However, short-term U.S. yields
moved higher over the course of the fiscal year in response to the Fed tapering its purchase of additional securities and their intention to begin raising short-term interest rates. The 10-Year U.S. Treasury yield at April 30 was 2.03%, down
from 2.65% from the start of the fiscal year. The 2-Year U.S. Treasury yield rose only 0.16% during the same period to a yield of 0.57%.
Looking forward, we anticipate economic growth to pick up from the weather induced slowdown of the quarter ended March 31,
2015. We also anticipate inflation to remain benign and the Fed to begin normalizing short-term interest rates by modestly raising short-term interest rates later this year.
The change in key interest rates over the last twelve months is presented below.
|
|
|
|
|
|
|
|
|
| |
|
|
|
4/30/14
|
|
10/31/14 |
|
4/30/15
|
|
|
Federal Fund Target
|
|
0.00%-0.25%
|
|
0.00%-0.25%
|
|
0.00%-0.25%
|
|
|
|
3-Month LIBOR
|
|
0.223%
|
|
0.232%
|
|
0.279%
|
|
|
2-Year Treasury
Note |
|
0.41%
|
|
0.49%
|
|
0.57%
|
|
|
10-Year Treasury
Note |
|
2.65%
|
|
2.34%
|
|
2.03%
|
The following is a comparison of the performance of the Wilmington Prime Money Market Fund,
Wilmington U.S. Government Money Market Fund, Wilmington U.S. Treasury Money Market Fund and Wilmington Tax-Exempt Money Market Fund versus their respective iMoneyNet and Lipper peer group average returns for the fiscal year ended April 30,
2015:
|
|
|
|
|
| Wilmington Prime Money Market Fund – Administrative Class |
|
|
0.01 |
% |
| Wilmington Prime Money Market Fund – Institutional Class |
|
|
0.01 |
% |
| Wilmington Prime Money Market Fund – Select Class |
|
|
0.01 |
% |
| Wilmington Prime Money Market Fund – Service Class |
|
|
0.01 |
% |
| iMoneyNet, Inc. First Tier Institutional Average |
|
|
0.03 |
% |
| Lipper Money Market Funds Average |
|
|
0.01 |
% |
|
|
| Wilmington U.S. Government Money Market Fund – Administrative Class |
|
|
0.01 |
% |
| Wilmington U.S. Government Money Market Fund – Institutional Class |
|
|
0.01 |
% |
| Wilmington U.S. Government Money Market Fund – Select Class |
|
|
0.01 |
% |
| Wilmington U.S. Government Money Market Fund – Service Class |
|
|
0.01 |
% |
| iMoneyNet, Inc. Government & Agency Institutional Average |
|
|
0.01 |
% |
| Lipper U.S. Government Money Market Funds Average |
|
|
0.02 |
% |
|
|
| Wilmington U.S. Treasury Money Market Fund – Administrative Class |
|
|
0.00 |
%** |
| Wilmington U.S. Treasury Money Market Fund – Select Class |
|
|
0.00 |
%** |
| Wilmington U.S. Treasury Money Market Fund – Service Class |
|
|
0.00 |
%** |
| iMoneyNet, Inc. Treasury and Repo Institutional Average |
|
|
0.01 |
% |
| Lipper U.S. Treasury Money Market Funds Average |
|
|
0.00 |
%** |
|
|
| Wilmington Tax-Exempt Money Market Fund – Administrative Class |
|
|
0.01 |
% |
| Wilmington Tax-Exempt Money Market Fund – Select Class |
|
|
0.01 |
% |
| Wilmington Tax-Exempt Money Market Fund – Service Class |
|
|
0.01 |
% |
| iMoneyNet, Inc. Tax-Free Institutional Average |
|
|
0.01 |
% |
| Lipper Tax-Exempt Money Market Funds |
|
|
0.01 |
% |
| Source: iMoneyNet, Inc. and Lipper |
|
|
|
|
** Represents less than 0.01%
|
| April 30, 2015 (unaudited) / ANNUAL REPORT |
Performance shown represents past performance and does not guarantee future results. Investment return
will fluctuate. The total return shown assumes the reinvestment of all distributions and does not reflect the deduction of taxes that a shareholder would pay on Fund distributions. Shares, when redeemed, may be worth more or less than
their original cost. Current performance may be lower or higher than that shown here. You should consider the investment objectives, risks, charges and expenses of the Funds carefully before investing. A prospectus with this and other information
may be obtained by calling 800-836-2211 or visiting the Funds’ web site at www.wilmingtonfunds.com. The prospectus should be read before investing.
The Funds’ shares are not bank deposits and are not insured by, guaranteed by, endorsed by or obligations of
the Federal Deposit Insurance Corporation, the Federal Reserve Board, any government agency or any bank. Although the Funds seek to preserve the value of your investment at $1.00 per share, it is
possible to lose money by investing in the Funds.
During the fiscal year ended April 30, 2015, Wilmington Funds Management Corporation
has voluntarily agreed to reduce their advisory fee and/or reimburse certain of the Funds’ operating expenses, and/or certain class-specific fees and expenses, in an effort to maintain the current yield of each share class at or above zero. The
fee waiver does not take into consideration acquired fund fees and expenses, taxes or extraordinary items. Any such waiver or expense reimbursement may be modified or discontinued at any time without notice.
|
| ANNUAL REPORT / April 30, 2015 (unaudited) |
SHAREHOLDER EXPENSE EXAMPLE
As a shareholder of the Fund, you incur ongoing costs, including management fees; to the extent
applicable, distribution (12b-1) fees, and/or shareholder services fees; and other Fund expenses. This Example is intended to help you to understand your ongoing costs (in dollars) of investing in the Funds and to compare these costs with the
ongoing costs of investing in other mutual funds. It is based on an investment of $1,000 invested at the beginning of the period and held for the entire period from November 1, 2014 to April 30, 2015.
Actual Expenses
This section of the following table
provides information about actual account values and actual expenses. You may use the information in this section, together with the amount you invested, to estimate the expenses that you incurred over the period. Simply divide your account
value by $1,000 (for example, an $8,600 account value divided by $1,000 = 8.6), then multiply the result by the number in the first section under the heading entitled “Expenses Paid During Period” to estimate the expenses attributable to
your investment during this period.
Hypothetical Example for Comparison Purposes
This section of the following table provides information about hypothetical account values and hypothetical expenses based on the Funds’
actual expense ratios and assumed rates of return of 5% per year before expenses, which are not the Funds’ actual returns. Thus, you should not use the hypothetical account values and expenses to estimate the actual ending
account balance or your expenses for the period. Rather, these figures are required to be provided to enable you to compare the ongoing costs of investing in the Funds with other funds. To do so, compare this 5% hypothetical example with the 5%
hypothetical examples that appear in the shareholder reports of the other funds.
Please note that the expenses shown in the table are
meant to highlight your ongoing costs only. Therefore, the Annualized Net Expense Ratio section of the table is useful in comparing ongoing costs only, and will not help you determine the relative total costs of owning different funds.
|
|
|
|
|
|
|
|
|
|
|
Beginning
Account Value
11/1/14 |
|
Ending
Account Value
4/30/15 |
|
Expenses Paid
During Period1 |
|
Annualized Net
Expense Ratio |
|
|
|
|
|
| WILMINGTON PRIME MONEY MARKET FUND |
|
|
|
|
|
|
|
|
| Actual |
|
|
|
|
|
|
|
|
| Administrative Class |
|
$1,000.00 |
|
$1,000.10 |
|
$0.69 |
|
0.14% |
| Institutional Class |
|
$1,000.00 |
|
$1,000.10 |
|
$0.69 |
|
0.14% |
| Select Class |
|
$1,000.00 |
|
$1,000.10 |
|
$0.69 |
|
0.14% |
| Service Class |
|
$1,000.00 |
|
$1,000.00 |
|
$0.69 |
|
0.14% |
| Hypothetical (assuming a 5% return before
expenses) |
|
|
|
|
|
|
|
|
| Administrative Class |
|
$1,000.00 |
|
$1,024.10 |
|
$0.70 |
|
0.14% |
| Institutional Class |
|
$1,000.00 |
|
$1,024.10 |
|
$0.70 |
|
0.14% |
| Select Class |
|
$1,000.00 |
|
$1,024.10 |
|
$0.70 |
|
0.14% |
| Service Class |
|
$1,000.00 |
|
$1,024.10 |
|
$0.70 |
|
0.14% |
|
|
|
|
|
| WILMINGTON U.S. GOVERNMENT MONEY MARKET FUND |
|
|
|
|
|
|
|
|
| Actual |
|
|
|
|
|
|
|
|
| Administrative Class |
|
$1,000.00 |
|
$1,000.00 |
|
$0.40 |
|
0.08% |
| Institutional Class |
|
$1,000.00 |
|
$1,000.00 |
|
$0.40 |
|
0.08% |
| Select Class |
|
$1,000.00 |
|
$1,000.00 |
|
$0.40 |
|
0.08% |
| Service Class |
|
$1,000.00 |
|
$1,000.00 |
|
$0.40 |
|
0.08% |
| Hypothetical (assuming a 5% return before
expenses) |
|
|
|
|
|
|
|
|
| Administrative Class |
|
$1,000.00 |
|
$1,024.40 |
|
$0.40 |
|
0.08% |
| Institutional Class |
|
$1,000.00 |
|
$1,024.40 |
|
$0.40 |
|
0.08% |
| Select Class |
|
$1,000.00 |
|
$1,024.40 |
|
$0.40 |
|
0.08% |
| Service Class |
|
$1,000.00 |
|
$1,024.40 |
|
$0.40 |
|
0.08% |
|
| April 30, 2015 (unaudited) / ANNUAL REPORT |
|
|
|
|
|
|
|
|
|
|
|
Beginning
Account Value
11/1/14 |
|
Ending
Account Value
4/30/15 |
|
Expenses Paid
During Period1 |
|
Annualized Net
Expense Ratio |
| WILMINGTON U.S. TREASURY MONEY MARKET FUND |
|
|
|
|
|
|
| Actual |
|
|
|
|
|
|
|
|
| Administrative Class |
|
$1,000.00 |
|
$1,000.00 |
|
$0.30 |
|
0.06% |
| Select Class |
|
$1,000.00 |
|
$1,000.00 |
|
$0.30 |
|
0.06% |
| Service Class |
|
$1,000.00 |
|
$1,000.00 |
|
$0.35 |
|
0.07% |
| Hypothetical (assuming a 5% return before
expenses) |
|
|
|
|
|
|
|
|
| Administrative Class |
|
$1,000.00 |
|
$1,024.50 |
|
$0.30 |
|
0.06% |
| Select Class |
|
$1,000.00 |
|
$1,024.50 |
|
$0.30 |
|
0.06% |
| Service Class |
|
$1,000.00 |
|
$1,024.45 |
|
$0.35 |
|
0.07% |
| WILMINGTON TAX-EXEMPT MONEY MARKET FUND |
|
|
|
|
|
|
|
|
| Actual |
|
|
|
|
|
|
|
|
| Administrative Class |
|
$1,000.00 |
|
$1,000.00 |
|
$0.15 |
|
0.03% |
| Select Class |
|
$1,000.00 |
|
$1,000.00 |
|
$0.15 |
|
0.03% |
| Service Class |
|
$1,000.00 |
|
$1,000.00 |
|
$0.15 |
|
0.03% |
| Hypothetical (assuming a 5% return before
expenses) |
|
|
|
|
|
|
|
|
| Administrative Class |
|
$1,000.00 |
|
$1,024.65 |
|
$0.15 |
|
0.03% |
| Select Class |
|
$1,000.00 |
|
$1,024.65 |
|
$0.15 |
|
0.03% |
| Service Class |
|
$1,000.00 |
|
$1,024.65 |
|
$0.15 |
|
0.03% |
| (1) |
Expenses are equal to the Funds’ annualized net expense ratios, multiplied by the average account value over the period, multiplied by 181/365 (to reflect the most recent one-half year period).
|
|
| ANNUAL REPORT / April 30, 2015 (unaudited) |
PORTFOLIO OF INVESTMENTS SUMMARY TABLE
Wilmington Prime Money Market Fund
At April 30, 2015, the
Fund’s portfolio composition was as follows (unaudited):
|
|
|
| |
|
Percentage of
Total Net Assets |
| Other Commercial Paper |
|
40.2% |
| U.S. Treasury Obligations |
|
13.6% |
| Certificates of Deposit |
|
13.4% |
| Asset-Backed Commercial Paper |
|
10.7% |
| Repurchase Agreements |
|
6.0% |
| Municipal Notes & Bonds |
|
5.5% |
| Financial Company Commercial
Paper |
|
5.4% |
| Municipal Commercial Paper |
|
5.0% |
| Other Assets and Liabilities - Net1 |
|
0.2% |
| TOTAL |
|
100.0% |
| (1) |
Assets, other than investments in securities, less liabilities. See Statement of Assets and Liabilities.
|
PORTFOLIO OF INVESTMENTS
April 30, 2015
|
|
|
|
|
|
|
|
|
|
|
|
| Description |
|
|
Par Value |
|
|
|
Value |
|
| ASSET-BACKED COMMERCIAL
PAPER – 10.7%‡ |
|
| CAFCO LLC, |
|
|
|
|
|
|
|
|
| 0.18%,
5/06/15W |
|
$ |
25,000,000 |
|
|
$ |
24,999,375 |
|
| Chariot Funding LLC |
|
|
|
|
|
|
|
|
| 0.27%, 8/03/15W |
|
|
50,000,000 |
|
|
|
49,964,750 |
|
| 0.27%, 8/11/15W |
|
|
25,000,000 |
|
|
|
24,980,875 |
|
| 0.27%, 8/21/15W |
|
|
25,000,000 |
|
|
|
24,979,000 |
|
| CIESCO LLC, |
|
|
|
|
|
|
|
|
| 0.18%,
5/07/15W |
|
|
50,000,000 |
|
|
|
49,998,500 |
|
| CRC Funding, LLC, |
|
|
|
|
|
|
|
|
| 0.18%,
8/03/15W |
|
|
25,000,000 |
|
|
|
24,988,250 |
|
| MetLife Short Term Fund LLC |
|
|
|
|
|
|
|
|
| 0.15%, 7/06/15W |
|
|
42,000,000 |
|
|
|
41,988,450 |
|
| 0.18%, 8/10/15W |
|
|
30,000,000 |
|
|
|
29,984,850 |
|
| 0.18%, 8/17/15W |
|
|
28,000,000 |
|
|
|
27,984,880 |
|
| Old Line Funding LLC, |
|
|
|
|
|
| 0.23%,
5/20/15W |
|
|
50,000,000 |
|
|
|
49,993,930 |
|
| Thunder Bay Funding LLC, |
|
|
|
|
|
|
|
|
| 0.24%,
6/25/15W |
|
|
50,000,000 |
|
|
|
49,981,667 |
|
|
|
|
|
|
|
|
|
|
| TOTAL ASSET-BACKED COMMERCIAL PAPER |
|
| (COST $399,844,527) |
|
|
|
|
|
$ |
399,844,527 |
|
| CERTIFICATES OF DEPOSIT – 13.4% |
|
| Bank of Montreal, CHI |
|
|
|
|
|
| 0.18%, 6/22/15 |
|
|
50,000,000 |
|
|
|
50,000,000 |
|
|
|
|
|
|
|
|
|
|
|
|
|
| Description |
|
|
Par Value |
|
|
|
Value |
|
| 0.18%, 6/24/15 |
|
$ |
50,000,000 |
|
|
$ |
50,000,000 |
|
|
|
| Bank of Nova Scotia, HOU |
|
|
|
|
|
| 0.26%, 7/28/15 |
|
|
50,000,000 |
|
|
|
50,000,000 |
|
| 0.30%, 12/11/15W |
|
|
50,000,000 |
|
|
|
50,000,000 |
|
| JP Morgan Chase Bank NA, |
|
|
|
|
|
|
|
|
| 0.32%,
10/23/15D |
|
|
50,000,000 |
|
|
|
50,000,000 |
|
| Toronto Dominion Bank, NY |
|
|
|
|
|
|
|
|
| 0.28%, 7/22/15 |
|
|
50,000,000 |
|
|
|
50,000,000 |
|
| 0.27%, 11/18/15 |
|
|
50,000,000 |
|
|
|
50,000,000 |
|
| US Bank National Association, |
|
|
|
|
|
|
|
|
| 0.27%, 10/30/15 |
|
|
50,000,000 |
|
|
|
50,000,000 |
|
| Wells Fargo Bank, NA |
|
|
|
|
|
| 0.30%, 11/18/15 |
|
|
50,000,000 |
|
|
|
50,000,000 |
|
| 0.32%, 3/04/16 |
|
|
50,000,000 |
|
|
|
50,000,000 |
|
|
|
|
|
|
|
|
|
|
| TOTAL CERTIFICATES OF DEPOSIT |
|
| (COST $500,000,000) |
|
|
|
|
|
$ |
500,000,000 |
|
| FINANCIAL COMPANY COMMERCIAL PAPER – 5.4%‡ |
|
| Commonwealth Bank of Australia, |
|
|
|
|
|
|
|
|
| 0.28%,
2/26/16W |
|
|
50,000,000 |
|
|
|
50,000,000 |
|
|
| April 30, 2015 / ANNUAL REPORT |
|
| PORTFOLIOS OF INVESTMENTS |
Wilmington Prime Money Market Fund (continued)
|
|
|
|
|
|
|
|
|
|
|
|
| Description |
|
|
Par Value |
|
|
|
Value |
|
| General Electric Capital Corp., |
|
|
|
|
|
|
|
|
| 0.26%, 8/20/15 |
|
$ |
50,000,000 |
|
|
$ |
49,959,917 |
|
|
|
|
| Svenska Handelsbanken, |
|
|
|
|
|
|
|
|
| 0.16%,
5/04/15W |
|
|
100,000,000 |
|
|
|
99,998,667 |
|
|
|
|
|
|
|
|
|
|
|
| TOTAL FINANCIAL COMPANY COMMERCIAL PAPER |
|
| (COST $199,958,584) |
|
|
|
|
|
$ |
199,958,584 |
|
|
| MUNICIPAL COMMERCIAL PAPER – 5.0%‡ |
|
|
|
| Catholic Health Initiatives |
|
|
|
|
|
|
|
|
| 0.25%, 5/06/15 |
|
|
17,150,000 |
|
|
|
17,149,404 |
|
|
|
|
| 0.22%, 5/12/15 |
|
|
15,700,000 |
|
|
|
15,698,945 |
|
|
|
|
| Emory University, |
|
|
|
|
|
|
|
|
| 0.18%, 6/17/15 |
|
|
27,400,000 |
|
|
|
27,400,000 |
|
|
|
|
| Salt River Project Agricultural Improvement & Power District, (Series C), |
|
|
|
|
|
|
|
|
|
|
|
| 0.16%, 5/04/15 |
|
|
30,000,000 |
|
|
|
29,999,600 |
|
|
|
|
| 0.16%, 5/06/15 |
|
|
45,000,000 |
|
|
|
44,999,000 |
|
|
|
|
| University of California, |
|
|
|
|
|
|
|
|
| 0.14%, 5/18/15 |
|
|
50,000,000 |
|
|
|
49,996,695 |
|
|
|
|
|
|
|
|
|
|
|
| TOTAL MUNICIPAL COMMERCIAL PAPER |
|
| (COST $185,243,644) |
|
|
|
|
|
$ |
185,243,644 |
|
|
| MUNICIPAL NOTES & BONDS – 5.5% |
|
|
|
|
| Industrial Development Authority of the City of Phoenix (The), (Series A), Weekly VRDNs, (Mayo Clinic), |
|
|
|
|
|
|
|
|
| 0.13%,
5/01/15¿ |
|
|
50,000,000 |
|
|
|
50,000,000 |
|
|
|
|
| Loudon County Industrial Development Authority, VA, Revenue Bonds, (Series C) Weekly VRDNs, (Howard Hughes Medical Institute, OBG), 0.07%, 5/07/15¿ |
|
|
23,685,000 |
|
|
|
23,685,000 |
|
|
|
|
| Mississippi Business Finance Corp., Revenue Bonds, (Series G), Daily VRDNs, |
|
|
|
|
|
|
|
|
| 0.11%,
5/01/15¿ |
|
|
31,690,000 |
|
|
|
31,690,000 |
|
|
|
|
| New York City, NY, Municipal Water Finance Authority, Water and Sewer System, Refunding Revenue Bonds, (Series F-2), Daily VRDNs, |
|
|
|
|
|
|
|
|
| 0.13%,
5/01/15¿ |
|
|
66,000,000 |
|
|
|
66,000,000 |
|
|
|
|
| State of Texas, Revenue Notes, GO Revenue Bonds, (Series 2006A) Weekly VRDNs, (Veterans Housing Assistance, OBG), |
|
|
|
|
|
|
|
|
| 0.09%,
5/07/15¿ |
|
|
32,975,000 |
|
|
|
32,975,000 |
|
|
|
|
|
|
|
|
|
|
|
| TOTAL MUNICIPAL NOTES & BONDS |
|
| (COST $204,350,000) |
|
|
|
|
|
$ |
204,350,000 |
|
|
| OTHER COMMERCIAL PAPER – 40.2%‡ |
|
|
|
| ABB Treasury Center USA, |
|
|
|
|
|
| 0.12%,
5/05/15W |
|
|
25,000,000 |
|
|
|
24,999,667 |
|
|
|
|
| Abbott Laboratories, |
|
|
|
|
|
|
|
|
| 0.13%,
7/07/15W |
|
|
60,000,000 |
|
|
|
59,985,483 |
|
|
|
|
| Air Products & Chemicals, |
|
|
|
|
|
|
|
|
| 0.10%,
5/01/15W |
|
|
41,000,000 |
|
|
|
41,000,000 |
|
|
|
|
| American Honda Finance Corp., |
|
|
|
|
|
|
|
|
| 0.10%, 5/20/15 |
|
|
40,000,000 |
|
|
|
39,997,889 |
|
|
|
|
| Bank of America NA |
|
|
|
|
|
|
|
|
| 0.23%, 5/13/15 |
|
|
50,000,000 |
|
|
|
50,000,000 |
|
|
|
|
|
|
|
|
|
|
|
|
|
| Description |
|
|
Par Value |
|
|
|
Value |
|
| 0.23%, 5/13/15 |
|
$ |
50,000,000 |
|
|
$ |
50,000,000 |
|
|
|
| BMW US Capital LLC, |
|
|
|
|
|
| 0.16%,
7/02/15W |
|
|
40,000,000 |
|
|
|
39,988,978 |
|
|
|
|
| Chevron Corporation, |
|
|
|
|
|
|
|
|
| 0.14%,
7/06/15W |
|
|
50,000,000 |
|
|
|
49,987,167 |
|
|
|
|
| Coca-Cola Co. |
|
|
|
|
|
|
|
|
|
|
|
| 0.15%,
8/24/15W |
|
|
26,500,000 |
|
|
|
26,487,302 |
|
|
|
|
| 0.27%, 9/01/15 |
|
|
50,000,000 |
|
|
|
50,009,823 |
|
|
|
|
| CPPIB Capital, Inc. |
|
|
|
|
|
|
|
|
|
|
|
| 0.14%,
5/04/15W |
|
|
25,000,000 |
|
|
|
24,999,708 |
|
|
|
|
| 0.14%,
5/05/15W |
|
|
25,000,000 |
|
|
|
24,999,611 |
|
|
|
|
| 0.14%,
7/06/15W |
|
|
50,000,000 |
|
|
|
49,987,167 |
|
|
|
|
| Electric de France |
|
|
|
|
|
|
|
|
|
|
|
| 0.20%,
5/06/15W |
|
|
46,900,000 |
|
|
|
46,898,697 |
|
|
|
|
| 0.14%,
5/22/15W |
|
|
25,000,000 |
|
|
|
24,997,958 |
|
|
|
|
| Exxon Mobil Corp., |
|
|
|
|
|
|
|
|
| 0.17%, 6/22/15 |
|
|
100,000,000 |
|
|
|
99,975,444 |
|
|
|
|
| Honeywell International Inc., |
|
|
|
|
|
|
|
|
| 0.31%, 11/17/15 |
|
|
94,120,000 |
|
|
|
94,162,162 |
|
|
|
|
| Illinois Tool Works, |
|
|
|
|
|
|
|
|
| 0.12%,
5/18/15W |
|
|
38,000,000 |
|
|
|
37,997,847 |
|
|
|
|
| Nestle Financial International Ltd., |
|
|
|
|
|
|
|
|
| 0.13%, 5/21/15 |
|
|
100,000,000 |
|
|
|
99,993,055 |
|
|
|
| Novartis Finance Corp., |
|
|
|
|
|
| 0.15%,
8/10/15W |
|
|
50,000,000 |
|
|
|
49,978,958 |
|
|
|
|
| Pfizer, Inc., |
|
|
|
|
|
|
|
|
| 0.15%,
7/09/15W |
|
|
50,000,000 |
|
|
|
49,985,625 |
|
|
|
|
| Province of British Columbia, |
|
|
|
|
|
|
|
|
| 0.29%, 6/15/15 |
|
|
70,806,000 |
|
|
|
71,041,976 |
|
|
|
|
| Province of Ontario |
|
|
|
|
|
|
|
|
|
|
|
| 0.46%, 5/26/15 |
|
|
19,151,000 |
|
|
|
19,209,785 |
|
|
|
|
| 0.31%, 8/13/15 |
|
|
70,000,000 |
|
|
|
70,014,402 |
|
|
|
|
| Simon Property Group LP |
|
|
|
|
|
|
|
|
|
|
|
| 0.15%,
6/08/15W |
|
|
25,000,000 |
|
|
|
24,996,042 |
|
|
|
|
| 0.15%,
6/15/15W |
|
|
37,500,000 |
|
|
|
37,492,969 |
|
|
|
|
| Southern California Gas Co., |
|
|
|
|
|
|
|
|
| 0.13%,
5/07/15W |
|
|
60,000,000 |
|
|
|
59,998,700 |
|
|
|
|
| Syngenta Wilmington |
|
|
|
|
|
|
|
|
|
|
|
| 0.12%,
5/14/15W |
|
|
75,000,000 |
|
|
|
74,996,750 |
|
|
|
|
| 0.12%,
6/01/15W |
|
|
25,000,000 |
|
|
|
24,997,417 |
|
|
|
| Toyota Motor Credit Corp., |
|
|
|
|
|
| 0.25%, 7/20/15 |
|
|
50,000,000 |
|
|
|
49,972,222 |
|
|
|
| United Technologies Corp., |
|
|
|
|
|
| 0.10%, 5/08/15 |
|
|
25,000,000 |
|
|
|
24,999,514 |
|
|
|
|
|
|
|
|
|
|
|
| TOTAL OTHER COMMERCIAL PAPER |
|
| (COST $1,494,152,318) |
|
|
$ |
1,494,152,318 |
|
|
| U.S. TREASURY OBLIGATIONS – 13.6% |
|
|
|
| U.S. TREASURY BILLS – 5.4%‡ |
|
|
|
|
|
|
|
|
| 0.07%, 5/28/15 |
|
|
100,000,000 |
|
|
|
99,994,956 |
|
|
|
|
| 0.07%, 7/23/15 |
|
|
100,000,000 |
|
|
|
99,983,400 |
|
|
|
|
|
|
|
|
|
|
|
|
| TOTAL U.S. TREASURY BILLS |
|
|
$ |
199,978,356 |
|
|
| ANNUAL REPORT / April 30, 2015 |
|
| PORTFOLIOS OF INVESTMENTS |
Wilmington Prime Money Market Fund (continued)
|
|
|
|
|
|
|
|
|
|
|
|
| Description |
|
|
Par Value |
|
|
|
Value |
|
|
|
| U.S. TREASURY NOTES – 8.2% |
|
|
|
|
|
|
|
|
| 0.25%, 7/15/15 |
|
$ |
75,000,000 |
|
|
|
75,014,812 |
|
|
|
|
| 0.25%, 9/15/15 |
|
|
50,000,000 |
|
|
|
50,022,486 |
|
|
|
|
| 0.38%, 6/15/15 |
|
|
130,000,000 |
|
|
|
130,040,634 |
|
|
|
|
| 4.25%, 8/15/15 |
|
|
50,000,000 |
|
|
|
50,606,235 |
|
|
|
|
|
|
|
|
|
|
| TOTAL U.S. TREASURY NOTES |
|
|
$ |
305,684,167 |
|
|
|
|
|
|
|
|
|
|
|
|
| TOTAL U.S. TREASURY OBLIGATIONS |
|
|
|
|
|
| (COST $505,662,523) |
|
|
|
|
|
$ |
505,662,523 |
|
|
|
| REPURCHASE AGREEMENTS – 6.0% |
|
|
|
|
|
|
|
|
| Credit Suisse First Boston LLC, 0.10%, dated 4/30/15, due 5/01/15, repurchase price $83,000,231, collateralized by U.S. Treasury Securities 4.50% to 8.75%, maturing
8/15/20 to 8/15/39; total market value of $84,650,735. |
|
|
83,000,000 |
|
|
|
83,000,000 |
|
|
|
|
| Deutsche Bank Securities, Inc., 0.10%, dated 4/30/15, due 5/01/15, repurchase price $65,000,181, collateralized by U.S. Government Security 0.18%, maturing 7/20/17;
total market value of $66,300,155. |
|
|
65,000,000 |
|
|
|
65,000,000 |
|
|
|
|
| TD Securities, Inc., 0.11%, dated 4/30/15, due 5/01/15, repurchase price $25,000,076, collateralized by U.S. Government & Treasury Securities 1.75% to 4.50%,
maturing 3/31/22 to 12/01/44; total market value of $25,746,580. |
|
|
25,000,000 |
|
|
|
25,000,000 |
|
|
|
|
|
|
|
|
|
|
|
|
|
| Description |
|
|
Par Value |
|
|
|
Value |
|
|
|
|
| TD Securities, Inc., 0.12%, dated 4/30/15, due 5/01/15, repurchase price $50,000,167, collateralized by U.S. Government & Treasury Securities 1.75% to 6.75%,
maturing 3/31/22 to 3/01/45; total market value of $51,415,896. |
|
$ |
50,000,000 |
|
|
$ |
50,000,000 |
|
|
|
|
|
|
|
|
|
|
|
|
| TOTAL REPURCHASE AGREEMENTS |
|
|
|
|
|
| (COST $223,000,000) |
|
|
|
|
|
$ |
223,000,000 |
|
|
|
|
|
|
|
|
|
|
|
|
| TOTAL INVESTMENTS – 99.8% |
|
|
|
|
|
| (COST $3,712,211,596) |
|
|
|
|
|
$ |
3,712,211,596 |
|
|
|
OTHER ASSETS LESS
LIABILITIES – 0.2% |
|
|
|
7,441,060 |
|
|
|
|
|
|
|
|
|
|
|
|
| TOTAL NET ASSETS – 100.0% |
|
|
$ |
3,719,652,656 |
|
|
|
|
|
|
|
|
|
|
Cost of investments for Federal
income tax purposes is the same as for financial statement purposes.
|
| April 30, 2015 / ANNUAL REPORT |
|
| PORTFOLIOS OF INVESTMENTS |
Wilmington Prime Money Market Fund (concluded)
Various inputs are used in determining the value of the Fund’s investments. These
inputs are summarized in the three broad levels listed below.
Level 1 – quoted prices in active markets for identical securities
Level 2 – other significant observable inputs (including quoted prices for similar securities, interest rates, prepayment
speeds, credit risk, etc.)
Level 3 – significant unobservable inputs (including the Fund’s own assumptions in determining
the fair value of investments)
The following is a summary of the inputs used as of April 30, 2015 in valuing the Fund’s
assets carried at fair value:
|
|
|
|
|
|
|
|
|
|
|
|
|
|
|
|
|
|
|
|
Level 1 |
|
|
|
Level 2 |
|
|
|
Level 3 |
|
|
|
Total |
|
| Investments in Securities |
|
|
|
|
|
|
|
|
|
|
|
|
|
|
|
|
| Asset-Backed Commercial Paper |
|
$ |
— |
|
|
$ |
399,844,527 |
|
|
$ |
— |
|
|
$ |
399,844,527 |
|
| Certificates of Deposit |
|
|
— |
|
|
|
500,000,000 |
|
|
|
— |
|
|
|
500,000,000 |
|
| Financial Company Commercial Paper |
|
|
— |
|
|
|
199,958,584 |
|
|
|
— |
|
|
|
199,958,584 |
|
| Municipal Commercial Paper |
|
|
— |
|
|
|
185,243,644 |
|
|
|
— |
|
|
|
185,243,644 |
|
| Municipal Notes & Bonds |
|
|
— |
|
|
|
204,350,000 |
|
|
|
— |
|
|
|
204,350,000 |
|
| Other Commercial Paper |
|
|
— |
|
|
|
1,494,152,318 |
|
|
|
— |
|
|
|
1,494,152,318 |
|
| U.S. Treasury Obligations |
|
|
— |
|
|
|
505,662,523 |
|
|
|
— |
|
|
|
505,662,523 |
|
| Repurchase Agreements |
|
|
— |
|
|
|
223,000,000 |
|
|
|
— |
|
|
|
223,000,000 |
|
|
|
|
|
|
|
|
|
|
|
|
|
|
|
|
|
|
| Total |
|
$ |
— |
|
|
$ |
3,712,211,596 |
|
|
$ |
— |
|
|
$ |
3,712,211,596 |
|
|
|
|
|
|
|
|
|
|
|
|
|
|
|
|
|
|
| D |
Floating rate note with current rate and stated maturity date shown. |
| ‡ |
The rate shown reflects the effective yield at purchase date. |
| ¨ |
Variable rate demand note with current rate shown. Date shown is the date on which the Fund can unconditionally demand payment. |
| W |
Denotes a restricted security that may be resold without restriction to “qualified institutional buyers” as defined in Rule 144A under the Securities Act of 1933 and that the Fund has determined to be liquid
under criteria established by the Fund’s Board of Trustees. At April 30, 2015, these liquid restricted securities amounted to $1,374,619,240 representing 37.0% of net assets. |
The following acronyms are used throughout this Fund:
CHI - Chicago
GO -
General Obligation
HOU - Houston
LLC - Limited Liability Corporation
NA - North America
NY
- New York
OBG - Obligation
VA - Virginia
VRDNs -
Variable Rate Demand Notes
See Notes which are an integral part of the Financial Statements
|
| ANNUAL REPORT / April 30, 2015 |
PORTFOLIO OF INVESTMENTS SUMMARY TABLE
Wilmington U.S. Government Money Market Fund
At April 30, 2015, the
Fund’s portfolio composition was as follows (unaudited):
|
|
|
|
|
| |
|
Percentage of
Total Net Assets |
|
| U.S. Government Agency Obligations |
|
|
75.7% |
|
| U.S. Treasury Obligations |
|
|
16.3% |
|
| Repurchase Agreements |
|
|
7.9% |
|
| Other Assets and Liabilities - Net1 |
|
|
0.1% |
|
| TOTAL |
|
|
100.0% |
|
| (1) |
Assets, other than investments in securities, less liabilities. See Statement of Assets and Liabilities.
|
PORTFOLIO OF INVESTMENTS
April 30, 2015
|
|
|
|
|
|
|
|
|
| Description |
|
|
Par Value |
|
|
|
Value |
|
| U.S. GOVERNMENT AGENCY OBLIGATIONS – 75.7% |
|
| FEDERAL FARM CREDIT BANK (FFCB) –
16.8% |
|
|
|
|
| 0.14%,
5/15/15D |
|
|
$ 75,000,000 |
|
|
|
$ 74,999,924 |
|
|
|
|
| 0.14%,
7/06/15D |
|
|
100,000,000 |
|
|
|
99,996,916 |
|
|
|
|
| 0.21%,
7/20/15D |
|
|
66,800,000 |
|
|
|
66,811,195 |
|
|
|
|
| 0.13%,
9/04/15D |
|
|
125,000,000 |
|
|
|
124,997,830 |
|
|
|
|
| 0.18%,
1/19/16D |
|
|
21,600,000 |
|
|
|
21,601,611 |
|
|
|
|
| 0.14%,
2/16/16D |
|
|
175,000,000 |
|
|
|
174,981,720 |
|
|
|
|
| 0.15%,
10/24/16D |
|
|
100,000,000 |
|
|
|
99,988,755 |
|
|
|
| TOTAL FEDERAL FARM CREDIT BANK (FFCB) |
|
|
|
$ 663,377,951 |
|
|
| FEDERAL HOME LOAN BANK (FHLB) – 29.9% |
|
|
|
|
| 0.08%, 5/06/15‡ |
|
|
29,500,000 |
|
|
|
29,499,693 |
|
|
|
|
| 0.05%, 5/08/15‡ |
|
|
77,050,000 |
|
|
|
77,049,251 |
|
|
|
|
| 0.08%, 5/20/15‡ |
|
|
122,900,000 |
|
|
|
122,895,082 |
|
|
|
|
| 0.07%, 5/22/15‡ |
|
|
50,000,000 |
|
|
|
49,997,900 |
|
|
|
|
| 0.07%, 6/03/15‡ |
|
|
50,000,000 |
|
|
|
49,996,792 |
|
|
|
|
| 0.07%, 6/24/15‡ |
|
|
100,000,000 |
|
|
|
99,989,050 |
|
|
|
|
| 0.09%, 7/10/15‡ |
|
|
230,833,000 |
|
|
|
230,793,996 |
|
|
|
|
| 0.08%, 7/15/15‡ |
|
|
150,000,000 |
|
|
|
149,974,063 |
|
|
|
|
| 0.08%, 7/17/15‡ |
|
|
50,000,000 |
|
|
|
49,991,444 |
|
|
|
|
| 0.08%, 7/24/15‡ |
|
|
54,100,000 |
|
|
|
54,089,586 |
|
|
|
|
| 0.14%, 8/26/15‡ |
|
|
50,000,000 |
|
|
|
49,977,738 |
|
|
|
|
| 0.10%, 9/01/15‡ |
|
|
175,000,000 |
|
|
|
174,940,216 |
|
|
|
|
| 0.10%, 9/02/15‡ |
|
|
39,625,000 |
|
|
|
39,611,351 |
|
|
|
| TOTAL FEDERAL HOME LOAN BANK (FHLB) |
|
|
|
$1,178,806,162 |
|
|
|
|
|
|
|
|
|
|
| Description |
|
|
Par Value |
|
|
|
Value |
|
| FEDERAL HOME LOAN MORTGAGE
CORPORATION |
|
| (FHLMC) – 17.5% |
|
|
|
|
|
|
|
|
|
|
|
| 0.06%, 5/06/15‡ |
|
|
$ 125,000,000 |
|
|
|
$ 124,998,958 |
|
|
|
|
| 0.15%, 5/13/15‡ |
|
|
73,200,000 |
|
|
|
73,196,340 |
|
|
|
|
| 0.17%, 5/29/15‡ |
|
|
50,000,000 |
|
|
|
49,993,389 |
|
|
|
|
| 0.05%, 6/01/15‡ |
|
|
50,000,000 |
|
|
|
49,997,933 |
|
|
|
|
| 0.07%, 6/02/15‡ |
|
|
100,000,000 |
|
|
|
99,993,778 |
|
|
|
|
| 0.06%, 6/17/15‡ |
|
|
50,000,000 |
|
|
|
49,996,083 |
|
|
|
|
| 0.07%, 6/22/15‡ |
|
|
50,000,000 |
|
|
|
49,994,944 |
|
|
|
|
| 0.17%,
7/16/15D |
|
|
100,000,000 |
|
|
|
100,007,521 |
|
|
|
|
| 0.11%, 8/05/15‡ |
|
|
50,000,000 |
|
|
|
49,986,000 |
|
|
|
|
| 0.12%, 8/28/15‡ |
|
|
18,935,000 |
|
|
|
18,927,614 |
|
|
|
|
| 0.13%, 9/02/15‡ |
|
|
22,100,000 |
|
|
|
22,090,104 |
|
|
|
| TOTAL FEDERAL HOME LOAN MORTGAGE CORPORATION (FHLMC) |
|
|
|
$ 689,182,664 |
|
|
| FEDERAL NATIONAL MORTGAGE ASSOCIATION (FNMA) – 11.5% |
|
|
|
|
| 0.10%, 5/18/15‡ |
|
|
47,600,000 |
|
|
|
47,597,752 |
|
|
|
|
| 0.17%, 6/10/15‡ |
|
|
50,000,000 |
|
|
|
49,990,556 |
|
|
|
|
| 0.10%, 7/01/15‡ |
|
|
100,000,000 |
|
|
|
99,983,056 |
|
|
|
|
| 0.09%, 7/02/15‡ |
|
|
50,000,000 |
|
|
|
49,992,250 |
|
|
|
|
| 0.10%, 8/03/15‡ |
|
|
30,000,000 |
|
|
|
29,992,167 |
|
|
|
|
| 0.12%, 8/26/15‡ |
|
|
25,000,000 |
|
|
|
24,990,656 |
|
|
|
|
| 0.17%,
10/21/15D |
|
|
150,000,000 |
|
|
|
150,023,353 |
|
|
|
| TOTAL FEDERAL NATIONAL MORTGAGE ASSOCIATION (FNMA) |
|
|
|
$ 452,569,790 |
|
|
|
| TOTAL U.S. GOVERNMENT AGENCY OBLIGATIONS |
|
|
|
|
|
| (COST $2,983,936,567) |
|
|
|
$2,983,936,567 |
|
|
| April 30, 2015 / ANNUAL REPORT |
|
| PORTFOLIOS OF INVESTMENTS |
Wilmington U.S. Government Money Market Fund (continued)
|
|
|
|
|
|
|
| Description |
|
|
Par Value |
|
|
Value |
|
|
|
| U.S. TREASURY OBLIGATIONS – 16.3% |
| U.S. TREASURY BILLS –
3.8% |
|
|
|
| 0.07%, 7/23/15‡ |
|
|
$ 100,000,000 |
|
|
$ 99,983,400 |
|
|
|
| 0.07%, 8/20/15‡ |
|
|
50,000,000 |
|
|
49,989,208 |
|
|
| TOTAL U.S. TREASURY BILLS |
|
|
$ 149,972,608 |
|
| U.S. TREASURY NOTES – 12.5% |
|
|
|
| 4.13%, 5/15/15 |
|
|
75,000,000 |
|
|
75,118,457 |
|
|
|
| 0.38%, 6/15/15 |
|
|
140,000,000 |
|
|
140,055,262 |
|
|
|
| 0.25%, 7/15/15 |
|
|
200,000,000 |
|
|
200,063,133 |
|
|
|
| 4.25%, 8/15/15 |
|
|
75,000,000 |
|
|
75,908,207 |
|
|
| TOTAL U.S. TREASURY NOTES |
|
|
$ 491,145,059 |
|
|
| TOTAL U.S. TREASURY OBLIGATIONS |
|
|
|
| (COST $641,117,667) |
|
|
|
|
|
$ 641,117,667 |
|
| REPURCHASE AGREEMENTS – 7.9% |
|
|
|
| Credit Suisse First Boston LLC, 0.10%, dated 4/30/15, due 5/01/15, repurchase price $56,000,156, collateralized by U.S. Treasury Securities 4.50% to 5.00%, maturing
5/15/37 to 5/15/38; total market value of $57,120,256. |
|
|
56,000,000 |
|
|
56,000,000 |
|
|
|
| Deutsche Bank Securities, Inc., 0.10%, dated 4/30/15, due 5/01/15, repurchase price $25,000,069, collateralized by U.S. Government Security 0.18%, maturing 7/20/17;
total market value of $25,500,060. |
|
|
25,000,000 |
|
|
25,000,000 |
|
|
|
| Merrill Lynch, Pierce, Fenner & Smith, Inc., 0.09%, dated 4/30/15, due 5/01/15, repurchase price $80,000,200, collateralized by U.S. Treasury Securities 0.00%
to 4.50%, maturing 2/15/28 to 5/15/40; total market value of $81,600,086. |
|
|
80,000,000 |
|
|
80,000,000 |
|
|
|
|
|
|
|
|
|
| Description |
|
|
Par Value |
|
|
|
Value |
|
| TD Securities, Inc., 0.11%, dated 4/30/15, due 5/01/15,
repurchase price $100,000,306, collateralized by U.S. Government & Treasury securities 0.07% to 5.00%, maturing 1/31/16 to 12/01/44; total market value of $102,999,990. |
|
|
$ 100,000,000 |
|
|
|
$ 100,000,000 |
|
|
|
|
| TD Securities, Inc., 0.12%, dated 4/30/15, due 5/01/15, repurchase price $50,000,167, collateralized by U.S. Government & Treasury Securities 3.13% to 5.00%,
maturing 7/01/25 to 12/01/44; total market value of $51,392,403. |
|
|
50,000,000 |
|
|
|
50,000,000 |
|
|
|
| TOTAL REPURCHASE AGREEMENTS |
|
|
|
|
|
| (COST $311,000,000) |
|
|
|
$ 311,000,000 |
|
|
|
| TOTAL INVESTMENTS – 99.9% |
|
|
|
|
|
| (COST $3,936,054,234) |
|
|
|
$3,936,054,234 |
|
|
|
| OTHER ASSETS LESS LIABILITIES – 0.1% |
|
|
|
4,087,925 |
|
|
|
| TOTAL NET ASSETS – 100.0% |
|
|
|
$3,940,142,159 |
|
Cost of
investments for Federal income tax purposes is the same as for financial statement purposes.
|
| ANNUAL REPORT / April 30, 2015 |
|
| PORTFOLIOS OF INVESTMENTS |
Wilmington U.S. Government Money Market Fund (concluded)
Various inputs are used in determining the value of the Fund’s investments. These
inputs are summarized in the three broad levels listed below.
Level 1 – quoted prices in active markets for identical securities
Level 2 – other significant observable inputs (including quoted prices for similar securities, interest rates, prepayment
speeds, credit risk, etc.)
Level 3 – significant unobservable inputs (including the Fund’s own assumptions in determining
the fair value of investments)
The following is a summary of the inputs used as of April 30, 2015 in valuing the Fund’s
assets carried at fair value:
|
|
|
|
|
|
|
|
|
|
|
|
|
|
|
|
|
| |
|
Level 1
|
|
|
Level 2 |
|
|
Level 3 |
|
|
Total |
|
| Investments in Securities |
|
|
|
|
|
|
|
|
|
|
|
|
|
|
|
|
| U.S. Government Agency Obligations |
|
$ |
— |
|
|
$ |
2,983,936,567 |
|
|
$ |
— |
|
|
$ |
2,983,936,567 |
|
| U.S. Treasury Obligations |
|
|
— |
|
|
|
641,117,667 |
|
|
|
— |
|
|
|
641,117,667 |
|
| Repurchase Agreements |
|
|
— |
|
|
|
311,000,000 |
|
|
|
— |
|
|
|
311,000,000 |
|
|
|
|
|
|
|
|
|
|
|
|
|
|
|
|
|
|
| Total |
|
$ |
— |
|
|
$ |
3,936,054,234 |
|
|
$ |
— |
|
|
$ |
3,936,054,234 |
|
|
|
|
|
|
|
|
|
|
|
|
|
|
|
|
|
|
| D |
Floating rate note with current rate and stated maturity date shown. |
| ‡ |
The rate shown reflects the effective yield at purchase date. |
The following acronyms are
used throughout this Fund:
FFCB - Federal Farm Credit Bank
FHLB - Federal Home Loan Bank
FHLMC - Federal Home Loan Mortgage Corporation
FNMA - Federal National Mortgage Association
LLC - Limited Liability Corporation
See Notes which are an integral part of the Financial Statements
|
| April 30, 2015 / ANNUAL REPORT |
PORTFOLIO OF INVESTMENTS SUMMARY TABLE
Wilmington U.S. Treasury Money Market Fund
At April 30, 2015, the
Fund’s portfolio composition was as follows (unaudited):
|
|
|
|
|
| |
|
Percentage of
Total Net Assets |
|
| U.S. Treasury Obligations |
|
|
89.9% |
|
| Repurchase Agreements |
|
|
9.9% |
|
| Other Assets and Liabilities – Net1 |
|
|
0.2% |
|
| TOTAL |
|
|
100.0% |
|
| (1) |
Assets, other than investments in securities, less liabilities. See Statement of Assets and Liabilities.
|
PORTFOLIO OF INVESTMENTS
April 30, 2015
|
|
|
|
|
|
|
| Description |
|
|
Par Value |
|
|
Value |
|
|
|
| U.S. TREASURY OBLIGATIONS – 89.9% |
|
| U.S. TREASURY BILLS – 27.9% |
|
|
|
| 0.01%, 5/07/15‡ |
|
|
$ 100,000,000 |
|
|
$ 99,999,817 |
|
|
|
| 0.01%, 7/16/15‡ |
|
|
50,000,000 |
|
|
49,992,031 |
|
|
|
| 0.07%, 8/20/15‡ |
|
|
50,000,000 |
|
|
49,989,208 |
|
|
|
| 0.07%, 8/27/15‡ |
|
|
25,000,000 |
|
|
24,994,223 |
|
|
|
| 0.08%, 9/03/15‡ |
|
|
25,000,000 |
|
|
24,993,403 |
|
|
| TOTAL U.S. TREASURY BILLS |
|
|
$ 249,968,682 |
|
| U.S. TREASURY NOTES – 62.0% |
|
|
|
| 4.13%, 5/15/15 |
|
|
75,000,000 |
|
|
75,118,457 |
|
|
|
| 0.25%, 5/31/15 |
|
|
200,000,000 |
|
|
200,032,675 |
|
|
|
| 0.38%, 6/15/15 |
|
|
80,000,000 |
|
|
80,025,821 |
|
|
|
| 0.25%, 7/15/15 |
|
|
100,000,000 |
|
|
100,034,285 |
|
|
|
| 4.25%, 8/15/15 |
|
|
25,000,000 |
|
|
25,302,736 |
|
|
|
| 0.25%, 9/15/15 |
|
|
25,000,000 |
|
|
25,016,125 |
|
|
|
| 0.07%,
10/31/16D |
|
|
50,000,000 |
|
|
49,988,261 |
|
|
| TOTAL U.S. TREASURY NOTES |
|
|
$ 555,518,360 |
|
| TOTAL U.S. TREASURY OBLIGATIONS |
| (COST $805,487,042) |
|
|
$ 805,487,042 |
|
|
|
|
|
|
|
|
|
| Description |
|
|
Par Value |
|
|
|
Value |
|
| REPURCHASE AGREEMENTS – 9.9% |
|
|
|
|
| Credit Suisse First Boston LLC, 0.10%, dated 4/30/15, due 5/01/15, repurchase price $39,000,108, collateralized by U.S. Treasury Securities 6.13%, maturing 11/15/27 to
8/15/29; total market value of $39,780,416. |
|
|
$ 39,000,000 |
|
|
|
$ 39,000,000 |
|
|
|
|
| Merrill Lynch, Pierce, Fenner & Smith, Inc., 0.09%, dated 4/30/15, due 5/01/15, repurchase price $50,000,125, collateralized by U.S. Treasury Securities
0.00%, maturing 2/15/36 to 11/15/36; total market value of $51,000,000. |
|
|
50,000,000 |
|
|
|
50,000,000 |
|
|
|
| TOTAL REPURCHASE AGREEMENTS |
|
|
|
|
|
| (COST $89,000,000) |
|
|
|
|
|
|
$ 89,000,000 |
|
|
|
| TOTAL INVESTMENTS – 99.8% |
|
|
|
|
|
| (COST $894,487,042) |
|
|
|
$ 894,487,042 |
|
|
|
| OTHER ASSETS LESS LIABILITIES – 0.2% |
|
|
|
1,957,630 |
|
|
|
| TOTAL NET ASSETS – 100.0% |
|
|
|
$ 896,444,672 |
|
Cost of
investments for Federal income tax purposes is the same as for financial statement purposes.
|
| ANNUAL REPORT / April 30, 2015 |
|
| PORTFOLIOS OF INVESTMENTS |
Wilmington U.S. Treasury Money Market Fund (concluded)
Various inputs are used in determining the value of the Fund’s investments. These
inputs are summarized in the three broad levels listed below.
Level 1 – quoted prices in active markets for identical securities
Level 2 – other significant observable inputs (including quoted prices for similar securities, interest rates, prepayment
speeds, credit risk, etc.)
Level 3 – significant unobservable inputs (including the Fund’s own assumptions in determining
the fair value of investments)
The following is a summary of the inputs used as of April 30, 2015 in valuing the Fund’s
assets carried at fair value:
|
|
|
|
|
|
|
|
|
|
|
|
|
|
|
|
|
|
|
|
Level 1 |
|
|
|
Level 2 |
|
|
|
Level 3 |
|
|
|
Total |
|
| Investments in Securities |
|
|
|
|
|
|
|
|
|
|
|
|
|
|
|
|
| U.S. Treasury Obligations |
|
$ |
— |
|
|
$ |
805,487,042 |
|
|
$ |
— |
|
|
$ |
805,487,042 |
|
| Repurchase Agreements |
|
|
— |
|
|
|
89,000,000 |
|
|
|
— |
|
|
|
89,000,000 |
|
|
|
|
|
|
|
|
|
|
|
|
|
|
|
|
|
|
| Total |
|
$ |
— |
|
|
$ |
894,487,042 |
|
|
$ |
— |
|
|
$ |
894,487,042 |
|
|
|
|
|
|
|
|
|
|
|
|
|
|
|
|
|
|
| D |
Floating rate note with current rate and stated maturity date shown. |
| ‡ |
The rate shown reflects the effective yield at purchase date. |
The following acronym is
used throughout this Fund:
LLC - Limited Liability Corporation
See Notes which are an integral part of the Financial Statements
|
| April 30, 2015 / ANNUAL REPORT |
PORTFOLIO OF INVESTMENTS SUMMARY TABLE
Wilmington Tax-Exempt Money Market Fund
At April 30, 2015, the
Fund’s geographical location classifications were as follows (unaudited):
|
|
|
|
|
| |
|
Percentage of
Total Net Assets |
|
| Texas |
|
|
22.8% |
|
| Maryland |
|
|
7.8% |
|
| Delaware |
|
|
7.7% |
|
| Minnesota |
|
|
7.7% |
|
| Massachusetts |
|
|
7.6% |
|
| Ohio |
|
|
5.0% |
|
| Virginia |
|
|
4.9% |
|
| Nevada |
|
|
4.1% |
|
| Illinois |
|
|
3.9% |
|
| Louisiana |
|
|
3.9% |
|
| North Carolina |
|
|
3.8% |
|
| Utah |
|
|
3.6% |
|
| Connecticut |
|
|
3.4% |
|
| Michigan |
|
|
3.4% |
|
| Rhode Island |
|
|
2.7% |
|
| Florida |
|
|
2.5% |
|
| New York |
|
|
1.9% |
|
| Tennessee |
|
|
1.5% |
|
| New Hampshire |
|
|
1.0% |
|
| Pennsylvania |
|
|
0.8% |
|
| Other Assets and Liabilities – Net1 |
|
|
0.0%2 |
|
| TOTAL |
|
|
100.0% |
|
| (1) |
Assets, other than investments in securities, less liabilities. See Statement of Assets and Liabilities. |
| (2) |
Represent less than 0.05%.
|
PORTFOLIO OF INVESTMENTS
April 30, 2015
|
|
|
|
|
|
|
|
|
| Description |
|
|
Par Value |
|
|
|
Value |
|
| COMMERCIAL PAPER – 61.4% |
|
|
| ILLINOIS – 3.9% |
|
|
|
|
| Illinois Educational Facilities Authority, (Northern Trust, LOC), 0.06%, 5/05/15 |
|
|
$ 20,793,000 |
|
|
|
$ 20,793,000 |
|
|
|
| TOTAL ILLINOIS |
|
|
|
$ 20,793,000 |
|
|
| MARYLAND – 7.8% |
|
|
| Johns Hopkins University, (Series B) |
|
|
|
|
| 0.05%, 5/07/15 |
|
|
5,000,000 |
|
|
|
5,000,000 |
|
|
|
|
| 0.05%, 6/15/15 |
|
|
5,000,000 |
|
|
|
5,000,000 |
|
|
|
|
| 0.05%, 7/06/15 |
|
|
12,000,000 |
|
|
|
12,000,000 |
|
|
|
|
| Montgomery County, MD, GO Unlimited Refunding Notes, BANs, (Series 10-A), (PNC Bank, LIQ) |
|
|
|
|
|
|
|
|
|
|
|
| 0.04%, 5/04/15 |
|
|
5,000,000 |
|
|
|
5,000,000 |
|
|
|
|
|
|
|
|
|
|
| Description |
|
|
Par Value |
|
|
|
Value |
|
| 0.06%, 5/18/15 |
|
|
$ 10,000,000 |
|
|
|
$ 10,000,000 |
|
|
|
|
| Montgomery County, MD, GO Unlimited Refunding Notes, BANs, (Series 10-B), (PNC Bank, State Street Bank), 0.05%, 5/07/15 |
|
|
5,000,000 |
|
|
|
5,000,000 |
|
|
|
| TOTAL MARYLAND |
|
|
|
$ 42,000,000 |
|
|
| MASSACHUSETTS – 7.0% |
|
|
|
|
| Massachusetts Bay Transportation Authority, (State Street Bank, LIQ), 0.05%, 6/05/15 |
|
|
10,000,000 |
|
|
|
10,000,000 |
|
|
| ANNUAL REPORT / April 30, 2015 |
|
| PORTFOLIOS OF INVESTMENTS |
Wilmington Tax-Exempt Money Market Fund (continued)
|
|
|
|
|
|
|
|
|
| Description |
|
|
Par Value |
|
|
|
Value |
|
| Massachusetts School Building Authority, (Series A), (Bank of
America, LOC), 0.05%, 6/03/15 |
|
|
$ 9,000,000 |
|
|
|
$ 9,000,000 |
|
|
|
|
| Massachusetts State Health & Educational Facilities Authority, (Series EE), (Harvard University), 0.04%, 5/06/15 |
|
|
18,403,000 |
|
|
|
18,403,000 |
|
|
|
|
| TOTAL MASSACHUSETTS |
|
|
|
|
|
|
$ 37,403,000 |
|
|
| MICHIGAN – 3.4% |
|
|
|
|
| University of Michigan, (Series J-1) |
|
|
|
|
|
|
|
|
|
|
|
| 0.04%, 5/04/15 |
|
|
5,000,000 |
|
|
|
5,000,000 |
|
|
|
|
| 0.05%, 7/01/15 |
|
|
13,350,000 |
|
|
|
13,350,000 |
|
|
|
|
| TOTAL MICHIGAN |
|
|
|
|
|
|
$ 18,350,000 |
|
|
| MINNESOTA – 6.0% |
|
|
|
|
| City of Rochester, MN, Health Care, (Series 00-C), (Mayo Medical Center), Revenue Bonds, 0.05%, 5/18/15 |
|
|
12,000,000 |
|
|
|
12,000,000 |
|
|
|
|
| University of Minnesota |
|
|
|
|
|
|
|
|
|
|
|
| 0.05%, 6/01/15 |
|
|
8,000,000 |
|
|
|
8,000,000 |
|
|
|
|
| 0.04%, 6/03/15 |
|
|
12,000,000 |
|
|
|
12,000,000 |
|
|
|
|
| TOTAL MINNESOTA |
|
|
|
|
|
|
$ 32,000,000 |
|
|
| NEVADA – 4.1% |
|
|
|
|
| Las Vegas Valley Water District, NV, (Series 2004-A), GO |
|
|
|
|
|
|
|
|
|
|
|
| 0.07%, 6/02/15 |
|
|
11,000,000 |
|
|
|
11,000,000 |
|
|
|
|
| 0.06%, 6/03/15 |
|
|
6,000,000 |
|
|
|
6,000,000 |
|
|
|
|
| 0.06%, 6/03/15 |
|
|
5,000,000 |
|
|
|
5,000,000 |
|
|
|
|
| TOTAL NEVADA |
|
|
|
|
|
|
$ 22,000,000 |
|
|
| NORTH CAROLINA – 3.8% |
|
|
|
|
| North Carolina Capital Facilities Finance Agency, Educational Facilities, (Duke University), Revenue Bonds, 0.10%, 5/07/15 |
|
|
7,928,000 |
|
|
|
7,928,000 |
|
|
|
|
| North Carolina Capital Facilities Finance Agency, Educational Facilities, (Series A2), (Duke University), Revenue Bonds, 0.06%, 5/07/15 |
|
|
12,406,000 |
|
|
|
12,406,000 |
|
|
|
| TOTAL NORTH CAROLINA |
|
|
|
$ 20,334,000 |
|
|
| OHIO – 2.9% |
|
|
|
|
| Ohio Higher Educational Facility Commission, (Case Western University), (JPMorgan Chase, LIQ), 0.08%, 5/07/15 |
|
|
3,500,000 |
|
|
|
3,500,000 |
|
|
|
|
| Ohio Higher Educational Facility Commission,
(Case Western University), (Northern Trust, LIQ), 0.07%, 5/12/15 |
|
|
12,000,000 |
|
|
|
12,000,000 |
|
|
|
|
| TOTAL OHIO |
|
|
|
|
|
|
$ 15,500,000 |
|
|
|
|
|
|
|
|
|
|
| Description |
|
|
Par Value |
|
|
|
Value |
|
| RHODE ISLAND –
2.7% |
|
|
|
|
| Rhode Island Health and Education Facilities Authority, (Series A), (Brown University) |
|
|
|
|
|
|
|
|
|
|
|
| 0.05%, 5/05/15 |
|
|
$ 9,000,000 |
|
|
|
$ 9,000,000 |
|
|
|
|
| 0.05%, 6/04/15 |
|
|
5,530,000 |
|
|
|
5,530,000 |
|
|
|
|
| TOTAL RHODE ISLAND |
|
|
|
|
|
|
$ 14,530,000 |
|
|
| TENNESSEE – 1.5% |
|
|
|
|
| State of Tennessee, (Series 00-A), (TN Consolidated Retirement System, LOC), GO, 0.05%, 5/21/15 |
|
|
8,250,000 |
|
|
|
8,250,000 |
|
|
|
|
| TOTAL TENNESSEE |
|
|
|
|
|
|
$ 8,250,000 |
|
|
| TEXAS – 16.8% |
|
|
|
|
| City of San Antonio, TX, Electric & Gas Systems, (Series A), (JPMorgan Chase, LIQ), 0.06%, 5/06/15 |
|
|
12,000,000 |
|
|
|
12,000,000 |
|
|
|
|
| City of San Antonio, TX, Water Systems, (Series B), (Wells Fargo, LIQ), 0.05%, 5/01/15 |
|
|
20,000,000 |
|
|
|
20,000,000 |
|
|
|
|
| Harris County Cultural Education Facilities Finance Corp., TX, (State Street Bank, LIQ), Refunding Revenue Bonds |
|
|
|
|
|
|
|
|
|
|
|
| 0.10%, 5/04/15 |
|
|
5,650,000 |
|
|
|
5,650,000 |
|
|
|
|
| 0.10%, 5/04/15 |
|
|
1,215,000 |
|
|
|
1,215,000 |
|
|
|
|
| Harris County Cultural Education Facilities Finance Corp., TX, (Series A), (Baylor College of Medicine, OBG), (JP Morgan Chase), Refunding Revenue Bonds,
0.10%, 5/04/15 |
|
|
8,132,000 |
|
|
|
8,132,000 |
|
|
|
|
| Texas Public Finance Authority, (Series 2003), (Comptroller of Public Accounts TX, LIQ), 0.05%, 5/06/15 |
|
|
8,850,000 |
|
|
|
8,850,000 |
|
|
|
|
| Texas Public Finance Authority, (Series 2008), (Comptroller of Public Accounts TX, LIQ), GO, 0.06%, 6/04/15 |
|
|
4,860,000 |
|
|
|
4,860,000 |
|
|
|
|
| Texas Technical University, (Series A), 0.06%, 7/22/15 |
|
|
8,997,000 |
|
|
|
8,997,000 |
|
|
|
|
| University of Texas, 0.06%, 5/06/15 |
|
|
20,000,000 |
|
|
|
20,000,000 |
|
|
|
|
| TOTAL TEXAS |
|
|
|
|
|
|
$ 89,704,000 |
|
|
|
|
| VIRGINIA – 1.5% |
|
|
|
|
|
|
|
|
|
|
|
| University of Virginia, (Series 03-A) |
|
|
|
|
|
|
|
|
|
|
|
| 0.06%, 5/05/15 |
|
|
5,000,000 |
|
|
|
5,000,000 |
|
|
|
|
| 0.06%, 5/14/15 |
|
|
3,200,000 |
|
|
|
3,200,000 |
|
|
|
|
| TOTAL VIRGINIA |
|
|
|
|
|
|
$ 8,200,000 |
|
|
| TOTAL COMMERCIAL PAPER |
|
| (COST $329,064,000) |
|
|
|
$ 329,064,000 |
|
|
| MUNICIPAL BONDS – 14.7%¿ |
|
|
| FLORIDA – 1.9% |
|
|
|
|
| JEA Electric System Revenue, Refunding Revenue Bonds, (Series 01-D), Daily VDRNs, (U.S. Bank, SPA), 0.12%, 5/01/15 |
|
|
7,200,000 |
|
|
|
7,200,000 |
|
|
| April 30, 2015 / ANNUAL REPORT |
|
| PORTFOLIOS OF INVESTMENTS |
Wilmington Tax-Exempt Money Market Fund (continued)
|
|
|
|
|
|
|
|
|
| Description |
|
|
Par Value |
|
|
|
Value |
|
| JEA Water & Sewer System Revenue, Revenue Bonds,
(Series A-1), Daily VRDNs, (U.S. Bank, SPA), 0.12%, 5/01/15 |
|
|
$ 3,000,000 |
|
|
|
$ 3,000,000 |
|
|
|
|
| TOTAL FLORIDA |
|
|
|
|
|
|
$ 10,200,000 |
|
|
| LOUISIANA – 3.9% |
|
|
|
|
| East Baton Rouge Parish Industrial Development Board, Inc., Revenue Bonds, Weekly VRDNs, (Exxon Mobil Project), 0.14%, 5/01/15 |
|
|
21,000,000 |
|
|
|
21,000,000 |
|
|
|
|
| TOTAL LOUISIANA |
|
|
|
|
|
|
$ 21,000,000 |
|
|
| MASSACHUSETTS – 0.6% |
|
|
|
|
| Commonwealth of Massachusetts, GO Unlimited, Refunding Revenue Notes, (Series A), Daily VRDNs, (Wells Fargo Bank N.A.), 0.12%, 5/01/15 |
|
|
3,000,000 |
|
|
|
3,000,000 |
|
|
|
|
| TOTAL MASSACHUSETTS |
|
|
|
|
|
|
$ 3,000,000 |
|
|
| NEW YORK – 1.9% |
|
|
|
|
| City of New York, NY, Municipal Water & Sewer System, GO, (SubSeries A-7), Daily VRDNs, (JP Morgan, LOC), 0.13%, 5/01/15 |
|
|
6,200,000 |
|
|
|
6,200,000 |
|
|
|
|
| City of New York, NY, Municipal Water & Sewer System, Refunding Revenue Bonds, (Series H-3), Daily VRDNs, (State Street B&T), (AGM),
0.14%, 5/01/15 |
|
|
3,900,000 |
|
|
|
3,900,000 |
|
|
|
|
| TOTAL NEW YORK |
|
|
|
|
|
|
$ 10,100,000 |
|
|
| PENNSYLVANIA – 0.8% |
|
|
|
|
| Philadelphia Hospitals & Higher Education Facilities Authority, Revenue Bonds, (Series B), Daily VRDNs, (Children’s Hospital, OBG)/(Wells Fargo Bank
N.A., SPA), 0.12%, 5/01/15 |
|
|
4,000,000 |
|
|
|
4,000,000 |
|
|
|
|
| TOTAL PENNSYLVANIA |
|
|
|
|
|
|
$ 4,000,000 |
|
|
| TEXAS – 3.7% |
|
|
|
|
| Port of Port Arthur, TX, Navarro District, Refunding Revenue Bonds, Daily VRDNs, (Texaco, Inc.), 0.14%, 5/01/15 |
|
|
20,000,000 |
|
|
|
20,000,000 |
|
|
|
|
| TOTAL TEXAS |
|
|
|
|
|
|
$ 20,000,000 |
|
|
| UTAH – 1.9% |
|
|
|
|
| City of Murray, Revenue Bonds, (Series B), Daily VRDNs, (IHC Health Services, Inc.), (JPMorgan Chase Bank N.A.), 0.13%, 5/01/15 |
|
|
100,000 |
|
|
|
100,000 |
|
|
|
|
| Utah County Hospital, Refunding Revenue Bonds, (Series C), Daily VRDNs, (IHC Health Services, Inc.), (U.S. Bank, SPA), 0.11%, 5/07/15 |
|
|
10,000,000 |
|
|
|
10,000,000 |
|
|
|
|
| TOTAL UTAH |
|
|
|
|
|
|
$ 10,100,000 |
|
|
| TOTAL MUNICIPAL BONDS |
|
| (COST $78,400,000) |
|
|
|
$ 78,400,000 |
|
|
|
|
|
|
|
|
|
|
| Description |
|
|
Par Value |
|
|
|
Value |
|
| SHORT-TERM MUNICIPAL BONDS – 23.9% |
|
|
|
| CONNECTICUT – 3.4% |
|
|
|
|
|
|
|
|
| Connecticut State Health & Educational Facility Authority, Revenue Bonds, (Series V-1), (Yale University), 0.04%, 5/04/15 |
|
|
$ 10,350,000 |
|
|
|
$ 10,350,000 |
|
|
|
|
| Connecticut State Health & Educational Facility Authority, Revenue Bonds, (Series V-2), Daily VRDNs, Yale University), 0.11%, 5/01/15¿ |
|
|
8,000,000 |
|
|
|
8,000,000 |
|
|
|
|
| TOTAL CONNECTICUT |
|
|
|
|
|
|
$ 18,350,000 |
|
|
| DELAWARE – 7.7% |
|
|
|
|
| Delaware State Health Facilities Authority, Refunding Revenue Bonds, (Series A), Daily VRDNs, (Christiana Care Health Services, OBG), 0.13%, 5/01/15¿ |
|
|
16,200,000 |
|
|
|
16,200,000 |
|
|
|
|
| Delaware State Health Facilities Authority, Revenue Bonds, (Series A), Weekly VRDNs, (Christiana Care Health Services, OBG), 0.11%, 5/07/15¿ |
|
|
4,000,000 |
|
|
|
4,000,000 |
|
|
|
|
| University of Delaware, Revenue Bonds, Daily VRDNs, (TD Bank N.A., SPA), 0.13%, 5/01/15¿ |
|
|
16,660,000 |
|
|
|
16,660,000 |
|
|
|
|
| University of Delaware, Revenue Bonds, (Series B), Daily VRDNs, (University & College Imps.)/(Bank of America N.A., SPA), 0.13%, 5/01/15¿ |
|
|
4,500,000 |
|
|
|
4,500,000 |
|
|
|
|
| TOTAL DELAWARE |
|
|
|
|
|
|
$ 41,360,000 |
|
|
| FLORIDA – 0.6% |
|
|
|
|
| Orange County Housing Finance Authority, Refunding Revenue Bonds, Weekly VRDNs, (Fannie Mae), 0.07%, 5/07/15¿ |
|
|
3,385,000 |
|
|
|
3,385,000 |
|
|
|
|
| TOTAL FLORIDA |
|
|
|
|
|
|
$ 3,385,000 |
|
|
| MINNESOTA – 1.7% |
|
|
|
|
| City of Rochester, MN, Refunding Revenue Bonds, (Series A), Weekly VRDNs, (Mayo Clinic, OBG), 0.11%, 5/07/15¿ |
|
|
8,900,000 |
|
|
|
8,900,000 |
|
|
|
|
| TOTAL MINNESOTA |
|
|
|
|
|
|
$ 8,900,000 |
|
|
| NEW HAMPSHIRE – 1.0% |
|
|
|
|
| New Hampshire, HEFA, Revenue Bonds, Weekly VRDNs, (Dartmouth College, OBG)/(U.S. Bank N.A., SPA), 0.11%, 5/07/15¿ |
|
|
5,350,000 |
|
|
|
5,350,000 |
|
|
|
|
| TOTAL NEW HAMPSHIRE |
|
|
|
|
|
|
$ 5,350,000 |
|
|
| OHIO – 2.1% |
|
|
|
|
| Ohio State Higher Educational Facility Commission, Refunding Revenue Bonds, (Series B-4), Daily VRDNs, (Cleveland Clinic, OBG), 0.13%, 5/01/15¿ |
|
|
11,000,000 |
|
|
|
11,000,000 |
|
|
|
|
| TOTAL OHIO |
|
|
|
|
|
|
$ 11,000,000 |
|
|
| ANNUAL REPORT / April 30, 2015 |
|
| PORTFOLIOS OF INVESTMENTS |
Wilmington Tax-Exempt Money Market Fund (concluded)
|
|
|
|
|
|
|
|
|
| Description |
|
|
Par Value |
|
|
|
Value |
|
|
|
|
|
|
|
| TEXAS –
2.3% |
|
|
|
|
| Gulf Coast Waste Disposal Authority, TX, Revenue Bonds, Weekly VRDNs, (Air Products & Chemicals Project, OBG), 0.10%, 5/07/15¿ |
|
|
$ 2,000,000 |
|
|
|
$ 2,000,000 |
|
|
|
|
| State of Texas, GO Unlimited Notes, (Series B), Weekly VRDNs, (State Street / CalPERS, SPA), 0.08%, 5/07/15¿ |
|
|
10,480,000 |
|
|
|
10,480,000 |
|
|
|
|
| TOTAL TEXAS |
|
|
|
|
|
|
$ 12,480,000 |
|
|
| UTAH – 1.7% |
|
|
|
|
| City of Murray, Revenue Bonds, (Series D), Daily VRDNs, (IHC Health Services, Inc., OBG), 0.12%, 5/01/15¿ |
|
|
6,700,000 |
|
|
|
6,700,000 |
|
|
|
|
| Weber County Hospital (IHC Health Services), Revenue Bonds, (Series A), Daily VRDNs, 0.13%, 5/01/15¿ |
|
|
2,600,000 |
|
|
|
2,600,000 |
|
|
|
| TOTAL UTAH |
|
|
|
$ 9,300,000 |
|
|
|
|
|
|
|
|
|
|
| Description |
|
|
Par Value |
|
|
|
Value |
|
| VIRGINIA –
3.4% |
|
|
|
|
| Loudon County Industrial Development Authority, Revenue Bonds, (Series D), Weekly VRDNs, (Howard Hughes Medical Center), 0.07%, 5/07/15¿ |
|
|
$ 18,000,000 |
|
|
|
$ 18,000,000 |
|
|
|
|
| TOTAL VIRGINIA |
|
|
|
|
|
|
$ 18,000,000 |
|
|
| TOTAL SHORT-TERM MUNICIPAL BONDS |
|
| (COST $128,125,000) |
|
|
|
$ 128,125,000 |
|
|
| TOTAL INVESTMENTS – 100.0% |
|
| (COST $535,589,000) |
|
|
|
$ 535,589,000 |
|
|
|
| OTHER ASSETS LESS LIABILITIES – 0.0%** |
|
|
|
102,392 |
|
|
|
| TOTAL NET ASSETS – 100.0% |
|
|
|
$ 535,691,392 |
|
Cost of investments
for Federal income tax purposes is the same as for financial statement purposes.
Various inputs are used in determining the value of
the Fund’s investments. These inputs are summarized in the three broad levels listed below.
Level 1 – quoted prices in
active markets for identical securities
Level 2 – other significant observable inputs (including quoted prices for similar
securities, interest rates, prepayment speeds, credit risk, etc.)
Level 3 – significant unobservable inputs (including the
Fund’s own assumptions in determining the fair value of investments)
The following is a summary of the inputs used as of
April 30, 2015 in valuing the Fund’s assets carried at fair value:
|
|
|
|
|
|
|
|
|
|
|
|
|
|
|
|
|
|
|
|
Level 1 |
|
|
|
Level 2 |
|
|
|
Level 3 |
|
|
|
Total |
|
| Investments in Securities |
|
|
|
|
|
|
|
|
|
|
|
|
|
|
|
|
| Commercial Paper |
|
$ |
— |
|
|
$ |
329,064,000 |
|
|
$ |
— |
|
|
$ |
329,064,000 |
|
| Municipal Bonds |
|
|
— |
|
|
|
78,400,000 |
|
|
|
— |
|
|
|
78,400,000 |
|
| Short-Term Municipal Bonds |
|
|
— |
|
|
|
128,125,000 |
|
|
|
— |
|
|
|
128,125,000 |
|
|
|
|
|
|
|
|
|
|
|
|
|
|
|
|
|
|
| Total |
|
$ |
— |
|
|
$ |
535,589,000 |
|
|
$ |
— |
|
|
$ |
535,589,000 |
|
|
|
|
|
|
|
|
|
|
|
|
|
|
|
|
|
|
| ¿ |
Variable rate demand note with current rate shown. Date shown is the date on which the Fund can unconditionally demand payment. |
| ** |
Represents less than 0.05%. |
The following acronyms are used throughout this Fund:
BANs - Bond Anticipation Notes
AGM - Insured by Assured Guaranty Municipal Corporation
GO - General Obligation
HEFA - Health and Educational Facilities Authority
LIQ - Liquid Agreement
LOC - Letter of Credit
MD - Maryland
MN -
Minnesota
N.A. - North America
NV - Nevada
NY - New York
OBG - Obligation
SPA - Sales and Purchase Agreement
TN - Tennessee
TX - Texas
VRDNs - Variable Rate Demand Notes
See Notes which are an
integral part of the Financial Statements
|
| April 30, 2015 / ANNUAL REPORT |
|
| STATEMENTS OF ASSETS AND LIABILITIES |
|
|
|
|
|
|
|
|
|
|
|
|
|
|
|
|
|
|
|
|
|
|
|
|
|
|
|
|
|
|
|
| April 30, 2015 |
|
|
|
|
Wilmington
Prime
Money Market
Fund |
|
|
|
|
|
|
|
Wilmington
U.S. Government
Money Market
Fund |
|
|
|
|
|
|
|
Wilmington
U.S. Treasury
Money Market
Fund |
|
|
|
|
|
|
|
Wilmington
Tax-Exempt
Money Market
Fund |
|
| ASSETS: |
|
|
|
|
|
|
|
|
|
|
|
|
|
|
|
|
|
|
|
|
|
|
|
|
|
|
|
|
|
|
| Investments, at identified cost |
|
|
|
$ |
3,712,211,596 |
|
|
|
|
|
|
$ |
3,936,054,234 |
|
|
|
|
|
|
$ |
894,487,042 |
|
|
|
|
|
|
$ |
535,589,000 |
|
|
|
|
|
|
|
|
|
|
|
|
|
|
|
|
|
|
|
|
|
|
|
|
|
|
|
|
|
|
|
|
| Investments in repurchase agreements, at value |
|
|
|
$ |
223,000,000 |
|
|
|
|
|
|
$ |
311,000,000 |
|
|
|
|
|
|
$ |
89,000,000 |
|
|
|
|
|
|
$ |
— |
|
| Investments in securities, at value |
|
|
|
|
3,489,211,596 |
|
|
|
|
|
|
|
3,625,054,234 |
|
|
|
|
|
|
|
805,487,042 |
|
|
|
|
|
|
|
535,589,000 |
|
|
|
|
|
|
|
|
|
|
|
|
|
|
|
|
|
|
|
|
|
|
|
|
|
|
|
|
|
|
|
|
|
TOTAL INVESTMENTS |
|
|
|
|
3,712,211,596 |
|
|
|
|
|
|
|
3,936,054,234 |
|
|
|
|
|
|
|
894,487,042 |
|
|
|
|
|
|
|
535,589,000 |
|
| |
|
|
|
|
|
|
|
|
|
|
|
|
|
|
|
|
|
|
|
|
|
|
|
|
|
|
|
|
|
|
| Cash |
|
|
|
|
777,115 |
|
|
|
|
|
|
|
628,353 |
|
|
|
|
|
|
|
— |
|
|
|
|
|
|
|
— |
|
| Interest receivable |
|
|
|
|
2,146,523 |
|
|
|
|
|
|
|
2,491,970 |
|
|
|
|
|
|
|
2,050,590 |
|
|
|
|
|
|
|
40,277 |
|
| Due from advisor |
|
|
|
|
— |
|
|
|
|
|
|
|
— |
|
|
|
|
|
|
|
11,430 |
|
|
|
|
|
|
|
28,654 |
|
| Receivable for shares sold |
|
|
|
|
4,993,234 |
|
|
|
|
|
|
|
1,276,633 |
|
|
|
|
|
|
|
800 |
|
|
|
|
|
|
|
476,244 |
|
| Other assets |
|
|
|
|
65,943 |
|
|
|
|
|
|
|
68,220 |
|
|
|
|
|
|
|
26,903 |
|
|
|
|
|
|
|
24,394 |
|
|
|
|
|
|
|
|
|
|
|
|
|
|
|
|
|
|
|
|
|
|
|
|
|
|
|
|
|
|
|
|
|
TOTAL ASSETS |
|
|
|
|
3,720,194,411 |
|
|
|
|
|
|
|
3,940,519,410 |
|
|
|
|
|
|
|
896,576,765 |
|
|
|
|
|
|
|
536,158,569 |
|
| |
|
|
|
|
|
|
|
|
|
|
|
|
|
|
|
|
|
|
|
|
|
|
|
|
|
|
|
|
|
|
| LIABILITIES: |
|
|
|
|
|
|
|
|
|
|
|
|
|
|
|
|
|
|
|
|
|
|
|
|
|
|
|
|
|
|
| Payable to custodian |
|
|
|
|
— |
|
|
|
|
|
|
|
— |
|
|
|
|
|
|
|
49,883 |
|
|
|
|
|
|
|
388,511 |
|
| Income distribution payable |
|
|
|
|
49,671 |
|
|
|
|
|
|
|
32,814 |
|
|
|
|
|
|
|
— |
|
|
|
|
|
|
|
4,359 |
|
| Payable for shares redeemed |
|
|
|
|
70,214 |
|
|
|
|
|
|
|
— |
|
|
|
|
|
|
|
1,043 |
|
|
|
|
|
|
|
2,406 |
|
| Payable for shareholder services fee |
|
|
|
|
4,303 |
|
|
|
|
|
|
|
— |
|
|
|
|
|
|
|
— |
|
|
|
|
|
|
|
— |
|
| Other accrued expenses |
|
|
|
|
417,567 |
|
|
|
|
|
|
|
344,437 |
|
|
|
|
|
|
|
81,167 |
|
|
|
|
|
|
|
71,901 |
|
|
|
|
|
|
|
|
|
|
|
|
|
|
|
|
|
|
|
|
|
|
|
|
|
|
|
|
|
|
|
|
|
TOTAL LIABILITIES |
|
|
|
|
541,755 |
|
|
|
|
|
|
|
377,251 |
|
|
|
|
|
|
|
132,093 |
|
|
|
|
|
|
|
467,177 |
|
| |
|
|
|
|
|
|
|
|
|
|
|
|
|
|
|
|
|
|
|
|
|
|
|
|
|
|
|
|
|
|
|
NET ASSETS |
|
|
|
$ |
3,719,652,656 |
|
|
|
|
|
|
$ |
3,940,142,159 |
|
|
|
|
|
|
$ |
896,444,672 |
|
|
|
|
|
|
$ |
535,691,392 |
|
| |
|
|
|
|
|
|
|
|
|
|
|
|
|
|
|
|
|
|
|
|
|
|
|
|
|
|
|
|
|
|
|
NET ASSETS CONSIST OF: |
|
|
|
|
|
|
|
|
|
|
|
|
|
|
|
|
|
|
|
|
|
|
|
|
|
|
|
|
|
|
| Paid-in capital |
|
|
|
$ |
3,719,655,514 |
|
|
|
|
|
|
$ |
3,940,165,085 |
|
|
|
|
|
|
$ |
896,479,475 |
|
|
|
|
|
|
$ |
535,763,709 |
|
| Undistributed (distributions in excess of) net investment
income |
|
|
|
|
(1,022 |
) |
|
|
|
|
|
|
1,636 |
|
|
|
|
|
|
|
449 |
|
|
|
|
|
|
|
(259 |
) |
| Accumulated net realized gain (loss) on
investments |
|
|
|
|
(1,836 |
) |
|
|
|
|
|
|
(24,562 |
) |
|
|
|
|
|
|
(35,252 |
) |
|
|
|
|
|
|
(72,058 |
) |
|
|
|
|
|
|
|
|
|
|
|
|
|
|
|
|
|
|
|
|
|
|
|
|
|
|
|
|
|
|
|
|
TOTAL NET ASSETS |
|
|
|
$ |
3,719,652,656 |
|
|
|
|
|
|
$ |
3,940,142,159 |
|
|
|
|
|
|
$ |
896,444,672 |
|
|
|
|
|
|
$ |
535,691,392 |
|
| |
|
|
|
|
|
|
|
|
|
|
|
|
|
|
|
|
|
|
|
|
|
|
|
|
|
|
|
|
|
|
| COMPUTATION OF NET ASSET VALUE AND OFFERING PRICE: |
|
|
|
|
|
|
|
|
|
|
|
|
|
|
|
|
|
|
|
|
|
|
|
|
|
|
|
|
|
|
| Administrative Class |
|
|
|
|
|
|
|
|
|
|
|
|
|
|
|
|
|
|
|
|
|
|
|
|
|
|
|
|
|
|
| Net Assets |
|
|
|
$ |
352,594,519 |
|
|
|
|
|
|
$ |
1,556,286,288 |
|
|
|
|
|
|
$ |
631,471,775 |
|
|
|
|
|
|
$ |
42,683,740 |
|
|
|
|
|
|
|
|
|
|
|
|
|
|
|
|
|
|
|
|
|
|
|
|
|
|
|
|
|
|
|
|
| Shares outstanding (unlimited shares
authorized) |
|
|
|
|
352,701,649 |
|
|
|
|
|
|
|
1,556,485,038 |
|
|
|
|
|
|
|
631,530,695 |
|
|
|
|
|
|
|
42,686,612 |
|
|
|
|
|
|
|
|
|
|
|
|
|
|
|
|
|
|
|
|
|
|
|
|
|
|
|
|
|
|
|
|
| Net Asset Value per share |
|
|
|
$ |
1.00 |
|
|
|
|
|
|
$ |
1.00 |
|
|
|
|
|
|
$ |
1.00 |
|
|
|
|
|
|
$ |
1.00 |
|
|
|
|
|
|
|
|
|
|
|
|
|
|
|
|
|
|
|
|
|
|
|
|
|
|
|
|
|
|
|
|
| Institutional Class |
|
|
|
|
|
|
|
|
|
|
|
|
|
|
|
|
|
|
|
|
|
|
|
|
|
|
|
|
|
|
| Net Assets |
|
|
|
$ |
237,698,331 |
|
|
|
|
|
|
$ |
26,079,217 |
|
|
|
|
|
|
$ |
— |
|
|
|
|
|
|
$ |
— |
|
|
|
|
|
|
|
|
|
|
|
|
|
|
|
|
|
|
|
|
|
|
|
|
|
|
|
|
|
|
|
|
| Shares outstanding (unlimited shares
authorized) |
|
|
|
|
237,698,693 |
|
|
|
|
|
|
|
26,081,651 |
|
|
|
|
|
|
|
— |
|
|
|
|
|
|
|
— |
|
|
|
|
|
|
|
|
|
|
|
|
|
|
|
|
|
|
|
|
|
|
|
|
|
|
|
|
|
|
|
|
| Net Asset Value per share |
|
|
|
$ |
1.00 |
|
|
|
|
|
|
$ |
1.00 |
|
|
|
|
|
|
$ |
— |
|
|
|
|
|
|
$ |
— |
|
|
|
|
|
|
|
|
|
|
|
|
|
|
|
|
|
|
|
|
|
|
|
|
|
|
|
|
|
|
|
|
| Select Class |
|
|
|
|
|
|
|
|
|
|
|
|
|
|
|
|
|
|
|
|
|
|
|
|
|
|
|
|
|
|
| Net Assets |
|
|
|
$ |
2,439,661,694 |
|
|
|
|
|
|
$ |
1,005,502,787 |
|
|
|
|
|
|
$ |
264,954,694 |
|
|
|
|
|
|
$ |
413,691,504 |
|
|
|
|
|
|
|
|
|
|
|
|
|
|
|
|
|
|
|
|
|
|
|
|
|
|
|
|
|
|
|
|
| Shares outstanding (unlimited shares
authorized) |
|
|
|
|
2,439,945,831 |
|
|
|
|
|
|
|
1,005,636,523 |
|
|
|
|
|
|
|
264,985,460 |
|
|
|
|
|
|
|
413,738,592 |
|
|
|
|
|
|
|
|
|
|
|
|
|
|
|
|
|
|
|
|
|
|
|
|
|
|
|
|
|
|
|
|
| Net Asset Value per share |
|
|
|
$ |
1.00 |
|
|
|
|
|
|
$ |
1.00 |
|
|
|
|
|
|
$ |
1.00 |
|
|
|
|
|
|
$ |
1.00 |
|
|
|
|
|
|
|
|
|
|
|
|
|
|
|
|
|
|
|
|
|
|
|
|
|
|
|
|
|
|
|
|
| Service Class |
|
|
|
|
|
|
|
|
|
|
|
|
|
|
|
|
|
|
|
|
|
|
|
|
|
|
|
|
|
|
| Net Assets |
|
|
|
$ |
689,698,111 |
|
|
|
|
|
|
$ |
1,352,273,868 |
|
|
|
|
|
|
$ |
18,202 |
|
|
|
|
|
|
$ |
79,316,148 |
|
|
|
|
|
|
|
|
|
|
|
|
|
|
|
|
|
|
|
|
|
|
|
|
|
|
|
|
|
|
|
|
| Shares outstanding (unlimited shares
authorized) |
|
|
|
|
689,739,084 |
|
|
|
|
|
|
|
1,352,268,368 |
|
|
|
|
|
|
|
18,202 |
|
|
|
|
|
|
|
79,363,561 |
|
|
|
|
|
|
|
|
|
|
|
|
|
|
|
|
|
|
|
|
|
|
|
|
|
|
|
|
|
|
|
|
| Net Asset Value per share |
|
|
|
$ |
1.00 |
|
|
|
|
|
|
$ |
1.00 |
|
|
|
|
|
|
$ |
1.00 |
|
|
|
|
|
|
$ |
1.00 |
|
|
|
|
|
|
|
|
|
|
|
|
|
|
|
|
|
|
|
|
|
|
|
|
|
|
|
|
|
|
|
|
See Notes which are an integral part of the Financial Statements
|
| ANNUAL REPORT / April 30, 2015 |
|
|
|
|
|
|
|
|
|
|
|
|
|
|
|
|
|
|
|
|
|
|
|
|
|
|
|
|
|
|
|
| Year Ended April 30, 2015 |
|
|
|
|
Wilmington
Prime Money
Market Fund |
|
|
|
|
|
|
|
Wilmington
U.S. Government
Money Market Fund |
|
|
|
|
|
|
|
Wilmington
U.S. Treasury
Money Market Fund |
|
|
|
|
|
|
|
Wilmington
Tax-Exempt
Money Market Fund |
|
| INVESTMENT INCOME: |
|
|
|
|
|
|
|
|
|
|
|
|
|
|
|
|
|
|
|
|
|
|
|
|
|
|
|
|
|
|
|
|
|
|
|
|
|
|
|
|
|
|
| Interest |
|
|
|
$ |
5,462,654 |
|
|
|
|
|
|
$ |
3,458,754 |
|
|
|
|
|
|
$ |
528,389 |
|
|
|
|
|
|
$ |
286,963 |
|
|
|
|
|
|
|
|
|
|
|
|
|
|
|
|
|
|
|
|
|
|
|
|
|
|
|
|
|
|
|
|
|
|
|
|
|
|
|
|
|
|
|
|
| TOTAL INVESTMENT INCOME |
|
|
|
|
5,462,654 |
|
|
|
|
|
|
|
3,458,754 |
|
|
|
|
|
|
|
528,389 |
|
|
|
|
|
|
|
286,963 |
|
|
|
|
|
|
|
|
|
|
|
|
|
|
|
|
|
|
|
|
|
|
|
|
|
|
|
|
|
|
|
|
| EXPENSES: |
|
|
|
|
|
|
|
|
|
|
|
|
|
|
|
|
|
|
|
|
|
|
|
|
|
|
|
|
|
|
|
|
|
|
|
|
|
|
|
|
|
|
| Investment advisory fee |
|
|
|
|
14,775,935 |
|
|
|
|
|
|
|
16,568,494 |
|
|
|
|
|
|
|
3,579,435 |
|
|
|
|
|
|
|
2,047,248 |
|
|
|
|
|
|
|
|
|
|
|
|
|
| Administrative personnel and services fee |
|
|
|
|
1,115,351 |
|
|
|
|
|
|
|
1,251,365 |
|
|
|
|
|
|
|
270,496 |
|
|
|
|
|
|
|
154,632 |
|
|
|
|
|
|
|
|
|
|
|
|
|
| Portfolio accounting and administration fees |
|
|
|
|
1,037,905 |
|
|
|
|
|
|
|
1,156,871 |
|
|
|
|
|
|
|
258,769 |
|
|
|
|
|
|
|
160,294 |
|
|
|
|
|
|
|
|
|
|
|
|
|
| Transfer and dividend disbursing agent fees and expenses |
|
|
|
|
185,255 |
|
|
|
|
|
|
|
2,128 |
|
|
|
|
|
|
|
4,887 |
|
|
|
|
|
|
|
28,608 |
|
|
|
|
|
|
|
|
|
|
|
|
|
| Custodian fees |
|
|
|
|
100,930 |
|
|
|
|
|
|
|
106,415 |
|
|
|
|
|
|
|
26,855 |
|
|
|
|
|
|
|
13,222 |
|
|
|
|
|
|
|
|
|
|
|
|
|
| Trustees’ fees |
|
|
|
|
33,067 |
|
|
|
|
|
|
|
33,067 |
|
|
|
|
|
|
|
33,066 |
|
|
|
|
|
|
|
33,067 |
|
|
|
|
|
|
|
|
|
|
|
|
|
| Professional fees |
|
|
|
|
54,897 |
|
|
|
|
|
|
|
55,064 |
|
|
|
|
|
|
|
50,854 |
|
|
|
|
|
|
|
50,656 |
|
|
|
|
|
|
|
|
|
|
|
|
|
| Distribution services fee—Administrative Class |
|
|
|
|
927,147 |
|
|
|
|
|
|
|
4,615,609 |
|
|
|
|
|
|
|
1,521,378 |
|
|
|
|
|
|
|
106,492 |
|
|
|
|
|
|
|
|
|
|
|
|
|
| Distribution services fee—Service Class |
|
|
|
|
1,916,873 |
|
|
|
|
|
|
|
3,128,743 |
|
|
|
|
|
|
|
18 |
|
|
|
|
|
|
|
183,308 |
|
|
|
|
|
|
|
|
|
|
|
|
|
| Shareholder services fee— Administrative Class |
|
|
|
|
927,147 |
|
|
|
|
|
|
|
4,615,609 |
|
|
|
|
|
|
|
1,521,378 |
|
|
|
|
|
|
|
106,492 |
|
|
|
|
|
|
|
|
|
|
|
|
|
| Shareholder services fee— Select Class |
|
|
|
|
5,964,192 |
|
|
|
|
|
|
|
2,523,931 |
|
|
|
|
|
|
|
715,746 |
|
|
|
|
|
|
|
989,727 |
|
|
|
|
|
|
|
|
|
|
|
|
|
| Shareholder services fee— Service Class |
|
|
|
|
1,915,395 |
|
|
|
|
|
|
|
3,128,743 |
|
|
|
|
|
|
|
18 |
|
|
|
|
|
|
|
183,308 |
|
|
|
|
|
|
|
|
|
|
|
|
|
| Share registration costs |
|
|
|
|
53,656 |
|
|
|
|
|
|
|
50,106 |
|
|
|
|
|
|
|
32,223 |
|
|
|
|
|
|
|
39,619 |
|
|
|
|
|
|
|
|
|
|
|
|
|
| Printing and postage |
|
|
|
|
161,508 |
|
|
|
|
|
|
|
17,148 |
|
|
|
|
|
|
|
9,793 |
|
|
|
|
|
|
|
21,969 |
|
|
|
|
|
|
|
|
|
|
|
|
|
| Miscellaneous |
|
|
|
|
193,457 |
|
|
|
|
|
|
|
220,401 |
|
|
|
|
|
|
|
72,682 |
|
|
|
|
|
|
|
36,057 |
|
|
|
|
|
|
|
|
|
|
|
|
|
|
|
|
|
|
|
|
|
|
|
|
|
|
|
|
|
|
|
|
|
|
|
|
|
|
|
|
|
|
|
|
| TOTAL EXPENSES |
|
|
|
|
29,362,715 |
|
|
|
|
|
|
|
37,473,694 |
|
|
|
|
|
|
|
8,097,598 |
|
|
|
|
|
|
|
4,154,699 |
|
|
|
|
|
|
|
|
|
|
|
|
|
|
|
|
|
|
|
|
|
|
|
|
|
|
|
|
|
|
|
|
| WAIVERS AND REIMBURSEMENTS: |
|
|
|
|
|
|
|
|
|
|
|
|
|
|
|
|
|
|
|
|
|
|
|
|
|
|
|
|
|
|
|
|
|
|
|
|
|
|
|
|
|
|
| Waiver/reimbursement by investment advisor |
|
|
|
|
(12,710,152 |
) |
|
|
|
|
|
|
(16,417,948 |
) |
|
|
|
|
|
|
(3,811,144 |
) |
|
|
|
|
|
|
(2,349,082 |
) |
|
|
|
|
|
|
|
|
|
|
|
|
| Waiver of distribution services fee—Administrative Class |
|
|
|
|
(927,147 |
) |
|
|
|
|
|
|
(4,615,609 |
) |
|
|
|
|
|
|
(1,521,378 |
) |
|
|
|
|
|
|
(106,492 |
) |
|
|
|
|
|
|
|
|
|
|
|
|
| Waiver of distribution services fee—Service Class |
|
|
|
|
(1,916,873 |
) |
|
|
|
|
|
|
(3,128,743 |
) |
|
|
|
|
|
|
(18 |
) |
|
|
|
|
|
|
(183,308 |
) |
|
|
|
|
|
|
|
|
|
|
|
|
| Waiver of shareholder services fee—Administrative Class |
|
|
|
|
(927,147 |
) |
|
|
|
|
|
|
(4,615,609 |
) |
|
|
|
|
|
|
(1,521,378 |
) |
|
|
|
|
|
|
(106,492 |
) |
|
|
|
|
|
|
|
|
|
|
|
|
| Waiver of shareholder services fee—Select Class |
|
|
|
|
(5,964,192 |
) |
|
|
|
|
|
|
(2,523,931 |
) |
|
|
|
|
|
|
(715,746 |
) |
|
|
|
|
|
|
(989,727 |
) |
|
|
|
|
|
|
|
|
|
|
|
|
| Waiver of shareholder services fee—Service Class |
|
|
|
|
(1,898,954 |
) |
|
|
|
|
|
|
(3,128,743 |
) |
|
|
|
|
|
|
(18 |
) |
|
|
|
|
|
|
(183,308 |
) |
|
|
|
|
|
|
|
|
|
|
|
|
|
|
|
|
|
|
|
|
|
|
|
|
|
|
|
|
|
|
|
|
|
|
|
|
|
|
|
|
|
|
|
| TOTAL WAIVERS AND REIMBURSEMENTS |
|
|
|
|
(24,344,465 |
) |
|
|
|
|
|
|
(34,430,583 |
) |
|
|
|
|
|
|
(7,569,682 |
) |
|
|
|
|
|
|
(3,918,409 |
) |
|
|
|
|
|
|
|
|
|
|
|
|
|
|
|
|
|
|
|
|
|
|
|
|
|
|
|
|
|
|
|
|
|
|
|
|
|
|
|
|
|
|
|
| Net expenses |
|
|
|
|
5,018,250 |
|
|
|
|
|
|
|
3,043,111 |
|
|
|
|
|
|
|
527,916 |
|
|
|
|
|
|
|
236,290 |
|
|
|
|
|
|
|
|
|
|
|
|
|
|
|
|
|
|
|
|
|
|
|
|
|
|
|
|
|
|
|
|
|
|
|
|
|
|
|
|
|
|
|
|
| Net investment income |
|
|
|
|
444,404 |
|
|
|
|
|
|
|
415,643 |
|
|
|
|
|
|
|
473 |
|
|
|
|
|
|
|
50,673 |
|
|
|
|
|
|
|
|
|
|
|
|
|
|
|
|
|
|
|
|
|
|
|
|
|
|
|
|
|
|
|
|
|
|
|
|
|
|
|
|
|
|
|
|
| REALIZED GAIN (LOSS) ON INVESTMENTS: |
|
|
|
|
|
|
|
|
|
|
|
|
|
|
|
|
|
|
|
|
|
|
|
|
|
|
|
|
|
|
|
|
|
|
|
|
|
|
|
|
|
|
| Net realized gain (loss) on investments |
|
|
|
|
12,180 |
|
|
|
|
|
|
|
4,315 |
|
|
|
|
|
|
|
415 |
|
|
|
|
|
|
|
— |
|
|
|
|
|
|
|
|
|
|
|
|
|
|
|
|
|
|
|
|
|
|
|
|
|
|
|
|
|
|
|
|
|
|
|
|
|
|
|
|
|
|
|
|
| Net realized gain (loss) on investments |
|
|
|
|
12,180 |
|
|
|
|
|
|
|
4,315 |
|
|
|
|
|
|
|
415 |
|
|
|
|
|
|
|
— |
|
|
|
|
|
|
|
|
|
|
|
|
|
|
|
|
|
|
|
|
|
|
|
|
|
|
|
|
|
|
|
|
|
|
|
|
|
|
|
|
|
|
|
|
| Change in net assets resulting from operations |
|
|
|
$ |
456,584 |
|
|
|
|
|
|
$ |
419,958 |
|
|
|
|
|
|
$ |
888 |
|
|
|
|
|
|
$ |
50,673 |
|
|
|
|
|
|
|
|
|
|
|
|
|
|
|
|
|
|
|
|
|
|
|
|
|
|
|
|
|
|
|
|
See Notes which are an integral part of the Financial Statements
|
| April 30, 2015 / ANNUAL REPORT |
|
| STATEMENTS OF CHANGES IN NET ASSETS |
|
|
|
|
|
|
|
|
|
|
|
|
|
|
|
|
|
|
|
|
|
|
|
|
|
|
|
|
|
|
|
|
|
|
|
| |
|
|
|
|
|
Wilmington
Prime
Money Market Fund |
|
|
|
|
|
|
Wilmington
U.S.
Government
Money Market Fund |
|
|
|
|
|
|
|
|
|
|
|
|
|
|
|
|
|
|
|
|
|
|
|
|
Year Ended
April 30,
2015 |
|
|
|
|
|
|
|
Year Ended
April 30,
2014 |
|
|
|
|
|
|
|
Year Ended
April 30,
2015 |
|
|
|
|
|
|
|
Year Ended
April 30,
2014 |
|
|
|
| OPERATIONS: |
|
|
|
|
|
|
|
|
|
|
|
|
|
|
|
|
|
|
|
|
|
|
|
|
|
|
|
|
|
|
|
|
|
|
| Net investment income |
|
|
|
|
|
$ |
444,404 |
|
|
|
|
|
|
$ |
416,762 |
|
|
|
|
|
|
$ |
415,643 |
|
|
|
|
|
|
$ |
417,767 |
|
|
|
| Net realized gain (loss) on investments |
|
|
|
|
|
|
12,180 |
|
|
|
|
|
|
|
(14,015 |
) |
|
|
|
|
|
|
4,315 |
|
|
|
|
|
|
|
(28,877 |
) |
|
|
|
|
|
|
|
|
|
|
|
|
|
|
|
|
|
|
|
|
|
|
|
|
|
|
|
|
|
|
|
|
|
|
|
|
|
| Change in net assets resulting from operations |
|
|
|
|
|
|
456,584 |
|
|
|
|
|
|
|
402,747 |
|
|
|
|
|
|
|
419,958 |
|
|
|
|
|
|
|
388,890 |
|
|
|
|
|
|
|
|
|
|
|
|
|
|
|
|
|
|
|
|
|
|
|
|
|
|
|
|
|
|
|
|
|
|
|
|
|
|
| DISTRIBUTIONS TO SHAREHOLDERS: |
|
|
|
|
|
|
|
|
|
|
|
|
|
|
|
|
|
|
|
|
|
|
|
|
|
|
|
|
|
|
|
|
|
|
| Distributions from net investment income |
|
|
|
|
|
|
|
|
|
|
|
|
|
|
|
|
|
|
|
|
|
|
|
|
|
|
|
|
|
|
|
|
|
|
| Administrative Class
|
|
|
|
|
|
|
(46,265 |
) |
|
|
|
|
|
|
(45,905 |
) |
|
|
|
|
|
|
(184,789 |
) |
|
|
|
|
|
|
(185,305 |
) |
|
|
| Institutional Class |
|
|
|
|
|
|
(24,467 |
) |
|
|
|
|
|
|
(6,629 |
) |
|
|
|
|
|
|
(3,473 |
) |
|
|
|
|
|
|
(3,738 |
) |
|
|
| Select Class |
|
|
|
|
|
|
(295,729 |
) |
|
|
|
|
|
|
(292,357 |
) |
|
|
|
|
|
|
(101,403 |
) |
|
|
|
|
|
|
(104,360 |
) |
|
|
| Service Class |
|
|
|
|
|
|
(76,769 |
) |
|
|
|
|
|
|
(90,184 |
) |
|
|
|
|
|
|
(125,210 |
) |
|
|
|
|
|
|
(115,104 |
) |
|
|
| Distributions from net realized gain on
investments |
|
|
|
|
|
|
|
|
|
|
|
|
|
|
|
|
|
|
|
|
|
|
|
|
|
|
|
|
|
|
|
|
|
|
| Administrative Class |
|
|
|
|
|
|
— |
|
|
|
|
|
|
|
(1,571 |
) |
|
|
|
|
|
|
— |
|
|
|
|
|
|
|
(270 |
) |
|
|
| Institutional Class |
|
|
|
|
|
|
— |
|
|
|
|
|
|
|
(230 |
) |
|
|
|
|
|
|
— |
|
|
|
|
|
|
|
(3 |
) |
|
|
| Select Class |
|
|
|
|
|
|
— |
|
|
|
|
|
|
|
(10,003 |
) |
|
|
|
|
|
|
— |
|
|
|
|
|
|
|
(140 |
) |
|
|
| Service Class |
|
|
|
|
|
|
— |
|
|
|
|
|
|
|
(3,844 |
) |
|
|
|
|
|
|
— |
|
|
|
|
|
|
|
(161 |
) |
|
|
|
|
|
|
|
|
|
|
|
|
|
|
|
|
|
|
|
|
|
|
|
|
|
|
|
|
|
|
|
|
|
|
|
|
|
| Change in net assets resulting from distributions to shareholders |
|
|
|
|
|
|
(443,230 |
) |
|
|
|
|
|
|
(450,723 |
) |
|
|
|
|
|
|
(414,875 |
) |
|
|
|
|
|
|
(409,081 |
) |
|
|
|
|
|
|
|
|
|
|
|
|
|
|
|
|
|
|
|
|
|
|
|
|
|
|
|
|
|
|
|
|
|
|
|
|
|
| SHARE TRANSACTIONS: |
|
|
|
|
|
|
|
|
|
|
|
|
|
|
|
|
|
|
|
|
|
|
|
|
|
|
|
|
|
|
|
|
|
|
| Proceeds from sale of shares |
|
|
|
|
|
|
|
|
|
|
|
|
|
|
|
|
|
|
|
|
|
|
|
|
|
|
|
|
|
|
|
|
|
|
| Administrative Class |
|
|
|
|
|
|
995,503,689 |
|
|
|
|
|
|
|
1,178,548,867 |
|
|
|
|
|
|
|
3,877,501,399 |
|
|
|
|
|
|
|
3,392,363,513 |
|
|
|
| Institutional Class |
|
|
|
|
|
|
1,060,689,984 |
|
|
|
|
|
|
|
424,008,347 |
|
|
|
|
|
|
|
37,157,622 |
|
|
|
|
|
|
|
81,575,282 |
|
|
|
| Select Class |
|
|
|
|
|
|
3,974,173,345 |
|
|
|
|
|
|
|
3,558,656,581 |
|
|
|
|
|
|
|
1,928,110,623 |
|
|
|
|
|
|
|
1,701,057,367 |
|
|
|
| Service Class |
|
|
|
|
|
|
2,639,297,327 |
|
|
|
|
|
|
|
2,787,041,927 |
|
|
|
|
|
|
|
2,761,898,754 |
|
|
|
|
|
|
|
2,235,776,360 |
|
|
|
| Distributions reinvested |
|
|
|
|
|
|
|
|
|
|
|
|
|
|
|
|
|
|
|
|
|
|
|
|
|
|
|
|
|
|
|
|
|
|
| Administrative Class |
|
|
|
|
|
|
20 |
|
|
|
|
|
|
|
13 |
|
|
|
|
|
|
|
5,209 |
|
|
|
|
|
|
|
4,115 |
|
|
|
| Institutional Class |
|
|
|
|
|
|
1,679 |
|
|
|
|
|
|
|
2,516 |
|
|
|
|
|
|
|
1,161 |
|
|
|
|
|
|
|
984 |
|
|
|
| Select Class |
|
|
|
|
|
|
51,805 |
|
|
|
|
|
|
|
49,715 |
|
|
|
|
|
|
|
1,117 |
|
|
|
|
|
|
|
1,539 |
|
|
|
| Service Class |
|
|
|
|
|
|
40,704 |
|
|
|
|
|
|
|
41,519 |
|
|
|
|
|
|
|
7,232 |
|
|
|
|
|
|
|
5,608 |
|
|
|
| Cost of shares redeemed |
|
|
|
|
|
|
|
|
|
|
|
|
|
|
|
|
|
|
|
|
|
|
|
|
|
|
|
|
|
|
|
|
|
|
| Administrative Class |
|
|
|
|
|
|
(968,605,086 |
) |
|
|
|
|
|
|
(1,235,605,494 |
) |
|
|
|
|
|
|
(3,994,684,719 |
) |
|
|
|
|
|
|
(3,604,090,252 |
) |
|
|
| Institutional Class |
|
|
|
|
|
|
(869,855,406 |
) |
|
|
|
|
|
|
(408,203,963 |
) |
|
|
|
|
|
|
(94,675,053 |
) |
|
|
|
|
|
|
(23,664,121 |
) |
|
|
| Select Class |
|
|
|
|
|
|
(3,847,371,614 |
) |
|
|
|
|
|
|
(3,773,941,923 |
) |
|
|
|
|
|
|
(1,811,768,074 |
) |
|
|
|
|
|
|
(1,976,283,004 |
) |
|
|
| Service Class |
|
|
|
|
|
|
(2,693,246,232 |
) |
|
|
|
|
|
|
(2,873,018,706 |
) |
|
|
|
|
|
|
(2,781,129,145 |
) |
|
|
|
|
|
|
(1,995,587,392 |
) |
|
|
|
|
|
|
|
|
|
|
|
|
|
|
|
|
|
|
|
|
|
|
|
|
|
|
|
|
|
|
|
|
|
|
|
|
|
| Change in net assets resulting from share transactions |
|
|
|
|
|
|
290,680,215 |
|
|
|
|
|
|
|
(342,420,601 |
) |
|
|
|
|
|
|
(77,573,874 |
) |
|
|
|
|
|
|
(188,840,001 |
) |
|
|
|
|
|
|
|
|
|
|
|
|
|
|
|
|
|
|
|
|
|
|
|
|
|
|
|
|
|
|
|
|
|
|
|
|
|
| Change in net assets |
|
|
|
|
|
|
290,693,569 |
|
|
|
|
|
|
|
(342,468,577 |
) |
|
|
|
|
|
|
(77,568,791 |
) |
|
|
|
|
|
|
(188,860,192 |
) |
|
|
| NET ASSETS: |
|
|
|
|
|
|
|
|
|
|
|
|
|
|
|
|
|
|
|
|
|
|
|
|
|
|
|
|
|
|
|
|
|
|
| Beginning of year |
|
|
|
|
|
|
3,428,959,087 |
|
|
|
|
|
|
|
3,771,427,664 |
|
|
|
|
|
|
|
4,017,710,950 |
|
|
|
|
|
|
|
4,206,571,142 |
|
|
|
|
|
|
|
|
|
|
|
|
|
|
|
|
|
|
|
|
|
|
|
|
|
|
|
|
|
|
|
|
|
|
|
|
|
|
| End of year |
|
|
|
|
|
$ |
3,719,652,656 |
|
|
|
|
|
|
$ |
3,428,959,087 |
|
|
|
|
|
|
$ |
3,940,142,159 |
|
|
|
|
|
|
$ |
4,017,710,950 |
|
|
|
|
|
|
|
|
|
|
|
|
|
|
|
|
|
|
|
|
|
|
|
|
|
|
|
|
|
|
|
|
|
|
|
|
|
|
| Undistributed (distributions in excess of) net investment
income included in net assets at end of year |
|
|
|
|
|
$ |
(1,022 |
) |
|
|
|
|
|
$ |
(2,196 |
) |
|
|
|
|
|
$ |
1,636 |
|
|
|
|
|
|
$ |
868 |
|
|
|
|
|
|
|
|
|
|
|
|
|
|
|
|
|
|
|
|
|
|
|
|
|
|
|
|
|
|
|
|
|
|
|
|
|
|
|
|
|
|
|
|
|
|
|
|
|
|
|
|
|
|
|
|
|
|
|
|
|
|
|
|
|
|
|
|
|
|
|
|
|
|
| ANNUAL REPORT / April 30, 2015 |
|
| STATEMENTS OF CHANGES IN NET ASSETS (continued) |
|
|
|
|
|
|
|
|
|
|
|
|
|
|
|
|
|
|
|
|
|
|
|
|
|
|
|
|
|
|
|
|
|
| |
|
|
|
Wilmington
Prime
Money Market Fund |
|
|
|
|
|
|
Wilmington
U.S.
Government
Money Market Fund |
|
|
|
|
|
|
|
|
|
|
|
|
|
|
|
|
|
|
|
|
|
Year Ended
April 30,
2015 |
|
|
|
|
|
|
|
Year Ended
April 30,
2014 |
|
|
|
|
|
|
|
Year Ended
April 30,
2015 |
|
|
|
|
|
|
|
Year Ended
April 30,
2014 |
|
|
|
| |
|
|
|
|
|
|
|
|
|
|
|
|
|
|
|
|
|
|
|
|
|
|
|
|
|
|
|
|
|
|
|
|
| SHARES OF BENEFICIAL INTEREST: |
|
|
|
|
|
|
|
|
|
|
|
|
|
|
|
|
|
|
|
|
|
|
|
|
|
|
|
|
|
|
|
|
| Shares sold |
|
|
|
|
|
|
|
|
|
|
|
|
|
|
|
|
|
|
|
|
|
|
|
|
|
|
|
|
|
|
|
|
| Administrative Class |
|
|
|
|
995,503,689 |
|
|
|
|
|
|
|
1,178,548,867 |
|
|
|
|
|
|
|
3,877,501,399 |
|
|
|
|
|
|
|
3,392,363,513 |
|
|
|
| Institutional Class |
|
|
|
|
1,060,689,984 |
|
|
|
|
|
|
|
424,008,347 |
|
|
|
|
|
|
|
37,157,622 |
|
|
|
|
|
|
|
81,575,282 |
|
|
|
| Select Class |
|
|
|
|
3,974,173,345 |
|
|
|
|
|
|
|
3,558,656,581 |
|
|
|
|
|
|
|
1,928,110,623 |
|
|
|
|
|
|
|
1,701,057,367 |
|
|
|
| Service Class |
|
|
|
|
2,639,297,327 |
|
|
|
|
|
|
|
2,787,041,927 |
|
|
|
|
|
|
|
2,761,898,754 |
|
|
|
|
|
|
|
2,235,776,360 |
|
|
|
| Distributions reinvested |
|
|
|
|
|
|
|
|
|
|
|
|
|
|
|
|
|
|
|
|
|
|
|
|
|
|
|
|
|
|
|
|
| Administrative Class |
|
|
|
|
20 |
|
|
|
|
|
|
|
13 |
|
|
|
|
|
|
|
5,209 |
|
|
|
|
|
|
|
4,115 |
|
|
|
| Institutional Class |
|
|
|
|
1,679 |
|
|
|
|
|
|
|
2,516 |
|
|
|
|
|
|
|
1,161 |
|
|
|
|
|
|
|
984 |
|
|
|
| Select Class |
|
|
|
|
51,805 |
|
|
|
|
|
|
|
49,715 |
|
|
|
|
|
|
|
1,117 |
|
|
|
|
|
|
|
1,539 |
|
|
|
| Service Class |
|
|
|
|
40,704 |
|
|
|
|
|
|
|
41,519 |
|
|
|
|
|
|
|
7,232 |
|
|
|
|
|
|
|
5,608 |
|
|
|
| Shares redeemed |
|
|
|
|
|
|
|
|
|
|
|
|
|
|
|
|
|
|
|
|
|
|
|
|
|
|
|
|
|
|
|
|
| Administrative Class |
|
|
|
|
(968,605,086 |
) |
|
|
|
|
|
|
(1,235,605,494 |
) |
|
|
|
|
|
|
(3,994,684,719 |
) |
|
|
|
|
|
|
(3,604,090,252 |
) |
|
|
| Institutional Class |
|
|
|
|
(869,855,406 |
) |
|
|
|
|
|
|
(408,203,963 |
) |
|
|
|
|
|
|
(94,675,053 |
) |
|
|
|
|
|
|
(23,664,121 |
) |
|
|
| Select Class |
|
|
|
|
(3,847,371,614 |
) |
|
|
|
|
|
|
(3,773,941,923 |
) |
|
|
|
|
|
|
(1,811,768,074 |
) |
|
|
|
|
|
|
(1,976,283,004 |
) |
|
|
| Service Class |
|
|
|
|
(2,693,246,232 |
) |
|
|
|
|
|
|
(2,873,018,706 |
) |
|
|
|
|
|
|
(2,781,129,145 |
) |
|
|
|
|
|
|
(1,995,587,392 |
) |
|
|
|
|
|
|
|
|
|
|
|
|
|
|
|
|
|
|
|
|
|
|
|
|
|
|
|
|
|
|
|
|
|
|
|
| Net change in shares outstanding |
|
|
|
|
290,680,215 |
|
|
|
|
|
|
|
(342,420,601 |
) |
|
|
|
|
|
|
(77,573,874 |
) |
|
|
|
|
|
|
(188,840,001 |
) |
|
|
|
|
|
|
|
|
|
|
|
|
|
|
|
|
|
|
|
|
|
|
|
|
|
|
|
|
|
|
|
|
|
|
|
|
|
|
|
|
|
|
|
|
|
|
|
|
|
|
|
|
|
|
|
|
|
|
|
|
|
|
|
|
|
|
|
|
See Notes which are an integral part of the Financial Statements
|
| April 30, 2015 / ANNUAL REPORT |
|
| STATEMENTS OF CHANGES IN NET ASSETS (concluded) |
|
|
|
|
|
|
|
|
|
|
|
|
|
|
|
|
|
|
|
|
|
|
|
|
|
|
|
|
|
|
|
|
|
| |
|
|
|
Wilmington
U.S.
Treasury
Money Market Fund |
|
|
|
|
|
|
Wilmington
Tax-Exempt
Money Market Fund |
|
|
|
|
|
|
|
|
|
|
|
|
|
|
|
|
|
|
|
|
|
Year Ended
April 30,
2015 |
|
|
|
|
|
|
|
Year Ended
April 30,
2014 |
|
|
|
|
|
|
|
Year Ended
April 30,
2015 |
|
|
|
|
|
|
|
Year Ended
April 30,
2014 |
|
|
|
| OPERATIONS: |
|
|
|
|
|
|
|
|
|
|
|
|
|
|
|
|
|
|
|
|
|
|
|
|
|
|
|
|
|
|
|
|
| Net investment income |
|
|
|
$ |
473 |
|
|
|
|
|
|
$ |
70,860 |
|
|
|
|
|
|
$ |
50,673 |
|
|
|
|
|
|
$ |
51,801 |
|
|
|
| Net realized gain (loss) on investments |
|
|
|
|
415 |
|
|
|
|
|
|
|
(35,667 |
) |
|
|
|
|
|
|
— |
|
|
|
|
|
|
|
— |
|
|
|
|
|
|
|
|
|
|
|
|
|
|
|
|
|
|
|
|
|
|
|
|
|
|
|
|
|
|
|
|
|
|
|
|
| Change in net assets resulting from operations |
|
|
|
|
888 |
|
|
|
|
|
|
|
35,193 |
|
|
|
|
|
|
|
50,673 |
|
|
|
|
|
|
|
51,801 |
|
|
|
|
|
|
|
|
|
|
|
|
|
|
|
|
|
|
|
|
|
|
|
|
|
|
|
|
|
|
|
|
|
|
|
|
| DISTRIBUTIONS TO SHAREHOLDERS: |
|
|
|
|
|
|
|
|
|
|
|
|
|
|
|
|
|
|
|
|
|
|
|
|
|
|
|
|
|
|
|
|
| Distributions from net investment income |
|
|
|
|
|
|
|
|
|
|
|
|
|
|
|
|
|
|
|
|
|
|
|
|
|
|
|
|
|
|
|
|
| Administrative Class |
|
|
|
|
(845 |
) |
|
|
|
|
|
|
(49,725 |
) |
|
|
|
|
|
|
(4,262 |
) |
|
|
|
|
|
|
(4,701 |
) |
|
|
| Select Class |
|
|
|
|
(381 |
) |
|
|
|
|
|
|
(24,964 |
) |
|
|
|
|
|
|
(39,332 |
) |
|
|
|
|
|
|
(43,717 |
) |
|
|
| Service Class |
|
|
|
|
— |
|
|
|
|
|
|
|
(775 |
) |
|
|
|
|
|
|
(7,329 |
) |
|
|
|
|
|
|
(7,768 |
) |
|
|
|
|
|
|
|
|
|
|
|
|
|
|
|
|
|
|
|
|
|
|
|
|
|
|
|
|
|
|
|
|
|
|
|
| Change in net assets resulting from distributions to shareholders |
|
|
|
|
(1,226 |
) |
|
|
|
|
|
|
(75,464 |
) |
|
|
|
|
|
|
(50,923 |
) |
|
|
|
|
|
|
(56,186 |
) |
|
|
|
|
|
|
|
|
|
|
|
|
|
|
|
|
|
|
|
|
|
|
|
|
|
|
|
|
|
|
|
|
|
|
|
| SHARE TRANSACTIONS: |
|
|
|
|
|
|
|
|
|
|
|
|
|
|
|
|
|
|
|
|
|
|
|
|
|
|
|
|
|
|
|
|
| Proceeds from sale of shares |
|
|
|
|
|
|
|
|
|
|
|
|
|
|
|
|
|
|
|
|
|
|
|
|
|
|
|
|
|
|
|
|
| Administrative Class |
|
|
|
|
1,224,054,650 |
|
|
|
|
|
|
|
1,381,133,464 |
|
|
|
|
|
|
|
45,149,714 |
|
|
|
|
|
|
|
53,056,531 |
|
|
|
| Select Class |
|
|
|
|
839,334,028 |
|
|
|
|
|
|
|
1,042,795,413 |
|
|
|
|
|
|
|
474,676,458 |
|
|
|
|
|
|
|
458,963,075 |
|
|
|
| Service Class |
|
|
|
|
12,201 |
|
|
|
|
|
|
|
14,073,657 |
|
|
|
|
|
|
|
135,589,560 |
|
|
|
|
|
|
|
145,781,542 |
|
|
|
| Distributions reinvested |
|
|
|
|
|
|
|
|
|
|
|
|
|
|
|
|
|
|
|
|
|
|
|
|
|
|
|
|
|
|
|
|
| Administrative Class |
|
|
|
|
4 |
|
|
|
|
|
|
|
64 |
|
|
|
|
|
|
|
— |
|
|
|
|
|
|
|
— |
|
|
|
| Select Class |
|
|
|
|
139 |
|
|
|
|
|
|
|
4,664 |
|
|
|
|
|
|
|
666 |
|
|
|
|
|
|
|
555 |
|
|
|
| Service Class |
|
|
|
|
— |
|
|
|
|
|
|
|
— |
|
|
|
|
|
|
|
7,453 |
|
|
|
|
|
|
|
6,966 |
|
|
|
| Cost of shares redeemed |
|
|
|
|
|
|
|
|
|
|
|
|
|
|
|
|
|
|
|
|
|
|
|
|
|
|
|
|
|
|
|
|
| Administrative Class |
|
|
|
|
(1,374,942,422 |
) |
|
|
|
|
|
|
(1,425,848,702 |
) |
|
|
|
|
|
|
(42,427,934 |
) |
|
|
|
|
|
|
(51,777,880 |
) |
|
|
| Select Class |
|
|
|
|
(888,754,034 |
) |
|
|
|
|
|
|
(1,114,987,122 |
) |
|
|
|
|
|
|
(482,564,643 |
) |
|
|
|
|
|
|
(443,767,538 |
) |
|
|
| Service Class |
|
|
|
|
— |
|
|
|
|
|
|
|
(24,102,195 |
) |
|
|
|
|
|
|
(130,989,192 |
) |
|
|
|
|
|
|
(128,504,675 |
) |
|
|
|
|
|
|
|
|
|
|
|
|
|
|
|
|
|
|
|
|
|
|
|
|
|
|
|
|
|
|
|
|
|
|
|
| Change in net assets resulting from share
transactions |
|
|
|
|
(200,295,434 |
) |
|
|
|
|
|
|
(126,930,757 |
) |
|
|
|
|
|
|
(557,918 |
) |
|
|
|
|
|
|
33,758,576 |
|
|
|
|
|
|
|
|
|
|
|
|
|
|
|
|
|
|
|
|
|
|
|
|
|
|
|
|
|
|
|
|
|
|
|
|
| Change in net assets |
|
|
|
|
(200,295,772 |
) |
|
|
|
|
|
|
(126,971,028 |
) |
|
|
|
|
|
|
(558,168 |
) |
|
|
|
|
|
|
33,754,191 |
|
|
|
| NET ASSETS: |
|
|
|
|
|
|
|
|
|
|
|
|
|
|
|
|
|
|
|
|
|
|
|
|
|
|
|
|
|
|
|
|
| Beginning of year |
|
|
|
|
1,096,740,444 |
|
|
|
|
|
|
|
1,223,711,472 |
|
|
|
|
|
|
|
536,249,560 |
|
|
|
|
|
|
|
502,495,369 |
|
|
|
|
|
|
|
|
|
|
|
|
|
|
|
|
|
|
|
|
|
|
|
|
|
|
|
|
|
|
|
|
|
|
|
|
| End of year |
|
|
|
$ |
896,444,672 |
|
|
|
|
|
|
$ |
1,096,740,444 |
|
|
|
|
|
|
$ |
535,691,392 |
|
|
|
|
|
|
$ |
536,249,560 |
|
|
|
|
|
|
|
|
|
|
|
|
|
|
|
|
|
|
|
|
|
|
|
|
|
|
|
|
|
|
|
|
|
|
|
|
| Undistributed (distributions in excess of) net investment income included in net assets at end of year |
|
|
|
$ |
449 |
|
|
|
|
|
|
$ |
1,202 |
|
|
|
|
|
|
$ |
(259 |
) |
|
|
|
|
|
$ |
(9 |
) |
|
|
|
|
|
|
|
|
|
|
|
|
|
|
|
|
|
|
|
|
|
|
|
|
|
|
|
|
|
|
|
|
|
|
|
| SHARES OF BENEFICIAL INTEREST: |
|
|
|
|
|
|
|
|
|
|
|
|
|
|
|
|
|
|
|
|
|
|
|
|
|
|
|
|
|
|
|
|
| Shares sold |
|
|
|
|
|
|
|
|
|
|
|
|
|
|
|
|
|
|
|
|
|
|
|
|
|
|
|
|
|
|
|
|
| Administrative Class |
|
|
|
|
1,224,054,650 |
|
|
|
|
|
|
|
1,381,133,464 |
|
|
|
|
|
|
|
45,149,714 |
|
|
|
|
|
|
|
53,056,531 |
|
|
|
| Select Class |
|
|
|
|
839,334,028 |
|
|
|
|
|
|
|
1,042,795,413 |
|
|
|
|
|
|
|
474,676,458 |
|
|
|
|
|
|
|
458,963,075 |
|
|
|
| Service Class |
|
|
|
|
12,201 |
|
|
|
|
|
|
|
14,073,657 |
|
|
|
|
|
|
|
135,589,560 |
|
|
|
|
|
|
|
145,781,542 |
|
|
|
| Distributions reinvested |
|
|
|
|
|
|
|
|
|
|
|
|
|
|
|
|
|
|
|
|
|
|
|
|
|
|
|
|
|
|
|
|
| Administrative Class |
|
|
|
|
4 |
|
|
|
|
|
|
|
64 |
|
|
|
|
|
|
|
— |
|
|
|
|
|
|
|
— |
|
|
|
| Select Class |
|
|
|
|
139 |
|
|
|
|
|
|
|
4,664 |
|
|
|
|
|
|
|
666 |
|
|
|
|
|
|
|
555 |
|
|
|
| Service Class |
|
|
|
|
— |
|
|
|
|
|
|
|
— |
|
|
|
|
|
|
|
7,453 |
|
|
|
|
|
|
|
6,966 |
|
|
|
| Shares redeemed |
|
|
|
|
|
|
|
|
|
|
|
|
|
|
|
|
|
|
|
|
|
|
|
|
|
|
|
|
|
|
|
|
| Administrative Class |
|
|
|
|
(1,374,942,422 |
) |
|
|
|
|
|
|
(1,425,848,702 |
) |
|
|
|
|
|
|
(42,427,934 |
) |
|
|
|
|
|
|
(51,777,880 |
) |
|
|
| Select Class |
|
|
|
|
(888,754,034 |
) |
|
|
|
|
|
|
(1,114,987,122 |
) |
|
|
|
|
|
|
(482,564,643 |
) |
|
|
|
|
|
|
(443,767,538 |
) |
|
|
| Service Class |
|
|
|
|
— |
|
|
|
|
|
|
|
(24,102,195 |
) |
|
|
|
|
|
|
(130,989,192 |
) |
|
|
|
|
|
|
(128,504,675 |
) |
|
|
|
|
|
|
|
|
|
|
|
|
|
|
|
|
|
|
|
|
|
|
|
|
|
|
|
|
|
|
|
|
|
|
|
| Net change in shares outstanding |
|
|
|
|
(200,295,434 |
) |
|
|
|
|
|
|
(126,930,757 |
) |
|
|
|
|
|
|
(557,918 |
) |
|
|
|
|
|
|
33,758,576 |
|
|
|
|
|
|
|
|
|
|
|
|
|
|
|
|
|
|
|
|
|
|
|
|
|
|
|
|
|
|
|
|
|
|
|
|
|
|
|
|
|
|
|
|
|
|
|
|
|
|
|
|
|
|
|
|
|
|
|
|
|
|
|
|
|
|
|
|
|
See Notes which are an integral part of the Financial Statements
|
| ANNUAL REPORT / April 30, 2015 |
For a share outstanding throughout each year ended April 30, unless otherwise noted:
|
|
|
|
|
|
|
|
|
|
|
| |
|
|
|
|
|
|
|
|
|
|
| WILMINGTON PRIME MONEY MARKET FUND |
|
|
|
|
|
|
|
|
|
|
|
|
|
|
|
|
|
|
|
|
|
|
|
| ADMINISTRATIVE CLASS |
|
2015 |
|
|
2014 |
|
|
2013 |
|
|
2012 |
|
|
2011 |
|
|
|
| Net Asset Value, Beginning of Year |
|
|
$1.0 |
00 |
|
|
$1.0 |
00 |
|
|
$1.0 |
00 |
|
|
$1.0 |
00 |
|
|
$1.0 |
00 |
|
|
| Income (Loss) From Operations: |
|
|
|
|
|
|
|
|
|
|
|
|
|
|
|
|
|
|
|
|
|
|
| Net Investment Income |
|
|
0.0 |
00(a) |
|
|
0.0 |
00(a) |
|
|
0.0 |
00(a) |
|
|
0.0 |
00(a) |
|
|
0.0 |
00(a) |
|
|
| Net Realized Gain (Loss) on Investments |
|
|
0.0 |
00(a) |
|
|
0.0 |
00(a) |
|
|
0.0 |
00(a) |
|
|
0.0 |
00(a) |
|
|
|
— |
|
|
| Total Income (Loss) From Operations |
|
|
0.0 |
00 |
|
|
0.0 |
00 |
|
|
0.0 |
00 |
|
|
0.0 |
00 |
|
|
0.0 |
00 |
|
|
| Less Distributions From: |
|
|
|
|
|
|
|
|
|
|
|
|
|
|
|
|
|
|
|
|
|
|
| Net Investment Income |
|
|
(0.0 |
00)(a) |
|
|
(0.0 |
00)(a) |
|
|
(0.0 |
00)(a) |
|
|
(0.0 |
00)(a) |
|
|
(0.0 |
00)(a) |
|
|
| Total Distributions |
|
|
(0.0 |
00) |
|
|
(0.0 |
00) |
|
|
(0.0 |
00) |
|
|
(0.0 |
00) |
|
|
(0.0 |
00) |
|
|
| Net Asset Value, End of Year |
|
|
$1.0 |
00 |
|
|
$1.0 |
00 |
|
|
$1.0 |
00 |
|
|
$1.0 |
00 |
|
|
$1.0 |
00 |
|
|
|
|
|
|
|
|
|
|
|
|
|
|
|
|
|
|
|
|
|
|
|
|
|
| Total Return(b) |
|
|
0. |
01% |
|
|
0. |
01% |
|
|
0. |
03% |
|
|
0. |
03% |
|
|
0. |
04% |
|
|
| Net Assets, End of Year (000’s) |
|
|
$352,5 |
95 |
|
|
$325,6 |
96 |
|
|
$382,7 |
57 |
|
|
$464,7 |
21 |
|
|
$416,3 |
87 |
|
|
| Ratios to Average Net Assets |
|
|
|
|
|
|
|
|
|
|
|
|
|
|
|
|
|
|
|
|
|
|
| Gross Expense |
|
|
0. |
98% |
|
|
0. |
98% |
|
|
0. |
97% |
|
|
0. |
80% |
|
|
0. |
75% |
|
|
| Net Expenses(c) |
|
|
0. |
14% |
|
|
0. |
13% |
|
|
0. |
17% |
|
|
0. |
16% |
|
|
0. |
25% |
|
|
| Net Investment Income |
|
|
0. |
01% |
|
|
0. |
01% |
|
|
0. |
03% |
|
|
0. |
02% |
|
|
0. |
04% |
|
|
|
|
|
|
|
|
|
|
|
|
|
|
|
|
|
|
|
|
|
|
|
|
|
|
|
| INSTITUTIONAL
CLASS |
|
2015 |
|
|
2014 |
|
|
2013 |
|
|
2012(d) |
|
|
|
|
|
|
|
| |
|
|
|
|
|
|
|
|
|
|
|
|
|
|
|
|
|
|
|
|
|
|
|
|
| Net Asset Value, Beginning of Period |
|
|
$1.000 |
|
|
|
$1.000 |
|
|
|
$1.000 |
|
|
|
$1.000 |
|
|
|
|
|
|
|
|
|
| Income (Loss) From Operations: |
|
|
|
|
|
|
|
|
|
|
|
|
|
|
|
|
|
|
|
|
|
|
|
|
| Net Investment Income |
|
|
0.000 |
(a) |
|
|
0.000 |
(a) |
|
|
0.000 |
(a) |
|
|
0.000 |
(a) |
|
|
|
|
|
|
|
|
| Net Realized Gain (Loss) on Investments |
|
|
0.000 |
(a) |
|
|
0.000 |
(a) |
|
|
0.000 |
(a) |
|
|
0.000 |
(a) |
|
|
|
|
|
|
|
|
| Total Income (Loss) From Operations |
|
|
0.000 |
|
|
|
0.000 |
|
|
|
0.000 |
|
|
|
0.000 |
|
|
|
|
|
|
|
|
|
| Less Distributions From: |
|
|
|
|
|
|
|
|
|
|
|
|
|
|
|
|
|
|
|
|
|
|
|
|
| Net Investment Income |
|
|
(0.000 |
)(a) |
|
|
(0.000 |
)(a) |
|
|
(0.000 |
)(a) |
|
|
(0.000 |
)(a) |
|
|
|
|
|
|
|
|
| Total Distributions |
|
|
(0.000 |
) |
|
|
(0.000 |
) |
|
|
(0.000 |
) |
|
|
(0.000 |
) |
|
|
|
|
|
|
|
|
| Net Asset Value, End of Period |
|
|
$1.000 |
|
|
|
$1.000 |
|
|
|
$1.000 |
|
|
|
$1.000 |
|
|
|
|
|
|
|
|
|
|
|
|
|
|
|
|
|
|
|
|
|
|
|
|
|
|
|
|
|
|
|
|
|
|
| Total Return(b) |
|
|
0.01 |
% |
|
|
0.01 |
% |
|
|
0.03 |
% |
|
|
0.01 |
% |
|
|
|
|
|
|
|
|
| Net Assets, End of Period (000’s) |
|
|
$237,698 |
|
|
|
$46,861 |
|
|
|
$31,056 |
|
|
|
$42,072 |
|
|
|
|
|
|
|
|
|
| Ratios to Average Net Assets |
|
|
|
|
|
|
|
|
|
|
|
|
|
|
|
|
|
|
|
|
|
|
|
|
| Gross Expense |
|
|
0.48 |
% |
|
|
0.48 |
% |
|
|
0.47 |
% |
|
|
0.46 |
%(e) |
|
|
|
|
|
|
|
|
| Net Expenses(c) |
|
|
0.14 |
% |
|
|
0.13 |
% |
|
|
0.17 |
% |
|
|
0.16 |
%(e) |
|
|
|
|
|
|
|
|
| Net Investment Income |
|
|
0.01 |
% |
|
|
0.01 |
% |
|
|
0.03 |
% |
|
|
0.04 |
%(e) |
|
|
|
|
|
|
|
|
|
|
|
|
|
|
|
|
|
|
|
|
|
|
|
|
|
|
|
|
|
|
|
| SELECT
CLASS |
|
|
2015 |
|
|
|
2014 |
|
|
|
2013 |
|
|
|
2012 |
|
|
|
2011 |
|
|
|
| |
|
|
|
|
|
|
|
|
|
|
|
|
|
|
|
|
|
|
|
|
|
|
| Net Asset Value, Beginning of Year |
|
|
$1.0 |
00 |
|
|
$1.0 |
00 |
|
|
$1.0 |
00 |
|
|
$1.0 |
00 |
|
|
$1.0 |
00 |
|
|
| Income (Loss) From Operations: |
|
|
|
|
|
|
|
|
|
|
|
|
|
|
|
|
|
|
|
|
|
|
| Net Investment Income |
|
|
0.0 |
00(a) |
|
|
0.0 |
00(a) |
|
|
0.0 |
00(a) |
|
|
0.0 |
00(a) |
|
|
0.0 |
00(a) |
|
|
| Net Realized Gain (Loss) on Investments |
|
|
0.0 |
00(a) |
|
|
0.0 |
00(a) |
|
|
0.0 |
00(a) |
|
|
0.0 |
00(a) |
|
|
|
— |
|
|
| Total Income (Loss) From Operations |
|
|
0.0 |
00 |
|
|
0.0 |
00 |
|
|
0.0 |
00 |
|
|
0.0 |
00 |
|
|
0.0 |
00 |
|
|
| Less Distributions From: |
|
|
|
|
|
|
|
|
|
|
|
|
|
|
|
|
|
|
|
|
|
|
| Net Investment Income |
|
|
(0.0 |
00)(a) |
|
|
(0.0 |
00)(a) |
|
|
(0.0 |
00)(a) |
|
|
(0.0 |
00)(a) |
|
|
(0.0 |
00)(a) |
|
|
| Total Distributions |
|
|
(0.0 |
00) |
|
|
(0.0 |
00) |
|
|
(0.0 |
00) |
|
|
(0.0 |
00) |
|
|
(0.0 |
00) |
|
|
| Net Asset Value, End of Year |
|
|
$1.0 |
00 |
|
|
$1.0 |
00 |
|
|
$1.0 |
00 |
|
|
$1.0 |
00 |
|
|
$1.0 |
00 |
|
|
|
|
|
|
|
|
|
|
|
|
|
|
|
|
|
|
|
|
|
|
|
|
|
| Total Return(b) |
|
|
0. |
01% |
|
|
0. |
01% |
|
|
0. |
03% |
|
|
0. |
02% |
|
|
0. |
01% |
|
|
| Net Assets, End of Year (000’s) |
|
|
$2,439,6 |
62 |
|
|
$2,312,8 |
00 |
|
|
$2,528,0 |
68 |
|
|
$2,424,7 |
83 |
|
|
$345,9 |
31 |
|
|
| Ratios to Average Net Assets |
|
|
|
|
|
|
|
|
|
|
|
|
|
|
|
|
|
|
|
|
|
|
| Gross Expense |
|
|
0. |
73% |
|
|
0. |
73% |
|
|
0. |
72% |
|
|
0. |
73% |
|
|
0. |
75% |
|
|
| Net Expenses(c) |
|
|
0. |
14% |
|
|
0. |
13% |
|
|
0. |
17% |
|
|
0. |
16% |
|
|
0. |
28% |
|
|
| Net Investment Income |
|
|
0. |
01% |
|
|
0. |
01% |
|
|
0. |
03% |
|
|
0. |
03% |
|
|
0. |
01% |
|
|
|
| April 30, 2015 / ANNUAL REPORT |
|
|
|
|
|
|
|
|
|
|
|
| WILMINGTON PRIME MONEY MARKET FUND
(continued) |
|
|
|
|
|
|
|
|
|
|
|
|
|
|
|
|
|
|
|
|
|
|
|
|
|
|
|
|
| SERVICE CLASS |
|
2015 |
|
2014 |
|
2013 |
|
2012 |
|
2011 |
|
|
| Net Asset Value, Beginning of Year |
|
|
|
$1.000 |
|
|
|
|
$1.000 |
|
|
|
|
$1.000 |
|
|
|
|
$1.000 |
|
|
|
|
$1.000 |
|
|
|
| Income (Loss) From Operations: |
|
|
|
|
|
|
|
|
|
|
|
|
|
|
|
|
|
|
|
|
|
|
|
|
|
|
|
| Net Investment Income |
|
|
|
0.000 |
(a) |
|
|
|
0.000 |
(a) |
|
|
|
0.000 |
(a) |
|
|
|
0.000 |
(a) |
|
|
|
0.000 |
(a) |
|
|
| Net Realized Gain (Loss) on Investments |
|
|
|
0.000 |
(a) |
|
|
|
0.000 |
(a) |
|
|
|
0.000 |
(a) |
|
|
|
0.000 |
(a) |
|
|
|
— |
|
|
|
| Total Income (Loss) From Operations |
|
|
|
0.000 |
|
|
|
|
0.000 |
|
|
|
|
0.000 |
|
|
|
|
0.000 |
|
|
|
|
0.000 |
|
|
|
| Less Distributions From: |
|
|
|
|
|
|
|
|
|
|
|
|
|
|
|
|
|
|
|
|
|
|
|
|
|
|
|
| Net Investment Income |
|
|
|
(0.000 |
)(a) |
|
|
|
(0.000 |
)(a) |
|
|
|
(0.000 |
)(a) |
|
|
|
(0.000 |
)(a) |
|
|
|
(0.000 |
)(a) |
|
|
| Total Distributions |
|
|
|
(0.000 |
) |
|
|
|
(0.000 |
) |
|
|
|
(0.000 |
) |
|
|
|
(0.000 |
) |
|
|
|
(0.000 |
) |
|
|
| Net Asset Value, End of Year |
|
|
|
$1.000 |
|
|
|
|
$1.000 |
|
|
|
|
$1.000 |
|
|
|
|
$1.000 |
|
|
|
|
$1.000 |
|
|
|
|
|
|
|
|
|
|
|
|
|
|
|
|
|
|
|
|
|
|
|
|
|
|
|
|
|
|
|
| Total Return(b) |
|
|
|
0.01 |
% |
|
|
|
0.01 |
% |
|
|
|
0.01 |
% |
|
|
|
0.01 |
% |
|
|
|
0.01 |
% |
|
|
| Net Assets, End of Year (000’s) |
|
|
|
$689,698 |
|
|
|
|
$743,602 |
|
|
|
|
$829,547 |
|
|
|
|
$779,543 |
|
|
|
|
$217,836 |
|
|
|
| Ratios to Average Net Assets |
|
|
|
|
|
|
|
|
|
|
|
|
|
|
|
|
|
|
|
|
|
|
|
|
|
|
|
| Gross Expense |
|
|
|
0.98 |
% |
|
|
|
0.98 |
% |
|
|
|
0.96 |
% |
|
|
|
0.98 |
% |
|
|
|
1.00 |
% |
|
|
| Net Expenses(c) |
|
|
|
0.14 |
% |
|
|
|
0.14 |
% |
|
|
|
0.19 |
% |
|
|
|
0.18 |
% |
|
|
|
0.28 |
% |
|
|
| Net Investment Income |
|
|
|
0.01 |
% |
|
|
|
0.01 |
% |
|
|
|
0.01 |
% |
|
|
|
0.01 |
% |
|
|
|
0.01 |
% |
|
|
(a) Represents
less than $0.001.
(b) Total returns for periods of less than one year, if any, are not annualized.
(c) The investment manager and other service providers voluntarily waived a portion of their fees.
(d) Reflects investment operations for the period from March 12, 2012 to April 30, 2012.
(e) Annualized for periods less than one year.
See Notes which are
an integral part of the Financial Statements
|
| ANNUAL REPORT / April 30, 2015 |
For a share outstanding throughout each year ended April 30, unless otherwise noted:
|
| WILMINGTON U.S. GOVERNMENT MONEY MARKET FUND |
|
|
|
|
|
|
|
|
|
|
|
|
|
|
|
|
|
|
|
|
|
|
|
|
|
|
|
|
| ADMINISTRATIVE CLASS |
|
2015 |
|
2014 |
|
2013 |
|
2012 |
|
2011 |
|
|
| Net Asset Value, Beginning of Year |
|
|
|
$1.000 |
|
|
|
|
$1.000 |
|
|
|
|
$1.000 |
|
|
|
|
$1.000 |
|
|
|
|
$1.000 |
|
|
|
| Income (Loss) From Operations: |
|
|
|
|
|
|
|
|
|
|
|
|
|
|
|
|
|
|
|
|
|
|
|
|
|
|
|
| Net Investment Income |
|
|
|
0.000 |
(a) |
|
|
|
0.000 |
(a) |
|
|
|
0.000 |
(a) |
|
|
|
0.000 |
(a) |
|
|
|
0.000 |
(a) |
|
|
| Net Realized Gain (Loss) on Investments |
|
|
|
0.000 |
(a) |
|
|
|
0.000 |
(a) |
|
|
|
0.000 |
(a) |
|
|
|
0.000 |
(a) |
|
|
|
— |
|
|
|
| Total Income (Loss) From Operations |
|
|
|
0.000 |
|
|
|
|
0.000 |
|
|
|
|
0.000 |
|
|
|
|
0.000 |
|
|
|
|
0.000 |
|
|
|
| Less Distributions From: |
|
|
|
|
|
|
|
|
|
|
|
|
|
|
|
|
|
|
|
|
|
|
|
|
|
|
|
| Net Investment Income |
|
|
|
(0.000 |
)(a) |
|
|
|
(0.000 |
)(a) |
|
|
|
(0.000 |
)(a) |
|
|
|
(0.000 |
)(a) |
|
|
|
(0.000 |
)(a) |
|
|
| Return of Capital |
|
|
|
— |
|
|
|
|
— |
|
|
|
|
— |
|
|
|
|
— |
|
|
|
|
(0.000 |
)(a) |
|
|
| Total Distributions |
|
|
|
(0.000 |
) |
|
|
|
(0.000 |
) |
|
|
|
(0.000 |
) |
|
|
|
(0.000 |
) |
|
|
|
(0.000 |
) |
|
|
| Net Asset Value, End of Year |
|
|
|
$1.000 |
|
|
|
|
$1.000 |
|
|
|
|
$1.000 |
|
|
|
|
$1.000 |
|
|
|
|
$1.000 |
|
|
|
|
|
|
|
|
|
|
|
|
|
|
|
|
|
|
|
|
|
|
|
|
|
|
|
|
|
|
|
| Total Return(b) |
|
|
|
0.01 |
% |
|
|
|
0.01 |
% |
|
|
|
0.01 |
% |
|
|
|
0.01 |
% |
|
|
|
0.01 |
% |
|
|
| Net Assets, End of Year (000’s) |
|
|
|
$1,556,286 |
|
|
|
|
$1,673,462 |
|
|
|
|
$1,885,193 |
|
|
|
|
$1,801,115 |
|
|
|
|
$1,493,139 |
|
|
|
| Ratios to Average Net Assets |
|
|
|
|
|
|
|
|
|
|
|
|
|
|
|
|
|
|
|
|
|
|
|
|
|
|
|
| Gross Expense |
|
|
|
0.97 |
% |
|
|
|
0.97 |
% |
|
|
|
0.96 |
% |
|
|
|
0.79 |
% |
|
|
|
0.73 |
% |
|
|
| Net Expenses(c) |
|
|
|
0.07 |
% |
|
|
|
0.08 |
% |
|
|
|
0.15 |
% |
|
|
|
0.12 |
% |
|
|
|
0.25 |
% |
|
|
| Net Investment Income |
|
|
|
0.01 |
% |
|
|
|
0.01 |
% |
|
|
|
0.01 |
% |
|
|
|
0.01 |
% |
|
|
|
0.01 |
% |
|
|
| INSTITUTIONAL CLASS |
|
2015 |
|
2014 |
|
2013 |
|
2012(d) |
|
|
|
|
| Net Asset Value, Beginning of Period |
|
|
|
$1.000 |
|
|
|
|
$1.000 |
|
|
|
|
$1.000 |
|
|
|
|
$1.000 |
|
|
|
|
|
|
|
|
| Income (Loss) From Operations: |
|
|
|
|
|
|
|
|
|
|
|
|
|
|
|
|
|
|
|
|
|
|
|
|
|
|
|
| Net Investment Income |
|
|
|
0.000 |
(a) |
|
|
|
0.000 |
(a) |
|
|
|
0.000 |
(a) |
|
|
|
0.000 |
(a) |
|
|
|
|
|
|
|
| Net Realized Gain (Loss) on Investments |
|
|
|
0.000 |
(a) |
|
|
|
0.000 |
(a) |
|
|
|
0.000 |
(a) |
|
|
|
0.000 |
(a) |
|
|
|
|
|
|
|
| Total Income (Loss) From Operations |
|
|
|
0.000 |
|
|
|
|
0.000 |
|
|
|
|
0.000 |
|
|
|
|
0.000 |
|
|
|
|
|
|
|
|
| Less Distributions From: |
|
|
|
|
|
|
|
|
|
|
|
|
|
|
|
|
|
|
|
|
|
|
|
|
|
|
|
| Net Investment Income |
|
|
|
(0.000 |
)(a) |
|
|
|
(0.000 |
)(a) |
|
|
|
(0.000 |
)(a) |
|
|
|
(0.000 |
)(a) |
|
|
|
|
|
|
|
| Total Distributions |
|
|
|
(0.000 |
) |
|
|
|
(0.000 |
) |
|
|
|
(0.000 |
) |
|
|
|
(0.000 |
) |
|
|
|
|
|
|
|
| Net Asset Value, End of Period |
|
|
|
$1.000 |
|
|
|
|
$1.000 |
|
|
|
|
$1.000 |
|
|
|
|
$1.000 |
|
|
|
|
|
|
|
|
|
|
|
|
|
|
|
|
|
|
|
|
|
|
|
|
|
|
|
|
|
|
|
|
|
|
|
|
| Total Return(b) |
|
|
|
0.01 |
% |
|
|
|
0.01 |
% |
|
|
|
0.01 |
% |
|
|
|
0.00 |
% |
|
|
|
|
|
|
|
| Net Assets, End of Period (000’s) |
|
|
|
$26,079 |
|
|
|
|
$83,595 |
|
|
|
|
$25,683 |
|
|
|
|
$85,322 |
|
|
|
|
|
|
|
|
| Ratios to Average Net Assets |
|
|
|
|
|
|
|
|
|
|
|
|
|
|
|
|
|
|
|
|
|
|
|
|
|
|
|
| Gross Expense |
|
|
|
0.47 |
% |
|
|
|
0.47 |
% |
|
|
|
0.46 |
% |
|
|
|
0.46 |
%(e) |
|
|
|
|
|
|
|
| Net Expenses(c) |
|
|
|
0.07 |
% |
|
|
|
0.08 |
% |
|
|
|
0.15 |
% |
|
|
|
0.13 |
%(e) |
|
|
|
|
|
|
|
| Net Investment Income |
|
|
|
0.01 |
% |
|
|
|
0.01 |
% |
|
|
|
0.01 |
% |
|
|
|
0.01 |
%(e) |
|
|
|
|
|
|
|
| SELECT CLASS |
|
2015 |
|
2014 |
|
2013 |
|
2012 |
|
2011 |
|
|
| Net Asset Value, Beginning of Year |
|
|
|
$1.000 |
|
|
|
|
$1.000 |
|
|
|
|
$1.000 |
|
|
|
|
$1.000 |
|
|
|
|
$1.000 |
|
|
|
| Income (Loss) From Operations: |
|
|
|
|
|
|
|
|
|
|
|
|
|
|
|
|
|
|
|
|
|
|
|
|
|
|
|
| Net Investment Income |
|
|
|
0.000 |
(a) |
|
|
|
0.000 |
(a) |
|
|
|
0.000 |
(a) |
|
|
|
0.000 |
(a) |
|
|
|
0.000 |
(a) |
|
|
| Net Realized Gain (Loss) on Investments |
|
|
|
0.000 |
(a) |
|
|
|
0.000 |
(a) |
|
|
|
0.000 |
(a) |
|
|
|
0.000 |
(a) |
|
|
|
— |
|
|
|
| Total Income (Loss) From Operations |
|
|
|
0.000 |
|
|
|
|
0.000 |
|
|
|
|
0.000 |
|
|
|
|
0.000 |
|
|
|
|
0.000 |
|
|
|
| Less Distributions From: |
|
|
|
|
|
|
|
|
|
|
|
|
|
|
|
|
|
|
|
|
|
|
|
|
|
|
|
| Net Investment Income |
|
|
|
(0.000 |
)(a) |
|
|
|
(0.000 |
)(a) |
|
|
|
(0.000 |
)(a) |
|
|
|
(0.000 |
)(a) |
|
|
|
(0.000 |
)(a) |
|
|
| Return of Capital |
|
|
|
— |
|
|
|
|
— |
|
|
|
|
— |
|
|
|
|
— |
|
|
|
|
(0.000 |
)(a) |
|
|
| Total Distributions |
|
|
|
(0.000 |
) |
|
|
|
(0.000 |
) |
|
|
|
(0.000 |
) |
|
|
|
(0.000 |
) |
|
|
|
(0.000 |
) |
|
|
| Net Asset Value, End of Year |
|
|
|
$1.000 |
|
|
|
|
$1.000 |
|
|
|
|
$1.000 |
|
|
|
|
$1.000 |
|
|
|
|
$1.000 |
|
|
|
|
|
|
|
|
|
|
|
|
|
|
|
|
|
|
|
|
|
|
|
|
|
|
|
|
|
|
|
| Total Return(b) |
|
|
|
0.01 |
% |
|
|
|
0.01 |
% |
|
|
|
0.01 |
% |
|
|
|
0.01 |
% |
|
|
|
0.01 |
% |
|
|
| Net Assets, End of Year (000’s) |
|
|
|
$1,005,503 |
|
|
|
|
$889,158 |
|
|
|
|
$1,164,388 |
|
|
|
|
$1,213,146 |
|
|
|
|
$355,506 |
|
|
|
| Ratios to Average Net Assets |
|
|
|
|
|
|
|
|
|
|
|
|
|
|
|
|
|
|
|
|
|
|
|
|
|
|
|
| Gross Expense |
|
|
|
0.72 |
% |
|
|
|
0.72 |
% |
|
|
|
0.71 |
% |
|
|
|
0.72 |
% |
|
|
|
0.74 |
% |
|
|
| Net Expenses(c) |
|
|
|
0.07 |
% |
|
|
|
0.08 |
% |
|
|
|
0.15 |
% |
|
|
|
0.12 |
% |
|
|
|
0.26 |
% |
|
|
| Net Investment Income |
|
|
|
0.01 |
% |
|
|
|
0.01 |
% |
|
|
|
0.01 |
% |
|
|
|
0.01 |
% |
|
|
|
0.01 |
% |
|
|
|
| April 30, 2015 / ANNUAL REPORT |
|
|
|
|
|
|
|
|
|
|
|
| WILMINGTON U.S. GOVERNMENT MONEY MARKET FUND
(continued) |
|
|
|
|
|
|
|
|
|
|
|
|
|
|
|
|
|
|
|
|
|
|
|
|
|
|
|
|
| SERVICE CLASS |
|
2015 |
|
2014 |
|
2013 |
|
2012 |
|
2011 |
|
|
| Net Asset Value, Beginning of Year |
|
|
|
$1.000 |
|
|
|
|
$1.000 |
|
|
|
|
$1.000 |
|
|
|
|
$1.000 |
|
|
|
|
$1.000 |
|
|
|
| Income (Loss) From Operations: |
|
|
|
|
|
|
|
|
|
|
|
|
|
|
|
|
|
|
|
|
|
|
|
|
|
|
|
| Net Investment Income |
|
|
|
0.000 |
(a) |
|
|
|
0.000 |
(a) |
|
|
|
0.000 |
(a) |
|
|
|
0.000 |
(a) |
|
|
|
0.000 |
(a) |
|
|
| Net Realized Gain (Loss) on Investments |
|
|
|
0.000 |
(a) |
|
|
|
0.000 |
(a) |
|
|
|
0.000 |
(a) |
|
|
|
0.000 |
(a) |
|
|
|
— |
|
|
|
| Total Income (Loss) From Operations |
|
|
|
0.000 |
|
|
|
|
0.000 |
|
|
|
|
0.000 |
|
|
|
|
0.000 |
|
|
|
|
0.000 |
|
|
|
| Less Distributions From: |
|
|
|
|
|
|
|
|
|
|
|
|
|
|
|
|
|
|
|
|
|
|
|
|
|
|
|
| Net Investment Income |
|
|
|
(0.000 |
)(a) |
|
|
|
(0.000 |
)(a) |
|
|
|
(0.000 |
)(a) |
|
|
|
(0.000 |
)(a) |
|
|
|
(0.000 |
)(a) |
|
|
| Return of Capital |
|
|
|
— |
|
|
|
|
— |
|
|
|
|
— |
|
|
|
|
— |
|
|
|
|
(0.000 |
)(a) |
|
|
| Total Distributions |
|
|
|
(0.000 |
) |
|
|
|
(0.000 |
) |
|
|
|
(0.000 |
) |
|
|
|
(0.000 |
) |
|
|
|
(0.000 |
) |
|
|
| Net Asset Value, End of Year |
|
|
|
$1.000 |
|
|
|
|
$1.000 |
|
|
|
|
$1.000 |
|
|
|
|
$1.000 |
|
|
|
|
$1.000 |
|
|
|
|
|
|
|
|
|
|
|
|
|
|
|
|
|
|
|
|
|
|
|
|
|
|
|
|
|
|
|
| Total Return(b) |
|
|
|
0.01 |
% |
|
|
|
0.01 |
% |
|
|
|
0.01 |
% |
|
|
|
0.01 |
% |
|
|
|
0.01 |
% |
|
|
| Net Assets, End of Year (000’s) |
|
|
|
$1,352,274 |
|
|
|
|
$1,371,495 |
|
|
|
|
$1,131,306 |
|
|
|
|
$873,278 |
|
|
|
|
$35,561 |
|
|
|
| Ratios to Average Net Assets |
|
|
|
|
|
|
|
|
|
|
|
|
|
|
|
|
|
|
|
|
|
|
|
|
|
|
|
| Gross Expense |
|
|
|
0.97 |
% |
|
|
|
0.97 |
% |
|
|
|
0.96 |
% |
|
|
|
0.97 |
% |
|
|
|
0.98 |
% |
|
|
| Net Expenses(c) |
|
|
|
0.07 |
% |
|
|
|
0.08 |
% |
|
|
|
0.14 |
% |
|
|
|
0.13 |
% |
|
|
|
0.25 |
% |
|
|
| Net Investment Income |
|
|
|
0.01 |
% |
|
|
|
0.01 |
% |
|
|
|
0.01 |
% |
|
|
|
0.01 |
% |
|
|
|
0.01 |
% |
|
|
(a) Represents
less than $0.001.
(b) Total returns for periods of less than one year, if any, are not annualized.
(c) The investment manager and other service providers voluntarily waived a portion of their fees.
(d) Reflects investment operations for the period from March 12, 2012 to April 30, 2012.
(e) Annualized for periods less than one year.
See Notes which are
an integral part of the Financial Statements
|
| ANNUAL REPORT / April 30, 2015 |
For a share outstanding throughout each year ended April 30, unless otherwise noted:
|
| WILMINGTON U.S. TREASURY MONEY MARKET FUND |
|
|
|
|
|
|
|
|
|
|
|
|
|
|
|
|
|
|
|
|
|
|
|
|
|
|
|
|
| ADMINISTRATIVE CLASS |
|
2015 |
|
2014 |
|
2013 |
|
2012 |
|
2011 |
|
|
| Net Asset Value, Beginning of Year |
|
|
|
$1.000 |
|
|
|
|
$1.000 |
|
|
|
|
$1.000 |
|
|
|
|
$1.000 |
|
|
|
|
$1.000 |
|
|
|
| Income (Loss) From Operations: |
|
|
|
|
|
|
|
|
|
|
|
|
|
|
|
|
|
|
|
|
|
|
|
|
|
|
|
| Net Investment Income |
|
|
|
0.000 |
(a) |
|
|
|
0.000 |
(a) |
|
|
|
0.000 |
(a) |
|
|
|
0.000 |
(a) |
|
|
|
0.000 |
(a) |
|
|
| Net Realized Gain (Loss) on Investments |
|
|
|
0.000 |
(a) |
|
|
|
0.000 |
(a) |
|
|
|
0.000 |
(a) |
|
|
|
0.000 |
(a) |
|
|
|
— |
|
|
|
| Total Income (Loss) From Operations |
|
|
|
0.000 |
|
|
|
|
0.000 |
|
|
|
|
0.000 |
|
|
|
|
0.000 |
|
|
|
|
0.000 |
|
|
|
| Less Distributions From: |
|
|
|
|
|
|
|
|
|
|
|
|
|
|
|
|
|
|
|
|
|
|
|
|
|
|
|
| Net Investment Income |
|
|
|
(0.000 |
)(a) |
|
|
|
(0.000 |
)(a) |
|
|
|
(0.000 |
)(a) |
|
|
|
(0.000 |
)(a) |
|
|
|
(0.000 |
)(a) |
|
|
| Net Asset Value, End of Year |
|
|
|
$1.000 |
|
|
|
|
$1.000 |
|
|
|
|
$1.000 |
|
|
|
|
$1.000 |
|
|
|
|
$1.000 |
|
|
|
|
|
|
|
|
|
|
|
|
|
|
|
|
|
|
|
|
|
|
|
|
|
|
|
|
|
|
|
| Total Return(b) |
|
|
|
0.00 |
%(c) |
|
|
|
0.01 |
% |
|
|
|
0.01 |
% |
|
|
|
0.01 |
% |
|
|
|
0.01 |
% |
|
|
| Net Assets, End of Year (000’s) |
|
|
|
$631,472 |
|
|
|
|
$782,360 |
|
|
|
|
$827,103 |
|
|
|
|
$909,306 |
|
|
|
|
$676,070 |
|
|
|
| Ratios to Average Net Assets |
|
|
|
|
|
|
|
|
|
|
|
|
|
|
|
|
|
|
|
|
|
|
|
|
|
|
|
| Gross Expense |
|
|
|
0.98 |
% |
|
|
|
0.97 |
% |
|
|
|
0.97 |
% |
|
|
|
0.80 |
% |
|
|
|
0.74 |
% |
|
|
| Net Expenses(d) |
|
|
|
0.06 |
% |
|
|
|
0.06 |
% |
|
|
|
0.14 |
% |
|
|
|
0.06 |
% |
|
|
|
0.16 |
% |
|
|
| Net Investment Income |
|
|
|
0.00 |
%(c) |
|
|
|
0.01 |
% |
|
|
|
0.01 |
% |
|
|
|
0.01 |
% |
|
|
|
0.01 |
% |
|
|
| SELECT CLASS |
|
2015 |
|
2014 |
|
2013 |
|
2012 |
|
2011 |
|
|
| Net Asset Value, Beginning of Year |
|
|
|
$1.000 |
|
|
|
|
$1.000 |
|
|
|
|
$1.000 |
|
|
|
|
$1.000 |
|
|
|
|
$1.000 |
|
|
|
| Income (Loss) From Operations: |
|
|
|
|
|
|
|
|
|
|
|
|
|
|
|
|
|
|
|
|
|
|
|
|
|
|
|
| Net Investment Income |
|
|
|
0.000 |
(a) |
|
|
|
0.000 |
(a) |
|
|
|
0.000 |
(a) |
|
|
|
0.000 |
(a) |
|
|
|
0.000 |
(a) |
|
|
| Net Realized Gain (Loss) on Investments |
|
|
|
0.000 |
(a) |
|
|
|
0.000 |
(a) |
|
|
|
0.000 |
(a) |
|
|
|
0.000 |
(a) |
|
|
|
— |
|
|
|
| Total Income (Loss) From Operations |
|
|
|
0.000 |
|
|
|
|
0.000 |
|
|
|
|
0.000 |
|
|
|
|
0.000 |
|
|
|
|
0.000 |
|
|
|
| Less Distributions From: |
|
|
|
|
|
|
|
|
|
|
|
|
|
|
|
|
|
|
|
|
|
|
|
|
|
|
|
| Net Investment Income |
|
|
|
(0.000 |
)(a) |
|
|
|
(0.000 |
)(a) |
|
|
|
(0.000 |
)(a) |
|
|
|
(0.000 |
)(a) |
|
|
|
(0.000 |
)(a) |
|
|
| Net Asset Value, End of Year |
|
|
|
$1.000 |
|
|
|
|
$1.000 |
|
|
|
|
$1.000 |
|
|
|
|
$1.000 |
|
|
|
|
$1.000 |
|
|
|
|
|
|
|
|
|
|
|
|
|
|
|
|
|
|
|
|
|
|
|
|
|
|
|
|
|
|
|
| Total Return(b) |
|
|
|
0.00 |
%(c) |
|
|
|
0.01 |
% |
|
|
|
0.01 |
% |
|
|
|
0.01 |
% |
|
|
|
0.01 |
% |
|
|
| Net Assets, End of Year (000’s) |
|
|
|
$264,955 |
|
|
|
|
$314,375 |
|
|
|
|
$386,574 |
|
|
|
|
$210,231 |
|
|
|
|
$71,929 |
|
|
|
| Ratios to Average Net Assets |
|
|
|
|
|
|
|
|
|
|
|
|
|
|
|
|
|
|
|
|
|
|
|
|
|
|
|
| Gross Expense |
|
|
|
0.74 |
% |
|
|
|
0.72 |
% |
|
|
|
0.73 |
% |
|
|
|
0.73 |
% |
|
|
|
0.74 |
% |
|
|
| Net Expenses(d) |
|
|
|
0.06 |
% |
|
|
|
0.06 |
% |
|
|
|
0.14 |
% |
|
|
|
0.06 |
% |
|
|
|
0.17 |
% |
|
|
| Net Investment Income |
|
|
|
0.00 |
%(c) |
|
|
|
0.01 |
% |
|
|
|
0.01 |
% |
|
|
|
0.01 |
% |
|
|
|
0.01 |
% |
|
|
| SERVICE CLASS |
|
2015 |
|
2014 |
|
2013 |
|
2012 |
|
2011 |
|
|
| Net Asset Value, Beginning of Year |
|
|
|
$1.000 |
|
|
|
|
$1.000 |
|
|
|
|
$1.000 |
|
|
|
|
$1.000 |
|
|
|
|
$1.000 |
|
|
|
| Income (Loss) From Operations: |
|
|
|
|
|
|
|
|
|
|
|
|
|
|
|
|
|
|
|
|
|
|
|
|
|
|
|
| Net Investment Income |
|
|
|
0.000 |
(a) |
|
|
|
0.000 |
(a) |
|
|
|
0.000 |
(a) |
|
|
|
0.000 |
(a) |
|
|
|
0.000 |
(a) |
|
|
| Net Realized Gain (Loss) on Investments |
|
|
|
0.000 |
(a) |
|
|
|
0.000 |
(a) |
|
|
|
0.000 |
(a) |
|
|
|
0.000 |
(a) |
|
|
|
— |
|
|
|
| Total Income (Loss) From Operations |
|
|
|
0.000 |
|
|
|
|
0.000 |
|
|
|
|
0.000 |
|
|
|
|
0.000 |
|
|
|
|
0.000 |
|
|
|
| Less Distributions From: |
|
|
|
|
|
|
|
|
|
|
|
|
|
|
|
|
|
|
|
|
|
|
|
|
|
|
|
| Net Investment Income |
|
|
|
(0.000 |
) |
|
|
|
(0.000 |
)(a) |
|
|
|
(0.000 |
)(a) |
|
|
|
(0.000 |
)(a) |
|
|
|
(0.000 |
)(a) |
|
|
| Net Asset Value, End of Year |
|
|
|
$1.000 |
|
|
|
|
$1.000 |
|
|
|
|
$1.000 |
|
|
|
|
$1.000 |
|
|
|
|
$1.000 |
|
|
|
|
|
|
|
|
|
|
|
|
|
|
|
|
|
|
|
|
|
|
|
|
|
|
|
|
|
|
|
| Total Return(b) |
|
|
|
0.00 |
%(c) |
|
|
|
0.01 |
% |
|
|
|
0.01 |
% |
|
|
|
0.01 |
% |
|
|
|
0.01 |
% |
|
|
| Net Assets, End of Year (000’s) |
|
|
|
$18 |
|
|
|
|
$6 |
|
|
|
|
$10,034 |
|
|
|
|
$8,909 |
|
|
|
|
$10,627 |
|
|
|
| Ratios to Average Net Assets |
|
|
|
|
|
|
|
|
|
|
|
|
|
|
|
|
|
|
|
|
|
|
|
|
|
|
|
| Gross Expense |
|
|
|
0.99 |
% |
|
|
|
0.97 |
% |
|
|
|
0.97 |
% |
|
|
|
0.99 |
% |
|
|
|
0.99 |
% |
|
|
| Net Expenses(d) |
|
|
|
0.06 |
% |
|
|
|
0.06 |
% |
|
|
|
0.14 |
% |
|
|
|
0.06 |
% |
|
|
|
0.16 |
% |
|
|
| Net Investment Income |
|
|
|
0.00 |
%(c) |
|
|
|
0.01 |
% |
|
|
|
0.01 |
% |
|
|
|
0.01 |
% |
|
|
|
0.01 |
% |
|
|
(a) Represents
less than $0.001.
(b) Total returns for periods of less than one year, if any, are not annualized.
(c) Represents less than 0.01%.
(d) The investment manager and other service
providers voluntarily waived a portion of their fees.
See Notes which are an integral part of the Financial Statements
|
| April 30, 2015 / ANNUAL REPORT |
|
| FINANCIAL HIGHLIGHTS (concluded) |
For a share outstanding throughout each year ended April 30, unless otherwise noted:
|
| WILMINGTON TAX-EXEMPT MONEY MARKET FUND |
|
|
|
|
|
|
|
|
|
|
|
|
|
|
|
|
|
|
|
|
|
|
|
|
|
|
|
|
| ADMINISTRATIVE CLASS |
|
2015 |
|
2014 |
|
2013 |
|
2012 |
|
2011 |
|
|
| Net Asset Value, Beginning of Year |
|
|
|
$1.000 |
|
|
|
|
$1.000 |
|
|
|
|
$1.000 |
|
|
|
|
$1.000 |
|
|
|
|
$1.000 |
|
|
|
| Income (Loss) From Operations: |
|
|
|
|
|
|
|
|
|
|
|
|
|
|
|
|
|
|
|
|
|
|
|
|
|
|
|
| Net Investment Income |
|
|
|
0.000 |
(a) |
|
|
|
0.000 |
(a) |
|
|
|
0.000 |
(a) |
|
|
|
0.000 |
(a) |
|
|
|
0.000 |
(a) |
|
|
| Net Realized Gain (Loss) on Investments |
|
|
|
— |
|
|
|
|
— |
|
|
|
|
— |
|
|
|
|
0.000 |
(a) |
|
|
|
— |
|
|
|
| Total Income (Loss) From Operations |
|
|
|
0.000 |
|
|
|
|
0.000 |
|
|
|
|
0.000 |
|
|
|
|
0.000 |
|
|
|
|
0.000 |
|
|
|
| Less Distributions From: |
|
|
|
|
|
|
|
|
|
|
|
|
|
|
|
|
|
|
|
|
|
|
|
|
|
|
|
| Net Investment Income |
|
|
|
(0.000 |
)(a) |
|
|
|
(0.000 |
)(a) |
|
|
|
(0.000 |
)(a) |
|
|
|
(0.000 |
)(a) |
|
|
|
(0.000 |
)(a) |
|
|
| Net Asset Value, End of Year |
|
|
|
$1.000 |
|
|
|
|
$1.000 |
|
|
|
|
$1.000 |
|
|
|
|
$1.000 |
|
|
|
|
$1.000 |
|
|
|
|
|
|
|
|
|
|
|
|
|
|
|
|
|
|
|
|
|
|
|
|
|
|
|
|
|
|
|
| Total Return(b) |
|
|
|
0.01 |
% |
|
|
|
0.01 |
% |
|
|
|
0.01 |
% |
|
|
|
0.01 |
% |
|
|
|
0.03 |
% |
|
|
| Net Assets, End of Year (000’s) |
|
|
|
$42,684 |
|
|
|
|
$39,962 |
|
|
|
|
$38,684 |
|
|
|
|
$41,513 |
|
|
|
|
$33,322 |
|
|
|
| Ratios to Average Net Assets |
|
|
|
|
|
|
|
|
|
|
|
|
|
|
|
|
|
|
|
|
|
|
|
|
|
|
|
| Gross Expense |
|
|
|
1.01 |
% |
|
|
|
1.00 |
% |
|
|
|
0.99 |
% |
|
|
|
0.87 |
% |
|
|
|
0.83 |
% |
|
|
| Net Expenses(c) |
|
|
|
0.05 |
% |
|
|
|
0.09 |
% |
|
|
|
0.16 |
% |
|
|
|
0.23 |
% |
|
|
|
0.39 |
% |
|
|
| Net Investment Income |
|
|
|
0.01 |
% |
|
|
|
0.01 |
% |
|
|
|
0.01 |
% |
|
|
|
0.01 |
% |
|
|
|
0.03 |
% |
|
|
| SELECT CLASS |
|
2015 |
|
2014 |
|
2013 |
|
2012 |
|
2011 |
|
|
| Net Asset Value, Beginning of Year |
|
|
|
$1.000 |
|
|
|
|
$1.000 |
|
|
|
|
$1.000 |
|
|
|
|
$1.000 |
|
|
|
|
$1.000 |
|
|
|
| Income (Loss) From Operations: |
|
|
|
|
|
|
|
|
|
|
|
|
|
|
|
|
|
|
|
|
|
|
|
|
|
|
|
| Net Investment Income |
|
|
|
0.000 |
(a) |
|
|
|
0.000 |
(a) |
|
|
|
0.000 |
(a) |
|
|
|
0.000 |
(a) |
|
|
|
0.000 |
(a) |
|
|
| Net Realized Gain (Loss) on Investments |
|
|
|
— |
|
|
|
|
— |
|
|
|
|
— |
|
|
|
|
0.000 |
(a) |
|
|
|
— |
|
|
|
| Total Income (Loss) From Operations |
|
|
|
0.000 |
|
|
|
|
0.000 |
|
|
|
|
0.000 |
|
|
|
|
0.000 |
|
|
|
|
0.000 |
|
|
|
| Less Distributions From: |
|
|
|
|
|
|
|
|
|
|
|
|
|
|
|
|
|
|
|
|
|
|
|
|
|
|
|
| Net Investment Income |
|
|
|
(0.000 |
)(a) |
|
|
|
(0.000 |
)(a) |
|
|
|
(0.000 |
)(a) |
|
|
|
0.000 |
(a) |
|
|
|
0.000 |
(a) |
|
|
| Net Asset Value, End of Year |
|
|
|
$1.000 |
|
|
|
|
$1.000 |
|
|
|
|
$1.000 |
|
|
|
|
$1.000 |
|
|
|
|
$1.000 |
|
|
|
|
|
|
|
|
|
|
|
|
|
|
|
|
|
|
|
|
|
|
|
|
|
|
|
|
|
|
|
| Total Return(b) |
|
|
|
0.01 |
% |
|
|
|
0.01 |
% |
|
|
|
0.01 |
% |
|
|
|
0.01 |
% |
|
|
|
0.03 |
% |
|
|
| Net Assets, End of Year (000’s) |
|
|
|
$413,692 |
|
|
|
|
$421,579 |
|
|
|
|
$406,386 |
|
|
|
|
$362,551 |
|
|
|
|
$108,802 |
|
|
|
| Ratios to Average Net Assets |
|
|
|
|
|
|
|
|
|
|
|
|
|
|
|
|
|
|
|
|
|
|
|
|
|
|
|
| Gross Expense |
|
|
|
0.76 |
% |
|
|
|
0.75 |
% |
|
|
|
0.74 |
% |
|
|
|
0.77 |
% |
|
|
|
0.83 |
% |
|
|
| Net Expenses(c) |
|
|
|
0.05 |
% |
|
|
|
0.09 |
% |
|
|
|
0.15 |
% |
|
|
|
0.23 |
% |
|
|
|
0.39 |
% |
|
|
| Net Investment Income |
|
|
|
0.01 |
% |
|
|
|
0.01 |
% |
|
|
|
0.01 |
% |
|
|
|
0.01 |
% |
|
|
|
0.03 |
% |
|
|
| SERVICE CLASS |
|
2015 |
|
2014 |
|
2013 |
|
2012 |
|
2011 |
|
|
| Net Asset Value, Beginning of Year |
|
|
|
$1.000 |
|
|
|
|
$1.000 |
|
|
|
|
$1.000 |
|
|
|
|
$1.000 |
|
|
|
|
$1.000 |
|
|
|
| Income (Loss) From Operations: |
|
|
|
|
|
|
|
|
|
|
|
|
|
|
|
|
|
|
|
|
|
|
|
|
|
|
|
| Net Investment Income |
|
|
|
0.000 |
(a) |
|
|
|
0.000 |
(a) |
|
|
|
0.000 |
(a) |
|
|
|
0.000 |
(a) |
|
|
|
0.000 |
(a) |
|
|
| Net Realized Gain (Loss) on Investments |
|
|
|
— |
|
|
|
|
— |
|
|
|
|
— |
|
|
|
|
0.000 |
(a) |
|
|
|
— |
|
|
|
| Total Income (Loss) From Operations |
|
|
|
0.000 |
|
|
|
|
0.000 |
|
|
|
|
0.000 |
|
|
|
|
0.000 |
|
|
|
|
0.000 |
|
|
|
| Less Distributions From: |
|
|
|
|
|
|
|
|
|
|
|
|
|
|
|
|
|
|
|
|
|
|
|
|
|
|
|
| Net Investment Income |
|
|
|
(0.000 |
)(a) |
|
|
|
(0.000 |
)(a) |
|
|
|
(0.000 |
)(a) |
|
|
|
(0.000 |
)(a) |
|
|
|
(0.000 |
)(a) |
|
|
| Net Asset Value, End of Year |
|
|
|
$1.000 |
|
|
|
|
$1.000 |
|
|
|
|
$1.000 |
|
|
|
|
$1.000 |
|
|
|
|
$1.000 |
|
|
|
|
|
|
|
|
|
|
|
|
|
|
|
|
|
|
|
|
|
|
|
|
|
|
|
|
|
|
|
| Total Return(b) |
|
|
|
0.01 |
% |
|
|
|
0.01 |
% |
|
|
|
0.01 |
% |
|
|
|
0.01 |
% |
|
|
|
0.01 |
% |
|
|
| Net Assets, End of Year (000’s) |
|
|
|
$79,316 |
|
|
|
|
$74,708 |
|
|
|
|
$57,425 |
|
|
|
|
$57,379 |
|
|
|
|
$11,779 |
|
|
|
| Ratios to Average Net Assets |
|
|
|
|
|
|
|
|
|
|
|
|
|
|
|
|
|
|
|
|
|
|
|
|
|
|
|
| Gross Expense |
|
|
|
1.01 |
% |
|
|
|
1.00 |
% |
|
|
|
0.99 |
% |
|
|
|
1.02 |
% |
|
|
|
1.08 |
% |
|
|
| Net Expenses(c) |
|
|
|
0.05 |
% |
|
|
|
0.09 |
% |
|
|
|
0.16 |
% |
|
|
|
0.23 |
% |
|
|
|
0.41 |
% |
|
|
| Net Investment Income |
|
|
|
0.01 |
% |
|
|
|
0.01 |
% |
|
|
|
0.01 |
% |
|
|
|
0.01 |
% |
|
|
|
0.01 |
% |
|
|
(a) Represents
less than $0.001.
(b) Total returns for periods of less than one year, if any, are not annualized.
(c) The investment manager and other service providers voluntarily waived a portion of their fees.
See Notes which are an integral part of the Financial Statements
|
| ANNUAL REPORT / April 30, 2015 |
|
| NOTES TO FINANCIAL STATEMENTS |
Wilmington Funds
April 30, 2015
1. ORGANIZATION
Wilmington Funds (the “Trust”) is registered under the Investment Company Act of 1940, as amended (the
“Act”), as an open-end management investment company. The Trust consists of 19 portfolios, 4 of which are presented herein (individually referred to as a “Fund” or collectively as the “Funds”). The remaining 15 funds
are presented in separate reports.
|
|
|
|
Fund |
|
Investment Goal |
| Wilmington Prime Money Market Fund
(“Prime Money Market Fund”)(d) |
|
The Fund seeks to provide current income while maintaining liquidity and stability of principal. |
| Wilmington U.S. Government Money Market Fund
(“U.S. Government Money Market Fund”)(d) |
|
The Fund seeks to provide current income while maintaining liquidity and stability of principal. |
| Wilmington U.S. Treasury Money Market Fund
(“U.S. Treasury Money Market Fund”)(d) |
|
The Fund seeks to provide current income while maintaining liquidity and stability of principal. |
| Wilmington Tax-Exempt Money Market Fund
(“Tax-Exempt Money Market Fund”)(d) |
|
The Fund seeks to provide current income that is exempt from federal income taxes while maintaining liquidity and stability of principal. |
(d) Diversified
The Trust offers 6 classes of shares: Class A, Service Class, Select Class, Administrative Class, Class I, and
Institutional Class. Class A and Class I are not available for the Funds. All shares of the Trust have equal rights with respect to voting, except on class-specific matters.
The assets of each portfolio are segregated and a shareholder’s interest is limited to the portfolio in which shares are
held.
In the normal course of business, the Funds may enter into contracts that provide general indemnifications. The
Funds’ maximum exposure under these arrangements is dependent on claims that may be made against the Funds in the future, and, therefore, cannot be estimated; however, based on experience, the risk of material loss from such claims is
considered remote.
2. SUMMARY OF SIGNIFICANT ACCOUNTING POLICIES
The following is a summary of significant accounting policies consistently followed by the Funds in the preparation of their
financial statements. These policies are in conformity with U.S. generally accepted accounting principles (“GAAP”). The Funds are investment companies and follow accounting and reporting guidance under Financial Accounting Standards Board
(“FASB”) Accounting Standard Codification (“ASU”) Topic 946, “Financial Services - Investment Companies.” The preparation of financial statements in conformity with GAAP requires management to make estimates and
assumptions that affect the amounts of assets, liabilities, expenses and revenues reported in the financial statements. Actual results could differ from those estimated.
Computation of Net Asset Value – It is each Fund’s policy to maintain a continuous net asset value of $1.00 per
share for each class. Each Fund has adopted certain investment, portfolio valuation and dividend and distribution policies to enable it to do so. There is no assurance, however, that each Fund will be able to maintain a stable net asset value of
$1.00 per share. The net asset value (“NAV”) per share for each of the Funds is computed by dividing the total current value of the assets of a Fund, less its liabilities, by the total number of shares outstanding at the time of such
computation. Each Fund’s NAV per share is computed as of 4:00 p.m. (Eastern Time), on days when the NYSE is open for regular trading and the Federal Reserve Bank of New York (the “Fed”) is open. In addition, the Funds may elect, in
their discretion if it is determined to be in shareholders’ best interests, to be open on days when the NYSE is open but the Fed is closed or to be open on days when the Fed is open but the NYSE is closed, except for Good Friday.
Investment Valuation – The Funds use the amortized cost method to value their portfolio securities in accordance
with Rule 2a-7 under the Act.
The Trust follows the authoritative guidance (GAAP) for fair value measurements. The guidance
establishes a framework for measuring fair value and a hierarchy for inputs used in measuring fair value that maximizes the use of observable inputs and minimizes the use of unobservable inputs by requiring that the most observable inputs be used
when available. The guidance establishes three tiers of inputs that may be used to measure fair value. The three tiers of inputs are summarized at the end of each Fund’s Portfolio of Investments. The inputs or methodology used for valuing
securities are not necessarily an indication of the risk associated with investing in those securities.
The Funds’
policy is to disclose transfers between levels based on valuations at the beginning of the reporting period. Each portfolio may hold securities which are periodically fair valued in accordance with the Funds’ fair value procedures. This may
result in movements between Levels 1, 2 and 3 throughout the period. As of April 30, 2015, there were no transfers between Levels 1, 2 and 3 assets and liabilities based on levels assigned to securities at the beginning of the period. Pursuant
to the Funds’ fair value procedures noted previously, fixed income securities and money market instruments are generally categorized as Level 2 securities in the fair value hierarchy.
|
| April 30, 2015 / ANNUAL REPORT |
|
| NOTES TO FINANCIAL STATEMENTS (continued) |
Repurchase Agreements – Repurchase agreements are transactions in
which a Fund buys a security from a dealer or bank and agrees to sell the security back at a mutually agreed upon time and price. The repurchase price exceeds the sale price, reflecting the Fund’s return on the transaction. It is each
Fund’s policy to require the counterparty to a repurchase agreement to transfer to the Funds’ custodian or sub-custodian eligible securities or cash with a market value (after transaction costs) at least equal to the repurchase price to be
paid under the repurchase agreement. The eligible securities are transferred to accounts with the custodian or sub-custodian in which the Funds hold a “securities entitlement” and exercise “control” as those terms are defined in
the Uniform Commercial Code. The Funds have established procedures for monitoring the market value of the transferred securities and requiring the transfer of additional eligible securities if necessary to equal at least the repurchase price. These
procedures also allow the counterparty to require securities to be transferred from the account to the extent that their market value exceeds the repurchase price or in exchange for other eligible securities of equivalent market value.
The insolvency of the counterparty or other failure to repurchase the securities may delay the disposition of the underlying
securities or cause the Funds to receive less than the full repurchase price.
Repurchase agreements are entered into by the
Funds under Master Repurchase Agreements (“MRA”) which permit the Funds, under certain circumstances including an event of default (such as bankruptcy or insolvency), to offset payables and/or receivables under the MRA with collateral held
and/or posted to the counterparty and create one single net payment due or from the Fund.
At April 30, 2015, the open
repurchase agreements by counterparty which are subject to a MRA on a net payment basis are as follows:
|
|
|
|
|
|
|
|
|
|
|
|
|
|
|
|
|
|
|
|
|
| Fund/Counterparty |
|
Repurchase
Agreements
|
|
Fair Value of
Non-cash
Collateral
Received |
|
Cash
Collateral
Received |
|
Net Amount(1) |
| Prime Money Market Fund |
|
|
|
|
|
|
|
|
|
|
|
|
|
|
|
|
|
|
|
|
| Credit Suisse First Boston LLC, |
|
|
|
$ 83,000,000 |
|
|
|
|
$ 83,000,000 |
|
|
|
|
$— |
|
|
|
|
$— |
|
| Deutsche Bank Securities, Inc., |
|
|
|
65,000,000 |
|
|
|
|
65,000,000 |
|
|
|
|
— |
|
|
|
|
— |
|
| TD Securities, Inc., |
|
|
|
25,000,000 |
|
|
|
|
25,000,000 |
|
|
|
|
— |
|
|
|
|
— |
|
| TD Securities, Inc., |
|
|
|
50,000,000 |
|
|
|
|
50,000,000 |
|
|
|
|
— |
|
|
|
|
— |
|
|
|
|
|
$223,000,000 |
|
|
|
|
$223,000,000 |
|
|
|
|
$— |
|
|
|
|
$— |
|
| U.S. Government Money Market
Fund |
|
|
|
|
|
|
|
|
|
|
|
|
|
|
|
|
|
|
|
|
| Credit Suisse First Boston LLC |
|
|
|
$ 56,000,000 |
|
|
|
|
$ 56,000,000 |
|
|
|
|
$— |
|
|
|
|
$— |
|
| Deutsche Bank Securities, Inc. |
|
|
|
25,000,000 |
|
|
|
|
25,000,000 |
|
|
|
|
— |
|
|
|
|
— |
|
| Merrill Lynch, Pierce, Fenner & Smith,
Inc. |
|
|
|
80,000,000 |
|
|
|
|
80,000,000 |
|
|
|
|
— |
|
|
|
|
— |
|
| TD Securities, Inc. |
|
|
|
100,000,000 |
|
|
|
|
100,000,000 |
|
|
|
|
— |
|
|
|
|
— |
|
| TD Securities, Inc. |
|
|
|
50,000,000 |
|
|
|
|
50,000,000 |
|
|
|
|
— |
|
|
|
|
— |
|
|
|
|
|
$311,000,000 |
|
|
|
|
$311,000,000 |
|
|
|
|
$— |
|
|
|
|
$— |
|
| U.S. Treasury Money Market
Fund |
|
|
|
|
|
|
|
|
|
|
|
|
|
|
|
|
|
|
|
|
| Credit Suisse First Boston LLC |
|
|
|
$ 39,000,000 |
|
|
|
|
$ 39,000,000 |
|
|
|
|
$— |
|
|
|
|
$— |
|
| Merrill Lynch, Pierce, Fenner & Smith,
Inc. |
|
|
|
50,000,000 |
|
|
|
|
50,000,000 |
|
|
|
|
— |
|
|
|
|
— |
|
|
|
|
|
$ 89,000,000 |
|
|
|
|
$ 89,000,000 |
|
|
|
|
$— |
|
|
|
|
$— |
|
(1)Net amount represents the net amount receivable
due from the counterparty in the event of default.
Investment Income, Gains and Losses, Expenses and Distributions
– Interest income and expenses are accrued daily. All premiums and discounts on fixed income securities are amortized/accreted for financial statement purposes. Gains and losses realized on principal payment of mortgage-backed securities
(paydown gains and losses) are classified as part of investment income. Dividends and distributions to shareholders are recorded on the ex-dividend date. Investment transactions are accounted for on a trade date basis for financial reporting
purposes. Realized gains and losses from investment transactions are recorded on an identified cost basis.
Expenses of the
Trust, which are directly identifiable to a specific Fund, are applied to that Fund. Expenses which are not identifiable to a specific Fund are allocated in such a manner as deemed equitable, taking into consideration the nature and type of expense.
All Funds offer multiple classes of shares. Investment income, realized gains and losses, and certain fund-level expenses
are allocated to each class based on relative daily net assets, except that each class bears certain expenses unique to that class such as distribution and shareholder services fees. Distributions are declared separately for each class. No class has
preferential distribution rights; differences in per share distributions rates are generally due to differences in class specific expenses. Distributions from net realized gains, if any, are declared and paid to shareholders annually. Distributions
from net investment income are declared daily and paid monthly.
Federal Taxes – It is the Funds’ policy to
comply with the Subchapter M provision of the Internal Revenue Code of 1986, as amended (the “Code”), and to distribute to shareholders each year substantially all of their income. Accordingly, no provisions for Federal income tax or
excise tax are necessary.
The Funds recognize interest and penalties, if any, related to unrecognized tax benefits as
income tax expense on the Statement of Operations. During the year ended April 30, 2015, the Funds did not incur any interest or penalties.
|
| ANNUAL REPORT / April 30, 2015 |
|
| NOTES TO FINANCIAL STATEMENTS (continued) |
Restricted Securities – Restricted securities are securities that
either (a) cannot be offered for public sale without first being registered, or being able to take advantage of an exemption from registration, under the Securities Act of 1933, as amended, or (b) are subject to contractual restrictions on
public sales. In some cases, when a security cannot be offered for public sale without first being registered, the issuer of the restricted security has agreed to register such securities for resale, at the issuer’s expense, either upon demand
by the Fund or in connection with another registered offering of the securities. Many such restricted securities may be resold in the secondary market in transactions exempt from registration. Restricted securities may be determined to be liquid
under criteria established by the Trustees. A Fund will not incur any registration costs upon such resales.
3. FEDERAL TAX INFORMATION
As of April 30, 2015, there are no uncertain tax positions that would require financial statement recognition,
de-recognition or disclosure. The Funds’ federal tax returns filed for the years ended 2014, 2013, and 2012, as well as the current tax year, remain subject to examination by the Internal Revenue Service.
The tax character of distributions for the corresponding fiscal years as reported on the Statements of Changes in Net Assets
were as follows:
|
|
|
|
|
|
|
|
|
|
|
|
|
|
|
|
|
|
|
|
|
|
|
|
|
|
|
|
|
|
|
| |
|
|
|
2015 |
|
|
|
|
|
2014 |
|
|
| |
|
Ordinary |
|
Tax-Exempt |
|
Long-Term |
|
Ordinary |
|
Tax-Exempt |
|
Long-Term |
| Fund |
|
Income* |
|
Income |
|
Capital Gains |
|
Income* |
|
Income |
|
Capital Gains |
|
|
|
|
|
|
|
| Prime Money Market Fund |
|
|
|
$443,230 |
|
|
|
$ |
— |
|
|
|
|
$— |
|
|
|
|
$450,723 |
|
|
|
$ |
— |
|
|
|
|
$— |
|
| U.S. Government Money Market Fund
|
|
|
|
414,875 |
|
|
|
|
— |
|
|
|
|
— |
|
|
|
|
409,081 |
|
|
|
|
— |
|
|
|
|
— |
|
| U.S. Treasury Money Market Fund
|
|
|
|
1,226 |
|
|
|
|
— |
|
|
|
|
— |
|
|
|
|
75,464 |
|
|
|
|
— |
|
|
|
|
— |
|
| Tax-Exempt Money Market Fund
|
|
|
|
576 |
|
|
|
|
50,347 |
|
|
|
|
— |
|
|
|
|
624 |
|
|
|
|
55,562 |
|
|
|
|
— |
|
* For tax purposes, short-term capital gain distributions are considered
ordinary income distributions.
As of April 30, 2015, the components of distributable earnings on a tax basis were as
follows:
|
|
|
|
|
|
|
|
|
|
|
|
|
|
|
|
|
|
|
|
|
|
|
|
|
|
| |
|
|
|
Undistributed |
|
Other |
|
Unrealized |
|
Capital Loss |
| |
|
Undistributed |
|
Long-Term |
|
Timing |
|
Appreciation |
|
Carryforwards |
| Fund |
|
Ordinary Income |
|
Capital Gains |
|
Differences |
|
(Depreciation) |
|
and Deferrals |
|
|
|
|
|
|
| Prime Money Market Fund |
|
|
|
$48,650 |
|
|
|
|
$— |
|
|
|
|
$(49,672) |
|
|
|
|
$— |
|
|
|
|
$ (1,836) |
|
| U.S. Government Money Market Fund
|
|
|
|
34,451 |
|
|
|
|
— |
|
|
|
|
(32,815) |
|
|
|
|
— |
|
|
|
|
(24,562) |
|
| U.S. Treasury Money Market Fund
|
|
|
|
449 |
|
|
|
|
— |
|
|
|
|
— |
|
|
|
|
— |
|
|
|
|
(35,252) |
|
| Tax-Exempt Money Market Fund
|
|
|
|
4,100 |
|
|
|
|
— |
|
|
|
|
(4,359) |
|
|
|
|
— |
|
|
|
|
(72,058) |
|
At April 30, 2015, the following Funds had capital loss carryforwards which will reduce
each Fund’s taxable income arising from future net realized gain on investments, if any, to the extent permitted by the Code and thus will reduce the amount of distributions to shareholders which would otherwise be necessary to relieve the Fund
of any liability for federal income tax. Pursuant to the Code, such capital loss carryforwards will expire as follows:
|
|
|
|
|
|
|
|
|
|
|
|
|
|
|
|
|
|
|
|
|
|
|
|
|
|
| |
|
|
|
Short-Term |
|
Total Capital |
| |
|
Capital Loss Available Through |
|
Post-Effective |
|
Loss |
| Fund |
|
2016 |
|
2017 |
|
2018 |
|
No Expiration |
|
Carryforwards |
|
|
|
|
|
|
| Prime Money Market Fund |
|
|
|
$ — |
|
|
|
|
$ — |
|
|
|
|
$ — |
|
|
|
|
$ 1,836 |
|
|
|
|
$ 1,836 |
|
| U.S. Government Money Market Fund
|
|
|
|
— |
|
|
|
|
— |
|
|
|
|
— |
|
|
|
|
24,562 |
|
|
|
|
24,562 |
|
| U.S. Treasury Money Market Fund
|
|
|
|
— |
|
|
|
|
— |
|
|
|
|
— |
|
|
|
|
35,252 |
|
|
|
|
35,252 |
|
| Tax-Exempt Money Market Fund
|
|
|
|
6,657 |
|
|
|
|
63,251 |
|
|
|
|
2,115 |
|
|
|
|
35 |
|
|
|
|
72,058 |
|
Under current tax regulations, capital losses on securities transactions realized after
October 31 may be deferred and treated as occurring on the first day of the following fiscal year. Under the Regulated Investment Company Modernization Act of 2010, the Funds are permitted to defer taxable ordinary income losses incurred after
December 31 and treat as occurring on the first day of the following fiscal year. At April 30, 2015, the Funds had no Post-October or Late Year losses to defer.
|
| April 30, 2015 / ANNUAL REPORT |
|
| NOTES TO FINANCIAL STATEMENTS (continued) |
The Funds utilized capital loss carryforwards as follows to offset taxable
capital gains realized during the year ended April 30, 2015:
|
|
|
|
|
| |
|
Capital
Loss |
|
| |
|
Carryforwards |
|
| Fund |
|
Utilized |
|
| |
|
| Prime Money Market Fund
|
|
|
$12,180 |
|
| U.S. Government Money Market Fund
|
|
|
4,315 |
|
| U.S. Treasury Money Market Fund
|
|
|
415 |
|
4. ADVISORY FEES, SERVICING FEES, AND OTHER SERVICE PROVIDERS
Investment Advisor – Wilmington Funds Management Corporation (“WFMC” or the “Advisor”) serves as
the Investment Advisor to each of the Funds. Wilmington Trust Investment Advisors, Inc. (“WTIA”) provides sub-advisory services to the Funds. WFMC and WTIA are wholly-owned subsidiaries of M&T Bank Corporation. For its services, the
Funds pay WFMC an annual investment advisory fee, accrued and paid daily, based on a percentage of each Fund’s average daily net assets as described below. WFMC, not the Funds, pays WTIA for its services.
|
|
|
|
|
| |
|
Advisory Fee |
|
| Fund |
|
Annual Rate |
|
|
|
| Prime Money Market Fund
|
|
|
0.40% |
|
| U.S. Government Money Market Fund |
|
|
0.40% |
|
| U.S. Treasury Money Market Fund |
|
|
0.40% |
|
| Tax-Exempt Money Market Fund |
|
|
0.40% |
|
WFMC has voluntarily agreed to reduce its advisory fee and/or reimburse each of the Fund’s
operating expenses, and/or certain class-specific fees and expenses, in an effort to maintain the current yield for each share class of the Funds at or above 0.00%. The fee waiver does not take into consideration acquired fund fees and expenses,
taxes or extraordinary items. Any such waiver or expense reimbursement may be modified or discontinued at any time without notice. WFMC will not recoup previously waived fees/expenses in subsequent years.
Administrative Fee – The Bank of New York Mellon (“BNYM”) provides the Trust with fund administration
services. WFMC in its role as co-administrator provides the Funds with certain administrative personnel and services necessary to operate the Funds. These services were provided for at an aggregate annual fee as specified below.
|
|
|
|
|
|
|
| Administration |
|
Maximum
Fee |
|
|
Average Aggregate Daily Net
Assets of the
Trust |
|
|
|
| WFMC |
|
|
0.040% |
|
|
On the first $5 billion |
|
|
|
0.030% |
|
|
On the next $2 billion |
|
|
|
0.025% |
|
|
On the next $3 billion |
|
|
|
0.018% |
|
|
On assets in excess of $10 billion
|
| BNYM |
|
|
0.0285% |
|
|
On the first $500 million |
|
|
|
0.0280% |
|
|
On the next $500 million |
|
|
|
0.0275% |
|
|
On assets in excess of $1 billion |
WFMC may voluntarily choose to waive any portion of its fee. WFMC can modify or terminate its
voluntary waiver at any time at its sole discretion. For the year ended April 30, 2015, WFMC did not waive any administrative personnel and services fee.
Distribution Services Fee – The Trust has adopted a Distribution Services Plan (the “Plan”) pursuant to
Rule 12b-1 under the Act. The Plan allows the Funds to pay fees to financial intermediaries, which may be paid through ALPS Distributors, Inc. (“ALPS”), the principal distributor, at an annual rate of up to 0.25% of the average daily net
assets of the Funds’ Administrative Class and Service Class shares for the sale, distribution, administration, customer servicing and record keeping of these shares.
The Trust may reduce the maximum amount of distribution services fees it pays from time to time at its sole discretion. In
addition, a financial intermediary (including ALPS, the Advisor or their affiliates), may voluntarily waive or reduce any fees to which they are entitled.
For the year ended April 30, 2015, no affiliates of the Advisor received these fees.
Shareholder Services Fee – Pursuant to a Shareholder Services Plan adopted by the Funds and administered by ALPS,
the Funds may pay up to 0.25% of the average daily net assets of each Fund’s Administrative Class, Select Class and Service Class shares to financial intermediaries (which may include ALPS, the Advisor or their affiliates) for providing
shareholder services and maintaining shareholder accounts. M&T Securities, Inc. and Traders Trust Company (together, “M&T”) affiliates of the Advisor, has entered into a Shareholders Services Agreement with ALPS, under which it is
entitled to receive up to 0.25% of the average daily net assets of each Fund’s shares for whom M&T provides shareholder services. The Funds may reduce the maximum amount of shareholder service fees it pays from time to time at its sole
discretion. In addition, a financial intermediary (including M&T) may waive or reduce any fees to which they are entitled.
|
| ANNUAL REPORT / April 30, 2015 |
|
| NOTES TO FINANCIAL STATEMENTS (continued) |
For the year ended April 30, 2015, M&T received a portion of the fees
paid by the following Funds which are listed below:
|
|
|
| |
|
Shareholder Services |
| Fund |
|
Fee |
|
|
| Prime Money Market Fund |
|
$16,363 |
Other Service Providers – Foreside Management Services, LLC (“FMS”)
provides a Principal Executive Officer and Principal Financial Officer to the Trust. FMS has no role in determining the investment policies or which securities are to be sold or purchased by the Trust or its Funds.
BNYM provides custody services to the Trust.
BNY Mellon Investment Servicing (U.S.) Inc. provides fund accounting and transfer agency services to the Trust.
General – Certain Officers of the Trust are also Officers or employees of the above companies that provide services
to the Funds, and during their terms of office, receive no compensation from the Funds. The Trust’s Statement of Additional Information includes additional information about the Trustees.
5. LINE OF CREDIT
The Trust participated in a $20,000,000 unsecured, committed revolving line of credit (“LOC”) agreement with BNYM. The
LOC was made available for extraordinary or emergency purposes, primarily for financing redemption payments. Borrowings are charged interest at a rate of 1.25% per annum over the greater of the Federal Funds Rate or the overnight LIBOR Rate.
The LOC included a commitment fee of 0.10% per annum on the daily unused portion. The LOC was in effect for the entire fiscal year and the termination date of this LOC is March 9, 2016. The Funds did not utilize the LOC during the year
ended April 30, 2015.
6. MONEY MARKET REFORM
On July 23, 2014, the U.S. Securities and Exchange Commission adopted amendments to money market fund regulations, which
structurally changes the way that certain money market funds will be required to operate. These amendments are generally not effective until 2016, but when implemented will affect the Funds’ operations and may affect the Funds’ return
potential. The intent of the increased regulations is to improve transparency and to prevent a run on money market fund assets during times of financial crisis in the markets. Some of the highlights of the changes include mandating that certain
money market funds move to a floating NAV, the ability of the funds to impose gates and redemption fees, and the requirement for additional disclosure on money market fund websites.
7. SUBSEQUENT EVENTS
Management has evaluated events and transactions for potential recognition or disclosure in the financial statements through the
date the financial statements were issued. Management has determined that, there are no material events that would require recognition or disclosure in the Funds’ financial statements through this date.
|
| April 30, 2015 / ANNUAL REPORT |
REPORT OF INDEPENDENT REGISTERED PUBLIC ACCOUNTING FIRM
TO THE SHAREHOLDERS AND BOARD OF TRUSTEES OF
WILMINGTON
FUNDS
We have audited the accompanying statements of assets and liabilities, including the portfolios of investments, of the
Wilmington Prime Money Market Fund, Wilmington U.S. Government Money Market Fund, Wilmington U.S. Treasury Money Market Fund and Wilmington Tax-Exempt Money Market Fund (four of the series constituting the Wilmington Funds) (the “Funds”)
as of April 30, 2015, and the related statements of operations for the year then ended, the statements of changes in net assets for each of the two years in the period then ended, and the financial highlights for each of the years or periods
indicated therein. These financial statements and financial highlights are the responsibility of the Funds’ management. Our responsibility is to express an opinion on these financial statements and financial highlights based on our audits.
We conducted our audits in accordance with standards of the Public Company Accounting Oversight Board (United States). Those standards require
that we plan and perform the audit to obtain reasonable assurance about whether the financial statements and financial highlights are free of material misstatement. We were not engaged to perform an audit of the Funds’ internal control over
financial reporting. Our audits included consideration of internal control over financial reporting as a basis for designing audit procedures that are appropriate in the circumstances, but not for the purpose of expressing an opinion on the
effectiveness of the Funds’ internal control over financial reporting. Accordingly, we express no such opinion. An audit also includes examining, on a test basis, evidence supporting the amounts and disclosures in the financial statements and
financial highlights, assessing the accounting principles used and significant estimates made by management, and evaluating the overall financial statement presentation. Our procedures included confirmation of securities owned as of April 30,
2015, by correspondence with the custodian and brokers. We believe that our audits provide a reasonable basis for our opinion.
In our
opinion, the financial statements and financial highlights referred to above present fairly, in all material respects, the financial position of the Wilmington Prime Money Market Fund, Wilmington U.S. Government Money Market Fund, Wilmington U.S.
Treasury Money Market Fund and Wilmington Tax-Exempt Money Market Fund (four of the series constituting the Wilmington Funds) at April 30, 2015, the results of their operations for the year then ended, the changes in their net assets for each
of the two years in the period then ended, and their financial highlights for each of the years or periods indicated therein, in conformity with U.S. generally accepted accounting principles.

Philadelphia, Pennsylvania
June 29, 2015
|
| ANNUAL REPORT / April 30, 2015 |
|
| BOARD OF TRUSTEES AND TRUST OFFICERS |
BOARD OF TRUSTEES AND TRUST OFFICERS
The following tables give information about each Trustee and the senior officers of the Trust. The tables separately list Trustee members who
are “interested persons” of the Fund (i.e., “Interested” Trustees) and those who are not (i.e., “Independent” Trustees). The Trust is comprised of 19 funds. Unless otherwise noted, the business address of each Trustee
and senior officer is 111 South Calvert Street, 26th floor, Baltimore, Maryland 21202. Each Trustee oversees all portfolios of the Trust and serves for an indefinite term. The Trust’s Statement of Additional Information includes additional
information about the Trustees and is available, without charge and upon request, by calling 1-800-836-2211.
INTERESTED TRUSTEES BACKGROUND
|
|
|
| Name
Address
Birth date
Position With Trust Date Service Began |
|
Principal Occupations for past five years and Other Directorships Held
|
| R. Samuel
Fraundorf, CFA, CPA* Birth date: 4/64
TRUSTEE Began serving: March 2012 |
|
Principal Occupations: Senior Vice
President, Chief Investment Strategist and Chief Client Officer of WTIA and WFMC.
Other Directorships Held: Director, WTIA (1/14 to present); Director, WFMC (1/14 to present).
Previous Positions: President of WTIA (1/12 to 1/14); President of Wilmington Trust
Investment Management (“WTIM”) (8/04 to 1/12); Chief Operating Officer of WTIM (1/08 to 1/09); Director of Research at WTIM (8/04 to 1/08). |
| Robert J.
Truesdell* Birth date: 11/55
TRUSTEE Began serving: December
2012 |
|
Principal Occupations: Group Vice
President and Senior Investment Advisor for Wilmington Trust Wealth Advisory Services, M&T Bank.
Other Directorships Held: None.
Previous Positions: Bond Department Manager, M&T Bank (2/88 to 7/12); Group Vice President, Managing Director and Chief Investment Officer, WTIA (6/02 to
6/12) and WFMC (3/12 to 6/12). |
| * |
R. Samuel Fraundorf is “interested” due to positions he holds with WTIA and WFMC. Robert J. Truesdell is “interested” due to the
positions he currently holds with Wilmington Trust Wealth Advisory Services, M&T Bank, the parent of the Funds’ Advisor, and previous positions held with WTIA and WFMC.
|
|
| April 30, 2015 (unaudited) / ANNUAL REPORT |
|
| BOARD OF TRUSTEES AND TRUST OFFICERS |
INDEPENDENT TRUSTEES BACKGROUND
|
|
|
| Name
Birth date
Position with Trust Date Service Began |
|
Principal Occupations for past five years and Other Directorships
|
| Nicholas A.
Giordano Birth date: 3/43 CHAIRMAN
AND TRUSTEE Began serving: March 2012 |
|
Principal Occupations: Consultant,
financial services organizations (1997 to present). Other Directorships Held:
Kalmar Pooled Investment Trust; The RBB Fund Inc. (19 portfolios) (registered investment companies); Independence Blue Cross; IntriCon Corporation (industrial furnaces and ovens).
Previous Positions: Interim President, LaSalle University (1998 to 1999); President and
Chief Executive Officer, Philadelphia Stock Exchange (1981 to 1997). |
| Robert H.
Arnold Birth date: 3/44 TRUSTEE
Began serving: March 2012 |
|
Principal Occupations: Managing
Director, R.H. Arnold & Co, Inc. (financial management consulting) (6/89 to present).
Other Directorships Held: Trustee, First Potomac Realty Trust (real estate investment trust) (5/01 to present); Director, Treasury Strategies, Inc. (private
treasury consulting services) (6/01 to present). |
| Joseph J.
Castiglia Birth date: 7/34
TRUSTEE Began serving: February
1988 |
|
Principal Occupations: Consultant
(not-for-profit) and Private Investor. Other Directorships Held: Chairman,
Trustee and Treasurer, Buffalo Olmsted Parks Conservancy (1/05 to 5/13); Chairman and Trustee, Buffalo Philharmonic Orchestra Foundation (1/06 to 11/12); Vice Chairman and Trustee, Christ the King Seminary (1/05 to present); Director, Dunn Tire
Corporation (1/05 to present); Chairman, Director and Treasurer, Read to Succeed Buffalo (1/08 to present).
Previous Positions: President, Chief Executive Officer, Vice President, Treasurer and Vice Chairman, Pratt & Lambert United (manufacturer of paints, coatings
and adhesives) (12/67- 1/96); Chairman and Director, Catholic Health (hospitals, nursing homes and home care) (1/97 to 5/03); Chairman and Director, Blue Cross Blue Shield of Western and Central New York (5/92 to 5/07); Lead Director and Director,
Energy East (gas and electric utility); Chairman and Director, Federal Reserve Bank of New York, Buffalo Branch; Chairman and Director, Community Foundation for Greater Buffalo; Chairman and Trustee, Canisius College; Chairman and Director, AAA of
Western & Central New York. |
| John S.
Cramer Birth date: 2/42 TRUSTEE
Began serving: December 2000 |
|
Principal Occupations: Senior
Consultant, Yaffe & Co. (health care consulting) (2/06 to present). Other
Directorships Held: Director, Chairman of the Executive Committee and Chairman of the Compensation Committee of Chek-Med Corporation (6/03 to present).
Previous Positions: President and Chief Executive Officer Emeriti, Pinnacle Health Systems (non-profit hospital and health care system in Central
Pennsylvania). |
| Daniel R. Gernatt,
Jr. Birth date: 7/40 TRUSTEE
Began serving: February 1988 |
|
Principal Occupations: President
and CEO, Gernatt Asphalt Products, Inc. (asphalt, sand and gravel products) (1979 to present).
Other Directorships Held: Director, Roswell Park Alliance (2008 to present); Trustee, Gernatt Family Foundation.
|
| Richard B.
Seidel Birth date: 4/41 TRUSTEE
Began serving: September 2003 |
|
Principal Occupations: Chairman,
Girard Capital (broker-dealer) (1/10 to present); Chairman, R.B. Seidel & Associates (consultants) (2014 to present).
Other Directorships Held: Director, Tristate Capital Bank (1/08 to present). |
|
| ANNUAL REPORT / April 30, 2015 (unaudited) |
|
| BOARD OF TRUSTEES AND TRUST OFFICERS |
OFFICERS
|
|
|
| Name
Address
Birth year
Position with Trust |
|
Principal Occupations for Past Five Years and Previous Positions
|
| Christopher D.
Randall Birth year: 1965
PRESIDENT Began serving: September
2014 |
|
Principal Occupations: President
and Chief Executive Officer of Wilmington Trust Investment Advisors, Inc.; President of Wilmington Trust Investment Management, LLC; Director of Wilmington Funds Management Corporation; Senior Vice President of M&T Bank.
Previous Positions: Senior Vice President, Head of Asset Management and Retirement Services
(2012 to 2014); President, Mid-Atlantic Division, Wilmington Trust, N.A. (2011 to 2012); President, M&T Securities, Inc. (2009 to 2011) |
| Michael D.
Daniels Birth year: 1967 CHIEF
OPERATING OFFICER Began serving: June 2007 |
|
Principal Occupations: Chief
Operating Officer, Wilmington Funds and Wilmington Trust Investment Advisors, Inc.; Administrative Vice President, M&T Bank.
Previous Positions: Senior Vice President, MSD&T and MCA (2006 to 2007); Vice President, Calamos Asset Management (2004 to 2006); Vice President, JP Morgan
Chase Bank (2002 to 2004). |
| Jeffrey M.
Seling Birth year: 1970 ASSISTANT
TREASURER Began serving: June 2013 VICE
PRESIDENT Began serving: June 2007 |
|
Principal Occupations: Vice
President, M&T Bank and Wilmington Trust Investment Advisors, Inc.; Assistant Treasurer, Wilmington Funds.
Previous Positions: Vice President, MSD&T; Assistant Vice President, Wells Fargo Bank; Assistant Vice President, JP Morgan Chase Bank. |
| John C.
McDonnell Birth year: 1966 VICE
PRESIDENT AND ASSISTANT TREASURER Began serving: June 2013 |
|
Principal Occupations: Vice
President, Wilmington Funds Management Corporation (2005 to Present); Vice President, Wilmington Trust Investment Advisors, Inc. (2012 to present).
Previous Positions: Vice President, Wilmington Trust Investment Management, LLC (2005 to 2012); Audit Senior, Deloitte LLP (2004 to 2005); Assistant Vice
President, 1838 Investment Advisors, LP (1999 to 2004). |
| Mary Ellen
Reilly Birth year: 1970 CHIEF
COMPLIANCE OFFICER and AML COMPLIANCE OFFICER Began serving: March 2015 |
|
Principal Occupations: Chief
Compliance Officer and Anti-Money Laundering Officer, Wilmington Funds; Administrative Vice President, M&T Bank.
Previous Positions: Administrative Vice President, M&T Bank, and Program Director, Buffalo Promise. Neighborhood (2013-2015); Vice President, M&T Bank,
and Product Manager, Wilmington Trust Retirement and Institutional Services Company (2010-2013); Vice President, M&T Bank, and Risk Manager, M&T Investment Group (2006-2010).
|
| Eric B.
Paul Birth year: 1974 VICE
PRESIDENT Began serving: June 2008 |
|
Principal Occupations:
Administrative Vice President, M&T Bank (2003 to present); Director of Proprietary Products, M&T Bank (2008 to present). |
| Ralph V. Partlow,
III 25 South Charles Street, 22nd floor
Baltimore, MD 21201 Birth year: 1957
VICE PRESIDENT Began serving: June 2010
|
|
Principal Occupation:
Administrative Vice President and Deputy General Counsel, M&T Bank (2003 to present).
Previous Positions: Vice President and Senior Counsel, Allfirst Bank (1995-2003). |
|
| April 30, 2015 (unaudited) / ANNUAL REPORT |
|
| BOARD OF TRUSTEES AND TRUST OFFICERS |
|
|
|
| Name
Address
Birth year
Position with Trust |
|
Principal Occupations for Past Five Years and Previous Positions
|
| Christopher W.
Roleke 10 High Street, Suite 302
Boston, MA 02110 Birth year: 1972
CHIEF FINANCIAL OFFICER AND TREASURER Began
serving: July 2013 |
|
Principal Occupation: Fund
Principal Financial Officer, Foreside Management Services, LLC (2011 to present).
Previous Positions: Assistant Vice President, JP Morgan Investor Services Co. (2006 to 2011). |
| Lisa R.
Grosswirth 2 Hanson Place, 12th Floor
Brooklyn, NY 11217 Birth year: 1963
SECRETARY Began serving: September 2007
|
|
Principal Occupation: Vice
President, BNY Mellon Asset Servicing (2004 to present). Previous Positions:
Supervisory Paralegal, The Dreyfus Corporation (1998 to 2004). |
| Richard J.
Berthy Three Canal Plaza, Suite 100
Portland, ME 04101 Birth year: 1958
CHIEF EXECUTIVE OFFICER Began serving:
September 2007 |
|
Principal Occupation: Chief
Executive Officer, Foreside Financial Group, LLC (2012 to present). Previous
Positions: President, Foreside Financial Group, LLC (2008 to 2012); Chief Administrative Officer, Foreside Financial Group, LLC (2005 to 2008); President and Secretary, Bainbridge Capital Management, LLC (2003 to 2006); Vice President,
Bainbridge Capital Management (2002 to 2004). |
|
| ANNUAL REPORT / April 30, 2015 (unaudited) |
Shares of the Wilmington Funds are not FDIC insured or otherwise protected by the U.S. government, are not deposits or other obligations
of, or guaranteed by, Manufacturers and Traders Trust Company, and are subject to investment risks, including possible loss of the principal amount invested.
VOTING PROXIES ON FUND PORTFOLIO SECURITIES
A description of the policies and procedures that the Funds use to determine how to vote proxies relating to securities held in the Funds’
portfolios is available, without charge and upon request, by calling 1-800-836-2211. A report on how the Funds voted any such proxies during the most recent 12-month period ended June 30 is available through Wilmington Funds’ website. Go
to www.wilmingtonfunds.com select “Proxy Voting Record” to access the link. This information is also available from the Edgar database on the SEC’s website at www.sec.gov.
QUARTERLY PORTFOLIO SCHEDULE
The Funds file
with the SEC a complete schedule of their portfolio holdings, as of the close of the first and third quarters of their fiscal year, on Form N-Q. These filings are available on the SEC’s website at www.sec.gov and may be reviewed and copied at
the SEC’s Public Reference Room in Washington DC. (Call 1-800-SEC-0330 for information on the operation of the Public Reference Room.)
Electronic
Delivery
Wilmington Funds encourages you to sign up for electronic delivery of investor materials. By doing so you will receive
information faster, help lower shareholder costs, and reduce the impact to the environment. To enroll in electronic delivery:
| |
1.) |
Go to www.wilmingtonfunds.com and select “Individual Investors” |
| |
2.) |
Click on the link “Sign up for Electronic Delivery” |
| |
3.) |
Login to your account or create new user ID |
| |
4.) |
Select E-Delivery Consent from the available options, and |
| |
5.) |
Complete the information requested, including providing the email address where you would like to receive notification for electronic documents.
|
* If you hold your account through a financial intermediary, please contact your advisor to request electronic
delivery of investor materials.
Householding
In an effort to reduce volume of mail you receive, only one copy of the prospectus, annual/semi-annual report, SAI and proxy statements will be
sent to shareholders who are part of the same family and share the same address.
If you would like to request additional copies of the
prospectus, annual/semi-annual report or SAI, or wish to opt out of householding mailings, please contact Shareholder Services at 1-800-836-2211, or write to Wilmington Funds, P.O. Box 9828, Providence, RI 02940-8025.
|
| April 30, 2015 / ANNUAL REPORT |
PRIVACY POLICY AND NOTICE
OF THE FUNDS AND THEIR DISTRIBUTOR
June 8, 2012
The
Wilmington Funds, their distributor and their agents (referred to as “the Funds”, “we” or “us”) recognize that consumers (referred to as “you” or “your”) expect us to protect both your assets and
financial information. We respect your right to privacy and your expectation that all personal information about you or your account will be maintained in a secure manner. We are committed to maintaining the confidentiality, security and integrity
of client and shareholder information. We want you to understand the Funds’ policy that governs the handling of your information, how the Funds gather information, how that information is used and how it is kept secure.
Information The Funds Collect:
The Funds
collect nonpublic personal information about you from the following sources:
| |
• |
We may receive information from you, or from your financial representative, on account applications, other forms or electronically (such as
through the Funds’ website or other electronic trading mechanisms). Examples of this information include your name, address, social security number, assets and income. |
| |
• |
We may receive information from you, or from your financial representative, through transactions with us or others, correspondence and other
communications. Examples of this information include specific investments and your account balances. |
| |
• |
We may obtain other personal information from you in connection with providing you a financial product or service. Examples of this
information include depository, debit or credit account numbers. |
Information Sharing Policy
The Funds may share nonpublic personal information about you, as described above, with financial or non-financial companies or other entities,
including companies that may be affiliated with the Funds and other nonaffiliated third parties, for the following purposes:
| |
• |
We may share information when it is necessary and required to process a transaction or to service a customer relationship. For example,
information may be shared with a company that provides account record keeping services or a company that provides proxy services to shareholders. |
| |
• |
We may share information when it is required or permitted by law. For example, information may be shared in response to a subpoena or to
protect you against fraud or with someone who has established a legal beneficial interest, such as a power of attorney. |
| |
• |
We may disclose some or all of the information described above to companies that perform marketing or other services on our behalf. For
example, we may share information about you with the financial intermediary (bank, investment bank or broker-dealer) through whom you purchased the Funds’ products or services, or with providers of marketing, legal, accounting or other
professional services. The Funds will not, however, disclose a consumer’s account number or similar form of access number or access code for credit card, deposit or transaction accounts to any nonaffiliated third party for use in telemarketing,
direct mail or other marketing purposes. |
Except as described above, the Funds do not share customer information. We will
not rent, sell, trade, or otherwise release or disclose any personal information about you. Any information you provide to us is for the Funds’ use only. If you decide to close your account(s) or become an inactive customer, we will adhere to
the privacy policies and practices as described in this notice.
Information Security:
When the Funds share nonpublic customer information with third parties hired to facilitate the delivery of certain products or services to our
customers, such information is made available for limited purposes and under controlled circumstances designed to protect our customers’ privacy. We require third parties to comply with our standards regarding security and confidentiality of
such information. We do not permit them to use that information for their own or any other purposes, or rent, sell, trade or otherwise release or disclose the information to any other party. These requirements are reflected in written agreements
between the Funds and the third party service providers.
The Funds protect your personal information in several ways. We maintain physical,
electronic, and procedural safeguards to guard your nonpublic personal information. In addition, the Funds’ Transfer Agent and Shareholder Servicing Agent have procedures in place for the appropriate disposal of nonpublic personal information
when they are no longer required to maintain the information.
Each of the following sections explains an aspect of the Funds’
commitment to protecting your personal information and respecting your privacy.
Employee Access to Information:
Our Code of Ethics, which applies to all employees, restricts the use of customer information and requires that it be held in the strictest of
confidence. Employee access to customer information is authorized for business purposes only, and the degree of access is based on the sensitivity of the information and on an employee’s or agent’s need to know the information in order to
service a customer’s account or comply with legal requirements.
Visiting The Funds’ Website:
The Funds’ website gathers and maintains statistics about the number of visitors as well as what information is viewed most frequently.
This information is used to improve the content and level of service we provide to our clients and shareholders.
|
| ANNUAL REPORT / April 30, 2015 |
| |
• |
Information or data entered into a website will be retained. |
| |
• |
Where registration to a website or re-entering personal information on a website is required, “cookies” are used to improve your
online experience. A cookie is a way for websites to recognize whether or not you have visited the site before. It is a small file that is stored on your computer that identifies you each time you re-visit our site so you don’t have to resubmit
personal information. Cookies provide faster access into the website. |
| |
• |
We may also collect non-personally identifiable Internet Protocol (“IP”) addresses for all other visitors to monitor the number of
visitors to the site. These non-personally identifiable IP addresses are never shared with any third party. |
E-mail:
If you have opted to receive marketing information from the Funds by e-mail, it is our policy to include instructions in all marketing messages
on how to unsubscribe from subsequent e-mail programs. Some products or services from the Funds are intended to be delivered and serviced electronically. E-mail communication may be utilized in such cases. If you participate in an employer-sponsored
retirement plan administered by the Funds, we may, at your employer’s request, send you e-mail on matters pertaining to the retirement plan.
Please do not provide any account or personal information such as social security numbers, account numbers, or account balances within your
e-mail correspondence to us. We cannot use e-mail to execute transaction instructions, provide personal account information, or change account registration. We can, however, use e-mail to provide you with the necessary forms or you may contact
customer service toll-free at 1-800-836-2211.
Surveys/Aggregate Data:
Periodically, the Funds may conduct surveys about financial products and services or review elements of customer information in an effort to
forecast future business needs. The Funds then generate reports that include aggregate data regarding its customers. Aggregate data classifies customer information in various ways but that does not identify individual customers. These reports may
also include information on website traffic patterns and related information. These reports are used for the Funds’ planning, statistical and other corporate purposes. Aggregate data may also be shared with external parties, such as marketing
organizations. However, no information is shared by which any individual customer could be identified.
Changes to Our Privacy Statement:
The effective date of this policy is June 8, 2012. We reserve the right to modify this policy at any time. When it is revised or materially
changed, we will update the effective date. You can determine whether there have been changes since the last time you reviewed by simply checking the effective date.
Notice will be provided to you in advance of any changes that would affect your rights under this policy statement
|
| April 30, 2015 / ANNUAL REPORT |
[This Page Intentionally Left Blank]
[This Page Intentionally Left Blank]

|
|
|
|
|
|
|
Wilmington Broad Market Bond Fund (“Broad Market Bond Fund”) |
|
|
|
|
|
|
|
Wilmington Intermediate-Term Bond Fund (“Intermediate-Term Bond Fund”) |
|
|
|
|
|
|
|
Wilmington Short-Term Bond Fund (formerly known as Wilmington Short-Term Corporate Bond Fund) (“Short-Term Bond Fund”) |
|
|
|
|
|
|
|
Wilmington Municipal Bond Fund (“Municipal Bond Fund”) |
|
|
|
|
|
|
|
Wilmington New York Municipal Bond Fund (“New York Municipal Bond Fund”) |
|
|

[This Page Intentionally Left Blank]
Dear Investor:
I am pleased to present the Annual Report of the Wilmington Funds (the “Trust”), covering the
Trust’s fiscal year of May 1, 2014, through April 30, 2015. Inside you will find a comprehensive review of the Funds’ holdings and financial statements.
The Economy and Financial Markets in Review
Wilmington Funds Management Corporation, the investment advisor to the Trust, and Wilmington Trust Investment
Advisors, Inc., the sub-advisor to the Trust, have provided the following review of the economy, bond markets, and stock markets for the Trust’s fiscal year.
The Economy
Economic reports painted an ambiguous picture of the U.S economy. The gross domestic product (GDP) expanded at
a very strong annualized rate in the 2nd and 3rd quarters of 2014 (+4.6% and +5.0%, respectively), but cooled off in the 4th quarter of 2014, recording a more modest 2.2% increase and posting a 0.7% decline in the 1st quarter of 2015.i
ihttp://www.bea.gov/index.htm
The headwinds responsible for this slowdown in economic growth were manifold. A dock worker strike at West
Coast ports, a strong U.S. dollar (and its concomitant drag on exports), sliding oil prices, and an unusually harsh winter all conspired to sap the building economic momentum.
Despite the uneven GDP performance, the employment situation steadily improved. Unemployment, which stood at
6.3% in May 2014, fell by nearly a full percentage point to 5.4% by April 2015, placing it in the range of what the Federal Reserve (the “Fed”) has come to view as “full
employment.”ii
iihttp://data.bls.gov/timeseries/LNS14000000
While the
unemployment picture brightened, the labor force participation rate remained unchanged at 62.8%.iii This rate is at a historical low and has shown little sign of bouncing back to pre-recession
levels.
iiihttp://data.bls.gov/timeseries/LNS11300000
Oil prices went on a wild ride, with West Texas Intermediate (WTI) crude falling nearly 60% in value, from
its $107.95 per barrel peak in June 2014 to a low of $43.39 on March 17th. Prices staged a partial recovery, rising to $59.62 by the end of April 2015.iv
ivhttp://www.eia.gov/dnav/pet/hist/LeafHandler.ashx?n=PET&s=RWTC&f=D
Though it might seem that declining oil prices would be a boost to the economy given their positive
impact on corporate earnings and consumer spending, the short-term effect was negative as oil-related companies ratcheted back their spending on capital goods. The expected boost from consumer spending was muted as individuals chose to reduce debt
with the savings accrued from lower gas prices, or adopt a wait-and-see attitude over whether lower prices would persist.
The Bond Markets
The bond market weathered the end of quantitative easing1
and performed well amid the persistent uncertainty of a hike in short-term rates by the Fed. While the path of the 10-year Treasury rate was a bit erratic, the direction was generally lower. The yield on the 10-year note, which was 2.65% at the
start of the Trust’s fiscal year, fell to 2.03% by April 30, 2015, after spending a substantial amount of time under 2% during the first quarter of 2015.v
vhttp://www.treasury.gov/resource-center/data-chart-center/interest-rates/Pages/TextView.aspx?data=yieldYear&year=2015
The Barclays U.S. Aggregate Index2 returned 4.46%
for the 12-month period ended April 30, 2015, powered by an increase of 15.06% in the Barclays U.S. Long Government Bond Index3.
Municipal bonds also turned in a good year, with the S&P Municipal Bond Intermediate Index4 gaining 3.94%.
The Barclays U.S. Corporate High Yield
Bond Index5, which returned a paltry 2.58%, was hampered by oil-related high yield bonds, which suffered as oil prices sagged.
Investors will be awaiting Fed interest rate policy actions in the latter half of 2015. The Fed has signaled
that it wishes to begin the process of normalizing monetary policy yet how the capital markets will react remains an open question.
|
| PRESIDENT’S MESSAGE / April 30, 2015(unaudited) |
ii
For the 12-month reporting period May 1, 2014 through
April 30, 2015, certain Barclays indices performed as follows6:
|
|
|
|
|
|
|
|
|
|
|
|
|
|
|
|
|
|
|
|
|
|
|
|
|
|
Barclays
U.S. Aggregate
Bond Index |
|
Barclays
U.S. Treasury
Bond Index7 |
|
Barclays
U.S. Mortgage-
Backed
Securities
Index8 |
|
Barclays
U.S. Credit
Bond Index9 |
|
Barclays
Municipal Bond
Index10
|
|
|
| 4.46% |
|
|
|
4.23% |
|
|
|
|
4.61% |
|
|
|
|
4.87% |
|
|
|
|
4.80% |
|
|
|
The Stock Markets
The current bull market in stocks entered its seventh year. Though economic growth and corporate earnings
deserve their fair share of the credit for this extended stock rally, the Federal Reserve policies of quantitative easing and low rates have provided substantial support to stock prices during this time.
With the end to quantitative easing in the 4th quarter of 2014, the markets remained fixated on when the Fed
might raise short-term rates. The mixed signals that each new economic report sent about the underlying strength of the economy was enough for the Fed to postpone a rate hike into the 2nd half of 2015, helping the markets record solid gains during
the Trust’s fiscal year period.
Through the period May 1, 2014 to April 30, 2015, the
S&P 500 index11 jumped 12.98%, the S&P MidCap 400 Index12 rose 12.28% and the S&P SmallCap 600 Index13 turned in a gain of 9.24%.
While smaller-cap stocks
underperformed for the full 12-month period, they raced ahead of large-cap stocks in the latter part of the period, aided, in part, by a lower exposure to foreign markets, which has become challenging to large companies because of the strengthening
U.S. dollar.
Growth stocks proved to be far better performers than value stocks, as evidenced by the
return gap between the S&P 500 Growth Index14 (+16.32%) and the S&P 500 Value Index15 (+9.43%). This return disparity was also
evident in the mid-cap and small-cap sectors which, while not as wide, were on the order of 400 basis points (4.0%).
The U.S. markets were driven by the healthcare (+25.12%), information technology (+20.53%) and consumer
discretionary (+19.84%) sectors. The only sector to lose ground was energy, which declined 9.84%. Real estate also enjoyed a strong year, as reflected in the +13.22% return in the FTSE NAREIT Equity REITs Index16.
International stocks trailed U.S. markets, with the
MSCI EAFE (Net) Index17 netting a small gain of 1.66%. Overseas markets were hampered by weak economic growth and a tight credit environment. However, following the implementation by the European
Central Bank (ECB) and the Bank of Japan (BOJ) of their own forms of quantitative easing, economic growth and investor enthusiasm for stocks picked up. In the three-month period, ending April 30, 2015, the MSCI EAFE Index turned positive,
gaining 8.63%.
For the 12-month reporting period May 1, 2014 through April 30, 2015, certain
stock market indices performed as follows:
|
|
|
|
|
|
|
|
|
|
|
|
|
|
|
|
|
|
S&P 500
Index |
|
Dow Jones
Industrial Average18 |
|
NASDAQ
Composite Index19 |
|
MSCI All
Country
World ex-US (Net)
Index20 |
|
|
| 12.98% |
|
|
|
10.11% |
|
|
|
|
21.52% |
|
|
|
|
2.63% |
|
|
|
I want to thank you for your continued trust in allowing us to help you reach
your important financial goals. We understand the profound responsibility you have placed with us in managing your investments. We work hard every day to ensure that we continue to deserve your confidence.
Sincerely,

Christopher D. Randall
President
May 29, 2015
For more complete information, please download the Funds’ prospectus, which is available on
www.wilmingtonfunds.com, or call 1-800-836-2211 for a copy. You should consider the Funds’ investment objectives, risks, charges, and expenses carefully before you invest. Information about these and other important subjects is in the
Funds’ prospectus, which you should read carefully before investing.
|
| April 30, 2015(unaudited) / PRESIDENT’S MESSAGE |
Past performance is no guarantee of future results. The index
performance quoted is for illustrative purposes only and is not representative of any specific investment. Diversification does not ensure a profit nor protect against loss.
All investments involve risk, including the possible loss of principal. Equity Securities are subject to
price fluctuation and possible loss of principal. Small and mid-cap stocks involve greater risks and volatility than large-cap stocks. International investments are subject to special risks, including currency fluctuations, social, economic, and
political uncertainties, which could increase volatility. These risks are magnified in emerging markets.
High yield, lower-rated securities generally entail greater market, credit and liquidity risks than
investment grade securities and may include higher volatility and higher risk of default.
An
investment in money market funds is neither insured nor guaranteed by the Federal Deposit Insurance Corporation or any other government agency. Although money market funds seek to preserve the value of your investment at $1.00 per share, it is
possible to lose money by investing in these funds.
| |
1. |
Quantitative Easing (QE) is a government monetary policy occasionally used to increase the money supply by buying government securities or other securities from the market. Quantitative Easing increases the money supply
by flooding the financial institutions with capital, in an effort to promote increased lending and liquidity loss. |
|
| |
2. |
Barclays U.S. Aggregate Bond Index is a widely used benchmark index for the domestic investment-grade bond market composed of securities from the Barclays Government/Corporate Bond Index, Mortgage-Backed Securities
Index and Asset-Backed Securities Index. The index typically includes fixed income securities with overall intermediate - to long-term average maturities. The index is unmanaged and investments cannot be made directly in an index. |
|
| |
3. |
Barclays U.S. Long Government Bond Index tracks the market for U.S. dollar-denominated, fixed rate, nominal U.S. Treasuries (with the exception of Federal Reserve holdings of U.S. Treasuries) and U.S. agency debentures
(with the exception of those U.S. agency debentures held in the Federal Reserve SOMA account). To be included in this index, securities must have at least 10 years to final maturity. |
|
| |
4. |
S&P Municipal Bond Intermediate Index is a broad, market value-weighted index that seeks to measure the performance of the U.S. municipal bond market. |
|
| |
5. |
Barclays U.S. Corporate High Yield Bond Index measures the USD-denominated, high yield, fixed-rate corporate bond market. Securities are classified as high yield if the middle rating of Moody’s, Fitch, and S&P
is Ba1/BB+/BB+ or below. Bonds from issuers with an emerging markets country of risk, based on Barclays EM country definition, are excluded. The U.S. Corporate High Yield Bond Index is a component of the U.S. Universal and Global High Yield Indices.
|
|
| |
6. |
Bond prices are sensitive to changes in interest rates and a rise in interest rates can cause a decline in their prices. |
|
| |
7. |
Barclays U.S. Treasury Bond Index is a market capitalization weighted index that includes all publicly issued, U.S. Treasury securities that have a remaining maturity of at least one year, are rated investment-grade,
and have $250 million or more of outstanding face value. The index is unmanaged and investments cannot be made directly in an index. |
|
| |
8. |
Barclays U.S. Mortgage Backed Securities Index is composed of all securities mortgage pools by GNMA, FNMA and the FHLMC, including GNMA graduated Payment Mortgages. The index is unmanaged and investments cannot be made
directly in an index. |
|
| |
9. |
Barclays U.S. Credit Bond Index tracks the performance of domestic investment-grade corporate bonds and is composed of all publicly issued, fixed-rate, nonconvertible, investment-grade corporate debt. The index is
unmanaged and investments cannot be made directly in an index. |
|
| |
10. |
Barclays Municipal Bond Index tracks the performance of long-term, tax-exempt, investment-grade bond market. To be included in the index, bonds must have an outstanding par balance of at least $7 million and be issued
as part of a transaction of at least $75 million. The index is unmanaged and investments cannot be made directly in an index. |
|
| |
11. |
The S&P 500 Index is a capitalization-weighted index of 500 stocks designed to measure performance of the broad domestic economy through changes in the aggregate market value of 500 stocks representing all major
industries. The index is unmanaged and investments cannot be made directly in an index. |
|
| |
12. |
The S&P MidCap 400 Index measures the mid cap segment of the U.S. equity market. To be included in the index, a stock must have a total market capitalization that ranges from roughly $750 million to $3.3 billion.
|
|
| |
13. |
The S&P SmallCap 600 Index measures the small cap segment of the U.S. equity market. The index is designed to be an investable portfolio of companies that meet specific inclusion criteria to ensure that they are
liquid and financially viable. The index is unmanaged and investments cannot be made directly in an index. |
|
| |
14. |
The S&P 500 Growth Index measures growth stocks using three factors: sales growth, the ratio of earnings change to price, and momentum. S&P Style Indices divide the complete market capitalization of each parent
index into growth and value segments. Constituents are drawn from the S&P 500 Index. The index is unmanaged and investments cannot be made directly in an index. |
|
| |
15. |
The S&P 500 Value Index measures value stocks using three factors: the ratios of book value, earnings, and sales to price. S&P Style Indices divide the complete market capitalization of each parent index into
growth and value segments. Constituents are drawn from the S&P 500 Index. The index is unmanaged and investments cannot be made directly in an index. |
|
| |
16. |
FTSE NAREIT Equity REITs Index is a free-float adjusted, market capitalization-weighted index of U.S. Equity REITs. Constituents of the Index include all tax-qualified REITs with more than 50 percent of total assets in
qualifying real estate assets other than mortgages secured by real property. |
|
| |
17. |
MSCI EAFE (Net) Index is a free float-adjusted market capitalization index that is designed to measure equity market performance of developed markets, excluding the U.S. & Canada. The index consisted of the
following 22 developed market country indices: Australia, Austria, Belgium, Denmark, Finland, France, Germany, Greece, Hong Kong, Ireland, Israel, Italy, Japan, Netherlands, New Zealand, Norway, Portugal, Singapore, Spain, Sweden, Switzerland and
the United Kingdom. The index is unmanaged and investments cannot be made directly in an index. |
|
| |
18. |
Dow Jones Industrial Average (“DJIA”) represents share prices of selected blue chip industrial corporations as well as public utility and transportation companies. The DJIA indicates daily changes in the
average prices of stocks in any of its categories. It also reports total sales for each group of industries. Because it represents the top corporations of America, the DJIA’s average movements are leading economic indicators for the stock
market as a whole. The average is unmanaged and investments cannot be made directly in an average. |
|
| |
19. |
NASDAQ Composite Index measures all NASDAQ domestic and non-U.S. based common stocks listed on the NASDAQ Stock Market. The index is unmanaged and investments cannot be made directly in an index. |
|
| |
20. |
MSCI All Country World ex-US (Net) Index is a free float-adjusted market capitalization weighted index that is designed to measure the equity market performance of developed and emerging markets excluding the U.S.
market. The index consists of 44 countries indices comprising 23 developed and 21 emerging market country indices. The index is unmanaged and investments cannot be made directly in an index. |
|
|
| PRESIDENT’S MESSAGE / April 30, 2015(unaudited) |
[This Page Intentionally Left Blank]
WILMINGTON BROAD MARKET BOND FUND
Management’s Discussion of Fund Performance
For the fiscal year ended April 30, 2015, Wilmington Broad Market Bond Fund
(the “Fund”) had a total return of 3.69%* for Class A Shares and 4.19%* for Class I Shares, versus its benchmark, the Barclays Capital U.S. Aggregate Bond Index**, which had a total return of 4.46%, and its peer group, the Lipper
Corporate A-Rated Debt Funds Average***, which had a total return of 4.70%.
The bond market rebounded during the past
fiscal year as intermediate and long-term interest rates moved lower in response to plummeting energy prices, a Federal Reserve (the “Fed”) that remains accommodative and a European Central Bank that implemented its own quantitative easing
program. Shorter-term interest rates moved slightly higher as the market began to expect the Fed to start tightening monetary policy later this year. The corporate bond market underperformed as investors required higher risk premiums to accommodate
another year of record supply.
Economic growth for the 12-month period ended March 31, 2015 improved to 3% as
measured by the GDP (gross domestic product). The consumer continued to pull their weight as evidenced by another year of strong auto sales. What was remarkable about this growth rate was that it included the two best consecutive quarters of
economic growth since 2003. GDP for the 2nd and 3rd quarters of 2014 was 4.6% and 5.0%, respectively. Once again the 1st quarter of 2015 was negatively impacted by harsh winter weather as GDP declined by 0.7%. We anticipate economic growth will pick
up for the remainder of 2015 as the weather improves. The labor market continued to improve as companies fired fewer employees, initial jobless claims have fallen to a 15-year low and the unemployment rate has declined to 5.4%. Over the past several
months, we have seen the manufacturing sector weaken as the stronger dollar has led to exported manufactured goods to be less competitive. The Institute for Supply Managements (ISM) surveys has weakened and industrial production has been shrinking.
Oil prices fell from a high of $107 per barrel to a low of $43.39 per barrel over the course of the fiscal year. The
catalyst for the sharp decline was increased supply from U.S. oil producers and weaker demand as China and European economic growth slowed. The sharp decline of energy prices caused the Consumer Price Index (CPI) to fall -0.02% in the fiscal year.
The less volatile core CPI, which excludes food and energy, increased by 1.8% this fiscal year. Wage growth also remains anemic, increasing at only a 2.2% annualized rate over the past year as there continues to be slack in the jobs market.
The yield curve flattened over the fiscal year as long-term interest rates moved lower in response to weaker inflation and in
response to European sovereign yields declining to all-time low yields and in some maturities fell to negative yields. The catalyst for the decline of European yields was the ECB’s implementation of a quantitative easing program, which is
similar to what the Fed had initiated several years ago, to stimulate economic growth and fears of deflation in the Eurozone. The low European yields acted as a “magnet” to pull U.S. treasury yields lower. However, short-term U.S. yields
moved higher over the course of the fiscal year in response to the Fed tapering its purchase of additional securities and their intention to begin raising short-term interest rates. The 10-Year U.S. Treasury
yield at April 30 was 2.03%, down from 2.65% from the start of the fiscal year. The 2-Year U.S. Treasury yield rose only 0.16% during the same period to a yield of 0.57%.
The corporate bond market underperformed over the fiscal year as the energy sector severely underperformed as investors required higher risk
premiums to compensate for the expectations of diminished earnings given the sharp decline in revenues associated with much lower oil prices. For the fiscal year, the corporate sector produced -124 basis points of excess return. The Energy portion
of the corporate sector produced -465 basis points of excess return. In contrast, the Finance sector produced 10 basis points of excess return as the banks continue to see asset quality improve and capital levels increase. The average risk premium
as measured by the Barclays U.S. Corporate Bond Index increased by 27 basis points to 128 basis points for the average investment grade bond over the past fiscal year. Also weighing on risk premiums was another year of record issuance as issuers
looked to take advantage of the low interest rate environment.
The mortgage backed sector slightly outperformed, providing 3 basis points
of excess return as the Fed continued to replace maturing mortgages and new supply was manageable given the tepid housing market.
Looking
forward, we anticipate economic growth to pick up from the weather induced slowdown of the quarter ended March 31, 2015. We also anticipate inflation to remain benign and the Fed to begin normalizing short-term interest rates by modestly
raising short-term interest rates later this year. With respect to interest rates, we do expect them to move higher in anticipation of the Fed raising short-term interest rates later this year.
The Fund’s underperformance can be attributed to our decision to remain overweight the corporate sector of the bond market which
underperformed. Although we reduced our allocation last summer from a sector weighting and an average maturity perspective, we still remained overweight versus the benchmark. We also maintained an underweight to the mortgage backed sector versus the
benchmark, while this sector provided slight outperformance. Our duration strategy of remaining slightly shorter than the benchmark’s duration had little impact on relative performance. Our yield curve strategy to maintain a benchmark weighting
to the long end of the yield curve aided performance as the yield curve flattened and this portion of the yield curve outperformed the shorter end of the yield curve.
| * |
Performance data quoted represents past performance, which is no guarantee of future results. Investment return and principal value will
fluctuate so that an investor’s shares, when redeemed, may be worth more or less than their original cost. The total return shown assumes the reinvestment of all distributions and does not reflect the deduction of taxes that a shareholder would
pay on fund distributions or the redemption of shares. The total return for Class A Shares was -0.96%, adjusted
|
|
| ANNUAL REPORT / April 30, 2015 (unaudited) |
for the Fund’s maximum sales charge. Mutual fund performance changes over time and current performance may be lower or higher than what is stated. For the most recent month-end performance,
please visit www.wilmingtonfunds.com or call 1-800-836-2211.
| |
** |
The Barclays Capital U.S. Aggregate Bond Index is an index measuring both the capital price changes and income provided by the underlying universe
of securities, comprised of U.S. Treasury obligations, U.S. investment grade corporate debt and mortgage backed obligations. The index is unmanaged and it is not possible to invest directly in an index. |
| |
*** |
Lipper figures represent the average of the total returns reported by all of the mutual funds designated by Lipper, Inc. as falling into the
respective category indicated. These figures do not reflect sales charges. |
Bond prices are sensitive
to changes in interest rates and a rise in short-term interest rates could cause a decline in bond prices.
Quantitative
Easing (QE) is government monetary policy occasionally used to increase the money supply by buying government securities or other securities from the market. Quantitative easing increases the money supply by flooding the financial institutions with
capital, in an effort to promote increased lending and liquidity.
GDP (gross domestic product) is the monetary value of
all the finished goods and services produced within a country’s borders in a specific time period, though GDP is usually calculated on an annual basis. It includes all of private and public consumption, government outlays, investments and
exports less imports that occur within a defined territory.
Consumer Price Index (CPI) is a measure that examines the
weighted average of prices of a basket of consumer goods and services, such as transportation, food and medical care. The CPI is calculated by taking price changes for each item in the predetermined basket of goods and averaging them; the goods are
weighted according to their importance. Changes in CPI are used to assess price changes associated with the cost of living.
Duration is a measure of a security’s price sensitivity to changes in interest rates. Securities with longer durations
are more sensitive to changes in interest rates than securities of shorter durations.
The Barclays U.S. Corporate Index
is a broad-based benchmark that measures the investment grade, U.S. dollar-denominated, fixed-rate, taxable corporate bond market. It includes USD-denominated securities publicly issued by U.S. and non-U.S. industrial, utility, and financial issuers
that meet specified maturity, liquidity, and quality requirements.
Basis Points (BPS) is a unit that is equal to 1/100th
of 1% and is used to denote the change in a financial instrument. The basis point is commonly used for calculating changes in interest rates, equity indices and the yield of a fixed-income security.
Excess Return is a security or sector’s return minus the return from a U.S. Treasury of similar maturity or duration.
|
| April 30, 2015 (unaudited) / ANNUAL REPORT |
WILMINGTON BROAD MARKET BOND FUND – CLASS A
The graph below illustrates the hypothetical investment of $10,0001 in the
Wilmington Broad Market Bond Fund (Class A) (the “Fund”) from April 30, 2005 to April 30, 2015, compared to the Barclays Capital U.S. Aggregate Bond Index (“BCAB”).2
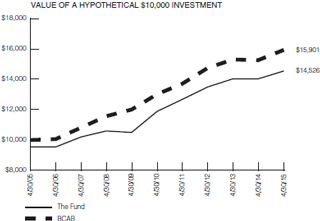
Average Annual Total Returns for the Periods Ended April 30, 2015
|
|
|
|
|
| |
|
|
| 1 Year
|
|
-0.96% |
| 5 Years
|
|
3.15% |
| 10 Years
|
|
3.80% |
Performance data quoted represents past performance which is no guarantee of future results. Returns shown do not reflect the deduction
of taxes that a shareholder would pay on Fund distributions or the redemption of Fund shares. Investment return and principal value will fluctuate so that an investor’s shares, when redeemed, may be worth more or less than their original cost.
Mutual funds are not obligations of or guaranteed by any bank and are not federally insured. Mutual fund performance changes over time and current performance may be lower or higher than what is stated. For current to the most recent month end
performance, visit www.wilmingtonfunds.com or call 1-800-836-2211. Total returns shown include the maximum sales charge of 4.50% for Class A.
Annual Operating
Expense Ratio
|
|
|
|
|
| |
|
|
|
Before Waivers |
|
1.12% |
|
After Waivers |
|
0.90% |
The Expense Ratio Before Waivers represents the operating costs borne by the Fund, expressed as a percentage of the Fund’s average
net assets, as shown in the Fees and Expenses table in the Fund’s current prospectus (under “Total Annual Fund Operating Expenses”).
| 1 |
Represents a hypothetical investment of $10,000 in Class A of the Fund after deducting the maximum sales charge of 4.50% ($10,000 investment minus $450 sales charge = $9,550). The Fund’s performance assumes
the reinvestment of all dividends and distributions. |
| 2 |
The performance for the BCAB assumes the reinvestment of all dividends and distributions but does not reflect the deduction of a sales charge required for the Fund’s performance by the Securities and Exchange
Commission. It is not possible to invest directly in an index, and the represented index is unmanaged.
|
|
| ANNUAL REPORT / April 30, 2015 (unaudited) |
WILMINGTON BROAD MARKET BOND FUND – CLASS I
The graph below illustrates the hypothetical investment of $1,000,0001.2
in the Wilmington Broad Market Bond Fund (Class I) (the “Fund”) from April 30, 2005 to April 30, 2015, compared to the Barclays Capital Aggregate Bond Index
(“BCAB”).2
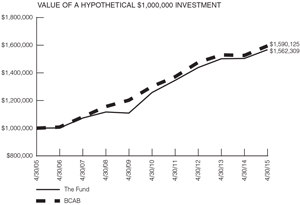
Average Annual Total Returns for the Periods Ended April 30, 2015
|
|
|
|
|
| |
|
|
| 1 Year
|
|
4.19% |
| 5 Years
|
|
4.47% |
| 10 Years
|
|
4.56% |
Performance data quoted represents past performance which is no guarantee of future results. Returns shown do not reflect the deduction
of taxes that a shareholder would pay on Fund distributions or the redemption of Fund shares. Investment return and principal value will fluctuate so that an investor’s shares, when redeemed, may be worth more or less than their original cost.
Mutual funds are not obligations of or guaranteed by any bank and are not federally insured. Mutual fund performance changes over time and current performance may be lower or higher than what is stated. For current to the most recent month end
performance, visit www.wilmingtonfunds.com or call 1-800-836-2211.
Annual Operating Expense Ratio
|
|
|
|
|
| |
|
|
|
Before Waivers |
|
0.87% |
|
After Waivers |
|
0.55% |
The Expense Ratio Before Waivers represents the operating costs borne by the Fund, expressed as a percentage of the Fund’s average
net assets, as shown in the Fees and Expenses table in the Fund’s current prospectus (under “Total Annual Fund Operating Expenses”).
| 1 |
Represents a hypothetical investment of $1,000,000 in Class I of the Fund and assumes the reinvestment of all dividends and distributions. |
| 2 |
The performance for the BCAB assumes the reinvestment of all dividends and distributions. It is not possible to invest directly in an index, and the represented index is unmanaged.
|
|
| April 30, 2015 (unaudited) / ANNUAL REPORT |
WILMINGTON INTERMEDIATE-TERM BOND FUND
Management’s Discussion of Fund Performance
For the fiscal year ended April 30, 2015, Wilmington Intermediate-Term Bond
Fund (the “Fund”) had a total return of 2.14%* for Class A Shares, and 2.57%* for Class I Shares, versus its benchmark, the Barclays Capital Intermediate U.S. Government/Credit Bond Index**, which had a total return of 3.02% and its
peer group, the Lipper Short-Intermediate Investment Grade Debt Funds Average***, which had a total return of 1.66%.
The
bond market rebounded during the past fiscal year as intermediate and long-term interest rates moved lower in response to plummeting energy prices, a Federal Reserve (the “Fed”) that remains accommodative and a European Central Bank that
implemented its own quantitative easing program. Shorter-term interest rates moved slightly higher as the market began to expect the Fed to start tightening monetary policy later this year. The corporate bond market underperformed as investors
required higher risk premiums to accommodate another year of record supply.
Economic growth for the 12-month period ended
March 31, 2015 improved to 3% as measured by the GDP (gross domestic product). The consumer continued to pull their weight as evidenced by another year of strong auto sales. What was remarkable about this growth rate was that it included the
two best consecutive quarters of economic growth since 2003. GDP for the 2nd and 3rd quarters of 2014 was 4.6% and 5.0%, respectively. Once again the 1st quarter of 2015 was negatively impacted by harsh winter weather as GDP only declined by 0.7%.
We anticipate economic growth will pick up for the remainder of 2015 as the weather improves. The labor market continued to improve as companies fired fewer employees, initial jobless claims have fallen to a 15-year low and the unemployment rate has
declined to 5.4%. Over the past several months, we have seen the manufacturing sector weaken as the stronger dollar has led to exported manufactured goods to be less competitive. The Institute for Supply Managements (ISM) surveys has weakened and
industrial production has been shrinking.
Oil prices fell from a high of $107 per barrel to a low of $43.39 per barrel
over the course of the fiscal year. The catalyst for the sharp decline was increased supply from U.S. oil producers and weaker demand as China and European economic growth slowed. The sharp decline of energy prices caused the Consumer Price Index
(CPI) to fall -0.2% in the fiscal year. The less volatile core CPI, which excludes food and energy, increased by 1.8% this fiscal year. Wage growth also remains anemic, increasing at only a 2.2% annualized rate over the past year as there continues
to be slack in the jobs market.
The yield curve flattened over the fiscal year as long-term interest rates moved lower in
response to weaker inflation and in response to European sovereign yields declining to all-time low yields and in some maturities fell to negative yields. The catalyst for the decline of European yields was the ECB’s implementation of a
quantitative easing program, which is similar to what the Fed had initiated several years ago, to stimulate economic growth and fears of deflation in the Eurozone. The low European yields acted as a “magnet” to pull U.S. treasury yields
lower. However, short-term U.S. yields moved higher over the course of the fiscal year in response to the Fed tapering its purchase of additional securities and their intention
to begin raising short-term interest rates. The 10-Year U.S. Treasury yield at April 30 was 2.03%, down from 2.65% from the start of the fiscal year. The 2-Year U.S. Treasury yield rose only
0.16% during the same period to a yield of 0.57%.
The corporate bond market underperformed over the fiscal year as the energy sector
severely underperformed as investors required higher risk premiums to compensate for the expectations of diminished earnings given the sharp decline in revenues associated with much lower oil prices. For the fiscal year, the corporate sector
produced -124 basis points of excess return. The Energy portion of the corporate sector produced -465 basis points of excess return. In contrast, the Finance sector produced 10 basis points of excess return as the banks continue to see asset quality
improve and capital levels increase. The average risk premium as measured by the Barclays U.S. Corporate Bond Index increased by 27 basis points to 128 basis points for the average investment grade bond over the past fiscal year. Also weighing on
risk premiums was another year of record issuance as issuers looked to take advantage of the low interest rate environment.
The mortgage
backed sector slightly outperformed, providing 3 basis points of excess return as the Fed continued to replace maturing mortgages and new supply was manageable given the tepid housing market.
Looking forward, we anticipate economic growth to pick up from the weather induced slowdown of the quarter ended March 31, 2015. We also
expect inflation to remain benign and the Fed to begin normalizing short-term interest rates by modestly raising short-term interest rates later this year. With respect to interest rates, we do expect them to move higher in anticipation of the Fed
raising short-term interest rates later this year.
The underperformance of the Fund relative to the benchmark can partially be attributed
to the Fund’s overweight position in corporate bonds. Although exposure to credit was reduced during the fiscal year, the Fund maintained a higher allocation to credit than the benchmark index. For the fiscal year, the corporate sector produced
-124 basis points of excess return. The option adjusted spread of the Barclays U.S. Corporate Bond Index increased by 27 basis points to 128 basis points over the same time period. In addition, Fund performance was negatively impacted by the
significant decline in long-term U.S. Treasury yields. The yield curve flattened over the fiscal year as long-term interest rates moved lower in response to European sovereign yields declining to all-time low yields. The 10-year U.S. Treasury yield
at April 30 was 2.03%, down from 2.65% from the start of the fiscal year.
| * |
Performance data quoted represents past performance, which is no guarantee of future results. Investment return and principal value will
fluctuate so that an investor’s shares, when redeemed, may be worth more or less than their original cost. The total return shown assumes the reinvestment of all distributions and does not reflect the deduction of taxes that a shareholder would
pay on fund distributions or the redemption of shares. The |
|
| ANNUAL REPORT / April 30, 2015 (unaudited) |
total return for Class A Shares was -2.49%, adjusted for the Fund’s maximum sales charge. Mutual fund performance changes over time and current performance may be lower or higher than
what is stated. For the most recent month-end performance, please visit www.wilmingtonfunds.com or call 1-800-836-2211.
| |
** |
The Barclays Capital Intermediate U.S. Government/Credit Bond Index is a widely recognized, market value weighted index of U.S. Treasury securities,
U.S. government agency obligations, corporate debt securities, Yankee bonds and non-convertible corporate debt securities issued by or guaranteed by foreign governments and agencies. The index is unmanaged and it is not possible to invest directly
in an index. |
| |
*** |
Lipper figures represent the average of the total returns reported by all of the mutual funds designated by Lipper, Inc. as falling into the
respective category indicated. These figures do not reflect sales charges. |
Bond prices are sensitive
to changes in interest rates and a rise in short-term interest rates could cause a decline in bond prices.
Quantitative
Easing (QE) is government monetary policy occasionally used to increase the money supply by buying government securities or other securities from the market. Quantitative easing increases the money supply by flooding the financial institutions with
capital, in an effort to promote increased lending and liquidity.
GDP (gross domestic product) is the monetary value of
all the finished goods and services produced within a country’s borders in a specific time period, though GDP is usually calculated on an annual basis. It includes all of private and public consumption, government outlays, investments and
exports less imports that occur within a defined territory.
Consumer Price Index (CPI) is a measure that examines the
weighted average of prices of a basket of consumer goods and services, such as transportation, food and medical care. The CPI is calculated by taking price changes for each item in the predetermined basket of goods and averaging them; the goods are
weighted according to their importance. Changes in CPI are used to assess price changes associated with the cost of living.
The Barclays Corporate Index is a broad-based benchmark that measures the investment grade, U.S. dollar-denominated,
fixed-rate, taxable corporate bond market. It includes USD-denominated securities publicly issued by U. S. and non-U.S. industrial, utility, and financial issuers that meet specified maturity, liquidity, and quality requirements.
Basis Points (BPS) is a unit that is equal to 1/100th of 1% and is used to denote the change in a financial instrument. The
basis point is commonly used for calculating changes in interest rates, equity indices and the yield of a fixed-income security.
The Barclays U.S. Credit Index comprises the U.S. Corporate Index and a non-corporate component that includes foreign
agencies, sovereigns, supranationals and local authorities. The U.S. Credit Index was called the U.S. Corporate Investment Grade Index until July 2000, when it was renamed to reflect its inclusion of both corporate and non-corporate issuers.
Excess Return is a security or sector’s return minus the return from a U.S. Treasury of similar maturity or duration.
|
| April 30, 2015 (unaudited) / ANNUAL REPORT |
WILMINGTON INTERMEDIATE-TERM BOND FUND – Class A
The graph below illustrates the hypothetical investment of $10,0001 in
the Wilmington Intermediate-Term Bond Fund (Class A) (the “Fund”) from April 30, 2005 to April 30, 2015, compared to the Barclays Capital Intermediate Government/Credit Bond Index (“BCIGC”).2
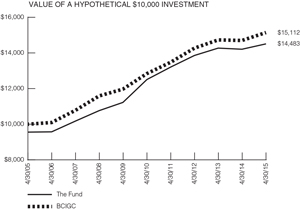
Average Annual Total Returns for the Periods Ended April 30, 2015
|
|
|
|
|
| |
|
|
| 1 Year
|
|
-2.49% |
| 5 Years
|
|
2.06% |
| 10 Years
|
|
3.77% |
Performance data quoted represents past performance which is no guarantee of future results. Returns shown do not reflect the deduction
of taxes that a shareholder would pay on Fund distributions or the redemption of Fund shares. Investment return and principal value will fluctuate so that an investor’s shares, when redeemed, may be worth more or less than their original cost.
Mutual funds are not obligations of or guaranteed by any bank and are not federally insured. Mutual fund performance changes over time and current performance may be lower or higher than what is stated. For current to the most recent month end
performance, visit www.wilmingtonfunds.com or call 1-800-836-2211. Total returns shown include the maximum sales charge of 4.50% for Class A.
Annual Operating
Expense Ratio
|
|
|
|
|
| |
|
|
|
Before Waivers |
|
1.11% |
|
After Waivers |
|
0.88% |
The Expense Ratio Before Waivers represents the operating costs borne by the Fund, expressed as a percentage of the Fund’s average
net assets, as shown in the Fees and Expenses table in the Fund’s current prospectus (under “Total Annual Fund Operating Expenses”).
| 1 |
Represents a hypothetical investment of $10,000 in Class A of the Fund after deducting the maximum sales charge of 4.50% ($10,000 investment minus $450 sales charge = $9,550). The Fund’s performance assumes
the reinvestment of all dividends and distributions. |
| 2 |
The performance for the BCIGC assumes the reinvestment of all dividends and distributions but does not reflect the deduction of a sales charge required for the Fund’s performance by the Securities and Exchange
Commission. It is not possible to invest directly in an index, and the represented index is unmanaged. |
|
| ANNUAL REPORT / April 30,2015 (unaudited) |
WILMINGTON INTERMEDIATE-TERM BOND FUND – Class I
The graph below illustrates the hypothetical investment of $1,000,0001.2
in the Wilmington Intermediate-Term Bond Fund (Class I) (the “Fund”) from April 30, 2005 to April 30, 2015, compared to the Barclays Capital Intermediate Government/Credit Bond Index (“BCIGC”).2
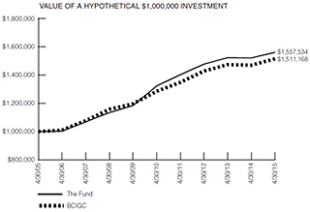
Average Annual Total Returns for the Periods Ended April 30, 2015
|
|
|
|
|
| |
|
|
| 1 Year
|
|
2.57% |
| 5 Years
|
|
3.36% |
| 10 Years
|
|
4.53% |
Performance data quoted represents past performance which is no guarantee of future results. Returns shown do not reflect the deduction
of taxes that a shareholder would pay on Fund distributions or the redemption of Fund shares. Investment return and principal value will fluctuate so that an investor’s shares, when redeemed, may be worth more or less than their original cost.
Mutual funds are not obligations of or guaranteed by any bank and are not federally insured. Mutual fund performance changes over time and current performance may be lower or higher than what is stated. For current to the most recent month end
performance, visit www.wilmingtonfunds.com or call 1-800-836-2211.
Annual Operating Expense Ratio
|
|
|
|
|
| |
|
|
|
Before Waivers |
|
0.86% |
|
After Waivers |
|
0.53% |
The Expense Ratio Before Waivers represents the operating costs borne by the Fund, expressed as a percentage of the Fund’s average
net assets, as shown in the Fees and Expenses table in the Fund’s current prospectus (under “Total Annual Fund Operating Expenses”).
| 1 |
Represents a hypothetical investment of $1,000,000 in Class I of the Fund and assumes the reinvestment of all dividends and distributions. |
| 2 |
The performance for the BCIGC assumes the reinvestment of all dividends and distributions. It is not possible to invest directly in an index, and the represented index is unmanaged.
|
|
| April 30, 2015 (unaudited) / ANNUAL REPORT |
WILMINGTON SHORT-TERM BOND FUND
Management’s Discussion of Fund Performance
For the fiscal year ended April 30, 2015, Wilmington Short-Term Bond Fund
(the “Fund”) had a total return of 0.51%* for Class A Shares and 0.76%* for Class I Shares, versus its benchmark, the Barclays Capital 1-3 Year U.S. Government/Credit Bond Index**, which had a total return of 1.05%, and its peer
group, the Lipper Short Investment Grade Debt Funds Average***, which had a total return of 0.82%.
The bond market
rebounded during the past fiscal year as intermediate and long-term interest rates moved lower in response to plummeting energy prices, a Federal Reserve (the “Fed”) that remains accommodative and a European Central Bank that implemented
its own quantitative easing program. Shorter-term interest rates moved slightly higher as the market began to expect the Fed to start tightening monetary policy later this year. The corporate bond market underperformed as investors required higher
risk premiums to accommodate another year of record supply.
Economic growth for the 12-month period ended March 31,
2015 improved to 3% as measured by the GDP (gross domestic product). The consumer continued to pull their weight as evidenced by another year of strong auto sales. What was remarkable about this growth rate was that it included the two best
consecutive quarters of economic growth since 2003. GDP for the 2nd and 3rd quarters of 2014 was 4.6% and 5.0%, respectively. Once again the 1st quarter of 2015 was negatively impacted by harsh winter weather as GDP declined by 0.7%. We anticipate
economic growth will pick up for the remainder of 2015 as the weather improves. The labor market continued to improve as companies fired fewer employees, initial jobless claims have fallen to a 15-year low and the unemployment rate has declined to
5.4%. Over the past several months, we have seen the manufacturing sector weaken as the stronger dollar has led to exported manufactured goods to be less competitive. The Institute for Supply Managements (ISM) surveys has weakened and industrial
production has been shrinking.
Oil prices fell from a high of $107 per barrel to a low of $43.39 per barrel over the
course of the fiscal year. The catalyst for the sharp decline was increased supply from U.S. oil producers and weaker demand as China and European economic growth slowed. The sharp decline of energy prices caused the Consumer Price Index (CPI) to
fall -0.2% in the fiscal year. The less volatile core CPI, which excludes food and energy, increased by 1.8% this fiscal year. Wage growth also remains anemic, increasing at only a 2.2% annualized rate over the past year as there continues to be
slack in the jobs market.
The yield curve flattened over the fiscal year as long-term interest rates moved lower in
response to weaker inflation and in response to European sovereign yields declining to all-time low yields and in some maturities fell to negative yields. The catalyst for the decline of European yields was the ECB’s implementation of a
quantitative easing program, which is similar to what the Fed had initiated several years ago to stimulate economic growth and fears of deflation in the Eurozone. The low European yields acted as a “magnet” to pull U.S. treasury yields
lower. However, short-term U.S. yields moved higher over the course of the fiscal year in response to the Fed tapering its purchase of additional securities and their intention
to begin raising short-term interest rates. The 10-Year U.S. Treasury yield at April 30 was 2.03%, down from 2.65% from the start of the fiscal year. The 2-Year U.S. Treasury yield rose only
0.16% during the same period to a yield of 0.57%.
The corporate bond market underperformed over the fiscal year as the energy sector
severely underperformed as investors required higher risk premiums to compensate for the expectations of diminished earnings given the sharp decline in revenues associated with much lower oil prices. For the fiscal year, the corporate sector
produced -124 basis points of excess return. The Energy portion of the corporate sector produced -465 basis points of excess return. In contrast, the Finance sector produced 10 basis points of excess return as the banks continue to see asset quality
improve and capital levels increase. The average risk premium as measured by the Barclays U.S. Corporate Bond Index increased by 27 basis points to 128 basis points for the average investment grade bond over the past fiscal year. Also weighing on
risk premiums was another year of record issuance as issuers looked to take advantage of the low interest rate environment.
The mortgage
backed sector slightly outperformed, providing 3 basis points of excess return as the Fed continued to replace maturing mortgages and new supply was manageable given the tepid housing market.
Looking forward, we anticipate economic growth to pick up from the weather induced slowdown of the quarter ended March 31, 2015. We also
anticipate inflation to remain benign and the Fed to begin normalizing short-term interest rates by modestly raising short-term interest rates later this year. With respect to interest rates, we do expect them to move higher in anticipation of the
Fed raising short-term interest rates later this year.
Given this economic backdrop and continued low yield environment, the Fund sought
higher yielding opportunities within the investment grade corporate bond sector. The Fund continued to have a high allocation to the finance sector versus the industrial and utility sectors relative to the Fund’s benchmark. This overweight was
initiated given our expectation that the finance sector would revert to trading more expensively than its industrial counterpart; a trend that we viewed temporarily broken after the financial crisis. The Fund’s overweight in the finance sector
was expressed by allocations to regional banks, insurance companies, and REITs. The Fund continued to be overweight bonds with maturities greater than three years as well as overweight investment grade floating rate notes (FRNs), anticipating a
flatter yield curve. The Fund continued to be underweight the two year portion of the yield curve. This activity resulted in a “barbelled” portfolio structure. The Fund’s overweight in higher yielding corporates as well as the
“barbelled” portfolio structure aided its relative performance. Over the course of the year, the Fund maintained a duration posture that was slightly shorter versus the benchmark index, as we anticipated a higher interest rate environment.
Going forward we anticipate a higher interest rate environment as well as a flatter yield curve. Therefore, we expect to continue to increase our allocation to FRNs, as well as to position the Fund’s portfolio in such a way as to benefit from a
flatter yield curve.
|
| ANNUAL REPORT / April 30, 2015 (unaudited) |
| * |
Performance data quoted represents past performance, which is no guarantee of future results. Investment return and principal value will
fluctuate so that an investor’s shares, when redeemed, may be worth more or less than their original cost. The total return shown assumes the reinvestment of all distributions and does not reflect the deduction of taxes that a shareholder would
pay on fund distributions or the redemption of shares. The total return for Class A Shares was -1.22%, adjusted for the Fund’s maximum sales charge. Mutual fund performance changes over time and current performance may be lower or higher
than what is stated. For the most recent month-end performance, please visit www.wilmingtonfunds.com or call 1-800-836-2211. |
| ** |
The Barclays Capital 1-3 Year U.S. Government/Credit Bond Index is an index that captures funds with exposures to both government and commercial
credit. The index is unmanaged and it is not possible to invest directly in an index. |
| *** |
Lipper figures represent the average of the total returns reported by all of the mutual funds designated by Lipper, Inc. as falling into the
respective category indicated. These figures do not reflect sales charges. |
Bond prices are sensitive
to changes in interest rates and a rise in short-term interest rates could cause a decline in bond prices.
Quantitative
Easing (QE) is government monetary policy occasionally used to increase the money supply by buying government securities or other securities from the market. Quantitative easing increases the money supply by flooding the financial institutions with
capital, in an effort to promote increased lending and liquidity.
GDP (gross domestic product) is the monetary value of
all the finished goods and services produced within a country’s borders in a specific time period, though GDP is usually calculated on an annual basis. It includes all of private and public consumption, government outlays, investments and
exports less imports that occur within a defined territory.
Consumer Price Index (CPI) is a measure that examines the
weighted average of prices of a basket of consumer goods and services, such as transportation, food and medical care. The CPI is calculated by taking price changes for each item in the predetermined basket of goods and averaging them; the goods are
weighted according to their importance. Changes in CPI are used to assess price changes associated with the cost of living.
Duration is a measure of a security’s price sensitivity to changes in interest rates. Securities with longer durations
are more sensitive to changes in interest rates than securities of shorter durations.
The Barclays U.S. Corporate Index
is a broad-based benchmark that measures the investment grade, U.S. dollar-denominated, fixed-rate, taxable corporate bond market. It includes USD-denominated securities publicly issued by U.S. and non-U.S. industrial, utility, and financial issuers
that meet specified maturity, liquidity, and quality requirements.
Basis Points (BPS) is a unit that is equal to 1/100th
of 1% and is used to denote the change in a financial instrument. The basis point is commonly used for calculating changes in interest rates, equity indices and the yield of a fixed-income security.
Excess Return is a security or sector’s return minus the return from a U.S. Treasury of
similar maturity or duration.
Barbell Portfolio Structure is an investment strategy primarily applicable to fixed-income investing in
which half the portfolio is made up of long-term bonds and the other half comprises very short-term bonds.
|
| April 30, 2015 (unaudited) / ANNUAL REPORT |
WILMINGTON SHORT-TERM BOND FUND – CLASS A
The graph below illustrates the hypothetical investment of $10,0001 in the
Wilmington Short-Term Bond Fund (Class A) (the “Fund”) from April 30, 2005 to April 30, 2015, compared to the Barclays Capital 1-3 Year U.S. Government/Credit Bond Index (“BC1-3GCB”).2
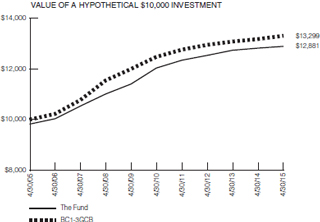
Average Annual Total Returns for the Periods Ended April 30, 2015
|
|
|
|
|
| |
|
|
| 1
Year |
|
-1.22% |
| 5 Years
|
|
1.03% |
| 10 Years
|
|
2.56% |
Performance data quoted represents past performance which is no guarantee of future results. Returns shown do not reflect the deduction
of taxes that a shareholder would pay on Fund distributions or the redemption of Fund shares. Investment return and principal value will fluctuate so that an investor’s shares, when redeemed, may be worth more or less than their original cost.
Mutual funds are not obligations of or guaranteed by any bank and are not federally insured. Mutual fund performance changes over time and current performance may be lower or higher than what is stated. For current to the most recent month end
performance, visit www.wilmingtonfunds.com or call 1-800-836-2211. Total returns shown include the maximum sales charge of 1.75% for Class A.
Annual Operating
Expense Ratio
|
|
|
|
|
| |
|
|
|
Before Waivers |
|
1.12% |
|
After Waivers |
|
0.73% |
The Expense Ratio Before Waivers represents the operating costs borne by the Fund, expressed as a percentage of the Fund’s average
net assets, as shown in the Fees and Expenses table in the Fund’s current prospectus (under “Total Annual Fund Operating Expenses”).
| 1 |
Represents a hypothetical investment of $10,000 in Class A of the Fund after deducting the maximum sales charge of 1.75% ($10,000 investment minus $175 sales charge = $9,825). The Fund’s performance assumes
the reinvestment of all dividends and distributions. |
| 2 |
The performance for the BC1-3GCB assumes the reinvestment of all dividends and distributions but does not reflect the deduction of a sales charge required for the Fund’s performance by the Securities and Exchange
Commission. It is not possible to invest directly in an index, and the represented index is unmanaged.
|
|
| ANNUAL REPORT / April 30, 2015 (unaudited) |
WILMINGTON SHORT-TERM BOND FUND – CLASS I
The graph below illustrates the hypothetical investment of $1,000,0001.2
in the Wilmington Short-Term Bond Fund (Class I) (the “Fund”) from April 30, 2005 to April 30, 2015, compared to the Barclays Capital 1-3 Year U.S. Government/Credit Bond Index (“BC1-3GCB”).2
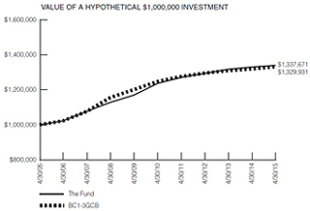
Average Annual Total Returns for the Periods Ended April 30, 2015
|
|
|
|
|
| |
|
|
| 1 Year
|
|
0.76% |
| 5 Years
|
|
1.63% |
| 10 Years
|
|
2.95% |
Performance data quoted represents past performance which is no guarantee of future results. Returns shown do not reflect the deduction
of taxes that a shareholder would pay on Fund distributions or the redemption of Fund shares. Investment return and principal value will fluctuate so that an investor’s shares, when redeemed, may be worth more or less than their original cost.
Mutual funds are not obligations of or guaranteed by any bank and are not federally insured. Mutual fund performance changes over time and current performance may be lower or higher than what is stated. For current to the most recent month end
performance, visit www.wilmingtonfunds.com or call 1-800-836-2211.
Annual Operating Expense Ratio
|
|
|
|
|
| |
|
|
|
Before Waivers |
|
0.87% |
|
After Waivers |
|
0.48% |
The Expense Ratio Before Waivers represents the operating costs borne by the Fund, expressed as a percentage of the Fund’s average
net assets, as shown in the Fees and Expenses table in the Fund’s current prospectus (under “Total Annual Fund Operating Expenses”).
| 1 |
Represents a hypothetical investment of $1,000,000 in Class I of the Fund and assumes the reinvestment of all dividends and distributions. |
| 2 |
The performance for the BC1-3GCB assumes the reinvestment of all dividends and distributions. It is not possible to invest directly in an index, and the represented index is unmanaged.
|
|
| April 30, 2015 (unaudited) / ANNUAL REPORT |
WILMINGTON MUNICIPAL BOND FUND
Management’s Discussion of Fund Performance
For the fiscal year ended April 30, 2015, Wilmington Municipal Bond Fund
(the “Fund”) had a total return of 2.83%* for Class A Shares and 3.17%* for Class I Shares, versus its benchmark, the S&P Municipal Bond Intermediate Index**, which had a total return of 3.94%, and its peer group, the Lipper
Intermediate Municipal Debt Funds Average***, which had a total return of 2.83%.
Last year’s institutional fixed
income research was teeming with predictions of rising interest rates and steepening yield curves. In the December 20, 2014 issue of Barron’s, Michael Aneiro wrote in the Current Yield column, “Nearly every bond-market pundit
predicted that interest rates would rise in 2014. Almost nobody forecast that rates would fall. Yet fall they did.” For the year, the S&P AAA Municipal Yield curve shifted downward by 132 basis points (bps), or 1.32%, on the long end, while
edging higher by 29 bps at the 3-year maturity.
In the 1st quarter of 2015, the market took on a cautious tone centered
on recurring themes: near low historical interest rates, unfunded pension liabilities, and the potential headline risk of adverse credit events. High-grade tax-exempt interest rates changes were mixed across the term structure, as the S&P AAA
Municipal Yield Curve was lower by 2 basis points (0.02%) at the 5-year maturity and 9 basis points lower at the 7-year point. Yields moved higher at the 1-and 3-year maturities by 6 and 5 basis points, respectively. The curve twisted at the 15-year
point, which was higher by 8 basis points, while the 30-year yield fell by the same amount. All in all, with shorter rates rising moderately, and the long end declining, the S&P AAA curve flattened by about 14 basis points over the three month
period.
Supply and demand for municipal bonds has been strong in 2014 and early 2015. Supply in the first quarter of 2015
was remarkably strong from the very start. January saw almost $29 billion of new deals brought to market, which was the strongest January since 2007. Total issuance in the 1st quarter topped $102 billion, the strongest pace since 2010. Demand for
municipal bonds was strong for most of 2014, with only momentary interruptions in an otherwise upbeat environment. In fact, investors put to work about $28 billion in municipal bond funds throughout the calendar year. That demand has continued into
2015, but started wavering late in March and into April.
The decline in intermediate and long yields produced solid total
returns. For the 12 months ending March 31, 2015, the S&P Municipal Bond Index generated 6.59% and the S&P Municipal Bond Intermediate Index produced a 5.34% total return. The shorter-term structures, such as the short and
short-intermediate indices, produced positive returns as well, with total returns of 0.98% and 2.65%, respectively.
The
Fund underperformed its benchmark, but outperformed its Lipper peer group. While the Fund and peer group performance are net of operating expenses, the benchmark returns reflect gross returns without any expense impact. The portfolio’s higher
quality positioning (underweight BBB’s and non-investment grade) detracted from performance relative to the index as the lower grade bonds outperformed
higher grade bonds during the Fund’s fiscal year ending April 30, 2015.
| * |
Performance data quoted represents past performance, which is no guarantee of future results. Investment return and principal value will
fluctuate so that an investor’s shares, when redeemed, may be worth more or less than their original cost. The total return shown assumes the reinvestment of all distributions and does not reflect the deduction of taxes that a shareholder would
pay on fund distributions or the redemption of shares. The total return for Class A Shares was -1.78%, adjusted for the Fund’s maximum sales charge. Mutual fund performance changes over time and current performance may be lower or higher
than what is stated. For the most recent month-end performance, please visit www.wilmingtonfunds.com or call 1-800-836-2211. |
| ** |
Standard & Poor’s (S&P) Municipal Bond Intermediate Index consists of bonds in the S&P Municipal Bond Index with a minimum
maturity of three years and a maximum maturity of up to, but not including, 15 years as measured from the Rebalancing Date. The S&P Municipal Bond Index is a broad, market value-weighted index that seeks to measure the performance of the U.S.
municipal bond market. All bonds in the index are exempt from U.S. federal income taxes or subject to the alternative minimum tax (AMT). The indices include general obligation bonds, revenue bonds, insured bonds and pre-refunded bonds. Indices are
unmanaged and it is not possible to invest directly in an index. |
| *** |
Lipper figures represent the average of the total returns reported by all of the mutual funds designated by Lipper, Inc. as falling into the
respective category indicated. These figures do not reflect sales charges. |
High yield, lower-rated
securities generally entail greater market, credit and liquidity risks than investment grade securities and may include higher volatility and higher risk of default.
Credit ratings pertain only to the securities in the portfolio and do not protect fund shares against market risk.
Bond prices are sensitive to changes in interest rates and a rise in short-term interest rates could cause a decline in bond
prices.
Basis Points (BPS) is a unit that is equal to 1/100th of 1% and is used to denote the change in a financial
instrument. The basis point is commonly used for calculating changes in interest rates, equity indices and the yield of a fixed-income security.
S&P AAA curve is derived from market estimates of yields for bonds with higher ratings levels in the municipal market.
|
| ANNUAL REPORT / April 30, 2015 (unaudited) |
WILMINGTON MUNICIPAL BOND FUND – CLASS A
The graph below illustrates the hypothetical investment of $10,0001 in
the Wilmington Municipal Bond Fund (Class A) (the “Fund”) from December 19, 2005 (start of performance) to April 30, 2015, compared to the S&P Municipal Bond Intermediate
Index2.
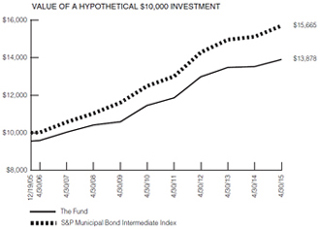
Average Annual Total Returns for the Periods Ended April 30, 2015
|
|
|
| |
|
| |
|
|
| 1 Year
|
|
-1.78% |
| 5 Years
|
|
2.97% |
| Start of Performance
(12/19/05) |
|
3.56% |
Performance data quoted represents past performance which is no guarantee of future results. Returns shown do not reflect the deduction
of taxes that a shareholder would pay on Fund distributions or the redemption of Fund shares. Investment return and principal value will fluctuate so that an investor’s shares, when redeemed, may be worth more or less than their original cost.
Mutual funds are not obligations of or guaranteed by any bank and are not federally insured. Mutual fund performance changes over time and current performance may be lower or higher than what is stated. For current to the most recent month end
performance, visit www.wilmingtonfunds.com or call 1-800-836-2211. Total returns shown include the maximum sales charge of 4.50%.
Annual Operating Expense
Ratio
|
|
|
| |
|
| |
|
|
|
Before Waivers |
|
1.09% |
|
After Waivers |
|
0.74% |
The Expense Ratio Before Waivers represents the operating costs borne by the Fund, expressed as a percentage of the Fund’s average
net assets, as shown in the Fees and Expenses table in the Fund’s current prospectus (under “Total Annual Fund Operating Expenses”).
| 1 |
Represents a hypothetical investment of $10,000 in Class A of the Fund after deducting the maximum sales charge of 4.50% ($10,000 investment minus $450 sales charge = $9,550). The Fund’s performance assumes
the reinvestment of all dividends and distributions. |
| 2 |
The performance for the S&P Municipal Bond Intermediate Index assumes the reinvestment of all dividends and distributions but does not reflect the deduction of a sales charge required for the Fund’s performance
by the Securities and Exchange Commission. It is not possible to invest directly in an index, and the represented index is unmanaged.
|
|
| April 30, 2015 (unaudited) / ANNUAL REPORT |
WILMINGTON MUNICIPAL BOND FUND – CLASS I
The graph below illustrates the hypothetical investment of $1,000,0001.2
in the Wilmington Municipal Bond Fund (Class I) (the “Fund”) from April 30, 2005 to April 30, 2015, compared to the S&P Municipal Bond Intermediate Index.2
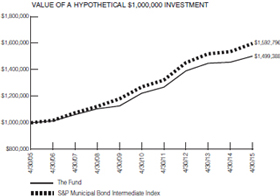
Average Annual Total Returns for the Periods Ended April 30, 2015
|
|
|
|
|
| |
|
|
|
1 Year |
|
3.17% |
|
5 Years |
|
4.20% |
|
10 Years |
|
4.13% |
Performance data quoted represents past performance which is no guarantee of future results. Returns shown do not reflect the deduction
of taxes that a shareholder would pay on Fund distributions or the redemption of Fund shares. Investment return and principal value will fluctuate so that an investor’s shares, when redeemed, may be worth more or less than their original cost.
Mutual funds are not obligations of or guaranteed by any bank and are not federally insured. Mutual fund performance changes over time and current performance may be lower or higher than what is stated. For current to the most recent month end
performance, visit www.wilmingtonfunds.com or call 1-800-836-2211.
Annual Operating Expense Ratio
|
|
|
|
|
| |
|
|
|
Before Waivers |
|
0.84% |
|
After Waivers |
|
0.49% |
The Expense Ratio Before Waivers represents the operating costs borne by the Fund, expressed as a percentage of the Fund’s average
net assets, as shown in the Fees and Expenses table in the Fund’s current prospectus (under “Total Annual Fund Operating Expenses”).
| 1 |
Represents a hypothetical investment of $1,000,000 in Class I of the Fund and assumes the reinvestment of all dividends and distributions. |
| 2 |
The performance for the S&P Municipal Bond Intermediate Index assumes the reinvestment of all dividends and distributions. It is not possible to invest directly in an index, and the represented index is unmanaged.
|
|
| ANNUAL REPORT / April 30, 2015 (unaudited) |
WILMINGTON NEW YORK MUNICIPAL BOND FUND
Management’s Discussion of Fund Performance
For the fiscal year ended April 30, 2015, Wilmington New York Municipal
Bond Fund (the “Fund”) had a total return of 2.91%* for Class A Shares and 3.17%* for Class I Shares, versus its benchmark, the S&P Municipal Bond Intermediate Index**, which had a total return of 3.94%, and its peer group, the
Lipper New York Intermediate Municipal Debt Funds Average***, which had a total return of 2.80%.
Last year’s
institutional fixed income research was teeming with predictions of rising interest rates and steepening yield curves. In the December 20, 2014 issue of Barron’s, Michael Aneiro wrote in the Current Yield column, “Nearly every
bond-market pundit predicted that interest rates would rise in 2014. Almost nobody forecast that rates would fall. Yet fall they did.” For the year, the S&P AAA Municipal Yield curve shifted downward by 132 basis points (bps), or 1.32%, on
the long end, while edging higher by 29 bps at the 3-year maturity.
In the 1st quarter of 2015, the market took on a
cautious tone centered on recurring themes: near low historical interest rates, unfunded pension liabilities, and the potential headline risk of adverse credit events. High-grade tax-exempt interest rates changes were mixed across the term
structure, as the S&P AAA Municipal Yield Curve was lower by 2 basis points (0.02%) at the 5-year maturity and 9 basis points lower at the 7-year point. Yields moved higher at the 1-and 3-year maturities by 6 and 5 basis points, respectively.
The curve twisted at the 15-year point, which was higher by 8 basis points, while the 30-year yield fell by the same amount. All in all, with shorter rates rising moderately, and the long end declining, the S&P AAA curve flattened by about 14
basis points over the three month period.
Supply and demand for municipal bonds has been strong in 2014 and early 2015.
Supply in the first quarter of 2015 was remarkably strong from the very start. January saw almost $29 billion of new deals brought to market, which was the strongest January since 2007. Total issuance in the 1st quarter topped $102 billion, the
strongest pace since 2010. Demand for municipal bonds was strong for most of 2014, with only momentary interruptions in an otherwise upbeat environment. In fact, investors put to work about $28 billion in municipal bond funds throughout the calendar
year. That demand has continued into 2015, but started wavering late in March and into April.
The decline in intermediate
and long yields produced solid total returns. For the 12 months ending March 31, 2015, the S&P Municipal Bond Index generated 6.59% and the S&P Municipal Bond Intermediate Index produced a 5.34% total return. The shorter-term
structures, such as the short and short-intermediate indices, produced positive returns as well, with total returns of 0.98% and 2.65%, respectively.
The Fund underperformed its benchmark, but outperformed its Lipper peer group. While the Fund and peer group performance are
net of operating expenses, the benchmark returns reflect gross returns without any expense impact. The portfolio’s higher quality positioning (underweight BBB’s and non-investment grade) detracted from performance relative to the index as
the lower grade bonds outperformed higher grade bonds during the Fund’s fiscal year ending April 30, 2015.
| * |
Performance data quoted represents past performance, which is no guarantee of future results. Investment return and principal value will
fluctuate so that an investor’s shares, when redeemed, may be worth more or less than their original cost. The total return shown assumes the reinvestment of all distributions and does not reflect the deduction of taxes that a shareholder would
pay on fund distributions or the redemption of shares. The total return for Class A Shares was -1.74%, adjusted for the Fund’s maximum sales charge. Mutual fund performance changes over time and current performance may be lower or higher
than what is stated. For the most recent month-end performance, please visit www.wilmingtonfunds.com or call 1-800-836-2211. |
| ** |
Standard & Poor’s (S&P) Municipal Bond Intermediate Index consists of bonds in the S&P Municipal Bond Index with a minimum
maturity of three years and a maximum maturity of up to, but not including, 15 years as measured from the Rebalancing Date. The S&P Municipal Bond Index is a broad, market value-weighted index that seeks to measure the performance of the U.S.
municipal bond market. All bonds in the index are exempt from U.S. federal income taxes or subject to the alternative minimum tax (AMT). The indices include general obligation bonds, revenue bonds, insured bonds and pre-refunded bonds. Indices are
unmanaged and it is not possible to invest directly in an index. |
| *** |
Lipper figures represent the average of the total returns reported by all of the mutual funds designated by Lipper, Inc. as falling into the
respective category indicated. These figures do not reflect sales charges. |
High yield, lower-rated
securities generally entail greater market, credit and liquidity risks than investment grade securities and may include higher volatility and higher risk of default.
Credit ratings pertain only to the securities in the portfolio and do not protect fund shares against market risk.
Bond prices are sensitive to changes in interest rates and a rise in short-term interest rates could cause a decline in bond
prices.
Basis Points (BPS) is a unit that is equal to 1/100th of 1% and is used to denote the change in a financial
instrument. The basis point is commonly used for calculating changes in interest rates, equity indices and the yield of a fixed-income security.
S&P AAA curve is derived from market estimates of yields for bonds with higher ratings levels in the municipal market.
|
| April 30, 2015 (unaudited) / ANNUAL REPORT |
WILMINGTON NEW YORK MUNICIPAL BOND FUND – CLASS A
The graph below illustrates the hypothetical investment of $10,0001 in the
Wilmington New York Municipal Bond Fund (Class A) (the “Fund”) from April 30, 2005 to April 30, 2015, compared to the S&P Municipal Bond Intermediate Index.2
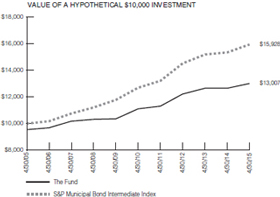
Average Annual Total Returns for the Periods Ended April 30, 2015
|
|
|
|
|
| |
|
|
|
1 Year |
|
-1.74% |
|
5 Years |
|
2.27% |
|
10 Years |
|
2.66% |
Performance data quoted represents past performance which is no guarantee of future results. Returns shown do not reflect the deduction
of taxes that a shareholder would pay on Fund distributions or the redemption of Fund shares. Investment return and principal value will fluctuate so that an investor’s shares, when redeemed, may be worth more or less than their original cost.
Mutual funds are not obligations of or guaranteed by any bank and are not federally insured. Mutual fund performance changes over time and current performance may be lower or higher than what is stated. For current to the most recent month end
performance, visit www.wilmingtonfunds.com or call 1-800-836-2211. Total returns shown include the maximum sales charge of 4.50%.
Annual Operating Expense
Ratio
|
|
|
|
|
| |
|
|
|
Before Waivers |
|
1.16% |
|
After Waivers |
|
0.84% |
The Expense Ratio Before Waivers represents the operating costs borne by the Fund, expressed as a percentage of the Fund’s average
net assets, as shown in the Fees and Expenses table in the Fund’s current prospectus (under “Total Annual Fund Operating Expenses”).
| 1 |
Represents a hypothetical investment of $10,000 in Class A of the Fund after deducting the maximum sales charge of 4.50% ($10,000 investment minus $450 sales charge = $9,550). The Fund’s performance assumes
the reinvestment of all dividends and distributions. |
| 2 |
The performance for the S&P Municipal Bond Intermediate Index assumes the reinvestment of all dividends and distributions but does not reflect the deduction of a sales charge required for the Fund’s performance
by the Securities and Exchange Commission. It is not possible to invest directly in an index, and the represented index is unmanaged.
|
|
| ANNUAL REPORT / April 30, 2015 (unaudited) |
WILMINGTON NEW YORK MUNICIPAL BOND FUND – CLASS I
The graph below illustrates the hypothetical investment of $1,000,0001.2
in the Wilmington New York Municipal Bond Fund (Class I) (the “Fund”) from April 30, 2005 to April 30, 2015, compared to the S&P Municipal Bond Intermediate Index.2
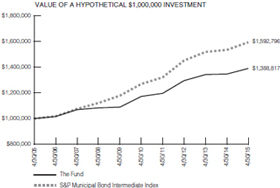
Average Annual Total Returns for the Periods Ended April 30, 2015
|
|
|
|
|
| |
|
|
|
1 Year |
|
3.17% |
|
5 Years |
|
3.47% |
|
10 Years |
|
3.34% |
Performance data quoted represents past performance which is no guarantee of future results. Returns shown do not reflect the deduction
of taxes that a shareholder would pay on Fund distributions or the redemption of Fund shares. Investment return and principal value will fluctuate so that an investor’s shares, when redeemed, may be worth more or less than their original cost.
Mutual funds are not obligations of or guaranteed by any bank and are not federally insured. Mutual fund performance changes over time and current performance may be lower or higher than what is stated. For current to the most recent month end
performance, visit www.wilmingtonfunds.com or call 1-800-836-2211.
Annual Operating Expense Ratio
|
|
|
|
|
| |
|
|
|
Before Waivers |
|
0.91% |
|
After Waivers |
|
0.59% |
The Expense Ratio Before Waivers represents the operating costs borne by the Fund, expressed as a percentage of the Fund’s average
net assets, as shown in the Fees and Expenses table in the Fund’s current prospectus (under “Total Annual Fund Operating Expenses”).
| 1 |
Represents a hypothetical investment of $1,000,000 in Class I of the Fund and assumes the reinvestment of all dividends and distributions. |
| 2 |
The performance for the S&P Municipal Bond Intermediate Index assumes the reinvestment of all dividends and distributions. It is not possible to invest directly in an index, and the represented index is unmanaged.
|
|
| April 30, 2015 (unaudited) / ANNUAL REPORT |
SHAREHOLDER EXPENSE EXAMPLE
|
|
|
| As a shareholder of the Fund, you incur ongoing costs, including management fees; to the extent applicable, distribution
(12b-1) fees, and/or shareholder services fees; and other Fund expenses. This Example is intended to help you to understand your ongoing costs (in dollars) of investing in the Funds and to compare these costs with the ongoing costs of investing
in other mutual funds. It is based on an investment of $1,000 invested at the beginning of the period and held for the entire period from November 1, 2014 to April 30, 2015.
Actual Expenses
This section of the following table provides information about actual
account values and actual expenses. You may use the information in this section, together with the amount you invested, to estimate the expenses that you incurred over the period. Simply divide your account value by $1,000 (for example, an
$8,600 account value divided by $1,000 = 8.6), then multiply the result by the number in the first section under the heading entitled “Expenses Paid During Period” to estimate the expenses attributable to your investment during this
period. |
|
Hypothetical Example for Comparison Purposes
This section of the following table provides information about hypothetical account values and hypothetical expenses based on the Funds’
actual expense ratios and assumed rates of return of 5% per year before expenses, which are not the Funds’ actual returns. Thus, you should not use the hypothetical account values and expenses to estimate the actual ending
account balance or your expenses for the period. Rather, these figures are required to be provided to enable you to compare the ongoing costs of investing in the Funds with other funds. To do so, compare this 5% hypothetical example with the 5%
hypothetical examples that appear in the shareholder reports of the other funds.
Please note that the expenses shown in the table are meant to highlight your ongoing costs only. Therefore, the Annualized Net Expense Ratio
section of the table is useful in comparing ongoing costs only, and will not help you determine the relative total costs of owning different funds. |
|
|
|
|
|
|
|
|
|
| |
|
Beginning
Account Value
11/1/14 |
|
Ending
Account Value
4/30/15 |
|
Expenses Paid
During Period1 |
|
Annualized Net
Expense Ratio2
|
|
|
|
|
|
| WILMINGTON BROAD MARKET BOND FUND |
|
|
|
|
|
|
|
|
| Actual |
|
|
|
|
|
|
|
|
| Class A |
|
$1,000.00 |
|
$1,017.60 |
|
$4.50 |
|
0.90% |
| Class I |
|
$1,000.00 |
|
$1,019.40 |
|
$2.85 |
|
0.57% |
| Hypothetical (assuming a 5% return before
expense) |
|
|
|
|
|
|
|
|
| Class A |
|
$1,000.00 |
|
$1,020.33 |
|
$4.51 |
|
0.90% |
| Class I |
|
$1,000.00 |
|
$1,021.97 |
|
$2.86 |
|
0.57% |
|
|
|
|
|
| WILMINGTON INTERMEDIATE-TERM BOND FUND |
|
|
|
|
|
|
|
|
| Actual |
|
|
|
|
|
|
|
|
| Class A |
|
$1,000.00 |
|
$1,012.10 |
|
$4.29 |
|
0.86% |
| Class I |
|
$1,000.00 |
|
$1,013.70 |
|
$2.70 |
|
0.54% |
| Hypothetical (assuming a 5% return before
expense) |
|
|
|
|
|
|
|
|
| Class A |
|
$1,000.00 |
|
$1,020.53 |
|
$4.31 |
|
0.86% |
| Class I |
|
$1,000.00 |
|
$1,022.12 |
|
$2.71 |
|
0.54% |
|
|
|
|
|
| WILMINGTON SHORT-TERM BOND FUND |
|
|
|
|
|
|
|
|
| Actual |
|
|
|
|
|
|
|
|
| Class A |
|
$1,000.00 |
|
$1,004.00 |
|
$3.68 |
|
0.74% |
| Class I |
|
$1,000.00 |
|
$1,005.20 |
|
$2.49 |
|
0.50% |
| Hypothetical (assuming a 5% return before
expense) |
|
|
|
|
|
|
|
|
| Class A |
|
$1,000.00 |
|
$1,021.12 |
|
$3.71 |
|
0.74% |
| Class I |
|
$1,000.00 |
|
$1,022.32 |
|
$2.51 |
|
0.50% |
|
|
|
|
|
| WILMINGTON MUNICIPAL BOND FUND |
|
|
|
|
|
|
|
|
| Actual |
|
|
|
|
|
|
|
|
| Class A |
|
$1,000.00 |
|
$1,003.40 |
|
$3.73 |
|
0.75% |
| Class I |
|
$1,000.00 |
|
$1,004.70 |
|
$2.53 |
|
0.51% |
| Hypothetical (assuming a 5% return before
expense) |
|
|
|
|
|
|
|
|
| Class A |
|
$1,000.00 |
|
$1,021.08 |
|
$3.76 |
|
0.75% |
| Class I |
|
$1,000.00 |
|
$1,022.27 |
|
$2.56 |
|
0.51% |
|
| SEMI-ANNUAL REPORT / April 30, 2015 |
|
|
|
|
|
|
|
|
|
|
|
|
|
|
|
|
|
| |
|
Beginning
Account Value
11/1/14 |
|
|
Ending
Account Value
4/30/15 |
|
|
Expenses Paid
During Period1 |
|
|
Annualized Net
Expense Ratio2 |
|
|
|
|
|
|
| WILMINGTON NEW YORK MUNICIPAL BOND FUND |
|
|
|
|
|
|
|
|
|
|
|
|
|
|
|
|
| Actual |
|
|
|
|
|
|
|
|
|
|
|
|
|
|
|
|
| Class A |
|
|
$1,000.00 |
|
|
|
$1,008.70 |
|
|
|
$4.18 |
|
|
|
0.84% |
|
| Class I |
|
|
$1,000.00 |
|
|
|
$1,009.90 |
|
|
|
$2.94 |
|
|
|
0.59% |
|
| Hypothetical (assuming a 5% return before expense)
|
|
|
|
|
|
|
|
|
|
|
|
|
|
|
|
|
| Class A |
|
|
$1,000.00 |
|
|
|
$1,020.63 |
|
|
|
$4.21 |
|
|
|
0.84% |
|
| Class I |
|
|
$1,000.00 |
|
|
|
$1,021.87 |
|
|
|
$2.96 |
|
|
|
0.59% |
|
| (1) |
Expenses are equal to the Funds’ annualized net expense ratios, multiplied by the average account value over the period, multiplied by 181/365 (to
reflect the most recent one-half year period). |
| (2) |
Expense ratio does not reflect the indirect expenses of the underlying funds in which it invests.
|
|
| April 30, 2015 / SEMI-ANNUAL REPORT |
PORTFOLIO OF INVESTMENTS SUMMARY TABLE
Wilmington Broad Market Bond Fund
At April 30, 2015, the Fund’s
portfolio composition was as follows (unaudited):
|
|
|
|
|
| |
|
Percentage of
Total Net Assets |
|
| Corporate Bonds |
|
|
44.7% |
|
| U.S. Treasury |
|
|
26.1% |
|
| Mortgage-Backed Securities |
|
|
23.0% |
|
| Commercial Paper |
|
|
2.4% |
|
| Collateralized Mortgage Obligations |
|
|
1.4% |
|
| Government Agencies |
|
|
1.4% |
|
| Enhanced Equipment Trust Certificates |
|
|
0.4% |
|
| Asset-Backed Securities |
|
|
0.3% |
|
| Cash Equivalents1 |
|
|
5.5% |
|
| Other Assets and Liabilities – Net2 |
|
|
(5.2)% |
|
|
|
| TOTAL |
|
|
100.0% |
|
| (1) |
Cash Equivalents include investments in a money market fund and repurchase agreements. |
| (2) |
Assets, other than investments in securities, less liabilities. See Statements of Assets and Liabilities. |
| (3) |
For financial reporting purposes, the Credit Quality Diversification table reflects the lowest rating assigned by either Moody’s Investors Service or Standard and Poor’s if the ratings differ. These rating
agencies are independent, nationally recognized statistical rating organizations and are widely used. Investment grade ratings are credit ratings of BBB/Baa or higher. Below investment grade ratings are credit ratings of BB/Ba or lower. Investments
designated as “Not Rated” are not rated by either rating agency and do not necessarily indicate low credit quality. Credit quality ratings are subject to change.
|
|
|
|
|
|
| Credit Quality Diversification3 |
|
Percentage of
Total Net Assets |
|
| U.S. Government Agency Securities |
|
|
25.0% |
|
| U.S. Treasury |
|
|
26.1% |
|
| AAA / Aaa |
|
|
0.5% |
|
| AA / Aa |
|
|
3.0% |
|
| A / A |
|
|
6.9% |
|
| BBB / Baa |
|
|
32.7% |
|
| BB / Ba |
|
|
2.3% |
|
| D |
|
|
0.1% |
|
| Not Rated |
|
|
8.6% |
|
| Other Assets and Liabilities – Net2 |
|
|
(5.2)% |
|
|
|
| TOTAL |
|
|
100.0% |
|
PORTFOLIO OF INVESTMENTS
April 30, 2015
|
|
|
|
|
|
|
|
|
|
|
|
| Description
|
|
|
Par Value |
|
|
|
Value |
|
|
|
| ASSET-BACKED SECURITIES – 0.3% |
|
|
|
|
|
|
|
| FINANCIAL SERVICES – 0.2% |
|
|
|
|
|
|
|
|
| LA Arena Funding LLC,
Series 1999-1, Class A, 7.66%, 12/15/26W |
|
$ |
847,841 |
|
|
$ |
947,987 |
|
|
|
|
| WHOLE LOAN – 0.1% |
|
|
|
|
|
|
|
|
|
|
|
| SLM Private Education Loan Trust,
Series 2011-A, Class A1, 1.17%, 10/15/24DW |
|
|
197,369 |
|
|
|
198,044 |
|
|
|
|
|
|
|
|
|
|
|
|
TOTAL ASSET-BACKED SECURITIES
(COST $1,045,210) |
|
|
$ |
1,146,031 |
|
|
|
| COLLATERALIZED MORTGAGE OBLIGATIONS – 1.4% |
|
|
|
|
|
|
| COMMERCIAL MORTGAGE-BACKED SECURITIES (CMBS) – 0.3% |
|
|
|
|
| Banc of America Commercial Mortgage Trust,
Series 2007-2, Class A2, 5.63%, 4/10/49D |
|
|
84,642 |
|
|
|
85,380 |
|
|
|
|
|
|
|
|
|
|
|
|
|
| Description
|
|
|
Par Value |
|
|
|
Value |
|
| Extended Stay America Trust, |
|
|
|
|
|
| Series 2013-ESH5, Class A15, 1.28%, 12/05/31W |
|
$ |
800,000 |
|
|
$ |
801,183 |
|
|
|
|
| JPMorgan Chase Commercial Mortgage Securities Trust,
Series 2007-CIBC18, Class A4, 5.44%, 6/12/47 |
|
|
562,229 |
|
|
|
596,306 |
|
|
|
|
|
|
|
|
|
|
|
|
| TOTAL COMMERCIAL MORTGAGE-BACKED SECURITIES (CMBS) |
|
|
$ |
1,482,869 |
|
|
| FEDERAL NATIONAL MORTGAGE ASSOCIATION (FNMA) – 0.6% |
|
|
|
|
| Series 1988-23, Class C, 9.75%, 9/25/18 |
|
|
2,054 |
|
|
|
2,277 |
|
|
|
|
| Series 2005-29, Class WC, 4.75%, 4/25/35 |
|
|
48,684 |
|
|
|
53,539 |
|
|
|
| Series 2012-114, Class VM, |
|
|
|
|
|
| 3.50%, 10/25/25 |
|
|
2,253,913 |
|
|
|
2,394,095 |
|
|
|
|
|
|
|
|
|
|
|
|
| TOTAL FEDERAL NATIONAL MORTGAGE ASSOCIATION (FNMA) |
|
|
$ |
2,449,911 |
|
|
| ANNUAL REPORT / April 30, 2015 |
|
| PORTFOLIOS OF INVESTMENTS |
Wilmington Broad Market Bond Fund (continued)
|
|
|
|
|
|
|
|
|
|
|
|
| Description
|
|
|
Par Value |
|
|
|
Value |
|
|
|
|
| WHOLE LOAN – 0.5% |
|
|
|
|
|
|
|
|
|
|
|
| Banc of America Mortgage Securities, Inc.,
Series 2004-A, Class 2A1, 2.93%, 2/25/34 |
|
$ |
228,823 |
|
|
$ |
227,139 |
|
|
|
|
| Countrywide Home Loan Mortgage Pass-Through Trust,
Series 2004-8, Class 2A1, 4.50%, 6/25/19 |
|
|
474,243 |
|
|
|
481,637 |
|
|
|
|
| IndyMac INDA Mortgage Loan Trust,
Series 2005-AR1, Class 2A1, 2.75%,
11/25/35D |
|
|
632,195 |
|
|
|
570,842 |
|
|
|
|
| WaMu Mortgage Pass-Through Certificates,
Series 2004-CB1, Class 1A, 5.25%, 6/25/19 |
|
|
741,577 |
|
|
|
762,725 |
|
|
|
|
|
|
|
|
|
|
|
|
|
| TOTAL WHOLE LOAN |
|
|
|
|
|
$ |
2,042,343 |
|
|
|
|
|
|
|
|
|
|
|
| TOTAL COLLATERALIZED MORTGAGE OBLIGATIONS |
|
| (COST $6,145,573) |
|
|
$ |
5,975,123 |
|
|
|
| COMMERCIAL PAPER – 2.4%¿ |
|
|
|
|
|
|
|
| COMMERCIAL PAPER – 2.4% |
|
|
|
|
|
|
|
|
| Consolidated Edison Co.,
0.27%,
5/06/15W |
|
|
3,500,000 |
|
|
|
3,499,842 |
|
|
|
|
| Hewlett Packard Co.,
0.69%,
5/11/15W |
|
|
1,500,000 |
|
|
|
1,499,688 |
|
|
|
|
| Mondelez International, Inc.,
0.44%,
5/12/15W |
|
|
3,000,000 |
|
|
|
2,999,570 |
|
|
|
|
| Thermo Fisher Scientific,
0.56%,
5/04/15W |
|
|
2,000,000 |
|
|
|
1,999,878 |
|
|
|
|
|
|
|
|
|
|
|
|
| TOTAL COMMERCIAL PAPER |
|
|
$ |
9,998,978 |
|
|
|
|
|
|
|
|
|
|
|
|
|
| TOTAL COMMERCIAL PAPER
(COST $9,999,100) |
|
|
|
|
|
$ |
9,998,978 |
|
|
|
|
| CORPORATE BONDS – 44.7% |
|
|
|
|
|
|
|
|
|
|
| AEROSPACE & DEFENSE – 0.9% |
|
|
|
|
|
|
|
|
| L-3 Communications Corp.,
Company Guaranteed, 3.95%, 11/15/16 |
|
|
1,735,000 |
|
|
|
1,799,428 |
|
|
|
|
| L-3 Communications Corp.,
Company Guaranteed, 4.75%, 7/15/20 |
|
|
1,000,000 |
|
|
|
1,081,584 |
|
|
|
|
| Textron, Inc.,
Sr. Unsecured, 3.88%, 3/01/25 |
|
|
750,000 |
|
|
|
771,057 |
|
|
|
|
|
|
|
|
|
|
|
|
| TOTAL AEROSPACE & DEFENSE |
|
|
$ |
3,652,069 |
|
|
|
| AUTO MANUFACTURERS – 0.2% |
|
|
|
|
|
|
|
|
| Ford Motor Credit Co. LLC,
Sr. Unsecured, 2.15%, 1/09/18 |
|
|
650,000 |
|
|
|
656,840 |
|
|
|
|
| AUTOMOTIVE – 2.1% |
|
|
|
|
|
|
|
|
|
|
|
| Daimler Finance North America LLC,
Company Guaranteed, 3.88%, 9/15/21W |
|
|
250,000 |
|
|
|
270,844 |
|
|
|
|
| Ford Motor Credit Co., LLC,
Sr. Unsecured, 3.00%, 6/12/17 |
|
|
1,200,000 |
|
|
|
1,234,278 |
|
|
|
|
| Ford Motor Credit Co., LLC,
Sr. Unsecured, 6.63%, 8/15/17 |
|
|
250,000 |
|
|
|
278,652 |
|
|
|
|
| Ford Motor Credit Co., LLC,
Sr. Unsecured, 5.75%, 2/01/21 |
|
|
500,000 |
|
|
|
577,978 |
|
|
|
|
| Ford Motor Credit Co., LLC,
Sr. Unsecured, 4.25%, 9/20/22 |
|
|
450,000 |
|
|
|
479,780 |
|
|
|
|
|
|
|
|
|
|
|
|
|
| Description
|
|
|
Par Value |
|
|
|
Value |
|
| General Motors Co., Inc.,
Sr. Unsecured,
6.25%, 10/02/43 |
|
$ |
2,000,000 |
|
|
$ |
2,420,000 |
|
|
|
|
| General Motors Financial Co., Inc.,
Company Guaranteed, 2.75%, 5/15/16 |
|
|
600,000 |
|
|
|
607,875 |
|
|
|
|
| General Motors Financial Co., Inc.,
Company Guaranteed, 4.75%, 8/15/17 |
|
|
300,000 |
|
|
|
316,875 |
|
|
|
|
| Hyundai Capital America,
Company Guaranteed, 4.00%, 6/08/17#W |
|
|
1,750,000 |
|
|
|
1,836,165 |
|
|
|
|
| Hyundai Capital America,
Sr. Unsecured, 1.63%, 10/02/15W |
|
|
250,000 |
|
|
|
250,931 |
|
|
|
|
| Hyundai Capital America,
Sr. Unsecured, 1.88%, 8/09/16W |
|
|
575,000 |
|
|
|
580,730 |
|
|
|
|
|
|
|
|
|
|
|
|
|
| TOTAL AUTOMOTIVE |
|
|
|
|
|
$ |
8,854,108 |
|
|
|
|
| BEVERAGES – 0.2% |
|
|
|
|
|
|
|
|
|
|
|
| Dr. Pepper Snapple Group,
Company Guaranteed, 2.60%, 1/15/19D |
|
|
1,000,000 |
|
|
|
1,024,148 |
|
|
|
|
| BIOTECHNOLOGY – 0.6% |
|
|
|
|
|
|
|
|
|
|
|
| Amgen, Inc.,
Sr. Unsecured, 4.40%, 5/01/45 |
|
|
1,180,000 |
|
|
|
1,157,769 |
|
|
|
|
| Celgene Corp.,
Sr. Unsecured, 2.25%, 5/15/19 |
|
|
1,500,000 |
|
|
|
1,516,800 |
|
|
|
|
|
|
|
|
|
|
|
|
|
| TOTAL BIOTECHNOLOGY |
|
|
|
|
|
$ |
2,674,569 |
|
|
|
| BUILDING MATERIALS – 0.3% |
|
|
|
|
|
|
|
|
| Masco Corp., Sr. Unsecured,
4.80%, 6/15/15 |
|
|
1,150,000 |
|
|
|
1,155,420 |
|
|
|
| CAPITAL MARKETS – 1.0% |
|
|
|
|
|
|
|
|
| BlackRock, Inc.,
Series 2, Sr. Unsecured, 5.00%, 12/10/19 |
|
|
250,000 |
|
|
|
284,085 |
|
|
|
|
| Charles Schwab Corp.,
Sr. Unsecured, 2.20%, 7/25/18 |
|
|
1,370,000 |
|
|
|
1,399,798 |
|
|
|
|
| Charles Schwab Corp.,
Sr. Unsecured, 4.45%, 7/22/20 |
|
|
250,000 |
|
|
|
280,515 |
|
|
|
|
| Morgan Stanley,
Sr. Unsecured, 1.51%, 2/25/16 |
|
|
1,050,000 |
|
|
|
1,058,503 |
|
|
|
|
| Raymond James Financial,
Sr. Unsecured, 4.25%, 4/15/16 |
|
|
1,000,000 |
|
|
|
1,030,397 |
|
|
|
|
|
|
|
|
|
|
|
|
| TOTAL CAPITAL MARKETS |
|
|
$ |
4,053,298 |
|
|
|
| COMMERCIAL BANKS – 6.7% |
|
|
|
|
|
|
|
|
| BB&T Corp.,
Sr. Unsecured, MTN, 3.20%, 3/15/16 |
|
|
700,000 |
|
|
|
714,278 |
|
|
|
|
| BB&T Corp.,
Sr. Unsecured, MTN, 2.45%, 1/15/20 |
|
|
1,640,000 |
|
|
|
1,662,966 |
|
|
|
|
| Branch Banking & Trust Co.,
Subordinated, 3.80%, 10/30/26 |
|
|
1,000,000 |
|
|
|
1,046,634 |
|
|
|
|
| Capital One Financial Corp.,
Sr. Unsecured, 2.45%, 4/24/19 |
|
|
750,000 |
|
|
|
757,534 |
|
|
|
|
| Capital One NA/Mclean VA,
Sr. Unsecured, BKNT, 1.65%, 2/05/18 |
|
|
680,000 |
|
|
|
677,711 |
|
|
|
|
| Citigroup, Inc.,
Sr. Unsecured, 1.70%, 4/27/18 |
|
|
1,685,000 |
|
|
|
1,679,131 |
|
|
|
|
| Comerica, Inc.,
Sr. Unsecured, 3.00%, 9/16/15 |
|
|
1,300,000 |
|
|
|
1,309,755 |
|
|
| April 30, 2015 / ANNUAL REPORT |
|
| PORTFOLIOS OF INVESTMENTS |
Wilmington Broad Market Bond Fund (continued)
|
|
|
|
|
|
|
|
|
|
|
|
| Description
|
|
|
Par Value |
|
|
|
Value |
|
| Comerica, Inc.,
Subordinated, 3.80%, 7/22/26 |
|
$ |
230,000 |
|
|
$ |
230,227 |
|
|
|
|
| Commonwealth Bank of Australia,
Sr. Unsecured, 0.67%, 3/12/18DW |
|
|
1,000,000 |
|
|
|
1,000,405 |
|
|
|
|
| Fifth Third Bancorp,
Sr. Unsecured, 3.50%, 3/15/22 |
|
|
1,250,000 |
|
|
|
1,303,557 |
|
|
|
|
| Fifth Third Bancorp,
Subordinated, 4.30%, 1/16/24 |
|
|
530,000 |
|
|
|
566,099 |
|
|
|
|
| Fifth Third Bank/Cincinnati OH,
Sr. Unsecured, 1.35%, 6/01/17 |
|
|
1,000,000 |
|
|
|
1,002,599 |
|
|
|
|
| Goldman Sachs Group, Inc.,
Sr. Unsecured, 1.44%, 4/23/20D |
|
|
1,850,000 |
|
|
|
1,872,103 |
|
|
|
|
| JPMorgan Chase & Co.,
Sr. Unsecured, 1.70%, 3/01/18 |
|
|
1,600,000 |
|
|
|
1,606,562 |
|
|
|
|
| KeyBank NA/Cleveland OH,
Sr. Unsecured, BKNT, 1.10%, 11/25/16 |
|
|
1,000,000 |
|
|
|
1,001,038 |
|
|
|
|
| KeyBank NA/Cleveland OH,
Sr. Unsecured, BKNT, 2.50%, 12/15/19 |
|
|
750,000 |
|
|
|
765,287 |
|
|
|
|
| PNC Bank NA,
Sr. Unsecured, 2.40%, 10/18/19 |
|
|
1,500,000 |
|
|
|
1,526,439 |
|
|
|
|
| PNC Bank NA,
Subordinated Note, 2.95%, 1/30/23 |
|
|
350,000 |
|
|
|
349,302 |
|
|
|
|
| PNC Financial Services Group, Inc.,
Subordinated, 3.90%, 4/29/24 |
|
|
1,500,000 |
|
|
|
1,563,698 |
|
|
|
|
| SunTrust Banks, Inc.,
Sr. Unsecured, 2.50%, 5/01/19 |
|
|
2,000,000 |
|
|
|
2,033,197 |
|
|
|
|
| TD Ameritrade Holding Corp.,
Sr. Unsecured, 2.95%, 4/01/22 |
|
|
847,000 |
|
|
|
858,426 |
|
|
|
|
| US Bancorp/MN,
Subordinated, MTN, 2.95%, 7/15/22 |
|
|
2,000,000 |
|
|
|
2,013,050 |
|
|
|
| US Bank NA/Cincinnati OH, |
|
|
|
|
|
| Sr. Unsecured, BKNT, 2.13%, 10/28/19 |
|
|
2,000,000 |
|
|
|
2,025,755 |
|
|
|
|
| Wells Fargo & Co.,
Sr. Unsecured, 3.68%, 6/15/16D |
|
|
500,000 |
|
|
|
516,739 |
|
|
|
|
|
|
|
|
|
|
|
|
| TOTAL COMMERCIAL BANKS |
|
|
$ |
28,082,492 |
|
|
|
| COMMERCIAL FINANCE – 0.1% |
|
|
|
|
|
|
|
| General Electric Capital Corp., |
|
|
|
|
|
| Subordinated Note, 5.30%, 2/11/21 |
|
|
250,000 |
|
|
|
289,118 |
|
|
|
| COMPUTERS – 0.6% |
|
|
|
|
|
|
|
|
| Apple, Inc.,
Sr. Unsecured, 1.05%, 5/05/17 |
|
|
1,580,000 |
|
|
|
1,590,729 |
|
|
|
|
| Hewlett-Packard Co.,
Sr. Unsecured, 3.00%, 9/15/16 |
|
|
500,000 |
|
|
|
513,259 |
|
|
|
|
| Hewlett-Packard Co., Sr.
Unsecured, 2.60%, 9/15/17 |
|
|
500,000 |
|
|
|
512,796 |
|
|
|
|
|
|
|
|
|
|
|
|
|
| TOTAL COMPUTERS |
|
|
|
|
|
$ |
2,616,784 |
|
|
|
| CONSUMER FINANCE – 0.2% |
|
|
|
|
|
|
|
|
| American Express Co.,
Sr. Unsecured, 0.85%, 5/22/18D |
|
|
655,000 |
|
|
|
655,686 |
|
|
| DIVERSIFIED FINANCIAL SERVICES – 2.4% |
|
|
|
|
| Bank of America Corp.,
Sr. Unsecured, 6.50%, 8/01/16 |
|
|
1,250,000 |
|
|
|
1,330,436 |
|
|
|
|
|
|
|
|
|
|
|
|
|
| Description
|
|
|
Par Value |
|
|
|
Value |
|
| Bank of America Corp.,
Sr. Unsecured,
2.00%, 1/11/18 |
|
$ |
1,275,000 |
|
|
$ |
1,285,292 |
|
|
|
|
| Bank of America Corp.,
Sr. Unsecured, MTN, 1.32%, 3/22/18D |
|
|
1,500,000 |
|
|
|
1,521,566 |
|
|
|
|
| Bank of America Corp.,
Subordinated, MTN, 4.25%, 10/22/26 |
|
|
1,000,000 |
|
|
|
1,005,065 |
|
|
|
|
| Citigroup, Inc.,
Sr. Unsecured, 1.25%, 1/15/16 |
|
|
63,000 |
|
|
|
63,227 |
|
|
|
|
| Citigroup, Inc.,
Sr. Unsecured, 4.45%, 1/10/17 |
|
|
250,000 |
|
|
|
262,884 |
|
|
|
|
| Citigroup, Inc.,
Sr. Unsecured, 6.13%, 5/15/18 |
|
|
275,000 |
|
|
|
309,585 |
|
|
|
|
| FMR LLC,
Sr. Unsecured,
6.45%, 11/15/39W |
|
|
1,000,000 |
|
|
|
1,320,135 |
|
|
|
|
| JPMorgan Chase & Co.,
Sr. Unsecured, 2.60%, 1/15/16 |
|
|
500,000 |
|
|
|
506,471 |
|
|
|
|
| JPMorgan Chase & Co.,
Sr. Unsecured, 6.00%, 1/15/18 |
|
|
150,000 |
|
|
|
167,288 |
|
|
|
|
| JPMorgan Chase & Co.,
Sr. Unsecured, 4.63%, 5/10/21 |
|
|
100,000 |
|
|
|
110,682 |
|
|
|
| JPMorgan Chase Capital XXIII, |
|
|
|
|
|
| Limited Guarantee,
1.26%, 5/15/47D |
|
|
1,000,000 |
|
|
|
811,250 |
|
|
|
|
| Morgan Stanley,
Sr. Unsecured, 1.09%, 1/24/19D |
|
|
810,000 |
|
|
|
813,575 |
|
|
|
|
| Morgan Stanley,
Subordinated, GMTN, 4.35%, 9/08/26 |
|
|
505,000 |
|
|
|
518,472 |
|
|
|
|
|
|
|
|
|
|
|
|
| TOTAL DIVERSIFIED FINANCIAL SERVICES |
|
|
$ |
10,025,928 |
|
|
| ELECTRIC – 2.3% |
|
|
|
|
| CMS Energy Corp.,
Sr. Unsecured, 6.55%, 7/17/17 |
|
|
300,000 |
|
|
|
334,580 |
|
|
|
|
| Dominion Resources, Inc./VA,
Sr. Unsecured, 1.25%, 3/15/17 |
|
|
960,000 |
|
|
|
961,716 |
|
|
|
|
| Dominion Resources, Inc./VA,
Sr. Unsecured, 2.50%, 12/01/19 |
|
|
1,500,000 |
|
|
|
1,525,398 |
|
|
|
|
| DTE Energy Co.,
Sr. Unsecured, 3.85%, 12/01/23 |
|
|
305,000 |
|
|
|
324,611 |
|
|
|
|
| Entergy Corp.,
Sr. Unsecured, 5.13%, 9/15/20 |
|
|
1,300,000 |
|
|
|
1,440,614 |
|
|
|
|
| Exelon Generation Co. LLC,
Sr. Unsecured, 6.20%, 10/01/17 |
|
|
650,000 |
|
|
|
717,468 |
|
|
|
|
| FirstEnergy Corp.,
Series A, Sr. Unsecured, 2.75%, 3/15/18 |
|
|
1,285,000 |
|
|
|
1,313,654 |
|
|
|
|
| FirstEnergy Transmission LLC,
Sr. Unsecured, 4.35%, 1/15/25W |
|
|
2,250,000 |
|
|
|
2,380,591 |
|
|
|
|
| System Energy Resources, Inc.,
1st Mortgage, 4.10%, 4/01/23 |
|
|
500,000 |
|
|
|
519,717 |
|
|
|
|
|
|
|
|
|
|
|
|
|
| TOTAL ELECTRIC |
|
|
|
|
|
$ |
9,518,349 |
|
|
|
| ELECTRIC UTILITIES – 0.2% |
|
|
|
|
|
|
|
|
| Entergy Arkansas, Inc.,
1st Mortgage, 4.95%, 12/15/44 |
|
|
1,000,000 |
|
|
|
1,036,256 |
|
|
|
|
| ELECTRONICS – 0.3% |
|
|
|
|
|
|
|
|
|
|
|
| Thermo Fisher Scientific, Inc.,
Sr. Unsecured, 3.30%, 2/15/22 |
|
|
1,100,000 |
|
|
|
1,120,494 |
|
|
| ANNUAL REPORT / April 30, 2015 |
|
| PORTFOLIOS OF INVESTMENTS |
Wilmington Broad Market Bond Fund (continued)
|
|
|
|
|
|
|
|
|
|
|
|
| Description |
|
|
Par Value |
|
|
|
Value |
|
|
|
| ENVIRONMENTAL CONTROL – 1.0% |
|
|
|
|
|
|
|
|
| Waste Management, Inc., |
|
|
|
|
|
|
|
|
| Company Guaranteed, 2.60%, 9/01/16 |
|
$ |
1,465,000 |
|
|
$ |
1,491,958 |
|
|
|
|
| Waste Management, Inc., |
|
|
|
|
|
|
|
|
| Company Guaranteed, 3.50%, 5/15/24 |
|
|
1,255,000 |
|
|
|
1,301,906 |
|
|
|
|
| Waste Management, Inc., |
|
|
|
|
|
|
|
|
| Company Guaranteed, 4.10%, 3/01/45 |
|
|
1,520,000 |
|
|
|
1,482,767 |
|
|
|
|
|
|
|
|
|
|
|
|
| TOTAL ENVIRONMENTAL CONTROL |
|
|
$ |
4,276,631 |
|
|
|
| FOOD PRODUCTS – 0.8% |
|
|
|
|
|
|
|
|
| General Mills, Inc., |
|
|
|
|
|
|
|
|
| Sr. Unsecured, 1.40%, 10/20/17 |
|
|
2,000,000 |
|
|
|
2,006,151 |
|
|
|
|
| McCormick & Co., Inc., |
|
|
|
|
|
|
|
|
| Sr. Unsecured, 5.75%, 12/15/17 |
|
|
500,000 |
|
|
|
559,505 |
|
|
|
|
| McCormick & Co., Inc., |
|
|
|
|
|
|
|
|
| Sr. Unsecured, 3.90%, 7/15/21 |
|
|
500,000 |
|
|
|
549,587 |
|
|
|
|
| WM Wrigley Jr. Co., |
|
|
|
|
|
|
|
|
| Sr. Unsecured,
1.40%, 10/21/16W |
|
|
125,000 |
|
|
|
125,610 |
|
|
|
|
|
|
|
|
|
|
|
|
|
| TOTAL FOOD PRODUCTS |
|
|
|
|
|
$ |
3,240,853 |
|
|
|
| FOOD RETAILING – 0.6% |
|
|
|
|
|
|
|
|
| Kroger Co., |
|
|
|
|
|
|
|
|
| Sr. Unsecured, 2.95%, 11/01/21 |
|
|
1,750,000 |
|
|
|
1,781,824 |
|
|
|
|
| Kroger Co., |
|
|
|
|
|
|
|
|
| Sr. Unsecured, 8.00%, 9/15/29 |
|
|
500,000 |
|
|
|
702,384 |
|
|
|
|
|
|
|
|
|
|
|
|
|
| TOTAL FOOD RETAILING |
|
|
|
|
|
$ |
2,484,208 |
|
|
| HEALTH CARE PROVIDERS & SERVICES – 0.2% |
|
|
|
|
| UnitedHealth Group, Inc., |
|
|
|
|
|
|
|
|
| Sr. Unsecured, 6.00%, 6/15/17# |
|
|
250,000 |
|
|
|
276,142 |
|
|
|
|
| UnitedHealth Group, Inc., |
|
|
|
|
|
|
|
|
| Sr. Unsecured, 1.40%, 12/15/17 |
|
|
450,000 |
|
|
|
453,784 |
|
|
|
|
| UnitedHealth Group, Inc., |
|
|
|
|
|
|
|
|
| Sr. Unsecured, 3.95%, 10/15/42 |
|
|
290,000 |
|
|
|
288,508 |
|
|
|
|
|
|
|
|
|
|
|
|
| TOTAL HEALTH CARE PROVIDERS & SERVICES |
|
|
$ |
1,018,434 |
|
|
|
| HOME FURNISHINGS – 0.5% |
|
|
|
|
|
|
|
|
| Whirlpool Corp., |
|
|
|
|
|
|
|
|
| Sr. Unsecured, 6.50%, 6/15/16 |
|
|
350,000 |
|
|
|
371,526 |
|
|
|
|
| Whirlpool Corp., |
|
|
|
|
|
|
|
|
| Sr. Unsecured, 4.70%, 6/01/22 |
|
|
1,500,000 |
|
|
|
1,647,963 |
|
|
|
|
| Whirlpool Corp., |
|
|
|
|
|
|
|
|
| Sr. Unsecured, MTN, 5.15%, 3/01/43 |
|
|
210,000 |
|
|
|
231,339 |
|
|
|
|
|
|
|
|
|
|
|
|
| TOTAL HOME FURNISHINGS |
|
|
$ |
2,250,828 |
|
|
|
| HOUSEHOLD PRODUCTS – 0.3% |
|
|
|
|
|
|
|
|
| Becton Dickinson and Co., |
|
|
|
|
|
|
|
|
| Sr. Unsecured, 1.80%, 12/15/17 |
|
|
670,000 |
|
|
|
677,147 |
|
|
|
|
| Medtronic, Inc., |
|
|
|
|
|
|
|
|
| Sr. Unsecured,
1.50%, 3/15/18W |
|
|
700,000 |
|
|
|
704,887 |
|
|
|
|
|
|
|
|
|
|
|
|
| TOTAL HOUSEHOLD PRODUCTS |
|
|
$ |
1,382,034 |
|
|
|
| INSURANCE – 2.9% |
|
|
|
|
|
|
|
|
| Aon PLC, |
|
|
|
|
|
|
|
|
| Sr. Unsecured, 4.00%, 11/27/23 |
|
|
1,450,000 |
|
|
|
1,538,924 |
|
|
|
|
|
|
|
|
|
|
|
|
|
| Description |
|
|
Par Value |
|
|
|
Value |
|
| Berkshire Hathaway Finance Corp., |
|
|
|
|
|
|
|
|
| Company Guaranteed, 4.30%, 5/15/43 |
|
$ |
425,000 |
|
|
$ |
455,265 |
|
|
|
|
| CNA Financial Corp., |
|
|
|
|
|
|
|
|
| Sr. Unsecured, 5.75%, 8/15/21 |
|
|
1,000,000 |
|
|
|
1,162,184 |
|
|
|
|
| CNA Financial Corp., |
|
|
|
|
|
|
|
|
| Sr. Unsecured, 3.95%, 5/15/24 |
|
|
950,000 |
|
|
|
978,106 |
|
|
|
|
| Hartford Financial Services Group, Inc., |
|
|
|
|
|
|
|
|
| Sr. Unsecured, 4.00%, 10/15/17 |
|
|
2,000,000 |
|
|
|
2,135,500 |
|
|
|
|
| Lincoln National Corp., |
|
|
|
|
|
|
|
|
| Sr. Unsecured, 4.20%, 3/15/22 |
|
|
1,000,000 |
|
|
|
1,076,540 |
|
|
|
|
| MetLife, Inc., |
|
|
|
|
|
|
|
|
| Sr. Unsecured, 5.00%, 6/15/15 |
|
|
400,000 |
|
|
|
402,130 |
|
|
|
|
| Principal Financial Group, Inc., |
|
|
|
|
|
|
|
|
| Company Guaranteed, 3.30%, 9/15/22 |
|
|
250,000 |
|
|
|
253,779 |
|
|
|
|
| Prudential Financial, Inc., |
|
|
|
|
|
|
|
|
| Sr. Unsecured, MTN, 3.00%, 5/12/16 |
|
|
1,000,000 |
|
|
|
1,021,957 |
|
|
|
|
| WR Berkley Corp., |
|
|
|
|
|
|
|
|
| Sr. Unsecured, 7.38%, 9/15/19 |
|
|
280,000 |
|
|
|
335,552 |
|
|
|
|
| WR Berkley Corp., |
|
|
|
|
|
|
|
|
| Sr. Unsecured, 4.63%, 3/15/22 |
|
|
1,000,000 |
|
|
|
1,076,987 |
|
|
|
|
| WR Berkley Corp., |
|
|
|
|
|
|
|
|
| Sr. Unsecured, 4.75%, 8/01/44 |
|
|
1,715,000 |
|
|
|
1,764,166 |
|
|
|
|
|
|
|
|
|
|
|
|
|
| TOTAL INSURANCE |
|
|
|
|
|
$ |
12,201,090 |
|
|
| INTERNET – 0.2% |
|
|
|
|
| Alibaba Group Holding Ltd., |
|
|
|
|
|
|
|
|
| Company Guaranteed,
1.63%, 11/28/17W |
|
|
635,000 |
|
|
|
637,281 |
|
|
|
| MEDIA – 1.8% |
|
|
|
|
|
|
|
|
| CBS Corp., |
|
|
|
|
|
|
|
|
| Company Guaranteed, 1.95%, 7/01/17 |
|
|
2,000,000 |
|
|
|
2,024,010 |
|
|
|
|
| CBS Corp., |
|
|
|
|
|
|
|
|
| Company Guaranteed, 4.60%, 1/15/45 |
|
|
1,100,000 |
|
|
|
1,064,411 |
|
|
|
|
| DIRECTV Holdings LLC / DIRECTV Financing Co., Inc., |
|
|
|
|
|
|
|
|
| Company Guaranteed, 3.50%, 3/01/16 |
|
|
500,000 |
|
|
|
510,486 |
|
|
|
|
| NBCUniversal Enterprise, Inc., |
|
|
|
|
|
|
|
|
| Company Guaranteed,
0.78%,
4/15/16DW
|
|
|
420,000 |
|
|
|
421,453 |
|
|
|
|
| TCI Communications, Inc., |
|
|
|
|
|
|
|
|
| Sr. Unsecured, 8.75%, 8/01/15 |
|
|
400,000 |
|
|
|
407,788 |
|
|
|
|
| Viacom, Inc., |
|
|
|
|
|
|
|
|
| Sr. Unsecured, 5.63%, 9/15/19 |
|
|
1,000,000 |
|
|
|
1,129,236 |
|
|
|
|
| Viacom, Inc., |
|
|
|
|
|
|
|
|
| Sr. Unsecured, 3.88%, 12/15/21 |
|
|
850,000 |
|
|
|
887,564 |
|
|
|
|
| Viacom, Inc., |
|
|
|
|
|
|
|
|
| Sr. Unsecured, 5.25%, 4/01/44 |
|
|
1,000,000 |
|
|
|
1,005,107 |
|
|
|
|
|
|
|
|
|
|
|
|
|
| TOTAL MEDIA |
|
|
|
|
|
$ |
7,450,055 |
|
|
|
| METALS & MINING – 0.5% |
|
|
|
|
|
|
|
|
| Alcoa, Inc., |
|
|
|
|
|
|
|
|
| Sr. Unsecured, 5.13%, 10/01/24 |
|
|
1,000,000 |
|
|
|
1,076,250 |
|
|
|
|
| Barrick Gold Corp., |
|
|
|
|
|
|
|
|
| Sr. Unsecured, 5.25%, 4/01/42 |
|
|
1,000,000 |
|
|
|
945,230 |
|
|
|
|
|
|
|
|
|
|
|
|
| TOTAL METALS & MINING |
|
|
$ |
2,021,480 |
|
|
| April 30, 2015 / ANNUAL REPORT |
|
| PORTFOLIOS OF INVESTMENTS |
Wilmington Broad Market Bond Fund (continued)
|
|
|
|
|
|
|
|
|
|
|
|
| Description |
|
|
Par Value |
|
|
|
Value |
|
|
| MISCELLANEOUS MANUFACTURING – 1.1% |
|
|
|
|
| Eaton Corp., |
|
|
|
|
|
|
|
|
| Company Guaranteed, 4.00%, 11/02/32 |
|
$ |
400,000 |
|
|
$ |
410,397 |
|
|
|
|
| GE Capital Trust I, |
|
|
|
|
|
|
|
|
| Limited Guaranteed,
6.38%, 11/15/67D |
|
|
1,000,000 |
|
|
|
1,095,000 |
|
|
|
|
| Illinois Tool Works, Inc., |
|
|
|
|
|
|
|
|
| Sr. Unsecured, 3.50%, 3/01/24 |
|
|
1,235,000 |
|
|
|
1,299,785 |
|
|
|
|
| Ingersoll-Rand Luxembourg Finance SA, |
|
|
|
|
|
|
|
|
| Company Guaranteed, 2.63%, 5/01/20 |
|
|
1,135,000 |
|
|
|
1,143,559 |
|
|
|
|
| John Deere Capital Corp., |
|
|
|
|
|
|
|
|
| Sr. Unsecured, MTN, 1.40%, 3/15/17 |
|
|
250,000 |
|
|
|
252,893 |
|
|
|
|
| Textron, Inc., |
|
|
|
|
|
|
|
|
| Sr. Unsecured, 3.65%, 3/01/21 |
|
|
480,000 |
|
|
|
499,847 |
|
|
|
|
|
|
|
|
|
|
|
|
| TOTAL MISCELLANEOUS MANUFACTURING |
|
|
$ |
4,701,481 |
|
|
|
| OIL & GAS – 2.8% |
|
|
|
|
|
|
|
|
| Anadarko Finance Co., |
|
|
|
|
|
|
|
|
| Series B, Company Guaranteed, |
|
|
|
|
|
|
|
|
| 7.50%, 5/01/31 |
|
|
1,000,000 |
|
|
|
1,316,940 |
|
|
|
|
| Anadarko Petroleum Corp., |
|
|
|
|
|
|
|
|
| Sr. Unsecured, 5.95%, 9/15/16 |
|
|
225,000 |
|
|
|
239,469 |
|
|
|
|
| Canadian Natural Resources Ltd., |
|
|
|
|
|
|
|
|
| Sr. Unsecured,
0.61%, 3/30/16D |
|
|
1,000,000 |
|
|
|
998,854 |
|
|
|
|
| Exxon Mobil Corp., |
|
|
|
|
|
|
|
|
| Sr. Unsecured, 1.82%, 3/15/19 |
|
|
925,000 |
|
|
|
935,957 |
|
|
|
|
| Husky Energy, Inc., |
|
|
|
|
|
|
|
|
| Sr. Unsecured, 4.00%, 4/15/24 |
|
|
480,000 |
|
|
|
486,862 |
|
|
|
|
| Marathon Petroleum Corp., |
|
|
|
|
|
|
|
|
| Sr. Unsecured, 3.63%, 9/15/24 |
|
|
745,000 |
|
|
|
759,897 |
|
|
|
|
| Murphy Oil Corp., |
|
|
|
|
|
|
|
|
| Sr. Unsecured, 5.13%, 12/01/42 |
|
|
1,000,000 |
|
|
|
886,951 |
|
|
|
|
| Nabors Industries, Inc., |
|
|
|
|
|
|
|
|
| Company Guaranteed, 2.35%, 9/15/16 |
|
|
800,000 |
|
|
|
802,740 |
|
|
|
|
| Nabors Industries, Inc., |
|
|
|
|
|
|
|
|
| Company Guaranteed, 4.63%, 9/15/21 |
|
|
500,000 |
|
|
|
497,677 |
|
|
|
|
| ONEOK Partners LP, |
|
|
|
|
|
|
|
|
| Company Guaranteed, 6.20%, 9/15/43 |
|
|
1,000,000 |
|
|
|
1,031,831 |
|
|
|
|
| Phillips 66, |
|
|
|
|
|
|
|
|
| Company Guaranteed, 2.95%, 5/01/17 |
|
|
2,250,000 |
|
|
|
2,328,396 |
|
|
|
|
| Sempra Energy, |
|
|
|
|
|
|
|
|
| Sr. Unsecured, 6.50%, 6/01/16 |
|
|
500,000 |
|
|
|
530,349 |
|
|
|
|
| Transocean, Inc., |
|
|
|
|
|
|
|
|
| Company Guaranteed, 4.95%, 11/15/15 |
|
|
374,000 |
|
|
|
381,013 |
|
|
|
|
| Valero Energy Corp., |
|
|
|
|
|
|
|
|
| Sr. Unsecured, 4.90%, 3/15/45 |
|
|
563,000 |
|
|
|
574,079 |
|
|
|
|
|
|
|
|
|
|
|
|
|
| TOTAL OIL & GAS |
|
|
|
|
|
$ |
11,771,015 |
|
|
|
| PHARMACEUTICALS – 2.6% |
|
|
|
|
|
|
|
|
| AbbVie, Inc., |
|
|
|
|
|
|
|
|
| Sr. Unsecured, 1.20%, 11/06/15 |
|
|
1,500,000 |
|
|
|
1,503,874 |
|
|
|
|
| AbbVie, Inc., |
|
|
|
|
|
|
|
|
| Sr. Unsecured, 1.75%, 11/06/17 |
|
|
1,000,000 |
|
|
|
1,006,549 |
|
|
|
|
| AbbVie, Inc., |
|
|
|
|
|
|
|
|
| Sr. Unsecured, 4.40%, 11/06/42 |
|
|
460,000 |
|
|
|
453,122 |
|
|
|
|
|
|
|
|
|
|
|
|
|
| Description |
|
|
Par Value |
|
|
|
Value |
|
| Actavis Funding SCS, |
|
|
|
|
|
|
|
|
| Company Guaranteed, 1.30%, 6/15/17 |
|
$ |
1,500,000 |
|
|
$ |
1,491,367 |
|
|
|
|
| Actavis Funding SCS, |
|
|
|
|
|
|
|
|
| Company Guaranteed, 4.75%, 3/15/45 |
|
|
570,000 |
|
|
|
576,943 |
|
|
|
|
| Celgene Corp., |
|
|
|
|
|
|
|
|
| Sr. Unsecured, 4.63%, 5/15/44 |
|
|
1,390,000 |
|
|
|
1,453,776 |
|
|
|
|
| McKesson Corp., |
|
|
|
|
|
|
|
|
| Sr. Unsecured, 1.29%, 3/10/17 |
|
|
460,000 |
|
|
|
461,588 |
|
|
|
|
| Medco Health Solutions, Inc., |
|
|
|
|
|
|
|
|
| Company Guaranteed, 4.13%, 9/15/20 |
|
|
940,000 |
|
|
|
1,016,693 |
|
|
|
|
| Merck & Co., Inc., |
|
|
|
|
|
|
|
|
| Sr. Unsecured, 3.70%, 2/10/45 |
|
|
550,000 |
|
|
|
532,561 |
|
|
|
|
| Novartis Capital Corp., |
|
|
|
|
|
|
|
|
| Company Guaranteed, 4.40%, 5/06/44 |
|
|
2,135,000 |
|
|
|
2,371,833 |
|
|
|
|
|
|
|
|
|
|
|
|
| TOTAL PHARMACEUTICALS |
|
|
$ |
10,868,306 |
|
|
|
| PIPELINES – 2.2% |
|
|
|
|
|
|
|
|
| Energy Transfer Partners LP, |
|
|
|
|
|
|
|
|
| Sr. Unsecured, 3.60%, 2/01/23# |
|
|
870,000 |
|
|
|
868,000 |
|
|
|
|
| Energy Transfer Partners LP, |
|
|
|
|
|
|
|
|
| Sr. Unsecured, 4.05%, 3/15/25 |
|
|
1,000,000 |
|
|
|
999,653 |
|
|
|
|
| Enterprise Products Operating LLC, |
|
|
|
|
|
|
|
|
| Company Guaranteed, 4.95%, 10/15/54 |
|
|
500,000 |
|
|
|
509,160 |
|
|
|
|
| Enterprise Products Operating LLC, |
|
|
|
|
|
|
|
|
| Series B, Company Guaranteed, |
|
|
|
|
|
|
|
|
|
7.03%, 1/15/68D |
|
|
2,000,000 |
|
|
|
2,175,000 |
|
|
|
|
| Kinder Morgan Energy Partners LP, |
|
|
|
|
|
|
|
|
| Sr. Unsecured, 5.40%, 9/01/44 |
|
|
1,000,000 |
|
|
|
990,434 |
|
|
|
|
| Kinder Morgan, Inc./DE, |
|
|
|
|
|
|
|
|
| Company Guaranteed, 5.05%, 2/15/46 |
|
|
1,000,000 |
|
|
|
942,665 |
|
|
|
|
| Plains All American Pipeline LP / PAA |
|
|
|
|
|
|
|
|
| Finance Corp., |
|
|
|
|
|
|
|
|
| Sr. Unsecured, 3.65%, 6/01/22 |
|
|
1,000,000 |
|
|
|
1,035,718 |
|
|
|
|
| Plains All American Pipeline LP / PAA |
|
|
|
|
|
|
|
|
| Finance Corp., |
|
|
|
|
|
|
|
|
| Sr. Unsecured, 3.85%, 10/15/23 |
|
|
400,000 |
|
|
|
411,222 |
|
|
|
|
| Spectra Energy Partners LP, |
|
|
|
|
|
|
|
|
| Sr. Unsecured, 4.50%, 3/15/45 |
|
|
1,125,000 |
|
|
|
1,100,465 |
|
|
|
|
|
|
|
|
|
|
|
|
|
| TOTAL PIPELINES |
|
|
|
|
|
$ |
9,032,317 |
|
|
| REAL ESTATE INVESTMENT TRUSTS – 4.3% |
|
|
|
|
| American Tower Corp., |
|
|
|
|
|
|
|
|
| Sr. Unsecured, 3.40%, 2/15/19 |
|
|
2,000,000 |
|
|
|
2,074,018 |
|
|
|
|
| American Tower Corp., |
|
|
|
|
|
|
|
|
| Sr. Unsecured, 5.00%, 2/15/24 |
|
|
415,000 |
|
|
|
450,119 |
|
|
|
|
| AvalonBay Communities, Inc., |
|
|
|
|
|
|
|
|
| Sr. Unsecured, 3.63%, 10/01/20 |
|
|
1,145,000 |
|
|
|
1,212,150 |
|
|
|
|
| BioMed Realty LP, |
|
|
|
|
|
|
|
|
| Company Guaranteed, 3.85%, 4/15/16 |
|
|
1,000,000 |
|
|
|
1,023,639 |
|
|
|
|
| CommonWealth REIT, |
|
|
|
|
|
|
|
|
| Sr. Unsecured, 6.65%, 1/15/18 |
|
|
500,000 |
|
|
|
544,019 |
|
|
|
|
| Digital Realty Trust LP, |
|
|
|
|
|
|
|
|
| Sr. Unsecured, 3.63%, 10/01/22 |
|
|
1,100,000 |
|
|
|
1,096,523 |
|
|
|
|
| HCP, Inc., |
|
|
|
|
|
|
|
|
| Sr. Unsecured, 4.20%, 3/01/24 |
|
|
450,000 |
|
|
|
467,688 |
|
|
| ANNUAL REPORT / April 30, 2015 |
|
| PORTFOLIOS OF INVESTMENTS |
Wilmington Broad Market Bond Fund (continued)
|
|
|
|
|
|
|
|
|
|
|
|
| Description |
|
|
Par Value |
|
|
|
Value |
|
| HCP, Inc., |
|
|
|
|
|
|
|
|
| Sr. Unsecured, MTN, 6.30%, 9/15/16 |
|
$ |
500,000 |
|
|
$ |
534,368 |
|
|
|
|
| Health Care REIT, Inc., |
|
|
|
|
|
|
|
|
| Sr. Unsecured, 2.25%, 3/15/18 |
|
|
2,000,000 |
|
|
|
2,028,854 |
|
|
|
|
| Health Care REIT, Inc., |
|
|
|
|
|
|
|
|
| Sr. Unsecured, 5.25%, 1/15/22 |
|
|
250,000 |
|
|
|
279,633 |
|
|
|
| Healthcare Realty Trust, Inc., |
|
|
|
|
|
| Sr. Unsecured, 3.75%, 4/15/23 |
|
|
695,000 |
|
|
|
691,976 |
|
|
|
| Healthcare Realty Trust, Inc., |
|
|
|
|
|
| Sr. Unsecured, 3.88%, 5/01/25 |
|
|
915,000 |
|
|
|
909,832 |
|
|
|
|
| Mack-Cali Realty LP, |
|
|
|
|
|
|
|
|
| Sr. Unsecured, 2.50%, 12/15/17 |
|
|
2,215,000 |
|
|
|
2,222,643 |
|
|
|
|
| Mack-Cali Realty LP, |
|
|
|
|
|
|
|
|
| Sr. Unsecured, 7.75%, 8/15/19 |
|
|
250,000 |
|
|
|
290,996 |
|
|
|
|
| ProLogis LP, |
|
|
|
|
|
|
|
|
| Sr. Unsecured, 2.75%, 2/15/19 |
|
|
450,000 |
|
|
|
461,728 |
|
|
|
|
| ProLogis LP, |
|
|
|
|
|
|
|
|
| Sr. Unsecured, 3.35%, 2/01/21 |
|
|
1,245,000 |
|
|
|
1,291,122 |
|
|
|
|
| Ventas Realty LP, |
|
|
|
|
|
|
|
|
| Company Guaranteed, 1.55%, 9/26/16 |
|
|
2,000,000 |
|
|
|
2,014,813 |
|
|
|
|
| Ventas Realty LP, |
|
|
|
|
|
|
|
|
| Sr. Unsecured, 5.70%, 9/30/43 |
|
|
380,000 |
|
|
|
444,185 |
|
|
|
|
|
|
|
|
|
|
|
|
| TOTAL REAL ESTATE INVESTMENT TRUSTS |
|
|
$ |
18,038,306 |
|
|
|
| RETAIL – 0.0%** |
|
|
|
|
|
|
|
|
| CVS Caremark Corp., |
|
|
|
|
|
|
|
|
| Sr. Unsecured, 5.75%, 6/01/17 |
|
|
151,000 |
|
|
|
165,402 |
|
|
| SOFTWARE – 0.9% |
|
|
|
|
| Oracle Corp., |
|
|
|
|
|
|
|
|
| Sr. Unsecured, 4.30%, 7/08/34 |
|
|
1,730,000 |
|
|
|
1,798,878 |
|
|
|
|
| Xerox Corp., |
|
|
|
|
|
|
|
|
| Sr. Unsecured, 2.80%, 5/15/20 |
|
|
1,820,000 |
|
|
|
1,832,816 |
|
|
|
|
|
|
|
|
|
|
|
|
|
| TOTAL SOFTWARE |
|
|
|
|
|
$ |
3,631,694 |
|
|
| TELECOMMUNICATIONS – 1.7% |
|
|
|
|
| AT&T, Inc., |
|
|
|
|
|
|
|
|
| Sr. Unsecured, 1.40%, 12/01/17 |
|
|
1,731,000 |
|
|
|
1,730,888 |
|
|
|
|
| AT&T, Inc., |
|
|
|
|
|
|
|
|
| Sr. Unsecured, 4.50%, 5/15/35 |
|
|
845,000 |
|
|
|
830,175 |
|
|
|
|
| Crown Castle Towers LLC, |
|
|
|
|
|
|
|
|
| Sr. Secured,
4.17%, 8/15/17W |
|
|
2,000,000 |
|
|
|
2,083,127 |
|
|
|
| Verizon Communications, Inc., |
|
|
|
|
|
| Sr. Unsecured,
1.00%, 6/17/19D |
|
|
1,000,000 |
|
|
|
1,009,206 |
|
|
|
| Verizon Communications, Inc., |
|
|
|
|
|
| Sr. Unsecured, 6.40%, 9/15/33 |
|
|
1,260,000 |
|
|
|
1,532,802 |
|
|
|
|
|
|
|
|
|
|
|
|
| TOTAL TELECOMMUNICATIONS |
|
|
$ |
7,186,198 |
|
|
|
| TRANSPORTATION – 1.3% |
|
|
|
|
|
|
|
|
| FedEx Corp., |
|
|
|
|
|
|
|
|
| Company Guaranteed, 4.90%, 1/15/34 |
|
|
500,000 |
|
|
|
548,043 |
|
|
|
|
| FedEx Corp., |
|
|
|
|
|
|
|
|
| Company Guaranteed, 4.10%, 2/01/45 |
|
|
685,000 |
|
|
|
658,156 |
|
|
|
|
| Norfolk Southern Corp., |
|
|
|
|
|
|
|
|
| Sr. Unsecured, 5.90%, 6/15/19 |
|
|
250,000 |
|
|
|
287,550 |
|
|
|
|
|
|
|
|
|
|
|
|
|
| Description |
|
|
Par Value |
|
|
|
Value |
|
| Ryder System, Inc., |
|
|
|
|
|
|
|
|
| Sr. Unsecured, MTN, 2.50%, 3/01/17 |
|
$ |
500,000 |
|
|
$ |
510,834 |
|
|
|
|
| Ryder System, Inc., |
|
|
|
|
|
|
|
|
| Sr. Unsecured, MTN, 2.50%, 3/01/18 |
|
|
1,155,000 |
|
|
|
1,182,573 |
|
|
|
|
| Ryder System, Inc., |
|
|
|
|
|
|
|
|
| Sr. Unsecured, MTN, 2.45%, 9/03/19# |
|
|
2,450,000 |
|
|
|
2,474,166 |
|
|
|
|
|
|
|
|
|
|
|
|
| TOTAL TRANSPORTATION |
|
|
$ |
5,661,322 |
|
|
|
| TRUCKING & LEASING – 0.5% |
|
|
|
|
|
|
|
|
| GATX Corp., |
|
|
|
|
|
|
|
|
| Sr. Unsecured, 3.50%, 7/15/16 |
|
|
1,500,000 |
|
|
|
1,542,360 |
|
|
|
|
| GATX Corp., |
|
|
|
|
|
|
|
|
| Sr. Unsecured, 5.20%, 3/15/44 |
|
|
640,000 |
|
|
|
699,321 |
|
|
|
|
|
|
|
|
|
|
|
|
| TOTAL TRUCKING & LEASING |
|
|
$ |
2,241,681 |
|
|
|
|
| UTILITIES – 0.4% |
|
|
|
|
|
|
|
|
|
|
|
| Appalachian Power Co., |
|
|
|
|
|
|
|
|
| Sr. Unsecured, 5.00%, 6/01/17 |
|
|
1,500,000 |
|
|
|
1,612,057 |
|
|
|
|
|
|
|
|
|
|
|
|
TOTAL CORPORATE BONDS
(COST $181,939,291) |
|
|
$ |
187,288,232 |
|
|
| ENHANCED EQUIPMENT TRUST CERTIFICATES – 0.4% |
|
|
|
|
| AIRLINES – 0.4% |
|
|
|
|
|
|
|
|
|
|
| American Airlines 2011-1, |
|
|
|
|
|
| Series A, Pass-Through Certificates, 5.25%, 1/31/21 |
|
|
361,394 |
|
|
|
394,372 |
|
|
|
| Continental Airlines 2009-2, |
|
|
|
|
|
| Series A, Pass-Through Certificates, 7.25%, 11/10/19 |
|
|
193,663 |
|
|
|
225,254 |
|
|
|
|
| Delta Air Lines 2007-1, |
|
|
|
|
|
|
|
|
| Series A, Pass-Through Certificates, 6.82%, 8/10/22 |
|
|
302,562 |
|
|
|
358,347 |
|
|
|
|
| Delta Air Lines 2009-1, |
|
|
|
|
|
|
|
|
| Series A, Pass-Through Certificates, 7.75%, 12/17/19 |
|
|
282,255 |
|
|
|
327,328 |
|
|
|
| United Air Lines 2009-2A, |
|
|
|
|
|
| Pass-Through Certificates, 9.75%, 1/15/17 |
|
|
237,439 |
|
|
|
261,034 |
|
|
|
|
|
|
|
|
|
|
|
|
|
| TOTAL AIRLINES |
|
|
|
|
|
$ |
1,566,335 |
|
|
|
|
|
|
|
|
|
|
|
| TOTAL ENHANCED EQUIPMENT TRUST CERTIFICATES |
|
| (COST $1,377,313) |
|
|
$ |
1,566,335 |
|
|
|
| GOVERNMENT AGENCIES – 1.4% |
|
|
|
|
|
|
| FEDERAL HOME LOAN MORTGAGE CORPORATION (FHLMC) – 0.8% |
|
|
|
|
| 1.25%, 10/02/19 |
|
|
1,300,000 |
|
|
|
1,289,263 |
|
| 1.75%, 5/30/19# |
|
|
2,000,000 |
|
|
|
2,032,167 |
|
| 2.38%, 1/13/22# |
|
|
125,000 |
|
|
|
128,557 |
|
|
|
|
|
|
|
|
|
|
|
|
| TOTAL FEDERAL HOME LOAN MORTGAGE CORPORATION (FHLMC) |
|
|
$ |
3,449,987 |
|
|
| FEDERAL NATIONAL MORTGAGE ASSOCIATION (FNMA) – 0.6% |
|
|
|
|
| 4.88%, 12/15/16 |
|
|
700,000 |
|
|
|
748,859 |
|
|
| April 30, 2015 / ANNUAL REPORT |
|
| PORTFOLIOS OF INVESTMENTS |
Wilmington Broad Market Bond Fund (continued)
|
|
|
|
|
|
|
|
|
|
|
|
| Description |
|
|
Par Value |
|
|
|
Value |
|
| 6.25%, 5/15/29 |
|
$ |
750,000 |
|
|
$ |
1,062,471 |
|
|
|
|
| 7.25%, 5/15/30 |
|
|
400,000 |
|
|
|
618,508 |
|
|
|
|
|
|
|
|
|
|
|
|
| TOTAL FEDERAL NATIONAL MORTGAGE ASSOCIATION (FNMA) |
|
|
$ |
2,429,838 |
|
|
|
|
|
|
|
|
|
|
|
|
TOTAL GOVERNMENT AGENCIES
(COST $5,507,399) |
|
|
$ |
5,879,825 |
|
|
| MORTGAGE-BACKED SECURITIES – 23.0% |
|
|
| FEDERAL HOME LOAN MORTGAGE CORPORATION (FHLMC) – 12.1% |
|
|
|
|
| Pool A13990, 4.50%, 10/01/33 |
|
|
54,323 |
|
|
|
59,530 |
|
|
|
|
| Pool A93415, 4.00%, 8/01/40 |
|
|
2,939,004 |
|
|
|
3,153,105 |
|
|
|
|
| Pool A93505, 4.50%, 8/01/40 |
|
|
2,561,585 |
|
|
|
2,791,937 |
|
|
|
|
| Pool A93996, 4.50%, 9/01/40 |
|
|
1,980,844 |
|
|
|
2,158,973 |
|
|
|
|
| Pool A97047, 4.50%, 2/01/41 |
|
|
1,868,232 |
|
|
|
2,036,818 |
|
|
|
|
| Pool B17616, 5.50%, 1/01/20 |
|
|
81,672 |
|
|
|
83,120 |
|
|
|
|
| Pool C00478, 8.50%, 9/01/26 |
|
|
23,125 |
|
|
|
26,971 |
|
|
|
|
| Pool C01272, 6.00%, 12/01/31 |
|
|
48,003 |
|
|
|
55,105 |
|
|
|
|
| Pool C03750, 3.50%, 2/01/42 |
|
|
550,799 |
|
|
|
577,319 |
|
|
|
|
| Pool C03849, 3.50%, 4/01/42 |
|
|
266,117 |
|
|
|
278,942 |
|
|
|
|
| Pool C04305, 3.00%, 11/01/42 |
|
|
3,806,017 |
|
|
|
3,877,350 |
|
|
|
|
| Pool C04444, 3.00%, 1/01/43 |
|
|
140,864 |
|
|
|
143,504 |
|
|
|
|
| Pool C09020, 3.50%, 11/01/42 |
|
|
4,077,350 |
|
|
|
4,273,850 |
|
|
|
|
| Pool C09044, 3.50%, 7/01/43 |
|
|
2,044,770 |
|
|
|
2,142,127 |
|
|
|
|
| Pool E09010, 2.50%, 9/01/27 |
|
|
1,593,609 |
|
|
|
1,644,504 |
|
|
|
|
| Pool G01625, 5.00%, 11/01/33 |
|
|
67,670 |
|
|
|
75,599 |
|
|
|
|
| Pool G02296, 5.00%, 6/01/36 |
|
|
381,854 |
|
|
|
425,164 |
|
|
|
|
| Pool G02390, 6.00%, 9/01/36 |
|
|
13,623 |
|
|
|
15,617 |
|
|
|
|
| Pool G03703, 5.50%, 12/01/37 |
|
|
42,020 |
|
|
|
47,623 |
|
|
|
|
| Pool G04776, 5.50%, 7/01/38 |
|
|
146,713 |
|
|
|
166,091 |
|
|
|
|
| Pool G05317, 5.00%, 4/01/37 |
|
|
1,510,891 |
|
|
|
1,682,256 |
|
|
|
|
| Pool G05500, 5.00%, 5/01/39 |
|
|
1,250,475 |
|
|
|
1,395,040 |
|
|
|
|
| Pool G06222, 4.00%, 1/01/41 |
|
|
3,120,548 |
|
|
|
3,342,999 |
|
|
|
|
| Pool G06956, 4.50%, 8/01/41 |
|
|
1,869,649 |
|
|
|
2,038,363 |
|
|
|
|
| Pool G07266, 4.00%, 12/01/42 |
|
|
4,178,608 |
|
|
|
4,473,871 |
|
|
|
|
| Pool G07624, 4.00%, 12/01/43 |
|
|
1,760,174 |
|
|
|
1,894,024 |
|
|
|
|
| Pool G07680, 4.00%, 4/01/44 |
|
|
2,800,175 |
|
|
|
3,013,112 |
|
|
|
|
| Pool G07889, 3.50%, 8/01/43 |
|
|
1,749,755 |
|
|
|
1,834,081 |
|
|
|
|
| Pool G08097, 6.50%, 11/01/35 |
|
|
25,691 |
|
|
|
29,644 |
|
|
|
|
| Pool G08534, 3.00%, 6/01/43 |
|
|
813,234 |
|
|
|
828,488 |
|
|
|
|
| Pool G08595, 4.00%, 7/01/44 |
|
|
1,971,946 |
|
|
|
2,112,230 |
|
|
|
|
| Pool G12709, 5.00%, 7/01/22 |
|
|
91,119 |
|
|
|
96,500 |
|
|
|
|
| Pool G18497, 3.00%, 1/01/29 |
|
|
204,775 |
|
|
|
214,832 |
|
|
|
|
| Pool Q08305, 3.50%, 5/01/42 |
|
|
1,509,259 |
|
|
|
1,588,597 |
|
|
|
|
| Pool Q19476, 3.50%, 6/01/43 |
|
|
1,644,894 |
|
|
|
1,723,211 |
|
|
|
|
| Pool Q23891, 4.00%, 12/01/43 |
|
|
422,474 |
|
|
|
453,310 |
|
|
|
|
|
|
|
|
|
|
|
|
| TOTAL FEDERAL HOME LOAN MORTGAGE CORPORATION (FHLMC) |
|
|
$ |
50,753,807 |
|
|
|
|
|
|
|
|
|
|
|
|
|
| Description |
|
|
Par Value |
|
|
|
Value |
|
|
| FEDERAL NATIONAL MORTGAGE ASSOCIATION (FNMA) – 10.8% |
|
|
|
|
| Pool 254007, 6.50%, 10/01/31 |
|
$ |
25,513 |
|
|
$ |
29,592 |
|
|
|
|
| Pool 254759, 4.50%, 6/01/18 |
|
|
74,523 |
|
|
|
78,080 |
|
|
|
|
| Pool 254833, 4.50%, 8/01/18 |
|
|
13,418 |
|
|
|
14,077 |
|
|
|
|
| Pool 256515, 6.50%, 12/01/36 |
|
|
34,669 |
|
|
|
40,039 |
|
|
|
|
| Pool 256639, 5.00%, 2/01/27 |
|
|
25,971 |
|
|
|
29,036 |
|
|
|
|
| Pool 256752, 6.00%, 6/01/27 |
|
|
41,253 |
|
|
|
47,295 |
|
|
|
|
| Pool 329794, 7.00%, 2/01/26 |
|
|
39,360 |
|
|
|
45,812 |
|
|
|
|
| Pool 402255, 6.50%, 12/01/27 |
|
|
1,755 |
|
|
|
1,823 |
|
|
|
|
| Pool 535939, 6.00%, 5/01/16 |
|
|
8,703 |
|
|
|
8,876 |
|
|
|
|
| Pool 629603, 5.50%, 2/01/17 |
|
|
4,151 |
|
|
|
4,277 |
|
|
|
|
| Pool 638023, 6.50%, 4/01/32 |
|
|
60,599 |
|
|
|
67,908 |
|
|
|
|
| Pool 642345, 6.50%, 5/01/32 |
|
|
72,190 |
|
|
|
84,049 |
|
|
|
|
| Pool 651292, 6.50%, 7/01/32 |
|
|
115,416 |
|
|
|
125,314 |
|
|
|
|
| Pool 686398, 6.00%, 3/01/33 |
|
|
221,652 |
|
|
|
253,079 |
|
|
|
|
| Pool 695818, 5.00%, 4/01/18 |
|
|
74,561 |
|
|
|
78,215 |
|
|
|
|
| Pool 745412, 5.50%, 12/01/35 |
|
|
47,089 |
|
|
|
53,576 |
|
|
|
|
| Pool 888789, 5.00%, 7/01/36 |
|
|
527,293 |
|
|
|
589,868 |
|
|
|
|
| Pool 890551, 4.50%, 8/01/41 |
|
|
175,576 |
|
|
|
191,503 |
|
|
|
|
| Pool 975207, 5.00%, 3/01/23 |
|
|
114,645 |
|
|
|
121,749 |
|
|
|
|
| Pool AB1796, 3.50%, 11/01/40 |
|
|
1,455,708 |
|
|
|
1,533,431 |
|
|
|
|
| Pool AB7936, 3.00%, 2/01/43 |
|
|
2,377,330 |
|
|
|
2,424,092 |
|
|
|
|
| Pool AB8997, 2.50%, 4/01/28 |
|
|
336,126 |
|
|
|
345,276 |
|
|
|
|
| Pool AE0217, 4.50%, 8/01/40 |
|
|
311,221 |
|
|
|
339,453 |
|
|
|
|
| Pool AE2520, 3.00%, 1/01/26 |
|
|
928,669 |
|
|
|
977,966 |
|
|
|
|
| Pool AH5583, 4.50%, 2/01/41 |
|
|
906,679 |
|
|
|
988,927 |
|
|
|
|
| Pool AK4523, 4.00%, 3/01/42 |
|
|
2,749,440 |
|
|
|
2,946,132 |
|
|
|
|
| Pool AL0658, 4.50%, 8/01/41 |
|
|
1,020,296 |
|
|
|
1,112,849 |
|
|
|
|
| Pool AL1319, 4.50%, 10/01/41 |
|
|
2,080,032 |
|
|
|
2,274,568 |
|
|
|
|
| Pool AL2034, 4.50%, 4/01/42 |
|
|
423,399 |
|
|
|
461,807 |
|
|
|
|
| Pool AL5537, 4.50%, 4/01/44 |
|
|
845,911 |
|
|
|
922,646 |
|
|
|
|
| Pool AS0302, 3.00%, 8/01/43 |
|
|
6,475,597 |
|
|
|
6,605,101 |
|
|
|
|
| Pool AS3155, 4.00%, 8/01/44 |
|
|
234,815 |
|
|
|
251,974 |
|
|
|
|
| Pool AS4480, 2.50%, 2/01/30 |
|
|
1,953,387 |
|
|
|
2,006,182 |
|
|
|
|
| Pool AT7899, 3.50%, 7/01/43 |
|
|
4,957,350 |
|
|
|
5,209,004 |
|
|
|
|
| Pool AU4279, 3.00%, 9/01/43 |
|
|
1,294,856 |
|
|
|
1,320,752 |
|
|
|
|
| Pool AX0833, 3.50%, 9/01/44 |
|
|
2,229,193 |
|
|
|
2,344,841 |
|
|
|
|
| Pool AX5302, 4.00%, 1/01/42 |
|
|
2,779,025 |
|
|
|
2,979,570 |
|
|
|
|
| Pool MA1458, 3.00%, 6/01/43 |
|
|
817,869 |
|
|
|
834,737 |
|
|
|
|
| Pool TBA, 5.00%, |
|
|
6,700,000 |
|
|
|
7,461,078 |
|
|
|
|
|
|
|
|
|
|
|
|
| TOTAL FEDERAL NATIONAL MORTGAGE ASSOCIATION (FNMA) |
|
|
$ |
45,204,554 |
|
|
| GOVERNMENT NATIONAL MORTGAGE ASSOCIATION (GNMA) – 0.1% |
|
|
|
|
| Pool 2077, 7.00%, 9/20/25 |
|
|
12,733 |
|
|
|
14,687 |
|
|
|
|
| Pool 354677, 7.50%, 10/15/23 |
|
|
27,775 |
|
|
|
32,395 |
|
|
|
|
| Pool 354713, 7.50%, 12/15/23 |
|
|
19,713 |
|
|
|
22,992 |
|
|
| ANNUAL REPORT / April 30, 2015 |
|
| PORTFOLIOS OF INVESTMENTS |
Wilmington Broad Market Bond Fund (continued)
|
|
|
|
|
|
|
|
|
|
|
|
| Description |
|
|
Par Value |
|
|
|
Value |
|
| Pool 354765, 7.00%, 2/15/24 |
|
$ |
38,093 |
|
|
$ |
44,371 |
|
|
|
|
| Pool 354827, 7.00%, 5/15/24 |
|
|
39,038 |
|
|
|
45,269 |
|
|
|
|
| Pool 360869, 7.50%, 5/15/24 |
|
|
25,849 |
|
|
|
26,672 |
|
|
|
|
| Pool 361843, 7.50%, 10/15/24 |
|
|
10,960 |
|
|
|
11,268 |
|
|
|
|
| Pool 373335, 7.50%, 5/15/22 |
|
|
10,028 |
|
|
|
10,341 |
|
|
|
|
| Pool 385623, 7.00%, 5/15/24 |
|
|
44,873 |
|
|
|
51,849 |
|
|
|
|
| Pool 503405, 6.50%, 4/15/29 |
|
|
50,753 |
|
|
|
58,841 |
|
|
|
|
|
|
|
|
|
|
|
|
| TOTAL GOVERNMENT NATIONAL MORTGAGE ASSOCIATION (GNMA) |
|
|
$ |
318,685 |
|
|
|
|
|
|
|
|
|
|
|
| TOTAL MORTGAGE-BACKED SECURITIES |
|
| (COST $94,996,067) |
|
|
$ |
96,277,046 |
|
|
| U.S. TREASURY – 26.1% |
|
|
| U.S. TREASURY BONDS – 4.7% |
|
|
|
|
| 3.00%, 5/15/42 |
|
|
500,000 |
|
|
|
525,357 |
|
|
|
|
| 3.00%, 11/15/44 |
|
|
2,000,000 |
|
|
|
2,105,209 |
|
|
|
|
| 3.13%, 8/15/44 |
|
|
7,887,000 |
|
|
|
8,497,853 |
|
|
|
|
| 3.63%, 2/15/44 |
|
|
2,106,000 |
|
|
|
2,481,713 |
|
|
|
|
| 3.63%, 8/15/43 |
|
|
881,000 |
|
|
|
1,037,067 |
|
|
|
|
| 3.75%, 11/15/43 |
|
|
365,000 |
|
|
|
439,357 |
|
|
|
|
| 5.25%, 2/15/29 |
|
|
500,000 |
|
|
|
673,536 |
|
|
|
|
| 5.38%, 2/15/31 |
|
|
600,000 |
|
|
|
836,746 |
|
|
|
|
| 6.25%, 5/15/30 |
|
|
500,000 |
|
|
|
747,054 |
|
|
|
|
| 6.38%, 8/15/27 |
|
|
450,000 |
|
|
|
652,511 |
|
|
|
|
| 7.50%, 11/15/16 |
|
|
300,000 |
|
|
|
332,228 |
|
|
|
|
| 8.88%, 2/15/19 |
|
|
1,130,000 |
|
|
|
1,456,294 |
|
|
|
|
|
|
|
|
|
|
|
|
| TOTAL U.S. TREASURY BONDS |
|
|
$ |
19,784,925 |
|
|
| U.S. TREASURY NOTES – 21.4% |
|
|
|
|
| 0.25%, 5/15/16 |
|
|
195,000 |
|
|
|
194,919 |
|
|
|
|
| 0.50%, 7/31/16 |
|
|
1,000,000 |
|
|
|
1,001,781 |
|
|
|
|
| 0.63%, 8/31/17 |
|
|
1,810,000 |
|
|
|
1,805,631 |
|
|
|
|
| 0.63%, 9/30/17 |
|
|
750,000 |
|
|
|
747,841 |
|
|
|
|
| 0.75%, 12/31/17 |
|
|
500,000 |
|
|
|
499,112 |
|
|
|
|
| 0.88%, 8/15/17# |
|
|
6,100,000 |
|
|
|
6,124,349 |
|
|
|
|
| 1.00%, 5/31/18 |
|
|
3,100,000 |
|
|
|
3,104,228 |
|
|
|
|
| 1.25%, 10/31/18 |
|
|
2,085,000 |
|
|
|
2,096,345 |
|
|
|
|
| 1.25%, 1/31/19 |
|
|
250,000 |
|
|
|
250,777 |
|
|
|
|
| 1.38%, 3/31/20# |
|
|
3,300,000 |
|
|
|
3,291,108 |
|
|
|
|
| 1.38%, 6/30/18 |
|
|
6,000,000 |
|
|
|
6,073,830 |
|
|
|
|
| 1.38%, 9/30/18 |
|
|
1,240,000 |
|
|
|
1,252,944 |
|
|
|
|
| 1.38%, 2/28/19 |
|
|
2,500,000 |
|
|
|
2,517,148 |
|
|
|
|
| 1.50%, 12/31/18 |
|
|
2,486,000 |
|
|
|
2,517,800 |
|
|
|
|
| 1.50%, 1/31/19 |
|
|
9,400,000 |
|
|
|
9,514,393 |
|
|
|
|
| 1.50%, 5/31/19 |
|
|
535,000 |
|
|
|
540,069 |
|
|
|
|
| 1.50%, 11/30/19 |
|
|
1,145,000 |
|
|
|
1,151,926 |
|
|
|
|
| 1.63%, 3/31/19 |
|
|
820,000 |
|
|
|
833,059 |
|
|
|
|
| 1.63%, 8/15/22 |
|
|
6,000,000 |
|
|
|
5,919,450 |
|
|
|
|
|
|
|
|
|
|
|
|
|
| Description |
|
|
Par Value |
|
|
|
Value |
|
|
|
|
| 1.63%, 11/15/22 |
|
$ |
1,928,000 |
|
|
$ |
1,898,210 |
|
|
|
|
| 1.75%, 9/30/19 |
|
|
5,700,000 |
|
|
|
5,800,365 |
|
|
|
|
| 1.75%, 5/15/22 |
|
|
380,000 |
|
|
|
378,875 |
|
|
|
|
| 1.88%, 6/30/20 |
|
|
10,845,000 |
|
|
|
11,061,565 |
|
|
|
|
| 2.00%, 11/15/21 |
|
|
1,000,000 |
|
|
|
1,015,780 |
|
|
|
|
| 2.00%, 2/15/25# |
|
|
4,655,000 |
|
|
|
4,640,025 |
|
|
|
|
| 2.13%, 8/15/21 |
|
|
3,750,000 |
|
|
|
3,839,627 |
|
|
|
|
| 2.25%, 7/31/18 |
|
|
500,000 |
|
|
|
519,905 |
|
|
|
|
| 2.25%, 7/31/21 |
|
|
6,600,000 |
|
|
|
6,811,367 |
|
|
|
|
| 2.38%, 8/15/24 |
|
|
1,400,000 |
|
|
|
1,443,175 |
|
|
|
|
| 2.50%, 8/15/23 |
|
|
200,000 |
|
|
|
208,977 |
|
|
|
|
| 2.63%, 11/15/20 |
|
|
500,000 |
|
|
|
527,724 |
|
|
|
|
| 3.13%, 5/15/19 |
|
|
750,000 |
|
|
|
805,389 |
|
|
|
|
| 3.63%, 2/15/20 |
|
|
750,000 |
|
|
|
827,084 |
|
|
|
|
| 4.00%, 8/15/18 |
|
|
500,000 |
|
|
|
548,970 |
|
|
|
|
|
|
|
|
|
|
|
|
| TOTAL U.S. TREASURY NOTES |
|
|
$ |
89,763,748 |
|
|
|
|
|
|
|
|
|
|
|
|
| TOTAL U.S. TREASURY
(COST $106,236,448) |
|
|
$ |
109,548,673 |
|
|
|
|
|
|
|
|
|
|
|
|
|
Number of
Shares |
|
|
|
|
|
|
|
| MONEY MARKET FUND – 2.0% |
|
|
|
|
|
|
|
|
| Dreyfus Cash Management Fund, Institutional Shares, 0.04%^ |
|
|
8,414,920 |
|
|
$ |
8,414,920 |
|
|
|
|
|
|
|
|
|
|
|
|
| TOTAL MONEY MARKET FUND
(COST $8,414,920) |
|
|
$ |
8,414,920 |
|
|
|
|
|
|
|
|
|
|
|
|
|
|
|
|
|
|
|
|
| TOTAL INVESTMENTS IN SECURITIES – 101.7% |
|
| (COST $415,661,321) |
|
|
$ |
426,095,163 |
|
|
|
|
|
|
|
|
|
|
|
|
|
|
|
|
|
|
|
|
|
|
|
|
|
Par Value |
|
|
|
|
|
|
| CASH COLLATERAL INVESTED FOR SECURITIES ON LOAN – 3.5% |
|
|
| REPURCHASE AGREEMENTS – 3.5% |
|
|
|
|
| BNP Paribas Securities Corp., 0.12%, dated 4/30/15, due 5/01/15, repurchase price $739,324, collateralized by U.S. Government & Treasury Securities 0.00% to
6.50%, maturing 5/01/16 to 4/20/45; total market value of $754,108. |
|
$ |
739,322 |
|
|
$ |
739,322 |
|
|
|
|
| Citigroup Global Markets, Inc., 0.13%, dated 4/30/15, due 5/01/15, repurchase price $2,809,570, collateralized by U.S. Government Securities 1.61% to 8.00%, maturing
6/01/17 to 6/15/52; total market value of $2,865,751. |
|
|
2,809,560 |
|
|
|
2,809,560 |
|
|
|
|
| Credit Suisse Securities (USA) LLC, 0.12%, dated 4/30/15, due 5/01/15, repurchase price $2,809,569, collateralized by U.S. Government Securities 3.00% to 4.50%,
maturing 8/01/38 to 4/01/45; total market value of $2,865,772. |
|
|
2,809,560 |
|
|
|
2,809,560 |
|
|
| April 30, 2015 / ANNUAL REPORT |
|
| PORTFOLIOS OF INVESTMENTS |
Wilmington Broad Market Bond Fund (continued)
|
|
|
|
|
|
|
|
|
|
|
|
| Description |
|
|
Par Value |
|
|
|
Value |
|
| Daiwa Capital Markets America, 0.16%, dated 4/30/15, due
5/01/15, repurchase price $2,809,572, collateralized by U.S. Government & Treasury Securities 0.00% to 9.25%, maturing 5/21/15 to 3/01/48; total market value of $2,865,752. |
|
$ |
2,809,560 |
|
|
$ |
2,809,560 |
|
|
|
|
| ING Financial Markets LLC, 0.12%, dated 4/30/15, due 5/01/15, repurchase price $2,809,569, collateralized by U.S. Government Securities 1.87% to 6.20%, maturing
5/01/33 to 11/01/44; total market value of $2,865,753. |
|
|
2,809,560 |
|
|
|
2,809,560 |
|
|
|
|
| Nomura Securities International, Inc., 0.12%, dated 4/30/15, due 5/01/15, repurchase price $2,809,569, collateralized by U.S. Government & Treasury Securities
0.00% to 10.50%, maturing 5/15/15 to 3/20/64; total market value of $2,865,751. |
|
|
2,809,560 |
|
|
|
2,809,560 |
|
|
|
|
|
|
|
|
|
|
|
| TOTAL CASH COLLATERAL INVESTED FOR SECURITIES ON LOAN |
|
| (COST $14,787,122) |
|
|
|
|
|
$ |
14,787,122 |
|
|
|
|
|
|
|
|
|
|
|
|
|
|
|
|
|
| Description |
|
|
Value |
|
| TOTAL INVESTMENTS – 105.2% |
|
|
|
|
| (COST $430,448,443) |
|
$ |
440,882,285 |
|
|
|
COLLATERAL FOR SECURITIES ON
LOAN – (3.5%) |
|
|
(14,787,122 |
) |
|
|
| OTHER LIABILITIES LESS ASSETS – (1.7%) |
|
|
(7,059,251 |
) |
|
|
|
|
|
|
|
| TOTAL NET ASSETS – 100.0% |
|
$ |
419,035,912 |
|
|
|
|
|
|
Cost of investments for Federal income
tax purposes is $430,448,443. The net unrealized appreciation/(depreciation) of investments was $10,433,842. This consists of net unrealized appreciation from investment for those securities having an excess of value over cost of $11,608,654 and net
unrealized depreciation from investments for those securities having an excess of cost over value of $1,174,812.
Various inputs are used in
determining the value of the Fund’s investments. These inputs are summarized in the three broad levels listed below.
Level 1 – quoted
prices in active markets for identical securities
Level 2 – other significant observable inputs (including quoted prices for similar securities,
interest rates, prepayment speeds, credit risk, etc.)
Level 3 – significant unobservable inputs (including the Fund’s own assumptions in
determining the fair value of investments)
The following is a summary of the inputs used as of April 30, 2015 in valuing the Fund’s assets
carried at fair value:
|
|
|
|
|
|
|
|
|
|
|
|
|
|
|
|
|
|
|
|
|
|
|
| |
|
Level 1 |
|
|
|
|
Level 2 |
|
|
|
|
Level 3 |
|
|
|
|
Total |
|
| Investments in Securities |
|
|
|
|
|
|
|
|
|
|
|
|
|
|
|
|
|
|
|
|
|
|
|
|
|
|
|
|
|
|
| Asset-Backed Securities |
|
$ |
— |
|
|
|
|
$ |
1,146,031 |
|
|
|
|
$ |
— |
|
|
|
|
$ |
1,146,031 |
|
|
|
|
|
|
|
|
|
| Collateralized Mortgage Obligations |
|
|
— |
|
|
|
|
|
5,975,123 |
|
|
|
|
|
— |
|
|
|
|
|
5,975,123 |
|
|
|
|
|
|
|
|
|
| Commercial Paper |
|
|
— |
|
|
|
|
|
9,998,978 |
|
|
|
|
|
— |
|
|
|
|
|
9,998,978 |
|
|
|
|
|
|
|
|
|
| Corporate Bonds |
|
|
— |
|
|
|
|
|
187,288,232 |
|
|
|
|
|
— |
|
|
|
|
|
187,288,232 |
|
|
|
|
|
|
|
|
|
| Enhanced Equipment Trust Certificates |
|
|
— |
|
|
|
|
|
1,566,335 |
|
|
|
|
|
— |
|
|
|
|
|
1,566,335 |
|
|
|
|
|
|
|
|
|
| Government Agencies |
|
|
— |
|
|
|
|
|
5,879,825 |
|
|
|
|
|
— |
|
|
|
|
|
5,879,825 |
|
|
|
|
|
|
|
|
|
| Mortgage-Backed Securities |
|
|
— |
|
|
|
|
|
96,277,046 |
|
|
|
|
|
— |
|
|
|
|
|
96,277,046 |
|
|
|
|
|
|
|
|
|
| U.S. Treasury |
|
|
— |
|
|
|
|
|
109,548,673 |
|
|
|
|
|
— |
|
|
|
|
|
109,548,673 |
|
|
|
|
|
|
|
|
|
| Money Market Fund |
|
|
8,414,920 |
|
|
|
|
|
— |
|
|
|
|
|
— |
|
|
|
|
|
8,414,920 |
|
|
|
|
|
|
|
|
|
| Repurchase Agreements |
|
|
— |
|
|
|
|
|
14,787,122 |
|
|
|
|
|
— |
|
|
|
|
|
14,787,122 |
|
|
|
|
|
|
|
|
|
|
|
|
|
|
|
|
|
|
|
|
|
|
|
|
|
|
|
|
|
|
|
|
| Total |
|
$ |
8,414,920 |
|
|
|
|
$ |
432,467,365 |
|
|
|
|
$ |
— |
|
|
|
|
$ |
440,882,285 |
|
|
|
|
|
|
|
|
|
|
|
|
|
|
|
|
|
|
|
|
|
|
|
|
| # |
Security, or a portion thereof, is on loan. See Note 2 in Notes to Financial Statements. |
| r |
Floating rate note with current rate and stated maturity date shown. |
| ¿ |
The rate shown reflects the effective yield at purchase date. |
| W |
Denotes a restricted security that may be resold without restriction to “qualified institutional buyers” as defined in Rule 144A under the Securities Act of 1933 and that the Fund has determined to be liquid
under criteria established by the Fund’s Board of Trustees. At April 30, 2015, these liquid restricted securities amounted to $23,558,351 representing 5.6% of total net assets. |
| ** |
Represents less than 0.05% |
|
| ANNUAL REPORT / April 30, 2015 |
|
| PORTFOLIOS OF INVESTMENTS |
Wilmington Broad Market Bond Fund (concluded)
|
|
|
|
|
|
|
|
|
The following acronyms are used throughout this Fund:
BKNT - Bank Note
CMBS - Commercial Mortgage-Backed Securities
FHLMC - Federal Home Loan Mortgage Corporation
FNMA - Federal National Mortgage Association
GMTN - Global Medium Term Note |
|
GNMA - Government National Mortgage Association
LLC - Limited Liability Corporation
LP - Limited Partnership
MTN - Medium Term Note
PLC - Public Limited Company
REIT - Real Estate Investment Trust |
|
|
See Notes which are an integral part of the Financial Statements
|
| April 30, 2015 / ANNUAL REPORT |
PORTFOLIO OF INVESTMENTS SUMMARY TABLE
Wilmington Intermediate-Term Bond Fund
At April 30, 2015, the
Fund’s portfolio composition was as follows (unaudited):
|
|
|
|
|
| |
|
Percentage of
Total Net Assets |
|
| Corporate Bonds |
|
|
52.2% |
|
| U.S. Treasury |
|
|
32.7% |
|
| Government Agencies |
|
|
11.3% |
|
| Mortgage-Backed Securities |
|
|
2.1% |
|
| Asset-Backed Security |
|
|
0.1% |
|
| Cash Equivalents1 |
|
|
10.6% |
|
| Other Assets and Liabilities – Net2 |
|
|
(9.0)% |
|
| TOTAL |
|
|
100.0% |
|
| (1) |
Cash Equivalents include investments in a money market fund and repurchase agreements. |
| (2) |
Assets, other than investments in securities, less liabilities. See Statements of Assets and Liabilities. |
| (3) |
For financial reporting purposes, the Credit Quality Diversification table reflects the lowest rating assigned by either Moody’s Investors Service or Standard and Poor’s if the ratings differ. These rating
agencies are independent, nationally recognized statistical rating organizations and are widely used. Investment grade ratings are credit ratings of BBB/Baa or higher. Below investment grade ratings are credit ratings of BB/Ba or lower. Investments
designated as “Not Rated” are not rated by either rating agency and do not necessarily indicate low credit quality. Credit quality ratings are subject to change.
|
|
|
|
|
|
| Credit Quality Diversification3 |
|
Percentage of
Total Net Assets |
|
| U.S. Government Agency Securities |
|
|
14.8% |
|
| U.S. Treasury |
|
|
32.8% |
|
| AAA / Aaa |
|
|
0.2% |
|
| AA / Aa |
|
|
4.5% |
|
| A / A |
|
|
10.6% |
|
| BBB / Baa |
|
|
35.4% |
|
| BB / Ba |
|
|
1.6% |
|
| Not Rated |
|
|
9.1% |
|
| Other Assets and Liabilities – Net2 |
|
|
(9.0)% |
|
| TOTAL |
|
|
100.0% |
|
PORTFOLIO OF INVESTMENTS
April 30, 2015
|
|
|
|
|
|
|
|
|
|
|
|
| Description |
|
|
Par Value |
|
|
|
Value |
|
| ASSET-BACKED SECURITY
– 0.1% |
|
|
|
|
|
|
|
|
| WHOLE LOAN – 0.1% |
|
|
|
|
|
|
|
|
|
|
| SLM Private Education Loan Trust, |
|
|
|
|
|
| Series 2011-A, Class A1,
1.17%,
10/15/24D,W
|
|
$ |
197,369 |
|
|
$ |
198,044 |
|
|
|
|
|
|
|
|
|
|
|
|
| TOTAL ASSET-BACKED SECURITY |
|
|
|
|
|
| (COST $197,369) |
|
|
|
|
|
$ |
198,044 |
|
|
|
| CORPORATE BONDS – 52.2% |
|
|
|
|
|
|
|
| AEROSPACE & DEFENSE – 1.2% |
|
|
|
|
|
|
|
|
| L-3 Communications Corp., |
|
|
|
|
|
|
|
|
| Company Guaranteed, 3.95%, 11/15/16 |
|
|
250,000 |
|
|
|
259,284 |
|
|
|
|
| L-3 Communications Corp., |
|
|
|
|
|
|
|
|
| Company Guaranteed, 4.75%, 7/15/20 |
|
|
1,250,000 |
|
|
|
1,351,980 |
|
|
|
|
|
|
|
|
|
|
|
|
| TOTAL AEROSPACE & DEFENSE |
|
|
$ |
1,611,264 |
|
|
|
| AUTO MANUFACTURERS – 1.7% |
|
|
|
|
|
|
|
|
| Daimler Finance North America LLC, |
|
|
|
|
|
|
|
|
| Company Guaranteed,
1.38%, 8/01/17W |
|
|
500,000 |
|
|
|
501,576 |
|
|
|
|
|
|
|
|
|
|
|
|
|
| Description |
|
|
Par Value |
|
|
|
Value |
|
| Ford Motor Credit Co. LLC, |
|
|
|
|
|
|
|
|
| Sr. Unsecured, 2.15%, 1/09/18 |
|
$ |
750,000 |
|
|
$ |
757,893 |
|
|
|
|
| General Motors Co., |
|
|
|
|
|
|
|
|
| Sr. Unsecured, 3.50%, 10/02/18 |
|
|
220,000 |
|
|
|
226,380 |
|
|
|
|
| Hyundai Capital America, |
|
|
|
|
|
|
|
|
| Sr. Unsecured,
2.00%, 3/19/18W |
|
|
250,000 |
|
|
|
252,001 |
|
|
|
|
| Toyota Motor Credit Corp., |
|
|
|
|
|
|
|
|
| Sr. Unsecured, MTN, 0.64%, 3/12/20 |
|
|
450,000 |
|
|
|
452,042 |
|
|
|
|
|
|
|
|
|
|
|
|
| TOTAL AUTO MANUFACTURERS |
|
|
$ |
2,189,892 |
|
|
|
| AUTO PARTS & EQUIPMENT – 0.2% |
|
|
|
|
|
|
|
|
| Johnson Controls, Inc., |
|
|
|
|
|
|
|
|
| Sr. Unsecured, 3.63%, 7/02/24 |
|
|
300,000 |
|
|
|
311,403 |
|
|
|
|
| AUTOMOTIVE – 0.2% |
|
|
|
|
|
|
|
|
|
|
|
| Ford Motor Credit Co. LLC, |
|
|
|
|
|
|
|
|
| Sr. Unsecured, 6.63%, 8/15/17 |
|
|
250,000 |
|
|
|
278,651 |
|
|
|
|
| BANKS – 8.9% |
|
|
|
|
|
|
|
|
|
|
|
| Bank of America Corp., |
|
|
|
|
|
|
|
|
| Sr. Unsecured,
1.29%, 1/15/19D |
|
|
500,000 |
|
|
|
507,167 |
|
|
| ANNUAL REPORT / April 30, 2015 |
|
| PORTFOLIOS OF INVESTMENTS |
Wilmington Intermediate-Term Bond Fund (continued)
|
|
|
|
|
|
|
|
|
|
|
|
| Description |
|
|
Par Value |
|
|
|
Value |
|
| Bank of America Corp., |
|
|
|
|
|
|
|
|
| Sr. Unsecured, MTN, 4.13%, 1/22/24 |
|
$ |
250,000 |
|
|
$ |
264,455 |
|
|
|
| Capital One Financial Corp., |
|
|
|
|
|
| Sr. Unsecured, 2.45%, 4/24/19 |
|
|
850,000 |
|
|
|
858,538 |
|
|
|
|
| Capital One NA/Mclean VA, |
|
|
|
|
|
|
|
|
| Sr. Unsecured, BKNT, 1.65%, 2/05/18 |
|
|
250,000 |
|
|
|
249,158 |
|
|
|
|
| Citigroup, Inc., |
|
|
|
|
|
|
|
|
| Sr. Unsecured, 1.70%, 4/27/18 |
|
|
600,000 |
|
|
|
597,910 |
|
|
|
|
| Fifth Third Bancorp, |
|
|
|
|
|
|
|
|
| Subordinated, 5.45%, 1/15/17 |
|
|
600,000 |
|
|
|
640,668 |
|
|
|
|
| Fifth Third Bancorp, |
|
|
|
|
|
|
|
|
| Subordinated, 4.30%, 1/16/24 |
|
|
370,000 |
|
|
|
395,201 |
|
|
|
| Goldman Sachs Group, Inc., |
|
|
|
|
|
| Sr. Unsecured, 1.44%, 4/23/20 |
|
|
750,000 |
|
|
|
758,961 |
|
|
|
| Huntington National Bank/The, |
|
|
|
|
|
| Sr. Unsecured, 2.40%, 4/01/20 |
|
|
350,000 |
|
|
|
351,614 |
|
|
|
|
| JPMorgan Chase & Co., |
|
|
|
|
|
|
|
|
| Sr. Unsecured, 6.00%, 1/15/18 |
|
|
250,000 |
|
|
|
278,814 |
|
|
|
|
| JPMorgan Chase & Co., |
|
|
|
|
|
|
|
|
| Sr. Unsecured, 1.70%, 3/01/18 |
|
|
500,000 |
|
|
|
502,051 |
|
|
|
|
| JPMorgan Chase & Co., |
|
|
|
|
|
|
|
|
| Sr. Unsecured, MTN, 1.35%, 2/15/17 |
|
|
750,000 |
|
|
|
753,058 |
|
|
|
|
| KeyBank NA/Cleveland OH, |
|
|
|
|
|
|
|
|
| Sr. Unsecured, BKNT, 2.50%, 12/15/19 |
|
|
500,000 |
|
|
|
510,192 |
|
|
|
|
| Morgan Stanley, |
|
|
|
|
|
|
|
|
| Sr. Unsecured,
1.11%, 1/24/19D |
|
|
550,000 |
|
|
|
552,427 |
|
|
|
|
| Morgan Stanley, |
|
|
|
|
|
|
|
|
| Sr. Unsecured, 2.50%, 1/24/19 |
|
|
325,000 |
|
|
|
330,214 |
|
|
|
| National Australia Bank Ltd./NY, |
|
|
|
|
|
| Sr. Unsecured, MTN, 2.75%, 3/09/17 |
|
|
300,000 |
|
|
|
309,951 |
|
|
|
| PNC Financial Services Group, Inc., |
|
|
|
|
|
| Subordinated, 3.90%, 4/29/24 |
|
|
750,000 |
|
|
|
781,849 |
|
|
|
|
| Royal Bank of Canada, |
|
|
|
|
|
|
|
|
| Sr. Unsecured, GMTN, 1.40%, 10/13/17 |
|
|
275,000 |
|
|
|
276,109 |
|
|
|
|
| SunTrust Banks, Inc., |
|
|
|
|
|
|
|
|
| Sr. Unsecured, 2.50%, 5/01/19 |
|
|
900,000 |
|
|
|
914,939 |
|
|
|
|
| US Bancorp/MN, |
|
|
|
|
|
|
|
|
| Sr. Unsecured, MTN, 1.65%, 5/15/17 |
|
|
500,000 |
|
|
|
507,949 |
|
|
|
|
| US Bank NA/Cincinnati OH, |
|
|
|
|
|
|
|
|
| Sr. Unsecured, BKNT, 1.10%, 1/30/17 |
|
|
750,000 |
|
|
|
754,032 |
|
|
|
|
| Wells Fargo & Co., |
|
|
|
|
|
|
|
|
| Sr. Unsecured, MTN, 1.40%, 9/08/17 |
|
|
550,000 |
|
|
|
552,880 |
|
|
|
|
|
|
|
|
|
|
|
|
|
| TOTAL BANKS |
|
|
|
|
|
$ |
11,648,137 |
|
|
| BEVERAGES – 0.1% |
|
|
|
| Dr. Pepper Snapple Group, Inc., |
|
|
|
|
|
| Company Guaranteed, 2.70%, 11/15/22 |
|
|
175,000 |
|
|
|
171,557 |
|
|
| BIOTECHNOLOGY – 0.9% |
|
|
|
|
| Amgen, Inc., |
|
|
|
|
|
|
|
|
| Sr. Unsecured,
0.83%, 5/22/19D |
|
|
500,000 |
|
|
|
499,485 |
|
|
|
|
| Celgene Corp., |
|
|
|
|
|
|
|
|
| Sr. Unsecured, 2.30%, 8/15/18 |
|
|
440,000 |
|
|
|
448,368 |
|
|
|
|
| Celgene Corp., |
|
|
|
|
|
|
|
|
| Sr. Unsecured, 4.00%, 8/15/23# |
|
|
250,000 |
|
|
|
267,557 |
|
|
|
|
|
|
|
|
|
|
|
|
|
| TOTAL BIOTECHNOLOGY |
|
|
|
|
|
$ |
1,215,410 |
|
|
|
|
|
|
|
|
|
|
|
|
|
| Description |
|
|
Par Value |
|
|
|
Value |
|
| CAPITAL MARKETS –
1.1% |
|
|
|
|
|
|
|
|
|
|
|
| BlackRock, Inc., |
|
|
|
|
|
|
|
|
| Series 2, Sr. Unsecured, 5.00%, 12/10/19 |
|
$ |
650,000 |
|
|
$ |
738,621 |
|
|
|
|
| Goldman Sachs Group, Inc., |
|
|
|
|
|
|
|
|
| Sr. Unsecured, 6.25%, 9/01/17 |
|
|
655,000 |
|
|
|
723,549 |
|
|
|
|
|
|
|
|
|
|
|
|
|
| TOTAL CAPITAL MARKETS |
|
|
|
|
|
$ |
1,462,170 |
|
|
|
|
| CHEMICALS – 0.7% |
|
|
|
|
|
|
|
|
|
|
|
| Ecolab, Inc., |
|
|
|
|
|
|
|
|
| Sr. Unsecured, 3.00%, 12/08/16 |
|
|
450,000 |
|
|
|
464,084 |
|
|
|
|
| Monsanto Co., |
|
|
|
|
|
|
|
|
| Sr. Unsecured, 2.75%, 7/15/21 |
|
|
500,000 |
|
|
|
510,026 |
|
|
|
|
|
|
|
|
|
|
|
|
|
| TOTAL CHEMICALS |
|
|
|
|
|
$ |
974,110 |
|
|
|
| COMMERCIAL BANKS – 1.7% |
|
|
|
|
|
|
|
|
| BB&T Corp., |
|
|
|
|
|
|
|
|
| Sr. Unsecured, MTN, FRN,
1.09%, 6/15/18D |
|
|
500,000 |
|
|
|
505,438 |
|
|
|
|
| Westpac Banking Corp., |
|
|
|
|
|
|
|
|
| Sr. Unsecured, 2.00%, 8/14/17 |
|
|
825,000 |
|
|
|
839,453 |
|
|
|
|
| Westpac Banking Corp., |
|
|
|
|
|
|
|
|
| Sr. Unsecured, 4.88%, 11/19/19 |
|
|
750,000 |
|
|
|
842,726 |
|
|
|
|
|
|
|
|
|
|
|
|
| TOTAL COMMERCIAL BANKS |
|
|
$ |
2,187,617 |
|
|
|
| COMMERCIAL FINANCE – 0.6% |
|
|
|
|
|
|
|
| General Electric Capital Corp., |
|
|
|
|
|
| Sr. Unsecured, MTN, 2.30%, 4/27/17 |
|
|
750,000 |
|
|
|
770,798 |
|
|
|
|
| COMPUTERS – 0.4% |
|
|
|
|
|
|
|
|
|
|
|
| Hewlett-Packard Co., |
|
|
|
|
|
|
|
|
| Sr. Unsecured, 3.30%, 12/09/16 |
|
|
500,000 |
|
|
|
517,154 |
|
|
|
| CONSUMER FINANCE – 1.5% |
|
|
|
|
|
|
|
|
| American Express Co., |
|
|
|
|
|
|
|
|
| Sr. Unsecured, 6.15%, 8/28/17 |
|
|
750,000 |
|
|
|
832,390 |
|
|
|
|
| American Express Co., |
|
|
|
|
|
|
|
|
| Sr. Unsecured, FRN,
0.82%, 5/22/18D |
|
|
1,080,000 |
|
|
|
1,081,131 |
|
|
|
|
|
|
|
|
|
|
|
|
| TOTAL CONSUMER FINANCE |
|
|
$ |
1,913,521 |
|
|
| DIVERSIFIED FINANCIAL SERVICES – 2.8% |
|
|
|
|
| Bank of America Corp., |
|
|
|
|
|
|
|
|
| Sr. Unsecured, 2.00%, 1/11/18 |
|
|
250,000 |
|
|
|
252,018 |
|
|
|
|
| BlackRock, Inc., |
|
|
|
|
|
|
|
|
| Sr. Unsecured, 3.50%, 3/18/24# |
|
|
750,000 |
|
|
|
786,225 |
|
|
|
|
| Charles Schwab Corp., |
|
|
|
|
|
|
|
|
| Sr. Unsecured, 1.50%, 3/10/18 |
|
|
650,000 |
|
|
|
653,244 |
|
|
|
|
| Ford Motor Credit Co. LLC, |
|
|
|
|
|
|
|
|
| Sr. Unsecured, FRN,
1.06%, 3/12/19D |
|
|
1,000,000 |
|
|
|
998,256 |
|
|
|
| General Motors Financial Co., Inc., |
|
|
|
|
|
| Company Guaranteed, 2.75%, 5/15/16 |
|
|
300,000 |
|
|
|
303,937 |
|
|
|
| General Motors Financial Co., Inc., |
|
|
|
|
|
| Company Guaranteed, 4.75%, 8/15/17 |
|
|
250,000 |
|
|
|
264,062 |
|
|
|
| TD Ameritrade Holding Corp., |
|
|
|
|
|
| Sr. Unsecured, 2.95%, 4/01/22 |
|
|
450,000 |
|
|
|
456,071 |
|
|
|
|
|
|
|
|
|
|
|
|
| TOTAL DIVERSIFIED FINANCIAL SERVICES |
|
|
$ |
3,713,813 |
|
|
|
|
| ELECTRIC – 3.2% |
|
|
|
|
|
|
|
|
|
|
|
| CMS Energy Corp., |
|
|
|
|
|
|
|
|
| Sr. Unsecured, 6.55%, 7/17/17 |
|
|
625,000 |
|
|
|
697,042 |
|
|
| April 30, 2015 / ANNUAL REPORT |
|
| PORTFOLIOS OF INVESTMENTS |
Wilmington Intermediate-Term Bond Fund (continued)
|
|
|
|
|
|
|
|
|
|
|
|
| Description |
|
|
Par Value |
|
|
|
Value |
|
| Duke Energy Indiana, Inc., |
|
|
|
|
|
|
|
|
| 1st Mortgage, 3.75%, 7/15/20 |
|
$ |
800,000 |
|
|
$ |
864,645 |
|
|
|
|
| Exelon Generation Co. LLC, |
|
|
|
|
|
|
|
|
| Sr. Unsecured, 6.20%, 10/01/17 |
|
|
200,000 |
|
|
|
220,759 |
|
|
|
|
| Exelon Generation Co. LLC, |
|
|
|
|
|
|
|
|
| Sr. Unsecured, 4.25%, 6/15/22 |
|
|
750,000 |
|
|
|
787,830 |
|
|
|
| FirstEnergy Transmission LLC, |
|
|
|
|
|
| Sr. Unsecured,
4.35%, 1/15/25W |
|
|
750,000 |
|
|
|
793,530 |
|
|
|
| Southern California Edison Co., |
|
|
|
|
|
| Series B, 1st Mortgage, 2.40%, 2/01/22 |
|
|
900,000 |
|
|
|
895,914 |
|
|
|
|
|
|
|
|
|
|
|
|
|
| TOTAL ELECTRIC |
|
|
|
|
|
$ |
4,259,720 |
|
|
|
|
| FOOD – 0.2% |
|
|
|
|
|
|
|
|
|
|
|
| Kroger Co., |
|
|
|
|
|
|
|
|
| Sr. Unsecured, 2.95%, 11/01/21 |
|
|
250,000 |
|
|
|
254,546 |
|
|
|
|
| FOOD PRODUCTS – 0.6% |
|
|
|
|
|
|
|
|
|
|
|
| Kroger Co., |
|
|
|
|
|
|
|
|
| Sr. Unsecured, 1.20%, 10/17/16 |
|
|
500,000 |
|
|
|
501,418 |
|
|
|
|
| WM Wrigley Jr. Co., |
|
|
|
|
|
|
|
|
| Sr. Unsecured,
1.40%, 10/21/16W |
|
|
250,000 |
|
|
|
251,220 |
|
|
|
|
|
|
|
|
|
|
|
|
| TOTAL FOOD PRODUCTS |
|
|
$ |
752,638 |
|
|
| HEALTH CARE EQUIPMENT & SUPPLIES – 0.2% |
|
|
|
|
| Zimmer Holdings, Inc., |
|
|
|
|
|
|
|
|
| Sr. Unsecured, 1.45%, 4/01/17 |
|
|
325,000 |
|
|
|
326,387 |
|
|
| HEALTH CARE PROVIDERS & SERVICES – 0.4% |
|
|
|
|
| WellPoint, Inc., |
|
|
|
|
|
|
|
|
| Sr. Unsecured, 2.38%, 2/15/17 |
|
|
500,000 |
|
|
|
510,722 |
|
|
|
| HOME FURNISHINGS – 0.4% |
|
|
|
|
|
|
|
|
| Whirlpool Corp., |
|
|
|
|
|
|
|
|
| Sr. Unsecured, 1.65%, 11/01/17 |
|
|
250,000 |
|
|
|
251,570 |
|
|
|
|
| Whirlpool Corp., |
|
|
|
|
|
|
|
|
| Sr. Unsecured, 2.40%, 3/01/19 |
|
|
220,000 |
|
|
|
222,495 |
|
|
|
|
|
|
|
|
|
|
|
|
| TOTAL HOME FURNISHINGS |
|
|
$ |
474,065 |
|
|
|
|
| INSURANCE – 3.9% |
|
|
|
|
|
|
|
|
|
|
| American International Group, Inc., |
|
|
|
|
|
| Sr. Unsecured, MTN, 5.85%, 1/16/18 |
|
|
685,000 |
|
|
|
763,664 |
|
|
|
|
| Aon PLC, |
|
|
|
|
|
|
|
|
| Company Guaranteed, 4.00%, 11/27/23 |
|
|
250,000 |
|
|
|
265,332 |
|
|
|
|
| Berkshire Hathaway, Inc., |
|
|
|
|
|
|
|
|
| Sr. Unsecured, 2.10%, 8/14/19 |
|
|
250,000 |
|
|
|
254,629 |
|
|
|
|
| Hartford Financial Services Group, Inc., |
|
|
|
|
|
|
|
|
| Sr. Unsecured, 4.00%, 10/15/17 |
|
|
750,000 |
|
|
|
800,812 |
|
|
|
|
| Hartford Financial Services Group, Inc., |
|
|
|
|
|
|
|
|
| Sr. Unsecured, 5.13%, 4/15/22 |
|
|
360,000 |
|
|
|
407,780 |
|
|
|
|
| MetLife, Inc., |
|
|
|
|
|
|
|
|
| Sr. Unsecured, 3.60%, 4/10/24# |
|
|
1,015,000 |
|
|
|
1,060,462 |
|
|
|
|
| Prudential Financial, Inc., |
|
|
|
|
|
|
|
|
| Sr. Unsecured, MTN, 6.00%, 12/01/17 |
|
|
650,000 |
|
|
|
724,182 |
|
|
|
|
| WR Berkley Corp., |
|
|
|
|
|
|
|
|
| Sr. Unsecured, 7.38%, 9/15/19 |
|
|
710,000 |
|
|
|
850,863 |
|
|
|
|
|
|
|
|
|
|
|
|
|
| TOTAL INSURANCE |
|
|
|
|
|
$ |
5,127,724 |
|
|
|
|
|
|
|
|
|
|
|
|
|
| Description |
|
|
Par Value |
|
|
|
Value |
|
| MACHINERY – 0.2% |
|
|
|
|
|
|
|
|
|
|
|
| John Deere Capital Corp., |
|
|
|
|
|
|
|
|
| Sr. Unsecured, MTN, 1.35%, 1/16/18 |
|
$ |
275,000 |
|
|
$ |
276,204 |
|
|
|
|
| MEDIA – 2.5% |
|
|
|
|
|
|
|
|
|
|
|
| CBS Corp., |
|
|
|
|
|
|
|
|
| Company Guaranteed, 3.38%, 3/01/22 |
|
|
350,000 |
|
|
|
356,218 |
|
|
|
|
| Time Warner Cable, Inc., |
|
|
|
|
|
|
|
|
| Company Guaranteed, 5.85%, 5/01/17 |
|
|
750,000 |
|
|
|
805,531 |
|
|
|
|
| Time Warner, Inc., |
|
|
|
|
|
|
|
|
| Company Guaranteed, 5.88%, 11/15/16 |
|
|
600,000 |
|
|
|
644,308 |
|
|
|
|
| Viacom, Inc., |
|
|
|
|
|
|
|
|
| Sr. Unsecured, 3.50%, 4/01/17 |
|
|
750,000 |
|
|
|
780,192 |
|
|
|
|
| Viacom, Inc., |
|
|
|
|
|
|
|
|
| Sr. Unsecured, 3.25%, 3/15/23 |
|
|
650,000 |
|
|
|
639,612 |
|
|
|
|
|
|
|
|
|
|
|
|
|
| TOTAL MEDIA |
|
|
|
|
|
$ |
3,225,861 |
|
|
|
| METALS & MINING – 0.4% |
|
|
|
|
|
|
|
|
| Alcoa, Inc., |
|
|
|
|
|
|
|
|
| Sr. Unsecured, 5.13%, 10/01/24 |
|
|
500,000 |
|
|
|
538,125 |
|
|
| MISCELLANEOUS MANUFACTURING – 1.7% |
|
|
|
|
| Eaton Corp., |
|
|
|
|
|
|
|
|
| Company Guaranteed, 1.50%, 11/02/17 |
|
|
225,000 |
|
|
|
226,583 |
|
|
|
|
| General Electric Co., |
|
|
|
|
|
|
|
|
| Sr. Unsecured, 5.25%, 12/06/17 |
|
|
660,000 |
|
|
|
728,081 |
|
|
|
|
| Ingersoll-Rand Luxembourg Finance SA, |
|
|
|
|
|
|
|
|
| Company Guaranteed, 2.63%, 5/01/20 |
|
|
250,000 |
|
|
|
251,885 |
|
|
|
|
| Textron, Inc., |
|
|
|
|
|
|
|
|
| Sr. Unsecured, 3.65%, 3/01/21 |
|
|
425,000 |
|
|
|
442,572 |
|
|
|
|
| Textron, Inc., |
|
|
|
|
|
|
|
|
| Sr. Unsecured, 4.30%, 3/01/24 |
|
|
500,000 |
|
|
|
531,531 |
|
|
|
|
|
|
|
|
|
|
|
|
| TOTAL MISCELLANEOUS MANUFACTURING |
|
|
$ |
2,180,652 |
|
|
|
| OFFICE/BUSINESS EQUIPMENT – 0.5% |
|
|
|
|
|
|
|
|
| Xerox Corp., |
|
|
|
|
|
|
|
|
| Sr. Unsecured, 2.80%, 5/15/20 |
|
|
600,000 |
|
|
|
604,225 |
|
|
|
|
| OIL & GAS – 4.0% |
|
|
|
|
|
|
|
|
|
|
|
| Anadarko Petroleum Corp., |
|
|
|
|
|
|
|
|
| Sr. Unsecured, 6.38%, 9/15/17 |
|
|
695,000 |
|
|
|
773,079 |
|
|
|
|
| Devon Energy Corp., |
|
|
|
|
|
|
|
|
| Sr. Unsecured, 2.25%, 12/15/18 |
|
|
370,000 |
|
|
|
374,617 |
|
|
|
|
| Husky Energy, Inc., |
|
|
|
|
|
|
|
|
| Sr. Unsecured, 4.00%, 4/15/24 |
|
|
275,000 |
|
|
|
278,931 |
|
|
|
|
| Marathon Oil Corp., |
|
|
|
|
|
|
|
|
| Sr. Unsecured, 6.00%, 10/01/17 |
|
|
1,000,000 |
|
|
|
1,103,849 |
|
|
|
|
| Marathon Petroleum Corp., |
|
|
|
|
|
|
|
|
| Sr. Unsecured, 3.63%, 9/15/24 |
|
|
125,000 |
|
|
|
127,499 |
|
|
|
|
| Murphy Oil Corp., |
|
|
|
|
|
|
|
|
| Sr. Unsecured, 2.50%, 12/01/17 |
|
|
750,000 |
|
|
|
751,249 |
|
|
|
|
| Phillips 66, |
|
|
|
|
|
|
|
|
| Company Guaranteed, 2.95%, 5/01/17 |
|
|
500,000 |
|
|
|
517,421 |
|
|
| ANNUAL REPORT / April 30, 2015 |
|
| PORTFOLIOS OF INVESTMENTS |
Wilmington Intermediate-Term Bond Fund (continued)
|
|
|
|
|
|
|
|
|
|
|
|
| Description |
|
|
Par Value |
|
|
|
Value |
|
| Sempra Energy, |
|
|
|
|
|
|
|
|
| Sr. Unsecured, 2.30%, 4/01/17 |
|
$ |
800,000 |
|
|
$ |
816,945 |
|
|
|
|
| Total Capital International SA, |
|
|
|
|
|
|
|
|
| Company Guaranteed, 0.58%, 6/19/19D |
|
|
450,000 |
|
|
|
447,691 |
|
|
|
|
|
|
|
|
|
|
|
|
|
| TOTAL OIL & GAS |
|
|
|
|
|
$ |
5,191,281 |
|
|
|
|
| PHARMACEUTICALS – 2.9% |
|
|
|
|
|
|
|
|
|
|
|
| AbbVie, Inc., |
|
|
|
|
|
|
|
|
| Company Guaranteed, 1.75%, 11/06/17 |
|
|
750,000 |
|
|
|
754,912 |
|
|
|
|
| Actavis Funding SCS, |
|
|
|
|
|
|
|
|
| Company Guaranteed, 1.52%, 3/12/20 |
|
|
500,000 |
|
|
|
509,418 |
|
|
|
|
| Actavis Funding SCS, |
|
|
|
|
|
|
|
|
| Company Guaranteed, 3.80%, 3/15/25 |
|
|
400,000 |
|
|
|
405,293 |
|
|
|
|
| Cardinal Health, Inc., |
|
|
|
|
|
|
|
|
| Sr. Unsecured, 1.90%, 6/15/17 |
|
|
250,000 |
|
|
|
253,361 |
|
|
|
|
| Express Scripts Holding Co., |
|
|
|
|
|
|
|
|
| Company Guaranteed, 1.25%, 6/02/17 |
|
|
415,000 |
|
|
|
414,809 |
|
|
|
|
| McKesson Corp., |
|
|
|
|
|
|
|
|
| Sr. Unsecured, 1.29%, 3/10/17 |
|
|
500,000 |
|
|
|
501,727 |
|
|
|
|
| Medco Health Solutions, Inc., |
|
|
|
|
|
|
|
|
| Company Guaranteed, 4.13%, 9/15/20 |
|
|
250,000 |
|
|
|
270,397 |
|
|
|
|
| Merck & Co., Inc., |
|
|
|
|
|
|
|
|
| Sr. Unsecured, 2.75%, 2/10/25 |
|
|
185,000 |
|
|
|
183,916 |
|
|
|
|
| Zoetis, Inc., |
|
|
|
|
|
|
|
|
| Sr. Unsecured, 3.25%, 2/01/23 |
|
|
500,000 |
|
|
|
497,486 |
|
|
|
|
|
|
|
|
|
|
|
|
|
| TOTAL PHARMACEUTICALS |
|
|
|
|
|
$ |
3,791,319 |
|
|
|
|
| PIPELINES – 1.4% |
|
|
|
|
|
|
|
|
|
|
|
| Energy Transfer Partners LP, |
|
|
|
|
|
|
|
|
| Sr. Unsecured, 4.15%, 10/01/20 |
|
|
500,000 |
|
|
|
529,428 |
|
|
|
|
| Enterprise Products Operating LLC, |
|
|
|
|
|
|
|
|
| Company Guaranteed, 2.55%, 10/15/19 |
|
|
325,000 |
|
|
|
330,766 |
|
|
|
|
| Kinder Morgan, Inc., |
|
|
|
|
|
|
|
|
| Company Guaranteed, 2.00%, 12/01/17 |
|
|
525,000 |
|
|
|
527,197 |
|
|
|
| Plains All American Pipeline LP / PAA |
|
|
|
|
|
| Finance Corp., |
|
|
|
|
|
|
|
|
| Sr. Unsecured, 3.85%, 10/15/23 |
|
|
500,000 |
|
|
|
514,028 |
|
|
|
|
|
|
|
|
|
|
|
|
|
| TOTAL PIPELINES |
|
|
|
|
|
$ |
1,901,419 |
|
|
| REAL ESTATE INVESTMENT TRUSTS – 3.4% |
|
|
|
|
| American Tower Corp., |
|
|
|
|
|
|
|
|
| Sr. Unsecured, 3.45%, 9/15/21# |
|
|
250,000 |
|
|
|
253,519 |
|
|
|
|
| American Tower Corp., |
|
|
|
|
|
|
|
|
| Sr. Unsecured, 5.00%, 2/15/24 |
|
|
505,000 |
|
|
|
547,735 |
|
|
|
|
| HCP, Inc., |
|
|
|
|
|
|
|
|
| Sr. Unsecured, 4.20%, 3/01/24 |
|
|
540,000 |
|
|
|
561,226 |
|
|
|
|
| Health Care REIT, Inc., |
|
|
|
|
|
|
|
|
| Sr. Unsecured, 2.25%, 3/15/18 |
|
|
450,000 |
|
|
|
456,492 |
|
|
|
|
| Healthcare Realty Trust, Inc., |
|
|
|
|
|
|
|
|
| Sr. Unsecured, 3.75%, 4/15/23 |
|
|
200,000 |
|
|
|
199,130 |
|
|
|
|
| Healthcare Realty Trust, Inc., |
|
|
|
|
|
|
|
|
| Sr. Unsecured, 3.88%, 5/01/25 |
|
|
550,000 |
|
|
|
546,894 |
|
|
|
|
| Mack-Cali Realty LP, |
|
|
|
|
|
|
|
|
| Sr. Unsecured, 2.50%, 12/15/17 |
|
|
250,000 |
|
|
|
250,863 |
|
|
|
|
|
|
|
|
|
|
|
|
|
| Description |
|
|
Par Value |
|
|
|
Value |
|
| ProLogis LP, |
|
|
|
|
|
|
|
|
| Company Guaranteed, 3.35%, 2/01/21 |
|
$ |
500,000 |
|
|
$ |
518,523 |
|
|
|
|
| Simon Property Group LP, |
|
|
|
|
|
|
|
|
| Sr. Unsecured, 2.15%, 9/15/17 |
|
|
500,000 |
|
|
|
511,229 |
|
|
|
|
| Ventas Realty LP / Ventas Capital Corp., |
|
|
|
|
|
|
|
|
| Company Guaranteed, 2.70%, 4/01/20# |
|
|
550,000 |
|
|
|
556,838 |
|
|
|
|
|
|
|
|
|
|
|
|
| TOTAL REAL ESTATE INVESTMENT TRUSTS |
|
|
$ |
4,402,449 |
|
|
|
|
| RETAIL – 0.6% |
|
|
|
|
|
|
|
|
|
|
|
| Walgreen Co., |
|
|
|
|
|
|
|
|
| Sr. Unsecured, 1.80%, 9/15/17 |
|
|
500,000 |
|
|
|
505,180 |
|
|
|
| Walgreens Boots Alliance, Inc., |
|
|
|
|
|
| Sr. Unsecured, 3.30%, 11/18/21 |
|
|
225,000 |
|
|
|
230,330 |
|
|
|
|
|
|
|
|
|
|
|
|
|
| TOTAL RETAIL |
|
|
|
|
|
$ |
735,510 |
|
|
|
| TELECOMMUNICATIONS – 1.9% |
|
|
|
|
|
|
|
|
| AT&T, Inc., |
|
|
|
|
|
|
|
|
| Sr. Unsecured, 1.40%, 12/01/17 |
|
|
250,000 |
|
|
|
249,984 |
|
|
|
|
| AT&T, Inc., |
|
|
|
|
|
|
|
|
| Sr. Unsecured, 1.16%, 6/30/20 |
|
|
500,000 |
|
|
|
502,401 |
|
|
|
|
| AT&T, Inc., |
|
|
|
|
|
|
|
|
| Sr. Unsecured, 3.40%, 5/15/25 |
|
|
275,000 |
|
|
|
272,373 |
|
|
|
| Verizon Communications, Inc., |
|
|
|
|
|
| Sr. Unsecured, 1.35%, 6/09/17 |
|
|
300,000 |
|
|
|
300,231 |
|
|
|
| Verizon Communications, Inc., |
|
|
|
|
|
| Sr. Unsecured, 4.50%, 9/15/20 |
|
|
600,000 |
|
|
|
658,283 |
|
|
|
| Verizon Communications, Inc., |
|
|
|
|
|
| FRN, Sr. Unsecured, 1.00%, 6/17/19D |
|
|
525,000 |
|
|
|
529,833 |
|
|
|
|
|
|
|
|
|
|
|
|
| TOTAL TELECOMMUNICATIONS |
|
|
$ |
2,513,105 |
|
|
|
| TRANSPORTATION – 0.8% |
|
|
|
|
|
|
|
|
| CSX Corp., |
|
|
|
|
|
|
|
|
| Sr. Unsecured, 4.25%, 6/01/21 |
|
|
500,000 |
|
|
|
548,432 |
|
|
|
|
| Ryder System, Inc., |
|
|
|
|
|
|
|
|
| Sr. Unsecured, MTN, 2.50%, 3/01/18 |
|
|
500,000 |
|
|
|
511,937 |
|
|
|
|
|
|
|
|
|
|
|
|
|
| TOTAL TRANSPORTATION |
|
|
|
|
|
$ |
1,060,369 |
|
|
|
| TRUCKING & LEASING – 1.0% |
|
|
|
|
|
|
|
|
| GATX Corp., |
|
|
|
|
|
|
|
|
| Sr. Unsecured, 3.50%, 7/15/16 |
|
|
615,000 |
|
|
|
632,368 |
|
|
|
|
| GATX Corp., |
|
|
|
|
|
|
|
|
| Sr. Unsecured, 2.38%, 7/30/18 |
|
|
625,000 |
|
|
|
634,451 |
|
|
|
|
|
|
|
|
|
|
|
|
| TOTAL TRUCKING & LEASING |
|
|
$ |
1,266,819 |
|
|
|
|
|
|
|
|
|
|
|
|
|
| TOTAL CORPORATE BONDS |
|
|
|
|
|
|
|
|
| (COST $66,978,467) |
|
|
|
|
|
$ |
68,358,637 |
|
|
|
| GOVERNMENT AGENCIES – 11.3% |
|
|
|
|
|
|
| FEDERAL HOME LOAN BANK (FHLB) – 3.1% |
|
|
|
|
| Series 1, 4.88%, 5/17/17 |
|
|
1,865,000 |
|
|
|
2,023,320 |
|
|
|
|
| Series 917, 1.00%, 6/21/17 |
|
|
2,000,000 |
|
|
|
2,012,444 |
|
|
|
|
|
|
|
|
|
|
|
|
| TOTAL FEDERAL HOME LOAN BANK (FHLB) |
|
|
$ |
4,035,764 |
|
|
| FEDERAL HOME LOAN MORTGAGE CORPORATION (FHLMC) – 5.8% |
|
|
|
|
| 1.38%, 5/01/20# |
|
|
1,250,000 |
|
|
|
1,240,498 |
|
|
| April 30, 2015 / ANNUAL REPORT |
|
| PORTFOLIOS OF INVESTMENTS |
Wilmington Intermediate-Term Bond Fund (continued)
|
|
|
|
|
|
|
|
|
|
|
|
| Description |
|
|
Par Value |
|
|
|
Value |
|
| 1.25%,
5/12/17# |
|
$ |
2,050,000 |
|
|
$ |
2,074,093 |
|
|
|
|
| 1.75%, 5/30/19# |
|
|
1,805,000 |
|
|
|
1,834,031 |
|
|
|
|
| 2.38%, 1/13/22# |
|
|
1,850,000 |
|
|
|
1,902,645 |
|
|
|
|
| 3.75%, 3/27/19 |
|
|
500,000 |
|
|
|
547,234 |
|
|
|
|
|
|
|
|
|
|
|
|
| TOTAL FEDERAL HOME LOAN MORTGAGE CORPORATION (FHLMC) |
|
|
$ |
7,598,501 |
|
|
| FEDERAL NATIONAL MORTGAGE ASSOCIATION (FNMA) – 2.4% |
|
|
|
|
| 5.00%, 5/11/17# |
|
|
1,500,000 |
|
|
|
1,630,053 |
|
|
|
|
| 1.75%, 9/12/19 |
|
|
1,475,000 |
|
|
|
1,495,185 |
|
|
|
|
|
|
|
|
|
|
|
|
| TOTAL FEDERAL NATIONAL MORTGAGE ASSOCIATION (FNMA) |
|
|
$ |
3,125,238 |
|
|
|
|
|
|
|
|
|
|
|
|
| TOTAL GOVERNMENT AGENCIES |
|
|
|
|
|
| (COST $14,400,124) |
|
|
|
|
|
$ |
14,759,503 |
|
|
| MORTGAGE-BACKED SECURITIES – 2.1% |
|
|
| FEDERAL HOME LOAN MORTGAGE CORPORATION (FHLMC) – 0.5% |
|
|
|
|
| Pool A18401, 6.00%, 2/01/34 |
|
|
77,344 |
|
|
|
89,078 |
|
|
|
|
| Pool B19228, 4.50%, 4/01/20 |
|
|
29,804 |
|
|
|
31,377 |
|
|
|
|
| Pool C90293, 7.50%, 9/01/19 |
|
|
89,100 |
|
|
|
99,031 |
|
|
|
|
| Pool C90504, 6.50%, 12/01/21 |
|
|
34,610 |
|
|
|
39,150 |
|
|
|
|
| Pool E83022, 6.00%, 4/01/16 |
|
|
4,553 |
|
|
|
4,621 |
|
|
|
|
| Pool E92817, 5.00%, 12/01/17 |
|
|
70,642 |
|
|
|
73,669 |
|
|
|
|
| Pool G01625, 5.00%, 11/01/33 |
|
|
67,670 |
|
|
|
75,599 |
|
|
|
|
| Pool G02390, 6.00%, 9/01/36 |
|
|
23,840 |
|
|
|
27,330 |
|
|
|
|
| Pool G08097, 6.50%, 11/01/35 |
|
|
41,575 |
|
|
|
47,971 |
|
|
|
|
| Pool G08193, 6.00%, 4/01/37 |
|
|
67,622 |
|
|
|
77,521 |
|
|
|
|
| Pool G11311, 5.00%, 10/01/17 |
|
|
39,439 |
|
|
|
40,956 |
|
|
|
|
|
|
|
|
|
|
|
|
| TOTAL FEDERAL HOME LOAN MORTGAGE CORPORATION (FHLMC) |
|
|
$ |
606,303 |
|
|
| FEDERAL NATIONAL MORTGAGE ASSOCIATION (FNMA) – 1.3% |
|
|
|
|
| Pool 254240, 7.00%, 3/01/32 |
|
|
74,527 |
|
|
|
86,185 |
|
|
|
|
| Pool 254833, 4.50%, 8/01/18 |
|
|
17,891 |
|
|
|
18,770 |
|
|
|
|
| Pool 256639, 5.00%, 2/01/27 |
|
|
51,942 |
|
|
|
58,072 |
|
|
|
|
| Pool 256752, 6.00%, 6/01/27 |
|
|
51,566 |
|
|
|
59,119 |
|
|
|
|
| Pool 257007, 6.00%, 12/01/27 |
|
|
93,748 |
|
|
|
107,478 |
|
|
|
|
| Pool 526062, 7.50%, 12/01/29 |
|
|
4,588 |
|
|
|
4,734 |
|
|
|
|
| Pool 612514,
2.22%, 5/01/33D |
|
|
47,606 |
|
|
|
49,642 |
|
|
|
|
| Pool 619054, 5.50%, 2/01/17 |
|
|
23,906 |
|
|
|
24,673 |
|
|
|
|
| Pool 629603, 5.50%, 2/01/17 |
|
|
6,919 |
|
|
|
7,129 |
|
|
|
|
| Pool 688996, 8.00%, 11/01/24 |
|
|
10,684 |
|
|
|
11,129 |
|
|
|
|
| Pool 745412, 5.50%, 12/01/35 |
|
|
47,466 |
|
|
|
54,005 |
|
|
|
|
| Pool 839291, 5.00%, 9/01/20 |
|
|
5,042 |
|
|
|
5,348 |
|
|
|
|
| Pool AE2520, 3.00%, 1/01/26 |
|
|
1,178,015 |
|
|
|
1,240,549 |
|
|
|
|
|
|
|
|
|
|
|
|
| TOTAL FEDERAL NATIONAL MORTGAGE ASSOCIATION (FNMA) |
|
|
$ |
1,726,833 |
|
|
| GOVERNMENT NATIONAL MORTGAGE ASSOCIATION (GNMA) – 0.3% |
|
|
|
|
| Pool 2616, 7.00%, 7/20/28 |
|
|
60,443 |
|
|
|
69,626 |
|
|
|
|
|
|
|
|
|
|
|
|
|
| Description |
|
|
Par Value |
|
|
|
Value |
|
| Pool 2701, 6.50%, 1/20/29 |
|
$ |
113,799 |
|
|
$ |
128,778 |
|
|
|
|
| Pool 426727, 7.00%, 2/15/29 |
|
|
11,133 |
|
|
|
11,987 |
|
|
|
|
| Pool 780825, 6.50%, 7/15/28 |
|
|
101,833 |
|
|
|
118,062 |
|
|
|
|
| Pool 781231, 7.00%, 12/15/30 |
|
|
52,910 |
|
|
|
61,632 |
|
|
|
|
|
|
|
|
|
|
|
|
| TOTAL GOVERNMENT NATIONAL MORTGAGE ASSOCIATION (GNMA) |
|
|
$ |
390,085 |
|
|
|
|
|
|
|
|
|
|
|
| TOTAL MORTGAGE-BACKED SECURITIES |
|
| (COST $2,511,202) |
|
|
|
|
|
$ |
2,723,221 |
|
|
|
|
| U.S. TREASURY – 32.7% |
|
|
|
|
|
|
|
|
|
|
| U.S. TREASURY NOTES – 32.7% |
|
|
|
|
|
|
|
|
| 0.50%, 9/30/16 |
|
|
500,000 |
|
|
|
500,582 |
|
|
|
|
| 0.63%, 12/15/16 |
|
|
500,000 |
|
|
|
501,134 |
|
|
|
|
| 0.88%, 11/15/17 |
|
|
640,000 |
|
|
|
641,460 |
|
|
|
|
| 0.88%, 1/31/18 |
|
|
750,000 |
|
|
|
750,545 |
|
|
|
|
| 0.88%, 1/31/17 |
|
|
1,000,000 |
|
|
|
1,006,181 |
|
|
|
|
| 1.00%, 8/31/16 |
|
|
1,000,000 |
|
|
|
1,008,035 |
|
|
|
|
| 1.00%, 5/31/18 |
|
|
500,000 |
|
|
|
500,682 |
|
|
|
|
| 1.00%, 9/30/19 |
|
|
1,000,000 |
|
|
|
985,418 |
|
|
|
|
| 1.25%, 11/30/18 |
|
|
1,540,000 |
|
|
|
1,546,940 |
|
|
|
|
| 1.25%, 1/31/19 |
|
|
1,450,000 |
|
|
|
1,454,504 |
|
|
|
|
| 1.25%, 2/29/20 |
|
|
1,500,000 |
|
|
|
1,487,752 |
|
|
|
|
| 1.38%, 6/30/18 |
|
|
1,230,000 |
|
|
|
1,245,135 |
|
|
|
|
| 1.38%, 5/31/20 |
|
|
3,250,000 |
|
|
|
3,236,177 |
|
|
|
|
| 1.50%, 8/31/18 |
|
|
1,000,000 |
|
|
|
1,014,967 |
|
|
|
|
| 1.50%, 11/30/19 |
|
|
450,000 |
|
|
|
452,722 |
|
|
|
|
| 1.63%, 8/15/22 |
|
|
1,350,000 |
|
|
|
1,331,876 |
|
|
|
|
| 1.75%, 5/15/23 |
|
|
2,000,000 |
|
|
|
1,975,681 |
|
|
|
|
| 2.00%, 11/15/21 |
|
|
750,000 |
|
|
|
761,835 |
|
|
|
|
| 2.00%, 2/15/22 |
|
|
1,500,000 |
|
|
|
1,522,038 |
|
|
|
|
| 2.00%, 2/15/23 |
|
|
1,500,000 |
|
|
|
1,514,100 |
|
|
|
|
| 2.00%, 2/15/25# |
|
|
1,713,000 |
|
|
|
1,707,489 |
|
|
|
|
| 2.13%, 1/31/21 |
|
|
1,500,000 |
|
|
|
1,541,458 |
|
|
|
|
| 2.13%, 6/30/21 |
|
|
775,000 |
|
|
|
794,368 |
|
|
|
|
| 2.13%, 9/30/21 |
|
|
500,000 |
|
|
|
511,717 |
|
|
|
|
| 2.13%, 8/15/21 |
|
|
1,000,000 |
|
|
|
1,023,900 |
|
|
|
|
| 2.38%, 8/15/24 |
|
|
750,000 |
|
|
|
773,130 |
|
|
|
|
| 2.50%, 8/15/23 |
|
|
750,000 |
|
|
|
783,662 |
|
|
|
|
| 2.63%, 4/30/16 |
|
|
500,000 |
|
|
|
511,666 |
|
|
|
|
| 2.63%, 8/15/20 |
|
|
1,500,000 |
|
|
|
1,584,571 |
|
|
|
|
| 2.63%, 11/15/20 |
|
|
1,000,000 |
|
|
|
1,055,449 |
|
|
|
|
| 2.75%, 2/15/19 |
|
|
1,500,000 |
|
|
|
1,586,934 |
|
|
|
|
| 2.75%, 11/15/23 |
|
|
1,450,000 |
|
|
|
1,543,185 |
|
|
|
|
| 3.13%, 5/15/21 |
|
|
550,000 |
|
|
|
595,801 |
|
|
|
|
| 3.63%, 2/15/20 |
|
|
500,000 |
|
|
|
551,389 |
|
|
|
|
| 4.00%, 8/15/18 |
|
|
1,000,000 |
|
|
|
1,097,941 |
|
|
| ANNUAL REPORT / April 30, 2015 |
|
| PORTFOLIOS OF INVESTMENTS |
Wilmington Intermediate-Term Bond Fund (continued)
|
|
|
|
|
|
|
|
|
|
|
|
| Description |
|
|
Par Value |
|
|
|
Value |
|
|
|
|
| 4.25%, 11/15/17 |
|
$ |
1,500,000 |
|
|
$ |
1,631,399 |
|
|
|
|
| 4.75%, 8/15/17 |
|
|
2,000,000 |
|
|
|
2,184,555 |
|
|
|
|
|
|
|
|
|
|
|
|
| TOTAL U.S. TREASURY NOTES |
|
|
$ |
42,916,378 |
|
|
|
|
|
|
|
|
|
|
|
|
|
| TOTAL U.S. TREASURY |
|
|
|
|
|
|
|
|
| (COST $42,217,854) |
|
|
|
|
|
$ |
42,916,378 |
|
|
|
|
Number of
Shares |
|
|
|
|
|
|
| MONEY MARKET FUND – 1.5% |
|
|
|
|
| Dreyfus Cash Management Fund, Institutional
Shares, 0.04%^ |
|
|
1,950,269 |
|
|
$ |
1,950,269 |
|
|
|
|
|
|
|
|
|
|
|
|
| TOTAL MONEY MARKET FUND |
|
|
|
|
|
| (COST $1,950,269) |
|
|
|
|
|
$ |
1,950,269 |
|
|
| TOTAL INVESTMENTS IN SECURITIES – 99.9% |
|
| (COST $128,255,285) |
|
|
|
|
|
$ |
130,906,052 |
|
|
|
|
|
|
|
Par Value |
|
|
|
|
|
|
| CASH COLLATERAL INVESTED FOR SECURITIES ON LOAN – 9.1% |
|
|
| REPURCHASE AGREEMENTS – 9.1% |
|
|
|
|
| BNP Paribas Securities Corp., 0.12%, dated 4/30/15, due 5/01/15, repurchase price $594,077, collateralized by U.S. Government & Treasury Securities 0.00% to
6.50%, maturing 5/01/16 to 4/20/45; total market value of $605,957. |
|
$ |
594,075 |
|
|
$ |
594,075 |
|
|
|
|
| Citigroup Global Markets, Inc., 0.13%, dated 4/30/15, due 5/01/15, repurchase price $2,257,573, collateralized by U.S. Government Securities 1.61% to 8.00%, maturing
6/01/17 to 6/15/52; total market value of $2,302,716. |
|
|
2,257,565 |
|
|
|
2,257,565 |
|
|
|
|
| Credit Suisse Securities (USA) LLC, 0.12%, dated 4/30/15, due 5/01/15, repurchase price $2,257,573, collateralized by U.S. Government Securities 3.00% to 4.50%,
maturing 8/01/38 to 4/01/45; total market value of $2,302,733. |
|
|
2,257,565 |
|
|
|
2,257,565 |
|
|
|
|
| Daiwa Capital Markets America, 0.16%, dated 4/30/15, due 5/01/15, repurchase price $2,257,575, collateralized by U.S. Government & Treasury Securities 0.00%
to 9.25%, maturing 5/21/15 to 3/01/48; total market value of $2,302,717. |
|
|
2,257,565 |
|
|
|
2,257,565 |
|
|
|
|
| ING Financial Markets LLC, 0.12%, dated 4/30/15, due 5/01/15, repurchase price $2,257,573, collateralized by U.S. Government Securities 1.87% to 6.20%, maturing
5/01/33 to 11/01/44; total market value of $2,302,717. |
|
|
2,257,565 |
|
|
|
2,257,565 |
|
|
|
|
|
|
|
|
|
|
|
|
|
| Description |
|
|
Par Value |
|
|
|
Value |
|
|
|
|
| Nomura Securities International, Inc. 0.13%, dated 4/30/15, due 5/01/15, repurchase price $2,257,573, collateralized by U.S. Government & Treasury Securities
0.00% to 10.50%, maturing 5/15/15 to 3/20/64; total market value of $2,302,716. |
|
$ |
2,257,565 |
|
|
$ |
2,257,565 |
|
|
|
|
|
|
|
|
|
|
|
|
| TOTAL CASH COLLATERAL INVESTED FOR SECURITIES ON LOAN |
|
|
|
|
|
| (COST $11,881,900) |
|
|
$ |
11,881,900 |
|
|
|
|
|
|
|
|
|
|
|
| TOTAL INVESTMENTS – 109.0% |
|
| (COST $140,137,185) |
|
|
$ |
142,787,952 |
|
|
|
| COLLATERAL FOR SECURITIES ON LOAN – (9.1%) |
|
|
|
(11,881,900 |
) |
|
|
| OTHER ASSETS LESS LIABILITIES – 0.1% |
|
|
|
56,578 |
|
|
|
|
|
|
|
|
|
|
|
|
|
| TOTAL NET ASSETS – 100.0% |
|
|
|
|
|
$ |
130,962,630 |
|
|
|
|
|
|
|
|
|
|
|
| April 30, 2015 / ANNUAL REPORT |
|
| PORTFOLIOS OF INVESTMENTS |
Wilmington Intermediate-Term Bond Fund (concluded)
Cost of investments for Federal income tax purposes is $140,137,808. The net unrealized
appreciation/(depreciation) of investments was $2,650,144. This consists of net unrealized appreciation from investment for those securities having an excess of value over cost of $2,790,313 and net unrealized depreciation from investments for those
securities having an excess of cost over value of $140,169.
Various inputs are used in determining the value of the Fund’s investments. These
inputs are summarized in the three broad levels listed below.
Level 1 – quoted prices in active markets for identical securities
Level 2 – other significant observable inputs (including quoted prices for similar securities, interest rates, prepayment speeds, credit risk, etc.)
Level 3 – significant unobservable inputs (including the Fund’s own assumptions in determining the fair value of investments)
The following is a summary of the inputs used as of April 30, 2015 in valuing the Fund’s assets carried at fair value:
|
|
|
|
|
|
|
|
|
|
|
|
|
|
|
|
|
|
|
|
|
|
|
|
|
Level 1 |
|
|
|
Level 2 |
|
|
|
Level 3 |
|
|
|
Total |
|
|
|
|
|
|
| Investments in Securities |
|
|
|
|
|
|
|
|
|
|
|
|
|
|
|
|
|
|
|
|
|
| Asset-Backed Security |
|
$ |
— |
|
|
$ |
198,044 |
|
|
$ |
— |
|
|
$ |
198,044 |
|
|
|
|
|
|
| Corporate Bonds |
|
|
— |
|
|
|
68,358,637 |
|
|
|
— |
|
|
|
68,358,637 |
|
|
|
|
|
|
| Government Agencies |
|
|
— |
|
|
|
14,759,503 |
|
|
|
— |
|
|
|
14,759,503 |
|
|
|
|
|
|
| Mortgage-Backed Securities |
|
|
— |
|
|
|
2,723,221 |
|
|
|
— |
|
|
|
2,723,221 |
|
|
|
|
|
|
| U.S. Treasury |
|
|
— |
|
|
|
42,916,378 |
|
|
|
— |
|
|
|
42,916,378 |
|
|
|
|
|
|
| Money Market Fund |
|
|
1,950,269 |
|
|
|
— |
|
|
|
— |
|
|
|
1,950,269 |
|
|
|
|
|
|
| Repurchase Agreements |
|
|
— |
|
|
|
11,881,900 |
|
|
|
— |
|
|
|
11,881,900 |
|
|
|
|
|
|
|
|
|
|
|
|
|
|
|
|
|
|
|
|
|
|
|
| Total |
|
$ |
1,950,269 |
|
|
$ |
140,837,683 |
|
|
$ |
— |
|
|
$ |
142,787,952 |
|
|
|
|
|
|
|
|
|
|
|
|
|
|
|
|
|
|
| # |
Security, or a portion thereof, is on loan. See Note 2 in Notes to Financial Statements. |
| D |
Floating rate note with current rate and stated maturity date shown. |
| W |
Denotes a restricted security that may be resold without restriction to “qualified institutional buyers” as defined in Rule 144A under the Securities Act of 1933 and that the Fund has determined to be liquid
under criteria established by the Fund’s Board of Trustees. At April 30, 2015, these liquid restricted securities amounted to $1,996,371 representing 1.5% of total net assets. |
The following acronyms are used throughout this Fund:
BKNT - Bank Note
FHLB
- Federal Home Loan Bank
FHLMC - Federal Home Loan Mortgage Corporation
FNMA - Federal National Mortgage Association
FRN - Floating Rate Note
GMTN - Global Medium Term Note
GNMA - Government National Mortgage Association
LLC - Limited Liability Corporation
LP - Limited Partnership
MTN - Medium Term Note
PLC - Public Limited Company
REIT - Real Estate Investment Trust
See Notes which are an integral part of the Financial Statements
|
| ANNUAL REPORT / April 30, 2015 |
PORTFOLIO OF INVESTMENTS SUMMARY TABLE
Wilmington Short-Term Bond Fund
At April 30, 2015, the Fund’s
portfolio classifications were as follows (unaudited):
|
|
|
|
|
|
| |
|
Percentage of
Total Net Assets |
|
|
| Commercial Banks |
|
|
|
15.3 |
% |
|
|
| Federal National Mortgage Association (FNMA) |
|
|
|
10.0 |
% |
|
|
| Federal Home Loan Mortgage Corporation (FHLMC) |
|
|
|
8.7 |
% |
|
|
| Real Estate Investment Trusts |
|
|
|
6.7 |
% |
|
|
| Diversified Financial Services |
|
|
|
6.1 |
% |
|
|
| U.S. Treasury |
|
|
|
5.2 |
% |
|
|
| Automotive |
|
|
|
4.3 |
% |
|
|
| Insurance |
|
|
|
4.2 |
% |
|
|
| Electric |
|
|
|
3.6 |
% |
|
|
| Capital Markets |
|
|
|
3.2 |
% |
|
|
| Oil & Gas |
|
|
|
3.0 |
% |
|
|
| Pharmaceuticals |
|
|
|
3.0 |
% |
|
|
| Beverages |
|
|
|
2.3 |
% |
|
|
| Health Care Providers & Services |
|
|
|
2.3 |
% |
|
|
| Food Products |
|
|
|
2.1 |
% |
|
|
| Telecommunications |
|
|
|
2.1 |
% |
|
|
| Government National Mortgage Association (GNMA) |
|
|
|
2.0 |
% |
|
|
| Retail |
|
|
|
1.5 |
% |
|
|
| Miscellaneous Manufacturing |
|
|
|
1.4 |
% |
|
|
| Semiconductors |
|
|
|
1.4 |
% |
|
|
| Forest Products & Paper |
|
|
|
1.3 |
% |
|
|
| Computers |
|
|
|
1.2 |
% |
|
|
| Media |
|
|
|
1.2 |
% |
|
|
| Pipelines |
|
|
|
1.1 |
% |
|
|
| Electronics |
|
|
|
1.1 |
% |
|
|
| Whole Loan |
|
|
|
0.9 |
% |
|
|
| Health Care Equipment & Supplies |
|
|
|
0.6 |
% |
|
|
| Environmental Control |
|
|
|
0.6 |
% |
|
|
| Commercial Mortgage-Backed Securities (CMBS) |
|
|
|
0.6 |
% |
|
|
| Metals & Mining |
|
|
|
0.6 |
% |
|
|
| Chemicals |
|
|
|
0.6 |
% |
|
|
| Transportation |
|
|
|
0.5 |
% |
|
|
| Home Furnishings |
|
|
|
0.5 |
% |
|
|
| Aerospace & Defense |
|
|
|
0.1 |
% |
|
|
| Internet |
|
|
|
0.1 |
% |
|
|
|
|
|
|
| |
|
Percentage of
Total Net Assets |
|
|
| Development |
|
|
|
0.1 |
% |
|
|
| Small Business Administration |
|
|
|
0.1 |
% |
|
|
| Cash Equivalents1 |
|
|
|
2.4 |
% |
|
|
| Other Assets and Liabilities – Net2 |
|
|
|
(2.0 |
)% |
|
|
| TOTAL |
|
|
|
100.0 |
% |
| (1) |
Cash Equivalents include investments in a money market fund and repurchase agreements. |
| (2) |
Assets, other than investments in securities, less liabilities. See Statements of Assets and Liabilities. |
| (3) |
For financial reporting purposes, the Credit Quality Diversification table reflects the lowest rating assigned by either Moody’s Investors Service or Standard and Poor’s if the ratings differ. These rating
agencies are independent, nationally recognized statistical rating organizations and are widely used. Investment grade ratings are credit ratings of BBB/Baa or higher. Below investment grade ratings are credit ratings of BB/Ba or lower. Investments
designated as “Not Rated” are not rated by either rating agency and do not necessarily indicate low credit quality. Credit quality ratings are subject to change. |
|
|
|
|
|
|
| Credit Quality Diversification3 |
|
Percentage of
Total Net Assets |
|
|
| U.S. Government Agency Securities |
|
|
|
17.5 |
% |
|
|
| U.S. Treasury |
|
|
|
5.2 |
% |
|
|
| AAA / Aaa |
|
|
|
0.1 |
% |
|
|
| AA / Aa |
|
|
|
11.3 |
% |
|
|
| A / A |
|
|
|
21.3 |
% |
|
|
| BBB / Baa |
|
|
|
43.8 |
% |
|
|
| BB / Ba |
|
|
|
0.9 |
% |
|
|
| D |
|
|
|
0.5 |
% |
|
|
| Not Rated |
|
|
|
1.4 |
% |
|
|
| Other Assets and Liabilities – Net2 |
|
|
|
(2.0 |
)% |
|
|
| TOTAL |
|
|
|
100.0 |
% |
PORTFOLIO OF INVESTMENTS
April 30, 2015
|
|
|
|
|
|
|
|
|
|
|
|
| Description |
|
|
Par Value |
|
|
|
Value |
|
|
|
| ADJUSTABLE RATE MORTGAGE – 0.0%** |
|
|
|
|
|
|
| FEDERAL NATIONAL MORTGAGE ASSOCIATION (FNMA) – 0.0%** |
|
|
|
|
| Pool 399251,
2.19%, 9/01/27D |
|
$ |
54 |
|
|
$ |
56 |
|
|
|
|
|
|
|
|
|
|
|
|
| TOTAL ADJUSTABLE RATE MORTGAGE |
|
|
|
|
|
| (COST $54) |
|
|
|
|
|
$ |
56 |
|
|
|
|
|
|
|
|
|
|
|
|
|
| Description |
|
|
Par Value |
|
|
|
Value |
|
|
|
| ASSET-BACKED SECURITY – 0.1% |
|
|
|
|
|
|
|
|
| WHOLE LOAN – 0.1% |
|
|
|
|
|
|
|
|
|
|
| SLM Private Education Loan Trust, |
|
|
|
|
|
| Series 2011-A, Class A1, |
|
|
|
|
|
|
|
|
| 1.18%, 10/15/24D,W |
|
$ |
263,158 |
|
|
$ |
264,059 |
|
|
|
|
|
|
|
|
|
|
|
|
| TOTAL ASSET-BACKED SECURITY |
|
|
|
|
|
| (COST $263,158) |
|
|
|
|
|
$ |
264,059 |
|
|
| April 30, 2015 / ANNUAL REPORT |
Wilmington Short-Term Bond Fund (continued)
|
|
|
|
|
|
|
|
|
|
|
|
| Description |
|
|
Par Value |
|
|
|
Value |
|
|
| COLLATERALIZED MORTGAGE OBLIGATIONS – 10.3% |
|
|
| COMMERCIAL MORTGAGE-BACKED SECURITIES (CMBS) – 0.6% |
|
|
|
|
| Extended Stay America Trust, |
|
|
|
|
|
|
|
|
| Series 2013-ESH5, Class A15, 1.28%, 12/05/31W |
|
$ |
505,000 |
|
|
|
505,747 |
|
|
|
|
| JPMorgan Chase Commercial Mortgage Securities Trust, |
|
|
|
|
|
|
|
|
| Series 2007-CIBC18, Class A4, 5.44%, 6/12/47 |
|
|
561,273 |
|
|
|
595,292 |
|
|
|
|
|
|
|
|
|
|
|
|
| TOTAL COMMERCIAL MORTGAGE-BACKED SECURITIES (CMBS) |
|
|
$ |
1,101,039 |
|
|
| FEDERAL HOME LOAN MORTGAGE CORPORATION (FHLMC) – 3.5% |
|
|
|
|
| Series 1988-6, Class C, 9.05%, 6/15/19 |
|
|
4,566 |
|
|
|
4,800 |
|
|
|
|
| Series 1989-112, Class I, 6.50%, 1/15/21 |
|
|
1,270 |
|
|
|
1,367 |
|
|
|
|
| Series 1990-136, Class E, 6.00%, 4/15/21 |
|
|
3,454 |
|
|
|
3,722 |
|
|
|
|
| Series 1990-141, Class D, 5.00%, 5/15/21 |
|
|
1,443 |
|
|
|
1,525 |
|
|
|
|
| Series 1993-1577, Class PK, 6.50%, 9/15/23 |
|
|
47,965 |
|
|
|
53,137 |
|
|
|
|
| Series 1993-1644, Class K, 6.75%, 12/15/23 |
|
|
40,232 |
|
|
|
44,672 |
|
|
|
|
| Series 1994-1686, Class PJ, 5.00%, 2/15/24 |
|
|
5,061 |
|
|
|
5,409 |
|
|
|
|
| Series 2003-2649, Class KA, 4.50%, 7/15/18 |
|
|
77,304 |
|
|
|
80,486 |
|
|
|
|
| Series 2005-3062, Class LU, 5.50%, 10/15/16 |
|
|
1,434,579 |
|
|
|
1,452,723 |
|
|
|
|
| Series 2011-3799, Class GK, 2.75%, 1/15/21 |
|
|
201,696 |
|
|
|
207,792 |
|
|
|
|
| Series 2012-K710, Class A1, 1.44%, 1/25/19 |
|
|
2,377,490 |
|
|
|
2,397,568 |
|
|
|
|
| Series 3893, Class DJ, 2.00%, 10/15/20 |
|
|
1,861,711 |
|
|
|
1,875,166 |
|
|
|
|
|
|
|
|
|
|
|
|
| TOTAL FEDERAL HOME LOAN MORTGAGE CORPORATION (FHLMC) |
|
|
$ |
6,128,367 |
|
|
| FEDERAL NATIONAL MORTGAGE ASSOCIATION (FNMA) – 3.7% |
|
|
|
|
| Series 1993-113, Class PK, 6.50%, 7/25/23 |
|
|
41,347 |
|
|
|
46,057 |
|
|
|
|
| Series 1993-127, Class H, 6.50%, 7/25/23 |
|
|
37,446 |
|
|
|
41,866 |
|
|
|
|
| Series 1993-202, Class J, 6.50%, 11/25/23 |
|
|
21,085 |
|
|
|
23,547 |
|
|
|
|
| Series 1994-3, Class PL, 5.50%, 1/25/24 |
|
|
42,787 |
|
|
|
46,717 |
|
|
|
|
| Series 1994-55, Class H, 7.00%, 3/25/24 |
|
|
44,039 |
|
|
|
49,841 |
|
|
|
|
| Series 2002-52, Class QA, 6.00%, 7/18/32 |
|
|
16,557 |
|
|
|
17,386 |
|
|
|
|
| Series 2002-94, Class HQ, 4.50%, 1/25/18 |
|
|
616,759 |
|
|
|
637,140 |
|
|
|
|
| Series 2003-3, Class BC, 5.00%, 2/25/18 |
|
|
464,640 |
|
|
|
487,938 |
|
|
|
|
| Series 2009-70, Class NM, 3.25%, 8/25/19 |
|
|
1,100,104 |
|
|
|
1,137,249 |
|
|
|
|
| Series 2011-66, Class QE, 2.00%, 7/25/21 |
|
|
736,130 |
|
|
|
745,402 |
|
|
|
|
| Series 2011-71, Class DJ, 3.00%, 3/25/25 |
|
|
849,529 |
|
|
|
869,719 |
|
|
|
|
| Series 2011-81, Class PA, 3.50%, 8/25/26 |
|
|
2,414,141 |
|
|
|
2,536,278 |
|
|
|
|
|
|
|
|
|
|
|
|
| TOTAL FEDERAL NATIONAL MORTGAGE ASSOCIATION (FNMA) |
|
|
$ |
6,639,140 |
|
|
| GOVERNMENT NATIONAL MORTGAGE ASSOCIATION (GNMA) – 1.7% |
|
|
|
|
| Series 2005-44, Class PC, 5.00%, 12/20/33 |
|
|
627,531 |
|
|
|
648,361 |
|
|
|
|
|
|
|
|
|
|
|
|
|
| Description |
|
|
Par Value |
|
|
|
Value |
|
|
|
|
| Series 2010-17, Class K, 4.00%, 3/16/22 |
|
$ |
2,334,073 |
|
|
$ |
2,398,099 |
|
|
|
|
|
|
|
|
|
|
|
|
| TOTAL GOVERNMENT NATIONAL MORTGAGE ASSOCIATION (GNMA) |
|
|
$ |
3,046,460 |
|
|
|
|
| WHOLE LOAN – 0.8% |
|
|
|
|
|
|
|
|
|
|
|
| Banc of America Mortgage Securities, Inc., |
|
|
|
|
|
|
|
|
| Series 2004-A, Class 2A1,
2.67%,
2/25/34D,S
|
|
|
245,285 |
|
|
|
243,480 |
|
|
|
|
| Banc of America Mortgage Securities, Inc., |
|
|
|
|
|
|
|
|
| Series 2004-B, Class 2A1,
2.66%, 3/25/34D |
|
|
164,964 |
|
|
|
158,576 |
|
|
|
|
| IndyMac INDA Mortgage Loan Trust, |
|
|
|
|
|
|
|
|
| Series 2005-AR1, Class 2A1,
2.75%, 11/25/35D |
|
|
1,053,658 |
|
|
|
951,404 |
|
|
|
|
|
|
|
|
|
|
|
|
|
| TOTAL WHOLE LOAN |
|
|
|
|
|
$ |
1,353,460 |
|
|
|
|
|
|
|
|
|
|
|
| TOTAL COLLATERALIZED MORTGAGE OBLIGATIONS |
|
| (COST $18,567,621) |
|
|
|
|
|
$ |
18,268,466 |
|
|
| CORPORATE BONDS – 72.0% |
|
|
|
| AEROSPACE & DEFENSE – 0.1% |
|
|
|
|
|
|
|
|
| L-3 Communications Corp., |
|
|
|
|
|
|
|
|
| Company Guaranteed, 3.95%, 11/15/16 |
|
|
246,000 |
|
|
|
255,135 |
|
|
|
|
| AUTOMOTIVE – 4.3% |
|
|
|
|
|
|
|
|
|
|
| American Honda Finance Corp., |
|
|
|
|
|
| Sr. Unsecured, MTN, 1.50%, 3/13/18 |
|
|
1,400,000 |
|
|
|
1,407,112 |
|
|
|
|
| Daimler Finance North America LLC, |
|
|
|
|
|
|
|
|
| Company Guaranteed,
1.38%, 8/01/17W |
|
|
2,000,000 |
|
|
|
2,006,304 |
|
|
|
|
| Hyundai Capital America, |
|
|
|
|
|
|
|
|
| Sr. Unsecured, 1.88%,
8/09/16W |
|
|
400,000 |
|
|
|
403,986 |
|
|
|
|
| Hyundai Capital America, |
|
|
|
|
|
|
|
|
| Sr. Unsecured,
2.00%, 3/19/18W |
|
|
1,250,000 |
|
|
|
1,260,004 |
|
|
|
|
| Johnson Controls, Inc., |
|
|
|
|
|
|
|
|
| Sr. Unsecured, 1.40%, 11/02/17 |
|
|
1,000,000 |
|
|
|
999,207 |
|
|
|
|
| Toyota Motor Credit Corp., |
|
|
|
|
|
|
|
|
| Sr. Unsecured, MTN,
0.64%, 3/12/20D |
|
|
1,500,000 |
|
|
|
1,506,806 |
|
|
|
|
|
|
|
|
|
|
|
|
|
| TOTAL AUTOMOTIVE |
|
|
|
|
|
$ |
7,583,419 |
|
|
|
|
| BEVERAGES – 2.3% |
|
|
|
|
|
|
|
|
|
|
|
| Anheuser-Busch InBev Finance, Inc., |
|
|
|
|
|
|
|
|
| Company Guaranteed,
0.68%, 2/01/19D |
|
|
160,000 |
|
|
|
160,134 |
|
|
|
|
| Diageo Capital PLC, |
|
|
|
|
|
|
|
|
| Company Guaranteed, 0.63%, 4/29/16 |
|
|
475,000 |
|
|
|
475,601 |
|
|
|
|
| Diageo Capital PLC, |
|
|
|
|
|
|
|
|
| Company Guaranteed, 5.50%, 9/30/16 |
|
|
2,000,000 |
|
|
|
2,129,782 |
|
|
|
| Dr. Pepper Snapple Group, Inc., |
|
|
|
|
|
| Company Guaranteed, 2.90%, 1/15/16 |
|
|
1,226,000 |
|
|
|
1,243,851 |
|
|
|
|
|
|
|
|
|
|
|
|
|
| TOTAL BEVERAGES |
|
|
|
|
|
$ |
4,009,368 |
|
|
| CAPITAL MARKETS – 3.2% |
|
|
|
| Branch Banking & Trust Co., |
|
|
|
|
|
| Sr. Unsecured, BKNT, 1.00%, 4/03/17 |
|
|
1,500,000 |
|
|
|
1,501,487 |
|
|
|
|
| Fifth Third Bancorp, |
|
|
|
|
|
|
|
|
| Subordinated, 5.45%, 1/15/17 |
|
|
2,500,000 |
|
|
|
2,669,450 |
|
|
|
| Raymond James Financial, Inc., |
|
|
|
|
|
| Sr. Unsecured, 4.25%, 4/15/16 |
|
|
1,500,000 |
|
|
|
1,545,596 |
|
|
|
|
|
|
|
|
|
|
|
|
|
| TOTAL CAPITAL MARKETS |
|
|
|
|
|
$ |
5,716,533 |
|
|
| ANNUAL REPORT / April 30, 2015 |
Wilmington Short-Term Bond Fund (continued)
|
|
|
|
|
|
|
|
|
|
|
|
| Description |
|
|
Par Value |
|
|
|
Value |
|
|
|
|
| CHEMICALS – 0.6% |
|
|
|
|
|
|
|
|
|
|
|
| Monsanto Co., |
|
|
|
|
|
|
|
|
| Sr. Unsecured, 1.15%, 6/30/17 |
|
$ |
1,000,000 |
|
|
$ |
1,004,410 |
|
|
|
| COMMERCIAL BANKS – 15.3% |
|
|
|
|
|
|
|
| American Express Bank FSB, |
|
|
|
|
|
| Sr. Unsecured, BKNT, 6.00%, 9/13/17 |
|
|
1,400,000 |
|
|
|
1,548,380 |
|
|
|
|
| Bank of America NA, |
|
|
|
|
|
|
|
|
| Sr. Unsecured, BKNT, 1.65%, 3/26/18 |
|
|
2,300,000 |
|
|
|
2,303,182 |
|
|
|
|
| BB&T Corp., |
|
|
|
|
|
|
|
|
| Sr. Unsecured, MTN,
0.94%, 2/01/19D |
|
|
1,000,000 |
|
|
|
1,002,353 |
|
|
|
|
| Capital One NA, |
|
|
|
|
|
|
|
|
| Sr. Unsecured, BKNT, 1.65%, 2/05/18 |
|
|
250,000 |
|
|
|
249,158 |
|
|
|
|
| Citigroup, Inc., |
|
|
|
|
|
|
|
|
| Sr. Unsecured, 1.70%, 4/27/18 |
|
|
1,680,000 |
|
|
|
1,674,149 |
|
|
|
|
| Commonwealth Bank of Australia, |
|
|
|
|
|
|
|
|
| Sr. Unsecured,
0.67%,
3/12/18D,W
|
|
|
2,000,000 |
|
|
|
2,000,810 |
|
|
|
|
| Goldman Sachs Group, Inc., |
|
|
|
|
|
|
|
|
| Sr. Unsecured,
1.44%, 4/23/20D |
|
|
945,000 |
|
|
|
956,290 |
|
|
|
| Huntington National Bank (The), |
|
|
|
|
|
| Sr. Unsecured, 1.38%, 4/24/17 |
|
|
2,000,000 |
|
|
|
2,001,259 |
|
|
|
|
| JPMorgan Chase & Co., |
|
|
|
|
|
|
|
|
| Sr. Unsecured, H, 1.70%, 3/01/18 |
|
|
795,000 |
|
|
|
798,261 |
|
|
|
|
| KeyBank N.A., |
|
|
|
|
|
|
|
|
| Subordinated, BKNT, 5.70%, 11/01/17 |
|
|
900,000 |
|
|
|
988,236 |
|
|
|
|
| KeyBank N.A., |
|
|
|
|
|
|
|
|
| Subordinated, MTN, 5.45%, 3/03/16 |
|
|
1,000,000 |
|
|
|
1,037,793 |
|
|
|
| National Australia Bank Ltd., |
|
|
|
|
|
| Sr. Unsecured, MTN, 2.75%, 3/09/17 |
|
|
2,000,000 |
|
|
|
2,066,340 |
|
|
|
|
| National City Bank, |
|
|
|
|
|
|
|
|
| Subordinated, BKNT, 0.63%, 6/07/17D |
|
|
2,000,000 |
|
|
|
1,991,600 |
|
|
|
|
| SunTrust Banks, Inc., |
|
|
|
|
|
|
|
|
| Sr. Unsecured, 3.60%, 4/15/16 |
|
|
2,000,000 |
|
|
|
2,048,225 |
|
|
|
| Toronto-Dominion Bank (The), |
|
|
|
|
|
| Sr. Unsecured, MTN, 0.57%, 3/13/18D |
|
|
2,000,000 |
|
|
|
2,000,266 |
|
|
|
|
| US Bancorp, |
|
|
|
|
|
|
|
|
| Sr. Unsecured, MTN, 0.75%, 11/15/18D |
|
|
430,000 |
|
|
|
431,507 |
|
|
|
|
| US Bancorp, |
|
|
|
|
|
|
|
|
| Sr. Unsecured, MTN, 0.68%, 4/25/19D |
|
|
2,000,000 |
|
|
|
1,992,013 |
|
|
|
|
| Wells Fargo & Co., |
|
|
|
|
|
|
|
|
| Sr. Unsecured, MTN, 1.15%, 6/02/17 |
|
|
2,000,000 |
|
|
|
2,002,966 |
|
|
|
|
|
|
|
|
|
|
|
|
| TOTAL COMMERCIAL BANKS |
|
|
$ |
27,092,788 |
|
|
|
|
| COMPUTERS – 1.2% |
|
|
|
|
|
|
|
|
|
|
|
| Hewlett-Packard Co., |
|
|
|
|
|
|
|
|
| Sr. Unsecured, 2.13%, 9/13/15 |
|
|
1,000,000 |
|
|
|
1,005,013 |
|
|
|
|
| Hewlett-Packard Co., |
|
|
|
|
|
|
|
|
| Sr. Unsecured, 3.30%, 12/09/16 |
|
|
1,000,000 |
|
|
|
1,034,308 |
|
|
|
|
|
|
|
|
|
|
|
|
|
| TOTAL COMPUTERS |
|
|
|
|
|
$ |
2,039,321 |
|
|
| DIVERSIFIED FINANCIAL SERVICES – 6.1% |
|
|
|
| American Express Credit Corp., |
|
|
|
|
|
| Sr. Unsecured, 0.82%, 3/18/19D |
|
|
800,000 |
|
|
|
800,752 |
|
|
|
|
|
|
|
|
|
|
|
|
|
| Description |
|
|
Par Value |
|
|
|
Value |
|
|
|
|
| Capital One NA, |
|
|
|
|
|
|
|
|
| Sr. Unsecured, BKNT, 1.50%, 9/05/17 |
|
$ |
1,200,000 |
|
|
$ |
1,199,789 |
|
|
|
|
| Charles Schwab Corp., |
|
|
|
|
|
|
|
|
| Sr. Unsecured, 1.50%, 3/10/18 |
|
|
1,975,000 |
|
|
|
1,984,856 |
|
|
|
| Ford Motor Credit Co. LLC, |
|
|
|
|
|
| Sr. Unsecured, FRN,
1.10%, 3/12/19D |
|
|
1,000,000 |
|
|
|
998,256 |
|
|
|
| General Electric Capital Corp., |
|
|
|
|
|
| Company Guaranteed,
1.27%, 3/15/23D |
|
|
2,000,000 |
|
|
|
2,014,993 |
|
|
|
|
| General Motors Financial Co., Inc., |
|
|
|
|
|
|
|
|
| Company Guaranteed, 4.75%, 8/15/17 |
|
|
200,000 |
|
|
|
211,250 |
|
|
|
|
| John Deere Capital Corp., |
|
|
|
|
|
|
|
|
| Sr. Unsecured, MTN, 1.05%, 12/15/16 |
|
|
2,500,000 |
|
|
|
2,511,485 |
|
|
|
|
| JPMorgan Chase & Co., |
|
|
|
|
|
|
|
|
| Sr. Unsecured, FRN,
0.91%, 1/28/19D |
|
|
1,000,000 |
|
|
|
1,002,955 |
|
|
|
|
|
|
|
|
|
|
|
|
| TOTAL DIVERSIFIED FINANCIAL SERVICES |
|
|
$ |
10,724,336 |
|
|
|
|
| ELECTRIC – 3.6% |
|
|
|
|
|
|
|
|
|
|
|
| Appalachian Power Co., |
|
|
|
|
|
|
|
|
| Sr. Unsecured, K, 5.00%, 6/01/17 |
|
|
1,000,000 |
|
|
|
1,074,704 |
|
|
|
|
| Consolidated Edison Co. of New York, Inc., |
|
|
|
|
|
|
|
|
| Series 05-C, Sr. Unsecured, 5.38%, 12/15/15 |
|
|
110,000 |
|
|
|
113,268 |
|
|
|
|
| Dominion Resources, Inc., |
|
|
|
|
|
|
|
|
| Sr. Unsecured, 2.25%, 9/01/15 |
|
|
400,000 |
|
|
|
402,100 |
|
|
|
|
| Entergy Corp., |
|
|
|
|
|
|
|
|
| Sr. Unsecured, 4.70%, 1/15/17 |
|
|
2,000,000 |
|
|
|
2,092,123 |
|
|
|
| Exelon Generation Co. LLC, |
|
|
|
|
|
| Sr. Unsecured, 6.20%, 10/01/17 |
|
|
1,505,000 |
|
|
|
1,661,215 |
|
|
|
|
| FirstEnergy Corp., |
|
|
|
|
|
|
|
|
| Series A, Sr. Unsecured, 2.75%, 3/15/18 |
|
|
1,000,000 |
|
|
|
1,022,299 |
|
|
|
|
|
|
|
|
|
|
|
|
|
| TOTAL ELECTRIC |
|
|
|
|
|
$ |
6,365,709 |
|
|
|
|
| ELECTRONICS – 1.1% |
|
|
|
|
|
|
|
|
|
|
| Thermo Fisher Scientific, Inc., |
|
|
|
|
|
| Sr. Unsecured, 1.30%, 2/01/17 |
|
|
2,000,000 |
|
|
|
2,004,025 |
|
|
|
| ENVIRONMENTAL CONTROL – 0.6% |
|
|
|
|
|
|
|
|
| Waste Management, Inc., |
|
|
|
|
|
|
|
|
| Company Guaranteed, 2.60%, 9/01/16 |
|
|
1,100,000 |
|
|
|
1,120,242 |
|
|
|
| FOOD PRODUCTS – 2.1% |
|
|
|
|
|
|
|
|
| Kroger Co., |
|
|
|
|
|
|
|
|
| Sr. Unsecured, 1.20%, 10/17/16 |
|
|
2,600,000 |
|
|
|
2,607,372 |
|
|
|
|
| McCormick & Co., Inc., |
|
|
|
|
|
|
|
|
| Sr. Unsecured, 5.20%, 12/15/15 |
|
|
1,000,000 |
|
|
|
1,028,331 |
|
|
|
|
| WM Wrigley Jr. Co., |
|
|
|
|
|
|
|
|
| Sr. Unsecured,
1.40%, 10/21/16W |
|
|
160,000 |
|
|
|
160,781 |
|
|
|
|
|
|
|
|
|
|
|
|
| TOTAL FOOD PRODUCTS |
|
|
$ |
3,796,484 |
|
|
|
| FOREST PRODUCTS & PAPER – 1.3% |
|
|
|
|
|
|
|
|
| International Paper Co., |
|
|
|
|
|
|
|
|
| Sr. Unsecured, 5.25%, 4/01/16 |
|
|
2,250,000 |
|
|
|
2,335,498 |
|
|
| HEALTH CARE EQUIPMENT & SUPPLIES – 0.6% |
|
|
|
|
| Zimmer Holdings, Inc., |
|
|
|
|
|
|
|
|
| Sr. Unsecured, 1.45%, 4/01/17 |
|
|
1,135,000 |
|
|
|
1,139,843 |
|
|
| April 30, 2015 / ANNUAL REPORT |
Wilmington Short-Term Bond Fund (continued)
|
|
|
|
|
|
|
|
|
|
|
|
| Description |
|
|
Par Value |
|
|
|
Value |
|
|
| HEALTH CARE PROVIDERS & SERVICES – 2.3% |
|
|
|
|
| UnitedHealth Group, Inc., |
|
|
|
|
|
|
|
|
| Sr. Unsecured, 1.40%, 10/15/17 |
|
$ |
3,000,000 |
|
|
$ |
3,030,177 |
|
|
|
|
| WellPoint, Inc., |
|
|
|
|
|
|
|
|
| Sr. Unsecured, 2.38%, 2/15/17 |
|
|
1,000,000 |
|
|
|
1,021,443 |
|
|
|
|
|
|
|
|
|
|
|
|
| TOTAL HEALTH CARE PROVIDERS & SERVICES |
|
|
$ |
4,051,620 |
|
|
|
| HOME FURNISHINGS – 0.5% |
|
|
|
|
|
|
|
|
| Whirlpool Corp., |
|
|
|
|
|
|
|
|
| Sr. Unsecured, 6.50%, 6/15/16 |
|
|
750,000 |
|
|
|
796,127 |
|
|
|
|
| INSURANCE – 4.2% |
|
|
|
|
|
|
|
|
|
|
| American International Group, Inc., |
|
|
|
|
|
| Sr. Unsecured, MTN, 5.85%, 1/16/18 |
|
|
1,000,000 |
|
|
|
1,114,837 |
|
|
|
|
| Berkshire Hathaway Finance Corp., |
|
|
|
|
|
|
|
|
| Company Guaranteed, 1.60%, 5/15/17 |
|
|
2,000,000 |
|
|
|
2,031,816 |
|
|
|
|
| Hartford Financial Services Group, Inc., |
|
|
|
|
|
|
|
|
| Sr. Unsecured, 4.00%, 10/15/17 |
|
|
2,000,000 |
|
|
|
2,135,500 |
|
|
|
| Principal Financial Group, Inc., |
|
|
|
|
|
| Company Guaranteed, 1.85%, 11/15/17 |
|
|
1,074,000 |
|
|
|
1,085,359 |
|
|
|
|
| WR Berkley Corp., |
|
|
|
|
|
|
|
|
| Sr. Unsecured, 5.60%, 5/15/15 |
|
|
1,150,000 |
|
|
|
1,152,242 |
|
|
|
|
|
|
|
|
|
|
|
|
|
| TOTAL INSURANCE |
|
|
|
|
|
$ |
7,519,754 |
|
|
|
|
| INTERNET – 0.1% |
|
|
|
|
|
|
|
|
|
|
| Alibaba Group Holding Ltd., |
|
|
|
|
|
| Company Guaranteed,
1.63%, 11/28/17W |
|
|
185,000 |
|
|
|
185,665 |
|
|
|
|
| MEDIA – 1.2% |
|
|
|
|
|
|
|
|
|
|
|
| DIRECTV Holdings LLC/DIRECTV Financing Co., Inc., |
|
|
|
|
|
|
|
|
| Company Guaranteed, 3.13%, 2/15/16 |
|
|
2,000,000 |
|
|
|
2,034,201 |
|
|
|
| METALS & MINING – 0.6% |
|
|
|
|
|
| Caterpillar Financial Services Corp., |
|
|
|
|
|
|
|
|
| Sr. Unsecured, 1.75%, 3/24/17 |
|
|
1,000,000 |
|
|
|
1,016,566 |
|
|
| MISCELLANEOUS MANUFACTURING – 1.4% |
|
|
|
|
| Eaton Corp., |
|
|
|
|
|
|
|
|
| Company Guaranteed, 1.50%, 11/02/17 |
|
|
1,000,000 |
|
|
|
1,007,036 |
|
|
|
|
| Ingersoll-Rand Global Holding Co. Ltd., |
|
|
|
|
|
|
|
|
| Company Guaranteed, 6.88%, 8/15/18 |
|
|
1,325,000 |
|
|
|
1,533,894 |
|
|
|
|
|
|
|
|
|
|
|
|
| TOTAL MISCELLANEOUS MANUFACTURING |
|
|
$ |
2,540,930 |
|
|
|
|
| OIL & GAS – 3.0% |
|
|
|
|
|
|
|
|
|
|
|
| Anadarko Petroleum Corp., |
|
|
|
|
|
|
|
|
| Sr. Unsecured, 6.38%, 9/15/17 |
|
|
1,500,000 |
|
|
|
1,668,515 |
|
|
|
|
| Chevron Corp., |
|
|
|
|
|
|
|
|
| Sr. Unsecured, 1.37%, 3/02/18 |
|
|
1,000,000 |
|
|
|
1,004,963 |
|
|
|
|
| Husky Oil Ltd., |
|
|
|
|
|
|
|
|
| Sr. Unsecured, 7.55%, 11/15/16 |
|
|
221,000 |
|
|
|
239,725 |
|
|
|
|
| Phillips 66, |
|
|
|
|
|
|
|
|
| Company Guaranteed, 2.95%, 5/01/17 |
|
|
1,000,000 |
|
|
|
1,034,843 |
|
|
|
|
| Valero Energy Corp., |
|
|
|
|
|
|
|
|
| Company Guaranteed, 6.13%, 2/01/20 |
|
|
1,207,000 |
|
|
|
1,397,861 |
|
|
|
|
|
|
|
|
|
|
|
|
|
| TOTAL OIL & GAS |
|
|
|
|
|
$ |
5,345,907 |
|
|
|
|
|
|
|
|
|
|
|
|
|
| Description |
|
|
Par Value |
|
|
|
Value |
|
|
|
| PHARMACEUTICALS – 3.0% |
|
|
|
|
|
|
|
|
| AbbVie, Inc., |
|
|
|
|
|
|
|
|
| Sr. Unsecured, 1.75%, 11/06/17 |
|
$ |
2,000,000 |
|
|
$ |
2,013,099 |
|
|
|
|
| Actavis Funding SCS, |
|
|
|
|
|
|
|
|
| Company Guaranteed,
1.35%, 3/12/18D |
|
|
800,000 |
|
|
|
807,736 |
|
|
|
|
| Actavis Funding SCS, |
|
|
|
|
|
|
|
|
| Company Guaranteed,
1.52%, 3/12/20D |
|
|
1,410,000 |
|
|
|
1,436,559 |
|
|
|
|
| Eli Lilly & Co., |
|
|
|
|
|
|
|
|
| Sr. Unsecured, 1.25%, 3/01/18 |
|
|
1,000,000 |
|
|
|
1,003,164 |
|
|
|
|
|
|
|
|
|
|
|
|
| TOTAL PHARMACEUTICALS |
|
|
$ |
5,260,558 |
|
|
|
|
| PIPELINES – 1.1% |
|
|
|
|
|
|
|
|
|
|
|
| Kinder Morgan, Inc., |
|
|
|
|
|
|
|
|
| Company Guaranteed, 2.00%, 12/01/17 |
|
|
1,000,000 |
|
|
|
1,004,185 |
|
|
|
|
| Plains All American Pipeline LP / PAA Finance Corp., |
|
|
|
|
|
|
|
|
| Sr. Unsecured, 3.95%, 9/15/15 |
|
|
1,000,000 |
|
|
|
1,011,415 |
|
|
|
|
|
|
|
|
|
|
|
|
|
| TOTAL PIPELINES |
|
|
|
|
|
$ |
2,015,600 |
|
|
| REAL ESTATE INVESTMENT TRUSTS – 6.7% |
|
|
|
| AvalonBay Communities, Inc., |
|
|
|
|
|
| Sr. Unsecured, 3.63%, 10/01/20 |
|
|
1,500,000 |
|
|
|
1,587,970 |
|
|
|
|
| BioMed Realty LP, |
|
|
|
|
|
|
|
|
| Company Guaranteed, 2.63%, 5/01/19 |
|
|
1,000,000 |
|
|
|
1,008,152 |
|
|
|
|
| Boston Properties LP, |
|
|
|
|
|
|
|
|
| Sr. Unsecured, 3.70%, 11/15/18 |
|
|
2,000,000 |
|
|
|
2,128,565 |
|
|
|
|
| Digital Realty Trust LP, |
|
|
|
|
|
|
|
|
| Company Guaranteed, 4.50%, 7/15/15 |
|
|
2,000,000 |
|
|
|
2,006,250 |
|
|
|
|
| HCP, Inc., |
|
|
|
|
|
|
|
|
| Sr. Unsecured, MTN, 6.30%, 9/15/16 |
|
|
2,000,000 |
|
|
|
2,137,472 |
|
|
|
|
| Health Care REIT, Inc., |
|
|
|
|
|
|
|
|
| Sr. Unsecured, 2.25%, 3/15/18 |
|
|
2,000,000 |
|
|
|
2,028,854 |
|
|
|
|
| Ventas Realty LP, |
|
|
|
|
|
|
|
|
| Company Guaranteed, 1.55%, 9/26/16 |
|
|
1,000,000 |
|
|
|
1,007,407 |
|
|
|
|
|
|
|
|
|
|
|
|
| TOTAL REAL ESTATE INVESTMENT TRUSTS |
|
|
$ |
11,904,670 |
|
|
|
|
| RETAIL – 1.5% |
|
|
|
|
|
|
|
|
|
|
|
| CVS Caremark Corp., |
|
|
|
|
|
|
|
|
| Sr. Unsecured, 1.20%, 12/05/16 |
|
|
2,200,000 |
|
|
|
2,215,465 |
|
|
|
|
| Walgreen Co., |
|
|
|
|
|
|
|
|
| Sr. Unsecured, 1.80%, 9/15/17 |
|
|
500,000 |
|
|
|
505,180 |
|
|
|
|
|
|
|
|
|
|
|
|
|
| TOTAL RETAIL |
|
|
|
|
|
$ |
2,720,645 |
|
|
|
| SEMICONDUCTORS – 1.4% |
|
|
|
|
|
|
|
|
| Intel Corp., |
|
|
|
|
|
|
|
|
| Sr. Unsecured, 1.35%, 12/15/17 |
|
|
2,500,000 |
|
|
|
2,515,877 |
|
|
|
| TELECOMMUNICATIONS – 2.1% |
|
|
|
|
|
|
|
|
| AT&T, Inc., |
|
|
|
|
|
|
|
|
| Sr. Unsecured,
1.16%, 6/30/20D |
|
|
900,000 |
|
|
|
904,322 |
|
|
|
|
| Cisco Systems, Inc., |
|
|
|
|
|
|
|
|
| Sr. Unsecured, 1.10%, 3/03/17 |
|
|
800,000 |
|
|
|
805,546 |
|
|
|
| Verizon Communications, Inc., |
|
|
|
|
|
| Sr. Unsecured,
1.04%, 6/17/19D |
|
|
2,000,000 |
|
|
|
2,018,411 |
|
|
|
|
|
|
|
|
|
|
|
|
| TOTAL TELECOMMUNICATIONS |
|
|
$ |
3,728,279 |
|
|
| ANNUAL REPORT / April 30, 2015 |
Wilmington Short-Term Bond Fund (continued)
|
|
|
|
|
|
|
|
|
|
|
|
| Description |
|
|
Par Value |
|
|
|
Value |
|
|
|
| TRANSPORTATION – 0.5% |
|
|
|
|
|
|
|
|
| Ryder System, Inc., Sr.
Unsecured, MTN, 3.60%, 3/01/16 |
|
$ |
400,000 |
|
|
$ |
408,682 |
|
|
|
|
| Vessel Management Services, Inc.,
U.S. Government Guaranteed, 6.75%, 7/15/25 |
|
|
437,000 |
|
|
|
515,196 |
|
|
|
|
|
|
|
|
|
|
|
|
|
| TOTAL TRANSPORTATION |
|
|
|
|
|
$ |
923,878 |
|
|
|
|
|
|
|
|
|
|
|
|
| TOTAL CORPORATE BONDS |
|
|
|
|
|
| (COST $127,175,328) |
|
|
$ |
127,747,388 |
|
|
|
| GOVERNMENT AGENCIES – 4.7% |
|
|
|
|
|
|
| FEDERAL HOME LOAN MORTGAGE CORPORATION (FHLMC) – 3.5% |
|
|
|
|
| 0.88%, 10/14/16 |
|
|
3,000,000 |
|
|
|
3,015,553 |
|
|
|
|
| 2.00%, 8/25/16 |
|
|
1,000,000 |
|
|
|
1,019,973 |
|
|
|
|
| 5.13%, 10/18/16 |
|
|
2,000,000 |
|
|
|
2,135,161 |
|
|
|
|
|
|
|
|
|
|
|
|
| TOTAL FEDERAL HOME LOAN MORTGAGE CORPORATION (FHLMC) |
|
|
$ |
6,170,687 |
|
|
| FEDERAL NATIONAL MORTGAGE ASSOCIATION (FNMA) – 1.1% |
|
|
|
|
| 0.38%, 7/05/16 |
|
|
2,000,000 |
|
|
|
1,999,840 |
|
|
| SMALL BUSINESS ADMINISTRATION – 0.1% |
|
|
|
|
| Small Business Administration Participation Certificates, U.S. Government Guaranteed, Series 1996-C, 6.70%, 3/01/16 |
|
|
5,026 |
|
|
|
5,166 |
|
|
|
|
| Small Business Administration Participation Certificates, U.S. Government Guaranteed, Series 1996-K, 6.95%, 11/01/16 |
|
|
65,255 |
|
|
|
67,685 |
|
|
|
|
| Small Business Administration Participation Certificates, U.S. Government Guaranteed, Series 1996-L, 6.70%, 12/01/16 |
|
|
33,977 |
|
|
|
34,939 |
|
|
|
|
| Small Business Administration Participation Certificates, U.S. Government Guaranteed, Series 1997-E, 7.30%, 5/01/17 |
|
|
1,406 |
|
|
|
1,483 |
|
|
|
|
| Small Business Administration Participation Certificates, U.S. Government Guaranteed, Series 1999-I, 7.30%, 9/01/19 |
|
|
4,011 |
|
|
|
4,334 |
|
|
|
|
|
|
|
|
|
|
|
|
| TOTAL SMALL BUSINESS ADMINISTRATION |
|
|
$ |
113,607 |
|
|
|
|
|
|
|
|
|
|
|
|
| TOTAL GOVERNMENT AGENCIES |
|
|
|
|
|
| (COST $8,100,871) |
|
|
|
|
|
$ |
8,284,134 |
|
|
| MORTGAGE-BACKED SECURITIES – 7.2% |
|
|
| FEDERAL HOME LOAN MORTGAGE CORPORATION (FHLMC) – 1.7% |
|
|
|
|
| Pool 287773, 7.50%, 3/01/17 |
|
|
353 |
|
|
|
364 |
|
|
|
|
| Pool 538733, 9.00%, 9/01/19 |
|
|
232 |
|
|
|
239 |
|
|
|
|
| Pool A18401, 6.00%, 2/01/34 |
|
|
637,406 |
|
|
|
734,105 |
|
|
|
|
| Pool C78010, 5.50%, 4/01/33 |
|
|
867,492 |
|
|
|
996,163 |
|
|
|
|
| Pool C80328, 7.50%, 7/01/25 |
|
|
31,037 |
|
|
|
36,048 |
|
|
|
|
| Pool G01425, 7.50%, 5/01/32 |
|
|
70,216 |
|
|
|
81,684 |
|
|
|
|
| Pool G01831, 6.00%, 5/01/35 |
|
|
167,967 |
|
|
|
191,822 |
|
|
|
|
|
|
|
|
|
|
|
|
|
| Description |
|
|
Par Value |
|
|
|
Value |
|
|
|
|
| Pool G12709, 5.00%, 7/01/22 |
|
$ |
139,029 |
|
|
$ |
147,240 |
|
|
|
|
| Pool G14695, 4.50%, 6/01/26 |
|
|
796,339 |
|
|
|
840,590 |
|
|
|
|
|
|
|
|
|
|
|
|
| TOTAL FEDERAL HOME LOAN MORTGAGE CORPORATION (FHLMC) |
|
|
$ |
3,028,255 |
|
|
| FEDERAL NATIONAL MORTGAGE ASSOCIATION (FNMA) – 5.2% |
|
|
|
|
| Pool 202957, 8.00%, 8/01/21 |
|
|
2,645 |
|
|
|
2,798 |
|
|
|
|
| Pool 252439, 6.50%, 5/01/29 |
|
|
31,774 |
|
|
|
36,756 |
|
|
|
|
| Pool 255933, 5.50%, 11/01/35 |
|
|
159,000 |
|
|
|
180,504 |
|
|
|
|
| Pool 323419, 6.00%, 12/01/28 |
|
|
56,409 |
|
|
|
64,760 |
|
|
|
|
| Pool 334593, 7.00%, 5/01/24 |
|
|
65,822 |
|
|
|
75,953 |
|
|
|
|
| Pool 39862, 9.75%, 9/01/17 |
|
|
3,700 |
|
|
|
3,879 |
|
|
|
|
| Pool 436746, 6.50%, 8/01/28 |
|
|
44,272 |
|
|
|
47,733 |
|
|
|
|
| Pool 440401, 6.50%, 8/01/28 |
|
|
152,706 |
|
|
|
176,361 |
|
|
|
|
| Pool 485678, 6.50%, 3/01/29 |
|
|
31,168 |
|
|
|
33,693 |
|
|
|
|
| Pool 494375, 6.50%, 4/01/29 |
|
|
2,607 |
|
|
|
2,691 |
|
|
|
|
| Pool 545051, 6.00%, 9/01/29 |
|
|
80,966 |
|
|
|
92,750 |
|
|
|
|
| Pool 725418, 6.50%, 5/01/34 |
|
|
151,516 |
|
|
|
174,892 |
|
|
|
|
| Pool 833143, 5.50%, 9/01/35 |
|
|
930,901 |
|
|
|
1,057,967 |
|
|
|
|
| Pool 843323, 5.50%, 10/01/35 |
|
|
99,080 |
|
|
|
112,480 |
|
|
|
|
| Pool AE2520, 3.00%, 1/01/26 |
|
|
392,672 |
|
|
|
413,516 |
|
|
|
|
| Pool MA0909, 3.00%, 11/01/21 |
|
|
774,095 |
|
|
|
815,408 |
|
|
|
|
| Pool MA0921, 3.00%, 12/01/21 |
|
|
5,631,486 |
|
|
|
5,932,038 |
|
|
|
|
|
|
|
|
|
|
|
|
| TOTAL FEDERAL NATIONAL MORTGAGE ASSOCIATION (FNMA) |
|
|
$ |
9,224,179 |
|
|
| GOVERNMENT NATIONAL MORTGAGE ASSOCIATION (GNMA) – 0.3% |
|
|
|
|
| Pool 1061, 9.00%, 4/20/23 |
|
|
14,584 |
|
|
|
15,181 |
|
|
|
|
| Pool 1886, 9.00%, 10/20/24 |
|
|
889 |
|
|
|
935 |
|
|
|
|
| Pool 188603, 9.00%, 11/15/16 |
|
|
2,984 |
|
|
|
3,049 |
|
|
|
|
| Pool 208196, 9.00%, 2/15/17 |
|
|
4,814 |
|
|
|
4,922 |
|
|
|
|
| Pool 306066, 8.50%, 7/15/21 |
|
|
3,701 |
|
|
|
4,275 |
|
|
|
|
| Pool 307983, 8.50%, 7/15/21 |
|
|
14,320 |
|
|
|
14,752 |
|
|
|
|
| Pool 341948, 8.50%, 1/15/23 |
|
|
6,041 |
|
|
|
6,207 |
|
|
|
|
| Pool 346572, 7.00%, 5/15/23 |
|
|
9,122 |
|
|
|
9,787 |
|
|
|
|
| Pool 484269, 7.00%, 9/15/28 |
|
|
40,761 |
|
|
|
44,504 |
|
|
|
|
| Pool 581522, 6.00%, 5/15/33 |
|
|
161,572 |
|
|
|
177,236 |
|
|
|
|
| Pool 592505, 6.00%, 4/15/33 |
|
|
147,291 |
|
|
|
159,260 |
|
|
|
|
| Pool 780440, 8.50%, 11/15/17 |
|
|
628 |
|
|
|
666 |
|
|
|
|
|
|
|
|
|
|
|
|
| TOTAL GOVERNMENT NATIONAL MORTGAGE ASSOCIATION (GNMA) |
|
|
$ |
440,774 |
|
|
|
|
|
|
|
|
|
|
|
| TOTAL MORTGAGE-BACKED SECURITIES |
|
| (COST $12,152,414) |
|
|
|
|
|
$ |
12,693,208 |
|
|
|
|
| MUNICIPAL BOND – 0.1% |
|
|
|
|
|
|
|
|
|
|
|
| DEVELOPMENT – 0.1% |
|
|
|
|
|
|
|
|
|
|
|
| City of Miami, FL, Rent Revenue, Series 1998, 8.65%, 7/01/19 |
|
|
115,000 |
|
|
|
131,530 |
|
|
|
|
|
|
|
|
|
|
|
| TOTAL MUNICIPAL BOND |
|
| (COST $122,721) |
|
|
|
|
|
$ |
131,530 |
|
|
| April 30, 2015 / ANNUAL REPORT |
Wilmington Short-Term Bond Fund (continued)
|
|
|
|
|
|
|
|
|
|
|
|
| Description |
|
|
Par Value |
|
|
|
Value |
|
|
|
| U.S. TREASURY – 5.2% |
|
|
|
|
|
|
|
| U.S. TREASURY NOTES – 5.2% |
|
|
|
|
|
|
|
|
| 0.38%, 10/31/16# |
|
$ |
3,500,000 |
|
|
$ |
3,496,433 |
|
|
|
|
| 0.50%, 4/30/17 |
|
|
5,750,000 |
|
|
|
5,741,433 |
|
|
|
|
|
|
|
|
|
|
|
|
| TOTAL U.S. TREASURY NOTES |
|
|
$ |
9,237,866 |
|
|
|
|
|
|
|
|
|
|
|
|
|
| TOTAL U.S. TREASURY |
|
|
|
|
|
|
|
|
| (COST $9,231,014) |
|
|
|
|
|
$ |
9,237,866 |
|
|
|
|
|
|
|
|
|
|
| Description |
|
|
Number of
Shares |
|
|
|
Value |
|
|
|
| MONEY MARKET FUND – 1.3% |
|
|
|
|
|
|
|
|
| Dreyfus Cash Management Fund, Institutional Shares, 0.04%^ |
|
|
2,326,733 |
|
|
$ |
2,326,733 |
|
|
|
|
|
|
|
|
|
|
|
|
| TOTAL MONEY MARKET FUND |
|
|
|
|
|
| (COST $2,326,733) |
|
|
|
|
|
$ |
2,326,733 |
|
|
|
|
|
|
|
|
|
|
|
|
|
|
|
|
|
|
|
|
| TOTAL INVESTMENTS IN SECURITIES – 100.9% |
|
| (COST $177,939,914) |
|
|
|
|
|
$ |
178,953,440 |
|
|
|
|
|
|
|
|
|
|
|
|
|
| Description |
|
|
Par Value |
|
|
|
Value |
|
|
|
| CASH COLLATERAL INVESTED FOR SECURITIES ON LOAN – 1.1% |
|
|
|
|
|
|
|
| REPURCHASE AGREEMENTS – 1.1% |
|
|
|
|
|
|
|
|
| BNP Paribas Securities Corp., 0.12%, dated 4/30/15, due 5/01/15, repurchase price $96,908, collateralized by U.S. Government & Treasury Securities 0.00% to
6.50%, maturing 5/01/16 to 4/20/45; total market value of $98,846. |
|
$ |
96,908 |
|
|
$ |
96,908 |
|
|
|
|
| Citigroup Global Markets, Inc., 0.13%, dated 4/30/15, due 5/01/15, repurchase price $368,272, collateralized by U.S. Government Securities 1.61% to 8.00%, maturing
6/01/17 to 6/15/52; total market value of $375,636. |
|
|
368,271 |
|
|
|
368,271 |
|
|
|
|
| Credit Suisse Securities (USA) LLC, 0.12%, dated 4/30/15, due 5/01/15, repurchase price $368,272, collateralized by U.S. Government Securities 3.00% to 4.50%, maturing
8/01/38 to 4/01/45; total market value of $375,639. |
|
|
368,271 |
|
|
|
368,271 |
|
|
|
|
| Daiwa Capital Markets America, 0.16%, dated 4/30/15, due 5/01/15, repurchase price $368,273, collateralized by U.S. Government & Treasury Securities 0.00% to
9.25%, maturing 5/21/15 to 3/01/48; total market value of $375,636. |
|
|
368,271 |
|
|
|
368,271 |
|
|
|
|
| ING Financial Markets LLC, 0.12%, dated 4/30/15, due 5/01/15, repurchase price $368,272, collateralized by U.S. Government Securities 1.87% to 6.20%, maturing 5/01/33
to 11/01/44; total market value of $375,637. |
|
|
368,271 |
|
|
|
368,271 |
|
|
|
|
| Nomura Securities International, Inc., 0.13%, dated 4/30/15, due 5/01/15, repurchase price $368,272, collateralized by U.S. Government & Treasury Securities
0.00% to 10.50%, maturing 5/15/15 to 3/20/64; total market value of $375,636. |
|
|
368,271 |
|
|
|
368,271 |
|
|
|
|
|
|
|
|
|
|
|
| TOTAL CASH COLLATERAL INVESTED FOR SECURITIES ON LOAN |
|
| (COST $1,938,263) |
|
|
|
|
|
$ |
1,938,263 |
|
|
|
|
|
|
|
|
|
|
|
|
| TOTAL INVESTMENTS – 102.0% |
|
|
|
|
|
| (COST $179,878,177) |
|
|
|
|
|
$ |
180,891,703 |
|
|
|
| COLLATERAL FOR SECURITIES ON LOAN – (1.1%) |
|
|
|
(1,938,263 |
) |
|
|
OTHER LIABILITIES LESS
ASSETS – (0.9%) |
|
|
|
(1,519,493 |
) |
|
|
|
|
|
|
|
|
|
|
|
| TOTAL NET ASSETS – 100.0% |
|
|
$ |
177,433,947 |
|
|
|
|
|
|
|
|
|
|
|
| ANNUAL REPORT / April 30, 2015 |
Wilmington Short-Term Bond Fund (concluded)
Cost of investments for Federal income tax purposes is $179,878,279. The net unrealized
appreciation/(depreciation) of investments was $1,013,424. This consists of net unrealized appreciation from investment for those securities having an excess of value over cost of $1,442,412 and net unrealized depreciation from investments for those
securities having an excess of cost over value of $428,988.
Various inputs are used in determining the value of the Fund’s investments. These
inputs are summarized in the three broad levels listed below.
Level 1 – quoted prices in active markets for identical securities
Level 2 – other significant observable inputs (including quoted prices for similar securities, interest rates, prepayment speeds, credit risk, etc.)
Level 3 – significant unobservable inputs (including the Fund’s own assumptions in determining the fair value of investments)
The following is a summary of the inputs used as of April 30, 2015 in valuing the Fund’s assets carried at fair value:
|
|
|
|
|
|
|
|
|
|
|
|
|
|
|
|
|
|
|
|
|
|
|
|
|
|
|
|
|
|
|
|
|
|
Level 1 |
|
|
|
|
|
Level 2 |
|
|
|
|
|
Level 3 |
|
|
|
|
|
Total |
|
|
|
|
|
|
|
|
|
| Investments in Securities |
|
|
|
|
|
|
|
|
|
|
|
|
|
|
|
|
|
|
|
|
|
|
|
|
|
|
|
|
|
|
| Adjustable Rate Mortgage |
|
$ |
— |
|
|
|
|
$ |
56 |
|
|
|
|
$ |
— |
|
|
|
|
$ |
56 |
|
|
|
|
|
|
|
|
|
| Asset-Backed Security |
|
|
— |
|
|
|
|
|
264,059 |
|
|
|
|
|
— |
|
|
|
|
|
264,059 |
|
|
|
|
|
|
|
|
|
| Collateralized Mortgage Obligations |
|
|
— |
|
|
|
|
|
18,268,466 |
|
|
|
|
|
— |
|
|
|
|
|
18,268,466 |
|
|
|
|
|
|
|
|
|
| Corporate Bonds |
|
|
— |
|
|
|
|
|
127,747,388 |
|
|
|
|
|
— |
|
|
|
|
|
127,747,388 |
|
|
|
|
|
|
|
|
|
| Government Agencies |
|
|
— |
|
|
|
|
|
8,284,134 |
|
|
|
|
|
— |
|
|
|
|
|
8,284,134 |
|
|
|
|
|
|
|
|
|
| Mortgage-Backed Securities |
|
|
— |
|
|
|
|
|
12,693,208 |
|
|
|
|
|
— |
|
|
|
|
|
12,693,208 |
|
|
|
|
|
|
|
|
|
| Municipal Bond |
|
|
— |
|
|
|
|
|
131,530 |
|
|
|
|
|
— |
|
|
|
|
|
131,530 |
|
|
|
|
|
|
|
|
|
| U.S. Treasury |
|
|
— |
|
|
|
|
|
9,237,866 |
|
|
|
|
|
— |
|
|
|
|
|
9,237,866 |
|
|
|
|
|
|
|
|
|
| Money Market Fund |
|
|
2,326,733 |
|
|
|
|
|
— |
|
|
|
|
|
— |
|
|
|
|
|
2,326,733 |
|
|
|
|
|
|
|
|
|
| Repurchase Agreements |
|
|
— |
|
|
|
|
|
1,938,263 |
|
|
|
|
|
— |
|
|
|
|
|
1,938,263 |
|
|
|
|
|
|
|
|
|
|
|
|
|
|
|
|
|
|
|
|
|
|
|
|
|
|
|
|
|
|
|
|
| Total |
|
$ |
2,326,733 |
|
|
|
|
$ |
178,564,970 |
|
|
|
|
$ |
— |
|
|
|
|
$ |
180,891,703 |
|
|
|
|
|
|
|
|
|
|
|
|
|
|
|
|
|
|
|
|
|
|
|
|
| # |
Security, or a portion thereof, is on loan. See Note 2 in Notes to Financial Statements. |
| D |
Floating rate note with current rate and stated maturity date shown. |
| S |
All or a portion of this security was segregated for extended settlement contracts. |
| W |
Denotes a restricted security that may be resold without restriction to “qualified institutional buyers” as defined in Rule 144A under the Securities Act of 1933 and that the Fund has determined to be liquid
under criteria established by the Fund’s Board of Trustees. At April 30, 2015, these liquid restricted securities amounted to $6,787,356 representing 3.8% of total net assets. |
| ** |
Represents less than 0.05%. |
The following acronyms are used throughout this Fund:
BKNT - Bank Note
CMBS
- Commercial Mortgage-Backed Securities
FHLMC - Federal Home Loan Mortgage Corporation
FNMA - Federal National Mortgage Association
FRN - Floating Rate Note
GNMA - Government National Mortgage Association
LLC - Limited Liability Corporation
LP - Limited Partnership
Ltd. - Limited
MTN -
Medium Term Note
NA - North America
PLC - Public Limited Company
See Notes which are an integral part of the Financial Statements
|
| April 30, 2015 / ANNUAL REPORT |
PORTFOLIO OF INVESTMENTS SUMMARY TABLE
Wilmington Municipal Bond Fund
At April 30, 2015, the Fund’s
portfolio composition was as follows (unaudited):
|
|
|
|
|
|
| |
|
Percentage of
Total Net Assets |
|
|
| General Obligations |
|
|
|
25.9 |
% |
|
|
| Transportation |
|
|
|
14.7 |
% |
|
|
| Medical |
|
|
|
14.2 |
% |
|
|
| Higher Education |
|
|
|
11.5 |
% |
|
|
| Dedicated Tax |
|
|
|
9.1 |
% |
|
|
| School District |
|
|
|
7.8 |
% |
|
|
| Water & Sewer |
|
|
|
7.4 |
% |
|
|
| Utilities |
|
|
|
2.4 |
% |
|
|
| Airport |
|
|
|
2.1 |
% |
|
|
| Pre-Refunded/Escrow |
|
|
|
2.1 |
% |
|
|
| Lease |
|
|
|
0.8 |
% |
|
|
| Continuing Care |
|
|
|
0.4 |
% |
|
|
| Power |
|
|
|
0.4 |
% |
|
|
| Cash Equivalents1 |
|
|
|
0.2 |
% |
|
|
| Other Assets and Liabilities – Net2 |
|
|
|
1.0 |
% |
|
|
|
|
|
|
|
|
| TOTAL |
|
|
|
100.0 |
% |
|
|
|
|
|
|
| (1) |
Cash Equivalents include investments in a money market fund. |
| (2) |
Assets, other than investments in securities, less liabilities. See Statements of Assets and Liabilities. |
| (3) |
For financial reporting purposes, the Credit Quality Diversification table reflects the lowest rating assigned by either Moody’s Investors Service or Standard and Poor’s if the ratings differ. These rating
agencies are independent, nationally recognized statistical rating organizations and are widely used. Investment grade ratings are credit ratings of BBB/Baa or higher. Below investment grade ratings are credit ratings of BB/Ba or lower. Investments
designated as “Not Rated” are not rated by either rating agency and do not necessarily indicate low credit quality. Credit quality ratings are subject to change.
|
|
|
|
|
|
|
| Credit Quality Diversification3 |
|
Percentage of
Total Net Assets |
|
|
| AAA / Aaa |
|
|
|
18.1 |
% |
|
|
| AA / Aa |
|
|
|
59.8 |
% |
|
|
| A / A |
|
|
|
18.8 |
% |
|
|
| Not Rated |
|
|
|
2.3 |
% |
|
|
| Other Assets and Liabilities – Net2 |
|
|
|
1.0 |
% |
|
|
|
|
|
|
|
|
| TOTAL |
|
|
|
100.0 |
% |
|
|
|
|
|
|
PORTFOLIO OF INVESTMENTS
April 30, 2015
|
|
|
|
|
|
|
|
|
|
|
|
| Description |
|
|
Par Value |
|
|
|
Value |
|
|
|
| MUNICIPAL BONDS – 98.8% |
|
|
|
|
|
|
|
|
| ALABAMA – 0.9% |
|
|
|
|
|
|
|
|
|
|
| HIGHER EDUCATION – 0.5% |
|
|
|
|
|
|
|
|
| Auburn University, AL, Advance Refunding Revenue Bonds, (Series A), 5.00%, 6/01/21 |
|
$ |
1,200,000 |
|
|
$ |
1,428,300 |
|
|
|
|
| MEDICAL – 0.4% |
|
|
|
|
|
|
|
|
|
|
|
| The University of Alabama, Refunding Revenue Bonds, (Series A), 5.75%, 9/01/22D |
|
|
1,000,000 |
|
|
|
1,142,920 |
|
|
|
|
|
|
|
|
|
|
|
|
|
| TOTAL ALABAMA |
|
|
|
|
|
$ |
2,571,220 |
|
|
|
|
|
|
|
|
|
|
|
|
|
| Description |
|
|
Par Value |
|
|
|
Value |
|
|
|
|
| ARIZONA – 2.8% |
|
|
|
|
|
|
|
|
|
|
|
| SCHOOL DISTRICT – 0.8% |
|
|
|
|
|
|
|
|
|
|
|
| Maricopa County Unified School District No 80 Chandler, AZ, GO Limited, Economic Defeasance, 5.00%, 7/01/21 |
|
$ |
2,000,000 |
|
|
$ |
2,382,440 |
|
|
|
|
| WATER & SEWER – 2.0% |
|
|
|
|
|
|
|
|
|
|
|
| Arizona Water Infrastructure Finance Authority, Revenue Bonds, Water Utility Improvements, (Series A), 5.00%, 10/01/23 |
|
|
3,000,000 |
|
|
|
3,393,690 |
|
|
|
|
| City of Tucson, AZ, Refunding Revenue Bonds, (Water Revenue), 5.00%, 7/01/30 |
|
|
2,255,000 |
|
|
|
2,651,993 |
|
|
|
|
|
|
|
|
|
|
|
|
|
| TOTAL WATER & SEWER |
|
|
|
|
|
$ |
6,045,683 |
|
|
|
|
|
|
|
|
|
|
|
|
|
| TOTAL ARIZONA |
|
|
|
|
|
$ |
8,428,123 |
|
|
| ANNUAL REPORT / April 30, 2015 |
|
| PORTFOLIOS OF INVESTMENTS |
Wilmington Municipal Bond Fund (continued)
|
|
|
|
|
|
|
|
|
|
|
|
| Description |
|
|
Par Value |
|
|
|
Value |
|
|
|
|
| CALIFORNIA – 6.4% |
|
|
|
|
|
|
|
|
|
|
| GENERAL OBLIGATIONS – 0.8% |
|
|
|
|
|
|
|
|
| Grossmont Healthcare District, CA, GO Unlimited, (Series C), (Health, Hospital & Nursing Home Improvements), 5.00%, 7/15/23 |
|
$ |
2,000,000 |
|
|
$ |
2,433,900 |
|
|
|
| HIGHER EDUCATION – 1.7% |
|
|
|
|
|
|
|
|
| Los Angeles Unified School District, CA, Certificate Participation Refunding Bonds, (Series B), (Headquarters Building), 5.00%, 10/01/27 |
|
|
4,300,000 |
|
|
|
4,974,154 |
|
|
|
|
| TRANSPORTATION – 2.0% |
|
|
|
|
|
|
|
|
|
|
|
| Bay Area Toll Authority, CA, Refunding Revenue Bonds, (San Francisco Bay Area), 5.00%, 4/01/26 |
|
|
5,000,000 |
|
|
|
5,979,950 |
|
|
|
|
| WATER & SEWER – 1.9% |
|
|
|
|
|
|
|
|
|
|
|
| City of San Francisco Public Utilities Commission Water Revenue, CA, Refunding Revenue Bonds, (Series C), (Water Revenue), 5.00%, 11/01/27 |
|
|
5,000,000 |
|
|
|
5,832,750 |
|
|
|
|
|
|
|
|
|
|
|
|
|
| TOTAL CALIFORNIA |
|
|
|
|
|
$ |
19,220,754 |
|
|
|
|
| COLORADO – 0.8% |
|
|
|
|
|
|
|
|
|
|
|
| AIRPORT – 0.8% |
|
|
|
|
|
|
|
|
|
|
|
| City & County of Denver Airport System Revenue, CO, Refunding Revenue Bonds, (Series B), 5.00%, 11/15/25 |
|
|
2,000,000 |
|
|
|
2,350,740 |
|
|
|
|
|
|
|
|
|
|
|
|
|
| TOTAL COLORADO |
|
|
|
|
|
$ |
2,350,740 |
|
|
|
| DISTRICT OF COLUMBIA – 0.8% |
|
|
|
|
|
|
|
|
| DEDICATED TAX – 0.8% |
|
|
|
|
|
|
|
|
|
|
|
| District of Columbia, Refunding Revenue Bonds, (Series B), 5.00%, 12/01/27 |
|
|
2,000,000 |
|
|
|
2,341,120 |
|
|
|
|
|
|
|
|
|
|
|
|
| TOTAL DISTRICT OF COLUMBIA |
|
|
$ |
2,341,120 |
|
|
|
|
| FLORIDA – 1.9% |
|
|
|
|
|
|
|
|
|
|
| HIGHER EDUCATION – 1.9% |
|
|
|
|
|
|
|
|
| Broward County School Board, FL, Certificate Participation Refunding Bonds,, (Series A), 5.00%, 7/01/21 |
|
|
3,000,000 |
|
|
|
3,537,090 |
|
|
|
|
| St. Johns County School Board, FL, Certificate Participation Refunding Bonds, 5.00%, 7/01/20 |
|
|
2,000,000 |
|
|
|
2,325,280 |
|
|
|
|
|
|
|
|
|
|
|
|
| TOTAL HIGHER EDUCATION |
|
|
$ |
5,862,370 |
|
|
|
|
|
|
|
|
|
|
|
|
|
| TOTAL FLORIDA |
|
|
|
|
|
$ |
5,862,370 |
|
|
|
|
| GEORGIA – 2.4% |
|
|
|
|
|
|
|
|
|
|
| GENERAL OBLIGATIONS – 2.4% |
|
|
|
|
|
|
|
|
| State of Georgia, GO Unlimited, (Series A-1), (Public Improvements), 5.00%, 2/01/22 |
|
|
6,000,000 |
|
|
|
7,291,320 |
|
|
|
|
|
|
|
|
|
|
|
|
|
| TOTAL GEORGIA |
|
|
|
|
|
$ |
7,291,320 |
|
|
|
|
|
|
|
|
|
|
|
|
|
| Description |
|
|
Par Value |
|
|
|
Value |
|
|
|
|
| ILLINOIS – 6.8% |
|
|
|
|
|
|
|
|
|
|
|
| DEDICATED TAX – 1.0% |
|
|
|
|
|
|
|
|
|
|
|
| State of Illinois, Revenue Bonds, Public Improvements, (National Reinsurance FGIC), 6.00%, 6/15/26 |
|
$ |
2,500,000 |
|
|
$ |
3,225,100 |
|
|
|
| GENERAL OBLIGATIONS – 2.3% |
|
|
|
|
|
|
|
|
| Metropolitan Water Reclamation District of Greater Chicago, GO Limited, (Series C-Green Bond), (Water Utility & Sewer Improvements),
5.00%, 12/01/28 |
|
|
5,865,000 |
|
|
|
6,924,160 |
|
|
|
|
| MEDICAL – 0.4% |
|
|
|
|
|
|
|
|
|
|
|
| Illinois State Finance Authority, Refunding Revenue Bonds, (Series A), (Rush University Medical Center), 5.00%, 11/15/29 |
|
|
1,000,000 |
|
|
|
1,147,510 |
|
|
|
| SCHOOL DISTRICT – 1.1% |
|
|
|
|
|
|
|
|
| Du Page & Will Counties, IL, Community School District No 204 Indian Prairie, GO Unlimited, Advance Refunding, (Series A), 5.00%, 12/30/19 |
|
|
2,785,000 |
|
|
|
3,230,934 |
|
|
|
| TRANSPORTATION – 2.0% |
|
|
|
|
|
|
|
|
| Illinois State Toll Highway Authority, Refunding Revenue Bonds, (Series D), 5.00%, 1/01/24 |
|
|
5,000,000 |
|
|
|
6,016,250 |
|
|
|
|
|
|
|
|
|
|
|
|
|
| TOTAL ILLINOIS |
|
|
|
|
|
$ |
20,543,954 |
|
|
|
|
| INDIANA – 1.2% |
|
|
|
|
|
|
|
|
|
|
| GENERAL OBLIGATIONS – 0.5% |
|
|
|
|
|
|
|
|
| Indianapolis-Marion County Public Library, GO Unlimited, Refunding Revenue Bonds, (State Intercept Program), 5.00%, 1/01/19 |
|
|
1,270,000 |
|
|
|
1,439,774 |
|
|
|
|
| MEDICAL – 0.7% |
|
|
|
|
|
|
|
|
|
|
|
| Indiana Finance Authority, Refunding Revenue Bonds, (Series C), (Franciscan Alliance Inc., OBG), 5.00%, 11/01/21 |
|
|
2,000,000 |
|
|
|
2,230,660 |
|
|
|
|
|
|
|
|
|
|
|
|
|
| TOTAL INDIANA |
|
|
|
|
|
$ |
3,670,434 |
|
|
|
|
| KANSAS – 1.2% |
|
|
|
|
|
|
|
|
|
|
| GENERAL OBLIGATIONS – 1.2% |
|
|
|
|
|
|
|
|
| City of Wichita, KS, GO Unlimited, Current Refunding, (Series A), 5.00%, 12/01/18 |
|
|
3,085,000 |
|
|
|
3,502,771 |
|
|
|
|
|
|
|
|
|
|
|
|
|
| TOTAL KANSAS |
|
|
|
|
|
$ |
3,502,771 |
|
|
|
|
| MARYLAND – 17.1% |
|
|
|
|
|
|
|
|
|
|
| CONTINUING CARE – 0.4% |
|
|
|
|
|
|
|
|
| Baltimore County, MD, Revenue Refunding Bonds, (Series A), (Oak Crest Village, Inc.), 5.00%, 1/01/22 |
|
|
1,200,000 |
|
|
|
1,263,456 |
|
|
|
| GENERAL OBLIGATIONS – 7.9% |
|
|
|
|
|
|
|
|
| Baltimore County, MD, GO Unlimited, Refunding Notes, 5.00%, 11/01/18 |
|
|
1,000,000 |
|
|
|
1,136,090 |
|
|
| April 30, 2015 / ANNUAL REPORT |
|
| PORTFOLIOS OF INVESTMENTS |
Wilmington Municipal Bond Fund (continued)
|
|
|
|
|
|
|
|
|
|
|
|
| Description |
|
|
Par Value |
|
|
|
Value |
|
|
|
|
| Baltimore County, MD, GO Unlimited, Refunding Notes, (Public Improvements), 5.00%, 2/01/28 |
|
$ |
1,000,000 |
|
|
$ |
1,171,070 |
|
|
|
|
| Cecil County, MD, GO Unlimited, Refunding Bonds, (County Commissioners-Consolidated Public Improvements), 5.00%, 11/01/23 |
|
|
2,590,000 |
|
|
|
3,148,585 |
|
|
|
|
| Charles County, MD, GO Unlimited, Refunding Bonds, (Public Improvements), 5.00%, 3/01/20 |
|
|
3,020,000 |
|
|
|
3,535,937 |
|
|
|
|
| Frederick County, MD, GO Unlimited, Refunding Bonds, (Public Facilities), 5.25%, 11/01/19 |
|
|
1,500,000 |
|
|
|
1,760,925 |
|
|
|
|
| Howard County, MD, GO Unlimited, Refunding Bonds, (Series B), 5.00%, 8/15/18 |
|
|
2,500,000 |
|
|
|
2,825,200 |
|
|
|
|
| Montgomery County, MD, GO Unlimited, Refunding Bonds, (Series A), 5.00%, 7/01/21 |
|
|
2,000,000 |
|
|
|
2,407,760 |
|
|
|
|
| Montgomery County, MD, GO Unlimited, Refunding Notes, (Public Improvements) |
|
|
|
|
|
|
|
|
|
|
|
| 5.00%, 8/01/19 |
|
|
1,570,000 |
|
|
|
1,817,055 |
|
|
|
|
| 5.00%, 7/01/22 |
|
|
2,000,000 |
|
|
|
2,316,540 |
|
|
|
|
| Prince George’s County, MD, GO Limited, Public Improvements, (Series A), 5.00%, 9/15/27 |
|
|
1,020,000 |
|
|
|
1,211,995 |
|
|
|
|
| Washington Suburban Sanitary Commission, MD, GO Unlimited, Refunding Bonds, (General Construction), 6.00%, 6/01/18 |
|
|
1,000,000 |
|
|
|
1,152,940 |
|
|
|
|
| Washington Suburban Sanitary Commission, MD, GO Unlimited, Water & Utility Improvements, 5.00%, 6/01/18 |
|
|
1,315,000 |
|
|
|
1,477,929 |
|
|
|
|
|
|
|
|
|
|
|
|
| TOTAL GENERAL OBLIGATIONS |
|
|
$ |
23,962,026 |
|
|
|
| HIGHER EDUCATION – 1.2% |
|
|
|
|
|
|
|
|
| Maryland Health & Higher Educational Facilities Authority, Refunding Revenue Bonds, (Series A), (Johns Hopkins University), 5.00%, 7/01/26 |
|
|
3,000,000 |
|
|
|
3,557,550 |
|
|
|
|
| LEASE – 0.4% |
|
|
|
|
|
|
|
|
|
|
|
| Maryland Economic Development Corp., Revenue Bonds, General Improvements, (Public Health Laboratory), 5.00%, 6/01/19 |
|
|
1,000,000 |
|
|
|
1,147,340 |
|
|
|
|
| MEDICAL – 2.7% |
|
|
|
|
|
|
|
|
|
|
|
| Maryland Health & Higher Educational Facilities Authority, Refunding Revenue Bonds, (Anne Arundel Health Systems) |
|
|
|
|
|
|
|
|
|
|
|
| 5.00%, 7/01/22 |
|
|
1,000,000 |
|
|
|
1,173,900 |
|
|
|
|
| 5.00%, 7/01/25 |
|
|
1,000,000 |
|
|
|
1,157,450 |
|
|
|
|
| 5.00%, 7/01/26 |
|
|
1,100,000 |
|
|
|
1,264,659 |
|
|
|
|
| Maryland Health & Higher Educational Facilities Authority, Refunding Revenue Bonds, (Series C), (Upper Chesapeake Medical Center),
5.50%, 1/01/28 |
|
|
2,500,000 |
|
|
|
2,729,000 |
|
|
|
|
| Maryland Health & Higher Educational Facilities Authority, Revenue Bonds, (Johns Hopkins Health System), 5.00%, 7/01/19 |
|
|
1,000,000 |
|
|
|
1,149,230 |
|
|
|
|
|
|
|
|
|
|
|
|
|
| Description |
|
|
Par Value |
|
|
|
Value |
|
|
|
|
| Maryland Health & Higher Educational Facilities Authority, Revenue Bonds, (Series C), (Johns Hopkins Health System), 5.00%, 5/15/28 |
|
$ |
675,000 |
|
|
$ |
781,258 |
|
|
|
|
|
|
|
|
|
|
|
|
|
| TOTAL MEDICAL |
|
|
|
|
|
$ |
8,255,497 |
|
|
|
|
| TRANSPORTATION – 3.5% |
|
|
|
|
|
|
|
|
|
|
|
| Maryland State Department of Transportation, Refunding Revenue Bonds, 5.00%, 5/01/18 |
|
|
825,000 |
|
|
|
924,561 |
|
|
|
|
| Maryland State Department of Transportation, Revenue Bonds, Transit Improvements, 5.00%, 2/15/28 |
|
|
1,375,000 |
|
|
|
1,578,706 |
|
|
|
|
| Maryland State Transportation Authority, Refunding Revenue Bonds |
|
|
|
|
|
|
|
|
|
|
|
| 5.00%, 7/01/18 |
|
|
2,500,000 |
|
|
|
2,814,525 |
|
|
|
|
| 5.00%, 7/01/25 |
|
|
1,000,000 |
|
|
|
1,184,400 |
|
|
|
|
| Maryland State Transportation Authority, Revenue Bonds, Highway Improvements, 5.25%, 3/01/18 |
|
|
3,520,000 |
|
|
|
3,949,651 |
|
|
|
|
|
|
|
|
|
|
|
|
|
| TOTAL TRANSPORTATION |
|
|
|
|
|
$ |
10,451,843 |
|
|
|
|
| WATER & SEWER – 1.0% |
|
|
|
|
|
|
|
|
|
|
|
| Maryland Water Quality Financing Administration Revolving Loan Fund, Revenue Bonds, Sewer Improvements, 5.00%, 3/01/20 |
|
|
2,525,000 |
|
|
|
2,968,011 |
|
|
|
|
|
|
|
|
|
|
|
|
|
| TOTAL MARYLAND |
|
|
|
|
|
$ |
51,605,723 |
|
|
|
|
| MASSACHUSETTS – 1.0% |
|
|
|
|
|
|
|
|
|
|
|
| WATER & SEWER – 1.0% |
|
|
|
|
|
|
|
|
|
|
|
| Massachusetts Water Resources Authority, Refunding Revenue Bonds, (Series B), (AGM), 5.25%, 8/01/27 |
|
|
2,325,000 |
|
|
|
2,958,051 |
|
|
|
|
|
|
|
|
|
|
|
|
|
| TOTAL MASSACHUSETTS |
|
|
|
|
|
$ |
2,958,051 |
|
|
|
|
| MICHIGAN – 8.8% |
|
|
|
|
|
|
|
|
|
|
|
| DEDICATED TAX – 4.1% |
|
|
|
|
|
|
|
|
|
|
|
| Michigan Finance Authority, Refunding Revenue Bonds, (Series A), (Unemployment Obligation Assessment), 5.00%, 7/01/18 |
|
|
3,500,000 |
|
|
|
3,941,490 |
|
|
|
|
| Michigan Finance Authority, Refunding Revenue Bonds, (Series B), (Unemployment Obligation Assessment), 5.00%, 7/01/21 |
|
|
2,000,000 |
|
|
|
2,234,060 |
|
|
|
|
| Michigan Finance Authority, Revenue Bonds, Repayment of Bank Loan, (Series H-1), 5.00%, 10/01/25 |
|
|
5,215,000 |
|
|
|
6,126,008 |
|
|
|
|
|
|
|
|
|
|
|
|
|
| TOTAL DEDICATED TAX |
|
|
|
|
|
$ |
12,301,558 |
|
|
|
|
| MEDICAL – 0.5% |
|
|
|
|
|
|
|
|
|
|
|
| Royal Oak Hospital Finance Authority, MI, Refunding Revenue Bonds, (Series D), (William Beaumont Hospital), 5.00%, 9/01/20 |
|
|
1,200,000 |
|
|
|
1,403,484 |
|
|
| ANNUAL REPORT / April 30, 2015 |
|
| PORTFOLIOS OF INVESTMENTS |
Wilmington Municipal Bond Fund (continued)
|
|
|
|
|
|
|
|
|
|
|
|
| Description |
|
|
Par Value |
|
|
|
Value |
|
|
|
| SCHOOL DISTRICT – 3.1% |
|
|
|
|
|
|
|
|
| Ann Arbor School District, MI, GO Unlimited, Refunding Revenue Bonds, (Q-SBLF), 5.00%, 5/01/17 |
|
$ |
1,000,000 |
|
|
$ |
1,084,260 |
|
|
|
|
| Grand Ledge Public Schools, MI, GO Unlimited, Current Refunding, (Q-SBLF) |
|
|
|
|
|
|
|
|
|
|
|
| 5.00%, 5/01/22 |
|
|
1,195,000 |
|
|
|
1,415,358 |
|
|
|
|
| 5.00%, 5/01/24 |
|
|
2,810,000 |
|
|
|
3,360,732 |
|
|
|
|
| Huron Valley School District, MI, GO Unlimited, Current Refunding, (Q-SBLF), 5.00%, 5/01/20 |
|
|
1,000,000 |
|
|
|
1,161,980 |
|
|
|
|
| Troy School District, MI, GO Unlimited, Advance Refunding, (Q-SBLF), 5.00%, 5/01/20 |
|
|
2,085,000 |
|
|
|
2,424,188 |
|
|
|
|
|
|
|
|
|
|
|
|
|
| TOTAL SCHOOL DISTRICT |
|
|
|
|
|
$ |
9,446,518 |
|
|
|
|
| UTILITIES – 1.1% |
|
|
|
|
|
|
|
|
|
|
|
| Lansing Board of Water & Light, Revenue Bonds, (Series A), 5.00%, 7/01/29 |
|
|
3,000,000 |
|
|
|
3,402,180 |
|
|
|
|
|
|
|
|
|
|
|
|
|
| TOTAL MICHIGAN |
|
|
|
|
|
$ |
26,553,740 |
|
|
|
|
| MINNESOTA – 0.9% |
|
|
|
|
|
|
|
|
|
|
|
| MEDICAL – 0.9% |
|
|
|
|
|
|
|
|
|
|
|
| City of Rochester, MN, Refunding Revenue Bonds, (Series A), (Mayo Clinic), 4.00%, 11/15/30D |
|
|
2,500,000 |
|
|
|
2,738,600 |
|
|
|
|
|
|
|
|
|
|
|
|
|
| TOTAL MINNESOTA |
|
|
|
|
|
$ |
2,738,600 |
|
|
|
|
| MISSOURI – 1.3% |
|
|
|
|
|
|
|
|
|
|
|
| AIRPORT – 0.3% |
|
|
|
|
|
|
|
|
|
|
|
| City of St Louis, MO, Airport Revenue, Refunding Revenue Bonds, (Series A), (Lambert International Airport), (AGM), 5.00%, 7/01/23 |
|
|
1,000,000 |
|
|
|
1,074,370 |
|
|
|
|
| MEDICAL – 1.0% |
|
|
|
|
|
|
|
|
|
|
|
| Missouri State Health & Educational Facilities Authority, MO, Refunding Revenue Bonds, (Series A), (SSM Health Care) |
|
|
|
|
|
|
|
|
|
|
|
| 5.00%, 6/01/20 |
|
|
1,000,000 |
|
|
|
1,167,030 |
|
|
|
|
| 5.00%, 6/01/28 |
|
|
1,500,000 |
|
|
|
1,741,005 |
|
|
|
|
|
|
|
|
|
|
|
|
|
| TOTAL MEDICAL |
|
|
|
|
|
$ |
2,908,035 |
|
|
|
|
|
|
|
|
|
|
|
|
|
| TOTAL MISSOURI |
|
|
|
|
|
$ |
3,982,405 |
|
|
|
|
| NEVADA – 1.1% |
|
|
|
|
|
|
|
|
|
|
|
| DEDICATED TAX – 0.7% |
|
|
|
|
|
|
|
|
|
|
|
| County of Clark, NV, Refunding Revenue Bonds, (Motor Vehicle Fuel Tax), 5.00%, 7/01/18 |
|
|
2,000,000 |
|
|
|
2,244,260 |
|
|
|
| SCHOOL DISTRICT – 0.4% |
|
|
|
|
|
|
|
|
| Washoe County School District, NV, GO Limited, Refunding Revenue Bonds, (Series A), 4.00%, 6/01/18 |
|
|
1,000,000 |
|
|
|
1,088,170 |
|
|
|
|
|
|
|
|
|
|
|
|
|
| TOTAL NEVADA |
|
|
|
|
|
$ |
3,332,430 |
|
|
|
|
|
|
|
|
|
|
|
|
|
| Description |
|
|
Par Value |
|
|
|
Value |
|
|
|
|
| NEW JERSEY – 2.5% |
|
|
|
|
|
|
|
|
|
|
| GENERAL OBLIGATIONS – 0.7% |
|
|
|
|
|
|
|
|
| County of Essex, NJ, GO Unlimited,, (Series A), ( Public Improvements), 5.00%, 8/01/19 |
|
$ |
1,870,000 |
|
|
$ |
2,151,828 |
|
|
|
| HIGHER EDUCATION – 1.2% |
|
|
|
|
|
|
|
|
| Gloucester County Improvement Authority, NJ, Advance Refunding Revenue Bonds, (Series B), (Rowan University Project), 5.00%, 7/01/27 |
|
|
3,000,000 |
|
|
|
3,492,420 |
|
|
|
| TRANSPORTATION – 0.6% |
|
|
|
|
|
|
|
|
| New Jersey State Turnpike Authority, Revenue Bonds, (Series A), (Highway Improvement), 5.00%, 1/01/27 |
|
|
1,645,000 |
|
|
|
1,928,565 |
|
|
|
|
|
|
|
|
|
|
|
|
|
| TOTAL NEW JERSEY |
|
|
|
|
|
$ |
7,572,813 |
|
|
|
|
| NEW YORK – 7.8% |
|
|
|
|
|
|
|
|
|
|
|
| DEDICATED TAX – 3.0% |
|
|
|
|
|
|
|
|
|
|
|
| Nassau County Interim Finance Authority, NY, Refunding Revenue Bonds, (Series A), (Sales Tax), 5.00%, 11/15/21 |
|
|
1,960,000 |
|
|
|
2,364,740 |
|
|
|
|
| New York City, Transitional Finance Authority, NY, Refunding Revenue Bonds, (Subseries E), 5.00%, 11/01/22 |
|
|
4,125,000 |
|
|
|
4,896,953 |
|
|
|
|
| New York Local Government Assistance Corp., NY, Refunding Revenue Bonds, (Series A), (GO of Corp.), 5.00%, 4/01/19 |
|
|
1,500,000 |
|
|
|
1,723,500 |
|
|
|
|
|
|
|
|
|
|
|
|
|
| TOTAL DEDICATED TAX |
|
|
|
|
|
$ |
8,985,193 |
|
|
|
| GENERAL OBLIGATIONS – 0.4% |
|
|
|
|
|
|
|
|
| County of Sullivan, NY, GO Limited, Refunding Revenue Bonds, (Public Improvement), 5.00%, 7/15/18 |
|
|
1,100,000 |
|
|
|
1,226,291 |
|
|
|
|
| LEASE – 0.4% |
|
|
|
|
|
|
|
|
|
|
|
| Erie County Industrial Development Agency School, NY, Refunding Revenue Bonds, (State Aid Withholding), 5.00%, 5/01/18 |
|
|
1,000,000 |
|
|
|
1,119,000 |
|
|
|
| TRANSPORTATION – 4.0% |
|
|
|
|
|
|
|
|
| Metropolitan Transportation Authority, NY, Revenue Bonds, (Series B), (Transit Improvements), 5.00%, 11/15/29 |
|
|
3,000,000 |
|
|
|
3,464,310 |
|
|
|
|
| New York State Thruway Authority, Refunding Revenue Bonds,, 5.00%, 1/01/30 |
|
|
5,500,000 |
|
|
|
6,344,745 |
|
|
|
|
| Port Authority of New York & New Jersey, Refunding Revenue Bonds, (Port, Airport & Marina Improvements), 5.00%, 12/01/23 |
|
|
2,000,000 |
|
|
|
2,412,760 |
|
|
|
|
|
|
|
|
|
|
|
|
|
| TOTAL TRANSPORTATION |
|
|
|
|
|
$ |
12,221,815 |
|
|
|
|
|
|
|
|
|
|
|
|
|
| TOTAL NEW YORK |
|
|
|
|
|
$ |
23,552,299 |
|
|
|
|
| NORTH CAROLINA – 1.0% |
|
|
|
|
|
|
|
|
|
|
| GENERAL OBLIGATIONS – 1.0% |
|
|
|
|
|
|
|
|
| City of Charlotte, NC, GO Unlimited, Refunding Revenue Bonds, (Series A), 5.00%, 7/01/18 |
|
|
2,745,000 |
|
|
|
3,092,188 |
|
|
|
|
|
|
|
|
|
|
|
|
|
| TOTAL NORTH CAROLINA |
|
|
|
|
|
$ |
3,092,188 |
|
|
| April 30, 2015 / ANNUAL REPORT |
|
| PORTFOLIOS OF INVESTMENTS |
Wilmington Municipal Bond Fund (continued)
|
|
|
|
|
|
|
|
|
|
|
|
| Description |
|
|
Par Value |
|
|
|
Value |
|
|
|
|
| OHIO – 0.8% |
|
|
|
|
|
|
|
|
|
|
| GENERAL OBLIGATIONS – 0.8% |
|
|
|
|
|
|
|
|
| Akron-Summit County Public Library, OH, GO Unlimited, Refunding Revenue Bonds, 5.00%, 12/01/20 |
|
$ |
1,960,000 |
|
|
$ |
2,311,742 |
|
|
|
|
|
|
|
|
|
|
|
|
|
| TOTAL OHIO |
|
|
|
|
|
$ |
2,311,742 |
|
|
|
|
| PENNSYLVANIA – 9.6% |
|
|
|
|
|
|
|
|
|
|
|
| DEDICATED TAX – 0.6% |
|
|
|
|
|
|
|
|
|
|
|
| Sports & Exhibition Authority of Pittsburgh & Allegheny County, PA, Refunding Revenue Bonds, (AGM), 5.00%, 2/01/23 |
|
|
1,520,000 |
|
|
|
1,746,328 |
|
|
|
| GENERAL OBLIGATIONS – 0.9% |
|
|
|
|
|
|
|
|
| Pennsylvania Convention Center Authority, Revenue Bonds, ETM, (Series A), (FGIC), 6.00%, 9/01/19 |
|
|
2,410,000 |
|
|
|
2,786,587 |
|
|
|
| HIGHER EDUCATION – 1.7% |
|
|
|
|
|
|
|
|
| Pennsylvania Higher Educational Facilities Authority, Current Refunding Revenue Bonds, (Series A), (University of Sciences, Philadelphia),
5.00%, 11/01/28 |
|
|
2,330,000 |
|
|
|
2,670,599 |
|
|
|
|
| Pennsylvania State University, Refunding Revenue Bonds, (Series B), 5.25%, 8/15/22 |
|
|
1,865,000 |
|
|
|
2,280,205 |
|
|
|
|
|
|
|
|
|
|
|
|
| TOTAL HIGHER EDUCATION |
|
|
$ |
4,950,804 |
|
|
|
|
| MEDICAL – 2.2% |
|
|
|
|
|
|
|
|
|
|
|
| Allegheny County Hospital Development Authority, PA, Revenue Bonds, (Series A), (UPMC, OBG), 5.00%, 10/15/22 |
|
|
1,430,000 |
|
|
|
1,712,382 |
|
|
|
|
| Lancaster County Hospital Authority, PA, Refunding Revenue Bonds, (Series B), (Lancaster General Hospital, OBG) |
|
|
|
|
|
|
|
|
|
|
|
| 5.00%, 3/15/19 |
|
|
1,485,000 |
|
|
|
1,600,043 |
|
|
|
|
| 5.00%, 3/15/23 |
|
|
1,770,000 |
|
|
|
1,896,803 |
|
|
|
|
| Pennsylvania Higher Educational Facilities Authority, Refunding Revenue Bonds, (Series A), (University of Pennsylvania Health System, OBG),
5.00%, 8/15/18 |
|
|
1,200,000 |
|
|
|
1,340,448 |
|
|
|
|
|
|
|
|
|
|
|
|
|
| TOTAL MEDICAL |
|
|
|
|
|
$ |
6,549,676 |
|
|
|
| PRE-REFUNDED/ESCROW – 2.1% |
|
|
|
|
|
|
|
|
| Bucks County Industrial Development Authority, PA, IDA, Revenue Bonds, ETM, (Senior Lifestyles, Inc., OBG), 10.00%, 5/15/19 |
|
|
4,775,000 |
|
|
|
6,431,352 |
|
|
|
| SCHOOL DISTRICT – 1.6% |
|
|
|
|
|
|
|
|
| Hamburg Area School District, PA, GO Unlimited, Refunding Revenue Notes, (Series A), (AGM State Aid Withholding), 5.50%, 4/01/24 |
|
|
2,405,000 |
|
|
|
2,837,395 |
|
|
|
|
| Pittsburgh Public Schools, PA, GO Unlimited, Refunding Revenue Bonds, (Series A), (AGM State Aid Withholding), 5.00%, 9/01/21 |
|
|
1,775,000 |
|
|
|
2,038,659 |
|
|
|
|
|
|
|
|
|
|
|
|
| TOTAL SCHOOL DISTRICT |
|
|
$ |
4,876,054 |
|
|
|
|
|
|
|
|
|
|
|
|
|
| Description |
|
|
Par Value |
|
|
|
Value |
|
|
|
|
| TRANSPORTATION – 0.5% |
|
|
|
|
|
|
|
|
|
|
|
| Pennsylvania State Turnpike Commission, PA, Refunding Revenue Bonds, (Series B), 5.00%, 12/01/21 |
|
$ |
1,400,000 |
|
|
$ |
1,613,010 |
|
|
|
|
|
|
|
|
|
|
|
|
|
| TOTAL PENNSYLVANIA |
|
|
|
|
|
$ |
28,953,811 |
|
|
|
|
| TENNESSEE – 0.6% |
|
|
|
|
|
|
|
|
|
|
| GENERAL OBLIGATIONS – 0.6% |
|
|
|
|
|
|
|
|
| Metropolitan Government of Nashville & Davidson County, TN, GO Unlimited, Refunding Revenue Bonds, 5.00%, 7/01/17 |
|
|
1,610,000 |
|
|
|
1,761,710 |
|
|
|
|
|
|
|
|
|
|
|
|
|
| TOTAL TENNESSEE |
|
|
|
|
|
$ |
1,761,710 |
|
|
|
|
| TEXAS – 14.5% |
|
|
|
|
|
|
|
|
|
|
|
| AIRPORT – 1.0% |
|
|
|
|
|
|
|
|
|
|
|
| Dallas/Fort Worth International Airport, TX, Refunding Revenue Bonds, (Series D), 5.25%, 11/01/23 |
|
|
2,500,000 |
|
|
|
3,001,525 |
|
|
|
| GENERAL OBLIGATIONS – 2.6% |
|
|
|
|
|
|
|
|
| City of Frisco, TX, GO Limited, Refunding Revenue Bonds, (Recreational Facilities Improvements), 5.00%, 2/15/18 |
|
|
2,000,000 |
|
|
|
2,225,260 |
|
|
|
|
| County of Travis, TX, GO Limited, Refunding Revenue Bonds, 5.00%, 3/01/19 |
|
|
1,270,000 |
|
|
|
1,450,924 |
|
|
|
|
| State of Texas, GO Unlimited, Highway Improvements, (Transportation Commission), 5.00%, 4/01/21 |
|
|
3,440,000 |
|
|
|
4,093,806 |
|
|
|
|
|
|
|
|
|
|
|
|
| TOTAL GENERAL OBLIGATIONS |
|
|
$ |
7,769,990 |
|
|
|
| HIGHER EDUCATION – 1.8% |
|
|
|
|
|
|
|
|
| Harris County Cultural Education Facilities Finance Corp., TX, Refunding Revenue Bonds, (Series A), (Baylor College of Medicine, OBG) |
|
|
|
|
|
|
|
|
|
|
|
| 5.00%, 11/15/18 |
|
|
1,690,000 |
|
|
|
1,898,732 |
|
|
|
|
| 5.00%, 11/15/19 |
|
|
3,105,000 |
|
|
|
3,554,697 |
|
|
|
|
|
|
|
|
|
|
|
|
| TOTAL HIGHER EDUCATION |
|
|
$ |
5,453,429 |
|
|
|
|
| MEDICAL – 4.5% |
|
|
|
|
|
|
|
|
|
|
|
| North Central Texas Health Facility Development Corp., TX, Refunding Revenue Bonds, (Children’s Medical Center of Dallas Project, OBG),
5.00%, 8/15/18 |
|
|
1,000,000 |
|
|
|
1,121,590 |
|
|
|
|
| Tarrant County Cultural Education Facilities Finance Corp., TX, Refunding Revenue Bonds, (Series A), (Texas Health Resources, OBG), 5.00%, 2/15/21 |
|
|
5,000,000 |
|
|
|
5,365,050 |
|
|
|
|
| Tarrant County Cultural Education Facilities Finance Corp., TX, Revenue Bonds, (Methodist Hospital of Dallas, OBG), 5.00%, 10/01/25 |
|
|
6,110,000 |
|
|
|
7,173,201 |
|
|
|
|
|
|
|
|
|
|
|
|
|
| TOTAL MEDICAL |
|
|
|
|
|
$ |
13,659,841 |
|
|
|
| SCHOOL DISTRICT – 0.8% |
|
|
|
|
|
|
|
|
| Mesquite Independent School District, TX, GO Unlimited, Refunding Revenue Bonds, (Series B), (PSF-GTD), 5.00%, 8/15/19 |
|
|
2,165,000 |
|
|
|
2,499,038 |
|
|
| ANNUAL REPORT / April 30, 2015 |
|
| PORTFOLIOS OF INVESTMENTS |
Wilmington Municipal Bond Fund (continued)
|
|
|
|
|
|
|
|
|
|
|
|
| Description |
|
|
Par Value |
|
|
|
Value |
|
|
|
| TRANSPORTATION – 1.0% |
|
|
|
|
|
|
|
|
| County of Harris, TX, Refunding Revenue Bonds, (Series C), (Senior Lien-Toll Road), 5.00%, 8/15/26 |
|
$ |
2,420,000 |
|
|
$ |
2,818,961 |
|
|
|
| UTILITIES – 1.3% |
|
|
|
|
|
|
|
|
| City of Houston Utility System, TX, Refunding Revenue Bonds, (Series C), (Comb-First Lien) |
|
|
|
|
|
|
|
|
|
|
|
| 5.00%, 5/15/21 |
|
|
1,250,000 |
|
|
|
1,487,550 |
|
|
|
|
| 5.00%, 5/15/23 |
|
|
2,000,000 |
|
|
|
2,440,060 |
|
|
|
|
|
|
|
|
|
|
|
|
|
| TOTAL UTILITIES |
|
|
|
|
|
$ |
3,927,610 |
|
|
|
| WATER & SEWER – 1.5% |
|
|
|
|
|
|
|
|
| City of Austin Water & Wastewater System, TX, Refunding Revenue Bonds, 5.00%, 5/15/20 |
|
|
3,810,000 |
|
|
|
4,463,948 |
|
|
|
|
|
|
|
|
|
|
|
|
|
| TOTAL TEXAS |
|
|
|
|
|
$ |
43,594,342 |
|
|
|
|
| UTAH – 0.9% |
|
|
|
|
|
|
|
|
|
|
|
| MEDICAL – 0.9% |
|
|
|
|
|
|
|
|
|
|
|
| County of Utah, UT, Revenue Bonds, (IHC Health Services Inc., OBG) |
|
|
|
|
|
|
|
|
|
|
|
| 5.00%, 5/15/25 |
|
|
1,165,000 |
|
|
|
1,346,903 |
|
|
|
|
| 5.00%, 5/15/26 |
|
|
1,200,000 |
|
|
|
1,381,776 |
|
|
|
|
|
|
|
|
|
|
|
|
|
| TOTAL MEDICAL |
|
|
|
|
|
$ |
2,728,679 |
|
|
|
|
|
|
|
|
|
|
|
|
|
| TOTAL UTAH |
|
|
|
|
|
$ |
2,728,679 |
|
|
|
|
| VIRGINIA – 1.5% |
|
|
|
|
|
|
|
|
|
|
| HIGHER EDUCATION – 1.5% |
|
|
|
|
|
|
|
|
| Virginia, College Building Authority, VA, Revenue Bonds, University & College Improvements, (Series A), (Public Higher Education Financing, OBG),
5.00%, 9/01/19 |
|
|
4,000,000 |
|
|
|
4,624,920 |
|
|
|
|
|
|
|
|
|
|
|
|
|
| TOTAL VIRGINIA |
|
|
|
|
|
$ |
4,624,920 |
|
|
|
| WASHINGTON – 3.1% |
|
|
|
|
|
|
|
| DEDICATED TAX – 0.9% |
|
|
|
|
|
|
|
|
| Central Puget Sound Regional Transit Authority, WA, Revenue Bonds, Transit Improvements, (National Reinsurance FGIC), 5.25%, 2/01/21 |
|
|
2,300,000 |
|
|
|
2,687,067 |
|
|
|
| GENERAL OBLIGATIONS – 1.8% |
|
|
|
|
|
|
|
|
| State of Washington, GO Unlimited, Refunding Revenue Bonds, (Series R-C), 5.00%, 7/01/24 |
|
|
4,500,000 |
|
|
|
5,463,585 |
|
|
|
|
| POWER – 0.4% |
|
|
|
|
|
|
|
|
|
|
|
| County of Lewis Public Utility District No. 1, WA, Current Refunding Revenue Bonds, 5.25%, 10/01/28 |
|
|
1,000,000 |
|
|
|
1,187,140 |
|
|
|
|
|
|
|
|
|
|
|
|
|
| TOTAL WASHINGTON |
|
|
|
|
|
$ |
9,337,792 |
|
|
|
|
|
|
|
|
|
|
|
|
|
| Description |
|
|
Par Value |
|
|
|
Value |
|
|
|
|
| WISCONSIN – 1.1% |
|
|
|
|
|
|
|
|
|
|
| TRANSPORTATION – 1.1% |
|
|
|
|
|
|
|
|
| Wisconsin Department of Transportation, Refunding Revenue Bonds, (Series 2), 5.00%, 7/01/19 |
|
$ |
1,500,000 |
|
|
$ |
1,727,805 |
|
|
|
|
| Wisconsin Department of Transportation, Revenue Bonds, (Series 1), (Highway Improvements), 5.00%, 7/01/22 |
|
|
1,500,000 |
|
|
|
1,732,110 |
|
|
|
|
|
|
|
|
|
|
|
|
|
| TOTAL TRANSPORTATION |
|
|
|
|
|
$ |
3,459,915 |
|
|
|
|
|
|
|
|
|
|
|
|
|
| TOTAL WISCONSIN |
|
|
|
|
|
$ |
3,459,915 |
|
|
|
|
|
|
|
|
|
|
|
|
|
| TOTAL MUNICIPAL BONDS |
|
|
|
|
|
|
|
|
| (COST $289,033,504) |
|
|
|
|
|
$ |
297,943,966 |
|
|
|
|
|
|
|
|
|
|
|
|
|
|
|
|
Number of
Shares |
|
|
|
|
|
|
|
| MONEY MARKET FUND – 0.2% |
|
|
|
|
|
|
|
|
| Dreyfus Tax Exempt Cash Management Fund, Institutional Shares, 0.00%^ |
|
|
646,674 |
|
|
$ |
646,674 |
|
|
|
|
|
|
|
|
|
|
|
|
| TOTAL MONEY MARKET FUND |
|
|
|
|
|
| (COST $646,674) |
|
|
|
|
|
$ |
646,674 |
|
|
|
|
|
|
|
|
|
|
|
|
| TOTAL INVESTMENTS – 99.0% |
|
|
|
|
|
| (COST $289,680,178) |
|
|
|
|
|
$ |
298,590,640 |
|
|
|
| OTHER ASSETS LESS LIABILITIES – 1.0% |
|
|
|
2,919,827 |
|
|
|
|
|
|
|
|
|
|
|
|
| TOTAL NET ASSETS – 100.0% |
|
|
$ |
301,510,467 |
|
|
|
|
|
|
|
|
|
|
|
| April 30, 2015 / ANNUAL REPORT |
|
| PORTFOLIOS OF INVESTMENTS |
Wilmington Municipal Bond Fund (concluded)
Cost of investments for Federal income tax purposes is $289,680,178. The net unrealized
appreciation/(depreciation) of investments was $8,910,462. This consists of net unrealized appreciation from investment for those securities having an excess of value over cost of $9,744,260 and net unrealized depreciation from investments for those
securities having an excess of cost over value of $833,798.
Various inputs are used in determining the value of the Fund’s investments. These
inputs are summarized in the three broad levels listed below.
Level 1 – quoted prices in active markets for identical securities
Level 2 – other significant observable inputs (including quoted prices for similar securities, interest rates, prepayment speeds, credit risk, etc.)
Level 3 – significant unobservable inputs (including the Fund’s own assumptions in determining the fair value of investments)
The following is a summary of the inputs used as of April 30, 2015 in valuing the Fund’s assets carried at fair value:
|
|
|
|
|
|
|
|
|
|
|
|
|
|
|
|
|
|
|
|
|
|
|
|
|
|
|
|
|
|
|
|
|
|
Level 1 |
|
|
|
|
|
Level 2 |
|
|
|
|
|
Level 3 |
|
|
|
|
|
Total |
|
|
|
|
|
|
|
|
|
| Investments in Securities |
|
|
|
|
|
|
|
|
|
|
|
|
|
|
|
|
|
|
|
|
|
|
|
|
|
|
|
|
|
|
| Municipal Bonds |
|
$ |
— |
|
|
|
|
$ |
297,943,966 |
|
|
|
|
$ |
— |
|
|
|
|
$ |
297,943,966 |
|
|
|
|
|
|
|
|
|
| Money Market Fund |
|
|
646,674 |
|
|
|
|
|
— |
|
|
|
|
|
— |
|
|
|
|
|
646,674 |
|
|
|
|
|
|
|
|
|
|
|
|
|
|
|
|
|
|
|
|
|
|
|
|
|
|
|
|
|
|
|
|
| Total |
|
$ |
646,674 |
|
|
|
|
$ |
297,943,966 |
|
|
|
|
$ |
— |
|
|
|
|
$ |
298,590,640 |
|
|
|
|
|
|
|
|
|
|
|
|
|
|
|
|
|
|
|
|
|
|
|
|
| D |
Floating rate note with current rate and stated maturity date shown. |
The following
acronyms are used throughout this Fund:
AGM - Assured Guaranty Municipal
ETM - Escrowed to Maturity
FGIC - Financial Guarantee Insurance Company
GO - General Obligation
GTD - Guaranteed
IDA -
Industrial Development Authority/Agency
OBG - Obligation
PSF - Permanent School Fund
Q-SBLF - Qualified School Bond Loan Fund
UPMC - University of Pittsburgh Medical Center
See Notes which are an integral part of the Financial Statements
|
| ANNUAL REPORT / April 30, 2015 |
PORTFOLIO OF INVESTMENTS SUMMARY TABLE
Wilmington New York Municipal Bond Fund
At April 30, 2015, the
Fund’s portfolio classifications were as follows (unaudited):
|
|
|
|
|
| |
|
Percentage of
Total Net Assets |
|
| General Obligations |
|
|
16.9% |
|
| Dedicated Tax |
|
|
15.2% |
|
| Lease |
|
|
14.1% |
|
| Transportation |
|
|
12.9% |
|
| School District |
|
|
9.8% |
|
| Medical |
|
|
8.8% |
|
| Water & Sewer |
|
|
7.1% |
|
| Higher Education |
|
|
4.8% |
|
| Pre-Refunded/Escrow |
|
|
4.8% |
|
| Power |
|
|
3.6% |
|
| Cash Equivalents1 |
|
|
3.5% |
|
| Other Assets and Liabilities – Net2 |
|
|
(1.5)% |
|
| TOTAL |
|
|
100.0% |
|
| (1) |
Cash Equivalents include investments in a money market fund. |
| (2) |
Assets, other than investments in securities, less liabilities. See Statements of Assets and Liabilities. |
| (3) |
For financial reporting purposes, the Credit Quality Diversification table reflects the lowest rating assigned by either Moody’s Investors Service or Standard and Poor’s if the ratings differ. These rating
agencies are independent, nationally recognized statistical rating organizations and are widely used. Investment grade ratings are credit ratings of BBB/Baa or higher. Below investment grade ratings are credit ratings of BB/Ba or lower. Investments
designated as “Not Rated” are not rated by either rating agency and do not necessarily indicate low credit quality. Credit quality ratings are subject to change.
|
|
|
|
|
|
| Credit Quality Diversification3 |
|
Percentage of
Total Net Assets |
|
| AAA / Aaa |
|
|
5.5% |
|
| AA / Aa |
|
|
65.2% |
|
| A / A |
|
|
16.8% |
|
| Not Rated |
|
|
14.0% |
|
| Other Assets and Liabilities – Net2 |
|
|
(1.5)% |
|
| TOTAL |
|
|
100.0% |
|
PORTFOLIO OF INVESTMENTS
April 30, 2015
|
|
|
|
|
|
|
|
|
|
|
|
| Description |
|
Par Value |
|
|
Value |
|
| MUNICIPAL BONDS –
98.0% |
|
|
| NEW YORK – 98.0% |
|
|
| DEDICATED TAX – 15.2% |
|
|
|
|
| Nassau County Interim Finance Authority, Refunding Revenue Bonds, (Series A), 5.00%, 11/15/21 |
|
$ |
1,000,000 |
|
|
$ |
1,206,500 |
|
|
|
|
| New York Local Government Assistance Corp., Refunding Revenue Notes, (Series A), (GO of Corp.), 5.00%, 4/01/20 |
|
|
3,000,000 |
|
|
|
3,541,410 |
|
|
|
|
| New York State Dormitory Authority, Revenue Bonds, University & College Improvements, (Series A), 5.00%, 3/15/25 |
|
|
5,100,000 |
|
|
|
6,190,074 |
|
|
|
|
|
|
|
|
|
|
|
|
|
| Description |
|
Par Value |
|
|
Value |
|
| New York State Thruway Authority, Revenue Bonds, Public
Improvements, (Series A), 5.25%, 3/15/23 |
|
$ |
1,000,000 |
|
|
$ |
1,106,070 |
|
|
|
|
| New York State Thruway Authority, Revenue Bonds, Transit Improvements, (Series A), 5.00%, 3/15/27 |
|
|
1,000,000 |
|
|
|
1,118,900 |
|
|
|
|
|
|
|
|
|
|
|
|
| TOTAL DEDICATED TAX |
|
|
$ |
13,162,954 |
|
|
| GENERAL OBLIGATIONS – 16.9% |
|
|
|
|
| County of Albany NY, AD Velorem Property Tax, GO, Refunding Bonds, 5.00%, 9/15/20 |
|
|
2,595,000 |
|
|
|
3,067,601 |
|
|
|
|
| New York Municipal Bond Bank Agency, Refunding Revenue Bonds, (Subseries B1)/(AGM), 5.00%, 4/15/21 |
|
|
3,000,000 |
|
|
|
3,400,500 |
|
|
|
|
| New York State, GO Unlimited, Highway Improvements, (Series E), (State Aid Withholding), 5.00%, 12/15/21 |
|
|
2,090,000 |
|
|
|
2,542,527 |
|
|
| April 30, 2015 / ANNUAL REPORT |
|
| PORTFOLIOS OF INVESTMENTS |
Wilmington New York Municipal Bond Fund (continued)
|
|
|
|
|
|
|
|
|
|
|
|
| Description |
|
Par Value |
|
|
Value |
|
| Town of Brookhaven NY, Refunding Bonds, Economic Defeasance, AD
Velorem Property Tax, 5.00%, 5/01/19 |
|
$ |
1,000,000 |
|
|
$ |
1,149,360 |
|
|
|
|
| Town of Hempstead NY, Refunding Bonds, Public Improvements, (Series A), AD Velorem Property Tax, 5.00%, 8/15/19 |
|
|
2,100,000 |
|
|
|
2,369,451 |
|
|
|
|
| Town of Islip NY, GO, Refunding Bonds, AD Valorem Property Tax, 5.00%, 2/01/19 |
|
|
1,795,000 |
|
|
|
2,046,641 |
|
|
|
|
|
|
|
|
|
|
|
|
| TOTAL GENERAL OBLIGATIONS |
|
|
$ |
14,576,080 |
|
|
| HIGHER EDUCATION – 4.8% |
|
|
|
|
| New York State Dormitory Authority, Revenue Bond, University and College Improvements, (Series A), 5.00%, 7/01/28 |
|
|
1,000,000 |
|
|
|
1,165,980 |
|
|
|
|
| New York State Dormitory Authority, Revenue Bonds, University College Improvements, (Series A), 5.00%, 7/01/21 |
|
|
1,000,000 |
|
|
|
1,191,860 |
|
|
|
|
| New York State Dormitory Authority, University & College Improvements, (Series A), (NATL-RE), 6.00%, 7/01/19 |
|
|
1,500,000 |
|
|
|
1,770,120 |
|
|
|
|
|
|
|
|
|
|
|
|
| TOTAL HIGHER EDUCATION |
|
|
$ |
4,127,960 |
|
|
| LEASE – 14.1% |
|
|
|
|
| Erie County, NY, IDA, Revenue Bonds, School Improvements, (Series A), (School District Buffalo Project)/(AGM, State Aid Withholding), 5.75%, 5/01/21 |
|
|
1,000,000 |
|
|
|
1,099,890 |
|
|
|
|
| Erie County, NY, IDA, Revenue Bonds, School Improvements, (Series A), (School District Buffalo Project)/(State Aid Withholding), 5.00%, 5/01/23 |
|
|
3,000,000 |
|
|
|
3,511,710 |
|
|
|
|
| New York City, NY, Transitional Finance Authority, Building Aid, Revenue Refunding Bonds, School Improvements,
(Series S-5), (State Aid Withholding), 5.00%, 1/15/27 |
|
|
2,770,000 |
|
|
|
3,119,962 |
|
|
|
|
| New York State Dormitory Authority, Refunding Revenue Bonds, (AGM), 5.00%, 7/01/18 |
|
|
1,000,000 |
|
|
|
1,084,940 |
|
|
|
|
| New York State Urban Development Corp., Refunding Revenue Notes, (Series B), 5.25%, 1/01/23 |
|
|
3,000,000 |
|
|
|
3,388,320 |
|
|
|
|
|
|
|
|
|
|
|
|
| TOTAL LEASE |
|
|
$ |
12,204,822 |
|
|
| MEDICAL – 8.8% |
|
|
|
|
| Monroe County, NY, IDA, Refunding Revenue Bonds, (Highland Hospital Rochester Project), 5.00%, 8/01/22 |
|
|
1,000,000 |
|
|
|
1,010,250 |
|
|
|
|
| New York State Dormitory Authority, Refunding Revenue Bonds, Health, Hospital, Nursing Home Revenue (NYU Hospitals Center), 5.00%, 7/01/27 |
|
|
4,650,000 |
|
|
|
5,441,384 |
|
|
|
|
| New York State Dormitory Authority, Revenue Refunding Bonds, (Series C), (Memorial Sloan Kettering Cancer Center)/(National Reinsurance),
5.75%, 7/01/19 |
|
|
1,010,000 |
|
|
|
1,175,276 |
|
|
|
|
|
|
|
|
|
|
|
|
| TOTAL MEDICAL |
|
|
$ |
7,626,910 |
|
|
|
|
|
|
|
|
|
|
|
|
|
| Description |
|
Par Value |
|
|
Value |
|
| POWER –
3.6% |
|
|
|
|
| New York Power Authority/The, Revenue Refunding Bonds, (Series A), (GO of Authority), 5.00%, 11/15/22 |
|
$ |
2,575,000 |
|
|
$ |
3,137,972 |
|
|
| PRE-REFUNDED/ESCROW – 4.8% |
|
|
|
|
| Triborough Bridge & Tunnel Authority, NY, Refunding Revenue Bonds, (Series Y), (CAPMAC - ITC GO of Authority), 6.13%, 1/01/21 |
|
|
3,500,000 |
|
|
|
4,177,040 |
|
|
| SCHOOL DISTRICT – 9.8% |
|
|
|
|
| Chester Union Free School District, GO Unlimited, Refunding Bonds, (State Aid Withholding), 5.00%, 4/15/27 |
|
|
1,555,000 |
|
|
|
1,796,212 |
|
|
|
|
| Commack Union Free School District/NY, Refunding Bonds, (GO, State Aid Withholding), 4.00%, 11/15/21 |
|
|
1,625,000 |
|
|
|
1,853,719 |
|
|
|
|
| New York State Dormitory Authority, Revenue Refunding Bonds, School Improvements, (Series C), (State Aid Withholding), 7.25%, 10/01/28 |
|
|
3,000,000 |
|
|
|
3,633,210 |
|
|
|
|
| Union Free School District of The Tarrytowns, Refunding Bonds, Economic Defeasance, (Series A), (State Aid Withholding), 5.00%, 1/15/19 |
|
|
1,000,000 |
|
|
|
1,142,450 |
|
|
|
|
|
|
|
|
|
|
|
|
| TOTAL SCHOOL DISTRICT |
|
|
$ |
8,425,591 |
|
|
| TRANSPORTATION – 12.9% |
|
|
|
|
| Metropolitan Transportation Authority, NY, Revenue Bonds, Transit Improvements, (Series B), 5.00%, 11/15/22 |
|
|
1,000,000 |
|
|
|
1,104,580 |
|
|
|
|
| Metropolitan Transportation Authority, NY Revenue, Revenue Refunding Bonds, Transit Improvements, (Series B), 5.00%, 11/15/29 |
|
|
2,000,000 |
|
|
|
2,309,540 |
|
|
|
|
| Metropolitan Transportation Authority, NY Revenue, Revenue Refunding Bonds, Transit Improvements, (Series E), 5.00%, 11/15/28 |
|
|
2,000,000 |
|
|
|
2,320,040 |
|
|
|
|
| Port Authority of New York & New Jersey, Refunding Revenue Bonds, Airport & Marina Improvements, (Series B), 5.00%, 12/01/23 |
|
|
3,000,000 |
|
|
|
3,619,140 |
|
|
|
|
| Triborough Bridge & Tunnel Authority, NY, Refunding Revenue Bonds, (Series B), 5.00%, 11/15/28 |
|
|
1,500,000 |
|
|
|
1,784,430 |
|
|
|
|
|
|
|
|
|
|
|
|
| TOTAL TRANSPORTATION |
|
|
$ |
11,137,730 |
|
|
| WATER & SEWER – 7.1% |
|
|
|
|
| Nassau County Sewer & Storm Water Finance Authority, Refunding Revenue Bonds, 5.00%, 10/01/26 |
|
|
1,500,000 |
|
|
|
1,824,555 |
|
|
|
|
| New York City Water & Sewer System, (Series BB), Refunding Revenue Bonds, 5.00%, 6/15/28 |
|
|
3,595,000 |
|
|
|
4,298,937 |
|
|
|
|
|
|
|
|
|
|
|
|
| TOTAL WATER & SEWER |
|
|
$ |
6,123,492 |
|
|
|
|
|
|
|
|
|
|
|
|
| TOTAL NEW YORK |
|
|
$ |
84,700,551 |
|
|
|
|
|
|
|
|
|
|
|
|
|
| TOTAL MUNICIPAL BONDS
(COST $80,627,884) |
|
|
|
|
|
$ |
84,700,551 |
|
|
| ANNUAL REPORT / April 30, 2015 |
|
| PORTFOLIOS OF INVESTMENTS |
Wilmington New York Municipal Bond Fund (concluded)
|
|
|
|
|
|
|
|
|
|
|
|
| Description |
|
|
Number of
Shares |
|
|
|
Value |
|
| MONEY MARKET FUND –
3.5% |
|
|
|
|
| Dreyfus Tax Exempt Cash Management Fund, Institutional Shares, 0.00%^ |
|
|
3,020,527 |
|
|
$ |
3,020,527 |
|
|
|
|
|
|
|
|
|
|
|
|
|
| TOTAL MONEY MARKET FUND
(COST $3,020,527) |
|
|
|
|
|
$ |
3,020,527 |
|
|
|
|
|
|
|
|
|
|
|
|
|
|
|
|
|
|
|
|
| Description |
|
|
|
|
Value |
|
| TOTAL INVESTMENTS –
101.5% (COST $83,648,411) |
|
$ |
87,721,078 |
|
|
|
| OTHER LIABILITIES LESS ASSETS – (1.5%) |
|
|
(1,327,874 |
) |
|
|
|
|
|
|
|
|
|
|
| TOTAL NET ASSETS – 100.0% |
|
|
|
$ |
86,393,204 |
|
|
|
|
|
|
|
|
Cost of investments for Federal
income tax purposes is $83,648,411. The net unrealized appreciation/(depreciation) of investments was $4,072,667. This consists of net unrealized appreciation from investment for those securities having an excess of value over cost of $4,196,321 and
net unrealized depreciation from investments for those securities having an excess of cost over value of $123,654.
Various inputs are used in
determining the value of the Fund’s investments. These inputs are summarized in the three broad levels listed below.
Level 1 – quoted
prices in active markets for identical securities
Level 2 – other significant observable inputs (including quoted prices for similar securities,
interest rates, prepayment speeds, credit risk, etc.)
Level 3 – significant unobservable inputs (including the Fund’s own assumptions in
determining the fair value of investments)
The following is a summary of the inputs used as of April 30, 2015 in valuing the Fund’s assets
carried at fair value:
|
|
|
|
|
|
|
|
|
|
|
|
|
|
|
|
|
|
|
|
|
|
| |
|
Level 1
|
|
|
Level 2
|
|
|
Level 3
|
|
|
Total
|
|
| Investments in Securities |
|
|
|
|
|
|
|
|
|
|
|
|
|
|
|
|
|
|
|
|
|
| Municipal Bonds |
|
$ |
— |
|
|
$ |
84,700,551 |
|
|
$ |
— |
|
|
$ |
84,700,551 |
|
|
|
|
|
|
| Money Market Fund |
|
|
3,020,527 |
|
|
|
— |
|
|
|
— |
|
|
|
3,020,527 |
|
|
|
|
|
|
|
|
|
|
|
|
|
|
|
|
|
|
|
|
|
|
|
| Total |
|
$ |
3,020,527 |
|
|
$ |
84,700,551 |
|
|
$ |
— |
|
|
$ |
87,721,078 |
|
|
|
|
|
|
|
|
|
|
|
|
|
|
|
|
|
|
| |
The following acronyms are used throughout this Fund: |
| |
AGM - Assured Guaranty Municipal |
| |
CAPMAC - Capital Markets Assurance Corporation |
| |
IDA - Industrial Development Authority/Agency |
| |
NATL-RE - National Public Finance Guarantee Corporation |
See Notes which are an integral part
of the Financial Statements
|
| April 30, 2015 / ANNUAL REPORT |
|
| STATEMENTS OF ASSETS AND LIABILITIES |
|
|
|
|
|
|
|
|
|
|
|
|
|
|
|
|
|
|
|
|
|
|
|
|
|
|
|
| April 30, 2015 |
|
|
|
Wilmington
Broad Market
Bond Fund |
|
Wilmington
Intermediate-Term
Bond Fund |
|
Wilmington
Short-Term Bond
Fund |
|
|
|
| ASSETS: |
|
|
|
|
|
|
|
|
|
|
|
|
|
|
|
|
|
|
|
|
|
|
|
|
|
|
| Investments, at identified cost |
|
|
|
|
|
$ |
430,448,443 |
|
|
|
|
|
|
$ |
140,137,185 |
|
|
|
|
|
|
$ |
179,878,177 |
|
|
|
|
|
|
|
|
|
|
|
|
|
|
|
|
|
|
|
|
|
|
|
|
|
|
|
|
|
|
| Investments in securities, at value (Including $14,370,775,
$11,533,330 and $1,898,064 of securities on loan, respectively) (Note 2) |
|
|
|
|
|
$ |
440,882,285 |
|
|
|
|
|
|
$ |
142,787,952 |
|
|
|
|
|
|
$ |
180,891,703 |
|
|
|
| Interest receivable |
|
|
|
|
|
|
2,487,914 |
|
|
|
|
|
|
|
874,366 |
|
|
|
|
|
|
|
798,942 |
|
|
|
| Receivable for shares sold |
|
|
|
|
|
|
824,914 |
|
|
|
|
|
|
|
158,145 |
|
|
|
|
|
|
|
101,377 |
|
|
|
| Receivable for investments sold |
|
|
|
|
|
|
— |
|
|
|
|
|
|
|
— |
|
|
|
|
|
|
|
4,489,286 |
|
|
|
| Other assets |
|
|
|
|
|
|
19,593 |
|
|
|
|
|
|
|
17,882 |
|
|
|
|
|
|
|
54,280 |
|
|
|
|
|
|
|
|
|
|
|
|
|
|
|
|
|
|
|
|
|
|
|
|
|
|
|
|
|
|
| TOTAL ASSETS |
|
|
|
|
|
|
444,214,706 |
|
|
|
|
|
|
|
143,838,345 |
|
|
|
|
|
|
|
186,335,588 |
|
|
|
| |
|
|
|
|
|
|
|
|
|
|
|
|
|
|
|
|
|
|
|
|
|
|
|
|
|
|
| LIABILITIES: |
|
|
|
|
|
|
|
|
|
|
|
|
|
|
|
|
|
|
|
|
|
|
|
|
|
|
| Payable for investments purchased |
|
|
|
|
|
|
9,465,111 |
|
|
|
|
|
|
|
774,186 |
|
|
|
|
|
|
|
6,638,847 |
|
|
|
| Collateral for securities on loan |
|
|
|
|
|
|
14,787,122 |
|
|
|
|
|
|
|
11,881,900 |
|
|
|
|
|
|
|
1,938,263 |
|
|
|
| Income distribution payable |
|
|
|
|
|
|
767,214 |
|
|
|
|
|
|
|
174,791 |
|
|
|
|
|
|
|
199,679 |
|
|
|
| Payable for shares redeemed |
|
|
|
|
|
|
71,683 |
|
|
|
|
|
|
|
6,390 |
|
|
|
|
|
|
|
51,072 |
|
|
|
| Payable for distribution services fee |
|
|
|
|
|
|
1,189 |
|
|
|
|
|
|
|
934 |
|
|
|
|
|
|
|
2,164 |
|
|
|
| Payable for shareholder services fee |
|
|
|
|
|
|
475 |
|
|
|
|
|
|
|
374 |
|
|
|
|
|
|
|
— |
|
|
|
| Other accrued expenses |
|
|
|
|
|
|
86,000 |
|
|
|
|
|
|
|
37,140 |
|
|
|
|
|
|
|
71,616 |
|
|
|
|
|
|
|
|
|
|
|
|
|
|
|
|
|
|
|
|
|
|
|
|
|
|
|
|
|
|
| TOTAL LIABILITIES |
|
|
|
|
|
|
25,178,794 |
|
|
|
|
|
|
|
12,875,715 |
|
|
|
|
|
|
|
8,901,641 |
|
|
|
| |
|
|
|
|
|
|
|
|
|
|
|
|
|
|
|
|
|
|
|
|
|
|
|
|
|
|
| NET ASSETS |
|
|
|
|
|
$ |
419,035,912 |
|
|
|
|
|
|
$ |
130,962,630 |
|
|
|
|
|
|
$ |
177,433,947 |
|
|
|
| |
|
|
|
|
|
|
|
|
|
|
|
|
|
|
|
|
|
|
|
|
|
|
|
|
|
|
| NET ASSETS CONSIST OF: |
|
|
|
|
|
|
|
|
|
|
|
|
|
|
|
|
|
|
|
|
|
|
|
|
|
|
| |
|
|
|
|
|
|
|
|
|
|
|
|
|
|
|
|
|
|
|
|
|
|
|
|
|
|
| Paid-in capital |
|
|
|
|
|
$ |
408,249,256 |
|
|
|
|
|
|
$ |
128,149,138 |
|
|
|
|
|
|
$ |
177,101,213 |
|
|
|
| Undistributed (distributions in excess of) net investment
income |
|
|
|
|
|
|
(138,104 |
) |
|
|
|
|
|
|
3,913 |
|
|
|
|
|
|
|
(116,113 |
) |
|
|
| Accumulated net realized gain (loss) on
investments |
|
|
|
|
|
|
490,918 |
|
|
|
|
|
|
|
158,812 |
|
|
|
|
|
|
|
(564,679 |
) |
|
|
| Net unrealized appreciation (depreciation) of
investments |
|
|
|
|
|
|
10,433,842 |
|
|
|
|
|
|
|
2,650,767 |
|
|
|
|
|
|
|
1,013,526 |
|
|
|
|
|
|
|
|
|
|
|
|
|
|
|
|
|
|
|
|
|
|
|
|
|
|
|
|
|
|
| TOTAL NET ASSETS |
|
|
|
|
|
$ |
419,035,912 |
|
|
|
|
|
|
$ |
130,962,630 |
|
|
|
|
|
|
$ |
177,433,947 |
|
|
|
| |
|
|
|
|
|
|
|
|
|
|
|
|
|
|
|
|
|
|
|
|
|
|
|
|
|
|
| COMPUTATION OF NET ASSET VALUE AND OFFERING PRICE: |
|
|
|
|
|
|
|
|
|
|
|
|
|
|
|
|
|
|
|
|
|
|
|
|
|
|
| Class A |
|
|
|
|
|
|
|
|
|
|
|
|
|
|
|
|
|
|
|
|
|
|
|
|
|
|
| Net Assets |
|
|
|
|
|
$ |
5,726,007 |
|
|
|
|
|
|
$ |
4,389,003 |
|
|
|
|
|
|
$ |
10,495,042 |
|
|
|
|
|
|
|
|
|
|
|
|
|
|
|
|
|
|
|
|
|
|
|
|
|
|
|
|
|
|
| Shares outstanding (unlimited shares authorized) |
|
|
|
|
|
|
575,318 |
|
|
|
|
|
|
|
437,916 |
|
|
|
|
|
|
|
1,038,952 |
|
|
|
|
|
|
|
|
|
|
|
|
|
|
|
|
|
|
|
|
|
|
|
|
|
|
|
|
|
|
| Net Asset Value per share |
|
|
|
|
|
$ |
9.95 |
|
|
|
|
|
|
$ |
10.02 |
|
|
|
|
|
|
$ |
10.10 |
|
|
|
|
|
|
|
|
|
|
|
|
|
|
|
|
|
|
|
|
|
|
|
|
|
|
|
|
|
|
| Offering price per share* |
|
|
|
|
|
$ |
10.42 |
*** |
|
|
|
|
|
$ |
10.49 |
*** |
|
|
|
|
|
$ |
10.28 |
** |
|
|
|
|
|
|
|
|
|
|
|
|
|
|
|
|
|
|
|
|
|
|
|
|
|
|
|
|
|
| Class I |
|
|
|
|
|
|
|
|
|
|
|
|
|
|
|
|
|
|
|
|
|
|
|
|
|
|
| Net Assets |
|
|
|
|
|
$ |
413,309,905 |
|
|
|
|
|
|
$ |
126,573,627 |
|
|
|
|
|
|
$ |
166,938,905 |
|
|
|
|
|
|
|
|
|
|
|
|
|
|
|
|
|
|
|
|
|
|
|
|
|
|
|
|
|
|
| Shares outstanding (unlimited shares authorized) |
|
|
|
|
|
|
42,235,278 |
|
|
|
|
|
|
|
12,622,255 |
|
|
|
|
|
|
|
16,521,929 |
|
|
|
|
|
|
|
|
|
|
|
|
|
|
|
|
|
|
|
|
|
|
|
|
|
|
|
|
|
|
| Net Asset Value per share |
|
|
|
|
|
$ |
9.79 |
|
|
|
|
|
|
$ |
10.03 |
|
|
|
|
|
|
$ |
10.10 |
|
|
|
|
|
|
|
|
|
|
|
|
|
|
|
|
|
|
|
|
|
|
|
|
|
|
|
|
|
|
| * |
See “How are Shares Priced?” in the Prospectus. |
| ** |
Computation of offering price per share 100/98.25 of net asset value. |
| *** |
Computation of offering price per share 100/95.50 of net asset value. |
See Notes which are an integral part
of the Financial Statements
|
| ANNUAL REPORT / April 30, 2015 |
|
| STATEMENTS OF ASSETS AND LIABILITIES (concluded) |
|
|
|
|
|
|
|
|
|
|
|
|
|
|
|
|
|
|
|
| April 30, 2015 |
|
|
|
Wilmington
Municipal
Bond
Fund |
|
Wilmington
New
York
Municipal Bond
Fund |
| ASSETS: |
|
|
|
|
|
|
|
|
|
|
|
|
|
|
|
|
|
|
| Investments, at identified cost |
|
|
|
|
|
$ |
289,680,178 |
|
|
|
|
|
|
$ |
83,648,411 |
|
|
|
|
|
|
|
|
|
|
|
|
|
|
|
|
|
|
|
|
|
|
| Investments in securities, at value |
|
|
|
|
|
$ |
298,590,640 |
|
|
|
|
|
|
$ |
87,721,078 |
|
|
|
| Interest receivable |
|
|
|
|
|
|
3,700,462 |
|
|
|
|
|
|
|
1,051,750 |
|
|
|
| Receivable for shares sold |
|
|
|
|
|
|
355,014 |
|
|
|
|
|
|
|
101,269 |
|
|
|
| Receivable for investments sold |
|
|
|
|
|
|
2,135,183 |
|
|
|
|
|
|
|
— |
|
|
|
| Other assets |
|
|
|
|
|
|
25,475 |
|
|
|
|
|
|
|
12,631 |
|
|
|
|
|
|
|
|
|
|
|
|
|
|
|
|
|
|
|
|
|
|
| TOTAL ASSETS |
|
|
|
|
|
|
304,806,774 |
|
|
|
|
|
|
|
88,886,728 |
|
|
|
| |
|
|
|
|
|
|
|
|
|
|
|
|
|
|
|
|
|
|
| LIABILITIES: |
|
|
|
|
|
|
|
|
|
|
|
|
|
|
|
|
|
|
| Payable for investments purchased |
|
|
|
|
|
|
2,435,800 |
|
|
|
|
|
|
|
2,287,270 |
|
|
|
| Income distribution payable |
|
|
|
|
|
|
479,432 |
|
|
|
|
|
|
|
153,729 |
|
|
|
| Payable for shares redeemed |
|
|
|
|
|
|
299,928 |
|
|
|
|
|
|
|
14,898 |
|
|
|
| Payable for distribution services fee |
|
|
|
|
|
|
8,810 |
|
|
|
|
|
|
|
4,723 |
|
|
|
| Other accrued expenses |
|
|
|
|
|
|
72,337 |
|
|
|
|
|
|
|
32,904 |
|
|
|
|
|
|
|
|
|
|
|
|
|
|
|
|
|
|
|
|
|
|
| TOTAL LIABILITIES |
|
|
|
|
|
|
3,296,307 |
|
|
|
|
|
|
|
2,493,524 |
|
|
|
| |
|
|
|
|
|
|
|
|
|
|
|
|
|
|
|
|
|
|
| NET ASSETS |
|
|
|
|
|
$ |
301,510,467 |
|
|
|
|
|
|
$ |
86,393,204 |
|
|
|
| |
|
|
|
|
|
|
|
|
|
|
|
|
|
|
|
|
|
|
| NET ASSETS CONSIST OF: |
|
|
|
|
|
|
|
|
|
|
|
|
|
|
|
|
|
|
| |
|
|
|
|
|
|
|
|
|
|
|
|
|
|
|
|
|
|
| Paid-in capital |
|
|
|
|
|
$ |
289,247,334 |
|
|
|
|
|
|
$ |
83,237,386 |
|
|
|
| Undistributed (distributions in excess of) net investment
income |
|
|
|
|
|
|
9 |
|
|
|
|
|
|
|
12 |
|
|
|
| Accumulated net realized gain (loss) on
investments |
|
|
|
|
|
|
3,352,662 |
|
|
|
|
|
|
|
(916,861 |
) |
|
|
| Net unrealized appreciation (depreciation) of
investments |
|
|
|
|
|
|
8,910,462 |
|
|
|
|
|
|
|
4,072,667 |
|
|
|
|
|
|
|
|
|
|
|
|
|
|
|
|
|
|
|
|
|
|
| TOTAL NET ASSETS |
|
|
|
|
|
$ |
301,510,467 |
|
|
|
|
|
|
$ |
86,393,204 |
|
|
|
| |
|
|
|
|
|
|
|
|
|
|
|
|
|
|
|
|
|
|
| COMPUTATION OF NET ASSET VALUE AND OFFERING PRICE: |
|
|
|
|
|
|
|
|
|
|
|
|
|
|
|
|
|
|
| Class A |
|
|
|
|
|
|
|
|
|
|
|
|
|
|
|
|
|
|
| Net Assets |
|
|
|
|
|
$ |
41,606,617 |
|
|
|
|
|
|
$ |
22,691,539 |
|
|
|
|
|
|
|
|
|
|
|
|
|
|
|
|
|
|
|
|
|
|
| Shares outstanding (unlimited shares authorized) |
|
|
|
|
|
|
3,102,600 |
|
|
|
|
|
|
|
2,128,587 |
|
|
|
|
|
|
|
|
|
|
|
|
|
|
|
|
|
|
|
|
|
|
| Net Asset Value per share |
|
|
|
|
|
$ |
13.41 |
|
|
|
|
|
|
$ |
10.66 |
|
|
|
|
|
|
|
|
|
|
|
|
|
|
|
|
|
|
|
|
|
|
| Offering price per share* |
|
|
|
|
|
$ |
14.04 |
*** |
|
|
|
|
|
$ |
11.16 |
*** |
|
|
|
|
|
|
|
|
|
|
|
|
|
|
|
|
|
|
|
|
|
| Class I |
|
|
|
|
|
|
|
|
|
|
|
|
|
|
|
|
|
|
| Net Assets |
|
|
|
|
|
$ |
259,903,850 |
|
|
|
|
|
|
$ |
63,701,665 |
|
|
|
|
|
|
|
|
|
|
|
|
|
|
|
|
|
|
|
|
|
|
| Shares outstanding (unlimited shares authorized) |
|
|
|
|
|
|
19,373,793 |
|
|
|
|
|
|
|
5,972,625 |
|
|
|
|
|
|
|
|
|
|
|
|
|
|
|
|
|
|
|
|
|
|
| Net Asset Value per share |
|
|
|
|
|
$ |
13.42 |
|
|
|
|
|
|
$ |
10.67 |
|
|
|
|
|
|
|
|
|
|
|
|
|
|
|
|
|
|
|
|
|
|
| * |
See “How are Shares Priced?” in the Prospectus. |
| *** |
Computation of offering price per share 100/95.50 of net asset value. |
See Notes which are an integral part
of the Financial Statements
|
| April 30, 2015 / ANNUAL REPORT |
|
|
|
|
|
|
|
|
|
|
|
|
|
|
|
|
|
|
|
|
|
|
|
|
|
|
|
| Year Ended April 30, 2015 |
|
|
|
Wilmington
Broad Market
Bond Fund |
|
Wilmington
Intermediate-Term
Bond Fund
|
|
Wilmington
Short-Term
Bond Fund |
|
|
|
| INVESTMENT INCOME: |
|
|
|
|
|
|
|
|
|
|
|
|
|
|
|
|
|
|
|
|
|
|
|
|
|
|
| Dividends |
|
|
|
|
|
$ |
3,662 |
|
|
|
|
|
|
$ |
365 |
|
|
|
|
|
|
$ |
578 |
|
|
|
| Interest |
|
|
|
|
|
|
9,048,342 |
|
|
|
|
|
|
|
2,849,146 |
|
|
|
|
|
|
|
1,979,018 |
|
|
|
| Securities lending income |
|
|
|
|
|
|
15,655 |
|
|
|
|
|
|
|
15,215 |
|
|
|
|
|
|
|
4,918 |
|
|
|
|
|
|
|
|
|
|
|
|
|
|
|
|
|
|
|
|
|
|
|
|
|
|
|
|
|
|
| TOTAL INVESTMENT INCOME |
|
|
|
|
|
|
9,067,659 |
|
|
|
|
|
|
|
2,864,726 |
|
|
|
|
|
|
|
1,984,514 |
|
|
|
| |
|
|
|
|
|
|
|
|
|
|
|
|
|
|
|
|
|
|
|
|
|
|
|
|
|
|
| EXPENSES: |
|
|
|
|
|
|
|
|
|
|
|
|
|
|
|
|
|
|
|
|
|
|
|
|
|
|
| Investment advisory fee |
|
|
|
|
|
|
1,615,592 |
|
|
|
|
|
|
|
640,851 |
|
|
|
|
|
|
|
662,339 |
|
|
|
| Administrative personnel and services fee |
|
|
|
|
|
|
102,539 |
|
|
|
|
|
|
|
40,366 |
|
|
|
|
|
|
|
43,647 |
|
|
|
| Portfolio accounting and administration fees |
|
|
|
|
|
|
118,049 |
|
|
|
|
|
|
|
55,677 |
|
|
|
|
|
|
|
55,113 |
|
|
|
| Transfer and dividend disbursing agent fees and
expenses |
|
|
|
|
|
|
120,470 |
|
|
|
|
|
|
|
14,551 |
|
|
|
|
|
|
|
76,398 |
|
|
|
| Trustees’ fees |
|
|
|
|
|
|
33,066 |
|
|
|
|
|
|
|
33,066 |
|
|
|
|
|
|
|
34,142 |
|
|
|
| Professional fees |
|
|
|
|
|
|
55,776 |
|
|
|
|
|
|
|
52,855 |
|
|
|
|
|
|
|
50,351 |
|
|
|
| Distribution services fee—Class A |
|
|
|
|
|
|
14,782 |
|
|
|
|
|
|
|
12,209 |
|
|
|
|
|
|
|
12,592 |
|
|
|
| Shareholder services fee—Class A |
|
|
|
|
|
|
13,965 |
|
|
|
|
|
|
|
10,713 |
|
|
|
|
|
|
|
12,592 |
|
|
|
| Shareholder services fee— Class I |
|
|
|
|
|
|
834,644 |
|
|
|
|
|
|
|
321,659 |
|
|
|
|
|
|
|
348,398 |
|
|
|
| Share registration costs |
|
|
|
|
|
|
30,072 |
|
|
|
|
|
|
|
29,337 |
|
|
|
|
|
|
|
40,077 |
|
|
|
| Printing and postage |
|
|
|
|
|
|
29,609 |
|
|
|
|
|
|
|
7,670 |
|
|
|
|
|
|
|
22,368 |
|
|
|
| Custodian fees |
|
|
|
|
|
|
14,062 |
|
|
|
|
|
|
|
5,453 |
|
|
|
|
|
|
|
5,904 |
|
|
|
| Miscellaneous |
|
|
|
|
|
|
37,737 |
|
|
|
|
|
|
|
26,450 |
|
|
|
|
|
|
|
29,829 |
|
|
|
|
|
|
|
|
|
|
|
|
|
|
|
|
|
|
|
|
|
|
|
|
|
|
|
|
|
|
| TOTAL EXPENSES |
|
|
|
|
|
|
3,020,363 |
|
|
|
|
|
|
|
1,250,857 |
|
|
|
|
|
|
|
1,393,750 |
|
|
|
| |
|
|
|
|
|
|
|
|
|
|
|
|
|
|
|
|
|
|
|
|
|
|
|
|
|
|
| WAIVERS AND REIMBURSEMENTS: |
|
|
|
|
|
|
|
|
|
|
|
|
|
|
|
|
|
|
|
|
|
|
|
|
|
|
| Waiver/reimbursement by investment advisor |
|
|
|
|
|
|
(114,984 |
) |
|
|
|
|
|
|
(142,633 |
) |
|
|
|
|
|
|
(216,886 |
) |
|
|
| Waiver of shareholder services fee—Class A |
|
|
|
|
|
|
(8,869 |
) |
|
|
|
|
|
|
(7,325 |
) |
|
|
|
|
|
|
(12,592 |
) |
|
|
| Waiver of shareholder services fee—Class I |
|
|
|
|
|
|
(834,644 |
) |
|
|
|
|
|
|
(321,659 |
) |
|
|
|
|
|
|
(348,398 |
) |
|
|
|
|
|
|
|
|
|
|
|
|
|
|
|
|
|
|
|
|
|
|
|
|
|
|
|
|
|
| TOTAL WAIVERS AND REIMBURSEMENTS |
|
|
|
|
|
|
(958,497 |
) |
|
|
|
|
|
|
(471,617 |
) |
|
|
|
|
|
|
(577,876 |
) |
|
|
| |
|
|
|
|
|
|
|
|
|
|
|
|
|
|
|
|
|
|
|
|
|
|
|
|
|
|
| Net expenses |
|
|
|
|
|
|
2,061,866 |
|
|
|
|
|
|
|
779,240 |
|
|
|
|
|
|
|
815,874 |
|
|
|
|
|
|
|
|
|
|
|
|
|
|
|
|
|
|
|
|
|
|
|
|
|
|
|
|
|
|
| Net investment income (loss) |
|
|
|
|
|
|
7,005,793 |
|
|
|
|
|
|
|
2,085,486 |
|
|
|
|
|
|
|
1,168,640 |
|
|
|
|
|
|
|
|
|
|
|
|
|
|
|
|
|
|
|
|
|
|
|
|
|
|
|
|
|
|
| REALIZED AND UNREALIZED GAIN (LOSS) ON INVESTMENTS: |
|
|
|
|
|
|
|
|
|
|
|
|
|
|
|
|
|
|
|
|
|
|
|
|
|
|
| Net realized gain (loss) on investments |
|
|
|
|
|
|
1,180,857 |
|
|
|
|
|
|
|
1,055,386 |
|
|
|
|
|
|
|
1,039,742 |
|
|
|
| Net change in unrealized appreciation (depreciation) of
investments |
|
|
|
|
|
|
4,734,634 |
|
|
|
|
|
|
|
147,780 |
|
|
|
|
|
|
|
(1,132,613 |
) |
|
|
|
|
|
|
|
|
|
|
|
|
|
|
|
|
|
|
|
|
|
|
|
|
|
|
|
|
|
| Net realized and unrealized gain (loss) on investments |
|
|
|
|
|
|
5,915,491 |
|
|
|
|
|
|
|
1,203,166 |
|
|
|
|
|
|
|
(92,871 |
) |
|
|
|
|
|
|
|
|
|
|
|
|
|
|
|
|
|
|
|
|
|
|
|
|
|
|
|
|
|
| Change in net assets resulting from operations |
|
|
|
|
|
$ |
12,921,284 |
|
|
|
|
|
|
$ |
3,288,652 |
|
|
|
|
|
|
$ |
1,075,769 |
|
|
|
|
|
|
|
|
|
|
|
|
|
|
|
|
|
|
|
|
|
|
|
|
|
|
|
|
|
|
See Notes which are an integral part of the Financial Statements
|
| ANNUAL REPORT / April 30, 2015 |
|
| STATEMENTS OF OPERATIONS (concluded) |
|
|
|
|
|
|
|
|
|
|
|
|
|
|
|
|
|
|
|
| Year Ended April 30, 2015 |
|
|
|
Wilmington
Municipal Bond
Fund |
|
Wilmington
New York
Municipal Bond
Fund |
|
|
|
| INVESTMENT INCOME: |
|
|
|
|
|
|
|
|
|
|
|
|
|
|
|
|
|
|
| Dividends |
|
|
|
|
|
$ |
518 |
|
|
|
|
|
|
$ |
215 |
|
|
|
| Interest |
|
|
|
|
|
|
6,256,478 |
|
|
|
|
|
|
|
2,488,068 |
|
|
|
|
|
|
|
|
|
|
|
|
|
|
|
|
|
|
|
|
|
|
| TOTAL INVESTMENT INCOME |
|
|
|
|
|
|
6,256,996 |
|
|
|
|
|
|
|
2,488,283 |
|
|
|
| |
|
|
|
|
|
|
|
|
|
|
|
|
|
|
|
|
|
|
| EXPENSES: |
|
|
|
|
|
|
|
|
|
|
|
|
|
|
|
|
|
|
| Investment advisory fee |
|
|
|
|
|
|
1,120,660 |
|
|
|
|
|
|
|
431,259 |
|
|
|
| Administrative personnel and services fee |
|
|
|
|
|
|
71,012 |
|
|
|
|
|
|
|
27,176 |
|
|
|
| Portfolio accounting and administration fees |
|
|
|
|
|
|
88,248 |
|
|
|
|
|
|
|
37,848 |
|
|
|
| Transfer and dividend disbursing agent fees and
expenses |
|
|
|
|
|
|
21,540 |
|
|
|
|
|
|
|
19,483 |
|
|
|
| Trustees’ fees |
|
|
|
|
|
|
34,142 |
|
|
|
|
|
|
|
33,067 |
|
|
|
| Professional fees |
|
|
|
|
|
|
50,085 |
|
|
|
|
|
|
|
51,212 |
|
|
|
| Distribution services fee—Class A |
|
|
|
|
|
|
58,293 |
|
|
|
|
|
|
|
58,838 |
|
|
|
| Shareholder services fee—Class A |
|
|
|
|
|
|
58,293 |
|
|
|
|
|
|
|
58,838 |
|
|
|
| Shareholder services fee— Class I |
|
|
|
|
|
|
529,693 |
|
|
|
|
|
|
|
165,956 |
|
|
|
| Share registration costs |
|
|
|
|
|
|
34,749 |
|
|
|
|
|
|
|
11,238 |
|
|
|
| Printing and postage |
|
|
|
|
|
|
13,135 |
|
|
|
|
|
|
|
8,711 |
|
|
|
| Custodian fees |
|
|
|
|
|
|
5,550 |
|
|
|
|
|
|
|
2,231 |
|
|
|
| Miscellaneous |
|
|
|
|
|
|
35,183 |
|
|
|
|
|
|
|
23,771 |
|
|
|
|
|
|
|
|
|
|
|
|
|
|
|
|
|
|
|
|
|
|
| TOTAL EXPENSES |
|
|
|
|
|
|
2,120,583 |
|
|
|
|
|
|
|
929,628 |
|
|
|
| |
|
|
|
|
|
|
|
|
|
|
|
|
|
|
|
|
|
|
| Waiver/reimbursement by investment advisor |
|
|
|
|
|
|
(172,430 |
) |
|
|
|
|
|
|
(115,481 |
) |
|
|
| Waiver of shareholder services fee—Class A |
|
|
|
|
|
|
(58,293 |
) |
|
|
|
|
|
|
(58,838 |
) |
|
|
| Waiver of shareholder services fee—Class I |
|
|
|
|
|
|
(529,693 |
) |
|
|
|
|
|
|
(165,956 |
) |
|
|
|
|
|
|
|
|
|
|
|
|
|
|
|
|
|
|
|
|
|
| TOTAL WAIVERS AND REIMBURSEMENTS |
|
|
|
|
|
|
(760,416 |
) |
|
|
|
|
|
|
(340,275 |
) |
|
|
| |
|
|
|
|
|
|
|
|
|
|
|
|
|
|
|
|
|
|
| Net expenses |
|
|
|
|
|
|
1,360,167 |
|
|
|
|
|
|
|
589,353 |
|
|
|
|
|
|
|
|
|
|
|
|
|
|
|
|
|
|
|
|
|
|
| Net investment income (loss) |
|
|
|
|
|
|
4,896,829 |
|
|
|
|
|
|
|
1,898,930 |
|
|
|
|
|
|
|
|
|
|
|
|
|
|
|
|
|
|
|
|
|
|
| REALIZED AND UNREALIZED GAIN (LOSS) ON INVESTMENTS: |
|
|
|
|
|
|
|
|
|
|
|
|
|
|
|
|
|
|
| Net realized gain (loss) on investments |
|
|
|
|
|
|
4,741,241 |
|
|
|
|
|
|
|
1,153,442 |
|
|
|
| Net change in unrealized appreciation (depreciation) of
investments |
|
|
|
|
|
|
(4,378,999 |
) |
|
|
|
|
|
|
(261,875 |
) |
|
|
|
|
|
|
|
|
|
|
|
|
|
|
|
|
|
|
|
|
|
| Net realized and unrealized gain (loss) on investments |
|
|
|
|
|
|
362,242 |
|
|
|
|
|
|
|
891,567 |
|
|
|
|
|
|
|
|
|
|
|
|
|
|
|
|
|
|
|
|
|
|
| Change in net assets resulting from operations |
|
|
|
|
|
$ |
5,259,071 |
|
|
|
|
|
|
$ |
2,790,497 |
|
|
|
|
|
|
|
|
|
|
|
|
|
|
|
|
|
|
|
|
|
|
See Notes which are an integral part of the Financial Statements
|
| April 30, 2015 / ANNUAL REPORT |
|
| STATEMENTS OF CHANGES IN NET ASSETS |
|
|
|
|
|
|
|
|
|
|
|
|
|
|
|
|
|
|
|
|
|
|
|
|
|
|
|
|
|
|
|
| |
|
Wilmington
Broad Market Bond Fund |
|
|
|
|
Wilmington
Intermediate-Term Bond Fund |
|
| |
|
Year
Ended
April 30,
2015 |
|
Year Ended
April 30,
2014 |
|
|
|
|
Year Ended
April 30,
2015 |
|
Year Ended
April 30,
2014 |
|
| OPERATIONS: |
|
|
|
|
|
|
|
|
|
|
|
|
|
|
|
|
|
|
|
|
|
|
|
|
|
|
|
|
|
|
| Net investment income (loss) |
|
|
|
$ |
7,005,793 |
|
|
|
|
|
|
$ |
5,756,092 |
|
|
|
|
|
|
$ |
2,085,486 |
|
|
|
|
|
|
$ |
2,887,297 |
|
| Net realized gain (loss) on investments |
|
|
|
|
1,180,857 |
|
|
|
|
|
|
|
1,506,274 |
|
|
|
|
|
|
|
1,055,386 |
|
|
|
|
|
|
|
3,297,446 |
|
| Net change in unrealized appreciation (depreciation) of
investments |
|
|
|
|
4,734,634 |
|
|
|
|
|
|
|
(8,193,649 |
) |
|
|
|
|
|
|
147,780 |
|
|
|
|
|
|
|
(7,248,008 |
) |
|
|
|
|
|
|
|
|
|
|
|
|
|
|
|
|
|
|
|
|
|
|
|
|
|
|
|
|
|
|
|
| Change in net assets resulting from operations |
|
|
|
|
12,921,284 |
|
|
|
|
|
|
|
(931,283 |
) |
|
|
|
|
|
|
3,288,652 |
|
|
|
|
|
|
|
(1,063,265 |
) |
|
|
|
|
|
|
|
|
|
|
|
|
|
|
|
|
|
|
|
|
|
|
|
|
|
|
|
|
|
|
|
| DISTRIBUTIONS TO SHAREHOLDERS: |
|
|
|
|
|
|
|
|
|
|
|
|
|
|
|
|
|
|
|
|
|
|
|
|
|
|
|
|
|
|
| Distributions from net investment income |
|
|
|
|
|
|
|
|
|
|
|
|
|
|
|
|
|
|
|
|
|
|
|
|
|
|
|
|
|
|
| Class A |
|
|
|
|
(111,927 |
) |
|
|
|
|
|
|
(150,759 |
) |
|
|
|
|
|
|
(61,884 |
) |
|
|
|
|
|
|
(109,480 |
) |
| Class I |
|
|
|
|
(7,422,566 |
) |
|
|
|
|
|
|
(6,144,802 |
) |
|
|
|
|
|
|
(2,043,707 |
) |
|
|
|
|
|
|
(2,990,544 |
) |
| Distributions from net realized gain on
investments |
|
|
|
|
|
|
|
|
|
|
|
|
|
|
|
|
|
|
|
|
|
|
|
|
|
|
|
|
|
|
| Class A |
|
|
|
|
(12,666 |
) |
|
|
|
|
|
|
(97,771 |
) |
|
|
|
|
|
|
(77,971 |
) |
|
|
|
|
|
|
(195,175 |
) |
| Class I |
|
|
|
|
(826,640 |
) |
|
|
|
|
|
|
(3,020,042 |
) |
|
|
|
|
|
|
(2,037,153 |
) |
|
|
|
|
|
|
(4,510,730 |
) |
|
|
|
|
|
|
|
|
|
|
|
|
|
|
|
|
|
|
|
|
|
|
|
|
|
|
|
|
|
|
|
| Change in net assets resulting from distributions to shareholders |
|
|
|
|
(8,373,799 |
) |
|
|
|
|
|
|
(9,413,374 |
) |
|
|
|
|
|
|
(4,220,715 |
) |
|
|
|
|
|
|
(7,805,929 |
) |
|
|
|
|
|
|
|
|
|
|
|
|
|
|
|
|
|
|
|
|
|
|
|
|
|
|
|
|
|
|
|
| SHARE TRANSACTIONS: |
|
|
|
|
|
|
|
|
|
|
|
|
|
|
|
|
|
|
|
|
|
|
|
|
|
|
|
|
|
|
| Proceeds from sale of shares |
|
|
|
|
|
|
|
|
|
|
|
|
|
|
|
|
|
|
|
|
|
|
|
|
|
|
|
|
|
|
| Class A |
|
|
|
|
281,884 |
|
|
|
|
|
|
|
397,474 |
|
|
|
|
|
|
|
283,137 |
|
|
|
|
|
|
|
406,678 |
|
| Class I |
|
|
|
|
225,471,169 |
|
|
|
|
|
|
|
103,588,127 |
|
|
|
|
|
|
|
28,291,499 |
|
|
|
|
|
|
|
15,145,445 |
|
| Distributions reinvested |
|
|
|
|
|
|
|
|
|
|
|
|
|
|
|
|
|
|
|
|
|
|
|
|
|
|
|
|
|
|
| Class A |
|
|
|
|
96,494 |
|
|
|
|
|
|
|
202,092 |
|
|
|
|
|
|
|
123,207 |
|
|
|
|
|
|
|
262,321 |
|
| Class I |
|
|
|
|
5,137,468 |
|
|
|
|
|
|
|
6,401,734 |
|
|
|
|
|
|
|
2,935,015 |
|
|
|
|
|
|
|
5,381,943 |
|
| Cost of shares redeemed |
|
|
|
|
|
|
|
|
|
|
|
|
|
|
|
|
|
|
|
|
|
|
|
|
|
|
|
|
|
|
| Class A |
|
|
|
|
(729,595 |
) |
|
|
|
|
|
|
(1,289,768 |
) |
|
|
|
|
|
|
(1,261,266 |
) |
|
|
|
|
|
|
(4,718,243 |
) |
| Class I |
|
|
|
|
(68,277,128 |
) |
|
|
|
|
|
|
(128,571,321 |
) |
|
|
|
|
|
|
(40,271,354 |
) |
|
|
|
|
|
|
(77,116,045 |
) |
|
|
|
|
|
|
|
|
|
|
|
|
|
|
|
|
|
|
|
|
|
|
|
|
|
|
|
|
|
|
|
| Change in net assets resulting from share transactions |
|
|
|
|
161,980,292 |
|
|
|
|
|
|
|
(19,271,662 |
) |
|
|
|
|
|
|
(9,899,762 |
) |
|
|
|
|
|
|
(60,637,901 |
) |
|
|
|
|
|
|
|
|
|
|
|
|
|
|
|
|
|
|
|
|
|
|
|
|
|
|
|
|
|
|
|
| Change in net assets |
|
|
|
|
166,527,777 |
|
|
|
|
|
|
|
(29,616,319 |
) |
|
|
|
|
|
|
(10,831,825 |
) |
|
|
|
|
|
|
(69,507,095 |
) |
| NET ASSETS: |
|
|
|
|
|
|
|
|
|
|
|
|
|
|
|
|
|
|
|
|
|
|
|
|
|
|
|
|
|
|
| Beginning of year |
|
|
|
|
252,508,135 |
|
|
|
|
|
|
|
282,124,454 |
|
|
|
|
|
|
|
141,794,455 |
|
|
|
|
|
|
|
211,301,550 |
|
|
|
|
|
|
|
|
|
|
|
|
|
|
|
|
|
|
|
|
|
|
|
|
|
|
|
|
|
|
|
|
| End of year |
|
|
|
$ |
419,035,912 |
|
|
|
|
|
|
$ |
252,508,135 |
|
|
|
|
|
|
$ |
130,962,630 |
|
|
|
|
|
|
$ |
141,794,455 |
|
|
|
|
|
|
|
|
|
|
|
|
|
|
|
|
|
|
|
|
|
|
|
|
|
|
|
|
|
|
|
|
| Undistributed (distributions in excess of) net investment income included in net assets at end of year |
|
|
|
$ |
(138,104 |
) |
|
|
|
|
|
$ |
52,413 |
|
|
|
|
|
|
$ |
3,913 |
|
|
|
|
|
|
$ |
13,616 |
|
|
|
|
|
|
|
|
|
|
|
|
|
|
|
|
|
|
|
|
|
|
|
|
|
|
|
|
|
|
|
|
|
|
|
|
|
|
|
|
|
|
|
|
| SHARES OF BENEFICIAL INTEREST: |
|
|
|
|
|
|
|
|
|
|
|
|
|
|
|
|
|
|
|
|
|
|
|
|
|
|
|
|
|
|
| Shares sold |
|
|
|
|
|
|
|
|
|
|
|
|
|
|
|
|
|
|
|
|
|
|
|
|
|
|
|
|
|
|
| Class A |
|
|
|
|
28,602 |
|
|
|
|
|
|
|
39,734 |
|
|
|
|
|
|
|
28,185 |
|
|
|
|
|
|
|
39,572 |
|
| Class I |
|
|
|
|
23,117,542 |
|
|
|
|
|
|
|
10,775,486 |
|
|
|
|
|
|
|
2,818,657 |
|
|
|
|
|
|
|
1,480,562 |
|
| Distributions reinvested |
|
|
|
|
|
|
|
|
|
|
|
|
|
|
|
|
|
|
|
|
|
|
|
|
|
|
|
|
|
|
| Class A |
|
|
|
|
9,727 |
|
|
|
|
|
|
|
20,770 |
|
|
|
|
|
|
|
12,296 |
|
|
|
|
|
|
|
25,907 |
|
| Class I |
|
|
|
|
526,065 |
|
|
|
|
|
|
|
669,184 |
|
|
|
|
|
|
|
292,860 |
|
|
|
|
|
|
|
532,221 |
|
| Shares redeemed |
|
|
|
|
|
|
|
|
|
|
|
|
|
|
|
|
|
|
|
|
|
|
|
|
|
|
|
|
|
|
| Class A |
|
|
|
|
(73,684 |
) |
|
|
|
|
|
|
(131,826 |
) |
|
|
|
|
|
|
(125,261 |
) |
|
|
|
|
|
|
(461,039 |
) |
| Class I |
|
|
|
|
(6,998,032 |
) |
|
|
|
|
|
|
(13,300,706 |
) |
|
|
|
|
|
|
(3,999,979 |
) |
|
|
|
|
|
|
(7,515,739 |
) |
|
|
|
|
|
|
|
|
|
|
|
|
|
|
|
|
|
|
|
|
|
|
|
|
|
|
|
|
|
|
|
| Net change in shares outstanding |
|
|
|
|
16,610,220 |
|
|
|
|
|
|
|
(1,927,358 |
) |
|
|
|
|
|
|
(973,242 |
) |
|
|
|
|
|
|
(5,898,516 |
) |
|
|
|
|
|
|
|
|
|
|
|
|
|
|
|
|
|
|
|
|
|
|
|
|
|
|
|
|
|
|
|
|
|
|
|
|
|
|
|
|
|
|
|
|
|
|
|
|
|
|
|
|
|
|
|
|
|
|
|
|
|
|
See Notes which are an integral part of the Financial Statements
|
| ANNUAL REPORT / April 30, 2015 |
|
| STATEMENTS OF CHANGES IN NET ASSETS (continued) |
|
|
|
|
|
|
|
|
|
|
|
|
|
|
|
|
|
|
|
|
|
|
|
|
|
|
|
|
|
|
|
| |
|
|
|
Wilmington
Short-Term Bond Fund |
|
|
|
|
Wilmington
Municipal Bond Fund |
|
| |
|
|
|
Year
Ended
April 30, 2015 |
|
|
|
|
|
|
Year Ended
April 30,
2014 |
|
|
|
|
|
|
Year Ended
April 30,
2015 |
|
|
|
|
Year Ended
April 30,
2014 |
|
| OPERATIONS: |
|
|
|
|
|
|
|
|
|
|
|
|
|
|
|
|
|
|
|
|
|
|
|
|
|
|
|
|
|
|
| Net investment income (loss) |
|
|
|
$ |
1,168,640 |
|
|
|
|
|
|
$ |
1,433,335 |
|
|
|
|
|
|
$ |
4,896,829 |
|
|
|
|
|
|
$ |
5,158,237 |
|
| Net realized gain (loss) on investments |
|
|
|
|
1,039,742 |
|
|
|
|
|
|
|
758,765 |
|
|
|
|
|
|
|
4,741,241 |
|
|
|
|
|
|
|
405,169 |
|
| Net change in unrealized appreciation (depreciation) of
investments |
|
|
|
|
(1,132,613 |
) |
|
|
|
|
|
|
(767,735 |
) |
|
|
|
|
|
|
(4,378,999 |
) |
|
|
|
|
|
|
(5,734,444 |
) |
|
|
|
|
|
|
|
|
|
|
|
|
|
|
|
|
|
|
|
|
|
|
|
|
|
|
|
|
|
|
|
| Change in net assets resulting from operations |
|
|
|
|
1,075,769 |
|
|
|
|
|
|
|
1,424,365 |
|
|
|
|
|
|
|
5,259,071 |
|
|
|
|
|
|
|
(171,038 |
) |
|
|
|
|
|
|
|
|
|
|
|
|
|
|
|
|
|
|
|
|
|
|
|
|
|
|
|
|
|
|
|
| DISTRIBUTIONS TO SHAREHOLDERS: |
|
|
|
|
|
|
|
|
|
|
|
|
|
|
|
|
|
|
|
|
|
|
|
|
|
|
|
|
|
|
| Distributions from net investment income |
|
|
|
|
|
|
|
|
|
|
|
|
|
|
|
|
|
|
|
|
|
|
|
|
|
|
|
|
|
|
| Class A |
|
|
|
|
(39,082 |
) |
|
|
|
|
|
|
(21,534 |
) |
|
|
|
|
|
|
(427,862 |
) |
|
|
|
|
|
|
(355,276 |
) |
| Class I |
|
|
|
|
(1,231,142 |
) |
|
|
|
|
|
|
(1,585,102 |
) |
|
|
|
|
|
|
(4,468,958 |
) |
|
|
|
|
|
|
(4,799,158 |
) |
| Distributions from net realized gain on
investments |
|
|
|
|
|
|
|
|
|
|
|
|
|
|
|
|
|
|
|
|
|
|
|
|
|
|
|
|
|
|
| Class A |
|
|
|
|
(43,075 |
) |
|
|
|
|
|
|
(26,033 |
) |
|
|
|
|
|
|
(139,702 |
) |
|
|
|
|
|
|
(160,333 |
) |
| Class I |
|
|
|
|
(1,101,622 |
) |
|
|
|
|
|
|
(1,316,952 |
) |
|
|
|
|
|
|
(1,659,743 |
) |
|
|
|
|
|
|
(1,925,141 |
) |
|
|
|
|
|
|
|
|
|
|
|
|
|
|
|
|
|
|
|
|
|
|
|
|
|
|
|
|
|
|
|
| Change in net assets resulting from distributions to shareholders |
|
|
|
|
(2,414,921 |
) |
|
|
|
|
|
|
(2,949,621 |
) |
|
|
|
|
|
|
(6,696,265 |
) |
|
|
|
|
|
|
(7,239,908 |
) |
|
|
|
|
|
|
|
|
|
|
|
|
|
|
|
|
|
|
|
|
|
|
|
|
|
|
|
|
|
|
|
| SHARE TRANSACTIONS: |
|
|
|
|
|
|
|
|
|
|
|
|
|
|
|
|
|
|
|
|
|
|
|
|
|
|
|
|
|
|
| Proceeds from sale of shares |
|
|
|
|
|
|
|
|
|
|
|
|
|
|
|
|
|
|
|
|
|
|
|
|
|
|
|
|
|
|
| Class A |
|
|
|
|
1,774,216 |
|
|
|
|
|
|
|
1,557,418 |
|
|
|
|
|
|
|
491,276 |
|
|
|
|
|
|
|
420,090 |
|
| Class I |
|
|
|
|
28,313,830 |
|
|
|
|
|
|
|
71,435,316 |
|
|
|
|
|
|
|
40,701,052 |
|
|
|
|
|
|
|
29,110,066 |
|
| Proceeds from merger (Note 8) |
|
|
|
|
|
|
|
|
|
|
|
|
— |
|
|
|
|
|
|
|
|
|
|
|
|
|
|
|
|
|
| Class A |
|
|
|
|
7,021,999 |
|
|
|
|
|
|
|
— |
|
|
|
|
|
|
|
27,966,651 |
|
|
|
|
|
|
|
— |
|
| Class I |
|
|
|
|
80,458,298 |
|
|
|
|
|
|
|
— |
|
|
|
|
|
|
|
60,097,517 |
|
|
|
|
|
|
|
— |
|
| Distributions reinvested |
|
|
|
|
|
|
|
|
|
|
|
|
|
|
|
|
|
|
|
|
|
|
|
|
|
|
|
|
|
|
| Class A |
|
|
|
|
48,598 |
|
|
|
|
|
|
|
28,820 |
|
|
|
|
|
|
|
412,194 |
|
|
|
|
|
|
|
364,230 |
|
| Class I |
|
|
|
|
1,328,578 |
|
|
|
|
|
|
|
1,857,787 |
|
|
|
|
|
|
|
2,439,629 |
|
|
|
|
|
|
|
2,755,866 |
|
| Cost of shares redeemed |
|
|
|
|
|
|
|
|
|
|
|
|
|
|
|
|
|
|
|
|
|
|
|
|
|
|
|
|
|
|
| Class A |
|
|
|
|
(1,077,901 |
) |
|
|
|
|
|
|
(1,897,685 |
) |
|
|
|
|
|
|
(3,919,924 |
) |
|
|
|
|
|
|
(4,519,792 |
) |
| Class I |
|
|
|
|
(106,936,255 |
) |
|
|
|
|
|
|
(89,330,926 |
) |
|
|
|
|
|
|
(41,871,708 |
) |
|
|
|
|
|
|
(73,438,014 |
) |
|
|
|
|
|
|
|
|
|
|
|
|
|
|
|
|
|
|
|
|
|
|
|
|
|
|
|
|
|
|
|
| Change in net assets resulting from share transactions |
|
|
|
|
10,931,363 |
|
|
|
|
|
|
|
(16,349,270 |
) |
|
|
|
|
|
|
86,316,687 |
|
|
|
|
|
|
|
(45,307,554 |
) |
|
|
|
|
|
|
|
|
|
|
|
|
|
|
|
|
|
|
|
|
|
|
|
|
|
|
|
|
|
|
|
| Change in net assets |
|
|
|
|
9,592,211 |
|
|
|
|
|
|
|
(17,874,526 |
) |
|
|
|
|
|
|
84,879,493 |
|
|
|
|
|
|
|
(52,718,500 |
) |
| NET ASSETS: |
|
|
|
|
|
|
|
|
|
|
|
|
|
|
|
|
|
|
|
|
|
|
|
|
|
|
|
|
|
|
| Beginning of year |
|
|
|
|
167,841,736 |
|
|
|
|
|
|
|
185,716,262 |
|
|
|
|
|
|
|
216,630,974 |
|
|
|
|
|
|
|
269,349,474 |
|
|
|
|
|
|
|
|
|
|
|
|
|
|
|
|
|
|
|
|
|
|
|
|
|
|
|
|
|
|
|
|
| End of year |
|
|
|
$ |
177,433,947 |
|
|
|
|
|
|
$ |
167,841,736 |
|
|
|
|
|
|
$ |
301,510,467 |
|
|
|
|
|
|
$ |
216,630,974 |
|
|
|
|
|
|
|
|
|
|
|
|
|
|
|
|
|
|
|
|
|
|
|
|
|
|
|
|
|
|
|
|
| Undistributed (distributions in excess of) net investment income included in net assets at end of year |
|
|
|
$ |
(116,113 |
) |
|
|
|
|
|
$ |
— |
|
|
|
|
|
|
$ |
9 |
|
|
|
|
|
|
$ |
— |
|
|
|
|
|
|
|
|
|
|
|
|
|
|
|
|
|
|
|
|
|
|
|
|
|
|
|
|
|
|
|
|
|
|
|
|
|
|
|
|
|
|
|
|
| SHARES OF BENEFICIAL INTEREST: |
|
|
|
|
|
|
|
|
|
|
|
|
|
|
|
|
|
|
|
|
|
|
|
|
|
|
|
|
|
|
| Shares sold |
|
|
|
|
|
|
|
|
|
|
|
|
|
|
|
|
|
|
|
|
|
|
|
|
|
|
|
|
|
|
| Class A |
|
|
|
|
174,101 |
|
|
|
|
|
|
|
151,906 |
|
|
|
|
|
|
|
36,432 |
|
|
|
|
|
|
|
31,677 |
|
| Class I |
|
|
|
|
2,785,307 |
|
|
|
|
|
|
|
6,975,513 |
|
|
|
|
|
|
|
3,006,490 |
|
|
|
|
|
|
|
2,196,580 |
|
| Shares issued in fund merger (Note 8) |
|
|
|
|
|
|
|
|
|
|
|
|
|
|
|
|
|
|
|
|
|
|
|
|
|
|
|
|
|
|
| Class A |
|
|
|
|
694,098 |
|
|
|
|
|
|
|
— |
|
|
|
|
|
|
|
2,047,329 |
|
|
|
|
|
|
|
— |
|
| Class I |
|
|
|
|
7,950,847 |
|
|
|
|
|
|
|
— |
|
|
|
|
|
|
|
4,397,825 |
|
|
|
|
|
|
|
— |
|
| Distributions reinvested |
|
|
|
|
|
|
|
|
|
|
|
|
|
|
|
|
|
|
|
|
|
|
|
|
|
|
|
|
|
|
| Class A |
|
|
|
|
4,808 |
|
|
|
|
|
|
|
2,817 |
|
|
|
|
|
|
|
30,537 |
|
|
|
|
|
|
|
27,613 |
|
| Class I |
|
|
|
|
131,229 |
|
|
|
|
|
|
|
181,585 |
|
|
|
|
|
|
|
180,783 |
|
|
|
|
|
|
|
209,590 |
|
| Shares redeemed |
|
|
|
|
|
|
|
|
|
|
|
|
|
|
|
|
|
|
|
|
|
|
|
|
|
|
|
|
|
|
| Class A |
|
|
|
|
(106,396 |
) |
|
|
|
|
|
|
(185,398 |
) |
|
|
|
|
|
|
(290,087 |
) |
|
|
|
|
|
|
(339,715 |
) |
| Class I |
|
|
|
|
(10,482,747 |
) |
|
|
|
|
|
|
(8,698,195 |
) |
|
|
|
|
|
|
(3,095,411 |
) |
|
|
|
|
|
|
(5,542,848 |
) |
|
|
|
|
|
|
|
|
|
|
|
|
|
|
|
|
|
|
|
|
|
|
|
|
|
|
|
|
|
|
|
| Net change in shares outstanding |
|
|
|
|
1,151,247 |
|
|
|
|
|
|
|
(1,571,772 |
) |
|
|
|
|
|
|
6,313,898 |
|
|
|
|
|
|
|
(3,417,103 |
) |
|
|
|
|
|
|
|
|
|
|
|
|
|
|
|
|
|
|
|
|
|
|
|
|
|
|
|
|
|
|
|
|
|
|
|
|
|
|
|
|
|
|
|
|
|
|
|
|
|
|
|
|
|
|
|
|
|
|
|
|
|
|
See Notes which are an integral part of the Financial Statements
|
| April 30, 2015 / ANNUAL REPORT |
|
| STATEMENTS OF CHANGES IN NET ASSETS (concluded) |
|
|
|
|
|
|
|
|
|
|
|
| |
|
Wilmington
New York
Municipal Bond Fund |
| |
|
Year
Ended
April 30, 2015 |
|
Year
Ended
April 30, 2014 |
| OPERATIONS: |
|
|
|
|
|
|
|
|
|
|
| Net investment income (loss) |
|
|
$ |
1,898,930 |
|
|
|
$ |
1,943,419 |
|
| Net realized gain (loss) on investments |
|
|
|
1,153,442 |
|
|
|
|
(444,597 |
) |
| Net change in unrealized appreciation (depreciation) of
investments |
|
|
|
(261,875 |
) |
|
|
|
(1,760,539 |
) |
|
|
|
|
|
|
|
|
|
|
|
| Change in net assets resulting from operations |
|
|
|
2,790,497 |
|
|
|
|
(261,717 |
) |
|
|
|
|
|
|
|
|
|
|
|
| DISTRIBUTIONS TO SHAREHOLDERS: |
|
|
|
|
|
|
|
|
|
|
| Distributions from net investment income |
|
|
|
|
|
|
|
|
|
|
| Class A |
|
|
|
(453,609 |
) |
|
|
|
(472,576 |
) |
| Class I |
|
|
|
(1,445,312 |
) |
|
|
|
(1,495,704 |
) |
|
|
|
|
|
|
|
|
|
|
|
| Change in net assets resulting from distributions to shareholders |
|
|
|
(1,898,921 |
) |
|
|
|
(1,968,280 |
) |
|
|
|
|
|
|
|
|
|
|
|
| SHARE TRANSACTIONS: |
|
|
|
|
|
|
|
|
|
|
| Proceeds from sale of shares |
|
|
|
|
|
|
|
|
|
|
| Class A |
|
|
|
102,135 |
|
|
|
|
59,253 |
|
| Class I |
|
|
|
12,661,038 |
|
|
|
|
13,374,234 |
|
| Distributions reinvested |
|
|
|
|
|
|
|
|
|
|
| Class A |
|
|
|
291,257 |
|
|
|
|
317,176 |
|
| Class I |
|
|
|
763,540 |
|
|
|
|
771,233 |
|
| Cost of shares redeemed |
|
|
|
|
|
|
|
|
|
|
| Class A |
|
|
|
(2,230,641 |
) |
|
|
|
(6,715,267 |
) |
| Class I |
|
|
|
(19,712,017 |
) |
|
|
|
(21,660,012 |
) |
|
|
|
|
|
|
|
|
|
|
|
| Change in net assets resulting from share transactions |
|
|
|
(8,124,688 |
) |
|
|
|
(13,853,383 |
) |
|
|
|
|
|
|
|
|
|
|
|
| Change in net assets |
|
|
|
(7,233,112 |
) |
|
|
|
(16,083,380 |
) |
| NET ASSETS: |
|
|
|
|
|
|
|
|
|
|
| Beginning of year |
|
|
|
93,626,316 |
|
|
|
|
109,709,696 |
|
|
|
|
|
|
|
|
|
|
|
|
| End of year |
|
|
$ |
86,393,204 |
|
|
|
$ |
93,626,316 |
|
|
|
|
|
|
|
|
|
|
|
|
| Undistributed (distributions in excess of) net investment income included in net assets at end of year |
|
|
$ |
12 |
|
|
|
$ |
3 |
|
|
|
|
|
|
|
|
|
|
|
|
| SHARES OF BENEFICIAL INTEREST: |
|
|
|
|
|
|
|
|
|
|
| Shares sold |
|
|
|
|
|
|
|
|
|
|
| Class A |
|
|
|
9,595 |
|
|
|
|
5,721 |
|
| Class I |
|
|
|
1,185,490 |
|
|
|
|
1,281,297 |
|
| Distributions reinvested |
|
|
|
|
|
|
|
|
|
|
| Class A |
|
|
|
27,290 |
|
|
|
|
30,500 |
|
| Class I |
|
|
|
71,480 |
|
|
|
|
74,111 |
|
| Shares redeemed |
|
|
|
|
|
|
|
|
|
|
| Class A |
|
|
|
(209,544 |
) |
|
|
|
(639,851 |
) |
| Class I |
|
|
|
(1,846,064 |
) |
|
|
|
(2,086,881 |
) |
|
|
|
|
|
|
|
|
|
|
|
| Net change in shares outstanding |
|
|
|
(761,753 |
) |
|
|
|
(1,335,103 |
) |
|
|
|
|
|
|
|
|
|
|
|
|
|
|
|
|
|
|
|
|
|
|
See Notes which are an integral part of the Financial Statements
|
| ANNUAL REPORT / April 30, 2015 |
For a share outstanding throughout each year ended April 30, unless otherwise noted:
|
| WILMINGTON BROAD MARKET BOND FUND |
|
|
|
|
|
|
|
|
|
|
|
|
|
|
|
|
|
|
|
|
|
|
|
|
|
|
|
|
|
|
|
|
|
|
|
|
|
|
|
|
|
|
|
|
|
|
|
|
|
|
|
|
|
| CLASS A |
|
2015 |
|
|
2014 |
|
|
2013 |
|
|
2012 |
|
|
2011 |
|
|
|
| Net Asset Value, Beginning of Year |
|
|
$9.80 |
|
|
|
$10.19 |
|
|
|
$10.23 |
|
|
|
$10.16 |
|
|
|
$10.05 |
|
|
|
| Income (Loss) From Operations: |
|
|
|
|
|
|
|
|
|
|
|
|
|
|
|
|
|
|
|
|
|
|
| Net Investment Income (Loss)(a) |
|
|
0.17 |
|
|
|
0.20 |
|
|
|
0.23 |
|
|
|
0.32 |
|
|
|
0.38 |
|
|
|
| Net Realized and Unrealized Gain (Loss) on Investments |
|
|
0.19 |
|
|
|
(0.21 |
) |
|
|
0.17 |
|
|
|
0.33 |
|
|
|
0.26 |
|
|
|
| Total Income (Loss) From Operations |
|
|
0.36 |
|
|
|
(0.01 |
) |
|
|
0.40 |
|
|
|
0.65 |
|
|
|
0.64 |
|
|
|
| Less Distributions From: |
|
|
|
|
|
|
|
|
|
|
|
|
|
|
|
|
|
|
|
|
|
|
| Net Investment Income |
|
|
(0.19 |
) |
|
|
(0.23 |
) |
|
|
(0.25 |
) |
|
|
(0.33 |
) |
|
|
(0.38 |
) |
|
|
| Net Realized Gains |
|
|
(0.02 |
) |
|
|
(0.15 |
) |
|
|
(0.19 |
) |
|
|
(0.25 |
) |
|
|
(0.15 |
) |
|
|
| Total Distributions |
|
|
(0.21 |
) |
|
|
(0.38 |
) |
|
|
(0.44 |
) |
|
|
(0.58 |
) |
|
|
(0.53 |
) |
|
|
| Net Asset Value, End of Year |
|
|
$9.95 |
|
|
|
$9.80 |
|
|
|
$10.19 |
|
|
|
$10.23 |
|
|
|
$10.16 |
|
|
|
|
|
|
|
|
|
|
|
|
|
|
|
|
|
|
|
|
|
|
|
|
|
|
| Total Return(b) |
|
|
3.69 |
% |
|
|
(0.03 |
)% |
|
|
3.93 |
% |
|
|
6.54 |
% |
|
|
6.50 |
% |
|
|
| Net Assets, End of Year (000’s) |
|
|
$5,726 |
|
|
|
$5,983 |
|
|
|
$6,951 |
|
|
|
$8,431 |
|
|
|
$6,602 |
|
|
|
| Ratios to Average Net Assets |
|
|
|
|
|
|
|
|
|
|
|
|
|
|
|
|
|
|
|
|
|
|
| Gross Expense |
|
|
1.12 |
% |
|
|
1.15 |
% |
|
|
1.17 |
% |
|
|
1.25 |
% |
|
|
1.28 |
% |
|
|
| Net Expenses(c) |
|
|
0.94 |
% |
|
|
0.98 |
% |
|
|
0.99 |
% |
|
|
1.00 |
% |
|
|
1.00 |
% |
|
|
| Net Investment Income (Loss) |
|
|
1.74 |
% |
|
|
2.09 |
% |
|
|
2.23 |
% |
|
|
3.12 |
% |
|
|
3.76 |
% |
|
|
| Portfolio Turnover Rate |
|
|
45 |
% |
|
|
113 |
% |
|
|
106 |
% |
|
|
93 |
% |
|
|
128 |
% |
|
|
|
|
|
|
|
|
|
|
|
|
|
|
|
|
|
|
|
|
|
|
|
|
|
|
|
|
|
|
|
|
| CLASS I |
|
2015 |
|
|
2014 |
|
|
2013 |
|
|
2012 |
|
|
2011 |
|
|
|
| Net Asset Value, Beginning of Year |
|
|
$9.63 |
|
|
|
$10.03 |
|
|
|
$10.07 |
|
|
|
$10.01 |
|
|
|
$9.90 |
|
|
|
| Income (Loss) From Operations: |
|
|
|
|
|
|
|
|
|
|
|
|
|
|
|
|
|
|
|
|
|
|
| Net Investment Income (Loss)(a) |
|
|
0.20 |
|
|
|
0.23 |
|
|
|
0.26 |
|
|
|
0.35 |
|
|
|
0.41 |
|
|
|
| Net Realized and Unrealized Gain (Loss) on Investments |
|
|
0.20 |
|
|
|
(0.22 |
) |
|
|
0.17 |
|
|
|
0.32 |
|
|
|
0.26 |
|
|
|
| Total Income (Loss) From Operations |
|
|
0.40 |
|
|
|
0.01 |
|
|
|
0.43 |
|
|
|
0.67 |
|
|
|
0.67 |
|
|
|
| Less Distributions From: |
|
|
|
|
|
|
|
|
|
|
|
|
|
|
|
|
|
|
|
|
|
|
| Net Investment Income |
|
|
(0.22 |
) |
|
|
(0.26 |
) |
|
|
(0.28 |
) |
|
|
(0.36 |
) |
|
|
(0.41 |
) |
|
|
| Net Realized Gains |
|
|
(0.02 |
) |
|
|
(0.15 |
) |
|
|
(0.19 |
) |
|
|
(0.25 |
) |
|
|
(0.15 |
) |
|
|
| Total Distributions |
|
|
(0.24 |
) |
|
|
(0.41 |
) |
|
|
(0.47 |
) |
|
|
(0.61 |
) |
|
|
(0.56 |
) |
|
|
| Net Asset Value, End of Year |
|
|
$9.79 |
|
|
|
$9.63 |
|
|
|
$10.03 |
|
|
|
$10.07 |
|
|
|
$10.01 |
|
|
|
|
|
|
|
|
|
|
|
|
|
|
|
|
|
|
|
|
|
|
|
|
|
|
| Total Return(b) |
|
|
4.12 |
% |
|
|
0.16 |
% |
|
|
4.32 |
% |
|
|
6.90 |
% |
|
|
6.93 |
% |
|
|
| Net Assets, End of Year (000’s) |
|
|
$413,310 |
|
|
|
$246,525 |
|
|
|
$275,173 |
|
|
|
$291,976 |
|
|
|
$209,386 |
|
|
|
| Ratios to Average Net Assets |
|
|
|
|
|
|
|
|
|
|
|
|
|
|
|
|
|
|
|
|
|
|
| Gross Expense |
|
|
0.88 |
% |
|
|
0.92 |
% |
|
|
0.92 |
% |
|
|
1.00 |
% |
|
|
1.03 |
% |
|
|
| Net Expenses(c) |
|
|
0.60 |
% |
|
|
0.65 |
% |
|
|
0.64 |
% |
|
|
0.66 |
% |
|
|
0.66 |
% |
|
|
| Net Investment Income (Loss) |
|
|
2.07 |
% |
|
|
2.41 |
% |
|
|
2.57 |
% |
|
|
3.47 |
% |
|
|
4.12 |
% |
|
|
| Portfolio Turnover Rate |
|
|
45 |
% |
|
|
113 |
% |
|
|
106 |
% |
|
|
93 |
% |
|
|
128 |
% |
|
|
| (a) |
Per share numbers have been calculated using the average shares method. |
| (b) |
Based on net asset value, which does not reflect the sales charge or contingent deferred sales charge, if applicable. Total returns for periods of less than one year, if any, are not annualized. |
| (c) |
The investment advisor and other service providers waived or reimbursed a portion of their fees. |
See Notes
which are an integral part of the Financial Statements
|
| April 30, 2015 / ANNUAL REPORT |
|
| FINANCIAL HIGHLIGHTS (continued) |
For a share outstanding throughout each year ended April 30, unless otherwise noted:
|
| WILMINGTON INTERMEDIATE-TERM BOND FUND |
|
|
|
|
|
|
|
|
|
|
|
|
|
|
|
|
|
|
|
|
|
|
|
| CLASS A |
|
2015 |
|
|
2014 |
|
|
2013 |
|
|
2012 |
|
|
2011 |
|
|
|
| Net Asset Value, Beginning of Year |
|
|
$10.10 |
|
|
|
$10.60 |
|
|
|
$10.64 |
|
|
|
$10.76 |
|
|
|
$10.63 |
|
|
|
| Income (Loss) From Operations: |
|
|
|
|
|
|
|
|
|
|
|
|
|
|
|
|
|
|
|
|
|
|
| Net Investment Income (Loss)(a) |
|
|
0.13 |
|
|
|
0.14 |
|
|
|
0.18 |
|
|
|
0.24 |
|
|
|
0.34 |
|
|
|
| Net Realized and Unrealized Gain (Loss) on Investments |
|
|
0.09 |
|
|
|
(0.19 |
) |
|
|
0.13 |
|
|
|
0.28 |
|
|
|
0.24 |
|
|
|
| Total Income (Loss) From Operations |
|
|
0.22 |
|
|
|
(0.05 |
) |
|
|
0.31 |
|
|
|
0.52 |
|
|
|
0.58 |
|
|
|
| Less Distributions From: |
|
|
|
|
|
|
|
|
|
|
|
|
|
|
|
|
|
|
|
|
|
|
| Net Investment Income |
|
|
(0.13 |
) |
|
|
(0.15 |
) |
|
|
(0.19 |
) |
|
|
(0.25 |
) |
|
|
(0.35 |
) |
|
|
| Net Realized Gains |
|
|
(0.17 |
) |
|
|
(0.30 |
) |
|
|
(0.16 |
) |
|
|
(0.39 |
) |
|
|
(0.10 |
) |
|
|
| Total Distributions |
|
|
(0.30 |
) |
|
|
(0.45 |
) |
|
|
(0.35 |
) |
|
|
(0.64 |
) |
|
|
(0.45 |
) |
|
|
| Net Asset Value, End of Year |
|
|
$10.02 |
|
|
|
$10.10 |
|
|
|
$10.60 |
|
|
|
$10.64 |
|
|
|
$10.76 |
|
|
|
|
|
|
|
|
|
|
|
|
|
|
|
|
|
|
|
|
|
|
|
|
|
|
| Total Return(b) |
|
|
2.14 |
% |
|
|
(0.40 |
)% |
|
|
2.90 |
% |
|
|
4.96 |
% |
|
|
5.51 |
% |
|
|
| Net Assets, End of Year (000’s) |
|
|
$4,389 |
|
|
|
$5,279 |
|
|
|
$9,730 |
|
|
|
$12,961 |
|
|
|
$6,744 |
|
|
|
| Ratios to Average Net Assets |
|
|
|
|
|
|
|
|
|
|
|
|
|
|
|
|
|
|
|
|
|
|
| Gross Expense |
|
|
1.15 |
% |
|
|
1.12 |
% |
|
|
1.14 |
% |
|
|
1.35 |
% |
|
|
1.43 |
% |
|
|
| Net Expenses(c) |
|
|
0.89 |
% |
|
|
0.91 |
% |
|
|
0.94 |
% |
|
|
1.00 |
% |
|
|
1.01 |
% |
|
|
| Net Investment Income (Loss) |
|
|
1.25 |
% |
|
|
1.38 |
% |
|
|
1.69 |
% |
|
|
2.22 |
% |
|
|
3.18 |
% |
|
|
| Portfolio Turnover Rate |
|
|
45 |
% |
|
|
43 |
% |
|
|
52 |
% |
|
|
253 |
% |
|
|
485 |
% |
|
|
|
|
|
|
|
|
|
|
|
|
|
|
|
|
|
|
|
|
|
|
|
|
|
|
|
|
|
|
|
|
| CLASS I |
|
2015 |
|
|
2014 |
|
|
2013 |
|
|
2012 |
|
|
2011 |
|
|
|
| Net Asset Value, Beginning of Year |
|
|
$10.10 |
|
|
|
$10.60 |
|
|
|
$10.65 |
|
|
|
$10.77 |
|
|
|
$10.64 |
|
|
|
| Income (Loss) From Operations: |
|
|
|
|
|
|
|
|
|
|
|
|
|
|
|
|
|
|
|
|
|
|
| Net Investment Income (Loss)(a) |
|
|
0.16 |
|
|
|
0.17 |
|
|
|
0.22 |
|
|
|
0.28 |
|
|
|
0.38 |
|
|
|
| Net Realized and Unrealized Gain (Loss) on Investments |
|
|
0.10 |
|
|
|
(0.18 |
) |
|
|
0.11 |
|
|
|
0.27 |
|
|
|
0.24 |
|
|
|
| Total Income (Loss) From Operations |
|
|
0.26 |
|
|
|
(0.01 |
) |
|
|
0.33 |
|
|
|
0.55 |
|
|
|
0.62 |
|
|
|
| Less Distributions From: |
|
|
|
|
|
|
|
|
|
|
|
|
|
|
|
|
|
|
|
|
|
|
| Net Investment Income |
|
|
(0.16 |
) |
|
|
(0.19 |
) |
|
|
(0.22 |
) |
|
|
(0.28 |
) |
|
|
(0.39 |
) |
|
|
| Net Realized Gains |
|
|
(0.17 |
) |
|
|
(0.30 |
) |
|
|
(0.16 |
) |
|
|
(0.39 |
) |
|
|
(0.10 |
) |
|
|
| Total Distributions |
|
|
(0.33 |
) |
|
|
(0.49 |
) |
|
|
(0.38 |
) |
|
|
(0.67 |
) |
|
|
(0.49 |
) |
|
|
| Net Asset Value, End of Year |
|
|
$10.03 |
|
|
|
$10.10 |
|
|
|
$10.60 |
|
|
|
$10.65 |
|
|
|
$10.77 |
|
|
|
|
|
|
|
|
|
|
|
|
|
|
|
|
|
|
|
|
|
|
|
|
|
|
| Total Return(b) |
|
|
2.57 |
% |
|
|
(0.09 |
)% |
|
|
3.15 |
% |
|
|
5.33 |
% |
|
|
5.96 |
% |
|
|
| Net Assets, End of Year (000’s) |
|
|
$126,574 |
|
|
|
$136,516 |
|
|
|
$201,572 |
|
|
|
$253,419 |
|
|
|
$107,625 |
|
|
|
| Ratios to Average Net Assets |
|
|
|
|
|
|
|
|
|
|
|
|
|
|
|
|
|
|
|
|
|
|
| Gross Expense |
|
|
0.93 |
% |
|
|
0.91 |
% |
|
|
0.89 |
% |
|
|
1.09 |
% |
|
|
1.17 |
% |
|
|
| Net Expenses(c) |
|
|
0.57 |
% |
|
|
0.60 |
% |
|
|
0.60 |
% |
|
|
0.64 |
% |
|
|
0.66 |
% |
|
|
| Net Investment Income (Loss) |
|
|
1.57 |
% |
|
|
1.69 |
% |
|
|
2.03 |
% |
|
|
2.58 |
% |
|
|
3.54 |
% |
|
|
| Portfolio Turnover Rate |
|
|
45 |
% |
|
|
43 |
% |
|
|
52 |
% |
|
|
253 |
% |
|
|
485 |
% |
|
|
| (a) |
Per share numbers have been calculated using the average shares method. |
| (b) |
Based on net asset value, which does not reflect the sales charge or contingent deferred sales charge, if applicable. Total returns for periods of less than one year, if any, are not annualized. |
| (c) |
The investment advisor and other service providers waived or reimbursed a portion of their fees. |
See Notes
which are an integral part of the Financial Statements
|
| ANNUAL REPORT / April 30, 2015 |
|
| FINANCIAL HIGHLIGHTS (continued) |
For a share outstanding throughout each year ended April 30, unless otherwise noted:
|
| WILMINGTON SHORT-TERM BOND FUND |
|
|
|
|
|
|
|
|
|
|
|
|
|
|
|
|
|
|
|
|
|
|
|
|
|
| CLASS A |
|
2015 |
|
|
2014 |
|
|
2013 |
|
|
2012 |
|
|
2011 |
|
|
|
|
| Net Asset Value, Beginning of Year |
|
|
$10.23 |
|
|
|
$10.33 |
|
|
|
$10.28 |
|
|
|
$10.29 |
|
|
|
$10.21 |
|
|
|
|
|
| Income (Loss) From Operations: |
|
|
|
|
|
|
|
|
|
|
|
|
|
|
|
|
|
|
|
|
|
|
|
|
| Net Investment Income (Loss)(a) |
|
|
0.07 |
|
|
|
0.07 |
|
|
|
0.09 |
|
|
|
0.12 |
|
|
|
0.16 |
|
|
|
|
|
| Net Realized and Unrealized Gain (Loss) on Investments |
|
|
(0.02 |
) |
|
|
0.00 |
(b) |
|
|
0.08 |
|
|
|
0.03 |
|
|
|
0.10 |
|
|
|
|
|
|
|
|
|
|
| Total Income (Loss) From Operations |
|
|
0.05 |
|
|
|
0.07 |
|
|
|
0.17 |
|
|
|
0.15 |
|
|
|
0.26 |
|
|
|
|
|
|
|
|
|
|
| Less Distributions From: |
|
|
|
|
|
|
|
|
|
|
|
|
|
|
|
|
|
|
|
|
|
|
|
|
| Net Investment Income |
|
|
(0.06 |
) |
|
|
(0.08 |
) |
|
|
(0.09 |
) |
|
|
(0.12 |
) |
|
|
(0.17 |
) |
|
|
|
|
| Net Realized Gains |
|
|
(0.12 |
) |
|
|
(0.09 |
) |
|
|
(0.03 |
) |
|
|
(0.04 |
) |
|
|
(0.01 |
) |
|
|
|
|
|
|
|
|
|
| Total Distributions |
|
|
(0.18 |
) |
|
|
(0.17 |
) |
|
|
(0.12 |
) |
|
|
(0.16 |
) |
|
|
(0.18 |
) |
|
|
|
|
|
|
|
|
|
| Net Asset Value, End of Year |
|
|
$10.10 |
|
|
|
$10.23 |
|
|
|
$10.33 |
|
|
|
$10.28 |
|
|
|
$10.29 |
|
|
|
|
|
|
|
|
|
|
| Total Return(c) |
|
|
0.51 |
% |
|
|
0.68 |
% |
|
|
1.66 |
% |
|
|
1.48 |
% |
|
|
2.57 |
% |
|
|
|
|
| Net Assets, End of Year (000’s) |
|
|
$10,495 |
|
|
|
$2,785 |
|
|
|
$3,129 |
|
|
|
$8,912 |
|
|
|
$11,905 |
|
|
|
|
|
| Ratios to Average Net Assets |
|
|
|
|
|
|
|
|
|
|
|
|
|
|
|
|
|
|
|
|
|
|
|
|
| Gross Expense |
|
|
1.17 |
% |
|
|
1.19 |
% |
|
|
1.20 |
% |
|
|
1.37 |
% |
|
|
1.45 |
% |
|
|
|
|
| Net Expenses(d) |
|
|
0.78 |
% |
|
|
0.83 |
% |
|
|
0.86 |
% |
|
|
0.86 |
% |
|
|
0.86 |
% |
|
|
|
|
| Net Investment Income (Loss) |
|
|
0.71 |
% |
|
|
0.64 |
% |
|
|
0.89 |
% |
|
|
1.16 |
% |
|
|
1.57 |
% |
|
|
|
|
| Portfolio Turnover Rate |
|
|
138 |
% |
|
|
196 |
% |
|
|
110 |
% |
|
|
73 |
% |
|
|
142 |
% |
|
|
|
|
| CLASS I |
|
2015 |
|
|
2014 |
|
|
2013 |
|
|
2012 |
|
|
2011 |
|
|
|
|
| Net Asset Value, Beginning of Year |
|
|
$10.23 |
|
|
|
$10.33 |
|
|
|
$10.28 |
|
|
|
$10.29 |
|
|
|
$10.21 |
|
|
|
|
|
| Income (Loss) From Operations: |
|
|
|
|
|
|
|
|
|
|
|
|
|
|
|
|
|
|
|
|
|
|
|
|
| Net Investment Income (Loss)(a) |
|
|
0.08 |
|
|
|
0.09 |
|
|
|
0.12 |
|
|
|
0.15 |
|
|
|
0.18 |
|
|
|
|
|
| Net Realized and Unrealized Gain (Loss) on Investments |
|
|
0.00 |
(b) |
|
|
0.00 |
(b) |
|
|
0.08 |
|
|
|
0.03 |
|
|
|
0.10 |
|
|
|
|
|
|
|
|
|
|
| Total Income (Loss) From Operations |
|
|
0.08 |
|
|
|
0.09 |
|
|
|
0.20 |
|
|
|
0.18 |
|
|
|
0.28 |
|
|
|
|
|
|
|
|
|
|
| Less Distributions From: |
|
|
|
|
|
|
|
|
|
|
|
|
|
|
|
|
|
|
|
|
|
|
|
|
| Net Investment Income |
|
|
(0.09 |
) |
|
|
(0.10 |
) |
|
|
(0.12 |
) |
|
|
(0.15 |
) |
|
|
(0.19 |
) |
|
|
|
|
| Net Realized Gains |
|
|
(0.12 |
) |
|
|
(0.09 |
) |
|
|
(0.03 |
) |
|
|
(0.04 |
) |
|
|
(0.01 |
) |
|
|
|
|
|
|
|
|
|
| Total Distributions |
|
|
(0.21 |
) |
|
|
(0.19 |
) |
|
|
(0.15 |
) |
|
|
(0.19 |
) |
|
|
(0.20 |
) |
|
|
|
|
|
|
|
|
|
| Net Asset Value, End of Year |
|
|
$10.10 |
|
|
|
$10.23 |
|
|
|
$10.33 |
|
|
|
$10.28 |
|
|
|
$10.29 |
|
|
|
|
|
|
|
|
|
|
| Total Return(c) |
|
|
0.76 |
% |
|
|
0.90 |
% |
|
|
1.91 |
% |
|
|
1.74 |
% |
|
|
2.83 |
% |
|
|
|
|
| Net Assets, End of Year (000’s) |
|
|
$166,939 |
|
|
|
$165,057 |
|
|
|
$182,588 |
|
|
|
$189,176 |
|
|
|
$176,531 |
|
|
|
|
|
| Ratios to Average Net Assets |
|
|
|
|
|
|
|
|
|
|
|
|
|
|
|
|
|
|
|
|
|
|
|
|
| Gross Expense |
|
|
0.96 |
% |
|
|
0.97 |
% |
|
|
0.96 |
% |
|
|
1.11 |
% |
|
|
1.20 |
% |
|
|
|
|
| Net Expenses(d) |
|
|
0.56 |
% |
|
|
0.61 |
% |
|
|
0.61 |
% |
|
|
0.61 |
% |
|
|
0.61 |
% |
|
|
|
|
| Net Investment Income (Loss) |
|
|
0.81 |
% |
|
|
0.86 |
% |
|
|
1.12 |
% |
|
|
1.42 |
% |
|
|
1.81 |
% |
|
|
|
|
| Portfolio Turnover Rate |
|
|
138 |
% |
|
|
196 |
% |
|
|
110 |
% |
|
|
73 |
% |
|
|
142 |
% |
|
|
|
|
| (a) |
Per share numbers have been calculated using the average shares method. |
| (b) |
Represents less than $0.005. |
| (c) |
Based on net asset value, which does not reflect the sales charge or contingent deferred sales charge, if applicable. Total returns for periods of less than one year, if any, are not annualized. |
| (d) |
The investment advisor and other service providers waived or reimbursed a portion of their fees. |
See Notes
which are an integral part of the Financial Statements
|
| April 30, 2015 / ANNUAL REPORT |
|
| FINANCIAL HIGHLIGHTS (continued) |
For a share outstanding throughout each period:
|
| WILMINGTON MUNICIPAL BOND FUND† |
|
|
|
|
|
|
|
|
|
|
|
|
|
|
|
|
|
|
|
|
|
|
|
|
|
|
|
|
|
|
|
|
|
|
|
|
| CLASS A |
|
Year Ended
April 30, 2015 |
|
Year Ended
April 30, 2014 |
|
Year Ended
April 30, 2013 |
|
For the Period
July 1, 2011
through
April 30,
2012* |
|
Year Ended
June 30, 2011 |
|
Year Ended
June 30, 2010 |
|
|
| Net Asset Value, Beginning of Period |
|
|
|
$13.40 |
|
|
|
|
$13.75 |
|
|
|
|
$13.79 |
|
|
|
|
$13.18 |
|
|
|
|
$13.22 |
|
|
|
|
$12.64 |
|
|
|
|
|
|
| Income (Loss) From Operations: |
|
|
|
|
|
|
|
|
|
|
|
|
|
|
|
|
|
|
|
|
|
|
|
|
|
|
|
|
|
|
|
|
|
|
|
| Net Investment Income (Loss)(a) |
|
|
|
0.25 |
|
|
|
|
0.27 |
|
|
|
|
0.24 |
|
|
|
|
0.29 |
|
|
|
|
0.42 |
|
|
|
|
0.46 |
|
|
|
|
|
|
| Net Realized and Unrealized Gain (Loss) on Investments |
|
|
|
0.13 |
|
|
|
|
(0.23 |
) |
|
|
|
0.27 |
|
|
|
|
0.78 |
|
|
|
|
0.04 |
|
|
|
|
0.61 |
|
|
|
|
|
|
|
|
|
|
|
|
| Total Income (Loss) From Operations |
|
|
|
0.38 |
|
|
|
|
0.04 |
|
|
|
|
0.51 |
|
|
|
|
1.07 |
|
|
|
|
0.46 |
|
|
|
|
1.07 |
|
|
|
|
|
|
|
|
|
|
|
|
| Less Distributions From: |
|
|
|
|
|
|
|
|
|
|
|
|
|
|
|
|
|
|
|
|
|
|
|
|
|
|
|
|
|
|
|
|
|
|
|
| Net Investment Income |
|
|
|
(0.25 |
) |
|
|
|
(0.27 |
) |
|
|
|
(0.24 |
) |
|
|
|
(0.29 |
) |
|
|
|
(0.42 |
) |
|
|
|
(0.46 |
) |
|
|
|
|
|
| Net Realized Gains |
|
|
|
(0.12 |
) |
|
|
|
(0.12 |
) |
|
|
|
(0.31 |
) |
|
|
|
(0.17 |
) |
|
|
|
(0.08 |
) |
|
|
|
(0.03 |
) |
|
|
|
|
|
|
|
|
|
|
|
| Total Distributions |
|
|
|
(0.37 |
) |
|
|
|
(0.39 |
) |
|
|
|
(0.55 |
) |
|
|
|
(0.46 |
) |
|
|
|
(0.50 |
) |
|
|
|
(0.49 |
) |
|
|
|
|
|
|
|
|
|
|
|
| Net Asset Value, End of Period |
|
|
|
$13.41 |
|
|
|
|
$13.40 |
|
|
|
|
$13.75 |
|
|
|
|
$13.79 |
|
|
|
|
$13.18 |
|
|
|
|
$13.22 |
|
|
|
|
|
|
|
|
|
|
|
|
| Total Return(b) |
|
|
|
2.83 |
% |
|
|
|
0.37 |
% |
|
|
|
3.74 |
% |
|
|
|
8.18 |
% |
|
|
|
3.56 |
% |
|
|
|
8.57 |
% |
|
|
|
|
|
| Net Assets, End of Period (000’s) |
|
|
|
$41,607 |
|
|
|
|
$17,128 |
|
|
|
|
$21,435 |
|
|
|
|
$708 |
|
|
|
|
$758 |
|
|
|
|
$579 |
|
|
|
|
|
|
| Ratios to Average Net Assets |
|
|
|
|
|
|
|
|
|
|
|
|
|
|
|
|
|
|
|
|
|
|
|
|
|
|
|
|
|
|
|
|
|
|
|
| Gross Expense |
|
|
|
1.12 |
% |
|
|
|
1.14 |
% |
|
|
|
1.13 |
% |
|
|
|
0.92 |
%(c) |
|
|
|
0.86 |
% |
|
|
|
0.85 |
% |
|
|
|
|
|
| Net Expenses(d) |
|
|
|
0.79 |
% |
|
|
|
0.86 |
% |
|
|
|
0.86 |
% |
|
|
|
0.87 |
%(c) |
|
|
|
0.86 |
% |
|
|
|
0.85 |
% |
|
|
|
|
|
| Net Investment Income (Loss) |
|
|
|
1.84 |
% |
|
|
|
2.00 |
% |
|
|
|
1.74 |
% |
|
|
|
2.56 |
%(c) |
|
|
|
3.20 |
% |
|
|
|
3.55 |
% |
|
|
|
|
|
| Portfolio Turnover Rate |
|
|
|
50 |
% |
|
|
|
38 |
% |
|
|
|
38 |
% |
|
|
|
52 |
% |
|
|
|
30 |
% |
|
|
|
44 |
% |
|
|
|
|
|
| CLASS I |
|
Year Ended
April 30, 2015 |
|
Year Ended
April 30, 2014 |
|
Year Ended
April 30, 2013 |
|
For the Period
July 1,
2011
through
April 30,
2012* |
|
Year Ended
June 30, 2011 |
|
Year Ended
June 30, 2010 |
|
|
| Net Asset Value, Beginning of Period |
|
|
|
$13.40 |
|
|
|
|
$13.76 |
|
|
|
|
$13.79 |
|
|
|
|
$13.19 |
|
|
|
|
$13.22 |
|
|
|
|
$12.64 |
|
|
|
|
|
|
| Income (Loss) From Operations: |
|
|
|
|
|
|
|
|
|
|
|
|
|
|
|
|
|
|
|
|
|
|
|
|
|
|
|
|
|
|
|
|
|
|
|
| Net Investment Income (Loss)(a) |
|
|
|
0.28 |
|
|
|
|
0.30 |
|
|
|
|
0.28 |
|
|
|
|
0.32 |
|
|
|
|
0.45 |
|
|
|
|
0.49 |
|
|
|
|
|
|
| Net Realized and Unrealized Gain (Loss) on Investments |
|
|
|
0.15 |
|
|
|
|
(0.24 |
) |
|
|
|
0.28 |
|
|
|
|
0.77 |
|
|
|
|
0.05 |
|
|
|
|
0.61 |
|
|
|
|
|
|
|
|
|
|
|
|
| Total Income (Loss) From Operations |
|
|
|
0.43 |
|
|
|
|
0.06 |
|
|
|
|
0.56 |
|
|
|
|
1.09 |
|
|
|
|
0.50 |
|
|
|
|
1.10 |
|
|
|
|
|
|
|
|
|
|
|
|
| Less Distributions From: |
|
|
|
|
|
|
|
|
|
|
|
|
|
|
|
|
|
|
|
|
|
|
|
|
|
|
|
|
|
|
|
|
|
|
|
| Net Investment Income |
|
|
|
(0.29 |
) |
|
|
|
(0.30 |
) |
|
|
|
(0.28 |
) |
|
|
|
(0.32 |
) |
|
|
|
(0.45 |
) |
|
|
|
(0.49 |
) |
|
|
|
|
|
| Net Realized Gains |
|
|
|
(0.12 |
) |
|
|
|
(0.12 |
) |
|
|
|
(0.31 |
) |
|
|
|
(0.17 |
) |
|
|
|
(0.08 |
) |
|
|
|
(0.03 |
) |
|
|
|
|
|
|
|
|
|
|
|
| Total Distributions |
|
|
|
(0.41 |
) |
|
|
|
(0.42 |
) |
|
|
|
(0.59 |
) |
|
|
|
(0.49 |
) |
|
|
|
(0.53 |
) |
|
|
|
(0.52 |
) |
|
|
|
|
|
|
|
|
|
|
|
| Net Asset Value, End of Period |
|
|
|
$13.42 |
|
|
|
|
$13.40 |
|
|
|
|
$13.76 |
|
|
|
|
$13.79 |
|
|
|
|
$13.19 |
|
|
|
|
$13.22 |
|
|
|
|
|
|
|
|
|
|
|
|
| Total Return(b) |
|
|
|
3.17 |
% |
|
|
|
0.55 |
% |
|
|
|
4.06 |
% |
|
|
|
8.33 |
% |
|
|
|
3.90 |
% |
|
|
|
8.84 |
% |
|
|
|
|
|
| Net Assets, End of Period (000’s) |
|
|
|
$259,904 |
|
|
|
|
$199,503 |
|
|
|
|
$247,914 |
|
|
|
|
$146,009 |
|
|
|
|
$141,519 |
|
|
|
|
$166,253 |
|
|
|
|
|
|
| Ratios to Average Net Assets |
|
|
|
|
|
|
|
|
|
|
|
|
|
|
|
|
|
|
|
|
|
|
|
|
|
|
|
|
|
|
|
|
|
|
|
| Gross Expense |
|
|
|
0.88 |
% |
|
|
|
0.89 |
% |
|
|
|
0.90 |
% |
|
|
|
0.68 |
%(c) |
|
|
|
0.61 |
% |
|
|
|
0.60 |
% |
|
|
|
|
|
| Net Expenses(d) |
|
|
|
0.55 |
% |
|
|
|
0.61 |
% |
|
|
|
0.61 |
% |
|
|
|
0.62 |
%(c) |
|
|
|
0.61 |
% |
|
|
|
0.60 |
% |
|
|
|
|
|
| Net Investment Income (Loss) |
|
|
|
2.11 |
% |
|
|
|
2.25 |
% |
|
|
|
2.01 |
% |
|
|
|
2.80 |
%(c) |
|
|
|
3.44 |
% |
|
|
|
3.79 |
% |
|
|
|
|
|
| Portfolio Turnover Rate |
|
|
|
50 |
% |
|
|
|
38 |
% |
|
|
|
38 |
% |
|
|
|
52 |
% |
|
|
|
30 |
% |
|
|
|
44 |
% |
|
|
|
|
|
| (a) |
Per share numbers have been calculated using the average shares method. |
| (b) |
Based on net asset value, which does not reflect the sales charge or contingent deferred sales charge, if applicable. Total returns for periods of less than one year, if any, are not annualized. |
| (c) |
Annualized for periods less than one year. |
| (d) |
The investment advisor and other service providers waived or reimbursed a portion of their fees. |
| * |
Year end changed from June 30 to April 30. |
| † |
Effective March 9, 2012, the Fund acquired all of the assets and liabilities of the Wilmington Municipal Bond Fund, a series of WT Mutual Fund (the “WT Fund”). The financial highlights for the periods
prior to that date reflect the performance of the WT Fund. |
See Notes which are an integral part of the Financial Statements.
|
| ANNUAL REPORT / April 30, 2015 |
|
| FINANCIAL HIGHLIGHTS (concluded) |
For a share outstanding throughout each year ended April 30, unless otherwise noted:
|
| WILMINGTON NEW YORK MUNICIPAL BOND FUND |
|
|
|
|
|
|
|
|
|
|
|
|
|
|
|
|
|
|
|
|
|
|
|
|
|
| CLASS A |
|
2015 |
|
|
2014 |
|
|
2013 |
|
|
2012 |
|
|
2011 |
|
|
|
|
| Net Asset Value, Beginning of Year |
|
|
$10.56 |
|
|
|
$10.75 |
|
|
|
$10.59 |
|
|
|
$10.08 |
|
|
|
$10.25 |
|
|
|
|
|
| Income (Loss) From Operations: |
|
|
|
|
|
|
|
|
|
|
|
|
|
|
|
|
|
|
|
|
|
|
|
|
| Net Investment Income (Loss)(a) |
|
|
0.21 |
|
|
|
0.19 |
|
|
|
0.21 |
|
|
|
0.28 |
|
|
|
0.35 |
|
|
|
|
|
| Net Realized and Unrealized Gain (Loss) on Investments |
|
|
0.10 |
|
|
|
(0.19 |
) |
|
|
0.16 |
|
|
|
0.51 |
|
|
|
(0.16 |
) |
|
|
|
|
|
|
|
|
|
| Total Income (Loss) From Operations |
|
|
0.31 |
|
|
|
0.00 |
|
|
|
0.37 |
|
|
|
0.79 |
|
|
|
0.19 |
|
|
|
|
|
|
|
|
|
|
| Less Distributions From: |
|
|
|
|
|
|
|
|
|
|
|
|
|
|
|
|
|
|
|
|
|
|
|
|
| Net Investment Income |
|
|
(0.21 |
) |
|
|
(0.19 |
) |
|
|
(0.21 |
) |
|
|
(0.28 |
) |
|
|
(0.36 |
) |
|
|
|
|
|
|
|
|
|
| Net Asset Value, End of Year |
|
|
$10.66 |
|
|
|
$10.56 |
|
|
|
$10.75 |
|
|
|
$10.59 |
|
|
|
$10.08 |
|
|
|
|
|
|
|
|
|
|
| Total Return(b) |
|
|
2.91 |
% |
|
|
0.04 |
% |
|
|
3.48 |
% |
|
|
7.99 |
% |
|
|
1.83 |
% |
|
|
|
|
| Net Assets, End of Year (000’s) |
|
|
$22,691 |
|
|
|
$24,301 |
|
|
|
$31,239 |
|
|
|
$35,099 |
|
|
|
$34,107 |
|
|
|
|
|
| Ratios to Average Net Assets |
|
|
|
|
|
|
|
|
|
|
|
|
|
|
|
|
|
|
|
|
|
|
|
|
| Gross Expense |
|
|
1.22 |
% |
|
|
1.21 |
% |
|
|
1.20 |
% |
|
|
1.36 |
% |
|
|
1.40 |
% |
|
|
|
|
| Net Expenses(c) |
|
|
0.84 |
% |
|
|
0.84 |
% |
|
|
0.84 |
% |
|
|
0.84 |
% |
|
|
0.84 |
% |
|
|
|
|
| Net Investment Income (Loss) |
|
|
1.93 |
% |
|
|
1.79 |
% |
|
|
1.94 |
% |
|
|
2.73 |
% |
|
|
3.47 |
% |
|
|
|
|
| Portfolio Turnover Rate |
|
|
31 |
% |
|
|
34 |
% |
|
|
41 |
% |
|
|
87 |
% |
|
|
67 |
% |
|
|
|
|
| CLASS I |
|
2015 |
|
|
2014 |
|
|
2013 |
|
|
2012 |
|
|
2011 |
|
|
|
|
| Net Asset Value, Beginning of Year |
|
|
$10.57 |
|
|
|
$10.76 |
|
|
|
$10.60 |
|
|
|
$10.08 |
|
|
|
$10.26 |
|
|
|
|
|
| Income (Loss) From Operations: |
|
|
|
|
|
|
|
|
|
|
|
|
|
|
|
|
|
|
|
|
|
|
|
|
| Net Investment Income (Loss)(a) |
|
|
0.23 |
|
|
|
0.21 |
|
|
|
0.23 |
|
|
|
0.31 |
|
|
|
0.38 |
|
|
|
|
|
| Net Realized and Unrealized Gain (Loss) on Investments |
|
|
0.10 |
|
|
|
(0.18 |
) |
|
|
0.16 |
|
|
|
0.52 |
|
|
|
(0.18 |
) |
|
|
|
|
|
|
|
|
|
| Total Income (Loss) From Operations |
|
|
0.33 |
|
|
|
0.03 |
|
|
|
0.39 |
|
|
|
0.83 |
|
|
|
0.20 |
|
|
|
|
|
|
|
|
|
|
| Less Distributions From: |
|
|
|
|
|
|
|
|
|
|
|
|
|
|
|
|
|
|
|
|
|
|
|
|
| Net Investment Income |
|
|
(0.23 |
) |
|
|
(0.22 |
) |
|
|
(0.23 |
) |
|
|
(0.31 |
) |
|
|
(0.38 |
) |
|
|
|
|
|
|
|
|
|
| Net Asset Value, End of Year |
|
|
$10.67 |
|
|
|
$10.57 |
|
|
|
$10.76 |
|
|
|
$10.60 |
|
|
|
$10.08 |
|
|
|
|
|
|
|
|
|
|
| Total Return(b) |
|
|
3.17 |
% |
|
|
0.30 |
% |
|
|
3.74 |
% |
|
|
8.33 |
% |
|
|
1.97 |
% |
|
|
|
|
| Net Assets, End of Year (000’s) |
|
|
$63,702 |
|
|
|
$69,325 |
|
|
|
$78,471 |
|
|
|
$74,913 |
|
|
|
$68,919 |
|
|
|
|
|
| Ratios to Average Net Assets |
|
|
|
|
|
|
|
|
|
|
|
|
|
|
|
|
|
|
|
|
|
|
|
|
| Gross Expense |
|
|
0.97 |
% |
|
|
0.96 |
% |
|
|
0.95 |
% |
|
|
1.11 |
% |
|
|
1.15 |
% |
|
|
|
|
| Net Expenses(c) |
|
|
0.59 |
% |
|
|
0.59 |
% |
|
|
0.59 |
% |
|
|
0.59 |
% |
|
|
0.59 |
% |
|
|
|
|
| Net Investment Income (Loss) |
|
|
2.18 |
% |
|
|
2.05 |
% |
|
|
2.18 |
% |
|
|
2.99 |
% |
|
|
3.71 |
% |
|
|
|
|
| Portfolio Turnover Rate |
|
|
31 |
% |
|
|
34 |
% |
|
|
41 |
% |
|
|
87 |
% |
|
|
67 |
% |
|
|
|
|
| (a) |
Per share numbers have been calculated using the average shares method. |
| (b) |
Based on net asset value, which does not reflect the sales charge or contingent deferred sales charge, if applicable. Total returns for periods of less than one year, if any, are not annualized. |
| (c) |
The investment advisor and other service providers waived or reimbursed a portion of their fees. |
See Notes
which are an integral part of the Financial Statements
|
| April 30, 2015 / ANNUAL REPORT |
|
| NOTES TO FINANCIAL STATEMENTS |
Wilmington Funds
April 30, 2015
1. ORGANIZATION
Wilmington Funds (the “Trust”) is registered under the Investment Company Act of 1940, as amended (the
“Act”), as an open-end management investment company. The Trust consists of 19 portfolios, 5 of which are presented herein (individually referred to as a “Fund” or collectively as the “Funds”). The remaining 14 funds
are presented in separate reports.
|
|
|
| Fund |
|
Investment
Goal |
| Wilmington Broad Market Bond Fund
(“Broad Market Bond Fund”)(d) |
|
The Fund seeks to provide current income and secondarily, capital growth. |
|
|
| Wilmington Intermediate-Term Bond Fund
(“Intermediate-Term Bond Fund”)(d) |
|
The Fund seeks to provide current income and secondarily, capital growth. |
|
|
| Wilmington Short-Term Bond Fund
Formerly known as Wilmington Short-Term Corporate Bond Fund
(“Short-Term Bond Fund”)(d) |
|
The Fund seeks to provide current income. |
|
|
| Wilmington Municipal Bond Fund
(“Municipal Bond Fund”)(d) |
|
The Fund seeks a high level of income exempt from federal income tax, consistent with the preservation of capital. |
|
|
| Wilmington New York Municipal Bond Fund
(“New York Municipal Bond Fund”)(n) |
|
The Fund seeks to provide current income that is exempt from both federal and New York personal income taxes. |
(d) Diversified
(n) Non-diversified
The Trust offers 6 classes of shares: Class A, Service Class, Select Class, Administrative Class, Class I and Institutional
Class. Service Class, Select Class, Administrative Class and Institutional Class are not available for the Funds. All shares of the Trust have equal rights with respect to voting, except on class-specific matters.
The assets of each portfolio are segregated and a shareholder’s interest is limited to the portfolio in which shares are
held.
In the normal course of business, the Funds may enter into contracts that provide general indemnifications. The
Funds’ maximum exposure under these arrangements is dependent on claims that may be made against the Funds in the future and therefore, cannot be estimated; however, based on experience, the risk of material loss from such claims is considered
remote.
2. SUMMARY OF SIGNIFICANT ACCOUNTING POLICIES
The following is a summary of significant accounting policies consistently followed by the Funds in the preparation of their
financial statements. These policies are in conformity with U.S. generally accepted accounting principles (“GAAP”). The Funds are investment companies and follow accounting and reporting guidance under Financial Accounting Standards Board
(“FASB”) Accounting Standards Codification (“ASU”) Topic 946, “Financial Services - Investment Companies.” The preparation of financial statements in conformity with GAAP requires management to make estimates and
assumptions that affect the amounts of assets, liabilities, expenses and revenues reported in the financial statements. Actual results could differ from those estimated.
Investment Valuation – Fair value of the Funds’ portfolio securities are determined as follows:
| |
• |
investments in open-end regulated investment companies are valued at net asset value (“NAV”); |
| |
• |
for fixed income securities, according to prices as furnished by an independent pricing service, except that fixed income securities with remaining maturities of less than 60 days at the time of purchase are valued at
amortized cost provided such amount approximates fair value; and |
| |
• |
for all other securities at fair value as determined in accordance with procedures established by and under the general supervision of the Board of Trustees (“Trustees”). |
The Trust follows the authoritative guidance (GAAP) for fair value measurements. The guidance establishes a framework for
measuring fair value and a hierarchy for inputs used in measuring fair value that maximizes the use of observable inputs and minimizes the use of unobservable inputs by requiring that the most observable inputs be used when available. The guidance
establishes three tiers of inputs that may be used to measure fair value. The three tiers of inputs are summarized at the end of each Fund’s Portfolio of Investments. The inputs or methodology used for valuing securities are not necessarily an
indication of the risk associated with investing in those securities.
The Funds’ policy is to disclose transfers
between levels based on valuations at the beginning of the reporting period. Each portfolio may hold securities which are periodically fair valued in accordance with the Funds’ fair value procedures. This may result in movements between
Levels 1, 2 and 3 throughout the period. As of April 30, 2015, there were no transfers between Levels 1, 2 and 3 assets and liabilities, based on levels assigned to securities at the beginning of the period. Pursuant to the Funds’
fair value procedures noted previously, fixed income securities and money market instruments are generally categorized as Level 2 securities in the fair value hierarchy.
|
| ANNUAL REPORT / April 30, 2015 |
|
| NOTES TO FINANCIAL STATEMENTS (continued) |
Investments for which there are no such quotations, or for which quotations do
not appear reliable, are valued at fair value in accordance with procedures approved by the Trustees. These valuations are typically categorized as Level 2 or Level 3 securities in the fair value hierarchy.
Repurchase Agreements – Repurchase agreements are transactions in which a Fund buys a security from a dealer or bank
and agrees to sell the security back at a mutually agreed upon time and price. The repurchase price exceeds the sale price, reflecting the Fund’s return on the transaction. It is each Fund’s policy to require the counterparty to a
repurchase agreement to transfer to the Funds’ custodian or sub-custodian eligible securities or cash with a market value (after transaction costs) at least equal to the repurchase price to be paid under the repurchase agreement. The eligible
securities are transferred to accounts with the custodian or sub-custodian in which the Funds hold a “securities entitlement” and exercise “control” as those terms are defined in the Uniform Commercial Code. The Funds have
established procedures for monitoring the market value of the transferred securities and requiring the transfer of additional eligible securities if necessary to equal at least the repurchase price. These procedures also allow the counterparty to
require securities to be transferred from the account to the extent that their market value exceeds the repurchase price or in exchange for other eligible securities of equivalent market value.
The insolvency of the counterparty or other failure to repurchase the securities may delay the disposition of the underlying
securities or cause the Funds to receive less than the full repurchase price.
Repurchase agreements are entered into by the
Funds under Master Repurchase Agreements (“MRA”) which permit the Funds, under certain circumstances including an event of default (such as bankruptcy or insolvency), to offset payables and/or receivables under the MRA with collateral held
and/or posted to the counterparty and create one single net payment due or from the Fund.
At April 30, 2015, the open
repurchase agreements by counterparty which are subject to a MRA on a net payment basis are as follows:
|
|
|
|
|
|
|
|
|
|
|
|
|
|
|
|
|
|
|
|
|
| Fund/Counterparty |
|
Repurchase
Agreements |
|
Fair Value of
Non-cash
Collateral
Received |
|
Cash
Collateral
Received |
|
Net Amount(1)
|
| Broad Market Bond Fund |
|
|
|
|
|
|
|
|
|
|
|
|
|
|
|
|
|
|
|
|
| BNP Paribas Securities Corp. |
|
|
|
$ 739,322 |
|
|
|
|
$ 739,322 |
|
|
|
|
$— |
|
|
|
|
$— |
|
| Citigroup Global Markets, Inc. |
|
|
|
2,809,560 |
|
|
|
|
2,809,560 |
|
|
|
|
— |
|
|
|
|
— |
|
| Credit Suisse Securities (USA) LLC |
|
|
|
2,809,560 |
|
|
|
|
2,809,560 |
|
|
|
|
— |
|
|
|
|
— |
|
| Daiwa Capital Markets America |
|
|
|
2,809,560 |
|
|
|
|
2,809,560 |
|
|
|
|
— |
|
|
|
|
— |
|
| ING Financial Markets LLC |
|
|
|
2,809,560 |
|
|
|
|
2,809,560 |
|
|
|
|
— |
|
|
|
|
— |
|
| Nomura Securities International, Inc. |
|
|
|
2,809,560 |
|
|
|
|
2,809,560 |
|
|
|
|
|
|
|
|
|
|
|
|
|
|
|
$14,787,122 |
|
|
|
|
$14,787,122 |
|
|
|
|
$— |
|
|
|
|
$— |
|
|
|
|
|
|
| Intermediate-Term Bond Fund |
|
|
|
|
|
|
|
|
|
|
|
|
|
|
|
|
|
|
|
|
| BNP Paribas Securities Corp. |
|
|
|
$ 594,075 |
|
|
|
|
$ 594,075 |
|
|
|
|
$— |
|
|
|
|
$— |
|
| Citigroup Global Markets, Inc. |
|
|
|
2,257,565 |
|
|
|
|
2,257,565 |
|
|
|
|
— |
|
|
|
|
— |
|
| Credit Suisse Securities (USA) LLC |
|
|
|
2,257,565 |
|
|
|
|
2,257,565 |
|
|
|
|
— |
|
|
|
|
— |
|
| Daiwa Capital Markets America |
|
|
|
2,257,565 |
|
|
|
|
2,257,565 |
|
|
|
|
— |
|
|
|
|
— |
|
| ING Financial Markets LLC |
|
|
|
2,257,565 |
|
|
|
|
2,257,565 |
|
|
|
|
— |
|
|
|
|
— |
|
| Nomura Securities International, Inc. |
|
|
|
2,257,565 |
|
|
|
|
2,257,565 |
|
|
|
|
— |
|
|
|
|
— |
|
|
|
|
|
$11,881,900 |
|
|
|
|
$11,881,900 |
|
|
|
|
$— |
|
|
|
|
$— |
|
|
|
|
|
|
| Short-Term Bond Fund |
|
|
|
|
|
|
|
|
|
|
|
|
|
|
|
|
|
|
|
|
| BNP Paribas Securities Corp. |
|
|
|
$ 96,908 |
|
|
|
|
$ 96,908 |
|
|
|
|
$— |
|
|
|
|
$— |
|
| Citigroup Global Markets, Inc. |
|
|
|
368,271 |
|
|
|
|
368,271 |
|
|
|
|
— |
|
|
|
|
— |
|
| Credit Suisse Securities (USA) LLC |
|
|
|
368,271 |
|
|
|
|
368,271 |
|
|
|
|
— |
|
|
|
|
— |
|
| Daiwa Capital Markets America |
|
|
|
368,271 |
|
|
|
|
368,271 |
|
|
|
|
— |
|
|
|
|
— |
|
| ING Financial Markets LLC |
|
|
|
368,271 |
|
|
|
|
368,271 |
|
|
|
|
— |
|
|
|
|
— |
|
| Nomura Securities International, Inc. |
|
|
|
368,271 |
|
|
|
|
368,271 |
|
|
|
|
— |
|
|
|
|
— |
|
|
|
|
|
$ 1,938,263 |
|
|
|
|
$ 1,938,263 |
|
|
|
|
$— |
|
|
|
|
$— |
|
|
|
|
|
|
|
|
|
|
|
|
|
|
|
|
|
|
|
|
|
|
(1)Net amount represents the net amount receivable due from the
counterparty in the event of default.
Investment Income, Gains and Losses, Expenses and Distributions –
Interest income and expenses are accrued daily. All premiums and discounts on fixed income securities are amortized/accreted for financial statement purposes. Gains and losses realized on principal payment of mortgage-backed securities (paydown
gains and losses) are classified as part of investment income. Dividends and distributions to shareholders are recorded on the ex-dividend date. Investment transactions are accounted for on a trade date basis for financial reporting purposes.
Inflation/deflation adjustments on Treasury Inflation–Protected Securities are included in interest income. Realized gains and losses from investment transactions are recorded on an identified cost basis.
|
| April 30, 2015 / ANNUAL REPORT |
|
| NOTES TO FINANCIAL STATEMENTS (continued) |
Expenses of the Trust, which are directly identifiable to a specific Fund, are
applied to that Fund. Expenses which are not identifiable to a specific Fund are allocated in such a manner as deemed equitable, taking into consideration the nature and type of expense.
All Funds offer multiple classes of shares. Investment income, realized and unrealized gains and losses, and certain fund-level
expenses are allocated to each class based on relative daily net assets, except that each class bears certain expenses unique to that class such as distribution and shareholder services fees. Distributions are declared separately for each class. No
class has preferential distribution rights; differences in per share distributions rates are generally due to differences in class specific expenses. Distributions from net realized gains, if any, are declared and paid to shareholders annually.
Distributions from net investment income are declared daily and paid monthly.
Federal Taxes – It is the
Funds’ policy to comply with the Subchapter M provision of the Internal Revenue Code of 1986, as amended (the “Code”), and to distribute to shareholders each year substantially all of their income. Accordingly, no provisions for
Federal income tax or excise tax are necessary.
Withholding taxes and where appropriate, deferred withholding taxes, on
foreign interest, dividends and capital gains have been provided for in accordance with the applicable country’s tax rules and rates.
The Funds recognize interest and penalties, if any, related to unrecognized tax benefits as income tax expense on the Statement
of Operations. During the year ended April 30, 2015, the Funds did not incur any interest or penalties.
When-Issued
and Delayed Delivery Transactions – The Funds may engage in when-issued or delayed delivery transactions. The Funds record when-issued securities on the trade date and maintain security positions such that sufficient liquid assets will be
available to make payment for the securities purchased. Securities purchased on a when-issued or delayed delivery basis are marked to market daily and begin earning interest on the settlement date. Losses may occur on these transactions due to
changes in market conditions or the failure of counterparties to perform under the contract.
The Funds may transact in
“To Be Announced Securities” (“TBAs”). As with other delayed delivery transactions, a seller agrees to issue TBAs at a future date. However, the seller does not specify the particular securities to be delivered. Instead, the
Funds agree to accept any security that meets specified criteria. For example, in a TBA mortgage transaction, the Fund and seller would agree upon the issuer, interest rate and terms of the underlying mortgages. The Funds record TBAs on the trade
date utilizing information associated with the specified terms of the transactions as opposed to the specific mortgages. TBAs are marked to market daily and begin earning interest of the settlement date. Losses may occur due to the fact the actual
underlying mortgages received may be less favorable than those anticipated by the Funds.
Restricted Securities
– Restricted securities are securities that either (a) cannot be offered for public sale without first being registered, or being able to take advantage of an exemption from registration, under the Securities Act of 1933, as amended,
or (b) are subject to contractual restrictions on public sales. In some cases, when a security cannot be offered for public sale without first being registered, the issuer of the restricted security has agreed to register such securities for
resale, at the issuer’s expense, either upon demand by the Fund or in connection with another registered offering of the securities. Many such restricted securities may be resold in the secondary market in transactions exempt from registration.
Restricted securities may be determined to be liquid under criteria established by the Trustees. A Fund will not incur any registration costs upon such resales. The Fund’s restricted securities are valued at the price provided by dealers in the
secondary market or, if no market prices are available, at the fair value as determined in accordance with procedures established by and under the general supervision of the Trustees.
Dollar Roll Transactions – The Intermediate-Term Bond Fund and Broad Market Bond Fund may enter into dollar roll
transactions, with respect to mortgage securities issued by GNMA, FNMA, and FHLMC, in which the Funds sell mortgage securities to financial institutions and simultaneously agree to accept substantially similar (same type, coupon, maturity)
securities at a later date at an agreed upon price. Dollar roll transactions, which are treated as purchases and sales, will not exceed 12 months. There were no dollar roll transactions outstanding during the year ended April 30, 2015.
Lending of Portfolio Securities – The Trust has entered into an agreement with their custodian whereby the custodian
may lend securities owned by the Funds to brokers, dealers and other financial organizations. Any increase or decrease in the fair value of securities loaned and any interest or dividends earned on those securities during the term of the loan would
be for the account of the Fund. In exchange for lending securities under the terms of the agreement with their custodian, the Funds receive a lender’s fee. Fees earned by the Funds on securities lending are recorded as income. Loans of
securities by the Funds are collateralized by cash, U.S. government securities or money market instruments that are maintained at all times in an amount at least equal to the current market value of the loaned securities plus a margin which varies
depending on the type of securities owned. The custodian establishes and maintains the collateral in a segregated account. The Funds have the right under the lending agreement to recover the securities from the borrower on demand. The market value
of the loaned securities is determined at the close of business of the Fund and any additional required collateral is delivered to the Fund on the next business day.
Investments purchased with cash collateral are presented on the portfolios of investments under the caption “Cash
Collateral Invested for Securities on Loan.”
The Funds maintain the risk of any loss on the securities on loan as well
as the potential loss on investments purchased with cash collateral received from securities lending.
|
| ANNUAL REPORT / April 30, 2015 |
|
| NOTES TO FINANCIAL STATEMENTS (continued) |
Securities lending transactions are entered into by the Funds under Master
Securities Lending Agreements (“MSLA”) which permit the Funds, under certain circumstances including an event of default (such as bankruptcy or insolvency), to offset amounts payable by the Fund to the same counterparty against amounts to
be received and create one single net payment due to or from the Fund. Utilization of acquired capital loss carryforwards from Short-Term Corporate Bond Fund’s acquisition of Short Duration Government Bond Fund and Municipal Bond Fund’s
acquisition of Maryland Municipal Bond Fund may be subject to annual limitations.
At April 30, 2015, the securities
loaned which are subject to a MSLA on a net payment basis are as follows:
|
|
|
|
|
|
|
|
|
|
|
|
|
| Fund |
|
Value of
Securities
on Loan |
|
|
Cash
Collateral
Received(1)
|
|
|
Net Amount(2) |
|
|
| Broad Market Bond Fund |
|
|
$14,370,775 |
|
|
|
$14,370,775 |
|
|
$— |
|
|
| Intermediate-Term Bond Fund |
|
|
11,533,330 |
|
|
|
11,533,330 |
|
|
— |
|
|
| Short-Term Bond Fund |
|
|
1,898,064 |
|
|
|
1,898,064 |
|
|
— |
|
|
| (1)Collateral with a value of $14,787,122,
$11,881,900 and $1,983,263 respectively, has been received in connection with securities lending transactions. (2)Net amount represents the net amount receivable due from the counterparty in the event of default. |
3. FEDERAL TAX INFORMATION
The timing and character of income and capital gain distributions are determined in accordance with income tax regulations,
which may differ from GAAP. These differences are due in part to the tax treatment of expiring capital loss carryforwards, net investment losses, market discount reclass, discount accretion/premium amortization on debt securities, capital gain or
loss as a result of paydown activity, and distributions recognition on income distribution payable. GAAP requires that permanent differences in net investment income and realized gains and losses due to differences between financial reporting and
tax reporting be reclassified between various components of net assets and have no effect on the net assets nor the NAV of the Funds.
As of April 30, 2015, there are no uncertain tax positions that would require financial statement recognition,
de-recognition or disclosure. The Funds’ federal tax returns filed for the periods ended 2014, 2013, and 2012, as well as the current tax year, remain subject to examination by the Internal Revenue Service.
For the year ended April 30, 2015, permanent differences identified and reclassified among the components of net assets
were as follows:
|
|
|
|
|
|
|
|
|
|
|
|
|
| Fund |
|
Paid-in
Capital |
|
|
Increase
(Decrease)
Undistributed Net
Investment Income |
|
|
Accumulated
Net Realized
Gain (Loss) |
|
| Broad Market Bond Fund |
|
$ |
— |
|
|
|
$338,183 |
|
|
$ |
(338,183) |
|
| Intermediate-Term Bond Fund |
|
|
— |
|
|
|
10,402 |
|
|
|
(10,402) |
|
| Short-Term Bond Fund |
|
|
1,081,413 |
|
|
|
(14,529) |
|
|
|
(1,066,884) |
|
| Municipal Bond Fund |
|
|
277 |
|
|
|
— |
|
|
|
(277) |
|
The tax character of distributions for the corresponding fiscal years as reported on the
Statements of Changes in Net Assets were as follows:
|
|
|
|
|
|
|
|
|
|
|
|
|
|
|
|
|
|
|
|
|
|
|
|
|
| Fund |
|
Ordinary
Income* |
|
|
2015
Tax Exempt
Income |
|
|
Long-Term
Capital Gains |
|
|
Ordinary
Income* |
|
|
2014
Tax Exempt
Income |
|
|
Long-Term
Capital Gains |
|
| Broad Market Bond Fund |
|
|
$7,699,108 |
|
|
$ |
— |
|
|
$ |
674,691 |
|
|
|
$6,683,784 |
|
|
$ |
— |
|
|
|
$2,729,590 |
|
| Intermediate-Term Bond Fund |
|
|
2,248,626 |
|
|
|
— |
|
|
|
1,972,089 |
|
|
|
3,282,561 |
|
|
|
— |
|
|
|
4,523,368 |
|
| Short-Term Bond Fund |
|
|
1,606,528 |
|
|
|
— |
|
|
|
808,393 |
|
|
|
2,059,726 |
|
|
|
— |
|
|
|
889,895 |
|
| Municipal Bond Fund |
|
|
46,207 |
|
|
|
4,887,359 |
|
|
|
1,762,699 |
|
|
|
544,777 |
|
|
|
5,095,492 |
|
|
|
1,599,639 |
|
| New York Municipal Bond Fund |
|
|
— |
|
|
|
1,898,921 |
|
|
|
— |
|
|
|
— |
|
|
|
1,968,280 |
|
|
|
— |
|
| |
* |
For tax purposes, short-term capital gain distributions are considered ordinary income distributions. |
As of April 30, 2015, the components of distributable earnings on a tax basis were as follows:
|
|
|
|
|
|
|
|
|
|
|
|
|
|
|
|
|
|
|
|
|
| Fund |
|
Undistributed/
Ordinary Income |
|
|
Undistributed
Long-Term
Capital Gains |
|
|
Other
Timing
Differences |
|
|
Unrealized
Appreciation
(Depreciation) |
|
|
Capital Loss
Carryforwards
and Deferrals |
|
| Broad Market Bond Fund |
|
|
$629,110 |
|
|
|
$ 490,918 |
|
|
|
$(767,214) |
|
|
|
$10,433,842 |
|
|
|
$ — |
|
| Intermediate-Term Bond Fund |
|
|
227,232 |
|
|
|
110,908 |
|
|
|
(174,791) |
|
|
|
2,650,143 |
|
|
|
— |
|
| Short-Term Bond Fund |
|
|
83,566 |
|
|
|
287,062 |
|
|
|
(199,679) |
|
|
|
1,013,424 |
|
|
|
(851,639) |
|
| Municipal Bond Fund |
|
|
709,288 |
|
|
|
3,063,129 |
|
|
|
(419,746) |
|
|
|
8,910,462 |
|
|
|
— |
|
| New York Municipal Bond Fund |
|
|
153,741 |
|
|
|
— |
|
|
|
(153,732) |
|
|
|
4,072,667 |
|
|
|
(916,858) |
|
|
| April 30, 2015 / ANNUAL REPORT |
|
| NOTES TO FINANCIAL STATEMENTS (continued) |
At April 30, 2015, the following Funds had capital loss carryforwards which
will reduce each Fund’s taxable income arising from future net realized gain on investments, if any, to the extent permitted by the Code and thus will reduce the amount of distributions to shareholders which would otherwise be necessary to
relieve the Fund of any liability for federal income tax. Pursuant to the Code, such capital loss carryforwards will expire as follows:
|
|
|
|
|
|
|
|
|
|
|
| |
|
Capital Loss Available Through |
|
Short-Term
Post-Effective
|
|
Long-Term
Post-Effective
|
|
Total Capital
Loss |
| Fund |
|
2018 |
|
2019 |
|
No Expiration |
|
No Expiration |
|
Carryforwards |
| Short-Term Bond Fund |
|
$108,426 |
|
$— |
|
$481,660 |
|
$261,553 |
|
$851,639 |
| New York Municipal Bond Fund |
|
916,858 |
|
— |
|
— |
|
— |
|
916,858 |
The Funds used capital loss carryforwards as follows to offset taxable capital gains realized
during the year ended April 30, 2015:
|
|
|
| Fund |
|
Capital Loss
Carryforwards
Utilized |
| Short-Term Bond Fund |
|
$ 229,672 |
| Municipal Bond Fund |
|
59,962 |
| New York Municipal Bond Fund |
|
1,215,748 |
The Short-Term Bond Fund had capital loss carryforwards expire in the amount of $129,435.
| 4. |
ADVISORY FEES, SERVICING FEES, AND OTHER SERVICE PROVIDERS |
Investment
Advisor – Wilmington Funds Management Corporation (“WFMC” or the “Advisor”) serves as the Investment Advisor to each of the Funds. Wilmington Trust Investment Advisors, Inc. (“WTIA”) provides sub-advisory
services to the Funds. WFMC and WTIA are wholly-owned subsidiaries of M&T Bank Corporation.
On September 18, 2014,
the Trustees voted to change the investment advisory fee rates for the Funds. Effective December 1, 2014, the following Funds pay WFMC an annual investment advisory fee, accrued and paid daily, based on a percentage of each Fund’s average
daily net assets as described below. WFMC, not the Funds, pays WTIA for it services.
|
|
|
| Fund |
|
Advisory Fee
Annual Rate |
| Broad Market Bond Fund |
|
0.45% |
| Intermediate-Term Bond Fund |
|
0.45% |
| Short-Term Bond Fund |
|
0.40% |
| Municipal Bond Fund |
|
0.45% |
| New York Municipal Bond Fund |
|
0.45% |
Prior to December 1, 2014, the Funds had annual investment advisory fees, accrued and paid
daily, based on a percentage of each Fund’s average daily net assets as described below.
|
|
|
| Fund |
|
Prior Advisory Fee
Annual Rate |
| Broad Market Bond Fund |
|
0.50% |
| Intermediate-Term Bond Fund |
|
0.50% |
| Short-Term Bond Fund |
|
0.50% |
| Municipal Bond Fund |
|
0.50% |
| New York Municipal Bond Fund |
|
0.50% |
On September 18, 2014, the Trustees voted to change the contractual expense limitations for
the Funds. Effective December 1, 2014, WFMC and the Funds’ distributor and shareholder service providers have contractually agreed to waive their fees and/or reimburse expenses through November 30, 2015, so that total annual fund
operating expenses paid by the Funds (not including the effects of dividends or interest on short positions, acquired fund fees and expenses, taxes, or other extraordinary expenses expressed as an annualized percentage of average daily net assets),
will not exceed the expense limitations set forth below. Neither WFMC nor the Funds’ distributor will recoup previously waived fees / expenses in subsequent years.
|
|
|
|
|
|
|
|
|
| |
|
Contractual
Expense Limitations |
|
| Fund |
|
Class A |
|
|
Class I |
|
| Broad Market Bond Fund |
|
|
0.90% |
|
|
|
0.55% |
|
| Intermediate-Term Bond Fund |
|
|
0.88% |
|
|
|
0.53% |
|
|
| ANNUAL REPORT / April 30, 2015 |
|
| NOTES TO FINANCIAL STATEMENTS (continued) |
|
|
|
|
|
|
|
|
|
| |
|
Contractual
Expense
Limitations |
|
| Fund |
|
Class A |
|
|
Class I |
|
| Short-Term Bond Fund |
|
|
0.73% |
|
|
|
0.48% |
|
| Municipal Bond Fund |
|
|
0.74% |
|
|
|
0.49% |
|
| New York Municipal Bond Fund |
|
|
0.84% |
|
|
|
0.59% |
|
Prior to December 1, 2014, WFMC and the Funds’ distributor and Shareholder Service
providers had contractually agreed to waive their fees and/or reimburse expenses, so that total annual fund operating expenses paid by the Funds (not including the effects of dividends or interest on short positions, acquired fund fees and expenses,
taxes, or other extraordinary expenses expressed as an annualized percentage of average daily net assets), would not exceed the expense limitations set forth below.
|
|
|
|
|
|
|
|
|
| |
|
Contractual
Expense Limitations |
|
| Fund |
|
Class A |
|
|
Class I |
|
| Broad Market Bond Fund |
|
|
1.00% |
|
|
|
0.65% |
|
| Intermediate-Term Bond Fund |
|
|
0.95% |
|
|
|
0.60% |
|
| Short-Term Bond Fund |
|
|
0.86% |
|
|
|
0.61% |
|
| Municipal Bond Fund |
|
|
0.86% |
|
|
|
0.61% |
|
| New York Municipal Bond Fund |
|
|
0.84% |
|
|
|
0.59% |
|
Administrative Fee – The Bank of New York Mellon (“BNYM”) provides
the Trust with fund administration services. WFMC in its role as co-administrator provides the Funds with certain administrative personnel and services necessary to operate the Funds. These services were provided for at an aggregate annual fee as
specified below.
|
|
|
|
|
|
|
| Administrator |
|
Maximum
Fee |
|
|
Average Aggregate Daily Net
Assets of the Trust |
| WFMC |
|
|
0.040% |
|
|
on the first $5 billion |
|
|
|
0.030% |
|
|
on the next $2 billion |
|
|
|
0.025% |
|
|
on the next $3 billion |
|
|
|
0.018% |
|
|
on assets in excess of $10 billion |
|
|
|
| BNYM |
|
|
0.0285% |
|
|
on the first $500 million |
|
|
|
0.0280% |
|
|
on the next $500 million |
|
|
|
0.0275% |
|
|
on assets in excess of $1 billion |
WFMC may voluntarily choose to waive any portion of its fee. WFMC can modify or terminate its
voluntary waiver at any time at its sole discretion. For the year ended April 30, 2015, WFMC did not waive any administrative personnel and services fee.
Distribution Services Fee – The Trust has adopted a Distribution Services Plan (the “Plan”) pursuant to
Rule 12b-1 under the Act. The Plan allows the Funds to pay fees to financial intermediaries, which may be paid through ALPS Distributors, Inc. (“ALPS”), the principal distributor, at an annual rate of up to 0.25% of the average daily net
assets of the Funds’ Class A shares for the sale, distribution, administration, customer servicing and recordkeeping of these shares.
The Trust may reduce the maximum amount of distribution services fees it pays from time to time at its sole discretion. In
addition, a financial intermediary (including ALPS, the Advisor or their affiliates), may voluntarily waive or reduce any fees to which they are entitled.
For the year ended April 30, 2015, M&T Securities, Inc. and Manufacturers and Traders Trust Company (together
“M&T”), affiliates of the Advisor, received all or a portion of the fees paid by the Funds which are listed below:
|
|
|
|
|
| Fund |
|
Distribution
Fees |
|
| Broad Market Bond Fund |
|
|
$11,247 |
|
| Intermediate-Term Bond Fund |
|
|
6,014 |
|
| Short-Term Bond Fund |
|
|
4,179 |
|
| Municipal Bond Fund |
|
|
51,848 |
|
| New York Municipal Bond Fund |
|
|
56,731 |
|
|
| April 30, 2015 / ANNUAL REPORT |
|
| NOTES TO FINANCIAL STATEMENTS (continued) |
Sales Charges – The Class A shares of all the Funds bear
front-end sales charges.
For the year ended April 30, 2015, M&T received the amounts listed below from sales
charges on the sale of Class A shares.
|
|
|
|
|
|
| Fund |
|
Sales Charges
from Class A |
| Broad Market Bond Fund |
|
|
|
$ 3,200 |
|
| Intermediate-Term Bond Fund |
|
|
|
814 |
|
| Short-Term Bond Fund |
|
|
|
77 |
|
| Municipal Bond Fund |
|
|
|
16,895 |
|
| New York Municipal Bond Fund |
|
|
|
3,688 |
|
Shareholder Services Fee – Pursuant to a Shareholder Services Plan adopted by the
Funds and administered by ALPS, the Funds may pay up to 0.25% of the average daily net assets of each Fund’s Class A and Class I shares to financial intermediaries (which may include ALPS, the Advisor or their affiliates) for providing
shareholder services and maintaining shareholder accounts. M&T has entered into a Shareholders Services Agreement with ALPS, under which it is entitled to receive up to 0.25% of the average daily net assets of each Fund’s shares for whom
M&T provides shareholder services. The Funds may reduce the maximum amount of shareholder service fees it pays from time to time at its sole discretion. In addition, a financial intermediary (including M&T) may waive or reduce any fees to
which they are entitled.
For the year ended April 30, 2015, M&T received a portion of the fees paid by the
following Funds which are listed below:
|
|
|
| Fund |
|
Shareholder Services
Fee |
| Broad Market Bond Fund |
|
$3,876 |
| Intermediate-Term Bond Fund |
|
1,977 |
Other Service Providers – Foreside Management Services, LLC (“FMS”)
provides a Principal Executive Officer and Principal Financial Officer to the Trust. FMS has no role in determining the investment policies or which securities are to be sold or purchased by the Trust or its Funds.
BNYM provides custody services to the Trust.
BNY Mellon Investment Servicing (U.S.) Inc. provides fund accounting and transfer agency services to the Trust.
General – Certain Officers of the Trust are also Officers or employees of the above companies that provide services
to the Funds, and during their terms of office, receive no compensation from the Funds. The Trust’s Statement of Additional Information includes additional information about the Trustees.
5. INVESTMENT TRANSACTIONS
Purchases and sales of investments, excluding short-term obligations, U.S. Government Securities and in-kind transactions, for
the year ended April 30, 2015 were as follows:
|
|
|
|
|
|
|
|
|
| |
|
Investments
|
|
| Fund |
|
Purchases |
|
|
Sales |
|
| Broad Market Bond Fund |
|
|
$228,442,424 |
|
|
|
$124,968,795 |
|
| Intermediate-Term Bond Fund |
|
|
39,978,433 |
|
|
|
56,423,443 |
|
| Short-Term Bond Fund |
|
|
90,321,869 |
|
|
|
166,167,366 |
|
| Municipal Bond Fund |
|
|
197,442,103 |
|
|
|
113,838,104 |
|
| New York Municipal Bond Fund |
|
|
27,244,889 |
|
|
|
33,775,064 |
|
Purchases and sales of investments of U.S. Government Securities for the year ended
April 30, 2015 were as follows:
|
|
|
|
|
|
|
|
|
| |
|
U.S.
Government Securities |
|
| Fund |
|
Purchases |
|
|
Sales |
|
| Broad Market Bond Fund |
|
|
$ 71,174,488 |
|
|
|
$19,443,182 |
|
| Intermediate-Term Bond Fund |
|
|
19,880,496 |
|
|
|
14,185,030 |
|
| Short-Term Bond Fund |
|
|
103,265,489 |
|
|
|
98,128,503 |
|
|
| ANNUAL REPORT / April 30, 2015 |
|
| NOTES TO FINANCIAL STATEMENTS (continued) |
6. CONCENTRATION OF RISK
Since New York Municipal Bond Fund invests a substantial portion of its assets in issuers located in one state, it will be more
susceptible to factors adversely affecting issuers of that state than would be a comparable tax-exempt mutual fund that invests nationally. In order to reduce the credit risk associated with such factors, at April 30, 2015, 14.5% of New York
Municipal Bond Fund’s total market value of the securities in the portfolio of investments are backed by bond insurance of various financial institutions and financial guaranty assurance agencies.
7. LINE OF CREDIT
The Trust participated in a $20,000,000 unsecured, committed revolving line of credit (“LOC”) agreement with BNYM. The
LOC was made available for extraordinary or emergency purposes, primarily for financing redemption payments. Borrowings are charged interest at a rate of 1.25% per annum over the greater of the Federal Funds Rate or the overnight LIBOR Rate.
The LOC included a commitment fee of 0.10% per annum on the daily unused portion. The LOC was in effect for the entire fiscal year and the termination date of this LOC is March 9, 2016. The Funds did not utilize the LOC during the year
ended April 30, 2015.
8. REORGANIZATION
REORGANIZATION - FISCAL YEAR 2015
On September 18, 2014, the Board approved an Agreement and Plans of Reorganization (the “Reorganizations”) which
provided for the transfer of all the assets of the Short Duration Government Bond Fund and the Maryland Municipal Bond Fund, each a series of the Trust (the “Acquired Funds”), for shares of the Short-Term Corporate Bond Fund and the
Municipal Bond Fund (the “Acquiring Funds”), respectively. Shareholders approved the Reorganizations at a meeting held on January 15, 2015 and the Reorganizations closed on January 30, 2015 based on net asset values determined as
of close of business on January 30, 2015. The acquisitions were accomplished through tax-free exchanges of assets and shares.
The purpose of this transaction was to combine the Funds with the same Investment Manager and with substantially similar
investment objectives, policies, and restrictions. Due to the small size of the Acquired Funds and the comparatively better prospects for asset growth of the Acquiring Funds, it was believed that the shareholders’ best interest would be served
by reorganizing the Acquired Funds into the Acquiring Funds.
In addition, the Short-Term Corporate Bond Fund (as one of the
Acquiring Funds) experienced the following changes. First, the name of the Acquiring Fund was changed to the “Wilmington Short-Term Bond Fund”. Second, the Principal Investment Strategies of the Acquiring Fund was revised to remove the 80%
limitation related to investment in corporate debt securities to allow the Fund to invest primarily in U.S. investment grade corporate and government fixed income securities.
For financial reporting purposes, each of the Acquiring Funds was deemed to be the accounting survivor.
|
|
|
|
|
|
|
|
|
|
|
|
|
|
|
|
|
|
|
|
|
|
|
| |
|
Value of Shares |
|
Acquired Fund
Shares Prior to
Reorganization |
|
Shares Issued
by Acquiring
Fund |
|
Net Assets |
|
|
| Acquiring Fund |
|
|
|
|
|
|
|
|
|
|
|
|
|
|
|
|
|
|
|
| Wilmington Short-Term Bond Fund |
|
|
|
|
|
|
|
|
|
|
|
|
|
|
|
$ 93,759,730 |
|
|
|
| Acquired Fund |
|
|
|
|
|
|
|
|
|
|
|
|
|
|
|
|
|
|
|
| Wilmington Short Duration Government Bond Fund |
|
|
|
|
|
|
|
|
|
|
|
|
|
|
|
87,480,297 |
|
|
|
| Class A shares in exchange for Class A |
|
|
|
$ 7,021,999 |
|
|
745,255 |
|
|
|
694,098 |
|
|
|
|
|
|
|
|
| Class I shares in exchange for Class I |
|
|
|
80,458,298 |
|
|
8,522,359 |
|
|
|
7,950,847 |
|
|
|
|
|
|
|
|
|
|
|
|
|
|
|
|
|
|
|
|
|
|
|
|
$181,240,027 |
|
|
|
|
|
|
|
|
|
|
|
|
|
|
|
|
|
|
|
|
|
|
|
|
| |
|
Value of Shares |
|
Acquired Fund
Shares Prior to
Reorganization |
|
Shares Issued
by Acquiring
Fund |
|
Net Assets |
|
|
| Acquiring Fund |
|
|
|
|
|
|
|
|
|
|
|
|
|
|
|
|
|
|
|
| Wilmington Municipal Bond Fund |
|
|
|
|
|
|
|
|
|
|
|
|
|
|
|
$219,313,878 |
|
|
|
| Acquired Fund |
|
|
|
|
|
|
|
|
|
|
|
|
|
|
|
|
|
|
|
| Wilmington Maryland Municipal Bond Fund |
|
|
|
|
|
|
|
|
|
|
|
|
|
|
|
88,064,168 |
|
|
|
| Class A shares in exchange for Class A |
|
|
|
$27,966,651 |
|
|
2,729,770 |
|
|
|
2,047,329 |
|
|
|
|
|
|
|
|
| Class I shares in exchange for Class I |
|
|
|
60,097,517 |
|
|
5,856,789 |
|
|
|
4,397,825 |
|
|
|
|
|
|
|
|
|
|
|
|
|
|
|
|
|
|
|
|
|
|
|
|
$307,378,046 |
|
|
|
|
| April 30, 2015 / ANNUAL REPORT |
|
| NOTES TO FINANCIAL STATEMENTS (continued) |
The net assets of the Acquired Funds included net unrealized appreciation on
investments of $1,165,527 and $4,651,902 and accumulated net realized gains (losses) of $(313,681) and $435,174 for the Short Duration Government Bond Fund and Maryland Municipal Bond Fund, respectively.
The financial statements of the Funds reflect the operations of the Acquiring Funds for the period prior to the Reorganizations
and the combined fund for the period subsequent to the Reorganizations. Because each of the combined investment portfolios have been managed as a single integrated portfolio since the Reorganizations were completed, it is not practicable to separate
the amounts of revenue and earnings of each Acquired Fund that have been included in each combined Fund’s Statement of Operations since the Reorganizations were completed. For every Class A Share and Class I Share exchanged, a shareholder
of Short Duration Government Bond Fund received approximately 0.93 Class A Shares and Class I Shares, respectively of Short-Term Bond Fund. For every Class A Share and Class I Share exchanged, a shareholder of Maryland Municipal Bond Fund
received approximately 0.75 Class A Shares and Class I Shares, respectively of Municipal Bond Fund. Assuming the Reorganizations had been completed on May 1, 2014, the pro forma net investment income, net realized and unrealized
gain/(loss) on investments and net increase in net assets from operations for the fiscal year ended April 30, 2015 would have been $2,202,814, $(545,502) and $1,657,312, for the Short Duration Government Bond Fund and $5,940,465, $3,103,054 and
$9,043,519, for the Maryland Municipal Bond Fund, respectively.
Management has evaluated events and transactions for
potential recognition or disclosure in the financial statements through the date the financial statements were issued. Management has determined that, there are no material events that would require recognition or disclosure in the Funds’
financial statements through this date.
|
| ANNUAL REPORT / April 30, 2015 |
REPORT OF INDEPENDENT REGISTERED PUBLIC ACCOUNTING FIRM
TO THE SHAREHOLDERS AND BOARD OF TRUSTEES OF
WILMINGTON
FUNDS
We have audited the accompanying statements of assets and liabilities, including the portfolios of investments, of the
Wilmington Broad Market Bond Fund, Wilmington Intermediate-Term Bond Fund, Wilmington Short-Term Bond Fund, Wilmington Municipal Bond Fund and Wilmington New York Municipal Bond Fund (five of the series constituting the Wilmington Funds) (the
“Funds”) as of April 30, 2015, and the related statements of operations for the year then ended, the statements of changes in net assets for each of the two years in the period then ended, and the financial highlights for each of the
years or periods indicated therein. These financial statements and financial highlights are the responsibility of the Funds’ management. Our responsibility is to express an opinion on these financial statements and financial highlights based on
our audits.
We conducted our audits in accordance with standards of the Public Company Accounting Oversight Board (United States). Those
standards require that we plan and perform the audit to obtain reasonable assurance about whether the financial statements and financial highlights are free of material misstatement. We were not engaged to perform an audit of the Funds’
internal control over financial reporting. Our audits included consideration of internal control over financial reporting as a basis for designing audit procedures that are appropriate in the circumstances, but not for the purpose of expressing an
opinion on the effectiveness of the Funds’ internal control over financial reporting. Accordingly, we express no such opinion. An audit also includes examining, on a test basis, evidence supporting the amounts and disclosures in the financial
statements and financial highlights, assessing the accounting principles used and significant estimates made by management, and evaluating the overall financial statement presentation. Our procedures included confirmation of securities owned as of
April 30, 2015, by correspondence with the custodian and brokers, or by other appropriate auditing procedures where replies from the brokers were not received. We believe that our audits provide a reasonable basis for our opinion.
In our opinion, the financial statements and financial highlights referred to above present fairly, in all material respects, the financial
position of the Wilmington Broad Market Bond Fund, Wilmington Intermediate-Term Bond Fund, Wilmington Short-Term Bond Fund, Wilmington Municipal Bond Fund and Wilmington New York Municipal Bond Fund (five of the series constituting the Wilmington
Funds) at April 30, 2015, the results of their operations for the year then ended, the changes in their net assets for each of the two years in the period then ended, and their financial highlights for each of the years or periods indicated
therein, in conformity with U.S. generally accepted accounting principles.

Philadelphia, Pennsylvania
June 29, 2015
|
| April 30, 2015 / ANNUAL REPORT |
|
| BOARD OF TRUSTEES AND TRUST OFFICERS |
BOARD OF TRUSTEES AND TRUST OFFICERS
The following tables give information about each Trustee and the senior officers of the Trust. The tables separately list Trustee members who
are “interested persons” of the Fund (i.e., “Interested” Trustees) and those who are not (i.e., “Independent” Trustees). The Trust is comprised of 23 funds. Unless otherwise noted, the business address of each Trustee
and senior officer is 111 South Calvert Street, 26th floor, Baltimore, Maryland 21202. Each Trustee oversees all portfolios of the Trust and serves for an indefinite term. The Trust’s Statement of Additional Information includes additional
information about the Trustees and is available, without charge and upon request, by calling 1-800-836-2211.
INTERESTED TRUSTEES BACKGROUND
|
|
|
|
Name
Address
Birth date
Position With Trust
Date Service Began
|
|
Principal Occupations for past five years and Other Directorships Held
|
|
|
| R. Samuel Fraundorf, CFA, CPA*
Birth date: 4/64 TRUSTEE
Began serving: March 2012 |
|
Principal Occupations: Senior Vice President, Chief Investment Strategist and Chief Client Officer of WTIA and WFMC.
Other Directorships Held: Director, WTIA
(1/14 to present); Director, WFMC (1/14 to present).
Previous Positions: President of WTIA (1/12 to 1/14); President of Wilmington Trust Investment Management (“WTIM”) (8/04 to 1/12); Chief Operating
Officer of WTIM (1/08 to 1/09); Director of Research at WTIM (8/04 to 1/08). |
| |
|
|
| Robert J. Truesdell*
Birth date: 11/55 TRUSTEE
Began serving: December 2012 |
|
Principal Occupations: Group Vice President and Senior Investment Advisor for Wilmington Trust Wealth Advisory Services, M&T Bank.
Other Directorships Held: None.
Previous Positions: Bond
Department Manager, M&T Bank (2/88 to 7/12); Group Vice President, Managing Director and Chief Investment Officer, WTIA (6/02 to 6/12) and WFMC (3/12 to 6/12). |
| |
| * |
R. Samuel Fraundorf is “interested” due to positions he holds with WTIA and WFMC. Robert J. Truesdell is “interested” due to the positions he currently holds with Wilmington Trust Wealth Advisory
Services, M&T Bank, the parent of the Funds’ Advisor, and previous positions held with WTIA and WFMC. |
|
| ANNUAL REPORT / April 30,2015 (unaudited) |
|
| BOARD OF TRUSTEES AND TRUST OFFICERS |
INDEPENDENT TRUSTEES BACKGROUND
|
|
|
|
Name
Birth date
Position with Trust
Date Service Began
|
|
Principal Occupations for past five years and Other Directorships
|
|
|
| Nicholas A. Giordano
Birth date: 3/43 CHAIRMAN AND TRUSTEE
Began serving: March 2012 |
|
Principal Occupations: Consultant, financial services organizations (1997 to present).
Other Directorships Held: Kalmar Pooled
Investment Trust; The RBB Fund Inc. (19 portfolios) (registered investment companies); Independence Blue Cross; IntriCon Corporation (industrial furnaces and ovens).
Previous Positions: Interim President,
LaSalle University (1998 to 1999); President and Chief Executive Officer, Philadelphia Stock Exchange (1981 to 1997). |
| |
|
|
| Robert H. Arnold
Birth date: 3/44 TRUSTEE
Began serving: March 2012 |
|
Principal Occupations: Managing Director, R.H. Arnold & Co, Inc. (financial management consulting) (6/89 to present).
Other Directorships Held: Trustee, First
Potomac Realty Trust (real estate investment trust) (5/01 to present); Director, Treasury Strategies, Inc. (private treasury consulting services) (6/01 to present). |
| |
|
|
| Joseph J. Castiglia
Birth date: 7/34 TRUSTEE
Began serving: February 1988 |
|
Principal Occupations: Consultant (not-for-profit) and Private Investor.
Other Directorships Held: Chairman, Trustee
and Treasurer, Buffalo Olmsted Parks Conservancy (1/05 to 5/13); Chairman and Trustee, Buffalo Philharmonic Orchestra Foundation (1/06 to 11/12); Vice Chairman and Trustee, Christ the King Seminary (1/05 to present); Director, Dunn Tire Corporation
(1/05 to present); Chairman, Director and Treasurer, Read to Succeed Buffalo (1/08 to present).
Previous Positions: President, Chief Executive Officer, Vice President, Treasurer and Vice Chairman, Pratt & Lambert United (manufacturer of paints, coatings
and adhesives) (12/67-1/96); Chairman and Director, Catholic Health (hospitals, nursing homes and home care) (1/97 to 5/03); Chairman and Director, Blue Cross Blue Shield of Western and Central New York (5/92 to 5/07); Lead Director and Director,
Energy East (gas and electric utility); Chairman and Director, Federal Reserve Bank of New York, Buffalo Branch; Chairman and Director, Community Foundation for Greater Buffalo; Chairman and Trustee, Canisius College; Chairman and Director, AAA of
Western & Central New York. |
| |
|
|
| John S. Cramer
Birth date: 2/42 TRUSTEE
Began serving: December 2000 |
|
Principal Occupations: Senior Consultant, Yaffe & Co. (health care consulting) (2/06 to present).
Other Directorships Held: Director,
Chairman of the Executive Committee and Chairman of the Compensation Committee of Chek-Med Corporation (6/03 to present).
Previous Positions: President and Chief Executive Officer Emeriti, Pinnacle Health Systems (non-profit hospital and health care
system in Central Pennsylvania). |
| |
|
|
| Daniel R. Gernatt, Jr.
Birth date: 7/40 TRUSTEE
Began serving: February 1988 |
|
Principal Occupations: President and CEO, Gernatt Asphalt Products, Inc. (asphalt, sand and gravel products) (1979 to present).
Other Directorships Held: Director, Roswell
Park Alliance (2008 to present); Trustee, Gernatt Family Foundation. |
| |
|
|
| Richard B. Seidel
Birth date: 4/41 TRUSTEE
Began serving: September 2003 |
|
Principal Occupations: Chairman, Girard Capital (broker-dealer) (1/10 to present); Chairman, R.B. Seidel & Associates (consultants) (2014
to present). Other Directorships
Held: Director, Tristate Capital Bank (1/08 to present). |
| |
|
| April 30, 2015 (unaudited) / ANNUAL REPORT |
|
| BOARD OF TRUSTEES AND TRUST OFFICERS |
OFFICERS
|
|
|
|
Name
Address
Birth year
Position with Trust
|
|
Principal Occupations for Past Five Years and Previous Positions
|
|
|
| Christopher D. Randall
Birth year: 1965 PRESIDENT
Began serving: September 2014 |
|
Principal Occupations: President and Chief Executive Officer of Wilmington Trust Investment Advisors, Inc.; President of Wilmington Trust
Investment Management, LLC; Director of Wilmington Funds Management Corporation; Senior Vice President of M&T Bank.
Previous Positions: Senior Vice President, Head of Asset Management and Retirement Services (2012 to 2014); President,
Mid-Atlantic Division, Wilmington Trust, N.A. (2011 to 2012); President, M&T Securities, Inc. (2009 to 2011) |
| |
|
|
| Michael D. Daniels
Birth year: 1967 CHIEF OPERATING
OFFICER Began serving: June 2007 |
|
Principal Occupations: Chief Operating Officer, Wilmington Funds and Wilmington Trust Investment Advisors, Inc.; Administrative Vice President,
M&T Bank. Previous Positions:
Senior Vice President, MSD&T and MCA (2006 to 2007); Vice President, Calamos Asset Management (2004 to 2006); Vice President, JP Morgan Chase Bank (2002 to 2004).
|
| |
|
|
| Jeffrey M. Seling
Birth year: 1970 ASSISTANT TREASURER
Began serving: June 2013 VICE PRESIDENT
Began serving: June 2007 |
|
Principal Occupations: Vice President, M&T Bank and Wilmington Trust Investment Advisors, Inc.; Assistant Treasurer, Wilmington Funds.
Previous Positions: Vice
President, MSD&T; Assistant Vice President, Wells Fargo Bank; Assistant Vice President, JP Morgan Chase Bank. |
| |
|
|
| John C. McDonnell
Birth year: 1966 VICE PRESIDENT AND
ASSISTANT TREASURER Began serving: June 2013 |
|
Principal Occupations: Vice President, Wilmington Funds Management Corporation (2005 to Present); Vice President, Wilmington Trust Investment
Advisors, Inc. (2012 to present).
Previous Positions: Vice President, Wilmington Trust Investment Management, LLC (2005 to 2012); Audit Senior, Deloitte LLP (2004 to 2005); Assistant Vice
President, 1838 Investment Advisors, LP (1999 to 2004). |
| |
|
|
| Mary Ellen Reilly
Birth year: 1970 CHIEF COMPLIANCE OFFICER
and AML COMPLIANCE OFFICER Began serving: March 2015 |
|
Principal Occupations: Chief Compliance Officer and Anti-Money Laundering Officer, Wilmington Funds; Administrative Vice President, M&T
Bank. Previous Positions:
Administrative Vice President, M&T Bank, and Program Director, Buffalo Promise. Neighborhood (2013-2015); Vice President, M&T Bank, and Product Manager, Wilmington Trust Retirement and Institutional Services Company (2010-2013); Vice
President, M&T Bank, and Risk Manager, M&T Investment Group (2006-2010). |
| |
|
|
| Eric B. Paul Birth
year: 1974 VICE PRESIDENT Began
serving: June 2008 |
|
Principal Occupations: Administrative Vice President, M&T Bank (2003 to present); Director of Proprietary Products, M&T Bank (2008 to present). |
| |
|
|
| Ralph V. Partlow, III
25 South Charles Street, 22nd floor
Baltimore, MD 21201 Birth year: 1957
VICE PRESIDENT Began serving: June 2010
|
|
Principal Occupation: Administrative Vice President and Deputy General Counsel, M&T Bank (2003 to present).
Previous Positions: Vice President and
Senior Counsel, Allfirst Bank (1995-2003). |
| |
|
| ANNUAL REPORT / April 30, 2015 (unaudited) |
|
| BOARD OF TRUSTEES AND TRUST OFFICERS |
|
|
|
|
Name
Address
Birth year
Position with Trust
|
|
Principal Occupations for Past Five Years and Previous Positions
|
|
|
| Christopher W. Roleke
10 High Street, Suite 302 Boston, MA
02110 Birth year: 1972 CHIEF FINANCIAL
OFFICER AND TREASURER Began serving: July 2013 |
|
Principal Occupation: Fund Principal Financial Officer, Foreside Management Services, LLC (2011 to present).
Previous Positions: Assistant Vice
President, JP Morgan Investor Services Co. (2006 to 2011). |
| |
|
|
| Lisa R. Grosswirth
2 Hanson Place, 12th Floor Brooklyn, NY
11217 Birth year: 1963 SECRETARY
Began serving: September 2007 |
|
Principal Occupation: Vice President, BNY Mellon Asset Servicing (2004 to present).
Previous Positions: Supervisory Paralegal,
The Dreyfus Corporation (1998 to 2004). |
| |
|
|
| Richard J. Berthy
Three Canal Plaza, Suite 100 Portland, ME
04101 Birth year: 1958 CHIEF EXECUTIVE
OFFICER Began serving: September 2007 |
|
Principal Occupation: Chief Executive Officer, Foreside Financial Group, LLC (2012 to present).
Previous Positions: President, Foreside
Financial Group, LLC (2008 to 2012); Chief Administrative Officer, Foreside Financial Group, LLC (2005 to 2008); President and Secretary, Bainbridge Capital Management, LLC (2003 to 2006); Vice President, Bainbridge Capital Management (2002 to
2004). |
| |
|
| April 30, 2015 (unaudited) / ANNUAL REPORT |
Shares of the
Wilmington Funds are not FDIC insured or otherwise protected by the U.S. government, are not deposits or other obligations of, or guaranteed by, Manufacturers and Traders Trust Company, and are subject to investment risks, including possible loss of
the principal amount invested.
VOTING PROXIES ON FUND PORTFOLIO SECURITIES
A description of the policies and procedures that the Funds use to determine how to vote proxies relating to securities held in the Funds’
portfolios is available, without charge and upon request, by calling 1-800-836-2211. A report on how the Funds voted any such proxies during the most recent 12-month period ended June 30 is available through Wilmington Funds’ website. Go
to www.wilmingtonfunds.com select “Proxy Voting Record” to access the link. This information is also available from the Edgar database on the SEC’s website at www.sec.gov.
QUARTERLY PORTFOLIO SCHEDULE
The Funds file
with the SEC a complete schedule of their portfolio holdings, as of the close of the first and third quarters of their fiscal year, on Form N-Q. These filings are available on the SEC’s website at www.sec.gov and may be reviewed and copied at
the SEC’s Public Reference Room in Washington DC. (Call 1-800-SEC-0330 for information on the operation of the Public Reference Room.)
Electronic
Delivery
Wilmington Funds encourages you to sign up for electronic delivery of investor materials. By doing so you will receive
information faster, help lower shareholder costs, and reduce the impact to the environment. To enroll in electronic delivery:
| |
1.) |
Go to www.wilmingtonfunds.com and select “Individual Investors” |
| |
2.) |
Click on the link “Sign up for Electronic Delivery” |
| |
3.) |
Login to your account or create new user ID |
| |
4.) |
Select E-Delivery Consent from the available options, and |
| |
5.) |
Complete the information requested, including providing the email address where you would like to receive notification for electronic documents.
|
| * |
If you hold your account through a financial intermediary, please contact your advisor to request electronic delivery of investor materials.
|
Householding
In
an effort to reduce volume of mail you receive, only one copy of the prospectus, annual/semi-annual report, SAI and proxy statements will be sent to shareholders who are part of the same family and share the same address.
If you would like to request additional copies of the prospectus, annual/semi-annual report or SAI, or wish to opt out of householding mailings,
please contact Shareholder Services at 1-800-836-2211, or write to Wilmington Funds, P.O. Box 9828, Providence, RI 02940-8025.
|
| SEMI-ANNUAL REPORT / April 30, 2015 |
PRIVACY POLICY AND NOTICE
OF THE FUNDS AND THEIR DISTRIBUTOR
June 8, 2012
The
Wilmington Funds, their distributor and their agents (referred to as “the Funds”, “we” or “us”) recognize that consumers (referred to as “you” or “your”) expect us to protect both your assets and
financial information. We respect your right to privacy and your expectation that all personal information about you or your account will be maintained in a secure manner. We are committed to maintaining the confidentiality, security and integrity
of client and shareholder information. We want you to understand the Funds’ policy that governs the handling of your information, how the Funds gather information, how that information is used and how it is kept secure.
Information The Funds Collect:
The Funds
collect nonpublic personal information about you from the following sources:
| |
• |
|
We may receive information from you, or from your financial representative, on account applications, other forms or electronically (such as through
the Funds’ website or other electronic trading mechanisms). Examples of this information include your name, address, social security number, assets and income. |
| |
• |
|
We may receive information from you, or from your financial representative, through transactions with us or others, correspondence and other
communications. Examples of this information include specific investments and your account balances. |
| |
• |
|
We may obtain other personal information from you in connection with providing you a financial product or service. Examples of this information
include depository, debit or credit account numbers. |
Information Sharing Policy
The Funds may share nonpublic personal information about you, as described above, with financial or non-financial companies or other entities,
including companies that may be affiliated with the Funds and other nonaffiliated third parties, for the following purposes:
| |
• |
|
We may share information when it is necessary and required to process a transaction or to service a customer relationship. For example, information
may be shared with a company that provides account record keeping services or a company that provides proxy services to shareholders. |
| |
• |
|
We may share information when it is required or permitted by law. For example, information may be shared in response to a subpoena or to protect you
against fraud or with someone who has established a legal beneficial interest, such as a power of attorney. |
| |
• |
|
We may disclose some or all of the information described above to companies that perform marketing or other services on our behalf. For example, we
may share information about you with the financial intermediary (bank, investment bank or broker-dealer) through whom you purchased the Funds’ products or services, or with providers of marketing, legal, accounting or other professional
services. The Funds will not, however, disclose a consumer’s account number or similar form of access number or access code for credit card, deposit or transaction accounts to any nonaffiliated third party for use in telemarketing, direct mail
or other marketing purposes. |
Except as described above, the Funds do not share customer information. We will not rent,
sell, trade, or otherwise release or disclose any personal information about you. Any information you provide to us is for the Funds’ use only. If you decide to close your account(s) or become an inactive customer, we will adhere to the privacy
policies and practices as described in this notice.
Information Security:
When the Funds share nonpublic customer information with third parties hired to facilitate the delivery of certain products or services to our
customers, such information is made available for limited purposes and under controlled circumstances designed to protect our customers’ privacy. We require third parties to comply with our standards regarding security and confidentiality of
such information. We do not permit them to use that information for their own or any other purposes, or rent, sell, trade or otherwise release or disclose the information to any other party. These requirements are reflected in written agreements
between the Funds and the third party service providers.
The Funds protect your personal information in several ways. We maintain
physical, electronic, and procedural safeguards to guard your nonpublic personal information. In addition, the Funds’ Transfer Agent and Shareholder Servicing Agent have procedures in place for the appropriate disposal of nonpublic personal
information when they are no longer required to maintain the information.
Each of the following sections explains an aspect of the
Funds’ commitment to protecting your personal information and respecting your privacy.
Employee Access to Information:
Our Code of Ethics, which applies to all employees, restricts the use of customer information and requires that it be held in the strictest of
confidence. Employee access to customer information is authorized for business purposes only, and the degree of access is based on the sensitivity of the information and on an employee’s or agent’s need to know the information in order to
service a customer’s account or comply with legal requirements.
Visiting The Funds’ Website:
The Funds’ website gathers and maintains statistics about the number of visitors as well as what information is viewed most frequently.
This information is used to improve the content and level of service we provide to our clients and shareholders.
|
| April 30, 2015 / SEMI-ANNUAL REPORT |
| |
• |
|
Information or data entered into a website will be retained. |
| |
• |
|
Where registration to a website or re-entering personal information on a website is required, “cookies” are used to improve your online
experience. A cookie is a way for websites to recognize whether or not you have visited the site before. It is a small file that is stored on your computer that identifies you each time you re-visit our site so you don’t have to resubmit
personal information. Cookies provide faster access into the website. |
| |
• |
|
We may also collect non-personally identifiable Internet Protocol (“IP”) addresses for all other visitors to monitor the number of
visitors to the site. These non-personally identifiable IP addresses are never shared with any third party. |
E-mail:
If you have opted to receive marketing information from the Funds by e-mail, it is our policy to include instructions in all marketing messages
on how to unsubscribe from subsequent e-mail programs. Some products or services from the Funds are intended to be delivered and serviced electronically. E-mail communication may be utilized in such cases. If you participate in an employer-sponsored
retirement plan administered by the Funds, we may, at your employer’s request, send you e-mail on matters pertaining to the retirement plan.
Please do not provide any account or personal information such as social security numbers, account numbers, or account balances within your
e-mail correspondence to us. We cannot use e-mail to execute transaction instructions, provide personal account information, or change account registration. We can, however, use e-mail to provide you with the necessary forms or you may contact
customer service toll-free at 1-800-836-2211.
Surveys/Aggregate Data:
Periodically, the Funds may conduct surveys about financial products and services or review elements of customer information in an effort to
forecast future business needs. The Funds then generate reports that include aggregate data regarding its customers. Aggregate data classifies customer information in various ways but that does not identify individual customers. These reports may
also include information on website traffic patterns and related information. These reports are used for the Funds’ planning, statistical and other corporate purposes. Aggregate data may also be shared with external parties, such as marketing
organizations. However, no information is shared by which any individual customer could be identified.
Changes to Our Privacy Statement:
The effective date of this policy is June 8, 2012. We reserve the right to modify this policy at any time. When it is revised or materially
changed, we will update the effective date. You can determine whether there have been changes since the last time you reviewed by simply checking the effective date.
Notice will be provided to you in advance of any changes that would affect your rights under this policy statement
|
| SEMI-ANNUAL REPORT / April 30, 2015 |
[This Page Intentionally
Left Blank]
[This Page Intentionally
Left Blank]
[This Page Intentionally
Left Blank]

Wilmington Large-Cap Strategy Fund (“Large-Cap Strategy Fund”)
Wilmington Mid-Cap Growth Fund (“Mid-Cap Growth Fund”)
Wilmington Small-Cap Growth Fund (“Small-Cap Growth Fund”)
Wilmington Small-Cap Strategy Fund (“Small-Cap Strategy Fund”)

CONTENTS
[This Page Intentionally Left Blank]
Dear Investor:
I am pleased to present the Annual Report of the Wilmington Funds (the “Trust”), covering the Trust’s fiscal year of May 1, 2014,
through April 30, 2015. Inside you will find a comprehensive review of the Funds’ holdings and financial statements.
The Economy and Financial
Markets in Review
Wilmington Funds Management Corporation, the investment advisor to the Trust, and Wilmington Trust Investment
Advisors, Inc., the sub-advisor to the Trust, have provided the following review of the economy, bond markets, and stock markets for the Trust’s fiscal year.
The Economy
Economic reports painted an
ambiguous picture of the U.S economy. The gross domestic product (GDP) expanded at a very strong annualized rate in the 2nd and 3rd quarters of 2014 (+4.6% and +5.0%, respectively), but cooled off in the 4th quarter of 2014, recording a more modest
2.2% increase and posting a 0.7% decline in the 1st quarter of 2015.i
ihttp://www.bea.org/index.htm
The headwinds responsible for this slowdown in economic
growth were manifold. A dock worker strike at West Coast ports, a strong U.S. dollar (and its concomitant drag on exports), sliding oil prices, and an unusually harsh winter all conspired to sap the building economic momentum.
Despite the uneven GDP performance, the employment situation steadily improved. Unemployment, which stood at 6.3% in May 2014, fell by nearly a
full percentage point to 5.4% by April 2015, placing it in the range of what the Federal Reserve (the “Fed”) has come to view as “full employment.”ii
iihttp://data.bls.gov/timeseries/LNS14000000
While the unemployment picture brightened, the labor force participation rate remained unchanged at 62.8%.iii This rate is at a historical low and has shown little sign of bouncing back to pre-recession levels.
iiihttp://data.bls.gov/timeseries/LNS11300000
Oil prices went on a wild ride, with West Texas Intermediate (WTI) crude falling nearly 60% in value, from its $107.95 per barrel peak in June
2014 to a low of $43.39 on March 17th. Prices staged a partial recovery, rising to $59.62 by the end of April 2015.iv
ivhttp://www.eia.gov/dnav/pet/hist/LeafHandler.ashx?n=PET&s=RWTC&f=D
Though it might seem that declining oil prices would be a boost to the economy given their positive impact on corporate earnings and consumer
spending, the short-term effect was negative as oil-related companies ratcheted back their spending on capital goods. The expected boost from consumer spending was muted as individuals chose to reduce debt with the savings accrued from lower gas
prices, or adopt a wait-and-see attitude over whether lower prices would persist.
The Bond Markets
The bond market weathered the end of quantitative easing1 and performed well amid the
persistent uncertainty of a hike in short-term rates by the Fed. While the path of the 10-year Treasury rate was a bit erratic, the direction was generally lower. The yield on the 10-year note, which was 2.65% at the start of the Trust’s fiscal
year, fell to 2.03% by April 30, 2015, after spending a substantial amount of time under 2% during the first quarter of 2015.v
vhttp://www.treasury.gov/resource-center/data-chart-center/interest-rates/Pages/TextView.aspx?data=yieldYear&year=2015
The Barclays U.S. Aggregate Index2 returned 4.46% for the 12-month period ended
April 30, 2015, powered by an increase of 15.06% in the Barclays U.S. Long Government Bond Index3.
Municipal bonds also turned in a good year, with the S&P Municipal Bond Intermediate
Index4 gaining 3.94%.
The Barclays U.S. Corporate High Yield Bond Index5, which returned a paltry 2.58%, was hampered by oil-related high yield bonds, which suffered as oil prices sagged.
Investors will be awaiting Fed interest rate policy actions in the latter half of 2015. The Fed has signaled that it wishes to begin the process
of normalizing monetary policy yet how the capital markets will react remains an open question.
PRESIDENT’S
MESSAGE / April 30, 2015 (unaudited)
For the 12-months reporting period May 1, 2014 through April 30, 2015, certain Barclays’ indices
performed as follows6:
|
|
|
|
|
|
|
|
|
|
|
|
|
|
|
|
|
|
|
|
|
|
|
| |
|
Barclays
U.S. Aggregate
Bond Index |
|
Barclays
U.S. Treasury
Bond Index7 |
|
Barclays
U.S. Mortgage-
Backed Securities Index8 |
|
Barclays
U.S. Credit
Bond Index9 |
|
Barclays
Municipal Bond
Index10 |
|
|
|
|
|
|
4.46% |
|
4.23% |
|
4.61% |
|
4.87% |
|
4.80% |
|
|
|
|
The Stock Markets
The current bull market in stocks entered its seventh year. Though economic growth and corporate earnings deserve their fair share of the credit
for this extended stock rally, the Federal Reserve policies of quantitative easing and low rates have provided substantial support to stock prices during this time.
With the end to quantitative easing in the 4th quarter of 2014, the markets remained fixated on when the Fed might raise short-term rates. The
mixed signals that each new economic report sent about the underlying strength of the economy was enough for the Fed to postpone a rate hike into the 2nd half of 2015, helping the markets record solid gains during the Trust’s fiscal year
period.
Through the period May 1, 2014 to April 30, 2015, the S&P 500
index11 jumped 12.98%, the S&P MidCap 400 Index12 rose 12.28% and the S&P SmallCap 600 Index13 turned in a gain of 9.24%.
While smaller-cap stocks underperformed for the full 12-month
period, they raced ahead of large-cap stocks in the latter part of the period, aided, in part, by a lower exposure to foreign markets, which has become challenging to large companies because of the strengthening U.S. dollar.
Growth stocks proved to be far better performers than value stocks, as evidenced by the return gap between the S&P 500 Growth Index14 (+16.32%) and the S&P 500 Value Index15 (+9.43%). This return disparity was also evident in the mid-cap and small-cap sectors which,
while not as wide, were on the order of 400 basis points (4.0%).
The U.S. markets were driven by the healthcare (+25.12%), information
technology (+20.53%) and consumer discretionary (+19.84%) sectors. The only sector to lose ground was energy, which declined 9.84%. Real estate also enjoyed a strong year, as reflected in the +13.22% return in the FTSE NAREIT Equity REITs
Index16.
International stocks trailed U.S. markets, with the MSCI EAFE (Net) Index17 netting a small gain of 1.66%. Overseas markets were hampered by weak economic growth and a tight credit environment. However, following the implementation by the European Central Bank (ECB) and the
Bank of Japan (BOJ) of their own forms of quantitative easing, economic growth and investor enthusiasm for stocks picked up. In the three-month period, ending April 30, 2015, the MSCI EAFE Index turned positive, gaining 8.63%.
For the 12-month reporting period May 1, 2014 through April 30, 2015, certain stock market indices performed as follows:
|
|
|
|
|
|
|
|
|
|
|
|
|
|
|
|
|
| |
|
S&P 500
Index |
|
Dow Jones
Industrial Average18 |
|
NASDAQ
Composite Index19 |
|
MSCI All
Country
World ex-US (Net)
Index20 |
|
|
|
|
12.98% |
|
10.11% |
|
21.52% |
|
2.63% |
|
|
I want to thank you for your continued trust in allowing us to help you reach your important financial goals. We
understand the profound responsibility you have placed with us in managing your investments. We work hard every day to ensure that we continue to deserve your confidence.
Sincerely,

Christopher D. Randall
President
May 29, 2015
For more complete information, please download the Trust’s prospectus, which is available on www.wilmingtonfunds.com, or call
1-800-836-2211 for a copy. You should consider the Funds’ investment objectives, risks, charges, and expenses carefully before you invest. Information about these and other important subjects is in the Trust’s prospectus, which you should
read carefully before investing.
April 30, 2015
(unaudited) / PRESIDENT’S MESSAGE
Past performance is no guarantee of future results. The index performance quoted is for
illustrative purposes only and is not representative of any specific investment. Diversification does not ensure a profit nor protect against loss.
All investments involve risk, including the possible loss of principal. Equity Securities are subject to price fluctuation and possible loss
of principal. Small- and mid-cap stocks involve greater risks and volatility than large-cap stocks. International investments are subject to special risks, including currency fluctuations, social, economic, and political uncertainties, which could
increase volatility. These risks are magnified in emerging markets.
High yield, lower-rated securities generally entail greater
market, credit and liquidity risks than investment grade securities and may include higher volatility and higher risk of default.
An
investment in money market funds is neither insured nor guaranteed by the Federal Deposit Insurance Corporation or any other government agency. Although money market funds seek to preserve the value of your investment at $1.00 per share, it is
possible to lose money by investing in these funds
| 1. |
Quantitative Easing (QE) is a government monetary policy occasionally used to increase the money supply by buying government securities or other securities from the market. Quantitative Easing increases the money supply
by flooding the financial institutions with capital, in an effort to promote increased lending and liquidity loss. |
| 2. |
Barclays U.S. Aggregate Bond Index is a widely used benchmark index for the domestic investment-grade bond market composed of securities from the Barclays Government/Corporate Bond Index, Mortgage-Backed Securities
Index and Asset-Backed Securities Index. The index typically includes fixed income securities with overall intermediate- to long-term average maturities. The index is unmanaged and investments cannot be made directly in an index. |
| 3. |
Barclays U.S. Long Government Bond Index tracks the market for U.S. dollar-denominated, fixed rate, nominal U.S. Treasuries (with the exception of Federal Reserve holdings of U.S. Treasuries) and U.S. agency debentures
(with the exception of those U.S. agency debentures held in the Federal Reserve SOMA account). To be included in this index, securities must have at least 10 years to final maturity. |
| 4. |
S&P Municipal Bond Intermediate Index is a broad, market value-weighted index that seeks to measure the performance of the U.S. municipal bond market. |
| 5. |
Barclays U.S. Corporate High Yield Bond Index measures the USD-denominated, high yield, fixed-rate corporate bond market. Securities are classified as high yield if the middle rating of Moody’s, Fitch, and S&P
is Ba1/BB+/BB+ or below. Bonds from issuers with an emerging markets country of risk, based on Barclays EM country definition, are excluded. The U.S. Corporate High Yield Bond Index is a component of the U.S. Universal and Global High Yield Indices.
|
| 6. |
Bond prices are sensitive to changes in interest rates and a rise in interest rates can cause a decline in their prices. |
| 7. |
Barclays U.S. Treasury Bond Index is a market capitalization weighted index that includes all publicly issued, U.S. Treasury securities that have a remaining maturity of at least one year, are rated investment-grade,
and have $250 million or more of outstanding face value. The index is unmanaged and investments cannot be made directly in an index. |
| 8. |
Barclays U.S. Mortgage Backed Securities Index is composed of all securities mortgage pools by GNMA, FNMA and the FHLMC, including GNMA graduated Payment Mortgages. The index is unmanaged and investments cannot be made
directly in an index. |
| 9. |
Barclays U.S. Credit Bond Index tracks the performance of domestic investment-grade corporate bonds and is composed of all publicly issued, fixed-rate, nonconvertible, investment-grade corporate debt. The index is
unmanaged and investments cannot be made directly in an index. |
| 10. |
Barclays Municipal Bond Index tracks the performance of long-term, tax-exempt, investment-grade bond market. To be included in the index, bonds must have an outstanding par balance of at least $7 million and be issued
as part of a transaction of at least $75 million. The index is unmanaged and investments cannot be made directly in an index. |
| 11. |
The S&P 500 Index is a capitalization-weighted index of 500 stocks designed to measure performance of the broad domestic economy through changes in the aggregate market value of 500 stocks representing all major
industries. The index is unmanaged and investments cannot be made directly in an index. |
| 12. |
The S&P MidCap 400 Index measures the mid cap segment of the U.S. equity market. To be included in the index, a stock must have a total market capitalization that ranges from roughly $750 million to $3.3 billion.
|
| 13. |
The S&P SmallCap 600 Index measures the small cap segment of the U.S. equity market. The index is designed to be an investable portfolio of companies that meet specific inclusion criteria to ensure that they are
liquid and financially viable. The index is unmanaged and investments cannot be made directly in an index. |
| 14. |
The S&P 500 Growth Index measures growth stocks using three factors: sales growth, the ratio of earnings change to price, and momentum. S&P Style Indices divide the complete market capitalization of each parent
index into growth and value segments. Constituents are drawn from the S&P 500 Index. The index is unmanaged and investments cannot be made directly in an index. |
| 15. |
The S&P 500 Value Index measures value stocks using three factors: the ratios of book value, earnings, and sales to price. S&P Style Indices divide the complete market capitalization of each parent index into
growth and value segments. Constituents are drawn from the S&P 500 Index. The index is unmanaged and investments cannot be made directly in an index. |
| 16. |
FTSE NAREIT Equity REITs Index is a free-float adjusted, market capitalization-weighted index of U.S. Equity REITs. Constituents of the Index include all tax-qualified REITs with more than 50 percent of total assets in
qualifying real estate assets other than mortgages secured by real property. |
| 17. |
MSCI EAFE (Net) Index is a free float-adjusted market capitalization index that is designed to measure equity market performance of developed markets, excluding the U.S. & Canada. The index consisted of the
following 22 developed market country indices: Australia, Austria, Belgium, Denmark, Finland, France, Germany, Greece, Hong Kong, Ireland, Israel, Italy, Japan, Netherlands, New Zealand, Norway, Portugal, Singapore, Spain, Sweden, Switzerland and
the United Kingdom. The index is unmanaged and investments cannot be made directly in an index. |
| 18. |
Dow Jones Industrial Average (“DJIA”) represents share prices of selected blue chip industrial corporations as well as public utility and transportation companies. The DJIA indicates daily changes in the
average prices of stocks in any of its categories. It also reports total sales for each group of industries. Because it represents the top corporations of America, the DJIA’s average movements are leading economic indicators for the stock
market as a whole. The average is unmanaged and investments cannot be made directly in an average. |
| 19. |
NASDAQ Composite Index measures all NASDAQ domestic and non-U.S. based common stocks listed on the NASDAQ Stock Market. The index is unmanaged and investments cannot be made directly in an index. |
| 20. |
MSCI All Country World ex-US (Net) Index is a free float-adjusted market capitalization weighted index that is designed to measure the equity market performance of developed and emerging markets excluding the U.S.
market. The index consists of 44 countries indices comprising 23 developed and 21 emerging market country indices. The index is unmanaged and investments cannot be made directly in an index. |
PRESIDENT’S MESSAGE / April 30, 2015 (unaudited)
[This Page Intentionally Left Blank]
5
WILMINGTON LARGE-CAP STRATEGY FUND
Management’s Discussion of Fund Performance
For the fiscal year ended April 30, 2015, Wilmington Large-Cap Strategy
Fund (the “Fund”) had a total return of 14.52%* for Class I Shares, versus its benchmark, the Russell 1000 Index**, which had a total return of 13.00%.
The Fund attempts to outperform the Russell 1000 Index by overweighting mega-cap, mid-cap, growth or value companies based on
recommendations from the Wilmington Trust Investment Advisors, Inc. Investment Strategy Team (IST). During the period April 2014 through November 2014, the Fund was positioned to track a custom index of 65% mega-cap and 35% mid-cap companies. The
Russell 1000 Index can be divided into the Russell Top 200 Index of mega-cap stocks and the Russell Midcap Index which represent the 800 mid-cap companies. The weight of the Russell Midcap Index has been approximately 31% of the Russell 1000 Index.
Over this period, the Russell Top 200 Index returned 11.1%, and the Russell Midcap Index returned 9.8%. The tactical overweight to growth had a -0.1% impact on relative performance.
At the March 2014 meeting, the IST recommended a tilt toward growth companies and maintained the capitalization tilt toward
mid-sized companies. The Fund was rebalanced to track a custom index incorporating both recommendations. For the 1 year period ending April 30, 2015, the Russell 1000 Growth Index returned 16.7%, the Russell 1000 Value Index returned 9.3%, the
Russell Midcap Index returned 13.3%, the Russell Top 200 Index returned 12.9%, and the Fund had a gross return of 15.0%. The IST tactical asset allocation advice added 2.0% in excess return. The net 1.8% outperformance was lower due to expenses and
transaction costs incurred during the year.
The IST and Investment Research Team are researching additional tactics to
improve the risk adjusted return of the portfolio.
| * |
Performance data quoted represents past performance, which is no guarantee of future results. Investment return and principal value will
fluctuate so that an investor’s shares, when redeemed, may be worth more or less than their original cost. The total return shown assumes the reinvestment of all distributions and does not reflect the deduction of taxes that a shareholder would
pay on fund distributions or the redemption of shares. Mutual fund performance changes over time and current performance may be lower or higher than what is stated. For the most recent month-end performance, please visit www.wilmingtonfunds.com or
call 1-800-836-2211. |
| ** |
The Russell 1000 Index measures the performance of the large-cap segment of the U.S. equity universe. It is subset of the Russell 3000 Index and
includes approximately 1,000 of the largest securities based on a combination of their market cap and current index membership. The Index represents approximately 92% of the U.S. market and is constructed to provide a comprehensive and unbiased
barometer for the large-cap segment and is completely reconstituted annually to ensure new and growing equities are reflected. The Russell 3000 Index measures the performance of the largest 3,000 U.S. companies representing approximately 98% of the
investable U.S. equity market. Russell 1000 Growth Index measures the performance of those Russell 1000 companies with higher price-to-book ratios and higher forecasted growth values. Russell 1000 Value Index measures the performance of those
Russell 1000 companies with lower price-to-book ratios and lower forecasted growth values. |
The Russell
Top 200 Index measures the performance of the largest cap segment of the U.S. equity universe. The Russell Top 200 Index is a subset of the Russell 3000 Index. It includes approximately 200 of the largest securities based on a combination of their
market cap and current index membership and represents approximately 68% of the U.S. market. The Russell Top 200 Index is constructed to provide a comprehensive and unbiased barometer for this very large cap segment and is completely reconstituted
annually to ensure new and growing equities are reflected.
The Russell Midcap Index measures the performance of the
mid-cap segment of the U.S. equity universe. The Russell Midcap Index is a subset of the Russell 1000 Index. It includes approximately 800 of the smallest securities based on a combination of their market cap and current index membership. The
Russell Midcap Index represents approximately 31% of the total market capitalization of the Russell 1000 companies. The Russell Midcap Index is constructed to provide a comprehensive and unbiased barometer for the mid-cap segment. The Index is
completely reconstituted annually to ensure larger stocks do not distort the performance and characteristics of the true mid-cap opportunity set.
ANNUAL
REPORT / April 30, 2015 (unaudited)
6
WILMINGTON LARGE-CAP
STRATEGY FUND
– Class I
The graph below illustrates the hypothetical investment of $1,000,0001,2 in the Wilmington Large-Cap Strategy Fund (Class I) (the “Fund”) from April 30, 2005 to April 30, 2015, compared to the Russell 1000 Index2.
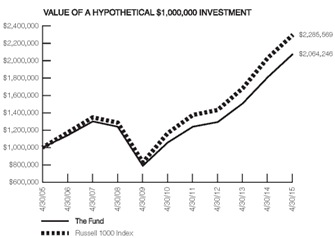
Average Annual Total Returns for the Periods
Ended April 30, 2015
|
|
|
|
|
|
|
|
|
1 Year |
|
|
14.52% |
|
|
5 Years |
|
|
14.37% |
|
|
10 Years |
|
|
7.52% |
|
Performance data quoted represents past performance which is no guarantee of future results. Returns shown do not reflect the deduction
of taxes that a shareholder would pay on Fund distributions or the redemption of Fund shares. Investment return and principal value will fluctuate so that an investor’s shares, when redeemed, may be worth more or less than their original cost.
Mutual funds are not obligations of or guaranteed by any bank and are not federally insured. Mutual fund performance changes over time and current performance may be lower or higher than what is stated. For current to the most recent month end
performance, visit www.wilmingtonfunds.com or call 1-800-836-2211.
Annual
Operating Expense Ratio
|
|
|
|
|
|
Before Waivers |
|
0.88%
|
|
After Waivers |
|
0.26% |
The Expense Ratio Before Waivers represents the operating costs borne by the Fund, expressed as a percentage of the Fund’s average
net assets, as shown in the Fees and Expenses table in the Fund’s current prospectus (under “Total Annual Fund Operating Expenses”).
| 1 |
Represents a hypothetical investment of $1,000,000 in Class I of the Fund and assumes the reinvestment of all dividends and distributions. |
| 2 |
The performance shown for the Russell 1000 Index assumes the reinvestment of all dividends and distributions. It is not possible to invest directly in an index, and the represented index is unmanaged.
|
April 30, 2015
(unaudited) / ANNUAL REPORT
7
WILMINGTON MID-CAP GROWTH FUND
Management’s Discussion of Fund Performance
For the fiscal year ended April 30, 2015, Wilmington Mid-Cap Growth Fund
(the “Fund”) had a total return of 8.26%* for Class A Shares and 8.47%* for Class I Shares, versus its benchmark, the Russell Mid Cap Growth Index**, which had a total return of 16.46%.
During the past fiscal year, the U.S. equity markets continued its upward march, entering year 6 of the current bull market.
The same underlying foundation of the markets remains intact, namely favorable monetary policy, strong corporate profit growth, and generally improving macroeconomic data. This past fiscal year, the market was able to absorb a few potentially
volatility-inducing developments, specifically a significant decline in energy prices, a strengthening of the U.S. Dollar relative to worldwide currencies, as well as continued geopolitical unrest. Despite these potential headwinds, investor
risk appetite continues to improve, evidenced by expanding valuation multiples, and corporate profits continue to grow, albeit at a moderate pace.
Our Fund has been positioned throughout the past 6 years of economic and equity market recovery to take advantage of a
pro-growth environment. While we have generally benefited from this positioning, our primary objective is to identify companies that are best positioned to generate profitable growth throughout the cycle. Our underperformance during the past fiscal
year, while disappointing to us, was the result of a sharp deterioration in the energy sector, a sector that has traditionally been a relative bright spot for the Fund, and a collection of several stocks that disappointed our expectations over the
past year. We always strive to identify the short-term market moves that go against our holdings as either cyclical or structural in nature. While this can be difficult to discern, it is the reason we focus primarily on company-level analysis and
hold true to our core investment tenants. We endeavor to invest in businesses with sustainable competitive advantages that produce growing cash flow and earnings through a durable economic business model. Our success or failure is rooted in
selecting these companies and paying a reasonable price for this growth.
The majority of the underperformance in the Fund
was attributable to adverse stock selection in the energy, consumer discretionary, and industrials sectors. Energy sector performance was significantly impacted by the large decline in both WTI crude oil and natural gas prices, which were down 40%
and 43%, respectively. The majority of the Fund’s holdings in the energy sector are tied directly or indirectly (via related capital spending) to commodity prices and experienced significantly higher beta to underlying commodity price
movements relative to the benchmark energy holdings. Specifically, 4 of our energy holdings were in the Fund’s bottom 5 detractors from a relative performance standpoint, including Core Laboratories NV, CARBO Ceramics Inc. (which we have since
exited), Southwestern Energy Company, and Whiting Petroleum Corporation. Consumer discretionary performance was negatively impacted primarily from the underperformance of PVH Corp., LKQ Corporation, and BorgWarner Inc. Each company had significant
exposure to the stronger U.S. Dollar. Our industrial sector’s relative underperformance was the result of not owning airlines, which increased 45% during the period, and weakness in our machinery holdings –
Cummins Inc. and Chart Industries Inc. (which we have exited). On the positive side, the
Fund experienced relative outperformance in financials, driven primarily by the
strong performance in two of the Fund’s larger holdings – CBRE Group, Inc. Class A and MarketAxess Holdings Inc.
As managers we are continuously testing our investment thesis in each holding. While we cannot control short-term volatility
in our portfolio, we are confident that the strategy most likely to generate superior performance over a cycle is to focus on the companies’ longer-term economic health and strategic positioning. Our fundamental approach emphasizes identifying
and investing in companies with superior growth prospects and attractive valuations. While short-term underperformance is disappointing to us, we will stay with our disciplined approach and have conviction that, when implemented consistently and
effectively, this strategy will pay off over time.
| |
* |
Performance data quoted represents past performance, which is no guarantee of future results. Investment return and principal value will
fluctuate so that an investor’s shares, when redeemed, may be worth more or less than their original cost. The total return shown assumes the reinvestment of all distributions and does not reflect the deduction of taxes that a shareholder would
pay on fund distributions or the redemption of shares. The total return for Class A Shares was 2.33%, adjusted for the Fund’s maximum sales charge. Mutual fund performance changes over time and current performance may be lower or higher
than what is stated. For the most recent month-end performance, please visit www.wilmingtonfunds.com or call 1-800-836-2211. |
| |
** |
The Russell Mid Cap Growth Index measures the performance of the mid-cap growth segment of the U.S. equity universe. It includes those Russell Mid
Cap Index companies with higher price-to-book ratios and higher forecasted growth values. The Russell Midcap Growth Index is constructed to provide a comprehensive and unbiased barometer of the mid-cap growth market. The index is completely
reconstituted annually to ensure larger stocks do not distort the performance and characteristics of the true mid-cap growth market. |
Valuation is the process of determining the current worth of an asset or company. There are many techniques that can be
used to determine value; some are subjective and others are objective.
ANNUAL
REPORT / April 30, 2015 (unaudited)
8
WILMINGTON MID-CAP GROWTH
FUND –
Class A
The graph below illustrates the hypothetical investment of $10,0001 in the Wilmington Mid-Cap Growth Fund (Class A) (the “Fund”) from April 30, 2005 to April 30, 2015, compared to the Russell Mid Cap Growth Index (“Russell Mid Cap
Growth”).2
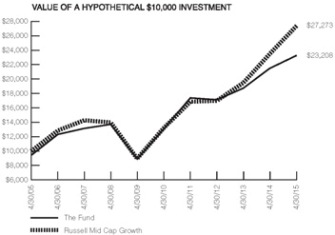
Average Annual Total Returns for the Periods Ended April 30, 2015
|
|
|
|
|
|
|
|
|
1 Year |
|
|
2.33% |
|
|
5 Years |
|
|
10.87% |
|
|
10 Years |
|
|
8.78% |
|
Performance data quoted represents past performance which is no guarantee of future results. Returns shown do not reflect the deduction
of taxes that a shareholder would pay on Fund distributions or the redemption of Fund shares. Investment return and principal value will fluctuate so that an investor’s shares, when redeemed, may be worth more or less than their original cost.
Mutual funds are not obligations of or guaranteed by any bank and are not federally insured. Mutual fund performance changes over time and current performance may be lower or higher than what is stated. For current to the most recent month end
performance, visit www.wilmingtonfunds.com or call 1-800-836-2211. Total returns shown include the maximum sales charge of 5.50%.
Annual Operating Expense Ratio
|
|
|
|
|
|
Before Waivers |
|
1.53%
|
|
After Waivers |
|
1.24% |
The Expense Ratio Before Waivers represents the operating costs borne by the Fund, expressed as a percentage of the Fund’s average
net assets, as shown in the Fees and Expenses table in the Fund’s current prospectus (under “Total Annual Fund Operating Expenses”).
| 1 |
Represents a hypothetical investment of $10,000 in Class A of the Fund after deducting the maximum sales charge of 5.50% ($10,000 investment minus $550 sales charge = $9,450). The Fund’s performance assumes
the reinvestment of all dividends and distributions. |
| 2 |
The performance for the Russell Mid Cap Growth Index assumes the reinvestment of all dividends and distributions but does not reflect the deduction of a sales charge required for the Fund’s performance by
Securities and Exchange Commission. It is not possible to invest directly in an index, and the represented index is unmanaged. |
April 30, 2015
(unaudited) / ANNUAL REPORT
9
WILMINGTON MID-CAP
GROWTH FUND –
Class I
The graph below illustrates the hypothetical investment of
$1,000,0001,2 in the Wilmington Mid-Cap Growth Fund (Class I) (the “Fund”) from April 30, 2005 to April 30, 2015, compared to the Russell Mid Cap Growth.2
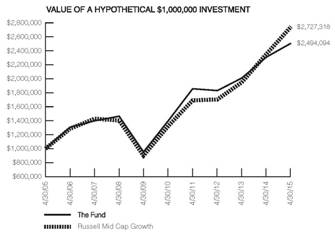
Average Annual Total Returns for the Periods Ended April 30, 2015
|
|
|
|
|
|
|
|
|
1 Year |
|
|
8.47% |
|
|
5 Years |
|
|
12.32% |
|
|
10 Years |
|
|
9.57% |
|
Performance data quoted represents past performance which is no guarantee of future results. Returns shown do not reflect the deduction
of taxes that a shareholder would pay on Fund distributions or the redemption of Fund shares. Investment return and principal value will fluctuate so that an investor’s shares, when redeemed, may be worth more or less than their original cost.
Mutual funds are not obligations of or guaranteed by any bank and are not federally insured. Mutual fund performance changes over time and current performance may be lower or higher than what is stated. For current to the most recent month end
performance, visit www.wilmingtonfunds.com or call 1-800-836-2211.
Annual
Operating Expense Ratio
|
|
|
|
|
|
Before Waivers |
|
1.28%
|
|
After Waivers |
|
1.08% |
The Expense Ratio Before Waivers represents the operating costs borne by the Fund, expressed as a percentage of the Fund’s average
net assets, as shown in the Fees and Expenses table in the Fund’s current prospectus (under “Total Annual Fund Operating Expenses”).
| 1 |
Represents a hypothetical investment of $1,000,000 in Class I of the Fund and assumes the reinvestment of all dividends and distributions. |
| 2 |
The performance shown for the Russell Mid Cap Growth assumes the reinvestment of all dividends and distributions. It is not possible to invest directly in an index, and the represented index is unmanaged.
|
ANNUAL
REPORT / April 30, 2015 (unaudited)
10
WILMINGTON SMALL-CAP GROWTH FUND
Management’s Discussion of Fund Performance
For the fiscal year ended April 30, 2015, the Wilmington Small-Cap Growth
Fund (the “Fund”) had a total return of 8.73%* for Class A Shares, and 8.93%* for Class I Shares, versus its benchmark, the Russell 2000 Growth Index,** which had a total return of 14.65%.
During the past fiscal year, the U.S. equity markets continued its upward march, entering year 6 of the current bull market.
The same underlying foundation of the markets remains intact, namely favorable monetary policy, strong corporate profit growth, and generally improving macroeconomic data. This past fiscal year the market was able to absorb a few potentially
volatility-inducing developments, specifically a significant decline in energy prices, a strengthening of the U.S. Dollar relative to worldwide currencies, as well as continued geopolitical unrest. Despite these potential headwinds, investor
risk appetite continues to improve, evidenced by expanding valuation multiples, and corporate profits continue to grow, albeit at a moderate pace.
For the fiscal year, the Fund’s best relative performing sector during the year was the energy sector due in large part
to an underweighted position versus the benchmark and avoiding much of the correction in stock value when oil prices collapsed. Performance was hurt by the health care and industrial sectors. The biotechnology exposure contributed the most to
underperformance as stock selection was poor and our underweighted position hurt relative performance as the industry rallied significantly versus the benchmark for the year. The industrial sector was a poor relative performer for the year and our
significant overweight to the sector all year was the main reason for underperformance.
The Fund utilizes a quantitative
approach to stock selection and portfolio construction. Factor preferences that paid off for the year included high market capitalization, low price/earnings ratios, low beta, low dividend yield, and low price volatility and low earnings volatility
companies along with high price momentum. However, the start of the period brought about a rotation in factor preferences that caused the underperformance for the fiscal year as it takes some time for the portfolio to adjust to rapid changes in
factor preferences. Stock selection is particularly difficult for the quantitative strategies in the biotechnology industry where many companies lack earnings and even revenues making valuation differentiation difficult. The industrial exposure had
many of these characteristics but suffered from industry specific and stock selection issues in distribution, construction, and engineering companies.
| |
* |
Performance data quoted represents past performance, which is no guarantee of future results. Investment return and principal value will
fluctuate so that an investor’s shares, when redeemed, may be worth more or less than their original cost. The total return shown assumes the reinvestment of all distributions and does not reflect the deduction of taxes that a
shareholder would pay on fund distributions or the redemption of shares. The total return for Class A Shares was 2.76%, adjusted for the Fund’s maximum sales charge. Mutual fund performance changes over time and
current performance may be lower or higher than what is stated. For the
|
| |
most recent month-end performance, please visit www.wilmingtonfunds.com or call 1-800-836-2211.
|
| |
** |
The Russell 2000 Growth Index measures the performance of the small-cap growth segment of the U.S. equity universe. It includes those Russell 2000
companies with higher price-to-book ratios and higher forecasted growth values. The Russell 2000 Growth Index is constructed to provide a comprehensive and unbiased barometer for the small-cap growth segment. The index is completely reconstituted
annually to ensure larger stocks do not distort the performance and characteristics of the true small-cap opportunity set and that the represented companies continue to reflect growth characteristics. |
The price-to-earnings ratio, or P/E ratio, is an equity valuation multiple. It is defined as market price per share divided
by annual earnings per share.
Valuation is the process of determining the current worth of an asset or company. There
are many techniques that can be used to determine value; some are subjective and others are objective.
Dividend Yield is
a financial ratio that shows how much a company pays out in dividends each year relative to its share price. In the absence of any capital gains, the dividend yield is the return on investment of a stock.
Beta is a measure of the volatility, or systematic risk, of a security or a portfolio in comparison to the market as a whole.
April 30, 2015
(unaudited) / ANNUAL REPORT
11
WILMINGTON SMALL-CAP GROWTH
FUND
– Class A
The graph below illustrates the hypothetical investment of $10,0001 in the Wilmington Small-Cap Growth Fund (Class A) (the “Fund”) from April 30, 2005 to April 30, 2015, compared to the Russell 2000 Growth Index (“Russell 2000 Growth”).2
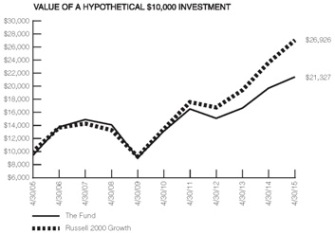
Average Annual Total Returns for the Periods Ended April 30, 2015
|
|
|
|
|
|
1 Year |
|
2.76% |
|
5 Years |
|
8.97% |
|
10 Years |
|
7.87% |
Performance data quoted represents past performance which is no guarantee of future results. Returns shown do not reflect the deduction
of taxes that a shareholder would pay on Fund distributions or the redemption of Fund shares. Investment return and principal value will fluctuate so that an investor’s shares, when redeemed, may be worth more or less than their original cost.
Mutual funds are not obligations of or guaranteed by any bank and are not federally insured. Mutual fund performance changes over time and current performance may be lower or higher than what is stated. For current to the most recent month end
performance, visit www.wilmingtonfunds.com or call 1-800-836-2211. Total returns shown include the maximum sales charge of 5.50%.
Annual Operating Expense Ratio
|
|
|
|
|
|
Before Waivers |
|
1.75% |
|
After Waivers |
|
1.31% |
The Expense Ratio Before Waivers represents the operating costs borne by the Fund, expressed as a percentage of the Fund’s average
net assets, as shown in the Fees and Expenses table in the Fund’s current prospectus (under “Total Annual Fund Operating Expenses”).
| 1 |
Represents a hypothetical investment of $10,000 in Class A of the Fund after deducting the maximum sales charge of 5.50% ($10,000 investment minus $550 sales charge = $9,450). The Fund’s performance assumes
the reinvestment of all dividends and distributions. |
| 2 |
The performance for the Russell 2000 Growth Index assumes the reinvestment of all dividends and distributions but does not reflect the deduction of a sales charge required for the Fund’s performance by Securities
and Exchange Commission. It is not possible to invest directly in an index, and the represented index is unmanaged.
|
ANNUAL
REPORT / April 30, 2015 (unaudited)
12
WILMINGTON SMALL-CAP GROWTH
FUND
– Class I
The graph below illustrates the hypothetical investment of $1,000,0001,2 in the Wilmington Small-Cap Growth Fund (Class I) (the “Fund”) from April 30, 2005 to April 30, 2015, compared to the Russell 2000 Growth.2
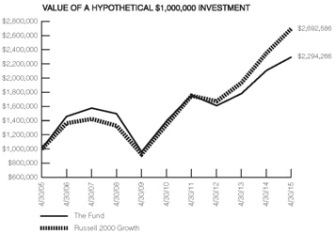
Average Annual Total Returns for the Periods Ended April 30, 2015
|
|
|
|
|
|
|
|
|
1 Year |
|
|
8.93% |
|
|
5 Years |
|
|
10.44%
|
|
|
10 Years |
|
|
8.66% |
|
Performance data quoted represents past performance which is no guarantee of future results. Returns shown do not reflect the deduction
of taxes that a shareholder would pay on Fund distributions or the redemption of Fund shares. Investment return and principal value will fluctuate so that an investor’s shares, when redeemed, may be worth more or less than their original cost.
Mutual funds are not obligations of or guaranteed by any bank and are not federally insured. Mutual fund performance changes over time and current performance may be lower or higher than what is stated. For current to the most recent month end
performance, visit www.wilmingtonfunds.com or call 1-800-836-2211.
Annual
Operating Expense Ratio
|
|
|
|
|
|
|
|
|
Before Waivers |
|
|
1.50% |
|
|
After Waivers |
|
|
1.09% |
|
The Expense Ratio Before Waivers represents the operating costs borne by the Fund, expressed as a percentage of the Fund’s average
net assets, as shown in the Fees and Expenses table in the Fund’s current prospectus (under “Total Annual Fund Operating Expenses”).
| 1 |
Represents a hypothetical investment of $1,000,000 in Class I of the Fund and assumes the reinvestment of all dividends and distributions. |
| 2 |
The performance shown for the Russell 2000 Growth assumes the reinvestment of all dividends and distributions. It is not possible to invest directly in an index, and the represented index is unmanaged.
|
April 30, 2015
(unaudited) / ANNUAL REPORT
13
WILMINGTON SMALL-CAP STRATEGY FUND
Management’s Discussion of Fund Performance
For the fiscal year ended April 30, 2015, Wilmington Small-Cap Strategy
Fund (the “Fund”) had a total return of 11.14% for Class I Shares, versus its benchmark, the Russell 2000 Index**, which had a total return of 9.71%.
The Fund attempts to outperform the Russell 2000 Index by overweighting growth or value companies based on recommendations
from the Wilmington Trust Investment Advisors, Inc. Investment Strategy Team (IST).
At the September 2013 meeting of the
IST, the team voted to rebalance at the end of September to track a custom index of 65% Russell 2000 Growth Index/ 35% Russell 2000 Value Index. IST advice remained unchanged through the end of April 2015. During the 1 year period ending
April 30, 2015, the Russell 2000 Growth Index returned 14.7% and the Russell 2000 Value Index returned 4.9%. Over the 12-month period, the tactical overweight to growth had a 1.3% positive impact on relative return.
At the April IST meeting, the proprietary U.S. small-cap style model continued to favor growth stocks. The IST voted to follow
the models and recommended maintaining the overweight to growth companies in domestic small cap-equity portfolios. The IST and Investment Research Team are researching additional tactics to improve the risk adjusted return of the portfolio.
| * |
Performance data quoted represents past performance, which is no guarantee of future results. Investment return and principal value will
fluctuate so that an investor’s shares, when redeemed, may be worth more or less than their original cost. The total return shown assumes the reinvestment of all distributions and does not reflect the deduction of taxes that a shareholder would
pay on fund distributions or the redemption of shares. Mutual fund performance changes over time and current performance may be lower or higher than what is stated. For the most recent month-end performance, please visit www.wilmingtonfunds.com or
call 1-800-836-2211. |
| ** |
The Russell 2000 Index measures the performance of the small-cap segment of the U.S. equity universe. It is a subset of the Russell 3000 Index
representing approximately 10% of the total market capitalization of the Index. It includes approximately 2,000 of the smallest securities based on a combination of their market cap and current index membership. The Index is constructed to provide a
comprehensive and unbiased small-cap barometer and is completely reconstituted annually to ensure large stocks do not distort the performance and characteristics of the true small-cap opportunity set. The Russell 3000 Index measures the performance
of the largest 3,000 U.S. companies representing approximately 98% of the investable U.S. equity market. Russell 2000 Growth Index measures the performance of those Russell 2000 Index companies with higher price-to-book ratios and higher forecasted
growth values. Russell 2000 Value Index measures the performance of those Russell 2000 Index companies with lower price-to-book ratios and lower forecasted growth values.
|
ANNUAL
REPORT / April 30, 2015 (unaudited)
14
WILMINGTON SMALL-CAP STRATEGY
FUND
– Class I
The graph below illustrates the hypothetical investment of $1,000,0001,2 in the Wilmington Small-Cap Strategy Fund (Class I) (the “Fund”) from April 30, 2005 to April 30, 2015, compared to the Russell 2000 Index.2
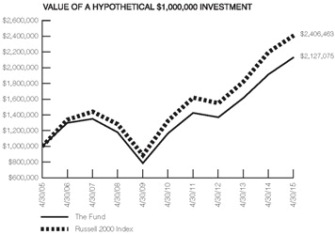
Average Annual Total Returns for the Periods Ended April 30, 2015
|
|
|
|
|
|
|
|
|
1 Year |
|
|
11.14% |
|
|
5 Years |
|
|
12.75% |
|
|
10 Years |
|
|
7.84% |
|
Performance data quoted represents past performance which is no guarantee of future results. Returns shown do not reflect the deduction
of taxes that a shareholder would pay on Fund distributions or the redemption of Fund shares. Investment return and principal value will fluctuate so that an investor’s shares, when redeemed, may be worth more or less than their original cost.
Mutual funds are not obligations of or guaranteed by any bank and are not federally insured. Mutual fund performance changes over time and current performance may be lower or higher than what is stated. For current to the most recent month end
performance, visit www.wilmingtonfunds.com or call 1-800-836-2211.
Annual
Operating Expense Ratio
|
|
|
|
|
|
Before Waivers |
|
1.18% |
|
After Waivers |
|
0.34% |
The Expense Ratio Before Waivers represents the operating costs borne by the Fund, expressed as a percentage of the Fund’s average
net assets, as shown in the Fees and Expenses table in the Fund’s current prospectus (under “Total Annual Fund Operating Expenses”).
| 1 |
Represents a hypothetical investment of $1,000,000 in Class I of the Fund and assumes the reinvestment of all dividends and distributions. |
| 2 |
The performance shown for the Russell 2000 Index assumes the reinvestment of all dividends and distributions. It is not possible to invest directly in an index, and the represented index is unmanaged.
|
April 30, 2015
(unaudited) / ANNUAL REPORT
15
SHAREHOLDER EXPENSE EXAMPLE
As a shareholder of the Fund, you incur ongoing costs, including management fees; to the extent
applicable, distribution (12b-1) fees, and/or shareholder services fees; and other Fund expenses. This Example is intended to help you to understand your ongoing costs (in dollars) of investing in the Funds and to compare these costs with the
ongoing costs of investing in other mutual funds. It is based on an investment of $1,000 invested at the beginning of the period and held for the entire period from November 1, 2014 to April 30, 2015.
Actual Expenses
This section of the following table
provides information about actual account values and actual expenses. You may use the information in this section, together with the amount you invested, to estimate the expenses that you incurred over the period. Simply divide your account value by
$1,000 (for example, an $8,600 account value divided by $1,000 = 8.6), then multiply the result by the number in the first section under the heading entitled “Expenses Paid During Period” to estimate the expenses attributable to your
investment during this period.
Hypothetical Example for Comparison Purposes
This section of the following table provides information about hypothetical account values and hypothetical expenses based on the Funds’
actual expense ratios and assumed rates of return of 5% per year before expenses, which are not the Funds’ actual returns. Thus, you should not use the hypothetical account values and expenses to estimate the actual ending account balance
or your expenses for the period. Rather, these figures are required to be provided to enable you to compare the ongoing costs of investing in the Funds with other funds. To do so, compare this 5% hypothetical example with the 5% hypothetical
examples that appear in the shareholder reports of the other funds.
Please note that the expenses shown in the table are meant to highlight
your ongoing costs only. Therefore, the Annualized Net Expense Ratio section of the table is useful in comparing ongoing costs only, and will not help you determine the relative total costs of owning different funds.
|
|
|
|
|
|
|
|
|
|
|
|
|
|
|
|
| |
|
Beginning
Account Value
11/1/14 |
|
Ending
Account Value
4/30/15 |
|
Expenses Paid
During Period1 |
|
Annualized Net
Expense Ratio2 |
|
|
|
|
|
|
| WILMINGTON LARGE-CAP STRATEGY FUND |
|
|
|
|
|
|
|
|
|
|
| Actual |
|
|
|
|
|
|
|
|
|
|
| Class I |
|
$1,000.00 |
|
$1,055.50 |
|
$1.27 |
|
|
0.25% |
|
| Hypothetical (assuming a 5% return before expense) |
|
|
|
|
|
|
|
|
|
|
| Class I |
|
$1,000.00 |
|
$1,023.55 |
|
$1.25 |
|
|
0.25% |
|
|
|
|
|
|
| WILMINGTON MID-CAP GROWTH FUND |
|
|
|
|
|
|
|
|
|
|
| Actual |
|
|
|
|
|
|
|
|
|
|
| Class A |
|
$1,000.00 |
|
$1,023.90 |
|
$6.22 |
|
|
1.24% |
|
| Class I |
|
$1,000.00 |
|
$1,024.80 |
|
$5.42 |
|
|
1.08% |
|
| Hypothetical (assuming a 5% return before expense) |
|
|
|
|
|
|
|
|
|
|
| Class A |
|
$1,000.00 |
|
$1,018.65 |
|
$6.21 |
|
|
1.24% |
|
| Class I |
|
$1,000.00 |
|
$1,019.44 |
|
$5.41 |
|
|
1.08% |
|
|
|
|
|
|
| WILMINGTON SMALL-CAP GROWTH FUND |
|
|
|
|
|
|
|
|
|
|
| Actual |
|
|
|
|
|
|
|
|
|
|
| Class A |
|
$1,000.00 |
|
$1,037.70 |
|
$6.42 |
|
|
1.27% |
|
| Class I |
|
$1,000.00 |
|
$1,038.50 |
|
$5.31 |
|
|
1.05% |
|
| Hypothetical (assuming a 5% return before expense) |
|
|
|
|
|
|
|
|
|
|
| Class A |
|
$1,000.00 |
|
$1,018.50 |
|
$6.36 |
|
|
1.27% |
|
| Class I |
|
$1,000.00 |
|
$1,019.59 |
|
$5.26 |
|
|
1.05% |
|
|
|
|
|
|
| WILMINGTON SMALL-CAP STRATEGY FUND |
|
|
|
|
|
|
|
|
|
|
| Actual |
|
|
|
|
|
|
|
|
|
|
| Class I |
|
$1,000.00 |
|
$1,053.80 |
|
$1.27 |
|
|
0.25% |
|
| Hypothetical (assuming a 5% return before expense) |
|
|
|
|
|
|
|
|
|
|
| Class I |
|
$1,000.00 |
|
$1,023.55 |
|
$1.25 |
|
|
0.25% |
|
| (1) |
Expenses are equal to the Funds’ annualized net expense ratios, multiplied by the average account value over the period, multiplied by 181/365 (to
reflect the most recent one-half year period). |
| (2) |
Expense ratio does not reflect the indirect expenses of the underlying funds in which it invests. |
ANNUAL
REPORT / April 30, 2015 (unaudited)
16
PORTFOLIO OF INVESTMENTS SUMMARY TABLE
Wilmington Large-Cap Strategy Fund
At April 30, 2015, the
Fund’s sector classifications were as follows (unaudited):
|
|
|
| |
|
Percentage of
Total Net Assets |
|
|
|
|
|
| Common Stocks |
|
|
|
|
|
|
| Information Technology |
|
|
24.0 |
% |
|
|
| Consumer Discretionary |
|
|
16.0 |
% |
|
|
| Health Care |
|
|
14.0 |
% |
|
|
| Industrials |
|
|
11.3 |
% |
|
|
| Financials |
|
|
11.1 |
% |
|
|
| Consumer Staples |
|
|
9.4 |
% |
|
|
| Energy |
|
|
6.5 |
% |
|
|
| Materials |
|
|
3.8 |
% |
|
|
| Telecommunication Services |
|
|
2.2 |
% |
|
|
| Utilities |
|
|
1.6 |
% |
|
|
| Investment Companies |
|
|
0.1 |
% |
|
|
| Rights |
|
|
0.0 |
%3 |
|
|
| Warrants |
|
|
0.0 |
%3 |
|
|
| Cash Equivalents1 |
|
|
1.2 |
% |
|
|
| Other Assets and Liabilities – Net2 |
|
|
(1.2 |
)% |
|
|
|
|
|
|
|
| TOTAL |
|
|
100.0 |
% |
|
|
|
|
|
| (1) |
Cash Equivalents include investments in repurchase agreements. |
| (2) |
Assets, other than investments in securities, less liabilities. See Statements of Assets and Liabilities. |
| (3) |
Represent less than 0.05%. |
PORTFOLIO OF INVESTMENTS
April 30, 2015
|
|
|
|
|
|
|
|
|
|
|
|
| Description
|
|
Number of
Shares
|
|
|
Value
|
|
| COMMON STOCKS – 99.9% |
|
|
|
|
|
|
|
|
|
|
| CONSUMER DISCRETIONARY – 16.0% |
|
|
|
|
|
|
|
|
| AUTO COMPONENTS – 0.4% |
|
|
|
|
|
|
|
|
|
|
|
| BorgWarner, Inc. |
|
|
7,980 |
|
|
$ |
472,416 |
|
|
|
|
| Gentex Corp. |
|
|
4,780 |
|
|
|
82,933 |
|
|
|
|
| Goodyear Tire & Rubber Co. (The) |
|
|
7,300 |
|
|
|
207,064 |
|
|
|
|
| Johnson Controls, Inc. |
|
|
9,830 |
|
|
|
495,235 |
|
|
|
|
| Lear Corp. |
|
|
2,500 |
|
|
|
277,575 |
|
|
|
|
| Remy International, Inc. |
|
|
151 |
|
|
|
3,360 |
|
|
|
|
| TRW Automotive Holdings Corp.* |
|
|
1,410 |
|
|
|
148,135 |
|
|
|
|
| Visteon Corp.* |
|
|
1,500 |
|
|
|
152,100 |
|
|
|
|
|
|
|
|
|
|
|
|
|
|
|
|
|
|
|
$ |
1,838,818 |
|
|
|
|
| AUTOMOBILES – 0.5% |
|
|
|
|
|
|
|
|
|
|
|
| Ford Motor Co. |
|
|
44,120 |
|
|
|
697,096 |
|
|
|
|
| General Motors Co. |
|
|
15,300 |
|
|
|
536,418 |
|
|
|
|
| Harley-Davidson, Inc. |
|
|
6,090 |
|
|
|
342,319 |
|
|
|
|
|
|
|
|
|
|
|
|
|
| Description
|
|
Number of
Shares
|
|
|
Value
|
|
|
|
|
| Tesla Motors, Inc.#,* |
|
|
2,900 |
|
|
$ |
655,545 |
|
|
|
|
| Thor Industries, Inc. |
|
|
1,380 |
|
|
|
83,035 |
|
|
|
|
|
|
|
|
|
|
|
|
|
|
|
|
|
|
|
$ |
2,314,413 |
|
|
|
|
| DISTRIBUTORS – 0.1% |
|
|
|
|
|
|
|
|
|
|
|
| Genuine Parts Co. |
|
|
4,620 |
|
|
|
415,107 |
|
|
|
|
| LKQ Corp.* |
|
|
6,080 |
|
|
|
164,586 |
|
|
|
|
|
|
|
|
|
|
|
|
|
|
|
|
|
|
|
$ |
579,693 |
|
|
|
| DIVERSIFIED CONSUMER SERVICES – 0.1% |
|
|
|
|
|
|
|
|
| Apollo Education Group, Inc.* |
|
|
887 |
|
|
|
14,888 |
|
|
|
|
| DeVry Education Group, Inc. |
|
|
1,040 |
|
|
|
31,450 |
|
|
|
|
| Graham Holdings Co., Class B |
|
|
140 |
|
|
|
143,210 |
|
|
|
|
| H&R Block, Inc. |
|
|
10,260 |
|
|
|
310,262 |
|
|
|
|
| Service Corp. International |
|
|
4,170 |
|
|
|
115,426 |
|
|
|
|
| Weight Watchers International, Inc.#,* |
|
|
1,560 |
|
|
|
13,338 |
|
|
|
|
|
|
|
|
|
|
|
|
|
|
|
|
|
|
|
$ |
628,574 |
|
April 30,
2015 / ANNUAL REPORT
PORTFOLIOS OF
INVESTMENTS 17
Wilmington Large-Cap Strategy Fund (continued)
|
|
|
|
|
|
|
|
|
|
|
|
| Description
|
|
Number of
Shares
|
|
|
Value
|
|
| HOTELS, RESTAURANTS & LEISURE – 2.3% |
|
|
|
|
|
|
|
|
| Brinker International, Inc. |
|
|
520 |
|
|
$ |
28,792 |
|
|
|
|
| Carnival Corp. |
|
|
3,820 |
|
|
|
167,965 |
|
|
|
|
| Chipotle Mexican Grill, Inc.* |
|
|
1,050 |
|
|
|
652,407 |
|
|
|
|
| Choice Hotels International, Inc. |
|
|
60 |
|
|
|
3,592 |
|
|
|
|
| Darden Restaurants, Inc. |
|
|
2,540 |
|
|
|
161,976 |
|
|
|
|
| Domino’s Pizza, Inc. |
|
|
2,200 |
|
|
|
237,270 |
|
|
|
|
| Dunkin’ Brands Group, Inc. |
|
|
3,900 |
|
|
|
203,229 |
|
|
|
|
| Hilton Worldwide Holdings, Inc.* |
|
|
700 |
|
|
|
20,272 |
|
|
|
|
| International Game Technology* |
|
|
1,273 |
|
|
|
25,918 |
|
|
|
|
| Las Vegas Sands Corp. |
|
|
11,420 |
|
|
|
603,890 |
|
|
|
|
| Marriott International, Inc., Class A |
|
|
6,972 |
|
|
|
558,109 |
|
|
|
|
| McDonald’s Corp. |
|
|
31,099 |
|
|
|
3,002,608 |
|
|
|
|
| MGM Resorts International* |
|
|
4,510 |
|
|
|
95,387 |
|
|
|
|
| Panera Bread Co., Class A* |
|
|
845 |
|
|
|
154,196 |
|
|
|
|
| Restaurant Brands International LP |
|
|
47 |
|
|
|
1,840 |
|
|
|
|
| Restaurant Brands International, Inc. |
|
|
4,652 |
|
|
|
189,709 |
|
|
|
|
| Royal Caribbean Cruises Ltd. |
|
|
1,780 |
|
|
|
121,147 |
|
|
|
|
| Six Flags Entertainment Corp. |
|
|
3,100 |
|
|
|
145,762 |
|
|
|
|
| Starbucks Corp. |
|
|
46,920 |
|
|
|
2,326,294 |
|
|
|
|
| Starwood Hotels & Resorts Worldwide, Inc. |
|
|
4,430 |
|
|
|
380,759 |
|
|
|
|
| Wendy’s Co. (The) |
|
|
1,200 |
|
|
|
12,144 |
|
|
|
|
| Wyndham Worldwide Corp. |
|
|
5,260 |
|
|
|
449,204 |
|
|
|
|
| Wynn Resorts Ltd. |
|
|
2,520 |
|
|
|
279,896 |
|
|
|
|
| Yum! Brands, Inc. |
|
|
13,250 |
|
|
|
1,138,970 |
|
|
|
|
|
|
|
|
|
|
|
|
|
|
|
|
|
|
|
|
|
|
$ |
10,961,336 |
|
|
|
|
| HOUSEHOLD DURABLES – 0.5% |
|
|
|
|
|
|
|
|
|
|
|
| DR Horton, Inc. |
|
|
1,470 |
|
|
|
37,338 |
|
|
|
|
| Garmin Ltd. |
|
|
1,990 |
|
|
|
89,928 |
|
|
|
|
| Harman International Industries, Inc. |
|
|
1,920 |
|
|
|
250,330 |
|
|
|
|
| Jarden Corp.* |
|
|
3,210 |
|
|
|
164,288 |
|
|
|
|
| Leggett & Platt, Inc. |
|
|
3,670 |
|
|
|
155,865 |
|
|
|
|
| Lennar Corp., Class A |
|
|
2,210 |
|
|
|
101,218 |
|
|
|
|
| Mohawk Industries, Inc.* |
|
|
850 |
|
|
|
147,475 |
|
|
|
|
| Newell Rubbermaid, Inc. |
|
|
7,820 |
|
|
|
298,177 |
|
|
|
|
| NVR, Inc.* |
|
|
130 |
|
|
|
172,444 |
|
|
|
|
| PulteGroup, Inc. |
|
|
4,040 |
|
|
|
77,972 |
|
|
|
|
| Taylor Morrison Home Corp., Class A* |
|
|
900 |
|
|
|
16,668 |
|
|
|
|
| Tempur Sealy International, Inc.* |
|
|
2,500 |
|
|
|
152,275 |
|
|
|
|
| Toll Brothers, Inc.* |
|
|
4,050 |
|
|
|
143,937 |
|
|
|
|
| Tupperware Brands Corp. |
|
|
1,100 |
|
|
|
73,546 |
|
|
|
|
| Whirlpool Corp. |
|
|
1,350 |
|
|
|
237,060 |
|
|
|
|
|
|
|
|
|
|
|
|
|
|
|
|
|
|
|
|
|
|
$ |
2,118,521 |
|
|
|
| INTERNET & CATALOG RETAIL – 2.0% |
|
|
|
|
|
|
|
|
| Amazon.com, Inc.* |
|
|
12,130 |
|
|
|
5,116,191 |
|
|
|
|
| Expedia, Inc. |
|
|
3,120 |
|
|
|
293,998 |
|
|
|
|
| Groupon, Inc.* |
|
|
14,200 |
|
|
|
98,264 |
|
|
|
|
|
|
|
|
|
|
|
|
|
| Description
|
|
Number of
Shares
|
|
|
Value
|
|
| HomeAway, Inc.* |
|
|
3,200 |
|
|
$ |
89,440 |
|
|
|
|
| Liberty Interactive Corp., Class A* |
|
|
11,650 |
|
|
|
335,054 |
|
|
|
|
| Liberty TripAdvisor Holdings, Inc., Class A* |
|
|
2,446 |
|
|
|
72,671 |
|
|
|
|
| Liberty Ventures* |
|
|
4,102 |
|
|
|
170,971 |
|
|
|
|
| Netflix, Inc.* |
|
|
2,000 |
|
|
|
1,113,000 |
|
|
|
|
| Priceline.com, Inc. (The)* |
|
|
1,630 |
|
|
|
2,017,630 |
|
|
|
|
| TripAdvisor, Inc.* |
|
|
3,180 |
|
|
|
255,958 |
|
|
|
|
|
|
|
|
|
|
|
|
|
|
|
|
|
|
|
|
|
|
$ |
9,563,177 |
|
|
| LEISURE EQUIPMENT & PRODUCTS – 0.2% |
|
|
|
|
| Hasbro, Inc. |
|
|
3,490 |
|
|
|
247,057 |
|
|
|
|
| Mattel, Inc. |
|
|
4,550 |
|
|
|
128,128 |
|
|
|
|
| Polaris Industries, Inc. |
|
|
2,000 |
|
|
|
273,920 |
|
|
|
|
| Vista Outdoor, Inc.* |
|
|
440 |
|
|
|
19,254 |
|
|
|
|
|
|
|
|
|
|
|
|
|
|
|
|
|
|
|
|
|
|
$ |
668,359 |
|
|
|
|
| MEDIA – 4.6% |
|
|
|
|
|
|
|
|
|
|
|
| AMC Networks, Inc., Class A#,* |
|
|
1,685 |
|
|
|
127,116 |
|
|
|
|
| Cablevision Systems Corp., Class A# |
|
|
6,540 |
|
|
|
130,669 |
|
|
|
|
| CBS Corp., Non-Voting |
|
|
15,030 |
|
|
|
933,814 |
|
|
|
|
| Charter Communications, Inc., Class A* |
|
|
3,000 |
|
|
|
561,180 |
|
|
|
|
| Cinemark Holdings, Inc. |
|
|
4,500 |
|
|
|
191,835 |
|
|
|
|
| Clear Channel Outdoor Holdings, Inc., Class A |
|
|
500 |
|
|
|
5,690 |
|
|
|
|
| Comcast Corp., Class A |
|
|
78,800 |
|
|
|
4,551,488 |
|
|
|
|
| DIRECTV* |
|
|
14,490 |
|
|
|
1,314,315 |
|
|
|
|
| Discovery Communications, Inc., Class A#,* |
|
|
6,200 |
|
|
|
200,632 |
|
|
|
|
| Discovery Communications, Inc., Class C* |
|
|
6,200 |
|
|
|
187,426 |
|
|
|
|
| DISH Network Corp., Class A* |
|
|
6,880 |
|
|
|
465,501 |
|
|
|
|
| DreamWorks Animation SKG, Inc., Class A#,* |
|
|
2,490 |
|
|
|
64,889 |
|
|
|
|
| Gannett Co., Inc. |
|
|
3,290 |
|
|
|
112,913 |
|
|
|
|
| Interpublic Group of Cos., Inc. (The) |
|
|
12,820 |
|
|
|
267,169 |
|
|
|
|
| John Wiley & Sons, Inc., Class A |
|
|
2,100 |
|
|
|
119,448 |
|
|
|
|
| Liberty Broadband Corp., Class A* |
|
|
235 |
|
|
|
12,746 |
|
|
|
|
| Liberty Broadband Corp., Class C* |
|
|
471 |
|
|
|
25,556 |
|
|
|
|
| Liberty Media Corp., Class A* |
|
|
943 |
|
|
|
36,192 |
|
|
|
|
| Liberty Media Corp., Class C* |
|
|
1,886 |
|
|
|
71,574 |
|
|
|
|
| Madison Square Garden Co., Class A* |
|
|
2,187 |
|
|
|
175,616 |
|
|
|
|
| Morningstar, Inc. |
|
|
1,100 |
|
|
|
83,479 |
|
|
|
|
| News Corp., Class A* |
|
|
11,157 |
|
|
|
176,057 |
|
|
|
|
| Omnicom Group, Inc. |
|
|
7,990 |
|
|
|
605,322 |
|
|
|
|
| Regal Entertainment Group, Class A# |
|
|
770 |
|
|
|
16,940 |
|
|
|
|
| Scripps Networks Interactive, Inc., Class A |
|
|
1,580 |
|
|
|
110,379 |
|
|
|
|
| Sirius XM Holdings, Inc.* |
|
|
92,640 |
|
|
|
365,928 |
|
|
|
|
| Starz, Class A* |
|
|
2,343 |
|
|
|
92,150 |
|
|
|
|
| Thomson Reuters Corp. |
|
|
3,500 |
|
|
|
143,710 |
|
|
|
|
| Time Warner Cable, Inc. |
|
|
8,424 |
|
|
|
1,310,100 |
|
|
|
|
| Time Warner, Inc. |
|
|
9,596 |
|
|
|
809,998 |
|
|
|
|
| Twenty-First Century Fox, Inc. |
|
|
48,230 |
|
|
|
1,643,678 |
|
ANNUAL
REPORT / April 30, 2015
18
PORTFOLIOS OF INVESTMENTS
Wilmington Large-Cap Strategy Fund (continued)
|
|
|
|
|
|
|
|
|
|
|
|
| Description
|
|
Number of
Shares
|
|
|
Value
|
|
|
|
|
| Viacom, Inc., Class B |
|
|
13,720 |
|
|
$ |
952,854 |
|
|
|
|
| Walt Disney Co. (The) |
|
|
50,226 |
|
|
|
5,460,571 |
|
|
|
|
|
|
|
|
|
|
|
|
|
|
|
|
|
|
|
|
|
|
$ |
21,326,935 |
|
|
|
| MULTILINE RETAIL – 0.8% |
|
|
|
|
|
|
|
|
| Big Lots, Inc. |
|
|
1,324 |
|
|
|
60,335 |
|
|
|
|
| Dillard’s, Inc., Class A |
|
|
1,400 |
|
|
|
184,226 |
|
|
|
|
| Dollar General Corp. |
|
|
10,800 |
|
|
|
785,268 |
|
|
|
|
| Dollar Tree, Inc.* |
|
|
7,262 |
|
|
|
554,889 |
|
|
|
|
| Family Dollar Stores, Inc. |
|
|
4,456 |
|
|
|
348,192 |
|
|
|
|
| JC Penney Co., Inc.#,* |
|
|
2,330 |
|
|
|
19,339 |
|
|
|
|
| Kohl’s Corp. |
|
|
2,410 |
|
|
|
172,676 |
|
|
|
|
| Macy’s, Inc. |
|
|
11,380 |
|
|
|
735,489 |
|
|
|
|
| Nordstrom, Inc. |
|
|
5,780 |
|
|
|
436,737 |
|
|
|
|
| Sears Holdings Corp.#,* |
|
|
70 |
|
|
|
2,796 |
|
|
|
|
| Target Corp. |
|
|
8,160 |
|
|
|
643,253 |
|
|
|
|
|
|
|
|
|
|
|
|
|
|
|
|
|
|
|
|
|
|
$ |
3,943,200 |
|
|
|
| SPECIALTY RETAIL – 3.3% |
|
|
|
|
|
|
|
|
| Abercrombie & Fitch Co., Class A# |
|
|
680 |
|
|
|
15,286 |
|
|
|
|
| Advance Auto Parts, Inc. |
|
|
3,150 |
|
|
|
450,450 |
|
|
|
|
| Ascena Retail Group, Inc.* |
|
|
540 |
|
|
|
8,095 |
|
|
|
|
| AutoNation, Inc.* |
|
|
3,080 |
|
|
|
189,574 |
|
|
|
|
| AutoZone, Inc.* |
|
|
1,160 |
|
|
|
780,286 |
|
|
|
|
| Bed, Bath & Beyond, Inc.* |
|
|
5,290 |
|
|
|
372,733 |
|
|
|
|
| Best Buy Co., Inc. |
|
|
5,680 |
|
|
|
196,812 |
|
|
|
|
| CarMax, Inc.* |
|
|
7,400 |
|
|
|
504,014 |
|
|
|
|
| Chico’s FAS, Inc. |
|
|
4,890 |
|
|
|
82,445 |
|
|
|
|
| CST Brands, Inc. |
|
|
1,718 |
|
|
|
71,658 |
|
|
|
|
| Dick’s Sporting Goods, Inc. |
|
|
780 |
|
|
|
42,323 |
|
|
|
|
| DSW, Inc., Class A |
|
|
200 |
|
|
|
7,254 |
|
|
|
|
| Foot Locker, Inc. |
|
|
1,630 |
|
|
|
96,903 |
|
|
|
|
| GameStop Corp., Class A# |
|
|
2,820 |
|
|
|
108,683 |
|
|
|
|
| Gap, Inc. (The) |
|
|
6,330 |
|
|
|
250,921 |
|
|
|
|
| GNC Holdings, Inc., Class A |
|
|
3,800 |
|
|
|
163,590 |
|
|
|
|
| Home Depot, Inc. (The) |
|
|
44,540 |
|
|
|
4,764,889 |
|
|
|
|
| L Brands, Inc. |
|
|
5,750 |
|
|
|
513,820 |
|
|
|
|
| Lowe’s Cos., Inc. |
|
|
31,300 |
|
|
|
2,155,318 |
|
|
|
|
| Murphy USA, Inc.* |
|
|
1,387 |
|
|
|
90,613 |
|
|
|
|
| O’Reilly Automotive, Inc.* |
|
|
3,600 |
|
|
|
784,188 |
|
|
|
|
| Ross Stores, Inc. |
|
|
7,080 |
|
|
|
700,070 |
|
|
|
|
| Sally Beauty Holdings, Inc.* |
|
|
4,700 |
|
|
|
146,687 |
|
|
|
|
| Signet Jewelers Ltd. |
|
|
2,520 |
|
|
|
338,008 |
|
|
|
|
| Staples, Inc. |
|
|
8,110 |
|
|
|
132,355 |
|
|
|
|
| Tiffany & Co. |
|
|
3,550 |
|
|
|
310,554 |
|
|
|
|
| TJX Cos., Inc. (The) |
|
|
21,240 |
|
|
|
1,370,830 |
|
|
|
|
| Tractor Supply Co. |
|
|
4,900 |
|
|
|
421,694 |
|
|
|
|
| Ulta Salon Cosmetics & Fragrance, Inc.* |
|
|
2,000 |
|
|
|
302,180 |
|
|
|
|
|
|
|
|
|
|
|
|
|
| Description
|
|
Number of
Shares
|
|
|
Value
|
|
|
|
|
| Urban Outfitters, Inc.* |
|
|
960 |
|
|
$ |
38,438 |
|
|
|
|
| Williams-Sonoma, Inc. |
|
|
3,240 |
|
|
|
238,237 |
|
|
|
|
|
|
|
|
|
|
|
|
|
|
|
|
|
|
|
|
|
|
$ |
15,648,908 |
|
|
| TEXTILES, APPAREL & LUXURY GOODS – 1.2% |
|
|
|
|
| Carter’s, Inc. |
|
|
1,400 |
|
|
|
139,804 |
|
|
|
|
| Coach, Inc. |
|
|
7,950 |
|
|
|
303,769 |
|
|
|
|
| Deckers Outdoor Corp.* |
|
|
800 |
|
|
|
59,200 |
|
|
|
|
| Fossil Group, Inc.* |
|
|
1,600 |
|
|
|
134,368 |
|
|
|
|
| Hanesbrands, Inc. |
|
|
14,000 |
|
|
|
435,120 |
|
|
|
|
| Kate Spade & Co.#,* |
|
|
3,400 |
|
|
|
111,180 |
|
|
|
|
| Michael Kors Holdings Ltd.* |
|
|
6,138 |
|
|
|
379,697 |
|
|
|
|
| NIKE, Inc. Class B |
|
|
22,320 |
|
|
|
2,206,109 |
|
|
|
|
| PVH Corp. |
|
|
2,100 |
|
|
|
217,035 |
|
|
|
|
| Ralph Lauren Corp. |
|
|
380 |
|
|
|
50,696 |
|
|
|
|
| Under Armour, Inc., Class A* |
|
|
7,100 |
|
|
|
550,605 |
|
|
|
|
| VF Corp. |
|
|
11,400 |
|
|
|
825,702 |
|
|
|
|
|
|
|
|
|
|
|
|
|
|
|
|
|
|
|
|
|
|
$ |
5,413,285 |
|
|
|
|
|
|
|
|
|
|
|
|
|
|
|
|
| TOTAL CONSUMER DISCRETIONARY |
|
|
|
|
|
$ |
75,005,219 |
|
|
|
| CONSUMER STAPLES - 9.4% |
|
|
|
|
|
|
|
| BEVERAGES – 2.6% |
|
|
|
|
|
|
|
|
| Brown-Forman Corp., Class B |
|
|
4,897 |
|
|
|
441,856 |
|
|
|
|
| Coca-Cola Co. (The) |
|
|
131,382 |
|
|
|
5,328,854 |
|
|
|
|
| Coca-Cola Enterprises, Inc. |
|
|
5,600 |
|
|
|
248,696 |
|
|
|
|
| Constellation Brands, Inc. Class A* |
|
|
4,930 |
|
|
|
571,584 |
|
|
|
|
| Dr. Pepper Snapple Group, Inc. |
|
|
5,750 |
|
|
|
428,835 |
|
|
|
|
| Molson Coors Brewing Co., Class B |
|
|
2,550 |
|
|
|
187,451 |
|
|
|
|
| Monster Beverage Corp.* |
|
|
5,568 |
|
|
|
763,428 |
|
|
|
|
| PepsiCo, Inc. |
|
|
46,759 |
|
|
|
4,447,716 |
|
|
|
|
|
|
|
|
|
|
|
|
|
|
|
|
|
|
|
|
|
|
$ |
12,418,420 |
|
|
|
| FOOD & STAPLES RETAILING – 2.0% |
|
|
|
|
|
|
|
|
| Costco Wholesale Corp. |
|
|
13,260 |
|
|
|
1,896,843 |
|
|
|
|
| CVS Health Corp. |
|
|
16,100 |
|
|
|
1,598,569 |
|
|
|
|
| Kroger Co. (The) |
|
|
19,076 |
|
|
|
1,314,527 |
|
|
|
|
| Rite Aid Corp.* |
|
|
19,940 |
|
|
|
153,737 |
|
|
|
|
| Sprouts Farmers Market, Inc.* |
|
|
2,560 |
|
|
|
81,882 |
|
|
|
|
| Sysco Corp. |
|
|
10,290 |
|
|
|
381,039 |
|
|
|
|
| Walgreens Boots Alliance, Inc. |
|
|
25,220 |
|
|
|
2,091,495 |
|
|
|
|
| Wal-Mart Stores, Inc. |
|
|
21,033 |
|
|
|
1,641,626 |
|
|
|
|
| Whole Foods Market, Inc. |
|
|
7,480 |
|
|
|
357,245 |
|
|
|
|
|
|
|
|
|
|
|
|
|
|
|
|
|
|
|
|
|
|
$ |
9,516,963 |
|
|
|
| FOOD PRODUCTS – 1.6% |
|
|
|
|
|
|
|
|
| Archer-Daniels-Midland Co. |
|
|
7,540 |
|
|
|
368,555 |
|
|
|
|
| Bunge Ltd. |
|
|
1,670 |
|
|
|
144,238 |
|
|
|
|
| Campbell Soup Co. |
|
|
1,156 |
|
|
|
51,685 |
|
|
|
|
| ConAgra Foods, Inc. |
|
|
5,730 |
|
|
|
207,139 |
|
|
|
|
| Flowers Foods, Inc. |
|
|
3,837 |
|
|
|
85,719 |
|
April 30,
2015 / ANNUAL REPORT
PORTFOLIOS OF
INVESTMENTS 19
Wilmington Large-Cap Strategy Fund (continued)
|
|
|
|
|
|
|
|
|
|
|
|
| Description
|
|
Number of
Shares
|
|
|
Value
|
|
|
|
|
| General Mills, Inc. |
|
|
15,224 |
|
|
$ |
842,496 |
|
|
|
|
| Hain Celestial Group, Inc. (The)* |
|
|
3,000 |
|
|
|
180,720 |
|
|
|
|
| Hershey Co. (The) |
|
|
4,640 |
|
|
|
426,509 |
|
|
|
|
| Hormel Foods Corp. |
|
|
3,460 |
|
|
|
188,051 |
|
|
|
|
| Ingredion, Inc. |
|
|
970 |
|
|
|
77,018 |
|
|
|
|
| JM Smucker Co. (The) |
|
|
1,799 |
|
|
|
208,540 |
|
|
|
|
| Kellogg Co. |
|
|
6,340 |
|
|
|
401,512 |
|
|
|
|
| Keurig Green Mountain, Inc. |
|
|
5,040 |
|
|
|
586,505 |
|
|
|
|
| Kraft Foods Group, Inc. |
|
|
17,462 |
|
|
|
1,479,904 |
|
|
|
|
| McCormick & Co., Inc. |
|
|
5,130 |
|
|
|
386,289 |
|
|
|
|
| Mead Johnson Nutrition Co. |
|
|
6,750 |
|
|
|
647,460 |
|
|
|
|
| Mondelez International, Inc. Class A |
|
|
18,787 |
|
|
|
720,857 |
|
|
|
|
| Tyson Foods, Inc., Class A |
|
|
3,300 |
|
|
|
130,350 |
|
|
|
|
| WhiteWave Foods Co. (The)* |
|
|
3,380 |
|
|
|
148,619 |
|
|
|
|
|
|
|
|
|
|
|
|
|
|
|
|
|
|
|
|
|
|
$ |
7,282,166 |
|
|
|
| HOUSEHOLD PRODUCTS – 1.4% |
|
|
|
|
|
|
|
|
| Church & Dwight Co., Inc. |
|
|
3,872 |
|
|
|
314,290 |
|
|
|
|
| Clorox Co. (The) |
|
|
4,868 |
|
|
|
516,495 |
|
|
|
|
| Colgate-Palmolive Co. |
|
|
28,176 |
|
|
|
1,895,681 |
|
|
|
|
| Energizer Holdings, Inc. |
|
|
990 |
|
|
|
135,254 |
|
|
|
|
| Kimberly-Clark Corp. |
|
|
10,440 |
|
|
|
1,145,164 |
|
|
|
|
| Procter & Gamble Co. (The) |
|
|
32,966 |
|
|
|
2,621,127 |
|
|
|
|
|
|
|
|
|
|
|
|
|
|
|
|
|
|
|
|
|
|
$ |
6,628,011 |
|
|
|
| PERSONAL PRODUCTS – 0.2% |
|
|
|
|
|
|
|
|
| Avon Products, Inc. |
|
|
5,070 |
|
|
|
41,422 |
|
|
|
|
| Estee Lauder Cos., Inc. Class A (The) |
|
|
6,780 |
|
|
|
551,146 |
|
|
|
|
| Herbalife Ltd.#,* |
|
|
2,260 |
|
|
|
93,835 |
|
|
|
|
| Nu Skin Enterprises, Inc., Class A |
|
|
1,600 |
|
|
|
90,480 |
|
|
|
|
|
|
|
|
|
|
|
|
|
|
|
|
|
|
|
|
|
|
$ |
776,883 |
|
|
|
| TOBACCO – 1.6% |
|
|
|
|
|
|
|
|
| Altria Group, Inc. |
|
|
62,990 |
|
|
|
3,152,649 |
|
|
|
|
| Lorillard, Inc. |
|
|
12,220 |
|
|
|
853,689 |
|
|
|
|
| Philip Morris International, Inc. |
|
|
36,340 |
|
|
|
3,033,300 |
|
|
|
|
| Reynolds American, Inc. |
|
|
7,440 |
|
|
|
545,352 |
|
|
|
|
|
|
|
|
|
|
|
|
|
|
|
|
|
|
|
|
|
|
$ |
7,584,990 |
|
|
|
|
|
|
|
|
|
|
|
|
|
|
|
|
| TOTAL CONSUMER STAPLES |
|
|
|
|
|
$ |
44,207,433 |
|
|
|
|
| ENERGY – 6.5% |
|
|
|
|
|
|
|
|
|
| ENERGY EQUIPMENT & SERVICES – 1.8% |
|
|
|
|
| Amec Foster Wheeler PLC ADR |
|
|
3,156 |
|
|
|
44,121 |
|
|
|
|
| Atwood Oceanics, Inc. |
|
|
550 |
|
|
|
18,359 |
|
|
|
|
| Baker Hughes, Inc. |
|
|
5,100 |
|
|
|
349,146 |
|
|
|
|
| Cameron International Corp.* |
|
|
5,880 |
|
|
|
322,342 |
|
|
|
|
|
|
|
|
|
|
|
|
|
| Description
|
|
Number of
Shares
|
|
|
Value
|
|
|
|
|
| Diamond Offshore Drilling, Inc.# |
|
|
1,440 |
|
|
$ |
48,197 |
|
|
|
|
| Dresser-Rand Group, Inc.* |
|
|
2,070 |
|
|
|
171,127 |
|
|
|
|
| Dril-Quip, Inc.* |
|
|
1,500 |
|
|
|
119,580 |
|
|
|
|
| FMC Technologies, Inc.* |
|
|
7,560 |
|
|
|
333,396 |
|
|
|
|
| Frank’s International NV |
|
|
4,900 |
|
|
|
101,920 |
|
|
|
|
| Halliburton Co. |
|
|
26,730 |
|
|
|
1,308,433 |
|
|
|
|
| Helmerich & Payne, Inc. |
|
|
2,880 |
|
|
|
224,554 |
|
|
|
|
| Nabors Industries Ltd. |
|
|
2,530 |
|
|
|
42,251 |
|
|
|
|
| National Oilwell Varco, Inc. |
|
|
5,755 |
|
|
|
313,130 |
|
|
|
|
| Oceaneering International, Inc. |
|
|
3,680 |
|
|
|
202,805 |
|
|
|
|
| Oil States International, Inc.* |
|
|
1,360 |
|
|
|
64,722 |
|
|
|
|
| Patterson-UTI Energy, Inc.# |
|
|
4,230 |
|
|
|
94,541 |
|
|
|
|
| Rowan Cos. PLC, Class A |
|
|
3,240 |
|
|
|
68,656 |
|
|
|
|
| RPC, Inc. |
|
|
450 |
|
|
|
7,160 |
|
|
|
|
| Schlumberger Ltd. |
|
|
42,284 |
|
|
|
4,000,489 |
|
|
|
|
| Seadrill Ltd.#,* |
|
|
18,500 |
|
|
|
242,165 |
|
|
|
|
| Seventy Seven Energy, Inc.* |
|
|
500 |
|
|
|
2,535 |
|
|
|
|
| Superior Energy Services, Inc. |
|
|
2,740 |
|
|
|
69,870 |
|
|
|
|
| Tidewater, Inc.# |
|
|
1,660 |
|
|
|
45,965 |
|
|
|
|
| Unit Corp.* |
|
|
220 |
|
|
|
7,665 |
|
|
|
|
|
|
|
|
|
|
|
|
|
|
|
|
|
|
|
|
|
|
$ |
8,203,129 |
|
|
|
| OIL, GAS & CONSUMABLE FUELS – 4.7% |
|
|
|
|
|
|
|
|
| Anadarko Petroleum Corp. |
|
|
6,750 |
|
|
|
635,175 |
|
|
|
|
| Apache Corp. |
|
|
3,573 |
|
|
|
244,393 |
|
|
|
|
| Cabot Oil & Gas Corp. |
|
|
14,280 |
|
|
|
482,950 |
|
|
|
|
| California Resources Corp. |
|
|
3,200 |
|
|
|
29,760 |
|
|
|
|
| Cheniere Energy, Inc.* |
|
|
8,100 |
|
|
|
619,569 |
|
|
|
|
| Chesapeake Energy Corp.# |
|
|
7,000 |
|
|
|
110,390 |
|
|
|
|
| Chevron Corp. |
|
|
22,600 |
|
|
|
2,509,956 |
|
|
|
|
| Cimarex Energy Co. |
|
|
950 |
|
|
|
118,180 |
|
|
|
|
| Cobalt International Energy,
Inc.#,* |
|
|
9,400 |
|
|
|
100,580 |
|
|
|
|
| Concho Resources, Inc.* |
|
|
3,580 |
|
|
|
453,443 |
|
|
|
|
| ConocoPhillips |
|
|
14,560 |
|
|
|
988,915 |
|
|
|
|
| CONSOL Energy, Inc. |
|
|
1,800 |
|
|
|
58,464 |
|
|
|
|
| Continental Resources, Inc.#,* |
|
|
2,720 |
|
|
|
143,154 |
|
|
|
|
| Denbury Resources, Inc. |
|
|
1,815 |
|
|
|
15,990 |
|
|
|
|
| Devon Energy Corp. |
|
|
4,100 |
|
|
|
279,661 |
|
|
|
|
| Energen Corp. |
|
|
1,530 |
|
|
|
108,890 |
|
|
|
|
| EOG Resources, Inc. |
|
|
17,700 |
|
|
|
1,751,415 |
|
|
|
|
| EQT Corp. |
|
|
4,950 |
|
|
|
445,203 |
|
|
|
|
| Exxon Mobil Corp. |
|
|
48,643 |
|
|
|
4,249,939 |
|
|
|
|
| Golar LNG Ltd. |
|
|
1,300 |
|
|
|
46,794 |
|
|
|
|
| Gulfport Energy Corp.* |
|
|
2,700 |
|
|
|
132,138 |
|
|
|
|
| Hess Corp. |
|
|
2,990 |
|
|
|
229,931 |
|
|
|
|
| HollyFrontier Corp. |
|
|
2,340 |
|
|
|
90,745 |
|
|
|
|
| Kinder Morgan, Inc. |
|
|
13,965 |
|
|
|
599,797 |
|
|
|
|
| Laredo Petroleum, Inc.#,* |
|
|
1,800 |
|
|
|
28,440 |
|
|
|
|
| Marathon Oil Corp. |
|
|
7,330 |
|
|
|
227,963 |
|
|
|
|
| Marathon Petroleum Corp. |
|
|
6,465 |
|
|
|
637,255 |
|
ANNUAL
REPORT / April 30, 2015
20 PORTFOLIOS OF
INVESTMENTS
Wilmington Large-Cap Strategy Fund (continued)
|
|
|
|
|
|
|
|
|
| Description
|
|
Number of
Shares
|
|
|
Value
|
|
| Murphy Oil Corp. |
|
|
1,950 |
|
|
$ |
92,840 |
|
|
|
|
| Newfield Exploration Co.* |
|
|
2,560 |
|
|
|
100,454 |
|
|
|
|
| Noble Energy, Inc. |
|
|
9,820 |
|
|
|
498,070 |
|
|
|
|
| Oasis Petroleum, Inc.#,* |
|
|
3,000 |
|
|
|
53,820 |
|
|
|
|
| Occidental Petroleum Corp. |
|
|
8,000 |
|
|
|
640,800 |
|
|
|
|
| ONEOK, Inc. |
|
|
4,860 |
|
|
|
233,766 |
|
|
|
|
| PBF Energy, Inc., Class A |
|
|
3,000 |
|
|
|
85,140 |
|
|
|
|
| Peabody Energy Corp.# |
|
|
2,070 |
|
|
|
9,791 |
|
|
|
|
| Phillips 66 |
|
|
11,330 |
|
|
|
898,582 |
|
|
|
|
| Pioneer Natural Resources Co. |
|
|
4,420 |
|
|
|
763,688 |
|
|
|
|
| QEP Resources, Inc. |
|
|
2,400 |
|
|
|
54,000 |
|
|
|
|
| Range Resources Corp. |
|
|
5,350 |
|
|
|
340,046 |
|
|
|
|
| Sandridge Energy, Inc.#,* |
|
|
730 |
|
|
|
1,380 |
|
|
|
|
| SM Energy Co. |
|
|
1,570 |
|
|
|
91,013 |
|
|
|
|
| Southwestern Energy Co.* |
|
|
11,728 |
|
|
|
328,736 |
|
|
|
|
| Spectra Energy Corp. |
|
|
9,100 |
|
|
|
338,975 |
|
|
|
|
| Targa Resources Corp. |
|
|
1,200 |
|
|
|
125,964 |
|
|
|
|
| Teekay Corp. |
|
|
520 |
|
|
|
25,849 |
|
|
|
|
| Tesoro Corp. |
|
|
2,340 |
|
|
|
200,842 |
|
|
|
|
| Ultra Petroleum Corp.#,* |
|
|
1,420 |
|
|
|
24,183 |
|
|
|
|
| Valero Energy Corp. |
|
|
7,570 |
|
|
|
430,733 |
|
|
|
|
| Whiting Petroleum Corp.* |
|
|
1,000 |
|
|
|
37,910 |
|
|
|
|
| Williams Cos., Inc. (The) |
|
|
24,470 |
|
|
|
1,252,619 |
|
|
|
|
| World Fuel Services Corp. |
|
|
2,100 |
|
|
|
116,550 |
|
|
|
|
| WPX Energy, Inc.* |
|
|
5,116 |
|
|
|
70,345 |
|
|
|
|
|
|
|
|
|
|
|
|
|
|
|
|
|
|
|
|
|
|
$ |
22,155,186 |
|
|
|
|
|
|
|
|
|
|
|
|
|
|
|
|
| TOTAL ENERGY |
|
|
|
|
|
$ |
30,358,315 |
|
|
|
|
| FINANCIALS – 11.1% |
|
|
|
|
|
|
|
|
|
|
|
| CAPITAL MARKETS – 1.7% |
|
|
|
|
|
|
|
|
|
|
|
| Affiliated Managers Group, Inc.* |
|
|
2,070 |
|
|
|
468,089 |
|
|
|
|
| Ameriprise Financial, Inc. |
|
|
3,840 |
|
|
|
481,075 |
|
|
|
|
| Bank of New York Mellon Corp. (The) |
|
|
10,870 |
|
|
|
460,236 |
|
|
|
|
| BlackRock, Inc. |
|
|
2,260 |
|
|
|
822,504 |
|
|
|
|
| Charles Schwab Corp. (The) |
|
|
14,470 |
|
|
|
441,335 |
|
|
|
|
| E*TRADE Financial Corp.* |
|
|
4,900 |
|
|
|
141,071 |
|
|
|
|
| Eaton Vance Corp. |
|
|
4,970 |
|
|
|
204,168 |
|
|
|
|
| Federated Investors, Inc., Class B |
|
|
4,970 |
|
|
|
170,968 |
|
|
|
|
| Franklin Resources, Inc. |
|
|
9,520 |
|
|
|
490,851 |
|
|
|
|
| Goldman Sachs Group, Inc. (The) |
|
|
5,090 |
|
|
|
999,778 |
|
|
|
|
| Interactive Brokers Group, Inc., Class A |
|
|
1,200 |
|
|
|
40,740 |
|
|
|
|
| Invesco Ltd. |
|
|
5,570 |
|
|
|
230,709 |
|
|
|
|
| Lazard Ltd., Class A |
|
|
3,550 |
|
|
|
188,257 |
|
|
|
|
| Legg Mason, Inc. |
|
|
1,110 |
|
|
|
58,441 |
|
|
|
|
| LPL Financial Holdings, Inc. |
|
|
300 |
|
|
|
12,141 |
|
|
|
|
| Morgan Stanley |
|
|
17,396 |
|
|
|
649,045 |
|
|
|
|
| Northern Trust Corp. |
|
|
2,580 |
|
|
|
188,727 |
|
|
|
|
|
|
|
|
|
|
| Description |
|
Number of
Shares |
|
|
Value |
|
| NorthStar Asset Management Group, Inc./NY |
|
|
3,650 |
|
|
$ |
76,760 |
|
|
|
|
| Raymond James Financial, Inc. |
|
|
2,110 |
|
|
|
119,278 |
|
|
|
|
| SEI Investments Co. |
|
|
6,240 |
|
|
|
284,918 |
|
|
|
|
| State Street Corp. |
|
|
4,520 |
|
|
|
348,582 |
|
|
|
|
| T. Rowe Price Group, Inc. |
|
|
6,480 |
|
|
|
526,046 |
|
|
|
|
| TD Ameritrade Holding Corp. |
|
|
7,050 |
|
|
|
255,563 |
|
|
|
|
| Waddell & Reed Financial, Inc., Class A |
|
|
2,740 |
|
|
|
135,137 |
|
|
|
|
|
|
|
|
|
|
|
|
|
|
|
|
|
|
|
|
|
|
$ |
7,794,419 |
|
|
|
| COMMERCIAL BANKS – 2.8% |
|
|
|
|
|
|
|
|
| Associated Banc-Corp. |
|
|
5,285 |
|
|
|
99,411 |
|
|
|
|
| Bank of America Corp. |
|
|
115,650 |
|
|
|
1,842,304 |
|
|
|
|
| Bank of Hawaii Corp. |
|
|
770 |
|
|
|
46,500 |
|
|
|
|
| BB&T Corp. |
|
|
6,990 |
|
|
|
267,647 |
|
|
|
|
| BOK Financial Corp. |
|
|
320 |
|
|
|
20,861 |
|
|
|
|
| CIT Group, Inc. |
|
|
2,400 |
|
|
|
108,072 |
|
|
|
|
| Citigroup, Inc. |
|
|
33,782 |
|
|
|
1,801,256 |
|
|
|
|
| City National Corp. |
|
|
940 |
|
|
|
87,608 |
|
|
|
|
| Comerica, Inc. |
|
|
1,230 |
|
|
|
58,314 |
|
|
|
|
| Commerce Bancshares, Inc. |
|
|
888 |
|
|
|
37,926 |
|
|
|
|
| Cullen/Frost Bankers, Inc. |
|
|
1,440 |
|
|
|
105,034 |
|
|
|
|
| East West Bancorp, Inc. |
|
|
2,500 |
|
|
|
101,475 |
|
|
|
|
| Fifth Third Bancorp |
|
|
11,100 |
|
|
|
222,000 |
|
|
|
|
| First Horizon National Corp. |
|
|
6,384 |
|
|
|
90,972 |
|
|
|
|
| First Niagara Financial Group, Inc. |
|
|
4,450 |
|
|
|
40,473 |
|
|
|
|
| Fulton Financial Corp. |
|
|
7,410 |
|
|
|
90,106 |
|
|
|
|
| Huntington Bancshares, Inc. |
|
|
9,441 |
|
|
|
102,529 |
|
|
|
|
| JPMorgan Chase & Co. |
|
|
42,120 |
|
|
|
2,664,511 |
|
|
|
|
| KeyCorp |
|
|
11,570 |
|
|
|
167,186 |
|
|
|
|
| M&T Bank Corp.§ |
|
|
1,610 |
|
|
|
192,669 |
|
|
|
|
| PacWest Bancorp. |
|
|
1,339 |
|
|
|
60,389 |
|
|
|
|
| PNC Financial Services Group, Inc. (The) |
|
|
5,360 |
|
|
|
491,673 |
|
|
|
|
| Popular, Inc.* |
|
|
800 |
|
|
|
25,944 |
|
|
|
|
| Regions Financial Corp. |
|
|
17,356 |
|
|
|
170,609 |
|
|
|
|
| Signature Bank* |
|
|
1,100 |
|
|
|
147,499 |
|
|
|
|
| SunTrust Banks, Inc. |
|
|
6,680 |
|
|
|
277,220 |
|
|
|
|
| SVB Financial Group* |
|
|
500 |
|
|
|
66,380 |
|
|
|
|
| Synovus Financial Corp. |
|
|
394 |
|
|
|
10,898 |
|
|
|
|
| TCF Financial Corp. |
|
|
910 |
|
|
|
14,251 |
|
|
|
|
| U.S. Bancorp |
|
|
18,520 |
|
|
|
793,952 |
|
|
|
|
| Wells Fargo & Co. |
|
|
52,925 |
|
|
|
2,916,168 |
|
|
|
|
| Zions Bancorporation |
|
|
890 |
|
|
|
25,218 |
|
|
|
|
|
|
|
|
|
|
|
|
|
|
|
|
|
|
|
|
|
|
$ |
13,147,055 |
|
|
|
| CONSUMER FINANCE – 0.7% |
|
|
|
|
|
|
|
|
| Ally Financial, Inc.* |
|
|
5,200 |
|
|
|
113,828 |
|
|
|
|
| American Express Co. |
|
|
28,760 |
|
|
|
2,227,462 |
|
|
|
|
| Capital One Financial Corp. |
|
|
5,700 |
|
|
|
460,845 |
|
April 30, 2015 /
ANNUAL REPORT
PORTFOLIOS OF
INVESTMENTS 21
Wilmington Large-Cap Strategy Fund (continued)
|
|
|
|
|
|
|
|
|
| Description
|
|
Number of
Shares
|
|
|
Value
|
|
| Discover Financial Services |
|
|
5,080 |
|
|
$ |
294,488 |
|
|
|
|
| Navient Corp. |
|
|
5,360 |
|
|
|
104,734 |
|
|
|
|
| SLM Corp. |
|
|
5,360 |
|
|
|
54,618 |
|
|
|
|
| Synchrony Financial* |
|
|
5,000 |
|
|
|
155,750 |
|
|
|
|
|
|
|
|
|
|
|
|
|
|
|
|
|
|
|
|
|
|
$ |
3,411,725 |
|
|
| DIVERSIFIED FINANCIAL SERVICES – 1.2% |
|
|
|
|
| Berkshire Hathaway, Inc., Class B* |
|
|
19,026 |
|
|
|
2,686,661 |
|
|
|
|
| CBOE Holdings, Inc. |
|
|
3,000 |
|
|
|
168,810 |
|
|
|
|
| CME Group, Inc. |
|
|
3,900 |
|
|
|
354,549 |
|
|
|
|
| FNFV Group* |
|
|
846 |
|
|
|
12,648 |
|
|
|
|
| Intercontinental Exchange, Inc. |
|
|
2,518 |
|
|
|
565,367 |
|
|
|
|
| Leucadia National Corp. |
|
|
3,310 |
|
|
|
78,679 |
|
|
|
|
| McGraw Hill Financial, Inc. |
|
|
9,040 |
|
|
|
942,872 |
|
|
|
|
| Moody’s Corp. |
|
|
6,940 |
|
|
|
746,189 |
|
|
|
|
| MSCI, Inc. |
|
|
2,520 |
|
|
|
154,199 |
|
|
|
|
| NASDAQ OMX Group, Inc. (The) |
|
|
530 |
|
|
|
25,774 |
|
|
|
|
|
|
|
|
|
|
|
|
|
|
|
|
|
|
|
|
|
|
$ |
5,735,748 |
|
|
|
|
| INSURANCE – 1.9% |
|
|
|
|
|
|
|
|
|
|
|
| ACE Ltd. |
|
|
3,400 |
|
|
|
363,766 |
|
|
|
|
| Aflac, Inc. |
|
|
4,750 |
|
|
|
299,440 |
|
|
|
|
| Alleghany Corp.* |
|
|
256 |
|
|
|
121,221 |
|
|
|
|
| Allied World Assurance Co. Holdings AG |
|
|
2,790 |
|
|
|
114,781 |
|
|
|
|
| Allstate Corp. (The) |
|
|
3,980 |
|
|
|
277,247 |
|
|
|
|
| American Financial Group, Inc. |
|
|
1,600 |
|
|
|
101,120 |
|
|
|
|
| American International Group, Inc. |
|
|
15,530 |
|
|
|
874,184 |
|
|
|
|
| American National Insurance Co. |
|
|
600 |
|
|
|
60,036 |
|
|
|
|
| Aon PLC |
|
|
8,300 |
|
|
|
798,709 |
|
|
|
|
| Arch Capital Group Ltd.* |
|
|
2,540 |
|
|
|
154,127 |
|
|
|
|
| Arthur J Gallagher & Co. |
|
|
3,880 |
|
|
|
185,580 |
|
|
|
|
| Aspen Insurance Holdings Ltd. |
|
|
190 |
|
|
|
8,879 |
|
|
|
|
| Assurant, Inc. |
|
|
1,130 |
|
|
|
69,450 |
|
|
|
|
| Assured Guaranty Ltd. |
|
|
1,600 |
|
|
|
41,584 |
|
|
|
|
| Axis Capital Holdings Ltd. |
|
|
3,280 |
|
|
|
170,757 |
|
|
|
|
| Brown & Brown, Inc. |
|
|
2,170 |
|
|
|
69,331 |
|
|
|
|
| Chubb Corp. (The) |
|
|
3,950 |
|
|
|
388,482 |
|
|
|
|
| Cincinnati Financial Corp. |
|
|
2,106 |
|
|
|
106,648 |
|
|
|
|
| CNA Financial Corp. |
|
|
1,050 |
|
|
|
42,315 |
|
|
|
|
| Endurance Specialty Holdings Ltd. |
|
|
2,000 |
|
|
|
120,760 |
|
|
|
|
| Erie Indemnity Co., Class A |
|
|
670 |
|
|
|
55,442 |
|
|
|
|
| Everest Re Group Ltd. |
|
|
270 |
|
|
|
48,306 |
|
|
|
|
| FNF Group |
|
|
2,541 |
|
|
|
91,451 |
|
|
|
|
| Genworth Financial, Inc., Class A* |
|
|
3,260 |
|
|
|
28,655 |
|
|
|
|
| Hanover Insurance Group, Inc. (The) |
|
|
1,100 |
|
|
|
75,427 |
|
|
|
|
| Hartford Financial Services Group, Inc. (The) |
|
|
6,790 |
|
|
|
276,828 |
|
|
|
|
| HCC Insurance Holdings, Inc. |
|
|
970 |
|
|
|
55,251 |
|
|
|
|
| Kemper Corp. |
|
|
370 |
|
|
|
13,938 |
|
|
|
|
| Lincoln National Corp. |
|
|
3,170 |
|
|
|
179,073 |
|
|
|
|
|
|
|
|
|
|
| Description
|
|
Number of
Shares
|
|
|
Value
|
|
|
|
|
| Loews Corp. |
|
|
5,050 |
|
|
$ |
210,282 |
|
|
|
|
| Markel Corp.* |
|
|
80 |
|
|
|
59,251 |
|
|
|
|
| Marsh & McLennan Cos., Inc. |
|
|
13,740 |
|
|
|
771,638 |
|
|
|
|
| MBIA, Inc.* |
|
|
1,650 |
|
|
|
14,438 |
|
|
|
|
| Mercury General Corp. |
|
|
370 |
|
|
|
20,328 |
|
|
|
|
| MetLife, Inc. |
|
|
8,901 |
|
|
|
456,532 |
|
|
|
|
| Old Republic International Corp. |
|
|
6,600 |
|
|
|
100,914 |
|
|
|
|
| PartnerRe Ltd. |
|
|
970 |
|
|
|
124,160 |
|
|
|
|
| Principal Financial Group, Inc. |
|
|
3,590 |
|
|
|
183,521 |
|
|
|
|
| ProAssurance Corp. |
|
|
500 |
|
|
|
22,475 |
|
|
|
|
| Progressive Corp. (The) |
|
|
9,880 |
|
|
|
263,401 |
|
|
|
|
| Prudential Financial, Inc. |
|
|
4,730 |
|
|
|
385,968 |
|
|
|
|
| Reinsurance Group of America, Inc. |
|
|
1,690 |
|
|
|
154,838 |
|
|
|
|
| RenaissanceRe Holdings Ltd.* |
|
|
20 |
|
|
|
2,050 |
|
|
|
|
| StanCorp Financial Group, Inc. |
|
|
40 |
|
|
|
2,883 |
|
|
|
|
| Torchmark Corp. |
|
|
1,695 |
|
|
|
95,106 |
|
|
|
|
| Travelers Cos., Inc. (The) |
|
|
5,080 |
|
|
|
513,639 |
|
|
|
|
| Unum Group |
|
|
2,210 |
|
|
|
75,494 |
|
|
|
|
| Validus Holdings Ltd. |
|
|
170 |
|
|
|
7,111 |
|
|
|
|
| White Mountains Insurance Group Ltd. |
|
|
160 |
|
|
|
108,155 |
|
|
|
|
| WR Berkley Corp. |
|
|
3,580 |
|
|
|
175,384 |
|
|
|
|
| XL Group PLC |
|
|
2,520 |
|
|
|
93,442 |
|
|
|
|
|
|
|
|
|
|
|
|
|
|
|
|
|
|
|
|
|
|
$ |
9,033,798 |
|
|
| REAL ESTATE INVESTMENT TRUSTS – 2.6% |
|
|
|
|
| Alexandria Real Estate Equities, Inc. |
|
|
740 |
|
|
|
68,361 |
|
|
|
|
| American Capital Agency Corp. |
|
|
1,600 |
|
|
|
33,016 |
|
|
|
|
| American Realty Capital Properties, Inc. |
|
|
10,300 |
|
|
|
93,009 |
|
|
|
|
| American Tower Corp. |
|
|
12,660 |
|
|
|
1,196,750 |
|
|
|
|
| Annaly Capital Management, Inc. |
|
|
5,510 |
|
|
|
55,486 |
|
|
|
|
| Apartment Investment & Management Co., Class A |
|
|
3,970 |
|
|
|
149,788 |
|
|
|
|
| AvalonBay Communities, Inc. |
|
|
1,222 |
|
|
|
200,823 |
|
|
|
|
| BioMed Realty Trust, Inc. |
|
|
4,100 |
|
|
|
85,075 |
|
|
|
|
| Boston Properties, Inc. |
|
|
1,950 |
|
|
|
258,004 |
|
|
|
|
| Brandywine Realty Trust |
|
|
730 |
|
|
|
10,643 |
|
|
|
|
| Camden Property Trust |
|
|
170 |
|
|
|
12,764 |
|
|
|
|
| Chimera Investment Corp. |
|
|
3,140 |
|
|
|
47,697 |
|
|
|
|
| Communications Sales & Leasing, Inc.* |
|
|
3,140 |
|
|
|
94,451 |
|
|
|
|
| Corrections Corp. of America |
|
|
2,767 |
|
|
|
101,798 |
|
|
|
|
| Crown Castle International Corp. |
|
|
12,140 |
|
|
|
1,014,054 |
|
|
|
|
| DDR Corp. |
|
|
2,800 |
|
|
|
47,740 |
|
|
|
|
| Digital Realty Trust, Inc. |
|
|
3,760 |
|
|
|
238,422 |
|
|
|
|
| Douglas Emmett, Inc. |
|
|
10 |
|
|
|
285 |
|
|
|
|
| Duke Realty Corp. |
|
|
6,310 |
|
|
|
125,001 |
|
|
|
|
| Equity Commonwealth* |
|
|
2,542 |
|
|
|
64,084 |
|
|
|
|
| Equity Lifestyle Properties, Inc. |
|
|
3,400 |
|
|
|
179,588 |
|
|
|
|
| Equity Residential |
|
|
3,050 |
|
|
|
225,273 |
|
|
|
|
| Essex Property Trust, Inc. |
|
|
1,073 |
|
|
|
238,152 |
|
ANNUAL
REPORT / April 30, 2015
22
PORTFOLIOS OF INVESTMENTS
Wilmington Large-Cap Strategy Fund (continued)
|
|
|
|
|
|
|
|
|
|
|
|
| Description
|
|
Number of
Shares
|
|
|
Value
|
|
| Extra Space Storage, Inc. |
|
|
4,600 |
|
|
$ |
303,278 |
|
|
|
|
| Federal Realty Investment Trust |
|
|
1,170 |
|
|
|
156,394 |
|
|
|
|
| Gaming and Leisure Properties, Inc. |
|
|
104 |
|
|
|
3,713 |
|
|
|
|
| General Growth Properties, Inc. |
|
|
8,143 |
|
|
|
223,118 |
|
|
|
|
| HCP, Inc. |
|
|
1,970 |
|
|
|
79,371 |
|
|
|
|
| Health Care REIT, Inc. |
|
|
6,520 |
|
|
|
469,570 |
|
|
|
|
| Home Properties, Inc. |
|
|
1,000 |
|
|
|
73,560 |
|
|
|
|
| Hospitality Properties Trust |
|
|
750 |
|
|
|
22,560 |
|
|
|
|
| Host Hotels & Resorts, Inc. |
|
|
8,640 |
|
|
|
174,010 |
|
|
|
|
| Iron Mountain, Inc. |
|
|
4,433 |
|
|
|
152,894 |
|
|
|
|
| Kilroy Realty Corp. |
|
|
2,000 |
|
|
|
141,980 |
|
|
|
|
| Kimco Realty Corp. |
|
|
6,880 |
|
|
|
165,808 |
|
|
|
|
| Lamar Advertising Co., Class A |
|
|
2,400 |
|
|
|
139,104 |
|
|
|
|
| Liberty Property Trust |
|
|
1,340 |
|
|
|
46,686 |
|
|
|
|
| Macerich Co. (The) |
|
|
2,610 |
|
|
|
213,394 |
|
|
|
|
| Mid-America Apartment Communities, Inc. |
|
|
1,800 |
|
|
|
134,298 |
|
|
|
|
| National Retail Properties, Inc.# |
|
|
100 |
|
|
|
3,840 |
|
|
|
|
| NorthStar Realty Finance Corp. |
|
|
3,650 |
|
|
|
68,474 |
|
|
|
|
| Omega Healthcare Investors, Inc. |
|
|
4,100 |
|
|
|
147,969 |
|
|
|
|
| Piedmont Office Realty Trust, Inc. Class A |
|
|
3,300 |
|
|
|
57,684 |
|
|
|
|
| Plum Creek Timber Co., Inc. |
|
|
2,270 |
|
|
|
95,794 |
|
|
|
|
| Post Properties, Inc. |
|
|
700 |
|
|
|
40,019 |
|
|
|
|
| Prologis, Inc. |
|
|
6,010 |
|
|
|
241,602 |
|
|
|
|
| Public Storage |
|
|
3,860 |
|
|
|
725,333 |
|
|
|
|
| Rayonier, Inc. |
|
|
3,915 |
|
|
|
100,185 |
|
|
|
|
| Realty Income Corp.# |
|
|
3,910 |
|
|
|
183,653 |
|
|
|
|
| Regency Centers Corp. |
|
|
2,060 |
|
|
|
129,327 |
|
|
|
|
| Simon Property Group, Inc. |
|
|
8,033 |
|
|
|
1,457,909 |
|
|
|
|
| SL Green Realty Corp. |
|
|
790 |
|
|
|
96,664 |
|
|
|
|
| Spirit Realty Capital, Inc. |
|
|
13,000 |
|
|
|
146,770 |
|
|
|
|
| Starwood Property Trust, Inc. |
|
|
220 |
|
|
|
5,282 |
|
|
|
|
| Tanger Factory Outlet Centers, Inc. |
|
|
3,100 |
|
|
|
104,098 |
|
|
|
|
| Taubman Centers, Inc. |
|
|
130 |
|
|
|
9,361 |
|
|
|
|
| UDR, Inc. |
|
|
2,580 |
|
|
|
84,547 |
|
|
|
|
| Urban Edge Properties |
|
|
1,836 |
|
|
|
41,549 |
|
|
|
|
| Ventas, Inc. |
|
|
6,566 |
|
|
|
452,397 |
|
|
|
|
| Vornado Realty Trust |
|
|
3,673 |
|
|
|
380,119 |
|
|
|
|
| Weingarten Realty Investors |
|
|
3,560 |
|
|
|
116,626 |
|
|
|
|
| Weyerhaeuser Co. |
|
|
13,010 |
|
|
|
409,945 |
|
|
|
|
| WP Carey, Inc. |
|
|
1,900 |
|
|
|
120,612 |
|
|
|
|
| WP GLIMCHER, Inc. |
|
|
1,276 |
|
|
|
19,140 |
|
|
|
|
|
|
|
|
|
|
|
|
|
|
|
|
|
|
|
$ |
12,278,901 |
|
|
| REAL ESTATE MANAGEMENT & DEVELOPMENT – 0.1% |
|
|
|
|
| CBRE Group, Inc. Class A* |
|
|
8,710 |
|
|
|
333,941 |
|
|
|
|
| Forest City Enterprises, Inc., Class A* |
|
|
4,300 |
|
|
|
102,168 |
|
|
|
|
| Howard Hughes Corp. (The)* |
|
|
658 |
|
|
|
97,693 |
|
|
|
|
|
|
|
|
|
|
|
|
|
| Description
|
|
Number of
Shares
|
|
|
Value
|
|
| Jones Lang LaSalle, Inc. |
|
|
170 |
|
|
$ |
28,230 |
|
|
|
|
| Realogy Holdings Corp.* |
|
|
1,020 |
|
|
|
48,358 |
|
|
|
|
|
|
|
|
|
|
|
|
|
|
|
|
|
|
|
$ |
610,390 |
|
|
|
| THRIFTS & MORTGAGE FINANCE – 0.1%** |
|
|
|
|
|
|
|
|
| Hudson City Bancorp, Inc. |
|
|
3,732 |
|
|
|
34,708 |
|
|
|
|
| New York Community Bancorp, Inc.# |
|
|
2,740 |
|
|
|
47,101 |
|
|
|
|
| Ocwen Financial Corp.#,* |
|
|
3,000 |
|
|
|
25,470 |
|
|
|
|
| People’s United Financial, Inc. |
|
|
7,600 |
|
|
|
114,836 |
|
|
|
|
| TFS Financial Corp. |
|
|
250 |
|
|
|
3,655 |
|
|
|
|
|
|
|
|
|
|
|
|
|
|
|
|
|
|
|
$ |
225,770 |
|
|
|
|
|
|
|
|
|
|
|
|
|
| TOTAL FINANCIALS |
|
|
|
|
|
$ |
52,237,806 |
|
|
|
|
| HEALTH CARE – 14.0% |
|
|
|
|
|
|
|
|
|
|
|
| BIOTECHNOLOGY – 4.3% |
|
|
|
|
|
|
|
|
|
|
|
| Alexion Pharmaceuticals, Inc.* |
|
|
6,440 |
|
|
|
1,089,841 |
|
|
|
|
| Alkermes PLC* |
|
|
4,400 |
|
|
|
243,628 |
|
|
|
|
| Alnylam Pharmaceuticals, Inc.* |
|
|
2,200 |
|
|
|
224,114 |
|
|
|
|
| Amgen, Inc. |
|
|
22,704 |
|
|
|
3,585,189 |
|
|
|
|
| Biogen, Inc.* |
|
|
7,800 |
|
|
|
2,916,654 |
|
|
|
|
| BioMarin Pharmaceutical, Inc.* |
|
|
4,800 |
|
|
|
537,840 |
|
|
|
|
| Celgene Corp.* |
|
|
25,966 |
|
|
|
2,805,886 |
|
|
|
|
| Gilead Sciences, Inc.* |
|
|
49,434 |
|
|
|
4,968,611 |
|
|
|
|
| Incyte Corp.* |
|
|
4,000 |
|
|
|
388,640 |
|
|
|
|
| Intercept Pharmaceuticals, Inc.#,* |
|
|
400 |
|
|
|
101,124 |
|
|
|
|
| Medivation, Inc.* |
|
|
2,500 |
|
|
|
301,850 |
|
|
|
|
| Myriad Genetics, Inc.#,* |
|
|
2,310 |
|
|
|
76,299 |
|
|
|
|
| Pharmacyclics, Inc.* |
|
|
1,900 |
|
|
|
486,780 |
|
|
|
|
| Regeneron Pharmaceuticals, Inc.* |
|
|
2,600 |
|
|
|
1,189,396 |
|
|
|
|
| Seattle Genetics, Inc.* |
|
|
3,400 |
|
|
|
116,756 |
|
|
|
|
| United Therapeutics Corp.* |
|
|
1,340 |
|
|
|
213,985 |
|
|
|
|
| Vertex Pharmaceuticals, Inc.* |
|
|
7,483 |
|
|
|
922,504 |
|
|
|
|
|
|
|
|
|
|
|
|
|
|
|
|
|
|
|
$ |
20,169,097 |
|
|
| HEALTH CARE EQUIPMENT & SUPPLIES – 1.9% |
|
|
|
|
| Abbott Laboratories |
|
|
16,409 |
|
|
|
761,706 |
|
|
|
|
| Alere, Inc.* |
|
|
2,650 |
|
|
|
125,822 |
|
|
|
|
| Align Technology, Inc.* |
|
|
2,160 |
|
|
|
127,094 |
|
|
|
|
| Baxter International, Inc. |
|
|
15,510 |
|
|
|
1,066,157 |
|
|
|
|
| Becton Dickinson & Co. |
|
|
5,240 |
|
|
|
738,159 |
|
|
|
|
| Boston Scientific Corp.* |
|
|
18,100 |
|
|
|
322,542 |
|
|
|
|
| Cooper Cos., Inc. (The) |
|
|
1,050 |
|
|
|
186,973 |
|
|
|
|
| CR Bard, Inc. |
|
|
2,280 |
|
|
|
379,802 |
|
|
|
|
| DENTSPLY International, Inc. |
|
|
3,670 |
|
|
|
187,170 |
|
|
|
|
| Edwards Lifesciences Corp.* |
|
|
3,886 |
|
|
|
492,162 |
|
|
|
|
| Halyard Health, Inc.* |
|
|
1,305 |
|
|
|
63,266 |
|
|
|
|
| Hill-Rom Holdings, Inc. |
|
|
2,260 |
|
|
|
112,864 |
|
|
|
|
| Hologic, Inc.* |
|
|
8,040 |
|
|
|
271,270 |
|
April 30,
2015 / ANNUAL REPORT
PORTFOLIOS OF
INVESTMENTS 23
Wilmington Large-Cap Strategy Fund (continued)
|
|
|
|
|
|
|
|
|
|
|
|
| Description
|
|
Number of
Shares
|
|
|
Value
|
|
| IDEXX Laboratories, Inc.* |
|
|
1,890 |
|
|
$ |
236,949 |
|
|
|
|
| Intuitive Surgical, Inc.* |
|
|
1,200 |
|
|
|
595,176 |
|
|
|
|
| Medtronic PLC |
|
|
14,666 |
|
|
|
1,091,884 |
|
|
|
|
| ResMed, Inc.# |
|
|
4,720 |
|
|
|
301,797 |
|
|
|
|
| Sirona Dental Systems, Inc.* |
|
|
1,700 |
|
|
|
157,675 |
|
|
|
|
| St. Jude Medical, Inc. |
|
|
7,370 |
|
|
|
516,269 |
|
|
|
|
| Stryker Corp. |
|
|
7,300 |
|
|
|
673,352 |
|
|
|
|
| Teleflex, Inc. |
|
|
60 |
|
|
|
7,378 |
|
|
|
|
| Varian Medical Systems, Inc.* |
|
|
4,250 |
|
|
|
377,613 |
|
|
|
|
| Zimmer Holdings, Inc. |
|
|
2,310 |
|
|
|
253,730 |
|
|
|
|
|
|
|
|
|
|
|
|
|
|
|
|
|
|
|
|
|
|
$ |
9,046,810 |
|
|
|
| HEALTH CARE PROVIDERS & SERVICES – 2.4% |
|
|
|
|
|
|
|
|
| Aetna, Inc. |
|
|
5,231 |
|
|
|
559,037 |
|
|
|
|
| AmerisourceBergen Corp. |
|
|
7,870 |
|
|
|
899,541 |
|
|
|
|
| Anthem, Inc. |
|
|
2,610 |
|
|
|
393,927 |
|
|
|
|
| Brookdale Senior Living, Inc.* |
|
|
4,570 |
|
|
|
165,571 |
|
|
|
|
| Cardinal Health, Inc. |
|
|
4,200 |
|
|
|
354,228 |
|
|
|
|
| Catamaran Corp.* |
|
|
5,832 |
|
|
|
346,129 |
|
|
|
|
| Centene Corp.* |
|
|
3,400 |
|
|
|
210,766 |
|
|
|
|
| Cigna Corp. |
|
|
4,190 |
|
|
|
522,242 |
|
|
|
|
| Community Health Systems, Inc.* |
|
|
3,446 |
|
|
|
184,981 |
|
|
|
|
| DaVita HealthCare Partners, Inc.* |
|
|
4,588 |
|
|
|
372,087 |
|
|
|
|
| Envision Healthcare Holdings, Inc.* |
|
|
500 |
|
|
|
18,980 |
|
|
|
|
| Express Scripts Holding Co.* |
|
|
22,162 |
|
|
|
1,914,797 |
|
|
|
|
| HCA Holdings, Inc.* |
|
|
3,600 |
|
|
|
266,436 |
|
|
|
|
| Health Net, Inc.* |
|
|
1,220 |
|
|
|
64,233 |
|
|
|
|
| Henry Schein, Inc.* |
|
|
2,460 |
|
|
|
337,266 |
|
|
|
|
| Humana, Inc. |
|
|
2,270 |
|
|
|
375,912 |
|
|
|
|
| Laboratory Corp. of America Holdings* |
|
|
1,957 |
|
|
|
233,979 |
|
|
|
|
| LifePoint Hospitals, Inc.* |
|
|
130 |
|
|
|
9,734 |
|
|
|
|
| McKesson Corp. |
|
|
7,100 |
|
|
|
1,586,140 |
|
|
|
|
| MEDNAX, Inc.* |
|
|
2,740 |
|
|
|
193,937 |
|
|
|
|
| Omnicare, Inc. |
|
|
1,959 |
|
|
|
172,353 |
|
|
|
|
| Patterson Cos., Inc. |
|
|
970 |
|
|
|
45,546 |
|
|
|
|
| Quest Diagnostics, Inc. |
|
|
1,850 |
|
|
|
132,127 |
|
|
|
|
| Tenet Healthcare Corp.* |
|
|
2,425 |
|
|
|
116,061 |
|
|
|
|
| UnitedHealth Group, Inc. |
|
|
10,320 |
|
|
|
1,149,648 |
|
|
|
|
| Universal Health Services, Inc., Class B |
|
|
2,580 |
|
|
|
301,731 |
|
|
|
|
| VCA, Inc.* |
|
|
870 |
|
|
|
44,344 |
|
|
|
|
|
|
|
|
|
|
|
|
|
|
|
|
|
|
|
|
|
|
$ |
10,971,733 |
|
|
|
| HEALTH CARE TECHNOLOGY – 0.2% |
|
|
|
|
|
|
|
|
| Allscripts Healthcare Solutions, Inc.* |
|
|
4,700 |
|
|
|
62,510 |
|
|
|
|
| athenahealth, Inc.* |
|
|
1,100 |
|
|
|
134,926 |
|
|
|
|
| Cerner Corp.* |
|
|
10,040 |
|
|
|
720,972 |
|
|
|
|
| IMS Health Holdings, Inc.* |
|
|
100 |
|
|
|
2,759 |
|
|
|
|
| Veeva Systems, Inc., Class A#,* |
|
|
3,520 |
|
|
|
93,456 |
|
|
|
|
|
|
|
|
|
|
|
|
|
|
|
|
|
|
|
|
|
|
$ |
1,014,623 |
|
|
|
|
|
|
|
|
|
|
|
|
|
| Description
|
|
Number of
Shares
|
|
|
Value
|
|
|
|
| LIFE SCIENCES TOOLS & SERVICES – 0.6% |
|
|
|
|
|
|
|
|
| Agilent Technologies, Inc. |
|
|
5,490 |
|
|
$ |
227,121 |
|
|
|
|
| Bio-Rad Laboratories, Inc., Class A* |
|
|
890 |
|
|
|
119,660 |
|
|
|
|
| Bruker Corp.* |
|
|
2,920 |
|
|
|
55,363 |
|
|
|
|
| Charles River Laboratories International, Inc.* |
|
|
1,920 |
|
|
|
132,787 |
|
|
|
|
| Illumina, Inc.* |
|
|
4,640 |
|
|
|
854,920 |
|
|
|
|
| Mettler-Toledo International, Inc.* |
|
|
920 |
|
|
|
291,649 |
|
|
|
|
| PerkinElmer, Inc. |
|
|
870 |
|
|
|
44,596 |
|
|
|
|
| QIAGEN N.V.* |
|
|
220 |
|
|
|
5,238 |
|
|
|
|
| Thermo Fisher Scientific, Inc. |
|
|
7,120 |
|
|
|
894,842 |
|
|
|
|
| Waters Corp.* |
|
|
2,610 |
|
|
|
326,746 |
|
|
|
|
|
|
|
|
|
|
|
|
|
|
|
|
|
|
|
|
|
|
$ |
2,952,922 |
|
|
|
| PHARMACEUTICALS – 4.6% |
|
|
|
|
|
|
|
|
| AbbVie, Inc. |
|
|
49,409 |
|
|
|
3,194,786 |
|
|
|
|
| Actavis PLC* |
|
|
11,585 |
|
|
|
3,276,933 |
|
|
|
|
| Bristol-Myers Squibb Co. |
|
|
30,600 |
|
|
|
1,950,138 |
|
|
|
|
| Eli Lilly & Co. |
|
|
12,890 |
|
|
|
926,404 |
|
|
|
|
| Endo International PLC* |
|
|
4,630 |
|
|
|
389,221 |
|
|
|
|
| Hospira, Inc.* |
|
|
2,270 |
|
|
|
198,148 |
|
|
|
|
| Jazz Pharmaceuticals PLC* |
|
|
2,200 |
|
|
|
393,140 |
|
|
|
|
| Johnson & Johnson |
|
|
39,560 |
|
|
|
3,924,352 |
|
|
|
|
| Mallinckrodt PLC* |
|
|
3,310 |
|
|
|
374,626 |
|
|
|
|
| Merck & Co., Inc. |
|
|
37,766 |
|
|
|
2,249,343 |
|
|
|
|
| Mylan NV* |
|
|
12,630 |
|
|
|
912,644 |
|
|
|
|
| Perrigo Co. PLC |
|
|
2,040 |
|
|
|
373,891 |
|
|
|
|
| Pfizer, Inc. |
|
|
71,203 |
|
|
|
2,415,918 |
|
|
|
|
| Zoetis, Inc. |
|
|
17,581 |
|
|
|
780,948 |
|
|
|
|
|
|
|
|
|
|
|
|
|
|
|
|
|
|
|
|
|
|
$ |
21,360,492 |
|
|
|
|
|
|
|
|
|
|
|
|
|
|
|
| TOTAL HEALTH CARE |
|
|
$ |
65,515,677 |
|
|
|
| INDUSTRIALS – 11.3% |
|
|
|
|
|
|
|
| AEROSPACE & DEFENSE – 2.8% |
|
|
|
|
|
|
|
|
| B/E Aerospace, Inc. |
|
|
2,900 |
|
|
|
173,391 |
|
|
|
|
| Boeing Co. (The) |
|
|
23,990 |
|
|
|
3,438,727 |
|
|
|
|
| Exelis, Inc. |
|
|
5,070 |
|
|
|
124,316 |
|
|
|
|
| General Dynamics Corp. |
|
|
2,810 |
|
|
|
385,869 |
|
|
|
|
| Hexcel Corp. |
|
|
3,600 |
|
|
|
180,540 |
|
|
|
|
| Honeywell International, Inc. |
|
|
25,370 |
|
|
|
2,560,340 |
|
|
|
|
| Huntington Ingalls Industries, Inc. |
|
|
1,645 |
|
|
|
216,466 |
|
|
|
|
| KLX, Inc.* |
|
|
1,450 |
|
|
|
60,769 |
|
|
|
|
| L-3 Communications Holdings, Inc. |
|
|
610 |
|
|
|
70,095 |
|
|
|
|
| Lockheed Martin Corp. |
|
|
8,150 |
|
|
|
1,520,790 |
|
|
|
|
| Northrop Grumman Corp. |
|
|
2,770 |
|
|
|
426,691 |
|
|
|
|
| Orbital ATK, Inc. |
|
|
220 |
|
|
|
16,095 |
|
|
|
|
| Precision Castparts Corp. |
|
|
4,490 |
|
|
|
928,038 |
|
|
|
|
| Raytheon Co. |
|
|
3,520 |
|
|
|
366,080 |
|
|
|
|
| Rockwell Collins, Inc. |
|
|
4,470 |
|
|
|
435,065 |
|
ANNUAL
REPORT / April 30, 2015
24 PORTFOLIOS OF INVESTMENTS
Wilmington Large-Cap Strategy Fund (continued)
|
|
|
|
|
|
|
|
|
| Description
|
|
Number of
Shares
|
|
|
Value
|
|
|
|
|
| Spirit Aerosystems Holdings, Inc., Class A* |
|
|
4,540 |
|
|
$ |
231,041 |
|
|
|
|
| Textron, Inc. |
|
|
3,270 |
|
|
|
143,815 |
|
|
|
|
| TransDigm Group, Inc. |
|
|
1,890 |
|
|
|
400,926 |
|
|
|
|
| Triumph Group, Inc. |
|
|
780 |
|
|
|
46,207 |
|
|
|
|
| United Technologies Corp. |
|
|
12,060 |
|
|
|
1,371,825 |
|
|
|
|
| Vectrus, Inc.* |
|
|
281 |
|
|
|
7,182 |
|
|
|
|
|
|
|
|
|
|
|
|
|
|
|
|
|
|
|
|
|
|
$ |
13,104,268 |
|
|
| AIR FREIGHT & LOGISTICS – 0.8% |
|
|
|
|
| C.H. Robinson Worldwide, Inc.# |
|
|
4,384 |
|
|
|
282,286 |
|
|
|
|
| Expeditors International of Washington, Inc. |
|
|
7,280 |
|
|
|
333,642 |
|
|
|
|
| FedEx Corp. |
|
|
5,760 |
|
|
|
976,723 |
|
|
|
|
| United Parcel Service, Inc. Class B |
|
|
21,930 |
|
|
|
2,204,623 |
|
|
|
|
|
|
|
|
|
|
|
|
|
|
|
|
|
|
|
|
|
|
$ |
3,797,274 |
|
|
|
| AIRLINES – 0.8% |
|
|
|
|
|
|
|
|
| Alaska Air Group, Inc. |
|
|
4,400 |
|
|
|
281,864 |
|
|
|
|
| American Airlines Group, Inc. |
|
|
21,600 |
|
|
|
1,042,956 |
|
|
|
|
| Copa Holdings SA, Class A# |
|
|
520 |
|
|
|
57,663 |
|
|
|
|
| Delta Air Lines, Inc. |
|
|
10,320 |
|
|
|
460,685 |
|
|
|
|
| Southwest Airlines Co. |
|
|
21,230 |
|
|
|
861,089 |
|
|
|
|
| Spirit Airlines, Inc.* |
|
|
2,300 |
|
|
|
157,481 |
|
|
|
|
| United Continental Holdings, Inc.* |
|
|
14,333 |
|
|
|
856,253 |
|
|
|
|
|
|
|
|
|
|
|
|
|
|
|
|
|
|
|
|
|
|
$ |
3,717,991 |
|
|
|
| BUILDING PRODUCTS – 0.3% |
|
|
|
|
|
|
|
|
| Allegion PLC |
|
|
2,233 |
|
|
|
136,548 |
|
|
|
|
| Armstrong World Industries, Inc.* |
|
|
2,340 |
|
|
|
128,092 |
|
|
|
|
| Fortune Brands Home & Security, Inc. |
|
|
4,760 |
|
|
|
212,296 |
|
|
|
|
| Lennox International, Inc. |
|
|
1,490 |
|
|
|
157,880 |
|
|
|
|
| Masco Corp. |
|
|
15,630 |
|
|
|
414,039 |
|
|
|
|
| Owens Corning |
|
|
890 |
|
|
|
34,407 |
|
|
|
|
| Smith (A.O.) Corp. |
|
|
2,500 |
|
|
|
159,750 |
|
|
|
|
| USG Corp.* |
|
|
2,660 |
|
|
|
70,596 |
|
|
|
|
|
|
|
|
|
|
|
|
|
|
|
|
|
|
|
|
|
|
$ |
1,313,608 |
|
|
| COMMERCIAL SERVICES & SUPPLIES – 0.4% |
|
|
|
|
| ADT Corp. (The)# |
|
|
1,750 |
|
|
|
65,800 |
|
|
|
|
| Cintas Corp. |
|
|
3,520 |
|
|
|
281,424 |
|
|
|
|
| Civeo Corp. |
|
|
1,220 |
|
|
|
5,697 |
|
|
|
|
| Clean Harbors, Inc.* |
|
|
1,300 |
|
|
|
71,825 |
|
|
|
|
| Copart, Inc.* |
|
|
1,580 |
|
|
|
56,201 |
|
|
|
|
| Covanta Holding Corp. |
|
|
4,900 |
|
|
|
99,421 |
|
|
|
|
| KAR Auction Services, Inc. |
|
|
4,100 |
|
|
|
152,561 |
|
|
|
|
| Pitney Bowes, Inc. |
|
|
2,330 |
|
|
|
52,122 |
|
|
|
|
| Republic Services, Inc. |
|
|
5,140 |
|
|
|
208,838 |
|
|
|
|
| RR Donnelley & Sons Co. |
|
|
3,270 |
|
|
|
60,887 |
|
|
|
|
| Stericycle, Inc.* |
|
|
2,752 |
|
|
|
367,199 |
|
|
|
|
| Tyco International PLC |
|
|
8,620 |
|
|
|
339,456 |
|
|
|
|
| Waste Connections, Inc. |
|
|
195 |
|
|
|
9,245 |
|
|
|
|
|
|
|
|
|
|
| Description
|
|
Number of
Shares
|
|
|
Value
|
|
|
|
|
| Waste Management, Inc. |
|
|
4,440 |
|
|
$ |
219,913 |
|
|
|
|
|
|
|
|
|
|
|
|
|
|
|
|
|
|
|
$ |
1,990,589 |
|
|
| CONSTRUCTION & ENGINEERING – 0.2% |
|
|
|
|
| AECOM* |
|
|
5,991 |
|
|
|
189,076 |
|
|
|
|
| Chicago Bridge & Iron Co. NV# |
|
|
2,762 |
|
|
|
131,609 |
|
|
|
|
| Fluor Corp. |
|
|
3,670 |
|
|
|
220,714 |
|
|
|
|
| Jacobs Engineering Group, Inc.* |
|
|
1,650 |
|
|
|
70,719 |
|
|
|
|
| KBR, Inc. |
|
|
2,070 |
|
|
|
36,163 |
|
|
|
|
| Quanta Services, Inc.* |
|
|
5,010 |
|
|
|
144,839 |
|
|
|
|
|
|
|
|
|
|
|
|
|
|
|
|
|
|
|
|
|
|
$ |
793,120 |
|
|
| ELECTRICAL EQUIPMENT – 0.6% |
|
|
|
|
| Acuity Brands, Inc. |
|
|
1,300 |
|
|
|
217,035 |
|
|
|
|
| AMETEK, Inc.# |
|
|
5,660 |
|
|
|
296,697 |
|
|
|
|
| Babcock & Wilcox Co. (The) |
|
|
2,940 |
|
|
|
95,021 |
|
|
|
|
| Eaton Corp. PLC |
|
|
4,728 |
|
|
|
324,955 |
|
|
|
|
| Emerson Electric Co. |
|
|
18,890 |
|
|
|
1,111,299 |
|
|
|
|
| Hubbell, Inc., Class B |
|
|
1,590 |
|
|
|
173,040 |
|
|
|
|
| Regal-Beloit Corp. |
|
|
600 |
|
|
|
46,920 |
|
|
|
|
| Rockwell Automation, Inc. |
|
|
4,220 |
|
|
|
500,492 |
|
|
|
|
| SolarCity Corp.#,* |
|
|
1,000 |
|
|
|
60,050 |
|
|
|
|
|
|
|
|
|
|
|
|
|
|
|
|
|
|
|
|
|
|
$ |
2,825,509 |
|
|
| INDUSTRIAL CONGLOMERATES – 1.6% |
|
|
|
|
| 3M Co. |
|
|
21,210 |
|
|
|
3,317,032 |
|
|
|
|
| Carlisle Cos., Inc. |
|
|
1,290 |
|
|
|
124,485 |
|
|
|
|
| Danaher Corp. |
|
|
7,880 |
|
|
|
645,214 |
|
|
|
|
| General Electric Co. |
|
|
109,620 |
|
|
|
2,968,510 |
|
|
|
|
| Roper Technologies, Inc. |
|
|
3,000 |
|
|
|
504,510 |
|
|
|
|
|
|
|
|
|
|
|
|
|
|
|
|
|
|
|
|
|
|
$ |
7,559,751 |
|
|
|
| MACHINERY – 1.8% |
|
|
|
|
|
|
|
|
| AGCO Corp. |
|
|
560 |
|
|
|
28,846 |
|
|
|
|
| Allison Transmission Holdings, Inc. |
|
|
4,800 |
|
|
|
147,264 |
|
|
|
|
| Caterpillar, Inc. |
|
|
8,900 |
|
|
|
773,232 |
|
|
|
|
| Colfax Corp.* |
|
|
2,700 |
|
|
|
133,893 |
|
|
|
|
| Cummins, Inc. |
|
|
5,480 |
|
|
|
757,665 |
|
|
|
|
| Deere & Co. |
|
|
4,990 |
|
|
|
451,695 |
|
|
|
|
| Donaldson Co., Inc. |
|
|
4,860 |
|
|
|
181,618 |
|
|
|
|
| Dover Corp. |
|
|
3,560 |
|
|
|
269,563 |
|
|
|
|
| Flowserve Corp. |
|
|
4,920 |
|
|
|
287,968 |
|
|
|
|
| Graco, Inc. |
|
|
2,140 |
|
|
|
153,267 |
|
|
|
|
| IDEX Corp.# |
|
|
2,120 |
|
|
|
159,021 |
|
|
|
|
| Illinois Tool Works, Inc. |
|
|
10,600 |
|
|
|
991,948 |
|
|
|
|
| Ingersoll-Rand PLC |
|
|
4,500 |
|
|
|
296,280 |
|
|
|
|
| ITT Corp. |
|
|
2,535 |
|
|
|
100,513 |
|
|
|
|
| Joy Global, Inc. |
|
|
1,080 |
|
|
|
46,051 |
|
|
|
|
| Kennametal, Inc. |
|
|
2,650 |
|
|
|
93,836 |
|
|
|
|
| Lincoln Electric Holdings, Inc. |
|
|
2,600 |
|
|
|
173,836 |
|
April 30,
2015 / ANNUAL REPORT
PORTFOLIOS OF
INVESTMENTS 25
Wilmington Large-Cap Strategy Fund (continued)
|
|
|
|
|
|
|
|
|
|
|
|
| Description
|
|
Number of
Shares
|
|
|
Value
|
|
| Manitowoc Co., Inc. (The) |
|
|
3,910 |
|
|
$ |
77,144 |
|
|
|
|
| Middleby Corp. (The)* |
|
|
1,600 |
|
|
|
162,144 |
|
|
|
|
| Navistar International Corp.#,* |
|
|
1,680 |
|
|
|
50,333 |
|
|
|
|
| Nordson Corp. |
|
|
2,000 |
|
|
|
159,300 |
|
|
|
|
| Oshkosh Corp. |
|
|
990 |
|
|
|
53,302 |
|
|
|
|
| PACCAR, Inc. |
|
|
10,790 |
|
|
|
705,127 |
|
|
|
|
| Pall Corp. |
|
|
3,170 |
|
|
|
308,504 |
|
|
|
|
| Parker Hannifin Corp. |
|
|
2,560 |
|
|
|
305,562 |
|
|
|
|
| Pentair PLC |
|
|
2,666 |
|
|
|
165,692 |
|
|
|
|
| Snap-On, Inc. |
|
|
1,280 |
|
|
|
191,424 |
|
|
|
|
| SPX Corp. |
|
|
1,230 |
|
|
|
94,710 |
|
|
|
|
| Stanley Black & Decker, Inc. |
|
|
1,820 |
|
|
|
179,634 |
|
|
|
|
| Terex Corp. |
|
|
2,030 |
|
|
|
55,744 |
|
|
|
|
| Timken Co. (The) |
|
|
300 |
|
|
|
11,787 |
|
|
|
|
| Toro Co. (The) |
|
|
2,340 |
|
|
|
156,874 |
|
|
|
|
| Trinity Industries, Inc. |
|
|
560 |
|
|
|
15,170 |
|
|
|
|
| Valmont Industries, Inc. |
|
|
1,060 |
|
|
|
133,581 |
|
|
|
|
| WABCO Holdings, Inc.* |
|
|
2,050 |
|
|
|
255,123 |
|
|
|
|
| Wabtec Corp. |
|
|
3,320 |
|
|
|
312,246 |
|
|
|
|
| Xylem, Inc. |
|
|
2,670 |
|
|
|
98,843 |
|
|
|
|
|
|
|
|
|
|
|
|
|
|
|
|
|
|
|
$ |
8,538,740 |
|
|
|
|
| MARINE – 0.0%** |
|
|
|
|
|
|
|
|
|
|
|
| Kirby Corp.* |
|
|
1,500 |
|
|
|
117,795 |
|
|
| PROFESSIONAL SERVICES – 0.5% |
|
|
|
|
| Dun & Bradstreet Corp. (The) |
|
|
930 |
|
|
|
118,733 |
|
|
|
|
| Equifax, Inc. |
|
|
4,060 |
|
|
|
393,536 |
|
|
|
|
| IHS, Inc., Class A* |
|
|
2,140 |
|
|
|
268,506 |
|
|
|
|
| ManpowerGroup, Inc. |
|
|
1,860 |
|
|
|
158,714 |
|
|
|
|
| Nielsen Holdings N.V. |
|
|
7,600 |
|
|
|
341,544 |
|
|
|
|
| Robert Half International, Inc. |
|
|
5,010 |
|
|
|
277,805 |
|
|
|
|
| Towers Watson & Co., Class A |
|
|
1,300 |
|
|
|
164,977 |
|
|
|
|
| Verisk Analytics, Inc., Class A* |
|
|
6,000 |
|
|
|
450,240 |
|
|
|
|
|
|
|
|
|
|
|
|
|
|
|
|
|
|
|
$ |
2,174,055 |
|
|
| ROAD & RAIL – 1.2% |
|
|
|
|
| AMERCO |
|
|
300 |
|
|
|
96,612 |
|
|
|
|
| Avis Budget Group, Inc.* |
|
|
3,600 |
|
|
|
194,904 |
|
|
|
|
| Con-way, Inc.# |
|
|
1,840 |
|
|
|
75,624 |
|
|
|
|
| CSX Corp. |
|
|
14,600 |
|
|
|
526,914 |
|
|
|
|
| Genesee & Wyoming, Inc., Class A* |
|
|
1,600 |
|
|
|
148,720 |
|
|
|
|
| Hertz Global Holdings, Inc.* |
|
|
13,850 |
|
|
|
288,634 |
|
|
|
|
| JB Hunt Transport Services, Inc. |
|
|
2,980 |
|
|
|
259,856 |
|
|
|
|
| Kansas City Southern |
|
|
4,000 |
|
|
|
409,960 |
|
|
|
|
| Landstar System, Inc. |
|
|
1,590 |
|
|
|
99,073 |
|
|
|
|
| Norfolk Southern Corp. |
|
|
4,160 |
|
|
|
419,536 |
|
|
|
|
| Old Dominion Freight Line, Inc.* |
|
|
2,800 |
|
|
|
199,164 |
|
|
|
|
|
|
|
|
|
|
|
|
|
| Description
|
|
Number of
Shares
|
|
|
Value
|
|
| Ryder System, Inc. |
|
|
40 |
|
|
$ |
3,814 |
|
|
|
|
| Union Pacific Corp. |
|
|
28,720 |
|
|
|
3,050,926 |
|
|
|
|
|
|
|
|
|
|
|
|
|
|
|
|
|
|
|
$ |
5,773,737 |
|
|
| TRADING COMPANIES & DISTRIBUTORS – 0.3% |
|
|
|
|
| Fastenal Co.# |
|
|
6,820 |
|
|
|
290,668 |
|
|
|
|
| GATX Corp. |
|
|
90 |
|
|
|
4,896 |
|
|
|
|
| MRC Global, Inc.* |
|
|
100 |
|
|
|
1,460 |
|
|
|
|
| MSC Industrial Direct Co., Inc., Class A |
|
|
1,390 |
|
|
|
98,773 |
|
|
|
|
| NOW, Inc.#,* |
|
|
1,063 |
|
|
|
25,406 |
|
|
|
|
| United Rentals, Inc.* |
|
|
2,920 |
|
|
|
282,014 |
|
|
|
|
| Veritiv Corp.* |
|
|
207 |
|
|
|
8,226 |
|
|
|
|
| WESCO International, Inc.#,* |
|
|
330 |
|
|
|
23,806 |
|
|
|
|
| WW Grainger, Inc. |
|
|
1,790 |
|
|
|
444,690 |
|
|
|
|
|
|
|
|
|
|
|
|
|
|
|
|
|
|
|
$ |
1,179,939 |
|
|
|
|
|
|
|
|
|
|
|
|
|
| TOTAL INDUSTRIALS |
|
|
|
|
|
$ |
52,886,376 |
|
|
| INFORMATION TECHNOLOGY – 24.0% |
|
|
| COMMUNICATIONS EQUIPMENT – 1.5% |
|
|
|
|
| ARRIS Group, Inc.* |
|
|
2,420 |
|
|
|
81,493 |
|
|
|
|
| Brocade Communications Systems, Inc. |
|
|
8,790 |
|
|
|
99,327 |
|
|
|
|
| Cisco Systems, Inc. |
|
|
56,660 |
|
|
|
1,633,508 |
|
|
|
|
| EchoStar Corp., Class A* |
|
|
270 |
|
|
|
13,500 |
|
|
|
|
| F5 Networks, Inc.* |
|
|
2,590 |
|
|
|
316,032 |
|
|
|
|
| Harris Corp. |
|
|
2,040 |
|
|
|
163,690 |
|
|
|
|
| JDS Uniphase Corp.* |
|
|
2,190 |
|
|
|
27,725 |
|
|
|
|
| Juniper Networks, Inc. |
|
|
10,440 |
|
|
|
275,929 |
|
|
|
|
| Motorola Solutions, Inc. |
|
|
2,770 |
|
|
|
165,508 |
|
|
|
|
| Palo Alto Networks, Inc.* |
|
|
1,800 |
|
|
|
265,896 |
|
|
|
|
| QUALCOMM, Inc. |
|
|
55,400 |
|
|
|
3,767,200 |
|
|
|
|
|
|
|
|
|
|
|
|
|
|
|
|
|
|
|
$ |
6,809,808 |
|
|
| COMPUTERS & PERIPHERALS – 5.7% |
|
|
|
|
| 3D Systems Corp.#,* |
|
|
3,000 |
|
|
|
75,270 |
|
|
|
|
| Apple, Inc. |
|
|
194,760 |
|
|
|
24,374,214 |
|
|
|
|
| Diebold, Inc. |
|
|
973 |
|
|
|
33,831 |
|
|
|
|
| EMC Corp. |
|
|
30,270 |
|
|
|
814,566 |
|
|
|
|
| Hewlett-Packard Co. |
|
|
19,490 |
|
|
|
642,585 |
|
|
|
|
| Lexmark International, Inc., Class A |
|
|
2,230 |
|
|
|
98,990 |
|
|
|
|
| NCR Corp.* |
|
|
5,320 |
|
|
|
145,981 |
|
|
|
|
| NetApp, Inc. |
|
|
5,143 |
|
|
|
186,434 |
|
|
|
|
| SanDisk Corp. |
|
|
4,650 |
|
|
|
311,271 |
|
|
|
|
| Stratasys Ltd.#,* |
|
|
1,300 |
|
|
|
48,685 |
|
|
|
|
| Western Digital Corp. |
|
|
2,280 |
|
|
|
222,847 |
|
|
|
|
|
|
|
|
|
|
|
|
|
|
|
|
|
|
|
$ |
26,954,674 |
|
|
| ELECTRONIC EQUIPMENT, INSTRUMENTS & COMPONENTS – 0.5% |
|
|
|
|
| Amphenol Corp., Class A |
|
|
10,300 |
|
|
|
570,311 |
|
ANNUAL
REPORT / April 30, 2015
26 PORTFOLIOS OF
INVESTMENTS
Wilmington Large-Cap Strategy Fund (continued)
|
|
|
|
|
|
|
|
|
|
|
|
| Description
|
|
Number of
Shares
|
|
|
Value
|
|
|
|
|
| Arrow Electronics, Inc.* |
|
|
1,340 |
|
|
$ |
80,011 |
|
|
|
|
| Avnet, Inc. |
|
|
3,060 |
|
|
|
130,448 |
|
|
|
|
| AVX Corp. |
|
|
200 |
|
|
|
2,754 |
|
|
|
|
| Corning, Inc. |
|
|
19,540 |
|
|
|
408,972 |
|
|
|
|
| Dolby Laboratories, Inc., Class A |
|
|
270 |
|
|
|
10,870 |
|
|
|
|
| FLIR Systems, Inc. |
|
|
3,390 |
|
|
|
104,717 |
|
|
|
|
| Ingram Micro, Inc., Class A* |
|
|
100 |
|
|
|
2,516 |
|
|
|
|
| IPG Photonics Corp.* |
|
|
2,000 |
|
|
|
177,160 |
|
|
|
|
| Jabil Circuit, Inc. |
|
|
5,240 |
|
|
|
118,005 |
|
|
|
|
| Keysight Technologies, Inc.* |
|
|
2,745 |
|
|
|
91,848 |
|
|
|
|
| Knowles Corp.#,* |
|
|
1,930 |
|
|
|
36,998 |
|
|
|
|
| National Instruments Corp. |
|
|
2,880 |
|
|
|
82,368 |
|
|
|
|
| Tech Data Corp.* |
|
|
1,700 |
|
|
|
95,829 |
|
|
|
|
| Trimble Navigation Ltd.* |
|
|
8,300 |
|
|
|
211,069 |
|
|
|
|
| Vishay Intertechnology, Inc. |
|
|
2,370 |
|
|
|
30,052 |
|
|
|
|
| Zebra Technologies Corp., Class A* |
|
|
50 |
|
|
|
4,604 |
|
|
|
|
|
|
|
|
|
|
|
|
|
|
|
|
|
|
|
|
|
|
$ |
2,158,532 |
|
|
| INTERNET SOFTWARE & SERVICES – 4.4% |
|
|
|
|
| Akamai Technologies, Inc.#,* |
|
|
7,350 |
|
|
|
542,283 |
|
|
|
|
| AOL, Inc.* |
|
|
2,331 |
|
|
|
93,007 |
|
|
|
|
| CoStar Group, Inc.* |
|
|
1,100 |
|
|
|
224,873 |
|
|
|
|
| eBay, Inc.* |
|
|
40,740 |
|
|
|
2,373,512 |
|
|
|
|
| Equinix, Inc. |
|
|
1,934 |
|
|
|
494,969 |
|
|
|
|
| Facebook, Inc., Class A* |
|
|
62,940 |
|
|
|
4,957,784 |
|
|
|
|
| Google, Inc. Class A* |
|
|
9,005 |
|
|
|
4,941,674 |
|
|
|
|
| Google, Inc. Class C* |
|
|
8,809 |
|
|
|
4,733,428 |
|
|
|
|
| IAC/InterActiveCorp |
|
|
1,030 |
|
|
|
71,915 |
|
|
|
|
| LinkedIn Corp.* |
|
|
3,460 |
|
|
|
872,370 |
|
|
|
|
| Pandora Media, Inc.* |
|
|
4,500 |
|
|
|
80,280 |
|
|
|
|
| Rackspace Hosting, Inc.* |
|
|
2,800 |
|
|
|
150,920 |
|
|
|
|
| Twitter, Inc.* |
|
|
14,000 |
|
|
|
545,440 |
|
|
|
|
| VeriSign, Inc.* |
|
|
3,950 |
|
|
|
250,865 |
|
|
|
|
| Yahoo!, Inc.* |
|
|
8,530 |
|
|
|
363,079 |
|
|
|
|
| Yelp, Inc.* |
|
|
1,900 |
|
|
|
74,841 |
|
|
|
|
| Zillow Group, Inc. Class A#,* |
|
|
460 |
|
|
|
44,914 |
|
|
|
|
|
|
|
|
|
|
|
|
|
|
|
|
|
|
|
|
|
|
$ |
20,816,154 |
|
|
| IT SERVICES – 4.5% |
|
|
|
|
| Accenture PLC, Class A |
|
|
20,300 |
|
|
|
1,880,795 |
|
|
|
|
| Alliance Data Systems Corp.* |
|
|
1,790 |
|
|
|
532,185 |
|
|
|
|
| Amdocs Ltd. |
|
|
2,720 |
|
|
|
149,790 |
|
|
|
|
| Automatic Data Processing, Inc. |
|
|
14,030 |
|
|
|
1,186,096 |
|
|
|
|
| Booz Allen Hamilton Holding Corp. |
|
|
160 |
|
|
|
4,400 |
|
|
|
|
| Broadridge Financial Solutions, Inc. |
|
|
3,630 |
|
|
|
195,730 |
|
|
|
|
| Cognizant Technology Solutions Corp.* |
|
|
18,120 |
|
|
|
1,060,745 |
|
|
|
|
| Computer Sciences Corp. |
|
|
1,600 |
|
|
|
103,120 |
|
|
|
|
| CoreLogic, Inc.* |
|
|
680 |
|
|
|
26,595 |
|
|
|
|
|
|
|
|
|
|
|
|
|
| Description
|
|
Number of
Shares
|
|
|
Value
|
|
|
|
|
| DST Systems, Inc. |
|
|
170 |
|
|
$ |
19,564 |
|
|
|
|
| Fidelity National Information Services, Inc. |
|
|
4,243 |
|
|
|
265,145 |
|
|
|
|
| Fiserv, Inc.* |
|
|
7,660 |
|
|
|
594,416 |
|
|
|
|
| FleetCor Technologies, Inc.* |
|
|
3,100 |
|
|
|
498,759 |
|
|
|
|
| Gartner, Inc.* |
|
|
3,500 |
|
|
|
290,430 |
|
|
|
|
| Global Payments, Inc. |
|
|
2,250 |
|
|
|
225,630 |
|
|
|
|
| International Business Machines Corp. |
|
|
30,660 |
|
|
|
5,251,751 |
|
|
|
|
| Jack Henry & Associates, Inc. |
|
|
1,900 |
|
|
|
126,369 |
|
|
|
|
| Leidos Holdings, Inc. |
|
|
2,200 |
|
|
|
91,608 |
|
|
|
|
| MasterCard, Inc., Class A |
|
|
31,120 |
|
|
|
2,807,335 |
|
|
|
|
| Paychex, Inc. |
|
|
9,670 |
|
|
|
467,931 |
|
|
|
|
| Science Applications International Corp. |
|
|
1,257 |
|
|
|
62,976 |
|
|
|
|
| Teradata Corp.* |
|
|
3,670 |
|
|
|
161,443 |
|
|
|
|
| Total System Services, Inc. |
|
|
4,520 |
|
|
|
178,811 |
|
|
|
|
| Vantiv, Inc., Class A* |
|
|
3,900 |
|
|
|
152,490 |
|
|
|
|
| VeriFone Systems, Inc.* |
|
|
2,600 |
|
|
|
93,002 |
|
|
|
|
| Visa, Inc., Class A |
|
|
64,120 |
|
|
|
4,235,126 |
|
|
|
|
| Western Union Co. (The) |
|
|
20,690 |
|
|
|
419,593 |
|
|
|
|
| Xerox Corp. |
|
|
15,860 |
|
|
|
182,390 |
|
|
|
|
|
|
|
|
|
|
|
|
|
|
|
|
|
|
|
|
|
|
$ |
21,264,225 |
|
|
| SEMICONDUCTORS & SEMICONDUCTOR EQUIPMENT – 2.3% |
|
|
|
|
| Advanced Micro Devices, Inc.#,* |
|
|
12,850 |
|
|
|
29,041 |
|
|
|
|
| Altera Corp. |
|
|
4,190 |
|
|
|
174,639 |
|
|
|
|
| Analog Devices, Inc. |
|
|
8,820 |
|
|
|
545,429 |
|
|
|
|
| Applied Materials, Inc. |
|
|
32,580 |
|
|
|
644,758 |
|
|
|
|
| Atmel Corp. |
|
|
11,220 |
|
|
|
85,048 |
|
|
|
|
| Avago Technologies Ltd. |
|
|
8,000 |
|
|
|
935,040 |
|
|
|
|
| Broadcom Corp., Class A |
|
|
9,230 |
|
|
|
408,012 |
|
|
|
|
| Cree, Inc.#,* |
|
|
3,430 |
|
|
|
108,662 |
|
|
|
|
| First Solar, Inc.* |
|
|
700 |
|
|
|
41,769 |
|
|
|
|
| Freescale Semiconductor Ltd.* |
|
|
5,500 |
|
|
|
214,995 |
|
|
|
|
| Intel Corp. |
|
|
61,770 |
|
|
|
2,010,613 |
|
|
|
|
| KLA-Tencor Corp. |
|
|
4,150 |
|
|
|
244,020 |
|
|
|
|
| Lam Research Corp. |
|
|
2,480 |
|
|
|
187,438 |
|
|
|
|
| Linear Technology Corp. |
|
|
6,070 |
|
|
|
280,009 |
|
|
|
|
| Marvell Technology Group Ltd. |
|
|
3,330 |
|
|
|
46,653 |
|
|
|
|
| Maxim Integrated Products, Inc. |
|
|
6,720 |
|
|
|
220,618 |
|
|
|
|
| Microchip Technology, Inc.# |
|
|
4,340 |
|
|
|
206,823 |
|
|
|
|
| Micron Technology, Inc.* |
|
|
30,190 |
|
|
|
849,245 |
|
|
|
|
| NVIDIA Corp. |
|
|
6,080 |
|
|
|
134,946 |
|
|
|
|
| ON Semiconductor Corp.* |
|
|
10,570 |
|
|
|
121,766 |
|
|
|
|
| Skyworks Solutions, Inc. |
|
|
7,600 |
|
|
|
701,100 |
|
|
|
|
| SunEdison, Inc.#,* |
|
|
3,140 |
|
|
|
79,505 |
|
|
|
|
| Teradyne, Inc. |
|
|
3,450 |
|
|
|
62,963 |
|
|
|
|
| Texas Instruments, Inc. |
|
|
34,050 |
|
|
|
1,845,851 |
|
|
|
|
| Xilinx, Inc. |
|
|
8,700 |
|
|
|
377,232 |
|
|
|
|
|
|
|
|
|
|
|
|
|
|
|
|
|
|
|
|
|
|
$ |
10,556,175 |
|
April 30,
2015 / ANNUAL REPORT
PORTFOLIOS OF
INVESTMENTS 27
Wilmington Large-Cap Strategy Fund (continued)
|
|
|
|
|
|
|
|
|
|
|
|
| Description
|
|
Number of
Shares
|
|
|
Value
|
|
|
| SOFTWARE – 5.1% |
|
|
|
|
| Activision Blizzard, Inc. |
|
|
10,270 |
|
|
$ |
234,310 |
|
|
|
|
| Adobe Systems, Inc.* |
|
|
14,880 |
|
|
|
1,131,773 |
|
|
|
|
| ANSYS, Inc.* |
|
|
2,080 |
|
|
|
178,547 |
|
|
|
|
| Autodesk, Inc.* |
|
|
7,530 |
|
|
|
427,930 |
|
|
|
|
| CA, Inc. |
|
|
4,180 |
|
|
|
132,799 |
|
|
|
|
| Cadence Design Systems, Inc.* |
|
|
11,710 |
|
|
|
218,391 |
|
|
|
|
| CDK Global, Inc. |
|
|
4,676 |
|
|
|
224,074 |
|
|
|
|
| Citrix Systems, Inc.* |
|
|
4,290 |
|
|
|
288,116 |
|
|
|
|
| Electronic Arts, Inc.* |
|
|
11,160 |
|
|
|
648,284 |
|
|
|
|
| FactSet Research Systems, Inc. |
|
|
1,540 |
|
|
|
242,381 |
|
|
|
|
| FireEye, Inc.#,* |
|
|
1,860 |
|
|
|
76,818 |
|
|
|
|
| Fortinet, Inc.* |
|
|
4,000 |
|
|
|
150,960 |
|
|
|
|
| Informatica Corp.* |
|
|
3,500 |
|
|
|
168,245 |
|
|
|
|
| Intuit, Inc. |
|
|
10,000 |
|
|
|
1,003,300 |
|
|
|
|
| Microsoft Corp. |
|
|
205,049 |
|
|
|
9,973,583 |
|
|
|
|
| NetSuite, Inc.#,* |
|
|
1,200 |
|
|
|
114,684 |
|
|
|
|
| Nuance Communications, Inc.* |
|
|
3,040 |
|
|
|
46,603 |
|
|
|
|
| Oracle Corp. |
|
|
106,520 |
|
|
|
4,646,402 |
|
|
|
|
| PTC, Inc.* |
|
|
2,620 |
|
|
|
100,451 |
|
|
|
|
| Red Hat, Inc.* |
|
|
6,230 |
|
|
|
468,870 |
|
|
|
|
| Rovi Corp.#,* |
|
|
1,650 |
|
|
|
30,542 |
|
|
|
|
| Salesforce.com, Inc.* |
|
|
19,380 |
|
|
|
1,411,252 |
|
|
|
|
| ServiceNow, Inc.* |
|
|
5,600 |
|
|
|
419,216 |
|
|
|
|
| SolarWinds, Inc.* |
|
|
340 |
|
|
|
16,585 |
|
|
|
|
| Solera Holdings, Inc. |
|
|
2,700 |
|
|
|
131,004 |
|
|
|
|
| Splunk, Inc.* |
|
|
4,200 |
|
|
|
278,649 |
|
|
|
|
| Symantec Corp. |
|
|
12,120 |
|
|
|
302,091 |
|
|
|
|
| Synopsys, Inc.* |
|
|
2,600 |
|
|
|
121,888 |
|
|
|
|
| Tableau Software, Inc., Class A* |
|
|
1,900 |
|
|
|
185,896 |
|
|
|
|
| VMware, Inc., Class A#,* |
|
|
2,310 |
|
|
|
203,511 |
|
|
|
|
| Workday, Inc., Class A* |
|
|
2,900 |
|
|
|
264,509 |
|
|
|
|
| Zynga, Inc., Class A* |
|
|
15,000 |
|
|
|
36,750 |
|
|
|
|
|
|
|
|
|
|
|
|
|
|
|
|
|
|
|
|
|
|
$ |
23,878,414 |
|
|
|
|
|
|
|
|
|
|
|
|
|
|
|
| TOTAL INFORMATION TECHNOLOGY |
|
|
$ |
112,437,982 |
|
|
|
| MATERIALS – 3.8% |
|
|
|
|
|
|
|
| CHEMICALS – 2.9% |
|
|
|
|
|
|
|
|
| Air Products & Chemicals, Inc. |
|
|
1,970 |
|
|
|
282,557 |
|
|
|
|
| Airgas, Inc. |
|
|
1,960 |
|
|
|
198,509 |
|
|
|
|
| Albemarle Corp. |
|
|
2,140 |
|
|
|
127,758 |
|
|
|
|
| Ashland, Inc. |
|
|
540 |
|
|
|
68,234 |
|
|
|
|
| Cabot Corp. |
|
|
460 |
|
|
|
19,660 |
|
|
|
|
| Celanese Corp. |
|
|
2,870 |
|
|
|
190,453 |
|
|
|
|
| CF Industries Holdings, Inc. |
|
|
723 |
|
|
|
207,841 |
|
|
|
|
| Cytec Industries, Inc. |
|
|
1,960 |
|
|
|
108,368 |
|
|
|
|
| Dow Chemical Co. (The) |
|
|
17,550 |
|
|
|
895,050 |
|
|
|
|
|
|
|
|
|
|
|
|
|
| Description
|
|
Number of
Shares
|
|
|
Value
|
|
|
|
|
| E.I. du Pont de Nemours & Co. |
|
|
27,930 |
|
|
$ |
2,044,476 |
|
|
|
|
| Eastman Chemical Co. |
|
|
4,288 |
|
|
|
326,831 |
|
|
|
|
| Ecolab, Inc. |
|
|
7,877 |
|
|
|
882,066 |
|
|
|
|
| FMC Corp. |
|
|
3,560 |
|
|
|
211,144 |
|
|
|
|
| Huntsman Corp. |
|
|
5,100 |
|
|
|
117,555 |
|
|
|
|
| International Flavors & Fragrances, Inc. |
|
|
2,900 |
|
|
|
332,775 |
|
|
|
|
| LyondellBasell Industries NV, Class A |
|
|
13,600 |
|
|
|
1,407,872 |
|
|
|
|
| Monsanto Co. |
|
|
16,750 |
|
|
|
1,908,830 |
|
|
|
|
| Mosaic Co. (The) |
|
|
3,750 |
|
|
|
165,000 |
|
|
|
|
| NewMarket Corp. |
|
|
400 |
|
|
|
178,760 |
|
|
|
|
| Platform Specialty Products Corp.* |
|
|
1,980 |
|
|
|
53,341 |
|
|
|
|
| PPG Industries, Inc. |
|
|
4,520 |
|
|
|
1,001,451 |
|
|
|
|
| Praxair, Inc. |
|
|
7,750 |
|
|
|
944,958 |
|
|
|
|
| Rayonier Advanced Materials, Inc. |
|
|
1,305 |
|
|
|
21,807 |
|
|
|
|
| RPM International, Inc. |
|
|
3,760 |
|
|
|
178,750 |
|
|
|
|
| Scotts Miracle-Gro Co. (The) Class A |
|
|
1,470 |
|
|
|
94,830 |
|
|
|
|
| Sherwin-Williams Co. (The) |
|
|
2,858 |
|
|
|
794,524 |
|
|
|
|
| Sigma-Aldrich Corp. |
|
|
3,490 |
|
|
|
484,831 |
|
|
|
|
| Valspar Corp. (The) |
|
|
2,720 |
|
|
|
220,592 |
|
|
|
|
| Westlake Chemical Corp. |
|
|
1,000 |
|
|
|
77,980 |
|
|
|
|
| WR Grace & Co.* |
|
|
1,600 |
|
|
|
154,752 |
|
|
|
|
|
|
|
|
|
|
|
|
|
|
|
|
|
|
|
|
|
|
$ |
13,701,555 |
|
|
| CONSTRUCTION MATERIALS – 0.1% |
|
|
|
|
| Eagle Materials, Inc. |
|
|
1,700 |
|
|
|
141,763 |
|
|
|
|
| Martin Marietta Materials, Inc. |
|
|
1,500 |
|
|
|
213,975 |
|
|
|
|
| Vulcan Materials Co. |
|
|
1,400 |
|
|
|
119,728 |
|
|
|
|
|
|
|
|
|
|
|
|
|
|
|
|
|
|
|
|
|
|
$ |
475,466 |
|
|
| CONTAINERS & PACKAGING – 0.4% |
|
|
|
|
| AptarGroup, Inc. |
|
|
580 |
|
|
|
36,001 |
|
|
|
|
| Avery Dennison Corp. |
|
|
910 |
|
|
|
50,587 |
|
|
|
|
| Ball Corp. |
|
|
6,200 |
|
|
|
455,142 |
|
|
|
|
| Bemis Co., Inc. |
|
|
240 |
|
|
|
10,800 |
|
|
|
|
| Crown Holdings, Inc.* |
|
|
4,340 |
|
|
|
235,488 |
|
|
|
|
| Greif, Inc., Class A |
|
|
270 |
|
|
|
11,005 |
|
|
|
|
| MeadWestvaco Corp. |
|
|
1,480 |
|
|
|
72,224 |
|
|
|
|
| Owens-Illinois, Inc.* |
|
|
3,380 |
|
|
|
80,816 |
|
|
|
|
| Packaging Corp. of America |
|
|
2,850 |
|
|
|
197,192 |
|
|
|
|
| Rock-Tenn Co., Class A |
|
|
4,000 |
|
|
|
251,920 |
|
|
|
|
| Sealed Air Corp. |
|
|
7,500 |
|
|
|
342,000 |
|
|
|
|
| Silgan Holdings, Inc. |
|
|
1,900 |
|
|
|
102,353 |
|
|
|
|
| Sonoco Products Co. |
|
|
2,410 |
|
|
|
107,703 |
|
|
|
|
|
|
|
|
|
|
|
|
|
|
|
|
|
|
|
|
|
|
$ |
1,953,231 |
|
|
| METALS & MINING – 0.3% |
|
|
|
|
| Alcoa, Inc. |
|
|
9,760 |
|
|
|
130,979 |
|
|
|
|
| Allegheny Technologies, Inc. |
|
|
1,150 |
|
|
|
39,088 |
|
|
|
|
| Carpenter Technology Corp. |
|
|
380 |
|
|
|
16,435 |
|
ANNUAL
REPORT / April 30, 2015
28
PORTFOLIOS OF INVESTMENTS
Wilmington Large-Cap Strategy Fund (continued)
|
|
|
|
|
|
|
|
|
|
| Description
|
|
Number of
Shares
|
|
|
Value
|
|
|
|
| Cliffs Natural Resources, Inc.# |
|
|
1,000 |
|
|
$ 5,940 |
|
|
|
| Compass Minerals International, Inc. |
|
|
900 |
|
|
79,497 |
|
|
|
| Freeport-McMoRan, Inc. |
|
|
10,465 |
|
|
243,521 |
|
|
|
| Newmont Mining Corp. |
|
|
5,170 |
|
|
136,953 |
|
|
|
| Nucor Corp. |
|
|
3,150 |
|
|
153,909 |
|
|
|
| Reliance Steel & Aluminum Co. |
|
|
750 |
|
|
48,540 |
|
|
|
| Royal Gold, Inc. |
|
|
400 |
|
|
25,812 |
|
|
|
| Southern Copper Corp.# |
|
|
4,610 |
|
|
150,194 |
|
|
|
| Steel Dynamics, Inc. |
|
|
5,700 |
|
|
126,141 |
|
|
|
| Tahoe Resources, Inc. |
|
|
760 |
|
|
10,724 |
|
|
|
| TimkenSteel Corp. |
|
|
150 |
|
|
4,379 |
|
|
|
| United States Steel Corp.# |
|
|
3,620 |
|
|
86,952 |
|
|
|
|
|
|
|
|
|
|
|
|
|
|
|
|
|
|
|
$1,259,064 |
|
|
| PAPER & FOREST PRODUCTS – 0.1% |
|
|
|
|
|
|
| Domtar Corp. |
|
|
320 |
|
|
13,830 |
|
|
|
| International Paper Co. |
|
|
7,540 |
|
|
405,049 |
|
|
|
|
|
|
|
|
|
|
|
|
|
|
|
|
|
|
|
$418,879 |
|
|
|
|
|
|
|
|
|
|
|
|
|
| TOTAL MATERIALS |
|
|
|
|
|
$ 17,808,195 |
|
| TELECOMMUNICATION SERVICES – 2.2% |
|
| DIVERSIFIED TELECOMMUNICATION SERVICES – 2.1% |
|
|
|
| AT&T, Inc. |
|
|
59,197 |
|
|
2,050,584 |
|
|
|
| CenturyLink, Inc. |
|
|
5,519 |
|
|
198,463 |
|
|
|
| Frontier Communications Corp. |
|
|
10,500 |
|
|
72,030 |
|
|
|
| Level 3 Communications, Inc.* |
|
|
8,898 |
|
|
497,754 |
|
|
|
| Verizon Communications, Inc. |
|
|
134,960 |
|
|
6,807,382 |
|
|
|
| Windstream Holdings, Inc. |
|
|
2,617 |
|
|
30,563 |
|
|
|
|
|
|
|
|
|
|
|
|
|
|
|
|
|
|
|
$9,656,776 |
|
| WIRELESS TELECOMMUNICATION SERVICES – 0.1% |
|
|
|
| SBA Communications Corp., Class A* |
|
|
4,510 |
|
|
522,348 |
|
|
|
| Sprint Corp.* |
|
|
6,460 |
|
|
33,140 |
|
|
|
| Telephone & Data Systems, Inc. |
|
|
2,424 |
|
|
64,745 |
|
|
|
| T-Mobile US, Inc.* |
|
|
2,465 |
|
|
83,909 |
|
|
|
| United States Cellular Corp.* |
|
|
90 |
|
|
3,324 |
|
|
|
|
|
|
|
|
|
|
|
|
|
|
|
|
|
|
|
$707,466 |
|
|
|
|
|
|
|
|
|
|
|
|
| TOTAL TELECOMMUNICATION SERVICES |
|
|
$10,364,242 |
|
|
|
| UTILITIES – 1.6% |
|
|
|
|
|
|
|
|
| ELECTRIC UTILITIES – 0.8% |
|
|
|
|
|
|
| American Electric Power Co., Inc. |
|
|
5,390 |
|
|
306,529 |
|
|
|
| Duke Energy Corp. |
|
|
5,395 |
|
|
418,490 |
|
|
|
| Edison International |
|
|
3,320 |
|
|
202,321 |
|
|
|
| Entergy Corp. |
|
|
2,770 |
|
|
213,789 |
|
|
|
| Eversource Energy |
|
|
5,713 |
|
|
278,566 |
|
|
|
| Exelon Corp.# |
|
|
8,199 |
|
|
278,930 |
|
|
|
|
|
|
|
|
|
|
| Description
|
|
Number of
Shares
|
|
|
Value
|
|
|
|
| FirstEnergy Corp. |
|
|
4,100 |
|
|
147,231 |
|
|
|
| Great Plains Energy, Inc. |
|
|
1,720 |
|
|
$45,030 |
|
|
|
| Hawaiian Electric Industries, Inc. |
|
|
2,710 |
|
|
84,823 |
|
|
|
| ITC Holdings Corp. |
|
|
3,960 |
|
|
142,560 |
|
|
|
| NextEra Energy, Inc. |
|
|
3,340 |
|
|
337,106 |
|
|
|
| OGE Energy Corp. |
|
|
3,020 |
|
|
98,694 |
|
|
|
| Pinnacle West Capital Corp. |
|
|
1,600 |
|
|
97,920 |
|
|
|
| PPL Corp. |
|
|
9,000 |
|
|
306,270 |
|
|
|
| Southern Co. (The) |
|
|
6,881 |
|
|
304,828 |
|
|
|
| Westar Energy, Inc. |
|
|
2,960 |
|
|
111,444 |
|
|
|
| Xcel Energy, Inc. |
|
|
7,770 |
|
|
263,481 |
|
|
|
|
|
|
|
|
|
|
|
|
|
|
|
|
|
|
|
$ 3,638,012 |
|
|
|
| GAS UTILITIES –0.1% |
|
|
|
|
|
|
|
|
|
| AGL Resources, Inc. |
|
|
1,320 |
|
|
66,356 |
|
|
|
| Atmos Energy Corp. |
|
|
2,610 |
|
|
140,940 |
|
|
|
| National Fuel Gas Co. |
|
|
1,410 |
|
|
90,875 |
|
|
|
| Questar Corp. |
|
|
6,500 |
|
|
152,360 |
|
|
|
| UGI Corp. |
|
|
2,835 |
|
|
98,686 |
|
|
|
|
|
|
|
|
|
|
|
|
|
|
|
|
|
|
|
$549,217 |
|
| INDEPENDENT POWER PRODUCERS & ENERGY TRADERS – 0.1%** |
|
|
|
| AES Corp. |
|
|
6,610 |
|
|
87,582 |
|
|
|
| Calpine Corp.* |
|
|
2,230 |
|
|
48,636 |
|
|
|
| NRG Energy, Inc. |
|
|
3,100 |
|
|
78,244 |
|
|
|
|
|
|
|
|
|
|
|
|
|
|
|
|
|
|
|
$214,462 |
|
|
|
| MULTI-UTILITIES – 0.6% |
|
|
|
|
|
|
|
|
|
| Alliant Energy Corp. |
|
|
2,000 |
|
|
120,940 |
|
|
|
| Ameren Corp. |
|
|
3,450 |
|
|
141,243 |
|
|
|
| CenterPoint Energy, Inc. |
|
|
2,760 |
|
|
57,877 |
|
|
|
| CMS Energy Corp. |
|
|
3,670 |
|
|
124,523 |
|
|
|
| Consolidated Edison, Inc.# |
|
|
4,340 |
|
|
267,127 |
|
|
|
| Dominion Resources, Inc. |
|
|
5,870 |
|
|
420,762 |
|
|
|
| DTE Energy Co. |
|
|
2,200 |
|
|
175,186 |
|
|
|
| Integrys Energy Group, Inc. |
|
|
1,760 |
|
|
128,656 |
|
|
|
| MDU Resources Group, Inc. |
|
|
4,280 |
|
|
95,401 |
|
|
|
| NiSource, Inc. |
|
|
4,700 |
|
|
204,074 |
|
|
|
| PG&E Corp. |
|
|
3,120 |
|
|
165,110 |
|
|
|
| Public Service Enterprise Group, Inc. |
|
|
6,200 |
|
|
257,548 |
|
|
|
| SCANA Corp. |
|
|
3,140 |
|
|
166,357 |
|
|
|
| Sempra Energy |
|
|
3,250 |
|
|
345,053 |
|
|
|
| TECO Energy, Inc. |
|
|
430 |
|
|
8,149 |
|
|
|
| Vectren Corp. |
|
|
1,680 |
|
|
72,526 |
|
|
|
| Wisconsin Energy Corp.# |
|
|
4,240 |
|
|
208,269 |
|
|
|
|
|
|
|
|
|
|
|
|
|
|
|
|
|
|
|
$2,958,801 |
|
|
|
| WATER UTILITIES – 0.0%** |
|
|
|
|
|
|
|
|
|
| American Water Works Co., Inc. |
|
|
1,690 |
|
|
92,139 |
April 30, 2015 / ANNUAL
REPORT
PORTFOLIOS OF
INVESTMENTS 29
Wilmington Large-Cap Strategy Fund (continued)
|
|
|
|
|
|
|
|
|
|
|
|
| Description
|
|
Number of
Shares
|
|
|
Value
|
|
|
|
|
| Aqua America, Inc. |
|
|
1,325 |
|
|
$ |
35,536 |
|
|
|
|
|
|
|
|
|
|
|
|
|
|
|
|
|
|
|
$ |
127,675 |
|
|
|
|
|
|
|
|
|
|
|
|
|
| TOTAL UTILITIES |
|
|
|
|
|
$ |
7,488,167 |
|
|
|
|
|
|
|
|
|
|
|
|
|
| TOTAL COMMON STOCKS |
|
|
|
|
|
|
|
|
| (COST $291,027,981) |
|
|
|
|
|
$ |
468,309,412 |
|
|
| INVESTMENT COMPANIES – 0.1% |
|
|
|
|
| EQUITY FUNDS – 0.1% |
|
|
|
|
|
|
|
|
|
|
|
| iShares Russell 1000 ETF |
|
|
1,660 |
|
|
|
193,871 |
|
|
|
|
| iShares Russell 1000 Growth ETF |
|
|
1,780 |
|
|
|
177,039 |
|
|
|
|
|
|
|
|
|
|
|
|
|
| TOTAL EQUITY FUNDS |
|
|
|
|
|
$ |
370,910 |
|
|
|
|
|
|
|
|
|
|
|
| TOTAL INVESTMENT COMPANIES |
|
| (COST $341,381) |
|
|
|
|
|
$ |
370,910 |
|
|
|
|
| RIGHTS – 0.0%** |
|
|
|
|
|
|
|
|
|
|
|
| Celgene Corp.* |
|
|
89 |
|
|
|
256 |
|
|
|
|
| Community Health Systems, Inc.* |
|
|
3,700 |
|
|
|
60 |
|
|
|
|
|
|
|
|
|
|
|
|
|
| TOTAL RIGHTS |
|
|
|
|
|
|
|
|
| (COST $142) |
|
|
|
|
|
$ |
316 |
|
|
|
|
| WARRANTS – 0.0%** |
|
|
|
|
|
|
|
|
|
|
|
| American International Group, Inc. CW21, Expire 1/19/21* |
|
|
2,055 |
|
|
|
47,779 |
|
|
|
|
| Kinder Morgan, Inc., Expire 5/25/17* |
|
|
16,345 |
|
|
|
79,764 |
|
|
|
|
|
|
|
|
|
|
|
|
|
| TOTAL WARRANTS |
|
|
|
|
|
|
|
|
| (COST $48,690) |
|
|
|
|
|
$ |
127,543 |
|
|
|
|
|
|
|
|
|
|
|
| TOTAL INVESTMENTS IN SECURITIES – 100.0% |
|
| (COST $291,418,194) |
|
|
|
|
|
$ |
468,808,181 |
|
|
|
|
|
|
|
|
|
|
|
|
|
| |
|
Par Value
|
|
|
|
|
|
| CASH COLLATERAL INVESTED FOR SECURITIES ON LOAN – 1.2% |
|
|
|
| REPURCHASE AGREEMENTS – 1.2% |
|
|
|
|
|
|
|
|
| BNP Paribas Securities Corp., 0.12%, dated 4/30/15, due 5/01/15, repurchase price $294,103, collateralized by U.S. |
|
|
|
|
|
|
|
|
| Government & Treasury Securities 0.00% to 6.50%, maturing 5/01/16 to 4/20/45; total market value of $299,984. |
|
$ |
294,102 |
|
|
$ |
294,102 |
|
|
|
|
| Citigroup Global Markets, Inc., 0.13%, dated 4/30/15, due 5/01/15, repurchase price $1,117,649, collateralized by U.S. |
|
|
|
|
|
|
|
|
| Government Securities 1.61% to 8.00%, maturing 6/01/17 to 6/15/52; total market value of $1,139,998. |
|
|
1,117,645 |
|
|
|
1,117,645 |
|
|
|
|
| Credit Suisse Securities (USA) LLC, 0.12%, dated 4/30/15, due 5/01/15, repurchase price $1,117,649, collateralized by U.S. |
|
|
|
|
|
|
|
|
| Government Securities 3.00% to 4.50%, maturing 8/01/38 to 4/01/45; total market value of $1,140,006. |
|
|
1,117,645 |
|
|
|
1,117,645 |
|
|
|
|
|
|
|
|
|
|
|
|
|
| Description
|
|
Par Value
|
|
|
Value
|
|
|
|
|
| ING Financial Markets LLC, 0.12%, dated 4/30/15, due 5/01/15, repurchase price $1,117,649, collateralized by U.S. |
|
|
|
|
|
|
|
|
| Government Securities 1.87% to 6.20%, maturing 5/01/33 to 11/01/44; total market value of $1,139,998. |
|
$ |
1,117,645 |
|
|
$ |
1,117,645 |
|
|
|
|
| JP Morgan Securities LLC, 0.13%, dated 4/30/15, due 5/01/15, repurchase price $1,117,649, collateralized by U.S. Government Securities 1.78% to 6.13%, maturing 3/01/19
to 2/01/45; total market value of $1,140,011. |
|
|
1,117,645 |
|
|
|
1,117,645 |
|
|
|
|
| Nomura Securities International, Inc., 0.13%, dated 4/30/15, due 5/01/15, repurchase price $1,117,649, collateralized by U.S. Government & Treasury Securities
0.00% to 10.50%, maturing 5/15/15 to 3/20/64; total market value of $1,139,998. |
|
|
1,117,645 |
|
|
|
1,117,645 |
|
|
|
|
|
|
|
|
|
|
|
TOTAL CASH COLLATERAL INVESTED FOR
SECURITIES ON LOAN |
|
| (COST $5,882,327) |
|
|
|
|
|
$ |
5,882,327 |
|
|
|
|
|
|
|
|
|
|
|
|
| TOTAL INVESTMENTS – 101.2% |
|
|
|
|
|
| (COST $297,300,521) |
|
|
|
|
|
$ |
474,690,508 |
|
|
|
COLLATERAL FOR SECURITIES ON
LOAN – (1.2%) |
|
|
|
(5,882,327 |
) |
|
|
| OTHER ASSETS LESS LIABILITIES – 0.0%** |
|
|
|
169,452 |
|
|
|
|
|
|
|
|
|
|
|
|
|
| TOTAL NET ASSETS – 100.0% |
|
|
|
|
|
$ |
468,977,633 |
|
|
|
|
|
|
|
|
|
|
ANNUAL
REPORT / April 30, 2015
30
PORTFOLIOS OF INVESTMENTS
Wilmington Large-Cap Strategy Fund (concluded)
Cost of investments for Federal income tax purposes is $301,048,053. The net unrealized
appreciation/(depreciation) of investments was $173,642,455. This consists of net unrealized appreciation from investment for those securities having an excess of value over cost of $183,028,827 and net unrealized depreciation from investments for
those securities having an excess of cost over value of $9,386,372.
Various inputs are used in determining the value of the
Fund’s investments. These inputs are summarized in the three broad levels listed below.
Level 1 – quoted prices in active
markets for identical securities
Level 2 – other significant observable inputs (including quoted prices for similar securities,
interest rates, prepayment speeds, credit risk, etc.)
Level 3 – significant unobservable inputs (including the Fund’s own
assumptions in determining the fair value of investments)
The following is a summary of the inputs used as of April 30, 2015 in
valuing the Fund’s assets carried at fair value:
|
|
|
|
|
|
|
|
|
|
|
|
|
|
|
|
|
|
|
|
|
|
| |
|
Level 1
|
|
|
Level 2
|
|
|
Level 3
|
|
|
Total
|
|
| Investments in Securities |
|
|
|
|
|
|
|
|
|
|
|
|
|
|
|
|
|
|
|
|
|
| Common Stocks |
|
|
$468,309,412 |
|
|
|
$ — |
|
|
|
$ — |
|
|
|
$468,309,412 |
|
|
|
|
|
|
| Investment Companies |
|
|
370,910 |
|
|
|
— |
|
|
|
— |
|
|
|
370,910 |
|
|
|
|
|
|
| Rights |
|
|
316 |
|
|
|
— |
|
|
|
— |
|
|
|
316 |
|
|
|
|
|
|
| Warrants |
|
|
127,543 |
|
|
|
— |
|
|
|
— |
|
|
|
127,543 |
|
|
|
|
|
|
| Repurchase Agreements |
|
|
— |
|
|
|
5,882,327 |
|
|
|
— |
|
|
|
5,882,327 |
|
|
|
|
|
|
|
|
|
|
|
|
|
|
|
|
|
|
|
|
|
|
|
| Total |
|
|
$468,808,181 |
|
|
|
$5,882,327 |
|
|
|
$ — |
|
|
|
$474,690,508 |
|
|
|
|
|
|
|
|
|
|
|
|
|
|
|
|
|
|
| # |
Security, or a portion thereof, is on loan. See Note 2 in Notes to Financial Statements. |
| * |
Non-income producing security. |
| ** |
Represents less than 0.05%. |
| § |
Affiliated company. See Note 4 in Notes to Financial Statements. |
The following acronyms are used throughout this Fund:
LP - Limited Partnership
PLC - Public Limited Company
REIT - Real Estate Investment Trust
See Notes which are an integral part of the Financial Statements
April 30,
2015 / ANNUAL REPORT
31
PORTFOLIO OF INVESTMENTS SUMMARY TABLE
Wilmington Mid-Cap Growth Fund
At April 30, 2015, the Fund’s
sector classifications were as follows (unaudited):
|
|
|
| |
|
Percentage of
Total Net Assets |
|
|
|
|
|
| Common Stocks |
|
|
|
|
| Consumer Discretionary |
|
|
21.8 |
% |
| Information Technology |
|
|
17.5 |
% |
| Industrials |
|
|
15.8 |
% |
| Health Care |
|
|
15.6 |
% |
| Financials |
|
|
12.6 |
% |
| Energy |
|
|
6.1 |
% |
| Materials |
|
|
5.0 |
% |
| Consumer Staples |
|
|
4.4 |
% |
| Cash Equivalents1 |
|
|
6.3 |
% |
| Other Assets and Liabilities – Net2 |
|
|
(5.1 |
)% |
|
|
|
|
|
| TOTAL |
|
|
100.0 |
% |
|
|
|
|
|
| (1) |
Cash Equivalents include investments in money market fund and repurchase agreements. |
| (2) |
Assets, other than investments in securities, less liabilities. See Statements of Assets and Liabilities. |
PORTFOLIO OF INVESTMENTS
April 30, 2015
|
|
|
|
|
|
|
|
|
| Description
|
|
Number of
Shares |
|
|
Value
|
|
| COMMON STOCKS – 98.8% |
|
|
|
|
|
|
|
|
|
|
| CONSUMER DISCRETIONARY – 21.8% |
|
|
|
|
|
|
|
|
| AUTO COMPONENTS – 2.1% |
|
|
|
|
|
|
|
|
|
|
|
| BorgWarner, Inc. |
|
|
121,000 |
|
|
$ |
7,163,200 |
|
|
|
|
| DISTRIBUTORS – 1.6% |
|
|
|
|
|
|
|
|
|
|
|
| LKQ Corp.* |
|
|
201,000 |
|
|
|
5,441,070 |
|
|
|
| HOTELS, RESTAURANTS & LEISURE – 2.4% |
|
|
|
|
|
|
|
|
| DineEquity, Inc. |
|
|
45,300 |
|
|
|
4,368,279 |
|
|
|
|
| Panera Bread Co.* |
|
|
20,600 |
|
|
|
3,759,088 |
|
|
|
|
|
|
|
|
|
|
|
|
|
|
|
|
|
|
|
$ |
8,127,367 |
|
|
|
| INTERNET & CATALOG RETAIL – 1.1% |
|
|
|
|
|
|
|
|
| TripAdvisor, Inc.* |
|
|
45,100 |
|
|
|
3,630,099 |
|
|
|
|
| MEDIA – 4.8% |
|
|
|
|
|
|
|
|
|
|
|
| CBS Corp., Class B Non-Voting |
|
|
128,400 |
|
|
|
7,977,492 |
|
|
|
|
| Lions Gate Entertainment Corp.# |
|
|
141,900 |
|
|
|
4,400,319 |
|
|
|
|
| Scripps Networks Interactive, Inc. |
|
|
50,900 |
|
|
|
3,555,874 |
|
|
|
|
|
|
|
|
|
|
|
|
|
|
|
|
|
|
|
$ |
15,933,685 |
|
|
|
|
| MULTILINE RETAIL – 1.7% |
|
|
|
|
|
|
|
|
|
|
|
| Nordstrom, Inc. |
|
|
76,600 |
|
|
|
5,787,896 |
|
|
|
|
| SPECIALTY RETAIL – 4.9% |
|
|
|
|
|
|
|
|
|
|
|
| GameStop Corp.# |
|
|
102,700 |
|
|
|
3,958,058 |
|
|
|
|
|
|
|
|
|
|
| Description
|
|
Number of
Shares
|
|
|
Value
|
|
|
|
|
|
|
| L Brands, Inc. |
|
|
80,300 |
|
|
$ 7,175,608 |
|
|
|
|
|
|
| Tile Shop Holdings, Inc.#,* |
|
|
212,900 |
|
|
2,761,313 |
|
|
|
|
|
|
| Vitamin Shoppe, Inc.* |
|
|
61,000 |
|
|
2,554,680 |
|
|
|
|
|
|
|
|
|
|
|
|
|
|
|
|
|
|
|
|
|
$ 16,449,659 |
|
|
|
|
| TEXTILES, APPAREL & LUXURY GOODS – 3.2% |
|
|
|
|
|
|
| Coach, Inc. |
|
|
67,200 |
|
|
2,567,712 |
|
|
|
|
|
|
| Lululemon Athletica, Inc.* |
|
|
53,300 |
|
|
3,392,012 |
|
|
|
|
|
|
| PVH Corp. |
|
|
46,200 |
|
|
4,774,770 |
|
|
|
|
|
|
|
|
|
|
|
|
|
|
|
|
|
|
|
|
|
$ 10,734,494 |
|
|
|
|
|
|
|
|
|
|
|
|
|
|
| TOTAL CONSUMER DISCRETIONARY |
|
|
$ 73,267,470 |
|
|
|
|
|
| CONSUMER STAPLES – 4.4% |
|
|
|
|
|
|
|
|
|
| BEVERAGES – 1.7% |
|
|
|
|
|
|
|
|
|
|
|
|
| Keurig Green Mountain, Inc. |
|
|
49,800 |
|
|
5,795,226 |
|
|
|
|
| FOOD & STAPLES RETAILING – 1.0% |
|
|
|
|
|
|
| Pricesmart, Inc. |
|
|
42,000 |
|
|
3,379,320 |
|
|
|
|
|
| HOUSEHOLD PRODUCTS – 1.7% |
|
|
|
|
|
|
|
|
|
| Church & Dwight Co., Inc. |
|
|
69,000 |
|
|
5,600,730 |
|
|
|
|
|
|
|
|
|
|
|
|
|
|
|
| TOTAL CONSUMER STAPLES |
|
|
|
|
|
$ 14,775,276 |
|
|
ANNUAL
REPORT / April 30, 2015
32
PORTFOLIOS OF INVESTMENTS
Wilmington Mid-Cap Growth Fund (continued)
|
|
|
|
|
|
|
|
|
|
|
|
| Description
|
|
Number of
Shares
|
|
|
Value
|
|
|
|
|
| ENERGY – 6.1% |
|
|
|
|
|
|
|
|
|
|
| ENERGY EQUIPMENT & SERVICES – 2.5% |
|
|
|
|
|
|
|
|
| Core Laboratories NV# |
|
|
33,400 |
|
|
$ |
4,384,752 |
|
|
|
|
| Oceaneering International, Inc. |
|
|
71,400 |
|
|
|
3,934,854 |
|
|
|
|
|
|
|
|
|
|
|
|
|
|
|
|
|
|
|
|
|
|
$ |
8,319,606 |
|
|
|
| OIL, GAS & CONSUMABLE FUELS – 3.6% |
|
|
|
|
|
|
|
|
| Cabot Oil & Gas Corp. |
|
|
97,600 |
|
|
|
3,300,832 |
|
|
|
|
| Southwestern Energy Co.* |
|
|
89,700 |
|
|
|
5,353,969 |
|
|
|
|
| Whiting Petroleum Corp.* |
|
|
88,400 |
|
|
|
3,351,244 |
|
|
|
|
|
|
|
|
|
|
|
|
|
|
|
|
|
|
|
|
|
|
$ |
12,006,045 |
|
|
|
|
|
|
|
|
|
|
|
|
|
|
|
|
| TOTAL ENERGY |
|
|
|
|
|
$ |
20,325,651 |
|
|
|
|
| FINANCIALS – 12.6% |
|
|
|
|
|
|
|
|
|
|
|
| CAPITAL MARKETS – 2.0% |
|
|
|
|
|
|
|
|
|
|
|
| Raymond James Financial, Inc. |
|
|
58,300 |
|
|
|
3,295,699 |
|
|
|
|
| T. Rowe Price Group, Inc. |
|
|
41,500 |
|
|
|
3,368,970 |
|
|
|
|
|
|
|
|
|
|
|
|
|
|
|
|
|
|
|
|
|
|
$ |
6,664,669 |
|
|
|
|
| COMMERCIAL BANKS – 3.9% |
|
|
|
|
|
|
|
|
|
|
|
| Signature Bank* |
|
|
43,100 |
|
|
|
5,779,279 |
|
|
|
|
| SVB Financial Group* |
|
|
54,800 |
|
|
|
7,275,248 |
|
|
|
|
|
|
|
|
|
|
|
|
|
|
|
|
|
|
|
|
|
|
$ |
13,054,527 |
|
|
|
| DIVERSIFIED FINANCIAL SERVICES – 2.2% |
|
|
|
|
|
|
|
|
| MarketAxess Holdings, Inc. |
|
|
84,400 |
|
|
|
7,245,740 |
|
|
|
|
| INSURANCE – 1.1% |
|
|
|
|
|
|
|
|
|
|
|
| Brown & Brown, Inc. |
|
|
119,700 |
|
|
|
3,824,415 |
|
|
| REAL ESTATE MANAGEMENT & DEVELOPMENT – 3.4% |
|
|
|
|
| CBRE Group, Inc.* |
|
|
169,500 |
|
|
|
6,498,630 |
|
|
|
|
| Realogy Holdings Corp.* |
|
|
102,000 |
|
|
|
4,835,820 |
|
|
|
|
|
|
|
|
|
|
|
|
|
|
|
|
|
|
|
|
|
|
$ |
11,334,450 |
|
|
|
|
|
|
|
|
|
|
|
|
|
|
|
|
| TOTAL FINANCIALS |
|
|
|
|
|
$ |
42,123,801 |
|
|
|
|
| HEALTH CARE – 15.6% |
|
|
|
|
|
|
|
|
|
|
|
| BIOTECHNOLOGY – 5.2% |
|
|
|
|
|
|
|
|
|
|
|
| Cepheid, Inc.* |
|
|
102,600 |
|
|
|
5,755,860 |
|
|
|
|
| Regeneron Pharmaceuticals, Inc.* |
|
|
15,550 |
|
|
|
7,113,503 |
|
|
|
|
| Vertex Pharmaceuticals, Inc.* |
|
|
36,500 |
|
|
|
4,499,720 |
|
|
|
|
|
|
|
|
|
|
|
|
|
|
|
|
|
|
|
|
|
|
$ |
17,369,083 |
|
|
| HEALTH CARE EQUIPMENT & SUPPLIES – 6.3% |
|
|
|
|
| Alere, Inc.* |
|
|
98,900 |
|
|
|
4,695,772 |
|
|
|
|
| Intuitive Surgical, Inc.* |
|
|
10,150 |
|
|
|
5,034,197 |
|
|
|
|
| Novadaq Technologies, Inc.#,* |
|
|
240,000 |
|
|
|
2,594,400 |
|
|
|
|
| ResMed, Inc. |
|
|
74,300 |
|
|
|
4,750,742 |
|
|
|
|
| West Pharmaceutical Services, Inc. |
|
|
76,000 |
|
|
|
4,049,280 |
|
|
|
|
|
|
|
|
|
|
|
|
|
|
|
|
|
|
|
|
|
|
$ |
21,124,391 |
|
|
|
| HEALTH CARE TECHNOLOGY – 1.9% |
|
|
|
|
|
|
|
|
| Cerner Corp.* |
|
|
91,700 |
|
|
|
6,584,977 |
|
|
|
|
|
|
|
|
|
|
|
|
|
| Description
|
|
Number of
Shares
|
|
|
Value
|
|
|
|
|
| PHARMACEUTICALS – 2.2% |
|
|
|
|
|
|
|
|
|
|
|
| Perrigo Co. PLC |
|
|
40,587 |
|
|
$ |
7,438,785 |
|
|
|
|
|
|
|
|
|
|
|
|
|
|
|
|
| TOTAL HEALTH CARE |
|
|
|
|
|
$ |
52,517,236 |
|
|
|
|
| INDUSTRIALS – 15.8% |
|
|
|
|
|
|
|
|
|
|
| AEROSPACE & DEFENSE – 2.4% |
|
|
|
|
|
|
|
|
| HEICO Corp. |
|
|
106,500 |
|
|
|
4,885,155 |
|
|
|
|
| Precision Castparts Corp. |
|
|
14,700 |
|
|
|
3,038,343 |
|
|
|
|
|
|
|
|
|
|
|
|
|
|
|
|
|
|
|
|
|
|
$ |
7,923,498 |
|
|
|
|
| BUILDING PRODUCTS – 0.6% |
|
|
|
|
|
|
|
|
|
|
|
| Lennox International, Inc. |
|
|
20,200 |
|
|
|
2,140,392 |
|
|
|
| COMMERCIAL SERVICES & SUPPLIES – 2.7% |
|
|
|
|
|
|
|
|
| MSA Safety, Inc. |
|
|
85,200 |
|
|
|
3,897,048 |
|
|
|
|
| Waste Connections, Inc. |
|
|
106,000 |
|
|
|
5,025,460 |
|
|
|
|
|
|
|
|
|
|
|
|
|
|
|
|
|
|
|
|
|
|
$ |
8,922,508 |
|
|
|
| ELECTRICAL EQUIPMENT – 3.4% |
|
|
|
|
|
|
|
|
| AMETEK, Inc. |
|
|
104,500 |
|
|
|
5,477,890 |
|
|
|
|
| Rockwell Automation, Inc. |
|
|
51,500 |
|
|
|
6,107,900 |
|
|
|
|
|
|
|
|
|
|
|
|
|
|
|
|
|
|
|
|
|
|
$ |
11,585,790 |
|
|
|
|
| MACHINERY – 3.6% |
|
|
|
|
|
|
|
|
|
|
|
| Cummins, Inc. |
|
|
27,500 |
|
|
|
3,802,150 |
|
|
|
|
| Graco, Inc. |
|
|
64,500 |
|
|
|
4,619,490 |
|
|
|
|
| Pall Corp. |
|
|
38,800 |
|
|
|
3,776,016 |
|
|
|
|
|
|
|
|
|
|
|
|
|
|
|
|
|
|
|
|
|
|
$ |
12,197,656 |
|
|
|
|
| ROAD & RAIL – 3.1% |
|
|
|
|
|
|
|
|
|
|
|
| Kansas City Southern |
|
|
48,500 |
|
|
|
4,970,765 |
|
|
|
|
| Old Dominion Freight Line, Inc.* |
|
|
76,500 |
|
|
|
5,441,445 |
|
|
|
|
|
|
|
|
|
|
|
|
|
|
|
|
|
|
|
|
|
|
$ |
10,412,210 |
|
|
|
|
|
|
|
|
|
|
|
|
|
|
|
|
| TOTAL INDUSTRIALS |
|
|
|
|
|
$ |
53,182,054 |
|
|
|
| INFORMATION TECHNOLOGY – 17.5% |
|
|
|
|
|
|
| COMMUNICATIONS EQUIPMENT – 0.5% |
|
|
|
|
| Aruba Networks, Inc.* |
|
|
69,600 |
|
|
|
1,712,856 |
|
|
|
| COMPUTERS & PERIPHERALS – 0.5% |
|
|
|
|
|
|
|
|
| Stratasys Ltd.#,* |
|
|
42,200 |
|
|
|
1,580,390 |
|
|
|
| ELECTRONIC EQUIPMENT, INSTRUMENTS & COMPONENTS –5.0% |
|
|
|
|
|
|
|
|
| Cognex Corp. |
|
|
46,700 |
|
|
|
2,096,363 |
|
|
|
|
| FEI Co. |
|
|
50,500 |
|
|
|
3,810,730 |
|
|
|
|
| IPG Photonics Corp.* |
|
|
74,900 |
|
|
|
6,634,642 |
|
|
|
|
| National Instruments Corp. |
|
|
145,500 |
|
|
|
4,161,300 |
|
|
|
|
|
|
|
|
|
|
|
|
|
|
|
|
|
|
|
|
|
|
$ |
16,703,035 |
|
|
|
| INTERNET SOFTWARE & SERVICES – 2.3% |
|
|
|
|
|
|
|
|
| CoStar Group, Inc.* |
|
|
22,900 |
|
|
|
4,681,447 |
|
|
|
|
| Xoom Corp.#,* |
|
|
184,000 |
|
|
|
3,251,280 |
|
|
|
|
|
|
|
|
|
|
|
|
|
|
|
|
|
|
|
|
|
|
$ |
7,932,727 |
|
April 30,
2015 / ANNUAL REPORT
PORTFOLIOS OF
INVESTMENTS 33
Wilmington Mid-Cap Growth Fund (continued)
|
|
|
|
|
|
|
|
|
| Description
|
|
Number of
Shares
|
|
|
Value
|
|
|
| IT SERVICES – 1.2% |
|
|
|
|
| Global Payments, Inc. |
|
|
39,600 |
|
|
$ |
3,971,088 |
|
|
| SEMICONDUCTORS & SEMICONDUCTOR
EQUIPMENT – 2.6% |
|
|
|
|
| Altera Corp. |
|
|
114,900 |
|
|
|
4,789,032 |
|
|
|
|
| Lam Research Corp. |
|
|
51,500 |
|
|
|
3,892,370 |
|
|
|
|
|
|
|
|
|
|
|
|
|
|
|
|
|
|
|
|
|
|
$ |
8,681,402 |
|
|
| SOFTWARE – 5.4% |
|
|
|
|
| ANSYS, Inc.* |
|
|
77,600 |
|
|
|
6,661,184 |
|
|
|
|
| Autodesk, Inc.* |
|
|
82,400 |
|
|
|
4,682,792 |
|
|
|
|
| Red Hat, Inc.* |
|
|
89,000 |
|
|
|
6,698,140 |
|
|
|
|
|
|
|
|
|
|
|
|
|
|
|
|
|
|
|
|
|
|
$ |
18,042,116 |
|
|
|
|
|
|
|
|
|
|
|
|
|
|
|
|
| TOTAL INFORMATION TECHNOLOGY |
|
|
|
|
|
$ |
58,623,614 |
|
|
|
|
| MATERIALS – 5.0% |
|
|
|
|
|
|
|
|
|
|
|
| CHEMICALS – 5.0% |
|
|
|
|
|
|
|
|
|
|
|
| Airgas, Inc. |
|
|
46,700 |
|
|
|
4,729,776 |
|
|
|
|
| Valspar Corp. (The) |
|
|
74,500 |
|
|
|
6,041,950 |
|
|
|
|
| WR Grace & Co.* |
|
|
61,600 |
|
|
|
5,957,952 |
|
|
|
|
|
|
|
|
|
|
|
|
|
|
|
|
|
|
|
|
|
|
$ |
16,729,678 |
|
|
|
|
|
|
|
|
|
|
|
|
|
|
|
|
| TOTAL MATERIALS |
|
|
|
|
|
$ |
16,729,678 |
|
|
|
|
| TOTAL COMMON STOCKS |
|
|
|
|
|
|
|
|
| (COST $225,903,654) |
|
|
|
|
|
$ |
331,544,780 |
|
|
|
|
| MONEY MARKET FUND – 0.7% |
|
|
|
|
|
|
|
|
|
|
|
| Dreyfus Cash Management Fund, |
|
|
|
|
|
|
|
|
| Institutional Shares, 0.04%^ |
|
|
2,295,154 |
|
|
|
2,295,154 |
|
|
|
|
|
|
|
|
|
|
|
|
|
|
|
|
| TOTAL MONEY MARKET FUND |
|
|
|
|
|
|
|
|
| (COST $2,295,154) |
|
|
|
|
|
$ |
2,295,154 |
|
|
|
|
|
|
|
|
|
|
|
|
|
|
| TOTAL INVESTMENTS IN SECURITIES – 99.5% |
|
| (COST $228,198,808) |
|
|
|
|
|
$ |
333,839,934 |
|
|
|
|
|
|
|
|
|
|
| Description
|
|
Par Value
|
|
|
Value
|
|
|
| CASH COLLATERAL INVESTED FOR SECURITIES ON LOAN
– 5.6% |
|
|
| REPURCHASE AGREEMENTS – 5.6% |
|
|
|
|
| BNP Paribas Securities Corp., 0.12%, dated 4/30/15, due 5/01/15, repurchase price $938,723, collateralized by U.S. Government & Treasury Securities 0.00% to
6.50%, maturing 5/01/16 to 4/20/45; total market value of $957,494. |
|
$ |
938,720 |
|
|
$ |
938,720 |
|
|
|
|
| Citigroup Global Markets, Inc., 0.13%, dated 4/30/15, due 5/01/15, repurchase price $3,567,292, collateralized by U.S. Government Securities 1.61% to 8.00%, maturing
6/01/17 to 6/15/52; total market value of $3,638,625. |
|
|
3,567,279 |
|
|
|
3,567,279 |
|
|
|
|
| Credit Suisse Securities (USA) LLC, 0.12%, dated 4/30/15, due 5/01/15, repurchase price $3,567,291, collateralized by U.S. Government Securities 3.00% to 4.50%,
maturing 8/01/38 to 4/01/45; total market value of $3,638,651. |
|
|
3,567,279 |
|
|
|
3,567,279 |
|
|
|
|
| Daiwa Capital Markets LLC, 0.16%, dated 4/30/15, due 5/01/15, repurchase price $3,567,295, collateralized by U.S. Government & Treasury Securities 0.00% to
9.25%, maturing 5/21/15 to 3/01/48; total market value of $3,638,625. |
|
|
3,567,279 |
|
|
|
3,567,279 |
|
|
|
|
| ING Financial Markets LLC, 0.12%, dated 4/30/15, due 5/01/15, repurchase price $3,567,291, collateralized by U.S. Government Securities 1.87% to 6.20%, maturing
5/01/33 to 11/01/44; total market value of $3,638,626. |
|
|
3,567,279 |
|
|
|
3,567,279 |
|
|
|
|
| Nomura Securities International, Inc. 0.13%, dated 4/30/15, due 5/01/15, repurchase price $3,567,292, collateralized by U.S. Government & Treasury Securities
0.00% to 10.50%, maturing 5/15/15 to 3/20/64; total market value of $3,638,625. |
|
|
3,567,279 |
|
|
|
3,567,279 |
|
|
|
|
|
|
|
|
|
|
|
| TOTAL CASH COLLATERAL INVESTED FOR SECURITIES ON LOAN |
|
| (COST $18,775,115) |
|
|
|
|
|
$ |
18,775,115 |
|
|
|
|
|
|
|
|
|
|
|
|
| TOTAL INVESTMENTS – 105.1% (COST
$246,973,923) |
|
|
$ |
352,615,049 |
|
|
|
| COLLATERAL FOR SECURITIES ON LOAN –
(5.6%) |
|
|
|
(18,775,115 |
) |
|
|
| OTHER ASSETS LESS LIABILITIES – 0.5% |
|
|
|
1,667,343 |
|
|
|
|
|
|
|
|
|
|
|
|
|
| TOTAL NET ASSETS – 100.0% |
|
|
|
|
|
$ |
335,507,277 |
|
|
|
|
|
|
|
|
|
|
ANNUAL
REPORT / April 30, 2015
34
PORTFOLIOS OF INVESTMENTS
Wilmington Mid-Cap Growth Fund (concluded)
Cost of investments for Federal income tax purposes is $249,462,518. The net unrealized
appreciation/(depreciation) of investments was $103,152,531. This consists of net unrealized appreciation from investment for those securities having an excess of value over cost of $113,483,077 and net unrealized depreciation from investments for
those securities having an excess of cost over value of $10,330,546.
Various inputs are used in determining the value of the
Fund’s investments. These inputs are summarized in the three broad levels listed below.
Level 1 – quoted
prices in active markets for identical securities
Level 2 – other significant observable inputs (including
quoted prices for similar securities, interest rates, prepayment speeds, credit risk, etc.)
Level 3 – significant unobservable inputs (including the Fund’s own assumptions in determining the fair
value of investments)
The following is a summary of the inputs used as of April 30, 2015 in valuing the Fund’s assets
carried at fair value:
|
|
|
|
|
|
|
|
|
|
|
|
|
|
|
|
|
|
|
|
|
|
| |
|
Level 1
|
|
|
Level 2
|
|
|
Level 3
|
|
|
Total
|
|
| Investments in Securities |
|
|
|
|
|
|
|
|
|
|
|
|
|
|
|
|
|
|
|
|
|
| Common Stocks |
|
$ |
331,544,780 |
|
|
$ |
— |
|
|
$ |
— |
|
|
$ |
331,544,780 |
|
|
|
|
|
|
| Money Market Fund |
|
|
2,295,154 |
|
|
|
— |
|
|
|
— |
|
|
|
2,295,154 |
|
|
|
|
|
|
| Repurchase Agreements |
|
|
— |
|
|
|
18,775,115 |
|
|
|
— |
|
|
|
18,775,115 |
|
|
|
|
|
|
|
|
|
|
|
|
|
|
|
|
|
|
|
|
|
|
|
| Total |
|
$ |
333,839,934 |
|
|
$ |
18,775,115 |
|
|
$ |
— |
|
|
$ |
352,615,049 |
|
|
|
|
|
|
|
|
|
|
|
|
|
|
|
|
|
|
| # |
Security, or a portion thereof, is on loan. See Note 2 in Notes to Financial Statements. |
| * |
Non-income producing security. |
The
following acronyms are used throughout this Fund:
LLC - Limited Liability Corporation
LP - Limited Partnership
PLC - Public Limited Company
See Notes which is an integral part of the Financial Statements
April 30,
2015 / ANNUAL REPORT
35
PORTFOLIO OF INVESTMENTS SUMMARY TABLE
Wilmington Small-Cap Growth Fund
At April 30, 2015, the Fund’s
sector classifications were as follows (unaudited):
|
|
|
| |
|
Percentage of
Total Net Assets |
|
|
|
|
|
|
|
| Common Stocks |
|
|
|
|
|
|
| Health Care |
|
|
28.1 |
% |
|
|
| Information Technology |
|
|
21.1 |
% |
|
|
| Industrials |
|
|
17.9 |
% |
|
|
| Consumer Discretionary |
|
|
18.3 |
% |
|
|
| Consumer Staples |
|
|
6.0 |
% |
|
|
| Financials |
|
|
4.0 |
% |
|
|
| Materials |
|
|
2.6 |
% |
|
|
| Energy |
|
|
0.4 |
% |
|
|
| Telecommunication Services |
|
|
0.3 |
% |
|
|
| Warrant |
|
|
0.0 |
%3 |
|
|
| Cash Equivalents1 |
|
|
11.7 |
% |
|
|
| Other Assets and Liabilities – Net2 |
|
|
(10.4 |
)% |
|
|
|
|
|
|
|
|
|
| TOTAL |
|
|
100.0 |
% |
|
|
|
|
|
|
|
|
|
| (1) |
Cash Equivalents include investments in a money market fund and repurchase agreements. |
| (2) |
Assets, other than investments in securities, less liabilities. See Statements of Assets and Liabilities. |
| (3) |
Represents less than 0.05%. |
PORTFOLIO OF INVESTMENTS
April 30, 2015
|
|
|
|
|
|
|
|
|
| Description
|
|
Number of
Shares
|
|
|
Value
|
|
|
|
|
| COMMON STOCKS – 98.7% |
|
|
|
|
|
|
|
|
|
| CONSUMER DISCRETIONARY – 18.3% |
|
|
| AUTO COMPONENTS – 0.5% |
|
|
|
|
| American Axle & Manufacturing Holdings, Inc.* |
|
|
3,955 |
|
|
$ |
98,598 |
|
|
|
|
| Modine Manufacturing Co.* |
|
|
3,956 |
|
|
|
48,619 |
|
|
|
|
| Sypris Solutions, Inc. |
|
|
12,369 |
|
|
|
18,925 |
|
|
|
|
| Tower International, Inc.* |
|
|
5,005 |
|
|
|
129,429 |
|
|
|
|
|
|
|
|
|
|
|
|
|
|
|
|
$ |
295,571 |
|
|
| DISTRIBUTORS – 1.3% |
|
|
|
|
| Core-Mark Holding Co., Inc. |
|
|
13,569 |
|
|
|
715,222 |
|
|
| DIVERSIFIED CONSUMER SERVICES – 0.5% |
|
|
|
|
| Education Management Corp.* |
|
|
11,809 |
|
|
|
2,805 |
|
|
|
|
| Steiner Leisure Ltd.* |
|
|
5,111 |
|
|
|
246,555 |
|
|
|
|
|
|
|
|
|
|
|
|
|
|
|
|
|
|
|
$ |
249,360 |
|
|
| HOTELS, RESTAURANTS & LEISURE – 3.8% |
|
|
|
|
| Cheesecake Factory, Inc. (The) |
|
|
6,745 |
|
|
|
338,127 |
|
|
|
|
|
|
|
|
|
|
| Description
|
|
Number of
Shares
|
|
|
Value
|
|
|
|
|
| DineEquity, Inc. |
|
|
1,309 |
|
|
$ |
126,227 |
|
|
|
|
| Krispy Kreme Doughnuts, Inc.* |
|
|
12,410 |
|
|
|
220,898 |
|
|
|
|
| Papa John’s International, Inc. |
|
|
9,690 |
|
|
|
594,675 |
|
|
|
|
| Popeyes Louisiana Kitchen, Inc.* |
|
|
2,622 |
|
|
|
145,993 |
|
|
|
|
| Premier Exhibitions, Inc.# |
|
|
3,840 |
|
|
|
17,971 |
|
|
|
|
| Scientific Games Corp.#,* |
|
|
19,840 |
|
|
|
251,373 |
|
|
|
|
| Sonic Corp.* |
|
|
14,796 |
|
|
|
423,905 |
|
|
|
|
|
|
|
|
|
|
|
|
|
|
|
|
|
|
|
$ |
2,119,169 |
|
|
| HOUSEHOLD DURABLES – 0.7% |
|
|
|
|
| La-Z-Boy, Inc. |
|
|
2,308 |
|
|
|
60,493 |
|
|
|
|
| Ryland Group, Inc. (The) |
|
|
8,269 |
|
|
|
340,848 |
|
|
|
|
|
|
|
|
|
|
|
|
|
|
|
|
|
|
|
$ |
401,341 |
|
|
| INTERNET & CATALOG RETAIL – 0.8% |
|
|
|
|
| EVINE Live, Inc.* |
|
|
10,891 |
|
|
|
64,910 |
|
|
|
|
| HSN, Inc. |
|
|
5,100 |
|
|
|
318,342 |
|
|
|
|
| Orbitz Worldwide, Inc.* |
|
|
7,000 |
|
|
|
82,040 |
|
|
|
|
|
|
|
|
|
|
|
|
|
|
|
|
|
|
|
$ |
465,292 |
|
ANNUAL
REPORT / April 30, 2015
36
PORTFOLIOS OF INVESTMENTS
Wilmington Small-Cap Growth Fund (continued)
|
|
|
|
|
|
|
|
|
|
|
|
| Description
|
|
Number of
Shares
|
|
|
Value
|
|
|
| LEISURE EQUIPMENT & PRODUCTS – 1.5% |
|
|
|
|
| Brunswick Corp. |
|
|
11,225 |
|
|
$ |
561,699 |
|
|
|
|
| Polaris Industries, Inc. |
|
|
2,062 |
|
|
|
282,412 |
|
|
|
|
|
|
|
|
|
|
|
|
|
|
|
|
|
|
|
$ |
844,111 |
|
|
|
|
| MEDIA – 2.7% |
|
|
|
|
|
|
|
|
|
|
|
| Entravision Communications Corp. |
|
|
17,716 |
|
|
|
115,863 |
|
|
|
|
| Lions Gate Entertainment Corp. |
|
|
7,008 |
|
|
|
217,318 |
|
|
|
|
| MDC Partners, Inc. |
|
|
10,737 |
|
|
|
224,833 |
|
|
|
|
| Nexstar Broadcasting Group, Inc.# |
|
|
7,008 |
|
|
|
409,688 |
|
|
|
|
| Sinclair Broadcast Group, Inc. |
|
|
17,022 |
|
|
|
521,554 |
|
|
|
|
|
|
|
|
|
|
|
|
|
|
|
|
|
|
|
$ |
1,489,256 |
|
|
|
|
| SPECIALTY RETAIL – 3.2% |
|
|
|
|
|
|
|
|
|
|
|
| Asbury Automotive Group, Inc.* |
|
|
4,896 |
|
|
|
411,411 |
|
|
|
|
| Cabela’s, Inc.#,* |
|
|
2,653 |
|
|
|
139,919 |
|
|
|
|
| Monro Muffler Brake, Inc. |
|
|
4,940 |
|
|
|
295,857 |
|
|
|
|
| Pier 1 Imports, Inc.# |
|
|
644 |
|
|
|
8,147 |
|
|
|
|
| Tractor Supply Co. |
|
|
8,272 |
|
|
|
711,888 |
|
|
|
|
| Winmark Corp. |
|
|
2,576 |
|
|
|
231,866 |
|
|
|
|
|
|
|
|
|
|
|
|
|
|
|
|
|
|
|
$ |
1,799,088 |
|
|
| TEXTILES, APPAREL & LUXURY GOODS – 3.3% |
|
|
|
|
| Quiksilver, Inc.* |
|
|
10,124 |
|
|
|
16,806 |
|
|
|
|
| Steven Madden Ltd.* |
|
|
13,989 |
|
|
|
545,851 |
|
|
|
|
| Under Armour, Inc., Class A#,* |
|
|
7,713 |
|
|
|
598,143 |
|
|
|
|
| Wolverine World Wide, Inc. |
|
|
21,920 |
|
|
|
673,602 |
|
|
|
|
|
|
|
|
|
|
|
|
|
|
|
|
|
|
|
$ |
1,834,402 |
|
|
|
|
|
|
|
|
|
|
|
|
|
| TOTAL CONSUMER DISCRETIONARY |
|
|
|
|
|
$ |
10,212,812 |
|
|
| CONSUMER STAPLES – 6.0% |
|
|
|
|
| BEVERAGES – 0.4% |
|
|
|
|
|
|
|
|
|
|
|
| National Beverage Corp.* |
|
|
9,433 |
|
|
|
210,828 |
|
|
|
| FOOD & STAPLES RETAILING – 2.1% |
|
|
|
|
|
|
|
|
| Andersons, Inc. (The) |
|
|
9,149 |
|
|
|
390,571 |
|
|
|
|
| Pricesmart, Inc. |
|
|
3,644 |
|
|
|
293,196 |
|
|
|
|
| Rite Aid Corp.* |
|
|
34,380 |
|
|
|
265,070 |
|
|
|
|
| SUPERVALU, Inc.* |
|
|
30,373 |
|
|
|
266,979 |
|
|
|
|
|
|
|
|
|
|
|
|
|
|
|
|
|
|
|
$ |
1,215,816 |
|
|
|
|
| FOOD PRODUCTS – 2.2% |
|
|
|
|
|
|
|
|
|
|
|
| Darling International, Inc.#,* |
|
|
10,340 |
|
|
|
141,244 |
|
|
|
|
| Hain Celestial Group, Inc. (The)* |
|
|
3,970 |
|
|
|
239,153 |
|
|
|
|
| J&J Snack Foods Corp. |
|
|
4,186 |
|
|
|
436,725 |
|
|
|
|
| Landec Corp.* |
|
|
14,129 |
|
|
|
200,773 |
|
|
|
|
| Omega Protein Corp.* |
|
|
17,431 |
|
|
|
222,768 |
|
|
|
|
|
|
|
|
|
|
|
|
|
|
|
|
|
|
|
$ |
1,240,663 |
|
|
| HOUSEHOLD PRODUCTS – 1.3% |
|
|
|
|
| Spectrum Brands Holdings, Inc. |
|
|
3,511 |
|
|
|
321,011 |
|
|
|
|
|
|
|
|
|
|
|
|
|
| Description
|
|
Number of
Shares
|
|
|
Value
|
|
|
|
|
| WD-40 Co. |
|
|
4,870 |
|
|
$ |
394,275 |
|
|
|
|
|
|
|
|
|
|
|
|
|
|
|
|
|
|
|
$ |
715,286 |
|
|
|
|
|
|
|
|
|
|
|
|
|
| TOTAL CONSUMER STAPLES |
|
|
|
|
|
$ |
3,382,593 |
|
|
|
|
| ENERGY – 0.4% |
|
|
|
|
|
|
|
|
|
|
| ENERGY EQUIPMENT & SERVICES – 0.4% |
|
|
|
|
|
|
|
|
| Dril-Quip, Inc.* |
|
|
2,283 |
|
|
|
182,001 |
|
|
|
|
| Geospace Technologies Corp.* |
|
|
1,264 |
|
|
|
27,302 |
|
|
|
|
| Mitcham Industries, Inc.* |
|
|
7,388 |
|
|
|
36,201 |
|
|
|
|
|
|
|
|
|
|
|
|
|
|
|
|
|
|
|
$ |
245,504 |
|
|
|
| OIL, GAS & CONSUMABLE FUELS – 0.0%** |
|
|
|
|
|
|
|
|
| Vertex Energy, Inc.#,* |
|
|
437 |
|
|
|
944 |
|
|
|
|
|
|
|
|
|
|
|
|
|
| TOTAL ENERGY |
|
|
|
|
|
$ |
246,448 |
|
|
|
|
| FINANCIALS – 4.0% |
|
|
|
|
|
|
|
|
|
|
|
| CAPITAL MARKETS – 2.3% |
|
|
|
|
|
|
|
|
|
|
|
| AllianceBernstein Holding LP |
|
|
13,702 |
|
|
|
429,558 |
|
|
|
|
| HFF, Inc. |
|
|
8,933 |
|
|
|
350,084 |
|
|
|
|
| Lazard Ltd., Class A |
|
|
5,725 |
|
|
|
303,597 |
|
|
|
|
| Virtus Investment Partners, Inc.* |
|
|
1,334 |
|
|
|
178,249 |
|
|
|
|
|
|
|
|
|
|
|
|
|
|
|
|
|
|
|
$ |
1,261,488 |
|
|
|
|
| COMMERCIAL BANKS – 0.1% |
|
|
|
|
|
|
|
|
|
|
|
| Glacier Bancorp, Inc. |
|
|
2,111 |
|
|
|
55,604 |
|
|
|
|
| INSURANCE – 0.2% |
|
|
|
|
|
|
|
|
|
|
|
| First American Financial Corp. |
|
|
2,597 |
|
|
|
90,350 |
|
|
| REAL ESTATE INVESTMENT TRUSTS – 1.2% |
|
|
|
|
| FelCor Lodging Trust, Inc. |
|
|
14,858 |
|
|
|
165,072 |
|
|
|
|
| GEO Group, Inc. |
|
|
2,772 |
|
|
|
108,108 |
|
|
|
|
| Omega Healthcare Investors, Inc.# |
|
|
4,081 |
|
|
|
147,283 |
|
|
|
|
| Strategic Hotels & Resorts, Inc.* |
|
|
21,861 |
|
|
|
255,774 |
|
|
|
|
|
|
|
|
|
|
|
|
|
|
|
|
|
|
|
$ |
676,237 |
|
|
|
| THRIFTS & MORTGAGE FINANCE – 0.2% |
|
|
|
|
|
|
|
|
| MGIC Investment Corp.* |
|
|
13,625 |
|
|
|
141,972 |
|
|
|
|
|
|
|
|
|
|
|
|
|
| TOTAL FINANCIALS |
|
|
|
|
|
$ |
2,225,651 |
|
|
|
|
| HEALTH CARE – 28.1% |
|
|
|
|
|
|
|
|
|
|
|
| BIOTECHNOLOGY – 9.3% |
|
|
|
|
|
|
|
|
|
|
|
| ACADIA Pharmaceuticals, Inc.#,* |
|
|
3,983 |
|
|
|
136,099 |
|
|
|
|
| Alnylam Pharmaceuticals, Inc.* |
|
|
5,246 |
|
|
|
534,410 |
|
|
|
|
| Exact Sciences Corp.#,* |
|
|
1,371 |
|
|
|
28,654 |
|
|
|
|
| Halozyme Therapeutics, Inc.#,* |
|
|
8,340 |
|
|
|
124,016 |
|
|
|
|
| Infinity Pharmaceuticals, Inc.* |
|
|
4,040 |
|
|
|
51,187 |
|
|
|
|
| Insys Therapeutics, Inc.#,* |
|
|
12,741 |
|
|
|
669,794 |
|
|
|
|
| Isis Pharmaceuticals, Inc.#,* |
|
|
16,560 |
|
|
|
939,283 |
|
|
|
|
| Keryx Biopharmaceuticals, Inc.#,* |
|
|
12,174 |
|
|
|
129,775 |
|
|
|
|
| MannKind Corp.#,* |
|
|
15,620 |
|
|
|
67,010 |
|
|
|
|
| MiMedx Group, Inc.#,* |
|
|
21,610 |
|
|
|
203,134 |
|
|
|
|
| Novavax, Inc.#,* |
|
|
43,250 |
|
|
|
334,322 |
|
April 30,
2015 / ANNUAL REPORT
PORTFOLIOS OF
INVESTMENTS 37
Wilmington Small-Cap Growth Fund (continued)
|
|
|
|
|
|
|
|
|
| Description
|
|
Number of
Shares
|
|
|
Value
|
|
|
|
|
| Orexigen Therapeutics, Inc.#,* |
|
|
17,152 |
|
|
$ |
112,689 |
|
|
|
|
| PDL BioPharma, Inc.# |
|
|
70,565 |
|
|
|
470,669 |
|
|
|
|
| Pharmacyclics, Inc.* |
|
|
1,572 |
|
|
|
402,746 |
|
|
|
|
| Prothena Corp. PLC* |
|
|
2,210 |
|
|
|
71,626 |
|
|
|
|
| Puma Biotechnology, Inc.* |
|
|
3,222 |
|
|
|
581,829 |
|
|
|
|
| Raptor Pharmaceutical Corp.#,* |
|
|
3,577 |
|
|
|
36,199 |
|
|
|
|
| Seattle Genetics, Inc.#,* |
|
|
2,497 |
|
|
|
85,747 |
|
|
|
|
| Spectrum Pharmaceuticals, Inc.#,* |
|
|
5,326 |
|
|
|
30,092 |
|
|
|
|
| Synageva BioPharma Corp.#,* |
|
|
1,343 |
|
|
|
123,502 |
|
|
|
|
| United Therapeutics Corp.* |
|
|
413 |
|
|
|
65,952 |
|
|
|
|
|
|
|
|
|
|
|
|
|
|
|
|
|
|
|
$ |
5,198,735 |
|
|
| HEALTH CARE EQUIPMENT & SUPPLIES – 7.8% |
|
|
|
|
| ABIOMED, Inc.* |
|
|
11,661 |
|
|
|
737,208 |
|
|
|
|
| Align Technology, Inc.* |
|
|
8,173 |
|
|
|
480,899 |
|
|
|
|
| Anika Therapeutics, Inc.* |
|
|
3,873 |
|
|
|
132,147 |
|
|
|
|
| Cantel Medical Corp. |
|
|
4,497 |
|
|
|
201,421 |
|
|
|
|
| Cardiovascular Systems, Inc.* |
|
|
9,278 |
|
|
|
290,401 |
|
|
|
|
| DexCom, Inc.* |
|
|
3,120 |
|
|
|
210,818 |
|
|
|
|
| Integra LifeSciences Holdings Corp.* |
|
|
3,254 |
|
|
|
191,270 |
|
|
|
|
| Neogen Corp.* |
|
|
12,192 |
|
|
|
543,032 |
|
|
|
|
| Sirona Dental Systems, Inc.* |
|
|
1,689 |
|
|
|
156,655 |
|
|
|
|
| STARR Surgical Co.#,* |
|
|
3,155 |
|
|
|
27,922 |
|
|
|
|
| STERIS Corp. |
|
|
6,704 |
|
|
|
445,816 |
|
|
|
|
| Utah Medical Products, Inc. |
|
|
6,588 |
|
|
|
355,159 |
|
|
|
|
| West Pharmaceutical Services, Inc. |
|
|
10,574 |
|
|
|
563,383 |
|
|
|
|
|
|
|
|
|
|
|
|
|
|
|
|
|
|
|
$ |
4,336,131 |
|
|
| HEALTH CARE PROVIDERS & SERVICES – 5.4% |
|
|
|
|
| Accretive Health, Inc.* |
|
|
2,123 |
|
|
|
11,931 |
|
|
|
|
| Aceto Corp. |
|
|
21,377 |
|
|
|
414,286 |
|
|
|
|
| Addus HomeCare Corp.* |
|
|
3,150 |
|
|
|
84,546 |
|
|
|
|
| Air Methods Corp.* |
|
|
970 |
|
|
|
44,329 |
|
|
|
|
| AMN Healthcare Services, Inc.* |
|
|
6,134 |
|
|
|
139,917 |
|
|
|
|
| Brookdale Senior Living, Inc.* |
|
|
1,835 |
|
|
|
66,482 |
|
|
|
|
| Centene Corp.* |
|
|
7,004 |
|
|
|
434,178 |
|
|
|
|
| CorVel Corp.* |
|
|
13,355 |
|
|
|
477,308 |
|
|
|
|
| ExamWorks Group, Inc. (The)* |
|
|
1,370 |
|
|
|
56,101 |
|
|
|
|
| HealthSouth Corp. |
|
|
6,087 |
|
|
|
275,254 |
|
|
|
|
| National Research Corp., Class B#,* |
|
|
1,872 |
|
|
|
65,052 |
|
|
|
|
| Providence Service Corp.* |
|
|
7,123 |
|
|
|
302,870 |
|
|
|
|
| Team Health Holdings, Inc.* |
|
|
10,950 |
|
|
|
652,291 |
|
|
|
|
|
|
|
|
|
|
|
|
|
|
|
|
|
|
|
$ |
3,024,545 |
|
|
|
| HEALTH CARE TECHNOLOGY – 0.2% |
|
|
|
|
|
|
|
|
| Cerner Corp.* |
|
|
1,722 |
|
|
|
123,657 |
|
|
| LIFE SCIENCES TOOLS & SERVICES – 0.6% |
|
|
|
|
| PAREXEL International Corp.* |
|
|
5,616 |
|
|
|
357,037 |
|
|
|
|
|
|
|
|
|
|
| Description
|
|
Number of
Shares
|
|
|
Value
|
|
|
|
| PHARMACEUTICALS – 4.8% |
|
|
|
|
|
|
|
|
| Akorn, Inc.#,* |
|
|
18,000 |
|
|
$ |
749,520 |
|
|
|
|
| ANI Pharmaceuticals, Inc.* |
|
|
7,152 |
|
|
|
436,129 |
|
|
|
|
| Furiex Pharmaceuticals
CVR†† |
|
|
734 |
|
|
|
7,171 |
|
|
|
|
| IGI Laboratories, Inc.#,* |
|
|
9,670 |
|
|
|
49,124 |
|
|
|
|
| Jazz Pharmaceuticals PLC* |
|
|
1,331 |
|
|
|
237,850 |
|
|
|
|
| Lannett Co., Inc.* |
|
|
10,630 |
|
|
|
611,225 |
|
|
|
|
| Pacira Pharmaceuticals, Inc.* |
|
|
5,808 |
|
|
|
397,732 |
|
|
|
|
| Prestige Brands Holdings, Inc.* |
|
|
4,334 |
|
|
|
170,109 |
|
|
|
|
|
|
|
|
|
|
|
|
|
|
|
|
|
|
|
$ |
2,658,860 |
|
|
|
|
|
|
|
|
|
|
|
|
|
| TOTAL HEALTH CARE |
|
|
|
|
|
$ |
15,698,965 |
|
|
|
|
| INDUSTRIALS – 17.9% |
|
|
|
|
|
|
|
|
|
|
| AEROSPACE & DEFENSE – 1.9% |
|
|
|
|
|
|
|
|
| Aerojet Rocketdyne Holdings, Inc.* |
|
|
12,244 |
|
|
|
240,717 |
|
|
|
|
| HEICO Corp.# |
|
|
2,694 |
|
|
|
150,433 |
|
|
|
|
| Hexcel Corp. |
|
|
8,484 |
|
|
|
425,473 |
|
|
|
|
| Moog, Inc.* |
|
|
1,930 |
|
|
|
134,868 |
|
|
|
|
| Teledyne Technologies, Inc.* |
|
|
1,308 |
|
|
|
137,301 |
|
|
|
|
|
|
|
|
|
|
|
|
|
|
|
|
|
|
|
$ |
1,088,792 |
|
|
|
| AIR FREIGHT & LOGISTICS – 0.9% |
|
|
|
|
|
|
|
|
| Park-Ohio Holdings Corp. |
|
|
6,343 |
|
|
|
293,871 |
|
|
|
|
| XPO Logistics, Inc.#,* |
|
|
4,058 |
|
|
|
196,813 |
|
|
|
|
|
|
|
|
|
|
|
|
|
|
|
|
|
|
|
$ |
490,684 |
|
|
|
|
| AIRLINES – 2.2% |
|
|
|
|
|
|
|
|
|
|
|
| American Airlines Group, Inc. |
|
|
5,512 |
|
|
|
266,147 |
|
|
|
|
| Hawaiian Holdings, Inc.#,* |
|
|
18,000 |
|
|
|
415,440 |
|
|
|
|
| Republic Airways Holdings, Inc.* |
|
|
12,571 |
|
|
|
153,869 |
|
|
|
|
| Spirit Airlines, Inc.* |
|
|
5,447 |
|
|
|
372,956 |
|
|
|
|
|
|
|
|
|
|
|
|
|
|
|
|
|
|
|
$ |
1,208,412 |
|
|
|
| BUILDING PRODUCTS – 1.7% |
|
|
|
|
|
|
|
|
| American Woodmark Corp.* |
|
|
3,717 |
|
|
|
188,452 |
|
|
|
|
| Trex Co., Inc.* |
|
|
15,779 |
|
|
|
740,351 |
|
|
|
|
|
|
|
|
|
|
|
|
|
|
|
|
|
|
|
$ |
928,803 |
|
|
| COMMERCIAL SERVICES & SUPPLIES – 1.0% |
|
|
|
|
| Healthcare Services Group, Inc. |
|
|
3,577 |
|
|
|
108,276 |
|
|
|
|
| Herman Miller, Inc. |
|
|
471 |
|
|
|
12,910 |
|
|
|
|
| Knoll, Inc. |
|
|
2,956 |
|
|
|
67,308 |
|
|
|
|
| Mobile Mini, Inc. |
|
|
4,215 |
|
|
|
162,446 |
|
|
|
|
| Team, Inc.* |
|
|
5,006 |
|
|
|
195,634 |
|
|
|
|
|
|
|
|
|
|
|
|
|
|
|
|
|
|
|
$ |
546,574 |
|
|
| CONSTRUCTION & ENGINEERING – 1.9% |
|
|
|
|
| Comfort Systems USA, Inc. |
|
|
2,860 |
|
|
|
59,173 |
|
|
|
|
| Dycom Industries, Inc.* |
|
|
14,650 |
|
|
|
673,607 |
|
|
|
|
| MYR Group, Inc.* |
|
|
2,742 |
|
|
|
80,395 |
|
ANNUAL
REPORT / April 30, 2015
38 PORTFOLIOS OF INVESTMENTS
Wilmington Small-Cap Growth Fund (continued)
|
|
|
|
|
|
|
|
|
|
|
|
| Description |
|
Number of
Shares |
|
|
Value |
|
|
|
|
| Primoris Services Corp. |
|
|
11,706 |
|
|
$ |
225,106 |
|
|
|
|
|
|
|
|
|
|
|
|
|
|
|
|
|
|
|
$ |
1,038,281 |
|
|
| ELECTRICAL EQUIPMENT – 1.4% |
|
|
|
|
| Acuity Brands, Inc. |
|
|
2,981 |
|
|
|
497,678 |
|
|
|
|
| Belden, Inc. |
|
|
3,577 |
|
|
|
300,289 |
|
|
|
|
|
|
|
|
|
|
|
|
|
|
|
|
|
|
|
$ |
797,967 |
|
|
|
|
| MACHINERY – 1.8% |
|
|
|
|
|
|
|
|
|
|
|
| Blount International, Inc.* |
|
|
4,055 |
|
|
|
53,769 |
|
|
|
|
| Gorman-Rupp Co. (The) |
|
|
251 |
|
|
|
6,805 |
|
|
|
|
| Meritor, Inc.* |
|
|
48,232 |
|
|
|
632,804 |
|
|
|
|
| Mueller Water Products, Inc. |
|
|
10,518 |
|
|
|
98,448 |
|
|
|
|
| TriMas Corp.* |
|
|
6,209 |
|
|
|
174,908 |
|
|
|
|
| Valmont Industries, Inc.# |
|
|
413 |
|
|
|
52,046 |
|
|
|
|
|
|
|
|
|
|
|
|
|
|
|
|
|
|
|
$ |
1,018,780 |
|
|
|
| PROFESSIONAL SERVICES – 3.9% |
|
|
|
|
|
|
|
|
| Advisory Board Co. (The)* |
|
|
8,110 |
|
|
|
420,828 |
|
|
|
|
| Exponent, Inc. |
|
|
7,126 |
|
|
|
631,435 |
|
|
|
|
| GP Strategies Corp.* |
|
|
16,032 |
|
|
|
522,483 |
|
|
|
|
| Kforce, Inc. |
|
|
9,310 |
|
|
|
211,709 |
|
|
|
|
| Navigant Consulting, Inc.* |
|
|
19,302 |
|
|
|
279,107 |
|
|
|
|
| On Assignment, Inc.* |
|
|
3,984 |
|
|
|
134,062 |
|
|
|
|
|
|
|
|
|
|
|
|
|
|
|
|
|
|
|
$ |
2,199,624 |
|
|
|
|
| ROAD & RAIL – 0.9% |
|
|
|
|
|
|
|
|
|
|
|
| ArcBest Corp. |
|
|
5,234 |
|
|
|
186,854 |
|
|
|
|
| Quality Distribution, Inc.* |
|
|
14,000 |
|
|
|
138,880 |
|
|
|
|
| Swift Transportation Co.* |
|
|
8,367 |
|
|
|
202,481 |
|
|
|
|
|
|
|
|
|
|
|
|
|
|
|
|
|
|
|
$ |
528,215 |
|
|
| TRADING COMPANIES & DISTRIBUTORS – 0.3% |
|
|
|
|
| TAL International Group, Inc. |
|
|
1,346 |
|
|
|
51,875 |
|
|
|
|
| United Rentals, Inc.* |
|
|
1,073 |
|
|
|
103,630 |
|
|
|
|
|
|
|
|
|
|
|
|
|
|
|
|
|
|
|
$ |
155,505 |
|
|
|
|
|
|
|
|
|
|
|
|
|
| TOTAL INDUSTRIALS |
|
|
|
|
|
$ |
10,001,637 |
|
|
| INFORMATION TECHNOLOGY – 21.1% |
|
|
| COMMUNICATIONS EQUIPMENT – 1.7% |
|
|
|
|
| ARRIS Group, Inc.* |
|
|
9,773 |
|
|
|
329,106 |
|
|
|
|
| CalAmp Corp.* |
|
|
9,746 |
|
|
|
192,094 |
|
|
|
|
| Infinera Corp.* |
|
|
10,000 |
|
|
|
188,000 |
|
|
|
|
| TESSCO Technologies, Inc. |
|
|
8,297 |
|
|
|
209,665 |
|
|
|
|
|
|
|
|
|
|
|
|
|
|
|
|
|
|
|
$ |
918,865 |
|
|
| COMPUTERS & PERIPHERALS – 0.3% |
|
|
|
|
| Cray, Inc.* |
|
|
6,087 |
|
|
|
170,984 |
|
|
| ELECTRONIC EQUIPMENT, INSTRUMENTS &
COMPONENTS – 0.8% |
|
|
|
|
| Coherent, Inc. |
|
|
1,881 |
|
|
|
112,860 |
|
|
|
|
|
|
|
|
|
|
|
|
|
| Description |
|
Number of
Shares |
|
|
Value |
|
|
|
|
| Methode Electronics, Inc. |
|
|
8,339 |
|
|
$ |
354,074 |
|
|
|
|
|
|
|
|
|
|
|
|
|
|
|
|
|
|
|
$ |
466,934 |
|
|
| INTERNET SOFTWARE & SERVICES – 1.9% |
|
|
|
|
| CoStar Group, Inc.* |
|
|
1,730 |
|
|
|
353,664 |
|
|
|
|
| Envestnet, Inc.* |
|
|
1,290 |
|
|
|
66,125 |
|
|
|
|
| LivePerson, Inc.* |
|
|
3,819 |
|
|
|
35,899 |
|
|
|
|
| Spark Networks, Inc.#,* |
|
|
8,682 |
|
|
|
34,207 |
|
|
|
|
| Stamps.com, Inc.* |
|
|
8,091 |
|
|
|
500,752 |
|
|
|
|
| support.com, Inc.* |
|
|
7,566 |
|
|
|
11,954 |
|
|
|
|
| TechTarget, Inc.* |
|
|
7,149 |
|
|
|
77,352 |
|
|
|
|
|
|
|
|
|
|
|
|
|
|
|
|
|
|
|
$ |
1,079,953 |
|
|
|
|
| IT SERVICES – 5.1% |
|
|
|
|
|
|
|
|
|
|
|
| Alliance Data Systems Corp.* |
|
|
269 |
|
|
|
79,976 |
|
|
|
|
| Cardtronics, Inc.* |
|
|
10,137 |
|
|
|
382,469 |
|
|
|
|
| Computer Task Group, Inc. |
|
|
2,906 |
|
|
|
23,916 |
|
|
|
|
| Hackett Group, Inc. (The) |
|
|
13,603 |
|
|
|
130,589 |
|
|
|
|
| iGATE Corp.* |
|
|
10,979 |
|
|
|
522,161 |
|
|
|
|
| Jack Henry & Associates, Inc. |
|
|
6,326 |
|
|
|
420,742 |
|
|
|
|
| Lionbridge Technologies, Inc.* |
|
|
8,527 |
|
|
|
47,325 |
|
|
|
|
| MAXIMUS, Inc. |
|
|
14,950 |
|
|
|
956,949 |
|
|
|
|
| MoneyGram International, Inc.* |
|
|
6,000 |
|
|
|
46,500 |
|
|
|
|
| TeleTech Holdings, Inc.* |
|
|
3,706 |
|
|
|
96,134 |
|
|
|
|
| WEX, Inc.* |
|
|
1,211 |
|
|
|
136,492 |
|
|
|
|
|
|
|
|
|
|
|
|
|
|
|
|
|
|
|
$ |
2,843,253 |
|
|
| SEMICONDUCTORS & SEMICONDUCTOR EQUIPMENT – 3.4% |
|
|
|
|
| Ambarella, Inc.#,* |
|
|
5,179 |
|
|
|
378,844 |
|
|
|
|
| Cypress Semiconductor Corp. |
|
|
18,182 |
|
|
|
242,184 |
|
|
|
|
| Integrated Device Technology, Inc.* |
|
|
5,901 |
|
|
|
107,339 |
|
|
|
|
| Microsemi Corp.* |
|
|
7,516 |
|
|
|
250,734 |
|
|
|
|
| Qorvo, Inc.* |
|
|
14,305 |
|
|
|
942,843 |
|
|
|
|
|
|
|
|
|
|
|
|
|
|
|
|
|
|
|
$ |
1,921,944 |
|
|
|
|
| SOFTWARE – 7.9% |
|
|
|
|
|
|
|
|
|
|
|
| ACI Worldwide, Inc.* |
|
|
5,576 |
|
|
|
128,415 |
|
|
|
|
| American Software, Inc. |
|
|
4,980 |
|
|
|
48,356 |
|
|
|
|
| ANSYS, Inc.* |
|
|
1,943 |
|
|
|
166,787 |
|
|
|
|
| Aspen Technology, Inc.* |
|
|
11,905 |
|
|
|
528,463 |
|
|
|
|
| Blackbaud, Inc. |
|
|
4,134 |
|
|
|
208,891 |
|
|
|
|
| Ebix, Inc.# |
|
|
1,068 |
|
|
|
29,146 |
|
|
|
|
| Ellie Mae, Inc.* |
|
|
11,060 |
|
|
|
608,300 |
|
|
|
|
| Fair Isaac Corp. |
|
|
1,521 |
|
|
|
134,548 |
|
|
|
|
| Manhattan Associates, Inc.* |
|
|
21,878 |
|
|
|
1,149,908 |
|
|
|
|
| Mentor Graphics Corp. |
|
|
7,687 |
|
|
|
183,950 |
|
|
|
|
| PTC, Inc.* |
|
|
4,690 |
|
|
|
179,815 |
|
|
|
|
| Qlik Technologies, Inc.* |
|
|
1,360 |
|
|
|
47,314 |
|
|
|
|
| Symantec Corp. |
|
|
10,068 |
|
|
|
250,945 |
|
April 30,
2015 / ANNUAL REPORT
PORTFOLIOS OF
INVESTMENTS 39
Wilmington Small-Cap Growth Fund (continued)
|
|
|
|
|
|
|
|
|
|
|
|
| Description
|
|
Number of
Shares
|
|
|
Value
|
|
|
|
|
| Take-Two Interactive Software, Inc.* |
|
|
6,065 |
|
|
$ |
143,740 |
|
|
|
|
| Tyler Technologies, Inc.* |
|
|
2,010 |
|
|
|
245,120 |
|
|
|
|
| Ultimate Software Group, Inc.* |
|
|
2,225 |
|
|
|
369,840 |
|
|
|
|
|
|
|
|
|
|
|
|
|
|
|
|
|
|
|
$ |
4,423,538 |
|
|
|
|
|
|
|
|
|
|
|
|
|
| TOTAL INFORMATION TECHNOLOGY |
|
|
|
|
|
$ |
11,825,471 |
|
|
|
|
| MATERIALS – 2.6% |
|
|
|
|
|
|
|
|
|
|
|
| CHEMICALS – 0.9% |
|
|
|
|
|
|
|
|
|
|
|
| American Vanguard Corp. |
|
|
2,175 |
|
|
|
23,729 |
|
|
|
|
| Chase Corp. |
|
|
1,418 |
|
|
|
50,779 |
|
|
|
|
| Flotek Industries, Inc.* |
|
|
2,546 |
|
|
|
36,382 |
|
|
|
|
| Hawkins, Inc. |
|
|
983 |
|
|
|
38,779 |
|
|
|
|
| Quaker Chemical Corp. |
|
|
4,482 |
|
|
|
372,992 |
|
|
|
|
|
|
|
|
|
|
|
|
|
|
|
|
|
|
|
$ |
522,661 |
|
|
|
|
| CONSTRUCTION MATERIALS – 1.1% |
|
|
|
|
|
|
|
|
|
|
|
| Eagle Materials, Inc. |
|
|
6,054 |
|
|
|
504,843 |
|
|
|
|
| Headwaters, Inc.* |
|
|
6,000 |
|
|
|
105,480 |
|
|
|
|
|
|
|
|
|
|
|
|
|
|
|
|
|
|
|
$ |
610,323 |
|
|
|
|
| CONTAINERS & PACKAGING – 0.2% |
|
|
|
|
|
|
|
|
|
|
|
| Graphic Packaging Holding Co.* |
|
|
9,441 |
|
|
|
133,118 |
|
|
|
|
| METALS & MINING – 0.1% |
|
|
|
|
|
|
|
|
|
|
|
| Materion Corp. |
|
|
1,313 |
|
|
|
52,507 |
|
|
|
|
| PAPER & FOREST PRODUCTS – 0.3% |
|
|
|
|
|
|
|
|
|
|
|
| Neenah Paper, Inc. |
|
|
2,318 |
|
|
|
140,169 |
|
|
|
|
|
|
|
|
|
|
|
|
|
| TOTAL MATERIALS |
|
|
|
|
|
$ |
1,458,778 |
|
|
|
|
| TELECOMMUNICATION SERVICES – 0.3% |
|
|
|
|
|
|
|
|
|
|
| DIVERSIFIED TELECOMMUNICATION SERVICES – 0.3% |
|
|
|
|
|
|
|
|
| Atlantic Tele-Network, Inc. |
|
|
2,495 |
|
|
|
164,720 |
|
|
|
|
|
|
|
|
|
|
|
|
|
| TOTAL COMMON STOCKS (COST $34,369,836) |
|
|
|
|
|
$ |
55,217,075 |
|
|
| MONEY MARKET FUND – 1.4% |
|
|
|
|
| Dreyfus Cash Management Fund, |
|
|
|
|
|
|
|
|
| Institutional Shares, 0.04%^ |
|
|
783,127 |
|
|
|
783,127 |
|
|
|
|
|
|
|
|
|
|
|
|
| TOTAL MONEY MARKET FUND (COST
$783,127) |
|
|
$ |
783,127 |
|
|
| WARRANTS – 0.0%** |
|
|
|
|
| Education Management Corp., Expire
1/19/49 |
|
|
16,944 |
|
|
|
— |
|
|
|
|
| Tejon Ranch Co., Expire 8/31/16 |
|
|
1,341 |
|
|
|
789 |
|
|
|
|
|
|
|
|
|
|
|
|
| TOTAL WARRANTS (COST $8,046) |
|
|
$ |
789 |
|
|
|
| TOTAL INVESTMENTS IN SECURITIES – 100.1%
(COST $35,161,009) |
|
|
$ |
56,000,991 |
|
|
|
|
|
|
|
|
|
|
|
|
|
|
Description |
|
Par
Value |
|
|
Value |
|
| CASH COLLATERAL INVESTED FOR SECURITIES ON LOAN – 10.3% |
|
|
| REPURCHASE AGREEMENTS – 10.3% |
|
|
|
|
| BNP Paribas Securities Corp., 0.12%, dated 4/30/15, due 5/01/15, repurchase price $289,427, collateralized by U.S. Government & Treasury Securities 0.00% to
6.50%, maturing 5/01/16 to 4/20/45; total market value of $295,214. |
|
$ |
289,426 |
|
|
$ |
289,426 |
|
|
|
|
| Citigroup Global Markets, Inc., 0.13%, dated 4/30/15, due 5/01/15, repurchase price $1,099,875, collateralized by U.S. Government Securities 1.61% to 8.00%, maturing
6/01/17 to 6/15/52; total market value of $1,121,868. |
|
|
1,099,871 |
|
|
|
1,099,871 |
|
|
|
|
| Credit Suisse Securities (USA) LLC, 0.12%, dated 4/30/15, due 5/01/15, repurchase price $1,099,875, collateralized by U.S. Government Securities 3.00% to 4.50%,
maturing 8/01/38 to 4/01/45; total market value of $1,121,877. |
|
|
1,099,871 |
|
|
|
1,099,871 |
|
|
|
|
| Daiwa Capital Markets LLC, 0.16%, dated 4/30/15, due 5/01/15, repurchase price $1,099,876, collateralized by U.S. Government & Treasury Securities 0.00% to
9.25%, maturing 5/21/15 to 3/01/48; total market value of $1,121,869. |
|
|
1,099,871 |
|
|
|
1,099,871 |
|
|
|
|
| ING Financial Markets LLC, 0.12%, dated 4/30/15, due 5/01/15, repurchase price $1,099,875, collateralized by U.S. Government Securities 1.87% to 6.20%, maturing
5/01/33 to 11/01/44; total market value of $1,121,869. |
|
|
1,099,871 |
|
|
|
1,099,871 |
|
|
|
|
| Nomura Securities International, Inc., 0.13%, dated 4/30/15, due 5/01/15, repurchase price $1,099,875, collateralized by U.S. Government & Treasury Securities
0.00% to 10.50%, maturing 5/15/15 to 3/20/64; total market value of $1,121,868. |
|
|
1,099,871 |
|
|
|
1,099,871 |
|
|
|
|
|
|
|
|
|
|
|
| TOTAL CASH COLLATERAL INVESTED FOR SECURITIES ON
LOAN |
|
| (COST $5,788,781) |
|
|
$ |
5,788,781 |
|
|
|
|
|
|
|
|
|
|
|
|
| TOTAL INVESTMENTS – 110.4% (COST
$40,949,790) |
|
|
$ |
61,789,772 |
|
|
|
| COLLATERAL FOR SECURITIES ON LOAN – (10.3%) |
|
|
|
(5,788,781 |
) |
|
|
| OTHER LIABILITIES LESS ASSETS – (0.1%) |
|
|
|
(53,376 |
) |
|
|
|
|
|
|
|
|
|
|
|
| TOTAL NET ASSETS – 100.0% |
|
|
$ |
55,947,615 |
|
|
|
|
|
|
|
|
|
|
ANNUAL
REPORT / April 30, 2015
40
PORTFOLIOS OF INVESTMENTS
Wilmington Small-Cap Growth Fund (concluded)
Cost of investments for Federal income tax purposes is $41,097,423. The net unrealized
appreciation/(depreciation) of investments was $20,692,349. This consists of net unrealized appreciation from investment for those securities having an excess of value over cost of $22,151,077 and net unrealized depreciation from investments for
those securities having an excess of cost over value of $1,458,728.
Various inputs are used in determining the value of the
Fund’s investments. These inputs are summarized in the three broad levels listed below.
Level 1 – quoted prices in active
markets for identical securities
Level 2 – other significant observable inputs (including quoted prices for similar securities,
interest rates, prepayment speeds, credit risk, etc.)
Level 3 – significant unobservable inputs (including the Fund’s own
assumptions in determining the fair value of investments)
The following is a summary of the inputs used as of April 30, 2015 in
valuing the Fund’s assets carried at fair value:
|
|
|
|
|
|
|
|
|
|
|
|
|
|
|
|
|
|
|
|
|
|
| |
|
Level 1
|
|
|
Level 2
|
|
|
Level 3
|
|
|
Total
|
|
| Investments in Securities |
|
|
|
|
|
|
|
|
|
|
|
|
|
|
|
|
|
|
|
|
|
| Common Stocks |
|
$ |
55,209,904 |
|
|
$ |
7,171 |
|
|
$ |
— |
|
|
$ |
55,217,075 |
|
|
|
|
|
|
| Money Market Fund |
|
|
783,127 |
|
|
|
— |
|
|
|
— |
|
|
|
783,127 |
|
|
|
|
|
|
| Warrants |
|
|
789 |
|
|
|
— |
|
|
|
— |
|
|
|
789 |
|
|
|
|
|
|
| Repurchase Agreements |
|
|
— |
|
|
|
5,788,781 |
|
|
|
— |
|
|
|
5,788,781 |
|
|
|
|
|
|
|
|
|
|
|
|
|
|
|
|
|
|
|
|
|
|
|
| Total |
|
$ |
55,993,820 |
|
|
$ |
5,795,952 |
|
|
$ |
— |
|
|
$ |
61,789,772 |
|
|
|
|
|
|
|
|
|
|
|
|
|
|
|
|
|
|
| # |
Security, or a portion thereof, is on loan. See Note 2 in Notes to Financial Statements. |
| * |
Non-income producing security. |
| †† |
Security is fair valued in accordance with procedures adopted by the Board of Trustees. See Note 2 in Notes to Financial Statements. At April 30, 2015,
the value of these securities amounted to $7,171 representing 0.0%** of total net assets. |
| ** |
Represents less than 0.05%. |
The following acronyms are used throughout this Fund:
CVR - Contingent Value Right
LLC - Limited Liability Corporation
LP - Limited Partnership
PLC - Public Limited Company
See Notes which are an integral part of the Financial Statements
April 30,
2015 / ANNUAL REPORT
41
PORTFOLIO OF INVESTMENTS SUMMARY TABLE
Wilmington Small-Cap Strategy Fund
At April 30, 2015, the
Fund’s sector classifications were as follows (unaudited):
|
|
|
| |
|
Percentage of
Total Net Assets |
|
|
|
|
|
| Common Stocks |
|
|
|
|
|
|
|
| Information Technology |
|
20.9% |
|
|
|
|
|
| Financials |
|
18.4% |
|
|
|
|
|
| Health Care |
|
17.7% |
|
|
|
|
|
| Consumer Discretionary |
|
14.3% |
|
|
|
|
|
| Industrials |
|
13.8% |
|
|
|
|
|
| Materials |
|
4.5% |
|
|
|
|
|
| Energy |
|
3.6% |
|
|
|
|
|
| Consumer Staples |
|
3.2% |
|
|
|
|
|
| Utilities |
|
2.4% |
|
|
|
|
|
| Telecommunication Services |
|
0.7% |
|
|
|
|
|
| Investment Companies |
|
0.4% |
|
|
|
|
|
| Rights |
|
0.0%3 |
|
|
|
|
|
| Warrants |
|
0.0%3 |
|
|
|
|
|
| Cash Equivalents1 |
|
12.2% |
|
|
|
|
|
| Other Assets and Liabilities – Net2 |
|
(12.1)% |
|
|
|
|
|
|
|
|
|
|
| TOTAL |
|
100.0% |
|
|
|
|
|
|
|
| (1) |
Cash Equivalents include investments in repurchase agreements. |
| (2) |
Assets, other than investments in securities, less liabilities. See Statements of Assets and Liabilities. |
| (3) |
Represent less than 0.05%. |
PORTFOLIO OF
INVESTMENTS
April 30, 2015
|
|
|
|
|
|
|
|
|
|
|
|
| Description
|
|
Number of
Shares
|
|
|
Value
|
|
|
| COMMON STOCKS – 99.5% |
|
|
| CONSUMER DISCRETIONARY – 14.3% |
|
|
| AUTO COMPONENTS – 1.3% |
|
|
|
|
| American Axle & Manufacturing Holdings, Inc.* |
|
|
5,105 |
|
|
$ |
127,268 |
|
|
|
|
| Cooper Tire & Rubber Co. |
|
|
2,106 |
|
|
|
89,484 |
|
|
|
|
| Cooper-Standard Holding, Inc.* |
|
|
240 |
|
|
|
14,645 |
|
|
|
|
| Dana Holding Corp. |
|
|
8,230 |
|
|
|
177,521 |
|
|
|
|
| Dorman Products, Inc.# |
|
|
1,962 |
|
|
|
91,880 |
|
|
|
|
| Drew Industries, Inc. |
|
|
1,804 |
|
|
|
102,233 |
|
|
|
|
| Exide Technologies* |
|
|
5,202 |
|
|
|
31 |
|
|
|
|
| Federal-Mogul Holdings Corp.* |
|
|
1,495 |
|
|
|
19,285 |
|
|
|
|
| Fox Factory Holding Corp.* |
|
|
1,100 |
|
|
|
16,742 |
|
|
|
|
| Fuel Systems Solutions, Inc.* |
|
|
566 |
|
|
|
6,283 |
|
|
|
|
| Gentherm, Inc.* |
|
|
2,747 |
|
|
|
144,849 |
|
|
|
|
|
|
|
|
|
|
|
|
|
| Description
|
|
Number of
Shares
|
|
|
Value
|
|
|
|
|
| Modine Manufacturing Co.* |
|
|
2,335 |
|
|
$ |
28,697 |
|
|
|
|
| Motorcar Parts of America, Inc.* |
|
|
1,320 |
|
|
|
38,584 |
|
|
|
|
| Remy International, Inc. |
|
|
710 |
|
|
|
15,798 |
|
|
|
|
| Spartan Motors, Inc. |
|
|
2,409 |
|
|
|
11,346 |
|
|
|
|
| Standard Motor Products, Inc. |
|
|
820 |
|
|
|
30,996 |
|
|
|
|
| Stoneridge, Inc.* |
|
|
778 |
|
|
|
9,367 |
|
|
|
|
| Strattec Security Corp. |
|
|
250 |
|
|
|
18,768 |
|
|
|
|
| Superior Industries International, Inc. |
|
|
296 |
|
|
|
5,506 |
|
|
|
|
| Tenneco, Inc.* |
|
|
3,980 |
|
|
|
232,631 |
|
|
|
|
| Tower International, Inc.* |
|
|
1,010 |
|
|
|
26,119 |
|
|
|
|
|
|
|
|
|
|
|
|
|
|
|
|
|
|
|
$ |
1,208,033 |
|
|
| AUTOMOBILES – 0.0%** |
|
|
|
|
| Winnebago Industries, Inc.#,* |
|
|
1,825 |
|
|
|
37,796 |
|
|
| DISTRIBUTORS – 0.3% |
|
|
|
|
| Core-Mark Holding Co., Inc. |
|
|
966 |
|
|
|
50,918 |
|
ANNUAL
REPORT / April 30, 2015
42
PORTFOLIOS OF INVESTMENTS
Wilmington Small-Cap Strategy Fund (continued)
|
|
|
|
|
|
|
|
|
|
|
|
| Description
|
|
Number of
Shares
|
|
|
Value
|
|
|
|
|
| Pool Corp. |
|
|
3,175 |
|
|
$ |
206,026 |
|
|
|
|
| VOXX International Corp.* |
|
|
1,868 |
|
|
|
17,802 |
|
|
|
|
| Weyco Group, Inc. |
|
|
591 |
|
|
|
16,844 |
|
|
|
|
|
|
|
|
|
|
|
|
|
|
|
|
|
|
|
$ |
291,590 |
|
|
| DIVERSIFIED CONSUMER SERVICES – 1.1% |
|
|
|
|
| American Public Education, Inc.* |
|
|
1,115 |
|
|
|
31,097 |
|
|
|
|
| Ascent Capital Group, Inc.* |
|
|
170 |
|
|
|
6,807 |
|
|
|
|
| Bridgepoint Education, Inc.* |
|
|
722 |
|
|
|
6,332 |
|
|
|
|
| Bright Horizons Family Solutions, Inc.* |
|
|
730 |
|
|
|
36,704 |
|
|
|
|
| Capella Education Co. |
|
|
855 |
|
|
|
46,196 |
|
|
|
|
| Career Education Corp.* |
|
|
3,120 |
|
|
|
13,104 |
|
|
|
|
| Carriage Services, Inc. |
|
|
620 |
|
|
|
14,657 |
|
|
|
|
| Chegg, Inc.#,* |
|
|
3,940 |
|
|
|
29,274 |
|
|
|
|
| Education Management Corp.* |
|
|
650 |
|
|
|
154 |
|
|
|
|
| Grand Canyon Education, Inc.* |
|
|
3,384 |
|
|
|
153,228 |
|
|
|
|
| Hillenbrand, Inc. |
|
|
4,300 |
|
|
|
126,377 |
|
|
|
|
| Houghton Mifflin Harcourt Co.* |
|
|
3,270 |
|
|
|
74,752 |
|
|
|
|
| K12, Inc.* |
|
|
1,790 |
|
|
|
28,944 |
|
|
|
|
| Liberty Tax, Inc.* |
|
|
350 |
|
|
|
9,695 |
|
|
|
|
| LifeLock, Inc.* |
|
|
6,380 |
|
|
|
93,212 |
|
|
|
|
| Matthews International Corp. |
|
|
1,168 |
|
|
|
56,683 |
|
|
|
|
| Regis Corp. |
|
|
1,598 |
|
|
|
26,399 |
|
|
|
|
| Sotheby’s |
|
|
3,012 |
|
|
|
128,643 |
|
|
|
|
| Steiner Leisure Ltd.* |
|
|
295 |
|
|
|
14,231 |
|
|
|
|
| Strayer Education, Inc. |
|
|
820 |
|
|
|
41,590 |
|
|
|
|
| Universal Technical Institute, Inc. |
|
|
901 |
|
|
|
7,613 |
|
|
|
|
| Weight Watchers International, Inc.#,* |
|
|
2,230 |
|
|
|
19,067 |
|
|
|
|
|
|
|
|
|
|
|
|
|
|
|
|
|
|
|
$ |
964,759 |
|
|
| HOTELS, RESTAURANTS & LEISURE – 3.7% |
|
|
|
|
| Belmond Ltd., Class A* |
|
|
3,610 |
|
|
|
44,475 |
|
|
|
|
| Biglari Holdings, Inc.* |
|
|
45 |
|
|
|
16,448 |
|
|
|
|
| BJ’s Restaurants, Inc.* |
|
|
1,230 |
|
|
|
57,564 |
|
|
|
|
| Bloomin’ Brands, Inc.* |
|
|
5,320 |
|
|
|
120,551 |
|
|
|
|
| Bob Evans Farms, Inc. |
|
|
1,396 |
|
|
|
60,056 |
|
|
|
|
| Boyd Gaming Corp.* |
|
|
4,670 |
|
|
|
61,644 |
|
|
|
|
| Bravo Brio Restaurant Group, Inc.* |
|
|
1,030 |
|
|
|
15,172 |
|
|
|
|
| Buffalo Wild Wings, Inc.* |
|
|
1,252 |
|
|
|
199,444 |
|
|
|
|
| Caesars Entertainment Corp.#,* |
|
|
2,850 |
|
|
|
27,046 |
|
|
|
|
| Carrols Restaurant Group, Inc.* |
|
|
1,060 |
|
|
|
9,582 |
|
|
|
|
| Cheesecake Factory, Inc. (The) |
|
|
2,966 |
|
|
|
148,686 |
|
|
|
|
| Churchill Downs, Inc. |
|
|
772 |
|
|
|
91,999 |
|
|
|
|
| Chuy’s Holdings, Inc.* |
|
|
850 |
|
|
|
19,227 |
|
|
|
|
| ClubCorp Holdings, Inc. |
|
|
400 |
|
|
|
8,756 |
|
|
|
|
| Cracker Barrel Old Country Store, Inc. |
|
|
1,242 |
|
|
|
164,540 |
|
|
|
|
| Del Frisco’s Restaurant Group, Inc.* |
|
|
1,020 |
|
|
|
20,573 |
|
|
|
|
| Denny’s Corp.* |
|
|
6,460 |
|
|
|
67,249 |
|
|
|
|
|
|
|
|
|
|
|
|
|
| Description
|
|
Number of
Shares
|
|
|
Value
|
|
|
|
|
| Diamond Resorts International, Inc.* |
|
|
1,240 |
|
|
$ |
39,692 |
|
|
|
|
| DineEquity, Inc. |
|
|
892 |
|
|
|
86,016 |
|
|
|
|
| El Pollo Loco Holdings, Inc.#,* |
|
|
710 |
|
|
|
18,588 |
|
|
|
|
| Fiesta Restaurant Group, Inc.* |
|
|
2,020 |
|
|
|
102,111 |
|
|
|
|
| Ignite Restaurant Group, Inc.* |
|
|
1,370 |
|
|
|
4,822 |
|
|
|
|
| International Speedway Corp. |
|
|
860 |
|
|
|
31,270 |
|
|
|
|
| Interval Leisure Group, Inc. |
|
|
2,300 |
|
|
|
57,017 |
|
|
|
|
| Isle of Capri Casinos, Inc.* |
|
|
1,841 |
|
|
|
26,179 |
|
|
|
|
| Jack in the Box, Inc.* |
|
|
3,926 |
|
|
|
340,659 |
|
|
|
|
| Jamba, Inc.#,* |
|
|
208 |
|
|
|
3,278 |
|
|
|
|
| Krispy Kreme Doughnuts, Inc.* |
|
|
3,990 |
|
|
|
71,022 |
|
|
|
|
| La Quinta Holdings, Inc.* |
|
|
3,040 |
|
|
|
73,203 |
|
|
|
|
| Life Time Fitness, Inc.* |
|
|
1,747 |
|
|
|
124,910 |
|
|
|
|
| Marcus Corp. (The) |
|
|
597 |
|
|
|
11,564 |
|
|
|
|
| Marriott Vacations Worldwide Corp.* |
|
|
1,160 |
|
|
|
95,364 |
|
|
|
|
| Monarch Casino & Resort, Inc.* |
|
|
928 |
|
|
|
16,982 |
|
|
|
|
| Morgans Hotel Group Co.* |
|
|
943 |
|
|
|
6,460 |
|
|
|
|
| Nathan’s Famous, Inc.* |
|
|
250 |
|
|
|
10,285 |
|
|
|
|
| Noodles & Co.#,* |
|
|
400 |
|
|
|
8,008 |
|
|
|
|
| Papa John’s International, Inc. |
|
|
2,272 |
|
|
|
139,433 |
|
|
|
|
| Penn National Gaming, Inc.* |
|
|
3,200 |
|
|
|
51,456 |
|
|
|
|
| Pinnacle Entertainment, Inc.* |
|
|
3,707 |
|
|
|
136,269 |
|
|
|
|
| Popeyes Louisiana Kitchen, Inc.* |
|
|
1,775 |
|
|
|
98,832 |
|
|
|
|
| Red Robin Gourmet Burgers, Inc.* |
|
|
1,012 |
|
|
|
75,991 |
|
|
|
|
| Ruby Tuesday, Inc.* |
|
|
1,370 |
|
|
|
9,974 |
|
|
|
|
| Ruth’s Hospitality Group, Inc. |
|
|
1,880 |
|
|
|
27,354 |
|
|
|
|
| Scientific Games Corp.#,* |
|
|
3,550 |
|
|
|
44,979 |
|
|
|
|
| Sonic Corp.* |
|
|
3,605 |
|
|
|
103,283 |
|
|
|
|
| Speedway Motorsports, Inc. |
|
|
371 |
|
|
|
8,496 |
|
|
|
|
| Texas Roadhouse, Inc. |
|
|
5,065 |
|
|
|
170,184 |
|
|
|
|
| Vail Resorts, Inc. |
|
|
2,430 |
|
|
|
241,080 |
|
|
|
|
| Zoe’s Kitchen, Inc.#,* |
|
|
10 |
|
|
|
306 |
|
|
|
|
|
|
|
|
|
|
|
|
|
|
|
|
|
|
|
$ |
3,368,079 |
|
|
| HOUSEHOLD DURABLES – 1.1% |
|
|
|
|
| Beazer Homes USA, Inc.* |
|
|
1,538 |
|
|
|
26,930 |
|
|
|
|
| Cavco Industries, Inc.* |
|
|
775 |
|
|
|
50,817 |
|
|
|
|
| CSS Industries, Inc. |
|
|
98 |
|
|
|
2,777 |
|
|
|
|
| Ethan Allen Interiors, Inc. |
|
|
1,206 |
|
|
|
29,209 |
|
|
|
|
| Flexsteel Industries, Inc. |
|
|
400 |
|
|
|
14,404 |
|
|
|
|
| Helen of Troy Ltd.* |
|
|
1,583 |
|
|
|
138,687 |
|
|
|
|
| Hovnanian Enterprises, Inc.#,* |
|
|
6,473 |
|
|
|
20,196 |
|
|
|
|
| iRobot Corp.* |
|
|
2,030 |
|
|
|
65,813 |
|
|
|
|
| KB Home# |
|
|
3,910 |
|
|
|
56,656 |
|
|
|
|
| La-Z-Boy, Inc. |
|
|
2,986 |
|
|
|
78,263 |
|
|
|
|
| LGI Homes, Inc.#,* |
|
|
360 |
|
|
|
5,929 |
|
|
|
|
| Libbey, Inc.* |
|
|
1,430 |
|
|
|
56,270 |
|
|
|
|
| Lifetime Brands, Inc. |
|
|
660 |
|
|
|
9,603 |
|
April 30,
2015 / ANNUAL REPORT
PORTFOLIOS OF
INVESTMENTS 43
Wilmington Small-Cap Strategy Fund (continued)
|
|
|
|
|
|
|
|
|
|
|
|
| Description
|
|
Number of
Shares
|
|
|
Value
|
|
|
|
|
| M/I Homes, Inc.* |
|
|
494 |
|
|
$ |
11,145 |
|
|
|
|
| MDC Holdings, Inc.# |
|
|
1,630 |
|
|
|
43,749 |
|
|
|
|
| Meritage Homes Corp.* |
|
|
1,212 |
|
|
|
51,837 |
|
|
|
|
| NACCO Industries, Inc. |
|
|
146 |
|
|
|
7,151 |
|
|
|
|
| Ryland Group, Inc. (The) |
|
|
1,931 |
|
|
|
79,596 |
|
|
|
|
| Skullcandy, Inc.* |
|
|
760 |
|
|
|
8,216 |
|
|
|
|
| Standard Pacific Corp.* |
|
|
5,050 |
|
|
|
40,905 |
|
|
|
|
| TRI Pointe Homes, Inc.* |
|
|
6,420 |
|
|
|
91,678 |
|
|
|
|
| UCP, Inc.* |
|
|
1,310 |
|
|
|
11,345 |
|
|
|
|
| Universal Electronics, Inc.* |
|
|
788 |
|
|
|
42,505 |
|
|
|
|
| WCI Communities, Inc.* |
|
|
1,000 |
|
|
|
23,250 |
|
|
|
|
| William Lyon Homes* |
|
|
400 |
|
|
|
8,660 |
|
|
|
|
|
|
|
|
|
|
|
|
|
|
|
|
|
|
|
$ |
975,591 |
|
|
| INTERNET & CATALOG RETAIL – 0.5% |
|
|
|
|
| 1-800-Flowers.com, Inc.* |
|
|
572 |
|
|
|
6,046 |
|
|
|
|
| Blue Nile, Inc.* |
|
|
1,102 |
|
|
|
29,985 |
|
|
|
|
| EVINE Live, Inc.* |
|
|
2,440 |
|
|
|
14,542 |
|
|
|
|
| FTD Cos, Inc.* |
|
|
866 |
|
|
|
24,716 |
|
|
|
|
| HSN, Inc. |
|
|
2,280 |
|
|
|
142,318 |
|
|
|
|
| Lands’ End, Inc.* |
|
|
910 |
|
|
|
26,736 |
|
|
|
|
| Nutrisystem, Inc. |
|
|
2,199 |
|
|
|
41,891 |
|
|
|
|
| Orbitz Worldwide, Inc.* |
|
|
2,819 |
|
|
|
33,039 |
|
|
|
|
| Overstock.com, Inc.#,* |
|
|
1,002 |
|
|
|
21,513 |
|
|
|
|
| PetMed Express, Inc. |
|
|
1,017 |
|
|
|
16,099 |
|
|
|
|
| Shutterfly, Inc.* |
|
|
1,252 |
|
|
|
56,040 |
|
|
|
|
|
|
|
|
|
|
|
|
|
|
|
|
|
|
|
$ |
412,925 |
|
|
| LEISURE EQUIPMENT & PRODUCTS – 0.6% |
|
|
|
|
| Arctic Cat, Inc. |
|
|
410 |
|
|
|
14,551 |
|
|
|
|
| Black Diamond, Inc.* |
|
|
930 |
|
|
|
8,379 |
|
|
|
|
| Brunswick Corp. |
|
|
4,961 |
|
|
|
248,248 |
|
|
|
|
| Callaway Golf Co. |
|
|
1,961 |
|
|
|
18,982 |
|
|
|
|
| JAKKS Pacific, Inc.# |
|
|
1,440 |
|
|
|
9,605 |
|
|
|
|
| Johnson Outdoors, Inc. |
|
|
120 |
|
|
|
3,780 |
|
|
|
|
| LeapFrog Enterprises, Inc.* |
|
|
3,377 |
|
|
|
7,632 |
|
|
|
|
| Malibu Boats, Inc.* |
|
|
120 |
|
|
|
2,540 |
|
|
|
|
| Marine Products Corp. |
|
|
1,100 |
|
|
|
7,810 |
|
|
|
|
| Nautilus, Inc.* |
|
|
1,920 |
|
|
|
32,275 |
|
|
|
|
| Smith & Wesson Holding Corp.* |
|
|
4,087 |
|
|
|
60,753 |
|
|
|
|
| Sturm Ruger & Co., Inc.# |
|
|
1,680 |
|
|
|
92,081 |
|
|
|
|
|
|
|
|
|
|
|
|
|
|
|
|
|
|
|
$ |
506,636 |
|
|
| MEDIA – 1.2% |
|
|
|
|
| AH Belo Corp. Class A |
|
|
610 |
|
|
|
4,081 |
|
|
|
|
| Carmike Cinemas, Inc.* |
|
|
1,220 |
|
|
|
36,820 |
|
|
|
|
| Central European Media Enterprises Ltd.* |
|
|
4,000 |
|
|
|
11,000 |
|
|
|
|
| Crown Media Holdings, Inc.* |
|
|
110 |
|
|
|
412 |
|
|
|
|
| Cumulus Media, Inc.* |
|
|
4,780 |
|
|
|
10,898 |
|
|
|
|
|
|
|
|
|
|
|
|
|
| Description
|
|
Number of
Shares
|
|
|
Value
|
|
|
|
|
| Daily Journal Corp.* |
|
|
30 |
|
|
$ |
6,030 |
|
|
|
|
| Dex Media, Inc.#,* |
|
|
1,070 |
|
|
|
2,814 |
|
|
|
|
| Digital Domain Media Group, Inc.* |
|
|
1,470 |
|
|
|
7 |
|
|
|
|
| Entercom Communications Corp.* |
|
|
1,180 |
|
|
|
14,018 |
|
|
|
|
| Entravision Communications Corp. |
|
|
4,360 |
|
|
|
28,514 |
|
|
|
|
| Eros International PLC* |
|
|
30 |
|
|
|
531 |
|
|
|
|
| EW Scripps Co. (The)* |
|
|
2,635 |
|
|
|
61,369 |
|
|
|
|
| Global Eagle Entertainment, Inc.#,* |
|
|
2,000 |
|
|
|
25,540 |
|
|
|
|
| Global Sources Ltd.* |
|
|
526 |
|
|
|
2,914 |
|
|
|
|
| Gray Television, Inc.* |
|
|
3,970 |
|
|
|
52,642 |
|
|
|
|
| Harte-Hanks, Inc. |
|
|
3,256 |
|
|
|
22,108 |
|
|
|
|
| Hemisphere Media Group, Inc.#,* |
|
|
440 |
|
|
|
5,562 |
|
|
|
|
| Journal Media Group, Inc.* |
|
|
810 |
|
|
|
7,525 |
|
|
|
|
| Loral Space & Communications, Inc. |
|
|
1,001 |
|
|
|
69,069 |
|
|
|
|
| Martha Stewart Living Omnimedia, Inc.* |
|
|
1,683 |
|
|
|
9,257 |
|
|
|
|
| McClatchy Co. (The)* |
|
|
3,460 |
|
|
|
4,809 |
|
|
|
|
| MDC Partners, Inc. |
|
|
2,335 |
|
|
|
48,895 |
|
|
|
|
| Media General, Inc.* |
|
|
1,860 |
|
|
|
31,415 |
|
|
|
|
| Meredith Corp. |
|
|
1,310 |
|
|
|
68,172 |
|
|
|
|
| National CineMedia, Inc. |
|
|
2,512 |
|
|
|
38,283 |
|
|
|
|
| New York Times Co. (The) |
|
|
5,860 |
|
|
|
78,465 |
|
|
|
|
| Nexstar Broadcasting Group, Inc. |
|
|
1,980 |
|
|
|
115,751 |
|
|
|
|
| ReachLocal, Inc.* |
|
|
260 |
|
|
|
728 |
|
|
|
|
| Reading International, Inc.* |
|
|
850 |
|
|
|
11,322 |
|
|
|
|
| Rentrak Corp.#,* |
|
|
700 |
|
|
|
33,180 |
|
|
|
|
| Saga Communications, Inc. |
|
|
230 |
|
|
|
9,198 |
|
|
|
|
| Salem Media Group, Inc. |
|
|
1,270 |
|
|
|
6,198 |
|
|
|
|
| Scholastic Corp. |
|
|
736 |
|
|
|
29,911 |
|
|
|
|
| SFX Entertainment, Inc.#,* |
|
|
3,200 |
|
|
|
13,984 |
|
|
|
|
| Sinclair Broadcast Group, Inc. |
|
|
4,248 |
|
|
|
130,159 |
|
|
|
|
| Sizmek, Inc.* |
|
|
687 |
|
|
|
4,782 |
|
|
|
|
| Time, Inc.* |
|
|
2,910 |
|
|
|
66,435 |
|
|
|
|
| World Wrestling Entertainment, Inc.# |
|
|
1,857 |
|
|
|
24,921 |
|
|
|
|
|
|
|
|
|
|
|
|
|
|
|
|
|
|
|
$ |
1,087,719 |
|
|
| MULTILINE RETAIL – 0.1% |
|
|
|
|
| Bon-Ton Stores, Inc. (The)# |
|
|
990 |
|
|
|
7,098 |
|
|
|
|
| Burlington Stores, Inc.* |
|
|
870 |
|
|
|
44,866 |
|
|
|
|
| Fred’s, Inc. |
|
|
2,032 |
|
|
|
34,280 |
|
|
|
|
| Tuesday Morning Corp.* |
|
|
2,990 |
|
|
|
47,302 |
|
|
|
|
|
|
|
|
|
|
|
|
|
|
|
|
|
|
|
$ |
133,546 |
|
|
| SPECIALTY RETAIL – 3.2% |
|
|
|
|
| American Eagle Outfitters, Inc. |
|
|
7,630 |
|
|
|
121,393 |
|
|
|
|
| America’s Car-Mart, Inc.* |
|
|
440 |
|
|
|
22,590 |
|
|
|
|
| ANN, Inc.* |
|
|
3,100 |
|
|
|
117,366 |
|
|
|
|
| Asbury Automotive Group, Inc.* |
|
|
2,124 |
|
|
|
178,480 |
|
|
|
|
| Barnes & Noble, Inc.* |
|
|
1,410 |
|
|
|
30,879 |
|
ANNUAL
REPORT / April 30, 2015
44
PORTFOLIOS OF INVESTMENTS
Wilmington Small-Cap Strategy Fund (continued)
|
|
|
|
|
|
|
|
|
|
|
|
| Description
|
|
Number of
Shares
|
|
|
Value
|
|
|
|
|
| bebe stores, Inc. |
|
|
2,446 |
|
|
$ |
8,096 |
|
|
|
|
| Big 5 Sporting Goods Corp. |
|
|
122 |
|
|
|
1,664 |
|
|
|
|
| Brown Shoe Co., Inc. |
|
|
2,475 |
|
|
|
73,507 |
|
|
|
|
| Buckle, Inc. (The)# |
|
|
1,615 |
|
|
|
72,352 |
|
|
|
|
| Build-A-Bear Workshop, Inc.* |
|
|
200 |
|
|
|
3,686 |
|
|
|
|
| Cato Corp. (The) |
|
|
1,503 |
|
|
|
59,128 |
|
|
|
|
| Children’s Place, Inc. (The) |
|
|
898 |
|
|
|
54,473 |
|
|
|
|
| Christopher & Banks Corp.* |
|
|
2,560 |
|
|
|
15,206 |
|
|
|
|
| Citi Trends, Inc.* |
|
|
746 |
|
|
|
16,994 |
|
|
|
|
| Conn’s, Inc.#,* |
|
|
1,946 |
|
|
|
54,430 |
|
|
|
|
| Container Store Group, Inc. (The)#,* |
|
|
1,060 |
|
|
|
19,356 |
|
|
|
|
| Destination Maternity Corp. |
|
|
830 |
|
|
|
9,786 |
|
|
|
|
| Destination XL Group, Inc.* |
|
|
2,440 |
|
|
|
11,883 |
|
|
|
|
| Express, Inc.* |
|
|
3,980 |
|
|
|
64,874 |
|
|
|
|
| Finish Line, Inc. (The) Class A |
|
|
1,614 |
|
|
|
39,591 |
|
|
|
|
| Five Below, Inc.* |
|
|
3,830 |
|
|
|
129,148 |
|
|
|
|
| Genesco, Inc.* |
|
|
1,021 |
|
|
|
69,009 |
|
|
|
|
| Group 1 Automotive, Inc. |
|
|
884 |
|
|
|
69,818 |
|
|
|
|
| Guess?, Inc. |
|
|
2,990 |
|
|
|
54,747 |
|
|
|
|
| Haverty Furniture Cos., Inc. |
|
|
347 |
|
|
|
7,447 |
|
|
|
|
| hhgregg, Inc.* |
|
|
75 |
|
|
|
429 |
|
|
|
|
| Hibbett Sports, Inc.* |
|
|
1,794 |
|
|
|
83,959 |
|
|
|
|
| Kirkland’s, Inc.* |
|
|
1,220 |
|
|
|
28,963 |
|
|
|
|
| Lithia Motors, Inc. |
|
|
1,670 |
|
|
|
166,549 |
|
|
|
|
| Lumber Liquidators Holdings, Inc.#,* |
|
|
1,111 |
|
|
|
30,541 |
|
|
|
|
| MarineMax, Inc.* |
|
|
860 |
|
|
|
18,989 |
|
|
|
|
| Mattress Firm Holding Corp.#,* |
|
|
1,030 |
|
|
|
60,852 |
|
|
|
|
| Men’s Wearhouse, Inc. (The) |
|
|
2,609 |
|
|
|
147,643 |
|
|
|
|
| Monro Muffler Brake, Inc. |
|
|
2,352 |
|
|
|
140,861 |
|
|
|
|
| New York & Co., Inc.* |
|
|
2,080 |
|
|
|
5,262 |
|
|
|
|
| Office Depot, Inc.* |
|
|
19,929 |
|
|
|
183,745 |
|
|
|
|
| Outerwall, Inc.#,* |
|
|
1,428 |
|
|
|
94,862 |
|
|
|
|
| Pacific Sunwear of California, Inc.* |
|
|
5,780 |
|
|
|
12,138 |
|
|
|
|
| Pep Boys-Manny Moe & Jack (The)* |
|
|
2,353 |
|
|
|
21,553 |
|
|
|
|
| Pier 1 Imports, Inc.# |
|
|
2,110 |
|
|
|
26,692 |
|
|
|
|
| Rent-A-Center, Inc. |
|
|
1,714 |
|
|
|
50,734 |
|
|
|
|
| Restoration Hardware Holdings, Inc.* |
|
|
2,060 |
|
|
|
177,510 |
|
|
|
|
| Sears Hometown & Outlet Stores, Inc.* |
|
|
370 |
|
|
|
2,564 |
|
|
|
|
| Select Comfort Corp.* |
|
|
3,660 |
|
|
|
112,801 |
|
|
|
|
| Shoe Carnival, Inc. |
|
|
243 |
|
|
|
6,345 |
|
|
|
|
| Sonic Automotive, Inc. |
|
|
1,548 |
|
|
|
36,146 |
|
|
|
|
| Stage Stores, Inc. |
|
|
988 |
|
|
|
19,078 |
|
|
|
|
| Stein Mart, Inc. |
|
|
460 |
|
|
|
5,442 |
|
|
|
|
| Systemax, Inc. |
|
|
272 |
|
|
|
2,842 |
|
|
|
|
| Tile Shop Holdings, Inc.#,* |
|
|
1,340 |
|
|
|
17,380 |
|
|
|
|
| Tilly’s, Inc.* |
|
|
710 |
|
|
|
9,471 |
|
|
|
|
| Vitamin Shoppe, Inc.* |
|
|
1,790 |
|
|
|
74,965 |
|
|
|
|
| West Marine, Inc.* |
|
|
1,550 |
|
|
|
15,578 |
|
|
|
|
|
|
|
|
|
|
|
|
|
| Description
|
|
Number of
Shares
|
|
|
Value
|
|
|
|
|
| Winmark Corp. |
|
|
230 |
|
|
$ |
20,702 |
|
|
|
|
| Zumiez, Inc.* |
|
|
1,513 |
|
|
|
47,977 |
|
|
|
|
|
|
|
|
|
|
|
|
|
|
|
|
|
|
|
$ |
2,928,476 |
|
|
| TEXTILES, APPAREL & LUXURY GOODS – 1.2% |
|
|
|
|
| Columbia Sportswear Co. |
|
|
936 |
|
|
|
58,687 |
|
|
|
|
| Crocs, Inc.* |
|
|
2,360 |
|
|
|
31,152 |
|
|
|
|
| Culp, Inc. |
|
|
640 |
|
|
|
16,544 |
|
|
|
|
| G-III Apparel Group Ltd.* |
|
|
1,177 |
|
|
|
130,859 |
|
|
|
|
| Iconix Brand Group, Inc.* |
|
|
1,635 |
|
|
|
43,017 |
|
|
|
|
| Kate Spade & Co.#,* |
|
|
181 |
|
|
|
5,919 |
|
|
|
|
| Movado Group, Inc. |
|
|
285 |
|
|
|
8,345 |
|
|
|
|
| Oxford Industries, Inc. |
|
|
950 |
|
|
|
75,478 |
|
|
|
|
| Perry Ellis International, Inc. |
|
|
577 |
|
|
|
13,802 |
|
|
|
|
| Quiksilver, Inc.* |
|
|
1,970 |
|
|
|
3,270 |
|
|
|
|
| Sequential Brands Group, Inc.#,* |
|
|
160 |
|
|
|
1,984 |
|
|
|
|
| Skechers U.S.A., Inc.* |
|
|
2,403 |
|
|
|
216,078 |
|
|
|
|
| Steven Madden Ltd.* |
|
|
3,619 |
|
|
|
141,213 |
|
|
|
|
| Tumi Holdings, Inc.* |
|
|
3,450 |
|
|
|
80,696 |
|
|
|
|
| Unifi, Inc.* |
|
|
746 |
|
|
|
26,326 |
|
|
|
|
| Vera Bradley, Inc.#,* |
|
|
1,330 |
|
|
|
18,939 |
|
|
|
|
| Vince Holding Corp.* |
|
|
290 |
|
|
|
5,345 |
|
|
|
|
| Wolverine World Wide, Inc. |
|
|
6,592 |
|
|
|
202,572 |
|
|
|
|
|
|
|
|
|
|
|
|
|
|
|
|
|
|
|
$ |
1,080,226 |
|
|
|
|
|
|
|
|
|
|
|
|
| TOTAL CONSUMER DISCRETIONARY |
|
|
$ |
12,995,376 |
|
|
| CONSUMER STAPLES – 3.2% |
|
|
| BEVERAGES – 0.2% |
|
|
|
|
| Boston Beer Co., Inc. (The)* |
|
|
595 |
|
|
|
147,441 |
|
|
|
|
| Coca-Cola Bottling Co. Consolidated |
|
|
261 |
|
|
|
29,493 |
|
|
|
|
| Craft Brew Alliance, Inc.* |
|
|
1,300 |
|
|
|
17,095 |
|
|
|
|
| National Beverage Corp.* |
|
|
1,440 |
|
|
|
32,184 |
|
|
|
|
|
|
|
|
|
|
|
|
|
|
|
|
|
|
|
$ |
226,213 |
|
|
| FOOD & STAPLES RETAILING – 1.1% |
|
|
|
|
| Andersons, Inc. (The) |
|
|
1,792 |
|
|
|
76,500 |
|
|
|
|
| Casey’s General Stores, Inc. |
|
|
2,706 |
|
|
|
222,379 |
|
|
|
|
| Chefs’ Warehouse, Inc. (The)* |
|
|
1,570 |
|
|
|
28,590 |
|
|
|
|
| Fairway Group Holdings Corp.#,* |
|
|
940 |
|
|
|
4,991 |
|
|
|
|
| Fresh Market, Inc. (The)* |
|
|
3,230 |
|
|
|
113,502 |
|
|
|
|
| Ingles Markets, Inc. |
|
|
490 |
|
|
|
20,511 |
|
|
|
|
| Natural Grocers by Vitamin Cottage, Inc.* |
|
|
830 |
|
|
|
21,846 |
|
|
|
|
| PriceSmart, Inc. |
|
|
1,236 |
|
|
|
99,449 |
|
|
|
|
| Roundy’s, Inc. |
|
|
2,010 |
|
|
|
10,130 |
|
|
|
|
| SpartanNash Co. |
|
|
1,604 |
|
|
|
48,393 |
|
|
|
|
| SUPERVALU, Inc.* |
|
|
7,860 |
|
|
|
69,089 |
|
|
|
|
| United Natural Foods, Inc.* |
|
|
3,457 |
|
|
|
233,209 |
|
|
|
|
| Village Super Market, Inc. |
|
|
650 |
|
|
|
20,755 |
|
April 30,
2015 / ANNUAL REPORT
PORTFOLIOS OF
INVESTMENTS 45
Wilmington Small-Cap Strategy Fund (continued)
|
|
|
|
|
|
|
|
|
|
|
|
| Description
|
|
Number of
Shares
|
|
|
Value
|
|
|
|
|
| Weis Markets, Inc. |
|
|
480 |
|
|
$ |
21,288 |
|
|
|
|
|
|
|
|
|
|
|
|
|
|
|
|
|
|
|
$ |
990,632 |
|
|
| FOOD PRODUCTS – 1.4% |
|
|
|
|
| Alico, Inc. |
|
|
260 |
|
|
|
12,160 |
|
|
|
|
| B&G Foods, Inc. |
|
|
2,226 |
|
|
|
67,670 |
|
|
|
|
| Boulder Brands, Inc.* |
|
|
4,049 |
|
|
|
38,627 |
|
|
|
|
| Calavo Growers, Inc. |
|
|
927 |
|
|
|
46,953 |
|
|
|
|
| Cal-Maine Foods, Inc.# |
|
|
2,304 |
|
|
|
103,012 |
|
|
|
|
| Darling International, Inc.* |
|
|
6,547 |
|
|
|
89,432 |
|
|
|
|
| Dean Foods Co. |
|
|
3,570 |
|
|
|
58,012 |
|
|
|
|
| Diamond Foods, Inc.* |
|
|
1,285 |
|
|
|
36,031 |
|
|
|
|
| Farmer Bros Co.* |
|
|
388 |
|
|
|
9,673 |
|
|
|
|
| Fresh Del Monte Produce, Inc. |
|
|
1,649 |
|
|
|
60,898 |
|
|
|
|
| Hain Celestial Group, Inc. (The)* |
|
|
44 |
|
|
|
2,651 |
|
|
|
|
| Inventure Foods, Inc.* |
|
|
1,690 |
|
|
|
16,477 |
|
|
|
|
| J&J Snack Foods Corp. |
|
|
1,114 |
|
|
|
116,224 |
|
|
|
|
| John B Sanfilippo & Son, Inc. |
|
|
480 |
|
|
|
24,965 |
|
|
|
|
| Lancaster Colony Corp. |
|
|
1,012 |
|
|
|
90,736 |
|
|
|
|
| Landec Corp.* |
|
|
857 |
|
|
|
12,178 |
|
|
|
|
| Lifeway Foods, Inc. |
|
|
720 |
|
|
|
14,551 |
|
|
|
|
| Limoneira Co.# |
|
|
120 |
|
|
|
2,753 |
|
|
|
|
| Omega Protein Corp.* |
|
|
450 |
|
|
|
5,751 |
|
|
|
|
| Pilgrim’s Pride Corp.#,* |
|
|
50 |
|
|
|
1,235 |
|
|
|
|
| Post Holdings, Inc.* |
|
|
1,670 |
|
|
|
78,390 |
|
|
|
|
| Sanderson Farms, Inc.# |
|
|
1,511 |
|
|
|
113,506 |
|
|
|
|
| Seaboard Corp. |
|
|
7 |
|
|
|
25,200 |
|
|
|
|
| Seneca Foods Corp.* |
|
|
420 |
|
|
|
12,104 |
|
|
|
|
| Snyders-Lance, Inc. |
|
|
1,121 |
|
|
|
33,103 |
|
|
|
|
| Tootsie Roll Industries, Inc.# |
|
|
90 |
|
|
|
2,788 |
|
|
|
|
| TreeHouse Foods, Inc.* |
|
|
2,182 |
|
|
|
177,309 |
|
|
|
|
|
|
|
|
|
|
|
|
|
|
|
|
|
|
|
$ |
1,252,389 |
|
|
| HOUSEHOLD PRODUCTS – 0.2% |
|
|
|
|
| Central Garden & Pet Co.* |
|
|
2,894 |
|
|
|
28,361 |
|
|
|
|
| HRG Group, Inc.* |
|
|
4,430 |
|
|
|
55,508 |
|
|
|
|
| Oil-Dri Corp. of America |
|
|
160 |
|
|
|
5,251 |
|
|
|
|
| Orchids Paper Products Co. |
|
|
480 |
|
|
|
10,315 |
|
|
|
|
| Spectrum Brands Holdings, Inc. |
|
|
10 |
|
|
|
914 |
|
|
|
|
| WD-40 Co. |
|
|
1,174 |
|
|
|
95,047 |
|
|
|
|
|
|
|
|
|
|
|
|
|
|
|
|
|
|
|
$ |
195,396 |
|
|
| PERSONAL PRODUCTS – 0.2% |
|
|
|
|
| Elizabeth Arden, Inc.#,* |
|
|
417 |
|
|
|
5,867 |
|
|
|
|
| Female Health Co. (The)# |
|
|
3,250 |
|
|
|
9,490 |
|
|
|
|
| Inter Parfums, Inc. |
|
|
658 |
|
|
|
19,858 |
|
|
|
|
| Medifast, Inc.* |
|
|
1,080 |
|
|
|
32,400 |
|
|
|
|
| Nature’s Sunshine Products, Inc. |
|
|
500 |
|
|
|
6,505 |
|
|
|
|
| Nutraceutical International Corp. |
|
|
460 |
|
|
|
8,970 |
|
|
|
|
| Revlon, Inc.* |
|
|
640 |
|
|
|
25,030 |
|
|
|
|
|
|
|
|
|
|
|
|
|
| Description
|
|
Number of
Shares
|
|
|
Value
|
|
|
|
|
| Synutra International, Inc.* |
|
|
869 |
|
|
$ |
6,309 |
|
|
|
|
| USANA Health Sciences, Inc.* |
|
|
435 |
|
|
|
49,477 |
|
|
|
|
|
|
|
|
|
|
|
|
|
|
|
|
|
|
|
$ |
163,906 |
|
|
| TOBACCO – 0.1% |
|
|
|
|
| 22nd Century Group, Inc.* |
|
|
4,610 |
|
|
|
4,656 |
|
|
|
|
| Alliance One International, Inc.* |
|
|
12,570 |
|
|
|
16,592 |
|
|
|
|
| Universal Corp. |
|
|
42 |
|
|
|
1,975 |
|
|
|
|
| Vector Group Ltd. |
|
|
3,647 |
|
|
|
80,781 |
|
|
|
|
|
|
|
|
|
|
|
|
|
|
|
|
|
|
|
$ |
104,004 |
|
|
|
|
|
|
|
|
|
|
|
|
| TOTAL CONSUMER STAPLES |
|
|
$ |
2,932,540 |
|
|
| ENERGY – 3.6% |
|
|
| ENERGY EQUIPMENT & SERVICES – 1.1% |
|
|
|
|
| Basic Energy Services, Inc.* |
|
|
2,972 |
|
|
|
30,285 |
|
|
|
|
| Bristow Group, Inc. |
|
|
1,231 |
|
|
|
76,482 |
|
|
|
|
| C&J Energy Services Ltd.* |
|
|
2,980 |
|
|
|
52,001 |
|
|
|
|
| CARBO Ceramics, Inc.# |
|
|
1,110 |
|
|
|
49,095 |
|
|
|
|
| CHC Group Ltd.* |
|
|
3,230 |
|
|
|
3,844 |
|
|
|
|
| Dawson Geophysical Co.* |
|
|
1,360 |
|
|
|
7,738 |
|
|
|
|
| Era Group, Inc.* |
|
|
660 |
|
|
|
14,639 |
|
|
|
|
| Exterran Holdings, Inc. |
|
|
2,430 |
|
|
|
90,080 |
|
|
|
|
| Forum Energy Technologies, Inc.#,* |
|
|
2,950 |
|
|
|
68,617 |
|
|
|
|
| Geospace Technologies Corp.* |
|
|
242 |
|
|
|
5,227 |
|
|
|
|
| Global Geophysical Services, Inc.* |
|
|
490 |
|
|
|
— |
|
|
|
|
| Gulf Island Fabrication, Inc. |
|
|
1,223 |
|
|
|
16,131 |
|
|
|
|
| Gulfmark Offshore, Inc.# |
|
|
791 |
|
|
|
11,873 |
|
|
|
|
| Helix Energy Solutions Group, Inc.* |
|
|
3,570 |
|
|
|
58,834 |
|
|
|
|
| Hercules Offshore, Inc.#,* |
|
|
1,430 |
|
|
|
1,151 |
|
|
|
|
| Hornbeck Offshore Services, Inc.* |
|
|
1,108 |
|
|
|
25,318 |
|
|
|
|
| ION Geophysical Corp.* |
|
|
1,287 |
|
|
|
2,934 |
|
|
|
|
| Key Energy Services, Inc.* |
|
|
6,600 |
|
|
|
16,104 |
|
|
|
|
| Matrix Service Co.* |
|
|
1,463 |
|
|
|
32,142 |
|
|
|
|
| McDermott International, Inc.#,* |
|
|
13,100 |
|
|
|
68,775 |
|
|
|
|
| Mitcham Industries, Inc.* |
|
|
1,210 |
|
|
|
5,929 |
|
|
|
|
| Natural Gas Services Group, Inc.* |
|
|
704 |
|
|
|
17,846 |
|
|
|
|
| Newpark Resources, Inc.* |
|
|
352 |
|
|
|
3,612 |
|
|
|
|
| North Atlantic Drilling Ltd. |
|
|
4,560 |
|
|
|
7,022 |
|
|
|
|
| Nuverra Environmental Solutions, Inc.#,* |
|
|
2,080 |
|
|
|
8,445 |
|
|
|
|
| Parker Drilling Co.* |
|
|
5,634 |
|
|
|
21,128 |
|
|
|
|
| PHI, Inc.* |
|
|
435 |
|
|
|
13,629 |
|
|
|
|
| Pioneer Energy Services Corp.* |
|
|
5,198 |
|
|
|
38,725 |
|
|
|
|
| RigNet, Inc.* |
|
|
980 |
|
|
|
36,711 |
|
|
|
|
| SEACOR Holdings, Inc. |
|
|
680 |
|
|
|
49,409 |
|
|
|
|
| Tesco Corp.* |
|
|
830 |
|
|
|
10,674 |
|
|
|
|
| TETRA Technologies, Inc.* |
|
|
3,620 |
|
|
|
26,136 |
|
|
|
|
| US Silica Holdings, Inc.# |
|
|
3,710 |
|
|
|
138,569 |
|
ANNUAL
REPORT / April 30, 2015
46
PORTFOLIOS OF INVESTMENTS
Wilmington Small-Cap Strategy Fund (continued)
|
|
|
|
|
|
|
|
|
|
|
|
| Description
|
|
Number of
Shares
|
|
|
Value
|
|
|
|
|
| Vantage Drilling Co.* |
|
|
7,760 |
|
|
$ |
3,092 |
|
|
|
|
| Willbros Group, Inc.* |
|
|
4,318 |
|
|
|
10,795 |
|
|
|
|
|
|
|
|
|
|
|
|
|
|
|
|
|
|
|
$ |
1,022,992 |
|
|
| OIL, GAS & CONSUMABLE FUELS – 2.5% |
|
|
|
|
| Abraxas Petroleum Corp.* |
|
|
2,070 |
|
|
|
7,866 |
|
|
|
|
| Adams Resources & Energy, Inc. |
|
|
90 |
|
|
|
4,194 |
|
|
|
|
| Alon USA Energy, Inc. |
|
|
804 |
|
|
|
12,936 |
|
|
|
|
| Alpha Natural Resources, Inc.#,* |
|
|
11,950 |
|
|
|
9,679 |
|
|
|
|
| American Eagle Energy Corp.* |
|
|
4,440 |
|
|
|
755 |
|
|
|
|
| Amyris, Inc.* |
|
|
990 |
|
|
|
2,237 |
|
|
|
|
| Approach Resources, Inc.#,* |
|
|
1,750 |
|
|
|
15,347 |
|
|
|
|
| Arch Coal, Inc. |
|
|
10,300 |
|
|
|
10,034 |
|
|
|
|
| ATP Oil & Gas Corp.* |
|
|
2,852 |
|
|
|
— |
|
|
|
|
| Bill Barrett Corp.* |
|
|
915 |
|
|
|
10,614 |
|
|
|
|
| Bonanza Creek Energy, Inc.* |
|
|
810 |
|
|
|
22,324 |
|
|
|
|
| BPZ Resources, Inc.* |
|
|
12,543 |
|
|
|
439 |
|
|
|
|
| Callon Petroleum Co.* |
|
|
2,980 |
|
|
|
26,641 |
|
|
|
|
| Carrizo Oil & Gas, Inc.* |
|
|
3,056 |
|
|
|
170,311 |
|
|
|
|
| Clayton Williams Energy, Inc.* |
|
|
373 |
|
|
|
20,765 |
|
|
|
|
| Clean Energy Fuels Corp.#,* |
|
|
2,369 |
|
|
|
23,382 |
|
|
|
|
| Cloud Peak Energy, Inc.* |
|
|
1,480 |
|
|
|
9,605 |
|
|
|
|
| Comstock Resources, Inc.# |
|
|
310 |
|
|
|
1,665 |
|
|
|
|
| Contango Oil & Gas Co. |
|
|
708 |
|
|
|
17,750 |
|
|
|
|
| Delek US Holdings, Inc. |
|
|
2,812 |
|
|
|
103,819 |
|
|
|
|
| DHT Holdings, Inc.# |
|
|
2,450 |
|
|
|
19,600 |
|
|
|
|
| Diamondback Energy, Inc.* |
|
|
2,790 |
|
|
|
230,370 |
|
|
|
|
| Eclipse Resources Corp.#,* |
|
|
1,550 |
|
|
|
9,811 |
|
|
|
|
| Emerald Oil, Inc.* |
|
|
2,347 |
|
|
|
1,502 |
|
|
|
|
| Energy XXI (Bermuda) Ltd.# |
|
|
3,954 |
|
|
|
17,279 |
|
|
|
|
| Evolution Petroleum Corp. |
|
|
1,160 |
|
|
|
7,981 |
|
|
|
|
| EXCO Resources, Inc. |
|
|
6,207 |
|
|
|
12,786 |
|
|
|
|
| Frontline Ltd.* |
|
|
2,000 |
|
|
|
5,120 |
|
|
|
|
| FX Energy, Inc.#,* |
|
|
6,870 |
|
|
|
9,274 |
|
|
|
|
| GasLog Ltd.# |
|
|
2,430 |
|
|
|
54,165 |
|
|
|
|
| Gastar Exploration, Inc.* |
|
|
5,520 |
|
|
|
20,038 |
|
|
|
|
| Goodrich Petroleum Corp.* |
|
|
2,055 |
|
|
|
7,953 |
|
|
|
|
| Green Plains, Inc. |
|
|
2,290 |
|
|
|
71,311 |
|
|
|
|
| Halcon Resources Corp.* |
|
|
14,321 |
|
|
|
21,338 |
|
|
|
|
| Hallador Energy Co. |
|
|
720 |
|
|
|
8,273 |
|
|
|
|
| Isramco, Inc.* |
|
|
20 |
|
|
|
2,471 |
|
|
|
|
| Jones Energy, Inc.#,* |
|
|
1,190 |
|
|
|
12,209 |
|
|
|
|
| L&L Energy, Inc.* |
|
|
4,530 |
|
|
|
138 |
|
|
|
|
| Magnum Hunter Resources Corp.* |
|
|
15,550 |
|
|
|
34,055 |
|
|
|
|
| Matador Resources Co.* |
|
|
3,680 |
|
|
|
102,010 |
|
|
|
|
| Midstates Petroleum Co., Inc.#,* |
|
|
1,460 |
|
|
|
1,679 |
|
|
|
|
| Miller Energy Resources, Inc.#,* |
|
|
1,970 |
|
|
|
1,428 |
|
|
|
|
| Navios Maritime Acquisition# |
|
|
7,710 |
|
|
|
29,375 |
|
|
|
|
|
|
|
|
|
|
|
|
|
| Description
|
|
Number of
Shares
|
|
|
Value
|
|
|
|
|
| Nordic American Offshore Ltd. |
|
|
46 |
|
|
$ |
434 |
|
|
|
|
| Nordic American Tankers Ltd.# |
|
|
4,548 |
|
|
|
55,622 |
|
|
|
|
| Northern Oil & Gas, Inc.#,* |
|
|
2,210 |
|
|
|
19,536 |
|
|
|
|
| Pacific Ethanol, Inc.#,* |
|
|
60 |
|
|
|
718 |
|
|
|
|
| Panhandle Oil & Gas, Inc. |
|
|
1,172 |
|
|
|
26,722 |
|
|
|
|
| Parsley Energy, Inc.* |
|
|
3,290 |
|
|
|
57,049 |
|
|
|
|
| PDC Energy, Inc.* |
|
|
989 |
|
|
|
56,116 |
|
|
|
|
| Penn Virginia Corp.#,* |
|
|
634 |
|
|
|
4,235 |
|
|
|
|
| PetroQuest Energy, Inc.* |
|
|
5,960 |
|
|
|
15,973 |
|
|
|
|
| Quicksilver Resources, Inc.* |
|
|
5,430 |
|
|
|
159 |
|
|
|
|
| Renewable Energy Group, Inc.* |
|
|
630 |
|
|
|
5,802 |
|
|
|
|
| Resolute Energy Corp.* |
|
|
3,090 |
|
|
|
3,832 |
|
|
|
|
| REX American Resources Corp.* |
|
|
210 |
|
|
|
13,276 |
|
|
|
|
| Rex Energy Corp.#,* |
|
|
1,355 |
|
|
|
6,775 |
|
|
|
|
| Ring Energy, Inc.* |
|
|
1,890 |
|
|
|
22,945 |
|
|
|
|
| Rosetta Resources, Inc.* |
|
|
1,498 |
|
|
|
34,199 |
|
|
|
|
| RSP Permian, Inc.* |
|
|
1,230 |
|
|
|
35,695 |
|
|
|
|
| Sabine Oil & Gas Corp.* |
|
|
4,920 |
|
|
|
332 |
|
|
|
|
| Sanchez Energy Corp.#,* |
|
|
2,240 |
|
|
|
32,906 |
|
|
|
|
| Scorpio Tankers, Inc. |
|
|
6,630 |
|
|
|
61,924 |
|
|
|
|
| SemGroup Corp. |
|
|
3,030 |
|
|
|
255,096 |
|
|
|
|
| Ship Finance International Ltd. |
|
|
2,143 |
|
|
|
33,774 |
|
|
|
|
| Solazyme, Inc.#,* |
|
|
7,980 |
|
|
|
30,723 |
|
|
|
|
| Stone Energy Corp.* |
|
|
1,624 |
|
|
|
27,722 |
|
|
|
|
| Swift Energy Co.#,* |
|
|
3,720 |
|
|
|
11,234 |
|
|
|
|
| Synergy Resources Corp.* |
|
|
3,630 |
|
|
|
43,487 |
|
|
|
|
| Targa Resources Corp. |
|
|
84 |
|
|
|
8,817 |
|
|
|
|
| Teekay Tankers Ltd., Class A |
|
|
2,078 |
|
|
|
13,091 |
|
|
|
|
| Transatlantic Petroleum Ltd.#,* |
|
|
2,370 |
|
|
|
13,746 |
|
|
|
|
| Triangle Petroleum Corp.#,* |
|
|
2,000 |
|
|
|
11,940 |
|
|
|
|
| VAALCO Energy, Inc.* |
|
|
707 |
|
|
|
1,746 |
|
|
|
|
| W&T Offshore, Inc.# |
|
|
1,960 |
|
|
|
12,603 |
|
|
|
|
| Warren Resources, Inc.* |
|
|
2,930 |
|
|
|
3,164 |
|
|
|
|
| Western Refining, Inc. |
|
|
3,475 |
|
|
|
153,074 |
|
|
|
|
| Westmoreland Coal Co.* |
|
|
200 |
|
|
|
5,684 |
|
|
|
|
| Whiting Petroleum Corp.* |
|
|
56 |
|
|
|
2,123 |
|
|
|
|
|
|
|
|
|
|
|
|
|
|
|
|
|
|
|
$ |
2,232,803 |
|
|
|
|
|
|
|
|
|
|
|
|
|
| TOTAL ENERGY |
|
|
|
|
|
$ |
3,255,795 |
|
April 30,
2015 / ANNUAL REPORT
PORTFOLIOS OF
INVESTMENTS 47
Wilmington Small-Cap Strategy Fund (continued)
|
|
|
|
|
|
|
|
|
|
|
|
| Description
|
|
Number of
Shares
|
|
|
Value
|
|
|
| FINANCIALS – 18.4% |
|
|
| CAPITAL MARKETS – 1.6% |
|
|
|
|
| Arlington Asset Investment Corp. |
|
|
670 |
|
|
$ |
14,526 |
|
|
|
|
| Ashford, Inc.* |
|
|
50 |
|
|
|
4,987 |
|
|
|
|
| BGC Partners, Inc. |
|
|
8,600 |
|
|
|
86,301 |
|
|
|
|
| Calamos Asset Management, Inc. |
|
|
845 |
|
|
|
10,453 |
|
|
|
|
| CIFC Corp. |
|
|
470 |
|
|
|
3,525 |
|
|
|
|
| Cohen & Steers, Inc. |
|
|
1,553 |
|
|
|
58,797 |
|
|
|
|
| Cowen Group, Inc.* |
|
|
1,815 |
|
|
|
10,146 |
|
|
|
|
| Diamond Hill Investment Group, Inc. |
|
|
120 |
|
|
|
21,864 |
|
|
|
|
| Evercore Partners, Inc. |
|
|
2,473 |
|
|
|
119,298 |
|
|
|
|
| FBR & Co.* |
|
|
557 |
|
|
|
11,953 |
|
|
|
|
| Financial Engines, Inc.# |
|
|
2,440 |
|
|
|
102,895 |
|
|
|
|
| FXCM, Inc.# |
|
|
1,300 |
|
|
|
2,613 |
|
|
|
|
| GAMCO Investors, Inc. |
|
|
462 |
|
|
|
35,717 |
|
|
|
|
| Greenhill & Co., Inc. |
|
|
2,050 |
|
|
|
81,077 |
|
|
|
|
| HFF, Inc. |
|
|
2,470 |
|
|
|
96,799 |
|
|
|
|
| INTL. FCStone, Inc.* |
|
|
766 |
|
|
|
24,589 |
|
|
|
|
| Investment Technology Group, Inc.* |
|
|
1,710 |
|
|
|
48,718 |
|
|
|
|
| Janus Capital Group, Inc. |
|
|
6,350 |
|
|
|
113,665 |
|
|
|
|
| KCG Holdings, Inc. |
|
|
2,420 |
|
|
|
31,073 |
|
|
|
|
| Ladenburg Thalmann Financial Services, Inc.#,* |
|
|
8,830 |
|
|
|
29,757 |
|
|
|
|
| Manning & Napier, Inc. |
|
|
1,080 |
|
|
|
11,480 |
|
|
|
|
| NorthStar Asset Management Group, Inc./NY |
|
|
755 |
|
|
|
15,878 |
|
|
|
|
| Oppenheimer Holdings, Inc. |
|
|
630 |
|
|
|
15,051 |
|
|
|
|
| Piper Jaffray Cos.* |
|
|
680 |
|
|
|
34,306 |
|
|
|
|
| Pzena Investment Management, Inc. |
|
|
715 |
|
|
|
6,578 |
|
|
|
|
| Safeguard Scientifics, Inc.* |
|
|
1,135 |
|
|
|
20,419 |
|
|
|
|
| Silvercrest Asset Management Group, Inc. |
|
|
1,500 |
|
|
|
23,385 |
|
|
|
|
| Stifel Financial Corp.* |
|
|
2,576 |
|
|
|
136,116 |
|
|
|
|
| Teton Advisors, Inc. |
|
|
10 |
|
|
|
560 |
|
|
|
|
| Virtus Investment Partners, Inc.* |
|
|
453 |
|
|
|
60,530 |
|
|
|
|
| Walter Investment Management Corp.#,* |
|
|
1,432 |
|
|
|
25,218 |
|
|
|
|
| Westwood Holdings Group, Inc. |
|
|
740 |
|
|
|
43,357 |
|
|
|
|
| WisdomTree Investments, Inc.#,* |
|
|
7,710 |
|
|
|
146,798 |
|
|
|
|
|
|
|
|
|
|
|
|
|
|
|
|
|
|
|
$ |
1,448,429 |
|
|
| COMMERCIAL BANKS – 5.7% |
|
|
|
|
| 1st Source Corp. |
|
|
878 |
|
|
|
27,323 |
|
|
|
|
| American National Bankshares, Inc. |
|
|
490 |
|
|
|
11,030 |
|
|
|
|
| Ameris Bancorp* |
|
|
1,110 |
|
|
|
27,739 |
|
|
|
|
| Ames National Corp. |
|
|
761 |
|
|
|
18,979 |
|
|
|
|
| Arrow Financial Corp. |
|
|
70 |
|
|
|
1,824 |
|
|
|
|
| Banc of California, Inc. |
|
|
500 |
|
|
|
6,200 |
|
|
|
|
| Bancfirst Corp. |
|
|
124 |
|
|
|
7,157 |
|
|
|
|
| Banco Latinoamericano de Comercio Exterior SA |
|
|
944 |
|
|
|
29,991 |
|
|
|
|
| Bancorp, Inc. (The)* |
|
|
1,540 |
|
|
|
15,000 |
|
|
|
|
|
|
|
|
|
|
|
|
|
| Description
|
|
Number of
Shares
|
|
|
Value
|
|
|
|
|
| BancorpSouth, Inc. |
|
|
3,210 |
|
|
$ |
77,714 |
|
|
|
|
| Bank of Kentucky Financial Corp. (The) |
|
|
370 |
|
|
|
17,719 |
|
|
|
|
| Bank of Marin Bancorp |
|
|
310 |
|
|
|
15,630 |
|
|
|
|
| Bank of the Ozarks, Inc. |
|
|
4,154 |
|
|
|
161,009 |
|
|
|
|
| Banner Corp. |
|
|
760 |
|
|
|
34,367 |
|
|
|
|
| BBCN Bancorp, Inc. |
|
|
2,741 |
|
|
|
38,895 |
|
|
|
|
| Berkshire Hills Bancorp, Inc. |
|
|
951 |
|
|
|
26,638 |
|
|
|
|
| BNC Bancorp |
|
|
900 |
|
|
|
16,425 |
|
|
|
|
| Boston Private Financial Holdings, Inc. |
|
|
3,118 |
|
|
|
41,002 |
|
|
|
|
| Bridge Bancorp, Inc. |
|
|
600 |
|
|
|
15,162 |
|
|
|
|
| Bridge Capital Holdings* |
|
|
300 |
|
|
|
8,115 |
|
|
|
|
| Bryn Mawr Bank Corp. |
|
|
475 |
|
|
|
14,293 |
|
|
|
|
| Camden National Corp. |
|
|
63 |
|
|
|
2,414 |
|
|
|
|
| Capital Bank Financial Corp.* |
|
|
1,280 |
|
|
|
34,714 |
|
|
|
|
| Capital City Bank Group, Inc. |
|
|
541 |
|
|
|
7,612 |
|
|
|
|
| Cardinal Financial Corp. |
|
|
1,330 |
|
|
|
27,438 |
|
|
|
|
| Cascade Bancorp* |
|
|
1,095 |
|
|
|
5,278 |
|
|
|
|
| Cathay General Bancorp |
|
|
3,242 |
|
|
|
92,656 |
|
|
|
|
| Centerstate Banks, Inc. |
|
|
746 |
|
|
|
9,071 |
|
|
|
|
| Central Pacific Financial Corp. |
|
|
410 |
|
|
|
9,389 |
|
|
|
|
| Century Bancorp, Inc. |
|
|
170 |
|
|
|
6,567 |
|
|
|
|
| Chemical Financial Corp. |
|
|
1,738 |
|
|
|
53,704 |
|
|
|
|
| Citizens & Northern Corp. |
|
|
831 |
|
|
|
16,487 |
|
|
|
|
| City Holding Co. |
|
|
762 |
|
|
|
35,029 |
|
|
|
|
| CNB Financial Corp. |
|
|
910 |
|
|
|
15,634 |
|
|
|
|
| CoBiz Financial, Inc. |
|
|
1,600 |
|
|
|
19,216 |
|
|
|
|
| Columbia Banking System, Inc. |
|
|
2,329 |
|
|
|
69,171 |
|
|
|
|
| Community Bank System, Inc. |
|
|
1,894 |
|
|
|
66,195 |
|
|
|
|
| Community Trust Bancorp, Inc. |
|
|
1,020 |
|
|
|
32,722 |
|
|
|
|
| CommunityOne Bancorp#,* |
|
|
780 |
|
|
|
7,683 |
|
|
|
|
| ConnectOne Bancorp, Inc. |
|
|
1,220 |
|
|
|
23,448 |
|
|
|
|
| CU BanCorp.* |
|
|
570 |
|
|
|
11,810 |
|
|
|
|
| CVB Financial Corp. |
|
|
4,664 |
|
|
|
72,992 |
|
|
|
|
| Eagle Bancorp, Inc.* |
|
|
1,474 |
|
|
|
54,332 |
|
|
|
|
| Enterprise Bancorp, Inc. |
|
|
60 |
|
|
|
1,288 |
|
|
|
|
| Enterprise Financial Services Corp. |
|
|
1,010 |
|
|
|
20,735 |
|
|
|
|
| Fidelity Southern Corp. |
|
|
978 |
|
|
|
16,430 |
|
|
|
|
| Financial Institutions, Inc. |
|
|
873 |
|
|
|
20,559 |
|
|
|
|
| First BanCorp* |
|
|
2,070 |
|
|
|
12,441 |
|
|
|
|
| First Bancorp |
|
|
825 |
|
|
|
13,390 |
|
|
|
|
| First Bancorp, Inc. |
|
|
439 |
|
|
|
7,323 |
|
|
|
|
| First Busey Corp. |
|
|
4,391 |
|
|
|
27,400 |
|
|
|
|
| First Citizens BancShares, Inc. |
|
|
200 |
|
|
|
48,068 |
|
|
|
|
| First Commonwealth Financial Corp. |
|
|
2,976 |
|
|
|
26,844 |
|
|
|
|
| First Community Bancshares, Inc. |
|
|
1,001 |
|
|
|
16,777 |
|
|
|
|
| First Connecticut Bancorp, Inc. |
|
|
1,340 |
|
|
|
19,805 |
|
|
|
|
| First Financial Bancorp |
|
|
1,995 |
|
|
|
34,434 |
|
|
|
|
| First Financial Bankshares, Inc.# |
|
|
2,822 |
|
|
|
81,725 |
|
ANNUAL
REPORT / April 30, 2015
48
PORTFOLIOS OF INVESTMENTS
Wilmington Small-Cap Strategy Fund (continued)
|
|
|
|
|
|
|
|
|
|
|
|
| Description
|
|
Number of
Shares
|
|
|
Value
|
|
|
|
|
| First Financial Corp. |
|
|
345 |
|
|
$ |
11,713 |
|
|
|
|
| First Interstate Bancsystem, Inc. |
|
|
1,060 |
|
|
|
28,684 |
|
|
|
|
| First Merchants Corp. |
|
|
1,475 |
|
|
|
33,291 |
|
|
|
|
| First Midwest Bancorp, Inc. |
|
|
2,771 |
|
|
|
47,384 |
|
|
|
|
| First NBC Bank Holding Co.* |
|
|
120 |
|
|
|
4,222 |
|
|
|
|
| First of Long Island Corp. (The) |
|
|
330 |
|
|
|
8,257 |
|
|
|
|
| FirstMerit Corp. |
|
|
6,372 |
|
|
|
123,426 |
|
|
|
|
| Flushing Financial Corp. |
|
|
1,594 |
|
|
|
30,541 |
|
|
|
|
| FNB Corp. |
|
|
5,186 |
|
|
|
68,818 |
|
|
|
|
| German American Bancorp, Inc. |
|
|
400 |
|
|
|
11,444 |
|
|
|
|
| Glacier Bancorp, Inc. |
|
|
3,001 |
|
|
|
79,046 |
|
|
|
|
| Great Southern Bancorp, Inc. |
|
|
490 |
|
|
|
19,316 |
|
|
|
|
| Guaranty Bancorp |
|
|
864 |
|
|
|
13,599 |
|
|
|
|
| Hancock Holding Co. |
|
|
2,288 |
|
|
|
66,604 |
|
|
|
|
| Hanmi Financial Corp. |
|
|
1,280 |
|
|
|
27,238 |
|
|
|
|
| Heartland Financial USA, Inc. |
|
|
443 |
|
|
|
15,244 |
|
|
|
|
| Heritage Commerce Corp. |
|
|
1,280 |
|
|
|
11,405 |
|
|
|
|
| Heritage Financial Corp. |
|
|
1,638 |
|
|
|
27,682 |
|
|
|
|
| Heritage Oaks Bancorp* |
|
|
1,820 |
|
|
|
14,505 |
|
|
|
|
| Home BancShares, Inc. |
|
|
3,004 |
|
|
|
98,772 |
|
|
|
|
| HomeTrust Bancshares, Inc.* |
|
|
250 |
|
|
|
3,910 |
|
|
|
|
| Horizon Bancorp |
|
|
580 |
|
|
|
13,543 |
|
|
|
|
| Hudson Valley Holding Corp. |
|
|
932 |
|
|
|
23,058 |
|
|
|
|
| IBERIABANK Corp. |
|
|
1,304 |
|
|
|
81,252 |
|
|
|
|
| Independent Bank Corp. |
|
|
906 |
|
|
|
37,798 |
|
|
|
|
| Independent Bank Corp./MI |
|
|
20 |
|
|
|
265 |
|
|
|
|
| Independent Bank Group, Inc. |
|
|
550 |
|
|
|
21,175 |
|
|
|
|
| International Bancshares Corp. |
|
|
2,412 |
|
|
|
62,664 |
|
|
|
|
| Investors Bancorp, Inc. |
|
|
5,898 |
|
|
|
69,832 |
|
|
|
|
| Lakeland Bancorp, Inc. |
|
|
1,199 |
|
|
|
13,609 |
|
|
|
|
| Lakeland Financial Corp. |
|
|
795 |
|
|
|
31,045 |
|
|
|
|
| LegacyTexas Financial Group, Inc. |
|
|
1,291 |
|
|
|
32,856 |
|
|
|
|
| Macatawa Bank Corp. |
|
|
1,260 |
|
|
|
6,615 |
|
|
|
|
| MainSource Financial Group, Inc. |
|
|
910 |
|
|
|
17,518 |
|
|
|
|
| MB Financial, Inc. |
|
|
2,732 |
|
|
|
82,315 |
|
|
|
|
| Mercantile Bank Corp. |
|
|
620 |
|
|
|
12,288 |
|
|
|
|
| Merchants Bancshares, Inc. |
|
|
290 |
|
|
|
8,543 |
|
|
|
|
| Metro Bancorp, Inc.* |
|
|
572 |
|
|
|
14,666 |
|
|
|
|
| MidSouth Bancorp, Inc.# |
|
|
820 |
|
|
|
10,635 |
|
|
|
|
| MidWestOne Financial Group, Inc. |
|
|
480 |
|
|
|
14,040 |
|
|
|
|
| National Bank Holdings Corp. |
|
|
1,130 |
|
|
|
21,470 |
|
|
|
|
| National Bankshares, Inc.# |
|
|
200 |
|
|
|
5,802 |
|
|
|
|
| National Penn Bancshares, Inc. |
|
|
4,141 |
|
|
|
43,066 |
|
|
|
|
| NBT Bancorp, Inc. |
|
|
2,230 |
|
|
|
53,855 |
|
|
|
|
| NewBridge Bancorp* |
|
|
1,690 |
|
|
|
13,605 |
|
|
|
|
| Northrim BanCorp, Inc. |
|
|
580 |
|
|
|
14,454 |
|
|
|
|
| OFG Bancorp |
|
|
1,954 |
|
|
|
27,532 |
|
|
|
|
| Old National Bancorp |
|
|
3,611 |
|
|
|
49,326 |
|
|
|
|
|
|
|
|
|
|
|
|
|
| Description
|
|
Number of
Shares
|
|
|
Value
|
|
|
|
|
| Pacific Continental Corp. |
|
|
1,340 |
|
|
$ |
17,286 |
|
|
|
|
| Pacific Premier Bancorp, Inc.* |
|
|
910 |
|
|
|
14,251 |
|
|
|
|
| Park National Corp.# |
|
|
578 |
|
|
|
47,720 |
|
|
|
|
| Park Sterling Corp. |
|
|
2,730 |
|
|
|
18,291 |
|
|
|
|
| Peapack Gladstone Financial Corp. |
|
|
1,195 |
|
|
|
25,011 |
|
|
|
|
| Penns Woods Bancorp, Inc. |
|
|
160 |
|
|
|
6,974 |
|
|
|
|
| Peoples Bancorp, Inc. |
|
|
596 |
|
|
|
13,821 |
|
|
|
|
| Pinnacle Financial Partners, Inc. |
|
|
1,421 |
|
|
|
67,711 |
|
|
|
|
| Preferred Bank* |
|
|
460 |
|
|
|
12,963 |
|
|
|
|
| PrivateBancorp, Inc. |
|
|
2,610 |
|
|
|
96,753 |
|
|
|
|
| Prosperity Bancshares, Inc. |
|
|
2,295 |
|
|
|
122,415 |
|
|
|
|
| Renasant Corp. |
|
|
572 |
|
|
|
16,994 |
|
|
|
|
| Republic Bancorp, Inc. |
|
|
827 |
|
|
|
19,666 |
|
|
|
|
| S&T Bancorp, Inc. |
|
|
1,220 |
|
|
|
32,818 |
|
|
|
|
| Sandy Spring Bancorp, Inc. |
|
|
1,397 |
|
|
|
36,406 |
|
|
|
|
| Seacoast Banking Corp. of Florida* |
|
|
942 |
|
|
|
13,150 |
|
|
|
|
| Sierra Bancorp |
|
|
516 |
|
|
|
8,452 |
|
|
|
|
| Simmons First National Corp. |
|
|
856 |
|
|
|
37,450 |
|
|
|
|
| South State Corp. |
|
|
508 |
|
|
|
34,402 |
|
|
|
|
| Southside Bancshares, Inc. |
|
|
615 |
|
|
|
16,802 |
|
|
|
|
| Southwest Bancorp, Inc. |
|
|
852 |
|
|
|
14,680 |
|
|
|
|
| State Bank Financial Corp. |
|
|
1,260 |
|
|
|
25,213 |
|
|
|
|
| Sterling Bancorp/DE |
|
|
3,654 |
|
|
|
47,429 |
|
|
|
|
| Stock Yards Bancorp, Inc. |
|
|
530 |
|
|
|
18,444 |
|
|
|
|
| Suffolk Bancorp* |
|
|
634 |
|
|
|
15,191 |
|
|
|
|
| Sun Bancorp, Inc./NJ* |
|
|
292 |
|
|
|
5,528 |
|
|
|
|
| Susquehanna Bancshares, Inc. |
|
|
6,442 |
|
|
|
86,580 |
|
|
|
|
| Texas Capital Bancshares, Inc.* |
|
|
1,978 |
|
|
|
104,161 |
|
|
|
|
| Tompkins Financial Corp. |
|
|
710 |
|
|
|
37,027 |
|
|
|
|
| TowneBank |
|
|
899 |
|
|
|
14,878 |
|
|
|
|
| TriCo Bancshares |
|
|
353 |
|
|
|
8,232 |
|
|
|
|
| TriState Capital Holdings, Inc.* |
|
|
1,040 |
|
|
|
13,000 |
|
|
|
|
| Trustmark Corp. |
|
|
2,348 |
|
|
|
55,882 |
|
|
|
|
| UMB Financial Corp. |
|
|
1,154 |
|
|
|
57,458 |
|
|
|
|
| Umpqua Holdings Corp. |
|
|
6,928 |
|
|
|
117,845 |
|
|
|
|
| Union Bankshares Corp. |
|
|
1,955 |
|
|
|
42,541 |
|
|
|
|
| United Bankshares, Inc. |
|
|
2,845 |
|
|
|
106,915 |
|
|
|
|
| United Community Banks, Inc.* |
|
|
2,044 |
|
|
|
38,039 |
|
|
|
|
| Univest Corp. of Pennsylvania |
|
|
853 |
|
|
|
16,642 |
|
|
|
|
| Valley National Bancorp |
|
|
5,098 |
|
|
|
48,074 |
|
|
|
|
| Washington Trust Bancorp, Inc. |
|
|
576 |
|
|
|
21,324 |
|
|
|
|
| Webster Financial Corp. |
|
|
3,540 |
|
|
|
126,838 |
|
|
|
|
| WesBanco, Inc. |
|
|
1,773 |
|
|
|
55,867 |
|
|
|
|
| West Bancorporation, Inc. |
|
|
1,097 |
|
|
|
20,799 |
|
|
|
|
| Westamerica Bancorporation# |
|
|
853 |
|
|
|
37,148 |
|
|
|
|
| Western Alliance Bancorp* |
|
|
4,171 |
|
|
|
128,967 |
|
|
|
|
| Wilshire Bancorp, Inc. |
|
|
3,290 |
|
|
|
34,710 |
|
|
|
|
| Wintrust Financial Corp. |
|
|
1,513 |
|
|
|
73,744 |
|
April 30,
2015 / ANNUAL REPORT
PORTFOLIOS OF
INVESTMENTS 49
Wilmington Small-Cap Strategy Fund (continued)
|
|
|
|
|
|
|
|
|
|
|
|
| Description
|
|
Number of
Shares
|
|
|
Value
|
|
|
|
|
| Yadkin Financial Corp.* |
|
|
41 |
|
|
$ |
807 |
|
|
|
|
|
|
|
|
|
|
|
|
|
|
|
|
|
|
|
$ |
5,194,220 |
|
| CONSUMER FINANCE – 0.7% |
|
|
|
|
| Cash America International, Inc. |
|
|
686 |
|
|
|
17,781 |
|
|
|
|
| Consumer Portfolio Services, Inc.* |
|
|
30 |
|
|
|
192 |
|
|
|
|
| Credit Acceptance Corp.* |
|
|
528 |
|
|
|
124,714 |
|
|
|
|
| Enova International, Inc.* |
|
|
602 |
|
|
|
11,143 |
|
|
|
|
| Ezcorp, Inc.* |
|
|
2,509 |
|
|
|
23,083 |
|
|
|
|
| First Cash Financial Services, Inc.* |
|
|
1,629 |
|
|
|
78,746 |
|
|
|
|
| Green Dot Corp.* |
|
|
1,290 |
|
|
|
20,769 |
|
|
|
|
| JG Wentworth Co. (The)#,* |
|
|
1,580 |
|
|
|
15,895 |
|
|
|
|
| Nelnet, Inc. |
|
|
702 |
|
|
|
31,429 |
|
|
|
|
| Nicholas Financial, Inc.# |
|
|
1,080 |
|
|
|
13,640 |
|
|
|
|
| PRA Group, Inc.* |
|
|
3,197 |
|
|
|
175,116 |
|
|
|
|
| Regional Management Corp.* |
|
|
650 |
|
|
|
10,498 |
|
|
|
|
| Springleaf Holdings, Inc.#,* |
|
|
1,000 |
|
|
|
50,000 |
|
|
|
|
| World Acceptance Corp.#,* |
|
|
384 |
|
|
|
32,494 |
|
|
|
|
|
|
|
|
|
|
|
|
|
|
|
|
|
|
|
$ |
605,500 |
|
|
| DIVERSIFIED FINANCIAL SERVICES – 0.3% |
|
|
|
|
| Gain Capital Holdings, Inc. |
|
|
1,370 |
|
|
|
13,536 |
|
|
|
|
| MarketAxess Holdings, Inc. |
|
|
2,647 |
|
|
|
227,245 |
|
|
|
|
| Marlin Business Services Corp. |
|
|
480 |
|
|
|
9,586 |
|
|
|
|
| NewStar Financial, Inc.* |
|
|
1,174 |
|
|
|
13,501 |
|
|
|
|
| PHH Corp.* |
|
|
1,497 |
|
|
|
37,605 |
|
|
|
|
| PICO Holdings, Inc.* |
|
|
80 |
|
|
|
1,441 |
|
|
|
|
| Resource America, Inc. |
|
|
770 |
|
|
|
6,576 |
|
|
|
|
|
|
|
|
|
|
|
|
|
|
|
|
|
|
|
$ |
309,490 |
|
|
| INSURANCE – 2.1% |
|
|
|
|
| Ambac Financial Group, Inc.* |
|
|
1,650 |
|
|
|
37,966 |
|
|
|
|
| American Equity Investment Life Holding Co. |
|
|
3,283 |
|
|
|
88,477 |
|
|
|
|
| AMERISAFE, Inc. |
|
|
1,082 |
|
|
|
48,896 |
|
|
|
|
| Amtrust Financial Services, Inc.# |
|
|
1,832 |
|
|
|
108,949 |
|
|
|
|
| Argo Group International Holdings Ltd. |
|
|
1,587 |
|
|
|
77,747 |
|
|
|
|
| Baldwin & Lyons, Inc. |
|
|
402 |
|
|
|
9,121 |
|
|
|
|
| Citizens, Inc.#,* |
|
|
1,867 |
|
|
|
10,530 |
|
|
|
|
| CNO Financial Group, Inc. |
|
|
7,590 |
|
|
|
129,030 |
|
|
|
|
| Crawford & Co. |
|
|
1,767 |
|
|
|
14,436 |
|
|
|
|
| Donegal Group, Inc. |
|
|
650 |
|
|
|
9,821 |
|
|
|
|
| eHealth, Inc.* |
|
|
794 |
|
|
|
9,734 |
|
|
|
|
| EMC Insurance Group, Inc. |
|
|
510 |
|
|
|
17,666 |
|
|
|
|
| Employers Holdings, Inc. |
|
|
647 |
|
|
|
15,793 |
|
|
|
|
| Enstar Group Ltd.* |
|
|
399 |
|
|
|
56,674 |
|
|
|
|
| FBL Financial Group, Inc. |
|
|
553 |
|
|
|
32,223 |
|
|
|
|
| Federated National Holding Co. |
|
|
110 |
|
|
|
3,168 |
|
|
|
|
| First American Financial Corp. |
|
|
4,220 |
|
|
|
146,814 |
|
|
|
|
| Global Indemnity PLC* |
|
|
524 |
|
|
|
14,384 |
|
|
|
|
| Greenlight Capital Re Ltd.* |
|
|
1,520 |
|
|
|
46,193 |
|
|
|
|
|
|
|
|
|
|
|
|
|
| Description
|
|
Number of
Shares
|
|
|
Value
|
|
|
|
|
| Hallmark Financial Services, Inc.* |
|
|
167 |
|
|
$ |
1,850 |
|
|
|
|
| HCI Group, Inc. |
|
|
410 |
|
|
|
17,868 |
|
|
|
|
| Heritage Insurance Holdings, Inc.* |
|
|
120 |
|
|
|
2,406 |
|
|
|
|
| Hilltop Holdings, Inc.* |
|
|
2,694 |
|
|
|
54,176 |
|
|
|
|
| Horace Mann Educators Corp. |
|
|
1,594 |
|
|
|
54,148 |
|
|
|
|
| Independence Holding Co. |
|
|
400 |
|
|
|
4,976 |
|
|
|
|
| Infinity Property & Casualty Corp. |
|
|
598 |
|
|
|
44,342 |
|
|
|
|
| Kansas City Life Insurance Co. |
|
|
370 |
|
|
|
16,606 |
|
|
|
|
| Kemper Corp. |
|
|
1,180 |
|
|
|
44,451 |
|
|
|
|
| Maiden Holdings Ltd. |
|
|
2,512 |
|
|
|
36,499 |
|
|
|
|
| Meadowbrook Insurance Group, Inc. |
|
|
255 |
|
|
|
2,178 |
|
|
|
|
| Montpelier Re Holdings Ltd. |
|
|
1,814 |
|
|
|
69,132 |
|
|
|
|
| National Interstate Corp. |
|
|
519 |
|
|
|
14,542 |
|
|
|
|
| National Western Life Insurance Co. |
|
|
75 |
|
|
|
17,971 |
|
|
|
|
| Navigators Group, Inc. (The)* |
|
|
566 |
|
|
|
44,176 |
|
|
|
|
| OneBeacon Insurance Group Ltd. |
|
|
620 |
|
|
|
9,350 |
|
|
|
|
| Phoenix Cos., Inc. (The)* |
|
|
281 |
|
|
|
9,585 |
|
|
|
|
| Primerica, Inc. |
|
|
2,240 |
|
|
|
103,533 |
|
|
|
|
| RenaissanceRe Holdings Ltd.* |
|
|
598 |
|
|
|
61,289 |
|
|
|
|
| RLI Corp. |
|
|
1,632 |
|
|
|
81,045 |
|
|
|
|
| Safety Insurance Group, Inc. |
|
|
654 |
|
|
|
38,030 |
|
|
|
|
| Selective Insurance Group, Inc. |
|
|
2,613 |
|
|
|
70,394 |
|
|
|
|
| State Auto Financial Corp. |
|
|
638 |
|
|
|
15,070 |
|
|
|
|
| Stewart Information Services Corp. |
|
|
969 |
|
|
|
35,369 |
|
|
|
|
| Symetra Financial Corp. |
|
|
3,480 |
|
|
|
82,650 |
|
|
|
|
| Third Point Reinsurance Ltd.* |
|
|
1,370 |
|
|
|
18,468 |
|
|
|
|
| United Fire Group, Inc. |
|
|
1,015 |
|
|
|
30,318 |
|
|
|
|
| Universal Insurance Holdings, Inc. |
|
|
2,460 |
|
|
|
59,089 |
|
|
|
|
|
|
|
|
|
|
|
|
|
|
|
|
|
|
|
$ |
1,917,133 |
|
|
| REAL ESTATE INVESTMENT TRUSTS – 6.4% |
|
|
|
|
| Acadia Realty Trust |
|
|
2,585 |
|
|
|
79,876 |
|
|
|
|
| AG Mortgage Investment Trust, Inc. |
|
|
770 |
|
|
|
14,799 |
|
|
|
|
| Agree Realty Corp. |
|
|
979 |
|
|
|
30,134 |
|
|
|
|
| Alexander’s, Inc. |
|
|
176 |
|
|
|
75,895 |
|
|
|
|
| Altisource Residential Corp. |
|
|
2,590 |
|
|
|
49,598 |
|
|
|
|
| American Assets Trust, Inc. |
|
|
1,210 |
|
|
|
48,158 |
|
|
|
|
| American Capital Mortgage Investment Corp. |
|
|
620 |
|
|
|
10,875 |
|
|
|
|
| American Residential Properties, Inc.* |
|
|
980 |
|
|
|
18,385 |
|
|
|
|
| Anworth Mortgage Asset Corp. |
|
|
3,431 |
|
|
|
17,429 |
|
|
|
|
| Apollo Commercial Real Estate Finance, Inc. |
|
|
590 |
|
|
|
10,083 |
|
|
|
|
| Apollo Residential Mortgage, Inc. |
|
|
1,530 |
|
|
|
24,266 |
|
|
|
|
| Ares Commercial Real Estate Corp. |
|
|
1,830 |
|
|
|
20,770 |
|
|
|
|
| Armada Hoffler Properties, Inc. |
|
|
1,420 |
|
|
|
14,583 |
|
|
|
|
| ARMOUR Residential REIT, Inc. |
|
|
11,670 |
|
|
|
35,010 |
|
|
|
|
| Ashford Hospitality Prime, Inc. |
|
|
882 |
|
|
|
13,812 |
|
|
|
|
| Ashford Hospitality Trust, Inc. |
|
|
2,150 |
|
|
|
19,479 |
|
|
|
|
| Associated Estates Realty Corp. |
|
|
2,234 |
|
|
|
63,669 |
|
ANNUAL
REPORT / April 30, 2015
50
PORTFOLIOS OF INVESTMENTS
Wilmington Small-Cap Strategy Fund (continued)
|
|
|
|
|
|
|
|
|
|
|
|
| Description
|
|
Number of
Shares
|
|
|
Value
|
|
|
|
|
| Campus Crest Communities, Inc. |
|
|
2,970 |
|
|
$ |
18,800 |
|
|
|
|
| Capstead Mortgage Corp. |
|
|
1,270 |
|
|
|
14,795 |
|
|
|
|
| CareTrust REIT, Inc. |
|
|
409 |
|
|
|
5,108 |
|
|
|
|
| Cedar Realty Trust, Inc. |
|
|
3,966 |
|
|
|
27,722 |
|
|
|
|
| Chambers Street Properties |
|
|
5,200 |
|
|
|
39,000 |
|
|
|
|
| Chatham Lodging Trust |
|
|
1,140 |
|
|
|
31,510 |
|
|
|
|
| Chesapeake Lodging Trust |
|
|
2,380 |
|
|
|
75,565 |
|
|
|
|
| Colony Capital, Inc. |
|
|
2,870 |
|
|
|
74,362 |
|
|
|
|
| CoreSite Realty Corp. |
|
|
1,320 |
|
|
|
63,466 |
|
|
|
|
| Cousins Properties, Inc. |
|
|
7,277 |
|
|
|
70,878 |
|
|
|
|
| CubeSmart |
|
|
4,534 |
|
|
|
104,599 |
|
|
|
|
| CyrusOne, Inc. |
|
|
1,240 |
|
|
|
40,275 |
|
|
|
|
| CYS Investments, Inc. |
|
|
6,790 |
|
|
|
60,567 |
|
|
|
|
| DCT Industrial Trust, Inc. |
|
|
2,846 |
|
|
|
94,032 |
|
|
|
|
| DiamondRock Hospitality Co. |
|
|
8,027 |
|
|
|
108,846 |
|
|
|
|
| DuPont Fabros Technology, Inc. |
|
|
3,345 |
|
|
|
104,197 |
|
|
|
|
| Dynex Capital, Inc. |
|
|
1,840 |
|
|
|
14,720 |
|
|
|
|
| EastGroup Properties, Inc. |
|
|
1,524 |
|
|
|
87,173 |
|
|
|
|
| Education Realty Trust, Inc. |
|
|
890 |
|
|
|
29,922 |
|
|
|
|
| Empire State Realty Trust, Inc.# |
|
|
5,130 |
|
|
|
92,340 |
|
|
|
|
| EPR Properties |
|
|
2,189 |
|
|
|
126,240 |
|
|
|
|
| Equity One, Inc. |
|
|
1,952 |
|
|
|
48,078 |
|
|
|
|
| Excel Trust, Inc. |
|
|
2,010 |
|
|
|
31,858 |
|
|
|
|
| FelCor Lodging Trust, Inc. |
|
|
5,050 |
|
|
|
56,105 |
|
|
|
|
| First Industrial Realty Trust, Inc. |
|
|
4,472 |
|
|
|
88,233 |
|
|
|
|
| First Potomac Realty Trust |
|
|
2,324 |
|
|
|
24,913 |
|
|
|
|
| Franklin Street Properties Corp. |
|
|
3,357 |
|
|
|
39,646 |
|
|
|
|
| GEO Group, Inc. (The) |
|
|
2,256 |
|
|
|
87,984 |
|
|
|
|
| Getty Realty Corp. |
|
|
447 |
|
|
|
7,764 |
|
|
|
|
| Gladstone Commercial Corp. |
|
|
20 |
|
|
|
356 |
|
|
|
|
| Government Properties Income Trust |
|
|
2,320 |
|
|
|
48,349 |
|
|
|
|
| Gramercy Property Trust, Inc. |
|
|
837 |
|
|
|
22,884 |
|
|
|
|
| Hannon Armstrong Sustainable Infrastructure Capital, Inc. |
|
|
1,350 |
|
|
|
25,650 |
|
|
|
|
| Hatteras Financial Corp. |
|
|
3,200 |
|
|
|
57,792 |
|
|
|
|
| Healthcare Realty Trust, Inc. |
|
|
3,226 |
|
|
|
82,586 |
|
|
|
|
| Hersha Hospitality Trust |
|
|
8,668 |
|
|
|
55,735 |
|
|
|
|
| Highwoods Properties, Inc. |
|
|
3,335 |
|
|
|
143,538 |
|
|
|
|
| Hudson Pacific Properties, Inc. |
|
|
2,490 |
|
|
|
75,098 |
|
|
|
|
| Inland Real Estate Corp. |
|
|
2,545 |
|
|
|
26,188 |
|
|
|
|
| Invesco Mortgage Capital, Inc. |
|
|
4,050 |
|
|
|
62,370 |
|
|
|
|
| Investors Real Estate Trust |
|
|
6,057 |
|
|
|
43,429 |
|
|
|
|
| iStar Financial, Inc.#,* |
|
|
3,490 |
|
|
|
47,255 |
|
|
|
|
| Kite Realty Group Trust |
|
|
1,537 |
|
|
|
40,269 |
|
|
|
|
| LaSalle Hotel Properties |
|
|
4,201 |
|
|
|
154,135 |
|
|
|
|
| Lexington Realty Trust |
|
|
6,601 |
|
|
|
61,191 |
|
|
|
|
| LTC Properties, Inc. |
|
|
1,572 |
|
|
|
68,319 |
|
|
|
|
|
|
|
|
|
|
|
|
|
| Description
|
|
Number of
Shares
|
|
|
Value
|
|
|
|
|
| Mack-Cali Realty Corp. |
|
|
3,590 |
|
|
$ |
64,440 |
|
|
|
|
| Medical Properties Trust, Inc. |
|
|
5,785 |
|
|
|
80,874 |
|
|
|
|
| Monmouth Real Estate Investment Corp. |
|
|
142 |
|
|
|
1,467 |
|
|
|
|
| National Health Investors, Inc. |
|
|
2,054 |
|
|
|
137,043 |
|
|
|
|
| New Residential Investment Corp. |
|
|
3,750 |
|
|
|
63,900 |
|
|
|
|
| New York Mortgage Trust, Inc.# |
|
|
2,900 |
|
|
|
22,649 |
|
|
|
|
| New York REIT, Inc. |
|
|
3,820 |
|
|
|
37,742 |
|
|
|
|
| NorthStar Realty Finance Corp. |
|
|
335 |
|
|
|
6,285 |
|
|
|
|
| Omega Healthcare Investors, Inc. |
|
|
720 |
|
|
|
25,985 |
|
|
|
|
| One Liberty Properties, Inc. |
|
|
150 |
|
|
|
3,372 |
|
|
|
|
| Parkway Properties, Inc. |
|
|
2,970 |
|
|
|
48,322 |
|
|
|
|
| Pebblebrook Hotel Trust |
|
|
2,580 |
|
|
|
110,785 |
|
|
|
|
| Pennsylvania Real Estate Investment Trust |
|
|
2,921 |
|
|
|
66,044 |
|
|
|
|
| PennyMac Mortgage Investment Trust |
|
|
2,260 |
|
|
|
47,347 |
|
|
|
|
| Physicians Realty Trust |
|
|
1,520 |
|
|
|
25,232 |
|
|
|
|
| Potlatch Corp. |
|
|
1,231 |
|
|
|
45,436 |
|
|
|
|
| PS Business Parks, Inc. |
|
|
839 |
|
|
|
64,058 |
|
|
|
|
| QTS Realty Trust, Inc. |
|
|
1,000 |
|
|
|
36,270 |
|
|
|
|
| RAIT Financial Trust |
|
|
2,347 |
|
|
|
15,209 |
|
|
|
|
| Ramco-Gershenson Properties Trust |
|
|
2,244 |
|
|
|
39,225 |
|
|
|
|
| Redwood Trust, Inc.# |
|
|
3,089 |
|
|
|
53,100 |
|
|
|
|
| Resource Capital Corp. |
|
|
4,970 |
|
|
|
21,918 |
|
|
|
|
| Retail Opportunity Investments Corp. |
|
|
3,420 |
|
|
|
57,388 |
|
|
|
|
| Rexford Industrial Realty, Inc. |
|
|
1,380 |
|
|
|
20,507 |
|
|
|
|
| RLJ Lodging Trust |
|
|
5,080 |
|
|
|
150,724 |
|
|
|
|
| Rouse Properties, Inc. |
|
|
1,520 |
|
|
|
26,554 |
|
|
|
|
| Ryman Hospitality Properties, Inc. |
|
|
2,492 |
|
|
|
143,639 |
|
|
|
|
| Sabra Health Care REIT, Inc. |
|
|
3,293 |
|
|
|
98,395 |
|
|
|
|
| Saul Centers, Inc. |
|
|
748 |
|
|
|
37,639 |
|
|
|
|
| Select Income REIT |
|
|
1,070 |
|
|
|
24,813 |
|
|
|
|
| Silver Bay Realty Trust Corp. |
|
|
429 |
|
|
|
6,637 |
|
|
|
|
| Sovran Self Storage, Inc. |
|
|
2,207 |
|
|
|
192,759 |
|
|
|
|
| STAG Industrial, Inc. |
|
|
2,110 |
|
|
|
45,850 |
|
|
|
|
| Starwood Waypoint Residential Trust |
|
|
890 |
|
|
|
22,909 |
|
|
|
|
| STORE Capital Corp. |
|
|
870 |
|
|
|
18,270 |
|
|
|
|
| Strategic Hotels & Resorts, Inc.* |
|
|
14,520 |
|
|
|
169,884 |
|
|
|
|
| Summit Hotel Properties, Inc. |
|
|
2,880 |
|
|
|
37,930 |
|
|
|
|
| Sun Communities, Inc. |
|
|
2,971 |
|
|
|
184,380 |
|
|
|
|
| Sunstone Hotel Investors, Inc. |
|
|
8,299 |
|
|
|
129,298 |
|
|
|
|
| Terreno Realty Corp. |
|
|
620 |
|
|
|
13,194 |
|
|
|
|
| UMH Properties, Inc. |
|
|
410 |
|
|
|
4,129 |
|
|
|
|
| Universal Health Realty Income Trust |
|
|
1,067 |
|
|
|
52,987 |
|
|
|
|
| Urstadt Biddle Properties, Inc. |
|
|
1,625 |
|
|
|
33,719 |
|
|
|
|
| Ventas, Inc. |
|
|
214 |
|
|
|
14,745 |
|
|
|
|
| Washington Real Estate Investment Trust |
|
|
1,842 |
|
|
|
45,534 |
|
|
|
|
| Western Asset Mortgage Capital Corp.# |
|
|
75 |
|
|
|
1,096 |
|
April 30,
2015 / ANNUAL REPORT
PORTFOLIOS OF
INVESTMENTS 51
Wilmington Small-Cap Strategy Fund (continued)
|
|
|
|
|
|
|
|
|
|
|
|
| Description
|
|
Number of
Shares
|
|
|
Value
|
|
|
|
|
| Winthrop Realty Trust |
|
|
30 |
|
|
$ |
494 |
|
|
|
|
| WP GLIMCHER, Inc. |
|
|
908 |
|
|
|
13,620 |
|
|
|
|
|
|
|
|
|
|
|
|
|
|
|
|
|
|
|
$ |
5,794,460 |
|
|
| REAL ESTATE MANAGEMENT & DEVELOPMENT – 0.4% |
|
|
|
|
| Alexander & Baldwin, Inc. |
|
|
1,450 |
|
|
|
58,696 |
|
|
|
|
| Altisource Asset Management Corp.* |
|
|
70 |
|
|
|
15,680 |
|
|
|
|
| Altisource Portfolio Solutions SA#,* |
|
|
1,070 |
|
|
|
25,948 |
|
|
|
|
| AV Homes, Inc.* |
|
|
512 |
|
|
|
8,079 |
|
|
|
|
| Consolidated-Tomoka Land Co. |
|
|
290 |
|
|
|
15,875 |
|
|
|
|
| Forestar Group, Inc.* |
|
|
2,258 |
|
|
|
33,328 |
|
|
|
|
| FRP Holdings, Inc.* |
|
|
250 |
|
|
|
8,680 |
|
|
|
|
| Kennedy-Wilson Holdings, Inc. |
|
|
3,230 |
|
|
|
80,039 |
|
|
|
|
| St. Joe Co. (The)* |
|
|
3,720 |
|
|
|
64,914 |
|
|
|
|
| Tejon Ranch Co.* |
|
|
508 |
|
|
|
12,548 |
|
|
|
|
|
|
|
|
|
|
|
|
|
|
|
|
|
|
|
$ |
323,787 |
|
|
| THRIFTS & MORTGAGE FINANCE – 1.2% |
|
|
|
|
| Astoria Financial Corp. |
|
|
4,080 |
|
|
|
53,734 |
|
|
|
|
| BankFinancial Corp. |
|
|
111 |
|
|
|
1,421 |
|
|
|
|
| BBX Capital Corp.* |
|
|
105 |
|
|
|
1,925 |
|
|
|
|
| Beneficial Bancorp, Inc.* |
|
|
1,528 |
|
|
|
17,725 |
|
|
|
|
| BofI Holding, Inc.* |
|
|
1,090 |
|
|
|
100,073 |
|
|
|
|
| Brookline Bancorp, Inc. |
|
|
1,808 |
|
|
|
19,472 |
|
|
|
|
| Capitol Federal Financial, Inc. |
|
|
1,370 |
|
|
|
16,440 |
|
|
|
|
| Charter Financial Corp. |
|
|
726 |
|
|
|
8,690 |
|
|
|
|
| Clifton Bancorp, Inc. |
|
|
1,067 |
|
|
|
14,565 |
|
|
|
|
| Dime Community Bancshares, Inc. |
|
|
1,703 |
|
|
|
27,112 |
|
|
|
|
| Essent Group Ltd.* |
|
|
1,700 |
|
|
|
42,415 |
|
|
|
|
| EverBank Financial Corp. |
|
|
1,620 |
|
|
|
30,083 |
|
|
|
|
| Federal Agricultural Mortgage Corp. Class C |
|
|
340 |
|
|
|
10,690 |
|
|
|
|
| First Defiance Financial Corp. |
|
|
550 |
|
|
|
19,250 |
|
|
|
|
| First Financial Northwest, Inc. |
|
|
500 |
|
|
|
5,950 |
|
|
|
|
| Flagstar Bancorp, Inc.* |
|
|
50 |
|
|
|
859 |
|
|
|
|
| Fox Chase Bancorp, Inc. |
|
|
980 |
|
|
|
16,297 |
|
|
|
|
| HomeStreet, Inc. |
|
|
280 |
|
|
|
5,790 |
|
|
|
|
| Kearny Financial Corp.* |
|
|
19 |
|
|
|
253 |
|
|
|
|
| Ladder Capital Corp.* |
|
|
100 |
|
|
|
1,754 |
|
|
|
|
| LendingTree, Inc.* |
|
|
490 |
|
|
|
26,965 |
|
|
|
|
| Meridian Bancorp, Inc.* |
|
|
538 |
|
|
|
6,913 |
|
|
|
|
| Meta Financial Group, Inc. |
|
|
10 |
|
|
|
409 |
|
|
|
|
| MGIC Investment Corp.* |
|
|
14,885 |
|
|
|
155,102 |
|
|
|
|
| NASB Financial, Inc.* |
|
|
630 |
|
|
|
16,695 |
|
|
|
|
| Northfield Bancorp, Inc. |
|
|
2,255 |
|
|
|
32,540 |
|
|
|
|
| Northwest Bancshares, Inc. |
|
|
2,928 |
|
|
|
36,044 |
|
|
|
|
| OceanFirst Financial Corp. |
|
|
758 |
|
|
|
12,719 |
|
|
|
|
| Oritani Financial Corp. |
|
|
1,250 |
|
|
|
18,625 |
|
|
|
|
| PennyMac Financial Services, Inc. |
|
|
870 |
|
|
|
16,426 |
|
|
|
|
| Provident Financial Services, Inc. |
|
|
1,655 |
|
|
|
29,790 |
|
|
|
|
|
|
|
|
|
|
|
|
|
| Description
|
|
Number of
Shares
|
|
|
Value
|
|
|
|
|
| Radian Group, Inc. |
|
|
8,316 |
|
|
$ |
148,524 |
|
|
|
|
| Territorial Bancorp, Inc. |
|
|
730 |
|
|
|
16,863 |
|
|
|
|
| TrustCo Bank Corp. |
|
|
1,850 |
|
|
|
12,340 |
|
|
|
|
| United Community Financial Corp.* |
|
|
2,140 |
|
|
|
11,535 |
|
|
|
|
| United Financial Bancorp, Inc. |
|
|
2,981 |
|
|
|
38,008 |
|
|
|
|
| Walker & Dunlop, Inc.* |
|
|
510 |
|
|
|
9,761 |
|
|
|
|
| Washington Federal, Inc. |
|
|
2,020 |
|
|
|
43,632 |
|
|
|
|
| Waterstone Financial, Inc. |
|
|
600 |
|
|
|
7,644 |
|
|
|
|
| WSFS Financial Corp. |
|
|
448 |
|
|
|
31,884 |
|
|
|
|
|
|
|
|
|
|
|
|
|
|
|
|
|
|
|
$ |
1,066,917 |
|
|
|
|
|
|
|
|
|
|
|
|
|
| TOTAL FINANCIALS |
|
|
|
|
|
$ |
16,659,936 |
|
|
| HEALTH CARE – 17.7% |
|
|
| BIOTECHNOLOGY – 7.3% |
|
|
|
|
| ACADIA Pharmaceuticals, Inc.#,* |
|
|
5,210 |
|
|
|
178,026 |
|
|
|
|
| Acceleron Pharma, Inc.* |
|
|
1,020 |
|
|
|
28,203 |
|
|
|
|
| Achillion Pharmaceuticals, Inc.* |
|
|
4,020 |
|
|
|
35,175 |
|
|
|
|
| Acorda Therapeutics, Inc.* |
|
|
3,113 |
|
|
|
93,608 |
|
|
|
|
| Aegerion Pharmaceuticals, Inc.* |
|
|
1,770 |
|
|
|
41,170 |
|
|
|
|
| Agenus, Inc.* |
|
|
1,390 |
|
|
|
9,188 |
|
|
|
|
| Agios Pharmaceuticals, Inc.#,* |
|
|
950 |
|
|
|
87,723 |
|
|
|
|
| Akebia Therapeutics, Inc.* |
|
|
920 |
|
|
|
7,056 |
|
|
|
|
| Alder Biopharmaceuticals, Inc.* |
|
|
710 |
|
|
|
18,105 |
|
|
|
|
| AMAG Pharmaceuticals, Inc.#,* |
|
|
1,390 |
|
|
|
70,848 |
|
|
|
|
| Anacor Pharmaceuticals, Inc.* |
|
|
1,690 |
|
|
|
89,046 |
|
|
|
|
| Applied Genetic Technologies Corp./DE* |
|
|
960 |
|
|
|
18,374 |
|
|
|
|
| Arena Pharmaceuticals, Inc.#,* |
|
|
13,610 |
|
|
|
59,340 |
|
|
|
|
| ARIAD Pharmaceuticals, Inc.#,* |
|
|
10,630 |
|
|
|
92,162 |
|
|
|
|
| Array BioPharma, Inc.* |
|
|
7,083 |
|
|
|
44,269 |
|
|
|
|
| Arrowhead Research Corp.#,* |
|
|
3,910 |
|
|
|
26,979 |
|
|
|
|
| Asterias Biotherapeutics, Inc.#,* |
|
|
294 |
|
|
|
3,340 |
|
|
|
|
| Auspex Pharmaceuticals, Inc.* |
|
|
650 |
|
|
|
65,578 |
|
|
|
|
| Avalanche Biotechnologies, Inc.* |
|
|
490 |
|
|
|
15,611 |
|
|
|
|
| BioCryst Pharmaceuticals, Inc.#,* |
|
|
4,160 |
|
|
|
38,646 |
|
|
|
|
| BioTime, Inc.#,* |
|
|
4,930 |
|
|
|
25,291 |
|
|
|
|
| Bluebird Bio, Inc.* |
|
|
1,440 |
|
|
|
191,794 |
|
|
|
|
| Celldex Therapeutics, Inc.* |
|
|
5,193 |
|
|
|
124,632 |
|
|
|
|
| Cellular Dynamics International, Inc.* |
|
|
3,320 |
|
|
|
54,846 |
|
|
|
|
| Cepheid, Inc.* |
|
|
4,757 |
|
|
|
266,868 |
|
|
|
|
| ChemoCentryx, Inc.#,* |
|
|
1,310 |
|
|
|
8,764 |
|
|
|
|
| Chimerix, Inc.* |
|
|
2,130 |
|
|
|
72,420 |
|
|
|
|
| Clovis Oncology, Inc.#,* |
|
|
1,530 |
|
|
|
122,951 |
|
|
|
|
| Coherus Biosciences, Inc.* |
|
|
610 |
|
|
|
13,280 |
|
|
|
|
| CTI BioPharma Corp.* |
|
|
3,920 |
|
|
|
6,978 |
|
|
|
|
| Cytokinetics, Inc.* |
|
|
2,700 |
|
|
|
16,983 |
|
|
|
|
| Cytori Therapeutics, Inc.* |
|
|
13,217 |
|
|
|
11,565 |
|
|
|
|
| CytRx Corp.#,* |
|
|
4,240 |
|
|
|
18,614 |
|
ANNUAL
REPORT / April 30, 2015
52
PORTFOLIOS OF INVESTMENTS
Wilmington Small-Cap Strategy Fund (continued)
|
|
|
|
|
|
|
|
|
|
|
|
| Description
|
|
Number of
Shares
|
|
|
Value
|
|
|
|
|
| Dendreon Corp.* |
|
|
13,300 |
|
|
$ |
492 |
|
|
|
|
| Dyax Corp.* |
|
|
9,331 |
|
|
|
223,104 |
|
|
|
|
| Dynavax Technologies Corp.#,* |
|
|
841 |
|
|
|
16,917 |
|
|
|
|
| Emergent Biosolutions, Inc.* |
|
|
1,701 |
|
|
|
50,503 |
|
|
|
|
| Enanta Pharmaceuticals, Inc.#,* |
|
|
610 |
|
|
|
20,886 |
|
|
|
|
| Epizyme, Inc.#,* |
|
|
440 |
|
|
|
7,176 |
|
|
|
|
| Esperion Therapeutics, Inc.#,* |
|
|
550 |
|
|
|
52,321 |
|
|
|
|
| Exact Sciences Corp.#,* |
|
|
5,780 |
|
|
|
120,802 |
|
|
|
|
| Exelixis, Inc.* |
|
|
9,082 |
|
|
|
23,341 |
|
|
|
|
| FibroGen, Inc.#,* |
|
|
630 |
|
|
|
14,647 |
|
|
|
|
| Five Prime Therapeutics, Inc.* |
|
|
1,290 |
|
|
|
25,877 |
|
|
|
|
| Foundation Medicine, Inc.#,* |
|
|
520 |
|
|
|
23,665 |
|
|
|
|
| Galectin Therapeutics, Inc.#,* |
|
|
2,100 |
|
|
|
6,279 |
|
|
|
|
| Galena Biopharma, Inc.* |
|
|
10,700 |
|
|
|
14,445 |
|
|
|
|
| Genomic Health, Inc.#,* |
|
|
1,500 |
|
|
|
40,605 |
|
|
|
|
| Geron Corp.#,* |
|
|
7,057 |
|
|
|
25,546 |
|
|
|
|
| Halozyme Therapeutics, Inc.#,* |
|
|
6,651 |
|
|
|
98,900 |
|
|
|
|
| Heron Therapeutics, Inc.* |
|
|
1,900 |
|
|
|
20,520 |
|
|
|
|
| Hyperion Therapeutics, Inc.* |
|
|
600 |
|
|
|
27,576 |
|
|
|
|
| Idera Pharmaceuticals, Inc.#,* |
|
|
2,790 |
|
|
|
7,840 |
|
|
|
|
| Immune Design Corp.#,* |
|
|
10 |
|
|
|
224 |
|
|
|
|
| ImmunoGen, Inc.* |
|
|
7,178 |
|
|
|
59,362 |
|
|
|
|
| Immunomedics, Inc.* |
|
|
710 |
|
|
|
2,556 |
|
|
|
|
| Infinity Pharmaceuticals, Inc.* |
|
|
3,000 |
|
|
|
38,010 |
|
|
|
|
| Inovio Pharmaceuticals, Inc.#,* |
|
|
3,440 |
|
|
|
28,070 |
|
|
|
|
| Insmed, Inc.* |
|
|
2,680 |
|
|
|
53,707 |
|
|
|
|
| Insys Therapeutics, Inc.#,* |
|
|
735 |
|
|
|
38,639 |
|
|
|
|
| Intrexon Corp.#,* |
|
|
2,700 |
|
|
|
104,841 |
|
|
|
|
| Ironwood Pharmaceuticals, Inc.* |
|
|
8,220 |
|
|
|
112,285 |
|
|
|
|
| Isis Pharmaceuticals, Inc.#,* |
|
|
7,822 |
|
|
|
443,664 |
|
|
|
|
| Karyopharm Therapeutics, Inc.#,* |
|
|
730 |
|
|
|
19,827 |
|
|
|
|
| Keryx Biopharmaceuticals, Inc.#,* |
|
|
5,960 |
|
|
|
63,534 |
|
|
|
|
| Kindred Biosciences, Inc.#,* |
|
|
1,700 |
|
|
|
11,594 |
|
|
|
|
| Kite Pharma, Inc.#,* |
|
|
840 |
|
|
|
42,319 |
|
|
|
|
| KYTHERA Biopharmaceuticals, Inc.* |
|
|
1,330 |
|
|
|
58,108 |
|
|
|
|
| Lexicon Pharmaceuticals, Inc.* |
|
|
9,060 |
|
|
|
9,060 |
|
|
|
|
| Ligand Pharmaceuticals, Inc.* |
|
|
1,285 |
|
|
|
99,767 |
|
|
|
|
| MacroGenics, Inc.* |
|
|
1,660 |
|
|
|
47,493 |
|
|
|
|
| MannKind Corp.#,* |
|
|
15,607 |
|
|
|
66,954 |
|
|
|
|
| Merrimack Pharmaceuticals, Inc.#,* |
|
|
5,380 |
|
|
|
59,718 |
|
|
|
|
| MiMedx Group, Inc.#,* |
|
|
6,790 |
|
|
|
63,826 |
|
|
|
|
| Mirati Therapeutics, Inc.#,* |
|
|
360 |
|
|
|
10,004 |
|
|
|
|
| Momenta Pharmaceuticals, Inc.* |
|
|
4,360 |
|
|
|
76,082 |
|
|
|
|
| NanoViricides, Inc.* |
|
|
6,080 |
|
|
|
10,458 |
|
|
|
|
| Navidea Biopharmaceuticals, Inc.* |
|
|
5,340 |
|
|
|
7,209 |
|
|
|
|
| NeoStem, Inc.#,* |
|
|
2,480 |
|
|
|
7,142 |
|
|
|
|
| Neuralstem, Inc.#,* |
|
|
370 |
|
|
|
625 |
|
|
|
|
| Neurocrine Biosciences, Inc.* |
|
|
5,117 |
|
|
|
174,439 |
|
|
|
|
|
|
|
|
|
|
|
|
|
| Description
|
|
Number of
Shares
|
|
|
Value
|
|
|
|
|
| NewLink Genetics Corp.* |
|
|
1,620 |
|
|
$ |
72,252 |
|
|
|
|
| Northwest Biotherapeutics, Inc.#,* |
|
|
3,010 |
|
|
|
23,659 |
|
|
|
|
| Novavax, Inc.#,* |
|
|
16,373 |
|
|
|
126,563 |
|
|
|
|
| Ohr Pharmaceutical, Inc.* |
|
|
50 |
|
|
|
141 |
|
|
|
|
| OncoMed Pharmaceuticals, Inc.#,* |
|
|
300 |
|
|
|
7,194 |
|
|
|
|
| Oncothyreon, Inc.* |
|
|
7,840 |
|
|
|
11,760 |
|
|
|
|
| Ophthotech Corp.* |
|
|
260 |
|
|
|
11,773 |
|
|
|
|
| OPKO Health, Inc.#,* |
|
|
14,100 |
|
|
|
194,016 |
|
|
|
|
| Orexigen Therapeutics, Inc.#,* |
|
|
7,015 |
|
|
|
46,089 |
|
|
|
|
| Organovo Holdings, Inc.#,* |
|
|
5,370 |
|
|
|
24,380 |
|
|
|
|
| Osiris Therapeutics, Inc.#,* |
|
|
184 |
|
|
|
2,791 |
|
|
|
|
| Otonomy, Inc.* |
|
|
70 |
|
|
|
1,837 |
|
|
|
|
| OvaScience, Inc.#,* |
|
|
880 |
|
|
|
21,776 |
|
|
|
|
| PDL BioPharma, Inc.# |
|
|
11,206 |
|
|
|
74,744 |
|
|
|
|
| Peregrine Pharmaceuticals, Inc.* |
|
|
4,640 |
|
|
|
6,078 |
|
|
|
|
| Portola Pharmaceuticals, Inc.* |
|
|
2,530 |
|
|
|
90,296 |
|
|
|
|
| Progenics Pharmaceuticals, Inc.* |
|
|
2,066 |
|
|
|
10,227 |
|
|
|
|
| Prothena Corp. PLC* |
|
|
1,260 |
|
|
|
40,837 |
|
|
|
|
| PTC Therapeutics, Inc.* |
|
|
1,650 |
|
|
|
96,938 |
|
|
|
|
| Puma Biotechnology, Inc.#,* |
|
|
1,570 |
|
|
|
283,511 |
|
|
|
|
| Radius Health, Inc.* |
|
|
420 |
|
|
|
15,053 |
|
|
|
|
| Raptor Pharmaceutical Corp.#,* |
|
|
4,080 |
|
|
|
41,290 |
|
|
|
|
| Receptos, Inc.* |
|
|
1,210 |
|
|
|
178,281 |
|
|
|
|
| Regulus Therapeutics, Inc.#,* |
|
|
1,310 |
|
|
|
16,441 |
|
|
|
|
| Repligen Corp.* |
|
|
2,580 |
|
|
|
76,136 |
|
|
|
|
| Retrophin, Inc.* |
|
|
1,400 |
|
|
|
30,156 |
|
|
|
|
| Rigel Pharmaceuticals, Inc.* |
|
|
821 |
|
|
|
3,497 |
|
|
|
|
| Sage Therapeutics, Inc.#,* |
|
|
170 |
|
|
|
9,010 |
|
|
|
|
| Sangamo BioSciences, Inc.* |
|
|
4,095 |
|
|
|
50,655 |
|
|
|
|
| Sarepta Therapeutics, Inc.#,* |
|
|
2,470 |
|
|
|
30,134 |
|
|
|
|
| Spectrum Pharmaceuticals, Inc.#,* |
|
|
2,800 |
|
|
|
15,820 |
|
|
|
|
| Stemline Therapeutics, Inc.* |
|
|
480 |
|
|
|
6,667 |
|
|
|
|
| Sunesis Pharmaceuticals, Inc.* |
|
|
4,130 |
|
|
|
9,664 |
|
|
|
|
| Synageva BioPharma Corp.#,* |
|
|
1,500 |
|
|
|
137,940 |
|
|
|
|
| Synergy Pharmaceuticals, Inc.#,* |
|
|
3,850 |
|
|
|
13,475 |
|
|
|
|
| Synta Pharmaceuticals Corp.* |
|
|
6,050 |
|
|
|
13,613 |
|
|
|
|
| TESARO, Inc.#,* |
|
|
1,670 |
|
|
|
90,965 |
|
|
|
|
| TG Therapeutics, Inc.#,* |
|
|
1,310 |
|
|
|
18,288 |
|
|
|
|
| Threshold Pharmaceuticals, Inc.#,* |
|
|
5,060 |
|
|
|
17,912 |
|
|
|
|
| Trius Therapeutics
CVR*,†† |
|
|
1,740 |
|
|
|
— |
|
|
|
|
| Ultragenyx Pharmaceutical, Inc.* |
|
|
530 |
|
|
|
29,908 |
|
|
|
|
| Vanda Pharmaceuticals, Inc.#,* |
|
|
2,150 |
|
|
|
19,673 |
|
|
|
|
| Verastem, Inc.* |
|
|
1,300 |
|
|
|
10,790 |
|
|
|
|
| Versartis, Inc.#,* |
|
|
950 |
|
|
|
16,226 |
|
|
|
|
| Xencor, Inc.* |
|
|
310 |
|
|
|
4,408 |
|
|
|
|
| XOMA Corp.* |
|
|
6,390 |
|
|
|
19,170 |
|
April 30,
2015 / ANNUAL REPORT
PORTFOLIOS OF
INVESTMENTS 53
Wilmington Small-Cap Strategy Fund (continued)
|
|
|
|
|
|
|
|
|
|
|
|
| Description
|
|
Number of
Shares
|
|
|
Value
|
|
|
|
|
| ZIOPHARM Oncology, Inc.#,* |
|
|
7,320 |
|
|
$ |
64,489 |
|
|
|
|
|
|
|
|
|
|
|
|
|
|
|
|
|
|
|
$ |
6,574,915 |
|
|
| HEALTH CARE EQUIPMENT & SUPPLIES – 4.1% |
|
|
|
|
| Abaxis, Inc. |
|
|
1,731 |
|
|
|
110,784 |
|
|
|
|
| ABIOMED, Inc.* |
|
|
2,782 |
|
|
|
175,878 |
|
|
|
|
| Accuray, Inc.#,* |
|
|
5,402 |
|
|
|
43,918 |
|
|
|
|
| Analogic Corp. |
|
|
388 |
|
|
|
32,786 |
|
|
|
|
| AngioDynamics, Inc.* |
|
|
989 |
|
|
|
16,506 |
|
|
|
|
| Anika Therapeutics, Inc.* |
|
|
970 |
|
|
|
33,096 |
|
|
|
|
| Antares Pharma, Inc.* |
|
|
3,040 |
|
|
|
7,448 |
|
|
|
|
| AtriCure, Inc.* |
|
|
2,120 |
|
|
|
46,661 |
|
|
|
|
| Atrion Corp. |
|
|
70 |
|
|
|
22,739 |
|
|
|
|
| Cantel Medical Corp. |
|
|
2,549 |
|
|
|
114,170 |
|
|
|
|
| Cardiovascular Systems, Inc.* |
|
|
1,840 |
|
|
|
57,592 |
|
|
|
|
| Cerus Corp.#,* |
|
|
6,370 |
|
|
|
28,283 |
|
|
|
|
| CONMED Corp. |
|
|
1,023 |
|
|
|
51,385 |
|
|
|
|
| CryoLife, Inc. |
|
|
1,550 |
|
|
|
15,810 |
|
|
|
|
| Cyberonics, Inc.* |
|
|
1,850 |
|
|
|
112,683 |
|
|
|
|
| Cynosure, Inc.* |
|
|
1,405 |
|
|
|
46,955 |
|
|
|
|
| Derma Sciences, Inc.* |
|
|
490 |
|
|
|
3,871 |
|
|
|
|
| DexCom, Inc.* |
|
|
4,963 |
|
|
|
335,350 |
|
|
|
|
| Endologix, Inc.* |
|
|
4,220 |
|
|
|
65,663 |
|
|
|
|
| Exactech, Inc.* |
|
|
622 |
|
|
|
13,591 |
|
|
|
|
| GenMark Diagnostics, Inc.#,* |
|
|
3,020 |
|
|
|
28,992 |
|
|
|
|
| Globus Medical, Inc.* |
|
|
3,940 |
|
|
|
94,127 |
|
|
|
|
| Greatbatch, Inc.* |
|
|
1,101 |
|
|
|
59,366 |
|
|
|
|
| Haemonetics Corp.* |
|
|
2,320 |
|
|
|
94,030 |
|
|
|
|
| HeartWare International, Inc.#,* |
|
|
1,070 |
|
|
|
81,010 |
|
|
|
|
| ICU Medical, Inc.* |
|
|
500 |
|
|
|
42,185 |
|
|
|
|
| Insulet Corp.* |
|
|
3,431 |
|
|
|
102,415 |
|
|
|
|
| Integra LifeSciences Holdings Corp.* |
|
|
1,427 |
|
|
|
83,879 |
|
|
|
|
| Invacare Corp. |
|
|
1,684 |
|
|
|
33,798 |
|
|
|
|
| K2M Group Holdings, Inc.* |
|
|
960 |
|
|
|
20,170 |
|
|
|
|
| LDR Holding Corp.* |
|
|
1,060 |
|
|
|
35,881 |
|
|
|
|
| Masimo Corp. |
|
|
3,591 |
|
|
|
121,232 |
|
|
|
|
| Meridian Bioscience, Inc. |
|
|
164 |
|
|
|
2,906 |
|
|
|
|
| Merit Medical Systems, Inc.* |
|
|
2,280 |
|
|
|
44,255 |
|
|
|
|
| Natus Medical, Inc.* |
|
|
1,753 |
|
|
|
66,106 |
|
|
|
|
| Neogen Corp.* |
|
|
2,519 |
|
|
|
112,196 |
|
|
|
|
| Nevro Corp.* |
|
|
440 |
|
|
|
19,809 |
|
|
|
|
| NuVasive, Inc.* |
|
|
2,930 |
|
|
|
131,059 |
|
|
|
|
| NxStage Medical, Inc.* |
|
|
4,431 |
|
|
|
81,220 |
|
|
|
|
| OraSure Technologies, Inc.* |
|
|
3,017 |
|
|
|
19,007 |
|
|
|
|
| Orthofix International NV* |
|
|
641 |
|
|
|
20,711 |
|
|
|
|
| Oxford Immunotec Global PLC* |
|
|
1,180 |
|
|
|
15,659 |
|
|
|
|
| PhotoMedex, Inc.#,* |
|
|
670 |
|
|
|
1,380 |
|
|
|
|
|
|
|
|
|
|
|
|
|
| Description
|
|
Number of
Shares
|
|
|
Value
|
|
|
|
|
| Quidel Corp.* |
|
|
1,947 |
|
|
$ |
45,365 |
|
|
|
|
| Rockwell Medical, Inc.#,* |
|
|
490 |
|
|
|
4,758 |
|
|
|
|
| RTI Surgical, Inc.* |
|
|
270 |
|
|
|
1,512 |
|
|
|
|
| Spectranetics Corp. (The)#,* |
|
|
3,148 |
|
|
|
80,746 |
|
|
|
|
| STAAR Surgical Co.#,* |
|
|
3,490 |
|
|
|
30,887 |
|
|
|
|
| STERIS Corp. |
|
|
3,940 |
|
|
|
262,010 |
|
|
|
|
| SurModics, Inc.* |
|
|
490 |
|
|
|
12,358 |
|
|
|
|
| Symmetry Surgical, Inc.* |
|
|
77 |
|
|
|
595 |
|
|
|
|
| Tandem Diabetes Care, Inc.* |
|
|
920 |
|
|
|
12,282 |
|
|
|
|
| Thoratec Corp.* |
|
|
2,540 |
|
|
|
101,879 |
|
|
|
|
| Tornier NV* |
|
|
1,100 |
|
|
|
28,457 |
|
|
|
|
| Unilife Corp.* |
|
|
9,460 |
|
|
|
31,691 |
|
|
|
|
| Utah Medical Products, Inc. |
|
|
300 |
|
|
|
16,173 |
|
|
|
|
| Vascular Solutions, Inc.* |
|
|
1,720 |
|
|
|
55,143 |
|
|
|
|
| West Pharmaceutical Services, Inc. |
|
|
4,660 |
|
|
|
248,285 |
|
|
|
|
| Wright Medical Group, Inc.* |
|
|
2,300 |
|
|
|
58,351 |
|
|
|
|
| Zeltiq Aesthetics, Inc.#,* |
|
|
2,010 |
|
|
|
61,707 |
|
|
|
|
|
|
|
|
|
|
|
|
|
|
|
|
|
|
|
$ |
3,698,761 |
|
|
| HEALTH CARE PROVIDERS & SERVICES – 2.9% |
|
|
|
|
| Acadia Healthcare Co., Inc.#,* |
|
|
2,920 |
|
|
|
200,020 |
|
|
|
|
| Aceto Corp. |
|
|
1,663 |
|
|
|
32,229 |
|
|
|
|
| Addus HomeCare Corp.* |
|
|
410 |
|
|
|
11,004 |
|
|
|
|
| Air Methods Corp.* |
|
|
2,543 |
|
|
|
116,215 |
|
|
|
|
| Almost Family, Inc. |
|
|
308 |
|
|
|
13,330 |
|
|
|
|
| Amedisys, Inc.* |
|
|
1,196 |
|
|
|
33,261 |
|
|
|
|
| AMN Healthcare Services, Inc.* |
|
|
2,068 |
|
|
|
47,171 |
|
|
|
|
| Amsurg Corp.* |
|
|
1,850 |
|
|
|
116,032 |
|
|
|
|
| Bio-Reference Labs, Inc.* |
|
|
1,688 |
|
|
|
55,907 |
|
|
|
|
| BioScrip, Inc.#,* |
|
|
3,240 |
|
|
|
15,228 |
|
|
|
|
| BioTelemetry, Inc.* |
|
|
1,740 |
|
|
|
13,937 |
|
|
|
|
| Brookdale Senior Living, Inc.* |
|
|
100 |
|
|
|
3,623 |
|
|
|
|
| Capital Senior Living Corp.* |
|
|
2,288 |
|
|
|
59,877 |
|
|
|
|
| Chemed Corp. |
|
|
1,305 |
|
|
|
150,401 |
|
|
|
|
| CorVel Corp.* |
|
|
520 |
|
|
|
18,585 |
|
|
|
|
| Cross Country Healthcare, Inc.* |
|
|
884 |
|
|
|
9,812 |
|
|
|
|
| Ensign Group, Inc. (The) |
|
|
1,619 |
|
|
|
68,176 |
|
|
|
|
| ExamWorks Group, Inc.* |
|
|
2,560 |
|
|
|
104,832 |
|
|
|
|
| Five Star Quality Care, Inc.* |
|
|
2,940 |
|
|
|
12,495 |
|
|
|
|
| Genesis Healthcare, Inc.* |
|
|
1,199 |
|
|
|
8,285 |
|
|
|
|
| Hanger, Inc.* |
|
|
913 |
|
|
|
20,396 |
|
|
|
|
| HealthEquity, Inc.* |
|
|
180 |
|
|
|
4,718 |
|
|
|
|
| HealthSouth Corp. |
|
|
5,544 |
|
|
|
250,700 |
|
|
|
|
| Healthways, Inc.* |
|
|
1,910 |
|
|
|
33,234 |
|
|
|
|
| HMS Holdings Corp.* |
|
|
5,997 |
|
|
|
102,009 |
|
|
|
|
| IPC Healthcare, Inc.* |
|
|
1,160 |
|
|
|
56,747 |
|
|
|
|
| Kindred Healthcare, Inc. |
|
|
3,108 |
|
|
|
71,329 |
|
ANNUAL
REPORT / April 30, 2015
54
PORTFOLIOS OF INVESTMENTS
Wilmington Small-Cap Strategy Fund (continued)
|
|
|
|
|
|
|
|
|
|
|
|
| Description
|
|
Number of
Shares
|
|
|
Value
|
|
|
|
|
| Landauer, Inc. |
|
|
366 |
|
|
$ |
11,807 |
|
|
|
|
| LHC Group, Inc.* |
|
|
547 |
|
|
|
17,537 |
|
|
|
|
| Magellan Health, Inc.* |
|
|
1,215 |
|
|
|
76,909 |
|
|
|
|
| Molina Healthcare, Inc.* |
|
|
2,022 |
|
|
|
119,763 |
|
|
|
|
| National Healthcare Corp. |
|
|
320 |
|
|
|
20,256 |
|
|
|
|
| National Research Corp.* |
|
|
630 |
|
|
|
9,085 |
|
|
|
|
| Owens & Minor, Inc. |
|
|
1,406 |
|
|
|
47,410 |
|
|
|
|
| PharMerica Corp.* |
|
|
1,409 |
|
|
|
40,382 |
|
|
|
|
| Providence Service Corp. (The)* |
|
|
930 |
|
|
|
39,544 |
|
|
|
|
| RadNet, Inc.* |
|
|
1,220 |
|
|
|
10,224 |
|
|
|
|
| Select Medical Holdings Corp. |
|
|
4,160 |
|
|
|
60,528 |
|
|
|
|
| Team Health Holdings, Inc.* |
|
|
4,820 |
|
|
|
287,127 |
|
|
|
|
| Triple-S Management Corp., Class B* |
|
|
941 |
|
|
|
17,616 |
|
|
|
|
| U.S. Physical Therapy, Inc. |
|
|
1,082 |
|
|
|
51,027 |
|
|
|
|
| Universal American Corp. |
|
|
2,463 |
|
|
|
24,605 |
|
|
|
|
| WellCare Health Plans, Inc.* |
|
|
1,890 |
|
|
|
146,343 |
|
|
|
|
|
|
|
|
|
|
|
|
|
|
|
|
|
|
|
$ |
2,609,716 |
|
|
| HEALTH CARE TECHNOLOGY – 0.5% |
|
|
|
|
| athenahealth, Inc.* |
|
|
15 |
|
|
|
1,840 |
|
|
|
|
| Castlight Health, Inc.#,* |
|
|
1,760 |
|
|
|
13,253 |
|
|
|
|
| Computer Programs & Systems, Inc. |
|
|
473 |
|
|
|
24,752 |
|
|
|
|
| HealthStream, Inc.* |
|
|
1,630 |
|
|
|
47,172 |
|
|
|
|
| MedAssets, Inc.* |
|
|
2,339 |
|
|
|
47,341 |
|
|
|
|
| Medidata Solutions, Inc.* |
|
|
2,870 |
|
|
|
153,344 |
|
|
|
|
| Merge Healthcare, Inc.* |
|
|
5,470 |
|
|
|
27,186 |
|
|
|
|
| Omnicell, Inc.* |
|
|
2,918 |
|
|
|
103,677 |
|
|
|
|
| Quality Systems, Inc. |
|
|
2,496 |
|
|
|
38,925 |
|
|
|
|
| Vocera Communications, Inc.* |
|
|
370 |
|
|
|
4,214 |
|
|
|
|
|
|
|
|
|
|
|
|
|
|
|
|
|
|
|
$ |
461,704 |
|
|
| LIFE SCIENCES TOOLS & SERVICES – 0.7% |
|
|
|
|
| Accelerate Diagnostics, Inc.#,* |
|
|
1,162 |
|
|
|
26,494 |
|
|
|
|
| Affymetrix, Inc.#,* |
|
|
3,474 |
|
|
|
42,140 |
|
|
|
|
| Albany Molecular Research, Inc.#,* |
|
|
1,310 |
|
|
|
23,659 |
|
|
|
|
| Cambrex Corp.* |
|
|
2,354 |
|
|
|
90,605 |
|
|
|
|
| Fluidigm Corp.* |
|
|
2,270 |
|
|
|
85,034 |
|
|
|
|
| INC Research Holdings, Inc.* |
|
|
620 |
|
|
|
20,795 |
|
|
|
|
| Luminex Corp.* |
|
|
1,998 |
|
|
|
31,009 |
|
|
|
|
| NanoString Technologies, Inc.* |
|
|
390 |
|
|
|
4,657 |
|
|
|
|
| Pacific Biosciences of California, Inc.* |
|
|
2,490 |
|
|
|
12,848 |
|
|
|
|
| PAREXEL International Corp.* |
|
|
3,999 |
|
|
|
254,236 |
|
|
|
|
| PRA Health Sciences, Inc.* |
|
|
1,060 |
|
|
|
30,189 |
|
|
|
|
| Sequenom, Inc.#,* |
|
|
7,542 |
|
|
|
33,486 |
|
|
|
|
|
|
|
|
|
|
|
|
|
|
|
|
|
|
|
$ |
655,152 |
|
|
| PHARMACEUTICALS – 2.2% |
|
|
|
|
| AcelRx Pharmaceuticals, Inc.#,* |
|
|
1,790 |
|
|
|
7,142 |
|
|
|
|
| Aerie Pharmaceuticals, Inc.* |
|
|
650 |
|
|
|
6,266 |
|
|
|
|
| Akorn, Inc.#,* |
|
|
4,380 |
|
|
|
182,383 |
|
|
|
|
|
|
|
|
|
|
|
|
|
| Description
|
|
Number of
Shares
|
|
|
Value
|
|
|
|
|
| Alimera Sciences, Inc.#,* |
|
|
800 |
|
|
$ |
3,488 |
|
|
|
|
| Ampio Pharmaceuticals, Inc.#,* |
|
|
3,390 |
|
|
|
8,170 |
|
|
|
|
| ANI Pharmaceuticals, Inc.* |
|
|
360 |
|
|
|
21,953 |
|
|
|
|
| Aratana Therapeutics, Inc.* |
|
|
1,820 |
|
|
|
23,496 |
|
|
|
|
| BioDelivery Sciences International, Inc.#,* |
|
|
1,560 |
|
|
|
12,574 |
|
|
|
|
| Bio-Path Holdings, Inc.* |
|
|
1,040 |
|
|
|
1,617 |
|
|
|
|
| Catalent, Inc.* |
|
|
3,270 |
|
|
|
94,078 |
|
|
|
|
| Cempra, Inc.* |
|
|
1,500 |
|
|
|
47,235 |
|
|
|
|
| Chelsea Therapeutics International Ltd. -
CVR†† |
|
|
9,820 |
|
|
|
786 |
|
|
|
|
| ContraVir Pharmaceuticals, Inc.#,* |
|
|
656 |
|
|
|
2,007 |
|
|
|
|
| Corcept Therapeutics, Inc.#,* |
|
|
850 |
|
|
|
4,904 |
|
|
|
|
| Depomed, Inc.* |
|
|
4,370 |
|
|
|
101,646 |
|
|
|
|
| Endo International PLC* |
|
|
218 |
|
|
|
18,326 |
|
|
|
|
| Endocyte, Inc.#,* |
|
|
3,580 |
|
|
|
20,764 |
|
|
|
|
| Furiex Pharmaceuticals
CVR†† |
|
|
710 |
|
|
|
6,937 |
|
|
|
|
| Horizon Pharma PLC# |
|
|
4,630 |
|
|
|
130,196 |
|
|
|
|
| IGI Laboratories, Inc.#,* |
|
|
810 |
|
|
|
4,115 |
|
|
|
|
| Impax Laboratories, Inc.* |
|
|
2,760 |
|
|
|
124,918 |
|
|
|
|
| Intra-Cellular Therapies, Inc.#,* |
|
|
1,500 |
|
|
|
30,675 |
|
|
|
|
| Lannett Co., Inc.#,* |
|
|
1,960 |
|
|
|
112,700 |
|
|
|
|
| Medicines Co. (The)* |
|
|
4,429 |
|
|
|
113,427 |
|
|
|
|
| Nektar Therapeutics#,* |
|
|
7,632 |
|
|
|
72,657 |
|
|
|
|
| Omeros Corp.#,* |
|
|
2,440 |
|
|
|
49,093 |
|
|
|
|
| Pacira Pharmaceuticals, Inc.#,* |
|
|
2,320 |
|
|
|
158,874 |
|
|
|
|
| Pain Therapeutics, Inc.* |
|
|
5,540 |
|
|
|
11,302 |
|
|
|
|
| Pernix Therapeutics Holdings, Inc.* |
|
|
1,760 |
|
|
|
11,229 |
|
|
|
|
| Phibro Animal Health Corp.* |
|
|
1,450 |
|
|
|
46,052 |
|
|
|
|
| POZEN, Inc.* |
|
|
1,045 |
|
|
|
8,172 |
|
|
|
|
| Prestige Brands Holdings, Inc.* |
|
|
3,887 |
|
|
|
152,565 |
|
|
|
|
| Relypsa, Inc.* |
|
|
1,390 |
|
|
|
40,213 |
|
|
|
|
| Repros Therapeutics, Inc.#,* |
|
|
1,950 |
|
|
|
14,996 |
|
|
|
|
| Revance Therapeutics, Inc.* |
|
|
750 |
|
|
|
14,756 |
|
|
|
|
| Sagent Pharmaceuticals, Inc.* |
|
|
1,210 |
|
|
|
28,205 |
|
|
|
|
| SciClone Pharmaceuticals, Inc.* |
|
|
2,900 |
|
|
|
23,693 |
|
|
|
|
| Sucampo Pharmaceuticals, Inc.#,* |
|
|
852 |
|
|
|
15,132 |
|
|
|
|
| Supernus Pharmaceuticals, Inc.* |
|
|
2,810 |
|
|
|
35,968 |
|
|
|
|
| Tetraphase Pharmaceuticals, Inc.* |
|
|
1,770 |
|
|
|
62,446 |
|
|
|
|
| TherapeuticsMD, Inc.* |
|
|
8,350 |
|
|
|
54,108 |
|
|
|
|
| Theravance, Inc.#,* |
|
|
5,400 |
|
|
|
87,750 |
|
|
|
|
| VIVUS, Inc.#,* |
|
|
6,370 |
|
|
|
14,205 |
|
|
|
|
| XenoPort, Inc.* |
|
|
2,584 |
|
|
|
15,323 |
|
|
|
|
| Zogenix, Inc.* |
|
|
10,000 |
|
|
|
13,900 |
|
|
|
|
| ZS Pharma, Inc.#,* |
|
|
620 |
|
|
|
23,603 |
|
|
|
|
|
|
|
|
|
|
|
|
|
|
|
|
|
|
|
$ |
2,034,045 |
|
|
|
|
|
|
|
|
|
|
|
|
|
| TOTAL HEALTH CARE |
|
|
|
|
|
$ |
16,034,293 |
|
April 30,
2015 / ANNUAL REPORT
PORTFOLIOS OF
INVESTMENTS 55
Wilmington Small-Cap Strategy Fund (continued)
|
|
|
|
|
|
|
|
|
|
|
|
| Description
|
|
Number of
Shares
|
|
|
Value
|
|
|
| INDUSTRIALS – 13.8% |
|
|
| AEROSPACE & DEFENSE – 1.7% |
|
|
|
|
| AAR Corp. |
|
|
1,876 |
|
|
$ |
56,730 |
|
|
|
|
| Aerojet Rocketdyne Holdings, Inc.* |
|
|
3,629 |
|
|
|
71,346 |
|
|
|
|
| Aerovironment, Inc.* |
|
|
824 |
|
|
|
21,094 |
|
|
|
|
| American Science & Engineering, Inc. |
|
|
224 |
|
|
|
8,382 |
|
|
|
|
| Astronics Corp.* |
|
|
1,020 |
|
|
|
68,656 |
|
|
|
|
| Astronics Corp.* |
|
|
272 |
|
|
|
18,727 |
|
|
|
|
| Cubic Corp. |
|
|
698 |
|
|
|
34,607 |
|
|
|
|
| Curtiss-Wright Corp. |
|
|
2,346 |
|
|
|
171,399 |
|
|
|
|
| DigitalGlobe, Inc.* |
|
|
2,547 |
|
|
|
81,937 |
|
|
|
|
| Ducommun, Inc.* |
|
|
760 |
|
|
|
23,104 |
|
|
|
|
| Engility Holdings, Inc. |
|
|
670 |
|
|
|
18,673 |
|
|
|
|
| Erickson, Inc.#,* |
|
|
1,710 |
|
|
|
6,070 |
|
|
|
|
| Esterline Technologies Corp.* |
|
|
1,277 |
|
|
|
142,117 |
|
|
|
|
| HEICO Corp. |
|
|
4,426 |
|
|
|
247,148 |
|
|
|
|
| KEYW Holding Corp. (The)#,* |
|
|
1,320 |
|
|
|
12,738 |
|
|
|
|
| Kratos Defense & Security Solutions, Inc.* |
|
|
3,161 |
|
|
|
17,291 |
|
|
|
|
| LMI Aerospace, Inc.* |
|
|
657 |
|
|
|
7,418 |
|
|
|
|
| Moog, Inc.* |
|
|
1,676 |
|
|
|
117,119 |
|
|
|
|
| National Presto Industries, Inc.# |
|
|
312 |
|
|
|
19,525 |
|
|
|
|
| Orbital ATK, Inc. |
|
|
1,230 |
|
|
|
89,987 |
|
|
|
|
| Sparton Corp.* |
|
|
940 |
|
|
|
24,224 |
|
|
|
|
| TASER International, Inc.#,* |
|
|
3,771 |
|
|
|
113,846 |
|
|
|
|
| Teledyne Technologies, Inc.* |
|
|
1,604 |
|
|
|
168,372 |
|
|
|
|
|
|
|
|
|
|
|
|
|
|
|
|
|
|
|
$ |
1,540,510 |
|
|
| AIR FREIGHT & LOGISTICS – 0.6% |
|
|
|
|
| Air Transport Services Group, Inc.* |
|
|
2,530 |
|
|
|
23,580 |
|
|
|
|
| Atlas Air Worldwide Holdings, Inc.* |
|
|
724 |
|
|
|
35,288 |
|
|
|
|
| Echo Global Logistics, Inc.* |
|
|
1,770 |
|
|
|
51,153 |
|
|
|
|
| Forward Air Corp. |
|
|
2,201 |
|
|
|
110,864 |
|
|
|
|
| Hub Group, Inc.* |
|
|
2,242 |
|
|
|
89,456 |
|
|
|
|
| Park-Ohio Holdings Corp. |
|
|
640 |
|
|
|
29,651 |
|
|
|
|
| UTi Worldwide, Inc.# |
|
|
4,550 |
|
|
|
41,087 |
|
|
|
|
| XPO Logistics, Inc.#,* |
|
|
2,402 |
|
|
|
116,497 |
|
|
|
|
|
|
|
|
|
|
|
|
|
|
|
|
|
|
|
$ |
497,576 |
|
|
| AIRLINES – 0.5% |
|
|
|
|
| Allegiant Travel Co. |
|
|
954 |
|
|
|
146,687 |
|
|
|
|
| Hawaiian Holdings, Inc.#,* |
|
|
2,443 |
|
|
|
56,384 |
|
|
|
|
| JetBlue Airways Corp.#,* |
|
|
10,734 |
|
|
|
220,369 |
|
|
|
|
| Republic Airways Holdings, Inc.* |
|
|
1,801 |
|
|
|
22,044 |
|
|
|
|
| SkyWest, Inc. |
|
|
2,173 |
|
|
|
29,661 |
|
|
|
|
| Spirit Airlines, Inc.* |
|
|
24 |
|
|
|
1,643 |
|
|
|
|
|
|
|
|
|
|
|
|
|
|
|
|
|
|
|
$ |
476,788 |
|
|
| BUILDING PRODUCTS – 0.9% |
|
|
|
|
| AAON, Inc. |
|
|
3,340 |
|
|
|
80,060 |
|
|
|
|
|
|
|
|
|
|
|
|
|
| Description
|
|
Number of
Shares
|
|
|
Value
|
|
|
|
|
| Advanced Drainage Systems, Inc.* |
|
|
1,160 |
|
|
$ |
32,480 |
|
|
|
|
| American Woodmark Corp.* |
|
|
1,055 |
|
|
|
53,488 |
|
|
|
|
| Apogee Enterprises, Inc. |
|
|
1,840 |
|
|
|
96,821 |
|
|
|
|
| Builders FirstSource, Inc.* |
|
|
1,700 |
|
|
|
21,692 |
|
|
|
|
| Continental Building Products, Inc.* |
|
|
1,520 |
|
|
|
33,455 |
|
|
|
|
| Gibraltar Industries, Inc.* |
|
|
600 |
|
|
|
9,936 |
|
|
|
|
| Griffon Corp. |
|
|
2,229 |
|
|
|
37,469 |
|
|
|
|
| Insteel Industries, Inc. |
|
|
1,360 |
|
|
|
27,554 |
|
|
|
|
| Masonite International Corp.* |
|
|
1,140 |
|
|
|
75,468 |
|
|
|
|
| NCI Building Systems, Inc.* |
|
|
1,862 |
|
|
|
28,824 |
|
|
|
|
| Nortek, Inc.* |
|
|
470 |
|
|
|
39,771 |
|
|
|
|
| Patrick Industries, Inc.* |
|
|
630 |
|
|
|
37,838 |
|
|
|
|
| PGT, Inc.* |
|
|
1,610 |
|
|
|
18,225 |
|
|
|
|
| Ply Gem Holdings, Inc.* |
|
|
800 |
|
|
|
10,864 |
|
|
|
|
| Quanex Building Products Corp. |
|
|
963 |
|
|
|
18,586 |
|
|
|
|
| Simpson Manufacturing Co., Inc. |
|
|
1,421 |
|
|
|
46,580 |
|
|
|
|
| Trex Co., Inc.* |
|
|
2,548 |
|
|
|
119,552 |
|
|
|
|
| Universal Forest Products, Inc. |
|
|
726 |
|
|
|
40,162 |
|
|
|
|
| USG Corp.* |
|
|
145 |
|
|
|
3,848 |
|
|
|
|
|
|
|
|
|
|
|
|
|
|
|
|
|
|
|
$ |
832,673 |
|
|
| COMMERCIAL SERVICES & SUPPLIES – 2.1% |
|
|
|
|
| ABM Industries, Inc. |
|
|
2,329 |
|
|
|
74,644 |
|
|
|
|
| ACCO Brands Corp.* |
|
|
2,770 |
|
|
|
21,800 |
|
|
|
|
| ARC Document Solutions, Inc.* |
|
|
1,558 |
|
|
|
13,305 |
|
|
|
|
| Brink’s Co. (The) |
|
|
2,470 |
|
|
|
65,381 |
|
|
|
|
| Capstone Turbine Corp.* |
|
|
25,640 |
|
|
|
16,107 |
|
|
|
|
| Casella Waste Systems, Inc.* |
|
|
1,130 |
|
|
|
6,192 |
|
|
|
|
| CECO Environmental Corp.# |
|
|
1,051 |
|
|
|
12,391 |
|
|
|
|
| Cenveo, Inc.#,* |
|
|
593 |
|
|
|
1,174 |
|
|
|
|
| Civeo Corp. |
|
|
2,740 |
|
|
|
12,796 |
|
|
|
|
| Deluxe Corp. |
|
|
2,825 |
|
|
|
182,919 |
|
|
|
|
| Encore Capital Group, Inc.* |
|
|
1,135 |
|
|
|
45,899 |
|
|
|
|
| EnerNOC, Inc.* |
|
|
1,694 |
|
|
|
18,719 |
|
|
|
|
| Ennis, Inc. |
|
|
1,079 |
|
|
|
16,595 |
|
|
|
|
| G&K Services, Inc. |
|
|
944 |
|
|
|
66,646 |
|
|
|
|
| Healthcare Services Group, Inc. |
|
|
5,035 |
|
|
|
152,409 |
|
|
|
|
| Heritage-Crystal Clean, Inc.* |
|
|
550 |
|
|
|
6,446 |
|
|
|
|
| Herman Miller, Inc. |
|
|
3,935 |
|
|
|
107,858 |
|
|
|
|
| HNI Corp. |
|
|
3,083 |
|
|
|
143,791 |
|
|
|
|
| InnerWorkings, Inc.* |
|
|
460 |
|
|
|
2,912 |
|
|
|
|
| Interface, Inc. |
|
|
2,825 |
|
|
|
61,387 |
|
|
|
|
| Kimball International, Inc. |
|
|
2,450 |
|
|
|
24,794 |
|
|
|
|
| Knoll, Inc. |
|
|
3,872 |
|
|
|
88,165 |
|
|
|
|
| McGrath RentCorp |
|
|
750 |
|
|
|
24,833 |
|
|
|
|
| Mobile Mini, Inc. |
|
|
2,078 |
|
|
|
80,086 |
|
|
|
|
| MSA Safety, Inc. |
|
|
1,713 |
|
|
|
78,353 |
|
ANNUAL
REPORT / April 30, 2015
56
PORTFOLIOS OF INVESTMENTS
Wilmington Small-Cap Strategy Fund (continued)
|
|
|
|
|
|
|
|
|
|
|
|
| Description
|
|
Number of
Shares
|
|
|
Value
|
|
|
|
|
| Multi-Color Corp. |
|
|
701 |
|
|
$ |
44,009 |
|
|
|
|
| NL Industries, Inc. |
|
|
42 |
|
|
|
310 |
|
|
|
|
| Performant Financial Corp.#,* |
|
|
3,580 |
|
|
|
10,633 |
|
|
|
|
| Quad/Graphics, Inc. |
|
|
1,270 |
|
|
|
27,356 |
|
|
|
|
| SP Plus Corp.* |
|
|
908 |
|
|
|
20,666 |
|
|
|
|
| Steelcase, Inc. |
|
|
5,000 |
|
|
|
87,850 |
|
|
|
|
| Team, Inc.* |
|
|
1,324 |
|
|
|
51,742 |
|
|
|
|
| Tetra Tech, Inc.* |
|
|
2,044 |
|
|
|
55,413 |
|
|
|
|
| UniFirst Corp. |
|
|
668 |
|
|
|
75,638 |
|
|
|
|
| United Stationers, Inc. |
|
|
1,448 |
|
|
|
58,803 |
|
|
|
|
| US Ecology, Inc. |
|
|
1,664 |
|
|
|
78,058 |
|
|
|
|
| Viad Corp. |
|
|
1,055 |
|
|
|
28,031 |
|
|
|
|
| West Corp. |
|
|
530 |
|
|
|
16,404 |
|
|
|
|
|
|
|
|
|
|
|
|
|
|
|
|
|
|
|
$ |
1,880,515 |
|
|
| CONSTRUCTION & ENGINEERING – 0.6% |
|
|
|
|
| Aegion Corp.* |
|
|
1,253 |
|
|
|
23,080 |
|
|
|
|
| Ameresco, Inc.* |
|
|
770 |
|
|
|
5,174 |
|
|
|
|
| Argan, Inc. |
|
|
810 |
|
|
|
26,171 |
|
|
|
|
| Comfort Systems USA, Inc. |
|
|
2,191 |
|
|
|
45,332 |
|
|
|
|
| Dycom Industries, Inc.* |
|
|
2,447 |
|
|
|
112,513 |
|
|
|
|
| EMCOR Group, Inc. |
|
|
2,222 |
|
|
|
99,168 |
|
|
|
|
| Furmanite Corp.* |
|
|
2,481 |
|
|
|
18,111 |
|
|
|
|
| Granite Construction, Inc. |
|
|
1,530 |
|
|
|
53,106 |
|
|
|
|
| Great Lakes Dredge & Dock Corp. |
|
|
1,636 |
|
|
|
9,489 |
|
|
|
|
| Layne Christensen Co.#,* |
|
|
520 |
|
|
|
3,494 |
|
|
|
|
| MasTec, Inc.* |
|
|
3,324 |
|
|
|
59,633 |
|
|
|
|
| MYR Group, Inc.* |
|
|
920 |
|
|
|
26,974 |
|
|
|
|
| Northwest Pipe Co.* |
|
|
501 |
|
|
|
12,144 |
|
|
|
|
| Orion Marine Group, Inc.* |
|
|
1,648 |
|
|
|
13,876 |
|
|
|
|
| Primoris Services Corp. |
|
|
2,420 |
|
|
|
46,537 |
|
|
|
|
| Sterling Construction Co., Inc.* |
|
|
1,705 |
|
|
|
7,485 |
|
|
|
|
| Tutor Perini Corp.#,* |
|
|
1,061 |
|
|
|
22,493 |
|
|
|
|
|
|
|
|
|
|
|
|
|
|
|
|
|
|
|
$ |
584,780 |
|
|
| ELECTRICAL EQUIPMENT – 1.2% |
|
|
|
|
| Acuity Brands, Inc. |
|
|
5 |
|
|
|
835 |
|
|
|
|
| AZZ, Inc. |
|
|
1,714 |
|
|
|
79,512 |
|
|
|
|
| Brady Corp. Class A |
|
|
2,309 |
|
|
|
61,489 |
|
|
|
|
| Encore Wire Corp. |
|
|
1,217 |
|
|
|
54,777 |
|
|
|
|
| EnerSys, Inc. |
|
|
2,017 |
|
|
|
136,954 |
|
|
|
|
| Enphase Energy, Inc.#,* |
|
|
1,540 |
|
|
|
19,358 |
|
|
|
|
| Franklin Electric Co., Inc. |
|
|
3,192 |
|
|
|
115,423 |
|
|
|
|
| FuelCell Energy, Inc.#,* |
|
|
11,154 |
|
|
|
13,719 |
|
|
|
|
| Generac Holdings, Inc.# |
|
|
4,690 |
|
|
|
195,526 |
|
|
|
|
| General Cable Corp. |
|
|
2,030 |
|
|
|
33,109 |
|
|
|
|
| Global Power Equipment Group, Inc. |
|
|
1,070 |
|
|
|
13,000 |
|
|
|
|
| GrafTech International Ltd.* |
|
|
2,340 |
|
|
|
11,326 |
|
|
|
|
| II-VI, Inc.* |
|
|
954 |
|
|
|
16,972 |
|
|
|
|
|
|
|
|
|
|
|
|
|
| Description
|
|
Number of
Shares
|
|
|
Value
|
|
|
|
|
| LSI Industries, Inc. |
|
|
1,963 |
|
|
$ |
17,588 |
|
|
|
|
| Plug Power, Inc.#,* |
|
|
3,040 |
|
|
|
7,722 |
|
|
|
|
| Polypore International, Inc.* |
|
|
2,970 |
|
|
|
173,923 |
|
|
|
|
| Powell Industries, Inc. |
|
|
369 |
|
|
|
12,247 |
|
|
|
|
| Power Solutions International, Inc.#,* |
|
|
310 |
|
|
|
19,778 |
|
|
|
|
| PowerSecure International, Inc.* |
|
|
220 |
|
|
|
2,884 |
|
|
|
|
| Preformed Line Products Co. |
|
|
194 |
|
|
|
8,138 |
|
|
|
|
| Revolution Lighting Technologies, Inc.* |
|
|
2,690 |
|
|
|
3,147 |
|
|
|
|
| Thermon Group Holdings, Inc.* |
|
|
1,850 |
|
|
|
43,050 |
|
|
|
|
| Vicor Corp.* |
|
|
689 |
|
|
|
10,507 |
|
|
|
|
|
|
|
|
|
|
|
|
|
|
|
|
|
|
|
$ |
1,050,984 |
|
|
| INDUSTRIAL CONGLOMERATES – 0.0% |
|
|
|
|
| Raven Industries, Inc. |
|
|
882 |
|
|
|
17,587 |
|
|
| MACHINERY – 3.2% |
|
|
|
|
| Accuride Corp.* |
|
|
1,400 |
|
|
|
5,712 |
|
|
|
|
| Actuant Corp. |
|
|
2,500 |
|
|
|
59,550 |
|
|
|
|
| Alamo Group, Inc. |
|
|
219 |
|
|
|
13,530 |
|
|
|
|
| Albany International Corp. |
|
|
1,190 |
|
|
|
46,648 |
|
|
|
|
| Altra Holdings, Inc. |
|
|
1,263 |
|
|
|
33,305 |
|
|
|
|
| American Railcar Industries, Inc.# |
|
|
589 |
|
|
|
31,241 |
|
|
|
|
| Ampco-Pittsburgh Corp. |
|
|
556 |
|
|
|
8,890 |
|
|
|
|
| Astec Industries, Inc. |
|
|
761 |
|
|
|
32,023 |
|
|
|
|
| Barnes Group, Inc. |
|
|
2,065 |
|
|
|
82,806 |
|
|
|
|
| Blount International, Inc.* |
|
|
4,080 |
|
|
|
54,101 |
|
|
|
|
| Briggs & Stratton Corp. |
|
|
1,338 |
|
|
|
26,158 |
|
|
|
|
| Chart Industries, Inc.* |
|
|
2,279 |
|
|
|
92,413 |
|
|
|
|
| CIRCOR International, Inc. |
|
|
1,098 |
|
|
|
59,995 |
|
|
|
|
| CLARCOR, Inc. |
|
|
3,488 |
|
|
|
226,720 |
|
|
|
|
| Columbus McKinnon Corp.* |
|
|
1,145 |
|
|
|
29,037 |
|
|
|
|
| Commercial Vehicle Group, Inc.* |
|
|
1,480 |
|
|
|
8,525 |
|
|
|
|
| Douglas Dynamics, Inc. |
|
|
1,430 |
|
|
|
31,102 |
|
|
|
|
| Dynamic Materials Corp. |
|
|
675 |
|
|
|
9,038 |
|
|
|
|
| Energy Recovery, Inc.* |
|
|
2,459 |
|
|
|
7,303 |
|
|
|
|
| EnPro Industries, Inc.* |
|
|
1,297 |
|
|
|
83,021 |
|
|
|
|
| ESCO Technologies, Inc. |
|
|
702 |
|
|
|
25,763 |
|
|
|
|
| ExOne Co.#,* |
|
|
520 |
|
|
|
7,129 |
|
|
|
|
| Federal Signal Corp.* |
|
|
2,689 |
|
|
|
42,271 |
|
|
|
|
| FreightCar America, Inc. |
|
|
753 |
|
|
|
19,646 |
|
|
|
|
| Global Brass & Copper Holdings, Inc. |
|
|
910 |
|
|
|
13,868 |
|
|
|
|
| Gorman-Rupp Co. (The) |
|
|
927 |
|
|
|
25,131 |
|
|
|
|
| Graham Corp. |
|
|
585 |
|
|
|
13,689 |
|
|
|
|
| Greenbrier Cos., Inc. (The)#,* |
|
|
1,570 |
|
|
|
90,573 |
|
|
|
|
| Harsco Corp. |
|
|
5,550 |
|
|
|
89,244 |
|
|
|
|
| Hurco Cos., Inc. |
|
|
510 |
|
|
|
16,504 |
|
|
|
|
| Hyster-Yale Materials Handling, Inc. |
|
|
546 |
|
|
|
40,044 |
|
|
|
|
| Hyster-Yale Materials Handling, Inc. |
|
|
216 |
|
|
|
15,841 |
|
|
|
|
| John Bean Technologies Corp. |
|
|
2,340 |
|
|
|
90,301 |
|
April 30,
2015 / ANNUAL REPORT
PORTFOLIOS OF
INVESTMENTS 57
Wilmington Small-Cap Strategy Fund (continued)
|
|
|
|
|
|
|
|
|
|
|
|
| Description
|
|
Number of
Shares
|
|
|
Value
|
|
|
|
|
| Kadant, Inc. |
|
|
554 |
|
|
$ |
28,232 |
|
|
|
|
| LB Foster Co. |
|
|
496 |
|
|
|
21,194 |
|
|
|
|
| Lindsay Corp.# |
|
|
838 |
|
|
|
66,361 |
|
|
|
|
| Lydall, Inc.* |
|
|
580 |
|
|
|
15,567 |
|
|
|
|
| Manitex International, Inc.#,* |
|
|
1,410 |
|
|
|
13,973 |
|
|
|
|
| Meritor, Inc.* |
|
|
5,310 |
|
|
|
69,667 |
|
|
|
|
| Middleby Corp. (The)* |
|
|
32 |
|
|
|
3,243 |
|
|
|
|
| Miller Industries, Inc. |
|
|
460 |
|
|
|
10,295 |
|
|
|
|
| Mueller Industries, Inc. |
|
|
3,572 |
|
|
|
125,163 |
|
|
|
|
| Mueller Water Products, Inc. |
|
|
11,550 |
|
|
|
108,108 |
|
|
|
|
| NN, Inc. |
|
|
1,450 |
|
|
|
36,482 |
|
|
|
|
| Omega Flex, Inc. |
|
|
150 |
|
|
|
4,469 |
|
|
|
|
| Proto Labs, Inc.* |
|
|
1,280 |
|
|
|
89,600 |
|
|
|
|
| RBC Bearings, Inc.* |
|
|
1,417 |
|
|
|
103,427 |
|
|
|
|
| Rexnord Corp.* |
|
|
4,240 |
|
|
|
112,318 |
|
|
|
|
| Standex International Corp. |
|
|
668 |
|
|
|
54,021 |
|
|
|
|
| Sun Hydraulics Corp. |
|
|
1,457 |
|
|
|
56,692 |
|
|
|
|
| Tennant Co. |
|
|
1,451 |
|
|
|
93,285 |
|
|
|
|
| Titan International, Inc.# |
|
|
1,025 |
|
|
|
10,650 |
|
|
|
|
| TriMas Corp.* |
|
|
2,690 |
|
|
|
75,777 |
|
|
|
|
| Twin Disc, Inc. |
|
|
493 |
|
|
|
8,869 |
|
|
|
|
| Wabash National Corp.* |
|
|
3,800 |
|
|
|
53,276 |
|
|
|
|
| Watts Water Technologies, Inc. |
|
|
1,154 |
|
|
|
62,951 |
|
|
|
|
| Woodward, Inc. |
|
|
4,071 |
|
|
|
191,541 |
|
|
|
|
| Xerium Technologies, Inc.* |
|
|
910 |
|
|
|
16,180 |
|
|
|
|
|
|
|
|
|
|
|
|
|
|
|
|
|
|
|
$ |
2,862,463 |
|
|
|
|
| MARINE – 0.1% |
|
|
|
|
|
|
|
|
|
|
|
| International Shipholding Corp. |
|
|
755 |
|
|
|
8,290 |
|
|
|
|
| Matson, Inc. |
|
|
2,260 |
|
|
|
91,530 |
|
|
|
|
| Navios Maritime Holdings, Inc.# |
|
|
4,400 |
|
|
|
16,676 |
|
|
|
|
| Scorpio Bulkers, Inc.#,* |
|
|
4,470 |
|
|
|
10,773 |
|
|
|
|
|
|
|
|
|
|
|
|
|
|
|
|
|
|
|
$ |
127,269 |
|
|
| PROFESSIONAL SERVICES – 1.5% |
|
|
|
|
| Acacia Research Corp. |
|
|
1,690 |
|
|
|
18,624 |
|
|
|
|
| Advisory Board Co.* |
|
|
2,046 |
|
|
|
106,167 |
|
|
|
|
| Barrett Business Services, Inc. |
|
|
220 |
|
|
|
9,783 |
|
|
|
|
| CBIZ, Inc.* |
|
|
2,407 |
|
|
|
21,759 |
|
|
|
|
| CDI Corp. |
|
|
453 |
|
|
|
6,179 |
|
|
|
|
| Corporate Executive Board Co. (The) |
|
|
2,260 |
|
|
|
189,456 |
|
|
|
|
| CRA International, Inc.* |
|
|
17 |
|
|
|
496 |
|
|
|
|
| Exponent, Inc. |
|
|
927 |
|
|
|
82,141 |
|
|
|
|
| Franklin Covey Co.* |
|
|
350 |
|
|
|
6,524 |
|
|
|
|
| FTI Consulting, Inc.* |
|
|
1,820 |
|
|
|
74,820 |
|
|
|
|
| GP Strategies Corp.* |
|
|
1,130 |
|
|
|
36,827 |
|
|
|
|
| Heidrick & Struggles International, Inc. |
|
|
1,080 |
|
|
|
25,985 |
|
|
|
|
| Huron Consulting Group, Inc.* |
|
|
1,042 |
|
|
|
63,166 |
|
|
|
|
|
|
|
|
|
|
|
|
|
| Description
|
|
Number of
Shares
|
|
|
Value
|
|
|
|
|
| ICF International, Inc.* |
|
|
927 |
|
|
$ |
35,689 |
|
|
|
|
| Insperity, Inc. |
|
|
1,081 |
|
|
|
52,061 |
|
|
|
|
| Kelly Services, Inc. |
|
|
917 |
|
|
|
15,057 |
|
|
|
|
| Kforce, Inc. |
|
|
2,073 |
|
|
|
47,140 |
|
|
|
|
| Korn/Ferry International* |
|
|
2,124 |
|
|
|
66,970 |
|
|
|
|
| Mistras Group, Inc.* |
|
|
630 |
|
|
|
11,315 |
|
|
|
|
| Navigant Consulting, Inc.* |
|
|
1,852 |
|
|
|
26,780 |
|
|
|
|
| On Assignment, Inc.* |
|
|
3,755 |
|
|
|
126,356 |
|
|
|
|
| Pendrell Corp.* |
|
|
1,650 |
|
|
|
1,799 |
|
|
|
|
| Resources Connection, Inc. |
|
|
1,395 |
|
|
|
21,985 |
|
|
|
|
| RPX Corp.* |
|
|
2,140 |
|
|
|
33,298 |
|
|
|
|
| TriNet Group, Inc.* |
|
|
1,090 |
|
|
|
38,172 |
|
|
|
|
| TrueBlue, Inc.* |
|
|
2,091 |
|
|
|
60,179 |
|
|
|
|
| VSE Corp. |
|
|
336 |
|
|
|
23,903 |
|
|
|
|
| WageWorks, Inc.* |
|
|
2,430 |
|
|
|
122,472 |
|
|
|
|
|
|
|
|
|
|
|
|
|
|
|
|
|
|
|
$ |
1,325,103 |
|
|
|
|
| ROAD & RAIL – 0.6% |
|
|
|
|
|
|
|
|
|
|
|
| ArcBest Corp. |
|
|
1,376 |
|
|
|
49,123 |
|
|
|
|
| Celadon Group, Inc. |
|
|
678 |
|
|
|
17,520 |
|
|
|
|
| Heartland Express, Inc. |
|
|
4,078 |
|
|
|
85,312 |
|
|
|
|
| Knight Transportation, Inc. |
|
|
3,907 |
|
|
|
112,912 |
|
|
|
|
| Marten Transport Ltd. |
|
|
1,078 |
|
|
|
23,996 |
|
|
|
|
| Patriot Transportation Holdings, Inc.* |
|
|
83 |
|
|
|
2,142 |
|
|
|
|
| Quality Distribution, Inc.* |
|
|
1,090 |
|
|
|
10,813 |
|
|
|
|
| Roadrunner Transportation Systems, Inc.* |
|
|
850 |
|
|
|
20,800 |
|
|
|
|
| Saia, Inc.* |
|
|
1,433 |
|
|
|
58,395 |
|
|
|
|
| Swift Transportation Co.* |
|
|
5,460 |
|
|
|
132,132 |
|
|
|
|
| Universal Truckload Services, Inc. |
|
|
380 |
|
|
|
8,071 |
|
|
|
|
| Werner Enterprises, Inc. |
|
|
1,421 |
|
|
|
38,182 |
|
|
|
|
| YRC Worldwide, Inc.* |
|
|
1,040 |
|
|
|
16,224 |
|
|
|
|
|
|
|
|
|
|
|
|
|
|
|
|
|
|
|
$ |
575,622 |
|
|
| TRADING COMPANIES & DISTRIBUTORS – 0.7% |
|
|
|
|
| Aircastle Ltd. |
|
|
3,355 |
|
|
|
80,453 |
|
|
|
|
| Applied Industrial Technologies, Inc. |
|
|
1,170 |
|
|
|
48,871 |
|
|
|
|
| CAI International, Inc.* |
|
|
50 |
|
|
|
1,191 |
|
|
|
|
| DXP Enterprises, Inc.* |
|
|
830 |
|
|
|
37,391 |
|
|
|
|
| H&E Equipment Services, Inc. |
|
|
1,605 |
|
|
|
39,676 |
|
|
|
|
| Houston Wire & Cable Co. |
|
|
1,199 |
|
|
|
11,319 |
|
|
|
|
| Kaman Corp. |
|
|
1,632 |
|
|
|
68,071 |
|
|
|
|
| Rush Enterprises, Inc.* |
|
|
1,720 |
|
|
|
44,961 |
|
|
|
|
| Stock Building Supply Holdings, Inc.* |
|
|
1,260 |
|
|
|
23,146 |
|
|
|
|
| TAL International Group, Inc. |
|
|
1,799 |
|
|
|
69,333 |
|
|
|
|
| Textainer Group Holdings Ltd.# |
|
|
804 |
|
|
|
24,361 |
|
|
|
|
| Titan Machinery, Inc.#,* |
|
|
140 |
|
|
|
2,051 |
|
|
|
|
| Watsco, Inc. |
|
|
1,843 |
|
|
|
221,694 |
|
|
|
|
|
|
|
|
|
|
|
|
|
|
|
|
|
|
|
$ |
672,518 |
|
ANNUAL
REPORT / April 30, 2015
58
PORTFOLIOS OF INVESTMENTS
Wilmington Small-Cap Strategy Fund (continued)
|
|
|
|
|
|
|
|
|
|
|
|
| Description
|
|
Number of
Shares
|
|
|
Value
|
|
|
| TRANSPORTATION INFRASTRUCTURE – 0.1% |
|
|
|
|
| Golden Ocean Group Ltd.#,* |
|
|
2,663 |
|
|
$ |
13,262 |
|
|
|
|
| Wesco Aircraft Holdings, Inc.* |
|
|
2,010 |
|
|
|
31,517 |
|
|
|
|
|
|
|
|
|
|
|
|
|
|
|
|
|
|
|
$ |
44,779 |
|
|
|
|
|
|
|
|
|
|
|
|
|
| TOTAL INDUSTRIALS |
|
|
|
|
|
$ |
12,489,167 |
|
|
| INFORMATION TECHNOLOGY – 20.9% |
|
|
| COMMUNICATIONS EQUIPMENT – 1.8% |
|
|
|
|
| ADTRAN, Inc. |
|
|
3,411 |
|
|
|
56,657 |
|
|
|
|
| Alliance Fiber Optic Products, Inc. |
|
|
850 |
|
|
|
15,606 |
|
|
|
|
| Applied Optoelectronics, Inc.#,* |
|
|
270 |
|
|
|
3,856 |
|
|
|
|
| Aruba Networks, Inc.* |
|
|
6,725 |
|
|
|
165,502 |
|
|
|
|
| Bel Fuse, Inc. |
|
|
447 |
|
|
|
9,177 |
|
|
|
|
| Black Box Corp. |
|
|
328 |
|
|
|
6,527 |
|
|
|
|
| CalAmp Corp.* |
|
|
2,450 |
|
|
|
48,289 |
|
|
|
|
| Calix, Inc.* |
|
|
2,114 |
|
|
|
15,622 |
|
|
|
|
| Ciena Corp.* |
|
|
5,530 |
|
|
|
117,789 |
|
|
|
|
| Clearfield, Inc.#,* |
|
|
1,450 |
|
|
|
19,647 |
|
|
|
|
| Comtech Telecommunications Corp. |
|
|
99 |
|
|
|
2,861 |
|
|
|
|
| Digi International, Inc.* |
|
|
812 |
|
|
|
8,201 |
|
|
|
|
| Emulex Corp.* |
|
|
3,130 |
|
|
|
25,103 |
|
|
|
|
| Extreme Networks, Inc.* |
|
|
4,716 |
|
|
|
11,884 |
|
|
|
|
| Finisar Corp.#,* |
|
|
6,210 |
|
|
|
126,249 |
|
|
|
|
| Harmonic, Inc.* |
|
|
4,982 |
|
|
|
34,924 |
|
|
|
|
| Infinera Corp.* |
|
|
8,026 |
|
|
|
150,889 |
|
|
|
|
| InterDigital, Inc. |
|
|
2,738 |
|
|
|
149,823 |
|
|
|
|
| Ixia* |
|
|
1,885 |
|
|
|
22,582 |
|
|
|
|
| KVH Industries, Inc.* |
|
|
690 |
|
|
|
9,308 |
|
|
|
|
| NETGEAR, Inc.* |
|
|
1,137 |
|
|
|
34,417 |
|
|
|
|
| Numerex Corp.* |
|
|
770 |
|
|
|
8,462 |
|
|
|
|
| Oclaro, Inc.* |
|
|
540 |
|
|
|
1,037 |
|
|
|
|
| ParkerVision, Inc.#,* |
|
|
11,130 |
|
|
|
7,568 |
|
|
|
|
| Plantronics, Inc. |
|
|
2,736 |
|
|
|
145,747 |
|
|
|
|
| Polycom, Inc.* |
|
|
6,380 |
|
|
|
83,259 |
|
|
|
|
| Procera Networks, Inc.* |
|
|
1,760 |
|
|
|
20,258 |
|
|
|
|
| Ruckus Wireless, Inc.* |
|
|
3,930 |
|
|
|
45,902 |
|
|
|
|
| ShoreTel, Inc.* |
|
|
5,550 |
|
|
|
38,628 |
|
|
|
|
| Sonus Networks, Inc.* |
|
|
3,336 |
|
|
|
26,421 |
|
|
|
|
| Tessco Technologies, Inc. |
|
|
450 |
|
|
|
11,372 |
|
|
|
|
| Ubiquiti Networks, Inc.# |
|
|
2,120 |
|
|
|
60,568 |
|
|
|
|
| ViaSat, Inc.* |
|
|
2,492 |
|
|
|
149,819 |
|
|
|
|
|
|
|
|
|
|
|
|
|
|
|
|
|
|
|
$ |
1,633,954 |
|
|
| COMPUTERS & PERIPHERALS – 0.5% |
|
|
|
|
| Cray, Inc.* |
|
|
2,250 |
|
|
|
63,202 |
|
|
|
|
| Dot Hill Systems Corp.* |
|
|
1,130 |
|
|
|
7,096 |
|
|
|
|
| Eastman Kodak Co.* |
|
|
1,050 |
|
|
|
20,338 |
|
|
|
|
|
|
|
|
|
|
|
|
|
| Description
|
|
Number of
Shares
|
|
|
Value
|
|
|
|
|
| Electronics For Imaging, Inc.* |
|
|
3,468 |
|
|
$ |
144,720 |
|
|
|
|
| Immersion Corp.* |
|
|
2,027 |
|
|
|
21,952 |
|
|
|
|
| Nimble Storage, Inc.#,* |
|
|
1,160 |
|
|
|
28,374 |
|
|
|
|
| QLogic Corp.* |
|
|
3,860 |
|
|
|
56,742 |
|
|
|
|
| Quantum Corp.* |
|
|
11,560 |
|
|
|
23,236 |
|
|
|
|
| Silicon Graphics International Corp.#,* |
|
|
2,450 |
|
|
|
19,870 |
|
|
|
|
| Super Micro Computer, Inc.* |
|
|
1,388 |
|
|
|
39,933 |
|
|
|
|
| Violin Memory, Inc.#,* |
|
|
5,790 |
|
|
|
19,744 |
|
|
|
|
|
|
|
|
|
|
|
|
|
|
|
|
|
|
|
$ |
445,207 |
|
|
| ELECTRONIC EQUIPMENT, INSTRUMENTS &
COMPONENTS – 2.8% |
|
|
|
|
| Agilysys, Inc.* |
|
|
1,000 |
|
|
|
9,410 |
|
|
|
|
| Anixter International, Inc.* |
|
|
1,395 |
|
|
|
98,487 |
|
|
|
|
| Badger Meter, Inc. |
|
|
1,218 |
|
|
|
75,784 |
|
|
|
|
| Belden, Inc. |
|
|
2,924 |
|
|
|
245,470 |
|
|
|
|
| Benchmark Electronics, Inc.* |
|
|
2,470 |
|
|
|
58,119 |
|
|
|
|
| Checkpoint Systems, Inc.* |
|
|
1,693 |
|
|
|
17,539 |
|
|
|
|
| Cognex Corp. |
|
|
6,130 |
|
|
|
275,176 |
|
|
|
|
| Coherent, Inc. |
|
|
834 |
|
|
|
50,040 |
|
|
|
|
| Control4 Corp.#,* |
|
|
1,750 |
|
|
|
20,510 |
|
|
|
|
| CTS Corp. |
|
|
1,878 |
|
|
|
33,691 |
|
|
|
|
| CUI Global, Inc.* |
|
|
90 |
|
|
|
496 |
|
|
|
|
| Daktronics, Inc. |
|
|
3,008 |
|
|
|
32,276 |
|
|
|
|
| DTS, Inc.* |
|
|
1,017 |
|
|
|
36,459 |
|
|
|
|
| Electro Rent Corp. |
|
|
824 |
|
|
|
8,932 |
|
|
|
|
| Electro Scientific Industries, Inc. |
|
|
1,343 |
|
|
|
7,655 |
|
|
|
|
| Fabrinet* |
|
|
910 |
|
|
|
16,480 |
|
|
|
|
| FARO Technologies, Inc.* |
|
|
1,313 |
|
|
|
52,297 |
|
|
|
|
| FEI Co. |
|
|
2,772 |
|
|
|
209,175 |
|
|
|
|
| GSI Group, Inc.* |
|
|
700 |
|
|
|
9,296 |
|
|
|
|
| Insight Enterprises, Inc.* |
|
|
1,680 |
|
|
|
48,082 |
|
|
|
|
| InvenSense, Inc.#,* |
|
|
3,660 |
|
|
|
54,607 |
|
|
|
|
| Itron, Inc.* |
|
|
1,480 |
|
|
|
53,073 |
|
|
|
|
| Kemet Corp.* |
|
|
3,580 |
|
|
|
15,466 |
|
|
|
|
| Kimball Electronics, Inc.* |
|
|
307 |
|
|
|
3,927 |
|
|
|
|
| Littelfuse, Inc. |
|
|
1,565 |
|
|
|
153,354 |
|
|
|
|
| Maxwell Technologies, Inc.#,* |
|
|
1,148 |
|
|
|
6,429 |
|
|
|
|
| Mercury Systems, Inc.* |
|
|
1,695 |
|
|
|
23,408 |
|
|
|
|
| Mesa Laboratories, Inc. |
|
|
210 |
|
|
|
17,827 |
|
|
|
|
| Methode Electronics, Inc. |
|
|
2,907 |
|
|
|
123,431 |
|
|
|
|
| MTS Systems Corp. |
|
|
1,230 |
|
|
|
86,813 |
|
|
|
|
| Multi-Fineline Electronix, Inc.* |
|
|
653 |
|
|
|
15,267 |
|
|
|
|
| Newport Corp.* |
|
|
1,892 |
|
|
|
36,080 |
|
|
|
|
| OSI Systems, Inc.* |
|
|
869 |
|
|
|
58,405 |
|
|
|
|
| Park Electrochemical Corp. |
|
|
1,152 |
|
|
|
25,021 |
|
|
|
|
| PC Connection, Inc. |
|
|
319 |
|
|
|
7,749 |
|
|
|
|
| Plexus Corp.* |
|
|
1,798 |
|
|
|
77,404 |
|
|
|
|
| RealD, Inc.#,* |
|
|
2,690 |
|
|
|
33,033 |
|
April 30,
2015 / ANNUAL REPORT
PORTFOLIOS OF
INVESTMENTS 59
Wilmington Small-Cap Strategy Fund (continued)
|
|
|
|
|
|
|
|
|
|
|
|
| Description
|
|
Number of
Shares
|
|
|
Value
|
|
|
|
|
| Rofin-Sinar Technologies, Inc.* |
|
|
843 |
|
|
$ |
19,945 |
|
|
|
|
| Rogers Corp.* |
|
|
992 |
|
|
|
72,128 |
|
|
|
|
| Sanmina Corp.* |
|
|
2,900 |
|
|
|
58,957 |
|
|
|
|
| ScanSource, Inc.* |
|
|
1,381 |
|
|
|
55,033 |
|
|
|
|
| Speed Commerce, Inc.* |
|
|
5,240 |
|
|
|
1,581 |
|
|
|
|
| SYNNEX Corp.* |
|
|
1,342 |
|
|
|
102,663 |
|
|
|
|
| TTM Technologies, Inc.* |
|
|
2,379 |
|
|
|
22,244 |
|
|
|
|
| Universal Display Corp.* |
|
|
2,067 |
|
|
|
91,093 |
|
|
|
|
| Viasystems Group, Inc.* |
|
|
20 |
|
|
|
356 |
|
|
|
|
| Vishay Precision Group, Inc.* |
|
|
480 |
|
|
|
6,850 |
|
|
|
|
|
|
|
|
|
|
|
|
|
|
|
|
|
|
|
$ |
2,527,518 |
|
|
| INTERNET SOFTWARE & SERVICES – 3.0% |
|
|
|
|
| Actua Corp.* |
|
|
1,924 |
|
|
|
27,840 |
|
|
|
|
| Angie’s List, Inc.#,* |
|
|
3,720 |
|
|
|
21,836 |
|
|
|
|
| Bankrate, Inc.* |
|
|
2,720 |
|
|
|
33,728 |
|
|
|
|
| Bazaarvoice, Inc.* |
|
|
930 |
|
|
|
5,003 |
|
|
|
|
| Benefitfocus, Inc.#,* |
|
|
590 |
|
|
|
20,384 |
|
|
|
|
| Blucora, Inc.* |
|
|
1,334 |
|
|
|
18,236 |
|
|
|
|
| Brightcove, Inc.* |
|
|
920 |
|
|
|
6,366 |
|
|
|
|
| Carbonite, Inc.* |
|
|
1,390 |
|
|
|
14,234 |
|
|
|
|
| Care.com, Inc.#,* |
|
|
2,060 |
|
|
|
13,225 |
|
|
|
|
| ChannelAdvisor Corp.* |
|
|
2,070 |
|
|
|
21,176 |
|
|
|
|
| Cimpress NV# |
|
|
2,390 |
|
|
|
200,617 |
|
|
|
|
| comScore, Inc.* |
|
|
2,355 |
|
|
|
123,308 |
|
|
|
|
| Constant Contact, Inc.* |
|
|
2,413 |
|
|
|
84,093 |
|
|
|
|
| Cornerstone OnDemand, Inc.* |
|
|
2,650 |
|
|
|
75,869 |
|
|
|
|
| CoStar Group, Inc.* |
|
|
23 |
|
|
|
4,702 |
|
|
|
|
| Coupons.com, Inc.#,* |
|
|
1,190 |
|
|
|
14,911 |
|
|
|
|
| Cvent, Inc.* |
|
|
580 |
|
|
|
15,590 |
|
|
|
|
| DealerTrack Holdings, Inc.* |
|
|
3,148 |
|
|
|
123,748 |
|
|
|
|
| Demand Media, Inc.* |
|
|
296 |
|
|
|
1,897 |
|
|
|
|
| Demandware, Inc.* |
|
|
2,110 |
|
|
|
129,976 |
|
|
|
|
| DHI Group, Inc.* |
|
|
2,050 |
|
|
|
15,580 |
|
|
|
|
| EarthLink Holdings Corp. |
|
|
4,880 |
|
|
|
23,082 |
|
|
|
|
| Endurance International Group Holdings, Inc.#,* |
|
|
1,940 |
|
|
|
35,580 |
|
|
|
|
| Envestnet, Inc.* |
|
|
1,990 |
|
|
|
102,007 |
|
|
|
|
| Everyday Health, Inc.* |
|
|
1,490 |
|
|
|
18,267 |
|
|
|
|
| Gogo, Inc.#,* |
|
|
3,860 |
|
|
|
81,600 |
|
|
|
|
| GrubHub, Inc.* |
|
|
340 |
|
|
|
13,998 |
|
|
|
|
| GTT Communications, Inc.* |
|
|
1,050 |
|
|
|
19,173 |
|
|
|
|
| Internap Corp.* |
|
|
905 |
|
|
|
8,507 |
|
|
|
|
| Intralinks Holdings, Inc.* |
|
|
1,670 |
|
|
|
16,366 |
|
|
|
|
| j2 Global, Inc. |
|
|
3,205 |
|
|
|
222,331 |
|
|
|
|
| Limelight Networks, Inc.* |
|
|
4,342 |
|
|
|
16,065 |
|
|
|
|
| Liquidity Services, Inc.* |
|
|
580 |
|
|
|
5,429 |
|
|
|
|
| LivePerson, Inc.* |
|
|
4,440 |
|
|
|
41,736 |
|
|
|
|
| LogMeIn, Inc.* |
|
|
1,840 |
|
|
|
118,091 |
|
|
|
|
|
|
|
|
|
|
|
|
|
| Description
|
|
Number of
Shares
|
|
|
Value
|
|
|
|
|
| Marchex, Inc. |
|
|
4,225 |
|
|
$ |
17,956 |
|
|
|
|
| Marin Software, Inc.* |
|
|
2,570 |
|
|
|
15,523 |
|
|
|
|
| Marketo, Inc.* |
|
|
1,620 |
|
|
|
46,089 |
|
|
|
|
| Millennial Media, Inc.#,* |
|
|
9,330 |
|
|
|
14,462 |
|
|
|
|
| Monster Worldwide, Inc.* |
|
|
6,150 |
|
|
|
36,224 |
|
|
|
|
| NIC, Inc. |
|
|
3,983 |
|
|
|
67,711 |
|
|
|
|
| Perficient, Inc.* |
|
|
2,246 |
|
|
|
46,335 |
|
|
|
|
| Q2 Holdings, Inc.* |
|
|
770 |
|
|
|
15,670 |
|
|
|
|
| QuinStreet, Inc.* |
|
|
1,450 |
|
|
|
7,874 |
|
|
|
|
| RealNetworks, Inc.* |
|
|
719 |
|
|
|
4,724 |
|
|
|
|
| Reis, Inc.* |
|
|
460 |
|
|
|
10,456 |
|
|
|
|
| RetailMeNot, Inc.#,* |
|
|
2,880 |
|
|
|
52,934 |
|
|
|
|
| Rightside Group Ltd.* |
|
|
296 |
|
|
|
2,409 |
|
|
|
|
| Rocket Fuel, Inc.#,* |
|
|
2,170 |
|
|
|
17,382 |
|
|
|
|
| SciQuest, Inc.* |
|
|
2,210 |
|
|
|
33,968 |
|
|
|
|
| Shutterstock, Inc.#,* |
|
|
960 |
|
|
|
64,790 |
|
|
|
|
| SPS Commerce, Inc.* |
|
|
1,070 |
|
|
|
69,828 |
|
|
|
|
| Stamps.com, Inc.* |
|
|
770 |
|
|
|
47,655 |
|
|
|
|
| TechTarget, Inc.* |
|
|
855 |
|
|
|
9,251 |
|
|
|
|
| Textura Corp.* |
|
|
1,770 |
|
|
|
46,321 |
|
|
|
|
| Travelzoo, Inc.* |
|
|
900 |
|
|
|
11,826 |
|
|
|
|
| Tremor Video, Inc.* |
|
|
2,240 |
|
|
|
5,600 |
|
|
|
|
| Unwired Planet, Inc.* |
|
|
6,333 |
|
|
|
3,738 |
|
|
|
|
| Web.com Group, Inc.* |
|
|
2,890 |
|
|
|
53,089 |
|
|
|
|
| WebMD Health Corp.#,* |
|
|
2,590 |
|
|
|
114,349 |
|
|
|
|
| Wix.Com Ltd.* |
|
|
890 |
|
|
|
17,328 |
|
|
|
|
| XO Group, Inc.* |
|
|
2,034 |
|
|
|
33,073 |
|
|
|
|
| Xoom Corp.* |
|
|
3,010 |
|
|
|
53,187 |
|
|
|
|
| Yelp, Inc.* |
|
|
221 |
|
|
|
8,705 |
|
|
|
|
| Zillow Group, Inc., Class A#,* |
|
|
1,118 |
|
|
|
109,162 |
|
|
|
|
|
|
|
|
|
|
|
|
|
|
|
|
|
|
|
$ |
2,732,170 |
|
|
| IT SERVICES – 2.9% |
|
|
|
|
| Acxiom Corp.* |
|
|
1,841 |
|
|
|
32,144 |
|
|
|
|
| Alliance Data Systems Corp.* |
|
|
25 |
|
|
|
7,433 |
|
|
|
|
| Blackhawk Network Holdings, Inc.* |
|
|
2,640 |
|
|
|
97,073 |
|
|
|
|
| CACI International, Inc.* |
|
|
973 |
|
|
|
85,858 |
|
|
|
|
| Cardtronics, Inc.* |
|
|
2,760 |
|
|
|
104,135 |
|
|
|
|
| Cass Information Systems, Inc. |
|
|
1,018 |
|
|
|
53,211 |
|
|
|
|
| Ciber, Inc.* |
|
|
3,842 |
|
|
|
13,562 |
|
|
|
|
| Computer Task Group, Inc. |
|
|
1,430 |
|
|
|
11,769 |
|
|
|
|
| Convergys Corp.# |
|
|
3,700 |
|
|
|
83,916 |
|
|
|
|
| CSG Systems International, Inc. |
|
|
2,020 |
|
|
|
58,822 |
|
|
|
|
| Datalink Corp.* |
|
|
1,130 |
|
|
|
13,063 |
|
|
|
|
| EPAM Systems, Inc.* |
|
|
2,080 |
|
|
|
134,597 |
|
|
|
|
| Euronet Worldwide, Inc.* |
|
|
3,646 |
|
|
|
213,218 |
|
|
|
|
| EVERTEC, Inc. |
|
|
3,650 |
|
|
|
75,664 |
|
|
|
|
| ExlService Holdings, Inc.* |
|
|
845 |
|
|
|
29,093 |
|
ANNUAL
REPORT / April 30, 2015
60
PORTFOLIOS OF INVESTMENTS
Wilmington Small-Cap Strategy Fund (continued)
|
|
|
|
|
|
|
|
|
|
|
|
| Description
|
|
Number of
Shares
|
|
|
Value
|
|
|
|
|
| Forrester Research, Inc. |
|
|
535 |
|
|
$ |
18,613 |
|
|
|
|
| Global Cash Access Holdings, Inc.* |
|
|
2,961 |
|
|
|
21,911 |
|
|
|
|
| Hackett Group, Inc. (The) |
|
|
1,523 |
|
|
|
14,621 |
|
|
|
|
| Heartland Payment Systems, Inc. |
|
|
2,659 |
|
|
|
135,343 |
|
|
|
|
| Higher One Holdings, Inc.* |
|
|
3,830 |
|
|
|
10,762 |
|
|
|
|
| iGATE Corp.* |
|
|
2,768 |
|
|
|
131,646 |
|
|
|
|
| Information Services Group, Inc.* |
|
|
50 |
|
|
|
196 |
|
|
|
|
| Lionbridge Technologies, Inc.* |
|
|
5,840 |
|
|
|
32,412 |
|
|
|
|
| Luxoft Holding, Inc.* |
|
|
810 |
|
|
|
41,982 |
|
|
|
|
| ManTech International Corp. |
|
|
891 |
|
|
|
26,044 |
|
|
|
|
| MAXIMUS, Inc. |
|
|
4,738 |
|
|
|
303,279 |
|
|
|
|
| ModusLink Global Solutions, Inc.* |
|
|
1,459 |
|
|
|
5,107 |
|
|
|
|
| MoneyGram International, Inc.* |
|
|
1,507 |
|
|
|
11,679 |
|
|
|
|
| NeuStar, Inc.#,* |
|
|
3,900 |
|
|
|
117,000 |
|
|
|
|
| PRGX Global, Inc.* |
|
|
1,750 |
|
|
|
7,420 |
|
|
|
|
| Science Applications International Corp. |
|
|
2,550 |
|
|
|
127,755 |
|
|
|
|
| Sykes Enterprises, Inc.* |
|
|
1,812 |
|
|
|
45,354 |
|
|
|
|
| Syntel, Inc. |
|
|
2,100 |
|
|
|
94,542 |
|
|
|
|
| TeleTech Holdings, Inc.* |
|
|
1,218 |
|
|
|
31,595 |
|
|
|
|
| Unisys Corp.* |
|
|
3,241 |
|
|
|
70,557 |
|
|
|
|
| Virtusa Corp.* |
|
|
1,909 |
|
|
|
75,978 |
|
|
|
|
| WEX, Inc.* |
|
|
2,716 |
|
|
|
306,120 |
|
|
|
|
|
|
|
|
|
|
|
|
|
|
|
|
|
|
|
$ |
2,643,474 |
|
|
| SEMICONDUCTORS & SEMICONDUCTOR
EQUIPMENT – 4.3% |
|
|
|
|
| Advanced Energy Industries, Inc.* |
|
|
3,262 |
|
|
|
79,789 |
|
|
|
|
| Alpha & Omega Semiconductor Ltd.* |
|
|
1,770 |
|
|
|
14,496 |
|
|
|
|
| Ambarella, Inc.* |
|
|
1,960 |
|
|
|
143,374 |
|
|
|
|
| Amkor Technology, Inc.* |
|
|
6,054 |
|
|
|
42,560 |
|
|
|
|
| Applied Micro Circuits Corp.* |
|
|
1,414 |
|
|
|
7,593 |
|
|
|
|
| Audience, Inc.#,* |
|
|
1,230 |
|
|
|
5,855 |
|
|
|
|
| Axcelis Technologies, Inc.* |
|
|
6,110 |
|
|
|
15,397 |
|
|
|
|
| Brooks Automation, Inc. |
|
|
2,644 |
|
|
|
28,449 |
|
|
|
|
| Cabot Microelectronics Corp.* |
|
|
1,811 |
|
|
|
85,660 |
|
|
|
|
| Cavium, Inc.* |
|
|
3,544 |
|
|
|
229,616 |
|
|
|
|
| CEVA, Inc.* |
|
|
22 |
|
|
|
455 |
|
|
|
|
| Cirrus Logic, Inc.* |
|
|
3,000 |
|
|
|
101,340 |
|
|
|
|
| Cohu, Inc. |
|
|
113 |
|
|
|
1,183 |
|
|
|
|
| Cypress Semiconductor Corp. |
|
|
20,898 |
|
|
|
278,361 |
|
|
|
|
| Diodes, Inc.* |
|
|
2,345 |
|
|
|
62,658 |
|
|
|
|
| DSP Group, Inc.* |
|
|
1,625 |
|
|
|
18,492 |
|
|
|
|
| Entegris, Inc.* |
|
|
5,980 |
|
|
|
79,594 |
|
|
|
|
| Entropic Communications, Inc.* |
|
|
6,160 |
|
|
|
18,603 |
|
|
|
|
| Exar Corp.* |
|
|
1,180 |
|
|
|
11,647 |
|
|
|
|
| Fairchild Semiconductor International, Inc.* |
|
|
4,220 |
|
|
|
76,656 |
|
|
|
|
| FormFactor, Inc.* |
|
|
31 |
|
|
|
247 |
|
|
|
|
| GT Advanced Technologies, Inc.* |
|
|
4,014 |
|
|
|
1,160 |
|
|
|
|
| Inphi Corp.#,* |
|
|
1,790 |
|
|
|
38,395 |
|
|
|
|
|
|
|
|
|
|
|
|
|
| Description
|
|
Number of
Shares
|
|
|
Value
|
|
|
|
|
| Integrated Device Technology, Inc.* |
|
|
8,290 |
|
|
$ |
150,795 |
|
|
|
|
| Integrated Silicon Solution, Inc.* |
|
|
1,200 |
|
|
|
22,260 |
|
|
|
|
| Intersil Corp. |
|
|
5,280 |
|
|
|
70,488 |
|
|
|
|
| IXYS Corp. |
|
|
1,532 |
|
|
|
17,327 |
|
|
|
|
| Kopin Corp.* |
|
|
3,008 |
|
|
|
9,987 |
|
|
|
|
| Lattice Semiconductor Corp.* |
|
|
8,050 |
|
|
|
47,736 |
|
|
|
|
| M/A-COM Technology Solutions Holdings, Inc.* |
|
|
1,040 |
|
|
|
31,689 |
|
|
|
|
| MaxLinear, Inc.* |
|
|
1,840 |
|
|
|
15,695 |
|
|
|
|
| Micrel, Inc. |
|
|
3,416 |
|
|
|
46,458 |
|
|
|
|
| Microsemi Corp.* |
|
|
5,912 |
|
|
|
197,224 |
|
|
|
|
| MKS Instruments, Inc. |
|
|
2,189 |
|
|
|
76,199 |
|
|
|
|
| Monolithic Power Systems, Inc. |
|
|
2,667 |
|
|
|
138,231 |
|
|
|
|
| Nanometrics, Inc.* |
|
|
910 |
|
|
|
14,069 |
|
|
|
|
| NVE Corp.* |
|
|
299 |
|
|
|
20,290 |
|
|
|
|
| OmniVision Technologies, Inc.* |
|
|
2,261 |
|
|
|
63,071 |
|
|
|
|
| PDF Solutions, Inc.* |
|
|
810 |
|
|
|
14,637 |
|
|
|
|
| Pericom Semiconductor Corp.* |
|
|
513 |
|
|
|
6,423 |
|
|
|
|
| Photronics, Inc.* |
|
|
2,660 |
|
|
|
23,328 |
|
|
|
|
| PMC - Sierra, Inc.* |
|
|
9,060 |
|
|
|
76,376 |
|
|
|
|
| Power Integrations, Inc. |
|
|
1,904 |
|
|
|
94,229 |
|
|
|
|
| Qorvo, Inc.* |
|
|
10,031 |
|
|
|
661,143 |
|
|
|
|
| QuickLogic Corp.* |
|
|
5,730 |
|
|
|
10,085 |
|
|
|
|
| Rambus, Inc.* |
|
|
7,550 |
|
|
|
104,492 |
|
|
|
|
| Rubicon Technology, Inc.#,* |
|
|
3,692 |
|
|
|
14,177 |
|
|
|
|
| Rudolph Technologies, Inc.* |
|
|
627 |
|
|
|
8,044 |
|
|
|
|
| Semtech Corp.* |
|
|
4,140 |
|
|
|
96,421 |
|
|
|
|
| Silicon Laboratories, Inc.* |
|
|
2,120 |
|
|
|
109,540 |
|
|
|
|
| Synaptics, Inc.* |
|
|
2,533 |
|
|
|
214,596 |
|
|
|
|
| Tessera Technologies, Inc. |
|
|
3,246 |
|
|
|
117,213 |
|
|
|
|
| Ultra Clean Holdings, Inc.* |
|
|
470 |
|
|
|
2,825 |
|
|
|
|
| Veeco Instruments, Inc.* |
|
|
1,700 |
|
|
|
50,167 |
|
|
|
|
| Xcerra Corp.* |
|
|
1,613 |
|
|
|
15,856 |
|
|
|
|
|
|
|
|
|
|
|
|
|
|
|
|
|
|
|
$ |
3,882,651 |
|
|
| SOFTWARE – 5.6% |
|
|
|
|
| A10 Networks, Inc.#,* |
|
|
2,120 |
|
|
|
9,646 |
|
|
|
|
| ACI Worldwide, Inc.* |
|
|
7,052 |
|
|
|
162,408 |
|
|
|
|
| Advent Software, Inc. |
|
|
3,474 |
|
|
|
150,806 |
|
|
|
|
| American Software, Inc. |
|
|
764 |
|
|
|
7,418 |
|
|
|
|
| Aspen Technology, Inc.* |
|
|
6,060 |
|
|
|
269,003 |
|
|
|
|
| AVG Technologies NV* |
|
|
1,740 |
|
|
|
41,621 |
|
|
|
|
| Barracuda Networks, Inc.#,* |
|
|
170 |
|
|
|
6,890 |
|
|
|
|
| Blackbaud, Inc. |
|
|
3,382 |
|
|
|
170,892 |
|
|
|
|
| Bottomline Technologies, Inc.* |
|
|
2,857 |
|
|
|
76,453 |
|
|
|
|
| BroadSoft, Inc.* |
|
|
1,050 |
|
|
|
33,222 |
|
|
|
|
| Callidus Software, Inc.* |
|
|
3,610 |
|
|
|
44,583 |
|
|
|
|
| CommVault Systems, Inc.* |
|
|
3,171 |
|
|
|
145,073 |
|
|
|
|
| Comverse, Inc.* |
|
|
1,493 |
|
|
|
36,578 |
|
April 30,
2015 / ANNUAL REPORT
PORTFOLIOS OF
INVESTMENTS 61
Wilmington Small-Cap Strategy Fund (continued)
|
|
|
|
|
|
|
|
|
|
|
|
| Description
|
|
Number of
Shares
|
|
|
Value
|
|
|
|
|
| Covisint Corp.* |
|
|
1,412 |
|
|
$ |
2,768 |
|
|
|
|
| Cyan, Inc.* |
|
|
7,240 |
|
|
|
27,005 |
|
|
|
|
| Digimarc Corp.# |
|
|
460 |
|
|
|
10,764 |
|
|
|
|
| Ebix, Inc.# |
|
|
1,298 |
|
|
|
35,422 |
|
|
|
|
| Ellie Mae, Inc.* |
|
|
1,910 |
|
|
|
105,050 |
|
|
|
|
| EPIQ Systems, Inc. |
|
|
481 |
|
|
|
8,615 |
|
|
|
|
| ePlus, Inc. |
|
|
210 |
|
|
|
17,422 |
|
|
|
|
| Fair Isaac Corp. |
|
|
2,144 |
|
|
|
189,658 |
|
|
|
|
| Fleetmatics Group PLC* |
|
|
2,460 |
|
|
|
112,127 |
|
|
|
|
| Gigamon, Inc.* |
|
|
830 |
|
|
|
24,427 |
|
|
|
|
| Glu Mobile, Inc.#,* |
|
|
7,070 |
|
|
|
47,793 |
|
|
|
|
| Guidance Software, Inc.* |
|
|
680 |
|
|
|
3,971 |
|
|
|
|
| Guidewire Software, Inc.* |
|
|
4,780 |
|
|
|
238,761 |
|
|
|
|
| Imperva, Inc.* |
|
|
1,700 |
|
|
|
77,554 |
|
|
|
|
| Infoblox, Inc.* |
|
|
4,120 |
|
|
|
97,067 |
|
|
|
|
| Interactive Intelligence Group, Inc.* |
|
|
293 |
|
|
|
12,886 |
|
|
|
|
| Jive Software, Inc.* |
|
|
2,140 |
|
|
|
11,513 |
|
|
|
|
| Kofax Ltd.* |
|
|
90 |
|
|
|
993 |
|
|
|
|
| Manhattan Associates, Inc.* |
|
|
5,320 |
|
|
|
279,619 |
|
|
|
|
| Mentor Graphics Corp. |
|
|
3,728 |
|
|
|
89,211 |
|
|
|
|
| MicroStrategy, Inc.* |
|
|
699 |
|
|
|
127,302 |
|
|
|
|
| Model N, Inc.* |
|
|
1,550 |
|
|
|
18,213 |
|
|
|
|
| Monotype Imaging Holdings, Inc. |
|
|
2,068 |
|
|
|
67,024 |
|
|
|
|
| NetScout Systems, Inc.#,* |
|
|
2,751 |
|
|
|
113,066 |
|
|
|
|
| Pegasystems, Inc. |
|
|
2,688 |
|
|
|
57,900 |
|
|
|
|
| Progress Software Corp.* |
|
|
1,814 |
|
|
|
47,890 |
|
|
|
|
| Proofpoint, Inc.#,* |
|
|
2,630 |
|
|
|
141,967 |
|
|
|
|
| PROS Holdings, Inc.* |
|
|
1,966 |
|
|
|
43,704 |
|
|
|
|
| QAD, Inc. |
|
|
607 |
|
|
|
14,799 |
|
|
|
|
| QLIK Technologies, Inc.* |
|
|
5,670 |
|
|
|
197,259 |
|
|
|
|
| Qualys, Inc.* |
|
|
1,530 |
|
|
|
75,766 |
|
|
|
|
| Rally Software Development Corp.* |
|
|
630 |
|
|
|
9,110 |
|
|
|
|
| RealPage, Inc.* |
|
|
2,970 |
|
|
|
58,925 |
|
|
|
|
| Rosetta Stone, Inc.* |
|
|
750 |
|
|
|
6,270 |
|
|
|
|
| Sapiens International Corp.* |
|
|
120 |
|
|
|
1,048 |
|
|
|
|
| Seachange International, Inc.* |
|
|
1,480 |
|
|
|
9,931 |
|
|
|
|
| Silver Spring Networks, Inc.#,* |
|
|
4,340 |
|
|
|
42,185 |
|
|
|
|
| SS&C Technologies Holdings, Inc.* |
|
|
4,450 |
|
|
|
267,757 |
|
|
|
|
| Synchronoss Technologies, Inc.* |
|
|
2,509 |
|
|
|
115,113 |
|
|
|
|
| Take-Two Interactive Software, Inc.* |
|
|
3,551 |
|
|
|
84,159 |
|
|
|
|
| Tangoe, Inc.* |
|
|
2,170 |
|
|
|
29,686 |
|
|
|
|
| TeleCommunication Systems, Inc.* |
|
|
550 |
|
|
|
1,716 |
|
|
|
|
| Telenav, Inc.* |
|
|
770 |
|
|
|
6,437 |
|
|
|
|
| TiVo, Inc.* |
|
|
3,980 |
|
|
|
43,979 |
|
|
|
|
| Tyler Technologies, Inc.* |
|
|
2,329 |
|
|
|
284,022 |
|
|
|
|
| Ultimate Software Group, Inc.* |
|
|
1,787 |
|
|
|
297,035 |
|
|
|
|
| VASCO Data Security International, Inc.#,* |
|
|
2,255 |
|
|
|
57,322 |
|
|
|
|
| Verint Systems, Inc.* |
|
|
4,087 |
|
|
|
251,064 |
|
|
|
|
|
|
|
|
|
|
|
|
|
| Description
|
|
Number of
Shares
|
|
|
Value
|
|
|
|
|
| VirnetX Holding Corp.#,* |
|
|
1,970 |
|
|
$ |
12,726 |
|
|
|
|
| Vringo, Inc.#,* |
|
|
5,130 |
|
|
|
3,181 |
|
|
|
|
| Zendesk, Inc.#,* |
|
|
1,370 |
|
|
|
31,592 |
|
|
|
|
| Zix Corp.* |
|
|
1,790 |
|
|
|
7,625 |
|
|
|
|
|
|
|
|
|
|
|
|
|
|
|
|
|
|
|
$ |
5,072,992 |
|
|
|
|
|
|
|
|
|
|
|
|
| TOTAL INFORMATION TECHNOLOGY |
|
|
$ |
18,937,966 |
|
|
|
|
| MATERIALS – 4.5% |
|
|
|
|
|
|
|
|
|
|
|
| CHEMICALS – 2.1% |
|
|
|
|
|
|
|
|
|
|
|
| A Schulman, Inc. |
|
|
1,558 |
|
|
|
66,137 |
|
|
|
|
| Advanced Emissions Solutions, Inc.#,* |
|
|
530 |
|
|
|
7,637 |
|
|
|
|
| American Vanguard Corp. |
|
|
794 |
|
|
|
8,663 |
|
|
|
|
| Axiall Corp. |
|
|
2,350 |
|
|
|
95,880 |
|
|
|
|
| Balchem Corp. |
|
|
2,250 |
|
|
|
117,945 |
|
|
|
|
| Calgon Carbon Corp.* |
|
|
3,191 |
|
|
|
70,808 |
|
|
|
|
| Chase Corp. |
|
|
550 |
|
|
|
19,695 |
|
|
|
|
| Chemtura Corp.* |
|
|
5,350 |
|
|
|
161,195 |
|
|
|
|
| Ferro Corp.* |
|
|
4,722 |
|
|
|
63,700 |
|
|
|
|
| Flotek Industries, Inc.* |
|
|
3,070 |
|
|
|
43,870 |
|
|
|
|
| FutureFuel Corp. |
|
|
620 |
|
|
|
6,739 |
|
|
|
|
| H.B. Fuller Co. |
|
|
3,589 |
|
|
|
149,913 |
|
|
|
|
| Hawkins, Inc. |
|
|
200 |
|
|
|
7,890 |
|
|
|
|
| Innophos Holdings, Inc. |
|
|
915 |
|
|
|
48,349 |
|
|
|
|
| Innospec, Inc. |
|
|
940 |
|
|
|
41,078 |
|
|
|
|
| Intrepid Potash, Inc. |
|
|
2,220 |
|
|
|
27,817 |
|
|
|
|
| KMG Chemicals, Inc. |
|
|
770 |
|
|
|
22,546 |
|
|
|
|
| Koppers Holdings, Inc. |
|
|
664 |
|
|
|
14,927 |
|
|
|
|
| Kraton Performance Polymers, Inc.* |
|
|
870 |
|
|
|
19,610 |
|
|
|
|
| Kronos Worldwide, Inc. |
|
|
1,300 |
|
|
|
17,485 |
|
|
|
|
| LSB Industries, Inc.* |
|
|
621 |
|
|
|
26,337 |
|
|
|
|
| Marrone Bio Innovations, Inc.#,* |
|
|
1,060 |
|
|
|
3,540 |
|
|
|
|
| Minerals Technologies, Inc. |
|
|
1,730 |
|
|
|
117,173 |
|
|
|
|
| Olin Corp. |
|
|
2,345 |
|
|
|
69,248 |
|
|
|
|
| OM Group, Inc. |
|
|
1,506 |
|
|
|
45,240 |
|
|
|
|
| OMNOVA Solutions, Inc.* |
|
|
4,500 |
|
|
|
35,955 |
|
|
|
|
| PolyOne Corp. |
|
|
6,602 |
|
|
|
257,808 |
|
|
|
|
| Quaker Chemical Corp. |
|
|
812 |
|
|
|
67,575 |
|
|
|
|
| Rentech, Inc. |
|
|
9,960 |
|
|
|
11,952 |
|
|
|
|
| Senomyx, Inc.#,* |
|
|
120 |
|
|
|
695 |
|
|
|
|
| Sensient Technologies Corp. |
|
|
1,912 |
|
|
|
124,968 |
|
|
|
|
| Stepan Co. |
|
|
578 |
|
|
|
29,438 |
|
|
|
|
| Trecora Resources* |
|
|
1,360 |
|
|
|
16,320 |
|
|
|
|
| Tredegar Corp. |
|
|
1,680 |
|
|
|
34,390 |
|
|
|
|
| Tronox Ltd. |
|
|
2,190 |
|
|
|
45,881 |
|
|
|
|
| Zep, Inc. |
|
|
714 |
|
|
|
14,194 |
|
|
|
|
|
|
|
|
|
|
|
|
|
|
|
|
|
|
|
$ |
1,912,598 |
|
ANNUAL
REPORT / April 30, 2015
62
PORTFOLIOS OF INVESTMENTS
Wilmington Small-Cap Strategy Fund (continued)
|
|
|
|
|
|
|
|
|
|
|
|
| Description
|
|
Number of
Shares
|
|
|
Value
|
|
|
| CONSTRUCTION MATERIALS – 0.2% |
|
|
|
|
| Headwaters, Inc.* |
|
|
4,765 |
|
|
$ |
83,769 |
|
|
|
|
| United States Lime & Minerals, Inc. |
|
|
246 |
|
|
|
16,236 |
|
|
|
|
| US Concrete, Inc.* |
|
|
1,020 |
|
|
|
37,026 |
|
|
|
|
|
|
|
|
|
|
|
|
|
|
|
|
|
|
|
$ |
137,031 |
|
|
| CONTAINERS & PACKAGING – 0.5% |
|
|
|
|
| AEP Industries, Inc.* |
|
|
77 |
|
|
|
3,858 |
|
|
|
|
| Berry Plastics Group, Inc.* |
|
|
3,850 |
|
|
|
131,747 |
|
|
|
|
| Graphic Packaging Holding Co.* |
|
|
22,600 |
|
|
|
318,660 |
|
|
|
|
| Myers Industries, Inc. |
|
|
1,732 |
|
|
|
28,006 |
|
|
|
|
| UFP Technologies, Inc.* |
|
|
580 |
|
|
|
11,768 |
|
|
|
|
|
|
|
|
|
|
|
|
|
|
|
|
|
|
|
$ |
494,039 |
|
|
| METALS & MINING – 0.9% |
|
|
|
|
| AK Steel Holding Corp.#,* |
|
|
8,300 |
|
|
|
42,164 |
|
|
|
|
| Allied Nevada Gold Corp.* |
|
|
9,340 |
|
|
|
1,400 |
|
|
|
|
| AM Castle & Co.#,* |
|
|
2,460 |
|
|
|
9,643 |
|
|
|
|
| Century Aluminum Co.* |
|
|
2,140 |
|
|
|
27,585 |
|
|
|
|
| Coeur Mining, Inc.* |
|
|
5,440 |
|
|
|
28,397 |
|
|
|
|
| Commercial Metals Co. |
|
|
4,090 |
|
|
|
67,894 |
|
|
|
|
| Globe Specialty Metals, Inc. |
|
|
3,740 |
|
|
|
74,501 |
|
|
|
|
| Gold Reserve, Inc.#,* |
|
|
2,870 |
|
|
|
11,078 |
|
|
|
|
| Gold Resource Corp. |
|
|
4,370 |
|
|
|
14,727 |
|
|
|
|
| Handy & Harman Ltd.* |
|
|
200 |
|
|
|
7,086 |
|
|
|
|
| Haynes International, Inc. |
|
|
574 |
|
|
|
25,526 |
|
|
|
|
| Hecla Mining Co. |
|
|
11,978 |
|
|
|
36,174 |
|
|
|
|
| Horsehead Holding Corp.#,* |
|
|
2,628 |
|
|
|
39,289 |
|
|
|
|
| Kaiser Aluminum Corp. |
|
|
561 |
|
|
|
45,088 |
|
|
|
|
| Materion Corp. |
|
|
1,162 |
|
|
|
46,468 |
|
|
|
|
| Molycorp, Inc.#,* |
|
|
15,320 |
|
|
|
14,137 |
|
|
|
|
| Noranda Aluminum Holding Corp. |
|
|
870 |
|
|
|
2,906 |
|
|
|
|
| Olympic Steel, Inc. |
|
|
625 |
|
|
|
6,844 |
|
|
|
|
| RTI International Metals, Inc.#,* |
|
|
1,582 |
|
|
|
59,562 |
|
|
|
|
| Schnitzer Steel Industries, Inc. |
|
|
1,420 |
|
|
|
24,736 |
|
|
|
|
| Stillwater Mining Co.* |
|
|
7,354 |
|
|
|
98,764 |
|
|
|
|
| SunCoke Energy, Inc.* |
|
|
3,170 |
|
|
|
55,570 |
|
|
|
|
| Universal Stainless & Alloy Products, Inc.* |
|
|
546 |
|
|
|
11,466 |
|
|
|
|
| Worthington Industries, Inc. |
|
|
3,279 |
|
|
|
88,631 |
|
|
|
|
|
|
|
|
|
|
|
|
|
|
|
|
|
|
|
$ |
839,636 |
|
|
| PAPER & FOREST PRODUCTS – 0.8% |
|
|
|
|
| Boise Cascade Co.* |
|
|
2,910 |
|
|
|
100,977 |
|
|
|
|
| Clearwater Paper Corp.* |
|
|
1,584 |
|
|
|
101,328 |
|
|
|
|
| Deltic Timber Corp. |
|
|
815 |
|
|
|
52,160 |
|
|
|
|
| KapStone Paper & Packaging Corp. |
|
|
5,970 |
|
|
|
166,861 |
|
|
|
|
| Louisiana-Pacific Corp.#,* |
|
|
5,126 |
|
|
|
78,120 |
|
|
|
|
| Neenah Paper, Inc. |
|
|
901 |
|
|
|
54,483 |
|
|
|
|
| PH Glatfelter Co. |
|
|
2,043 |
|
|
|
50,666 |
|
|
|
|
|
|
|
|
|
|
|
|
|
| Description
|
|
Number of
Shares
|
|
|
Value
|
|
|
|
|
| Resolute Forest Products, Inc.* |
|
|
2,910 |
|
|
$ |
44,872 |
|
|
|
|
| Schweitzer-Mauduit International, Inc. |
|
|
658 |
|
|
|
29,090 |
|
|
|
|
| Wausau Paper Corp. |
|
|
2,650 |
|
|
|
24,698 |
|
|
|
|
|
|
|
|
|
|
|
|
|
|
|
|
|
|
|
$ |
703,255 |
|
|
|
|
|
|
|
|
|
|
|
|
|
| TOTAL MATERIALS |
|
|
|
|
|
$ |
4,086,559 |
|
|
| TELECOMMUNICATION SERVICES – 0.7% |
|
|
| DIVERSIFIED TELECOMMUNICATION SERVICES – 0.6% |
|
|
|
|
| 8x8, Inc.* |
|
|
3,830 |
|
|
|
33,436 |
|
|
|
|
| Atlantic Tele-Network, Inc. |
|
|
430 |
|
|
|
28,389 |
|
|
|
|
| Cincinnati Bell, Inc.* |
|
|
5,710 |
|
|
|
19,585 |
|
|
|
|
| Cogent Communications Holdings, Inc. |
|
|
3,053 |
|
|
|
106,824 |
|
|
|
|
| Consolidated Communications Holdings, Inc. |
|
|
3,050 |
|
|
|
64,263 |
|
|
|
|
| FairPoint Communications, Inc.* |
|
|
1,450 |
|
|
|
28,594 |
|
|
|
|
| General Communication, Inc.* |
|
|
282 |
|
|
|
4,473 |
|
|
|
|
| Globalstar, Inc.#,* |
|
|
6,620 |
|
|
|
17,146 |
|
|
|
|
| Hawaiian Telcom Holdco, Inc.#,* |
|
|
550 |
|
|
|
14,487 |
|
|
|
|
| IDT Corp. |
|
|
1,300 |
|
|
|
22,139 |
|
|
|
|
| inContact, Inc.* |
|
|
2,210 |
|
|
|
22,873 |
|
|
|
|
| Inteliquent, Inc. |
|
|
2,090 |
|
|
|
39,731 |
|
|
|
|
| Intelsat SA* |
|
|
1,410 |
|
|
|
17,752 |
|
|
|
|
| Iridium Communications, Inc.#,* |
|
|
2,830 |
|
|
|
28,781 |
|
|
|
|
| Lumos Networks Corp. |
|
|
1,737 |
|
|
|
24,561 |
|
|
|
|
| magicJack VocalTec Ltd.#,* |
|
|
2,030 |
|
|
|
13,195 |
|
|
|
|
| ORBCOMM, Inc.* |
|
|
2,560 |
|
|
|
15,411 |
|
|
|
|
| Premiere Global Services, Inc.* |
|
|
700 |
|
|
|
7,147 |
|
|
|
|
| Vonage Holdings Corp.* |
|
|
5,910 |
|
|
|
27,363 |
|
|
|
|
|
|
|
|
|
|
|
|
|
|
|
|
|
|
|
$ |
536,150 |
|
|
| WIRELESS TELECOMMUNICATION SERVICES – 0.1% |
|
|
|
|
| Boingo Wireless, Inc.* |
|
|
1,190 |
|
|
|
9,829 |
|
|
|
|
| NTELOS Holdings Corp. |
|
|
1,647 |
|
|
|
9,569 |
|
|
|
|
| RingCentral, Inc.#,* |
|
|
1,800 |
|
|
|
31,014 |
|
|
|
|
| Shenandoah Telecommunications Co. |
|
|
1,746 |
|
|
|
60,167 |
|
|
|
|
| Spok Holdings, Inc. |
|
|
1,488 |
|
|
|
28,012 |
|
|
|
|
|
|
|
|
|
|
|
|
|
|
|
|
|
|
|
$ |
138,591 |
|
|
|
|
|
|
|
|
|
|
|
|
| TOTAL TELECOMMUNICATION SERVICES |
|
|
$ |
674,741 |
|
|
|
|
| UTILITIES – 2.4% |
|
|
|
|
|
|
|
|
|
| ELECTRIC UTILITIES – 0.9% |
|
|
|
|
| ALLETE, Inc. |
|
|
1,056 |
|
|
|
53,117 |
|
|
|
|
| Cleco Corp. |
|
|
2,345 |
|
|
|
127,451 |
|
|
|
|
| El Paso Electric Co. |
|
|
1,680 |
|
|
|
62,513 |
|
|
|
|
| Empire District Electric Co. (The) |
|
|
896 |
|
|
|
21,119 |
|
|
|
|
| IDACORP, Inc. |
|
|
1,942 |
|
|
|
117,161 |
|
|
|
|
| MGE Energy, Inc. |
|
|
1,068 |
|
|
|
44,301 |
|
|
|
|
| NRG Yield, Inc.# |
|
|
1,140 |
|
|
|
56,088 |
|
|
|
|
| Otter Tail Corp. |
|
|
710 |
|
|
|
21,236 |
|
|
|
|
| PNM Resources, Inc. |
|
|
3,377 |
|
|
|
93,813 |
|
April 30,
2015 / ANNUAL REPORT
PORTFOLIOS OF
INVESTMENTS 63
Wilmington Small-Cap Strategy Fund (continued)
|
|
|
|
|
|
|
|
|
|
|
|
| Description
|
|
Number of
Shares
|
|
|
Value
|
|
|
|
|
| Portland General Electric Co. |
|
|
2,967 |
|
|
$ |
104,320 |
|
|
|
|
| UIL Holdings Corp. |
|
|
1,636 |
|
|
|
81,604 |
|
|
|
|
| Unitil Corp. |
|
|
810 |
|
|
|
27,702 |
|
|
|
|
|
|
|
|
|
|
|
|
|
|
|
|
|
|
|
$ |
810,425 |
|
|
|
|
| GAS UTILITIES – 0.7% |
|
|
|
|
|
|
|
|
|
|
|
| Chesapeake Utilities Corp. |
|
|
755 |
|
|
|
36,074 |
|
|
|
|
| Laclede Group, Inc. (The) |
|
|
1,718 |
|
|
|
89,216 |
|
|
|
|
| New Jersey Resources Corp. |
|
|
3,494 |
|
|
|
106,602 |
|
|
|
|
| Northwest Natural Gas Co. |
|
|
798 |
|
|
|
37,267 |
|
|
|
|
| Piedmont Natural Gas Co., Inc. |
|
|
2,864 |
|
|
|
107,228 |
|
|
|
|
| South Jersey Industries, Inc. |
|
|
921 |
|
|
|
48,583 |
|
|
|
|
| Southwest Gas Corp. |
|
|
1,968 |
|
|
|
108,240 |
|
|
|
|
| WGL Holdings, Inc. |
|
|
1,890 |
|
|
|
103,969 |
|
|
|
|
|
|
|
|
|
|
|
|
|
|
|
|
|
|
|
$ |
637,179 |
|
|
| INDEPENDENT POWER PRODUCERS & ENERGY |
|
|
|
|
| TRADERS – 0.3% |
|
|
|
|
|
|
|
|
|
|
|
| Abengoa Yield PLC |
|
|
220 |
|
|
|
7,460 |
|
|
|
|
| Atlantic Power Corp. |
|
|
4,610 |
|
|
|
14,982 |
|
|
|
|
| Dynegy, Inc.* |
|
|
4,310 |
|
|
|
143,394 |
|
|
|
|
| Ormat Technologies, Inc. |
|
|
850 |
|
|
|
31,102 |
|
|
|
|
| Pattern Energy Group, Inc. |
|
|
2,680 |
|
|
|
77,666 |
|
|
|
|
| TerraForm Power, Inc. Class A* |
|
|
860 |
|
|
|
33,996 |
|
|
|
|
|
|
|
|
|
|
|
|
|
|
|
|
|
|
|
$ |
308,600 |
|
|
|
|
| MULTI-UTILITIES – 0.3% |
|
|
|
|
|
|
|
|
|
|
|
| Avista Corp. |
|
|
2,378 |
|
|
|
77,570 |
|
|
|
|
| Black Hills Corp. |
|
|
1,688 |
|
|
|
83,202 |
|
|
|
|
| NorthWestern Corp. |
|
|
1,639 |
|
|
|
85,376 |
|
|
|
|
|
|
|
|
|
|
|
|
|
|
|
|
|
|
|
$ |
246,148 |
|
|
|
|
| WATER UTILITIES – 0.2% |
|
|
|
|
|
|
|
|
|
|
|
| American States Water Co. |
|
|
1,524 |
|
|
|
58,506 |
|
|
|
|
| Artesian Resources Corp. |
|
|
630 |
|
|
|
13,570 |
|
|
|
|
| California Water Service Group |
|
|
2,380 |
|
|
|
56,811 |
|
|
|
|
| Connecticut Water Service, Inc. |
|
|
363 |
|
|
|
13,068 |
|
|
|
|
| Middlesex Water Co. |
|
|
991 |
|
|
|
22,565 |
|
|
|
|
| SJW Corp. |
|
|
368 |
|
|
|
10,764 |
|
|
|
|
| York Water Co. (The) |
|
|
130 |
|
|
|
3,272 |
|
|
|
|
|
|
|
|
|
|
|
|
|
|
|
|
|
|
|
$ |
178,556 |
|
|
|
|
|
|
|
|
|
|
|
|
|
| TOTAL UTILITIES |
|
|
|
|
|
$ |
2,180,908 |
|
|
|
|
|
|
|
|
|
|
|
|
|
| TOTAL COMMON STOCKS |
|
|
|
|
|
|
|
|
| (COST $67,995,957) |
|
|
|
|
|
$ |
90,247,281 |
|
|
|
| INVESTMENT COMPANIES – 0.4% |
|
|
|
|
|
|
|
|
| EQUITY FUNDS – 0.4% |
|
|
|
|
|
|
|
|
|
|
|
| iShares Russell 2000 Growth ETF# |
|
|
1,086 |
|
|
|
159,696 |
|
|
|
|
|
|
|
|
|
|
|
|
|
| Description
|
|
Number of
Shares
|
|
|
Value
|
|
|
|
|
| iShares Russell 2000 Index Fund# |
|
|
1,109 |
|
|
$ |
134,366 |
|
|
|
|
|
|
|
|
|
|
|
|
|
| TOTAL EQUITY FUNDS |
|
|
|
|
|
$ |
294,062 |
|
|
|
|
|
|
|
|
|
|
| TOTAL INVESTMENT COMPANIES |
|
|
|
|
|
| (COST $272,356) |
|
|
|
|
|
$ |
294,062 |
|
|
|
|
| RIGHTS – 0.0%** |
|
|
|
|
|
|
|
|
|
|
|
| Leap Wireless International,
Inc.*,†† |
|
|
4,140 |
|
|
|
10,102 |
|
|
|
|
|
|
|
|
|
|
|
|
|
| TOTAL RIGHTS |
|
|
|
|
|
|
|
|
| (COST $10,102) |
|
|
|
|
|
$ |
10,102 |
|
|
|
|
| WARRANTS – 0.0%** |
|
|
|
|
|
|
|
|
|
|
|
| BioTime, Inc., Expire 10/01/18#,* |
|
|
359 |
|
|
|
790 |
|
|
|
|
| Education Management Corp., Expire
1/19/49†† |
|
|
932 |
|
|
|
— |
|
|
|
|
| Magnum Hunter Re, Expire
5/15/16†† |
|
|
1,281 |
|
|
|
— |
|
|
|
|
| Tejon Ranch Co., Expire 8/31/16 |
|
|
118 |
|
|
|
69 |
|
|
|
|
|
|
|
|
|
|
|
|
|
| TOTAL WARRANTS |
|
|
|
|
|
|
|
|
| (COST $1,050) |
|
|
|
|
|
$ |
859 |
|
|
| TOTAL INVESTMENTS IN SECURITIES – 99.9% |
|
| (COST $68,279,465) |
|
|
|
|
|
$ |
90,552,304 |
|
|
|
|
|
|
|
|
|
|
|
|
|
| Description
|
|
Par Value
|
|
|
Value
|
|
|
CASH COLLATERAL INVESTED FOR SECURITIES ON
LOAN – 12.2% |
|
|
| REPURCHASE AGREEMENTS – 12.2% |
|
|
|
|
| BNP Paribas Securities Corp., 0.12%, dated 4/30/15, due 5/01/15, repurchase price $554,302, collateralized by U.S. Government & Treasury Securities 0.00% to
6.50%, maturing 5/01/16 to 4/20/45; total market value of $565,386. |
|
$ |
554,300 |
|
|
$ |
554,300 |
|
|
|
|
| Citigroup Global Markets, Inc., 0.13%, dated 4/30/15, due 5/01/15, repurchase price $2,106,431, collateralized by U.S. Government Securities 1.61% to 8.00%, maturing
6/01/17 to 6/15/52; total market value of $2,148,552. |
|
|
2,106,423 |
|
|
|
2,106,423 |
|
|
|
|
| Credit Suisse Securities (USA) LLC, 0.12%, dated 4/30/15, due 5/01/15, repurchase price $2,106,430, collateralized by U.S. Government Securities 3.00% to 4.50%,
maturing 8/01/38 to 4/01/45; total market value of $2,148,567. |
|
|
2,106,423 |
|
|
|
2,106,423 |
|
|
|
|
| ING Financial Markets LLC, 0.12%, dated 4/30/15, due 5/01/15, repurchase price $2,106,430, collateralized by U.S. Government Securities 1.87% to 6.20%, maturing
5/01/33 to 11/01/44; total market value of $2,148,552. |
|
|
2,106,423 |
|
|
|
2,106,423 |
|
|
|
|
| JP Morgan Securities LLC, 0.13%, dated 4/30/15, due 5/01/15, repurchase price $2,106,431, collateralized by U.S. Government Securities 1.78% to 6.13%, maturing 3/01/19
to 2/01/45; total market value of $2,148,576. |
|
|
2,106,423 |
|
|
|
2,106,423 |
|
ANNUAL
REPORT / April 30, 2015
64
PORTFOLIOS OF INVESTMENTS
Wilmington Small-Cap Strategy Fund (continued)
|
|
|
|
|
|
|
|
|
|
|
|
| Description
|
|
Par Value
|
|
|
Value
|
|
|
|
|
| Nomura Securities International, Inc., 0.13%, dated 4/30/15, due 5/01/15. repurchase price $2,106,431, collateralized by U.S. Government & Treasury Securities
0.00% to 10.50%, maturing 5/15/15 to 3/20/64; total market value of $2,148,551. |
|
$ |
2,106,423 |
|
|
$ |
2,106,423 |
|
|
| TOTAL CASH COLLATERAL INVESTED FOR SECURITIES ON LOAN |
|
| (COST $11,086,415) |
|
|
|
|
|
$ |
11,086,415 |
|
|
|
|
|
|
|
|
|
|
|
|
|
| TOTAL INVESTMENTS – 112.1% |
|
|
|
|
|
|
|
|
| (COST $79,365,880) |
|
|
|
|
|
$ |
101,638,719 |
|
|
|
COLLATERAL FOR SECURITIES ON
LOAN – (12.2%) |
|
|
|
(11,086,415 |
) |
|
|
| OTHER ASSETS LESS LIABILITIES – 0.1% |
|
|
|
126,408 |
|
|
|
|
|
|
|
|
|
|
|
|
| TOTAL NET ASSETS – 100.0% |
|
|
$ |
90,678,712 |
|
|
|
|
|
|
|
|
|
|
Cost of investments for Federal income tax purposes
is $80,379,240. The net unrealized appreciation/(depreciation) of investments was $21,259,479. This consists of net unrealized appreciation from investment for those securities having an excess of value over cost of $27,710,001 and net unrealized
depreciation from investments for those securities having an excess of cost over value of $6,450,522.
Various inputs are used in determining the value of the
Fund’s investments. These inputs are summarized in the three broad levels listed below.
Level 1 – quoted prices in active markets for
identical securities
Level 2 – other significant observable inputs (including quoted prices for similar securities, interest rates, prepayment
speeds, credit risk, etc.)
Level 3 – significant unobservable inputs (including the Fund’s own assumptions in determining the fair value of
investments)
The following is a summary of the inputs used as of April 30, 2015 in valuing the Fund’s assets carried at fair value:
|
|
|
|
|
|
|
|
|
|
|
|
|
|
|
|
|
|
|
|
|
|
| |
|
Level 1 |
|
|
Level 2 |
|
|
Level 3 |
|
|
Total |
|
| Investments in Securities |
|
|
|
|
|
|
|
|
|
|
|
|
|
|
|
|
|
|
|
|
|
| Common Stocks |
|
$ |
90,239,558 |
|
|
$ |
7,723 |
|
|
$ |
— |
|
|
$ |
90,247,281 |
|
|
|
|
|
|
| Investment Companies |
|
|
294,062 |
|
|
|
— |
|
|
|
— |
|
|
|
294,062 |
|
|
|
|
|
|
| Rights |
|
|
— |
|
|
|
10,102 |
|
|
|
— |
|
|
|
10,102 |
|
|
|
|
|
|
| Warrants |
|
|
859 |
|
|
|
— |
|
|
|
— |
|
|
|
859 |
|
|
|
|
|
|
| Repurchase Agreements |
|
|
— |
|
|
|
11,086,415 |
|
|
|
— |
|
|
|
11,086,415 |
|
|
|
|
|
|
|
|
|
|
|
|
|
|
|
|
|
|
|
|
|
|
|
| Total |
|
$ |
90,534,479 |
|
|
$ |
11,104,240 |
|
|
$ |
— |
|
|
$ |
101,638,719 |
|
|
|
|
|
|
|
|
|
|
|
|
|
|
|
|
|
|
| # |
Security, or a portion thereof, is on loan. See Note 2 in Notes to Financial Statements. |
| * |
Non-income producing security. |
| †† |
Security is fair valued in accordance with procedures adopted by the Board of Trustees. See Note 2 in Notes to Financial Statements. At April 30, 2015,
the value of these securities amounted to $17,825 representing 0.0%** of total net assets. |
| ** |
Represents less than 0.05%. |
| The |
following acronyms are used throughout this Fund: |
| CVR |
- Contingent Value Right |
| LLC |
- Limited Liability Corporation |
| PLC |
- Public Limited Company |
| REIT |
- Real Estate Investment Trust |
See
Notes which are an integral part of the Financial Statements
April 30,
2015 / ANNUAL REPORT
|
|
|
|
|
| STATEMENTS OF ASSETS AND LIABILITIES |
|
|
65 |
|
|
|
|
|
|
|
|
|
|
|
|
|
|
|
|
|
|
|
|
|
|
| April 30, 2015 |
|
|
|
Wilmington
Large-Cap
Strategy
Fund
|
|
|
Wilmington
Mid-Cap
Growth
Fund
|
|
|
Wilmington
Small-Cap
Growth
Fund
|
|
|
Wilmington
Small-Cap
Strategy
Fund
|
|
|
|
| ASSETS: |
|
|
|
|
|
|
|
|
|
|
|
|
|
|
|
|
|
|
|
|
| Investments, at identified cost |
|
|
|
$ |
297,300,521 |
|
|
$ |
246,973,923 |
|
|
$ |
40,949,790 |
|
|
$ |
79,365,880 |
|
|
|
|
|
|
|
|
|
|
|
|
|
|
|
|
|
|
|
|
|
|
|
|
| Investments in repurchase agreements, at value |
|
|
|
$ |
5,882,327 |
|
|
$ |
18,775,115 |
|
|
$ |
5,788,781 |
|
|
$ |
11,086,415 |
|
|
|
| Investments in securities, at value (Including
$5,772,108, $18,180,925, $5,429,742,and
$10,446,754 of securities on loan, respectively)
(Note 2) |
|
|
|
|
468,808,181 |
(a) |
|
|
333,839,934 |
|
|
|
56,000,991 |
|
|
|
90,552,304 |
|
|
|
|
|
|
|
|
|
|
|
|
|
|
|
|
|
|
|
|
|
|
|
|
| TOTAL INVESTMENTS IN SECURITIES AND
REPURCHASE AGREEMENTS |
|
|
|
|
474,690,508 |
|
|
|
352,615,049 |
|
|
|
61,789,772 |
|
|
|
101,638,719 |
|
|
|
| |
|
|
|
|
|
|
|
|
|
|
|
|
|
|
|
|
|
|
|
|
| Income receivable |
|
|
|
|
352,818 |
|
|
|
120,998 |
|
|
|
13,679 |
|
|
|
46,883 |
|
|
|
| Due from advisor |
|
|
|
|
— |
|
|
|
— |
|
|
|
— |
|
|
|
6,774 |
|
|
|
| Receivable for shares sold |
|
|
|
|
600 |
|
|
|
175,521 |
|
|
|
795 |
|
|
|
27,748 |
|
|
|
| Receivable for investments sold |
|
|
|
|
498,495 |
|
|
|
2,214,835 |
|
|
|
— |
|
|
|
137,227 |
|
|
|
| Other assets |
|
|
|
|
16,290 |
|
|
|
21,175 |
|
|
|
15,731 |
|
|
|
12,126 |
|
|
|
|
|
|
|
|
|
|
|
|
|
|
|
|
|
|
|
|
|
|
|
|
| TOTAL ASSETS |
|
|
|
|
475,558,711 |
|
|
|
355,147,578 |
|
|
|
61,819,977 |
|
|
|
101,869,477 |
|
|
|
| |
|
|
|
|
|
|
|
|
|
|
|
|
|
|
|
|
|
|
|
|
| LIABILITIES: |
|
|
|
|
|
|
|
|
|
|
|
|
|
|
|
|
|
|
|
|
| Payable to custodian |
|
|
|
|
242,812 |
|
|
|
— |
|
|
|
— |
|
|
|
28,723 |
|
|
|
| Payable for investments purchased |
|
|
|
|
— |
|
|
|
549,757 |
|
|
|
— |
|
|
|
— |
|
|
|
| Collateral for securities on loan |
|
|
|
|
5,882,327 |
|
|
|
18,775,115 |
|
|
|
5,788,781 |
|
|
|
11,086,415 |
|
|
|
| Payable for shares redeemed |
|
|
|
|
370,951 |
|
|
|
154,048 |
|
|
|
16,065 |
|
|
|
20,656 |
|
|
|
| Payable for distribution services fee |
|
|
|
|
— |
|
|
|
11,850 |
|
|
|
8,190 |
|
|
|
— |
|
|
|
| Payable for shareholder services fee |
|
|
|
|
— |
|
|
|
32,766 |
|
|
|
4,859 |
|
|
|
— |
|
|
|
| Pending Litigation (See Note 7) |
|
|
|
|
— |
|
|
|
— |
|
|
|
— |
|
|
|
— |
|
|
|
| Other accrued expenses |
|
|
|
|
84,988 |
|
|
|
116,765 |
|
|
|
54,467 |
|
|
|
54,971 |
|
|
|
|
|
|
|
|
|
|
|
|
|
|
|
|
|
|
|
|
|
|
|
|
| TOTAL LIABILITIES |
|
|
|
|
6,581,078 |
|
|
|
19,640,301 |
|
|
|
5,872,362 |
|
|
|
11,190,765 |
|
|
|
| |
|
|
|
|
|
|
|
|
|
|
|
|
|
|
|
|
|
|
|
|
| NET ASSETS |
|
|
|
$ |
468,977,633 |
|
|
$ |
335,507,277 |
|
|
$ |
55,947,615 |
|
|
$ |
90,678,712 |
|
|
|
| |
|
|
|
|
|
|
|
|
|
|
|
|
|
|
|
|
|
|
|
|
| NET ASSETS CONSIST OF: |
|
|
|
|
|
|
|
|
|
|
|
|
|
|
|
|
|
|
|
|
| Paid-in capital |
|
|
|
$ |
286,188,053 |
|
|
$ |
227,898,038 |
|
|
$ |
34,089,967 |
|
|
$ |
66,374,130 |
|
|
|
| Undistributed (accumulated) net investment income
(loss) |
|
|
|
|
508,024 |
|
|
|
— |
|
|
|
(73,956) |
|
|
|
(35,622) |
|
|
|
| Accumulated net realized gain (loss) on investments |
|
|
|
|
4,891,569 |
|
|
|
1,968,113 |
|
|
|
1,091,622 |
|
|
|
2,067,365 |
|
|
|
| Net unrealized appreciation (depreciation) of
investments |
|
|
|
|
177,389,987 |
|
|
|
105,641,126 |
|
|
|
20,839,982 |
|
|
|
22,272,839 |
|
|
|
|
|
|
|
|
|
|
|
|
|
|
|
|
|
|
|
|
|
|
|
|
| TOTAL NET ASSETS |
|
|
|
$ |
468,977,633 |
|
|
$ |
335,507,277 |
|
|
$ |
55,947,615 |
|
|
$ |
90,678,712 |
|
|
|
| |
|
|
|
|
|
|
|
|
|
|
|
|
|
|
|
|
|
|
|
|
| COMPUTATION OF NET ASSET VALUE AND
OFFERING PRICE: |
|
|
|
|
|
|
|
|
|
|
|
|
|
|
|
|
|
|
|
|
| Class A |
|
|
|
|
|
|
|
|
|
|
|
|
|
|
|
|
|
|
|
|
| Net Assets |
|
|
|
$ |
— |
|
|
$ |
56,271,106 |
|
|
$ |
37,749,391 |
|
|
$ |
— |
|
|
|
|
|
|
|
|
|
|
|
|
|
|
|
|
|
|
|
|
|
|
|
|
| Shares outstanding (unlimited shares authorized) |
|
|
|
|
— |
|
|
|
3,215,600 |
|
|
|
1,923,927 |
|
|
|
— |
|
|
|
|
|
|
|
|
|
|
|
|
|
|
|
|
|
|
|
|
|
|
|
|
| Net Asset Value per share |
|
|
|
$ |
— |
|
|
$ |
17.50 |
|
|
$ |
19.62 |
|
|
$ |
— |
|
|
|
|
|
|
|
|
|
|
|
|
|
|
|
|
|
|
|
|
|
|
|
|
| Offering price per share* |
|
|
|
$ |
— |
|
|
$ |
18.52** |
|
|
$ |
20.76** |
|
|
$ |
— |
|
|
|
|
|
|
|
|
|
|
|
|
|
|
|
|
|
|
|
|
|
|
|
|
| Class I |
|
|
|
|
|
|
|
|
|
|
|
|
|
|
|
|
|
|
|
|
|
|
|
|
|
|
|
|
|
|
|
|
|
|
|
|
|
|
|
|
|
| Net Assets |
|
|
|
$ |
468,977,633 |
|
|
$ |
279,236,171 |
|
|
$ |
18,198,224 |
|
|
$ |
90,678,712 |
|
|
|
|
|
|
|
|
|
|
|
|
|
|
|
|
|
|
|
|
|
|
|
|
| Shares outstanding (unlimited shares authorized) |
|
|
|
|
25,402,999 |
|
|
|
15,413,588 |
|
|
|
886,860 |
|
|
|
6,043,060 |
|
|
|
|
|
|
|
|
|
|
|
|
|
|
|
|
|
|
|
|
|
|
|
|
| Net Asset Value per share |
|
|
|
$ |
18.46 |
|
|
$ |
18.12 |
|
|
$ |
20.52 |
|
|
$ |
15.01 |
|
|
|
|
|
|
|
|
|
|
|
|
|
|
|
|
|
|
|
|
|
|
|
|
|
|
|
|
|
|
|
|
|
|
|
|
|
|
|
|
|
|
|
|
|
| (a) |
Includes $192,669 of investments in affiliated issuers. |
| * |
See “How are Shares Priced?” in the Prospectus. |
| ** |
Computation of offering price per share 100/94.50 of net asset value. |
See Notes which are an integral part of the Financial Statements
ANNUAL REPORT / April 30, 2015
|
|
|
| 66 |
|
STATEMENTS OF OPERATIONS |
|
|
|
|
|
|
|
|
|
|
|
|
|
|
|
|
|
|
|
|
|
| Year Ended April 30, 2015 |
|
|
|
Wilmington
Large-Cap
Strategy
Fund |
|
|
Wilmington
Mid-Cap
Growth
Fund |
|
|
Wilmington
Small-Cap
Growth
Fund |
|
|
Wilmington
Small-Cap Strategy
Fund |
|
|
|
| INVESTMENT INCOME: |
|
|
|
|
|
|
|
|
|
|
|
|
|
|
|
|
|
|
|
|
| Dividends |
|
|
|
|
$7,831,210(a)(b) |
|
|
$ |
3,431,611(a) |
|
|
$ |
627,731(a) |
|
|
$ |
1,295,294(a) |
|
|
|
| Securities lending income |
|
|
|
|
77,941 |
|
|
|
289,474 |
|
|
|
109,966 |
|
|
|
360,019 |
|
|
|
|
|
|
|
|
|
|
|
|
|
|
|
|
|
|
|
|
|
|
|
|
|
|
|
|
|
|
|
| TOTAL INVESTMENT INCOME |
|
|
|
|
7,909,151 |
|
|
|
3,721,085 |
|
|
|
737,697 |
|
|
|
1,655,313 |
|
|
|
| |
|
|
|
|
|
|
|
|
|
|
|
|
|
|
|
|
|
|
|
|
| EXPENSES: |
|
|
|
|
|
|
|
|
|
|
|
|
|
|
|
|
|
|
|
|
| Investment advisory fee |
|
|
|
|
2,236,953 |
|
|
|
3,352,804 |
|
|
|
609,797 |
|
|
|
623,872 |
|
|
|
| Administrative personnel and services fee |
|
|
|
|
135,156 |
|
|
|
119,304 |
|
|
|
21,711 |
|
|
|
34,329 |
|
|
|
| Portfolio accounting and administration fees |
|
|
|
|
135,681 |
|
|
|
119,261 |
|
|
|
33,135 |
|
|
|
86,327 |
|
|
|
| Custodian fees |
|
|
|
|
23,343 |
|
|
|
35,885 |
|
|
|
18,018 |
|
|
|
36,466 |
|
|
|
| Transfer and dividend disbursing agent fees and expenses |
|
|
|
|
6,835 |
|
|
|
281,568 |
|
|
|
142,605 |
|
|
|
6,197 |
|
|
|
| Trustees’ fees |
|
|
|
|
33,066 |
|
|
|
33,067 |
|
|
|
33,067 |
|
|
|
33,066 |
|
|
|
| Professional fees |
|
|
|
|
58,017 |
|
|
|
51,934 |
|
|
|
51,664 |
|
|
|
55,616 |
|
|
|
| Distribution services fee—Class A |
|
|
|
|
— |
|
|
|
143,846 |
|
|
|
95,787 |
|
|
|
— |
|
|
|
| Shareholder services fee—Class A |
|
|
|
|
— |
|
|
|
143,414 |
|
|
|
92,671 |
|
|
|
— |
|
|
|
| Shareholder services fee— Class I |
|
|
|
|
1,118,474 |
|
|
|
841,000 |
|
|
|
83,223 |
|
|
|
283,578 |
|
|
|
| Share registration costs |
|
|
|
|
18,751 |
|
|
|
43,376 |
|
|
|
26,627 |
|
|
|
18,382 |
|
|
|
| Printing and postage |
|
|
|
|
7,031 |
|
|
|
60,107 |
|
|
|
23,471 |
|
|
|
6,405 |
|
|
|
| Miscellaneous |
|
|
|
|
91,504 |
|
|
|
45,004 |
|
|
|
23,690 |
|
|
|
43,087 |
|
|
|
|
|
|
|
|
|
|
|
|
|
|
|
|
|
|
|
|
|
|
|
|
|
|
|
|
|
|
|
| TOTAL EXPENSES |
|
|
|
|
3,864,811 |
|
|
|
5,270,570 |
|
|
|
1,255,466 |
|
|
|
1,227,325 |
|
|
|
| |
|
|
|
|
|
|
|
|
|
|
|
|
|
|
|
|
|
|
|
|
| WAIVERS AND REIMBURSEMENTS: |
|
|
|
|
|
|
|
|
|
|
|
|
|
|
|
|
|
|
|
|
| Waiver/reimbursement by investment advisor |
|
|
|
|
(1,627,860) |
|
|
|
(395,058) |
|
|
|
(231,286) |
|
|
|
(660,169) |
|
|
|
| Waiver of shareholder services fee—Class A |
|
|
|
|
— |
|
|
|
(120,850) |
|
|
|
(61,305) |
|
|
|
— |
|
|
|
| Waiver of shareholder services fee—Class I |
|
|
|
|
(1,118,474) |
|
|
|
(404,283) |
|
|
|
(43,453) |
|
|
|
(283,578) |
|
|
|
|
|
|
|
|
|
|
|
|
|
|
|
|
|
|
|
|
|
|
|
|
| TOTAL WAIVERS AND REIMBURSEMENTS |
|
|
|
|
(2,746,334) |
|
|
|
(920,191) |
|
|
|
(336,044) |
|
|
|
(943,747) |
|
|
|
| |
|
|
|
|
|
|
|
|
|
|
|
|
|
|
|
|
|
|
|
|
| Net expenses |
|
|
|
|
1,118,477 |
|
|
|
4,350,379 |
|
|
|
919,422 |
|
|
|
283,578 |
|
|
|
|
|
|
|
|
|
|
|
|
|
|
|
|
|
|
|
|
|
|
|
|
| Net investment income (loss) |
|
|
|
|
6,790,674 |
|
|
|
(629,294) |
|
|
|
(181,725) |
|
|
|
1,371,735 |
|
|
|
|
|
|
|
|
|
|
|
|
|
|
|
|
|
|
|
|
|
|
|
|
| REALIZED AND UNREALIZED GAIN (LOSS) ON INVESTMENTS: |
|
|
|
|
|
|
|
|
|
|
|
|
|
|
|
|
|
|
|
|
| Net realized gain (loss) on investments |
|
|
|
|
21,054,159 |
|
|
|
30,222,496 |
|
|
|
10,917,698 |
|
|
|
7,496,684 |
|
|
|
| Net change in unrealized appreciation (depreciation) of investments |
|
|
|
|
33,516,495 |
|
|
|
1,557,736 |
|
|
|
(4,621,507) |
|
|
|
2,552,206 |
|
|
|
|
|
|
|
|
|
|
|
|
|
|
|
|
|
|
|
|
|
|
|
|
| Net realized and unrealized gain (loss) on investments |
|
|
|
|
54,570,654 |
|
|
|
31,780,232 |
|
|
|
6,296,191 |
|
|
|
10,048,890 |
|
|
|
|
|
|
|
|
|
|
|
|
|
|
|
|
|
|
|
|
|
|
|
|
| Change in net assets resulting from operations |
|
|
|
$ |
61,361,328 |
|
|
$ |
31,150,938 |
|
|
$ |
6,114,466 |
|
|
$ |
11,420,625 |
|
|
|
|
|
|
|
|
|
|
|
|
|
|
|
|
|
|
|
|
|
|
|
|
| (a) |
Net of foreign withholding taxes withheld of $2,302, $16,571, $1,852 and $694, respectively. |
| (b) |
Includes $4,508 received from affiliated issuers. |
See Notes which are an integral part of the Financial Statements
April 30, 2015 / ANNUAL REPORT
|
|
|
|
|
| STATEMENTS OF CHANGES IN NET ASSETS |
|
|
67 |
|
|
|
|
|
|
|
|
|
|
|
|
|
|
|
|
|
|
|
|
| |
|
|
|
Wilmington
Large-Cap
Strategy Fund
|
|
|
Wilmington
Mid-Cap
Growth Fund
|
|
| |
|
|
|
Year Ended
April 30,
2015 |
|
|
Year Ended
April 30,
2014 |
|
|
Year Ended
April 30,
2015 |
|
|
Year Ended
April 30,
2014 |
|
| OPERATIONS: |
|
|
|
|
|
|
|
|
|
|
|
|
|
|
|
|
|
|
| Net investment income (loss) |
|
|
|
$ |
6,790,674 |
|
|
$ |
6,886,323 |
|
|
$ |
(629,294) |
|
|
$ |
(730,800) |
|
| Net realized gain (loss) on investments |
|
|
|
|
21,054,159 |
|
|
|
53,552,193 |
|
|
|
30,222,496 |
|
|
|
28,351,232 |
|
| Net change in unrealized appreciation (depreciation) of investments |
|
|
|
|
33,516,495 |
|
|
|
13,297,909 |
|
|
|
1,557,736 |
|
|
|
16,167,784 |
|
|
|
|
|
|
|
|
|
|
|
|
|
|
|
|
|
|
|
|
| Change in net assets resulting from operations |
|
|
|
|
61,361,328 |
|
|
|
73,736,425 |
|
|
|
31,150,938 |
|
|
|
43,788,216 |
|
|
|
|
|
|
|
|
|
|
|
|
|
|
|
|
|
|
|
|
| DISTRIBUTIONS TO SHAREHOLDERS: |
|
|
|
|
|
|
|
|
|
|
|
|
|
|
|
|
|
|
| Distributions from net investment income |
|
|
|
|
|
|
|
|
|
|
|
|
|
|
|
|
|
|
| Class A |
|
|
|
|
— |
|
|
|
— |
|
|
|
— |
|
|
|
— |
|
| Class I |
|
|
|
|
(6,747,267) |
|
|
|
(6,931,023) |
|
|
|
— |
|
|
|
— |
|
| Distributions from net realized gain on investments |
|
|
|
|
|
|
|
|
|
|
|
|
|
|
|
|
|
|
| Class A |
|
|
|
|
— |
|
|
|
— |
|
|
|
(4,754,136) |
|
|
|
(2,327,727) |
|
| Class I |
|
|
|
|
(24,762,981) |
|
|
|
— |
|
|
|
(26,948,079) |
|
|
|
(10,267,019) |
|
|
|
|
|
|
|
|
|
|
|
|
|
|
|
|
|
|
|
|
| Change in net assets resulting from distributions to shareholders |
|
|
|
|
(31,510,248) |
|
|
|
(6,931,023) |
|
|
|
(31,702,215) |
|
|
|
(12,594,746) |
|
|
|
|
|
|
|
|
|
|
|
|
|
|
|
|
|
|
|
|
| SHARE TRANSACTIONS: |
|
|
|
|
|
|
|
|
|
|
|
|
|
|
|
|
|
|
| Proceeds from sale of shares |
|
|
|
|
|
|
|
|
|
|
|
|
|
|
|
|
|
|
| Class A |
|
|
|
|
— |
|
|
|
— |
|
|
|
2,194,504 |
|
|
|
2,487,859 |
|
| Class I |
|
|
|
|
60,761,127 |
|
|
|
16,030,887 |
|
|
|
99,300,577 |
|
|
|
112,488,819 |
|
| Distributions reinvested |
|
|
|
|
|
|
|
|
|
|
|
|
|
|
|
|
|
|
| Class A |
|
|
|
|
— |
|
|
|
— |
|
|
|
4,182,900 |
|
|
|
2,105,354 |
|
| Class I |
|
|
|
|
25,089,595 |
|
|
|
2,105,697 |
|
|
|
22,502,007 |
|
|
|
9,019,417 |
|
| Cost of shares redeemed |
|
|
|
|
|
|
|
|
|
|
|
|
|
|
|
|
|
|
| Class A |
|
|
|
|
— |
|
|
|
— |
|
|
|
(7,896,891) |
|
|
|
(9,357,996) |
|
| Class I |
|
|
|
|
(44,130,686) |
|
|
|
(87,245,073) |
|
|
|
(164,450,049) |
|
|
|
(68,975,454) |
|
|
|
|
|
|
|
|
|
|
|
|
|
|
|
|
|
|
|
|
| Change in net assets resulting from share transactions |
|
|
|
|
41,720,036 |
|
|
|
(69,108,489) |
|
|
|
(44,166,952) |
|
|
|
47,767,999 |
|
|
|
|
|
|
|
|
|
|
|
|
|
|
|
|
|
|
|
|
| Change in net assets |
|
|
|
|
71,571,116 |
|
|
|
(2,303,087) |
|
|
|
(44,718,229) |
|
|
|
78,961,469 |
|
| NET ASSETS: |
|
|
|
|
|
|
|
|
|
|
|
|
|
|
|
|
|
|
| Beginning of year |
|
|
|
|
397,406,517 |
|
|
|
399,709,604 |
|
|
|
380,225,506 |
|
|
|
301,264,037 |
|
|
|
|
|
|
|
|
|
|
|
|
|
|
|
|
|
|
|
|
| End of year |
|
|
|
$ |
468,977,633 |
|
|
$ |
397,406,517 |
|
|
$ |
335,507,277 |
|
|
$ |
380,225,506 |
|
|
|
|
|
|
|
|
|
|
|
|
|
|
|
|
|
|
|
|
| Undistributed (accumulated) net investment income (loss) included in net assets at end of year |
|
|
|
$ |
508,024 |
|
|
$ |
457,163 |
|
|
$ |
— |
|
|
$ |
(327,157) |
|
|
|
|
|
|
|
|
|
|
|
|
|
|
|
|
|
|
|
|
| SHARES OF BENEFICIAL INTEREST: |
|
|
|
|
|
|
|
|
|
|
|
|
|
|
|
|
|
|
| Shares sold |
|
|
|
|
|
|
|
|
|
|
|
|
|
|
|
|
|
|
| Class A |
|
|
|
|
— |
|
|
|
— |
|
|
|
123,541 |
|
|
|
141,838 |
|
| Class I |
|
|
|
|
3,448,351 |
|
|
|
1,018,939 |
|
|
|
5,463,125 |
|
|
|
6,143,384 |
|
| Distributions reinvested |
|
|
|
|
|
|
|
|
|
|
|
|
|
|
|
|
|
|
| Class A |
|
|
|
|
— |
|
|
|
— |
|
|
|
243,475 |
|
|
|
118,879 |
|
| Class I |
|
|
|
|
1,383,832 |
|
|
|
132,729 |
|
|
|
1,266,292 |
|
|
|
494,215 |
|
| Shares redeemed |
|
|
|
|
|
|
|
|
|
|
|
|
|
|
|
|
|
|
| Class A |
|
|
|
|
— |
|
|
|
— |
|
|
|
(442,507) |
|
|
|
(531,685) |
|
| Class I |
|
|
|
|
(2,435,973) |
|
|
|
(5,469,888) |
|
|
|
(9,067,542) |
|
|
|
(3,786,555) |
|
|
|
|
|
|
|
|
|
|
|
|
|
|
|
|
|
|
|
|
| Net change resulting from share transactions |
|
|
|
|
2,396,210 |
|
|
|
(4,318,220) |
|
|
|
(2,413,616) |
|
|
|
2,580,076 |
|
|
|
|
|
|
|
|
|
|
|
|
|
|
|
|
|
|
|
|
See Notes which are an integral part of the Financial Statements
ANNUAL REPORT / April 30, 2015
|
|
|
| 68 |
|
STATEMENTS OF CHANGES IN NET ASSETS (continued) |
|
|
|
|
|
|
|
|
|
|
|
|
|
|
|
|
|
|
|
| |
|
|
|
Wilmington
Small-Cap
Growth
Fund |
|
|
Wilmington
Small-Cap Strategy
Fund |
|
| |
|
|
|
|
|
| |
|
|
|
Year Ended
April 30,
2015 |
|
|
Year Ended
April 30,
2014 |
|
|
Year Ended
April 30,
2015 |
|
|
Year Ended
April 30,
2014 |
|
| OPERATIONS: |
|
|
|
|
|
|
|
|
|
|
|
|
|
|
|
|
|
|
| Net investment income (loss) |
|
|
|
$ |
(181,725) |
|
|
$ |
(128,958) |
|
|
$ |
1,371,735 |
|
|
$ |
1,246,385 |
|
| Net realized gain (loss) on investments |
|
|
|
|
10,917,698 |
|
|
|
28,438,977 |
|
|
|
7,496,684 |
|
|
|
14,611,507 |
|
| Net change in unrealized appreciation (depreciation) of investments |
|
|
|
|
(4,621,507) |
|
|
|
901,718 |
|
|
|
2,552,206 |
|
|
|
(805,797) |
|
|
|
|
|
|
|
|
|
|
|
|
|
|
|
|
|
|
|
|
| Change in net assets resulting from operations |
|
|
|
|
6,114,466 |
|
|
|
29,211,737 |
|
|
|
11,420,625 |
|
|
|
15,052,095 |
|
|
|
|
|
|
|
|
|
|
|
|
|
|
|
|
|
|
|
|
| DISTRIBUTIONS TO SHAREHOLDERS: |
|
|
|
|
|
|
|
|
|
|
|
|
|
|
|
|
|
|
| Distributions from net investment income |
|
|
|
|
|
|
|
|
|
|
|
|
|
|
|
|
|
|
| Class A |
|
|
|
|
— |
|
|
|
(28,448) |
|
|
|
— |
|
|
|
— |
|
| Class I |
|
|
|
|
— |
|
|
|
(105,552) |
|
|
|
(1,406,315) |
|
|
|
(1,238,125) |
|
| Distributions from net realized gain on investments |
|
|
|
|
|
|
|
|
|
|
|
|
|
|
|
|
|
|
| Class A |
|
|
|
|
(6,217,652) |
|
|
|
— |
|
|
|
— |
|
|
|
— |
|
| Class I |
|
|
|
|
(3,421,498) |
|
|
|
— |
|
|
|
(6,025,802) |
|
|
|
— |
|
|
|
|
|
|
|
|
|
|
|
|
|
|
|
|
|
|
|
|
| Change in net assets resulting from distributions to shareholders |
|
|
|
|
(9,639,150) |
|
|
|
(134,000) |
|
|
|
(7,432,117) |
|
|
|
(1,238,125) |
|
|
|
|
|
|
|
|
|
|
|
|
|
|
|
|
|
|
|
|
| SHARE TRANSACTIONS: |
|
|
|
|
|
|
|
|
|
|
|
|
|
|
|
|
|
|
| Proceeds from sale of shares |
|
|
|
|
|
|
|
|
|
|
|
|
|
|
|
|
|
|
| Class A |
|
|
|
|
449,561 |
|
|
|
665,356 |
|
|
|
— |
|
|
|
— |
|
| Class I |
|
|
|
|
920,358 |
|
|
|
9,672,535 |
|
|
|
8,858,900 |
|
|
|
70,925,875 |
|
| Distributions reinvested |
|
|
|
|
|
|
|
|
|
|
|
|
|
|
|
|
|
|
| Class A |
|
|
|
|
5,968,127 |
|
|
|
27,356 |
|
|
|
— |
|
|
|
— |
|
| Class I |
|
|
|
|
2,571,325 |
|
|
|
47,825 |
|
|
|
5,921,232 |
|
|
|
264,230 |
|
| Cost of shares redeemed |
|
|
|
|
|
|
|
|
|
|
|
|
|
|
|
|
|
|
| Class A |
|
|
|
|
(4,749,917) |
|
|
|
(4,416,047) |
|
|
|
— |
|
|
|
— |
|
| Class I |
|
|
|
|
(31,309,052) |
|
|
|
(90,049,853) |
|
|
|
(54,980,490) |
|
|
|
(30,600,036) |
|
|
|
|
|
|
|
|
|
|
|
|
|
|
|
|
|
|
|
|
| Change in net assets resulting from share transactions |
|
|
|
|
(26,149,598) |
|
|
|
(84,052,828) |
|
|
|
(40,200,358) |
|
|
|
40,590,069 |
|
|
|
|
|
|
|
|
|
|
|
|
|
|
|
|
|
|
|
|
| Change in net assets |
|
|
|
|
(29,674,282) |
|
|
|
(54,975,091) |
|
|
|
(36,211,850) |
|
|
|
54,404,039 |
|
| NET ASSETS: |
|
|
|
|
|
|
|
|
|
|
|
|
|
|
|
|
|
|
| Beginning of year |
|
|
|
|
85,621,897 |
|
|
|
140,596,988 |
|
|
|
126,890,562 |
|
|
|
72,486,523 |
|
|
|
|
|
|
|
|
|
|
|
|
|
|
|
|
|
|
|
|
| End of year |
|
|
|
$ |
55,947,615 |
|
|
$ |
85,621,897 |
|
|
$ |
90,678,712 |
|
|
$ |
126,890,562 |
|
|
|
|
|
|
|
|
|
|
|
|
|
|
|
|
|
|
|
|
| Undistributed (accumulated) net investment income (loss) included in net assets at end of year |
|
|
|
$ |
(73,956) |
|
|
$ |
(353,137) |
|
|
$ |
(35,622) |
|
|
$ |
131,708 |
|
|
|
|
|
|
|
|
|
|
|
|
|
|
|
|
|
|
|
|
| SHARES OF BENEFICIAL INTEREST: |
|
|
|
|
|
|
|
|
|
|
|
|
|
|
|
|
|
|
| Shares sold |
|
|
|
|
|
|
|
|
|
|
|
|
|
|
|
|
|
|
| Class A |
|
|
|
|
21,735 |
|
|
|
31,085 |
|
|
|
— |
|
|
|
— |
|
| Class I |
|
|
|
|
41,155 |
|
|
|
451,386 |
|
|
|
603,409 |
|
|
|
5,024,347 |
|
| Distributions reinvested |
|
|
|
|
|
|
|
|
|
|
|
|
|
|
|
|
|
|
| Class A |
|
|
|
|
312,631 |
|
|
|
1,204 |
|
|
|
— |
|
|
|
— |
|
| Class I |
|
|
|
|
128,888 |
|
|
|
2,032 |
|
|
|
411,137 |
|
|
|
19,044 |
|
| Shares redeemed |
|
|
|
|
|
|
|
|
|
|
|
|
|
|
|
|
|
|
| Class A |
|
|
|
|
(225,692) |
|
|
|
(207,755) |
|
|
|
— |
|
|
|
— |
|
| Class I |
|
|
|
|
(1,369,857) |
|
|
|
(3,900,870) |
|
|
|
(3,767,816) |
|
|
|
(2,137,886) |
|
|
|
|
|
|
|
|
|
|
|
|
|
|
|
|
|
|
|
|
| Net change resulting from share transactions |
|
|
|
|
(1,091,140) |
|
|
|
(3,622,918) |
|
|
|
(2,753,270) |
|
|
|
2,905,505 |
|
|
|
|
|
|
|
|
|
|
|
|
|
|
|
|
|
|
|
|
| |
|
|
|
|
|
|
|
|
|
|
|
|
|
|
|
|
|
|
See Notes which are an integral part of the Financial Statements
April 30, 2014 / ANNUAL REPORT
|
|
|
|
|
|
|
|
|
|
|
|
|
|
|
|
|
|
|
|
|
|
|
|
|
| For a share outstanding throughout each period: |
|
| WILMINGTON LARGE-CAP STRATEGY FUND† |
|
|
|
|
|
|
|
|
|
|
|
|
|
|
|
|
|
|
|
|
|
|
|
|
|
|
| CLASS I |
|
Year Ended
April 30, 2015 |
|
|
Year Ended
April 30, 2014 |
|
|
Year Ended
April 30, 2013 |
|
|
For the Period
July 1, 2011
through
April 30,
2012* |
|
|
Year Ended
June 30, 2011 |
|
|
Year Ended
June 30, 2010 |
|
| Net Asset Value, Beginning of Period |
|
|
$17.27 |
|
|
|
$14.63 |
|
|
|
$12.84 |
|
|
|
$12.13 |
|
|
|
$9.39 |
|
|
|
$8.61 |
|
| Income (Loss) From Operations: |
|
|
|
|
|
|
|
|
|
|
|
|
|
|
|
|
|
|
|
|
|
|
|
|
| Net Investment Income (Loss)(a) |
|
|
0.28 |
|
|
|
0.27 |
|
|
|
0.26 |
|
|
|
0.16 |
|
|
|
0.20 |
|
|
|
0.10 |
|
| Net Realized and Unrealized Gain (Loss) on Investments |
|
|
2.19 |
|
|
|
2.65 |
|
|
|
1.79 |
|
|
|
0.71 |
|
|
|
2.72 |
|
|
|
0.79 |
|
| Total Income (Loss) From Operations |
|
|
2.47 |
|
|
|
2.92 |
|
|
|
2.05 |
|
|
|
0.87 |
|
|
|
2.92 |
|
|
|
0.89 |
|
| Less Distributions From: |
|
|
|
|
|
|
|
|
|
|
|
|
|
|
|
|
|
|
|
|
|
|
|
|
| Net Investment Income |
|
|
(0.27 |
) |
|
|
(0.28 |
) |
|
|
(0.26 |
) |
|
|
(0.16 |
) |
|
|
(0.18 |
) |
|
|
(0.11 |
) |
| Net Realized Gains |
|
|
(1.01 |
) |
|
|
— |
|
|
|
— |
|
|
|
— |
|
|
|
— |
|
|
|
— |
|
| Total Distributions |
|
|
(1.28 |
) |
|
|
(0.28 |
) |
|
|
(0.26 |
) |
|
|
(0.16 |
) |
|
|
(0.18 |
) |
|
|
(0.11 |
) |
| Net Asset Value, End of Period |
|
|
$18.46 |
|
|
|
$17.27 |
|
|
|
$14.63 |
|
|
|
$12.84 |
|
|
|
$12.13 |
|
|
|
$9.39 |
|
|
|
|
|
|
| Total Return(b) |
|
|
14.52 |
% |
|
|
20.12 |
% |
|
|
16.25 |
% |
|
|
7.32 |
% |
|
|
31.24 |
% |
|
|
10.28 |
% |
| Net Assets, End of Period (000’s) |
|
|
$468,978 |
|
|
|
$397,407 |
|
|
|
$399,710 |
|
|
|
$374,903 |
|
|
|
$429,467 |
|
|
|
$118,102 |
|
| Ratios to Average Net Assets |
|
|
|
|
|
|
|
|
|
|
|
|
|
|
|
|
|
|
|
|
|
|
|
|
| Gross Expense |
|
|
0.86 |
% |
|
|
0.87 |
% |
|
|
0.88 |
% |
|
|
0.74 |
%(c) |
|
|
0.69 |
% |
|
|
1.01 |
% |
| Net Expenses(d) |
|
|
0.25 |
% |
|
|
0.25 |
% |
|
|
0.25 |
% |
|
|
0.25 |
%(c) |
|
|
0.25 |
% |
|
|
0.93 |
% |
| Net Investment Income (Loss) |
|
|
1.52 |
% |
|
|
1.71 |
% |
|
|
1.99 |
% |
|
|
1.70 |
%(c) |
|
|
1.72 |
% |
|
|
0.99 |
% |
| Portfolio Turnover Rate |
|
|
15 |
% |
|
|
29 |
% |
|
|
24 |
% |
|
|
19 |
% |
|
|
39 |
% |
|
|
160 |
% |
| (a) |
Per share numbers have been calculated using the average shares method. |
| (b) |
Based on net asset value, which does not reflect the sales charge or contingent deferred sales charge, if applicable. Total returns for periods of less than
one year, if any, are not annualized. |
| (c) |
Annualized for periods less than one year. |
| (d) |
The investment advisor and other service providers waived or reimbursed a portion of their fees. |
| † |
Effective March 9, 2012, the Fund acquired all of the assets and liabilities of the Wilmington Large-Cap Strategy Fund, a series of WT Mutual Fund (the
“WT Fund”). The financial highlights for the periods prior to that date reflect the performance of the WT Fund. |
| * |
Year end changed from June 30 to April 30. |
See Notes which are an integral part of the Financial Statements
ANNUAL REPORT / April 30, 2015
|
|
|
| 70 |
|
FINANCIAL HIGHLIGHTS (continued) |
|
|
|
|
|
|
|
|
|
|
|
|
|
|
|
|
|
|
|
|
|
| For a share outstanding throughout each year ended April 30, unless otherwise noted:
|
|
| WILMINGTON MID-CAP GROWTH FUND |
|
|
|
|
|
|
|
|
|
|
|
|
|
|
|
|
|
|
|
|
|
|
| CLASS A |
|
2015 |
|
|
2014 |
|
|
2013 |
|
|
2012 |
|
|
2011 |
|
| Net Asset Value, Beginning of Year |
|
|
$17.61 |
|
|
|
$15.96 |
|
|
|
$15.21 |
|
|
|
$16.21 |
|
|
|
$12.24 |
|
| Income (Loss) From Operations: |
|
|
|
|
|
|
|
|
|
|
|
|
|
|
|
|
|
|
|
|
| Net Investment Income (Loss)(a) |
|
|
(0.05 |
) |
|
|
(0.06 |
) |
|
|
(0.01 |
) |
|
|
(0.07 |
) |
|
|
(0.11 |
) |
| Net Realized and Unrealized Gain (Loss) on Investments |
|
|
1.48 |
|
|
|
2.40 |
|
|
|
1.38 |
|
|
|
(0.25 |
) |
|
|
4.08 |
|
| Total Income (Loss) From Operations |
|
|
1.43 |
|
|
|
2.34 |
|
|
|
1.37 |
|
|
|
(0.32 |
) |
|
|
3.97 |
|
| Less Distributions From: |
|
|
|
|
|
|
|
|
|
|
|
|
|
|
|
|
|
|
|
|
| Net Realized Gains |
|
|
(1.54 |
) |
|
|
(0.69 |
) |
|
|
(0.62 |
) |
|
|
(0.68 |
) |
|
|
— |
|
| Total Distributions |
|
|
(1.54 |
) |
|
|
(0.69 |
) |
|
|
(0.62 |
) |
|
|
(0.68 |
) |
|
|
— |
|
| Net Asset Value, End of Year |
|
|
$17.50 |
|
|
|
$17.61 |
|
|
|
$15.96 |
|
|
|
$15.21 |
|
|
|
$16.21 |
|
|
|
|
|
|
|
|
|
|
|
|
|
|
|
|
|
|
|
|
|
|
| Total Return(b) |
|
|
8.26 |
% |
|
|
14.64 |
% |
|
|
9.55 |
% |
|
|
(1.55 |
)% |
|
|
32.43 |
% |
| Net Assets, End of Year (000’s) |
|
|
$56,271 |
|
|
|
$57,960 |
|
|
|
$56,837 |
|
|
|
$60,666 |
|
|
|
$63,168 |
|
| Ratios to Average Net Assets |
|
|
|
|
|
|
|
|
|
|
|
|
|
|
|
|
|
|
|
|
| Gross Expense |
|
|
1.55 |
% |
|
|
1.52 |
% |
|
|
1.56 |
% |
|
|
1.57 |
% |
|
|
1.62 |
% |
| Net Expenses(c) |
|
|
1.24 |
% |
|
|
1.24 |
% |
|
|
1.24 |
% |
|
|
1.24 |
% |
|
|
1.24 |
% |
| Net Investment Income (Loss) |
|
|
(0.29 |
)% |
|
|
(0.34 |
)% |
|
|
(0.08 |
)% |
|
|
(0.47 |
)% |
|
|
(0.85 |
)% |
| Portfolio Turnover Rate |
|
|
27 |
% |
|
|
32 |
% |
|
|
36 |
% |
|
|
44 |
% |
|
|
34 |
% |
|
|
|
|
|
|
|
|
|
|
|
|
|
|
|
|
|
|
|
|
|
| CLASS I |
|
2015 |
|
|
2014 |
|
|
2013 |
|
|
2012 |
|
|
2011 |
|
| Net Asset Value, Beginning of Year |
|
|
$18.15 |
|
|
|
$16.40 |
|
|
|
$15.59 |
|
|
|
$16.57 |
|
|
|
$12.49 |
|
| Income (Loss) From Operations: |
|
|
|
|
|
|
|
|
|
|
|
|
|
|
|
|
|
|
|
|
| Net Investment Income (Loss)(a) |
|
|
(0.03 |
) |
|
|
(0.03 |
) |
|
|
0.01 |
|
|
|
(0.04 |
) |
|
|
(0.07 |
) |
| Net Realized and Unrealized Gain (Loss) on Investments |
|
|
1.54 |
|
|
|
2.47 |
|
|
|
1.42 |
|
|
|
(0.26 |
) |
|
|
4.15 |
|
| Total Income (Loss) From Operations |
|
|
1.51 |
|
|
|
2.44 |
|
|
|
1.43 |
|
|
|
(0.30 |
) |
|
|
4.08 |
|
| Less Distributions From: |
|
|
|
|
|
|
|
|
|
|
|
|
|
|
|
|
|
|
|
|
| Net Realized Gains |
|
|
(1.54 |
) |
|
|
(0.69 |
) |
|
|
(0.62 |
) |
|
|
(0.68 |
) |
|
|
— |
|
| Total Distributions |
|
|
(1.54 |
) |
|
|
(0.69 |
) |
|
|
(0.62 |
) |
|
|
(0.68 |
) |
|
|
— |
|
| Net Asset Value, End of Year |
|
|
$18.12 |
|
|
|
$18.15 |
|
|
|
$16.40 |
|
|
|
$15.59 |
|
|
|
$16.57 |
|
|
|
|
|
|
|
|
|
|
|
|
|
|
|
|
|
|
|
|
|
|
| Total Return(b) |
|
|
8.47 |
% |
|
|
14.86 |
% |
|
|
9.70 |
% |
|
|
(1.40 |
)% |
|
|
32.67 |
% |
| Net Assets, End of Year (000’s) |
|
|
$279,236 |
|
|
|
$322,266 |
|
|
|
$244,427 |
|
|
|
$232,860 |
|
|
|
$187,207 |
|
| Ratios to Average Net Assets |
|
|
|
|
|
|
|
|
|
|
|
|
|
|
|
|
|
|
|
|
| Gross Expense |
|
|
1.30 |
% |
|
|
1.28 |
% |
|
|
1.31 |
% |
|
|
1.33 |
% |
|
|
1.37 |
% |
| Net Expenses(c) |
|
|
1.08 |
% |
|
|
1.08 |
% |
|
|
1.08 |
% |
|
|
1.06 |
% |
|
|
1.06 |
% |
| Net Investment Income (Loss) |
|
|
(0.14 |
)% |
|
|
(0.19 |
)% |
|
|
0.08 |
% |
|
|
(0.30 |
)% |
|
|
(0.54 |
)% |
| Portfolio Turnover Rate |
|
|
27 |
% |
|
|
32 |
% |
|
|
36 |
% |
|
|
44 |
% |
|
|
34 |
% |
| (a) |
Per share numbers have been calculated using the average shares method. |
| (b) |
Based on net asset value, which does not reflect the sales charge or contingent deferred sales charge, if applicable. Total returns for periods of less than
one year, if any, are not annualized. |
| (c) |
The investment advisor and other service providers waived or reimbursed a portion of their fees. |
See Notes which are an integral part of the Financial Statements
April 30, 2015 / ANNUAL REPORT
|
|
|
|
|
| FINANCIAL HIGHLIGHTS (continued) |
|
|
71 |
|
|
|
|
|
|
|
|
|
|
|
|
|
|
|
|
|
|
|
|
|
|
| For a share outstanding throughout each year ended April 30, unless otherwise noted:
|
|
| WILMINGTON SMALL-CAP GROWTH FUND |
|
|
|
|
|
|
|
|
|
|
|
|
|
|
|
|
|
|
|
|
|
|
| CLASS A |
|
2015 |
|
|
2014 |
|
|
2013 |
|
|
2012 |
|
|
2011 |
|
| Net Asset Value, Beginning of Year |
|
|
$21.52 |
|
|
|
$18.22 |
|
|
|
$16.62 |
|
|
|
$18.20 |
|
|
|
$14.48 |
|
| Income (Loss) From Operations: |
|
|
|
|
|
|
|
|
|
|
|
|
|
|
|
|
|
|
|
|
| Net Investment Income (Loss)(a) |
|
|
(0.06 |
) |
|
|
(0.07 |
) |
|
|
(0.00 |
)(b) |
|
|
(0.08 |
) |
|
|
(0.21 |
) |
| Net Realized and Unrealized Gain (Loss) on Investments |
|
|
1.84 |
|
|
|
3.39 |
|
|
|
1.69 |
|
|
|
(1.50 |
) |
|
|
3.93 |
|
| Total Income (Loss) From Operations |
|
|
1.78 |
|
|
|
3.32 |
|
|
|
1.69 |
|
|
|
(1.58 |
) |
|
|
3.72 |
|
| Less Distributions From: |
|
|
|
|
|
|
|
|
|
|
|
|
|
|
|
|
|
|
|
|
| Net Investment Income |
|
|
— |
|
|
|
(0.02 |
) |
|
|
(0.09 |
) |
|
|
— |
|
|
|
— |
|
| Net Realized Gains |
|
|
(3.68 |
) |
|
|
— |
|
|
|
— |
|
|
|
— |
|
|
|
— |
|
| Total Distributions |
|
|
(3.68 |
) |
|
|
(0.02 |
) |
|
|
(0.09 |
) |
|
|
— |
|
|
|
— |
|
| Net Asset Value, End of Year |
|
|
$19.62 |
|
|
|
$21.52 |
|
|
|
$18.22 |
|
|
|
$16.62 |
|
|
|
$18.20 |
|
|
|
|
|
|
|
|
|
|
|
|
|
|
|
|
|
|
|
|
|
|
| Total Return(c) |
|
|
8.73 |
% |
|
|
18.19 |
% |
|
|
10.21 |
% |
|
|
(8.68 |
)% |
|
|
25.69 |
% |
| Net Assets, End of Year (000’s) |
|
|
$37,749 |
|
|
|
$39,072 |
|
|
|
$36,269 |
|
|
|
$38,439 |
|
|
|
$47,884 |
|
| Ratios to Average Net Assets |
|
|
|
|
|
|
|
|
|
|
|
|
|
|
|
|
|
|
|
|
| Gross Expense |
|
|
1.88 |
% |
|
|
1.66 |
% |
|
|
1.71 |
% |
|
|
1.64 |
% |
|
|
1.67 |
% |
| Net Expenses(d) |
|
|
1.36 |
% |
|
|
1.46 |
% |
|
|
1.47 |
% |
|
|
1.44 |
% |
|
|
1.45 |
% |
| Net Investment Income (Loss) |
|
|
(0.27 |
)% |
|
|
(0.34 |
)% |
|
|
(0.01 |
)% |
|
|
(0.54 |
)% |
|
|
(1.43 |
)% |
| Portfolio Turnover Rate |
|
|
40 |
% |
|
|
37 |
% |
|
|
142 |
% |
|
|
561 |
% |
|
|
393 |
% |
|
|
|
|
|
|
|
|
|
|
|
|
|
|
|
|
|
|
|
|
|
| CLASS I |
|
2015 |
|
|
2014 |
|
|
2013 |
|
|
2012 |
|
|
2011 |
|
| Net Asset Value, Beginning of Year |
|
|
$22.31 |
|
|
|
$18.85 |
|
|
|
$17.16 |
|
|
|
$18.76 |
|
|
|
$14.89 |
|
| Income (Loss) From Operations: |
|
|
|
|
|
|
|
|
|
|
|
|
|
|
|
|
|
|
|
|
| Net Investment Income (Loss)(a) |
|
|
(0.05 |
) |
|
|
0.00 |
(b) |
|
|
0.04 |
|
|
|
(0.05 |
) |
|
|
(0.12 |
) |
| Net Realized and Unrealized Gain (Loss) on Investments |
|
|
1.94 |
|
|
|
3.49 |
|
|
|
1.75 |
|
|
|
(1.55 |
) |
|
|
3.99 |
|
| Total Income (Loss) From Operations |
|
|
1.89 |
|
|
|
3.49 |
|
|
|
1.79 |
|
|
|
(1.60 |
) |
|
|
3.87 |
|
| Less Distributions From: |
|
|
|
|
|
|
|
|
|
|
|
|
|
|
|
|
|
|
|
|
| Net Investment Income |
|
|
— |
|
|
|
(0.03 |
) |
|
|
(0.10 |
) |
|
|
— |
|
|
|
— |
|
| Net Realized Gains |
|
|
(3.68 |
) |
|
|
— |
|
|
|
— |
|
|
|
— |
|
|
|
— |
|
| Total Distributions |
|
|
(3.68 |
) |
|
|
(0.03 |
) |
|
|
(0.10 |
) |
|
|
— |
|
|
|
— |
|
| Net Asset Value, End of Year |
|
|
$20.52 |
|
|
|
$22.31 |
|
|
|
$18.85 |
|
|
|
$17.16 |
|
|
|
$18.76 |
|
|
|
|
|
|
|
|
|
|
|
|
|
|
|
|
|
|
|
|
|
|
| Total Return(c) |
|
|
8.93 |
% |
|
|
18.49 |
% |
|
|
10.47 |
% |
|
|
(8.53 |
)% |
|
|
25.99 |
% |
| Net Assets, End of Year (000’s) |
|
|
$18,198 |
|
|
|
$46,549 |
|
|
|
$104,328 |
|
|
|
$124,964 |
|
|
|
$148,560 |
|
| Ratios to Average Net Assets |
|
|
|
|
|
|
|
|
|
|
|
|
|
|
|
|
|
|
|
|
| Gross Expense |
|
|
1.60 |
% |
|
|
1.42 |
% |
|
|
1.46 |
% |
|
|
1.39 |
% |
|
|
1.42 |
% |
| Net Expenses(d) |
|
|
1.19 |
% |
|
|
1.25 |
% |
|
|
1.25 |
% |
|
|
1.21 |
% |
|
|
1.24 |
% |
| Net Investment Income (Loss) |
|
|
(0.23 |
)% |
|
|
0.01 |
% |
|
|
0.21 |
% |
|
|
(0.30 |
)% |
|
|
(0.81 |
)% |
| Portfolio Turnover Rate |
|
|
40 |
% |
|
|
37 |
% |
|
|
142 |
% |
|
|
561 |
% |
|
|
393 |
% |
| (a) |
Per share numbers have been calculated using the average shares method. |
| (b) |
Represents less than $0.005. |
| (c) |
Based on net asset value, which does not reflect the sales charge or contingent deferred sales charge, if applicable. Total returns for periods of less than
one year, if any, are not annualized. |
| (d) |
The investment advisor and other service providers waived or reimbursed a portion of their fees. |
See Notes which are an integral part of the Financial Statements
ANNUAL REPORT / April 30, 2015
|
|
|
| 72 |
|
FINANCIAL HIGHLIGHTS (continued) |
For a share outstanding throughout each period:
|
|
|
|
|
|
|
|
|
|
|
|
|
|
|
|
|
|
|
|
|
|
|
|
|
| WILMINGTON SMALL-CAP STRATEGY FUND† |
|
|
|
|
|
|
|
|
|
|
|
|
|
|
|
|
|
|
|
|
|
|
|
|
|
|
| CLASS I |
|
Year Ended
April 30, 2015 |
|
|
Year Ended
April 30, 2014 |
|
|
Year Ended
April 30, 2013 |
|
|
For the Period
July 1, 2011
through
April 30,
2012* |
|
|
Year Ended
June 30, 2011 |
|
|
Year Ended
June 30, 2010 |
|
| Net Asset Value, Beginning of Period |
|
|
$14.43 |
|
|
|
$12.30 |
|
|
|
$10.59 |
|
|
|
$10.70 |
|
|
|
$7.90 |
|
|
|
$6.57 |
|
| Income (Loss) From Operations: |
|
|
|
|
|
|
|
|
|
|
|
|
|
|
|
|
|
|
|
|
|
|
|
|
| Net Investment Income (Loss)(a) |
|
|
0.18 |
|
|
|
0.16 |
|
|
|
0.18 |
|
|
|
0.09 |
|
|
|
0.11 |
|
|
|
0.09 |
|
| Net Realized and Unrealized Gain (Loss) on Investments |
|
|
1.38 |
|
|
|
2.14 |
|
|
|
1.70 |
|
|
|
(0.10 |
) |
|
|
2.80 |
|
|
|
1.32 |
|
| Total Income (Loss) From Operations |
|
|
1.56 |
|
|
|
2.30 |
|
|
|
1.88 |
|
|
|
(0.01 |
) |
|
|
2.91 |
|
|
|
1.41 |
|
| Less Distributions From: |
|
|
|
|
|
|
|
|
|
|
|
|
|
|
|
|
|
|
|
|
|
|
|
|
| Net Investment Income |
|
|
(0.19 |
) |
|
|
(0.17 |
) |
|
|
(0.17 |
) |
|
|
(0.10 |
) |
|
|
(0.11 |
) |
|
|
(0.08 |
) |
| Net Realized Gains |
|
|
(0.79 |
) |
|
|
— |
|
|
|
— |
|
|
|
— |
|
|
|
— |
|
|
|
— |
|
| Total Distributions |
|
|
(0.98 |
) |
|
|
(0.17 |
) |
|
|
(0.17 |
) |
|
|
(0.10 |
) |
|
|
(0.11 |
) |
|
|
(0.08 |
) |
| Net Asset Value, End of Period |
|
|
$15.01 |
|
|
|
$14.43 |
|
|
|
$12.30 |
|
|
|
$10.59 |
|
|
|
$10.70 |
|
|
|
$7.90 |
|
|
|
|
|
|
| Total Return(b) |
|
|
11.14 |
% |
|
|
18.74 |
% |
|
|
18.07 |
% |
|
|
0.06 |
% |
|
|
36.96 |
% |
|
|
21.47 |
% |
| Net Assets, End of Period (000’s) |
|
|
$90,679 |
|
|
|
$126,891 |
|
|
|
$72,487 |
|
|
|
$48,974 |
|
|
|
$127,968 |
|
|
|
$99,057 |
|
| Ratios to Average Net Assets |
|
|
|
|
|
|
|
|
|
|
|
|
|
|
|
|
|
|
|
|
|
|
|
|
| Gross Expense |
|
|
1.08 |
% |
|
|
1.09 |
% |
|
|
1.32 |
% |
|
|
1.16 |
%(c) |
|
|
0.96 |
% |
|
|
1.07 |
% |
| Net Expenses(d) |
|
|
0.25 |
% |
|
|
0.25 |
% |
|
|
0.25 |
% |
|
|
0.25 |
%(c) |
|
|
0.25 |
% |
|
|
0.25 |
% |
| Net Investment Income (Loss) |
|
|
1.21 |
% |
|
|
1.17 |
% |
|
|
1.60 |
% |
|
|
1.17 |
%(c) |
|
|
1.18 |
% |
|
|
1.14 |
% |
| Portfolio Turnover Rate |
|
|
24 |
% |
|
|
47 |
% |
|
|
42 |
% |
|
|
10 |
% |
|
|
48 |
% |
|
|
84 |
% |
| (a) |
Per share numbers have been calculated using the average shares method. |
| (b) |
Based on net asset value, which does not reflect the sales charge or contingent deferred sales charge, if applicable. Total returns for periods of less than
one year, if any, are not annualized. |
| (c) |
Annualized for periods less than one year. |
| (d) |
The investment advisor and other service providers waived or reimbursed a portion of their fees. |
| † |
Effective March 9, 2012, the Fund acquired all of the assets and liabilities of the Wilmington Small-Cap Strategy Fund, a series of WT Mutual Fund (the
“WT Fund”). The financial highlights for the periods prior to that date reflect the performance of the WT Fund. |
| * |
Year end changed from June 30 to April 30. |
See Notes which are an integral part of the Financial Statements
April 30, 2015 / ANNUAL REPORT
|
|
|
|
|
| NOTES TO FINANCIAL STATEMENTS |
|
|
73 |
|
Wilmington Funds
April 30,
2015
Wilmington Funds (the “Trust”) is registered under the
Investment Company Act of 1940, as amended (the “Act”), as an open-end management investment company. The Trust consists of 19 portfolios, 4 of which are presented herein (individually referred to as a “Fund” or collectively as
the “Funds”). The remaining 15 funds are presented in separate reports.
|
|
|
| Fund |
|
Investment Goal |
| Wilmington Large-Cap Strategy
Fund*(“Large-Cap Strategy Fund”)(d) |
|
The Fund seeks to achieve long-term capital appreciation. |
| Wilmington Mid-Cap Growth Fund (“Mid-Cap Growth Fund”)(d)
|
|
The Fund seeks to provide long-term capital appreciation. |
| Wilmington Small-Cap Growth Fund (“Small-Cap Growth Fund”)(d)
|
|
The Fund seeks to provide long-term capital appreciation. |
| Wilmington Small-Cap Strategy Fund*(“Small-Cap Strategy Fund”)(d) |
|
The Fund seeks to achieve long-term capital appreciation. |
(d) Diversified
The Trust offers 6 classes of shares: Class A, Service Class, Select Class, Administrative Class, Class I and Institutional
Class. Service Class, Select Class, Administrative Class and Institutional Class are not available for the Funds. In addition, Class A is not currently being offered for Large Cap Strategy Fund or Small Cap Strategy Fund. All shares of the
Trust have equal rights with respect to voting, except on class-specific matters.
The assets of each portfolio are
segregated and a shareholder’s interest is limited to the portfolio in which shares are held.
In the normal course of
business, the Funds may enter into contracts that provide general indemnifications. The Funds’ maximum exposure under these arrangements is dependent on claims that may be made against the Funds in the future, and, therefore, cannot be
estimated; however, based on experience, the risk of material loss from such claims is considered remote.
| 2. |
SUMMARY OF SIGNIFICANT ACCOUNTING POLICIES |
The following is a summary of
significant accounting policies consistently followed by the Funds in the preparation of their financial statements. These policies are in conformity with U.S. generally accepted accounting principles (“GAAP”). The Funds are investment
companies and follow accounting and reporting guidance under Financial Accounting Standards Board (“FASB”) Accounting Standards Codification (“ASU”) Topic 946, “Financial Services - Investment Companies.” The
preparation of financial statements in conformity with GAAP requires management to make estimates and assumptions that affect the amounts of assets, liabilities, expenses and revenues reported in the financial statements. Actual results could differ
from those estimated.
Investment Valuation – Fair value of the Funds’ portfolio securities are determined
as follows:
| |
• |
|
for equity securities, according to the last sale price or official closing price reported in the market in which they are primarily traded (either
a national securities exchange or the over-the-counter market), if available; |
| |
• |
|
in the absence of recorded sales for equity securities, according to the mean between the last closing bid and asked prices; |
| |
• |
|
investments in open-end regulated investment companies are valued at net asset value (“NAV”); and |
| |
• |
|
for all other securities at fair value as determined in accordance with procedures established by and under the general supervision of the Board of
Trustees (“Trustees”). |
Trading in foreign securities may be completed at times which vary from
the closing of the New York Stock Exchange (“NYSE”). In computing their NAV, the Funds value foreign securities using the latest closing price on the primary exchange on which they are traded immediately prior to the closing of the NYSE.
Certain foreign currency exchange rates are generally determined at the latest rate prior to the closing of the NYSE. Foreign securities quoted in foreign currencies are translated into U.S. dollars at current rates. Events that affect these values
and exchange rates may occur between the times at which they are determined and the closing of the NYSE. If such events materially affect the value of portfolio securities, these securities may be valued at their fair value in accordance with
procedures approved by the Trustees, although the actual calculation may be done by others. An event is considered material if there is both an affirmative expectation that the security’s value will change in response to the event and a
reasonable basis for quantifying the resulting change in value.
The Trust follows the authoritative guidance (GAAP) for
fair value measurements. The guidance establishes a framework for measuring fair value and a hierarchy for inputs used in measuring fair value that maximizes the use of observable inputs and minimizes the use of unobservable inputs by requiring that
the most observable inputs be used when available. The guidance establishes three tiers of inputs that may be used to measure fair value. The three tiers of inputs are summarized at the end of each Fund’s Portfolio of Investments. The inputs or
methodology used for valuing securities are not necessarily an indication of the risk associated with investing in those securities.
The Funds’ policy is to disclose transfers between levels based on valuations at the beginning of the reporting period.
Each portfolio may hold securities which are periodically fair valued in accordance with the Funds’ fair value procedures. This may result in movements between Levels 1, 2 and 3 throughout the period. As of April 30, 2015, there were no
transfers between Levels 1, 2 and 3 assets and liabilities, based
ANNUAL REPORT / April 30, 2015
|
|
|
|
|
|
|
74 |
|
NOTES TO FINANCIAL STATEMENTS (continued) |
on levels assigned to securities at the beginning of the period. Pursuant to the Funds’ fair value procedures noted previously, equity securities (including exchange traded securities and
other open-end regulated investment companies) are generally categorized as Level 1 securities in the fair value hierarchy. Fixed income securities and money market instruments are generally categorized as Level 2 securities in the fair value
hierarchy.
Investments for which there are no such quotations, or for which quotations do not appear reliable, are valued
at fair value as determined in accordance with procedures established by and under the general supervision of the Trustees. These valuations are typically categorized as Level 2 or Level 3 securities in the fair value hierarchy.
Repurchase Agreements – Repurchase agreements are transactions in which a Fund buys a security from a dealer or bank
and agrees to sell the security back at a mutually agreed upon time and price. The repurchase price exceeds the sale price, reflecting the Fund’s return on the transaction. It is each Fund’s policy to require the counterparty to a
repurchase agreement to transfer to the Funds’ custodian or sub-custodian eligible securities or cash with a market value (after transaction costs) at least equal to the repurchase price to be paid under the repurchase agreement. The eligible
securities are transferred to accounts with the custodian or sub-custodian in which the Funds hold a “securities entitlement” and exercise “control” as those terms are defined in the Uniform Commercial Code. The Funds have
established procedures for monitoring the market value of the transferred securities and requiring the transfer of additional eligible securities if necessary to equal at least the repurchase price. These procedures also allow the counterparty to
require securities to be transferred from the account to the extent that their market value exceeds the repurchase price or in exchange for other eligible securities of equivalent market value.
The insolvency of the counterparty or other failure to repurchase the securities may delay the disposition of the underlying
securities or cause the Funds to receive less than the full repurchase price.
Repurchase agreements are entered into by the
Funds under Master Repurchase Agreements (“MRA”) which permit the Funds, under certain circumstances including an event of default (such as bankruptcy or insolvency), to offset payables and/or receivables under the MRA with collateral held
and/or posted to the counterparty and create one single net payment due to or from the Funds.
At April 30, 2015, the
open repurchase agreements by counterparty which are subject to a MRA on a net payment basis are as follows:
|
|
|
|
|
|
|
|
|
|
|
|
|
| Fund/Counterparty |
|
Repurchase
Agreements
|
|
|
Fair Value of
Non-cash
Collateral
Received
|
|
|
Cash
Collateral
Received
|
|
Net Amount(1) |
| Large-Cap Strategy Fund |
|
|
|
|
|
|
|
|
|
|
|
|
| BNP Paribas Securities Corp. |
|
|
$ 294,102 |
|
|
|
$ 294,102 |
|
|
$— |
|
$— |
| Citigroup Global Markets, Inc. |
|
|
1,117,645 |
|
|
|
1,117,645 |
|
|
— |
|
— |
| Credit Suisse Securities (USA) LLC |
|
|
1,117,645 |
|
|
|
1,117,645 |
|
|
— |
|
— |
| ING Financial Markets LLC |
|
|
1,117,645 |
|
|
|
1,117,645 |
|
|
— |
|
— |
| JP Morgan Securities LLC |
|
|
1,117,645 |
|
|
|
1,117,645 |
|
|
— |
|
— |
| Nomura Securities International, Inc. |
|
|
1,117,645 |
|
|
|
1,117,645 |
|
|
— |
|
— |
| |
|
|
$ 5,882,327 |
|
|
|
$ 5,882,327 |
|
|
$— |
|
$— |
| Mid-Cap Growth Fund |
|
|
|
|
|
|
|
|
|
|
|
|
| BNP Paribas Securities Corp. |
|
|
$ 938,720 |
|
|
|
$ 938,720 |
|
|
$— |
|
$— |
| Citigroup Global Markets, Inc. |
|
|
3,567,279 |
|
|
|
3,567,279 |
|
|
— |
|
— |
| Credit Suisse Securities (USA) LLC |
|
|
3,567,279 |
|
|
|
3,567,279 |
|
|
— |
|
— |
| Daiwa Capital Markets LLC |
|
|
3,567,279 |
|
|
|
3,567,279 |
|
|
— |
|
— |
| ING Financial Markets LLC |
|
|
3,567,279 |
|
|
|
3,567,279 |
|
|
— |
|
— |
| Nomura Securities International, Inc. |
|
|
3,567,279 |
|
|
|
3,567,279 |
|
|
— |
|
— |
| |
|
|
$ 18,775,115 |
|
|
|
$ 18,775,115 |
|
|
$— |
|
$— |
| Small-Cap Growth Fund |
|
|
|
|
|
|
|
|
|
|
|
|
| BNP Paribas Securities Corp. |
|
|
$ 289,426 |
|
|
|
$ 289,426 |
|
|
$— |
|
$— |
| Citigroup Global Markets, Inc. |
|
|
1,099,871 |
|
|
|
1,099,871 |
|
|
— |
|
— |
| Credit Suisse Securities (USA) LLC |
|
|
1,099,871 |
|
|
|
1,099,871 |
|
|
— |
|
— |
| Daiwa Capital Markets LLC |
|
|
1,099,871 |
|
|
|
1,099,871 |
|
|
— |
|
— |
| ING Financial Markets LLC |
|
|
1,099,871 |
|
|
|
1,099,871 |
|
|
— |
|
— |
| Nomura Securities International, Inc. |
|
|
1,099,871 |
|
|
|
1,099,871 |
|
|
— |
|
— |
| |
|
|
$ 5,788,781 |
|
|
|
$ 5,788,781 |
|
|
$— |
|
$— |
April 30, 2015 / ANNUAL REPORT
|
|
|
|
|
| NOTES TO FINANCIAL STATEMENTS (continued) |
|
|
75 |
|
|
|
|
|
|
|
|
|
|
|
|
|
|
| Fund/Counterparty |
|
Repurchase
Agreements |
|
|
Fair Value of
Non-cash
Collateral
Received |
|
|
Cash
Collateral
Received |
|
Net Amount(1) |
| Small-Cap Strategy Fund |
|
|
|
|
|
|
|
|
|
|
|
|
| BNP Paribas Securities Corp. |
|
|
$ 554,300 |
|
|
|
$ 554,300 |
|
|
$— |
|
$— |
| Citigroup Global Markets, Inc. |
|
|
2,106,423 |
|
|
|
2,106,423 |
|
|
— |
|
— |
| Credit Suisse Securities (USA) LLC |
|
|
2,106,423 |
|
|
|
2,106,423 |
|
|
— |
|
— |
| ING Financial Markets LLC |
|
|
2,106,423 |
|
|
|
2,106,423 |
|
|
— |
|
— |
| JP Morgan Securities LLC |
|
|
2,106,423 |
|
|
|
2,106,423 |
|
|
— |
|
— |
| Nomura Securities International, Inc. |
|
|
2,106,423 |
|
|
|
2,106,423 |
|
|
— |
|
— |
| |
|
|
$ 11,086,415 |
|
|
|
$11,086,415 |
|
|
$— |
|
$— |
(1) Net amount represents the net amount
receivable due from the counterparty in the event of default.
Investment Income, Gains and Losses, Expenses and
Distributions – Interest income and expenses are accrued daily. Dividends and distributions to shareholders are recorded on the ex-dividend date. Non-cash dividends included in dividend income, if any, are recorded at fair value. Foreign
dividends are recorded on the ex-dividend date or when the Funds are informed of the ex-dividend date. Investment transactions are accounted for on a trade date basis for financial reporting purposes. Realized gains and losses from investment
transactions are recorded on an identified cost basis.
Expenses of the Trust, which are directly identifiable to a specific
Fund, are applied to that Fund. Expenses which are not identifiable to a specific Fund are allocated in such a manner as deemed equitable, taking into consideration the nature and type of expense.
All Funds (except Large-Cap Strategy Fund and Small-Cap Strategy Fund) offer multiple classes of shares. Investment income,
realized and unrealized gains and losses, and certain fund-level expenses are allocated to each class based on relative daily net assets, except that each class bears certain expenses unique to that class such as distribution and shareholder
services fees. Distributions are declared separately for each class. No class has preferential distribution rights; differences in per share distributions rates are generally due to differences in class specific expenses. Distributions from net
realized gains, if any, are declared and paid to shareholders annually. Distributions from net investment income, if any, are declared and paid as follows:
|
|
|
|
|
|
|
|
|
| Fund |
|
Dividends
Declared |
|
|
Dividends
Paid |
|
| Large-Cap Strategy Fund |
|
|
Quarterly |
|
|
|
Quarterly |
|
| Mid-Cap Growth Fund |
|
|
Annually |
|
|
|
Annually |
|
| Small-Cap Growth Fund |
|
|
Annually |
|
|
|
Annually |
|
| Small-Cap Strategy Fund |
|
|
Quarterly |
|
|
|
Quarterly |
|
Real Estate Investment Trusts – The Funds may invest in real estate investment
trusts (“REITs”) that involve risks not associated with investing in stocks. Risks include declines in the value of real estate, general and economic conditions, changes in the value of the underlying property and defaults by borrowers.
The value of assets in the real estate industry may go through cycles of relative underperformance and outperformance in comparison to equity securities markets in general. Dividend income is recorded using management’s estimate of the income
included in distributions received from REIT investments. The actual amounts of income, return of capital and capital gains are only determined by each REIT after its fiscal year-end and may differ from the estimated amount. Estimates of income are
adjusted in the Funds to the actual amounts when the amounts are determined.
Federal Taxes – It is the
Funds’ policy to comply with the Subchapter M provision of the Internal Revenue Code of 1986, as amended (the “Code”), and to distribute to shareholders each year substantially all of their income. Accordingly, no provisions for
Federal income or excise tax are necessary.
Withholding taxes and where appropriate, deferred withholding taxes, on foreign
interest, dividends and capital gains have been provided for in accordance with the applicable country’s tax rules and rates.
The Funds recognize interest and penalties, if any, related to unrecognized tax benefits as income tax expense on the Statements
of Operations. During the year ended April 30, 2015, the Funds did not incur any interest or penalties.
Warrants
and Rights – Certain Funds hold warrants and rights acquired either through a direct purchase, including as part of private placement, or pursuant to corporate actions. Warrants and rights entitle the holder to buy a proportionate amount of
common stock at a specific price and time through the expiration dates. Such warrants and rights are held as long positions by the Funds until exercised, sold or expired. Equity-linked warrants are purchased in order to own local exposure to certain
countries in which the Funds are not locally registered. Warrants and rights are valued at fair value in accordance with the Trustees’ approved fair value procedures.
Lending of Portfolio Securities – The Trust has entered into an agreement with their custodian whereby the custodian
may lend securities owned by the Funds to brokers, dealers and other financial organizations. Any increase or decrease in the fair value of securities loaned and any interest or dividends earned on those securities during the term of the loan would
be for the account of the Fund. In exchange for lending
ANNUAL REPORT / April 30, 2015
|
|
|
|
|
|
|
76 |
|
NOTES TO FINANCIAL STATEMENTS (continued) |
securities under the terms of the agreement with their custodian, the Funds
receive a lender’s fee. Fees earned by the Funds on securities lending are recorded as income. Loans of securities by the Funds are collateralized by cash, U.S. government securities or money market instruments that are maintained at all times
in an amount at least equal to the current market value of the loaned securities plus a margin which varies depending on the type of securities owned. The custodian establishes and maintains the collateral in a segregated account. The Funds have the
right under the lending agreement to recover the securities from the borrower on demand. The market value of the loaned securities is determined at the close of business of the Fund and any additional required collateral is delivered to the Fund on
the next business day.
Investments purchased with cash collateral are presented on the portfolios of investments under the
caption “Cash Collateral Invested for Securities on Loan.”
The Funds maintain the risk of any loss on the
securities on loan as well as the potential loss on investments purchased with cash collateral received from securities lending.
Securities lending transactions are entered into by the Funds under Master Securities Lending Agreements (“MSLA”)
which permit the Funds, under certain circumstances including an event of default (such as bankruptcy or insolvency), to offset amounts payable by the Fund to the same counterparty against amounts received and create one single net payment due to or
from the Fund.
At April 30, 2015, the securities loaned which are subject to a MSLA on a net payment basis are as
follows:
|
|
|
|
|
|
|
|
|
|
|
|
|
|
|
|
|
|
|
|
|
| Fund |
|
Value of
Securities
on Loan |
|
|
|
|
Cash
Collateral
Received(1) |
|
|
|
|
Net Amount(2)
|
| Large-Cap Strategy Fund |
|
|
$ 5,772,108 |
|
|
|
|
|
$ 5,772,108 |
|
|
|
|
$— |
| Mid-Cap Growth Fund |
|
|
18,180,925 |
|
|
|
|
|
18,180,925 |
|
|
|
|
— |
| Small-Cap Growth Fund |
|
|
5,429,742 |
|
|
|
|
|
5,429,742 |
|
|
|
|
— |
| Small-Cap Strategy Fund |
|
|
10,446,754 |
|
|
|
|
|
10,446,754 |
|
|
|
|
— |
(1) Collateral with a value of $5,882,327,
$18,775,115, $5,788,781, and $11,086,415, respectively, has been received in connection with securities lending transactions.
(2) Net amount represents the net amount receivable due from the counterparty in the event of default.
| 3. |
FEDERAL TAX INFORMATION |
The timing and character of income and capital gain
distributions are determined in accordance with income tax regulations, which may differ from GAAP. These differences are due in part to the tax treatment of expiring capital loss carryforwards, net investment losses, the “mark-to-market”
of certain passive foreign investment companies (PFICs), and losses deferred due to wash sales. GAAP requires that permanent differences in net investment income and realized gains and losses due to differences between financial reporting and tax
reporting be reclassified between various components of net assets and have no effect on the net assets nor the NAV of the Funds.
As of April 30, 2015, there are no uncertain tax positions that would require financial statement recognition,
de-recognition or disclosure. The Funds’ federal tax returns filed for the periods ended 2014, 2013, and 2012, as well as the current year, remain subject to examination by the Internal Revenue Service.
For the year ended April 30, 2015, permanent differences identified and reclassified among the components of net assets
were as follows:
|
|
|
|
|
|
|
|
|
|
|
|
|
|
|
|
|
| Fund |
|
Paid-in
Capital |
|
|
Increase (Decrease)
Undistributed
Net Investment
Income |
|
|
Accumulated
Net Realized
Gain (Loss) |
|
| Large-Cap Strategy Fund |
|
|
$ — |
|
|
|
$ 7,454 |
|
|
|
$ (7,454) |
|
| Mid-Cap Growth Fund |
|
|
(4,216,350) |
|
|
|
956,451 |
|
|
|
3,259,899 |
|
| Small-Cap Growth Fund |
|
|
(466,038) |
|
|
|
460,906 |
|
|
|
5,132 |
|
| Small-Cap Strategy Fund |
|
|
— |
|
|
|
(132,750) |
|
|
|
132,750 |
|
The tax character of distributions for the corresponding fiscal years as reported on the
Statements of Changes in Net Assets were as follows:
|
|
|
|
|
|
|
|
|
|
|
|
|
|
|
|
|
|
|
|
|
| |
|
2015 |
|
2014 |
| |
|
Ordinary |
|
Long-Term |
|
Ordinary |
|
Long-Term |
| Fund |
|
Income* |
|
Capital Gains |
|
Income* |
|
Capital Gains |
| Large-Cap Strategy Fund |
|
|
$ |
6,747,267 |
|
|
|
$ |
24,762,981 |
|
|
|
$ |
6,931,023 |
|
|
|
$ |
— |
|
| Mid-Cap Growth Fund |
|
|
|
— |
|
|
|
|
31,702,215 |
|
|
|
|
— |
|
|
|
|
12,594,746 |
|
| Small-Cap Growth Fund |
|
|
|
— |
|
|
|
|
9,639,150 |
|
|
|
|
— |
|
|
|
|
134,000 |
|
| Small-Cap Strategy Fund |
|
|
|
2,040,054 |
|
|
|
|
5,392,063 |
|
|
|
|
1,238,125 |
|
|
|
|
— |
|
* For tax purposes, short-term capital gain distributions are
considered ordinary income distributions.
April 30, 2015 / ANNUAL REPORT
|
|
|
|
|
| NOTES TO FINANCIAL STATEMENTS (continued) |
|
|
77 |
|
As of April 30, 2015, the components of distributable earnings on a tax
basis were as follows:
|
|
|
|
|
|
|
|
|
|
|
|
|
|
|
|
|
|
|
|
|
|
|
| Fund |
|
Undistributed
Ordinary Income |
|
|
Undistributed
Long-Term Capital Gains |
|
|
Unrealized
Appreciation |
|
|
Late Year
Ordinary
Deferrals |
|
Other
Timing
Differences |
|
|
Capital Loss
Carryforwards
and Deferrals |
|
| Large-Cap Strategy Fund |
|
|
$922,238 |
|
|
|
$ 8,224,888 |
|
|
|
$173,642,454 |
|
|
— |
|
|
$ — |
|
|
|
$ — |
|
| Mid-Cap Growth Fund |
|
|
— |
|
|
|
12,337,436 |
|
|
|
103,152,531 |
|
|
— |
|
|
— |
|
|
|
(7,880,728) |
|
| Small-Cap Growth Fund |
|
|
— |
|
|
|
4,811,970 |
|
|
|
20,692,348 |
|
|
— |
|
|
— |
|
|
|
(3,646,670) |
|
| Small-Cap Strategy Fund |
|
|
— |
|
|
|
3,046,470 |
|
|
|
21,259,479 |
|
|
— |
|
|
(1,367) |
|
|
|
— |
|
At April 30, 2015, the following Funds had capital loss carryforwards which will reduce
each Fund’s taxable income arising from future net realized gain on investments, if any, to the extent permitted by the Code and thus will reduce the amount of distributions to shareholders which would otherwise be necessary to relieve the Fund
of any liability for federal income tax. Pursuant to the Code, such capital loss carryforwards will expire as follows:
|
|
|
|
|
|
|
|
|
|
|
|
|
|
|
|
|
|
|
|
|
| |
|
|
|
|
|
|
|
|
|
|
Short-Term |
|
Long-Term |
|
Total Capital |
|
| |
|
Capital Loss Available Through |
|
|
Post-Effective |
|
Post-Effective |
|
Loss |
|
| Fund |
|
2016 |
|
|
2017 |
|
|
2018 |
|
|
No Expiration |
|
No Expiration |
|
Carryforwards |
|
| Mid-Cap Growth Fund |
|
|
$ — |
|
|
|
$6,519,798 |
|
|
|
$1,360,930 |
|
|
$— |
|
$— |
|
|
$7,880,728 |
|
| Small-Cap Growth Fund |
|
|
1,823,335 |
|
|
|
1,823,335 |
|
|
|
— |
|
|
— |
|
— |
|
|
3,646,670 |
|
The Funds utilized capital loss carryforwards as follows to offset taxable capital gains
realized during the year ended April 30, 2015:
|
|
|
|
|
| |
|
Capital Loss |
|
| |
|
Carryforwards |
|
| Fund |
|
Utilized |
|
| Mid-Cap Growth Fund |
|
|
$3,259,899 |
|
| Small-Cap Growth Fund |
|
|
1,823,335 |
|
* At April 30, 2015, there was an additional Capital
Loss Carryforward write-off of $3,259,899 for Mid-Cap Growth Fund.
| 4. |
ADVISORY FEES, SERVICING FEES, AND OTHER SERVICE PROVIDERS |
Investment
Advisor – Wilmington Funds Management Corporation (“WFMC” or the “Advisor”) serves as the Investment Advisor to each of the Funds. Wilmington Trust Investment Advisors, Inc. (“WTIA”) provides sub-advisory
services to the Funds. WFMC and WTIA are wholly-owned subsidiaries of M&T Bank Corporation. For its services, the Funds pay WFMC an annual investment advisory fee, accrued and paid daily, based on a percentage of each Fund’s average daily
net assets as described below. WFMC, not the Funds, pays WTIA for its services.
|
|
|
| Fund |
|
Advisory Fee
Annual Rate |
| Large-Cap Strategy Fund |
|
0.50% |
| Mid-Cap Growth Fund |
|
0.85% |
| Small-Cap Growth Fund |
|
0.85% |
| Small-Cap Strategy Fund |
|
0.55% |
WFMC and the Funds’ distributor and shareholder service providers have contractually agreed
to waive their fees and/or reimburse expenses through November 30, 2015, so that total annual fund operating expenses paid by the Funds (not including the effects of dividends or interest on short positions, acquired fund fees and expenses,
taxes, or other extraordinary expenses expressed as an annualized percentage of average daily net assets), will not exceed the expense limitations set forth below. Neither WFMC nor the Funds’ distributor will recoup previously waived
fees/expenses in subsequent years.
|
|
|
|
|
| |
|
Contractual Current Expense
Limitations |
| Fund |
|
Class A |
|
Class I |
| Large-Cap Strategy Fund |
|
N/A |
|
0.25% |
| Mid-Cap Growth Fund |
|
1.24% |
|
1.08% |
| Small-Cap Growth Fund |
|
1.23% |
|
1.01% |
| Small-Cap Strategy Fund |
|
N/A |
|
0.25% |
ANNUAL REPORT / April 30, 2015
|
|
|
|
|
|
|
78 |
|
NOTES TO FINANCIAL STATEMENTS (continued) |
On September 18, 2014, the Trustees voted to change the contractual
expense limitations for the Small-Cap Growth Fund. Prior to the effective date of December 1, 2014, the Small-Cap Growth Fund had contractually agreed to waive its fees and/or reimburse expenses, so that total annual fund operating expenses
paid by the Fund (not including the effects of dividends or interest on short positions, acquired fund fees and expenses, taxes, or other extraordinary expenses expressed as an annualized percentage of average daily net assets), would not exceed the
expense limitations set forth below.
|
|
|
|
|
| |
|
Contractual
Prior Expense Limitations |
| Fund |
|
Class A |
|
Class I |
| Small-Cap Growth Fund |
|
1.47% |
|
1.25% |
Administrative Fee – The Bank of New York Mellon (“BNYM”) provides the
Trust with fund administration services. WFMC in its role as co-administrator provides the Funds with certain administrative personnel and services necessary to operate the Funds. These services were provided for at an aggregate annual fee as
specified below.
|
|
|
|
|
|
|
| Administrator |
|
Maximum
Fee |
|
|
Average Aggregate
Daily Net
Assets of the Trust |
| WFMC |
|
|
0.040 |
% |
|
on the first $5 billion |
|
|
|
0.030 |
% |
|
on the next $2 billion |
|
|
|
0.025 |
% |
|
on the next $3 billion |
|
|
|
0.018 |
% |
|
on assets in excess of $10 billion |
|
|
|
| BNYM |
|
|
0.0285 |
% |
|
on the first $500 million |
|
|
|
0.0280 |
% |
|
on the next $500 million |
|
|
|
0.0275 |
% |
|
on assets in excess of $1 billion |
WFMC may voluntarily choose to waive any portion of its fee. WFMC can modify or terminate its
voluntary waiver at any time at its sole discretion. For the year ended April 30, 2015, WFMC did not waive any administrative personnel and services fee.
Distribution Services Fee – The Trust has adopted a Distribution Services Plan (the “Plan”) pursuant to
Rule 12b-1 under the Act. The Plan allows the Funds to pay fees to financial intermediaries, which may be paid through ALPS Distributors, Inc. (“ALPS”), the principal distributor, at an annual rate of up to 0.25% of the average daily net
assets of the Funds’ Class A shares, for the sale, distribution, administration, customer servicing and record keeping of these shares.
The Trust may reduce the maximum amount of distribution services fees it pays from time to time at its sole discretion. In
addition, a financial intermediary (including ALPS, the Advisor or their affiliates), may voluntarily waive or reduce any fees to which they are entitled.
For the year ended April 30, 2015, M&T Securities, Inc. and Manufacturers and Traders Trust Company (together
“M&T”), affiliates of the Advisor, received all or a portion of the fees paid by the Funds which are listed below:
|
|
|
|
|
| Fund |
|
Distribution
Fees |
|
| Mid-Cap Growth Fund |
|
|
$99,344 |
|
| Small-Cap Growth Fund |
|
|
37,284 |
|
April 30, 2015 / ANNUAL
REPORT
|
|
|
|
|
| NOTES TO FINANCIAL STATEMENTS (continued) |
|
|
79 |
|
Sales Charges – The Class A shares of all the Funds bear
front-end sales charges.
For the year ended April 30, 2015, M&T received the amounts listed below from sales
charges on the sale of Class A shares.
|
|
|
|
|
| Fund |
|
Sales Charges
from Class A
|
|
| Mid-Cap Growth Fund |
|
|
$10,370 |
|
| Small-Cap Growth Fund |
|
|
3,893 |
|
Shareholder Services Fee – Pursuant to a Shareholder Services Plan adopted by the
Funds and administered by ALPS, the Funds may pay up to 0.25% of the average daily net assets of each Fund’s Class A and Class I shares to financial intermediaries (which may include ALPS, the Advisor or their affiliates) for providing
shareholder services and maintaining shareholder accounts. M&T has entered into a Shareholders Services Agreement with ALPS, under which it is entitled to receive up to 0.25% of the average daily net assets of each Fund’s shares for whom
M&T provides shareholder services. The Funds may reduce the maximum amount of shareholder service fees it pays from time to time at its sole discretion. In addition, a financial intermediary (including M&T) may waive or reduce any fees to
which they are entitled.
For the year ended April 30, 2015, M&T received a portion of the fees paid by the
following Funds which are listed below:
|
|
|
|
|
| Fund |
|
Shareholder
Services
Fee |
|
| Mid-Cap Growth Fund |
|
|
$431,279 |
|
| Small-Cap Growth Fund |
|
|
52,389 |
|
Other Service Providers – Foreside Management Services, LLC (“FMS”)
provides a Principal Executive Officer and Principal Financial Officer to the Trust. FMS has no role in determining the investment policies or which securities are to be sold or purchased by the Trust or its Funds.
BNYM provides custody services to the Trust.
BNY Mellon Investment Servicing (U.S.) Inc. provides fund accounting and transfer agency services to the Trust.
General – Certain Officers of the Trust are also Officers or employees of the above companies that provide services
to the Funds, and during their terms of office, receive no compensation from the Funds. The Trust’s Statement of Additional Information includes additional information about the Trustees.
Other Affiliated Parties and Transactions – Affiliated holdings are securities which are managed by the Advisor or
an affiliate of the Advisor or which are distributed by an affiliate of the Funds’ distributor. Transactions with affiliated companies during the years ended April 30, 2015 are as follows:
|
|
|
|
|
|
|
|
|
|
|
|
|
|
|
| |
|
Balance of |
|
|
|
|
|
Balance
of |
|
|
|
|
|
|
| |
|
Shares Held |
|
Purchases/ |
|
Sales/ |
|
Shares Held |
|
Value at |
|
Dividend |
|
Realized |
| Fund/Affiliated Security Name |
|
4/30/2014 |
|
Additions |
|
Reductions |
|
4/30/2015 |
|
4/30/2015 |
|
Income |
|
Gain/(Loss) |
| Large-Cap Strategy Fund: |
|
|
|
|
|
|
|
|
|
|
|
|
|
|
| M&T Bank Corp. |
|
1,610 |
|
— |
|
— |
|
1,610 |
|
$192,669 |
|
$4,508 |
|
$— |
Certain Funds execute trades for security purchase and sale transactions through brokers that
are affiliates of the Advisor or sub-advisors. Commissions paid on those trades for the year ended April 30, 2015 were as follows:
|
|
|
|
|
| Fund |
|
Commissions |
|
| Large-Cap Strategy Fund |
|
|
$23,293 |
|
| Mid-Cap Growth Fund |
|
|
— |
|
| Small-Cap Growth Fund |
|
|
66,591 |
|
| Small-Cap Strategy Fund |
|
|
48,483 |
|
ANNUAL REPORT / April 30, 2015
|
|
|
|
|
|
|
80 |
|
NOTES TO FINANCIAL STATEMENTS (continued) |
| 5. |
INVESTMENT TRANSACTIONS |
Purchases and sales of investments, excluding
short-term obligations U.S. Government Securities, and in-kind transactions, for the year ended April 30, 2015 were as follows:
|
|
|
|
|
|
|
|
|
| |
|
Investments
|
|
| Fund |
|
Purchases |
|
|
Sales |
|
| Large-Cap Strategy Fund |
|
|
$ 85,335,778 |
|
|
|
$ 67,927,966 |
|
| Mid-Cap Growth Fund |
|
|
105,293,372 |
|
|
|
181,131,463 |
|
| Small-Cap Growth Fund |
|
|
28,506,461 |
|
|
|
64,690,488 |
|
| Small-Cap Strategy Fund |
|
|
27,016,462 |
|
|
|
72,898,185 |
|
The Trust participated in a $20,000,000 unsecured, committed
revolving line of credit (“LOC”) agreement with BNYM. The LOC was made available for extraordinary or emergency purposes, primarily for financing redemption payments. Borrowings are charged interest at a rate of 1.25% per annum over
the greater of the Federal Funds Rate or the overnight LIBOR Rate. The LOC included a commitment fee of 0.10% per annum on the daily unused portion. The LOC was in effect for the entire fiscal year and the termination date of this LOC is
March 9, 2016. The Funds did not utilize the LOC for the year ended April 30, 2015.
The Funds are subject to claims and suits that arise from
time to time in the ordinary course of business. For example, certain creditors of Tribune Co., which has recently emerged from bankruptcy, have filed actions against former Tribune shareholders, (collectively, the “Lawsuits”) who tendered
their shares when Tribune went private in 2007 as part of a leveraged buyout (“LBO”). These creditor plaintiffs seek the return of all proceeds received by the former Tribune shareholders. These cases are consolidated in a Multi-District
Litigation (“MDL”) in the U.S. District Court for the Southern District of New York. One of the cases remains pending before the trial court, while the others were dismissed by the trial court on a motion to dismiss. The dismissal order is
currently on appeal to the U.S. Court of Appeals for the Second Circuit. There are thousands of defendants in the MDL, including the Large-Cap Strategy Fund and the Mid-Cap Growth Fund. The suits all seek the same thing: disgorgement of the amounts
received by the former Tribune shareholders as part of the LBO, but by different legal theories. Although management currently believes that the resolution of the claims against the Funds, individually or in the aggregate, will not have a materially
adverse impact on the Funds’ financial positions, results of operations, or cash flows, these matters are subject to inherent uncertainties and management’s view of these matters could change in the future.
Litigation counsel to the Large-Cap Strategy Fund and the Mid-Cap Growth Fund in the Lawsuits does not believe that it is
possible, at this stage in the proceedings, to predict with any reasonable certainty the probable outcome of the Lawsuits or quantify the ultimate exposure to the Large-Cap Strategy Fund and the Mid-Cap Growth Fund arising from the Lawsuits. Until
the Large-Cap Strategy Fund and the Mid-Cap Growth Fund can do so, no reduction of their net asset values will be made relating to the Lawsuits. However, even if the plaintiffs in the Lawsuits were to obtain the full recovery they seek, the amount
would be less than 0.5% of each of the Large-Cap Strategy Fund and the Mid-Cap Growth Fund’s net asset value at this time. Neither the Large-Cap Strategy Fund nor the Mid-Cap Growth Fund can predict what their size might be at the time that the
cost of the Lawsuits might be quantifiable and thus potentially deducted from their net asset value. Therefore, at this time, those buying or redeeming shares of the Large-Cap Strategy Fund and the Mid-Cap Growth Fund will pay or receive, as the
case may be, a price based on net asset value of the Large-Cap Strategy Fund and the Mid-Cap Growth Fund, with no adjustment relating to the Lawsuits. The attorneys’ fees and costs relating to the Lawsuits will be taken as expenses by the
Large-Cap Strategy Fund and the Mid-Cap Growth Fund as incurred and in a manner similar to any other expense incurred by the Large-Cap Strategy Fund and the Mid-Cap Growth Fund.
Management has evaluated events and transactions for
potential recognition or disclosure in the financial statements through the date the financial statements were issued. Management has determined that, there are no material events that would require recognition or disclosure in the Funds’
financial statements through this date, except as follows:
On June 18, 2015, WFMC and WTIA, recommended, and the
Trustees approved the liquidation of the Mid-Cap Growth Fund, Small-Cap Growth Fund and the Small-Cap Strategy Fund (the “Liquidating Funds”). Effective upon the close of business of the New York Stock Exchange on June 22, 2015, the
Liquidating Funds no longer accepted purchase orders of any kind. The liquidation date will be July 20, 2015 for the Small-Cap Growth Fund and August 3, 2015 for the Mid-Cap Growth Fund and Small-Cap Strategy Fund. On the liquidation date,
each Liquidating Fund will make a liquidating distribution to its remaining shareholders equal to each shareholder’s proportionate share of the net assets of the respective Fund in a complete redemption and cancellation of each Fund’s
shares held by each remaining shareholder, and the Fund will then dissolve.
April 30, 2015 / ANNUAL REPORT
|
|
|
|
|
| NOTES TO FINANCIAL STATEMENTS (continued) |
|
|
81 |
|
| 9. |
FEDERAL TAX INFORMATION (UNAUDITED) |
Complete information regarding the tax
status of distributions will be reported on Forms 1099.
Of the ordinary income (including short-term capital gain)
distributions made by the Funds during the year ended April 30, 2015, the Funds designate the following percentages, or such greater percentages that constitute the maximum amount allowable pursuant to Code Sections Section 243 and
854(b)(2), as qualifying for the corporate dividends received deduction:
|
|
|
|
|
|
| Fund |
|
| Large-Cap Strategy Fund |
|
|
100.00% |
|
| Small-Cap Strategy Fund |
|
|
46.17% |
|
For the year ended April 30, 2015, the Funds designate the following percentages of the
ordinary income dividends, or such greater percentages that constitute the maximum amount allowable pursuant to Code Sections 1(h)(11) and 854(b)(2), as qualified dividend income which may be subject to a maximum rate of federal income tax of 15%:
|
|
|
|
|
|
| Fund |
|
| Large-Cap Strategy Fund |
|
|
100.00% |
|
| Small-Cap Strategy Fund |
|
|
43.28% |
|
If the Funds meet the requirements of Section 853 of the Code, the Funds will pass through
to shareholders credits of foreign taxes paid.
ANNUAL REPORT / April 30, 2015
82
REPORT OF INDEPENDENT REGISTERED PUBLIC ACCOUNTING FIRM
TO THE SHAREHOLDERS AND BOARD OF TRUSTEES OF
WILMINGTON
FUNDS
We have audited the accompanying statements of assets and liabilities, including the portfolios of investments, of the
Wilmington Large-Cap Strategy Fund, Wilmington Mid-Cap Growth Fund, Wilmington Small-Cap Growth Fund and Wilmington Small-Cap Strategy Fund (four of the series constituting the Wilmington Funds) (the “Funds”) as of April 30, 2015, and
the related statements of operations for the year then ended, the statements of changes in net assets for each of the two years in the period then ended, and the financial highlights for each of the years or periods indicated therein. These
financial statements and financial highlights are the responsibility of the Funds’ management. Our responsibility is to express an opinion on these financial statements and financial highlights based on our audits.
We conducted our audits in accordance with standards of the Public Company Accounting Oversight Board (United States). Those standards require
that we plan and perform the audit to obtain reasonable assurance about whether the financial statements and financial highlights are free of material misstatement. We were not engaged to perform an audit of the Funds’ internal control over
financial reporting. Our audits included consideration of internal control over financial reporting as a basis for designing audit procedures that are appropriate in the circumstances, but not for the purpose of expressing an opinion on the
effectiveness of the Funds’ internal control over financial reporting. Accordingly, we express no such opinion. An audit also includes examining, on a test basis, evidence supporting the amounts and disclosures in the financial statements and
financial highlights, assessing the accounting principles used and significant estimates made by management, and evaluating the overall financial statement presentation. Our procedures included confirmation of securities owned as of April 30,
2015, by correspondence with the custodian and brokers, or by other appropriate auditing procedures where replies from the brokers were not received. We believe that our audits provide a reasonable basis for our opinion.
In our opinion, the financial statements and financial highlights referred to above present fairly, in all material respects, the financial
position of the Wilmington Large-Cap Strategy Fund, Wilmington Mid-Cap Growth Fund, Wilmington Small-Cap Growth Fund and Wilmington Small-Cap Strategy Fund (four of the series constituting the Wilmington Funds) at April 30, 2015, the results of
their operations for the year then ended, the changes in their net assets for each of the two years in the period then ended, and their financial highlights for each of the years or periods indicated therein, in conformity with U.S. generally
accepted accounting principles.
Philadelphia, Pennsylvania
June 29, 2015
April 30, 2015 / ANNUAL REPORT
|
|
|
|
|
| BOARD OF TRUSTEES AND TRUST OFFICERS |
|
|
83 |
|
BOARD OF TRUSTEES AND TRUST OFFICERS
The following tables give information about each Trustee and the senior officers of the Trust. The tables separately list Trustee members who
are “interested persons” of the Fund (i.e., “Interested” Trustees) and those who are not (i.e., “Independent” Trustees). The Trust is comprised of 19 funds. Unless otherwise noted, the business address of each Trustee
and senior officer is 111 South Calvert Street, 26th floor, Baltimore, Maryland 21202. Each Trustee oversees all portfolios of the Trust and serves for an indefinite term. The Trust’s Statement of Additional Information includes additional
information about the Trustees and is available, without charge and upon request, by calling 1-800-836-2211.
INTERESTED TRUSTEES BACKGROUND
|
|
|
|
|
| Name
Address Birth date Position With
Trust Date Service Began
|
|
|
|
Principal Occupations for past five years and Other Directorships Held
|
|
|
|
| R. Samuel Fraundorf, CFA, CPA*
Birth date: 4/64
TRUSTEE
Began serving: March 2012 |
|
|
|
Principal Occupations: Senior Vice President, Chief Investment Strategist and
Chief Client Officer of WTIA and WFMC.
Other Directorships Held: Director, WTIA (1/14 to present); Director, WFMC (1/14 to present). |
|
|
|
| |
|
|
|
Previous Positions: President of WTIA (1/12 to 1/14); President of Wilmington Trust Investment
Management (“WTIM”) (8/04 to 1/12); Chief Operating Officer of WTIM (1/08 to 1/09); Director of Research at WTIM (8/04 to 1/08). |
| Robert J.
Truesdell* Birth date: 11/55
TRUSTEE |
|
|
|
Principal Occupations: Group Vice President and Senior Investment Advisor
for Wilmington Trust Wealth Advisory Services, M&T Bank. |
| Began serving: December 2012 |
|
|
|
Other Directorships Held: None. |
|
|
|
| |
|
|
|
Previous Positions: Bond Department Manager, M&T Bank (2/88 to 7/12); Group Vice President, Managing
Director and Chief Investment Officer, WTIA (6/02 to 6/12) and WFMC (3/12 to 6/12). |
| * |
R.Samuel Fraundorf is “interested” due to positions he holds with WTIA and WFMC. Robert J.Truesdell is “interested” due to the
positions he currently holds with Wilmington Trust Wealth Advisory Services, M&T Bank, the parent of the Funds’ Advisor, and previous positions held with WTIA and WFMC. |
ANNUAL REPORT / April 30, 2015
|
|
|
|
|
|
|
84 |
|
BOARD OF TRUSTEES AND TRUST OFFICERS |
INTERESTED TRUSTEES BACKGROUND
|
|
|
|
|
| Name
Birth date
Position with Trust
Date Service Began
|
|
|
|
Principal Occupations for past five years and Other Directorships
|
| Nicholas A.
Giordano Birth date: 3/43 |
|
|
|
Principal Occupations: Consultant, financial services organizations (1997 to present). |
| CHAIRMAN AND TRUSTEE Began serving: March
2012 |
|
|
|
Other Directorships Held: Kalmar Pooled Investment Trust; The RBB Fund Inc. (19 portfolios) (registered investment companies); Independence Blue Cross; IntriCon Corporation (industrial furnaces and ovens). |
|
|
|
| |
|
|
|
Previous Positions: Interim President, LaSalle University (1998 to 1999); President and Chief
Executive Officer, Philadelphia Stock Exchange (1981 to 1997). |
| Robert H. Arnold
Birth date: 3/44 |
|
|
|
Principal Occupations: Managing Director, R.H. Arnold & Co, Inc.
(financial management consulting) (6/89 to present). |
| TRUSTEE |
|
|
|
|
| Began serving: March 2012 |
|
|
|
Other Directorships Held: Trustee, First Potomac Realty Trust (real estate investment trust) (5/01 to
present); Director, Treasury Strategies, Inc. (private treasury consulting services) (6/01 to present). |
| Joseph J. Castiglia
Birth date: 7/34 TRUSTEE
Began serving: February 1988 |
|
|
|
Principal Occupations: Consultant (not-for-profit) and Private
Investor. Other Directorships Held: Chairman, Trustee and Treasurer, Buffalo Olmsted
Parks Conservancy (1/05 to 5/13); Chairman and Trustee, Buffalo Philharmonic Orchestra Foundation (1/06 to 11/12); Vice Chairman and Trustee, Christ the King Seminary (1/05 to present); Director, Dunn Tire Corporation (1/05 to present); Chairman,
Director and Treasurer, Read to Succeed Buffalo (1/08 to present). |
|
|
|
| |
|
|
|
Previous Positions: President, Chief Executive Officer, Vice President, Treasurer and Vice Chairman,
Pratt & Lambert United (manufacturer of paints, coatings and adhesives) (12/67- 1/96); Chairman and Director, Catholic Health (hospitals, nursing homes and home care) (1/97 to 5/03); Chairman and Director, Blue Cross Blue Shield of Western and
Central New York (5/92 to 5/07); Lead Director and Director, Energy East (gas and electric utility); Chairman and Director, Federal Reserve Bank of New York, Buffalo Branch; Chairman and Director, Community Foundation for Greater Buffalo; Chairman
and Trustee, Canisius College; Chairman and Director, AAA of Western & Central New York. |
| John S.
Cramer Birth date: 2/42
TRUSTEE
Began serving: December 2000 |
|
|
|
Principal Occupations: Senior Consultant, Yaffe & Co. (health care
consulting) (2/06 to present). Other Directorships Held: Director, Chairman of the
Executive Committee and Chairman of the Compensation Committee of Chek-Med Corporation (6/03 to present). |
|
|
|
| |
|
|
|
Previous Positions: President and Chief Executive Officer Emeriti, Pinnacle Health Systems
(non-profit hospital and health care system in Central Pennsylvania). |
| Daniel R. Gernatt,
Jr. Birth date: 7/40 TRUSTEE
Began serving: February 1988 |
|
|
|
Principal Occupations: President
and CEO, Gernatt Asphalt Products, Inc. (asphalt, sand and gravel products) (1979 to present).
Other Directorships Held: Director, Roswell Park Alliance (2008 to present); Trustee, Gernatt Family Foundation.
|
| Richard B. Seidel
Birth date: 4/41
TRUSTEE
Began serving: September 2003 |
|
|
|
Principal Occupations: Chairman,
Girard Capital (broker-dealer) (1/10 to present); Chairman, R.B. Seidel & Associates (consultants) (2014 to present).
Other Directorships Held: Director, Tristate Capital Bank (1/08 to present). |
April 30, 2015 / ANNUAL REPORT
|
|
|
|
|
| BOARD OF TRUSTEES AND TRUST OFFICERS |
|
|
85 |
|
OFFICERS
|
|
|
|
Name Address Birth
year Position with Trust
|
|
Principal Occupations for Past Five Years and Previous Positions
|
|
|
| Christopher D. Randall
Birth year: 1965 PRESIDENT
Began serving: September 2014 |
|
Principal Occupations: President and Chief Executive Officer of Wilmington Trust Investment Advisors,
Inc.; President of Wilmington Trust Investment Management, LLC; Director of Wilmington Funds Management Corporation; Senior Vice President of M&T Bank.
Previous Positions: Senior Vice President, Head of Asset Management and Retirement Services (2012 to 2014); President, Mid-Atlantic Division, Wilmington Trust,
N.A. (2011 to 2012); President, M&T Securities, Inc. (2009 to 2011) |
|
|
| Michael D. Daniels
Birth year: 1967 CHIEF OPERATING OFFICER
Began serving: June 2007 |
|
Principal Occupations: Chief Operating Officer, Wilmington Funds and Wilmington Trust Investment
Advisors, Inc.; Administrative Vice President, M&T Bank. Previous Positions: Senior
Vice President, MSD&T and MCA (2006 to 2007); Vice President, Calamos Asset Management (2004 to 2006); Vice President, JP Morgan Chase Bank (2002 to 2004). |
|
|
| Jeffrey M. Seling
Birth year: 1970 ASSISTANT TREASURER
Began serving: June 2013 VICE PRESIDENT
Began serving: June 2007 |
|
Principal Occupations: Vice President, M&T Bank and Wilmington Trust Investment Advisors, Inc.;
Assistant Treasurer, Wilmington Funds. Previous Positions: Vice President,
MSD&T; Assistant Vice President, Wells Fargo Bank; Assistant Vice President, JP Morgan Chase Bank. |
|
|
| John C. McDonnell
Birth year: 1966 VICE PRESIDENT AND ASSISTANT
TREASURER Began serving: June 2013 |
|
Principal Occupations: Vice President, Wilmington Funds Management Corporation (2005 to Present); Vice
President, Wilmington Trust Investment Advisors, Inc. (2012 to present). Previous
Positions: Vice President, Wilmington Trust Investment Management, LLC (2005 to 2012); Audit Senior, Deloitte LLP (2004 to 2005); Assistant Vice President, 1838 Investment Advisors, LP (1999 to 2004).
|
|
|
| Mary Ellen Reilly
Birth year: 1970 CHIEF COMPLIANCE OFFICER and
AML COMPLIANCE OFFICER Began serving:
March 2015 |
|
Principal Occupations: Chief Compliance Officer and Anti-Money Laundering Officer, Wilmington Funds;
Administrative Vice President, M&T Bank. Previous Positions: Administrative
Vice President, M&T Bank, and Program Director, Buffalo Promise. Neighborhood (2013-2015); Vice President, M&T Bank, and Product Manager, Wilmington Trust Retirement and Institutional Services Company (2010-2013); Vice President, M&T
Bank, and Risk Manager, M&T Investment Group (2006-2010). |
|
|
| Eric B. Paul
Birth year: 1974 VICE PRESIDENT
Began serving: June 2008 |
|
Principal Occupations: Administrative Vice President, M&T Bank (2003 to present); Director of Proprietary Products, M&T Bank (2008 to present). |
|
|
| Ralph V. Partlow, III
25 South Charles Street, 22nd floor
Baltimore, MD 21201 Birth year: 1957
VICE PRESIDENT Began serving: June 2010
|
|
Principal Occupation: Administrative Vice President and Deputy General Counsel, M&T Bank (2003 to
present). Previous Positions: Vice President and Senior Counsel, Allfirst Bank
(1995-2003). |
ANNUAL REPORT / April 30, 2015
|
|
|
|
|
|
|
86 |
|
BOARD OF TRUSTEES AND TRUST OFFICERS |
|
|
|
|
Name Address Birth
year Position with Trust
|
|
Principal Occupations for Past Five Years and Previous Positions
|
|
|
| Christopher W. Roleke
10 High Street, Suite 302 Boston, MA
02110 Birth year: 1972 CHIEF FINANCIAL
OFFICER AND TREASURER Began serving: July 2013 |
|
Principal Occupation: Fund Principal Financial Officer, Foreside Management Services, LLC (2011 to
present). Previous Positions: Assistant Vice President, JP Morgan Investor
Services Co. (2006 to 2011). |
|
|
| Lisa R. Grosswirth
2 Hanson Place, 12th Floor Brooklyn, NY
11217 Birth year: 1963 SECRETARY
Began serving: September 2007 |
|
Principal Occupation: Vice President, BNY Mellon Asset Servicing (2004 to present).
Previous Positions: Supervisory Paralegal, The Dreyfus Corporation (1998 to 2004).
|
|
|
| Richard J. Berthy
Three Canal Plaza, Suite 100 Portland, ME
04101 Birth year: 1958 CHIEF EXECUTIVE
OFFICER Began serving: September 2007 |
|
Principal Occupation: Chief Executive Officer, Foreside Financial Group, LLC (2012 to present).
Previous Positions: President, Foreside Financial Group, LLC (2008 to 2012);
Chief Administrative Officer, Foreside Financial Group, LLC (2005 to 2008); President and Secretary, Bainbridge Capital Management, LLC (2003 to 2006); Vice President, Bainbridge Capital Management (2002 to 2004).
|
April 30, 2015 / ANNUAL REPORT
Shares of the
Wilmington Funds are not FDIC insured or otherwise protected by the U.S. government, are not deposits or other obligations of, or guaranteed by, Manufacturers and Traders Trust Company, and are subject to investment risks, including possible loss of
the principal amount invested.
VOTING PROXIES ON FUND PORTFOLIO SECURITIES
A description of the policies and procedures that the Funds use to determine how to vote proxies relating to securities held in the Funds’
portfolios is available, without charge and upon request, by calling 1-800-836-2211. A report on how the Funds voted any such proxies during the most recent 12-month period ended June 30 is available through Wilmington Funds’ website. Go
to www.wilmingtonfunds.com select “Proxy Voting Record” to access the link. This information is also available from the Edgar database on the SEC’s website at www.sec.gov.
QUARTERLY PORTFOLIO SCHEDULE
The Funds file
with the SEC a complete schedule of their portfolio holdings, as of the close of the first and third quarters of their fiscal year, on Form N-Q. These filings are available on the SEC’s website at www.sec.gov and may be reviewed and copied at
the SEC’s Public Reference Room in Washington DC. (Call 1-800-SEC-0330 for information on the operation of the Public Reference Room.)
Electronic
Delivery
Wilmington Funds encourages you to sign up for electronic delivery of investor materials. By doing so you will receive
information faster, help lower shareholder costs, and reduce the impact to the environment. To enroll in electronic delivery:
| |
1.) |
Go to www.wilmingtonfunds.com and select “Individual Investors” |
| |
2.) |
Click on the link “Sign up for Electronic Delivery” |
| |
3.) |
Login to your account or create new user ID |
| |
4.) |
Select E-Delivery Consent from the available options, and |
| |
5.) |
Complete the information requested, including providing the email address where you would like to receive notification for electronic documents.
|
* If you hold your account through a financial intermediary, please contact your advisor to request electronic
delivery of investor materials.
Householding
In an effort to reduce volume of mail you receive, only one copy of the prospectus, annual/semi-annual report, SAI and proxy statements will be
sent to shareholders who are part of the same family and share the same address.
If you would like to request additional copies of the
prospectus, annual/semi-annual report or SAI, or wish to opt out of householding mailings, please contact Shareholder Services at 1-800-836-2211, or write to Wilmington Funds, P.O. Box 9828, Providence, RI 02940-8025.
ANNUAL REPORT / April 30, 2015
PRIVACY POLICY AND NOTICE
OF THE FUNDS AND THEIR DISTRIBUTOR
June 8, 2012
The
Wilmington Funds, their distributor and their agents (referred to as “the Funds”, “we” or “us”) recognize that consumers (referred to as “you” or “your”) expect us to protect both your assets and
financial information. We respect your right to privacy and your expectation that all personal information about you or your account will be maintained in a secure manner. We are committed to maintaining the confidentiality, security and integrity
of client and shareholder information. We want you to understand the Funds’ policy that governs the handling of your information, how the Funds gather information, how that information is used and how it is kept secure.
Information The Funds Collect:
The Funds
collect nonpublic personal information about you from the following sources:
| |
• |
|
We may receive information from you, or from your financial representative, on account applications, other forms or electronically (such as through
the Funds’ website or other electronic trading mechanisms). Examples of this information include your name, address, social security number, assets and income. |
| |
• |
|
We may receive information from you, or from your financial representative, through transactions with us or others, correspondence and other
communications. Examples of this information include specific investments and your account balances. |
| |
• |
|
We may obtain other personal information from you in connection with providing you a financial product or service. Examples of this information
include depository, debit or credit account numbers. |
Information Sharing Policy
The Funds may share nonpublic personal information about you, as described above, with financial or non-financial companies or other entities,
including companies that may be affiliated with the Funds and other nonaffiliated third parties, for the following purposes:
| |
• |
|
We may share information when it is necessary and required to process a transaction or to service a customer relationship. For example, information
may be shared with a company that provides account record keeping services or a company that provides proxy services to shareholders. |
| |
• |
|
We may share information when it is required or permitted by law. For example, information may be shared in response to a subpoena or to protect you
against fraud or with someone who has established a legal beneficial interest, such as a power of attorney. |
| |
• |
|
We may disclose some or all of the information described above to companies that perform marketing or other services on our behalf. For example, we
may share information about you with the financial intermediary (bank, investment bank or broker-dealer) through whom you purchased the Funds’ products or services, or with providers of marketing, legal, accounting or other professional
services. The Funds will not, however, disclose a consumer’s account number or similar form of access number or access code for credit card, deposit or transaction accounts to any nonaffiliated third party for use in telemarketing, direct mail
or other marketing purposes. |
Except as described above, the Funds do not share customer information. We will not rent,
sell, trade, or otherwise release or disclose any personal information about you. Any information you provide to us is for the Funds’ use only. If you decide to close your account(s) or become an inactive customer, we will adhere to the privacy
policies and practices as described in this notice.
Information Security:
When the Funds share nonpublic customer information with third parties hired to facilitate the delivery of certain products or services to our
customers, such information is made available for limited purposes and under controlled circumstances designed to protect our customers’ privacy. We require third parties to comply with our standards regarding security and confidentiality of
such information. We do not permit them to use that information for their own or any other purposes, or rent, sell, trade or otherwise release or disclose the information to any other party. These requirements are reflected in written agreements
between the Funds and the third party service providers.
The Funds protect your personal information in several ways. We maintain physical,
electronic, and procedural safeguards to guard your nonpublic personal information. In addition, the Funds’ Transfer Agent and Shareholder Servicing Agent have procedures in place for the appropriate disposal of nonpublic personal information
when they are no longer required to maintain the information.
Each of the following sections explains an aspect of the Funds’
commitment to protecting your personal information and respecting your privacy.
Employee Access to Information:
Our Code of Ethics, which applies to all employees, restricts the use of customer information and requires that it be held in the strictest of
confidence. Employee access to customer information is authorized for business purposes only, and the degree of access is based on the sensitivity of the information and on an employee’s or agent’s need to know the information in order to
service a customer’s account or comply with legal requirements.
Visiting The Funds’ Website:
The Funds’ website gathers and maintains statistics about the number of visitors as well as what information is viewed most frequently.
This information is used to improve the content and level of service we provide to our clients and shareholders.
April 30, 2015 / ANNUAL REPORT
| |
• |
|
Information or data entered into a website will be retained. |
| |
• |
|
Where registration to a website or re-entering personal information on a website is required, “cookies” are used to improve your online
experience. A cookie is a way for websites to recognize whether or not you have visited the site before. It is a small file that is stored on your computer that identifies you each time you re-visit our site so you don’t have to resubmit
personal information. Cookies provide faster access into the website. |
| |
• |
|
We may also collect non-personally identifiable Internet Protocol (“IP”) addresses for all other visitors to monitor the number of
visitors to the site. These non-personally identifiable IP addresses are never shared with any third party. |
E-mail:
If you have opted to receive marketing information from the Funds by e-mail, it is our policy to include instructions in all marketing messages
on how to unsubscribe from subsequent e-mail programs. Some products or services from the Funds are intended to be delivered and serviced electronically. E-mail communication may be utilized in such cases. If you participate in an employer-sponsored
retirement plan administered by the Funds, we may, at your employer’s request, send you e-mail on matters pertaining to the retirement plan.
Please do not provide any account or personal information such as social security numbers, account numbers, or account balances within your
e-mail correspondence to us. We cannot use e-mail to execute transaction instructions, provide personal account information, or change account registration. We can, however, use e-mail to provide you with the necessary forms or you may contact
customer service toll-free at 1-800-836-2211.
Surveys/Aggregate Data:
Periodically, the Funds may conduct surveys about financial products and services or review elements of customer information in an effort to
forecast future business needs. The Funds then generate reports that include aggregate data regarding its customers. Aggregate data classifies customer information in various ways but that does not identify individual customers. These reports may
also include information on website traffic patterns and related information. These reports are used for the Funds’ planning, statistical and other corporate purposes. Aggregate data may also be shared with external parties, such as marketing
organizations. However, no information is shared by which any individual customer could be identified.
Changes to Our Privacy Statement:
The effective date of this policy is June 8, 2012. We reserve the right to modify this policy at any time. When it is revised or materially
changed, we will update the effective date. You can determine whether there have been changes since the last time you reviewed by simply checking the effective date.
Notice will be provided to you in advance of any changes that would affect your rights under this policy statement
ANNUAL REPORT / April 30, 2015
[This Page Intentionally Left Blank]


Wilmington Multi-Manager International Fund (“International Fund”)
Wilmington Multi-Manager Alternatives Fund (“Alternatives Fund”)
Wilmington Multi-Manager Real Asset Fund (“Real Asset Fund”)
Wilmington Strategic Allocation Conservative Fund (“Strategic Allocation Conservative Fund”)
Wilmington Strategic Allocation Moderate Fund (“Strategic Allocation Moderate Fund”)
Wilmington Strategic Allocation Aggressive Fund (“Strategic Allocation Aggressive Fund”)
CONTENTS
[This Page Intentionally Left Blank]
i
Dear Investor:
I am pleased to present the Annual Report of the Wilmington Funds (the “Trust”), covering the Trust’s fiscal year of May 1, 2014, through
April 30, 2015. Inside you will find a comprehensive review of the Funds’ holdings and financial statements.
The Economy and Financial Markets
in Review
Wilmington Funds Management Corporation, the investment advisor to the Trust, and Wilmington Trust Investment Advisors, Inc.,
the sub-advisor to the Trust, have provided the following review of the economy, bond markets, and stock markets for the Trust’s fiscal year.
The
Economy
Economic reports painted an ambiguous picture of the U.S economy. The gross domestic product (GDP) expanded at a very strong
annualized rate in the 2nd and 3rd quarters of 2014 (+4.6% and +5.0%, respectively), but cooled off in the 4th quarter of 2014, recording a more modest 2.2% increase and posting a 0.7% decline in the 1st quarter of 2015.i
ihttp://www.bea.gov/index.htm
The headwinds responsible for this slowdown in economic growth were manifold. A dock worker strike at West Coast ports, a strong U.S. dollar
(and its concomitant drag on exports), sliding oil prices, and an unusually harsh winter all conspired to sap the building economic momentum.
Despite the uneven GDP performance, the employment situation steadily improved. Unemployment, which stood at 6.3% in May 2014, fell by nearly a
full percentage point to 5.4% by April 2015, placing it in the range of what the Federal Reserve (the “Fed”) has come to view as “full employment.”ii
iihttp://data.bls.gov/timeseries/LN14000000
While the unemployment picture brightened, the labor force participation rate remained unchanged at 62.8%.iii This rate is at a historical low and has shown little sign of bouncing back to pre-recession levels.
iiihttp://data.bls.gov/timeseries/LNS11300000
Oil prices went on a wild ride, with West
Texas Intermediate (WTI) crude falling nearly 60% in value, from its $107.95 per barrel peak in June 2014 to a low of $43.39 on March 17th. Prices staged a partial recovery, rising to $59.62 by the end of April 2015.iv
ivhttp://www.eia.gov/dnav/pet/hist/LeafHandler.ashx?n=PET&s=RWTC&f=D
Though it might seem that declining oil prices would be a boost to the economy given their positive impact on corporate earnings and consumer
spending, the short-term effect was negative as oil-related companies ratcheted back their spending on capital goods. The expected boost from consumer spending was muted as individuals chose to reduce debt with the savings accrued from lower gas
prices, or adopt a wait-and-see attitude over whether lower prices would persist.
The Bond Markets
The bond market weathered the end of quantitative easing1 and performed well amid the
persistent uncertainty of a hike in short-term rates by the Fed. While the path of the 10-year Treasury rate was a bit erratic, the direction was generally lower. The yield on the 10-year note, which was 2.65% at the start of the Trust’s fiscal
year, fell to 2.03% by April 30, 2015, after spending a substantial amount of time under 2% during the first quarter of 2015.v
vhttp://www.treasury.gov/resource-center/data-chart-center/interest-rates/Pages/TextView.aspx?data=yieldYear&year=2015
The Barclays U.S. Aggregate Index2 returned 4.46% for the 12-month period ended
April 30, 2015, powered by an increase of 15.06% in the Barclays U.S. Long Government Bond Index3.
Municipal bonds also turned in a good year, with the S&P Municipal Bond Intermediate Index4 gaining
3.94%.
The Barclays U.S. Corporate High Yield Bond Index5, which returned a paltry
2.58%, was hampered by oil-related high yield bonds, which suffered as oil prices sagged.
Investors will be awaiting Fed interest rate
policy actions in the latter half of 2015. The Fed has signaled that it wishes to begin the process of normalizing monetary policy, yet how the capital markets will react remains an open question.
PRESIDENT’S
MESSAGE / April 30, 2015 (unaudited)
ii
For the 12-month reporting period May 1, 2014 through April 30, 2015, certain Barclays’ Indices
performed as follows6:
|
|
|
|
|
|
|
|
|
|
Barclays U.S.
Aggregate
Bond Index |
|
Barclays U.S.
U.S. Treasury Bond
Index7 |
|
Barclays
U.S.
Mortgage-Backed
Securities
Index8 |
|
Barclays
U.S. Credit Bond
Index9 |
|
Barclays
Municipal
Bond Index10 |
| 4.46% |
|
4.23% |
|
4.61% |
|
4.87% |
|
4.80% |
The Stock Markets
The current bull market in stocks entered its seventh year. Though economic growth and corporate earnings deserve their fair share of the credit
for this extended stock rally, the Federal Reserve policies of quantitative easing and low rates have provided substantial support to stock prices during this time.
With the end to quantitative easing in the 4th quarter of 2014, the markets remained fixated on when the Fed might raise short-term rates. The
mixed signals that each new economic report sent about the underlying strength of the economy was enough for the Fed to postpone a rate hike into the 2nd half of 2015, helping the markets record solid gains during the Trust’s fiscal year
period.
Through the period May 1, 2014 to April 30, 2015, the S&P 500
index11 jumped 12.98%, the S&P MidCap 400 Index12 rose 12.28% and the S&P SmallCap 600 Index13 turned in a gain of 9.24%.
While smaller-cap stocks underperformed for the full 12-month
period, they raced ahead of large-cap stocks in the latter part of the period, aided, in part, by a lower exposure to foreign markets, which has become challenging to large companies because of the strengthening U.S. dollar.
Growth stocks proved to be far better performers than value stocks, as evidenced by the return gap between the S&P 500 Growth Index14 (+16.32%) and the S&P 500 Value Index15 (+9.43%). This return disparity was also evident in the mid-cap and small-cap sectors which,
while not as wide, were on the order of 400 basis points (4.0%).
The U.S. markets were driven by the healthcare (+25.12%), information
technology (+20.53%) and consumer discretionary (+19.84%) sectors. The only sector to lose ground was energy, which declined 9.84%. Real estate also enjoyed a strong year, as reflected in the +13.22% return in the FTSE NAREIT Equity REITs
Index16.
International stocks trailed U.S. markets, with the MSCI EAFE (Net) Index17 netting a small gain of 1.66%. Overseas markets were hampered by weak economic growth and a tight credit environment. However, following the implementation by the European Central Bank (ECB) and the
Bank of Japan (BOJ) of their own forms of quantitative easing, economic growth and investor enthusiasm for stocks picked up. In the three-month period, ending April 30, 2015, the MSCI EAFE Index turned positive, gaining 8.63%.
For the 12-month reporting period May 1, 2014 through April 30, 2015, certain stock market indices performed as follows:
|
|
|
|
|
|
|
S&P 500
Index |
|
Dow Jones
Industrial Average18 |
|
NASDAQ
Composite Index19 |
|
MSCI All Country
World ex-US
(Net)
Index20 |
| 12.98% |
|
10.11% |
|
21.52% |
|
2.63% |
I want to thank you for your continued trust in allowing us to help you reach your important financial goals. We
understand the profound responsibility you have placed with us in managing your investments. We work hard every day to ensure that we continue to deserve your confidence.
Sincerely,

Christopher D. Randall
President
May 29, 2015
For more complete information, please download the Trust’s prospectus, which is available on www.wilmingtonfunds.com, or call
1-800-836-2211 for a copy. You should consider the Funds’ investment objectives, risks, charges, and expenses carefully before you invest. Information about these and other important subjects is in the Trust’s prospectus, which you should
read carefully before investing.
April 30, 2015 (unaudited) /
PRESIDENT’S MESSAGE
iii
Past performance is no guarantee of future results. The index performance quoted is for
illustrative purposes only and is not representative of any specific investment. Diversification does not ensure a profit nor protect against loss.
All investments involve risk, including the possible loss of principal. Equity Securities are subject to price fluctuation and possible loss
of principal. Small - and mid-cap stocks involve greater risks and volatility than large-cap stocks. International investments are subject to special risks, including currency fluctuations, social, economic, and political uncertainties, which could
increase volatility. These risks are magnified in emerging markets.
High yield, lower-rated securities generally entail greater
market, credit and liquidity risks than investment grade securities and may include higher volatility and higher risk of default.
An
investment in money market funds is neither insured nor guaranteed by the Federal Deposit Insurance Corporation or any other government agency. Although money market funds seek to preserve the value of your investment at $1.00 per share, it is
possible to lose money by investing in these funds.
| 1. |
Quantitative Easing (QE) is a government monetary policy occasionally used to increase the money supply by buying government securities or other securities from the market. Quantitative Easing increases the money supply
by flooding the financial institutions with capital, in an effort to promote increased lending and liquidity loss. |
| 2. |
Barclays U.S. Aggregate Bond Index is a widely used benchmark index for the domestic investment-grade bond market composed of securities from the Barclays Government/Corporate Bond Index, Mortgage-Backed Securities
Index and Asset-Backed Securities Index. The index typically includes fixed income securities with overall intermediate- to long-term average maturities. The index is unmanaged and investments cannot be made directly in an index. |
| 3. |
Barclays U.S. Long Government Bond Index tracks the market for U.S. dollar-denominated, fixed rate, nominal U.S. Treasuries (with the exception of Federal Reserve holdings of U.S. Treasuries) and U.S. agency debentures
(with the exception of those U.S. agency debentures held in the Federal Reserve SOMA account). To be included in this index, securities must have at least 10 years to final maturity. |
| 4. |
S&P Municipal Bond Intermediate Index is a broad, market value-weighted index that seeks to measure the performance of the U.S. municipal bond market. |
| 5. |
Barclays U.S. Corporate High Yield Bond Index measures the USD-denominated, high yield, fixed-rate corporate bond market. Securities are classified as high yield if the middle rating of Moody’s, Fitch, and S&P
is Ba1/BB+/BB+ or below. Bonds from issuers with an emerging markets country of risk, based on Barclays EM country definition, are excluded. The U.S. Corporate High Yield Bond Index is a component of the U.S. Universal and Global High Yield Indices.
|
| 6. |
Bond prices are sensitive to changes in interest rates and a rise in interest rates can cause a decline in their prices. |
| 7. |
Barclays U.S. Treasury Bond Index is a market capitalization weighted index that includes all publicly issued, U.S. Treasury securities that have a remaining maturity of at least one year, are rated investment-grade,
and have $250 million or more of outstanding face value. The index is unmanaged and investments cannot be made directly in an index. |
| 8. |
Barclays U.S. Mortgage Backed Securities Index is composed of all securities mortgage pools by GNMA, FNMA and the FHLMC, including GNMA graduated Payment Mortgages. The index is unmanaged and investments cannot be made
directly in an index. |
| 9. |
Barclays U.S. Credit Bond Index tracks the performance of domestic investment-grade corporate bonds and is composed of all publicly issued, fixed-rate, nonconvertible, investment-grade corporate debt. The index is
unmanaged and investments cannot be made directly in an index. |
| 10. |
Barclays Municipal Bond Index tracks the performance of long-term, tax-exempt, investment-grade bond market. To be included in the index, bonds must have an outstanding par balance of at least $7 million and be issued
as part of a transaction of at least $75 million. The index is unmanaged and investments cannot be made directly in an index. |
| 11. |
The S&P 500 Index is a capitalization-weighted index of 500 stocks designed to measure performance of the broad domestic economy through changes in the aggregate market value of 500 stocks representing all major
industries. The index is unmanaged and investments cannot be made directly in an index. |
| 12. |
The S&P MidCap 400 Index measures the mid cap segment of the U.S. equity market. To be included in the index, a stock must have a total market capitalization that ranges from roughly $750 million to $3.3 billion.
|
| 13. |
The S&P SmallCap 600 Index measures the small cap segment of the U.S. equity market. The index is designed to be an investable portfolio of companies that meet specific inclusion criteria to ensure that they are
liquid and financially viable. The index is unmanaged and investments cannot be made directly in an index. |
| 14. |
The S&P 500 Growth Index measures growth stocks using three factors: sales growth, the ratio of earnings change to price, and momentum. S&P Style Indices divide the complete market capitalization of each parent
index into growth and value segments. Constituents are drawn from the S&P 500 Index. The index is unmanaged and investments cannot be made directly in an index. |
| 15. |
The S&P 500 Value Index measures value stocks using three factors: the ratios of book value, earnings, and sales to price. S&P Style Indices divide the complete market capitalization of each parent index into
growth and value segments. Constituents are drawn from the S&P 500 Index. The index is unmanaged and investments cannot be made directly in an index. |
| 16. |
FTSE NAREIT Equity REITs Index is a free-float adjusted, market capitalization-weighted index of U.S. Equity REITs. Constituents of the Index include all tax-qualified REITs with more than 50 percent of total assets in
qualifying real estate assets other than mortgages secured by real property. |
| 17. |
MSCI EAFE (Net) Index is a free float-adjusted market capitalization index that is designed to measure equity market performance of developed markets, excluding the U.S. & Canada. The index consisted of the
following 22 developed market country indices: Australia, Austria, Belgium, Denmark, Finland, France, Germany, Greece, Hong Kong, Ireland, Israel, Italy, Japan, Netherlands, New Zealand, Norway, Portugal, Singapore, Spain, Sweden, Switzerland and
the United Kingdom. The index is unmanaged and investments cannot be made directly in an index. |
| 18. |
Dow Jones Industrial Average (“DJIA”) represents share prices of selected blue chip industrial corporations as well as public utility and transportation companies. The DJIA indicates daily changes in the
average prices of stocks in any of its categories. It also reports total sales for each group of industries. Because it represents the top corporations of America, the DJIA’s average movements are leading economic indicators for the stock
market as a whole. The average is unmanaged and investments cannot be made directly in an average. |
| 19. |
NASDAQ Composite Index measures all NASDAQ domestic and non-U.S. based common stocks listed on the NASDAQ Stock Market. The index is unmanaged and investments cannot be made directly in an index. |
| 20. |
MSCI All Country World ex-US (Net) Index is a free float-adjusted market capitalization weighted index that is designed to measure the equity market performance of developed and emerging markets excluding the U.S.
market. The index consists of 44 countries indices comprising 23 developed and 21 emerging market country indices. The index is unmanaged and investments cannot be made directly in an index. |
PRESIDENT’S MESSAGE /
April 30, 2015 (unaudited)
[This Page Intentionally Left Blank]
1
WILMINGTON MULTI-MANAGER INTERNATIONAL FUND
Management’s Discussion of Fund Performance
For the fiscal year ended April 30, 2015, Wilmington Multi-Manager
International Fund (the “Fund”) had a total return of 3.29% for Class A shares and 3.46% for Class I shares, versus its benchmark, the Morgan Stanley Capital International – All Country World ex-US Index (Net, USD) (“MSCI
ACWI ex-US”)** which had a total return of 2.63%. The MSCI ACWI ex-US is a free float-adjusted market capitalization index that is designed to measure developed and emerging market equity performance, excluding the United States.
During the reporting year, international stocks underperformed U.S. stocks. While the MSCI ACWI ex-US returned a modest
2.63%, the Russell 1000 Index of large-cap U.S. stocks returned 13.00%. During the reporting period, there were large variations in performance among stocks domiciled in Japan, the Euro Area, the UK, and Emerging Markets.
Japanese stocks provided the greatest positive contribution to international equities performance. The MSCI Japan Index
returned 14.82%, in U.S. dollars. This strong performance was due to a combination of factors. Perhaps the most important factor was the lagged positive contribution of earlier yen depreciation to the earnings of Japanese manufacturing exporters.
Additionally, Japanese stocks received a further boost as initiatives were announced for reducing corporate taxes and adopting a shareholder-friendly corporate governance code.
Also supportive of Japanese stock returns were the Bank of Japan’s purchases of equity under its quantitative easing
program as well as the rebalancing of Japanese government pension plans to reduce holdings of government bonds in favor of local equities. Highly accommodative monetary policy did produce further large yen depreciation in the 4th quarter of 2014,
but local currency equity returns throughout the reporting period were much larger, producing that 14.82% return in U.S. dollars.
European share prices began rising, in local currency terms, in mid-to-late 2014 when the European Central Bank first began
signaling that it was considering introducing full-scale quantitative easing. However, such appreciation in local-currency share prices was more than offset by large euro depreciation, producing negative returns in U.S. dollars. While the MSCI
Europe Index returned 13.16% in local currency terms, it returned -3.23% in U.S. dollar terms.
Within Europe, there was
considerable variation in returns among stocks domiciled in various countries. German and U.K. equities performance were similar to that of the Europe benchmark, while Swiss, Dutch, Belgian and Irish stocks outperformed. However, Italian, Spanish,
and French stocks substantially underperformed the rest of Europe, returning -15.35%, -14.60%, and -9.84%, respectively.
There were two reasons for Italian and Spanish underperformance. First, the Greek elections brought in a new radical
government whose policy platform increased the risk of Greece exiting the Euro Area. Greek exit poses some continuing contagion risks for the Italian and Spanish financial systems. Second, such underperformance reveals the market’s pessimism
regarding their governments’ capacity to
under-
take pro-growth economic reforms and the ability of European Central Bank quantitative easing to substitute for the lack of such reforms.
During the reporting period, emerging market stocks produced significant positive returns. The MSCI Emerging Markets Index
returned 7.80%. Chinese equities made by far the greatest contribution to emerging market equity returns. China constitutes about 17% of the MSCI emerging markets index, and the MSCI China index returned an astounding 48.06%.
Beginning in mid-2014, data indicating a significant deceleration of the Chinese economy alarmed authorities, who then
undertook measures to introduce liquidity. In particular, the authorities lowered bank interest rates, reduced reserve requirements, and directed banks to lend more to smaller enterprises. A portion of this additional liquidity found its way into
highly speculative purchases of stocks on the “A-Shares” market traditionally accessible only to domestic Chinese investors, driving up that market to price levels well beyond levels supported by corporate earnings.
In late 2014, the Shanghai and Hong Kong stock exchanges established a mutual electronic trading platform, allowing a
substantially greater volume of two-way flows. These two-way flows tempted foreign investors to speculate in “A-Shares” while at the same time caused a price surge for “H-Shares”, Chinese stocks traded in Hong Kong. It was this
surge in “H-Shares” that is reflected in the 48.06% return of the MSCI China index. Under MSCI index construction rules, the MSCI China index covers “H-Shares” because they are fully accessible to foreign investors.
Other emerging markets registered mixed performance during the reporting period. MSCI Taiwan returned 16.14%, partly on the
strength of the neighboring Chinese market, and partly on the strength of semiconductor exports. MSCI Korea returned only -0.61%, the result of currency depreciation and loss of some market share in the global mobile market. The recently elected
Indian administration of Prime Minister Modi began adopting market-oriented economic policies in 2014 and has promised additional measures. As a result, the MSCI India index returned 14.07% during the reporting period.
Brazil, Russia, and Turkey stood in stark contrast to China, India, and Taiwan. The MSCI Brazil index returned -19.68% as a
consequence of allegations of high-level corruption within the administration of President Rousseff, especially in connection with Petrobras, which constitutes a significant part of Brazilian market cap. Such uncertainty has only been partly
alleviated by the appointment of a pro-market finance minister. The MSCI Russia index returned -6.60%. During the reporting period, Russian stocks suffered from both the drop in crude oil prices and from economic sanctions. MSCI Turkey registered a
-9.73% return due to market concerns over President Erdogan’s adverse interventions into central bank policymaking.
The Fund allocates assets between developed and emerging markets based on the advice by Wilmington Trust Investment Advisors
Investment Strategy Team’s (“IST”) tactical asset allocation recommendations. During the reporting period, the Fund had a target 72% allocation to developed large-cap countries, 12% to developed small-cap countries, and 16% allocation
to emerging markets. In addition, the current allocation to developed large-cap countries was 50% value and 50% growth.
ANNUAL REPORT / April 30,
2015 (unaudited)
2
In May of 2014, we replaced Baring International Investment Limited
(“Barings”) with JO Hambro Capital Management, Ltd.
As of April 30, 2015, our sub-advisor line-up
consisted of the following asset managers: JO Hambro Capital Management (“Hambro”), Dimensional Fund Advisors LP (“DFA”), LSV Asset Management (“LSV”), Northern Cross LLC (“Northern Cross”), Oberweis Asset
Management (“Oberweis”), Parametric Portfolio Associates LLC (“Parametric”), and Wilmington Trust Investment Advisors, Inc. (“WTIA”).
Hambro and Northern Cross provide developed-country growth sleeves. DFA and LSV offer developed-country value sleeves.
Oberweis offers a developed-country small cap sleeve. Parametric offers an emerging market sleeve. WTIA allocates assets of the Fund among the sub-advisors to achieve the IST’s cap/style/regional weightings.
During the reporting period, the portfolios managed by Hambro, Oberweis, and LSV outperformed their respective style/cap
indexes. The portfolios managed by Northern Cross, DFA, and Parametric underperformed their respective indexes.
During
the reporting period, country allocation provided the largest contribution to the Fund’s overall returns in excess of the benchmark.
An overweight to the United States, which is off-benchmark, provided the single largest contribution, given the appreciation
of the U.S. dollar against major currencies and also the comparatively large appreciation of the U.S. stock market. Underweights to Australia, Canada, the U.K., Brazil, and South Korea were also contributors. Detracting from performance was a
collective overweight to countries using the euro and to Switzerland.
As for sectors, an overweight to health care and
information technology, as well as an underweight to telecoms, contributed to performance. An overweight to industrials detracted from performance.
| |
* |
Performance data quoted represents past performance, which is no guarantee of future results. Investment return and principal value will
fluctuate so that an investor’s shares, when redeemed, may be worth more or less than their original cost. The total return shown assumes the reinvestment of all distributions and does not reflect the deduction of taxes that a shareholder would
pay on fund distributions or the redemption of shares. The total return for Class A Shares was -2.40%, adjusted for the Fund’s maximum sales charge. Mutual fund performance changes over time and current performance may be lower or higher
than what is stated. For the most recent month-end performance, please visit www.wilmingtonfunds.com or call 1-800-836-2211. |
| |
** |
The MSCI All Country World ex-US Index (Net, USD) (MSCI ACWI ex-US) is a free float-adjusted market capitalization weighted index that is designed
to measure the equity market performance of developed and emerging markets, excluding the United States. The MSCI ACWI ex-US consists of 45 country indices comprising 22 developed and 23 emerging market country indices. The developed market country
indices included are:Australia,Austria, Belgium, Canada, Denmark, Finland, France, Germany, |
| |
Greece, Hong Kong, Ireland, Italy, Japan, Netherlands, New Zealand, Norway, Portugal, Singapore, Spain, Sweden, Switzerland, and the United Kingdom. The emerging market country indices included
are: Argentina, Brazil, Chile, China, Colombia, Czech Republic, Egypt, Hungary, India, Indonesia, Israel, Korea, Malaysia, Mexico, Morocco, Peru, Philippines, Poland, Russia, South Africa, Taiwan, Thailand, and Turkey. The index is unmanaged and it
is not possible to invest directly in an index. |
| |
*** |
The MSCI EAFE Index (Europe, Australasia, Far East) (Net, USD) is a free float-adjusted market capitalization index that is designed to measure the
equity market performance of developed markets, excluding the US & Canada. The MSCI EAFE Index consisted of the following 22 developed market country indices: Australia, Austria, Belgium, Denmark, Finland, France, Germany, Greece, Hong Kong,
Ireland, Israel, Italy, Japan, Netherlands, New Zealand, Norway, Portugal, Singapore, Spain, Sweden, Switzerland and the United Kingdom. The index is unmanaged and it is not possible to invest directly in an index. |
| |
|
MSCI Emerging Markets Index (Net, USD) is a free float-adjusted market capitalization index that is designed to measure equity market performance of
emerging markets. The MSCI Emerging Markets Index consisted of the following 23 emerging market country indices: Brazil, Chile, China, Colombia, Czech Republic, Egypt, Greece, Hungary, India, Indonesia, Korea, Malaysia, Mexico, Morocco, Peru,
Philippines, Poland, Qatar, Russia, South Africa, Taiwan, Thailand, and Turkey. |
| |
|
MSCI World ex-US Index (Net, USD) is a free float-adjusted market capitalization weighted index that is designed to measure the equity market
performance of developed markets excluding the U.S. market. The MSCI World ex-US Index consisted of 23 developed market country indices: Australia, Austria, Belgium, Canada, Denmark, Finland, France, Germany, Greece, Hong Kong, Ireland, Israel,
Italy, Japan, Netherlands, New Zealand, Norway, Portugal, Singapore, Spain, Sweden, Switzerland and the United Kingdom. |
| |
|
MSCI World ex-US Growth and Value Indices (Net, USD) are free float-adjusted market capitalization weighted indices that are designed to measure the
equity market performance of developed markets excluding the U.S. market. MSCI uses a two dimensional framework for style segmentation in which value and growth securities are categorized using a multi-factor approach, which uses three variables to
define the value investment style characteristics and five variables to define the growth investment style characteristics including forward looking variables. The objective of the index design is to divide constituents of the MSCI World ex-US Index
into respective value and growth indices, each targeting 50% of the free float adjusted market capitalization of the underlying market index. |
| |
|
The MSCI ACWI ex-US Small Cap Index captures small cap representation across 23 of 24 Developed Markets countries (excluding the US) and 21 Emerging
Markets countries*. With 4,168 constituents, the index covers approximately 14% of the global equity opportunity set outside the US. International investing involves special risks including currency risks, increased volatility of foreign securities,
political risks and differences in auditing and other financial standards. |
| |
|
The MSCI Brazil Index is designed to measure the performance of the large and mid cap segments of the Brazilian market. With 70 constituents, the
index covers approximately 85% of the equity universe. |
| |
|
The MSCI China Index captures large and mid cap representation across China H shares, B shares, Red chips and P chips. With 139 constituents, the
index covers approximately 85% of the China equity universe. |
| |
|
The MSCI India Index is designed to measure the performance of the large and mid cap segments of the Indian market. With 64 constituents, the index
covers approximately 85% of the Indian equity universe. |
| |
|
The MSCI Korea Index is designed to measure the performance of the large and mid cap segments of the South Korean market. With 107 constituents, the
index covers approximately 85% of the Korean equity universe. |
April 30, 2015 (unaudited) /
ANNUAL REPORT
3
The MSCI Russia Index is designed to measure the performance of the large and
mid cap segments of the Russian market. With 22 constituents, the index covers approximately 85% of the free float-adjusted market capitalization in Russia.
The MSCI Taiwan Index is designed to measure the performance of the large and mid cap segments of the Taiwan market. With 101
constituents, the index covers approximately 85% of the free float-adjusted market capitalization in Taiwan.
The MSCI
Turkey Index is designed to measure the performance of the large and mid cap segments of the Turkish market. With 25 constituents, the index covers approximately 85% of the equity universe in Turkey.
ANNUAL REPORT / April 30,
2015 (unaudited)
4
WILMINGTON MULTI-MANAGER INTERNATIONAL FUND – CLASS A†
The graph below illustrates the hypothetical investment of
$10,0001 in the Wilmington Multi-Manager International Fund (Class A) (the “Fund”) from December 19, 2005 (start of performance) to April 30, 2015, compared to the MSCI ACWI
ex-US.2
VALUE OF
A HYPOTHETICAL $10,000 INVESTMENT
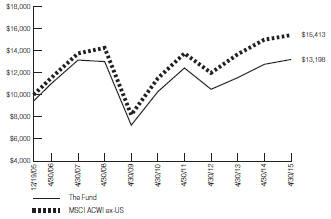
Average Annual Total Returns for the Periods Ended April 30, 2015
|
|
|
|
|
|
|
| |
|
|
|
|
1 Year |
|
|
-2.40% |
|
|
5 Years |
|
|
3.95% |
|
|
Start of Performance (12/19/05)
|
|
|
3.01% |
|
Performance data quoted represents past performance which is no guarantee of future results. Returns shown do not reflect the
deduction of taxes that a shareholder would pay on Fund distributions or the redemption of Fund shares. Investment return and principal value will fluctuate so that an investor’s shares, when redeemed, may be worth more or less than their
original cost. Mutual funds are not obligations of or guaranteed by any bank and are not federally insured. Mutual fund performance changes over time and current performance may be lower or higher than what is stated. For current to the most recent
month end performance, visit www.wilmingtonfunds.com or call 1-800-836-2211. Total returns shown include the maximum sales charge of 5.50%.
Annual Operating
Expense Ratio
|
|
|
|
|
|
|
| |
|
|
|
|
Before Waivers |
|
|
1.75% |
|
|
After Waivers |
|
|
1.34% |
|
The Expense Ratio Before Waivers represents the operating costs borne by the Fund, expressed as a percentage of the Fund’s average
net assets, as shown in the Fees and Expenses table in the Fund’s current prospectus (under “Total Annual Fund Operating Expenses”).
| 1 |
Represents a hypothetical investment of $10,000 in Class A of the Fund after deducting the maximum sales charge of 5.50% ($10,000 investment minus $550 sales charge = $9,450). The Fund’s performance assumes
the reinvestment of all dividends and distributions. |
| 2 |
The performance for the MSCI ACWI ex-US assumes the reinvestment of all dividends and distributions but does not reflect the deduction of a sales charge required for the Fund’s performance by the Securities and
Exchange Commission. It is not possible to invest directly in an index and the represented index is unmanaged. |
| † |
The information presented above, for the period prior to March 12, 2012, is historical information for the WT Multi-Manager International Fund.
|
April 30, 2015 (unaudited) / ANNUAL
REPORT
5
WILMINGTON MULTI-MANAGER INTERNATIONAL FUND – CLASS I†
The graph below illustrates the hypothetical investment of
$1,000,0001,2 in the Wilmington Multi-Manager International Fund (Class I) (the “Fund”) from April 30, 2005 to April 30, 2015, compared to the Morgan Stanley Capital
International All Country World Index ex-US (Net, USD) (“MSCI ACWI ex-US”).2
VALUE OF A HYPOTHETICAL $1,000,000 INVESTMENT
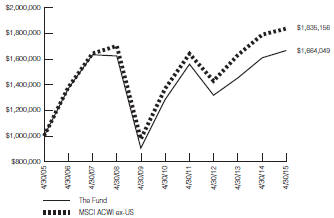
Average Annual Total Returns for the Periods Ended April 30, 2015
|
|
|
|
|
|
|
| |
|
|
|
|
1 Year |
|
|
3.46% |
|
|
5 Years |
|
|
5.31% |
|
|
10 Years |
|
|
5.22% |
|
Performance data quoted represents past performance which is no guarantee of future results. Returns shown do not reflect the deduction
of taxes that a shareholder would pay on Fund distributions or the redemption of Fund shares. Investment return and principal value will fluctuate so that an investor’s shares, when redeemed, may be worth more or less than their original cost.
Mutual funds are not obligations of or guaranteed by any bank and are not federally insured. Mutual fund performance changes over time and current performance may be lower or higher than what is stated. For current to the most recent month end
performance, visit www.wilmingtonfunds.com or call 1-800-836-2211.
Annual Operating Expense Ratio
|
|
|
|
|
|
|
| |
|
|
|
|
Before Waivers |
|
|
1.50% |
|
|
After Waivers |
|
|
1.21% |
|
The Expense Ratio Before Waivers represents the operating costs borne by the Fund, expressed as a percentage of the Fund’s average
net assets, as shown in the Fees and Expenses table in the Fund’s current prospectus (under “Total Annual Fund Operating Expenses”).
| 1 |
Represents a hypothetical investment of $1,000,000 in Class I of the Fund and assumes the reinvestment of all dividends and distributions. |
| 2 |
The performance for the MSCI ACWI ex-US assumes the reinvestment of all dividends and distributions. It is not possible to invest directly in an index and the represented index is unmanaged. |
| † |
The information presented above, for the period prior to March 12, 2012, is historical information for the WT Multi-Manager International Fund.
|
ANNUAL REPORT / April 30, 2015
(unaudited)
6
WILMINGTON MULTI-MANAGER ALTERNATIVES FUND
Management’s Discussion of Fund Performance
For the fiscal year ended April 30, 2015, Wilmington Multi-Manager
Alternatives Fund (the “Fund”) had a total return of 2.73%* for Class A Shares and 2.91%* for Class I Shares, versus its benchmark, the HFRX Global Hedge Fund Index**, which had a total return of 1.31%.
Fund Highlights
The Fund
produced positive performance and met its risk objectives. Manager cross correlation was low and each strategy produced gains gross of fees. The Fund’s annualized volatility for the fiscal year was 3.33%, the realized beta to S&P 500 was
0.08, and the realized correlation to the Barclays U.S. Aggregate was 0.17.
Performance by Strategy
The global macro strategy, managed by PE/Global was the largest contributor to the Fund’s performance as the strategy
maintained a long dollar position versus a number of currencies based on the manager’s quantitative model. The positioning paid off handsomely as the dollar rose dramatically from July 2014 onward. In addition to the positive performance, P/E
Global maintained its diversification properties as it showed negative cross-correlation to the other strategies.
Long/short equity was slightly positive. The year saw a number of manager changes as 2 sub-advisors left the portfolio and 3
were added. The additions were generalist managers Highland Long/ Short and Calamos Long/Short as well as sector specialist Highland Healthcare. Each of the new sub-advisors have been managing their strategies for a number of years and have produced
solid performance since they began trading for the Fund. For the year, all allocations within the strategy showed small gains with the notable exception of Calypso Capital Management, LP (Calypso). Calypso is a European focused manager which had
been a strong performer in the Fund, but experienced losses in 2014 as European equity markets declined. At the same time, the firm experienced personnel turnover and asset outflows and the decision was made to end the sub-advisory relationship. Our
relationship with Loeb King also ended after the principal decided to return outside capital and focus on investing his own money. While the relationship was shorter than we expected, it was slightly profitable while it existed. The sub-advisor
turnover within the portfolio was higher than we expect going forward but the Fund was able to manage through the process without any disruption to our process and we have conviction in our current slate of relationships.
Our event driven strategy, accessed through investment in the Arbitrage Fund, posted modest gains. The manager was able to
minimize losses around AbbVie/Shire failed deal in October, 2014, and was able to take advantage of increased opportunities that arose thereafter.
Our corporate credit strategies contributed positively to returns. Acuity Capital Management, LLC (Acuity) remains primarily
focused on short-dated credits but has recently been successful by selectively investing in longer-duration credits where they found opportunities for high returns and minimal downside after sell off during the 4th quarter of 2014. Osterweis
Strategic Income Fund continues
to believe that attractive returns can be secured by purchasing high yield
bonds nearing maturity.
Options arbitrage, managed by Parametric Risk Advisers, was positive and remained negatively
correlated to the other strategies. After a period of low volatility and rising stock prices, the VIX rose sharply in the 4th quarter of 2014. While the strategy lost money around this rise, it
subsequently made back those losses and more as the expectations for increased volatility did not come to fruition.
Commentary & Outlook
We believe opportunities for strong risk adjusted returns remain across financial markets in which our managers
participate. While economies in the developed world are not growing particularly fast, most are slowly improving and we believe risk of a near-term recession is low. We expect equity market performance to moderate from the rates experienced in the
past five years, but fundamentals still support gains. Additionally, dispersion among individual stock performance has led to a better environment for active managers in general and long/short managers in particular. In high yield credit markets,
spreads are 100 to 150 basis points higher than lows of last summer while company fundamentals remain strong and default rates extremely low. Different pockets of the high yield market, such as energy related names and lower rated issues have seen
more dramatic cheapening giving rise to potentially attractive return prospects. Volatility within currency markets has risen sharply and looks to remain elevated –while this causes issues for multinational corporations, commodity investors and
market participants; it has proven very profitable for our global macro strategy. And finally, merger activity continues to be robust with deal volume continuing to increase year over year.
| |
* |
Performance data quoted represents past performance, which is no guarantee of future results. Investment return and principal value will
fluctuate so that an investor’s shares, when redeemed, may be worth more or less than their original cost. The total return shown assumes the reinvestment of all distributions and does not reflect the deduction of taxes that a shareholder would
pay on fund distributions or the redemption of shares. The total return for Class A Shares was -2.97%, adjusted for the Fund’s maximum sales charge. Mutual fund performance changes over time and current performance may be lower or higher
than what is stated. For the most recent month-end performance, please visit www.wilmingtonfunds.com or call 1-800-836-2211. |
| |
** |
The HFRX Global Hedge Fund Index is designed to be representative of the overall composition of the hedge fund universe and is composed of active
private funds with assets under management of a least $50 million reporting to Hedge Fund Research, Inc. (HFRX). The performance results reported by HFRX are asset weighted. The index is unmanaged and it is not possible to invest directly in an
index. |
| |
|
Barclays U.S. Aggregate Bond Index is an index measuring both the capital price changes and income provided by the underlying universe of
securities, comprised of U.S. Treasury obligations, U.S. investment grade corporate debt and mortgage backed obligations.
|
April 30, 2015 (unaudited) / ANNUAL
REPORT
7
| |
|
Beta is a coefficient which measures the volatility of the stock’s returns relative to a given market index. |
| |
|
Chicago Board Options Exchange Volatility Index (VIX) - VIX is designed to measure the market’s expectation of 30-day volatility implied by
at-the-money S&P 500® Index option prices. VIX estimates expected volatility by averaging the weighted prices of S&P 500® puts
and calls over a wide range of strike prices. As such, VIX does not serve as a benchmark for returns, but rather as an indication of opportunities that may be present in the marketplace when utilizing volatility-based, or volatility management,
strategies. There is no established return benchmark for volatility or options strategies. International investing involves special risks including currency risk, political risks, increased volatility of foreign securities, and differences in
auditing and other financial standards. |
| |
|
Valuation is the process of determining the current worth of an asset or company. There are many techniques that can be used to determine value,
some are subjective and others are objective. |
| |
|
Correlation is a statistical measure of how two securities move in relation to each other. |
| |
|
Investing involves risk and you may incur a profit or a loss. Investments such as mutual funds which focus on alternative strategies are subject to
increased risk and loss of principal and are not suitable for all investors. Diversification does not ensure a profit or guarantee against a loss. There is no assurance that any investment strategy will be successful. Any investment in the Fund
should be part of an overall investment program rather than, in itself, a complete program. Because the Fund invests in underlying mutual funds or other managed strategies, an investor in the Fund will bear the management fees and operating expenses
of the “Underlying Strategies” in which the Fund invests. The total expenses borne by an investor in the Fund will be higher than if the investor invested directly in the Underlying Strategies, and the returns may therefore be lower.
|
| |
|
The Fund, the Sub-Advisers, and the Underlying Strategies may use aggressive investment strategies, which are riskier than those used by typical
mutual funds. If the Fund and Sub-Advisers are unsuccessful in applying these investment strategies, the Fund and you may lose more money than if you had invested in another fund that did not invest aggressively. The Fund is subject to risks
associated with the Sub-Advisers making trading decisions independently, investing in other investment companies, using a particular style or set of styles, basing investment decisions on historical relationships and correlations, trading
frequently, using leverage, making short sales, being non-diversified, and investing in securities with low correlation to the market. The use of leverage may magnify losses. |
| |
|
The Fund is also subject to risks associated with investments in foreign markets, emerging market securities, small cap companies, debt securities,
derivatives, commodity-linked instruments, illiquid securities, asset-backed securities, and CMOs. Please see the prospectus and summary prospectus for information on these as well as other risk considerations. |
| |
|
Quantitative Easing (QE) is government monetary policy occasionally used to increase the money supply by buying government securities or other
securities from the market. Quantitative easing increases the money supply by flooding the financial institutions with capital, in an effort to promote increased lending and liquidity.
|
ANNUAL REPORT / April 30,
2015 (unaudited)
8
WILMINGTON MULTI-MANAGER ALTERNATIVES FUND – CLASS A
The graph below illustrates the hypothetical investment of $10,0001 in
the Wilmington Multi-Manager Alternatives Fund (Class A) (the “Fund”) from January 12, 2012 (start of performance) to April 30, 2015, compared to the HFRX Global Hedge Fund
Index.2
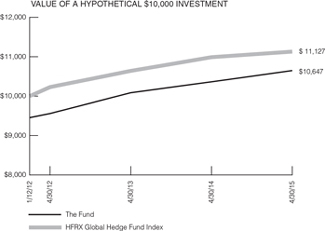
Average Annual Total Returns for the Periods Ended April 30, 2015
|
|
|
|
|
|
|
| |
|
|
|
|
1 Year |
|
|
-2.97% |
|
|
Start of Performance (1/12/12) |
|
|
1.92% |
|
Performance data quoted represents past performance which is no guarantee of future results. Returns shown do not reflect the deduction
of taxes that a shareholder would pay on Fund distributions or the redemption of Fund shares. Investment return and principal value will fluctuate so that an investor’s shares, when redeemed, may be worth more or less than their original cost.
Mutual funds are not obligations of or guaranteed by any bank and are not federally insured. Mutual fund performance changes over time and current performance may be lower or higher than what is stated. For current to the most recent month end
performance, visit www.wilmingtonfunds.com or call 1-800-836-2211. Total returns shown include the maximum sales charge of 5.50%.
Annual Operating Expense Ratio
|
|
|
|
|
|
|
| |
|
|
|
|
Before Waivers |
|
|
3.39% |
|
|
After Waivers |
|
|
2.80% |
|
The Expense Ratio Before Waivers represents the operating costs borne by the Fund, expressed as a percentage of the Fund’s average
net assets, as shown in the Fees and Expenses table in the Fund’s current prospectus (under “Total Annual Fund Operating Expenses”).
| 1 |
Represents a hypothetical investment of $10,000 in Class A of the Fund after deducting the maximum sales charge of 5.50% ($10,000 investment minus $550 sales charge = $9,450). The Fund’s performance assumes
the reinvestment of all dividends and distributions. |
| 2 |
The performance for the HFRX Global Hedge Fund Index assumes the reinvestment of all dividends and distributions but does not reflect the deduction of a sales charge required for the Fund’s performance by the
Securities and Exchange Commission. It is not possible to invest directly in an index and the represented index is unmanaged.
|
April 30, 2015 (unaudited) /
ANNUAL REPORT
9
WILMINGTON MULTI-MANAGER ALTERNATIVES FUND – CLASS I
The graph below illustrates the hypothetical investment of $1,000,0001,2
in the Wilmington Multi-Manager Alternatives Fund (Class I) (the “Fund”) from January 12, 2012 (start of performance) to April 30, 2015, compared to the HFRX Global Hedge Fund
Index.2
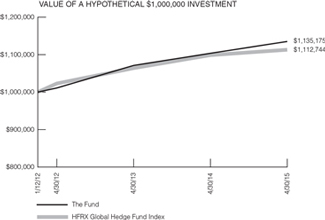
Average Annual Total Returns for the Periods Ended April 30, 2015
|
|
|
|
|
|
|
| |
|
|
|
|
1 Year |
|
|
2.91% |
|
|
Start of Performance (1/12/12) |
|
|
3.92% |
|
Performance data quoted represents past performance which is no guarantee of future results. Returns shown do not reflect the deduction
of taxes that a shareholder would pay on Fund distributions or the redemption of Fund shares. Investment return and principal value will fluctuate so that an investor’s shares, when redeemed, may be worth more or less than their original cost.
Mutual funds are not obligations of or guaranteed by any bank and are not federally insured. Mutual fund performance changes over time and current performance may be lower or higher than what is stated. For current to the most recent month end
performance, visit www.wilmingtonfunds.com or call 1-800-836-2211.
Annual
Operating Expense Ratio
|
|
|
|
|
|
|
| |
|
|
|
|
Before Waivers |
|
|
3.14% |
|
|
After Waivers |
|
|
2.55% |
|
The Expense Ratio Before Waivers represents the operating costs borne by the Fund, expressed as a percentage of the Fund’s average
net assets, as shown in the Fees and Expenses table in the Fund’s current prospectus (under “Total Annual Fund Operating Expenses”).
| 1 |
Represents a hypothetical investment of $1,000,000 in Class I of the Fund and assumes the reinvestment of all dividends and distributions. |
| 2 |
The performance for the HFRX Global Hedge Fund Index assumes the reinvestment of all dividends and distributions. It is not possible to invest directly in an index and the represented index is unmanaged.
|
ANNUAL REPORT / April 30, 2015
(unaudited)
10
WILMINGTON MULTI-MANAGER REAL ASSET FUND
Management’s Discussion of Fund Performance
For the fiscal year ended April 30, 2015, Wilmington Multi-Manager Real
Asset Fund (the “Fund”) had a total return of 1.14%* for Class A Shares and 1.40%* for Class I Shares, versus its benchmarks, the Barclays Capital World Government Inflation Linked Bond Index (hedged, USD) (Barclays World GILB
Index) ** and its Blended Index which had total returns of 7.76% and 3.76%, respectively.
The Blended Index is
currently a mix of 50% Barclays World GILB Index, 35% S&P Developed Property Index**, and 15% Dow Jones-UBS Commodity Index (“DJUBSCI”) **. During this period, the Fund’s underlying managers and investments underperformed their
individual benchmarks while tactical asset allocation decisions at the Fund level to underweight global inflation linked bonds (ILBs) and overweight real estate related securities were positive contributors over the course of the fiscal year.
The Fund allocated 5% more than its blended benchmark to public real estate securities during the year while reducing the
allocation to global ILB’s by 5%. The Fund’s target weightings of 45% global ILB’s, 40% real estate related securities and 15% commodities reflected our belief that a slowly growing economy, low interest rates, available financing and
restrained inflation would benefit real estate to a greater extent than ILB’s or commodities.
Real yields on
ILB’s fell steadily during the fiscal year from 0.15% to -0.43% as measured by the Barclays World GILB Index with volatility picking up noticeably in 2015 as quantitative easing initiated by the European Central Bank and a slowdown in U.S.
growth reduced expectations that the Federal Reserve would finally begin raising interest rates at their upcoming meeting in June. The long average maturities of ILB’s are particularly sensitive to these changes in overall interest rate levels
and the index returned 7.76% for the fiscal year. The Fund’s overall ILB allocation under-performed its index 5.89% vs 7.76% as the active managers trailed slightly during the year and HSBC was removed from the portfolio. An overweight position
in U.S. Treasury Inflation-Protected Securities and a reduced duration exposure for a portion of the year also reduced returns relative to the index.
Global real estate securities were up 11.92% during the fiscal year, measured by the S&P Developed Property Index, as real
estate markets benefited from declining interest rates, European stimulus and continued improvement in the operating characteristics of most properties. Performance of the real estate allocation within the Fund trailed the benchmark but was
attractive on an absolute basis, 9.58%. Most of the weak relative performance was attributable to EII Investors which was replaced during the year by Parametric, a new sub-advisor to the Fund.
Commodities proved to be the worst performer among the three asset classes, for the fiscal year ending -24.69% as measured by
the Bloomberg Commodity Index. The extremely poor absolute performance was driven by a collapse in energy prices as recognition of global oversupply driven by U.S. exploitation of shale gas and tight oil fields appeared to sink in. Beyond the more
than 40% loss in energy, agricultural commodities were off -31%, further hurting overall index returns.
The Fund’s overall commodity allocation underperformed its index slightly -26.09% for the
fiscal year. An overweight to energy in the earlier part of the year led to most of the poor relative performance before we reduced energy exposure and increased ownership of deferred contracts while moving to a more rapid rebalancing methodology to
take advantage of the volatility occurring across the commodity complex.
| * |
Performance data quoted represents past performance, which is no guarantee of future results. Investment return and principal value will
fluctuate so that an investor’s shares, when redeemed, may be worth more or less than their original cost. The total return shown assumes the reinvestment of all distributions and does not reflect the deduction of taxes that a shareholder would
pay on fund distributions or the redemption of shares. The total return for Class A Shares was -4.41%, adjusted for the Fund’s maximum sales charge. Mutual fund performance changes over time and current performance may be lower or higher
than what is stated. For the most recent month-end performance, please visit www.wilmingtonfunds.com or call 1-800-836-2211. |
| ** |
Barclays Capital World Government Inflation-Linked Bond Index measures the performance of the major government inflation-linked bond markets. The
index is designed to include only those markets in which a global government linker fund is likely to invest. |
| |
S&P Developed Property Index defines and measures the investable universe of publicly traded property companies in developed global markets.
|
| |
Dow Jones - UBS Commodity Index Total Return is designed to be a diversified benchmark for commodities as an asset class, and reflects the returns
that are potentially available through an unleveraged investment in the futures contracts on physical commodities comprising the Index plus the rate of interest that could be earned on cash collateral invested in specified Treasury Bills. The Index
is currently composed of futures contracts on 20 physical commodities. |
| |
Quantitative Easing (QE) is government monetary policy occasionally used to increase the money supply by buying government securities or other
securities from the market. Quantitative easing increases the money supply by flooding the financial institutions with capital, in an effort to promote increased lending and liquidity. |
| |
Bloomberg Commodity Index is a broadly diversified commodity price index distributed by Bloomberg Indexes. |
| |
International investing involves special risks including currency risks, increased volatility of foreign securities, political risks and differences
in auditing and other financial standards. |
April 30, 2015 (unaudited) / ANNUAL REPORT
11
WILMINGTON MULTI-MANAGER REAL ASSET FUND – CLASS A
The graph below illustrates the hypothetical investment of $10,0001 in
the Wilmington Multi-Manager Real Asset Fund (Class A) (the “Fund”) from December 19, 2005 (start of performance) to April 30, 2015, compared to the Barclays Capital World Government Inflation-Linked Bond Index
(“BCWGILB”)2 and the Real Asset Blended Index.2,3
VALUE OF A HYPOTHETICAL $10,000 INVESTMENT
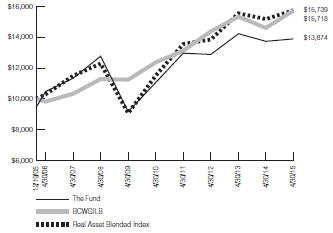
Average Annual Total Returns for the Periods Ended April 30, 2015
|
|
|
|
|
|
|
| |
|
|
|
|
1 Year |
|
|
-4.41% |
|
|
5 Years |
|
|
3.46% |
|
|
Start of Performance (12/19/05)
|
|
|
3.56% |
|
Performance data quoted represents past performance which is no guarantee of future results. Returns shown do not reflect the deduction
of taxes that a shareholder would pay on Fund distributions or the redemption of Fund shares. Investment return and principal value will fluctuate so that an investor’s shares, when redeemed, may be worth more or less than their original cost.
Mutual funds are not obligations of or guaranteed by any bank and are not federally insured. Mutual fund performance changes over time and current performance may be lower or higher than what is stated. For current to the most recent month end
performance, visit www.wilmingtonfunds.com or call 1-800-836-2211. Total returns shown include the maximum sales charge of
5.50%.
Annual Operating Expense Ratio
|
|
|
|
|
|
|
| |
|
|
|
|
Before Waivers |
|
|
1.62% |
|
|
After Waivers |
|
|
1.36% |
|
The Expense Ratio Before Waivers represents the operating costs borne by the Fund, expressed as a percentage of the Fund’s average
net assets, as shown in the Fees and Expenses table in the Fund’s current prospectus (under “Total Annual Fund Operating Expenses”).
| 1 |
Represents a hypothetical investment of $10,000 in Class A of the Fund after deducting the maximum sales charge of 5.50% ($10,000 investment minus $550 sales charge = $9,450). The Fund’s performance assumes
the reinvestment of all dividends and distributions. |
| 2 |
The performance for the BCWGILB and the Real Asset Blended Index assumes the reinvestment of all dividends and distributions but does not reflect the deduction of a sales charge required for the Fund’s performance
by the Securities and Exchange Commission. It is not possible to invest directly in an index and the represented index is unmanaged. |
| 3 |
The Real Asset Blended Index is calculated by the investment advisor and is currently based on a weighting of the following indices: 50% Barclays World Government ILB Index, 35% S&P Developed Property Index, 15% Dow
Jones-UBS Commodity Index. For the period January 1, 2009 through December 31, 2010, the Real Asset Blended Index was based on the following weightings of the indices: 40% Barclays World Government ILB Index, 30% S&P Developed Property
Index and 30% Dow Jones-UBS Commodity Index. For the period since inception through December 31, 2008 the Real Asset Blended Index was based on the following weightings of the indices: 50% Barclays US
Treasury Inflation Protected Securities (TIPS) Index, 30% FTSE NAREIT Equity Index and 20% Dow Jones-UBS Commodity Index.
|
ANNUAL REPORT / April 30,
2015 (unaudited)
12
WILMINGTON MULTI-MANAGER REAL ASSET FUND – CLASS I
The graph below illustrates the hypothetical investment of $1,000,0001,2
in the Wilmington Multi-Manager Real Asset Fund (Class I) (the “Fund”) from April 30, 2005 to April 30, 2015, compared to the BCWGILB2 and the Real Asset Blended Index.2,3
VALUE OF A HYPOTHETICAL $1,000,000 INVESTMENT
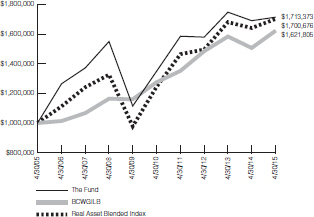
Average Annual Total Returns for the Periods Ended April 30, 2015
|
|
|
|
|
|
|
| |
|
|
|
|
1 Year |
|
|
1.40% |
|
|
5 Years |
|
|
4.92% |
|
|
10 Years |
|
|
5.53% |
|
Performance data quoted represents past performance which is no guarantee of future results. Returns shown do not reflect the
deduction of taxes that a shareholder would pay on Fund distributions or the redemption of Fund shares. Investment return and principal value will fluctuate so that an investor’s shares, when redeemed, may be worth more or less than their
original cost. Mutual funds are not obligations of or guaranteed by any bank and are not federally insured. Mutual fund performance changes over time and current performance may be lower or higher than what is stated. For current to the most recent
month end performance, visit www.wilmingtonfunds.com or call 1-800-836-2211.
Annual Operating Expense Ratio
|
|
|
|
|
|
|
| |
|
|
|
|
Before Waivers |
|
|
1.37% |
|
|
After Waivers |
|
|
1.11% |
|
The Expense Ratio Before Waivers represents the operating costs borne by the Fund, expressed as a percentage of the Fund’s average
net assets, as shown in the Fees and Expenses table in the Fund’s current prospectus (under “Total Annual Fund Operating Expenses”).
| 1 |
Represents a hypothetical investment of $1,000,000 in Class I of the Fund and assumes the reinvestment of all dividends and distributions. |
| 2 |
The performance for the BCWGILB and the Real Asset Blended Index assumes the reinvestment of all dividends and distributions. It is not possible to invest directly in an index and the represented index is unmanaged.
|
| 3 |
The Real Asset Blended Index is calculated by the investment advisor and is currently based on a weighting of the following indices: 50% Barclays World Government ILB Index, 35% S&P Developed Property Index, 15% Dow
Jones-UBS Commodity Index. For the period January 1, 2009 through December 31, 2010, the Real Asset Blended Index was based on the following weightings of the indices: 40% Barclays World Government ILB Index, 30% S&P Developed Property
Index and 30% Dow Jones-UBS Commodity Index. For the period since inception through December 31, 2008 the Real Asset Blended Index was based on the following weightings of the indices: 50% Barclays US Treasury Inflation Protected Securities
(TIPS) Index, 30% FTSE NAREIT Equity Index and 20% Dow Jones-UBS Commodity Index. |
April 30, 2015 (unaudited) / ANNUAL REPORT
13
WILMINGTON STRATEGIC ALLOCATION CONSERVATIVE FUND
Management’s Discussion of Fund Performance
For the fiscal year ended April 30, 2015, Wilmington Strategic Allocation
Conservative Fund (the “Fund”) returned 3.28%* for Class A Shares and 3.63%* for Class I Shares, versus its benchmarks, the Barclays Capital U.S. Aggregate Bond Index and the Conservative Blended Index**, which returned 4.46% and
3.33%, respectively.
The Fund is managed by first replicating tactical asset allocation decisions made by the Wilmington
Trust Investment Advisors, Inc. Investment Strategy Team and then overlaying upon the asset allocation framework, active and passive managers that are closely benchmarked against the tactical asset allocations. The portfolio managers seek to add
value through the combination of tactical asset allocation and manager selection. The primary focus of the portfolio managers is in beating the Conservative Blended Index.
Over the past year, the Class I Shares outperformed the Conservative Blended Index by 0.30%. During the period, tactical
decisions contributed to relative performance, while manager performance was essentially neutral to overall Fund performance. Netting fees charged by the Fund and the various mutual funds employed by the Fund yielded a modest outperformance for the
fiscal year. During the fiscal year, the Fund faced a now familiar environment that witnessed the continuation of stimulus tapering by the Federal Reserve (the “Fed”), and markets increasingly focused on the timing and magnitude of Fed
interest rate actions. The Eurozone, faced with the threat of deflation, initiated its own version of Quantitative Easing in the latter half of the fiscal year. Toss in a collapse in energy prices, and the fiscal year had all the makings of another
macro-driven global economic environment.
Against this backdrop, several tactical positions proved beneficial for the
Conservative Fund. In a market hungry for growth, the Fund’s sizeable overweight of growth equities versus value proved beneficial, as growth outpaced value by a wide margin. In large capitalization domestic equities, as measured by the Russell
1000 Index, growth outperformed value by 7.35% in the fiscal year. The effect was more dramatic in small capitalization stocks, as measured by the Russell 2000 Index, where growth outperformed value by 9.76% in the fiscal year. In an ongoing
environment of tepid growth with low inflation, equities outperformed bonds and inflation hedges, and the Fund benefitted from an overweight of equities funded principally from an underweight of inflation hedges, core bonds, and international fixed
income. Performance of the active managers utilized by the Fund was mixed during the year, and proved neutral to overall performance.
| |
* |
Performance data quoted represents past performance, which is no guarantee of future results. Investment return and principal value will
fluctuate so that an investor’s shares, when redeemed, may be worth more or less than their original cost. The total return shown assumes the reinvestment of all distributions and does not reflect the deduction of taxes that a shareholder would
pay on fund distributions or the redemption of shares. The total return for Class A Shares was -2.42%, adjusted for the Fund’s maximum sales charge. Mutual fund
|
| |
performance changes over time and current performance may be lower or higher than what is stated. For the most recent month-end performance, please visit www.wilmingtonfunds.com
or call 1-800-836-2211. |
| |
** |
The Barclays Capital U.S. Aggregate Bond Index is an index measuring both the capital price changes and income provided by the underlying universe
of securities, comprised of U.S. Treasury obligations, U.S. investment grade corporate debt and mortgage backed obligations. The Conservative Blended Index is calculated by the investment advisor and represents the weighted returns for the following
indices: 53% Barclays Capital U.S. Aggregate Bond Index; 7.5% HFRX Absolute Index; 7.5% HFRX Global Index; 7.2% Russell 3000 Index; 7% Barclays Capital Global Aggregate ex-US (unhedged) Index; 5% Barclays Capital World Government Inflation-Linked
Bond Index (hedged USD); 4.8% MSCI All Country World ex-US Investable Market Index; 3.5% S&P Global Developed Property Index; 1.5% Dow Jones-UBS Commodity Index; and 3% Citigroup 3-Month T-Bill Index. The indexes are unmanaged and it is not
possible to invest directly in an index. |
| |
|
Quantitative Easing (QE) is government monetary policy occasionally used to increase the money supply by buying government securities or other
securities from the market. Quantitative easing increases the money supply by flooding the financial institutions with capital, in an effort to promote increased lending and liquidity. |
| |
|
International investing involves special risks including currency risk, political risks, increased volatility of foreign securities, and differences
in auditing and other financial standards. |
| |
|
Bond prices are sensitive to changes in interest rates and a rise in short-term interest rates could cause a decline in bond prices.
|
| |
|
Due to its strategy of investing in other mutual funds, this Fund may incur certain additional expenses and tax results that would not be present
with a direct investment in the underlying funds. |
| |
|
The Russell 1000 is a market capitalization-weighted index, meaning that the largest companies constitute the largest percentages in the index and
will affect performance more than the smallest index. |
| |
|
The Russell 2000 is an index measuring the performance of approximately 2,000 small-cap companies in the Russell 3000 Index. |
| |
|
Eurozone is the collective group of countries which use the Euro as their common currency.
|
ANNUAL REPORT / April 30, 2015
(unaudited)
14
WILMINGTON STRATEGIC ALLOCATION CONSERVATIVE
FUND – CLASS A
The graph below
illustrates the hypothetical investment of $10,0001 in the Wilmington Strategic Allocation Conservative Fund (Class A) (the “Fund”) from December 19, 2005 (start of performance) to
April 30, 2015, compared to the Barclays Capital U.S. Aggregate Bond Index (“BCAB”)2 and the Conservative Blended Index.2,3
VALUE OF A HYPOTHETICAL $10,000 INVESTMENT
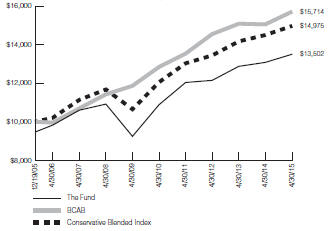
Average Annual Total Returns for the Periods Ended April 30, 2015
|
|
|
|
|
|
|
| |
|
|
|
|
1 Year |
|
|
-2.42% |
|
|
5 Years |
|
|
3.24% |
|
|
Start of Performance (12/19/05)
|
|
|
3.26% |
|
Performance data quoted represents past performance which is no guarantee of future results. Returns shown do not reflect the deduction
of taxes that a shareholder would pay on Fund distributions or the redemption of Fund shares. Investment return and principal value will fluctuate so that an investor’s shares, when redeemed, may be worth more or less than their original cost.
Mutual funds are not obligations of or guaranteed by any bank and are not federally insured. Mutual fund performance changes over time and current performance may be lower or higher than what is stated. For current to the most recent month end
performance, visit www.wilmingtonfunds.com or call 1-800-836-2211. Total returns shown include the maximum sales charge of 5.50%.
Annual Operating Expense Ratio
|
|
|
|
|
|
|
| |
|
|
|
|
Before Waivers |
|
|
1.99% |
|
|
After Waivers |
|
|
1.46% |
|
The Expense Ratio Before Waivers represents the operating costs borne by the Fund, expressed as a percentage of the Fund’s average
net assets, as shown in the Fees and Expenses table in the Fund’s current prospectus (under “Total Annual Fund Operating Expenses”).
| 1 |
Represents a hypothetical investment of $10,000 in Class A of the Fund after deducting the maximum sales charge of 5.50% ($10,000 investment minus $550 sales charge = $9,450). The Fund’s performance assumes
the reinvestment of all dividends and distributions. |
| 2 |
The performance for the BCAB and the Conservative Blended Index assumes the reinvestment of all dividends and distributions. It is not possible to invest directly in an index and the represented index is unmanaged.
|
| 3 |
The Conservative Blended Index is currently based on a weighting of the following indices: 53% Barclays U.S. Aggregate Bond Index, 7.5% HFRX Absolute Hedge Fund Index, 7.5% HFRX Global Hedge Fund Index, 7.2% Russell
3000 Index, 7.0% Barclays Global Aggregate ex-U.S. Index, 5.0% Barclays World Government Inflation-Linked Bond Index, 4.8% MSCI All Country World ex-U.S. Index, 3.5% S&P Global Developed Property Index, 1.5% Dow Jones-UBS Commodity Index, 3%
Citigroup 3-Month T-Bill. |
April 30, 2015 (unaudited) / ANNUAL
REPORT
15
WILMINGTON STRATEGIC ALLOCATION CONSERVATIVE
FUND – CLASS I
The graph below
illustrates the hypothetical investment of $1,000,0001,2 in the Wilmington Strategic Allocation Conservative Fund (Class I) (the “Fund”) from December 19, 2005 (start of
performance) to April 30, 2015, compared to the BCAB2 and the Conservative Blended Index.2,3
VALUE OF A HYPOTHETICAL $1,000,000
INVESTMENT
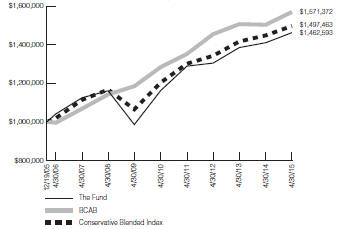
Average Annual Total Returns for the Periods Ended April 30, 2015
|
|
|
|
|
|
|
| |
|
|
|
|
1 Year |
|
|
3.63% |
|
|
5 Years |
|
|
4.68% |
|
|
Start of Performance (12/19/05)
|
|
|
4.14% |
|
Performance data quoted represents past performance which is no guarantee of future results. Returns shown do not reflect the deduction
of taxes that a shareholder would pay on Fund distributions or the redemption of Fund shares. Investment return and principal value will fluctuate so that an investor’s shares, when redeemed, may be worth more or less than their original cost.
Mutual funds are not obligations of or guaranteed by any bank and are not federally insured. Mutual fund performance changes over time and current performance may be lower or higher than what is stated. For current to the most recent month end
performance, visit www.wilmingtonfunds.com or call 1-800-836-2211.
Annual Operating Expense Ratio
|
|
|
|
|
|
|
| |
|
|
|
|
Before Waivers |
|
|
1.74% |
|
|
After Waivers |
|
|
1.21% |
|
The Expense Ratio Before Waivers represents the operating costs borne by the Fund, expressed as a percentage of the Fund’s average
net assets, as shown in the Fees and Expenses table in the Fund’s current prospectus (under “Total Annual Fund Operating Expenses”).
| 1 |
Represents a hypothetical investment of $1,000,000 in Class I of the Fund and assumes the reinvestment of all dividends and distributions. |
| 2 |
The performance for the BCAB and the Conservative Blended Index assumes the reinvestment of all dividends and distributions. It is not possible to invest directly in an index and the represented index is unmanaged.
|
| 3 |
The Conservative Blended Index is currently based on a weighting of the following indices: 53% Barclays U.S. Aggregate Bond Index, 7.5% HFRX Absolute Hedge Fund Index, 7.5% HFRX Global Hedge Fund Index, 7.2% Russell
3000 Index, 7.0% Barclays Global Aggregate ex-U.S. Index, 5.0% Barclays World Government Inflation-Linked Bond Index, 4.8% MSCI All Country World ex-U.S. Index, 3.5% S&P Global Developed Property Index, 1.5% Dow Jones-UBS Commodity Index, 3%
Citigroup 3-Month T-Bill. |
ANNUAL REPORT / April 30,
2015 (unaudited)
16
WILMINGTON STRATEGIC ALLOCATION MODERATE FUND
Management’s Discussion of Fund Performance
For the fiscal year ended April 30, 2015, Wilmington Strategic Allocation
Moderate Fund (the “Fund”) had a total return of 6.09%* for Class A Shares and 6.35%* for Class I Shares, versus its current benchmarks, the Russell 3000 Index, Barclays Capital U.S. Aggregate Bond Index, and the Moderate Blended
Index**, which had total returns of 12.74%, 4.46%, and 4.72%, respectively.
The Fund is managed by first replicating
tactical asset allocation decisions made by the Wilmington Trust Investment Advisors, Inc. Investment Strategy Team and then overlaying upon the asset allocation framework, active and passive managers that are closely benchmarked against the
tactical asset allocations. The portfolio managers seek to add value through the combination of tactical asset allocation and manager selection. The primary focus of the portfolio managers is in beating the Moderate Blended Index.
Over the past year, the Class I Shares outperformed the Moderate Blended Index by 1.63%. During the period, both tactical
decisions and manager performance contributed to overall Fund performance, with expenses charged by the Fund and the various mutual funds employed by the Fund recapturing a portion of the benefit. During the fiscal year, the Fund faced a now
familiar environment that witnessed the continuation of stimulus tapering by the Federal Reserve (the “Fed”), and markets increasingly focused on the timing and magnitude of Fed interest rate actions. The Eurozone, faced with the threat of
deflation, initiated its own version of Quantitative Easing in the latter half of the fiscal year. Toss in a collapse in energy prices, and the fiscal year had all the makings of another macro-driven global economic environment.
Against this backdrop, several tactical positions proved beneficial for the Moderate Fund. In a market hungry for growth, the
Fund’s sizeable overweight of growth equities versus value proved beneficial, as growth outpaced value by a wide margin. In large capitalization domestic equities, as measured by the Russell 1000 Index, growth outperformed value by 7.35% in the
fiscal year. The effect was more dramatic in small capitalization stocks, as measured by the Russell 2000 Index, where growth outperformed value by 9.76% in the fiscal year. In an ongoing environment of tepid growth with low inflation, equities
outperformed bonds and inflation hedges, and the Fund benefitted from an overweight of equities funded principally from an underweight of inflation hedges, core bonds, and international fixed income. The active managers utilized by the Moderate Fund
witnessed a tough start to calendar year 2014, but rebounded nicely to provide a significant contribution to relative performance in the fiscal year.
| |
* |
Performance data quoted represents past performance, which is no guarantee of future results. Investment return and principal value will
fluctuate so that an investor’s shares, when redeemed, may be worth more or less than their original cost. The total return shown assumes the reinvestment of all distributions and does not reflect the deduction of taxes that a shareholder would
pay on fund distributions or the redemption of shares. The total return for Class A Shares was 0.25%, adjusted for the Fund’s maximum sales charge. Mutual fund
|
| |
performance changes over time and current performance may be lower or higher than what is stated. For the most recent month-end performance, please visit www.wilmingtonfunds.com or call
1-800-836-2211. |
| |
** |
The Russell 3000 Index measures the performance of the largest 3,000 U.S. companies representing approximately 98% of the investable U.S. equity
market. Barclays Capital U.S. Aggregate Bond Index is an index measuring both the capital price changes and income provided by the underlying universe of securities, comprised of U.S. Treasury obligations, U.S. investment grade corporate debt and
mortgage backed obligations. The Moderate Blended Index is calculated by the investment advisor and represents the weighted returns for the following indices: 27% Russell 3000 Index; 20% Barclays Capital U.S. Aggregate Bond Index; 18% MSCI All
Country World ex-US Investable Market Index; 7.5% HFRX Absolute Index; 7.5% HFRX Global Index; 7% Barclays Capital Global Aggregate ex-US (unhedged) Index; 5% Barclays Capital World Government Inflation-Linked Bond Index (hedged USD); 3.5% S&P
Global Developed Property Index; 1.5% Dow Jones-UBS Commodity Index; and 3% Citigroup 3-Month T-Bill Index. The indexes are unmanaged and it is not possible to invest directly in an index. |
| |
|
Quantitative Easing (QE) is government monetary policy occasionally used to increase the money supply by buying government securities or other
securities from the market. Quantitative easing increases the money supply by flooding the financial institutions with capital, in an effort to promote increased lending and liquidity. |
| |
|
International investing involves special risks including currency risk, political risks, increased volatility of foreign securities, and differences
in auditing and other financial standards. |
| |
|
Bond prices are sensitive to changes in interest rates and a rise in short-term interest rates could cause a decline in bond prices.
|
| |
|
Due to its strategy of investing in other mutual funds, this Fund may incur certain additional expenses and tax results that would not be present
with a direct investment in the underlying funds. |
| |
|
The Russell 2000 is an index measuring the performance of approximately 2,000 small-cap companies in the Russell 3000 Index. |
| |
|
Eurozone is the collective group of countries which use the Euro as their common currency.
|
April 30, 2015 (unaudited) / ANNUAL
REPORT
17
WILMINGTON STRATEGIC
ALLOCATION
MODERATE FUND – CLASS A
The graph below illustrates the hypothetical investment of $10,0001 in the Wilmington Strategic Allocation Moderate Fund (Class A) (the “Fund”) from April 30, 2005 to April 30, 2015, compared to the Barclays Capital U.S. Aggregate Bond Index
(“BCAB”)2, the Russell 3000 Index2 and the Moderate Blended Index.2,3
VALUE OF A HYPOTHETICAL $10,000 INVESTMENT
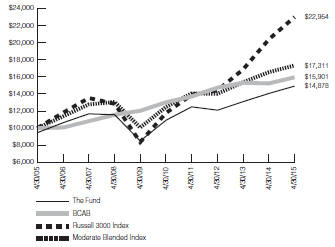
Average Annual Total Returns for the Periods Ended April 30, 2015
|
|
|
|
|
|
|
| |
|
|
|
|
1 Year |
|
|
0.25% |
|
|
5 Years |
|
|
5.24% |
|
|
10 Years |
|
|
4.05% |
|
Performance data quoted represents past performance which is no guarantee of future results. Returns shown do not reflect the deduction
of taxes that a shareholder would pay on Fund distributions or the redemption of Fund shares. Investment return and principal value will fluctuate so that an investor’s shares, when redeemed, may be worth more or less than their original cost.
Mutual funds are not obligations of or guaranteed by any bank and are not federally insured. Mutual fund performance changes over time and current performance may be lower or higher than what is stated. For current to the most recent month end
performance, visit www.wilmingtonfunds.com or call 1-800-836-2211. Total returns shown include the maximum sales charge of 5.50%.
Annual Operating Expense Ratio
|
|
|
|
|
|
|
| |
|
|
|
|
Before Waivers |
|
|
2.05% |
|
|
After Waivers |
|
|
1.44% |
|
The Expense Ratio Before Waivers represents the operating costs borne by the Fund, expressed as a percentage of the Fund’s average
net assets, as shown in the Fees and Expenses table in the Fund’s current prospectus (under “Total Annual Fund Operating Expenses”).
| 1 |
Represents a hypothetical investment of $10,000 in Class A of the Fund after deducting the maximum sales charge of 5.50% ($10,000 investment minus $550 sales charge = $9,450). The Fund’s performance assumes
the reinvestment of all dividends and distributions. |
| 2 |
The performance for the BCAB, the Russell 3000 Index and the Moderate Blended Index assumes the reinvestment of all dividends and distributions. It is not possible to invest directly in an index and the represented
index is unmanaged. |
| 3 |
The Moderate Blended Index is currently based on a weighting of the following indices: 27% Russell 3000 Index, 20% Barclays U.S. Aggregate Bond Index, 18% MSCI All Country World
ex-U.S. Index, 7.5% HFRX Absolute Hedge Fund Index, 7.5% HFRX Global Hedge Fund Index, 7% Barclays Global Aggregate ex-U.S. Index, 5% Barclays World Government Inflation-Linked Bond Index, 3.5% S&P Global
Developed Property Index, 1.5% Dow Jones-UBS Commodity Index, 3% Citigroup 3-Month T-Bill. |
ANNUAL REPORT / April 30,
2015 (unaudited)
18
WILMINGTON STRATEGIC
ALLOCATION
MODERATE FUND – Class I
The graph below illustrates the hypothetical investment of $1,000,0001,2 in the Wilmington Strategic Allocation Moderate Fund (Class I) (the “Fund”) from June 11, 2010 (start of performance) to April 30, 2015, compared to the BCAB2, the Russell 3000 Index2 and the Moderate Blended Index.2,3
VALUE OF A HYPOTHETICAL $1,000,000
INVESTMENT
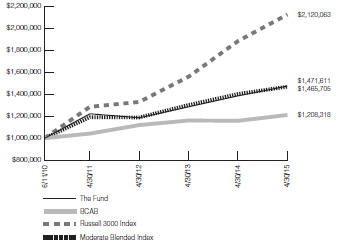
Average Annual Total Returns for the Periods Ended April 30, 2015
|
|
|
|
|
|
|
| |
|
|
|
|
1 Year |
|
|
6.35% |
|
|
Start of Performance (6/11/10)
|
|
|
8.23% |
|
Performance data quoted represents past performance which is no guarantee of future results. Returns shown do not reflect the deduction
of taxes that a shareholder would pay on Fund distributions or the redemption of Fund shares. Investment return and principal value will fluctuate so that an investor’s shares, when redeemed, may be worth more or less than their original cost.
Mutual funds are not obligations of or guaranteed by any bank and are not federally insured. Mutual fund performance changes over time and current performance may be lower or higher than what is stated. For current to the most recent month end
performance, visit www.wilmingtonfunds.com or call 1-800-836-2211.
Annual Operating Expense Ratio
|
|
|
|
|
|
|
| |
|
|
|
|
Before Waivers |
|
|
1.80% |
|
|
After Waivers |
|
|
1.19% |
|
The Expense Ratio Before Waivers represents the operating costs borne by the Fund, expressed as a percentage of the Fund’s average
net assets, as shown in the Fees and Expenses table in the Fund’s current prospectus (under “Total Annual Fund Operating Expenses”).
| 1 |
Represents a hypothetical investment of $1,000,000 in Class I of the Fund and assumes the reinvestment of all dividends and distributions. |
| 2 |
The performance for the BCAB, the Russell 3000 Index and the Moderate Blended Index assumes the reinvestment of all dividends and distributions. It is not possible to invest directly in an index and the represented
index is unmanaged. |
| 3 |
The Moderate Blended Index is currently based on a weighting of the following indices: 27% Russell 3000 Index, 20% Barclays U.S. Aggregate Bond Index, 18% MSCI All Country World
ex-U.S. Index, 7.5% HFRX Absolute Hedge Fund Index, 7.5% HFRX Global Hedge Fund Index, 7% Barclays Global Aggregate ex-U.S. Index, 5% Barclays World Government
Inflation-Linked Bond Index, 3.5% S&P Global Developed Property Index, 1.5% Dow Jones-UBS Commodity Index, 3% Citigroup 3-Month T-Bill. |
April 30, 2015 (unaudited) / ANNUAL
REPORT
19
WILMINGTON STRATEGIC ALLOCATION AGGRESSIVE FUND
Management’s Discussion of Fund Performance
For the fiscal year ended April 30, 2015, Wilmington Strategic Allocation
Aggressive Fund (the “Fund”) had a total return of 7.89%* for Class A Shares and 8.08%* for Class I Shares, versus its benchmarks, the Russell 3000 Index**, MSCI All Country World ex-US Investable Market Index**, and the Aggressive
Blended Index**, which returned 12.74%, 2.60%, and 7.43%, respectively.
The Fund is managed by first replicating tactical
asset allocation decisions made by the Wilmington Trust Investment Advisors, Inc. Investment Strategy Team and then overlaying upon the asset allocation framework, active and passive managers that are closely benchmarked against the tactical asset
allocations. The portfolio managers seek to add value through the combination of tactical asset allocation and manager selection. The primary focus of the portfolio managers is in beating the Aggressive Blended Index.
Over the past year, the Class I Shares outperformed the Aggressive Blended Index by 0.65%. During the period, both tactical
decisions and manager performance contributed to overall Fund performance, with expenses charged by the Fund and the various mutual funds employed by the Fund recapturing a portion of the benefit. During the fiscal year, the Fund faced a now
familiar environment that witnessed the continuation of stimulus tapering by the Federal Reserve (the “Fed”), and markets increasingly focused on the timing and magnitude of Fed interest rate actions. The Eurozone, faced with the threat of
deflation, initiated its own version of Quantitative Easing in the latter half of the fiscal year. Toss in a collapse in energy prices, and the fiscal year had all the makings of another macro-driven global economic environment. Against this
backdrop, several tactical positioning moves proved beneficial for the Fund. In a market hungry for growth, the Fund’s sizeable overweight of growth equities versus value proved beneficial, as growth outpaced value by a wide margin. In large
capitalization domestic equities, as measured by the Russell 1000 Index, growth outperformed value by 7.35% in the fiscal year. The effect was more dramatic in small capitalization stocks, as measured by the Russell 2000 Index, where growth
outperformed value by 9.76% in the fiscal year. With no imminent threat of inflation, the Fund’s overweight of equities funded by an underweight position to inflation hedges also proved beneficial. The active managers utilized by the Fund
witnessed a tough start to calendar year 2014, but rebounded nicely to provide a significant contribution to relative performance in the fiscal year.
| |
* |
Performance data quoted represents past performance, which is no guarantee of future results. Investment return and principal value will
fluctuate so that an investor’s shares, when redeemed, may be worth more or less than their original cost. The total return shown assumes the reinvestment of all distributions and does not reflect the deduction of taxes that a
shareholder would pay on fund distributions or the redemption of shares. The total return for Class A Shares was 1.96%, adjusted for the Fund’s maximum sales charge. Mutual fund performance changes over time and current performance may be
lower or higher than what is stated. For the
|
| |
most recent month-end performance, please visit www.wilmingtonfunds.com or call 1-800-836-2211. |
| |
** |
The Russell 3000 Index measures the performance of the largest 3,000 U.S. companies representing approximately 98% of the investable U.S. equity
market. MSCI All Country World ex-US Index (ACWI ex-US) is a free float-adjusted market capitalization weighted index that is designed to measure the large-cap and mid-cap equity market performance of developed and emerging markets excluding the
U.S. market. The MSCI All Country World ex-US Investable Market Index (ACWI IMI ex-US) is designed to also include the small-cap equity market performance which is not included in the ACWI ex-US. The ACWI ex-US and ACWI IMI ex-US Indices consisted
of 45 country indices comprising 22 developed and 23 emerging market country indices. The Aggressive Blended Index is calculated by the investment advisor and represents the weighted returns for the following indices: 48% Russell 3000 Index; 32%
MSCI All Country World ex-US Investable Market Index; 7% HFRX Global Index; 5% Barclays Capital World Government Inflation-Linked Bond Index (hedged USD); 3.5% S&P Global Developed Property Index; 1.5% Dow Jones-UBS Commodity Index; and 3%
Citigroup 3-Month T-Bill Index. The indexes are unmanaged and it is not possible to invest directly in an index. |
| |
|
International investing involves special risks including currency risk, political risks, increased volatility of foreign securities, and differences
in auditing and other financial standards. |
| |
|
Quantitative Easing (QE) is government monetary policy occasionally used to increase the money supply by buying government securities or other
securities from the market. Quantitative easing increases the money supply by flooding the financial institutions with capital, in an effort to promote increased lending and liquidity. |
| |
|
Bond prices are sensitive to changes in interest rates and a rise in short-term interest rates could cause a decline in bond prices.
|
| |
|
Due to its strategy of investing in other mutual funds, this Fund may incur certain additional expenses and tax results that would not be present
with a direct investment in the underlying funds. |
| |
|
The Russell 1000 is a market capitalization-weighted index, meaning that the largest companies constitute the largest percentages in the index and
will affect performance more than the smallest index. |
| |
|
The Russell 2000 is an index measuring the performance of approximately 2,000 small-cap companies in the Russell 3000 Index.
|
ANNUAL REPORT / April 30,
2015 (unaudited)
20
WILMINGTON STRATEGIC
ALLOCATION
AGGRESSIVE FUND – CLASS A
The graph below illustrates the hypothetical investment of $10,0001 in the Wilmington Strategic Allocation Aggressive Fund (Class A) (the “Fund”) from December 19, 2005 (start of performance) to April 30, 2015, compared to the Russell 3000 Index2, the MSCI All Country World ex-US Investable Market Index (“MSCI ACWI ex-US Investable Market Index”)2 and the Aggressive Blended Index.2,3
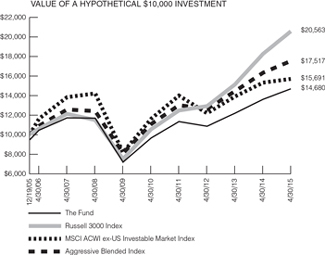
Average Annual Total Returns for the Periods Ended April 30, 2015
|
|
|
|
|
|
|
| |
|
|
|
|
1 Year |
|
|
1.96% |
|
|
5 Years |
|
|
7.53% |
|
|
Start of Performance (12/19/05)
|
|
|
4.19% |
|
Performance data quoted represents past performance which is no guarantee of future results. Returns shown do not reflect the deduction
of taxes that a shareholder would pay on Fund distributions or the redemption of Fund shares. Investment return and principal value will fluctuate so that an investor’s shares, when redeemed, may be worth more or less than their original cost.
Mutual funds are not obligations of or guaranteed by any bank and are not federally insured. Mutual fund performance changes over time and current performance may be lower or higher than what is stated. For current to the most recent month end
performance, visit www.wilmingtonfunds.com or call 1-800-836-2211. Total returns shown include the maximum sales charge of
5.50%.
Annual Operating Expense Ratio
|
|
|
|
|
|
|
| |
|
|
|
|
Before Waivers |
|
|
2.23% |
|
|
After Waivers |
|
|
1.70% |
|
The Expense Ratio Before Waivers represents the operating costs borne by the Fund, expressed as a percentage of the Fund’s average
net assets, as shown in the Fees and Expenses table in the Fund’s current prospectus (under “Total Annual Fund Operating Expenses”).
| 1 |
Represents a hypothetical investment of $10,000 in A Shares of the Fund after deducting the maximum sales charge of 5.50% ($10,000 investment minus $550 sales charge = $9,450). The Fund’s performance assumes the
reinvestment of all dividends and distributions. |
| 2 |
The performance for the Russell 3000 Index, the MSCI ACWI ex-US Investable Market Index and the Aggressive Blended Index assumes the reinvestment of all dividends and
distributions. It is not possible to invest directly in an index and the represented index is unmanaged. |
| 3 |
The Aggressive Blended Index is currently based on a weighting of the following indices: 48% Russell 3000 Index, 32% MSCI All Country World ex-U.S. Index, 7% HFRX Global Hedge Fund Index, 5% Barclays World Government
Inflation-Linked Bond Index, 3.5% S&P Global Developed Property Index, 1.5% Dow Jones-UBS Commodity Index, 3% Citigroup 3-Month T-Bill.
|
April 30, 2015 (unaudited) / ANNUAL
REPORT
21
WILMINGTON STRATEGIC
ALLOCATION
AGGRESSIVE FUND – CLASS I
The graph below illustrates the hypothetical investment of $1,000,0001,2 in the Wilmington Strategic Allocation Moderate Fund (I Shares) (the “Fund”) from December 19, 2005 (start of performance) to April 30, 2015, compared to the Russell 3000 Index2, the MSCI All Country World ex-US Investable Market Index (“MSCI ACWI ex-US Investable Market Index”)2 and the Aggressive Blended Index.2,3
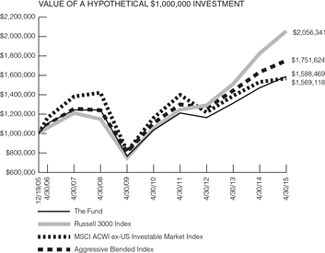
Average Annual Total Returns for the Periods Ended April 30, 2015
|
|
|
|
|
|
|
| |
|
|
|
|
1 Year |
|
|
8.08% |
|
|
5 Years |
|
|
9.01% |
|
|
Start of Performance (12/19/05)
|
|
|
5.07% |
|
Performance data quoted represents past performance which is no guarantee of future results. Returns shown do not reflect the deduction
of taxes that a shareholder would pay on Fund distributions or the redemption of Fund shares. Investment return and principal value will fluctuate so that an investor’s shares, when redeemed, may be worth more or less than their original cost.
Mutual funds are not obligations of or guaranteed by any bank and are not federally insured. Mutual fund performance changes over time and current performance may be lower or higher than what is stated. For current to the most recent month end
performance, visit www.wilmingtonfunds.com or call 1-800-836-2211.
Annual Operating Expense Ratio
|
|
|
|
|
|
|
| |
|
|
|
|
Before Waivers |
|
|
1.98% |
|
|
After Waivers |
|
|
1.45% |
|
The Expense Ratio Before Waivers represents the operating costs borne by the Fund, expressed as a percentage of the Fund’s average
net assets, as shown in the Fees and Expenses table in the Fund’s current prospectus (under “Total Annual Fund Operating Expenses”).
| 1 |
Represents a hypothetical investment of $1,000,000 in Class I of the Fund and assumes the reinvestment of all dividends and distributions. |
| 2 |
The performance for the Russell 3000 Index, the MSCI ACWI ex-US Investable Market Index and the Aggressive Blended Index assumes the reinvestment of all dividends and
distributions. It is not possible to invest directly in an index and the represented index is unmanaged. |
| 3 |
The Aggressive Blended Index is currently based on a weighting of the following indices: 48% Russell 3000 Index, 32% MSCI All Country World ex-U.S. Index, 7% HFRX Global Hedge Fund Index, 5% Barclays World Government
Inflation-Linked Bond Index, 3.5% S&P Global Developed Property Index, 1.5% Dow Jones-UBS Commodity Index, 3% Citigroup 3-Month T-Bill.
|
ANNUAL REPORT / April 30,
2015 (unaudited)
22
SHAREHOLDER EXPENSE EXAMPLE
As a shareholder of the Fund, you incur ongoing costs, including management fees; to the extent
applicable, distribution (12b-1) fees, and/or shareholder services fees; and other Fund expenses. This Example is intended to help you to understand your ongoing costs (in dollars) of investing in the Funds and to compare these costs with the
ongoing costs of investing in other mutual funds. It is based on an investment of $1,000 invested at the beginning of the period and held for the entire period from November 1, 2014 to April 30, 2015.
Actual Expenses
This section of the following table
provides information about actual account values and actual expenses. You may use the information in this section, together with the amount you invested, to estimate the expenses that you incurred over the period. Simply divide your account
value by $1,000 (for example, an $8,600 account value divided by $1,000 = 8.6), then multiply the result by the number in the first section under the heading entitled “Expenses Paid During Period” to estimate the expenses attributable to
your investment during this period.
Hypothetical Example for
Comparison
Purposes
This section of the following table provides information about hypothetical account values and hypothetical expenses based on the
Funds’ actual expense ratios and assumed rates of return of 5% per year before expenses, which is not the Funds’ actual returns. Thus, you should not use the hypothetical account values and expenses to estimate the
actual ending account balance or your expenses for the period. Rather, these figures are required to be provided to enable you to compare the ongoing costs of investing in the Funds with other funds. To do so, compare this 5% hypothetical example
with the 5% hypothetical examples that appear in the shareholder reports of the other funds.
Please note that the expenses shown in the
table are meant to highlight your ongoing costs only. Therefore, the Annualized Net Expense Ratio section of the table is useful in comparing ongoing costs only, and will not help you determine the relative total costs of owning different
funds.
|
|
|
|
|
|
|
|
|
|
|
|
|
|
|
|
|
|
|
|
|
| |
|
Beginning
Account Value
11/01/14 |
|
Ending
Account Value
04/30/15 |
|
Expenses Paid
During
Period1 |
|
Annualized Net
Expense Ratio2 |
|
|
|
|
|
| WILMINGTON MULTI-MANAGER INTERNATIONAL FUND |
|
|
|
|
|
|
|
|
|
|
|
|
|
| Actual |
|
|
|
|
|
|
|
|
|
|
|
|
|
| Class A |
|
$1,000.00 |
|
$1,062.80 |
|
$ 6.85 |
|
1.34% |
|
|
|
|
|
| Class I |
|
$1,000.00 |
|
$1,064.20 |
|
$ 6.19 |
|
1.21% |
|
|
|
|
|
| Hypothetical (assuming a 5% return before expense) |
|
|
|
|
|
|
|
|
|
|
|
|
|
| Class A |
|
$1,000.00 |
|
$1,018.15 |
|
$ 6.71 |
|
1.34% |
|
|
|
|
|
| Class I |
|
$1,000.00 |
|
$1,018.79 |
|
$ 6.06 |
|
1.21% |
|
|
|
|
|
| WILMINGTON MULTI-MANAGER ALTERNATIVES FUND |
|
|
|
|
|
|
|
|
|
|
|
|
|
| Actual |
|
|
|
|
|
|
|
|
|
|
|
|
|
| Class A |
|
$1,000.00 |
|
$1,025.30 |
|
$12.30 |
|
2.45% |
|
|
|
|
|
| Class I |
|
$1,000.00 |
|
$1,025.30 |
|
$11.10 |
|
2.21% |
|
|
|
|
|
| Hypothetical (assuming a 5% return before expense) |
|
|
|
|
|
|
|
|
|
|
|
|
|
| Class A |
|
$1,000.00 |
|
$1,012.65 |
|
$12.23 |
|
2.45% |
|
|
|
|
|
| Class I |
|
$1,000.00 |
|
$1,013.84 |
|
$11.03 |
|
2.21% |
|
|
|
|
|
| WILMINGTON MULTI-MANAGER REAL ASSET FUND |
|
|
|
|
|
|
|
|
|
|
|
|
|
| Actual |
|
|
|
|
|
|
|
|
|
|
|
|
|
| Class A |
|
$1,000.00 |
|
$1,001.10 |
|
$ 6.10 |
|
1.23% |
|
|
|
|
|
| Class I |
|
$1,000.00 |
|
$1,002.40 |
|
$ 4.92 |
|
0.99% |
|
|
|
|
|
| Hypothetical (assuming a 5% return before expense) |
|
|
|
|
|
|
|
|
|
|
|
|
|
| Class A |
|
$1,000.00 |
|
$1,018.70 |
|
$ 6.16 |
|
1.23% |
|
|
|
|
|
| Class I |
|
$1,000.00 |
|
$1,019.89 |
|
$ 4.96 |
|
0.99% |
|
|
|
|
|
| WILMINGTON STRATEGIC ALLOCATION CONSERVATIVE
FUND |
|
|
|
|
|
|
|
|
|
|
|
|
|
| Actual |
|
|
|
|
|
|
|
|
|
|
|
|
|
| Class A |
|
$1,000.00 |
|
$1,019.50 |
|
$ 4.01 |
|
0.80% |
|
|
|
|
|
| Class I |
|
$1,000.00 |
|
$1,020.80 |
|
$ 2.76 |
|
0.55% |
|
|
|
|
|
| Hypothetical (assuming a 5% return before expense) |
|
|
|
|
|
|
|
|
|
|
|
|
|
| Class A |
|
$1,000.00 |
|
$1,020.83 |
|
$ 4.01 |
|
0.80% |
|
|
|
|
|
| Class I |
|
$1,000.00 |
|
$1,022.07 |
|
$ 2.76 |
|
0.55% |
April 30, 2015 (unaudited) / ANNUAL
REPORT
23
|
|
|
|
|
|
|
|
|
|
|
|
|
|
|
|
|
|
|
|
|
| |
|
Beginning
Account Value
11/01/14 |
|
Ending
Account Value
04/30/15 |
|
Expenses Paid
During
Period1 |
|
Annualized Net
Expense Ratio2 |
|
|
|
|
|
| WILMINGTON STRATEGIC ALLOCATION MODERATE FUND |
|
|
|
|
|
|
|
|
|
|
|
|
|
| Actual |
|
|
|
|
|
|
|
|
|
|
|
|
|
| Class A |
|
$1,000.00 |
|
$1,038.00 |
|
$3.84 |
|
0.76% |
|
|
|
|
|
| Class I |
|
$1,000.00 |
|
$1,039.30 |
|
$2.58 |
|
0.51% |
|
|
|
|
|
| Hypothetical (assuming a 5% return before expense) |
|
|
|
|
|
|
|
|
|
|
|
|
|
| Class A |
|
$1,000.00 |
|
$1,021.03 |
|
$3.81 |
|
0.76% |
|
|
|
|
|
| Class I |
|
$1,000.00 |
|
$1,022.27 |
|
$2.56 |
|
0.51% |
|
|
|
|
|
| WILMINGTON STRATEGIC ALLOCATION AGGRESSIVE FUND |
|
|
|
|
|
|
|
|
|
|
|
|
|
| Actual |
|
|
|
|
|
|
|
|
|
|
|
|
|
| Class A |
|
$1,000.00 |
|
$1,049.20 |
|
$4.57 |
|
0.90% |
|
|
|
|
|
| Class I |
|
$1,000.00 |
|
$1,050.50 |
|
$3.30 |
|
0.65% |
|
|
|
|
|
| Hypothetical (assuming a 5% return before expense) |
|
|
|
|
|
|
|
|
|
|
|
|
|
| Class A |
|
$1,000.00 |
|
$1,020.33 |
|
$4.51 |
|
0.90% |
|
|
|
|
|
| Class I |
|
$1,000.00 |
|
$1,021.57 |
|
$3.26 |
|
0.65% |
| (1) |
Expenses are equal to the Funds’ annualized net expense ratios, multiplied by the average account value over the period, multiplied by 181/365 (to
reflect the most recent one-half year period). |
| (2) |
Expense ratio does not reflect the indirect expenses of the underlying funds it invests in. |
ANNUAL REPORT / April 30,
2015 (unaudited)
24
PORTFOLIO OF INVESTMENTS SUMMARY TABLE
Wilmington Multi-Manager International Fund
At
April 30, 2015, the Fund’s sector classifications and country allocations were as follows (unaudited):
|
|
|
|
|
|
| Common Stocks |
|
Percentage of
Total Net Assets |
| Financials |
|
|
|
21.0 |
% |
| Health Care |
|
|
|
13.2 |
% |
| Industrials |
|
|
|
11.7 |
% |
| Consumer Discretionary |
|
|
|
10.9 |
% |
| Information Technology |
|
|
|
9.5 |
% |
| Consumer Staples |
|
|
|
9.1 |
% |
| Materials |
|
|
|
8.6 |
% |
| Energy |
|
|
|
4.6 |
% |
| Telecommunication Services |
|
|
|
3.6 |
% |
| Utilities |
|
|
|
1.4 |
% |
| Real Estate & Development |
|
|
|
0.1 |
% |
| Preferred Stocks |
|
|
|
1.3 |
% |
| Call Warrants |
|
|
|
0.9 |
% |
| Real Estate Investment Trusts |
|
|
|
0.6 |
% |
| Investment Companies |
|
|
|
0.3 |
% |
| Certificates |
|
|
|
0.2 |
% |
| Rights |
|
|
|
0.0 |
%3 |
| Cash Equivalents1 |
|
|
|
6.4 |
% |
| Other Assets and Liabilities – Net2 |
|
|
|
(3.4 |
)% |
|
|
|
|
|
|
|
|
| TOTAL |
|
|
|
100.0 |
% |
|
|
|
|
|
|
| (1) |
Cash Equivalents include investments in a money market fund and repurchase agreements. |
| (2) |
Assets, other than investments in securities, less liabilities. See Statements of Assets and Liabilities. |
| (3) |
Represents less than 0.05%.
|
|
|
|
|
|
|
| Country Allocation |
|
Percentage of
Total Net Assets |
| Common Stocks |
|
|
|
|
|
| Japan |
|
|
|
14.7 |
% |
| United Kingdom |
|
|
|
12.6 |
% |
| Switzerland |
|
|
|
9.2 |
% |
| France |
|
|
|
7.9 |
% |
| Germany |
|
|
|
7.4 |
% |
| China |
|
|
|
4.0 |
% |
| Canada |
|
|
|
3.9 |
% |
| Australia |
|
|
|
2.8 |
% |
| Sweden |
|
|
|
2.6 |
% |
| Netherlands |
|
|
|
2.1 |
% |
| United States |
|
|
|
1.9 |
% |
| Spain |
|
|
|
1.8 |
% |
| South Korea |
|
|
|
1.7 |
% |
| Ireland |
|
|
|
1.6 |
% |
| Italy |
|
|
|
1.6 |
% |
| Denmark |
|
|
|
1.5 |
% |
| Taiwan |
|
|
|
1.5 |
% |
| Finland |
|
|
|
1.2 |
% |
| Singapore |
|
|
|
1.2 |
% |
| Hong Kong |
|
|
|
1.0 |
% |
| All other countries less than 1.0% |
|
|
|
11.5 |
% |
| Preferred Stocks |
|
|
|
1.3 |
% |
| Call Warrants |
|
|
|
0.9 |
% |
| Real Estate Investment Trusts |
|
|
|
0.6 |
% |
| Investment Companies |
|
|
|
0.3 |
% |
| Certificates |
|
|
|
0.2 |
% |
| Rights |
|
|
|
0.0 |
%3 |
| Cash Equivalents1 |
|
|
|
6.4 |
% |
| Other Assets and Liabilities – Net2 |
|
|
|
(3.4 |
)% |
|
|
|
|
|
|
|
|
| TOTAL |
|
|
|
100.0 |
% |
|
|
|
|
|
|
PORTFOLIO OF INVESTMENTS
April 30, 2015
|
|
|
|
|
|
|
|
|
| Description |
|
Number of
Shares |
|
|
Value |
|
|
|
|
| COMMON STOCKS – 93.7% |
|
|
|
|
|
|
|
|
|
|
|
| ARGENTINA – 0.1% |
|
|
|
|
|
|
|
|
|
|
|
| Adecoagro SA* |
|
|
5,500 |
|
|
$ |
53,405 |
|
|
|
|
| Arcos Dorados Holdings, Inc.# |
|
|
6,100 |
|
|
|
36,600 |
|
|
|
|
| Banco Macro SA ADR |
|
|
580 |
|
|
|
32,045 |
|
|
|
|
| BBVA Banco Frances SA ADR* |
|
|
1,270 |
|
|
|
24,486 |
|
|
|
|
| Cresud SACIF y A ADR |
|
|
2,251 |
|
|
|
29,601 |
|
|
|
|
|
|
|
|
|
|
| Description |
|
Number of
Shares |
|
|
Value |
|
|
|
|
| Grupo Financiero Galicia SA ADR |
|
|
1,320 |
|
|
$ |
29,093 |
|
|
|
|
| MercadoLibre, Inc. |
|
|
740 |
|
|
|
105,324 |
|
|
|
|
| Petrobras Argentina SA ADR |
|
|
8,536 |
|
|
|
60,350 |
|
|
|
|
| Telecom Argentina SA ADR* |
|
|
4,350 |
|
|
|
90,741 |
|
|
|
|
| Transportadora de Gas del Sur SA ADR |
|
|
10,400 |
|
|
|
51,272 |
|
|
|
|
|
|
|
|
|
|
|
|
|
| TOTAL ARGENTINA |
|
|
|
|
|
$ |
512,917 |
|
|
|
|
| AUSTRALIA – 2.8% |
|
|
|
|
|
|
|
|
|
|
|
| AGL Energy Ltd.†† |
|
|
4,217 |
|
|
|
50,590 |
|
April 30, 2015 / ANNUAL REPORT
PORTFOLIOS OF INVESTMENTS 25
Wilmington Multi-Manager International Fund
(continued)
|
|
|
|
|
|
|
|
|
| Description |
|
Number of
Shares |
|
|
Value |
|
|
|
|
| Alumina Ltd.*,†† |
|
|
31,910 |
|
|
$ |
38,721 |
|
|
|
|
| Alumina Ltd. ADR* |
|
|
4,000 |
|
|
|
19,277 |
|
|
|
|
| Amcor Ltd.†† |
|
|
7,111 |
|
|
|
75,705 |
|
|
|
|
| AMP Ltd.†† |
|
|
10,091 |
|
|
|
51,116 |
|
|
|
|
| APA Group†† |
|
|
5,889 |
|
|
|
44,539 |
|
|
|
|
| Arrium Ltd.†† |
|
|
532,800 |
|
|
|
72,673 |
|
|
|
|
| Asciano Ltd.†† |
|
|
29,174 |
|
|
|
151,586 |
|
|
|
|
| ASX Ltd.†† |
|
|
1,019 |
|
|
|
33,848 |
|
|
|
|
| Aurizon Holdings Ltd.†† |
|
|
10,737 |
|
|
|
40,990 |
|
|
|
|
| Australia & New Zealand Banking Group
Ltd.†† |
|
|
24,664 |
|
|
|
659,958 |
|
|
|
|
| Bendigo & Adelaide Bank
Ltd.†† |
|
|
38,763 |
|
|
|
368,988 |
|
|
|
|
| BHP Billiton Ltd.†† |
|
|
19,987 |
|
|
|
510,397 |
|
|
|
|
| BlueScope Steel Ltd.*,†† |
|
|
6,507 |
|
|
|
17,904 |
|
|
|
|
| Boart Longyear Ltd.*,†† |
|
|
48,400 |
|
|
|
7,570 |
|
|
|
|
| Boral Ltd.†† |
|
|
9,548 |
|
|
|
47,562 |
|
|
|
|
| Brambles Ltd.†† |
|
|
6,521 |
|
|
|
55,583 |
|
|
|
|
| Challenger Ltd.†† |
|
|
44,000 |
|
|
|
244,322 |
|
|
|
|
| Commonwealth Bank of
Australia†† |
|
|
3,657 |
|
|
|
255,980 |
|
|
|
|
| Crown Ltd.†† |
|
|
3,064 |
|
|
|
31,375 |
|
|
|
|
| CSL Ltd.†† |
|
|
868 |
|
|
|
62,221 |
|
|
|
|
| Domino’s Pizza Enterprises
L†† |
|
|
10,500 |
|
|
|
302,198 |
|
|
|
|
| Downer EDI Ltd.†† |
|
|
40,700 |
|
|
|
141,527 |
|
|
|
|
| Echo Entertainment Group
Ltd.†† |
|
|
18,904 |
|
|
|
67,498 |
|
|
|
|
| Fortescue Metals Group
Ltd.#,†† |
|
|
16,743 |
|
|
|
28,284 |
|
|
|
|
| GPT Group†† |
|
|
8,152 |
|
|
|
28,730 |
|
|
|
|
| Harvey Norman Holdings
Ltd.†† |
|
|
9,633 |
|
|
|
33,408 |
|
|
|
|
| Incitec Pivot Ltd.†† |
|
|
31,391 |
|
|
|
98,584 |
|
|
|
|
| James Hardie Industries†† |
|
|
2,466 |
|
|
|
28,324 |
|
|
|
|
| Lend Lease Group†† |
|
|
34,696 |
|
|
|
438,395 |
|
|
|
|
| Macquarie Group Ltd.†† |
|
|
14,670 |
|
|
|
898,870 |
|
|
|
|
| Mcmillan Shakespeare
Ltd.†† |
|
|
23,900 |
|
|
|
218,170 |
|
|
|
|
| Metcash Ltd.#,†† |
|
|
42,500 |
|
|
|
44,364 |
|
|
|
|
| Mineral Resources
Ltd.#,†† |
|
|
24,300 |
|
|
|
123,538 |
|
|
|
|
| National Australia Bank
Ltd.†† |
|
|
23,843 |
|
|
|
690,385 |
|
|
|
|
| Newcrest Mining Ltd.†† |
|
|
445,895 |
|
|
|
4,998,266 |
|
|
|
|
| Orica Ltd.#,†† |
|
|
13,403 |
|
|
|
212,406 |
|
|
|
|
| Origin Energy Ltd.†† |
|
|
15,480 |
|
|
|
154,734 |
|
|
|
|
| Orora Ltd.†† |
|
|
296,300 |
|
|
|
515,524 |
|
|
|
|
| Primary Health Care
Ltd.†† |
|
|
44,600 |
|
|
|
174,564 |
|
|
|
|
| Qantas Airways Ltd.*,†† |
|
|
125,500 |
|
|
|
335,455 |
|
|
|
|
| QBE Insurance Group Ltd. |
|
|
11,717 |
|
|
|
126,377 |
|
|
|
|
| Rio Tinto Ltd.†† |
|
|
11,005 |
|
|
|
496,078 |
|
|
|
|
| Santos Ltd.†† |
|
|
31,969 |
|
|
|
208,193 |
|
|
|
|
| Scentre Group†† |
|
|
5,363 |
|
|
|
15,798 |
|
|
|
|
| Sims Metal Management
Ltd.#,†† |
|
|
2,669 |
|
|
|
22,748 |
|
|
|
|
| Skilled Group Ltd.†† |
|
|
65,800 |
|
|
|
66,979 |
|
|
|
|
|
|
|
|
|
|
| Description |
|
Number of
Shares |
|
|
Value |
|
|
|
|
| Suncorp Group Ltd.†† |
|
|
16,400 |
|
|
$ |
169,599 |
|
|
|
|
| Tabcorp Holdings Ltd.†† |
|
|
24,444 |
|
|
|
93,906 |
|
|
|
|
| Tatts Group Ltd.†† |
|
|
32,697 |
|
|
|
104,155 |
|
|
|
|
| Telstra Corp. Ltd.†† |
|
|
5,228 |
|
|
|
25,699 |
|
|
|
|
| Toll Holdings Ltd.†† |
|
|
11,181 |
|
|
|
79,136 |
|
|
|
|
| Transurban Group†† |
|
|
2,109 |
|
|
|
16,488 |
|
|
|
|
| Treasury Wine Estates
Ltd.†† |
|
|
5,439 |
|
|
|
23,854 |
|
|
|
|
| Wesfarmers Ltd.#,†† |
|
|
15,485 |
|
|
|
533,758 |
|
|
|
|
| Westfield Corp.†† |
|
|
4,442 |
|
|
|
33,025 |
|
|
|
|
| Westpac Banking Corp.†† |
|
|
6,909 |
|
|
|
198,501 |
|
|
|
|
| Woodside Petroleum Ltd.†† |
|
|
15,283 |
|
|
|
421,464 |
|
|
|
|
| Woolworths Ltd.†† |
|
|
2,759 |
|
|
|
64,058 |
|
|
|
|
|
|
|
|
|
|
|
|
|
| TOTAL AUSTRALIA |
|
|
|
|
|
$ |
15,073,945 |
|
|
|
|
| AUSTRIA – 0.6% |
|
|
|
|
|
|
|
|
|
|
|
| Ams AG†† |
|
|
16,000 |
|
|
|
869,878 |
|
|
|
|
| Buwog AG#,*,†† |
|
|
365 |
|
|
|
7,380 |
|
|
|
|
| Erste Group Bank AG#,†† |
|
|
51,067 |
|
|
|
1,441,808 |
|
|
|
|
| OMV AG†† |
|
|
8,231 |
|
|
|
273,958 |
|
|
|
|
| Raiffeisen International Bank Holding
AG#,†† |
|
|
6,757 |
|
|
|
112,169 |
|
|
|
|
| Voestalpine AG†† |
|
|
9,400 |
|
|
|
393,560 |
|
|
|
|
|
|
|
|
|
|
|
|
|
| TOTAL AUSTRIA |
|
|
|
|
|
$ |
3,098,753 |
|
|
|
|
| BAHRAIN – 0.0%** |
|
|
|
|
|
|
|
|
|
|
|
| Al-Salam Bank†† |
|
|
268,200 |
|
|
|
99,859 |
|
|
|
|
| GFH*,†† |
|
|
169,936 |
|
|
|
37,530 |
|
|
|
|
|
|
|
|
|
|
|
|
|
| TOTAL BAHRAIN |
|
|
|
|
|
$ |
137,389 |
|
|
|
|
| BELGIUM – 0.9% |
|
|
|
|
|
|
|
|
|
|
|
| Ageas†† |
|
|
4,379 |
|
|
|
164,529 |
|
|
|
|
| Anheuser-Busch InBev
NV#,†† |
|
|
24,363 |
|
|
|
2,966,158 |
|
|
|
|
| bpost SA†† |
|
|
11,500 |
|
|
|
329,803 |
|
|
|
|
| Colruyt SA†† |
|
|
454 |
|
|
|
21,457 |
|
|
|
|
| Delhaize Group SA†† |
|
|
8,947 |
|
|
|
720,238 |
|
|
|
|
| Delhaize Group SA ADR |
|
|
7,850 |
|
|
|
157,157 |
|
|
|
|
| KBC Groep NV†† |
|
|
1,940 |
|
|
|
127,639 |
|
|
|
|
| Solvay SA†† |
|
|
1,700 |
|
|
|
250,317 |
|
|
|
|
| Telenet Group Holding
NV*,†† |
|
|
726 |
|
|
|
43,629 |
|
|
|
|
| UCB SA†† |
|
|
1,492 |
|
|
|
107,473 |
|
|
|
|
| Umicore SA†† |
|
|
1,295 |
|
|
|
64,370 |
|
|
|
|
|
|
|
|
|
|
|
|
|
| TOTAL BELGIUM |
|
|
|
|
|
$ |
4,952,770 |
|
|
|
|
| BOTSWANA – 0.1% |
|
|
|
|
|
|
|
|
|
|
|
| Barclays Bank of Botswana
Ltd.†† |
|
|
100,300 |
|
|
|
41,432 |
|
|
|
|
| Botswana Insurance Holdings
Ltd.†† |
|
|
60,900 |
|
|
|
76,314 |
|
|
|
|
| First National Bank of
Botswana†† |
|
|
274,700 |
|
|
|
106,180 |
|
|
|
|
| Sechaba Breweries Ltd.†† |
|
|
61,203 |
|
|
|
179,252 |
|
|
|
|
| Standard Chartered Bank Botswana Ltd. |
|
|
41,700 |
|
|
|
53,542 |
|
|
|
|
|
|
|
|
|
|
|
|
|
| TOTAL BOTSWANA |
|
|
|
|
|
$ |
456,720 |
|
ANNUAL REPORT / April 30,
2015
26 PORTFOLIOS OF
INVESTMENTS
Wilmington Multi-Manager International Fund
(continued)
|
|
|
|
|
|
|
|
|
| Description |
|
Number of
Shares |
|
|
Value |
|
|
|
|
| BRAZIL – 0.7% |
|
|
|
|
|
|
|
|
|
|
|
| Ambev SA |
|
|
33,575 |
|
|
$ |
211,282 |
|
|
|
|
| Banco do Brasil SA |
|
|
8,167 |
|
|
|
70,991 |
|
|
|
|
| BB Seguridade Participacoes SA |
|
|
6,000 |
|
|
|
69,181 |
|
|
|
|
| BM&FBovespa SA |
|
|
11,907 |
|
|
|
48,806 |
|
|
|
|
| BR Malls Participacoes SA |
|
|
5,800 |
|
|
|
31,609 |
|
|
|
|
| BRF SA |
|
|
6,756 |
|
|
|
144,832 |
|
|
|
|
| CCR SA |
|
|
22,200 |
|
|
|
121,944 |
|
|
|
|
| Centrais Eletricas Brasileiras SA |
|
|
19,300 |
|
|
|
46,633 |
|
|
|
|
| CETIP SA - Mercados Organizados |
|
|
1,600 |
|
|
|
18,225 |
|
|
|
|
| Cia de Saneamento Basico do Estado de Sao Paulo |
|
|
9,000 |
|
|
|
53,170 |
|
|
|
|
| Cia Energetica de Minas Gerais |
|
|
2,768 |
|
|
|
13,450 |
|
|
|
|
| Cia Siderurgica Nacional SA |
|
|
4,700 |
|
|
|
12,589 |
|
|
|
|
| Cielo SA |
|
|
28,399 |
|
|
|
390,693 |
|
|
|
|
| Cosan SA Industria e Comercio |
|
|
1,200 |
|
|
|
11,566 |
|
|
|
|
| CPFL Energia SA |
|
|
12,589 |
|
|
|
83,023 |
|
|
|
|
| Cyrela Brazil Realty SA Empreendimentos e Participacoes |
|
|
7,500 |
|
|
|
29,124 |
|
|
|
|
| EDP - Energias do Brasil SA |
|
|
10,300 |
|
|
|
38,425 |
|
|
|
|
| Embraer SA |
|
|
16,100 |
|
|
|
125,681 |
|
|
|
|
| Estacio Participacoes SA |
|
|
7,700 |
|
|
|
45,669 |
|
|
|
|
| Fibria Celulose SA* |
|
|
3,300 |
|
|
|
46,440 |
|
|
|
|
| Gafisa SA |
|
|
28,700 |
|
|
|
26,672 |
|
|
|
|
| Itau Unibanco Holding SA ADR |
|
|
92,435 |
|
|
|
1,185,017 |
|
|
|
|
| Klabin SA - Unit |
|
|
8,000 |
|
|
|
49,121 |
|
|
|
|
| Kroton Educacional SA |
|
|
22,600 |
|
|
|
82,961 |
|
|
|
|
| Localiza Rent a Car SA |
|
|
4,440 |
|
|
|
52,049 |
|
|
|
|
| Lojas Renner SA |
|
|
2,500 |
|
|
|
87,165 |
|
|
|
|
| Marfrig Alimentos SA* |
|
|
14,350 |
|
|
|
19,527 |
|
|
|
|
| MRV Engenharia e Participacoes SA |
|
|
6,800 |
|
|
|
18,394 |
|
|
|
|
| Natura Cosmeticos SA |
|
|
3,600 |
|
|
|
34,411 |
|
|
|
|
| Odontoprev SA |
|
|
13,200 |
|
|
|
46,308 |
|
|
|
|
| Qualicorp SA |
|
|
8,500 |
|
|
|
68,582 |
|
|
|
|
| Rumo Logistica Operadora Mulimodal SA* |
|
|
49,524 |
|
|
|
21,533 |
|
|
|
|
| Souza Cruz SA |
|
|
2,900 |
|
|
|
25,603 |
|
|
|
|
| Tim Participacoes SA |
|
|
32,506 |
|
|
|
104,112 |
|
|
|
|
| Totvs SA |
|
|
4,400 |
|
|
|
51,565 |
|
|
|
|
| Tractebel Energia SA |
|
|
4,900 |
|
|
|
57,490 |
|
|
|
|
| Ultrapar Participacoes SA |
|
|
4,600 |
|
|
|
105,299 |
|
|
|
|
| Weg SA |
|
|
15,240 |
|
|
|
81,538 |
|
|
|
|
|
|
|
|
|
|
|
|
|
| TOTAL BRAZIL |
|
|
|
|
|
$ |
3,730,680 |
|
|
|
|
| BULGARIA – 0.0%** |
|
|
|
|
|
|
|
|
|
|
|
| Central Cooperative Bank
AD*,†† |
|
|
20,482 |
|
|
|
12,493 |
|
|
|
|
| Chimimport AD*,†† |
|
|
10,600 |
|
|
|
10,596 |
|
|
|
|
| Doverie Holding AD*,†† |
|
|
11,040 |
|
|
|
7,478 |
|
|
|
|
| Olovno Tzinkov Komplex AD* |
|
|
900 |
|
|
|
— |
|
|
|
|
| Petrol AD* |
|
|
37,250 |
|
|
|
21,383 |
|
|
|
|
|
|
|
|
|
|
| Description |
|
Number of
Shares |
|
|
Value |
|
|
|
|
| Sopharma AD Sofia†† |
|
|
14,000 |
|
|
$ |
25,712 |
|
|
|
|
|
|
|
|
|
|
|
|
|
| TOTAL BULGARIA |
|
|
|
|
|
$ |
77,662 |
|
|
|
|
| CANADA – 3.9% |
|
|
|
|
|
|
|
|
|
|
|
| Agnico-Eagle Mines Ltd. |
|
|
1,785 |
|
|
|
54,051 |
|
|
|
|
| Agrium, Inc. |
|
|
2,192 |
|
|
|
227,103 |
|
|
|
|
| Air Canada |
|
|
35,800 |
|
|
|
341,828 |
|
|
|
|
| Alimentation Couche Tard, Inc. |
|
|
1,532 |
|
|
|
58,639 |
|
|
|
|
| Bank of Montreal |
|
|
4,027 |
|
|
|
262,963 |
|
|
|
|
| Bank of Montreal |
|
|
874 |
|
|
|
57,098 |
|
|
|
|
| Bank of Nova Scotia# |
|
|
2,161 |
|
|
|
119,164 |
|
|
|
|
| Barrick Gold Corp. |
|
|
53,976 |
|
|
|
702,768 |
|
|
|
|
| BCE, Inc. |
|
|
168 |
|
|
|
7,406 |
|
|
|
|
| Blackberry Ltd.#,* |
|
|
3,556 |
|
|
|
36,125 |
|
|
|
|
| Bombardier, Inc. |
|
|
131,900 |
|
|
|
266,752 |
|
|
|
|
| Bonavista Energy Corp.# |
|
|
1,621 |
|
|
|
11,165 |
|
|
|
|
| Brookfield Asset Management, Inc. |
|
|
1,986 |
|
|
|
106,946 |
|
|
|
|
| CAE, Inc. |
|
|
1,400 |
|
|
|
17,371 |
|
|
|
|
| Cameco Corp. |
|
|
5,717 |
|
|
|
100,517 |
|
|
|
|
| Canadian Imperial Bank of Commerce# |
|
|
8,353 |
|
|
|
670,733 |
|
|
|
|
| Canadian National Railway Co. |
|
|
1,755 |
|
|
|
113,315 |
|
|
|
|
| Canadian Natural Resources Ltd. (2171573)# |
|
|
22,904 |
|
|
|
761,476 |
|
|
|
|
| Canadian Oil Sands Ltd. |
|
|
2,858 |
|
|
|
31,055 |
|
|
|
|
| Canadian Pacific Railway Ltd. |
|
|
199 |
|
|
|
37,941 |
|
|
|
|
| Canadian Tire Corp. Ltd. |
|
|
2,973 |
|
|
|
314,894 |
|
|
|
|
| Canadian Utilities Ltd. |
|
|
1,396 |
|
|
|
45,357 |
|
|
|
|
| Catamaran Corp.* |
|
|
878 |
|
|
|
52,109 |
|
|
|
|
| CCL Industries, Inc. Class B |
|
|
2,365 |
|
|
|
271,902 |
|
|
|
|
| Cenovus Energy, Inc. |
|
|
9,737 |
|
|
|
183,283 |
|
|
|
|
| Cott Corp.# |
|
|
37,800 |
|
|
|
329,238 |
|
|
|
|
| Crescent Point Energy Corp.# |
|
|
5,512 |
|
|
|
143,863 |
|
|
|
|
| Dirtt Environmental Solution* |
|
|
25,500 |
|
|
|
166,759 |
|
|
|
|
| Dollarama, Inc. |
|
|
8,333 |
|
|
|
478,500 |
|
|
|
|
| Dominion Diamond Corp. |
|
|
19,000 |
|
|
|
374,488 |
|
|
|
|
| Dorel Industries, Inc. |
|
|
8,700 |
|
|
|
255,988 |
|
|
|
|
| Eldorado Gold Corp. |
|
|
6,710 |
|
|
|
33,406 |
|
|
|
|
| Empire Co. Ltd. |
|
|
6,834 |
|
|
|
493,759 |
|
|
|
|
| Enbridge, Inc. |
|
|
2,696 |
|
|
|
140,912 |
|
|
|
|
| Encana Corp. |
|
|
22,681 |
|
|
|
322,297 |
|
|
|
|
| Ensign Energy Services, Inc. |
|
|
2,332 |
|
|
|
18,594 |
|
|
|
|
| Fairfax Financial Holdings Ltd. |
|
|
656 |
|
|
|
358,312 |
|
|
|
|
| First Quantum Minerals Ltd. |
|
|
8,817 |
|
|
|
135,050 |
|
|
|
|
| Firstservice Corp. |
|
|
4,400 |
|
|
|
288,033 |
|
|
|
|
| Franco-Nevada Corp. |
|
|
993 |
|
|
|
51,555 |
|
|
|
|
| Genworth MI Canada, Inc. |
|
|
1,061 |
|
|
|
30,911 |
|
|
|
|
| Gildan Activewear, Inc. |
|
|
1,200 |
|
|
|
38,034 |
|
|
|
|
| Goldcorp, Inc. |
|
|
6,282 |
|
|
|
118,290 |
|
April 30, 2015 / ANNUAL REPORT
PORTFOLIOS OF INVESTMENTS 27
Wilmington Multi-Manager International Fund
(continued)
|
|
|
|
|
|
|
|
|
| Description |
|
Number of
Shares |
|
|
Value |
|
|
|
|
| Husky Energy, Inc. |
|
|
7,942 |
|
|
$ |
177,601 |
|
|
|
|
| Imperial Oil Ltd. |
|
|
1,692 |
|
|
|
74,580 |
|
|
|
|
| Industrial Alliance Insurance & Financial Services, Inc. |
|
|
1,794 |
|
|
|
65,292 |
|
|
|
|
| Intact Financial Corp. |
|
|
587 |
|
|
|
45,213 |
|
|
|
|
| Keyera Corp. |
|
|
8,500 |
|
|
|
299,208 |
|
|
|
|
| Kinross Gold Corp.* |
|
|
20,413 |
|
|
|
49,573 |
|
|
|
|
| Laurentian Bank of Canada |
|
|
5,700 |
|
|
|
228,142 |
|
|
|
|
| Lundin Mining Corp.* |
|
|
15,100 |
|
|
|
75,093 |
|
|
|
|
| Magna International, Inc. |
|
|
12,358 |
|
|
|
622,765 |
|
|
|
|
| Manulife Financial Corp.# |
|
|
31,084 |
|
|
|
565,773 |
|
|
|
|
| Martinrea International, Inc. |
|
|
4,600 |
|
|
|
45,943 |
|
|
|
|
| MEG Energy Corp. |
|
|
1,178 |
|
|
|
22,720 |
|
|
|
|
| Metro, Inc. |
|
|
16,145 |
|
|
|
466,753 |
|
|
|
|
| National Bank of Canada |
|
|
13,100 |
|
|
|
529,320 |
|
|
|
|
| Nevsun Resources Ltd. |
|
|
42,600 |
|
|
|
168,070 |
|
|
|
|
| New Gold, Inc.* |
|
|
4,369 |
|
|
|
14,666 |
|
|
|
|
| Onex Corp. |
|
|
258 |
|
|
|
15,536 |
|
|
|
|
| Open Text Corp. |
|
|
600 |
|
|
|
30,316 |
|
|
|
|
| Pan American Silver Corp. |
|
|
589 |
|
|
|
5,607 |
|
|
|
|
| Parex Resources, Inc.* |
|
|
40,400 |
|
|
|
324,138 |
|
|
|
|
| Pembina Pipeline Corp.# |
|
|
1,266 |
|
|
|
44,061 |
|
|
|
|
| Pengrowth Energy Corp.# |
|
|
576 |
|
|
|
1,934 |
|
|
|
|
| Penn West Petroleum Ltd. |
|
|
3,500 |
|
|
|
8,645 |
|
|
|
|
| Peyto Exploration & Dev Corp. |
|
|
700 |
|
|
|
20,347 |
|
|
|
|
| Potash Corp. of Saskatchewan, Inc. (2696980) |
|
|
476 |
|
|
|
15,544 |
|
|
|
|
| Power Corp. of Canada# |
|
|
1,700 |
|
|
|
46,709 |
|
|
|
|
| Power Financial Corp. |
|
|
554 |
|
|
|
17,137 |
|
|
|
|
| Precision Drilling Corp. |
|
|
3,100 |
|
|
|
22,537 |
|
|
|
|
| Rogers Communications, Inc. |
|
|
1,122 |
|
|
|
40,081 |
|
|
|
|
| Royal Bank of Canada |
|
|
2,547 |
|
|
|
169,117 |
|
|
|
|
| Saputo, Inc. |
|
|
729 |
|
|
|
21,601 |
|
|
|
|
| Secure Energy Services, Inc.# |
|
|
16,500 |
|
|
|
233,311 |
|
|
|
|
| Shaw Communications, Inc.# |
|
|
14,324 |
|
|
|
327,440 |
|
|
|
|
| Silver Wheaton Corp. |
|
|
1,091 |
|
|
|
21,522 |
|
|
|
|
| Sun Life Financial, Inc. |
|
|
3,587 |
|
|
|
114,790 |
|
|
|
|
| Suncor Energy, Inc. |
|
|
29,505 |
|
|
|
960,967 |
|
|
|
|
| Superior Plus Corp.# |
|
|
29,000 |
|
|
|
333,386 |
|
|
|
|
| Talisman Energy, Inc. |
|
|
25,355 |
|
|
|
202,328 |
|
|
|
|
| Teck Resources Ltd.# |
|
|
8,809 |
|
|
|
133,721 |
|
|
|
|
| TELUS Corp. |
|
|
1,729 |
|
|
|
59,802 |
|
|
|
|
| Thomson Reuters Corp.# |
|
|
2,729 |
|
|
|
112,123 |
|
|
|
|
| Toronto-Dominion Bank |
|
|
3,201 |
|
|
|
147,779 |
|
|
|
|
| Tourmaline Oil Corp.* |
|
|
2,741 |
|
|
|
94,600 |
|
|
|
|
| TransAlta Corp.# |
|
|
7,100 |
|
|
|
70,544 |
|
|
|
|
| TransCanada Corp. |
|
|
1,159 |
|
|
|
53,795 |
|
|
|
|
| Transcontinental, Inc. |
|
|
12,000 |
|
|
|
184,799 |
|
|
|
|
|
|
|
|
|
|
| Description |
|
Number of
Shares |
|
|
Value |
|
|
|
|
| Turquoise Hill Resources Ltd. |
|
|
5,300 |
|
|
$ |
22,228 |
|
|
|
|
| Valeant Pharmaceuticals International, Inc.* |
|
|
21,451 |
|
|
|
4,651,658 |
|
|
|
|
| Vermilion Energy, Inc. |
|
|
982 |
|
|
|
47,273 |
|
|
|
|
| WestJet Airlines Ltd. |
|
|
12,000 |
|
|
|
271,828 |
|
|
|
|
| Whitecap Resources, Inc.# |
|
|
5,000 |
|
|
|
61,956 |
|
|
|
|
| Yamana Gold, Inc. |
|
|
14,015 |
|
|
|
53,551 |
|
|
|
|
|
|
|
|
|
|
|
|
|
| TOTAL CANADA |
|
|
|
|
|
$ |
21,023,373 |
|
|
|
|
| CHILE – 0.4% |
|
|
|
|
|
|
|
|
|
|
|
| AES Gener SA |
|
|
53,119 |
|
|
|
30,603 |
|
|
|
|
| Aguas Andinas SA |
|
|
57,100 |
|
|
|
33,775 |
|
|
|
|
| Antarchile SA |
|
|
5,564 |
|
|
|
70,045 |
|
|
|
|
| Banco de Chile |
|
|
861,492 |
|
|
|
99,016 |
|
|
|
|
| Banco de Credito e Inversiones |
|
|
1,241 |
|
|
|
61,870 |
|
|
|
|
| Banco Santander Chile |
|
|
876,218 |
|
|
|
47,174 |
|
|
|
|
| Banco Santander Chile ADR |
|
|
2,592 |
|
|
|
56,532 |
|
|
|
|
| Banmedica SA |
|
|
35,543 |
|
|
|
74,933 |
|
|
|
|
| CAP SA |
|
|
2,590 |
|
|
|
9,244 |
|
|
|
|
| Cencosud SA |
|
|
25,800 |
|
|
|
66,848 |
|
|
|
|
| Cia Cervecerias Unidas SA ADR |
|
|
2,500 |
|
|
|
54,675 |
|
|
|
|
| Colbun SA |
|
|
160,447 |
|
|
|
48,542 |
|
|
|
|
| Corpbanca SA |
|
|
6,076,800 |
|
|
|
68,830 |
|
|
|
|
| Empresa Nacional de Electricidad SA ADR |
|
|
2,110 |
|
|
|
97,313 |
|
|
|
|
| Empresas CMPC SA |
|
|
40,150 |
|
|
|
112,648 |
|
|
|
|
| Empresas COPEC SA |
|
|
17,135 |
|
|
|
196,692 |
|
|
|
|
| Enersis SA |
|
|
404,755 |
|
|
|
141,388 |
|
|
|
|
| ENTEL Chile SA |
|
|
16,674 |
|
|
|
188,579 |
|
|
|
|
| Latam Airlines Group SA |
|
|
5,926 |
|
|
|
56,711 |
|
|
|
|
| Parque Arauco SA |
|
|
33,651 |
|
|
|
68,661 |
|
|
|
|
| Quinenco SA |
|
|
31,602 |
|
|
|
68,722 |
|
|
|
|
| Ripley Corp. SA |
|
|
37,500 |
|
|
|
19,926 |
|
|
|
|
| SACI Falabella |
|
|
21,748 |
|
|
|
169,646 |
|
|
|
|
| Sociedad Matriz SAAM SA |
|
|
373,941 |
|
|
|
33,020 |
|
|
|
|
| Sonda SA |
|
|
49,407 |
|
|
|
116,706 |
|
|
|
|
| Vina Concha y Toro SA ADR# |
|
|
1,100 |
|
|
|
42,922 |
|
|
|
|
|
|
|
|
|
|
|
|
|
| TOTAL CHILE |
|
|
|
|
|
$ |
2,035,021 |
|
|
|
|
| CHINA – 4.0% |
|
|
|
|
|
|
|
|
|
|
|
| Agricultural Bank of China
Ltd.†† |
|
|
132,000 |
|
|
|
74,313 |
|
|
|
|
| Anhui Conch Cement Co.
Ltd.†† |
|
|
24,000 |
|
|
|
97,038 |
|
|
|
|
| Baidu, Inc. ADR* |
|
|
1,100 |
|
|
|
220,308 |
|
|
|
|
| Bank of China Ltd.†† |
|
|
138,000 |
|
|
|
94,558 |
|
|
|
|
| Bank of Communications Co.
Ltd.†† |
|
|
78,800 |
|
|
|
80,775 |
|
|
|
|
| Belle International Holdings
Ltd.†† |
|
|
55,000 |
|
|
|
70,591 |
|
|
|
|
| Brilliance China Automotive Holdings
Ltd.†† |
|
|
28,000 |
|
|
|
52,548 |
|
|
|
|
| Byd Co.
Ltd.#,*,††
|
|
|
6,000 |
|
|
|
36,248 |
|
|
|
|
| China Agri-Industries Holdings
Ltd.†† |
|
|
145,000 |
|
|
|
82,802 |
|
|
|
|
| China CITIC Bank Corp.
Ltd.†† |
|
|
42,000 |
|
|
|
38,088 |
|
|
|
|
| China Coal Energy Co.
Ltd.#,†† |
|
|
75,000 |
|
|
|
49,300 |
|
ANNUAL REPORT / April 30, 2015
28 PORTFOLIOS OF
INVESTMENTS
Wilmington Multi-Manager International Fund
(continued)
|
|
|
|
|
|
|
|
|
| Description |
|
Number of
Shares |
|
|
Value |
|
|
|
|
| China Communications Construction Co.
Ltd.†† |
|
|
96,000 |
|
|
$ |
174,610 |
|
|
|
|
| China Construction Bank
Corp.†† |
|
|
144,810 |
|
|
|
140,572 |
|
|
|
|
| China COSCO Holdings Co. Ltd.#,*,†† |
|
|
135,500 |
|
|
|
124,579 |
|
|
|
|
| China Eastern Airlines Corp.
Ltd.*,†† |
|
|
74,000 |
|
|
|
57,141 |
|
|
|
|
| China Life Insurance Co.
Ltd.†† |
|
|
16,000 |
|
|
|
77,653 |
|
|
|
|
| China Longyuan Power Group
Corp.†† |
|
|
37,000 |
|
|
|
45,854 |
|
|
|
|
| China Mengniu Dairy Co.
Ltd.†† |
|
|
15,000 |
|
|
|
75,989 |
|
|
|
|
| China Merchants Bank Co.
Ltd.†† |
|
|
23,052 |
|
|
|
69,194 |
|
|
|
|
| China Merchants Holdings International Co.
Ltd.†† |
|
|
18,000 |
|
|
|
81,660 |
|
|
|
|
| China Minsheng Banking Corp.
Ltd.†† |
|
|
72,000 |
|
|
|
105,132 |
|
|
|
|
| China Mobile Ltd.†† |
|
|
377,989 |
|
|
|
5,398,925 |
|
|
|
|
| China National Building Material Co.
Ltd.†† |
|
|
34,000 |
|
|
|
41,240 |
|
|
|
|
| China Oilfield Services
Ltd.†† |
|
|
16,000 |
|
|
|
32,851 |
|
|
|
|
| China Overseas Land & Investment
Ltd.†† |
|
|
20,320 |
|
|
|
84,641 |
|
|
|
|
| China Pacific Insurance Group Co.
Ltd.†† |
|
|
6,800 |
|
|
|
36,858 |
|
|
|
|
| China Petroleum & Chemical
Corp.†† |
|
|
235,800 |
|
|
|
222,540 |
|
|
|
|
| China Railway Construction Corp.
Ltd.†† |
|
|
29,400 |
|
|
|
58,704 |
|
|
|
|
| China Resources Enterprise
Ltd.†† |
|
|
26,000 |
|
|
|
79,647 |
|
|
|
|
| China Resources Land
Ltd.†† |
|
|
10,222 |
|
|
|
37,088 |
|
|
|
|
| China Resources Power Holdings Co.
Ltd.†† |
|
|
39,600 |
|
|
|
119,459 |
|
|
|
|
| China Shenhua Energy Co.
Ltd.†† |
|
|
32,000 |
|
|
|
83,106 |
|
|
|
|
| China Southern Airlines Co.
Ltd.†† |
|
|
81,000 |
|
|
|
79,600 |
|
|
|
|
| China Telecom Corp.
Ltd.†† |
|
|
202,000 |
|
|
|
149,643 |
|
|
|
|
| China Unicom Hong Kong
Ltd.†† |
|
|
54,652 |
|
|
|
102,644 |
|
|
|
|
| China Yurun Food Group Ltd.#,*,†† |
|
|
106,000 |
|
|
|
36,552 |
|
|
|
|
| CNOOC Ltd.†† |
|
|
150,000 |
|
|
|
255,782 |
|
|
|
|
| COSCO Pacific Ltd.†† |
|
|
38,000 |
|
|
|
59,590 |
|
|
|
|
| Ctrip.com International Ltd. ADR* |
|
|
1,600 |
|
|
|
101,888 |
|
|
|
|
| Datang International Power Generation Co.
Ltd.†† |
|
|
132,000 |
|
|
|
77,215 |
|
|
|
|
| Dongfeng Motor Group Co.
Ltd.†† |
|
|
30,000 |
|
|
|
49,841 |
|
|
|
|
| Great Wall Motor Co.
Ltd.#,†† |
|
|
616,426 |
|
|
|
4,677,182 |
|
|
|
|
| Guangzhou Automobile Group Co.
Ltd.†† |
|
|
64,974 |
|
|
|
70,538 |
|
|
|
|
| Hengan International Group Co.
Ltd.†† |
|
|
6,500 |
|
|
|
80,190 |
|
|
|
|
| Industrial & Commercial Bank of
China†† |
|
|
149,000 |
|
|
|
129,252 |
|
|
|
|
| Inner Mongolia Yitai Coal
Co.†† |
|
|
13,200 |
|
|
|
20,026 |
|
|
|
|
| Intime Retail Group Co.
Ltd.†† |
|
|
35,000 |
|
|
|
39,135 |
|
|
|
|
| Jiangxi Copper Co. Ltd.†† |
|
|
20,000 |
|
|
|
41,274 |
|
|
|
|
| Kingboard Chemical Holdings
Ltd.†† |
|
|
136,200 |
|
|
|
247,885 |
|
|
|
|
| Kunlun Energy Co.
Ltd.#,†† |
|
|
28,000 |
|
|
|
33,240 |
|
|
|
|
| Lenovo Group Ltd.†† |
|
|
40,000 |
|
|
|
68,783 |
|
|
|
|
| NetEase, Inc. ADR |
|
|
1,100 |
|
|
|
141,009 |
|
|
|
|
| New Oriental Education & Technology |
|
|
|
|
|
|
|
|
|
|
|
| Group ADR |
|
|
2,600 |
|
|
|
66,534 |
|
|
|
|
| Parkson Retail Group
Ltd.†† |
|
|
84,000 |
|
|
|
21,282 |
|
|
|
|
| PetroChina Co. Ltd.†† |
|
|
196,000 |
|
|
|
252,794 |
|
|
|
|
|
|
|
|
|
|
| Description |
|
Number of
Shares |
|
|
Value |
|
|
|
|
| PICC Property & Casualty Co.
Ltd.†† |
|
|
20,000 |
|
|
$ |
44,311 |
|
|
|
|
| Ping An Insurance Group Co. of China
Ltd.†† |
|
|
5,000 |
|
|
|
71,506 |
|
|
|
|
| Qihoo 360 Technology Co. Ltd. ADR* |
|
|
700 |
|
|
|
42,210 |
|
|
|
|
| Shandong Weigao Group Medical Polymer Co.
Ltd.†† |
|
|
64,000 |
|
|
|
59,147 |
|
|
|
|
| Shanghai Electric Group Co.
Ltd.#,†† |
|
|
90,000 |
|
|
|
91,773 |
|
|
|
|
| Shanghai Industrial Holdings
Ltd.#,†† |
|
|
13,000 |
|
|
|
51,831 |
|
|
|
|
| Sihuan Pharmaceutical Holdings Group Ltd. |
|
|
69,000 |
|
|
|
31,408 |
|
|
|
|
| SINA Corp.* |
|
|
900 |
|
|
|
39,596 |
|
|
|
|
| Sinopec Shanghai Petrochemical Co.
Ltd.†† |
|
|
81,000 |
|
|
|
48,936 |
|
|
|
|
| Sinopharm Group Co.-H†† |
|
|
14,400 |
|
|
|
68,397 |
|
|
|
|
| Sohu.com, Inc.* |
|
|
700 |
|
|
|
46,515 |
|
|
|
|
| Tencent Holdings Ltd.†† |
|
|
271,996 |
|
|
|
5,613,693 |
|
|
|
|
| Tingyi Cayman Islands Holding
Corp.†† |
|
|
14,000 |
|
|
|
29,565 |
|
|
|
|
| Want Want China Holdings
Ltd.#,†† |
|
|
65,000 |
|
|
|
71,300 |
|
|
|
|
| Wumart Stores, Inc.†† |
|
|
27,000 |
|
|
|
23,599 |
|
|
|
|
| Yangzijiang Shipbuilding Holdings
Ltd.†† |
|
|
28,000 |
|
|
|
30,921 |
|
|
|
|
| Yantai Changyu Pioneer Wine Co.
Ltd.†† |
|
|
9,100 |
|
|
|
42,002 |
|
|
|
|
| Yanzhou Coal Mining Co.
Ltd.†† |
|
|
40,000 |
|
|
|
39,998 |
|
|
|
|
| Youku Tudou, Inc. ADR#,* |
|
|
1,300 |
|
|
|
24,310 |
|
|
|
|
| Zijin Mining Group Co. Ltd. |
|
|
90,000 |
|
|
|
34,720 |
|
|
|
|
| ZTE Corp.†† |
|
|
11,440 |
|
|
|
38,496 |
|
|
|
|
|
|
|
|
|
|
|
|
|
| TOTAL CHINA |
|
|
|
|
|
$ |
21,390,125 |
|
|
|
|
| COLOMBIA – 0.4% |
|
|
|
|
|
|
|
|
|
|
|
| Almacenes Exito SA |
|
|
5,850 |
|
|
|
63,707 |
|
|
|
|
| Banco de Bogota SA |
|
|
1,888 |
|
|
|
49,839 |
|
|
|
|
| Bancolombia SA ADR# |
|
|
30,608 |
|
|
|
1,385,624 |
|
|
|
|
| Celsia SA Esp |
|
|
6,600 |
|
|
|
13,992 |
|
|
|
|
| Cementos Argos SA |
|
|
19,300 |
|
|
|
81,997 |
|
|
|
|
| Corp. Financiera Colombiana SA |
|
|
1,730 |
|
|
|
27,817 |
|
|
|
|
| Ecopetrol SA |
|
|
64,690 |
|
|
|
55,130 |
|
|
|
|
| Ecopetrol SA ADR# |
|
|
8,000 |
|
|
|
136,960 |
|
|
|
|
| Empresa de Energia de Bogota SA |
|
|
67,410 |
|
|
|
48,110 |
|
|
|
|
| Grupo Argos SA |
|
|
10,017 |
|
|
|
78,639 |
|
|
|
|
| Grupo Aval Acciones y Valores |
|
|
107,700 |
|
|
|
54,483 |
|
|
|
|
| Grupo de Inversiones Suramericana SA |
|
|
5,400 |
|
|
|
88,730 |
|
|
|
|
| Grupo Nutresa SA |
|
|
12,078 |
|
|
|
125,546 |
|
|
|
|
| Grupo Odinsa SA |
|
|
6,695 |
|
|
|
26,589 |
|
|
|
|
| Interconexion Electrica SA ESP |
|
|
13,178 |
|
|
|
44,259 |
|
|
|
|
| Isagen SA ESP |
|
|
48,800 |
|
|
|
65,251 |
|
|
|
|
|
|
|
|
|
|
|
|
|
| TOTAL COLOMBIA |
|
|
|
|
|
$ |
2,346,673 |
|
|
|
|
| CROATIA – 0.1% |
|
|
|
|
|
|
|
|
|
|
|
| Atlantska Plovidba DD*,†† |
|
|
262 |
|
|
|
8,259 |
|
|
|
|
| Ericsson Nikola Tesla†† |
|
|
200 |
|
|
|
39,920 |
|
|
|
|
| Hrvatski Telekom DD†† |
|
|
5,250 |
|
|
|
128,892 |
|
|
|
|
| April 30, 2015 / ANNUAL REPORT |
|
|
PORTFOLIOS OF INVESTMENTS 29
Wilmington Multi-Manager International Fund
(continued)
|
|
|
|
|
|
|
|
|
| Description |
|
Number of
Shares |
|
|
Value |
|
|
|
|
| Koncar-Elektroindustrija
DD†† |
|
|
720 |
|
|
$ |
75,118 |
|
|
|
|
| Ledo DD†† |
|
|
20 |
|
|
|
22,739 |
|
|
|
|
| Podravka DD*,†† |
|
|
1,000 |
|
|
|
47,363 |
|
|
|
|
| Privredna Banka Zagreb DD |
|
|
830 |
|
|
|
67,782 |
|
|
|
|
| Valamar Riviera DD†† |
|
|
16,851 |
|
|
|
51,605 |
|
|
|
|
| VIRO Tvornica Secera*,†† |
|
|
370 |
|
|
|
16,191 |
|
|
|
|
| Zagrebacka Banka DD†† |
|
|
3,000 |
|
|
|
15,808 |
|
|
|
|
|
|
|
|
|
|
|
|
|
| TOTAL CROATIA |
|
|
|
|
|
$ |
473,677 |
|
|
|
|
| CZECH REPUBLIC – 0.2% |
|
|
|
|
|
|
|
|
|
|
|
| CEZ AS†† |
|
|
13,570 |
|
|
|
352,551 |
|
|
|
|
| Komercni Banka AS†† |
|
|
1,400 |
|
|
|
311,983 |
|
|
|
|
| Pegas Nonwovens SA†† |
|
|
1,790 |
|
|
|
53,340 |
|
|
|
|
| Philip Morris CR AS†† |
|
|
180 |
|
|
|
76,687 |
|
|
|
|
| Unipetrol AS*,†† |
|
|
15,059 |
|
|
|
94,676 |
|
|
|
|
|
|
|
|
|
|
|
|
|
| TOTAL CZECH REPUBLIC |
|
|
|
|
|
$ |
889,237 |
|
|
|
|
| DENMARK – 1.5% |
|
|
|
|
|
|
|
|
|
|
|
| AP Moeller - Maersk A/S Class
A†† |
|
|
275 |
|
|
|
134,953 |
|
|
|
|
| AP Moeller - Maersk A/S Class
B†† |
|
|
70 |
|
|
|
545,761 |
|
|
|
|
| Carlsberg A/S#,†† |
|
|
2,102 |
|
|
|
191,636 |
|
|
|
|
| CHR Hansen Holding A/S†† |
|
|
5,000 |
|
|
|
242,060 |
|
|
|
|
| Coloplast A/S†† |
|
|
246 |
|
|
|
20,080 |
|
|
|
|
| Danske Bank A/S†† |
|
|
5,976 |
|
|
|
169,484 |
|
|
|
|
| DSV A/S†† |
|
|
1,213 |
|
|
|
42,079 |
|
|
|
|
| Genmab A/S*,†† |
|
|
6,412 |
|
|
|
493,732 |
|
|
|
|
| Jyske Bank-Reg†† |
|
|
897 |
|
|
|
43,925 |
|
|
|
|
| Novo Nordisk A/S Class
B†† |
|
|
71,332 |
|
|
|
4,004,627 |
|
|
|
|
| Novozymes A/S†† |
|
|
785 |
|
|
|
36,217 |
|
|
|
|
| Pandora A/S†† |
|
|
7,300 |
|
|
|
754,539 |
|
|
|
|
| Royal Unibrew†† |
|
|
1,231 |
|
|
|
235,660 |
|
|
|
|
| Sydbank A/S†† |
|
|
8,200 |
|
|
|
307,813 |
|
|
|
|
| TDC A/S†† |
|
|
72,292 |
|
|
|
550,389 |
|
|
|
|
| Tryg A/S†† |
|
|
98 |
|
|
|
10,642 |
|
|
|
|
| Vestas Wind Systems A/S*,†† |
|
|
3,479 |
|
|
|
157,799 |
|
|
|
|
| William Demant Holding
A/S*,†† |
|
|
4,131 |
|
|
|
339,700 |
|
|
|
|
|
|
|
|
|
|
|
|
|
| TOTAL DENMARK |
|
|
|
|
|
$ |
8,281,096 |
|
|
|
|
| EGYPT – 0.2% |
|
|
|
|
|
|
|
|
|
|
|
| Alexandria Mineral Oils
Co.†† |
|
|
6,200 |
|
|
|
38,100 |
|
|
|
|
| Commercial International Bank Egypt
SAE†† |
|
|
39,655 |
|
|
|
287,003 |
|
|
|
|
| Eastern Tobacco†† |
|
|
3,670 |
|
|
|
94,227 |
|
|
|
|
| Egyptian Financial Group-Hermes
Holding*,†† |
|
|
30,365 |
|
|
|
56,642 |
|
|
|
|
| Egyptian Kuwaiti Holding Co.
SAE*,†† |
|
|
49,507 |
|
|
|
32,632 |
|
|
|
|
| ElSwedy Electric Co.†† |
|
|
17,100 |
|
|
|
106,161 |
|
|
|
|
| EZZ Steel* |
|
|
27,000 |
|
|
|
45,646 |
|
|
|
|
| Juhayna Food Industries†† |
|
|
61,900 |
|
|
|
75,620 |
|
|
|
|
| Orascom Telecom Holding
SAE*,†† |
|
|
272,255 |
|
|
|
115,664 |
|
|
|
|
|
|
|
|
|
|
| Description |
|
Number of
Shares |
|
|
Value |
|
|
|
|
| Orascom Telecom Media & Technology Holding SAE*,†† |
|
|
224,975 |
|
|
$ |
28,285 |
|
|
|
|
| Oriental Weavers†† |
|
|
40,500 |
|
|
|
55,976 |
|
|
|
|
| Sidi Kerir Petrochemicals
Co.†† |
|
|
30,650 |
|
|
|
59,154 |
|
|
|
|
| Six of October
Development*,†† |
|
|
8,300 |
|
|
|
12,578 |
|
|
|
|
| Talaat Moustafa Group†† |
|
|
63,935 |
|
|
|
84,170 |
|
|
|
|
|
|
|
|
|
|
|
|
|
| TOTAL EGYPT |
|
|
|
|
|
$ |
1,091,858 |
|
|
|
|
| ESTONIA – 0.1% |
|
|
|
|
|
|
|
|
|
|
|
| AS Merko Ehitus†† |
|
|
4,300 |
|
|
|
48,112 |
|
|
|
|
| AS Tallinna Vesi†† |
|
|
5,400 |
|
|
|
89,776 |
|
|
|
|
| Nordecon AS†† |
|
|
12,000 |
|
|
|
14,690 |
|
|
|
|
| Olympic Entertainment Group
AS†† |
|
|
42,630 |
|
|
|
91,769 |
|
|
|
|
| Tallink Group AS†† |
|
|
198,320 |
|
|
|
171,288 |
|
|
|
|
| Tallinna Kaubamaja AS†† |
|
|
11,600 |
|
|
|
77,684 |
|
|
|
|
|
|
|
|
|
|
|
|
|
| TOTAL ESTONIA |
|
|
|
|
|
$ |
493,319 |
|
|
|
|
| FINLAND – 1.2% |
|
|
|
|
|
|
|
|
|
|
|
| Amer Sports OYJ†† |
|
|
10,200 |
|
|
|
255,266 |
|
|
|
|
| Cargotec Corp. Class B†† |
|
|
8,600 |
|
|
|
346,715 |
|
|
|
|
| Fortum OYJ†† |
|
|
10,774 |
|
|
|
212,758 |
|
|
|
|
| Huhtamaki OYJ†† |
|
|
12,400 |
|
|
|
396,401 |
|
|
|
|
| Kone OYJ†† |
|
|
1,037 |
|
|
|
44,613 |
|
|
|
|
| Neste Oil OYJ#,†† |
|
|
17,629 |
|
|
|
479,475 |
|
|
|
|
| Nokia OYJ*,†† |
|
|
558,216 |
|
|
|
3,766,530 |
|
|
|
|
| Outotec OYJ#,*,†† |
|
|
37,000 |
|
|
|
258,517 |
|
|
|
|
| Stora Enso OYJ†† |
|
|
15,540 |
|
|
|
163,532 |
|
|
|
|
| UPM-Kymmene OYJ†† |
|
|
20,475 |
|
|
|
370,487 |
|
|
|
|
| Uponor OYJ†† |
|
|
7,100 |
|
|
|
109,338 |
|
|
|
|
| Wartsila OYJ Abp†† |
|
|
1,296 |
|
|
|
59,461 |
|
|
|
|
|
|
|
|
|
|
|
|
|
| TOTAL FINLAND |
|
|
|
|
|
$ |
6,463,093 |
|
|
|
|
| FRANCE – 7.9% |
|
|
|
|
|
|
|
|
|
|
|
| Accor SA†† |
|
|
11,238 |
|
|
|
616,235 |
|
|
|
|
| Air Liquide SA†† |
|
|
10,899 |
|
|
|
1,425,377 |
|
|
|
|
| Alstom SA†† |
|
|
9,000 |
|
|
|
282,729 |
|
|
|
|
| Arkema SA#,†† |
|
|
2,079 |
|
|
|
167,304 |
|
|
|
|
| AtoS†† |
|
|
133 |
|
|
|
10,395 |
|
|
|
|
| AXA SA†† |
|
|
148,173 |
|
|
|
3,746,685 |
|
|
|
|
| BNP Paribas SA†† |
|
|
18,371 |
|
|
|
1,160,154 |
|
|
|
|
| Bollore SA†† |
|
|
6,403 |
|
|
|
36,593 |
|
|
|
|
| Bouygues SA†† |
|
|
6,300 |
|
|
|
260,094 |
|
|
|
|
| Bureau Veritas SA†† |
|
|
1,528 |
|
|
|
35,981 |
|
|
|
|
| Casino Guichard Perrachon
SA†† |
|
|
1,573 |
|
|
|
139,097 |
|
|
|
|
| Christian Dior SA†† |
|
|
241 |
|
|
|
47,116 |
|
|
|
|
| Cie de St-Gobain#,†† |
|
|
38,013 |
|
|
|
1,727,582 |
|
|
|
|
| Cie Generale des Etablissements
Michelin†† |
|
|
21,905 |
|
|
|
2,442,758 |
|
|
|
|
| CNP Assurances†† |
|
|
33,410 |
|
|
|
600,495 |
|
|
|
|
| Credit Agricole SA†† |
|
|
30,899 |
|
|
|
480,738 |
|
|
|
|
| Danone SA†† |
|
|
670 |
|
|
|
48,483 |
|
ANNUAL REPORT / April 30,
2015
30 PORTFOLIOS
OF INVESTMENTS
Wilmington Multi-Manager International Fund
(continued)
|
|
|
|
|
|
|
|
|
| Description |
|
Number of
Shares |
|
|
Value |
|
|
|
|
| Edenred†† |
|
|
974 |
|
|
$ |
26,112 |
|
|
|
|
| Electricite de France
SA†† |
|
|
29,206 |
|
|
|
743,144 |
|
|
|
|
| Essilor International
SA†† |
|
|
20,626 |
|
|
|
2,512,870 |
|
|
|
|
| GDF Suez†† |
|
|
22,279 |
|
|
|
453,298 |
|
|
|
|
| Gemalto NV†† |
|
|
147 |
|
|
|
13,657 |
|
|
|
|
| Hermes International†† |
|
|
400 |
|
|
|
150,852 |
|
|
|
|
| Iliad SA†† |
|
|
79 |
|
|
|
18,624 |
|
|
|
|
| Ingenico Group†† |
|
|
1,400 |
|
|
|
175,662 |
|
|
|
|
| JCDecaux SA†† |
|
|
22,391 |
|
|
|
884,536 |
|
|
|
|
| Kering†† |
|
|
249 |
|
|
|
46,049 |
|
|
|
|
| Lafarge SA†† |
|
|
4,064 |
|
|
|
296,530 |
|
|
|
|
| Lagardere SCA†† |
|
|
2,100 |
|
|
|
67,412 |
|
|
|
|
| Legrand SA†† |
|
|
25,645 |
|
|
|
1,482,867 |
|
|
|
|
| L’Oreal SA†† |
|
|
36,783 |
|
|
|
7,019,708 |
|
|
|
|
| LVMH Moet Hennessy Louis Vuitton
SA†† |
|
|
9,916 |
|
|
|
1,733,976 |
|
|
|
|
| Metropole Television SA†† |
|
|
16,500 |
|
|
|
344,369 |
|
|
|
|
| Natixis†† |
|
|
18,680 |
|
|
|
154,623 |
|
|
|
|
| Orange SA†† |
|
|
32,409 |
|
|
|
533,820 |
|
|
|
|
| Pernod-Ricard SA†† |
|
|
20,372 |
|
|
|
2,531,914 |
|
|
|
|
| Peugeot SA*,†† |
|
|
13,836 |
|
|
|
261,579 |
|
|
|
|
| Publicis Groupe SA |
|
|
1,052 |
|
|
|
88,232 |
|
|
|
|
| Renault SA†† |
|
|
5,479 |
|
|
|
576,488 |
|
|
|
|
| Rexel SA†† |
|
|
4,831 |
|
|
|
91,048 |
|
|
|
|
| Sa des Ciments Vicat†† |
|
|
165 |
|
|
|
11,898 |
|
|
|
|
| Sanofi†† |
|
|
9,655 |
|
|
|
982,789 |
|
|
|
|
| Schneider Electric SA†† |
|
|
44,138 |
|
|
|
3,299,250 |
|
|
|
|
| SCOR SE†† |
|
|
7,560 |
|
|
|
272,098 |
|
|
|
|
| SEB SA†† |
|
|
6,100 |
|
|
|
564,882 |
|
|
|
|
| SES SA†† |
|
|
1,261 |
|
|
|
44,193 |
|
|
|
|
| Societe BIC SA†† |
|
|
157 |
|
|
|
26,821 |
|
|
|
|
| Societe Generale SA†† |
|
|
18,578 |
|
|
|
928,803 |
|
|
|
|
| STMicroelectronics NV†† |
|
|
15,609 |
|
|
|
124,491 |
|
|
|
|
| Suez Environnement
Co.*,†† |
|
|
2,225 |
|
|
|
45,380 |
|
|
|
|
| Technip SA†† |
|
|
482 |
|
|
|
32,859 |
|
|
|
|
| Teleperformance†† |
|
|
4,300 |
|
|
|
322,776 |
|
|
|
|
| Thales SA†† |
|
|
7,600 |
|
|
|
462,657 |
|
|
|
|
| Total SA†† |
|
|
22,998 |
|
|
|
1,245,342 |
|
|
|
|
| Valeo SA†† |
|
|
2,700 |
|
|
|
432,864 |
|
|
|
|
| Vallourec SA†† |
|
|
2,403 |
|
|
|
56,665 |
|
|
|
|
| Veolia Environnement SA†† |
|
|
1,458 |
|
|
|
30,851 |
|
|
|
|
| Vinci SA†† |
|
|
1,080 |
|
|
|
66,242 |
|
|
|
|
| Vivendi SA†† |
|
|
7,707 |
|
|
|
193,204 |
|
|
|
|
| Zodiac Aerospace†† |
|
|
1,495 |
|
|
|
54,901 |
|
|
|
|
|
|
|
|
|
|
|
|
|
| TOTAL FRANCE |
|
|
|
|
|
$ |
42,634,152 |
|
|
|
|
| GERMANY – 7.4% |
|
|
|
|
|
|
|
|
|
|
|
| Adidas AG†† |
|
|
1,066 |
|
|
|
87,344 |
|
|
|
|
|
|
|
|
|
|
| Description |
|
Number of
Shares |
|
|
Value |
|
|
|
|
| Allianz SE†† |
|
|
27,568 |
|
|
$ |
4,692,486 |
|
|
|
|
| Aurelius AG†† |
|
|
3,900 |
|
|
|
187,005 |
|
|
|
|
| BASF SE#,†† |
|
|
9,053 |
|
|
|
899,399 |
|
|
|
|
| Bayer AG†† |
|
|
1,988 |
|
|
|
286,138 |
|
|
|
|
| Bayerische Motoren Werke
AG†† |
|
|
12,596 |
|
|
|
1,485,884 |
|
|
|
|
| Brenntag AG†† |
|
|
454 |
|
|
|
27,240 |
|
|
|
|
| Celesio AG†† |
|
|
1,825 |
|
|
|
54,156 |
|
|
|
|
| Commerzbank AG*,†† |
|
|
9,457 |
|
|
|
127,584 |
|
|
|
|
| Continental AG# |
|
|
451 |
|
|
|
105,694 |
|
|
|
|
| Daimler AG†† |
|
|
46,938 |
|
|
|
4,512,941 |
|
|
|
|
| Deutsche Bank AG†† |
|
|
24,901 |
|
|
|
796,804 |
|
|
|
|
| Deutsche Lufthansa AG†† |
|
|
5,417 |
|
|
|
74,709 |
|
|
|
|
| Deutsche Post AG†† |
|
|
2,070 |
|
|
|
68,162 |
|
|
|
|
| Deutsche Telekom AG†† |
|
|
6,972 |
|
|
|
128,150 |
|
|
|
|
| E.ON AG†† |
|
|
22,227 |
|
|
|
346,030 |
|
|
|
|
| Fraport AG Frankfurt Airport Services
Worldwide†† |
|
|
1,145 |
|
|
|
72,420 |
|
|
|
|
| Freenet AG†† |
|
|
12,600 |
|
|
|
408,116 |
|
|
|
|
| Fresenius Medical Care AG & Co.
KGaA†† |
|
|
11,577 |
|
|
|
972,952 |
|
|
|
|
| Fresenius SE & Co.
KGaA†† |
|
|
23,264 |
|
|
|
1,384,045 |
|
|
|
|
| GEA Group AG†† |
|
|
91,237 |
|
|
|
4,381,747 |
|
|
|
|
| Hannover Rueck SE†† |
|
|
812 |
|
|
|
82,540 |
|
|
|
|
| HeidelbergCement AG†† |
|
|
3,305 |
|
|
|
253,694 |
|
|
|
|
| Henkel AG & Co.
KGaA†† |
|
|
42,837 |
|
|
|
4,339,199 |
|
|
|
|
| K+S AG#,†† |
|
|
3,051 |
|
|
|
99,461 |
|
|
|
|
| Kion Group AG*,†† |
|
|
6,400 |
|
|
|
283,936 |
|
|
|
|
| Linde AG†† |
|
|
13,224 |
|
|
|
2,584,101 |
|
|
|
|
| Merck KGaA†† |
|
|
2,174 |
|
|
|
234,368 |
|
|
|
|
| Metro AG†† |
|
|
3,123 |
|
|
|
113,192 |
|
|
|
|
| Muenchener Rueckversicherungs
AG†† |
|
|
4,387 |
|
|
|
856,333 |
|
|
|
|
| Osram Licht AG*,†† |
|
|
311 |
|
|
|
16,385 |
|
|
|
|
| ProSiebenSat.1 Media AG†† |
|
|
1,194 |
|
|
|
61,046 |
|
|
|
|
| Rheinmetall AG†† |
|
|
2,600 |
|
|
|
133,115 |
|
|
|
|
| RWE AG†† |
|
|
4,651 |
|
|
|
115,575 |
|
|
|
|
| SAP AG†† |
|
|
42,303 |
|
|
|
3,196,630 |
|
|
|
|
| Siemens AG†† |
|
|
1,359 |
|
|
|
147,835 |
|
|
|
|
| Sixt SE†† |
|
|
4,500 |
|
|
|
215,482 |
|
|
|
|
| Stada Arzneimittel AG†† |
|
|
5,400 |
|
|
|
197,526 |
|
|
|
|
| Stroeer Media SE†† |
|
|
9,200 |
|
|
|
340,145 |
|
|
|
|
| Symrise AG†† |
|
|
69,433 |
|
|
|
4,209,965 |
|
|
|
|
| Talanx AG†† |
|
|
928 |
|
|
|
29,520 |
|
|
|
|
| Telefonica Deutschland
Holdi†† |
|
|
11,335 |
|
|
|
70,250 |
|
|
|
|
| United Internet AG†† |
|
|
702 |
|
|
|
31,386 |
|
|
|
|
| Volkswagen AG†† |
|
|
2,822 |
|
|
|
714,852 |
|
|
|
|
| Wincor Nixdorf AG†† |
|
|
7,300 |
|
|
|
276,310 |
|
|
|
|
| Zalando SE*,†† |
|
|
11,200 |
|
|
|
344,271 |
|
|
|
|
|
|
|
|
|
|
|
|
|
| TOTAL GERMANY |
|
|
|
|
|
$ |
40,046,123 |
|
April 30, 2015 / ANNUAL REPORT
PORTFOLIOS OF INVESTMENTS 31
Wilmington Multi-Manager International Fund
(continued)
|
|
|
|
|
|
|
|
|
| Description |
|
Number of
Shares |
|
|
Value |
|
|
|
|
| GHANA – 0.1% |
|
|
|
|
|
|
|
|
|
|
|
| CAL Bank Ltd.†† |
|
|
498,146 |
|
|
$ |
135,114 |
|
|
|
|
| Ghana Commercial Bank
Ltd.†† |
|
|
92,696 |
|
|
|
129,323 |
|
|
|
|
| HFC Bank Ghana Ltd. |
|
|
160,050 |
|
|
|
71,087 |
|
|
|
|
| Produce Buying Co. Ltd.* |
|
|
288,000 |
|
|
|
8,977 |
|
|
|
|
| Standard Chartered Bank Ghana
Ltd.†† |
|
|
13,200 |
|
|
|
69,650 |
|
|
|
|
|
|
|
|
|
|
|
|
|
| TOTAL GHANA |
|
|
|
|
|
$ |
414,151 |
|
|
|
|
| GREECE – 0.2% |
|
|
|
|
|
|
|
|
|
|
|
| Alpha Bank AE*,†† |
|
|
128,958 |
|
|
|
45,188 |
|
|
|
|
| Athens Water Supply & Sewage
Co.†† |
|
|
3,776 |
|
|
|
21,178 |
|
|
|
|
| Costamare, Inc. |
|
|
1,300 |
|
|
|
26,299 |
|
|
|
|
| Diana Shipping, Inc.* |
|
|
4,511 |
|
|
|
28,194 |
|
|
|
|
| Dryships, Inc.* |
|
|
30,400 |
|
|
|
21,584 |
|
|
|
|
| Ellaktor SA†† |
|
|
8,300 |
|
|
|
18,633 |
|
|
|
|
| Eurobank Ergasias SA*,†† |
|
|
204,553 |
|
|
|
31,139 |
|
|
|
|
| FF Group†† |
|
|
800 |
|
|
|
24,123 |
|
|
|
|
| Frigoglass SA*,†† |
|
|
3,182 |
|
|
|
5,723 |
|
|
|
|
| GasLog Ltd.# |
|
|
2,400 |
|
|
|
53,496 |
|
|
|
|
| GEK Terna Holding Real Estate Construction
SA†† |
|
|
7,360 |
|
|
|
14,634 |
|
|
|
|
| Hellenic Petroleum SA†† |
|
|
5,916 |
|
|
|
29,502 |
|
|
|
|
| Hellenic Telecommunications Organization
SA†† |
|
|
13,519 |
|
|
|
122,887 |
|
|
|
|
| Jumbo SA* |
|
|
4,495 |
|
|
|
46,384 |
|
|
|
|
| Metka SA†† |
|
|
1,500 |
|
|
|
13,990 |
|
|
|
|
| Motor Oil Hellas Corinth Refineries
SA†† |
|
|
4,200 |
|
|
|
36,777 |
|
|
|
|
| Mytilineos Holdings
SA*,†† |
|
|
7,642 |
|
|
|
52,705 |
|
|
|
|
| National Bank of Greece
SA*,†† |
|
|
34,284 |
|
|
|
48,071 |
|
|
|
|
| OPAP SA†† |
|
|
9,420 |
|
|
|
84,276 |
|
|
|
|
| Piraeus Bank SA*,†† |
|
|
39,200 |
|
|
|
17,495 |
|
|
|
|
| Public Power Corp. SA†† |
|
|
21,344 |
|
|
|
143,569 |
|
|
|
|
| Titan Cement Co. SA*,†† |
|
|
3,548 |
|
|
|
89,485 |
|
|
|
|
| Tsakos Energy Naviagation Ltd. |
|
|
5,100 |
|
|
|
46,818 |
|
|
|
|
| Viohalco SA*,†† |
|
|
4,300 |
|
|
|
12,803 |
|
|
|
|
|
|
|
|
|
|
|
|
|
| TOTAL GREECE |
|
|
|
|
|
$ |
1,034,953 |
|
|
|
|
| HONG KONG – 1.0% |
|
|
|
|
|
|
|
|
|
|
|
| AIA Group Ltd.†† |
|
|
35,000 |
|
|
|
232,767 |
|
|
|
|
| ASM Pacific Technology
Ltd.†† |
|
|
1,100 |
|
|
|
12,277 |
|
|
|
|
| Bank of East Asia Ltd.†† |
|
|
9,200 |
|
|
|
39,914 |
|
|
|
|
| Cathay Pacific Airways
Ltd.†† |
|
|
10,000 |
|
|
|
25,750 |
|
|
|
|
| Cheung Kong Infrastructure Holdings
Ltd.†† |
|
|
3,000 |
|
|
|
25,414 |
|
|
|
|
| China Taiping Insurance
Hold†† |
|
|
155,273 |
|
|
|
576,856 |
|
|
|
|
| CK Hutchison Holdings
Ltd.†† |
|
|
15,868 |
|
|
|
344,212 |
|
|
|
|
| CLP Holdings Ltd.†† |
|
|
3,000 |
|
|
|
26,261 |
|
|
|
|
| Dah Sing Financial Holdings
Ltd.†† |
|
|
49,044 |
|
|
|
344,318 |
|
|
|
|
| Hang Lung Group Ltd.†† |
|
|
15,000 |
|
|
|
79,416 |
|
|
|
|
| Hang Lung Properties
Ltd.†† |
|
|
67,301 |
|
|
|
227,516 |
|
|
|
|
|
|
|
|
|
|
| Description |
|
Number of
Shares |
|
|
Value |
|
|
|
|
| Henderson Land Development Co.
Ltd.†† |
|
|
5,094 |
|
|
$ |
40,839 |
|
|
|
|
| HKT Trust / HKT Ltd.†† |
|
|
346 |
|
|
|
463 |
|
|
|
|
| Hong Kong & China Gas Co.
Ltd.†† |
|
|
34,587 |
|
|
|
82,386 |
|
|
|
|
| Hong Kong Exchanges and Clearing
Ltd.#,†† |
|
|
2,100 |
|
|
|
80,053 |
|
|
|
|
| Hongkong & Shanghai
Hotels†† |
|
|
6,000 |
|
|
|
8,794 |
|
|
|
|
| Hopewell Holdings Ltd.†† |
|
|
5,500 |
|
|
|
21,152 |
|
|
|
|
| Huabao International Holdings
Ltd.†† |
|
|
569,000 |
|
|
|
639,125 |
|
|
|
|
| Hutchison Port Holdings
Trust†† |
|
|
75,500 |
|
|
|
50,869 |
|
|
|
|
| Hutchison Whampoa Ltd.†† |
|
|
25,400 |
|
|
|
373,424 |
|
|
|
|
| Hysan Development Co.
Ltd.†† |
|
|
8,000 |
|
|
|
36,965 |
|
|
|
|
| Kerry Logistics Network
Ltd.†† |
|
|
2,500 |
|
|
|
4,026 |
|
|
|
|
| Kerry Properties Ltd.†† |
|
|
5,000 |
|
|
|
20,406 |
|
|
|
|
| MTR Corp. Ltd.†† |
|
|
9,000 |
|
|
|
44,232 |
|
|
|
|
| New World Development Co.
Ltd.†† |
|
|
154,217 |
|
|
|
204,547 |
|
|
|
|
| Orient Overseas International
Ltd.†† |
|
|
2,500 |
|
|
|
15,344 |
|
|
|
|
| Sands China Ltd.†† |
|
|
13,600 |
|
|
|
55,439 |
|
|
|
|
| Shangri-La Asia Ltd.†† |
|
|
28,857 |
|
|
|
43,767 |
|
|
|
|
| Sino Land Co. Ltd.†† |
|
|
20,000 |
|
|
|
35,187 |
|
|
|
|
| Skyworth Digital Holdings
Ltd.†† |
|
|
486,000 |
|
|
|
432,948 |
|
|
|
|
| Smartone Telecommunications Holdings
Ltd.†† |
|
|
116,500 |
|
|
|
212,279 |
|
|
|
|
| Sun Hung Kai Properties
Ltd.†† |
|
|
30,165 |
|
|
|
500,997 |
|
|
|
|
| Swire Pacific Ltd.†† |
|
|
10,000 |
|
|
|
25,280 |
|
|
|
|
| Swire Pacific Ltd.†† |
|
|
9,000 |
|
|
|
121,385 |
|
|
|
|
| Television Broadcasts
Ltd.†† |
|
|
48,200 |
|
|
|
314,013 |
|
|
|
|
| Wharf Holdings Ltd.†† |
|
|
22,000 |
|
|
|
158,512 |
|
|
|
|
| Wheelock & Co.
Ltd.†† |
|
|
14,703 |
|
|
|
82,792 |
|
|
|
|
| Wynn Macau Ltd.†† |
|
|
8,800 |
|
|
|
17,813 |
|
|
|
|
|
|
|
|
|
|
|
|
|
| TOTAL HONG KONG |
|
|
|
|
|
$ |
5,557,738 |
|
|
|
|
| HUNGARY – 0.2% |
|
|
|
|
|
|
|
|
|
|
|
| Magyar Telekom Telecommunications
PLC†† |
|
|
81,250 |
|
|
|
121,528 |
|
|
|
|
| MOL Hungarian Oil & Gas
PLC†† |
|
|
4,913 |
|
|
|
273,296 |
|
|
|
|
| OTP Bank PLC†† |
|
|
18,150 |
|
|
|
401,337 |
|
|
|
|
| Richter Gedeon Nyrt†† |
|
|
15,760 |
|
|
|
264,587 |
|
|
|
|
|
|
|
|
|
|
|
|
|
| TOTAL HUNGARY |
|
|
|
|
|
$ |
1,060,748 |
|
|
|
|
| INDIA – 0.2% |
|
|
|
|
|
|
|
|
|
|
|
| GAIL India Ltd. GDR†† |
|
|
1,170 |
|
|
|
39,563 |
|
|
|
|
| ICICI Bank Ltd. ADR |
|
|
18,000 |
|
|
|
196,740 |
|
|
|
|
| Infosys Ltd. ADR |
|
|
10,600 |
|
|
|
328,388 |
|
|
|
|
| Larsen & Toubro Ltd. GDR - Reg S |
|
|
1,204 |
|
|
|
30,401 |
|
|
|
|
| Reliance Industries Ltd. GDR††,W |
|
|
8,800 |
|
|
|
235,755 |
|
|
|
|
| State Bank of India GDR†† |
|
|
1,700 |
|
|
|
71,524 |
|
|
|
|
| Tata Motors Ltd. ADR |
|
|
2,390 |
|
|
|
98,444 |
|
|
|
|
| Wipro Ltd. ADR |
|
|
7,400 |
|
|
|
84,878 |
|
|
|
|
|
|
|
|
|
|
|
|
|
| TOTAL INDIA |
|
|
|
|
|
$ |
1,085,693 |
|
|
|
|
| INDONESIA – 0.4% |
|
|
|
|
|
|
|
|
|
|
|
| Adaro Energy Tbk PT†† |
|
|
470,600 |
|
|
|
31,686 |
|
ANNUAL REPORT / April 30,
2015
32 PORTFOLIOS OF
INVESTMENTS
Wilmington Multi-Manager International Fund
(continued)
|
|
|
|
|
|
|
|
|
| Description |
|
Number of
Shares |
|
|
Value |
|
|
|
|
| AKR Corporindo Tbk PT†† |
|
|
143,500 |
|
|
$ |
57,444 |
|
|
|
|
| Aneka Tambang Persero Tbk
PT†† |
|
|
221,500 |
|
|
|
13,541 |
|
|
|
|
| Astra International Tbk
PT†† |
|
|
309,500 |
|
|
|
162,869 |
|
|
|
|
| Bank Central Asia Tbk
PT†† |
|
|
215,500 |
|
|
|
223,130 |
|
|
|
|
| Bank Danamon Indonesia Tbk
PT†† |
|
|
81,122 |
|
|
|
24,814 |
|
|
|
|
| Bank Mandiri Persero Tbk
PT†† |
|
|
117,900 |
|
|
|
96,978 |
|
|
|
|
| Bank Negara Indonesia Persero Tbk
PT†† |
|
|
142,000 |
|
|
|
70,079 |
|
|
|
|
| Bank Rakyat Indonesia Persero Tbk
PT†† |
|
|
133,300 |
|
|
|
119,010 |
|
|
|
|
| Bumi Resources Tbk PT*,†† |
|
|
1,083,000 |
|
|
|
5,990 |
|
|
|
|
| Bumi Serpong Damai PT†† |
|
|
230,800 |
|
|
|
33,071 |
|
|
|
|
| Charoen Pokphand Indonesia Tbk
PT†† |
|
|
200,000 |
|
|
|
43,611 |
|
|
|
|
| Gudang Garam Tbk PT†† |
|
|
6,700 |
|
|
|
25,751 |
|
|
|
|
| Indo Tambangraya Megah Tbk
PT†† |
|
|
21,000 |
|
|
|
20,391 |
|
|
|
|
| Indocement Tunggal Prakarsa Tbk
PT†† |
|
|
48,000 |
|
|
|
77,516 |
|
|
|
|
| Indofood Sukses Makmur Tbk
PT†† |
|
|
148,000 |
|
|
|
76,816 |
|
|
|
|
| Indosat Tbk PT†† |
|
|
70,500 |
|
|
|
21,746 |
|
|
|
|
| International Nickel
Indones†† |
|
|
89,700 |
|
|
|
19,271 |
|
|
|
|
| Kalbe Farma Tbk PT†† |
|
|
274,000 |
|
|
|
37,880 |
|
|
|
|
| Lippo Karawaci Tbk PT†† |
|
|
501,000 |
|
|
|
45,709 |
|
|
|
|
| Perusahaan Gas Negara Persero Tbk
PT†† |
|
|
275,000 |
|
|
|
86,679 |
|
|
|
|
| Semen Indonesia Persero Tbk
PT†† |
|
|
100,500 |
|
|
|
96,643 |
|
|
|
|
| Surya Semesta Internusa Tbk
PT†† |
|
|
410,000 |
|
|
|
37,183 |
|
|
|
|
| Tambang Batubara Bukit Asam Persero Tbk
PT†† |
|
|
25,000 |
|
|
|
17,975 |
|
|
|
|
| Telekomunikasi Indonesia Persero Tbk
PT†† |
|
|
1,046,200 |
|
|
|
210,413 |
|
|
|
|
| Unilever Indonesia Tbk
PT†† |
|
|
24,000 |
|
|
|
78,703 |
|
|
|
|
| United Tractors Tbk PT†† |
|
|
75,500 |
|
|
|
124,143 |
|
|
|
|
| XL Axiata Tbk PT†† |
|
|
70,000 |
|
|
|
21,725 |
|
|
|
|
|
|
|
|
|
|
|
|
|
| TOTAL INDONESIA |
|
|
|
|
|
$ |
1,880,767 |
|
|
|
|
| IRELAND – 1.6% |
|
|
|
|
|
|
|
|
|
|
|
| Bank of Ireland*,†† |
|
|
369,635 |
|
|
|
142,891 |
|
|
|
|
| Endo International PLC* |
|
|
48,664 |
|
|
|
4,090,939 |
|
|
|
|
| Icon PLC |
|
|
9,700 |
|
|
|
624,098 |
|
|
|
|
| Kerry Group PLC†† |
|
|
988 |
|
|
|
72,670 |
|
|
|
|
| Mallinckrodt PLC* |
|
|
34,513 |
|
|
|
3,906,181 |
|
|
|
|
| Permanent TSB Group Holdings
PLC*,†† |
|
|
380 |
|
|
|
2,146 |
|
|
|
|
|
|
|
|
|
|
|
|
|
| TOTAL IRELAND |
|
|
|
|
|
$ |
8,838,925 |
|
|
|
|
| ISRAEL – 0.2% |
|
|
|
|
|
|
|
|
|
|
|
| Bank Hapoalim BM†† |
|
|
28,839 |
|
|
|
144,252 |
|
|
|
|
| Bank Leumi Le-Israel
BM*,†† |
|
|
20,667 |
|
|
|
80,326 |
|
|
|
|
| Elbit Systems Ltd.†† |
|
|
274 |
|
|
|
21,682 |
|
|
|
|
| Israel Discount Bank
Ltd.*,†† |
|
|
13,897 |
|
|
|
24,413 |
|
|
|
|
| Mizrahi Tefahot Bank
Ltd.†† |
|
|
2,704 |
|
|
|
30,244 |
|
|
|
|
| Teva Pharmaceutical Industries
Ltd.†† |
|
|
14,578 |
|
|
|
885,823 |
|
|
|
|
| Teva Pharmaceutical Industries Ltd. ADR |
|
|
2,106 |
|
|
|
127,245 |
|
|
|
|
|
|
|
|
|
|
|
|
|
| TOTAL ISRAEL |
|
|
|
|
|
$ |
1,313,985 |
|
|
|
|
|
|
|
|
|
|
| Description |
|
Number of
Shares |
|
|
Value |
|
|
|
|
| ITALY – 1.6% |
|
|
|
|
|
|
|
|
|
|
|
| Anima Holding SpA*,†† |
|
|
27,800 |
|
|
$ |
247,520 |
|
|
|
|
| Assicurazioni Generali
SpA†† |
|
|
2,595 |
|
|
|
50,704 |
|
|
|
|
| Astaldi SpA†† |
|
|
28,300 |
|
|
|
246,026 |
|
|
|
|
| Atlantia SpA†† |
|
|
1,615 |
|
|
|
45,422 |
|
|
|
|
| Azimut Holding SpA†† |
|
|
20,400 |
|
|
|
598,796 |
|
|
|
|
| Banca Monte Dei Paschi
Siena#,†† |
|
|
17,224 |
|
|
|
10,615 |
|
|
|
|
| Banco Popolare Sc*,†† |
|
|
888 |
|
|
|
14,039 |
|
|
|
|
| Brembo-SpA†† |
|
|
8,600 |
|
|
|
344,023 |
|
|
|
|
| Enel SpA†† |
|
|
114,365 |
|
|
|
542,085 |
|
|
|
|
| Eni SpA†† |
|
|
23,254 |
|
|
|
446,149 |
|
|
|
|
| ERG SpA†† |
|
|
10,500 |
|
|
|
150,941 |
|
|
|
|
| Exor SpA†† |
|
|
99,523 |
|
|
|
4,591,408 |
|
|
|
|
| Finmeccanica SpA*,†† |
|
|
2,961 |
|
|
|
37,779 |
|
|
|
|
| Intesa Sanpaolo SpA†† |
|
|
25,562 |
|
|
|
85,876 |
|
|
|
|
| Luxottica Group SpA†† |
|
|
392 |
|
|
|
25,816 |
|
|
|
|
| Mediobanca SpA†† |
|
|
12,419 |
|
|
|
120,558 |
|
|
|
|
| Moncler SpA†† |
|
|
22,100 |
|
|
|
393,558 |
|
|
|
|
| Pirelli & C.
SpA†† |
|
|
1,489 |
|
|
|
25,763 |
|
|
|
|
| Prysmian SpA†† |
|
|
1,573 |
|
|
|
32,078 |
|
|
|
|
| Salini Impregilo SpA†† |
|
|
46,600 |
|
|
|
203,340 |
|
|
|
|
| Telecom Italia SpA ADR |
|
|
4,715 |
|
|
|
55,401 |
|
|
|
|
| UniCredit SpA†† |
|
|
59,895 |
|
|
|
429,935 |
|
|
|
|
| Unione di Banche Italiane
SCPA†† |
|
|
23,449 |
|
|
|
186,124 |
|
|
|
|
|
|
|
|
|
|
|
|
|
| TOTAL ITALY |
|
|
|
|
|
$ |
8,883,956 |
|
|
|
|
| JAPAN – 14.7% |
|
|
|
|
|
|
|
|
|
|
|
| ABC-Mart, Inc.†† |
|
|
100 |
|
|
|
5,690 |
|
|
|
|
| Adastria Holdings Co.
Ltd.†† |
|
|
8,400 |
|
|
|
254,830 |
|
|
|
|
| Aeon Co. Ltd.# |
|
|
14,700 |
|
|
|
182,881 |
|
|
|
|
| Aida Engineering Ltd.†† |
|
|
21,300 |
|
|
|
242,830 |
|
|
|
|
| Ain Pharmaciez, Inc.†† |
|
|
4,500 |
|
|
|
158,763 |
|
|
|
|
| Aisin Seiki Co. Ltd.†† |
|
|
3,900 |
|
|
|
178,339 |
|
|
|
|
| Ajinomoto Co., Inc.†† |
|
|
2,000 |
|
|
|
44,345 |
|
|
|
|
| Alfresa Holdings Corp.†† |
|
|
3,600 |
|
|
|
53,952 |
|
|
|
|
| Alps Electric Co.#,†† |
|
|
14,600 |
|
|
|
362,670 |
|
|
|
|
| Amada Co. Ltd.†† |
|
|
3,600 |
|
|
|
36,328 |
|
|
|
|
| Aoyama Trading Co. Ltd.†† |
|
|
400 |
|
|
|
13,835 |
|
|
|
|
| Asahi Glass Co. Ltd.#,†† |
|
|
11,000 |
|
|
|
74,030 |
|
|
|
|
| Asahi Group Holdings
Ltd.†† |
|
|
1,400 |
|
|
|
45,020 |
|
|
|
|
| Asahi Intecc Co. Ltd.†† |
|
|
1,800 |
|
|
|
110,850 |
|
|
|
|
| Asahi Kasei Corp.†† |
|
|
20,000 |
|
|
|
188,333 |
|
|
|
|
| Asics Corp.#,†† |
|
|
800 |
|
|
|
20,528 |
|
|
|
|
| Astellas Pharma, Inc.†† |
|
|
1,700 |
|
|
|
26,470 |
|
|
|
|
| Bank of Kyoto Ltd.†† |
|
|
4,000 |
|
|
|
43,606 |
|
|
|
|
| Bank of Yokohama Ltd.†† |
|
|
17,000 |
|
|
|
107,891 |
|
|
|
|
| Benesse Holdings, Inc.†† |
|
|
700 |
|
|
|
21,939 |
|
|
|
|
| Bridgestone Corp.†† |
|
|
2,200 |
|
|
|
92,144 |
|
|
|
|
| April 30, 2015 / ANNUAL REPORT |
|
|
PORTFOLIOS OF INVESTMENTS 33
Wilmington Multi-Manager International Fund
(continued)
|
|
|
|
|
|
|
|
|
| Description |
|
Number of
Shares |
|
|
Value |
|
|
|
|
| Brother Industries Ltd.†† |
|
|
18,700 |
|
|
$ |
297,525 |
|
|
|
|
| Canon Marketing Japan,
Inc.†† |
|
|
1,600 |
|
|
|
30,055 |
|
|
|
|
| Canon, Inc.†† |
|
|
1,100 |
|
|
|
39,220 |
|
|
|
|
| Casio Computer Co. Ltd.†† |
|
|
1,200 |
|
|
|
24,262 |
|
|
|
|
| Central Glass Co. Ltd.†† |
|
|
82,000 |
|
|
|
376,764 |
|
|
|
|
| Central Japan Railway
Co.†† |
|
|
500 |
|
|
|
89,303 |
|
|
|
|
| Chiba Bank Ltd.†† |
|
|
10,000 |
|
|
|
82,184 |
|
|
|
|
| Chugai Pharmaceutical Co.
Ltd.†† |
|
|
500 |
|
|
|
15,206 |
|
|
|
|
| Chugoku Bank Ltd.†† |
|
|
1,500 |
|
|
|
24,099 |
|
|
|
|
| Citizen Holdings Co.
Ltd.†† |
|
|
7,300 |
|
|
|
57,770 |
|
|
|
|
| Coca-Cola East Japan Co.
Ltd.#,†† |
|
|
2,500 |
|
|
|
46,718 |
|
|
|
|
| Coca-Cola West Co. Ltd.†† |
|
|
1,400 |
|
|
|
22,274 |
|
|
|
|
| Cosmo Oil Co. Ltd.#,†† |
|
|
12,000 |
|
|
|
17,791 |
|
|
|
|
| Credit Saison Co. Ltd.†† |
|
|
1,500 |
|
|
|
28,365 |
|
|
|
|
| Dai Nippon Printing Co.
Ltd.†† |
|
|
9,000 |
|
|
|
92,975 |
|
|
|
|
| Daido Steel Co. Ltd.†† |
|
|
5,000 |
|
|
|
23,908 |
|
|
|
|
| Daihatsu Motor Co. Ltd.†† |
|
|
6,300 |
|
|
|
91,258 |
|
|
|
|
| Dai-ichi Life Insurance Co.
Ltd.†† |
|
|
9,900 |
|
|
|
162,715 |
|
|
|
|
| Daiichi Sankyo Co. Ltd.†† |
|
|
11,800 |
|
|
|
204,951 |
|
|
|
|
| Dainippon Ink & Chemicals,
Inc.†† |
|
|
7,000 |
|
|
|
21,178 |
|
|
|
|
| Daito Trust Construction Co.
Ltd.†† |
|
|
600 |
|
|
|
69,870 |
|
|
|
|
| Daiwa House Industry Co.
Ltd.†† |
|
|
3,000 |
|
|
|
66,975 |
|
|
|
|
| Daiwa Securities Group,
Inc.†† |
|
|
567,648 |
|
|
|
4,709,104 |
|
|
|
|
| DCM Holdings Co. Ltd.†† |
|
|
28,600 |
|
|
|
238,513 |
|
|
|
|
| Denki Kagaku Kogyo KK#,†† |
|
|
8,000 |
|
|
|
32,666 |
|
|
|
|
| Denso Corp.†† |
|
|
100 |
|
|
|
4,965 |
|
|
|
|
| Dentsu, Inc.†† |
|
|
31,365 |
|
|
|
1,462,070 |
|
|
|
|
| Dynam Japan Holdings Co.
Ltd.†† |
|
|
122,200 |
|
|
|
259,063 |
|
|
|
|
| East Japan Railway Co.†† |
|
|
1,300 |
|
|
|
114,903 |
|
|
|
|
| Ebara Corp.†† |
|
|
14,000 |
|
|
|
62,238 |
|
|
|
|
| Eisai Co.Ltd.†† |
|
|
700 |
|
|
|
46,660 |
|
|
|
|
| Eizo Nanao Corp.†† |
|
|
9,500 |
|
|
|
210,731 |
|
|
|
|
| FamilyMart Co. Ltd.†† |
|
|
300 |
|
|
|
12,919 |
|
|
|
|
| FANUC Corp.†† |
|
|
36,913 |
|
|
|
8,119,483 |
|
|
|
|
| Fast Retailing Co. Ltd.†† |
|
|
200 |
|
|
|
78,776 |
|
|
|
|
| Foster Electric Co.
Ltd.†† |
|
|
14,900 |
|
|
|
385,577 |
|
|
|
|
| Fuji Machine Manufacturing Co.# |
|
|
14,600 |
|
|
|
180,160 |
|
|
|
|
| FUJIFILM Holdings Corp.†† |
|
|
7,457 |
|
|
|
280,883 |
|
|
|
|
| Fujitsu Ltd.†† |
|
|
8,000 |
|
|
|
53,027 |
|
|
|
|
| Fukuoka Financial Group,
Inc.†† |
|
|
14,690 |
|
|
|
84,397 |
|
|
|
|
| Geo Holdings Corp.†† |
|
|
20,000 |
|
|
|
217,233 |
|
|
|
|
| Glory Ltd.†† |
|
|
1,200 |
|
|
|
33,213 |
|
|
|
|
| Gunma Bank Ltd.†† |
|
|
3,000 |
|
|
|
21,244 |
|
|
|
|
| H2O Retailing Corp.†† |
|
|
1,000 |
|
|
|
17,993 |
|
|
|
|
| Hachijuni Bank Ltd.†† |
|
|
2,000 |
|
|
|
15,591 |
|
|
|
|
| Hakuhodo DY Holdings,
Inc.†† |
|
|
1,300 |
|
|
|
13,912 |
|
|
|
|
| Hamamatsu Photonics KK†† |
|
|
600 |
|
|
|
17,501 |
|
|
|
|
| Hankyu Hanshin Holdings,
Inc.†† |
|
|
2,000 |
|
|
|
12,072 |
|
|
|
|
|
|
|
|
|
|
| Description |
|
Number of
Shares |
|
|
Value |
|
|
|
|
| Haseko Corp.†† |
|
|
25,700 |
|
|
$ |
253,769 |
|
|
|
|
| Heiwa Corp.†† |
|
|
19,100 |
|
|
|
398,226 |
|
|
|
|
| Hino Motors Ltd.†† |
|
|
15,100 |
|
|
|
196,991 |
|
|
|
|
| Hirose Electric Co.
Ltd.#,†† |
|
|
315 |
|
|
|
44,353 |
|
|
|
|
| Hiroshima Bank Ltd.†† |
|
|
12,000 |
|
|
|
70,090 |
|
|
|
|
| Hitachi Capital Corp.#,†† |
|
|
1,800 |
|
|
|
40,779 |
|
|
|
|
| Hitachi Chemical Co.
Ltd.†† |
|
|
2,200 |
|
|
|
42,583 |
|
|
|
|
| Hitachi Construction Machinery Co.
Ltd.†† |
|
|
800 |
|
|
|
14,203 |
|
|
|
|
| Hitachi Ltd.†† |
|
|
9,000 |
|
|
|
61,406 |
|
|
|
|
| Hitachi Metals Ltd.†† |
|
|
2,000 |
|
|
|
31,278 |
|
|
|
|
| Hitachi Transport System
Ltd.†† |
|
|
1,300 |
|
|
|
20,966 |
|
|
|
|
| Hokkaido Electric Power Co.,
Inc.#,*,†† |
|
|
2,300 |
|
|
|
21,212 |
|
|
|
|
| Hokuhoku Financial Group,
Inc.†† |
|
|
9,000 |
|
|
|
21,523 |
|
|
|
|
| Honda Motor Co. Ltd.†† |
|
|
24,700 |
|
|
|
828,077 |
|
|
|
|
| House Foods Corp.†† |
|
|
1,600 |
|
|
|
32,674 |
|
|
|
|
| Hoya Corp.†† |
|
|
1,300 |
|
|
|
50,103 |
|
|
|
|
| Ibiden Co. Ltd.#,†† |
|
|
6,100 |
|
|
|
106,686 |
|
|
|
|
| Idemitsu Kosan Co. Ltd.†† |
|
|
1,200 |
|
|
|
23,246 |
|
|
|
|
| IHI Corp.†† |
|
|
8,000 |
|
|
|
36,677 |
|
|
|
|
| Inpex Corp.†† |
|
|
3,016 |
|
|
|
37,852 |
|
|
|
|
| Isuzu Motors Ltd.†† |
|
|
21,700 |
|
|
|
287,608 |
|
|
|
|
| ITOCHU Corp.†† |
|
|
61,200 |
|
|
|
753,560 |
|
|
|
|
| Iyo Bank Ltd.†† |
|
|
3,000 |
|
|
|
37,371 |
|
|
|
|
| J Front Retailing Co.
Ltd.†† |
|
|
3,500 |
|
|
|
58,323 |
|
|
|
|
| Japan Airlines Co. Ltd.†† |
|
|
1,200 |
|
|
|
40,011 |
|
|
|
|
| Japan Exchange Group,
Inc.†† |
|
|
155,518 |
|
|
|
4,493,252 |
|
|
|
|
| Japan Tobacco, Inc.†† |
|
|
60,410 |
|
|
|
2,109,569 |
|
|
|
|
| JFE Holdings, Inc.†† |
|
|
7,998 |
|
|
|
180,554 |
|
|
|
|
| JGC Corp.†† |
|
|
2,000 |
|
|
|
41,622 |
|
|
|
|
| Joyo Bank Ltd.†† |
|
|
9,000 |
|
|
|
49,229 |
|
|
|
|
| Juroku Bank Ltd.†† |
|
|
3,000 |
|
|
|
11,943 |
|
|
|
|
| JX Holdings, Inc.†† |
|
|
70,182 |
|
|
|
305,620 |
|
|
|
|
| Kamigumi Co. Ltd.†† |
|
|
4,000 |
|
|
|
40,049 |
|
|
|
|
| Kaneka Corp.†† |
|
|
9,000 |
|
|
|
62,747 |
|
|
|
|
| Kansai Electric Power Co.,
Inc.*,†† |
|
|
5,100 |
|
|
|
51,254 |
|
|
|
|
| Kansai Paint Co. Ltd.†† |
|
|
2,000 |
|
|
|
35,651 |
|
|
|
|
| Kao Corp.†† |
|
|
1,400 |
|
|
|
67,045 |
|
|
|
|
| Kawasaki Kisen Kaisha
Ltd.†† |
|
|
21,000 |
|
|
|
54,245 |
|
|
|
|
| Kayaba Industry Co.
Ltd.†† |
|
|
76,000 |
|
|
|
288,564 |
|
|
|
|
| KDDI Corp.†† |
|
|
22,200 |
|
|
|
525,304 |
|
|
|
|
| Keisei Electric Railway Co.
Ltd.†† |
|
|
1,000 |
|
|
|
11,854 |
|
|
|
|
| Keyence Corp.†† |
|
|
130 |
|
|
|
69,400 |
|
|
|
|
| Kintetsu Corp.†† |
|
|
12,000 |
|
|
|
42,500 |
|
|
|
|
| Kirin Holdings Co. Ltd.†† |
|
|
4,300 |
|
|
|
56,916 |
|
|
|
|
| Kobe Steel Ltd.†† |
|
|
64,000 |
|
|
|
116,326 |
|
|
|
|
| Komatsu Ltd.†† |
|
|
53,847 |
|
|
|
1,083,355 |
|
|
|
|
| Konica Minolta, Inc.†† |
|
|
8,500 |
|
|
|
93,858 |
|
|
|
|
| K’s Holdings Corp.†† |
|
|
800 |
|
|
|
26,712 |
|
ANNUAL REPORT / April 30,
2015
34 PORTFOLIOS OF
INVESTMENTS
Wilmington Multi-Manager International Fund
(continued)
|
|
|
|
|
|
|
|
|
| Description |
|
Number of
Shares |
|
|
Value |
|
|
|
|
| Kubota Corp.†† |
|
|
5,000 |
|
|
$ |
78,255 |
|
|
|
|
| Kuraray Co. Ltd.†† |
|
|
4,500 |
|
|
|
60,852 |
|
|
|
|
| Kyocera Corp.†† |
|
|
2,374 |
|
|
|
123,926 |
|
|
|
|
| Kyocera Corp. ADR |
|
|
200 |
|
|
|
10,392 |
|
|
|
|
| Kyowa Exeo Corp.#,†† |
|
|
16,100 |
|
|
|
187,830 |
|
|
|
|
| Kyushu Electric Power Co.,
Inc.*,†† |
|
|
2,600 |
|
|
|
27,729 |
|
|
|
|
| Lawson, Inc.†† |
|
|
500 |
|
|
|
35,955 |
|
|
|
|
| LIXIL Group Corp.†† |
|
|
19,103 |
|
|
|
398,174 |
|
|
|
|
| M3, Inc.†† |
|
|
12,048 |
|
|
|
227,653 |
|
|
|
|
| Mabuchi Motor Co. Ltd.†† |
|
|
8,200 |
|
|
|
490,998 |
|
|
|
|
| Makita Corp.†† |
|
|
400 |
|
|
|
19,962 |
|
|
|
|
| Marubeni Corp.†† |
|
|
79,500 |
|
|
|
492,269 |
|
|
|
|
| Medipal Holdings Corp.†† |
|
|
3,400 |
|
|
|
46,384 |
|
|
|
|
| Megmilk Snow Brand Co.
Ltd.†† |
|
|
11,700 |
|
|
|
140,297 |
|
|
|
|
| Miraca Holdings, Inc.#,†† |
|
|
3,400 |
|
|
|
171,052 |
|
|
|
|
| Misumi Group, Inc.†† |
|
|
9,900 |
|
|
|
371,529 |
|
|
|
|
| Mitsubishi Chemical Holdings
Corp.†† |
|
|
32,500 |
|
|
|
202,353 |
|
|
|
|
| Mitsubishi Corp.†† |
|
|
19,010 |
|
|
|
410,174 |
|
|
|
|
| Mitsubishi Electric
Corp.†† |
|
|
3,000 |
|
|
|
39,179 |
|
|
|
|
| Mitsubishi Estate Co.
Ltd.†† |
|
|
6,659 |
|
|
|
156,735 |
|
|
|
|
| Mitsubishi Gas Chemical Co.,
Inc.†† |
|
|
2,000 |
|
|
|
11,176 |
|
|
|
|
| Mitsubishi Heavy Industries
Ltd.#,†† |
|
|
36,000 |
|
|
|
199,466 |
|
|
|
|
| Mitsubishi Materials
Corp.†† |
|
|
32,000 |
|
|
|
115,199 |
|
|
|
|
| Mitsubishi Motors Corp.†† |
|
|
2,000 |
|
|
|
18,402 |
|
|
|
|
| Mitsubishi UFJ Financial Group,
Inc.†† |
|
|
262,194 |
|
|
|
1,862,718 |
|
|
|
|
| Mitsui & Co.
Ltd.†† |
|
|
14,037 |
|
|
|
196,323 |
|
|
|
|
| Mitsui Chemicals, Inc.†† |
|
|
18,000 |
|
|
|
59,508 |
|
|
|
|
| Mitsui Fudosan Co. Ltd.†† |
|
|
3,000 |
|
|
|
88,933 |
|
|
|
|
| Mitsui OSK Lines Ltd.#,†† |
|
|
28,000 |
|
|
|
98,860 |
|
|
|
|
| Mizuho Financial Group,
Inc.†† |
|
|
634,700 |
|
|
|
1,209,917 |
|
|
|
|
| Mochida Pharmaceutical Co.
Ltd.†† |
|
|
2,300 |
|
|
|
157,214 |
|
|
|
|
| MS&AD Insurance Group
Holdings†† |
|
|
5,882 |
|
|
|
168,325 |
|
|
|
|
| Nabtesco Corp.†† |
|
|
1,000 |
|
|
|
27,504 |
|
|
|
|
| NEC Corp.†† |
|
|
60,000 |
|
|
|
199,621 |
|
|
|
|
| Nhk Spring Co. Ltd.†† |
|
|
4,600 |
|
|
|
52,663 |
|
|
|
|
| Nichirei Corp.†† |
|
|
63,000 |
|
|
|
332,542 |
|
|
|
|
| Nikkiso Co. Ltd.#,†† |
|
|
27,700 |
|
|
|
259,117 |
|
|
|
|
| Nikon Corp.†† |
|
|
5,900 |
|
|
|
83,889 |
|
|
|
|
| Nintendo Co. Ltd.†† |
|
|
300 |
|
|
|
50,370 |
|
|
|
|
| Nippo Corp.†† |
|
|
2,000 |
|
|
|
33,448 |
|
|
|
|
| Nippon Electric Glass Co.
Ltd.†† |
|
|
3,000 |
|
|
|
17,060 |
|
|
|
|
| Nippon Express Co. Ltd.†† |
|
|
20,000 |
|
|
|
114,809 |
|
|
|
|
| Nippon Paper Industries Co.
Ltd.#,†† |
|
|
2,200 |
|
|
|
38,364 |
|
|
|
|
| Nippon Shokubai Co.
Ltd.†† |
|
|
1,000 |
|
|
|
13,807 |
|
|
|
|
| Nippon Steel & Sumitomo Metal
Corp.†† |
|
|
132,442 |
|
|
|
344,510 |
|
|
|
|
| Nippon Telegraph & Telephone
Corp.†† |
|
|
15,300 |
|
|
|
1,033,133 |
|
|
|
|
| Nippon Yusen KK†† |
|
|
41,000 |
|
|
|
128,884 |
|
|
|
|
| Nishi-Nippon City Bank
Ltd.†† |
|
|
9,000 |
|
|
|
28,678 |
|
|
|
|
|
|
|
|
|
|
| Description |
|
Number of
Shares |
|
|
Value |
|
|
|
|
| Nissan Motor Co. Ltd.†† |
|
|
91,400 |
|
|
$ |
948,795 |
|
|
|
|
| Nisshinbo Holdings,
Inc.†† |
|
|
3,000 |
|
|
|
31,074 |
|
|
|
|
| Nitto Denko Corp.†† |
|
|
500 |
|
|
|
32,043 |
|
|
|
|
| NKSJ Holdings, Inc.†† |
|
|
3,900 |
|
|
|
127,413 |
|
|
|
|
| Nomura Holdings, Inc.†† |
|
|
34,300 |
|
|
|
222,519 |
|
|
|
|
| Nomura Real Estate Holdings,
Inc.†† |
|
|
2,200 |
|
|
|
44,720 |
|
|
|
|
| North Pacific Bank
Ltd.#,†† |
|
|
8,800 |
|
|
|
34,752 |
|
|
|
|
| NTN Corp.*,†† |
|
|
5,000 |
|
|
|
27,293 |
|
|
|
|
| NTT Data Corp.†† |
|
|
300 |
|
|
|
13,423 |
|
|
|
|
| NTT DoCoMo, Inc.†† |
|
|
26,333 |
|
|
|
466,423 |
|
|
|
|
| Oji Paper Co. Ltd.†† |
|
|
31,000 |
|
|
|
137,870 |
|
|
|
|
| Omron Corp.†† |
|
|
108,736 |
|
|
|
4,992,947 |
|
|
|
|
| Open House Co. Ltd. |
|
|
11,500 |
|
|
|
292,483 |
|
|
|
|
| Oriental Land Co. Ltd.†† |
|
|
800 |
|
|
|
54,160 |
|
|
|
|
| Otsuka Corp.†† |
|
|
900 |
|
|
|
41,453 |
|
|
|
|
| Otsuka Holdings Co.
Ltd.†† |
|
|
10,100 |
|
|
|
318,802 |
|
|
|
|
| Paltac Corp.†† |
|
|
14,200 |
|
|
|
203,453 |
|
|
|
|
| Panasonic Corp.†† |
|
|
3,300 |
|
|
|
47,269 |
|
|
|
|
| Paramount Bed Holdings Co.
Ltd.#,†† |
|
|
7,200 |
|
|
|
195,085 |
|
|
|
|
| Rakuten, Inc.†† |
|
|
1,700 |
|
|
|
29,700 |
|
|
|
|
| Resona Holdings, Inc.†† |
|
|
127,000 |
|
|
|
677,173 |
|
|
|
|
| Ricoh Co. Ltd.†† |
|
|
46,600 |
|
|
|
481,599 |
|
|
|
|
| Rinnai Corp.†† |
|
|
200 |
|
|
|
15,175 |
|
|
|
|
| Sankyo Co. Ltd.†† |
|
|
700 |
|
|
|
26,514 |
|
|
|
|
| Sankyu, Inc.#,†† |
|
|
34,000 |
|
|
|
159,458 |
|
|
|
|
| Santen Pharmaceutical Co.
Ltd.†† |
|
|
27,200 |
|
|
|
360,049 |
|
|
|
|
| SBI Holdings, Inc.†† |
|
|
3,500 |
|
|
|
46,430 |
|
|
|
|
| Secom Co. Ltd.†† |
|
|
900 |
|
|
|
63,784 |
|
|
|
|
| Sega Sammy Holdings,
Inc.†† |
|
|
1,600 |
|
|
|
22,337 |
|
|
|
|
| Seiko Epson Corp.†† |
|
|
200 |
|
|
|
3,495 |
|
|
|
|
| Sekisui House Ltd.†† |
|
|
15,100 |
|
|
|
234,060 |
|
|
|
|
| Seven & I Holdings Co.
Ltd.†† |
|
|
1,600 |
|
|
|
68,775 |
|
|
|
|
| Seven Bank Ltd.†† |
|
|
1,000 |
|
|
|
5,388 |
|
|
|
|
| Sharp Corp.#,*,†† |
|
|
11,000 |
|
|
|
23,704 |
|
|
|
|
| Shimadzu Corp.†† |
|
|
18,000 |
|
|
|
210,543 |
|
|
|
|
| Shimano, Inc.†† |
|
|
200 |
|
|
|
28,650 |
|
|
|
|
| Shin-Etsu Chemical Co.
Ltd.†† |
|
|
1,100 |
|
|
|
67,242 |
|
|
|
|
| Shinsei Bank Ltd.#,†† |
|
|
18,000 |
|
|
|
36,834 |
|
|
|
|
| Shionogi & Co.
Ltd.†† |
|
|
600 |
|
|
|
19,779 |
|
|
|
|
| Shizuoka Bank Y50†† |
|
|
2,000 |
|
|
|
22,018 |
|
|
|
|
| Showa Denko KK#,†† |
|
|
19,000 |
|
|
|
25,973 |
|
|
|
|
| Showa Shell Sekiyu KK†† |
|
|
5,000 |
|
|
|
48,231 |
|
|
|
|
| Sky Perfect JSAT Holdings,
Inc.†† |
|
|
3,700 |
|
|
|
23,175 |
|
|
|
|
| SMC Corp.#,†† |
|
|
6,887 |
|
|
|
2,071,761 |
|
|
|
|
| Softbank Corp.†† |
|
|
2,800 |
|
|
|
175,029 |
|
|
|
|
| Sony Corp.†† |
|
|
6,525 |
|
|
|
197,262 |
|
|
|
|
| Sumco Corp.#,†† |
|
|
1,000 |
|
|
|
15,088 |
|
|
|
|
| Sumitomo Chemical Co.
Ltd.†† |
|
|
135,000 |
|
|
|
759,233 |
|
|
|
|
| April 30, 2015 / ANNUAL REPORT |
|
|
PORTFOLIOS OF INVESTMENTS 35
Wilmington Multi-Manager International Fund
(continued)
|
|
|
|
|
|
|
|
|
| Description |
|
Number of
Shares |
|
|
Value |
|
|
|
|
| Sumitomo Corp.†† |
|
|
28,507 |
|
|
$ |
336,602 |
|
|
|
|
| Sumitomo Electric Industries
Ltd.†† |
|
|
17,700 |
|
|
|
250,068 |
|
|
|
|
| Sumitomo Forestry Co.
Ltd.#,†† |
|
|
1,000 |
|
|
|
11,591 |
|
|
|
|
| Sumitomo Heavy Industries
Ltd.†† |
|
|
8,000 |
|
|
|
49,704 |
|
|
|
|
| Sumitomo Metal Mining Co.
Ltd.†† |
|
|
41,798 |
|
|
|
612,642 |
|
|
|
|
| Sumitomo Mitsui Financial Group,
Inc.#,†† |
|
|
30,000 |
|
|
|
1,309,937 |
|
|
|
|
| Sumitomo Mitsui Trust Holdings,
Inc.†† |
|
|
59,000 |
|
|
|
259,715 |
|
|
|
|
| Sumitomo Rubber Industries
Ltd.†† |
|
|
5,300 |
|
|
|
98,269 |
|
|
|
|
| Suruga Bank Ltd.†† |
|
|
1,000 |
|
|
|
22,043 |
|
|
|
|
| Suzuken Co. Ltd.†† |
|
|
7,260 |
|
|
|
227,183 |
|
|
|
|
| Suzuki Motor Corp.†† |
|
|
1,123 |
|
|
|
36,298 |
|
|
|
|
| Sysmex Corp.†† |
|
|
79,569 |
|
|
|
4,402,693 |
|
|
|
|
| T&D Holdings, Inc.†† |
|
|
11,300 |
|
|
|
163,057 |
|
|
|
|
| Takashimaya Co. Ltd.†† |
|
|
7,000 |
|
|
|
65,327 |
|
|
|
|
| Takeda Pharmaceutical Co.
Ltd.#,†† |
|
|
600 |
|
|
|
30,805 |
|
|
|
|
| Takeuchi Manufacturing Co.
Ltd.†† |
|
|
8,700 |
|
|
|
421,342 |
|
|
|
|
| TDK Corp.†† |
|
|
2,700 |
|
|
|
194,487 |
|
|
|
|
| Technopro Holdings,
Inc.*,†† |
|
|
18,100 |
|
|
|
503,032 |
|
|
|
|
| Teijin Ltd.†† |
|
|
129,000 |
|
|
|
438,209 |
|
|
|
|
| Temp Holdings Co. Ltd.†† |
|
|
6,200 |
|
|
|
196,373 |
|
|
|
|
| Tokai Rika Co. Ltd.†† |
|
|
900 |
|
|
|
21,989 |
|
|
|
|
| Tokio Marine Holdings,
Inc.†† |
|
|
56,905 |
|
|
|
2,319,773 |
|
|
|
|
| Tokyu Corp.†† |
|
|
8,000 |
|
|
|
53,189 |
|
|
|
|
| Toppan Printing Co.
Ltd.†† |
|
|
6,000 |
|
|
|
50,306 |
|
|
|
|
| Toray Industries, Inc.†† |
|
|
2,000 |
|
|
|
17,385 |
|
|
|
|
| Tosoh Corp.†† |
|
|
6,000 |
|
|
|
32,168 |
|
|
|
|
| TOTO Ltd.†† |
|
|
1,000 |
|
|
|
14,147 |
|
|
|
|
| Towa Pharmaceutical Co.
Ltd.#,†† |
|
|
5,100 |
|
|
|
269,703 |
|
|
|
|
| Toyo Ink SC Holdings Co.
Ltd.†† |
|
|
1,000 |
|
|
|
4,762 |
|
|
|
|
| Toyo Seikan Kaisha Ltd.†† |
|
|
4,800 |
|
|
|
75,901 |
|
|
|
|
| Toyo Tire & Rubber Co.
Ltd.†† |
|
|
18,000 |
|
|
|
344,792 |
|
|
|
|
| Toyoda Gosei Co. Ltd.†† |
|
|
19,900 |
|
|
|
460,418 |
|
|
|
|
| Toyota Motor Corp.†† |
|
|
6,600 |
|
|
|
459,420 |
|
|
|
|
| Toyota Tsusho Corp. |
|
|
4,600 |
|
|
|
118,274 |
|
|
|
|
| Trend Micro, Inc./Japan†† |
|
|
8,100 |
|
|
|
274,035 |
|
|
|
|
| Tsuruha Holdings, Inc.†† |
|
|
6,300 |
|
|
|
456,931 |
|
|
|
|
| Ube Industries Ltd.†† |
|
|
15,000 |
|
|
|
24,886 |
|
|
|
|
| Unicharm Corp.†† |
|
|
1,400 |
|
|
|
35,238 |
|
|
|
|
| UNY Group Holdings Co.
Ltd.†† |
|
|
6,000 |
|
|
|
33,927 |
|
|
|
|
| Yahoo Japan Corp.†† |
|
|
3,200 |
|
|
|
13,073 |
|
|
|
|
| Yamada Denki Co. Ltd.#,†† |
|
|
11,000 |
|
|
|
45,024 |
|
|
|
|
| Yamaguchi Financial Group,
Inc.#,†† |
|
|
4,000 |
|
|
|
50,139 |
|
|
|
|
| Yamaha Motor Co. Ltd.†† |
|
|
1,300 |
|
|
|
30,592 |
|
|
|
|
| Yamato Holdings Co.
Ltd.†† |
|
|
1,100 |
|
|
|
24,619 |
|
|
|
|
| Yamato Kogyo Co. Ltd.†† |
|
|
700 |
|
|
|
16,470 |
|
|
|
|
| Yamazaki Baking Co.
Ltd.†† |
|
|
3,000 |
|
|
|
53,102 |
|
|
|
|
| Yaskawa Electric Corp.†† |
|
|
304,508 |
|
|
|
4,183,792 |
|
|
|
|
| Yokogawa Electric
Corp.#,†† |
|
|
700 |
|
|
|
8,198 |
|
|
|
|
|
|
|
|
|
|
| Description |
|
Number of
Shares |
|
|
Value |
|
|
|
|
| Yokohama Rubber Co.
Ltd.†† |
|
|
42,100 |
|
|
$ |
453,020 |
|
|
|
|
| Zenkoku Hosho Co. Ltd.†† |
|
|
21,700 |
|
|
|
801,158 |
|
|
|
|
| Zojirushi Corp.#,†† |
|
|
16,000 |
|
|
|
218,798 |
|
|
|
|
|
|
|
|
|
|
|
|
|
| TOTAL JAPAN |
|
|
|
|
|
$ |
79,543,850 |
|
|
|
|
| JORDAN – 0.1% |
|
|
|
|
|
|
|
|
|
|
|
| Al Eqbal Co. For Investment
P†† |
|
|
1,440 |
|
|
|
27,766 |
|
|
|
|
| Arab Bank PLC†† |
|
|
25,110 |
|
|
|
224,826 |
|
|
|
|
| Arab Potash Co.†† |
|
|
2,100 |
|
|
|
47,209 |
|
|
|
|
| Bank of Jordan†† |
|
|
8,070 |
|
|
|
30,477 |
|
|
|
|
| Capital Bank of Jordan†† |
|
|
11,634 |
|
|
|
25,265 |
|
|
|
|
| Jordan Ahli Bank*,†† |
|
|
20,342 |
|
|
|
35,219 |
|
|
|
|
| Jordan Petroleum Refinery
Co.†† |
|
|
8,078 |
|
|
|
64,438 |
|
|
|
|
| Jordan Phosphate Mines†† |
|
|
1,700 |
|
|
|
15,638 |
|
|
|
|
| Jordan Telecommunications Co.
PSC†† |
|
|
4,950 |
|
|
|
20,557 |
|
|
|
|
| Jordanian Electric Power
Co.†† |
|
|
12,017 |
|
|
|
45,063 |
|
|
|
|
|
|
|
|
|
|
|
|
|
| TOTAL JORDAN |
|
|
|
|
|
$ |
536,458 |
|
|
|
|
| KAZAKHSTAN – 0.1% |
|
|
|
|
|
|
|
|
|
|
|
| Halyk Savings Bank of Kazakhstan
JSC GDR†† |
|
|
10,490 |
|
|
|
81,417 |
|
|
|
|
| Kazakhmys PLC*,†† |
|
|
38,412 |
|
|
|
152,766 |
|
|
|
|
| Kazkommertsbank JSC
GDR#,*,†† |
|
|
28,000 |
|
|
|
89,076 |
|
|
|
|
| KazMunaiGas Exploration Production
JSC GDR†† |
|
|
9,600 |
|
|
|
109,189 |
|
|
|
|
| KCell JSC GDR†† |
|
|
8,400 |
|
|
|
70,754 |
|
|
|
|
| Nostrum Oil & Gas
PLC*,†† |
|
|
4,923 |
|
|
|
46,335 |
|
|
|
|
|
|
|
|
|
|
|
|
|
| TOTAL KAZAKHSTAN |
|
|
|
|
|
$ |
549,537 |
|
|
|
|
| KENYA – 0.1% |
|
|
|
|
|
|
|
|
|
|
|
| ARM Cement Ltd.†† |
|
|
31,800 |
|
|
|
25,530 |
|
|
|
|
| Bamburi Cement Co. Ltd.†† |
|
|
6,600 |
|
|
|
10,465 |
|
|
|
|
| Barclays Bank of Kenya
Ltd.†† |
|
|
135,900 |
|
|
|
22,921 |
|
|
|
|
| East African Breweries
Ltd.†† |
|
|
25,180 |
|
|
|
85,297 |
|
|
|
|
| Equity Bank Ltd.†† |
|
|
141,500 |
|
|
|
73,708 |
|
|
|
|
| Kenya Airways Ltd.*,†† |
|
|
154,800 |
|
|
|
11,623 |
|
|
|
|
| Kenya Commercial Bank
Ltd.†† |
|
|
128,700 |
|
|
|
85,131 |
|
|
|
|
| Kenya Power & Lighting
Ltd.†† |
|
|
58,087 |
|
|
|
10,501 |
|
|
|
|
| Nation Media Group Ltd.†† |
|
|
16,244 |
|
|
|
40,099 |
|
|
|
|
| Safaricom Ltd.†† |
|
|
782,500 |
|
|
|
144,016 |
|
|
|
|
| Standard Chartered Bank Kenya
Ltd.†† |
|
|
10,458 |
|
|
|
37,964 |
|
|
|
|
|
|
|
|
|
|
|
|
|
| TOTAL KENYA |
|
|
|
|
|
$ |
547,255 |
|
|
|
|
| LATVIA – 0.0%** |
|
|
|
|
|
|
|
|
|
|
|
| Latvian Shipping Co.*,†† |
|
|
36,206 |
|
|
|
15,391 |
|
|
|
|
| LEBANON – 0.0%** |
|
|
|
|
|
|
|
|
|
|
|
| Solidere GDR#,*,†† |
|
|
19,314 |
|
|
|
213,889 |
|
|
|
|
| LITHUANIA – 0.0%** |
|
|
|
|
|
|
|
|
|
|
|
| Apranga PVA†† |
|
|
22,400 |
|
|
|
74,352 |
|
ANNUAL REPORT / April 30, 2015
36 PORTFOLIOS OF
INVESTMENTS
Wilmington Multi-Manager International Fund
(continued)
|
|
|
|
|
|
|
|
|
| Description |
|
Number of
Shares |
|
|
Value |
|
|
|
|
| Invalda Privatus Kapitalas
AB*,†† |
|
|
7,855 |
|
|
$ |
15,303 |
|
|
|
|
| Lesto AB†† |
|
|
19,018 |
|
|
|
20,927 |
|
|
|
|
| Lietuvos Energijos Gamyba
AB†† |
|
|
10,949 |
|
|
|
10,863 |
|
|
|
|
| Litgrid AB†† |
|
|
8,818 |
|
|
|
6,920 |
|
|
|
|
| Panevezio Statybos
Trestas†† |
|
|
16,900 |
|
|
|
19,710 |
|
|
|
|
| Pieno Zvaigzdes†† |
|
|
10,687 |
|
|
|
18,965 |
|
|
|
|
| Siauliu Bankas*,†† |
|
|
72,546 |
|
|
|
24,344 |
|
|
|
|
|
|
|
|
|
|
|
|
|
| TOTAL LITHUANIA |
|
|
|
|
|
$ |
191,384 |
|
|
|
|
| LUXEMBOURG – 0.1% |
|
|
|
|
|
|
|
|
|
|
|
| Aperam*,†† |
|
|
10,000 |
|
|
|
381,238 |
|
|
|
|
| MALAYSIA – 0.5% |
|
|
|
|
|
|
|
|
|
|
|
| Alliance Financial Group
Bhd†† |
|
|
14,400 |
|
|
|
19,114 |
|
|
|
|
| AMMB Holdings Bhd†† |
|
|
18,600 |
|
|
|
33,781 |
|
|
|
|
| Astro Malaysia Holdings
Bhd†† |
|
|
21,000 |
|
|
|
18,489 |
|
|
|
|
| Axiata Group Bhd†† |
|
|
37,600 |
|
|
|
71,053 |
|
|
|
|
| Batu Kawan Bhd†† |
|
|
7,300 |
|
|
|
37,221 |
|
|
|
|
| Boustead Holdings Bhd†† |
|
|
17,400 |
|
|
|
22,544 |
|
|
|
|
| British American Tobacco Malaysia
Bhd†† |
|
|
1,800 |
|
|
|
33,789 |
|
|
|
|
| Bumi Armada Bhd†† |
|
|
102,000 |
|
|
|
33,990 |
|
|
|
|
| CIMB Group Holdings Bhd†† |
|
|
32,500 |
|
|
|
53,765 |
|
|
|
|
| Dialog Group Bhd†† |
|
|
65,520 |
|
|
|
29,721 |
|
|
|
|
| DiGi.Com Bhd†† |
|
|
35,500 |
|
|
|
59,848 |
|
|
|
|
| Felda Global Ventures Holdings
Bhd†† |
|
|
27,800 |
|
|
|
16,128 |
|
|
|
|
| Gamuda Bhd†† |
|
|
47,300 |
|
|
|
69,420 |
|
|
|
|
| Genting Bhd†† |
|
|
235,108 |
|
|
|
577,133 |
|
|
|
|
| Genting Malaysia Bhd†† |
|
|
44,500 |
|
|
|
53,638 |
|
|
|
|
| Hong Leong Bank Bhd†† |
|
|
6,400 |
|
|
|
25,261 |
|
|
|
|
| IHH Healthcare Bhd†† |
|
|
119,700 |
|
|
|
198,698 |
|
|
|
|
| IJM Corp. Bhd†† |
|
|
24,060 |
|
|
|
49,544 |
|
|
|
|
| IOI Corp. Bhd†† |
|
|
37,780 |
|
|
|
45,998 |
|
|
|
|
| IOI Properties Group
Bhd*,†† |
|
|
24,189 |
|
|
|
14,496 |
|
|
|
|
| KLCC Property Holdings
Bhd†† |
|
|
11,200 |
|
|
|
22,183 |
|
|
|
|
| Kuala Lumpur Kepong Bhd†† |
|
|
5,700 |
|
|
|
35,461 |
|
|
|
|
| Lafarge Malayan Cement
Bhd†† |
|
|
16,000 |
|
|
|
43,313 |
|
|
|
|
| Magnum Bhd†† |
|
|
20,738 |
|
|
|
15,881 |
|
|
|
|
| Malayan Banking Bhd†† |
|
|
26,790 |
|
|
|
69,228 |
|
|
|
|
| Maxis Bhd†† |
|
|
23,100 |
|
|
|
44,922 |
|
|
|
|
| MMC Corp. Bhd†† |
|
|
24,100 |
|
|
|
18,198 |
|
|
|
|
| Muhibbah Engineering M
Bhd†† |
|
|
32,000 |
|
|
|
22,438 |
|
|
|
|
| Petronas Chemicals Group
Bhd†† |
|
|
53,700 |
|
|
|
88,299 |
|
|
|
|
| Petronas Dagangan Bhd†† |
|
|
11,100 |
|
|
|
66,719 |
|
|
|
|
| Petronas Gas Bhd†† |
|
|
6,200 |
|
|
|
39,530 |
|
|
|
|
| PPB Group Bhd†† |
|
|
8,100 |
|
|
|
34,843 |
|
|
|
|
| Public Bank Bhd†† |
|
|
12,900 |
|
|
|
70,524 |
|
|
|
|
| RHB Capital Bhd†† |
|
|
18,000 |
|
|
|
39,852 |
|
|
|
|
| Sapurakencana Petroleum
Bhd*,†† |
|
|
123,217 |
|
|
|
91,752 |
|
|
|
|
|
|
|
|
|
|
| Description |
|
Number of
Shares |
|
|
Value |
|
|
|
|
| Sime Darby Bhd†† |
|
|
52,346 |
|
|
$ |
133,003 |
|
|
|
|
| Ta Ann Holdings Bhd†† |
|
|
19,008 |
|
|
|
19,988 |
|
|
|
|
| Telekom Malaysia Bhd†† |
|
|
22,900 |
|
|
|
47,551 |
|
|
|
|
| Tenaga Nasional Bhd†† |
|
|
30,725 |
|
|
|
123,660 |
|
|
|
|
| Top Glove Corp. Bhd†† |
|
|
25,100 |
|
|
|
39,509 |
|
|
|
|
| UMW Holdings Bhd†† |
|
|
7,100 |
|
|
|
21,190 |
|
|
|
|
| UMW Oil & Gas Corp.
Bhd†† |
|
|
53,900 |
|
|
|
33,094 |
|
|
|
|
| WCT Holdings Bhd†† |
|
|
41,193 |
|
|
|
21,079 |
|
|
|
|
| YTL Corp. Bhd†† |
|
|
57,476 |
|
|
|
26,931 |
|
|
|
|
| YTL Power International
Bhd*,†† |
|
|
37,501 |
|
|
|
16,825 |
|
|
|
|
|
|
|
|
|
|
|
|
|
| TOTAL MALAYSIA |
|
|
|
|
|
$ |
2,649,604 |
|
|
|
|
| MAURITIUS – 0.1% |
|
|
|
|
|
|
|
|
|
|
|
| Alteo Ltd.†† |
|
|
36,100 |
|
|
|
33,998 |
|
|
|
|
| CIM Financial Services
Ltd.†† |
|
|
191,700 |
|
|
|
49,378 |
|
|
|
|
| Lux Island Resorts Ltd.†† |
|
|
7,000 |
|
|
|
11,847 |
|
|
|
|
| MCB Group Ltd.*,†† |
|
|
33,000 |
|
|
|
192,475 |
|
|
|
|
| New Mauritius Hotels
Ltd.†† |
|
|
45,057 |
|
|
|
79,506 |
|
|
|
|
| Rogers & Co.
Ltd.†† |
|
|
71,000 |
|
|
|
60,170 |
|
|
|
|
| SBM Holdings Ltd.†† |
|
|
3,060,000 |
|
|
|
83,401 |
|
|
|
|
| Sun Resorts Ltd. Class
A*,†† |
|
|
21,165 |
|
|
|
23,968 |
|
|
|
|
|
|
|
|
|
|
|
|
|
| TOTAL MAURITIUS |
|
|
|
|
|
$ |
534,743 |
|
|
|
|
| MEXICO – 0.7% |
|
|
|
|
|
|
|
|
|
|
|
| Alfa SAB de CV |
|
|
100,800 |
|
|
|
204,662 |
|
|
|
|
| America Movil SAB de CV |
|
|
675,224 |
|
|
|
707,704 |
|
|
|
|
| Arca Continental SAB de CV |
|
|
10,200 |
|
|
|
62,568 |
|
|
|
|
| Cemex SAB de CV* |
|
|
318,373 |
|
|
|
307,333 |
|
|
|
|
| Coca-Cola Femsa SAB de CV |
|
|
8,700 |
|
|
|
69,574 |
|
|
|
|
| Compartamos SAB de CV |
|
|
108,000 |
|
|
|
184,857 |
|
|
|
|
| Empresas ICA SAB de CV* |
|
|
20,800 |
|
|
|
18,438 |
|
|
|
|
| Fomento Economico Mexicano SAB de CV |
|
|
30,400 |
|
|
|
275,070 |
|
|
|
|
| Grupo Aeroportuario del Centro Norte SABde CV |
|
|
5,400 |
|
|
|
26,961 |
|
|
|
|
| Grupo Aeroportuario del Pacifico SAB de CV |
|
|
14,700 |
|
|
|
104,468 |
|
|
|
|
| Grupo Aeroportuario del Sureste SAB de CV |
|
|
2,300 |
|
|
|
32,541 |
|
|
|
|
| Grupo Bimbo SAB de CV |
|
|
43,000 |
|
|
|
115,278 |
|
|
|
|
| Grupo Carso SAB de CV |
|
|
20,100 |
|
|
|
83,822 |
|
|
|
|
| Grupo Elektra SA de CV |
|
|
1,460 |
|
|
|
37,666 |
|
|
|
|
| Grupo Financiero Banorte SAB de CV |
|
|
59,900 |
|
|
|
339,793 |
|
|
|
|
| Grupo Financiero Inbursa SAB de CV |
|
|
86,100 |
|
|
|
205,681 |
|
|
|
|
| Grupo Mexico SAB de CV |
|
|
66,221 |
|
|
|
204,637 |
|
|
|
|
| Grupo Televisa SAB |
|
|
32,000 |
|
|
|
232,981 |
|
|
|
|
| Impulsora del Desarrollo y El Empleo en America Latina SAB de CV* |
|
|
28,295 |
|
|
|
62,337 |
|
|
|
|
| Industrias CH SAB de CV* |
|
|
7,500 |
|
|
|
30,588 |
|
|
|
|
| Industrias Penoles SAB de CV |
|
|
3,930 |
|
|
|
66,602 |
|
|
|
|
| Kimberly-Clark de Mexico SAB de CV |
|
|
22,000 |
|
|
|
48,440 |
|
|
|
|
| Mexichem SAB de CV |
|
|
29,605 |
|
|
|
84,693 |
|
April 30, 2015 / ANNUAL REPORT
PORTFOLIOS OF INVESTMENTS 37
Wilmington Multi-Manager International Fund
(continued)
|
|
|
|
|
|
|
|
|
| Description |
|
Number of
Shares |
|
|
Value |
|
|
|
|
| Minera Frisco SAB de CV* |
|
|
16,600 |
|
|
$ |
13,741 |
|
|
|
|
| Organizacion Soriana SAB de CV |
|
|
10,800 |
|
|
|
26,426 |
|
|
|
|
| Promotora y Operadora de Infraestructura SAB de CV* |
|
|
10,400 |
|
|
|
119,306 |
|
|
|
|
| TV Azteca SAB de CV |
|
|
95,000 |
|
|
|
28,979 |
|
|
|
|
| Walmart de Mexico SAB de CV |
|
|
85,200 |
|
|
|
200,477 |
|
|
|
|
|
|
|
|
|
|
|
|
|
| TOTAL MEXICO |
|
|
|
|
|
$ |
3,895,623 |
|
|
|
|
| MOROCCO – 0.1% |
|
|
|
|
|
|
|
|
|
|
|
| Attijariwafa Bank†† |
|
|
2,400 |
|
|
|
89,307 |
|
|
|
|
| Auto Hall†† |
|
|
2,300 |
|
|
|
21,509 |
|
|
|
|
| Banque Centrale
Populaire†† |
|
|
2,450 |
|
|
|
56,558 |
|
|
|
|
| BMCE Bank†† |
|
|
2,000 |
|
|
|
45,542 |
|
|
|
|
| Cie Generale
Immobiliere†† |
|
|
190 |
|
|
|
7,105 |
|
|
|
|
| Douja Promotion Groupe Addoha
SA†† |
|
|
5,000 |
|
|
|
15,961 |
|
|
|
|
| Holcim Maroc SA†† |
|
|
240 |
|
|
|
55,210 |
|
|
|
|
| Lafarge Ciments†† |
|
|
460 |
|
|
|
80,841 |
|
|
|
|
| Maroc Telecom SA†† |
|
|
10,200 |
|
|
|
135,906 |
|
|
|
|
|
|
|
|
|
|
|
|
|
| TOTAL MOROCCO |
|
|
|
|
|
$ |
507,939 |
|
|
|
|
| NETHERLANDS – 2.1% |
|
|
|
|
|
|
|
|
|
|
|
| Aegon NV†† |
|
|
66,621 |
|
|
|
525,634 |
|
|
|
|
| ArcelorMittal#,†† |
|
|
6,059 |
|
|
|
64,477 |
|
|
|
|
| ArcelorMittal, NY Reg. Shares# |
|
|
20,624 |
|
|
|
220,471 |
|
|
|
|
| ASM International NV†† |
|
|
3,500 |
|
|
|
169,932 |
|
|
|
|
| ASML Holding NV#,†† |
|
|
1,037 |
|
|
|
111,595 |
|
|
|
|
| BE Semiconductor
Industry†† |
|
|
5,900 |
|
|
|
168,282 |
|
|
|
|
| Corbion NV*,†† |
|
|
11,200 |
|
|
|
255,790 |
|
|
|
|
| Delta Lloyd NV†† |
|
|
4,341 |
|
|
|
82,093 |
|
|
|
|
| Euronext NV†† |
|
|
7,900 |
|
|
|
331,649 |
|
|
|
|
| European Aeronautic Defence and Space Co. NV |
|
|
1,139 |
|
|
|
78,935 |
|
|
|
|
| Fiat Chrysler Automobiles NV# |
|
|
1,513 |
|
|
|
22,317 |
|
|
|
|
| Fugro NV†† |
|
|
650 |
|
|
|
18,694 |
|
|
|
|
| Heineken NV*,†† |
|
|
29,224 |
|
|
|
2,302,211 |
|
|
|
|
| ING Groep NV*,†† |
|
|
75,113 |
|
|
|
1,152,351 |
|
|
|
|
| Koninklijke Ahold NV†† |
|
|
29,832 |
|
|
|
577,970 |
|
|
|
|
| Koninklijke Bam Groep
NV#,†† |
|
|
47,800 |
|
|
|
199,259 |
|
|
|
|
| Koninklijke Boskalis Westminster
NV†† |
|
|
2,279 |
|
|
|
118,418 |
|
|
|
|
| Koninklijke DSM NV†† |
|
|
4,268 |
|
|
|
243,407 |
|
|
|
|
| Koninklijke KPN NV†† |
|
|
15,000 |
|
|
|
55,616 |
|
|
|
|
| Koninklijke Philips NV†† |
|
|
11,662 |
|
|
|
334,050 |
|
|
|
|
| Koninklijke Philips NV |
|
|
7,619 |
|
|
|
217,980 |
|
|
|
|
| NXP Semiconductors NV |
|
|
41,520 |
|
|
|
3,990,902 |
|
|
|
|
| PostNL NV†† |
|
|
37,000 |
|
|
|
183,746 |
|
|
|
|
| Randstad Holding NV†† |
|
|
480 |
|
|
|
28,628 |
|
|
|
|
| TNT Express NV†† |
|
|
1,322 |
|
|
|
11,285 |
|
|
|
|
| Unilever NV†† |
|
|
3,077 |
|
|
|
134,221 |
|
|
|
|
|
|
|
|
|
|
|
|
|
| TOTAL NETHERLANDS |
|
|
|
|
|
$ |
11,599,913 |
|
|
|
|
|
|
|
|
|
|
| Description |
|
Number of
Shares |
|
|
Value |
|
|
|
|
| NEW ZEALAND – 0.0%** |
|
|
|
|
|
|
|
|
|
|
|
| Air New Zealand Ltd.†† |
|
|
14,500 |
|
|
$ |
29,798 |
|
|
|
|
| Auckland International Airport
Ltd.†† |
|
|
6,006 |
|
|
|
21,076 |
|
|
|
|
| Contact Energy Ltd.†† |
|
|
7,123 |
|
|
|
30,846 |
|
|
|
|
| Fletcher Building Ltd.†† |
|
|
5,027 |
|
|
|
31,822 |
|
|
|
|
|
|
|
|
|
|
|
|
|
| TOTAL NEW ZEALAND |
|
|
|
|
|
$ |
113,542 |
|
|
|
|
| NIGERIA – 0.1% |
|
|
|
|
|
|
|
|
|
|
|
| Access Bank PLC†† |
|
|
866,753 |
|
|
|
26,032 |
|
|
|
|
| Dangote Cement PLC†† |
|
|
51,150 |
|
|
|
47,221 |
|
|
|
|
| Ecobank Transnational,
Inc.†† |
|
|
306,748 |
|
|
|
31,874 |
|
|
|
|
| FBN Holdings PLC†† |
|
|
629,542 |
|
|
|
30,881 |
|
|
|
|
| Forte Oil PLC†† |
|
|
55,651 |
|
|
|
49,387 |
|
|
|
|
| Guaranty Trust Bank PLC†† |
|
|
576,410 |
|
|
|
83,237 |
|
|
|
|
| Guinness Nigeria PLC†† |
|
|
29,925 |
|
|
|
25,360 |
|
|
|
|
| Lafarge Cement WAPCO Nigeria
PLC†† |
|
|
36,300 |
|
|
|
17,139 |
|
|
|
|
| Nestle Nigeria PLC†† |
|
|
7,636 |
|
|
|
36,472 |
|
|
|
|
| Nigerian Breweries PLC†† |
|
|
70,380 |
|
|
|
55,588 |
|
|
|
|
| Oando PLC†† |
|
|
308,975 |
|
|
|
27,990 |
|
|
|
|
| Seplat Petroleum Development Co.
PLC†† |
|
|
17,254 |
|
|
|
33,541 |
|
|
|
|
| UAC of Nigeria PLC†† |
|
|
162,220 |
|
|
|
34,181 |
|
|
|
|
| Unilever Nigeria PLC†† |
|
|
79,800 |
|
|
|
16,904 |
|
|
|
|
| United Bank for Africa
PLC†† |
|
|
812,013 |
|
|
|
21,487 |
|
|
|
|
| Zenith Bank PLC†† |
|
|
535,775 |
|
|
|
56,602 |
|
|
|
|
|
|
|
|
|
|
|
|
|
| TOTAL NIGERIA |
|
|
|
|
|
$ |
593,896 |
|
|
|
|
| NORWAY – 0.3% |
|
|
|
|
|
|
|
|
|
|
|
| Akastor ASA†† |
|
|
954 |
|
|
|
1,862 |
|
|
|
|
| Aker Solutions ASA†† |
|
|
954 |
|
|
|
5,808 |
|
|
|
|
| Petroleum Geo-Services
ASA†† |
|
|
2,167 |
|
|
|
14,388 |
|
|
|
|
| Salmar ASA#,†† |
|
|
18,800 |
|
|
|
305,226 |
|
|
|
|
| Seadrill Ltd.# |
|
|
6,288 |
|
|
|
81,559 |
|
|
|
|
| Statoil ASA†† |
|
|
29,485 |
|
|
|
625,093 |
|
|
|
|
| Storebrand ASA*,†† |
|
|
10,389 |
|
|
|
36,732 |
|
|
|
|
| Subsea 7 SA#,†† |
|
|
2,902 |
|
|
|
32,235 |
|
|
|
|
| Telenor ASA†† |
|
|
3,856 |
|
|
|
87,088 |
|
|
|
|
| Yara International ASA†† |
|
|
8,200 |
|
|
|
420,147 |
|
|
|
|
|
|
|
|
|
|
|
|
|
| TOTAL NORWAY |
|
|
|
|
|
$ |
1,610,138 |
|
|
|
|
| OMAN – 0.1% |
|
|
|
|
|
|
|
|
|
|
|
| Al-Anwar Ceramic Tile
Co.†† |
|
|
16,080 |
|
|
|
17,084 |
|
|
|
|
| Bank Dhofar SAOG†† |
|
|
56,744 |
|
|
|
41,671 |
|
|
|
|
| Bank Muscat SAOG |
|
|
7,928 |
|
|
|
— |
|
|
|
|
| Bank Sohar†† |
|
|
56,074 |
|
|
|
26,243 |
|
|
|
|
| BankMuscat SAOG†† |
|
|
56,049 |
|
|
|
76,583 |
|
|
|
|
| Dhofar International Development &
Investment Holding
Co.†† |
|
|
14,336 |
|
|
|
18,362 |
|
|
|
|
| Galfar Engineering & Contracting
SAOG†† |
|
|
85,058 |
|
|
|
27,923 |
|
|
|
|
| National Bank of Oman
SAOG†† |
|
|
59,742 |
|
|
|
48,491 |
|
|
|
|
| Oman Cement Co.†† |
|
|
23,240 |
|
|
|
30,951 |
|
ANNUAL REPORT / April 30, 2015
38 PORTFOLIOS OF
INVESTMENTS
Wilmington Multi-Manager International Fund
(continued)
|
|
|
|
|
|
|
|
|
| Description |
|
Number of
Shares |
|
|
Value |
|
|
|
|
| Oman Flour Mills Co.
SAOG†† |
|
|
16,000 |
|
|
$ |
20,814 |
|
|
|
|
| Oman Oil Marketing Co. |
|
|
7,300 |
|
|
|
42,278 |
|
|
|
|
| Oman Telecommunications Co.
SAOG†† |
|
|
31,500 |
|
|
|
132,521 |
|
|
|
|
| Renaissance Services
SAOG†† |
|
|
11,992 |
|
|
|
11,113 |
|
|
|
|
|
|
|
|
|
|
|
|
|
| TOTAL OMAN |
|
|
|
|
|
$ |
494,034 |
|
|
|
|
| PANAMA – 0.0%** |
|
|
|
|
|
|
|
|
|
|
|
| Copa Holdings SA Class A# |
|
|
1,941 |
|
|
|
215,237 |
|
|
|
|
| PAPUA NEW GUINEA – 0.0%** |
|
|
|
|
|
|
|
|
|
|
|
| Oil Search Ltd.†† |
|
|
3,898 |
|
|
|
24,747 |
|
|
|
|
| PERU – 0.2% |
|
|
|
|
|
|
|
|
|
|
|
| Alicorp SA |
|
|
51,200 |
|
|
|
98,933 |
|
|
|
|
| BBVA Banco Continental SA |
|
|
16,829 |
|
|
|
22,736 |
|
|
|
|
| Cia de Minas Buenaventura SA ADR |
|
|
5,000 |
|
|
|
55,900 |
|
|
|
|
| Credicorp Ltd. |
|
|
2,250 |
|
|
|
343,238 |
|
|
|
|
| Edegel SAA |
|
|
37,100 |
|
|
|
41,709 |
|
|
|
|
| Ferreycorp SAA |
|
|
60,958 |
|
|
|
26,673 |
|
|
|
|
| Grana y Montero SA |
|
|
32,600 |
|
|
|
52,581 |
|
|
|
|
| Inretail Peru Corp.* |
|
|
3,106 |
|
|
|
46,279 |
|
|
|
|
| Luz del Sur SAA |
|
|
6,400 |
|
|
|
21,810 |
|
|
|
|
| Minsur SA |
|
|
35,670 |
|
|
|
14,924 |
|
|
|
|
| Sociedad Minera Cerro Verde SAA* |
|
|
1,400 |
|
|
|
33,642 |
|
|
|
|
| Sociedad Minera el Brocal SA |
|
|
4,000 |
|
|
|
9,939 |
|
|
|
|
| Southern Copper Corp.# |
|
|
7,159 |
|
|
|
233,240 |
|
|
|
|
| Volcan Cia Minera SAA |
|
|
131,614 |
|
|
|
25,642 |
|
|
|
|
|
|
|
|
|
|
|
|
|
| TOTAL PERU |
|
|
|
|
|
$ |
1,027,246 |
|
|
|
|
| PHILIPPINES – 0.4% |
|
|
|
|
|
|
|
|
|
|
|
| Aboitiz Equity Ventures,
Inc.†† |
|
|
31,200 |
|
|
|
39,627 |
|
|
|
|
| Aboitiz Power Corp.†† |
|
|
81,200 |
|
|
|
78,175 |
|
|
|
|
| Alliance Global Group,
Inc.†† |
|
|
57,000 |
|
|
|
32,393 |
|
|
|
|
| Ayala Corp.†† |
|
|
5,200 |
|
|
|
90,929 |
|
|
|
|
| Ayala Land, Inc.†† |
|
|
94,700 |
|
|
|
81,929 |
|
|
|
|
| Bank of the Philippine
Islands†† |
|
|
27,653 |
|
|
|
62,807 |
|
|
|
|
| BDO Unibank, Inc.†† |
|
|
25,762 |
|
|
|
63,000 |
|
|
|
|
| Bloomberry Resorts
Corp.*,†† |
|
|
158,600 |
|
|
|
39,794 |
|
|
|
|
| D&L Industries,
Inc.†† |
|
|
89,100 |
|
|
|
39,921 |
|
|
|
|
| Emperador, Inc.†† |
|
|
132,700 |
|
|
|
34,485 |
|
|
|
|
| Energy Development
Corp.†† |
|
|
465,500 |
|
|
|
84,425 |
|
|
|
|
| First Gen Corp.†† |
|
|
89,800 |
|
|
|
56,526 |
|
|
|
|
| Globe Telecom, Inc.†† |
|
|
1,450 |
|
|
|
70,892 |
|
|
|
|
| GT Capital Holdings,
Inc.†† |
|
|
1,680 |
|
|
|
47,336 |
|
|
|
|
| International Container Terminal Services,
Inc.†† |
|
|
16,400 |
|
|
|
40,452 |
|
|
|
|
| JG Summit Holdings,
Inc.†† |
|
|
50,900 |
|
|
|
81,534 |
|
|
|
|
| Jollibee Foods Corp.†† |
|
|
33,800 |
|
|
|
150,831 |
|
|
|
|
| LT Group, Inc.†† |
|
|
110,800 |
|
|
|
36,991 |
|
|
|
|
| Manila Electric Co.†† |
|
|
16,210 |
|
|
|
94,749 |
|
|
|
|
|
|
|
|
|
|
| Description |
|
Number of
Shares |
|
|
Value |
|
|
|
|
| Metro Pacific Investments
Corp.†† |
|
|
190,000 |
|
|
$ |
19,293 |
|
|
|
|
| Metropolitan Bank &
Trust†† |
|
|
26,134 |
|
|
|
54,479 |
|
|
|
|
| Philex Mining Corp.†† |
|
|
216,150 |
|
|
|
33,779 |
|
|
|
|
| Philippine Long Distance Telephone
Co.†† |
|
|
3,600 |
|
|
|
225,894 |
|
|
|
|
| Puregold Price Club,
Inc.†† |
|
|
50,000 |
|
|
|
44,503 |
|
|
|
|
| Robinsons Retail Holdings,
Inc.†† |
|
|
20,320 |
|
|
|
39,714 |
|
|
|
|
| San Miguel Corp.†† |
|
|
13,000 |
|
|
|
19,976 |
|
|
|
|
| Semirara Mining And Power
Co.†† |
|
|
23,100 |
|
|
|
85,800 |
|
|
|
|
| SM Investments Corp.†† |
|
|
5,162 |
|
|
|
104,286 |
|
|
|
|
| SM Prime Holdings, Inc.†† |
|
|
170,300 |
|
|
|
71,213 |
|
|
|
|
| Universal Robina Corp.†† |
|
|
32,100 |
|
|
|
156,539 |
|
|
|
|
|
|
|
|
|
|
|
|
|
| TOTAL PHILIPPINES |
|
|
|
|
|
$ |
2,082,272 |
|
|
|
|
| POLAND – 0.4% |
|
|
|
|
|
|
|
|
|
|
|
| AmRest Holdings SE*,†† |
|
|
2,700 |
|
|
|
98,400 |
|
|
|
|
| Asseco Poland SA†† |
|
|
7,073 |
|
|
|
119,157 |
|
|
|
|
| Bank Pekao SA†† |
|
|
2,850 |
|
|
|
148,139 |
|
|
|
|
| BRE Bank SA |
|
|
390 |
|
|
|
50,440 |
|
|
|
|
| Budimex SA#,†† |
|
|
730 |
|
|
|
35,672 |
|
|
|
|
| Cyfrowy Polsat SA†† |
|
|
6,760 |
|
|
|
47,127 |
|
|
|
|
| Energa SA†† |
|
|
4,947 |
|
|
|
34,295 |
|
|
|
|
| Eurocash SA†† |
|
|
4,940 |
|
|
|
50,106 |
|
|
|
|
| Getin Noble Bank SA*,†† |
|
|
54,005 |
|
|
|
26,813 |
|
|
|
|
| Grupa Kety SA†† |
|
|
385 |
|
|
|
33,816 |
|
|
|
|
| Grupa Lotos SA*,†† |
|
|
2,600 |
|
|
|
22,205 |
|
|
|
|
| ING Bank Slaski SA†† |
|
|
2,000 |
|
|
|
78,823 |
|
|
|
|
| Jastrzebska Spolka Weglowa
SA#,†† |
|
|
6,600 |
|
|
|
26,295 |
|
|
|
|
| Kernel Holding SA*,†† |
|
|
9,932 |
|
|
|
95,816 |
|
|
|
|
| KGHM Polska Miedz SA†† |
|
|
5,069 |
|
|
|
177,732 |
|
|
|
|
| Kruk SA†† |
|
|
1,654 |
|
|
|
70,348 |
|
|
|
|
| LPP SA†† |
|
|
50 |
|
|
|
106,200 |
|
|
|
|
| Lubelski Wegiel Bogdanka
SA#,†† |
|
|
700 |
|
|
|
17,070 |
|
|
|
|
| Netia SA†† |
|
|
39,573 |
|
|
|
64,749 |
|
|
|
|
| Orbis SA†† |
|
|
1,520 |
|
|
|
23,238 |
|
|
|
|
| PGE SA†† |
|
|
27,800 |
|
|
|
159,965 |
|
|
|
|
| Polski Koncern Naftowy Orlen
SA†† |
|
|
10,795 |
|
|
|
205,014 |
|
|
|
|
| Polskie Gornictwo Naftowe i Gazownictwo
SA†† |
|
|
58,932 |
|
|
|
106,296 |
|
|
|
|
| Powszechna Kasa Oszczednosci Bank Polski
SA†† |
|
|
21,090 |
|
|
|
210,909 |
|
|
|
|
| Powszechny Zaklad Ubezpieczen
SA†† |
|
|
1,220 |
|
|
|
159,118 |
|
|
|
|
| Synthos SA†† |
|
|
33,729 |
|
|
|
44,175 |
|
|
|
|
| Tauron Polska Energia
SA†† |
|
|
47,180 |
|
|
|
63,103 |
|
|
|
|
| Telekomunikacja Polska
SA#,†† |
|
|
26,910 |
|
|
|
76,225 |
|
|
|
|
| TVN SA†† |
|
|
6,666 |
|
|
|
31,473 |
|
|
|
|
|
|
|
|
|
|
|
|
|
| TOTAL POLAND |
|
|
|
|
|
$ |
2,382,719 |
|
|
|
|
| PORTUGAL – 0.0%** |
|
|
|
|
|
|
|
|
|
|
|
| Banco Comercial Portugues
SA†† |
|
|
394,943 |
|
|
|
39,329 |
|
April 30, 2015 / ANNUAL REPORT
PORTFOLIOS OF INVESTMENTS 39
Wilmington Multi-Manager International Fund
(continued)
|
|
|
|
|
|
|
|
|
| Description |
|
Number of
Shares |
|
|
Value |
|
|
|
|
| Banco Espirito Santo
SA*,†† |
|
|
15,937 |
|
|
$ |
— |
|
|
|
|
| EDP - Energias de Portugal
SA†† |
|
|
11,747 |
|
|
|
46,969 |
|
|
|
|
| EDP Renovaveis SA†† |
|
|
5,470 |
|
|
|
38,237 |
|
|
|
|
|
|
|
|
|
|
|
|
|
| TOTAL PORTUGAL |
|
|
|
|
|
$ |
124,535 |
|
|
|
|
| QATAR – 0.2% |
|
|
|
|
|
|
|
|
|
|
|
| Al Meera Consumer Goods
Co.†† |
|
|
1,000 |
|
|
|
67,510 |
|
|
|
|
| Barwa Real Estate Co.†† |
|
|
4,800 |
|
|
|
65,645 |
|
|
|
|
| Commercial Bank of Qatar
QSC†† |
|
|
2,530 |
|
|
|
39,136 |
|
|
|
|
| Doha Bank QSC†† |
|
|
3,322 |
|
|
|
49,706 |
|
|
|
|
| Gulf International Services
QSC†† |
|
|
3,625 |
|
|
|
88,473 |
|
|
|
|
| Industries Qatar QSC†† |
|
|
3,900 |
|
|
|
154,753 |
|
|
|
|
| Masraf Al Rayan†† |
|
|
10,600 |
|
|
|
140,146 |
|
|
|
|
| Ooredoo QSC†† |
|
|
2,600 |
|
|
|
70,645 |
|
|
|
|
| Qatar Electricity & Water
Co.†† |
|
|
1,080 |
|
|
|
62,631 |
|
|
|
|
| Qatar Gas Transport Co.
Nakilat†† |
|
|
8,700 |
|
|
|
54,094 |
|
|
|
|
| Qatar Islamic Bank†† |
|
|
2,200 |
|
|
|
60,266 |
|
|
|
|
| Qatar National Bank SAQ†† |
|
|
2,000 |
|
|
|
108,498 |
|
|
|
|
| Qatar National Cement
Co.†† |
|
|
1,672 |
|
|
|
55,564 |
|
|
|
|
| Qatar Navigation†† |
|
|
1,703 |
|
|
|
47,004 |
|
|
|
|
|
|
|
|
|
|
|
|
|
| TOTAL QATAR |
|
|
|
|
|
$ |
1,064,071 |
|
|
|
|
| ROMANIA – 0.1% |
|
|
|
|
|
|
|
|
|
|
|
| Banca Transilvania*,†† |
|
|
345,830 |
|
|
|
215,137 |
|
|
|
|
| BRD-Groupe Societe
Generale*,†† |
|
|
68,300 |
|
|
|
184,526 |
|
|
|
|
| OMV Petrom SA†† |
|
|
1,206,500 |
|
|
|
120,188 |
|
|
|
|
| Societatea Nationala De Gaze Naturale ROMGAZ
SA†† |
|
|
5,414 |
|
|
|
49,965 |
|
|
|
|
| Transelectrica SA†† |
|
|
2,450 |
|
|
|
17,597 |
|
|
|
|
|
|
|
|
|
|
|
|
|
| TOTAL ROMANIA |
|
|
|
|
|
$ |
587,413 |
|
|
|
|
| RUSSIA – 0.8% |
|
|
|
|
|
|
|
|
|
|
|
| CTC Media, Inc. |
|
|
16,400 |
|
|
|
57,236 |
|
|
|
|
| Federal Hydrogenerating Co. JSC ADR |
|
|
141,960 |
|
|
|
167,513 |
|
|
|
|
| Gazprom Neft OAO ADR |
|
|
1,400 |
|
|
|
19,306 |
|
|
|
|
| Gazprom OAO ADR |
|
|
90,210 |
|
|
|
530,435 |
|
|
|
|
| Globaltrans Investment PLC
GDR†† |
|
|
11,780 |
|
|
|
58,311 |
|
|
|
|
| Lenta Ltd.-Reg S†† |
|
|
5,658 |
|
|
|
49,354 |
|
|
|
|
| LSR Group GDR†† |
|
|
17,440 |
|
|
|
48,448 |
|
|
|
|
| Lukoil OAO ADR†† |
|
|
8,000 |
|
|
|
409,244 |
|
|
|
|
| Magnit OJSC GDR†† |
|
|
7,926 |
|
|
|
434,841 |
|
|
|
|
| Mail.Ru Group Ltd.
GDR*,†† |
|
|
4,643 |
|
|
|
110,756 |
|
|
|
|
| MegaFon OAO GDR†† |
|
|
7,446 |
|
|
|
126,298 |
|
|
|
|
| MMC Norilsk Nickel OJSC ADR
(B114RK6)†† |
|
|
14,910 |
|
|
|
280,868 |
|
|
|
|
| Mobile Telesystems OJSC ADR |
|
|
9,500 |
|
|
|
114,760 |
|
|
|
|
| NovaTek OAO GDR†† |
|
|
1,350 |
|
|
|
130,714 |
|
|
|
|
| Novolipetsk Steel OJSC
GDR†† |
|
|
7,200 |
|
|
|
95,062 |
|
|
|
|
| OTCPharm PJSC*,†† |
|
|
3,313 |
|
|
|
2,984 |
|
|
|
|
| Pharmstandard OJSC
GDR*,†† |
|
|
3,313 |
|
|
|
16,173 |
|
|
|
|
|
|
|
|
|
|
| Description |
|
Number of
Shares |
|
|
Value |
|
|
|
|
| QIWI PLC ADR# |
|
|
1,600 |
|
|
$ |
43,424 |
|
|
|
|
| Rosneft OAO GDR†† |
|
|
20,548 |
|
|
|
101,388 |
|
|
|
|
| Rostelecom OJSC ADR†† |
|
|
6,038 |
|
|
|
56,663 |
|
|
|
|
| Sberbank of Russia ADR |
|
|
67,867 |
|
|
|
409,917 |
|
|
|
|
| Severstal OAO GDR†† |
|
|
11,080 |
|
|
|
122,827 |
|
|
|
|
| Sistema JSFC GDR†† |
|
|
20,411 |
|
|
|
154,158 |
|
|
|
|
| Surgutneftegas OAO ADR |
|
|
17,807 |
|
|
|
128,923 |
|
|
|
|
| Tatneft OAO ADR†† |
|
|
4,000 |
|
|
|
137,209 |
|
|
|
|
| TMK OAO GDR†† |
|
|
4,860 |
|
|
|
19,696 |
|
|
|
|
| Uralkali OJSC GDR†† |
|
|
8,100 |
|
|
|
119,133 |
|
|
|
|
| VimpelCom Ltd. ADR |
|
|
21,300 |
|
|
|
120,771 |
|
|
|
|
| VTB Bank OJSC GDR†† |
|
|
64,826 |
|
|
|
160,336 |
|
|
|
|
| X5 Retail Group NV
GDR*,†† |
|
|
3,800 |
|
|
|
76,934 |
|
|
|
|
| Yandex NV* |
|
|
10,100 |
|
|
|
194,324 |
|
|
|
|
|
|
|
|
|
|
|
|
|
| TOTAL RUSSIA |
|
|
|
|
|
$ |
4,498,006 |
|
|
|
|
| SINGAPORE – 1.3% |
|
|
|
|
|
|
|
|
|
|
|
| Avago Technologies Ltd. |
|
|
33,467 |
|
|
|
3,911,623 |
|
|
|
|
| CapitaLand Ltd.†† |
|
|
13,405 |
|
|
|
37,304 |
|
|
|
|
| City Developments Ltd.†† |
|
|
10,000 |
|
|
|
80,459 |
|
|
|
|
| DBS Group Holdings Ltd.†† |
|
|
64,000 |
|
|
|
1,016,984 |
|
|
|
|
| Global Logistic Properties
Ltd.†† |
|
|
17,000 |
|
|
|
35,259 |
|
|
|
|
| Golden Agri-Resources
Ltd.†† |
|
|
126,000 |
|
|
|
39,860 |
|
|
|
|
| Jardine Cycle & Carriage
Ltd.†† |
|
|
1,000 |
|
|
|
30,471 |
|
|
|
|
| Noble Group Ltd.†† |
|
|
92,000 |
|
|
|
59,912 |
|
|
|
|
| Oversea-Chinese Banking
Corp.†† |
|
|
8,000 |
|
|
|
64,423 |
|
|
|
|
| Singapore Airlines Ltd.†† |
|
|
14,000 |
|
|
|
128,999 |
|
|
|
|
| Singapore Exchange Ltd.†† |
|
|
7,000 |
|
|
|
44,995 |
|
|
|
|
| Singapore Telecommunications
Ltd.†† |
|
|
33,000 |
|
|
|
110,273 |
|
|
|
|
| United Overseas Bank
Ltd.†† |
|
|
49,028 |
|
|
|
905,301 |
|
|
|
|
| UOL Group Ltd.†† |
|
|
4,000 |
|
|
|
24,052 |
|
|
|
|
| Venture Corp. Ltd.†† |
|
|
5,000 |
|
|
|
31,888 |
|
|
|
|
| Wilmar International
Ltd.†† |
|
|
27,000 |
|
|
|
66,315 |
|
|
|
|
| Wing Tai Holdings Ltd.†† |
|
|
107,000 |
|
|
|
158,332 |
|
|
|
|
|
|
|
|
|
|
|
|
|
| TOTAL SINGAPORE |
|
|
|
|
|
$ |
6,746,450 |
|
|
|
|
| SLOVENIA – 0.1% |
|
|
|
|
|
|
|
|
|
|
|
| Cinkarna Celje†† |
|
|
306 |
|
|
|
71,372 |
|
|
|
|
| Krka d.d., Novo mesto†† |
|
|
2,280 |
|
|
|
175,648 |
|
|
|
|
| Petrol DD Ljubljana†† |
|
|
210 |
|
|
|
66,706 |
|
|
|
|
| Telekom Slovenije DD†† |
|
|
600 |
|
|
|
76,728 |
|
|
|
|
| Zavarovalnica Triglav
DD†† |
|
|
3,470 |
|
|
|
110,569 |
|
|
|
|
|
|
|
|
|
|
|
|
|
| TOTAL SLOVENIA |
|
|
|
|
|
$ |
501,023 |
|
|
|
|
| SOUTH AFRICA – 0.8% |
|
|
|
|
|
|
|
|
|
|
|
| African Bank Investments
Ltd.#,†† |
|
|
36,266 |
|
|
|
— |
|
|
|
|
| African Rainbow Minerals
Ltd.†† |
|
|
2,100 |
|
|
|
19,160 |
|
|
|
|
| Anglo American Platinum
Ltd.*,†† |
|
|
800 |
|
|
|
22,096 |
|
ANNUAL REPORT / April 30, 2015
40 PORTFOLIOS OF
INVESTMENTS
Wilmington Multi-Manager International Fund
(continued)
|
|
|
|
|
|
|
|
|
| Description |
|
Number of
Shares |
|
|
Value |
|
|
|
|
| AngloGold Ashanti Ltd.†† |
|
|
5,430 |
|
|
$ |
61,665 |
|
|
|
|
| Aspen Pharmacare Holdings
Ltd.†† |
|
|
4,808 |
|
|
|
146,209 |
|
|
|
|
| Aveng Ltd.†† |
|
|
21,500 |
|
|
|
19,298 |
|
|
|
|
| AVI Ltd.†† |
|
|
5,800 |
|
|
|
39,745 |
|
|
|
|
| Barclays Africa Group
Ltd.†† |
|
|
3,700 |
|
|
|
59,267 |
|
|
|
|
| Barloworld Ltd.†† |
|
|
7,800 |
|
|
|
62,224 |
|
|
|
|
| Bidvest Group Ltd.†† |
|
|
6,970 |
|
|
|
188,915 |
|
|
|
|
| Discovery Ltd.†† |
|
|
3,999 |
|
|
|
44,379 |
|
|
|
|
| Exxaro Resources Ltd.#,†† |
|
|
1,400 |
|
|
|
11,461 |
|
|
|
|
| FirstRand Ltd.†† |
|
|
25,000 |
|
|
|
119,427 |
|
|
|
|
| Foschini Group Ltd. |
|
|
4,400 |
|
|
|
65,149 |
|
|
|
|
| Gold Fields Ltd.†† |
|
|
15,890 |
|
|
|
73,363 |
|
|
|
|
| Grindrod Ltd.†† |
|
|
17,500 |
|
|
|
23,937 |
|
|
|
|
| Growthpoint Properties
Ltd.†† |
|
|
19,600 |
|
|
|
45,973 |
|
|
|
|
| Harmony Gold Mining Co.
Ltd.†† |
|
|
8,390 |
|
|
|
16,149 |
|
|
|
|
| Impala Platinum Holdings
Ltd.†† |
|
|
7,674 |
|
|
|
42,710 |
|
|
|
|
| Imperial Holdings Ltd.†† |
|
|
1,900 |
|
|
|
31,818 |
|
|
|
|
| Kumba Iron Ore Ltd.#,†† |
|
|
1,560 |
|
|
|
21,041 |
|
|
|
|
| Liberty Holdings Ltd.†† |
|
|
3,300 |
|
|
|
46,021 |
|
|
|
|
| Life Healthcare Group Holdings
Ltd.†† |
|
|
10,800 |
|
|
|
37,092 |
|
|
|
|
| Massmart Holdings Ltd.†† |
|
|
1,574 |
|
|
|
19,792 |
|
|
|
|
| MMI Holdings Ltd.†† |
|
|
22,679 |
|
|
|
64,526 |
|
|
|
|
| Mr. Price Group
Ltd.†† |
|
|
2,100 |
|
|
|
44,835 |
|
|
|
|
| MTN Group Ltd.†† |
|
|
34,400 |
|
|
|
690,715 |
|
|
|
|
| Murray & Roberts Holdings
Ltd.*,†† |
|
|
26,380 |
|
|
|
29,183 |
|
|
|
|
| Nampak Ltd.†† |
|
|
5,000 |
|
|
|
17,907 |
|
|
|
|
| Naspers Ltd.†† |
|
|
3,771 |
|
|
|
591,616 |
|
|
|
|
| Nedbank Group Ltd.†† |
|
|
2,600 |
|
|
|
56,158 |
|
|
|
|
| Netcare Ltd.†† |
|
|
12,300 |
|
|
|
43,028 |
|
|
|
|
| Pick n Pay Stores
Ltd.#,†† |
|
|
8,300 |
|
|
|
39,740 |
|
|
|
|
| PPC Ltd.#,†† |
|
|
10,921 |
|
|
|
15,643 |
|
|
|
|
| Remgro Ltd.†† |
|
|
5,090 |
|
|
|
113,058 |
|
|
|
|
| Reunert Ltd.†† |
|
|
3,450 |
|
|
|
17,596 |
|
|
|
|
| RMB Holdings Ltd.†† |
|
|
7,800 |
|
|
|
46,938 |
|
|
|
|
| RMI Holdings |
|
|
17,600 |
|
|
|
69,214 |
|
|
|
|
| Sanlam Ltd.†† |
|
|
19,700 |
|
|
|
127,412 |
|
|
|
|
| Sasol Ltd.†† |
|
|
5,970 |
|
|
|
240,373 |
|
|
|
|
| Shoprite Holdings Ltd.†† |
|
|
3,920 |
|
|
|
56,087 |
|
|
|
|
| Sibanye Gold Ltd.†† |
|
|
14,690 |
|
|
|
34,864 |
|
|
|
|
| Standard Bank Group
Ltd.†† |
|
|
13,540 |
|
|
|
198,468 |
|
|
|
|
| Steinhoff International Holdings
Ltd.#,†† |
|
|
15,300 |
|
|
|
97,083 |
|
|
|
|
| Tiger Brands Ltd.†† |
|
|
2,090 |
|
|
|
54,397 |
|
|
|
|
| Truworths International
Ltd.†† |
|
|
4,900 |
|
|
|
35,713 |
|
|
|
|
| Vodacom Group Ltd.#,†† |
|
|
6,700 |
|
|
|
83,532 |
|
|
|
|
| Wilson Bayly Holmes-Ovcon
Ltd.†† |
|
|
4,800 |
|
|
|
44,974 |
|
|
|
|
| Woolworths Holdings
Ltd.†† |
|
|
7,280 |
|
|
|
54,766 |
|
|
|
|
|
|
|
|
|
|
|
|
|
| TOTAL SOUTH AFRICA |
|
|
|
|
|
$ |
4,084,717 |
|
|
|
|
|
|
|
|
|
|
| Description |
|
Number of
Shares |
|
|
Value |
|
|
|
|
| SOUTH KOREA – 1.7% |
|
|
|
|
|
|
|
|
|
|
|
| Amorepacific Corp. |
|
|
40 |
|
|
$ |
144,925 |
|
|
|
|
| BS Financial Group,
Inc.†† |
|
|
3,215 |
|
|
|
48,063 |
|
|
|
|
| Celltrion, Inc.†† |
|
|
2,762 |
|
|
|
219,898 |
|
|
|
|
| Coway Co. Ltd.†† |
|
|
210 |
|
|
|
17,636 |
|
|
|
|
| Daewoo Engineering & Construction Co.
Ltd.*,†† |
|
|
4,364 |
|
|
|
28,892 |
|
|
|
|
| Doosan Heavy Industries & Construction Co. Ltd.†† |
|
|
1,030 |
|
|
|
29,223 |
|
|
|
|
| E-Mart Co. Ltd.†† |
|
|
421 |
|
|
|
86,732 |
|
|
|
|
| Green Cross Corp.†† |
|
|
337 |
|
|
|
55,525 |
|
|
|
|
| Green Cross Holdings
Corp.†† |
|
|
2,178 |
|
|
|
59,253 |
|
|
|
|
| GS Holdings†† |
|
|
1,300 |
|
|
|
60,643 |
|
|
|
|
| Hana Financial Group,
Inc.†† |
|
|
2,898 |
|
|
|
85,305 |
|
|
|
|
| Hyosung Corp.†† |
|
|
550 |
|
|
|
60,835 |
|
|
|
|
| Hyundai Department Store Co.
Ltd.†† |
|
|
430 |
|
|
|
58,370 |
|
|
|
|
| Hyundai Glovis Co. Ltd.†† |
|
|
270 |
|
|
|
59,226 |
|
|
|
|
| Hyundai Heavy Industries Co.
Ltd.†† |
|
|
297 |
|
|
|
38,589 |
|
|
|
|
| Hyundai Mobis†† |
|
|
363 |
|
|
|
79,816 |
|
|
|
|
| Hyundai Motor Co.†† |
|
|
990 |
|
|
|
155,372 |
|
|
|
|
| Hyundai Steel Co.†† |
|
|
690 |
|
|
|
50,433 |
|
|
|
|
| KB Financial Group,
Inc.†† |
|
|
2,873 |
|
|
|
109,560 |
|
|
|
|
| KCC Corp.†† |
|
|
35 |
|
|
|
17,940 |
|
|
|
|
| Kia Motors Corp.†† |
|
|
1,355 |
|
|
|
62,441 |
|
|
|
|
| KJB Financial Group Co.
Ltd.†† |
|
|
190 |
|
|
|
1,416 |
|
|
|
|
| KNB Financial Group Co.
Ltd.†† |
|
|
290 |
|
|
|
2,739 |
|
|
|
|
| Korea Electric Power
Corp.†† |
|
|
2,500 |
|
|
|
108,710 |
|
|
|
|
| Korea Zinc Co. Ltd.†† |
|
|
200 |
|
|
|
89,071 |
|
|
|
|
| Korean Air Lines Co.
Ltd.*,†† |
|
|
644 |
|
|
|
27,484 |
|
|
|
|
| KT Corp.†† |
|
|
1,531 |
|
|
|
45,256 |
|
|
|
|
| KT&G Corp.†† |
|
|
1,270 |
|
|
|
112,471 |
|
|
|
|
| LG Chem Ltd.†† |
|
|
418 |
|
|
|
105,590 |
|
|
|
|
| LG Corp.†† |
|
|
1,030 |
|
|
|
63,911 |
|
|
|
|
| LG Display Co. Ltd.*,†† |
|
|
2,660 |
|
|
|
73,664 |
|
|
|
|
| LG Electronics, Inc.†† |
|
|
770 |
|
|
|
43,299 |
|
|
|
|
| LG Household & Health Care
Ltd.†† |
|
|
150 |
|
|
|
110,205 |
|
|
|
|
| LG Uplus Corp.†† |
|
|
2,560 |
|
|
|
25,611 |
|
|
|
|
| Lotte Chemical Corp.†† |
|
|
380 |
|
|
|
88,158 |
|
|
|
|
| Lotte Shopping Co. Ltd.†† |
|
|
190 |
|
|
|
45,822 |
|
|
|
|
| Macquarie Korea Infrastructure
Fund†† |
|
|
5,769 |
|
|
|
42,597 |
|
|
|
|
| Medy-Tox, Inc.†† |
|
|
218 |
|
|
|
75,363 |
|
|
|
|
| Naturalendo Tech Co.
Ltd.†† |
|
|
863 |
|
|
|
27,474 |
|
|
|
|
| NHN Corp.†† |
|
|
197 |
|
|
|
119,122 |
|
|
|
|
| OCI Co. Ltd.*,†† |
|
|
270 |
|
|
|
24,885 |
|
|
|
|
| POSCO†† |
|
|
720 |
|
|
|
169,606 |
|
|
|
|
| Samsung C&T Corp.†† |
|
|
850 |
|
|
|
45,141 |
|
|
|
|
| Samsung Card Co. Ltd.†† |
|
|
1,000 |
|
|
|
38,265 |
|
|
|
|
| Samsung Electronics Co. Ltd.
GDR†† |
|
|
545 |
|
|
|
714,960 |
|
|
| April 30, 2015 / ANNUAL REPORT |
PORTFOLIOS OF INVESTMENTS 41
Wilmington Multi-Manager International Fund
(continued)
|
|
|
|
|
|
|
|
|
| Description |
|
Number of
Shares |
|
|
Value |
|
|
|
|
| Samsung Fire & Marine Insurance Co.
Ltd.†† |
|
|
380 |
|
|
$ |
100,116 |
|
|
|
|
| Samsung Heavy Industries Co.
Ltd.†† |
|
|
1,680 |
|
|
|
28,297 |
|
|
|
|
| Samsung Life Insurance Co.
Ltd.†† |
|
|
1,300 |
|
|
|
127,156 |
|
|
|
|
| Samsung Sdi Co. Ltd. Krw5000
0640†† |
|
|
393 |
|
|
|
43,753 |
|
|
|
|
| Shinhan Financial Group Co.
Ltd.†† |
|
|
4,050 |
|
|
|
167,622 |
|
|
|
|
| SK Holdings Co. Ltd.†† |
|
|
320 |
|
|
|
55,100 |
|
|
|
|
| SK Hynix, Inc.*,†† |
|
|
107,521 |
|
|
|
4,600,295 |
|
|
|
|
| SK Innovation Co. Ltd.†† |
|
|
600 |
|
|
|
65,673 |
|
|
|
|
| SK Telecom Co. Ltd.†† |
|
|
520 |
|
|
|
139,346 |
|
|
|
|
| S-Oil Corp.†† |
|
|
740 |
|
|
|
50,419 |
|
|
|
|
| ViroMed Co. Ltd.†† |
|
|
658 |
|
|
|
71,000 |
|
|
|
|
| Woori Bank†† |
|
|
2,508 |
|
|
|
25,054 |
|
|
|
|
| Woori Investment & Securities Co.
Ltd.†† |
|
|
2,868 |
|
|
|
39,706 |
|
|
|
|
| Yuhan Corp.†† |
|
|
339 |
|
|
|
73,036 |
|
|
|
|
|
|
|
|
|
|
|
|
|
| TOTAL SOUTH KOREA |
|
|
|
|
|
$ |
9,316,070 |
|
|
|
|
| SPAIN – 1.8% |
|
|
|
|
|
|
|
|
|
|
|
| ACS Actividades de Construccion y Servicios
SA†† |
|
|
4,845 |
|
|
|
170,717 |
|
|
|
|
| Amadeus IT Holding SA†† |
|
|
1,985 |
|
|
|
90,480 |
|
|
|
|
| Banco Bilbao Vizcaya Argentaria
SA†† |
|
|
343,357 |
|
|
|
3,450,084 |
|
|
|
|
| Banco de Sabadell SA#,†† |
|
|
78,996 |
|
|
|
211,271 |
|
|
|
|
| Banco Popular Espanol
SA†† |
|
|
35,999 |
|
|
|
187,305 |
|
|
|
|
| Banco Santander SA†† |
|
|
291,403 |
|
|
|
2,203,175 |
|
|
|
|
| Banco Santander SA - Temp Line* |
|
|
5,158 |
|
|
|
39,128 |
|
|
|
|
| CaixaBank†† |
|
|
17,080 |
|
|
|
85,666 |
|
|
|
|
| Cemex Latam Holdings SA |
|
|
4,828 |
|
|
|
26,957 |
|
|
|
|
| Gamesa Corp. Tecnologica
SA#,*,†† |
|
|
41,439 |
|
|
|
554,139 |
|
|
|
|
| Grifols SA†† |
|
|
850 |
|
|
|
36,067 |
|
|
|
|
| Iberdrola SA†† |
|
|
115,705 |
|
|
|
774,448 |
|
|
|
|
| Inditex Sm# |
|
|
1,925 |
|
|
|
61,772 |
|
|
|
|
| Mapfre SA†† |
|
|
195,272 |
|
|
|
725,651 |
|
|
|
|
| Red Electrica Corp. SA†† |
|
|
761 |
|
|
|
63,867 |
|
|
|
|
| Repsol SA†† |
|
|
33,130 |
|
|
|
682,941 |
|
|
|
|
| Telefonica SA†† |
|
|
19,023 |
|
|
|
289,539 |
|
|
|
|
|
|
|
|
|
|
|
|
|
| TOTAL SPAIN |
|
|
|
|
|
$ |
9,653,207 |
|
|
|
|
| SWEDEN – 2.6% |
|
|
|
|
|
|
|
|
|
|
|
| Assa Abloy AB†† |
|
|
1,611 |
|
|
|
93,460 |
|
|
|
|
| Atlas Copco AB Class A†† |
|
|
86,076 |
|
|
|
2,686,689 |
|
|
|
|
| Atlas Copco AB Class B†† |
|
|
1,468 |
|
|
|
40,876 |
|
|
|
|
| Axfood AB†† |
|
|
11,500 |
|
|
|
181,673 |
|
|
|
|
| Boliden AB†† |
|
|
20,099 |
|
|
|
436,665 |
|
|
|
|
| Elekta AB†† |
|
|
731 |
|
|
|
6,840 |
|
|
|
|
| Getinge AB†† |
|
|
1,185 |
|
|
|
28,801 |
|
|
|
|
| Hennes & Mauritz
AB†† |
|
|
1,299 |
|
|
|
51,644 |
|
|
|
|
| Hexagon AB†† |
|
|
1,146 |
|
|
|
42,448 |
|
|
|
|
| Hexpol AB†† |
|
|
3,100 |
|
|
|
332,200 |
|
|
|
|
| Holmen AB†† |
|
|
346 |
|
|
|
11,448 |
|
|
|
|
|
|
|
|
|
|
| Description |
|
Number of
Shares |
|
|
Value |
|
|
|
|
| Investor AB†† |
|
|
49,719 |
|
|
$ |
2,025,937 |
|
|
|
|
| Inwido AB*,†† |
|
|
20,100 |
|
|
|
220,976 |
|
|
|
|
| Lundin Petroleum AB*,†† |
|
|
1,490 |
|
|
|
24,118 |
|
|
|
|
| Meda AB†† |
|
|
23,882 |
|
|
|
400,869 |
|
|
|
|
| Mycronic AB†† |
|
|
43,600 |
|
|
|
316,958 |
|
|
|
|
| Nordea Bank AB†† |
|
|
49,164 |
|
|
|
624,635 |
|
|
|
|
| Saab AB#,†† |
|
|
8,200 |
|
|
|
211,664 |
|
|
|
|
| Sandvik AB#,†† |
|
|
96,012 |
|
|
|
1,213,503 |
|
|
|
|
| Securitas AB Class B†† |
|
|
25,700 |
|
|
|
384,333 |
|
|
|
|
| Skandinaviska Enskilda Banken
AB†† |
|
|
45,519 |
|
|
|
575,209 |
|
|
|
|
| SKF AB†† |
|
|
1,793 |
|
|
|
43,794 |
|
|
|
|
| SSAB AB Class A#,*,†† |
|
|
3,828 |
|
|
|
23,157 |
|
|
|
|
| SSAB AB Class B*,†† |
|
|
1,865 |
|
|
|
9,686 |
|
|
|
|
| Svenska Cellulosa AB†† |
|
|
11,459 |
|
|
|
289,855 |
|
|
|
|
| Svenska Handelsbanken
AB†† |
|
|
3,510 |
|
|
|
162,018 |
|
|
|
|
| Swedbank AB†† |
|
|
10,000 |
|
|
|
232,527 |
|
|
|
|
| Swedish Match AB†† |
|
|
603 |
|
|
|
18,563 |
|
|
|
|
| Tele2 AB†† |
|
|
6,995 |
|
|
|
93,298 |
|
|
|
|
| Telefonaktiebolaget LM Ericsson ADR |
|
|
5,941 |
|
|
|
64,876 |
|
|
|
|
| Telefonaktiebolaget LM Ericsson Class
B†† |
|
|
41,125 |
|
|
|
449,776 |
|
|
|
|
| TeliaSonera AB†† |
|
|
104,492 |
|
|
|
649,640 |
|
|
|
|
| Volvo AB†† |
|
|
134,743 |
|
|
|
1,861,502 |
|
|
|
|
|
|
|
|
|
|
|
|
|
| TOTAL SWEDEN |
|
|
|
|
|
$ |
13,809,638 |
|
|
|
|
| SWITZERLAND – 9.2% |
|
|
|
|
|
|
|
|
|
|
|
| ABB Ltd.†† |
|
|
99,412 |
|
|
|
2,178,360 |
|
|
|
|
| Actelion Ltd.†† |
|
|
36,629 |
|
|
|
4,819,675 |
|
|
|
|
| Adecco SA†† |
|
|
3,459 |
|
|
|
281,897 |
|
|
|
|
| Aryzta AG†† |
|
|
2,543 |
|
|
|
171,594 |
|
|
|
|
| Baloise Holding AG†† |
|
|
3,851 |
|
|
|
501,155 |
|
|
|
|
| Barry Callebaut AG†† |
|
|
17 |
|
|
|
20,623 |
|
|
|
|
| Bucher Industries AG†† |
|
|
1,000 |
|
|
|
251,348 |
|
|
|
|
| Cembra Money Bank AG†† |
|
|
5,100 |
|
|
|
339,293 |
|
|
|
|
| Cie Financiere Richemont
SA†† |
|
|
31,465 |
|
|
|
2,804,569 |
|
|
|
|
| Clariant AG†† |
|
|
6,591 |
|
|
|
144,703 |
|
|
|
|
| Credit Suisse Group AG†† |
|
|
44,147 |
|
|
|
1,168,441 |
|
|
|
|
| Dufry AG†† |
|
|
297 |
|
|
|
43,670 |
|
|
|
|
| Forbo Holdings AG†† |
|
|
150 |
|
|
|
181,667 |
|
|
|
|
| Geberit AG†† |
|
|
190 |
|
|
|
67,293 |
|
|
|
|
| Givaudan SA†† |
|
|
32 |
|
|
|
59,878 |
|
|
|
|
| Helvetia Holding AG†† |
|
|
600 |
|
|
|
340,886 |
|
|
|
|
| Holcim Ltd.†† |
|
|
30,377 |
|
|
|
2,440,200 |
|
|
|
|
| Julius Baer Group
Ltd.*,†† |
|
|
2,140 |
|
|
|
112,009 |
|
|
|
|
| Lonza Group AG†† |
|
|
811 |
|
|
|
114,667 |
|
|
|
|
| Nestle SA*,†† |
|
|
40,044 |
|
|
|
3,106,783 |
|
|
|
|
| Novartis AG*,†† |
|
|
96,588 |
|
|
|
9,858,949 |
|
|
|
|
| OC Oerlikon Corp. AG |
|
|
1,761 |
|
|
|
23,037 |
|
|
|
|
| Pargesa Holding SA†† |
|
|
3,700 |
|
|
|
269,498 |
|
ANNUAL REPORT / April 30, 2015
42 PORTFOLIOS OF
INVESTMENTS
Wilmington Multi-Manager International Fund
(continued)
|
|
|
|
|
|
|
|
|
| Description |
|
Number of
Shares |
|
|
Value |
|
|
|
|
| Partners Group Holding
AG†† |
|
|
37 |
|
|
$ |
11,597 |
|
|
|
|
| Roche Holding AG†† |
|
|
30,357 |
|
|
|
8,686,810 |
|
|
|
|
| Schindler Holding AG
(B11TCY0)†† |
|
|
282 |
|
|
|
47,705 |
|
|
|
|
| SGS SA†† |
|
|
23 |
|
|
|
44,565 |
|
|
|
|
| Sika AG†† |
|
|
13 |
|
|
|
44,620 |
|
|
|
|
| Sonova Holding AG*,†† |
|
|
100 |
|
|
|
13,815 |
|
|
|
|
| Sulzer AG†† |
|
|
391 |
|
|
|
43,631 |
|
|
|
|
| Swatch Group AG†† |
|
|
4,094 |
|
|
|
1,830,245 |
|
|
|
|
| Swatch Group Ag/The†† |
|
|
237 |
|
|
|
20,999 |
|
|
|
|
| Swiss Life Holding AG†† |
|
|
2,972 |
|
|
|
705,258 |
|
|
|
|
| Swiss Re AG†† |
|
|
10,090 |
|
|
|
895,058 |
|
|
|
|
| Syngenta AG†† |
|
|
7,837 |
|
|
|
2,622,494 |
|
|
|
|
| U-Blox AG†† |
|
|
3,888 |
|
|
|
738,199 |
|
|
|
|
| UBS Group AG†† |
|
|
157,504 |
|
|
|
3,146,510 |
|
|
|
|
| Wolseley PLC†† |
|
|
644 |
|
|
|
38,089 |
|
|
|
|
| Zurich Financial Services
AG†† |
|
|
5,135 |
|
|
|
1,584,936 |
|
|
|
|
|
|
|
|
|
|
|
|
|
| TOTAL SWITZERLAND |
|
|
|
|
|
$ |
49,774,726 |
|
|
|
|
| TAIWAN – 1.5% |
|
|
|
|
|
|
|
|
|
|
|
| Acer, Inc.*,†† |
|
|
80,222 |
|
|
|
52,458 |
|
|
|
|
| Advanced Semiconductor Engineering,
Inc.†† |
|
|
37,804 |
|
|
|
53,611 |
|
|
|
|
| Asia Cement Corp.†† |
|
|
43,020 |
|
|
|
54,399 |
|
|
|
|
| Asustek Computer, Inc.†† |
|
|
4,700 |
|
|
|
49,793 |
|
|
|
|
| AU Optronics Corp.†† |
|
|
147,126 |
|
|
|
73,835 |
|
|
|
|
| Catcher Technology Co.
Ltd.†† |
|
|
9,438 |
|
|
|
110,442 |
|
|
|
|
| Cathay Financial Holding Co.
Ltd.†† |
|
|
68,479 |
|
|
|
119,635 |
|
|
|
|
| Chang Hwa Commercial
Bank†† |
|
|
34,283 |
|
|
|
20,947 |
|
|
|
|
| Cheng Shin Rubber Industry Co.
Ltd.†† |
|
|
26,358 |
|
|
|
63,081 |
|
|
|
|
| China Development Financial Holding
Corp.†† |
|
|
192,750 |
|
|
|
80,306 |
|
|
|
|
| China Steel Corp.†† |
|
|
130,232 |
|
|
|
109,389 |
|
|
|
|
| Chunghwa Telecom Co.
Ltd.†† |
|
|
47,024 |
|
|
|
151,760 |
|
|
|
|
| Compal Electronics,
Inc.†† |
|
|
59,736 |
|
|
|
54,385 |
|
|
|
|
| CTBC Financial Holding Co.
Ltd.†† |
|
|
154,622 |
|
|
|
120,354 |
|
|
|
|
| Delta Electronics, Inc.†† |
|
|
9,888 |
|
|
|
59,501 |
|
|
|
|
| D-Link Corp.†† |
|
|
36,766 |
|
|
|
19,036 |
|
|
|
|
| E.Sun Financial Holding Co.
Ltd.†† |
|
|
49,911 |
|
|
|
34,176 |
|
|
|
|
| Far Eastern Department Stores Co.
Ltd.†† |
|
|
70,264 |
|
|
|
56,471 |
|
|
|
|
| Far Eastern New Century
Corp.†† |
|
|
60,270 |
|
|
|
66,201 |
|
|
|
|
| Far EasTone Telecommunications Co.
Ltd.†† |
|
|
42,000 |
|
|
|
100,139 |
|
|
|
|
| First Financial Holding Co.
Ltd.†† |
|
|
98,459 |
|
|
|
61,899 |
|
|
|
|
| Formosa Chemicals & Fibre
Corp.†† |
|
|
37,198 |
|
|
|
94,787 |
|
|
|
|
| Formosa Petrochemical
Corp.†† |
|
|
28,990 |
|
|
|
74,738 |
|
|
|
|
| Formosa Plastics Corp.†† |
|
|
51,601 |
|
|
|
132,645 |
|
|
|
|
| Foxconn Technology Co.
Ltd.†† |
|
|
21,994 |
|
|
|
62,684 |
|
|
|
|
| Fubon Financial Holding Co.
Ltd.†† |
|
|
71,314 |
|
|
|
153,365 |
|
|
|
|
| Giant Manufacturing Co.
Ltd.†† |
|
|
3,000 |
|
|
|
25,875 |
|
|
|
|
|
|
|
|
|
|
| Description |
|
Number of
Shares |
|
|
Value |
|
|
|
|
| Hon Hai Precision Industry Co.
Ltd.†† |
|
|
65,675 |
|
|
$ |
196,792 |
|
|
|
|
| Hotai Motor Co. Ltd.†† |
|
|
7,000 |
|
|
|
121,285 |
|
|
|
|
| HTC Corp.†† |
|
|
9,465 |
|
|
|
38,970 |
|
|
|
|
| Hua Nan Financial Holdings Co.
Ltd.†† |
|
|
74,898 |
|
|
|
46,008 |
|
|
|
|
| Innolux Corp.†† |
|
|
53,624 |
|
|
|
27,661 |
|
|
|
|
| Inotera Memories, Inc.†† |
|
|
2,982,085 |
|
|
|
3,424,599 |
|
|
|
|
| Largan Precision Co.
Ltd.†† |
|
|
1,000 |
|
|
|
100,206 |
|
|
|
|
| Lite-On Technology
Corp.†† |
|
|
34,401 |
|
|
|
43,465 |
|
|
|
|
| MediaTek, Inc.†† |
|
|
11,082 |
|
|
|
142,450 |
|
|
|
|
| Mega Financial Holding Co.
Ltd.†† |
|
|
76,175 |
|
|
|
67,755 |
|
|
|
|
| Nan Kang Rubber Tire Co.
Ltd.†† |
|
|
15,599 |
|
|
|
16,025 |
|
|
|
|
| Nan Ya Plastics Corp.†† |
|
|
55,597 |
|
|
|
136,646 |
|
|
|
|
| Novatek Microelectronics
Corp.†† |
|
|
10,145 |
|
|
|
53,024 |
|
|
|
|
| Pou Chen Corp.†† |
|
|
37,157 |
|
|
|
52,070 |
|
|
|
|
| President Chain Store
Corp.†† |
|
|
7,496 |
|
|
|
55,472 |
|
|
|
|
| Quanta Computer, Inc.†† |
|
|
16,571 |
|
|
|
41,575 |
|
|
|
|
| Realtek Semiconductor
Corp.†† |
|
|
14,315 |
|
|
|
44,582 |
|
|
|
|
| Shin Kong Financial Holding Co.
Ltd.†† |
|
|
72,165 |
|
|
|
23,405 |
|
|
|
|
| Siliconware Precision Industries
Co.†† |
|
|
36,000 |
|
|
|
59,141 |
|
|
|
|
| SinoPac Financial Holdings Co.
Ltd.†† |
|
|
73,546 |
|
|
|
33,335 |
|
|
|
|
| Synnex Technology International
Corp.†† |
|
|
23,941 |
|
|
|
33,922 |
|
|
|
|
| Tainan Spinning Co.
Ltd.†† |
|
|
118,619 |
|
|
|
68,816 |
|
|
|
|
| Taishin Financial Holding Co.
Ltd.†† |
|
|
124,182 |
|
|
|
56,848 |
|
|
|
|
| Taiwan Cement Corp.†† |
|
|
32,057 |
|
|
|
45,526 |
|
|
|
|
| Taiwan Cooperative Financial Holding Co.
Ltd.†† |
|
|
46,033 |
|
|
|
24,836 |
|
|
|
|
| Taiwan Fertilizer Co.
Ltd.†† |
|
|
16,000 |
|
|
|
29,427 |
|
|
|
|
| Taiwan Mobile Co. Ltd.†† |
|
|
27,874 |
|
|
|
98,201 |
|
|
|
|
| Taiwan Semiconductor Manufacturing Co.
Ltd.†† |
|
|
95,911 |
|
|
|
461,742 |
|
|
|
|
| Tatung Co. Ltd.*,†† |
|
|
245,916 |
|
|
|
65,208 |
|
|
|
|
| Teco Electric &
Machinery†† |
|
|
50,000 |
|
|
|
48,546 |
|
|
|
|
| TSRC Corp.†† |
|
|
19,635 |
|
|
|
22,617 |
|
|
|
|
| Tung Ho Steel Enterprise
Corp.†† |
|
|
37,476 |
|
|
|
29,278 |
|
|
|
|
| Uni-President Enterprises
Corp.†† |
|
|
81,360 |
|
|
|
133,150 |
|
|
|
|
| United Microelectronics
Corp.†† |
|
|
110,000 |
|
|
|
52,703 |
|
|
|
|
| Walsin Lihwa Corp.*,†† |
|
|
120,000 |
|
|
|
35,404 |
|
|
|
|
| Wistron Corp.†† |
|
|
34,294 |
|
|
|
29,174 |
|
|
|
|
| Yuanta Financial Holding Co.
Ltd.†† |
|
|
106,776 |
|
|
|
62,062 |
|
|
|
|
| Yulon Motor Co. Ltd.†† |
|
|
49,640 |
|
|
|
64,776 |
|
|
|
|
| Zinwell Corp.†† |
|
|
22,435 |
|
|
|
21,881 |
|
|
|
|
|
|
|
|
|
|
|
|
|
| TOTAL TAIWAN |
|
|
|
|
|
$ |
8,164,495 |
|
|
|
|
| THAILAND – 0.4% |
|
|
|
|
|
|
|
|
|
|
|
| Advanced Info Service
PCL†† |
|
|
15,100 |
|
|
|
109,599 |
|
|
|
|
| Airports of Thailand
PCL†† |
|
|
7,000 |
|
|
|
61,375 |
|
|
|
|
| Bangkok Bank PCL†† |
|
|
12,100 |
|
|
|
67,919 |
|
|
|
|
| Bangkok Dusit Med
Service†† |
|
|
89,000 |
|
|
|
54,375 |
|
|
|
|
| Bangkok Expressway PCL†† |
|
|
24,400 |
|
|
|
28,818 |
|
|
| April 30, 2015 / ANNUAL REPORT |
PORTFOLIOS OF INVESTMENTS 43
Wilmington Multi-Manager International Fund
(continued)
|
|
|
|
|
|
|
|
|
| Description |
|
Number of
Shares |
|
|
Value |
|
|
|
|
| Banpu Public Co. Ltd.†† |
|
|
29,000 |
|
|
$ |
25,489 |
|
|
|
|
| BEC World PCL†† |
|
|
18,000 |
|
|
|
21,963 |
|
|
|
|
| Berli Jucker PCL†† |
|
|
60,600 |
|
|
|
67,886 |
|
|
|
|
| Big C Supercenter PCL†† |
|
|
5,400 |
|
|
|
36,205 |
|
|
|
|
| BTS Group Holdings PCL†† |
|
|
134,400 |
|
|
|
37,608 |
|
|
|
|
| Bumrungrad Hospital PCL†† |
|
|
16,000 |
|
|
|
77,726 |
|
|
|
|
| Central Pattana PCL†† |
|
|
15,100 |
|
|
|
19,177 |
|
|
|
|
| Charoen Pokphand Foods
PCL†† |
|
|
91,300 |
|
|
|
61,729 |
|
|
|
|
| CP ALL PCL†† |
|
|
60,600 |
|
|
|
77,089 |
|
|
|
|
| Electricity Generating
PCL†† |
|
|
8,600 |
|
|
|
39,428 |
|
|
|
|
| Glow Energy PCL†† |
|
|
9,100 |
|
|
|
23,523 |
|
|
|
|
| Hana Microelectronics
PCL†† |
|
|
113,100 |
|
|
|
152,287 |
|
|
|
|
| Indorama Ventures PCL†† |
|
|
46,100 |
|
|
|
34,408 |
|
|
|
|
| Intouch Holdings PCL Class
F†† |
|
|
17,200 |
|
|
|
40,096 |
|
|
|
|
| IRPC PCL†† |
|
|
269,900 |
|
|
|
37,580 |
|
|
|
|
| Kasikornbank PCL†† |
|
|
6,600 |
|
|
|
41,901 |
|
|
|
|
| Krung Thai Bank PCL†† |
|
|
93,750 |
|
|
|
56,726 |
|
|
|
|
| PTT Exploration & Production
PCL†† |
|
|
26,409 |
|
|
|
93,548 |
|
|
|
|
| PTT Global Chemical PCL†† |
|
|
24,800 |
|
|
|
48,243 |
|
|
|
|
| PTT Global Chemical PCL
(Foreign)†† |
|
|
1,681 |
|
|
|
3,270 |
|
|
|
|
| PTT PCL†† |
|
|
13,500 |
|
|
|
145,558 |
|
|
|
|
| Ratchaburi Electricity Generating Holding
PCL†† |
|
|
19,500 |
|
|
|
35,454 |
|
|
|
|
| Siam Cement PCL†† |
|
|
4,700 |
|
|
|
75,965 |
|
|
|
|
| Siam City Cement PCL†† |
|
|
1,000 |
|
|
|
11,109 |
|
|
|
|
| Siam Commercial Bank
PCL†† |
|
|
8,600 |
|
|
|
41,380 |
|
|
|
|
| Thai Beverage PCL†† |
|
|
142,569 |
|
|
|
76,857 |
|
|
|
|
| Thai Oil PCL†† |
|
|
15,800 |
|
|
|
27,982 |
|
|
|
|
| Thai Union Frozen Products
(Foreign)†† |
|
|
82,656 |
|
|
|
51,147 |
|
|
|
|
| TMB Bank PCL†† |
|
|
703,000 |
|
|
|
55,296 |
|
|
|
|
| Total Access Communication
PCL†† |
|
|
18,100 |
|
|
|
47,547 |
|
|
|
|
| True Corp. PCL*,†† |
|
|
255,525 |
|
|
|
94,128 |
|
|
|
|
|
|
|
|
|
|
|
|
|
| TOTAL THAILAND |
|
|
|
|
|
$ |
1,980,391 |
|
|
|
|
| TUNISIA – 0.0%** |
|
|
|
|
|
|
|
|
|
|
|
| Banque de Tunisie†† |
|
|
7,750 |
|
|
|
43,949 |
|
|
|
|
| Carthage Cement*,†† |
|
|
21,000 |
|
|
|
21,546 |
|
|
|
|
| Ennakl†† |
|
|
4,230 |
|
|
|
23,908 |
|
|
|
|
| Poulina Group Holding†† |
|
|
7,600 |
|
|
|
20,733 |
|
|
|
|
| Soc Tunisienne D’Assur
Reass*,†† |
|
|
230 |
|
|
|
21,200 |
|
|
|
|
| Societe D’Articles
Hygieniques†† |
|
|
6,910 |
|
|
|
47,162 |
|
|
|
|
| Societe Moderne de
Ceramique†† |
|
|
11,100 |
|
|
|
17,506 |
|
|
|
|
| Tunisie Profiles
Aluminium†† |
|
|
7,500 |
|
|
|
17,452 |
|
|
|
|
|
|
|
|
|
|
|
|
|
| TOTAL TUNISIA |
|
|
|
|
|
$ |
213,456 |
|
|
|
|
| TURKEY – 0.4% |
|
|
|
|
|
|
|
|
|
|
|
| Akbank TAS†† |
|
|
41,103 |
|
|
|
119,755 |
|
|
|
|
| Akenerji Elektrik Uretim
AS*,†† |
|
|
1 |
|
|
|
— |
|
|
|
|
| Anadolu Efes Biracilik Ve Malt Sanayii
AS†† |
|
|
4,363 |
|
|
|
36,730 |
|
|
|
|
|
|
|
|
|
|
| Description |
|
Number of
Shares |
|
|
Value |
|
|
|
|
| Arcelik AS†† |
|
|
16,998 |
|
|
$ |
91,561 |
|
|
|
|
| BIM Birlesik Magazalar
AS†† |
|
|
6,720 |
|
|
|
124,412 |
|
|
|
|
| Coca-Cola Icecek AS†† |
|
|
2,500 |
|
|
|
42,348 |
|
|
|
|
| Dogan Sirketler Grubu Holding
AS*,†† |
|
|
85,907 |
|
|
|
19,588 |
|
|
|
|
| Dogus Otomotiv Servis ve Ticaret
AS#,†† |
|
|
6,600 |
|
|
|
32,095 |
|
|
|
|
| Emlak Konut Gayrimenkul Yatirim Ortakligi
AS†† |
|
|
37,200 |
|
|
|
42,970 |
|
|
|
|
| Enka Insaat ve Sanayi
AS†† |
|
|
31,455 |
|
|
|
67,607 |
|
|
|
|
| Eregli Demir ve Celik Fabrikalari
TAS†† |
|
|
72,356 |
|
|
|
122,102 |
|
|
|
|
| Ford Otomotiv Sanayi
A.S.†† |
|
|
4,698 |
|
|
|
58,056 |
|
|
|
|
| Haci Omer Sabanci Holding
AS†† |
|
|
16,548 |
|
|
|
60,495 |
|
|
|
|
| Kardemir Karabuk Demir Celik Sanayi ve Ticaret AS#,*,†† |
|
|
89,334 |
|
|
|
61,580 |
|
|
|
|
| KOC Holding AS†† |
|
|
25,028 |
|
|
|
118,372 |
|
|
|
|
| Koza Altin Isletmeleri
AS†† |
|
|
2,800 |
|
|
|
29,250 |
|
|
|
|
| Petkim Petrokimya Holding
AS*,†† |
|
|
16,518 |
|
|
|
23,212 |
|
|
|
|
| TAV Havalimanlari Holding
AS†† |
|
|
5,400 |
|
|
|
47,476 |
|
|
|
|
| Tekfen Holding AS†† |
|
|
18,500 |
|
|
|
34,576 |
|
|
|
|
| Tofas Turk Otomobil Fabrikasi
AS†† |
|
|
8,221 |
|
|
|
50,382 |
|
|
|
|
| Tupras Turkiye Petrol Rafinerileri
AS†† |
|
|
5,636 |
|
|
|
136,896 |
|
|
|
|
| Turk Hava Yollari†† |
|
|
22,042 |
|
|
|
73,118 |
|
|
|
|
| Turk Telekomunikasyon
AS†† |
|
|
25,727 |
|
|
|
71,109 |
|
|
|
|
| Turkcell Iletisim Hizmetleri
AS*,†† |
|
|
35,168 |
|
|
|
156,588 |
|
|
|
|
| Turkiye Garanti Bankasi
AS†† |
|
|
41,123 |
|
|
|
130,843 |
|
|
|
|
| Turkiye Halk Bankasi AS†† |
|
|
13,054 |
|
|
|
66,129 |
|
|
|
|
| Turkiye Is Bankasi†† |
|
|
30,292 |
|
|
|
68,114 |
|
|
|
|
| Turkiye Sinai Kalkinma Bankasi
AS†† |
|
|
40,312 |
|
|
|
30,430 |
|
|
|
|
| Turkiye Vakiflar Bankasi
Tao†† |
|
|
22,040 |
|
|
|
39,104 |
|
|
|
|
| Ulker Biskuvi Sanayi AS†† |
|
|
5,481 |
|
|
|
41,882 |
|
|
|
|
| Yapi ve Kredi Bankasi
AS†† |
|
|
15,178 |
|
|
|
23,765 |
|
|
|
|
| Yazicilar Holding AS#,†† |
|
|
6,080 |
|
|
|
54,451 |
|
|
|
|
|
|
|
|
|
|
|
|
|
| TOTAL TURKEY |
|
|
|
|
|
$ |
2,074,996 |
|
|
|
|
| UKRAINE – 0.0%** |
|
|
|
|
|
|
|
|
|
|
|
| Astarta Holding NV*,†† |
|
|
3,855 |
|
|
|
25,735 |
|
|
|
|
| Avangardco Investments Public Ltd.
GDR†† |
|
|
5,322 |
|
|
|
13,329 |
|
|
|
|
| Ferrexpo PLC†† |
|
|
36,650 |
|
|
|
43,931 |
|
|
|
|
| MHP SA GDR†† |
|
|
4,100 |
|
|
|
46,901 |
|
|
|
|
|
|
|
|
|
|
|
|
|
| TOTAL UKRAINE |
|
|
|
|
|
$ |
129,896 |
|
|
|
| UNITED ARAB EMIRATES – 0.2% |
|
|
|
|
|
|
|
|
| Abu Dhabi Commercial Bank
PJSC†† |
|
|
49,070 |
|
|
|
98,964 |
|
|
|
|
| Abu Dhabi National Hotels |
|
|
32,000 |
|
|
|
21,798 |
|
|
|
|
| Air Arabia PJSC†† |
|
|
210,900 |
|
|
|
93,607 |
|
|
|
|
| Aldar Properties PJSC†† |
|
|
73,140 |
|
|
|
54,314 |
|
|
|
|
| Arabtec Holding Co.*,†† |
|
|
108,460 |
|
|
|
85,611 |
|
|
|
|
| DP World Ltd.†† |
|
|
7,100 |
|
|
|
163,557 |
|
|
|
|
| Dubai Financial Market†† |
|
|
56,800 |
|
|
|
33,358 |
|
ANNUAL REPORT / April 30, 2015
44 PORTFOLIOS OF
INVESTMENTS
Wilmington Multi-Manager International Fund
(continued)
|
|
|
|
|
|
|
|
|
| Description |
|
Number of
Shares |
|
|
Value |
|
|
|
|
| Emaar Properties PJSC†† |
|
|
71,056 |
|
|
$ |
157,566 |
|
|
|
|
| First Gulf Bank PJSC†† |
|
|
25,223 |
|
|
|
104,314 |
|
|
|
|
| National Bank of Abu Dhabi
PJSC†† |
|
|
28,649 |
|
|
|
86,348 |
|
|
|
|
| Ras Al Khaimah Ceramics†† |
|
|
45,200 |
|
|
|
46,553 |
|
|
|
|
| Union National Bank
PJSC†† |
|
|
19,982 |
|
|
|
37,115 |
|
|
|
|
|
|
|
|
|
|
|
|
|
| TOTAL UNITED ARAB EMIRATES |
|
|
|
|
|
$ |
983,105 |
|
|
|
|
| UNITED KINGDOM – 12.6% |
|
|
|
|
|
|
|
|
|
|
|
| 3i Group PLC†† |
|
|
617,873 |
|
|
|
4,786,472 |
|
|
|
|
| Abcam PLC†† |
|
|
15,700 |
|
|
|
126,335 |
|
|
|
|
| Aberdeen Asset Management
PLC†† |
|
|
4,302 |
|
|
|
31,239 |
|
|
|
|
| Alent PLC†† |
|
|
34 |
|
|
|
189 |
|
|
|
|
| Anglo American PLC†† |
|
|
84,528 |
|
|
|
1,432,109 |
|
|
|
|
| ARM Holdings PLC†† |
|
|
5,879 |
|
|
|
99,892 |
|
|
|
|
| Ashtead Group PLC†† |
|
|
22,700 |
|
|
|
389,248 |
|
|
|
|
| ASOS PLC*,†† |
|
|
4,800 |
|
|
|
275,745 |
|
|
|
|
| Associated British Foods
PLC†† |
|
|
635 |
|
|
|
27,723 |
|
|
|
|
| AstraZeneca PLC†† |
|
|
8,882 |
|
|
|
609,538 |
|
|
|
|
| Aviva PLC†† |
|
|
49,850 |
|
|
|
401,064 |
|
|
|
|
| Babcock International Group
PLC†† |
|
|
1,497 |
|
|
|
23,092 |
|
|
|
|
| BAE Systems PLC†† |
|
|
84,134 |
|
|
|
651,799 |
|
|
|
|
| Barclays PLC†† |
|
|
122,992 |
|
|
|
481,197 |
|
|
|
|
| Barclays PLC ADR# |
|
|
51,176 |
|
|
|
805,510 |
|
|
|
|
| Barratt Developments
PLC†† |
|
|
25,727 |
|
|
|
204,100 |
|
|
|
|
| Betfair Group PLC†† |
|
|
9,700 |
|
|
|
345,649 |
|
|
|
|
| BG Group PLC†† |
|
|
4,374 |
|
|
|
79,228 |
|
|
|
|
| BHP Billiton PLC†† |
|
|
2,716 |
|
|
|
65,283 |
|
|
|
|
| BP PLC†† |
|
|
163,404 |
|
|
|
1,178,528 |
|
|
|
|
| BP PLC ADR |
|
|
58,323 |
|
|
|
2,517,221 |
|
|
|
|
| British American Tobacco
PLC†† |
|
|
4,499 |
|
|
|
247,190 |
|
|
|
|
| Britvic PLC*,†† |
|
|
20,200 |
|
|
|
224,331 |
|
|
|
|
| BT Group PLC†† |
|
|
84,938 |
|
|
|
592,403 |
|
|
|
|
| Bunzl PLC†† |
|
|
1,783 |
|
|
|
50,133 |
|
|
|
|
| Burberry Group PLC†† |
|
|
1,588 |
|
|
|
42,334 |
|
|
|
|
| Carnival PLC†† |
|
|
725 |
|
|
|
32,985 |
|
|
|
|
| Carnival PLC ADR ADR |
|
|
1,057 |
|
|
|
47,872 |
|
|
|
|
| Centrica PLC†† |
|
|
129,003 |
|
|
|
503,688 |
|
|
|
|
| Chemring Group PLC†† |
|
|
46,900 |
|
|
|
154,104 |
|
|
|
|
| Cobham PLC†† |
|
|
6,837 |
|
|
|
31,015 |
|
|
|
|
| Compass Group PLC†† |
|
|
4,826 |
|
|
|
85,312 |
|
|
|
|
| Computacenter PLC†† |
|
|
14,558 |
|
|
|
156,307 |
|
|
|
|
| Crest Nicholson Holdings
PLC†† |
|
|
52,200 |
|
|
|
358,389 |
|
|
|
|
| Croda International PLC†† |
|
|
623 |
|
|
|
27,036 |
|
|
|
|
| Dairy Crest Group PLC#,†† |
|
|
13,900 |
|
|
|
97,177 |
|
|
|
|
| Debenhams PLC†† |
|
|
148,800 |
|
|
|
204,406 |
|
|
|
|
| Diageo PLC†† |
|
|
107,363 |
|
|
|
2,980,633 |
|
|
|
|
| Dialog Semiconductor
PLC†† |
|
|
16,400 |
|
|
|
739,458 |
|
|
|
|
|
|
|
|
|
|
| Description |
|
Number of
Shares |
|
|
Value |
|
|
|
|
| Direct Line Insurance
Group†† |
|
|
46,200 |
|
|
$ |
225,549 |
|
|
|
|
| Domino’s Pizza Group
PLC†† |
|
|
27,200 |
|
|
|
329,071 |
|
|
|
|
| DS Smith PLC*,†† |
|
|
33,800 |
|
|
|
180,726 |
|
|
|
|
| Essentra PLC†† |
|
|
28,000 |
|
|
|
411,018 |
|
|
|
|
| Experian PLC†† |
|
|
964 |
|
|
|
17,217 |
|
|
|
|
| Fresnillo PLC†† |
|
|
1,879 |
|
|
|
20,840 |
|
|
|
|
| GKN PLC†† |
|
|
11,542 |
|
|
|
61,906 |
|
|
|
|
| GlaxoSmithKline PLC†† |
|
|
31,166 |
|
|
|
719,827 |
|
|
|
|
| Glencore Xstrata PLC†† |
|
|
387,373 |
|
|
|
1,840,231 |
|
|
|
|
| Greggs PLC*,†† |
|
|
3,800 |
|
|
|
69,059 |
|
|
|
|
| Howden Joinery Group
PLC†† |
|
|
74,000 |
|
|
|
526,789 |
|
|
|
|
| HSBC Holdings PLC
(0540528)†† |
|
|
107,801 |
|
|
|
1,076,872 |
|
|
|
|
| HSBC Holdings PLC, ADR (404280406) |
|
|
32,242 |
|
|
|
1,600,170 |
|
|
|
|
| IG Group Holdings PLC†† |
|
|
31,200 |
|
|
|
351,782 |
|
|
|
|
| IMI PLC†† |
|
|
2,116 |
|
|
|
40,548 |
|
|
|
|
| Imperial Tobacco Group
PLC†† |
|
|
1,620 |
|
|
|
79,105 |
|
|
|
|
| Indivior PLC†† |
|
|
128,208 |
|
|
|
392,108 |
|
|
|
|
| International Consolidated Airlines Group
SA*,†† |
|
|
3,534 |
|
|
|
29,310 |
|
|
|
|
| Intertek Group PLC†† |
|
|
875 |
|
|
|
34,970 |
|
|
|
|
| Investec PLC†† |
|
|
3,817 |
|
|
|
36,448 |
|
|
|
|
| ITV PLC†† |
|
|
1,102,336 |
|
|
|
4,279,812 |
|
|
|
|
| J Sainsbury PLC†† |
|
|
106,521 |
|
|
|
442,920 |
|
|
|
|
| John Wood Group PLC†† |
|
|
9,400 |
|
|
|
99,042 |
|
|
|
|
| Johnson Matthey PLC†† |
|
|
1,139 |
|
|
|
58,235 |
|
|
|
|
| Kingfisher PLC†† |
|
|
50,477 |
|
|
|
271,187 |
|
|
|
|
| Kuwait Finance House |
|
|
29,832 |
|
|
|
67,249 |
|
|
|
|
| Legal & General Group
PLC†† |
|
|
1,622 |
|
|
|
6,448 |
|
|
|
|
| Lloyds Banking Group
PLC*,†† |
|
|
3,121,073 |
|
|
|
3,696,196 |
|
|
|
|
| Lloyds Banking Group PLC ADR# |
|
|
106,642 |
|
|
|
508,682 |
|
|
|
|
| London Stock Exchange Group
PLC†† |
|
|
1,831 |
|
|
|
71,272 |
|
|
|
|
| Meggitt PLC†† |
|
|
6,123 |
|
|
|
49,482 |
|
|
|
|
| Melrose Industries PLC†† |
|
|
5,135 |
|
|
|
20,838 |
|
|
|
|
| Mitie Group PLC†† |
|
|
30,500 |
|
|
|
133,792 |
|
|
|
|
| Mondi PLC†† |
|
|
18,800 |
|
|
|
380,663 |
|
|
|
|
| National Grid PLC†† |
|
|
6,792 |
|
|
|
91,375 |
|
|
|
|
| National Industries Group, Class H |
|
|
58,170 |
|
|
|
36,254 |
|
|
|
|
| Next PLC†† |
|
|
781 |
|
|
|
87,808 |
|
|
|
|
| Old Mutual PLC†† |
|
|
105,300 |
|
|
|
377,722 |
|
|
|
|
| Petrofac Ltd.†† |
|
|
2,059 |
|
|
|
27,482 |
|
|
|
|
| Premier Foods PLC*,†† |
|
|
201,280 |
|
|
|
142,052 |
|
|
|
|
| Prudential PLC†† |
|
|
7,635 |
|
|
|
190,092 |
|
|
|
|
| Randgold Resources Ltd.†† |
|
|
440 |
|
|
|
33,484 |
|
|
|
|
| Reckitt Benckiser Group
PLC†† |
|
|
72,171 |
|
|
|
6,423,498 |
|
|
|
|
| Redrow PLC†† |
|
|
68,300 |
|
|
|
386,860 |
|
|
|
|
| Reed Elsevier PLC†† |
|
|
3,692 |
|
|
|
61,103 |
|
|
|
|
| Rexam PLC†† |
|
|
55,647 |
|
|
|
493,907 |
|
April 30, 2015 / ANNUAL REPORT
PORTFOLIOS OF INVESTMENTS 45
Wilmington Multi-Manager
International Fund (continued)
|
|
|
|
|
|
|
|
|
| Description |
|
Number of
Shares |
|
|
Value |
|
|
|
|
| Rightmove PLC*,†† |
|
|
7,600 |
|
|
$ |
367,909 |
|
|
|
|
| Rio Tinto PLC†† |
|
|
3,630 |
|
|
|
162,445 |
|
|
|
|
| Rolls-Royce Holdings* |
|
|
28,974,795 |
|
|
|
44,476 |
|
|
|
|
| Rolls-Royce Holdings
PLC†† |
|
|
205,495 |
|
|
|
3,276,167 |
|
|
|
|
| Royal Bank of Scotland Group PLC ADR* |
|
|
9,368 |
|
|
|
96,865 |
|
|
|
|
| Royal Bank of Scotland Group
PLC*,†† |
|
|
1,907 |
|
|
|
9,880 |
|
|
|
|
| Royal Dutch Shell PLC†† |
|
|
11,118 |
|
|
|
350,551 |
|
|
|
|
| Royal Dutch Shell PLC ADR# |
|
|
15,596 |
|
|
|
1,007,346 |
|
|
|
|
| Royal Dutch Shell PLC ADR |
|
|
8,283 |
|
|
|
525,391 |
|
|
|
|
| Royal Dutch Shell PLC
Class B†† |
|
|
40,620 |
|
|
|
1,300,475 |
|
|
|
|
| SABMiller PLC†† |
|
|
2,245 |
|
|
|
118,834 |
|
|
|
|
| Sage Group PLC†† |
|
|
4,362 |
|
|
|
32,432 |
|
|
|
|
| Schroders PLC†† |
|
|
648 |
|
|
|
32,140 |
|
|
|
|
| Severn Trent PLC†† |
|
|
1,386 |
|
|
|
45,133 |
|
|
|
|
| Shire PLC†† |
|
|
80,989 |
|
|
|
6,581,417 |
|
|
|
|
| Smith & Nephew
PLC†† |
|
|
3,256 |
|
|
|
55,415 |
|
|
|
|
| Smiths Group PLC†† |
|
|
1,864 |
|
|
|
32,632 |
|
|
|
|
| SSE PLC†† |
|
|
1,850 |
|
|
|
43,833 |
|
|
|
|
| Standard Chartered PLC†† |
|
|
154,184 |
|
|
|
2,524,317 |
|
|
|
|
| Tate & Lyle
PLC†† |
|
|
27,400 |
|
|
|
249,613 |
|
|
|
|
| Tesco PLC†† |
|
|
41,835 |
|
|
|
141,011 |
|
|
|
|
| Thomas Cook Group PLC*,†† |
|
|
231,200 |
|
|
|
507,109 |
|
|
|
|
| Tullow Oil PLC†† |
|
|
3,633 |
|
|
|
23,066 |
|
|
|
|
| Unilever PLC†† |
|
|
3,172 |
|
|
|
139,042 |
|
|
|
|
| Vedanta Resources PLC†† |
|
|
2,533 |
|
|
|
24,329 |
|
|
|
|
| Vesuvius PLC†† |
|
|
33,100 |
|
|
|
230,193 |
|
|
|
|
| Virgin Money Holdings UK
PLC*,†† |
|
|
40,500 |
|
|
|
244,908 |
|
|
|
|
| Vodafone Group PLC†† |
|
|
225,120 |
|
|
|
793,139 |
|
|
|
|
| Vodafone Group PLC ADR |
|
|
23,770 |
|
|
|
836,704 |
|
|
|
|
| Weir Group PLC†† |
|
|
1,043 |
|
|
|
29,987 |
|
|
|
|
| Whitbread PLC†† |
|
|
604 |
|
|
|
48,501 |
|
|
|
|
| WM Morrison Supermarkets
PLC†† |
|
|
164,129 |
|
|
|
467,975 |
|
|
|
|
| WPP PLC†† |
|
|
5,130 |
|
|
|
119,639 |
|
|
|
|
|
|
|
|
|
|
|
|
|
| TOTAL UNITED KINGDOM |
|
|
|
|
|
$ |
68,049,809 |
|
|
|
|
| UNITED STATES – 1.9% |
|
|
|
|
|
|
|
|
|
|
|
| Freeport-McMoRan Copper & Gold, Inc. |
|
|
68,877 |
|
|
|
1,602,768 |
|
|
|
|
| Jazz Pharmaceuticals PLC* |
|
|
24,806 |
|
|
|
4,432,832 |
|
|
|
|
| Las Vegas Sands Corp. |
|
|
46,479 |
|
|
|
2,457,810 |
|
|
|
|
| Schlumberger Ltd. |
|
|
18,643 |
|
|
|
1,763,814 |
|
|
|
|
| Wynn Resorts Ltd. |
|
|
2,161 |
|
|
|
240,022 |
|
|
|
|
|
|
|
|
|
|
|
|
|
| TOTAL UNITED STATES |
|
|
|
|
|
$ |
10,497,246 |
|
|
|
|
|
|
|
|
|
|
|
|
|
| TOTAL COMMON STOCKS |
|
|
|
|
|
|
|
|
| (COST $437,335,556) |
|
|
|
|
|
$ |
507,243,404 |
|
|
|
|
| INVESTMENT COMPANIES – 0.3% |
|
|
|
|
|
|
|
|
|
|
|
| DFA International Small Cap Value Portfolio |
|
|
303 |
|
|
|
6,188 |
|
|
|
|
|
|
|
|
|
|
| Description |
|
Number of
Shares |
|
|
Value |
|
|
|
|
| Vanguard FTSE Developed Markets ETF |
|
|
41,009 |
|
|
$ |
1,696,542 |
|
|
|
|
|
|
|
|
|
|
|
|
|
| TOTAL INVESTMENT COMPANIES |
|
|
|
|
|
|
|
|
| (COST $1,594,866) |
|
|
|
|
|
$ |
1,702,730 |
|
|
|
|
| PREFERRED STOCKS – 1.3% |
|
|
|
|
|
|
|
|
|
|
|
| BRAZIL – 0.6% |
|
|
|
|
|
|
|
|
|
|
|
| AES Tiete SA |
|
|
3,080 |
|
|
|
17,470 |
|
|
|
|
| Alpargatas SA |
|
|
10,197 |
|
|
|
33,912 |
|
|
|
|
| Banco Bradesco SA |
|
|
142,459 |
|
|
|
1,521,543 |
|
|
|
|
| Bradespar SA |
|
|
2,600 |
|
|
|
10,398 |
|
|
|
|
| Braskem SA |
|
|
3,300 |
|
|
|
13,636 |
|
|
|
|
| Cia Brasileira de Distribuicao |
|
|
|
|
|
|
|
|
| Grupo Pao de Acucar |
|
|
823 |
|
|
|
27,589 |
|
|
|
|
| Cia Energetica de Minas Gerais |
|
|
12,676 |
|
|
|
61,214 |
|
|
|
|
| Cia Energetica de Sao Paulo |
|
|
5,900 |
|
|
|
37,206 |
|
|
|
|
| Eletropaulo Metropolitana Eletricidade de Sao Paulo SA |
|
|
5,760 |
|
|
|
20,265 |
|
|
|
|
| Gerdau SA |
|
|
13,300 |
|
|
|
44,496 |
|
|
|
|
| Itau Unibanco Holding SA |
|
|
19,624 |
|
|
|
251,345 |
|
|
|
|
| Itausa - Investimentos Itau SA |
|
|
29,646 |
|
|
|
104,791 |
|
|
|
|
| Lojas Americanas SA |
|
|
11,727 |
|
|
|
66,401 |
|
|
|
|
| Marcopolo SA |
|
|
20,400 |
|
|
|
18,687 |
|
|
|
|
| Metalurgica Gerdau SA |
|
|
3,500 |
|
|
|
11,373 |
|
|
|
|
| Oi SA |
|
|
20,420 |
|
|
|
38,631 |
|
|
|
|
| Petroleo Brasileiro SA |
|
|
89,659 |
|
|
|
388,340 |
|
|
|
|
| Telefonica Brasil SA |
|
|
12,810 |
|
|
|
210,244 |
|
|
|
|
| Usinas Siderurgicas de Minas Gerais SA* |
|
|
19,100 |
|
|
|
38,480 |
|
|
|
|
| Vale SA |
|
|
48,141 |
|
|
|
287,285 |
|
|
|
|
|
|
|
|
|
|
|
|
|
| TOTAL BRAZIL |
|
|
|
|
|
$ |
3,203,306 |
|
|
|
|
| CHILE – 0.0%** |
|
|
|
|
|
|
|
|
|
|
|
| Embotelladora Andina SA |
|
|
10,300 |
|
|
|
32,676 |
|
|
|
|
| Sociedad Quimica y Minera de Chile SA |
|
|
3,740 |
|
|
|
82,015 |
|
|
|
|
|
|
|
|
|
|
|
|
|
| TOTAL CHILE |
|
|
|
|
|
$ |
114,691 |
|
|
|
|
| COLOMBIA – 0.1% |
|
|
|
|
|
|
|
|
|
|
|
| Avianca Holdings SA |
|
|
23,964 |
|
|
|
38,733 |
|
|
|
|
| Grupo Argos SA |
|
|
2,418 |
|
|
|
18,394 |
|
|
|
|
| Grupo Aval Acciones y Valores |
|
|
147,700 |
|
|
|
75,028 |
|
|
|
|
|
|
|
|
|
|
|
|
|
| TOTAL COLOMBIA |
|
|
|
|
|
$ |
132,155 |
|
|
|
|
| CROATIA – 0.0%** |
|
|
|
|
|
|
|
|
|
|
|
| Adris Grupa DD†† |
|
|
1,559 |
|
|
|
76,932 |
|
|
|
|
| GERMANY – 0.6% |
|
|
|
|
|
|
|
|
|
|
|
| Bayerische Motoren Werke
AG†† |
|
|
809 |
|
|
|
73,926 |
|
|
|
|
| Henkel AG & Co.
KGaA†† |
|
|
105 |
|
|
|
12,197 |
|
|
|
|
| Porsche Automobil Holding
SE†† |
|
|
1,440 |
|
|
|
136,632 |
|
|
|
|
| Volkswagen AG†† |
|
|
11,636 |
|
|
|
2,995,642 |
|
|
|
|
|
|
|
|
|
|
|
|
|
| TOTAL GERMANY |
|
|
|
|
|
$ |
3,218,397 |
|
ANNUAL REPORT / April 30, 2015
46 PORTFOLIOS OF
INVESTMENTS
Wilmington Multi-Manager International Fund
(continued)
|
|
|
|
|
|
|
|
|
| Description |
|
Number of
Shares |
|
|
Value |
|
|
|
|
| PHILIPPINES – 0.0%** |
|
|
|
|
|
|
|
|
|
|
|
| Ayala Land Voting†† |
|
|
178,200 |
|
|
$ |
400 |
|
|
|
|
| RUSSIA – 0.0%** |
|
|
|
|
|
|
|
|
|
|
|
| Surgutneftegas OAO ADR |
|
|
9,400 |
|
|
|
70,500 |
|
|
|
|
|
|
|
|
|
|
|
|
|
| TOTAL PREFERRED STOCKS |
|
|
|
|
|
|
|
|
| (COST $7,171,034) |
|
|
|
|
|
$ |
6,816,381 |
|
|
|
|
| MONEY MARKET FUND – 2.4% |
|
|
|
|
|
|
|
|
|
|
|
| Dreyfus Cash Management Fund, |
|
|
|
|
|
|
|
|
|
|
|
| Institutional Shares, 0.04%^ |
|
|
13,249,484 |
|
|
|
13,249,484 |
|
|
|
|
|
|
|
|
|
|
|
|
|
| TOTAL MONEY MARKET FUND |
|
|
|
|
|
|
|
|
| (COST $13,249,484) |
|
|
|
|
|
$ |
13,249,484 |
|
|
|
|
| RIGHTS – 0.0%** |
|
|
|
|
|
|
|
|
|
|
|
| INDIA – 0.0%** |
|
|
|
|
|
|
|
|
|
|
|
| Tata Motors Ltd. ADR |
|
|
131 |
|
|
|
871 |
|
|
|
|
| KUWAIT – 0.0%** |
|
|
|
|
|
|
|
|
|
|
|
| Burgan Bank†† |
|
|
1,853 |
|
|
|
— |
|
|
|
|
| MALAYSIA – 0.0%** |
|
|
|
|
|
|
|
|
|
|
|
| MMC Corp. Bhd |
|
|
24,100 |
|
|
|
— |
|
|
|
|
| SPAIN – 0.0%** |
|
|
|
|
|
|
|
|
|
|
|
| Banco de Sabadell SA |
|
|
77,679 |
|
|
|
18,229 |
|
|
|
|
| Banco Popular Espanol |
|
|
28,141 |
|
|
|
537 |
|
|
|
|
| Banco Santander SA |
|
|
32 |
|
|
|
5 |
|
|
|
|
|
|
|
|
|
|
|
|
|
| TOTAL SPAIN |
|
|
|
|
|
$ |
18,771 |
|
|
|
|
| TUNISIA – 0.0%** |
|
|
|
|
|
|
|
|
|
|
|
| Societe D’Articles Hygieniques |
|
|
2,800 |
|
|
|
806 |
|
|
|
|
|
|
|
|
|
|
|
|
|
| TOTAL RIGHTS |
|
|
|
|
|
|
|
|
| (COST $551) |
|
|
|
|
|
$ |
20,448 |
|
|
|
|
| CALL WARRANTS – 0.9% |
|
|
|
|
|
|
|
|
|
|
|
| Citigroup Global Markets - |
|
|
|
|
|
|
|
|
|
|
|
| Boubyan Petrochemicals Co., Expire 3/24/16* |
|
|
139,265 |
|
|
|
264,607 |
|
|
|
|
| DG Khan Cement Co. Ltd., Expire 1/17/17*,W |
|
|
22,943 |
|
|
|
30,992 |
|
|
|
|
| Engro Corp. Ltd., Expire
1/17/17W |
|
|
9,300 |
|
|
|
28,830 |
|
|
|
|
| Fauji Fertilizer Co. Ltd., Expire 1/17/17*,W |
|
|
37,000 |
|
|
|
51,833 |
|
|
|
|
| Hub Power Co Ltd./The, Expire 1/17/17*,W |
|
|
69,299 |
|
|
|
66,358 |
|
|
|
|
| MCB Bank Ltd., Expire
1/15/16*,W |
|
|
19,051 |
|
|
|
51,762 |
|
|
|
|
| Merrill Lynch International & Co., Expire 5/22/19* |
|
|
1,340 |
|
|
|
56,305 |
|
|
|
|
| Mobile Telecommunications Co., Expire 3/24/16* |
|
|
434,045 |
|
|
|
587,014 |
|
|
|
|
| Nishat Mills Ltd., Expire 1/17/17*,W |
|
|
41,400 |
|
|
|
45,701 |
|
|
|
|
| Pakistan State Oil Co. Ltd., Expire 1/17/17*,W |
|
|
13,090 |
|
|
|
49,027 |
|
|
|
|
| Peugeot SA, Expire 4/29/17* |
|
|
4,944 |
|
|
|
20,346 |
|
|
|
|
| United Bank Ltd., Expire
01/17/17W |
|
|
16,600 |
|
|
|
28,884 |
|
|
|
|
| JPMorgan Chase Bank NA - HAGL JSC, Expires 8/27/19 |
|
|
65,348 |
|
|
|
60,838 |
|
|
|
|
|
|
|
|
|
|
| Description |
|
Number of
Shares |
|
|
Value |
|
|
|
|
| Hoa Phat Group JSC, Expires 2/24/20 |
|
|
26,224 |
|
|
$ |
53,444 |
|
|
|
|
| Masan Group Corp., Expire 7/07/16* |
|
|
27,330 |
|
|
|
101,941 |
|
|
|
|
| Saudi Pharmaceutical Industries Ltd., Expire 9/24/15* |
|
|
1,988 |
|
|
|
24,379 |
|
|
|
|
| Vietnam Joint Stock Commercial Bank for Industry and Trade, Expire 10/27/16* |
|
|
80,698 |
|
|
|
66,979 |
|
|
|
|
| Vingroup JSC, Expire
7/31/19*,W |
|
|
33,606 |
|
|
|
75,277 |
|
|
|
|
| Merrill Lynch International & Co. - ABB India Ltd., Expire 6/05/17* |
|
|
2,560 |
|
|
|
53,675 |
|
|
|
|
| Aditya Birla Nuvo Ltd., Expire 6/11/15*,W |
|
|
1,600 |
|
|
|
39,600 |
|
|
|
|
| Ambuja Cements Ltd., Expire 6/11/15*,W |
|
|
17,000 |
|
|
|
62,127 |
|
|
|
|
| Axis Bank Ltd., Expire
3/16/20*,W |
|
|
12,800 |
|
|
|
114,584 |
|
|
|
|
| Bharat Heavy Electricals Ltd., Expire 8/17/15* |
|
|
8,720 |
|
|
|
33,003 |
|
|
|
|
| Bharti Airtel Ltd., Expire 2/08/16* |
|
|
26,300 |
|
|
|
157,926 |
|
|
|
|
| Cairn India Ltd., Expire 11/14/16* |
|
|
8,870 |
|
|
|
29,841 |
|
|
|
|
| Cipla Ltd., Expire 9/09/15* |
|
|
4,300 |
|
|
|
43,162 |
|
|
|
|
| Coal India Ltd., Expire 11/02/15* |
|
|
7,780 |
|
|
|
44,424 |
|
|
|
|
| Colgate-Palmolive India Ltd., Expire 8/10/17* |
|
|
900 |
|
|
|
28,253 |
|
|
|
|
| DLF Ltd., Expire 2/01/16* |
|
|
11,800 |
|
|
|
25,502 |
|
|
|
|
| Dr. Reddy’s Laboratories Ltd., Expire 12/17/15* |
|
|
1,400 |
|
|
|
72,925 |
|
|
|
|
| Essar Oil Ltd., Expire 3/27/17* |
|
|
23,290 |
|
|
|
39,789 |
|
|
|
|
| HCL Technologies Ltd., Expire 8/17/15* |
|
|
7,000 |
|
|
|
97,193 |
|
|
|
|
| HDFC Bank Ltd., Expire
5/26/15*,W |
|
|
12,230 |
|
|
|
190,838 |
|
|
|
|
| Hero Motocorp Ltd., Expire 4/18/16* |
|
|
900 |
|
|
|
33,006 |
|
|
|
|
| Hindustan Unilever Ltd., Expire 12/14/15* |
|
|
9,900 |
|
|
|
133,060 |
|
|
|
|
| Housing Development Finance Corp., Expire 8/19/15* |
|
|
15,300 |
|
|
|
283,881 |
|
|
|
|
| Idea Cellular Ltd., Expire 2/14/17* |
|
|
24,300 |
|
|
|
66,951 |
|
|
|
|
| IDFC Ltd., Expire 7/29/15* |
|
|
32,000 |
|
|
|
84,598 |
|
|
|
|
| Indian Oil Corp. Ltd., Expire 7/29/16* |
|
|
9,400 |
|
|
|
53,535 |
|
|
|
|
| ITC Ltd., Expire 8/04/15* |
|
|
23,500 |
|
|
|
119,361 |
|
|
|
|
| Jaiprakash Associates Ltd., Expire 6/15/15*,W |
|
|
19,500 |
|
|
|
6,400 |
|
|
|
|
| Jindal Steel & Power Ltd., Expire 10/8/15* |
|
|
9,510 |
|
|
|
20,837 |
|
|
|
|
| Kotak Mahindra Bank Ltd., Expire 3/27/17* |
|
|
3,900 |
|
|
|
81,702 |
|
|
|
|
| Mahindra & Mahindra Ltd., Expire 12/10/15* |
|
|
4,400 |
|
|
|
79,547 |
|
|
|
|
| Maruti Suzuki India Ltd., Expire 11/30/15* |
|
|
1,000 |
|
|
|
58,735 |
|
|
|
|
| Nestle India Ltd., Expire 9/17/15* |
|
|
570 |
|
|
|
58,901 |
|
|
|
|
| Oil & Natural Gas Corp. Ltd., Expire 2/28/16* |
|
|
21,500 |
|
|
|
102,819 |
|
|
|
|
| Piramal Enterprises Ltd., Expire 1/19/18* |
|
|
4,505 |
|
|
|
67,140 |
|
|
|
|
| Power Grid Corp. of India Ltd., Expire 3/27/17* |
|
|
36,900 |
|
|
|
82,483 |
|
|
|
|
| Ranbaxy Laboratories Ltd., Expire 10/26/15* |
|
|
5,000 |
|
|
|
67,599 |
|
|
|
|
| Reliance Capital Ltd., Expire 8/30/16* |
|
|
7,700 |
|
|
|
48,947 |
|
April 30, 2015 / ANNUAL REPORT
PORTFOLIOS OF INVESTMENTS 47
Wilmington Multi-Manager
International Fund (continued)
|
|
|
|
|
|
|
|
|
| Description |
|
Number of
Shares |
|
|
Value |
|
|
|
|
| Reliance Communications Ltd., Expire 12/28/15* |
|
|
16,729 |
|
|
$ |
15,946 |
|
|
|
|
| Reliance Infrastructure Ltd., Expire 2/11/16* |
|
|
4,900 |
|
|
|
31,934 |
|
|
|
|
| Reliance Power Ltd., Expire 3/27/17* |
|
|
23,200 |
|
|
|
20,643 |
|
|
|
|
| Steel Authority, Expire 5/30/18* |
|
|
32,680 |
|
|
|
35,621 |
|
|
|
|
| Sun Pharmaceuticals Industries Ltd., Expire 7/27/18 |
|
|
12,000 |
|
|
|
177,877 |
|
|
|
|
| Suzlon Energy Ltd., Expire 8/15/15* |
|
|
163,300 |
|
|
|
61,107 |
|
|
|
|
| Tata Consultancy Services Ltd., Expire 12/14/15* |
|
|
5,840 |
|
|
|
227,580 |
|
|
|
|
| Tata Power Co. Ltd., Expire 9/17/15* |
|
|
33,500 |
|
|
|
39,912 |
|
|
|
|
| United Spirits Ltd., Expire 1/13/16* |
|
|
1,200 |
|
|
|
63,193 |
|
|
|
|
|
|
|
|
|
|
|
|
| TOTAL CALL WARRANTS |
|
|
|
|
|
| (COST $4,182,151) |
|
|
|
|
|
$ |
4,820,674 |
|
|
|
|
| CERTIFICATES – 0.2% |
|
|
|
|
|
|
|
|
|
|
|
| Citigroup Global Markets - |
|
|
|
|
|
|
|
|
|
|
|
| Bank Alfalah Ltd., Expire 1/15/16*,W |
|
|
65,000 |
|
|
|
19,030 |
|
|
|
|
| Commercial Bank of Kuwait, Expire 3/17/17* |
|
|
21,312 |
|
|
|
43,804 |
|
|
|
|
| Lucky Cement Ltd., Expire 1/15/16*,W |
|
|
8,363 |
|
|
|
40,071 |
|
|
|
|
| National Bank of Pakistan, Expire 1/15/16*,W |
|
|
55,000 |
|
|
|
30,847 |
|
|
|
|
| Oil & Gas Development Co. Ltd., Expire 1/15/16*,W |
|
|
32,300 |
|
|
|
58,079 |
|
|
|
|
| Pakistan Telecommunication Co. Ltd., Expire 1/15/16*,W |
|
|
91,800 |
|
|
|
18,769 |
|
|
|
|
| SUI Southern Gas Co. Ltd., Expire 1/15/16*,W |
|
|
91,500 |
|
|
|
33,051 |
|
|
|
|
| HSBC Bank PLC - |
|
|
|
|
|
|
|
|
|
|
|
| Agility Public Warehousing K.S.C., Expire 10/17/16* |
|
|
19,950 |
|
|
|
52,248 |
|
|
|
|
| Ahli United Bank BSC, Expire 11/24/17 |
|
|
81,033 |
|
|
|
58,562 |
|
|
|
|
| Al Rajhi Bank, Expire 1/22/18 |
|
|
3,575 |
|
|
|
59,713 |
|
|
|
|
| Alinma Bank, Expire 1/22/18 |
|
|
4,730 |
|
|
|
30,938 |
|
|
|
|
| Etihad Etisalat, Expire 11/20/17 |
|
|
2,000 |
|
|
|
19,743 |
|
|
|
|
| Samba Financial Group, Expire 6/02/27 |
|
|
3,888 |
|
|
|
31,714 |
|
|
|
|
| Saudi Arabian Fertilizer Co., Expire 7/31/17 |
|
|
12,027 |
|
|
|
196,426 |
|
|
|
|
| Saudi Basic Industries Corp., Expire 1/15/18 |
|
|
1,830 |
|
|
|
53,032 |
|
|
|
|
| Saudi Cement Co., Expire 8/10/15* |
|
|
960 |
|
|
|
24,457 |
|
|
|
|
| Saudi Electricity Co., Expire 1/22/18 |
|
|
5,670 |
|
|
|
30,314 |
|
|
|
|
| Saudi Industry Investment Group, Expire 9/27/17 |
|
|
3,310 |
|
|
|
25,516 |
|
|
|
|
| Saudi Kayan Petrochemical Co., Expire 1/22/18 |
|
|
5,500 |
|
|
|
17,804 |
|
|
|
|
| Savola, Expire 2/06/17 |
|
|
1,870 |
|
|
|
38,724 |
|
|
|
|
| Sultan Center Food Production, Expire 7/27/15* |
|
|
100,000 |
|
|
|
28,841 |
|
|
|
|
| JPMorgan Chase Bank NA - |
|
|
|
|
|
|
|
|
|
|
|
| PetroVietnam Drilling & Well Services JSC, Expire 9/6/16*,W |
|
|
30,182 |
|
|
|
75,757 |
|
|
|
|
|
|
|
|
|
|
| Description |
|
Number of
Shares |
|
|
Value |
|
|
|
|
| Petrovietnam Fret & Chemical, Expire 3/24/16 |
|
|
12,430 |
|
|
$ |
17,387 |
|
|
|
|
| PetroVietnam Technical Service Corp., Expire 9/6/16 |
|
|
52,650 |
|
|
|
66,332 |
|
|
|
|
| Pha Lai Therma, Expire 11/07/18* |
|
|
38,600 |
|
|
|
42,909 |
|
|
|
|
|
|
|
|
|
|
|
|
| TOTAL CERTIFICATES |
|
|
|
|
|
| (COST $1,059,728) |
|
|
|
|
|
$ |
1,114,068 |
|
|
| REAL ESTATE INVESTMENT TRUSTS – 0.6% |
|
|
|
|
| AUSTRALIA – 0.0%** |
|
|
|
|
|
|
|
|
|
|
|
| Federation Centres†† |
|
|
15,794 |
|
|
|
36,695 |
|
|
|
|
| Stockland†† |
|
|
12,010 |
|
|
|
41,975 |
|
|
|
|
|
|
|
|
|
|
|
|
|
| TOTAL AUSTRALIA |
|
|
|
|
|
$ |
78,670 |
|
|
|
|
| FRANCE – 0.6% |
|
|
|
|
|
|
|
|
|
|
|
| Unibail-Rodamco SE†† |
|
|
11,386 |
|
|
|
3,143,798 |
|
|
|
|
| HONG KONG – 0.0%** |
|
|
|
|
|
|
|
|
|
|
|
| Link REIT†† |
|
|
12,000 |
|
|
|
74,436 |
|
|
|
|
| NIGERIA – 0.0%** |
|
|
|
|
|
|
|
|
|
|
|
| Afriland Properties
PLC*,†† |
|
|
24,606 |
|
|
|
— |
|
|
|
|
|
|
|
|
|
|
|
|
| TOTAL REAL ESTATE INVESTMENT TRUSTS |
|
|
|
|
|
| (COST $2,706,277) |
|
|
|
|
|
$ |
3,296,904 |
|
|
|
|
|
|
|
|
|
|
|
|
| TOTAL INVESTMENTS IN SECURITIES – 99.4% |
|
|
|
|
|
| (COST $467,299,647) |
|
|
|
|
|
$ |
538,264,093 |
|
|
|
|
|
|
|
|
|
|
| |
|
Par
Value |
|
|
|
|
|
| CASH COLLATERAL INVESTED FOR SECURITIES ON
LOAN – 4.0% |
|
|
|
| REPURCHASE AGREEMENTS – 4.0% |
|
|
|
|
|
|
|
|
| BNP Paribas Securities Corp., 0.12%, dated 4/30/15, due 5/01/15, repurchase price $1,069,282, collateralized by U.S. Government & Treasury Securities 0.00% to
6.50%, maturing 5/01/16 to 4/20/45; total market value of $1,090,664. |
|
$ |
1,069,278 |
|
|
$ |
1,069,278 |
|
|
|
|
| Citigroup Global Markets, Inc., 0.13%, dated 4/30/15, due 5/01/15, repurchase price $4,063,442, collateralized by U.S. Government Securities 1.61% to 8.00%, maturing
6/01/17 to 6/15/52; total market value of $4,144,696. |
|
|
4,063,427 |
|
|
|
4,063,427 |
|
|
|
|
| Credit Suisse Securities (USA) LLC, 0.12%, dated 4/30/15, due 5/01/15, repurchase price $4,063,441, collateralized by U.S. Government Securities 3.00% to 4.50%,
maturing 8/01/38 to 4/01/45; total market value of $4,144,726. |
|
|
4,063,427 |
|
|
|
4,063,427 |
|
ANNUAL REPORT / April 30,
2015
48 PORTFOLIOS OF
INVESTMENTS
Wilmington Multi-Manager International Fund (continued)
|
|
|
|
|
|
|
|
|
|
|
|
| Description |
|
|
Par Value |
|
|
|
Value |
|
|
|
|
| Daiwa Capital Markets America, 0.16%, dated 4/30/15, due 5/01/15, repurchase price $4,063,445, collateralized by U.S. Government & Treasury Securities 0.00% to
9.25%, maturing 5/21/15 to 3/01/48; total market value of $4,144,696. |
|
$ |
4,063,427 |
|
|
$ |
4,063,427 |
|
|
|
|
| ING Financial Markets LLC, 0.12%, dated 4/30/15, due 5/01/15, repurchase price $4,063,441, collateralized by U.S. Government Securities 1.87% to 6.20%, maturing
5/01/33 to 11/01/44; total market value of $4,144,697. |
|
|
4,063,427 |
|
|
|
4,063,427 |
|
|
|
|
| Nomura Securities Internal, Inc., 0.13%, dated 4/30/15, due 5/01/15, repurchase price $4,063,442, collateralized by U.S. Government & Treasury Securities 0.00% to
9.50%, maturing 5/15/15 to 3/20/64; total market value of $4,144,695. |
|
|
4,063,427 |
|
|
|
4,063,427 |
|
|
|
|
|
|
|
|
|
|
|
|
| TOTAL CASH COLLATERAL INVESTED FOR SECURITIES ON LOAN
(COST $21,386,413) |
|
|
$ |
21,386,413 |
|
|
|
|
|
|
|
|
|
|
|
|
|
| TOTAL INVESTMENTS – 103.4% (COST
$488,686,060) |
|
|
|
|
|
$ |
559,650,506 |
|
|
|
| COLLATERAL FOR SECURITIES ON LOAN – (4.0%) |
|
|
|
(21,386,413 |
) |
|
|
| OTHER ASSETS LESS LIABILITIES – 0.6% |
|
|
|
3,091,064 |
|
|
|
|
|
|
|
|
|
|
|
|
|
| TOTAL NET ASSETS – 100.0% |
|
|
|
|
|
$ |
541,355,157 |
|
|
|
|
|
|
|
|
|
|
Cost of investments for Federal
income tax purposes is $497,098,390. The net unrealized appreciation/(depreciation) of investments was $62,552,116. This consists of net unrealized appreciation from investment for those securities having an excess of value over cost of $96,979,641
and net unrealized depreciation from investments for those securities having an excess of cost over value of $34,427,525.
Various inputs are used in
determining the value of the Fund’s investments. These inputs are summarized in the three broad levels listed below.
Level 1 –
quoted prices in active markets for identical securities
Level 2 – other significant observable inputs (including quoted prices for
similar securities, interest rates, prepayment speeds, credit risk, etc.)
Level 3 – significant unobservable inputs (including the
Fund’s own assumptions in determining the fair value of investments)
The following is a summary of the inputs used as of April 30, 2015 in
valuing the Fund’s assets carried at fair value:
|
|
|
|
|
|
|
|
|
|
|
|
|
|
|
|
|
|
|
|
|
|
|
|
|
Level 1 |
|
|
|
Level 2 |
|
|
|
Level 3 |
|
|
|
Total |
|
| Assets |
|
|
|
|
|
|
|
|
|
|
|
|
|
|
|
|
|
|
|
|
|
| Investments in Securities |
|
|
|
|
|
|
|
|
|
|
|
|
|
|
|
|
|
|
|
|
|
| Common Stocks |
|
|
|
|
|
|
|
|
|
|
|
|
|
|
|
|
| Argentina |
|
$ |
512,917 |
|
|
$ |
— |
|
|
$ |
— |
|
|
$ |
512,917 |
|
| Australia |
|
|
19,277 |
|
|
|
15,054,668 |
|
|
|
— |
|
|
|
15,073,945 |
|
| Austria |
|
|
— |
|
|
|
3,098,753 |
|
|
|
— |
|
|
|
3,098,753 |
|
| Bahrain |
|
|
— |
|
|
|
137,389 |
|
|
|
— |
|
|
|
137,389 |
|
| Belgium |
|
|
157,157 |
|
|
|
4,795,613 |
|
|
|
— |
|
|
|
4,952,770 |
|
| Botswana |
|
|
53,542 |
|
|
|
403,178 |
|
|
|
— |
|
|
|
456,720 |
|
| Brazil |
|
|
3,730,680 |
|
|
|
— |
|
|
|
— |
|
|
|
3,730,680 |
|
| Bulgaria |
|
|
— |
|
|
|
77,662 |
|
|
|
— |
|
|
|
77,662 |
|
| Canada |
|
|
21,023,373 |
|
|
|
— |
|
|
|
— |
|
|
|
21,023,373 |
|
| Chile |
|
|
2,035,021 |
|
|
|
— |
|
|
|
— |
|
|
|
2,035,021 |
|
| China |
|
|
717,090 |
|
|
|
20,673,035 |
|
|
|
— |
|
|
|
21,390,125 |
|
April 30, 2015 / ANNUAL REPORT
PORTFOLIOS OF
INVESTMENTS 49
Wilmington Multi-Manager International Fund
(continued)
|
|
|
|
|
|
|
|
|
|
|
|
|
|
|
|
|
|
|
|
|
|
| |
|
Level 1
|
|
|
Level 2
|
|
|
Level 3
|
|
|
Total
|
|
|
|
|
|
|
| Colombia |
|
$ |
2,320,084 |
|
|
$ |
26,589 |
|
|
$ |
— |
|
|
$ |
2,346,673 |
|
|
|
|
|
|
| Croatia |
|
|
67,782 |
|
|
|
405,895 |
|
|
|
— |
|
|
|
473,677 |
|
|
|
|
|
|
| Czech Republic |
|
|
— |
|
|
|
889,237 |
|
|
|
— |
|
|
|
889,237 |
|
|
|
|
|
|
| Denmark |
|
|
— |
|
|
|
8,281,096 |
|
|
|
— |
|
|
|
8,281,096 |
|
|
|
|
|
|
| Egypt |
|
|
— |
|
|
|
1,091,858 |
|
|
|
— |
|
|
|
1,091,858 |
|
|
|
|
|
|
| Estonia |
|
|
— |
|
|
|
493,319 |
|
|
|
— |
|
|
|
493,319 |
|
|
|
|
|
|
| Finland |
|
|
— |
|
|
|
6,463,093 |
|
|
|
— |
|
|
|
6,463,093 |
|
|
|
|
|
|
| France |
|
|
— |
|
|
|
42,634,152 |
|
|
|
— |
|
|
|
42,634,152 |
|
|
|
|
|
|
| Germany |
|
|
— |
|
|
|
40,046,123 |
|
|
|
— |
|
|
|
40,046,123 |
|
|
|
|
|
|
| Ghana |
|
|
80,064 |
|
|
|
334,087 |
|
|
|
— |
|
|
|
414,151 |
|
|
|
|
|
|
| Greece |
|
|
222,775 |
|
|
|
812,178 |
|
|
|
— |
|
|
|
1,034,953 |
|
|
|
|
|
|
| Hong Kong |
|
|
— |
|
|
|
5,557,738 |
|
|
|
— |
|
|
|
5,557,738 |
|
|
|
|
|
|
| Hungary |
|
|
— |
|
|
|
1,060,748 |
|
|
|
— |
|
|
|
1,060,748 |
|
|
|
|
|
|
| India |
|
|
738,851 |
|
|
|
346,842 |
|
|
|
— |
|
|
|
1,085,693 |
|
|
|
|
|
|
| Indonesia |
|
|
— |
|
|
|
1,880,767 |
|
|
|
— |
|
|
|
1,880,767 |
|
|
|
|
|
|
| Ireland |
|
|
8,621,218 |
|
|
|
217,707 |
|
|
|
— |
|
|
|
8,838,925 |
|
|
|
|
|
|
| Israel |
|
|
127,245 |
|
|
|
1,186,740 |
|
|
|
— |
|
|
|
1,313,985 |
|
|
|
|
|
|
| Italy |
|
|
55,401 |
|
|
|
8,828,555 |
|
|
|
— |
|
|
|
8,883,956 |
|
|
|
|
|
|
| Japan |
|
|
10,392 |
|
|
|
79,533,458 |
|
|
|
— |
|
|
|
79,543,850 |
|
|
|
|
|
|
| Jordan |
|
|
— |
|
|
|
536,458 |
|
|
|
— |
|
|
|
536,458 |
|
|
|
|
|
|
| Kazakhstan |
|
|
— |
|
|
|
549,537 |
|
|
|
— |
|
|
|
549,537 |
|
|
|
|
|
|
| Kenya |
|
|
— |
|
|
|
547,255 |
|
|
|
— |
|
|
|
547,255 |
|
|
|
|
|
|
| Latvia |
|
|
— |
|
|
|
15,391 |
|
|
|
— |
|
|
|
15,391 |
|
|
|
|
|
|
| Lebanon |
|
|
— |
|
|
|
213,889 |
|
|
|
— |
|
|
|
213,889 |
|
|
|
|
|
|
| Lithuania |
|
|
— |
|
|
|
191,384 |
|
|
|
— |
|
|
|
191,384 |
|
|
|
|
|
|
| Luxembourg |
|
|
— |
|
|
|
381,238 |
|
|
|
— |
|
|
|
381,238 |
|
|
|
|
|
|
| Malaysia |
|
|
— |
|
|
|
2,649,604 |
|
|
|
— |
|
|
|
2,649,604 |
|
|
|
|
|
|
| Mauritius |
|
|
— |
|
|
|
534,743 |
|
|
|
— |
|
|
|
534,743 |
|
|
|
|
|
|
| Mexico |
|
|
3,895,623 |
|
|
|
— |
|
|
|
— |
|
|
|
3,895,623 |
|
|
|
|
|
|
| Morocco |
|
|
— |
|
|
|
507,939 |
|
|
|
— |
|
|
|
507,939 |
|
|
|
|
|
|
| Netherlands |
|
|
4,451,670 |
|
|
|
7,148,243 |
|
|
|
— |
|
|
|
11,599,913 |
|
|
|
|
|
|
| New Zealand |
|
|
— |
|
|
|
113,542 |
|
|
|
— |
|
|
|
113,542 |
|
|
|
|
|
|
| Nigeria |
|
|
— |
|
|
|
593,896 |
|
|
|
— |
|
|
|
593,896 |
|
|
|
|
|
|
| Norway |
|
|
— |
|
|
|
1,610,138 |
|
|
|
— |
|
|
|
1,610,138 |
|
|
|
|
|
|
| Oman |
|
|
42,278 |
|
|
|
451,756 |
|
|
|
— |
|
|
|
494,034 |
|
|
|
|
|
|
| Panama |
|
|
215,237 |
|
|
|
— |
|
|
|
— |
|
|
|
215,237 |
|
|
|
|
|
|
| Papua New Guinea |
|
|
— |
|
|
|
24,747 |
|
|
|
— |
|
|
|
24,747 |
|
|
|
|
|
|
| Peru |
|
|
1,027,246 |
|
|
|
— |
|
|
|
— |
|
|
|
1,027,246 |
|
|
|
|
|
|
| Philippines |
|
|
— |
|
|
|
2,082,272 |
|
|
|
— |
|
|
|
2,082,272 |
|
|
|
|
|
|
| Poland |
|
|
— |
|
|
|
2,382,719 |
|
|
|
— |
|
|
|
2,382,719 |
|
|
|
|
|
|
| Portugal |
|
|
— |
|
|
|
124,535 |
|
|
|
— |
|
|
|
124,535 |
|
|
|
|
|
|
| Qatar |
|
|
— |
|
|
|
1,064,071 |
|
|
|
— |
|
|
|
1,064,071 |
|
|
|
|
|
|
| Romania |
|
|
— |
|
|
|
587,413 |
|
|
|
— |
|
|
|
587,413 |
|
|
|
|
|
|
| Russia |
|
|
1,786,609 |
|
|
|
2,711,397 |
|
|
|
— |
|
|
|
4,498,006 |
|
|
|
|
|
|
| Singapore |
|
|
3,911,623 |
|
|
|
2,834,827 |
|
|
|
— |
|
|
|
6,746,450 |
|
|
|
|
|
|
| Slovenia |
|
|
— |
|
|
|
501,023 |
|
|
|
— |
|
|
|
501,023 |
|
|
|
|
|
|
| South Africa |
|
|
— |
|
|
|
4,084,717 |
|
|
|
— |
|
|
|
4,084,717 |
|
|
|
|
|
|
| South Korea |
|
|
— |
|
|
|
9,316,070 |
|
|
|
— |
|
|
|
9,316,070 |
|
|
|
|
|
|
| Spain |
|
|
26,957 |
|
|
|
9,626,250 |
|
|
|
— |
|
|
|
9,653,207 |
|
|
|
|
|
|
| Sweden |
|
|
64,876 |
|
|
|
13,744,762 |
|
|
|
— |
|
|
|
13,809,638 |
|
|
|
|
|
|
| Switzerland |
|
|
— |
|
|
|
49,774,726 |
|
|
|
— |
|
|
|
49,774,726 |
|
ANNUAL REPORT / April 30,
2015
50 PORTFOLIOS OF
INVESTMENTS
Wilmington Multi-Manager International Fund
(continued)
|
|
|
|
|
|
|
|
|
|
|
|
|
|
|
|
|
|
|
|
|
|
| |
|
Level 1
|
|
|
Level 2
|
|
|
Level 3
|
|
|
Total |
|
|
|
|
|
|
| Taiwan |
|
$ |
— |
|
|
$ |
8,164,495 |
|
|
$ |
— |
|
|
$ |
8,164,495 |
|
|
|
|
|
|
| Thailand |
|
|
— |
|
|
|
1,980,391 |
|
|
|
— |
|
|
|
1,980,391 |
|
|
|
|
|
|
| Tunisia |
|
|
— |
|
|
|
213,456 |
|
|
|
— |
|
|
|
213,456 |
|
|
|
|
|
|
| Turkey |
|
|
— |
|
|
|
2,074,996 |
|
|
|
— |
|
|
|
2,074,996 |
|
|
|
|
|
|
| Ukraine |
|
|
— |
|
|
|
129,896 |
|
|
|
— |
|
|
|
129,896 |
|
|
|
|
|
|
| United Arab Emirates |
|
|
21,798 |
|
|
|
961,307 |
|
|
|
— |
|
|
|
983,105 |
|
|
|
|
|
|
| United Kingdom |
|
|
8,049,264 |
|
|
|
60,000,545 |
|
|
|
— |
|
|
|
68,049,809 |
|
|
|
|
|
|
| United States |
|
|
10,497,246 |
|
|
|
— |
|
|
|
— |
|
|
|
10,497,246 |
|
|
|
|
|
|
| Investment Companies |
|
|
1,702,730 |
|
|
|
— |
|
|
|
— |
|
|
|
1,702,730 |
|
|
|
|
|
|
| Preferred Stock |
|
|
|
|
|
|
|
|
|
|
|
|
|
|
|
|
|
|
|
|
|
| Brazil |
|
|
3,203,306 |
|
|
|
— |
|
|
|
— |
|
|
|
3,203,306 |
|
|
|
|
|
|
| Chile |
|
|
114,691 |
|
|
|
— |
|
|
|
— |
|
|
|
114,691 |
|
|
|
|
|
|
| Colombia |
|
|
132,155 |
|
|
|
— |
|
|
|
— |
|
|
|
132,155 |
|
|
|
|
|
|
| Croatia |
|
|
— |
|
|
|
76,932 |
|
|
|
— |
|
|
|
76,932 |
|
|
|
|
|
|
| Germany |
|
|
— |
|
|
|
3,218,397 |
|
|
|
— |
|
|
|
3,218,397 |
|
|
|
|
|
|
| Philippines |
|
|
— |
|
|
|
400 |
|
|
|
— |
|
|
|
400 |
|
|
|
|
|
|
| Russia |
|
|
70,500 |
|
|
|
— |
|
|
|
— |
|
|
|
70,500 |
|
|
|
|
|
|
| Money Market Fund |
|
|
13,249,484 |
|
|
|
— |
|
|
|
— |
|
|
|
13,249,484 |
|
|
|
|
|
|
| Rights |
|
|
|
|
|
|
|
|
|
|
|
|
|
|
|
|
|
|
|
|
|
| India |
|
|
— |
|
|
|
871 |
|
|
|
— |
|
|
|
871 |
|
|
|
|
|
|
| Kuwait |
|
|
— |
|
|
|
— |
|
|
|
— |
|
|
|
— |
|
|
|
|
|
|
| Malaysia |
|
|
— |
|
|
|
— |
|
|
|
— |
|
|
|
— |
|
|
|
|
|
|
| Spain |
|
|
542 |
|
|
|
18,229 |
|
|
|
— |
|
|
|
18,771 |
|
|
|
|
|
|
| Tunisia |
|
|
— |
|
|
|
806 |
|
|
|
— |
|
|
|
806 |
|
|
|
|
|
|
| Call Warrants |
|
|
4,820,674 |
|
|
|
— |
|
|
|
— |
|
|
|
4,820,674 |
|
|
|
|
|
|
| Certificates |
|
|
1,114,068 |
|
|
|
— |
|
|
|
— |
|
|
|
1,114,068 |
|
|
|
|
|
|
| Real Estate Investment Trust |
|
|
|
|
|
|
|
|
|
|
|
|
|
|
|
|
|
|
|
|
|
| Australia |
|
|
— |
|
|
|
78,670 |
|
|
|
— |
|
|
|
78,670 |
|
|
|
|
|
|
| France |
|
|
— |
|
|
|
3,143,798 |
|
|
|
— |
|
|
|
3,143,798 |
|
|
|
|
|
|
| Hong Kong |
|
|
— |
|
|
|
74,436 |
|
|
|
— |
|
|
|
74,436 |
|
|
|
|
|
|
| Nigeria |
|
|
— |
|
|
|
— |
|
|
|
— |
|
|
|
— |
|
|
|
|
|
|
| Repurchase Agreements |
|
|
— |
|
|
|
21,386,413 |
|
|
|
— |
|
|
|
21,386,413 |
|
|
|
|
|
|
|
|
|
|
|
|
|
|
|
|
|
|
|
|
|
|
|
| Total Investments in Securities |
|
|
98,891,446 |
|
|
|
460,759,060 |
|
|
|
— |
|
|
|
559,650,506 |
|
|
|
|
|
|
|
|
|
|
|
|
|
|
|
|
|
|
|
|
|
|
|
| Other Financial Instruments^ |
|
|
|
|
|
|
|
|
|
|
|
|
|
|
|
|
|
|
|
|
|
| Forward Foreign Currency Contracts |
|
$ |
— |
|
|
$ |
1,274 |
|
|
$ |
— |
|
|
$ |
1,274 |
|
|
|
|
|
|
|
|
|
|
|
|
|
|
|
|
|
|
|
|
|
|
|
| Total Assets |
|
$ |
98,891,446 |
|
|
$ |
460,760,334 |
|
|
$ |
— |
|
|
$ |
559,651,780 |
|
|
|
|
|
|
|
|
|
|
|
|
|
|
|
|
|
|
|
|
|
|
|
| Liabilities |
|
|
|
|
|
|
|
|
|
|
|
|
|
|
|
|
|
|
|
|
|
| Other Financial Instruments^ |
|
|
|
|
|
|
|
|
|
|
|
|
|
|
|
|
|
|
|
|
|
| Forward Foreign Currency Contracts |
|
$ |
— |
|
|
$ |
(2,702 |
) |
|
$ |
— |
|
|
$ |
(2,702 |
) |
|
|
|
|
|
|
|
|
|
|
|
|
|
|
|
|
|
|
|
|
|
|
| Total Liabilities |
|
$ |
— |
|
|
$ |
(2,702 |
) |
|
$ |
— |
|
|
$ |
(2,702 |
) |
|
|
|
|
|
|
|
|
|
|
|
|
|
|
|
|
|
| ^ |
Other financial instruments are derivative instruments not reflected in the value of total investments in securities in the Portfolio of Investments such as forward foreign currency contracts, which are valued at the
unrealized appreciation (depreciation) on the instrument. |
| # |
Security, or a portion thereof, is on loan. See Note 2 in Notes to Financial Statements. |
| * |
Non-income producing security. |
| †† |
Security is fair valued in accordance with procedures adopted by the Board of Trustees. See Note 2 in Notes to Financial Statements. At April 30, 2015, the value of these securities amounted to $437,474,979
representing 80.8% of total net assets. |
| W |
Denotes a restricted security that may be resold without restriction to “qualified institutional buyers” as defined in Rule 144A under the Securities Act of 1933 and that the |
April 30, 2015 / ANNUAL REPORT
PORTFOLIOS OF INVESTMENTS
51
Wilmington Multi-Manager International Fund
(continued)
| |
Fund has determined to be liquid under criteria established by the Fund’s Board of Trustees. At April 30, 2015, these liquid restricted securities
amounted to $1,353,572 representing 0.3% of total net assets. |
| ** |
Represents less than 0.05%. |
The
following acronyms are used throughout this Fund:
ADR - American Depositary Receipt
ETF - Exchange Traded Fund
GDR - Global Depositary
Receipt
LLC - Limited Liability Corporation
MTN -
Medium Term Note
PCL - Public Company Limited
PLC
- Public Limited Company
REIT - Real Estate Investment Trust
At April 30, 2015, the International Fund had the following outstanding forward foreign currency contracts, which contractually obligates the Fund to
deliver or receive currencies at specified future dates. The open contracts were as follows:
|
|
|
|
|
|
|
|
|
|
|
|
|
|
|
|
|
|
|
|
|
|
|
|
|
| Settlement Date
|
|
Counterparty
|
|
|
Contracts to
Deliver/Receive
|
|
Contract
Amount
|
|
|
Contracts at
Value
|
|
|
Unrealized
Appreciation
(Depreciation)
|
|
| CONTRACTS PURCHASED |
|
|
|
|
|
|
|
|
|
|
|
|
|
|
|
|
|
|
| 5/1/2015 |
|
|
Deutsche Bank |
|
|
1,770 Pound Sterling |
|
$ |
2,731 |
|
|
$ |
2,717 |
|
|
|
$ (14) |
|
| 5/4/2015 |
|
|
Bank of New York |
|
|
731,328 Swedish Krona |
|
|
87,467 |
|
|
|
87,767 |
|
|
|
300 |
|
| 5/4/2015 |
|
|
Bank of New York |
|
|
64,143 Australian Dollar |
|
|
51,647 |
|
|
|
50,748 |
|
|
|
(899) |
|
| 5/4/2015 |
|
|
Bank of New York |
|
|
24,014 Canadian Dollar |
|
|
19,977 |
|
|
|
19,902 |
|
|
|
(75) |
|
| 5/4/2015 |
|
|
Bank of New York |
|
|
22,136 Euro |
|
|
24,604 |
|
|
|
24,857 |
|
|
|
253 |
|
| 5/5/2015 |
|
|
Bank of New York |
|
|
198,661 Norwegian Krone |
|
|
26,411 |
|
|
|
26,380 |
|
|
|
(31) |
|
| 5/5/2015 |
|
|
Bank of New York |
|
|
47,648 Australian Dollar |
|
|
37,645 |
|
|
|
37,696 |
|
|
|
51 |
|
| 5/5/2015 |
|
|
Bank of New York |
|
|
45,069 Pound Sterling |
|
|
69,183 |
|
|
|
69,177 |
|
|
|
(6) |
|
| 5/5/2015 |
|
|
Bank of New York |
|
|
38,414 Swedish Krona |
|
|
4,600 |
|
|
|
4,611 |
|
|
|
11 |
|
| 5/5/2015 |
|
|
Bank of New York |
|
|
31,855 Pound Sterling |
|
|
48,831 |
|
|
|
48,894 |
|
|
|
63 |
|
| 5/5/2015 |
|
|
Bank of New York |
|
|
12,667 Euro |
|
|
14,213 |
|
|
|
14,223 |
|
|
|
10 |
|
| 5/5/2015 |
|
|
Deutsche Bank |
|
|
1,011 Great Britain Pound |
|
|
1,551 |
|
|
|
1,551 |
|
|
|
— |
|
| 5/7/2015 |
|
|
Bank of New York |
|
|
1,119,050 Japanese Yen |
|
|
9,388 |
|
|
|
9,373 |
|
|
|
(15) |
|
| 5/8/2015 |
|
|
Citigroup Global Markets |
|
|
7,267,631 Japanese Yen |
|
|
60,767 |
|
|
|
60,873 |
|
|
|
106 |
|
| 5/8/2015 |
|
|
Citigroup Global Markets |
|
|
4,333,163 Japanese Yen |
|
|
36,214 |
|
|
|
36,294 |
|
|
|
80 |
|
| CONTRACTS SOLD |
|
|
|
|
|
|
|
|
|
|
|
|
|
|
|
|
|
|
| 5/4/2015 |
|
|
Bank of New York |
|
|
1,688,392 Hong Kong Dollar |
|
|
217,842 |
|
|
|
217,842 |
|
|
|
— |
|
| 5/4/2015 |
|
|
Citigroup Global Markets |
|
|
99,403 Euro |
|
|
110,190 |
|
|
|
111,621 |
|
|
|
(1,431) |
|
| 5/4/2015 |
|
|
Bank of New York |
|
|
59,794 Singapore Dollar |
|
|
45,213 |
|
|
|
45,185 |
|
|
|
28 |
|
| 5/4/2015 |
|
|
Citigroup Global Markets |
|
|
49,885 New Zealand Dollar |
|
|
38,416 |
|
|
|
38,059 |
|
|
|
357 |
|
| 5/5/2015 |
|
|
Bank of New York |
|
|
79,501 New Zealand Dollar |
|
|
60,565 |
|
|
|
60,649 |
|
|
|
(84) |
|
| 5/5/2015 |
|
|
Bank of New York |
|
|
15,293 Singapore Dollar |
|
|
11,572 |
|
|
|
11,557 |
|
|
|
15 |
|
| 5/5/2015 |
|
|
Bank of New York |
|
|
6,324 Euro |
|
|
6,960 |
|
|
|
7,101 |
|
|
|
(141) |
|
| 5/5/2015 |
|
|
Deutsche Bank |
|
|
1,962 Australian Dollar |
|
|
1,551 |
|
|
|
1,552 |
|
|
|
(1) |
|
| 5/5/2015 |
|
|
Citigroup Global Markets |
|
|
116 Euro |
|
|
130 |
|
|
|
130 |
|
|
|
— |
|
| 5/6/2015 |
|
|
Bank of New York |
|
|
1,360 Pound Sterling |
|
|
2,083 |
|
|
|
2,088 |
|
|
|
(5) |
|
| NET UNREALIZED APPRECIATION (DEPRECIATION) ON FORWARD FOREIGN CURRENCY CONTRACTS |
|
|
|
|
|
|
|
|
|
|
|
|
|
$(1,428) |
|
ANNUAL REPORT / April 30,
2015
52 PORTFOLIOS OF
INVESTMENTS
Wilmington Multi-Manager International Fund (concluded)
|
|
|
|
|
|
|
|
|
|
|
|
|
|
|
|
|
|
|
| At April 30, 2015, the International Fund had the following outstanding foreign exchange
contracts: |
|
| |
|
Settlement
Date |
|
Counterparty |
|
Contracts to
Deliver/Receive |
|
In Exchange
For |
|
|
Contracts at
Value |
|
|
Unrealized
Appreciation
(Depreciation) |
|
|
|
CONTRACTS PURCHASED |
|
|
|
|
|
|
|
|
|
|
|
|
| |
5/1/2015 |
|
Bank of New York |
|
2,060,000 Japanese Yen |
|
|
$ 17,278 |
|
|
|
$ 17,253 |
|
|
|
$ (25) |
|
| |
5/1/2015 |
|
Bank of New York |
|
1,655,762 Japanese Yen |
|
|
13,906 |
|
|
|
13,868 |
|
|
|
(38) |
|
| |
5/1/2015 |
|
Bank of New York |
|
12,798 Pound Sterling |
|
|
19,721 |
|
|
|
19,644 |
|
|
|
(77) |
|
| |
CONTRACTS SOLD |
|
|
|
|
|
|
|
|
|
|
|
|
| |
5/1/2015 |
|
Bank of New York |
|
33,700,030 Japanese Yen |
|
|
283,091 |
|
|
|
282,245 |
|
|
|
846 |
|
| |
5/1/2015 |
|
Citigroup Global Markets |
|
71,250 New Zealand Dollar |
|
|
55,032 |
|
|
|
54,381 |
|
|
|
651 |
|
| |
5/1/2015 |
|
Citigroup Global Markets |
|
51,385 Canadian Dollar |
|
|
42,951 |
|
|
|
42,590 |
|
|
|
361 |
|
| |
5/1/2015 |
|
Deutsche Bank |
|
3,403 Australian Dollar |
|
|
2,731 |
|
|
|
2,694 |
|
|
|
37 |
|
| |
5/4/2015 |
|
Bank of New York |
|
63,100 Euro |
|
|
70,684 |
|
|
|
70,852 |
|
|
|
(168) |
|
| |
5/6/2015 |
|
Bank of New York |
|
3,944 Pound Sterling |
|
|
6,040 |
|
|
|
6,053 |
|
|
|
(13) |
|
| |
NET UNREALIZED APPRECIATION (DEPRECIATION) ON FOREIGN EXCHANGE CONTRACTS |
|
|
|
|
|
|
|
|
|
|
|
|
$1,574 |
|
See Notes which are an integral part of the Financial Statements
April 30, 2015 / ANNUAL REPORT
PORTFOLIO OF INVESTMENTS SUMMARY TABLE
Wilmington Multi-Manager Alternatives Fund
At
April 30, 2015, the Fund’s portfolio composition was as follows (unaudited):
|
|
|
|
|
|
| |
|
Percentage of
Total Net Assets |
| Common Stocks |
|
|
|
30.8 |
% |
|
|
| Corporate Bonds |
|
|
|
18.7 |
% |
|
|
| Investment Companies |
|
|
|
10.9 |
% |
|
|
| U.S. Government Obligation |
|
|
|
1.5 |
% |
|
|
| Purchased Options |
|
|
|
0.2 |
% |
|
|
| Cash Equivalent1 |
|
|
|
31.2 |
% |
|
|
| Securities Sold Short |
|
|
|
(11.9 |
)% |
|
|
| Written Options |
|
|
|
(0.3 |
)% |
|
|
| Other Assets and Liabilities – Net2 |
|
|
|
18.9 |
% |
|
|
|
|
|
|
|
|
| TOTAL |
|
|
|
100.0 |
% |
|
|
|
|
|
|
| (1) |
Cash Equivalent includes investment in a money market fund. |
| (2) |
Assets, other than investments in securities, less liabilities. See Statements of Assets and Liabilities.
|
PORTFOLIO OF INVESTMENTS
April 30, 2015
|
|
|
|
|
|
|
|
|
| Description
|
|
Number of
Shares
|
|
|
Value
|
|
|
|
|
| COMMON STOCKS – 30.8% |
|
|
|
|
|
|
|
|
|
|
| AIRLINES – 0.6% |
|
|
|
|
|
|
|
|
| Southwest Airlines
Co.Ö |
|
|
31,021 |
|
|
$ |
1,258,212 |
|
|
|
| BIOTECHNOLOGY – 1.1% |
|
|
|
|
|
|
|
|
| Celgene Corp.*,Ö |
|
|
10,027 |
|
|
|
1,083,518 |
|
|
|
|
| Otonomy, Inc.*,Ö |
|
|
32,143 |
|
|
|
843,432 |
|
|
|
|
| Portola Pharmaceuticals, Inc.* |
|
|
4,953 |
|
|
|
176,773 |
|
|
|
|
|
|
|
|
|
|
|
|
|
| TOTAL BIOTECHNOLOGY |
|
|
|
|
|
$ |
2,103,723 |
|
|
|
| CAPITAL MARKETS – 1.1% |
|
|
|
|
|
|
|
|
| E*TRADE Financial Corp.*,Ö |
|
|
30,090 |
|
|
|
866,291 |
|
|
|
|
| Legg Mason,
Inc.Ö |
|
|
25,880 |
|
|
|
1,362,582 |
|
|
|
|
|
|
|
|
|
|
|
|
|
| TOTAL CAPITAL MARKETS |
|
|
|
|
|
$ |
2,228,873 |
|
|
|
| COMMERCIAL BANKS – 0.8% |
|
|
|
|
|
|
|
|
| CIT Group, Inc. |
|
|
36,470 |
|
|
|
1,642,244 |
|
|
|
| COMPUTERS & PERIPHERALS – 1.8% |
|
|
|
|
|
|
|
|
| Apple,
Inc.Ö |
|
|
28,806 |
|
|
|
3,605,070 |
|
|
|
| CONSUMER FINANCE – 0.6% |
|
|
|
|
|
|
|
|
| Navient
Corp.Ö |
|
|
61,033 |
|
|
|
1,192,585 |
|
|
|
| CONTAINERS & PACKAGING – 0.6% |
|
|
|
|
|
|
|
|
| Berry Plastics Group, Inc.* |
|
|
33,090 |
|
|
|
1,132,340 |
|
|
|
|
|
|
|
|
|
|
| Description
|
|
Number of
Shares
|
|
|
Value
|
|
|
|
| DIVERSIFIED CONSUMER SERVICES – 0.6% |
|
|
|
|
|
|
|
|
| H&R Block, Inc. |
|
|
21,500 |
|
|
$ |
650,160 |
|
|
|
|
| Service Corp.
InternationalÖ |
|
|
17,023 |
|
|
|
471,197 |
|
|
|
|
|
|
|
|
|
|
|
|
| TOTAL DIVERSIFIED CONSUMER SERVICES |
|
|
$ |
1,121,357 |
|
|
|
| DIVERSIFIED FINANCIAL SERVICES – 0.7% |
|
|
|
|
|
|
|
|
| JPMorgan Chase &
Co.Ö |
|
|
23,000 |
|
|
|
1,454,980 |
|
|
|
| FOOD PRODUCTS – 0.2% |
|
|
|
|
|
|
|
|
| Pinnacle Foods,
Inc.Ö |
|
|
7,860 |
|
|
|
318,723 |
|
|
| HEALTH CARE EQUIPMENT & SUPPLIES – 3.6% |
|
|
|
|
| ABIOMED, Inc.*,Ö |
|
|
16,104 |
|
|
|
1,018,095 |
|
|
|
|
| Edwards Lifesciences Corp.*,Ö |
|
|
4,971 |
|
|
|
629,577 |
|
|
|
|
| Globus Medical, Inc.*,Ö |
|
|
12,349 |
|
|
|
295,018 |
|
|
|
|
| Hill-Rom Holdings,
Inc.Ö |
|
|
10,372 |
|
|
|
517,978 |
|
|
|
|
| LDR Holding Corp.*,Ö |
|
|
32,950 |
|
|
|
1,115,357 |
|
|
|
|
| Medtronic
PLCÖ |
|
|
29,888 |
|
|
|
2,225,161 |
|
|
|
|
| Neovasc, Inc. |
|
|
45,783 |
|
|
|
376,794 |
|
|
|
|
| NuVasive, Inc.*,Ö |
|
|
19,974 |
|
|
|
893,437 |
|
|
|
|
|
|
|
|
|
|
|
|
| TOTAL HEALTH CARE EQUIPMENT & SUPPLIES |
|
|
$ |
7,071,417 |
|
|
| HEALTH CARE PROVIDERS & SERVICES – 3.7% |
|
|
|
|
| Aetna,
Inc.Ö |
|
|
5,230 |
|
|
|
558,930 |
|
ANNUAL REPORT / April 30, 2015
|
|
|
| 54 |
|
PORTFOLIOS OF INVESTMENTS |
Wilmington Multi-Manager Alternatives Fund (continued)
|
|
|
|
|
|
|
|
|
| Description |
|
Number of
Shares |
|
|
Value |
|
|
|
|
| Amsurg Corp.* |
|
|
6,698 |
|
|
$ |
420,099 |
|
|
|
|
| Brookdale Senior Living,
Inc.*,Ö |
|
|
10,000 |
|
|
|
362,300 |
|
|
|
|
| Capital Senior Living Corp.* |
|
|
4,386 |
|
|
|
114,782 |
|
|
|
|
| Cardinal Health,
Inc.Ö |
|
|
5,263 |
|
|
|
443,881 |
|
|
|
|
| Centene Corp.* |
|
|
3,293 |
|
|
|
204,133 |
|
|
|
|
| ExamWorks Group,
Inc.*,Ö |
|
|
10,111 |
|
|
|
414,045 |
|
|
|
|
| HCA Holdings,
Inc.*,Ö |
|
|
7,819 |
|
|
|
578,684 |
|
|
|
|
| HealthSouth
Corp.Ö |
|
|
18,524 |
|
|
|
837,655 |
|
|
|
|
| Humana,
Inc.Ö |
|
|
880 |
|
|
|
145,728 |
|
|
|
|
| Kindred Healthcare,
Inc.Ö |
|
|
27,000 |
|
|
|
619,650 |
|
|
|
|
| McKesson Corp. |
|
|
1,981 |
|
|
|
442,555 |
|
|
|
|
| PharMerica
Corp.*,Ö |
|
|
17,941 |
|
|
|
514,189 |
|
|
|
|
| Surgical Care Affiliates, Inc. |
|
|
10,083 |
|
|
|
380,129 |
|
|
|
|
| Tenet Healthcare Corp.* |
|
|
10,808 |
|
|
|
517,271 |
|
|
|
|
| VCA,
Inc.*,Ö |
|
|
14,208 |
|
|
|
724,182 |
|
|
|
|
|
|
|
|
|
|
|
|
| TOTAL HEALTH CARE PROVIDERS & SERVICES |
|
|
$ |
7,278,213 |
|
|
| HOTELS, RESTAURANTS & LEISURE – 1.5% |
|
|
|
|
| Hilton Worldwide Holdings,
Inc.*,Ö |
|
|
25,580 |
|
|
|
740,797 |
|
|
|
|
| La Quinta Holdings,
Inc.*,Ö |
|
|
53,295 |
|
|
|
1,283,344 |
|
|
|
|
| Royal Caribbean Cruises
Ltd.Ö |
|
|
12,610 |
|
|
|
858,237 |
|
|
|
|
|
|
|
|
|
|
|
|
| TOTAL HOTELS, RESTAURANTS & LEISURE |
|
|
$ |
2,882,378 |
|
|
|
| INSURANCE – 0.6% |
|
|
|
|
|
|
|
|
| FNF
GroupÖ |
|
|
33,014 |
|
|
|
1,188,174 |
|
|
| INTERNET SOFTWARE & SERVICES – 2.8% |
|
|
|
|
| Facebook, Inc., Class
A*,Ö |
|
|
18,175 |
|
|
|
1,431,645 |
|
|
|
|
| Google,
Inc.*,Ö |
|
|
2,611 |
|
|
|
1,432,839 |
|
|
|
|
|
IAC/InterActiveCorpÖ
|
|
|
21,485 |
|
|
|
1,500,083 |
|
|
|
|
| Rackspace Hosting,
Inc.*,Ö |
|
|
19,623 |
|
|
|
1,057,680 |
|
|
|
|
|
|
|
|
|
|
|
|
| TOTAL INTERNET SOFTWARE & SERVICES |
|
|
$ |
5,422,247 |
|
|
| LEISURE EQUIPMENT & PRODUCTS – 0.4% |
|
|
|
|
| Brunswick Corp. |
|
|
16,795 |
|
|
|
840,422 |
|
|
|
|
| LEISURE TIME – 0.9% |
|
|
|
|
|
|
|
|
|
|
|
| Norwegian Cruise Line
HoldingsÖ |
|
|
36,969 |
|
|
|
1,793,366 |
|
|
| LIFE SCIENCES TOOLS & SERVICES – 1.2% |
|
|
|
|
| Agilent Technologies,
Inc.Ö |
|
|
41,229 |
|
|
|
1,705,644 |
|
|
|
|
| Icon
PLC-ADRÖ |
|
|
6,248 |
|
|
|
401,996 |
|
|
|
|
| Illumina, Inc.* |
|
|
1,647 |
|
|
|
303,460 |
|
|
|
|
|
|
|
|
|
|
|
|
| TOTAL LIFE SCIENCES TOOLS & SERVICES |
|
|
$ |
2,411,100 |
|
|
|
| MEDIA – 1.8% |
|
|
|
|
|
|
|
|
| CBS Corp.,
Non-VotingÖ |
|
|
19,452 |
|
|
|
1,208,553 |
|
|
|
|
| McGraw Hill Financial,
Inc.Ö |
|
|
10,665 |
|
|
|
1,112,359 |
|
|
|
|
| Time Warner Cable, Inc. |
|
|
8,130 |
|
|
|
1,264,378 |
|
|
|
|
|
|
|
|
|
|
|
|
|
| TOTAL MEDIA |
|
|
|
|
|
$ |
3,585,290 |
|
|
|
| MULTILINE RETAIL – 0.9% |
|
|
|
|
|
|
|
|
| Dollar General
Corp.Ö |
|
|
23,910 |
|
|
|
1,738,496 |
|
|
|
|
|
|
|
|
|
|
| Description |
|
Number of
Shares |
|
|
Value |
|
|
| OIL, GAS & CONSUMABLE FUELS – 1.1% |
|
|
|
|
| Concho Resources, Inc.* |
|
|
7,210 |
|
|
$ |
913,218 |
|
|
|
|
| Pioneer Natural Resources Co. |
|
|
6,820 |
|
|
|
1,178,360 |
|
|
|
|
|
|
|
|
|
|
|
|
| TOTAL OIL, GAS & CONSUMABLE FUELS |
|
|
$ |
2,091,578 |
|
|
|
| PHARMACEUTICALS – 1.2% |
|
|
|
|
|
|
|
|
| Akorn, Inc.* |
|
|
12,641 |
|
|
|
526,371 |
|
|
|
|
| Endo International
PLC*,Ö |
|
|
6,500 |
|
|
|
546,423 |
|
|
|
|
| Intersect Ent, Inc. |
|
|
19,134 |
|
|
|
480,168 |
|
|
|
|
| Valeant Pharmaceuticals International, Inc.*,Ö |
|
|
3,500 |
|
|
|
759,255 |
|
|
|
|
|
|
|
|
|
|
|
|
| TOTAL PHARMACEUTICALS |
|
|
$ |
2,312,217 |
|
|
| REAL ESTATE INVESTMENT TRUSTS – 0.3% |
|
|
|
|
| Ryman Hospitality Properties, Inc.Ö |
|
|
10,350 |
|
|
|
596,574 |
|
|
| SEMICONDUCTORS & SEMICONDUCTOR
EQUIPMENT – 1.5% |
|
|
|
|
| Micron Technology, Inc.* |
|
|
48,000 |
|
|
|
1,350,240 |
|
|
|
|
| NXP Semiconductors
NVÖ |
|
|
15,450 |
|
|
|
1,485,054 |
|
|
|
|
|
|
|
|
|
|
|
|
| TOTAL SEMICONDUCTORS & SEMICONDUCTOR EQUIPMENT |
|
|
$ |
2,835,294 |
|
|
|
| SOFTWARE – 0.6% |
|
|
|
|
|
|
|
|
| CDK Global,
Inc.Ö |
|
|
25,275 |
|
|
|
1,211,178 |
|
|
|
| SPECIALTY RETAIL – 0.6% |
|
|
|
|
|
|
|
|
| Party City Holdco, Inc. |
|
|
375 |
|
|
|
7,796 |
|
|
|
|
| Vitamin Shoppe,
Inc.*,Ö |
|
|
29,139 |
|
|
|
1,220,340 |
|
|
|
|
|
|
|
|
|
|
|
|
| TOTAL SPECIALTY RETAIL |
|
|
$ |
1,228,136 |
|
|
|
|
|
|
|
|
|
|
|
|
| TOTAL COMMON STOCKS (COST
$59,960,718) |
|
|
$ |
60,544,187 |
|
|
|
| INVESTMENT COMPANIES – 10.9% |
|
|
|
|
|
|
| ALTERNATIVE INVESTMENT FUNDS – 3.4% |
|
|
|
|
| Arbitrage Fund, Class I |
|
|
380,430 |
|
|
|
5,040,703 |
|
|
|
|
| Gateway Fund, Class Y |
|
|
52,975 |
|
|
|
1,588,191 |
|
|
|
|
|
|
|
|
|
|
|
|
| TOTAL ALTERNATIVE INVESTMENT FUNDS |
|
|
$ |
6,628,894 |
|
|
|
| DEBT FUND – 2.5% |
|
|
|
|
|
|
|
|
| Professionally Managed Portfolios - The Osterweis Strategic Income Fund, Class I |
|
|
431,357 |
|
|
|
4,995,109 |
|
|
|
| EQUITY FUND – 5.0% |
|
|
|
|
|
|
|
|
| Boston Partners Long/Short Research Fund |
|
|
630,124 |
|
|
|
9,722,807 |
|
|
|
|
|
|
|
|
|
|
|
|
| TOTAL INVESTMENT COMPANIES (COST
$21,081,309) |
|
|
$ |
21,346,810 |
|
| |
|
Par Value |
|
|
|
|
|
|
| CORPORATE BONDS – 18.7% |
|
|
|
|
|
|
|
| AUTO MANUFACTURERS – 1.4% |
|
|
|
|
|
|
|
|
| Chrysler Group LLC / CG Co.-Issuer, Inc., Secured, 8.25%, 6/15/21 |
|
$ |
2,500,000 |
|
|
$ |
2,768,750 |
|
April 30, 2015 / ANNUAL REPORT
|
|
|
|
|
| PORTFOLIOS OF INVESTMENTS |
|
|
55 |
|
Wilmington Multi-Manager Alternatives Fund (continued)
|
|
|
|
|
|
|
|
|
|
Description |
|
Par Value
|
|
|
Value
|
|
|
|
|
| DISTRIBUTORS – 1.3% |
|
|
|
|
|
|
|
|
|
|
|
| HD Supply, Inc., Company
Guaranteed, 11.50%, 7/15/20 |
|
$ |
2,150,000 |
|
|
$ |
2,518,188 |
|
|
|
|
| FOOD – 2.0% |
|
|
|
|
|
|
|
|
|
|
|
| Albertsons Holdings LLC/Saturn Acquisition Merger Sub, Inc.,
Sr. Secured, 7.75%, 10/15/22W |
|
|
1,901,000 |
|
|
|
2,074,466 |
|
|
|
|
| US Foods, Inc., |
|
|
|
|
|
|
|
|
| Company Guaranteed, 8.50%,
6/30/19 |
|
|
1,725,000 |
|
|
|
1,822,031 |
|
|
|
|
|
|
|
|
|
|
|
|
|
| TOTAL FOOD |
|
|
|
|
|
$ |
3,896,497 |
|
|
|
|
| HEALTH CARE PROVIDERS & SERVICES – 1.1% |
|
|
|
|
|
|
|
|
|
|
|
| Tenet Healthcare Corp., Sr.
Unsecured, 8.13%, 4/01/22 |
|
|
2,000,000 |
|
|
|
2,197,500 |
|
|
|
|
| LODGING – 2.2% |
|
|
|
|
|
|
|
|
|
|
|
| Boyd Gaming Corp., Company
Guaranteed, 9.13%, 12/01/18 |
|
|
2,075,000 |
|
|
|
2,173,562 |
|
|
|
|
| Marina District Finance Co., Inc.,
Sr. Secured, 9.88%, 8/15/18 |
|
|
2,000,000 |
|
|
|
2,095,000 |
|
|
|
|
|
|
|
|
|
|
|
|
|
| TOTAL LODGING |
|
|
|
|
|
$ |
4,268,562 |
|
|
|
|
| MEDIA – 2.5% |
|
|
|
|
|
|
|
|
|
|
|
| Univision Communications, Inc.,
Company Guaranteed, 8.50%, 5/15/21W |
|
|
2,550,000 |
|
|
|
2,741,250 |
|
|
|
|
| WideOpenWest Finance LLC / WideOpenWest Capital Corp.,
Company Guaranteed, 10.25%, 7/15/19 |
|
|
2,000,000 |
|
|
|
2,165,000 |
|
|
|
|
|
|
|
|
|
|
|
|
|
| TOTAL MEDIA |
|
|
|
|
|
$ |
4,906,250 |
|
|
|
|
| RETAIL – 2.2% |
|
|
|
|
|
|
|
|
|
|
|
| Michaels Finco Holding LLC / Michaels Finco, Inc., |
|
|
|
|
|
|
|
|
| Sr. Unsecured, 7.50%,
8/01/18W |
|
|
558,000 |
|
|
|
569,160 |
|
|
|
|
| Neiman Marcus Group Ltd. LLC,
Company Guaranteed, 8.00%, 10/15/21W |
|
|
1,625,000 |
|
|
|
1,752,969 |
|
|
|
|
| Rite Aid Corp., Company
Guaranteed, 6.13%, 4/01/23W |
|
|
2,000,000 |
|
|
|
2,080,000 |
|
|
|
|
|
|
|
|
|
|
|
|
|
| TOTAL RETAIL |
|
|
|
|
|
$ |
4,402,129 |
|
|
|
|
| SOFTWARE – 1.5% |
|
|
|
|
|
|
|
|
|
|
|
| First Data Corp., Company
Guaranteed, 11.75%, 8/15/21 |
|
|
2,504,000 |
|
|
|
2,885,860 |
|
|
|
|
| TELECOMMUNICATIONS – 4.5% |
|
|
|
|
|
|
|
|
|
|
|
| Altice SA, Company
Guaranteed, 7.63%, 2/15/25W |
|
|
2,000,000 |
|
|
|
2,027,600 |
|
|
|
|
| Intelsat Jackson Holdings SA,
Company Guaranteed, 7.25%, 4/01/19 |
|
|
1,650,000 |
|
|
|
1,716,000 |
|
|
|
|
| Level 3 Financing, Inc.,
Company Guaranteed, 8.13%, 7/01/19 |
|
|
2,475,000 |
|
|
|
2,601,844 |
|
|
|
|
| Sprint Corp., Company
Guaranteed, 7.63%, 2/15/25 |
|
|
2,500,000 |
|
|
|
2,481,250 |
|
|
|
|
|
|
|
|
|
|
|
|
|
| TOTAL TELECOMMUNICATIONS |
|
|
|
|
|
$ |
8,826,694 |
|
|
|
|
|
|
|
|
|
|
|
|
| TOTAL CORPORATE BONDS |
|
|
|
|
|
| (COST $36,522,240) |
|
|
$ |
36,670,430 |
|
|
|
|
|
|
|
|
|
|
|
Description |
|
Par Value
|
|
|
Value
|
|
|
|
| U.S. GOVERNMENT OBLIGATION – 1.5% |
|
|
|
|
|
|
|
|
| U.S. TREASURY BILL – 1.5% |
|
|
|
|
|
|
|
|
|
|
|
| 0.02%, 5/07/15 |
|
$ |
3,000,000 |
|
|
$ |
2,999,993 |
|
|
|
|
|
|
|
|
|
|
|
|
| TOTAL U.S. GOVERNMENT OBLIGATION (COST
$2,999,995) |
|
|
$ |
2,999,993 |
|
|
|
|
| |
|
Number of
Shares
|
|
|
|
|
|
|
| MONEY MARKET FUND – 31.2% |
|
|
|
|
|
|
|
|
| Dreyfus Cash Management Fund, Institutional Shares, 0.04%^ |
|
|
61,157,315 |
|
|
$ |
61,157,315 |
|
|
|
|
|
|
|
|
|
|
|
|
| TOTAL MONEY MARKET FUND (COST
$61,157,315) |
|
|
$ |
61,157,315 |
|
| |
|
Contracts
|
|
|
|
|
|
|
| PURCHASED OPTIONS – 0.2% |
|
|
|
|
|
|
|
|
| CALL OPTIONS – 0.0%** |
|
|
|
|
|
|
|
|
|
|
|
| Cablevision Systems Corporation, Strike Price $19.00, Expiring 6/19/2015 |
|
|
106 |
|
|
$ |
15,635 |
|
|
|
|
| Nu Skin Enterprises, Inc., Strike Price $55.00, Expiring 6/19/2015 |
|
|
120 |
|
|
|
54,600 |
|
|
|
|
| S&P 500 Index, Strike Price $2,215.00, Expiring 5/01/2015 |
|
|
20 |
|
|
|
100 |
|
|
|
|
| S&P 500 Index, Strike Price $2,220.00, Expiring 5/06/2015 |
|
|
20 |
|
|
|
— |
|
|
|
|
| S&P 500 Index, Strike Price $2,225.00, Expiring 5/04/2015 |
|
|
20 |
|
|
|
— |
|
|
|
|
| S&P 500 Index, Strike Price $2,225.00, Expiring 5/15/2015 |
|
|
20 |
|
|
|
300 |
|
|
|
|
| S&P 500 Index, Strike Price $2,230.00, Expiring 5/08/2015 |
|
|
20 |
|
|
|
100 |
|
|
|
|
| S&P 500 Index, Strike Price $2,235.00, Expiring 5/18/2015 |
|
|
20 |
|
|
|
19 |
|
|
|
|
| S&P 500 Index, Strike Price $2,240.00, Expiring 5/20/2015 |
|
|
20 |
|
|
|
25 |
|
|
|
|
| S&P 500 Index, Strike Price $2,240.00, Expiring 5/27/2015 |
|
|
20 |
|
|
|
79 |
|
|
|
|
| S&P 500 Index, Strike Price $2,245.00, Expiring 5/13/2015 |
|
|
20 |
|
|
|
1 |
|
|
|
|
| S&P 500 Index, Strike Price $2,250.00, Expiring 5/11/2015 |
|
|
20 |
|
|
|
— |
|
|
|
|
| S&P 500 Index, Strike Price $2,250.00, Expiring 5/22/2015 |
|
|
19 |
|
|
|
190 |
|
|
|
|
| S&P 500 Index, Strike Price $2,263.00, Expiring 5/26/2015 |
|
|
20 |
|
|
|
19 |
|
|
|
|
|
|
|
|
|
|
|
|
|
| TOTAL CALL OPTIONS |
|
|
|
|
|
$ |
71,068 |
|
|
|
|
| PUT OPTIONS – 0.2% |
|
|
|
|
|
|
|
|
|
|
|
| S&P 500 Index, Strike Price $1,875.00, Expiring 5/01/2015 |
|
|
20 |
|
|
|
100 |
|
ANNUAL REPORT / April 30, 2015
56 PORTFOLIOS OF
INVESTMENTS
Wilmington Multi-Manager Alternatives Fund (continued)
|
|
|
|
|
|
|
|
|
|
Description |
|
Contracts
|
|
|
Value
|
|
|
|
|
| S&P 500 Index, Strike Price $1,875.00, Expiring 5/06/2015 |
|
|
20 |
|
|
$ |
267 |
|
|
|
|
| S&P 500 Index, Strike Price $1,880.00, Expiring 5/15/2015 |
|
|
20 |
|
|
|
1,600 |
|
|
|
|
| S&P 500 Index, Strike Price $1,885.00, Expiring 5/04/2015 |
|
|
20 |
|
|
|
59 |
|
|
|
|
| S&P 500 Index, Strike Price $1,900.00, Expiring 5/08/2015 |
|
|
20 |
|
|
|
700 |
|
|
|
|
| S&P 500 Index, Strike Price $1,905.00, Expiring 5/13/2015 |
|
|
20 |
|
|
|
1,790 |
|
|
|
|
| S&P 500 Index, Strike Price $1,905.00, Expiring 5/27/2015 |
|
|
20 |
|
|
|
5,831 |
|
|
|
|
| S&P 500 Index, Strike Price $1,910.00, Expiring 5/11/2015 |
|
|
20 |
|
|
|
1,469 |
|
|
|
|
| S&P 500 Index, Strike Price $1,910.00, Expiring 5/18/2015 |
|
|
20 |
|
|
|
3,389 |
|
|
|
|
| S&P 500 Index, Strike Price $1,910.00, Expiring 5/20/2015 |
|
|
20 |
|
|
|
4,038 |
|
|
|
|
| S&P 500 Index, Strike Price $1,920.00, Expiring 5/22/2015 |
|
|
19 |
|
|
|
4,750 |
|
|
|
|
| S&P 500 Index, Strike Price $1,930.00, Expiring 5/26/2015 |
|
|
20 |
|
|
|
7,674 |
|
|
|
|
| Southwest Airlines Co., Strike Price $40.50, Expiring 5/15/2015 |
|
|
350 |
|
|
|
28,000 |
|
|
|
|
| SPDR S&P Biotech ETF, Strike Price $225.00, Expiring 6/19/2015 |
|
|
149 |
|
|
|
344,190 |
|
|
|
|
|
|
|
|
|
|
|
|
|
| TOTAL PUT OPTIONS |
|
|
|
|
|
$ |
403,857 |
|
|
|
|
|
|
|
|
|
|
|
|
| TOTAL PURCHASED OPTIONS |
|
|
|
|
|
| (COST $301,648) |
|
|
|
|
|
$ |
474,925 |
|
|
|
|
|
|
|
|
|
|
|
|
|
|
|
| TOTAL INVESTMENTS IN SECURITIES – 93.3% |
|
|
|
|
|
| (COST $182,023,225) |
|
|
|
|
|
$ |
183,193,660 |
|
| |
|
Number of
Shares
|
|
|
|
|
|
|
| SECURITIES SOLD SHORT – (11.9%) |
|
|
|
|
|
|
| CONSUMER DISCRETIONARY – (1.7%) |
|
|
|
|
| DISTRIBUTORS – (0.1%) |
|
|
|
|
|
|
|
|
|
|
|
| Genuine Parts Co. |
|
|
(2,000 |
) |
|
$ |
(179,700 |
) |
|
|
| HOTELS, RESTAURANTS &
LEISURE – (0.1%) |
|
|
|
|
|
|
|
|
| Starwood Hotels & Resorts |
|
|
(1,730 |
) |
|
|
(148,694 |
) |
|
|
|
| LEISURE EQUIPMENT & PRODUCTS – (0.1%) |
|
|
|
|
|
|
|
|
|
|
|
| Polaris Industries, Inc. |
|
|
(1,645 |
) |
|
|
(225,299 |
) |
|
|
|
| MEDIA – (0.7%) |
|
|
|
|
|
|
|
|
|
|
|
| Cablevision Systems-NY Grp-A |
|
|
(40,097 |
) |
|
|
(801,138 |
) |
|
|
|
| Omnicom Group |
|
|
(7,355 |
) |
|
|
(557,215 |
) |
|
|
|
|
|
|
|
|
|
|
|
|
| TOTAL MEDIA |
|
|
|
|
|
$ |
(1,358,353 |
) |
|
|
|
| MULTILINE RETAIL – (0.1%) |
|
|
|
|
|
|
|
|
|
|
|
| Big Lots, Inc. |
|
|
(5,540 |
) |
|
|
(252,458 |
) |
|
|
|
| SPECIALIZED – (0.3%) |
|
|
|
|
|
|
|
|
|
|
|
|
|
|
|
|
|
|
Description
|
|
Number of
Shares
|
|
|
Value
|
|
|
|
|
| Nielsen NV |
|
|
(13,593 |
) |
|
$ |
(610,869 |
) |
|
|
| SPECIALTY RETAIL – (0.3%) |
|
|
|
|
|
|
|
|
| L Brands, Inc. |
|
|
(6,236 |
) |
|
|
(557,249 |
) |
|
|
|
|
|
|
|
|
|
|
|
|
| TOTAL CONSUMER DISCRETIONARY |
|
|
|
|
|
$ |
(3,332,622 |
) |
|
| CONSUMER STAPLES – (0.1%) |
|
|
|
| FOOD & STAPLES RETAILING – (0.1%) |
|
|
|
|
|
|
|
|
| Walgreens Boots Alliance, Inc. |
|
|
(3,910 |
) |
|
|
(324,256 |
) |
|
|
|
| FINANCIALS – (2.4%) |
|
|
|
|
|
|
|
|
|
|
| CAPITAL MARKETS – (1.0%) |
|
|
|
|
|
|
|
|
| Cohen & Steers, Inc. |
|
|
(22,608 |
) |
|
|
(855,939 |
) |
|
|
|
| Federated Investors, Inc.-Cl B |
|
|
(10,430 |
) |
|
|
(358,792 |
) |
|
|
|
| Raymond James Financial, Inc. |
|
|
(3,630 |
) |
|
|
(205,204 |
) |
|
|
|
| T Rowe Price Group, Inc. |
|
|
(4,370 |
) |
|
|
(354,757 |
) |
|
|
|
| TD Ameritrade Holding Corp. |
|
|
(6,330 |
) |
|
|
(229,463 |
) |
|
|
|
|
|
|
|
|
|
|
|
|
| TOTAL CAPITAL MARKETS |
|
|
|
|
|
$ |
(2,004,155 |
) |
|
|
| COMMERCIAL BANKS – (0.3%) |
|
|
|
|
|
|
|
|
| Cullen/Frost Bankers, Inc. |
|
|
(1,480 |
) |
|
|
(107,951 |
) |
|
|
|
| Prosperity Bancshares, Inc. |
|
|
(2,900 |
) |
|
|
(154,686 |
) |
|
|
|
| Royal Bank Of Canada |
|
|
(500 |
) |
|
|
(33,199 |
) |
|
|
|
| Royal Bank Of Canada |
|
|
(3,750 |
) |
|
|
(249,300 |
) |
|
|
|
|
|
|
|
|
|
|
|
|
| TOTAL COMMERCIAL BANKS |
|
|
|
|
|
$ |
(545,136 |
) |
|
| DIVERSIFIED FINANCIAL SERVICES – (1.0%) |
|
|
|
|
| Financial Select Sector SPDR |
|
|
(33,840 |
) |
|
|
(816,559 |
) |
|
|
|
| Ishares Russell 2000 Growth |
|
|
(3,000 |
) |
|
|
(441,150 |
) |
|
|
|
| Moody’s Corp. |
|
|
(1,155 |
) |
|
|
(124,186 |
) |
|
|
|
| Nasdaq OMX Group/The |
|
|
(12,790 |
) |
|
|
(621,978 |
) |
|
|
|
|
|
|
|
|
|
|
|
|
| TOTAL DIVERSIFIED FINANCIAL SERVICES |
|
|
|
|
|
$ |
(2,003,873 |
) |
|
|
| INSURANCE – (0.1%) |
|
|
|
|
|
|
|
|
| Primerica, Inc. |
|
|
(4,869 |
) |
|
|
(225,045 |
) |
|
|
|
|
|
|
|
|
|
|
|
|
| TOTAL FINANCIALS |
|
|
|
|
|
$ |
(4,778,209 |
) |
|
|
|
| HEALTH CARE – (4.8%) |
|
|
|
|
|
|
|
|
|
|
| BIOTECHNOLOGY – (1.0%) |
|
|
|
|
|
|
|
|
| Dyax Corp. |
|
|
(8,046 |
) |
|
|
(192,380 |
) |
|
|
|
| Foundation Medicine, Inc. |
|
|
(5,038 |
) |
|
|
(229,279 |
) |
|
|
|
| Incyte Corp. |
|
|
(3,518 |
) |
|
|
(341,809 |
) |
|
|
|
| Intrexon Corp. |
|
|
(10,000 |
) |
|
|
(388,300 |
) |
|
|
|
| Isis Pharmaceuticals, Inc. |
|
|
(2,012 |
) |
|
|
(114,121 |
) |
|
|
|
| Juno Therapeutics, Inc. |
|
|
(1,905 |
) |
|
|
(81,420 |
) |
|
|
|
| MannKind Corp. |
|
|
(13,335 |
) |
|
|
(57,207 |
) |
|
|
|
| Myriad Genetics, Inc. |
|
|
(4,190 |
) |
|
|
(138,396 |
) |
|
|
|
| Synageva Biopharma Corp. |
|
|
(1,143 |
) |
|
|
(105,110 |
) |
|
|
|
| Ziopharm Oncology, Inc. |
|
|
(32,636 |
) |
|
|
(287,523 |
) |
|
|
|
|
|
|
|
|
|
|
|
|
| TOTAL BIOTECHNOLOGY |
|
|
|
|
|
$ |
(1,935,545 |
) |
|
| HEALTH CARE EQUIPMENT & SUPPLIES – (1.6%) |
|
|
|
|
| Dexcom, Inc. |
|
|
(8,737 |
) |
|
|
(590,359 |
) |
April 30, 2015 / ANNUAL REPORT
|
|
|
|
|
| PORTFOLIOS OF INVESTMENTS |
|
|
57 |
|
Wilmington Multi-Manager Alternatives Fund (continued)
|
|
|
|
|
|
|
|
|
|
Description |
|
Number of
Shares
|
|
|
Value
|
|
|
|
|
| Elekta AB-B Shares |
|
|
(27,171 |
) |
|
$ |
(260,026 |
) |
|
|
|
| William Demant Holding†† |
|
|
(14,796 |
) |
|
|
(1,216,704 |
) |
|
|
|
| Zimmer Holdings, Inc. |
|
|
(9,090 |
) |
|
|
(998,446 |
) |
|
|
|
|
|
|
|
|
|
|
|
|
| TOTAL HEALTH CARE EQUIPMENT & SUPPLIES |
|
|
|
|
|
$ |
(3,065,535 |
) |
|
| HEALTH CARE PROVIDERS & SERVICES – (0.9%) |
|
|
|
|
| Amerisourcebergen Corp. |
|
|
(1,845 |
) |
|
|
(210,884 |
) |
|
|
|
| Chemed Corp. |
|
|
(4,515 |
) |
|
|
(520,354 |
) |
|
|
|
| Express Scripts Holding Co. |
|
|
(11,704 |
) |
|
|
(1,011,226 |
) |
|
|
|
| IPC Healthcare, Inc. |
|
|
(1,477 |
) |
|
|
(72,255 |
) |
|
|
|
|
|
|
|
|
|
|
|
|
| TOTAL HEALTH CARE PROVIDERS & SERVICES |
|
|
|
|
|
$ |
(1,814,719 |
) |
|
| HEALTH CARE TECHNOLOGY – (0.2%) |
|
|
|
|
| Computer Programs & Systems |
|
|
(4,609 |
) |
|
|
(241,189 |
) |
|
|
|
| Medidata Solutions, Inc. |
|
|
(4,474 |
) |
|
|
(239,046 |
) |
|
|
|
|
|
|
|
|
|
|
|
|
| TOTAL HEALTH CARE TECHNOLOGY |
|
|
|
|
|
$ |
(480,235 |
) |
|
| LIFE SCIENCES TOOLS & SERVICES – (0.3%) |
|
|
|
|
| Bruker Corp. |
|
|
(12,219 |
) |
|
|
(231,672 |
) |
|
|
|
| Waters Corp. |
|
|
(2,339 |
) |
|
|
(292,819 |
) |
|
|
|
|
|
|
|
|
|
|
|
|
| TOTAL LIFE SCIENCES TOOLS & SERVICES |
|
|
|
|
|
$ |
(524,491 |
) |
|
| PHARMACEUTICALS – (0.8%) |
|
|
|
|
| Astrazeneca PLC - ADR |
|
|
(6,678 |
) |
|
|
(457,309 |
) |
|
|
|
| Johnson & Johnson |
|
|
(6,630 |
) |
|
|
(657,696 |
) |
|
|
|
| Medicines Company |
|
|
(2,857 |
) |
|
|
(73,168 |
) |
|
|
|
| Roche Holding AG - ADR |
|
|
(10,455 |
) |
|
|
(375,125 |
) |
|
|
|
|
|
|
|
|
|
|
|
|
| TOTAL PHARMACEUTICALS |
|
|
|
|
|
$ |
(1,563,298 |
) |
|
|
|
|
|
|
|
|
|
|
|
|
| TOTAL HEALTH CARE |
|
|
|
|
|
$ |
(9,383,823 |
) |
|
|
|
| INDUSTRIALS – (1.2%) |
|
|
|
|
|
|
|
|
|
| AIR FREIGHT & LOGISTICS – (0.1%) |
|
|
|
|
| C.H. Robinson Worldwide, Inc. |
|
|
(2,783 |
) |
|
|
(179,197 |
) |
|
|
|
| AIRLINES – (0.2%) |
|
|
|
|
|
|
|
|
|
|
|
| Delta Air Lines, Inc. |
|
|
(5,653 |
) |
|
|
(252,350 |
) |
|
|
|
| United Continental Holdings |
|
|
(2,360 |
) |
|
|
(140,986 |
) |
|
|
|
|
|
|
|
|
|
|
|
|
| TOTAL AIRLINES |
|
|
|
|
|
$ |
(393,336 |
) |
|
| COMMERCIAL SERVICES & SUPPLIES – (0.4%) |
|
|
|
|
| Deluxe Corp. |
|
|
(12,971 |
) |
|
|
(839,872 |
) |
|
|
|
| MACHINERY – (0.2%) |
|
|
|
|
|
|
|
|
|
|
|
| Middleby Corp. |
|
|
(1,360 |
) |
|
|
(137,822 |
) |
|
|
|
| Sensata Technologies Holding |
|
|
(4,611 |
) |
|
|
(254,573 |
) |
|
|
|
|
|
|
|
|
|
|
|
|
| TOTAL MACHINERY |
|
|
|
|
|
$ |
(392,395 |
) |
|
|
|
| ROAD & RAIL – (0.3%) |
|
|
|
|
|
|
|
|
|
|
|
| Avis Budget Group, Inc. |
|
|
(6,055 |
) |
|
|
(327,818 |
) |
|
|
|
|
|
|
|
|
|
|
Description |
|
Number of
Shares
|
|
|
Value
|
|
|
|
|
| Con-Way, Inc. |
|
|
(4,560 |
) |
|
$ |
(187,416 |
) |
|
|
|
|
|
|
|
|
|
|
|
|
| TOTAL ROAD & RAIL |
|
|
|
|
|
$ |
(515,234 |
) |
|
|
|
|
|
|
|
|
|
|
|
|
| TOTAL INDUSTRIALS |
|
|
|
|
|
$ |
(2,320,034 |
) |
|
| INFORMATION TECHNOLOGY – (0.6%) |
|
|
|
|
| COMPUTERS – (0.1%) |
|
|
|
|
|
|
|
|
|
|
|
| Freescale Semiconductor Ltd. |
|
|
(2,685 |
) |
|
|
(104,957 |
) |
|
|
|
| COMPUTERS & PERIPHERALS – (0.1%) |
|
|
|
|
|
|
|
|
|
|
|
| NCR Corp. |
|
|
(4,000 |
) |
|
|
(109,760 |
) |
|
|
|
| INTERNET SOFTWARE & SERVICES – (0.1%) |
|
|
|
|
|
|
|
|
|
|
|
| Check Point Software Technologies |
|
|
(1,820 |
) |
|
|
(151,934 |
) |
|
|
|
| Dealertrack Technologies, Inc. |
|
|
(2,737 |
) |
|
|
(107,591 |
) |
|
|
|
|
|
|
|
|
|
|
|
| TOTAL INTERNET SOFTWARE & SERVICES |
|
|
$ |
(259,525 |
) |
|
|
|
| IT SERVICES – (0.3%) |
|
|
|
|
|
|
|
|
|
|
|
| Western Union Co. |
|
|
(31,959 |
) |
|
|
(648,129 |
) |
|
|
|
|
|
|
|
|
|
|
|
|
| TOTAL INFORMATION TECHNOLOGY |
|
|
|
|
|
$ |
(1,122,371 |
) |
|
| INVESTMENT COMPANIES – (0.6%) |
|
|
|
|
| EQUITY FUNDS – (0.6%) |
|
|
|
|
|
|
|
|
|
|
|
| Market Vectors Semiconductor ETF |
|
|
(8,683 |
) |
|
|
(481,559 |
) |
|
|
|
| Technology Select Sector SPDR Fund |
|
|
(17,280 |
) |
|
|
(735,782 |
) |
|
|
|
|
|
|
|
|
|
|
|
|
| TOTAL EQUITY FUNDS |
|
|
|
|
|
$ |
(1,217,341 |
) |
|
|
|
|
|
|
|
|
|
|
|
|
| TOTAL INVESTMENT COMPANIES |
|
|
|
|
|
$ |
(1,217,341 |
) |
|
|
| MATERIALS – (0.1%) |
|
|
|
|
|
|
|
|
| CHEMICALS – (0.1%) |
|
|
|
|
|
|
|
|
|
|
|
| Minerals Technologies, Inc. |
|
|
(2,200 |
) |
|
|
(149,006 |
) |
|
| TELECOMMUNICATION SERVICES – (0.4%) |
|
|
|
| DIVERSIFIED TELECOMMUNICATION SERVICES – (0.4%) |
|
|
|
|
|
|
|
|
| AT&T, Inc. |
|
|
(18,243 |
) |
|
|
(631,938 |
) |
|
|
|
| Level 3 Communications, Inc. |
|
|
(3,610 |
) |
|
|
(201,943 |
) |
|
|
|
|
|
|
|
|
|
|
|
|
| TOTAL DIVERSIFIED TELECOMMUNICATION
SERVICES |
|
|
|
|
|
$ |
(833,881 |
) |
|
|
|
|
|
|
|
|
|
|
|
|
| TOTAL TELECOMMUNICATION SERVICES |
|
|
|
|
|
$ |
(833,881 |
) |
|
|
|
|
|
|
|
|
|
| TOTAL SECURITIES SOLD SHORT (PROCEEDS
$(23,621,831)) |
|
|
|
|
|
$ |
(23,461,543 |
) |
| |
|
Contracts
|
|
|
|
|
| WRITTEN OPTIONS – (0.3%) |
|
| CALL OPTIONS – (0.1%) |
|
|
|
|
|
|
|
|
|
|
|
| CBS Corp., Strike Price $62.50, Expiring 5/15/2015 |
|
|
(194 |
) |
|
$ |
(26,384 |
) |
|
|
|
| S&P 500 Index, Strike Price $2,115.00, |
|
|
|
|
|
|
|
|
| Expiring 5/01/2015 |
|
|
(20 |
) |
|
|
(400 |
) |
|
|
|
| S&P 500 Index, Strike Price $2,120.00, |
|
|
|
|
|
|
|
|
| Expiring 5/06/2015 |
|
|
(20 |
) |
|
|
(4,183 |
) |
ANNUAL REPORT / April 30, 2015
|
|
|
| 58 |
|
PORTFOLIOS OF INVESTMENTS |
Wilmington Multi-Manager Alternatives Fund (continued)
|
|
|
|
|
|
|
|
|
|
Description |
|
Contracts
|
|
|
Value
|
|
|
|
|
| S&P 500 Index, Strike Price $2,125.00, Expiring 5/04/2015 |
|
|
(20 |
) |
|
$ |
(1,131 |
) |
|
|
|
| S&P 500 Index, Strike Price $2,125.00, Expiring 5/15/2015 |
|
|
(20 |
) |
|
|
(9,200 |
) |
|
|
|
| S&P 500 Index, Strike Price $2,130.00, Expiring 5/08/2015 |
|
|
(20 |
) |
|
|
(2,900 |
) |
|
|
|
| S&P 500 Index, Strike Price $2,135.00, Expiring 5/18/2015 |
|
|
(20 |
) |
|
|
(7,942 |
) |
|
|
|
| S&P 500 Index, Strike Price $2,135.00, Expiring 5/20/2015 |
|
|
(20 |
) |
|
|
(9,188 |
) |
|
|
|
| S&P 500 Index, Strike Price $2,140.00, Expiring 5/13/2015 |
|
|
(20 |
) |
|
|
(3,391 |
) |
|
|
|
| S&P 500 Index, Strike Price $2,140.00, Expiring 5/27/2015 |
|
|
(20 |
) |
|
|
(10,475 |
) |
|
|
|
| S&P 500 Index, Strike Price $2,145.00, Expiring 5/11/2015 |
|
|
(20 |
) |
|
|
(1,792 |
) |
|
|
|
| S&P 500 Index, Strike Price $2,145.00, Expiring 5/22/2015 |
|
|
(19 |
) |
|
|
(4,655 |
) |
|
|
|
| S&P 500 Index, Strike Price $2,158.00, Expiring 5/26/2015 |
|
|
(20 |
) |
|
|
(4,422 |
) |
|
|
|
| Vitamin Shoppe, Inc., Strike Price $40.00, Expiring 5/15/2015 |
|
|
(75 |
) |
|
|
(19,688 |
) |
|
|
|
| Vitamin Shoppe, Inc., Strike Price $45.00, Expiring 5/15/2015 |
|
|
(75 |
) |
|
|
(3,750 |
) |
|
|
|
|
|
|
|
|
|
|
|
|
| TOTAL CALL OPTIONS |
|
|
|
|
|
$ |
(109,501 |
) |
|
|
|
| PUT OPTIONS – (0.2%) |
|
|
|
|
|
|
|
|
|
|
|
| Brunswick Corp., Strike Price $50.00, Expiring 6/19/2015 |
|
|
(44 |
) |
|
|
(5,940 |
) |
|
|
|
| Deluxe Corp., Strike Price $65.00, Expiring 5/15/2015 |
|
|
(129 |
) |
|
|
(15,480 |
) |
|
|
|
| S&P 500 Index, Strike Price $1,975.00, Expiring 5/01/2015 |
|
|
(20 |
) |
|
|
(200 |
) |
|
|
|
| S&P 500 Index, Strike Price $1,975.00, Expiring 5/06/2015 |
|
|
(20 |
) |
|
|
(1,537 |
) |
|
|
|
| S&P 500 Index, Strike Price $1,980.00, Expiring 5/15/2015 |
|
|
(20 |
) |
|
|
(5,800 |
) |
|
|
|
| S&P 500 Index, Strike Price $1,985.00, Expiring 5/04/2015 |
|
|
(20 |
) |
|
|
(676 |
) |
|
|
|
| S&P 500 Index, Strike Price $2,000.00, Expiring 5/08/2015 |
|
|
(20 |
) |
|
|
(3,660 |
) |
|
|
|
| S&P 500 Index, Strike Price $2,005.00, Expiring 5/27/2015 |
|
|
(20 |
) |
|
|
(22,306 |
) |
|
|
|
| S&P 500 Index, Strike Price $2,010.00, Expiring 5/13/2015 |
|
|
(20 |
) |
|
|
(10,381 |
) |
|
|
|
| S&P 500 Index, Strike Price $2,010.00, Expiring 5/18/2015 |
|
|
(20 |
) |
|
|
(15,982 |
) |
|
|
|
| S&P 500 Index, Strike Price $2,015.00, Expiring 5/11/2015 |
|
|
(20 |
) |
|
|
(9,499 |
) |
|
|
|
| S&P 500 Index, Strike Price $2,015.00, Expiring 5/20/2015 |
|
|
(20 |
) |
|
|
(19,531 |
) |
|
|
|
| S&P 500 Index, Strike Price $2,025.00, Expiring 5/22/2015 |
|
|
(19 |
) |
|
|
(22,990 |
) |
|
|
|
|
|
|
|
|
|
|
Description |
|
Contracts
|
|
|
Value
|
|
|
|
|
| S&P 500 Index, Strike Price $2,035.00, Expiring 5/26/2015 |
|
|
(20 |
) |
|
$ |
(32,357 |
) |
|
|
|
| SPDR S&P Biotech ETF, Strike Price $210.00, Expiring 6/19/2015 |
|
|
(149 |
) |
|
|
(217,540 |
) |
|
|
|
| Zimmer Holdings, Inc., Strike Price $110.00, |
|
|
|
|
|
|
|
|
| Expiring 6/19/2015 |
|
|
(90 |
) |
|
|
(29,700 |
) |
|
|
|
|
|
|
|
|
|
|
|
|
| TOTAL PUT OPTIONS |
|
|
|
|
|
$ |
(413,579 |
) |
|
|
|
|
|
|
|
|
|
|
|
|
| TOTAL WRITTEN OPTIONS |
|
|
|
|
|
|
|
|
| (PREMIUMS RECEIVED $(543,340)) |
|
|
$ |
(523,080 |
) |
|
|
|
|
|
|
|
|
|
|
|
|
| TOTAL INVESTMENTS NET OF SECURITIES SOLD SHORT AND |
|
|
|
|
|
|
|
|
| WRITTEN OPTIONS – 81.1% |
|
|
|
|
|
|
|
|
|
|
|
|
|
|
$ |
159,209,037 |
|
| OTHER ASSETS LESS LIABILITIES – 18.9% |
|
|
|
|
|
|
37,152,827 |
|
|
|
|
|
|
|
|
|
|
|
|
| TOTAL NET ASSETS – 100.0% |
|
|
$ |
196,361,864 |
|
|
|
|
|
|
|
|
|
|
April 30, 2015 / ANNUAL REPORT
PORTFOLIOS OF
INVESTMENTS 59
Wilmington Multi-Manager Alternatives Fund
(continued)
Cost of investments for Federal income tax purposes is $182,630,604. The net unrealized
appreciation/(depreciation) of investments was $563,056. This consists of net unrealized appreciation from investment for those securities having an excess of value over cost of $4,509,525 and net unrealized depreciation from investments for those
securities having an excess of cost over value of $3,946,469.
Various inputs are used in determining the value of the Fund’s investments. These
inputs are summarized in the three broad levels listed below.
Level 1 – quoted prices in active markets for identical securities
Level 2 – other significant observable inputs (including quoted prices for similar securities, interest rates, prepayment speeds, credit risk, etc.)
Level 3 – significant unobservable inputs (including the Fund’s own assumptions in determining the fair value of investments)
The following is a summary of the inputs used as of April 30, 2015 in valuing the Fund’s assets carried at fair value:
|
|
|
|
|
|
|
|
|
|
|
|
|
|
|
|
|
|
|
|
|
|
| |
|
Level 1
|
|
|
Level 2
|
|
|
Level 3
|
|
|
Total
|
|
| Assets |
|
|
|
|
|
|
|
|
|
|
|
|
|
|
|
|
|
|
|
|
|
| Investments in Securities |
|
|
|
|
|
|
|
|
|
|
|
|
|
|
|
|
|
|
|
|
|
| Common Stocks |
|
$ |
60,544,187 |
|
|
$ |
— |
|
|
$ |
— |
|
|
$ |
60,544,187 |
|
|
|
|
|
|
| Investment Companies |
|
|
21,346,810 |
|
|
|
— |
|
|
|
— |
|
|
|
21,346,810 |
|
|
|
|
|
|
| Corporate Bonds |
|
|
— |
|
|
|
36,670,430 |
|
|
|
— |
|
|
|
36,670,430 |
|
|
|
|
|
|
| U.S. Government Obligation |
|
|
— |
|
|
|
2,999,993 |
|
|
|
— |
|
|
|
2,999,993 |
|
|
|
|
|
|
| Money Market Fund |
|
|
61,157,315 |
|
|
|
— |
|
|
|
— |
|
|
|
61,157,315 |
|
|
|
|
|
|
| Purchased Options |
|
|
98,235 |
|
|
|
376,690 |
|
|
|
— |
|
|
|
474,925 |
|
|
|
|
|
|
|
|
|
|
|
|
|
|
|
|
|
|
|
|
|
|
|
| Total Investments in Securities |
|
|
143,146,547 |
|
|
|
40,047,113 |
|
|
|
— |
|
|
|
183,193,660 |
|
|
|
|
|
|
|
|
|
|
|
|
|
|
|
|
|
|
|
|
|
|
|
| Total Assets |
|
$ |
143,146,547 |
|
|
$ |
40,047,113 |
|
|
$ |
— |
|
|
$ |
183,193,660 |
|
|
|
|
|
|
|
|
|
|
|
|
|
|
|
|
|
|
|
|
|
|
|
| Liabilities |
|
|
|
|
|
|
|
|
|
|
|
|
|
|
|
|
|
|
|
|
|
| Other Financial Instruments^ |
|
|
|
|
|
|
|
|
|
|
|
|
|
|
|
|
|
|
|
|
|
| Financial Futures Contracts |
|
$ |
(1,367,058 |
) |
|
$ |
— |
|
|
$ |
— |
|
|
$ |
(1,367,058 |
) |
|
|
|
|
|
| Securities Sold Short |
|
|
(22,244,839 |
) |
|
|
(1,216,704 |
) |
|
|
— |
|
|
|
(23,461,543 |
) |
|
|
|
|
|
| Written Options |
|
|
(100,942 |
) |
|
|
(422,138 |
) |
|
|
— |
|
|
|
(523,080 |
) |
|
|
|
|
|
|
|
|
|
|
|
|
|
|
|
|
|
|
|
|
|
|
| Total Liabilities |
|
$ |
(23,712,839 |
) |
|
$ |
(1,638,842 |
) |
|
$ |
— |
|
|
$ |
(25,351,681 |
) |
|
|
|
|
|
|
|
|
|
|
|
|
|
|
|
|
|
| |
^ |
Other financial instruments are derivative instruments not reflected in the value of total investments in securities in the Portfolio of Investments such as financial futures contracts which are valued at the unrealized
appreciation (depreciation) on the instrument. Securities Sold Short and Written options are reported at their market value at period end. |
| * |
Non-income producing security. |
| †† |
Security is fair valued in accordance with procedures adopted by the Board of Trustees. See Note 2 in Notes to Financial Statements. At April 30, 2015, the value of these securities amounted to $(1,216,704)
representing 0.6% of total net assets. |
| Ö |
All or a portion of this security is segregated as collateral in connection with the fund’s short positions and written options carried by the Funds. The total value of all securities segregated at April 30,
2015 amounted to $33,569,213 representing 17.1% of total net assets. |
| W |
Denotes a restricted security that may be resold without restriction to “qualified institutional buyers” as defined in Rule 144A under the Securities Act of 1933 and that the Fund has determined to be liquid
under criteria established by the Fund’s Board of Trustees. At April 30, 2015, these liquid restricted amounted to $11,245,445 representing 5.7% of total net assets. |
| ** |
Represents less than 0.05%. |
The
following acronyms are used throughout this Fund:
ADR - American Depositary Receipt
ETF - Exchange Traded Fund
LLC - Limited Liability
Corporation
PLC - Public Limited Company
SPDR -
Standard & Poor’s Depository Receipts
ANNUAL REPORT / April 30,
2015
|
|
|
| 60 |
|
PORTFOLIOS OF INVESTMENTS |
Wilmington Multi-Manager Alternatives Fund (concluded)
At April 30, 2015, the Alternatives Fund had open financial futures contracts as follows:
|
|
|
|
|
|
|
|
|
|
|
|
|
|
|
|
|
|
|
|
|
|
|
| |
|
Underlying Contracts to Buy/Sell |
|
Expiration
Date |
|
|
Number of
Contracts |
|
|
Contract
Amount |
|
|
Contract
at Value |
|
|
Unrealized
Appreciation
(Depreciation) |
|
|
|
SHORT POSITIONS: |
|
|
|
|
|
|
|
|
|
|
|
|
|
|
|
|
|
|
|
|
|
|
Australian Dollar Futures |
|
|
June 2015 |
|
|
|
148 |
|
|
$ |
11,297,423 |
|
|
$ |
11,686,080 |
|
|
$ |
(388,657 |
) |
|
|
Euro Futures |
|
|
June 2015 |
|
|
|
174 |
|
|
|
23,525,149 |
|
|
|
24,503,550 |
|
|
|
(978,401 |
) |
|
|
NET UNREALIZED APPRECIATION (DEPRECIATION) ON FINANCIAL
FUTURES CONTRACTS |
|
|
$ |
(1,367,058 |
) |
See Notes which are an integral part of the Financial Statements
April 30, 2015 / ANNUAL REPORT
61
PORTFOLIO OF INVESTMENTS SUMMARY TABLE
Wilmington Multi-Manager Real Asset Fund
At
April 30, 2015, the Fund’s portfolio composition was as follows (unaudited):
|
|
|
|
|
| |
|
Percentage of
Total Net Assets |
|
|
|
|
|
|
|
|
|
|
| Inflation-Linked & Fixed Income Securities: |
|
|
|
|
|
|
|
|
|
| Foreign Government Inflation-Linked Securities |
|
|
26.3 |
% |
|
|
|
|
|
| U.S. Government Inflation-Linked Securities |
|
|
21.7 |
% |
|
|
|
|
|
| Foreign Government Securities |
|
|
4.7 |
% |
|
|
|
|
|
| Corporate Bonds |
|
|
2.4 |
% |
|
|
|
|
|
| U.S. Treasury |
|
|
1.1 |
% |
|
|
|
|
|
| Asset-Backed Securities |
|
|
0.7 |
% |
|
|
|
|
|
| Mortgage-Backed Securities |
|
|
0.5 |
% |
|
|
|
|
|
| U.S. Government Agency Obligation |
|
|
0.0 |
%3 |
|
|
|
|
|
| Real Estate Related Securities: |
|
|
|
|
|
|
|
|
|
| Real Estate Investment Trusts |
|
|
29.2 |
% |
|
|
|
|
|
| Common Stocks |
|
|
10.1 |
% |
|
|
|
|
|
| Exchange-Traded Funds |
|
|
1.0 |
% |
|
|
|
|
|
| Investment Companies |
|
|
0.1 |
% |
|
|
|
|
|
| Preferred Stock |
|
|
0.0 |
%3 |
|
|
|
|
|
| Warrant |
|
|
0.0 |
%3 |
|
|
|
|
|
| Commodity Related Securities: |
|
|
|
|
|
|
|
|
|
| Investment Companies |
|
|
13.6 |
% |
|
|
|
|
|
| Purchased Options |
|
|
0.1 |
% |
|
|
|
|
|
| Written Options |
|
|
(0.1 |
)% |
|
|
|
|
|
| TBA Sale Commitments |
|
|
(0.9 |
)% |
|
|
|
|
|
| Short-Term Investments |
|
|
|
|
|
|
|
|
|
| Cash Equivalents1 |
|
|
1.3 |
% |
|
|
|
|
|
| Other Assets and Liabilities – Net2 |
|
|
(11.8 |
)% |
|
|
|
|
|
|
|
|
|
| TOTAL |
|
|
100.0 |
% |
|
|
|
|
|
|
|
|
|
| (1) |
Cash Equivalents include investments in a money market fund and repurchase agreements. |
| (2) |
Assets, other than investments in securities, less liabilities. See Statements of Assets and Liabilities. |
| (3) |
Represents less than 0.05%.
|
PORTFOLIO OF INVESTMENTS
April 30, 2015
|
|
|
|
|
|
|
|
|
|
Description |
|
Par Value |
|
|
Value |
|
|
| INFLATION-LINKED & FIXED INCOME SECURITIES – 57.4% |
|
|
| ASSET-BACKED SECURITIES – 0.7% |
|
|
| COLLATERALIZED LOAN OBLIGATION – 0.0%** |
|
|
|
|
| MAGI Funding PLC Series I-A, Class A, 1.31% 4/11/21W |
|
|
16,946 |
EUR |
|
$ |
18,988 |
|
|
| DIVERSIFIED FINANCIAL SERVICES – 0.3% |
|
|
|
|
| Ameriquest Mortgage Securities Trust Series 2006-R1, Class M1, 0.57% 3/25/36D |
|
$ |
300,000 |
|
|
|
257,359 |
|
|
|
|
|
|
|
|
|
|
|
Description |
|
Par Value |
|
|
Value |
|
|
|
|
| Bear Stearns Asset Backed Securities I Trust Series 2005-TC1, Class M2, 0.82% 5/25/35D |
|
$ |
545,623 |
|
|
$ |
439,201 |
|
|
|
|
| Bear Stearns Asset Backed Securities Trust Series 2005-1, Class M2, 2.28% 3/25/35D |
|
|
500,000 |
|
|
|
466,601 |
|
|
|
|
| Countrywide Asset-Backed Certificates Series 2006-6, Class 2A2, 0.36% 9/25/36D |
|
|
216,090 |
|
|
|
211,989 |
|
|
|
|
| Venture VII CDO Ltd. Series 2006-7A, Class A1A, 0.51%
1/20/22D,W |
|
|
268,973 |
|
|
|
265,321 |
|
|
|
|
|
|
|
|
|
|
|
|
|
| TOTAL DIVERSIFIED FINANCIAL SERVICES |
|
|
|
|
|
$ |
1,640,471 |
|
ANNUAL REPORT / April 30,
2015
62 PORTFOLIOS OF
INVESTMENTS
Wilmington Multi-Manager Real Asset Fund (continued)
|
|
|
|
|
|
|
|
|
|
Description
|
|
Par Value
|
|
|
Value
|
|
|
|
| WHOLE LOAN – 0.4% |
|
|
|
|
|
|
|
|
| Citigroup Mortgage Loan Trust, Inc. Series 2006-WFH2, Class A3, 0.40% 8/25/36D |
|
$ |
1,200,000 |
|
|
$ |
1,052,532 |
|
|
|
|
| Credit-Based Asset Servicing and Securitization LLC Series 2005-CB2, Class M2, 1.13% 4/25/36D |
|
|
241,321 |
|
|
|
209,058 |
|
|
|
|
| Symphony CLO VIII LP Series 2012-8AR, Class AR,
1.35% 1/09/23D,W |
|
|
495,014 |
|
|
|
495,395 |
|
|
|
|
|
|
|
|
|
|
|
|
| TOTAL WHOLE LOAN |
|
|
$ |
1,756,985 |
|
|
|
|
|
|
|
|
|
|
|
|
| TOTAL ASSET-BACKED SECURITIES
(COST $3,378,769) |
|
|
$ |
3,416,444 |
|
|
|
| CORPORATE BONDS – 2.4% |
|
|
|
|
|
|
|
|
| ENERGY – 0.1% |
|
|
|
|
|
|
|
|
|
|
|
| Petrobras Global Finance BV Company Guaranteed,
3.15% 3/17/20D |
|
|
100,000 |
|
|
|
94,250 |
|
|
|
|
| Sabine Pass LNG LP Sr. Secured, 7.50% 11/30/16 |
|
|
400,000 |
|
|
|
428,000 |
|
|
|
|
|
|
|
|
|
|
|
|
|
| TOTAL ENERGY |
|
|
|
|
|
$ |
522,250 |
|
|
|
| FINANCIALS – 1.9% |
|
|
|
|
|
|
|
|
| Ally Financial, Inc. Company Guaranteed, 5.50% 2/15/17 |
|
|
569,000 |
|
|
|
596,028 |
|
|
|
|
| Banco Espirito Santo Sr. Unsecured, 5.00% 4/23/19 |
|
|
150,000EUR |
|
|
|
173,222 |
|
|
|
|
| Banco Espirito Santo SA Sr. Unsecured, MTN, 7.00% 3/04/16 |
|
|
100,000EUR |
|
|
|
113,965 |
|
|
|
|
| Bank of America Corp. Sr. Unsecured, MTN, 3.96% 10/21/25D |
|
|
14,000,000MXN |
|
|
|
999,218 |
|
|
|
|
| Barclays Bank PLC, Sr. Unsecured, GMTN, |
|
|
|
|
|
|
|
|
|
|
|
| 2.01%, 12/21/20 |
|
|
7,500,000MXN |
|
|
|
472,966 |
|
|
|
|
| 7.63%, 11/21/22 |
|
$ |
2,400,000 |
|
|
|
2,816,100 |
|
|
|
|
| BPCE SA Subordinated, 4.63% 7/11/24 |
|
|
700,000 |
|
|
|
705,698 |
|
|
|
|
| CIT Group, Inc. Sr. Unsecured, 4.25% 8/15/17 |
|
|
594,000 |
|
|
|
605,880 |
|
|
|
|
| Eksportfinans ASA Sr. Unsecured, 5.50% 6/26/17 |
|
|
1,000,000 |
|
|
|
1,066,790 |
|
|
|
|
| Ford Motor Credit Co. LLC Sr. Unsecured, 5.63% 9/15/15 |
|
|
400,000 |
|
|
|
406,947 |
|
|
|
|
| International Lease Finance Corp. Sr. Unsecured, 8.63% 9/15/15 |
|
|
200,000 |
|
|
|
204,000 |
|
|
|
|
| Intesa Sanpaolo SpA, Company Guaranteed, |
|
|
|
|
|
|
|
|
|
|
|
| 3.13%, 1/15/16 |
|
|
100,000 |
|
|
|
101,211 |
|
|
|
|
| 6.50%,
2/24/21W |
|
|
300,000 |
|
|
|
352,188 |
|
|
|
|
|
|
|
|
|
|
|
|
| TOTAL FINANCIALS |
|
|
$ |
8,614,213 |
|
|
|
|
| MEDIA – 0.1% |
|
|
|
|
|
|
|
|
|
|
|
| Univision Communications, Inc. Sr. Secured, 5.13% 2/15/25 |
|
|
500,000 |
|
|
|
506,875 |
|
|
|
|
|
|
|
|
|
|
|
Description
|
|
Par Value
|
|
|
Value
|
|
|
|
| PHARMACEUTICALS – 0.1% |
|
|
|
|
|
|
|
|
| Actavis Funding SCS, Company Guaranteed, |
|
|
|
|
|
|
|
|
|
|
|
| 3.45%, 3/15/22 |
|
$ |
100,000 |
|
|
$ |
101,802 |
|
|
|
|
| 3.80%, 3/15/25 |
|
|
300,000 |
|
|
|
303,970 |
|
|
|
|
|
|
|
|
|
|
|
|
| TOTAL PHARMACEUTICALS |
|
|
$ |
405,772 |
|
|
|
| TELECOMMUNICATIONS – 0.1% |
|
|
|
|
|
|
|
|
| BellSouth Corp. Company Guaranteed, 4.82% 4/26/16 |
|
|
500,000 |
|
|
|
518,440 |
|
|
|
| UTILITIES – 0.1% |
|
|
|
|
|
|
|
|
| Dynegy, Inc. Company Guaranteed, 6.75% 11/01/19 |
|
|
600,000 |
|
|
|
630,000 |
|
|
|
|
|
|
|
|
|
|
|
|
| TOTAL CORPORATE BONDS
(COST $11,326,612) |
|
|
$ |
11,197,550 |
|
|
| FOREIGN GOVERNMENT INFLATION-LINKED SECURITIES – 26.3% |
|
|
|
| GOVERNMENT – 26.3% |
|
|
|
|
|
|
|
|
| Brazil Notas do Tesouro Nacional Series B, |
|
|
|
|
|
|
|
|
|
|
|
| 6.00%, 5/15/35 |
|
|
300,000BRL |
|
|
|
257,556 |
|
|
|
|
| 6.00%, 5/15/45 |
|
|
1,508,000BRL |
|
|
|
1,297,320 |
|
|
|
|
| 6.00%, 8/15/50 |
|
|
2,632,000BRL |
|
|
|
2,268,589 |
|
|
|
|
| Bundesrepublik Deutschland Bundesob-ligation Inflation Linked Bond, 0.75%, 4/15/18 |
|
|
15,792,106EUR |
|
|
|
19,466,577 |
|
|
|
|
| Colombian Tesoreria, 3.00%, 3/25/33 |
|
|
4,657,920,348COP |
|
|
|
1,734,510 |
|
|
|
|
| Deutsche Bundesrepublik Inflation Linked Bond, 0.10%, 4/15/23 |
|
|
610,000EUR |
|
|
|
771,107 |
|
|
|
|
| France Government Bond OAT, |
|
|
|
|
|
|
|
|
|
|
|
| 0.10%, 7/25/21 |
|
|
3,250,000EUR |
|
|
|
3,946,427 |
|
|
|
|
| 0.25%, 7/25/18 |
|
|
14,200,000EUR |
|
|
|
17,247,748 |
|
|
|
|
| 0.25%, 7/25/24 |
|
|
5,000,000EUR |
|
|
|
6,294,898 |
|
|
|
|
| 1.00%, 7/25/17 |
|
|
732,817EUR |
|
|
|
865,212 |
|
|
|
|
| 1.10%, 7/25/22 |
|
|
500,000EUR |
|
|
|
700,799 |
|
|
|
|
| 1.80%, 7/25/40 |
|
|
226,312EUR |
|
|
|
411,352 |
|
|
|
|
| 2.10%, 7/25/23 |
|
|
350,000EUR |
|
|
|
542,881 |
|
|
|
|
| Italy Buoni Poliennali Del Tesoro, |
|
|
|
|
|
|
|
|
|
|
|
| 2.10%, 9/15/21 |
|
|
130,000EUR |
|
|
|
178,112 |
|
|
|
|
| 2.25%, 4/22/17 |
|
|
2,702,025EUR |
|
|
|
3,151,538 |
|
|
|
|
| 2.35%, 9/15/24 |
|
|
460,000EUR |
|
|
|
610,643 |
|
|
|
|
| Japan Government CPI Linked Bond, Sr. Unsecured, 0.10%, 9/10/24Ö |
|
|
228,160,000JPY |
|
|
|
2,087,645 |
|
|
|
|
| Mexican Udibonos, |
|
|
|
|
|
|
|
|
|
|
|
| 4.00%, 11/15/40 |
|
|
9,883,379MXN |
|
|
|
709,094 |
|
|
|
|
| 4.50%, 11/22/35 |
|
|
57,331,462MXN |
|
|
|
4,411,518 |
|
|
|
|
| New Zealand Government Bond, Sr. Unsecured, 2.00%, 9/20/25 |
|
|
6,150,000NZD |
|
|
|
4,943,930 |
|
April 30, 2015 / ANNUAL REPORT
|
|
|
|
|
| PORTFOLIOS OF INVESTMENTS |
|
|
63 |
|
Wilmington Multi-Manager Real Asset Fund (continued)
|
|
|
|
|
|
|
|
|
Description |
|
Par Value |
|
|
Value |
|
|
|
|
| 3.00%, 9/20/30 |
|
|
2,025,000NZD |
|
|
$ |
1,824,760 |
|
|
|
|
| Spain Government Inflation Linked Bond, Sr. Unsecured, 1.00%, 11/30/30 |
|
|
200,000EUR |
|
|
|
234,549 |
|
|
|
|
| Thailand Government Bond, Unsecured, 1.25%, 3/12/28 |
|
|
38,864,680THB |
|
|
|
1,074,882 |
|
|
|
|
| U.K. Gilt Inflation Linked, |
|
|
|
|
|
|
|
|
|
|
|
| 0.13%, 3/22/44 |
|
|
4,446,624GBP |
|
|
|
8,931,539 |
|
|
|
|
| 0.25%, 3/22/52 |
|
|
848,280GBP |
|
|
|
1,915,938 |
|
|
|
|
| 0.50%, 3/22/50 |
|
|
396,891GBP |
|
|
|
941,373 |
|
|
|
|
| 0.63%, 3/22/40 |
|
|
355,608GBP |
|
|
|
765,288 |
|
|
|
|
| 0.63%, 11/22/42 |
|
|
2,899,200GBP |
|
|
|
6,502,090 |
|
|
|
|
| 0.75%, 3/22/34 |
|
|
2,210,380GBP |
|
|
|
4,486,101 |
|
|
|
|
| 0.75%, 11/22/47 |
|
|
1,062,367GBP |
|
|
|
2,607,409 |
|
|
|
|
| 1.13%, 11/22/37 |
|
|
824,883GBP |
|
|
|
1,888,554 |
|
|
|
|
| 0.13%, 3/22/29 |
|
|
1,275,604GBP |
|
|
|
2,236,452 |
|
|
|
|
| 0.13%, 3/22/58 |
|
|
2,487,465GBP |
|
|
|
5,773,361 |
|
|
|
|
| 0.13%, 3/22/24 |
|
|
6,775,872GBP |
|
|
|
11,424,345 |
|
|
|
|
|
|
|
|
|
|
|
|
|
| TOTAL GOVERNMENT |
|
|
|
|
|
$ |
122,504,097 |
|
|
|
|
|
|
|
|
|
|
|
|
| TOTAL FOREIGN GOVERNMENT INFLATION-LINKED SECURITIES (COST$125,528,196) |
|
|
$ |
122,504,097 |
|
|
| FOREIGN GOVERNMENT SECURITIES – 4.7% |
|
|
|
|
| GOVERNMENT – 4.7% |
|
|
|
|
|
|
|
|
|
|
|
| Autonomous Community of Catalonia, Sr. Unsecured, 4.75%, 6/04/18 |
|
|
100,000EUR |
|
|
|
124,222 |
|
|
|
| Brazil Notas do Tesouro Nacional
Series F, |
|
|
|
|
|
|
|
|
| 10.00%, 1/01/23 |
|
|
8,330,000BRL |
|
|
|
2,423,634 |
|
|
|
|
| 10.00%, 1/01/25 |
|
|
17,120,000BRL |
|
|
|
4,863,417 |
|
|
|
|
| Corp. Andina de Fomento, 11U, Unsecured, 3.95%, 10/15/21 |
|
|
4,411,748MXN |
|
|
|
288,877 |
|
|
|
|
| Credit Agricole SA, |
|
|
|
|
|
|
|
|
| 8.13%, 9/19/33 |
|
|
900,000USD |
|
|
|
1,019,250 |
|
|
|
|
| France Government Bond OAT, |
|
|
|
|
|
|
|
|
| 3.50%, 4/25/20 |
|
|
60,000EUR |
|
|
|
78,720 |
|
|
|
|
| Hellenic Republic Government International Bond,
Sr. Unsecured, 4.50%, 7/03/17 |
|
|
30,000,000JPY |
|
|
|
161,575 |
|
|
|
|
| Italy Buoni Poliennali Del Tesoro, |
|
|
|
|
|
|
|
|
|
|
|
| 2.35%, 9/15/19 |
|
|
3,587,467EUR |
|
|
|
4,520,396 |
|
|
|
|
| 2.55%, 9/15/41 |
|
|
644,088EUR |
|
|
|
977,324 |
|
|
|
|
| 5.00%, 9/01/40 |
|
|
1,100,000EUR |
|
|
|
1,828,310 |
|
|
|
|
| Mexican Bonos de Proteccion al Ahorro, 3.05%, 4/01/18D |
|
|
15,500,000MXN |
|
|
|
1,020,817 |
|
|
|
|
| Mexican Udibonos, 4.50%, 12/04/25 |
|
|
25,951,177MXN |
|
|
|
1,945,821 |
|
|
|
|
|
|
|
|
|
|
Description |
|
Par Value |
|
|
Value |
|
|
|
|
| Slovenia Government Bond, Sr.
Unsecured, 3.00%, 4/08/21 |
|
|
1,000,000EUR |
|
|
$ |
1,266,019 |
|
|
|
|
| South Africa Government Bond,
Series R207, 7.25%, 1/15/20 |
|
|
15,475,000ZAR |
|
|
|
1,292,086 |
|
|
|
|
|
|
|
|
|
|
|
|
| TOTAL GOVERNMENT |
|
|
$ |
21,810,468 |
|
|
|
|
|
|
|
|
|
|
|
|
| TOTAL FOREIGN GOVERNMENT SECURITIES
(COST $24,957,169) |
|
|
$ |
21,810,468 |
|
|
| MORTGAGE-BACKED SECURITIES – 0.5% |
|
|
|
| WHOLE LOAN – 0.5% |
|
|
|
|
|
|
|
|
| BCAP LLC Trust Series 2009-RR6-I, Class 3A1, 2.80% 12/26/37D,W |
|
$ |
55,750 |
|
|
|
54,817 |
|
|
|
|
| CIFC Funding 2011-I Ltd. Series 2011-1AR, Class A1R, 1.55%
1/19/23D,W |
|
|
870,133 |
|
|
|
868,828 |
|
|
|
|
| Grifonas Finance PLC 0.39% 8/28/39D |
|
|
630,141EUR |
|
|
|
482,933 |
|
|
|
|
| JP Morgan Resecuritization Trust Series 2009-7, Class 13A1, 2.38% 6/27/37W |
|
$ |
53,949 |
|
|
|
52,932 |
|
|
|
|
| Rise Ltd. 2014-1, Class A, 4.75%
2/15/39†† |
|
|
278,501 |
|
|
|
281,864 |
|
|
|
|
| WAMU Mortgage Pass-Through Certificates, Series 2006-AR14, Class 1A4, |
|
|
|
|
|
|
|
|
|
|
|
| 1.96%,
11/25/36D |
|
|
363,004 |
|
|
|
317,788 |
|
|
|
|
| 2.36%,
3/25/37D |
|
|
154,766 |
|
|
|
143,072 |
|
|
|
|
|
|
|
|
|
|
|
|
| TOTAL WHOLE LOAN |
|
|
$ |
2,202,234 |
|
|
|
|
|
|
|
|
|
|
|
|
| TOTAL MORTGAGE-BACKED SECURITIES
(COST $2,127,640) |
|
|
$ |
2,202,234 |
|
|
| U.S. GOVERNMENT AGENCY OBLIGATION – 0.0%** |
|
|
| FEDERAL HOME LOAN BANK (FHLB) – 0.0%** |
|
|
|
|
| Federal Home Loan Bank Discount Notes 0.10% 7/29/15‡ |
|
|
100,000 |
|
|
|
99,976 |
|
|
|
|
|
|
|
|
|
|
|
|
| TOTAL U.S. GOVERNMENT AGENCY OBLIGATION
(COST $99,980) |
|
|
$ |
99,976 |
|
|
| U.S. GOVERNMENT INFLATION-LINKED
SECURITIES – 21.7% |
|
|
| U.S. TREASURY INFLATION INDEXED BONDS – 15.2% |
|
|
|
| U.S. Treasury Inflation Indexed Bond, |
|
|
|
|
|
|
|
|
| 0.13%, 4/15/18 |
|
|
5,550,000 |
|
|
|
5,772,891 |
|
|
|
|
| 0.13%, 4/15/19 |
|
|
11,300,000 |
|
|
|
11,582,917 |
|
|
|
|
| 0.13%, 1/15/23 |
|
|
1,500,000 |
|
|
|
1,539,769 |
|
|
|
|
| 0.13%, 7/15/24 |
|
|
11,700,000 |
|
|
|
11,646,174 |
|
|
|
|
| 0.25%, 1/15/25 |
|
|
7,100,000 |
|
|
|
7,134,557 |
|
|
|
|
| 0.63%, 1/15/24 |
|
|
3,200,000 |
|
|
|
3,373,700 |
|
|
|
|
| 0.75%, 2/15/42 |
|
|
3,640,000 |
|
|
|
3,785,224 |
|
|
|
|
| 0.75%, 2/15/45 |
|
|
400,000 |
|
|
|
401,209 |
|
|
|
|
| 1.38%, 2/15/44 |
|
|
3,250,000 |
|
|
|
3,808,811 |
|
|
|
|
| 1.88%, 7/15/19 |
|
|
800,000 |
|
|
|
972,577 |
|
|
|
|
| 2.00%, 1/15/26 |
|
|
1,318,000 |
|
|
|
1,852,847 |
|
|
|
|
| 2.38%, 1/15/25 |
|
|
1,323,000 |
|
|
|
2,004,656 |
|
|
|
|
| 2.38%, 1/15/27 |
|
|
3,180,000 |
|
|
|
4,580,935 |
|
|
|
|
| 2.50%, 1/15/29 |
|
|
1,900,000 |
|
|
|
2,659,278 |
|
|
|
|
| 3.63%, 4/15/28 |
|
|
2,700,000 |
|
|
|
5,536,749 |
|
ANNUAL REPORT / April 30, 2015
64 PORTFOLIOS OF
INVESTMENTS
Wilmington Multi-Manager Real Asset Fund
(continued)
|
|
|
|
|
|
|
|
|
Description |
|
Par Value |
|
|
Value |
|
|
|
|
| 3.88%, 4/15/29 |
|
$ |
2,050,000 |
|
|
$ |
4,305,774 |
|
|
|
|
|
|
|
|
|
|
|
|
| TOTAL U.S. TREASURY INFLATION INDEXED BONDS |
|
|
$ |
70,958,068 |
|
|
| U.S. TREASURY INFLATION INDEXED NOTES – 6.5% |
|
|
|
|
| U.S. Treasury Inflation Indexed Note, |
|
|
|
|
|
|
|
|
|
|
|
| 0.13%, 1/15/22 |
|
|
5,650,000 |
|
|
|
5,934,539 |
|
|
|
|
| 0.13%, 7/15/22 |
|
|
7,200,000 |
|
|
|
7,471,262 |
|
|
|
|
| 0.38%, 7/15/23 |
|
|
1,750,000 |
|
|
|
1,819,491 |
|
|
|
|
| 0.63%, 7/15/21 |
|
|
2,710,000 |
|
|
|
2,970,885 |
|
|
|
|
| 1.13%, 1/15/21 |
|
|
8,600,000 |
|
|
|
9,935,684 |
|
|
|
|
| 1.63%, 1/15/18 |
|
|
1,750,000 |
|
|
|
2,093,582 |
|
|
|
|
|
|
|
|
|
|
|
|
| TOTAL U.S. TREASURY INFLATION INDEXED NOTES |
|
|
$ |
30,225,443 |
|
|
|
|
|
|
|
|
|
|
|
|
| TOTAL U.S. GOVERNMENT INFLATION-LINKED SECURITIES
(COST $100,141,168) |
|
|
$ |
101,183,511 |
|
|
|
|
| U.S. TREASURY – 1.1% |
|
|
|
|
|
|
|
|
|
|
| U.S. TREASURY BOND – 0.4% |
|
|
|
|
|
|
|
|
| U.S. Treasury Bond 2.50% 2/15/45 |
|
|
1,900,000 |
|
|
|
1,805,763 |
|
|
|
| U.S. TREASURY NOTE – 0.7% |
|
|
|
|
|
|
|
|
| U.S. Treasury Note 1.75% 3/31/22 |
|
|
3,100,000 |
|
|
|
3,090,814 |
|
|
|
|
|
|
|
|
|
|
|
|
|
| TOTAL U.S. TREASURY
(COST $4,916,270) |
|
|
|
|
|
$ |
4,896,577 |
|
|
|
|
|
|
|
|
|
|
|
|
| TOTAL INFLATION-LINKED & FIXED INCOME SECURITIES
(COST $272,475,804) |
|
|
$ |
267,310,857 |
|
| |
|
|
|
|
|
|
|
|
| |
|
Number of
Shares |
|
|
|
|
|
| REAL ESTATE RELATED SECURITIES – 40.4% |
|
|
|
| COMMON STOCKS – 10.1% |
|
|
|
|
|
|
|
| DIVERSIFIED – 0.0%** |
|
|
|
|
|
|
|
|
| DNZ Property Fund Ltd.†† |
|
|
22,431 |
|
|
$ |
34,735 |
|
|
|
|
| Kiwi Property Group
Ltd.†† |
|
|
74,066 |
|
|
|
73,092 |
|
|
|
|
|
|
|
|
|
|
|
|
|
| TOTAL DIVERSIFIED |
|
|
|
|
|
$ |
107,827 |
|
|
| DIVERSIFIED REAL ESTATE ACTIVITIES – 5.6% |
|
|
|
|
| Alexander & Baldwin, Inc. |
|
|
3,343 |
|
|
|
135,325 |
|
|
|
|
| Allreal Holding AG†† |
|
|
823 |
|
|
|
118,077 |
|
|
|
|
| Al-Rov (Israel) Ltd.*,†† |
|
|
2,782 |
|
|
|
81,576 |
|
|
|
|
| Argosy Property Ltd.†† |
|
|
58,962 |
|
|
|
51,041 |
|
|
|
|
| CapitaLand Ltd.†† |
|
|
580,000 |
|
|
|
1,614,045 |
|
|
|
|
| City Developments Ltd.†† |
|
|
44,000 |
|
|
|
354,022 |
|
|
|
|
| Consolidated-Tomoka Land Co. |
|
|
629 |
|
|
|
34,431 |
|
|
|
|
| Daito Trust Construction Co.
Ltd.†† |
|
|
9,301 |
|
|
|
1,083,107 |
|
|
|
|
| Daiwa House Industry Co.
Ltd.†† |
|
|
68,906 |
|
|
|
1,538,328 |
|
|
|
|
| Development Securities
PLC†† |
|
|
18,118 |
|
|
|
70,354 |
|
|
|
|
| Dic Asset AG†† |
|
|
9,282 |
|
|
|
93,493 |
|
|
|
|
| DREAM Unlimited Corp., Class A* |
|
|
4,100 |
|
|
|
32,182 |
|
|
|
|
| Elbit Imaging Ltd.*,†† |
|
|
22,440 |
|
|
|
29,987 |
|
|
|
|
|
|
|
|
|
|
| Description |
|
Number of
Shares |
|
|
Value |
|
|
|
|
| Goldin Properties Holdings
Ltd.*,†† |
|
|
110,000 |
|
|
$ |
266,843 |
|
|
|
|
| Great Eagle Holdings
Ltd.†† |
|
|
35,000 |
|
|
|
129,144 |
|
|
|
|
| Hang Lung Properties
Ltd.†† |
|
|
198,000 |
|
|
|
669,352 |
|
|
|
|
| Heiwa Real Estate Co.
Ltd.†† |
|
|
6,400 |
|
|
|
86,859 |
|
|
|
|
| Henderson Land Development Co.
Ltd.†† |
|
|
104,000 |
|
|
|
833,780 |
|
|
|
|
| HKR International Ltd.†† |
|
|
60,800 |
|
|
|
34,481 |
|
|
|
|
| Kerry Properties Ltd.†† |
|
|
67,500 |
|
|
|
275,487 |
|
|
|
|
| Lend Lease Group†† |
|
|
53,752 |
|
|
|
679,174 |
|
|
|
|
| Leopalace21 Corp.*,†† |
|
|
28,400 |
|
|
|
163,796 |
|
|
|
|
| Mitsubishi Estate Co.
Ltd.†† |
|
|
152,210 |
|
|
|
3,582,609 |
|
|
|
|
| Mitsui Fudosan Co. Ltd.†† |
|
|
164,589 |
|
|
|
4,879,126 |
|
|
|
|
| Mobimo Holding AG†† |
|
|
484 |
|
|
|
107,998 |
|
|
|
|
| Nomura Real Estate Holdings,
Inc.†† |
|
|
12,200 |
|
|
|
247,990 |
|
|
|
|
| Patrizia Immobilien AG*,†† |
|
|
2,555 |
|
|
|
50,329 |
|
|
|
|
| Shinoken Group Co. Ltd.†† |
|
|
2,800 |
|
|
|
35,803 |
|
|
|
|
| Soundwill Holdings Ltd.†† |
|
|
54,000 |
|
|
|
97,315 |
|
|
|
|
| St Joe Co. (The)* |
|
|
8,591 |
|
|
|
149,913 |
|
|
|
|
| Sumitomo Realty & Development Co.
Ltd.†† |
|
|
67,498 |
|
|
|
2,605,142 |
|
|
|
|
| Sun Hung Kai Properties
Ltd.†† |
|
|
242,900 |
|
|
|
4,034,210 |
|
|
|
|
| Takara Leben Co. Ltd.†† |
|
|
8,800 |
|
|
|
53,650 |
|
|
|
|
| Tejon Ranch Co.* |
|
|
1,252 |
|
|
|
30,924 |
|
|
|
|
| Tokyo Tatemono Co. Ltd.†† |
|
|
29,100 |
|
|
|
210,995 |
|
|
|
|
| Tokyu Fudosan Holdings
Corp.†† |
|
|
34,900 |
|
|
|
259,340 |
|
|
|
|
| United Industrial Corp.
Ltd.†† |
|
|
35,000 |
|
|
|
90,670 |
|
|
|
|
| UOL Group Ltd.†† |
|
|
62,000 |
|
|
|
372,805 |
|
|
|
|
| Wheelock & Co.
Ltd.†† |
|
|
135,000 |
|
|
|
760,175 |
|
|
|
|
|
|
|
|
|
|
|
|
| TOTAL DIVERSIFIED REAL ESTATE ACTIVITIES |
|
|
$ |
25,943,878 |
|
|
| INDUSTRIALS – 0.0%** |
|
|
|
|
| Property For Industry
Ltd.†† |
|
|
30,878 |
|
|
|
37,315 |
|
|
| OFFICE – 0.0%** |
|
|
|
|
| Precinct Properties New Zealand
Ltd.†† |
|
|
62,898 |
|
|
|
55,357 |
|
|
| REAL ESTATE DEVELOPMENT – 1.5% |
|
|
|
|
| Aveo Group†† |
|
|
43,613 |
|
|
|
95,127 |
|
|
|
|
| Cedar Woods Properties
Ltd.†† |
|
|
4,556 |
|
|
|
19,270 |
|
|
|
|
| China Overseas Land & Investment
Ltd.†† |
|
|
150,592 |
|
|
|
627,273 |
|
|
|
|
| CK Hutchison Holdings
Ltd.†† |
|
|
186,634 |
|
|
|
4,048,499 |
|
|
|
|
| Conwert Immobilien Invest
SE†† |
|
|
3,988 |
|
|
|
50,417 |
|
|
|
|
| Forestar Group, Inc.* |
|
|
5,730 |
|
|
|
84,575 |
|
|
|
|
| Goldcrest Co. Ltd.†† |
|
|
1,800 |
|
|
|
35,378 |
|
|
|
|
| Helical Bar PLC†† |
|
|
12,786 |
|
|
|
76,286 |
|
|
|
|
| Howard Hughes Corp. (The)* |
|
|
1,559 |
|
|
|
231,465 |
|
|
|
|
| New World China Land
Ltd.†† |
|
|
264,000 |
|
|
|
179,049 |
|
|
|
|
| Nexity SA†† |
|
|
3,537 |
|
|
|
155,333 |
|
|
|
|
| Selvaag Bolig ASA†† |
|
|
11,740 |
|
|
|
44,247 |
|
|
|
|
| Sino Land Co. Ltd.†† |
|
|
466,000 |
|
|
|
819,862 |
|
|
|
|
| St. Modwen Properties
PLC†† |
|
|
19,036 |
|
|
|
126,852 |
|
|
|
|
| Tag Immobilien AG†† |
|
|
12,979 |
|
|
|
166,175 |
|
|
| April 30, 2015 / ANNUAL REPORT |
PORTFOLIOS OF
INVESTMENTS 65
Wilmington Multi-Manager Real Asset Fund
(continued)
|
|
|
|
|
|
|
|
|
| Description |
|
Number of
Shares |
|
|
Value |
|
|
|
|
| Urban & Civic
PLC†† |
|
|
11,314 |
|
|
$ |
45,139 |
|
|
|
|
| Villa World Ltd.†† |
|
|
19,108 |
|
|
|
34,533 |
|
|
|
|
| Wing Tai Holdings Ltd.†† |
|
|
37,000 |
|
|
|
54,750 |
|
|
|
|
|
|
|
|
|
|
|
|
| TOTAL REAL ESTATE DEVELOPMENT |
|
|
$ |
6,894,230 |
|
|
| REAL ESTATE OPERATING COMPANIES – 3.0% |
|
|
|
|
| Aeon Mall Co. Ltd.†† |
|
|
13,600 |
|
|
|
253,693 |
|
|
|
|
| Airport Facilities Co.
Ltd.†† |
|
|
5,100 |
|
|
|
28,917 |
|
|
|
|
| Atrium European Real Estate
Ltd.†† |
|
|
27,546 |
|
|
|
135,194 |
|
|
|
|
| Atrium Ljungberg AB†† |
|
|
2,092 |
|
|
|
30,525 |
|
|
|
|
| Azrieli Group†† |
|
|
2,200 |
|
|
|
94,911 |
|
|
|
|
| Buwog AG*,†† |
|
|
6,438 |
|
|
|
130,169 |
|
|
|
|
| Capital & Counties Properties
PLC†† |
|
|
64,375 |
|
|
|
389,173 |
|
|
|
|
| Castellum AB†† |
|
|
12,730 |
|
|
|
198,490 |
|
|
|
|
| Citycon OYJ†† |
|
|
9,711 |
|
|
|
31,400 |
|
|
|
|
| Daejan Holdings PLC†† |
|
|
667 |
|
|
|
55,410 |
|
|
|
|
| Deutsche Annington Immobilien
SE†† |
|
|
25,300 |
|
|
|
849,198 |
|
|
|
|
| Deutsche Euroshop AG†† |
|
|
1,721 |
|
|
|
85,670 |
|
|
|
|
| Deutsche Wohnen AG†† |
|
|
41,440 |
|
|
|
1,086,959 |
|
|
|
|
| do Deutsche Office AG*,†† |
|
|
23,263 |
|
|
|
110,658 |
|
|
|
|
| Entra ASA*,†† |
|
|
5,463 |
|
|
|
56,044 |
|
|
|
|
| Fabege AB†† |
|
|
10,564 |
|
|
|
161,036 |
|
|
|
|
| Fastighets AB Balder*,†† |
|
|
4,764 |
|
|
|
84,920 |
|
|
|
|
| Forest City Enterprises, Inc., Class A#, * |
|
|
13,426 |
|
|
|
319,002 |
|
|
|
|
| Gazit Globe Ltd.†† |
|
|
8,919 |
|
|
|
118,031 |
|
|
|
|
| Global Logistic Properties
Ltd.†† |
|
|
287,000 |
|
|
|
595,250 |
|
|
|
|
| Grainger PLC†† |
|
|
45,014 |
|
|
|
145,988 |
|
|
|
|
| Hang Lung Group Ltd.†† |
|
|
38,000 |
|
|
|
201,188 |
|
|
|
|
| Hemfosa Fastigheter AB*,†† |
|
|
4,890 |
|
|
|
112,983 |
|
|
|
|
| Hispania Activos Inmobiliarios
SAU*,†† |
|
|
9,283 |
|
|
|
132,285 |
|
|
|
|
| Hongkong Land Holdings
Ltd.†† |
|
|
248,381 |
|
|
|
2,010,088 |
|
|
|
|
| Hufvudstaden AB†† |
|
|
36,804 |
|
|
|
508,765 |
|
|
|
|
| Hulic Co. Ltd.†† |
|
|
17,400 |
|
|
|
186,244 |
|
|
|
|
| Hysan Development Co.
Ltd.†† |
|
|
69,000 |
|
|
|
318,825 |
|
|
|
|
| Immofinanz AG*,†† |
|
|
34,737 |
|
|
|
104,498 |
|
|
|
|
| Intershop Holding AG†† |
|
|
211 |
|
|
|
90,477 |
|
|
|
|
| Jerusalem Oil
Exploration*,†† |
|
|
978 |
|
|
|
37,150 |
|
|
|
|
| Jeudan A/S*,†† |
|
|
797 |
|
|
|
78,433 |
|
|
|
|
| Keihanshin Building Co.
Ltd.†† |
|
|
11,300 |
|
|
|
66,730 |
|
|
|
|
| Killam Properties, Inc. |
|
|
6,336 |
|
|
|
56,822 |
|
|
|
|
| Klovern AB-B Shares*,†† |
|
|
36,260 |
|
|
|
40,224 |
|
|
|
|
| Kungsleden AB†† |
|
|
15,009 |
|
|
|
109,249 |
|
|
|
|
| LEG Immobilien AG†† |
|
|
18,837 |
|
|
|
1,461,513 |
|
|
|
|
| Melisron Ltd.†† |
|
|
1,000 |
|
|
|
38,344 |
|
|
|
|
| Norstar Holdings, Inc.†† |
|
|
2,510 |
|
|
|
68,411 |
|
|
|
|
| NTT Urban Development
Corp.†† |
|
|
36,200 |
|
|
|
376,884 |
|
|
|
|
| Olav Thon Eiendomsselskap
ASA†† |
|
|
5,280 |
|
|
|
115,644 |
|
|
|
|
|
|
|
|
|
|
| Description |
|
Number of
Shares |
|
|
Value |
|
|
|
|
| Perennial Real Estate Holdings
Ltd.*,†† |
|
|
35,647 |
|
|
$ |
29,428 |
|
|
|
|
| Platzer Fastigheter Holding, Class
B*,†† |
|
|
7,280 |
|
|
|
32,147 |
|
|
|
|
| PSP Swiss Property AG†† |
|
|
5,866 |
|
|
|
547,136 |
|
|
|
|
| Quintain Estates & Development PLC*,†† |
|
|
39,479 |
|
|
|
58,076 |
|
|
|
|
| S Immo AG†† |
|
|
10,793 |
|
|
|
100,964 |
|
|
|
|
| Sagax AB†† |
|
|
6,013 |
|
|
|
41,609 |
|
|
|
|
| Sponda OYJ†† |
|
|
33,377 |
|
|
|
145,968 |
|
|
|
|
| Swire Properties Ltd.†† |
|
|
222,500 |
|
|
|
764,410 |
|
|
|
|
| Swiss Prime Site†† |
|
|
4,582 |
|
|
|
401,738 |
|
|
|
|
| TLG Immobilien AG*,†† |
|
|
2,575 |
|
|
|
43,226 |
|
|
|
|
| Toc Co. Ltd.†† |
|
|
12,100 |
|
|
|
92,459 |
|
|
|
|
| Tribona AB*,†† |
|
|
6,323 |
|
|
|
29,059 |
|
|
|
|
| Unite Group PLC (The)*,†† |
|
|
32,882 |
|
|
|
302,141 |
|
|
|
|
| Wallenstam AB†† |
|
|
10,092 |
|
|
|
170,152 |
|
|
|
|
| Wihlborgs Fastigheter
AB†† |
|
|
5,129 |
|
|
|
99,269 |
|
|
|
|
|
|
|
|
|
|
|
|
| TOTAL REAL ESTATE OPERATING COMPANIES |
|
|
$ |
13,933,177 |
|
|
|
|
|
|
|
|
|
|
|
|
| TOTAL COMMON STOCKS
(COST $38,837,442) |
|
|
$ |
46,971,784 |
|
|
| EXCHANGE-TRADED FUNDS – 1.0% |
|
|
| EQUITY FUNDS – 1.0% |
|
|
|
|
| SPDR Dow Jones International Real Estate ETF |
|
|
51,700 |
|
|
|
2,291,861 |
|
|
|
|
| Vanguard REIT ETF |
|
|
28,900 |
|
|
|
2,294,082 |
|
|
|
|
|
|
|
|
|
|
|
|
|
| TOTAL EQUITY FUNDS |
|
|
|
|
|
$ |
4,585,943 |
|
|
|
|
|
|
|
|
|
|
|
|
| TOTAL EXCHANGE-TRADED FUNDS
(COST $3,958,439) |
|
|
$ |
4,585,943 |
|
|
| INVESTMENT COMPANIES – 0.1% |
|
|
| DIVERSIFIED REAL ESTATE ACTIVITIES – 0.0%** |
|
|
|
|
| U.K. Commercial Property Trust
Ltd.†† |
|
|
34,242 |
|
|
|
48,245 |
|
|
| REAL ESTATE OPERATING COMPANIES – 0.1% |
|
|
|
|
| F&C Commercial Property Trust
Ltd.*,†† |
|
|
58,277 |
|
|
|
125,369 |
|
|
|
|
| Schroder Real Estate Investment Trust
Ltd.†† |
|
|
35,581 |
|
|
|
33,565 |
|
|
|
|
| Solvalor 61†† |
|
|
294 |
|
|
|
80,119 |
|
|
|
|
|
|
|
|
|
|
|
|
| TOTAL REAL ESTATE OPERATING COMPANIES** |
|
|
$ |
239,053 |
|
|
|
|
|
|
|
|
|
|
|
|
| TOTAL INVESTMENT COMPANIES
(COST $272,342) |
|
|
$ |
287,298 |
|
|
| PREFERRED STOCK – 0.0%** |
|
|
| CONSUMER FINANCE – 0.0%** |
|
|
|
|
| SLM Corp. 3.56% |
|
|
3,000 |
|
|
|
72,240 |
|
|
|
|
|
|
|
|
|
|
|
|
| TOTAL PREFERRED STOCK
(COST $71,100) |
|
|
$ |
72,240 |
|
|
| REAL ESTATE INVESTMENT TRUSTS – 29.2% |
|
|
| DIVERSIFIED – 4.3% |
|
|
|
|
| Abacus Property Group†† |
|
|
43,103 |
|
|
|
100,422 |
|
|
|
|
| Activia Properties,
Inc.†† |
|
|
20 |
|
|
|
181,894 |
|
|
|
|
| American Assets Trust, Inc. |
|
|
4,691 |
|
|
|
186,702 |
|
ANNUAL REPORT / April 30, 2015
66 PORTFOLIOS OF
INVESTMENTS
Wilmington Multi-Manager Real Asset Fund
(continued)
|
|
|
|
|
|
|
|
|
| Description |
|
Number of
Shares |
|
|
Value |
|
|
|
|
| American Realty Capital Properties, Inc. |
|
|
136,163 |
|
|
$ |
1,229,552 |
|
|
|
|
| ANF Immobilier†† |
|
|
3,061 |
|
|
|
80,453 |
|
|
|
|
| Armada Hoffler Properties, Inc. |
|
|
3,286 |
|
|
|
33,747 |
|
|
|
|
| Artis Real Estate Investment Trust |
|
|
4,911 |
|
|
|
60,568 |
|
|
|
|
| Astro Japan Property
Group†† |
|
|
10,795 |
|
|
|
45,167 |
|
|
|
|
| British Land Co. PLC†† |
|
|
162,962 |
|
|
|
2,075,525 |
|
|
|
|
| Canadian Real Estate Investment Trust |
|
|
2,615 |
|
|
|
98,856 |
|
|
|
|
| Chambers Street Properties |
|
|
22,734 |
|
|
|
170,505 |
|
|
|
|
| Cominar Real Estate Investment Trust |
|
|
5,697 |
|
|
|
90,283 |
|
|
|
|
| Cousins Properties, Inc. |
|
|
1,987 |
|
|
|
19,353 |
|
|
|
|
| Daiwa House Real Estate Investment
Corp.†† |
|
|
21 |
|
|
|
93,820 |
|
|
|
|
| Daiwa House Residential Investment
Corp.†† |
|
|
76 |
|
|
|
165,497 |
|
|
|
|
| Dream Global Real Estate Investment Trust |
|
|
4,100 |
|
|
|
34,356 |
|
|
|
|
| Duke Realty Corp. |
|
|
71,930 |
|
|
|
1,424,933 |
|
|
|
|
| Fonciere Des Regions†† |
|
|
1,906 |
|
|
|
180,438 |
|
|
|
|
| Gecina SA†† |
|
|
2,725 |
|
|
|
373,714 |
|
|
|
|
| Gladstone Commercial Corp. |
|
|
1,641 |
|
|
|
29,226 |
|
|
|
|
| Goodman Property Trust†† |
|
|
95,812 |
|
|
|
86,160 |
|
|
|
|
| GPT Group†† |
|
|
344,394 |
|
|
|
1,213,747 |
|
|
|
|
| Green Real Estate Investment Trust
PLC†† |
|
|
42,272 |
|
|
|
74,555 |
|
|
|
|
| Growthpoint Properties Australia
Ltd.†† |
|
|
33,826 |
|
|
|
84,714 |
|
|
|
|
| H&R Real Estate Investment Trust |
|
|
1,515 |
|
|
|
29,069 |
|
|
|
|
| Hamborner Real Estate Investment Trust
AG†† |
|
|
3,124 |
|
|
|
36,495 |
|
|
|
|
| Hankyu Real Estate Investment Trust,
Inc.†† |
|
|
64 |
|
|
|
81,429 |
|
|
|
|
| Heiwa Real Estate Investment Trust,
Inc.†† |
|
|
33 |
|
|
|
26,645 |
|
|
|
|
| Investors Real Estate Trust |
|
|
13,684 |
|
|
|
98,114 |
|
|
|
|
| Kenedix Office Investment
Corp.†† |
|
|
116 |
|
|
|
627,661 |
|
|
|
|
| Land Securities Group
PLC†† |
|
|
141,901 |
|
|
|
2,715,475 |
|
|
|
|
| Lexington Realty Trust |
|
|
18,108 |
|
|
|
167,861 |
|
|
|
|
| Liberty Property Trust |
|
|
21,723 |
|
|
|
756,829 |
|
|
|
|
| Londonmetric Property
PLC*,†† |
|
|
44,648 |
|
|
|
113,041 |
|
|
|
|
| Mapletree Greater China Commercial
Trust†† |
|
|
135,000 |
|
|
|
108,061 |
|
|
|
|
| Mirvac Group†† |
|
|
770,544 |
|
|
|
1,220,727 |
|
|
|
|
| Morguard Real Estate Investment Trust |
|
|
10 |
|
|
|
144 |
|
|
|
|
| Nieuwe Steen Investments
NV†† |
|
|
88,361 |
|
|
|
414,994 |
|
|
|
|
| NIPPON Real Estate Investment Trust Investment
Corp.†† |
|
|
11 |
|
|
|
30,522 |
|
|
|
|
| Nomura Real Estate Master Fund,
Inc.†† |
|
|
161 |
|
|
|
209,457 |
|
|
|
|
| One Liberty Properties, Inc. |
|
|
1,381 |
|
|
|
31,045 |
|
|
|
|
| PS Business Parks, Inc. |
|
|
1,520 |
|
|
|
116,052 |
|
|
|
|
| Sekisui House Si Residential Investment
Corp.†† |
|
|
115 |
|
|
|
127,898 |
|
|
|
|
| Select Income Real Estate Investment Trust |
|
|
4,720 |
|
|
|
109,457 |
|
|
|
|
| Shaftesbury PLC†† |
|
|
20,716 |
|
|
|
266,408 |
|
|
|
|
| Spirit Realty Capital, Inc. |
|
|
108,494 |
|
|
|
1,224,897 |
|
|
|
|
| Stockland†† |
|
|
364,113 |
|
|
|
1,272,580 |
|
|
|
|
|
|
|
|
|
|
| Description |
|
Number of
Shares |
|
|
Value |
|
|
|
|
| Sunlight Real Estate Investment
Trust†† |
|
|
177,000 |
|
|
$ |
89,394 |
|
|
|
|
| Suntec Real Estate Investment
Trust†† |
|
|
504,800 |
|
|
|
673,895 |
|
|
|
|
| Tokyu Real Estate Investment Trust,
Inc.†† |
|
|
91 |
|
|
|
122,555 |
|
|
|
|
| Top Real Estate Investment Trust,
Inc.†† |
|
|
13 |
|
|
|
56,078 |
|
|
|
|
| United Urban Investment
Corp.†† |
|
|
458 |
|
|
|
726,971 |
|
|
|
|
| Washington Real Estate Investment Trust |
|
|
4,991 |
|
|
|
123,378 |
|
|
|
|
| Wereldhave NV*,†† |
|
|
2,271 |
|
|
|
145,775 |
|
|
|
|
| Whitestone Real Estate Investment Trust |
|
|
1,951 |
|
|
|
28,680 |
|
|
|
|
| Winthrop Realty Trust |
|
|
2,434 |
|
|
|
40,064 |
|
|
|
|
| Yuexiu Real Estate Investment
Trust†† |
|
|
136,000 |
|
|
|
76,784 |
|
|
|
|
|
|
|
|
|
|
|
|
|
| TOTAL DIVERSIFIED |
|
|
|
|
|
$ |
20,002,622 |
|
|
| DIVERSIFIED REAL ESTATE ACTIVITIES – 0.0%** |
|
|
|
|
| Merlin Properties Socimi
SA*,†† |
|
|
18,227 |
|
|
|
248,949 |
|
|
| INDUSTRIALS – 1.9% |
|
|
|
|
| Ascendas Real Estate Investment
Trust†† |
|
|
204,000 |
|
|
|
380,169 |
|
|
|
|
| Australian Industrial Real Estate Investment
Trust†† |
|
|
41,622 |
|
|
|
77,712 |
|
|
|
|
| BWP Trust†† |
|
|
75,742 |
|
|
|
181,630 |
|
|
|
|
| DCT Industrial Trust, Inc. |
|
|
18,654 |
|
|
|
616,328 |
|
|
|
|
| EastGroup Properties, Inc. |
|
|
4,226 |
|
|
|
241,727 |
|
|
|
|
| First Industrial Realty Trust, Inc. |
|
|
9,049 |
|
|
|
178,537 |
|
|
|
|
| GLP J-REIT†† |
|
|
463 |
|
|
|
476,047 |
|
|
|
|
| Goodman Group†† |
|
|
297,665 |
|
|
|
1,460,616 |
|
|
|
|
| Granite Real Estate Investment Trust |
|
|
3,100 |
|
|
|
107,504 |
|
|
|
|
| Hansteen Holdings PLC*,†† |
|
|
69,778 |
|
|
|
126,095 |
|
|
|
|
| Industria Real Estate Investment
Trust†† |
|
|
37,595 |
|
|
|
61,487 |
|
|
|
|
| Industrial & Infrastructure Fund Investment Corp.†† |
|
|
30 |
|
|
|
144,689 |
|
|
|
|
| Japan Logistics Fund,
Inc.†† |
|
|
68 |
|
|
|
144,201 |
|
|
|
|
| Mapletree Industrial
Trust†† |
|
|
88,000 |
|
|
|
106,969 |
|
|
|
|
| Mapletree Logistics
Trust†† |
|
|
110,000 |
|
|
|
102,205 |
|
|
|
|
| Monmouth Real Estate Investment Corp. |
|
|
4,131 |
|
|
|
42,673 |
|
|
|
|
| Nippon Prologis REIT,
Inc.†† |
|
|
319 |
|
|
|
691,194 |
|
|
|
|
| Prologis, Inc.# |
|
|
73,712 |
|
|
|
2,963,222 |
|
|
|
|
| Pure Industrial Real Estate Trust |
|
|
20,600 |
|
|
|
86,737 |
|
|
|
|
| Rexford Industrial Realty, Inc. |
|
|
4,240 |
|
|
|
63,006 |
|
|
|
|
| Segro PLC†† |
|
|
60,228 |
|
|
|
395,662 |
|
|
|
|
| STAG Industrial, Inc. |
|
|
4,083 |
|
|
|
88,724 |
|
|
|
|
| Terreno Realty Corp. |
|
|
2,510 |
|
|
|
53,413 |
|
|
|
|
| Warehouses De Pauw CVA†† |
|
|
1,047 |
|
|
|
83,222 |
|
|
|
|
|
|
|
|
|
|
|
|
|
| TOTAL INDUSTRIALS |
|
|
|
|
|
$ |
8,873,769 |
|
|
| OFFICE – 5.7% |
|
|
|
|
| Alexandria Real Estate Equities, Inc. |
|
|
14,592 |
|
|
|
1,348,009 |
|
|
|
|
| Allied Properties Real Estate Investment Trust |
|
|
4,335 |
|
|
|
143,722 |
|
|
|
|
| Axia Real Estate Socimi
SA*,†† |
|
|
2,470 |
|
|
|
33,363 |
|
April 30, 2015 / ANNUAL REPORT
PORTFOLIOS OF INVESTMENTS 67
Wilmington Multi-Manager Real Asset Fund
(continued)
|
|
|
|
|
|
|
|
|
| Description |
|
Number of
Shares |
|
|
Value |
|
|
|
|
| BioMed Realty Trust, Inc. |
|
|
14,452 |
|
|
$ |
299,879 |
|
|
|
|
| Boston Properties, Inc. |
|
|
17,609 |
|
|
|
2,329,847 |
|
|
|
|
| Brandywine Realty Trust |
|
|
42,495 |
|
|
|
619,577 |
|
|
|
|
| CapitaLand Commercial
Trust†† |
|
|
599,400 |
|
|
|
766,387 |
|
|
|
|
| Champion Real Estate Investment
Trust†† |
|
|
308,000 |
|
|
|
166,853 |
|
|
|
|
| Columbia Property Trust, Inc. |
|
|
7,769 |
|
|
|
203,781 |
|
|
|
|
| Confinimmo SA†† |
|
|
1,448 |
|
|
|
159,814 |
|
|
|
|
| Coresite Realty Corp. |
|
|
1,615 |
|
|
|
77,649 |
|
|
|
|
| Corporate Office Properties Trust |
|
|
7,659 |
|
|
|
202,121 |
|
|
|
|
| CyrusOne, Inc. |
|
|
2,641 |
|
|
|
85,780 |
|
|
|
|
| Daiwa Office Investment
Corp.†† |
|
|
25 |
|
|
|
131,589 |
|
|
|
|
| Derwent London PLC†† |
|
|
21,402 |
|
|
|
1,126,499 |
|
|
|
|
| Dexus Property Group†† |
|
|
44,053 |
|
|
|
255,973 |
|
|
|
|
| Digital Realty Trust, Inc. |
|
|
10,185 |
|
|
|
645,831 |
|
|
|
|
| Douglas Emmett, Inc. |
|
|
34,974 |
|
|
|
996,759 |
|
|
|
|
| Dream Office Real Estate Investment Trust |
|
|
7,300 |
|
|
|
167,480 |
|
|
|
|
| DuPont Fabros Technology, Inc. |
|
|
7,917 |
|
|
|
246,615 |
|
|
|
|
| Empire State Realty Trust, Inc. |
|
|
14,309 |
|
|
|
257,562 |
|
|
|
|
| Equity Commonwealth* |
|
|
9,064 |
|
|
|
228,503 |
|
|
|
|
| First Potomac Realty Trust |
|
|
4,414 |
|
|
|
47,318 |
|
|
|
|
| Franklin Street Properties Corp. |
|
|
9,236 |
|
|
|
109,077 |
|
|
|
|
| Global One Real Estate Investment
Corp.†† |
|
|
19 |
|
|
|
67,033 |
|
|
|
|
| Government Properties Income Trust |
|
|
6,371 |
|
|
|
132,772 |
|
|
|
|
| Gramercy Property Trust, Inc. |
|
|
1,930 |
|
|
|
52,766 |
|
|
|
|
| Great Portland Estates
PLC†† |
|
|
77,373 |
|
|
|
944,492 |
|
|
|
|
| Highwoods Properties, Inc. |
|
|
16,457 |
|
|
|
708,309 |
|
|
|
|
| Hudson Pacific Properties, Inc. |
|
|
4,127 |
|
|
|
124,470 |
|
|
|
|
| ICADE†† |
|
|
12,694 |
|
|
|
1,104,072 |
|
|
|
|
| Invesco Office J-Reit,
Inc.†† |
|
|
80 |
|
|
|
76,539 |
|
|
|
|
| Investa Office Fund†† |
|
|
202,138 |
|
|
|
592,092 |
|
|
|
|
| Japan Excellent, Inc.†† |
|
|
121 |
|
|
|
160,385 |
|
|
|
|
| Japan Prime Realty Investment
Corp.†† |
|
|
57 |
|
|
|
204,511 |
|
|
|
|
| Japan Real Estate Investment
Corp.†† |
|
|
251 |
|
|
|
1,185,232 |
|
|
|
|
| Kilroy Realty Corp. |
|
|
23,461 |
|
|
|
1,665,496 |
|
|
|
|
| Lar Espana Real Estate Socimi
SA*,†† |
|
|
2,094 |
|
|
|
24,594 |
|
|
|
|
| Mack-Cali Realty Corp. |
|
|
9,666 |
|
|
|
173,505 |
|
|
|
|
| MID Real Estate Investment Trust,
Inc.†† |
|
|
12 |
|
|
|
35,478 |
|
|
|
|
| Mori Hills Real Estate Investment Trust Investment Corp.†† |
|
|
126 |
|
|
|
172,919 |
|
|
|
|
| Mori Trust Sogo Real Estate Investment Trust,
Inc.†† |
|
|
102 |
|
|
|
200,940 |
|
|
|
|
| New York Real Estate Investment Trust, Inc. |
|
|
12,191 |
|
|
|
120,447 |
|
|
|
|
| Nippon Building Fund,
Inc.†† |
|
|
105 |
|
|
|
522,467 |
|
|
|
|
| Nomura Real Estate Office Fund,
Inc.†† |
|
|
27 |
|
|
|
124,108 |
|
|
|
|
| Orix JREIT, Inc.†† |
|
|
553 |
|
|
|
817,422 |
|
|
|
|
| Paramount Group, Inc. |
|
|
32,600 |
|
|
|
597,232 |
|
|
|
|
| Parkway Properties, Inc. |
|
|
8,992 |
|
|
|
146,300 |
|
|
|
|
| Piedmont Office Realty Trust, Inc. |
|
|
11,569 |
|
|
|
202,226 |
|
|
|
|
|
|
|
|
|
|
| Description |
|
Number of
Shares |
|
|
Value |
|
|
|
|
| Premier Investment
Corp.†† |
|
|
15 |
|
|
$ |
83,594 |
|
|
|
|
| Prosperity Real Estate Investment
Trust†† |
|
|
91,000 |
|
|
|
33,877 |
|
|
|
|
| QTS Realty Trust, Inc. |
|
|
1,013 |
|
|
|
36,742 |
|
|
|
|
| SL Green Realty Corp. |
|
|
19,662 |
|
|
|
2,405,842 |
|
|
|
|
| Spring Real Estate Investment
Trust†† |
|
|
65,000 |
|
|
|
30,384 |
|
|
|
|
| Vornado Realty Trust# |
|
|
27,083 |
|
|
|
2,802,819 |
|
|
|
|
| Workspace Group PLC†† |
|
|
11,332 |
|
|
|
146,315 |
|
|
|
|
|
|
|
|
|
|
|
|
|
| TOTAL OFFICE |
|
|
|
|
|
$ |
26,345,368 |
|
|
| REAL ESTATE OPERATING COMPANIES – 0.0%** |
|
|
|
|
| Picton Property Income
Ltd.†† |
|
|
33,236 |
|
|
|
37,623 |
|
|
| RESIDENTIAL – 3.8% |
|
|
|
|
| Advance Residence Investment
Corp.†† |
|
|
107 |
|
|
|
252,443 |
|
|
|
|
| Aedifica SA†† |
|
|
700 |
|
|
|
49,888 |
|
|
|
|
| American Campus Communities, Inc. |
|
|
8,709 |
|
|
|
349,579 |
|
|
|
|
| American Homes 4 Rent |
|
|
12,041 |
|
|
|
203,373 |
|
|
|
|
| American Residential Properties, Inc.* |
|
|
1,532 |
|
|
|
28,740 |
|
|
|
|
| Apartment Investment & Management Co. |
|
|
11,029 |
|
|
|
416,124 |
|
|
|
|
| Ascott Residence Trust†† |
|
|
63,000 |
|
|
|
60,651 |
|
|
|
|
| Associated Estates Realty Corp. |
|
|
4,349 |
|
|
|
123,947 |
|
|
|
|
| AvalonBay Communities, Inc. |
|
|
19,238 |
|
|
|
3,161,572 |
|
|
|
|
| Boardwalk Real Estate Investment Trust |
|
|
1,876 |
|
|
|
94,476 |
|
|
|
|
| Camden Property Trust |
|
|
6,413 |
|
|
|
481,488 |
|
|
|
|
| Canadian Apartment Properties Real Estate Investment Trust |
|
|
6,504 |
|
|
|
157,250 |
|
|
|
|
| Comforia Residential Real Estate Investment Trust, Inc.†† |
|
|
26 |
|
|
|
56,965 |
|
|
|
|
| Education Realty Trust, Inc. |
|
|
3,441 |
|
|
|
115,686 |
|
|
|
|
| Equity Lifestyle Properties, Inc. |
|
|
5,965 |
|
|
|
315,071 |
|
|
|
|
| Equity Residential |
|
|
57,837 |
|
|
|
4,271,841 |
|
|
|
|
| Essex Property Trust, Inc. |
|
|
11,167 |
|
|
|
2,478,516 |
|
|
|
|
| Home Properties, Inc. |
|
|
4,379 |
|
|
|
322,119 |
|
|
|
|
| Ichigo Real Estate Investment
Corp.†† |
|
|
78 |
|
|
|
58,483 |
|
|
|
|
| Independence Realty Trust, Inc. |
|
|
3,100 |
|
|
|
28,520 |
|
|
|
|
| InterRent Real Estate Investment Trust |
|
|
6,334 |
|
|
|
35,017 |
|
|
|
|
| Invincible Investment
Corp.†† |
|
|
166 |
|
|
|
86,375 |
|
|
|
|
| Japan Rental Housing Investments,
Inc.†† |
|
|
99 |
|
|
|
69,923 |
|
|
|
|
| Kenedix Residential Investment
Corp.†† |
|
|
19 |
|
|
|
55,272 |
|
|
|
|
| Mid-America Apartment Communities, Inc. |
|
|
5,677 |
|
|
|
423,561 |
|
|
|
|
| Milestone Apartments Real Estate Investment Trust |
|
|
2,900 |
|
|
|
33,266 |
|
|
|
|
| Nippon Accommodations Fund,
Inc.†† |
|
|
38 |
|
|
|
147,437 |
|
|
|
|
| Nomura Real Estate Residential Fund,
Inc.†† |
|
|
24 |
|
|
|
135,737 |
|
|
|
|
| Northern Property Real Estate Investment Trust |
|
|
3,700 |
|
|
|
76,975 |
|
|
|
|
| Post Properties, Inc. |
|
|
13,796 |
|
|
|
788,717 |
|
|
|
|
| Preferred Apartment Communities, Inc. |
|
|
3,500 |
|
|
|
38,710 |
|
|
|
|
| Silver Bay Realty Trust Corp. |
|
|
4,617 |
|
|
|
71,425 |
|
|
|
|
| Starts Proceed Investment
Corp.†† |
|
|
17 |
|
|
|
29,003 |
|
ANNUAL REPORT / April 30, 2015
68 PORTFOLIOS OF
INVESTMENTS
Wilmington Multi-Manager Real Asset Fund
(continued)
|
|
|
|
|
|
|
|
|
| Description |
|
Number of
Shares |
|
|
Value |
|
|
|
|
| Sun Communities, Inc. |
|
|
11,346 |
|
|
$ |
704,133 |
|
|
|
|
| UDR, Inc. |
|
|
59,514 |
|
|
|
1,950,274 |
|
|
|
|
| UMH Properties, Inc. |
|
|
3,172 |
|
|
|
31,942 |
|
|
|
|
|
|
|
|
|
|
|
|
|
| TOTAL RESIDENTIAL |
|
|
|
|
|
$ |
17,704,499 |
|
|
| RETAIL – 8.4% |
|
|
|
|
| Acadia Realty Trust |
|
|
4,329 |
|
|
|
133,766 |
|
|
|
|
| Aeon Real Estate Investment Trust Investment
Corp.†† |
|
|
95 |
|
|
|
131,324 |
|
|
|
|
| Agree Realty Corp. |
|
|
998 |
|
|
|
30,718 |
|
|
|
|
| Alexander’s, Inc. |
|
|
247 |
|
|
|
106,511 |
|
|
|
|
| Brixmor Property Group, Inc. |
|
|
6,708 |
|
|
|
157,303 |
|
|
|
|
| Calloway Real Estate Investment Trust |
|
|
7,151 |
|
|
|
181,072 |
|
|
|
|
| CapitaLand Mall Trust†† |
|
|
502,600 |
|
|
|
829,862 |
|
|
|
|
| CapitaLand Retail China Trust Management
Ltd.†† |
|
|
49,000 |
|
|
|
64,200 |
|
|
|
|
| CBL & Associates Properties, Inc. |
|
|
15,254 |
|
|
|
274,725 |
|
|
|
|
| Cedar Realty Trust, Inc. |
|
|
4,681 |
|
|
|
32,720 |
|
|
|
|
| Charter Hall Retail Real Estate Investment
Trust†† |
|
|
15,427 |
|
|
|
52,408 |
|
|
|
|
| CT Real Estate Investment Trust |
|
|
2,626 |
|
|
|
27,337 |
|
|
|
|
| DDR Corp. |
|
|
77,850 |
|
|
|
1,327,343 |
|
|
|
|
| Equity One, Inc. |
|
|
6,112 |
|
|
|
150,539 |
|
|
|
|
| Eurocommercial Properties
NV†† |
|
|
7,222 |
|
|
|
330,009 |
|
|
|
|
| Excel Trust, Inc. |
|
|
4,465 |
|
|
|
70,770 |
|
|
|
|
| Federal Realty Investment Trust |
|
|
5,033 |
|
|
|
672,761 |
|
|
|
|
| Federation Centres†† |
|
|
359,889 |
|
|
|
836,137 |
|
|
|
|
| Fortune Real Estate Investment
Trust†† |
|
|
142,000 |
|
|
|
146,500 |
|
|
|
|
| Frasers Centrepoint
Trust†† |
|
|
100,000 |
|
|
|
156,149 |
|
|
|
|
| Fukuoka Real Investment Trust
Corp.†† |
|
|
59 |
|
|
|
107,486 |
|
|
|
|
| General Growth Properties, Inc. |
|
|
109,601 |
|
|
|
3,003,068 |
|
|
|
|
| Getty Realty Corp. |
|
|
3,637 |
|
|
|
63,175 |
|
|
|
|
| Hammerson PLC†† |
|
|
143,491 |
|
|
|
1,470,136 |
|
|
|
|
| Inland Real Estate Corp. |
|
|
6,326 |
|
|
|
65,095 |
|
|
|
|
| Intu Properties PLC†† |
|
|
38,766 |
|
|
|
203,366 |
|
|
|
|
| Japan Retail Fund Investment
Corp.†† |
|
|
690 |
|
|
|
1,468,916 |
|
|
|
|
| Kimco Realty Corp. |
|
|
82,413 |
|
|
|
1,986,153 |
|
|
|
|
| Kite Realty Group Trust |
|
|
6,126 |
|
|
|
160,501 |
|
|
|
|
| Klepierre†† |
|
|
44,940 |
|
|
|
2,179,847 |
|
|
|
|
| Link REIT (The)†† |
|
|
267,000 |
|
|
|
1,656,196 |
|
|
|
|
| Macerich Co. (The) |
|
|
17,860 |
|
|
|
1,460,234 |
|
|
|
|
| Mapletree Commercial
Trust†† |
|
|
100,000 |
|
|
|
116,298 |
|
|
|
|
| Mercialys SA†† |
|
|
18,129 |
|
|
|
450,500 |
|
|
|
|
| National Retail Properties, Inc.# |
|
|
9,262 |
|
|
|
355,661 |
|
|
|
|
| Novion Property Group†† |
|
|
272,647 |
|
|
|
530,289 |
|
|
|
|
| Pennsylvania Real Estate Investment Trust |
|
|
5,171 |
|
|
|
116,916 |
|
|
|
|
| Plaza Retail Real Estate Investment Trust |
|
|
8,600 |
|
|
|
31,435 |
|
|
|
|
| Ramco-Gershenson Properties Trust |
|
|
25,505 |
|
|
|
445,827 |
|
|
|
|
|
|
|
|
|
|
| Description |
|
Number of
Shares |
|
|
Value |
|
|
|
|
| Realty Income Corp.# |
|
|
16,728 |
|
|
$ |
785,714 |
|
|
|
|
| Regency Centers Corp. |
|
|
6,927 |
|
|
|
434,877 |
|
|
|
|
| Retail Opportunity Investments Corp. |
|
|
8,569 |
|
|
|
143,788 |
|
|
|
|
| Retail Properties of America, Inc. |
|
|
17,621 |
|
|
|
266,253 |
|
|
|
|
| Retrocom Real Estate Investment Trust |
|
|
18,100 |
|
|
|
59,858 |
|
|
|
|
| RioCan Real Estate Investment Trust |
|
|
11,962 |
|
|
|
296,051 |
|
|
|
|
| Rouse Properties, Inc.# |
|
|
4,151 |
|
|
|
72,518 |
|
|
|
|
| Saul Centers, Inc. |
|
|
957 |
|
|
|
48,156 |
|
|
|
|
| Scentre Group†† |
|
|
511,766 |
|
|
|
1,507,499 |
|
|
|
|
| Shopping Centres Australasia Property
Group†† |
|
|
34,722 |
|
|
|
58,325 |
|
|
|
|
| Simon Property Group, Inc. |
|
|
41,011 |
|
|
|
7,443,084 |
|
|
|
|
| Tanger Factory Outlet Centers, Inc. |
|
|
7,218 |
|
|
|
242,380 |
|
|
|
|
| Taubman Centers, Inc. |
|
|
8,791 |
|
|
|
633,040 |
|
|
|
|
| Unibail-Rodamco SE†† |
|
|
12,842 |
|
|
|
3,545,816 |
|
|
|
|
| Urban Edge Properties |
|
|
6,543 |
|
|
|
148,068 |
|
|
|
|
| Urstadt Biddle Properties, Inc. |
|
|
1,937 |
|
|
|
40,193 |
|
|
|
|
| Vastned Retail NV†† |
|
|
1,260 |
|
|
|
61,528 |
|
|
|
|
| Weingarten Realty Investors |
|
|
8,402 |
|
|
|
275,250 |
|
|
|
|
| Westfield Corp.†† |
|
|
168,765 |
|
|
|
1,254,733 |
|
|
|
|
| WP GLIMCHER, Inc. |
|
|
11,993 |
|
|
|
179,895 |
|
|
|
|
|
|
|
|
|
|
|
|
|
| TOTAL RETAIL |
|
|
|
|
|
$ |
39,080,279 |
|
|
| SPECIALIZED – 5.1% |
|
|
|
|
| ALE Property Group†† |
|
|
22,174 |
|
|
|
66,455 |
|
|
|
|
| Ashford Hospitality Prime, Inc. |
|
|
4,129 |
|
|
|
64,660 |
|
|
|
|
| Ashford Hospitality Trust, Inc. |
|
|
2,893 |
|
|
|
26,211 |
|
|
|
|
| Big Yellow Group PLC†† |
|
|
12,620 |
|
|
|
129,033 |
|
|
|
|
| CareTrust Real Estate Investment Trust, Inc. |
|
|
2,417 |
|
|
|
30,188 |
|
|
|
|
| CDL Hospitality Trusts†† |
|
|
50,000 |
|
|
|
64,787 |
|
|
|
|
| Chartwell Retirement Residences |
|
|
11,453 |
|
|
|
114,957 |
|
|
|
|
| Chatham Lodging Trust |
|
|
1,959 |
|
|
|
54,147 |
|
|
|
|
| Chesapeake Lodging Trust |
|
|
4,775 |
|
|
|
151,606 |
|
|
|
|
| Corrections Corp. of America |
|
|
9,592 |
|
|
|
352,890 |
|
|
|
|
| CubeSmart |
|
|
11,837 |
|
|
|
273,080 |
|
|
|
|
| DiamondRock Hospitality Co. |
|
|
14,595 |
|
|
|
197,908 |
|
|
|
|
| EPR Properties |
|
|
4,615 |
|
|
|
266,147 |
|
|
|
|
| Extra Space Storage, Inc. |
|
|
8,213 |
|
|
|
541,483 |
|
|
|
|
| FelCor Lodging Trust, Inc. |
|
|
8,425 |
|
|
|
93,602 |
|
|
|
|
| First Real Estate Investment
Trust†† |
|
|
92,000 |
|
|
|
100,809 |
|
|
|
|
| Folkestone Education
Trust†† |
|
|
17,729 |
|
|
|
30,804 |
|
|
|
|
| Gaming and Leisure Properties, Inc. |
|
|
7,800 |
|
|
|
278,460 |
|
|
|
|
| Geo Group, Inc. (The) |
|
|
5,461 |
|
|
|
212,979 |
|
|
|
|
| HCP, Inc. |
|
|
34,530 |
|
|
|
1,391,214 |
|
|
|
|
| Health Care REIT, Inc. |
|
|
54,406 |
|
|
|
3,918,320 |
|
|
|
|
| Healthcare Realty Trust, Inc. |
|
|
29,519 |
|
|
|
755,686 |
|
|
|
|
| Healthcare Trust of America, Inc. |
|
|
27,499 |
|
|
|
711,949 |
|
|
| April 30, 2015 / ANNUAL REPORT |
PORTFOLIOS OF INVESTMENTS 69
Wilmington Multi-Manager Real Asset Fund
(continued)
|
|
|
|
|
|
|
|
|
| Description |
|
Number of
Shares |
|
|
Value |
|
|
|
|
| Hersha Hospitality Trust |
|
|
14,443 |
|
|
$ |
92,869 |
|
|
|
|
| Hospitality Properties Trust |
|
|
12,768 |
|
|
|
384,061 |
|
|
|
|
| Host Hotels & Resorts, Inc. |
|
|
132,424 |
|
|
|
2,667,019 |
|
|
|
|
| InnVest Real Estate Investment Trust |
|
|
11,769 |
|
|
|
55,114 |
|
|
|
|
| Iron Mountain, Inc. |
|
|
13,753 |
|
|
|
474,341 |
|
|
|
|
| Japan Hotel REIT Investment
Corp.†† |
|
|
570 |
|
|
|
420,033 |
|
|
|
|
| LaSalle Hotel Properties |
|
|
9,019 |
|
|
|
330,907 |
|
|
|
|
| LTC Properties, Inc. |
|
|
2,588 |
|
|
|
112,475 |
|
|
|
|
| Medical Properties Trust, Inc. |
|
|
12,856 |
|
|
|
179,727 |
|
|
|
|
| National Health Investors, Inc. |
|
|
2,193 |
|
|
|
146,317 |
|
|
|
|
| New Senior Investment Group, Inc. |
|
|
8,143 |
|
|
|
131,591 |
|
|
|
|
| NorthWest Healthcare Properties Real Estate Investment Trust |
|
|
7,900 |
|
|
|
58,669 |
|
|
|
|
| Omega Healthcare Investors, Inc. |
|
|
11,146 |
|
|
|
402,259 |
|
|
|
|
| Parkway Life Real Estate Investment
Trust†† |
|
|
54,000 |
|
|
|
99,884 |
|
|
|
|
| Pebblebrook Hotel Trust |
|
|
15,255 |
|
|
|
655,050 |
|
|
|
|
| Physicians Realty Trust |
|
|
2,587 |
|
|
|
42,944 |
|
|
|
|
| Primary Health Properties
PLC†† |
|
|
7,489 |
|
|
|
44,513 |
|
|
|
|
| Public Storage |
|
|
15,358 |
|
|
|
2,885,921 |
|
|
|
|
| Regal Real Estate Investment
Trust†† |
|
|
106,000 |
|
|
|
31,547 |
|
|
|
|
| RLJ Lodging Trust |
|
|
9,851 |
|
|
|
292,279 |
|
|
|
|
| Ryman Hospitality Properties, Inc. |
|
|
3,803 |
|
|
|
219,205 |
|
|
|
|
| Sabra Health Care Real Estate Investment Trust, Inc. |
|
|
4,628 |
|
|
|
138,285 |
|
|
|
|
| Safestore Holdings PLC†† |
|
|
68,288 |
|
|
|
293,067 |
|
|
|
|
| Senior Housing Properties Trust |
|
|
16,567 |
|
|
|
339,127 |
|
|
|
|
| Sovran Self Storage, Inc. |
|
|
2,465 |
|
|
|
215,293 |
|
|
|
|
| Strategic Hotels & Resorts, Inc.* |
|
|
66,315 |
|
|
|
775,886 |
|
|
|
|
| Summit Hotel Properties, Inc. |
|
|
6,545 |
|
|
|
86,198 |
|
|
|
|
| Sunstone Hotel Investors, Inc. |
|
|
55,854 |
|
|
|
870,205 |
|
|
|
|
| Universal Health Realty Income Trust |
|
|
969 |
|
|
|
48,121 |
|
|
|
|
| Ventas, Inc. |
|
|
22,292 |
|
|
|
1,535,919 |
|
|
|
|
| Xenia Hotels & Resorts, Inc. |
|
|
1,329 |
|
|
|
29,118 |
|
|
|
|
|
|
|
|
|
|
|
|
|
| TOTAL SPECIALIZED |
|
|
|
|
|
$ |
23,885,319 |
|
|
|
|
|
|
|
|
|
|
| TOTAL REAL ESTATE INVESTMENT TRUSTS
(COST $111,559,012) |
|
|
$ |
136,178,428 |
|
|
| WARRANT – 0.0%** |
|
|
| REAL ESTATE DEVELOPMENT – 0.0%** |
|
|
|
|
| Sun Hung Kai Properties Ltd., Expire 5/22/16* |
|
|
4,725 |
|
|
|
18,594 |
|
|
|
|
|
|
|
|
|
|
|
|
| TOTAL WARRANT
(COST $1,462) |
|
|
$ |
18,594 |
|
|
|
|
|
|
|
|
|
|
| TOTAL REAL ESTATE RELATED SECURITIES
(COST $154,699,797) |
|
|
$ |
188,114,287 |
|
|
|
|
|
|
|
|
|
|
| Description |
|
Number of
Shares |
|
|
Value |
|
| COMMODITY RELATED SECURITIES – 13.6% |
|
|
| INVESTMENT COMPANIES – 13.6% |
|
|
| COMMODITY FUNDS – 13.6% |
|
|
|
|
| Credit Suisse Commodity Return Strategy Fund, Class I* |
|
|
6,386,150 |
|
|
$ |
37,997,594 |
|
|
|
|
| PIMCO CommoditiesPLUS Strategy Fund, Institutional Shares* |
|
|
3,200,178 |
|
|
|
25,441,415 |
|
|
|
|
|
|
|
|
|
|
|
|
| TOTAL COMMODITY FUNDS |
|
|
$ |
63,439,009 |
|
|
|
|
|
|
|
|
|
|
|
|
| TOTAL INVESTMENT COMPANIES
(COST $73,484,657) |
|
|
$ |
63,439,009 |
|
|
|
|
|
|
|
|
|
|
|
|
| TOTAL COMMODITY RELATED SECURITIES (COST
$73,484,657) |
|
|
$ |
63,439,009 |
|
| |
|
|
|
|
|
|
|
|
| |
|
Notional
Amount |
|
|
|
|
| PURCHASED OPTIONS – 0.1% |
|
|
| CALL OPTIONS – 0.0%** |
|
|
|
|
| INF CAP US YOY, Strike Price $0.01, Expiring 4/10/2020 |
|
$ |
8,300,000 |
|
|
$ |
3,510 |
|
|
|
|
| IRO USD 1Y MYC, Strike Price $0.80, Expiring 1/19/2016 |
|
|
9,200,000 |
|
|
|
10,042 |
|
|
|
|
|
|
|
|
|
|
|
|
|
| TOTAL CALL OPTIONS |
|
|
|
|
|
$ |
13,552 |
|
|
| PUT OPTIONS – 0.1% |
|
|
|
|
| IRO USD 30Y BOA, Strike Price $2.59, Expiring 5/22/2015 |
|
|
300,000 |
|
|
|
3,349 |
|
|
|
|
| IRO USD 30Y MYC, Strike Price $2.68, Expiring 12/11/2017 |
|
|
1,000,000 |
|
|
|
105,621 |
|
|
|
|
|
|
|
|
|
|
|
|
|
| TOTAL PUT OPTIONS |
|
|
|
|
|
$ |
108,970 |
|
|
|
|
|
|
|
|
|
|
|
|
| TOTAL PURCHASED OPTIONS (COST
$156,070) |
|
|
$ |
122,522 |
|
| |
|
|
|
|
|
|
|
|
| |
|
Number of
Shares |
|
|
|
|
| SHORT-TERM INVESTMENTS – 1.0% |
|
|
| MONEY MARKET FUND – 1.0% |
|
|
|
|
| Dreyfus Cash Management Fund, Institutional Shares, 0.04%^ |
|
|
4,760,369 |
|
|
$ |
4,760,369 |
|
|
|
|
|
|
|
|
|
|
|
|
| TOTAL SHORT-TERM INVESTMENTS (COST
$4,760,369) |
|
|
$ |
4,760,369 |
|
|
| ANNUAL REPORT / April 30, 2015 |
70 PORTFOLIOS OF
INVESTMENTS
Wilmington Multi-Manager Real Asset Fund
(continued)
|
|
|
|
|
|
|
|
|
| |
|
Par Value |
|
|
|
|
| CASH COLLATERAL INVESTED FOR SECURITIES ON
LOAN – 0.3% |
|
|
| REPURCHASE AGREEMENT – 0.3% |
|
|
|
|
| BNP Paribas Securities Corp., 0.12%, dated 4/30/15, due 5/01/15, repurchase price $64,647, collateralized by U.S. Government & Treasury Securities 0.00% to 6.50%,
maturing 5/01/16 to 4/20/45; total market value of $65,940. |
|
$ |
64,647 |
|
|
$ |
64,647 |
|
|
|
|
| Citigroup Global Markets, Inc., 0.13%, dated 4/30/15, due 5/01/15, repurchase price $245,663, collateralized by U.S. Government Securities 1.61% to 8.00%, maturing
6/01/17 to 6/15/52; total market value of $250,575. |
|
|
245,662 |
|
|
|
245,662 |
|
|
|
|
| Credit Suisse Securities (USA) LLC, 0.12%, dated 4/30/15, due 5/01/15, repurchase price $245,663, collateralized by U.S. Government Securities 3.00% to 4.50%, maturing
8/01/38 to 4/01/45; total market value of $250,577. |
|
|
245,662 |
|
|
|
245,662 |
|
|
|
|
| ING Financial Markets LLC, 0.12%, dated 4/30/15, due 5/01/15, repurchase price $245,663, collateralized by U.S. Government Securities 1.85% to 6.20%, maturing 5/01/33
to 11/01/44; total market value of $250,576. |
|
|
245,662 |
|
|
|
245,662 |
|
|
|
|
| JP Morgan Securities LLC, 0.13%, dated 4/30/15, due 5/01/15, repurchase price $245,663, collateralized by U.S. Government Securities 1.78% to 6.13%, maturing 3/01/19
to 2/01/45; total market value of $250,578. |
|
|
245,662 |
|
|
|
245,662 |
|
|
|
|
| Nomura Securities International, Inc. 0.13%, dated 4/30/15, due 5/01/15, repurchase price $245,663, collateralized by U.S. Government & Treasury Securities
0.00% to 10.50%, maturing 5/15/15 to 3/20/64; total market value of $250,575. |
|
|
245,662 |
|
|
|
245,662 |
|
|
|
|
|
|
|
|
|
|
| TOTAL CASH COLLATERAL INVESTED FOR SECURITIES ON LOAN
(COST $1,292,957) |
|
|
$ |
1,292,957 |
|
|
|
|
|
|
|
|
|
|
|
|
| TOTAL INVESTMENTS IN SECURITIES 112.8%
(COST $506,869,654) |
|
|
$ |
525,040,001 |
|
| |
|
|
|
|
|
|
|
|
| |
|
Contracts |
|
|
|
|
| WRITTEN OPTIONS – (0.1%) |
|
|
|
|
|
|
|
|
|
|
|
| CALL OPTIONS – 0.0%** |
|
|
|
|
|
|
|
|
|
|
|
| Euro Bund Option, Strike Price $157.00, Expiring 5/22/2015 |
|
|
(205 |
) |
|
$ |
(211,770 |
) |
|
|
|
| U.S. 10Y Futures Option JUN15C, Strike Price $130.50, Expiring 5/22/2015 |
|
|
(55 |
) |
|
|
(3,438 |
) |
|
|
|
|
|
|
|
|
|
|
|
|
| TOTAL CALL OPTIONS |
|
|
|
|
|
$ |
(215,208 |
) |
|
|
|
|
|
|
|
|
|
| |
|
Notional
Amount |
|
|
Value |
|
| CALL OPTIONS – 0.0%** |
|
|
|
|
|
|
|
|
|
|
|
| IRO EUR 30Y GLM, Strike Price $0.75, Expiring 9/11/2015 |
|
$ |
(400,000 |
) |
|
$ |
(8,091 |
) |
|
|
|
| IRO USD 1Y MYC, Strike Price $0.52, Expiring 1/19/2016 |
|
|
(9,200,000 |
) |
|
|
(3,156 |
) |
|
|
|
| IRO USD 1Y MYC, Strike Price $0.66, Expiring 1/19/2016 |
|
|
(9,200,000 |
) |
|
|
(5,895 |
) |
|
|
|
| OTC Eput T BOA, Strike Price $2.50, Expiring 5/22/2015 |
|
|
(330,000 |
) |
|
|
(3,767 |
) |
|
|
|
|
|
|
|
|
|
|
|
|
| TOTAL CALL OPTIONS |
|
|
|
|
|
$ |
(20,909 |
) |
|
|
|
| CALL SWAPTIONS – (0.1%) |
|
|
|
|
|
|
|
|
|
|
|
| U.S. Dollar vs BRL, Strike Price $2.68, Expiring 6/29/2015 |
|
|
(1,715,000 |
) |
|
|
(212,444 |
) |
|
|
|
| U.S. Dollar vs BRL, Strike Price $2.68, Expiring 7/01/2015 |
|
|
(370,000 |
) |
|
|
(46,106 |
) |
|
|
|
|
|
|
|
|
|
|
|
|
| TOTAL CALL SWAPTIONS |
|
|
|
|
|
$ |
(258,550 |
) |
|
|
|
| PUT OPTIONS – 0.0%** |
|
|
|
|
|
|
|
|
|
|
|
| INF FLOOR US YOY, Strike Price $0.01, Expiring 4/10/2020 |
|
|
(8,300,000 |
) |
|
|
(1,403 |
) |
|
|
|
| IRO USD 5Y MYC, Strike Price $2.50, Expiring 12/11/2017 |
|
|
(4,200,000 |
) |
|
|
(107,196 |
) |
|
|
|
| OTC EPUT Euro vs U.S. Dollar BRC, Strike Price $1.05, Expiring 5/15/2015 |
|
|
(1,000 |
) |
|
|
— |
|
|
|
|
|
|
|
|
|
|
|
|
|
| TOTAL PUT OPTIONS |
|
|
|
|
|
$ |
(108,599 |
) |
|
|
|
|
|
|
|
|
|
|
|
|
| |
|
Contracts |
|
|
|
|
| PUT OPTION – 0.0%** |
|
|
|
|
|
|
|
|
|
|
|
| U.S. 10Y Futures Option JUN15P, Strike Price $127.50, Expiring 5/22/2015 |
|
|
(55 |
) |
|
$ |
(16,328 |
) |
|
|
|
|
|
|
|
|
|
|
|
|
| TOTAL PUT OPTION |
|
|
|
|
|
$ |
(16,328 |
) |
|
|
|
|
|
|
|
|
|
|
|
|
| |
|
Notional
Amount |
|
|
|
|
| PUT SWAPTIONS – 0.0%** |
|
|
|
|
|
|
|
|
|
|
|
| INF Cap U.S. 10Y JPM, Strike Price $4.00, Expiring 4/22/2024 |
|
$ |
(1,300,000 |
) |
|
$ |
(4,030 |
) |
|
|
|
| INF Cap U.S. 10Y JPM, Strike Price $4.00, Expiring 5/16/2024 |
|
|
(100,000 |
) |
|
|
(330 |
) |
|
|
|
| INF FLOOR U.S. YOY JPM, Strike Price $2.35, Expiring 3/24/2020 |
|
|
(2,300,000 |
) |
|
|
(28,905 |
) |
|
|
|
| INF FLOOR USD, Strike Price $216.69, Expiring 4/07/2020 |
|
|
(2,600,000 |
) |
|
|
(2,147 |
) |
|
|
|
| ITRAXX Eu23 5Y GST, Strike Price $0.90, Expiring 9/16/2015 |
|
|
(1,800,000 |
) |
|
|
(3,808 |
) |
|
|
|
|
|
|
|
|
|
|
|
|
| TOTAL PUT SWAPTIONS |
|
|
|
|
|
$ |
(39,220 |
) |
|
|
|
|
|
|
|
|
|
|
|
| TOTAL WRITTEN OPTIONS (PREMIUMS RECEIVED
$(355,320)) |
|
|
$ |
(658,814 |
) |
|
| April 30, 2015 / ANNUAL REPORT |
PORTFOLIOS OF INVESTMENTS 71
Wilmington Multi-Manager Real Asset Fund (continued)
|
|
|
|
|
|
|
|
|
| Description |
|
Par Value |
|
|
Value |
|
|
| TBA SALE COMMITMENTS – (0.9%) |
|
|
| MORTGAGE-BACKED SECURITIES – (0.9%) |
|
|
|
|
| Federal National Mortgage Association (FNMA), 3.00%, 5/01/45 |
|
$ |
(3,600,000 |
) |
|
$ |
(3,664,969 |
) |
|
|
|
| Federal National Mortgage Association (FNMA), 3.50%, 5/01/45 |
|
|
(400,000 |
) |
|
|
(419,313 |
) |
|
|
|
|
|
|
|
|
|
|
|
|
| TOTAL MORTGAGE-BACKED SECURITIES |
|
|
|
|
|
$ |
(4,084,282 |
) |
|
|
|
|
|
|
|
|
|
|
|
| TOTAL TBA SALE COMMITMENTS (PROCEEDS
$(4,103,040)) |
|
|
$ |
(4,084,282 |
) |
|
|
|
|
|
|
|
| Description |
|
|
|
Value |
|
|
|
|
TOTAL INVESTMENTS NET OF WRITTEN OPTIONS AND TBA SALE
COMMITMENTS – 111.8% |
|
|
|
$ |
520,296,905 |
|
COLLATERAL FOR SECURITIES ON
LOAN – (0.3%) |
|
|
|
|
(1,292,957 |
) |
|
|
|
| OTHER LIABILITIES LESS ASSETS – (11.5%) |
|
|
|
|
(53,386,441 |
) |
|
|
|
|
|
|
|
|
|
|
| TOTAL NET ASSETS – 100.0% |
|
|
|
$ |
465,617,507 |
|
|
|
|
|
|
|
|
Cost of investments for Federal
income tax purposes is $516,130,604. The net unrealized appreciation/(depreciation) of investments was $8,909,397. This consists of net unrealized appreciation from investment for those securities having an excess of value over cost of $34,919,558
and net unrealized depreciation from investments for those securities having an excess of cost over value of $26,010,161.
ANNUAL REPORT / April 30, 2015
72 PORTFOLIOS OF
INVESTMENTS
Wilmington Multi-Manager Real Asset Fund (continued)
Various inputs are used in determining the value of the Fund’s investments. These inputs are
summarized in the three broad levels listed below.
|
|
|
|
|
| Level 1 |
|
– |
|
quoted prices in active markets for identical securities |
| Level 2 |
|
– |
|
other significant observable inputs (including quoted prices for similar securities, interest rates, prepayment speeds, credit risk, etc.) |
| Level 3 |
|
– |
|
significant unobservable inputs (including the Fund’s own assumptions in determining the fair value of investments) |
The following is a summary of the inputs used as of April 30, 2015 in valuing the Fund’s assets
carried at fair value:
|
|
|
|
|
|
|
|
|
|
|
|
|
|
|
|
|
| |
|
Level 1 |
|
|
Level 2 |
|
|
Level 3 |
|
|
Total |
|
|
|
|
|
|
| Assets |
|
|
|
|
|
|
|
|
|
|
|
|
|
|
|
|
|
|
|
|
|
| Investments in Securities |
|
|
|
|
|
|
|
|
|
|
|
|
|
|
|
|
|
|
|
|
|
| Inflation-Linked & Fixed Income Securities |
|
|
|
|
|
|
|
|
|
|
|
|
|
|
|
|
|
|
|
|
|
| Asset-Backed Securities |
|
$ |
— |
|
|
$ |
3,416,444 |
|
|
$ |
— |
|
|
$ |
3,416,444 |
|
|
|
|
|
|
| Corporate Bonds |
|
|
— |
|
|
|
11,197,550 |
|
|
|
— |
|
|
|
11,197,550 |
|
|
|
|
|
|
| Foreign Government Inflation-Linked Securities |
|
|
— |
|
|
|
122,504,097 |
|
|
|
— |
|
|
|
122,504,097 |
|
|
|
|
|
|
| Foreign Government Securities |
|
|
— |
|
|
|
21,810,468 |
|
|
|
— |
|
|
|
21,810,468 |
|
|
|
|
|
|
| Mortgage-Backed Securities |
|
|
— |
|
|
|
2,202,234 |
|
|
|
— |
|
|
|
2,202,234 |
|
|
|
|
|
|
| U.S. Government Agency Obligation |
|
|
— |
|
|
|
99,976 |
|
|
|
— |
|
|
|
99,976 |
|
|
|
|
|
|
| U.S. Government Inflation-Linked Securities |
|
|
— |
|
|
|
101,183,511 |
|
|
|
— |
|
|
|
101,183,511 |
|
|
|
|
|
|
| U.S. Treasury |
|
|
— |
|
|
|
4,896,577 |
|
|
|
— |
|
|
|
4,896,577 |
|
|
|
|
|
|
| Real Estate Related Securities |
|
|
|
|
|
|
|
|
|
|
|
|
|
|
|
|
|
|
|
|
|
| Common Stocks |
|
|
1,074,639 |
|
|
|
45,897,145 |
|
|
|
— |
|
|
|
46,971,784 |
|
|
|
|
|
|
| Exchange-Traded Funds |
|
|
4,585,943 |
|
|
|
— |
|
|
|
— |
|
|
|
4,585,943 |
|
|
|
|
|
|
| Investment Companies |
|
|
— |
|
|
|
287,298 |
|
|
|
— |
|
|
|
287,298 |
|
|
|
|
|
|
| Preferred Stock |
|
|
72,240 |
|
|
|
— |
|
|
|
— |
|
|
|
72,240 |
|
|
|
|
|
|
| Real Estate Investment Trusts |
|
|
88,953,442 |
|
|
|
47,224,986 |
|
|
|
— |
|
|
|
136,178,428 |
|
|
|
|
|
|
| Warrant |
|
|
18,594 |
|
|
|
— |
|
|
|
— |
|
|
|
18,594 |
|
|
|
|
|
|
| Commodity Related Securities |
|
|
|
|
|
|
|
|
|
|
|
|
|
|
|
|
|
|
|
|
|
| Investment Companies |
|
|
63,439,009 |
|
|
|
— |
|
|
|
— |
|
|
|
63,439,009 |
|
|
|
|
|
|
| Purchased Options |
|
|
— |
|
|
|
122,522 |
|
|
|
— |
|
|
|
122,522 |
|
|
|
|
|
|
| Short-Term Investments |
|
|
|
|
|
|
|
|
|
|
|
|
|
|
|
|
|
|
|
|
|
| Money Market Fund |
|
|
4,760,369 |
|
|
|
— |
|
|
|
— |
|
|
|
4,760,369 |
|
|
|
|
|
|
| Repurchase Agreements |
|
|
— |
|
|
|
1,292,957 |
|
|
|
— |
|
|
|
1,292,957 |
|
|
|
|
|
|
|
|
|
|
|
|
|
|
|
|
|
|
|
|
|
|
|
| Total Investments in Securities |
|
|
162,904,236 |
|
|
|
362,135,765 |
|
|
|
— |
|
|
|
525,040,001 |
|
|
|
|
|
|
|
|
|
|
|
|
|
|
|
|
|
|
|
|
|
|
|
| Other Financial Instruments^ |
|
|
|
|
|
|
|
|
|
|
|
|
|
|
|
|
|
|
|
|
|
| Forward Foreign Currency Contracts |
|
$ |
— |
|
|
$ |
4,741,852 |
|
|
$ |
— |
|
|
$ |
4,741,852 |
|
|
|
|
|
|
| Credit Default Swaps |
|
|
— |
|
|
|
15,944 |
|
|
|
— |
|
|
|
15,944 |
|
|
|
|
|
|
| Interest Rate Swaps |
|
|
— |
|
|
|
681,177 |
|
|
|
— |
|
|
|
681,177 |
|
|
|
|
|
|
|
|
|
|
|
|
|
|
|
|
|
|
|
|
|
|
|
| Total Assets |
|
|
162,904,236 |
|
|
|
367,574,738 |
|
|
|
— |
|
|
|
530,478,974 |
|
|
|
|
|
|
|
|
|
|
|
|
|
|
|
|
|
|
|
|
|
|
|
| Liabilities |
|
|
|
|
|
|
|
|
|
|
|
|
|
|
|
|
|
|
|
|
|
| Other Financial Instruments^ |
|
|
|
|
|
|
|
|
|
|
|
|
|
|
|
|
|
|
|
|
|
| Written Options |
|
$ |
— |
|
|
$ |
(658,814 |
) |
|
$ |
— |
|
|
$ |
(658,814 |
) |
|
|
|
|
|
| Forward Foreign Currency Contracts |
|
|
— |
|
|
|
(9,423,998 |
) |
|
|
— |
|
|
|
(9,423,998 |
) |
|
|
|
|
|
| Financial Futures Contracts |
|
|
(301,582 |
) |
|
|
— |
|
|
|
— |
|
|
|
(301,582 |
) |
|
|
|
|
|
| Credit Default Swaps |
|
|
— |
|
|
|
(110,510 |
) |
|
|
— |
|
|
|
(110,510 |
) |
|
|
|
|
|
| Interest Rate Swaps |
|
|
— |
|
|
|
(1,311,421 |
) |
|
|
— |
|
|
|
(1,311,421 |
) |
|
|
|
|
|
| TBA Sale Commitments |
|
|
— |
|
|
|
(4,084,282 |
) |
|
|
— |
|
|
|
(4,084,282 |
) |
|
|
|
|
|
|
|
|
|
|
|
|
|
|
|
|
|
|
|
|
|
|
| Total Liabilities |
|
$ |
(301,582 |
) |
|
$ |
(15,589,025 |
) |
|
$ |
— |
|
|
$ |
(15,890,607 |
) |
|
|
|
|
|
|
|
|
|
|
|
|
|
|
|
|
|
| |
^ |
Other financial instruments are derivative instruments not reflected in the value of total investments in securities in the Portfolio of Investments. Financial futures contracts, credit default swaps, interest rate
swaps and forward foreign currency contracts are valued at the unrealized appreciation (depreciation) on the instrument. Written options and TBA sale commitments are reported at their market value at year end. |
April 30, 2015 / ANNUAL REPORT
PORTFOLIOS OF
INVESTMENTS 73
Wilmington
Multi-Manager Real Asset Fund (continued)
| # |
Security, or a portion thereof, is on loan. See Note 2 in Notes to Financial Statements. |
| D |
Floating rate note with current rate and stated maturity date shown. |
| ‡ |
Zero coupon security. The rate shown reflects the effective yield at purchase date. |
| * |
Non-income producing security. |
| Ö |
All or a portion of this security is segregated as collateral in connection with the fund’s derivatives and TBA’s carried by the Fund. The total value of all securities segregated at April 30, 2015
amounted to $2,087,645 representing 0.45% of total net assets. |
| †† |
Security is fair valued in accordance with procedures adopted by the Board of Trustees. See Note 2 in Notes to Financial Statements. At April 30, 2015, the value of these securities amounted to $93,691,293
representing 20.1% of total net assets. |
| W |
Denotes a restricted security that may be resold without restriction to “qualified institutional buyers” as defined in Rule 144A under the Securities Act of 1933 and that the Fund has determined to be liquid
under criteria established by the Fund’s Board of Trustees. At April 30, 2015, these liquid restricted securities amounted to $2,108,469 representing 0.5% of total net assets. |
| ** |
Represents less than 0.05%. |
|
|
|
|
|
The following acronyms are used throughout this Fund: |
|
|
ETF - Exchange Traded Fund |
|
|
FHLB - Federal Home Loan Bank |
|
|
LLC - Limited Liability Corporation |
|
|
LP - Limited Partnership |
|
|
GMTN - Global Medium Term Note |
|
|
MTN - Medium Term Note |
|
|
OAT - Obligations Assimilables |
|
|
PLC - Public Limited Company |
|
|
REIT - Real Estate Investment Trust |
|
|
SPDR - Standard & Poor’s Depository Receipts |
|
|
|
| Currency Code |
|
Currency |
| |
| BRL |
|
Brazilian Real |
| COP |
|
Colombian Peso |
| EUR |
|
Euro |
| GBP |
|
Pound Sterling |
| JPY |
|
Japanese Yen |
| MXN |
|
Mexican Peso |
| NZD |
|
New Zealand Dollar |
| THB |
|
Thai Baht |
| ZAR |
|
South African Rand |
| USD |
|
United States Dollar |
At April 30, 2015, the Real
Asset Fund had the following outstanding forward foreign currency contracts, which contractually obligates the Fund to deliver or receive currencies at specified future dates. The open contracts were as follows:
|
|
|
|
|
|
|
|
|
|
|
|
|
|
|
|
|
| Settlement Date |
|
Counterparty |
|
Contracts to
Deliver/Receive |
|
Contract
Amount |
|
|
Contract
at Value |
|
|
Unrealized
Appreciation
(Depreciation) |
|
| CONTRACTS PURCHASED |
|
| 5/4/2015 |
|
Brown Brothers Harriman & Co. |
|
101,985 Euro |
|
$ |
113,846 |
|
|
$ |
114,520 |
|
|
$ |
674 |
|
| 5/5/2015 |
|
JP Morgan Securities |
|
27,748,306 Brazilian Real |
|
|
9,269,210 |
|
|
|
9,193,001 |
|
|
|
(76,209) |
|
| 5/5/2015 |
|
Deutsche Bank |
|
23,307,313 Brazilian Real |
|
|
7,511,219 |
|
|
|
7,721,702 |
|
|
|
210,483 |
|
| 5/5/2015 |
|
Royal Bank of Canada |
|
14,764,627 Mexican Peso |
|
|
963,151 |
|
|
|
962,014 |
|
|
|
(1,137) |
|
| 5/5/2015 |
|
HSBC Securities, Inc. |
|
9,767,538 Mexican Peso |
|
|
660,000 |
|
|
|
636,421 |
|
|
|
(23,579) |
|
| 5/5/2015 |
|
Deutsche Bank |
|
7,187,256 Brazilian Real |
|
|
2,221,443 |
|
|
|
2,381,134 |
|
|
|
159,691 |
|
| 5/5/2015 |
|
Credit Suisse |
|
6,044,642 Brazilian Real |
|
|
2,019,188 |
|
|
|
2,002,587 |
|
|
|
(16,601) |
|
| 5/5/2015 |
|
HSBC Securities, Inc. |
|
5,628,000 Mexican Peso |
|
|
373,569 |
|
|
|
366,702 |
|
|
|
(6,867) |
|
| 5/5/2015 |
|
HSBC Securities, Inc. |
|
5,434,880 Mexican Peso |
|
|
365,000 |
|
|
|
354,119 |
|
|
|
(10,881) |
|
| 5/5/2015 |
|
Goldman Sachs & Company |
|
4,959,000 Brazilian Real |
|
|
1,539,297 |
|
|
|
1,642,914 |
|
|
|
103,617 |
|
| 5/5/2015 |
|
HSBC Securities, Inc. |
|
4,758,000 Mexican Peso |
|
|
305,906 |
|
|
|
310,016 |
|
|
|
4,110 |
|
| 5/5/2015 |
|
HSBC Securities, Inc. |
|
2,008,000 Brazilian Real |
|
|
670,764 |
|
|
|
665,249 |
|
|
|
(5,515) |
|
| 5/5/2015 |
|
Bank of New York |
|
499,694 Hong Kong Dollar |
|
|
64,473 |
|
|
|
64,472 |
|
|
|
(1) |
|
| 5/5/2015 |
|
Goldman Sachs & Company |
|
347,379 Brazilian Real |
|
|
111,913 |
|
|
|
115,087 |
|
|
|
3,174 |
|
| 5/5/2015 |
|
Brown Brothers Harriman & Co. |
|
113,717 Euro |
|
|
126,943 |
|
|
|
127,696 |
|
|
|
753 |
|
| 5/5/2015 |
|
Bank of New York |
|
63,496 Euro |
|
|
71,249 |
|
|
|
71,302 |
|
|
|
53 |
|
| 5/5/2015 |
|
Bank of New York |
|
16,834 Pound Sterling |
|
|
25,840 |
|
|
|
25,838 |
|
|
|
(2) |
|
| 5/5/2015 |
|
Brown Brothers Harriman & Co. |
|
1,721 Euro |
|
|
1,927 |
|
|
|
1,933 |
|
|
|
6 |
|
| 5/6/2015 |
|
Citigroup Global Markets |
|
50,847,645 Euro |
|
|
55,118,847 |
|
|
|
57,098,954 |
|
|
|
1,980,107 |
|
| 5/6/2015 |
|
Banc of America Securities |
|
31,329,000 Pound Sterling |
|
|
47,541,758 |
|
|
|
48,087,638 |
|
|
|
545,880 |
|
| 5/6/2015 |
|
Deutsche Bank |
|
14,480,355 Euro |
|
|
15,761,866 |
|
|
|
16,260,598 |
|
|
|
498,732 |
|
| 5/6/2015 |
|
Goldman Sachs & Company |
|
5,807,000 Euro |
|
|
6,300,676 |
|
|
|
6,520,924 |
|
|
|
220,248 |
|
| 5/6/2015 |
|
Citigroup Global Markets |
|
2,677,000 Australian Dollar |
|
|
2,140,275 |
|
|
|
2,117,730 |
|
|
|
(22,545) |
|
| 5/6/2015 |
|
Goldman Sachs & Company |
|
1,875,000 Pound Sterling |
|
|
2,794,344 |
|
|
|
2,877,983 |
|
|
|
83,639 |
|
ANNUAL REPORT / April 30, 2015
|
|
|
| 74 |
|
PORTFOLIOS OF INVESTMENTS |
Wilmington Multi-Manager Real Asset Fund (continued)
|
|
|
|
|
|
|
|
|
|
|
|
|
|
|
|
|
|
|
|
|
| Settlement Date |
|
Counterparty |
|
|
Contracts to
Deliver/Receive |
|
|
Contract
Amount |
|
|
Contract
at Value |
|
|
Unrealized
Appreciation
(Depreciation) |
|
| CONTRACTS PURCHASED (continued) |
|
|
|
|
|
|
|
|
|
|
|
|
|
|
|
|
|
| 5/6/2015 |
|
|
Deutsche Bank |
|
|
|
1,116,000 Euro |
|
|
$ |
1,176,376 |
|
|
$ |
1,253,203 |
|
|
$ |
76,827 |
|
| 5/6/2015 |
|
|
Deutsche Bank |
|
|
|
627,000 Pound Sterling |
|
|
|
935,920 |
|
|
|
962,397 |
|
|
|
26,477 |
|
| 5/6/2015 |
|
|
Citigroup Global Markets |
|
|
|
310,000 Canadian Dollar |
|
|
|
245,224 |
|
|
|
256,920 |
|
|
|
11,696 |
|
| 5/6/2015 |
|
|
Goldman Sachs & Company |
|
|
|
201,000 Euro |
|
|
|
217,858 |
|
|
|
225,711 |
|
|
|
7,853 |
|
| 5/6/2015 |
|
|
Citigroup Global Markets |
|
|
|
169,000 Euro |
|
|
|
178,510 |
|
|
|
189,777 |
|
|
|
11,267 |
|
| 5/6/2015 |
|
|
Bank of New York |
|
|
|
52,546 Euro |
|
|
|
58,962 |
|
|
|
59,006 |
|
|
|
44 |
|
| 5/8/2015 |
|
|
Chase Manhattan Corp. |
|
|
|
461,900,000 Japanese Yen |
|
|
|
3,882,165 |
|
|
|
3,868,799 |
|
|
|
(13,366) |
|
| 5/8/2015 |
|
|
Citigroup Global Markets |
|
|
|
196,800,000 Japanese Yen |
|
|
|
1,641,817 |
|
|
|
1,648,365 |
|
|
|
6,548 |
|
| 5/8/2015 |
|
|
Citigroup Global Markets |
|
|
|
3,412,705 Japanese Yen |
|
|
|
28,535 |
|
|
|
28,584 |
|
|
|
49 |
|
| 5/18/2015 |
|
|
Goldman Sachs & Company |
|
|
|
110,145,049 Indian Rupee |
|
|
|
1,747,779 |
|
|
|
1,726,858 |
|
|
|
(20,921) |
|
| 5/18/2015 |
|
|
JP Morgan Securities |
|
|
|
490,000 Thai Baht |
|
|
|
14,772 |
|
|
|
14,855 |
|
|
|
83 |
|
| 6/26/2015 |
|
|
Goldman Sachs & Company |
|
|
|
13,472,420 Indian Rupee |
|
|
|
213,070 |
|
|
|
209,554 |
|
|
|
(3,516) |
|
| 7/24/2015 |
|
|
Barclays Bank International |
|
|
|
138,042,134 Indian Rupee |
|
|
|
2,175,434 |
|
|
|
2,135,082 |
|
|
|
(40,352) |
|
| 7/30/2015 |
|
|
Barclays Bank International |
|
|
|
2,643,609 Polish Zloty |
|
|
|
690,923 |
|
|
|
732,083 |
|
|
|
41,160 |
|
| CONTRACTS SOLD |
|
|
|
|
|
|
|
|
|
|
|
|
|
|
|
|
|
| 5/4/2015 |
|
|
Brown Brothers Harriman & Co. |
|
|
|
8,162 Singapore Dollar |
|
|
|
6,186 |
|
|
|
6,168 |
|
|
|
18 |
|
| 5/5/2015 |
|
|
Deutsche Bank |
|
|
|
30,494,569 Brazilian Real |
|
|
|
10,186,588 |
|
|
|
10,102,836 |
|
|
|
83,752 |
|
| 5/5/2015 |
|
|
JP Morgan Securities |
|
|
|
27,748,306 Brazilian Real |
|
|
|
8,559,009 |
|
|
|
9,193,001 |
|
|
|
(633,992) |
|
| 5/5/2015 |
|
|
HSBC Securities, Inc. |
|
|
|
8,372,803 Mexican Peso |
|
|
|
541,000 |
|
|
|
545,544 |
|
|
|
(4,544) |
|
| 5/5/2015 |
|
|
Citigroup Global Markets |
|
|
|
7,216,000 Mexican Peso |
|
|
|
470,266 |
|
|
|
470,171 |
|
|
|
95 |
|
| 5/5/2015 |
|
|
Credit Suisse |
|
|
|
6,044,642 Brazilian Real |
|
|
|
1,886,828 |
|
|
|
2,002,587 |
|
|
|
(115,759) |
|
| 5/5/2015 |
|
|
Goldman Sachs & Company |
|
|
|
5,306,379 Brazilian Real |
|
|
|
1,772,575 |
|
|
|
1,758,001 |
|
|
|
14,574 |
|
| 5/5/2015 |
|
|
Royal Bank of Canada |
|
|
|
5,248,000 Mexican Peso |
|
|
|
349,301 |
|
|
|
341,942 |
|
|
|
7,359 |
|
| 5/5/2015 |
|
|
Citigroup Global Markets |
|
|
|
4,948,000 Mexican Peso |
|
|
|
329,531 |
|
|
|
322,395 |
|
|
|
7,136 |
|
| 5/5/2015 |
|
|
Goldman Sachs & Company |
|
|
|
4,400,007 Mexican Peso |
|
|
|
294,500 |
|
|
|
286,690 |
|
|
|
7,810 |
|
| 5/5/2015 |
|
|
Credit Suisse |
|
|
|
2,722,000 Mexican Peso |
|
|
|
182,856 |
|
|
|
177,357 |
|
|
|
5,499 |
|
| 5/5/2015 |
|
|
Citigroup Global Markets |
|
|
|
2,245,980 Mexican Peso |
|
|
|
150,000 |
|
|
|
146,341 |
|
|
|
3,659 |
|
| 5/5/2015 |
|
|
HSBC Securities, Inc. |
|
|
|
2,008,000 Brazilian Real |
|
|
|
616,821 |
|
|
|
665,249 |
|
|
|
(48,428) |
|
| 5/5/2015 |
|
|
Deutsche Bank |
|
|
|
1,802,820 Mexican Peso |
|
|
|
120,000 |
|
|
|
117,466 |
|
|
|
2,534 |
|
| 5/5/2015 |
|
|
Citigroup Global Markets |
|
|
|
1,351,435 Mexican Peso |
|
|
|
90,000 |
|
|
|
88,055 |
|
|
|
1,945 |
|
| 5/5/2015 |
|
|
Citigroup Global Markets |
|
|
|
629,000 Mexican Peso |
|
|
|
42,063 |
|
|
|
40,984 |
|
|
|
1,079 |
|
| 5/5/2015 |
|
|
Barclays Bank International |
|
|
|
416,000 Mexican Peso |
|
|
|
27,816 |
|
|
|
27,105 |
|
|
|
711 |
|
| 5/5/2015 |
|
|
HSBC Securities, Inc. |
|
|
|
320,000 Mexican Peso |
|
|
|
20,969 |
|
|
|
20,850 |
|
|
|
119 |
|
| 5/5/2015 |
|
|
HSBC Securities, Inc. |
|
|
|
277,000 Mexican Peso |
|
|
|
18,410 |
|
|
|
18,048 |
|
|
|
362 |
|
| 5/5/2015 |
|
|
HSBC Securities, Inc. |
|
|
|
262,000 Mexican Peso |
|
|
|
17,391 |
|
|
|
17,071 |
|
|
|
320 |
|
| 5/5/2015 |
|
|
Citigroup Global Markets |
|
|
|
142,000 Mexican Peso |
|
|
|
9,506 |
|
|
|
9,252 |
|
|
|
254 |
|
| 5/5/2015 |
|
|
Brown Brothers Harriman & Co. |
|
|
|
5,915 Singapore Dollar |
|
|
|
4,489 |
|
|
|
4,470 |
|
|
|
19 |
|
| 5/6/2015 |
|
|
Banc of America Securities |
|
|
|
50,843,461 Euro |
|
|
|
54,712,750 |
|
|
|
57,094,255 |
|
|
|
(2,381,505) |
|
| 5/6/2015 |
|
|
HSBC Securities, Inc. |
|
|
|
27,018,000 Pound Sterling |
|
|
|
39,962,481 |
|
|
|
41,470,580 |
|
|
|
(1,508,099) |
|
| 5/6/2015 |
|
|
Citigroup Global Markets |
|
|
|
8,285,841 New Zealand Dollar |
|
|
|
6,316,936 |
|
|
|
6,320,360 |
|
|
|
(3,424) |
|
| 5/6/2015 |
|
|
Citigroup Global Markets |
|
|
|
6,564,000 Euro |
|
|
|
7,154,925 |
|
|
|
7,370,991 |
|
|
|
(216,066) |
|
| 5/6/2015 |
|
|
Royal Bank of Canada |
|
|
|
5,136,000 Pound Sterling |
|
|
|
7,623,473 |
|
|
|
7,883,370 |
|
|
|
(259,897) |
|
| 5/6/2015 |
|
|
HSBC Securities, Inc. |
|
|
|
4,174,000 Euro |
|
|
|
4,584,993 |
|
|
|
4,687,160 |
|
|
|
(102,167) |
|
| 5/6/2015 |
|
|
Goldman Sachs & Company |
|
|
|
4,085,539 Euro |
|
|
|
4,398,178 |
|
|
|
4,587,824 |
|
|
|
(189,646) |
|
| 5/6/2015 |
|
|
Goldman Sachs & Company |
|
|
|
3,637,000 Euro |
|
|
|
3,913,208 |
|
|
|
4,084,140 |
|
|
|
(170,932) |
|
| 5/6/2015 |
|
|
Banc of America Securities |
|
|
|
2,971,000 Euro |
|
|
|
3,268,923 |
|
|
|
3,336,261 |
|
|
|
(67,338) |
|
| 5/6/2015 |
|
|
Deutsche Bank |
|
|
|
1,677,000 Pound Sterling |
|
|
|
2,485,792 |
|
|
|
2,574,068 |
|
|
|
(88,276) |
|
| 5/6/2015 |
|
|
Citigroup Global Markets |
|
|
|
1,354,000 Australian Dollar |
|
|
|
1,042,839 |
|
|
|
1,071,127 |
|
|
|
(28,288) |
|
| 5/6/2015 |
|
|
HSBC Securities, Inc. |
|
|
|
1,323,000 Australian Dollar |
|
|
|
1,003,384 |
|
|
|
1,046,603 |
|
|
|
(43,219) |
|
April 30, 2015 / ANNUAL REPORT
|
|
|
|
|
| PORTFOLIOS OF INVESTMENTS |
|
|
75 |
|
Wilmington Multi-Manager Real Asset Fund (continued)
|
|
|
|
|
|
|
|
|
|
|
|
|
|
|
|
|
|
|
|
|
| Settlement Date |
|
Counterparty |
|
|
Contracts to
Deliver/Receive |
|
|
Contract
Amount |
|
|
Contract
at Value |
|
|
Unrealized
Appreciation
(Depreciation) |
|
| CONTRACTS SOLD (continued) |
|
|
|
|
|
|
|
|
|
|
|
|
|
|
|
|
|
| 5/6/2015 |
|
|
Deutsche Bank |
|
|
|
346,000 Euro |
|
|
$ |
372,698 |
|
|
$ |
388,538 |
|
|
$ |
(15,840) |
|
| 5/6/2015 |
|
|
Brown Brothers Harriman & Co. |
|
|
|
5,565 Singapore Dollar |
|
|
|
4,194 |
|
|
|
4,205 |
|
|
|
(11) |
|
| 5/8/2015 |
|
|
Banc of America Securities |
|
|
|
410,000,000 Japanese Yen |
|
|
|
3,431,499 |
|
|
|
3,434,093 |
|
|
|
(2,594) |
|
| 5/8/2015 |
|
|
Goldman Sachs & Company |
|
|
|
248,700,000 Japanese Yen |
|
|
|
2,079,420 |
|
|
|
2,083,071 |
|
|
|
(3,651) |
|
| 5/18/2015 |
|
|
Credit Suisse |
|
|
|
751,965,000 South Korean Won |
|
|
|
682,147 |
|
|
|
701,087 |
|
|
|
(18,940) |
|
| 5/18/2015 |
|
|
JP Morgan Securities |
|
|
|
34,648,671 Thai Baht |
|
|
|
1,051,553 |
|
|
|
1,050,444 |
|
|
|
1,109 |
|
| 6/2/2015 |
|
|
Citigroup Global Markets |
|
|
|
50,847,645 Euro |
|
|
|
55,137,051 |
|
|
|
57,119,735 |
|
|
|
(1,982,684) |
|
| 6/2/2015 |
|
|
Banc of America Securities |
|
|
|
31,329,000 Pound Sterling |
|
|
|
47,533,111 |
|
|
|
48,078,414 |
|
|
|
(545,303) |
|
| 6/2/2015 |
|
|
Deutsche Bank |
|
|
|
23,307,313 Brazilian Real |
|
|
|
7,444,048 |
|
|
|
7,644,091 |
|
|
|
(200,043) |
|
| 6/2/2015 |
|
|
Deutsche Bank |
|
|
|
14,480,355 Euro |
|
|
|
15,767,166 |
|
|
|
16,266,516 |
|
|
|
(499,350) |
|
| 6/2/2015 |
|
|
Citigroup Global Markets |
|
|
|
2,677,000 Australian Dollar |
|
|
|
2,137,049 |
|
|
|
2,114,483 |
|
|
|
22,566 |
|
| 6/2/2015 |
|
|
Goldman Sachs & Company |
|
|
|
347,379 Brazilian Real |
|
|
|
110,916 |
|
|
|
113,930 |
|
|
|
(3,014) |
|
| 6/3/2015 |
|
|
Credit Suisse |
|
|
|
4,073,311,320 Colombian Peso |
|
|
|
1,749,554 |
|
|
|
1,704,208 |
|
|
|
45,346 |
|
| 6/3/2015 |
|
|
Chase Manhattan Corp. |
|
|
|
461,900,000 Japanese Yen |
|
|
|
3,883,112 |
|
|
|
3,869,829 |
|
|
|
13,283 |
|
| 6/9/2015 |
|
|
HSBC Securities, Inc. |
|
|
|
31,686,149 Mexican Peso |
|
|
|
2,053,675 |
|
|
|
2,059,272 |
|
|
|
(5,597) |
|
| 6/11/2015 |
|
|
Deutsche Bank |
|
|
|
110,359,212 Mexican Peso |
|
|
|
7,213,020 |
|
|
|
7,171,150 |
|
|
|
41,870 |
|
| 7/2/2015 |
|
|
Deutsche Bank |
|
|
|
7,437,424 Brazilian Real |
|
|
|
2,741,402 |
|
|
|
2,415,061 |
|
|
|
326,341 |
|
| 7/2/2015 |
|
|
Credit Suisse |
|
|
|
5,052,615 Brazilian Real |
|
|
|
1,800,326 |
|
|
|
1,640,672 |
|
|
|
159,654 |
|
| 7/7/2015 |
|
|
Royal Bank of Canada |
|
|
|
14,764,627 Mexican Peso |
|
|
|
958,873 |
|
|
|
957,606 |
|
|
|
1,267 |
|
| 7/30/2015 |
|
|
Barclays Bank International |
|
|
|
15,095,706 South African Rand |
|
|
|
1,233,813 |
|
|
|
1,249,586 |
|
|
|
(15,773) |
|
| 7/30/2015 |
|
|
JP Morgan Securities |
|
|
|
2,644,636 Polish Zloty |
|
|
|
704,241 |
|
|
|
732,367 |
|
|
|
(28,126) |
|
| NET UNREALIZED APPRECIATION (DEPRECIATION) ON FORWARD FOREIGN CURRENCY CONTRACTS |
|
|
|
|
|
|
|
|
|
|
|
|
|
|
|
$(4,682,146) |
|
At April 30, 2015, the Real Asset Fund had open financial futures contracts as follows:
|
|
|
|
|
|
|
|
|
|
|
|
|
|
| Underlying Contracts to Buy/Sell |
|
Expiration
Date |
|
Number of
Contracts |
|
Contract
Amount |
|
Contract
at Value |
|
Unrealized
Appreciation
(Depreciation) |
| LONG POSITIONS: |
|
|
|
|
|
|
|
|
|
|
|
|
|
| 30YR US Treasury Bond(CBT) |
|
|
|
June 2015 |
|
|
14 |
|
$ 2,302,461 |
|
$ 2,234,313 |
|
$ (68,148) |
| EUR Commodity Future |
|
|
|
June 2015 |
|
|
3 |
|
526,585 |
|
522,315 |
|
(4,270) |
| SHORT POSITIONS: |
|
|
|
|
|
|
|
|
|
|
|
|
|
| 10YR US Treasury Note(CBT) |
|
|
|
June 2015 |
|
|
40 |
|
$ 5,119,073 |
|
$ 5,135,000 |
|
$ (15,927) |
| 5YR US Treasury Note(CBT) |
|
|
|
June 2015 |
|
|
21 |
|
2,493,238 |
|
2,522,789 |
|
(29,551) |
| 90 DAY EURO DOLLAR |
|
|
|
June 2015 |
|
|
171 |
|
42,582,895 |
|
42,617,475 |
|
(34,580) |
| 90 DAY EURO DOLLAR |
|
|
|
September 2015 |
|
|
116 |
|
28,829,624 |
|
28,873,850 |
|
(44,226) |
| 90 DAY EURO DOLLAR |
|
|
|
December 2015 |
|
|
117 |
|
29,045,149 |
|
29,071,575 |
|
(26,426) |
| 90 DAY EURO DOLLAR |
|
|
|
March 2016 |
|
|
151 |
|
37,371,433 |
|
37,449,887 |
|
(78,454) |
| NET UNREALIZED APPRECIATION (DEPRECIATION) ON FINANCIAL FUTURES CONTRACTS |
|
|
|
|
|
|
|
|
|
|
|
|
$(301,582) |
ANNUAL REPORT / April 30, 2015
|
|
|
| 76 |
|
PORTFOLIOS OF INVESTMENTS |
Wilmington Multi-Manager Real Asset Fund (continued)
At April 30, 2015, the Real Asset Fund had open interest rate swap contracts as follows:
|
|
|
|
|
|
|
|
|
|
|
|
|
|
|
|
|
|
|
|
|
|
|
|
|
|
|
|
|
|
|
|
|
|
|
| Counterparty
|
|
Termination
Date
|
|
|
Notional
Amount
|
|
|
Fixed
Rate
|
|
|
Floating Rate
|
|
Fair
Value
|
|
|
Upfront
Premium Paid
(Received)
|
|
|
Unrealized
Appreciation
(Depreciation)
|
|
| Centrally Cleared |
|
|
|
|
|
|
|
|
|
|
|
|
|
|
|
|
|
|
|
|
|
|
|
|
|
|
|
|
|
|
|
|
|
|
| Chicago Mercantile Exchange* |
|
|
02/03/17 |
|
|
$ |
50,000,000 |
|
|
|
4.04% |
|
|
28 Day MXN TIIE |
|
$ |
6,578 |
|
|
$ |
12,384 |
|
|
$ |
(5,806 |
) |
|
|
|
|
|
|
|
|
| Chicago Mercantile Exchange* |
|
|
06/17/17 |
|
|
|
11,500,000 |
|
|
|
1.25% |
|
|
3 Month USD LIBOR |
|
|
(79,388 |
) |
|
|
(91,425 |
) |
|
|
12,037 |
|
|
|
|
|
|
|
|
|
| Chicago Mercantile Exchange# |
|
|
06/17/25 |
|
|
|
1,300,000 |
|
|
|
2.75% |
|
|
3 Month USD LIBOR |
|
|
(70,538 |
) |
|
|
(53,040 |
) |
|
|
(17,498 |
) |
|
|
|
|
|
|
|
|
| Chicago Mercantile Exchange# |
|
|
12/17/44 |
|
|
|
2,700,000 |
|
|
|
3.50% |
|
|
3 Month USD LIBOR |
|
|
(573,279 |
) |
|
|
(728,622 |
) |
|
|
155,343 |
|
|
|
|
|
|
|
|
|
| Chicago Mercantile Exchange# |
|
|
06/17/45 |
|
|
|
1,400,000 |
|
|
|
3.25% |
|
|
3 Month USD LIBOR |
|
|
(217,464 |
) |
|
|
(182,476 |
) |
|
|
(34,988 |
) |
|
|
|
|
|
|
|
|
| Chicago Mercantile Exchange# |
|
|
09/16/25 |
|
|
|
6,000,000 |
|
|
|
0.75% |
|
|
6 Month EUR LIBOR |
|
|
(15,926 |
) |
|
|
(72,762 |
) |
|
|
56,836 |
|
|
|
|
|
|
|
|
|
| Chicago Mercantile Exchange* |
|
|
12/31/16 |
|
|
|
25,600,000 |
|
|
|
1.60% |
|
|
6 Month GBP LIBOR |
|
|
437,312 |
|
|
|
— |
|
|
|
437,312 |
|
|
|
|
|
|
|
|
|
| Chicago Mercantile Exchange* |
|
|
06/17/17 |
|
|
|
4,200,000 |
|
|
|
1.25% |
|
|
6 Month GBP LIBOR |
|
|
(24,048 |
) |
|
|
(9,336 |
) |
|
|
(14,712 |
) |
|
|
|
|
|
|
|
|
| Chicago Mercantile Exchange* |
|
|
12/31/19 |
|
|
|
10,500,000 |
|
|
|
2.27% |
|
|
6 Month GBP LIBOR |
|
|
(565,555 |
) |
|
|
— |
|
|
|
(565,555 |
) |
|
|
|
|
|
|
|
|
| Chicago Mercantile Exchange* |
|
|
09/18/23 |
|
|
|
140,000,000 |
|
|
|
1.00% |
|
|
6 Month JPY LIBOR |
|
|
(54,541 |
) |
|
|
(9,264 |
) |
|
|
(45,277 |
) |
|
|
|
|
|
|
|
|
| Chicago Mercantile Exchange* |
|
|
09/18/23 |
|
|
|
120,000,000 |
|
|
|
1.00% |
|
|
6 Month JPY LIBOR |
|
|
(46,749 |
) |
|
|
(6,099 |
) |
|
|
(40,650 |
) |
|
|
|
|
|
|
|
|
| Chicago Mercantile Exchange* |
|
|
03/20/24 |
|
|
|
60,000,000 |
|
|
|
1.00% |
|
|
6 Month JPY LIBOR |
|
|
(23,363 |
) |
|
|
(21,678 |
) |
|
|
(1,685 |
) |
|
|
|
|
|
|
|
|
| |
|
|
|
|
|
|
|
|
|
|
|
|
|
|
|
$ |
(1,226,961 |
) |
|
$ |
(1,162,318 |
) |
|
$ |
(64,643 |
) |
| Over the Counter |
|
|
|
|
|
|
|
|
|
|
|
|
|
|
|
|
|
|
|
|
|
|
|
|
|
|
|
|
|
|
|
|
|
|
| Credit Suisse International# |
|
|
01/02/17 |
|
|
$ |
1,900,000 |
|
|
|
12.33% |
|
|
BRL Cetip |
|
$ |
(8,476 |
) |
|
$ |
234 |
|
|
$ |
(8,710 |
) |
|
|
|
|
|
|
|
|
| Goldman Sachs Group, Inc.* |
|
|
10/15/19 |
|
|
|
6,500,000 |
|
|
|
0.90% |
|
|
Eurostat Eurozone HICP
Ex Tobacco |
|
|
(3,650 |
) |
|
|
(13,633 |
) |
|
|
9,983 |
|
|
|
|
|
|
|
|
|
| Goldman Sachs Group, Inc.# |
|
|
01/14/30 |
|
|
|
1,180,000 |
|
|
|
3.14% |
|
|
UK RPI All Items NSA |
|
|
(41,097 |
) |
|
|
— |
|
|
|
(41,097 |
) |
|
|
|
|
|
|
|
|
| Goldman Sachs Group, Inc.# |
|
|
04/15/30 |
|
|
|
1,100,000 |
|
|
|
3.20% |
|
|
UK RPI All Items NSA |
|
|
(39,676 |
) |
|
|
— |
|
|
|
(39,676 |
) |
|
|
|
|
|
|
|
|
| Bank of America NA# |
|
|
04/08/35 |
|
|
|
600,000 |
|
|
|
3.31% |
|
|
UK RPI All Items NSA |
|
|
(37,556 |
) |
|
|
— |
|
|
|
(37,556 |
) |
|
|
|
|
|
|
|
|
| Credit Suisse International# |
|
|
04/15/35 |
|
|
|
700,000 |
|
|
|
3.34% |
|
|
UK RPI All Items NSA |
|
|
(35,619 |
) |
|
|
374 |
|
|
|
(35,993 |
) |
|
|
|
|
|
|
|
|
| Goldman Sachs Group, Inc.# |
|
|
04/15/35 |
|
|
|
200,000 |
|
|
|
3.36% |
|
|
UK RPI All Items NSA |
|
|
(8,355 |
) |
|
|
— |
|
|
|
(8,355 |
) |
|
|
|
|
|
|
|
|
| Bank of America NA# |
|
|
12/11/44 |
|
|
|
200,000 |
|
|
|
3.55% |
|
|
UK RPI All Items NSA |
|
|
9,802 |
|
|
|
136 |
|
|
|
9,666 |
|
|
|
|
|
|
|
|
|
| Credit Suisse International# |
|
|
01/12/45 |
|
|
|
100,000 |
|
|
|
3.33% |
|
|
UK RPI All Items NSA |
|
|
(11,738 |
) |
|
|
1,071 |
|
|
|
(12,809 |
) |
|
|
|
|
|
|
|
|
| Barclays Bank PLC* |
|
|
12/19/15 |
|
|
|
2,800,000 |
|
|
|
1.73% |
|
|
US Urban Consumers NSA |
|
|
(49,072 |
) |
|
|
— |
|
|
|
(49,072 |
) |
|
|
|
|
|
|
|
|
| Deutsche Bank AG* |
|
|
11/29/16 |
|
|
|
3,500,000 |
|
|
|
1.85% |
|
|
US Urban Consumers NSA |
|
|
(73,349 |
) |
|
|
— |
|
|
|
(73,349 |
) |
|
|
|
|
|
|
|
|
| Deutsche Bank AG* |
|
|
02/10/17 |
|
|
|
6,200,000 |
|
|
|
1.93% |
|
|
US Urban Consumers NSA |
|
|
(127,646 |
) |
|
|
— |
|
|
|
(127,646 |
) |
|
|
|
|
|
|
|
|
| Goldman Sachs Group, Inc.* |
|
|
02/12/17 |
|
|
|
500,000 |
|
|
|
2.42% |
|
|
US Urban Consumers NSA |
|
|
(23,826 |
) |
|
|
— |
|
|
|
(23,826 |
) |
|
|
|
|
|
|
|
|
| RBS Securities, Inc.* |
|
|
07/15/17 |
|
|
|
2,400,000 |
|
|
|
2.25% |
|
|
US Urban Consumers NSA |
|
|
(117,256 |
) |
|
|
111 |
|
|
|
(117,367 |
) |
|
|
|
|
|
|
|
|
| Citibank NA* |
|
|
07/15/17 |
|
|
|
200,000 |
|
|
|
2.25% |
|
|
US Urban Consumers NSA |
|
|
(9,771 |
) |
|
|
23 |
|
|
|
(9,794 |
) |
|
|
|
|
|
|
|
|
| |
|
|
|
|
|
|
|
|
|
|
|
|
|
|
|
$ |
(577,285 |
) |
|
$ |
(11,684 |
) |
|
$ |
(565,601 |
) |
|
|
|
|
|
|
|
| Net Unrealized Appreciation (Depreciation) on Interest Rate Swap Contracts |
|
|
|
|
|
|
|
|
|
|
|
|
$ |
(1,804,246 |
) |
|
$ |
(1,174,002 |
) |
|
$ |
(630,244 |
) |
April 30, 2015 / ANNUAL REPORT
|
|
|
|
|
| PORTFOLIOS OF INVESTMENTS |
|
|
77 |
|
Wilmington Multi-Manager Real Asset Fund (concluded)
At April 30, 2015, the Real Asset Fund had open credit default swap contracts as follows:
|
|
|
|
|
|
|
|
|
|
|
|
|
|
|
|
|
|
|
|
|
|
|
|
|
|
|
|
|
| Counterparty
|
|
Termination
Date
|
|
|
Notional
Amount(a)
|
|
|
Fixed
Rate
|
|
|
Reference Equity
/Obligation
|
|
Implied
Credit
Spread at
April 30,
2015(b) |
|
Fair
Value(c)
|
|
|
Upfront
Premium Paid
(Received)
|
|
|
Unrealized
Appreciation
(Depreciation)
|
|
|
|
|
|
|
|
|
|
|
| Centrally Cleared |
|
|
|
|
|
|
|
|
|
|
|
|
|
|
|
|
|
|
|
|
|
|
|
|
|
|
|
|
|
|
|
|
|
|
|
|
|
| Intercontinental Exchange### |
|
|
06/20/20 |
|
|
$ |
5,300,000 |
|
|
|
1.00% |
|
|
CDX ITRAXX MAIN23 5Y ICE |
|
0.60% |
|
$ |
(120,093 |
) |
|
$ |
(129,425 |
) |
|
$ |
9,332 |
|
|
|
|
|
|
|
|
|
|
| |
|
|
|
|
|
|
|
|
|
|
|
|
|
|
|
|
|
$ |
(120,093 |
) |
|
$ |
(129,425 |
) |
|
$ |
9,332 |
|
|
|
|
|
|
|
|
|
|
| Over the Counter |
|
|
|
|
|
|
|
|
|
|
|
|
|
|
|
|
|
|
|
|
|
|
|
|
|
|
|
|
|
|
|
|
|
|
|
|
|
| Morgan Stanley
Capital Services## |
|
|
06/20/15 |
|
|
$ |
900,000 |
|
|
|
1.00% |
|
|
BARC SNR SE SP MYC |
|
0.26% |
|
$ |
2,221 |
|
|
$ |
1,986 |
|
|
$ |
235 |
|
|
|
|
|
|
|
|
|
|
| Goldman Sachs
Group, Inc.## |
|
|
03/20/16 |
|
|
|
100,000 |
|
|
|
1.00% |
|
|
GAZPROM SNR EM SP GST |
|
3.84% |
|
|
(2,386 |
) |
|
|
(5,905 |
) |
|
|
3,519 |
|
|
|
|
|
|
|
|
|
|
| JP Morgan Chase
Bank NA## |
|
|
03/20/16 |
|
|
|
100,000 |
|
|
|
1.00% |
|
|
GAZPROM SNR EM SP JPM |
|
3.84% |
|
|
(2,386 |
) |
|
|
(5,244 |
) |
|
|
2,858 |
|
|
|
|
|
|
|
|
|
|
| Morgan Stanley
Capital Services## |
|
|
12/20/19 |
|
|
|
2,800,000 |
|
|
|
1.00% |
|
|
PETROBRAS LA SP MYC |
|
4.06% |
|
|
(347,797 |
) |
|
|
(237,287 |
) |
|
|
(110,510 |
) |
|
|
|
|
|
|
|
|
|
| |
|
|
|
|
|
|
|
|
|
|
|
|
|
|
|
|
|
$ |
(350,348 |
) |
|
$ |
(246,450 |
) |
|
$ |
(103,898 |
) |
|
|
|
|
|
|
|
|
| NET UNREALIZED APPRECIATION
(DEPRECIATION) ON CREDIT DEFAULT SWAP CONTRACTS |
|
|
|
|
|
|
|
|
|
|
|
|
|
|
$ |
(470,441 |
) |
|
$ |
(375,875 |
) |
|
$ |
(94,566 |
) |
* Portfolio pays the fixed rate and receives the floating rate.
# Portfolio pays the floating rate and receives the fixed rate.
## The
Portfolio is a seller of protection, it receives the fixed rate. When a credit event occurs, as defined under the terms of that particular swap agreement, the Portfolio will either (i) pay to the buyer of protection an amount equal to the
notional amount of the swap and take delivery of the referenced obligation or underlying securities comprising the referenced index or (ii) pay a net settlement amount in the form of cash or securities equal to the notional amount of the swap
less the recovery value of the referenced obligation or underlying securities comprising the referenced index.
### The Portfolio is a buyer of protection, it pays
the fixed rate. When a credit event occurs, as defined under the terms of that particular swap agreement, the Portfolio will either (i) receive from the seller of protection an amount equal to the notional amount of the swap and make delivery
of the referenced obligation or underlying securities comprising the referenced index or (ii) receive a net settlement amount in the form of cash or securities equal to the notional amount of the swap less the recovery value of the referenced
obligation or underlying securities comprising the referenced index.
(a) “Notional amount” represents the maximum potential amount the Portfolio could be
required to pay as a seller of credit protection or receive as a buyer of credit protection if a credit event occurs as defined under the terms of that particular swap agreement.
(b) “Implied credit spreads”, represented in absolute terms, are utilized in determining the fair value of credit default swap agreements on corporate issues or
sovereign issues of an emerging country as of reporting date. Implied credit spreads serve as an indicator of the current status of the payment/performance risk and represent the likelihood of risk of default for the credit derivative. The implied
credit spread of a particular referenced entity reflects the cost of buying/selling protection and may include up-front payments required to be made to enter into the agreement. Wider credit spreads represent a deterioration of the referenced
entity’s credit soundness and a greater likelihood of risk of default or other credit event occurring as defined under the terms of the agreement.
(c)
“Fair value” of credit default swap agreements on asset-backed securities and credit indices serves as an indicator of the current status of the payment/performance risk and represents the likelihood of an expected liability (or profit)
for the credit derivative should the notional amount of the swap agreement be closed/sold as of the reporting date. Increasing fair value in absolute terms, represents a deterioration of the referenced entity’s credit soundness and a greater
likelihood of risk of default or other credit event occurring as defined under the terms of the agreement.
See Notes which are an integral
part of the Financial Statements
ANNUAL REPORT / April 30, 2015
PORTFOLIO OF INVESTMENTS SUMMARY TABLE
Wilmington Strategic Allocation Conservative Fund
At April 30, 2015,
the Fund’s portfolio composition was as follows (unaudited):
|
|
|
|
|
|
| |
|
Percentage of
Total Net Assets |
|
|
| Debt Funds |
|
|
|
55.8 |
% |
|
|
| Equity Funds |
|
|
|
17.8 |
% |
|
|
| Alternative Investment Funds |
|
|
|
10.1 |
% |
|
|
| Exchange-Traded Funds |
|
|
|
8.3 |
% |
|
|
| Money Market Fund |
|
|
|
6.3 |
% |
|
|
| Commodity Fund |
|
|
|
0.7 |
% |
|
|
| Other Assets and Liabilities – Net1 |
|
|
|
1.0 |
% |
|
|
|
|
|
|
|
|
| TOTAL |
|
|
|
100.0 |
% |
|
|
|
|
|
|
| (1) |
Assets, other than investments in securities, less liabilities. See Statements of Assets and Liabilities.
|
PORTFOLIO OF INVESTMENTS
April 30, 2015
|
|
|
|
|
|
|
|
|
| Description |
|
Number of
Shares |
|
|
Value |
|
|
| INVESTMENT COMPANIES – 92.7% |
|
|
| ALTERNATIVE INVESTMENT FUNDS – 10.1% |
|
|
|
|
| AQR Managed Futures Strategy Fund, Class I |
|
|
103,740 |
|
|
$ |
1,158,778 |
|
|
|
|
| Gateway Fund, Class Y |
|
|
39,321 |
|
|
|
1,178,831 |
|
|
|
|
| Legg Mason BW Absolute Return Opportunities Fund, Class I |
|
|
122,384 |
|
|
|
1,523,678 |
|
|
|
|
|
|
|
|
|
|
|
|
|
| TOTAL ALTERNATIVE INVESTMENT FUNDS |
|
|
|
|
|
$ |
3,861,287 |
|
|
|
| COMMODITY FUND – 0.7% |
|
|
|
|
|
|
|
|
| Credit Suisse Commodity Return Strategy Fund, Class I* |
|
|
44,495 |
|
|
|
264,744 |
|
|
|
| DEBT FUNDS – 55.8% |
|
|
|
|
|
|
|
|
| FPA New Income, Inc. |
|
|
141,787 |
|
|
|
1,436,301 |
|
|
|
|
| RidgeWorth Seix Floating Rate High Income Fund, Class I |
|
|
87,660 |
|
|
|
781,053 |
|
|
|
|
| Wilmington Broad Market Bond Fund, Class I§ |
|
|
604,943 |
|
|
|
5,922,396 |
|
|
|
|
| Wilmington Intermediate-Term Bond Fund, Class I§ |
|
|
1,315,335 |
|
|
|
13,192,808 |
|
|
|
|
|
|
|
|
|
|
|
|
|
| TOTAL DEBT FUNDS |
|
|
|
|
|
$ |
21,332,558 |
|
|
|
| EQUITY FUNDS – 17.8% |
|
|
|
|
|
|
|
|
| DFA U.S. Small Cap Value Portfolio, Institutional Shares |
|
|
6,318 |
|
|
|
223,264 |
|
|
|
|
| Diamond Hill Large Cap Fund, Class Y |
|
|
9,360 |
|
|
|
217,145 |
|
|
|
|
| LSV Value Equity Fund, Class I |
|
|
9,472 |
|
|
|
229,132 |
|
|
|
|
|
|
|
|
|
|
| Description |
|
Number of
Shares |
|
|
Value |
|
|
|
|
| Morgan Stanley Institutional Fund, Inc. - Growth Portfolio, Class I |
|
|
16,653 |
|
|
$ |
699,776 |
|
|
|
|
| Morgan Stanley Institutional Fund, Inc. - Small Company Growth Portfolio, Class I |
|
|
18,975 |
|
|
|
322,770 |
|
|
|
|
| T Rowe Price Institutional Large-Cap Growth Fund, Class I |
|
|
22,657 |
|
|
|
657,969 |
|
|
|
|
| Wilmington Large-Cap Strategy Fund, Class I§ |
|
|
40,999 |
|
|
|
756,833 |
|
|
|
|
| Wilmington Mid-Cap Growth Fund, Class I§ |
|
|
21,195 |
|
|
|
384,058 |
|
|
|
|
| Wilmington Multi-Manager International Fund, Class I§ |
|
|
377,220 |
|
|
|
3,051,707 |
|
|
|
|
| Wilmington Small-Cap Strategy Fund, Class I§ |
|
|
17,811 |
|
|
|
267,347 |
|
|
|
|
|
|
|
|
|
|
|
|
|
| TOTAL EQUITY FUNDS |
|
|
|
|
|
$ |
6,810,001 |
|
|
|
| EXCHANGE-TRADED FUNDS – 8.3% |
|
|
|
|
|
|
|
|
| iShares Cohen & Steers REIT ETF |
|
|
4,245 |
|
|
|
403,912 |
|
|
|
|
| iShares Global Energy ETF |
|
|
2,120 |
|
|
|
82,532 |
|
|
|
|
| iShares Russell Mid-Cap Value ETF |
|
|
1,500 |
|
|
|
111,555 |
|
|
|
|
| iShares Russell Top 200 Growth ETF |
|
|
16,700 |
|
|
|
873,243 |
|
|
|
|
| iShares Russell Top 200 Value ETF |
|
|
6,275 |
|
|
|
275,472 |
|
|
|
|
| iShares TIPS ETF |
|
|
8,297 |
|
|
|
948,845 |
|
|
|
|
| SPDR Dow Jones International Real Estate ETF |
|
|
10,360 |
|
|
|
459,259 |
|
|
|
|
|
|
|
|
|
|
|
|
|
| TOTAL EXCHANGE-TRADED FUNDS |
|
|
|
|
|
$ |
3,154,818 |
|
|
|
|
|
|
|
|
|
|
|
|
|
| TOTAL INVESTMENT COMPANIES (COST $33,461,971) |
|
|
|
|
|
$ |
35,423,408 |
|
April 30, 2015 / ANNUAL REPORT
PORTFOLIOS OF
INVESTMENTS 79
Wilmington Strategic
Allocation Conservative Fund (concluded)
|
|
|
|
|
|
|
|
|
| Description |
|
Number of
Shares |
|
|
Value |
|
|
| MONEY MARKET FUND – 6.3% |
|
|
|
|
| Dreyfus Cash Management Fund, Institutional Shares, 0.04%^ |
|
|
2,410,570 |
|
|
$ |
$2,410,570 |
|
|
|
|
|
|
|
|
|
|
|
|
| TOTAL MONEY MARKET FUND |
|
|
|
|
|
| (COST $2,410,570) |
|
|
|
|
|
$ |
2,410,570 |
|
|
|
|
|
|
| Description |
|
Value |
|
|
|
| TOTAL INVESTMENTS – 99.0% |
|
|
|
|
| (COST $35,872,541) |
|
|
$ 37,833,978 |
|
|
|
| OTHER ASSETS LESS LIABILITIES – 1.0% |
|
|
399,601 |
|
|
|
|
|
|
|
|
| TOTAL NET ASSETS – 100.0% |
|
|
$ 38,233,579 |
|
|
|
|
|
|
Cost of investments for Federal income
tax purposes is $36,270,494. The net unrealized appreciation/(depreciation) of investments was $1,563,484. This consists of net unrealized appreciation from investment for those securities having an excess of value over cost of $1,737,657 and net
unrealized depreciation from investments for those securities having an excess of cost over value of $174,173.
Various inputs are used in determining
the value of the Fund’s investments. These inputs are summarized in the three broad levels listed below.
Level 1 – quoted prices in active
markets for identical securities
Level 2 – other significant observable inputs (including quoted prices for similar securities, interest rates,
prepayment speeds, credit risk, etc.)
Level 3 – significant unobservable inputs (including the Fund’s own assumptions in determining the
fair value of investments)
The following is a summary of the inputs used as of April 30, 2015 in valuing the Fund’s assets carried at fair
value:
|
|
|
|
|
|
|
|
|
|
|
|
|
|
|
|
|
| |
|
Level 1 |
|
|
Level 2 |
|
|
Level 3 |
|
|
Total |
|
|
|
|
|
|
| Investments in Securities |
|
|
|
|
|
|
|
|
|
|
|
|
|
|
|
|
|
|
|
|
|
| Investment Companies |
|
$ |
35,423,408 |
|
|
$ |
— |
|
|
$ |
— |
|
|
$ |
35,423,408 |
|
|
|
|
|
|
| Money Market Fund |
|
|
2,410,570 |
|
|
|
— |
|
|
|
— |
|
|
|
2,410,570 |
|
|
|
|
|
|
|
|
|
|
|
|
|
|
|
|
|
|
|
|
|
|
|
| Total |
|
$ |
37,833,978 |
|
|
$ |
— |
|
|
$ |
— |
|
|
$ |
37,833,978 |
|
|
|
|
|
|
|
|
|
|
|
|
|
|
|
|
|
|
| * |
Non-income producing security. |
| § |
Affiliated company. See Note 5 in Notes to Financial Statements. |
The following acronyms are used throughout this Fund:
ETF - Exchange Traded Fund
REIT - Real Estate
Investment Trust
SPDR - Standard & Poor’s Depository Receipts
TIPS - Treasury Inflation Protected Security
See Notes which are an integral part of the Financial Statements
ANNUAL REPORT / April 30, 2015
80
PORTFOLIO OF INVESTMENTS SUMMARY TABLE
Wilmington Strategic Allocation Moderate Fund
At
April 30, 2015, the Fund’s portfolio composition was as follows (unaudited):
|
|
|
|
|
|
| Investment Companies: |
|
Percentage of
Total Net Assets |
|
|
| Equity Funds |
|
|
|
43.5 |
% |
|
|
| Exchange-Traded Funds |
|
|
|
20.1 |
% |
|
|
| Alternative Investment Funds |
|
|
|
11.9 |
% |
|
|
| Debt Funds |
|
|
|
4.7 |
% |
|
|
| Commodity Fund |
|
|
|
0.7 |
% |
|
|
| Corporate Bonds |
|
|
|
6.5 |
% |
|
|
| Mortgage-Backed Securities |
|
|
|
4.1 |
% |
|
|
| U.S. Treasury |
|
|
|
3.7 |
% |
|
|
| Collateralized Mortgage Obligations |
|
|
|
0.5 |
% |
|
|
| Enhanced Equipment Trust Certificates |
|
|
|
0.2 |
% |
|
|
| Cash Equivalents1 |
|
|
|
6.8 |
% |
|
|
| Other Assets and Liabilities – Net2 |
|
|
|
(2.7 |
)% |
|
|
|
|
|
|
|
|
| TOTAL |
|
|
|
100.0 |
% |
|
|
|
|
|
|
| (1) |
Cash Equivalents include investments in a money market fund and repurchase agreements. |
| (2) |
Assets, other than investments in securities, less liabilities. See Statements of Assets and Liabilities.
|
PORTFOLIO OF INVESTMENTS
April 30, 2015
|
|
|
|
|
|
|
|
|
| Description |
|
Number of
Shares |
|
|
Value |
|
|
|
| INVESTMENT COMPANIES – 80.9% |
|
|
|
|
|
|
| ALTERNATIVE INVESTMENT FUNDS – 11.9% |
|
|
|
|
| AQR Managed Futures Strategy Fund, Class I |
|
|
162,675 |
|
|
$ |
1,817,080 |
|
|
|
|
| Gateway Fund, Class Y |
|
|
79,557 |
|
|
|
2,385,130 |
|
|
|
|
| Legg Mason BW Absolute Return Opportunities Fund, Class I |
|
|
180,541 |
|
|
|
2,247,738 |
|
|
|
|
|
|
|
|
|
|
|
|
|
| TOTAL ALTERNATIVE INVESTMENT FUNDS |
|
|
|
|
|
$ |
6,449,948 |
|
|
|
| COMMODITY FUND – 0.7% |
|
|
|
|
|
|
|
|
| Credit Suisse Commodity Return Strategy Fund, Class I* |
|
|
67,439 |
|
|
|
401,260 |
|
|
|
| DEBT FUNDS – 4.7% |
|
|
|
|
|
|
|
|
| FPA New Income, Inc. |
|
|
137,478 |
|
|
|
1,392,650 |
|
|
|
|
| RidgeWorth Seix Floating Rate High Income Fund, Class I |
|
|
127,874 |
|
|
|
1,139,358 |
|
|
|
|
|
|
|
|
|
|
|
|
|
| TOTAL DEBT FUNDS |
|
|
|
|
|
$ |
2,532,008 |
|
|
|
| EQUITY FUNDS – 43.5% |
|
|
|
|
|
|
|
|
| DFA U.S. Small Cap Value Portfolio, Institutional Shares |
|
|
12,710 |
|
|
|
449,161 |
|
|
|
|
|
|
|
|
|
|
| Description |
|
Number of
Shares |
|
|
Value |
|
|
|
|
| Diamond Hill Large Cap Fund, Class Y |
|
|
43,470 |
|
|
$ |
1,008,505 |
|
|
|
|
| Harbor International Fund, Institutional Shares |
|
|
65,113 |
|
|
|
4,673,832 |
|
|
|
|
| Lazard Emerging Markets Equity Portfolio, Institutional Shares |
|
|
16,210 |
|
|
|
292,268 |
|
|
|
|
| LSV Value Equity Fund, Class I |
|
|
41,573 |
|
|
|
1,005,655 |
|
|
|
|
| MFS International New Discovery Fund, Class I |
|
|
21,951 |
|
|
|
656,112 |
|
|
|
|
| Morgan Stanley Institutional Fund, Inc. - Growth Portfolio, Class I |
|
|
76,420 |
|
|
|
3,211,165 |
|
|
|
|
| Morgan Stanley Institutional Fund, Inc. - Small Company Growth Portfolio, Class I |
|
|
45,824 |
|
|
|
779,459 |
|
|
|
|
| T Rowe Price Institutional Large-Cap Growth Fund,
Class I |
|
|
107,935 |
|
|
|
3,134,445 |
|
|
|
|
| Wilmington Mid-Cap Growth Fund, Class I§ |
|
|
104,716 |
|
|
|
1,897,452 |
|
|
|
|
| Wilmington Multi-Manager International Fund, Class I§ |
|
|
752,693 |
|
|
|
6,089,286 |
|
|
|
|
| Wilmington Small-Cap Strategy Fund, Class I§ |
|
|
26,897 |
|
|
|
403,730 |
|
|
|
|
|
|
|
|
|
|
|
|
|
| TOTAL EQUITY FUNDS |
|
|
|
|
|
$ |
23,601,070 |
|
|
| EXCHANGE-TRADED FUNDS – 20.1% |
|
|
|
|
| iShares Cohen & Steers REIT ETF# |
|
|
6,925 |
|
|
|
658,914 |
|
April 30, 2015 / ANNUAL REPORT
PORTFOLIOS OF
INVESTMENTS 81
Wilmington Strategic
Allocation Moderate Fund (continued)
|
|
|
|
|
|
|
|
|
| Description |
|
Number of
Shares |
|
|
Value |
|
|
|
|
| iShares Global Energy ETF# |
|
|
10,650 |
|
|
$ |
414,604 |
|
|
|
|
| iShares Russell Mid-Cap Value ETF# |
|
|
8,050 |
|
|
|
598,679 |
|
|
|
|
| iShares Russell Top 200 Growth ETF |
|
|
102,675 |
|
|
|
5,368,876 |
|
|
|
|
| iShares Russell Top 200 Value ETF# |
|
|
38,675 |
|
|
|
1,697,833 |
|
|
|
|
| iShares TIPS ETF# |
|
|
12,350 |
|
|
|
1,412,346 |
|
|
|
|
| SPDR Dow Jones International Real Estate |
|
|
|
|
|
|
|
|
| ETF# |
|
|
16,300 |
|
|
|
722,579 |
|
|
|
|
|
|
|
|
|
|
|
|
| TOTAL EXCHANGE-TRADED FUNDS |
|
|
$ |
10,873,831 |
|
|
|
|
|
|
|
|
|
|
|
|
| TOTAL INVESTMENT COMPANIES |
|
|
|
|
|
| (COST $38,755,107) |
|
|
|
|
|
$ |
43,858,117 |
|
| |
|
|
|
|
|
|
|
|
| |
|
Par Value |
|
|
|
|
|
| COLLATERALIZED MORTGAGE OBLIGATIONS – 0.5% |
|
|
| FEDERAL NATIONAL MORTGAGE ASSOCIATION (FNMA) – 0.3% |
|
|
|
|
| Series 1988-23, Class C, 9.75%, 9/25/18 |
|
$ |
684 |
|
|
$ |
759 |
|
|
|
|
| Series 2012-114, Class VM, 3.50%, 10/25/25 |
|
|
166,957 |
|
|
|
177,340 |
|
|
|
|
|
|
|
|
|
|
|
|
| TOTAL FEDERAL NATIONAL MORTGAGE ASSOCIATION (FNMA) |
|
|
$ |
178,099 |
|
|
|
|
| WHOLE LOAN – 0.2% |
|
|
|
|
|
|
|
|
|
|
|
| Banc of America Mortgage Securities, Inc., Series 2004-A, Class 2A1, 2.68%, 2/25/34D |
|
|
46,094 |
|
|
|
45,755 |
|
|
|
|
| IndyMac INDA Mortgage Loan Trust, Series 2005-AR1, Class 2A1, 2.75%, 11/25/35D |
|
|
31,610 |
|
|
|
28,543 |
|
|
|
|
|
|
|
|
|
|
|
|
|
| TOTAL WHOLE LOAN |
|
|
|
|
|
$ |
74,298 |
|
|
|
|
|
|
|
|
|
|
| TOTAL COLLATERALIZED MORTGAGE OBLIGATIONS (COST
$264,559) |
|
|
$ |
252,397 |
|
|
|
| CORPORATE BONDS – 6.5% |
|
|
|
|
|
|
|
| AEROSPACE & DEFENSE – 0.2% |
|
|
|
|
|
|
|
|
| L-3 Communications Corp., Company Guaranteed, 3.95%, 11/15/16 |
|
|
85,000 |
|
|
|
88,156 |
|
|
|
|
| BANKS – 0.2% |
|
|
|
|
|
|
|
|
|
|
|
| BB&T Corp., Sr. Unsecured, MTN, 2.45%, 1/15/20 |
|
|
30,000 |
|
|
|
30,420 |
|
|
|
|
| Citigroup, Inc., Sr. Unsecured, 1.70%, 4/27/18 |
|
|
35,000 |
|
|
|
34,878 |
|
|
|
|
| Comerica, Inc., Subordinated, 3.80%, 7/22/26 |
|
|
5,000 |
|
|
|
5,005 |
|
|
|
|
| Fifth Third Bancorp, Subordinated, 4.30%, 1/16/24 |
|
|
20,000 |
|
|
|
21,362 |
|
|
|
|
| Morgan Stanley, Subordinated, GMTN, 4.35%, 9/08/26 |
|
|
10,000 |
|
|
|
10,267 |
|
|
|
|
|
|
|
|
|
|
|
|
|
| TOTAL BANKS |
|
|
|
|
|
$ |
101,932 |
|
|
|
|
| BEVERAGES – 0.3% |
|
|
|
|
|
|
|
|
|
|
|
| Anheuser-Busch Cos. LLC, Company Guaranteed, 5.05%, 10/15/16 |
|
|
130,000 |
|
|
|
137,979 |
|
|
|
|
|
|
|
|
|
|
| Description |
|
Par Value |
|
|
Value |
|
|
|
|
| Dr. Pepper Snapple Group, Inc., |
|
|
|
|
|
|
|
|
| Company Guaranteed, 2.00%, 1/15/20 |
|
$ |
10,000 |
|
|
$ |
9,907 |
|
|
|
|
| Dr. Pepper Snapple Group, Inc., |
|
|
|
|
|
|
|
|
| Company Guaranteed, 2.70%, 11/15/22 |
|
|
40,000 |
|
|
|
39,213 |
|
|
|
|
|
|
|
|
|
|
|
|
|
| TOTAL BEVERAGES |
|
|
|
|
|
$ |
187,099 |
|
|
|
|
| BIOTECHNOLOGY – 0.1% |
|
|
|
|
|
|
|
|
|
|
|
| Amgen, Inc., |
|
|
|
|
|
|
|
|
| Sr. Unsecured, 4.40%, 5/01/45 |
|
|
25,000 |
|
|
|
24,529 |
|
|
|
|
| Celgene Corp., |
|
|
|
|
|
|
|
|
| Sr. Unsecured, 4.63%, 5/15/44 |
|
|
40,000 |
|
|
|
41,835 |
|
|
|
|
|
|
|
|
|
|
|
|
|
| TOTAL BIOTECHNOLOGY |
|
|
|
|
|
$ |
66,364 |
|
|
|
|
| CAPITAL MARKETS – 0.4% |
|
|
|
|
|
|
|
|
|
|
|
| BlackRock, Inc., |
|
|
|
|
|
|
|
|
| Sr. Unsecured, 3.38%, 6/01/22 |
|
|
38,000 |
|
|
|
40,096 |
|
|
|
|
| Charles Schwab Corp., |
|
|
|
|
|
|
|
|
| Sr. Unsecured, 2.20%, 7/25/18 |
|
|
15,000 |
|
|
|
15,326 |
|
|
|
|
| Goldman Sachs Group, Inc., |
|
|
|
|
|
|
|
|
| Sr. Unsecured, 3.30%, 5/03/15 |
|
|
100,000 |
|
|
|
100,021 |
|
|
|
|
| Morgan Stanley, |
|
|
|
|
|
|
|
|
| Sr. Unsecured, 1.48%, 2/25/16D |
|
|
35,000 |
|
|
|
35,283 |
|
|
|
|
| Morgan Stanley, |
|
|
|
|
|
|
|
|
| Sr. Unsecured, 1.08%, 1/24/19D |
|
|
30,000 |
|
|
|
30,132 |
|
|
|
|
|
|
|
|
|
|
|
|
|
| TOTAL CAPITAL MARKETS |
|
|
|
|
|
$ |
220,858 |
|
|
|
| COMMERCIAL BANKS – 0.1% |
|
|
|
|
|
|
|
|
| HSBC USA, Inc., |
|
|
|
|
|
|
|
|
| Sr. Unsecured, 2.63%, 9/24/18 |
|
|
40,000 |
|
|
|
41,151 |
|
|
|
|
| Wells Fargo & Co., |
|
|
|
|
|
|
|
|
| Series M, Subordinated, 3.45%, 2/13/23 |
|
|
35,000 |
|
|
|
35,697 |
|
|
|
|
|
|
|
|
|
|
|
|
|
| TOTAL COMMERCIAL BANKS |
|
|
|
|
|
$ |
76,848 |
|
|
|
| COMMERCIAL FINANCE – 0.1% |
|
|
|
|
|
|
|
|
| General Electric Capital Corp., |
|
|
|
|
|
|
|
|
| Sr. Unsecured, MTN, 2.30%, 4/27/17 |
|
|
70,000 |
|
|
|
71,941 |
|
|
|
|
| COMPUTERS – 0.1% |
|
|
|
|
|
|
|
|
|
|
|
| Apple, Inc., |
|
|
|
|
|
|
|
|
| Sr. Unsecured, 1.05%, 5/05/17 |
|
|
45,000 |
|
|
|
45,306 |
|
|
|
|
| CONSUMER FINANCE – 0.1% |
|
|
|
|
|
|
|
|
|
|
|
| American Express Co., |
|
|
|
|
|
|
|
|
| Sr. Unsecured, FRN, 0.82%, 5/22/18D |
|
|
30,000 |
|
|
|
30,031 |
|
|
| DIVERSIFIED FINANCIAL SERVICES – 0.6% |
|
|
|
|
| Bank of America Corp., |
|
|
|
|
|
|
|
|
| Sr. Unsecured, 2.00%, 1/11/18 |
|
|
50,000 |
|
|
|
50,404 |
|
|
|
|
| Citigroup, Inc., |
|
|
|
|
|
|
|
|
| Sr. Unsecured, 6.00%, 8/15/17 |
|
|
100,000 |
|
|
|
109,712 |
|
|
|
|
| FMR LLC, Sr. Unsecured, 6.45%, 11/15/39W |
|
|
100,000 |
|
|
|
132,014 |
|
|
|
|
| Hyundai Capital America, |
|
|
|
|
|
|
|
|
| Sr. Unsecured, 1.88%, 8/09/16W |
|
|
25,000 |
|
|
|
25,249 |
|
|
|
|
| TD Ameritrade Holding Corp., Sr. Unsecured, 2.95%, 4/01/22 |
|
|
18,000 |
|
|
|
18,243 |
|
|
|
|
|
|
|
|
|
|
|
|
|
| TOTAL DIVERSIFIED FINANCIAL SERVICES |
|
|
|
|
|
$ |
335,622 |
|
ANNUAL REPORT / April 30,
2015
82 PORTFOLIOS OF
INVESTMENTS
Wilmington Strategic Allocation Moderate Fund
(continued)
|
|
|
|
|
|
|
|
|
|
|
|
| Description |
|
Par Value |
|
|
Value |
|
|
|
|
| ELECTRIC – 0.5% |
|
|
|
|
|
|
|
|
|
|
|
| Appalachian Power Co.,
Sr. Unsecured, 5.00%, 6/01/17 |
|
$ |
35,000 |
|
|
$ |
37,615 |
|
|
|
|
| DTE Energy Co.,
Sr. Unsecured, 3.85%, 12/01/23 |
|
|
10,000 |
|
|
|
10,643 |
|
|
|
|
| Entergy Corp.,
Sr. Unsecured, 5.13%, 9/15/20 |
|
|
90,000 |
|
|
|
99,735 |
|
|
|
|
| Pacific Gas & Electric Co.,
Sr. Unsecured, 3.75%, 2/15/24 |
|
|
20,000 |
|
|
|
21,302 |
|
|
|
|
| UIL Holdings Corp.,
Sr. Unsecured, 4.63%, 10/01/20 |
|
|
70,000 |
|
|
|
75,384 |
|
|
|
|
|
|
|
|
|
|
|
|
|
| TOTAL ELECTRIC |
|
|
|
|
|
$ |
244,679 |
|
|
|
|
| ELECTRONICS – 0.0%** |
|
|
|
|
|
|
|
|
|
|
|
| Thermo Fisher Scientific, Inc.,
Sr. Unsecured, 3.30%, 2/15/22 |
|
|
20,000 |
|
|
|
20,373 |
|
|
| ENVIRONMENTAL CONTROL – 0.2% |
|
|
|
|
| Waste Management, Inc., Company Guaranteed, 2.60%, 9/01/16 |
|
|
60,000 |
|
|
|
61,104 |
|
|
|
|
| Waste Management, Inc., Company Guaranteed, 3.50%, 5/15/24 |
|
|
35,000 |
|
|
|
36,308 |
|
|
|
|
| Waste Management, Inc., Company Guaranteed, 4.10%, 3/01/45 |
|
|
25,000 |
|
|
|
24,388 |
|
|
|
|
|
|
|
|
|
|
|
|
| TOTAL ENVIRONMENTAL CONTROL |
|
|
$ |
121,800 |
|
|
|
|
| FOOD – 0.2% |
|
|
|
|
|
|
|
|
|
|
|
| Kroger Co., Company Guaranteed, 3.90%, 10/01/15 |
|
|
100,000 |
|
|
|
101,269 |
|
|
| HEALTH CARE PROVIDERS & SERVICES – 0.0%** |
|
|
|
|
| UnitedHealth Group, Inc.,
Sr. Unsecured, 2.75%, 2/15/23 |
|
|
25,000 |
|
|
|
25,080 |
|
|
|
|
| HOME FURNISHINGS – 0.2% |
|
|
|
|
|
|
|
|
|
|
|
| Whirlpool Corp.,
Sr. Unsecured, 4.70%, 6/01/22 |
|
|
65,000 |
|
|
|
71,412 |
|
|
|
|
| Whirlpool Corp.,
Sr. Unsecured, MTN, 5.15%, 3/01/43 |
|
|
10,000 |
|
|
|
11,016 |
|
|
|
|
|
|
|
|
|
|
|
|
|
| TOTAL HOME FURNISHINGS |
|
|
|
|
|
$ |
82,428 |
|
|
| HOUSEHOLD PRODUCTS – 0.1% |
|
|
|
|
| Tupperware Brands Corp., Company Guaranteed, 4.75%, 6/01/21 |
|
|
60,000 |
|
|
|
64,547 |
|
|
|
|
| INSURANCE – 0.4% |
|
|
|
|
|
|
|
|
|
|
|
| Aon PLC, Company Guaranteed, 4.00%, 11/27/23 |
|
|
40,000 |
|
|
|
42,453 |
|
|
|
|
| CNA Financial Corp.,
Sr. Unsecured, 3.95%, 5/15/24 |
|
|
35,000 |
|
|
|
36,036 |
|
|
|
|
| WR Berkley Corp.,
Sr. Unsecured, 4.63%, 3/15/22 |
|
|
60,000 |
|
|
|
64,619 |
|
|
|
|
| WR Berkley Corp.,
Sr. Unsecured, 4.75%, 8/01/44 |
|
|
45,000 |
|
|
|
46,290 |
|
|
|
|
|
|
|
|
|
|
|
|
|
| TOTAL INSURANCE |
|
|
|
|
|
$ |
189,398 |
|
|
|
|
| MEDIA – 0.2% |
|
|
|
|
|
|
|
|
|
|
|
| CBS Corp., Company Guaranteed, 4.60%, 1/15/45 |
|
|
25,000 |
|
|
|
24,191 |
|
|
|
|
|
|
|
|
|
|
|
|
|
| Description |
|
Par Value |
|
|
Value |
|
|
|
|
| Viacom, Inc.,
Sr. Unsecured, 2.50%, 12/15/16 |
|
$ |
60,000 |
|
|
$ |
61,296 |
|
|
|
|
|
|
|
|
|
|
|
|
|
| TOTAL MEDIA |
|
|
|
|
|
$ |
85,487 |
|
|
|
|
| METALS & MINING – 0.1% |
|
|
|
|
|
|
|
|
|
|
|
| Rio Tinto Finance USA Ltd., Company Guaranteed, 9.00%, 5/01/19 |
|
|
60,000 |
|
|
|
75,536 |
|
|
| MISCELLANEOUS MANUFACTURING – 0.1% |
|
|
|
|
| Illinois Tool Works, Inc.,
Sr. Unsecured, 3.50%, 3/01/24 |
|
|
45,000 |
|
|
|
47,361 |
|
|
|
|
| Textron, Inc.,
Sr. Unsecured, 3.65%, 3/01/21 |
|
|
20,000 |
|
|
|
20,827 |
|
|
|
|
|
|
|
|
|
|
|
|
| TOTAL MISCELLANEOUS MANUFACTURING |
|
|
$ |
68,188 |
|
|
|
| OFFICE/BUSINESS EQUIPMENT – 0.1% |
|
|
|
|
|
|
|
|
| Xerox Corp.,
Sr. Unsecured, 2.75%, 3/15/19# |
|
|
30,000 |
|
|
|
30,641 |
|
|
|
|
| OIL & GAS – 0.4% |
|
|
|
|
|
|
|
|
|
|
|
| BP Capital Markets PLC, Company Guaranteed, 2.50%, 11/06/22 |
|
|
50,000 |
|
|
|
48,906 |
|
|
|
|
| Exxon Mobil Corp.,
Sr. Unsecured, 1.82%, 3/15/19 |
|
|
30,000 |
|
|
|
30,355 |
|
|
|
|
| Husky Energy, Inc.,
Sr. Unsecured, 4.00%, 4/15/24 |
|
|
15,000 |
|
|
|
15,214 |
|
|
|
|
| Marathon Oil Corp.,
Sr. Unsecured, 2.80%, 11/01/22 |
|
|
45,000 |
|
|
|
43,857 |
|
|
|
|
| Marathon Petroleum Corp.,
Sr. Unsecured, 3.63%, 9/15/24 |
|
|
20,000 |
|
|
|
20,400 |
|
|
|
|
| Murphy Oil Corp.,
Sr. Unsecured, 5.13%, 12/01/42 |
|
|
70,000 |
|
|
|
62,087 |
|
|
|
|
| Valero Energy Corp.,
Sr. Unsecured, 4.90%, 3/15/45 |
|
|
10,000 |
|
|
|
10,197 |
|
|
|
|
|
|
|
|
|
|
|
|
|
| TOTAL OIL & GAS |
|
|
|
|
|
$ |
231,016 |
|
|
|
|
| PHARMACEUTICALS – 0.1% |
|
|
|
|
|
|
|
|
|
|
|
| AbbVie, Inc.,
Sr. Unsecured, 4.40%, 11/06/42 |
|
|
20,000 |
|
|
|
19,701 |
|
|
|
|
| Actavis Funding SCS, Company Guaranteed, 4.75%, 3/15/45 |
|
|
10,000 |
|
|
|
10,122 |
|
|
|
|
| Medco Health Solutions, Inc., Company Guaranteed, 4.13%, 9/15/20 |
|
|
20,000 |
|
|
|
21,632 |
|
|
|
|
| Merck & Co., Inc.,
Sr. Unsecured, 3.70%, 2/10/45 |
|
|
10,000 |
|
|
|
9,683 |
|
|
|
|
|
|
|
|
|
|
|
|
|
| TOTAL PHARMACEUTICALS |
|
|
|
|
|
$ |
61,138 |
|
|
|
|
| PIPELINES – 0.2% |
|
|
|
|
|
|
|
|
|
|
|
| Energy Transfer Partners LP,
Sr. Unsecured, 3.60%, 2/01/23 |
|
|
35,000 |
|
|
|
34,920 |
|
|
|
|
| ONEOK Partners LP, Company Guaranteed, 6.20%, 9/15/43 |
|
|
45,000 |
|
|
|
46,432 |
|
|
|
|
| Spectra Energy Partners LP,
Sr. Unsecured, 4.50%, 3/15/45 |
|
|
25,000 |
|
|
|
24,455 |
|
|
|
|
|
|
|
|
|
|
|
|
|
| TOTAL PIPELINES |
|
|
|
|
|
$ |
105,807 |
|
|
| April 30, 2015 / ANNUAL REPORT |
PORTFOLIOS OF INVESTMENTS 83
Wilmington Strategic Allocation Moderate Fund
(continued)
|
|
|
|
|
|
|
|
|
|
|
|
| Description |
|
Par Value |
|
|
Value |
|
|
| REAL ESTATE INVESTMENT TRUSTS – 0.8% |
|
|
|
|
| American Tower Corp.,
Sr. Unsecured, 5.00%, 2/15/24 |
|
$ |
15,000 |
|
|
$ |
16,269 |
|
|
|
|
| CommonWealth REIT,
Sr. Unsecured, 6.65%, 1/15/18 |
|
|
100,000 |
|
|
|
108,804 |
|
|
|
|
| Digital Realty Trust LP, Company Guaranteed,
5.88%, 2/01/20# |
|
|
100,000 |
|
|
|
113,746 |
|
|
|
|
| HCP, Inc.,
Sr. Unsecured, 4.20%, 3/01/24 |
|
|
15,000 |
|
|
|
15,590 |
|
|
|
|
| Health Care REIT, Inc.,
Sr. Unsecured, 4.70%, 9/15/17 |
|
|
100,000 |
|
|
|
107,437 |
|
|
|
|
| Healthcare Realty Trust, Inc.,
Sr. Unsecured, 3.75%, 4/15/23 |
|
|
40,000 |
|
|
|
39,826 |
|
|
|
|
| Healthcare Realty Trust, Inc.,
Sr. Unsecured, 3.88%, 5/01/25 |
|
|
15,000 |
|
|
|
14,915 |
|
|
|
|
| ProLogis LP,
Company Guaranteed, 3.35%, 2/01/21 |
|
|
35,000 |
|
|
|
36,297 |
|
|
|
|
|
|
|
|
|
|
|
|
| TOTAL REAL ESTATE INVESTMENT TRUSTS |
|
|
$ |
452,884 |
|
|
| RETAIL – 0.1% |
|
|
|
|
| CVS Caremark Corp.,
Sr. Unsecured, 5.75%, 6/01/17 |
|
|
30,000 |
|
|
|
32,861 |
|
|
| SEMICONDUCTORS – 0.1% |
|
|
|
|
| Intel Corp.,
Sr. Unsecured, 2.70%, 12/15/22 |
|
|
35,000 |
|
|
|
35,279 |
|
|
| TELECOMMUNICATIONS – 0.3% |
|
|
|
|
| AT&T, Inc.,
Sr. Unsecured, 1.40%, 12/01/17 |
|
|
35,000 |
|
|
|
34,998 |
|
|
|
|
| AT&T, Inc.,
Sr. Unsecured, 4.50%, 5/15/35 |
|
|
15,000 |
|
|
|
14,737 |
|
|
|
|
| AT&T, Inc.,
FRN, Sr. Unsecured, 1.15%, 11/27/18D |
|
|
55,000 |
|
|
|
55,792 |
|
|
|
|
| Verizon Communications, Inc., Sr. Unsecured, 6.40%, 9/15/33 |
|
|
35,000 |
|
|
|
42,578 |
|
|
|
|
|
|
|
|
|
|
|
|
| TOTAL TELECOMMUNICATIONS |
|
|
$ |
148,105 |
|
|
| TRANSPORTATION – 0.2% |
|
|
|
|
| FedEx Corp.,
Company Guaranteed, 3.88%, 8/01/42 |
|
|
30,000 |
|
|
|
28,123 |
|
|
|
|
| FedEx Corp.,
Company Guaranteed, 4.10%, 2/01/45 |
|
|
15,000 |
|
|
|
14,412 |
|
|
|
|
| Ryder System, Inc.,
Sr. Unsecured, MTN, 2.50%, 3/01/18 |
|
|
55,000 |
|
|
|
56,313 |
|
|
|
|
|
|
|
|
|
|
|
|
|
| TOTAL TRANSPORTATION |
|
|
|
|
|
$ |
98,848 |
|
|
| TRUCKING & LEASING – 0.0%** |
|
|
|
|
| GATX Corp.,
Sr. Unsecured, 5.20%, 3/15/44 |
|
|
20,000 |
|
|
|
21,854 |
|
|
|
|
|
|
|
|
|
|
|
|
|
| TOTAL CORPORATE BONDS (COST $3,389,375) |
|
|
|
|
|
$ |
3,521,375 |
|
|
|
|
|
|
|
|
|
|
|
|
|
| Description |
|
Par Value |
|
|
Value |
|
|
| ENHANCED EQUIPMENT TRUST CERTIFICATES – 0.2% |
|
|
| AIRLINES – 0.2% |
|
|
|
|
| Continental Airlines 2009-2, Series A, Pass-Through Certificates, 7.25%, 11/10/19 |
|
$ |
61,972 |
|
|
$ |
72,081 |
|
|
|
|
| Delta Air Lines, 2007-1, Series A, Pass-Through Certificates, 6.82%, 8/10/22 |
|
|
48,410 |
|
|
|
57,335 |
|
|
|
|
|
|
|
|
|
|
|
|
|
| TOTAL AIRLINES |
|
|
|
|
|
$ |
129,416 |
|
|
|
|
|
|
|
|
|
|
|
|
| TOTAL ENHANCED EQUIPMENT TRUST CERTIFICATES
(COST $109,852) |
|
|
$ |
129,416 |
|
|
| MORTGAGE-BACKED SECURITIES – 4.1% |
|
|
| FEDERAL HOME LOAN MORTGAGE CORPORATION (FHLMC) – 2.5% |
|
|
|
|
| Pool A15865,
5.50%, 11/01/33 |
|
|
58,740 |
|
|
|
66,535 |
|
|
|
|
| Pool A19412, 5.00%, 3/01/34 |
|
|
177,091 |
|
|
|
200,055 |
|
|
|
|
| Pool C00478, 8.50%, 9/01/26 |
|
|
2,570 |
|
|
|
2,997 |
|
|
|
|
| Pool C03517, 4.50%, 9/01/40 |
|
|
49,551 |
|
|
|
54,007 |
|
|
|
|
| Pool C03849, 3.50%, 4/01/42 |
|
|
66,529 |
|
|
|
69,735 |
|
|
|
|
| Pool C04305,
3.00%, 11/01/42 |
|
|
216,022 |
|
|
|
220,070 |
|
|
|
|
| Pool C09020,
3.50%, 11/01/42 |
|
|
215,577 |
|
|
|
225,966 |
|
|
|
|
| Pool G05774, 5.00%, 1/01/40 |
|
|
352,193 |
|
|
|
394,780 |
|
|
|
|
| Pool G07889, 3.50%, 8/01/43 |
|
|
50,735 |
|
|
|
53,180 |
|
|
|
|
| Pool Q23891,
4.00%, 12/01/43 |
|
|
84,495 |
|
|
|
90,662 |
|
|
|
|
|
|
|
|
|
|
|
|
| TOTAL FEDERAL HOME LOAN MORTGAGE CORPORATION
(FHLMC) |
|
|
$ |
1,377,987 |
|
|
| FEDERAL NATIONAL MORTGAGE ASSOCIATION
(FNMA) – 1.5% |
|
|
|
|
| Pool 326445, 0.88%, 5/21/18 |
|
|
165,000 |
|
|
|
164,402 |
|
|
|
|
| Pool 533246, 7.50%, 4/01/30 |
|
|
5,207 |
|
|
|
5,378 |
|
|
|
|
| Pool 580676,
1.63%, 11/27/18 |
|
|
165,000 |
|
|
|
167,635 |
|
|
|
|
| Pool AB4089,
3.00%, 12/01/26 |
|
|
47,048 |
|
|
|
49,458 |
|
|
|
|
| Pool AJ4050,
4.00%, 10/01/41 |
|
|
151,663 |
|
|
|
162,607 |
|
|
|
|
| Pool AS0302, 3.00%, 8/01/43 |
|
|
90,015 |
|
|
|
91,816 |
|
|
|
|
| Pool AT7899, 3.50%, 7/01/43 |
|
|
95,747 |
|
|
|
100,607 |
|
|
|
|
| Pool AX5302, 4.00%, 1/01/42 |
|
|
45,937 |
|
|
|
49,252 |
|
|
|
|
|
|
|
|
|
|
|
|
| TOTAL FEDERAL NATIONAL MORTGAGE
ASSOCIATION (FNMA) |
|
|
$ |
791,155 |
|
|
| GOVERNMENT NATIONAL MORTGAGE ASSOCIATION
(GNMA) – 0.1% |
|
|
|
|
| Pool 354677,
7.50%, 10/15/23 |
|
|
17,463 |
|
|
|
20,367 |
|
|
|
|
| Pool 354765, 7.00%, 2/15/24 |
|
|
21,738 |
|
|
|
25,321 |
|
|
|
|
| Pool 354827, 7.00%, 5/15/24 |
|
|
23,423 |
|
|
|
27,162 |
|
|
|
|
|
|
|
|
|
|
|
|
| TOTAL GOVERNMENT NATIONAL MORTGAGE ASSOCIATION
(GNMA) |
|
|
$ |
72,850 |
|
|
|
|
|
|
|
|
|
|
|
|
| TOTAL MORTGAGE-BACKED SECURITIES (COST
$2,178,516) |
|
|
$ |
2,241,992 |
|
ANNUAL REPORT / April 30, 2015
84 PORTFOLIOS OF
INVESTMENTS
Wilmington Strategic Allocation Moderate Fund
(continued)
|
|
|
|
|
|
|
|
|
|
|
|
| Description |
|
Par Value |
|
|
Value |
|
|
|
|
| U.S. TREASURY – 3.7% |
|
|
|
|
|
|
|
|
|
| U.S. TREASURY BONDS – 1.0% |
|
|
|
|
| 3.00%, 11/15/44 |
|
$ |
53,000 |
|
|
$ |
55,788 |
|
|
|
|
| 3.13%, 8/15/44 |
|
|
11,000 |
|
|
|
11,852 |
|
|
|
|
| 3.38%, 5/15/44 |
|
|
139,000 |
|
|
|
156,760 |
|
|
|
|
| 3.63%, 2/15/44 |
|
|
87,000 |
|
|
|
102,521 |
|
|
|
|
| 4.38%, 5/15/40 |
|
|
120,000 |
|
|
|
156,820 |
|
|
|
|
| 4.75%, 2/15/37 |
|
|
21,000 |
|
|
|
28,697 |
|
|
|
|
|
|
|
|
|
|
|
|
| TOTAL U.S. TREASURY BONDS |
|
|
$ |
512,438 |
|
|
| U.S. TREASURY NOTES – 2.7% |
|
|
|
|
| 0.63%, 9/30/17 |
|
|
40,000 |
|
|
|
39,885 |
|
|
|
|
| 0.88%, 10/15/17 |
|
|
360,000 |
|
|
|
361,045 |
|
|
|
|
| 1.50%, 12/31/18 |
|
|
87,000 |
|
|
|
88,113 |
|
|
|
|
| 1.50%, 3/31/19 |
|
|
100,000 |
|
|
|
101,139 |
|
|
|
|
| 1.50%, 11/30/19 |
|
|
40,000 |
|
|
|
40,242 |
|
|
|
|
| 1.63%, 11/15/22 |
|
|
96,000 |
|
|
|
94,517 |
|
|
|
|
| 2.00%, 2/15/25 |
|
|
115,000 |
|
|
|
114,630 |
|
|
|
|
| 2.13%, 5/31/15 |
|
|
65,000 |
|
|
|
65,109 |
|
|
|
|
| 2.13%, 8/31/20 |
|
|
115,000 |
|
|
|
118,555 |
|
|
|
|
| 2.25%, 11/15/24 |
|
|
80,000 |
|
|
|
81,542 |
|
|
|
|
| 2.38%, 8/15/24 |
|
|
55,000 |
|
|
|
56,696 |
|
|
|
|
| 3.50%, 5/15/20 |
|
|
100,000 |
|
|
|
109,903 |
|
|
|
|
| 4.50%, 2/15/16 |
|
|
100,000 |
|
|
|
103,395 |
|
|
|
|
| 4.50%, 5/15/17 |
|
|
100,000 |
|
|
|
107,867 |
|
|
|
|
|
|
|
|
|
|
|
|
| TOTAL U.S. TREASURY NOTES |
|
|
$ |
1,482,638 |
|
|
|
|
|
|
|
|
|
|
|
|
|
| TOTAL U.S. TREASURY (COST $1,905,476) |
|
|
|
|
|
$ |
1,995,076 |
|
| |
|
|
|
|
|
|
|
|
| |
|
Number of
Shares |
|
|
|
|
|
| MONEY MARKET FUND – 2.6% |
|
|
|
|
| Dreyfus Cash Management Fund, Institutional Shares, 0.04%^ |
|
|
1,389,032 |
|
|
$ |
1,389,032 |
|
|
|
|
|
|
|
|
|
|
|
|
| TOTAL MONEY MARKET FUND (COST
$1,389,032) |
|
|
$ |
1,389,032 |
|
|
|
|
|
|
|
|
|
|
|
|
| TOTAL INVESTMENTS IN SECURITIES – 98.5%
(COST $47,991,917) |
|
|
$ |
53,387,405 |
|
| |
|
|
|
|
|
|
|
|
|
|
|
| Description |
|
Par Value |
|
|
Value |
|
|
CASH COLLATERAL INVESTED FOR SECURITIES ON
LOAN – 4.2% |
|
|
| REPURCHASE AGREEMENTS – 4.2% |
|
|
|
|
| BNP Paribas Securities Corp., 0.12%, dated 4/30/15, due 5/01/15, repurchase price $114,179, collateralized by U.S. Government & Treasury Securities 0.00% to 6.50%,
maturing 5/01/16 to 4/20/45; total market value of $116,463. |
|
$ |
114,179 |
|
|
$ |
$114,179 |
|
|
|
|
|
|
|
|
|
|
|
|
|
| Description |
|
Par Value |
|
|
Value |
|
|
|
|
| Citigroup Global Markets, Inc., 0.13%, dated 4/30/15, due 5/01/15, repurchase price $433,908, collateralized by U.S. Government Securities 1.61% to 8.00%, maturing
6/01/17 to 6/15/52; total market value of $442,584. |
|
$ |
433,906 |
|
|
$ |
433,906 |
|
|
|
|
| Credit Suisse Securities USA LLC, 0.12%, dated 4/30/15, due 5/01/15, repurchase price $433,907, collateralized by U.S. Government Securities 3.00% to 4.50%, maturing
8/01/38 to 4/01/45; total market value of $442,587. |
|
|
433,906 |
|
|
|
433,906 |
|
|
|
|
| Daiwa Capital Markets America, 0.16%, dated 4/30/15, due 5/01/15, repurchase price $433,908, collateralized by U.S. Government & Treasury Securities 0.00% to
9.25%, maturing 5/21/15 to 3/01/48; total market value of $442,584. |
|
|
433,906 |
|
|
|
433,906 |
|
|
|
|
| HSBC Securities USA, Inc., 0.11%, dated 4/30/15, due 5/01/15, repurchase price $433,907, collateralized by U.S. Government Securities 3.50% to 6.00%, maturing 6/01/34
to 1/01/45; total market value of $442,588. |
|
|
433,906 |
|
|
|
433,906 |
|
|
|
|
| Nomura Securities International, Inc., 0.13%, dated 4/30/15, due 5/01/15, repurchase price $433,908, collateralized by U.S. Government & Treasury Securities
0.00% to 10.50%, maturing 5/15/15 to 3/20/64; total market value of $442,584. |
|
|
433,906 |
|
|
|
433,906 |
|
|
|
|
|
|
|
|
|
|
|
|
| TOTAL REPURCHASE AGREEMENTS |
|
|
$ |
2,283,709 |
|
|
|
|
|
|
|
|
|
|
|
|
| TOTAL CASH COLLATERAL INVESTED FOR SECURITIES ON LOAN
(COST $2,283,709) |
|
|
$ |
2,283,709 |
|
|
|
|
|
|
|
|
|
|
|
|
| TOTAL INVESTMENTS – 102.7% (COST
$50,275,626) |
|
|
$ |
55,671,114 |
|
|
|
COLLATERAL FOR SECURITIES ON
LOAN – (4.2%) |
|
|
|
(2,283,709 |
) |
|
|
| OTHER ASSETS LESS LIABILITIES – 1.5% |
|
|
|
795,382 |
|
|
|
|
|
|
|
|
|
|
|
|
| TOTAL NET ASSETS – 100.0% |
|
|
$ |
54,182,787 |
|
|
|
|
|
|
|
|
|
|
April 30, 2015 / ANNUAL REPORT
PORTFOLIOS OF
INVESTMENTS 85
Wilmington Strategic Allocation Moderate Fund
(continued)
Cost of investments for Federal income tax purposes is $50,960,019. The net unrealized
appreciation/(depreciation) of investments was $4,711,095. This consists of net unrealized appreciation from investment for those securities having an excess of value over cost of $5,029,679 and net unrealized depreciation from investments for those
securities having an excess of cost over value of $318,584.
Various inputs are used in determining the value of the Fund’s investments. These
inputs are summarized in the three broad levels listed below.
|
|
|
|
|
| Level 1 |
|
– |
|
quoted prices in active markets for identical securities |
| Level 2 |
|
– |
|
other significant observable inputs (including quoted prices for similar securities, interest rates, prepayment speeds, credit risk, etc.) |
| Level 3 |
|
– |
|
significant unobservable inputs (including the Fund’s own assumptions in determining the fair value of investments) |
The following is a summary of the inputs used as of April 30, 2015 in valuing the Fund’s assets carried at fair
value:
|
|
|
|
|
|
|
|
|
|
|
|
|
|
|
|
|
| |
|
Level
1 |
|
|
Level
2 |
|
|
Level 3 |
|
|
Total |
|
|
|
|
|
|
| Investments in Securities |
|
|
|
|
|
|
|
|
|
|
|
|
|
|
|
|
|
|
|
|
|
| Investment Companies |
|
$ |
43,858,117 |
|
|
$ |
— |
|
|
$ |
— |
|
|
$ |
43,858,117 |
|
|
|
|
|
|
| Collateralized Mortgage Obligations |
|
|
— |
|
|
|
252,397 |
|
|
|
— |
|
|
|
252,397 |
|
|
|
|
|
|
| Corporate Bonds |
|
|
— |
|
|
|
3,521,375 |
|
|
|
— |
|
|
|
3,521,375 |
|
|
|
|
|
|
| Enhanced Equipment Trust Certificates |
|
|
— |
|
|
|
129,416 |
|
|
|
— |
|
|
|
129,416 |
|
|
|
|
|
|
| Mortgage-Backed Securities |
|
|
— |
|
|
|
2,241,992 |
|
|
|
— |
|
|
|
2,241,992 |
|
|
|
|
|
|
| U.S. Treasury |
|
|
— |
|
|
|
1,995,076 |
|
|
|
— |
|
|
|
1,995,076 |
|
|
|
|
|
|
| Money Market Fund |
|
|
1,389,032 |
|
|
|
— |
|
|
|
— |
|
|
|
1,389,032 |
|
|
|
|
|
|
| Repurchase Agreements |
|
|
— |
|
|
|
2,283,709 |
|
|
|
— |
|
|
|
2,283,709 |
|
|
|
|
|
|
|
|
|
|
|
|
|
|
|
|
|
|
|
|
|
|
|
| Total |
|
$ |
45,247,149 |
|
|
$ |
10,423,965 |
|
|
$ |
— |
|
|
$ |
55,671,114 |
|
|
|
|
|
|
|
|
|
|
|
|
|
|
|
|
|
|
| # |
Security, or a portion thereof, is on loan. See Note 2 in Notes to Financial Statements. |
| * |
Non-income producing security. |
| D |
Floating rate note with current rate and stated maturity date shown. |
| § |
Affiliated company. See Note 5 in Notes to Financial Statements. |
| W |
Denotes a restricted security that may be resold without restriction to “qualified institutional buyers” as defined in Rule 144A under the
Securities Act of 1933 and that the Fund has determined to be liquid under criteria established by the Fund’s Board of Trustees. At April 30, 2015, these liquid restricted securities amounted to $157,263 representing 0.3% of total net
assets. |
| ** |
Represents less than 0.05%. |
The following acronyms are used throughout this Fund:
ETF - Exchange Traded Fund
FHLMC - Federal Home Loan Mortgage Corporation
FNMA - Federal National Mortgage Association
FRN - Floating Rate Note
GMTN - Global Medium Term Note
GNMA - Government National Mortgage Association
LLC - Limited Liability Corporation
LP - Limited Partnership
MTN - Medium Term Note
OAT - Obligations Assimilables
PLC - Public Limited Company
REIT - Real Estate Investment Trust
SPDR - Standard & Poor’s Depository Receipts
TIPS - Treasury Inflation Protected Security
See Notes which are an integral part of the Financial Statements
ANNUAL REPORT / April 30, 2015
PORTFOLIO OF INVESTMENTS SUMMARY TABLE
Wilmington Strategic Allocation Aggressive Fund
At April 30, 2015,
the Fund’s portfolio composition was as follows (unaudited):
|
|
|
|
|
|
| |
|
Percentage of
Total Net Assets |
| Equity Funds |
|
|
|
67.5 |
% |
| Exchange-Traded Funds |
|
|
|
25.0
|
%
|
| Alternative Investment Funds |
|
|
|
6.2 |
% |
| Commodity Fund |
|
|
|
0.8 |
% |
| Money Market Fund |
|
|
|
0.5 |
% |
| Other Assets and Liabilities – Net1 |
|
|
|
0.0 |
%2 |
|
|
|
|
|
|
| TOTAL |
|
|
|
100.0 |
% |
|
|
|
|
|
|
| (1) |
Assets, other than investments in securities, less liabilities. See Statements of Assets and Liabilities. |
| (2) |
Represents less than 0.05%.
|
PORTFOLIO OF INVESTMENTS
April 30, 2015
|
|
|
|
|
|
|
|
|
| Description
|
|
|
Number of
Shares
|
|
|
|
Value |
|
|
|
|
| INVESTMENT COMPANIES – 99.5% |
|
|
|
|
|
|
|
|
|
|
|
| ALTERNATIVE INVESTMENT FUNDS – 6.2% |
|
|
|
|
|
|
|
|
|
|
|
| AQR Managed Futures Strategy Fund, Class I |
|
|
89,201 |
|
|
$ |
996,377 |
|
|
|
|
| Gateway Fund, Class Y |
|
|
35,898 |
|
|
|
1,076,219 |
|
|
|
|
|
|
|
|
|
|
|
|
|
| TOTAL ALTERNATIVE INVESTMENT FUNDS |
|
|
|
|
|
$ |
2,072,596 |
|
|
|
|
| COMMODITY FUND – 0.8% |
|
|
|
|
|
|
|
|
|
|
|
| Credit Suisse Commodity Return Strategy Fund, Class I* |
|
|
43,324 |
|
|
|
257,779 |
|
|
|
|
| EQUITY FUNDS – 67.5% |
|
|
|
|
|
|
|
|
|
|
|
| DFA U.S. Small Cap Value Portfolio, Institutional Class |
|
|
9,008 |
|
|
|
318,358 |
|
|
|
|
| Diamond Hill Large Cap Fund, Class Y |
|
|
43,552 |
|
|
|
1,010,412 |
|
|
|
|
| Harbor International Fund, Institutional Shares |
|
|
23,970 |
|
|
|
1,720,539 |
|
|
|
|
| LSV Value Equity Fund, Class I |
|
|
43,579 |
|
|
|
1,054,167 |
|
|
|
|
| MFS International New Discovery Fund, Class I |
|
|
5,842 |
|
|
|
174,615 |
|
|
|
|
| Morgan Stanley Institutional Fund, Inc. - Growth Portfolio, Class I |
|
|
76,797 |
|
|
|
3,227,019 |
|
|
|
|
| Morgan Stanley Institutional Fund, Inc. - Small Company Growth Portfolio, Class I |
|
|
39,040 |
|
|
|
664,077 |
|
|
|
|
| T Rowe Price Institutional Large-Cap Growth Fund, Class I |
|
|
103,802 |
|
|
|
3,014,402 |
|
|
|
|
| Wilmington Large-Cap Strategy Fund, Class I§ |
|
|
10,541 |
|
|
|
194,578 |
|
|
|
|
|
|
|
|
| Description
|
|
Number of
Shares |
|
|
Value |
|
|
|
|
| Wilmington Mid-Cap Growth Fund, Class I§ |
|
86,738 |
|
$ |
1,571,692 |
|
|
|
|
| Wilmington Multi-Manager International Fund, Class I§ |
|
1,093,649 |
|
|
8,847,623 |
|
|
|
|
| Wilmington Small-Cap Strategy Fund, Class I§ |
|
40,727 |
|
|
611,313 |
|
|
|
|
|
|
|
|
|
|
|
| TOTAL EQUITY FUNDS |
|
|
|
$ |
22,408,795 |
|
|
| EXCHANGE-TRADED FUNDS – 25.0% |
|
|
|
|
| iShares Cohen & Steers REIT ETF |
|
3,871 |
|
|
368,326 |
|
|
|
|
| iShares Global Energy ETF |
|
9,675 |
|
|
376,648 |
|
|
|
|
| iShares Russell Mid-Cap Value |
|
7,850 |
|
|
583,804 |
|
|
|
|
| iShares Russell Top 200 Growth |
|
83,617 |
|
|
4,372,333 |
|
|
|
|
| iShares Russell Top 200 Value |
|
31,104 |
|
|
1,365,466 |
|
|
|
|
| iShares TIPS ETF |
|
7,562 |
|
|
864,790 |
|
|
|
|
| SPDR Dow Jones International Real Estate ETF |
|
7,890 |
|
|
349,764 |
|
|
|
|
|
|
|
|
|
|
|
| TOTAL EXCHANGE-TRADED FUNDS |
|
|
|
$ |
8,281,131 |
|
|
|
|
|
|
|
|
|
|
| TOTAL INVESTMENT COMPANIES (COST
$27,184,224) |
|
$ |
33,020,301 |
|
|
|
|
| MONEY MARKET FUND – 0.5% |
|
|
|
|
|
|
|
|
|
| Dreyfus Cash Management Fund,
Institutional Shares, 0.04%^ |
|
182,324 |
|
|
182,324 |
|
|
|
|
| TOTAL MONEY MARKET FUND (COST $182,324) |
|
|
|
$ |
182,324 |
|
April 30, 2015 / ANNUAL REPORT
|
|
|
|
|
| PORTFOLIOS OF INVESTMENTS |
|
|
87 |
|
Wilmington Strategic Allocation Aggressive Fund (concluded)
|
|
|
|
|
|
|
| Description |
|
Number of
Shares |
|
Value |
|
|
|
| TOTAL INVESTMENTS – 100.0% |
|
|
|
|
| (COST $27,366,548) |
|
|
|
$ |
33,202,625 |
|
|
|
| OTHER LIABILITIES LESS ASSETS – 0.0%** |
|
|
(9,656 |
) |
|
|
|
|
|
|
|
|
|
| TOTAL NET ASSETS – 100.0% |
|
$ |
33,192,969 |
|
|
|
|
|
|
|
|
Cost of investments for Federal income
tax purposes is $31,375,488. The net unrealized appreciation/(depreciation) of investments was $1,827,137. This consists of net unrealized appreciation from investment for those securities having an excess of value over cost of $2,078,463 and net
unrealized depreciation from investments for those securities having an excess of cost over value of $251,326.
Various inputs are
used in determining the value of the Fund’s investments. These inputs are summarized in the three broad levels listed below.
Level 1 –
quoted prices in active markets for identical securities
Level 2 – other significant observable inputs (including quoted prices for similar
securities, interest rates, prepayment speeds, credit risk, etc.)
Level 3 – significant unobservable inputs (including the Fund’s own
assumptions in determining the fair value of investments)
The following is a summary of the inputs used as of April 30, 2015 in
valuing the Fund’s assets carried at fair value:
|
|
|
|
|
|
|
|
|
|
|
|
|
|
|
|
|
| |
|
Level 1 |
|
|
Level 2 |
|
|
Level 3 |
|
|
Total |
|
|
|
|
|
|
| Investments in Securities |
|
|
|
|
|
|
|
|
|
|
|
|
|
|
|
|
|
|
|
|
|
| Investment Companies |
|
$ |
33,020,301 |
|
|
$ |
— |
|
|
$ |
— |
|
|
$ |
33,020,301 |
|
|
|
|
|
|
| Money Market Fund |
|
|
182,324 |
|
|
|
— |
|
|
|
— |
|
|
|
182,324 |
|
|
|
|
|
|
|
|
|
|
|
|
|
|
|
|
|
|
|
|
|
|
|
| Total |
|
$ |
33,202,625 |
|
|
$ |
— |
|
|
$ |
— |
|
|
$ |
33,202,625 |
|
|
|
|
|
|
|
|
|
|
|
|
|
|
|
|
|
|
| * |
Non-income producing security. |
| § |
Affiliated company. See Note 5 in Notes to Financial Statements. |
The following acronyms are used throughout this Fund:
ETF - Exchange Traded Fund
REIT - Real Estate Investment Trust
SPDR - Standard & Poor’s Depository Receipts
TIPS - Treasury Inflation Protected Security
See Notes which are an integral part of the Financial Statements
ANNUAL REPORT / April 30, 2015
|
|
|
| 88 |
|
STATEMENTS OF ASSETS AND LIABILITIES |
|
|
|
|
|
|
|
|
|
|
|
|
|
|
|
|
|
|
| April 30, 2015 |
|
|
|
Wilmington
Multi-Manager
International
Fund |
|
Wilmington
Multi-Manager
Alternatives
Fund |
|
Wilmington
Multi-Manager
Real Asset
Fund |
| ASSETS: |
|
|
|
|
|
|
|
|
|
|
|
|
|
|
|
|
|
| Investments, at identified cost |
|
|
|
|
$ |
488,686,060 |
|
|
|
$ |
182,023,225 |
|
|
|
$ |
506,869,654 |
|
|
|
|
|
|
|
|
|
|
|
|
|
|
|
|
|
|
|
| Investments in securities, at value (Including $20,377,739, $0, and $1,240,294 of securities on loan, respectively) (Note 2) |
|
|
|
|
$ |
559,650,506 |
|
|
|
$ |
183,193,660 |
|
|
|
$ |
525,040,001 |
|
|
|
|
|
|
|
|
|
|
|
|
|
|
|
|
|
|
|
| Cash |
|
|
|
|
|
569 |
|
|
|
|
9,488,793 |
|
|
|
|
— |
|
| Deposits for futures contracts |
|
|
|
|
|
— |
|
|
|
|
— |
|
|
|
|
619,183 |
|
| Deposits for securities sold short |
|
|
|
|
|
— |
|
|
|
|
26,129,322 |
|
|
|
|
— |
|
| Deposits for swaps |
|
|
|
|
|
— |
|
|
|
|
— |
|
|
|
|
791,773 |
|
| Cash denominated in foreign currencies(a) |
|
|
|
|
|
1,331,422 |
|
|
|
|
1,173,333 |
|
|
|
|
424,609 |
|
| Variation margin receivable for centrally cleared swap agreements |
|
|
|
|
|
— |
|
|
|
|
— |
|
|
|
|
243,117 |
|
| Variation margin receivable for financial futures contracts |
|
|
|
|
|
— |
|
|
|
|
— |
|
|
|
|
24,733 |
|
| Income receivable |
|
|
|
|
|
2,649,531 |
|
|
|
|
739,409 |
|
|
|
|
1,421,010 |
|
| Receivable for shares sold |
|
|
|
|
|
206,887 |
|
|
|
|
151,114 |
|
|
|
|
263,993 |
|
| Over the counter swap agreements, at value (Including net upfront payments paid of $2,122) |
|
|
|
|
|
— |
|
|
|
|
— |
|
|
|
|
12,023 |
|
| Unrealized appreciation on foreign currency exchange contracts |
|
|
|
|
|
1,274 |
|
|
|
|
— |
|
|
|
|
4,741,852 |
|
| Receivable for investments sold |
|
|
|
|
|
1,214,394 |
|
|
|
|
5,696,232 |
|
|
|
|
4,462,243 |
|
| Receivable for foreign currencies sold |
|
|
|
|
|
50,765 |
|
|
|
|
— |
|
|
|
|
8,573,781 |
|
| Other assets |
|
|
|
|
|
23,606 |
|
|
|
|
26,776 |
|
|
|
|
28,545 |
|
|
|
|
|
|
|
|
|
|
|
|
|
|
|
|
|
|
|
| TOTAL ASSETS |
|
|
|
|
|
565,128,954 |
|
|
|
|
226,598,639 |
|
|
|
|
546,646,863 |
|
| |
|
|
|
|
|
|
|
|
|
|
|
|
|
|
|
|
|
| LIABILITIES: |
|
|
|
|
|
|
|
|
|
|
|
|
|
|
|
|
|
| TBA Sale Commitments, at value |
|
|
|
|
|
— |
|
|
|
|
— |
|
|
|
|
4,084,282 |
(b) |
| Options written, at value |
|
|
|
|
|
— |
|
|
|
|
523,080 |
(c) |
|
|
|
658,814 |
(c) |
| Deferred capital gains tax payable |
|
|
|
|
|
123,789 |
|
|
|
|
— |
|
|
|
|
3,303 |
|
| Variation margin payable for centrally cleared swap agreements |
|
|
|
|
|
— |
|
|
|
|
— |
|
|
|
|
25,971 |
|
| Variation margin payable for financial futures contracts |
|
|
|
|
|
— |
|
|
|
|
— |
|
|
|
|
8,217 |
|
| Payable for securities sold short |
|
|
|
|
|
— |
|
|
|
|
23,461,543 |
(d) |
|
|
|
— |
|
| Payable for investments purchased |
|
|
|
|
|
911,781 |
|
|
|
|
4,774,112 |
|
|
|
|
55,159,519 |
|
| Payable for foreign currencies purchased |
|
|
|
|
|
462,243 |
|
|
|
|
— |
|
|
|
|
8,573,781 |
|
| Collateral for securities on loan |
|
|
|
|
|
21,386,413 |
|
|
|
|
— |
|
|
|
|
1,292,957 |
|
| Due to broker for foreign exchange contracts |
|
|
|
|
|
— |
|
|
|
|
— |
|
|
|
|
290,000 |
|
| Due to broker for swap agreements |
|
|
|
|
|
— |
|
|
|
|
— |
|
|
|
|
60,000 |
|
| Due to prime broker for securities sold short |
|
|
|
|
|
— |
|
|
|
|
1,175,062 |
|
|
|
|
— |
|
| Over the counter swap agreements, at value (Including net upfront payments received of $2,122) |
|
|
|
|
|
— |
|
|
|
|
— |
|
|
|
|
939,656 |
|
| Unrealized depreciation on foreign currency exchange contracts |
|
|
|
|
|
2,702 |
|
|
|
|
— |
|
|
|
|
9,423,998 |
|
| Payable for shares redeemed |
|
|
|
|
|
300,895 |
|
|
|
|
51,570 |
|
|
|
|
199,340 |
|
| Payable to sub-advisors |
|
|
|
|
|
268,008 |
|
|
|
|
140,912 |
|
|
|
|
103,835 |
|
| Payable for distribution services fee |
|
|
|
|
|
1,209 |
|
|
|
|
624 |
|
|
|
|
462 |
|
| Payable for shareholder services fee |
|
|
|
|
|
52,596 |
|
|
|
|
— |
|
|
|
|
— |
|
| Other accrued expenses |
|
|
|
|
|
264,161 |
|
|
|
|
109,872 |
|
|
|
|
205,221 |
|
|
|
|
|
|
|
|
|
|
|
|
|
|
|
|
|
|
|
| TOTAL LIABILITIES |
|
|
|
|
|
23,773,797 |
|
|
|
|
30,236,775 |
|
|
|
|
81,029,356 |
|
| |
|
|
|
|
|
|
|
|
|
|
|
|
|
|
|
|
|
| NET ASSETS |
|
|
|
|
$ |
541,355,157 |
|
|
|
$ |
196,361,864 |
|
|
|
$ |
465,617,507 |
|
| |
|
|
|
|
|
|
|
|
|
|
|
|
|
|
|
|
|
| NET ASSETS CONSIST OF: |
|
|
|
|
|
|
|
|
|
|
|
|
|
|
|
|
|
| |
|
|
|
|
|
|
|
|
|
|
|
|
|
|
|
|
|
| Paid-in capital |
|
|
|
|
$ |
801,580,687 |
|
|
|
$ |
191,895,076 |
|
|
|
$ |
545,564,515 |
|
| Undistributed (distributions in excess of) net investment income |
|
|
|
|
|
695,062 |
|
|
|
|
4,184,371 |
|
|
|
|
16,133,626 |
|
| Accumulated net realized gain (loss) on investments and foreign currency transactions |
|
|
|
|
|
(331,872,366) |
|
|
|
|
306,018 |
|
|
|
|
(108,239,253) |
|
| Net unrealized appreciation (depreciation) of investments and foreign currencies |
|
|
|
|
|
70,951,774 |
|
|
|
|
(23,601) |
|
|
|
|
12,158,619 |
|
|
|
|
|
|
|
|
|
|
|
|
|
|
|
|
|
|
|
| TOTAL NET ASSETS |
|
|
|
|
$ |
541,355,157 |
|
|
|
$ |
196,361,864 |
|
|
|
$ |
465,617,507 |
|
| |
|
|
|
|
|
|
|
|
|
|
|
|
|
|
|
|
|
| COMPUTATION OF NET ASSET VALUE AND OFFERING PRICE: |
|
|
|
|
|
|
|
|
|
|
|
|
|
|
|
|
|
| Class A |
|
|
|
|
|
|
|
|
|
|
|
|
|
|
|
|
|
| Net Assets |
|
|
|
|
$ |
5,909,351 |
|
|
|
$ |
2,723,049 |
|
|
|
$ |
2,242,364 |
|
|
|
|
|
|
|
|
|
|
|
|
|
|
|
|
|
|
|
| Shares outstanding (unlimited shares authorized) |
|
|
|
|
|
735,337 |
|
|
|
|
250,707 |
|
|
|
|
151,827 |
|
|
|
|
|
|
|
|
|
|
|
|
|
|
|
|
|
|
|
| Net Asset Value per share |
|
|
|
|
$ |
8.04 |
|
|
|
$ |
10.86 |
|
|
|
$ |
14.77 |
|
|
|
|
|
|
|
|
|
|
|
|
|
|
|
|
|
|
|
| Offering price per share* |
|
|
|
|
$ |
8.51 |
** |
|
|
$ |
11.49 |
** |
|
|
$ |
15.63 |
** |
|
|
|
|
|
|
|
|
|
|
|
|
|
|
|
|
|
|
| Class I |
|
|
|
|
|
|
|
|
|
|
|
|
|
|
|
|
|
| Net Assets |
|
|
|
|
$ |
535,445,806 |
|
|
|
$ |
193,638,815 |
|
|
|
$ |
463,375,143 |
|
|
|
|
|
|
|
|
|
|
|
|
|
|
|
|
|
|
|
| Shares outstanding (unlimited shares authorized) |
|
|
|
|
|
66,216,244 |
|
|
|
|
17,789,910 |
|
|
|
|
31,185,380 |
|
|
|
|
|
|
|
|
|
|
|
|
|
|
|
|
|
|
|
| Net Asset Value per share |
|
|
|
|
$ |
8.09 |
|
|
|
$ |
10.88 |
|
|
|
$ |
14.86 |
|
|
|
|
|
|
|
|
|
|
|
|
|
|
|
|
|
|
|
| (a) |
Cost of cash denominated in foreign currencies was $1,313,496, $1,170,452 and $421,118, respectively. |
| (b) |
Proceeds from TBA Sale Commitments was $4,103,040. |
| (c) |
Premiums received for options written was $543,340 and $355,320, respectively. |
| (d) |
Proceeds received for securities sold short was $23,621,831. |
| * |
See “What Do Shares Cost?” in the Prospectus. |
| ** |
Computation of offering price per share 100/94.50 of net asset value. |
See Notes which are an integral part of the Financial Statements
April 30, 2015 / ANNUAL REPORT
|
|
|
|
|
| STATEMENTS OF ASSETS AND LIABILITIES (concluded) |
|
|
89 |
|
|
|
|
|
|
|
|
|
|
|
|
|
|
|
|
|
|
|
|
|
| April 30, 2015 |
|
|
|
Wilmington
Strategic Allocation
Conservative Fund |
|
Wilmington
Strategic Allocation
Moderate Fund |
|
Wilmington
Strategic Allocation
Aggressive Fund |
|
|
| ASSETS: |
|
|
|
|
|
|
|
|
|
|
|
|
|
|
|
|
|
|
|
| Investments, at identified cost |
|
|
|
|
$ |
35,872,541 |
(a) |
|
|
$ |
50,275,626 |
(a) |
|
|
$ |
27,366,548 |
(a) |
|
|
|
|
|
|
|
|
|
|
|
|
|
|
|
|
|
|
|
|
|
|
| Investments in securities, at value (Including $0, $2,207,527 and $0 of securities on loan,respectively) (Note 2) |
|
|
|
|
$ |
37,833,978 |
(b) |
|
|
$ |
55,671,114 |
(b) |
|
|
$ |
33,202,625 |
(b) |
|
|
|
|
|
|
|
|
|
|
|
|
|
|
|
|
|
|
|
|
|
|
| Income receivable |
|
|
|
|
|
28,849 |
|
|
|
|
67,936 |
|
|
|
|
8 |
|
|
|
| Due from advisor |
|
|
|
|
|
971 |
|
|
|
|
1,524 |
|
|
|
|
— |
|
|
|
| Receivable for shares sold |
|
|
|
|
|
— |
|
|
|
|
36,399 |
|
|
|
|
429 |
|
|
|
| Receivable for investments sold |
|
|
|
|
|
380,028 |
|
|
|
|
822,335 |
|
|
|
|
— |
|
|
|
| Other assets |
|
|
|
|
|
20,211 |
|
|
|
|
12,866 |
|
|
|
|
20,233 |
|
|
|
|
|
|
|
|
|
|
|
|
|
|
|
|
|
|
|
|
|
|
|
| TOTAL ASSETS |
|
|
|
|
|
38,264,037 |
|
|
|
|
56,612,174 |
|
|
|
|
33,223,295 |
|
|
|
| |
|
|
|
|
|
|
|
|
|
|
|
|
|
|
|
|
|
|
|
| LIABILITIES: |
|
|
|
|
|
|
|
|
|
|
|
|
|
|
|
|
|
|
|
| Payable for investments purchased |
|
|
|
|
|
— |
|
|
|
|
39,808 |
|
|
|
|
— |
|
|
|
| Collateral for securities on loan |
|
|
|
|
|
— |
|
|
|
|
2,283,709 |
|
|
|
|
— |
|
|
|
| Payable for shares redeemed |
|
|
|
|
|
3,145 |
|
|
|
|
55,063 |
|
|
|
|
1,750 |
|
|
|
| Payable for distribution services fee |
|
|
|
|
|
772 |
|
|
|
|
11,002 |
|
|
|
|
582 |
|
|
|
| Other accrued expenses |
|
|
|
|
|
26,541 |
|
|
|
|
39,805 |
|
|
|
|
27,994 |
|
|
|
|
|
|
|
|
|
|
|
|
|
|
|
|
|
|
|
|
|
|
|
| TOTAL LIABILITIES |
|
|
|
|
|
30,458 |
|
|
|
|
2,429,387 |
|
|
|
|
30,326 |
|
|
|
| |
|
|
|
|
|
|
|
|
|
|
|
|
|
|
|
|
|
|
|
| NET ASSETS |
|
|
|
|
$ |
38,233,579 |
|
|
|
$ |
54,182,787 |
|
|
|
$ |
33,192,969 |
|
|
|
| |
|
|
|
|
|
|
|
|
|
|
|
|
|
|
|
|
|
|
|
| NET ASSETS CONSIST OF: |
|
|
|
|
|
|
|
|
|
|
|
|
|
|
|
|
|
|
|
| |
|
|
|
|
|
|
|
|
|
|
|
|
|
|
|
|
|
|
|
| Paid-in capital |
|
|
|
|
$ |
36,029,575 |
|
|
|
$ |
53,943,017 |
|
|
|
$ |
30,787,663 |
|
|
|
| Undistributed (distributions in excess of) net investment income |
|
|
|
|
|
38,134 |
|
|
|
|
69,282 |
|
|
|
|
— |
|
|
|
| Accumulated net realized gain (loss) on investments |
|
|
|
|
|
204,433 |
|
|
|
|
(5,225,000) |
|
|
|
|
(3,430,771) |
|
|
|
| Net unrealized appreciation (depreciation) of investments |
|
|
|
|
|
1,961,437 |
|
|
|
|
5,395,488 |
|
|
|
|
5,836,077 |
|
|
|
|
|
|
|
|
|
|
|
|
|
|
|
|
|
|
|
|
|
|
|
| TOTAL NET ASSETS |
|
|
|
|
$ |
38,233,579 |
|
|
|
$ |
54,182,787 |
|
|
|
$ |
33,192,969 |
|
|
|
| |
|
|
|
|
|
|
|
|
|
|
|
|
|
|
|
|
|
|
|
| COMPUTATION OF NET ASSET VALUE AND OFFERING PRICE: |
|
|
|
|
|
|
|
|
|
|
|
|
|
|
|
|
|
|
|
| Class A |
|
|
|
|
|
|
|
|
|
|
|
|
|
|
|
|
|
|
|
| Net Assets |
|
|
|
|
$ |
3,614,828 |
|
|
|
$ |
52,859,994 |
|
|
|
$ |
2,730,528 |
|
|
|
|
|
|
|
|
|
|
|
|
|
|
|
|
|
|
|
|
|
|
|
| Shares outstanding (unlimited shares authorized) |
|
|
|
|
|
329,377 |
|
|
|
|
4,815,431 |
|
|
|
|
224,633 |
|
|
|
|
|
|
|
|
|
|
|
|
|
|
|
|
|
|
|
|
|
|
|
| Net Asset Value per share |
|
|
|
|
$ |
10.97 |
|
|
|
$ |
10.98 |
|
|
|
$ |
12.16 |
|
|
|
|
|
|
|
|
|
|
|
|
|
|
|
|
|
|
|
|
|
|
|
| Offering price per share* |
|
|
|
|
$ |
11.61 |
** |
|
|
$ |
11.62 |
** |
|
|
$ |
12.87 |
** |
|
|
|
|
|
|
|
|
|
|
|
|
|
|
|
|
|
|
|
|
|
|
| Class I |
|
|
|
|
|
|
|
|
|
|
|
|
|
|
|
|
|
|
|
| Net Assets |
|
|
|
|
$ |
34,618,751 |
|
|
|
$ |
1,322,793 |
|
|
|
$ |
30,462,441 |
|
|
|
|
|
|
|
|
|
|
|
|
|
|
|
|
|
|
|
|
|
|
|
| Shares outstanding (unlimited shares authorized) |
|
|
|
|
|
3,147,735 |
|
|
|
|
120,478 |
|
|
|
|
2,494,990 |
|
|
|
|
|
|
|
|
|
|
|
|
|
|
|
|
|
|
|
|
|
|
|
| Net Asset Value per share |
|
|
|
|
$ |
11.00 |
|
|
|
$ |
10.98 |
|
|
|
$ |
12.21 |
|
|
|
|
|
|
|
|
|
|
|
|
|
|
|
|
|
|
|
|
|
|
|
| (a) |
Includes $22,135,273, $6,379,079 and $7,346,863 of investments in affiliated issuers, respectively. |
| (b) |
Includes $23,575,149, $8,390,468 and $11,225,206 of investments in affiliated issuers, respectively. |
| * |
See “What Do Shares Cost?” in the Prospectus. |
| ** |
Computation of offering price per share 100/94.50 of net asset value. |
See Notes which are an integral part of the Financial Statements
ANNUAL REPORT / April 30, 2015
|
|
|
| 90 |
|
STATEMENTS OF OPERATIONS |
|
|
|
|
|
|
|
|
|
|
|
|
|
|
|
|
|
|
| Year Ended April 30, 2015 |
|
|
|
Wilmington
Multi-Manager
International
Fund |
|
Wilmington
Multi-Manager
Alternatives
Fund |
|
Wilmington
Multi-Manager
Real Asset
Fund |
| INVESTMENT INCOME: |
|
|
|
|
|
|
|
|
|
|
|
|
|
|
|
|
|
| Dividends |
|
|
|
|
$ |
13,452,255 |
(a) |
|
|
$ |
1,878,128 |
(a) |
|
|
$ |
6,956,293 |
(a) |
| Interest |
|
|
|
|
|
— |
|
|
|
|
2,670,181 |
|
|
|
|
2,809,634 |
(a) |
| Securities lending income |
|
|
|
|
|
314,564 |
|
|
|
|
— |
|
|
|
|
68,643 |
|
|
|
|
|
|
|
|
|
|
|
|
|
|
|
|
|
|
|
| TOTAL INVESTMENT INCOME |
|
|
|
|
|
13,766,819 |
|
|
|
|
4,548,309 |
|
|
|
|
9,834,570 |
|
| |
|
|
|
|
|
|
|
|
|
|
|
|
|
|
|
|
|
| EXPENSES: |
|
|
|
|
|
|
|
|
|
|
|
|
|
|
|
|
|
| Investment advisory fee |
|
|
|
|
|
5,646,243 |
|
|
|
|
3,795,687 |
|
|
|
|
3,531,842 |
|
| Administrative personnel and services fee |
|
|
|
|
|
159,682 |
|
|
|
|
64,320 |
|
|
|
|
140,718 |
|
| Portfolio accounting and administration fees |
|
|
|
|
|
424,249 |
|
|
|
|
92,484 |
|
|
|
|
253,894 |
|
| Custodian fees |
|
|
|
|
|
371,299 |
|
|
|
|
32,100 |
|
|
|
|
232,513 |
|
| Transfer and dividend disbursing agent fees and expenses |
|
|
|
|
|
155,805 |
|
|
|
|
136,237 |
|
|
|
|
164,140 |
|
| Trustees’ fees |
|
|
|
|
|
33,066 |
|
|
|
|
33,066 |
|
|
|
|
33,066 |
|
| Professional fees |
|
|
|
|
|
171,606 |
|
|
|
|
128,782 |
|
|
|
|
109,598 |
|
| Distribution services fee—Class A |
|
|
|
|
|
14,602 |
|
|
|
|
11,385 |
|
|
|
|
6,846 |
|
| Shareholder services fee—Class A |
|
|
|
|
|
14,602 |
|
|
|
|
11,385 |
|
|
|
|
6,846 |
|
| Shareholder services fee— Class I |
|
|
|
|
|
1,303,823 |
|
|
|
|
520,720 |
|
|
|
|
1,157,168 |
|
| Share registration costs |
|
|
|
|
|
26,735 |
|
|
|
|
36,855 |
|
|
|
|
31,798 |
|
| Printing and postage |
|
|
|
|
|
46,231 |
|
|
|
|
48,044 |
|
|
|
|
49,573 |
|
| Dividend expense on securities sold short |
|
|
|
|
|
— |
|
|
|
|
679,961 |
|
|
|
|
— |
|
| Prime broker interest expense |
|
|
|
|
|
— |
|
|
|
|
302,635 |
|
|
|
|
— |
|
| Miscellaneous |
|
|
|
|
|
59,719 |
|
|
|
|
33,129 |
|
|
|
|
51,852 |
|
|
|
|
|
|
|
|
|
|
|
|
|
|
|
|
|
|
|
| TOTAL EXPENSES |
|
|
|
|
|
8,427,662 |
|
|
|
|
5,926,790 |
|
|
|
|
5,769,854 |
|
| |
|
|
|
|
|
|
|
|
|
|
|
|
|
|
|
|
|
| WAIVERS AND REIMBURSEMENTS: |
|
|
|
|
|
|
|
|
|
|
|
|
|
|
|
|
|
| Waiver/reimbursement by investment advisor/subadvisors |
|
|
|
|
|
(929,991) |
|
|
|
|
(256,584) |
|
|
|
|
(15,162) |
|
| Waiver of shareholder services fee—Class A |
|
|
|
|
|
(14,602) |
|
|
|
|
(11,385) |
|
|
|
|
(6,846) |
|
| Waiver of shareholder services fee—Class I |
|
|
|
|
|
(679,163) |
|
|
|
|
(520,720) |
|
|
|
|
(1,157,168) |
|
|
|
|
|
|
|
|
|
|
|
|
|
|
|
|
|
|
|
| TOTAL WAIVERS AND REIMBURSEMENTS |
|
|
|
|
|
(1,623,756) |
|
|
|
|
(788,689) |
|
|
|
|
(1,179,176) |
|
| |
|
|
|
|
|
|
|
|
|
|
|
|
|
|
|
|
|
| Net expenses |
|
|
|
|
|
6,803,906 |
|
|
|
|
5,138,101 |
|
|
|
|
4,590,678 |
|
|
|
|
|
|
|
|
|
|
|
|
|
|
|
|
|
|
|
| Net investment income (loss) |
|
|
|
|
|
6,962,913 |
|
|
|
|
(589,792) |
|
|
|
|
5,243,892 |
|
|
|
|
|
|
|
|
|
|
|
|
|
|
|
|
|
|
|
| REALIZED AND UNREALIZED GAIN (LOSS) ON INVESTMENTS: |
|
|
|
|
|
|
|
|
|
|
|
|
|
|
|
|
|
| Net realized gain (loss) on investments |
|
|
|
|
|
28,306,047 |
|
|
|
|
(5,097,677) |
|
|
|
|
5,143,356 |
|
| Net realized gain (loss) on foreign currency transactions |
|
|
|
|
|
(786,072) |
|
|
|
|
3,704,345 |
|
|
|
|
24,352,816 |
|
| Net realized gain (loss) on futures contracts |
|
|
|
|
|
— |
|
|
|
|
10,545,104 |
|
|
|
|
(762,819) |
|
| Net realized gain (loss) on swap agreements |
|
|
|
|
|
— |
|
|
|
|
— |
|
|
|
|
(1,316,918) |
|
| Net realized gain (loss) on options purchased |
|
|
|
|
|
— |
|
|
|
|
(1,976,270) |
|
|
|
|
(90,435) |
|
| Net realized gain (loss) on options written |
|
|
|
|
|
— |
|
|
|
|
938,805 |
|
|
|
|
432,032 |
|
| Net realized gain (loss) on securities sold short |
|
|
|
|
|
— |
|
|
|
|
(1,550,907) |
|
|
|
|
12,912 |
|
| Net change in unrealized appreciation (depreciation) on investments |
|
|
|
|
|
(16,633,822) |
|
|
|
|
(248,329) |
|
|
|
|
(22,517,353) |
|
| Net change in unrealized appreciation (depreciation) on foreign currency transactions |
|
|
|
|
|
(51,658) |
|
|
|
|
101,243 |
|
|
|
|
(2,799,004) |
|
| Net change in unrealized appreciation (depreciation) on futures contracts |
|
|
|
|
|
— |
|
|
|
|
(1,314,141) |
|
|
|
|
(285,082) |
|
| Net change in unrealized appreciation (depreciation) on swap agreements |
|
|
|
|
|
— |
|
|
|
|
— |
|
|
|
|
(814,928) |
|
| Net change in unrealized appreciation (depreciation) on options purchased |
|
|
|
|
|
— |
|
|
|
|
244,941 |
|
|
|
|
(33,548) |
|
| Net change in unrealized appreciation (depreciation) on options written |
|
|
|
|
|
— |
|
|
|
|
(96,427) |
|
|
|
|
(341,458) |
|
| Net change in unrealized appreciation (depreciation) on securities sold short |
|
|
|
|
|
— |
|
|
|
|
1,885,765 |
|
|
|
|
— |
|
| Net change in unrealized appreciation (depreciation) on TBA Sales Commitments |
|
|
|
|
|
— |
|
|
|
|
— |
|
|
|
|
18,758 |
|
|
|
|
|
|
|
|
|
|
|
|
|
|
|
|
|
|
|
| Net realized and unrealized gain (loss) on investments |
|
|
|
|
|
10,834,495 |
|
|
|
|
7,136,452 |
|
|
|
|
998,329 |
|
|
|
|
|
|
|
|
|
|
|
|
|
|
|
|
|
|
|
| Change in net assets resulting from operations |
|
|
|
|
$ |
17,797,408 |
|
|
|
$ |
6,546,660 |
|
|
|
$ |
6,242,221 |
|
|
|
|
|
|
|
|
|
|
|
|
|
|
|
|
|
|
|
| (a) |
Net of foreign withholding taxes withheld of $1,373,183, $110,493 and $274,555, respectively. |
See Notes which are an integral part of the Financial Statements
April 30, 2015 / ANNUAL REPORT
|
|
|
|
|
| STATEMENTS OF OPERATIONS (concluded) |
|
|
91 |
|
|
|
|
|
|
|
|
|
|
|
|
|
|
|
|
|
|
|
| Year Ended April 30, 2015 |
|
|
|
Wilmington
Strategic Allocation
Conservative Fund |
|
Wilmington
Strategic Allocation
Moderate Fund |
|
Wilmington
Strategic Allocation
Aggressive Fund |
| INVESTMENT INCOME: |
|
|
|
|
|
|
|
|
|
|
|
|
|
|
|
|
|
| Dividends |
|
|
|
|
$ |
311,436 |
|
|
|
$ |
609,879 |
|
|
|
$ |
263,764 |
|
| Dividends received from affiliated issuers |
|
|
|
|
|
356,972 |
|
|
|
|
97,510 |
|
|
|
|
157,387 |
|
| Interest |
|
|
|
|
|
— |
|
|
|
|
236,072 |
|
|
|
|
— |
|
| Securities lending income |
|
|
|
|
|
— |
|
|
|
|
12,380 |
|
|
|
|
— |
|
|
|
|
|
|
|
|
|
|
|
|
|
|
|
|
|
|
|
| TOTAL INVESTMENT INCOME |
|
|
|
|
|
668,408 |
|
|
|
|
955,841 |
|
|
|
|
421,151 |
|
| |
|
|
|
|
|
|
|
|
|
|
|
|
|
|
|
|
|
| EXPENSES: |
|
|
|
|
|
|
|
|
|
|
|
|
|
|
|
|
|
| Investment advisory fee |
|
|
|
|
|
183,752 |
|
|
|
|
258,723 |
|
|
|
|
164,743 |
|
| Administrative personnel and services fee |
|
|
|
|
|
12,078 |
|
|
|
|
17,013 |
|
|
|
|
10,808 |
|
| Portfolio accounting and administration fees |
|
|
|
|
|
34,905 |
|
|
|
|
28,723 |
|
|
|
|
34,812 |
|
| Custodian fees |
|
|
|
|
|
89 |
|
|
|
|
2,302 |
|
|
|
|
202 |
|
| Transfer and dividend disbursing agent fees and expenses |
|
|
|
|
|
4,536 |
|
|
|
|
92,567 |
|
|
|
|
4,562 |
|
| Trustees’ fees |
|
|
|
|
|
33,066 |
|
|
|
|
33,066 |
|
|
|
|
33,066 |
|
| Professional fees |
|
|
|
|
|
49,629 |
|
|
|
|
49,648 |
|
|
|
|
45,326 |
|
| Distribution services fee—Class A |
|
|
|
|
|
10,151 |
|
|
|
|
137,957 |
|
|
|
|
7,201 |
|
| Shareholder services fee—Class A |
|
|
|
|
|
10,151 |
|
|
|
|
137,957 |
|
|
|
|
7,201 |
|
| Shareholder services fee— Class I |
|
|
|
|
|
89,743 |
|
|
|
|
2,755 |
|
|
|
|
82,174 |
|
| Share registration costs |
|
|
|
|
|
28,860 |
|
|
|
|
18,045 |
|
|
|
|
27,825 |
|
| Printing and postage |
|
|
|
|
|
7,905 |
|
|
|
|
18,802 |
|
|
|
|
7,459 |
|
| Miscellaneous |
|
|
|
|
|
20,197 |
|
|
|
|
21,677 |
|
|
|
|
20,000 |
|
|
|
|
|
|
|
|
|
|
|
|
|
|
|
|
|
|
|
| TOTAL EXPENSES |
|
|
|
|
|
485,062 |
|
|
|
|
819,235 |
|
|
|
|
445,379 |
|
| |
|
|
|
|
|
|
|
|
|
|
|
|
|
|
|
|
|
| WAIVERS AND REIMBURSEMENTS: |
|
|
|
|
|
|
|
|
|
|
|
|
|
|
|
|
|
| Waiver/reimbursement by investment advisor |
|
|
|
|
|
(134,536) |
|
|
|
|
(231,187) |
|
|
|
|
(92,363) |
|
| Waiver of shareholder services fee—Class A |
|
|
|
|
|
(10,151) |
|
|
|
|
(137,957) |
|
|
|
|
(7,201) |
|
| Waiver of shareholder services fee—Class I |
|
|
|
|
|
(89,743) |
|
|
|
|
(2,755) |
|
|
|
|
(82,174) |
|
|
|
|
|
|
|
|
|
|
|
|
|
|
|
|
|
|
|
| TOTAL WAIVERS AND REIMBURSEMENTS |
|
|
|
|
|
(234,430) |
|
|
|
|
(371,899) |
|
|
|
|
(181,738) |
|
| |
|
|
|
|
|
|
|
|
|
|
|
|
|
|
|
|
|
| Net expenses |
|
|
|
|
|
250,632 |
|
|
|
|
447,336 |
|
|
|
|
263,641 |
|
|
|
|
|
|
|
|
|
|
|
|
|
|
|
|
|
|
|
| Net investment income |
|
|
|
|
|
417,776 |
|
|
|
|
508,505 |
|
|
|
|
157,510 |
|
|
|
|
|
|
|
|
|
|
|
|
|
|
|
|
|
|
|
| REALIZED AND UNREALIZED GAIN (LOSS) ON INVESTMENTS: |
|
|
|
|
|
|
|
|
|
|
|
|
|
|
|
|
|
| Net realized gain (loss) on investments |
|
|
|
|
|
43,946 |
|
|
|
|
465,784 |
|
|
|
|
386,225 |
|
| Net realized gain (loss) on affiliated investment companies |
|
|
|
|
|
12,281 |
|
|
|
|
1,363,720 |
|
|
|
|
1,109,824 |
|
| Realized gain on distributions received from investment companies |
|
|
|
|
|
240,819 |
|
|
|
|
824,510 |
|
|
|
|
703,987 |
|
| Realized gain on distributions received from affiliated investment companies |
|
|
|
|
|
405,553 |
|
|
|
|
381,238 |
|
|
|
|
392,033 |
|
| Net change in unrealized appreciation (depreciation) of investments |
|
|
|
|
|
313,463 |
|
|
|
|
1,053,239 |
|
|
|
|
981,951 |
|
| Net change in unrealized appreciation (depreciation) of affiliated investment companies |
|
|
|
|
|
(23,718) |
|
|
|
|
(1,291,151) |
|
|
|
|
(958,716) |
|
|
|
|
|
|
|
|
|
|
|
|
|
|
|
|
|
|
|
| Net realized and unrealized gain (loss) on investments |
|
|
|
|
|
992,344 |
|
|
|
|
2,797,340 |
|
|
|
|
2,615,304 |
|
|
|
|
|
|
|
|
|
|
|
|
|
|
|
|
|
|
|
| Change in net assets resulting from operations |
|
|
|
|
$ |
1,410,120 |
|
|
|
$ |
3,305,845 |
|
|
|
$ |
2,772,814 |
|
|
|
|
|
|
|
|
|
|
|
|
|
|
|
|
|
|
|
See Notes which are an integral part of the Financial Statements
ANNUAL REPORT / April 30, 2015
|
|
|
| 92 |
|
STATEMENTS OF CHANGES IN NET ASSETS |
|
|
|
|
|
|
|
|
|
|
|
|
|
|
|
|
|
|
|
|
|
|
|
| |
|
|
|
Wilmington
Multi-Manager
International Fund |
|
Wilmington
Multi-Manager
Alternatives Fund |
| |
|
|
|
Year
Ended April 30,
2015 |
|
Year
Ended April 30,
2014 |
|
Year
Ended April 30,
2015 |
|
Year Ended
April 30,
2014 |
| OPERATIONS: |
|
|
|
|
|
|
|
|
|
|
|
|
|
|
|
|
|
|
|
|
|
|
| Net investment income (loss) |
|
|
|
|
$ |
6,962,913 |
|
|
|
$ |
9,143,789 |
|
|
|
$ |
(589,792) |
|
|
|
$ |
(52,564) |
|
| Net realized gain (loss) on investments |
|
|
|
|
|
27,519,975 |
|
|
|
|
13,267,380 |
|
|
|
|
6,563,400 |
|
|
|
|
3,495,664 |
|
| Net change in unrealized appreciation (depreciation) of investments |
|
|
|
|
|
(16,685,480) |
|
|
|
|
31,325,697 |
|
|
|
|
573,052 |
|
|
|
|
(2,608,605) |
|
|
|
|
|
|
|
|
|
|
|
|
|
|
|
|
|
|
|
|
|
|
|
|
| Change in net assets resulting from operations |
|
|
|
|
|
17,797,408 |
|
|
|
|
53,736,866 |
|
|
|
|
6,546,660 |
|
|
|
|
834,495 |
|
|
|
|
|
|
|
|
|
|
|
|
|
|
|
|
|
|
|
|
|
|
|
|
| DISTRIBUTIONS TO SHAREHOLDERS: |
|
|
|
|
|
|
|
|
|
|
|
|
|
|
|
|
|
|
|
|
|
|
| Distributions from net investment income |
|
|
|
|
|
|
|
|
|
|
|
|
|
|
|
|
|
|
|
|
|
|
| Class A |
|
|
|
|
|
(91,190) |
|
|
|
|
(100,744) |
|
|
|
|
— |
|
|
|
|
(1,588) |
|
| Class I |
|
|
|
|
|
(8,394,062) |
|
|
|
|
(9,081,446) |
|
|
|
|
— |
|
|
|
|
(148,469) |
|
| Distributions from net realized gain on investments |
|
|
|
|
|
|
|
|
|
|
|
|
|
|
|
|
|
|
|
|
|
|
| Class A |
|
|
|
|
|
— |
|
|
|
|
— |
|
|
|
|
(73,584) |
|
|
|
|
(34,832) |
|
| Class I |
|
|
|
|
|
— |
|
|
|
|
— |
|
|
|
|
(3,345,957) |
|
|
|
|
(1,351,865) |
|
|
|
|
|
|
|
|
|
|
|
|
|
|
|
|
|
|
|
|
|
|
|
|
| Change in net assets resulting from distributions to shareholders |
|
|
|
|
|
(8,485,252) |
|
|
|
|
(9,182,190) |
|
|
|
|
(3,419,541) |
|
|
|
|
(1,536,754) |
|
|
|
|
|
|
|
|
|
|
|
|
|
|
|
|
|
|
|
|
|
|
|
|
| SHARE TRANSACTIONS: |
|
|
|
|
|
|
|
|
|
|
|
|
|
|
|
|
|
|
|
|
|
|
| Proceeds from sale of shares |
|
|
|
|
|
|
|
|
|
|
|
|
|
|
|
|
|
|
|
|
|
|
| Class A |
|
|
|
|
|
205,894 |
|
|
|
|
137,022 |
|
|
|
|
2,785,459 |
|
|
|
|
2,033,438 |
|
| Class I |
|
|
|
|
|
53,749,158 |
|
|
|
|
50,989,190 |
|
|
|
|
47,952,089 |
|
|
|
|
177,165,983 |
|
| Distributions reinvested |
|
|
|
|
|
|
|
|
|
|
|
|
|
|
|
|
|
|
|
|
|
|
| Class A |
|
|
|
|
|
84,082 |
|
|
|
|
94,256 |
|
|
|
|
57,566 |
|
|
|
|
19,874 |
|
| Class I |
|
|
|
|
|
5,106,382 |
|
|
|
|
3,099,392 |
|
|
|
|
3,193,804 |
|
|
|
|
1,235,059 |
|
| Cost of shares redeemed |
|
|
|
|
|
|
|
|
|
|
|
|
|
|
|
|
|
|
|
|
|
|
| Class A |
|
|
|
|
|
(577,668) |
|
|
|
|
(924,964) |
|
|
|
|
(4,347,017) |
|
|
|
|
(312,867) |
|
| Class I |
|
|
|
|
|
(59,505,440) |
|
|
|
|
(84,158,652) |
|
|
|
|
(68,093,175) |
|
|
|
|
(14,810,513) |
|
|
|
|
|
|
|
|
|
|
|
|
|
|
|
|
|
|
|
|
|
|
|
|
| Change in net assets resulting from share transactions |
|
|
|
|
|
(937,592) |
|
|
|
|
(30,763,756) |
|
|
|
|
(18,451,274) |
|
|
|
|
165,330,974 |
|
|
|
|
|
|
|
|
|
|
|
|
|
|
|
|
|
|
|
|
|
|
|
|
| Change in net assets |
|
|
|
|
|
8,374,564 |
|
|
|
|
13,790,920 |
|
|
|
|
(15,324,155) |
|
|
|
|
164,628,715 |
|
| NET ASSETS: |
|
|
|
|
|
|
|
|
|
|
|
|
|
|
|
|
|
|
|
|
|
|
| Beginning of year |
|
|
|
|
|
532,980,593 |
|
|
|
|
519,189,673 |
|
|
|
|
211,686,019 |
|
|
|
|
47,057,304 |
|
|
|
|
|
|
|
|
|
|
|
|
|
|
|
|
|
|
|
|
|
|
|
|
| End of year |
|
|
|
|
$ |
541,355,157 |
|
|
|
$ |
532,980,593 |
|
|
|
$ |
196,361,864 |
|
|
|
$ |
211,686,019 |
|
|
|
|
|
|
|
|
|
|
|
|
|
|
|
|
|
|
|
|
|
|
|
|
| Undistributed (distributions in excess of) net investment income included in net assets at end of year |
|
|
|
|
$ |
695,062 |
|
|
|
$ |
2,418,285 |
|
|
|
$ |
4,184,371 |
|
|
|
$ |
86,713 |
|
|
|
|
|
|
|
|
|
|
|
|
|
|
|
|
|
|
|
|
|
|
|
|
| SHARES OF BENEFICIAL INTEREST: |
|
|
|
|
|
|
|
|
|
|
|
|
|
|
|
|
|
|
|
|
|
|
| Shares sold |
|
|
|
|
|
|
|
|
|
|
|
|
|
|
|
|
|
|
|
|
|
|
| Class A |
|
|
|
|
|
26,464 |
|
|
|
|
18,251 |
|
|
|
|
258,540 |
|
|
|
|
187,539 |
|
| Class I |
|
|
|
|
|
6,935,843 |
|
|
|
|
6,846,276 |
|
|
|
|
4,470,296 |
|
|
|
|
16,352,366 |
|
| Distributions reinvested |
|
|
|
|
|
|
|
|
|
|
|
|
|
|
|
|
|
|
|
|
|
|
| Class A |
|
|
|
|
|
10,418 |
|
|
|
|
13,226 |
|
|
|
|
5,410 |
|
|
|
|
1,838 |
|
| Class I |
|
|
|
|
|
629,900 |
|
|
|
|
428,856 |
|
|
|
|
299,887 |
|
|
|
|
114,237 |
|
| Shares redeemed |
|
|
|
|
|
|
|
|
|
|
|
|
|
|
|
|
|
|
|
|
|
|
| Class A |
|
|
|
|
|
(74,672) |
|
|
|
|
(125,478) |
|
|
|
|
(400,212) |
|
|
|
|
(28,946) |
|
| Class I |
|
|
|
|
|
(7,686,723) |
|
|
|
|
(11,165,156) |
|
|
|
|
(6,306,107) |
|
|
|
|
(1,369,535) |
|
|
|
|
|
|
|
|
|
|
|
|
|
|
|
|
|
|
|
|
|
|
|
|
| Net change resulting from share transactions |
|
|
|
|
|
(158,770) |
|
|
|
|
(3,984,025) |
|
|
|
|
(1,672,186) |
|
|
|
|
15,257,499 |
|
|
|
|
|
|
|
|
|
|
|
|
|
|
|
|
|
|
|
|
|
|
|
|
See Notes which are an integral part of the Financial Statements
April 30, 2015 / ANNUAL REPORT
|
|
|
|
|
| STATEMENTS OF CHANGES IN NET ASSETS (continued) |
|
|
93 |
|
|
|
|
|
|
|
|
|
|
|
|
|
|
|
|
|
|
|
|
|
|
|
|
| |
|
|
|
Wilmington
Multi-Manager
Real Asset Fund |
|
Wilmington
Strategic
Allocation
Conservative Fund |
| |
|
|
|
Year
Ended April 30,
2015 |
|
Year
Ended April 30,
2014 |
|
Year
Ended April 30,
2015 |
|
Year Ended
April 30,
2014 |
| OPERATIONS: |
|
|
|
|
|
|
|
|
|
|
|
|
|
|
|
|
|
|
|
|
|
|
| Net investment income (loss) |
|
|
|
|
$ |
5,243,892 |
|
|
|
$ |
4,019,903 |
|
|
|
$ |
417,776 |
|
|
|
$ |
581,178 |
|
| Net realized gain (loss) on investments |
|
|
|
|
|
27,770,944 |
|
|
|
|
511,372 |
|
|
|
|
702,599 |
|
|
|
|
2,322,184 |
|
| Net change in unrealized appreciation (depreciation) of investments |
|
|
|
|
|
(26,772,615) |
|
|
|
|
(18,354,098) |
|
|
|
|
289,745 |
|
|
|
|
(2,171,155) |
|
|
|
|
|
|
|
|
|
|
|
|
|
|
|
|
|
|
|
|
|
|
|
|
| Change in net assets resulting from operations |
|
|
|
|
|
6,242,221 |
|
|
|
|
(13,822,823) |
|
|
|
|
1,410,120 |
|
|
|
|
732,207 |
|
|
|
|
|
|
|
|
|
|
|
|
|
|
|
|
|
|
|
|
|
|
|
|
| DISTRIBUTIONS TO SHAREHOLDERS: |
|
|
|
|
|
|
|
|
|
|
|
|
|
|
|
|
|
|
|
|
|
|
| Distributions from net investment income |
|
|
|
|
|
|
|
|
|
|
|
|
|
|
|
|
|
|
|
|
|
|
| Class A |
|
|
|
|
|
(37,226) |
|
|
|
|
(70,292) |
|
|
|
|
(43,427) |
|
|
|
|
(86,628) |
|
| Class I |
|
|
|
|
|
(6,962,928) |
|
|
|
|
(6,365,654) |
|
|
|
|
(475,323) |
|
|
|
|
(721,293) |
|
| Distributions from net realized gain on investments |
|
|
|
|
|
|
|
|
|
|
|
|
|
|
|
|
|
|
|
|
|
|
| Class A |
|
|
|
|
|
— |
|
|
|
|
— |
|
|
|
|
(76,046) |
|
|
|
|
(36,042) |
|
| Class I |
|
|
|
|
|
— |
|
|
|
|
— |
|
|
|
|
(682,529) |
|
|
|
|
(270,649) |
|
|
|
|
|
|
|
|
|
|
|
|
|
|
|
|
|
|
|
|
|
|
|
|
| Change in net assets resulting from distributions to shareholders |
|
|
|
|
|
(7,000,154) |
|
|
|
|
(6,435,946) |
|
|
|
|
(1,277,325) |
|
|
|
|
(1,114,612) |
|
|
|
|
|
|
|
|
|
|
|
|
|
|
|
|
|
|
|
|
|
|
|
|
| SHARE TRANSACTIONS: |
|
|
|
|
|
|
|
|
|
|
|
|
|
|
|
|
|
|
|
|
|
|
| Proceeds from sale of shares |
|
|
|
|
|
|
|
|
|
|
|
|
|
|
|
|
|
|
|
|
|
|
| Class A |
|
|
|
|
|
920,159 |
|
|
|
|
456,530 |
|
|
|
|
53,499 |
|
|
|
|
267,212 |
|
| Class I |
|
|
|
|
|
68,766,495 |
|
|
|
|
94,787,111 |
|
|
|
|
979,730 |
|
|
|
|
2,166,977 |
|
| Distributions reinvested |
|
|
|
|
|
|
|
|
|
|
|
|
|
|
|
|
|
|
|
|
|
|
| Class A |
|
|
|
|
|
28,746 |
|
|
|
|
60,601 |
|
|
|
|
110,130 |
|
|
|
|
112,340 |
|
| Class I |
|
|
|
|
|
2,294,912 |
|
|
|
|
2,253,884 |
|
|
|
|
1,129,671 |
|
|
|
|
933,462 |
|
| Cost of shares redeemed |
|
|
|
|
|
|
|
|
|
|
|
|
|
|
|
|
|
|
|
|
|
|
| Class A |
|
|
|
|
|
(1,296,786) |
|
|
|
|
(3,825,835) |
|
|
|
|
(1,173,984) |
|
|
|
|
(1,736,476) |
|
| Class I |
|
|
|
|
|
(59,856,239) |
|
|
|
|
(65,291,287) |
|
|
|
|
(5,259,373) |
|
|
|
|
(7,034,024) |
|
|
|
|
|
|
|
|
|
|
|
|
|
|
|
|
|
|
|
|
|
|
|
|
| Change in net assets resulting from share transactions |
|
|
|
|
|
10,857,287 |
|
|
|
|
28,441,004 |
|
|
|
|
(4,160,327) |
|
|
|
|
(5,290,509) |
|
|
|
|
|
|
|
|
|
|
|
|
|
|
|
|
|
|
|
|
|
|
|
|
| Change in net assets |
|
|
|
|
|
10,099,354 |
|
|
|
|
8,182,235 |
|
|
|
|
(4,027,532) |
|
|
|
|
(5,672,914) |
|
| NET ASSETS: |
|
|
|
|
|
|
|
|
|
|
|
|
|
|
|
|
|
|
|
|
|
|
| Beginning of year |
|
|
|
|
|
455,518,153 |
|
|
|
|
447,335,918 |
|
|
|
|
42,261,111 |
|
|
|
|
47,934,025 |
|
|
|
|
|
|
|
|
|
|
|
|
|
|
|
|
|
|
|
|
|
|
|
|
| End of year |
|
|
|
|
$ |
465,617,507 |
|
|
|
$ |
455,518,153 |
|
|
|
$ |
38,233,579 |
|
|
|
$ |
42,261,111 |
|
|
|
|
|
|
|
|
|
|
|
|
|
|
|
|
|
|
|
|
|
|
|
|
| Undistributed (distributions in excess of) net investment income included in net assets at end of year |
|
|
|
|
$ |
16,133,626 |
|
|
|
$ |
(3,791,351) |
|
|
|
$ |
38,134 |
|
|
|
$ |
95,931 |
|
|
|
|
|
|
|
|
|
|
|
|
|
|
|
|
|
|
|
|
|
|
|
|
| SHARES OF BENEFICIAL INTEREST: |
|
|
|
|
|
|
|
|
|
|
|
|
|
|
|
|
|
|
|
|
|
|
| Shares sold |
|
|
|
|
|
|
|
|
|
|
|
|
|
|
|
|
|
|
|
|
|
|
| Class A |
|
|
|
|
|
61,539 |
|
|
|
|
31,056 |
|
|
|
|
4,865 |
|
|
|
|
24,601 |
|
| Class I |
|
|
|
|
|
4,599,175 |
|
|
|
|
6,548,509 |
|
|
|
|
89,278 |
|
|
|
|
198,386 |
|
| Distributions reinvested |
|
|
|
|
|
|
|
|
|
|
|
|
|
|
|
|
|
|
|
|
|
|
| Class A |
|
|
|
|
|
1,974 |
|
|
|
|
4,301 |
|
|
|
|
10,119 |
|
|
|
|
10,425 |
|
| Class I |
|
|
|
|
|
156,785 |
|
|
|
|
159,217 |
|
|
|
|
103,574 |
|
|
|
|
86,408 |
|
| Shares redeemed |
|
|
|
|
|
|
|
|
|
|
|
|
|
|
|
|
|
|
|
|
|
|
| Class A |
|
|
|
|
|
(87,612) |
|
|
|
|
(266,938) |
|
|
|
|
(106,588) |
|
|
|
|
(159,664) |
|
| Class I |
|
|
|
|
|
(4,006,614) |
|
|
|
|
(4,518,152) |
|
|
|
|
(477,557) |
|
|
|
|
(646,380) |
|
|
|
|
|
|
|
|
|
|
|
|
|
|
|
|
|
|
|
|
|
|
|
|
| Net change resulting from share transactions |
|
|
|
|
|
725,247 |
|
|
|
|
1,957,993 |
|
|
|
|
(376,309) |
|
|
|
|
(486,224) |
|
|
|
|
|
|
|
|
|
|
|
|
|
|
|
|
|
|
|
|
|
|
|
|
See Notes which are an integral part of the Financial Statements
ANNUAL REPORT / April 30, 2015
|
|
|
| 94 |
|
STATEMENTS OF CHANGES IN NET ASSETS (concluded) |
|
|
|
|
|
|
|
|
|
|
|
|
|
|
|
|
|
|
|
|
|
|
|
| |
|
|
|
Wilmington
Strategic
Allocation
Moderate Fund |
|
|
Wilmington
Strategic
Allocation
Aggressive Fund |
|
|
|
|
|
|
|
| |
|
|
|
Year Ended
April 30,
2015 |
|
|
Year Ended
April 30,
2014 |
|
|
Year Ended
April 30,
2015 |
|
|
Year Ended
April 30,
2014 |
|
| OPERATIONS: |
|
|
|
|
|
|
|
|
|
|
|
|
|
|
|
|
|
|
| Net investment income (loss) |
|
|
|
$ |
508,505 |
|
|
$ |
586,860 |
|
|
$ |
157,510 |
|
|
$ |
219,866 |
|
| Net realized gain (loss) on investments |
|
|
|
|
3,035,252 |
|
|
|
6,545,713 |
|
|
|
2,592,069 |
|
|
|
8,957,568 |
|
| Net change in unrealized appreciation (depreciation) of investments |
|
|
|
|
(237,912) |
|
|
|
(2,779,410) |
|
|
|
23,235 |
|
|
|
(4,625,166) |
|
|
|
|
|
|
|
|
|
|
|
|
|
|
|
|
|
|
|
|
| Change in net assets resulting from operations |
|
|
|
|
3,305,845 |
|
|
|
4,353,163 |
|
|
|
2,772,814 |
|
|
|
4,552,268 |
|
|
|
|
|
|
|
|
|
|
|
|
|
|
|
|
|
|
|
|
| DISTRIBUTIONS TO SHAREHOLDERS: |
|
|
|
|
|
|
|
|
|
|
|
|
|
|
|
|
|
|
| Distributions from net investment income |
|
|
|
|
|
|
|
|
|
|
|
|
|
|
|
|
|
|
| Class A |
|
|
|
|
(633,887) |
|
|
|
(636,970) |
|
|
|
(19,456) |
|
|
|
(19,582) |
|
| Class I |
|
|
|
|
(15,500) |
|
|
|
(41,402) |
|
|
|
(266,723) |
|
|
|
(290,529) |
|
|
|
|
|
|
|
|
|
|
|
|
|
|
|
|
|
|
|
|
| Change in net assets resulting from distributions to shareholders |
|
|
|
|
(649,387) |
|
|
|
(678,372) |
|
|
|
(286,179) |
|
|
|
(310,111) |
|
|
|
|
|
|
|
|
|
|
|
|
|
|
|
|
|
|
|
|
| SHARE TRANSACTIONS: |
|
|
|
|
|
|
|
|
|
|
|
|
|
|
|
|
|
|
| Proceeds from sale of shares |
|
|
|
|
|
|
|
|
|
|
|
|
|
|
|
|
|
|
| Class A |
|
|
|
|
1,893,349 |
|
|
|
1,505,386 |
|
|
|
146,794 |
|
|
|
105,225 |
|
| Class I |
|
|
|
|
323,478 |
|
|
|
1,312,531 |
|
|
|
1,817,410 |
|
|
|
3,712,404 |
|
| Distributions reinvested |
|
|
|
|
|
|
|
|
|
|
|
|
|
|
|
|
|
|
| Class A |
|
|
|
|
600,598 |
|
|
|
603,379 |
|
|
|
19,021 |
|
|
|
18,626 |
|
| Class I |
|
|
|
|
1,400 |
|
|
|
36,056 |
|
|
|
83,891 |
|
|
|
87,571 |
|
| Cost of shares redeemed |
|
|
|
|
|
|
|
|
|
|
|
|
|
|
|
|
|
|
| Class A |
|
|
|
|
(9,553,638) |
|
|
|
(8,953,240) |
|
|
|
(609,143) |
|
|
|
(691,931) |
|
| Class I |
|
|
|
|
(27,237) |
|
|
|
(3,283,872) |
|
|
|
(9,117,673) |
|
|
|
(8,139,037) |
|
|
|
|
|
|
|
|
|
|
|
|
|
|
|
|
|
|
|
|
| Change in net assets resulting from share transactions |
|
|
|
|
(6,762,050) |
|
|
|
(8,779,760) |
|
|
|
(7,659,700) |
|
|
|
(4,907,142) |
|
|
|
|
|
|
|
|
|
|
|
|
|
|
|
|
|
|
|
|
| Change in net assets |
|
|
|
|
(4,105,592) |
|
|
|
(5,104,969) |
|
|
|
(5,173,065) |
|
|
|
(664,985) |
|
| NET ASSETS: |
|
|
|
|
|
|
|
|
|
|
|
|
|
|
|
|
|
|
| Beginning of year |
|
|
|
|
58,288,379 |
|
|
|
63,393,348 |
|
|
|
38,366,034 |
|
|
|
39,031,019 |
|
|
|
|
|
|
|
|
|
|
|
|
|
|
|
|
|
|
|
|
| End of year |
|
|
|
$ |
54,182,787 |
|
|
$ |
58,288,379 |
|
|
$ |
33,192,969 |
|
|
$ |
38,366,034 |
|
|
|
|
|
|
|
|
|
|
|
|
|
|
|
|
|
|
|
|
| Undistributed (distributions in excess of) net investment income included in net assets at end of year |
|
|
|
$ |
69,282 |
|
|
$ |
97,447 |
|
|
$ |
— |
|
|
$ |
25,581 |
|
|
|
|
|
|
|
|
|
|
|
|
|
|
|
|
|
|
|
|
| SHARES OF BENEFICIAL INTEREST: |
|
|
|
|
|
|
|
|
|
|
|
|
|
|
|
|
|
|
| Shares sold |
|
|
|
|
|
|
|
|
|
|
|
|
|
|
|
|
|
|
| Class A |
|
|
|
|
176,588 |
|
|
|
147,756 |
|
|
|
12,480 |
|
|
|
9,611 |
|
| Class I |
|
|
|
|
30,095 |
|
|
|
130,859 |
|
|
|
155,596 |
|
|
|
343,392 |
|
| Distributions reinvested |
|
|
|
|
|
|
|
|
|
|
|
|
|
|
|
|
|
|
| Class A |
|
|
|
|
56,397 |
|
|
|
59,124 |
|
|
|
1,636 |
|
|
|
1,668 |
|
| Class I |
|
|
|
|
131 |
|
|
|
3,548 |
|
|
|
7,191 |
|
|
|
7,911 |
|
| Shares redeemed |
|
|
|
|
|
|
|
|
|
|
|
|
|
|
|
|
|
|
| Class A |
|
|
|
|
(893,932) |
|
|
|
(882,214) |
|
|
|
(51,503) |
|
|
|
(63,104) |
|
| Class I |
|
|
|
|
(2,511) |
|
|
|
(321,291) |
|
|
|
(776,431) |
|
|
|
(742,129) |
|
|
|
|
|
|
|
|
|
|
|
|
|
|
|
|
|
|
|
|
| Net change resulting from share transactions |
|
|
|
|
(633,232) |
|
|
|
(862,218) |
|
|
|
(651,031) |
|
|
|
(442,651) |
|
|
|
|
|
|
|
|
|
|
|
|
|
|
|
|
|
|
|
|
See Notes which are an integral part of the Financial Statements
April 30, 2015 / ANNUAL REPORT
For a share outstanding throughout each period.
|
|
|
|
|
|
|
|
|
|
|
|
|
|
|
|
|
|
|
|
|
|
|
|
|
|
|
|
|
|
|
|
|
|
|
|
|
|
|
|
|
| WILMINGTON MULTI-MANAGER INTERNATIONAL
FUND† |
|
|
| |
|
|
|
|
|
|
|
|
|
|
|
|
|
|
|
|
|
|
|
|
|
|
|
|
|
|
|
|
|
|
|
|
|
|
|
|
| CLASS A
|
|
|
|
Year Ended
April 30, 2015
|
|
Year Ended
April 30, 2014
|
|
Year Ended
April 30, 2013
|
|
For the Period
July 1,
2011
through
April 30, 2012*
|
|
Year Ended
June 30, 2011
|
|
Year Ended
June 30, 2010
|
|
|
| Net Asset Value, Beginning of Period |
|
|
|
|
|
$7.90 |
|
|
|
|
$7.27 |
|
|
|
|
$6.72 |
|
|
|
|
$7.63 |
|
|
|
|
$5.95 |
|
|
|
|
$5.36 |
|
|
|
| Income (Loss) From Operations: |
|
|
|
|
|
|
|
|
|
|
|
|
|
|
|
|
|
|
|
|
|
|
|
|
|
|
|
|
|
|
|
|
|
|
| Net Investment Income (Loss)(a) |
|
|
|
|
|
0.09 |
|
|
|
|
0.12 |
|
|
|
|
0.09 |
|
|
|
|
0.16 |
|
|
|
|
0.12 |
|
|
|
|
0.06 |
|
|
|
| Net Realized and Unrealized Gain (Loss) on Investments and Foreign Currency |
|
|
|
|
|
0.17 |
|
|
|
|
0.63 |
|
|
|
|
0.57 |
|
|
|
|
(1.05 |
) |
|
|
|
1.64 |
|
|
|
|
0.63 |
|
|
|
|
|
|
|
|
|
| Total Income (Loss) From Operations |
|
|
|
|
|
0.26 |
|
|
|
|
0.75 |
|
|
|
|
0.66 |
|
|
|
|
(0.89 |
) |
|
|
|
1.76 |
|
|
|
|
0.69 |
|
|
|
|
|
|
|
|
|
| Less Distributions From: |
|
|
|
|
|
|
|
|
|
|
|
|
|
|
|
|
|
|
|
|
|
|
|
|
|
|
|
|
|
|
|
|
|
|
| Net Investment Income |
|
|
|
|
|
(0.12 |
) |
|
|
|
(0.12 |
) |
|
|
|
(0.11 |
) |
|
|
|
(0.02 |
) |
|
|
|
(0.08 |
) |
|
|
|
(0.10 |
) |
|
|
| Return of Capital |
|
|
|
|
|
— |
|
|
|
|
— |
|
|
|
|
— |
|
|
|
|
— |
|
|
|
|
— |
|
|
|
|
0.00 |
(b) |
|
|
|
|
|
|
|
|
| Total Distributions |
|
|
|
|
|
(0.12 |
) |
|
|
|
(0.12 |
) |
|
|
|
(0.11 |
) |
|
|
|
(0.02 |
) |
|
|
|
(0.08 |
) |
|
|
|
(0.10 |
) |
|
|
|
|
|
|
|
|
| Net Asset Value, End of Period |
|
|
|
|
|
8.04 |
|
|
|
|
7.90 |
|
|
|
|
7.27 |
|
|
|
|
6.72 |
|
|
|
|
$7.63 |
|
|
|
|
$5.95 |
|
|
|
|
|
|
|
|
|
| Total Return(c) |
|
|
|
|
|
3.29 |
% |
|
|
|
10.53 |
% |
|
|
|
10.17 |
% |
|
|
|
(11.65 |
)% |
|
|
|
29.57 |
% |
|
|
|
12.74 |
% |
|
|
| Net Assets, End of Period (000’s) |
|
|
|
|
|
$5,909 |
|
|
|
|
$6,107 |
|
|
|
|
$6,301 |
|
|
|
|
$6,682 |
|
|
|
|
$571 |
|
|
|
|
$83 |
|
|
|
| Ratios to Average Net Assets |
|
|
|
|
|
|
|
|
|
|
|
|
|
|
|
|
|
|
|
|
|
|
|
|
|
|
|
|
|
|
|
|
|
|
| Gross Expense |
|
|
|
|
|
1.84 |
% |
|
|
|
1.78 |
% |
|
|
|
1.78 |
% |
|
|
|
1.62 |
%(d) |
|
|
|
1.59 |
% |
|
|
|
1.63 |
% |
|
|
| Net Expenses(e) |
|
|
|
|
|
1.42 |
% |
|
|
|
1.49 |
% |
|
|
|
1.48 |
% |
|
|
|
1.42 |
%(d) |
|
|
|
1.58 |
% |
|
|
|
1.62 |
% |
|
|
| Net Investment Income (Loss) |
|
|
|
|
|
1.20 |
% |
|
|
|
1.64 |
% |
|
|
|
1.38 |
% |
|
|
|
2.77 |
%(d) |
|
|
|
1.61 |
% |
|
|
|
0.89 |
% |
|
|
| Portfolio Turnover Rate |
|
|
|
|
|
78 |
% |
|
|
|
49 |
% |
|
|
|
72 |
% |
|
|
|
85 |
% |
|
|
|
98 |
% |
|
|
|
107 |
% |
|
|
|
|
|
|
|
|
|
|
|
|
|
|
|
|
|
|
|
|
|
|
|
|
|
|
|
|
|
|
|
|
|
|
|
|
|
|
|
| CLASS I
|
|
|
|
Year Ended
April 30, 2015
|
|
Year Ended
April 30, 2014
|
|
Year Ended
April 30, 2013
|
|
For the Period
July 1, 2011
through
April 30,
2012*
|
|
Year Ended
June 30, 2011
|
|
Year Ended
June 30, 2010
|
|
|
| Net Asset Value, Beginning of Period |
|
|
|
|
|
$7.94 |
|
|
|
|
$7.30 |
|
|
|
|
$6.75 |
|
|
|
|
$7.66 |
|
|
|
|
$5.97 |
|
|
|
|
$5.37 |
|
|
|
| Income (Loss) From Operations: |
|
|
|
|
|
|
|
|
|
|
|
|
|
|
|
|
|
|
|
|
|
|
|
|
|
|
|
|
|
|
|
|
|
|
| Net Investment Income (Loss)(a) |
|
|
|
|
|
0.10 |
|
|
|
|
0.13 |
|
|
|
|
0.10 |
|
|
|
|
0.06 |
|
|
|
|
0.10 |
|
|
|
|
0.07 |
|
|
|
| Net Realized and Unrealized Gain (Loss) on Investments and Foreign Currency |
|
|
|
|
|
0.18 |
|
|
|
|
0.64 |
|
|
|
|
0.57 |
|
|
|
|
(0.94 |
) |
|
|
|
1.67 |
|
|
|
|
0.64 |
|
|
|
|
|
|
|
|
|
| Total Income (Loss) From Operations |
|
|
|
|
|
0.28 |
|
|
|
|
0.77 |
|
|
|
|
0.67 |
|
|
|
|
(0.88 |
) |
|
|
|
1.77 |
|
|
|
|
0.71 |
|
|
|
|
|
|
|
|
|
| Less Distributions From: |
|
|
|
|
|
|
|
|
|
|
|
|
|
|
|
|
|
|
|
|
|
|
|
|
|
|
|
|
|
|
|
|
|
|
| Net Investment Income |
|
|
|
|
|
(0.13 |
) |
|
|
|
(0.13 |
) |
|
|
|
(0.12 |
) |
|
|
|
(0.03 |
) |
|
|
|
(0.08 |
) |
|
|
|
(0.11 |
) |
|
|
| Return of Capital |
|
|
|
|
|
— |
|
|
|
|
— |
|
|
|
|
— |
|
|
|
|
— |
|
|
|
|
— |
|
|
|
|
0.00 |
(b) |
|
|
|
|
|
|
|
|
| Total Distributions |
|
|
|
|
|
(0.13 |
) |
|
|
|
(0.13 |
) |
|
|
|
(0.12 |
) |
|
|
|
(0.03 |
) |
|
|
|
(0.08 |
) |
|
|
|
(0.11 |
) |
|
|
|
|
|
|
|
|
| Net Asset Value, End of Period |
|
|
|
|
|
$8.09 |
|
|
|
|
$7.94 |
|
|
|
|
$7.30 |
|
|
|
|
$6.75 |
|
|
|
|
$7.66 |
|
|
|
|
$5.97 |
|
|
|
|
|
|
|
|
|
| Total Return(c) |
|
|
|
|
|
3.46 |
% |
|
|
|
10.73 |
% |
|
|
|
10.22 |
% |
|
|
|
(11.45 |
)% |
|
|
|
29.78 |
% |
|
|
|
13.10 |
% |
|
|
| Net Assets, End of Period (000’s) |
|
|
|
|
|
$535,446 |
|
|
|
|
$526,874 |
|
|
|
|
$512,889 |
|
|
|
|
$395,690 |
|
|
|
|
$373,798 |
|
|
|
|
$249,031 |
|
|
|
| Ratios to Average Net Assets |
|
|
|
|
|
|
|
|
|
|
|
|
|
|
|
|
|
|
|
|
|
|
|
|
|
|
|
|
|
|
|
|
|
|
| Gross Expense |
|
|
|
|
|
1.59 |
% |
|
|
|
1.53 |
% |
|
|
|
1.54 |
% |
|
|
|
1.42 |
%(d) |
|
|
|
1.43 |
% |
|
|
|
1.38 |
% |
|
|
| Net Expenses(e) |
|
|
|
|
|
1.29 |
% |
|
|
|
1.36 |
% |
|
|
|
1.35 |
% |
|
|
|
1.38 |
%(d) |
|
|
|
1.41 |
% |
|
|
|
1.37 |
% |
|
|
| Net Investment Income (Loss) |
|
|
|
|
|
1.32 |
% |
|
|
|
1.75 |
% |
|
|
|
1.47 |
% |
|
|
|
1.17 |
%(d) |
|
|
|
1.38 |
% |
|
|
|
1.03 |
% |
|
|
| Portfolio Turnover Rate |
|
|
|
|
|
78 |
% |
|
|
|
49 |
% |
|
|
|
72 |
% |
|
|
|
85 |
% |
|
|
|
98 |
% |
|
|
|
107 |
% |
|
|
| (a) |
Per share numbers have been calculated using the average shares method. |
| (b) |
Represents less than $0.005. |
| (c) |
Based on net asset value, which does not reflect the sales charge or contingent deferred sales charge, if applicable. Total returns for periods of less than
one year, if any, are not annualized. |
| (d) |
Annualized for periods less than one year. |
| (e) |
The investment advisor and other service providers waived or reimbursed a portion of their fees. |
| † |
Effective March 9, 2012, the Fund acquired all the assets and liabilities of the Wilmington Multi-Manager International Fund, a series of WT Mutual Fund
(the “WT Fund”). The financial highlights for the period prior to this date reflect the performance of the WT Fund. |
| * |
Year end changed from June 30 to April 30. |
See Notes which are an integral part of the Financial Statements
ANNUAL REPORT / April 30, 2015
|
|
|
| 96 |
|
FINANCIAL HIGHLIGHTS (continued) |
For a share outstanding throughout each period.
|
|
|
|
|
|
|
|
|
|
|
|
|
|
|
|
|
|
|
|
|
|
|
|
|
|
|
|
|
|
|
| WILMINGTON MULTI-MANAGER ALTERNATIVES
FUND |
|
|
| |
|
|
|
|
|
|
|
|
|
|
|
|
|
|
|
|
|
|
|
|
|
|
|
|
|
|
| CLASS A
|
|
|
|
Year Ended
April 30, 2015
|
|
Year Ended
April 30, 2014
|
|
Year Ended
April 30, 2013
|
|
For the Period
January 12, 2012*
through
April 30, 2012
|
|
|
| Net Asset Value, Beginning of Period |
|
|
|
|
|
$10.74 |
|
|
|
|
$10.58 |
|
|
|
|
$10.11 |
|
|
|
|
$10.00 |
|
|
|
| Income (Loss) From Operations: |
|
|
|
|
|
|
|
|
|
|
|
|
|
|
|
|
|
|
|
|
|
|
|
|
| Net Investment Income (Loss)(a) |
|
|
|
|
|
(0.06 |
) |
|
|
|
(0.04 |
) |
|
|
|
0.00 |
(b) |
|
|
|
0.03 |
|
|
|
| Net Realized and Unrealized Gain (Loss) on
Investments and Foreign Currency |
|
|
|
|
|
0.35 |
|
|
|
|
0.34 |
|
|
|
|
0.56 |
|
|
|
|
0.08 |
|
|
|
|
|
|
|
|
|
| Total Income (Loss) From Operations |
|
|
|
|
|
0.29 |
|
|
|
|
0.30 |
|
|
|
|
0.56 |
|
|
|
|
0.11 |
|
|
|
|
|
|
|
|
|
| Less Distributions From: |
|
|
|
|
|
|
|
|
|
|
|
|
|
|
|
|
|
|
|
|
|
|
|
|
| Net Investment Income |
|
|
|
|
|
— |
|
|
|
|
(0.01 |
) |
|
|
|
(0.03 |
) |
|
|
|
— |
|
|
|
| Net Realized Gains |
|
|
|
|
|
(0.17 |
) |
|
|
|
(0.13 |
) |
|
|
|
(0.06 |
) |
|
|
|
— |
|
|
|
|
|
|
|
|
|
| Total Distributions |
|
|
|
|
|
(0.17 |
) |
|
|
|
(0.14 |
) |
|
|
|
(0.09 |
) |
|
|
|
— |
|
|
|
|
|
|
|
|
|
| Net Asset Value, End of Period |
|
|
|
|
|
$10.86 |
|
|
|
|
$10.74 |
|
|
|
|
$10.58 |
|
|
|
|
$10.11 |
|
|
|
|
|
|
|
|
|
| Total Return(c) |
|
|
|
|
|
2.73 |
% |
|
|
|
2.74 |
% |
|
|
|
5.56 |
% |
|
|
|
1.10 |
% |
|
|
| Net Assets, End of Period (000’s) |
|
|
|
|
|
$2,723 |
|
|
|
|
$4,156 |
|
|
|
|
$2,397 |
|
|
|
|
$121 |
|
|
|
| Ratios to Average Net Assets |
|
|
|
|
|
|
|
|
|
|
|
|
|
|
|
|
|
|
|
|
|
|
|
|
| Gross Expense |
|
|
|
|
|
3.04 |
% |
|
|
|
3.30 |
% |
|
|
|
3.98 |
% |
|
|
|
4.66 |
%(d)(e) |
|
|
| Net Expenses(f)(g) |
|
|
|
|
|
2.68 |
% |
|
|
|
2.71 |
% |
|
|
|
2.84 |
% |
|
|
|
2.89 |
%(d)(e) |
|
|
| Net Investment Income (Loss) |
|
|
|
|
|
(0.52 |
)% |
|
|
|
(0.33 |
)% |
|
|
|
0.00 |
%(h) |
|
|
|
0.88 |
%(d) |
|
|
| Portfolio Turnover Rate |
|
|
|
|
|
434 |
% |
|
|
|
403 |
% |
|
|
|
367 |
% |
|
|
|
8 |
% |
|
|
|
|
|
|
|
|
|
|
|
|
|
|
|
|
|
|
|
|
|
|
|
|
|
|
|
|
|
| CLASS I
|
|
|
|
Year Ended
April 30, 2015
|
|
Year Ended
April 30, 2014
|
|
Year Ended
April 30, 2013
|
|
For the Period
January 12, 2012*
through
April 30, 2012
|
|
|
| Net Asset Value, Beginning of Period |
|
|
|
|
|
$10.74 |
|
|
|
|
$10.56 |
|
|
|
|
$10.08 |
|
|
|
|
$10.00 |
|
|
|
| Income (Loss) From Operations: |
|
|
|
|
|
|
|
|
|
|
|
|
|
|
|
|
|
|
|
|
|
|
|
|
| Net Investment Income (Loss)(a) |
|
|
|
|
|
(0.03 |
) |
|
|
|
0.00 |
(b) |
|
|
|
0.03 |
|
|
|
|
0.06 |
|
|
|
| Net Realized and Unrealized Gain (Loss) on
Investments and Foreign Currency |
|
|
|
|
|
0.34 |
|
|
|
|
0.32 |
|
|
|
|
0.56 |
|
|
|
|
0.05 |
|
|
|
|
|
|
|
|
|
| Total Income (Loss) From Operations |
|
|
|
|
|
0.31 |
|
|
|
|
0.32 |
|
|
|
|
0.59 |
|
|
|
|
0.11 |
|
|
|
|
|
|
|
|
|
| Less Distributions From: |
|
|
|
|
|
|
|
|
|
|
|
|
|
|
|
|
|
|
|
|
|
|
|
|
| Net Investment Income |
|
|
|
|
|
— |
|
|
|
|
(0.01 |
) |
|
|
|
(0.05 |
) |
|
|
|
(0.03 |
) |
|
|
| Net Realized Gains |
|
|
|
|
|
(0.17 |
) |
|
|
|
(0.13 |
) |
|
|
|
(0.06 |
) |
|
|
|
— |
|
|
|
|
|
|
|
|
|
| Total Distributions |
|
|
|
|
|
(0.17 |
) |
|
|
|
(0.14 |
) |
|
|
|
(0.11 |
) |
|
|
|
(0.03 |
) |
|
|
|
|
|
|
|
|
| Net Asset Value, End of Period |
|
|
|
|
|
$10.88 |
|
|
|
|
$10.74 |
|
|
|
|
$10.56 |
|
|
|
|
$10.08 |
|
|
|
|
|
|
|
|
|
| Total Return(c) |
|
|
|
|
|
2.91 |
% |
|
|
|
3.01 |
% |
|
|
|
5.91 |
% |
|
|
|
1.10 |
% |
|
|
| Net Assets, End of Period (000’s) |
|
|
|
|
|
$193,639 |
|
|
|
|
$207,530 |
|
|
|
|
$44,660 |
|
|
|
|
$24,935 |
|
|
|
| Ratios to Average Net Assets |
|
|
|
|
|
|
|
|
|
|
|
|
|
|
|
|
|
|
|
|
|
|
|
|
| Gross Expense |
|
|
|
|
|
2.78 |
% |
|
|
|
2.95 |
% |
|
|
|
3.77 |
% |
|
|
|
4.33 |
%(d)(e) |
|
|
| Net Expenses(f)(g) |
|
|
|
|
|
2.41 |
% |
|
|
|
2.43 |
% |
|
|
|
2.65 |
% |
|
|
|
2.39 |
%(d)(e) |
|
|
| Net Investment Income (Loss) |
|
|
|
|
|
(0.27 |
)% |
|
|
|
(0.04 |
)% |
|
|
|
0.29 |
% |
|
|
|
2.11 |
%(d) |
|
|
| Portfolio Turnover Rate |
|
|
|
|
|
434 |
% |
|
|
|
403 |
% |
|
|
|
367 |
% |
|
|
|
8 |
% |
|
|
| (a) |
Per share numbers have been calculated using the average shares method. |
| (b) |
Represents less than $0.005. |
| (c) |
Based on net asset value, which does not reflect the sales charge or contingent deferred sales charge, if applicable. Total returns for periods of less than
one year, if any, are not annualized. |
| (d) |
Annualized for periods less than one year. |
| (e) |
Ratio of expenses to average net assets was increased by 0.41% to include dividend and interest expenses related to securities sold short.
|
| (f) |
The investment advisor and other service providers waived or reimbursed a portion of their fees. |
| (g) |
Expense ratio includes dividend and interest expense related to securities sold short. Excluding such dividend and interest expense, the ratio of expenses to
average net assets for the years and the periods presented would be: |
|
|
|
|
|
|
|
|
|
|
|
| |
|
Class A |
|
|
Class I |
|
|
|
| April 30, 2015 |
|
|
2.19% |
|
|
|
1.95% |
|
|
|
| April 30, 2014 |
|
|
2.23% |
|
|
|
1.98% |
|
|
|
| April 30, 2013 |
|
|
2.24% |
|
|
|
1.98% |
|
|
|
| April 30, 2012 |
|
|
2.48% |
|
|
|
1.98% |
|
|
|
| (h) |
Represents less than 0.005%. |
| * |
Commencement of operations. |
See Notes which
are an integral part of the Financial Statements
April 30, 2015 / ANNUAL REPORT
|
|
|
|
|
| FINANCIAL HIGHLIGHTS (continued) |
|
|
97 |
|
For a share outstanding throughout each period.
|
| WILMINGTON MULTI-MANAGER REAL ASSET FUND† |
|
|
|
|
|
|
|
|
|
|
|
|
|
|
|
|
|
|
|
|
|
|
|
|
|
|
|
|
|
|
|
|
|
|
|
|
|
|
|
|
|
| CLASS A |
|
|
|
Year Ended
April 30, 2015 |
|
Year Ended
April 30, 2014 |
|
Year Ended
April 30, 2013 |
|
For the Period
July 1,
2011
through
April 30,
2012* |
|
Year Ended
April 30, 2011 |
|
Year Ended
April 30, 2010 |
|
|
| Net Asset Value, Beginning of Period |
|
|
|
|
|
$14.81 |
|
|
|
|
$15.55 |
|
|
|
|
$14.28 |
|
|
|
|
$14.00 |
|
|
|
|
$12.10 |
|
|
|
|
$11.60 |
|
|
|
| Income (Loss) From Operations: |
|
|
|
|
|
|
|
|
|
|
|
|
|
|
|
|
|
|
|
|
|
|
|
|
|
|
|
|
|
|
|
|
|
|
| Net Investment Income (Loss)(a) |
|
|
|
|
|
0.13 |
|
|
|
|
0.10 |
|
|
|
|
0.18 |
|
|
|
|
(0.21 |
) |
|
|
|
0.63 |
|
|
|
|
0.02 |
|
|
|
| Net Realized and Unrealized Gain (Loss) on Investments and Foreign Currency |
|
|
|
|
|
0.04 |
|
|
|
|
(0.65 |
) |
|
|
|
1.28 |
|
|
|
|
0.50 |
|
|
|
|
1.91 |
|
|
|
|
0.75 |
|
|
|
|
|
|
|
|
|
| Total Income (Loss) From Operations |
|
|
|
|
|
0.17 |
|
|
|
|
(0.55 |
) |
|
|
|
1.46 |
|
|
|
|
0.29 |
|
|
|
|
2.54 |
|
|
|
|
0.77 |
|
|
|
|
|
|
|
|
|
| Less Distributions From: |
|
|
|
|
|
|
|
|
|
|
|
|
|
|
|
|
|
|
|
|
|
|
|
|
|
|
|
|
|
|
|
|
|
|
| Net Investment Income |
|
|
|
|
|
(0.21 |
) |
|
|
|
(0.19 |
) |
|
|
|
(0.19 |
) |
|
|
|
(0.01 |
) |
|
|
|
(0.64 |
) |
|
|
|
(0.27 |
) |
|
|
|
|
|
|
|
|
| Net Asset Value, End of Period |
|
|
|
|
|
$14.77 |
|
|
|
|
$14.81 |
|
|
|
|
$15.55 |
|
|
|
|
$14.28 |
|
|
|
|
$14.00 |
|
|
|
|
$12.10 |
|
|
|
|
|
|
|
|
|
| Total Return(b) |
|
|
|
|
|
1.14 |
% |
|
|
|
(3.46 |
)% |
|
|
|
10.33 |
% |
|
|
|
2.04 |
% |
|
|
|
21.45 |
% |
|
|
|
6.57 |
% |
|
|
| Net Assets, End of Period (000’s) |
|
|
|
|
|
$2,242 |
|
|
|
|
$2,606 |
|
|
|
|
$6,337 |
|
|
|
|
$7,038 |
|
|
|
|
$13,773 |
|
|
|
|
$16,305 |
|
|
|
| Ratios to Average Net Assets |
|
|
|
|
|
|
|
|
|
|
|
|
|
|
|
|
|
|
|
|
|
|
|
|
|
|
|
|
|
|
|
|
|
|
| Gross Expense |
|
|
|
|
|
1.49 |
% |
|
|
|
1.54 |
% |
|
|
|
1.55 |
% |
|
|
|
1.33 |
%(c) |
|
|
|
1.25 |
% |
|
|
|
1.20 |
% |
|
|
| Net Expenses(d) |
|
|
|
|
|
1.23 |
% |
|
|
|
1.28 |
% |
|
|
|
1.27 |
% |
|
|
|
1.28 |
%(c) |
|
|
|
1.25 |
% |
|
|
|
1.19 |
% |
|
|
| Net Investment Income (Loss) |
|
|
|
|
|
0.89 |
% |
|
|
|
0.72 |
% |
|
|
|
1.13 |
% |
|
|
|
(1.86 |
)%(c) |
|
|
|
4.64 |
% |
|
|
|
0.13 |
% |
|
|
| Portfolio Turnover Rate |
|
|
|
|
|
242 |
% |
|
|
|
149 |
% |
|
|
|
131 |
% |
|
|
|
180 |
% |
|
|
|
199 |
% |
|
|
|
156 |
% |
|
|
| CLASS I |
|
|
|
Year Ended
April 30, 2015 |
|
Year Ended
April 30, 2014 |
|
Year Ended
April 30, 2013 |
|
For the Period
July 1,
2011
through April 30,
2012* |
|
Year Ended
April 30, 2011 |
|
Year Ended
April 30, 2010 |
|
|
| Net Asset Value, Beginning of Period |
|
|
|
|
|
$14.88 |
|
|
|
|
$15.61 |
|
|
|
|
$14.33 |
|
|
|
|
$14.02 |
|
|
|
|
$12.11 |
|
|
|
|
$11.61 |
|
|
|
| Income (Loss) From Operations: |
|
|
|
|
|
|
|
|
|
|
|
|
|
|
|
|
|
|
|
|
|
|
|
|
|
|
|
|
|
|
|
|
|
|
| Net Investment Income (Loss)(a) |
|
|
|
|
|
0.17 |
|
|
|
|
0.13 |
|
|
|
|
0.20 |
|
|
|
|
(0.09 |
) |
|
|
|
0.65 |
|
|
|
|
0.04 |
|
|
|
| Net Realized and Unrealized Gain (Loss) on Investments and Foreign Currency |
|
|
|
|
|
0.03 |
|
|
|
|
(0.64 |
) |
|
|
|
1.30 |
|
|
|
|
0.41 |
|
|
|
|
1.94 |
|
|
|
|
0.75 |
|
|
|
|
|
|
|
|
|
| Total Income (Loss) From Operations |
|
|
|
|
|
0.20 |
|
|
|
|
(0.51 |
) |
|
|
|
1.50 |
|
|
|
|
0.32 |
|
|
|
|
2.59 |
|
|
|
|
0.79 |
|
|
|
|
|
|
|
|
|
| Less Distributions From: |
|
|
|
|
|
|
|
|
|
|
|
|
|
|
|
|
|
|
|
|
|
|
|
|
|
|
|
|
|
|
|
|
|
|
| Net Investment Income |
|
|
|
|
|
(0.22 |
) |
|
|
|
(0.22 |
) |
|
|
|
(0.22 |
) |
|
|
|
(0.01 |
) |
|
|
|
(0.68 |
) |
|
|
|
(0.29 |
) |
|
|
|
|
|
|
|
|
| Net Asset Value, End of Period |
|
|
|
|
|
$14.86 |
|
|
|
|
$14.88 |
|
|
|
|
$15.61 |
|
|
|
|
$14.33 |
|
|
|
|
$14.02 |
|
|
|
|
$12.11 |
|
|
|
|
|
|
|
|
|
| Total Return(b) |
|
|
|
|
|
1.40 |
% |
|
|
|
(3.20 |
)% |
|
|
|
10.58 |
% |
|
|
|
2.31 |
% |
|
|
|
21.70 |
% |
|
|
|
6.76 |
% |
|
|
| Net Assets, End of Period (000’s) |
|
|
|
|
|
$463,375 |
|
|
|
|
$452,913 |
|
|
|
|
$440,999 |
|
|
|
|
$344,650 |
|
|
|
|
$252,497 |
|
|
|
|
$283,703 |
|
|
|
| Ratios to Average Net Assets |
|
|
|
|
|
|
|
|
|
|
|
|
|
|
|
|
|
|
|
|
|
|
|
|
|
|
|
|
|
|
|
|
|
|
| Gross Expense |
|
|
|
|
|
1.24 |
% |
|
|
|
1.29 |
% |
|
|
|
1.31 |
% |
|
|
|
1.08 |
%(c) |
|
|
|
1.00 |
% |
|
|
|
0.95 |
% |
|
|
| Net Expenses(d) |
|
|
|
|
|
0.98 |
% |
|
|
|
1.03 |
% |
|
|
|
1.02 |
% |
|
|
|
1.02 |
%(c) |
|
|
|
1.00 |
% |
|
|
|
0.94 |
% |
|
|
| Net Investment Income (Loss) |
|
|
|
|
|
1.13 |
% |
|
|
|
0.93 |
% |
|
|
|
1.39 |
% |
|
|
|
(0.74 |
)%(c) |
|
|
|
4.82 |
% |
|
|
|
0.33 |
% |
|
|
| Portfolio Turnover Rate |
|
|
|
|
|
242 |
% |
|
|
|
149 |
% |
|
|
|
131 |
% |
|
|
|
180 |
% |
|
|
|
199 |
% |
|
|
|
156 |
% |
|
|
| (a) |
Per share numbers have been calculated using the average shares method. |
| (b) |
Based on net asset value, which does not reflect the sales charge or contingent deferred sales charge, if applicable. Total returns for periods of less than one year, if any, are not annualized. |
| (c) |
Annualized for periods less than one year. |
| (d) |
The investment advisor and other service providers waived or reimbursed a portion of their fees. |
| † |
Effective March 9, 2012, the Fund acquired all of the assets and liabilities of the Wilmington Multi-Manager Real Asset Fund, a series of WT Mutual Fund (the “WT Fund”). The financial highlights for the
periods prior to that date reflect the performance of the WT Fund. |
| * |
Year end changed from June 30 to April 30. |
See Notes which are an integral part of the Financial
Statements
ANNUAL REPORT / April 30, 2015
|
|
|
| 98 |
|
FINANCIAL HIGHLIGHTS (continued) |
For a share outstanding throughout each period.
|
| WILMINGTON STRATEGIC ALLOCATION CONSERVATIVE FUND† |
|
|
|
|
|
|
|
|
|
|
|
|
|
|
|
|
|
|
|
|
|
|
|
|
|
|
|
|
|
|
|
|
|
|
|
|
|
|
|
|
|
| CLASS A |
|
|
|
Year Ended
April 30, 2015 |
|
Year Ended
April 30, 2014 |
|
Year Ended
April 30, 2013 |
|
For the Period
July 1, 2011
through
April 30,
2012* |
|
Year Ended
April 30, 2011 |
|
Year Ended
April 30, 2010 |
|
|
| Net Asset Value, Beginning of Period |
|
|
|
|
|
$10.95 |
|
|
|
|
$11.03 |
|
|
|
|
$10.61 |
|
|
|
|
$10.60 |
|
|
|
|
$9.66 |
|
|
|
|
$9.02 |
|
|
|
| Income (Loss) From Operations: |
|
|
|
|
|
|
|
|
|
|
|
|
|
|
|
|
|
|
|
|
|
|
|
|
|
|
|
|
|
|
|
|
|
|
| Net Investment Income (Loss)(a) |
|
|
|
|
|
0.09 |
|
|
|
|
0.12 |
|
|
|
|
0.18 |
|
|
|
|
0.17 |
|
|
|
|
0.26 |
|
|
|
|
0.26 |
|
|
|
| Net Realized and Unrealized Gain (Loss) on Investments |
|
|
|
|
|
0.27 |
|
|
|
|
0.05 |
|
|
|
|
0.45 |
|
|
|
|
0.05 |
|
|
|
|
0.95 |
|
|
|
|
0.64 |
|
|
|
|
|
|
|
|
|
| Total Income (Loss) From Operations |
|
|
|
|
|
0.36 |
|
|
|
|
0.17 |
|
|
|
|
0.63 |
|
|
|
|
0.22 |
|
|
|
|
1.21 |
|
|
|
|
0.90 |
|
|
|
|
|
|
|
|
|
| Less Distributions From: |
|
|
|
|
|
|
|
|
|
|
|
|
|
|
|
|
|
|
|
|
|
|
|
|
|
|
|
|
|
|
|
|
|
|
| Net Investment Income |
|
|
|
|
|
(0.12 |
) |
|
|
|
(0.17 |
) |
|
|
|
(0.21 |
) |
|
|
|
(0.21 |
) |
|
|
|
(0.27 |
) |
|
|
|
(0.26 |
) |
|
|
| Net Realized Gains |
|
|
|
|
|
(0.22 |
) |
|
|
|
(0.08 |
) |
|
|
|
— |
|
|
|
|
— |
|
|
|
|
— |
|
|
|
|
— |
|
|
|
|
|
|
|
|
|
| Total Distributions |
|
|
|
|
|
(0.34 |
) |
|
|
|
(0.25 |
) |
|
|
|
(0.21 |
) |
|
|
|
(0.21 |
) |
|
|
|
(0.27 |
) |
|
|
|
(0.26 |
) |
|
|
|
|
|
|
|
|
| Net Asset Value, End of Period |
|
|
|
|
|
$10.97 |
|
|
|
|
$10.95 |
|
|
|
|
$11.03 |
|
|
|
|
$10.61 |
|
|
|
|
$10.60 |
|
|
|
|
$9.66 |
|
|
|
|
|
|
|
|
|
| Total Return(b) |
|
|
|
|
|
3.28 |
% |
|
|
|
1.60 |
% |
|
|
|
5.97 |
% |
|
|
|
2.15 |
% |
|
|
|
12.58 |
% |
|
|
|
9.98 |
% |
|
|
| Net Assets, End of Period (000’s) |
|
|
|
|
|
$3,615 |
|
|
|
|
$4,608 |
|
|
|
|
$6,016 |
|
|
|
|
$7,003 |
|
|
|
|
$8,003 |
|
|
|
|
$9,890 |
|
|
|
| Ratios to Average Net Assets |
|
|
|
|
|
|
|
|
|
|
|
|
|
|
|
|
|
|
|
|
|
|
|
|
|
|
|
|
|
|
|
|
|
|
| Gross Expense(c) |
|
|
|
|
|
1.44 |
% |
|
|
|
1.41 |
% |
|
|
|
1.35 |
% |
|
|
|
0.77 |
%(d) |
|
|
|
0.60 |
% |
|
|
|
0.64 |
% |
|
|
| Net Expenses(c)(e) |
|
|
|
|
|
0.85 |
% |
|
|
|
0.75 |
% |
|
|
|
0.72 |
% |
|
|
|
0.63 |
%(d) |
|
|
|
0.60 |
% |
|
|
|
0.64 |
% |
|
|
| Net Investment Income (Loss) |
|
|
|
|
|
0.83 |
% |
|
|
|
1.10 |
% |
|
|
|
1.71 |
% |
|
|
|
1.95 |
%(d) |
|
|
|
2.54 |
% |
|
|
|
2.65 |
% |
|
|
| Portfolio Turnover Rate |
|
|
|
|
|
24 |
% |
|
|
|
33 |
% |
|
|
|
29 |
% |
|
|
|
37 |
% |
|
|
|
26 |
% |
|
|
|
92 |
% |
|
|
| CLASS I |
|
|
|
Year Ended
April 30, 2015 |
|
Year Ended
April 30, 2014 |
|
Year Ended
April 30, 2013 |
|
For the
Period
January 12,
2012
through
April 30,
2012* |
|
Year Ended
April 30, 2011 |
|
Year Ended
April 30, 2010 |
|
|
| Net Asset Value, Beginning of Period |
|
|
|
|
|
$10.97 |
|
|
|
|
$11.05 |
|
|
|
|
$10.64 |
|
|
|
|
$10.62 |
|
|
|
|
$9.67 |
|
|
|
|
$9.04 |
|
|
|
| Income (Loss) From Operations: |
|
|
|
|
|
|
|
|
|
|
|
|
|
|
|
|
|
|
|
|
|
|
|
|
|
|
|
|
|
|
|
|
|
|
| Net Investment Income (Loss)(a) |
|
|
|
|
|
0.12 |
|
|
|
|
0.15 |
|
|
|
|
0.21 |
|
|
|
|
0.19 |
|
|
|
|
0.29 |
|
|
|
|
0.29 |
|
|
|
| Net Realized and Unrealized Gain (Loss) on Investments |
|
|
|
|
|
0.28 |
|
|
|
|
0.05 |
|
|
|
|
0.43 |
|
|
|
|
0.06 |
|
|
|
|
0.95 |
|
|
|
|
0.62 |
|
|
|
|
|
|
|
|
|
| Total Income (Loss) From Operations |
|
|
|
|
|
0.40 |
|
|
|
|
0.20 |
|
|
|
|
0.64 |
|
|
|
|
0.25 |
|
|
|
|
1.24 |
|
|
|
|
0.91 |
|
|
|
|
|
|
|
|
|
| Less Distributions From: |
|
|
|
|
|
|
|
|
|
|
|
|
|
|
|
|
|
|
|
|
|
|
|
|
|
|
|
|
|
|
|
|
|
|
| Net Investment Income |
|
|
|
|
|
(0.15 |
) |
|
|
|
(0.20 |
) |
|
|
|
(0.23 |
) |
|
|
|
(0.23 |
) |
|
|
|
(0.29 |
) |
|
|
|
(0.28 |
) |
|
|
| Net Realized Gains |
|
|
|
|
|
(0.22 |
) |
|
|
|
(0.08 |
) |
|
|
|
— |
|
|
|
|
— |
|
|
|
|
— |
|
|
|
|
— |
|
|
|
|
|
|
|
|
|
| Total Distributions |
|
|
|
|
|
(0.37 |
) |
|
|
|
(0.28 |
) |
|
|
|
(0.23 |
) |
|
|
|
(0.23 |
) |
|
|
|
(0.29 |
) |
|
|
|
(0.28 |
) |
|
|
|
|
|
|
|
|
| Net Asset Value, End of Period |
|
|
|
|
|
$11.00 |
|
|
|
|
$10.97 |
|
|
|
|
$11.05 |
|
|
|
|
$10.64 |
|
|
|
|
$10.62 |
|
|
|
|
$9.67 |
|
|
|
|
|
|
|
|
|
| Total Return(b) |
|
|
|
|
|
3.63 |
% |
|
|
|
1.85 |
% |
|
|
|
6.13 |
% |
|
|
|
2.44 |
% |
|
|
|
12.96 |
% |
|
|
|
10.12 |
% |
|
|
| Net Assets, End of Period (000’s) |
|
|
|
|
|
$34,619 |
|
|
|
|
$37,653 |
|
|
|
|
$41,918 |
|
|
|
|
$45,299 |
|
|
|
|
$55,226 |
|
|
|
|
$53,131 |
|
|
|
| Ratios to Average Net Assets |
|
|
|
|
|
|
|
|
|
|
|
|
|
|
|
|
|
|
|
|
|
|
|
|
|
|
|
|
|
|
|
|
|
|
| Gross Expense(c) |
|
|
|
|
|
1.19 |
% |
|
|
|
1.16 |
% |
|
|
|
1.10 |
% |
|
|
|
0.52 |
%(d) |
|
|
|
0.35 |
% |
|
|
|
0.39 |
% |
|
|
| Net Expenses(c)(e) |
|
|
|
|
|
0.60 |
% |
|
|
|
0.50 |
% |
|
|
|
0.47 |
% |
|
|
|
0.38 |
%(d) |
|
|
|
0.35 |
% |
|
|
|
0.39 |
% |
|
|
| Net Investment Income (Loss) |
|
|
|
|
|
1.07 |
% |
|
|
|
1.34 |
% |
|
|
|
1.95 |
% |
|
|
|
2.20 |
%(d) |
|
|
|
2.81 |
% |
|
|
|
2.91 |
% |
|
|
| Portfolio Turnover Rate |
|
|
|
|
|
24 |
% |
|
|
|
33 |
% |
|
|
|
29 |
% |
|
|
|
37 |
% |
|
|
|
26 |
% |
|
|
|
92 |
% |
|
|
| (a) |
Per share numbers have been calculated using the average shares method. |
| (b) |
Based on net asset value, which does not reflect the sales charge or contingent deferred sales charge, if applicable. Total returns for periods of less than one year, if any, are not annualized. |
| (c) |
The Fund invests in other underlying funds and indirectly bears its proportionate share of fees and expenses incurred by the underlying funds in which the Fund is invested. This ratio does not include these indirect
fees and expenses. |
| (d) |
Annualized for periods less than one year. |
| (e) |
The investment advisor and other service providers waived or reimbursed a portion of their fees. |
| † |
Effective March 9, 2012, the Fund acquired all of the assets and liabilities of the Wilmington Conservative Asset Allocation Fund, a series of WT Mutual Fund (the “WT Fund”). The financial highlights for
the periods prior to that date reflect the performance of the WT Fund. |
| * |
Year end changed from June 30 to April 30. |
See Notes which are an integral part of the Financial
Statements
April 30, 2015 / ANNUAL REPORT
|
|
|
|
|
| FINANCIAL HIGHLIGHTS (continued) |
|
|
99 |
|
For a share outstanding throughout each year ended April 30, unless otherwise noted:
|
| WILMINGTON STRATEGIC ALLOCATION MODERATE FUND† |
|
|
|
|
|
|
|
|
|
|
|
|
|
|
|
|
|
|
|
|
|
|
|
| CLASS A |
|
2015 |
|
|
2014 |
|
|
2013 |
|
|
2012 |
|
|
2011 |
|
|
|
| Net Asset Value, Beginning of Period |
|
|
$10.47 |
|
|
|
$9.86 |
|
|
|
$9.26 |
|
|
|
$9.70 |
|
|
|
$8.62 |
|
|
|
| Income (Loss) From Operations: |
|
|
|
|
|
|
|
|
|
|
|
|
|
|
|
|
|
|
|
|
|
|
| Net Investment Income (Loss)(a) |
|
|
0.10 |
|
|
|
0.10 |
|
|
|
0.13 |
|
|
|
0.11 |
|
|
|
0.10 |
|
|
|
| Net Realized and Unrealized Gain (Loss) on Investments |
|
|
0.53 |
|
|
|
0.62 |
|
|
|
0.61 |
|
|
|
(0.42 |
) |
|
|
1.13 |
|
|
|
| Total Income (Loss) From Operations |
|
|
0.63 |
|
|
|
0.72 |
|
|
|
0.74 |
|
|
|
(0.31 |
) |
|
|
1.23 |
|
|
|
| Less Distributions From: |
|
|
|
|
|
|
|
|
|
|
|
|
|
|
|
|
|
|
|
|
|
|
| Net Investment Income |
|
|
(0.12 |
) |
|
|
(0.11 |
) |
|
|
(0.14 |
) |
|
|
(0.12 |
) |
|
|
(0.12 |
) |
|
|
| Net Realized Gains |
|
|
— |
|
|
|
— |
|
|
|
— |
|
|
|
(0.01 |
) |
|
|
(0.03 |
) |
|
|
| Total Distributions |
|
|
(0.12 |
) |
|
|
(0.11 |
) |
|
|
(0.14 |
) |
|
|
(0.13 |
) |
|
|
(0.15 |
) |
|
|
| Net Asset Value, End of Period |
|
|
$10.98 |
|
|
|
$10.47 |
|
|
|
$9.86 |
|
|
|
$9.26 |
|
|
|
$9.70 |
|
|
|
|
|
|
|
|
|
|
|
|
|
|
|
|
|
|
|
|
|
|
|
|
|
|
| Total Return(b) |
|
|
6.09 |
% |
|
|
7.34 |
% |
|
|
8.12 |
% |
|
|
(3.13 |
)% |
|
|
14.54 |
% |
|
|
| Net Assets, End of Period (000’s) |
|
|
$52,860 |
|
|
|
$57,317 |
|
|
|
$60,640 |
|
|
|
$65,285 |
|
|
|
$75,554 |
|
|
|
| Ratios to Average Net Assets |
|
|
|
|
|
|
|
|
|
|
|
|
|
|
|
|
|
|
|
|
|
|
| Gross Expense(c) |
|
|
1.46 |
% |
|
|
1.45 |
% |
|
|
1.45 |
% |
|
|
1.64 |
% |
|
|
1.51 |
% |
|
|
| Net Expenses(c)(d) |
|
|
0.80 |
% |
|
|
0.84 |
% |
|
|
0.84 |
% |
|
|
0.79 |
% |
|
|
0.73 |
% |
|
|
| Net Investment Income (Loss) |
|
|
0.90 |
% |
|
|
0.94 |
% |
|
|
1.36 |
% |
|
|
1.26 |
% |
|
|
0.97 |
% |
|
|
| Portfolio Turnover Rate |
|
|
23 |
% |
|
|
54 |
% |
|
|
32 |
% |
|
|
41 |
% |
|
|
55 |
% |
|
|
|
|
|
|
|
|
|
|
|
|
|
|
|
|
|
|
|
|
|
|
|
|
|
|
|
|
|
|
|
|
| CLASS I |
|
2015 |
|
|
2014 |
|
|
2013 |
|
|
2012 |
|
|
2011(e) |
|
|
|
| Net Asset Value, Beginning of Period |
|
|
$10.47 |
|
|
|
$9.84 |
|
|
|
$9.25 |
|
|
|
$9.70 |
|
|
|
$8.08 |
|
|
|
| Income (Loss) From Operations: |
|
|
|
|
|
|
|
|
|
|
|
|
|
|
|
|
|
|
|
|
|
|
| Net Investment Income (Loss)(a) |
|
|
0.12 |
|
|
|
0.13 |
|
|
|
0.15 |
|
|
|
0.14 |
|
|
|
0.10 |
|
|
|
| Net Realized and Unrealized Gain (Loss) on Investments |
|
|
0.54 |
|
|
|
0.63 |
|
|
|
0.61 |
|
|
|
(0.43 |
) |
|
|
1.66 |
|
|
|
| Total Income (Loss) From Operations |
|
|
0.66 |
|
|
|
0.76 |
|
|
|
0.76 |
|
|
|
(0.29 |
) |
|
|
1.76 |
|
|
|
| Less Distributions From: |
|
|
|
|
|
|
|
|
|
|
|
|
|
|
|
|
|
|
|
|
|
|
| Net Investment Income |
|
|
(0.15 |
) |
|
|
(0.13 |
) |
|
|
(0.17 |
) |
|
|
(0.15 |
) |
|
|
(0.11 |
) |
|
|
| Net Realized Gains |
|
|
— |
|
|
|
— |
|
|
|
— |
|
|
|
(0.01 |
) |
|
|
(0.03 |
) |
|
|
| Total Distributions |
|
|
(0.15 |
) |
|
|
(0.13 |
) |
|
|
(0.17 |
) |
|
|
(0.16 |
) |
|
|
(0.14 |
) |
|
|
| Net Asset Value, End of Period |
|
|
$10.98 |
|
|
|
$10.47 |
|
|
|
$9.84 |
|
|
|
$9.25 |
|
|
|
$9.70 |
|
|
|
|
|
|
|
|
|
|
|
|
|
|
|
|
|
|
|
|
|
|
|
|
|
|
| Total Return(b) |
|
|
6.35 |
% |
|
|
7.76 |
% |
|
|
8.29 |
% |
|
|
(2.87 |
)% |
|
|
22.07 |
% |
|
|
| Net Assets, End of Period (000’s) |
|
|
$1,323 |
|
|
|
$971 |
|
|
|
$2,753 |
|
|
|
$3,108 |
|
|
|
$3,426 |
|
|
|
| Ratios to Average Net Assets |
|
|
|
|
|
|
|
|
|
|
|
|
|
|
|
|
|
|
|
|
|
|
| Gross Expense(c) |
|
|
1.21 |
% |
|
|
1.19 |
% |
|
|
1.20 |
% |
|
|
1.39 |
% |
|
|
1.44 |
%(f) |
|
|
| Net Expenses(c)(d) |
|
|
0.55 |
% |
|
|
0.59 |
% |
|
|
0.59 |
% |
|
|
0.51 |
% |
|
|
0.67 |
%(f) |
|
|
| Net Investment Income (Loss) |
|
|
1.16 |
% |
|
|
1.33 |
% |
|
|
1.59 |
% |
|
|
1.53 |
% |
|
|
1.25 |
%(f) |
|
|
| Portfolio Turnover Rate |
|
|
23 |
% |
|
|
54 |
% |
|
|
32 |
% |
|
|
41 |
% |
|
|
55 |
%(g) |
|
|
| (a) |
Per share numbers have been calculated using the average shares method. |
| (b) |
Based on net asset value, which does not reflect the sales charge or contingent deferred sales charge, if applicable. Total returns for periods of less than one year, if any, are not annualized. |
| (c) |
The Fund invests in other underlying funds and indirectly bears its proportionate share of fees and expenses incurred by the underlying funds in which the Fund is invested. This ratio does not include these indirect
fees and expenses. |
| (d) |
The investment advisor and other service providers waived or reimbursed a portion of their fees. |
| (e) |
For the period from June 11, 2010 (commencement of operations) to April 30, 2011. |
| (f) |
Annualized for periods less than one year. |
| (g) |
Reflects portfolio turnover for the Fund for the year ended April 30, 2011. |
| † |
Effective June 11, 2010, shareholders of the former Managed Allocation Fund—Aggressive Growth, Managed Allocation Fund—Moderate Growth, and Managed Allocation Fund—Conservative Growth became owners
of the Strategic Allocation Fund in a plan of reorganization. Additionally, the accounting and performance history of the Managed Allocation Fund—Moderate Growth Fund was redesignated as that of the Strategic Allocation Fund for A Shares for
periods prior to June 14, 2010. |
See Notes which are an integral part of the Financial Statements
ANNUAL REPORT / April 30, 2015
|
|
|
| 100 |
|
FINANCIAL HIGHLIGHTS (concluded) |
For a share outstanding throughout each period.
|
| WILMINGTON STRATEGIC ALLOCATION AGGRESSIVE FUND† |
|
|
|
|
|
|
|
|
|
|
|
|
|
|
|
|
|
|
|
|
|
|
|
|
|
|
|
|
|
|
|
|
|
|
|
|
|
|
|
|
|
| CLASS A |
|
|
|
Year Ended
April 30, 2015 |
|
Year Ended
April 30, 2014 |
|
Year Ended
April 30, 2013 |
|
For the Period
July 1,
2011
through
April 30,
2012* |
|
Year Ended
April 30, 2011 |
|
Year Ended
April 30, 2010 |
|
|
| Net Asset Value, Beginning of Period |
|
|
|
|
|
$11.35 |
|
|
|
|
$10.21 |
|
|
|
|
$9.20 |
|
|
|
|
$9.33 |
|
|
|
|
$7.49 |
|
|
|
|
$6.81 |
|
|
|
| Income (Loss) From Operations: |
|
|
|
|
|
|
|
|
|
|
|
|
|
|
|
|
|
|
|
|
|
|
|
|
|
|
|
|
|
|
|
|
|
|
| Net Investment Income (Loss)(a) |
|
|
|
|
|
0.02 |
|
|
|
|
0.04 |
|
|
|
|
0.10 |
|
|
|
|
0.05 |
|
|
|
|
0.14 |
|
|
|
|
0.10 |
|
|
|
| Net Realized and Unrealized Gain (Loss) on Investments |
|
|
|
|
|
0.87 |
|
|
|
|
1.17 |
|
|
|
|
1.02 |
|
|
|
|
(0.13 |
) |
|
|
|
1.85 |
|
|
|
|
0.68 |
|
|
|
|
|
|
|
|
|
| Total Income (Loss) From Operations |
|
|
|
|
|
0.89 |
|
|
|
|
1.21 |
|
|
|
|
1.12 |
|
|
|
|
(0.08 |
) |
|
|
|
1.99 |
|
|
|
|
0.78 |
|
|
|
|
|
|
|
|
|
| Less Distributions From: |
|
|
|
|
|
|
|
|
|
|
|
|
|
|
|
|
|
|
|
|
|
|
|
|
|
|
|
|
|
|
|
|
|
|
| Net Investment Income |
|
|
|
|
|
(0.08 |
) |
|
|
|
(0.07 |
) |
|
|
|
(0.11 |
) |
|
|
|
(0.05 |
) |
|
|
|
(0.15 |
) |
|
|
|
(0.10 |
) |
|
|
|
|
|
|
|
|
| Net Asset Value, End of Period |
|
|
|
|
|
$12.16 |
|
|
|
|
$11.35 |
|
|
|
|
$10.21 |
|
|
|
|
$9.20 |
|
|
|
|
$9.33 |
|
|
|
|
$7.49 |
|
|
|
|
|
|
|
|
|
| Total Return(b) |
|
|
|
|
|
7.89 |
% |
|
|
|
11.84 |
% |
|
|
|
12.26 |
% |
|
|
|
(0.75 |
)% |
|
|
|
26.66 |
% |
|
|
|
11.41 |
% |
|
|
| Net Assets, End of Period (000’s) |
|
|
|
|
|
$2,731 |
|
|
|
|
$2,974 |
|
|
|
|
$3,205 |
|
|
|
|
$3,074 |
|
|
|
|
$3,502 |
|
|
|
|
$3,788 |
|
|
|
| Ratios to Average Net Assets |
|
|
|
|
|
|
|
|
|
|
|
|
|
|
|
|
|
|
|
|
|
|
|
|
|
|
|
|
|
|
|
|
|
|
| Gross Expense(c) |
|
|
|
|
|
1.48 |
% |
|
|
|
1.50 |
% |
|
|
|
1.46 |
% |
|
|
|
0.88 |
%(d) |
|
|
|
0.67 |
% |
|
|
|
0.58 |
% |
|
|
| Net Expenses(c)(e) |
|
|
|
|
|
0.97 |
% |
|
|
|
0.95 |
% |
|
|
|
0.87 |
% |
|
|
|
0.73 |
%(d) |
|
|
|
0.67 |
% |
|
|
|
0.58 |
% |
|
|
| Net Investment Income (Loss) |
|
|
|
|
|
0.19 |
% |
|
|
|
0.34 |
% |
|
|
|
1.10 |
% |
|
|
|
0.75 |
%(d) |
|
|
|
1.64 |
% |
|
|
|
1.23 |
% |
|
|
| Portfolio Turnover Rate |
|
|
|
|
|
20 |
% |
|
|
|
72 |
% |
|
|
|
43 |
% |
|
|
|
17 |
% |
|
|
|
34 |
% |
|
|
|
53 |
% |
|
|
| CLASS I |
|
|
|
Year Ended
April 30, 2015 |
|
Year Ended
April 30, 2014 |
|
Year Ended
April 30, 2013 |
|
For the Period
January
12,
2012 through
April 30,
2012* |
|
Year Ended
April 30, 2011 |
|
Year Ended
April 30, 2010 |
|
|
| Net Asset Value, Beginning of Period |
|
|
|
|
|
$11.39 |
|
|
|
|
$10.24 |
|
|
|
|
$9.22 |
|
|
|
|
$9.35 |
|
|
|
|
$7.51 |
|
|
|
|
$6.82 |
|
|
|
| Income (Loss) From Operations: |
|
|
|
|
|
|
|
|
|
|
|
|
|
|
|
|
|
|
|
|
|
|
|
|
|
|
|
|
|
|
|
|
|
|
| Net Investment Income (Loss)(a) |
|
|
|
|
|
0.05 |
|
|
|
|
0.06 |
|
|
|
|
0.13 |
|
|
|
|
0.07 |
|
|
|
|
0.17 |
|
|
|
|
0.11 |
|
|
|
| Net Realized and Unrealized Gain (Loss) on Investments |
|
|
|
|
|
0.87 |
|
|
|
|
1.18 |
|
|
|
|
1.02 |
|
|
|
|
(0.13 |
) |
|
|
|
1.84 |
|
|
|
|
0.70 |
|
|
|
|
|
|
|
|
|
| Total Income (Loss) From Operations |
|
|
|
|
|
0.92 |
|
|
|
|
1.24 |
|
|
|
|
1.15 |
|
|
|
|
(0.06 |
) |
|
|
|
2.01 |
|
|
|
|
0.81 |
|
|
|
|
|
|
|
|
|
| Less Distributions From: |
|
|
|
|
|
|
|
|
|
|
|
|
|
|
|
|
|
|
|
|
|
|
|
|
|
|
|
|
|
|
|
|
|
|
| Net Investment Income |
|
|
|
|
|
(0.10 |
) |
|
|
|
(0.09 |
) |
|
|
|
(0.13 |
) |
|
|
|
(0.07 |
) |
|
|
|
(0.17 |
) |
|
|
|
(0.12 |
) |
|
|
|
|
|
|
|
|
| Net Asset Value, End of Period |
|
|
|
|
|
$12.21 |
|
|
|
|
$11.39 |
|
|
|
|
$10.24 |
|
|
|
|
$9.22 |
|
|
|
|
$9.35 |
|
|
|
|
$7.51 |
|
|
|
|
|
|
|
|
|
| Total Return(b) |
|
|
|
|
|
8.08 |
% |
|
|
|
12.11 |
% |
|
|
|
12.62 |
% |
|
|
|
(0.62 |
)% |
|
|
|
26.91 |
% |
|
|
|
11.80 |
% |
|
|
| Net Assets, End of Period (000’s) |
|
|
|
|
|
$30,462 |
|
|
|
|
$35,392 |
|
|
|
|
$35,826 |
|
|
|
|
$39,257 |
|
|
|
|
$51,887 |
|
|
|
|
$46,058 |
|
|
|
| Ratios to Average Net Assets |
|
|
|
|
|
|
|
|
|
|
|
|
|
|
|
|
|
|
|
|
|
|
|
|
|
|
|
|
|
|
|
|
|
|
| Gross Expense(c) |
|
|
|
|
|
1.23 |
% |
|
|
|
1.25 |
% |
|
|
|
1.21 |
% |
|
|
|
0.61 |
%(d) |
|
|
|
0.42 |
% |
|
|
|
0.33 |
% |
|
|
| Net Expenses(c)(e) |
|
|
|
|
|
0.72 |
% |
|
|
|
0.70 |
% |
|
|
|
0.62 |
% |
|
|
|
0.48 |
%(d) |
|
|
|
0.42 |
% |
|
|
|
0.33 |
% |
|
|
| Net Investment Income (Loss) |
|
|
|
|
|
0.46 |
% |
|
|
|
0.58 |
% |
|
|
|
1.38 |
% |
|
|
|
1.02 |
%(d) |
|
|
|
1.89 |
% |
|
|
|
1.41 |
% |
|
|
| Portfolio Turnover Rate |
|
|
|
|
|
20 |
% |
|
|
|
72 |
% |
|
|
|
43 |
% |
|
|
|
17 |
% |
|
|
|
34 |
% |
|
|
|
53 |
% |
|
|
| (a) |
Per share numbers have been calculated using the average shares method. |
| (b) |
Based on net asset value, which does not reflect the sales charge or contingent deferred sales charge, if applicable. Total returns for periods of less than one year, if any, are not annualized. |
| (c) |
The Fund invests in other underlying funds and indirectly bears its proportionate share of fees and expenses incurred by the underlying funds in which the Fund is invested. This ratio does not include these indirect
fees and expenses. |
| (d) |
Annualized for periods less than one year. |
| (e) |
The investment advisor and other service providers waived or reimbursed a portion of their fees. |
| † |
Effective March 9, 2012, the Fund acquired all of the assets and liabilities of the Wilmington Aggressive Asset Allocation Fund, a series of WT Mutual Fund (the “WT Fund”). The financial highlights for
the periods prior to that date reflect the performance of the WT Fund. |
| * |
Year end changed from June 30 to April 30. |
See Notes which are an integral part of the Financial
Statements
April 30, 2015 / ANNUAL REPORT
|
|
|
|
|
| NOTES TO FINANCIAL STATEMENTS |
|
|
101 |
|
Wilmington Funds
April 30,
2015
Wilmington Funds
(the “Trust”) is registered under the Investment Company Act of 1940, as amended (the “Act”), as an open-end management investment company. The Trust consists of 19 portfolios, 6 of which are presented herein (individually
referred to as a “Fund” or collectively as the “Funds”). The remaining 13 funds are presented in separate reports.
|
|
|
|
|
| Fund |
|
Investment Goal |
| Wilmington Multi-Manager International Fund (“International Fund”)(d) |
|
The Fund seeks to provide long-term capital appreciation primarily through a diversified portfolio of non-U.S. equity securities.
|
| Wilmington Multi-Manager Alternatives Fund (“Alternatives Fund”)(d) |
|
The Fund seeks to achieve long-term growth of capital through consistent returns from investments that have a low correlation to traditional asset
classes. |
| Wilmington Multi-Manager Real Asset Fund (“Real Asset Fund”)(d) |
|
The Fund seeks to achieve long-term preservation of capital with current income.
|
| Wilmington Strategic Allocation Conservative Fund
(“Strategic Allocation Conservative Fund”)(d) |
|
The Fund seeks a high level of total return consistent with a conservative level of risk relative to other Wilmington Strategic Allocation
Funds. |
| Wilmington Strategic Allocation Moderate Fund
(“Strategic Allocation Moderate Fund”)(d) |
|
The Fund seeks a high level of total return consistent with a moderate level of risk relative to the other Wilmington Strategic Allocation
Funds. |
| Wilmington Strategic Allocation Aggressive Fund
(“Strategic Allocation Aggressive Fund”)(d) |
|
The Fund seeks a high level of total return consistent with an aggressive level of risk relative to other Wilmington Strategic Allocation
Funds. |
The Trust offers 6 classes of shares: Class A, Service Class, Select Class, Administrative Class, Class I and Institutional Class. Service
Class, Select Class, Administrative Class and Institutional Class are not available for the Funds. All shares of the Trust have equal rights with respect to voting, except on class-specific matters.
The assets of each portfolio are segregated and a shareholder’s interest is limited to the portfolio in which shares are held.
In the normal course of business, the Funds may enter into contracts that provide general indemnifications. The Funds’ maximum exposure
under these arrangements is dependent on claims that may be made against the Funds in the future, and, therefore, cannot be estimated; however, based on experience, the risk of material loss from such claims is considered remote.
| 2. |
SUMMARY OF SIGNIFICANT ACCOUNTING POLICIES |
The following is a summary of significant accounting policies consistently followed by the Funds in the preparation of their
financial statements. These policies are in conformity with U.S. generally accepted accounting principles (“GAAP”). The Funds are investment companies and follow accounting and reporting guidance under Financial Accounting Standards Board
(“FASB”) Accounting Standards Codification (“ASU”) Topic 946, “Financial Services - Investment Companies.” The preparation of financial statements in conformity with GAAP requires management to make estimates and
assumptions that affect the amounts of assets, liabilities, expenses and revenues reported in the financial statements. Actual results could differ from those estimated.
Investment Valuation – Fair value of the Funds’ portfolio securities are determined as follows:
| |
• |
for equity securities, according to the last sale price or official closing price reported in the market in which they are primarily traded (either
a national securities exchange or the over-the-counter market), if available; |
| |
• |
in the absence of recorded sales for equity securities, according to the mean between the last closing bid and asked prices; |
| |
• |
futures contracts and options are generally valued at market values established by the exchanges on which they are traded at the close of trading on
such exchanges. Options traded in the over-the-counter market are generally valued according to the mean between the last bid and the last asked price for the option as provided by an investment dealer or other financial institution that deals in
the option. The Board of Trustees (“Trustees”) may determine in good faith that another method of valuing such investments is necessary to appraise their fair value; |
| |
• |
forward foreign currency contracts are valued at the mean between the last bid and asked prices; |
| |
• |
investments in open-end regulated investment companies are valued at net asset value (“NAV”); |
| |
• |
for fixed income securities according to prices as furnished by an independent pricing service, except that fixed income securities with remaining
maturities of less than 60 days at the time of purchase are valued at amortized cost, provided such amount approximates fair value; |
| |
• |
price information on listed securities, including underlying Exchange Traded Funds (“ETF’s”) and Exchange Traded Notes
(“ETN’s”), is taken from the exchange where the security is primarily traded; and |
| |
• |
for all other securities at fair value as determined in accordance with procedures established by and under the general supervision of the Trustees.
|
ANNUAL REPORT / April 30, 2015
|
|
|
| 102 |
|
NOTES TO FINANCIAL STATEMENTS (continued) |
Trading in foreign securities may be completed at times which vary from the closing of the
New York Stock Exchange (“NYSE”). In computing its NAV, the Funds value foreign securities using the latest closing price on the primary exchange on which they are traded immediately prior to the closing of the NYSE. Certain foreign
currency exchange rates are generally determined at the latest rate prior to the closing of the NYSE. Foreign securities quoted in foreign currencies are translated into U.S. dollars at current rates. Events that affect these values and exchange
rates may occur between the times at which they are determined and the closing of the NYSE. If such events materially affect the value of portfolio securities, these securities may be valued at their fair value in accordance with procedures approved
by the Trustees, although the actual calculation may be done by others. An event is considered material if there is both an affirmative expectation that the security’s value will change in response to the event and a reasonable basis for
quantifying the resulting change in value.
The Trust follows the authoritative guidance (GAAP) for fair value measurements. The guidance
establishes a framework for measuring fair value and a hierarchy for inputs used in measuring fair value that maximizes the use of observable inputs and minimizes the use of unobservable inputs by requiring that the most observable inputs be used
when available. The guidance establishes three tiers of inputs that may be used to measure fair value. The three tiers of inputs are summarized at the end of each Fund’s Portfolio of Investments. The inputs or methodology used for valuing
securities are not necessarily an indication of the risk associated with investing in those securities.
The Funds’ policy is to
disclose transfers between levels based on valuations at the beginning of the reporting period. Each portfolio may hold securities which are periodically fair valued in accordance with the Funds’ fair value procedures. This may result in
movements between Levels 1, 2 and 3 throughout the period. As of April 30, 2015, there were no transfers between Levels 1, 2 and 3 assets and liabilities, based on levels assigned to securities at the beginning of the period. This does not
include transfers between Level 1 and Level 2 due to the International Fund and the Real Asset Fund utilizing international fair value pricing during the period. Pursuant to the Funds’ fair value procedures noted previously, equity securities
(including exchange traded securities and other open-end regulated investment companies) and exchange traded derivatives are generally categorized as Level 1 securities in the fair value hierarchy. Securities utilizing international fair value
pricing, fixed income securities, non-exchange traded derivatives and money market instruments are generally categorized as Level 2 securities in the fair value hierarchy.
Investments for which there are no such quotations, or for which quotations do not appear reliable, are valued at fair value as determined in
accordance with procedures established by and under the general supervision of the Trustees. These valuations are typically categorized as Level 2 or Level 3 securities in the fair value hierarchy.
Repurchase Agreements – Repurchase agreements are transactions in which a Fund buys a security from a dealer or bank and agrees to
sell the security back at a mutually agreed upon time and price. The repurchase price exceeds the sale price, reflecting the Fund’s return on the transaction. It is each Fund’s policy to require the counterparty to a repurchase agreement
to transfer to the Funds’ custodian or sub-custodian eligible securities or cash with a market value (after transaction costs) at least equal to the repurchase price to be paid under the repurchase agreement. The eligible securities are
transferred to accounts with the custodian or sub-custodian in which the Funds hold a “securities entitlement” and exercise “control” as those terms are defined in the Uniform Commercial Code. The Funds have established
procedures for monitoring the market value of the transferred securities and requiring the transfer of additional eligible securities if necessary to equal at least the repurchase price. These procedures also allow the counterparty to require
securities to be transferred from the account to the extent that their market value exceeds the repurchase price or in exchange for other eligible securities of equivalent market value.
The insolvency of the counterparty or other failure to repurchase the securities may delay the disposition of the underlying securities or cause
the Funds to receive less than the full repurchase price.
Repurchase agreements are entered into by the Funds under Master Repurchase
Agreements (“MRA”) which permit the Funds, under certain circumstances including an event of default (such as bankruptcy or insolvency), to offset payables and/or receivables under the MRA with collateral held and/or posted to the
counterparty and create one single net payment due or from the Fund.
At April 30, 2015, the open repurchase agreements by counterparty
which are subject to a MRA on a net payment basis are as follows:
|
|
|
|
|
|
|
|
|
|
|
|
|
|
|
|
|
| Fund/Counterparty |
|
Repurchase
Agreements |
|
|
Fair Value
of
Non-cash
Collateral
Received |
|
|
Cash
Collateral
Received |
|
|
Net Amount(1) |
|
| International Fund |
|
|
|
|
|
|
|
|
|
|
|
|
|
|
|
|
| BNP Paribas Securities Corp. |
|
$ |
1,069,278 |
|
|
$ |
1,069,278 |
|
|
$ |
— |
|
|
$ |
— |
|
| Citigroup Global Markets, Inc. |
|
|
4,063,427 |
|
|
|
4,063,427 |
|
|
|
— |
|
|
|
— |
|
| Credit Suisse Securities (USA) LLC |
|
|
4,063,427 |
|
|
|
4,063,427 |
|
|
|
— |
|
|
|
— |
|
| Daiwa Capital Markets America |
|
|
4,063,427 |
|
|
|
4,063,427 |
|
|
|
— |
|
|
|
— |
|
| ING Financial Markets LLC |
|
|
4,063,427 |
|
|
|
4,063,427 |
|
|
|
— |
|
|
|
— |
|
| Nomura Securities International, Inc. |
|
|
4,063,427 |
|
|
|
4,063,427 |
|
|
|
— |
|
|
|
— |
|
|
|
|
|
|
|
|
|
|
|
|
|
|
|
|
|
|
|
|
$ |
21,386,413 |
|
|
$ |
21,386,413 |
|
|
$ |
— |
|
|
$ |
— |
|
|
|
|
|
|
|
|
|
|
|
|
|
|
|
|
|
|
|
|
|
|
|
|
|
|
|
|
|
|
|
|
|
|
|
April 30, 2015 / ANNUAL REPORT
|
|
|
|
|
| NOTES TO FINANCIAL STATEMENTS (continued) |
|
|
103 |
|
|
|
|
|
|
|
|
|
|
|
|
|
|
|
|
|
|
| Fund/Counterparty |
|
Repurchase
Agreements |
|
|
Fair Value of
Non-cash
Collateral
Received |
|
|
Cash
Collateral
Received |
|
|
Net Amount(1) |
|
| Real Asset Fund |
|
|
|
|
|
|
|
|
|
|
|
|
|
|
|
|
| BNP Paribas Securities Corp. |
|
$ |
64,647 |
|
|
$ |
64,647 |
|
|
$ |
— |
|
|
$ |
— |
|
| Citigroup Global Markets, Inc. |
|
|
245,662 |
|
|
|
245,662 |
|
|
|
|
|
|
|
— |
|
| Credit Suisse Securities (USA) LLC |
|
|
245,662 |
|
|
|
245,662 |
|
|
|
— |
|
|
|
— |
|
| ING Financial Markets LLC |
|
|
245,662 |
|
|
|
245,662 |
|
|
|
— |
|
|
|
— |
|
| JP Morgan Securities LLC |
|
|
245,662 |
|
|
|
245,662 |
|
|
|
— |
|
|
|
— |
|
| Nomura Securities Internal, Inc. |
|
|
245,662 |
|
|
|
245,662 |
|
|
|
— |
|
|
|
— |
|
|
|
|
|
|
|
|
|
|
|
|
|
|
|
|
|
|
|
|
$ |
1,292,957 |
|
|
$ |
1,292,957 |
|
|
$ |
— |
|
|
$ |
— |
|
|
|
|
|
|
|
|
|
|
|
|
|
|
|
|
|
|
|
|
|
|
|
| Strategic Allocation Moderate Fund |
|
|
|
|
|
|
|
|
|
|
|
|
|
|
|
|
| BNP Paribas Securities Corp. |
|
$ |
114,179 |
|
|
$ |
114,179 |
|
|
$ |
— |
|
|
$ |
— |
|
| Citigroup Global Markets, Inc. |
|
|
433,906 |
|
|
|
433,906 |
|
|
|
— |
|
|
|
— |
|
| Credit Suisse Securities (USA) LLC |
|
|
433,906 |
|
|
|
433,906 |
|
|
|
— |
|
|
|
— |
|
| Daiwa Capital Markets America |
|
|
433,906 |
|
|
|
433,906 |
|
|
|
— |
|
|
|
— |
|
| HSBC Securities USA, Inc. |
|
|
433,906 |
|
|
|
433,906 |
|
|
|
— |
|
|
|
— |
|
| Nomura Securities International, Inc. |
|
|
433,906 |
|
|
|
433,906 |
|
|
|
— |
|
|
|
— |
|
|
|
|
|
|
|
|
|
|
|
|
|
|
|
|
|
|
|
|
$ |
2,283,709 |
|
|
$ |
2,283,709 |
|
|
$ |
— |
|
|
$ |
— |
|
|
|
|
|
|
|
|
|
|
|
|
|
|
|
|
|
|
(1)Net amount represents the net amount receivable due from the
counterparty in the event of default.
Investment Income, Gains and Losses, Expenses and Distributions – Interest income and
expenses are accrued daily. All premiums and discounts on fixed income securities are amortized/accreted for financial statement purposes. Gains and losses realized on principal payment of mortgage-backed securities (paydown gains and losses) are
classified as part of investment income. Dividends and distributions to shareholders are recorded on the ex-dividend date. Non-cash dividends included in dividend income, if any, are recorded at fair value. Foreign dividends are recorded on the
ex-dividend date or when the Funds are informed of the ex-dividend date. Investment transactions are accounted for on a trade date basis for financial reporting purposes. Realized gains and losses from investment transactions are recorded on an
identified cost basis.
Expenses of the Trust, which are directly identifiable to a specific Fund, are applied to that Fund. Expenses which
are not identifiable to a specific Fund are allocated in such a manner as deemed equitable, taking into consideration the nature and type of expense.
All Funds offer multiple classes of shares. Investment income, realized and unrealized gains and losses, and certain fund-level expenses are
allocated to each class based on relative daily net assets, except that each class bears certain expenses unique to that class such as distribution and shareholder services fees. Distributions are declared separately for each class. No class has
preferential distribution rights; differences in per share distributions rates are generally due to differences in class specific expenses. Distributions from net realized gains, if any, are declared and paid to shareholders annually. Distributions
from net investment income are declared and paid quarterly.
Real Estate Investment Trusts – The Funds may invest in real estate
investment trusts (“REITs”) that involve risks not associated with investing in stocks. Risks include declines in the value of real estate, general and economic conditions, changes in the value of the underlying property and defaults by
borrowers. The value of assets in the real estate industry may go through cycles of relative underperformance and out performance in comparison to equity securities markets in general. Dividend income is recorded using management’s estimate of
the income included in distributions received from REIT investments. The actual amounts of income, return of capital and capital gains are only determined by each REIT after its fiscal year-end and may differ from the estimated amount. Estimates of
income are adjusted in the Funds to the actual amounts when the amounts are determined.
Federal Taxes – It is the Funds’
policy to comply with the Subchapter M provision of the Internal Revenue Code of 1986, as amended (the “Code”), and to distribute to shareholders each year substantially all of their income. Accordingly, no provisions for Federal income
tax or excise tax are necessary.
Withholding taxes and where appropriate, deferred withholding taxes, on foreign interest, dividends and
capital gains have been provided for in accordance with the applicable country’s tax rules and rates.
The Funds recognize interest and
penalties, if any, related to unrecognized tax benefits as income tax expense on the Statement of Operations. During the year or period, the Funds did not incur any interest or penalties.
Warrants and Rights – Certain Funds hold warrants and rights acquired either through a direct purchase, including as part of private
placement, or pursuant to corporate actions. Warrants and rights entitle the holder to buy a proportionate amount of common stock at a specific price and time through the expiration dates. Such warrants and rights are held as long positions by the
Funds until exercised, sold or expired. Equity-linked warrants are purchased in order to own local exposure to certain countries in which the Funds are not locally registered. Warrants and rights are valued at fair value in accordance with the
Trustees’ approved fair value procedures.
ANNUAL REPORT / April 30, 2015
|
|
|
| 104 |
|
NOTES TO FINANCIAL STATEMENTS (continued) |
Foreign Currency Translation – The accounting records of the Funds are maintained
in U.S. dollars. All assets and liabilities denominated in foreign currencies (“FCs”) are translated into U.S. dollars based on the rates of exchange of such currencies against U.S. dollars on the date of valuation. Purchases and sales of
securities, income and expenses are translated at the rate of exchange quoted on the respective date that such transactions are recorded. The Funds do not isolate that portion of results of operations resulting from changes in foreign exchange rates
on investments from fluctuations arising from changes in the net realized and unrealized gain or loss on investments.
Reported net realized
foreign exchange gains or losses arise from sales of portfolio securities, sales and maturities of short-term securities, sales of FCs, currency gains or losses realized between the trade and settlement dates on securities transactions, the
difference between the amounts of dividends, interest, and foreign withholding taxes recorded on the Funds’ books and the U.S. dollar equivalent of the amounts actually received or paid. Net unrealized foreign exchange gains and losses arise
from changes in the value of assets and liabilities other than investments in securities at period end, resulting from changes in the exchange rate.
Restricted Securities – Restricted securities are securities that either (a) cannot be offered for public sale without first
being registered, or being able to take advantage of an exemption from registration, under the Securities Act of 1933, as amended, or (b) are subject to contractual restrictions on public sales. In some cases, when a security cannot be offered
for public sale without first being registered, the issuer of the restricted security has agreed to register such securities for resale, at the issuer’s expense, either upon demand by the Funds or in connection with another registered offering
of the securities. Many such restricted securities may be resold in the secondary market in transactions exempt from registration. Restricted securities may be determined to be liquid under criteria established by the Trustees. A Fund will not incur
any registration costs upon such resales. The Funds’ restricted securities are valued at the price provided by dealers in the secondary market or, if no market prices are available, at the fair value as determined in accordance with procedures
established by and under the general supervision of the Trustees.
Securities Sold Short – Certain Funds may sell securities
short. A short sale is a transaction in which the Fund sells a security it does not own in anticipation of a decline in market price. To sell a security short, the Fund must borrow the security. The Fund’s obligation to replace the security
borrowed and sold short will be fully collateralized at all times by the proceeds from the short sale retained by the broker and by cash and securities deposited in a segregated account with the Fund’s custodian. If the price of the security
sold short increases between the time of the short sale and the time the Fund replaces the borrowed security, the Fund will realize a loss, and if the price declines during the period, the Fund will realize a gain. Any realized gain will be
decreased, and any realized loss increased, by the amount of transaction costs. The Funds are required to pay the lender any dividends declared on short positions. Such amounts are recorded on the ex-dividend date as dividends expense on securities
sold short on the Statement of Operations.
In accordance with the terms of its prime brokerage agreement, the Funds may be charged a fee on
borrowed securities. Such fees are calculated on a daily basis based upon the market value of each borrowed security and a variable rate that is dependent upon the availability of such security. The Funds are required to maintain margin cash
balances at the prime broker sufficiently to satisfy its short sales positions on a daily basis. The Fund is charged interest expense at the Fed Funds open rate plus 50 basis points on the amount of any shortfall in the required cash margin. The
Funds record these prime broker charges on a net basis as Prime Broker interest expense on securities sold short on the Statement of Operations.
As of April 30, 2015, the Alternatives Fund had borrowings of $1,175,062. Interest expense on securities sold short for the year ended
April 30, 2015 totaled $81,005, and is included in the prime broker interest expense on the Statement of Operations.
The Alternatives Fund
had the following borrowings for the year ended year ended April 30, 2015:
|
|
|
|
|
|
|
|
|
|
|
|
|
|
|
| Currency |
|
|
|
Average Daily
Borrowings |
|
|
Days
Utilized |
|
|
Weighted
Average
Interest
Rate |
|
| United States Dollar |
|
USD |
|
|
686,725 |
|
|
|
262 |
|
|
|
1.72 |
% |
| Canadian Dollar |
|
CAD |
|
|
4,742,949 |
|
|
|
262 |
|
|
|
1.72 |
% |
| Danish Krone |
|
DKK |
|
|
904,810 |
|
|
|
57 |
|
|
|
0.81 |
% |
| Pound Sterling |
|
GBP |
|
|
1,567,573 |
|
|
|
111 |
|
|
|
1.25 |
% |
| Hong Kong Dollar |
|
HKD |
|
|
4,596,376 |
|
|
|
127 |
|
|
|
0.98 |
% |
| Japanese Yen |
|
JPY |
|
|
251,465,063 |
|
|
|
262 |
|
|
|
0.84 |
% |
| Swedish Krona |
|
SEK |
|
|
4,806,541 |
|
|
|
93 |
|
|
|
0.77 |
% |
| |
|
|
|
|
|
|
|
|
|
|
|
|
|
|
Lending of Portfolio Securities – The Trust has entered into an agreement with their custodian
whereby the custodian may lend securities owned by the Funds to brokers, dealers and other financial organizations. Any increase or decrease in the fair value of securities loaned and any interest or dividends earned on those securities during the
term of the loan would be for the account of the Fund. In exchange for lending securities under the terms of the agreement with their custodian, the Funds receive a lender’s fee. Fees earned by the Funds on securities lending are recorded as
income. Loans of securities by the Funds are collateralized by cash, U.S. government securities or money market instruments that are maintained at all times in an amount at least equal to the current market value of the loaned securities plus a
margin which varies depending on the type of securities owned. The custodian establishes and maintains the collateral in a segregated account. The
April 30, 2015 / ANNUAL REPORT
|
|
|
|
|
| NOTES TO FINANCIAL STATEMENTS (continued) |
|
|
105 |
|
Funds have the right under the lending agreement to recover the securities
from the borrower on demand. The market value of the loaned securities is determined at the close of business of the Fund and any additional required collateral is delivered to the Fund on the next business day.
Investments purchased with cash collateral are presented on the portfolios of investments under the caption “Cash
Collateral Invested for Securities on Loan.”
The Funds maintain the risk of any loss on the securities on loan as well
as the potential loss on investments purchased with cash collateral received from securities lending.
Securities lending
transactions are entered into by the Funds under Master Securities Lending Agreements (“MSLA”) which permit the Funds, under certain circumstances including an event of default (such as bankruptcy or insolvency), to offset amounts payable
by the Fund to the same counterparty against amounts to be received and create one single net payment due to or from the Fund.
At April 30, 2015, the securities loaned which are subject to a MSLA on a net payment basis are as follows:
|
|
|
|
|
|
|
|
|
|
|
| Fund |
|
Value
of
Securities
on Loan |
|
|
Cash
Collateral
Received(1) |
|
|
Net Amount(2)
|
| International Fund |
|
$ |
20,377,739 |
|
|
$ |
20,377,739 |
|
|
$— |
| Real Asset Fund |
|
|
1,240,294 |
|
|
|
1,240,294 |
|
|
— |
| Strategic Allocation Moderate Fund |
|
|
2,207,527 |
|
|
|
2,207,527 |
|
|
— |
| (1)Collateral with a value of $21,386,413, $1,292,957 and $2,283,709,
respectively, has been received in connection with securities lending transactions. |
| (2)Net amount represents the net amount receivable due from the counterparty
in the event of default. |
TBA Commitments – “TBA” (to be announced) commitments are commitments to
purchase or sell mortgage-backed securities for a fixed price at a future date, typically not exceeding 45 days. TBAs may be considered securities in themselves and involve a risk of loss if the value of the TBA changes relative to our
“basis” in the position prior to the settlement date. Unsettled TBAs are valued according to the procedures described in the section entitled “Investment Valuation.”
3. DERIVATIVE FINANCIAL INSTRUMENTS
Disclosures about derivative instruments and hedging activities are intended to improve financial reporting for derivative
instruments by requiring enhanced disclosures that enables investors to understand how and why an entity uses derivatives, how derivatives are accounted for, and how derivative instruments affect and entity’s results of operations and financial
position.
Options – Certain Funds may either purchase or write options in order to hedge against adverse market
movements or fluctuations in value caused by changes in prevailing interest rates, value of equities or foreign exchange rates, with respect to securities which the Fund currently owns or intends to purchase. A Fund’s principal reason for
writing options is to realize, through receipt of premiums, a greater current return than would be realized on the underlying security alone. When a Fund purchases an option, it pays a premium and an amount equal to that premium is recorded as an
asset. When a Fund writes an option, it receives a premium and an amount equal to that premium is recorded as a liability. The asset or liability is adjusted daily to reflect the current market value of the option. If an option expires unexercised,
a Fund realizes a gain or loss to the extent of the premium received or paid. If an option is exercised, the premium received or paid is recorded as an adjustment to the proceeds from the sale or the cost of the purchase in determining whether a
Fund has realized a gain or loss. The difference between the premium and the amount received or paid on affecting a closing purchase or sale transaction is also treated as a realized gain or loss. Gain or loss on purchased options is included in net
realized gain or loss on investment transactions. Gain or loss on written options is presented separately as net realized gain or loss on options written. A Fund, as writer of options, may have no control over whether the underlying securities may
be sold (called) or purchased (put). As a result, a Fund bears the market risk of an unfavorable change in the price of the security underlying the written option. A Fund, as purchaser of over-the-counter options, bears the risk of the potential
inability of the counterparties to meet the terms of their contracts.
The Alternatives Fund had transactions in options
written during the year ended April 30, 2015 as follows:
|
|
|
|
|
|
|
|
|
| |
|
Number of
Contracts |
|
|
Premiums
Received |
|
| Outstanding options at April 30, 2014 |
|
|
11,069 |
|
|
$ |
1,888,564 |
|
|
Option closed |
|
|
(21,774) |
|
|
|
(3,787,683) |
|
|
Options written |
|
|
23,253 |
|
|
|
7,860,534 |
|
|
Options expired |
|
|
(6,836) |
|
|
|
(3,937,146) |
|
|
Options exercised |
|
|
(4,478) |
|
|
|
(1,480,929) |
|
| |
|
|
|
|
|
|
|
|
|
Options outstanding at April 30, 2015 |
|
|
1,234 |
|
|
$ |
543,340 |
|
| |
|
|
|
|
|
|
|
|
ANNUAL REPORT / April 30, 2015
106 NOTES TO FINANCIAL
STATEMENTS (continued)
The Real Asset Fund had transactions in options written during the year ended April 30,
2015 as follows:
|
|
|
|
|
|
|
|
|
|
|
|
|
|
|
|
| |
|
Notional
Amount* |
|
Number of
Contracts |
|
Premiums
Received |
| Options outstanding at April 30, 2014 |
|
|
$ |
9,100,000 |
|
|
|
|
225 |
|
|
|
$ |
137,323 |
|
| Options closed |
|
|
|
(4,200,000) |
|
|
|
|
— |
|
|
|
|
(25,517) |
|
| Options written |
|
|
|
132,468,000 |
|
|
|
|
437 |
|
|
|
|
709,279 |
|
| Options expired |
|
|
|
(77,974,534) |
|
|
|
|
(286) |
|
|
|
|
(300,952) |
|
| Options exercised |
|
|
|
(17,577,466) |
|
|
|
|
(61) |
|
|
|
|
(164,813) |
|
| |
|
|
|
|
|
|
|
|
|
|
|
|
|
|
|
| Options outstanding at April 30, 2015 |
|
|
$ |
41,816,000 |
|
|
|
|
315 |
|
|
|
$ |
355,320 |
|
| |
|
|
|
|
|
|
|
|
|
|
|
|
|
|
|
|
|
| *Reflects notional amount of Written Options. |
|
|
|
|
|
|
Forward Foreign Currency Contracts – Certain Funds may enter into foreign currency commitments or
foreign currency exchange transactions. The Fund may enter into foreign currency contract transactions to protect assets against adverse changes in foreign currency exchange rates or exchange control regulations. Purchased contracts are used to
acquire exposure to foreign currencies; whereas, contracts to sell are used to hedge the Fund’s securities against currency fluctuations. Risks may arise upon entering into these transactions from the potential inability of counterparties to
meet the terms of their commitments and from unanticipated movements in security prices or foreign exchange rates. The foreign currency transactions are adjusted by the daily exchange rate of the underlying currency and any gains or losses are
recorded for financial statement purposes as unrealized until the settlement date.
Futures Contracts – The Funds may invest in
financial futures contracts to hedge their existing portfolios, manage cash flows, enhance yield and to potentially reduce transaction costs. Upon entering into a futures contract with a broker, the Fund is required to deposit in a segregated
account a specified amount of cash or U.S. government securities. Futures contracts are valued daily and unrealized gains or losses are recorded in a “variation margin” account. Daily, and prior to computing its NAV, the Fund receives from
or pays to the broker a specified amount of cash based upon changes in the variation margin account. When a contract is closed, the Fund recognizes a realized gain or loss. Futures contracts have market risks, including the risk that the change in
the value of the contract may not correlate with the changes in the value of the underlying securities. Risk of loss may exceed amounts recognized on the statements of assets and liabilities.
Swap Agreements – Certain Funds may enter into credit default, interest rate, total return and other forms of swap agreements. A
swap agreement is an agreement to exchange the return generated by one instrument for the return generated by another instrument. The swap agreements are valued daily at current market value and any change in value is included in the net unrealized
appreciation or depreciation on investments. Payments received or paid by the Fund are recorded as realized gains or losses upon termination or maturity of the swap. Risk of loss may exceed amounts recognized on the statements of assets and
liabilities. Swap agreements outstanding at period end, if any, are listed on the Portfolio of Investments.
Interest rate swaps
– Interest rate swaps represent an agreement between counterparties to exchange cash flows based on the difference between two interest rates, applied to a notional principal amount for a specified period. The Fund is subject to interest
rate risk exposure in the normal course of pursuing its investment objectives. The Fund may use interest rate swaps to either maintain its ability to generate steady cash flow by receiving a stream of fixed rate payments or to increase exposure to
prevailing market rates by receiving floating rate payments using interest rate swap contracts. The Fund’s maximum risk of loss from counterparty credit risk is the discounted net value of the cash flows to be received from the counterparty
over the contract’s remaining life. This risk may be mitigated by having a master netting arrangement between the Fund and the counterparty which may permit the Fund to offset amounts payable by the Fund to the same counterparty against amounts
to be received; and by the receipt of collateral from the counterparty by the Fund, to cover the Fund’s exposure to the counterparty. However, there is no assurance that such mitigating factors are easily enforceable.
Centrally cleared swap agreements – Centrally cleared swap agreements (“swap”) are agreements executed through a broker
but are cleared through a central counterparty (the “CCP”) and a Fund’s counterparty on the swap becomes the CCP. The Fund is required to interface with the CCP through a broker and upon entering into a centrally cleared swap is
required to deposit initial margin with the broker in the form of cash or securities in an amount that varies depending on the size and risk profile of a particular swap. Centrally cleared swaps are subject to general market risks and to liquidity
risk. Pursuant to the swap, the Fund agrees to pay to or receive from the counterparty an amount of cash equal to the daily fluctuation in the value of the swap (“variation margin”). Such payments are recorded by the Fund as unrealized
gains or losses until the contract is closed or settled at which point the gain or loss is realized.
Credit default swap agreements
– Credit default swap agreements involve one party making a stream of payments (referred to as the buyer of protection) to another party (the seller of protection) in exchange for the right to receive a specified return in the event of a
default or other credit event for the referenced entity, obligation or index. As a seller of protection on credit default swap agreements, a Fund will generally receive from the buyer of protection a fixed rate of income throughout the term of the
swap provided that there is no credit event. As the seller, a Fund would effectively add leverage to its portfolio because, in addition to its total net assets, a Fund would be subject to investment exposure on the notional amount of the swap.
If a Fund is a seller of protection and a credit event occurs, as defined under the terms of that particular swap agreement, a Fund will either
(i) pay to the buyer of protection an amount equal to the notional amount of the swap and take delivery of the referenced obligation, other deliverable obligations or underlying securities comprising the referenced index or (ii) pay a net
settlement amount in the form of cash or
April 30, 2015 / ANNUAL REPORT
|
|
|
|
|
| NOTES TO FINANCIAL STATEMENTS (continued) |
|
|
107 |
|
securities equal to the notional amount of the swap less the recovery value of the referenced
obligation or underlying securities comprising the referenced index. If a Fund is a buyer of protection and a credit event occurs, as defined under the terms of that particular swap agreement, a Fund will either (i) receive from the seller of
protection an amount equal to the notional amount of the swap and deliver the referenced obligation, other deliverable obligations or underlying securities comprising the referenced index or (ii) receive a net settlement amount in the form of
cash or securities equal to the notional amount of the swap less the recovery value of the referenced obligation or underlying securities comprising the referenced index. Recovery values are estimated by market makers considering either industry
standard recovery rates or entity specific factors and considerations until a credit event occurs. If a credit event has occurred, the recovery value is determined by a facilitated auction whereby a minimum number of allowable broker bids, together
with a specified valuation method, are used to calculate the settlement value.
Credit default swap agreements on corporate issues,
sovereign issues of an emerging country or U.S. municipal issues involve one party making a stream of payments to another party in exchange for the right to receive a specified return in the event of a default or other credit event. If a credit
event occurs and cash settlement is not elected, a variety of other deliverable obligations may be delivered in lieu of the specific referenced obligation. The ability to deliver other obligations may result in a cheapest-to deliver option (the
buyer of protection’s right to choose the deliverable obligation with the lowest value following a credit event). A Fund may use credit default swaps on corporate issues, sovereign issues of an emerging country or U.S. municipal issues to
provide a measure of protection against defaults of the issuers (i.e., to reduce risk where a Fund owns or has exposure to the referenced obligation) or to take an active long or short position with respect to the likelihood of a particular
issuer’s default.
Credit default swap agreements on credit indices involve one party making a stream of payments to another party in
exchange for the right to receive a specified return in the event of a write-down, principal shortfall, interest shortfall or default of all or part of the referenced entities comprising the credit index. A credit index is a basket of credit
instruments or exposures designed to be representative of some part of the credit market as a whole. These indices are made up of reference credits that are judged by a poll of dealers to be the most liquid entities in the credit default swap market
based on the sector of the index. Components of the indices may include, but are not limited to, investment grade securities, high yield securities, asset-backed securities, emerging markets, and/or various credit ratings within each sector. Credit
indices are traded using credit default swaps with standardized terms including a fixed spread and standard maturity dates. An index credit default swap references all the names in the index, and if there is a default, the credit event is settled
based on that name’s weight in the index. The composition of the indices changes periodically, usually every six months, and for most indices, each name has an equal weight in the index. A Fund may use credit default swaps on credit indices to
hedge a portfolio of credit default swaps or bonds, which is less expensive than it would be to buy many credit default swaps to achieve a similar effect. Credit default swaps on indices are benchmarks for protecting investors owning bonds against
default, and traders use them to speculate on changes in credit quality. Implied credit spreads, represented in absolute terms, utilized in determining the market value of credit default swap agreements on corporate issues, sovereign issues of an
emerging country or U.S. municipal issues as of period end are disclosed in the footnotes to the Portfolios of Investments and serve as an indicator of the current status of the payment/performance risk and represent the likelihood or risk of
default for the credit derivative. The implied credit spread of a particular referenced entity reflects the cost of buying/ selling protection and may include upfront payments required to be made to enter into the agreement. For credit default swap
agreements on credit indices, the quoted market prices and resulting values serve as the indicator of the current status of the payment/ performance risk. Wider credit spreads represent a deterioration of the referenced entity’s credit
soundness and a greater likelihood or risk of default or other credit event occurring as defined under the terms of the agreement. The maximum potential amount of future payments (undiscounted) that a Fund as a seller of protection could be required
to make under a credit default swap agreement would be an amount equal to the notional amount of the agreement.
ANNUAL REPORT / April 30,
2015
|
|
|
|
|
|
|
108 |
|
NOTES TO FINANCIAL STATEMENTS (continued) |
The following is a summary of the location of derivatives on the Funds’
Statements of Assets and Liabilities as of April 30, 2015.
|
|
|
|
|
| |
|
Location on the Statement of Assets and Liabilities
|
| Derivative Type |
|
Asset Derivatives |
|
Liability Derivatives |
| Credit Contracts |
|
Variation margin receivable for centrally cleared swap
agreements.* |
|
Variation margin payable for centrally cleared swap
agreements.* |
|
|
Over the counter swap agreements, at value.** |
|
Over the counter swap agreements, at value.** |
| Interest rate contracts |
|
Variation margin receivable for centrally cleared swap
agreements.* |
|
Options written, at value. |
|
|
Variation margin receivable for financial futures contracts.* |
|
Variation margin payable for centrally cleared swap
agreements.* |
|
|
Over the counter swap agreements, at value.** |
|
Variation margin payable for financial futures contracts.* |
|
|
|
|
Over the counter swap agreements, at value.** |
|
Foreign exchange contracts |
|
Unrealized appreciation on forward foreign currency exchange
contracts. |
|
Unrealized depreciation on forward foreign currency exchange
contracts. |
| Equity contracts |
|
Investments in securities, at value. |
|
Options written, at value. |
*The variation margin shown on the Statements of Assets and Liabilities is the daily change in the unrealized
appreciation (depreciation) for centrally cleared swap and financial futures contracts. The variation margin presented below is the cumulative change in unrealized appreciation (depreciation) from the date the contract was opened until
April 30, 2015.
**The amounts shown represent the unrealized appreciation (depreciation) from the date the contract was open.
|
|
|
|
|
|
|
|
|
|
|
|
|
|
|
|
|
|
|
|
|
|
|
|
|
|
| |
|
Asset
Derivative Fair Value |
| Fund |
|
Total Value |
|
Equity
Contracts |
|
Foreign
Exchange
Contracts |
|
Interest Rate
Contracts |
|
Credit
Contracts |
| International Fund |
|
|
|
|
|
|
|
|
|
|
|
|
|
|
|
|
|
|
|
|
|
|
|
|
|
|
Forward Foreign Currency Contracts |
|
|
$ |
1,274 |
|
|
|
$ |
— |
|
|
|
$ |
1,274 |
|
|
|
$ |
— |
|
|
|
$ |
— |
|
|
|
|
|
|
|
|
|
|
|
|
|
|
|
|
|
|
|
|
|
|
|
|
|
|
|
| Alternatives Fund |
|
|
|
|
|
|
|
|
|
|
|
|
|
|
|
|
|
|
|
|
|
|
|
|
|
|
Purchased Options |
|
|
$ |
474,925 |
|
|
|
$ |
474,925 |
|
|
|
$ |
— |
|
|
|
$ |
— |
|
|
|
$ |
— |
|
|
|
|
|
|
|
|
|
|
|
|
|
|
|
|
|
|
|
|
|
|
|
|
|
|
|
| Real Asset Fund |
|
|
|
|
|
|
|
|
|
|
|
|
|
|
|
|
|
|
|
|
|
|
|
|
|
|
Forward Foreign Currency Contracts |
|
|
$ |
4,741,852 |
|
|
|
$ |
— |
|
|
|
$ |
4,741,852 |
|
|
|
$ |
— |
|
|
|
$ |
— |
|
|
Purchased Options |
|
|
|
122,522 |
|
|
|
|
— |
|
|
|
|
— |
|
|
|
|
122,522 |
|
|
|
|
— |
|
|
Swap Contracts |
|
|
|
697,121 |
|
|
|
|
— |
|
|
|
|
— |
|
|
|
|
681,177 |
|
|
|
|
15,944 |
|
|
|
|
|
|
|
|
|
|
|
|
|
|
|
|
|
|
|
|
|
|
|
|
|
|
|
|
Totals |
|
|
$ |
5,561,495 |
|
|
|
$ |
— |
|
|
|
$ |
4,741,852 |
|
|
|
$ |
803,699 |
|
|
|
$ |
15,944 |
|
|
|
|
|
|
|
|
|
|
|
|
|
|
|
|
|
|
|
|
|
|
|
|
|
|
|
|
|
|
|
|
|
|
|
|
|
|
|
|
|
|
|
|
|
|
|
|
|
|
|
|
|
| |
|
Liability Derivative Fair Value
|
| Fund |
|
Total Value |
|
Equity
Contracts |
|
Foreign
Exchange
Contracts |
|
Interest Rate
Contracts |
|
Credit
Contracts |
| International Fund |
|
|
|
|
|
|
|
|
|
|
|
|
|
|
|
|
|
|
|
|
|
|
|
|
|
|
Forward Foreign Currency Contracts |
|
|
$ |
2,702 |
|
|
|
$ |
— |
|
|
|
$ |
2,702 |
|
|
|
$ |
— |
|
|
|
$ |
— |
|
|
|
|
|
|
|
|
|
|
|
|
|
|
|
|
|
|
|
|
|
|
|
|
|
|
|
| Alternatives Fund |
|
|
|
|
|
|
|
|
|
|
|
|
|
|
|
|
|
|
|
|
|
|
|
|
|
|
Financial Futures Contracts |
|
|
$ |
1,367,058 |
|
|
|
$ |
— |
|
|
|
$ |
1,367,058 |
|
|
|
$ |
— |
|
|
|
$ |
— |
|
|
Written Options |
|
|
|
523,080 |
|
|
|
|
523,080 |
|
|
|
|
|
|
|
|
|
— |
|
|
|
|
— |
|
|
|
|
|
|
|
|
|
|
|
|
|
|
|
|
|
|
|
|
|
|
|
|
|
|
|
|
Totals |
|
|
$ |
1,890,138 |
|
|
|
$ |
523,080 |
|
|
|
$ |
1,367,058 |
|
|
|
$ |
— |
|
|
|
$ |
— |
|
|
|
|
|
|
|
|
|
|
|
|
|
|
|
|
|
|
|
|
|
|
|
|
|
|
|
| Real Asset Fund |
|
|
|
|
|
|
|
|
|
|
|
|
|
|
|
|
|
|
|
|
|
|
|
|
|
|
Financial Futures Contracts |
|
|
$ |
301,582 |
|
|
|
$ |
— |
|
|
|
$ |
— |
|
|
|
$ |
301,582 |
|
|
|
$ |
— |
|
|
Forward Foreign Currency Contracts |
|
|
|
9,423,998 |
|
|
|
|
— |
|
|
|
|
9,423,998 |
|
|
|
|
— |
|
|
|
|
— |
|
|
Swap Contracts |
|
|
|
1,421,931 |
|
|
|
|
— |
|
|
|
|
— |
|
|
|
|
1,311,421 |
|
|
|
|
110,510 |
|
|
Written Options |
|
|
|
658,814 |
|
|
|
|
— |
|
|
|
|
258,550 |
|
|
|
|
396,456 |
|
|
|
|
3,808 |
|
|
|
|
|
|
|
|
|
|
|
|
|
|
|
|
|
|
|
|
|
|
|
|
|
|
|
|
Totals |
|
|
$ |
11,806,325 |
|
|
|
$ |
— |
|
|
|
$ |
9,682,548 |
|
|
|
$ |
2,009,459 |
|
|
|
$ |
114,318 |
|
|
|
|
|
|
|
|
|
|
|
|
|
|
|
|
|
|
|
|
|
|
|
|
|
|
|
April 30, 2015 / ANNUAL REPORT
|
|
|
|
|
| NOTES TO FINANCIAL STATEMENTS (continued) |
|
|
109 |
|
The effect of derivative instruments on the
Statements of Operations for the year ended April 30, 2015 are as follows:
|
|
|
| Derivative Type |
|
Location on the
Statement of Operations |
| Equity contracts |
|
Net realized gain (loss) on investments, options written and futures
contracts |
|
|
Net change in unrealized appreciation (depreciation) on investments |
| Credit contracts |
|
Net realized gain (loss) on swap agreements |
|
|
Net change in unrealized appreciation (depreciation) on investments |
| Interest rate contracts |
|
Net realized gain (loss) on investments, swap agreements, options written and
futures contracts |
|
|
Net change in unrealized appreciation (depreciation) on investments |
|
Foreign exchange contracts |
|
Net realized gain (loss) on investments, foreign currency transactions and
options written |
|
|
Net change in unrealized appreciation (depreciation) on investments |
|
|
|
|
|
|
|
|
|
|
|
|
|
|
|
|
|
|
|
|
|
|
|
|
|
|
| |
|
Total
Realized Gain (Loss) on Derivatives Recognized in Results from
Operations |
| Fund |
|
Total |
|
Equity
Contracts |
|
Foreign
Exchange
Contracts |
|
Interest Rate
Contracts |
|
Credit
Contracts |
| International Fund |
|
|
|
|
|
|
|
|
|
|
|
|
|
|
|
|
|
|
|
|
|
|
|
|
|
|
Forward Foreign Currency Contracts |
|
|
$ |
(87,100) |
|
|
|
$ |
— |
|
|
|
$ |
(87,100) |
|
|
|
$ |
— |
|
|
|
$ |
— |
|
|
|
|
|
|
|
|
|
|
|
|
|
|
|
|
|
|
|
|
|
|
|
|
|
|
|
|
|
|
|
|
|
| Alternatives Fund |
|
|
|
|
|
|
|
|
|
|
|
|
|
|
|
|
|
|
|
|
|
|
|
|
|
|
Financial Futures Contracts |
|
|
$ |
10,545,104 |
|
|
|
$ |
— |
|
|
|
$ |
10,545,104 |
|
|
|
$ |
— |
|
|
|
$ |
— |
|
|
Forward Foreign Currency Contracts |
|
|
|
2,335,851 |
|
|
|
|
— |
|
|
|
|
2,335,851 |
|
|
|
|
— |
|
|
|
|
— |
|
|
Purchased Option |
|
|
|
(1,976,270) |
|
|
|
|
(1,976,270) |
|
|
|
|
— |
|
|
|
|
— |
|
|
|
|
— |
|
|
Written Options |
|
|
|
938,805 |
|
|
|
|
938,805 |
|
|
|
|
— |
|
|
|
|
— |
|
|
|
|
— |
|
|
|
|
|
|
|
|
|
|
|
|
|
|
|
|
|
|
|
|
|
|
|
|
|
|
|
|
Totals |
|
|
$ |
11,843,490 |
|
|
|
$ |
(1,037,465) |
|
|
|
$ |
12,880,955 |
|
|
|
$ |
— |
|
|
|
$ |
— |
|
|
|
|
|
|
|
|
|
|
|
|
|
|
|
|
|
|
|
|
|
|
|
|
|
|
|
| Real Asset Fund |
|
|
|
|
|
|
|
|
|
|
|
|
|
|
|
|
|
|
|
|
|
|
|
|
|
|
Financial Futures Contracts |
|
|
$ |
(762,819) |
|
|
|
$ |
— |
|
|
|
$ |
— |
|
|
|
$ |
(762,819) |
|
|
|
$ |
— |
|
|
Forward Foreign Currency Contracts |
|
|
|
24,261,592 |
|
|
|
|
— |
|
|
|
|
24,261,592 |
|
|
|
|
— |
|
|
|
|
— |
|
|
Purchased Options |
|
|
|
(90,435) |
|
|
|
|
— |
|
|
|
|
— |
|
|
|
|
(90,435) |
|
|
|
|
— |
|
|
Swap Contracts |
|
|
|
(1,316,918) |
|
|
|
|
— |
|
|
|
|
— |
|
|
|
|
(1,485,215) |
|
|
|
|
168,297 |
|
|
Written Options |
|
|
|
432,032 |
|
|
|
|
— |
|
|
|
|
80,252 |
|
|
|
|
223,338 |
|
|
|
|
128,442 |
|
|
|
|
|
|
|
|
|
|
|
|
|
|
|
|
|
|
|
|
|
|
|
|
|
|
|
|
Totals |
|
|
$ |
22,523,452 |
|
|
|
$ |
— |
|
|
|
$ |
24,341,844 |
|
|
|
$ |
(2,115,131) |
|
|
|
$ |
296,739 |
|
|
|
|
|
|
|
|
|
|
|
|
|
|
|
|
|
|
|
|
|
|
|
|
|
|
|
| |
|
Change in Unrealized Appreciation (Depreciation) on Derivatives
Recognized in Results from Operations
|
| Fund |
|
Total |
|
Equity
Contracts |
|
Foreign
Exchange
Contracts |
|
Interest Rate
Contracts |
|
Credit
Contracts |
| International Fund |
|
|
|
|
|
|
|
|
|
|
|
|
|
|
|
|
|
|
|
|
|
|
|
|
|
|
Forward Foreign Currency Contracts |
|
|
$ |
(3,379) |
|
|
|
$ |
— |
|
|
|
$ |
(3,379) |
|
|
|
$ |
— |
|
|
|
$ |
— |
|
|
|
|
|
|
|
|
|
|
|
|
|
|
|
|
|
|
|
|
|
|
|
|
|
|
|
|
|
|
|
|
|
| Alternatives Fund |
|
|
|
|
|
|
|
|
|
|
|
|
|
|
|
|
|
|
|
|
|
|
|
|
|
|
Financial Futures Contracts |
|
|
$ |
(1,314,141) |
|
|
|
$ |
— |
|
|
|
$ |
(1,314,141) |
|
|
|
$ |
— |
|
|
|
$ |
— |
|
|
Forward Foreign Currency Contracts |
|
|
|
140,981 |
|
|
|
|
— |
|
|
|
|
140,981 |
|
|
|
|
— |
|
|
|
|
— |
|
|
Purchased Options |
|
|
|
244,941 |
|
|
|
|
244,941 |
|
|
|
|
— |
|
|
|
|
— |
|
|
|
|
— |
|
|
Written Options |
|
|
|
(96,427) |
|
|
|
|
(96,427) |
|
|
|
|
— |
|
|
|
|
— |
|
|
|
|
— |
|
|
|
|
|
|
|
|
|
|
|
|
|
|
|
|
|
|
|
|
|
|
|
|
|
|
|
|
Totals |
|
|
$ |
(1,024,646) |
|
|
|
$ |
148,514 |
|
|
|
$ |
(1,173,160) |
|
|
|
$ |
— |
|
|
|
$ |
— |
|
|
|
|
|
|
|
|
|
|
|
|
|
|
|
|
|
|
|
|
|
|
|
|
|
|
|
|
|
|
|
|
|
| Real Asset Fund |
|
|
|
|
|
|
|
|
|
|
|
|
|
|
|
|
|
|
|
|
|
|
|
|
|
|
Financial Futures Contracts |
|
|
$ |
(285,082) |
|
|
|
$ |
— |
|
|
|
$ |
— |
|
|
|
$ |
(285,082) |
|
|
|
$ |
— |
|
|
Forward Foreign Currency Contracts |
|
|
|
(2,666,694) |
|
|
|
|
— |
|
|
|
|
(2,666,694) |
|
|
|
|
— |
|
|
|
|
— |
|
|
Purchased Options |
|
|
|
(33,548) |
|
|
|
|
— |
|
|
|
|
— |
|
|
|
|
(33,548) |
|
|
|
|
— |
|
|
Written Options |
|
|
|
(341,458) |
|
|
|
|
— |
|
|
|
|
(209,081) |
|
|
|
|
(123,125) |
|
|
|
|
(9,252) |
|
|
Swap Contracts |
|
|
|
(814,928) |
|
|
|
|
— |
|
|
|
|
— |
|
|
|
|
(645,098) |
|
|
|
|
(169,830) |
|
|
|
|
|
|
|
|
|
|
|
|
|
|
|
|
|
|
|
|
|
|
|
|
|
|
|
|
Totals |
|
|
$ |
(4,141,710) |
|
|
|
$ |
— |
|
|
|
$ |
(2,875,775) |
|
|
|
$ |
(1,086,853) |
|
|
|
$ |
(179,082) |
|
|
|
|
|
|
|
|
|
|
|
|
|
|
|
|
|
|
|
|
|
|
|
|
|
|
|
ANNUAL REPORT / April 30, 2015
|
|
|
|
|
|
|
110 |
|
NOTES TO FINANCIAL STATEMENTS (continued) |
The Funds’ derivative financial instruments outstanding as of
April 30, 2015, as disclosed in the Portfolios of Investments, are indicative of the volume of derivative activity for the Funds.
Certain Funds are parties to International Swap and Derivatives Association, Inc. (“ISDA”) Master Agreements
(“MA”) with various counterparties that govern over-the-counter derivative and foreign exchange contracts entered into from time to time. The ISDA MA may contain provisions regarding, among other things, the parties’ general
obligations, representations, agreements, collateral requirements, events of default and early termination. With respect to certain counterparties, in accordance with the terms of the ISDA MA, collateral posted to the Fund is held in a segregated
account by the Fund’s custodian and with respect to those amounts which can be sold or repledged, are presented in the Fund’s portfolio or Statements of Assets and Liabilities.
At April 30, 2015, derivative assets and liabilities (by type) held by the Funds are as follows:
|
|
|
|
|
|
|
|
|
|
Fund |
|
Assets |
|
|
Liabilities |
|
| International Fund |
|
|
|
|
|
|
|
|
| Derivative Financial Instruments: |
|
|
|
|
|
|
|
|
| Forward foreign currency contracts |
|
$ |
1,274 |
|
|
$ |
2,702 |
|
|
|
|
|
|
|
|
|
|
| Total derivative assets and liabilities in the |
|
|
|
|
|
|
|
|
| Statements of Assets and Liabilities |
|
|
1,274 |
|
|
|
2,702 |
|
| Derivatives not subject to a MA or similar
agreement |
|
|
— |
|
|
|
— |
|
|
|
|
|
|
|
|
|
|
| Total assets and liabilities subject to a MA |
|
$ |
1,274 |
|
|
$ |
2,702 |
|
|
|
|
|
|
|
|
|
|
| Alternatives Fund |
|
|
|
|
|
|
|
|
| Derivative Financial Instruments: |
|
|
|
|
|
|
|
|
| Financial futures contracts |
|
$ |
— |
|
|
$ |
1,367,058 |
|
| Forward foreign currency contracts |
|
|
— |
|
|
|
— |
|
| Options |
|
|
474,925 |
|
|
|
523,080 |
|
|
|
|
|
|
|
|
|
|
| Total derivative assets and liabilities in the |
|
|
|
|
|
|
|
|
| Statements of Assets and Liabilities |
|
|
474,925 |
|
|
|
1,890,138 |
|
| Derivatives not subject to a MA or similar agreement |
|
|
442,425 |
|
|
|
1,685,540 |
|
|
|
|
|
|
|
|
|
|
| Total assets and liabilities subject to a MA |
|
$ |
32,500 |
|
|
$ |
204,598 |
|
|
|
|
|
|
|
|
|
|
| Real Asset Fund |
|
|
|
|
|
|
|
|
| Derivative Financial Instruments: |
|
|
|
|
|
|
|
|
| Financial futures contracts |
|
$ |
— |
|
|
$ |
301,582 |
|
| Forward foreign currency contracts |
|
|
4,741,852 |
|
|
|
9,423,998 |
|
| Options |
|
|
122,522 |
|
|
|
658,814 |
|
| Swaps |
|
|
697,121 |
|
|
|
1,421,931 |
|
|
|
|
|
|
|
|
|
|
| Total derivative assets and liabilities in the |
|
|
|
|
|
|
|
|
| Statements of Assets and Liabilities |
|
|
5,561,495 |
|
|
|
11,806,325 |
|
| Derivatives not subject to a MA or similar
agreement |
|
|
670,860 |
|
|
|
1,259,289 |
|
|
|
|
|
|
|
|
|
|
| Total assets and liabilities subject to a MA |
|
$ |
4,890,635 |
|
|
$ |
10,547,036 |
|
|
|
|
|
|
|
|
|
|
April 30, 2015 / ANNUAL REPORT
NOTES TO FINANCIAL STATEMENTS (continued) 111
At April 30, 2015, derivative assets and liabilities by type net of amounts available
for offset under a MA and net of the related collateral received by each Fund are as follows:
|
|
|
|
|
|
|
|
|
|
|
|
|
|
|
|
|
|
|
|
|
|
|
|
|
|
| Fund/Derivative Type |
|
Derivative
Assets Subject to
a MA by
Type |
|
Derivatives
Available for
Offset |
|
Non-Cash
Collateral
Received(1) |
|
Cash
Collateral
Received(1) |
|
Net Amount
of Derivative
Assets(2) |
| International Fund |
|
|
|
|
|
|
|
|
|
|
|
|
|
|
|
|
|
|
|
|
|
|
|
|
|
|
|
|
|
|
|
| Forward foreign exchange contracts |
|
|
$ |
1,274 |
|
|
|
$ |
(1,274 |
) |
|
|
$ |
— |
|
|
|
$ |
— |
|
|
|
$ |
— |
|
|
|
|
|
|
|
|
|
|
|
|
|
|
|
|
|
|
|
|
|
|
|
|
|
|
|
|
|
|
|
|
|
| Total Derivative Assets |
|
|
$ |
1,274 |
|
|
|
$ |
(1,274 |
) |
|
|
$ |
— |
|
|
|
$ |
— |
|
|
|
$ |
— |
|
|
|
|
|
|
|
|
|
|
|
|
|
|
|
|
|
|
|
|
|
|
|
|
|
|
|
|
|
|
|
|
|
|
|
|
|
|
|
|
|
|
|
|
|
|
|
|
|
|
|
|
|
| |
|
Derivative
Liabilities Subject to
a MA by Type |
|
Derivatives
Available for
Offset |
|
Non-Cash
Collateral
Pledged(3) |
|
Cash
Collateral
Pledged(3)
|
|
Net Amount
of Derivative
Liabilities(4) |
| Forward foreign exchange contracts |
|
|
$ |
2,702 |
|
|
|
$ |
(1,274 |
) |
|
|
$ |
— |
|
|
|
$ |
— |
|
|
|
$ |
1,428 |
|
|
|
|
|
|
|
|
|
|
|
|
|
|
|
|
|
|
|
|
|
|
|
|
|
|
|
|
|
|
|
|
|
| Total Derivative Liabilities |
|
|
$ |
2,702 |
|
|
|
$ |
(1,274 |
) |
|
|
$ |
— |
|
|
|
$ |
— |
|
|
|
$ |
1,428 |
|
|
|
|
|
|
|
|
|
|
|
|
|
|
|
|
|
|
|
|
|
|
|
|
|
|
|
| |
|
Derivative
Assets Subject to
a MA by Type |
|
Derivatives
Available for
Offset |
|
Non-Cash
Collateral
Received(1) |
|
Cash
Collateral
Received(1) |
|
Net Amount
of Derivative
Assets(2) |
|
|
|
|
|
|
| Alternatives Fund |
|
|
|
|
|
|
|
|
|
|
|
|
|
|
|
|
|
|
|
|
|
|
|
|
|
|
|
|
|
|
|
| Options |
|
|
$ |
32,500 |
|
|
|
$ |
(32,500 |
) |
|
|
$ |
— |
|
|
|
$ |
— |
|
|
|
$ |
— |
|
|
|
|
|
|
|
|
|
|
|
|
|
|
|
|
|
|
|
|
|
|
|
|
|
|
|
|
|
|
|
|
|
| Total Derivative Assets |
|
|
$ |
32,500 |
|
|
|
$ |
(32,500 |
) |
|
|
$ |
— |
|
|
|
$ |
— |
|
|
|
$ |
— |
|
|
|
|
|
|
|
|
|
|
|
|
|
|
|
|
|
|
|
|
|
|
|
|
|
|
|
|
|
|
|
|
|
|
|
|
|
|
|
|
|
|
|
|
|
|
|
|
|
|
|
|
|
| |
|
Derivative
Liabilities Subject to
a MA by Type |
|
Derivatives
Available for
Offset |
|
Non-Cash
Collateral
Pledged(3) |
|
Cash
Collateral
Pledged(3) |
|
Net Amount
of Derivative
Liabilities(4)
|
| Alternatives Fund |
|
|
|
|
|
|
|
|
|
|
|
|
|
|
|
|
|
|
|
|
|
|
|
|
|
|
|
|
|
|
|
| Options |
|
|
$ |
204,598 |
|
|
|
$ |
(32,500 |
) |
|
|
$ |
(172,098 |
) |
|
|
$ |
— |
|
|
|
$ |
— |
|
|
|
|
|
|
|
|
|
|
|
|
|
|
|
|
|
|
|
|
|
|
|
|
|
|
|
|
|
|
|
|
|
| Total Derivative Liabilities |
|
|
$ |
204,598 |
|
|
|
$ |
(32,500 |
) |
|
|
$ |
(172,098 |
) |
|
|
$ |
— |
|
|
|
$ |
— |
|
|
|
|
|
|
|
|
|
|
|
|
|
|
|
|
|
|
|
|
|
|
|
|
|
|
|
|
|
|
|
|
|
|
|
|
|
|
|
|
|
|
|
|
|
|
|
|
|
|
|
|
|
| |
|
Derivative
Assets Subject to
a MA by Type |
|
Derivatives
Available for
Offset |
|
Non-Cash
Collateral
Received(1) |
|
Cash
Collateral
Received(1) |
|
Net Amount
of Derivative
Assets(2) |
|
|
|
|
|
|
| Real Asset Fund |
|
|
|
|
|
|
|
|
|
|
|
|
|
|
|
|
|
|
|
|
|
|
|
|
|
|
|
|
|
|
|
| Forward foreign exchange contracts |
|
|
$ |
4,741,852 |
|
|
|
$ |
(4,008,667 |
) |
|
|
$ |
— |
|
|
|
$ |
— |
|
|
|
$ |
733,185 |
|
| Options |
|
|
|
122,522 |
|
|
|
|
(122,522 |
) |
|
|
|
— |
|
|
|
|
— |
|
|
|
|
— |
|
| Swaps |
|
|
|
26,261 |
|
|
|
|
(23,403 |
) |
|
|
|
— |
|
|
|
|
— |
|
|
|
|
2,858 |
|
|
|
|
|
|
|
|
|
|
|
|
|
|
|
|
|
|
|
|
|
|
|
|
|
|
|
|
|
|
|
|
|
| Total Derivative Assets |
|
|
$ |
4,890,635 |
|
|
|
$ |
(4,154,592 |
) |
|
|
$ |
— |
|
|
|
$ |
— |
|
|
|
$ |
736,043 |
|
|
|
|
|
|
|
|
|
|
|
|
|
|
|
|
|
|
|
|
|
|
|
|
|
|
|
| Real Asset Fund (continued) |
|
Derivative
Liabilities Subject to
a MA by Type |
|
Derivatives
Available for
Offset |
|
Non-Cash
Collateral
Pledged(3) |
|
Cash
Collateral
Pledged(3) |
|
Net Amount
of Derivative
Liabilities(4)
|
| Forward foreign exchange contracts |
|
|
$ |
9,423,998 |
|
|
|
$ |
(4,008,667 |
) |
|
|
$ |
— |
|
|
|
$ |
— |
|
|
|
$ |
5,415,331 |
|
| Options |
|
|
|
427,278 |
|
|
|
|
(122,522 |
) |
|
|
|
(304,756 |
) |
|
|
|
— |
|
|
|
|
— |
|
| Swaps |
|
|
|
695,760 |
|
|
|
|
(23,403 |
) |
|
|
|
— |
|
|
|
|
(672,357 |
) |
|
|
|
— |
|
|
|
|
|
|
|
|
|
|
|
|
|
|
|
|
|
|
|
|
|
|
|
|
|
|
|
|
|
|
|
|
|
| Total Derivative Liabilities |
|
|
$ |
10,547,036 |
|
|
|
$ |
(4,154,592 |
) |
|
|
$ |
(304,756 |
) |
|
|
$ |
(672,357 |
) |
|
|
$ |
5,415,331 |
|
|
|
|
|
|
|
|
|
|
|
|
|
|
|
|
|
|
|
|
|
|
|
|
|
|
|
| |
(1) |
Excess of collateral received is not shown for financial reporting purposes. |
| |
(2) |
Net amount represents the net amount receivable in the event of default. |
| |
(3) |
Excess of collateral pledged is not shown for financial reporting purposes. |
| |
(4) |
Net amount represents the net amount payable due in the event of default. |
ANNUAL REPORT / April 30, 2015
|
|
|
|
|
|
|
112 |
|
NOTES TO FINANCIAL STATEMENTS (continued) |
4. FEDERAL TAX INFORMATION
As of April 30, 2015, there are no uncertain tax positions that would require financial statement recognition,
de-recognition or disclosure. The Funds’ federal tax returns filed for the periods ended 2014, 2013, and 2012, as well as the current tax year, remain subject to examination by the Internal Revenue Service.
For the year ended April 30, 2015, permanent differences identified and reclassified among the components of net assets
were as follows:
|
|
|
|
|
|
|
|
|
|
|
|
|
|
|
|
| Fund |
|
Paid-in
Capital |
|
Increase (Decrease)
Undistributed Net
Investment
Income |
|
Accumulated
Net Realized
Gain (Loss) |
| International Fund |
|
|
|
$ — |
|
|
|
|
$ (200,884) |
|
|
|
|
$ 200,884 |
|
| Alternatives Fund |
|
|
|
— |
|
|
|
|
4,687,450 |
|
|
|
|
(4,687,450) |
|
| Real Asset Fund |
|
|
|
2,603 |
|
|
|
|
21,681,239 |
|
|
|
|
(21,683,842) |
|
| Strategic Allocation Conservative Fund |
|
|
|
— |
|
|
|
|
43,177 |
|
|
|
|
(43,177) |
|
| Strategic Allocation Moderate Fund |
|
|
|
— |
|
|
|
|
112,717 |
|
|
|
|
(112,717) |
|
| Strategic Allocation Aggressive Fund |
|
|
|
— |
|
|
|
|
103,088 |
|
|
|
|
(103,088) |
|
The tax character of distributions for the corresponding years as reported on the Statements of
Changes in the Net Asset were as follows:
|
|
|
|
|
|
|
|
|
|
|
|
|
|
|
|
|
|
|
|
|
| |
|
2015 |
|
2014 |
| Fund |
|
Ordinary
Income* |
|
Long-Term
Capital Gains |
|
Ordinary
Income* |
|
Long-Term
Capital Gains |
| International Fund |
|
|
|
$8,485,252 |
|
|
|
$ |
— |
|
|
|
|
$9,182,190 |
|
|
|
$ |
— |
|
| Alternatives Fund |
|
|
|
1,957,694 |
|
|
|
|
1,461,848 |
|
|
|
|
161,975 |
|
|
|
|
1,374,779 |
|
| Real Asset Fund |
|
|
|
7,000,154 |
|
|
|
|
— |
|
|
|
|
6,435,946 |
|
|
|
|
— |
|
| Strategic Allocation Conservative Fund |
|
|
|
537,025 |
|
|
|
|
740,300 |
|
|
|
|
807,921 |
|
|
|
|
306,691 |
|
| Strategic Allocation Moderate Fund |
|
|
|
649,387 |
|
|
|
|
— |
|
|
|
|
678,372 |
|
|
|
|
— |
|
| Strategic Allocation Aggressive Fund |
|
|
|
286,179 |
|
|
|
|
— |
|
|
|
|
310,111 |
|
|
|
|
— |
|
| |
* |
For tax purposes, short-term capital gain distributions are considered ordinary income distributions. |
As of April 30, 2015, the components of distributable earnings on a tax basis were as follows:
|
|
|
|
|
|
|
|
|
|
|
|
|
|
|
|
|
|
|
|
|
|
|
|
|
|
|
|
|
|
|
| Fund |
|
Undistributed
Ordinary Income
|
|
Undistributed
Long-Term
Capital Gains |
|
Other
Timing
Differences |
|
Unrealized
Appreciation/
(Depreciation) |
|
Capital Loss
Carryforwards
and Deferrals |
|
Late Year
Deferrals |
| International Fund |
|
|
|
$ 3,722,593 |
|
|
|
|
$ — |
|
|
|
|
$ — |
|
|
|
|
$62,539,649 |
|
|
|
|
$(326,487,772) |
|
|
|
|
$ — |
|
| Alternatives Fund |
|
|
|
4,181,440 |
|
|
|
|
— |
|
|
|
|
(8,400) |
|
|
|
|
514,310 |
|
|
|
|
(220,563) |
|
|
|
|
— |
|
| Real Asset Fund |
|
|
|
19,760,087 |
|
|
|
|
— |
|
|
|
|
(3,460,154) |
|
|
|
|
7,441,614 |
|
|
|
|
(93,194,308) |
|
|
|
|
(10,494,247) |
|
| Strategic Allocation Conservative Fund |
|
|
|
38,134 |
|
|
|
|
602,387 |
|
|
|
|
— |
|
|
|
|
1,563,484 |
|
|
|
|
— |
|
|
|
|
— |
|
| Strategic Allocation Moderate Fund |
|
|
|
69,282 |
|
|
|
|
93,671 |
|
|
|
|
— |
|
|
|
|
4,711,096 |
|
|
|
|
(4,634,279) |
|
|
|
|
— |
|
| Strategic Allocation Aggressive Fund |
|
|
|
— |
|
|
|
|
578,169 |
|
|
|
|
— |
|
|
|
|
1,827,137 |
|
|
|
|
— |
|
|
|
|
— |
|
At April 30, 2015, the following Funds had capital loss carryforwards which will reduce
each Fund’s taxable income arising from future net realized gain on investments, if any, to the extent permitted by the (“Code”) and thus will reduce the amount of distributions to shareholders which would otherwise be necessary to
relieve the Fund of any liability for federal income tax. Pursuant to the Code, such capital loss carryforwards will expire as follows:
|
|
|
|
|
|
|
|
|
|
|
|
|
|
|
|
|
|
|
|
|
|
|
|
|
|
|
|
|
|
|
|
|
|
|
|
| |
|
Capital Loss Available Through |
|
Short-Term
Post-Effective
|
|
Long-Term
Post-Effective
No Expiration |
|
Total
Capital |
| |
|
|
|
Loss |
| Fund |
|
2016 |
|
2017 |
|
2018 |
|
2019 |
|
No Expiration |
|
|
Carryforwards |
| International Fund |
|
|
|
$61,778,327 |
|
|
|
|
$236,603,604 |
|
|
|
|
$28,105,841 |
|
|
|
|
$— |
|
|
|
|
$ — |
|
|
|
|
$— |
|
|
|
|
$326,487,772 |
|
| Alternatives Fund |
|
|
|
— |
|
|
|
|
— |
|
|
|
|
— |
|
|
|
|
— |
|
|
|
|
220,563 |
|
|
|
|
— |
|
|
|
|
220,563 |
|
| Real Asset Fund |
|
|
|
— |
|
|
|
|
— |
|
|
|
|
93,194,308 |
|
|
|
|
— |
|
|
|
|
— |
|
|
|
|
— |
|
|
|
|
93,194,308 |
|
| Strategic Allocation Moderate Fund |
|
|
|
— |
|
|
|
|
3,787,513 |
|
|
|
|
846,766 |
|
|
|
|
— |
|
|
|
|
— |
|
|
|
|
— |
|
|
|
|
4,634,279 |
|
April 30, 2015 / ANNUAL REPORT
NOTES TO FINANCIAL STATEMENTS
(continued) 113
The Funds used capital loss carryforwards as follows to offset taxable
capital gains realized during the year ended April 30, 2015:
|
|
|
|
|
| Fund |
|
Capital Loss
Carryforwards
Used |
|
| International Fund |
|
|
$27,065,861 |
|
| Real Asset Fund |
|
|
11,462,731 |
|
| Strategic Allocation Moderate Fund |
|
|
2,780,834 |
|
| Strategic Allocation Aggressive Fund |
|
|
1,811,800 |
|
5. ADVISORY FEES, SERVICING FEES, AND OTHER SERVICE PROVIDERS
Investment Advisor – Wilmington Funds Management Corporation (“WFMC” or the “Advisor”) serves as
the Investment Advisor to each of the Funds. Wilmington Trust Investment Advisors, Inc. (“WTIA”) provides sub-advisory services to the Funds. WFMC and WTIA are wholly-owned subsidiaries of M&T Bank Corporation. For its services, the
Funds pay WFMC an annual investment advisory fee, accrued and paid daily, based on a percentage of each Fund’s average daily net assets as described below. WFMC, not the Funds, pays WTIA for its services.
The International Fund, Alternatives Fund and Real Asset Fund, utilize a multi-manager strategy, whereby WFMC allocates all or a
portion of the Funds’ assets among a number of sub-advisors. For their services, the Funds pay each sub-advisor fees, accrued daily and paid monthly, as described below. Certain sub-advisors have entered into an agreement with WFMC to waive
their fees to the extent that the fee calculation determined by taking into account similarly managed assets in the accounts of clients of WFMC or its affiliates, results in a fee that is less than the fee calculation under the sub-advisory
agreement.
On September 18, 2014, the Trustees voted to change the investment advisory fee rates for the Funds.
Effective December 1, 2014, the Funds pay WFMC an annual investment advisory fee, accrued and paid daily, based on a percentage of each Fund’s average daily net assets as described below. WFMC, not the Funds, pays WTIA for it services.
|
|
|
| Fund |
|
Current Advisory Fee
Annual
Rate |
| International Fund |
|
0.45% |
| Alternatives Fund |
|
0.95% |
| Real Asset Fund |
|
0.45% |
| Strategic Allocation Conservative Fund |
|
0.40% |
| Strategic Allocation Moderate Fund |
|
0.40% |
| Strategic Allocation Aggressive Fund |
|
0.40% |
Prior to December 1, 2014, the Funds had annual investment advisory fee, accrued and paid
daily, based on a percentage of each Fund’s average daily net assets as described below.
|
|
|
| Fund |
|
Prior Advisory Fee
Annual Rate |
| International Fund |
|
0.50% |
| Alternatives Fund |
|
1.00% |
| Real Asset Fund |
|
0.50% |
| Strategic Allocation Conservative Fund |
|
0.50% |
| Strategic Allocation Moderate Fund |
|
0.50% |
| Strategic Allocation Aggressive Fund |
|
0.50% |
Effective December 1, 2014, the Trustees voted to change the contractual expense
limitations for the funds below. WFMC and the Funds’ distributor and shareholder service providers have contractually agreed to waive their fees and/or reimburse expenses through November 30, 2015, so that total annual fund operating
expenses paid by the Funds (not including the effects of dividends or interest on short positions, acquired fund fees and expenses, taxes, or other extraordinary expenses expressed as an annualized percentage of average daily net assets), will not
exceed the expense limitations set forth below. Neither WFMC nor the Funds’ distributor will recoup previously waived fees/expenses in subsequent years.
|
|
|
|
|
| |
|
Current Contractual
Expense Limitations
|
| Fund |
|
Class A |
|
Class I |
| International Fund |
|
1.31% |
|
1.18% |
| Alternatives Fund |
|
2.15% |
|
1.90% |
| Real Asset Fund |
|
1.23% |
|
0.98% |
| Strategic Allocation Conservative Fund |
|
0.78% |
|
0.53% |
| Strategic Allocation Moderate Fund |
|
0.74% |
|
0.49% |
| Strategic Allocation Aggressive Fund |
|
0.87% |
|
0.62% |
ANNUAL REPORT / April 30,
2015
114 NOTES TO FINANCIAL
STATEMENTS (continued)
Prior to December 1, 2014, the following funds had contractually agreed
to waive their fees and/or reimburse expenses, so that total annual fund operating expenses paid by the Funds (not including the effects of dividends or interest on short positions, acquired fund fees and expenses, taxes, or other extraordinary
expenses expressed as an annualized percentage of average daily net assets), would not exceed the expense limitations set forth below.
|
|
|
|
|
| |
|
Prior Contractual
Expense Limitations
|
| Fund |
|
Class A |
|
Class I |
| International Fund |
|
1.49% |
|
1.36% |
| Alternatives Fund |
|
2.23% |
|
1.98% |
| Real Asset Fund |
|
1.28% |
|
1.03% |
| Strategic Allocation Conservative Fund |
|
0.90% |
|
0.65% |
| Strategic Allocation Moderate Fund |
|
0.84% |
|
0.59% |
| Strategic Allocation Aggressive Fund |
|
1.03% |
|
0.78% |
|
|
|
|
|
|
|
|
|
|
|
| Fund |
|
Gross Fees |
|
|
Fees Waived |
|
|
Current Fee as a % of average net asset
of
the Fund/ Allocated Net Assets for Sub-advisors |
| International Fund |
|
|
|
|
|
|
|
|
|
|
| WFMC |
|
|
$2,534,170 |
|
|
|
$(886,354) |
|
|
0.45% |
| Sub-advisors: |
|
|
|
|
|
|
|
|
|
|
| Baring International Investment Limited
(terminated 5/16/2014) |
|
|
8,456 |
|
|
|
— |
|
|
0.45% |
| Dimensional Fund Advisors LP |
|
|
245,326 |
|
|
|
(40,397) |
|
|
0.45% on the first $50 million in assets; and |
| |
|
|
|
|
|
|
|
|
|
0.30% on assets in excess of $50 million |
| J O Hambro Capital Management Limited
(Since 5/16/2014) |
|
|
788,842 |
|
|
|
— |
|
|
0.70% |
| LSV Asset Management |
|
|
260,032 |
|
|
|
— |
|
|
0.49% |
| Northern Cross LLC |
|
|
724,693 |
|
|
|
— |
|
|
0.55% on the first $1 billion in assets; and |
| |
|
|
|
|
|
|
|
|
|
0.50% on assets in excess $1 billion |
| Oberweis Asset Management, Inc. |
|
|
388,032 |
|
|
|
(3,240) |
|
|
1.00% on the first $50 million; |
| |
|
|
|
|
|
|
|
|
|
0.90% on the next $50 million; and |
| |
|
|
|
|
|
|
|
|
|
0.80% on assets in excess of $100 million |
| Parametric Portfolio Associates LLC |
|
|
567,592 |
|
|
|
— |
|
|
0.80% on the first $100 million in assets; and |
| (Emerging Markets Strategy) |
|
|
|
|
|
|
|
|
|
0.75% on assets in excess of $100 million |
| Parametric Portfolio Associates LLC |
|
|
129,100 |
|
|
|
— |
|
|
0.275% on the first $50 million in assets; and |
| (Developed Country Index Replication Strategy) |
|
|
|
|
|
|
|
|
|
0.20% on assets in excess of $50 million |
|
|
|
|
|
|
|
|
|
|
|
| |
|
|
5,646,243 |
|
|
|
(929,991) |
|
|
|
|
|
|
|
|
|
|
|
|
|
|
| |
|
|
|
| Alternatives Fund |
|
|
|
|
|
|
|
|
|
|
| WFMC |
|
|
2,084,575 |
|
|
|
(256,584) |
|
|
0.95% |
| Sub-advisors: |
|
|
|
|
|
|
|
|
|
|
| Acuity Capital Management, LLC |
|
|
411,056 |
|
|
|
— |
|
|
1.00% |
| Calamos Advisors, LLC (since 2/03/2015) |
|
|
60,269 |
|
|
|
— |
|
|
0.95% |
| Calypso Capital Management, LP (terminated
11/21/2014) |
|
|
254,951 |
|
|
|
— |
|
|
1.00% |
| Highland Capital Healthcare Advisors, LP
(since 2/03/2015) |
|
|
55,418 |
|
|
|
— |
|
|
1.00% |
| Highland Capital Management Fund Advisors,
LP (since 2/03/2015) |
|
|
59,911 |
|
|
|
— |
|
|
0.90% |
| Loeb King Capital Management (terminated
2/06/2015) |
|
|
374,259 |
|
|
|
— |
|
|
1.05% on the first $100 million of assets; and |
| |
|
|
|
|
|
|
|
|
|
1.00% on assets in excess of $100 million |
| Parametric Risk Advisers |
|
|
224,116 |
|
|
|
— |
|
|
0.90% |
| P\E Global LLC |
|
|
271,132 |
|
|
|
— |
|
|
1.00% |
|
|
|
|
|
|
|
|
|
|
|
| |
|
|
3,795,687 |
|
|
|
(256,584) |
|
|
|
|
|
|
|
|
|
|
|
|
|
|
| |
|
|
|
| Real Asset Fund |
|
|
|
|
|
|
|
|
|
|
| WFMC |
|
|
2,232,184 |
|
|
|
— |
|
|
0.45% on all Assets except assets allocated to the inflation-protected and fixed-income securities (“TIPS”) strategy or the Enhanced Cash Strategy. The fee for assets allocated to the TIPS strategy: 0.52% of the first
$25 million; 0.49% of the next $25 million; and 0.47% of Assets over $50 million. The fee for assets allocated to the Enhanced Cash strategy is 0.53% on the assets. |
| |
|
|
|
| WFMC- Enhanced Cash Strategy |
|
|
4,103 |
|
|
|
— |
|
|
For assets allocated to the Enhanced Cash Strategy, an additional fee as follows: 0.53% on the assets allocated to the Enhanced Cash Strategy |
| Sub-advisors: |
|
|
|
|
|
|
|
|
|
|
| CBRE Clarion Securities LLC |
|
|
446,839 |
|
|
|
(8,963) |
|
|
0.65% on the first $50 million in assets; |
| |
|
|
|
|
|
|
|
|
|
0.55% of the next $50 million in assets; and |
| |
|
|
|
|
|
|
|
|
|
0.45% of assets in excess of $100 million |
April 30, 2015 / ANNUAL REPORT
NOTES TO FINANCIAL STATEMENTS
(continued) 115
|
|
|
|
|
|
|
|
|
|
|
| Fund |
|
Gross Fees |
|
|
Fees Waived |
|
|
Current Fee as a % of average net asset
of
the Fund/ Allocated Net Assets for Sub-advisors |
| |
|
|
|
| Real Asset Fund(continued) |
|
|
|
|
|
|
|
|
|
|
| E.I.I. Realty Securities, Inc. (terminated
8/22/2014) |
|
$ |
193,762 |
|
|
$ |
(3,882) |
|
|
0.65% on the first $100 million in assets; and |
| |
|
|
|
|
|
|
|
|
|
0.60% in excess of $100 million |
| HSBC Global Asset Management (France)
(terminated 8/08/2014) |
|
|
27,130 |
|
|
|
— |
|
|
0.20% on the first $100 million in assets; 0.15% on the
next $400 million in assets; and |
| |
|
|
|
|
|
|
|
|
|
0.10% of assets in excess of $500 million |
| Pacific Investment Management Company, LLC |
|
|
516,650 |
|
|
|
— |
|
|
0.29% |
| Parametric Portfolio Associates LLC (since
9/25/2014) |
|
|
111,174 |
|
|
|
(2,317) |
|
|
0.25% on the first $20 million in assets; |
| |
|
|
|
|
|
|
|
|
|
0.20% of the next $20 million in assets; and |
| |
|
|
|
|
|
|
|
|
|
0.15% of assets in excess of $40 million |
|
|
|
|
|
|
|
|
|
|
|
| |
|
|
3,531,842 |
|
|
|
(15,162) |
|
|
|
|
|
|
|
|
|
|
|
|
|
|
| |
|
|
|
| Strategic Allocation Conservative Fund |
|
|
183,752 |
|
|
|
(134,536) |
|
|
0.40% |
| Strategic Allocation Moderate Fund |
|
|
258,723 |
|
|
|
(231,187) |
|
|
0.40% |
| Strategic Allocation Aggressive Fund |
|
|
164,743 |
|
|
|
(92,363) |
|
|
0.40% |
| |
|
|
|
|
|
|
|
|
|
|
Administrative Fee – The Bank of New York Mellon (“BNYM”) provides the
Trust with fund administration services. WFMC in its role as co-administrator provides the Funds with certain administrative personnel and services necessary to operate the Funds. These services were provided for at an aggregate annual fee as
specified below.
|
|
|
|
|
|
|
| Administrator |
|
Maximum
Fee |
|
|
Average Aggregate
Daily Net
Assets of the Trust |
| WFMC |
|
|
0.040 |
% |
|
on the first $5 billion |
|
|
|
0.030 |
% |
|
on the next $2 billion |
|
|
|
0.025 |
% |
|
on the next $3 billion |
|
|
|
0.018 |
% |
|
on assets in excess of $10 billion |
| BNYM |
|
|
0.0285 |
% |
|
on the first $500 million |
|
|
|
0.0280 |
% |
|
on the next $500 million |
|
|
|
0.0275 |
% |
|
on assets in excess of $1 billion |
WFMC may voluntarily choose to waive any portion of its fee. WFMC can modify or terminate its
voluntary waiver at any time at its sole discretion. For the year ended April 30, 2015, WFMC did not waive any administrative personnel and services fee.
Distribution Services Fee – The Trust has adopted a Distribution Services Plan (the “Plan”) pursuant to
Rule 12b-1 under the Act. The Plan allows the Funds to pay fees to financial intermediaries, which may be paid through ALPS Distributors, Inc. (“ALPS”), the principal distributor, at an annual rate of up to 0.25% of the average daily net
assets of the Funds’ Class A shares, for the sale, distribution, administration, customer servicing and record keeping of these shares.
The Trust may reduce the maximum amount of distribution services fees it pays from time to time at its sole discretion. In
addition, a financial intermediary (including ALPS, the Advisor or their affiliates), may voluntarily waive or reduce any fees to which they are entitled.
For the year ended April 30, 2015, M&T Securities, Inc. and Manufacturers and Traders Trust Company (together
“M&T”), affiliates of the Advisor, received a portion of the fees paid by the Funds which are listed below:
|
|
|
| Fund |
|
Distribution
Fees |
| International Fund |
|
$ 5,837 |
| Alternatives Fund |
|
131 |
| Real Asset Fund |
|
2,086 |
| Strategic Allocation Conservative Fund |
|
9,997 |
| Strategic Allocation Moderate Fund |
|
129,298 |
| Strategic Allocation Aggressive Fund |
|
6,989 |
ANNUAL REPORT / April 30,
2015
116 NOTES TO FINANCIAL
STATEMENTS (continued)
Sales Charges – The Class A shares of all the Funds bear
front-end sales charges.
For the year ended April 30, 2015, M&T received the amounts listed below from sales
charges on the sale of Class A shares.
|
|
|
| Fund |
|
Sales Charges
from Class
A |
| International Fund |
|
$ 2,667 |
| Alternatives Fund |
|
54 |
| Real Asset Fund |
|
10,315 |
| Strategic Allocation Conservative Fund |
|
1,921 |
| Strategic Allocation Moderate Fund |
|
61,793 |
| Strategic Allocation Aggressive Fund |
|
2,873 |
Shareholder Services Fee – Pursuant to a Shareholder Services Plan adopted by the
Funds and administered by ALPS, the Funds may pay up to 0.25% of the average daily net assets of each Fund’s Class A and Class I shares to financial intermediaries (which may include ALPS, the Advisor or their affiliates) for providing
shareholder services and maintaining shareholder accounts. M&T has entered into a Shareholders Services Agreement with ALPS, under which it is entitled to receive up to 0.25% of the average daily net assets of each Fund’s shares for whom
M&T provides shareholder services. The Funds may reduce the maximum amount of shareholder service fees it pays from time to time at its sole discretion. In addition, a financial intermediary (including M&T) may waive or reduce any fees to
which they are entitled.
For the year ended April 30, 2015, M&T received a portion of the fees paid by the
following Fund which is listed below:
|
|
|
| Fund |
|
Shareholder
Services
Fee |
| International Fund |
|
$595,878 |
Other Service Providers – Foreside Management Services, LLC (“FMS”)
provides a Principal Executive Officer and Principal Financial Officer to the Trust. FMS has no role in determining the investment policies or which securities are to be sold or purchased by the Trust or its Funds.
BNYM provides custody services to the Trust.
BNY Mellon Investment Servicing (U.S.) Inc. provides fund accounting and transfer agency services to the Trust.
General – Certain Officers of the Trust are also Officers or employees of the above companies that provide services
to the Funds, and during their terms of office, receive no compensation from the Funds. The Trust’s Statement of Additional Information includes additional information about the Trustees.
Other Affiliated Parties and Transactions – Affiliated holdings are securities and mutual funds which are managed by
the Advisor or an affiliate of the Advisor or which are distributed by an affiliate of the Funds’ distributor. Transactions with affiliated companies during the year ended April 30, 2015 are as follows:
|
|
|
|
|
|
|
|
|
|
|
|
|
|
|
|
|
|
|
|
|
|
|
|
|
|
|
|
|
|
|
|
|
|
|
|
| Fund/Affiliated Fund Name |
|
Balance of
Shares Held
4/30/14 |
|
Purchases/
Additions |
|
Sales/
Reductions |
|
Balance of
Shares Held
04/30/15 |
|
Value at
04/30/15 |
|
Dividend
Income(a) |
|
Realized
Gain/(Loss)(b) |
| Strategic Allocation Conservative Fund: |
|
|
|
|
|
|
|
|
|
|
|
|
|
|
|
|
|
|
|
|
|
|
|
|
|
|
|
|
|
|
|
|
|
|
|
| |
|
|
|
|
|
|
|
| Wilmington Prime Money Market Fund |
|
|
|
504,720 |
|
|
|
|
8,644,214 |
|
|
|
|
9,148,934 |
|
|
|
|
— |
|
|
|
$ |
— |
|
|
|
$ |
141 |
|
|
|
$ |
— |
|
| |
|
|
|
|
|
|
|
| Wilmington Mid-Cap Growth Fund |
|
|
|
54,798 |
|
|
|
|
4,465 |
|
|
|
|
38,068 |
|
|
|
|
21,195 |
|
|
|
|
384,058 |
|
|
|
|
— |
|
|
|
|
167,228 |
|
| |
|
|
|
|
|
|
|
| Wilmington Large-Cap Strategy Fund |
|
|
|
32,816 |
|
|
|
|
8,183 |
|
|
|
|
— |
|
|
|
|
40,999 |
|
|
|
|
756,833 |
|
|
|
|
10,021 |
|
|
|
|
33,302 |
|
| |
|
|
|
|
|
|
|
| Wilmington Small-Cap Strategy Fund |
|
|
|
23,850 |
|
|
|
|
1,160 |
|
|
|
|
7,199 |
|
|
|
|
17,811 |
|
|
|
|
267,347 |
|
|
|
|
3,604 |
|
|
|
|
74,099 |
|
| |
|
|
|
|
|
|
|
| Wilmington Intermediate-Term Bond Fund |
|
|
|
1,775,859 |
|
|
|
|
53,597 |
|
|
|
|
514,121 |
|
|
|
|
1,315,335 |
|
|
|
|
13,192,808 |
|
|
|
|
247,355 |
|
|
|
|
108,439 |
|
| |
|
|
|
|
|
|
|
| Wilmington Multi-Manager International Fund |
|
|
|
396,644 |
|
|
|
|
6,103 |
|
|
|
|
25,527 |
|
|
|
|
377,220 |
|
|
|
|
3,051,707 |
|
|
|
|
49,471 |
|
|
|
|
34,766 |
|
| |
|
|
|
|
|
|
|
| Wilmington Broad Market |
|
|
|
— |
|
|
|
|
604,943 |
|
|
|
|
— |
|
|
|
|
604,943 |
|
|
|
|
5,922,396 |
|
|
|
|
46,380 |
|
|
|
|
— |
|
| |
|
|
|
|
|
|
|
|
|
|
|
|
|
|
|
|
|
|
|
|
|
|
|
|
|
|
|
|
|
|
|
|
|
|
|
| |
|
|
|
|
|
|
|
| TOTAL |
|
|
|
|
|
|
|
|
9,322,665 |
|
|
|
|
9,733,849 |
|
|
|
|
|
|
|
|
$ |
23,575,149 |
|
|
|
$ |
356,972 |
|
|
|
$ |
417,834 |
|
| |
|
|
|
|
|
|
|
|
|
|
|
|
|
|
|
|
|
|
|
|
|
|
|
|
|
|
|
|
|
|
|
|
|
|
|
| |
|
|
|
|
|
|
|
|
|
|
|
|
|
|
|
|
|
|
|
|
|
|
|
|
|
|
|
|
|
|
|
|
|
|
|
April 30, 2015 / ANNUAL REPORT
|
|
|
|
|
| NOTES TO FINANCIAL STATEMENTS (continued) |
|
|
117 |
|
|
|
|
|
|
|
|
|
|
|
|
|
|
|
|
|
|
|
|
|
|
|
|
|
|
|
|
|
|
|
|
|
|
|
|
|
| Fund/Affiliated Fund Name |
|
Balance of
Shares Held
4/30/14 |
|
Purchases/
Additions |
|
Sales/
Reductions |
|
Balance of
Shares Held
04/30/15 |
|
Value at
04/30/15 |
|
Dividend
Income(a) |
|
Realized
Gain/(Loss)(b)
|
| Strategic Allocation Moderate Fund: |
|
|
|
|
|
|
|
|
|
|
|
|
|
|
|
|
|
|
|
|
|
|
|
|
|
|
|
|
|
|
|
|
|
|
|
| Wilmington Prime Money Market Fund |
|
|
|
727,547 |
|
|
|
|
16,309,933 |
|
|
|
|
17,037,480 |
|
|
|
|
— |
|
|
|
$ |
— |
|
|
|
$ |
196 |
|
|
|
$ |
— |
|
| Wilmington Mid-Cap Growth Fund |
|
|
|
226,973 |
|
|
|
|
484 |
|
|
|
|
122,741 |
|
|
|
|
104,716 |
|
|
|
|
1,897,452 |
|
|
|
|
— |
|
|
|
|
1,530,262 |
|
| Wilmington Multi-Manager International Fund |
|
|
|
764,554 |
|
|
|
|
49,937 |
|
|
|
|
61,798 |
|
|
|
|
752,693 |
|
|
|
|
6,089,286 |
|
|
|
|
88,343 |
|
|
|
|
73,682 |
|
| Wilmington Small-Cap Strategy Fund |
|
|
|
90,727 |
|
|
|
|
— |
|
|
|
|
63,830 |
|
|
|
|
26,897 |
|
|
|
|
403,730 |
|
|
|
|
8,971 |
|
|
|
|
141,014 |
|
|
|
|
|
|
|
|
|
|
|
|
|
|
|
|
|
|
|
|
|
|
|
|
|
|
|
|
|
|
|
|
|
|
|
|
|
|
|
|
|
|
|
|
|
| TOTAL |
|
|
|
|
|
|
|
|
16,360,354 |
|
|
|
|
17,285,849 |
|
|
|
|
|
|
|
|
$ |
8,390,468 |
|
|
|
$ |
97,510 |
|
|
|
$ |
1,744,958 |
|
|
|
|
|
|
|
|
|
|
|
|
|
|
|
|
|
|
|
|
|
|
|
|
|
|
|
|
|
|
|
|
|
|
|
|
|
|
|
|
|
|
|
|
|
| Strategic Allocation Aggressive Fund: |
|
|
|
|
|
|
|
|
|
|
|
|
|
|
|
|
|
|
|
|
|
|
|
|
|
|
|
|
|
|
|
|
|
|
|
| Wilmington Prime Money Market Fund |
|
|
|
526,966 |
|
|
|
|
11,182,395 |
|
|
|
|
11,709,361 |
|
|
|
|
— |
|
|
|
$ |
— |
|
|
|
$ |
56 |
|
|
|
$ |
— |
|
| Wilmington Mid-Cap Growth Fund |
|
|
|
251,907 |
|
|
|
|
18,131 |
|
|
|
|
183,300 |
|
|
|
|
86,738 |
|
|
|
|
1,571,692 |
|
|
|
|
— |
|
|
|
|
852,347 |
|
| Wilmington Large-Cap Strategy Fund |
|
|
|
14,913 |
|
|
|
|
1,026 |
|
|
|
|
5,398 |
|
|
|
|
10,541 |
|
|
|
|
194,578 |
|
|
|
|
3,456 |
|
|
|
|
36,862 |
|
| Wilmington Small-Cap Strategy Fund |
|
|
|
104,454 |
|
|
|
|
4,592 |
|
|
|
|
68,319 |
|
|
|
|
40,727 |
|
|
|
|
611,313 |
|
|
|
|
11,734 |
|
|
|
|
421,378 |
|
| Wilmington Multi-Manager International Fund |
|
|
|
1,201,789 |
|
|
|
|
17,533 |
|
|
|
|
125,673 |
|
|
|
|
1,093,649 |
|
|
|
|
8,847,623 |
|
|
|
|
142,141 |
|
|
|
|
191,270 |
|
|
|
|
|
|
|
|
|
|
|
|
|
|
|
|
|
|
|
|
|
|
|
|
|
|
|
|
|
|
|
|
|
|
|
|
|
|
|
|
|
|
|
|
|
| TOTAL |
|
|
|
|
|
|
|
|
11,223,677 |
|
|
|
|
12,092,051 |
|
|
|
|
|
|
|
|
$ |
11,225,206 |
|
|
|
$ |
157,387 |
|
|
|
$ |
1,501,857 |
|
|
|
|
|
|
|
|
|
|
|
|
|
|
|
|
|
|
|
|
|
|
|
|
|
|
|
|
|
|
|
|
|
|
|
|
|
| |
(a) |
Dividend Income may include distributions from net investment income and return of capital paid
by the affiliated fund to the Fund. |
| |
(b) |
Realized Gain/(Loss) includes realized capital gain distributions paid by the affiliated fund
and gain/(loss) received by the Fund for sales of the affiliated fund. |
Certain Funds effect trades for
security purchase and sale transactions through brokers that are affiliates of the Advisor or sub-advisors. Commissions paid on those trades for the year ended April 30, 2015 were as follows:
|
|
|
|
|
|
Fund |
|
Commissions |
|
| International Fund |
|
|
$5,453 |
|
6. INVESTMENT TRANSACTIONS
Purchases and sales of investments, excluding short-term obligations, U.S. Government Securities for the year ended
April 30, 2015 were as follows:
|
|
|
|
|
|
|
|
|
| |
|
Investments |
|
| Fund |
|
Purchases |
|
|
Sales |
|
| International Fund |
|
$ |
400,871,971 |
|
|
$ |
409,157,023 |
|
| Alternatives Fund |
|
|
725,611,460 |
|
|
|
736,562,937 |
|
| Real Asset Fund |
|
|
1,272,669,711 |
|
|
|
1,161,545,621 |
|
| Strategic Allocation Conservative Fund |
|
|
9,005,889 |
|
|
|
15,668,745 |
|
| Strategic Allocation Moderate Fund |
|
|
11,549,038 |
|
|
|
19,488,324 |
|
| Strategic Allocation Aggressive Fund |
|
|
7,062,868 |
|
|
|
13,435,476 |
|
Purchases and sales of investments of U.S. Government Securities for the year ended
April 30, 2015 were as follows:
|
|
|
|
|
|
|
|
|
| |
|
U.S.
Government
Securities |
|
| Fund |
|
Purchases |
|
|
Sales |
|
| Real Asset Fund |
|
$ |
868,515,821 |
|
|
$ |
826,144,493 |
|
| Strategic Allocation Moderate Fund |
|
|
1,026,352 |
|
|
|
157,515 |
|
ANNUAL REPORT / April 30,
2015
118 NOTES TO FINANCIAL
STATEMENTS (continued)
7. LINE OF CREDIT
The Trust participated in a $20,000,000 unsecured, committed revolving line of credit (“LOC”) agreement with BNYM. The
LOC was made available for extraordinary or emergency purposes, primarily for financing redemption payments. Borrowings are charged interest at a rate of 1.25% per annum over the greater of the Federal Funds Rate or the overnight LIBOR Rate.
The LOC included a commitment fee of 0.10% per annum on the daily unused portion. The LOC was in effect for the entire fiscal year and the termination date of this LOC is March 9, 2016. The Funds did not utilize the LOC for the year ended
April 30, 2015.
8. SUBSEQUENT EVENTS
Management has evaluated events and transactions for potential recognition or disclosure in the financial statements through the
date the financial statements were issued. Management has determined that there are no additional material events that would require recognition or disclosure in the Funds’ financial statements through this date.
9. FEDERAL TAX INFORMATION (UNAUDITED)
Complete information regarding the tax status of distributions will be reported on Forms 1099.
Of the ordinary income (including short-term capital gain) distributions made by the Funds during the year ended April 30,
2015, the Funds designate the following percentages, or such greater percentages that constitute the maximum amount allowable pursuant to Code Sections Section 243 and 854(b)(2), as qualifying for the corporate dividends received deduction:
|
|
|
|
Fund |
| International Fund |
|
0.00% |
| Alternatives Fund |
|
24.23% |
| Real Asset Fund |
|
6.48% |
| Strategic Allocation Conservative Fund |
|
21.57% |
| Strategic Allocation Moderate Fund |
|
51.42% |
| Strategic Allocation Aggressive Fund |
|
100.00% |
For the year ended April 30, 2015, the Funds designate the following percentages of the
ordinary income dividends, or such greater percentages that constitute the maximum amount allowable pursuant to Code Sections 1(h)(11) and 854(b)(2), as qualified dividend income which may be subject to a maximum rate of federal income tax of 15%:
|
|
|
|
Fund |
| International Fund |
|
100.00% |
| Alternatives Fund |
|
17.82% |
| Real Asset Fund |
|
0.22% |
| Strategic Allocation Conservative Fund |
|
10.78% |
| Strategic Allocation Moderate Fund |
|
23.02% |
| Strategic Allocation Aggressive Fund |
|
53.03% |
If the Funds meet the requirements of Section 853 of the Code, the Funds will pass through
to shareholders credits of foreign taxes paid.
April 30, 2015 / ANNUAL REPORT
REPORT OF INDEPENDENT REGISTERED PUBLIC ACCOUNTING FIRM
TO THE SHAREHOLDERS AND BOARD OF TRUSTEES OF
WILMINGTON
FUNDS
We have audited the accompanying statements of assets and liabilities, including the portfolios of investments, of the
Wilmington Multi-Manager International Fund, Wilmington Multi-Manager Alternatives Fund, Wilmington Multi-Manager Real Asset Fund, Wilmington Strategic Allocation Conservative Fund, Wilmington Strategic Allocation Moderate Fund and Wilmington
Strategic Allocation Aggressive Fund (six of the series constituting the Wilmington Funds) (the “Funds”) as of April 30, 2015, and the related statements of operations for the year then ended, the statements of changes in net assets
for each of the two years in the period then ended, and the financial highlights for each of years or periods indicated therein. These financial statements and financial highlights are the responsibility of the Funds’ management. Our
responsibility is to express an opinion on these financial statements and financial highlights based on our audits.
We conducted our audits
in accordance with standards of the Public Company Accounting Oversight Board (United States). Those standards require that we plan and perform the audit to obtain reasonable assurance about whether the financial statements and financial highlights
are free of material misstatement. We were not engaged to perform an audit of the Funds’ internal control over financial reporting. Our audits included consideration of internal control over financial reporting as a basis for designing audit
procedures that are appropriate in the circumstances, but not for the purpose of expressing an opinion on the effectiveness of the Funds’ internal control over financial reporting. Accordingly, we express no such opinion. An audit also includes
examining, on a test basis, evidence supporting the amounts and disclosures in the financial statements and financial highlights, assessing the accounting principles used and significant estimates made by management, and evaluating the overall
financial statement presentation. Our procedures included confirmation of securities owned as of April 30, 2015, by correspondence with the custodian and brokers, or by other appropriate auditing procedures where replies from the brokers were
not received. We believe that our audits provide a reasonable basis for our opinion.
In our opinion, the financial statements and financial
highlights referred to above present fairly, in all material respects, the financial position of the Wilmington Multi-Manager International Fund, Wilmington Multi-Manager Alternatives Fund, Wilmington Multi-Manager Real Asset Fund, Wilmington
Strategic Allocation Conservative Fund, Wilmington Strategic Allocation Moderate Fund and Wilmington Strategic Allocation Aggressive Fund (six of the series constituting the Wilmington Funds) at April 30, 2015, the results of their operations
for the year then ended, the changes in their net assets for each of the two years in the period then ended, and their financial highlights for each of the years or periods indicated therein, in conformity with U.S. generally accepted accounting
principles.
Philadelphia, Pennsylvania
June 29, 2015
ANNUAL REPORT / April 30,
2015
|
|
|
| 120 |
|
BOARD OF TRUSTEES AND TRUST OFFICERS |
BOARD OF TRUSTEES AND TRUST OFFICERS
The following tables give information about each Trustee and the senior officers of the Trust. The tables separately list Trustee members who
are “interested persons” of the Fund (i.e., “Interested” Trustees) and those who are not (i.e., “Independent” Trustees). The Trust is comprised of 19 funds. Unless otherwise noted, the business address of each Trustee
and senior officer is 111 South Calvert Street, 26th floor, Baltimore, Maryland 21202. Each Trustee oversees all portfolios of the Trust and serves for an indefinite term. The Trust’s Statement of Additional Information includes additional
information about the Trustees and is available, without charge and upon request, by calling 1-800-836-2211.
INTERESTED TRUSTEES BACKGROUND
|
|
|
|
|
| Name
Address Birth date
Position With Trust
Date Service Began
|
|
|
|
Principal Occupations for past five years and Other Directorships Held
|
|
|
|
| R. Samuel Fraundorf, CFA, CPA*
Birth date: 4/64
TRUSTEE
Began serving: March 2012 |
|
|
|
Principal Occupations: Senior Vice President, Chief Investment Strategist and Chief Client Officer of WTIA and WFMC.
Other Directorships Held: Director, WTIA (1/14 to present); Director, WFMC (1/14 to
present). |
| |
|
|
|
Previous Positions: President of WTIA (1/12 to 1/14); President of Wilmington Trust Investment
Management (“WTIM”) (8/04 to 1/12); Chief Operating Officer of WTIM (1/08 to 1/09); Director of Research at WTIM (8/04 to 1/08). |
|
|
|
| Robert J. Truesdell*
Birth date: 11/55
TRUSTEE
Began serving: December 2012 |
|
|
|
Principal Occupations: Group Vice President and Senior Investment Advisor for Wilmington Trust Wealth Advisory Services, M&T Bank.
Other Directorships Held: None.
Previous Positions: Bond Department Manager, M&T Bank (2/88 to 7/12); Group Vice
President, Managing Director and Chief Investment Officer, WTIA (6/02 to 6/12) and WFMC (3/12 to 6/12). |
| * |
R. Samuel Fraundorf is “interested” due to positions he holds with WTIA and WFMC. Robert J. Truesdell is “interested” due to the
positions he currently holds with Wilmington Trust Wealth Advisory Services, M&T Bank, the parent of the Funds’ Advisor, and previous positions held with WTIA and WFMC. |
April 30, 2015 (unaudited) / ANNUAL
REPORT
|
|
|
|
|
| BOARD OF TRUSTEES AND TRUST OFFICERS |
|
|
121 |
|
INDEPENDENT TRUSTEES BACKGROUND
|
|
|
| Name
Birth date
Position with Trust
Date Service Began
|
|
Principal Occupations for past five years and Other Directorships
|
|
|
| Nicholas A. Giordano
Birth date: 3/43 CHAIRMAN
AND TRUSTEE Began serving: March 2012 |
|
Principal Occupations: Consultant, financial services organizations (1997 to present).
Other Directorships Held: Kalmar Pooled
Investment Trust; The RBB Fund Inc. (19 portfolios) (registered investment companies); Independence Blue Cross; IntriCon Corporation (industrial furnaces and ovens).
Previous Positions: Interim President, LaSalle
University (1998 to 1999); President and Chief Executive Officer, Philadelphia Stock Exchange (1981 to 1997). |
|
|
| Robert H. Arnold
Birth date: 3/44
TRUSTEE Began serving:
March 2012 |
|
Principal Occupations: Managing Director, R.H. Arnold & Co, Inc. (financial management consulting)
(6/89 to present). Other Directorships
Held: Trustee, First Potomac Realty Trust (real estate investment trust) (5/01 to present); Director, Treasury Strategies, Inc. (private treasury consulting services) (6/01 to present).
|
|
|
| Joseph J. Castiglia
Birth date: 7/34
TRUSTEE Began serving:
February 1988 |
|
Principal Occupations: Consultant (not-for-profit) and Private Investor.
Other Directorships Held: Chairman, Trustee and
Treasurer, Buffalo Olmsted Parks Conservancy (1/05 to 5/13); Chairman and Trustee, Buffalo Philharmonic Orchestra Foundation (1/06 to 11/12); Vice Chairman and Trustee, Christ the King Seminary (1/05 to present); Director, Dunn Tire Corporation
(1/05 to present); Chairman, Director and Treasurer, Read to Succeed Buffalo (1/08 to present).
Previous Positions: President, Chief Executive Officer, Vice President, Treasurer and Vice Chairman, Pratt & Lambert United (manufacturer of paints, coatings
and adhesives) (12/67- 1/96); Chairman and Director, Catholic Health (hospitals, nursing homes and home care) (1/97 to 5/03); Chairman and Director, Blue Cross Blue Shield of Western and Central New York (5/92 to 5/07); Lead Director and Director,
Energy East (gas and electric utility); Chairman and Director, Federal Reserve Bank of New York, Buffalo Branch; Chairman and Director, Community Foundation for Greater Buffalo; Chairman and Trustee, Canisius College; Chairman and Director, AAA of
Western & Central New York. |
|
|
| John S. Cramer
Birth date: 2/42
TRUSTEE Began serving:
December 2000 |
|
Principal Occupations: Senior Consultant, Yaffe & Co. (health care consulting) (2/06 to present).
Other Directorships Held:
Director, Chairman of the Executive Committee and Chairman of the Compensation Committee of Chek-Med Corporation (6/03 to present).
Previous Positions: President and Chief Executive
Officer Emeriti, Pinnacle Health Systems (non-profit hospital and health care system in Central Pennsylvania). |
|
|
| Daniel R. Gernatt, Jr.
Birth date: 7/40
TRUSTEE Began serving:
February 1988 |
|
Principal Occupations: President and CEO, Gernatt Asphalt Products, Inc. (asphalt, sand and gravel
products) (1979 to present). Other
Directorships Held: Director, Roswell Park Alliance (2008 to present); Trustee, Gernatt Family Foundation. |
|
|
| Richard B. Seidel
Birth date: 4/41
TRUSTEE Began serving:
September 2003 |
|
Principal Occupations: Chairman, Girard Capital (broker-dealer) (1/10 to present); Chairman, R.B.
Seidel & Associates (consultants) (2014 to present).
Other Directorships Held: Director, Tristate Capital Bank (1/08 to present). |
ANNUAL REPORT / April 30,
2015 (unaudited)
|
|
|
| 122 |
|
BOARD OF TRUSTEES AND TRUST OFFICERS |
OFFICERS
|
|
|
| Name
Address Birth year
Position with Trust
|
|
Principal Occupations for Past Five Years and Previous Positions
|
|
|
| Christopher D. Randall
Birth year: 1965
PRESIDENT Began serving:
September 2014 |
|
Principal Occupations: President and Chief Executive Officer of Wilmington Trust Investment Advisors,
Inc.; President of Wilmington Trust Investment Management, LLC; Director of Wilmington Funds Management Corporation; Senior Vice President of M&T Bank.
Previous Positions: Senior Vice President, Head of Asset Management and Retirement Services (2012 to 2014); President, Mid-Atlantic Division, Wilmington Trust,
N.A. (2011 to 2012); President, M&T Securities, Inc. (2009 to 2011) |
|
|
| Michael D. Daniels
Birth year: 1967 CHIEF
OPERATING OFFICER Began serving: June 2007 |
|
Principal Occupations: Chief Operating Officer, Wilmington Funds and Wilmington Trust Investment
Advisors, Inc.; Administrative Vice President, M&T Bank. Previous Positions: Senior
Vice President, MSD&T and MCA (2006 to 2007); Vice President, Calamos Asset Management (2004 to 2006); Vice President, JP Morgan Chase Bank (2002 to 2004). |
|
|
| Jeffrey M. Seling
Birth year: 1970 ASSISTANT
TREASURER Began serving: June 2013
VICE PRESIDENT Began
serving: June 2007 |
|
Principal Occupations: Vice President, M&T Bank and Wilmington Trust Investment Advisors, Inc.;
Assistant Treasurer, Wilmington Funds. Previous Positions: Vice President,
MSD&T; Assistant Vice President, Wells Fargo Bank; Assistant Vice President, JP Morgan Chase Bank. |
|
|
| John C. McDonnell
Birth year: 1966 VICE
PRESIDENT AND ASSISTANT TREASURER
Began serving: June 2013 |
|
Principal Occupations: Vice President, Wilmington Funds Management Corporation (2005 to Present); Vice
President, Wilmington Trust Investment Advisors, Inc. (2012 to present). Previous
Positions: Vice President, Wilmington Trust Investment Management, LLC (2005 to 2012); Audit Senior, Deloitte LLP (2004 to 2005); Assistant Vice President, 1838 Investment Advisors, LP (1999 to 2004).
|
|
|
| Mary Ellen Reilly
Birth year: 1970 CHIEF
COMPLIANCE OFFICER and AML COMPLIANCE OFFICER
Began serving: March 2015 |
|
Principal Occupations: Chief Compliance Officer and Anti-Money Laundering Officer, Wilmington Funds;
Administrative Vice President, M&T Bank. Previous Positions: Administrative
Vice President, M&T Bank, and Program Director, Buffalo Promise. Neighborhood (2013-2015); Vice President, M&T Bank, and Product Manager, Wilmington Trust Retirement and Institutional Services Company (2010-2013); Vice President, M&T
Bank, and Risk Manager, M&T Investment Group (2006-2010). |
|
|
| Eric B. Paul
Birth year: 1974 VICE
PRESIDENT Began serving: June 2008 |
|
Principal Occupations: Administrative Vice President, M&T Bank (2003 to present); Director of Proprietary Products, M&T Bank (2008 to present). |
|
|
| Ralph V. Partlow, III
25 South Charles Street, 22nd floor
Baltimore, MD 21201 Birth
year: 1957 VICE PRESIDENT
Began serving: June 2010 |
|
Principal Occupation: Administrative Vice President and Deputy General Counsel, M&T Bank (2003 to
present). Previous Positions: Vice President and Senior Counsel, Allfirst Bank
(1995-2003). |
April 30, 2015 (unaudited) / ANNUAL
REPORT
|
|
|
|
|
| BOARD OF TRUSTEES AND TRUST OFFICERS |
|
|
123 |
|
|
|
|
| Name
Address Birth year Position with
Trust |
|
Principal Occupations for Past Five Years and Previous Positions
|
|
|
| Christopher W. Roleke
10 High Street, Suite 302 Boston, MA 02110
Birth year: 1972 CHIEF FINANCIAL OFFICER AND
TREASURER Began serving: July 2013
|
|
Principal Occupation: Fund Principal Financial Officer, Foreside Management Services, LLC (2011 to
present). Previous Positions: Assistant
Vice President, JP Morgan Investor Services Co. (2006 to 2011). |
|
|
| Lisa R. Grosswirth
2 Hanson Place, 12th Floor Brooklyn, NY 11217
Birth year: 1963 SECRETARY
Began serving: September 2007 |
|
Principal Occupation: Vice President, BNY Mellon Asset Servicing (2004 to present).
Previous Positions: Supervisory Paralegal, The
Dreyfus Corporation (1998 to 2004). |
|
|
| Richard J. Berthy
Three Canal Plaza, Suite 100 Portland, ME 04101
Birth year: 1958 CHIEF EXECUTIVE OFFICER
Began serving: September 2007 |
|
Principal Occupation: Chief Executive Officer, Foreside Financial Group, LLC (2012 to present).
Previous Positions: President, Foreside
Financial Group, LLC (2008 to 2012); Chief Administrative Officer, Foreside Financial Group, LLC (2005 to 2008); President and Secretary, Bainbridge Capital Management, LLC (2003 to 2006); Vice President, Bainbridge Capital Management (2002 to
2004). |
ANNUAL REPORT / April 30,
2015 (unaudited)
BOARD APPROVAL OF INVESTMENT ADVISORY AND SUB-ADVISORY AGREEMENTS
Approval of New Subadvisory Agreements
At the December 3-4, 2014 meeting of the Board of Trustees (the “December meeting”), the Board, including the
Independent Trustees, discussed and unanimously approved, for the Wilmington Multi-Manager Alternatives Fund (the “Fund”), investment subadvisory agreements (the “New Subadvisory Agreements”) with Calamos Advisors LLC
(“Calamos”), Highland Capital Healthcare Advisors, L.P. (“HCHA”), and Highland Capital Management Fund Advisors, L.P. (“HCMFA” and, collectively with Calamos and HCHA, the “New Subadvisors”). The Trustees were
provided with detailed materials relating to the New Subadvisors in advance of and at the meeting. The material factors and conclusions that formed the basis for the approval are discussed below.
At the December meeting, the Trustees met in person with Wilmington Funds Management Corporation and Wilmington Trust Investment
Advisors, Inc. (collectively, the “Advisor”), Trust and Independent Legal Counsel, representatives of the New Subadvisors, and others. The Fund has multiple subadvisers but only the contracts with Calamos, HCHA, and HCMFA, each to manage a
portion of the Fund’s assets, were subject to approval.
In evaluating the New Subadvisory Agreements, the Trustees
took into account management styles, investment strategies, and prevailing market conditions as well as each New Subadvisor’s investment philosophy and process, past performance, and personnel. The Trustees also reviewed information concerning:
(i) the nature, extent and quality of the services to be provided by each New Subadvisor; (ii) the prior investment performance of each New Subadvisor; (iii) the prior investment performance of the Fund against a relevant benchmark
and against other comparable mutual funds; (iv) each New Subadvisor’s anticipated cost of/profitability in providing the services to the Fund; (v) possible fall-out benefits to each New Subadvisor due to its position with the Fund,
including the use of soft dollars; (vi) the proposed fees of the New Subadvisors and fees charged by other investment advisors to other mutual funds for similar services; and (vii) the Advisor’s recommendation that the Independent
Trustees approve the New Subadvisory Agreements. The New Subadvisors and the Trustees did not specifically address economies of scale due to the amount of assets to be managed by each New Subadvisor.
The Board considered management’s independence from each of the recommended New Subadvisors, and management’s view
that (i) the “liquid alternatives” asset class, of which the Fund is a part, is new and growing rapidly; (ii) the peer group is an imperfect comparison due to the widely varying objectives and constructions of its members
(including, in the case of the Fund, the use of specialized Sub-advisors); and (iii) the Fund is not managed to improve its relative ranking in a peer group, but to provide specific investment characteristics to client portfolios. The Board
considered that the Adviser agreed, effective December 1, 2014, to reduce the Fund’s contractual management fee by 5 basis points, and to increase the Fund’s advisory fee waiver by 3 basis points at least through November 30,
2015, such that the Fund’s net expense ratio is decreased by 8 basis points. The Board determined that the Fund’s level of performance and expense generally supported a recommendation to approve the New Subadvisory Agreements.
After discussion and consideration among themselves, and with Independent Legal Counsel and the Advisor, the Board, including
all of the Independent Trustees, determined that the fees to be paid by the Fund to Calamos, HCHA, and HCMFA, as applicable, under the New Subadvisory Agreements appeared to be fair and reasonable in light of the information provided. Based on all
relevant information and factors, none of which was individually determinative of the outcome, the Board, including all of the Independent Trustees, concluded that the approval of the New Subadvisory Agreements for a two-year period was in the best
interests of the Fund and its shareholders and approved the New Subadvisory Agreements.
April 30, 2015 (unaudited) / ANNUAL
REPORT
Shares of the
Wilmington Funds are not FDIC insured or otherwise protected by the U.S. government, are not deposits or other obligations of, or guaranteed by, Manufacturers and Traders Trust Company, and are subject to investment risks, including possible loss of
the principal amount invested.
VOTING PROXIES ON FUND PORTFOLIO SECURITIES
A description of the policies and procedures that the Funds use to determine how to vote proxies relating to securities held in the Funds’
portfolios is available, without charge and upon request, by calling 1-800-836-2211. A report on how the Funds voted any such proxies during the most recent 12-month period ended June 30 is available through Wilmington Funds’ website. Go
to www.wilmingtonfunds.com select “Proxy Voting Record” to access the link. This information is also available from the Edgar database on the SEC’s website at www.sec.gov.
QUARTERLY PORTFOLIO SCHEDULE
The Funds file
with the SEC a complete schedule of their portfolio holdings, as of the close of the first and third quarters of their fiscal year, on Form N-Q. These filings are available on the SEC’s website at www.sec.gov and may be reviewed and copied at
the SEC’s Public Reference Room in Washington DC. (Call 1-800-SEC-0330 for information on the operation of the Public Reference Room.)
Electronic
Delivery
Wilmington Funds encourages you to sign up for electronic delivery of investor materials. By doing so you will receive
information faster, help lower shareholder costs, and reduce the impact to the environment. To enroll in electronic delivery:
| |
1.) |
Go to www.wilmingtonfunds.com and select “Individual Investors” |
| |
2.) |
Click on the link “Sign up for Electronic Delivery” |
| |
3.) |
Login to your account or create new user ID |
| |
4.) |
Select E-Delivery Consent from the available options, and |
| |
5.) |
Complete the information requested, including providing the email address where you would like to receive notification for electronic documents.
|
| * |
If you hold your account through a financial intermediary, please contact your advisor to request electronic delivery of investor materials.
|
Householding
In
an effort to reduce volume of mail you receive, only one copy of the prospectus, annual/semi-annual report, SAI and proxy statements will be sent to shareholders who are part of the same family and share the same address.
If you would like to request additional copies of the prospectus, annual/semi-annual report or SAI, or wish to opt out of householding mailings,
please contact Shareholder Services at 1-800-836-2211, or write to Wilmington Funds, P.O. Box 9828, Providence, RI 02940-8025.
SEMI-ANNUAL REPORT /
April 30, 2015
PRIVACY POLICY AND NOTICE
OF THE FUNDS AND THEIR DISTRIBUTOR
June 8, 2012
The
Wilmington Funds, their distributor and their agents (referred to as “the Funds”, “we” or “us”) recognize that consumers (referred to as “you” or “your”) expect us to protect both your assets and
financial information. We respect your right to privacy and your expectation that all personal information about you or your account will be maintained in a secure manner. We are committed to maintaining the confidentiality, security and integrity
of client and shareholder information. We want you to understand the Funds’ policy that governs the handling of your information, how the Funds gather information, how that information is used and how it is kept secure.
Information The Funds Collect:
The Funds collect nonpublic
personal information about you from the following sources:
| |
• |
We may receive information from you, or from your financial representative, on account applications, other forms or electronically (such as through
the Funds’ website or other electronic trading mechanisms). Examples of this information include your name, address, social security number, assets and income. |
| |
• |
We may receive information from you, or from your financial representative, through transactions with us or others, correspondence and other
communications. Examples of this information include specific investments and your account balances. |
| |
• |
We may obtain other personal information from you in connection with providing you a financial product or service. Examples of this information
include depository, debit or credit account numbers. |
Information Sharing Policy
The Funds may share nonpublic personal information about you, as described above, with financial or non-financial companies or other entities,
including companies that may be affiliated with the Funds and other nonaffiliated third parties, for the following purposes:
| |
• |
We may share information when it is necessary and required to process a transaction or to service a customer relationship. For example, information
may be shared with a company that provides account record keeping services or a company that provides proxy services to shareholders. |
| |
• |
We may share information when it is required or permitted by law. For example, information may be shared in response to a subpoena or to protect you
against fraud or with someone who has established a legal beneficial interest, such as a power of attorney. |
| |
• |
We may disclose some or all of the information described above to companies that perform marketing or other services on our behalf. For example, we
may share information about you with the financial intermediary (bank, investment bank or broker-dealer) through whom you purchased the Funds’ products or services, or with providers of marketing, legal, accounting or other professional
services. The Funds will not, however, disclose a consumer’s account number or similar form of access number or access code for credit card, deposit or transaction accounts to any nonaffiliated third party for use in telemarketing, direct mail
or other marketing purposes. |
Except as described above, the Funds do not share customer information. We will not rent,
sell, trade, or otherwise release or disclose any personal information about you. Any information you provide to us is for the Funds’ use only. If you decide to close your account(s) or become an inactive customer, we will adhere to the privacy
policies and practices as described in this notice.
Information Security:
When the Funds share nonpublic customer information with third parties hired to facilitate the delivery of certain products or services to our
customers, such information is made available for limited purposes and under controlled circumstances designed to protect our customers’ privacy. We require third parties to comply with our standards regarding security and confidentiality of
such information. We do not permit them to use that information for their own or any other purposes, or rent, sell, trade or otherwise release or disclose the information to any other party. These requirements are reflected in written agreements
between the Funds and the third party service providers.
The Funds protect your personal information in several ways. We maintain physical,
electronic, and procedural safeguards to guard your nonpublic personal information. In addition, the Funds’ Transfer Agent and Shareholder Servicing Agent have procedures in place for the appropriate disposal of nonpublic personal information
when they are no longer required to maintain the information.
Each of the following sections explains an aspect of the Funds’
commitment to protecting your personal information and respecting your privacy.
Employee Access to Information:
Our Code of Ethics, which applies to all employees, restricts the use of customer information and requires that it be held in the strictest of
confidence. Employee access to customer information is authorized for business purposes only, and the degree of access is based on the sensitivity of the information and on an employee’s or agent’s need to know the information in order to
service a customer’s account or comply with legal requirements.
Visiting The Funds’ Website:
The Funds’ website gathers and maintains statistics about the number of visitors as well as what information is viewed most frequently.
This information is used to improve the content and level of service we provide to our clients and shareholders.
April 30, 2015 / ANNUAL REPORT
| |
• |
Information or data entered into a website will be retained. |
| |
• |
Where registration to a website or re-entering personal information on a website is required, “cookies” are used to improve your online
experience. A cookie is a way for websites to recognize whether or not you have visited the site before. It is a small file that is stored on your computer that identifies you each time you re-visit our site so you don’t have to resubmit
personal information. Cookies provide faster access into the website. |
| |
• |
We may also collect non-personally identifiable Internet Protocol (“IP”) addresses for all other visitors to monitor the number of
visitors to the site. These non-personally identifiable IP addresses are never shared with any third party. |
E-mail:
If you have opted to receive marketing information from the Funds by e-mail, it is our policy to include instructions in all marketing messages
on how to unsubscribe from subsequent e-mail programs. Some products or services from the Funds are intended to be delivered and serviced electronically. E-mail communication may be utilized in such cases. If you participate in an employer-sponsored
retirement plan administered by the Funds, we may, at your employer’s request, send you e-mail on matters pertaining to the retirement plan.
Please do not provide any account or personal information such as social security numbers, account numbers, or account balances within your
e-mail correspondence to us. We cannot use e-mail to execute transaction instructions, provide personal account information, or change account registration. We can, however, use e-mail to provide you with the necessary forms or you may contact
customer service toll-free at 1-800-836-2211.
Surveys/Aggregate Data:
Periodically, the Funds may conduct surveys about financial products and services or review elements of customer information in an effort to
forecast future business needs. The Funds then generate reports that include aggregate data regarding its customers. Aggregate data classifies customer information in various ways but that does not identify individual customers. These reports may
also include information on website traffic patterns and related information. These reports are used for the Funds’ planning, statistical and other corporate purposes. Aggregate data may also be shared with external parties, such as marketing
organizations. However, no information is shared by which any individual customer could be identified.
Changes to Our Privacy Statement:
The effective date of this policy is June 8, 2012. We reserve the right to modify this policy at any time. When it is revised or materially
changed, we will update the effective date. You can determine whether there have been changes since the last time you reviewed by simply checking the effective date.
Notice will be provided to you in advance of any changes that would affect your rights under this policy statement
ANNUAL REPORT / April 30,
2015
[This Page Intentionally Left Blank]
[This Page Intentionally Left Blank]
[This Page Intentionally Left Blank]
Item 2. Code of Ethics.
| |
(a) |
As of the end of the period covered by this report, the registrant has adopted a code of ethics (the “Section 406 Standards for Investment
Companies - Ethical Standards for Principal Executive and Financial Officers”) that applies to the registrant’s Principal Executive Officer and Principal Financial Officer; the registrant’s Principal Financial Officer also serves as
the Principal Accounting Officer |
| |
(b) |
There have been no amendments to the registrant’s code of ethics that apply to its Principal Executive Officer or Principal Financial Officer.
|
| |
(c) |
There have been no amendments to the Funds’ code of ethics during the reporting period for this Form N-CSR. |
| |
(d) |
The registrant has not granted any waivers, including an implicit waiver, from any provisions of its code of ethics during the reporting period for
this Form N-CSR. |
| |
(f)(3) |
The registrant hereby undertakes to provide any person, without charge, upon request, a copy of the code of ethics. To request a copy of the code
of ethics, contact the registrant at 1-800-836-2211, and ask for a copy of the Section 406 Standards for Investment Companies - Ethical Standards for Principal Executive and Financial Officers. |
Item 3. Audit Committee Financial Expert.
The
registrant’s Board has determined that each member of the Board’s Audit Committee is an “audit committee financial expert,” and that each such member is “independent,” for purposes of this Item. The Audit Committee
consists of the following Board members: Nicholas A. Giordano, Joseph J. Castiglia, and John S. Cramer.
Item 4. Principal Accountant Fees and
Services.
| |
(a) |
The Audit Fees. The aggregate fees billed for each of the last two fiscal years for professional services rendered by the principal accountant for the audit of the Registrant’s annual financial statements or
services that are normally provided by the accountant in connection with statutory and regulatory filings or engagements were as follows: |
Fiscal year ended 2015 - $473,490
Fiscal year ended 2014 - $498,190
| |
(b) |
Audit-Related Fees. The aggregate fees billed for each of the last two fiscal years for professional services rendered by the principal accountant for assurance and related services by the principal accountant that are
reasonably related to the performance of the audit of the Registrant’s financial statements and are not reported above in Item 4(a) were as follows: |
Fiscal year ended 2015 - $0
Fiscal year ended 2014 - $0
Amount requiring approval of the registrant’s audit committee pursuant to paragraph (c)(7)(ii) of Rule 2-01 of Regulation S-X, $0
and $0 respectively.
| |
(c) |
Tax Fees. The aggregate fees billed for each of the last two fiscal years for professional services rendered by the principal accountant for
tax compliance, tax advice and tax planning were as follows: |
Fiscal year ended 2015 - $186,920
Fiscal year ended 2014 - $181,785
Amount requiring approval of the registrant’s audit committee pursuant to paragraph (c)(7)(ii) of Rule 2-01 of Regulation S-X,
$186,920 and $181,785 respectively.
| |
(d) |
All Other Fees. The aggregate fees billed in each of the last two fiscal years for products and services provided by the principal accountant, other than the services reported in paragraphs (a) and (c) of this
Item were as follows: |
Fiscal year ended 2015 - $0
Fiscal year ended 2014 - $0
Amount requiring approval of the registrant’s audit committee pursuant to paragraph (c)(7)(ii) of Rule 2-01 of Regulation S-X, $0
and $0 respectively.
(e)(1) Audit Committee Policies regarding Pre-approval of Services.
The Audit Committee is required to pre-approve audit and non-audit services performed by the independent auditor in order to
assure that the provision of such services do not impair the auditor’s independence. Unless a type of service to be provided by the independent auditor has received general pre-approval, it will require specific pre-approval by the Audit
Committee. Any proposed services exceeding pre-approved cost levels will require specific pre- approval by the Audit Committee.
Certain
services have the general pre-approval of the Audit Committee. The term of the general pre-approval is 12 months from the date of pre-approval, unless the Audit Committee specifically provides for a different period. The Audit Committee will
annually review the services that may be provided by the independent auditor without obtaining specific pre-approval from the Audit Committee and may grant general pre-approval for such services. The Audit Committee will revise the list of general
pre-approved services from time to time, based on subsequent determinations. The Audit Committee will not delegate its responsibilities to pre-approve services performed by the independent auditor to management.
The Audit Committee has delegated pre-approval authority to its Chairman. The Chairman will
report any pre-approval decisions to the Audit Committee at its next scheduled meeting. The Committee will designate another member with such pre-approval authority when the Chairman is unavailable.
AUDIT SERVICES
The annual Audit services
engagement terms and fees will be subject to the specific pre-approval of the Audit Committee. The Audit Committee must approve any changes in terms, conditions and fees resulting from changes in audit scope, registered investment company (RIC)
structure or other matters.
In addition to the annual Audit services engagement specifically approved by the Audit Committee, the Audit
Committee may grant general pre-approval for other Audit Services, which are those services that only the independent auditor reasonably can provide. The Audit Committee has pre-approved certain Audit services, all other Audit services must be
specifically pre-approved by the Audit Committee.
AUDIT-RELATED SERVICES
Audit-related services are assurance and related services that are reasonably related to the performance of the audit or review of the
Company’s financial statements or that are traditionally performed by the independent auditor. The Audit Committee believes that the provision of Audit-related services does not impair the independence of the auditor, and has pre-approved
certain Audit-related services, all other Audit-related services must be specifically pre-approved by the Audit Committee.
TAX SERVICES
The Audit Committee believes that the independent auditor can provide Tax services to the Company such as tax compliance, tax planning and
tax advice without impairing the auditor’s independence. However, the Audit Committee will not permit the retention of the independent auditor in connection with a transaction initially recommended by the independent auditor, the purpose of
which may be tax avoidance and the tax treatment of which may not be supported in the Internal Revenue Code and related regulations. The Audit Committee has pre-approved certain Tax services, all Tax services involving large and complex transactions
must be specifically pre-approved by the Audit Committee.
ALL OTHER SERVICES
With respect to the provision of services other than audit, review or attest services the pre-approval requirement is waived if:
| |
(1) |
The aggregate amount of all such services provided constitutes no more than five percent of the total amount of revenues paid by the registrant, the registrant’s adviser (not including any sub-adviser whose role is
primarily portfolio management and is subcontracted with or overseen by another investment adviser), and any entity controlling, controlled by, or under common control with the investment adviser that provides ongoing services to the registrant or
to its accountant during the fiscal year in which the services are provided; |
| |
(2) |
Such services were not recognized by the registrant, the registrant’s adviser (not including any sub-adviser whose role is primarily portfolio management and is subcontracted with or overseen by another investment
adviser), and any entity controlling, controlled by, or under common control with the investment adviser that provides ongoing services to the registrant at the time of the engagement to be non-audit services; and |
| |
(3) |
Such services are promptly brought to the attention of the Audit Committee of the issuer and approved prior to the completion of the audit by the Audit Committee or by one or more members of the Audit Committee who are
members of the board of directors to whom authority to grant such approvals has been delegated by the Audit Committee. |
The
Audit Committee may grant general pre-approval to those permissible non-audit services classified as All Other services that it believes are routine and recurring services, and would not impair the independence of the auditor.
The SEC’s rules and relevant guidance should be consulted to determine the precise definitions of prohibited non-audit services and the
applicability of exceptions to certain of the prohibitions.
PRE-APPROVAL FEE LEVELS
Pre-approval fee levels for all services to be provided by the independent auditor will be established annually by the Audit Committee. Any
proposed services exceeding these levels will require specific pre-approval by the Audit Committee.
PROCEDURES
Requests or applications to provide services that require specific approval by the Audit Committee will be submitted to the Audit Committee by
both the independent auditor and the Principal Accounting Officer and/or Internal Auditor, and must include a joint statement as to whether, in their view, the request or application is consistent with the SEC’s rules on auditor independence.
|
|
|
| (e)(2) |
|
Percentage of services identified in items 4(b) through 4(d) that were approved by the registrants audit committee pursuant to paragraph (c)(7)(i)(C) of Rule
2-01 of Regulation S-X: |
4(b)
Fiscal year ended 2015 – 0 %
Fiscal year ended 2014 – 0 %
Percentage of services provided to the registrant’s investment adviser and any entity controlling, controlled by, or under
common control with the investment adviser that provides ongoing services to the registrant that were approved by the registrant’s audit committee pursuant to paragraph (c)(7)(i)(C) of Rule 2-01 of Regulation S-X, 0% and 0% respectively.
4(c)
Fiscal year ended 2015 – 100 %
Fiscal year ended 2014 – 100 %
Percentage of services provided to the registrant’s investment adviser and any entity controlling, controlled by, or under
common control with the investment adviser that provides ongoing services to the registrant that were approved by the registrant’s audit committee pursuant to paragraph (c)(7)(i)(C) of Rule 2-01 of Regulation S-X, 100% and 100% respectively.
4(d)
Fiscal year ended 2015 – 0 %
Fiscal year ended 2014 – 0 %
Percentage of services provided to the registrant’s investment adviser and any entity controlling, controlled by, or under
common control with the investment adviser that provides ongoing services to the registrant that were approved by the registrant’s audit committee pursuant to paragraph (c)(7)(i)(C) of Rule 2-01 of Regulation S-X, 0% and 0% respectively.
| (g) |
Non-Audit Fees billed to the registrant, the registrant’s investment adviser, and certain entities controlling, controlled by or under common control with the investment adviser that provide ongoing services to the
registrant: |
Fiscal year ended 2015 – $841,920
Fiscal year ended 2014 – $181,785
| (h) |
The registrant’s Audit Committee has considered that the provision of non-audit services that were rendered to the registrant’s adviser (not including any sub-adviser whose role is primarily portfolio
management and is subcontracted with or overseen by another investment adviser), and any entity controlling, controlled by, or under common control with the investment adviser that provides ongoing services to the registrant that were not
pre-approved pursuant to paragraph (c)(7)(ii) of Rule 2-01 of Regulation S-X is compatible with maintaining the principal accountant’s independence. |
Item 5. Audit Committee of Listed Registrants.
Not
applicable.
Item 6. Investments.
| (a) |
Schedule of Investments in securities of unaffiliated issuers as of the close of the reporting period is included as part of the report to
shareholders filed under Item 1 of this form. |
| Item 7. |
Disclosure of Proxy Voting Policies and Procedures for Closed-End Management Investment Companies. |
Not
applicable.
| Item 8. |
Portfolio Managers of Closed-End Management Investment Companies. |
Not applicable.
| Item 9. |
Purchases of Equity Securities by Closed-End Management Investment Company and Affiliated Purchasers. |
Not applicable.
| Item 10. |
Submission of Matters to a Vote of Security Holders. |
No changes to report.
| Item 11. |
Controls and Procedures. |
| |
(a) |
The registrant’s principal executive and principal financial officers, or persons performing similar functions, have concluded that the
registrant’s disclosure controls and procedures (as defined in Rule 30a-3(c) under the Investment Company Act of 1940, as amended (the “1940 Act”) (17 CFR 270.30a-3(c))) are effective, as of a date within 90 days of the filing date of
the report that includes the disclosure required by this paragraph, based on their evaluation of these controls and procedures required by Rule 30a-3(b) under the 1940 Act (17 CFR 270.30a-3(b)) and Rules 13a-15(b) or 15d-15(b) under the Securities
Exchange Act of 1934, as amended (17 CFR 240.13a-15(b) or 240.15d-15(b)). |
| |
(b) |
There were no changes in the registrant’s internal control over financial reporting (as defined in Rule 30a-3(d) under the 1940 Act (17 CFR
270.30a-3(d)) that occurred during the registrant’s second fiscal quarter of the period covered by this report that has materially affected, or is reasonably likely to materially affect, the registrant’s internal control over financial
reporting. |
| |
(a)(2) |
Certifications pursuant to Rule 30a-2(a) under the 1940 Act and Section 302 of the Sarbanes-Oxley Act of 2002 are attached hereto.
|
| |
(b) |
Certifications pursuant to Rule 30a-2(b) under the 1940 Act and Section 906 of the Sarbanes-Oxley Act of 2002 are attached hereto.
|
(12.other) Not applicable.
SIGNATURES
Pursuant to the requirements of the Securities Exchange Act of 1934 and the Investment Company Act of 1940, the registrant has duly caused
this report to be signed on its behalf by the undersigned, thereunto duly authorized.
|
|
|
| (Registrant) Wilmington
Funds
|
|
| By (Signature and Title)* /s/ Richard J.
Berthy
|
|
Richard J. Berthy |
|
(Principal Executive Officer) |
|
| Date 7/7/2015
|
Pursuant to the requirements of the Securities Exchange Act of 1934 and the Investment Company Act of 1940,
this report has been signed below by the following persons on behalf of the registrant and in the capacities and on the dates indicated.
|
|
|
| By (Signature and Title)* /s/ Richard J.
Berthy
|
|
Richard J. Berthy |
|
(Principal Executive Officer) |
|
| Date 7/7/2015
|
|
| By (Signature and Title)* /s/ Christopher W.
Roleke
|
|
Christopher W. Roleke |
|
(Principal Financial Officer) |
|
| Date 7/7/2015
|
| * |
Print the name and title of each signing officer under his or her signature. |