Wilmington Funds
UNITED STATES
SECURITIES AND EXCHANGE COMMISSION
Washington, D.C. 20549
FORM N-CSR
CERTIFIED SHAREHOLDER REPORT OF REGISTERED MANAGEMENT
INVESTMENT COMPANIES
Investment Company Act file number
811-05514
Wilmington Funds
(Exact name of registrant as
specified in charter)
Wilmington Trust Investment Advisors, Inc.
111 South Calvert Street, 26th Floor
Baltimore, Maryland 21202
(Address of principal executive offices) (Zip code)
Hope L. Brown
Wilmington Trust Investment Advisors, Inc.
111 South Calvert Street, 26th Floor
Baltimore, Maryland 21202
(Name and address of agent for
service)
registrant’s telephone number, including area code: 410-986-5600
Date of fiscal year end: April 30
Date of reporting period: April 30, 2013
Form N-CSR is to be
used by management investment companies to file reports with the Commission not later than 10 days after the transmission to stockholders of any report that is required to be transmitted to stockholders under Rule 30e-1 under the Investment Company
Act of 1940 (17 CFR 270.30e-1). The Commission may use the information provided on Form N-CSR in its regulatory, disclosure review, inspection, and policymaking roles.
A registrant is required to disclose the information specified by Form N-CSR, and the Commission will make this information public. A registrant is not required to respond to the collection of information
contained in Form N-CSR unless the Form displays a currently valid Office of Management and Budget (“OMB”) control number. Please direct comments concerning the accuracy of the information collection burden estimate and any suggestions for
reducing the burden to Secretary, Securities and Exchange Commission, 100 F Street, NE, Washington, DC 20549. The OMB has reviewed this collection of information under the clearance requirements of 44 U.S.C. § 3507.
Item 1. Reports to Stockholders.
The Report to Shareholders is attached herewith.


Wilmington Prime Money Market Fund
(“Prime Money Market Fund”)
Wilmington U.S. Government Money Market Fund (“U.S. Government Money Market Fund”)
Wilmington U.S. Treasury Money Market Fund (“U.S. Treasury Money Market Fund”)
Wilmington Tax-Exempt Money Market Fund (“Tax-Exempt Money Market Fund”)
CONTENTS
|
|
|
|
|
| PRESIDENT’S MESSAGE |
|
|
|
|
|
|
| President’s Message |
|
|
i |
|
|
|
| WILMINGTON FUNDS ANNUAL REPORT |
|
|
|
|
|
|
| Management’s Discussion of Fund Performance |
|
|
1 |
|
|
|
| Shareholder Expense Example |
|
|
3 |
|
|
|
| Portfolios of Investments |
|
|
5 |
|
|
|
| Notes to Portfolios of Investments |
|
|
18 |
|
|
|
| Statements of Assets and Liabilities |
|
|
20 |
|
|
|
| Statements of Operations |
|
|
21 |
|
|
|
| Statements of Changes in Net Assets |
|
|
22 |
|
|
|
| Financial Highlights |
|
|
25 |
|
|
|
| Notes to Financial Statements |
|
|
31 |
|
|
|
| Report of Independent Registered Public Accounting Firm |
|
|
38 |
|
|
|
| Board of Trustees and Trust Officers |
|
|
39 |
|
[This Page Intentionally
Left Blank]
Dear Investor:
I am pleased to present the Annual Report of the Wilmington Funds (“Trust”). This report covers the Trust’s fiscal year, which is
the 12-month reporting period from May 1, 2012 through April 30, 2013. Inside, you will find a discussion of the factors impacting each Fund’s performance during the reporting period, as well as a complete listing of each Fund’s
holdings and financial statements.
The Economy and Financial Markets in Review
Wilmington Funds Management Corporation, the investment advisor to the Trust, and Wilmington Trust Investment Advisors, Inc., the sub-advisor to
the Trust, have provided the following review of the economy, bond markets, and stock markets over the 12-month reporting period.
The Economy
The U.S. economic expansion continued during the 12 months ended April 30, 2013, though its pace remained tepid. The production of goods
and services grew 3.1%, 0.4%, and 2.5% faster than the rate of inflation during the third and fourth quarters of 2012 and the first quarter of 2013, respectively. U.S. consumer spending propelled the gains, though consumers were still cautious amid
the long, slow recovery from the Great Recession of 2007–2009. Retail and food sales, for example, amounted to $4.94 trillion during our fiscal year, up 2.5% in real (inflation-adjusted) terms over the preceding 12-month period. The housing
market continued its nascent recovery, and inflation averaged about 1.1%.
Source: Federal Reserve Bank of St. Louis, May 28,
2013
If consumers were feeling somewhat better, business managers remained wary. During the third and fourth quarters of 2012 and the first
quarter of 2013, investments in U.S. plants, property, and equipment expected to last three years or more were made at lower rates than they had been made in the corresponding quarters five years earlier, as the recession was beginning. Employers
likewise remained cautious in hiring. The number of U.S. private-sector workers grew in all 12 months of our fiscal year, but the rate of private-sector job growth remained slow. At the end of April, there were still 2.0 million fewer
private-sector workers than there had been at the labor market’s January 2008 peak. Much of the blame for soft business enthusiasm was laid at the doorsteps of Congress and the White House. Many business leaders said lawmakers needed to make
meaningful changes in U.S. tax and spending policies to shore up the nation’s finances and to clarify the legal and regulatory environment.
Despite the modest rate of expansion, the U.S. recovery looked solid in relation to economic conditions in Europe, where a recession appeared to
be worsening. Greece appeared likely to remain at least a near-term participant in the continent’s common currency experiment, but Spain, Portugal and Italy all joined Greece in struggling under heavy sovereign debts. Debate about the
possibility of developing common fiscal policies and banking regulations continued, and investors were soothed by the European Central Bank President’s assurance that the bank would do “whatever it takes to preserve the euro.” In
China, growth appeared to slow, though it remained strong in absolute terms. On balance, the global economy appeared to be expanding at a modest rate.
The Bond Markets
The good times rolled on
in the U.S. bond market during our fiscal year. The Barclays Capital U.S. Aggregate Bond Index returned 3.68%. The index tracks the overall market for taxable, investment-grade U.S. bonds and includes U.S. Treasury and agency securities, corporate
bonds, and mortgage-backed securities (MBS). The gain was propelled by strong results among corporate issues (+7.49%, according to the Barclays Capital U.S. Credit Bond Index), into which investors piled as the search for investment opportunities
with meaningful yields continued.
The yield of the 10-year U.S. Treasury note, against which many other interest rates are set, declined
from 1.91% at the end of April 2012 to a low of 1.43% in late July 2012 before climbing to 1.67% at the end of April 2013. The net 12-month decrease of a quarter of a percentage point boosted the prices of bonds across the market.
The S&P Municipal Bond Intermediate Index1 returned 4.71%. Demand for shares of
municipal bond mutual funds, which account for much of the total demand for municipal bonds, accelerated as fears of widespread municipal bankruptcies dissipated and the rates of U.S. taxation on interest, dividends, and capital gains were allowed
to revert in 2013 to prior, higher levels for higher-income taxpayers. Talk of limiting the federal tax exemption on municipal bond interest income, meanwhile, continued to be just talk.
PRESIDENT’S
MESSAGE / April 30, 2013
For the 12-month reporting period May 1, 2012 through April 30, 2013, certain Barclays
Capital indices performed as follows2:
|
|
|
|
|
|
|
|
|
|
|
|
|
|
|
|
|
|
|
|
| |
|
Barclays Capital
U.S. Aggregate Bond Index3 |
|
Barclays Capital
U.S. Treasury
Bond Index4 |
|
Barclays Capital
U.S. Mortgage-
Backed Securities
Index5 |
|
Barclays Capital
U.S. Credit
Bond Index6 |
|
Barclays Capital
Municipal Bond
Index7 |
|
|
|
|
3.68% |
|
2.56% |
|
1.85% |
|
7.49% |
|
5.19% |
|
|
The Stock Markets
Investors heard plenty about the “lost decade” of equity returns when the effects of the financial crisis were in full swing in early
2009. Commercials decrying 401(k) retirement plans as “201(k)s” promoted “gold 401(k)s” or day trading as solutions; “buy and hold,” it was said, was dead. Fast forward four years and anyone who abandoned equities may
be wishing they hadn’t. The “lost decade” has turned into a pretty normal “found decade,” with a trailing 10-year total return for the S&P 500 Index of 7.88%, annualized. Granted, ten years ago we were emerging from the
tech bubble; one must always be leery of the period selected in drawing conclusions from economic or investment data.
Stocks generally did
very well during the 12 months ended April 30, 2013. Six broad stock market indices, which together offer a rough portrait of the world’s equity securities, returned between +3.97% and +19.39% in U.S. dollars during the fiscal year. The
weakest return came from the MSCI Emerging Markets (Net) Index8 (+3.97%) and the strongest return (+19.39%) was recorded by the MSCI EAFE (Net) Index9 of developed international stock markets. In between were the returns of the Russell Top 200 Index10 (+16.30%), which tracks mega-capitalization
U.S. stocks, the Russell Midcap Index11 (+19.20%) of mid-cap U.S. stocks, the Russell 2000 Index12 (+17.69%) of small-cap U.S.
stocks, and the S&P 500 Index13 (+16.89%), a widely watched gauge consisting mainly of large-cap U.S. stocks.
For the 12-month reporting period May 1, 2012 through April 30, 2013, certain stock market indices performed as follows:
|
|
|
|
|
|
|
|
|
|
|
|
|
|
|
|
|
| |
|
S&P 500
Index13 |
|
Dow Jones
Industrial Average14 |
|
NASDAQ
Composite Index15 |
|
MSCI All Country
World ex-US (Net)
Index16 |
|
|
|
|
16.89% |
|
15.39% |
|
10.78% |
|
14.15% |
|
|
The Trust, with assets of $13.3 billion as of April 30, 2013, gives investors access to every major asset
class and sector. Whether you are looking for a comfortable retirement, to fund a child’s higher education, pursue tax-free income17, stay ahead of inflation, or keep your cash working, one
or more of the Trust’s Funds may provide you with the diversification, flexibility and professional management you need.
Sincerely,

Sam Guerrieri
President
May 28, 2013
April 30, 2013 / PRESIDENT’S
MESSAGE
For more complete information, please download the Funds’ prospectus available on
www.wilmingtonfunds.com, or call 1-800-836-2211 for a copy. You should consider the Funds’ investment objectives, risks, charges, and expenses carefully before you invest. Information about these and other important subjects is in the
Funds’ prospectus, which you should read carefully before investing.
Past performance is no guarantee of future results.
The index performance quoted is for illustrative purposes only and is not representative of any specific investment. Diversification does not ensure a profit nor protect against loss.
All investments involve risk, including the possible loss of principal. Equity Securities are subject to price fluctuation and possible loss
of principal. Small- and mid-cap stocks involve greater risks and volatility than large-cap stocks. International investments are subject to special risks, including currency fluctuations, social, economic, and political uncertainties, which could
increase volatility. These risks are magnified in emerging markets.
High yield, lower-rated securities generally entail greater
market, credit and liquidity risks than investment grade securities and may include higher volatility and higher risk of default.
An
investment in money market funds is neither insured nor guaranteed by the Federal Deposit Insurance Corporation or any other government agency. Although money market funds seek to preserve the value of your investment at $1.00 per share, it is
possible to lose money by investing in these funds.
| 1. |
S&P Municipal Bond Intermediate Index is a broad, market value-weighted index that seeks to measure the performance of the U.S. municipal bond market. |
| 2. |
Bond prices are sensitive to changes in interest rates and a rise in interest rates can cause a decline in their prices. |
| 3. |
Barclays Capital U.S. Aggregate Bond Index is a widely used benchmark index for the domestic investment-grade bond market composed of securities from the Barclays Capital Government/Corporate Bond Index, Mortgage-Backed
Securities Index and Asset-Backed Securities Index. The index typically includes fixed income securities with overall intermediate- to long-term average maturities. The index is unmanaged and investments cannot be made directly in an index.
|
| 4. |
Barclays Capital U.S. Treasury Bond Index is a market capitalization weighted index that includes all publicly issued U.S. Treasury securities that have a remaining maturity of at least one year, are rated
investment-grade, and have $250 million or more of outstanding face value. The index is unmanaged and investments cannot be made directly in an index. |
| 5. |
Barclays Capital U.S. Mortgage-Backed Securities Index is composed of all securities mortgage pools by GNMA, FNMA and the FHLMC, including GNMA graduated Payment Mortgages. The index is unmanaged and investments cannot
be made directly in an index. |
| 6. |
Barclays Capital U.S. Credit Bond Index tracks the performance of domestic investment-grade corporate bonds and is composed of all publicly issued, fixed-rate, nonconvertible, investment-grade corporate debt. The index
is unmanaged and investments cannot be made directly in an index. |
| 7. |
Barclays Capital Municipal Bond Index tracks the performance of the long-term, tax-exempt, investment-grade bond market. To be included in the index, bonds must have an outstanding par balance of at least $7 million and
be issued as part of a transaction of at least $75 million. The index is unmanaged and investments cannot be made directly in an index. |
| 8. |
MSCI Emerging Markets (Net) Index is a free float-adjusted market capitalization index that is designed to measure equity market performance of emerging markets. The MSCI Emerging Markets Index consisted of the
following 21 emerging market country indices: Brazil, Chile, China, Colombia, Czech Republic, Egypt, Hungary, India, Indonesia, Korea, Malaysia, Mexico, Morocco, Peru, Philippines, Poland, Russia, South Africa, Taiwan, Thailand, and Turkey.
|
| 9. |
MSCI EAFE (Net) Index is a free float-adjusted market capitalization index that is designed to measure equity market performance of developed markets, excluding the U.S. & Canada. The index consists of the following
22 developed market country indices: Australia, Austria, Belgium, Denmark, Finland, France, Germany, Greece, Hong Kong, Ireland, Israel, Italy, Japan, Netherlands, New Zealand, Norway, Portugal, Singapore, Spain, Sweden, Switzerland and the United
Kingdom. |
| 10. |
Russell Top 200 Index measures the performance of the largest cap segment of the U.S. equity universe. The Russell Top 200 is a subset of the Russell 3000 Index. It includes approximately 200 of the largest securities
based on a combination of their market cap and current index membership and represents approximately 68% of the U.S. market. |
| 11. |
Russell Midcap Index measures the performance of the 800 smallest companies in the Russell 1000 Index, which represents approximately 25% of the total market capitalization of the Russell 1000 Index. |
| 12. |
Russell 2000 Index measures the performance of the 2,000 smallest companies in the Russell 3000 Index, which represents approximately 8% of the total market capitalization of the Russell 3000 Index. |
| 13. |
The S&P 500 Index is a capitalization-weighted index of 500 stocks designed to measure performance of the broad domestic economy through changes in the aggregate market value of 500 stocks representing all major
industries. The index is unmanaged and investments cannot be made directly in an index. |
| 14. |
Dow Jones Industrial Average (“DJIA”) represents share prices of selected blue chip industrial corporations as well as public utility and transportation companies. The DJIA indicates daily changes in the
average prices of stocks in any of its categories. It also reports total sales for each group of industries. Because it represents the top corporations of America, the DJIA’s average movements are leading economic indicators for the stock
market as a whole. The DJIA is unmanaged and investments cannot be made directly in the DJIA. |
| 15. |
NASDAQ Composite Index measures all NASDAQ domestic and non-U.S. based common stocks listed on the NASDAQ Stock Market. The index is unmanaged and investments cannot be made directly in an index. |
| 16. |
MSCI All Country World ex-US (Net) Index is a free float-adjusted market capitalization weighted index that is designed to measure the equity market performance of developed and emerging markets excluding the U.S.
market. The index consists of 45 country indices comprising 23 developed and 22 emerging market country indices. |
| 17. |
Income generated by tax-free funds may be subject to the federal alternative minimum tax and state and local taxes. |
PRESIDENT’S
MESSAGE / April 30, 2013
[This Page Intentionally
Left Blank]
WILMINGTON MONEY MARKET FUNDS
Management’s Discussion of Fund Performance
This past fiscal year saw record low interest rates, slow but steady economic
growth, low inflation, additional quantitative easing from the Federal Reserve and a continuation of the search for yield by investors in this ultra-low interest rate environment. The search for yield contributed to the corporate bond market
producing its second best year of outperformance as measured by excess returns for 2012.
The tepid economic recovery
continued as Gross Domestic Product (“GDP”) grew at only a 1.8% rate for the year ended March 31, 2013, slightly slower than the prior year’s pace of 2.1%. Uncertainty surrounding fiscal policy, higher taxes and cuts in
government spending brought on from the sequestration were some of the head-winds leading to slower growth. Consumers and business managers continue to remain cautious in their spending given these head-winds. On a positive note, the housing market
is improving as evidenced by rising home prices and housing starts reaching a 5-year high.
The Federal Reserve (the
“Fed”) maintained its accommodative monetary policy during the fiscal year and announced a 3rd round of quantitative easing last September that increased their monthly buying of mortgage and treasury bonds to $85 billion per month. The
Fed’s goal is to keep long-term interest rates low enough to continue to aid the housing market and stimulate the economy. The Fed has stated that it will maintain its policies until the unemployment rate declines to at least 6.5% and inflation
moves up to 2%. Currently, the unemployment rate is at 7.5%, down from 8.1% a year ago. Although job growth has improved, it still remains slower than during past recoveries. The slack in the overall economy coupled with lower energy prices and wage
growth of only 2% has caused the Consumer Price Index (“CPI”) to decline to 1.1% for the past year. Given the Fed’s mandate to lower unemployment and allow inflation to rise, we expect the current low interest rate polices to be
maintained for the foreseeable future.
The combination of low inflation, slow economic growth, the Fed’s
accommodative policies and concerns over the European debt crisis caused 10-year treasury yields to decline to a record low yield of 1.38% last July. Over the past year, interest rates declined all along the yield curve. Longer-term interest rates
declined more than shorter-term interest rates causing the yield curve to flatten. At April 30, the 10-year treasury yield was 1.67%, down 24 basis points from April 30, 2012.
Source: Bloomberg, May 1, 2013
Looking forward, we expect economic growth to remain slow, inflation to remain low and the Fed to continue with its low
interest rate policies. However, as the unemployment rate moves lower we do expect longer-term interest rates to slowly move higher as the Fed will look to taper its quantitative easing. Unfortunately, we do not expect the Fed to begin raising
short-term interest rates for some time. While the Fed did alter its official policy stance on raising interest rates to remove its mid 2015 target, we continue to view 2015 as the most likely time frame for a move higher.
Given our outlook, we continue to maintain longer weighted average maturities for the money market funds. Despite the abatement
in European financial system concerns (see the decline in Libor rates in the chart below), we remain hesitant to delve back into this sector for our funds. We continue to concentrate our focus on high quality industrial, along with select U.S.,
Canadian and Australian financials credits; whether taking direct exposure in the Prime Fund, or as liquidity or credit support providers in the Tax-Exempt Fund.
The Wilmington Funds have, and will continue to maintain a conservative posture
for its money market fund shareholders. Preservation of principal remains our priority.
The change in key interest rates
over the last twelve months is presented below.
|
|
|
|
|
|
|
|
|
|
|
|
|
|
|
|
| |
|
|
|
4/30/12 |
|
10/31/12 |
|
4/30/13 |
| |
|
Federal Fund Target |
|
|
|
0.00%-0.25% |
|
0.00%-0.25% |
|
0.00%-0.25% |
| |
|
3 Month LIBOR |
|
|
|
0.466% |
|
0.313% |
|
0.273% |
| |
|
2 Year Treasury Note |
|
|
|
0.26% |
|
0.28% |
|
0.21% |
| |
|
10 Year Treasury Note |
|
|
|
1.91% |
|
1.69% |
|
1.67% |
The following is a comparison of the performance of the Wilmington Prime Money Market Fund,
Wilmington U.S. Government Money Market Fund, Wilmington U.S. Treasury Money Market Fund and Wilmington Tax-Exempt Money Market Fund versus their respective iMoneyNet and Lipper peer group average returns for the fiscal year ended April 30,
2013:
|
|
|
| Wilmington Prime Money Market Fund – Administrative Class |
|
0.03% |
| Wilmington Prime Money Market Fund – Institutional Class |
|
0.03% |
| Wilmington Prime Money Market Fund – Select Class |
|
0.03% |
| Wilmington Prime Money Market Fund – Service Class |
|
0.01% |
| iMoneyNet, Inc. First Tier Institutional Average |
|
0.06% |
| Lipper Money Market Funds Average |
|
0.02% |
|
|
| Wilmington U.S. Government Money Market Fund – Administrative Class |
|
0.01% |
| Wilmington U.S. Government Money Market Fund – Institutional Class |
|
0.01% |
| Wilmington U.S. Government Money Market Fund – Select Class |
|
0.01% |
| Wilmington U.S. Government Money Market Fund – Service Class |
|
0.01% |
| iMoneyNet, Inc. Government & Agency Institutional Average |
|
0.02% |
| Lipper U.S. Government Money Market Funds Average |
|
0.01% |
|
|
| Wilmington U.S. Treasury Money Market Fund – Administrative Class |
|
0.01% |
| Wilmington U.S. Treasury Money Market Fund – Select Class |
|
0.01% |
| Wilmington U.S. Treasury Money Market Fund – Service Class |
|
0.01% |
| iMoneyNet, Inc. Treasury and Repo Institutional Average |
|
0.01% |
| Lipper U.S. Treasury Money Market Funds Average |
|
0.01% |
|
|
| Wilmington Tax-Exempt Money Market Fund – Administrative Class |
|
0.01% |
| Wilmington Tax-Exempt Money Market Fund – Select Class |
|
0.01% |
| Wilmington Tax-Exempt Money Market Fund – Service Class |
|
0.01% |
| iMoneyNet, Inc. Tax-Free Institutional Average |
|
0.01% |
| Lipper Tax-Exempt Money Market Funds |
|
0.02% |
Source: iMoneyNet, Inc. and Lipper
ANNUAL REPORT / April
30, 2013
Performance shown represents past performance and does not guarantee future results.
Investment return will fluctuate. The total return shown assumes the reinvestment of all distributions and does not reflect the deduction of taxes that a shareholder would pay on Fund distributions. Shares, when redeemed, may be worth more or less
than their original cost. Current performance may be lower or higher than that shown here. You should consider the investment objectives, risks, charges and expenses of the Funds carefully before investing. A prospectus with this and other
information may be obtained by calling 800-836-2211 or visiting the Funds’ web site at www.wilmingtonfunds.com. The prospectus should be read before investing.
The Funds’ shares are not bank deposits and are not insured by, guaranteed by, endorsed by or obligations of the Federal Deposit
Insurance Corporation, the Federal Reserve Board, any government agency or any bank. Although the Funds seek to preserve the value of your investment at $1.00 per share, it is possible to lose money by investing in the Funds.
During the fiscal year ended April 30, 2013, Wilmington Funds Management Corporation voluntarily agreed to reduce its advisory fees
and/or reimburse certain of the Funds’ operating expenses, or certain “class-specific fees and expenses” to prevent the Funds’ (or a class thereof, as applicable) current annualized yield from being below 0.01% (1 basis point)
annually. The fee waiver does not take into consideration acquired fund fees and expenses. Any such waiver or expense reimbursement may be discontinued at any time.
Quantitative Easing (QE) is government monetary policy occasionally used to increase the money supply by buying government
securities or other securities from the market. Quantitative Easing increases the money supply by flooding the financial institutions with capital, in an effort to promote increased lending and liquidity.
Basis Points (bps) is a unit that is equal to 1/100th of 1%, and is used to denote the change in a financial instrument. The
basis point is commonly used for calculating changes in interest rates, equity indices and the yield of a fixed-income security.
Consumer Price Index (CPI) is a measure that examines the weighted average of prices of a basket of consumer goods and
services, such as transportation, food and medical care. The CPI is calculated by taking price changes for each item in the predetermined basket of goods and averaging them; the goods are weighted according to their importance. Changes in CPI are
used to assess price changes associated with the cost of living.
April 30, 2013 / ANNUAL REPORT
SHAREHOLDER EXPENSE EXAMPLE
As a shareholder of the Fund, you incur ongoing costs, including management fees; to the extent
applicable, distribution (12b-1) fees, and/or shareholder services fees; and other Fund expenses. This Example is intended to help you to understand your ongoing costs (in dollars) of investing in the Funds and to compare these costs with the
ongoing costs of investing in other mutual funds. It is based on an investment of $1,000 invested at the beginning of the period and held for the entire period from November 1, 2012 to April 30, 2013.
Actual Expenses
This section of the following table
provides information about actual account values and actual expenses. You may use the information in this section, together with the amount you invested, to estimate the expenses that you incurred over the period. Simply divide your account
value by $1,000 (for example, an $8,600 account value divided by $1,000 = 8.6), then multiply the result by the number in the first section under the heading entitled “Expenses Paid During Period” to estimate the expenses attributable to
your investment during this period.
Hypothetical Example for Comparison Purposes
This section of the following table provides information about hypothetical account values and hypothetical expenses based on the Funds’
actual expense ratios and assumed rates of return of 5% per year before expenses, which are not the Funds’ actual returns. Thus, you should not use the hypothetical account values and expenses to estimate the actual ending
account balance or your expenses for the period. Rather, these figures are required to be provided to enable you to compare the ongoing costs of investing in the Funds with other funds. To do so, compare this 5% hypothetical example with the 5%
hypothetical examples that appear in the shareholder reports of the other funds.
Please note that the expenses shown in the table are
meant to highlight your ongoing costs only. Therefore, the Annualized Net Expense Ratio section of the table is useful in comparing ongoing costs only, and will not help you determine the relative total costs of owning different funds.
|
|
|
|
|
|
|
|
|
|
|
|
|
|
| |
|
Beginning
Account Value
11/1/12 |
|
Ending
Account Value
4/30/13 |
|
Expenses Paid
During Period1 |
|
Annualized Net
Expense Ratio |
|
|
|
|
|
| WILMINGTON PRIME MONEY MARKET FUND |
|
|
|
|
|
|
|
|
|
|
|
|
|
| Actual |
|
|
|
|
|
|
|
|
|
|
|
|
|
| Administrative Class |
|
$1,000.00 |
|
$1,000.10 |
|
$0.79 |
|
0.16% |
|
|
|
|
|
| Institutional Class |
|
$1,000.00 |
|
$1,000.10 |
|
$0.79 |
|
0.16% |
|
|
|
|
|
| Select Class |
|
$1,000.00 |
|
$1,000.10 |
|
$0.79 |
|
0.16% |
|
|
|
|
|
| Service Class |
|
$1,000.00 |
|
$1,000.10 |
|
$0.89 |
|
0.18% |
|
|
|
|
|
| Hypothetical (assuming a 5% return before expenses) |
|
|
|
|
|
|
|
|
|
|
|
|
|
| Administrative Class |
|
$1,000.00 |
|
$1,024.00 |
|
$0.80 |
|
0.16% |
|
|
|
|
|
| Institutional Class |
|
$1,000.00 |
|
$1,024.00 |
|
$0.80 |
|
0.16% |
|
|
|
|
|
| Select Class |
|
$1,000.00 |
|
$1,024.00 |
|
$0.80 |
|
0.16% |
|
|
|
|
|
| Service Class |
|
$1,000.00 |
|
$1,023.90 |
|
$0.90 |
|
0.18% |
|
|
|
|
|
| WILMINGTON U.S. GOVERNMENT MONEY MARKET FUND |
|
|
|
|
|
|
|
|
|
|
|
|
|
| Actual |
|
|
|
|
|
|
|
|
|
|
|
|
|
| Administrative Class |
|
$1,000.00 |
|
$1,000.10 |
|
$0.69 |
|
0.14% |
|
|
|
|
|
| Institutional Class |
|
$1,000.00 |
|
$1,000.10 |
|
$0.74 |
|
0.15% |
|
|
|
|
|
| Select Class |
|
$1,000.00 |
|
$1,000.10 |
|
$0.69 |
|
0.14% |
|
|
|
|
|
| Service Class |
|
$1,000.00 |
|
$1,000.10 |
|
$0.69 |
|
0.14% |
|
|
|
|
|
| Hypothetical (assuming a 5% return before expenses) |
|
|
|
|
|
|
|
|
|
|
|
|
|
| Administrative Class |
|
$1,000.00 |
|
$1,024.10 |
|
$0.70 |
|
0.14% |
|
|
|
|
|
| Institutional Class |
|
$1,000.00 |
|
$1,024.05 |
|
$0.75 |
|
0.15% |
|
|
|
|
|
| Select Class |
|
$1,000.00 |
|
$1,024.10 |
|
$0.70 |
|
0.14% |
|
|
|
|
|
| Service Class |
|
$1,000.00 |
|
$1,024.10 |
|
$0.70 |
|
0.14% |
ANNUAL REPORT / April 30, 2013
|
|
|
|
|
|
|
|
|
|
|
|
|
|
| |
|
Beginning
Account Value
11/1/12 |
|
Ending
Account Value
4/30/13 |
|
Expenses Paid
During Period1 |
|
Annualized Net
Expense Ratio |
|
|
|
|
|
| WILMINGTON U.S. TREASURY MONEY MARKET FUND |
|
|
|
|
|
|
|
|
|
|
|
|
|
| Actual |
|
|
|
|
|
|
|
|
|
|
|
|
|
| Administrative Class |
|
$1,000.00 |
|
$1,000.00 |
|
$0.69 |
|
0.14% |
|
|
|
|
|
| Select Class |
|
$1,000.00 |
|
$1,000.00 |
|
$0.64 |
|
0.13% |
|
|
|
|
|
| Service Class |
|
$1,000.00 |
|
$1,000.00 |
|
$0.69 |
|
0.14% |
|
|
|
|
|
| Hypothetical (assuming a 5% return before expenses) |
|
|
|
|
|
|
|
|
|
|
|
|
|
| Administrative Class |
|
$1,000.00 |
|
$1,024.10 |
|
$0.70 |
|
0.14% |
|
|
|
|
|
| Select Class |
|
$1,000.00 |
|
$1,024.15 |
|
$0.65 |
|
0.13% |
|
|
|
|
|
| Service Class |
|
$1,000.00 |
|
$1,024.10 |
|
$0.70 |
|
0.14% |
|
|
|
|
|
| WILMINGTON TAX-EXEMPT MONEY MARKET FUND |
|
|
|
|
|
|
|
|
|
|
|
|
|
| Actual |
|
|
|
|
|
|
|
|
|
|
|
|
|
| Administrative Class |
|
$1,000.00 |
|
$1,000.00 |
|
$0.69 |
|
0.14% |
|
|
|
|
|
| Select Class |
|
$1,000.00 |
|
$1,000.00 |
|
$0.69 |
|
0.14% |
|
|
|
|
|
| Service Class |
|
$1,000.00 |
|
$1,000.00 |
|
$0.69 |
|
0.14% |
|
|
|
|
|
| Hypothetical (assuming a 5% return before expenses) |
|
|
|
|
|
|
|
|
|
|
|
|
|
| Administrative Class |
|
$1,000.00 |
|
$1,024.10 |
|
$0.70 |
|
0.14% |
|
|
|
|
|
| Select Class |
|
$1,000.00 |
|
$1,024.10 |
|
$0.70 |
|
0.14% |
|
|
|
|
|
| Service Class |
|
$1,000.00 |
|
$1,024.10 |
|
$0.70 |
|
0.14% |
| (1) |
Expenses are equal to the Funds’ annualized net expense ratios, multiplied by the average account value over the period, multiplied by 181/365 (to reflect the most recent one-half year period). |
April 30, 2013 / ANNUAL REPORT
PORTFOLIO OF INVESTMENTS SUMMARY TABLE
Wilmington Prime Money Market Fund
At April 30,
2013, the Fund’s portfolio composition was as follows (unaudited):
|
|
|
|
|
|
| |
|
Percentages of
Total Net Assets |
| Other Commercial Paper |
|
|
|
30.8 |
% |
| Municipal Notes & Bonds |
|
|
|
20.3 |
% |
| Financial Company Commercial Paper |
|
|
|
10.3 |
% |
| Asset-Backed Commercial Paper |
|
|
|
9.6 |
% |
| Certificate of Deposit |
|
|
|
8.0 |
% |
| U.S. Government Agency Obligations |
|
|
|
6.2 |
% |
| Municipal Commercial Paper |
|
|
|
5.9 |
% |
| U.S. Treasury Obligations |
|
|
|
4.9 |
% |
| Repurchase Agreements |
|
|
|
4.0 |
% |
| Other Assets and Liabilities – Net1 |
|
|
|
0.0 |
%2 |
|
|
|
|
|
|
| TOTAL |
|
|
|
100.0 |
% |
|
|
|
|
|
|
| (1) |
Assets, other than investments in securities, less liabilities. See Statements of Assets and Liabilities. |
| (2) |
Represent less than 0.05%.
|
PORTFOLIO OF INVESTMENTS
April 30, 2013
|
|
|
|
|
|
|
|
|
|
|
|
| Description |
|
Par Value |
|
|
Value |
|
|
| ASSET-BACKED COMMERCIAL PAPER – 9.6%¨ |
|
| Chariot Funding LLC |
|
|
|
|
|
|
|
|
|
|
|
| 0.30%, 7/09/13lW |
|
$ |
50,000,000 |
|
|
$ |
49,971,250 |
|
|
|
|
| 0.32%, 5/16/13lW |
|
|
50,000,000 |
|
|
|
49,993,333 |
|
|
|
|
| MetLife Short Term Fund LLC |
|
|
|
|
|
|
|
|
|
|
|
| 0.17%, 8/01/13lW |
|
|
50,000,000 |
|
|
|
49,978,278 |
|
|
|
|
| 0.19%, 7/08/13lW |
|
|
35,000,000 |
|
|
|
34,987,439 |
|
|
|
|
| Old Line Funding LLC, |
|
|
|
|
|
|
|
|
| 0.25%, 10/03/13lW |
|
|
50,000,000 |
|
|
|
49,946,181 |
|
|
|
|
| Straight-A Funding LLC |
|
|
|
|
|
|
|
|
|
|
|
| 0.18%, 6/04/13 |
|
|
52,048,000 |
|
|
|
52,039,152 |
|
|
|
|
| 0.18%, 6/05/13 |
|
|
25,013,000 |
|
|
|
25,008,623 |
|
|
|
|
| Thunder Bay Funding LLC, |
|
|
|
|
|
|
|
|
| 0.25%, 10/02/13lW |
|
|
50,000,000 |
|
|
|
49,946,528 |
|
|
|
TOTAL ASSET-BACKED COMMERCIAL PAPER
(COST $361,870,784) |
|
|
$ |
361,870,784 |
|
|
|
|
|
|
|
|
|
|
|
|
|
| Description |
|
Par Value |
|
|
Value |
|
|
|
| CERTIFICATE OF DEPOSIT – 8.0% |
|
|
|
|
|
|
|
|
| Bank of Montreal, CHl, |
|
|
|
|
|
|
|
|
| 0.20%, 5/17/13 |
|
$ |
100,000,000 |
|
|
$ |
100,000,000 |
|
|
|
|
| Bank of Nova Scotia, HOU |
|
|
|
|
|
|
|
|
|
|
|
| 0.23%, 7/16/13 |
|
|
50,000,000 |
|
|
|
50,000,000 |
|
|
|
|
| 0.23%, 9/11/13 |
|
|
50,000,000 |
|
|
|
50,000,000 |
|
|
|
|
| Toronto Dominion Bank, NY, |
|
|
|
|
|
|
|
|
| 0.22%, 8/12/13 |
|
|
100,000,000 |
|
|
|
100,000,000 |
|
|
|
|
TOTAL CERTIFICATE OF DEPOSIT
(COST $300,000,000) |
|
|
|
|
|
$ |
300,000,000 |
|
|
| FINANCIAL COMPANY COMMERCIAL PAPER – 10.3%¨ |
|
|
|
|
| Australia & New Zealand Banking Group Ltd., |
|
|
|
|
|
|
|
|
| 0.18%, 6/21/13lW |
|
|
100,000,000 |
|
|
|
99,974,500 |
|
|
|
|
| Commonwealth Bank of Australia |
|
|
|
|
|
|
|
|
|
|
|
| 0.18%, 5/21/13lW |
|
|
50,000,000 |
|
|
|
49,995,000 |
|
|
|
|
| 0.18%, 7/03/13lW |
|
|
37,000,000 |
|
|
|
36,988,345 |
|
|
|
|
| JP Morgan Chase & Co. |
|
|
|
|
|
|
|
|
|
|
|
| 0.30%, 8/06/13 |
|
|
50,000,000 |
|
|
|
49,959,583 |
|
ANNUAL REPORT / April
30, 2013
|
|
|
| 6 |
|
PORTFOLIOS OF INVESTMENTS |
Wilmington Prime Money Market Fund (continued)
|
|
|
|
|
|
|
|
|
|
|
|
| Description |
|
Par Value |
|
|
Value |
|
| 0.35%, 2/03/14lW |
|
$ |
50,000,000 |
|
|
$ |
49,864,861 |
|
|
|
|
| National Australia Funding, Delaware, Inc.,
0.18%, 5/06/13lW |
|
|
100,000,000 |
|
|
|
99,997,569 |
|
|
|
TOTAL FINANCIAL COMPANY COMMERCIAL PAPER
(COST $386,779,858) |
|
|
$ |
386,779,858 |
|
|
|
| MUNICIPAL COMMERCIAL PAPER – 5.9%¨ |
|
|
|
|
|
|
|
|
| Alaska Housing Finance Corp.,
0.18%, 5/01/13 |
|
|
71,300,000 |
|
|
|
71,300,000 |
|
|
|
|
| Catholic Health Initiatives,
0.20%, 5/07/13 |
|
|
48,500,000 |
|
|
|
48,498,383 |
|
|
|
|
| Houston Texas Utility,
(Series B-1), 0.15%, 5/23/13 |
|
|
25,000,000 |
|
|
|
25,000,000 |
|
|
|
|
| Texas A&M University,
0.15%, 5/08/13 |
|
|
26,900,000 |
|
|
|
26,900,000 |
|
|
|
|
| University of California,
0.17%, 5/22/13 |
|
|
50,000,000 |
|
|
|
49,995,042 |
|
|
|
|
TOTAL MUNICIPAL COMMERCIAL PAPER
(COST $221,693,425) |
|
|
|
|
|
$ |
221,693,425 |
|
|
|
| MUNICIPAL NOTES & BONDS – 20.3% |
|
|
|
|
|
|
|
|
| Commonwealth of Massachusetts,
GO Limited Bonds, (Series B) Daily VRDNs, (JP Morgan Chase Bank, SPA), 0.21%, 5/01/13 |
|
|
24,435,000 |
|
|
|
24,435,000 |
|
|
|
|
| Commonwealth of Massachusetts,
GO Limited Bonds, (Series B) Daily VRDNs, (U.S. Bank NA, SPA), 0.20%, 5/01/13 |
|
|
23,335,000 |
|
|
|
23,335,000 |
|
|
|
|
| Connecticut State Health and Educational Facilities Authority,
Revenue Bonds, (Series T-2) Weekly VRDNs, (Yale University, OBG),
0.21%, 5/07/13 |
|
|
39,250,000 |
|
|
|
39,250,000 |
|
|
|
|
| Geisinger Authority, PA,
Revenue Bonds, Daily VRDNs, (Geisinger Health System Foundation, OBG), (Northern Trust Company, SPA),
0.14%, 5/01/13 |
|
|
22,200,000 |
|
|
|
22,200,000 |
|
|
|
|
| Loudoun County Industrial Development Authority, VA,
Revenue Bonds, (Series B) Weekly VRDNs, (Howard Hughes Medical Institute,
OBG), 0.20%, 5/07/13 |
|
|
65,000,000 |
|
|
|
65,000,000 |
|
|
|
|
| Lower Neches Valley Authority Industrial Development Corp., TX,
Refunding Revenue Bonds,
(Series A) Daily VRDNs, (Exxon Mobil
Corporation, OBG), 0.17%, 5/01/13 |
|
|
29,235,000 |
|
|
|
29,235,000 |
|
|
|
|
| Mississippi Business Finance Corp., Gulf Opportunity, Revenue Bonds, (Series C) Daily VRDNs,
(Chevron Corp., OBG), 0.17%, 5/01/13 |
|
|
16,010,000 |
|
|
|
16,010,000 |
|
|
|
|
| Mississippi Business Finance Corp., Gulf Opportunity, Revenue Bonds, (Series E) Daily VRDNs, (Chevron Corp., OBG), 0.20%, 5/01/13 |
|
|
25,000,000 |
|
|
|
25,000,000 |
|
|
|
|
| Mississippi Business Finance Corp., Gulf Opportunity, Revenue Bonds, (Series K) Daily VRDNs,
(Chevron Corp., OBG), 0.18%, 5/01/13 |
|
|
58,100,000 |
|
|
|
58,100,000 |
|
|
|
|
|
|
|
|
|
|
|
|
|
| Description |
|
Par Value |
|
|
Value |
|
| New York City Municipal Water Finance Authority, NY,
Revenue Bonds, (Series AA-1) Daily VRDNs, (PNC Bank, SPA), 0.16%, 5/01/13 |
|
$ |
43,000,000 |
|
|
$ |
43,000,000 |
|
|
|
|
| New York City Municipal Water Finance Authority, NY, Revenue Bonds, (Subseries DD-1) Daily VRDNs,
(TD Bank N.A., SPA), 0.17%, 5/01/13 |
|
|
39,365,000 |
|
|
|
39,365,000 |
|
|
|
|
| New York, NY,
GO Unlimited Bonds, (Subseries G-5) Daily VRDNs, (Wells Fargo Bank N.A., SPA), 0.18%, 5/01/13 |
|
|
45,765,000 |
|
|
|
45,765,000 |
|
|
|
|
| Private Colleges & Universities Authority, GA,
Revenue Bonds, (Series 2005C-1) Weekly VRDNs, (Emory University, OBG) |
|
|
|
|
|
|
|
|
|
|
|
| 0.20%, 5/07/13 |
|
|
49,150,000 |
|
|
|
49,150,000 |
|
|
|
|
| 0.20%, 5/07/13 |
|
|
50,000,000 |
|
|
|
50,000,000 |
|
|
|
|
| State of Texas, Veterans Housing Assistance, Weekly VRDNs, (JP Morgan Chase, SPA), 0.25%, 5/07/13 |
|
|
36,725,000 |
|
|
|
36,725,000 |
|
|
|
|
| Texas Transportation Commission,
GO Unlimited Bonds,
(Series 2006-B) Weekly VRDNs, (State Street/Calpers, SPA), 0.21%, 5/07/13 |
|
|
25,000,000 |
|
|
|
25,000,000 |
|
|
|
|
| University of Michigan, MI,
Revenue Bonds, (Series B), Weekly VRDNs (US Bank, N.A., SPA), 0.20%, 5/07/13 |
|
|
60,000,000 |
|
|
|
60,000,000 |
|
|
|
|
| University of Texas Permanent University Fund, TX,
Revenue Bonds, (Series A) Weekly VRDNs, 0.19%, 5/07/13 |
|
|
90,535,000 |
|
|
|
90,535,000 |
|
|
|
|
| Valdez, AK,
Revenue Bonds, (Series B) Daily VRDNs, (Exxon Mobil Corporation, OBG), 0.17%, 5/01/13 |
|
|
24,690,000 |
|
|
|
24,690,000 |
|
|
|
|
TOTAL MUNICIPAL NOTES & BONDS
(COST $766,795,000) |
|
|
|
|
|
$ |
766,795,000 |
|
|
|
| OTHER COMMERCIAL PAPER –
30.8%¨ |
|
|
|
|
|
| ABB Treasury Center
USA,
0.27%, 6/18/13lW |
|
|
25,000,000 |
|
|
|
24,991,000 |
|
|
|
|
| American Honda Motor Co, Inc.,
0.15%, 7/22/13 |
|
|
20,000,000 |
|
|
|
19,993,167 |
|
|
|
|
| Baker Hughes,
Inc.,
0.16%, 5/08/13lW |
|
|
33,310,000 |
|
|
|
33,308,964 |
|
|
|
|
| BASF SE,
0.14%, 5/31/13lW |
|
|
100,000,000 |
|
|
|
99,988,333 |
|
|
|
|
| BHP Billiton Finance Ltd. |
|
|
|
|
|
|
|
|
|
|
|
| 0.16%, 7/16/13lW |
|
|
50,000,000 |
|
|
|
49,983,111 |
|
|
|
|
| 0.16%, 7/17/13lW |
|
|
50,000,000 |
|
|
|
49,982,889 |
|
|
|
|
| BMW US Capital LLC |
|
|
|
|
|
|
|
|
|
|
|
| 0.16%, 8/20/13lW |
|
|
40,000,000 |
|
|
|
39,980,267 |
|
|
|
|
| 0.20%, 10/21/13lW |
|
|
30,000,000 |
|
|
|
29,971,166 |
|
|
|
|
| Caterpillar Financial Service Corp.,
0.15%, 5/09/13 |
|
|
25,000,000 |
|
|
|
24,999,167 |
|
|
|
|
| Coca Cola
Co.
0.16%, 8/01/13lW |
|
|
50,000,000 |
|
|
|
49,979,556 |
|
April 30, 2013 / ANNUAL REPORT
|
|
|
|
|
| PORTFOLIOS OF INVESTMENTS |
|
|
7 |
|
Wilmington Prime Money Market Fund (continued)
|
|
|
|
|
|
|
|
|
|
|
|
| Description |
|
Par Value |
|
|
Value |
|
| 0.16%, 8/05/13lW |
|
$ |
50,000,000 |
|
|
$ |
49,978,667 |
|
|
|
|
| CPPIB Capital,
Inc.,
0.16%, 7/25/13lW |
|
|
100,000,000 |
|
|
|
99,962,222 |
|
|
|
|
| Honeywell International, Inc.,
0.17%, 6/24/13lW |
|
|
79,400,000 |
|
|
|
79,379,753 |
|
|
|
|
| Parker-Hannifin
Corp.,
0.17%, 6/10/13lW |
|
|
54,750,000 |
|
|
|
54,739,658 |
|
|
|
|
| Procter & Gamble Co.,
0.15%, 5/28/13lW |
|
|
50,000,000 |
|
|
|
49,994,375 |
|
|
|
|
| Province of Ontario,
0.14%, 7/08/13 |
|
|
25,000,000 |
|
|
|
24,993,389 |
|
|
|
|
| Roche Holdings,
Inc.,
0.17%, 5/02/13lW |
|
|
30,000,000 |
|
|
|
29,999,858 |
|
|
|
|
| Sanofi,
0.15%, 6/17/13lW |
|
|
100,000,000 |
|
|
|
99,980,417 |
|
|
|
|
| Siemens Capital Co.,
LLC,
0.15%, 6/27/13lW |
|
|
50,000,000 |
|
|
|
49,988,125 |
|
|
|
|
| Syngenta Wilmington, Inc. |
|
|
|
|
|
|
|
|
|
|
|
| 0.17%, 6/03/13lW |
|
|
25,000,000 |
|
|
|
24,996,104 |
|
|
|
|
| 0.14%, 6/07/13lW |
|
|
50,000,000 |
|
|
|
49,992,805 |
|
|
|
|
| 0.18%, 7/24/13lW |
|
|
25,000,000 |
|
|
|
24,989,500 |
|
|
|
|
| Toyota Motor Credit Corp.,
0.21%, 5/20/13 |
|
|
100,000,000 |
|
|
|
99,988,917 |
|
|
|
TOTAL OTHER COMMERCIAL PAPER
(COST $1,162,161,410) |
|
|
$ |
1,162,161,410 |
|
|
| U.S. GOVERNMENT AGENCY OBLIGATIONS – 6.2% |
|
|
|
|
| Federal Home Loan Bank,
0.09%, 9/04/13D |
|
|
25,000,000 |
|
|
|
25,000,000 |
|
|
|
|
| Federal Home Loan Mortgage Corporation |
|
|
|
|
|
|
|
|
|
|
|
|
0.15%,
6/17/13D |
|
|
50,000,000 |
|
|
|
50,001,320 |
|
|
|
|
|
0.14%,
9/13/13D |
|
|
75,000,000 |
|
|
|
74,995,551 |
|
|
|
|
| 0.15%, 9/05/13 |
|
|
25,000,000 |
|
|
|
24,986,771 |
|
|
|
|
| Federal National Mortgage Association,
0.17%, 11/08/13D |
|
|
60,200,000 |
|
|
|
60,193,816 |
|
|
|
TOTAL U.S. GOVERNMENT AGENCY OBLIGATIONS
(COST $235,177,458) |
|
|
$ |
235,177,458 |
|
|
|
| U.S. TREASURY OBLIGATIONS – 4.9% |
|
|
|
|
|
|
|
|
| U.S. TREASURY NOTES – 4.9% |
|
|
|
|
|
|
|
|
|
|
|
| 1.00%, 7/15/13 |
|
|
100,000,000 |
|
|
|
100,167,551 |
|
|
|
|
| 3.38%, 7/31/13 |
|
|
35,000,000 |
|
|
|
35,284,375 |
|
|
|
|
| 4.25%, 8/15/13 |
|
|
50,000,000 |
|
|
|
50,598,309 |
|
|
|
TOTAL U.S. TREASURY OBLIGATIONS
(COST $186,050,235) |
|
|
$ |
186,050,235 |
|
|
|
| REPURCHASE AGREEMENTS – 4.0% |
|
|
|
|
|
|
|
|
| Barclays Capital, Inc. 0.15% dated 04/30/13, due 05/01/13, repurchase price $50,000,208, collateralized by a U.S. Treasury Security
0.38%, maturing 11/15/15; total market value of $51,000,096. |
|
|
50,000,000 |
|
|
|
50,000,000 |
|
|
|
|
|
|
|
|
|
|
|
|
|
| Description |
|
Par Value |
|
|
Value |
|
| TD Securities, Inc., 0.15%, dated 04/30/13, due 05/01/13, repurchase price $25,000,104, collateralized by U.S. Government Securities 0.65% to
0.75%, maturing 01/15/16 to 02/01/16; total market value of $25,500,779. |
|
$ |
25,000,000 |
|
|
$ |
25,000,000 |
|
|
|
|
| TD Securities, Inc., 0.17%, dated 04/30/13, due 05/01/13, repurchase price $75,000,354, collateralized by U.S. Government Securities 4.00% to
6.00%, maturing 01/01/42 to 04/01/43; total market value of $77,250,001. |
|
|
75,000,000 |
|
|
|
75,000,000 |
|
|
|
|
TOTAL REPURCHASE AGREEMENTS
(COST $150,000,000) |
|
|
|
|
|
$ |
150,000,000 |
|
|
|
|
TOTAL INVESTMENTS – 100.0%
(COST $3,770,528,170) |
|
|
|
|
|
$ |
3,770,528,170 |
|
|
|
|
OTHER ASSETS LESS
LIABILITIES – 0.0%** |
|
|
|
|
|
|
899,494 |
|
|
|
|
| TOTAL NET ASSETS – 100.0% |
|
|
|
|
|
$ |
3,771,427,664 |
|
ANNUAL REPORT / April
30, 2013
|
|
|
| 8 |
|
PORTFOLIOS OF INVESTMENTS |
Wilmington Prime Money Market Fund (concluded)
Cost of investments for Federal income tax purposes is the same as for financial statement purposes.
Various inputs are used in determining the value of the Fund’s investments. These inputs are summarized in the three broad levels
listed below.
Level 1 – quoted prices in active markets for identical securities
Level 2 – other significant observable inputs (including quoted prices for similar securities, interest rates,
prepayment speeds, credit risk, etc.)
Level 3 – significant unobservable inputs (including the Fund’s own
assumptions in determining the fair value of investments)
The following is a summary of the inputs used as of April 30, 2013 in
valuing the Fund’s assets carried at fair value:
|
|
|
|
|
|
|
|
|
|
|
|
|
|
|
|
|
|
|
|
|
|
| |
|
Level 1 |
|
|
Level 2 |
|
|
Level 3 |
|
|
Total |
|
| Investments in Securities |
|
|
|
|
|
|
|
|
|
|
|
|
|
|
|
|
|
|
|
|
|
| Asset-Backed Commercial Paper |
|
$ |
— |
|
|
$ |
361,870,784 |
|
|
$ |
— |
|
|
$ |
361,870,784 |
|
|
|
|
|
|
| Certificate of Deposit |
|
|
— |
|
|
|
300,000,000 |
|
|
|
— |
|
|
|
300,000,000 |
|
|
|
|
|
|
| Financial Company Commercial Paper |
|
|
— |
|
|
|
386,779,858 |
|
|
|
— |
|
|
|
386,779,858 |
|
|
|
|
|
|
| Municipal Commercial Paper |
|
|
— |
|
|
|
221,693,425 |
|
|
|
— |
|
|
|
221,693,425 |
|
|
|
|
|
|
| Municipal Notes & Bonds |
|
|
— |
|
|
|
766,795,000 |
|
|
|
— |
|
|
|
766,795,000 |
|
|
|
|
|
|
| Other Commercial Paper |
|
|
— |
|
|
|
1,162,161,410 |
|
|
|
— |
|
|
|
1,162,161,410 |
|
|
|
|
|
|
| U.S. Government Agency Obligations |
|
|
— |
|
|
|
235,177,458 |
|
|
|
— |
|
|
|
235,177,458 |
|
|
|
|
|
|
| U.S. Treasury Obligations |
|
|
— |
|
|
|
186,050,235 |
|
|
|
— |
|
|
|
186,050,235 |
|
|
|
|
|
|
| Repurchase Agreements |
|
|
— |
|
|
|
150,000,000 |
|
|
|
— |
|
|
|
150,000,000 |
|
|
|
|
|
|
|
|
|
|
|
|
|
|
|
|
|
|
|
|
|
|
|
| Total |
|
$ |
— |
|
|
$ |
3,770,528,170 |
|
|
$ |
— |
|
|
$ |
3,770,528,170 |
|
|
|
|
|
|
|
|
|
|
|
|
|
|
|
|
|
|
See Notes to Portfolios of Investments
See Notes which are an integral part of the Financial Statements
April 30, 2013 / ANNUAL REPORT
PORTFOLIO OF INVESTMENTS SUMMARY TABLE
Wilmington U.S. Government Money Market Fund
At
April 30, 2013, the Fund’s portfolio composition was as follows (unaudited):
|
|
|
|
|
|
| |
|
Percentage of
Total Net Assets |
| U.S. Government Agency Obligations |
|
|
|
69.8 |
% |
| Repurchase Agreements |
|
|
|
27.6 |
% |
| U.S. Treasury Obligations |
|
|
|
2.6 |
% |
| Other Assets and Liabilities – Net1 |
|
|
|
0.0 |
%2 |
|
|
|
|
|
|
| TOTAL |
|
|
|
100.0 |
% |
|
|
|
|
|
|
| (1) |
Assets, other than investments in securities, less liabilities. See Statements of Assets and Liabilities. |
| (2) |
Represent less than 0.05%.
|
PORTFOLIO OF INVESTMENTS
April 30, 2013
|
|
|
|
|
|
|
|
|
|
|
|
| Description |
|
Par Value |
|
|
Value |
|
|
|
U.S. GOVERNMENT AGENCY
OBLIGATIONS – 69.8% |
|
|
|
|
|
|
|
| FEDERAL FARM CREDIT
BANK (FFCB) – 2.9% |
|
|
|
|
|
|
|
|
| 0.10%,
10/03/13D |
|
$ |
50,000,000 |
|
|
$ |
49,988,898 |
|
|
|
|
| 0.15%, 8/06/13‡ |
|
|
25,000,000 |
|
|
|
24,989,896 |
|
|
|
|
| 0.16%, 5/28/13‡ |
|
|
30,000,000 |
|
|
|
29,996,400 |
|
|
|
|
| 0.22%,
8/22/13D |
|
|
16,750,000 |
|
|
|
16,753,480 |
|
|
|
| TOTAL FEDERAL FARM CREDIT BANK (FFCB) |
|
|
$ |
121,728,674 |
|
|
|
| FEDERAL HOME LOAN
BANK (FHLB) – 24.7% |
|
|
|
|
|
|
|
|
| 0.09%, 9/04/13D |
|
|
25,000,000 |
|
|
|
25,000,000 |
|
|
|
|
| 0.10%, 6/12/13‡ |
|
|
30,000,000 |
|
|
|
29,996,500 |
|
|
|
|
| 0.10%, 10/25/13‡ |
|
|
75,000,000 |
|
|
|
74,963,125 |
|
|
|
|
| 0.11%, 5/17/13‡ |
|
|
50,000,000 |
|
|
|
49,997,556 |
|
|
|
|
| 0.11%, 8/01/13 |
|
|
50,000,000 |
|
|
|
49,998,017 |
|
|
|
|
| 0.11%, 10/16/13‡ |
|
|
25,000,000 |
|
|
|
24,987,458 |
|
|
|
|
| 0.11%, 10/18/13‡ |
|
|
25,000,000 |
|
|
|
24,987,309 |
|
|
|
|
| 0.11%, 10/23/13‡ |
|
|
50,000,000 |
|
|
|
49,974,480 |
|
|
|
|
| 0.13%, 8/16/13‡ |
|
|
100,000,000 |
|
|
|
99,962,847 |
|
|
|
|
| 0.14%, 5/24/13‡ |
|
|
34,000,000 |
|
|
|
33,997,068 |
|
|
|
|
| 0.14%, 6/17/13 |
|
|
108,100,000 |
|
|
|
108,099,772 |
|
|
|
|
| 0.14%, 8/28/13 |
|
|
50,000,000 |
|
|
|
49,996,318 |
|
|
|
|
| 0.14%,
2/28/14D |
|
|
100,000,000 |
|
|
|
99,991,773 |
|
|
|
|
| 0.15%, 5/03/13‡ |
|
|
100,000,000 |
|
|
|
99,999,190 |
|
|
|
|
| 0.16%, 5/08/13‡ |
|
|
67,700,000 |
|
|
|
67,697,933 |
|
|
|
|
|
|
|
|
|
|
|
|
|
| Description |
|
Par Value |
|
|
Value |
|
|
|
|
| 0.16%,
5/23/13D |
|
$ |
50,000,000 |
|
|
$ |
50,000,000 |
|
|
|
|
| 0.16%,
2/05/14D |
|
|
100,000,000 |
|
|
|
100,000,000 |
|
|
|
| TOTAL FEDERAL HOME LOAN BANK (FHLB) |
|
|
$ |
1,039,649,346 |
|
|
|
| FEDERAL HOME LOAN MORTGAGE
CORPORATION (FHLMC) – 21.8% |
|
|
|
|
|
|
|
|
| 0.09%, 5/07/13 |
|
|
30,000,000 |
|
|
|
29,999,550 |
|
|
|
|
| 0.10%, 6/17/13‡ |
|
|
35,000,000 |
|
|
|
34,995,431 |
|
|
|
|
| 0.10%, 10/21/13‡ |
|
|
100,000,000 |
|
|
|
99,951,944 |
|
|
|
|
| 0.10%, 10/28/13‡ |
|
|
50,000,000 |
|
|
|
49,975,000 |
|
|
|
|
| 0.11%, 7/22/13‡ |
|
|
50,000,000 |
|
|
|
49,987,472 |
|
|
|
|
| 0.12%, 7/02/13‡ |
|
|
100,000,000 |
|
|
|
99,979,764 |
|
|
|
|
| 0.12%, 8/05/13‡ |
|
|
25,000,000 |
|
|
|
24,992,333 |
|
|
|
|
| 0.12%, 8/19/13‡ |
|
|
50,000,000 |
|
|
|
49,981,667 |
|
|
|
|
| 0.13%, 9/09/13‡ |
|
|
50,000,000 |
|
|
|
49,976,347 |
|
|
|
|
| 0.14%,
9/13/13D |
|
|
159,785,000 |
|
|
|
159,786,429 |
|
|
|
|
| 0.15%, 5/06/13‡ |
|
|
26,648,000 |
|
|
|
26,647,445 |
|
|
|
|
| 0.15%,
5/16/13D |
|
|
50,000,000 |
|
|
|
50,000,341 |
|
|
|
|
| 0.15%, 6/05/13‡ |
|
|
63,800,000 |
|
|
|
63,790,696 |
|
|
|
|
| 0.15%, 6/10/13‡ |
|
|
50,000,000 |
|
|
|
49,991,667 |
|
|
|
|
| 0.15%,
6/17/13D |
|
|
50,000,000 |
|
|
|
50,001,320 |
|
|
|
|
| 0.17%,
11/04/13D |
|
|
25,000,000 |
|
|
|
24,999,140 |
|
|
|
| TOTAL FEDERAL HOME LOAN MORTGAGE
CORPORATION (FHLMC) |
|
|
$ |
915,056,546 |
|
ANNUAL REPORT / April
30, 2013
|
|
|
| 10 |
|
PORTFOLIOS OF INVESTMENTS |
Wilmington U.S. Government Money Market Fund (continued)
|
|
|
|
|
|
|
|
|
|
|
|
| Description |
|
Par Value |
|
|
Value |
|
|
|
| FEDERAL NATIONAL MORTGAGE
ASSOCIATION (FNMA) – 20.4% |
|
|
|
|
|
|
|
|
| 0.10%, 7/03/13‡ |
|
$ |
25,176,000 |
|
|
$ |
25,171,594 |
|
|
|
|
| 0.10%, 10/16/13‡ |
|
|
75,000,000 |
|
|
|
74,965,000 |
|
|
|
|
| 0.11%, 5/20/13‡ |
|
|
20,000,000 |
|
|
|
19,998,839 |
|
|
|
|
| 0.11%, 10/09/13‡ |
|
|
82,500,000 |
|
|
|
82,461,259 |
|
|
|
|
| 0.11%, 11/01/13‡ |
|
|
50,000,000 |
|
|
|
49,973,167 |
|
|
|
|
| 0.12%, 7/01/13‡ |
|
|
38,812,000 |
|
|
|
38,804,108 |
|
|
|
|
| 0.12%, 7/22/13‡ |
|
|
50,000,000 |
|
|
|
49,986,333 |
|
|
|
|
| 0.12%, 8/21/13‡ |
|
|
50,000,000 |
|
|
|
49,981,333 |
|
|
|
|
| 0.13%, 6/06/13‡ |
|
|
50,000,000 |
|
|
|
49,993,500 |
|
|
|
|
| 0.14%, 5/08/13 |
|
|
100,000,000 |
|
|
|
99,997,365 |
|
|
|
|
| 0.14%, 7/02/13‡ |
|
|
75,000,000 |
|
|
|
74,981,917 |
|
|
|
|
| 0.15%, 6/12/13‡ |
|
|
50,000,000 |
|
|
|
49,991,542 |
|
|
|
|
| 0.15%, 9/03/13‡ |
|
|
25,000,000 |
|
|
|
24,986,979 |
|
|
|
|
| 0.15%, 2/03/14‡ |
|
|
22,517,000 |
|
|
|
22,490,918 |
|
|
|
|
| 0.17%,
11/08/13D |
|
|
45,000,000 |
|
|
|
44,995,378 |
|
|
|
|
| 1.00%, 9/23/13 |
|
|
100,000,000 |
|
|
|
100,340,282 |
|
| TOTAL FEDERAL NATIONAL MORTGAGE
ASSOCIATION (FNMA) |
|
|
$ |
859,119,514 |
|
|
|
TOTAL U.S. GOVERNMENT AGENCY OBLIGATIONS
(COST $2,935,554,080) |
|
|
$ |
2,935,554,080 |
|
|
|
| U.S. TREASURY OBLIGATIONS – 2.6% |
|
|
|
|
|
|
|
| U.S. TREASURY NOTES – 2.6% |
|
|
|
|
|
|
|
|
| 1.00%, 7/15/13 |
|
|
25,000,000 |
|
|
|
25,041,888 |
|
|
|
|
| 3.38%, 7/31/13 |
|
|
35,000,000 |
|
|
|
35,284,375 |
|
|
|
|
| 4.25%, 8/15/13 |
|
|
50,000,000 |
|
|
|
50,598,309 |
|
|
|
TOTAL U.S. TREASURY OBLIGATIONS
(COST $110,924,572) |
|
|
$ |
110,924,572 |
|
|
|
| REPURCHASE AGREEMENTS – 27.6% |
|
|
|
|
|
|
|
|
| Barclays Capital, Inc., 0.15%, dated 04/30/13, due 05/01/13, repurchase price $100,000,417, collateralized by a U.S. Treasury Security 0.25%,
maturing 08/15/15; total market value of $102,000,000. |
|
|
100,000,000 |
|
|
|
100,000,000 |
|
|
|
|
|
|
|
|
|
|
|
|
|
| Description |
|
Par Value |
|
|
Value |
|
| Credit Suisse First Boston LLC, 0.14%, dated 04/30/13, due 05/01/13, repurchase price $94,000,366, collateralized by a U.S. Treasury Security
1.50%, maturing 06/30/16; total market value of $95,880,959. |
|
$ |
94,000,000 |
|
|
$ |
94,000,000 |
|
|
|
|
| Deutsche Bank Securities, Inc., 0.15%, dated 04/30/13, due 05/01/13, repurchase price $450,001,875, collateralized by U.S. Government Securities
0.00% to 6.25%, maturing 06/21/13 to 05/15/29; total market value of $459,003,693. |
|
|
450,000,000 |
|
|
|
450,000,000 |
|
|
|
|
| Merrill Lynch, Pierce, Fenner & Smith, Inc., 0.14%, dated 04/30/13, due 05/1/13, repurchase price $65,000,253, collateralized by U.S.
Treasury Securities 0.00% to 0.25%, maturing 07/25/13 to 11/30/14; total market value of $66,300,077. |
|
|
65,000,000 |
|
|
|
65,000,000 |
|
|
|
|
| TD Securities, Inc., 0.15%, dated 04/30/13, due 05/01/13, repurchase price $375,001,563, collateralized by U.S. Government Securities 0.17% to
6.63%, maturing 05/07/13 to 11/15/30; total market value of $382,500,530. |
|
|
375,000,000 |
|
|
|
375,000,000 |
|
|
|
|
| TD Securities, Inc., 0.17%, dated 04/30/13, due 05/01/13, repurchase price $75,000,354, collateralized by a U.S. Government Security 4.00%,
maturing 01/01/42; total market value of $77,250,001. |
|
|
75,000,000 |
|
|
|
75,000,000 |
|
|
|
|
TOTAL REPURCHASE AGREEMENTS
(COST $1,159,000,000) |
|
|
|
|
|
$ |
1,159,000,000 |
|
|
|
|
TOTAL INVESTMENTS – 100.0%
(COST $4,205,478,652) |
|
|
|
|
|
$ |
4,205,478,652 |
|
|
|
| OTHER ASSETS LESS LIABILITIES – 0.0%** |
|
|
|
1,092,490 |
|
|
|
|
| TOTAL NET ASSETS – 100.0% |
|
|
|
|
|
$ |
4,206,571,142 |
|
Cost of investments
for Federal income tax purposes is the same as for financial statement purposes.
April 30, 2013 / ANNUAL REPORT
|
|
|
|
|
| PORTFOLIOS OF INVESTMENTS |
|
|
11 |
|
Wilmington U.S. Government Money Market Fund (concluded)
Various inputs are used in determining the value of the Fund’s investments. These inputs are summarized in the three broad levels
listed below.
Level 1 – quoted prices in active markets for identical securities
Level 2 – other significant observable inputs (including quoted prices for similar securities, interest rates,
prepayment speeds, credit risk, etc.)
Level 3 – significant unobservable inputs (including the Fund’s own
assumptions in determining the fair value of investments)
The following is a summary of the inputs used as of April 30, 2013 in
valuing the Fund’s assets carried at fair value:
|
|
|
|
|
|
|
|
|
|
|
|
|
|
|
|
|
|
|
|
|
|
| |
|
Level 1 |
|
|
Level 2 |
|
|
Level 3 |
|
|
Total |
|
| Investments in Securities |
|
|
|
|
|
|
|
|
|
|
|
|
|
|
|
|
|
|
|
|
|
| U.S. Government Agency Obligations |
|
$ |
— |
|
|
$ |
2,935,554,080 |
|
|
$ |
— |
|
|
$ |
2,935,554,080 |
|
|
|
|
|
|
| U.S. Treasury Obligations |
|
|
— |
|
|
|
110,924,572 |
|
|
|
— |
|
|
|
110,924,572 |
|
|
|
|
|
|
| Repurchase Agreements |
|
|
— |
|
|
|
1,159,000,000 |
|
|
|
— |
|
|
|
1,159,000,000 |
|
|
|
|
|
|
|
|
|
|
|
|
|
|
|
|
|
|
|
|
|
|
|
| Total |
|
$ |
— |
|
|
$ |
4,205,478,652 |
|
|
$ |
— |
|
|
$ |
4,205,478,652 |
|
|
|
|
|
|
|
|
|
|
|
|
|
|
|
|
|
|
See Notes to Portfolios of Investments
See Notes which are an integral part of the Financial Statements
ANNUAL REPORT / April
30, 2013
PORTFOLIO OF INVESTMENTS SUMMARY TABLE
Wilmington U.S. Treasury Money Market Fund
At
April 30, 2013, the Fund’s portfolio composition was as follows (unaudited):
|
|
|
|
|
|
| |
|
Percentage of
Total Net Assets |
| U.S. Treasury Obligations |
|
|
|
45.6 |
% |
| Repurchase Agreements |
|
|
|
54.2 |
% |
| Other Assets and Liabilities – Net1 |
|
|
|
0.2 |
% |
|
|
|
|
|
|
| TOTAL |
|
|
|
100.0 |
% |
|
|
|
|
|
|
| (1) |
Assets, other than investments in securities, less liabilities. See Statements of Assets and Liabilities.
|
PORTFOLIO OF INVESTMENTS
April 30, 2013
|
|
|
|
|
|
|
|
|
|
|
|
| Description |
|
Par Value |
|
|
Value |
|
|
|
| U.S. TREASURY OBLIGATIONS – 45.6% |
|
|
|
|
|
|
|
|
| U.S. TREASURY BILL – 2.1% |
|
|
|
|
|
|
|
|
|
|
|
| 0.12%, 7/18/13‡ |
|
$ |
25,000,000 |
|
|
$ |
24,993,500 |
|
|
|
|
| U.S. TREASURY NOTES – 43.5% |
|
|
|
|
|
|
|
|
|
|
|
| 1.38%, 5/15/13 |
|
|
75,000,000 |
|
|
|
75,035,340 |
|
|
|
|
| 3.63%, 5/15/13 |
|
|
25,000,000 |
|
|
|
25,033,231 |
|
|
|
|
| 0.38%, 7/31/13 |
|
|
50,000,000 |
|
|
|
50,030,973 |
|
|
|
|
| 3.38%, 7/31/13 |
|
|
61,000,000 |
|
|
|
61,495,301 |
|
|
|
|
| 0.75%, 8/15/13 |
|
|
25,000,000 |
|
|
|
25,043,584 |
|
|
|
|
| 4.25%, 8/15/13 |
|
|
25,000,000 |
|
|
|
25,299,155 |
|
|
|
|
| 0.13%, 8/31/13 |
|
|
75,000,000 |
|
|
|
75,000,944 |
|
|
|
|
| 0.75%, 9/15/13 |
|
|
50,000,000 |
|
|
|
50,115,115 |
|
|
|
|
| 0.50%, 10/15/13 |
|
|
50,000,000 |
|
|
|
50,093,192 |
|
|
|
|
| 2.75%, 10/31/13 |
|
|
25,000,000 |
|
|
|
25,330,227 |
|
|
|
|
| 0.50%, 11/15/13 |
|
|
25,000,000 |
|
|
|
25,051,209 |
|
|
|
|
| 0.25%, 11/30/13 |
|
|
45,000,000 |
|
|
|
45,032,277 |
|
|
|
|
| TOTAL U.S. TREASURY NOTES |
|
|
|
|
|
$ |
532,560,548 |
|
|
|
|
| TOTAL U.S. TREASURY OBLIGATIONS (COST $557,554,048) |
|
|
|
|
|
$ |
557,554,048 |
|
|
|
| REPURCHASE AGREEMENTS – 54.2% |
|
|
|
|
|
|
|
|
| Barclays Capital, Inc., 0.15%, dated 04/30/13, due 05/01/13, repurchase price $175,000,729, collateralized by U.S. Treasury Securities 0.25% to
4.75%, maturing 11/30/14 to 02/15/41; total market value of $178,500,050. |
|
|
175,000,000 |
|
|
|
175,000,000 |
|
|
|
|
|
|
|
|
|
|
|
|
|
| Description |
|
Par Value |
|
|
Value |
|
|
|
|
| Credit Suisse First Boston LLC, 0.14%, dated 04/30/13, due 05/01/13, repurchase price $144,000,560, collateralized by a U.S. Treasury Security
0.25%, maturing 05/15/15; total market value of $146,883,744. |
|
$ |
144,000,000 |
|
|
$ |
144,000,000 |
|
|
|
|
| Deutsche Bank Securities, Inc., 0.14%, dated 04/30/13, due 05/01/13, repurchase price $230,000,894, collateralized by U.S. Treasury Securities
0.00% to 8.88%, maturing 06/15/13 to 08/15/42; total market value of $234,600,000. |
|
|
230,000,000 |
|
|
|
230,000,000 |
|
|
|
|
| Merrill Lynch, Pierce, Fenner & Smith, Inc., 0.14%, dated 04/30/13, due 05/01/13, repurchase price $115,000,447, collateralized by a U.S.
Treasury Security 3.13%, maturing 11/15/41; total market value of $117,300,082. |
|
|
115,000,000 |
|
|
|
115,000,000 |
|
|
|
|
TOTAL REPURCHASE AGREEMENTS
(COST $664,000,000) |
|
|
|
|
|
$ |
664,000,000 |
|
|
|
|
TOTAL INVESTMENTS – 99.8%
(COST $1,221,554,048) |
|
|
|
|
|
$ |
1,221,554,048 |
|
|
|
| OTHER ASSETS LESS LIABILITIES – 0.2% |
|
|
|
2,157,424 |
|
|
|
|
| TOTAL NET ASSETS – 100.0% |
|
|
|
|
|
$ |
1,223,711,472 |
|
April 30, 2013 / ANNUAL REPORT
|
|
|
|
|
| PORTFOLIOS OF INVESTMENTS |
|
|
13 |
|
Wilmington U.S. Treasury Money Market Fund (concluded)
Cost of investments for Federal income tax purposes is the same as for financial statement purposes.
Various inputs are used in determining the value of the Fund’s investments. These inputs are summarized in the three broad levels
listed below.
Level 1 – quoted prices in active markets for identical securities
Level 2 – other significant observable inputs (including quoted prices for similar securities, interest rates, prepayment speeds,
credit risk, etc.)
Level 3 – significant unobservable inputs (including the Fund’s own assumptions in determining the fair
value of investments)
The following is a summary of the inputs used as of April 30, 2013 in valuing the Fund’s assets
carried at fair value:
|
|
|
|
|
|
|
|
|
|
|
|
|
|
|
|
|
|
|
|
|
|
| |
|
Level 1 |
|
|
Level 2 |
|
|
Level 3 |
|
|
Total |
|
| Investments in Securities |
|
|
|
|
|
|
|
|
|
|
|
|
|
|
|
|
|
|
|
|
|
| U.S. Treasury Obligations |
|
$ |
— |
|
|
$ |
557,554,048 |
|
|
$ |
— |
|
|
$ |
557,554,048 |
|
|
|
|
|
|
| Repurchase Agreements |
|
|
— |
|
|
|
664,000,000 |
|
|
|
— |
|
|
|
664,000,000 |
|
|
|
|
|
|
|
|
|
|
|
|
|
|
|
|
|
|
|
|
|
|
|
| Total |
|
$ |
— |
|
|
$ |
1,221,554,048 |
|
|
$ |
— |
|
|
$ |
1,221,554,048 |
|
|
|
|
|
|
|
|
|
|
|
|
|
|
|
|
|
|
See Notes to Portfolios of Investments
See Notes which are an integral part of the Financial Statements
ANNUAL REPORT / April
30, 2013
PORTFOLIO OF INVESTMENTS SUMMARY TABLE
Wilmington Tax-Exempt Money Market Fund
At April 30,
2013, the Fund’s geographical location classifications were as follows (unaudited):
|
|
|
|
|
|
| |
|
Percentages of
Total Net Assets |
| Texas |
|
|
|
21.9 |
% |
| Delaware |
|
|
|
7.8 |
% |
| Minnesota |
|
|
|
7.3 |
% |
| Tennessee |
|
|
|
6.0 |
% |
| Massachusetts |
|
|
|
5.6 |
% |
| Ohio |
|
|
|
5.2 |
% |
| Utah |
|
|
|
4.4 |
% |
| Virginia |
|
|
|
4.4 |
% |
| South Carolina |
|
|
|
4.1 |
% |
| Missouri |
|
|
|
4.0 |
% |
| Louisiana |
|
|
|
3.8 |
% |
| New Hampshire |
|
|
|
2.8 |
% |
| Maryland |
|
|
|
2.7 |
% |
| Nevada |
|
|
|
2.6 |
% |
| Mississippi |
|
|
|
2.5 |
% |
| All Other |
|
|
|
14.9 |
% |
| Other Assets and Liabilities – Net1 |
|
|
|
0.0 |
%2 |
|
|
|
|
|
|
| TOTAL |
|
|
|
100.0 |
% |
|
|
|
|
|
|
| (1) |
Assets, other than investments in securities, less liabilities. See Statements of Assets and Liabilities. |
| (2) |
Represent less than 0.05%.
|
PORTFOLIO OF INVESTMENTS
April 30, 2013
|
|
|
|
|
|
|
|
|
|
|
|
| Description |
|
Par Value |
|
|
Value |
|
|
|
|
| COMMERCIAL PAPER – 50.1% |
|
|
|
|
|
|
|
|
|
|
|
| ARIZONA – 1.4% |
|
|
|
|
|
|
|
|
|
|
|
| Salt River Project, AZ, Agricultural Improvement & Power District,
(Series C), (US Bank, LIQ), 0.15%, 6/06/13 |
|
$ |
7,150,000 |
|
|
$ |
7,150,000 |
|
|
|
|
| TOTAL ARIZONA |
|
|
|
|
|
$ |
7,150,000 |
|
|
|
|
| ILLINOIS – 1.4% |
|
|
|
|
|
|
|
|
|
|
|
| Illinois Educational Facilities Authority, Pooled Financing Program,
(Series 95), (Northern Trust, LOC), 0.15%, 5/07/13 |
|
|
7,083,000 |
|
|
|
7,083,000 |
|
| TOTAL ILLINOIS |
|
|
|
|
|
$ |
7,083,000 |
|
|
|
|
| MARYLAND – 2.7% |
|
|
|
|
|
|
|
|
|
|
|
| Anne Arundel County, MD, Consolidated Water & Sewer,
GO BANs,
(Series 97-A), (State Street, LIQ), 0.14%, 5/15/13 |
|
|
6,000,000 |
|
|
|
6,000,000 |
|
|
|
|
|
|
|
|
|
|
|
|
|
| Description |
|
Par Value |
|
|
Value |
|
|
|
|
| Johns Hopkins University, (Series B), 0.15%, 7/03/13 |
|
$ |
7,700,000 |
|
|
$ |
7,700,000 |
|
|
|
|
| TOTAL MARYLAND |
|
|
|
|
|
$ |
13,700,000 |
|
|
|
|
| MICHIGAN – 1.6% |
|
|
|
|
|
|
|
|
| University of Michigan,
(Series I), 0.15%, 7/02/13 |
|
|
8,305,000 |
|
|
|
8,305,000 |
|
|
|
|
| TOTAL MICHIGAN |
|
|
|
|
|
$ |
8,305,000 |
|
|
|
|
| MINNESOTA – 5.5% |
|
|
|
|
|
|
|
|
|
|
|
| Rochester, MN, Municipal Health Care Facilities (Mayo Clinic),
(Series A), 0.14%, 5/16/13 |
|
|
5,000,000 |
|
|
|
5,000,000 |
|
|
|
|
| University of Minnesota |
|
|
|
|
|
|
|
|
|
|
|
| 0.15%, 6/05/13 |
|
|
12,600,000 |
|
|
|
12,600,000 |
|
|
|
|
| 0.15%, 6/11/13 |
|
|
10,000,000 |
|
|
|
10,000,000 |
|
|
|
|
| TOTAL MINNESOTA |
|
|
|
|
|
$ |
27,600,000 |
|
April 30, 2013 / ANNUAL REPORT
|
|
|
|
|
| PORTFOLIOS OF INVESTMENTS |
|
|
15 |
|
Wilmington Tax-Exempt Money Market Fund (continued)
|
|
|
|
|
|
|
|
|
|
|
|
| Description |
|
Par Value |
|
|
Value |
|
|
|
|
| MISSOURI – 4.0% |
|
|
|
|
|
|
|
|
|
|
|
| University of Missouri, (Series A) |
|
|
|
|
|
|
|
|
|
|
|
| 0.14%, 5/03/13 |
|
$ |
15,500,000 |
|
|
$ |
15,500,000 |
|
|
|
|
| 0.14%, 5/16/13 |
|
|
4,500,000 |
|
|
|
4,500,000 |
|
|
|
|
| TOTAL MISSOURI |
|
|
|
|
|
$ |
20,000,000 |
|
|
|
|
| NEVADA – 2.6% |
|
|
|
|
|
|
|
|
|
|
|
| Las Vegas Valley Water District, (Series 2004-A), (JP Morgan Chase, LIQ) |
|
|
|
|
|
|
|
|
|
|
|
| 0.15%, 5/07/13 |
|
|
8,000,000 |
|
|
|
8,000,000 |
|
|
|
|
| 0.16%, 6/11/13 |
|
|
5,000,000 |
|
|
|
5,000,000 |
|
|
|
|
| TOTAL NEVADA |
|
|
|
|
|
$ |
13,000,000 |
|
|
|
|
| NORTH CAROLINA – 0.7% |
|
|
|
|
|
|
|
|
|
|
|
| Charlotte, NC, Water Sewer Systems, Revenue Bonds,
(Wells Fargo, LIQ), 0.23%, 12/09/13 |
|
|
3,479,000 |
|
|
|
3,479,000 |
|
|
|
|
| TOTAL NORTH CAROLINA |
|
|
|
|
|
$ |
3,479,000 |
|
|
|
|
| OHIO – 2.5% |
|
|
|
|
|
|
|
|
|
|
|
| Ohio Higher Educational Facility Commission, (Case Western University), (JPMorgan Chase, LIQ), 0.17%, 5/08/13 |
|
|
3,500,000 |
|
|
|
3,500,000 |
|
|
|
|
| Ohio Higher Educational Facility Commission, (Case Western University), (Northern Trust, LIQ), 0.15%, 5/08/13 |
|
|
9,000,000 |
|
|
|
9,000,000 |
|
|
|
|
| TOTAL OHIO |
|
|
|
|
|
$ |
12,500,000 |
|
|
|
|
| SOUTH CAROLINA – 4.1% |
|
|
|
|
|
|
|
|
|
|
|
| South Carolina State Public Service Authority,
(Series A), (JPMorgan Chase, LIQ) |
|
|
|
|
|
|
|
|
|
|
|
| 0.15%, 5/06/13 |
|
|
5,500,000 |
|
|
|
5,500,000 |
|
|
|
|
| 0.15%, 6/05/13 |
|
|
11,663,000 |
|
|
|
11,663,000 |
|
|
|
|
| South Carolina State Public Service Authority,
(Series B), (Wells Fargo, LIQ), 0.16%, 8/07/13 |
|
|
3,360,000 |
|
|
|
3,360,000 |
|
|
|
|
| TOTAL SOUTH CAROLINA |
|
|
|
|
|
$ |
20,523,000 |
|
|
|
|
| TENNESSEE – 6.0% |
|
|
|
|
|
|
|
|
|
|
|
| Metropolitan Government of Nashville & Davidson County, TN, (State Street /CalSTRS / Calpers, LIQ), (Series A), 0.16%, 5/07/13 |
|
|
9,000,000 |
|
|
|
9,000,000 |
|
|
|
|
| Metropolitan Government of Nashville & Davidson County, TN, (State Street /CalSTRS / Calpers, LIQ), (Series B), 0.18%, 5/07/13 |
|
|
3,000,000 |
|
|
|
3,000,000 |
|
|
|
|
| State of Tennessee, (Series 00-A), (TN Consolidated Retirement Systems, LIQ) |
|
|
|
|
|
|
|
|
|
|
|
| 0.17%, 8/07/13 |
|
|
6,370,000 |
|
|
|
6,370,000 |
|
|
|
|
| 0.17%, 8/08/13 |
|
|
12,000,000 |
|
|
|
12,000,000 |
|
|
|
|
| TOTAL TENNESSEE |
|
|
|
|
|
$ |
30,370,000 |
|
|
|
|
| TEXAS – 11.2% |
|
|
|
|
|
|
|
|
|
|
|
| City of Houston, TX, GO,
(Series H-2), 0.14%, 5/16/13 |
|
|
6,000,000 |
|
|
|
6,000,000 |
|
|
|
|
|
|
|
|
|
|
|
|
|
| Description |
|
Par Value |
|
|
Value |
|
|
|
|
| City of Houston, TX, GO (JPMorgan Chase, LIQ),
(Series E-1), 0.18%, 6/06/13 |
|
$ |
10,000,000 |
|
|
$ |
10,000,000 |
|
|
|
|
| City of Houston, TX, GO (Wells Fargo, LIQ),
(Series E-2), 0.17%, 5/16/13 |
|
|
5,000,000 |
|
|
|
5,000,000 |
|
|
|
|
| City of San Antonio, TX,
(Series B), (Wells Fargo, LIQ), 0.15%, 6/06/13 |
|
|
11,750,000 |
|
|
|
11,750,000 |
|
|
|
|
| Texas A&M University,
(Series B), 0.14%, 5/03/13 |
|
|
10,300,000 |
|
|
|
10,300,000 |
|
|
|
|
| Texas Tech University, (Series A), |
|
|
|
|
|
|
|
|
|
|
|
| 0.14%, 5/06/13 |
|
|
3,252,000 |
|
|
|
3,252,000 |
|
|
|
|
| 0.15%, 7/03/13 |
|
|
9,795,000 |
|
|
|
9,795,000 |
|
|
|
|
| TOTAL TEXAS |
|
|
|
|
|
$ |
56,097,000 |
|
|
|
|
| VIRGINIA – 4.4% |
|
|
|
|
|
|
|
|
|
|
|
| University of Virginia Rector & Visitors |
|
|
|
|
|
|
|
|
|
|
|
| 0.15%, 7/03/13 |
|
|
20,000,000 |
|
|
|
20,000,000 |
|
|
|
|
| 0.16%, 7/08/13 |
|
|
2,000,000 |
|
|
|
2,000,000 |
|
|
|
|
| TOTAL VIRGINIA |
|
|
|
|
|
$ |
22,000,000 |
|
|
|
|
| WISCONSIN – 2.0% |
|
|
|
|
|
|
|
|
|
|
|
| Wisconsin State, GO,
(Series 05-A), 0.15%, 5/08/13 |
|
|
10,000,000 |
|
|
|
10,000,000 |
|
|
|
|
| TOTAL WISCONSIN |
|
|
|
|
|
$ |
10,000,000 |
|
|
|
|
TOTAL COMMERCIAL PAPER
(COST $251,807,000) |
|
|
|
|
|
$ |
251,807,000 |
|
|
|
|
| MUNICIPAL BONDS – 3.4% |
|
|
|
|
|
|
|
|
|
|
|
| IDAHO – 0.4% |
|
|
|
|
|
|
|
|
|
|
|
| Idaho State, GO Unlimited Notes, TANs, 2.00%, 6/28/13 |
|
|
2,000,000 |
|
|
|
2,005,707 |
|
|
|
|
| TOTAL IDAHO |
|
|
|
|
|
$ |
2,005,707 |
|
|
|
|
| TEXAS – 3.0% |
|
|
|
|
|
|
|
|
|
|
|
| Texas State, Revenue Bonds, TRANs, 2.50%, 8/30/13 |
|
|
15,000,000 |
|
|
|
15,113,077 |
|
|
|
|
| TOTAL TEXAS |
|
|
|
|
|
$ |
15,113,077 |
|
|
|
|
TOTAL MUNICIPAL BONDS
(COST $17,118,784) |
|
|
|
|
|
$ |
17,118,784 |
|
ANNUAL REPORT / April
30, 2013
|
|
|
| 16 |
|
PORTFOLIOS OF INVESTMENTS |
Wilmington Tax-Exempt Money Market Fund (continued)
|
|
|
|
|
|
|
|
|
|
|
|
| Description |
|
Par Value |
|
|
Value |
|
|
| SHORT-TERM MUNICIPAL BONDS – 46.5% |
|
|
|
|
| DELAWARE – 7.8% |
|
|
|
|
|
|
|
|
|
|
|
| Delaware State Health Facilities Authority, Revenue Bonds, (Christiana Care Health Services, OBG), Daily VRDNs, 0.17%, 5/01/13 |
|
$ |
16,200,000 |
|
|
$ |
16,200,000 |
|
|
|
|
| Delaware State Health Facilities Authority, Revenue Bonds, (Christiana Care Health Services, OBG), Weekly VRDNs, 0.20%, 5/07/13 |
|
|
4,000,000 |
|
|
|
4,000,000 |
|
|
|
|
| University of Delaware, DE, Refunding Revenue Bonds, (TD Bank N.A., SPA), Daily VRDNs, 0.19%, 5/01/13 |
|
|
18,955,000 |
|
|
|
18,955,000 |
|
|
|
|
| TOTAL DELAWARE |
|
|
|
|
|
$ |
39,155,000 |
|
|
|
|
| FLORIDA – 0.8% |
|
|
|
|
|
|
|
|
|
|
|
| Orange County Housing Finance Authority, FL, Refunding Revenue Bonds, Weekly VRDNs, (Fannie Mae), 0.22%, 5/07/13 |
|
|
3,835,000 |
|
|
|
3,835,000 |
|
|
|
|
| TOTAL FLORIDA |
|
|
|
|
|
$ |
3,835,000 |
|
|
|
|
| ILLINOIS – 0.8% |
|
|
|
|
|
|
|
|
|
|
|
| Illinois Finance Authority, Revenue Bonds, (Series E-1), Daily VRDNs, (University of Chicago Medical Center), (JPMorgan Chase Bank N.A., LOC),
0.18%, 5/01/13 |
|
|
4,000,000 |
|
|
|
4,000,000 |
|
|
|
|
| TOTAL ILLINOIS |
|
|
|
|
|
$ |
4,000,000 |
|
|
|
|
| KENTUCKY – 0.9% |
|
|
|
|
|
|
|
|
|
|
|
| Shelby County, KY, Revenue Bonds, (Series A), Daily VRDNs, (U.S. Bank N.A., LOC), 0.18%, 5/01/13 |
|
|
4,390,000 |
|
|
|
4,390,000 |
|
|
|
|
| TOTAL KENTUCKY |
|
|
|
|
|
$ |
4,390,000 |
|
|
|
|
| LOUISIANA – 3.8% |
|
|
|
|
|
|
|
|
|
|
|
| East Baton Rouge Parish Industrial Development Board, Inc., Revenue Bonds, Daily VRDNs, (Exxon Mobil Corp.), 0.19%, 5/01/13 |
|
|
2,000,000 |
|
|
|
2,000,000 |
|
|
|
|
| Louisiana Public Facilities Authority, Revenue Bonds, Daily VRDNs, (Air Products & Chemicals) |
|
|
|
|
|
|
|
|
|
|
|
| 0.17%, 5/01/13 |
|
|
5,500,000 |
|
|
|
5,500,000 |
|
|
|
|
| 0.17%, 5/01/13 |
|
|
5,200,000 |
|
|
|
5,200,000 |
|
|
|
|
| 0.17%, 5/01/13 |
|
|
5,000,000 |
|
|
|
5,000,000 |
|
|
|
|
| Louisiana Public Facilities Authority, Revenue Bonds, (Series C), Daily VRDNs, (Air Products & Chemicals), 0.17%, 5/01/13 |
|
|
1,600,000 |
|
|
|
1,600,000 |
|
|
|
|
| TOTAL LOUISIANA |
|
|
|
|
|
$ |
19,300,000 |
|
|
|
|
| MASSACHUSETTS – 5.6% |
|
|
|
|
|
|
|
|
|
|
|
| Commonwealth of Massachusetts, GO Limited Bonds, (Series B), Daily VRDNs, (U.S Bank N.A., SPA), 0.20%, 5/01/13 |
|
|
12,800,000 |
|
|
|
12,800,000 |
|
|
|
|
|
|
|
|
|
|
|
|
|
| Description |
|
Par Value |
|
|
Value |
|
|
|
|
| Commonwealth of Massachusetts, GO Unlimited Bonds, (Series A), Daily VRDNs, (Wells Fargo Bank N.A., SPA), 0.20%, 5/01/13 |
|
$ |
7,200,000 |
|
|
$ |
7,200,000 |
|
|
|
|
| Massachusetts Health & Educational Facilities Authority, Refunding Revenue Bonds, (Amherst College), (Series J-2), Daily VRDNs,
0.18%, 5/01/13 |
|
|
8,000,000 |
|
|
|
8,000,000 |
|
|
|
|
| TOTAL MASSACHUSETTS |
|
|
|
|
|
$ |
28,000,000 |
|
|
|
|
| MICHIGAN – 0.6% |
|
|
|
|
|
|
|
|
|
|
|
| University of Michigan, MI, Refunding Revenue Notes, (Series B), Daily VRDNs, (Northern Trust Co., SPA), 0.16%, 5/01/13 |
|
|
3,300,000 |
|
|
|
3,300,000 |
|
|
|
|
| TOTAL MICHIGAN |
|
|
|
|
|
$ |
3,300,000 |
|
|
|
|
| MINNESOTA – 1.8% |
|
|
|
|
|
|
|
|
|
|
|
| Rochester, MN, Health Care Facilities, Refunding Revenue Bonds, (Series A), Weekly VRDNs, (Mayo Clinic OBG), 0.20%, 5/07/13 |
|
|
8,900,000 |
|
|
|
8,900,000 |
|
|
|
|
| TOTAL MINNESOTA |
|
|
|
|
|
$ |
8,900,000 |
|
|
|
|
| MISSISSIPPI – 2.5% |
|
|
|
|
|
|
|
|
|
|
|
| Jackson County, MS, Port Facility, Refunding Revenue Bonds, Daily VRDNs, (Chevron Corp.),
0.17%, 5/01/13 |
|
|
4,300,000 |
|
|
|
4,300,000 |
|
|
|
|
| Mississippi Business Finance Corp., Revenue Bonds, (Series D), Daily VRDNs, (Chevron Corp.), 0.17%, 5/01/13 |
|
|
2,500,000 |
|
|
|
2,500,000 |
|
|
|
|
| Mississippi Business Finance Corp., Revenue Bonds, (Series G), Daily VRDNs, (Chevron Corp.), 0.17%, 5/01/13 |
|
|
3,000,000 |
|
|
|
3,000,000 |
|
|
|
|
| Mississippi Business Finance Corp., Revenue Bonds, (Series I), Daily VRDNs, (Chevron Corp.), 0.17%, 5/01/13 |
|
|
2,820,000 |
|
|
|
2,820,000 |
|
|
|
|
| TOTAL MISSISSIPPI |
|
|
|
|
|
$ |
12,620,000 |
|
|
|
|
| NEW HAMPSHIRE – 2.8% |
|
|
|
|
|
|
|
|
|
|
|
| New Hampshire, HEFA, Refunding Revenue Bonds, Weekly VRDNs, (Dartmouth College)/(U.S. Bank N.A.), 0.21%, 5/07/13 |
|
|
6,400,000 |
|
|
|
6,400,000 |
|
|
|
|
| New Hampshire, HEFA, Refunding Revenue Bonds, (Series A), Daily VRDNs, (Dartmouth College)/(JPMorgan Chase Bank N.A.), 0.17%, 5/01/13 |
|
|
7,495,000 |
|
|
|
7,495,000 |
|
|
|
|
| TOTAL NEW HAMPSHIRE |
|
|
|
|
|
$ |
13,895,000 |
|
|
|
|
| OHIO – 2.7% |
|
|
|
|
|
|
|
|
|
|
|
| Ohio State Higher Educational Facility Commission, Revenue Bonds, (Series B-4), Daily VRDNs, (Cleveland Clinic, OBG), 0.17%, 5/01/13 |
|
|
13,415,000 |
|
|
|
13,415,000 |
|
|
|
|
| TOTAL OHIO |
|
|
|
|
|
$ |
13,415,000 |
|
|
|
|
| OKLAHOMA – 1.6% |
|
|
|
|
|
|
|
|
|
|
|
| Oklahoma State Turnpike Authority, Refunding Revenue Bonds, (Series E), Daily VRDNs, (JPMorgan Chase Bank N.A., SPA), 0.18%, 5/01/13 |
|
|
3,900,000 |
|
|
|
3,900,000 |
|
April 30, 2013 / ANNUAL
REPORT
|
|
|
|
|
| PORTFOLIOS OF INVESTMENTS |
|
|
17 |
|
Wilmington Tax-Exempt Money Market Fund (concluded)
|
|
|
|
|
|
|
|
|
|
|
|
| Description |
|
Par Value |
|
|
Value |
|
|
|
|
| Oklahoma State Turnpike Authority, Refunding Revenue Bonds, (Series F), Daily VRDNs, (JPMorgan Chase Bank N.A., SPA), 0.18%, 5/01/13 |
|
$ |
4,000,000 |
|
|
$ |
4,000,000 |
|
|
|
|
| TOTAL OKLAHOMA |
|
|
|
|
|
$ |
7,900,000 |
|
|
|
|
| PENNSYLVANIA – 1.2% |
|
|
|
|
|
|
|
|
|
|
|
| Geisinger Authority, PA, Refunding Revenue Bonds, (Series C), Daily VRDNs, (TD Bank N.A., SPA), 0.15%, 5/01/13 |
|
|
5,900,000 |
|
|
|
5,900,000 |
|
|
|
|
| TOTAL PENNSYLVANIA |
|
|
|
|
|
$ |
5,900,000 |
|
|
|
|
| TEXAS – 7.7% |
|
|
|
|
|
|
|
|
|
|
|
| Lower Neches Valley Authority Industrial Development Corp., TX, Refunding Revenue Bonds, Daily VRDNs, (Exxon Mobil
Corp.), 0.17%, 5/01/13 |
|
|
6,800,000 |
|
|
|
6,800,000 |
|
|
|
|
| Lower Neches Valley Authority Industrial Development Corp., TX, Revenue Bonds, Daily VRDNs, (Exxon Mobil Corp.), 0.17%, 5/01/13 |
|
|
10,825,000 |
|
|
|
10,825,000 |
|
|
|
|
| Port of Arthur Navigation District Industrial Development Corp., Revenue Bonds, Daily VRDNs, (Air Products &
Chemicals), 0.21%, 5/01/13 |
|
|
5,000,000 |
|
|
|
5,000,000 |
|
|
|
|
| Texas State, GO Unlimited Notes, Series B, (State Street / Calpers), 0.21%, 5/07/13 |
|
|
1,480,000 |
|
|
|
1,480,000 |
|
|
|
|
| Texas Water Development Board, Refunding Revenue Bonds, (Series A), Daily VRDNs, (JPMorgan Chase Bank N.A., SPA), 0.19%, 5/01/13 |
|
|
14,840,000 |
|
|
|
14,840,000 |
|
|
|
|
| TOTAL TEXAS |
|
|
|
|
|
$ |
38,945,000 |
|
|
|
|
|
|
|
|
|
|
|
|
|
| Description |
|
Par Value |
|
|
Value |
|
|
|
|
| UTAH – 4.4% |
|
|
|
|
|
|
|
|
|
|
|
| Murray, UT, Revenue Bonds, (Series C), Daily VRDNs, (IHC Health Services, Inc.), 0.17%, 5/01/13 |
|
$ |
2,000,000 |
|
|
$ |
2,000,000 |
|
|
|
|
| Murray, UT, Revenue Bonds, (Series D), Daily VRDNs, (IHC Health Services, Inc.), 0.17%, 5/01/13 |
|
|
20,000,000 |
|
|
|
20,000,000 |
|
|
|
|
| TOTAL UTAH |
|
|
|
|
|
$ |
22,000,000 |
|
|
|
|
| WYOMING – 1.5% |
|
|
|
|
|
|
|
|
|
|
|
| Uinta County, WY, Refunding Revenue Bonds, Daily VRDNs, (Chevron Corp.), 0.17%, 5/01/13 |
|
|
7,800,000 |
|
|
|
7,800,000 |
|
|
|
|
| TOTAL WYOMING |
|
|
|
|
|
$ |
7,800,000 |
|
|
|
|
| TOTAL SHORT-TERM MUNICIPAL BONDS (COST $233,355,000) |
|
|
|
|
|
$ |
233,355,000 |
|
|
|
|
TOTAL INVESTMENTS – 100.0%
(COST $502,280,784) |
|
|
|
|
|
$ |
502,280,784 |
|
|
|
|
OTHER ASSETS LESS
LIABILITIES – 0.0%** |
|
|
|
|
|
|
214,585 |
|
|
|
|
| TOTAL NET ASSETS – 100.0% |
|
|
|
|
|
$ |
502,495,369 |
|
Cost of investments
for Federal income tax purposes is the same as for financial statement purposes.
Various inputs are used in determining the value of
the Fund’s investments. These inputs are summarized in the three broad levels listed below.
Level 1 – quoted prices in
active markets for identical securities
Level 2 – other significant observable inputs (including quoted prices for similar
securities, interest rates, prepayment speeds, credit risk, etc.)
Level 3 – significant unobservable inputs (including the
Fund’s own assumptions in determining the fair value of investments)
The following is a summary of the inputs used as of April
30, 2013 in valuing the Fund’s assets carried at fair value:
|
|
|
|
|
|
|
|
|
|
|
|
|
|
|
|
|
|
|
|
|
|
| |
|
Level 1 |
|
|
Level 2 |
|
|
Level 3 |
|
|
Total |
|
| Investments in Securities |
|
|
|
|
|
|
|
|
|
|
|
|
|
|
|
|
|
|
|
|
|
| Commercial Paper |
|
$ |
— |
|
|
$ |
251,807,000 |
|
|
$ |
— |
|
|
$ |
251,807,000 |
|
|
|
|
|
|
| Municipal Bonds |
|
|
— |
|
|
|
17,118,784 |
|
|
|
— |
|
|
|
17,118,784 |
|
|
|
|
|
|
| Short-Term Municipal Bonds |
|
|
— |
|
|
|
233,355,000 |
|
|
|
— |
|
|
|
233,355,000 |
|
|
|
|
|
|
|
|
|
|
|
|
|
|
|
|
|
|
|
|
|
|
|
| Total |
|
$ |
— |
|
|
$ |
502,280,784 |
|
|
$ |
— |
|
|
$ |
502,280,784 |
|
|
|
|
|
|
|
|
|
|
|
|
|
|
|
|
|
|
See Notes to Portfolios of Investments
See Notes which are an integral part of the Financial Statements
ANNUAL REPORT / April
30, 2013
NOTES TO PORTFOLIOS OF INVESTMENTS
| D |
Floating rate note with current rate and stated maturity date shown. |
| ‡ |
Zero coupon security. The rate shown reflects the effective yield at purchase date. |
| @ |
Current rate and next reset date shown for Variable Rate Demand Notes. |
| ¨ |
Securities with discount rate at the time of purchase shown. |
| W |
Denotes a restricted security, or a portion thereof, that may be resold without restriction to “qualified institutional buyers” as defined in Rule 144A under the Securities Act of 1933 and that the Fund has
determined to be liquid under criteria established by the Fund’s Board of Trustees. At April 30, 2013, these liquid restricted securities were as follows: |
|
|
|
|
|
|
|
|
|
|
|
|
|
|
|
| |
|
Fund |
|
Amount |
|
|
Percentage of
Total Net
Assets |
|
|
|
Prime Money Market Fund |
|
|
$1,613,830,056 |
|
|
|
42.8% |
|
| Ÿ |
Denotes a restricted security, or a portion thereof, that either (a) cannot be offered for public sale without first being registered, or being able to take advantage of an exemption from registration, under the
Securities Act of 1933, or (b) is subject to a contractual restriction on public sales. At April 30, 2013, these restricted securities were as follows: |
|
|
|
|
|
|
|
|
|
|
|
|
|
|
|
|
|
|
|
|
|
|
|
|
|
| |
|
Security |
|
Acquisition
Date |
|
|
Acquisition
Cost |
|
|
Market
Value |
|
|
Percentage
of Total
Net Assets |
|
|
|
Prime Money Market Fund |
|
|
|
|
|
|
|
|
|
|
|
|
|
|
|
|
|
|
ABB Treasury Center USA |
|
|
03/18/2013 |
|
|
|
$24,982,750 |
|
|
|
$24,991,000 |
|
|
|
|
|
|
|
Australia & New Zealand Banking Group Ltd. |
|
|
03/20/2013 |
|
|
|
99,954,000 |
|
|
|
99,974,500 |
|
|
|
|
|
|
|
Baker Hughes, Inc. |
|
|
02/08/2013 |
|
|
|
33,296,824 |
|
|
|
33,308,964 |
|
|
|
|
|
|
|
BASF SE |
|
|
04/09/2013 |
|
|
|
49,989,889 |
|
|
|
49,994,167 |
|
|
|
|
|
|
|
BASF SE |
|
|
04/09/2013 |
|
|
|
49,989,889 |
|
|
|
49,994,167 |
|
|
|
|
|
|
|
BHP Billiton Finance Ltd. |
|
|
04/16/2013 |
|
|
|
49,979,778 |
|
|
|
49,983,111 |
|
|
|
|
|
|
|
BHP Billiton Finance Ltd. |
|
|
04/17/2013 |
|
|
|
49,980,000 |
|
|
|
49,982,889 |
|
|
|
|
|
|
|
BMW US Capital LLC |
|
|
04/22/2013 |
|
|
|
39,978,667 |
|
|
|
39,980,267 |
|
|
|
|
|
|
|
BMW US Capital LLC |
|
|
04/23/2013 |
|
|
|
29,969,833 |
|
|
|
29,971,166 |
|
|
|
|
|
|
|
Chariot Funding LLC |
|
|
11/16/2012 |
|
|
|
49,919,556 |
|
|
|
49,993,333 |
|
|
|
|
|
|
|
Chariot Funding LLC |
|
|
01/09/2013 |
|
|
|
49,924,584 |
|
|
|
49,971,250 |
|
|
|
|
|
|
|
Coca-Cola Co. |
|
|
02/08/2013 |
|
|
|
49,961,334 |
|
|
|
49,979,556 |
|
|
|
|
|
|
|
Coca-Cola Co. |
|
|
03/19/2013 |
|
|
|
49,969,111 |
|
|
|
49,978,667 |
|
|
|
|
|
|
|
Commonwealth Bank of Australia |
|
|
02/19/2013 |
|
|
|
49,977,750 |
|
|
|
49,995,000 |
|
|
|
|
|
|
|
Commonwealth Bank of Australia |
|
|
04/04/2013 |
|
|
|
36,983,350 |
|
|
|
36,988,345 |
|
|
|
|
|
|
|
CPPIB Capital, Inc. |
|
|
04/26/2013 |
|
|
|
99,960,000 |
|
|
|
99,962,222 |
|
|
|
|
|
|
|
Honeywell International, Inc. |
|
|
03/05/2013 |
|
|
|
79,358,381 |
|
|
|
79,379,753 |
|
|
|
|
|
|
|
JPMorgan Chase & Co. |
|
|
04/30/2013 |
|
|
|
49,864,861 |
|
|
|
49,864,861 |
|
|
|
|
|
|
|
MetLife Short Term Funding LLC |
|
|
04/11/2013 |
|
|
|
34,983,744 |
|
|
|
34,987,439 |
|
|
|
|
|
|
|
MetLife Short Term Funding LLC |
|
|
04/30/2013 |
|
|
|
49,978,042 |
|
|
|
49,978,278 |
|
|
|
|
|
|
|
National Australia Funding, Delaware, Inc. |
|
|
02/06/2013 |
|
|
|
99,956,736 |
|
|
|
99,997,569 |
|
|
|
|
|
|
|
Old Line Funding LLC |
|
|
04/05/2013 |
|
|
|
49,938,195 |
|
|
|
49,946,181 |
|
|
|
|
|
|
|
Parker-Hannifin Corp. |
|
|
03/28/2013 |
|
|
|
54,730,868 |
|
|
|
54,739,658 |
|
|
|
|
|
|
|
Procter & Gamble Co. |
|
|
02/26/2013 |
|
|
|
49,981,042 |
|
|
|
49,994,375 |
|
|
|
|
|
|
|
Roche Holdings, Inc. |
|
|
02/20/2013 |
|
|
|
29,989,942 |
|
|
|
29,999,858 |
|
|
|
|
|
|
|
Sanofi |
|
|
04/09/2013 |
|
|
|
99,971,250 |
|
|
|
99,980,417 |
|
|
|
|
|
|
|
Siemens Capital Co., LLC |
|
|
04/17/2013 |
|
|
|
49,985,208 |
|
|
|
49,988,125 |
|
|
|
|
|
|
|
Syngenta Wilmington, Inc. |
|
|
03/22/2013 |
|
|
|
24,991,382 |
|
|
|
24,996,104 |
|
|
|
|
|
|
|
Syngenta Wilmington, Inc. |
|
|
04/24/2013 |
|
|
|
49,991,444 |
|
|
|
49,992,806 |
|
|
|
|
|
|
|
Syngenta Wilmington, Inc. |
|
|
04/29/2013 |
|
|
|
24,989,250 |
|
|
|
24,989,500 |
|
|
|
|
|
|
|
Thunder Bay Funding LLC |
|
|
04/04/2013 |
|
|
|
49,937,500 |
|
|
|
49,946,528 |
|
|
|
|
|
|
|
|
|
|
|
|
|
|
|
|
|
|
$1,613,830,056 |
|
|
|
42.8% |
|
| ** |
Represents less than 0.05%. |
April 30, 2013 / ANNUAL REPORT
|
|
|
|
|
| NOTES TO PORTFOLIOS OF INVESTMENTS |
|
|
19 |
|
The following acronyms are used throughout this report:
BANs – Bond Anticipation Notes
FHLMC –
Federal Home Loan Mortgage Corporation
FFCB – Federal Farm Credit Bank
FHLB – Federal Home Loan Bank
FNMA –
Federal National Mortgage Association
GO – General Obligation
HEFA – Health and Educational Facilities Authority
LIQ – Liquidity Agreement
LLC – Limited Liability Corporation
LOC – Letter of Credit
OBG –
Obligation
SPA – Sales and Purchase Agreement
TANs – Tax Anticipation Notes
TRANs –
Tax Revenue Anticipation Notes
VRDNs – Variable Rate Demand Notes
ANNUAL REPORT / April
30, 2013
|
|
|
| 20 |
|
STATEMENTS OF ASSETS AND LIABILITIES |
|
|
|
|
|
|
|
|
|
|
|
|
|
|
|
|
|
|
|
| April 30, 2013
|
|
|
|
Wilmington
Prime
Money Market
Fund
|
|
|
Wilmington
U.S. Government
Money Market
Fund
|
|
|
Wilmington
U.S. Treasury
Money Market
Fund
|
|
|
Wilmington
Tax-Exempt
Money Market
Fund
|
|
| ASSETS: |
|
|
|
|
|
|
|
|
|
|
|
|
|
|
|
|
|
|
| Investments, at identified cost |
|
|
|
$ |
3,770,528,170 |
|
|
$ |
4,205,478,652 |
|
|
$ |
1,221,554,048 |
|
|
$ |
502,280,784 |
|
|
|
|
|
|
|
|
|
|
|
|
|
|
|
|
|
|
|
|
| Investments in repurchase agreements, at value |
|
|
|
$ |
150,000,000 |
|
|
$ |
1,159,000,000 |
|
|
$ |
664,000,000 |
|
|
$ |
— |
|
| Investments in securities, at value |
|
|
|
|
3,620,528,170 |
|
|
|
3,046,478,652 |
|
|
|
557,554,048 |
|
|
|
502,280,784 |
|
|
|
|
|
|
|
|
|
|
|
|
|
|
|
|
|
|
|
|
| TOTAL INVESTMENTS IN SECURITIES AND REPURCHASE AGREEMENTS |
|
|
|
|
3,770,528,170 |
|
|
|
4,205,478,652 |
|
|
|
1,221,554,048 |
|
|
|
502,280,784 |
|
| |
|
|
|
|
|
|
|
|
|
|
|
|
|
|
|
|
|
|
| Cash |
|
|
|
|
449,370 |
|
|
|
819,249 |
|
|
|
521,127 |
|
|
|
1,480,996 |
|
| Interest receivable |
|
|
|
|
1,306,250 |
|
|
|
1,072,770 |
|
|
|
1,895,017 |
|
|
|
371,179 |
|
| Receivable for shares sold |
|
|
|
|
3,467 |
|
|
|
— |
|
|
|
— |
|
|
|
4,567 |
|
| Receivable for investments sold |
|
|
|
|
50,004,045 |
|
|
|
— |
|
|
|
— |
|
|
|
— |
|
| Other assets |
|
|
|
|
46,158 |
|
|
|
40,087 |
|
|
|
14,514 |
|
|
|
12,577 |
|
|
|
|
|
|
|
|
|
|
|
|
|
|
|
|
|
|
|
|
| TOTAL ASSETS |
|
|
|
|
3,822,337,460 |
|
|
|
4,207,410,758 |
|
|
|
1,223,984,706 |
|
|
|
504,150,103 |
|
| |
|
|
|
|
|
|
|
|
|
|
|
|
|
|
|
|
|
|
| LIABILITIES: |
|
|
|
|
|
|
|
|
|
|
|
|
|
|
|
|
|
|
| Payable for investments purchased |
|
|
|
|
49,864,861 |
|
|
|
— |
|
|
|
— |
|
|
|
1,500,183 |
|
| Income distribution payable |
|
|
|
|
57,152 |
|
|
|
33,456 |
|
|
|
9,597 |
|
|
|
4,309 |
|
| Payable for Trustees’ fees |
|
|
|
|
597 |
|
|
|
630 |
|
|
|
688 |
|
|
|
642 |
|
| Payable for shareholder services fee |
|
|
|
|
32,798 |
|
|
|
— |
|
|
|
— |
|
|
|
— |
|
| Other accrued expenses |
|
|
|
|
954,388 |
|
|
|
805,530 |
|
|
|
262,949 |
|
|
|
149,600 |
|
|
|
|
|
|
|
|
|
|
|
|
|
|
|
|
|
|
|
|
| TOTAL LIABILITIES |
|
|
|
|
50,909,796 |
|
|
|
839,616 |
|
|
|
273,234 |
|
|
|
1,654,734 |
|
| |
|
|
|
|
|
|
|
|
|
|
|
|
|
|
|
|
|
|
| NET ASSETS |
|
|
|
$ |
3,771,427,664 |
|
|
$ |
4,206,571,142 |
|
|
$ |
1,223,711,472 |
|
|
$ |
502,495,369 |
|
| |
|
|
|
|
|
|
|
|
|
|
|
|
|
|
|
|
|
|
| NET ASSETS CONSIST OF: |
|
|
|
|
|
|
|
|
|
|
|
|
|
|
|
|
|
|
| Paid-in capital |
|
|
|
$ |
3,771,395,900 |
|
|
$ |
4,206,578,960 |
|
|
$ |
1,223,705,666 |
|
|
$ |
502,563,051 |
|
| Undistributed (distributions in excess of) net investment income |
|
|
|
|
16,117 |
|
|
|
(8,392 |
) |
|
|
5,806 |
|
|
|
4,376 |
|
| Accumulated net realized gain (loss) on investments |
|
|
|
|
15,647 |
|
|
|
574 |
|
|
|
— |
|
|
|
(72,058 |
) |
|
|
|
|
|
|
|
|
|
|
|
|
|
|
|
|
|
|
|
| TOTAL NET ASSETS |
|
|
|
$ |
3,771,427,664 |
|
|
$ |
4,206,571,142 |
|
|
$ |
1,223,711,472 |
|
|
$ |
502,495,369 |
|
| |
|
|
|
|
|
|
|
|
|
|
|
|
|
|
|
|
|
|
| COMPUTATION OF NET ASSET VALUE AND OFFERING PRICE: |
|
|
|
|
|
|
|
|
|
|
|
|
|
|
|
|
|
|
| Administrative Class |
|
|
|
|
|
|
|
|
|
|
|
|
|
|
|
|
|
|
| Net Assets |
|
|
|
$ |
382,757,205 |
|
|
$ |
1,885,193,496 |
|
|
$ |
827,102,741 |
|
|
$ |
38,683,716 |
|
|
|
|
|
|
|
|
|
|
|
|
|
|
|
|
|
|
|
|
| Shares outstanding (unlimited shares authorized) |
|
|
|
|
382,859,640 |
|
|
|
1,885,385,773 |
|
|
|
827,133,637 |
|
|
|
38,686,181 |
|
|
|
|
|
|
|
|
|
|
|
|
|
|
|
|
|
|
|
|
| Net Asset Value per share |
|
|
|
$ |
1.00 |
|
|
$ |
1.00 |
|
|
$ |
1.00 |
|
|
$ |
1.00 |
|
|
|
|
|
|
|
|
|
|
|
|
|
|
|
|
|
|
|
|
| Institutional Class |
|
|
|
|
|
|
|
|
|
|
|
|
|
|
|
|
|
|
| Net Assets |
|
|
|
$ |
31,055,559 |
|
|
$ |
25,683,404 |
|
|
$ |
— |
|
|
$ |
— |
|
|
|
|
|
|
|
|
|
|
|
|
|
|
|
|
|
|
|
|
| Shares outstanding (unlimited shares authorized) |
|
|
|
|
31,055,536 |
|
|
|
25,685,776 |
|
|
|
— |
|
|
|
— |
|
|
|
|
|
|
|
|
|
|
|
|
|
|
|
|
|
|
|
|
| Net Asset Value per share |
|
|
|
$ |
1.00 |
|
|
$ |
1.00 |
|
|
$ |
— |
|
|
$ |
— |
|
|
|
|
|
|
|
|
|
|
|
|
|
|
|
|
|
|
|
|
| Select Class |
|
|
|
|
|
|
|
|
|
|
|
|
|
|
|
|
|
|
| Net Assets |
|
|
|
$ |
2,528,067,801 |
|
|
$ |
1,164,387,961 |
|
|
$ |
386,574,448 |
|
|
$ |
406,386,391 |
|
|
|
|
|
|
|
|
|
|
|
|
|
|
|
|
|
|
|
|
| Shares outstanding (unlimited shares authorized) |
|
|
|
|
2,528,327,922 |
|
|
|
1,164,516,955 |
|
|
|
386,592,372 |
|
|
|
406,430,019 |
|
|
|
|
|
|
|
|
|
|
|
|
|
|
|
|
|
|
|
|
| Net Asset Value per share |
|
|
|
$ |
1.00 |
|
|
$ |
1.00 |
|
|
$ |
1.00 |
|
|
$ |
1.00 |
|
|
|
|
|
|
|
|
|
|
|
|
|
|
|
|
|
|
|
|
| Service Class |
|
|
|
|
|
|
|
|
|
|
|
|
|
|
|
|
|
|
| Net Assets |
|
|
|
$ |
829,547,099 |
|
|
$ |
1,131,306,281 |
|
|
$ |
10,034,283 |
|
|
$ |
57,425,262 |
|
|
|
|
|
|
|
|
|
|
|
|
|
|
|
|
|
|
|
|
| Shares outstanding (unlimited shares authorized) |
|
|
|
|
829,582,545 |
|
|
|
1,131,296,951 |
|
|
|
10,034,539 |
|
|
|
57,471,907 |
|
|
|
|
|
|
|
|
|
|
|
|
|
|
|
|
|
|
|
|
| Net Asset Value per share |
|
|
|
$ |
1.00 |
|
|
$ |
1.00 |
|
|
$ |
1.00 |
|
|
$ |
1.00 |
|
|
|
|
|
|
|
|
|
|
|
|
|
|
|
|
|
|
|
|
See Notes which are an integral part of the Financial Statements
April 30, 2013 / ANNUAL REPORT
|
|
|
|
|
| STATEMENTS OF OPERATIONS |
|
|
21 |
|
|
|
|
|
|
|
|
|
|
|
|
|
|
|
|
|
|
|
|
| Year Ended April 30, 2013
|
|
|
|
Wilmington
Prime Money
Market Fund
|
|
|
Wilmington
U.S. Government
Money Market Fund
|
|
|
Wilmington
U.S. Treasury
Money Market Fund
|
|
|
Wilmington
Tax-Exempt
Money Market Fund
|
|
| INVESTMENT INCOME: |
|
|
|
|
|
|
|
|
|
|
|
|
|
|
|
|
|
|
| Interest |
|
|
|
$ |
7,623,624 |
|
|
$ |
6,284,899 |
|
|
$ |
1,645,261 |
|
|
$ |
856,278 |
|
|
|
|
|
|
|
|
|
|
|
|
|
|
|
|
|
|
|
|
| TOTAL INVESTMENT INCOME |
|
|
|
|
7,623,624 |
|
|
|
6,284,899 |
|
|
|
1,645,261 |
|
|
|
856,278 |
|
| |
|
|
|
|
|
|
|
|
|
|
|
|
|
|
|
|
|
|
| EXPENSES: |
|
|
|
|
|
|
|
|
|
|
|
|
|
|
|
|
|
|
| Investment advisory fee |
|
|
|
|
15,508,625 |
|
|
|
16,128,943 |
|
|
|
4,464,021 |
|
|
|
2,068,870 |
|
| Administrative personnel and services fee |
|
|
|
|
888,821 |
|
|
|
924,152 |
|
|
|
255,934 |
|
|
|
118,597 |
|
| Portfolio accounting, administration and custodian fees |
|
|
|
|
1,197,376 |
|
|
|
1,253,002 |
|
|
|
366,538 |
|
|
|
181,117 |
|
| Transfer and dividend disbursing agent fees and expenses |
|
|
|
|
183,888 |
|
|
|
7,785 |
|
|
|
4,603 |
|
|
|
21,628 |
|
| Trustees’ fees |
|
|
|
|
29,396 |
|
|
|
27,845 |
|
|
|
29,446 |
|
|
|
28,707 |
|
| Professional fees |
|
|
|
|
51,819 |
|
|
|
55,066 |
|
|
|
51,213 |
|
|
|
52,446 |
|
| Distribution services fee—Administrative Class |
|
|
|
|
1,058,844 |
|
|
|
4,714,703 |
|
|
|
2,096,633 |
|
|
|
108,431 |
|
| Distribution services fee—Service Class |
|
|
|
|
2,053,267 |
|
|
|
2,182,449 |
|
|
|
23,980 |
|
|
|
161,604 |
|
| Shareholder services fee—Administrative Class |
|
|
|
|
1,058,844 |
|
|
|
4,714,703 |
|
|
|
2,096,633 |
|
|
|
108,431 |
|
| Shareholder services fee—Select Class |
|
|
|
|
6,461,640 |
|
|
|
3,025,441 |
|
|
|
669,396 |
|
|
|
1,022,982 |
|
| Shareholder services fee—Service Class |
|
|
|
|
2,053,267 |
|
|
|
2,182,449 |
|
|
|
23,980 |
|
|
|
161,604 |
|
| Share registration costs |
|
|
|
|
45,565 |
|
|
|
47,923 |
|
|
|
34,994 |
|
|
|
32,266 |
|
| Printing and postage |
|
|
|
|
185,552 |
|
|
|
40,755 |
|
|
|
20,339 |
|
|
|
30,888 |
|
| Miscellaneous |
|
|
|
|
137,796 |
|
|
|
180,523 |
|
|
|
56,845 |
|
|
|
18,051 |
|
|
|
|
|
|
|
|
|
|
|
|
|
|
|
|
|
|
|
|
| TOTAL EXPENSES |
|
|
|
|
30,914,700 |
|
|
|
35,485,739 |
|
|
|
10,194,555 |
|
|
|
4,115,622 |
|
| |
|
|
|
|
|
|
|
|
|
|
|
|
|
|
|
|
|
|
| WAIVERS AND REIMBURSEMENTS: |
|
|
|
|
|
|
|
|
|
|
|
|
|
|
|
|
|
|
| Waiver/reimbursement by investment advisor |
|
|
|
|
(11,747,763 |
) |
|
|
(12,808,948 |
) |
|
|
(3,747,009 |
) |
|
|
(1,750,751 |
) |
| Waiver of distribution services fee—Administrative Class |
|
|
|
|
(1,058,844 |
) |
|
|
(4,714,703 |
) |
|
|
(2,096,633 |
) |
|
|
(108,431 |
) |
| Waiver of distribution services fee—Service Class |
|
|
|
|
(2,053,267 |
) |
|
|
(2,182,449 |
) |
|
|
(23,980 |
) |
|
|
(161,604 |
) |
| Waiver of shareholder services fee—Administrative Class |
|
|
|
|
(1,058,844 |
) |
|
|
(4,714,703 |
) |
|
|
(2,096,633 |
) |
|
|
(108,431 |
) |
| Waiver of shareholder services fee—Select Class |
|
|
|
|
(6,461,640 |
) |
|
|
(3,025,441 |
) |
|
|
(669,396 |
) |
|
|
(1,022,982 |
) |
| Waiver of shareholder services fee—Service Class |
|
|
|
|
(1,890,228 |
) |
|
|
(2,182,449 |
) |
|
|
(23,980 |
) |
|
|
(161,604 |
) |
|
|
|
|
|
|
|
|
|
|
|
|
|
|
|
|
|
|
|
| TOTAL WAIVERS AND REIMBURSEMENTS |
|
|
|
|
(24,270,586 |
) |
|
|
(29,628,693 |
) |
|
|
(8,657,631 |
) |
|
|
(3,313,803 |
) |
| |
|
|
|
|
|
|
|
|
|
|
|
|
|
|
|
|
|
|
| Net expenses |
|
|
|
|
6,644,114 |
|
|
|
5,857,046 |
|
|
|
1,536,924 |
|
|
|
801,819 |
|
|
|
|
|
|
|
|
|
|
|
|
|
|
|
|
|
|
|
|
| Net investment income |
|
|
|
|
979,510 |
|
|
|
427,853 |
|
|
|
108,337 |
|
|
|
54,459 |
|
|
|
|
|
|
|
|
|
|
|
|
|
|
|
|
|
|
|
|
| REALIZED AND UNREALIZED GAIN (LOSS) ON INVESTMENTS: |
|
|
|
|
|
|
|
|
|
|
|
|
|
|
|
|
|
|
| Net realized gain (loss) on investments |
|
|
|
|
21,654 |
|
|
|
574 |
|
|
|
927 |
|
|
|
— |
|
|
|
|
|
|
|
|
|
|
|
|
|
|
|
|
|
|
|
|
| Net realized and unrealized gain (loss) on investments |
|
|
|
|
21,654 |
|
|
|
574 |
|
|
|
927 |
|
|
|
— |
|
|
|
|
|
|
|
|
|
|
|
|
|
|
|
|
|
|
|
|
| Change in net assets resulting from operations |
|
|
|
$ |
1,001,164 |
|
|
$ |
428,427 |
|
|
$ |
109,264 |
|
|
$ |
54,459 |
|
|
|
|
|
|
|
|
|
|
|
|
|
|
|
|
|
|
|
|
See Notes which are an integral part of the Financial Statements
ANNUAL REPORT / April
30, 2013
|
|
|
| 22 |
|
STATEMENTS OF CHANGES IN NET ASSETS |
|
|
|
|
|
|
|
|
|
|
|
|
|
|
|
|
|
| |
|
Wilmington
Prime
Money Market Fund |
|
|
Wilmington
U.S. Government
Money Market Fund |
|
| |
|
Year Ended
April
30,
2013 |
|
|
Year Ended
April
30,
2012 |
|
|
Year Ended
April
30,
2013 |
|
|
Year Ended
April
30,
2012 |
|
| OPERATIONS: |
|
|
|
|
|
|
|
|
|
|
|
|
|
|
|
|
| Net investment income |
|
$ |
979,510 |
|
|
$ |
465,205 |
|
|
$ |
427,853 |
|
|
$ |
262,741 |
|
| Net realized gain (loss) on investments |
|
|
21,654 |
|
|
|
5,879 |
|
|
|
574 |
|
|
|
31,971 |
|
|
|
|
|
|
|
|
|
|
|
|
|
|
|
|
|
|
| Change in net assets resulting from operations |
|
|
1,001,164 |
|
|
|
471,084 |
|
|
|
428,427 |
|
|
|
294,712 |
|
|
|
|
|
|
|
|
|
|
|
|
|
|
|
|
|
|
| DISTRIBUTIONS TO SHAREHOLDERS: |
|
|
|
|
|
|
|
|
|
|
|
|
|
|
|
|
| Distributions from net investment income |
|
|
|
|
|
|
|
|
|
|
|
|
|
|
|
|
| Administrative Class |
|
|
(125,869 |
) |
|
|
(97,456 |
) |
|
|
(197,548 |
) |
|
|
(203,073 |
) |
| Institutional I Class |
|
|
— |
|
|
|
(96,235 |
) |
|
|
— |
|
|
|
— |
|
| Institutional Class |
|
|
(12,238 |
) |
|
|
(2,187 |
) |
|
|
(6,344 |
) |
|
|
(1,276 |
) |
| Class S |
|
|
— |
|
|
|
(511 |
) |
|
|
— |
|
|
|
— |
|
| Select Class |
|
|
(754,101 |
) |
|
|
(204,449 |
) |
|
|
(126,399 |
) |
|
|
(49,244 |
) |
| Service Class |
|
|
(84,286 |
) |
|
|
(30,012 |
) |
|
|
(91,136 |
) |
|
|
(8,510 |
) |
| Distributions from net realized gain on investments |
|
|
|
|
|
|
|
|
|
|
|
|
|
|
|
|
| Administrative Class |
|
|
(894 |
) |
|
|
(1,010 |
) |
|
|
(8,792 |
) |
|
|
(11,203 |
) |
| Institutional I Class |
|
|
— |
|
|
|
(1,762 |
) |
|
|
— |
|
|
|
— |
|
| Institutional Class |
|
|
(88 |
) |
|
|
— |
|
|
|
(226 |
) |
|
|
— |
|
| Class S |
|
|
— |
|
|
|
(17 |
) |
|
|
— |
|
|
|
— |
|
| Select Class |
|
|
(5,024 |
) |
|
|
(863 |
) |
|
|
(5,391 |
) |
|
|
(2,131 |
) |
| Service Class |
|
|
(1,673 |
) |
|
|
(555 |
) |
|
|
(4,055 |
) |
|
|
(173 |
) |
|
|
|
|
|
|
|
|
|
|
|
|
|
|
|
|
|
| Change in net assets resulting from distributions to shareholders |
|
|
(984,173 |
) |
|
|
(435,057 |
) |
|
|
(439,891 |
) |
|
|
(275,610 |
) |
|
|
|
|
|
|
|
|
|
|
|
|
|
|
|
|
|
| SHARE TRANSACTIONS: |
|
|
|
|
|
|
|
|
|
|
|
|
|
|
|
|
| Proceeds from sale of shares |
|
|
|
|
|
|
|
|
|
|
|
|
|
|
|
|
| Administrative Class |
|
|
1,368,478,722 |
|
|
|
854,721,908 |
|
|
|
3,419,134,416 |
|
|
|
3,841,287,817 |
|
| Institutional I Class |
|
|
— |
|
|
|
976,613,959 |
|
|
|
— |
|
|
|
— |
|
| Institutional Class |
|
|
385,385,435 |
|
|
|
42,909,072 |
|
|
|
12,210,854 |
|
|
|
97 |
|
| Class S |
|
|
— |
|
|
|
53,086,901 |
|
|
|
— |
|
|
|
— |
|
| Select Class |
|
|
4,949,063,389 |
|
|
|
2,657,192,587 |
|
|
|
2,088,539,257 |
|
|
|
1,434,890,575 |
|
| Service Class |
|
|
2,804,259,105 |
|
|
|
474,230,548 |
|
|
|
1,772,162,761 |
|
|
|
379,016,399 |
|
| Proceeds from shares issued in connection with Reorganization (Note 6) |
|
|
— |
|
|
|
2,179,476,547 |
|
|
|
— |
|
|
|
1,785,990,941 |
|
| Distributions reinvested |
|
|
|
|
|
|
|
|
|
|
|
|
|
|
|
|
| Administrative Class |
|
|
— |
|
|
|
5 |
|
|
|
7,512 |
|
|
|
5,148 |
|
| Institutional I Class |
|
|
— |
|
|
|
6,058 |
|
|
|
— |
|
|
|
— |
|
| Institutional Class |
|
|
3,707 |
|
|
|
497 |
|
|
|
689 |
|
|
|
1 |
|
| Class S |
|
|
— |
|
|
|
17 |
|
|
|
— |
|
|
|
— |
|
| Select Class |
|
|
126,135 |
|
|
|
59,435 |
|
|
|
2,223 |
|
|
|
1,523 |
|
| Service Class |
|
|
37,423 |
|
|
|
23,172 |
|
|
|
4,816 |
|
|
|
3,299 |
|
| Cost of shares redeemed |
|
|
|
|
|
|
|
|
|
|
|
|
|
|
|
|
| Administrative Class |
|
|
(1,450,444,013 |
) |
|
|
(806,384,915 |
) |
|
|
(3,335,058,329 |
) |
|
|
(3,533,335,430 |
) |
| Institutional I Class |
|
|
— |
|
|
|
(1,488,987,356 |
) |
|
|
— |
|
|
|
— |
|
| Institutional Class |
|
|
(396,406,186 |
) |
|
|
(47,746,474 |
) |
|
|
(71,850,255 |
) |
|
|
(14,039,669 |
) |
| Class S |
|
|
— |
|
|
|
(58,957,563 |
) |
|
|
— |
|
|
|
— |
|
| Select Class |
|
|
(4,845,914,825 |
) |
|
|
(2,071,526,559 |
) |
|
|
(2,137,295,307 |
) |
|
|
(1,525,934,420 |
) |
| Service Class |
|
|
(2,754,297,346 |
) |
|
|
(552,021,749 |
) |
|
|
(1,514,137,027 |
) |
|
|
(279,249,973 |
) |
|
|
|
|
|
|
|
|
|
|
|
|
|
|
|
|
|
| Change in net assets resulting from share transactions |
|
|
60,291,546 |
|
|
|
2,212,696,090 |
|
|
|
233,721,610 |
|
|
|
2,088,636,308 |
|
|
|
|
|
|
|
|
|
|
|
|
|
|
|
|
|
|
| Change in net assets |
|
|
60,308,537 |
|
|
|
2,212,732,117 |
|
|
|
233,710,146 |
|
|
|
2,088,655,410 |
|
| NET ASSETS: |
|
|
|
|
|
|
|
|
|
|
|
|
|
|
|
|
| Beginning of year |
|
|
3,711,119,127 |
|
|
|
1,498,387,010 |
|
|
|
3,972,860,996 |
|
|
|
1,884,205,586 |
|
|
|
|
|
|
|
|
|
|
|
|
|
|
|
|
|
|
| End of year |
|
$ |
3,771,427,664 |
|
|
$ |
3,711,119,127 |
|
|
$ |
4,206,571,142 |
|
|
$ |
3,972,860,996 |
|
|
|
|
|
|
|
|
|
|
|
|
|
|
|
|
|
|
| Undistributed (distributions in excess of) net investment income included in net assets at end of year |
|
$ |
16,117 |
|
|
$ |
13,101 |
|
|
$ |
(8,392 |
) |
|
$ |
(14,818 |
) |
|
|
|
|
|
|
|
|
|
|
|
|
|
|
|
|
|
April 30, 2013 / ANNUAL REPORT
|
|
|
|
|
| STATEMENTS OF CHANGES IN NET ASSETS (continued) |
|
|
23 |
|
|
|
|
|
|
|
|
|
|
|
|
|
|
|
|
|
|
| |
|
Wilmington
Prime
Money Market Fund |
|
|
Wilmington
U.S. Government
Money Market Fund |
|
| |
|
Year Ended
April
30,
2013 |
|
|
Year Ended
April
30,
2012 |
|
|
Year Ended
April 30,
2013 |
|
|
Year Ended
April
30,
2012 |
|
| SHARES OF BENEFICIAL INTEREST: |
|
|
|
|
|
|
|
|
|
|
|
|
|
|
|
|
| Shares sold |
|
|
|
|
|
|
|
|
|
|
|
|
|
|
|
|
| Administrative Class |
|
|
1,368,478,722 |
|
|
|
854,721,908 |
|
|
|
3,419,134,416 |
|
|
|
3,841,287,817 |
|
| Institutional I Class |
|
|
— |
|
|
|
976,450,856 |
|
|
|
— |
|
|
|
— |
|
| Institutional Class |
|
|
385,385,435 |
|
|
|
42,909,072 |
|
|
|
12,210,854 |
|
|
|
97 |
|
| Class S |
|
|
— |
|
|
|
53,081,909 |
|
|
|
— |
|
|
|
— |
|
| Select Class |
|
|
4,949,063,389 |
|
|
|
2,657,355,690 |
|
|
|
2,088,539,257 |
|
|
|
1,434,890,575 |
|
| Service Class |
|
|
2,804,259,105 |
|
|
|
474,235,600 |
|
|
|
1,772,162,761 |
|
|
|
379,016,421 |
|
| Shares issued in connection with Reorganization (Note 6) |
|
|
— |
|
|
|
2,179,479,827 |
|
|
|
— |
|
|
|
1,785,986,774 |
|
| Distributions reinvested |
|
|
|
|
|
|
|
|
|
|
|
|
|
|
|
|
| Administrative Class |
|
|
— |
|
|
|
5 |
|
|
|
7,512 |
|
|
|
5,148 |
|
| Institutional I Class |
|
|
— |
|
|
|
6,058 |
|
|
|
— |
|
|
|
— |
|
| Institutional Class |
|
|
3,707 |
|
|
|
497 |
|
|
|
689 |
|
|
|
1 |
|
| Class S |
|
|
— |
|
|
|
17 |
|
|
|
— |
|
|
|
— |
|
| Select Class |
|
|
126,135 |
|
|
|
59,435 |
|
|
|
2,223 |
|
|
|
1,523 |
|
| Service Class |
|
|
37,423 |
|
|
|
23,172 |
|
|
|
4,816 |
|
|
|
3,299 |
|
| Shares redeemed |
|
|
|
|
|
|
|
|
|
|
|
|
|
|
|
|
| Administrative Class |
|
|
(1,450,444,013 |
) |
|
|
(806,384,915 |
) |
|
|
(3,335,058,329 |
) |
|
|
(3,533,335,430 |
) |
| Institutional I Class |
|
|
— |
|
|
|
(1,488,987,356 |
) |
|
|
— |
|
|
|
— |
|
| Institutional Class |
|
|
(396,406,186 |
) |
|
|
(47,746,474 |
) |
|
|
(71,850,255 |
) |
|
|
(14,039,669 |
) |
| Class S |
|
|
— |
|
|
|
(58,957,563 |
) |
|
|
— |
|
|
|
— |
|
| Select Class |
|
|
(4,845,914,825 |
) |
|
|
(2,071,526,559 |
) |
|
|
(2,137,295,307 |
) |
|
|
(1,525,934,420 |
) |
| Service Class |
|
|
(2,754,297,346 |
) |
|
|
(552,021,749 |
) |
|
|
(1,514,137,027 |
) |
|
|
(279,249,973 |
) |
|
|
|
|
|
|
|
|
|
|
|
|
|
|
|
|
|
| Net change resulting from share transactions |
|
|
60,291,546 |
|
|
|
2,212,699,430 |
|
|
|
233,721,610 |
|
|
|
2,088,632,163 |
|
|
|
|
|
|
|
|
|
|
|
|
|
|
|
|
|
|
See Notes which are an integral part of the Financial Statements
ANNUAL REPORT / April
30, 2013
|
|
|
| 24 |
|
STATEMENTS OF CHANGES IN NET ASSETS (concluded) |
|
|
|
|
|
|
|
|
|
|
|
|
|
|
|
|
|
| |
|
Wilmington
U.S. Treasury
Money Market Fund |
|
|
Wilmington
Tax-Exempt
Money Market Fund |
|
| |
|
Year Ended
April 30,
2013 |
|
|
Year Ended
April
30,
2012 |
|
|
Year Ended
April
30,
2013 |
|
|
Year Ended
April
30,
2012 |
|
| OPERATIONS: |
|
|
|
|
|
|
|
|
|
|
|
|
|
|
|
|
| Net investment income |
|
$ |
108,337 |
|
|
$ |
128,116 |
|
|
$ |
54,459 |
|
|
$ |
23,126 |
|
| Net realized gain (loss) on investments |
|
|
927 |
|
|
|
13,750 |
|
|
|
— |
|
|
|
46 |
|
|
|
|
|
|
|
|
|
|
|
|
|
|
|
|
|
|
| Change in net assets resulting from operations |
|
|
109,264 |
|
|
|
141,866 |
|
|
|
54,459 |
|
|
|
23,172 |
|
|
|
|
|
|
|
|
|
|
|
|
|
|
|
|
|
|
| DISTRIBUTIONS TO SHAREHOLDERS: |
|
|
|
|
|
|
|
|
|
|
|
|
|
|
|
|
| Distributions from net investment income |
|
|
|
|
|
|
|
|
|
|
|
|
|
|
|
|
| Administrative Class |
|
|
(83,683 |
) |
|
|
(100,268 |
) |
|
|
(4,657 |
) |
|
|
(4,780 |
) |
| Select Class |
|
|
(26,899 |
) |
|
|
(24,945 |
) |
|
|
(43,418 |
) |
|
|
(16,128 |
) |
| Service Class |
|
|
(959 |
) |
|
|
(1,116 |
) |
|
|
(6,438 |
) |
|
|
(1,848 |
) |
| Distributions from net realized gain on investments |
|
|
|
|
|
|
|
|
|
|
|
|
|
|
|
|
| Administrative Class |
|
|
— |
|
|
|
(15,067 |
) |
|
|
— |
|
|
|
(23 |
) |
| Select Class |
|
|
— |
|
|
|
(3,840 |
) |
|
|
— |
|
|
|
(54 |
) |
| Service Class |
|
|
— |
|
|
|
(143 |
) |
|
|
— |
|
|
|
(4 |
) |
|
|
|
|
|
|
|
|
|
|
|
|
|
|
|
|
|
| Change in net assets resulting from distributions to shareholders |
|
|
(111,541 |
) |
|
|
(145,379 |
) |
|
|
(54,513 |
) |
|
|
(22,837 |
) |
|
|
|
|
|
|
|
|
|
|
|
|
|
|
|
|
|
| SHARE TRANSACTIONS: |
|
|
|
|
|
|
|
|
|
|
|
|
|
|
|
|
| Proceeds from sale of shares |
|
|
|
|
|
|
|
|
|
|
|
|
|
|
|
|
| Administrative Class |
|
|
1,594,352,762 |
|
|
|
3,301,935,173 |
|
|
|
51,196,573 |
|
|
|
51,092,331 |
|
| Select Class |
|
|
1,501,944,043 |
|
|
|
1,322,087,786 |
|
|
|
703,446,996 |
|
|
|
181,390,336 |
|
| Service Class |
|
|
14,336,458 |
|
|
|
23,723,341 |
|
|
|
125,709,359 |
|
|
|
44,887,670 |
|
| Proceeds from shares issued in connection with Reorganization (Note 6) |
|
|
— |
|
|
|
— |
|
|
|
— |
|
|
|
369,618,689 |
|
| Distributions reinvested |
|
|
|
|
|
|
|
|
|
|
|
|
|
|
|
|
| Administrative Class |
|
|
56 |
|
|
|
5 |
|
|
|
— |
|
|
|
— |
|
| Select Class |
|
|
6,105 |
|
|
|
7,776 |
|
|
|
787 |
|
|
|
493 |
|
| Service Class |
|
|
— |
|
|
|
14 |
|
|
|
6,224 |
|
|
|
2,982 |
|
| Cost of shares redeemed |
|
|
|
|
|
|
|
|
|
|
|
|
|
|
|
|
| Administrative Class |
|
|
(1,676,554,899 |
) |
|
|
(3,068,693,891 |
) |
|
|
(54,025,509 |
) |
|
|
(44,650,435 |
) |
| Select Class |
|
|
(1,325,605,795 |
) |
|
|
(1,349,589,815 |
) |
|
|
(659,612,241 |
) |
|
|
(242,756,850 |
) |
| Service Class |
|
|
(13,211,001 |
) |
|
|
(25,441,891 |
) |
|
|
(125,669,590 |
) |
|
|
(52,046,105 |
) |
|
|
|
|
|
|
|
|
|
|
|
|
|
|
|
|
|
| Change in net assets resulting from share transactions |
|
|
95,267,729 |
|
|
|
204,028,498 |
|
|
|
41,052,599 |
|
|
|
307,539,111 |
|
|
|
|
|
|
|
|
|
|
|
|
|
|
|
|
|
|
| Change in net assets |
|
|
95,265,452 |
|
|
|
204,024,985 |
|
|
|
41,052,545 |
|
|
|
307,539,446 |
|
| NET ASSETS: |
|
|
|
|
|
|
|
|
|
|
|
|
|
|
|
|
| Beginning of year |
|
|
1,128,446,020 |
|
|
|
924,421,035 |
|
|
|
461,442,824 |
|
|
|
153,903,378 |
|
|
|
|
|
|
|
|
|
|
|
|
|
|
|
|
|
|
| End of year |
|
$ |
1,223,711,472 |
|
|
$ |
1,128,446,020 |
|
|
$ |
502,495,369 |
|
|
$ |
461,442,824 |
|
|
|
|
|
|
|
|
|
|
|
|
|
|
|
|
|
|
| Undistributed (distributions in excess of) net investment income included in net assets at end of year |
|
$ |
5,806 |
|
|
$ |
8,083 |
|
|
$ |
4,376 |
|
|
$ |
4,430 |
|
|
|
|
|
|
|
|
|
|
|
|
|
|
|
|
|
|
| SHARES OF BENEFICIAL INTEREST: |
|
|
|
|
|
|
|
|
|
|
|
|
|
|
|
|
| Shares sold |
|
|
|
|
|
|
|
|
|
|
|
|
|
|
|
|
| Administrative Class |
|
|
1,594,352,762 |
|
|
|
3,301,935,173 |
|
|
|
51,196,573 |
|
|
|
51,092,331 |
|
| Select Class |
|
|
1,501,944,043 |
|
|
|
1,322,087,786 |
|
|
|
703,446,996 |
|
|
|
181,390,336 |
|
| Service Class |
|
|
14,336,458 |
|
|
|
23,723,341 |
|
|
|
125,709,359 |
|
|
|
44,887,670 |
|
| Shares issued in connection with Reorganization (Note 6) |
|
|
— |
|
|
|
— |
|
|
|
— |
|
|
|
369,702,380 |
|
| Distributions reinvested |
|
|
|
|
|
|
|
|
|
|
|
|
|
|
|
|
| Administrative Class |
|
|
56 |
|
|
|
5 |
|
|
|
— |
|
|
|
— |
|
| Select Class |
|
|
6,105 |
|
|
|
7,776 |
|
|
|
787 |
|
|
|
493 |
|
| Service Class |
|
|
— |
|
|
|
14 |
|
|
|
6,224 |
|
|
|
2,982 |
|
| Shares redeemed |
|
|
|
|
|
|
|
|
|
|
|
|
|
|
|
|
| Administrative Class |
|
|
(1,676,554,899 |
) |
|
|
(3,068,693,891 |
) |
|
|
(54,025,509 |
) |
|
|
(44,650,435 |
) |
| Select Class |
|
|
(1,325,605,795 |
) |
|
|
(1,349,589,815 |
) |
|
|
(659,612,241 |
) |
|
|
(242,756,850 |
) |
| Service Class |
|
|
(13,211,001 |
) |
|
|
(25,441,891 |
) |
|
|
(125,669,590 |
) |
|
|
(52,046,105 |
) |
|
|
|
|
|
|
|
|
|
|
|
|
|
|
|
|
|
| Net change resulting from share transactions |
|
|
95,267,729 |
|
|
|
204,028,498 |
|
|
|
41,052,599 |
|
|
|
307,622,802 |
|
|
|
|
|
|
|
|
|
|
|
|
|
|
|
|
|
|
See Notes which are an integral part of the Financial Statements
April 30, 2013 / ANNUAL REPORT
For a share outstanding throughout each year ended April 30, unless otherwise noted:
|
|
|
|
|
|
|
|
|
|
|
|
|
|
|
|
|
|
|
|
|
|
|
|
|
|
|
|
| WILMINGTON PRIME MONEY MARKET FUND |
|
|
|
|
|
|
|
|
|
|
|
|
|
|
|
|
|
|
|
|
|
|
|
|
|
|
|
|
|
|
|
|
|
|
|
|
|
|
|
| ADMINISTRATIVE
CLASS |
|
2013
|
|
|
2012
|
|
|
|
|
2011
|
|
|
2010
|
|
|
2009
|
|
|
|
| Net Asset Value, Beginning of Year |
|
|
$1.000 |
|
|
|
$1.000 |
|
|
|
|
|
$1.000 |
|
|
|
$1.000 |
|
|
|
$1.000 |
|
|
|
| Income (Loss) From Operations: |
|
|
|
|
|
|
|
|
|
|
|
|
|
|
|
|
|
|
|
|
|
|
|
|
| Net Investment Income |
|
|
0.000 |
(a) |
|
|
0.000 |
(a) |
|
|
|
|
0.000 |
(a) |
|
|
0.000 |
(a) |
|
|
0.012 |
|
|
|
| Net Realized and Unrealized Gain (Loss) on Investments |
|
|
0.000 |
(a) |
|
|
0.000 |
(a) |
|
|
|
|
— |
|
|
|
— |
|
|
|
— |
|
|
|
|
|
|
|
| Total Income (Loss) From Operations |
|
|
0.000 |
|
|
|
0.000 |
|
|
|
|
|
0.000 |
|
|
|
0.000 |
|
|
|
0.012 |
|
|
|
|
|
|
|
| Less Distributions From: |
|
|
|
|
|
|
|
|
|
|
|
|
|
|
|
|
|
|
|
|
|
|
|
|
| Net Investment Income |
|
|
(0.000 |
)(a) |
|
|
(0.000 |
)(a) |
|
|
|
|
(0.000 |
)(a) |
|
|
(0.000 |
)(a) |
|
|
(0.012 |
) |
|
|
| Return of Capital |
|
|
— |
|
|
|
— |
|
|
|
|
|
— |
|
|
|
(0.000 |
)(a) |
|
|
— |
|
|
|
|
|
|
|
| Total Distributions |
|
|
(0.000 |
) |
|
|
(0.000 |
) |
|
|
|
|
(0.000 |
) |
|
|
(0.000 |
) |
|
|
(0.012 |
) |
|
|
|
|
|
|
| Net Asset Value, End of Year |
|
|
$1.000 |
|
|
|
$1.000 |
|
|
|
|
|
$1.000 |
|
|
|
$1.000 |
|
|
|
$1.000 |
|
|
|
|
|
|
|
| Total Return(b) |
|
|
0.03 |
% |
|
|
0.03 |
% |
|
|
|
|
0.04 |
% |
|
|
0.04 |
% |
|
|
1.25 |
% |
|
|
| Net Assets, End of Year (000’s) |
|
|
$382,757 |
|
|
|
$464,721 |
|
|
|
|
|
$416,387 |
|
|
|
$425,103 |
|
|
|
$447,219 |
|
|
|
| Ratios to Average Net Assets |
|
|
|
|
|
|
|
|
|
|
|
|
|
|
|
|
|
|
|
|
|
|
|
|
| Gross Expense |
|
|
0.97 |
% |
|
|
0.80 |
% |
|
|
|
|
0.75 |
% |
|
|
0.77 |
% |
|
|
0.74 |
% |
|
|
| Net Expenses(c) |
|
|
0.17 |
% |
|
|
0.16 |
% |
|
|
|
|
0.25 |
% |
|
|
0.26 |
% |
|
|
0.53 |
% |
|
|
| Net Investment Income |
|
|
0.03 |
% |
|
|
0.02 |
% |
|
|
|
|
0.04 |
% |
|
|
0.04 |
% |
|
|
1.55 |
% |
|
|
|
|
|
|
|
|
|
|
|
|
|
|
|
|
|
|
|
|
|
|
|
|
|
|
|
|
|
|
|
|
|
|
|
| INSTITUTIONAL
CLASS |
|
2013
|
|
|
2012(d)
|
|
|
|
|
|
|
|
|
|
|
|
|
|
|
| Net Asset Value, Beginning of Period |
|
|
$1.000 |
|
|
|
$1.000 |
|
|
|
|
|
|
|
|
|
|
|
|
|
|
|
|
|
| Income (Loss) From Operations: |
|
|
|
|
|
|
|
|
|
|
|
|
|
|
|
|
|
|
|
|
|
|
|
|
| Net Investment Income |
|
|
0.000 |
(a) |
|
|
0.000 |
(a) |
|
|
|
|
|
|
|
|
|
|
|
|
|
|
|
|
| Net Realized and Unrealized Gain (Loss) on Investments |
|
|
0.000 |
(a) |
|
|
0.000 |
(a) |
|
|
|
|
|
|
|
|
|
|
|
|
|
|
|
|
|
|
|
|
|
|
|
|
|
|
|
|
|
|
|
|
|
|
| Total Income (Loss) From Operations |
|
|
0.000 |
|
|
|
0.000 |
|
|
|
|
|
|
|
|
|
|
|
|
|
|
|
|
|
|
|
|
|
|
|
|
|
|
|
|
|
|
|
|
|
|
|
| Less Distributions From: |
|
|
|
|
|
|
|
|
|
|
|
|
|
|
|
|
|
|
|
|
|
|
|
|
| Net Investment Income |
|
|
(0.000 |
)(a) |
|
|
(0.000 |
)(a) |
|
|
|
|
|
|
|
|
|
|
|
|
|
|
|
|
|
|
|
|
|
|
|
|
|
|
|
|
|
|
|
|
|
|
| Total Distributions |
|
|
(0.000 |
) |
|
|
(0.000 |
) |
|
|
|
|
|
|
|
|
|
|
|
|
|
|
|
|
|
|
|
|
|
|
|
|
|
|
|
|
|
|
|
|
|
|
| Net Asset Value, End of Period |
|
|
$1.000 |
|
|
|
$1.000 |
|
|
|
|
|
|
|
|
|
|
|
|
|
|
|
|
|
|
|
|
|
|
|
|
|
|
|
|
|
|
|
|
|
|
|
| Total Return(b) |
|
|
0.03 |
% |
|
|
0.01 |
% |
|
|
|
|
|
|
|
|
|
|
|
|
|
|
|
|
| Net Assets, End of Period (000’s) |
|
|
$31,056 |
|
|
|
$42,072 |
|
|
|
|
|
|
|
|
|
|
|
|
|
|
|
|
|
| Ratios to Average Net Assets |
|
|
|
|
|
|
|
|
|
|
|
|
|
|
|
|
|
|
|
|
|
|
|
|
| Gross Expense |
|
|
0.47 |
% |
|
|
0.46 |
%(e) |
|
|
|
|
|
|
|
|
|
|
|
|
|
|
|
|
| Net Expenses(c) |
|
|
0.17 |
% |
|
|
0.16 |
%(e) |
|
|
|
|
|
|
|
|
|
|
|
|
|
|
|
|
| Net Investment Income |
|
|
0.03 |
% |
|
|
0.04 |
%(e) |
|
|
|
|
|
|
|
|
|
|
|
|
|
|
|
|
|
|
|
|
|
|
|
|
|
|
|
|
|
|
|
|
|
|
|
|
|
|
|
|
|
|
|
|
|
|
|
|
|
| SELECT CLASS |
|
2013
|
|
|
2012
|
|
|
|
|
2011
|
|
|
2010
|
|
|
2009
|
|
|
|
| Net Asset Value, Beginning of Year |
|
|
$1.000 |
|
|
|
$1.000 |
|
|
|
|
|
$1.000 |
|
|
|
$1.000 |
|
|
|
$1.000 |
|
|
|
| Income (Loss) From Operations: |
|
|
|
|
|
|
|
|
|
|
|
|
|
|
|
|
|
|
|
|
|
|
|
|
| Net Investment Income |
|
|
0.000 |
(a) |
|
|
0.000 |
(a) |
|
|
|
|
0.000 |
(a) |
|
|
0.000 |
(a) |
|
|
0.011 |
|
|
|
| Net Realized and Unrealized Gain (Loss) on Investments |
|
|
0.000 |
(a) |
|
|
0.000 |
(a) |
|
|
|
|
— |
|
|
|
— |
|
|
|
— |
|
|
|
|
|
|
|
| Total Income (Loss) From Operations |
|
|
0.000 |
|
|
|
0.000 |
|
|
|
|
|
0.000 |
|
|
|
0.000 |
|
|
|
0.011 |
|
|
|
|
|
|
|
| Less Distributions From: |
|
|
|
|
|
|
|
|
|
|
|
|
|
|
|
|
|
|
|
|
|
|
|
|
| Net Investment Income |
|
|
(0.000 |
)(a) |
|
|
(0.000 |
)(a) |
|
|
|
|
(0.000 |
)(a) |
|
|
(0.000 |
)(a) |
|
|
(0.011 |
) |
|
|
| Return of Capital |
|
|
— |
|
|
|
— |
|
|
|
|
|
— |
|
|
|
(0.000 |
)(a) |
|
|
— |
|
|
|
|
|
|
|
| Total Distributions |
|
|
(0.000 |
) |
|
|
(0.000 |
) |
|
|
|
|
(0.000 |
) |
|
|
(0.000 |
) |
|
|
(0.011 |
) |
|
|
|
|
|
|
| Net Asset Value, End of Year |
|
|
$1.000 |
|
|
|
$1.000 |
|
|
|
|
|
$1.000 |
|
|
|
$1.000 |
|
|
|
$1.000 |
|
|
|
|
|
|
|
| Total Return(b) |
|
|
0.03 |
% |
|
|
0.02 |
% |
|
|
|
|
0.01 |
% |
|
|
0.02 |
% |
|
|
1.13 |
% |
|
|
| Net Assets, End of Year (000’s) |
|
|
$2,528,068 |
|
|
|
$2,424,783 |
|
|
|
|
|
$345,931 |
|
|
|
$459,497 |
|
|
|
$630,429 |
|
|
|
| Ratios to Average Net Assets |
|
|
|
|
|
|
|
|
|
|
|
|
|
|
|
|
|
|
|
|
|
|
|
|
| Gross Expense |
|
|
0.72 |
% |
|
|
0.73 |
% |
|
|
|
|
0.75 |
% |
|
|
0.77 |
% |
|
|
0.76 |
% |
|
|
| Net Expenses(c) |
|
|
0.17 |
% |
|
|
0.16 |
% |
|
|
|
|
0.28 |
% |
|
|
0.29 |
% |
|
|
0.67 |
% |
|
|
| Net Investment Income |
|
|
0.03 |
% |
|
|
0.03 |
% |
|
|
|
|
0.01 |
% |
|
|
0.02 |
% |
|
|
1.20 |
% |
|
|
ANNUAL REPORT / April
30, 2013
|
|
|
|
|
|
|
|
|
|
|
|
|
|
|
|
|
|
|
|
|
|
|
|
|
|
| WILMINGTON PRIME MONEY MARKET FUND (continued) |
|
|
|
|
|
|
|
|
|
|
|
|
|
|
|
|
|
|
|
|
|
|
|
|
|
|
|
|
|
|
|
|
|
|
|
|
| SERVICE CLASS
|
|
2013
|
|
|
2012
|
|
|
2011
|
|
|
2010
|
|
|
2009
|
|
|
|
| Net Asset Value, Beginning of Year |
|
|
$1.000 |
|
|
|
$1.000 |
|
|
|
$1.000 |
|
|
|
$1.000 |
|
|
|
$1.000 |
|
|
|
| Income (Loss) From Operations: |
|
|
|
|
|
|
|
|
|
|
|
|
|
|
|
|
|
|
|
|
|
|
| Net Investment Income |
|
|
0.000 |
(a) |
|
|
0.000 |
(a) |
|
|
0.000 |
(a) |
|
|
0.000 |
(a) |
|
|
0.013 |
|
|
|
| Net Realized and Unrealized Gain (Loss) on Investments |
|
|
0.000 |
(a) |
|
|
0.000 |
(a) |
|
|
— |
|
|
|
— |
|
|
|
— |
|
|
|
|
|
|
|
| Total Income (Loss) From Operations |
|
|
0.000 |
|
|
|
0.000 |
|
|
|
0.000 |
|
|
|
0.000 |
|
|
|
0.013 |
|
|
|
|
|
|
|
| Less Distributions From: |
|
|
|
|
|
|
|
|
|
|
|
|
|
|
|
|
|
|
|
|
|
|
| Net Investment Income |
|
|
(0.000 |
)(a) |
|
|
(0.000 |
)(a) |
|
|
(0.000 |
)(a) |
|
|
(0.000 |
)(a) |
|
|
(0.013 |
) |
|
|
| Return of Capital |
|
|
— |
|
|
|
— |
|
|
|
— |
|
|
|
(0.000 |
)(a) |
|
|
— |
|
|
|
|
|
|
|
| Total Distributions |
|
|
(0.000 |
) |
|
|
(0.000 |
) |
|
|
(0.000 |
) |
|
|
(0.000 |
) |
|
|
(0.013 |
) |
|
|
|
|
|
|
| Net Asset Value, End of Year |
|
|
$1.000 |
|
|
|
$1.000 |
|
|
|
$1.000 |
|
|
|
$1.000 |
|
|
|
$1.000 |
|
|
|
|
|
|
|
| Total Return(b) |
|
|
0.01 |
% |
|
|
0.01 |
% |
|
|
0.01 |
% |
|
|
0.03 |
% |
|
|
1.30 |
% |
|
|
| Net Assets, End of Year (000’s) |
|
|
$829,547 |
|
|
|
$779,543 |
|
|
|
$217,836 |
|
|
|
$244,661 |
|
|
|
$320,238 |
|
|
|
| Ratios to Average Net Assets |
|
|
|
|
|
|
|
|
|
|
|
|
|
|
|
|
|
|
|
|
|
|
| Gross Expense |
|
|
0.96 |
% |
|
|
0.98 |
% |
|
|
1.00 |
% |
|
|
1.02 |
% |
|
|
1.00 |
% |
|
|
| Net Expenses(c) |
|
|
0.19 |
% |
|
|
0.18 |
% |
|
|
0.28 |
% |
|
|
0.28 |
% |
|
|
0.49 |
% |
|
|
| Net Investment Income |
|
|
0.01 |
% |
|
|
0.01 |
% |
|
|
0.01 |
% |
|
|
0.03 |
% |
|
|
1.42 |
% |
|
|
| (a) |
Represents less than $0.001. |
| (b) |
Total returns for periods of less than one year, if any, are not annualized. |
| (c) |
The investment manager and other service providers voluntarily waived a portion of their fees. |
| (d) |
Reflects investment operations for the period from March 12, 2012 to April 30, 2012. |
| (e) |
Annualized for periods less the one year. |
See Notes which are an integral part of the Financial Statements
April 30, 2013 / ANNUAL REPORT
For a share outstanding throughout each year ended April 30, unless otherwise noted:
|
|
|
|
|
|
|
|
|
|
|
|
|
|
|
|
|
|
|
|
|
|
|
|
|
|
|
| WILMINGTON U.S. GOVERNMENT MONEY MARKET FUND |
|
|
|
|
|
|
|
|
|
|
|
|
|
|
|
|
|
|
|
|
|
|
|
|
|
|
|
|
| ADMINISTRATIVE CLASS |
|
2013
|
|
|
2012
|
|
|
|
|
2011
|
|
|
2010
|
|
|
2009
|
|
|
|
| Net Asset Value, Beginning of Year |
|
|
$1.000 |
|
|
|
$1.000 |
|
|
|
|
|
$1.000 |
|
|
|
$1.000 |
|
|
|
$1.000 |
|
|
|
| Income (Loss) From Operations: |
|
|
|
|
|
|
|
|
|
|
|
|
|
|
|
|
|
|
|
|
|
|
|
|
| Net Investment Income |
|
|
0.000 |
(a) |
|
|
0.000 |
(a) |
|
|
|
|
0.000 |
(a) |
|
|
0.000 |
(a) |
|
|
0.012 |
|
|
|
| Net Realized and Unrealized Gain (Loss) on Investments |
|
|
0.000 |
(a) |
|
|
0.000 |
(a) |
|
|
|
|
— |
|
|
|
— |
|
|
|
— |
|
|
|
|
|
|
|
| Total Income (Loss) From Operations |
|
|
0.000 |
|
|
|
0.000 |
|
|
|
|
|
0.000 |
|
|
|
0.000 |
|
|
|
0.012 |
|
|
|
|
|
|
|
| Less Distributions From: |
|
|
|
|
|
|
|
|
|
|
|
|
|
|
|
|
|
|
|
|
|
|
|
|
| Net Investment Income |
|
|
(0.000 |
)(a) |
|
|
(0.000 |
)(a) |
|
|
|
|
(0.000 |
)(a) |
|
|
(0.000 |
)(a) |
|
|
(0.012 |
) |
|
|
| Return of Capital |
|
|
— |
|
|
|
— |
|
|
|
|
|
(0.000 |
)(a) |
|
|
(0.000 |
)(a) |
|
|
— |
|
|
|
|
|
|
|
| Total Distributions |
|
|
(0.000 |
) |
|
|
(0.000 |
) |
|
|
|
|
(0.000 |
) |
|
|
(0.000 |
) |
|
|
(0.012 |
) |
|
|
|
|
|
|
| Net Asset Value, End of Year |
|
|
$1.000 |
|
|
|
$1.000 |
|
|
|
|
|
$1.000 |
|
|
|
$1.000 |
|
|
|
$1.000 |
|
|
|
|
|
|
|
| Total Return(b) |
|
|
0.01 |
% |
|
|
0.01 |
% |
|
|
|
|
0.01 |
% |
|
|
0.02 |
% |
|
|
1.23 |
% |
|
|
| Net Assets, End of Year (000’s) |
|
|
$1,885,193 |
|
|
|
$1,801,115 |
|
|
|
|
|
$1,493,139 |
|
|
|
$1,582,317 |
|
|
|
$1,642,160 |
|
|
|
| Ratios to Average Net Assets |
|
|
|
|
|
|
|
|
|
|
|
|
|
|
|
|
|
|
|
|
|
|
|
|
| Gross Expense |
|
|
0.96 |
% |
|
|
0.79 |
% |
|
|
|
|
0.73 |
% |
|
|
0.74 |
% |
|
|
0.73 |
% |
|
|
| Net Expenses(c) |
|
|
0.15 |
% |
|
|
0.12 |
% |
|
|
|
|
0.25 |
% |
|
|
0.29 |
% |
|
|
0.58 |
% |
|
|
| Net Investment Income |
|
|
0.01 |
% |
|
|
0.01 |
% |
|
|
|
|
0.01 |
% |
|
|
0.02 |
% |
|
|
1.17 |
% |
|
|
|
|
|
|
|
|
|
|
|
|
|
|
|
|
|
|
|
|
|
|
|
|
|
|
|
| INSTITUTIONAL CLASS |
|
2013
|
|
|
2012(d)
|
|
|
|
|
|
|
|
|
|
|
|
|
|
|
| Net Asset Value, Beginning of Period |
|
|
$1.000 |
|
|
|
$1.000 |
|
|
|
|
|
|
|
|
|
|
|
|
|
|
|
|
|
| Income (Loss) From Operations: |
|
|
|
|
|
|
|
|
|
|
|
|
|
|
|
|
|
|
|
|
|
|
|
|
| Net Investment Income |
|
|
0.000 |
(a) |
|
|
0.000 |
(a) |
|
|
|
|
|
|
|
|
|
|
|
|
|
|
|
|
| Net Realized and Unrealized Gain (Loss) on Investments |
|
|
0.000 |
(a) |
|
|
0.000 |
(a) |
|
|
|
|
|
|
|
|
|
|
|
|
|
|
|
|
|
|
|
|
|
|
|
|
|
|
|
|
|
|
|
|
|
|
| Total Income (Loss) From Operations |
|
|
0.000 |
|
|
|
0.000 |
|
|
|
|
|
|
|
|
|
|
|
|
|
|
|
|
|
|
|
|
|
|
|
|
|
|
|
|
|
|
|
|
|
|
|
| Less Distributions From: |
|
|
|
|
|
|
|
|
|
|
|
|
|
|
|
|
|
|
|
|
|
|
|
|
| Net Investment Income |
|
|
(0.000 |
)(a) |
|
|
(0.000 |
)(a) |
|
|
|
|
|
|
|
|
|
|
|
|
|
|
|
|
|
|
|
|
|
|
|
|
|
|
|
|
|
|
|
|
|
|
| Total Distributions |
|
|
(0.000 |
) |
|
|
(0.000 |
) |
|
|
|
|
|
|
|
|
|
|
|
|
|
|
|
|
|
|
|
|
|
|
|
|
|
|
|
|
|
|
|
|
|
|
| Net Asset Value, End of Period |
|
|
$1.000 |
|
|
|
$1.000 |
|
|
|
|
|
|
|
|
|
|
|
|
|
|
|
|
|
|
|
|
|
|
|
|
|
|
|
|
|
|
|
|
|
|
|
| Total Return(b) |
|
|
0.01 |
% |
|
|
0.00 |
% |
|
|
|
|
|
|
|
|
|
|
|
|
|
|
|
|
| Net Assets, End of Period (000’s) |
|
|
$25,683 |
|
|
|
$85,322 |
|
|
|
|
|
|
|
|
|
|
|
|
|
|
|
|
|
| Ratios to Average Net Assets |
|
|
|
|
|
|
|
|
|
|
|
|
|
|
|
|
|
|
|
|
|
|
|
|
| Gross Expense |
|
|
0.46 |
% |
|
|
0.46 |
%(e) |
|
|
|
|
|
|
|
|
|
|
|
|
|
|
|
|
| Net Expenses(c) |
|
|
0.15 |
% |
|
|
0.13 |
%(e) |
|
|
|
|
|
|
|
|
|
|
|
|
|
|
|
|
| Net Investment Income |
|
|
0.01 |
% |
|
|
0.01 |
%(e) |
|
|
|
|
|
|
|
|
|
|
|
|
|
|
|
|
|
|
|
|
|
|
|
|
|
|
|
|
|
|
|
|
|
|
|
|
|
|
|
|
|
| SELECT CLASS |
|
2013
|
|
|
2012
|
|
|
|
|
2011
|
|
|
2010
|
|
|
2009
|
|
|
|
| Net Asset Value, Beginning of Year |
|
|
$1.000 |
|
|
|
$1.000 |
|
|
|
|
|
$1.000 |
|
|
|
$1.000 |
|
|
|
$1.000 |
|
|
|
| Income (Loss) From Operations: |
|
|
|
|
|
|
|
|
|
|
|
|
|
|
|
|
|
|
|
|
|
|
|
|
| Net Investment Income |
|
|
0.000 |
(a) |
|
|
0.000 |
(a) |
|
|
|
|
0.000 |
(a) |
|
|
0.000 |
(a) |
|
|
0.013 |
|
|
|
| Net Realized and Unrealized Gain (Loss) on Investments |
|
|
0.000 |
(a) |
|
|
0.000 |
(a) |
|
|
|
|
— |
|
|
|
— |
|
|
|
— |
|
|
|
|
|
|
|
| Total Income (Loss) From Operations |
|
|
0.000 |
|
|
|
0.000 |
|
|
|
|
|
0.000 |
|
|
|
0.000 |
|
|
|
0.013 |
|
|
|
|
|
|
|
| Less Distributions From: |
|
|
|
|
|
|
|
|
|
|
|
|
|
|
|
|
|
|
|
|
|
|
|
|
| Net Investment Income |
|
|
(0.000 |
)(a) |
|
|
(0.000 |
)(a) |
|
|
|
|
(0.000 |
)(a) |
|
|
(0.000 |
)(a) |
|
|
(0.013 |
) |
|
|
| Return of Capital |
|
|
— |
|
|
|
— |
|
|
|
|
|
(0.000 |
)(a) |
|
|
(0.000 |
)(a) |
|
|
— |
|
|
|
|
|
|
|
| Total Distributions |
|
|
(0.000 |
) |
|
|
(0.000 |
) |
|
|
|
|
(0.000 |
) |
|
|
(0.000 |
) |
|
|
(0.013 |
) |
|
|
|
|
|
|
| Net Asset Value, End of Year |
|
|
$1.000 |
|
|
|
$1.000 |
|
|
|
|
|
$1.000 |
|
|
|
$1.000 |
|
|
|
$1.000 |
|
|
|
|
|
|
|
| Total Return(b) |
|
|
0.01 |
% |
|
|
0.01 |
% |
|
|
|
|
0.01 |
% |
|
|
0.02 |
% |
|
|
1.34 |
% |
|
|
| Net Assets, End of Year (000’s) |
|
|
$1,164,388 |
|
|
|
$1,213,146 |
|
|
|
|
|
$355,506 |
|
|
|
$496,004 |
|
|
|
$1,394,758 |
|
|
|
| Ratios to Average Net Assets |
|
|
|
|
|
|
|
|
|
|
|
|
|
|
|
|
|
|
|
|
|
|
|
|
| Gross Expense |
|
|
0.71 |
% |
|
|
0.72 |
% |
|
|
|
|
0.74 |
% |
|
|
0.75 |
% |
|
|
0.73 |
% |
|
|
| Net Expenses(c) |
|
|
0.15 |
% |
|
|
0.12 |
% |
|
|
|
|
0.26 |
% |
|
|
0.32 |
% |
|
|
0.48 |
% |
|
|
| Net Investment Income |
|
|
0.01 |
% |
|
|
0.01 |
% |
|
|
|
|
0.01 |
% |
|
|
0.02 |
% |
|
|
1.38 |
% |
|
|
ANNUAL REPORT / April
30, 2013
|
|
|
|
|
|
|
|
|
|
|
|
|
|
|
|
|
|
|
|
|
|
|
|
|
|
| WILMINGTON U.S. GOVERNMENT MONEY MARKET FUND (continued) |
|
|
|
|
|
|
|
|
|
|
|
|
|
|
|
|
|
|
|
|
|
|
|
|
|
|
|
|
|
| SERVICE CLASS |
|
2013
|
|
|
2012
|
|
|
2011
|
|
|
2010
|
|
|
2009
|
|
|
|
| Net Asset Value, Beginning of Year |
|
|
$1.000 |
|
|
|
$1.000 |
|
|
|
$1.000 |
|
|
|
$1.000 |
|
|
|
$1.000 |
|
|
|
| Income (Loss) From Operations: |
|
|
|
|
|
|
|
|
|
|
|
|
|
|
|
|
|
|
|
|
|
|
| Net Investment Income |
|
|
0.000 |
(a) |
|
|
0.000 |
(a) |
|
|
0.000 |
(a) |
|
|
0.000 |
(a) |
|
|
0.011 |
|
|
|
| Net Realized and Unrealized Gain (Loss) on Investments |
|
|
0.000 |
(a) |
|
|
0.000 |
(a) |
|
|
— |
|
|
|
— |
|
|
|
— |
|
|
|
|
|
|
|
| Total Income (Loss) From Operations |
|
|
0.000 |
|
|
|
0.000 |
|
|
|
0.000 |
|
|
|
0.000 |
|
|
|
0.011 |
|
|
|
|
|
|
|
| Less Distributions From: |
|
|
|
|
|
|
|
|
|
|
|
|
|
|
|
|
|
|
|
|
|
|
| Net Investment Income |
|
|
(0.000 |
)(a) |
|
|
(0.000 |
)(a) |
|
|
(0.000 |
)(a) |
|
|
(0.000 |
)(a) |
|
|
(0.011 |
) |
|
|
| Return of Capital |
|
|
— |
|
|
|
— |
|
|
|
(0.000 |
)(a) |
|
|
(0.000 |
)(a) |
|
|
— |
|
|
|
|
|
|
|
| Total Distributions |
|
|
(0.000 |
) |
|
|
(0.000 |
) |
|
|
(0.000 |
) |
|
|
(0.000 |
) |
|
|
(0.011 |
) |
|
|
|
|
|
|
| Net Asset Value, End of Year |
|
|
$1.000 |
|
|
|
$1.000 |
|
|
|
$1.000 |
|
|
|
$1.000 |
|
|
|
$1.000 |
|
|
|
|
|
|
|
| Total Return(b) |
|
|
0.01 |
% |
|
|
0.01 |
% |
|
|
0.01 |
% |
|
|
0.02 |
% |
|
|
1.14 |
% |
|
|
| Net Assets, End of Year (000’s) |
|
|
$1,131,306 |
|
|
|
$873,278 |
|
|
|
$35,561 |
|
|
|
$35,502 |
|
|
|
$42,427 |
|
|
|
| Ratios to Average Net Assets |
|
|
|
|
|
|
|
|
|
|
|
|
|
|
|
|
|
|
|
|
|
|
| Gross Expense |
|
|
0.96 |
% |
|
|
0.97 |
% |
|
|
0.98 |
% |
|
|
1.00 |
% |
|
|
0.99 |
% |
|
|
| Net Expenses(c) |
|
|
0.14 |
% |
|
|
0.13 |
% |
|
|
0.25 |
% |
|
|
0.30 |
% |
|
|
0.73 |
% |
|
|
| Net Investment Income |
|
|
0.01 |
% |
|
|
0.01 |
% |
|
|
0.01 |
% |
|
|
0.02 |
% |
|
|
0.97 |
% |
|
|
| (a) |
Represents less than $0.001. |
| (b) |
Total returns for periods of less than one year, if any, are not annualized. |
| (c) |
The investment manager and other service providers voluntarily waived a portion of their fees. |
| (d) |
Reflects investment operations for the period from March 12, 2012 to April 30, 2012. |
| (e) |
Annualized for periods less the one year. |
See Notes which are an integral part of the Financial Statements
April 30, 2013 / ANNUAL REPORT
For a share outstanding throughout each year ended April 30, unless otherwise noted:
|
|
|
|
|
|
|
|
|
|
|
|
|
|
|
|
|
|
|
|
|
|
|
|
|
|
| WILMINGTON U.S. TREASURY MONEY MARKET FUND |
|
|
|
|
|
|
|
|
|
|
|
|
|
|
|
|
|
|
|
|
|
|
|
|
|
|
|
|
|
|
|
|
|
|
|
|
|
ADMINISTRATIVE CLASS
|
|
2013 |
|
|
2012 |
|
|
2011 |
|
|
2010 |
|
|
2009 |
|
|
|
| Net Asset Value, Beginning of Year |
|
|
$1.000 |
|
|
|
$1.000 |
|
|
|
$1.000 |
|
|
|
$1.000 |
|
|
|
$1.000 |
|
|
|
| Income (Loss) From Operations: |
|
|
|
|
|
|
|
|
|
|
|
|
|
|
|
|
|
|
|
|
|
|
| Net Investment Income |
|
|
0.000 |
(a) |
|
|
0.000 |
(a) |
|
|
0.000 |
(a) |
|
|
0.000 |
(a) |
|
|
0.006 |
|
|
|
| Net Realized and Unrealized Gain (Loss) on Investments |
|
|
0.000 |
(a) |
|
|
0.000 |
(a) |
|
|
— |
|
|
|
— |
|
|
|
— |
|
|
|
|
|
|
|
| Total Income (Loss) From Operations |
|
|
0.000 |
|
|
|
0.000 |
|
|
|
0.000 |
|
|
|
0.000 |
|
|
|
0.006 |
|
|
|
|
|
|
|
| Less Distributions From: |
|
|
|
|
|
|
|
|
|
|
|
|
|
|
|
|
|
|
|
|
|
|
| Net Investment Income |
|
|
(0.000 |
)(a) |
|
|
(0.000 |
)(a) |
|
|
(0.000 |
)(a) |
|
|
(0.000 |
)(a) |
|
|
(0.006 |
) |
|
|
|
|
|
|
| Net Asset Value, End of Year |
|
|
$1.000 |
|
|
|
$1.000 |
|
|
|
$1.000 |
|
|
|
$1.000 |
|
|
|
$1.000 |
|
|
|
|
|
|
|
| Total Return(b) |
|
|
0.01 |
% |
|
|
0.01 |
% |
|
|
0.01 |
% |
|
|
0.02 |
% |
|
|
0.58 |
% |
|
|
| Net Assets, End of Year (000’s) |
|
|
$827,103 |
|
|
|
$909,306 |
|
|
|
$676,070 |
|
|
|
$654,530 |
|
|
|
$752,284 |
|
|
|
| Ratios to Average Net Assets |
|
|
|
|
|
|
|
|
|
|
|
|
|
|
|
|
|
|
|
|
|
|
| Gross Expense |
|
|
0.97 |
% |
|
|
0.80 |
% |
|
|
0.74 |
% |
|
|
0.73 |
% |
|
|
0.74 |
% |
|
|
| Net Expenses(c) |
|
|
0.14 |
% |
|
|
0.06 |
% |
|
|
0.16 |
% |
|
|
0.22 |
% |
|
|
0.54 |
% |
|
|
| Net Investment Income |
|
|
0.01 |
% |
|
|
0.01 |
% |
|
|
0.01 |
% |
|
|
0.03 |
% |
|
|
0.39 |
% |
|
|
|
|
|
|
|
|
|
|
|
|
|
|
|
|
|
|
|
|
|
|
|
|
|
|
|
|
|
|
|
|
|
SELECT CLASS
|
|
2013 |
|
|
2012 |
|
|
2011 |
|
|
2010 |
|
|
2009 |
|
|
|
| Net Asset Value, Beginning of Year |
|
|
$1.000 |
|
|
|
$1.000 |
|
|
|
$1.000 |
|
|
|
$1.000 |
|
|
|
$1.000 |
|
|
|
| Income (Loss) From Operations: |
|
|
|
|
|
|
|
|
|
|
|
|
|
|
|
|
|
|
|
|
|
|
| Net Investment Income |
|
|
0.000 |
(a) |
|
|
0.000 |
(a) |
|
|
0.000 |
(a) |
|
|
0.000 |
(a) |
|
|
0.005 |
|
|
|
| Net Realized and Unrealized Gain (Loss) on Investments |
|
|
0.000 |
(a) |
|
|
0.000 |
(a) |
|
|
— |
|
|
|
— |
|
|
|
— |
|
|
|
|
|
|
|
| Total Income (Loss) From Operations |
|
|
0.000 |
|
|
|
0.000 |
|
|
|
0.000 |
|
|
|
0.000 |
|
|
|
0.005 |
|
|
|
|
|
|
|
| Less Distributions From: |
|
|
|
|
|
|
|
|
|
|
|
|
|
|
|
|
|
|
|
|
|
|
| Net Investment Income |
|
|
(0.000 |
)(a) |
|
|
(0.000 |
)(a) |
|
|
(0.000 |
)(a) |
|
|
(0.000 |
)(a) |
|
|
(0.005 |
) |
|
|
|
|
|
|
| Net Asset Value, End of Year |
|
|
$1.000 |
|
|
|
$1.000 |
|
|
|
$1.000 |
|
|
|
$1.000 |
|
|
|
$1.000 |
|
|
|
|
|
|
|
| Total Return(b) |
|
|
0.01 |
% |
|
|
0.01 |
% |
|
|
0.01 |
% |
|
|
0.02 |
% |
|
|
0.54 |
% |
|
|
| Net Assets, End of Year (000’s) |
|
|
$386,574 |
|
|
|
$210,231 |
|
|
|
$71,929 |
|
|
|
$141,648 |
|
|
|
$133,754 |
|
|
|
| Ratios to Average Net Assets |
|
|
|
|
|
|
|
|
|
|
|
|
|
|
|
|
|
|
|
|
|
|
| Gross Expense |
|
|
0.73 |
% |
|
|
0.73 |
% |
|
|
0.74 |
% |
|
|
0.74 |
% |
|
|
0.74 |
% |
|
|
| Net Expenses(c) |
|
|
0.14 |
% |
|
|
0.06 |
% |
|
|
0.17 |
% |
|
|
0.20 |
% |
|
|
0.60 |
% |
|
|
| Net Investment Income |
|
|
0.01 |
% |
|
|
0.01 |
% |
|
|
0.01 |
% |
|
|
0.02 |
% |
|
|
0.48 |
% |
|
|
|
|
|
|
|
|
|
|
|
|
|
|
|
|
|
|
|
|
|
|
|
|
|
|
|
|
|
|
|
|
|
SERVICE CLASS
|
|
2013 |
|
|
2012 |
|
|
2011 |
|
|
2010 |
|
|
2009 |
|
|
|
| Net Asset Value, Beginning of Year |
|
|
$1.000 |
|
|
|
$1.000 |
|
|
|
$1.000 |
|
|
|
$1.000 |
|
|
|
$1.000 |
|
|
|
| Income (Loss) From Operations: |
|
|
|
|
|
|
|
|
|
|
|
|
|
|
|
|
|
|
|
|
|
|
| Net Investment Income |
|
|
0.000 |
(a) |
|
|
0.000 |
(a) |
|
|
0.000 |
(a) |
|
|
0.000 |
(a) |
|
|
0.004 |
|
|
|
| Net Realized and Unrealized Gain (Loss) on Investments |
|
|
0.000 |
(a) |
|
|
0.000 |
(a) |
|
|
— |
|
|
|
— |
|
|
|
— |
|
|
|
|
|
|
|
| Total Income (Loss) From Operations |
|
|
0.000 |
|
|
|
0.000 |
|
|
|
0.000 |
|
|
|
0.000 |
|
|
|
0.004 |
|
|
|
|
|
|
|
| Less Distributions From: |
|
|
|
|
|
|
|
|
|
|
|
|
|
|
|
|
|
|
|
|
|
|
| Net Investment Income |
|
|
(0.000 |
)(a) |
|
|
(0.000 |
)(a) |
|
|
(0.000 |
)(a) |
|
|
(0.000 |
)(a) |
|
|
(0.004 |
) |
|
|
|
|
|
|
| Net Asset Value, End of Year |
|
|
$1.000 |
|
|
|
$1.000 |
|
|
|
$1.000 |
|
|
|
$1.000 |
|
|
|
$1.000 |
|
|
|
|
|
|
|
| Total Return(b) |
|
|
0.01 |
% |
|
|
0.01 |
% |
|
|
0.01 |
% |
|
|
0.02 |
% |
|
|
0.43 |
% |
|
|
| Net Assets, End of Year (000’s) |
|
|
$10,034 |
|
|
|
$8,909 |
|
|
|
$10,627 |
|
|
|
$10,755 |
|
|
|
$10,271 |
|
|
|
| Ratios to Average Net Assets |
|
|
|
|
|
|
|
|
|
|
|
|
|
|
|
|
|
|
|
|
|
|
| Gross Expense |
|
|
0.97 |
% |
|
|
0.99 |
% |
|
|
0.99 |
% |
|
|
0.98 |
% |
|
|
0.99 |
% |
|
|
| Net Expenses(c) |
|
|
0.14 |
% |
|
|
0.06 |
% |
|
|
0.16 |
% |
|
|
0.20 |
% |
|
|
0.74 |
% |
|
|
| Net Investment Income |
|
|
0.01 |
% |
|
|
0.01 |
% |
|
|
0.01 |
% |
|
|
0.02 |
% |
|
|
0.45 |
% |
|
|
| (a) |
Represents less than $0.001. |
| (b) |
Total returns for periods of less than one year, if any, are not annualized. |
| (c) |
The investment manager and other service providers voluntarily waived a portion of their fees. |
See Notes
which are an integral part of the Financial Statements
ANNUAL REPORT / April
30, 2013
|
|
|
| 30 |
|
FINANCIAL HIGHLIGHTS (concluded) |
For a share outstanding throughout each year ended April 30, unless otherwise noted:
|
|
|
|
|
|
|
|
|
|
|
|
|
|
|
|
|
|
|
|
|
|
|
|
|
|
| WILMINGTON TAX-EXEMPT MONEY MARKET FUND |
|
|
|
|
|
|
|
|
|
|
|
|
|
|
|
|
|
|
|
|
|
|
|
|
|
|
|
|
|
|
|
|
|
|
|
|
|
ADMINISTRATIVE CLASS
|
|
2013 |
|
|
2012 |
|
|
2011 |
|
|
2010 |
|
|
2009 |
|
|
|
| Net Asset Value, Beginning of Year |
|
|
$1.000 |
|
|
|
$1.000 |
|
|
|
$1.000 |
|
|
|
$1.000 |
|
|
|
$1.000 |
|
|
|
| Income (Loss) From Operations: |
|
|
|
|
|
|
|
|
|
|
|
|
|
|
|
|
|
|
|
|
|
|
| Net Investment Income |
|
|
0.000 |
(a) |
|
|
0.000 |
(a) |
|
|
0.000 |
(a) |
|
|
0.001 |
|
|
|
0.012 |
|
|
|
| Net Realized and Unrealized Gain (Loss) on Investments |
|
|
— |
|
|
|
0.000 |
(a) |
|
|
— |
|
|
|
— |
|
|
|
— |
|
|
|
|
|
|
|
| Total Income (Loss) From Operations |
|
|
0.000 |
|
|
|
0.000 |
|
|
|
0.000 |
|
|
|
0.001 |
|
|
|
0.012 |
|
|
|
|
|
|
|
| Less Distributions From: |
|
|
|
|
|
|
|
|
|
|
|
|
|
|
|
|
|
|
|
|
|
|
| Net Investment Income |
|
|
(0.000 |
)(a) |
|
|
(0.000 |
)(a) |
|
|
(0.000 |
)(a) |
|
|
(0.001 |
) |
|
|
(0.012 |
) |
|
|
|
|
|
|
| Net Asset Value, End of Year |
|
|
$1.000 |
|
|
|
$1.000 |
|
|
|
$1.000 |
|
|
|
$1.000 |
|
|
|
$1.000 |
|
|
|
|
|
|
|
| Total Return(b) |
|
|
0.01 |
% |
|
|
0.01 |
% |
|
|
0.03 |
% |
|
|
0.06 |
% |
|
|
1.25 |
% |
|
|
| Net Assets, End of Year (000’s) |
|
|
$38,684 |
|
|
|
$41,513 |
|
|
|
$33,322 |
|
|
|
$36,870 |
|
|
|
$49,143 |
|
|
|
| Ratios to Average Net Assets |
|
|
|
|
|
|
|
|
|
|
|
|
|
|
|
|
|
|
|
|
|
|
| Gross Expense |
|
|
0.99 |
% |
|
|
0.87 |
% |
|
|
0.83 |
% |
|
|
0.78 |
% |
|
|
0.78 |
% |
|
|
| Net Expenses(c) |
|
|
0.16 |
% |
|
|
0.23 |
% |
|
|
0.39 |
% |
|
|
0.45 |
% |
|
|
0.56 |
% |
|
|
| Net Investment Income |
|
|
0.01 |
% |
|
|
0.01 |
% |
|
|
0.03 |
% |
|
|
0.06 |
% |
|
|
1.21 |
% |
|
|
|
|
|
|
|
|
|
|
|
|
|
|
|
|
|
|
|
|
|
|
|
|
|
|
|
|
|
|
|
|
|
SELECT CLASS
|
|
2013 |
|
|
2012 |
|
|
2011 |
|
|
2010 |
|
|
2009 |
|
|
|
| Net Asset Value, Beginning of Year |
|
|
$1.000 |
|
|
|
$1.000 |
|
|
|
$1.000 |
|
|
|
$1.000 |
|
|
|
$1.000 |
|
|
|
| Income (Loss) From Operations: |
|
|
|
|
|
|
|
|
|
|
|
|
|
|
|
|
|
|
|
|
|
|
| Net Investment Income |
|
|
0.000 |
(a) |
|
|
0.000 |
(a) |
|
|
0.000 |
(a) |
|
|
0.001 |
|
|
|
0.014 |
|
|
|
| Net Realized and Unrealized Gain (Loss) on Investments |
|
|
— |
|
|
|
0.000 |
(a) |
|
|
— |
|
|
|
— |
|
|
|
— |
|
|
|
|
|
|
|
| Total Income (Loss) From Operations |
|
|
0.000 |
|
|
|
0.000 |
|
|
|
0.000 |
|
|
|
0.001 |
|
|
|
0.014 |
|
|
|
|
|
|
|
| Less Distributions From: |
|
|
|
|
|
|
|
|
|
|
|
|
|
|
|
|
|
|
|
|
|
|
| Net Investment Income |
|
|
(0.000 |
)(a) |
|
|
0.000 |
(a) |
|
|
0.000 |
(a) |
|
|
(0.001 |
) |
|
|
(0.014 |
) |
|
|
|
|
|
|
| Net Asset Value, End of Year |
|
|
$1.000 |
|
|
|
$1.000 |
|
|
|
$1.000 |
|
|
|
$1.000 |
|
|
|
$1.000 |
|
|
|
|
|
|
|
| Total Return(b) |
|
|
0.01 |
% |
|
|
0.01 |
% |
|
|
0.03 |
% |
|
|
0.09 |
% |
|
|
1.40 |
% |
|
|
| Net Assets, End of Year (000’s) |
|
|
$406,386 |
|
|
|
$362,551 |
|
|
|
$108,802 |
|
|
|
$83,916 |
|
|
|
$180,584 |
|
|
|
| Ratios to Average Net Assets |
|
|
|
|
|
|
|
|
|
|
|
|
|
|
|
|
|
|
|
|
|
|
| Gross Expense |
|
|
0.74 |
% |
|
|
0.77 |
% |
|
|
0.83 |
% |
|
|
0.78 |
% |
|
|
0.78 |
% |
|
|
| Net Expenses(c) |
|
|
0.15 |
% |
|
|
0.23 |
% |
|
|
0.39 |
% |
|
|
0.41 |
% |
|
|
0.42 |
% |
|
|
| Net Investment Income |
|
|
0.01 |
% |
|
|
0.01 |
% |
|
|
0.03 |
% |
|
|
0.10 |
% |
|
|
1.14 |
% |
|
|
|
|
|
|
|
|
|
|
|
|
|
|
|
|
|
|
|
|
|
|
|
|
|
|
|
|
|
|
|
|
|
SERVICE CLASS
|
|
2013 |
|
|
2012 |
|
|
2011 |
|
|
2010 |
|
|
2009 |
|
|
|
| Net Asset Value, Beginning of Year |
|
|
$1.000 |
|
|
|
$1.000 |
|
|
|
$1.000 |
|
|
|
$1.000 |
|
|
|
$1.000 |
|
|
|
| Income (Loss) From Operations: |
|
|
|
|
|
|
|
|
|
|
|
|
|
|
|
|
|
|
|
|
|
|
| Net Investment Income |
|
|
0.000 |
(a) |
|
|
0.000 |
(a) |
|
|
0.000 |
(a) |
|
|
0.000 |
(a) |
|
|
0.010 |
|
|
|
| Net Realized and Unrealized Gain (Loss) on Investments |
|
|
— |
|
|
|
0.000 |
(a) |
|
|
— |
|
|
|
— |
|
|
|
— |
|
|
|
|
|
|
|
| Total Income (Loss) From Operations |
|
|
0.000 |
|
|
|
0.000 |
|
|
|
0.000 |
|
|
|
0.000 |
|
|
|
0.010 |
|
|
|
|
|
|
|
| Less Distributions From: |
|
|
|
|
|
|
|
|
|
|
|
|
|
|
|
|
|
|
|
|
|
|
| Net Investment Income |
|
|
(0.000 |
)(a) |
|
|
(0.000 |
)(a) |
|
|
(0.000 |
)(a) |
|
|
(0.000 |
)(a) |
|
|
(0.010 |
) |
|
|
|
|
|
|
| Net Asset Value, End of Year |
|
|
$1.000 |
|
|
|
$1.000 |
|
|
|
$1.000 |
|
|
|
$1.000 |
|
|
|
$1.000 |
|
|
|
|
|
|
|
| Total Return(b) |
|
|
0.01 |
% |
|
|
0.01 |
% |
|
|
0.01 |
% |
|
|
0.03 |
% |
|
|
1.00 |
% |
|
|
| Net Assets, End of Year (000’s) |
|
|
$57,425 |
|
|
|
$57,379 |
|
|
|
$11,779 |
|
|
|
$18,949 |
|
|
|
$21,338 |
|
|
|
| Ratios to Average Net Assets |
|
|
|
|
|
|
|
|
|
|
|
|
|
|
|
|
|
|
|
|
|
|
| Gross Expense |
|
|
0.99 |
% |
|
|
1.02 |
% |
|
|
1.08 |
% |
|
|
1.04 |
% |
|
|
1.03 |
% |
|
|
| Net Expenses(c) |
|
|
0.16 |
% |
|
|
0.23 |
% |
|
|
0.41 |
% |
|
|
0.47 |
% |
|
|
0.80 |
% |
|
|
| Net Investment Income |
|
|
0.01 |
% |
|
|
0.01 |
% |
|
|
0.01 |
% |
|
|
0.04 |
% |
|
|
0.99 |
% |
|
|
| (a) |
Represents less than $0.001. |
| (b) |
Total returns for periods of less than one year, if any, are not annualized. |
| (c) |
The investment manager and other service providers voluntarily waived a portion of their fees. |
See Notes
which are an integral part of the Financial Statements
April 30, 2013 / ANNUAL REPORT
|
|
|
|
|
| NOTES TO FINANCIAL STATEMENTS |
|
|
31 |
|
Wilmington Funds
April 30,
2013
Wilmington Funds (the “Trust”) is
registered under the Investment Company Act of 1940, as amended (the “Act”), as an open-end management investment company. The Trust consists of 23 portfolios, 4 of which are presented herein (individually referred to as a “Fund”
or collectively as the “Funds”). The remaining 19 funds are presented in separate reports.
|
|
|
|
|
|
|
|
| |
|
Fund |
|
Investment Goal |
|
|
|
|
|
Wilmington Prime Money Market Fund
(“Prime Money Market Fund”)(d) |
|
The Fund seeks to provide current income while maintaining liquidity and stability of principal. |
|
|
|
|
|
Wilmington U.S. Government Money Market Fund
(“U.S. Government Money Market Fund”)(d) |
|
The Fund seeks to provide current income while maintaining liquidity and stability of principal. |
|
|
|
|
|
Wilmington U.S. Treasury Money Market Fund
(“U.S. Treasury Money Market Fund”)(d) |
|
The Fund seeks to provide current income while maintaining liquidity and stability of principal. |
|
|
|
|
|
Wilmington Tax-Exempt Money Market Fund
(“Tax-Exempt Money Market Fund”)(d) |
|
The Fund seeks to provide current income that is exempt from federal income taxes while maintaining liquidity and stability of principal. |
(d) Diversified
The Trust offers 6 classes of shares: Class A, Service Class, Select Class, Administrative Class, Class I
and Institutional Class. All shares of the Trust have equal rights with respect to voting, except on class-specific matters.
The assets of each portfolio are segregated and a shareholder’s interest is limited to the portfolio in
which shares are held.
| 2. |
|
SUMMARY OF SIGNIFICANT ACCOUNTING POLICIES |
|
The following is a summary of significant accounting policies
consistently followed by the Funds in the preparation of their financial statements. These policies are in conformity with U.S. generally accepted accounting principles (“GAAP”). The preparation of financial statements in conformity with
GAAP requires management to make estimates and assumptions that affect the amounts of assets, liabilities, expenses and revenues reported in the financial statements. Actual results could differ from those estimated.
Investment Valuation – The Funds use the amortized cost method to value their portfolio securities
in accordance with Rule 2a-7 under the Act.
The Trust follows the authoritative guidance (GAAP) for fair
value measurements. The guidance establishes a framework for measuring fair value and a hierarchy for inputs used in measuring fair value that maximizes the use of observable inputs and minimizes the use of unobservable inputs by requiring that the
most observable inputs be used when available. The guidance establishes three tiers of inputs that may be used to measure fair value. The three tiers of inputs are summarized at the end of each Fund’s Portfolio of Investments. The inputs or
methodology used for valuing securities are not necessarily an indication of the risk associated with investing in those securities.
The Funds’ policy is to disclose transfers between levels based on valuations at the beginning of the
reporting period. Each portfolio may hold securities which are periodically fair valued in accordance with the Funds’ fair value procedures. This may result in movements between Levels 1, 2 and 3 throughout the period. As of April 30,
2013, there were no transfers between Levels 1, 2 and 3 assets and liabilities based on levels assigned to securities at the beginning of the period. Pursuant to the Funds’ fair value procedures noted previously, fixed income securities and
money market instruments are generally categorized as Level 2 securities in the fair value hierarchy.
Repurchase Agreements – Repurchase agreements are transactions in which a Fund buys a security from
a dealer or bank and agrees to sell the security back at a mutually agreed upon time and price. The repurchase price exceeds the sale price, reflecting the Fund’s return on the transaction. It is each Fund’s policy to require the
counterparty to a repurchase agreement to transfer to the Funds’ custodian or sub-custodian eligible securities or cash with a market value (after transaction costs) at least equal to the repurchase price to be paid under the repurchase
agreement. The eligible securities are transferred to accounts with the custodian or sub-custodian in which the Funds hold a “securities entitlement” and exercise “control” as those terms are defined in the Uniform Commercial
Code. The Funds have established procedures for monitoring the market value of the transferred securities and requiring the transfer of additional eligible securities if necessary to equal at least the repurchase price. These procedures also allow
the counterparty to require securities to be transferred from the account to the extent that their market value exceeds the repurchase price or in exchange for other eligible securities of equivalent market value.
The insolvency of the counterparty or other failure to repurchase the securities may delay the disposition of
the underlying securities or cause the Funds to receive less than the full repurchase price.
ANNUAL REPORT / April
30, 2013
|
|
|
| 32 |
|
NOTES TO FINANCIAL STATEMENTS (continued) |
Investment Income, Gains and Losses, Expenses and Distributions –
Interest income and expenses are accrued daily. Dividends and distributions to shareholders are recorded on the ex-dividend date. Investment transactions are accounted for on a trade date basis for financial reporting purposes. Realized gains and
losses from investment transactions are recorded on an identified cost basis.
Expenses of the Trust, which are directly
identifiable to a specific Fund, are applied to that Fund. Expenses which are not identifiable to a specific Fund are allocated in such a manner as deemed equitable, taking into consideration the nature and type of expense.
All Funds offer multiple classes of shares. Investment income, realized gains and losses, and certain fund-level expenses are
allocated to each class based on relative daily net assets, except that each class bears certain expenses unique to that class such as distribution and shareholder services fees. Distributions are declared separately for each class. No class has
preferential distribution rights; differences in per share distributions rates are generally due to differences in class specific expenses. Distributions from net realized gains, if any, are declared and paid to shareholders annually. Distributions
from net investment income are declared daily and paid monthly.
Premium and Discount Amortization/Accretion and Paydown
Gains and Losses – All premiums and discounts on fixed income securities are amortized/accreted for financial statement purposes. Gains and losses realized on principal payment of mortgage-backed securities (paydown gains and losses) are
classified as part of investment income.
Federal Taxes – It is the Funds’ policy to comply with the
Subchapter M provision of the Internal Revenue Code of 1986, as amended (the “Code”), and to distribute to shareholders each year substantially all of their income. Accordingly, no provisions for Federal income tax are necessary.
Restricted Securities – Restricted securities are securities that either (a) cannot be offered for public sale
without first being registered, or being able to take advantage of an exemption from registration, under the Securities Act of 1933, as amended, or (b) are subject to contractual restrictions on public sales. In some cases, when a security
cannot be offered for public sale without first being registered, the issuer of the restricted security has agreed to register such securities for resale, at the issuer’s expense, either upon demand by the Fund or in connection with another
registered offering of the securities. Many such restricted securities may be resold in the secondary market in transactions exempt from registration. Restricted securities may be determined to be liquid under criteria established by the Trustees. A
Fund will not incur any registration costs upon such resales.
| 3. |
|
FEDERAL TAX INFORMATION |
The timing and character of income and capital gain
distributions are determined in accordance with income tax regulations, which may differ from GAAP. These differences are due in part to the tax treatment of expiring capital loss carryforwards, reclassification of ordinary loss to short-term gains,
market discount reclass, discount accretion/premium amortization on debt securities and distributions recognition on income distribution payable.
As of April 30, 2013, there are no uncertain tax positions that would require financial statement recognition,
de-recognition or disclosure. The Funds’ federal tax returns filed for the years ended 2012, 2011 and 2010, as well as the current tax year, remain subject to examination by the Internal Revenue Service.
For the year ended April 30, 2013, permanent differences identified and reclassified among the components of net assets
were as follows:
|
|
|
|
|
|
|
|
|
|
|
|
|
|
|
|
|
| |
|
Fund |
|
Paid-in
Capital |
|
Undistributed
(Distributions
in Excess of) Net
Investment Income |
|
Accumulated
Net Realized
Gain (Loss) |
|
|
|
|
U.S. Treasury Money Market
Fund |
|
$— |
|
$927 |
|
$(927) |
|
|
April 30, 2013 / ANNUAL REPORT
|
|
|
|
|
| NOTES TO FINANCIAL STATEMENTS (continued) |
|
|
33 |
|
The tax character of distributions for the corresponding years as reported
on the Statements of Changes in Net Assets were as follows:
|
|
|
|
|
|
|
|
|
|
|
|
|
|
|
|
|
|
|
| |
|
2013 |
|
2012 |
|
|
| Fund |
|
Ordinary
Income* |
|
|
Long-Term
Capital Gains |
|
Ordinary
Income* |
|
|
Long-Term
Capital Gains |
|
|
| Prime Money Market Fund |
|
|
$984,173 |
|
|
$— |
|
|
$435,057 |
|
|
$— |
|
|
| U.S. Government Money Market Fund |
|
|
439,891 |
|
|
— |
|
|
275,610 |
|
|
— |
|
|
| U.S. Treasury Money Market Fund |
|
|
111,541 |
|
|
— |
|
|
145,379 |
|
|
— |
|
|
| Tax-Exempt Money Market Fund |
|
|
54,513 |
** |
|
— |
|
|
22,837 |
*** |
|
— |
|
|
| |
* |
|
For tax purposes, short-term capital gain distributions are considered ordinary income distributions. |
| |
** |
|
Included in this amount is tax exempt income of $54,513. |
| |
*** |
|
Included in this amount is tax exempt income of $22,756. |
As of April 30, 2013, the components of distributable earnings on a tax basis were as follows:
|
|
|
|
|
|
|
|
|
|
|
|
|
|
|
|
|
|
|
| Fund |
|
Undistributed/
(Over Distributed)
Ordinary Income |
|
Undistributed
Long-Term
Capital Gains |
|
Other
Timing
Differences |
|
Unrealized
Appreciation
(Depreciation) |
|
Capital Loss
Carryforwards
and Deferrals |
|
| Prime Money Market Fund |
|
$88,918 |
|
$— |
|
$(57,154) |
|
— |
|
|
— |
|
| U.S. Government Money Market Fund |
|
25,638 |
|
— |
|
(33,456) |
|
— |
|
|
— |
|
| U.S. Treasury Money Market Fund |
|
15,402 |
|
— |
|
(9,596) |
|
— |
|
|
— |
|
| Tax-Exempt Money Market Fund |
|
8,685 |
|
— |
|
(4,309) |
|
— |
|
|
(72,058 |
) |
Under the recently enacted Regulated Investment Company Modernization Act of
2010, the Funds are permitted to carry forward capital losses incurred in taxable years beginning after December 22, 2010 for an unlimited period. However, any losses incurred during those future taxable years will be required to be utilized
prior to the losses incurred in pre-enactment taxable years. As a result of this ordering rule, pre-enactment capital loss carryforwards may have an increased likelihood to expire unused. Additionally, post-enactment capital losses that are carried
forward will retain their character as either short-term or long-term capital losses rather than being considered all short-term as under previous law.
At April 30, 2013, the following Funds had capital loss carryforwards which will reduce each Fund’s
taxable income arising from future net realized gain on investments, if any, to the extent permitted by the Code and thus will reduce the amount of distributions to shareholders which would otherwise be necessary to relieve the Fund of any liability
for federal income tax. Pursuant to the Code, such capital loss carryforwards will expire as follows:
|
|
|
|
|
|
|
|
|
|
|
|
|
|
|
|
|
|
|
|
| |
|
Capital Loss Available Through |
|
Short-Term
Post-Effective
No Expiration |
|
Total Capital
Loss
Carryforwards |
|
|
| Fund |
|
2016 |
|
2017 |
|
2018 |
|
2019 |
|
|
|
| Tax-Exempt Money Market Fund |
|
$6,657 |
|
$63,251 |
|
$2,115 |
|
$— |
|
$35 |
|
$72,058 |
|
|
Under current tax regulations, capital losses on securities transactions
realized after October 31 may be deferred and treated as occurring on the first day of the following fiscal year. Under the recently enacted Regulated Investment Company Modernization Act of 2010, the Funds are permitted to defer taxable
ordinary income losses incurred after December 31 and treat as occurring on the first day of the following fiscal year. At April 30, 2013, the Funds had no Post-October or Late Year losses to defer.
| 4. |
|
ADVISORY FEES, SERVICING FEES, AND OTHER SERVICE PROVIDERS |
|
Investment Advisor – Wilmington Funds Management
Corporation (“WFMC” or the “Advisor”) serves as the Investment Advisor to each of the Funds. Wilmington Trust Investment Advisors, Inc. (“WTIA”) provides sub-advisory services to the Funds. WFMC and WTIA are
wholly-owned subsidiaries of M&T Bank Corporation. For its services, the Funds pay WFMC an annual investment advisory fee, accrued and paid daily, based on a percentage of each Fund’s average daily net assets as described below. WFMC, not
the Funds, pays WTIA for its services.
|
|
|
|
|
| Fund |
|
Advisory Fee
Annual Rate |
| Prime Money Market Fund |
|
0.40% |
| U.S. Government Money Market Fund |
|
0.40% |
| U.S. Treasury Money Market Fund |
|
0.40% |
| Tax-Exempt Money Market Fund |
|
0.40% |
ANNUAL REPORT / April
30, 2013
|
|
|
| 34 |
|
NOTES TO FINANCIAL STATEMENTS (continued) |
WFMC has voluntarily agreed to reduce its advisory fee and/or reimburse each
of the Fund’s operating expenses, or certain “class-specific fees and expenses” to prevent each Fund’s (or class thereof, as applicable) current annualized yield from being below 0.01% (1 basis point) annually. The fee waiver
does not take into consideration acquired fund fees and expenses. Any such waiver or expense reimbursement may be discontinued at any time.
Administrative Fee – The Bank of New York Mellon (“BNYM”) provides the Trust with fund administration
services. Effective October 1, 2012, WFMC replaced WFMC as Co-Administrator for the Funds. WFMC in its role as co-administrator provides the Funds with certain administrative personnel and services necessary to operate the Funds. These services
were provided for at an aggregate annual fee as specified below.
|
|
|
|
|
|
|
|
|
|
|
|
|
|
|
|
| |
|
Administration |
|
Maximum
Fee |
|
|
Average Aggregate Daily Net
Assets of the Trust |
|
|
|
|
WFMC |
|
|
0.033 |
% |
|
On the first $5 billion |
|
|
|
|
|
|
|
0.020 |
% |
|
On the next $2 billion |
|
|
|
|
|
|
|
0.016 |
% |
|
On the next $3 billion |
|
|
|
|
|
|
|
0.015 |
% |
|
On assets in excess of $10 billion |
|
|
|
|
BNYM |
|
|
0.0285 |
% |
|
On the first $500 million |
|
|
|
|
|
|
|
0.0280 |
% |
|
On the next $500 million |
|
|
|
|
|
|
|
0.0275 |
% |
|
On assets in excess of $1 billion |
|
|
WFMC may voluntarily choose to waive any portion of its fee. WFMC can modify or terminate its
voluntary waiver at any time at its sole discretion. For the year ended April 30, 2013, WTIA and WFMC did not waive any administrative personnel and services fee.
Distribution Services Fee – The Trust has adopted a Distribution Services Plan (the “Plan”) pursuant to
Rule 12b-1 under the Act. The Plan allows the Funds to pay fees to financial intermediaries, which may be paid through ALPS Distributors, Inc. (“ALPS”), the principal distributor, at an annual rate of up to 0.25% of the average daily net
assets of the Funds’ Administrative Class and Service Class for the sale, distribution, administration, customer servicing and record keeping of these shares.
The Trust may reduce the maximum amount of distribution services fees it pays from time to time at its sole discretion. In
addition, a financial intermediary (including ALPS, the Advisor or their affiliates), may voluntarily waive or reduce any fees to which they are entitled.
For the year ended April 30, 2013, M&T Securities, Inc. and Manufacturers and Traders Trust Company (together
“M&T”), affiliates of the Advisor, received a portion of the fees paid by the Funds which are listed below:
|
|
|
|
|
|
|
|
|
|
|
| |
|
Fund |
|
Distribution
Fees |
|
|
|
|
Tax-Exempt Money Market Fund |
|
$1,113 |
|
|
Shareholder Services Fee – Pursuant to a Shareholder Services Plan adopted by the
Funds and administered by ALPS, the Funds may pay up to 0.25% of the average daily net assets of each Fund’s Administrative Class, Select Class and Service Class to financial intermediaries (which may include ALPS, the Advisor or their
affiliates) for providing shareholder services and maintaining shareholder accounts. M&T, an affiliate of the Advisor, has entered into a Shareholders Services Agreement with ALPS, under which it is entitled to receive up to 0.25% of the average
daily net assets of each Fund’s shares for whom M&T provides shareholder services. The Funds may reduce the maximum amount of shareholder service fees it pays from time to time at its sole discretion. In addition, a financial intermediary
(including M&T) may waive or reduce any fees to which they are entitled.
For the year ended April 30, 2013, M&T received a
portion of the fees paid by the following Funds which are listed below:
|
|
|
|
|
|
|
|
|
|
|
|
|
| |
|
Fund |
|
Shareholder Services
Fee |
|
|
|
|
|
Prime Money Market Fund |
|
|
$160,247 |
|
|
|
|
|
Tax-Exempt Money Market Fund |
|
|
451 |
|
|
|
Other Service Providers – Foreside Management Services, LLC (“FMS”)
provides a Principal Executive Officer to the Trust. FMS has no role in determining the investment policies or which securities are to be sold or purchased by the Trust or its Funds.
BNYM provides fund accounting and custody services to the Trust.
BNY Mellon Investment Servicing (U.S.) Inc. provides transfer agency services to the Trust.
General – Certain Officers of the Trust are also Officers or employees of the above companies that provide services
to the Funds, and during their terms of office, receive no compensation from the Funds. The Trust’s Statement of Additional Information includes additional information about the Trustees.
April 30, 2013 / ANNUAL REPORT
|
|
|
|
|
| NOTES TO FINANCIAL STATEMENTS (continued) |
|
|
35 |
|
The Trust participated in a $20,000,000
unsecured, committed revolving line of credit (“LOC”) agreement with BNYM. The LOC was made available for extraordinary or emergency purposes, primarily for financing redemption payments. Borrowings are charged interest at a rate of
1.25% per annum over the greater of the Federal Funds Rate or the overnight LIBOR Rate. The LOC included a commitment fee of 0.12% per annum on the daily unused portion. In addition, an upfront commitment fee of 0.02% was paid to BNYM. The
termination date of this LOC is March 10, 2014. The Funds did not utilize the LOC for the year ended April 30, 2013.
On February 21, 2012, the Board approved an Agreement and Plan of
Reorganization (the “Reorganization”) which provided the transfer all of the assets of Wilmington Prime Money Market Fund, Wilmington U.S. Government Money Market Fund, and Wilmington Tax-Exempt Money Market Fund, each a series of WT
Mutual Fund, and the MTB Prime Money Market Fund, MTB Pennsylvania Tax-Free Money Market Fund, and MTB New York Tax-Free Money Market Fund, each a series of the Trust (the “Acquired Funds”) in exchange for shares of the series of the Trust
shown below (the “Acquiring Funds”).
The Reorganization is believed to be in the best interest
of shareholders as combining the series of WT Funds and the Trust onto a single operating platform will create a larger fund family that will offer a broader range of investment options. Additionally, the Reorganization is believed to present the
opportunity to achieve asset growth through combined distribution networks, to achieve economies of scale, and to operate with greater efficiency and lower overall costs. The shareholders of the Acquired Funds approved the Reorganization at a
meeting on February 21, 2012 and the Reorganization took place on March 9, 2012. The Reorganization was treated as tax-free reorganization for federal income tax purposes and, accordingly, the basis of the assets of each Acquiring Fund
reflected the historical basis of the assets of each respective Acquired Fund as of the date of the Reorganization. WFMC and its affiliates bore the expenses related to the Reorganization, except for brokerage fees and other transaction costs
associated with the disposition and/or purchase of securities in contemplation of or as a result of the Reorganization.
|
|
|
|
|
|
|
|
| New Name after the Reorganizations |
|
Acquiring Funds |
|
Acquired Funds |
| Wilmington Prime Money Market Fund |
|
MTB Money Market Fund |
|
Wilmington Prime Money Market Fund
MTB Prime Money Market Fund |
|
|
|
| Wilmington U.S. Government Money Market Fund |
|
MTB U.S. Government Money Market Fund |
|
Wilmington U.S. Government Money Market Fund |
|
|
|
| Wilmington Tax-Exempt Money Market Fund |
|
MTB Tax-Free Money Market Fund |
|
Wilmington Tax-Exempt Money Market Fund
MTB Pennsylvania Tax-Free Money Market Fund
MTB New York Tax-Free Money Market Fund |
In exchange for their shares, shareholders of the Acquired Funds received
shares of the Acquiring Funds with an aggregate net asset value equal to the aggregate net asset value of their shares immediately prior to the Reorganization. The following information summarizes the essential elements of the Reorganization as of
March 9, 2012:
|
|
|
|
|
|
|
|
|
|
|
|
|
|
|
|
|
|
|
|
|
|
|
|
|
| Wilmington Prime Money Market Fund |
|
Value of
Shares |
|
|
Acquired Fund
Shares Prior to
Reorganization |
|
|
Shares Issued
by Acquiring
Fund |
|
|
Net Assets |
|
|
|
| Acquiring Fund |
|
|
|
|
|
|
|
|
|
|
|
|
|
|
|
|
|
|
| MTB Money Market Fund |
|
|
|
|
|
|
|
|
|
|
|
|
|
|
$1,548,554,794 |
|
|
|
| Acquired Funds |
|
|
|
|
|
|
|
|
|
|
|
|
|
|
|
|
|
|
| Wilmington Prime Money Market Fund |
|
|
|
|
|
|
|
|
|
|
|
|
|
|
1,894,729,066 |
|
|
|
| W Shares in exchange for Select Class |
|
|
$1,208,345,372 |
|
|
|
1,208,360,799 |
|
|
|
1,208,360,799 |
|
|
|
|
|
|
|
| Service Shares in exchange for Service Class |
|
|
639,474,385 |
|
|
|
639,458,864 |
|
|
|
639,458,864 |
|
|
|
|
|
|
|
| Institutional Shares in exchange for Institutional Class |
|
|
46,909,309 |
|
|
|
46,909,485 |
|
|
|
46,909,485 |
|
|
|
|
|
|
|
| MTB Prime Money Market Fund |
|
|
|
|
|
|
|
|
|
|
|
|
|
|
284,747,481 |
|
|
|
| Corporate Shares in exchange for Select Class |
|
|
284,747,481 |
|
|
|
284,750,679 |
|
|
|
284,750,679 |
|
|
|
|
|
|
|
|
|
|
|
|
|
|
|
|
|
|
|
|
|
|
|
|
|
|
|
|
|
|
|
|
|
|
|
|
|
|
|
|
|
$3,728,031,341 |
|
|
|
|
|
|
|
|
|
|
|
|
|
|
|
|
|
|
|
|
|
|
The net assets of the Acquired Fund(s) included accumulated net realized
gains/(losses) of $738 for the Wilmington Prime Money Market Fund and ($728) for the MTB Prime Money Market Fund.
The financial statements of the Fund reflect the operations of the Acquiring Fund for the period prior to the
Reorganization and the combined fund for the period subsequent to the Reorganization. Because the combined investment portfolios have been managed as a single integrated portfolio since the Reorganization was completed, it is not practicable to
separate the amounts of revenue and earnings of the Acquired Funds that have been included in the combined fund’s Statement of Operations since the Reorganization was completed. Assuming the Reorganization had been completed on May 1,
2011, the pro forma net investment income, net gain on investments and net increase in net assets from operations for the fiscal year ended April 30, 2012 would have been $688,854, $8,792, and $697,646, respectively.
ANNUAL REPORT / April
30, 2013
|
|
|
| 36 |
|
NOTES TO FINANCIAL STATEMENTS (continued) |
|
|
|
|
|
|
|
|
|
|
|
|
|
|
|
|
|
|
|
|
|
|
|
|
|
| |
|
Wilmington U.S. Government Money Market Fund |
|
Value of Shares |
|
|
Acquired Fund
Shares Prior to
Reorganization |
|
|
Shares Issued
by Acquiring
Fund |
|
|
Net Assets |
|
|
|
Acquiring Fund |
|
|
|
|
|
|
|
|
|
|
|
|
|
|
|
|
|
|
MTB U.S. Government Money Market Fund |
|
|
|
|
|
|
|
|
|
|
|
|
|
|
$2,199,868,466 |
|
|
|
Acquired Funds |
|
|
|
|
|
|
|
|
|
|
|
|
|
|
|
|
|
|
Wilmington U.S. Government Money Market Fund |
|
|
|
|
|
|
|
|
|
|
|
|
|
|
1,785,990,941 |
|
|
|
W Shares in exchange for Select Class |
|
|
$737,947,983 |
|
|
|
737,931,587 |
|
|
|
737,931,587 |
|
|
|
|
|
|
|
Service Shares in exchange for Service Class |
|
|
948,680,846 |
|
|
|
948,691,128 |
|
|
|
948,691,128 |
|
|
|
|
|
|
|
Institutional Shares in exchange for Institutional Class |
|
|
99,362,112 |
|
|
|
99,364,059 |
|
|
|
99,364,059 |
|
|
|
|
|
|
|
|
|
|
|
|
|
|
|
|
|
|
|
|
|
|
|
|
|
|
|
|
|
|
|
|
|
|
|
|
|
|
|
|
|
$3,985,859,407 |
|
|
|
|
|
|
|
|
|
|
|
|
|
|
|
|
|
|
|
|
The net assets of the Acquired Fund included accumulated net realized losses of $261.
The financial statements of the Fund reflect the operations of the Acquiring Fund for the period prior to the Reorganization and
the combined fund for the period subsequent to the Reorganization. Because the combined investment portfolios have been managed as a single integrated portfolio since the Reorganization was completed, it is not practicable to separate the amounts of
revenue and earnings of the Acquired Funds that have been included in the combined fund’s Statement of Operations since the Reorganization was completed. Assuming the Reorganization had been completed on May 1, 2011, the pro forma net
investment income, net gain on investments and net increase in net assets from operations for the fiscal year ended April 30, 2012 would have been $2,854,689, $38,256 and $2,892,945, respectively.
|
|
|
|
|
|
|
|
|
|
|
|
|
|
|
|
|
|
|
|
|
|
| Wilmington Tax-Exempt Money Market Fund |
|
Value of Shares |
|
|
Acquired Fund
Shares Prior to
Reorganization |
|
|
Shares Issued
by Acquiring
Fund |
|
|
Net Assets |
|
| Acquiring Fund |
|
|
|
|
|
|
|
|
|
|
|
|
|
|
|
|
| MTB Tax-Free Money Market Fund |
|
|
|
|
|
|
|
|
|
|
|
|
|
|
$129,239,511 |
|
| Acquired Funds |
|
|
|
|
|
|
|
|
|
|
|
|
|
|
|
|
| Wilmington Tax-Exempt Money Market Fund |
|
|
|
|
|
|
|
|
|
|
|
|
|
|
260,164,979 |
|
| W Shares in exchange for Select Class |
|
|
$260,019,317 |
|
|
|
260,026,244 |
|
|
|
260,026,244 |
|
|
|
|
|
| Institutional Shares in exchange for Institutional Class |
|
|
145,662 |
|
|
|
145,667 |
|
|
|
145,667 |
|
|
|
|
|
| MTB New York Tax-Free Money Market Fund |
|
|
|
|
|
|
|
|
|
|
|
|
|
|
87,841,224 |
|
| Service Class |
|
|
46,004,012 |
|
|
|
46,049,092 |
|
|
|
46,049,092 |
|
|
|
|
|
| Select Class |
|
|
41,837,212 |
|
|
|
41,868,889 |
|
|
|
41,868,889 |
|
|
|
|
|
| MTB Pennsylvania Tax-Free Money Market Fund |
|
|
|
|
|
|
|
|
|
|
|
|
|
|
21,612,486 |
|
| Service Class |
|
|
6,751,848 |
|
|
|
6,752,580 |
|
|
|
6,752,580 |
|
|
|
|
|
| Select Class |
|
|
13,112,355 |
|
|
|
13,111,398 |
|
|
|
13,111,398 |
|
|
|
|
|
| Administrative Class |
|
|
1,748,283 |
|
|
|
1,748,510 |
|
|
|
1,748,510 |
|
|
|
|
|
|
|
|
|
|
|
|
|
|
|
|
|
|
|
|
|
|
|
|
|
|
|
|
|
|
|
|
|
|
|
|
|
$498,858,200 |
|
|
|
|
|
|
|
|
|
|
|
|
|
|
|
|
|
|
The financial statements of the Fund reflect the operations of the Acquiring Fund for the
period prior to the Reorganization and the combined fund for the period subsequent to the Reorganization. Because the combined investment portfolios have been managed as a single integrated portfolio since the Reorganization was completed, it is not
practicable to separate the amounts of revenue and earnings of the Acquired Funds that have been included in the combined fund’s Statement of Operations since the Reorganization was completed. Assuming the Reorganization had been completed on
May 1, 2011, the pro forma net investment income, net gain on investments and net increase in net assets from operations for the fiscal year ended April 30, 2012 would have been $53,382, $77 and $53,459, respectively.
| 7. |
|
RECENT ACCOUNTING PRONOUNCEMENT |
In December 2011, the Financial Accounting
Standards Board (“FASB”) issued Accounting Standards Update (“ASU”) No. 2011-11 regarding “Disclosures about Offsetting Assets and Liabilities”. The amendments, which will be effective for annual reporting periods
beginning on or after January 1, 2013 and interim periods within those annual periods, require an entity to disclose information about offsetting and related arrangements for assets and liabilities, financial instruments and derivatives that
are either currently offset in accordance with current requirements or are subject to enforceable master netting arrangements or similar agreements. At this time, management is evaluating the implications of ASU No. 2011-11 and its impact on
the financial statements has not yet been determined.
April 30, 2013 / ANNUAL REPORT
|
|
|
|
|
| NOTES TO FINANCIAL STATEMENTS (continued) |
|
|
37 |
|
Management has evaluated events and
transactions for potential recognition or disclosure in the financial statements through the date the financial statements were issued. Management has determined that, there are no material events that would require disclosure in the Funds’
financial statements through this date.
ANNUAL REPORT / April
30, 2013
REPORT OF INDEPENDENT REGISTERED PUBLIC ACCOUNTING FIRM
TO THE SHAREHOLDERS AND BOARD OF TRUSTEES OF
WILMINGTON FUNDS
We have audited the accompanying statements of assets and liabilities, including the portfolios of investments, of Wilmington
Prime Money Market Fund, Wilmington U.S. Government Money Market Fund, Wilmington U.S. Treasury Money Market Fund and Wilmington Tax-Exempt Money Market Fund (four of the series constituting the Wilmington Funds) (the “Funds”) as of
April 30, 2013, and the related statements of operations for the year then ended, the statements of changes in net assets for each of the two years in the period then ended, and financial highlights for each of the years or periods indicated
therein. These financial statements and financial highlights are the responsibility of the Funds’ management. Our responsibility is to express an opinion on these financial statements and financial highlights based on our audits.
We conducted our audits in accordance with standards of the Public Company Accounting Oversight Board (United States). Those
standards require that we plan and perform the audit to obtain reasonable assurance about whether the financial statements and financial highlights are free of material misstatement. We were not engaged to perform an audit of the Funds’
internal control over financial reporting. Our audits included consideration of internal control over financial reporting as a basis for designing audit procedures that are appropriate in the circumstances, but not for the purpose of expressing an
opinion on the effectiveness of the Funds’ internal control over financial reporting. Accordingly, we express no such opinion. An audit also includes examining, on a test basis, evidence supporting the amounts and disclosures in the financial
statements and financial highlights, assessing the accounting principles used and significant estimates made by management, and evaluating the overall financial statement presentation. Our procedures included confirmation of securities owned as of
April 30, 2013, by correspondence with the custodian and brokers, or by other appropriate auditing procedures where replies from the brokers were not received. We believe that our audits provide a reasonable basis for our opinion.
In our opinion, the financial statements and financial highlights referred to above present fairly, in all material respects,
the financial position of the Wilmington Prime Money Market Fund, Wilmington U.S. Government Money Market Fund, Wilmington U.S. Treasury Money Market Fund and Wilmington Tax-Exempt Money Market Fund at April 30, 2013, the results of their
operations for the year then ended, the changes in their net assets for each of the two years in the period the ended, and their financial highlights for each of the years or periods indicated therein, in conformity with U.S. generally accepted
accounting principles.

Philadelphia, Pennsylvania
June 28, 2013
April 30, 2013 / ANNUAL REPORT
|
|
|
|
|
| BOARD OF TRUSTEES AND TRUST OFFICERS |
|
|
39 |
|
BOARD OF TRUSTEES AND
TRUST OFFICERS
The following tables give information about each Trustee and the senior officers of the Trust. The tables
separately list Trustee members who are “interested persons” of the Fund (i.e., “Interested” Trustees) and those who are not (i.e., “Independent” Trustees). The Trust is comprised of 23 funds. Unless otherwise noted,
the business address of each Trustee and senior officer is 111 South Calvert Street, 26th floor, Baltimore, Maryland 21202. Each Trustee oversees all portfolios of the Trust and serves for an indefinite term. The Trust’s Statement of Additional
Information includes additional information about the Trustees and is available, without charge and upon request, by calling
1-800-836-2211.
INTERESTED
TRUSTEES BACKGROUND
|
|
|
|
|
| Name
Address Birth date Position With Trust
Date Service Began |
|
Principal Occupations and Other Directorships Held for Past Five Years |
|
|
| R. Samuel Fraundorf, CFA, CPA*
Birth date: 4/64 TRUSTEE
Began serving: March 2012 |
|
Principal Occupations: President of WTIA, President of Wilmington Trust Investment Managements
(“WTIM”), Director of Wilmington Funds Management Corporation (formerly known as Rodney Square Management Corporation).
Other Directorships Held: None.
Previous Positions: Chief Operating Officer of WTIM (1/08 to 1/09); Director of Research at WTIM (8/04 to 1/08); Senior Manager and Tax Manager, KPMG Investment
Advisors (1/99 to 8/04). |
|
|
| Robert J. Truesdell*
Birth date: 11/55 TRUSTEE
Began serving: December 2012 |
|
Principal Occupations: Group Vice President and Senior Investment Advisor for Wilmington Trust Wealth
Advisory Services, M&T Bank. Other Directorships Held: None.
Previous Positions: Group Vice President, Managing Director and Chief Investment Officer,
WTIA (6/02-6/12) and WFMC (3/12 to 6/12). |
| * |
|
R. Samuel Fraundorf is “interested” due to positions he holds with WTIA and WTIM. Robert J. Truesdell is “interested” due to the
positions he currently holds with Wilmington Trust Wealth Advisory Services, M&T Bank, the parent of the Funds’ Advisor, and previous positions held with WTIA and WFMC. |
|
ANNUAL REPORT / April 30, 2013
|
|
|
| 40 |
|
BOARD OF TRUSTEES AND TRUST OFFICERS |
INDEPENDENT TRUSTEES BACKGROUND
|
|
|
|
|
| Name
Birth date
Position with Trust Date Service Began |
|
Principal Occupations and Other Directorships Held for Past Five Years |
|
|
| Joseph J. Castiglia
Birth date: 7/34 CHAIRMAN AND TRUSTEE
Began serving: February 1988 |
|
Principal Occupations: Private Investor, Consultant and Community Volunteer.
Other Directorships Held: Chairman (3/06 to 3/08), Trustee (3/04 to present) and Treasurer
(3/10 to 3/12), Buffalo Olmstead Parks Conservancy (1/05 to present); Chairman and Trustee, Buffalo Philharmonic Orchestra Foundation (1/06 to 1/12); Vice Chairman and Trustee, Christ the King Seminary (1/05 to present); Director, Dunn Tire
Corporation (1/05 to present); Chairman (5/12 to present), Director (1/08 to present), Read to Succeed Buffalo (1/08 to present); Director, Catholic Medical Partners (7/12 to present); Director, Roycroft Campus Corporation (8/12 to present).
Previous Positions: President, Chief Executive Officer, Vice President, Treasurer, Controller
and Vice Chairman, Pratt & Lambert United (manufacturing of paints, coatings and adhesives) (12/67 to 1/96); Chairman and Director, Catholic Health Systems of Western New York (1/97 to 5/03); Chairman and Director, Blue Cross Blue Shield of
Western and Central New York (health insurance provider) (5/92 to 5/07); Lead Director and Director, Energy East (gas and electric utility); Chairman and Director, Federal Reserve Bank of New York, Buffalo Branch.
|
|
|
| Robert H. Arnold
Birth date: 3/44 TRUSTEE
Began serving: March 2012 |
|
Principal Occupations: Founder and Co-Manager, R.H. Arnold & Co. (financial consulting) (1989 to
present). Other Directorships Held: First Potomac Realty Trust (real estate investment
trust). |
|
|
| William H. Cowie, Jr.
Birth date: 1/31 TRUSTEE
Began serving: September 2003 |
|
Principal Occupations: Retired.
Other Directorships Held: MedStar Community Health (not-for-profit owner and operator
of hospitals) (1972 to present). Previous Positions: Vice Chairman of Signet
Banking Corp. |
|
|
| John S. Cramer
Birth date: 2/42 TRUSTEE
Began serving: December 2000 |
|
Principal Occupations: Senior Consultant, Yaffe & Co. (health care consulting) (2/06 to present).
Other Directorships Held: Director, Chairman of the Executive Committee and Chairman of the
Compensation Committee of ChekMed Corporation (6/03 to present). Previous Positions:
President and Chief Executive Officer Emeriti, Pinnacle Health Systems (non-profit hospital and health care system in Central Pennsylvania). |
|
|
| Daniel R. Gernatt, Jr.
Birth date: 7/40 TRUSTEE
Began serving: February 1988 |
|
Principal Occupations: CEO, Gernatt Asphalt Products, Inc. (asphalt, sand and gravel products) (1979 to
present). Other Directorships Held: Director, Roswell Park Alliance (2008 to present);
Trustee, Gernatt Family Foundation. |
|
|
| Nicholas A. Giordano
Birth date: 3/43 TRUSTEE
Began serving: March 2012 |
|
Principal Occupations: Consultant, financial services organizations (1997 to present).
Other Directorships Held: Kalmar Pooled Investment Trust; The RBB Fund Inc. (19 portfolios)
(registered investment companies); Independence Blue Cross; IntriCon Corporation (industrial furnaces and ovens).
Previous Positions: Interim President, LaSalle University (1998 to 1999); President and Chief Executive Officer, Philadelphia Stock Exchange (1981 to 1997).
|
April 30, 2013 / ANNUAL REPORT
|
|
|
|
|
| BOARD OF TRUSTEES AND TRUST OFFICERS |
|
|
41 |
|
|
|
|
|
|
| Name
Birth date Position with Trust Date Service Began |
|
Principal Occupations and Other Directorships Held for Past Five Years |
|
|
| Richard B. Seidel
Birth date: 4/41 TRUSTEE
Began serving: September 2003 |
|
Principal Occupations: Chairman and Director, Girard Partners, Ltd. (investment advisor) (9/95 to
present); Chairman and Director, Girard Capital (broker-dealer) (3/09 to present).
Other Directorships Held: Director, Tristate Capital Bank (9/07 to present).
|
OFFICERS
|
|
|
|
|
| Name
Address Birth year Positions with Trust |
|
Principal Occupations for Past Five Years and Previous Positions |
|
|
| Samuel Guerrieri
Birth year: 1965 PRESIDENT
Began serving: December 2012 |
|
Principal Occupations: President and Chief Executive Officer, M&T Securities, Senior Vice President, M&T
Bank. |
|
|
| Michael D. Daniels
Birth year: 1967 CHIEF OPERATING OFFICER
Began serving: June 2007 |
|
Principal Occupations: Chief Operating Officer, Wilmington Funds and Wilmington Trust Investment
Advisors, Inc., Administrative Vice President, M&T Bank. Previous Positions:
Senior Vice President, MSD&T and MCA (2006 to 2007); Vice President, Calamos Asset Management (2004 to 2006); Vice President, JP Morgan Chase Bank (2002 to 2004).
|
|
|
| Jeffrey M. Seling
Birth year: 1970 VICE PRESIDENT
Began serving: June 2007 |
|
Principal Occupations: Vice President, M&T Bank and Wilmington Trust Investment
Advisors, Inc. Previous Positions: Vice President, MSD&T; Assistant
Vice President, Wells Fargo Bank; Assistant Vice President, JP Morgan Chase Bank. |
|
|
| Hope L. Brown
Birth year: 1973 CHIEF COMPLIANCE OFFICER,
AML COMPLIANCE OFFICER AND ASSISTANT SECRETARY Began serving: December 2012 |
|
Principal Occupations: Vice President, Wilmington Trust Investment Advisors, Inc.; Chief Compliance
Officer, Wilmington Funds. Previous Positions: Assistant Vice President,
Lead Manager, Risk Management and Divisional Compliance for T. Rowe Price (2005 to 2010); Senior Compliance Officer, Manager of Compliance for RE Investment, Inc., RE Advisers, Inc. and the Homestead Funds (2001 to 2005).
|
|
|
| Eric B. Paul
Birth year: 1974 VICE PRESIDENT
Began serving: June 2008 |
|
Principal Occupations: Administrative Vice President, M&T Bank (2003 to present); Director of Proprietary Products, M&T Bank
since April 2008. |
|
|
| Ralph V. Partlow, III
25 South Charles Street, 22nd floor Baltimore,
MD 21201
Birth year: 1957
VICE PRESIDENT
Began serving: June 2010 |
|
Principal Occupation: Administrative Vice President and Deputy General Counsel, M&T Bank (2003
to present). Previous Positions: Vice President and Senior Counsel, Allfirst Bank
(1995-2003). |
ANNUAL REPORT / April 30, 2013
|
|
|
| 42 |
|
BOARD OF TRUSTEES AND TRUST OFFICERS |
|
|
|
|
|
| Name
Address
Birth year Positions with Trust |
|
Principal Occupations for Past Five Years and Previous Positions |
|
|
| Guy Nordahl
101 Barclay Street, 13E New York, NY 10286
Birth year: 1965 CHIEF FINANCIAL OFFICER AND
TREASURER Began serving: September 2007 |
|
Principal Occupations: Vice President, BNY Mellon Asset Servicing (2009 to present).
Previous Positions: Vice President, BNY Mellon Asset Management (2003 to 2009);
Vice President, BNY Mellon Asset Servicing (1999 to 2003). |
|
|
| Lisa R. Grosswirth
101 Barclay Street, 13E New York, NY 10286
Birth year: 1963 SECRETARY
Began serving: September 2007 |
|
Principal Occupations: Vice President, BNY Mellon Asset Servicing (2004 to present).
Previous Positions: Supervisory Paralegal, The Dreyfus Corporation (1998 to
2004). |
|
|
| Richard J. Berthy
Three Canal Plaza, Suite 100 Portland, ME
04101 Birth year: 1958 CHIEF EXECUTIVE
OFFICER Began serving: September 2007 |
|
Principal Occupations: Chief Executive Officer, Foreside Financial Group, LLC (7/12 to present).
Previous Positions: President, Foreside Financial Group, LLC (5/08 to 7/12);
Chief Administrative Officer, Foreside Financial Group, LLC (2005 to 2008); President and Secretary, Bainbridge Capital Management, LLC (6/03 to 6/06); Vice President, Bainbridge Capital Management (8/02 to 5/04).
|
April 30, 2013 / ANNUAL REPORT
Shares of the Wilmington Funds are not FDIC insured or otherwise protected by the U.S. government, are not deposits or
other obligations of, or guaranteed by, Manufacturers and Traders Trust Company, and are subject to investment risks, including possible loss of the principal amount invested.
VOTING PROXIES ON FUND PORTFOLIO SECURITIES
A description of the policies and procedures that the Funds use to determine how to vote proxies relating to securities held in
the Funds’ portfolios is available, without charge and upon request, by calling 1-800-836-2211. A report on how the Funds voted any such proxies during the most recent 12-month period ended June 30 is available through Wilmington
Funds’ website. Go to www.wilmingtonfunds.com select “Proxy Voting Record” to access the link. This information is also available from the Edgar database on the SEC’s website at www.sec.gov.
QUARTERLY PORTFOLIO SCHEDULE
The Funds file with the SEC a complete schedule of their portfolio holdings, as of the close of the first and third quarters of
their fiscal year, on Form N-Q. These filings are available on the SEC’s website at www.sec.gov and may be reviewed and copied at the SEC’s Public Reference Room in Washington DC. (Call 1-800-SEC-0330 for information on the operation of
the Public Reference Room.)
Electronic Delivery
Wilmington Funds encourages you to sign up for electronic delivery of investor materials. By doing so you will receive
information faster, help lower shareholder costs, and reduce the impact to the environment. To enroll in electronic delivery:
| |
1.) |
Go to www.wilmingtonfunds.com and select “Individual Investors” |
|
| |
2.) |
Click on the link “Sign up for Electronic Delivery” |
|
| |
3.) |
Login to your account or create new user ID |
|
| |
4.) |
Select E-Delivery Consent from the available options, and |
|
| |
5.) |
Complete the information requested, including providing the email address where you would like to receive notification for
electronic documents. |
|
* If you hold your account through a financial intermediary, please contact your
advisor to request electronic delivery of investor materials.
Householding
In an effort to reduce volume of mail you receive, only one copy of the prospectus, annual/semi-annual report, SAI and proxy
statements will be sent to shareholders who are part of the same family and share the same address.
If you would like to
request additional copies of the prospectus, annual/semi-annual report or SAI, or wish to opt out of householding mailings, please contact Shareholder Services at 1-800-836-2211, or write to Wilmington Funds, P.O. Box 9828, Providence, RI
02940-8025.
ANNUAL REPORT / April 30, 2013
PRIVACY POLICY AND NOTICE
OF THE FUNDS AND THEIR DISTRIBUTOR
June 8, 2012
The Wilmington Funds, their distributor and their agents (referred to as “the Funds”, “we” or
“us”) recognize that consumers (referred to as “you” or “your”) expect us to protect both your assets and financial information. We respect your right to privacy and your expectation that all personal information about
you or your account will be maintained in a secure manner. We are committed to maintaining the confidentiality, security and integrity of client and shareholder information. We want you to understand the Funds’ policy that governs the handling
of your information, how the Funds gather information, how that information is used and how it is kept secure.
Information The Funds
Collect:
The Funds collect nonpublic personal information about you from the following sources:
| |
• |
|
We may receive information from you, or from your financial representative, on account applications, other forms or electronically (such as through
the Funds’ website or other electronic trading mechanisms). Examples of this information include your name, address, social security number, assets and income. |
| |
• |
|
We may receive information from you, or from your financial representative, through transactions with us or others, correspondence and other
communications. Examples of this information include specific investments and your account balances. |
| |
• |
|
We may obtain other personal information from you in connection with providing you a financial product or service. Examples of this information
include depository, debit or credit account numbers. |
Information Sharing Policy
The Funds may share nonpublic personal information about you, as described above, with financial or non-financial companies or
other entities, including companies that may be affiliated with the Funds and other nonaffiliated third parties, for the following purposes:
| |
• |
|
We may share information when it is necessary and required to process a transaction or to service a customer relationship. For example, information
may be shared with a company that provides account record keeping services or a company that provides proxy services to shareholders. |
| |
• |
|
We may share information when it is required or permitted by law. For example, information may be shared in response to a subpoena or to protect you
against fraud or with someone who has established a legal beneficial interest, such as a power of attorney. |
| |
• |
|
We may disclose some or all of the information described above to companies that perform marketing or other services on our behalf. For example, we
may share information about you with the financial intermediary (bank, investment bank or broker-dealer) through whom you purchased the Funds’ products or services, or with providers of marketing, legal, accounting or other professional
services. The Funds will not, however, disclose a consumer’s account number or similar form of access number or access code for credit card, deposit or transaction accounts to any nonaffiliated third party for use in telemarketing, direct mail
or other marketing purposes. |
Except as described above, the Funds do not share customer information. We
will not rent, sell, trade, or otherwise release or disclose any personal information about you. Any information you provide to us is for the Funds’ use only. If you decide to close your account(s) or become an inactive customer, we will adhere
to the privacy policies and practices as described in this notice.
Information Security:
When the Funds share nonpublic customer information with third parties hired to facilitate the delivery of certain products or
services to our customers, such information is made available for limited purposes and under controlled circumstances designed to protect our customers’ privacy. We require third parties to comply with our standards regarding security and
confidentiality of such information. We do not permit them to use that information for their own or any other purposes, or rent, sell, trade or otherwise release or disclose the information to any other party. These requirements are reflected in
written agreements between the Funds and the third party service providers.
The Funds protect your personal information in
several ways. We maintain physical, electronic, and procedural safeguards to guard your nonpublic personal information. In addition, the Funds’ Transfer Agent and Shareholder Servicing Agent have procedures in place for the appropriate disposal
of nonpublic personal information when they are no longer required to maintain the information.
Each of the following
sections explains an aspect of the Funds’ commitment to protecting your personal information and respecting your privacy.
Employee
Access to Information:
Our Code of Ethics, which applies to all employees, restricts the use of customer information
and requires that it be held in the strictest of confidence. Employee access to customer information is authorized for business purposes only, and the degree of access is based on the sensitivity of the information and on an employee’s or
agent’s need to know the information in order to service a customer’s account or comply with legal requirements.
Visiting The
Funds’ Website:
The Funds’ website gathers and maintains statistics about the number of visitors as well as
what information is viewed most frequently. This information is used to improve the content and level of service we provide to our clients and shareholders.
April 30, 2013 / ANNUAL REPORT
| |
• |
|
Information or data entered into a website will be retained. |
|
| |
• |
|
Where registration to a website or re-entering personal information on a website is required, “cookies” are used to improve your online
experience. A cookie is a way for websites to recognize whether or not you have visited the site before. It is a small file that is stored on your computer that identifies you each time you re-visit our site so you don’t have to resubmit
personal information. Cookies provide faster access into the website. |
|
| |
• |
|
We may also collect non-personally identifiable Internet Protocol (“IP”) addresses for all other visitors to monitor the number of
visitors to the site. These non-personally identifiable IP addresses are never shared with any third party. |
|
E-mail:
If you have opted to receive marketing information from the Funds by e-mail, it is our policy to include instructions in all
marketing messages on how to unsubscribe from subsequent e-mail programs. Some products or services from the Funds are intended to be delivered and serviced electronically. E-mail communication may be utilized in such cases. If you participate in an
employer-sponsored retirement plan administered by the Funds, we may, at your employer’s request, send you e-mail on matters pertaining to the retirement plan.
Please do not provide any account or personal information such as social security numbers, account numbers, or account balances
within your e-mail correspondence to us. We cannot use e-mail to execute transaction instructions, provide personal account information, or change account registration. We can, however, use e-mail to provide you with the necessary forms or you may
contact customer service toll-free at 1-800-836-2211.
Surveys/Aggregate Data:
Periodically, the Funds may conduct surveys about financial products and services or review elements of customer information in
an effort to forecast future business needs. The Funds then generate reports that include aggregate data regarding its customers. Aggregate data classifies customer information in various ways but that does not identify individual customers. These
reports may also include information on website traffic patterns and related information. These reports are used for the Funds’ planning, statistical and other corporate purposes. Aggregate data may also be shared with external parties, such as
marketing organizations. However, no information is shared by which any individual customer could be identified.
Changes to Our Privacy
Statement:
The effective date of this policy is June 8, 2012. We reserve the right to modify this policy at any
time. When it is revised or materially changed, we will update the effective date. You can determine whether there have been changes since the last time you reviewed by simply checking the effective date.
Notice will be provided to you in advance of any changes that would affect your rights under this policy statement
ANNUAL REPORT / April 30, 2013
[This Page Intentionally
Left Blank]


Wilmington Broad Market Bond Fund (“Broad Market Bond Fund”)
Wilmington Intermediate-Term Bond Fund (“Intermediate-Term Bond Fund”)
Wilmington Short-Term Corporate Bond Fund (“Short-Term Corporate Bond Fund”)
Wilmington Short Duration Government Bond Fund (“Short Duration Government Bond Fund”)
Wilmington Municipal Bond Fund (“Municipal Bond Fund”)
Wilmington Maryland Municipal Bond Fund (“Maryland Municipal Bond Fund”)
Wilmington New York Municipal Bond Fund (“New York Municipal Bond Fund”)

[This Page Intentionally Left Blank]
i
Dear Investor:
I am pleased to present the Annual Report of the Wilmington Funds (“Trust”). This report covers the Trust’s fiscal year,
which is the 12-month reporting period from May 1, 2012 through April 30, 2013. Inside, you will find a discussion of the factors impacting each Fund’s performance during the reporting period, as well as a complete listing of each
Fund’s holdings and financial statements.
The Economy and Financial Markets in Review
Wilmington Funds Management Corporation, the investment advisor to the Trust, and Wilmington Trust Investment Advisors, Inc., the
sub-advisor to the Trust, have provided the following review of the economy, bond markets, and stock markets over the 12-month reporting period.
The Economy
The U.S. economic expansion continued during the 12 months
ended April 30, 2013, though its pace remained tepid. The production of goods and services grew 3.1%, 0.4%, and 2.5% faster than the rate of inflation during the third and fourth quarters of 2012 and the first quarter of 2013, respectively.
U.S. consumer spending propelled the gains, though consumers were still cautious amid the long, slow recovery from the Great Recession of 2007–2009. Retail and food sales, for example, amounted to $4.94 trillion during our fiscal year, up 2.5%
in real (inflation-adjusted) terms over the preceding 12-month period. The housing market continued its nascent recovery, and inflation averaged about 1.1%.
Source: Federal Reserve Bank of St. Louis, May 28, 2013
If consumers were feeling
somewhat better, business managers remained wary. During the third and fourth quarters of 2012 and the first quarter of 2013, investments in U.S. plants, property, and equipment expected to last three years or more were made at lower rates than they
had been made in the corresponding quarters five years earlier, as the recession was beginning. Employers likewise remained cautious in hiring. The number of U.S. private sector workers grew in all 12 months of our fiscal year, but the rate of
private-sector job growth remained slow. At the end of April, there were still 2.0 million fewer private-sector workers than there had been at the labor market’s January 2008 peak. Much of the blame for soft business enthusiasm was laid at
the doorsteps of Congress and the White House. Many business leaders said lawmakers needed to make meaningful changes in U.S. tax and spending policies to shore up the nation’s finances and to clarify the legal and regulatory environment.
Despite the modest rate of expansion, the U.S. recovery looked solid in relation to economic conditions in Europe, where a
recession appeared to be worsening. Greece appeared likely to remain at least a near-term participant in the continent’s common currency experiment, but Spain, Portugal and Italy all joined Greece in struggling under heavy sovereign debts.
Debate about the possibility of developing common fiscal policies and banking regulations continued, and investors were soothed by the European Central Bank President’s assurance that the bank would do “whatever it takes to preserve the
euro.” In China, growth appeared to slow, though it remained strong in absolute terms. On balance, the global economy appeared to be expanding at a modest rate.
The Bond Markets
The good times rolled on in the U.S. bond market during
our fiscal year. The Barclays Capital U.S. Aggregate Bond Index returned 3.68%. The index tracks the overall market for taxable, investment-grade U.S. bonds and includes U.S. Treasury and agency securities, corporate bonds, and mortgage-backed
securities (MBS). The gain was propelled by strong results among corporate issues (+7.49%, according to the Barclays Capital U.S. Credit Bond Index), into which investors piled as the search for investment opportunities with meaningful yields
continued.
The yield of the 10-year U.S. Treasury note, against which many other interest rates are set, declined from 1.91%
at the end of April 2012 to a low of 1.43% in late July 2012 before climbing to 1.67% at the end of April 2013. The net 12-month decrease of a quarter of a percentage point boosted the prices of bonds across the market.
The S&P Municipal Bond Intermediate
Index1 returned 4.71%. Demand for shares of municipal bond mutual funds, which account for much of the total demand for municipal bonds, accelerated as fears of widespread
municipal bankruptcies dissipated and the rates of U.S. taxation on interest, dividends, and capital gains were allowed to revert in 2013 to prior, higher levels for higher-income taxpayers. Talk of limiting the federal tax exemption on municipal
bond interest income, meanwhile, continued to be just talk.
PRESIDENT’S
MESSAGE / April 30, 2013
ii
For the 12-month reporting period May 1, 2012 through
April 30, 2013, certain Barclays Capital indices performed as follows2:
|
|
|
|
|
|
|
|
|
| Barclays Capital U.S. Aggregate
Bond Index3 |
|
Barclays Capital U.S. Treasury
Bond Index4 |
|
Barclays Capital U.S. Mortgage-
Backed
Securities Index5 |
|
Barclays Capital U.S. Credit
Bond Index6 |
|
Barclays Capital Municipal Bond
Index7 |
| 3.68% |
|
2.56% |
|
1.85% |
|
7.49% |
|
5.19% |
The Stock Markets
Investors heard plenty about the “lost decade” of equity returns when the effects of the financial crisis were in full swing in early 2009. Commercials decrying 401(k) retirement plans as
“201(k)s” promoted “gold 401(k)s” or day trading as solutions; “buy and hold,” it was said, was dead. Fast forward four years and anyone who abandoned equities may be wishing they hadn’t. The “lost
decade” has turned into a pretty normal “found decade,” with a trailing 10-year total return for the S&P 500 Index of 7.88%, annualized. Granted, ten years ago we were emerging from the tech bubble; one must always be leery of the
period selected in drawing conclusions from economic or investment data.
Stocks generally did very well
during the 12 months ended April 30, 2013. Six broad stock market indices, which together offer a rough portrait of the world’s equity securities, returned between +3.97% and +19.39% in U.S. dollars during the fiscal year. The weakest
return came from the MSCI Emerging Markets (Net) Index8 (+3.97%) and the strongest return (+19.39%) was recorded by the MSCI EAFE (Net) Index9 of developed international stock markets. In between were the returns of the Russell Top 200 Index10
(+16.30%), which tracks mega-capitalization U.S. stocks, the Russell Midcap Index11 (+19.20%) of mid-cap U.S. stocks, the Russell 2000 Index12 (+17.69%) of small-cap U.S. stocks, and the S&P 500 Index13 (+16.89%), a widely watched
gauge consisting mainly of large-cap U.S. stocks.
For the 12-month reporting period May 1, 2012 through April 30,
2013, certain stock market indices performed as follows:
|
|
|
|
|
|
|
| S&P 500
Index13 |
|
Dow Jones
Industrial
Average14 |
|
NASDAQ Composite Index15 |
|
MSCI All Country World ex-US (Net) Index16 |
| 16.89% |
|
15.39% |
|
10.78% |
|
14.15% |
The Trust, with assets of $13.3 billion as of April 30, 2013, gives investors
access to every major asset class and sector. Whether you are looking for a comfortable retirement, to fund a child’s higher education, pursue tax-free income17, stay
ahead of inflation, or keep your cash working, one or more of the Trust’s Funds may provide you with the diversification, flexibility and professional management you need.
Sincerely,

Sam Guerrieri
President
May 28, 2013
April 30, 2013 /
PRESIDENT’S MESSAGE
iii
For more complete information, please download the Funds’ prospectus available on
www.wilmingtonfunds.com, or call 1-800-836-2211 for a copy. You should consider the Funds’ investment objectives, risks, charges, and expenses carefully before you invest. Information about these and other important subjects is in the
Funds’ prospectus, which you should read carefully before investing.
Past performance is no guarantee of
future results. The index performance quoted is for illustrative purposes only and is not representative of any specific investment. Diversification does not ensure a profit nor protect against loss.
All investments involve risk, including possible loss of principal. Equity securities are subject to price fluctuations and possible
loss of principal. Small and mid-cap stocks involve greater risks and volatility than large-cap stocks. International investments are subject to special risks, including currency fluctuations, social, economic, and political uncertainties, which
could increase volatility. The risks are magnified in emerging markets.
High yield, lower-rated securities generally
entail greater market, credit and liquidity risks than investment grade securities and may include higher volatility and higher risk of default. Credit ratings pertain only to the securities in the portfolio and do not protect fund shares against
market risk.
An investment in money market funds is neither insured nor guaranteed by the Federal Deposit Insurance
Corporation or any other government agency. Although money market funds seek to preserve the value of your investment at $1.00 per share, it is possible to lose money by investing in these funds.
| 1. |
S&P Municipal Bond Intermediate Index is a broad, market value-weighted index that seeks to measure the performance of the U.S. municipal bond market.
|
| 2. |
Bond prices are sensitive to changes in interest rates and a rise in interest rates can cause a decline in their prices. |
| 3. |
Barclays Capital U.S. Aggregate Bond Index is a widely used benchmark index for the domestic investment-grade bond market composed of securities from the Barclays
Capital Government/Corporate Bond Index, Mortgage-Backed Securities Index and Asset-Backed Securities Index. The index typically includes fixed income securities with overall intermediate- to long-term average maturities. The index is unmanaged and
investments cannot be made directly in an index. |
| 4. |
Barclays Capital U.S. Treasury Bond Index is a market capitalization weighted index that includes all publicly issued U.S. Treasury securities that have a remaining
maturity of at least one year, are rated investment-grade, and have $250 million or more of outstanding face value. The index is unmanaged and investments cannot be made directly in an index. |
| 5. |
Barclays Capital U.S. Mortgage Backed Securities Index is composed of all securities mortgage pools by GNMA, FNMA and the FHLMC, including GNMA graduated Payment
Mortgages. The index is unmanaged and investments cannot be made directly in an index. |
| 6. |
Barclays Capital U.S. Credit Bond Index tracks the performance of domestic investment-grade corporate bonds and is composed of all publicly issued, fixed-rate,
nonconvertible, investment-grade corporate debt. The index is unmanaged and investments cannot be made directly in an index. |
| 7. |
Barclays Capital Municipal Bond Index tracks the performance of the long-term, tax-exempt, investment-grade bond market. To be included in the index, bonds must have an
outstanding par balance of at least $7 million and be issued as part of a transaction of at least $75 million. The index is unmanaged and investments cannot be made directly in an index. |
| 8. |
MSCI Emerging Markets (Net) Index is a free float-adjusted market capitalization index that is designed to measure equity market performance of emerging markets. The
MSCI Emerging Markets Index consisted of the following 21 emerging market country indices: Brazil, Chile, China, Colombia, Czech Republic, Egypt, Hungary, India, Indonesia, Korea, Malaysia, Mexico, Morocco, Peru, Philippines, Poland, Russia, South
Africa, Taiwan, Thailand, and Turkey. |
| 9. |
MSCI EAFE (Net) Index is a free float-adjusted market capitalization index that is designed to measure equity market performance of developed markets, excluding the
U.S. & Canada. The index consists of the following 22 developed market country indices: Australia, Austria, Belgium, Denmark, Finland, France, Germany, Greece, Hong Kong, Ireland, Israel, Italy, Japan, Netherlands, New Zealand, Norway,
Portugal, Singapore, Spain, Sweden, Switzerland and the United Kingdom. |
| 10. |
Russell Top 200 Index measures the performance of the largest cap segment of the U.S. equity universe. The Russell Top 200 is a subset of the Russell 3000 Index. It
includes approximately 200 of the largest securities based on a combination of their market cap and current index membership and represents approximately 68% of the U.S. market. |
| 11. |
Russell Midcap Index measures the performance of the 800 smallest companies in the Russell 1000 Index, which represents approximately 25% of the total market
capitalization of the Russell 1000 Index. |
| 12. |
Russell 2000 Index measures the performance of the 2,000 smallest companies in the Russell 3000 Index, which represents approximately 8% of the total market
capitalization of the Russell 3000 Index. |
| 13. |
The S&P 500 Index is a capitalization-weighted index of 500 stocks designed to measure performance of the broad domestic economy through changes in the aggregate
market value of 500 stocks representing all major industries. The index is unmanaged and investments cannot be made directly in an index. |
| 14. |
Dow Jones Industrial Average (“DJIA”) represents share prices of selected blue chip industrial corporations as well as public utility and transportation
companies. The DJIA indicates daily changes in the average prices of stocks in any of its categories. It also reports total sales for each group of industries. Because it represents the top corporations of America, the DJIA’s average movements
are leading economic indicators for the stock market as a whole. The DJIA is unmanaged and investments cannot be made directly in the DJIA. |
| 15. |
NASDAQ Composite Index measures all NASDAQ domestic and non-U.S. based common stocks listed on the NASDAQ Stock Market. The index is unmanaged and investments cannot be
made directly in an index. |
| 16. |
MSCI All Country World ex-US (Net) Index is a free float-adjusted market capitalization weighted index that is designed to measure the equity market performance of
developed and emerging markets excluding the U.S. market. The index consists of 45 country indices comprising 23 developed and 22 emerging market country indices. |
| 17. |
Income generated by tax-free funds may be subject to the federal alternative minimum tax and state and local taxes. |
PRESIDENT’S
MESSAGE / April 30, 2013
[This Page Intentionally Left Blank]
1
WILMINGTON BROAD MARKET BOND FUND
Management’s Discussion of Fund Performance
For the fiscal year ended April 30, 2013, Wilmington Broad Market Bond Fund (the
“Fund”) had a total return of 3.93%* for Class A Shares and 4.32%* for Class I Shares, versus its benchmark, the Barclays Capital U.S. Aggregate Bond Index**, which had a total return of 3.68%, and its peer group, the Lipper Corporate
A-Rated Debt Funds Average***, which had a total return of 6.34%.
This past fiscal year saw record low interest rates, slow
but steady economic growth, low inflation, additional quantitative easing from the Federal Reserve and a continuation of the search for yield by investors in this ultra-low interest rate environment. The search for yield contributed to the corporate
bond market producing its second best year of outperformance as measured by excess returns for 2012.
The tepid economic
recovery continued as Gross Domestic Product (“GDP”) grew at only a 1.8% rate for the year ended March 31, 2013, slightly slower than the prior year’s pace of 2.1%. Uncertainty surrounding fiscal policy, higher taxes and cuts in
government spending brought on from the sequestration were some of the head-winds leading to slower growth. Consumers and business managers continue to remain cautious in their spending given these head-winds. On a positive note, the housing market
is improving as evidenced by rising home prices and housing starts reaching a 5-year high.
The Federal Reserve (the
“Fed”) maintained its accommodative monetary policy during the fiscal year and announced a 3rd round of quantitative easing last September that increased its monthly buying of mortgage and Treasury bonds to $85 billion per month. The
Fed’s goal is to keep long-term interest rates low enough to continue to aid the housing market and stimulate the economy. The Fed has stated that it will maintain its policies until the unemployment rate declines to at least 6.5% and inflation
moves up to 2%. Currently, the unemployment rate is at 7.5%, down from 8.1% a year ago. Although job growth has improved, it still remains slower than during past recoveries. The slack in the overall economy coupled with lower energy prices and wage
growth of only 2% has caused the Consumer Price Index (“CPI”) to decline to 1.1% for the past year. Given the Fed’s mandate to lower unemployment and allow inflation to rise, we expect the current low interest rate polices to be
maintained for the foreseeable future.
The combination of low inflation, slow economic growth, the Fed’s accommodative
policies and concerns over the European debt crisis caused 10-year treasury yields to decline to a record low yield of 1.38% last July. Over the past year, interest rates declined all along the yield curve. Longer-term interest rates declined more
than shorter-term interest rates causing the yield curve to flatten. At April 30, 2013 the 10-year treasury yield was 1.67%, down 24 basis points from April 30, 2012.
Source: Bloomberg, May 1, 2013
The corporate bond market continued to benefit as investors sought higher yields. With corporate balance sheets flush with cash and improving earnings, investors required smaller risk premiums. For the 12
months ended April 30, 2013, the average risk premium as measured by Barclays declined by 50 basis points to 135 basis points for the average investment grade bond.
Source: Barclays Capital, May 1, 2013
Looking forward, we expect economic growth to remain slow, inflation to remain low and the Fed to continue with its low interest rate
policies. However, as the unemployment rate moves lower we do expect interest rates to slowly move higher as the Fed will look to taper its Quantitative Easing.
Over the course of the year, of all the sectors of the taxable bond market, we viewed the corporate sector as the most attractive. As such, the Fund continued its overweight position in corporate
securities versus the benchmark. This resulted in the Fund outperforming its benchmark for the year. In addition, because the 1- to 10-year corporate yield curve was deemed to be very steep, the Fund sold corporate securities with maturities less
than one year, and purchased corporate securities with greater durations as well as higher yields. The Fund’s overall duration profile over the year was slightly shorter than the benchmark. As interest rates fell over the course of the year,
our duration posture detracted from our relative performance versus the benchmark. Our overweight to the intermediate portion of the yield curve also aided our relative performance as the yield curve flattened over the period.
| * |
Performance data quoted represents past performance, which is no guarantee of future results. Investment return and principal value will
fluctuate so that an investor’s shares, when redeemed, may be worth more or less than their original cost. The total return shown assumes the reinvestment of all distributions and does not reflect the deduction of taxes that a shareholder would
pay on fund distributions or the redemption of shares. The total return for Class A Shares was -0.73%, adjusted for the Fund’s maximum sales charge. Mutual fund performance changes over time and current performance may be lower or higher
than what is stated. For the most recent month-end performance, please visit www.wilmingtonfunds.com or call 1-800-836-2211. |
|
| ** |
The Barclays Capital U.S. Aggregate Bond Index is an index measuring both the capital price changes and income provided by the underlying universe
of securities, comprised of U.S. Treasury obligations, U.S. investment grade corporate debt and mortgage backed obligations. The index is unmanaged and it is not possible to invest directly in an index. |
| *** |
Lipper figures represent the average of the total returns reported by all of the mutual funds designated by Lipper, Inc. as falling into the
respective category indicated. These figures do not reflect sales charges. |
Duration is a
measure of a security’s price sensitivity to changes in interest rates. Securities with longer durations are more sensitive to changes in interest rates than securities of shorter durations.
Quantitative Easing (QE) is government monetary policy occasionally used to increase the money supply by buying
government securities or other securities from the market. Quantitative easing increases the money supply by flooding the financial institutions with capital, in an effort to promote increased lending and liquidity.
ANNUAL REPORT /
April 30, 2013
2
Basis Points (BPS) is a unit that is equal to 1/100th of 1% and is used
to denote the change in a financial instrument. The basis point is commonly used for calculating changes in interest rates, equity indices and the yield of a fixed-income security.
Consumer Price Index (CPI) is a measure that examines the weighted average of prices of a basket of consumer goods and
services, such as transportation, food and medical care. The CPI is calculated by taking price changes for each item in the predetermined basket of goods and averaging them; the goods are weighted according to their importance. Changes in CPI are
used to assess price changes associated with the cost of living.
April 30, 2013 / ANNUAL REPORT
3
WILMINGTON BROAD MARKET BOND FUND – CLASS A†
The graph below illustrates the hypothetical investment of $10,0001 in the Wilmington Broad Market Bond Fund (Class A) (the
“Fund”) from April 30, 2003 to April 30, 2013, compared to the Barclays Capital U.S. Aggregate Bond Index (“BCAB”).2
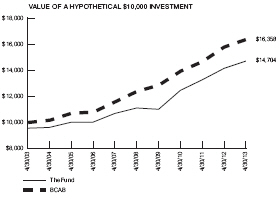
Average Annual Total Returns for the Year Ended April 30, 2013
|
|
|
| |
|
|
| 1 Year |
|
-0.73% |
| 5 Years |
|
4.79% |
| 10 Years |
|
3.93% |
Performance data quoted represents past performance which is no guarantee of future results. Returns shown do not reflect the
deduction of taxes that a shareholder would pay on Fund distributions or the redemption of Fund shares. Investment return and principal value will fluctuate so that an investor’s shares, when redeemed, may be worth more or less than their
original cost. Mutual funds are not obligations of or guaranteed by any bank and are not federally insured. Mutual fund performance changes over time and current performance may be lower or higher than what is stated. For current to the most recent
month end performance, visit www.wilmingtonfunds.com or call 1-800-836-2211. Total returns shown include the maximum sales charge of 4.50% for Class A.
Annual Operating Expense Ratio
|
|
|
| |
|
|
| Before Waivers |
|
1.17% |
| After Waivers |
|
1.00% |
The Expense Ratio Before Waivers represents the operating costs borne by the Fund, expressed as a percentage of the Fund’s
average net assets, as shown in the Fees and Expenses table in the Fund’s current prospectus (under “Total Annual Fund Operating Expenses”).
| 1 |
Represents a hypothetical investment of $10,000 in Class A of the Fund after deducting the maximum sales charge of 4.50% ($10,000 investment minus $450 sales charge =
$9,550). The Fund’s performance assumes the reinvestment of all dividends and distributions. |
| 2 |
The performance for the BCAB assumes the reinvestment of all dividends and distributions but does not reflect the deduction of a sales charge required for the Fund’s
performance by the Securities and Exchange Commission. It is not possible to invest directly in an index, and the represented index is unmanaged. |
| † |
The Wilmington Broad Market Bond Fund is the successor to the ARK Income Portfolio pursuant to a reorganization which took place on August 22, 2003. The information
presented above, for the periods prior to August 22, 2003, is historical information for the ARK Income Portfolio.
|
ANNUAL REPORT /
April 30, 2013
4
WILMINGTON BROAD MARKET BOND FUND – CLASS I†
The graph below illustrates the hypothetical investment of $1,000,0001 in the Wilmington Broad Market Bond Fund (Class I) (the
“Fund”) from April 30, 2003 to April 30, 2013, compared to the Barclays Capital Aggregate Bond Index (“BCAB”).2
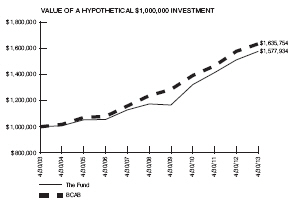
Average Annual Total Returns for the Year Ended April 30, 2013
|
|
|
| |
|
|
| 1 Year |
|
4.32% |
| 5 Years |
|
6.07% |
| 10 Years |
|
4.67% |
Performance data quoted represents past performance which is no guarantee of future results. Returns shown do not reflect the
deduction of taxes that a shareholder would pay on Fund distributions or the redemption of Fund shares. Investment return and principal value will fluctuate so that an investor’s shares, when redeemed, may be worth more or less than their
original cost. Mutual funds are not obligations of or guaranteed by any bank and are not federally insured. Mutual fund performance changes over time and current performance may be lower or higher than what is stated. For current to the most recent
month end performance, visit www.wilmingtonfunds.com or call 1-800-836-2211.
Annual Operating Expense Ratio
|
|
|
| |
|
|
| Before Waivers |
|
0.92% |
| After Waivers |
|
0.65% |
The Expense Ratio Before Waivers represents the operating costs borne by the Fund, expressed as a percentage of the Fund’s
average net assets, as shown in the Fees and Expenses table in the Fund’s current prospectus (under “Total Annual Fund Operating Expenses”).
| 1 |
Represents a hypothetical investment of $1,000,000 in Class I of the Fund and assumes the reinvestment of all dividends and distributions. |
| 2 |
The performance for the Fund and the BCAB assumes the reinvestment of all dividends and distributions. It is not possible to invest directly in an index, and the represented
index is unmanaged. |
| † |
The Wilmington Broad Market Bond Fund is the successor to the ARK Income Portfolio pursuant to a reorganization which took place on August 22, 2003. The information
presented above, for the periods prior to August 22, 2003, is historical information for the ARK Income Portfolio.
|
April 30, 2013 / ANNUAL REPORT
5
WILMINGTON INTERMEDIATE-TERM BOND FUND
Management’s Discussion of Fund Performance
For the fiscal year ended April 30, 2013, Wilmington Intermediate-Term Bond Fund (the
“Fund”) had a total return of 2.90%* for Class A Shares, and 3.15%* for Class I Shares, versus its benchmark, the Barclays Capital Intermediate U.S. Government/Credit Bond Index**, which had a total return of 3.23% and its peer group,
the Lipper Short-Intermediate Investment Grade Debt Funds Average***, which had a total return of 3.84%.
This past fiscal
year saw record low interest rates, slow but steady economic growth, low inflation, additional quantitative easing from the Federal Reserve and a continuation of the search for yield by investors in this ultra-low interest rate environment. The
search for yield contributed to the corporate bond market producing its second best year of outperformance as measured by excess returns for 2012.
The tepid economic recovery continued as Gross Domestic Product (“GDP”) grew at only a 1.8% rate for the year ended March 31, 2013, slightly slower than the prior year’s pace of 2.1%.
Uncertainty surrounding fiscal policy, higher taxes and cuts in government spending brought on from the sequestration were some of the head-winds leading to slower growth. Consumers and business managers continue to remain cautious in their spending
given these head-winds. On a positive note, the housing market is improving as evidenced by rising home prices and housing starts reaching a 5-year high.
The Federal Reserve (the “Fed”) maintained its accommodative monetary policy during the fiscal year and announced a 3rd round of quantitative easing last September that increased its monthly
buying of mortgage and Treasury bonds to $85 billion per month. The Fed’s goal is to keep long-term interest rates low enough to continue to aid the housing market and stimulate the economy. The Fed has stated that it will maintain its policies
until the unemployment rate declines to at least 6.5% and inflation moves up to 2%. Currently, the unemployment rate is at 7.5%, down from 8.1% a year ago. Although job growth has improved, it still remains slower than during past recoveries. The
slack in the overall economy coupled with lower energy prices and wage growth of only 2% has caused the Consumer Price Index (“CPI”) to decline to 1.1% for the past year. Given the Fed’s mandate to lower unemployment and allow
inflation to rise, we expect the current low interest rate polices to be maintained for the foreseeable future.
The
combination of low inflation, slow economic growth, the Fed’s accommodative policies and concerns over the European debt crisis caused 10-year treasury yields to decline to a record low yield of 1.38% last July. Over the past year, interest
rates declined all along the yield curve. Longer-term interest rates declined more than shorter-term interest rates causing the yield curve to flatten. At April 30, 2013, the 10-year treasury yield was 1.67%, down 24 basis points from
April 30, 2012.
Source: Bloomberg, May 1, 2013
The corporate bond market continued to benefit as investors sought higher yields. With corporate balance sheets flush with cash and
improving earnings, investors required smaller risk premiums. For the 12 months ended April 30, 2013, the average risk premium as
measured by Barclays declined by 50 basis points to 135 basis points for the average investment grade bond.
Source: Barclays Capital, May 1, 2013
Looking forward, we expect economic growth to remain slow, inflation to remain low and the Fed to continue with its low interest rate policies. However, as the unemployment rate moves lower we do expect
interest rates to slowly move higher as the Fed will look to taper its Quantitative Easing.
The modest underperformance of
the Fund relative to the benchmark can be attributed to the following factors. For the balance of the year, the Fund maintained an average duration that was shorter than the benchmark index. Therefore, the Fund did not benefit to the same degree as
its benchmark from the lower level of interest rates. In addition, the Fund was positioned to benefit from a steeper yield curve and a rise in longer-term interest rates. As highlighted above, longer-term interest rates declined more than short-term
interest rates due to lower than expected inflation and weaker than expected economic growth. This flattening of the Treasury yield curve also detracted from Fund performance. Finally, the Fund did benefit from its overweight position in corporate
bonds. However, the Fund’s higher quality composition relative to the benchmark also detracted from performance.
| * |
Performance data quoted represents past performance, which is no guarantee of future results. Investment return and principal value will
fluctuate so that an investor’s shares, when redeemed, may be worth more or less than their original cost. The total return shown assumes the reinvestment of all distributions and does not reflect the deduction of taxes that a shareholder would
pay on fund distributions or the redemption of shares. The total return for Class A Shares was -1.72%, adjusted for the Fund’s maximum sales charge. Mutual fund performance changes over time and current performance may be lower or higher
than what is stated. For the most recent month-end performance, please visit www.wilmingtonfunds.com or call 1-800-836-2211. |
| ** |
The Barclays Capital Intermediate U.S. Government/Credit Bond Index is a widely recognized, market value weighted index of U.S. Treasury securities,
U.S. government agency obligations, corporate debt securities, Yankee bonds and non-convertible corporate debt securities issued by or guaranteed by foreign governments and agencies. The index is unmanaged and it is not possible to invest directly
in an index. |
| *** |
Lipper figures represent the average of the total returns reported by all of the mutual funds designated by Lipper, Inc. as falling into the
respective category indicated. These figures do not reflect sales charges. |
Duration is a
measure of a security’s price sensitivity to changes in interest rates. Securities with longer durations are more sensitive to changes in interest rates than securities of shorter durations.
Quantitative Easing (QE) is government monetary policy occasionally used to increase the money supply by buying
government securities or
ANNUAL REPORT /
April 30, 2013
6
other securities from the market. Quantitative easing increases the money supply by flooding the financial institutions with capital, in an effort to promote increased lending and liquidity.
Basis Points (BPS) is a unit that is equal to 1/100th of 1% and is used to denote the change in a financial
instrument. The basis point is commonly used for calculating changes in interest rates, equity indices and the yield of a fixed-income security.
Consumer Price Index (CPI) is a measure that examines the weighted average of prices of a basket of consumer goods and services, such as transportation, food and medical care. The CPI is calculated by
taking price changes for each item in the predetermined basket of goods and averaging them; the goods are weighted according to their importance. Changes in CPI are used to assess price changes associated with the cost of living.
April 30, 2013 / ANNUAL REPORT
7
WILMINGTON INTERMEDIATE-TERM BOND FUND – Class A
The graph below illustrates the hypothetical investment of $10,0001 in the Wilmington Intermediate-Term Bond Fund (Class A) (the “Fund”) from August 18, 2003 (start of performance) to April 30, 2013, compared to the Barclays
Capital Intermediate Government/Credit Bond Index (“BCIGC”).2
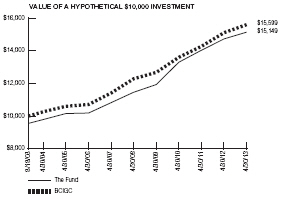
Average Annual Total Returns for the Year Ended April 30, 2013
|
|
|
| |
|
|
| 1 Year |
|
-1.72% |
| 5 Years |
|
4.79% |
| Start of Performance (8/18/03) |
|
4.37% |
Performance data quoted represents past performance which is no guarantee of future results. Returns shown do not reflect the
deduction of taxes that a shareholder would pay on Fund distributions or the redemption of Fund shares. Investment return and principal value will fluctuate so that an investor’s shares, when redeemed, may be worth more or less than their
original cost. Mutual funds are not obligations of or guaranteed by any bank and are not federally insured. Mutual fund performance changes over time and current performance may be lower or higher than what is stated. For current to the most recent
month end performance, visit www.wilmingtonfunds.com or call 1-800-836-2211. Total returns shown include the maximum sales charge of 4.50% for Class A.
Annual Operating Expense Ratio
|
|
|
| |
|
|
| Before Waivers |
|
1.19% |
| After Waivers |
|
0.95% |
The Expense Ratio Before Waivers represents the operating costs borne by the Fund, expressed as a percentage of the Fund’s
average net assets, as shown in the Fees and Expenses table in the Fund’s current prospectus (under “Total Annual Fund Operating Expenses”).
| 1 |
Represents a hypothetical investment of $10,000 in Class A of the Fund after deducting the maximum sales charge of 4.50% ($10,000 investment minus $450 sales charge =
$9,550). The Fund’s performance assumes the reinvestment of all dividends and distributions. |
| 2 |
The performance for the BCIGC assumes the reinvestment of all dividends and distributions but does not reflect the deduction of a sales charge required for the Fund’s
performance by the Securities and Exchange Commission. It is not possible to invest directly in an index, and the represented index is unmanaged.
|
ANNUAL REPORT / April
30, 2013
8
WILMINGTON INTERMEDIATE-TERM BOND FUND – Class I†
The graph below illustrates the hypothetical investment of $1,000,0001 in the Wilmington Intermediate-Term Bond Fund (Class I)
(the “Fund”) from April 30, 2003 to April 30, 2013, compared to the Barclays Capital Intermediate Government/Credit Bond Index (“BCIGC”).2
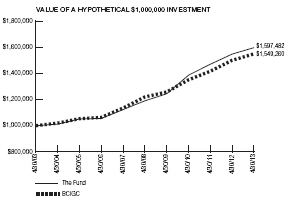
Average Annual Total Returns for the Year Ended April 30, 2013
|
|
|
| |
|
|
| 1 Year |
|
3.15% |
| 5 Years |
|
6.04% |
| 10 Years |
|
4.80% |
Performance data quoted represents past performance which is no guarantee of future results. Returns shown do not reflect the
deduction of taxes that a shareholder would pay on Fund distributions or the redemption of Fund shares. Investment return and principal value will fluctuate so that an investor’s shares, when redeemed, may be worth more or less than their
original cost. Mutual funds are not obligations of or guaranteed by any bank and are not federally insured. Mutual fund performance changes over time and current performance may be lower or higher than what is stated. For current to the most recent
month end performance, visit www.wilmingtonfunds.com or call 1-800-836-2211.
Annual Operating Expense Ratio
|
|
|
| |
|
|
| Before Waivers |
|
0.94% |
| After Waivers |
|
0.60% |
The Expense Ratio Before Waivers represents the operating costs borne by the Fund, expressed as a percentage of the Fund’s
average net assets, as shown in the Fees and Expenses table in the Fund’s current prospectus (under “Total Annual Fund Operating Expenses”).
| 1 |
Represents a hypothetical investment of $1,000,000 in Class I of the Fund and assumes the reinvestment of all dividends and distributions. |
| 2 |
The performance for the Fund and the BCIGC assumes the reinvestment of all dividends and distributions. It is not possible to invest directly in an index, and the represented
index is unmanaged. |
| † |
The Wilmington Intermediate-Term Bond Fund is the successor to the ARK Intermediate Fixed-Income Portfolio pursuant to a reorganization that took place on August 15, 2003.
The information presented above, for the periods prior to August 15, 2003, is historical information for the ARK Intermediate Fixed-Income Portfolio.
|
April 30, 2013 / ANNUAL REPORT
9
WILMINGTON SHORT-TERM CORPORATE BOND FUND
Management’s Discussion of Fund Performance
For the fiscal year ended April 30, 2013, Wilmington Short-Term Corporate Bond Fund
(the “Fund”) had a total return of 1.66%* for Class A Shares and 1.91%* for Class I Shares, versus its benchmark, the Barclays Capital 1-3 Year U.S. Government/Credit Bond Index**, which had a total return of 1.04%, and its peer
group, the Lipper Short Investment Grade Debt Funds Average***, which had a total return of 2.50%.
This past fiscal year saw
record low interest rates, slow but steady economic growth, low inflation, additional quantitative easing from the Federal Reserve and a continuation of the search for yield by investors in this ultra-low interest rate environment. The search for
yield contributed to the corporate bond market producing its second best year of outperformance as measured by excess returns for 2012.
The tepid economic recovery continued as Gross Domestic Products (“GDP”) grew at only a 1.8% rate for the year ended March 31, 2013, slightly slower than the prior year’s pace of 2.1%.
Uncertainty surrounding fiscal policy, higher taxes and cuts in government spending brought on from the sequestration were some of the head-winds leading to slower growth. Consumers and business managers continue to remain cautious in their spending
given these head-winds. On a positive note, the housing market is improving as evidenced by rising home prices and housing starts reaching a 5-year high.
The Federal Reserve (the “Fed”) maintained its accommodative monetary policy during the fiscal year and announced a 3rd round of quantitative easing last September that increased its monthly
buying of mortgage and Treasury bonds to $85 billion per month. The Fed’s goal is to keep long-term interest rates low enough to continue to aid the housing market and stimulate the economy. The Fed has stated that it will maintain its policies
until the unemployment rate declines to at least 6.5% and inflation moves up to 2%. Currently, the unemployment rate is at 7.5%, down from 8.1% a year ago. Although job growth has improved, it still remains slower than during past recoveries. The
slack in the overall economy coupled with lower energy prices and wage growth of only 2% has caused the Consumer Price Index (“CPI”) to decline to 1.1% for the past year. Given the Fed’s mandate to lower unemployment and allow
inflation to rise, we expect the current low interest rate polices to be maintained for the foreseeable future.
The
combination of low inflation, slow economic growth, the Fed’s accommodative policies and concerns over the European debt crisis caused 10-year treasury yields to decline to a record low yield of 1.38% last July. Over the past year, interest
rates declined all along the yield curve. Longer-term interest rates declined more than shorter-term interest rates causing the yield curve to flatten. At April 30, 2013, the 10-year treasury yield was 1.67%, down 24 basis points from
April 30, 2012.
Source: Bloomberg, May 1, 2013
The corporate bond market continued to benefit as investors sought higher yields. With corporate balance sheets flush with cash and
improving earnings, investors required smaller risk premiums. For the 12 months ended April 30, 2013, the average risk premium as
measured by Barclays declined by 50 basis points to 135 basis points for the average investment grade bond.
Source: Barclays Capital, May 1, 2013
Looking forward, we expect economic growth to remain slow, inflation to remain low and the Fed to continue with its low interest rate policies. However, as the unemployment rate moves lower we do expect
interest rates to slowly move higher as the Fed will look to taper its Quantitative Easing.
The Fund focused on investment
grade corporate securities with three to five year maturities. Over the course of the year, the Fund sold lower yielding U.S. Treasuries and U.S. Government Agencies, favoring higher yielding corporate securities. In addition, because the 1- to
5-year corporate yield curve was deemed to be very steep, the Fund sold corporate securities with maturities less than one year, and purchased corporate securities with greater durations as well as higher yields. The strategy of increasing our
allocation to the corporate sector aided our outperformance to the benchmark. Recently, the Fund has increased its allocation to floating rate notes, anticipating higher future interest rates. The Fund’s overall duration profile over the year
was slightly shorter than the benchmark. As interest rates fell slightly over the course of the year, our duration posture detracted from our relative performance versus the benchmark.
| * |
Performance data quoted represents past performance, which is no guarantee of future results. Investment return and principal value will
fluctuate so that an investor’s shares, when redeemed, may be worth more or less than their original cost. The total return shown assumes the reinvestment of all distributions and does not reflect the deduction of taxes that a shareholder would
pay on fund distributions or the redemption of shares. The total return for Class A Shares was -0.09%, adjusted for the Fund’s maximum sales charge. Mutual fund performance changes over time and current performance may be lower or higher
than what is stated. For the most recent month-end performance, please visit www.wilmingtonfunds.com or call 1-800-836-2211. |
| ** |
The Barclays Capital 1-3 Year U.S. Government/Credit Bond Index is an index that captures funds with exposures to both government and commercial
credit. The index is unmanaged and it is not possible to invest directly in an index. |
| *** |
Lipper figures represent the average of the total returns reported by all of the mutual funds designated by Lipper, Inc. as falling into the
respective category indicated. These figures do not reflect sales charges. |
Duration is a
measure of a security’s price sensitivity to changes in interest rates. Securities with longer durations are more sensitive to changes in interest rates than securities of shorter durations.
Quantitative Easing (QE) is government monetary policy occasionally used to increase the money supply by buying
government securities or other securities from the market. Quantitative easing increases the money supply by flooding the financial institutions with capital, in an effort to promote increased lending and liquidity.
ANNUAL REPORT / April
30, 2013
10
Basis Points (BPS) is a unit that is equal to 1/100th of 1% and is used to denote the change in a financial instrument. The basis point is commonly used for calculating changes in interest rates,
equity indices and the yield of a fixed-income security.
Consumer Price Index (CPI) is a measure that
examines the weighted average of prices of a basket of consumer goods and services, such as transportation, food and medical care. The CPI is calculated by taking price changes for each item in the predetermined basket of goods and averaging them;
the goods are weighted according to their importance. Changes in CPI are used to assess price changes associated with the cost of living.
April 30, 2013 / ANNUAL REPORT
11
WILMINGTON SHORT-TERM CORPORATE BOND FUND – CLASS A
The graph below illustrates the hypothetical investment of $10,0001 in the Wilmington Short-Term Corporate Bond Fund (Class A) (the “Fund”) from August 25, 2003 (start of performance) to April 30, 2013, compared to the
Barclays Capital 1-3 Year U.S. Government/ Credit Bond Index (“BC1-3GCB”).2

Average Annual Total Returns for the Year Ended April 30, 2013
|
|
|
| |
|
|
| 1 Year |
|
-0.09% |
| 5 Years |
|
2.57% |
| Start of Performance (8/25/03) |
|
2.77% |
Performance data quoted represents past performance which is no guarantee of future results. Returns shown do not reflect the
deduction of taxes that a shareholder would pay on Fund distributions or the redemption of Fund shares. Investment return and principal value will fluctuate so that an investor’s shares, when redeemed, may be worth more or less than their
original cost. Mutual funds are not obligations of or guaranteed by any bank and are not federally insured. Mutual fund performance changes over time and current performance may be lower or higher than what is stated. For current to the most recent
month end performance, visit www.wilmingtonfunds.com or call 1-800-836-2211. Total returns shown include the maximum sales charge of 1.75% for Class A.
Annual Operating Expense Ratio
|
|
|
| |
|
|
| Before Waivers |
|
1.19% |
| After Waivers |
|
0.86% |
The Expense Ratio Before Waivers represents the operating costs borne by the Fund, expressed as a percentage of the Fund’s
average net assets, as shown in the Fees and Expenses table in the Fund’s current prospectus (under “Total Annual Fund Operating Expenses”).
| 1 |
Represents a hypothetical investment of $10,000 in Class A of the Fund after deducting the maximum sales charge of 1.75% ($10,000 investment minus $175 sales charge =
$9,825). The Fund’s performance assumes the reinvestment of all dividends and distributions. |
| 2 |
The performance for the BC1-3GCB assumes the reinvestment of all dividends and distributions but does not reflect the deduction of a sales charge required for the Fund’s
performance by the Securities and Exchange Commission. It is not possible to invest directly in an index, and the represented index is unmanaged.
|
ANNUAL REPORT / April
30, 2013
12
WILMINGTON SHORT-TERM CORPORATE BOND FUND – CLASS I†
The graph below illustrates the hypothetical investment of $1,000,0001 in the Wilmington Short-Term Corporate Bond Fund (Class I)
(the “Fund”) from April 30, 2003 to April 30, 2013, compared to the Barclays Capital 1-3 Year U.S. Government/Credit Bond Index (“BC1-3GCB”).2
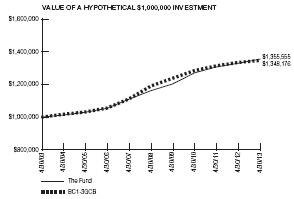
Average Annual Total Returns for the Year Ended April 30, 2013
|
|
|
| |
|
|
| 1 Year |
|
1.91% |
| 5 Years |
|
3.14% |
| 10 Years |
|
3.09% |
Performance data quoted represents past performance which is no guarantee of future results. Returns shown do not reflect the
deduction of taxes that a shareholder would pay on Fund distributions or the redemption of Fund shares. Investment return and principal value will fluctuate so that an investor’s shares, when redeemed, may be worth more or less than their
original cost. Mutual funds are not obligations of or guaranteed by any bank and are not federally insured. Mutual fund performance changes over time and current performance may be lower or higher than what is stated. For current to the most recent
month end performance, visit www.wilmingtonfunds.com or call 1-800-836-2211.
Annual Operating Expense Ratio
|
|
|
| |
|
|
| Before Waivers |
|
0.94% |
| After Waivers |
|
0.61% |
The Expense Ratio Before Waivers represents the operating costs borne by the Fund, expressed as a percentage of the Fund’s
average net assets, as shown in the Fees and Expenses table in the Fund’s current prospectus (under “Total Annual Fund Operating Expenses”).
| 1 |
Represents a hypothetical investment of $1,000,000 in Class I of the Fund and assumes the reinvestment of all dividends and distributions. |
| 2 |
The performance for the Fund and BC1-3GCB assumes the reinvestment of all dividends and distributions. It is not possible to invest directly in an index, and the represented
index is unmanaged. |
| † |
Performance prior to August 22, 2003 reflects the performance of the ARK Short-Term Bond Portfolio, which the Wilmington Short-Term Corporate Bond Fund acquired pursuant to
a reorganization that date. |
April 30, 2013 / ANNUAL REPORT
13
WILMINGTON SHORT DURATION GOVERNMENT BOND FUND
Management’s Discussion of Fund Performance
For the fiscal year ended April 30, 2013, Wilmington Short Duration Government Bond
Fund (the “Fund”) had a total return of 0.82%* for Class A Shares, and 1.07%* for Class I Shares, versus its benchmark, the Barclays Capital 1-3 Year U.S. Government Bond Index**, which had a total return of 0.55%, and its peer group,
the Lipper Short U.S. Government Bond Funds Average***, which had a total return of 0.49%.
This past fiscal year saw record
low interest rates, slow but steady economic growth, low inflation, additional quantitative easing from the Federal Reserve and a continuation of the search for yield by investors in this ultra-low interest rate environment. The search for yield
contributed to the corporate bond market producing its second best year of outperformance as measured by excess returns for 2012.
The tepid economic recovery continued as Gross Domestic Product (“GDP”) grew at only a 1.8% rate for the year ended March 31, 2013, slightly slower than the prior year’s pace of 2.1%.
Uncertainty surrounding fiscal policy, higher taxes and cuts in government spending brought on from the sequestration were some of the head-winds leading to slower growth. Consumers and business managers continue to remain cautious in their spending
given these head-winds. On a positive note, the housing market is improving as evidenced by rising home prices and housing starts reaching a 5-year high.
The Federal Reserve (the “Fed”) maintained its accommodative monetary policy during the fiscal year and announced a 3rd round of quantitative easing last September that increased its monthly
buying of mortgage and Treasury bonds to $85 billion per month. The Fed’s goal is to keep long-term interest rates low enough to continue to aid the housing market and stimulate the economy. The Fed has stated that it will maintain its policies
until the unemployment rate declines to at least 6.5% and inflation moves up to 2%. Currently, the unemployment rate is at 7.5%, down from 8.1% a year ago. Although job growth has improved, it still remains slower than during past recoveries. The
slack in the overall economy coupled with lower energy prices and wage growth of only 2% has caused the Consumer Price Index (“CPI”) to decline to 1.1% for the past year. Given the Fed’s mandate to lower unemployment and allow
inflation to rise, we expect the current low interest rate polices to be maintained for the foreseeable future.
The
combination of low inflation, slow economic growth, the Fed’s accommodative policies and concerns over the European debt crisis caused 10-year treasury yields to decline to a record low yield of 1.38% last July. Over the past year, interest
rates declined all along the yield curve. Longer-term interest rates declined more than shorter-term interest rates causing the yield curve to flatten. At April 30 2013, the 10-year treasury yield was 1.67%, down 24 basis points from
April 30, 2012.
Source: Bloomberg, May 1, 2013
The corporate bond market continued to benefit as investors sought higher yields. With corporate balance sheets flush with cash and
improving earnings, investors required smaller risk premiums. For the 12 months ended April 30, 2013, the average risk premium as
measured by Barclays declined by 50 basis points to 135 basis points for the average investment grade bond.
Source: Barclays Capital, May 1, 2013
Looking forward, we expect economic growth to remain slow, inflation to remain low and the Fed to continue with its low interest rate policies. However, as the unemployment rate moves lower we do expect
interest rates to slowly move higher as the Fed will look to taper its Quantitative Easing.
The outperformance of the Fund
can be attributed to our strategy to overweight the higher yielding mortgage backed securities sector. In addition, our yield curve strategy to allocate some assets of the Fund to the intermediate portion of the yield curve also aided performance as
the yield curve flattened with intermediate maturity yields falling more than short-term yields.
| * |
Performance data quoted represents past performance, which is no guarantee of future results. Investment return and principal value will
fluctuate so that an investor’s shares, when redeemed, may be worth more or less than their original cost. The total return shown assumes the reinvestment of all distributions and does not reflect the deduction of taxes that a shareholder would
pay on fund distributions or the redemption of shares. The total return for Class A Shares was -0.91%, adjusted for the Fund’s maximum sales charge. Mutual fund performance changes over time and current performance may be lower or higher
than what is stated. For the most recent month-end performance, please visit www.wilmingtonfunds.com or call 1-800-836-2211. |
| ** |
The Barclays Capital 1-3 Year U.S. Government Bond Index is a widely recognized index of U.S. Government obligations with maturities between one and
three years. This index is unmanaged and it is not possible to invest directly in an index. |
| *** |
Lipper figures represent the average of the total returns reported by all of the mutual funds designated by Lipper, Inc. as falling into the
respective category indicated. These figures do not reflect sales charges. |
Duration is a
measure of a security’s price sensitivity to changes in interest rates. Securities with longer durations are more sensitive to changes in interest rates than securities of shorter durations.
Quantitative Easing (QE) is government monetary policy occasionally used to increase the money supply by buying
government securities or other securities from the market. Quantitative easing increases the money supply by flooding the financial institutions with capital, in an effort to promote increased lending and liquidity.
Basis Points (BPS) is a unit that is equal to 1/100th of 1% and is used to denote the change in a financial instrument.
The basis point is commonly used for calculating changes in interest rates, equity indices and the yield of a fixed-income security.
ANNUAL REPORT / April
30, 2013
14
Consumer Price Index (CPI) is a measure that examines the weighted
average of prices of a basket of consumer goods and services, such as transportation, food and medical care. The CPI is calculated by taking price changes for each item in the predetermined basket of goods and averaging them; the goods are weighted
according to their importance. Changes in CPI are used to assess price changes associated with the cost of living.
April 30, 2013 / ANNUAL REPORT
15
WILMINGTON SHORT DURATION GOVERNMENT BOND FUND – CLASS A
The graph below illustrates the hypothetical investment of $10,0001 in the Wilmington Short Duration Government Bond Fund (Class A) (the “Fund”) from August 18, 2003 (start of performance) to April 30, 2013, compared to the
Barclays Capital 1-3 Year U.S. Government Bond Index (“BC1-3GB”).2
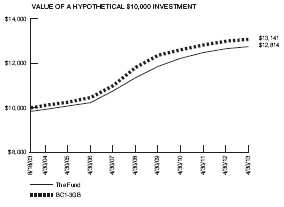
Average Annual Total Returns for the Year Ended April 30, 2013
|
|
|
| |
|
|
| 1 Year |
|
-0.91% |
| 5 Years |
|
2.05% |
| Start of Performance (8/18/03) |
|
2.59% |
Performance data quoted represents past performance which is no guarantee of future results. Returns shown do not reflect the
deduction of taxes that a shareholder would pay on Fund distributions or the redemption of Fund shares. Investment return and principal value will fluctuate so that an investor’s shares, when redeemed, may be worth more or less than their
original cost. Mutual funds are not obligations of or guaranteed by any bank and are not federally insured. Mutual fund performance changes over time and current performance may be lower or higher than what is stated. For current to the most recent
month end performance, visit www.wilmingtonfunds.com or call 1-800-836-2211. Total returns shown include the maximum sales charge of 1.75% for Class A.
Annual Operating Expense Ratio
|
|
|
| |
|
|
| Before Waivers |
|
1.18% |
| After Waivers |
|
0.89% |
The Expense Ratio Before Waivers represents the operating costs borne by the Fund, expressed as a percentage of the Fund’s
average net assets, as shown in the Fees and Expenses table in the Fund’s current prospectus (under “Total Annual Fund Operating Expenses”).
| 1 |
Represents a hypothetical investment of $10,000 in Class A of the Fund after deducting the maximum sales charge of 1.75% ($10,000 investment minus $175
sales charge = $9,825). The Fund’s performance assumes the reinvestment of all dividends and distributions. |
| 2 |
The performance for the BC1-3GB assumes the reinvestment of all dividends and distributions but does not reflect the deduction of a sales charge required for
the Fund’s performance by the Securities and Exchange Commission. It is not possible to invest directly in an index, and the represented index is unmanaged.
|
ANNUAL REPORT / April
30, 2013
16
WILMINGTON SHORT DURATION GOVERNMENT BOND FUND – CLASS I
The graph below illustrates the hypothetical investment of $1,000,0001 in the Wilmington Short Duration Government Bond Fund (Class I) (the “Fund”) from April 30, 2003 to April 30, 2013, compared to the Barclays Capital 1-3 Year
U.S. Government Bond Index (“BC1-3GB”).2
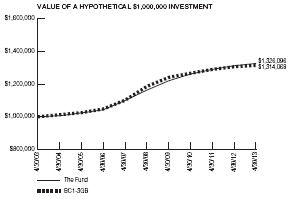
Average Annual Total Returns for the Year Ended April 30, 2013
|
|
|
| |
|
|
| 1 Year |
|
1.07% |
| 5 Years |
|
2.66% |
| 10 Years |
|
2.86% |
Performance data quoted represents past performance which is no guarantee of future results. Returns shown do not reflect the
deduction of taxes that a shareholder would pay on Fund distributions or the redemption of Fund shares. Investment return and principal value will fluctuate so that an investor’s shares, when redeemed, may be worth more or less than their
original cost. Mutual funds are not obligations of or guaranteed by any bank and are not federally insured. Mutual fund performance changes over time and current performance may be lower or higher than what is stated. For current to the most recent
month end performance, visit www.wilmingtonfunds.com or call 1-800-836-2211.
Annual Operating Expense Ratio
|
|
|
| |
|
|
| Before Waivers |
|
0.93% |
| After Waivers |
|
0.64% |
The Expense Ratio Before Waivers represents the operating costs borne by the Fund, expressed as a percentage of the Fund’s
average net assets, as shown in the Fees and Expenses table in the Fund’s current prospectus (under “Total Annual Fund Operating Expenses”).
| 1 |
Represents a hypothetical investment of $1,000,000 in Class I of the Fund and assumes the reinvestment of all dividends and distributions. |
| 2 |
The performance for the Fund and the BC1-3GB assumes the reinvestment of all dividends and distributions. It is not possible to invest directly in an index, and the represented
index is unmanaged. |
April 30, 2013 / ANNUAL REPORT
17
WILMINGTON MUNICIPAL BOND FUND
Management’s Discussion of Fund Performance
For the fiscal year ended April 30, 2013, Wilmington Municipal Bond Fund (the
“Fund”) had a total return of 3.74%* for Class A Shares and 4.06%* for Class I Shares, versus its benchmark, the S&P Municipal Bond Intermediate Index**, which had a total return of 4.71%, and its peer group, the Lipper
Intermediate Municipal Debt Funds Average***, which had a total return of 3.98%.
The business of forecasting the timing,
size, and direction of interest rate changes is an uncertain one. For this reason, we manage our clients’ municipal fixed income portfolios without expressing a view about the future path of interest rates. We do, however, recognize that many
investors do not view the markets in this mannaer through our practical and dispassionate lens. Sentiment can drive relative valuations and create opportunity for nimble investors, and attitudes seemed to turn decidedly negative toward interest
rates during the quarter. Many investors have been poised for higher rates over the last three years. Those who shortened their portfolios’ duration—simply, their sensitivity to interest rates, which move in the opposite direction of bond
prices—in anticipation of higher rates likely experienced lost opportunities as interest rates fell over that same period.
What has changed to drive up that negative sentiment? First, investors have become increasingly enamored by equities once again. Time
heals all wounds, and we are now five years from the 2008 financial meltdown. Many investors have been willing to increase their exposures to riskier assets, such as equities, at a time when domestic stock markets are at record highs, finally
breaking through pre-crisis levels. Second, several core economic indicators appear to be trending higher. As recently as the last week of March, many economic prognosticators were lifting their gross domestic product estimates for the first
quarter. According to a monthly Bloomberg survey, economists now believe the economy grew at a 2.0% annualized rate during the quarter, up from a 1.5% projected rate in January. Certainly the employment estimates for March caught some economists off
guard and, naturally, survey trends can reverse as new and revised data is released.
Nevertheless, investors are diversifying
out of fixed income into equities, or shifting their bond portfolios to reduce their interest rate exposure. Evidence of these moves can be gleaned from the weekly flows into and out of tax-exempt bond mutual funds, as measured by Lipper: Investors
were net sellers of tax-exempt bond funds, including long-term funds, during the six weeks ended May 1, but they were net buyers of intermediate-term funds.
The S&P Municipal Intermediate Index posted a 1.63% total return during the first four months of 2013, with mixed monthly results. Positive results in January and February (which themselves were a
recovery from a weak December) were followed by a rise in rates and negative total returns in March. April reversed the March move and then some, as the Intermediate index was up nearly 1% for that month alone.
Total new municipal bond issuance reached about $117 billion year-to-date through the end of April versus $114 billion for the same
period in 2012, about a 2.5% increase. The year started strong out of the gate, with January’s deals totaling almost $27 billion. That
was a 53% increase over January 2012. February was slightly ahead of last year’s pace, with about $24 billion in supply, and March lagged on a year-over-year basis at $30.4 billion.
April’s issuance of $34 billion was on par with April 2012 issuance. Thus far, California tops the leader board with almost $19.4 billion in deals, while Texas, New York, and New Jersey follow with $10.7, $9.9, and $7.1 billion, respectively.
Source: Bond Buyer, May 1, 2013
The Fund underperformed its benchmark. While the Fund and peer group performance are net of management fees, the benchmark returns reflect gross returns without any fee impact. One aspect hurting relative
performance was the higher quality positions in the Fund. The lower rated bonds within the benchmark index (rated A and below) were stronger performers than the higher rated bonds (AA or better). The Fund was overweight inAAAbonds, offset by
underweights in A and BBB rated bonds. Offsetting the negative impact of the quality positioning was an overweight to Healthcare bonds. The Fund’s nearly 5% overweight to high-grade healthcare bonds added to relative performance as the
healthcare sector was one of the strongest performing sectors for the 12 months ending April 30, 2013.
| * |
Performance data quoted represents past performance, which is no guarantee of future results. Investment return and principal value will
fluctuate so that an investor’s shares, when redeemed, may be worth more or less than their original cost. The total return shown assumes the reinvestment of all distributions and does not reflect the deduction of taxes that a shareholder would
pay on fund distributions or the redemption of shares. The total return for Class A Shares was -0.93% for the fiscal year ended April 30, 2013, adjusted for the Fund’s maximum sales charge. Mutual fund performance changes over time
and current performance may be lower or higher than what is stated. For the most recent month-end performance, please visit www.wilmingtonfunds.com or call 1-800-836-2211. |
| ** |
Standard & Poor’s (S&P) Municipal Bond Intermediate Index consists of bonds in the S&P Municipal Bond Index with a minimum
maturity of three years and a maximum maturity of up to, but not including, 15 years as measured from the Rebalancing Date. The S&P Municipal Bond Index is a broad, market value-weighted index that seeks to measure the performance of the U.S.
municipal bond market. All bonds in the index are exempt from U.S. federal income taxes or subject to the alternative minimum tax (AMT). The indices include general obligation bonds, revenue bonds, insured bonds and pre-refunded bonds. Indices are
unmanaged and it is not possible to invest directly in an index. |
ANNUAL REPORT / April
30, 2013
18
| *** |
Lipper figures represent the average of the total returns reported by all of the mutual funds designated by Lipper, Inc. as falling into the
respective category indicated. These figures do not reflect sales charges. |
Duration is a
measure of a security’s price sensitivity to changes in interest rates. Securities with longer durations are more sensitive to changes in interest rates than securities of shorter durations.
Credit ratings pertain only to the securities in the portfolio and do not protect fund shares against market risk.
Income may be subject to the federal alternative minimum tax.
Basis Points (BPS) is a unit that is equal to 1/100th of 1% and is used to denote the change in a financial instrument.
The basis point is commonly used for calculating changes in interest rates, equity indices and the yield of a fixed-income security.
April 30, 2013 / ANNUAL REPORT
19
WILMINGTON MUNICIPAL BOND
FUND – CLASS A
The graph below illustrates the hypothetical
investment of $10,0001 in the Wilmington Municipal Bond Fund (Class A) (the “Fund”) from December 19, 2005 to April 30, 2013, compared to the S&P
Intermediate Municipal Index2.
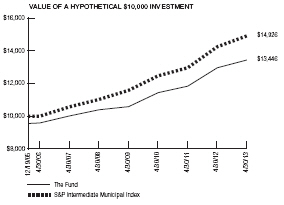
Average Annual Total Returns for the Year Ended April 30, 2013
|
|
|
| |
|
|
| 1 Year |
|
-0.93% |
| 5 Years |
|
4.31% |
| Start of Performance (12/19/05) |
|
4.10% |
Performance data quoted represents past performance which is no guarantee of future results. Returns shown do not reflect the
deduction of taxes that a shareholder would pay on Fund distributions or the redemption of Fund shares. Investment return and principal value will fluctuate so that an investor’s shares, when redeemed, may be worth more or less than their
original cost. Mutual funds are not obligations of or guaranteed by any bank and are not federally insured. Mutual fund performance changes over time and current performance may be lower or higher than what is stated. For current to the most recent
month end performance, visit www.wilmingtonfunds.com or call 1-800-836-2211. Total returns shown include the maximum sales charge of 4.50%.
Annual
Operating Expense Ratio
|
|
|
| |
|
|
| Before Waivers |
|
1.18% |
| After Waivers |
|
0.87% |
The Expense Ratio Before Waivers represents the operating costs borne by the Fund, expressed as a percentage of the Fund’s
average net assets, as shown in the Fees and Expenses table in the Fund’s current prospectus (under “Total Annual Fund Operating Expenses”).
| 1 |
Represents a hypothetical investment of $10,000 in Class A of the Fund after deducting the maximum sales charge of 4.50% ($10,000 investment minus $450 sales charge =
$9,550). The Fund’s performance assumes the reinvestment of all dividends and distributions. |
| 2 |
The performance for the S&P Intermediate Municipal Index assumes the reinvestment of all dividends and distributions but does not reflect the deduction of a sales charge
required for the Fund’s performance by the Securities and Exchange Commission. It is not possible to invest directly in an index, and the represented index is unmanaged.
|
ANNUAL REPORT / April
30, 2013
20
WILMINGTON MUNICIPAL BOND
FUND – CLASS I
The graph below illustrates the hypothetical
investment of $1,000,0001 in the Wilmington Municipal Bond Fund (Class I) (the “Fund”) from April 30, 2003 to April 30, 2013, compared to the S&P
Intermediate Municipal Index.2
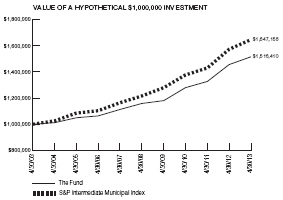
Average Annual Total Returns for the Year Ended April 30, 2013
|
|
|
| |
|
|
| 1 Year |
|
4.06% |
| 5 Years |
|
5.54% |
| 10 Years |
|
4.25% |
Performance data quoted represents past performance which is no guarantee of future results. Returns shown do not reflect the
deduction of taxes that a shareholder would pay on Fund distributions or the redemption of Fund shares. Investment return and principal value will fluctuate so that an investor’s shares, when redeemed, may be worth more or less than their
original cost. Mutual funds are not obligations of or guaranteed by any bank and are not federally insured. Mutual fund performance changes over time and current performance may be lower or higher than what is stated. For current to the most recent
month end performance, visit www.wilmingtonfunds.com or call 1-800-836-2211.
Annual Operating Expense Ratio
|
|
|
| |
|
|
| Before Waivers |
|
0.93% |
| After Waivers |
|
0.62% |
The Expense Ratio Before Waivers represents the operating costs borne by the Fund, expressed as a percentage of the Fund’s
average net assets, as shown in the Fees and Expenses table in the Fund’s current prospectus (under “Total Annual Fund Operating Expenses”).
| 1 |
Represents a hypothetical investment of $1,000,000 in Class I of the Fund and assumes the reinvestment of all dividends and distributions. |
| 2 |
The performance for the Fund and the S&P 500 Intermediate Municipal Index assumes the reinvestment of all dividends and distributions. It is not possible to invest directly
in an index, and the represented index is unmanaged. |
April 30, 2013 / ANNUAL REPORT
21
WILMINGTON MARYLAND MUNICIPAL BOND FUND
Management’s Discussion of Fund Performance
For the fiscal year ended April 30, 2013, Wilmington Maryland Municipal Bond Fund (the
“Fund”) had a total return of 2.92%* for Class A Shares and 3.31%* for Class I Shares, versus its primary benchmark, the S&P Municipal Bond Intermediate Index**, and its secondary benchmark, the Barclays Capital 10-Year Municipal
Bond Index**, which had total returns of 4.71% and 5.21%, respectively. The Fund’s peer group, the Lipper Other States Intermediate Municipal Debt Funds Average***, had a total return of 3.37%.
The business of forecasting the timing, size, and direction of interest rate changes is an uncertain one. For this reason, we manage our
clients’ municipal fixed income portfolios without expressing a view about the future path of interest rates. We do, however, recognize that many investors do not view the markets through our practical and dispassionate lens. Sentiment can
drive relative valuations and create opportunity for nimble investors, and attitudes seemed to turn decidedly negative toward interest rates during the quarter. Many investors have been poised for higher rates over the last three years. Those who
shortened their portfolios’ duration—simply, their sensitivity to interest rates, which move in the opposite direction of bond prices—in anticipation of higher rates likely experienced lost opportunities as interest rates fell over
that same period.
What has changed to drive up that negative sentiment? First, investors have become increasingly enamored by
equities once again. Time heals all wounds, and we are now five years from the 2008 financial meltdown. Many investors have been willing to increase their exposures to riskier assets, such as equities, at a time when domestic stock markets are at
record highs, finally breaking through pre-crisis levels. Second, several core economic indicators appear to be trending higher. As recently as the last week of March, many economic prognosticators were lifting their gross domestic product estimates
for the first quarter. According to a monthly Bloomberg survey, economists now believe the economy grew at a 2.0% annualized rate during the quarter, up from a 1.5% projected rate in January. Certainly the employment estimates for March caught some
economists off guard and, naturally, survey trends can reverse as new and revised data is released.
Nevertheless, investors
are diversifying out of fixed income into equities, or shifting their bond portfolios to reduce their interest rate exposure. Evidence of these moves can be gleaned from the weekly flows into and out of tax-exempt bond mutual funds, as measured by
Lipper: Investors were net sellers of tax-exempt bond funds, including long-term funds, during the six weeks ended May 1, but they were net buyers of intermediate-term funds.
The S&P Municipal Intermediate Index posted a 1.63% total return during the first four months of 2013, with mixed monthly results.
Positive results in January and February (which themselves were a recovery from a weak December) were followed by a rise in rates and negative total returns in March. April reversed the March move and then some, as the Intermediate index was up
nearly 1% for that month alone.
Total new municipal bond issuance reached about $117 billion year-to-date through the end of
April versus $114 billion for the same period in 2012, about a 2.5% increase. The year started strong out of the gate, with January’s deals totaling almost $27 billion. That was a 53% increase over January
2012. February was slightly ahead of last year’s pace, with about $24 billion in supply, and March lagged on a year-over-year basis at $30.4 billion. April’s issuance of $34
billion was on par with April 2012 issuance. Thus far, California tops the leader board with almost $19.4 billion in deals, while Texas, New York, and New Jersey follow with $10.7, $9.9, and $7.1 billion, respectively.
Source: Bond Buyer, May 1, 2013
The Fund underperformed both its benchmark and its Lipper peer group. While the Fund and peer group performance are net of management fees, the benchmark returns reflect gross returns without any fee
impact. The largest driver of the return difference between the benchmark index and the Fund was the underperformance of Maryland (MD) bonds versus the national market during the 12 months ending April 30. While the national intermediate index
generated a 4.71% return, the MD component of that index returned nearly 100 basis points less at 3.73%. Beyond that large difference, there were other factors impacting the Fund’s relative performance, both positive and negative. Higher grade
bonds underperformed lower grade bonds during the year and the Fund’s overweights in AA and AAA rated bonds were a further drag on performance. A positive influence on relative performance was the Fund’s significant overweight in
healthcare bonds. That sector was among the strongest performers in the benchmark index and the Fund’s nearly 11% overweight was beneficial.
| * |
Performance data quoted represents past performance, which is no guarantee of future results. Investment return and principal value will
fluctuate so that an investor’s shares, when redeemed, may be worth more or less than their original cost. The total return shown assumes the reinvestment of all distributions and does not reflect the deduction of taxes that a shareholder would
pay on fund distributions or the redemption of shares. The total return for Class A Shares was -1.72%, adjusted for the Fund’s maximum sales charge. Mutual fund performance changes over time and current performance may be lower or higher
than what is stated. For the most recent month-end performance, please visit www.wilmingtonfunds.com or call 1-800-836-2211. |
|
| ** |
Standard & Poor’s (S&P) Municipal Bond Intermediate Index consists of bonds in the S&P Municipal Bond Index with a minimum
maturity of three years and a maximum maturity of up to, but not including, 15 years as measured from the Rebalancing Date. The S&P Municipal Bond Index is a broad, market value-weighted index that seeks to measure the performance of the U.S.
municipal bond market. All bonds in the index are exempt from U.S. federal income taxes or subject to the alternative minimum tax (AMT). The Barclays Capital 3-, 5-, 10-Year, and Long Municipal Bond Indices are widely recognized indices of
investment grade tax-exempt bonds with maturities representative of the appropriately named Index. The indices include general obligation bonds, revenue bonds, insured bonds and pre-refunded bonds. Indices are unmanaged and it is not possible to
invest directly in an index. |
ANNUAL REPORT / April
30, 2013
22
| *** |
Lipper figures represent the average of the total returns reported by all of the mutual funds designated by Lipper, Inc. as falling into the
respective category indicated. These figures do not reflect sales charges. |
Duration is a
measure of a security’s price sensitivity to changes in interest rates. Securities with longer durations are more sensitive to changes in interest rates than securities of shorter durations.
Credit ratings pertain only to the securities in the portfolio and do not protect fund shares against market risk.
Maryland Investment Risks. The Fund will be more susceptible to any economic, business, political or other developments which
generally affect securities issued by Maryland issuers. The economy of Maryland is relatively diversified across the service, trade and government sectors, but could be adversely impacted by changes to any of these sectors.
Income may be subject to the federal alternative minimum tax.
April 30, 2013 / ANNUAL REPORT
23
WILMINGTON MARYLAND MUNICIPAL BOND FUND – CLASS A†
The graph below illustrates the hypothetical investment of $10,0001 in the Wilmington Maryland Municipal Bond Fund (Class A) (the
“Fund”) from April 30, 2003 to April 30, 2013, compared to the Barclays Capital 10-Year Municipal Bond Index (“BC10MB”)2, the Barclays Capital
7-Year Municipal Bond Index (“BC7MB”)2 and the S&P Intermediate Municipal Index.2
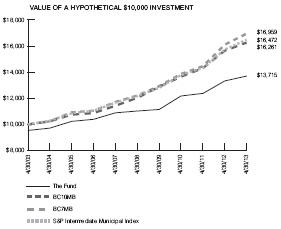
Average Annual Total Returns for the Year Ended April 30, 2013
|
|
|
| |
|
|
| 1 Year |
|
-1.72% |
| 5 Years |
|
3.50% |
| 10 Years |
|
3.21% |
Performance data quoted represents past performance which is no guarantee of future results. Returns shown do not reflect the
deduction of taxes that a shareholder would pay on Fund distributions or the redemption of Fund shares. Investment return and principal value will fluctuate so that an investor’s shares, when redeemed, may be worth more or less than their
original cost. Mutual funds are not obligations of or guaranteed by any bank and are not federally insured. Mutual fund performance changes over time and current performance may be lower or higher than what is stated. For current to the most recent
month end performance, visit www.wilmingtonfunds.com or call 1-800-836-2211. Total returns shown include the maximum sales charge of 4.50% for Class A.
Annual Operating Expense Ratio
|
|
|
| |
|
|
| Before Waivers |
|
1.19% |
| After Waivers |
|
0.95% |
The Expense Ratio Before Waivers represents the operating costs borne by the Fund, expressed as a percentage of the Fund’s
average net assets, as shown in the Fees and Expenses table in the Fund’s current prospectus (under “Total Annual Fund Operating Expenses”).
| 1 |
Represents a hypothetical investment of $10,000 in Class A of the Fund after deducting the maximum sales charge of 4.50% ($10,000 investment minus $450 sales charge =
$9,550). The Fund’s performance assumes the reinvestment of all dividends and distributions. |
| 2 |
The performance for the BC10MB, the BC7MB and the S&P Intermediate Municipal Index assumes the reinvestment of all dividends and distributions but does not reflect the
deduction of a sales charge required for the Fund’s performance by the Securities and Exchange Commission. It is not possible to invest directly in an index,and the represented index is unmanaged. |
| † |
The Wilmington Maryland Municipal Bond Fund is the successor to the ARK Maryland Tax-Free Portfolio pursuant to a reorganization which took place on August 22, 2003. The
information presented above, for the period prior to August 22, 2003, is historical information for the ARK Maryland Tax-Free Portfolio.
|
ANNUAL REPORT / April
30, 2013
24
WILMINGTON MARYLAND MUNICIPAL BOND FUND – CLASS I†
The graph below illustrates the hypothetical investment of $1,000,0001 in the Wilmington Maryland Municipal Bond Fund (Class I)
(the “Fund”) from April 30, 2003 to April 30, 2013, compared to the BC10MB2, the
BC7MB2 and the S&P Intermediate Municipal Index.2

Average Annual Total Returns for the Year Ended April 30, 2013
|
|
|
| |
|
|
| 1 Year |
|
3.31% |
| 5 Years |
|
4.67% |
| 10 Years |
|
3.87% |
Performance data quoted represents past performance which is no guarantee of future results. Returns shown do not reflect the
deduction of taxes that a shareholder would pay on Fund distributions or the redemption of Fund shares. Investment return and principal value will fluctuate so that an investor’s shares, when redeemed, may be worth more or less than their
original cost. Mutual funds are not obligations of or guaranteed by any bank and are not federally insured. Mutual fund performance changes over time and current performance may be lower or higher than what is stated. For current to the most recent
month end performance, visit www.wilmingtonfunds.com or call 1-800-836-2211.
Annual Operating Expense Ratio
|
|
|
| |
|
|
| Before Waivers |
|
0.94% |
| After Waivers |
|
0.67% |
The Expense Ratio Before Waivers represents the operating costs borne by the Fund, expressed as a percentage of the Fund’s
average net assets, as shown in the Fees and Expenses table in the Fund’s current prospectus (under “Total Annual Fund Operating Expenses”).
| 1 |
Represents a hypothetical investment of $1,000,000 in Class I of the Fund and assumes the reinvestment of all dividends and distributions. |
| 2 |
The performance for the Fund, the BC10MB, the BC7MB and the S&P Intermediate Municipal Index assumes the reinvestment of all dividends and distributions. It is not possible
to invest directly in an index,and the represented index is unmanaged. |
| † |
The Wilmington Maryland Municipal Bond Fund is the successor to the ARK Maryland Tax-Free Portfolio pursuant to a reorganization which took place on August 22, 2003. The
information presented above, for the period prior to August 22, 2003, is historical information for the ARK Maryland Tax-Free Portfolio.
|
April 30, 2013 / ANNUAL REPORT
25
WILMINGTON NEW YORK MUNICIPAL BOND FUND
Management’s Discussion of Fund Performance
For the fiscal year ended April 30, 2013, Wilmington New York Municipal Bond Fund (the
“Fund”) had a total return of 3.48%* for Class A Shares and 3.74%* for Class I Shares, versus its primary benchmark, the S&P Municipal Bond Intermediate Index**, and its secondary benchmark, the Barclays Capital New York
Tax-Exempt Index***, which had total returns of 4.71% and 4.85%, respectively. Its peer group, the Lipper New York Intermediate Municipal Debt Funds Average****, had a total return of 3.40%.
The business of forecasting the timing, size, and direction of interest rate changes is an uncertain one. For this reason, we manage our
clients’ municipal fixed income portfolios without expressing a view about the future path of interest rates. We do, however, recognize that many investors do not view the markets through our practical and dispassionate lens. Sentiment can
drive relative valuations and create opportunity for nimble investors, and attitudes seemed to turn decidedly negative toward interest rates during the quarter. Many investors have been poised for higher rates over the last three years. Those who
shortened their portfolios’ duration—simply, their sensitivity to interest rates, which move in the opposite direction of bond prices—in anticipation of higher rates likely experienced lost opportunities as interest rates fell over
that same period.
What has changed to drive up that negative sentiment? First, investors have become increasingly enamored by
equities once again. Time heals all wounds, and we are now five years from the 2008 financial meltdown. Many investors have been willing to increase their exposures to riskier assets, such as equities, at a time when domestic stock markets are at
record highs, finally breaking through pre-crisis levels. Second, several core economic indicators appear to be trending higher. As recently as the last week of March, many economic prognosticators were lifting their gross domestic product estimates
for the first quarter. According to a monthly Bloomberg survey, economists now believe the economy grew at a 2.0% annualized rate during the quarter, up from a 1.5% projected rate in January. Certainly the employment estimates for March caught some
economists off guard and, naturally, survey trends can reverse as new and revised data is released.
Nevertheless, investors
are diversifying out of fixed income into equities, or shifting their bond portfolios to reduce their interest rate exposure. Evidence of these moves can be gleaned from the weekly flows into and out of tax-exempt bond mutual funds, as measured by
Lipper: Investors were net sellers of tax-exempt bond funds, including long-term funds, during the six weeks ended May 1, but they were net buyers of intermediate-term funds.
The S&P Municipal Intermediate Index posted a 1.63% total return during the first four months of 2013, with mixed monthly results.
Positive results in January and February (which themselves were a recovery from a weak December) were followed by a rise in rates and negative total returns in March. April reversed the March move and then some, as the Intermediate index was up
nearly 1% for that month alone.
Total new municipal bond issuance reached about $117 billion year-to-date through the end of
April versus $114 billion for the same period in 2012, about a 2.5% increase. The year started strong out
of the gate, with January’s deals totaling almost $27 billion. That was a 53% increase over January 2012. February was slightly ahead of last year’s pace, with about $24 billion in
supply, and March lagged on a year-over-year basis at $30.4 billion. April’s issuance of $34 billion was on par with April 2012 issuance. Thus far, California tops the leader board with almost $19.4 billion in deals, while Texas, New York, and
New Jersey follow with $10.7, $9.9, and $7.1 billion, respectively.
Source: Bond Buyer, May 1, 2013
The Fund underperformed its benchmark, but outperformed its Lipper peer group. While the Fund and peer group performance are net of
management fees, the benchmark returns reflect gross returns without any fee impact. The largest driver of the return difference between the primary benchmark index and the Fund was the underperformance of New York (NY) bonds versus the national
market during the 12 months ending April 30. While the national intermediate index generated a 4.71% return, the NY component of that index returned over 50 basis points less at 4.16%. Beyond that large difference, there were other factors
impacting the Fund’s relative performance, both positive and negative. Higher grade bonds underperformed lower grade bonds during the year and the Fund’s overweights in AA and AAA rated bonds were a further drag on performance. A positive
influence on relative performance was the Fund’s significant overweight in appropriated bonds. That sector was among the strongest performers in the benchmark index and the Fund’s nearly 22% overweight was beneficial.
| * |
Performance data quoted represents past performance, which is no guarantee of future results. Investment return and principal value will
fluctuate so that an investor’s shares, when redeemed, may be worth more or less than their original cost. The total return shown assumes the reinvestment of all distributions and does not reflect the deduction of taxes that a shareholder would
pay on fund distributions or the redemption of shares. The total return for Class A Shares was -1.19%, adjusted for the Fund’s maximum sales charge. Mutual fund performance changes over time and current performance may be lower or higher
than what is stated. For the most recent month-end performance, please visit www.wilmingtonfunds.com or call 1-800-836-2211. |
| ** |
Standard & Poor’s (S&P) Municipal Bond Intermediate Index consists of bonds in the S&P Municipal Bond Index with a minimum
maturity of three years and a maximum maturity of up to, but not including, 15 years as measured from the Rebalancing Date. The S&P Municipal Bond Index is a broad, market value-weighted index that seeks to measure the performance of the U.S.
municipal bond market. All bonds in the index are exempt from U.S. federal income taxes or subject to the alternative minimum tax (AMT). The index include general obligation bonds, revenue bonds, insured bonds and pre-refunded bonds. Indices are
unmanaged and it is not possible to invest directly in an index. |
ANNUAL REPORT / April
30, 2013
26
| *** |
The Barclays Capital NewYork Tax-Exempt Index is a total return performance benchmark for the New York long-term investment grade tax-exempt bond
market. Returns and attributes for this index are calculated semi-monthly using approximately 22,000 municipal bonds classified as general obligation bonds (state and local), revenue bonds (excluding insured revenue bonds), insured bonds (includes
all bond insurers with Aaa/AAA ratings), and pre-refunded bonds. The Barclays Capital 3-, 5-, 10-Year, and Long Municipal Bond Indices are widely recognized indices of investment grade tax-exempt bonds with maturities representative of the
appropriately named index. The indices include general obligation bonds, revenue bonds, insured bonds and pre-refunded bonds. The index is unmanaged and it is not possible to invest directly in an index. |
| **** |
Lipper figures represent the average of the total returns reported by all of the mutual funds designated by Lipper, Inc. as falling into the
respective category indicated. These figures do not reflect sales charges. |
Duration is a
measure of a security’s price sensitivity to changes in interest rates. Securities with longer durations are more sensitive to changes in interest rates than securities of shorter durations.
Credit ratings pertain only to the securities in the portfolio and do not protect fund shares against market risk.
New York Investment Risks. The Fund will be more susceptible to any economic, business, political or other developments which
generally affect securities issued by New York issuers. The economy of New York state is large and diverse, from agriculture, manufacturing, and high technology in upstate counties to advertising, finance and banking in New York City. Any major
changes to the financial conditions on New York City, however, would ultimately have an effect on the state.
Income may be subject to the federal alternative minimum tax.
April 30, 2013 / ANNUAL REPORT
27
WILMINGTON NEW YORK MUNICIPAL BOND FUND – CLASS A
The graph below illustrates the hypothetical investment of $10,0001 in the Wilmington New York Municipal Bond Fund (Class A) (the “Fund”) from April 30, 2003 to April 30, 2013, compared to the Barclays Capital New York
Tax-Exempt Index (“BCNYTE”)2 and the S&P Intermediate Municipal Index.2
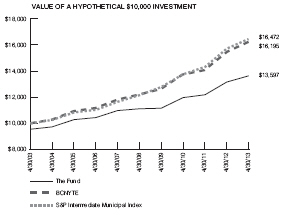
Average Annual Total Returns for the Year Ended April 30, 2013
|
|
|
| |
|
|
| 1 Year |
|
-1.19% |
| 5 Years |
|
3.20% |
| 10 Years |
|
3.12% |
Performance data quoted represents past performance which is no guarantee of future results. Returns shown do not reflect the
deduction of taxes that a shareholder would pay on Fund distributions or the redemption of Fund shares. Investment return and principal value will fluctuate so that an investor’s shares, when redeemed, may be worth more or less than their
original cost. Mutual funds are not obligations of or guaranteed by any bank and are not federally insured. Mutual fund performance changes over time and current performance may be lower or higher than what is stated. For current to the most recent
month end performance, visit www.wilmingtonfunds.com or call 1-800-836-2211. Total returns shown include the maximum sales charge of 4.50%.
Annual
Operating Expense Ratio
|
|
|
| |
|
|
| Before Waivers |
|
1.19% |
| After Waivers |
|
0.84% |
The Expense Ratio Before Waivers represents the operating costs borne by the Fund, expressed as a percentage of the Fund’s
average net assets, as shown in the Fees and Expenses table in the Fund’s current prospectus (under “Total Annual Fund Operating Expenses”).
| 1 |
Represents a hypothetical investment of $10,000 in Class A of the Fund after deducting the maximum sales charge of 4.50% ($10,000 investment minus $450 sales charge =
$9,550). The Fund’s performance assumes the reinvestment of all dividends and distributions. |
| 2 |
The performance for the BCNYTE and the S&P Intermediate Municipal Index assumes the reinvestment of all dividends and distributions but does not reflect the deduction of a
sales charge required for the Fund’s performance by the Securities and Exchange Commission. It is not possible to invest directly in an index, and the represented index is unmanaged.
|
ANNUAL REPORT / April
30, 2013
28
WILMINGTON NEW YORK MUNICIPAL BOND FUND – CLASS I
The graph below illustrates the hypothetical investment of $1,000,0001 in the Wilmington New York Municipal Bond Fund (Class I) (the “Fund”) from August 18, 2003 (start of performance) to April 30, 2013, compared to the BCNYTE2 and the S&P Intermediate Municipal Index.2
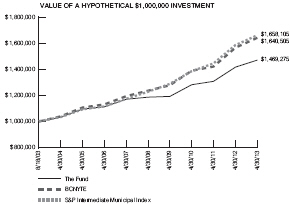
Average Annual Total Returns for the Year Ended April 30, 2013
|
|
|
| |
|
|
| 1 Year |
|
3.74% |
| 5 Years |
|
4.38% |
| Start of Performance (8/18/03) |
|
4.05% |
Performance data quoted represents past performance which is no guarantee of future results. Returns shown do not reflect the
deduction of taxes that a shareholder would pay on Fund distributions or the redemption of Fund shares. Investment return and principal value will fluctuate so that an investor’s shares, when redeemed, may be worth more or less than their
original cost. Mutual funds are not obligations of or guaranteed by any bank and are not federally insured. Mutual fund performance changes over time and current performance may be lower or higher than what is stated. For current to the most recent
month end performance, visit www.wilmingtonfunds.com or call 1-800-836-2211.
Annual Operating Expense Ratio
|
|
|
| |
|
|
| Before Waivers |
|
0.94% |
| After Waivers |
|
0.59% |
The Expense Ratio Before Waivers represents the operating costs borne by the Fund, expressed as a percentage of the Fund’s
average net assets, as shown in the Fees and Expenses table in the Fund’s current prospectus (under “Total Annual Fund Operating Expenses”).
| 1 |
Represents a hypothetical investment of $1,000,000 in Class I of the Fund and assumes the reinvestment of all dividends and distributions. |
| 2 |
The performance for the Fund, the BCNYTE and the S&P Intermediate Municipal Index assumes the reinvestment of all dividends and distributions. It is not possible to invest
directly in an index, and the represented index is unmanaged. |
April 30, 2013 / ANNUAL REPORT
29
SHAREHOLDER EXPENSE EXAMPLE
As a shareholder of the Fund, you incur ongoing costs, including management fees; to the
extent applicable, distribution (12b-1) fees, and/or shareholder services fees; and other Fund expenses. This Example is intended to help you to understand your ongoing costs (in dollars) of investing in the Funds and to compare these costs with the
ongoing costs of investing in other mutual funds. It is based on an investment of $1,000 invested at the beginning of the period and held for the entire period from November 1, 2012 to April 30, 2013.
Actual Expenses
This section of the
following table provides information about actual account values and actual expenses. You may use the information in this section, together with the amount you invested, to estimate the expenses that you incurred over the period. Simply
divide your account value by $1,000 (for example, an $8,600 account value divided by $1,000 = 8.6), then multiply the result by the number in the first section under the heading entitled “Expenses Paid During Period” to estimate the
expenses attributable to your investment during this period.
Hypothetical Example for Comparison Purposes
This section of the following table provides information about hypothetical account values and hypothetical expenses based on the
Funds’ actual expense ratios and assumed rates of return of 5% per year before expenses, which are not the Funds’ actual returns. Thus, you should not use the hypothetical account values and expenses to estimate the
actual ending account balance or your expenses for the period. Rather, these figures are required to be provided to enable you to compare the ongoing costs of investing in the Funds with other funds. To do so, compare this 5% hypothetical example
with the 5% hypothetical examples that appear in the shareholder reports of the other funds.
Please note that the expenses
shown in the table are meant to highlight your ongoing costs only. Therefore, the Annualized Net Expense Ratio section of the table is useful in comparing ongoing costs only, and will not help you determine the relative total costs of owning
different funds.
|
|
|
|
|
|
|
|
|
| |
|
Beginning
Account
Value
11/1/12 |
|
Ending
Account
Value
4/30/13 |
|
Expenses Paid
During Period1 |
|
Annualized Net
Expense Ratio2 |
|
|
|
|
|
| WILMINGTON BROAD MARKET BOND FUND |
|
|
|
|
|
|
|
|
| Actual |
|
|
|
|
|
|
|
|
| Class A |
|
$1,000.00 |
|
$1,007.60 |
|
$4.93 |
|
0.99% |
| Class I |
|
$1,000.00 |
|
$1,010.20 |
|
$3.24 |
|
0.65% |
| Hypothetical (assuming a 5% return before expense) |
|
|
|
|
|
|
|
|
| Class A |
|
$1,000.00 |
|
$1,019.89 |
|
$4.96 |
|
0.99% |
| Class I |
|
$1,000.00 |
|
$1,021.57 |
|
$3.26 |
|
0.65% |
|
|
|
|
|
| WILMINGTON INTERMEDIATE-TERM BOND FUND |
|
|
|
|
|
|
|
|
| Actual |
|
|
|
|
|
|
|
|
| Class A |
|
$1,000.00 |
|
$1,007.30 |
|
$4.63 |
|
0.93% |
| Class I |
|
$1,000.00 |
|
$1,008.00 |
|
$2.99 |
|
0.60% |
| Hypothetical (assuming a 5% return before expense) |
|
|
|
|
|
|
|
|
| Class A |
|
$1,000.00 |
|
$1,020.18 |
|
$4.66 |
|
0.93% |
| Class I |
|
$1,000.00 |
|
$1,021.82 |
|
$3.01 |
|
0.60% |
|
|
|
|
|
| WILMINGTON SHORT-TERM CORPORATE BOND FUND |
|
|
|
|
|
|
|
|
| Actual |
|
|
|
|
|
|
|
|
| Class A |
|
$1,000.00 |
|
$1,005.50 |
|
$4.28 |
|
0.86% |
| Class I |
|
$1,000.00 |
|
$1,005.80 |
|
$3.03 |
|
0.61% |
| Hypothetical (assuming a 5% return before expense) |
|
|
|
|
|
|
|
|
| Class A |
|
$1,000.00 |
|
$1,020.53 |
|
$4.31 |
|
0.86% |
| Class I |
|
$1,000.00 |
|
$1,021.77 |
|
$3.06 |
|
0.61% |
ANNUAL REPORT / April
30, 2013
30
|
|
|
|
|
|
|
|
|
| |
|
Beginning
Account
Value
11/1/12 |
|
Ending
Account
Value
4/30/13 |
|
Expenses Paid During
Period1 |
|
Annualized Net
Expense Ratio2 |
|
|
|
|
|
| WILMINGTON SHORT DURATION GOVERNMENT BOND FUND |
|
|
|
|
|
|
|
|
| Actual |
|
|
|
|
|
|
|
|
| Class A |
|
$1,000.00 |
|
$1,002.10 |
|
$4.42 |
|
0.89% |
| Class I |
|
$1,000.00 |
|
$1,003.40 |
|
$3.18 |
|
0.64% |
| Hypothetical (assuming a 5% return before expense) |
|
|
|
|
|
|
|
|
| Class A |
|
$1,000.00 |
|
$1,020.38 |
|
$4.46 |
|
0.89% |
| Class I |
|
$1,000.00 |
|
$1,021.62 |
|
$3.21 |
|
0.64% |
|
|
|
|
|
| WILMINGTON MUNICIPAL BOND FUND |
|
|
|
|
|
|
|
|
| Actual |
|
|
|
|
|
|
|
|
| Class A |
|
$1,000.00 |
|
$1,011.80 |
|
$4.29 |
|
0.86% |
| Class I |
|
$1,000.00 |
|
$1,013.80 |
|
$3.05 |
|
0.61% |
| Hypothetical (assuming a 5% return before expense) |
|
|
|
|
|
|
|
|
| Class A |
|
$1,000.00 |
|
$1,020.53 |
|
$4.31 |
|
0.86% |
| Class I |
|
$1,000.00 |
|
$1,021.77 |
|
$3.06 |
|
0.61% |
|
|
|
|
|
| WILMINGTON MARYLAND MUNICIPAL BOND FUND |
|
|
|
|
|
|
|
|
| Actual |
|
|
|
|
|
|
|
|
| Class A |
|
$1,000.00 |
|
$1,007.60 |
|
$4.73 |
|
0.95% |
| Class I |
|
$1,000.00 |
|
$1,009.00 |
|
$3.34 |
|
0.67% |
| Hypothetical (assuming a 5% return before expense) |
|
|
|
|
|
|
|
|
| Class A |
|
$1,000.00 |
|
$1,020.08 |
|
$4.76 |
|
0.95% |
| Class I |
|
$1,000.00 |
|
$1,021.47 |
|
$3.36 |
|
0.67% |
|
|
|
|
|
| WILMINGTON NEW YORK MUNICIPAL BOND FUND |
|
|
|
|
|
|
|
|
| Actual |
|
|
|
|
|
|
|
|
| Class A |
|
$1,000.00 |
|
$1,010.70 |
|
$4.19 |
|
0.84% |
| Class I |
|
$1,000.00 |
|
$1,012.90 |
|
$2.94 |
|
0.59% |
| Hypothetical (assuming a 5% return before expense) |
|
|
|
|
|
|
|
|
| Class A |
|
$1,000.00 |
|
$1,020.63 |
|
$4.21 |
|
0.84% |
| Class I |
|
$1,000.00 |
|
$1,021.87 |
|
$2.96 |
|
0.59% |
| (1) |
Expenses are equal to the Funds’ annualized net expense ratios, multiplied by the average account value over the period, multiplied by 181/365 (to
reflect the most recent one-half year period. |
| (2) |
Expense ratio does not reflect the indirect expenses of the underlying funds in which it invests. |
April 30, 2013 / ANNUAL REPORT
31
PORTFOLIO OF INVESTMENTS SUMMARY TABLE
Wilmington Broad Market Bond Fund
At April 30, 2013, the Fund’s portfolio composition was as follows (unaudited):
|
|
|
|
|
|
| |
|
Percentage of
Total Net Assets |
| Corporate Bonds |
|
|
|
59.3 |
% |
| Mortgage-Backed Securities |
|
|
|
21.9 |
% |
| U.S. Treasury |
|
|
|
13.3 |
% |
| Collateralized Mortgage Obligations |
|
|
|
4.4 |
% |
| Government Agencies |
|
|
|
4.0 |
% |
| Enhanced Equipment Trust Certificates |
|
|
|
0.7 |
% |
| Asset-Backed Securities |
|
|
|
0.6 |
% |
| Municipal Bond |
|
|
|
0.2 |
% |
| Cash Equivalents1 |
|
|
|
3.4 |
% |
| Other Assets and Liabilities – Net2 |
|
|
|
(7.8 |
)% |
|
|
|
|
|
|
| TOTAL |
|
|
|
100.0 |
% |
|
|
|
|
|
|
| (1) |
Cash Equivalents include investments in repurchase agreements. |
| (2) |
Assets, other than investments in securities, less liabilities. See Statements of Assets and Liabilities. |
| (3) |
Derived from data provided by Moody’s Investors Service and Standard and Poor’s.
|
|
|
|
|
|
|
| Credit Quality Diversification3 |
|
Percentage of
Total Net Assets |
| AAA |
|
|
|
5.5 |
% |
| AA |
|
|
|
2.9 |
% |
| A |
|
|
|
15.5 |
% |
| BBB |
|
|
|
40.5 |
% |
| BB |
|
|
|
2.5 |
% |
| B |
|
|
|
0.2 |
% |
| CCC |
|
|
|
0.3 |
% |
| NR |
|
|
|
3.4 |
% |
| U.S. Government Agency Securities |
|
|
|
23.7 |
% |
| U.S. Treasuries |
|
|
|
13.3 |
% |
| Other Assets and Liabilities – Net2 |
|
|
|
(7.8 |
)% |
|
|
|
|
|
|
| TOTAL |
|
|
|
100.0 |
% |
|
|
|
|
|
|
PORTFOLIO OF
INVESTMENTS
April 30, 2013
|
|
|
|
|
|
|
|
|
|
Description |
|
Par Value |
|
|
Value |
|
|
|
|
| ASSET-BACKED SECURITIES – 0.6% |
|
|
|
|
|
|
|
|
|
|
|
| FINANCIAL SERVICES – 0.4% |
|
|
|
|
|
|
|
|
|
|
|
| LA Arena Funding LLC, |
|
|
|
|
|
|
|
|
| Series 1999-1, Class A, 7.66%, 12/15/26•,W |
|
$ |
1,147,175 |
|
|
$ |
1,323,085 |
|
|
|
|
| WHOLE LOAN – 0.2% |
|
|
|
|
|
|
|
|
|
|
|
| SLM Private Education Loan Trust, |
|
|
|
|
|
|
|
|
| Series 2011-A, Class A1, |
|
|
|
|
|
|
|
|
| 1.20%, 10/15/24D,S,•,W |
|
|
486,528 |
|
|
|
490,273 |
|
|
|
|
|
|
|
|
|
|
|
|
|
| TOTAL ASSET-BACKED SECURITIES |
|
|
|
|
|
|
|
|
| (COST $1,633,703) |
|
|
|
|
|
$ |
1,813,358 |
|
|
| COLLATERALIZED MORTGAGE OBLIGATIONS – 4.4% |
|
|
| COMMERCIAL MORTGAGE-BACKED SECURITIES
(CMBS) – 1.2% |
|
|
|
|
| Banc of America Commercial Mortgage Trust, |
|
|
|
|
|
|
|
|
| Series 2007-2, Class A2, 5.63%, 4/10/49D,S |
|
|
251,287 |
|
|
|
258,139 |
|
|
|
|
| Extended Stay America Trust, |
|
|
|
|
|
|
|
|
| Series 2013-ESH5, Class A15, |
|
|
|
|
|
|
|
|
| 1.28%, 12/05/31•,W |
|
|
800,000 |
|
|
|
809,625 |
|
|
|
|
| JP Morgan Chase Commercial Mortgage Securities Trust, |
|
|
|
|
|
|
|
|
| Series 2007-CIBC18, Class A4, |
|
|
|
|
|
|
|
|
| 5.44%, 6/12/47 |
|
|
588,000 |
|
|
|
683,495 |
|
|
|
|
|
|
|
|
|
|
|
Description |
|
Par Value |
|
|
Value |
|
|
|
|
| Merrill Lynch Mortgage Trust, |
|
|
|
|
|
|
|
|
| Series 2006-C1, Class A2, |
|
|
|
|
|
|
|
|
| 5.83%, 5/12/39D,S |
|
$ |
420,226 |
|
|
$ |
432,524 |
|
|
|
|
| Morgan Stanley Capital I Trust, |
|
|
|
|
|
|
|
|
| Series 2004-IQ7, Class A4, |
|
|
|
|
|
|
|
|
| 5.54%, 6/15/38D,S |
|
|
886,948 |
|
|
|
915,365 |
|
|
|
|
| Morgan Stanley Capital I Trust, |
|
|
|
|
|
|
|
|
| Series 2005-T19, Class AAB, |
|
|
|
|
|
|
|
|
| 4.85%, 6/12/47 |
|
|
210,468 |
|
|
|
213,510 |
|
|
|
|
|
|
|
|
|
|
|
|
| TOTAL COMMERCIAL MORTGAGE-BACKED SECURITIES (CMBS) |
|
|
$ |
3,312,658 |
|
|
| FEDERAL NATIONAL MORTGAGE ASSOCIATION
(FNMA) – 1.9% |
|
|
|
|
| Series 1988-23, Class C, 9.75%, 9/25/18 |
|
|
5,937 |
|
|
|
6,785 |
|
|
|
|
| Series 2005-29, Class WC, 4.75%, 4/25/35 |
|
|
83,237 |
|
|
|
91,435 |
|
|
|
|
| Series 2012-114, Class VM, |
|
|
|
|
|
|
|
|
| 3.50%, 10/25/25 |
|
|
4,627,132 |
|
|
|
5,141,831 |
|
|
|
|
|
|
|
|
|
|
|
|
| TOTAL FEDERAL NATIONAL MORTGAGE ASSOCIATION (FNMA) |
|
|
$ |
5,240,051 |
|
|
|
|
| WHOLE LOAN – 1.3% |
|
|
|
|
|
|
|
|
|
|
|
| Banc of America Mortgage Trust, |
|
|
|
|
|
|
|
|
| Series 2004-A, Class 2A1, |
|
|
|
|
|
|
|
|
| 2.92%, 2/25/34D,S |
|
|
324,163 |
|
|
|
323,140 |
|
ANNUAL REPORT / April
30, 2013
|
|
|
| 32 |
|
PORTFOLIOS OF INVESTMENTS |
Wilmington Broad Market Bond Fund (continued)
|
|
|
|
|
|
|
|
|
|
Description |
|
Par Value |
|
|
Value |
|
|
|
|
| Countrywide Home Loan Mortgage |
|
|
|
|
|
|
|
|
| Pass-Through Trust, |
|
|
|
|
|
|
|
|
| Series 2004-8, Class 2A1, 4.50%, 6/25/19 |
|
$ |
1,167,415 |
|
|
$ |
1,174,993 |
|
|
|
|
| IndyMac INDA Mortgage Loan Trust, |
|
|
|
|
|
|
|
|
| Series 2005-AR1, Class 2A1, |
|
|
|
|
|
|
|
|
| 2.90%, 11/25/35D |
|
|
976,985 |
|
|
|
864,083 |
|
|
|
|
| WaMu Mortgage Pass-Through Certificates, |
|
|
|
|
|
|
|
|
| Series 2004-CB1, Class 1A, 5.25%, 6/25/19 |
|
|
1,365,172 |
|
|
|
1,447,624 |
|
|
|
|
|
|
|
|
|
|
|
|
|
| TOTAL WHOLE LOAN |
|
|
|
|
|
$ |
3,809,840 |
|
|
|
|
|
|
|
|
|
|
|
|
|
| TOTAL COLLATERALIZED MORTGAGE OBLIGATIONS |
|
|
|
|
|
|
|
|
| (COST $12,346,120) |
|
|
|
|
|
$ |
12,362,549 |
|
|
|
|
| CORPORATE BONDS – 59.3% |
|
|
|
|
|
|
|
|
|
|
|
| AEROSPACE & DEFENSE – 1.1% |
|
|
|
|
|
|
|
|
|
|
|
| L-3 Communications Corp., |
|
|
|
|
|
|
|
|
| Company Guaranteed, 3.95%, 11/15/16 |
|
|
1,735,000 |
|
|
|
1,872,440 |
|
|
|
|
| L-3 Communications Corp., |
|
|
|
|
|
|
|
|
| Company Guaranteed, 4.75%, 7/15/20 |
|
|
1,000,000 |
|
|
|
1,117,439 |
|
|
|
|
|
|
|
|
|
|
|
|
|
| TOTAL AEROSPACE & DEFENSE |
|
|
|
|
|
$ |
2,989,879 |
|
|
|
|
| AUTO PARTS & EQUIPMENT – 0.1% |
|
|
|
|
|
|
|
|
|
|
|
| Johnson Controls, Inc., |
|
|
|
|
|
|
|
|
| Sr. Unsecured, 1.75%, 3/01/14 |
|
|
250,000 |
|
|
|
252,765 |
|
|
|
|
| AUTOMOTIVE – 2.5% |
|
|
|
|
|
|
|
|
|
|
|
| Daimler Finance North America LLC, |
|
|
|
|
|
|
|
|
| Company Guaranteed, 3.88%, 9/15/21•,W |
|
|
250,000 |
|
|
|
275,338 |
|
|
|
|
| Ford Motor Credit Co., LLC, |
|
|
|
|
|
|
|
|
| Sr. Unsecured, 3.88%, 1/15/15 |
|
|
800,000 |
|
|
|
833,699 |
|
|
|
|
| Ford Motor Credit Co., LLC, |
|
|
|
|
|
|
|
|
| Sr. Unsecured, 7.00%, 4/15/15 |
|
|
250,000 |
|
|
|
275,870 |
|
|
|
|
| Ford Motor Credit Co., LLC, |
|
|
|
|
|
|
|
|
| Sr. Unsecured, 3.00%, 6/12/17 |
|
|
1,200,000 |
|
|
|
1,246,396 |
|
|
|
|
| Ford Motor Credit Co., LLC, |
|
|
|
|
|
|
|
|
| Sr. Unsecured, 6.63%, 8/15/17 |
|
|
250,000 |
|
|
|
294,029 |
|
|
|
|
| Ford Motor Credit Co., LLC, |
|
|
|
|
|
|
|
|
| Sr. Unsecured, 5.75%, 2/01/21 |
|
|
500,000 |
|
|
|
579,812 |
|
|
|
|
| Ford Motor Credit Co., LLC, |
|
|
|
|
|
|
|
|
| Sr. Unsecured, 5.88%, 8/02/21 |
|
|
1,000,000 |
|
|
|
1,167,367 |
|
|
|
|
| Ford Motor Credit Co., LLC, |
|
|
|
|
|
|
|
|
| Sr. Unsecured, 4.25%, 9/20/22 |
|
|
450,000 |
|
|
|
476,834 |
|
|
|
|
| General Motors Financial Co., Inc., |
|
|
|
|
|
|
|
|
| Company Guaranteed, 4.75%, 8/15/17•,W |
|
|
300,000 |
|
|
|
318,750 |
|
|
|
|
| Harley-Davidson Funding Corp., |
|
|
|
|
|
|
|
|
| Company Guaranteed, 5.75%, 12/15/14•,W |
|
|
500,000 |
|
|
|
538,331 |
|
|
|
|
| Hyundai Capital America, |
|
|
|
|
|
|
|
|
| Company Guaranteed, 4.00%, 6/08/17•,W |
|
|
250,000 |
|
|
|
270,503 |
|
|
|
|
| Hyundai Capital America, |
|
|
|
|
|
|
|
|
| Sr. Unsecured, 1.63%, 10/02/15•,W |
|
|
250,000 |
|
|
|
251,336 |
|
|
|
|
| Hyundai Capital Services, Inc., |
|
|
|
|
|
|
|
|
| Sr. Unsecured, 3.50%, 9/13/17•,W |
|
|
250,000 |
|
|
|
266,867 |
|
|
|
|
| Toyota Motor Credit Corp., |
|
|
|
|
|
|
|
|
| Sr. Unsecured, MTN, 2.05%, 1/12/17 |
|
|
300,000 |
|
|
|
311,394 |
|
|
|
|
|
|
|
|
|
|
|
|
|
| TOTAL AUTOMOTIVE |
|
|
|
|
|
$ |
7,106,526 |
|
|
|
|
|
|
|
|
|
|
|
Description |
|
Par Value |
|
|
Value |
|
|
|
|
| BEVERAGES – 0.7% |
|
|
|
|
|
|
|
|
|
|
|
| Anheuser-Busch InBev Worldwide, Inc., |
|
|
|
|
|
|
|
|
| Company Guaranteed, 8.20%, 1/15/39 |
|
$ |
500,000 |
|
|
$ |
833,062 |
|
|
|
|
| Coca-Cola Enterprises, Inc., |
|
|
|
|
|
|
|
|
| Sr. Unsecured, 3.25%, 8/19/21 |
|
|
150,000 |
|
|
|
158,050 |
|
|
|
|
| Diageo Capital PLC, |
|
|
|
|
|
|
|
|
| Company Guaranteed, 3.88%, 4/29/43 |
|
|
390,000 |
|
|
|
388,352 |
|
|
|
|
| Dr Pepper Snapple Group, Inc., |
|
|
|
|
|
|
|
|
| Company Guaranteed, 2.60%, 1/15/19 |
|
|
500,000 |
|
|
|
523,110 |
|
|
|
|
| Dr Pepper Snapple Group, Inc., |
|
|
|
|
|
|
|
|
| Company Guaranteed, 2.00%, 1/15/20 |
|
|
215,000 |
|
|
|
214,480 |
|
|
|
|
|
|
|
|
|
|
|
|
|
| TOTAL BEVERAGES |
|
|
|
|
|
$ |
2,117,054 |
|
|
|
|
| BUILDING MATERIALS – 0.4% |
|
|
|
|
|
|
|
|
|
|
|
| Masco Corp., |
|
|
|
|
|
|
|
|
| Sr. Unsecured, 4.80%, 6/15/15 |
|
|
1,000,000 |
|
|
|
1,048,497 |
|
|
|
|
| CAPITAL MARKETS – 4.4% |
|
|
|
|
|
|
|
|
|
|
|
| Bank of New York Mellon Corp., |
|
|
|
|
|
|
|
|
| Sr. Unsecured, MTN, 2.30%, 7/28/16 |
|
|
1,000,000 |
|
|
|
1,051,155 |
|
|
|
|
| BlackRock, Inc., |
|
|
|
|
|
|
|
|
| Sr. Unsecured, 5.00%, 12/10/19 |
|
|
250,000 |
|
|
|
299,171 |
|
|
|
|
| BlackRock, Inc., |
|
|
|
|
|
|
|
|
| Sr. Unsecured, 3.38%, 6/01/22 |
|
|
850,000 |
|
|
|
912,317 |
|
|
|
|
| BNY Institutional Capital Trust A, |
|
|
|
|
|
|
|
|
| Limited Guarantee, 7.78%, 12/01/26•,W |
|
|
1,500,000 |
|
|
|
1,530,937 |
|
|
|
|
| Charles Schwab Corp., |
|
|
|
|
|
|
|
|
| Sr. Unsecured, 4.45%, 7/22/20 |
|
|
250,000 |
|
|
|
290,006 |
|
|
|
|
| Charles Schwab Corp., |
|
|
|
|
|
|
|
|
| Sr. Unsecured, MTN, 6.38%, 9/01/17 |
|
|
1,000,000 |
|
|
|
1,200,517 |
|
|
|
|
| Goldman Sachs Group, Inc., |
|
|
|
|
|
|
|
|
| Sr. Notes, 3.30%, 5/03/15 |
|
|
1,000,000 |
|
|
|
1,041,093 |
|
|
|
|
| Goldman Sachs Group, Inc., |
|
|
|
|
|
|
|
|
| Sr. Unsecured, FRN, 1.48%, 4/30/18D,S |
|
|
1,850,000 |
|
|
|
1,847,728 |
|
|
|
|
| Merrill Lynch & Co., Inc., |
|
|
|
|
|
|
|
|
| Sr. Unsecured, MTN, 5.45%, 7/15/14 |
|
|
400,000 |
|
|
|
420,980 |
|
|
|
|
| Morgan Stanley, |
|
|
|
|
|
|
|
|
| Sr. Unsecured, 1.88%, 1/24/14D,S |
|
|
450,000 |
|
|
|
453,141 |
|
|
|
|
| Morgan Stanley, |
|
|
|
|
|
|
|
|
| Sr. Unsecured, 4.20%, 11/20/14 |
|
|
1,000,000 |
|
|
|
1,046,807 |
|
|
|
|
| Morgan Stanley, |
|
|
|
|
|
|
|
|
| Sr. Unsecured, 1.54%, 2/25/16D,S |
|
|
1,050,000 |
|
|
|
1,057,334 |
|
|
|
|
| Raymond James Financial, Inc., |
|
|
|
|
|
|
|
|
| Sr. Unsecured, 4.25%, 4/15/16 |
|
|
1,000,000 |
|
|
|
1,067,147 |
|
|
|
|
| State Street Corp., |
|
|
|
|
|
|
|
|
| Sr. Unsecured, 4.30%, 5/30/14 |
|
|
250,000 |
|
|
|
260,713 |
|
|
|
|
|
|
|
|
|
|
|
|
|
| TOTAL CAPITAL MARKETS |
|
|
|
|
|
$ |
12,479,046 |
|
|
|
|
| CHEMICALS – 0.9% |
|
|
|
|
|
|
|
|
|
|
|
| Dow Chemical Co., |
|
|
|
|
|
|
|
|
| Sr. Unsecured, 4.13%, 11/15/21 |
|
|
500,000 |
|
|
|
546,858 |
|
|
|
|
| Dow Chemical Co., |
|
|
|
|
|
|
|
|
| Sr. Unsecured, 3.00%, 11/15/22 |
|
|
1,555,000 |
|
|
|
1,564,193 |
|
|
|
|
| Dow Chemical Co., |
|
|
|
|
|
|
|
|
| Sr. Unsecured, 5.25%, 11/15/41 |
|
|
500,000 |
|
|
|
567,906 |
|
|
|
|
|
|
|
|
|
|
|
|
|
| TOTAL CHEMICALS |
|
|
|
|
|
$ |
2,678,957 |
|
April 30, 2013 / ANNUAL REPORT
|
|
|
|
|
| PORTFOLIOS OF INVESTMENTS |
|
|
33 |
|
Wilmington Broad Market Bond Fund (continued)
|
|
|
|
|
|
|
|
|
|
Description |
|
Par Value |
|
|
Value |
|
|
|
|
| COAL – 0.2% |
|
|
|
|
|
|
|
|
|
|
|
| Consol Energy, Inc., |
|
|
|
|
|
|
|
|
| Company Guaranteed, 8.00%, 4/01/17 |
|
$ |
625,000 |
|
|
$ |
680,469 |
|
|
|
|
| COMMERCIAL BANKS – 5.1% |
|
|
|
|
|
|
|
|
|
|
|
| BB&T Corp., |
|
|
|
|
|
|
|
|
| Sr. Unsecured, MTN, 3.20%, 3/15/16 |
|
|
700,000 |
|
|
|
743,789 |
|
|
|
|
| BB&T Corp., |
|
|
|
|
|
|
|
|
| Sr. Unsecured, MTN, 6.85%, 4/30/19 |
|
|
905,000 |
|
|
|
1,160,573 |
|
|
|
|
| Comerica, Inc., |
|
|
|
|
|
|
|
|
| Sr. Unsecured, 3.00%, 9/16/15 |
|
|
1,300,000 |
|
|
|
1,371,764 |
|
|
|
|
| Fifth Third Bancorp, |
|
|
|
|
|
|
|
|
| Sr. Unsecured, 3.50%, 3/15/22 |
|
|
1,250,000 |
|
|
|
1,320,940 |
|
|
|
|
| KeyCorp, |
|
|
|
|
|
|
|
|
| Sr. Unsecured, MTN, 6.50%, 5/14/13S |
|
|
1,000,000 |
|
|
|
1,002,212 |
|
|
|
|
| PNC Bank N.A., |
|
|
|
|
|
|
|
|
| Subordinated, 2.95%, 1/30/23 |
|
|
350,000 |
|
|
|
354,189 |
|
|
|
|
| PNC Funding Corp., |
|
|
|
|
|
|
|
|
| Bank Guaranteed, 0.48%, 1/31/14D,S |
|
|
500,000 |
|
|
|
500,399 |
|
|
|
|
| Royal Bank of Canada, |
|
|
|
|
|
|
|
|
| Sr. Unsecured, 2.30%, 7/20/16 |
|
|
1,500,000 |
|
|
|
1,569,632 |
|
|
|
|
| SunTrust Banks, Inc., |
|
|
|
|
|
|
|
|
| Sr. Unsecured, 3.60%, 4/15/16 |
|
|
2,100,000 |
|
|
|
2,247,005 |
|
|
|
|
| Toronto-Dominion Bank, |
|
|
|
|
|
|
|
|
| Sr. Unsecured, 2.50%, 7/14/16 |
|
|
1,000,000 |
|
|
|
1,052,480 |
|
|
|
|
| U.S. Bancorp, |
|
|
|
|
|
|
|
|
| Sr. Unsecured, MTN, 2.20%, 11/15/16 |
|
|
500,000 |
|
|
|
524,188 |
|
|
|
|
| Wells Fargo & Co., |
|
|
|
|
|
|
|
|
| Sr. Unsecured, 1.25%, 2/13/15 |
|
|
240,000 |
|
|
|
242,630 |
|
|
|
|
| Wells Fargo & Co., |
|
|
|
|
|
|
|
|
| Sr. Unsecured, 3.68%, 6/15/16 |
|
|
500,000 |
|
|
|
540,023 |
|
|
|
|
| Wells Fargo & Co., |
|
|
|
|
|
|
|
|
| Sr. Unsecured, 3.50%, 3/08/22 |
|
|
750,000 |
|
|
|
804,964 |
|
|
|
|
| Wells Fargo & Co., |
|
|
|
|
|
|
|
|
| Subordinated, 3.45%, 2/13/23 |
|
|
820,000 |
|
|
|
835,105 |
|
|
|
|
|
|
|
|
|
|
|
|
|
| TOTAL COMMERCIAL BANKS |
|
|
|
|
|
$ |
14,269,893 |
|
|
|
|
| COMMERCIAL FINANCE – 1.0% |
|
|
|
|
|
|
|
|
|
|
|
| General Electric Capital Corp., |
|
|
|
|
|
|
|
|
| Sr. Unsecured, 0.47%, 10/06/15D,S |
|
|
200,000 |
|
|
|
199,056 |
|
|
|
|
| General Electric Capital Corp., |
|
|
|
|
|
|
|
|
| Sr. Unsecured, 2.90%, 1/09/17 |
|
|
1,000,000 |
|
|
|
1,061,459 |
|
|
|
|
| General Electric Capital Corp., |
|
|
|
|
|
|
|
|
| Subordinated, 5.30%, 2/11/21 |
|
|
250,000 |
|
|
|
290,935 |
|
|
|
|
| International Lease Finance Corp., |
|
|
|
|
|
|
|
|
| Sr. Unsecured, 5.88%, 5/01/13 |
|
|
1,150,000 |
|
|
|
1,150,141 |
|
|
|
|
|
|
|
|
|
|
|
|
|
| TOTAL COMMERCIAL FINANCE |
|
|
|
|
|
$ |
2,701,591 |
|
|
|
|
| COMPUTERS – 0.9% |
|
|
|
|
|
|
|
|
|
|
|
| Apple, Inc., |
|
|
|
|
|
|
|
|
| Sr. Unsecured, 3.85%, 5/04/43†† |
|
|
860,000 |
|
|
|
854,995 |
|
|
|
|
| Hewlett-Packard Co., |
|
|
|
|
|
|
|
|
| Sr. Unsecured, 2.20%, 12/01/15# |
|
|
500,000 |
|
|
|
512,214 |
|
|
|
|
| Hewlett-Packard Co., |
|
|
|
|
|
|
|
|
| Sr. Unsecured, 3.00%, 9/15/16 |
|
|
500,000 |
|
|
|
518,198 |
|
|
|
|
|
|
|
|
|
|
|
Description |
|
Par Value |
|
|
Value |
|
|
|
|
| Hewlett-Packard Co., |
|
|
|
|
|
|
|
|
| Sr. Unsecured, 2.60%, 9/15/17 |
|
$ |
500,000 |
|
|
$ |
510,911 |
|
|
|
|
| International Business Machines Corp., |
|
|
|
|
|
|
|
|
| Sr. Unsecured, 1.95%, 7/22/16 |
|
|
275,000 |
|
|
|
284,551 |
|
|
|
|
|
|
|
|
|
|
|
|
|
| TOTAL COMPUTERS |
|
|
|
|
|
$ |
2,680,869 |
|
|
|
|
| CONSUMER FINANCE – 0.6% |
|
|
|
|
|
|
|
|
|
|
|
| American Express Co., |
|
|
|
|
|
|
|
|
| Sr. Unsecured, 4.88%, 7/15/13S |
|
|
335,000 |
|
|
|
338,001 |
|
|
|
|
| Capital One Financial Corp., |
|
|
|
|
|
|
|
|
| Sr. Unsecured, 7.38%, 5/23/14 |
|
|
250,000 |
|
|
|
267,797 |
|
|
|
|
| SLM Corp., |
|
|
|
|
|
|
|
|
| Sr. Unsecured, MTN, 5.00%, 10/01/13S |
|
|
1,000,000 |
|
|
|
1,018,181 |
|
|
|
|
|
|
|
|
|
|
|
|
|
| TOTAL CONSUMER FINANCE |
|
|
|
|
|
$ |
1,623,979 |
|
|
| DIVERSIFIED FINANCIAL SERVICES – 3.9% |
|
|
|
|
| Bank of America Corp., |
|
|
|
|
|
|
|
|
| Sr. Unsecured, 6.50%, 8/01/16 |
|
|
1,250,000 |
|
|
|
1,442,284 |
|
|
|
|
| Bank of America Corp., |
|
|
|
|
|
|
|
|
| Sr. Unsecured, 2.00%, 1/11/18 |
|
|
1,275,000 |
|
|
|
1,278,720 |
|
|
|
|
| Bank of America Corp., |
|
|
|
|
|
|
|
|
| Sr. Unsecured, MTN, 1.35%, 3/22/18D,S |
|
|
1,500,000 |
|
|
|
1,499,634 |
|
|
|
|
| Citigroup, Inc., |
|
|
|
|
|
|
|
|
| Sr. Unsecured, 0.41%, 3/07/14D,S |
|
|
275,000 |
|
|
|
274,462 |
|
|
|
|
| Citigroup, Inc., |
|
|
|
|
|
|
|
|
| Sr. Unsecured, 5.50%, 10/15/14 |
|
|
500,000 |
|
|
|
533,064 |
|
|
|
|
| Citigroup, Inc., |
|
|
|
|
|
|
|
|
| Sr. Unsecured, 1.25%, 1/15/16 |
|
|
500,000 |
|
|
|
501,610 |
|
|
|
|
| Citigroup, Inc., |
|
|
|
|
|
|
|
|
| Sr. Unsecured, 4.45%, 1/10/17 |
|
|
250,000 |
|
|
|
276,874 |
|
|
|
|
| Citigroup, Inc., |
|
|
|
|
|
|
|
|
| Sr. Unsecured, 6.13%, 5/15/18 |
|
|
275,000 |
|
|
|
331,187 |
|
|
|
|
| FMR LLC, |
|
|
|
|
|
|
|
|
| Sr. Unsecured, 6.45%, 11/15/39•,W |
|
|
1,000,000 |
|
|
|
1,263,992 |
|
|
|
|
| JPMorgan Chase & Co., |
|
|
|
|
|
|
|
|
| Sr. Unsecured, 4.65%, 6/01/14 |
|
|
500,000 |
|
|
|
522,057 |
|
|
|
|
| JPMorgan Chase & Co., |
|
|
|
|
|
|
|
|
| Sr. Unsecured, 2.60%, 1/15/16 |
|
|
500,000 |
|
|
|
521,276 |
|
|
|
|
| JPMorgan Chase & Co., |
|
|
|
|
|
|
|
|
| Sr. Unsecured, 2.00%, 8/15/17 |
|
|
1,100,000 |
|
|
|
1,128,060 |
|
|
|
|
| JPMorgan Chase & Co., |
|
|
|
|
|
|
|
|
| Sr. Unsecured, 6.00%, 1/15/18 |
|
|
150,000 |
|
|
|
178,457 |
|
|
|
|
| JPMorgan Chase & Co., |
|
|
|
|
|
|
|
|
| Sr. Unsecured, 4.63%, 5/10/21 |
|
|
100,000 |
|
|
|
113,964 |
|
|
|
|
| JPMorgan Chase & Co., |
|
|
|
|
|
|
|
|
| Sub. Notes, 3.38%, 5/01/23 |
|
|
380,000 |
|
|
|
379,571 |
|
|
|
|
| JPMorgan Chase Capital XXIII, |
|
|
|
|
|
|
|
|
| Limited Guarantee, 1.29%, 5/15/47D,S |
|
|
1,000,000 |
|
|
|
800,327 |
|
|
|
|
|
|
|
|
|
|
|
|
| TOTAL DIVERSIFIED FINANCIAL SERVICES |
|
|
$ |
11,045,539 |
|
|
|
|
| EDUCATION – 0.2% |
|
|
|
|
|
|
|
|
|
|
|
| Stanford University, |
|
|
|
|
|
|
|
|
| Bonds, 4.75%, 5/01/19 |
|
|
500,000 |
|
|
|
598,231 |
|
|
|
|
| ELECTRIC – 5.0% |
|
|
|
|
|
|
|
|
|
|
|
| Ameren Illinois Co., |
|
|
|
|
|
|
|
|
| Sr. Secured, 9.75%, 11/15/18 |
|
|
600,000 |
|
|
|
847,262 |
|
ANNUAL REPORT / April
30, 2013
|
|
|
| 34 |
|
PORTFOLIOS OF INVESTMENTS |
Wilmington Broad Market Bond Fund (continued)
|
|
|
|
|
|
|
|
|
|
Description |
|
Par Value |
|
|
Value |
|
|
|
|
| CMS Energy Corp., |
|
|
|
|
|
|
|
|
| Sr. Unsecured, 4.25%, 9/30/15 |
|
$ |
2,000,000 |
|
|
$ |
2,152,500 |
|
|
|
|
| CMS Energy Corp., |
|
|
|
|
|
|
|
|
| Sr. Unsecured, 6.55%, 7/17/17 |
|
|
300,000 |
|
|
|
360,000 |
|
|
|
|
| Commonwealth Edison Co., |
|
|
|
|
|
|
|
|
| 1st Mortgage, 1.95%, 9/01/16 |
|
|
1,000,000 |
|
|
|
1,037,388 |
|
|
|
|
| Dominion Resources, Inc., |
|
|
|
|
|
|
|
|
| Series A, Sr. Unsecured, 5.60%, 11/15/16 |
|
|
500,000 |
|
|
|
576,279 |
|
|
|
|
| DTE Energy Co., |
|
|
|
|
|
|
|
|
| Sr. Unsecured, 7.63%, 5/15/14 |
|
|
250,000 |
|
|
|
267,674 |
|
|
|
|
| Duke Energy Corp., |
|
|
|
|
|
|
|
|
| Sr. Unsecured, 6.30%, 2/01/14 |
|
|
714,000 |
|
|
|
744,374 |
|
|
|
|
| Duke Energy Florida, Inc., |
|
|
|
|
|
|
|
|
| 1st Mortgage, 6.35%, 9/15/37 |
|
|
425,000 |
|
|
|
581,277 |
|
|
|
|
| Entergy Corp., |
|
|
|
|
|
|
|
|
| Sr. Unsecured, 5.13%, 9/15/20 |
|
|
2,000,000 |
|
|
|
2,226,048 |
|
|
|
|
| Exelon Generation Co., LLC, |
|
|
|
|
|
|
|
|
| Sr. Unsecured, 5.35%, 1/15/14 |
|
|
2,000,000 |
|
|
|
2,066,902 |
|
|
|
|
| Exelon Generation Co., LLC, |
|
|
|
|
|
|
|
|
| Sr. Unsecured, 6.20%, 10/01/17# |
|
|
650,000 |
|
|
|
767,584 |
|
|
|
|
| FirstEnergy Corp., |
|
|
|
|
|
|
|
|
| Series A, Sr. Unsecured, 2.75%, 3/15/18 |
|
|
285,000 |
|
|
|
290,018 |
|
|
|
|
| Pacific Gas & Electric Co., |
|
|
|
|
|
|
|
|
| Sr. Unsecured, 3.25%, 9/15/21 |
|
|
125,000 |
|
|
|
134,597 |
|
|
|
|
| System Energy Resources, Inc., |
|
|
|
|
|
|
|
|
| 1st Mortgage, 4.10%, 4/01/23 |
|
|
500,000 |
|
|
|
531,029 |
|
|
|
|
| UIL Holdings Corp., |
|
|
|
|
|
|
|
|
| Sr. Unsecured, 4.63%, 10/01/20 |
|
|
1,500,000 |
|
|
|
1,625,742 |
|
|
|
|
|
|
|
|
|
|
|
|
|
| TOTAL ELECTRIC |
|
|
|
|
|
$ |
14,208,674 |
|
|
| ENVIRONMENTAL CONTROL – 0.5% |
|
|
|
|
| Waste Management, Inc., |
|
|
|
|
|
|
|
|
| Company Guaranteed, 2.60%, 9/01/16 |
|
|
1,465,000 |
|
|
|
1,538,129 |
|
|
|
|
| FOOD PRODUCTS – 1.1% |
|
|
|
|
|
|
|
|
|
|
|
| Kellogg Co., |
|
|
|
|
|
|
|
|
| Sr. Unsecured, 1.88%, 11/17/16 |
|
|
1,000,000 |
|
|
|
1,032,861 |
|
|
|
|
| McCormick & Co., Inc., |
|
|
|
|
|
|
|
|
| Sr. Unsecured, 5.75%, 12/15/17 |
|
|
500,000 |
|
|
|
599,269 |
|
|
|
|
| McCormick & Co., Inc., |
|
|
|
|
|
|
|
|
| Sr. Unsecured, 3.90%, 7/15/21 |
|
|
500,000 |
|
|
|
553,612 |
|
|
|
|
| Mondelez International, Inc., |
|
|
|
|
|
|
|
|
| Sr. Unsecured, 5.25%, 10/01/13 |
|
|
400,000 |
|
|
|
407,886 |
|
|
|
|
| WM Wrigley Jr. Co., |
|
|
|
|
|
|
|
|
| Sr. Secured, 3.70%, 6/30/14•,W |
|
|
500,000 |
|
|
|
514,834 |
|
|
|
|
|
|
|
|
|
|
|
|
|
| TOTAL FOOD PRODUCTS |
|
|
|
|
|
$ |
3,108,462 |
|
|
|
|
| FOOD RETAILING – 0.4% |
|
|
|
|
|
|
|
|
|
|
|
| Kroger Co., |
|
|
|
|
|
|
|
|
| Company Guaranteed, 3.90%, 10/01/15 |
|
|
250,000 |
|
|
|
268,257 |
|
|
|
|
| Kroger Co., |
|
|
|
|
|
|
|
|
| Company Guaranteed, 8.00%, 9/15/29 |
|
|
500,000 |
|
|
|
675,182 |
|
|
|
|
| Kroger Co., |
|
|
|
|
|
|
|
|
| Sr. Unsecured, 2.20%, 1/15/17 |
|
|
250,000 |
|
|
|
258,795 |
|
|
|
|
|
|
|
|
|
|
|
|
|
| TOTAL FOOD RETAILING |
|
|
|
|
|
$ |
1,202,234 |
|
|
|
|
|
|
|
|
|
|
|
Description |
|
Par Value |
|
|
Value |
|
|
| FOREST PRODUCTS & PAPER – 0.8% |
|
|
|
|
| International Paper Co., |
|
|
|
|
|
|
|
|
| Sr. Unsecured, 5.30%, 4/01/15 |
|
$ |
2,000,000 |
|
|
$ |
2,163,006 |
|
|
| HEALTH CARE PROVIDERS & SERVICES – 0.4% |
|
|
|
|
| UnitedHealth Group, Inc., |
|
|
|
|
|
|
|
|
| Sr. Unsecured, 6.00%, 6/15/17 |
|
|
250,000 |
|
|
|
298,674 |
|
|
|
|
| UnitedHealth Group, Inc., |
|
|
|
|
|
|
|
|
| Sr. Unsecured, 2.75%, 2/15/23 |
|
|
560,000 |
|
|
|
565,346 |
|
|
|
|
| UnitedHealth Group, Inc., |
|
|
|
|
|
|
|
|
| Sr. Unsecured, 3.95%, 10/15/42 |
|
|
290,000 |
|
|
|
284,604 |
|
|
|
|
|
|
|
|
|
|
|
|
| TOTAL HEALTH CARE PROVIDERS & SERVICES |
|
|
$ |
1,148,624 |
|
|
|
|
| HOME FURNISHINGS – 0.8% |
|
|
|
|
|
|
|
|
|
|
|
| Whirlpool Corp., |
|
|
|
|
|
|
|
|
| Notes, MTN, 5.15%, 3/01/43 |
|
|
210,000 |
|
|
|
221,619 |
|
|
|
|
| Whirlpool Corp., |
|
|
|
|
|
|
|
|
| Sr. Unsecured, 6.50%, 6/15/16 |
|
|
350,000 |
|
|
|
400,624 |
|
|
|
|
| Whirlpool Corp., |
|
|
|
|
|
|
|
|
| Sr. Unsecured, 4.70%, 6/01/22 |
|
|
1,500,000 |
|
|
|
1,671,209 |
|
|
|
|
|
|
|
|
|
|
|
|
|
| TOTAL HOME FURNISHINGS |
|
|
|
|
|
$ |
2,293,452 |
|
|
|
|
| HOUSEHOLD PRODUCTS – 0.6% |
|
|
|
|
|
|
|
|
|
|
|
| Tupperware Brands Corp., |
|
|
|
|
|
|
|
|
| Company Guaranteed, 4.75%, 6/01/21 |
|
|
1,465,000 |
|
|
|
1,573,809 |
|
|
|
|
| INSURANCE – 3.5% |
|
|
|
|
|
|
|
|
|
|
|
| Berkshire Hathaway Finance Corp., |
|
|
|
|
|
|
|
|
| Company Guaranteed, 4.40%, 5/15/42 |
|
|
2,000,000 |
|
|
|
2,086,128 |
|
|
|
|
| CNA Financial Corp., |
|
|
|
|
|
|
|
|
| Sr. Unsecured, 5.75%, 8/15/21 |
|
|
1,000,000 |
|
|
|
1,202,490 |
|
|
|
|
| Lincoln National Corp., |
|
|
|
|
|
|
|
|
| Sr. Unsecured, 4.20%, 3/15/22# |
|
|
1,000,000 |
|
|
|
1,108,120 |
|
|
|
|
| MetLife, Inc., |
|
|
|
|
|
|
|
|
| Sr. Unsecured, 5.00%, 6/15/15 |
|
|
400,000 |
|
|
|
435,063 |
|
|
|
|
| MetLife, Inc., |
|
|
|
|
|
|
|
|
| Sr. Unsecured, 4.75%, 2/08/21 |
|
|
500,000 |
|
|
|
583,981 |
|
|
|
|
| Principal Financial Group, Inc., |
|
|
|
|
|
|
|
|
| Company Guaranteed, 3.30%, 9/15/22 |
|
|
250,000 |
|
|
|
259,751 |
|
|
|
|
| Prudential Financial, Inc., |
|
|
|
|
|
|
|
|
| Sr. Unsecured, MTN, 3.88%, 1/14/15 |
|
|
1,000,000 |
|
|
|
1,052,002 |
|
|
|
|
| Prudential Financial, Inc., |
|
|
|
|
|
|
|
|
| Sr. Unsecured, MTN, 6.20%, 1/15/15 |
|
|
500,000 |
|
|
|
544,295 |
|
|
|
|
| Prudential Financial, Inc., |
|
|
|
|
|
|
|
|
| Sr. Unsecured, MTN, 3.00%, 5/12/16 |
|
|
1,000,000 |
|
|
|
1,059,172 |
|
|
|
|
| WR Berkley Corp., |
|
|
|
|
|
|
|
|
| Sr. Unsecured, 7.38%, 9/15/19 |
|
|
280,000 |
|
|
|
353,572 |
|
|
|
|
| WR Berkley Corp., |
|
|
|
|
|
|
|
|
| Sr. Unsecured, 4.63%, 3/15/22 |
|
|
1,000,000 |
|
|
|
1,109,348 |
|
|
|
|
|
|
|
|
|
|
|
|
|
| TOTAL INSURANCE |
|
|
|
|
|
$ |
9,793,922 |
|
|
| INTERNET SOFTWARE & SERVICES – 0.2% |
|
|
|
|
| eBay, Inc., |
|
|
|
|
|
|
|
|
| Sr. Unsecured, 1.63%, 10/15/15 |
|
|
500,000 |
|
|
|
514,495 |
|
|
|
|
| IRON/STEEL – 0.4% |
|
|
|
|
|
|
|
|
|
|
|
| Cliffs Natural Resources, Inc., |
|
|
|
|
|
|
|
|
| Sr. Unsecured, 3.95%, 1/15/18 |
|
|
1,030,000 |
|
|
|
1,044,901 |
|
April 30, 2013 / ANNUAL REPORT
|
|
|
|
|
| PORTFOLIOS OF INVESTMENTS |
|
|
35 |
|
Wilmington Broad Market Bond Fund (continued)
|
|
|
|
|
|
|
|
|
|
Description |
|
Par Value |
|
|
Value |
|
|
|
|
| LEISURE TIME – 0.1% |
|
|
|
|
|
|
|
|
|
|
|
| Royal Caribbean Cruises Ltd., |
|
|
|
|
|
|
|
|
| Sr. Unsecured, 7.00%, 6/15/13S |
|
$ |
300,000 |
|
|
$ |
302,262 |
|
|
|
|
| MEDIA – 4.2% |
|
|
|
|
|
|
|
|
|
|
|
| Comcast Corp., |
|
|
|
|
|
|
|
|
| Company Guaranteed, 5.90%, 3/15/16 |
|
|
1,000,000 |
|
|
|
1,145,056 |
|
|
|
|
| Comcast Corp., |
|
|
|
|
|
|
|
|
| Company Guaranteed, 4.65%, 7/15/42 |
|
|
825,000 |
|
|
|
907,955 |
|
|
|
|
| COX Communications, Inc., |
|
|
|
|
|
|
|
|
| Sr. Unsecured, 4.50%, 6/30/43•,W |
|
|
1,900,000 |
|
|
|
1,903,305 |
|
|
|
|
| DIRECTV Holdings LLC / DIRECTV Financing Co., Inc., |
|
|
|
|
|
|
|
|
| Company Guaranteed, 3.50%, 3/01/16 |
|
|
1,.500,000 |
|
|
|
1,602,399 |
|
|
|
|
| DIRECTV Holdings LLC / DIRECTV Financing Co., Inc., |
|
|
|
|
|
|
|
|
| Company Guaranteed, 5.15%, 3/15/42 |
|
|
500,000 |
|
|
|
512,233 |
|
|
|
|
| NBCUniversal Enterprise, Inc., |
|
|
|
|
|
|
|
|
| Company Guaranteed, 0.82%, 4/15/16D,•,W |
|
|
420,000 |
|
|
|
420,398 |
|
|
|
|
| NBCUniversal Media LLC, |
|
|
|
|
|
|
|
|
| Company Guaranteed, 3.65%, 4/30/15 |
|
|
480,000 |
|
|
|
509,098 |
|
|
|
|
| TCI Communications, Inc., |
|
|
|
|
|
|
|
|
| Sr. Unsecured, 8.75%, 8/01/15 |
|
|
400,000 |
|
|
|
470,646 |
|
|
|
|
| Time Warner, Inc., |
|
|
|
|
|
|
|
|
| Company Guaranteed, 5.88%, 11/15/16 |
|
|
1,500,000 |
|
|
|
1,747,350 |
|
|
|
|
| Viacom, Inc., |
|
|
|
|
|
|
|
|
| Sr. Unsecured, 4.38%, 9/15/14 |
|
|
350,000 |
|
|
|
367,343 |
|
|
|
|
| Viacom, Inc., |
|
|
|
|
|
|
|
|
| Sr. Unsecured, 5.63%, 9/15/19 |
|
|
1,000,000 |
|
|
|
1,204,760 |
|
|
|
|
| Viacom, Inc., |
|
|
|
|
|
|
|
|
| Sr. Unsecured, 3.88%, 12/15/21 |
|
|
850,000 |
|
|
|
925,732 |
|
|
|
|
|
|
|
|
|
|
|
|
|
| TOTAL MEDIA |
|
|
|
|
|
$ |
11,716,275 |
|
|
| METALS & MINING – 1.4% |
|
|
|
|
| Alcoa, Inc., |
|
|
|
|
|
|
|
|
| Sr. Unsecured, 5.72%, 2/23/19 |
|
|
550,000 |
|
|
|
596,043 |
|
|
|
|
| Barrick Gold Corp., |
|
|
|
|
|
|
|
|
| Sr. Unsecured, 2.50%, 5/01/18•,W |
|
|
500,000 |
|
|
|
503,021 |
|
|
|
|
| Barrick Gold Corp., |
|
|
|
|
|
|
|
|
| Sr. Unsecured, 5.25%, 4/01/42 |
|
|
2,000,000 |
|
|
|
1,911,502 |
|
|
|
|
| Rio Tinto Finance USA Ltd., |
|
|
|
|
|
|
|
|
| Company Guaranteed, 9.00%, 5/01/19 |
|
|
750,000 |
|
|
|
1,038,979 |
|
|
|
|
|
|
|
|
|
|
|
|
|
| TOTAL METALS & MINING |
|
|
|
|
|
$ |
4,049,545 |
|
|
| MISCELLANEOUS MANUFACTURING – 1.8% |
|
|
|
|
| Eaton Corp., |
|
|
|
|
|
|
|
|
| Company Guaranteed, 2.75%, 11/02/22•,W |
|
|
250,000 |
|
|
|
253,172 |
|
|
|
|
| Eaton Corp., |
|
|
|
|
|
|
|
|
| Company Guaranteed, 4.00%, 11/02/32•,W |
|
|
400,000 |
|
|
|
412,690 |
|
|
|
|
| GE Capital Trust I, |
|
|
|
|
|
|
|
|
| Limited Guaranteed, 6.38%, 11/15/67D |
|
|
1,000,000 |
|
|
|
1,068,750 |
|
|
|
|
| General Electric Co., |
|
|
|
|
|
|
|
|
| Sr. Unsecured, 4.13%, 10/09/42 |
|
|
795,000 |
|
|
|
845,814 |
|
|
|
|
| Ingersoll-Rand Co., |
|
|
|
|
|
|
|
|
| Series B, Company Guaranteed, |
|
|
|
|
|
|
|
|
| 6.02%, 2/15/28 |
|
|
900,000 |
|
|
|
1,075,895 |
|
|
|
|
|
|
|
|
|
|
|
Description |
|
Par Value |
|
|
Value |
|
|
|
|
| Ingersoll-Rand Global Holding Co., Ltd., |
|
|
|
|
|
|
|
|
| Company Guaranteed, 6.00%, 8/15/13S |
|
$ |
700,000 |
|
|
$ |
711,255 |
|
|
|
|
| John Deere Capital Corp., |
|
|
|
|
|
|
|
|
| Sr. Unsecured, MTN, 1.40%, 3/15/17 |
|
|
250,000 |
|
|
|
254,410 |
|
|
|
|
| Textron, Inc., |
|
|
|
|
|
|
|
|
| Sr. Unsecured, 6.20%, 3/15/15 |
|
|
500,000 |
|
|
|
543,339 |
|
|
|
|
|
|
|
|
|
|
|
|
|
| TOTAL MISCELLANEOUS MANUFACTURING |
|
|
|
|
|
$ |
5,165,325 |
|
|
|
|
| OIL & GAS – 4.1% |
|
|
|
|
|
|
|
|
|
|
|
| Anadarko Finance Co., |
|
|
|
|
|
|
|
|
| Series B, Company Guaranteed, |
|
|
|
|
|
|
|
|
| 7.50%, 5/01/31 |
|
|
1,000,000 |
|
|
|
1,379,680 |
|
|
|
|
| Anadarko Petroleum Corp., |
|
|
|
|
|
|
|
|
| Sr. Unsecured, 5.75%, 6/15/14 |
|
|
250,000 |
|
|
|
263,341 |
|
|
|
|
| BP Capital Markets PLC, |
|
|
|
|
|
|
|
|
| Company Guaranteed, 3.20%, 3/11/16 |
|
|
300,000 |
|
|
|
320,698 |
|
|
|
|
| Murphy Oil Corp., |
|
|
|
|
|
|
|
|
| Sr. Unsecured, 5.13%, 12/01/42 |
|
|
1,540,000 |
|
|
|
1,495,706 |
|
|
|
|
| Nabors Industries, Inc., |
|
|
|
|
|
|
|
|
| Company Guaranteed, 4.63%, 9/15/21 |
|
|
500,000 |
|
|
|
527,165 |
|
|
|
|
| Phillips 66, |
|
|
|
|
|
|
|
|
| Company Guaranteed, 2.95%, 5/01/17 |
|
|
1,250,000 |
|
|
|
1,331,319 |
|
|
|
|
| Phillips 66, |
|
|
|
|
|
|
|
|
| Company Guaranteed, 4.30%, 4/01/22 |
|
|
500,000 |
|
|
|
560,518 |
|
|
|
|
| Sempra Energy, |
|
|
|
|
|
|
|
|
| Sr. Unsecured, 1.04%, 3/15/14D,S |
|
|
1,000,000 |
|
|
|
1,004,454 |
|
|
|
|
| Sempra Energy, |
|
|
|
|
|
|
|
|
| Sr. Unsecured, 6.50%, 6/01/16 |
|
|
500,000 |
|
|
|
581,336 |
|
|
|
|
| Sunoco, Inc., |
|
|
|
|
|
|
|
|
| Company Guaranteed, 9.63%, 4/15/15 |
|
|
550,000 |
|
|
|
637,478 |
|
|
|
|
| Transocean, Inc., |
|
|
|
|
|
|
|
|
| Company Guaranteed, 4.95%, 11/15/15 |
|
|
450,000 |
|
|
|
487,441 |
|
|
|
|
| Transocean, Inc., |
|
|
|
|
|
|
|
|
| Company Guaranteed, 6.50%, 11/15/20 |
|
|
1,175,000 |
|
|
|
1,395,683 |
|
|
|
|
| Valero Energy Corp., |
|
|
|
|
|
|
|
|
| Company Guaranteed, 4.75%, 4/01/14 |
|
|
550,000 |
|
|
|
570,832 |
|
|
|
|
| Valero Energy Corp., |
|
|
|
|
|
|
|
|
| Company Guaranteed, 4.50%, 2/01/15 |
|
|
1,000,000 |
|
|
|
1,064,425 |
|
|
|
|
|
|
|
|
|
|
|
|
|
| TOTAL OIL & GAS |
|
|
|
|
|
$ |
11,620,076 |
|
|
| OIL & GAS FIELD SERVICES – 0.4% |
|
|
|
|
| Weatherford International Ltd., |
|
|
|
|
|
|
|
|
| Company Guaranteed, 6.00%, 3/15/18 |
|
|
1,000,000 |
|
|
|
1,150,284 |
|
|
| PHARMACEUTICALS – 0.8% |
|
|
|
|
| AbbVie, Inc., |
|
|
|
|
|
|
|
|
| Sr. Unsecured, 2.90%, 11/06/22•,W |
|
|
850,000 |
|
|
|
869,311 |
|
|
|
|
| AbbVie, Inc., |
|
|
|
|
|
|
|
|
| Sr. Unsecured, 4.40%, 11/06/42•,W |
|
|
460,000 |
|
|
|
486,039 |
|
|
|
|
| Teva Pharmaceutical Finance Co. BV, |
|
|
|
|
|
|
|
|
| Company Guaranteed, 2.40%, 11/10/16 |
|
|
400,000 |
|
|
|
420,697 |
|
|
|
|
| Zoetis, Inc., |
|
|
|
|
|
|
|
|
| Sr. Unsecured, 4.70%, 2/01/43•,W |
|
|
400,000 |
|
|
|
423,987 |
|
|
|
|
|
|
|
|
|
|
|
|
|
| TOTAL PHARMACEUTICALS |
|
|
|
|
|
$ |
2,200,034 |
|
|
| ANNUAL REPORT / April 30, 2013 |
|
|
|
| 36 |
|
PORTFOLIOS OF INVESTMENTS |
Wilmington Broad Market Bond Fund (continued)
|
|
|
|
|
|
|
|
|
|
Description |
|
Par Value |
|
|
Value |
|
|
| PIPELINES – 2.6% |
|
|
|
|
| Energy Transfer Partners LP, |
|
|
|
|
|
|
|
|
| Sr. Unsecured, 3.60%, 2/01/23 |
|
$ |
870,000 |
|
|
$ |
887,307 |
|
|
|
|
| Enterprise Products Operating LLC, |
|
|
|
|
|
|
|
|
| Company Guaranteed, 5.70%, 2/15/42 |
|
|
500,000 |
|
|
|
597,283 |
|
|
|
|
| Enterprise Products Operating LLC, |
|
|
|
|
|
|
|
|
| Series B, Company Guaranteed, |
|
|
|
|
|
|
|
|
| 7.03%, 1/15/68D |
|
|
2,000,000 |
|
|
|
2,325,000 |
|
|
|
|
| NuStar Pipeline Operating Partnership, LP, |
|
|
|
|
|
|
|
|
| Company Guaranteed, 5.88%, 6/01/13S |
|
|
1,250,000 |
|
|
|
1,252,097 |
|
|
|
|
| Plains All American Pipeline LP / PAA Finance Corp., |
|
|
|
|
|
|
|
|
| Sr. Unsecured, 5.00%, 2/01/21 |
|
|
500,000 |
|
|
|
588,714 |
|
|
|
|
| Plains All American Pipeline LP / PAA Finance Corp., |
|
|
|
|
|
|
|
|
| Sr. Unsecured, 3.65%, 6/01/22 |
|
|
1,000,000 |
|
|
|
1,082,854 |
|
|
|
|
| Rockies Express Pipeline LLC, |
|
|
|
|
|
|
|
|
| Sr. Unsecured, 5.63%, 4/15/20•,W |
|
|
500,000 |
|
|
|
470,625 |
|
|
|
|
|
|
|
|
|
|
|
|
|
| TOTAL PIPELINES |
|
|
|
|
|
$ |
7,203,880 |
|
|
| REAL ESTATE INVESTMENT TRUSTS – 4.6% |
|
|
|
|
| BioMed Realty LP, |
|
|
|
|
|
|
|
|
| Company Guaranteed, 3.85%, 4/15/16 |
|
|
1,000,000 |
|
|
|
1,068,790 |
|
|
|
|
| Boston Properties LP, |
|
|
|
|
|
|
|
|
| Sr. Unsecured, 5.00%, 6/01/15 |
|
|
650,000 |
|
|
|
705,800 |
|
|
|
|
| CommonWealth REIT, |
|
|
|
|
|
|
|
|
| Sr. Unsecured, 6.65%, 1/15/18 |
|
|
500,000 |
|
|
|
566,188 |
|
|
|
|
| Digital Realty Trust LP, |
|
|
|
|
|
|
|
|
| Company Guaranteed, 5.25%, 3/15/21 |
|
|
500,000 |
|
|
|
570,828 |
|
|
|
|
| HCP, Inc., |
|
|
|
|
|
|
|
|
| Sr. Unsecured, MTN, 6.30%, 9/15/16 |
|
|
500,000 |
|
|
|
581,741 |
|
|
|
|
| Health Care REIT, Inc., |
|
|
|
|
|
|
|
|
| Sr. Unsecured, 4.95%, 1/15/21 |
|
|
1,000,000 |
|
|
|
1,133,257 |
|
|
|
|
| Health Care REIT, Inc., |
|
|
|
|
|
|
|
|
| Sr. Unsecured, 5.25%, 1/15/22 |
|
|
250,000 |
|
|
|
291,564 |
|
|
|
|
| Healthcare Realty Trust, Inc., |
|
|
|
|
|
|
|
|
| Sr. Unsecured, 3.75%, 4/15/23 |
|
|
975,000 |
|
|
|
995,420 |
|
|
|
|
| Mack-Cali Realty LP, |
|
|
|
|
|
|
|
|
| Sr. Unsecured, 2.50%, 12/15/17# |
|
|
2,215,000 |
|
|
|
2,262,162 |
|
|
|
|
| Mack-Cali Realty LP, |
|
|
|
|
|
|
|
|
| Sr. Unsecured, 7.75%, 8/15/19 |
|
|
250,000 |
|
|
|
321,258 |
|
|
|
|
| ProLogis LP, |
|
|
|
|
|
|
|
|
| Company Guaranteed, 6.13%, 12/01/16 |
|
|
864,000 |
|
|
|
999,445 |
|
|
|
|
| ProLogis LP, |
|
|
|
|
|
|
|
|
| Company Guaranteed, 4.50%, 8/15/17 |
|
|
250,000 |
|
|
|
276,455 |
|
|
|
|
| ProLogis LP, |
|
|
|
|
|
|
|
|
| Company Guaranteed, 6.63%, 12/01/19 |
|
|
515,000 |
|
|
|
626,899 |
|
|
|
|
| Simon Property Group LP, |
|
|
|
|
|
|
|
|
| Sr. Unsecured, 5.65%, 2/01/20 |
|
|
500,000 |
|
|
|
608,661 |
|
|
|
|
| Ventas Realty LP / Ventas Capital Corp., |
|
|
|
|
|
|
|
|
| Company Guaranteed, 2.70%, 4/01/20 |
|
|
2,000,000 |
|
|
|
2,036,885 |
|
|
|
|
|
|
|
|
|
|
|
|
| TOTAL REAL ESTATE INVESTMENT TRUSTS |
|
|
$ |
13,045,353 |
|
|
|
|
| RESTAURANT – 0.1% |
|
|
|
|
|
|
|
|
|
|
|
| Yum! Brands, Inc., |
|
|
|
|
|
|
|
|
| Sr. Unsecured, 3.75%, 11/01/21 |
|
|
250,000 |
|
|
|
266,317 |
|
|
|
|
|
|
|
|
|
|
|
Description |
|
Par Value |
|
|
Value |
|
|
| RETAIL – 0.3% |
|
|
|
|
| CVS Caremark Corp., |
|
|
|
|
|
|
|
|
| Sr. Unsecured, 5.75%, 6/01/17 |
|
$ |
244,000 |
|
|
$ |
289,288 |
|
|
|
|
| CVS Caremark Corp., |
|
|
|
|
|
|
|
|
| Sr. Unsecured, 4.75%, 5/18/20 |
|
|
500,000 |
|
|
|
583,870 |
|
|
|
|
|
|
|
|
|
|
|
|
|
| TOTAL RETAIL |
|
|
|
|
|
$ |
873,158 |
|
|
| SEMICONDUCTORS – 0.3% |
|
|
|
|
| Broadcom Corp., |
|
|
|
|
|
|
|
|
| Sr. Unsecured, 2.70%, 11/01/18 |
|
|
500,000 |
|
|
|
534,961 |
|
|
|
|
| Texas Instruments, Inc., |
|
|
|
|
|
|
|
|
| Sr. Unsecured, 2.38%, 5/16/16 |
|
|
250,000 |
|
|
|
262,917 |
|
|
|
|
|
|
|
|
|
|
|
|
| TOTAL SEMICONDUCTORS |
|
|
$ |
797,878 |
|
|
| TELECOMMUNICATIONS – 1.3% |
|
|
|
|
| Crown Castle Towers LLC, |
|
|
|
|
|
|
|
|
| Sr. Secured, 4.17%, 8/15/17•,W |
|
|
2,000,000 |
|
|
|
2,193,348 |
|
|
|
|
| Verizon Communications, Inc., |
|
|
|
|
|
|
|
|
| Sr. Unsecured, 1.25%, 11/03/14 |
|
|
295,000 |
|
|
|
298,151 |
|
|
|
|
| Verizon Communications, Inc., |
|
|
|
|
|
|
|
|
| Sr. Unsecured, 3.00%, 4/01/16 |
|
|
1,000,000 |
|
|
|
1,060,531 |
|
|
|
|
|
|
|
|
|
|
|
|
| TOTAL TELECOMMUNICATIONS |
|
|
$ |
3,552,030 |
|
|
| TRANSPORTATION – 1.4% |
|
|
|
|
| CSX Corp., |
|
|
|
|
|
|
|
|
| Sr. Unsecured, 7.90%, 5/01/17 |
|
|
1,114,000 |
|
|
|
1,390,190 |
|
|
|
|
| CSX Corp., |
|
|
|
|
|
|
|
|
| Sr. Unsecured, 4.75%, 5/30/42 |
|
|
250,000 |
|
|
|
271,680 |
|
|
|
|
| Norfolk Southern Corp., |
|
|
|
|
|
|
|
|
| Sr. Unsecured, 5.90%, 6/15/19 |
|
|
250,000 |
|
|
|
308,713 |
|
|
|
|
| Ryder System, Inc., |
|
|
|
|
|
|
|
|
| Sr. Unsecured, MTN, 3.15%, 3/02/15 |
|
|
300,000 |
|
|
|
311,367 |
|
|
|
|
| Ryder System, Inc., |
|
|
|
|
|
|
|
|
| Sr. Unsecured, MTN, 2.50%, 3/01/17 |
|
|
500,000 |
|
|
|
516,933 |
|
|
|
|
| Ryder System, Inc., |
|
|
|
|
|
|
|
|
| Sr. Unsecured, MTN, 2.50%, 3/01/18 |
|
|
1,155,000 |
|
|
|
1,189,810 |
|
|
|
|
|
|
|
|
|
|
|
|
| TOTAL TRANSPORTATION |
|
|
$ |
3,988,693 |
|
|
| TRUCKING & LEASING – 0.2% |
|
|
|
|
| GATX Corp., |
|
|
|
|
|
|
|
|
| Sr. Unsecured, 8.75%, 5/15/14 |
|
|
500,000 |
|
|
|
539,222 |
|
|
|
|
|
|
|
|
|
|
|
|
| TOTAL CORPORATE BONDS |
|
|
|
|
|
| (COST $158,099,469) |
|
|
$ |
167,333,335 |
|
|
| ENHANCED EQUIPMENT TRUST CERTIFICATES – 0.7% |
|
|
| AIRLINES – 0.7% |
|
|
|
|
| American Airlines 2011-1, |
|
|
|
|
|
|
|
|
| Series A, Pass-Through Certificates, 5.25%, 1/31/21 |
|
|
450,858 |
|
|
|
493,126 |
|
|
|
|
| Continental Airlines 2009-2, |
|
|
|
|
|
|
|
|
| Pass-Through Certificates, 7.25%, 11/10/19 |
|
|
219,145 |
|
|
|
257,632 |
|
|
|
|
| Delta Air Lines 2007-1, |
|
|
|
|
|
|
|
|
| Series A, Pass-Through Certificates, 6.82%, 8/10/22 |
|
|
344,036 |
|
|
|
401,232 |
|
April 30, 2013 / ANNUAL REPORT
|
|
|
|
|
| PORTFOLIOS OF INVESTMENTS |
|
|
37 |
|
Wilmington Broad Market Bond Fund (continued)
|
|
|
|
|
|
|
|
|
|
Description |
|
Par Value |
|
|
Value |
|
|
|
|
| Delta Air Lines 2009-1, |
|
|
|
|
|
|
|
|
| Series A, Pass-Through Certificates, |
|
|
|
|
|
|
|
|
| 7.75%, 12/17/19 |
|
$ |
383,474 |
|
|
$ |
451,781 |
|
|
|
|
| United Air Lines 2009-2A, |
|
|
|
|
|
|
|
|
| Pass-Through Certificates, 9.75%, 1/15/17 |
|
|
355,618 |
|
|
|
414,518 |
|
|
|
|
|
|
|
|
|
|
|
|
|
| TOTAL AIRLINES |
|
|
|
|
|
$ |
2,018,289 |
|
|
|
|
|
|
|
|
|
|
|
|
| TOTAL ENHANCED EQUIPMENT TRUST CERTIFICATES |
|
|
|
|
|
| (COST $1,753,131) |
|
|
|
|
|
$ |
2,018,289 |
|
|
|
|
| GOVERNMENT AGENCIES – 4.0% |
|
|
|
|
|
|
|
|
|
| FEDERAL HOME LOAN BANK (FHLB) – 0.1% |
|
|
|
|
| 5.25%, 6/18/14 |
|
|
175,000 |
|
|
|
184,970 |
|
|
| FEDERAL HOME LOAN MORTGAGE CORPORATION
(FHLMC) – 2.5% |
|
|
|
|
| 1.25%, 10/02/19 |
|
|
4,300,000 |
|
|
|
4,321,548 |
|
|
|
|
| 1.75%, 5/30/19# |
|
|
2,000,000 |
|
|
|
2,078,805 |
|
|
|
|
| 2.38%, 1/13/22 |
|
|
125,000 |
|
|
|
131,734 |
|
|
|
|
| 4.38%, 7/17/15 |
|
|
500,000 |
|
|
|
544,997 |
|
|
|
|
|
|
|
|
|
|
|
|
| TOTAL FEDERAL HOME LOAN MORTGAGE CORPORATION (FHLMC) |
|
|
$ |
7,077,084 |
|
|
| FEDERAL NATIONAL MORTGAGE ASSOCIATION
(FNMA) – 1.4% |
|
|
|
|
| 1.38%, 11/15/16# |
|
|
500,000 |
|
|
|
515,552 |
|
|
|
|
| 4.88%, 12/15/16 |
|
|
700,000 |
|
|
|
810,086 |
|
|
|
|
| 5.00%, 5/11/17 |
|
|
750,000 |
|
|
|
881,608 |
|
|
|
|
| 6.25%, 5/15/29 |
|
|
750,000 |
|
|
|
1,087,068 |
|
|
|
|
| 7.25%, 5/15/30 |
|
|
400,000 |
|
|
|
640,319 |
|
|
|
|
|
|
|
|
|
|
|
|
| TOTAL FEDERAL NATIONAL MORTGAGE ASSOCIATION (FNMA) |
|
|
$ |
3,934,633 |
|
|
|
|
|
|
|
|
|
|
|
|
|
| TOTAL GOVERNMENT AGENCIES |
|
|
|
|
|
|
|
|
| (COST $10,443,884) |
|
|
|
|
|
$ |
11,196,687 |
|
|
| MORTGAGE-BACKED SECURITIES – 21.9% |
|
|
| FEDERAL HOME LOAN MORTGAGE CORPORATION (FHLMC) – 14.5% |
|
|
|
|
| Pool A13990, 4.50%, 10/01/33 |
|
|
112,714 |
|
|
|
121,704 |
|
|
|
|
| Pool A93415, 4.00%, 8/01/40 |
|
|
6,573,220 |
|
|
|
7,016,624 |
|
|
|
|
| Pool A93505, 4.50%, 8/01/40 |
|
|
4,288,826 |
|
|
|
4,591,752 |
|
|
|
|
| Pool A97047, 4.50%, 2/01/41 |
|
|
4,820,256 |
|
|
|
5,172,768 |
|
|
|
|
| Pool B17616, 5.50%, 1/01/20 |
|
|
173,821 |
|
|
|
185,187 |
|
|
|
|
| Pool C00478, 8.50%, 9/01/26 |
|
|
28,040 |
|
|
|
32,595 |
|
|
|
|
| Pool C01272, 6.00%, 12/01/31 |
|
|
87,355 |
|
|
|
96,332 |
|
|
|
|
| Pool C03750, 3.50%, 2/01/42 |
|
|
707,158 |
|
|
|
751,957 |
|
|
|
|
| Pool C04305, 3.00%, 11/01/42 |
|
|
5,610,306 |
|
|
|
5,850,051 |
|
|
|
|
| Pool C09020, 3.50%, 11/01/42 |
|
|
7,127,454 |
|
|
|
7,583,952 |
|
|
|
|
| Pool E00560, 6.00%, 7/01/13∑ |
|
|
2,056 |
|
|
|
2,075 |
|
|
|
|
| Pool E09010, 2.50%, 9/01/27 |
|
|
2,651,555 |
|
|
|
2,770,890 |
|
|
|
|
| Pool G01625, 5.00%, 11/01/33 |
|
|
125,672 |
|
|
|
135,907 |
|
|
|
|
| Pool G02296, 5.00%, 6/01/36 |
|
|
782,261 |
|
|
|
845,484 |
|
|
|
|
| Pool G02390, 6.00%, 9/01/36 |
|
|
33,531 |
|
|
|
36,537 |
|
|
|
|
| Pool G03703, 5.50%, 12/01/37 |
|
|
260,112 |
|
|
|
281,054 |
|
|
|
|
| Pool G04776, 5.50%, 7/01/38 |
|
|
375,838 |
|
|
|
405,628 |
|
|
|
|
|
|
|
|
|
|
|
Description |
|
Par Value |
|
|
Value |
|
|
|
|
| Pool G06222, 4.00%, 1/01/41 |
|
$ |
4,401,155 |
|
|
$ |
4,699,415 |
|
|
|
|
| Pool G08097, 6.50%, 11/01/35 |
|
|
46,031 |
|
|
|
52,002 |
|
|
|
|
| Pool G12709, 5.00%, 7/01/22 |
|
|
187,612 |
|
|
|
200,991 |
|
|
|
|
|
|
|
|
|
|
|
|
| TOTAL FEDERAL HOME LOAN MORTGAGE CORPORATION (FHLMC) |
|
|
$ |
40,832,905 |
|
|
| FEDERAL NATIONAL MORTGAGE ASSOCIATION
(FNMA) – 7.2% |
|
|
|
|
| Pool 254007, 6.50%, 10/01/31 |
|
|
40,883 |
|
|
|
46,114 |
|
|
|
|
| Pool 254759, 4.50%, 6/01/18 |
|
|
189,527 |
|
|
|
204,016 |
|
|
|
|
| Pool 254833, 4.50%, 8/01/18 |
|
|
32,140 |
|
|
|
34,326 |
|
|
|
|
| Pool 256515, 6.50%, 12/01/36 |
|
|
78,865 |
|
|
|
87,870 |
|
|
|
|
| Pool 256639, 5.00%, 2/01/27∑ |
|
|
57,482 |
|
|
|
62,519 |
|
|
|
|
| Pool 256752, 6.00%, 6/01/27 |
|
|
82,263 |
|
|
|
90,267 |
|
|
|
|
| Pool 329794, 7.00%, 2/01/26 |
|
|
50,252 |
|
|
|
57,953 |
|
|
|
|
| Pool 398162, 6.50%, 1/01/28 |
|
|
15,216 |
|
|
|
15,976 |
|
|
|
|
| Pool 402255, 6.50%, 12/01/27 |
|
|
5,976 |
|
|
|
6,351 |
|
|
|
|
| Pool 535939, 6.00%, 5/01/16 |
|
|
57,125 |
|
|
|
60,395 |
|
|
|
|
| Pool 629603, 5.50%, 2/01/17 |
|
|
22,765 |
|
|
|
24,355 |
|
|
|
|
| Pool 638023, 6.50%, 4/01/32 |
|
|
85,200 |
|
|
|
95,914 |
|
|
|
|
| Pool 642345, 6.50%, 5/01/32 |
|
|
104,592 |
|
|
|
117,745 |
|
|
|
|
| Pool 651292, 6.50%, 7/01/32 |
|
|
235,531 |
|
|
|
265,149 |
|
|
|
|
| Pool 686398, 6.00%, 3/01/33 |
|
|
237,213 |
|
|
|
263,112 |
|
|
|
|
| Pool 688987, 6.00%, 5/01/33 |
|
|
358,111 |
|
|
|
397,210 |
|
|
|
|
| Pool 695818, 5.00%, 4/01/18 |
|
|
199,516 |
|
|
|
214,701 |
|
|
|
|
| Pool 745412, 5.50%, 12/01/35 |
|
|
91,032 |
|
|
|
99,855 |
|
|
|
|
| Pool 838891, 6.00%, 7/01/35 |
|
|
34,864 |
|
|
|
38,431 |
|
|
|
|
| Pool 975207, 5.00%, 3/01/23 |
|
|
180,710 |
|
|
|
195,255 |
|
|
|
|
| Pool AB1796, 3.50%, 11/01/40 |
|
|
1,924,394 |
|
|
|
2,050,619 |
|
|
|
|
| Pool AE2520, 3.00%, 1/01/26 |
|
|
1,752,309 |
|
|
|
1,854,543 |
|
|
|
|
| Pool TBA, 5.00%, 5/01/37 |
|
|
13,000,000 |
|
|
|
14,074,531 |
|
|
|
|
|
|
|
|
|
|
|
|
| TOTAL FEDERAL NATIONAL MORTGAGE ASSOCIATION (FNMA) |
|
|
$ |
20,357,207 |
|
|
| GOVERNMENT NATIONAL MORTGAGE ASSOCIATION
(GNMA) – 0.2% |
|
|
|
|
| Pool 2077, 7.00%, 9/20/25 |
|
|
20,746 |
|
|
|
23,764 |
|
|
|
|
| Pool 354677, 7.50%, 10/15/23 |
|
|
41,974 |
|
|
|
48,330 |
|
|
|
|
| Pool 354713, 7.50%, 12/15/23 |
|
|
31,120 |
|
|
|
35,832 |
|
|
|
|
| Pool 354765, 7.00%, 2/15/24 |
|
|
60,641 |
|
|
|
69,658 |
|
|
|
|
| Pool 354827, 7.00%, 5/15/24 |
|
|
57,913 |
|
|
|
66,524 |
|
|
|
|
| Pool 360869, 7.50%, 5/15/24 |
|
|
29,943 |
|
|
|
34,584 |
|
|
|
|
| Pool 361843, 7.50%, 10/15/24 |
|
|
52,888 |
|
|
|
60,897 |
|
|
|
|
| Pool 373335, 7.50%, 5/15/22 |
|
|
23,130 |
|
|
|
26,549 |
|
|
|
|
| Pool 385623, 7.00%, 5/15/24 |
|
|
60,336 |
|
|
|
69,308 |
|
|
|
|
| Pool 503405, 6.50%, 4/15/29 |
|
|
83,680 |
|
|
|
96,465 |
|
|
|
|
|
|
|
|
|
|
|
|
| TOTAL GOVERNMENT NATIONAL MORTGAGE ASSOCIATION (GNMA) |
|
|
$ |
531,911 |
|
|
|
|
|
|
|
|
|
|
|
|
|
| TOTAL MORTGAGE-BACKED SECURITIES |
|
|
|
|
|
|
|
|
| (COST $60,352,078) |
|
|
|
|
|
$ |
61,722,023 |
|
ANNUAL REPORT / April
30, 2013
|
|
|
| 38 |
|
PORTFOLIOS OF INVESTMENTS |
Wilmington Broad Market Bond Fund (continued)
|
|
|
|
|
|
|
|
|
|
Description |
|
Par Value |
|
|
Value |
|
|
|
|
| MUNICIPAL BOND – 0.2% |
|
|
|
|
|
|
|
|
|
|
|
| BUILD AMERICA BONDS – 0.2% |
|
|
|
|
|
|
|
|
|
|
|
| New Jersey State, EDA, |
|
|
|
|
|
|
|
|
| Revenue Bonds, 1.28%, 6/15/13D,∑ |
|
$ |
650,000 |
|
|
$ |
650,162 |
|
|
|
|
|
|
|
|
|
|
|
|
|
| TOTAL MUNICIPAL BOND |
|
|
|
|
|
|
|
|
| (COST $650,000) |
|
|
|
|
|
$ |
650,162 |
|
|
|
|
| U.S. TREASURY – 13.3% |
|
|
|
|
|
|
|
|
|
|
|
| U.S. TREASURY BONDS – 2.9% |
|
|
|
|
|
|
|
|
|
|
|
| 2.75%, 8/15/42 |
|
|
2,815,000 |
|
|
|
2,738,268 |
|
| 3.00%, 5/15/42 |
|
|
500,000 |
|
|
|
512,703 |
|
| 5.25%, 2/15/29 |
|
|
500,000 |
|
|
|
695,492 |
|
| 5.38%, 2/15/31 |
|
|
600,000 |
|
|
|
858,042 |
|
| 6.25%, 5/15/30 |
|
|
500,000 |
|
|
|
774,959 |
|
| 6.38%, 8/15/27 |
|
|
450,000 |
|
|
|
684,038 |
|
| 7.50%, 11/15/16 |
|
|
300,000 |
|
|
|
374,576 |
|
| 8.88%, 2/15/19 |
|
|
1,130,000 |
|
|
|
1,648,411 |
|
|
|
|
|
|
|
|
|
|
|
|
|
| TOTAL U.S. TREASURY BONDS |
|
|
|
|
|
$ |
8,286,489 |
|
|
|
|
| U.S. TREASURY NOTES – 10.4% |
|
|
|
|
|
|
|
|
|
|
|
| 0.63%, 8/31/17 |
|
|
1,860,000 |
|
|
|
1,866,593 |
|
| 0.63%, 9/30/17 |
|
|
750,000 |
|
|
|
751,957 |
|
| 0.75%, 10/31/17 |
|
|
2,380,000 |
|
|
|
2,397,743 |
|
| 0.75%, 12/31/17# |
|
|
500,000 |
|
|
|
503,183 |
|
| 0.88%, 2/28/17 |
|
|
4,000,000 |
|
|
|
4,063,699 |
|
| 0.88%, 4/30/17 |
|
|
2,000,000 |
|
|
|
2,030,938 |
|
| 1.00%, 3/31/17 |
|
|
1,500,000 |
|
|
|
1,530,689 |
|
| 1.25%, 9/30/15 |
|
|
1,000,000 |
|
|
|
1,023,998 |
|
| 1.25%, 1/31/19 |
|
|
250,000 |
|
|
|
256,051 |
|
| 1.38%, 2/28/19 |
|
|
2,500,000 |
|
|
|
2,576,924 |
|
| 1.63%, 11/15/22 |
|
|
1,928,000 |
|
|
|
1,926,014 |
|
| 1.75%, 7/31/15 |
|
|
500,000 |
|
|
|
516,918 |
|
| 1.75%, 5/15/22 |
|
|
1,380,000 |
|
|
|
1,405,120 |
|
| 2.00%, 11/15/21 |
|
|
1,210,000 |
|
|
|
1,265,455 |
|
| 2.13%, 8/15/21 |
|
|
250,000 |
|
|
|
264,660 |
|
| 2.25%, 1/31/15 |
|
|
1,000,000 |
|
|
|
1,035,714 |
|
| 2.25%, 3/31/16 |
|
|
1,250,000 |
|
|
|
1,320,844 |
|
| 2.25%, 7/31/18 |
|
|
500,000 |
|
|
|
539,520 |
|
| 2.50%, 4/30/15 |
|
|
1,000,000 |
|
|
|
1,045,233 |
|
| 2.63%, 11/15/20 |
|
|
500,000 |
|
|
|
551,345 |
|
| 3.13%, 5/15/19 |
|
|
750,000 |
|
|
|
850,196 |
|
| 3.63%, 2/15/20 |
|
|
750,000 |
|
|
|
878,455 |
|
| 4.00%, 8/15/18 |
|
|
500,000 |
|
|
|
586,009 |
|
|
|
|
|
|
|
|
|
|
|
|
|
| TOTAL U.S. TREASURY NOTES |
|
|
|
|
|
$ |
29,187,258 |
|
|
|
|
|
|
|
|
|
|
|
|
|
| TOTAL U.S. TREASURY |
|
|
|
|
|
|
|
|
| (COST $35,398,908) |
|
|
|
|
|
$ |
37,473,747 |
|
|
|
|
|
|
|
|
|
|
|
Description |
|
Par Value |
|
|
Value |
|
|
|
|
| REPURCHASE AGREEMENT – 1.5% |
|
|
|
|
|
|
|
|
|
|
|
| Credit Suisse First Boston LLC, 0.14%, dated 04/30/13, due 05/01/13, repurchase price $4,116,973, collateralized by a U.S. Treasury Security 2.75%, maturing
08/15/42; total market value of $4,200,174. |
|
$ |
4,116,957 |
|
|
$ |
4,116,957 |
|
|
|
|
|
|
|
|
|
|
|
|
| TOTAL REPURCHASE AGREEMENT |
|
|
|
|
|
| (COST $4,116,957) |
|
|
|
|
|
$ |
4,116,957 |
|
|
|
|
|
|
|
|
|
|
|
|
| TOTAL INVESTMENTS IN SECURITIES – 105.9% |
|
|
|
|
|
| (COST $284,794,250) |
|
|
|
|
|
$ |
298,687,107 |
|
|
|
|
|
|
|
|
|
|
|
| CASH COLLATERAL INVESTED FOR SECURITIES ON LOAN – 1.9% |
|
|
|
|
| REPURCHASE AGREEMENTS – 1.9% |
|
|
|
|
|
|
|
|
|
|
|
| Citigroup Global Markets, Inc., 0.18%, dated 04/30/13, due 05/01/13, repurchase price $1,302,352, collateralized by U.S. Government Securities 0.84% to 6. 50%,
maturing 11/01/18 to 03/15/53; total market value of $ 1,328,964. |
|
|
1,302,345 |
|
|
|
1,302,345 |
|
|
|
|
| Deutsche Bank Securities, Inc., 0. 15%, dated 04/30/13, due 05/01/13, repurchase price $273,551, collateralized by U.S. Treasury Securities 0.00% to 10. 63%,
maturing 05/15/13 to 05/15/42; total market value of $ 279,021. |
|
|
273,550 |
|
|
|
273,550 |
|
|
|
|
| Goldman Sachs & Co., 0.17%, dated 04/30/13, due 05/01/13, repurchase price $1,302,351, collateralized by U.S. Government Securities 2.50% to 6. 50%,
maturing 05/01/20 to 04/01/43; total market value of $ 1,328,392. |
|
|
1,302,345 |
|
|
|
1,302,345 |
|
|
|
|
| Mizuho Securities USA, Inc., 0.20%, dated 04/30/13, due 05/01/13, repurchase price $1,303,352, collateralized by U.S. Government Securities 2.08% to 7. 00%,
maturing 01/01/22 to 04/15/52; total market value of $ 1,328,392. |
|
|
1,302,345 |
|
|
|
1,302,345 |
|
|
|
|
| RBC Capital Markets LLC, 0.17%, dated 04/30/13, due 05/01/13, repurchase price $1,302,351, collateralized by U.S. Government Securities 1.97% to 4. 50%,
maturing 08/01/24 to 12/15/44; total market value of $ 1,328,392. |
|
|
1,302,345 |
|
|
|
1,302,345 |
|
|
|
|
|
|
|
|
|
|
|
|
| TOTAL CASH COLLATERAL INVESTED FOR SECURITIES ON LOAN |
|
|
|
|
|
| (COST $5,482,930) |
|
|
|
|
|
$ |
5,482,930 |
|
|
|
|
|
|
|
|
|
|
| |
|
|
|
|
|
|
|
|
|
|
|
|
|
|
Value |
|
|
|
|
| TOTAL INVESTMENTS – 107.8% |
|
|
|
|
|
|
|
|
| (COST $290,277,180) |
|
|
|
|
|
$ |
304,170,037 |
|
|
|
| COLLATERAL FOR SECURITIES ON LOAN – (1.9%) |
|
|
|
(5,482,930 |
) |
|
|
| OTHER LIABILITIES LESS ASSETS – (5.9%) |
|
|
|
(16,562,653 |
) |
|
|
|
|
|
|
|
|
|
|
|
|
| TOTAL NET ASSETS – 100.0% |
|
|
|
|
|
$ |
282,124,454 |
|
|
|
|
|
|
|
|
|
|
Cost of investments for Federal
income tax purposes is $290,277,180. The net unrealized appreciation/(depreciation) of investments was $13,892,857. This consists of net unrealized appreciation from investment for those securities having an excess of value over cost of $14,537,456
and net unrealized depreciation from investments for those securities having an excess of cost over value of $644,599.
April 30, 2013 / ANNUAL REPORT
|
|
|
|
|
| PORTFOLIOS OF INVESTMENTS |
|
|
39 |
|
Wilmington Broad Market Bond Fund (concluded)
Various inputs are used in determining the value of the Fund’s investments. These inputs are summarized in the three broad levels listed below.
Level 1 – quoted prices in active markets for identical securities
Level 2 – other significant observable inputs (including quoted prices for similar securities, interest rates, prepayment
speeds, credit risk, etc.)
Level 3 – significant unobservable inputs (including the Fund’s own assumptions in
determining the fair value of investments)
The following is a summary of the inputs used as of April 30, 2013 in valuing the
Fund’s assets carried at fair value:
|
|
|
|
|
|
|
|
|
|
|
|
|
|
|
|
|
|
|
|
Level 1
|
|
|
Level 2 |
|
|
Level 3
|
|
|
Total |
|
| Investments in Securities |
|
|
|
|
|
|
|
|
|
|
|
|
|
|
|
|
| Asset-Backed Securities |
|
$ |
— |
|
|
$ |
1,813,358 |
|
|
$ |
— |
|
|
$ |
1,813,358 |
|
| Collateralized Mortgage Obligations |
|
|
— |
|
|
|
12,362,549 |
|
|
|
— |
|
|
|
12,362,549 |
|
| Corporate Bonds |
|
|
— |
|
|
|
167,333,335 |
|
|
|
— |
|
|
|
167,333,335 |
|
| Enhanced Equipment Trust Certificates |
|
|
— |
|
|
|
2,018,289 |
|
|
|
— |
|
|
|
2,018,289 |
|
| Government Agencies |
|
|
— |
|
|
|
11,196,687 |
|
|
|
— |
|
|
|
11,196,687 |
|
| Mortgage-Backed Securities |
|
|
— |
|
|
|
61,722,023 |
|
|
|
— |
|
|
|
61,722,023 |
|
| Municipal Bond |
|
|
— |
|
|
|
650,162 |
|
|
|
— |
|
|
|
650,162 |
|
| U.S. Treasury |
|
|
— |
|
|
|
37,473,747 |
|
|
|
— |
|
|
|
37,473,747 |
|
| Repurchase Agreements |
|
|
— |
|
|
|
9,599,887 |
|
|
|
— |
|
|
|
9,599,887 |
|
|
|
|
|
|
|
|
|
|
|
|
|
|
|
|
|
|
| Total |
|
$ |
— |
|
|
$ |
304,170,037 |
|
|
$ |
— |
|
|
$ |
304,170,037 |
|
|
|
|
|
|
|
|
|
|
|
|
|
|
|
|
|
|
See Notes to Portfolios of Investments
See Notes which are an integral part of the Financial Statements
ANNUAL REPORT / April
30, 2013
40
PORTFOLIO OF INVESTMENTS SUMMARY TABLE
Wilmington Intermediate-Term Bond Fund
At April 30, 2013, the Fund’s portfolio composition was as follows (unaudited):
|
|
|
|
|
|
| |
|
Percentage of
Total Net Assets |
| Corporate Bonds |
|
|
|
55.7 |
% |
| U.S. Treasury |
|
|
|
18.2 |
% |
| Government Agencies |
|
|
|
16.0 |
% |
| Mortgage-Backed Securities |
|
|
|
6.4 |
% |
| Collateralized Mortgage Obligations |
|
|
|
2.1 |
% |
| Municipal Bond |
|
|
|
0.7 |
% |
| Asset-Backed Security |
|
|
|
0.2 |
% |
| Cash Equivalents1 |
|
|
|
7.4 |
% |
| Other Assets and Liabilities – Net2 |
|
|
|
(6.7 |
)% |
|
|
|
|
|
|
| TOTAL |
|
|
|
100.0 |
% |
|
|
|
|
|
|
| (1) |
Cash Equivalents include investments in repurchase agreements. |
| (2) |
Assets, other than investments in securities, less liabilities. See Statements of Assets and Liabilities. |
| (3) |
Derived from data provided by Moody’s Investors Service and Standard and Poor’s.
|
|
|
|
|
|
|
| Credit Quality Diversification3 |
|
Percentage of
Total Net Assets |
| AAA |
|
|
|
17.7 |
% |
| AA |
|
|
|
5.3 |
% |
| A |
|
|
|
17.9 |
% |
| BBB |
|
|
|
32.3 |
% |
| BB |
|
|
|
1.0 |
% |
| CCC |
|
|
|
0.4 |
% |
| Not Rated |
|
|
|
7.4 |
% |
| U.S. Government Agency Securities |
|
|
|
6.5 |
% |
| U.S. Treasury |
|
|
|
18.2 |
% |
| Other Assets and Liabilities – Net2 |
|
|
|
(6.7 |
)% |
|
|
|
|
|
|
| TOTAL |
|
|
|
100.0 |
% |
|
|
|
|
|
|
PORTFOLIO OF INVESTMENTS
April 30, 2013
|
|
|
|
|
|
|
|
|
|
Description |
|
Par Value |
|
|
Value |
|
|
|
|
| ASSET-BACKED SECURITY – 0.2% |
|
|
|
|
|
|
|
|
|
|
|
| WHOLE LOAN – 0.2% |
|
|
|
|
|
|
|
|
|
|
|
| SLM Private Education Loan Trust, |
|
|
|
|
|
|
|
|
| Series 2011-A, Class A1, |
|
|
|
|
|
|
|
|
| 1.20%, 10/15/24D,•,
W |
|
$ |
486,528 |
|
|
$ |
490,273 |
|
|
|
|
|
|
|
|
|
|
|
|
|
| TOTAL ASSET-BACKED SECURITY |
|
|
|
|
|
|
|
|
| (COST $486,528) |
|
|
|
|
|
$ |
490,273 |
|
|
| COLLATERALIZED MORTGAGE OBLIGATIONS – 2.1% |
|
|
| COMMERCIAL MORTGAGE-BACKED SECURITIES
(CMBS) – 0.7% |
|
|
|
|
| Merrill Lynch Mortgage Trust, |
|
|
|
|
|
|
|
|
| Series 2006-C1, Class A2, 5.83%, 5/12/39D |
|
|
420,226 |
|
|
|
432,524 |
|
|
|
|
| Morgan Stanley Capital I Trust, |
|
|
|
|
|
|
|
|
| Series 2004-IQ7, Class A4, 5.54%, 6/15/38D |
|
|
886,948 |
|
|
|
915,365 |
|
|
|
|
|
|
|
|
|
|
|
|
| TOTAL COMMERCIAL MORTGAGE-BACKED SECURITIES (CMBS) |
|
|
$ |
1,347,889 |
|
|
| FEDERAL HOME LOAN BANK (FHLB) – 0.9% |
|
|
|
|
| Series 1, 4.88%, 5/17/17# |
|
|
1,615,000 |
|
|
|
1,894,992 |
|
|
| FEDERAL NATIONAL MORTGAGE ASSOCIATION
(FNMA) – 0.1% |
|
|
|
|
| Series 2005-29, Class WC, 4.75%, 4/25/35 |
|
|
180,347 |
|
|
|
198,108 |
|
|
|
|
|
|
|
|
|
|
|
Description |
|
Par Value |
|
|
Value |
|
|
| WHOLE LOAN – 0.4% |
|
|
|
|
| IndyMac INDA Mortgage Loan Trust, |
|
|
|
|
|
|
|
|
| Series 2005-AR1, Class 2A1, |
|
|
|
|
|
|
|
|
| 2.90%, 11/25/35D |
|
$ |
976,985 |
|
|
$ |
864,083 |
|
|
|
|
|
|
|
|
|
|
|
|
|
| TOTAL COLLATERALIZED MORTGAGE OBLIGATIONS |
|
|
|
|
|
|
|
|
| (COST $4,242,753) |
|
|
|
|
|
$ |
4,305,072 |
|
|
| CORPORATE BONDS – 55.7% |
|
|
| AEROSPACE & DEFENSE – 0.8% |
|
|
|
|
| L-3 Communications Corp., |
|
|
|
|
|
|
|
|
| Company Guaranteed, 3.95%, 11/15/16 |
|
|
250,000 |
|
|
|
269,804 |
|
|
|
|
| L-3 Communications Corp., |
|
|
|
|
|
|
|
|
| Company Guaranteed, 4.75%, 7/15/20 |
|
|
1,250,000 |
|
|
|
1,396,799 |
|
|
|
|
|
|
|
|
|
|
|
|
|
| TOTAL AEROSPACE & DEFENSE |
|
|
|
|
|
$ |
1,666,603 |
|
|
| AUTO PARTS & EQUIPMENT – 0.4% |
|
|
|
|
| Johnson Controls, Inc., |
|
|
|
|
|
|
|
|
| Sr. Unsecured, 2.60%, 12/01/16 |
|
|
845,000 |
|
|
|
884,079 |
|
|
| AUTOMOTIVE – 2.5% |
|
|
|
|
| Ford Motor Credit Co., LLC, |
|
|
|
|
|
|
|
|
| Sr. Unsecured, 3.88%, 1/15/15 |
|
|
1,500,000 |
|
|
|
1,563,185 |
|
|
|
|
| Ford Motor Credit Co., LLC, |
|
|
|
|
|
|
|
|
| Sr. Unsecured, 6.63%, 8/15/17 |
|
|
250,000 |
|
|
|
294,029 |
|
|
|
|
| Ford Motor Credit Co., LLC, |
|
|
|
|
|
|
|
|
| Sr. Unsecured, 5.88%, 8/02/21 |
|
|
1,000,000 |
|
|
|
1,167,367 |
|
April 30, 2013 / ANNUAL REPORT
|
|
|
|
|
| PORTFOLIOS OF INVESTMENTS |
|
|
41 |
|
Wilmington Intermediate-Term Bond Fund (continued)
|
|
|
|
|
|
|
|
|
|
Description |
|
Par Value |
|
|
Value |
|
|
|
|
| General Motors Financial Co., Inc., |
|
|
|
|
|
|
|
|
| Company Guaranteed, 4.75%, 8/15/17•,W
|
|
$ |
250,000 |
|
|
$ |
265,625 |
|
|
|
|
| Hyundai Capital America, |
|
|
|
|
|
|
|
|
| Sr. Unsecured, 1.63%, 10/02/15•,W
|
|
|
825,000 |
|
|
|
829,408 |
|
|
|
|
| Toyota Motor Credit Corp., |
|
|
|
|
|
|
|
|
| Sr. Unsecured, MTN, 1.00%, 2/17/15 |
|
|
500,000 |
|
|
|
504,723 |
|
|
|
|
| Toyota Motor Credit Corp., |
|
|
|
|
|
|
|
|
| Sr. Unsecured, MTN, 2.05%, 1/12/17 |
|
|
700,000 |
|
|
|
726,587 |
|
|
|
|
|
|
|
|
|
|
|
|
|
| TOTAL AUTOMOTIVE |
|
|
|
|
|
$ |
5,350,924 |
|
|
| BEVERAGES – 1.6% |
|
|
|
|
| Anheuser-Busch InBev Worldwide, Inc., |
|
|
|
|
|
|
|
|
| Company Guaranteed, 7.75%, 1/15/19 |
|
|
1,000,000 |
|
|
|
1,324,469 |
|
|
|
|
| Coca-Cola Co., |
|
|
|
|
|
|
|
|
| Sr. Unsecured, 1.80%, 9/01/16# |
|
|
2,000,000 |
|
|
|
2,077,343 |
|
|
|
|
|
|
|
|
|
|
|
|
|
| TOTAL BEVERAGES |
|
|
|
|
|
$ |
3,401,812 |
|
|
| BIOTECHNOLOGY – 0.5% |
|
|
|
|
| Gilead Sciences, Inc., |
|
|
|
|
|
|
|
|
| Sr. Unsecured, 4.50%, 4/01/21 |
|
|
500,000 |
|
|
|
575,689 |
|
|
|
|
| Gilead Sciences, Inc., |
|
|
|
|
|
|
|
|
| Sr. Unsecured, 4.40%, 12/01/21 |
|
|
350,000 |
|
|
|
401,969 |
|
|
|
|
|
|
|
|
|
|
|
|
|
| TOTAL BIOTECHNOLOGY |
|
|
|
|
|
$ |
977,658 |
|
|
| CAPITAL MARKETS – 2.1% |
|
|
|
|
| BlackRock, Inc., |
|
|
|
|
|
|
|
|
| Series 2, Sr. Unsecured, 5.00%, 12/10/19 |
|
|
650,000 |
|
|
|
777,844 |
|
|
|
|
| Charles Schwab Corp., |
|
|
|
|
|
|
|
|
| Sr. Unsecured, MTN, 6.38%, 9/01/17 |
|
|
1,000,000 |
|
|
|
1,200,517 |
|
|
|
|
| Goldman Sachs Group, Inc., |
|
|
|
|
|
|
|
|
| Sr. Unsecured, 6.25%, 9/01/17 |
|
|
655,000 |
|
|
|
770,749 |
|
|
|
|
| Goldman Sachs Group, Inc., |
|
|
|
|
|
|
|
|
| Sr. Unsecured, FRN, 1.48%, 4/30/18D |
|
|
750,000 |
|
|
|
749,079 |
|
|
|
|
| Morgan Stanley, |
|
|
|
|
|
|
|
|
| Sr. Unsecured, 1.54%, 2/25/16D |
|
|
867,000 |
|
|
|
873,056 |
|
|
|
|
|
|
|
|
|
|
|
|
|
| TOTAL CAPITAL MARKETS |
|
|
|
|
|
$ |
4,371,245 |
|
|
| CHEMICALS – 0.5% |
|
|
|
|
| Dow Chemical Co., |
|
|
|
|
|
|
|
|
| Sr. Unsecured, 2.50%, 2/15/16 |
|
|
501,000 |
|
|
|
522,715 |
|
|
|
|
| Dow Chemical Co., |
|
|
|
|
|
|
|
|
| Sr. Unsecured, 4.13%, 11/15/21 |
|
|
500,000 |
|
|
|
546,858 |
|
|
|
|
|
|
|
|
|
|
|
|
|
| TOTAL CHEMICALS |
|
|
|
|
|
$ |
1,069,573 |
|
|
| COAL – 0.3% |
|
|
|
|
| Consol Energy, Inc., |
|
|
|
|
|
|
|
|
| Company Guaranteed, 8.00%, 4/01/17 |
|
|
625,000 |
|
|
|
680,469 |
|
|
| COMMERCIAL BANKS – 6.8% |
|
|
|
|
| Bank of Montreal, |
|
|
|
|
|
|
|
|
| Sr. Unsecured, MTN, 2.50%, 1/11/17 |
|
|
1,500,000 |
|
|
|
1,575,083 |
|
|
|
|
| Bank of Nova Scotia, |
|
|
|
|
|
|
|
|
| Sr. Unsecured, 1.38%, 12/18/17 |
|
|
1,000,000 |
|
|
|
1,006,901 |
|
|
|
|
| BB&T Corp., |
|
|
|
|
|
|
|
|
| Sr. Unsecured, MTN, 3.20%, 3/15/16 |
|
|
1,000,000 |
|
|
|
1,062,556 |
|
|
|
|
|
|
|
|
|
|
|
Description |
|
Par Value |
|
|
Value |
|
|
|
|
| Comerica, Inc., |
|
|
|
|
|
|
|
|
| Sr. Unsecured, 3.00%, 9/16/15 |
|
$ |
1,000,000 |
|
|
$ |
1,055,203 |
|
|
|
|
| Fifth Third Bancorp, |
|
|
|
|
|
|
|
|
| Sr. Unsecured, 3.63%, 1/25/16 |
|
|
850,000 |
|
|
|
910,398 |
|
|
|
|
| Fifth Third Bank, |
|
|
|
|
|
|
|
|
| Sr. Unsecured, BKNT, 1.45%, 2/28/18 |
|
|
425,000 |
|
|
|
426,626 |
|
|
|
|
| KeyCorp, |
|
|
|
|
|
|
|
|
| Sr. Unsecured, MTN, 3.75%, 8/13/15 |
|
|
750,000 |
|
|
|
799,334 |
|
|
|
|
| SunTrust Banks, Inc., |
|
|
|
|
|
|
|
|
| Sr. Unsecured, 3.60%, 4/15/16 |
|
|
1,475,000 |
|
|
|
1,578,254 |
|
|
|
|
| Toronto-Dominion Bank, |
|
|
|
|
|
|
|
|
| Sr. Unsecured, 2.50%, 7/14/16 |
|
|
1,000,000 |
|
|
|
1,052,480 |
|
|
|
|
| U.S. Bancorp, |
|
|
|
|
|
|
|
|
| Sr. Unsecured, MTN, 2.20%, 11/15/16 |
|
|
500,000 |
|
|
|
524,188 |
|
|
|
|
| Wells Fargo & Co., |
|
|
|
|
|
|
|
|
| Sr. Unsecured, 1.50%, 1/16/18 |
|
|
1,000,000 |
|
|
|
1,002,741 |
|
|
|
|
| Wells Fargo & Co., |
|
|
|
|
|
|
|
|
| Sr. Unsecured, MTN, 3.50%, 3/08/22 |
|
|
750,000 |
|
|
|
804,964 |
|
|
|
|
| Wells Fargo & Co., |
|
|
|
|
|
|
|
|
| Series M, Subordinated, 3.45%, 2/13/23 |
|
|
750,000 |
|
|
|
763,816 |
|
|
|
|
| Westpac Banking Corp., |
|
|
|
|
|
|
|
|
| Sr. Unsecured, 2.00%, 8/14/17# |
|
|
825,000 |
|
|
|
856,156 |
|
|
|
|
| Westpac Banking Corp., |
|
|
|
|
|
|
|
|
| Sr. Unsecured, 4.88%, 11/19/19 |
|
|
750,000 |
|
|
|
887,656 |
|
|
|
|
|
|
|
|
|
|
|
|
|
| TOTAL COMMERCIAL BANKS |
|
|
|
|
|
$ |
14,306,356 |
|
|
| COMMERCIAL FINANCE – 0.4% |
|
|
|
|
| General Electric Capital Corp., |
|
|
|
|
|
|
|
|
| Sr. Unsecured, MTN, 2.30%, 4/27/17 |
|
|
750,000 |
|
|
|
781,716 |
|
|
| COMPUTERS – 0.9% |
|
|
|
|
| Apple, Inc., |
|
|
|
|
|
|
|
|
| Sr. Unsecured, 1.00%, 5/03/18 |
|
|
500,000 |
|
|
|
498,155 |
|
|
|
|
| Apple, Inc., |
|
|
|
|
|
|
|
|
| Sr. Unsecured, 2.40%, 5/03/23 |
|
|
645,000 |
|
|
|
644,142 |
|
|
|
|
| International Business Machines Corp., |
|
|
|
|
|
|
|
|
| Sr. Unsecured, 1.95%, 7/22/16 |
|
|
725,000 |
|
|
|
750,179 |
|
|
|
|
|
|
|
|
|
|
|
|
|
| TOTAL COMPUTERS |
|
|
|
|
|
$ |
1,892,476 |
|
|
| CONSUMER FINANCE – 1.2% |
|
|
|
|
| American Express Co., |
|
|
|
|
|
|
|
|
| Sr. Unsecured, 6.15%, 8/28/17 |
|
|
750,000 |
|
|
|
901,695 |
|
|
|
|
| Capital One Financial Corp., |
|
|
|
|
|
|
|
|
| Sr. Unsecured, 2.15%, 3/23/15 |
|
|
1,655,000 |
|
|
|
1,690,233 |
|
|
|
|
|
|
|
|
|
|
|
|
|
| TOTAL CONSUMER FINANCE |
|
|
|
|
|
$ |
2,591,928 |
|
|
| DIVERSIFIED FINANCIAL SERVICES – 2.6% |
|
|
|
|
| Bank of America Corp., |
|
|
|
|
|
|
|
|
| Sr. Unsecured, MTN, 1.10%, 3/22/16D |
|
|
750,000 |
|
|
|
748,817 |
|
|
|
|
| Bank of America Corp., |
|
|
|
|
|
|
|
|
| Sr. Unsecured, MTN, 2.00%, 1/11/18 |
|
|
750,000 |
|
|
|
752,188 |
|
|
|
|
| Citigroup, Inc., |
|
|
|
|
|
|
|
|
| Sr. Unsecured, 5.85%, 8/02/16 |
|
|
750,000 |
|
|
|
858,443 |
|
|
|
|
| Citigroup, Inc., |
|
|
|
|
|
|
|
|
| Sr. Unsecured, 6.13%, 5/15/18 |
|
|
750,000 |
|
|
|
903,238 |
|
|
|
|
| JPMorgan Chase & Co., |
|
|
|
|
|
|
|
|
| Sr. Unsecured, 6.00%, 1/15/18 |
|
|
250,000 |
|
|
|
297,428 |
|
ANNUAL REPORT /
April 30, 2013
|
|
|
| 42 |
|
PORTFOLIOS OF INVESTMENTS |
Wilmington Intermediate-Term Bond Fund (continued)
|
|
|
|
|
|
|
|
|
|
Description |
|
Par Value |
|
|
Value |
|
|
|
|
| JPMorgan Chase & Co., |
|
|
|
|
|
|
|
|
| Sr. Unsecured, GMTN, 0.91%, 2/26/16D |
|
$ |
1,005,000 |
|
|
$ |
1,007,978 |
|
|
|
|
| JPMorgan Chase & Co., |
|
|
|
|
|
|
|
|
| Subordinated, 3.38%, 5/01/23 |
|
|
855,000 |
|
|
|
854,035 |
|
|
|
|
|
|
|
|
|
|
|
|
|
| TOTAL DIVERSIFIED FINANCIAL SERVICES |
|
|
|
|
|
$ |
5,422,127 |
|
|
| ELECTRIC – 6.6% |
|
|
|
|
| Ameren Illinois Co., |
|
|
|
|
|
|
|
|
| Sr. Secured, 9.75%, 11/15/18 |
|
|
2,775,000 |
|
|
|
3,918,589 |
|
|
|
|
| CMS Energy Corp., |
|
|
|
|
|
|
|
|
| Sr. Unsecured, 6.55%, 7/17/17 |
|
|
625,000 |
|
|
|
750,000 |
|
|
|
|
| Commonwealth Edison Co., |
|
|
|
|
|
|
|
|
| 1st Mortgage, 1.95%, 9/01/16 |
|
|
1,000,000 |
|
|
|
1,037,388 |
|
|
|
|
| Detroit Edison Co., |
|
|
|
|
|
|
|
|
| Series G, Sr. Secured, 5.60%, 6/15/18 |
|
|
950,000 |
|
|
|
1,153,965 |
|
|
|
|
| Dominion Resources, Inc., |
|
|
|
|
|
|
|
|
| Sr. Unsecured, 2.25%, 9/01/15 |
|
|
500,000 |
|
|
|
518,166 |
|
|
|
|
| Entergy Corp., |
|
|
|
|
|
|
|
|
| Sr. Unsecured, 4.70%, 1/15/17 |
|
|
1,950,000 |
|
|
|
2,136,499 |
|
|
|
|
| Exelon Generation Co. LLC, |
|
|
|
|
|
|
|
|
| Sr. Unsecured, 4.25%, 6/15/22 |
|
|
750,000 |
|
|
|
797,524 |
|
|
|
|
| Exelon Generation Co., LLC, |
|
|
|
|
|
|
|
|
| Sr. Unsecured, 6.20%, 10/01/17# |
|
|
200,000 |
|
|
|
236,180 |
|
|
|
|
| FirstEnergy Corp., |
|
|
|
|
|
|
|
|
| Series A, Sr. Unsecured, 2.75%, 3/15/18 |
|
|
230,000 |
|
|
|
234,050 |
|
|
|
|
| Florida Power & Light Co., |
|
|
|
|
|
|
|
|
| 1st Mortgage, 5.55%, 11/01/17 |
|
|
500,000 |
|
|
|
599,634 |
|
|
|
|
| Florida Power Corp., |
|
|
|
|
|
|
|
|
| 1st Mortgage, 3.10%, 8/15/21 |
|
|
500,000 |
|
|
|
536,705 |
|
|
|
|
| Southern California Edison Co., |
|
|
|
|
|
|
|
|
| Series 05-A, 1st Mortgage, 5.00%, 1/15/16 |
|
|
654,000 |
|
|
|
732,469 |
|
|
|
|
| UIL Holdings Corp., |
|
|
|
|
|
|
|
|
| Sr. Unsecured, 4.63%, 10/01/20 |
|
|
1,250,000 |
|
|
|
1,354,785 |
|
|
|
|
|
|
|
|
|
|
|
|
|
| TOTAL ELECTRIC |
|
|
|
|
|
$ |
14,005,954 |
|
|
| ELECTRONICS – 0.8% |
|
|
|
|
| Thermo Fisher Scientific, Inc., |
|
|
|
|
|
|
|
|
| Sr. Unsecured, 2.25%, 8/15/16 |
|
|
1,605,000 |
|
|
|
1,653,137 |
|
|
| FOOD PRODUCTS – 0.3% |
|
|
|
|
| Mondelez International, Inc., |
|
|
|
|
|
|
|
|
| Sr. Unsecured, 4.13%, 2/09/16 |
|
|
500,000 |
|
|
|
544,692 |
|
|
| FOOD RETAILING – 0.7% |
|
|
|
|
| Kroger Co., |
|
|
|
|
|
|
|
|
| Company Guaranteed, 4.95%, 1/15/15 |
|
|
675,000 |
|
|
|
722,148 |
|
|
|
|
| Kroger Co., |
|
|
|
|
|
|
|
|
| Company Guaranteed, 3.90%, 10/01/15 |
|
|
250,000 |
|
|
|
268,257 |
|
|
|
|
| Kroger Co., |
|
|
|
|
|
|
|
|
| Sr. Unsecured, 2.20%, 1/15/17 |
|
|
500,000 |
|
|
|
517,590 |
|
|
|
|
|
|
|
|
|
|
|
|
|
| TOTAL FOOD RETAILING |
|
|
|
|
|
$ |
1,507,995 |
|
|
| HEALTH CARE PROVIDERS & SERVICES – 0.3% |
|
|
|
|
| UnitedHealth Group, Inc., |
|
|
|
|
|
|
|
|
| Sr. Unsecured, 6.00%, 6/15/17 |
|
|
500,000 |
|
|
|
597,348 |
|
|
|
|
|
|
|
|
|
|
|
Description |
|
Par Value |
|
|
Value |
|
|
| HOME FURNISHINGS – 0.7% |
|
|
|
|
| Whirlpool Corp., |
|
|
|
|
|
|
|
|
| Notes, MTN, 3.70%, 3/01/23 |
|
$ |
275,000 |
|
|
$ |
286,544 |
|
|
|
|
| Whirlpool Corp., |
|
|
|
|
|
|
|
|
| Sr. Unsecured, 6.50%, 6/15/16 |
|
|
1,000,000 |
|
|
|
1,144,641 |
|
|
|
|
|
|
|
|
|
|
|
|
|
| TOTAL HOME FURNISHINGS |
|
|
|
|
|
$ |
1,431,185 |
|
|
| HOUSEHOLD PRODUCTS – 0.6% |
|
|
|
|
| Tupperware Brands Corp., |
|
|
|
|
|
|
|
|
| Company Guaranteed, 4.75%, 6/01/21 |
|
|
1,250,000 |
|
|
|
1,342,840 |
|
|
| INSURANCE – 1.9% |
|
|
|
|
| Hartford Financial Services Group, Inc., |
|
|
|
|
|
|
|
|
| Sr. Unsecured, 4.00%, 10/15/17 |
|
|
500,000 |
|
|
|
553,060 |
|
|
|
|
| MetLife, Inc., |
|
|
|
|
|
|
|
|
| Sr. Unsecured, 5.00%, 6/15/15 |
|
|
730,000 |
|
|
|
793,989 |
|
|
|
|
| Prudential Financial, Inc., |
|
|
|
|
|
|
|
|
| Sr. Unsecured, MTN, 3.88%, 1/14/15 |
|
|
1,000,000 |
|
|
|
1,052,002 |
|
|
|
|
| Prudential Financial, Inc., |
|
|
|
|
|
|
|
|
| Sr. Unsecured, MTN, 6.00%, 12/01/17 |
|
|
650,000 |
|
|
|
778,472 |
|
|
|
|
| WR Berkley Corp., |
|
|
|
|
|
|
|
|
| Sr. Unsecured, 7.38%, 9/15/19 |
|
|
710,000 |
|
|
|
896,559 |
|
|
|
|
|
|
|
|
|
|
|
|
|
| TOTAL INSURANCE |
|
|
|
|
|
$ |
4,074,082 |
|
|
| LEISURE TIME – 0.6% |
|
|
|
|
| Royal Caribbean Cruises Ltd., |
|
|
|
|
|
|
|
|
| Sr. Unsecured, 7.00%, 6/15/13 |
|
|
1,200,000 |
|
|
|
1,209,049 |
|
|
| MEDIA – 2.7% |
|
|
|
|
| Comcast Corp., |
|
|
|
|
|
|
|
|
| Company Guaranteed, 5.90%, 3/15/16 |
|
|
500,000 |
|
|
|
572,528 |
|
|
|
|
| Comcast Corp., |
|
|
|
|
|
|
|
|
| Company Guaranteed, 5.70%, 7/01/19 |
|
|
500,000 |
|
|
|
616,692 |
|
|
|
|
| COX Communications, Inc., |
|
|
|
|
|
|
|
|
| Sr. Unsecured, 2.95%, 6/30/23•,W
|
|
|
240,000 |
|
|
|
240,232 |
|
|
|
|
| DIRECTV Holdings LLC / DIRECTV Financing Co., Inc., |
|
|
|
|
|
|
|
|
| Company Guaranteed, 3.50%, 3/01/16 |
|
|
250,000 |
|
|
|
267,066 |
|
|
|
|
| Discovery Communications LLC, |
|
|
|
|
|
|
|
|
| Company Guaranteed, 3.25%, 4/01/23 |
|
|
750,000 |
|
|
|
779,778 |
|
|
|
|
| NBCUniversal Media LLC, |
|
|
|
|
|
|
|
|
| Sr. Unsecured, 3.65%, 4/30/15 |
|
|
1,000,000 |
|
|
|
1,060,620 |
|
|
|
|
| Time Warner Entertainment Co., LP, |
|
|
|
|
|
|
|
|
| Company Guaranteed, 8.38%, 3/15/23 |
|
|
175,000 |
|
|
|
243,896 |
|
|
|
|
| Time Warner, Inc., |
|
|
|
|
|
|
|
|
| Company Guaranteed, 5.88%, 11/15/16 |
|
|
890,000 |
|
|
|
1,036,761 |
|
|
|
|
| Viacom, Inc., |
|
|
|
|
|
|
|
|
| Sr. Unsecured, 3.50%, 4/01/17 |
|
|
750,000 |
|
|
|
810,795 |
|
|
|
|
|
|
|
|
|
|
|
|
|
| TOTAL MEDIA |
|
|
|
|
|
$ |
5,628,368 |
|
|
| METALS & MINING – 0.6% |
|
|
|
|
| Alcoa, Inc., |
|
|
|
|
|
|
|
|
| Sr. Unsecured, 5.72%, 2/23/19 |
|
|
1,100,000 |
|
|
|
1,192,087 |
|
|
| MISCELLANEOUS MANUFACTURING – 3.5% |
|
|
|
|
| Eaton Corp., |
|
|
|
|
|
|
|
|
| Company Guaranteed, 2.75%, 11/02/22•,W
|
|
|
500,000 |
|
|
|
506,343 |
|
April 30, 2013 / ANNUAL REPORT
|
|
|
|
|
| PORTFOLIOS OF INVESTMENTS |
|
|
43 |
|
Wilmington Intermediate-Term Bond Fund (continued)
|
|
|
|
|
|
|
|
|
|
Description |
|
Par Value |
|
|
Value |
|
|
|
|
| General Electric Co., |
|
|
|
|
|
|
|
|
| Sr. Unsecured, 5.25%, 12/06/17 |
|
$ |
1,160,000 |
|
|
$ |
1,367,871 |
|
|
|
|
| Ingersoll-Rand Co., |
|
|
|
|
|
|
|
|
| Series B, Company Guaranteed, MTN, |
|
|
|
|
|
|
|
|
| 6.02%, 2/15/28 |
|
|
2,015,000 |
|
|
|
2,408,808 |
|
|
|
|
| John Deere Capital Corp., |
|
|
|
|
|
|
|
|
| Sr. Unsecured, MTN, 1.40%, 3/15/17 |
|
|
1,040,000 |
|
|
|
1,058,345 |
|
|
|
|
| Textron, Inc., |
|
|
|
|
|
|
|
|
| Sr. Unsecured, 6.20%, 3/15/15 |
|
|
1,900,000 |
|
|
|
2,064,687 |
|
|
|
|
|
|
|
|
|
|
|
|
|
| TOTAL MISCELLANEOUS MANUFACTURING |
|
|
|
|
|
$ |
7,406,054 |
|
|
| OIL & GAS – 3.9% |
|
|
|
|
| Anadarko Petroleum Corp., |
|
|
|
|
|
|
|
|
| Sr. Unsecured, 6.38%, 9/15/17 |
|
|
695,000 |
|
|
|
833,620 |
|
|
|
|
| BP Capital Markets PLC, |
|
|
|
|
|
|
|
|
| Company Guaranteed, 1.85%, 5/05/17 |
|
|
525,000 |
|
|
|
541,748 |
|
|
|
|
| BP Capital Markets PLC, |
|
|
|
|
|
|
|
|
| Company Guaranteed, 3.25%, 5/06/22 |
|
|
525,000 |
|
|
|
555,155 |
|
|
|
|
| Hess Corp., |
|
|
|
|
|
|
|
|
| Sr. Unsecured, 8.13%, 2/15/19 |
|
|
700,000 |
|
|
|
914,084 |
|
|
|
|
| Marathon Oil Corp., |
|
|
|
|
|
|
|
|
| Sr. Unsecured, 0.90%, 11/01/15 |
|
|
750,000 |
|
|
|
751,218 |
|
|
|
|
| Marathon Oil Corp., |
|
|
|
|
|
|
|
|
| Sr. Unsecured, 6.00%, 10/01/17 |
|
|
1,000,000 |
|
|
|
1,190,217 |
|
|
|
|
| Sempra Energy, |
|
|
|
|
|
|
|
|
| Sr. Unsecured, 2.30%, 4/01/17 |
|
|
800,000 |
|
|
|
835,885 |
|
|
|
|
| Sunoco, Inc., |
|
|
|
|
|
|
|
|
| Sr. Unsecured, 9.63%, 4/15/15 |
|
|
1,200,000 |
|
|
|
1,390,860 |
|
|
|
|
| Transocean, Inc., |
|
|
|
|
|
|
|
|
| Company Guaranteed, 6.50%, 11/15/20 |
|
|
1,000,000 |
|
|
|
1,187,815 |
|
|
|
|
|
|
|
|
|
|
|
|
|
| TOTAL OIL & GAS |
|
|
|
|
|
$ |
8,200,602 |
|
|
| PHARMACEUTICALS – 1.9% |
|
|
|
|
| AbbVie, Inc., |
|
|
|
|
|
|
|
|
| Company Guaranteed, 1.20%, 11/06/15•,W
|
|
|
250,000 |
|
|
|
252,578 |
|
|
|
|
| AbbVie, Inc., |
|
|
|
|
|
|
|
|
| Company Guaranteed, 1.75%, 11/06/17•,W
|
|
|
500,000 |
|
|
|
510,387 |
|
|
|
|
| AstraZeneca PLC, |
|
|
|
|
|
|
|
|
| Sr. Unsecured, 5.90%, 9/15/17 |
|
|
1,000,000 |
|
|
|
1,204,510 |
|
|
|
|
| Express Scripts Holding Co., |
|
|
|
|
|
|
|
|
| Company Guaranteed, 3.50%, 11/15/16 |
|
|
500,000 |
|
|
|
540,227 |
|
|
|
|
| McKesson Corp., |
|
|
|
|
|
|
|
|
| Sr. Unsecured, 1.40%, 3/15/18 |
|
|
1,075,000 |
|
|
|
1,083,380 |
|
|
|
|
| Zoetis, Inc., |
|
|
|
|
|
|
|
|
| Sr. Unsecured, 3.25%, 2/01/23•,W
|
|
|
500,000 |
|
|
|
516,105 |
|
|
|
|
|
|
|
|
|
|
|
|
|
| TOTAL PHARMACEUTICALS |
|
|
|
|
|
$ |
4,107,187 |
|
|
| PIPELINES – 2.3% |
|
|
|
|
| Energy Transfer Partners LP, |
|
|
|
|
|
|
|
|
| Sr. Unsecured, 5.95%, 2/01/15 |
|
|
300,000 |
|
|
|
324,825 |
|
|
|
|
| Energy Transfer Partners LP, |
|
|
|
|
|
|
|
|
| Sr. Unsecured, 6.70%, 7/01/18 |
|
|
300,000 |
|
|
|
367,907 |
|
|
|
|
| Energy Transfer Partners LP, |
|
|
|
|
|
|
|
|
| Sr. Unsecured, 3.60%, 2/01/23 |
|
|
200,000 |
|
|
|
203,979 |
|
|
|
|
|
|
|
|
|
|
|
Description |
|
Par Value |
|
|
Value |
|
|
|
|
| Enterprise Products Operating LLC, |
|
|
|
|
|
|
|
|
| Company Guaranteed, 3.70%, 6/01/15 |
|
$ |
1,000,000 |
|
|
$ |
1,060,187 |
|
|
|
|
| Enterprise Products Operating LLC, |
|
|
|
|
|
|
|
|
| Company Guaranteed, 4.05%, 2/15/22 |
|
|
500,000 |
|
|
|
555,825 |
|
|
|
|
| Kinder Morgan Energy Partners LP, |
|
|
|
|
|
|
|
|
| Sr. Unsecured, 3.95%, 9/01/22 |
|
|
1,000,000 |
|
|
|
1,084,529 |
|
|
|
|
| ONEOK, Inc., |
|
|
|
|
|
|
|
|
| Sr. Unsecured, 5.20%, 6/15/15 |
|
|
650,000 |
|
|
|
705,111 |
|
|
|
|
| Plains All American Pipeline LP / PAA |
|
|
|
|
|
|
|
|
| Finance Corp., |
|
|
|
|
|
|
|
|
| Company Guaranteed, 5.00%, 2/01/21 |
|
|
500,000 |
|
|
|
588,714 |
|
|
|
|
|
|
|
|
|
|
|
|
|
| TOTAL PIPELINES |
|
|
|
|
|
$ |
4,891,077 |
|
|
| REAL ESTATE INVESTMENT TRUSTS – 3.0% |
|
|
|
|
| Boston Properties LP, |
|
|
|
|
|
|
|
|
| Sr. Unsecured, 3.70%, 11/15/18 |
|
|
700,000 |
|
|
|
774,634 |
|
|
|
|
| Digital Realty Trust LP, |
|
|
|
|
|
|
|
|
| Company Guaranteed, 3.63%, 10/01/22 |
|
|
750,000 |
|
|
|
771,502 |
|
|
|
|
| HCP, Inc., |
|
|
|
|
|
|
|
|
| Sr. Unsecured, MTN, 6.70%, 1/30/18 |
|
|
500,000 |
|
|
|
609,981 |
|
|
|
|
| Healthcare Realty Trust, Inc., |
|
|
|
|
|
|
|
|
| Sr. Unsecured, 3.75%, 4/15/23 |
|
|
500,000 |
|
|
|
510,472 |
|
|
|
|
| Mack-Cali Realty LP, |
|
|
|
|
|
|
|
|
| Sr. Unsecured, 2.50%, 12/15/17 |
|
|
250,000 |
|
|
|
255,323 |
|
|
|
|
| ProLogis LP, |
|
|
|
|
|
|
|
|
| Company Guaranteed, 4.50%, 8/15/17 |
|
|
1,250,000 |
|
|
|
1,382,276 |
|
|
|
|
| Ventas Realty LP / Ventas Capital Corp., |
|
|
|
|
|
|
|
|
| Company Guaranteed, 3.13%, 11/30/15 |
|
|
965,000 |
|
|
|
1,019,931 |
|
|
|
|
| Ventas Realty LP / Ventas Capital Corp., |
|
|
|
|
|
|
|
|
| Company Guaranteed, 2.70%, 4/01/20 |
|
|
550,000 |
|
|
|
560,143 |
|
|
|
|
| Vornado Realty LP, |
|
|
|
|
|
|
|
|
| Sr. Unsecured, 4.25%, 4/01/15 |
|
|
500,000 |
|
|
|
525,570 |
|
|
|
|
|
|
|
|
|
|
|
|
|
| TOTAL REAL ESTATE INVESTMENT TRUSTS |
|
|
|
|
|
$ |
6,409,832 |
|
|
| RETAIL – 0.5% |
|
|
|
|
| Walgreen Co., |
|
|
|
|
|
|
|
|
| Sr. Unsecured, 1.80%, 9/15/17 |
|
|
1,000,000 |
|
|
|
1,024,828 |
|
|
| SEMICONDUCTORS – 0.2% |
|
|
|
|
| Broadcom Corp., |
|
|
|
|
|
|
|
|
| Sr. Unsecured, 2.50%, 8/15/22#,•,W
|
|
|
490,000 |
|
|
|
487,238 |
|
|
| TELECOMMUNICATIONS – 0.5% |
|
|
|
|
| AT&T, Inc., |
|
|
|
|
|
|
|
|
| Sr. Unsecured, 0.90%, 2/12/16 |
|
|
360,000 |
|
|
|
360,897 |
|
|
|
|
| Verizon Communications, Inc., |
|
|
|
|
|
|
|
|
| Sr. Unsecured, 1.25%, 11/03/14 |
|
|
760,000 |
|
|
|
768,118 |
|
|
|
|
|
|
|
|
|
|
|
|
|
| TOTAL TELECOMMUNICATIONS |
|
|
|
|
|
$ |
1,129,015 |
|
|
| TRANSPORTATION – 2.7% |
|
|
|
|
| CSX Corp., |
|
|
|
|
|
|
|
|
| Sr. Unsecured, 7.90%, 5/01/17 |
|
|
685,000 |
|
|
|
854,829 |
|
|
|
|
| CSX Corp., |
|
|
|
|
|
|
|
|
| Sr. Unsecured, 4.25%, 6/01/21 |
|
|
500,000 |
|
|
|
567,611 |
|
|
|
|
| Ryder System, Inc., |
|
|
|
|
|
|
|
|
| Sr. Unsecured, MTN, 7.20%, 9/01/15 |
|
|
590,000 |
|
|
|
669,633 |
|
ANNUAL REPORT /
April 30, 2013
|
|
|
| 44 |
|
PORTFOLIOS OF INVESTMENTS |
Wilmington Intermediate-Term Bond Fund (continued)
|
|
|
|
|
|
|
|
|
|
Description |
|
Par Value |
|
|
Value |
|
|
|
|
| Ryder System, Inc., |
|
|
|
|
|
|
|
|
| Sr. Unsecured, MTN, 2.50%, 3/01/18 |
|
$ |
1,850,000 |
|
|
$ |
1,905,757 |
|
|
|
|
| Union Pacific Corp., |
|
|
|
|
|
|
|
|
| Sr. Unsecured, 5.75%, 11/15/17# |
|
|
1,500,000 |
|
|
|
1,796,996 |
|
|
|
|
|
|
|
|
|
|
|
|
|
| TOTAL TRANSPORTATION |
|
|
|
|
|
$ |
5,794,826 |
|
|
| TRUCKING & LEASING – 0.8% |
|
|
|
|
| GATX Corp., |
|
|
|
|
|
|
|
|
| Sr. Unsecured, 8.75%, 5/15/14 |
|
|
1,000,000 |
|
|
|
1,078,445 |
|
|
|
|
| GATX Corp., |
|
|
|
|
|
|
|
|
| Sr. Unsecured, 2.38%, 7/30/18 |
|
|
625,000 |
|
|
|
642,397 |
|
|
|
|
|
|
|
|
|
|
|
|
| TOTAL TRUCKING & LEASING |
|
|
$ |
1,720,842 |
|
|
|
|
|
|
|
|
|
|
|
|
|
| TOTAL CORPORATE BONDS |
|
|
|
|
|
|
|
|
| (COST $111,576,574) |
|
|
|
|
|
$ |
117,755,204 |
|
|
| GOVERNMENT AGENCIES – 16.0% |
|
|
| FEDERAL HOME LOAN BANK (FHLB) – 1.0% |
|
|
|
|
| 1.00%, 6/21/17# |
|
|
2,000,000 |
|
|
|
2,033,809 |
|
|
| FEDERAL HOME LOAN MORTGAGE CORPORATION (FHLMC) – 5.9% |
|
|
|
|
| 1.25%, 5/12/17 |
|
|
3,000,000 |
|
|
|
3,076,816 |
|
|
|
|
| 1.75%, 5/30/19# |
|
|
2,000,000 |
|
|
|
2,078,805 |
|
|
|
|
| 2.38%, 1/13/22 |
|
|
795,000 |
|
|
|
837,828 |
|
|
|
|
| 2.50%, 5/27/16# |
|
|
2,500,000 |
|
|
|
2,661,515 |
|
|
|
|
| 3.75%, 3/27/19# |
|
|
2,000,000 |
|
|
|
2,311,398 |
|
|
|
|
| 4.38%, 7/17/15 |
|
|
1,315,000 |
|
|
|
1,433,343 |
|
|
|
|
|
|
|
|
|
|
|
|
| TOTAL FEDERAL HOME LOAN MORTGAGE CORPORATION (FHLMC) |
|
|
$ |
12,399,705 |
|
|
| FEDERAL NATIONAL MORTGAGE ASSOCIATION
(FNMA) – 9.1% |
|
|
|
|
| 0.38%, 3/16/15 |
|
|
1,500,000 |
|
|
|
1,504,144 |
|
|
|
|
| 0.50%, 5/27/15# |
|
|
1,500,000 |
|
|
|
1,508,070 |
|
|
|
|
| 0.88%, 10/26/17 |
|
|
4,000,000 |
|
|
|
4,029,866 |
|
|
|
|
| 1.25%, 9/28/16 |
|
|
4,000,000 |
|
|
|
4,108,579 |
|
|
|
|
| 1.38%, 11/15/16# |
|
|
2,500,000 |
|
|
|
2,577,758 |
|
|
|
|
| 1.63%, 10/26/15 |
|
|
2,000,000 |
|
|
|
2,063,912 |
|
|
|
|
| 5.00%, 5/11/17 |
|
|
3,000,000 |
|
|
|
3,526,430 |
|
|
|
|
|
|
|
|
|
|
|
|
| TOTAL FEDERAL NATIONAL MORTGAGE ASSOCIATION (FNMA) |
|
|
$ |
19,318,759 |
|
|
|
|
|
|
|
|
|
|
|
|
| TOTAL GOVERNMENT AGENCIES |
|
|
|
|
|
| (COST $32,970,780) |
|
|
|
|
|
$ |
33,752,273 |
|
|
| MORTGAGE-BACKED SECURITIES – 6.4% |
|
|
| FEDERAL HOME LOAN MORTGAGE CORPORATION (FHLMC) – 3.7% |
|
|
|
|
| Pool A18401, 6.00%, 2/01/34 |
|
|
118,457 |
|
|
|
130,408 |
|
|
|
|
| Pool A93415, 4.00%, 8/01/40 |
|
|
3,228,950 |
|
|
|
3,446,763 |
|
|
|
|
| Pool B19228, 4.50%, 4/01/20 |
|
|
58,123 |
|
|
|
62,060 |
|
|
|
|
| Pool C90293, 7.50%, 9/01/19 |
|
|
177,196 |
|
|
|
202,626 |
|
|
|
|
| Pool C90504, 6.50%, 12/01/21 |
|
|
65,146 |
|
|
|
72,925 |
|
|
|
|
| Pool E76204, 5.50%, 4/01/14 |
|
|
199 |
|
|
|
202 |
|
|
|
|
| Pool E83022, 6.00%, 4/01/16 |
|
|
19,732 |
|
|
|
20,854 |
|
|
|
|
|
|
|
|
|
|
|
Description |
|
Par Value |
|
|
Value |
|
|
|
|
| Pool E92817, 5.00%, 12/01/17 |
|
$ |
188,414 |
|
|
$ |
201,262 |
|
|
|
|
| Pool G01625, 5.00%, 11/01/33 |
|
|
125,672 |
|
|
|
135,907 |
|
|
|
|
| Pool G02390, 6.00%, 9/01/36 |
|
|
58,679 |
|
|
|
63,939 |
|
|
|
|
| Pool G08097, 6.50%, 11/01/35 |
|
|
74,489 |
|
|
|
84,153 |
|
|
|
|
| Pool G08193, 6.00%, 4/01/37 |
|
|
155,293 |
|
|
|
169,214 |
|
|
|
|
| Pool G11311, 5.00%, 10/01/17 |
|
|
122,092 |
|
|
|
130,417 |
|
|
|
|
| Pool G12709, 5.00%, 7/01/22 |
|
|
1,220,820 |
|
|
|
1,307,880 |
|
|
|
|
| Pool G13077, 5.50%, 4/01/23 |
|
|
1,724,219 |
|
|
|
1,835,885 |
|
|
|
|
|
|
|
|
|
|
|
|
| TOTAL FEDERAL HOME LOAN MORTGAGE CORPORATION (FHLMC) |
|
|
$ |
7,864,495 |
|
|
| FEDERAL NATIONAL MORTGAGE ASSOCIATION
(FNMA) – 2.4% |
|
|
|
|
| Pool 254240, 7.00%, 3/01/32 |
|
|
116,062 |
|
|
|
133,195 |
|
|
|
|
| Pool 254833, 4.50%, 8/01/18 |
|
|
42,853 |
|
|
|
45,768 |
|
|
|
|
| Pool 256639, 5.00%, 2/01/27 |
|
|
114,964 |
|
|
|
125,038 |
|
|
|
|
| Pool 256752, 6.00%, 6/01/27 |
|
|
102,829 |
|
|
|
112,834 |
|
|
|
|
| Pool 257007, 6.00%, 12/01/27 |
|
|
184,901 |
|
|
|
202,893 |
|
|
|
|
| Pool 526062, 7.50%, 12/01/29 |
|
|
14,953 |
|
|
|
16,246 |
|
|
|
|
| Pool 612514, 2.72%, 5/01/33D |
|
|
79,967 |
|
|
|
83,223 |
|
|
|
|
| Pool 619054, 5.50%, 2/01/17 |
|
|
85,821 |
|
|
|
91,815 |
|
|
|
|
| Pool 629603, 5.50%, 2/01/17 |
|
|
37,942 |
|
|
|
40,592 |
|
|
|
|
| Pool 688996, 8.00%, 11/01/24 |
|
|
14,456 |
|
|
|
15,888 |
|
|
|
|
| Pool 745412, 5.50%, 12/01/35 |
|
|
91,760 |
|
|
|
100,654 |
|
|
|
|
| Pool 832365, 5.50%, 8/01/20 |
|
|
1,145,379 |
|
|
|
1,229,844 |
|
|
|
|
| Pool 838741, 5.00%, 9/01/20 |
|
|
948,763 |
|
|
|
1,022,751 |
|
|
|
|
| Pool 839291, 5.00%, 9/01/20 |
|
|
11,281 |
|
|
|
12,182 |
|
|
|
|
| Pool AE2520, 3.00%, 1/01/26 |
|
|
1,752,309 |
|
|
|
1,854,543 |
|
|
|
|
|
|
|
|
|
|
|
|
| TOTAL FEDERAL NATIONAL MORTGAGE ASSOCIATION (FNMA) |
|
|
$ |
5,087,466 |
|
|
| GOVERNMENT NATIONAL MORTGAGE ASSOCIATION (GNMA) – 0.3% |
|
|
|
|
| Pool 2616, 7.00%, 7/20/28 |
|
|
83,320 |
|
|
|
95,982 |
|
|
|
|
| Pool 2701, 6.50%, 1/20/29 |
|
|
157,944 |
|
|
|
186,207 |
|
|
|
|
| Pool 426727, 7.00%, 2/15/29 |
|
|
16,937 |
|
|
|
19,626 |
|
|
|
|
| Pool 780825, 6.50%, 7/15/28 |
|
|
152,073 |
|
|
|
175,308 |
|
|
|
|
| Pool 781231, 7.00%, 12/15/30 |
|
|
75,140 |
|
|
|
87,389 |
|
|
|
|
|
|
|
|
|
|
|
|
| TOTAL GOVERNMENT NATIONAL MORTGAGE ASSOCIATION (GNMA) |
|
|
$ |
564,512 |
|
|
|
|
|
|
|
|
|
|
|
|
| TOTAL MORTGAGE-BACKED SECURITIES |
|
|
|
|
|
| (COST $12,767,569) |
|
|
|
|
|
$ |
13,516,473 |
|
|
| MUNICIPAL BOND – 0.7% |
|
|
|
| BUILD AMERICA BONDS – 0.7% |
|
|
|
|
|
|
|
|
| New Jersey State, EDA, |
|
|
|
|
|
|
|
|
| Revenue Bonds, 1.31%, 6/15/13D |
|
|
1,500,000 |
|
|
|
1,500,373 |
|
|
|
|
|
|
|
|
|
|
| TOTAL MUNICIPAL BOND |
|
|
|
|
|
| (COST $1,500,000) |
|
|
$ |
1,500,373 |
|
|
|
|
| U.S. TREASURY – 18.2% |
|
|
|
|
|
|
|
|
|
| U.S. TREASURY INFLATION INDEXED NOTES – 1.1% |
|
|
|
|
| 0.13%, 4/15/16 |
|
|
1,500,000 |
|
|
|
1,652,841 |
|
|
| April 30, 2013 / ANNUAL REPORT |
|
|
|
|
|
| PORTFOLIOS OF INVESTMENTS |
|
|
45 |
|
Wilmington Intermediate-Term Bond Fund (continued)
|
|
|
|
|
|
|
|
|
|
Description |
|
Par Value |
|
|
Value |
|
|
|
|
| 1.25%, 7/15/20 |
|
$ |
500,000 |
|
|
$ |
632,365 |
|
|
|
|
|
|
|
|
|
|
|
|
| TOTAL U.S. TREASURY INFLATION INDEXED NOTES |
|
|
$ |
2,285,206 |
|
|
|
| U.S. TREASURY NOTES – 17.1% |
|
|
|
|
|
|
|
|
| 0.25%, 12/15/14 |
|
|
1,000,000 |
|
|
|
1,000,862 |
|
|
|
|
| 0.88%, 1/31/17 |
|
|
4,000,000 |
|
|
|
4,064,313 |
|
|
|
|
| 1.00%, 9/30/19 |
|
|
1,000,000 |
|
|
|
1,001,405 |
|
|
|
|
| 1.25%, 1/31/19 |
|
|
1,750,000 |
|
|
|
1,792,358 |
|
|
|
|
| 1.25%, 2/29/20 |
|
|
1,000,000 |
|
|
|
1,012,197 |
|
|
|
|
| 1.50%, 8/31/18 |
|
|
1,750,000 |
|
|
|
1,819,686 |
|
|
|
|
| 1.63%, 8/15/22 |
|
|
500,000 |
|
|
|
501,670 |
|
|
|
|
| 2.00%, 1/31/16 |
|
|
1,000,000 |
|
|
|
1,046,824 |
|
|
|
|
| 2.00%, 4/30/16 |
|
|
1,600,000 |
|
|
|
1,680,184 |
|
|
|
|
| 2.00%, 11/15/21 |
|
|
500,000 |
|
|
|
522,915 |
|
|
|
|
| 2.63%, 4/30/16 |
|
|
485,000 |
|
|
|
518,324 |
|
|
|
|
| 2.63%, 8/15/20 |
|
|
750,000 |
|
|
|
827,599 |
|
|
|
|
| 2.63%, 11/15/20 |
|
|
500,000 |
|
|
|
551,345 |
|
|
|
|
| 2.75%, 2/15/19 |
|
|
1,500,000 |
|
|
|
1,663,818 |
|
|
|
|
| 3.50%, 2/15/18 |
|
|
1,500,000 |
|
|
|
1,704,097 |
|
|
|
|
| 3.63%, 2/15/20 |
|
|
500,000 |
|
|
|
585,636 |
|
|
|
|
| 4.00%, 8/15/18 |
|
|
1,000,000 |
|
|
|
1,172,017 |
|
|
|
|
| 4.13%, 5/15/15 |
|
|
1,125,000 |
|
|
|
1,214,035 |
|
|
|
|
| 4.25%, 8/15/15 |
|
|
2,000,000 |
|
|
|
2,182,681 |
|
|
|
|
| 4.25%, 11/15/17 |
|
|
2,500,000 |
|
|
|
2,911,243 |
|
|
|
|
| 4.50%, 2/15/16 |
|
|
2,000,000 |
|
|
|
2,234,286 |
|
|
|
|
| 4.75%, 8/15/17 |
|
|
5,250,000 |
|
|
|
6,193,972 |
|
|
|
|
|
|
|
|
|
|
|
|
|
| TOTAL U.S. TREASURY NOTES |
|
|
|
|
|
$ |
36,201,467 |
|
|
|
|
|
|
|
|
|
|
|
|
|
| TOTAL U.S. TREASURY |
|
|
|
|
|
|
|
|
| (COST $36,511,142) |
|
|
|
|
|
$ |
38,486,673 |
|
|
|
|
| REPURCHASE AGREEMENT – 0.9% |
|
|
|
|
|
|
|
|
|
|
|
| Credit Suisse First Boston LLC, 0. 14%, dated 04/30/13, due 05/01/13, repurchase price $1,955,008, collateralized by a U.S. Treasury Security 2.75%, maturing
08/15/42; total market value of $1,997,286. |
|
|
1,955,000 |
|
|
|
1,955,000 |
|
|
|
|
|
|
|
|
|
|
|
|
| TOTAL REPURCHASE AGREEMENT |
|
|
|
|
|
| (COST $1,955,000) |
|
|
$ |
1,955,000 |
|
|
|
|
|
|
|
|
|
|
|
|
| TOTAL INVESTMENTS IN SECURITIES – 100.2% |
|
|
|
|
|
| (COST $202,010,346) |
|
|
$ |
211,761,341 |
|
|
|
|
|
|
|
|
|
|
|
Description |
|
Par Value |
|
|
Value |
|
|
| CASH COLLATERAL INVESTED FOR SECURITIES ON LOAN – 6.5% |
|
|
| REPURCHASE AGREEMENTS – 6.5% |
|
|
|
|
| Citigroup Global Markets, Inc., 0.18%, dated 04/30/13, due 05/01/13, repurchase price $3,262,633, collateralized by U.S. Government Securities 0.84% to 6. 50%,
maturing 11/01/18 to 03/15/53; total market value of $ 3,329,302. |
|
$ |
3,262,617 |
|
|
$ |
3,262,617 |
|
|
|
|
| Deutsche Bank Securities, Inc., 0. 15%, dated 04/30/13, due 05/01/13, repurchase price $685,736, collateralized by U.S. Treasury Securities 0.00% to 10. 63%,
maturing 05/15/13 to 05/15/42; total market value of $ 699,448. |
|
|
685,733 |
|
|
|
685,733 |
|
|
|
|
| Goldman Sachs & Co., 0.17%, dated 04/30/13, due 05/01/13, repurchase price $3,262,632, collateralized by U.S. Government Securities 2.50% to 6. 50%,
maturing 05/01/20 to 04/01/43; total market value of $ 3,327,869. |
|
|
3,262,617 |
|
|
|
3,262,617 |
|
|
|
|
| Mizuho Securities USA, Inc., 0.20%, dated 04/30/13, due 05/01/13, repurchase price $3,262,635, collateralized by U.S. Government Securities 2.08% to 7. 00%,
maturing 01/01/22 to 04/15/52; total market value of $ 3,327,869. |
|
|
3,262,617 |
|
|
|
3,262,617 |
|
|
|
|
| RBC Capital Markets LLC, 0.17%, dated 04/30/13, due 05/01/13, repurchase price $3,262,632, collateralized by U.S. Government Securities 1.97% to 4. 50%,
maturing 08/01/24 to 12/15/44; total market value of $ 3,327,869. |
|
|
3,262,617 |
|
|
|
3,262,617 |
|
|
|
|
|
|
|
|
|
|
|
|
| TOTAL CASH COLLATERAL INVESTED FOR SECURITIES ON LOAN |
|
|
|
|
|
| (COST $13,736,201) |
|
|
|
|
|
$ |
13,736,201 |
|
|
|
|
|
|
|
|
|
|
|
|
| TOTAL INVESTMENTS – 106.7% |
|
|
|
|
|
| (COST $215,746,547) |
|
|
|
|
|
$ |
225,497,542 |
|
|
|
| COLLATERAL FOR SECURITIES ON LOAN – (6.5%) |
|
|
|
(13,736,201 |
) |
|
|
| OTHER LIABILITIES LESS ASSETS – (0.2%) |
|
|
|
(459,791 |
) |
|
|
|
|
|
|
|
|
|
|
|
|
| TOTAL NET ASSETS – 100.0% |
|
|
|
|
|
$ |
211,301,550 |
|
|
|
|
|
|
|
|
|
|
Cost of investments for Federal
income tax purposes is $215,759,372. The net unrealized appreciation/(depreciation) of investments was $9,738,170. This consists of net unrealized appreciation from investment for those securities having an excess of value over cost of $9,928,297
and net unrealized depreciation from investments for those securities having an excess of cost over value of $190,127.
Various inputs
are used in determining the value of the Fund’s investments. These inputs are summarized in the three broad levels listed below.
Level 1 – quoted prices in active markets for identical securities
Level 2
– other significant observable inputs (including quoted prices for similar securities, interest rates, prepayment speeds, credit risk, etc.)
Level 3 – significant unobservable inputs (including the Fund’s own assumptions in determining the fair value of investments)
The following is a summary of the inputs used as of April 30, 2013 in valuing the Fund’s assets carried at fair value:
ANNUAL REPORT / April
30, 2013
|
|
|
| 46 |
|
PORTFOLIOS OF INVESTMENTS |
Wilmington Intermediate-Term Bond Fund (concluded)
|
|
|
|
|
|
|
|
|
|
|
|
|
|
|
|
|
|
|
|
Level 1 |
|
|
Level 2 |
|
|
Level 3 |
|
|
Total |
|
| Investments in Securities |
|
|
|
|
|
|
|
|
|
|
|
|
|
|
|
|
| Asset-Backed Security |
|
$ |
— |
|
|
$ |
490,273 |
|
|
$ |
— |
|
|
$ |
490,273 |
|
| Collateralized Mortgage Obligations |
|
|
— |
|
|
|
4,305,072 |
|
|
|
— |
|
|
|
4,305,072 |
|
| Corporate Bonds |
|
|
— |
|
|
|
117,755,204 |
|
|
|
— |
|
|
|
117,755,204 |
|
| Government Agencies |
|
|
— |
|
|
|
33,752,273 |
|
|
|
— |
|
|
|
33,752,273 |
|
| Mortgage-Backed Securities |
|
|
— |
|
|
|
13,516,473 |
|
|
|
— |
|
|
|
13,516,473 |
|
| Municipal Bond |
|
|
— |
|
|
|
1,500,373 |
|
|
|
— |
|
|
|
1,500,373 |
|
| U.S. Treasury |
|
|
— |
|
|
|
38,486,673 |
|
|
|
— |
|
|
|
38,486,673 |
|
| Repurchase Agreements |
|
|
— |
|
|
|
15,691,201 |
|
|
|
— |
|
|
|
15,691,201 |
|
|
|
|
|
|
|
|
|
|
|
|
|
|
|
|
|
|
| Total |
|
$ |
— |
|
|
$ |
225,497,542 |
|
|
$ |
— |
|
|
$ |
225,497,542 |
|
|
|
|
|
|
|
|
|
|
|
|
|
|
|
|
|
|
See Notes to Portfolios of Investments
See Notes which are an integral part of the Financial Statements
April 30, 2013 / ANNUAL REPORT
PORTFOLIO OF INVESTMENTS SUMMARY TABLE
Wilmington Short-Term Corporate Bond Fund
At April 30, 2013, the Fund’s sector classifications
were as follows (unaudited):
|
|
|
|
|
|
| |
|
Percentage of
Total Net Assets |
| Commercial Banks |
|
|
|
13.0 |
% |
| Media |
|
|
|
10.3 |
% |
| Real Estate Investment Trusts |
|
|
|
9.0 |
% |
| Oil & Gas |
|
|
|
8.1 |
% |
| Electric |
|
|
|
6.8 |
% |
| Capital Markets |
|
|
|
6.5 |
% |
| Food Products |
|
|
|
4.0 |
% |
| Consumer Finance |
|
|
|
3.4 |
% |
| Diversified Financial Services |
|
|
|
3.4 |
% |
| Insurance |
|
|
|
3.4 |
% |
| Automotive |
|
|
|
3.1 |
% |
| Pipelines |
|
|
|
2.6 |
% |
| Biotechnology |
|
|
|
2.5 |
% |
| Beverages |
|
|
|
2.0 |
% |
| Commercial Mortgage-Backed Securities (CMBS) |
|
|
|
2.0 |
% |
| Miscellaneous Manufacturing |
|
|
|
1.8 |
% |
| Telecommunications |
|
|
|
1.6 |
% |
| Healthcare Providers & Services |
|
|
|
1.6 |
% |
| Chemicals |
|
|
|
1.4 |
% |
| Pharmaceuticals |
|
|
|
1.4 |
% |
| Transportation |
|
|
|
1.3 |
% |
| Forest Products & Paper |
|
|
|
1.3 |
% |
| U.S. Treasury Notes |
|
|
|
1.1 |
% |
| Computers |
|
|
|
1.1 |
% |
| Home Furnishings |
|
|
|
1.1 |
% |
| Commercial Finance |
|
|
|
1.0 |
% |
| Software |
|
|
|
0.8 |
% |
| Retail |
|
|
|
0.7 |
% |
| Aerospace & Defense |
|
|
|
0.7 |
% |
| Environmental Control |
|
|
|
0.6 |
% |
| Electronics |
|
|
|
0.6 |
% |
| Building Materials |
|
|
|
0.6 |
% |
| Oil & Gas Field Services |
|
|
|
0.6 |
% |
| Iron/Steel |
|
|
|
0.5 |
% |
| Whole Loan |
|
|
|
0.4 |
% |
| Metals & Mining |
|
|
|
0.3 |
% |
| Federal Home Loan Mortgage Corporation (FHLMC) |
|
|
|
0.2 |
% |
| Federal National Mortgage Association (FNMA) |
|
|
|
0.0 |
%4 |
| Cash Equivalents1 |
|
|
|
2.1 |
% |
| Other Assets and Liabilities – Net2 |
|
|
|
(2.9 |
)% |
|
|
|
|
|
|
| TOTAL |
|
|
|
100.0 |
% |
|
|
|
|
|
|
| (1) |
Cash Equivalents include investments in repurchase agreements. |
| (2) |
Assets, other than investments in securities, less liabilities. See Statements of Assets and Liabilities. |
| (3) |
Derived from data provided by Moody’s Investors Service and Standard and Poor’s. |
| (4) |
Represents less than 0.05%. |
|
|
|
|
|
|
| Credit Quality Diversification3 |
|
Percentage of
Total Net Assets |
| AAA |
|
|
|
2.3 |
% |
| AA |
|
|
|
4.4 |
% |
| A |
|
|
|
24.7 |
% |
| BBB |
|
|
|
66.8 |
% |
| BB |
|
|
|
1.2 |
% |
| Not Rated |
|
|
|
2.2 |
% |
| U.S. Government Agency Securities |
|
|
|
0.2 |
% |
| U.S. Treasuries |
|
|
|
1.1 |
% |
| Other Assets and Liabilities – Net2 |
|
|
|
(2.9 |
)% |
|
|
|
|
|
|
| TOTAL |
|
|
|
100.0 |
% |
|
|
|
|
|
|
ANNUAL REPORT /
|
|
|
| 48 |
|
PORTFOLIOS OF INVESTMENTS |
Wilmington Short-Term Corporate Bond Fund (continued)
PORTFOLIO OF INVESTMENTS
April 30, 2013
|
|
|
|
|
|
|
|
|
|
Description |
|
Par Value |
|
|
Value |
|
|
| ADJUSTABLE RATE MORTGAGE – 0.0%** |
|
|
| FEDERAL NATIONAL MORTGAGE ASSOCIATION
(FNMA) – 0.0%** |
|
|
|
|
| Pool 399251, 2.19%, 9/01/27D |
|
$ |
61 |
|
|
$ |
64 |
|
|
|
|
|
|
|
|
|
|
|
|
| TOTAL ADJUSTABLE RATE MORTGAGE
(COST $61) |
|
|
$ |
64 |
|
|
|
| ASSET-BACKED SECURITY – 0.4% |
|
|
|
|
|
|
|
|
| WHOLE LOAN – 0.4% |
|
|
|
|
|
|
|
|
|
|
|
| SLM Private Education Loan Trust, |
|
|
|
|
|
|
|
|
| Series 2011-A, Class A1, |
|
|
|
|
|
|
|
|
| 1.20%, 10/15/24D,•,W |
|
|
648,704 |
|
|
|
653,697 |
|
|
|
|
|
|
|
|
|
|
|
|
| TOTAL ASSET-BACKED SECURITY
(COST $648,704) |
|
|
$ |
653,697 |
|
|
| COLLATERALIZED MORTGAGE OBLIGATIONS – 2.2% |
|
|
| COMMERCIAL MORTGAGE-BACKED SECURITIES
(CMBS) – 2.0% |
|
|
|
|
| Extended Stay America Trust, |
|
|
|
|
|
|
|
|
| Series 2013-ESH5, Class A15, |
|
|
|
|
|
|
|
|
| 1.28%, 12/05/31•,W |
|
|
505,000 |
|
|
|
511,076 |
|
|
|
|
| JP Morgan Chase Commercial Mortgage Securities Trust, Series 2007-CIBC18, Class A4, 5.44%, 6/12/47 |
|
|
587,000 |
|
|
|
682,332 |
|
|
|
|
| Merrill Lynch Mortgage Trust, |
|
|
|
|
|
|
|
|
| Series 2006-C1, Class A2, 5.83%, 5/12/39D |
|
|
560,301 |
|
|
|
576,699 |
|
|
|
|
| Morgan Stanley Capital I Trust, |
|
|
|
|
|
|
|
|
| Series 2004-IQ7, Class A4, 5.54%,
6/15/38D |
|
|
1,773,896 |
|
|
|
1,830,730 |
|
|
|
|
|
|
|
|
|
|
|
|
| TOTAL COMMERCIAL MORTGAGE-BACKED SECURITIES (CMBS) |
|
|
$ |
3,600,837 |
|
|
| FEDERAL HOME LOAN MORTGAGE CORPORATION (FHLMC) – 0.2% |
|
|
|
|
| Series 2003-2632, Class A, 4.00%, 1/15/18 |
|
|
214,204 |
|
|
|
217,842 |
|
| Series 2003-2649, Class KA, |
|
|
|
|
|
|
|
|
| 4.50%, 7/15/18 |
|
|
183,913 |
|
|
|
193,920 |
|
|
|
|
|
|
|
|
|
|
|
|
| TOTAL FEDERAL HOME LOAN MORTGAGE CORPORATION (FHLMC) |
|
|
$ |
411,762 |
|
|
|
|
|
|
|
|
|
|
|
|
| TOTAL COLLATERALIZED MORTGAGE OBLIGATIONS (COST $4,090,197) |
|
|
$ |
4,012,599 |
|
|
|
|
| CORPORATE BONDS – 97.1% |
|
|
|
|
|
|
|
|
|
|
| AEROSPACE & DEFENSE – 0.7% |
|
|
|
|
|
|
|
|
| L-3 Communications Corp., |
|
|
|
|
|
|
|
|
| Company Guaranteed, 3.95%, 11/15/16 |
|
|
1,235,000 |
|
|
|
1,332,832 |
|
|
|
| AUTOMOTIVE – 3.1% |
|
|
|
|
|
|
|
|
| Daimler Finance North America LLC, |
|
|
|
|
|
|
|
|
| Company Guaranteed, 0.88%, 1/09/15D,•,W |
|
|
1,000,000 |
|
|
|
1,001,278 |
|
|
|
|
| Ford Motor Credit Co., LLC, |
|
|
|
|
|
|
|
|
| Sr. Unsecured, 3.88%, 1/15/15 |
|
|
400,000 |
|
|
|
416,849 |
|
|
|
|
| Ford Motor Credit Co., LLC, |
|
|
|
|
|
|
|
|
| Sr. Unsecured, 2.50%, 1/15/16# |
|
|
2,000,000 |
|
|
|
2,046,373 |
|
|
|
|
|
|
|
|
|
|
|
Description |
|
Par Value |
|
|
Value |
|
|
|
|
| General Motors Financial Co., Inc., |
|
|
|
|
|
|
|
|
| Company Guaranteed, 4.75%, 8/15/17•,W |
|
$ |
200,000 |
|
|
$ |
212,500 |
|
|
|
|
| Hyundai Capital America, |
|
|
|
|
|
|
|
|
| Sr. Unsecured, 1.63%, 10/02/15•,W |
|
|
250,000 |
|
|
|
251,336 |
|
|
|
|
| Hyundai Motor Manufacturing Czech, |
|
|
|
|
|
|
|
|
| Company Guaranteed, 4.50%, 4/15/15•,W |
|
|
250,000 |
|
|
|
264,368 |
|
|
|
|
| Toyota Motor Credit Corp., |
|
|
|
|
|
|
|
|
| Sr. Unsecured, 0.88%, 7/17/15 |
|
|
1,500,000 |
|
|
|
1,510,371 |
|
|
|
|
|
|
|
|
|
|
|
|
|
| TOTAL AUTOMOTIVE |
|
|
|
|
|
$ |
5,703,075 |
|
|
|
|
| BEVERAGES – 2.0% |
|
|
|
|
|
|
|
|
|
|
|
| Anheuser-Busch InBev Worldwide, Inc., |
|
|
|
|
|
|
|
|
| Series WI, Company Guaranteed, |
|
|
|
|
|
|
|
|
| 5.38%, 11/15/14# |
|
|
2,000,000 |
|
|
|
2,146,048 |
|
|
|
|
| Diageo Capital PLC, |
|
|
|
|
|
|
|
|
| Company Guaranteed, 0.63%, 4/29/16 |
|
|
475,000 |
|
|
|
475,309 |
|
|
|
|
| Diageo Finance BV, |
|
|
|
|
|
|
|
|
| Company Guaranteed, 3.25%, 1/15/15 |
|
|
1,000,000 |
|
|
|
1,047,431 |
|
|
|
|
|
|
|
|
|
|
|
|
|
| TOTAL BEVERAGES |
|
|
|
|
|
$ |
3,668,788 |
|
|
|
|
| BIOTECHNOLOGY – 2.5% |
|
|
|
|
|
|
|
|
|
|
|
| Amgen, Inc., |
|
|
|
|
|
|
|
|
| Sr. Unsecured, 1.88%, 11/15/14 |
|
|
2,500,000 |
|
|
|
2,551,122 |
|
|
|
|
| Gilead Sciences, Inc., |
|
|
|
|
|
|
|
|
| Sr. Unsecured, 2.40%, 12/01/14 |
|
|
2,000,000 |
|
|
|
2,055,993 |
|
|
|
|
|
|
|
|
|
|
|
|
|
| TOTAL BIOTECHNOLOGY |
|
|
|
|
|
$ |
4,607,115 |
|
|
|
| BUILDING MATERIALS – 0.6% |
|
|
|
|
|
|
|
|
| Masco Corp., |
|
|
|
|
|
|
|
|
| Sr. Unsecured, 4.80%, 6/15/15 |
|
|
1,000,000 |
|
|
|
1,048,497 |
|
|
|
|
| CAPITAL MARKETS – 6.5% |
|
|
|
|
|
|
|
|
|
|
|
| Bank of New York Mellon Corp., |
|
|
|
|
|
|
|
|
| Sr. Unsecured, MTN, 1.20%, 2/20/15 |
|
|
1,000,000 |
|
|
|
1,011,803 |
|
|
|
|
| Charles Schwab Corp., |
|
|
|
|
|
|
|
|
| Sr. Unsecured, 0.85%, 12/04/15 |
|
|
570,000 |
|
|
|
573,967 |
|
|
|
|
| Goldman Sachs Group, Inc., |
|
|
|
|
|
|
|
|
| Sr. Unsecured, 0.73%, 3/22/16D |
|
|
3,000,000 |
|
|
|
2,977,844 |
|
|
|
|
| Goldman Sachs Group, Inc., |
|
|
|
|
|
|
|
|
| Sr. Unsecured, FRN, 1.48%, 4/30/18D |
|
|
700,000 |
|
|
|
699,140 |
|
|
|
|
| Morgan Stanley, |
|
|
|
|
|
|
|
|
| Sr. Unsecured, 4.20%, 11/20/14 |
|
|
1,000,000 |
|
|
|
1,046,807 |
|
|
|
|
| Morgan Stanley, |
|
|
|
|
|
|
|
|
| Sr. Unsecured, 1.54%, 2/25/16D |
|
|
2,000,000 |
|
|
|
2,013,970 |
|
|
|
|
| Raymond James Financial, Inc., |
|
|
|
|
|
|
|
|
| Sr. Unsecured, 4.25%, 4/15/16 |
|
|
1,500,000 |
|
|
|
1,600,720 |
|
|
|
|
| TD Ameritrade Holding Corp., |
|
|
|
|
|
|
|
|
| Company Guaranteed, 4.15%, 12/01/14 |
|
|
2,000,000 |
|
|
|
2,109,724 |
|
|
|
|
|
|
|
|
|
|
|
|
|
| TOTAL CAPITAL MARKETS |
|
|
|
|
|
$ |
12,033,975 |
|
|
|
|
| CHEMICALS – 1.4% |
|
|
|
|
|
|
|
|
|
|
|
| Dow Chemical Co., |
|
|
|
|
|
|
|
|
| Sr. Unsecured, 5.90%, 2/15/15 |
|
|
2,000,000 |
|
|
|
2,180,817 |
|
|
| April 30, 2013 / ANNUAL REPORT |
|
|
|
|
|
| PORTFOLIOS OF INVESTMENTS |
|
|
49 |
|
Wilmington Short-Term Corporate Bond Fund (continued)
|
|
|
|
|
|
|
|
|
| Description |
|
Par Value |
|
|
Value |
|
| Ecolab, Inc., |
|
|
|
|
|
|
|
|
| Sr. Unsecured, 1.00%, 8/09/15 |
|
$ |
500,000 |
|
|
$ |
502,307 |
|
|
|
|
|
|
|
|
|
|
|
|
|
| TOTAL CHEMICALS |
|
|
|
|
|
$ |
2,683,124 |
|
|
|
| COMMERCIAL BANKS – 13.0% |
|
|
|
|
|
|
|
|
| Bank of Nova Scotia, |
|
|
|
|
|
|
|
|
| Sr. Unsecured, 0.75%, 10/09/15 |
|
|
2,000,000 |
|
|
|
2,002,118 |
|
|
|
|
| Branch Banking & Trust Co., |
|
|
|
|
|
|
|
|
| Subordinated, BKNT, 0.60%, 9/13/16D |
|
|
1,000,000 |
|
|
|
991,163 |
|
|
|
|
| Comerica, Inc., |
|
|
|
|
|
|
|
|
| Sr. Unsecured, 3.00%, 9/16/15 |
|
|
2,000,000 |
|
|
|
2,110,406 |
|
|
|
|
| Cooperatieve Centrale Raiffeisen- |
|
|
|
|
|
|
|
|
| Boerenleenbank BA, |
|
|
|
|
|
|
|
|
| Sr. Unsecured, FRN, 0.76%, 3/18/16D |
|
|
725,000 |
|
|
|
726,674 |
|
|
|
|
| Fifth Third Bancorp, |
|
|
|
|
|
|
|
|
| Subordinated, 0.70%, 12/20/16D |
|
|
3,000,000 |
|
|
|
2,944,473 |
|
|
|
|
| KeyBank N.A., |
|
|
|
|
|
|
|
|
| Subordinated, BKNT, 5.80%, 7/01/14 |
|
|
2,000,000 |
|
|
|
2,118,712 |
|
|
|
|
| KeyBank N.A., |
|
|
|
|
|
|
|
|
| Subordinated, MTN, 5.45%, 3/03/16 |
|
|
1,000,000 |
|
|
|
1,120,613 |
|
|
|
|
| National City Bank, |
|
|
|
|
|
|
|
|
| Subordinated, BKNT, 0.63%, 12/15/16D |
|
|
2,000,000 |
|
|
|
1,981,858 |
|
|
|
|
| National City Corp., |
|
|
|
|
|
|
|
|
| Sr. Unsecured, 4.90%, 1/15/15 |
|
|
1,000,000 |
|
|
|
1,070,683 |
|
|
|
|
| PNC Funding Corp., |
|
|
|
|
|
|
|
|
| Bank Guaranteed, 3.63%, 2/08/15 |
|
|
1,000,000 |
|
|
|
1,052,826 |
|
|
|
|
| Royal Bank of Canada, |
|
|
|
|
|
|
|
|
| Sr. Unsecured, GMTN, 0.65%, 3/08/16D |
|
|
700,000 |
|
|
|
701,882 |
|
|
|
|
| SunTrust Banks, Inc., |
|
|
|
|
|
|
|
|
| Sr. Unsecured, 3.60%, 4/15/16 |
|
|
3,000,000 |
|
|
|
3,210,007 |
|
|
|
|
| Wells Fargo & Co., |
|
|
|
|
|
|
|
|
| Sr. Unsecured, 3.63%, 4/15/15 |
|
|
250,000 |
|
|
|
264,342 |
|
|
|
|
| Wells Fargo & Co., |
|
|
|
|
|
|
|
|
| Sr. Unsecured, 0.91%, 4/23/18D |
|
|
1,750,000 |
|
|
|
1,756,459 |
|
|
|
|
| Wells Fargo & Co., |
|
|
|
|
|
|
|
|
| Sr. Unsecured, FRN, 1.20%, 6/26/15D |
|
|
1,000,000 |
|
|
|
1,014,618 |
|
|
|
|
| Wells Fargo & Co., |
|
|
|
|
|
|
|
|
| Sr. Unsecured, MTN, 1.25%, 2/13/15 |
|
|
1,000,000 |
|
|
|
1,010,958 |
|
|
|
|
|
|
|
|
|
|
|
|
|
| TOTAL COMMERCIAL BANKS |
|
|
|
|
|
$ |
24,077,792 |
|
|
|
| COMMERCIAL FINANCE – 1.0% |
|
|
|
|
|
|
|
|
| General Electric Capital Corp., |
|
|
|
|
|
|
|
|
| Sr. Unsecured, MTN, 0.54%, 8/07/18D |
|
|
2,000,000 |
|
|
|
1,966,550 |
|
|
|
|
| COMPUTERS – 1.1% |
|
|
|
|
|
|
|
|
|
|
|
| Apple, Inc., |
|
|
|
|
|
|
|
|
| Sr. Unsecured, 0.52%, 5/03/18D,††
|
|
|
2,000,000 |
|
|
|
2,000,000 |
|
|
|
| CONSUMER FINANCE – 3.4% |
|
|
|
|
|
|
|
|
| American Express Co., |
|
|
|
|
|
|
|
|
| Sr. Unsecured, 7.25%, 5/20/14 |
|
|
1,000,000 |
|
|
|
1,069,598 |
|
|
|
|
| American Express Credit Corp., |
|
|
|
|
|
|
|
|
| Sr. Unsecured, MTN, 5.13%, 8/25/14 |
|
|
1,000,000 |
|
|
|
1,060,711 |
|
|
|
|
| Capital One Bank USA N.A., |
|
|
|
|
|
|
|
|
| Subordinated, 6.50%, 6/13/13 |
|
|
1,000,000 |
|
|
|
1,006,790 |
|
|
|
|
|
|
|
|
|
|
| Description |
|
Par Value |
|
|
Value |
|
|
|
|
| Capital One Financial Corp., |
|
|
|
|
|
|
|
|
| Sr. Unsecured, 7.38%, 5/23/14 |
|
$ |
250,000 |
|
|
$ |
267,797 |
|
|
|
|
| Capital One Financial Corp., |
|
|
|
|
|
|
|
|
| Sr. Unsecured, 2.13%, 7/15/14 |
|
|
675,000 |
|
|
|
685,990 |
|
|
|
|
| Capital One Financial Corp., |
|
|
|
|
|
|
|
|
| Sr. Unsecured, 2.15%, 3/23/15 |
|
|
1,000,000 |
|
|
|
1,021,289 |
|
|
|
|
| Capital One Financial Corp., |
|
|
|
|
|
|
|
|
| Sr. Unsecured, 1.00%, 11/06/15 |
|
|
150,000 |
|
|
|
149,599 |
|
|
|
|
| SLM Corp., |
|
|
|
|
|
|
|
|
| Series A, Sr. Unsecured, MTN, |
|
|
|
|
|
|
|
|
| 5.00%, 10/01/13 |
|
|
1,000,000 |
|
|
|
1,018,181 |
|
|
|
|
|
|
|
|
|
|
|
|
|
| TOTAL CONSUMER FINANCE |
|
|
|
|
|
$ |
6,279,955 |
|
|
|
| DIVERSIFIED FINANCIAL SERVICES – 3.4% |
|
|
|
|
|
|
|
|
| Bank of America Corp., |
|
|
|
|
|
|
|
|
| Sr. Unsecured, MTN, 1.35%, 3/22/18D |
|
|
1,500,000 |
|
|
|
1,499,634 |
|
|
|
|
| JPMorgan Chase & Co., |
|
|
|
|
|
|
|
|
| Sr. Unsecured, 3.70%, 1/20/15 |
|
|
1,000,000 |
|
|
|
1,048,396 |
|
|
|
|
| JPMorgan Chase & Co., |
|
|
|
|
|
|
|
|
| Sr. Unsecured, FRN, 1.18%, 1/25/18D |
|
|
2,000,000 |
|
|
|
2,018,681 |
|
|
|
|
| JPMorgan Chase & Co., |
|
|
|
|
|
|
|
|
| Sr. Unsecured, GMTN, 1.10%, 10/15/15 |
|
|
1,000,000 |
|
|
|
1,003,177 |
|
|
|
|
| JPMorgan Chase Capital XXIII, |
|
|
|
|
|
|
|
|
| Limited Guarantee, 1.29%, 5/15/47D |
|
|
1,000,000 |
|
|
|
800,327 |
|
|
|
|
|
|
|
|
|
|
|
|
| TOTAL DIVERSIFIED FINANCIAL SERVICES |
|
|
$ |
6,370,215 |
|
|
|
|
| ELECTRIC – 6.8% |
|
|
|
|
|
|
|
|
|
|
|
| CMS Energy Corp., |
|
|
|
|
|
|
|
|
| Sr. Unsecured, 4.25%, 9/30/15 |
|
|
2,000,000 |
|
|
|
2,152,500 |
|
|
|
|
| Consolidated Edison Co. of New York, Inc., |
|
|
|
|
|
|
|
|
| Series 05-C, Sr. Unsecured, |
|
|
|
|
|
|
|
|
| 5.38%, 12/15/15 |
|
|
110,000 |
|
|
|
123,267 |
|
|
|
|
| Dominion Resources, Inc., |
|
|
|
|
|
|
|
|
| Sr. Unsecured, 2.25%, 9/01/15 |
|
|
2,000,000 |
|
|
|
2,072,665 |
|
|
|
|
| Entergy Corp., |
|
|
|
|
|
|
|
|
| Sr. Unsecured, 4.70%, 1/15/17 |
|
|
2,000,000 |
|
|
|
2,191,281 |
|
|
|
|
| Exelon Generation Co., LLC, |
|
|
|
|
|
|
|
|
| Sr. Unsecured, 6.20%, 10/01/17# |
|
|
2,000,000 |
|
|
|
2,361,798 |
|
|
|
|
| FirstEnergy Corp., |
|
|
|
|
|
|
|
|
| Series A, Sr. Unsecured, 2.75%, 3/15/18 |
|
|
2,000,000 |
|
|
|
2,035,216 |
|
|
|
|
| Progress Energy, Inc., |
|
|
|
|
|
|
|
|
| Sr. Unsecured, 6.05%, 3/15/14 |
|
|
1,640,000 |
|
|
|
1,716,483 |
|
|
|
|
|
|
|
|
|
|
|
|
|
| TOTAL ELECTRIC |
|
|
|
|
|
$ |
12,653,210 |
|
|
|
|
| ELECTRONICS – 0.6% |
|
|
|
|
|
|
|
|
|
|
|
| Agilent Technologies, Inc., |
|
|
|
|
|
|
|
|
| Sr. Unsecured, 5.50%, 9/14/15 |
|
|
1,000,000 |
|
|
|
1,104,010 |
|
|
|
| ENVIORNMENTAL CONTROL – 0.6% |
|
|
|
|
|
| Waste Management, Inc., |
|
|
|
|
|
|
|
|
| Company Guaranteed, 2.60%, 9/01/16 |
|
|
1,100,000 |
|
|
|
1,154,909 |
|
|
|
|
| FOOD PRODUCTS – 4.0% |
|
|
|
|
|
|
|
|
|
|
|
| General Mills, Inc., |
|
|
|
|
|
|
|
|
| Sr. Unsecured, FRN, 0.58%, 1/29/16D |
|
|
500,000 |
|
|
|
500,619 |
|
ANNUAL REPORT / April
30, 2013
|
|
|
| 50 |
|
PORTFOLIOS OF INVESTMENTS |
Wilmington Short-Term Corporate Bond Fund (continued)
|
|
|
|
|
|
|
|
|
|
Description |
|
Par Value |
|
|
Value |
|
|
|
|
| Kellogg Co., |
|
|
|
|
|
|
|
|
| Sr. Unsecured, 1.13%, 5/15/15 |
|
$ |
1,000,000 |
|
|
$ |
1,009,902 |
|
|
|
|
| McCormick & Co., Inc., |
|
|
|
|
|
|
|
|
| Sr. Unsecured, 5.20%, 12/15/15 |
|
|
2,000,000 |
|
|
|
2,228,284 |
|
|
|
|
| Mondelez International, Inc., |
|
|
|
|
|
|
|
|
| Sr. Unsecured, 4.13%, 2/09/16 |
|
|
2,000,000 |
|
|
|
2,178,769 |
|
|
|
|
| WM Wrigley Jr. Co., |
|
|
|
|
|
|
|
|
| Sr. Secured, 3.70%, 6/30/14•,W |
|
|
1,500,000 |
|
|
|
1,544,502 |
|
|
|
|
|
|
|
|
|
|
|
|
| TOTAL FOOD PRODUCTS |
|
|
$ |
7,462,076 |
|
|
|
| FOREST PRODUCTS & PAPER – 1.3% |
|
|
|
|
|
|
|
|
| International Paper Co., |
|
|
|
|
|
|
|
|
| Sr. Unsecured, 5.25%, 4/01/16 |
|
|
2,250,000 |
|
|
|
2,496,679 |
|
|
|
| HEALTH CARE PROVIDERS & SERVICES – 1.6% |
|
|
|
|
|
|
|
|
| Quest Diagnostics, Inc., |
|
|
|
|
|
|
|
|
| Company Guaranteed, 1.13%, 3/24/14D |
|
|
2,000,000 |
|
|
|
2,010,114 |
|
|
|
|
| UnitedHealth Group, Inc., |
|
|
|
|
|
|
|
|
| Sr. Unsecured, 0.85%, 10/15/15 |
|
|
1,000,000 |
|
|
|
1,007,679 |
|
|
|
|
|
|
|
|
|
|
|
|
| TOTAL HEALTH CARE PROVIDERS & SERVICES |
|
|
$ |
3,017,793 |
|
|
|
|
| HOME FURNISHINGS – 1.1% |
|
|
|
|
|
|
|
|
|
|
|
| Whirlpool Corp., |
|
|
|
|
|
|
|
|
| Sr. Unsecured, MTN, 8.60%, 5/01/14 |
|
|
2,000,000 |
|
|
|
2,157,474 |
|
|
|
|
| INSURANCE – 3.4% |
|
|
|
|
|
|
|
|
|
|
|
| AON Corp., |
|
|
|
|
|
|
|
|
| Company Guaranteed, 3.50%, 9/30/15 |
|
|
2,730,000 |
|
|
|
2,891,718 |
|
|
|
|
| Jefferson-Pilot Corp., |
|
|
|
|
|
|
|
|
| Sr. Unsecured, 4.75%, 1/30/14 |
|
|
1,000,000 |
|
|
|
1,028,049 |
|
|
|
|
| Prudential Financial, Inc., |
|
|
|
|
|
|
|
|
| Sr. Unsecured, GMTN, 5.50%, 3/15/16 |
|
|
1,000,000 |
|
|
|
1,124,454 |
|
|
|
|
| WR Berkley Corp., |
|
|
|
|
|
|
|
|
| Sr. Unsecured, 5.60%, 5/15/15 |
|
|
1,150,000 |
|
|
|
1,239,638 |
|
|
|
|
|
|
|
|
|
|
|
|
|
| TOTAL INSURANCE |
|
|
|
|
|
$ |
6,283,859 |
|
|
|
|
| IRON/STEEL – 0.5% |
|
|
|
|
|
|
|
|
|
|
|
| Cliffs Natural Resources, Inc., |
|
|
|
|
|
|
|
|
| Sr. Unsecured, 3.95%, 1/15/18 |
|
|
885,000 |
|
|
|
897,803 |
|
|
|
|
| MEDIA – 10.3% |
|
|
|
|
|
|
|
|
|
|
|
| COX Communications, Inc., |
|
|
|
|
|
|
|
|
| Sr. Unsecured, 5.45%, 12/15/14 |
|
|
2,000,000 |
|
|
|
2,156,687 |
|
|
|
|
| DIRECTV Holdings LLC / DIRECTV Financing Co., Inc., |
|
|
|
|
|
|
|
|
| Company Guaranteed, 3.55%, 3/15/15 |
|
|
2,000,000 |
|
|
|
2,096,574 |
|
|
|
|
| DIRECTV Holdings LLC / DIRECTV Financing Co., Inc., |
|
|
|
|
|
|
|
|
| Company Guaranteed, 3.50%, 3/01/16 |
|
|
2,000,000 |
|
|
|
2,136,531 |
|
|
|
|
| NBCUniversal Enterprise, Inc., |
|
|
|
|
|
|
|
|
| Company Guaranteed, 0.82%, 4/15/16D,•,W |
|
|
630,000 |
|
|
|
630,598 |
|
|
|
|
| NBCUniversal Media LLC, |
|
|
|
|
|
|
|
|
| Company Guaranteed, 2.88%, 4/01/16 |
|
|
1,730,000 |
|
|
|
1,835,995 |
|
|
|
|
| News America, Inc., |
|
|
|
|
|
|
|
|
| Company Guaranteed, 5.30%, 12/15/14 |
|
|
2,000,000 |
|
|
|
2,149,505 |
|
|
|
|
| TCI Communications, Inc., |
|
|
|
|
|
|
|
|
| Sr. Unsecured, 8.75%, 8/01/15 |
|
|
2,000,000 |
|
|
|
2,353,230 |
|
|
|
|
|
|
|
|
|
|
|
Description |
|
Par Value |
|
|
Value |
|
|
|
|
| Time Warner Cable, Inc., |
|
|
|
|
|
|
|
|
| Company Guaranteed, 7.50%, 4/01/14 |
|
$ |
1,000,000 |
|
|
$ |
1,061,876 |
|
|
|
|
| Time Warner, Inc., |
|
|
|
|
|
|
|
|
| Company Guaranteed, 5.88%, 11/15/16 |
|
|
2,000,000 |
|
|
|
2,329,801 |
|
|
|
|
| Viacom, Inc., |
|
|
|
|
|
|
|
|
| Sr. Unsecured, 4.38%, 9/15/14 |
|
|
2,001,000 |
|
|
|
2,100,155 |
|
|
|
|
| Viacom, Inc., |
|
|
|
|
|
|
|
|
| Sr. Unsecured, 1.25%, 2/27/15 |
|
|
300,000 |
|
|
|
302,896 |
|
|
|
|
|
|
|
|
|
|
|
|
|
| TOTAL MEDIA |
|
|
|
|
|
$ |
19,153,848 |
|
|
|
|
| METALS & MINING – 0.3% |
|
|
|
|
|
|
|
|
|
|
|
| Barrick Gold Corp., |
|
|
|
|
|
|
|
|
| Sr. Unsecured, 2.50%, 5/01/18•,W |
|
|
500,000 |
|
|
|
503,021 |
|
|
|
| MISCELLANEOUS MANUFACTURING – 1.8% |
|
|
|
|
|
|
|
|
| Eaton Corp., |
|
|
|
|
|
|
|
|
| Company Guaranteed, 0.95%, 11/02/15•,W |
|
|
2,000,000 |
|
|
|
2,007,695 |
|
|
|
|
| John Deere Capital Corp., |
|
|
|
|
|
|
|
|
| Sr. Unsecured, 0.88%, 4/17/15# |
|
|
750,000 |
|
|
|
755,992 |
|
|
|
|
| Textron, Inc., |
|
|
|
|
|
|
|
|
| Sr. Unsecured, 6.20%, 3/15/15 |
|
|
515,000 |
|
|
|
559,639 |
|
|
|
|
|
|
|
|
|
|
|
|
| TOTAL MISCELLANEOUS MANUFACTURING |
|
|
$ |
3,323,326 |
|
|
|
|
| OIL & GAS – 8.1% |
|
|
|
|
|
|
|
|
|
|
|
| Anadarko Petroleum Corp., |
|
|
|
|
|
|
|
|
| Sr. Unsecured, 5.75%, 6/15/14 |
|
|
1,000,000 |
|
|
|
1,053,362 |
|
|
|
|
| BP Capital Markets PLC, |
|
|
|
|
|
|
|
|
| Company Guaranteed, 0.70%, 11/06/15 |
|
|
2,000,000 |
|
|
|
2,000,790 |
|
|
|
|
| Devon Energy Corp., |
|
|
|
|
|
|
|
|
| Sr. Unsecured, 5.63%, 1/15/14 |
|
|
2,000,000 |
|
|
|
2,071,312 |
|
|
|
|
| Diamond Offshore Drilling, Inc., |
|
|
|
|
|
|
|
|
| Sr. Unsecured, 4.88%, 7/01/15 |
|
|
1,000,000 |
|
|
|
1,090,648 |
|
|
|
|
| Hess Corp., |
|
|
|
|
|
|
|
|
| Sr. Unsecured, 7.00%, 2/15/14 |
|
|
1,390,000 |
|
|
|
1,457,046 |
|
|
|
|
| Husky Energy, Inc., |
|
|
|
|
|
|
|
|
| Sr. Unsecured, 5.90%, 6/15/14 |
|
|
2,210,000 |
|
|
|
2,334,107 |
|
|
|
|
| Marathon Oil Corp., |
|
|
|
|
|
|
|
|
| Sr. Unsecured, 0.90%, 11/01/15 |
|
|
1,810,000 |
|
|
|
1,812,939 |
|
|
|
|
| Phillips 66, |
|
|
|
|
|
|
|
|
| Company Guaranteed, 1.95%, 3/05/15 |
|
|
1,000,000 |
|
|
|
1,023,090 |
|
|
|
|
| Valero Energy Corp., |
|
|
|
|
|
|
|
|
| Company Guaranteed, 4.50%, 2/01/15 |
|
|
2,000,000 |
|
|
|
2,128,850 |
|
|
|
|
|
|
|
|
|
|
|
|
|
| TOTAL OIL & GAS |
|
|
|
|
|
$ |
14,972,144 |
|
|
|
| OIL & GAS FIELD SERVICES – 0.6% |
|
|
|
|
|
|
|
|
| Weatherford International Ltd., |
|
|
|
|
|
|
|
|
| Company Guaranteed, 6.00%, 3/15/18 |
|
|
1,000,000 |
|
|
|
1,150,284 |
|
|
|
|
| PHARMACEUTICALS – 1.4% |
|
|
|
|
|
|
|
|
|
|
|
| AbbVie, Inc., |
|
|
|
|
|
|
|
|
| Company Guaranteed, 1.20%, 11/06/15•,W |
|
|
2,200,000 |
|
|
|
2,222,682 |
|
|
|
|
| Zoetis, Inc., |
|
|
|
|
|
|
|
|
| Sr. Unsecured, 1.15%, 2/01/16•,W |
|
|
400,000 |
|
|
|
403,150 |
|
|
|
|
|
|
|
|
|
|
|
|
| TOTAL PHARMACEUTICALS |
|
|
$ |
2,625,832 |
|
|
|
|
| PIPELINES – 2.6% |
|
|
|
|
|
|
|
|
|
|
|
| Energy Transfer Partners LP, |
|
|
|
|
|
|
|
|
| Sr. Unsecured, 5.95%, 2/01/15 |
|
|
1,000,000 |
|
|
|
1,082,750 |
|
|
| April 30, 2013 / ANNUAL REPORT |
|
|
|
|
|
| PORTFOLIOS OF INVESTMENTS |
|
|
51 |
|
Wilmington Short-Term Corporate Bond Fund (continued)
|
|
|
|
|
|
|
|
|
| Description |
|
Par Value |
|
|
Value |
|
|
|
|
| Enterprise Products Operating LLC, |
|
|
|
|
|
|
|
|
| Series G, Company Guaranteed, |
|
|
|
|
|
|
|
|
| 5.60%, 10/15/14 |
|
$ |
1,000,000 |
|
|
$ |
1,070,502 |
|
|
|
|
| Kinder Morgan Energy Partners LP, |
|
|
|
|
|
|
|
|
| Sr. Unsecured, 5.63%, 2/15/15 |
|
|
2,500,000 |
|
|
|
2,714,338 |
|
|
|
|
|
|
|
|
|
|
|
|
|
| TOTAL PIPELINES |
|
|
|
|
|
$ |
4,867,590 |
|
|
| REAL ESTATE INVESTMENT TRUSTS – 9.0% |
|
|
|
|
| Boston Properties LP, |
|
|
|
|
|
|
|
|
| Sr. Unsecured, 5.63%, 4/15/15 |
|
|
1,000,000 |
|
|
|
1,092,471 |
|
|
|
|
| Digital Realty Trust LP, |
|
|
|
|
|
|
|
|
| Company Guaranteed, 4.50%, 7/15/15 |
|
|
885,000 |
|
|
|
938,186 |
|
|
|
|
| HCP, Inc., |
|
|
|
|
|
|
|
|
| Sr. Unsecured, 2.70%, 2/01/14 |
|
|
3,000,000 |
|
|
|
3,045,882 |
|
|
|
|
| Health Care REIT, Inc., |
|
|
|
|
|
|
|
|
| Sr. Unsecured, 6.00%, 11/15/13 |
|
|
2,000,000 |
|
|
|
2,056,626 |
|
|
|
|
| Mack-Cali Realty LP, |
|
|
|
|
|
|
|
|
| Sr. Unsecured, 2.50%, 12/15/17 |
|
|
2,021,000 |
|
|
|
2,064,031 |
|
|
|
|
| ProLogis LP, |
|
|
|
|
|
|
|
|
| Company Guaranteed, 6.13%, 12/01/16 |
|
|
1,000,000 |
|
|
|
1,156,765 |
|
|
|
|
| ProLogis LP, |
|
|
|
|
|
|
|
|
| Company Guaranteed, 4.50%, 8/15/17 |
|
|
925,000 |
|
|
|
1,022,884 |
|
|
|
|
| Simon Property Group LP, |
|
|
|
|
|
|
|
|
| Sr. Unsecured, 5.10%, 6/15/15 |
|
|
1,325,000 |
|
|
|
1,447,149 |
|
|
|
|
| Ventas Realty LP / Ventas Capital Corp., |
|
|
|
|
|
|
|
|
| Company Guaranteed, 3.13%, 11/30/15 |
|
|
3,637,000 |
|
|
|
3,844,028 |
|
|
|
|
|
|
|
|
|
|
|
|
| TOTAL REAL ESTATE INVESTMENT TRUSTS |
|
|
$ |
16,668,022 |
|
|
|
|
| RETAIL – 0.7% |
|
|
|
|
|
|
|
|
|
|
|
| Walgreen Co., |
|
|
|
|
|
|
|
|
| Sr. Unsecured, 1.00%, 3/13/15 |
|
|
1,000,000 |
|
|
|
1,007,872 |
|
|
|
|
| Wal-Mart Stores Pass-Through Trust 1994, |
|
|
|
|
|
|
|
|
| Series A-2, Pass-Through Certificates, |
|
|
|
|
|
|
|
|
| 8.85%, 1/02/15 |
|
|
251,569 |
|
|
|
267,450 |
|
|
|
|
|
|
|
|
|
|
|
|
|
| TOTAL RETAIL |
|
|
|
|
|
$ |
1,275,322 |
|
|
|
|
| SOFTWARE – 0.8% |
|
|
|
|
|
|
|
|
|
|
|
| Symantec Corp., |
|
|
|
|
|
|
|
|
| Sr. Unsecured, 2.75%, 9/15/15 |
|
|
1,415,000 |
|
|
|
1,466,887 |
|
|
|
| TELECOMMUNICATIONS – 1.6% |
|
|
|
|
|
|
|
|
| AT&T, Inc., |
|
|
|
|
|
|
|
|
| Sr. Unsecured, FRN, 0.66%, 2/12/16D |
|
|
3,000,000 |
|
|
|
3,011,341 |
|
|
|
| TRANSPORTATION – 1.3% |
|
|
|
|
|
|
|
|
| CSX Corp., |
|
|
|
|
|
|
|
|
| Sr. Unsecured, 6.25%, 4/01/15 |
|
|
265,000 |
|
|
|
292,687 |
|
|
|
|
| Ryder System, Inc., |
|
|
|
|
|
|
|
|
| Sr. Unsecured, MTN, 3.15%, 3/02/15 |
|
|
2,000,000 |
|
|
|
2,075,777 |
|
|
|
|
|
|
|
|
|
|
|
|
|
| TOTAL TRANSPORTATION |
|
|
|
|
|
$ |
2,368,464 |
|
|
|
|
|
|
|
|
|
|
|
|
| TOTAL CORPORATE BONDS (COST
$178,567,989) |
|
|
$ |
180,385,812 |
|
|
|
|
| U.S. TREASURY – 1.1% |
|
|
|
|
|
|
|
|
|
|
| U.S. TREASURY NOTES – 1.1% |
|
|
|
|
|
| 0.25%, 3/31/15 |
|
|
100,000 |
|
|
|
100,088 |
|
|
|
|
|
|
|
|
|
|
| Description |
|
Par Value |
|
|
Value |
|
|
|
|
| 0.75%, 3/31/18 |
|
$ |
2,000,000 |
|
|
$ |
2,008,992 |
|
|
|
|
|
|
|
|
|
|
|
|
| TOTAL U.S. TREASURY NOTES |
|
|
$ |
2,109,080 |
|
|
|
|
|
|
|
|
|
|
|
|
| TOTAL U.S. TREASURY (COST
$2,105,954) |
|
|
$ |
2,109,080 |
|
|
|
|
| REPURCHASE AGREEMENT – 0.1% |
|
|
|
|
|
|
|
|
|
|
|
| Credit Suisse First Boston LLC, 0.14%, dated 04/30/13, due 05/01/13, repurchase price $161,018, collateralized by a U.S. Treasury Security 2.75%, maturing
08/15/42; total market value of $ 166,440. |
|
|
161,017 |
|
|
|
161,017 |
|
|
|
|
|
|
|
|
|
|
|
|
| TOTAL REPURCHASE AGREEMENT
(COST $161,017) |
|
|
$ |
161,017 |
|
|
|
|
|
|
|
|
|
|
|
|
| TOTAL INVESTMENTS IN SECURITIES – 100.9% (COST $185,573,922) |
|
|
$ |
187,322,269 |
|
|
| CASH COLLATERAL INVESTED FOR SECURITIES ON LOAN – 2.0% |
|
|
|
| REPURCHASE AGREEMENTS – 2.0% |
|
|
|
|
|
|
|
|
| Citigroup Global Markets, Inc., 0.18%, dated 04/30/13, due 05/01/13, repurchase price $1,000,005, collateralized by U.S. Government Securities 0.84% to 6.50%,
maturing 11/01/18 to 03/15/53; total market value of $ 1,020,439. |
|
|
1,000,000 |
|
|
|
1,000,000 |
|
|
|
|
| Mizuho Securities USA, Inc., 0.20%, dated 04/30/13, due 05/01/13, repurchase price $1,000,006, collateralized by U.S. Government Securities 2.08% to 7.00%,
maturing 01/01/22 to 04/15/52; total market value of $ 1,020,000. |
|
|
1,000,000 |
|
|
|
1,000,000 |
|
|
|
|
| RBS Securities, Inc., 0.14%, dated 04/30/13, due 05/01/13, repurchase price $798,044, collateralized by U.S. Treasury Securities 0.13% to 3.88%, maturing
07/15/13 to 02/15/43; total market value of $ 814,005. |
|
|
798,041 |
|
|
|
798,041 |
|
|
|
|
| Royal Bank of Scotland PLC, 0.19%, dated 04/30/13, due 05/01/13, repurchase price $1,000,005, collateralized by U.S. Government & Treasury Securities
1.75% to 6.25%, maturing 11/15/13 to 05/15/29; total market value of $ 1,020,001. |
|
|
1,000,000 |
|
|
|
1,000,000 |
|
|
|
|
|
|
|
|
|
|
|
|
| TOTAL CASH COLLATERAL INVESTED FOR SECURITIES ON LOAN (COST $3,798,041) |
|
|
$ |
3,798,041 |
|
|
|
|
|
|
|
|
|
|
|
|
| TOTAL INVESTMENTS – 102.9%
(COST $189,371,963) |
|
|
$ |
191,120,310 |
|
|
|
| COLLATERAL FOR SECURITIES ON
LOAN – (2.0%) |
|
|
|
(3,798,041 |
) |
|
|
| OTHER LIABILITIES LESS ASSETS – (0.9%) |
|
|
|
(1,606,007 |
) |
|
|
|
|
|
|
|
|
|
|
|
| TOTAL NET ASSETS – 100.0% |
|
|
$ |
185,716,262 |
|
|
|
|
|
|
|
|
|
|
|
| ANNUAL REPORT / April 30, 2013 |
|
|
|
| 52 |
|
PORTFOLIOS OF INVESTMENTS |
Wilmington Short-Term Corporate Bond Fund (concluded)
Cost of investments for Federal income tax purposes is $189,372,237. The net unrealized
appreciation/(depreciation) of investments was $1,748,073. This consists of net unrealized appreciation from investment for those securities having an excess of value over cost of $1,905,137 and net unrealized depreciation from investments for those
securities having an excess of cost over value of $157,064.
Various inputs are used in determining the value of the Fund’s
investments. These inputs are summarized in the three broad levels listed below.
Level 1 – quoted prices in active
markets for identical securities
Level 2 – other significant observable inputs (including quoted prices for similar
securities, interest rates, prepayment speeds, credit risk, etc.)
Level 3 – significant unobservable inputs
(including the Fund’s own assumptions in determining the fair value of investments)
The following is a summary of the inputs used
as of April 30, 2013 in valuing the Fund’s assets carried at fair value:
|
|
|
|
|
|
|
|
|
|
|
|
|
|
|
|
|
| |
|
Level 1 |
|
|
Level 2 |
|
|
Level 3 |
|
|
Total |
|
| Investments in Securities |
|
|
|
|
|
|
|
|
|
|
|
|
|
|
|
|
| Adjustable Rate Mortgage |
|
$ |
— |
|
|
$ |
64 |
|
|
$ |
— |
|
|
$ |
64 |
|
| Asset-Backed Security |
|
|
— |
|
|
|
653,697 |
|
|
|
— |
|
|
|
653,697 |
|
| Collateralized Mortgage Obligations |
|
|
— |
|
|
|
4,012,599 |
|
|
|
— |
|
|
|
4,012,599 |
|
| Corporate Bonds |
|
|
— |
|
|
|
180,385,812 |
|
|
|
— |
|
|
|
180,385,812 |
|
| U.S. Treasury |
|
|
— |
|
|
|
2,109,080 |
|
|
|
— |
|
|
|
2,109,080 |
|
| Repurchase Agreements |
|
|
— |
|
|
|
3,959,058 |
|
|
|
— |
|
|
|
3,959,058 |
|
|
|
|
|
|
|
|
|
|
|
|
|
|
|
|
|
|
| Total |
|
$ |
— |
|
|
$ |
191,120,310 |
|
|
$ |
— |
|
|
$ |
191,120,310 |
|
|
|
|
|
|
|
|
|
|
|
|
|
|
|
|
|
|
See Notes to Portfolios of Investments
See Notes which are an integral part of the Financial Statements
April 30, 2013 / ANNUAL REPORT
53
PORTFOLIO OF INVESTMENTS SUMMARY TABLE
Wilmington Short Duration Government Bond Fund
At April 30, 2013, the Fund’s portfolio
composition was as follows (unaudited):
|
|
|
|
|
|
| |
|
Percentage of Total Net Assets |
| Federal National Mortgage Association (FNMA) |
|
|
|
26.7 |
% |
| Federal Home Loan Mortgage Corporation (FHLMC) |
|
|
|
24.5 |
% |
| U.S. Treasury Notes |
|
|
|
19.3 |
% |
| Federal Home Loan Bank (FHLB) |
|
|
|
10.4 |
% |
| Government National Mortgage Association (GNMA) |
|
|
|
9.4 |
% |
| U.S. Treasury Inflation Indexed Notes |
|
|
|
3.0 |
% |
| Student Loan Marketing Association |
|
|
|
1.6 |
% |
| Whole Loan |
|
|
|
1.6 |
% |
| Transportation |
|
|
|
0.5 |
% |
| Healthcare Providers & Services |
|
|
|
0.4 |
% |
| Small Business Administration |
|
|
|
0.3 |
% |
| Facilities |
|
|
|
0.1 |
% |
| Development |
|
|
|
0.1 |
% |
| Cash Equivalents1 |
|
|
|
1.9 |
% |
| Other Assets and Liabilities – Net2 |
|
|
|
0.2 |
% |
|
|
|
|
|
|
| TOTAL |
|
|
|
100.0 |
% |
|
|
|
|
|
|
| (1) |
Cash Equivalents include investments in repurchase agreements. |
| (2) |
Assets, other than investments in securities, less liabilities. See Statements of Assets and Liabilities. |
| (3) |
Derived from data provided by Moody’s Investors Service and Standard and Poor’s.
|
|
|
|
|
|
|
| Credit Quality Diversification3 |
|
Percentage of Total Net Assets |
| AAA |
|
|
|
34.7 |
% |
| AA |
|
|
|
0.2 |
% |
| BB |
|
|
|
0.5 |
% |
| CCC |
|
|
|
1.1 |
% |
| Not Rated |
|
|
|
1.9 |
% |
| U.S. Government Agency Securities |
|
|
|
39.1 |
% |
| U.S. Treasuries |
|
|
|
22.3 |
% |
| Other Assets and Liabilities – Net2 |
|
|
|
0.2 |
% |
|
|
|
|
|
|
| TOTAL |
|
|
|
100.0 |
% |
|
|
|
|
|
|
PORTFOLIO OF INVESTMENTS
April 30, 2013
|
|
|
|
|
|
|
|
|
|
Description |
|
Par Value |
|
|
Value |
|
|
| COLLATERALIZED MORTGAGE OBLIGATIONS – 26.0% |
|
|
| FEDERAL HOME LOAN MORTGAGE CORPORATION (FHLMC) – 7.3% |
|
|
|
|
| Series 1988-6, Class C, 9.05%, 6/15/19 |
|
$ |
13,111 |
|
|
$ |
14,428 |
|
|
|
|
| Series 1989-112, Class I, 6.50%, 1/15/21 |
|
|
2,412 |
|
|
|
2,641 |
|
|
|
|
| Series 1990-136, Class E, 6.00%, 4/15/21 |
|
|
6,657 |
|
|
|
7,296 |
|
|
|
|
| Series 1990-141, Class D, 5.00%, 5/15/21 |
|
|
2,529 |
|
|
|
2,719 |
|
|
|
|
| Series 1993-1577, Class PK, 6.50%, 9/15/23 |
|
|
96,863 |
|
|
|
108,583 |
|
|
|
|
| Series 1993-1644, Class K, 6.75%, 12/15/23 |
|
|
84,219 |
|
|
|
94,497 |
|
|
|
|
| Series 1994-1686, Class PJ, 5.00%, 2/15/24 |
|
|
13,635 |
|
|
|
14,617 |
|
|
|
|
|
|
|
|
|
|
|
Description |
|
Par Value |
|
|
Value |
|
|
|
|
| Series 2004-2773, Class JD, 5.00%, 3/15/18 |
|
$ |
204,400 |
|
|
$ |
206,200 |
|
|
|
|
| Series 2004-2786, Class PD, 4.50%, 1/15/18 |
|
|
72,546 |
|
|
|
72,789 |
|
|
|
|
| Series 2004-2844, Class PV, 5.00%, 8/15/15 |
|
|
321,151 |
|
|
|
332,369 |
|
|
|
|
| Series 2005-2931, Class QC, 4.50%, 1/15/19 |
|
|
352,982 |
|
|
|
357,525 |
|
|
|
|
| Series 2005-3062, Class LU, 5.50%, 10/15/16 |
|
|
3,177,189 |
|
|
|
3,399,768 |
|
|
|
|
| Series 2005-3074, Class BG, 5.00%, 9/15/33 |
|
|
961,787 |
|
|
|
998,580 |
|
|
|
|
| Series 2009-3610, Class AB, 1.40%, 12/15/14 |
|
|
506,342 |
|
|
|
510,570 |
|
|
|
|
| Series 2012-K710, Class A1, 1.44%, 1/25/19 |
|
|
2,924,506 |
|
|
|
2,986,309 |
|
ANNUAL REPORT / April
30, 2013
|
|
|
| 54 |
|
PORTFOLIOS OF INVESTMENTS |
Wilmington Short Duration Government Bond Fund (continued)
|
|
|
|
|
|
|
|
|
|
Description |
|
Par Value |
|
|
Value |
|
|
|
|
| Series 3799, Class GK, 2.75%, 1/15/21 |
|
$ |
387,410 |
|
|
$ |
404,796 |
|
|
|
|
|
|
|
|
|
|
|
|
| TOTAL FEDERAL HOME LOAN MORTGAGE CORPORATION (FHLMC) |
|
|
$ |
9,513,687 |
|
|
| FEDERAL NATIONAL MORTGAGE ASSOCIATION
(FNMA) – 8.2% |
|
|
|
|
| Series 1993-113, Class PK, 6.50%, 7/25/23 |
|
|
66,833 |
|
|
|
75,062 |
|
|
|
|
| Series 1993-127, Class H, 6.50%, 7/25/23 |
|
|
64,917 |
|
|
|
72,801 |
|
|
|
|
| Series 1993-202, Class J, 6.50%, 11/25/23 |
|
|
35,204 |
|
|
|
39,740 |
|
|
|
|
| Series 1994-3, Class PL, 5.50%, 1/25/24 |
|
|
64,536 |
|
|
|
71,266 |
|
|
|
|
| Series 1994-55, Class H, 7.00%, 3/25/24 |
|
|
72,383 |
|
|
|
82,619 |
|
|
|
|
| Series 2002-52, Class QA, 6.00%, 7/18/32 |
|
|
35,546 |
|
|
|
38,866 |
|
|
|
|
| Series 2003-3, Class BC, 5.00%, 2/25/18 |
|
|
1,211,781 |
|
|
|
1,294,522 |
|
|
|
|
| Series 2003-45, Class AB, 3.75%, 5/25/33 |
|
|
21,957 |
|
|
|
22,416 |
|
|
|
|
| Series 2003-74, Class VA, 5.50%, 7/25/14 |
|
|
1,079,955 |
|
|
|
1,100,586 |
|
|
|
|
| Series 2003-80, Class BA, 5.00%, 5/25/31 |
|
|
53,342 |
|
|
|
53,735 |
|
|
|
|
| Series 2003-80, Class CD, 5.00%, 4/25/30 |
|
|
43,497 |
|
|
|
43,741 |
|
|
|
|
| Series 2004-96, Class QB, 5.00%, 2/25/32 |
|
|
28,578 |
|
|
|
28,668 |
|
|
|
|
| Series 2007-26, Class C, 5.50%, 3/25/33 |
|
|
337,600 |
|
|
|
341,749 |
|
|
|
|
| Series 2011-66, Class QE, 2.00%, 7/25/21 |
|
|
1,365,379 |
|
|
|
1,405,240 |
|
|
|
|
| Series 2011-71, Class DJ, 3.00%, 3/25/25 |
|
|
1,839,815 |
|
|
|
1,876,271 |
|
|
|
|
| Series 2011-81, Class PA, 3.50%, 8/25/26 |
|
|
3,890,657 |
|
|
|
4,110,567 |
|
|
|
|
|
|
|
|
|
|
|
|
| TOTAL FEDERAL NATIONAL MORTGAGE ASSOCIATION (FNMA) |
|
|
$ |
10,657,849 |
|
|
| GOVERNMENT NATIONAL MORTGAGE ASSOCIATION (GNMA) – 8.9% |
|
|
|
|
| Series 2003-10, Class PV, 5.50%, 1/20/14 |
|
|
977,011 |
|
|
|
992,440 |
|
|
|
|
| Series 2005-44, Class PC, 5.00%, 12/20/33 |
|
|
1,665,404 |
|
|
|
1,781,449 |
|
|
|
|
| Series 2010-17, Class K, 4.00%, 3/16/22 |
|
|
6,453,619 |
|
|
|
6,692,946 |
|
|
|
|
| Series 2010-91, Class PA, 3.00%, 8/20/31 |
|
|
2,107,075 |
|
|
|
2,151,051 |
|
|
|
|
|
|
|
|
|
|
|
|
| TOTAL GOVERNMENT NATIONAL MORTGAGE ASSOCIATION (GNMA) |
|
|
$ |
11,617,886 |
|
|
| WHOLE LOAN – 1.6% |
|
|
|
|
| Banc of America Mortgage Securities, Inc., Series 2004-A, Class 2A1, 2.92%, 2/25/34D |
|
|
347,484 |
|
|
|
346,387 |
|
|
|
|
| Banc of America Mortgage Securities, Inc., Series 2004-B, Class 2A1, 3.04%, 3/25/34D |
|
|
294,677 |
|
|
|
301,000 |
|
|
|
|
| IndyMac INDA Mortgage Loan Trust, Series 2005-AR1, Class 2A1, 2.90%, 11/25/35D |
|
|
1,628,308 |
|
|
|
1,440,138 |
|
|
|
|
|
|
|
|
|
|
|
|
|
| TOTAL WHOLE LOAN |
|
|
|
|
|
$ |
2,087,525 |
|
|
|
|
|
|
|
|
|
|
|
|
| TOTAL COLLATERALIZED MORTGAGE OBLIGATIONS (COST $34,006,987) |
|
|
$ |
33,876,947 |
|
|
|
|
| CORPORATE BOND – 0.4% |
|
|
|
|
|
|
|
|
|
| HEALTH CARE PROVIDERS & SERVICES – 0.4% |
|
|
|
|
| Howard Hughes Medical Institute, Sr. Unsecured, 3.45%, 9/01/14 |
|
|
500,000 |
|
|
|
520,312 |
|
|
|
|
|
|
|
|
|
|
|
|
| TOTAL CORPORATE BOND (COST
$499,378) |
|
|
$ |
520,312 |
|
|
|
|
|
|
|
|
|
|
|
Description |
|
Par Value |
|
|
Value |
|
|
| GOVERNMENT AGENCIES – 35.0% |
|
|
| FEDERAL HOME LOAN BANK (FHLB) – 10.4% |
|
|
|
|
| 0.50%, 11/20/15 |
|
$ |
2,000,000 |
|
|
$ |
2,009,352 |
|
|
|
|
| 1.75%, 9/11/15 |
|
|
4,000,000 |
|
|
|
4,138,391 |
|
|
|
|
| 3.13%, 12/13/13 |
|
|
5,000,000 |
|
|
|
5,091,755 |
|
|
|
|
| 5.38%, 5/18/16 |
|
|
2,000,000 |
|
|
|
2,303,298 |
|
|
|
|
|
|
|
|
|
|
|
|
| TOTAL FEDERAL HOME LOAN BANK (FHLB) |
|
|
$ |
13,542,796 |
|
|
| FEDERAL HOME LOAN MORTGAGE CORPORATION (FHLMC) – 14.5% |
|
|
|
|
| 0.50%, 5/13/16 |
|
|
2,000,000 |
|
|
|
2,007,476 |
|
|
|
|
| 0.63%, 12/29/14 |
|
|
3,000,000 |
|
|
|
3,020,194 |
|
|
|
|
| 0.88%, 3/07/18 |
|
|
1,650,000 |
|
|
|
1,656,975 |
|
|
|
|
| 1.00%, 3/08/17 |
|
|
3,000,000 |
|
|
|
3,054,889 |
|
|
|
|
| 2.00%, 8/25/16 |
|
|
1,000,000 |
|
|
|
1,051,443 |
|
|
|
|
| 4.75%, 1/19/16 |
|
|
1,000,000 |
|
|
|
1,119,844 |
|
|
|
|
| 4.88%, 6/13/18 |
|
|
2,000,000 |
|
|
|
2,403,770 |
|
|
|
|
| 5.13%, 10/18/16 |
|
|
2,000,000 |
|
|
|
2,320,555 |
|
|
|
|
| 5.25%, 4/18/16 |
|
|
2,000,000 |
|
|
|
2,287,048 |
|
|
|
|
|
|
|
|
|
|
|
|
| TOTAL FEDERAL HOME LOAN MORTGAGE CORPORATION (FHLMC) |
|
|
$ |
18,922,194 |
|
|
| FEDERAL NATIONAL MORTGAGE ASSOCIATION
(FNMA) –7.7% |
|
|
|
|
| 0.38%, 3/16/15 |
|
|
4,000,000 |
|
|
|
4,011,050 |
|
|
|
|
| 0.38%, 12/21/15 |
|
|
3,000,000 |
|
|
|
3,004,228 |
|
|
|
|
| 0.50%, 5/27/15 |
|
|
3,000,000 |
|
|
|
3,016,140 |
|
|
|
|
|
|
|
|
|
|
|
|
| TOTAL FEDERAL NATIONAL MORTGAGE ASSOCIATION (FNMA) |
|
|
$ |
10,031,418 |
|
|
| SMALL BUSINESS ADMINISTRATION – 0.3% |
|
|
|
|
| Small Business Administration Participation Certificates, U.S. Government Guaranteed,
Series 1996-C, 6.70%, 3/01/16 |
|
|
21,847 |
|
|
|
23,284 |
|
|
|
|
| Small Business Administration Participation Certificates, U.S. Government Guaranteed,
Series 1996-K, 6.95%, 11/01/16 |
|
|
186,083 |
|
|
|
198,123 |
|
|
|
|
| Small Business Administration Participation Certificates, U.S. Government Guaranteed,
Series 1996-L, 6.70%, 12/01/16 |
|
|
85,162 |
|
|
|
90,015 |
|
|
|
|
| Small Business Administration Participation Certificates, U.S. Government Guaranteed,
Series 1997-E, 7.30%, 5/01/17 |
|
|
4,713 |
|
|
|
5,120 |
|
|
|
|
| Small Business Administration Participation Certificates, U.S. Government Guaranteed,
Series 1999-I, 7.30%, 9/01/19 |
|
|
7,467 |
|
|
|
8,282 |
|
|
|
|
|
|
|
|
|
|
|
|
| TOTAL SMALL BUSINESS ADMINISTRATION |
|
|
$ |
324,824 |
|
|
| STUDENT LOAN MARKETING ASSOCIATION – 1.6% |
|
|
|
|
| Sallie Mae, Inc., Sr. Unsecured, 2.77%, 10/03/22‡ |
|
|
2,595,000 |
|
|
|
2,064,668 |
|
|
| TRANSPORTATION – 0.5% |
|
|
|
|
| Vessel Management Services, Inc., U.S. Government Guaranteed, 6.75%, 7/15/25 |
|
|
518,000 |
|
|
|
630,735 |
|
|
|
|
|
|
|
|
|
|
|
|
| TOTAL GOVERNMENT AGENCIES
(COST $43,394,443) |
|
|
$ |
45,516,635 |
|
April 30, 2013 / ANNUAL REPORT
|
|
|
|
|
| PORTFOLIOS OF INVESTMENTS |
|
|
55 |
|
Wilmington Short Duration Government Bond Fund (continued)
|
|
|
|
|
|
|
|
|
|
Description |
|
Par Value |
|
|
Value |
|
|
| MORTGAGE-BACKED SECURITIES – 14.0% |
|
|
| FEDERAL HOME LOAN MORTGAGE CORPORATION
(FHLMC) – 2.7% |
|
|
|
|
| Pool 287773, 7.50%, 3/01/17 |
|
$ |
803 |
|
|
$ |
849 |
|
|
|
|
| Pool 538733, 9.00%, 9/01/19 |
|
|
298 |
|
|
|
343 |
|
|
|
|
| Pool A18401, 6.00%, 2/01/34 |
|
|
976,229 |
|
|
|
1,074,720 |
|
|
|
|
| Pool C78010, 5.50%, 4/01/33 |
|
|
1,446,746 |
|
|
|
1,576,791 |
|
|
|
|
| Pool C80328, 7.50%, 7/01/25 |
|
|
49,016 |
|
|
|
56,310 |
|
|
|
|
| Pool G01425, 7.50%, 5/01/32 |
|
|
110,414 |
|
|
|
127,502 |
|
|
|
|
| Pool G01831, 6.00%, 5/01/35 |
|
|
302,891 |
|
|
|
333,260 |
|
|
|
|
| Pool G12709, 5.00%, 7/01/22 |
|
|
286,257 |
|
|
|
306,670 |
|
|
|
|
|
|
|
|
|
|
|
|
| TOTAL FEDERAL HOME LOAN MORTGAGE CORPORATION (FHLMC) |
|
|
$ |
3,476,445 |
|
|
| FEDERAL NATIONAL MORTGAGE ASSOCIATION
(FNMA) – 10.8% |
|
|
|
|
| Pool 202957, 8.00%, 8/01/21 |
|
|
4,258 |
|
|
|
4,719 |
|
|
|
|
| Pool 252439, 6.50%, 5/01/29 |
|
|
49,209 |
|
|
|
55,381 |
|
|
|
|
| Pool 255933, 5.50%, 11/01/35 |
|
|
359,483 |
|
|
|
393,990 |
|
|
|
|
| Pool 323419, 6.00%, 12/01/28 |
|
|
87,645 |
|
|
|
96,831 |
|
|
|
|
| Pool 334593, 7.00%, 5/01/24 |
|
|
87,675 |
|
|
|
100,108 |
|
|
|
|
| Pool 39862, 9.75%, 9/01/17 |
|
|
6,536 |
|
|
|
7,276 |
|
|
|
|
| Pool 436746, 6.50%, 8/01/28 |
|
|
68,284 |
|
|
|
76,388 |
|
|
|
|
| Pool 440401, 6.50%, 8/01/28 |
|
|
196,608 |
|
|
|
219,735 |
|
|
|
|
| Pool 485678, 6.50%, 3/01/29 |
|
|
98,670 |
|
|
|
110,399 |
|
|
|
|
| Pool 494375, 6.50%, 4/01/29 |
|
|
29,020 |
|
|
|
32,661 |
|
|
|
|
| Pool 545051, 6.00%, 9/01/29 |
|
|
165,580 |
|
|
|
182,830 |
|
|
|
|
| Pool 604867, 7.00%, 1/01/25 |
|
|
10,460 |
|
|
|
11,317 |
|
|
|
|
| Pool 625596, 7.00%, 2/01/32 |
|
|
17,373 |
|
|
|
19,217 |
|
|
|
|
| Pool 725418, 6.50%, 5/01/34 |
|
|
259,539 |
|
|
|
292,744 |
|
|
|
|
| Pool 763704, 5.00%, 4/01/34 |
|
|
530,296 |
|
|
|
587,952 |
|
|
|
|
| Pool 833143, 5.50%, 9/01/35 |
|
|
1,447,061 |
|
|
|
1,588,225 |
|
|
|
|
| Pool 843323, 5.50%, 10/01/35 |
|
|
150,975 |
|
|
|
165,467 |
|
|
|
|
| Pool AB1796, 3.50%, 11/01/40 |
|
|
641,464 |
|
|
|
683,539 |
|
|
|
|
| Pool AB3417, 4.00%, 8/01/41 |
|
|
1,365,681 |
|
|
|
1,463,820 |
|
|
|
|
| Pool AE2520, 3.00%, 1/01/26 |
|
|
584,103 |
|
|
|
618,181 |
|
|
|
|
| Pool MA0921, 3.00%, 12/01/21 |
|
|
6,937,814 |
|
|
|
7,388,752 |
|
|
|
|
|
|
|
|
|
|
|
|
| TOTAL FEDERAL NATIONAL MORTGAGE ASSOCIATION (FNMA) |
|
|
$ |
14,099,532 |
|
|
| GOVERNMENT NATIONAL MORTGAGE ASSOCIATION
(GNMA) – 0.5% |
|
|
|
|
| Pool 1061, 9.00%, 4/20/23 |
|
|
18,136 |
|
|
|
21,281 |
|
|
|
|
| Pool 1886, 9.00%, 10/20/24 |
|
|
1,536 |
|
|
|
1,790 |
|
|
|
|
| Pool 188603, 9.00%, 11/15/16 |
|
|
6,197 |
|
|
|
7,138 |
|
|
|
|
| Pool 208196, 9.00%, 2/15/17 |
|
|
9,498 |
|
|
|
10,941 |
|
|
|
|
| Pool 306066, 8.50%, 7/15/21 |
|
|
5,491 |
|
|
|
6,393 |
|
|
|
|
| Pool 307983, 8.50%, 7/15/21 |
|
|
17,978 |
|
|
|
20,929 |
|
|
|
|
| Pool 341948, 8.50%, 1/15/23 |
|
|
11,646 |
|
|
|
13,361 |
|
|
|
|
| Pool 346572, 7.00%, 5/15/23 |
|
|
13,167 |
|
|
|
15,125 |
|
|
|
|
| Pool 484269, 7.00%, 9/15/28 |
|
|
48,454 |
|
|
|
56,147 |
|
|
|
|
|
|
|
|
|
|
|
Description |
|
Par Value |
|
|
Value |
|
|
|
|
| Pool 581522, 6.00%, 5/15/33 |
|
$ |
244,828 |
|
|
$ |
279,326 |
|
|
|
|
| Pool 592505, 6.00%, 4/15/33 |
|
|
210,252 |
|
|
|
238,958 |
|
|
|
|
| Pool 780440, 8.50%, 11/15/17 |
|
|
1,700 |
|
|
|
1,942 |
|
|
|
|
|
|
|
|
|
|
|
|
| TOTAL GOVERNMENT NATIONAL MORTGAGE ASSOCIATION (GNMA) |
|
|
$ |
673,331 |
|
|
|
|
|
|
|
|
|
|
|
|
| TOTAL MORTGAGE-BACKED SECURITIES
(COST $17,349,080) |
|
|
$ |
18,249,308 |
|
|
| MUNICIPAL BONDS – 0.2% |
|
|
| DEVELOPMENT – 0.1% |
|
|
|
|
| Miami, FL, Rent Revenue, Series 1998 (Lease payments guaranteed by U.S. Government), 8.65%, 7/01/19 |
|
|
130,000 |
|
|
|
163,495 |
|
|
| FACILITIES – 0.1% |
|
|
|
|
| Tacoma City, WA, Lease Revenue Bonds, (Lease payments guaranteed by U.S. Government), 8.20%, 9/15/13 |
|
|
105,000 |
|
|
|
106,916 |
|
|
|
|
|
|
|
|
|
|
|
|
|
| TOTAL MUNICIPAL BONDS (COST
$334,656) |
|
|
|
|
|
$ |
270,411 |
|
|
| U.S. TREASURY – 22.3% |
|
|
| U.S. TREASURY INFLATION INDEXED NOTES – 3.0% |
|
|
|
|
| 1.13%, 1/15/21 |
|
|
1,100,000 |
|
|
|
1,372,195 |
|
|
|
|
| 2.00%, 1/15/14 |
|
|
2,000,000 |
|
|
|
2,562,545 |
|
|
|
|
|
|
|
|
|
|
|
|
| TOTAL U.S. TREASURY INFLATION INDEXED NOTES |
|
|
$ |
3,934,740 |
|
|
| U.S. TREASURY NOTES – 19.3% |
|
|
|
|
| 0.25%, 10/31/13 |
|
|
2,300,000 |
|
|
|
2,301,854 |
|
|
|
|
| 0.25%, 4/30/14 |
|
|
9,000,000 |
|
|
|
9,010,899 |
|
|
|
|
| 0.50%, 10/15/13 |
|
|
6,700,000 |
|
|
|
6,712,716 |
|
|
|
|
| 3.13%, 8/31/13 |
|
|
7,000,000 |
|
|
|
7,070,118 |
|
|
|
|
|
|
|
|
|
|
|
|
|
| TOTAL U.S. TREASURY NOTES |
|
|
|
|
|
$ |
25,095,587 |
|
|
|
|
|
|
|
|
|
|
|
|
|
| TOTAL U.S. TREASURY |
|
|
|
|
|
|
|
|
| (COST $28,736,533) |
|
|
|
|
|
$ |
29,030,327 |
|
|
| REPURCHASE AGREEMENT – 1.9% |
|
|
|
|
| Credit Suisse First Boston LLC, 0.14%, dated 04/30/13, due 05/01/13, repurchase price $2,413,533, collateralized by a U.S. Treasury Security 2.75%, maturing
08/15/42; total market value of $2,462,340. |
|
|
2,413,524 |
|
|
|
2,413,524 |
|
|
|
|
|
|
|
|
|
|
|
|
| TOTAL REPURCHASE AGREEMENT |
|
|
|
|
|
| (COST $2,413,524) |
|
|
$ |
2,413,524 |
|
|
|
|
|
|
|
|
|
|
|
|
| TOTAL INVESTMENTS – 99.8% |
|
|
|
|
|
| (COST $126,734,601) |
|
|
$ |
129,877,464 |
|
|
|
| OTHER ASSETS LESS LIABILITIES – 0.2% |
|
|
|
293,603 |
|
|
|
|
|
|
|
|
|
|
|
|
| TOTAL NET ASSETS – 100.0% |
|
|
$ |
130,171,067 |
|
|
|
|
|
|
|
|
|
|
|
| ANNUAL REPORT / April 30, 2013 |
|
|
|
| 56 |
|
PORTFOLIOS OF INVESTMENTS |
Wilmington Short Duration Government Bond Fund (concluded)
Cost of investments for Federal income tax purposes is $126,743,011. The net unrealized appreciation/(depreciation) of investments was $3,134,453. This consists of
net unrealized appreciation from investment for those securities having an excess of value over cost of $3,857,391 and net unrealized depreciation from investments for those securities having an excess of cost over value of $722,938
Various inputs are used in determining the value of the Fund’s investments. These inputs are summarized in the three broad levels listed below.
Level 1 – quoted prices in active markets for identical securities
Level 2 – other significant observable inputs (including quoted prices for similar securities, interest rates, prepayment
speeds, credit risk, etc.)
Level 3 – significant unobservable inputs (including the Fund’s own assumptions in
determining the fair value of investments)
The following is a summary of the inputs used as of April 30, 2013 in valuing the Fund’s assets
carried at fair value:
|
|
|
|
|
|
|
|
|
|
|
|
|
|
|
|
|
| |
|
Level 1 |
|
|
Level 2 |
|
|
Level 3 |
|
|
Total |
|
| Investments in Securities |
|
|
|
|
|
|
|
|
|
|
|
|
|
|
|
|
| Collateralized Mortgage Obligations |
|
$ |
— |
|
|
$ |
33,876,947 |
|
|
$ |
— |
|
|
$ |
33,876,947 |
|
| Corporate Bond |
|
|
— |
|
|
|
520,312 |
|
|
|
— |
|
|
|
520,312 |
|
| Government Agencies |
|
|
— |
|
|
|
45,516,635 |
|
|
|
— |
|
|
|
45,516,635 |
|
| Mortgage-Backed Securities |
|
|
— |
|
|
|
18,249,308 |
|
|
|
— |
|
|
|
18,249,308 |
|
| Municipal Bonds |
|
|
— |
|
|
|
270,411 |
|
|
|
— |
|
|
|
270,411 |
|
| U.S. Treasury |
|
|
— |
|
|
|
29,030,327 |
|
|
|
— |
|
|
|
29,030,327 |
|
| Repurchase Agreement |
|
|
— |
|
|
|
2,413,524 |
|
|
|
— |
|
|
|
2,413,524 |
|
|
|
|
|
|
|
|
|
|
|
|
|
|
|
|
|
|
| Total |
|
$ |
— |
|
|
$ |
129,877,464 |
|
|
$ |
— |
|
|
$ |
129,877,464 |
|
|
|
|
|
|
|
|
|
|
|
|
|
|
|
|
|
|
The following is a reconciliation of assets in which significant unobservable inputs (Level 3) were used in
determining fair value:
|
|
|
|
|
| |
|
Investments
In
Securities |
|
| Balance as of 4/30/2012 (Government Agencies) |
|
$ |
34,986 |
|
| Realized gain (loss) |
|
|
4,152 |
|
| Change in unrealized appreciation (depreciation) |
|
|
(3,799 |
) |
| Purchases |
|
|
— |
|
| Sales |
|
|
(35,339 |
) |
| Transfers into Level 3 |
|
|
— |
|
| Transfers out of Level 3 |
|
|
— |
|
|
|
|
|
|
| Balance as of 4/30/2013 |
|
$ |
— |
|
|
|
|
|
|
See Notes to Portfolios of Investments
See Notes which are an integral part of the Financial Statements
April 30, 2013 / ANNUAL REPORT
57
PORTFOLIO OF INVESTMENTS SUMMARY TABLE
Wilmington Municipal Bond Fund
At April 30, 2013, the Fund’s portfolio composition was as follows
(unaudited):
|
|
|
|
|
|
| |
|
Percentage of Total Net Assets |
| General Obligation |
|
|
|
18.1 |
% |
| Higher Education |
|
|
|
15.8 |
% |
| Dedicated Tax |
|
|
|
13.3 |
% |
| Lease |
|
|
|
11.3 |
% |
| Medical |
|
|
|
11.0 |
% |
| School District |
|
|
|
9.2 |
% |
| Water & Sewer |
|
|
|
6.7 |
% |
| Pre-Refunded/Escrow |
|
|
|
3.9 |
% |
| Transportation |
|
|
|
3.3 |
% |
| Power |
|
|
|
2.0 |
% |
| Airport |
|
|
|
0.9 |
% |
| Cash Equivalents1 |
|
|
|
2.0 |
% |
| Other Assets and Liabilities – Net2 |
|
|
|
2.5 |
% |
|
|
|
|
|
|
| TOTAL |
|
|
|
100.0 |
% |
|
|
|
|
|
|
| (1) |
Cash Equivalents include investments in a money market fund. |
| (2) |
Assets, other than investments in securities, less liabilities. See Statements of Assets and Liabilities. |
| (3) |
Derived from data provided by Moody’s Investors Service and Standard and Poor’s.
|
|
|
|
|
|
|
| Credit Quality Diversification3 |
|
Percentage of Total Net Assets |
| AAA |
|
|
|
18.5 |
% |
| AA |
|
|
|
49.2 |
% |
| A |
|
|
|
22.9 |
% |
| BBB |
|
|
|
1.2 |
% |
| Not Rated |
|
|
|
5.7 |
% |
| Other Assets and Liabilities – Net2 |
|
|
|
2.5 |
% |
|
|
|
|
|
|
| TOTAL |
|
|
|
100.0 |
% |
|
|
|
|
|
|
PORTFOLIO OF INVESTMENTS
April 30, 2013
|
|
|
|
|
|
|
|
|
|
Description |
|
Par Value |
|
|
Value |
|
|
|
|
| MUNICIPAL BONDS – 95.5% |
|
|
|
|
|
|
|
|
|
|
|
| ALABAMA – 0.4% |
|
|
|
|
|
|
|
|
|
|
|
| MEDICAL – 0.4% |
|
|
|
|
|
|
|
|
|
|
|
| University of Alabama, Hospital Revenue, Refunding Bonds, (Series A), 5.75%, 9/01/22 |
|
$ |
1,000,000 |
|
|
$ |
1,180,260 |
|
|
|
|
|
|
|
|
|
|
|
|
|
| TOTAL ALABAMA |
|
|
|
|
|
$ |
1,180,260 |
|
|
|
|
| ARIZONA – 2.2% |
|
|
|
|
|
|
|
|
|
|
|
| DEDICATED TAX – 0.4% |
|
|
|
|
|
|
|
|
|
|
|
| Mesa, AZ, Highway Revenue Bonds, (Series A), 5.00%, 7/01/19 |
|
|
1,000,000 |
|
|
|
1,097,780 |
|
|
|
|
| LEASE – 0.4% |
|
|
|
|
|
|
|
|
|
|
|
| Tucson, AZ, Certificate Participation Bonds, (Series A), (National Reinsurance), 5.00%, 7/01/21 |
|
|
1,000,000 |
|
|
|
1,125,520 |
|
|
|
|
| WATER & SEWER – 1.4% |
|
|
|
|
|
|
|
|
|
|
|
| Arizona State, Water Infrastructure Finance Authority, Revenue Bonds, (Series A), 5.00%, 10/01/23 |
|
|
3,000,000 |
|
|
|
3,561,960 |
|
|
|
|
|
|
|
|
|
|
|
|
|
| TOTAL ARIZONA |
|
|
|
|
|
$ |
5,785,260 |
|
|
|
|
|
|
|
|
|
|
|
Description |
|
Par Value |
|
|
Value |
|
|
|
|
| CALIFORNIA – 9.1% |
|
|
|
|
|
|
|
|
|
|
|
| GENERAL OBLIGATION – 1.4% |
|
|
|
|
|
|
|
|
|
|
|
| State of California, CA, GO Unlimited, Refunding Revenue Bonds, 5.00%, 10/01/21 |
|
$ |
3,000,000 |
|
|
$ |
3,736,230 |
|
|
|
|
| HIGHER EDUCATION – 0.9% |
|
|
|
|
|
|
|
|
|
|
|
| University of California, CA, Refunding Revenue Bonds, (Series A-F), 5.00%, 5/15/27 |
|
|
2,000,000 |
|
|
|
2,459,800 |
|
|
|
|
| LEASE – 1.7% |
|
|
|
|
|
|
|
|
|
|
|
| Sacramento, CA, City Financing Authority, Refunding Revenue Bonds, (Series B), 5.40%, 11/01/20 |
|
|
4,000,000 |
|
|
|
4,621,800 |
|
|
|
|
| MEDICAL – 1.1% |
|
|
|
|
|
|
|
|
|
|
|
| California State, Health Facilities Financing Authority, Revenue Bonds, (Series H), (Catholic Healthcare West, OBG), 5.13%, 7/01/22 |
|
|
685,000 |
|
|
|
749,130 |
|
|
|
|
| California State, Statewide Communities Development Authority, Revenue Bonds, (Series E-1), 5.00%, 5/01/17 |
|
|
2,000,000 |
|
|
|
2,321,540 |
|
|
|
|
|
|
|
|
|
|
|
|
|
| TOTAL MEDICAL |
|
|
|
|
|
$ |
3,070,670 |
|
ANNUAL REPORT /
April 30, 2013
|
|
|
| 58 |
|
PORTFOLIOS OF INVESTMENTS |
Wilmington Municipal Bond Fund (continued)
|
|
|
|
|
|
|
|
|
|
Description |
|
Par Value |
|
|
Value |
|
|
|
|
| POWER – 2.0% |
|
|
|
|
|
|
|
|
|
|
|
| Southern California Public Power Authority, Refunding Revenue Bonds, (Series A), 5.00%, 7/01/17 |
|
$ |
4,500,000 |
|
|
$ |
5,263,425 |
|
|
|
|
| WATER & SEWER – 2.0% |
|
|
|
|
|
|
|
|
|
|
|
| Orange County Sanitation District, Refunding Revenue Bonds, (Series B), 5.00%, 2/01/21 |
|
|
3,000,000 |
|
|
|
3,819,360 |
|
|
|
|
| San Diego County Water Authority, CA, Refunding Revenue Bonds, (Series A), 5.00%, 5/01/23 |
|
|
1,240,000 |
|
|
|
1,529,862 |
|
|
|
|
|
|
|
|
|
|
|
|
|
| TOTAL WATER & SEWER |
|
|
|
|
|
$ |
5,349,222 |
|
|
|
|
|
|
|
|
|
|
|
|
|
| TOTAL CALIFORNIA |
|
|
|
|
|
$ |
24,501,147 |
|
|
|
|
| COLORADO – 1.3% |
|
|
|
|
|
|
|
|
|
|
|
| AIRPORT – 0.9% |
|
|
|
|
|
|
|
|
|
|
|
| Denver County, CO, Airport System Revenue, Refunding Revenue Bonds, (Series B), 5.00%, 11/15/25 |
|
|
2,000,000 |
|
|
|
2,433,720 |
|
|
|
|
| DEDICATED TAX – 0.4% |
|
|
|
|
|
|
|
|
|
|
|
| Grand Junction, CO, Refunding Revenue Bonds, 5.00%, 3/01/16 |
|
|
1,000,000 |
|
|
|
1,124,500 |
|
|
|
|
|
|
|
|
|
|
|
|
|
| TOTAL COLORADO |
|
|
|
|
|
$ |
3,558,220 |
|
|
|
|
| DELAWARE – 0.5% |
|
|
|
|
|
|
|
|
|
|
| GENERAL OBLIGATION – 0.5% |
|
|
|
|
|
|
|
|
| State of Delaware, DE, GO Unlimited, Refunding Revenue Bonds, (Series A), 5.00%, 8/01/18 |
|
|
1,000,000 |
|
|
|
1,218,110 |
|
|
|
|
|
|
|
|
|
|
|
|
|
| TOTAL DELAWARE |
|
|
|
|
|
$ |
1,218,110 |
|
|
|
| DISTRICT OF COLUMBIA – 0.9% |
|
|
|
|
|
|
|
|
| DEDICATED TAX – 0.9% |
|
|
|
|
|
|
|
|
|
|
|
| District of Columbia, Income Tax Secured, Refunding Revenue Bonds, (Series B), 5.00%, 12/01/27 |
|
|
2,000,000 |
|
|
|
2,445,920 |
|
|
|
|
|
|
|
|
|
|
|
|
| TOTAL DISTRICT OF COLUMBIA |
|
|
$ |
2,445,920 |
|
|
|
|
| FLORIDA – 1.2% |
|
|
|
|
|
|
|
|
|
|
|
| LEASE – 1.2% |
|
|
|
|
|
|
|
|
|
|
|
| City of Jacksonville, FL, Special Refunding Revenue Bonds, (Series C), 5.00%, 10/01/26 |
|
|
2,640,000 |
|
|
|
3,173,623 |
|
|
|
|
|
|
|
|
|
|
|
|
|
| TOTAL FLORIDA |
|
|
|
|
|
$ |
3,173,623 |
|
|
|
|
| GEORGIA – 2.4% |
|
|
|
|
|
|
|
|
|
|
| GENERAL OBLIGATION – 0.9% |
|
|
|
|
|
|
|
|
| Georgia State, GO Unlimited, Refunding Revenue Bonds, (Series C), 5.00%, 7/01/21 |
|
|
2,000,000 |
|
|
|
2,355,140 |
|
|
|
| HIGHER EDUCATION – 0.9% |
|
|
|
|
|
|
|
|
| Fulton County Development Authority, GA, Refunding Revenue Bonds, (Series A), (Georgia Technology Foundation Inc., OBG),
5.25%, 11/01/24 |
|
|
1,750,000 |
|
|
|
2,345,315 |
|
|
|
|
|
|
|
|
|
|
|
Description |
|
Par Value |
|
|
Value |
|
|
|
|
| MEDICAL – 0.6% |
|
|
|
|
|
|
|
|
|
|
|
| Cobb County Kennestone Hospital Authority, Refunding Revenue Bonds, 5.00%, 4/01/27 |
|
$ |
1,500,000 |
|
|
$ |
1,784,055 |
|
|
|
|
|
|
|
|
|
|
|
|
|
| TOTAL GEORGIA |
|
|
|
|
|
$ |
6,484,510 |
|
|
|
|
| ILLINOIS – 1.8% |
|
|
|
|
|
|
|
|
|
|
|
| DEDICATED TAX – 1.8% |
|
|
|
|
|
|
|
|
|
|
|
| Illinois State, Sales Tax Revenue Bonds, 5.00%, 6/15/19 |
|
|
1,195,000 |
|
|
|
1,257,988 |
|
|
|
|
| Illinois State, Sales Tax Revenue Bonds, (National Reinsurance FGIC), 6.00%, 6/15/26 |
|
|
2,500,000 |
|
|
|
3,462,250 |
|
|
|
|
|
|
|
|
|
|
|
|
|
| TOTAL DEDICATED TAX |
|
|
|
|
|
$ |
4,720,238 |
|
|
|
|
|
|
|
|
|
|
|
|
|
| TOTAL ILLINOIS |
|
|
|
|
|
$ |
4,720,238 |
|
|
|
|
| INDIANA – 0.9% |
|
|
|
|
|
|
|
|
|
|
|
| MEDICAL – 0.9% |
|
|
|
|
|
|
|
|
|
|
|
| Indiana State, Finance Authority Health System, Refunding Revenue Bonds, (Series C), (Franciscan Alliance Inc., OBG), 5.00%, 11/01/21 |
|
|
2,000,000 |
|
|
|
2,302,360 |
|
|
|
|
|
|
|
|
|
|
|
|
|
| TOTAL INDIANA |
|
|
|
|
|
$ |
2,302,360 |
|
|
|
|
| LOUISIANA – 0.4% |
|
|
|
|
|
|
|
|
|
|
|
| HIGHER EDUCATION – 0.4% |
|
|
|
|
|
|
|
|
|
|
|
| Louisiana State, Public Facilities Authority, Revenue Bonds, (Loyola University, OBG), 5.00%, 10/01/19 |
|
|
1,000,000 |
|
|
|
1,203,420 |
|
|
|
|
|
|
|
|
|
|
|
|
|
| TOTAL LOUISIANA |
|
|
|
|
|
$ |
1,203,420 |
|
|
|
|
| MARYLAND – 1.4% |
|
|
|
|
|
|
|
|
|
|
|
| LEASE – 0.9% |
|
|
|
|
|
|
|
|
|
|
|
| Baltimore County, MD, Certificate Participation Bonds, 5.00%, 10/01/21 |
|
|
2,000,000 |
|
|
|
2,501,880 |
|
|
|
|
| TRANSPORTATION – 0.5% |
|
|
|
|
|
|
|
|
|
|
|
| Maryland State Department of Transportation, Refunding Revenue Bonds, 5.00%, 5/01/17 |
|
|
1,000,000 |
|
|
|
1,174,870 |
|
|
|
|
|
|
|
|
|
|
|
|
|
| TOTAL MARYLAND |
|
|
|
|
|
$ |
3,676,750 |
|
|
|
|
| MASSACHUSETTS – 2.7% |
|
|
|
|
|
|
|
|
|
|
|
| DEDICATED TAX – 1.5% |
|
|
|
|
|
|
|
|
|
|
|
| Massachusetts Bay, MA, Transportation Authority, Sales Tax Refunding Revenue Bonds, (Series C), 5.50%, 7/01/23 |
|
|
2,000,000 |
|
|
|
2,664,040 |
|
|
|
|
| School Building Authority, MA, Sales Tax Revenue, Refunding Revenue Bonds, (Series B), 5.00%, 8/15/19 |
|
|
1,000,000 |
|
|
|
1,236,820 |
|
|
|
|
|
|
|
|
|
|
|
|
|
| TOTAL DEDICATED TAX |
|
|
|
|
|
$ |
3,900,860 |
|
|
|
|
| LEASE – 0.1% |
|
|
|
|
|
|
|
|
|
|
|
| Massachusetts State, Development Finance Agency, Lease Revenue Bonds, (Visual & Performing Arts Project), 6.00%, 8/01/16 |
|
|
310,000 |
|
|
|
360,356 |
|
April 30, 2013 / ANNUAL REPORT
|
|
|
|
|
| PORTFOLIOS OF INVESTMENTS |
|
|
59 |
|
Wilmington Municipal Bond Fund (continued)
|
|
|
|
|
|
|
|
|
|
Description |
|
Par Value |
|
|
Value |
|
|
|
|
| WATER & SEWER – 1.1% |
|
|
|
|
|
|
|
|
|
|
|
| Massachusetts State, Water Resources Authority, Revenue Bonds, (Series B), (AGM), 5.25%, 8/01/27 |
|
$ |
2,325,000 |
|
|
$ |
3,016,594 |
|
|
|
|
|
|
|
|
|
|
|
|
|
| TOTAL MASSACHUSETTS |
|
|
|
|
|
$ |
7,277,810 |
|
|
|
|
| MICHIGAN – 3.2% |
|
|
|
|
|
|
|
|
|
|
|
| LEASE – 1.6% |
|
|
|
|
|
|
|
|
|
|
|
| Michigan State, Finance Authority, Refunding Revenue Bonds, (Series A), 5.00%,7/01/18 |
|
|
3,500,000 |
|
|
|
4,247,950 |
|
|
|
|
| SCHOOL DISTRICT – 1.6% |
|
|
|
|
|
|
|
|
|
|
|
| Ann Arbor School District, MI, GO Unlimited, Refunding Revenue Bonds, (Q-SBLF), 5.00%, 5/01/17 |
|
|
1,000,000 |
|
|
|
1,165,360 |
|
|
|
|
| Dexter Community Schools, MI, GO Unlimited, Refunding Revenue Bonds, (Q-SBLF), 5.00%, 5/01/15 |
|
|
1,000,000 |
|
|
|
1,088,070 |
|
|
|
|
| Lansing School District, MI, GO Unlimited, Refunding Revenue Bonds, (Q-SBLF), 4.00%, 5/01/16 |
|
|
2,000,000 |
|
|
|
2,180,060 |
|
|
|
|
|
|
|
|
|
|
|
|
|
| TOTAL SCHOOL DISTRICT |
|
|
|
|
|
$ |
4,433,490 |
|
|
|
|
|
|
|
|
|
|
|
|
|
| TOTAL MICHIGAN |
|
|
|
|
|
$ |
8,681,440 |
|
|
|
|
| NEVADA – 2.6% |
|
|
|
|
|
|
|
|
|
|
|
| DEDICATED TAX – 0.9% |
|
|
|
|
|
|
|
|
|
|
|
| Clark County, NV, Highway Improvement, Motor Vehicle Fuel Tax, Refunding Revenue Bonds, 5.00%, 7/01/18 |
|
|
2,000,000 |
|
|
|
2,389,280 |
|
|
|
| GENERAL OBLIGATIONS – 1.3% |
|
|
|
|
|
|
|
|
| Clark County, NV, GO Limited Bonds, (AMBAC), 5.00%, 11/01/25 |
|
|
1,000,000 |
|
|
|
1,133,360 |
|
|
|
|
| Las Vegas Valley, NV, Water District, GO Limited Bonds, (Series A), (AGM), 5.00%, 6/01/20 |
|
|
2,000,000 |
|
|
|
2,260,040 |
|
|
|
|
|
|
|
|
|
|
|
|
| TOTAL GENERAL OBLIGATIONS |
|
|
$ |
3,393,400 |
|
|
|
|
| SCHOOL DISTRICT – 0.4% |
|
|
|
|
|
|
|
|
|
|
|
| Washoe County, NV, School District, GO Limited, Refunding Revenue Bonds, (Series A), 4.00%, 6/01/18 |
|
|
1,000,000 |
|
|
|
1,141,920 |
|
|
|
|
|
|
|
|
|
|
|
|
|
| TOTAL NEVADA |
|
|
|
|
|
$ |
6,924,600 |
|
|
|
|
| NEW YORK – 9.2% |
|
|
|
|
|
|
|
|
|
|
|
| DEDICATED TAX – 5.2% |
|
|
|
|
|
|
|
|
|
|
|
| Nassau County Interim Finance Authority, NY, Sales Tax Refunding Revenue Bonds, 5.00%, 11/15/21 |
|
|
1,960,000 |
|
|
|
2,508,290 |
|
|
|
|
| New York City, NY, Transitional Finance Authority, Future Tax Secured Revenue, Refunding Revenue Bonds, (Subseries E), 5.00%, 11/01/22 |
|
|
4,125,000 |
|
|
|
5,116,774 |
|
|
|
|
| New York Local Government Assistance Corp., Refunding Revenue Bonds, (Series A), (GO OF CORP), 5.00%, 4/01/19 |
|
|
1,500,000 |
|
|
|
1,843,560 |
|
|
|
|
|
|
|
|
|
|
|
Description |
|
Par Value |
|
|
Value |
|
|
|
|
| New York State Dormitory Authority, State Personal Income Tax Revenue Bonds, (Series B), (AMBAC), 5.50%, 3/15/25 |
|
$ |
1,750,000 |
|
|
$ |
2,322,320 |
|
|
|
|
| New York State Environmental Facilities Corp., Personal Income Tax, Revenue Bonds, (Series A), 5.00%, 12/15/21 |
|
|
2,000,000 |
|
|
|
2,238,220 |
|
|
|
|
|
|
|
|
|
|
|
|
|
| TOTAL DEDICATED TAX |
|
|
|
|
|
$ |
14,029,164 |
|
|
|
| GENERAL OBLIGATIONS – 3.6% |
|
|
|
|
|
|
|
|
| County of Sullivan, NY, GO Unlimited, Refunding Revenue Bonds, 5.00%, 7/15/18 |
|
|
1,100,000 |
|
|
|
1,318,174 |
|
|
|
|
| New York City, NY, GO Unlimited Bonds, (Series D), 5.00%, 8/01/19 |
|
|
5,000,000 |
|
|
|
6,134,150 |
|
|
|
|
| New York City, NY, GO Unlimited Bonds, (Series D1), 5.00%, 12/01/21 |
|
|
1,000,000 |
|
|
|
1,180,090 |
|
|
|
|
| New York City, NY, GO Unlimited Bonds,
(Series E-1), 6.00%, 10/15/23 |
|
|
750,000 |
|
|
|
931,920 |
|
|
|
|
|
|
|
|
|
|
|
|
| TOTAL GENERAL OBLIGATIONS |
|
|
$ |
9,564,334 |
|
|
|
|
| LEASE – 0.4% |
|
|
|
|
|
|
|
|
|
|
|
| Erie County, NY, IDA, School Facility, Refunding Revenue Bonds, (State Aid Withholding), 5.00%, 5/01/18 |
|
|
1,000,000 |
|
|
|
1,193,220 |
|
|
|
|
|
|
|
|
|
|
|
|
|
| TOTAL NEW YORK |
|
|
|
|
|
$ |
24,786,718 |
|
|
|
|
| NORTH CAROLINA – 1.8% |
|
|
|
|
|
|
|
|
|
|
| GENERAL OBLIGATIONS – 1.2% |
|
|
|
|
|
|
|
|
| City of Charlotte, NC, GO Unlimited, Refunding Revenue Bonds, (Series A), 5.00%, 7/01/22 |
|
|
1,000,000 |
|
|
|
1,295,330 |
|
|
|
|
| State of North Carolina, NC, GO Unlimited, Refunding Revenue Bonds, (Series C), 5.00%, 5/01/26 |
|
|
1,500,000 |
|
|
|
1,978,395 |
|
|
|
|
|
|
|
|
|
|
|
|
| TOTAL GENERAL OBLIGATIONS |
|
|
$ |
3,273,725 |
|
|
|
|
| WATER & SEWER – 0.6% |
|
|
|
|
|
|
|
|
|
|
|
| Charlotte, NC, Water & Sewer System, Refunding Revenue Bonds, 5.00%, 12/01/19 |
|
|
1,250,000 |
|
|
|
1,563,225 |
|
|
|
|
|
|
|
|
|
|
|
|
|
| TOTAL NORTH CAROLINA |
|
|
|
|
|
$ |
4,836,950 |
|
|
|
|
| OHIO – 3.1% |
|
|
|
|
|
|
|
|
|
|
|
| DEDICATED TAX – 0.6% |
|
|
|
|
|
|
|
|
|
|
|
| Hamilton County, OH, Sales Tax Revenue Bonds, (Series A), (AMBAC), 5.00%, 12/01/17 |
|
|
1,500,000 |
|
|
|
1,723,740 |
|
|
|
| GENERAL OBLIGATIONS – 1.4% |
|
|
|
|
|
|
|
|
| Akron, OH, GO Limited, (AMBAC), 5.00%, 12/01/24 |
|
|
1,275,000 |
|
|
|
1,405,267 |
|
|
|
|
| Akron-Summit County, OH, Public Library, GO Unlimited, Refunding Revenue Bonds, 5.00%, 12/01/20 |
|
|
1,960,000 |
|
|
|
2,421,482 |
|
|
|
|
|
|
|
|
|
|
|
|
| TOTAL GENERAL OBLIGATIONS |
|
|
$ |
3,826,749 |
|
|
| ANNUAL REPORT / April 30, 2013 |
|
|
|
| 60 |
|
PORTFOLIOS OF INVESTMENTS |
Wilmington Municipal Bond Fund (continued)
|
|
|
|
|
|
|
|
|
|
Description |
|
Par Value |
|
|
Value |
|
|
|
|
| WATER & SEWER – 1.1% |
|
|
|
|
|
|
|
|
|
|
|
| Ohio State, Water Development Authority, Refunding Revenue Bonds, (Series C), (Water Pollution Center), 5.00%, 12/01/20 |
|
$ |
2,275,000 |
|
|
$ |
2,882,721 |
|
|
|
|
|
|
|
|
|
|
|
|
|
| TOTAL OHIO |
|
|
|
|
|
$ |
8,433,210 |
|
|
|
|
| PENNSYLVANIA – 28.9% |
|
|
|
|
|
|
|
|
|
|
|
| DEDICATED TAX – 0.5% |
|
|
|
|
|
|
|
|
|
|
|
| Pittsburgh & Allegheny County, PA, Sports & Exhibition Authority, Regional Asset District, Sales Tax Refunding Revenue Bonds, (AGM), 5.00%,
2/01/23 |
|
|
1,250,000 |
|
|
|
1,459,513 |
|
|
|
| GENERAL OBLIGATIONS – 4.0% |
|
|
|
|
|
|
|
|
| Commonwealth of Pennsylvania, GO Unlimited, Refunding Revenue Bonds, 5.00%, 7/01/18 |
|
|
2,910,000 |
|
|
|
3,517,084 |
|
|
|
|
| Northampton County, PA, GO Unlimited, Refunding Revenue Bonds, (Series B), 5.00%, 10/01/24 |
|
|
2,000,000 |
|
|
|
2,502,520 |
|
|
|
|
| Philadelphia, PA, GO Unlimited Bonds, (CIFG), 5.00%, 8/01/23 |
|
|
1,000,000 |
|
|
|
1,060,220 |
|
|
|
|
| Philadelphia, PA, GO Unlimited, Refunding Revenue Bonds, (Series A) |
|
|
|
|
|
|
|
|
|
|
|
| 5.00%, 9/15/19 |
|
|
1,000,000 |
|
|
|
1,190,240 |
|
|
|
|
| 5.00%, 9/15/21 |
|
|
2,040,000 |
|
|
|
2,439,534 |
|
|
|
|
|
|
|
|
|
|
|
|
| TOTAL GENERAL OBLIGATIONS |
|
|
$ |
10,709,598 |
|
|
|
| HIGHER EDUCATION – 7.4% |
|
|
|
|
|
|
|
|
| Huntingdon County, PA, General Authority Refunding Revenue Bonds, (Series A), (Juniata College), 5.00%, 5/01/27 |
|
|
1,765,000 |
|
|
|
1,987,319 |
|
|
|
|
| Lancaster, PA, Higher Education Authority, College Revenue, Refunding Bonds, (Franklin & Marshall College), 5.00%, 4/15/18 |
|
|
2,350,000 |
|
|
|
2,607,466 |
|
|
|
|
| Montgomery County, PA, Higher Education & Health Authority Hospital, (Series FF1), (Dickinson College)/(CIFG INS) |
|
|
|
|
|
|
|
|
|
|
|
| 5.00%, 5/01/19 |
|
|
1,420,000 |
|
|
|
1,595,981 |
|
|
|
|
| 5.00%, 5/01/20 |
|
|
1,490,000 |
|
|
|
1,674,656 |
|
|
|
|
| Pennsylvania State Higher Education Facilities Authority, (Series EE 1), (York College of PA)/(XLCA), 5.00%, 11/01/18 |
|
|
1,020,000 |
|
|
|
1,101,386 |
|
|
|
|
| Pennsylvania State Higher Educational Facilities Authority, Refunding Revenue Bonds, (Drexel University, OBG), 5.00%, 5/01/18 |
|
|
1,000,000 |
|
|
|
1,179,300 |
|
|
|
|
| Pennsylvania State Higher Educational Revenue, (National Reinsurance FGIC)/(Drexel University), 5.00%, 5/01/27 |
|
|
1,250,000 |
|
|
|
1,384,438 |
|
|
|
|
|
|
|
|
|
|
|
Description |
|
Par Value |
|
|
Value |
|
|
|
|
| Pennsylvania State, Higher Educational Facilities Authority, Refunding Revenue Bonds, (Bryn Mawr College), 5.00%, 12/01/17 |
|
$ |
2,400,000 |
|
|
$ |
2,859,552 |
|
|
|
|
| Pennsylvania State, Higher Educational Facilities Authority, Refunding Revenue Bonds, (Series A), (Ursinus College, OBG) |
|
|
|
|
|
|
|
|
|
|
|
| 5.00%, 1/01/23 |
|
|
1,620,000 |
|
|
|
1,920,769 |
|
|
|
|
| 5.00%, 1/01/25 |
|
|
1,000,000 |
|
|
|
1,153,700 |
|
|
|
|
| State Public School Building Authority, PA, College Revenue Bonds, (Harrisburg Area Community College, OBG), 5.00%, 10/01/19 |
|
|
2,150,000 |
|
|
|
2,492,474 |
|
|
|
|
|
|
|
|
|
|
|
|
| TOTAL HIGHER EDUCATION |
|
|
$ |
19,957,041 |
|
|
|
|
| LEASE – 2.5% |
|
|
|
|
|
|
|
|
|
|
|
| Berks County, PA, Vocational Technical School Authority, Refunding Revenue Bonds, (National-Reinsurance), 5.00%, 6/01/14 |
|
|
1,655,000 |
|
|
|
1,728,565 |
|
|
|
|
| Philadelphia Redevelopment Authority, PA, Transportation Initiative, Refunding Revenue Bonds, 5.00%, 4/15/24 |
|
|
3,000,000 |
|
|
|
3,524,670 |
|
|
|
|
| Philadelphia, PA, Redevelopment Authority, (Series C), (National Reinsurance FGIC), 5.00%, 4/15/27 |
|
|
1,500,000 |
|
|
|
1,548,795 |
|
|
|
|
|
|
|
|
|
|
|
|
|
| TOTAL LEASE |
|
|
|
|
|
$ |
6,802,030 |
|
|
|
|
| MEDICAL – 4.3% |
|
|
|
|
|
|
|
|
|
|
|
| Allegheny County, PA, Hospital Development Authority, Revenue Bonds, (Series A), (UPMC, OBG), 5.00%, 10/15/22 |
|
|
1,430,000 |
|
|
|
1,764,391 |
|
|
|
|
| Central Bradford Progress Authority, PA, Refunding Revenue Bonds, (Guthrie Healthcare System, OBG), 5.00%, 12/01/26 |
|
|
2,000,000 |
|
|
|
2,309,760 |
|
|
|
|
| Lancaster County, PA, Hospital Authority, (Series B), (Lancaster General Hospital), 5.00%, 3/15/23 |
|
|
1,770,000 |
|
|
|
1,983,533 |
|
|
|
|
| Lancaster County, PA, Hospital Authority, Refunding Revenue Bonds, (Series B), (Lancaster General Hospital, OBG), 5.00%, 3/15/19 |
|
|
1,485,000 |
|
|
|
1,685,044 |
|
|
|
|
| Pennsylvania State Higher Educational Facilities Authority, Revenue Bonds, (Series A), (University of Pennsylvania Health System, OBG), 5.00%,
8/15/24 |
|
|
2,000,000 |
|
|
|
2,436,060 |
|
|
|
|
| Pennsylvania State, Higher Educational Facilities Authority, Refunding Revenue Bonds, (Series A), (University of Pennsylvania Health System, OBG), 5.00%,
8/15/18 |
|
|
1,200,000 |
|
|
|
1,421,304 |
|
|
|
|
|
|
|
|
|
|
|
|
|
| TOTAL MEDICAL |
|
|
|
|
|
$ |
11,600,092 |
|
|
|
| PRE-REFUNDED/ESCROW – 3.8% |
|
|
|
|
|
|
|
|
| Bucks County, PA, IDA, Refunding Revenue Bonds, ETM, (Series A), (Senior Lifestyles, Inc., OBG), 10.00%, 5/15/19 |
|
|
4,775,000 |
|
|
|
7,275,238 |
|
|
|
|
| Pennsylvania Convention Center Authority, Revenue Bonds, ETM, (Series A), (FGIC INS), 6.00%, 9/01/19 |
|
|
2,410,000 |
|
|
|
3,081,812 |
|
|
|
|
|
|
|
|
|
|
|
|
| TOTAL PRE-REFUNDED/ESCROW |
|
|
$ |
10,357,050 |
|
April 30, 2013 / ANNUAL REPORT
|
|
|
|
|
| PORTFOLIOS OF INVESTMENTS |
|
|
61 |
|
Wilmington Municipal Bond Fund (continued)
|
|
|
|
|
|
|
|
|
|
Description |
|
Par Value |
|
|
Value |
|
|
|
| SCHOOL DISTRICT – 3.6% |
|
|
|
|
|
|
|
|
| Eastern York, PA, School District, GO Unlimited Bonds, (Series A), (FSA State Aid Withholding), 5.00%, 9/01/24 |
|
$ |
1,200,000 |
|
|
$ |
1,353,996 |
|
|
|
|
| Hamburg, PA, Area School District, GO Unlimited, Refunding Revenue Notes, (Series A), (AGM State Aid Withholding), 5.50%, 4/01/24 |
|
|
2,405,000 |
|
|
|
2,940,016 |
|
|
|
|
| Philadelphia, PA, School District, GO Unlimited, (Series D), (FSA State Aid Withholding), 5.50%, 6/01/17 |
|
|
1,300,000 |
|
|
|
1,510,444 |
|
|
|
|
| Pittsburgh Public Schools, PA, GO Unlimited, Refunding Revenue Bonds, (Series A), (State Aid Withholding), 5.00%, 9/01/16 |
|
|
1,500,000 |
|
|
|
1,702,260 |
|
|
|
|
| Pittsburgh School District, PA, GO Unlimited Bonds, (Series A), (AGM State Aid Withholding), 5.00%, 9/01/21 |
|
|
1,775,000 |
|
|
|
2,144,892 |
|
|
|
|
|
|
|
|
|
|
|
|
| TOTAL SCHOOL DISTRICT |
|
|
$ |
9,651,608 |
|
|
|
| TRANSPORTATION – 2.8% |
|
|
|
|
|
|
|
|
| Allegheny County Port Authority, PA, Special Refunding Revenue Bonds, 5.00%, 3/01/16 |
|
|
1,000,000 |
|
|
|
1,112,070 |
|
|
|
|
| Delaware River Joint Toll Bridge Commission, PA, Refunding Revenue Bonds, (Series A), 5.00%, 7/01/26 |
|
|
1,000,000 |
|
|
|
1,191,500 |
|
|
|
|
| Pennsylvania State Turnpike Commission, Refunding Revenue Bonds, (Series B), 5.00%, 12/01/21 |
|
|
1,400,000 |
|
|
|
1,678,642 |
|
|
|
|
| Pittsburgh, PA, Public Parking Authority, Refunding Revenue Bonds, (Series A), (National Reinsurance FGIC), 5.00%, 12/01/20 |
|
|
2,565,000 |
|
|
|
2,701,920 |
|
|
|
|
| Southeastern Pennsylvania Transportation Authority, Refunding Revenue Bonds, 5.00%, 3/01/28 |
|
|
650,000 |
|
|
|
747,767 |
|
|
|
|
|
|
|
|
|
|
|
|
| TOTAL TRANSPORTATION |
|
|
$ |
7,431,899 |
|
|
|
|
|
|
|
|
|
|
|
|
| TOTAL PENNSYLVANIA |
|
|
$ |
77,968,831 |
|
|
|
|
| TENNESSEE – 1.2% |
|
|
|
|
|
|
|
|
|
|
| GENERAL OBLIGATION – 0.7% |
|
|
|
|
|
|
|
|
| Metropolitan Government of Nashville & Davidson County, TN, GO Unlimited, Refunding Revenue Bonds, 5.00%, 7/01/17 |
|
|
1,610,000 |
|
|
|
1,900,911 |
|
|
|
| HIGHER EDUCATION – 0.5% |
|
|
|
|
|
|
|
|
| Tennessee State, School Bond Authority, Higher Educational Facilities, Refunding Revenue Bonds, (Series A), 5.00%, 5/01/19 |
|
|
1,035,000 |
|
|
|
1,268,330 |
|
|
|
|
|
|
|
|
|
|
|
|
|
| TOTAL TENNESSEE |
|
|
|
|
|
$ |
3,169,241 |
|
|
|
|
| TEXAS – 8.5% |
|
|
|
|
|
|
|
|
|
|
| HIGHER EDUCATION – 2.8% |
|
|
|
|
|
|
|
|
| Harris County, TX, Cultural Education Facilities Finance Corp., Refunding Revenue Bonds, (Series A), (Baylor College of Medicine, OBG), 5.00%,
11/15/19 |
|
|
3,105,000 |
|
|
|
3,719,573 |
|
|
|
|
|
|
|
|
|
|
|
Description |
|
Par Value |
|
|
Value |
|
|
|
|
| Texas State A&M University, Permanent University Fund, Refunding Revenue Bonds, (Series A), 5.00%, 7/01/24 |
|
$ |
3,000,000 |
|
|
$ |
3,793,590 |
|
|
|
|
|
|
|
|
|
|
|
|
| TOTAL HIGHER EDUCATION |
|
|
$ |
7,513,163 |
|
|
|
|
| MEDICAL – 2.5% |
|
|
|
|
|
|
|
|
|
|
|
| North Central Texas, Health Facility Development Corp., Refunding Revenue Bonds, (Children’s Medical Center, OBG), 5.00%, 8/15/18 |
|
|
1,000,000 |
|
|
|
1,193,910 |
|
|
|
|
| Tarrant County, TX, Cultural Education Facilities Finance Corp., Refunding Revenue Bonds, (Series A), (Texas Health Resources, OBG), 5.00%,
2/15/21 |
|
|
5,000,000 |
|
|
|
5,655,000 |
|
|
|
|
|
|
|
|
|
|
|
|
|
| TOTAL MEDICAL |
|
|
|
|
|
$ |
6,848,910 |
|
|
|
| SCHOOL DISTRICT – 3.2% |
|
|
|
|
|
|
|
|
| Lewisville, TX, Independent School District, GO Unlimited Bonds, (PSF-GTD), 5.00%, 8/15/17 |
|
|
715,000 |
|
|
|
818,661 |
|
|
|
|
| San Antonio, TX, Independent School District, GO Unlimited Bonds,
(PSF-GTD), 5.00%,
8/15/21 |
|
|
5,000,000 |
|
|
|
5,522,350 |
|
|
|
|
| Spring, TX, Independent School District, GO Unlimited Bonds, (Series A),
(PSF-GTD), 5.00%,
8/15/16 |
|
|
2,000,000 |
|
|
|
2,296,300 |
|
|
|
|
|
|
|
|
|
|
|
|
| TOTAL SCHOOL DISTRICT |
|
|
$ |
8,637,311 |
|
|
|
|
|
|
|
|
|
|
|
|
|
| TOTAL TEXAS |
|
|
|
|
|
$ |
22,999,384 |
|
|
|
|
| UTAH – 0.9% |
|
|
|
|
|
|
|
|
|
|
|
| MEDICAL – 0.9% |
|
|
|
|
|
|
|
|
|
|
|
| Utah County, UT, Hospital Revenue Bonds, (IHC Health Services Inc., OBG) |
|
|
|
|
|
|
|
|
|
|
|
| 5.00%, 5/15/25 |
|
|
1,025,000 |
|
|
|
1,218,643 |
|
|
|
|
| 5.00%, 5/15/26 |
|
|
1,000,000 |
|
|
|
1,179,100 |
|
|
|
|
|
|
|
|
|
|
|
|
|
| TOTAL MEDICAL |
|
|
|
|
|
$ |
2,397,743 |
|
|
|
|
|
|
|
|
|
|
|
|
|
| TOTAL UTAH |
|
|
|
|
|
$ |
2,397,743 |
|
|
|
|
| VIRGINIA – 8.8% |
|
|
|
|
|
|
|
|
|
|
| GENERAL OBLIGATIONS – 3.1% |
|
|
|
|
|
|
|
|
| Alexandria, VA, GO Unlimited Bonds, (Series B), (State Aid Withholding), 5.00%, 6/15/18 |
|
|
500,000 |
|
|
|
606,965 |
|
|
|
|
| Chesterfield County, VA, GO Unlimited, Refunding Revenue Bonds, (Series B), (State Aid Withholding), 5.00%, 1/01/24 |
|
|
850,000 |
|
|
|
1,069,351 |
|
|
|
|
| Hampton, VA, GO Unlimited, Refunding Revenue Bonds, (Series A), (State Aid Withholding), 5.00%, 4/01/24 |
|
|
1,000,000 |
|
|
|
1,259,070 |
|
|
|
|
| Henrico County, VA, GO Unlimited, Refunding Bonds, 5.00%, 7/15/19 |
|
|
600,000 |
|
|
|
746,946 |
|
|
|
|
| Leesburg, VA, GO Unlimited, Refunding Revenue Bonds, (Series A), 5.00%, 1/15/24 |
|
|
500,000 |
|
|
|
610,365 |
|
|
|
|
| Norfolk, VA, GO Unlimited, Revenue Bonds, (Series C), 5.00%, 4/01/16 |
|
|
1,405,000 |
|
|
|
1,588,451 |
|
|
|
|
| Poquoson, VA, GO Unlimited, Refunding Revenue Bonds, 5.00%, 2/15/18 |
|
|
500,000 |
|
|
|
595,085 |
|
|
| ANNUAL REPORT / April 30, 2013 |
|
|
|
| 62 |
|
PORTFOLIOS OF INVESTMENTS |
Wilmington Municipal Bond Fund (continued)
|
|
|
|
|
|
|
|
|
|
Description |
|
Par Value |
|
|
Value |
|
|
|
|
| Prince William County, VA, GO Unlimited, Refunding Revenue Bonds, (Series A), 5.00%, 8/01/27 |
|
$ |
620,000 |
|
|
$ |
819,026 |
|
|
|
|
| Virginia Beach, Public Improvement, GO Unlimited Bonds, (Series B), 5.00%, 5/01/20 |
|
|
400,000 |
|
|
|
458,156 |
|
|
|
|
| Virginia Beach, VA, GO Unlimited, Refunding Revenue Bonds, (Series B), (State Aid Withholding), 5.00%, 4/01/24 |
|
|
500,000 |
|
|
|
627,195 |
|
|
|
|
|
|
|
|
|
|
|
|
| TOTAL GENERAL OBLIGATIONS |
|
|
$ |
8,380,610 |
|
|
|
| HIGHER EDUCATION – 2.9% |
|
|
|
|
|
|
|
|
| Virginia College Building Authority, Educational Facilities, Refunding Revenue Bonds, (Series B), (University of Richmond, OBG), 5.00%, 3/01/21 |
|
|
250,000 |
|
|
|
314,085 |
|
|
|
|
| Virginia State, College Building Authority, Educational Facilities Revenue Bonds, (Series A), (Public Higher Education Financing, OBG), 5.00%,
9/01/19 |
|
|
6,000,000 |
|
|
|
7,386,240 |
|
|
|
|
|
|
|
|
|
|
|
|
| TOTAL HIGHER EDUCATION |
|
|
$ |
7,700,325 |
|
|
|
|
| LEASE – 1.5% |
|
|
|
|
|
|
|
|
|
|
|
| Fairfax County, VA, EDA, Refunding Revenue Bonds, (Series A), (Laurel Hill Public Facilities Projects), 5.00%, 6/01/17 |
|
|
750,000 |
|
|
|
876,547 |
|
|
|
|
| Frederick County, VA, IDA, Revenue Bonds, (AMBAC INS), 5.00%, 12/01/14 |
|
|
455,000 |
|
|
|
486,718 |
|
|
|
|
| Henrico County, VA, EDA, Refunding Revenue Bonds, (Series B), 4.50%, 8/01/21 |
|
|
325,000 |
|
|
|
384,748 |
|
|
|
|
| Virginia State, Public Building Authority, Public Facility Revenue Bonds, (Series B), 5.00%, 8/01/23 |
|
|
500,000 |
|
|
|
573,230 |
|
|
|
|
| Virginia State, Public School Authority, Revenue Bonds, (Series B), (School Financing-1997 Resolution)/(National- Reinsurance), 5.00%, 8/01/26 |
|
|
400,000 |
|
|
|
461,712 |
|
|
|
|
| Virginia State, Resources Authority Infrastructure, Refunding Revenue Bonds, (Series A), (VA Pooled Funding Program), 5.00%, 11/01/17 |
|
|
1,000,000 |
|
|
|
1,190,430 |
|
|
|
|
|
|
|
|
|
|
|
|
|
| TOTAL LEASE |
|
|
|
|
|
$ |
3,973,385 |
|
|
|
|
| MEDICAL – 0.3% |
|
|
|
|
|
|
|
|
|
|
|
| Fairfax County, VA, IDA, Refunding Revenue Bonds, (Inova Health System), 5.25%, 8/15/19 |
|
|
500,000 |
|
|
|
589,935 |
|
|
|
|
| Fairfax County, VA, IDA, Revenue Bonds, (Inova Health System), 5.00%, 8/15/23 |
|
|
250,000 |
|
|
|
313,147 |
|
|
|
|
|
|
|
|
|
|
|
|
|
| TOTAL MEDICAL |
|
|
|
|
|
$ |
903,082 |
|
|
|
| PRE-REFUNDED/ESCROW – 0.1% |
|
|
|
|
|
|
|
|
| Southeastern Public Service Authority, VA, Prerefunded Revenue Bonds, ETM, (AMBAC), 5.00%, 7/01/15 |
|
|
255,000 |
|
|
|
274,344 |
|
|
|
|
|
|
|
|
|
|
|
Description |
|
Par Value |
|
|
Value |
|
|
|
| SCHOOL DISTRICT – 0.4% |
|
|
|
|
|
|
|
|
| Fauquier County, VA, GO Unlimited, Refunding Revenue Bonds, (State Aid Withholding), 4.00%, 7/15/20 |
|
$ |
1,000,000 |
|
|
$ |
1,183,610 |
|
|
|
|
| WATER & SEWER – 0.5% |
|
|
|
|
|
|
|
|
|
|
|
| Henrico County, VA, Water & Sewer Revenue, Refunding Bonds, 5.00%, 5/01/24 |
|
|
550,000 |
|
|
|
666,506 |
|
|
|
|
| Upper Occoquan Sewage Authority, VA, (Series A), (National Reinsurance), 5.15%, 7/01/20 |
|
|
575,000 |
|
|
|
690,592 |
|
|
|
|
|
|
|
|
|
|
|
|
| TOTAL WATER & SEWER |
|
|
$ |
1,357,098 |
|
|
|
|
|
|
|
|
|
|
|
|
|
| TOTAL VIRGINIA |
|
|
|
|
|
$ |
23,772,454 |
|
|
|
|
| WASHINGTON – 2.1% |
|
|
|
|
|
|
|
|
|
|
|
| DEDICATED TAX – 1.1% |
|
|
|
|
|
|
|
|
|
|
|
| Central Puget Sound Regional Transit Authority, WA, Revenue Bonds, (National Reinsurance FGIC), 5.25%, 2/01/21 |
|
|
2,300,000 |
|
|
|
2,835,210 |
|
|
|
|
| LEASE – 1.0% |
|
|
|
|
|
|
|
|
|
|
|
| Washington State, Economic Development Finance Authority, Lease Revenue Bonds, (National Reinsurance)/(Washington Biomedical, OBG) |
|
|
|
|
|
|
|
|
|
|
|
| 5.00%, 6/01/23 |
|
|
1,510,000 |
|
|
|
1,690,581 |
|
|
|
|
| 5.25%, 6/01/21 |
|
|
1,000,000 |
|
|
|
1,117,810 |
|
|
|
|
|
|
|
|
|
|
|
|
|
| TOTAL LEASE |
|
|
|
|
|
$ |
2,808,391 |
|
|
|
|
|
|
|
|
|
|
|
|
|
| TOTAL WASHINGTON |
|
|
|
|
|
$ |
5,643,601 |
|
|
|
|
|
|
|
|
|
|
|
|
| TOTAL MUNICIPAL BONDS (COST $242,769,797) |
|
|
$ |
257,141,800 |
|
| |
|
|
|
|
|
|
|
|
| |
|
Number of
Shares
|
|
|
|
|
|
|
| MONEY MARKET FUND – 2.0% |
|
|
|
|
|
|
|
|
| Dreyfus Tax Exempt Cash Management Fund, Institutional Shares,
0.00%^ |
|
|
5,370,041 |
|
|
$ |
5,370,041 |
|
|
|
|
|
|
|
|
|
|
|
|
| TOTAL MONEY MARKET FUND
(COST $5,370,041) |
|
|
$ |
5,370,041 |
|
|
|
|
|
|
|
|
|
|
|
|
| TOTAL INVESTMENTS – 97.5%
(COST $248,139,838) |
|
|
$ |
262,511,841 |
|
|
|
| OTHER ASSETS LESS LIABILITIES – 2.5% |
|
|
|
6,837,633 |
|
|
|
|
|
|
|
|
|
|
|
|
| TOTAL NET ASSETS – 100.0% |
|
|
$ |
269,349,474 |
|
|
|
|
|
|
|
|
|
|
|
| Cost of investments for Federal income tax purposes is $248,139,838. The net unrealized appreciation/(depreciation) of investments was $14,372,003. This consists of net
unrealized appreciation from investment for those securities having an excess of value over cost of $14,442,822 and net unrealized depreciation from investments for those securities having an excess of cost over value of
$70,819. |
|
| April 30, 2013 / ANNUAL REPORT |
|
|
|
|
|
| PORTFOLIOS OF INVESTMENTS |
|
|
63 |
|
Wilmington Municipal Bond Fund (concluded)
Various inputs are used in determining the value of the Fund’s investments. These inputs are summarized in the three broad levels listed below.
Level 1 – quoted prices in active markets for identical securities
Level 2 – other significant observable inputs (including quoted prices for similar securities, interest rates, prepayment speeds, credit risk, etc.)
Level 3 – significant unobservable inputs (including the Fund’s own assumptions in determining the fair value of investments)
The following is a summary of the inputs used as of April 30, 2013 in valuing the Fund’s assets carried at fair value:
|
|
|
|
|
|
|
|
|
|
|
|
|
|
|
|
|
| |
|
Level 1 |
|
|
Level 2 |
|
|
Level 3 |
|
|
Total |
|
| Investments in Securities |
|
|
|
|
|
|
|
|
|
|
|
|
|
|
|
|
| Municipal Bonds |
|
$ |
— |
|
|
$ |
257,141,800 |
|
|
$ |
— |
|
|
$ |
257,141,800 |
|
| Money Market Fund |
|
|
5,370,041 |
|
|
|
— |
|
|
|
— |
|
|
|
5,370,041 |
|
|
|
|
|
|
|
|
|
|
|
|
|
|
|
|
|
|
| Total |
|
$ |
5,370,041 |
|
|
$ |
257,141,800 |
|
|
$ |
— |
|
|
$ |
262,511,841 |
|
|
|
|
|
|
|
|
|
|
|
|
|
|
|
|
|
|
See Notes to Portfolios of Investments
See Notes which are an integral part of the Financial Statements
ANNUAL REPORT / April
30, 2013
64
PORTFOLIO OF INVESTMENTS SUMMARY TABLE
Wilmington Maryland Municipal Bond Fund
At April 30, 2013, the Fund’s sector classifications as
follows (unaudited):
|
|
|
|
|
|
| |
|
Percentage of Total Net Assets |
| General Obligation |
|
|
|
38.1 |
% |
| Transportation |
|
|
|
20.9 |
% |
| Medical |
|
|
|
11.0 |
% |
| Lease |
|
|
|
9.9 |
% |
| Higher Education |
|
|
|
8.2 |
% |
| Pre-Refunded/Escrow |
|
|
|
6.2 |
% |
| Water & Sewer |
|
|
|
2.1 |
% |
| Continuing Care |
|
|
|
1.2 |
% |
| Cash Equivalents1 |
|
|
|
3.2 |
% |
| Other Assets and Liabilities – Net2 |
|
|
|
(0.8 |
)% |
|
|
|
|
|
|
| TOTAL |
|
|
|
100.0 |
% |
|
|
|
|
|
|
| (1) |
Cash Equivalents include investments in a money market fund. |
| (2) |
Assets, other than investments in securities, less liabilities. See Statements of Assets and Liabilities. |
| (3) |
Derived from data provided by Moody’s Investors Service and Standard and Poor’s.
|
|
|
|
|
|
|
| Credit Quality Diversification3 |
|
Percentage of Total Net Assets |
| AAA |
|
|
|
21.4 |
% |
| AA |
|
|
|
61.3 |
% |
| A |
|
|
|
4.6 |
% |
| BBB |
|
|
|
5.7 |
% |
| Not Rated |
|
|
|
7.8 |
% |
| Other Assets and Liabilities – Net2 |
|
|
|
(0.8 |
)% |
|
|
|
|
|
|
| TOTAL |
|
|
|
100.0 |
% |
|
|
|
|
|
|
PORTFOLIO OF INVESTMENTS
April 30, 2013
|
|
|
|
|
|
|
|
|
|
Description |
|
Par Value |
|
|
Value |
|
|
|
|
| MUNICIPAL BONDS – 97.6% |
|
|
|
|
|
|
|
|
|
|
|
| MARYLAND – 97.6% |
|
|
|
|
|
|
|
|
|
|
|
| CONTINUING CARE – 1.2% |
|
|
|
|
|
|
|
|
|
|
|
| Baltimore County, MD, Revenue Refunding Bonds, (Series A), (Oak Crest Village, Inc.), 5.00%, 1/01/22 |
|
$ |
1,200,000 |
|
|
$ |
1,281,252 |
|
|
|
| GENERAL OBLIGATIONS – 38.1% |
|
|
|
|
|
|
|
|
| Anne Arundel County, MD, GO Limited Bonds, General Improvements, 4.50%, 3/01/25 |
|
|
2,000,000 |
|
|
|
2,237,840 |
|
|
|
|
| Anne Arundel County, MD, Tax Allocation, Refunding Bonds, (National Business Park Project)/(County Guaranty), 5.13%, 7/01/28 |
|
|
2,200,000 |
|
|
|
2,311,584 |
|
|
|
|
| Baltimore County, MD, GO Unlimited, Refunding Notes, 5.00%, 11/01/18 |
|
|
1,000,000 |
|
|
|
1,224,940 |
|
|
|
|
| Baltimore County, MD, GO Unlimited, Refunding Revenue Notes, 5.00%, 2/01/25 |
|
|
2,200,000 |
|
|
|
2,749,824 |
|
|
|
|
| Cecil County, MD, GO Unlimited, Public Improvements, (AGM), 4.00%, 12/01/16 |
|
|
1,000,000 |
|
|
|
1,122,520 |
|
|
|
|
| Cecil County, MD, GO Unlimited, Refunding Bonds, 5.00%, 11/01/23 |
|
|
2,590,000 |
|
|
|
3,294,920 |
|
|
|
|
| Charles County, MD, GO Unlimited, Refunding Bonds, 5.00%, 3/01/20 |
|
|
4,020,000 |
|
|
|
5,034,246 |
|
|
|
|
|
|
|
|
|
|
|
Description |
|
Par Value |
|
|
Value |
|
|
|
|
| Frederick County, MD, GO Unlimited Bonds, Public Improvements, 5.00%, 5/01/25 |
|
$ |
1,600,000 |
|
|
$ |
2,030,176 |
|
|
|
|
| Frederick County, MD, GO Unlimited, Refunding Bonds, 5.25%, 11/01/19 |
|
|
1,500,000 |
|
|
|
1,891,920 |
|
|
|
|
| Harford County, MD, GO Unlimited Bonds, Public Improvements, 4.00%, 7/01/20 |
|
|
2,000,000 |
|
|
|
2,352,220 |
|
|
|
|
| Howard County, MD, GO Unlimited, Refunding Bonds, (Series B), 5.00%, 8/15/18 |
|
|
2,500,000 |
|
|
|
3,042,650 |
|
|
|
|
| Montgomery County, MD, GO Unlimited, Refunding Bonds, (Series A), 5.00%, 7/01/21 |
|
|
2,000,000 |
|
|
|
2,563,780 |
|
|
|
|
| Montgomery County, MD, GO Unlimited, Refunding Notes, (Series A) |
|
|
|
|
|
|
|
|
|
|
|
| 5.00%, 8/01/19 |
|
|
2,315,000 |
|
|
|
2,881,527 |
|
|
|
|
| 5.00%, 7/01/22 |
|
|
2,000,000 |
|
|
|
2,457,280 |
|
|
|
|
| Prince Georges County, MD, GO Limited Bonds, Public Improvements, (Series A), 5.00%, 9/15/27 |
|
|
2,570,000 |
|
|
|
3,130,311 |
|
|
|
|
| Queen Anne’s County, MD, GO Unlimited, Refunding Bonds, (National Reinsurance), 5.00%, 11/15/16 |
|
|
1,000,000 |
|
|
|
1,111,360 |
|
|
|
|
| Washington Suburban Sanitation District, MD, GO Unlimited, Refunding Bonds, 6.00%, 6/01/18 |
|
|
1,000,000 |
|
|
|
1,260,190 |
|
|
|
|
|
|
|
|
|
|
|
|
| TOTAL GENERAL OBLIGATIONS |
|
|
$ |
40,697,288 |
|
April 30, 2013 / ANNUAL REPORT
|
|
|
|
|
| PORTFOLIOS OF INVESTMENTS |
|
|
65 |
|
Wilmington Maryland Municipal Bond Fund (continued)
|
|
|
|
|
|
|
|
|
|
Description |
|
Par Value |
|
|
Value |
|
|
|
| HIGHER EDUCATION – 8.2% |
|
|
|
|
|
|
|
|
| Maryland State Health & Higher Educational Facilities Authority, Refunding Revenue Bonds, (Series A), (John Hopkins University, OBG) |
|
|
|
|
|
|
|
|
|
|
|
| 5.00%, 7/01/24 |
|
$ |
2,000,000 |
|
|
$ |
2,502,260 |
|
|
|
|
| 5.00%, 7/01/26 |
|
|
3,000,000 |
|
|
|
3,675,840 |
|
|
|
|
| Maryland State Health & Higher Educational Facilities Authority, Revenue Bonds, (Series 2006), (Washington Christian Academy), 5.00%, 7/01/38†≠ |
|
|
1,000,000 |
|
|
|
350,020 |
|
|
|
|
| University System, MD, Auxiliary Facility & Tuition Revenue Bonds, (Series A), 4.00%, 4/01/16 |
|
|
2,000,000 |
|
|
|
2,206,300 |
|
|
|
|
|
|
|
|
|
|
|
|
| TOTAL HIGHER EDUCATION |
|
|
$ |
8,734,420 |
|
|
|
|
| LEASE – 9.9% |
|
|
|
|
|
|
|
|
|
|
|
| Baltimore County, MD, Certificate of Participation, Public Improvements, 5.00%, 10/01/22 |
|
|
1,200,000 |
|
|
|
1,506,192 |
|
|
|
|
| Maryland Economic Development Corp., Refunding Revenue Bonds, (Dept. Transaction Headquarters), 4.00%, 6/01/21 |
|
|
2,570,000 |
|
|
|
3,041,826 |
|
|
|
|
| Maryland Economic Development Corp., Revenue Bonds, General Improvements, (Public Health Laboratory), 5.00%, 6/01/19 |
|
|
1,000,000 |
|
|
|
1,226,240 |
|
|
|
|
| Maryland Stadium Authority, MD, Refunding Revenue Bonds |
|
|
|
|
|
|
|
|
|
|
|
| 5.00%, 6/15/17 |
|
|
1,055,000 |
|
|
|
1,234,466 |
|
|
|
|
| 5.00%, 6/15/19 |
|
|
1,160,000 |
|
|
|
1,418,193 |
|
|
|
|
| Prince Georges County, MD, Certificates of Participation, Public Improvements, (Equipments Acquisition Program), 4.00%, 10/15/15 |
|
|
2,000,000 |
|
|
|
2,171,420 |
|
|
|
|
|
|
|
|
|
|
|
|
|
| TOTAL LEASE |
|
|
|
|
|
$ |
10,598,337 |
|
|
|
|
| MEDICAL – 11.0% |
|
|
|
|
|
|
|
|
|
|
|
| Maryland State Health & Higher Educational Facilities Authority, Refunding Revenue Bonds, (Anne Arundel Health Systems), 5.00%, 7/01/27 |
|
|
535,000 |
|
|
|
624,639 |
|
|
|
|
| Maryland State Health & Higher Educational Facilities Authority, Refunding Revenue Bonds, (Series A), (Baltimore Medical Center), 5.00%,
7/01/25 |
|
|
1,015,000 |
|
|
|
1,203,019 |
|
|
|
|
| Maryland State Health & Higher Educational Facilities Authority, Refunding Revenue Bonds, (Series A), (Western Maryland Health System)/(National
Reinsurance FHA 242), 4.00%, 1/01/18 |
|
|
1,935,000 |
|
|
|
2,070,179 |
|
|
|
|
| Maryland State Health & Higher Educational Facilities Authority, Refunding Revenue Bonds, (Series C), (Upper Chesapeake Medical Center), 5.50%,
1/01/28 |
|
|
2,500,000 |
|
|
|
2,781,275 |
|
|
|
|
| Maryland State Health & Higher Educational Facilities Authority, Revenue Bonds, (Johns Hopkins Health System) 5.00%, 7/01/19 |
|
|
1,000,000 |
|
|
|
1,231,010 |
|
|
|
|
|
|
|
|
|
|
|
Description |
|
Par Value |
|
|
Value |
|
|
|
|
| 5.00%, 7/01/22 |
|
$ |
1,000,000 |
|
|
$ |
1,261,170 |
|
|
|
|
| Maryland State Health & Higher Educational Facilities Authority, Revenue Bonds, (Peninsula Regional Medical Center), 5.00%, 7/01/17 |
|
|
1,745,000 |
|
|
|
1,967,453 |
|
|
|
|
| Maryland State Health & Higher Educational Facilities Authority, Revenue Bonds, (Series A), (Suburban Hospital), 5.50%, 7/01/16 |
|
|
600,000 |
|
|
|
631,632 |
|
|
|
|
|
|
|
|
|
|
|
|
|
| TOTAL MEDICAL |
|
|
|
|
|
$ |
11,770,377 |
|
|
|
| PRE-REFUNDED/ESCROW – 6.2% |
|
|
|
|
|
|
|
|
| Baltimore City, MD, Water Projects Revenue Bonds, ETM, (Series A), (FGIC INS), 5.38%, 7/01/15 |
|
|
775,000 |
|
|
|
820,539 |
|
|
|
|
| Maryland State Health & Higher Educational Facilities Authority, ETM, (Helix Health Systems, Inc.), (AMBAC), 5.00%, 7/01/27 |
|
|
3,630,000 |
|
|
|
4,573,219 |
|
|
|
|
| Montgomery County, MD, GO Unlimited, Refunding Notes, (Series A), (PRF 5/1/17 @ 100), 5.00%, 5/01/19 |
|
|
1,000,000 |
|
|
|
1,173,710 |
|
|
|
|
|
|
|
|
|
|
|
|
| TOTAL PRE-REFUNDED/ESCROW |
|
|
$ |
6,567,468 |
|
|
|
| TRANSPORTATION – 20.9% |
|
|
|
|
|
|
|
|
| Baltimore City, MD, Refunding Revenue Bonds, (Series A), (National Reinsurance FGIC), 5.25%, 7/01/17 |
|
|
1,000,000 |
|
|
|
1,106,910 |
|
|
|
|
| Maryland State Department of Transportation, Refunding Revenue Bonds |
|
|
|
|
|
|
|
|
|
|
|
| 5.00%, 5/01/17 |
|
|
2,000,000 |
|
|
|
2,349,740 |
|
|
|
|
| 5.00%, 5/01/18 |
|
|
825,000 |
|
|
|
995,437 |
|
|
|
|
| Maryland State Department of Transportation, Revenue Bonds, General Improvements |
|
|
|
|
|
|
|
|
|
|
|
| 5.50%, 2/01/16 |
|
|
1,000,000 |
|
|
|
1,138,580 |
|
|
|
|
| 5.50%, 2/01/17 |
|
|
1,785,000 |
|
|
|
2,112,351 |
|
|
|
|
| 5.50%, 2/15/17 |
|
|
1,740,000 |
|
|
|
2,030,145 |
|
|
|
|
| Maryland State Transportation Authority, Refunding Bonds, 5.00%, 7/01/18 |
|
|
2,500,000 |
|
|
|
3,020,125 |
|
|
|
|
| Maryland State Transportation Authority, Revenue Bonds, General Improvements, 5.25%, 3/01/18 |
|
|
3,520,000 |
|
|
|
4,258,285 |
|
|
|
|
| Montgomery County, MD, Parking System Revenue, Refunding Revenue Bonds |
|
|
|
|
|
|
|
|
|
|
|
| 4.00%, 6/01/15 |
|
|
1,385,000 |
|
|
|
1,486,770 |
|
|
|
|
| 4.00%, 6/01/16 |
|
|
1,440,000 |
|
|
|
1,589,472 |
|
|
|
|
| 5.00%, 6/01/21 |
|
|
1,820,000 |
|
|
|
2,293,382 |
|
|
|
|
|
|
|
|
|
|
|
|
| TOTAL TRANSPORTATION |
|
|
$ |
22,381,197 |
|
|
|
| WATER & SEWER – 2.1% |
|
|
|
|
|
|
|
|
| Baltimore City, MD, Wastewater Project Revenue Bonds, (Series A), 5.00%, 7/01/22 |
|
|
1,810,000 |
|
|
|
2,267,731 |
|
|
|
|
|
|
|
|
|
|
|
|
|
| TOTAL MARYLAND |
|
|
|
|
|
$ |
104,298,070 |
|
|
|
|
|
|
|
|
|
|
| TOTAL MUNICIPAL BONDS (COST
$99,733,588) |
|
|
$ |
104,298,070 |
|
ANNUAL REPORT / April
30, 2013
|
|
|
| 66 |
|
PORTFOLIOS OF INVESTMENTS |
Wilmington Maryland Municipal Bond Fund (concluded)
|
|
|
|
|
|
|
|
|
| Description |
|
Number of
Shares
|
|
|
Value |
|
|
|
|
| MONEY MARKET FUND – 3.2% |
|
|
|
|
|
|
|
|
|
|
|
| Dreyfus Tax Exempt Cash Management Fund, Institutional Shares,
0.00%^ |
|
|
3,411,378 |
|
|
$ |
3,411,378 |
|
|
|
|
|
|
|
|
|
|
|
|
|
| TOTAL MONEY MARKET FUND (COST
$3,411,378) |
|
|
|
|
|
$ |
3,411,378 |
|
|
|
|
|
|
| |
|
Value |
|
|
|
| TOTAL INVESTMENTS – 100.8% (COST
$103,144,966) |
|
$ |
107,709,448 |
|
|
|
| OTHER LIABILITIES LESS ASSETS – (0.8%) |
|
|
(802,347 |
) |
|
|
|
|
|
|
|
| TOTAL NET ASSETS – 100.0% |
|
$ |
106,907,101 |
|
|
|
|
|
|
Cost of investments for Federal income tax
purposes is $103,084,260. The net unrealized appreciation/(depreciation) of investments was $4,625,188. This consists of net unrealized appreciation from investment for those securities having an excess of value over cost of $5,276,491 and net
unrealized depreciation from investments for those securities having an excess of cost over value of $651,303.
Various inputs are used in determining
the value of the Fund’s investments. These inputs are summarized in the three broad levels listed below.
Level 1 – quoted
prices in active markets for identical securities
Level 2 – other significant observable inputs (including quoted prices for
similar securities, interest rates, prepayment speeds, credit risk, etc.)
Level 3 – significant unobservable inputs (including the
Fund’s own assumptions in determining the fair value of investments)
The following is a summary of the inputs used as of April 30, 2013 in
valuing the Fund’s assets carried at fair value:
|
|
|
|
|
|
|
|
|
|
|
|
|
|
|
|
|
| |
|
Level 1 |
|
|
Level 2 |
|
|
Level 3 |
|
|
Total |
|
| Investments in Securities |
|
|
|
|
|
|
|
|
|
|
|
|
|
|
|
|
| Municipal Bonds |
|
$ |
— |
|
|
$ |
104,298,070 |
|
|
$ |
— |
|
|
$ |
104,298,070 |
|
| Money Market Fund |
|
|
3,411,378 |
|
|
|
— |
|
|
|
— |
|
|
|
3,411,378 |
|
|
|
|
|
|
|
|
|
|
|
|
|
|
|
|
|
|
| Total |
|
$ |
3,411,378 |
|
|
$ |
104,298,070 |
|
|
$ |
— |
|
|
$ |
107,709,448 |
|
|
|
|
|
|
|
|
|
|
|
|
|
|
|
|
|
|
See Notes to Portfolios of Investments
See Notes which are an integral part of the Financial Statements
April 30, 2013 / ANNUAL REPORT
67
PORTFOLIO OF INVESTMENTS SUMMARY TABLE
Wilmington New York Municipal Bond Fund
At April 30, 2013, the Fund’s sector classifications were
as follows (unaudited):
|
|
|
|
|
|
| |
|
Percentage of Total Net Assets |
| School District |
|
|
|
18.1 |
% |
| Lease |
|
|
|
17.8 |
% |
| Dedicated Tax |
|
|
|
16.2 |
% |
| General Obligations |
|
|
|
15.0 |
% |
| Water & Sewer |
|
|
|
12.1 |
% |
| Transportation |
|
|
|
7.8 |
% |
| Medical |
|
|
|
4.5 |
% |
| Pre-Refunded/Escrow |
|
|
|
4.2 |
% |
| Higher Education |
|
|
|
1.1 |
% |
| Not-For-Profit |
|
|
|
1.0 |
% |
| Cash Equivalents1 |
|
|
|
4.2 |
% |
| Other Assets and Liabilities – Net2 |
|
|
|
(2.0 |
)% |
|
|
|
|
|
|
| TOTAL |
|
|
|
100.0 |
% |
|
|
|
|
|
|
| (1) |
Cash Equivalents include investments in a money market fund. |
| (2) |
Assets, other than investments in securities, less liabilities. See Statements of Assets and Liabilities. |
| (3) |
Derived from data provided by Moody’s Investors Service and Standard and Poor’s.
|
|
|
|
|
|
|
| Credit Quality Diversification3 |
|
Percentage of Total Net Assets |
| AAA |
|
|
|
21.7 |
% |
| AA |
|
|
|
54.5 |
% |
| A |
|
|
|
17.4 |
% |
| Not Rated |
|
|
|
8.4 |
% |
| Other Assets and Liabilities – Net2 |
|
|
|
(2.0 |
)% |
|
|
|
|
|
|
| TOTAL |
|
|
|
100.0 |
% |
|
|
|
|
|
|
PORTFOLIO OF INVESTMENTS
April 30, 2013
|
|
|
|
|
|
|
|
|
|
Description |
|
Par Value |
|
|
Value |
|
|
|
|
| MUNICIPAL BONDS – 97.8% |
|
|
|
|
|
|
|
|
|
|
|
| NEW YORK – 97.8% |
|
|
|
|
|
|
|
|
|
|
|
| DEDICATED TAX – 16.2% |
|
|
|
|
|
|
|
|
|
|
|
| Metropolitan Transportation Authority, NY, Dedicated Tax Fund, Refunding Revenue Bonds, (Series A), 5.00%, 11/15/24 |
|
$ |
1,750,000 |
|
|
$ |
2,183,510 |
|
|
|
|
| Metropolitan Transportation Authority, NY, Dedicated Tax Fund, Refunding Revenue Bonds, (Subseries B-2), 5.00%, 11/01/16 |
|
|
1,000,000 |
|
|
|
1,153,160 |
|
|
|
|
| Nassau County Interim Finance Authority, Sales Tax Secured, Refunding Revenue Bonds, (Series A), 5.00%, 11/15/21 |
|
|
1,000,000 |
|
|
|
1,279,740 |
|
|
|
|
| New York State Dormitory Authority, Revenue Refunding Bonds, (Series A), 5.00%, 12/15/24 |
|
|
2,440,000 |
|
|
|
3,045,998 |
|
|
|
|
| New York State Local Government Assistance Corp., Refunding Revenue Bonds, (Series A), 5.00%, 4/01/16 |
|
|
2,000,000 |
|
|
|
2,266,140 |
|
|
|
|
|
|
|
|
|
|
|
Description |
|
Par Value |
|
|
Value |
|
|
|
|
| New York State Local Government Assistance Corp., Refunding Revenue Bonds, (Series A), (GO of Corp.), 5.00%, 4/01/20 |
|
$ |
3,000,000 |
|
|
$ |
3,763,260 |
|
|
|
|
| New York State Thruway Authority, State Personal Income Tax Revenue, (Series A) |
|
|
|
|
|
|
|
|
|
|
|
| 5.00%, 3/15/27 |
|
|
1,000,000 |
|
|
|
1,172,160 |
|
|
|
|
| 5.25%, 3/15/23 |
|
|
2,500,000 |
|
|
|
2,953,175 |
|
|
|
|
|
|
|
|
|
|
|
|
|
| TOTAL DEDICATED TAX |
|
|
|
|
|
$ |
17,817,143 |
|
|
| GENERAL OBLIGATIONS – 15.0% |
|
|
|
|
| City of New York NY, GO Unlimited, Refunding Revenue Bonds, (Series B), 4.00%, 8/01/16 |
|
|
1,500,000 |
|
|
|
1,662,075 |
|
|
|
|
| New York City, NY, GO Unlimited Bonds, (Subseries G-1), 5.00%, 4/01/19 |
|
|
3,000,000 |
|
|
|
3,653,880 |
|
|
|
|
| New York City, NY, GO Unlimited, Refunding Revenue Bonds, (Series E), 5.00%, 8/01/17 |
|
|
1,390,000 |
|
|
|
1,635,210 |
|
ANNUAL REPORT / April
30, 2013
|
|
|
| 68 |
|
PORTFOLIOS OF INVESTMENTS |
Wilmington New York Municipal Bond Fund (continued)
|
|
|
|
|
|
|
|
|
|
Description |
|
Par Value |
|
|
Value |
|
|
|
|
| New York State, GO Unlimited Bonds, (Series E), 5.00%, 12/15/21 |
|
$ |
2,090,000 |
|
|
$ |
2,689,600 |
|
|
|
|
| New York State Municipal Bond Bank Agency, Recovery Act, Refunding Revenue Bonds, (Subseries B1), (AGM), 5.00%, 4/15/21 |
|
|
3,000,000 |
|
|
|
3,546,630 |
|
|
|
|
| Southampton Town, NY, Public Improvement, GO Limited, Refunding Revenue Bonds, 4.00%, 10/01/15 |
|
|
1,385,000 |
|
|
|
1,505,453 |
|
|
|
|
| Westchester County, NY, GO Unlimited, Refunding Revenue Bonds, (Series A), 5.00%, 10/15/17 |
|
|
1,425,000 |
|
|
|
1,701,137 |
|
|
|
|
|
|
|
|
|
|
|
|
| TOTAL GENERAL OBLIGATIONS |
|
|
$ |
16,393,985 |
|
|
|
| HIGHER EDUCATION – 1.1% |
|
|
|
|
|
|
|
|
| New York State Dormitory Authority, Non-State Supported Debt, Refunding Revenue Bonds, (Yeshiva University, OBG), 5.00%, 9/01/26 |
|
|
1,000,000 |
|
|
|
1,153,110 |
|
|
|
|
| LEASE – 17.8% |
|
|
|
|
|
|
|
|
|
|
|
| Erie County, NY, IDA, School Facility Revenue Bonds, (Series A), (School District Buffalo Project), (AGM), 5.75%, 5/01/21 |
|
|
1,000,000 |
|
|
|
1,185,170 |
|
|
|
|
| Erie County, NY, IDA, School Facility Revenue Bonds, (Series A), (School District Buffalo Project)/(State Aid Withholding), 5.00%, 5/01/23 |
|
|
3,000,000 |
|
|
|
3,632,550 |
|
|
|
|
| Erie County, NY, IDA, School Facility Revenue, Refunding Revenue Bonds, (State Aid Withholding), 5.00%, 5/01/17 |
|
|
1,400,000 |
|
|
|
1,628,298 |
|
|
|
|
| Monroe County, NY, IDA, School Facility Revenue Bonds, (Series A), (Rochester School Modernization Project), 5.00%, 5/01/16 |
|
|
2,000,000 |
|
|
|
2,249,920 |
|
|
|
|
| New York City, NY, Transitional Finance Authority, Building Aid Revenue Bonds,
(Series S-5), (State Aid Withholding), 5.00%, 1/15/27 |
|
|
2,770,000 |
|
|
|
3,213,338 |
|
|
|
|
| New York State Dormitory Authority, State Supported Debt, Refunding Revenue Bonds, (AGM), 5.00%, 7/01/18 |
|
|
1,000,000 |
|
|
|
1,167,190 |
|
|
|
|
| New York State Urban Development Corp., Service Contract Obligation, Refunding Revenue Bonds, (Series B), 5.25%, 1/01/23 |
|
|
5,500,000 |
|
|
|
6,470,035 |
|
|
|
|
|
|
|
|
|
|
|
|
|
| TOTAL LEASE |
|
|
|
|
|
$ |
19,546,501 |
|
|
|
|
| MEDICAL – 4.5% |
|
|
|
|
|
|
|
|
|
|
|
| Monroe County, NY, IDA, Refunding Revenue Bonds, (Highland Hospital Rochester Project), 5.00%, 8/01/22 |
|
|
1,000,000 |
|
|
|
1,072,110 |
|
|
|
|
|
|
|
|
|
|
|
Description |
|
Par Value |
|
|
Value |
|
|
|
|
| New York State Dormitory Authority, Highland Hospital Rochester, Refunding Revenue Bond, (Series C), (Sloan Kettering Cancer Center), (National Reinsurance),
5.75%, 7/01/19 |
|
$ |
1,010,000 |
|
|
$ |
1,276,317 |
|
|
|
|
| New York State Dormitory Authority, Non-State Supported Debt, Refunding Revenue Bonds, (Series A), (North Shore Long Island Jewish, OBG) |
|
|
|
|
|
|
|
|
|
|
|
| 5.00%, 5/01/16 |
|
|
1,000,000 |
|
|
|
1,125,380 |
|
|
|
|
| 5.00%, 5/01/17 |
|
|
1,300,000 |
|
|
|
1,499,576 |
|
|
|
|
|
|
|
|
|
|
|
|
|
| TOTAL MEDICAL |
|
|
|
|
|
$ |
4,973,383 |
|
|
|
| NOT-FOR-PROFIT – 1.0% |
|
|
|
|
|
|
|
|
| New York City, NY, Trust for Cultural Resources, Refunding Revenue Bonds, (Series A), 5.00%, 4/01/15 |
|
|
1,000,000 |
|
|
|
1,089,480 |
|
|
|
| PRE-REFUNDED/ESCROW – 4.2% |
|
|
|
|
|
|
|
|
| Triborough Bridge & Tunnel Authority, NY, Refunding Revenue Bonds, ETM, (Series Y), (CAPMAC - ITC GO of Authority), 6.13%, 1/01/21 |
|
|
3,500,000 |
|
|
|
4,625,355 |
|
|
|
| SCHOOL DISTRICT – 18.1% |
|
|
|
|
|
|
|
|
| Arlington Central School District, NY, GO Unlimited, (State Aid Withholding), 5.00%, 12/15/25 |
|
|
1,295,000 |
|
|
|
1,613,907 |
|
|
|
|
| Byram Hills Central School District, NY, GO Unlimited, Refunding Bonds, (State Aid Withholding), 5.00%, 11/15/17 |
|
|
1,000,000 |
|
|
|
1,197,590 |
|
|
|
|
| Greece Central School District, NY, Refunding Revenue Bonds, (Series A), (State Aid Withholding), 5.00%, 6/15/18 |
|
|
1,000,000 |
|
|
|
1,186,960 |
|
|
|
|
| New Rochelle City School District, NY, GO Limited, Refunding Bonds, (State Aid Withholding) |
|
|
|
|
|
|
|
|
|
|
|
| 4.00%, 9/01/15 |
|
|
1,395,000 |
|
|
|
1,512,040 |
|
|
|
|
| 4.00%, 9/01/16 |
|
|
1,000,000 |
|
|
|
1,117,350 |
|
|
|
|
| 5.00%, 9/01/17 |
|
|
1,530,000 |
|
|
|
1,814,213 |
|
|
|
|
| New York State Dormitory Authority, Current Refunding Bonds, (Series F), (AGM State Aid Withholding), 5.00%, 10/01/27 |
|
|
1,720,000 |
|
|
|
2,037,615 |
|
|
|
|
| New York State Dormitory Authority, Non-State Supported Debt, School District Board Funding Program, Refunding Revenue Bonds, (Series C), (State Aid
Withholding)/(GO of Authority), 7.25%, 10/01/28 |
|
|
3,000,000 |
|
|
|
3,809,910 |
|
|
|
|
| New York State Dormitory Authority, Non-State Supported Debt, School District Board Funding Program, Revenue Bonds, (Series B), (Assured Guaranty State Aid
Withholding), 5.25%, 10/01/23 |
|
|
2,000,000 |
|
|
|
2,438,120 |
|
|
|
|
| New York State Dormitory Authority, School Districts Financing Program, (Series D), (National Reinsurance State Aid Withholding), 5.50%,
10/01/17 |
|
|
30,000 |
|
|
|
30,118 |
|
|
| April 30, 2013 / ANNUAL REPORT |
|
|
|
|
|
| PORTFOLIOS OF INVESTMENTS |
|
|
69 |
|
Wilmington New York Municipal Bond Fund (concluded)
|
|
|
|
|
|
|
|
|
|
Description |
|
Par Value |
|
|
Value |
|
|
|
|
| Pittsford Central School District, NY, GO Unlimited, Refunding Bonds, (Series B), (State Aid Withholding), 5.00%, 12/15/24 |
|
$ |
1,390,000 |
|
|
$ |
1,739,335 |
|
|
|
|
| Rye City School District, NY, GO Unlimited, Refunding Bonds, (State Aid Withholding), 4.00%, 8/15/15 |
|
|
1,280,000 |
|
|
|
1,389,466 |
|
|
|
|
|
|
|
|
|
|
|
|
|
| TOTAL SCHOOL DISTRICT |
|
|
|
|
|
$ |
19,886,624 |
|
|
|
|
| TRANSPORTATION – 7.8% |
|
|
|
|
|
|
|
|
|
|
|
| Metropolitan Transportation Authority, NY, Revenue Bonds, (Series B), 5.00%, 11/15/22 |
|
|
1,000,000 |
|
|
|
1,150,220 |
|
|
|
|
| Triborough Bridge & Tunnel Authority, NY, Refunding Revenue Bonds, (Series A), (Highway Improvements), 5.00%, 11/15/20 |
|
|
2,070,000 |
|
|
|
2,602,238 |
|
|
|
|
| Triborough Bridge & Tunnel Authority, NY, Refunding Revenue Bonds, (Series B) |
|
|
|
|
|
|
|
|
|
|
|
| 5.00%, 11/15/25 |
|
|
1,000,000 |
|
|
|
1,249,340 |
|
|
|
|
| 5.00%, 11/15/28 |
|
|
1,500,000 |
|
|
|
1,830,825 |
|
|
|
|
| Triborough Bridge & Tunnel Authority, NY, Refunding Revenue Bonds, (Series C), (Highway Improvements), 5.00%, 11/15/25 |
|
|
1,350,000 |
|
|
|
1,672,421 |
|
|
|
|
|
|
|
|
|
|
|
|
|
| TOTAL TRANSPORTATION |
|
|
|
|
|
$ |
8,505,044 |
|
|
|
|
| WATER & SEWER – 12.1% |
|
|
|
|
|
|
|
|
|
|
|
| New York City, NY, Municipal Water Finance Authority, Water & Sewer System, Refunding Revenue Bonds, (Series BB), 5.00%, 6/15/27 |
|
|
5,000,000 |
|
|
|
6,002,550 |
|
|
|
|
| New York State Environmental Facilities Corp., State Clean Water & Drinking, Refunding Revenue Bonds, (Subseries A), 5.00%, 6/15/24 |
|
|
2,500,000 |
|
|
|
3,154,325 |
|
|
|
|
| New York State Environmental Facilities Corp., State Clean Water & Drinking Revolving Funds, New York Municipal Water, Refunding Revenue Bonds, 5.00%,
6/15/17 |
|
|
1,020,000 |
|
|
|
1,204,814 |
|
|
|
|
|
|
|
|
|
|
|
Description |
|
Par Value |
|
|
Value |
|
|
|
|
| New York State Environmental Facilities Corp., State Clean Water & Drinking Revolving Funds, Pooled Financing Program, (Series B), 5.00%,
11/15/18 |
|
$ |
1,450,000 |
|
|
$ |
1,521,761 |
|
|
|
|
| New York State Environmental Facilities Corp., State Revolving Funds, Refunding Revenue Bonds, (Series B), 5.00%, 8/15/16 |
|
|
1,235,000 |
|
|
|
1,422,028 |
|
|
|
|
|
|
|
|
|
|
|
|
|
| TOTAL WATER & SEWER |
|
|
|
|
|
$ |
13,305,478 |
|
|
|
|
|
|
|
|
|
|
|
|
|
| TOTAL NEW YORK |
|
|
|
|
|
$ |
107,296,103 |
|
|
|
|
|
|
|
|
|
|
|
|
| TOTAL MUNICIPAL BONDS (COST
$101,201,022) |
|
|
$ |
107,296,103 |
|
| |
|
|
|
|
|
|
|
|
| Description |
|
Number of
Shares
|
|
|
Value |
|
|
|
| MONEY MARKET FUND – 4.2% |
|
|
|
|
|
|
|
|
| Dreyfus Tax Exempt Cash Management Fund, Institutional Shares,
0.00%^ |
|
|
4,593,038 |
|
|
$ |
4,593,038 |
|
|
|
|
|
|
|
|
|
|
|
|
| TOTAL MONEY MARKET FUND
(COST $4,593,038) |
|
|
$ |
4,593,038 |
|
|
|
|
|
|
|
|
|
|
|
|
| TOTAL INVESTMENTS – 102.0%
(COST $105,794,060) |
|
|
$ |
111,889,141 |
|
|
|
| OTHER LIABILITIES LESS ASSETS – (2.0%) |
|
|
|
(2,179,445 |
) |
|
|
|
|
|
|
|
|
|
|
|
| TOTAL NET ASSETS – 100.0% |
|
|
$ |
109,709,696 |
|
|
|
|
|
|
|
|
|
|
Cost of investments for Federal income tax
purposes is $105,731,757. The net unrealized appreciation/(depreciation) of investments was $6,157,384. This consists of net unrealized appreciation from investment for those securities having an excess of value over cost of $6,214,409 and net
unrealized depreciation from investments for those securities having an excess of cost over value of $57,025.
Various inputs are used in determining
the value of the Fund’s investments. These inputs are summarized in the three broad levels listed below.
Level 1 – quoted
prices in active markets for identical securities
Level 2 – other significant observable inputs (including quoted prices for
similar securities, interest rates, prepayment speeds, credit risk, etc.)
Level 3 – significant unobservable inputs (including the
Fund’s own assumptions in determining the fair value of investments)
The following is a summary of the inputs used as of April 30, 2013 in
valuing the Fund’s assets carried at fair value:
|
|
|
|
|
|
|
|
|
|
|
|
|
|
|
|
|
| |
|
Level 1 |
|
|
Level 2 |
|
|
Level 3 |
|
|
Total |
|
| Investments in Securities |
|
|
|
|
|
|
|
|
|
|
|
|
|
|
|
|
| Municipal Bonds |
|
$ |
— |
|
|
$ |
107,296,103 |
|
|
$ |
— |
|
|
$ |
107,296,103 |
|
| Money Market Fund |
|
|
4,593,038 |
|
|
|
— |
|
|
|
— |
|
|
|
4,593,038 |
|
|
|
|
|
|
|
|
|
|
|
|
|
|
|
|
|
|
| Total |
|
$ |
4,593,038 |
|
|
$ |
107,296,103 |
|
|
$ |
— |
|
|
$ |
111,889,141 |
|
|
|
|
|
|
|
|
|
|
|
|
|
|
|
|
|
|
See Notes to Portfolios of Investments
See Notes which are an integral part of the Financial Statements
ANNUAL REPORT / April
30, 2013
70
NOTES TO PORTFOLIOS OF INVESTMENTS
| D |
Floating rate note with current rate and stated maturity date shown. |
| ‡ |
Zero coupon security. The rate shown reflects the effective yield at purchase date. |
| @ |
Current rate and next reset date shown for Variable Rate Demand Notes. |
| ¿ |
Securities with discount rate at time of purchase shown. |
| W |
Denotes a restricted security, or a portion thereof, that may be resold without restriction to “qualified institutional buyers” as defined in Rule 144A under the
Securities Act of 1933 and that the Fund has determined to be liquid under criteria established by the Fund’s Board of Trustees. At April 30, 2013, these liquid restricted securities were as follows: |
|
|
|
|
|
|
|
|
|
|
|
|
|
| |
|
Fund |
|
Amount
|
|
|
Percentage
of
Total
Net Assets |
|
|
|
|
|
Broad Market Bond Fund |
|
|
$15,789,767 |
|
|
|
5.6 |
% |
|
|
|
|
Intermediate-Term Bond Fund |
|
|
4,098,189 |
|
|
|
1.9 |
% |
|
|
|
|
Short-Term Corporate Bond Fund |
|
|
10,205,903 |
|
|
|
5.5 |
% |
|
|
| • |
Denotes a restricted security, or a portion thereof, that either (a) cannot be offered for public sale without first being registered, or being able to take advantage of an
exemption from registration, under the Securities Act of 1933, or (b) is subject to a contractual restriction on public sales. At April 30, 2013, these restricted securities were as follows: |
|
|
|
|
|
|
|
|
|
|
|
|
|
|
|
|
|
|
|
| |
|
Security |
|
Acquisition
Date |
|
|
Acquisition
Cost |
|
|
Market Value |
|
|
Percentage
of Total Net Assets |
|
|
|
Broad Market Bond Fund |
|
|
|
|
|
|
|
|
|
|
|
|
|
|
|
|
|
|
AbbVie, Inc. |
|
|
11/05/2012 |
|
|
|
$844,526 |
|
|
|
$869,311 |
|
|
|
|
|
|
|
AbbVie, Inc. |
|
|
11/05/2012 |
|
|
|
455,234 |
|
|
|
486,039 |
|
|
|
|
|
|
|
BNY Institutional Capital Trust A |
|
|
11/25/1996 |
|
|
|
1,500,000 |
|
|
|
1,530,937 |
|
|
|
|
|
|
|
Barrick Gold Corp. |
|
|
04/29/2013 |
|
|
|
374,494 |
|
|
|
377,266 |
|
|
|
|
|
|
|
Barrick Gold Corp. |
|
|
04/30/2013 |
|
|
|
125,790 |
|
|
|
125,755 |
|
|
|
|
|
|
|
Cox Communications, Inc. |
|
|
04/24/2013 |
|
|
|
1,897,625 |
|
|
|
1,903,305 |
|
|
|
|
|
|
|
Crown Castle Towers LLC |
|
|
07/29/2010 |
|
|
|
1,000,000 |
|
|
|
1,096,674 |
|
|
|
|
|
|
|
Crown Castle Towers LLC |
|
|
08/04/2010 |
|
|
|
1,003,370 |
|
|
|
1,096,674 |
|
|
|
|
|
|
|
Daimler Finance North America LLC |
|
|
09/07/2011 |
|
|
|
247,588 |
|
|
|
275,338 |
|
|
|
|
|
|
|
Eaton Corp. |
|
|
11/14/2012 |
|
|
|
398,752 |
|
|
|
412,690 |
|
|
|
|
|
|
|
Eaton Corp. |
|
|
11/14/2012 |
|
|
|
249,160 |
|
|
|
253,172 |
|
|
|
|
|
|
|
Extended Stay America Trust 2013-ESH |
|
|
01/25/2013 |
|
|
|
797,998 |
|
|
|
809,625 |
|
|
|
|
|
|
|
FMR LLC |
|
|
10/28/2009 |
|
|
|
997,720 |
|
|
|
1,263,992 |
|
|
|
|
|
|
|
General Motors Financial Co., Inc. |
|
|
08/13/2012 |
|
|
|
300,000 |
|
|
|
318,750 |
|
|
|
|
|
|
|
Harley-Davidson Funding Corp. |
|
|
11/19/2009 |
|
|
|
499,195 |
|
|
|
538,331 |
|
|
|
|
|
|
|
Hyundai Capital America |
|
|
12/01/2011 |
|
|
|
248,878 |
|
|
|
270,503 |
|
|
|
|
|
|
|
Hyundai Capital America |
|
|
09/24/2012 |
|
|
|
249,855 |
|
|
|
251,336 |
|
|
|
|
|
|
|
Hyundai Capital Services, Inc. |
|
|
03/06/2012 |
|
|
|
249,073 |
|
|
|
266,867 |
|
|
|
|
|
|
|
LA Arena Funding LLC |
|
|
04/23/1999 |
|
|
|
1,147,175 |
|
|
|
1,323,085 |
|
|
|
|
|
|
|
NBC Universal Enterprise, Inc. |
|
|
03/20/2013 |
|
|
|
420,475 |
|
|
|
420,398 |
|
|
|
|
|
|
|
Rockies Express Pipeline LLC |
|
|
03/17/2010 |
|
|
|
499,555 |
|
|
|
470,625 |
|
|
|
|
|
|
|
SLM Student Loan Trust |
|
|
04/14/2011 |
|
|
|
486,528 |
|
|
|
490,273 |
|
|
|
|
|
|
|
WM Wrigley Jr. Co. |
|
|
06/21/2010 |
|
|
|
499,485 |
|
|
|
514,834 |
|
|
|
|
|
|
|
Zoetis, Inc. |
|
|
01/16/2013 |
|
|
|
$397,072 |
|
|
|
423,987 |
|
|
|
|
|
|
|
|
|
|
|
|
|
|
|
|
|
|
$15,789,767 |
|
|
|
5.6 |
% |
|
|
Intermediate-Term Bond Fund |
|
|
|
|
|
|
|
|
|
|
|
|
|
|
|
|
|
|
AbbVie, Inc. |
|
|
11/13/2012 |
|
|
|
250,818 |
|
|
|
252,578 |
|
|
|
|
|
|
|
AbbVie, Inc. |
|
|
11/05/2012 |
|
|
|
199,582 |
|
|
|
204,155 |
|
|
|
|
|
|
|
AbbVie, Inc. |
|
|
11/06/2012 |
|
|
|
302,553 |
|
|
|
306,232 |
|
|
|
|
|
|
|
Broadcom Corp. |
|
|
08/14/2012 |
|
|
|
485,159 |
|
|
|
487,238 |
|
|
|
|
|
|
|
Cox Communications, Inc. |
|
|
04/24/2013 |
|
|
|
238,944 |
|
|
|
240,232 |
|
|
|
|
|
|
|
Eaton Corp. |
|
|
11/14/2012 |
|
|
|
174,412 |
|
|
|
177,220 |
|
|
|
|
|
|
|
Eaton Corp. |
|
|
11/15/2012 |
|
|
|
324,412 |
|
|
|
329,123 |
|
|
|
|
|
April 30, 2013 / ANNUAL REPORT
|
|
|
|
|
| NOTES TO PORTFOLIOS OF INVESTMENTS |
|
|
71 |
|
|
|
|
|
|
|
|
|
|
|
|
|
|
|
|
|
|
|
|
| |
|
Security |
|
Acquisition
Date
|
|
|
Acquisition
Cost |
|
|
Market Value |
|
|
Percentage
of
Total
Net
Assets |
|
|
|
General Motors Financial Co., Inc. |
|
|
08/13/2012 |
|
|
|
250,000 |
|
|
|
265,625 |
|
|
|
|
|
|
|
Hyundai Capital America |
|
|
09/24/2012 |
|
|
|
329,809 |
|
|
|
331,763 |
|
|
|
|
|
|
|
Hyundai Capital America |
|
|
09/25/2012 |
|
|
|
496,015 |
|
|
|
497,645 |
|
|
|
|
|
|
|
SLM Student Loan Trust |
|
|
04/14/2011 |
|
|
|
486,528 |
|
|
|
490,273 |
|
|
|
|
|
|
|
Zoetis, Inc. |
|
|
02/01/2013 |
|
|
|
501,170 |
|
|
|
516,105 |
|
|
|
|
|
|
|
|
|
|
|
|
|
|
|
|
|
|
4,098,189 |
|
|
|
1.9 |
% |
|
|
Short-Term Corporate Bond Fund |
|
|
|
|
|
|
|
|
|
|
|
|
|
|
|
|
|
|
AbbVie, Inc. |
|
|
11/05/2012 |
|
|
|
2,198,526 |
|
|
|
2,222,682 |
|
|
|
|
|
|
|
Barrick Gold Corp. |
|
|
04/29/2013 |
|
|
|
374,494 |
|
|
|
377,266 |
|
|
|
|
|
|
|
Barrick Gold Corp. |
|
|
04/30/2013 |
|
|
|
125,790 |
|
|
|
125,755 |
|
|
|
|
|
|
|
Daimler Finance North America LLC |
|
|
01/08/2013 |
|
|
|
1,000,000 |
|
|
|
1,001,278 |
|
|
|
|
|
|
|
Eaton Corp. |
|
|
11/14/2012 |
|
|
|
749,348 |
|
|
|
752,886 |
|
|
|
|
|
|
|
Eaton Corp. |
|
|
01/09/2013 |
|
|
|
1,255,250 |
|
|
|
1,254,809 |
|
|
|
|
|
|
|
Extended Stay America Trust 2013-ESH |
|
|
01/25/2013 |
|
|
|
503,736 |
|
|
|
511,076 |
|
|
|
|
|
|
|
General Motors Financial Co., Inc. |
|
|
08/13/2012 |
|
|
|
200,000 |
|
|
|
212,500 |
|
|
|
|
|
|
|
Hyundai Capital America |
|
|
09/24/2012 |
|
|
|
249,855 |
|
|
|
251,336 |
|
|
|
|
|
|
|
Hyundai Motor Manufacturing Czech s.r.o. |
|
|
04/15/2010 |
|
|
|
249,248 |
|
|
|
264,368 |
|
|
|
|
|
|
|
NBC Universal Enterprise, Inc. |
|
|
03/20/2013 |
|
|
|
630,712 |
|
|
|
630,598 |
|
|
|
|
|
|
|
SLM Student Loan Trust |
|
|
04/14/2011 |
|
|
|
648,704 |
|
|
|
653,697 |
|
|
|
|
|
|
|
WM Wrigley Jr. Co. |
|
|
04/20/2011 |
|
|
|
1,553,175 |
|
|
|
1,544,502 |
|
|
|
|
|
|
|
Zoetis, Inc. |
|
|
01/17/2013 |
|
|
|
399,892 |
|
|
|
403,150 |
|
|
|
|
|
|
|
|
|
|
|
|
|
|
|
|
|
|
$10,205,903 |
|
|
|
5.5 |
% |
| †† |
Security is fair valued in accordance with procedures adopted by the Board of Trustees. See Note 2 in Notes to Financial Statements. At April 30, 2013,
the value of these securities amounted to: |
|
|
|
|
|
|
|
|
|
|
|
| |
|
Fund |
|
Amount
|
|
|
Percentage
of
Total
Net Assets |
|
|
|
Broad Market Bond Fund |
|
|
$854,995 |
|
|
|
0.3 |
% |
|
|
Short-Term Corporate Bond Fund |
|
|
2,000,000 |
|
|
|
1.1 |
% |
| † |
Security is in default. |
| # |
Security, or a portion thereof, is on loan. See Note 2 in Notes to Financial Statements. |
| ≠ |
The Fund’s advisor has deemed this security to be illiquid based upon procedures approved by the Board of Trustees. |
| ∑ |
All or a portion of this security was segregated for extended settlement contracts. |
| ** |
Represents less than 0.05%. |
ANNUAL REPORT / April
30, 2013
|
|
|
| 72 |
|
NOTES TO PORTFOLIOS OF INVESTMENTS |
The following acronyms are used throughout this report:
AGM – Assured Guaranty Municipal
AMBAC – American Bond Assurance Corporation
BKNT – Bank Note
CAPMAC – Capital Markets Assurance Corporation
EDA – Economic Development Agency
ETM – Escrowed to Maturity
FHA – Federal Housing Administration
FHLB – Federal Home Loan Bank
FHLMC – Federal Home Loan Mortgage Corporation
FGIC – Financial Guarantee Insurance Company
FNMA – Federal National Mortgage Association
FRN – Floating Rate Note
FSA – Financial Security Assurance Inc.
GMTN –Global Medium Term Note
GNMA – Government National Mortgage Association
GO – General Obligation
GTD – Guaranteed
IDA – Industrial Development Authority/Agency
INS – Insured
LLC – Limited Liability Corporation
LP – Limited Partnership
MTN – Medium Term Note
PLC – Public Company Limited
PRF – Prerefunded
PSF – Permanent School Fund
Q-SBLF – Qualified School Bond Loan Fund
REIT – Real Estate Investment
Trust
TBA – To Be Announced
TRANs – Tax & Revenue Anticipation Notes
UPMC – University of Pittsburgh Medical Center
VRDNs – Variable Rate Demand Notes
XLCA – XL Capital Assurance Inc.
April 30, 2013 / ANNUAL REPORT
|
|
|
|
|
| STATEMENTS OF ASSETS AND LIABILITIES |
|
|
73 |
|
|
|
|
|
|
|
|
|
|
|
|
|
|
|
|
|
|
|
|
| April 30, 2013 |
|
|
|
Wilmington
Broad
Market
Bond
Fund |
|
|
Wilmington
Intermediate-Term
Bond
Fund |
|
|
Wilmington
Short-Term
Corporate
Bond
Fund
|
|
|
Wilmington
Short
Duration Government Bond Fund |
|
| ASSETS: |
|
|
|
|
|
|
|
|
|
|
|
|
|
|
|
|
|
|
| Investments, at identified cost |
|
|
|
$ |
290,277,180 |
|
|
$ |
215,746,547 |
|
|
$ |
189,371,963 |
|
|
$ |
126,734,601 |
|
|
|
|
|
|
|
|
|
|
|
|
|
|
|
|
|
|
|
|
| Investments in securities, at value (Including $5,338,193, $13,397,278, $3,694,502 and $0 of securities on loan, respectively) (Note 2) |
|
|
|
|
304,170,037 |
|
|
|
225,497,542 |
|
|
|
191,120,310 |
|
|
|
129,877,464 |
|
| Cash |
|
|
|
|
— |
|
|
|
217 |
|
|
|
733 |
|
|
|
— |
|
| Interest receivable |
|
|
|
|
2,337,450 |
|
|
|
1,724,308 |
|
|
|
1,531,448 |
|
|
|
454,658 |
|
| Receivable for shares sold |
|
|
|
|
983,274 |
|
|
|
308,014 |
|
|
|
597,944 |
|
|
|
130,953 |
|
| Receivable for investments sold |
|
|
|
|
— |
|
|
|
1,500,283 |
|
|
|
— |
|
|
|
21 |
|
| Other assets |
|
|
|
|
7,246 |
|
|
|
11,775 |
|
|
|
6,398 |
|
|
|
9,530 |
|
|
|
|
|
|
|
|
|
|
|
|
|
|
|
|
|
|
|
|
| TOTAL ASSETS |
|
|
|
|
307,498,007 |
|
|
|
229,042,139 |
|
|
|
193,256,833 |
|
|
|
130,472,626 |
|
| |
|
|
|
|
|
|
|
|
|
|
|
|
|
|
|
|
|
|
| LIABILITIES: |
|
|
|
|
|
|
|
|
|
|
|
|
|
|
|
|
|
|
| Payable to custodian |
|
|
|
|
11 |
|
|
|
— |
|
|
|
— |
|
|
|
11 |
|
| Payable for investments purchased |
|
|
|
|
18,758,665 |
|
|
|
3,035,156 |
|
|
|
3,400,045 |
|
|
|
— |
|
| Income distribution payable |
|
|
|
|
629,272 |
|
|
|
353,556 |
|
|
|
150,601 |
|
|
|
200,694 |
|
| Payable for shares redeemed |
|
|
|
|
311,679 |
|
|
|
496,016 |
|
|
|
51,920 |
|
|
|
3,214 |
|
| Collateral for securities on loan |
|
|
|
|
5,482,930 |
|
|
|
13,736,201 |
|
|
|
3,798,041 |
|
|
|
— |
|
| Payable for Trustees’ fees |
|
|
|
|
452 |
|
|
|
451 |
|
|
|
501 |
|
|
|
272 |
|
| Payable for distribution services fee |
|
|
|
|
2,121 |
|
|
|
3,017 |
|
|
|
881 |
|
|
|
5,078 |
|
| Payable for shareholder services fee |
|
|
|
|
597 |
|
|
|
850 |
|
|
|
— |
|
|
|
— |
|
| Other accrued expenses |
|
|
|
|
187,826 |
|
|
|
115,342 |
|
|
|
138,582 |
|
|
|
92,290 |
|
|
|
|
|
|
|
|
|
|
|
|
|
|
|
|
|
|
|
|
| TOTAL LIABILITIES |
|
|
|
|
25,373,553 |
|
|
|
17,740,589 |
|
|
|
7,540,571 |
|
|
|
301,559 |
|
| |
|
|
|
|
|
|
|
|
|
|
|
|
|
|
|
|
|
|
| NET ASSETS |
|
|
|
$ |
282,124,454 |
|
|
$ |
211,301,550 |
|
|
$ |
185,716,262 |
|
|
$ |
130,171,067 |
|
| |
|
|
|
|
|
|
|
|
|
|
|
|
|
|
|
|
|
|
| NET ASSETS CONSIST OF: |
|
|
|
|
|
|
|
|
|
|
|
|
|
|
|
|
|
|
| |
|
|
|
|
|
|
|
|
|
|
|
|
|
|
|
|
|
|
| Paid-in capital |
|
|
|
$ |
265,540,626 |
|
|
$ |
198,686,801 |
|
|
$ |
182,603,234 |
|
|
$ |
128,771,481 |
|
| Undistributed (distributions in excess of) net investment income |
|
|
|
|
213,664 |
|
|
|
96,315 |
|
|
|
24,473 |
|
|
|
450,252 |
|
| Accumulated net realized gain (loss) on investments |
|
|
|
|
2,477,307 |
|
|
|
2,767,439 |
|
|
|
1,340,208 |
|
|
|
(2,193,529 |
) |
| Net unrealized appreciation (depreciation) of investments |
|
|
|
|
13,892,857 |
|
|
|
9,750,995 |
|
|
|
1,748,347 |
|
|
|
3,142,863 |
|
|
|
|
|
|
|
|
|
|
|
|
|
|
|
|
|
|
|
|
| TOTAL NET ASSETS |
|
|
|
$ |
282,124,454 |
|
|
$ |
211,301,550 |
|
|
$ |
185,716,262 |
|
|
$ |
130,171,067 |
|
| |
|
|
|
|
|
|
|
|
|
|
|
|
|
|
|
|
|
|
| COMPUTATION OF NET ASSET VALUE AND OFFERING PRICE: |
|
|
|
|
|
|
|
|
|
|
|
|
|
|
|
|
|
|
| Class A |
|
|
|
|
|
|
|
|
|
|
|
|
|
|
|
|
|
|
| Net Assets |
|
|
|
$ |
6,951,272 |
|
|
$ |
9,729,538 |
|
|
$ |
3,128,744 |
|
|
$ |
20,135,783 |
|
|
|
|
|
|
|
|
|
|
|
|
|
|
|
|
|
|
|
|
| Shares outstanding (unlimited shares authorized) |
|
|
|
|
681,995 |
|
|
|
918,256 |
|
|
|
303,016 |
|
|
|
2,079,781 |
|
|
|
|
|
|
|
|
|
|
|
|
|
|
|
|
|
|
|
|
| Net Asset Value per share |
|
|
|
$ |
10.19 |
|
|
$ |
10.60 |
|
|
$ |
10.33 |
|
|
$ |
9.68 |
|
|
|
|
|
|
|
|
|
|
|
|
|
|
|
|
|
|
|
|
| Offering price per share* |
|
|
|
$ |
10.67 |
*** |
|
$ |
11.10 |
*** |
|
$ |
10.51 |
** |
|
$ |
9.85 |
** |
|
|
|
|
|
|
|
|
|
|
|
|
|
|
|
|
|
|
|
| Class I |
|
|
|
|
|
|
|
|
|
|
|
|
|
|
|
|
|
|
| Net Assets |
|
|
|
$ |
275,173,182 |
|
|
$ |
201,572,012 |
|
|
$ |
182,587,518 |
|
|
$ |
110,035,284 |
|
|
|
|
|
|
|
|
|
|
|
|
|
|
|
|
|
|
|
|
| Shares outstanding (unlimited shares authorized) |
|
|
|
|
27,445,739 |
|
|
|
19,013,673 |
|
|
|
17,678,390 |
|
|
|
11,342,853 |
|
|
|
|
|
|
|
|
|
|
|
|
|
|
|
|
|
|
|
|
| Net Asset Value per share |
|
|
|
$ |
10.03 |
|
|
$ |
10.60 |
|
|
$ |
10.33 |
|
|
$ |
9.70 |
|
|
|
|
|
|
|
|
|
|
|
|
|
|
|
|
|
|
|
|
| * |
See “How are Shares Priced?” in the Prospectus. |
| ** |
Computation of offering price per share 100/98.25 of net asset value. |
| *** |
Computation of offering price per share 100/95.50 of net asset value. |
See Notes which are an integral part of the Financial Statements
ANNUAL REPORT / April
30, 2013
|
|
|
| 74 |
|
STATEMENTS OF ASSETS AND LIABILITIES (concluded) |
|
|
|
|
|
|
|
|
|
|
|
|
|
|
|
| April 30, 2013 |
|
|
|
Wilmington
Municipal
Bond
Fund
|
|
|
Wilmington
Maryland
Municipal
Bond
Fund
|
|
|
Wilmington
New
York
Municipal
Bond
Fund
|
|
| ASSETS: |
|
|
|
|
|
|
|
|
|
|
|
|
|
|
| Investments, at identified cost |
|
|
|
$ |
248,139,838 |
|
|
$ |
103,144,966 |
|
|
$ |
105,794,060 |
|
|
|
|
|
|
|
|
|
|
|
|
|
|
|
|
| Investments in securities, at value |
|
|
|
|
262,511,841 |
|
|
|
107,709,448 |
|
|
|
111,889,141 |
|
| Interest receivable |
|
|
|
|
3,279,380 |
|
|
|
1,292,425 |
|
|
|
1,244,267 |
|
| Receivable for shares sold |
|
|
|
|
407,213 |
|
|
|
132,438 |
|
|
|
162,219 |
|
| Receivable for investments sold |
|
|
|
|
3,802,697 |
|
|
|
— |
|
|
|
— |
|
| Other assets |
|
|
|
|
7,644 |
|
|
|
5,826 |
|
|
|
5,825 |
|
|
|
|
|
|
|
|
|
|
|
|
|
|
|
|
| TOTAL ASSETS |
|
|
|
|
270,008,775 |
|
|
|
109,140,137 |
|
|
|
113,301,452 |
|
| |
|
|
|
|
|
|
|
|
|
|
|
|
|
|
| LIABILITIES: |
|
|
|
|
|
|
|
|
|
|
|
|
|
|
| Payable for investments purchased |
|
|
|
|
— |
|
|
|
2,018,096 |
|
|
|
3,334,125 |
|
| Income distribution payable |
|
|
|
|
430,983 |
|
|
|
125,767 |
|
|
|
159,510 |
|
| Payable for shares redeemed |
|
|
|
|
80,725 |
|
|
|
9,067 |
|
|
|
8,979 |
|
| Payable for Trustees’ fees |
|
|
|
|
1,099 |
|
|
|
504 |
|
|
|
256 |
|
| Payable for distribution services fee |
|
|
|
|
5,826 |
|
|
|
7,537 |
|
|
|
15,723 |
|
| Payable for shareholder services fee |
|
|
|
|
— |
|
|
|
821 |
|
|
|
— |
|
| Other accrued expenses |
|
|
|
|
140,668 |
|
|
|
71,244 |
|
|
|
73,163 |
|
|
|
|
|
|
|
|
|
|
|
|
|
|
|
|
| TOTAL LIABILITIES |
|
|
|
|
659,301 |
|
|
|
2,233,036 |
|
|
|
3,591,756 |
|
| |
|
|
|
|
|
|
|
|
|
|
|
|
|
|
| NET ASSETS |
|
|
|
$ |
269,349,474 |
|
|
$ |
106,907,101 |
|
|
$ |
109,709,696 |
|
| |
|
|
|
|
|
|
|
|
|
|
|
|
|
|
| NET ASSETS CONSIST OF: |
|
|
|
|
|
|
|
|
|
|
|
|
|
|
| |
|
|
|
|
|
|
|
|
|
|
|
|
|
|
| Paid-in capital |
|
|
|
$ |
252,889,826 |
|
|
$ |
101,428,885 |
|
|
$ |
105,215,457 |
|
| Undistributed (distributions in excess of) net investment income |
|
|
|
|
(235 |
) |
|
|
68,422 |
|
|
|
24,864 |
|
| Accumulated net realized gain (loss) on investments |
|
|
|
|
2,087,880 |
|
|
|
845,312 |
|
|
|
(1,625,706 |
) |
| Net unrealized appreciation (depreciation) of investments |
|
|
|
|
14,372,003 |
|
|
|
4,564,482 |
|
|
|
6,095,081 |
|
|
|
|
|
|
|
|
|
|
|
|
|
|
|
|
| TOTAL NET ASSETS |
|
|
|
$ |
269,349,474 |
|
|
$ |
106,907,101 |
|
|
$ |
109,709,696 |
|
| |
|
|
|
|
|
|
|
|
|
|
|
|
|
|
| COMPUTATION OF NET ASSET VALUE AND OFFERING PRICE: |
|
|
|
|
|
|
|
|
|
|
|
|
|
|
| Class A |
|
|
|
|
|
|
|
|
|
|
|
|
|
|
| Net Assets |
|
|
|
$ |
21,435,565 |
|
|
$ |
33,460,928 |
|
|
$ |
31,238,923 |
|
|
|
|
|
|
|
|
|
|
|
|
|
|
|
|
| Shares outstanding (unlimited shares authorized) |
|
|
|
|
1,558,814 |
|
|
|
3,258,319 |
|
|
|
2,904,876 |
|
|
|
|
|
|
|
|
|
|
|
|
|
|
|
|
| Net Asset Value per share |
|
|
|
$ |
13.75 |
|
|
$ |
10.27 |
|
|
$ |
10.75 |
|
|
|
|
|
|
|
|
|
|
|
|
|
|
|
|
| Offering price per share* |
|
|
|
$ |
14.40 |
*** |
|
$ |
10.75 |
*** |
|
$ |
11.26 |
*** |
|
|
|
|
|
|
|
|
|
|
|
|
|
|
|
| Class I |
|
|
|
|
|
|
|
|
|
|
|
|
|
|
| Net Assets |
|
|
|
$ |
247,913,909 |
|
|
$ |
73,446,173 |
|
|
$ |
78,470,773 |
|
|
|
|
|
|
|
|
|
|
|
|
|
|
|
|
| Shares outstanding (unlimited shares authorized) |
|
|
|
|
18,020,784 |
|
|
|
7,140,643 |
|
|
|
7,293,192 |
|
|
|
|
|
|
|
|
|
|
|
|
|
|
|
|
| Net Asset Value per share |
|
|
|
$ |
13.76 |
|
|
$ |
10.29 |
|
|
$ |
10.76 |
|
|
|
|
|
|
|
|
|
|
|
|
|
|
|
|
| * |
See “How are Shares Priced?” in the Prospectus. |
| *** |
Computation of offering price per share 100/95.50 of net asset value. |
See Notes which are an integral part of the Financial Statements
April 30, 2013 / ANNUAL REPORT
|
|
|
|
|
| STATEMENTS OF OPERATIONS |
|
|
75 |
|
|
|
|
|
|
|
|
|
|
|
|
|
|
|
|
|
|
|
|
| Year Ended April 30,
2013 |
|
|
|
Wilmington
Broad Market Bond Fund |
|
|
Wilmington
Intermediate-Term
Bond
Fund |
|
|
Wilmington
Short-Term
Corporate
Bond
Fund
|
|
|
Wilmington
Short
Duration Government Bond Fund |
|
| INVESTMENT INCOME: |
|
|
|
|
|
|
|
|
|
|
|
|
|
|
|
|
|
|
| Dividends |
|
|
|
$ |
5,023 |
|
|
$ |
145 |
|
|
$ |
153 |
|
|
$ |
53 |
|
| Interest |
|
|
|
|
9,531,423 |
|
|
|
6,419,552 |
|
|
|
3,286,760 |
|
|
|
2,898,227 |
|
| Securities lending income |
|
|
|
|
15,329 |
|
|
|
22,498 |
|
|
|
1,905 |
|
|
|
— |
|
|
|
|
|
|
|
|
|
|
|
|
|
|
|
|
|
|
|
|
| TOTAL INVESTMENT INCOME |
|
|
|
|
9,551,775 |
|
|
|
6,442,195 |
|
|
|
3,288,818 |
|
|
|
2,898,280 |
|
| |
|
|
|
|
|
|
|
|
|
|
|
|
|
|
|
|
|
|
| EXPENSES: |
|
|
|
|
|
|
|
|
|
|
|
|
|
|
|
|
|
|
| Investment advisory fee |
|
|
|
|
1,484,838 |
|
|
|
1,226,813 |
|
|
|
952,040 |
|
|
|
757,656 |
|
| Administrative personnel and services fee |
|
|
|
|
67,781 |
|
|
|
56,001 |
|
|
|
43,701 |
|
|
|
34,814 |
|
| Portfolio accounting, administration and custodian fees |
|
|
|
|
133,503 |
|
|
|
108,014 |
|
|
|
87,522 |
|
|
|
70,100 |
|
| Transfer and dividend disbursing agent fees and expenses |
|
|
|
|
89,352 |
|
|
|
24,962 |
|
|
|
94,873 |
|
|
|
41,994 |
|
| Trustees’ fees |
|
|
|
|
28,661 |
|
|
|
28,619 |
|
|
|
28,585 |
|
|
|
28,744 |
|
| Professional fees |
|
|
|
|
57,588 |
|
|
|
55,456 |
|
|
|
53,671 |
|
|
|
57,512 |
|
| Distribution services fee—Class A |
|
|
|
|
18,804 |
|
|
|
29,417 |
|
|
|
9,601 |
|
|
|
53,747 |
|
| Distribution services fee—Class C |
|
|
|
|
— |
|
|
|
10,172 |
(a) |
|
|
2,790 |
(a) |
|
|
6,727 |
(a) |
| Shareholder services fee—Class A |
|
|
|
|
18,804 |
|
|
|
29,417 |
|
|
|
9,601 |
|
|
|
53,747 |
|
| Shareholder services fee—Class C |
|
|
|
|
— |
|
|
|
2,543 |
(a) |
|
|
697 |
(a) |
|
|
1,682 |
(a) |
| Shareholder services fee— Class I |
|
|
|
|
723,614 |
|
|
|
581,445 |
|
|
|
465,721 |
|
|
|
323,399 |
|
| Share registration costs |
|
|
|
|
31,882 |
|
|
|
32,047 |
|
|
|
41,133 |
|
|
|
23,156 |
|
| Printing and postage |
|
|
|
|
56,621 |
|
|
|
17,188 |
|
|
|
33,761 |
|
|
|
19,057 |
|
| Miscellaneous |
|
|
|
|
29,349 |
|
|
|
23,917 |
|
|
|
23,728 |
|
|
|
19,742 |
|
|
|
|
|
|
|
|
|
|
|
|
|
|
|
|
|
|
|
|
| TOTAL EXPENSES |
|
|
|
|
2,740,797 |
|
|
|
2,226,011 |
|
|
|
1,847,424 |
|
|
|
1,492,077 |
|
| |
|
|
|
|
|
|
|
|
|
|
|
|
|
|
|
|
|
|
| WAIVERS AND REIMBURSEMENTS: |
|
|
|
|
|
|
|
|
|
|
|
|
|
|
|
|
|
|
| Waiver/reimbursement by investment advisor |
|
|
|
|
(70,919 |
) |
|
|
(100,830 |
) |
|
|
(197,525 |
) |
|
|
(82,847 |
) |
| Waiver of distribution services fee—Class A |
|
|
|
|
(1 |
) |
|
|
— |
|
|
|
— |
|
|
|
(37 |
) |
| Waiver of shareholder services fee—Class A |
|
|
|
|
(11,640 |
) |
|
|
(18,793 |
) |
|
|
(9,601 |
) |
|
|
(53,747 |
) |
| Waiver of shareholder services fee—Class C |
|
|
|
|
— |
|
|
|
(1,787 |
)(a) |
|
|
(697 |
)(a) |
|
|
(1,682 |
)(a) |
| Waiver of shareholder services fee—Class I |
|
|
|
|
(723,614 |
) |
|
|
(581,445 |
) |
|
|
(465,721 |
) |
|
|
(323,399 |
) |
|
|
|
|
|
|
|
|
|
|
|
|
|
|
|
|
|
|
|
| TOTAL WAIVERS AND REIMBURSEMENTS |
|
|
|
|
(806,174 |
) |
|
|
(702,855 |
) |
|
|
(673,544 |
) |
|
|
(461,712 |
) |
| |
|
|
|
|
|
|
|
|
|
|
|
|
|
|
|
|
|
|
| Net expenses |
|
|
|
|
1,934,623 |
|
|
|
1,523,156 |
|
|
|
1,173,880 |
|
|
|
1,030,365 |
|
|
|
|
|
|
|
|
|
|
|
|
|
|
|
|
|
|
|
|
| Net investment income (loss) |
|
|
|
|
7,617,152 |
|
|
|
4,919,039 |
|
|
|
2,114,938 |
|
|
|
1,867,915 |
|
|
|
|
|
|
|
|
|
|
|
|
|
|
|
|
|
|
|
|
| REALIZED AND UNREALIZED GAIN (LOSS) ON INVESTMENTS: |
|
|
|
|
|
|
|
|
|
|
|
|
|
|
|
|
|
|
| Net realized gain (loss) on investments |
|
|
|
|
6,762,586 |
|
|
|
5,203,367 |
|
|
|
1,824,790 |
|
|
|
1,278,289 |
|
| Net change in unrealized appreciation (depreciation) of investments |
|
|
|
|
(1,719,094 |
) |
|
|
(2,460,544 |
) |
|
|
(333,334 |
) |
|
|
(1,438,262 |
) |
|
|
|
|
|
|
|
|
|
|
|
|
|
|
|
|
|
|
|
| Net realized and unrealized gain (loss) on investments |
|
|
|
|
5,043,492 |
|
|
|
2,742,823 |
|
|
|
1,491,456 |
|
|
|
(159,973 |
) |
|
|
|
|
|
|
|
|
|
|
|
|
|
|
|
|
|
|
|
| Change in net assets resulting from operations |
|
|
|
$ |
12,660,644 |
|
|
$ |
7,661,862 |
|
|
$ |
3,606,394 |
|
|
$ |
1,707,942 |
|
|
|
|
|
|
|
|
|
|
|
|
|
|
|
|
|
|
|
|
| (a) |
On April 13, 2013, Class C shares of the Fund were terminated after the
conversion to Class A shares of the Fund. |
See Notes which are an integral part of the Financial Statements
ANNUAL REPORT / April
30, 2013
|
|
|
| 76 |
|
STATEMENTS OF OPERATIONS (concluded) |
|
|
|
|
|
|
|
|
|
|
|
|
|
|
|
| Year Ended April 30, 2013 |
|
|
|
Wilmington
Municipal
Bond
Fund |
|
|
Wilmington
Maryland
Municipal
Bond
Fund
|
|
|
Wilmington
New
York
Municipal
Bond
Fund |
|
| INVESTMENT INCOME: |
|
|
|
|
|
|
|
|
|
|
|
|
|
|
| Dividends |
|
|
|
$ |
15 |
|
|
$ |
6 |
|
|
$ |
9 |
|
| Interest |
|
|
|
|
5,247,461 |
|
|
|
2,737,074 |
|
|
|
3,013,286 |
|
|
|
|
|
|
|
|
|
|
|
|
|
|
|
|
| TOTAL INVESTMENT INCOME |
|
|
|
|
5,247,476 |
|
|
|
2,737,080 |
|
|
|
3,013,295 |
|
| |
|
|
|
|
|
|
|
|
|
|
|
|
|
|
| EXPENSES: |
|
|
|
|
|
|
|
|
|
|
|
|
|
|
| Investment advisory fee |
|
|
|
|
1,001,444 |
|
|
|
551,439 |
|
|
|
543,531 |
|
| Administrative personnel and services fee |
|
|
|
|
46,519 |
|
|
|
25,310 |
|
|
|
24,943 |
|
| Portfolio accounting, administration and custodian fees |
|
|
|
|
72,115 |
|
|
|
45,469 |
|
|
|
48,874 |
|
| Transfer and dividend disbursing agent fees and expenses |
|
|
|
|
18,421 |
|
|
|
10,420 |
|
|
|
19,948 |
|
| Trustees’ fees |
|
|
|
|
28,810 |
|
|
|
28,812 |
|
|
|
28,593 |
|
| Professional fees |
|
|
|
|
58,928 |
|
|
|
52,071 |
|
|
|
52,166 |
|
| Distribution services fee—Class A |
|
|
|
|
29,253 |
|
|
|
87,954 |
|
|
|
82,931 |
|
| Shareholder services fee—Class A |
|
|
|
|
29,253 |
|
|
|
87,954 |
|
|
|
82,931 |
|
| Shareholder services fee— Class I |
|
|
|
|
471,821 |
|
|
|
187,765 |
|
|
|
188,834 |
|
| Share registration costs |
|
|
|
|
32,068 |
|
|
|
18,490 |
|
|
|
12,836 |
|
| Printing and postage |
|
|
|
|
20,157 |
|
|
|
11,867 |
|
|
|
13,276 |
|
| Miscellaneous |
|
|
|
|
25,602 |
|
|
|
16,140 |
|
|
|
14,127 |
|
|
|
|
|
|
|
|
|
|
|
|
|
|
|
|
| TOTAL EXPENSES |
|
|
|
|
1,834,391 |
|
|
|
1,123,691 |
|
|
|
1,112,990 |
|
| |
|
|
|
|
|
|
|
|
|
|
|
|
|
|
| WAIVERS AND REIMBURSEMENTS: |
|
|
|
|
|
|
|
|
|
|
|
|
|
|
| Waiver/reimbursement by investment advisor |
|
|
|
|
(81,442 |
) |
|
|
(20,960 |
) |
|
|
(116,928 |
) |
| Waiver of distribution services fee—Class A |
|
|
|
|
— |
|
|
|
(12 |
) |
|
|
— |
|
| Waiver of shareholder services fee—Class A |
|
|
|
|
(29,253 |
) |
|
|
(77,685 |
) |
|
|
(82,931 |
) |
| Waiver of shareholder services fee—Class I |
|
|
|
|
(471,821 |
) |
|
|
(187,765 |
) |
|
|
(188,834 |
) |
|
|
|
|
|
|
|
|
|
|
|
|
|
|
|
| TOTAL WAIVERS AND REIMBURSEMENTS |
|
|
|
|
(582,516 |
) |
|
|
(286,422 |
) |
|
|
(388,693 |
) |
| |
|
|
|
|
|
|
|
|
|
|
|
|
|
|
| Net expenses |
|
|
|
|
1,251,875 |
|
|
|
837,269 |
|
|
|
724,297 |
|
|
|
|
|
|
|
|
|
|
|
|
|
|
|
|
| Net investment income (loss) |
|
|
|
|
3,995,601 |
|
|
|
1,899,811 |
|
|
|
2,288,998 |
|
|
|
|
|
|
|
|
|
|
|
|
|
|
|
|
| REALIZED AND UNREALIZED GAIN (LOSS) ON INVESTMENTS: |
|
|
|
|
|
|
|
|
|
|
|
|
|
|
| Net realized gain (loss) on investments |
|
|
|
|
3,289,820 |
|
|
|
1,789,143 |
|
|
|
1,653,399 |
|
| Net change in unrealized appreciation (depreciation) of investments |
|
|
|
|
(1,338,347 |
) |
|
|
(267,207 |
) |
|
|
(31,655 |
) |
|
|
|
|
|
|
|
|
|
|
|
|
|
|
|
| Net realized and unrealized gain (loss) on investments |
|
|
|
|
1,951,473 |
|
|
|
1,521,936 |
|
|
|
1,621,744 |
|
|
|
|
|
|
|
|
|
|
|
|
|
|
|
|
| Change in net assets resulting from operations |
|
|
|
$ |
5,947,074 |
|
|
$ |
3,421,747 |
|
|
$ |
3,910,742 |
|
|
|
|
|
|
|
|
|
|
|
|
|
|
|
|
See Notes which are an integral part of the Financial Statements
April 30, 2013 / ANNUAL REPORT
|
|
|
|
|
| STATEMENTS OF CHANGES IN NET ASSETS |
|
|
77 |
|
|
|
|
|
|
|
|
|
|
|
|
|
|
|
|
|
|
|
|
| |
|
|
|
Wilmington
Broad Market Bond Fund
|
|
|
Wilmington
Intermediate-Term Bond Fund |
|
|
|
|
|
|
|
| |
|
|
|
Year Ended April 30,
2013
|
|
|
Year Ended April 30,
2012
|
|
|
Year Ended
April
30,
2013
|
|
|
Year Ended
April
30,
2012
|
|
| OPERATIONS: |
|
|
|
|
|
|
|
|
|
|
|
|
|
|
|
|
|
|
| Net investment income (loss) |
|
|
|
$ |
7,617,152 |
|
|
$ |
8,096,058 |
|
|
$ |
4,919,039 |
|
|
$ |
3,406,061 |
|
| Net realized gain (loss) on investments |
|
|
|
|
6,762,586 |
|
|
|
6,123,925 |
|
|
|
5,203,367 |
|
|
|
4,066,312 |
|
| Net change in unrealized appreciation (depreciation) of investments |
|
|
|
|
(1,719,094 |
) |
|
|
1,282,204 |
|
|
|
(2,460,544 |
) |
|
|
(693,946 |
) |
|
|
|
|
|
|
|
|
|
|
|
|
|
|
|
|
|
|
|
| Change in net assets resulting from operations |
|
|
|
|
12,660,644 |
|
|
|
15,502,187 |
|
|
|
7,661,862 |
|
|
|
6,778,427 |
|
|
|
|
|
|
|
|
|
|
|
|
|
|
|
|
|
|
|
|
| DISTRIBUTIONS TO SHAREHOLDERS: |
|
|
|
|
|
|
|
|
|
|
|
|
|
|
|
|
|
|
| Distributions from net investment income |
|
|
|
|
|
|
|
|
|
|
|
|
|
|
|
|
|
|
| Class A |
|
|
|
|
(181,722 |
) |
|
|
(219,962 |
) |
|
|
(205,115 |
) |
|
|
(183,231 |
) |
| Class C |
|
|
|
|
— |
|
|
|
— |
|
|
|
(10,329 |
) |
|
|
(21,044 |
) |
| Class I |
|
|
|
|
(7,984,284 |
) |
|
|
(8,190,147 |
) |
|
|
(4,848,047 |
) |
|
|
(3,258,611 |
) |
| Distributions from net realized gain on investments |
|
|
|
|
|
|
|
|
|
|
|
|
|
|
|
|
|
|
| Class A |
|
|
|
|
(135,577 |
) |
|
|
(155,794 |
) |
|
|
(180,045 |
) |
|
|
(277,193 |
) |
| Class C |
|
|
|
|
— |
|
|
|
— |
|
|
|
(16,895 |
) |
|
|
(46,621 |
) |
| Class I |
|
|
|
|
(5,425,335 |
) |
|
|
(5,189,617 |
) |
|
|
(3,368,228 |
) |
|
|
(3,682,030 |
) |
|
|
|
|
|
|
|
|
|
|
|
|
|
|
|
|
|
|
|
| Change in net assets resulting from distributions to shareholders |
|
|
|
|
(13,726,918 |
) |
|
|
(13,755,520 |
) |
|
|
(8,628,659 |
) |
|
|
(7,468,730 |
) |
|
|
|
|
|
|
|
|
|
|
|
|
|
|
|
|
|
|
|
| SHARE TRANSACTIONS: |
|
|
|
|
|
|
|
|
|
|
|
|
|
|
|
|
|
|
| Proceeds from sale of shares |
|
|
|
|
|
|
|
|
|
|
|
|
|
|
|
|
|
|
| Class A |
|
|
|
|
1,134,080 |
|
|
|
338,445 |
|
|
|
1,255,340 |
|
|
|
2,574,273 |
|
| Class C |
|
|
|
|
— |
|
|
|
— |
|
|
|
145,702 |
|
|
|
619,511 |
|
| Class I |
|
|
|
|
71,265,641 |
|
|
|
65,940,446 |
|
|
|
25,564,738 |
|
|
|
27,033,293 |
|
| Proceeds from shares issued in connection with Reorganization (Note 8) |
|
|
|
|
— |
|
|
|
58,782,175 |
|
|
|
— |
|
|
|
147,980,426 |
|
| Proceeds from exchange of Class C for Class A |
|
|
|
|
|
|
|
|
|
|
|
|
|
|
|
|
|
|
| Class A |
|
|
|
|
— |
|
|
|
— |
|
|
|
717,567 |
(a) |
|
|
— |
|
| Class C |
|
|
|
|
— |
|
|
|
— |
|
|
|
(717,567 |
)(a) |
|
|
— |
|
| Distributions reinvested |
|
|
|
|
|
|
|
|
|
|
|
|
|
|
|
|
|
|
| Class A |
|
|
|
|
255,335 |
|
|
|
337,682 |
|
|
|
318,516 |
|
|
|
392,754 |
|
| Class C |
|
|
|
|
— |
|
|
|
— |
|
|
|
24,258 |
|
|
|
56,008 |
|
| Class I |
|
|
|
|
9,463,910 |
|
|
|
9,693,413 |
|
|
|
5,278,968 |
|
|
|
4,689,799 |
|
| Cost of shares redeemed |
|
|
|
|
|
|
|
|
|
|
|
|
|
|
|
|
|
|
| Class A |
|
|
|
|
(2,851,238 |
) |
|
|
(767,544 |
) |
|
|
(5,457,857 |
) |
|
|
(1,127,972 |
) |
| Class C |
|
|
|
|
— |
|
|
|
— |
|
|
|
(817,746 |
) |
|
|
(623,521 |
) |
| Class I |
|
|
|
|
(96,483,813 |
) |
|
|
(51,652,201 |
) |
|
|
(81,789,148 |
) |
|
|
(28,850,257 |
) |
|
|
|
|
|
|
|
|
|
|
|
|
|
|
|
|
|
|
|
| Change in net assets resulting from share transactions |
|
|
|
|
(17,216,085 |
) |
|
|
82,672,416 |
|
|
|
(55,477,229 |
) |
|
|
152,744,314 |
|
|
|
|
|
|
|
|
|
|
|
|
|
|
|
|
|
|
|
|
| Change in net assets |
|
|
|
|
(18,282,359 |
) |
|
|
84,419,083 |
|
|
|
(56,444,026 |
) |
|
|
152,054,011 |
|
| NET ASSETS: |
|
|
|
|
|
|
|
|
|
|
|
|
|
|
|
|
|
|
| Beginning of year |
|
|
|
|
300,406,813 |
|
|
|
215,987,730 |
|
|
|
267,745,576 |
|
|
|
115,691,565 |
|
|
|
|
|
|
|
|
|
|
|
|
|
|
|
|
|
|
|
|
| End of year |
|
|
|
$ |
282,124,454 |
|
|
$ |
300,406,813 |
|
|
$ |
211,301,550 |
|
|
$ |
267,745,576 |
|
|
|
|
|
|
|
|
|
|
|
|
|
|
|
|
|
|
|
|
| Undistributed (distributions in excess of) net investment income included in net assets at end of year |
|
|
|
$ |
213,664 |
|
|
$ |
95,859 |
|
|
$ |
96,315 |
|
|
$ |
47,637 |
|
|
|
|
|
|
|
|
|
|
|
|
|
|
|
|
|
|
|
|
ANNUAL REPORT / April
30, 2013
|
|
|
| 78 |
|
STATEMENTS OF CHANGES IN NET ASSETS (continued) |
|
|
|
|
|
|
|
|
|
|
|
|
|
|
|
|
|
|
|
| |
|
|
|
Wilmington
Broad Market Bond Fund |
|
|
Wilmington
Intermediate-Term Bond Fund |
|
|
|
|
|
|
|
| |
|
|
|
Year Ended
April
30,
2013
|
|
|
Year Ended
April
30,
2012
|
|
|
Year Ended
April
30,
2013
|
|
|
Year Ended
April
30,
2012
|
|
| SHARES OF BENEFICIAL INTEREST: |
|
|
|
|
|
|
|
|
|
|
|
|
|
|
|
|
|
|
| Shares sold |
|
|
|
|
|
|
|
|
|
|
|
|
|
|
|
|
|
|
| Class A |
|
|
|
|
110,462 |
|
|
|
31,833 |
|
|
|
117,911 |
|
|
|
240,914 |
|
| Class C |
|
|
|
|
— |
|
|
|
— |
|
|
|
13,556 |
|
|
|
57,791 |
|
| Class I |
|
|
|
|
7,064,293 |
|
|
|
6,573,305 |
|
|
|
2,403,713 |
|
|
|
2,537,108 |
|
| Shares issued in connection with Reorganization (Note 8) |
|
|
|
|
— |
|
|
|
5,858,174 |
|
|
|
— |
|
|
|
13,946,072 |
|
| Shares exchanged |
|
|
|
|
|
|
|
|
|
|
|
|
|
|
|
|
|
|
| Class A |
|
|
|
|
— |
|
|
|
— |
|
|
|
67,154 |
(a) |
|
|
— |
|
| Class C |
|
|
|
|
— |
|
|
|
— |
|
|
|
(67,009 |
)(a) |
|
|
— |
|
| Distributions reinvested |
|
|
|
|
|
|
|
|
|
|
|
|
|
|
|
|
|
|
| Class A |
|
|
|
|
24,906 |
|
|
|
33,350 |
|
|
|
29,932 |
|
|
|
37,284 |
|
| Class C |
|
|
|
|
— |
|
|
|
— |
|
|
|
2,275 |
|
|
|
5,324 |
|
| Class I |
|
|
|
|
939,016 |
|
|
|
974,780 |
|
|
|
495,961 |
|
|
|
445,485 |
|
| Shares redeemed |
|
|
|
|
|
|
|
|
|
|
|
|
|
|
|
|
|
|
| Class A |
|
|
|
|
(277,557 |
) |
|
|
(73,823 |
) |
|
|
(514,348 |
) |
|
|
(105,708 |
) |
| Class C |
|
|
|
|
— |
|
|
|
— |
|
|
|
(76,818 |
) |
|
|
(57,861 |
) |
| Class I |
|
|
|
|
(9,563,559 |
) |
|
|
(5,138,452 |
) |
|
|
(7,680,421 |
) |
|
|
(2,711,555 |
) |
|
|
|
|
|
|
|
|
|
|
|
|
|
|
|
|
|
|
|
| Net change resulting from share transactions |
|
|
|
|
(1,702,439 |
) |
|
|
8,259,167 |
|
|
|
(5,208,094 |
) |
|
|
14,394,854 |
|
|
|
|
|
|
|
|
|
|
|
|
|
|
|
|
|
|
|
|
| (a) |
On April 13, 2013, Class C shares of the Fund were terminated after the conversion to Class A shares of the Fund. |
See Notes which are an integral part of the Financial Statements
April 30, 2013 / ANNUAL REPORT
|
|
|
|
|
| STATEMENTS OF CHANGES IN NET ASSETS (continued) |
|
|
79 |
|
|
|
|
|
|
|
|
|
|
|
|
|
|
|
|
|
|
| |
|
Wilmington
Short-Term
Corporate Bond Fund |
|
|
Wilmington
Short
Duration Government Bond Fund |
|
|
|
|
|
|
| |
|
Year Ended
April
30,
2013
|
|
|
Year Ended
April
30,
2012
|
|
|
Year Ended
April
30,
2013
|
|
|
Year Ended
April
30,
2012
|
|
| OPERATIONS: |
|
|
|
|
|
|
|
|
|
|
|
|
|
|
|
|
| Net investment income (loss) |
|
$ |
2,114,938 |
|
|
$ |
2,709,526 |
|
|
$ |
1,867,915 |
|
|
$ |
2,204,554 |
|
| Net realized gain (loss) on investments |
|
|
1,824,790 |
|
|
|
378,568 |
|
|
|
1,278,289 |
|
|
|
1,826,640 |
|
| Net change in unrealized appreciation (depreciation) of investments |
|
|
(333,334 |
) |
|
|
63,770 |
|
|
|
(1,438,262 |
) |
|
|
(1,991,670 |
) |
|
|
|
|
|
|
|
|
|
|
|
|
|
|
|
|
|
| Change in net assets resulting from operations |
|
|
3,606,394 |
|
|
|
3,151,864 |
|
|
|
1,707,942 |
|
|
|
2,039,524 |
|
|
|
|
|
|
|
|
|
|
|
|
|
|
|
|
|
|
| DISTRIBUTIONS TO SHAREHOLDERS: |
|
|
|
|
|
|
|
|
|
|
|
|
|
|
|
|
| Distributions from net investment income |
|
|
|
|
|
|
|
|
|
|
|
|
|
|
|
|
| Class A |
|
|
(35,543 |
) |
|
|
(127,699 |
) |
|
|
(325,374 |
) |
|
|
(384,724 |
) |
| Class C |
|
|
(508 |
) |
|
|
(1,852 |
) |
|
|
(5,073 |
) |
|
|
(15,881 |
) |
| Class I |
|
|
(2,151,733 |
) |
|
|
(2,645,212 |
) |
|
|
(2,289,679 |
) |
|
|
(2,532,776 |
) |
| Distributions from net realized gain on investments |
|
|
|
|
|
|
|
|
|
|
|
|
|
|
|
|
| Class A |
|
|
(7,776 |
) |
|
|
(36,859 |
) |
|
|
(92,383 |
) |
|
|
— |
|
| Class C |
|
|
(797 |
) |
|
|
(1,477 |
) |
|
|
(2,856 |
) |
|
|
— |
|
| Class I |
|
|
(463,007 |
) |
|
|
(646,562 |
) |
|
|
(505,332 |
) |
|
|
— |
|
|
|
|
|
|
|
|
|
|
|
|
|
|
|
|
|
|
| Change in net assets resulting from distributions to shareholders |
|
|
(2,659,364 |
) |
|
|
(3,459,661 |
) |
|
|
(3,220,697 |
) |
|
|
(2,933,381 |
) |
|
|
|
|
|
|
|
|
|
|
|
|
|
|
|
|
|
| SHARE TRANSACTIONS: |
|
|
|
|
|
|
|
|
|
|
|
|
|
|
|
|
| Proceeds from sale of shares |
|
|
|
|
|
|
|
|
|
|
|
|
|
|
|
|
| Class A |
|
|
904,288 |
|
|
|
6,816,943 |
|
|
|
1,320,956 |
|
|
|
3,592,852 |
|
| Class C |
|
|
46,550 |
|
|
|
197,370 |
|
|
|
50,386 |
|
|
|
355,365 |
|
| Class I |
|
|
64,351,456 |
|
|
|
63,222,247 |
|
|
|
17,403,153 |
|
|
|
61,490,495 |
|
| Proceeds from shares issued in connection with Reorganization (Note 8) |
|
|
— |
|
|
|
— |
|
|
|
— |
|
|
|
63,847,406 |
|
| Proceeds from exchange of Class C for Class A |
|
|
— |
|
|
|
— |
|
|
|
— |
|
|
|
— |
|
| Class A |
|
|
215,042 |
(a) |
|
|
— |
|
|
|
480,225 |
(a) |
|
|
— |
|
| Class C |
|
|
(215,042 |
)(a) |
|
|
— |
|
|
|
(480,225 |
)(a) |
|
|
— |
|
| Distributions reinvested |
|
|
|
|
|
|
|
|
|
|
|
|
|
|
|
|
| Class A |
|
|
30,304 |
|
|
|
152,669 |
|
|
|
277,192 |
|
|
|
290,578 |
|
| Class C |
|
|
598 |
|
|
|
1,417 |
|
|
|
5,458 |
|
|
|
9,954 |
|
| Class I |
|
|
1,553,005 |
|
|
|
2,099,699 |
|
|
|
1,449,747 |
|
|
|
1,066,256 |
|
| Cost of shares redeemed |
|
|
|
|
|
|
|
|
|
|
|
|
|
|
|
|
| Class A |
|
|
(6,950,038 |
) |
|
|
(9,920,311 |
) |
|
|
(4,555,497 |
) |
|
|
(3,585,926 |
) |
| Class C |
|
|
(179,893 |
) |
|
|
(240,015 |
) |
|
|
(504,605 |
) |
|
|
(681,389 |
) |
| Class I |
|
|
(73,425,311 |
) |
|
|
(52,413,258 |
) |
|
|
(58,941,821 |
) |
|
|
(51,428,411 |
) |
|
|
|
|
|
|
|
|
|
|
|
|
|
|
|
|
|
| Change in net assets resulting from share transactions |
|
|
(13,669,041 |
) |
|
|
9,916,761 |
|
|
|
(43,495,031 |
) |
|
|
74,957,180 |
|
|
|
|
|
|
|
|
|
|
|
|
|
|
|
|
|
|
| Change in net assets |
|
|
(12,722,011 |
) |
|
|
9,608,964 |
|
|
|
(45,007,786 |
) |
|
|
74,063,323 |
|
| NET ASSETS: |
|
|
|
|
|
|
|
|
|
|
|
|
|
|
|
|
| Beginning of year |
|
|
198,438,273 |
|
|
|
188,829,309 |
|
|
|
175,178,853 |
|
|
|
101,115,530 |
|
|
|
|
|
|
|
|
|
|
|
|
|
|
|
|
|
|
| End of year |
|
$ |
185,716,262 |
|
|
$ |
198,438,273 |
|
|
$ |
130,171,067 |
|
|
$ |
175,178,853 |
|
|
|
|
|
|
|
|
|
|
|
|
|
|
|
|
|
|
| Undistributed (distributions in excess of) net investment income included in net assets at end of year |
|
$ |
24,473 |
|
|
$ |
23,865 |
|
|
$ |
450,252 |
|
|
$ |
(51,557 |
) |
|
|
|
|
|
|
|
|
|
|
|
|
|
|
|
|
|
ANNUAL REPORT / April
30, 2013
|
|
|
| 80 |
|
STATEMENTS OF CHANGES IN NET ASSETS (continued) |
|
|
|
|
|
|
|
|
|
|
|
|
|
|
|
|
|
| |
|
Wilmington
Short-Term
Corporate Bond Fund |
|
|
Wilmington
Short
Duration Government Bond Fund |
|
|
|
|
|
|
| |
|
Year Ended April 30,
2013
|
|
|
Year Ended April 30,
2012
|
|
|
Year Ended April 30,
2013
|
|
|
Year Ended April 30,
2012
|
|
| SHARES OF BENEFICIAL INTEREST: |
|
|
|
|
|
|
|
|
|
|
|
|
|
|
|
|
| Shares sold |
|
|
|
|
|
|
|
|
|
|
|
|
|
|
|
|
| Class A |
|
|
87,780 |
|
|
|
663,009 |
|
|
|
135,272 |
|
|
|
366,327 |
|
| Class C |
|
|
4,505 |
|
|
|
19,230 |
|
|
|
5,184 |
|
|
|
36,087 |
|
| Class I |
|
|
6,243,916 |
|
|
|
6,160,045 |
|
|
|
1,780,447 |
|
|
|
6,256,075 |
|
| Shares issued in connection with Reorganization (Note 8) |
|
|
— |
|
|
|
— |
|
|
|
— |
|
|
|
6,515,306 |
|
| Shares exchanged |
|
|
|
|
|
|
|
|
|
|
|
|
|
|
|
|
| Class A |
|
|
21,187 |
(a) |
|
|
— |
|
|
|
46,460 |
(a) |
|
|
— |
|
| Class C |
|
|
(21,164 |
)(a) |
|
|
— |
|
|
|
(46,361 |
)(a) |
|
|
— |
|
| Distributions reinvested |
|
|
|
|
|
|
|
|
|
|
|
|
|
|
|
|
| Class A |
|
|
2,943 |
|
|
|
14,899 |
|
|
|
28,420 |
|
|
|
29,600 |
|
| Class C |
|
|
58 |
|
|
|
138 |
|
|
|
558 |
|
|
|
1,011 |
|
| Class I |
|
|
150,670 |
|
|
|
204,972 |
|
|
|
148,318 |
|
|
|
108,485 |
|
| Shares redeemed |
|
|
|
|
|
|
|
|
|
|
|
|
|
|
|
|
| Class A |
|
|
(675,978 |
) |
|
|
(967,743 |
) |
|
|
(467,422 |
) |
|
|
(365,307 |
) |
| Class C |
|
|
(17,441 |
) |
|
|
(23,452 |
) |
|
|
(51,669 |
) |
|
|
(69,313 |
) |
| Class I |
|
|
(7,120,728 |
) |
|
|
(5,113,279 |
) |
|
|
(6,024,162 |
) |
|
|
(5,240,005 |
) |
|
|
|
|
|
|
|
|
|
|
|
|
|
|
|
|
|
| Net change resulting from share transactions |
|
|
(1,324,252 |
) |
|
|
957,819 |
|
|
|
(4,444,955 |
) |
|
|
7,638,266 |
|
|
|
|
|
|
|
|
|
|
|
|
|
|
|
|
|
|
| (a) |
On April 13, 2013, Class C shares of the Fund were terminated after the conversion to Class A shares of the Fund. |
See Notes which are an integral part of the Financial Statements
April 30, 2013 / ANNUAL REPORT
|
|
|
|
|
| STATEMENTS OF CHANGES IN NET ASSETS (continued) |
|
|
81 |
|
|
|
|
|
|
|
|
|
|
|
|
|
|
|
|
|
|
|
|
|
|
| |
|
Wilmington
Municipal Bond
Fund
|
|
|
Wilmington
Maryland Municipal Bond Fund |
|
|
|
|
|
|
|
| |
|
Year Ended
April
30,
2013
|
|
|
Ten Months Ended April 30,
2012(a)
|
|
|
Year Ended
June
30,
2011
|
|
|
Year Ended
April
30,
2013
|
|
|
Year Ended April 30,
2012
|
|
| OPERATIONS: |
|
|
|
|
|
|
|
|
|
|
|
|
|
|
|
|
|
|
|
|
| Net investment income (loss) |
|
$ |
3,995,601 |
|
|
$ |
3,352,458 |
|
|
$ |
5,463,723 |
|
|
$ |
1,899,811 |
|
|
$ |
4,069,265 |
|
| Net realized gain (loss) on investments |
|
|
3,289,820 |
|
|
|
3,265,303 |
|
|
|
654,624 |
|
|
|
1,789,143 |
|
|
|
(421,195 |
) |
| Net change in unrealized appreciation (depreciation) of investments |
|
|
(1,338,347 |
) |
|
|
5,001,572 |
|
|
|
(273,365 |
) |
|
|
(267,207 |
) |
|
|
4,937,390 |
|
|
|
|
|
|
|
|
|
|
|
|
|
|
|
|
|
|
|
|
|
|
| Change in net assets resulting from operations |
|
|
5,947,074 |
|
|
|
11,619,333 |
|
|
|
5,844,982 |
|
|
|
3,421,747 |
|
|
|
8,585,460 |
|
|
|
|
|
|
|
|
|
|
|
|
|
|
|
|
|
|
|
|
|
|
| DISTRIBUTIONS TO SHAREHOLDERS: |
|
|
|
|
|
|
|
|
|
|
|
|
|
|
|
|
|
|
|
|
| Distributions from net investment income |
|
|
|
|
|
|
|
|
|
|
|
|
|
|
|
|
|
|
|
|
| Class A |
|
|
(203,271 |
) |
|
|
(16,766 |
) |
|
|
(20,833 |
) |
|
|
(540,025 |
) |
|
|
(1,221,463 |
) |
| Class I |
|
|
(3,789,729 |
) |
|
|
(3,335,788 |
) |
|
|
(5,442,890 |
) |
|
|
(1,361,347 |
) |
|
|
(2,860,460 |
) |
| Distributions from net realized gain on investments |
|
|
|
|
|
|
|
|
|
|
|
|
|
|
|
|
|
|
|
|
| Class A |
|
|
(27,705 |
) |
|
|
(10,129 |
) |
|
|
(3,181 |
) |
|
|
(131,453 |
) |
|
|
— |
|
| Class I |
|
|
(3,351,722 |
) |
|
|
(1,733,845 |
) |
|
|
(999,078 |
) |
|
|
(280,965 |
) |
|
|
— |
|
|
|
|
|
|
|
|
|
|
|
|
|
|
|
|
|
|
|
|
|
|
| Change in net assets resulting from distributions to shareholders |
|
|
(7,372,427 |
) |
|
|
(5,096,528 |
) |
|
|
(6,465,982 |
) |
|
|
(2,313,790 |
) |
|
|
(4,081,923 |
) |
|
|
|
|
|
|
|
|
|
|
|
|
|
|
|
|
|
|
|
|
|
| SHARE TRANSACTIONS: |
|
|
|
|
|
|
|
|
|
|
|
|
|
|
|
|
|
|
|
|
| Proceeds from sale of shares |
|
|
|
|
|
|
|
|
|
|
|
|
|
|
|
|
|
|
|
|
| Class A |
|
|
1,176,614 |
|
|
|
68,090 |
|
|
|
409,604 |
|
|
|
787,780 |
|
|
|
1,613,461 |
|
| Class I |
|
|
60,509,663 |
|
|
|
31,325,608 |
|
|
|
34,655,128 |
|
|
|
6,718,543 |
|
|
|
5,357,945 |
|
| Proceeds from shares issued in connection with Reorganization (Note 8) |
|
|
|
|
|
|
|
|
|
|
|
|
|
|
|
|
|
|
|
|
| Class A |
|
|
28,984,371 |
|
|
|
— |
|
|
|
— |
|
|
|
— |
|
|
|
— |
|
| Class I |
|
|
88,406,939 |
|
|
|
— |
|
|
|
— |
|
|
|
— |
|
|
|
— |
|
| Distributions reinvested |
|
|
|
|
|
|
|
|
|
|
|
|
|
|
|
|
|
|
|
|
| Class A |
|
|
129,119 |
|
|
|
22,813 |
|
|
|
16,031 |
|
|
|
512,136 |
|
|
|
990,695 |
|
| Class I |
|
|
3,959,423 |
|
|
|
2,373,765 |
|
|
|
2,386,205 |
|
|
|
418,813 |
|
|
|
335,735 |
|
| Cost of shares redeemed |
|
|
|
|
|
|
|
|
|
|
|
|
|
|
|
|
|
|
|
|
| Class A |
|
|
(9,244,980 |
) |
|
|
(176,393 |
) |
|
|
(247,382 |
) |
|
|
(4,271,066 |
) |
|
|
(2,486,938 |
) |
| Class I |
|
|
(49,863,029 |
) |
|
|
(35,697,116 |
) |
|
|
(61,153,482 |
) |
|
|
(9,869,369 |
) |
|
|
(12,273,784 |
) |
|
|
|
|
|
|
|
|
|
|
|
|
|
|
|
|
|
|
|
|
|
| Change in net assets resulting from share transactions |
|
|
124,058,120 |
|
|
|
(2,083,233 |
) |
|
|
(23,933,896 |
) |
|
|
(5,703,163 |
) |
|
|
(6,462,886 |
) |
|
|
|
|
|
|
|
|
|
|
|
|
|
|
|
|
|
|
|
|
|
| Change in net assets |
|
|
122,632,767 |
|
|
|
4,439,572 |
|
|
|
(24,554,896 |
) |
|
|
(4,595,206 |
) |
|
|
(1,959,349 |
) |
| NET ASSETS: |
|
|
|
|
|
|
|
|
|
|
|
|
|
|
|
|
|
|
|
|
| Beginning of period |
|
|
146,716,707 |
|
|
|
142,277,135 |
|
|
|
166,832,031 |
|
|
|
111,502,307 |
|
|
|
113,461,656 |
|
|
|
|
|
|
|
|
|
|
|
|
|
|
|
|
|
|
|
|
|
|
| End of period |
|
$ |
269,349,474 |
|
|
$ |
146,716,707 |
|
|
$ |
142,277,135 |
|
|
$ |
106,907,101 |
|
|
$ |
111,502,307 |
|
|
|
|
|
|
|
|
|
|
|
|
|
|
|
|
|
|
|
|
|
|
| Undistributed (distributions in excess of) net investment income included in net assets at end of period |
|
$ |
(235 |
) |
|
$ |
(201 |
) |
|
$ |
(105 |
) |
|
$ |
68,422 |
|
|
$ |
21,419 |
|
|
|
|
|
|
|
|
|
|
|
|
|
|
|
|
|
|
|
|
|
|
| SHARES OF BENEFICIAL INTEREST: |
|
|
|
|
|
|
|
|
|
|
|
|
|
|
|
|
|
|
|
|
| Shares sold |
|
|
|
|
|
|
|
|
|
|
|
|
|
|
|
|
|
|
|
|
| Class A |
|
|
85,294 |
|
|
|
5,004 |
|
|
|
31,504 |
|
|
|
76,733 |
|
|
|
161,476 |
|
| Class I |
|
|
4,390,600 |
|
|
|
2,307,549 |
|
|
|
2,623,517 |
|
|
|
654,857 |
|
|
|
533,219 |
|
| Shares issued in connection with Reorganization (Note 8) |
|
|
|
|
|
|
|
|
|
|
|
|
|
|
|
|
|
|
|
|
| Class A |
|
|
2,089,295 |
|
|
|
— |
|
|
|
— |
|
|
|
— |
|
|
|
— |
|
| Class I |
|
|
6,370,639 |
|
|
|
— |
|
|
|
— |
|
|
|
— |
|
|
|
— |
|
| Distributions reinvested |
|
|
|
|
|
|
|
|
|
|
|
|
|
|
|
|
|
|
|
|
| Class A |
|
|
9,410 |
|
|
|
1,687 |
|
|
|
1,218 |
|
|
|
49,811 |
|
|
|
98,962 |
|
| Class I |
|
|
285,685 |
|
|
|
175,583 |
|
|
|
181,311 |
|
|
|
40,517 |
|
|
|
33,491 |
|
| Shares redeemed |
|
|
|
|
|
|
|
|
|
|
|
|
|
|
|
|
|
|
|
|
| Class A |
|
|
(676,526 |
) |
|
|
(12,840 |
) |
|
|
(19,039 |
) |
|
|
(416,363 |
) |
|
|
(248,089 |
) |
| Class I |
|
|
(3,613,370 |
) |
|
|
(2,627,310 |
) |
|
|
(4,648,399 |
) |
|
|
(960,347 |
) |
|
|
(1,223,458 |
) |
|
|
|
|
|
|
|
|
|
|
|
|
|
|
|
|
|
|
|
|
|
| Net change resulting from share transactions |
|
|
8,941,027 |
|
|
|
(150,327 |
) |
|
|
(1,829,888 |
) |
|
|
(554,792 |
) |
|
|
(644,399 |
) |
|
|
|
|
|
|
|
|
|
|
|
|
|
|
|
|
|
|
|
|
|
| (a) |
Year end changed from June 30 to April 30. |
See Notes which are an integral part of the Financial Statements
ANNUAL REPORT / April
30, 2013
|
|
|
| 82 |
|
STATEMENTS OF CHANGES IN NET ASSETS (concluded) |
|
|
|
|
|
|
|
|
|
| |
|
Wilmington
New
York
Municipal Bond Fund
|
|
|
|
|
| |
|
Year Ended April 30,
2013
|
|
|
Year Ended April 30,
2012
|
|
| OPERATIONS: |
|
|
|
|
|
|
|
|
| Net investment income (loss) |
|
$ |
2,288,998 |
|
|
$ |
3,084,645 |
|
| Net realized gain (loss) on investments |
|
|
1,653,399 |
|
|
|
1,125,425 |
|
| Net change in unrealized appreciation (depreciation) of investments |
|
|
(31,655 |
) |
|
|
4,137,027 |
|
|
|
|
|
|
|
|
|
|
| Change in net assets resulting from operations |
|
|
3,910,742 |
|
|
|
8,347,097 |
|
|
|
|
|
|
|
|
|
|
| DISTRIBUTIONS TO SHAREHOLDERS: |
|
|
|
|
|
|
|
|
| Distributions from net investment income |
|
|
|
|
|
|
|
|
| Class A |
|
|
(640,368 |
) |
|
|
(948,523 |
) |
| Class I |
|
|
(1,641,762 |
) |
|
|
(2,122,485 |
) |
|
|
|
|
|
|
|
|
|
| Change in net assets resulting from distributions to shareholders |
|
|
(2,282,130 |
) |
|
|
(3,071,008 |
) |
|
|
|
|
|
|
|
|
|
| SHARE TRANSACTIONS: |
|
|
|
|
|
|
|
|
| Proceeds from sale of shares |
|
|
|
|
|
|
|
|
| Class A |
|
|
567,278 |
|
|
|
1,396,095 |
|
| Class I |
|
|
18,652,117 |
|
|
|
14,491,388 |
|
| Distributions reinvested |
|
|
|
|
|
|
|
|
| Class A |
|
|
440,175 |
|
|
|
782,863 |
|
| Class I |
|
|
812,318 |
|
|
|
1,075,560 |
|
| Cost of shares redeemed |
|
|
|
|
|
|
|
|
| Class A |
|
|
(5,368,705 |
) |
|
|
(2,935,575 |
) |
| Class I |
|
|
(17,034,370 |
) |
|
|
(13,100,538 |
) |
|
|
|
|
|
|
|
|
|
| Change in net assets resulting from share transactions |
|
|
(1,931,187 |
) |
|
|
1,709,793 |
|
|
|
|
|
|
|
|
|
|
| Change in net assets |
|
|
(302,575 |
) |
|
|
6,985,882 |
|
| NET ASSETS: |
|
|
|
|
|
|
|
|
| Beginning of year |
|
|
110,012,271 |
|
|
|
103,026,389 |
|
|
|
|
|
|
|
|
|
|
| End of year |
|
$ |
109,709,696 |
|
|
$ |
110,012,271 |
|
|
|
|
|
|
|
|
|
|
| Undistributed (distributions in excess of) net investment income included in net assets at end of year |
|
$ |
24,864 |
|
|
$ |
24,569 |
|
|
|
|
|
|
|
|
|
|
| SHARES OF BENEFICIAL INTEREST: |
|
|
|
|
|
|
|
|
| Shares sold |
|
|
|
|
|
|
|
|
| Class A |
|
|
53,037 |
|
|
|
134,466 |
|
| Class I |
|
|
1,742,747 |
|
|
|
1,394,887 |
|
| Distributions reinvested |
|
|
|
|
|
|
|
|
| Class A |
|
|
41,142 |
|
|
|
75,819 |
|
| Class I |
|
|
75,842 |
|
|
|
104,094 |
|
| Shares redeemed |
|
|
|
|
|
|
|
|
| Class A |
|
|
(502,211 |
) |
|
|
(281,345 |
) |
| Class I |
|
|
(1,592,521 |
) |
|
|
(1,266,350 |
) |
|
|
|
|
|
|
|
|
|
| Net change resulting from share transactions |
|
|
(181,964 |
) |
|
|
161,571 |
|
|
|
|
|
|
|
|
|
|
See Notes which are an integral part of the Financial Statements
April 30, 2013 / ANNUAL REPORT
For a share outstanding throughout each year ended April 30, unless
otherwise noted:
|
|
|
|
|
|
|
|
|
|
|
|
|
|
|
|
|
|
|
|
|
|
|
| WILMINGTON BROAD MARKET BOND FUND |
|
|
|
|
|
|
|
|
|
|
|
|
|
|
|
|
|
|
|
|
|
|
|
|
|
|
|
|
|
|
|
|
|
|
|
|
|
|
|
|
| CLASS A |
|
2013 |
|
|
2012 |
|
|
2011 |
|
|
2010 |
|
|
2009 |
|
|
|
| Net Asset Value, Beginning of Year |
|
|
$10.23 |
|
|
|
$10.16 |
|
|
|
$10.05 |
|
|
|
$9.24 |
|
|
|
$9.77 |
|
|
|
| Income (Loss) From Operations: |
|
|
|
|
|
|
|
|
|
|
|
|
|
|
|
|
|
|
|
|
|
|
| Net Investment Income (Loss)(a) |
|
|
0.23 |
|
|
|
0.32 |
|
|
|
0.38 |
|
|
|
0.39 |
|
|
|
0.45 |
|
|
|
| Net Realized and Unrealized Gain (Loss)on Investments |
|
|
0.17 |
|
|
|
0.33 |
|
|
|
0.26 |
|
|
|
0.81 |
|
|
|
(0.54 |
) |
|
|
|
|
|
|
| Total Income (Loss) From Operations |
|
|
0.40 |
|
|
|
0.65 |
|
|
|
0.64 |
|
|
|
1.20 |
|
|
|
(0.09 |
) |
|
|
|
|
|
|
| Less Distributions From: |
|
|
|
|
|
|
|
|
|
|
|
|
|
|
|
|
|
|
|
|
|
|
| Net Investment Income |
|
|
(0.25 |
) |
|
|
(0.33 |
) |
|
|
(0.38 |
) |
|
|
(0.39 |
) |
|
|
(0.44 |
) |
|
|
| Net Realized Gains |
|
|
(0.19 |
) |
|
|
(0.25 |
) |
|
|
(0.15 |
) |
|
|
— |
|
|
|
— |
|
|
|
|
|
|
|
| Total Distributions |
|
|
(0.44 |
) |
|
|
(0.58 |
) |
|
|
(0.53 |
) |
|
|
(0.39 |
) |
|
|
(0.44 |
) |
|
|
|
|
|
|
| Net Asset Value, End of Year |
|
|
$10.19 |
|
|
|
$10.23 |
|
|
|
$10.16 |
|
|
|
$10.05 |
|
|
|
$9.24 |
|
|
|
|
|
|
|
| Total Return(b) |
|
|
3.93 |
% |
|
|
6.54 |
% |
|
|
6.50 |
% |
|
|
13.13 |
% |
|
|
(0.84 |
)% |
|
|
| Net Assets, End of Year (000’s) |
|
|
$6,951 |
|
|
|
$8,431 |
|
|
|
$6,602 |
|
|
|
$6,289 |
|
|
|
$5,681 |
|
|
|
| Ratios to Average Net Assets |
|
|
|
|
|
|
|
|
|
|
|
|
|
|
|
|
|
|
|
|
|
|
| Gross Expense |
|
|
1.17 |
% |
|
|
1.25 |
% |
|
|
1.28 |
% |
|
|
1.26 |
% |
|
|
1.32 |
% |
|
|
| Net Expenses(c) |
|
|
0.99 |
% |
|
|
1.00 |
% |
|
|
1.00 |
% |
|
|
0.84 |
% |
|
|
0.78 |
% |
|
|
| Net Investment Income (Loss) |
|
|
2.23 |
% |
|
|
3.12 |
% |
|
|
3.76 |
% |
|
|
4.00 |
% |
|
|
4.75 |
% |
|
|
| Portfolio Turnover Rate |
|
|
106 |
% |
|
|
93 |
% |
|
|
128 |
% |
|
|
142 |
% |
|
|
93 |
% |
|
|
|
|
|
|
|
|
|
|
|
|
|
|
|
|
|
|
|
|
|
|
|
|
|
| CLASS I |
|
2013 |
|
|
2012 |
|
|
2011 |
|
|
2010 |
|
|
2009 |
|
|
|
| Net Asset Value, Beginning of Year |
|
|
$10.07 |
|
|
|
$10.01 |
|
|
|
$9.90 |
|
|
|
$9.10 |
|
|
|
$9.63 |
|
|
|
| Income (Loss) From Operations: |
|
|
|
|
|
|
|
|
|
|
|
|
|
|
|
|
|
|
|
|
|
|
| Net Investment Income (Loss)(a) |
|
|
0.26 |
|
|
|
0.35 |
|
|
|
0.41 |
|
|
|
0.40 |
|
|
|
0.43 |
|
|
|
| Net Realized and Unrealized Gain (Loss)on Investments |
|
|
0.17 |
|
|
|
0.32 |
|
|
|
0.26 |
|
|
|
0.80 |
|
|
|
(0.50 |
) |
|
|
|
|
|
|
| Total Income (Loss) From Operations |
|
|
0.43 |
|
|
|
0.67 |
|
|
|
0.67 |
|
|
|
1.20 |
|
|
|
(0.07 |
) |
|
|
|
|
|
|
| Less Distributions From: |
|
|
|
|
|
|
|
|
|
|
|
|
|
|
|
|
|
|
|
|
|
|
| Net Investment Income |
|
|
(0.28 |
) |
|
|
(0.36 |
) |
|
|
(0.41 |
) |
|
|
(0.40 |
) |
|
|
(0.46 |
) |
|
|
| Net Realized Gains |
|
|
(0.19 |
) |
|
|
(0.25 |
) |
|
|
(0.15 |
) |
|
|
— |
|
|
|
— |
|
|
|
|
|
|
|
| Total Distributions |
|
|
(0.47 |
) |
|
|
(0.61 |
) |
|
|
(0.56 |
) |
|
|
(0.40 |
) |
|
|
(0.46 |
) |
|
|
|
|
|
|
| Net Asset Value, End of Year |
|
|
$10.03 |
|
|
|
$10.07 |
|
|
|
$10.01 |
|
|
|
$9.90 |
|
|
|
$9.10 |
|
|
|
|
|
|
|
| Total Return(b) |
|
|
4.32 |
% |
|
|
6.90 |
% |
|
|
6.93 |
% |
|
|
13.39 |
% |
|
|
(0.71 |
)% |
|
|
| Net Assets, End of Year (000’s) |
|
|
$275,173 |
|
|
|
$291,976 |
|
|
|
$209,386 |
|
|
|
$205,794 |
|
|
|
$159,120 |
|
|
|
| Ratios to Average Net Assets |
|
|
|
|
|
|
|
|
|
|
|
|
|
|
|
|
|
|
|
|
|
|
| Gross Expense |
|
|
0.92 |
% |
|
|
1.00 |
% |
|
|
1.03 |
% |
|
|
1.01 |
% |
|
|
1.06 |
% |
|
|
| Net Expenses(c) |
|
|
0.64 |
% |
|
|
0.66 |
% |
|
|
0.66 |
% |
|
|
0.64 |
% |
|
|
0.64 |
% |
|
|
| Net Investment Income (Loss) |
|
|
2.57 |
% |
|
|
3.47 |
% |
|
|
4.12 |
% |
|
|
4.21 |
% |
|
|
4.83 |
% |
|
|
| Portfolio Turnover Rate |
|
|
106 |
% |
|
|
93 |
% |
|
|
128 |
% |
|
|
142 |
% |
|
|
93 |
% |
|
|
| (a) |
Per share numbers have been calculated using the average shares method. |
| (b) |
Based on net asset value, which does not reflect the sales charge or contingent deferred sales charge, if applicable. Total returns for periods of less than
one year, if any, are not annualized. |
| (c) |
The investment advisor and other service providers waived or reimbursed a portion of their fees. |
See Notes which are an integral part of the Financial Statements
ANNUAL REPORT / April
30, 2013
|
|
|
| 84 |
|
FINANCIAL HIGHLIGHTS (continued) |
For a share outstanding throughout each year ended April 30, unless otherwise noted:
|
|
|
|
|
|
|
|
|
|
|
|
|
|
|
|
|
|
|
|
|
|
|
| WILMINGTON INTERMEDIATE-TERM BOND FUND |
|
|
|
|
|
|
|
|
|
|
|
|
|
|
|
|
|
|
|
|
|
|
|
|
|
|
|
|
|
|
|
|
|
|
|
|
|
|
|
|
| CLASS A |
|
2013 |
|
|
2012 |
|
|
2011 |
|
|
2010 |
|
|
2009 |
|
|
|
| Net Asset Value, Beginning of Year |
|
|
$10.64 |
|
|
|
$10.76 |
|
|
|
$10.63 |
|
|
|
$9.96 |
|
|
|
$9.97 |
|
|
|
| Income (Loss) From Operations: |
|
|
|
|
|
|
|
|
|
|
|
|
|
|
|
|
|
|
|
|
|
|
| Net Investment Income (Loss)(a) |
|
|
0.18 |
|
|
|
0.24 |
|
|
|
0.34 |
|
|
|
0.43 |
|
|
|
0.41 |
|
|
|
| Net Realized and Unrealized Gain (Loss)on Investments |
|
|
0.13 |
|
|
|
0.28 |
|
|
|
0.24 |
|
|
|
0.68 |
|
|
|
(0.00 |
) |
|
|
|
|
|
|
| Total Income (Loss) From Operations |
|
|
0.31 |
|
|
|
0.52 |
|
|
|
0.58 |
|
|
|
1.11 |
|
|
|
0.41 |
|
|
|
|
|
|
|
| Less Distributions From: |
|
|
|
|
|
|
|
|
|
|
|
|
|
|
|
|
|
|
|
|
|
|
| Net Investment Income |
|
|
(0.19 |
) |
|
|
(0.25 |
) |
|
|
(0.35 |
) |
|
|
(0.44 |
) |
|
|
(0.42 |
) |
|
|
| Net Realized Gains |
|
|
(0.16 |
) |
|
|
(0.39 |
) |
|
|
(0.10 |
) |
|
|
— |
|
|
|
— |
|
|
|
|
|
|
|
| Total Distributions |
|
|
(0.35 |
) |
|
|
(0.64 |
) |
|
|
(0.45 |
) |
|
|
(0.44 |
) |
|
|
(0.42 |
) |
|
|
|
|
|
|
| Net Asset Value, End of Year |
|
|
$10.60 |
|
|
|
$10.64 |
|
|
|
$10.76 |
|
|
|
$10.63 |
|
|
|
$9.96 |
|
|
|
|
|
|
|
| Total Return(b) |
|
|
2.90 |
% |
|
|
4.96 |
% |
|
|
5.51 |
% |
|
|
11.33 |
% |
|
|
4.20 |
% |
|
|
| Net Assets, End of Year (000’s) |
|
|
$9,730 |
|
|
|
$12,961 |
|
|
|
$6,744 |
|
|
|
$5,777 |
|
|
|
$2,619 |
|
|
|
| Ratios to Average Net Assets |
|
|
|
|
|
|
|
|
|
|
|
|
|
|
|
|
|
|
|
|
|
|
| Gross Expense |
|
|
1.14 |
% |
|
|
1.35 |
% |
|
|
1.43 |
% |
|
|
1.41 |
% |
|
|
1.35 |
% |
|
|
| Net Expenses(c) |
|
|
0.94 |
% |
|
|
1.00 |
% |
|
|
1.01 |
% |
|
|
0.87 |
% |
|
|
0.78 |
% |
|
|
| Net Investment Income (Loss) |
|
|
1.69 |
% |
|
|
2.22 |
% |
|
|
3.18 |
% |
|
|
4.23 |
% |
|
|
4.22 |
% |
|
|
| Portfolio Turnover Rate |
|
|
52 |
% |
|
|
253 |
% |
|
|
485 |
% |
|
|
164 |
% |
|
|
191 |
% |
|
|
|
|
|
|
|
|
|
|
|
|
|
|
|
|
|
|
|
|
|
|
|
|
|
| CLASS I |
|
2013 |
|
|
2012 |
|
|
2011 |
|
|
2010 |
|
|
2009 |
|
|
|
| Net Asset Value, Beginning of Year |
|
|
$10.65 |
|
|
|
$10.77 |
|
|
|
$10.64 |
|
|
|
$9.96 |
|
|
|
$9.97 |
|
|
|
| Income (Loss) From Operations: |
|
|
|
|
|
|
|
|
|
|
|
|
|
|
|
|
|
|
|
|
|
|
| Net Investment Income (Loss)(a) |
|
|
0.22 |
|
|
|
0.28 |
|
|
|
0.38 |
|
|
|
0.47 |
|
|
|
0.43 |
|
|
|
| Net Realized and Unrealized Gain (Loss)on Investments |
|
|
0.11 |
|
|
|
0.27 |
|
|
|
0.24 |
|
|
|
0.67 |
|
|
|
(0.01 |
) |
|
|
|
|
|
|
| Total Income (Loss) From Operations |
|
|
0.33 |
|
|
|
0.55 |
|
|
|
0.62 |
|
|
|
1.14 |
|
|
|
0.42 |
|
|
|
|
|
|
|
| Less Distributions From: |
|
|
|
|
|
|
|
|
|
|
|
|
|
|
|
|
|
|
|
|
|
|
| Net Investment Income |
|
|
(0.22 |
) |
|
|
(0.28 |
) |
|
|
(0.39 |
) |
|
|
(0.46 |
) |
|
|
(0.43 |
) |
|
|
| Net Realized Gains |
|
|
(0.16 |
) |
|
|
(0.39 |
) |
|
|
(0.10 |
) |
|
|
— |
|
|
|
— |
|
|
|
|
|
|
|
| Total Distributions |
|
|
(0.38 |
) |
|
|
(0.67 |
) |
|
|
(0.49 |
) |
|
|
(0.46 |
) |
|
|
(0.43 |
) |
|
|
|
|
|
|
| Net Asset Value, End of Year |
|
|
$10.60 |
|
|
|
$10.65 |
|
|
|
$10.77 |
|
|
|
$10.64 |
|
|
|
$9.96 |
|
|
|
|
|
|
|
| Total Return(b) |
|
|
3.15 |
% |
|
|
5.33 |
% |
|
|
5.96 |
% |
|
|
11.62 |
% |
|
|
4.35 |
% |
|
|
| Net Assets, End of Year (000’s) |
|
|
$201,572 |
|
|
|
$253,419 |
|
|
|
$107,625 |
|
|
|
$122,553 |
|
|
|
$126,742 |
|
|
|
| Ratios to Average Net Assets |
|
|
|
|
|
|
|
|
|
|
|
|
|
|
|
|
|
|
|
|
|
|
| Gross Expense |
|
|
0.89 |
% |
|
|
1.09 |
% |
|
|
1.17 |
% |
|
|
1.15 |
% |
|
|
1.09 |
% |
|
|
| Net Expenses(c) |
|
|
0.60 |
% |
|
|
0.64 |
% |
|
|
0.66 |
% |
|
|
0.63 |
% |
|
|
0.63 |
% |
|
|
| Net Investment Income (Loss) |
|
|
2.03 |
% |
|
|
2.58 |
% |
|
|
3.54 |
% |
|
|
4.49 |
% |
|
|
4.31 |
% |
|
|
| Portfolio Turnover Rate |
|
|
52 |
% |
|
|
253 |
% |
|
|
485 |
% |
|
|
164 |
% |
|
|
191 |
% |
|
|
| (a) |
Per share numbers have been calculated using the average shares method. |
| (b) |
Based on net asset value, which does not reflect the sales charge or contingent deferred sales charge, if applicable. Total returns for periods of less than
one year, if any, are not annualized. |
| (c) |
The investment advisor and other service providers waived or reimbursed a portion of their fees. |
See Notes which are an integral part of the Financial Statements
April 30, 2013 / ANNUAL REPORT
|
|
|
|
|
| FINANCIAL HIGHLIGHTS (continued) |
|
|
85 |
|
For a share outstanding throughout each year ended April 30, unless otherwise noted:
|
|
|
|
|
|
|
|
|
|
|
|
|
|
|
|
|
|
|
|
|
|
|
| WILMINGTON SHORT-TERM CORPORATE BOND FUND |
|
|
|
|
|
|
|
|
|
|
|
|
|
|
|
|
|
|
|
|
|
|
|
|
|
|
|
|
|
| CLASS A |
|
2013 |
|
|
2012 |
|
|
2011 |
|
|
2010 |
|
|
2009 |
|
|
|
| Net Asset Value, Beginning of Year |
|
|
$10.28 |
|
|
|
$10.29 |
|
|
|
$10.21 |
|
|
|
$9.89 |
|
|
|
$9.87 |
|
|
|
| Income (Loss) From Operations: |
|
|
|
|
|
|
|
|
|
|
|
|
|
|
|
|
|
|
|
|
|
|
| Net Investment Income (Loss)(a) |
|
|
0.09 |
|
|
|
0.12 |
|
|
|
0.16 |
|
|
|
0.21 |
|
|
|
0.27 |
|
|
|
| Net Realized and Unrealized Gain (Loss)on Investments |
|
|
0.08 |
|
|
|
0.03 |
|
|
|
0.10 |
|
|
|
0.33 |
|
|
|
0.08 |
|
|
|
|
|
|
|
| Total Income (Loss) From Operations |
|
|
0.17 |
|
|
|
0.15 |
|
|
|
0.26 |
|
|
|
0.54 |
|
|
|
0.35 |
|
|
|
|
|
|
|
| Less Distributions From: |
|
|
|
|
|
|
|
|
|
|
|
|
|
|
|
|
|
|
|
|
|
|
| Net Investment Income |
|
|
(0.09 |
) |
|
|
(0.12 |
) |
|
|
(0.17 |
) |
|
|
(0.22 |
) |
|
|
(0.33 |
) |
|
|
| Net Realized Gains |
|
|
(0.03 |
) |
|
|
(0.04 |
) |
|
|
(0.01 |
) |
|
|
— |
|
|
|
— |
|
|
|
|
|
|
|
| Total Distributions |
|
|
(0.12 |
) |
|
|
(0.16 |
) |
|
|
(0.18 |
) |
|
|
(0.22 |
) |
|
|
(0.33 |
) |
|
|
|
|
|
|
| Net Asset Value, End of Year |
|
|
$10.33 |
|
|
|
$10.28 |
|
|
|
$10.29 |
|
|
|
$10.21 |
|
|
|
$9.89 |
|
|
|
|
|
|
|
| Total Return(b) |
|
|
1.66 |
% |
|
|
1.48 |
% |
|
|
2.57 |
% |
|
|
5.47 |
% |
|
|
3.59 |
% |
|
|
| Net Assets, End of Year (000’s) |
|
|
$3,129 |
|
|
|
$8,912 |
|
|
|
$11,905 |
|
|
|
$5,461 |
|
|
|
$453 |
|
|
|
| Ratios to Average Net Assets |
|
|
|
|
|
|
|
|
|
|
|
|
|
|
|
|
|
|
|
|
|
|
| Gross Expense |
|
|
1.20 |
% |
|
|
1.37 |
% |
|
|
1.45 |
% |
|
|
1.49 |
% |
|
|
1.48 |
% |
|
|
| Net Expenses(c) |
|
|
0.86 |
% |
|
|
0.86 |
% |
|
|
0.86 |
% |
|
|
0.92 |
% |
|
|
0.89 |
% |
|
|
| Net Investment Income (Loss) |
|
|
0.89 |
% |
|
|
1.16 |
% |
|
|
1.57 |
% |
|
|
2.04 |
% |
|
|
3.21 |
% |
|
|
| Portfolio Turnover Rate |
|
|
110 |
% |
|
|
73 |
% |
|
|
142 |
% |
|
|
81 |
% |
|
|
94 |
% |
|
|
|
|
|
|
|
|
|
|
|
|
|
|
|
|
|
|
|
|
|
|
|
|
|
| CLASS I |
|
2013 |
|
|
2012 |
|
|
2011 |
|
|
2010 |
|
|
2009 |
|
|
|
| Net Asset Value, Beginning of Year |
|
|
$10.28 |
|
|
|
$10.29 |
|
|
|
$10.21 |
|
|
|
$9.89 |
|
|
|
$9.88 |
|
|
|
| Income (Loss) From Operations: |
|
|
|
|
|
|
|
|
|
|
|
|
|
|
|
|
|
|
|
|
|
|
| Net Investment Income (Loss)(a) |
|
|
0.12 |
|
|
|
0.15 |
|
|
|
0.18 |
|
|
|
0.23 |
|
|
|
0.33 |
|
|
|
| Net Realized and Unrealized Gain (Loss)on Investments |
|
|
0.08 |
|
|
|
0.03 |
|
|
|
0.10 |
|
|
|
0.32 |
|
|
|
0.02 |
|
|
|
|
|
|
|
| Total Income (Loss) From Operations |
|
|
0.20 |
|
|
|
0.18 |
|
|
|
0.28 |
|
|
|
0.55 |
|
|
|
0.35 |
|
|
|
|
|
|
|
| Less Distributions From: |
|
|
|
|
|
|
|
|
|
|
|
|
|
|
|
|
|
|
|
|
|
|
| Net Investment Income |
|
|
(0.12 |
) |
|
|
(0.15 |
) |
|
|
(0.19 |
) |
|
|
(0.23 |
) |
|
|
(0.34 |
) |
|
|
| Net Realized Gains |
|
|
(0.03 |
) |
|
|
(0.04 |
) |
|
|
(0.01 |
) |
|
|
— |
|
|
|
— |
|
|
|
|
|
|
|
| Total Distributions |
|
|
(0.15 |
) |
|
|
(0.19 |
) |
|
|
(0.20 |
) |
|
|
(0.23 |
) |
|
|
(0.34 |
) |
|
|
|
|
|
|
| Net Asset Value, End of Year |
|
|
$10.33 |
|
|
|
$10.28 |
|
|
|
$10.29 |
|
|
|
$10.21 |
|
|
|
$9.89 |
|
|
|
|
|
|
|
| Total Return(b) |
|
|
1.91 |
% |
|
|
1.74 |
% |
|
|
2.83 |
% |
|
|
5.66 |
% |
|
|
3.64 |
% |
|
|
| Net Assets, End of Year (000’s) |
|
|
$182,588 |
|
|
|
$189,176 |
|
|
|
$176,531 |
|
|
|
$108,636 |
|
|
|
$61,655 |
|
|
|
| Ratios to Average Net Assets |
|
|
|
|
|
|
|
|
|
|
|
|
|
|
|
|
|
|
|
|
|
|
| Gross Expense |
|
|
0.96 |
% |
|
|
1.11 |
% |
|
|
1.20 |
% |
|
|
1.22 |
% |
|
|
1.23 |
% |
|
|
| Net Expenses(c) |
|
|
0.61 |
% |
|
|
0.61 |
% |
|
|
0.61 |
% |
|
|
0.71 |
% |
|
|
0.73 |
% |
|
|
| Net Investment Income (Loss) |
|
|
1.12 |
% |
|
|
1.42 |
% |
|
|
1.81 |
% |
|
|
2.32 |
% |
|
|
3.42 |
% |
|
|
| Portfolio Turnover Rate |
|
|
110 |
% |
|
|
73 |
% |
|
|
142 |
% |
|
|
81 |
% |
|
|
94 |
% |
|
|
| (a) |
Per share numbers have been calculated using the average shares method. |
| (b) |
Based on net asset value, which does not reflect the sales charge or contingent deferred sales charge, if applicable. Total returns for periods of less than
one year, if any, are not annualized. |
| (c) |
The investment advisor and other service providers waived or reimbursed a portion of their fees. |
See Notes which are an integral part of the Financial Statements
ANNUAL REPORT / April
30, 2013
|
|
|
| 86 |
|
FINANCIAL HIGHLIGHTS (continued) |
For a share outstanding throughout each year ended April 30, unless otherwise noted:
|
|
|
|
|
|
|
|
|
|
|
|
|
|
|
|
|
|
|
|
|
|
|
| WILMINGTON SHORT DURATION GOVERNMENT BOND FUND |
|
|
|
|
|
|
|
|
|
|
|
|
|
|
|
|
|
|
|
|
|
|
|
|
|
|
|
|
|
| CLASS A |
|
2013 |
|
|
2012 |
|
|
2011 |
|
|
2010 |
|
|
2009 |
|
|
|
| Net Asset Value, Beginning of Year |
|
|
$9.79 |
|
|
|
$9.87 |
|
|
|
$9.90 |
|
|
|
$9.90 |
|
|
|
$9.78 |
|
|
|
| Income (Loss) From Operations: |
|
|
|
|
|
|
|
|
|
|
|
|
|
|
|
|
|
|
|
|
|
|
| Net Investment Income (Loss)(a) |
|
|
0.10 |
|
|
|
0.16 |
|
|
|
0.21 |
(b) |
|
|
0.30 |
|
|
|
0.32 |
|
|
|
| Net Realized and Unrealized Gain (Loss)on Investments |
|
|
(0.02 |
) |
|
|
(0.02 |
) |
|
|
0.00 |
(b)(c) |
|
|
0.01 |
|
|
|
0.12 |
|
|
|
|
|
|
|
| Total Income (Loss) From Operations |
|
|
0.08 |
|
|
|
0.14 |
|
|
|
0.21 |
|
|
|
0.31 |
|
|
|
0.44 |
|
|
|
|
|
|
|
| Less Distributions From: |
|
|
|
|
|
|
|
|
|
|
|
|
|
|
|
|
|
|
|
|
|
|
| Net Investment Income |
|
|
(0.15 |
) |
|
|
(0.22 |
) |
|
|
(0.24 |
) |
|
|
(0.31 |
) |
|
|
(0.32 |
) |
|
|
| Net Realized Gains |
|
|
(0.04 |
) |
|
|
— |
|
|
|
— |
|
|
|
— |
|
|
|
— |
|
|
|
|
|
|
|
| Total Distributions |
|
|
(0.19 |
) |
|
|
(0.22 |
) |
|
|
(0.24 |
) |
|
|
(0.31 |
) |
|
|
(0.32 |
) |
|
|
|
|
|
|
| Net Asset Value, End of Year |
|
|
$9.68 |
|
|
|
$9.79 |
|
|
|
$9.87 |
|
|
|
$9.90 |
|
|
|
$9.90 |
|
|
|
|
|
|
|
| Total Return(d) |
|
|
0.82 |
% |
|
|
1.40 |
% |
|
|
2.10 |
% |
|
|
3.15 |
% |
|
|
4.59 |
% |
|
|
| Net Assets, End of Year (000’s) |
|
|
$20,136 |
|
|
|
$22,874 |
|
|
|
$16,848 |
|
|
|
$10,680 |
|
|
|
$5,209 |
|
|
|
| Ratios to Average Net Assets |
|
|
|
|
|
|
|
|
|
|
|
|
|
|
|
|
|
|
|
|
|
|
| Gross Expense |
|
|
1.20 |
% |
|
|
1.27 |
% |
|
|
1.36 |
% |
|
|
1.36 |
% |
|
|
1.25 |
% |
|
|
| Net Expenses(e) |
|
|
0.89 |
% |
|
|
0.88 |
% |
|
|
0.89 |
% |
|
|
0.86 |
% |
|
|
0.80 |
% |
|
|
| Net Investment Income (Loss) |
|
|
1.02 |
% |
|
|
1.65 |
% |
|
|
2.09 |
%(b) |
|
|
3.04 |
% |
|
|
3.27 |
% |
|
|
| Portfolio Turnover Rate |
|
|
31 |
% |
|
|
131 |
% |
|
|
255 |
% |
|
|
164 |
% |
|
|
84 |
% |
|
|
|
|
|
|
|
|
|
|
|
|
|
|
|
|
|
|
|
|
|
|
|
|
|
| CLASS I |
|
2013 |
|
|
2012 |
|
|
2011 |
|
|
2010 |
|
|
2009 |
|
|
|
| Net Asset Value, Beginning of Year |
|
|
$9.81 |
|
|
|
$9.89 |
|
|
|
$9.92 |
|
|
|
$9.92 |
|
|
|
$9.78 |
|
|
|
| Income (Loss) From Operations: |
|
|
|
|
|
|
|
|
|
|
|
|
|
|
|
|
|
|
|
|
|
|
| Net Investment Income (Loss)(a) |
|
|
0.12 |
|
|
|
0.18 |
|
|
|
0.23 |
(b) |
|
|
0.32 |
|
|
|
0.35 |
|
|
|
| Net Realized and Unrealized Gain (Loss)on Investments |
|
|
(0.02 |
) |
|
|
(0.02 |
) |
|
|
0.00 |
(b)(c) |
|
|
0.00 |
(c) |
|
|
0.13 |
|
|
|
|
|
|
|
| Total Income (Loss) From Operations |
|
|
0.10 |
|
|
|
0.16 |
|
|
|
0.23 |
|
|
|
0.32 |
|
|
|
0.48 |
|
|
|
|
|
|
|
| Less Distributions From: |
|
|
|
|
|
|
|
|
|
|
|
|
|
|
|
|
|
|
|
|
|
|
| Net Investment Income |
|
|
(0.17 |
) |
|
|
(0.24 |
) |
|
|
(0.26 |
) |
|
|
(0.32 |
) |
|
|
(0.34 |
) |
|
|
| Net Realized Gains |
|
|
(0.04 |
) |
|
|
— |
|
|
|
— |
|
|
|
— |
|
|
|
— |
|
|
|
|
|
|
|
| Total Distributions |
|
|
(0.21 |
) |
|
|
(0.24 |
) |
|
|
(0.26 |
) |
|
|
(0.32 |
) |
|
|
(0.34 |
) |
|
|
|
|
|
|
| Net Asset Value, End of Year |
|
|
$9.70 |
|
|
|
$9.81 |
|
|
|
$9.89 |
|
|
|
$9.92 |
|
|
|
$9.92 |
|
|
|
|
|
|
|
| Total Return(d) |
|
|
1.07 |
% |
|
|
1.66 |
% |
|
|
2.35 |
% |
|
|
3.32 |
% |
|
|
4.96 |
% |
|
|
| Net Assets, End of Year (000’s) |
|
|
$110,035 |
|
|
|
$151,399 |
|
|
|
$83,037 |
|
|
|
$77,725 |
|
|
|
$69,442 |
|
|
|
| Ratios to Average Net Assets |
|
|
|
|
|
|
|
|
|
|
|
|
|
|
|
|
|
|
|
|
|
|
| Gross Expense |
|
|
0.94 |
% |
|
|
1.01 |
% |
|
|
1.11 |
% |
|
|
1.11 |
% |
|
|
0.99 |
% |
|
|
| Net Expenses(e) |
|
|
0.64 |
% |
|
|
0.63 |
% |
|
|
0.64 |
% |
|
|
0.65 |
% |
|
|
0.65 |
% |
|
|
| Net Investment Income (Loss) |
|
|
1.27 |
% |
|
|
1.85 |
% |
|
|
2.34 |
%(b) |
|
|
3.25 |
% |
|
|
3.45 |
% |
|
|
| Portfolio Turnover Rate |
|
|
31 |
% |
|
|
131 |
% |
|
|
255 |
% |
|
|
164 |
% |
|
|
84 |
% |
|
|
| (a) |
Per share numbers have been calculated using the average shares method. |
| (b) |
Net investment income per share and net realized and unrealized gain (loss) per share were (decreased)/increased by ($0.03) and $0.03, respectively, to
reflect amortization adjustments and paydown losses. A corresponding adjustment was made to decrease the net investment income ratio by 0.27%. |
| (c) |
Represents less than $0.005. |
| (d) |
Based on net asset value, which does not reflect the sales charge or contingent deferred sales charge, if applicable. Total returns for periods of less than
one year, if any, are not annualized. |
| (e) |
The investment advisor and other service providers waived or reimbursed a portion of their fees. |
See Notes which are an integral part of the Financial Statements
April 30, 2013 / ANNUAL REPORT
|
|
|
|
|
| FINANCIAL HIGHLIGHTS (continued) |
|
|
87 |
|
For a share outstanding throughout each period:
|
|
|
|
|
|
|
|
|
|
|
|
|
|
|
|
|
|
|
|
|
|
|
|
|
|
|
|
|
|
|
|
|
| WILMINGTON MUNICIPAL BOND FUND† |
|
|
|
|
|
|
|
|
|
|
|
|
|
|
|
|
|
|
|
|
|
|
|
|
|
|
|
|
|
|
|
|
|
|
|
| CLASS A |
|
Year Ended
April
30, 2013 |
|
For the Period
July 1, 2011
through April 30,
2012* |
|
Year Ended
June 30,
2011 |
|
Year Ended
June 30,
2010 |
|
Year Ended
June 30,
2009 |
|
Year Ended
June 30,
2008 |
|
|
| Net Asset Value, Beginning of Period |
|
|
|
$13.79 |
|
|
|
|
$13.18 |
|
|
|
|
$13.22 |
|
|
|
|
$12.64 |
|
|
|
|
$12.79 |
|
|
|
|
$12.75 |
|
|
|
| Income (Loss) From Operations: |
|
|
|
|
|
|
|
|
|
|
|
|
|
|
|
|
|
|
|
|
|
|
|
|
|
|
|
|
|
|
|
|
| Net Investment Income (Loss)(a) |
|
|
|
0.24 |
|
|
|
|
0.29 |
|
|
|
|
0.42 |
|
|
|
|
0.46 |
|
|
|
|
0.47 |
|
|
|
|
0.45 |
|
|
|
| Net Realized and Unrealized Gain (Loss)on Investments |
|
|
|
0.27 |
|
|
|
|
0.78 |
|
|
|
|
0.04 |
|
|
|
|
0.61 |
|
|
|
|
(0.10 |
) |
|
|
|
0.04 |
|
|
|
|
|
|
|
|
|
| Total Income (Loss) From Operations |
|
|
|
0.51 |
|
|
|
|
1.07 |
|
|
|
|
0.46 |
|
|
|
|
1.07 |
|
|
|
|
0.37 |
|
|
|
|
0.49 |
|
|
|
|
|
|
|
|
|
| Less Distributions From: |
|
|
|
|
|
|
|
|
|
|
|
|
|
|
|
|
|
|
|
|
|
|
|
|
|
|
|
|
|
|
|
|
| Net Investment Income |
|
|
|
(0.24 |
) |
|
|
|
(0.29 |
) |
|
|
|
(0.42 |
) |
|
|
|
(0.46 |
) |
|
|
|
(0.47 |
) |
|
|
|
(0.45 |
) |
|
|
| Net Realized Gains |
|
|
|
(0.31 |
) |
|
|
|
(0.17 |
) |
|
|
|
(0.08 |
) |
|
|
|
(0.03 |
) |
|
|
|
(0.05 |
) |
|
|
|
— |
|
|
|
|
|
|
|
|
|
| Total Distributions |
|
|
|
(0.55 |
) |
|
|
|
(0.46 |
) |
|
|
|
(0.50 |
) |
|
|
|
(0.49 |
) |
|
|
|
(0.52 |
) |
|
|
|
(0.45 |
) |
|
|
|
|
|
|
|
|
| Net Asset Value, End of Period |
|
|
|
$13.75 |
|
|
|
|
$13.79 |
|
|
|
|
$13.18 |
|
|
|
|
$13.22 |
|
|
|
|
$12.64 |
|
|
|
|
$12.79 |
|
|
|
|
|
|
|
|
|
| Total Return(b) |
|
|
|
3.74 |
% |
|
|
|
8.18 |
% |
|
|
|
3.56 |
% |
|
|
|
8.57 |
% |
|
|
|
3.04 |
% |
|
|
|
3.86 |
% |
|
|
| Net Assets, End of Period (000’s) |
|
|
|
$21,435 |
|
|
|
|
$708 |
|
|
|
|
$758 |
|
|
|
|
$579 |
|
|
|
|
$164 |
|
|
|
|
$11 |
|
|
|
| Ratios to Average Net Assets |
|
|
|
|
|
|
|
|
|
|
|
|
|
|
|
|
|
|
|
|
|
|
|
|
|
|
|
|
|
|
|
|
| Gross Expense |
|
|
|
1.13 |
% |
|
|
|
0.92 |
%(c) |
|
|
|
0.86 |
% |
|
|
|
0.85 |
% |
|
|
|
0.87 |
% |
|
|
|
0.86 |
% |
|
|
| Net Expenses(d) |
|
|
|
0.86 |
% |
|
|
|
0.87 |
%(c) |
|
|
|
0.86 |
% |
|
|
|
0.85 |
% |
|
|
|
0.87 |
% |
|
|
|
0.86 |
% |
|
|
| Net Investment Income (Loss) |
|
|
|
1.74 |
% |
|
|
|
2.56 |
%(c) |
|
|
|
3.20 |
% |
|
|
|
3.55 |
% |
|
|
|
3.50 |
% |
|
|
|
3.48 |
% |
|
|
| Portfolio Turnover Rate |
|
|
|
38 |
% |
|
|
|
52 |
% |
|
|
|
30 |
% |
|
|
|
44 |
% |
|
|
|
19 |
% |
|
|
|
37 |
% |
|
|
|
|
|
|
|
|
|
|
|
|
|
|
|
|
|
|
|
|
|
|
|
|
|
|
|
|
|
|
|
|
|
|
|
| CLASS I |
|
Year Ended
April 30,
2013 |
|
For the Period
July 1, 2011
through April 30,
2012* |
|
Year Ended
June 30,
2011 |
|
Year Ended
June 30,
2010 |
|
Year Ended
June 30,
2009 |
|
Year Ended
June 30,
2008 |
|
|
| Net Asset Value, Beginning of Period |
|
|
|
$13.79 |
|
|
|
|
$13.19 |
|
|
|
|
$13.22 |
|
|
|
|
$12.64 |
|
|
|
|
$12.79 |
|
|
|
|
$12.75 |
|
|
|
| Income (Loss) From Operations: |
|
|
|
|
|
|
|
|
|
|
|
|
|
|
|
|
|
|
|
|
|
|
|
|
|
|
|
|
|
|
|
|
| Net Investment Income (Loss)(a) |
|
|
|
0.28 |
|
|
|
|
0.32 |
|
|
|
|
0.45 |
|
|
|
|
0.49 |
|
|
|
|
0.50 |
|
|
|
|
0.48 |
|
|
|
| Net Realized and Unrealized Gain (Loss)on Investments |
|
|
|
0.28 |
|
|
|
|
0.77 |
|
|
|
|
0.05 |
|
|
|
|
0.61 |
|
|
|
|
(0.10 |
) |
|
|
|
0.04 |
|
|
|
|
|
|
|
|
|
| Total Income (Loss) From Operations |
|
|
|
0.56 |
|
|
|
|
1.09 |
|
|
|
|
0.50 |
|
|
|
|
1.10 |
|
|
|
|
0.40 |
|
|
|
|
0.52 |
|
|
|
|
|
|
|
|
|
| Less Distributions From: |
|
|
|
|
|
|
|
|
|
|
|
|
|
|
|
|
|
|
|
|
|
|
|
|
|
|
|
|
|
|
|
|
| Net Investment Income |
|
|
|
(0.28 |
) |
|
|
|
(0.32 |
) |
|
|
|
(0.45 |
) |
|
|
|
(0.49 |
) |
|
|
|
(0.50 |
) |
|
|
|
(0.48 |
) |
|
|
| Net Realized Gains |
|
|
|
(0.31 |
) |
|
|
|
(0.17 |
) |
|
|
|
(0.08 |
) |
|
|
|
(0.03 |
) |
|
|
|
(0.05 |
) |
|
|
|
— |
|
|
|
|
|
|
|
|
|
| Total Distributions |
|
|
|
(0.59 |
) |
|
|
|
(0.49 |
) |
|
|
|
(0.53 |
) |
|
|
|
(0.52 |
) |
|
|
|
(0.55 |
) |
|
|
|
(0.48 |
) |
|
|
|
|
|
|
|
|
| Net Asset Value, End of Period |
|
|
|
$13.76 |
|
|
|
|
$13.79 |
|
|
|
|
$13.19 |
|
|
|
|
$13.22 |
|
|
|
|
$12.64 |
|
|
|
|
$12.79 |
|
|
|
|
|
|
|
|
|
| Total Return(b) |
|
|
|
4.06 |
% |
|
|
|
8.33 |
% |
|
|
|
3.90 |
% |
|
|
|
8.84 |
% |
|
|
|
3.27 |
% |
|
|
|
4.09 |
% |
|
|
| Net Assets, End of Period (000’s) |
|
|
|
$247,914 |
|
|
|
|
$146,009 |
|
|
|
|
$141,519 |
|
|
|
|
$166,253 |
|
|
|
|
$135,073 |
|
|
|
|
$134,272 |
|
|
|
| Ratios to Average Net Assets |
|
|
|
|
|
|
|
|
|
|
|
|
|
|
|
|
|
|
|
|
|
|
|
|
|
|
|
|
|
|
|
|
| Gross Expense |
|
|
|
0.90 |
% |
|
|
|
0.68 |
%(c) |
|
|
|
0.61 |
% |
|
|
|
0.60 |
% |
|
|
|
0.62 |
% |
|
|
|
0.61 |
% |
|
|
| Net Expenses(d) |
|
|
|
0.61 |
% |
|
|
|
0.62 |
%(c) |
|
|
|
0.61 |
% |
|
|
|
0.60 |
% |
|
|
|
0.62 |
% |
|
|
|
0.61 |
% |
|
|
| Net Investment Income (Loss) |
|
|
|
2.01 |
% |
|
|
|
2.80 |
%(c) |
|
|
|
3.44 |
% |
|
|
|
3.79 |
% |
|
|
|
3.99 |
% |
|
|
|
3.70 |
% |
|
|
| Portfolio Turnover Rate |
|
|
|
38 |
% |
|
|
|
52 |
% |
|
|
|
30 |
% |
|
|
|
44 |
% |
|
|
|
19 |
% |
|
|
|
37 |
% |
|
|
| (a) |
Per share numbers have been calculated using the average shares method. |
| (b) |
Based on net asset value, which does not reflect the sales charge or contingent deferred sales charge, if applicable. Total returns for periods of less than
one year, if any, are not annualized. |
| (c) |
Annualized for periods less the one year. |
| (d) |
The investment advisor and other service providers waived or reimbursed a portion of their fees. |
| * |
Year end changed from June 30 to April 30. |
| † |
Effective March 9, 2012, the Fund acquired all of the assets and liabilities of the Wilmington Municipal Bond Fund, a series of WT Mutual Fund (the
“WT Fund”). The financial highlights for the periods prior to that date reflect the performance of the WT Fund. |
See Notes which are an integral part of the Financial Statements.
ANNUAL REPORT / April
30, 2013
|
|
|
| 88 |
|
FINANCIAL HIGHLIGHTS (continued) |
For a share outstanding throughout each year ended April 30, unless otherwise noted:
|
|
|
|
|
|
|
|
|
|
|
|
|
|
|
|
|
|
|
|
|
|
|
| WILMINGTON MARYLAND MUNICIPAL BOND FUND |
|
|
|
|
|
|
|
|
|
|
|
|
|
|
|
|
|
|
|
|
|
|
|
|
|
|
|
|
|
| CLASS A |
|
2013 |
|
|
2012 |
|
|
2011 |
|
|
2010 |
|
|
2009 |
|
|
|
| Net Asset Value, Beginning of Year |
|
|
$10.17 |
|
|
|
$9.77 |
|
|
|
$9.98 |
|
|
|
$9.50 |
|
|
|
$9.82 |
|
|
|
| Income (Loss) From Operations: |
|
|
|
|
|
|
|
|
|
|
|
|
|
|
|
|
|
|
|
|
|
|
| Net Investment Income (Loss)(a) |
|
|
0.16 |
|
|
|
0.34 |
|
|
|
0.36 |
|
|
|
0.38 |
|
|
|
0.40 |
|
|
|
| Net Realized and Unrealized Gain (Loss)on Investments |
|
|
0.14 |
|
|
|
0.40 |
|
|
|
(0.21 |
) |
|
|
0.49 |
|
|
|
(0.30 |
) |
|
|
|
|
|
|
| Total Income (Loss) From Operations |
|
|
0.30 |
|
|
|
0.74 |
|
|
|
0.15 |
|
|
|
0.87 |
|
|
|
0.10 |
|
|
|
|
|
|
|
| Less Distributions From: |
|
|
|
|
|
|
|
|
|
|
|
|
|
|
|
|
|
|
|
|
|
|
| Net Investment Income |
|
|
(0.16 |
) |
|
|
(0.34 |
) |
|
|
(0.36 |
) |
|
|
(0.39 |
) |
|
|
(0.40 |
) |
|
|
| Net Realized Gains |
|
|
(0.04 |
) |
|
|
— |
|
|
|
— |
|
|
|
— |
|
|
|
(0.02 |
) |
|
|
|
|
|
|
| Total Distributions |
|
|
(0.20 |
) |
|
|
(0.34 |
) |
|
|
(0.36 |
) |
|
|
(0.39 |
) |
|
|
(0.42 |
) |
|
|
|
|
|
|
| Net Asset Value, End of Year |
|
|
$10.27 |
|
|
|
$10.17 |
|
|
|
$9.77 |
|
|
|
$9.98 |
|
|
|
$9.50 |
|
|
|
|
|
|
|
| Total Return(b) |
|
|
2.92 |
% |
|
|
7.71 |
% |
|
|
1.54 |
% |
|
|
9.24 |
% |
|
|
1.10 |
% |
|
|
| Net Assets, End of Year (000’s) |
|
|
$33,461 |
|
|
|
$36,079 |
|
|
|
$34,550 |
|
|
|
$42,303 |
|
|
|
$38,627 |
|
|
|
| Ratios to Average Net Assets |
|
|
|
|
|
|
|
|
|
|
|
|
|
|
|
|
|
|
|
|
|
|
| Gross Expense |
|
|
1.19 |
% |
|
|
1.36 |
% |
|
|
1.38 |
% |
|
|
1.38 |
% |
|
|
1.38 |
% |
|
|
| Net Expenses(c) |
|
|
0.95 |
% |
|
|
0.94 |
% |
|
|
0.94 |
% |
|
|
0.82 |
% |
|
|
0.79 |
% |
|
|
| Net Investment Income (Loss) |
|
|
1.53 |
% |
|
|
3.41 |
% |
|
|
3.62 |
% |
|
|
3.90 |
% |
|
|
4.21 |
% |
|
|
| Portfolio Turnover Rate |
|
|
41 |
% |
|
|
34 |
% |
|
|
6 |
% |
|
|
8 |
% |
|
|
6 |
% |
|
|
|
|
|
|
|
|
|
|
|
|
|
|
|
|
|
|
|
|
|
|
|
|
|
| CLASS I |
|
2013 |
|
|
2012 |
|
|
2011 |
|
|
2010 |
|
|
2009 |
|
|
|
| Net Asset Value, Beginning of Year |
|
|
$10.18 |
|
|
|
$9.79 |
|
|
|
$9.99 |
|
|
|
$9.51 |
|
|
|
$9.83 |
|
|
|
| Income (Loss) From Operations: |
|
|
|
|
|
|
|
|
|
|
|
|
|
|
|
|
|
|
|
|
|
|
| Net Investment Income (Loss)(a) |
|
|
0.19 |
|
|
|
0.37 |
|
|
|
0.39 |
|
|
|
0.40 |
|
|
|
0.41 |
|
|
|
| Net Realized and Unrealized Gain (Loss)on Investments |
|
|
0.15 |
|
|
|
0.39 |
|
|
|
(0.20 |
) |
|
|
0.48 |
|
|
|
(0.30 |
) |
|
|
|
|
|
|
| Total Income (Loss) From Operations |
|
|
0.34 |
|
|
|
0.76 |
|
|
|
0.19 |
|
|
|
0.88 |
|
|
|
0.11 |
|
|
|
|
|
|
|
| Less Distributions From: |
|
|
|
|
|
|
|
|
|
|
|
|
|
|
|
|
|
|
|
|
|
|
| Net Investment Income |
|
|
(0.19 |
) |
|
|
(0.37 |
) |
|
|
(0.39 |
) |
|
|
(0.40 |
) |
|
|
(0.41 |
) |
|
|
| Net Realized Gains |
|
|
(0.04 |
) |
|
|
— |
|
|
|
— |
|
|
|
— |
|
|
|
(0.02 |
) |
|
|
|
|
|
|
| Total Distributions |
|
|
(0.23 |
) |
|
|
(0.37 |
) |
|
|
(0.39 |
) |
|
|
(0.40 |
) |
|
|
(0.43 |
) |
|
|
|
|
|
|
| Net Asset Value, End of Year |
|
|
$10.29 |
|
|
|
$10.18 |
|
|
|
$9.79 |
|
|
|
$9.99 |
|
|
|
$9.51 |
|
|
|
|
|
|
|
| Total Return(b) |
|
|
3.31 |
% |
|
|
7.89 |
% |
|
|
1.90 |
% |
|
|
9.33 |
% |
|
|
1.20 |
% |
|
|
| Net Assets, End of Year (000’s) |
|
|
$73,446 |
|
|
|
$75,423 |
|
|
|
$78,912 |
|
|
|
$85,039 |
|
|
|
$79,494 |
|
|
|
| Ratios to Average Net Assets |
|
|
|
|
|
|
|
|
|
|
|
|
|
|
|
|
|
|
|
|
|
|
| Gross Expense |
|
|
0.94 |
% |
|
|
1.11 |
% |
|
|
1.13 |
% |
|
|
1.13 |
% |
|
|
1.13 |
% |
|
|
| Net Expenses(c) |
|
|
0.67 |
% |
|
|
0.66 |
% |
|
|
0.67 |
% |
|
|
0.70 |
% |
|
|
0.70 |
% |
|
|
| Net Investment Income (Loss) |
|
|
1.81 |
% |
|
|
3.69 |
% |
|
|
3.90 |
% |
|
|
4.02 |
% |
|
|
4.30 |
% |
|
|
| Portfolio Turnover Rate |
|
|
41 |
% |
|
|
34 |
% |
|
|
6 |
% |
|
|
8 |
% |
|
|
6 |
% |
|
|
| (a) |
Per share numbers have been calculated using the average shares method. |
| (b) |
Based on net asset value, which does not reflect the sales charge or contingent deferred sales charge, if applicable. Total returns for periods of less than
one year, if any, are not annualized. |
| (c) |
The investment advisor and other service providers waived or reimbursed a portion of their fees. |
See Notes which are an integral part of the Financial Statements
April 30, 2013 / ANNUAL REPORT
|
|
|
|
|
| FINANCIAL HIGHLIGHTS (concluded) |
|
|
89 |
|
For a share outstanding throughout each year ended April 30, unless otherwise noted:
|
|
|
|
|
|
|
|
|
|
|
|
|
|
|
|
|
|
|
|
|
|
|
| WILMINGTON NEW YORK MUNICIPAL BOND FUND |
|
|
|
|
|
|
|
|
|
|
|
|
|
|
|
|
|
|
|
|
|
|
|
|
|
|
|
|
|
| CLASS A |
|
2013 |
|
|
2012 |
|
|
2011 |
|
|
2010 |
|
|
2009 |
|
|
|
| Net Asset Value, Beginning of Year |
|
|
$10.59 |
|
|
|
$10.08 |
|
|
|
$10.25 |
|
|
|
$9.89 |
|
|
|
$10.25 |
|
|
|
| Income (Loss) From Operations: |
|
|
|
|
|
|
|
|
|
|
|
|
|
|
|
|
|
|
|
|
|
|
| Net Investment Income (Loss)(a) |
|
|
0.21 |
|
|
|
0.28 |
|
|
|
0.35 |
|
|
|
0.35 |
|
|
|
0.38 |
|
|
|
| Net Realized and Unrealized Gain (Loss)on Investments |
|
|
0.16 |
|
|
|
0.51 |
|
|
|
(0.16 |
) |
|
|
0.36 |
|
|
|
(0.34 |
) |
|
|
|
|
|
|
| Total Income (Loss) From Operations |
|
|
0.37 |
|
|
|
0.79 |
|
|
|
0.19 |
|
|
|
0.71 |
|
|
|
0.04 |
|
|
|
|
|
|
|
| Less Distributions From: |
|
|
|
|
|
|
|
|
|
|
|
|
|
|
|
|
|
|
|
|
|
|
| Net Investment Income |
|
|
(0.21 |
) |
|
|
(0.28 |
) |
|
|
(0.36 |
) |
|
|
(0.35 |
) |
|
|
(0.40 |
) |
|
|
| Net Realized Gains |
|
|
— |
|
|
|
— |
|
|
|
— |
|
|
|
— |
|
|
|
— |
|
|
|
|
|
|
|
| Total Distributions |
|
|
(0.21 |
) |
|
|
(0.28 |
) |
|
|
(0.36 |
) |
|
|
(0.35 |
) |
|
|
(0.40 |
) |
|
|
|
|
|
|
| Net Asset Value, End of Year |
|
|
$10.75 |
|
|
|
$10.59 |
|
|
|
$10.08 |
|
|
|
$10.25 |
|
|
|
$9.89 |
|
|
|
|
|
|
|
| Total Return(b) |
|
|
3.48 |
% |
|
|
7.99 |
% |
|
|
1.83 |
% |
|
|
7.28 |
% |
|
|
0.44 |
% |
|
|
| Net Assets, End of Year (000’s) |
|
|
$31,239 |
|
|
|
$35,099 |
|
|
|
$34,107 |
|
|
|
$40,748 |
|
|
|
$33,904 |
|
|
|
| Ratios to Average Net Assets |
|
|
|
|
|
|
|
|
|
|
|
|
|
|
|
|
|
|
|
|
|
|
| Gross Expense |
|
|
1.20 |
% |
|
|
1.36 |
% |
|
|
1.40 |
% |
|
|
1.40 |
% |
|
|
1.40 |
% |
|
|
| Net Expenses(c) |
|
|
0.84 |
% |
|
|
0.84 |
% |
|
|
0.84 |
% |
|
|
0.80 |
% |
|
|
0.75 |
% |
|
|
| Net Investment Income (Loss) |
|
|
1.94 |
% |
|
|
2.73 |
% |
|
|
3.47 |
% |
|
|
3.42 |
% |
|
|
3.96 |
% |
|
|
| Portfolio Turnover Rate |
|
|
41 |
% |
|
|
87 |
% |
|
|
67 |
% |
|
|
64 |
% |
|
|
102 |
% |
|
|
|
|
|
|
|
|
|
|
|
|
|
|
|
|
|
|
|
|
|
|
|
|
|
| CLASS I |
|
2013 |
|
|
2012 |
|
|
2011 |
|
|
2010 |
|
|
2009 |
|
|
|
| Net Asset Value, Beginning of Year |
|
|
$10.60 |
|
|
|
$10.08 |
|
|
|
$10.26 |
|
|
|
$9.89 |
|
|
|
$10.25 |
|
|
|
| Income (Loss) From Operations: |
|
|
|
|
|
|
|
|
|
|
|
|
|
|
|
|
|
|
|
|
|
|
| Net Investment Income (Loss)(a) |
|
|
0.23 |
|
|
|
0.31 |
|
|
|
0.38 |
|
|
|
0.36 |
|
|
|
0.41 |
|
|
|
| Net Realized and Unrealized Gain (Loss)on Investments |
|
|
0.16 |
|
|
|
0.52 |
|
|
|
(0.18 |
) |
|
|
0.37 |
|
|
|
(0.36 |
) |
|
|
|
|
|
|
| Total Income (Loss) From Operations |
|
|
0.39 |
|
|
|
0.83 |
|
|
|
0.20 |
|
|
|
0.73 |
|
|
|
0.05 |
|
|
|
|
|
|
|
| Less Distributions From: |
|
|
|
|
|
|
|
|
|
|
|
|
|
|
|
|
|
|
|
|
|
|
| Net Investment Income |
|
|
(0.23 |
) |
|
|
(0.31 |
) |
|
|
(0.38 |
) |
|
|
(0.36 |
) |
|
|
(0.41 |
) |
|
|
| Net Realized Gains |
|
|
— |
|
|
|
— |
|
|
|
— |
|
|
|
— |
|
|
|
— |
|
|
|
|
|
|
|
| Total Distributions |
|
|
(0.23 |
) |
|
|
(0.31 |
) |
|
|
(0.38 |
) |
|
|
(0.36 |
) |
|
|
(0.41 |
) |
|
|
|
|
|
|
| Net Asset Value, End of Year |
|
|
$10.76 |
|
|
|
$10.60 |
|
|
|
$10.08 |
|
|
|
$10.26 |
|
|
|
$9.89 |
|
|
|
|
|
|
|
| Total Return(b) |
|
|
3.74 |
% |
|
|
8.33 |
% |
|
|
1.97 |
% |
|
|
7.54 |
% |
|
|
0.54 |
% |
|
|
| Net Assets, End of Year (000’s) |
|
|
$78,471 |
|
|
|
$74,913 |
|
|
|
$68,919 |
|
|
|
$67,239 |
|
|
|
$57,173 |
|
|
|
| Ratios to Average Net Assets |
|
|
|
|
|
|
|
|
|
|
|
|
|
|
|
|
|
|
|
|
|
|
| Gross Expense |
|
|
0.95 |
% |
|
|
1.11 |
% |
|
|
1.15 |
% |
|
|
1.15 |
% |
|
|
1.15 |
% |
|
|
| Net Expenses(c) |
|
|
0.59 |
% |
|
|
0.59 |
% |
|
|
0.59 |
% |
|
|
0.64 |
% |
|
|
0.65 |
% |
|
|
| Net Investment Income (Loss) |
|
|
2.18 |
% |
|
|
2.99 |
% |
|
|
3.71 |
% |
|
|
3.58 |
% |
|
|
4.11 |
% |
|
|
| Portfolio Turnover Rate |
|
|
41 |
% |
|
|
87 |
% |
|
|
67 |
% |
|
|
64 |
% |
|
|
102 |
% |
|
|
| (a) |
Per share numbers have been calculated using the average shares method. |
| (b) |
Based on net asset value, which does not reflect the sales charge or contingent deferred sales charge, if applicable. Total returns for periods of less than
one year, if any, are not annualized. |
| (c) |
The investment advisor and other service providers waived or reimbursed a portion of their fees. |
See Notes which are an integral part of the Financial Statements
ANNUAL REPORT / April
30, 2013
|
|
|
| 90 |
|
NOTES TO FINANCIAL STATEMENTS |
Wilmington Funds
April 30, 2013
Wilmington Funds (the “Trust”) is registered under the Investment Company Act of 1940, as amended (the “Act”), as an
open-end management investment company. The Trust consists of 23 portfolios, 7 of which are presented herein (individually referred to as a “Fund” or collectively as the “Funds”). The remaining 16 funds are presented in separate
reports.
|
|
|
|
Fund |
|
Investment Goal |
| Wilmington Broad Market Bond Fund |
|
The Fund seeks to provide current income and secondarily, capital growth. |
| (“Broad Market Bond Fund”)(d) |
|
|
|
|
| Wilmington Intermediate-Term Bond Fund |
|
The Fund seeks to provide current income and secondarily, capital growth. |
| (“Intermediate-Term Bond Fund”)(d) |
|
|
|
|
| Wilmington Short-Term Corporate Bond Fund |
|
The Fund seeks to provide current income |
| (“Short-Term Corporate Bond Fund”)(d) |
|
|
|
|
| Wilmington Short Duration Government Bond Fund (“Short Duration Government Bond Fund”)(d) |
|
The Fund seeks to provide current income and secondarily, preservation of capital. |
|
|
| Wilmington Municipal Bond Fund (“Municipal Bond Fund”)(d)* |
|
The Fund seeks a high level of income exempt from federal income tax, consistent with the preservation of capital. |
|
|
| Wilmington Maryland Municipal Bond Fund
(“Maryland Municipal Bond Fund”)(n) |
|
The Fund seeks to provide current income that is exempt from both federal and Maryland state and local income taxes. |
|
|
| Wilmington New York Municipal Bond Fund
(“New York Municipal Bond Fund”)(n) |
|
The Fund seeks to provide current income that is exempt from both federal and New York personal income taxes. |
(d) Diversified
(n) Non-diversified
| * |
Effective March 9, 2012, the Wilmington Municipal Bond Fund (the “WT Municipal Bond Fund”), a series of WT Mutual Fund, was reorganized into the Trust.
For financial reporting purposes, the WT Municipal Bond Fund’s financial and performance history prior to the reorganization has been carried forward and is reflected in the Fund’s financial statements and financial highlights. See Note 8
for additional information regarding the reorganization. |
The Trust offers 6 classes of shares: Class A,
Service Class, Select Class, Administrative Class, Class I and Institutional Class. All shares of the Trust have equal rights with respect to voting, except on class-specific matters.
On April 13, 2013, Class C shares of the Intermediate-Term Bond, Short-Term Corporate Bond and Short Duration Government Bond Funds
were terminated after the conversion to Class A of the Funds.
The assets of each portfolio are segregated and a
shareholder’s interest is limited to the portfolio in which shares are held.
| 2. |
SUMMARY OF SIGNIFICANT ACCOUNTING POLICIES |
The following is a summary of significant accounting policies consistently followed by the Funds in the preparation of their financial statements. These policies are in conformity with U.S. generally
accepted accounting principles (“GAAP”). The preparation of financial statements in conformity with GAAP requires management to make estimates and assumptions that affect the amounts of assets, liabilities, expenses and revenues reported
in the financial statements. Actual results could differ from those estimated.
Investment Valuation – Fair value
of the Funds’ portfolio securities are determined as follows:
| |
• |
|
investments in open-end regulated investment companies are valued at net asset value (“NAV”); |
| |
• |
|
for fixed income securities, according to prices as furnished by an independent pricing service, except that fixed income securities with remaining
maturities of less than 60 days at the time of purchase are valued at amortized cost; and |
| |
• |
|
for all other securities at fair value as determined in accordance with procedures established by and under the general supervision of the Board of
Trustees. (“Trustees”) |
The Trust follows the authoritative guidance (GAAP) for fair value
measurements. The guidance establishes a framework for measuring fair value and a hierarchy for inputs used in measuring fair value that maximizes the use of observable inputs and minimizes the use of unobservable inputs by requiring that the most
observable inputs be used when available. The guidance establishes three tiers of inputs that may be used to measure fair value. The three tiers of inputs are summarized at the end of each Fund’s Portfolio of Investments. The inputs or
methodology used for valuing securities are not necessarily an indication of the risk associated with investing in those securities.
The Funds’ policy is to disclose transfers between levels based on valuations at the beginning of the reporting period. Each portfolio may hold securities which are periodically fair valued in
accordance with the Funds’ fair value procedures. This may result in movements between Levels 1, 2 and 3 throughout the period. As of April 30, 2013, there were no transfers between Levels 1, 2 and 3 assets and liabilities, based on
levels assigned to securities at the beginning of the period. Pursuant to the Funds’ fair value procedures noted previously, fixed income securities and money market instruments are generally categorized as Level 2 securities in the fair value
hierarchy.
April 30, 2013 / ANNUAL REPORT
|
|
|
|
|
| NOTES TO FINANCIAL STATEMENTS (continued) |
|
|
91 |
|
Investments for which there are no such quotations, or for which quotations do not appear
reliable, are valued at fair value as determined in accordance with procedures established by and under the general supervision of the Trustees. These valuations are typically categorized as Level 2 or Level 3 securities in the fair value hierarchy.
Repurchase Agreements – Repurchase agreements are transactions in which a Fund buys a security from a dealer or
bank and agrees to sell the security back at a mutually agreed upon time and price. The repurchase price exceeds the sale price, reflecting the Fund’s return on the transaction. It is each Fund’s policy to require the counterparty to a
repurchase agreement to transfer to the Funds’ custodian or sub-custodian eligible securities or cash with a market value (after transaction costs) at least equal to the repurchase price to be paid under the repurchase agreement. The eligible
securities are transferred to accounts with the custodian or sub-custodian in which the Funds hold a “securities entitlement” and exercise “control” as those terms are defined in the Uniform Commercial Code. The Funds have
established procedures for monitoring the market value of the transferred securities and requiring the transfer of additional eligible securities if necessary to equal at least the repurchase price. These procedures also allow the counterparty to
require securities to be transferred from the account to the extent that their market value exceeds the repurchase price or in exchange for other eligible securities of equivalent market value.
The insolvency of the counterparty or other failure to repurchase the securities may delay the disposition of the underlying securities or
cause the Funds to receive less than the full repurchase price.
Investment Income, Gains and Losses, Expenses and
Distributions – Interest income and expenses are accrued daily. Dividends and distributions to shareholders are recorded on the ex-dividend date. Investment transactions are accounted for on a trade date basis for financial reporting
purposes. Inflation/deflation adjustments on Treasury Inflation–Protected Securities are included in interest income. Realized gains and losses from investment transactions are recorded on an identified cost basis.
Expenses of the Trust, which are directly identifiable to a specific Fund, are applied to that Fund. Expenses which are not identifiable
to a specific Fund are allocated in such a manner as deemed equitable, taking into consideration the nature and type of expense.
All Funds offer multiple classes of shares. Investment income, realized gains and losses, and certain fund-level expenses are allocated to
each class based on relative daily net assets, except that each class bears certain expenses unique to that class such as distribution and shareholder services fees. Distributions are declared separately for each class. No class has preferential
distribution rights; differences in per share distributions rates are generally due to differences in class specific expenses. Distributions from net realized gains, if any, are declared and paid to shareholders annually. Distributions from net
investment income are declared daily and paid monthly.
Premium and Discount Amortization/Accretion and Paydown Gains and
Losses – All premiums and discounts on fixed income securities are amortized/accreted for financial statement purposes. Gains and losses realized on principal payment of mortgage-backed securities (paydown gains and losses) are classified
as part of investment income.
Federal Taxes – It is the Funds’ policy to comply with the Subchapter M
provision of the Internal Revenue Code of 1986, as amended (the “Code”), and to distribute to shareholders each year substantially all of their income. Accordingly, no provisions for Federal income tax are necessary.
Withholding taxes and where appropriate, deferred withholding taxes, on foreign interest, dividends and capital gains have been provided
for in accordance with the applicable country’s tax rules and rates.
When-Issued and Delayed Delivery Transactions
– The Funds may engage in when-issued or delayed delivery transactions. The Funds record when-issued securities on the trade date and maintain security positions such that sufficient liquid assets will be available to make payment for the
securities purchased. Securities purchased on a when-issued or delayed delivery basis are marked to market daily and begin earning interest on the settlement date. Losses may occur on these transactions due to changes in market conditions or the
failure of counterparties to perform under the contract.
The Funds may transact in “To Be Announced Securities”
(“TBAs”). As with other delayed delivery transactions, a seller agrees to issue TBAs at a future date. However, the seller does not specify the particular securities to be delivered. Instead, the Funds agree to accept any security that
meets specified criteria. For example, in a TBA mortgage transaction, the Fund and seller would agree upon the issuer, interest rate and terms of the underlying mortgages. The Funds record TBAs on the trade date utilizing information associated with
the specified terms of the transactions as opposed to the specific mortgages. TBAs are marked to market daily and begin earning interest of the settlement date. Losses may occur due to the fact the actual underlying mortgages received may be less
favorable than those anticipated by the Funds.
Restricted Securities – Restricted securities are securities that
either (a) cannot be offered for public sale without first being registered, or being able to take advantage of an exemption from registration, under the Securities Act of 1933, as amended, or (b) are subject to contractual restrictions on
public sales. In some cases, when a security cannot be offered for public sale without first being registered, the issuer of the restricted security has agreed to register such securities for resale, at the issuer’s expense, either upon demand
by the Fund or in connection with another registered offering of the securities. Many such restricted securities may be resold in the secondary market in transactions exempt from registration. Restricted securities may be determined to be liquid
under criteria established by the Trustees. A Fund will not incur any registration costs upon such resales. The Fund’s restricted securities are valued at the price provided by dealers in the secondary market or, if no market prices are
available, at the fair value as determined in accordance with procedures established by and under the general supervision of the Trustees.
ANNUAL REPORT / April
30, 2013
|
|
|
| 92 |
|
NOTES TO FINANCIAL STATEMENTS (continued) |
Dollar Roll Transactions – The Short Duration Government Bond Fund,
Intermediate-Term Bond Fund and Broad Market Bond Fund may enter into dollar roll transactions, with respect to mortgage securities issued by GNMA, FNMA, and FHLMC, in which the Funds sell mortgage securities to financial institutions and
simultaneously agree to accept substantially similar (same type, coupon, maturity) securities at a later date at an agreed upon price. Dollar roll transactions, which are treated as purchases and sales, will not exceed 12 months. There were no
dollar roll transactions outstanding during the year ended April 30, 2013.
Lending of Portfolio Securities –
The Trust has entered into an agreement with their custodian whereby the custodian may lend securities owned by the Funds to brokers, dealers and other financial organizations. Any increase or decrease in the fair value of securities loaned and any
interest or dividends earned on those securities during the term of the loan would be for the account of the Fund. In exchange for lending securities under the terms of the agreement with their custodian, the Funds receive a lender’s fee. Fees
earned by the Funds on securities lending are recorded as income. Loans of securities by the Funds are collateralized by cash, U.S. government securities or money market instruments that are maintained at all times in an amount at least equal to the
current market value of the loaned securities plus a margin which varies depending on the type of securities owned. The custodian establishes and maintains the collateral in a segregated account. The Funds have the right under the lending agreement
to recover the securities from the borrower on demand.
Investments purchased with cash collateral are presented on the
portfolios of investments under the caption “Cash Collateral Invested for Securities on Loan.”
As of April 30,
2013, the Funds listed below had securities with the following values on loan:
|
|
|
|
|
|
|
|
|
| Fund
|
|
Value of
Securities
on Loan |
|
|
Value
of
Collateral |
|
| Broad Market Bond Fund |
|
$ |
5,338,193 |
|
|
$ |
5,482,930 |
|
| Intermediate-Term Bond Fund |
|
|
13,397,278 |
|
|
|
13,736,201 |
|
| Short-Term Corporate Bond Fund |
|
|
3,694,502 |
|
|
|
3,798,041 |
|
The Funds maintain the risk of any loss on the securities on loan as well as the potential loss on
investments purchased with cash collateral received from securities lending.
| 3. |
FEDERAL TAX INFORMATION |
The timing and character of income and capital gain distributions are determined in accordance with income tax regulations, which may differ from GAAP. These differences are due in part to the tax
treatment of expiring capital loss carryforwards, reclassification of ordinary loss to short-term gains, market discount reclass, partnership adjustments, discount accretion/premium amortization on debt securities and distributions recognition on
income distribution payable.
As of April 30, 2013, there are no uncertain tax positions that would require financial
statement recognition, de-recognition or disclosure. The Funds’ federal tax returns filed for the periods ended 2012, 2011, and 2010, as well as the current tax year, remain subject to examination by the Internal Revenue Service.
For the year ended April 30, 2013, permanent differences identified and reclassified among the components of net assets were as
follows:
|
|
|
|
|
|
|
|
|
|
|
|
|
| Fund
|
|
Paid-in
Capital |
|
|
Undistributed
(Distributions
in Excess of) Net
Investment Income |
|
|
Accumulated
Net Realized
Gain
(Loss) |
|
| Broad Market Bond Fund |
|
$ |
— |
|
|
$ |
666,659 |
|
|
$ |
(666,659 |
) |
| Intermediate-Term Bond Fund |
|
|
— |
|
|
|
193,130 |
|
|
|
(193,130 |
) |
| Short-Term Corporate Bond Fund |
|
|
— |
|
|
|
73,454 |
|
|
|
(73,454 |
) |
| Short Duration Government Bond Fund |
|
|
(385,099 |
) |
|
|
1,254,020 |
|
|
|
(868,921 |
) |
| Municipal Bond Fund |
|
|
— |
|
|
|
(2,635 |
) |
|
|
2,635 |
|
| Maryland Municipal Bond Fund |
|
|
— |
|
|
|
48,564 |
|
|
|
(48,564 |
) |
| New York Municipal Bond Fund |
|
|
— |
|
|
|
(6,573 |
) |
|
|
6,573 |
|
April 30, 2013 / ANNUAL REPORT
|
|
|
|
|
| NOTES TO FINANCIAL STATEMENTS (continued) |
|
|
93 |
|
The tax character of distributions for the corresponding years or periods as reported on the
Statements of Changes in Net Assets were as follows:
|
|
|
|
|
|
|
|
|
|
|
|
|
|
|
|
|
| |
|
2013 |
|
|
2012 |
|
| Fund |
|
Ordinary
Income* |
|
|
Long-Term
Capital
Gains |
|
|
Ordinary
Income* |
|
|
Long-Term
Capital
Gains |
|
| Broad Market Bond Fund |
|
|
$10,116,058 |
|
|
|
$3,610,860 |
|
|
|
$10,360,344 |
|
|
|
$3,395,176 |
|
| Intermediate-Term Corporate Bond Fund |
|
|
6,535,290 |
|
|
|
2,093,369 |
|
|
|
5,573,369 |
|
|
|
1,895,361 |
|
| Short-Term Corporate Bond Fund |
|
|
2,501,043 |
|
|
|
158,321 |
|
|
|
3,118,418 |
|
|
|
341,243 |
|
| Short Duration Government Bond Fund |
|
|
2,620,248 |
|
|
|
600,449 |
|
|
|
2,933,381 |
|
|
|
— |
|
| Municipal Bond Fund |
|
|
4,924,173 |
** |
|
|
2,448,254 |
|
|
|
3,352,554 |
*** |
|
|
1,743,974 |
|
| Maryland Municipal Bond Fund |
|
|
1,901,372 |
** |
|
|
412,418 |
|
|
|
4,081,923 |
*** |
|
|
— |
|
| New York Municipal Bond Fund |
|
|
2,282,130 |
** |
|
|
— |
|
|
|
3,071,008 |
*** |
|
|
— |
|
| * |
For tax purposes, short-term capital gain distributions are considered ordinary income distributions. |
| ** |
Included in this amount is tax exempt income of $3,946,261, $1,863,194 and $2,282,130, respectively. |
| *** |
Included in this amount is tax exempt income of $3,344,842, $4,047,836 and $3,054,578, respectively. |
For the year ended June 30, 2011, the tax character of distributions paid for the Municipal Bond Fund was ordinary income in the
amount of $5,577,824, (including tax exempt income in the amount of $5,155,523) and long-term capital gains in the amount of $888,158.
As of April 30, 2013, the components of distributable earnings on a tax basis were as follows:
|
|
|
|
|
|
|
|
|
|
|
|
|
|
|
|
|
|
|
|
|
| Fund |
|
Undistributed/
(Over Distributed)
Ordinary Income |
|
|
Undistributed
Long-Term
Capital
Gains |
|
|
Other
Timing
Differences
|
|
|
Unrealized
Appreciation
(Depreciation)
|
|
|
Capital Loss
Carryforwards
and
Deferrals |
|
| Broad Market Bond Fund |
|
$ |
1,231,159 |
|
|
|
$2,089,084 |
|
|
|
$(629,272) |
|
|
|
$13,892,857 |
|
|
|
— |
|
| Intermediate-Term Bond Fund |
|
|
632,408 |
|
|
|
2,597,728 |
|
|
|
(353,557) |
|
|
|
9,738,170 |
|
|
|
— |
|
| Short-Term Corporate Bond Fund |
|
|
628,131 |
|
|
|
887,425 |
|
|
|
(150,601) |
|
|
|
1,748,073 |
|
|
|
— |
|
| Short Duration Government Bond Fund |
|
|
650,946 |
|
|
|
— |
|
|
|
(200,694) |
|
|
|
3,134,453 |
|
|
|
(2,185,119 |
) |
| Municipal Bond Fund |
|
|
916,583 |
|
|
|
1,599,410 |
|
|
|
(428,348) |
|
|
|
14,372,003 |
|
|
|
— |
|
| Maryland Municipal Bond Fund |
|
|
322,421 |
|
|
|
784,604 |
|
|
|
(253,997) |
|
|
|
4,625,188 |
|
|
|
— |
|
| New York Municipal Bond Fund |
|
|
184,374 |
|
|
|
— |
|
|
|
(159,510) |
|
|
|
6,157,384 |
|
|
|
(1,688,009 |
) |
Under the recently enacted Regulated Investment Company Modernization Act of 2010, the Funds are
permitted to carry forward capital losses incurred in taxable years beginning after December 22, 2010 for an unlimited period. However, any losses incurred during those future taxable years will be required to be utilized prior to the losses
incurred in pre-enactment taxable years. As a result of this ordering rule, pre-enactment capital loss carryforwards may have an increased likelihood to expire unused. Additionally, post-enactment capital losses that are carried forward will retain
their character as either short-term or long-term capital losses rather than being considered all short-term as under previous law.
At April 30, 2013, the following Funds had capital loss carryforwards which will reduce each Fund’s taxable income arising from future net realized gain on investments, if any, to the extent
permitted by the Code and thus will reduce the amount of distributions to shareholders which would otherwise be necessary to relieve the Fund of any liability for federal income tax. Pursuant to the Code, such capital loss carryforwards will expire
as follows:
|
|
|
|
|
|
|
|
|
|
|
|
|
|
|
|
|
|
|
|
|
|
|
|
|
|
|
|
|
|
|
|
|
| |
|
|
|
|
|
|
|
|
|
|
Capital
Loss Available Through |
|
|
|
|
|
Short-Term
Post-Effective
No |
|
|
Total Capital Loss |
|
| Fund |
|
2014
|
|
|
2015
|
|
|
2016
|
|
|
2017
|
|
|
2018
|
|
|
2019
|
|
|
Expiration |
|
|
Carryforwards |
|
| Short Duration Government Bond Fund |
|
|
$1,434,935 |
|
|
|
$129,435 |
|
|
|
$— |
|
|
|
$— |
|
|
|
$— |
|
|
|
$108,426 |
|
|
|
$428,120 |
|
|
|
$2,100,916 |
|
|
|
|
|
|
|
|
|
|
| New York Municipal Bond Fund |
|
|
— |
|
|
|
— |
|
|
|
— |
|
|
|
— |
|
|
|
1,688,009 |
|
|
|
— |
|
|
|
— |
|
|
|
1,688,009 |
|
The Funds used capital loss carryforwards as follows to offset taxable capital gains realized during the
period ended April 30, 2013:
|
|
|
|
|
| Fund |
|
Capital Loss
Carryforwards
Used
|
|
| Short Duration Government Bond Fund |
|
$ |
72,430 |
|
| Maryland Municipal Bond Fund |
|
|
212,739 |
|
| New York Municipal Bond Fund |
|
|
1,663,200 |
|
ANNUAL REPORT / April
30, 2013
|
|
|
| 94 |
|
NOTES TO FINANCIAL STATEMENTS (continued) |
The Short Duration Government Bond Fund expired capital loss carryforwards in the amount of
$385,099.
Under current tax regulations, capital losses on securities transactions realized after October 31 may be
deferred and treated as occurring on the first day of the following fiscal year. Under the recently enacted Regulated Investment Company Modernization Act of 2010, the Funds are permitted to defer taxable ordinary income losses incurred after
December 31 and treat as occurring on the first day of the following fiscal year. Post-October and Late Year losses deferred to May 1, 2013 are as follows:
|
|
|
|
|
|
|
| Fund |
|
Ordinary Post-December
Losses
|
|
Short-Term
Post-October/
Late
Year
Losses
|
|
Long-Term
Post-October/
Late
Year
Losses
|
| Short Duration Government Bond Fund |
|
$— |
|
$84,203 |
|
$— |
| 4. |
ADVISORY FEES, SERVICING FEES, AND OTHER SERVICE PROVIDERS |
Investment Advisor – Wilmington Funds Management Corporation (“WFMC”) serves as the Investment Advisor to each of the Funds. Wilmington Trust Investment Advisors, Inc.
(“WTIA”) provides sub-advisory services to the Funds. WFMC and WTIA are wholly-owned subsidiaries of M&T Bank Corporation. For its services, the Funds pay WFMC an annual investment advisory fee, accrued and paid daily, based on a
percentage of each Fund’s average daily net assets as described below. WFMC, not the Funds, pays WTIA for its services.
|
|
|
| Fund |
|
Advisory Fee
Annual Rate |
| Broad Market Bond Fund |
|
0.50% |
| Intermediate-Term Bond Fund |
|
0.50% |
| Short-Term Corporate Bond Fund |
|
0.50% |
| Short Duration Government Bond Fund |
|
0.50% |
| Municipal Bond Fund |
|
0.50% |
| Maryland Municipal Bond Fund |
|
0.50% |
| New York Municipal Bond Fund |
|
0.50% |
WFMC and the Funds’ distributor and shareholder service providers have contractually agreed to waive
their fees and/or reimburse expenses through August 31, 2013, so that total annual fund operating expenses paid by the Funds (not including the effects of dividends or interest on short positions, acquired fund fees and expenses, taxes, or
other extraordinary expenses expressed as an annualized percentage of average daily net assets), will not exceed the expense limitations set forth below.
|
|
|
|
|
| |
|
Contractual
Expense Limitations |
| Fund |
|
Class A |
|
Class I |
| Broad Market Bond Fund |
|
1.00% |
|
0.65% |
| Intermediate-Term Bond Fund |
|
0.95% |
|
0.60% |
| Short-Term Corporate Bond Fund |
|
0.86% |
|
0.61% |
| Short Duration Government Bond Fund |
|
0.89% |
|
0.64% |
| Municipal Bond Fund |
|
0.86% |
|
0.61% |
| Maryland Municipal Bond Fund |
|
0.95% |
|
0.67% |
| New York Municipal Bond Fund |
|
0.84% |
|
0.59% |
Administrative Fee – The Bank of New York Mellon (“BNYM”) provides the Trust with
fund administration services. Effective October 1, 2012, WFMC replaced WTIA as Co-Administrator for the Funds. WFMC in its role as co-administrator provides the Funds with certain administrative personnel and services necessary to operate the
Funds. These services were provided for at an aggregate annual fee as specified below.
|
|
|
|
|
| Administrator
|
|
Maximum
Fee |
|
Average Aggregate Daily Net Assets of the Trust |
| WFMC |
|
0.033% |
|
On the first $5 billion |
| |
|
0.020% |
|
On the next $2 billion |
| |
|
0.016% |
|
On the next $3 billion |
| |
|
0.015% |
|
On assets in excess of $10 billion |
| BNYM |
|
0.0285% |
|
On the first $500 million |
| |
|
0.0280% |
|
On the next $500 million |
| |
|
0.0275% |
|
On assets in excess of $1 billion |
WFMC may voluntarily choose to waive any portion of its fee. WFMC can modify or terminate its voluntary
waiver at any time at its sole discretion. For the year ended April 30, 2013, WTIA and WFMC did not waive any administrative personnel and services fee.
April 30, 2013 / ANNUAL REPORT
|
|
|
|
|
| NOTES TO FINANCIAL STATEMENTS (continued) |
|
|
95 |
|
Distribution Services Fee – The Trust has adopted a Distribution Services Plan
(the “Plan”) pursuant to Rule 12b-1 under the Act. The Plan allows the Funds to pay fees to financial intermediaries, which may be paid through ALPS Distributors, Inc. (“ALPS”), the principal distributor, at an annual rate of up
to 0.25% of the average daily net assets of the Funds’ Class A shares for the sale, distribution, administration, customer servicing and recordkeeping of these shares.
The Funds may reduce the maximum amount of distribution services fees it pays from time to time at its sole discretion. In addition, a
financial intermediary (including ALPS, the Advisor or their affiliates), may voluntarily waive or reduce any fees to which they are entitled.
For the year ended April 30, 2013, M&T Securities, Inc. and Manufacturers and Traders Trust Company (together “M&T”), affiliates of the Advisor, received a portion of the fees paid
by the Funds which are listed below:
|
|
|
|
|
| Fund |
|
Distribution
Fees
|
|
| Broad Market Bond Fund |
|
$ |
11,863 |
|
| Intermediate-Term Bond Fund |
|
|
9,678 |
|
| Short-Term Corporate Bond Fund |
|
|
1,655 |
|
| Short Duration Government Bond Fund |
|
|
34,574 |
|
| Municipal Bond Fund |
|
|
25,179 |
|
| Maryland Municipal Bond Fund |
|
|
75,124 |
|
| New York Municipal Bond Fund |
|
|
66,499 |
|
Sales Charges – The Class A shares of all the Funds bear front-end sales charges.
For the year ended April 30, 2013, M&T received the amounts listed below from sales charges on the sale of Class A shares.
|
|
|
|
|
| Fund |
|
Sales Charges from
Class
A |
|
| Broad Market Bond Fund |
|
$ |
5,223 |
|
| Intermediate-Term Bond Fund |
|
|
1,763 |
|
| Short-Term Corporate Bond Fund |
|
|
47 |
|
| Short Duration Government Bond Fund |
|
|
1,501 |
|
| Municipal Bond Fund |
|
|
11,940 |
|
| Maryland Municipal Bond Fund |
|
|
6,488 |
|
| New York Municipal Bond Fund |
|
|
9,955 |
|
Shareholder Services Fee – Pursuant to a Shareholder Services Plan adopted by the Funds and
administered by ALPS, the Funds may pay up to 0.25% of the average daily net assets of each Fund’s Class A and Class I to financial intermediaries (which may include ALPS, the Advisor or their affiliates) for providing shareholder services
and maintaining shareholder accounts. M&T has entered into a Shareholders Services Agreement with ALPS, under which it is entitled to receive up to 0.25% of the average daily net assets of each Fund’s shares for whom M&T provides
shareholder services. The Funds may reduce the maximum amount of shareholder service fees it pays from time to time at its sole discretion. In addition, a financial intermediary (including M&T) may waive or reduce any fees to which they are
entitled.
For the year ended April 30, 2013, M&T received a portion of the fees paid by the following Funds which are
listed below:
|
|
|
|
|
| Fund |
|
Shareholder
Services
Fee |
|
| Broad Market Bond Fund |
|
$ |
3,572 |
|
| Intermediate-Term Bond Fund |
|
|
2,587 |
|
| Short Duration Government Bond Fund |
|
|
22 |
|
| Maryland Municipal Bond Fund |
|
|
9,015 |
|
Other Service Providers – Foreside Management Services, LLC (“FMS”) provides a
Principal Executive Officer to the Trust. FMS has no role in determining the investment policies or which securities are to be sold or purchased by the Trust or its Funds.
BNYM provides fund accounting and custody services to the Trust.
BNY Mellon Investment Servicing
(U.S.) Inc. provides transfer agency services to the Trust.
General – Certain Officers of the Trust are also
Officers or employees of the above companies that provide services to the Funds, and during their terms of office, receive no compensation from the Funds. The Trust’s Statement of Additional Information includes additional information about the
Trustees.
ANNUAL REPORT / April
30, 2013
|
|
|
| 104 |
|
96 NOTES TO FINANCIAL STATEMENTS (continued) |
| 5. |
INVESTMENT TRANSACTIONS |
Purchases and sales of investments, excluding short-term obligations, U.S. Government Securities and in-kind transactions, for the year ended April 30, 2013 were as follows:
|
|
|
|
|
|
|
|
|
| |
|
Investments |
|
| Fund
|
|
Purchases |
|
|
Sales |
|
| Broad Market Bond Fund |
|
$ |
288,108,096 |
|
|
$ |
289,081,802 |
|
| Intermediate-Term Bond Fund |
|
|
105,197,003 |
|
|
|
132,732,861 |
|
| Short-Term Corporate Bond Fund |
|
|
183,554,838 |
|
|
|
186,046,499 |
|
| Short Duration Government Bond Fund |
|
|
35,402,045 |
|
|
|
88,052,266 |
|
| Municipal Bond Fund |
|
|
75,616,099 |
|
|
|
72,168,353 |
|
| Maryland Municipal Bond Fund |
|
|
43,408,281 |
|
|
|
44,990,988 |
|
| New York Municipal Bond Fund |
|
|
43,916,366 |
|
|
|
43,792,449 |
|
Purchases and sales of investments of U.S. Government Securities for the year ended April 30, 2013
were as follows:
|
|
|
|
|
|
|
|
|
| |
|
U.S. Government Securities |
|
| Fund
|
|
Purchases |
|
|
Sales |
|
| Broad Market Bond Fund |
|
$ |
28,710,110 |
|
|
$ |
33,212,920 |
|
| Intermediate-Term Bond Fund |
|
|
16,825,066 |
|
|
|
31,000,964 |
|
| Short-Term Corporate Bond Fund |
|
|
21,844,891 |
|
|
|
24,827,439 |
|
| Short Duration Government Bond Fund |
|
|
8,995,273 |
|
|
|
6,716,425 |
|
Since Maryland Municipal Bond Fund and New York Municipal Bond Fund invest a substantial portion of their assets in issuers located in one state, they will be more susceptible to factors adversely
affecting issuers of that state than would be a comparable tax-exempt mutual fund that invests nationally. In order to reduce the credit risk associated with such factors, at April 30, 2013, 12.2% for Maryland Municipal Bond Fund and 39.3% for
New York Municipal Bond Fund of the total market value of the securities in the portfolio of investments are backed by letters of credit or bond insurance of various financial institutions and financial guaranty assurance agencies. The largest
percentage of the total market value of investments insured by or supported (backed) by a letter of credit from any one institution or agency was 4.2% for Maryland Municipal Bond Fund and 21.9% for New York Municipal Bond Fund.
The Trust participated in a $20,000,000 unsecured, committed revolving line of credit (“LOC”) agreement with BNYM. The LOC was
made available for extraordinary or emergency purposes, primarily for financing redemption payments. Borrowings are charged interest at a rate of 1.25% per annum over the greater of the Federal Funds Rate or the overnight LIBOR Rate. The LOC
included a commitment fee of 0.12% per annum on the daily unused portion. In addition, an upfront commitment fee of 0.02% was paid to BNYM. The termination date of this LOC is March 10, 2014. The Funds did not utilize the LOC for the year
ended April 30, 2013.
REORGANIZATION
- FISCAL YEAR 2012
On February 21, 2012, the Board approved an Agreement and Plan of Reorganization (the
“Reorganization” to transfer all of the assets of Wilmington Broad Market Fund, Wilmington Short/Intermediate-Term Bond Fund, and Wilmington Municipal Bond Fund, each a series of WT Mutual Fund, and the MTB U.S. Government Bond Fund, a
series of the Trust (the “Acquired Funds”) in exchange for shares of the series of the Trust (the “Acquired Funds”) in exchange for shares of the series of the Trust shown below (“the Acquiring Funds”).
The Reorganization is believed to be in the best interest of shareholders as combining the series of WT Funds and the Trust onto a single
operating platform will create a larger fund family that will offer a broader range of investment options. Additionally, the Reorganization is believed to present the opportunity to achieve asset growth through combined distribution networks, to
achieve economies of scale, and to operate with greater efficiency and lower overall costs. The shareholders of the Acquired Funds approved the Reorganization at a meeting on February 21, 2012 and the Reorganization took place on March 9,
2012. The Reorganization was treated as tax-free reorganization for federal income tax purposes and, accordingly, the basis of the assets of each Acquiring Fund reflected the historical basis of the assets of each respective Acquired Fund as of the
date of the Reorganization. WFMC and its affiliates bore the expenses related to the Reorganization,except for brokerage fees and other transaction costs associated with the disposition and/or purchase of securities in contemplation of or as a
result of the Reorganization.
April 30, 2013 / ANNUAL REPORT
|
|
|
|
|
| NOTES TO FINANCIAL STATEMENTS (continued) |
|
|
97 |
|
|
|
|
|
|
|
New
Name after the Reorganizations |
|
Acquiring Funds |
|
Acquired Funds |
| Wilmington Broad Market Bond Fund |
|
MTB Income Fund |
|
Wilmington Broad Market Bond Fund |
| Wilmington Intermediate-Term Bond |
|
MTB Intermediate-Term Bond Fund |
|
Wilmington Short/Intermediate-Term Bond Fund |
| Wilmington Short Duration Government Bond Fund |
|
MTB Short Duration Government Bond Fund |
|
MTB U.S. Government Bond Fund |
| Wilmington Municipal Bond Fund |
|
Wilmington Municipal Bond Fund |
|
Wilmington Municipal Bond Fund |
In exchange for their shares, shareholders of the Acquired Funds received shares of the Acquiring Funds
with an aggregate net asset value equal to the aggregate net asset value of their shares immediately prior to the Reorganization. The following information summarizes the essential elements of the Reorganization as of March 9, 2012:
|
|
|
|
|
|
|
|
|
|
|
|
|
|
|
|
|
| Wilmington
Broad Market Bond Fund |
|
Value of
Shares |
|
|
Acquired
Fund
Shares Prior to
Reorganization |
|
|
Shares Issued
by
Acquiring
Fund |
|
|
Net Assets |
|
| Acquiring Fund |
|
|
|
|
|
|
|
|
|
|
|
|
|
|
|
|
| MTB Income Fund |
|
|
|
|
|
|
|
|
|
|
|
|
|
$ |
234,005,891 |
|
| Acquired Funds |
|
|
|
|
|
|
|
|
|
|
|
|
|
|
|
|
| Wilmington Broad Market Bond Fund |
|
|
|
|
|
|
|
|
|
|
|
|
|
|
58,782,175 |
|
| Class A Shares in exchange for Class A |
|
$ |
1,867,478 |
|
|
|
183,086 |
|
|
|
183,257 |
|
|
|
|
|
| Institutional Shares in exchange for Class I |
|
|
56,914,697 |
|
|
|
5,582,079 |
|
|
|
5,674,917 |
|
|
|
|
|
| |
|
|
|
|
|
|
|
|
|
|
|
|
|
|
|
|
| |
|
|
|
|
|
|
|
|
|
|
|
|
|
$ |
292,788,066 |
|
| |
|
|
|
|
|
|
|
|
|
|
|
|
|
|
|
|
The net assets of the Acquired Fund included net unrealized appreciation on investments of $5,205,025 and
accumulated net realized gains of $2,566.
The financial statements of the Fund reflect the operations of the Acquiring Fund
for the period prior to the Reorganization and the combined fund for the period subsequent to the Reorganization. Because the combined investment portfolios have been managed as a single integrated portfolio since the Reorganization was completed,
it is not practicable to separate the amounts of revenue and earnings of the Acquired Fund that have been included in the combined fund’s Statement of Operations since the Reorganization was completed. Assuming the Reorganization had been
completed on May 1, 2011, the pro forma net investment income, net gain on investments and net increase in net assets from operations for the fiscal year ended April 30, 2012 would have been $9,552,266, $8,006,754 and $18,927,561,
respectively.
|
|
|
|
|
|
|
|
|
|
|
|
|
|
|
|
|
| Wilmington
Intermediate-Term Bond Fund |
|
Value of
Shares |
|
|
Acquired Fund
Shares
Prior to
Reorganization |
|
|
Shares Issued
by
Acquiring
Fund |
|
|
Net
Assets |
|
| Acquiring Fund |
|
|
|
|
|
|
|
|
|
|
|
|
|
|
|
|
| MTB Intermediate-Term Bond Fund |
|
|
|
|
|
|
|
|
|
|
|
|
|
$ |
114,500,229 |
|
| Acquired Funds |
|
|
|
|
|
|
|
|
|
|
|
|
|
|
|
|
| Wilmington Short/Intermediate-Term Bond Fund |
|
|
|
|
|
|
|
|
|
|
|
|
|
|
147,980,426 |
|
| Class A Shares in exchange for Class A |
|
$ |
4,443,745 |
|
|
|
422,307 |
|
|
|
418,433 |
|
|
|
|
|
| Institutional Shares in exchange for Class I |
|
|
143,536,681 |
|
|
|
13,503,815 |
|
|
|
13,527,639 |
|
|
|
|
|
| |
|
|
|
|
|
|
|
|
|
|
|
|
|
|
|
|
| |
|
|
|
|
|
|
|
|
|
|
|
|
|
$ |
262,480,655 |
|
| |
|
|
|
|
|
|
|
|
|
|
|
|
|
|
|
|
The net assets of the Acquired Fund included net unrealized appreciation on investments of $9,114,247 and
accumulated net realized gains of $8,512, respectively.
The financial statements of the Fund reflect the operations of the
Acquiring Fund for the period prior to the Reorganization and the combined fund for the period subsequent to the Reorganization. Because the combined investment portfolios have been managed as a single integrated portfolio since the Reorganization
was completed, it is not practicable to separate the amounts of revenue and earnings of the Acquired Fund that have been included in the combined fund’s Statement of Operations since the Reorganization was completed. Assuming the Reorganization
had been completed on May 1, 2011, the pro forma net investment loss, net gain on investments and net increase (decrease) in net assets from operations for the fiscal year ended April 30, 2012 would have been $6,687,727, $6,514,938 and
$13,202,666.
ANNUAL REPORT / April
30, 2013
|
|
|
| 98 |
|
NOTES TO FINANCIAL STATEMENTS (continued) |
|
|
|
|
|
|
|
|
|
|
|
|
|
|
|
|
|
| Wilmington
Short Duration Government Bond Fund |
|
Value of
Shares |
|
|
Acquired Fund
Shares Prior
to
Reorganization |
|
|
Shares Issued
by
Acquiring
Fund |
|
|
Net Assets |
|
| Acquiring Fund |
|
|
|
|
|
|
|
|
|
|
|
|
|
|
|
|
| MTB Short Duration Government Bond Fund |
|
|
|
|
|
|
|
|
|
|
|
|
|
$ |
123,764,502 |
|
| Acquired Funds |
|
|
|
|
|
|
|
|
|
|
|
|
|
|
|
|
| MTB U.S. Government Bond Fund |
|
|
|
|
|
|
|
|
|
|
|
|
|
|
63,847,406 |
|
| Class A |
|
$ |
5,861,284 |
|
|
|
585,561 |
|
|
|
599,123 |
|
|
|
|
|
| Class I |
|
|
57,986,122 |
|
|
|
5,791,381 |
|
|
|
5,916,183 |
|
|
|
|
|
| |
|
|
|
|
|
|
|
|
|
|
|
|
|
|
|
|
| |
|
|
|
|
|
|
|
|
|
|
|
|
|
$ |
187,611,908 |
|
| |
|
|
|
|
|
|
|
|
|
|
|
|
|
|
|
|
The net assets of the Acquired Fund included net unrealized depreciation on investments of $4,641,551 and
accumulated net realized losses of $2,927,170, respectively.
The financial statements of the Fund reflect the operations of
the Acquiring Fund for the period prior to the Reorganization and the combined fund for the period subsequent to the Reorganization. Because the combined investment portfolios have been managed as a single integrated portfolio since the
Reorganization was completed, it is not practicable to separate the amounts of revenue and earnings of the Acquired Fund that have been included in the combined fund’s Statement of Operations since the Reorganization was completed. Assuming the
Reorganization had been completed on May 1, 2011, the pro forma net investment income, net loss on investments and net increase in net assets from operations for the fiscal year ended April 30, 2012 would have been $4,262,763, $(90,446)
and $2,966,683.
In exchange for their shares (A Shares and Institutional Shares), shareholders of the WT Municipal Bond Fund
received an identical number of shares of the corresponding class (Class A and Class I) of the Municipal Bond Fund, with an aggregate net asset value equal to the aggregate net asset value of their shares immediately prior to the Reorganization. The
Municipal Bond Fund had no operations prior to March 9, 2012. The Wilmington Municipal Bond Fund investment objectives, policies and limitations were identical to those of the Municipal Bond Fund. Accordingly, for financial reporting purposes,
the operating history of the WT Municipal Bond Fund prior to the Reorganization is reflected in the financial statements and financial highlights.
REORGANIZATION - FISCAL YEAR 2013
On June 22, 2012, the Board
approved an Agreement and Plans of Reorganization (the “Reorganization”) which provided for the transfer of all the assets of the Wilmington Pennsylvania Municipal Bond Fund and the Wilmington Virginia Municipal Bond Fund, each a series of
the Trust, (the “Acquired Funds”) for shares of the Municipal Bond Fund (the “Acquiring Fund”). Shareholders approved the Plans at a meeting held on November 15, 2012 and the reorganization closed on December 3, 2012
based on net asset values determined as of the close of business on November 30, 2012. The acquisitions were accomplished through tax-free exchanges of assets and shares.
The purpose of this transaction was to combine the three Funds with the same Investment Manager and with substantially similar investment objectives, policies, and restrictions. Due to the small size of
the Acquired Funds, and the comparatively better prospects for asset growth of the Acquiring Fund, it was believed that the shareholders’ best interests would be served by reorganizing the Acquired Funds into the Acquiring Fund.
For financial reporting purposes, the Municipal Bond Fund was deemed to be the accounting survivor.
|
|
|
|
|
|
|
|
|
|
|
|
|
|
|
|
|
| Wilmington Municipal Bond Fund |
|
Value of
Shares |
|
|
Acquired Fund
Shares
Prior to
Reorganization |
|
|
Shares Issued
by
Acquiring
Fund |
|
|
Net Assets |
|
| Acquiring Fund |
|
|
|
|
|
|
|
|
|
|
|
|
|
|
|
|
| Wilmington Municipal Bond Fund |
|
|
|
|
|
|
|
|
|
|
|
|
|
$ |
156,582,398 |
|
| Acquired Funds |
|
|
|
|
|
|
|
|
|
|
|
|
|
|
|
|
| Wilmington Pennsylvania Municipal Bond Fund |
|
|
|
|
|
|
|
|
|
|
|
|
|
|
97,525,271 |
|
| Class A shares in exchange for Class A |
|
$ |
9,118,331 |
|
|
|
861,667 |
|
|
|
657,281 |
|
|
|
|
|
| Class I in exchange for Class I |
|
|
88,406,940 |
|
|
|
8,351,297 |
|
|
|
6,370,639 |
|
|
|
|
|
| Wilmington Virginia Municipal Bond Fund |
|
|
|
|
|
|
|
|
|
|
|
|
|
|
19,866,040 |
|
| Class A in exchange for Class A |
|
|
19,866,040 |
|
|
|
1,787,700 |
|
|
|
1,432,014 |
|
|
|
|
|
|
|
|
|
|
|
|
|
|
|
|
|
|
|
|
|
|
|
|
|
|
|
|
|
|
|
|
|
|
|
|
$ |
273,973,709 |
|
|
|
|
|
|
|
|
|
|
|
|
|
|
|
|
|
|
The net assets of the Acquired Funds included net unrealized appreciation on investments of $7,032,753 and
$1,288,589 and accumulated net realized gains of $1,384,529 and $239,773 for the Wilmington Pennsylvania Municipal Bond Fund and Wilmington Virginia Municipal Bond Fund, respectively.
The financial statements of the Fund reflect the operations of the Acquiring Fund for the period prior to the Reorganization and the combined fund
for the period subsequent to the Reorganization. Because the combined investment portfolios have been managed as a single integrated
April 30, 2013 / ANNUAL REPORT
|
|
|
|
|
| NOTES TO FINANCIAL STATEMENTS (continued) |
|
|
99 |
|
portfolio since the Reorganization was completed, it is not practicable to separate the
amounts of revenue and earnings of the Acquired Fund that have been included in the combined fund’s Statement of Operations since the Reorganization was completed. Assuming the Reorganization had been completed on May 1, 2012, the pro
forma net investment income, net gain on investments and net increase in net assets from operations for the fiscal year ended April 30, 2013 would have been $5,548,565, $20,218,458 and $25,767,023, respectively.
| 9. |
RECENT ACCOUNTING PRONOUNCEMENT |
In December 2011, the Financial Accounting Standards Board (“FASB”) issued Accounting Standards Update (“ASU”) No. 2011-11 regarding “Disclosures about Offsetting Assets and
Liabilities”. The amendments, which will be effective for annual reporting periods beginning on or after January 1, 2013 and interim periods within those annual periods, require an entity to disclose information about offsetting and
related arrangements for assets and liabilities, financial instruments and derivatives that are either currently offset in accordance with current requirements or are subject to enforceable master netting arrangements or similar agreements. At this
time, management is evaluating the implications of ASU No. 2011-11 and its impact on the financial statements has not yet been determined.
Management has evaluated events and transactions for potential recognition or disclosure in the financial statements through the date the
financial statements were issued. Management has determined that, there are no material events that would require disclosure in the Funds’ financial statements through this date.
ANNUAL REPORT / April
30, 2013
REPORT OF INDEPENDENT REGISTERED PUBLIC ACCOUNTING FIRM
TO THE SHAREHOLDERS AND BOARD OF TRUSTEES OF
WILMINGTON FUNDS
We have audited the accompanying statements of assets
and liabilities, including the portfolios of investments, of Wilmington Broad Market Bond Fund, Wilmington Intermediate-Term Bond Fund, Wilmington Short-Term Corporate Bond Fund, Wilmington Short Duration Government Bond Fund, Wilmington Municipal
Bond Fund, Wilmington Maryland Municipal Bond Fund and Wilmington New York Municipal Bond Fund (seven of the series constituting the Wilmington Funds) (the “Funds”) as of April 30, 2013, and the related statements of operations for
the year then ended, and the statements of changes in net assets and financial highlights for each of the years or periods indicated therein. These financial statements and financial highlights are the responsibility of the Funds’ management.
Our responsibility is to express an opinion on these financial statements and financial highlights based on our audits.
We
conducted our audits in accordance with standards of the Public Company Accounting Oversight Board (United States). Those standards require that we plan and perform the audit to obtain reasonable assurance about whether the financial statements and
financial highlights are free of material misstatement. We were not engaged to perform an audit of the Funds’ internal control over financial reporting. Our audits included consideration of internal control over financial reporting as a basis
for designing audit procedures that are appropriate in the circumstances, but not for the purpose of expressing an opinion on the effectiveness of the Funds’ internal control over financial reporting. Accordingly, we express no such opinion. An
audit also includes examining, on a test basis, evidence supporting the amounts and disclosures in the financial statements and financial highlights, assessing the accounting principles used and significant estimates made by management, and
evaluating the overall financial statement presentation. Our procedures included confirmation of securities owned as of April 30, 2013, by correspondence with the custodian and brokers, or by other appropriate auditing procedures where replies
from the brokers were not received. We believe that our audits provide a reasonable basis for our opinion.
In our opinion,
the financial statements and financial highlights referred to above present fairly, in all material respects, the financial position of the Wilmington Broad Market Bond Fund, Wilmington Intermediate-Term Bond Fund, Wilmington Short-Term Corporate
Bond Fund, Wilmington Short Duration Government Bond Fund, Wilmington Municipal Bond Fund, Wilmington Maryland Municipal Bond Fund and Wilmington New York Municipal Bond Fund at April 30, 2013, the results of their operations for the year then
ended, and the changes in their net assets and their financial highlights for each of the years or periods indicated therein, in conformity with U.S. generally accepted accounting principles.

Philadelphia, Pennsylvania
June 28, 2013
April 30, 2013 / ANNUAL REPORT
|
|
|
|
|
| BOARD OF TRUSTEES AND TRUST OFFICERS |
|
|
101 |
|
BOARD OF TRUSTEES AND TRUST OFFICERS
The following tables give information about each Trustee and the senior officers of the Trust. The tables separately list Trustee members
who are “interested persons” of the Fund (i.e., “Interested” Trustees) and those who are not (i.e., “Independent” Trustees). The Trust is comprised of 23 funds. Unless otherwise noted, the business address of each
Trustee and senior officer is 111 South Calvert Street, 26th floor, Baltimore, Maryland 21202. Each Trustee oversees all portfolios of the Trust and serves for an indefinite term. The Trust’s Statement of Additional Information includes
additional information about the Trustees and is available, without charge and upon request, by calling 1-800-836-2211.
INTERESTED TRUSTEES
BACKGROUND
|
|
|
|
Name
Address
Birth date
Position With
Trust Date Service
Began |
|
Principal Occupations and Other Directorships Held for Past Five
Years |
|
|
| R. Samuel Fraundorf, CFA, CPA* Birth date:
4/64 TRUSTEE Began serving: March 2012 |
|
Principal Occupations: President of WTIA, President of Wilmington Trust Investment Managements (“WTIM”), Director of Wilmington Funds Management Corporation (formerly known
as Rodney Square Management Corporation). |
|
|
|
|
Other Directorships Held: None. |
|
|
| |
|
Previous Positions: Chief Operating Officer of WTIM (1/08 to 1/09); Director of Research at WTIM
(8/04 to 1/08); Senior Manager and Tax Manager, KPMG Investment Advisors (1/99 to 8/04). |
|
|
| Robert J. Truesdell* Birth date:
11/55 TRUSTEE |
|
Principal Occupations: Group Vice President and Senior Investment Advisor for Wilmington Trust Wealth Advisory Services, M&T Bank.
|
| Began serving: December 2012 |
|
Other Directorships Held: None. |
|
|
| |
|
Previous Positions: Group Vice President, Managing Director and Chief Investment Officer, WTIA
(6/02-6/12) and WFMC (3/12 to 6/12). |
| * |
R. Samuel Fraundorf is “interested” due to positions he holds with WTIA and WTIM. Robert J. Truesdell is “interested” due to the
positions he currently holds with Wilmington Trust Wealth Advisory Services, M&T Bank, the parent of the Funds’ Advisor, and previous positions held with WTIA and WFMC. |
ANNUAL REPORT / April
30, 2013
|
|
|
| 102 |
|
BOARD OF TRUSTEES AND TRUST OFFICERS |
INDEPENDENT TRUSTEES BACKGROUND
|
|
|
|
Name
Birth date
Position with
Trust Date Service
Began |
|
Principal Occupations and Other Directorships Held for Past Five
Years |
|
|
| Joseph J. Castiglia Birth date: 7/34 CHAIRMAN AND TRUSTEE Began serving: February 1988 |
|
Principal Occupations: Private Investor, Consultant and Community Volunteer.
Other Directorships Held: Chairman (3/06 to 3/08), Trustee (3/04 to present) and
Treasurer (3/10 to 3/12), Buffalo Olmstead Parks Conservancy (1/05 to present); Chairman and Trustee, Buffalo Philharmonic Orchestra Foundation (1/06 to 1/12); Vice Chairman and Trustee, Christ the King Seminary (1/05 to present); Director, Dunn
Tire Corporation (1/05 to present); Chairman (5/12 to present), Director (1/08 to present), Read to Succeed Buffalo (1/08 to present); Director, Catholic Medical Partners (7/12 to present); Director, Roycroft Campus Corporation (8/12 to present).
Previous Positions: President, Chief Executive Officer, Vice
President, Treasurer, Controller and Vice Chairman, Pratt & Lambert United (manufacturing of paints, coatings and adhesives) (12/67 to 1/96); Chairman and Director, Catholic Health Systems of Western New York (1/97 to 5/03); Chairman and
Director, Blue Cross Blue Shield of Western and Central New York (health insurance provider) (5/92 to 5/07); Lead Director and Director, Energy East (gas and electric utility); Chairman and Director, Federal Reserve Bank of New York, Buffalo
Branch. |
|
|
| Robert H. Arnold Birth date: 3/44 TRUSTEE
Began serving: March 2012 |
|
Principal Occupations: Founder and Co-Manager, R.H. Arnold & Co. (financial consulting)
(1989 to present). Other Directorships Held: First Potomac Realty
Trust (real estate investment trust). |
|
|
| William H. Cowie, Jr. Birth date: 1/31 TRUSTEE
Began serving: September 2003 |
|
Principal Occupations: Retired.
Other Directorships Held: MedStar Community Health (not-for-profit owner and operator
of hospitals) (1972 to present). Previous Positions: Vice Chairman of Signet
Banking Corp. |
|
|
| John S. Cramer Birth date: 2/42 TRUSTEE
Began serving: December 2000 |
|
Principal Occupations: Senior Consultant, Yaffe & Co. (health care consulting) (2/06 to
present). Other Directorships Held: Director, Chairman of the
Executive Committee and Chairman of the Compensation Committee of ChekMed Corporation (6/03 to present). Previous Positions: President and Chief Executive Officer Emeriti, Pinnacle Health Systems (non-profit hospital and health care system in Central Pennsylvania).
|
|
|
| Daniel R. Gernatt, Jr. Birth date: 7/40 TRUSTEE
Began serving: February 1988 |
|
Principal Occupations: CEO, Gernatt Asphalt Products, Inc. (asphalt, sand and gravel products)
(1979 to present). Other Directorships Held: Director, Roswell Park
Alliance (2008 to present); Trustee, Gernatt Family Foundation. |
|
|
| Nicholas A. Giordano Birth date: 3/43 TRUSTEE
Began serving: March 2012 |
|
Principal Occupations: Consultant, financial services organizations (1997 to present).
Other Directorships Held: Kalmar Pooled Investment Trust; The RBB
Fund Inc. (19 portfolios) (registered investment companies); Independence Blue Cross; IntriCon Corporation (industrial furnaces and ovens).
Previous Positions: Interim President, LaSalle University (1998 to 1999); President and Chief Executive Officer, Philadelphia Stock Exchange (1981 to
1997). |
April 30, 2013 / ANNUAL REPORT
|
|
|
|
|
| BOARD OF TRUSTEES AND TRUST OFFICERS |
|
|
103 |
|
|
|
|
|
Name
Birth date
Position with
Trust Date Service
Began |
|
Principal Occupations and
Other Directorships Held for Past Five Years |
|
|
| Richard B. Seidel Birth date: 4/41 TRUSTEE
Began serving: September 2003 |
|
Principal Occupations: Chairman and Director, Girard Partners, Ltd. (investment advisor) (9/95 to
present); Chairman and Director, Girard Capital (broker-dealer) (3/09 to present). Other Directorships Held: Director, Tristate Capital Bank (9/07 to present). |
|
|
| OFFICERS |
|
|
|
Name
Address
Birth year
Positions with
Trust |
|
Principal
Occupations for Past Five Years and Previous Positions |
|
|
| Samuel Guerrieri Birth year: 1965 PRESIDENT Began serving: December 2012 |
|
Principal Occupations: President and Chief Executive Officer, M&T Securities, Senior Vice President, M&T Bank. |
|
|
| Michael D. Daniels Birth year: 1967 CHIEF OPERATING OFFICER Began serving: June 2007 |
|
Principal Occupations: Chief Operating Officer, Wilmington Funds and Wilmington Trust Investment
Advisors, Inc., Administrative Vice President, M&T Bank. Previous
Positions: Senior Vice President, MSD&T and MCA (2006 to 2007); Vice President, Calamos Asset Management (2004 to 2006); Vice President, JP Morgan Chase Bank (2002 to 2004).
|
|
|
| Jeffrey M. Seling Birth year: 1970 VICE PRESIDENT Began serving: June 2007 |
|
Principal Occupations: Vice President, M&T Bank and Wilmington Trust Investment Advisors,
Inc. Previous Positions: Vice President, MSD&T; Assistant Vice
President, Wells Fargo Bank; Assistant Vice President, JP Morgan Chase Bank. |
|
|
| Hope L. Brown Birth year: 1973 CHIEF COMPLIANCE OFFICER, AML COMPLIANCE OFFICER AND ASSISTANT SECRETARY
Began serving: December 2012 |
|
Principal Occupations: Vice President, Wilmington Trust Investment Advisors, Inc.; Chief
Compliance Officer, Wilmington Funds. Previous Positions: Assistant
Vice President, Lead Manager, Risk Management and Divisional Compliance for T. Rowe Price (2005 to 2010); Senior Compliance Officer, Manager of Compliance for RE Investment, Inc., RE Advisers, Inc. and the Homestead Funds (2001 to 2005).
|
|
|
| Eric B. Paul Birth year: 1974 VICE PRESIDENT Began serving: June 2008 |
|
Principal Occupations: Administrative Vice President, M&T Bank (2003 to present); Director of Proprietary Products, M&T Bank since April
2008. |
|
|
| Ralph V. Partlow, III
25 South Charles Street, 22nd floor Baltimore, MD 21201 Birth year: 1957 VICE PRESIDENT
Began serving: June 2010 |
|
Principal Occupation: Administrative Vice President and Deputy General Counsel, M&T Bank (2003
to present). Previous Positions: Vice President and Senior Counsel,
Allfirst Bank (1995-2003). |
ANNUAL REPORT / April
30, 2013
|
|
|
| 104 |
|
BOARD OF TRUSTEES AND TRUST OFFICERS |
|
|
|
|
Name
Address
Birth year
Positions with
Trust |
|
Principal
Occupations for Past Five Years and Previous Positions |
|
|
| Guy Nordahl 101 Barclay Street, 13E New York, NY 10286 Birth year: 1965 CHIEF FINANCIAL OFFICER AND TREASURER Began serving: September 2007 |
|
Principal Occupations: Vice President, BNY Mellon Asset Servicing (2009 to present).
Previous Positions: Vice President, BNY Mellon Asset Management
(2003 to 2009); Vice President, BNY Mellon Asset Servicing (1999 to 2003). |
|
|
| Lisa R. Grosswirth 101 Barclay Street, 13E New York, NY 10286 Birth year: 1963 SECRETARY Began serving: September 2007 |
|
Principal Occupations: Vice President, BNY Mellon Asset Servicing (2004 to present).
Previous Positions: Supervisory Paralegal, The Dreyfus Corporation
(1998 to 2004). |
|
|
| Richard J. Berthy Three Canal Plaza, Suite 100 Portland, ME 04101 Birth year: 1958 CHIEF EXECUTIVE OFFICER Began serving: September 2007 |
|
Principal Occupations: Chief Executive Officer, Foreside Financial Group, LLC (7/12 to present).
Previous Positions: President, Foreside Financial Group, LLC (5/08
to 7/12); Chief Administrative Officer, Foreside Financial Group, LLC (2005 to 2008); President and Secretary, Bainbridge Capital Management, LLC (6/03 to 6/06); Vice President, Bainbridge Capital Management (8/02 to 5/04).
|
April 30, 2013 / ANNUAL REPORT
105
SHAREHOLDER PROXY RESULTS
A special meeting of the shareholders of the Wilmington Pennsylvania Municipal Bond Fund (the “PA Fund”) and the Wilmington
Virginia Municipal Bond Fund (the “VA Fund;” the PA Fund and VA Fund may be referred to as the “Target Funds” or a “Target Fund”), each a series of the Wilmington Funds (the “Trust”), was held at 3:00 p.m.
Eastern Time on November 15, 2012, at the Trust’s principal executive offices at 111 South Calvert Street, 26th Floor, Baltimore, Maryland 21202 (the “Meeting”). The purpose of the Meeting was to consider and act upon the
following proposal, and to transact such other business as may properly come before the Meeting or any adjournments thereof.
The proposal: To approve a Plan of Reorganization providing for the (i) transfer of substantially all of the assets and liabilities
of each Target Fund to the Wilmington Municipal Bond Fund (“Acquiring Fund”), a series of the Trust, in exchange for shares of the designated classes of Acquiring Fund; and (ii) the distribution of the shares of designated classes of
Acquiring Fund to the shareholders of each Target Fund in liquidation of each of the Target Funds.
Under the terms of the
Plan of Reorganization each of the Target Funds would be acquired by Acquiring Fund, as follows:
|
|
|
| Target Fund |
|
Acquiring Fund |
| Wilmington Pennsylvania Municipal Bond Fund |
|
Wilmington Municipal Bond Fund |
| Wilmington Virginia Municipal Bond Fund |
|
Wilmington Municipal Bond Fund |
All shareholders of record at the close of business on September 10, 2012 were entitled to attend or
submit proxies.
As of the record date, each Fund had the following number of shares outstanding:
|
|
|
|
|
|
| Target Fund |
|
Shares Outstanding |
| Wilmington Pennsylvania Municipal Bond Fund |
|
|
|
9,271,459 |
|
| Wilmington Virginia Municipal Bond Fund |
|
|
|
1,832,133 |
|
|
|
|
|
|
|
| Total for all Funds |
|
|
|
11,103,592 |
|
At the Meeting, the shareholders of each Target Fund approved the Plan of Reorganization. The results of
the voting for the proposal were as follows:
|
|
|
|
|
|
|
|
|
|
|
|
|
|
|
|
|
|
|
|
|
| Fund |
|
Shares Voted For |
|
Shares Voted Against |
|
Share Votes Abstained |
|
Broker Non-Votes |
| Wilmington Pennsylvania Municipal Bond Fund |
|
|
|
7,795,476 |
|
|
|
|
4,394 |
|
|
|
|
21,921 |
|
|
None |
| Wilmington Virginia Municipal Bond Fund |
|
|
|
1,042,712 |
|
|
|
|
81,159 |
|
|
|
|
23,534 |
|
|
None |
ANNUAL REPORT / April
30, 2013
106
Shares of the Wilmington Funds are not FDIC insured or otherwise
protected by the U.S. government, are not deposits or other obligations of, or guaranteed by, Manufacturers and Traders Trust Company, and are subject to investment risks, including possible loss of the principal amount invested.
VOTING PROXIES ON FUND PORTFOLIO SECURITIES
A description of the policies and procedures that the Funds use to determine how to vote proxies relating to securities held in the Funds’ portfolios is available, without charge and upon request, by
calling 1-800-836-2211. A report on how the Funds voted any such proxies during the most recent 12-month period ended June 30 is available through Wilmington Funds’ website. Go to www.wilmingtonfunds.com select “Proxy Voting
Record” to access the link. This information is also available from the Edgar database on the SEC’s website at www.sec.gov.
QUARTERLY PORTFOLIO SCHEDULE
The Funds file with the SEC a complete schedule of their portfolio holdings, as of the close of the first and third quarters of their fiscal year, on Form N-Q. These filings are available on the
SEC’s website at www.sec.gov and may be reviewed and copied at the SEC’s Public Reference Room in Washington DC. (Call 1-800-SEC-0330 for information on the operation of the Public Reference Room.)
Electronic Delivery
Wilmington Funds encourages you to sign up for electronic delivery of investor materials. By doing so you will receive information faster,
help lower shareholder costs, and reduce the impact to the environment. To enroll in electronic delivery:
| |
1.) |
Go to www.wilmingtonfunds.com and select “Individual Investors” |
| |
2.) |
Click on the link “Sign up for Electronic Delivery” |
| |
3.) |
Login to your account or create new user ID |
| |
4.) |
Select E-Delivery Consent from the available options, and |
| |
5.) |
Complete the information requested, including providing the email address where you would like to receive notification for electronic documents.
|
* If you hold your account through a financial intermediary, please contact your advisor to request
electronic delivery of investor materials.
Householding
In an effort to reduce volume of mail you receive, only one copy of the prospectus, annual/semi-annual report, SAI and proxy statements will be sent to shareholders who are part of the same family and
share the same address.
If you would like to request additional copies of the prospectus, annual/semi-annual report or SAI, or
wish to opt out of householding mailings, please contact Shareholder Services at 1-800-836-2211, or write to Wilmington Funds, P.O. Box 9828, Providence, RI 02940-8025.
April 30, 2013 / ANNUAL REPORT
107
PRIVACY POLICY AND NOTICE
OF THE FUNDS AND THEIR DISTRIBUTOR
June 8, 2012
The Wilmington Funds, their distributor and their agents
(referred to as “the Funds”, “we” or “us”) recognize that consumers (referred to as “you” or “your”) expect us to protect both your assets and financial information. We respect your right to privacy
and your expectation that all personal information about you or your account will be maintained in a secure manner. We are committed to maintaining the confidentiality, security and integrity of client and shareholder information. We want you to
understand the Funds’ policy that governs the handling of your information, how the Funds gather information, how that information is used and how it is kept secure.
Information The Funds Collect:
The Funds collect nonpublic personal
information about you from the following sources:
| |
• |
|
We may receive information from you, or from your financial representative, on account applications, other forms or electronically (such as through
the Funds’ website or other electronic trading mechanisms). Examples of this information include your name, address, social security number, assets and income. |
| |
• |
|
We may receive information from you, or from your financial representative, through transactions with us or others, correspondence and other
communications. Examples of this information include specific investments and your account balances. |
| |
• |
|
We may obtain other personal information from you in connection with providing you a financial product or service. Examples of this information
include depository, debit or credit account numbers. |
Information Sharing Policy
The Funds may share nonpublic personal information about you, as described above, with financial or non-financial companies or other
entities, including companies that may be affiliated with the Funds and other nonaffiliated third parties, for the following purposes:
| |
• |
|
We may share information when it is necessary and required to process a transaction or to service a customer relationship. For example, information
may be shared with a company that provides account record keeping services or a company that provides proxy services to shareholders. |
| |
• |
|
We may share information when it is required or permitted by law. For example, information may be shared in response to a subpoena or to protect you
against fraud or with someone who has established a legal beneficial interest, such as a power of attorney. |
| |
• |
|
We may disclose some or all of the information described above to companies that perform marketing or other services on our behalf. For example, we
may share information about you with the financial intermediary (bank, investment bank or broker-dealer) through whom you purchased the Funds’ products or services, or with providers of marketing, legal, accounting or other professional
services. The Funds will not, however, disclose a consumer’s account number or similar form of access number or access code for credit card, deposit or transaction accounts to any nonaffiliated third party for use in telemarketing, direct mail
or other marketing purposes. |
Except as described above, the Funds do not share customer information. We will
not rent, sell, trade, or otherwise release or disclose any personal information about you. Any information you provide to us is for the Funds’ use only. If you decide to close your account(s) or become an inactive customer, we will adhere to
the privacy policies and practices as described in this notice.
Information Security:
When the Funds share nonpublic customer information with third parties hired to facilitate the delivery of certain products or services to
our customers, such information is made available for limited purposes and under controlled circumstances designed to protect our customers’ privacy. We require third parties to comply with our standards regarding security and confidentiality
of such information. We do not permit them to use that information for their own or any other purposes, or rent, sell, trade or otherwise release or disclose the information to any other party. These requirements are reflected in written agreements
between the Funds and the third party service providers.
The Funds protect your personal information in several ways. We
maintain physical, electronic, and procedural safeguards to guard your nonpublic personal information. In addition, the Funds’ Transfer Agent and Shareholder Servicing Agent have procedures in place for the appropriate disposal of nonpublic
personal information when they are no longer required to maintain the information.
Each of the following sections explains an
aspect of the Funds’ commitment to protecting your personal information and respecting your privacy.
Employee Access to Information:
Our Code of Ethics, which applies to all employees, restricts the use of customer information and requires that it be held
in the strictest of confidence. Employee access to customer information is authorized for business purposes only, and the degree of access is based on the sensitivity of the information and on an employee’s or agent’s need to know the
information in order to service a customer’s account or comply with legal requirements.
Visiting The Funds’ Website:
The Funds’ website gathers and maintains statistics about the number of visitors as well as what information is
viewed most frequently. This information is used to improve the content and level of service we provide to our clients and shareholders.
ANNUAL REPORT / April
30, 2013
| |
• |
|
Information or data entered into a website will be retained. |
| |
• |
|
Where registration to a website or re-entering personal information on a website is required, “cookies” are used to improve your online
experience. A cookie is a way for websites to recognize whether or not you have visited the site before. It is a small file that is stored on your computer that identifies you each time you re-visit our site so you don’t have to resubmit
personal information. Cookies provide faster access into the website. |
| |
• |
|
We may also collect non-personally identifiable Internet Protocol (“IP”) addresses for all other visitors to monitor the number of
visitors to the site. These non-personally identifiable IP addresses are never shared with any third party. |
E-mail:
If you have opted to receive marketing information from the Funds by e-mail, it is our policy to include instructions in
all marketing messages on how to unsubscribe from subsequent e-mail programs. Some products or services from the Funds are intended to be delivered and serviced electronically. E-mail communication may be utilized in such cases. If you participate
in an employer-sponsored retirement plan administered by the Funds, we may, at your employer’s request, send you e-mail on matters pertaining to the retirement plan.
Please do not provide any account or personal information such as social security numbers, account numbers, or account balances within your e-mail correspondence to us. We cannot use e-mail to execute
transaction instructions, provide personal account information, or change account registration. We can, however, use e-mail to provide you with the necessary forms or you may contact customer service toll-free at 1-800-836-2211.
Surveys/Aggregate Data:
Periodically, the Funds may conduct surveys about financial products and services or review elements of customer information in an effort
to forecast future business needs. The Funds then generate reports that include aggregate data regarding its customers. Aggregate data classifies customer information in various ways but that does not identify individual customers. These reports may
also include information on website traffic patterns and related information. These reports are used for the Funds’ planning, statistical and other corporate purposes. Aggregate data may also be shared with external parties, such as marketing
organizations. However, no information is shared by which any individual customer could be identified.
Changes to Our Privacy Statement:
The effective date of this policy is June 8, 2012. We reserve the right to modify this policy at any time. When it is
revised or materially changed, we will update the effective date. You can determine whether there have been changes since the last time you reviewed by simply checking the effective date.
Notice will be provided to you in advance of any changes that would affect your rights under this policy statement
April 30, 2013 / ANNUAL REPORT
[This Page Intentionally Left Blank]
[This Page Intentionally Left Blank]


Wilmington Large-Cap Growth Fund (“Large-Cap Growth Fund”)
Wilmington Large-Cap Strategy Fund (“Large-Cap Strategy Fund”)
Wilmington Large-Cap Value Fund (“Large-Cap Value Fund”)
Wilmington Mid-Cap Growth Fund (“Mid-Cap Growth Fund”)
Wilmington Small-Cap Growth Fund (“Small-Cap Growth Fund”)
Wilmington Small-Cap Strategy Fund (“Small-Cap Strategy Fund”)
CONTENTS
[This Page Intentionally Left Blank]
Dear Investor:
I am pleased to present the Annual Report of the Wilmington Funds (“Trust”). This report covers the Trust’s fiscal year, which is
the 12-month reporting period from May 1, 2012 through April 30, 2013. Inside, you will find a discussion of the factors impacting each Fund’s performance during the reporting period, as well as a complete listing of each Fund’s
holdings and financial statements.
The Economy and Financial Markets in Review
Wilmington Funds Management Corporation, the investment advisor to the Trust, and Wilmington Trust Investment Advisors, Inc., the sub-advisor to
the Trust, have provided the following review of the economy, bond markets, and stock markets over the 12-month reporting period.
The Economy
The U.S. economic expansion continued during the 12 months ended April 30, 2013, though its pace remained tepid. The production of goods
and services grew 3.1%, 0.4%, and 2.5% faster than the rate of inflation during the third and fourth quarters of 2012 and the first quarter of 2013, respectively. U.S. consumer spending propelled the gains, though consumers were still cautious amid
the long, slow recovery from the Great Recession of 2007–2009. Retail and food sales, for example, amounted to $4.94 trillion during our fiscal year, up 2.5% in real (inflation-adjusted) terms over the preceding 12-month period. The housing
market continued its nascent recovery, and inflation averaged about 1.1%.
Source: Federal Reserve Bank of St. Louis, May 28,
2013
If consumers were feeling somewhat better, business managers remained wary. During the third and fourth quarters of 2012 and the first
quarter of 2013, investments in U.S. plants, property, and equipment expected to last three years or more were made at lower rates than they had been made in the corresponding quarters five years earlier, as the recession was beginning. Employers
likewise remained cautious in hiring. The number of U.S. private-sector workers grew in all 12 months of our fiscal year, but the rate of private-sector job growth remained slow. At the end of April, there were still 2.0 million fewer
private-sector workers than there had been at the labor market’s January 2008 peak. Much of the blame for soft business enthusiasm was laid at the doorsteps of Congress and the White House. Many business leaders said lawmakers needed to make
meaningful changes in U.S. tax and spending policies to shore up the nation’s finances and to clarify the legal and regulatory environment.
Despite the modest rate of expansion, the U.S. recovery looked solid in relation to economic conditions in Europe, where a recession appeared to
be worsening. Greece appeared likely to remain at least a near-term participant in the continent’s common currency experiment, but Spain, Portugal and Italy all joined Greece in struggling under heavy sovereign debts. Debate about the
possibility of developing common fiscal policies and banking regulations continued, and investors were soothed by the European Central Bank President’s assurance that the bank would do “whatever it takes to preserve the euro.” In
China, growth appeared to slow, though it remained strong in absolute terms. On balance, the global economy appeared to be expanding at a modest rate.
The Bond Markets
The good times rolled on
in the U.S. bond market during our fiscal year. The Barclays Capital U.S. Aggregate Bond Index returned 3.68%. The index tracks the overall market for taxable, investment-grade U.S. bonds and includes U.S. Treasury and agency securities, corporate
bonds, and mortgage-backed securities (MBS). The gain was propelled by strong results among corporate issues (+7.49%, according to the Barclays Capital U.S. Credit Bond Index), into which investors piled as the search for investment opportunities
with meaningful yields continued.
The yield of the 10-year U.S. Treasury note, against which many other interest rates are set, declined
from 1.91% at the end of April 2012 to a low of 1.43% in late July 2012 before climbing to 1.67% at the end of April 2013. The net 12-month decrease of a quarter of a percentage point boosted the prices of bonds across the market.
The S&P Municipal Bond Intermediate Index1 returned 4.71%. Demand for shares of municipal bond mutual funds, which account for much of the
total demand for municipal bonds, accelerated as fears of widespread municipal bankruptcies dissipated and the rates of U.S. taxation on interest, dividends, and capital gains were allowed to revert in 2013 to prior, higher levels for higher-income
taxpayers. Talk of limiting the federal tax exemption on municipal bond interest income, meanwhile, continued to be just talk.
PRESIDENT’S
MESSAGE / April 30, 2013
For the 12-month reporting period May 1, 2012 through April 30, 2013, certain Barclays
Capital indices performed as follows2:
|
|
|
|
|
|
|
|
|
Barclays Capital
U.S. Aggregate
Bond Index3 |
|
Barclays Capital
U.S. Treasury
Bond Index4 |
|
Barclays Capital
U.S.
Mortgage-
Backed Securities
Index5 |
|
Barclays Capital
U.S. Credit
Bond Index6 |
|
Barclays Capital
Municipal Bond
Index7 |
| 3.68% |
|
2.56% |
|
1.85% |
|
7.49% |
|
5.19% |
The Stock Markets
Investors heard plenty about the “lost decade” of equity returns when the effects of the financial crisis were in full swing in early
2009. Commercials decrying 401(k) retirement plans as “201(k)s” promoted “gold 401(k)s” or day trading as solutions; “buy and hold,” it was said, was dead. Fast forward four years and anyone who abandoned equities may
be wishing they hadn’t. The “lost decade” has turned into a pretty normal “found decade,” with a trailing 10-year total return for the S&P 500 Index of 7.88%, annualized. Granted, ten years ago we were emerging from the
tech bubble; one must always be leery of the period selected in drawing conclusions from economic or investment data.
Stocks generally did
very well during the 12 months ended April 30, 2013. Six broad stock market indices, which together offer a rough portrait of the world’s equity securities, returned between +3.97% and +19.39% in U.S. dollars during the fiscal year. The
weakest return came from the MSCI Emerging Markets (Net) Index8 (+3.97%) and the strongest return (+19.39%) was recorded by the MSCI EAFE (Net) Index9 of developed international stock markets. In between were the returns of the Russell Top 200 Index10 (+16.30%), which tracks mega-capitalization
U.S. stocks, the Russell Midcap Index11 (+19.20%) of mid-cap U.S. stocks, the Russell 2000 Index12 (+17.69%) of small-cap U.S.
stocks, and the S&P 500 Index13 (+16.89%), a widely watched gauge consisting mainly of large-cap U.S. stocks.
For the 12-month reporting period May 1, 2012 through April 30, 2013, certain stock market indices performed as follows:
|
|
|
|
|
|
|
S&P 500
Index13 |
|
Dow Jones
Industrial Average14 |
|
NASDAQ
Composite Index15 |
|
MSCI All Country
World ex-US (Net)
Index16 |
| 16.89% |
|
15.39% |
|
10.78% |
|
14.15% |
The Trust, with assets of $13.3 billion as of April 30, 2013, gives investors access to every major asset
class and sector. Whether you are looking for a comfortable retirement, to fund a child’s higher education, pursue tax-free income17, stay ahead of inflation, or keep your cash working, one or more of the Trust’s Funds may provide you with
the diversification, flexibility and professional management you need.
Sincerely,

Sam Guerrieri
President
May 28, 2013
April 30,
2013 / PRESIDENT’S MESSAGE
For more complete information, please download the Funds’ prospectus available on
www.wilmingtonfunds.com, or call 1-800-836-2211 for a copy. You should consider the Funds’ investment objectives, risks, charges, and expenses carefully before you invest. Information about these and other important subjects is in the
Funds’ prospectus, which you should read carefully before investing.
Past performance is no guarantee of future results.
The index performance quoted is for illustrative purposes only and is not representative of any specific investment. Diversification does not ensure a profit nor protect against loss.
All investments involve risk, including possible loss of principal. Equity securities are subject to price fluctuation and possible loss of
principal. Small- and mid-cap stocks involve greater risks and volatility than large-cap stocks. International investments are subject to special risks, including currency fluctuations, social, economic, and political uncertainties, which could
increase volatility. These risks are magnified in emerging markets.
High yield, lower-rated securities generally entail greater
market, credit and liquidity risks than investment grade securities and may include higher volatility and higher risk of default.
An
investment in money market funds is neither insured nor guaranteed by the Federal Deposit Insurance Corporation or any other government agency. Although money market funds seek to preserve the value of your investment at $1.00 per share, it is
possible to lose money by investing in these funds.
| 1. |
S&P Municipal Bond Intermediate Index is a broad, market value-weighted index that seeks to measure the performance of the U.S. municipal bond market. |
| 2. |
Bond prices are sensitive to changes in interest rates and a rise in interest rates can cause a decline in their prices. |
| 3. |
Barclays Capital U.S. Aggregate Bond Index is a widely used benchmark index for the domestic investment-grade bond market composed of securities from the Barclays Capital Government/Corporate Bond Index, Mortgage-Backed
Securities Index and Asset-Backed Securities Index. The index typically includes fixed income securities with overall intermediate- to long-term average maturities. The index is unmanaged and investments cannot be made directly in an index.
|
| 4. |
Barclays Capital U.S. Treasury Bond Index is a market capitalization weighted index that includes all publicly issued U.S. Treasury securities that have a remaining maturity of at least one year, are rated
investment-grade, and have $250 million or more of outstanding face value. The index is unmanaged and investments cannot be made directly in an index. |
| 5. |
Barclays Capital U.S. Mortgage Backed Securities Index is composed of all securities mortgage pools by GNMA, FNMA and the FHLMC, including GNMA graduated Payment Mortgages. The index is unmanaged and investments cannot
be made directly in an index. |
| 6. |
Barclays Capital U.S. Credit Bond Index tracks the performance of domestic investment-grade corporate bonds and is composed of all publicly issued, fixed-rate, nonconvertible, investment-grade corporate debt. The index
is unmanaged and investments cannot be made directly in an index. |
| 7. |
Barclays Capital Municipal Bond Index tracks the performance of the long-term, tax-exempt, investment-grade bond market. To be included in the index, bonds must have an outstanding par balance of at least $7 million and
be issued as part of a transaction of at least $75 million. The index is unmanaged and investments cannot be made directly in an index. |
| 8. |
MSCI Emerging Markets (Net) Index is a free float-adjusted market capitalization index that is designed to measure equity market performance of emerging markets. The MSCI Emerging Markets Index consisted of the
following 21 emerging market country indices: Brazil, Chile, China, Colombia, Czech Republic, Egypt, Hungary, India, Indonesia, Korea, Malaysia, Mexico, Morocco, Peru, Philippines, Poland, Russia, South Africa, Taiwan, Thailand, and Turkey.
|
| 9. |
MSCI EAFE (Net) Index is a free float-adjusted market capitalization index that is designed to measure equity market performance of developed markets, excluding the U.S. & Canada. The index consists of the
following 22 developed market country indices: Australia, Austria, Belgium, Denmark, Finland, France, Germany, Greece, Hong Kong, Ireland, Israel, Italy, Japan, Netherlands, New Zealand, Norway, Portugal, Singapore, Spain, Sweden, Switzerland and
the United Kingdom. |
| 10. |
Russell Top 200 Index measures the performance of the largest cap segment of the U.S. equity universe. The Russell Top 200 is a subset of the Russell 3000 Index. It includes approximately 200 of the largest securities
based on a combination of their market cap and current index membership and represents approximately 68% of the U.S. market. |
| 11. |
Russell Midcap Index measures the performance of the 800 smallest companies in the Russell 1000 Index, which represents approximately 25% of the total market capitalization of the Russell 1000 Index. |
| 12. |
Russell 2000 Index measures the performance of the 2,000 smallest companies in the Russell 3000 Index, which represents approximately 8% of the total market capitalization of the Russell 3000 Index. |
| 13. |
The S&P 500 Index is a capitalization-weighted index of 500 stocks designed to measure performance of the broad domestic economy through changes in the aggregate market value of 500 stocks representing all major
industries. The index is unmanaged and investments cannot be made directly in an index. |
| 14. |
Dow Jones Industrial Average (“DJIA”) represents share prices of selected blue chip industrial corporations as well as public utility and transportation companies. The DJIA indicates daily changes in the
average prices of stocks in any of its categories. It also reports total sales for each group of industries. Because it represents the top corporations of America, the DJIA’s average movements are leading economic indicators for the stock
market as a whole. The DJIA is unmanaged and investments cannot be made directly in the DJIA. |
| 15. |
NASDAQ Composite Index measures all NASDAQ domestic and non-U.S. based common stocks listed on the NASDAQ Stock Market. The index is unmanaged and investments cannot be made directly in an index. |
| 16. |
MSCI All Country World ex-US (Net) Index is a free float-adjusted market capitalization weighted index that is designed to measure the equity market performance of developed and emerging markets excluding the U.S.
market. The index consists of 45 country indices comprising 23 developed and 22 emerging market country indices. |
| 17. |
Income generated by tax-free funds may be subject to the federal alternative minimum tax and state and local taxes.
|
PRESIDENT’S
MESSAGE / April 30, 2013
[This Page Intentionally Left Blank]
WILMINGTON LARGE-CAP GROWTH FUND
Management’s Discussion of Fund Performance
For the fiscal year ended April 30, 2013, Wilmington Large-Cap Growth Fund
(the “Fund”) had a total return of 5.39%* for Class A Shares and 5.92%* for Class I Shares, versus its benchmark, the Russell 1000 Growth Index**, which had a total return of 12.60%.
Over the twelve month period which ended April 30, 2013, the stock market reached a new all time high as measured by the
S&P 500 Index (“S&P 500”). The crossover point was on April 10, 2013 when the S&P 500 rose through the 1576 level that was attained on October 11, 2007. At that time, little did investors know that the Great Recession
was looming, and that the S&P 500 would be more than cut in half to its ultimate low point of 666 on March 6, 2009. Fortunately, since then, the Federal Reserve has implemented repeated rounds of monetary easing with the latest version,
called Quantitative Easing, still going strong. The result has been near zero money market rates and record low interest rates in U.S. Treasury notes and other high quality bonds. This has forced investors to move into riskier asset classes such as
junk bonds and higher yielding equities in the pursuit of yield. Corporations have also been active buyers of their own shares, as borrowing costs fell well below the cost of equity and, in many cases, below the dividend yield itself.
The resulting rise in equity values has served to boost retirement accounts and re-liquefy consumer balance sheets, which in
turn has boosted consumer confidence (at least among higher level consumers). Of course, mortgage rates have also dropped to all time lows and finally begun to stimulate the housing market. Up until this year, “Wall Street” seemed to be
ahead of “Main Street” as employment trends remained sluggish. This too seems to have shifted into positive mode as payroll employment gains have averaged 173,000 over the past twelve months. The unemployment rate is now down to 7.5%, and
a regular feature of the monthly payroll employment report is upward revision to prior month job totals. This is a strong indication that the financially led recovery is finally beginning to benefit mainstream America. That gives us confidence that
the economic recovery is taking on an aura of sustainability that we had not felt previously. Despite record low interest rates, investors had been so disillusioned by the equity market pummeling of 2008 and the subsequent (European-related)
corrections in 2010 and 2011 that money flows to equity mutual funds had remained largely negative.
| Source: |
|
Bureau of Labor Statistics, May 3, 2013 |
As growth rates have moderated, the attractiveness of lower risk, lower duration equities with yield characteristics have been
bid up versus their cyclical counterparts. Within the equity market, value may be found with cyclical stocks with low valuations versus defensive companies with above average dividend yields and higher valuations. If growth rates accelerate at all,
a shift towards longer duration cyclical exposure should take place. One of the remaining pieces of the puzzle is business confidence among small to medium enterprises which is critical for continued hiring and investment for the broad economy. Even
here there appears to be good news with a sharp upturn since November that followed many months of decline. It remains to be seen whether or not we
are on the verge of a new secular bull market in equities. The final test will be the durability of equity prices once the Federal Reserve begins pull back on monetary stimulus. If the stock
market can withstand the competition from gradually rising interest rates, both the real economy and the financial markets can be viewed as re-entering a prolonged period of recovery and prosperity. In our opinion, valuations in the equity market
are reasonable enough that, even with a continuation of only modest mid-single-digit earnings growth, the stock market can continue to rise.
The Fund was managed by two different portfolio management teams, each with Wilmington Trust Investment Advisors, Inc., during
the fiscal year ended April 30, 2013. In June 2012, the old portfolio management team which had managed the Fund for several years was replaced with a new portfolio management team. Unfortunately, the strategies utilized by both portfolio
management teams underperformed the Fund’s benchmark, the Russell 1000 Growth Index, during the periods they managed assets for the Fund.
During the period from May 1, 2012 through June 30, 2012, the Fund returned -7.21% trailing the benchmark which
returned -3.87%. This underperformance was broad based across all sectors, except health care and utilities, which performed in line with the benchmark. The bigger underperforming sectors within the Fund were consumer discretionary, consumer
staples, energy and information technology. In consumer discretionary, the worst performing stocks were Borg Warner in the autos industry and Target, Lululemon, Nike and Limited Brands in the retail sector. Outperforming was the position in
homebuilder D.R. Horton. In consumer staples, the larger underperformers were Green Mountain Coffee, Estee Lauder and Walmart which were somewhat offset by good relative performance by Whole Foods Market and Pepsi. Poor performance in the energy
sector was punctuated by underperformance by oil service companies Halliburton and National Oilwell Varco, as well as coal company Alpha Natural Resources. In technology, poor performance by Qualcomm, Riverbed, Juniper and AMD contributed to the
underperformance.
For the period July 1, 2012 through April 30, 2013, the Fund returned 14.14%, which trailed
the benchmark return of 17.14%. The largest underperformance within the Fund came from the technology and industrial sectors while the health care sector posted positive relative performance. Within technology, overweight positions in Apple and EMC
contributed to the underperformance. Industrials underperformed due to insufficient weight in aerospace companies like Boeing and Honeywell along with underweighted positions in transportation stocks. The health care sector benefitted from positive
performance from bio-technology positions such as Gilead Sciences, Celgene, Regeneron and Biogen Idec all of which were up between 50% and 100% over this period.
ANNUAL
REPORT / April 30, 2013
| |
* |
Performance data quoted represents past performance, which is no guarantee of future results. Investment return and principal value will
fluctuate so that an investor’s shares, when redeemed, may be worth more or less than their original cost. The total return shown assumes the reinvestment of all distributions and does not reflect the deduction of taxes that a shareholder would
pay on fund distributions or the redemption of shares. The total return for Class A Shares was -0.39%, adjusted for the Fund’s maximum sales charge. Mutual fund performance changes over time and current performance may be lower or higher
than what is stated. For the most recent month-end performance, please visit www.wilmingtonfunds.com or call 1-800-836-2211. |
| |
** |
The Russell 1000 Growth Index measures the performance of the large-cap growth segment of the U.S. equity universe. It includes those Russell 1000
Index companies with higher price-to-book ratios and higher forecasted growth values. The Russell 1000 Growth Index is constructed to provide a comprehensive and unbiased barometer for the large-cap growth segment. The Russell 1000 Growth Index is
completely reconstituted annually to ensure new and growing equities are included and that the represented companies continue to reflect value characteristics. |
Quantitative Easing (QE) is government monetary policy occasionally used to increase the money supply by buying government
securities or other securities from the market. Quantitative easing increases the money supply by flooding financial institutions with capital, in an effort to promote increased lending and liquidity.
Duration is a measure of a security’s price sensitivity to changes in interest rates. Securities with longer durations are
more sensitive to changes in interest rates than securities of shorter durations.
Valuation is the process of determining
the current worth of an asset or company. There are many techniques that can be used to determine value; some are subjective and others are objective.
Dividend Yield is a financial ratio that shows how much a company pays out in dividends each year relative to its share price.
In the absence of any capital gains, the dividend yield is the return on investment of a stock.
April 30,
2013 / ANNUAL REPORT
WILMINGTON LARGE-CAP GROWTH FUND – Class A
The graph below illustrates the hypothetical investment of $10,0001 in the
Wilmington Large-Cap Growth Fund (Class A) (the “Fund”) from April 30, 2003 to April 30, 2013, compared to the Russell 1000 Growth Index (“Russell 1000 Growth”).2
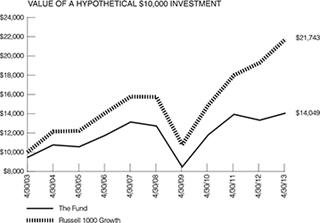
Average Annual Total Returns for the Year Ended April 30, 2013
|
|
|
|
|
| |
|
|
|
| 1 Year |
|
|
-0.39% |
|
| 5 Years |
|
|
0.82% |
|
| 10 Years |
|
|
3.46% |
|
Performance data quoted represents past performance which is no guarantee of future results. Returns shown do not reflect the deduction
of taxes that a shareholder would pay on Fund distributions or the redemption of Fund shares. Investment return and principal value will fluctuate so that an investor’s shares, when redeemed, may be worth more or less than their original cost.
Mutual funds are not obligations of or guaranteed by any bank and are not federally insured. Mutual fund performance changes over time and current performance may be lower or higher than what is stated. For current to the most recent month end
performance, visit www.wilmingtonfunds.com or call 1-800-836-2211. Total returns shown include the maximum sales charge of 5.50%.
Annual Operating Expense Ratio
|
|
|
|
|
| |
|
|
|
| Before Waivers |
|
|
1.66% |
|
| After Waivers |
|
|
1.42% |
|
The Expense Ratio Before Waivers represents the operating costs borne by the Fund, expressed as a percentage of the Fund’s average
net assets, as shown in the Fees and Expenses table in the Fund’s current prospectus (under “Total Annual Fund Operating Expenses”).
| 1 |
|
Represents a hypothetical investment of $10,000 in Class A of the Fund after deducting the maximum sales charge of 5.50% ($10,000 investment minus $550 sales charge =
$9,450). The Fund’s performance assumes the reinvestment of all dividends and distributions. |
| 2 |
|
The performance for the Russell 1000 Growth Index assumes the reinvestment of all dividends and distributions but does not reflect the deduction of a sales charge required
for the Fund’s performance by Securities and Exchange Commission. It is not possible to invest directly in an index, and the represented index is unmanaged.
|
ANNUAL
REPORT / April 30, 2013
WILMINGTON LARGE-CAP GROWTH FUND – Class I
The graph below illustrates the hypothetical investment of $1,000,0001 in
the Wilmington Large-Cap Growth Fund (Class I) (the “Fund”) from August 18, 2003 (start of performance) to April 30, 2013, compared to the Russell 1000 Growth.2

Average Annual Total Returns for the Year Ended April 30, 2013
|
|
|
|
|
| |
|
|
|
| 1 Year |
|
|
5.92% |
|
| 5 Years |
|
|
2.28% |
|
| Start of Performance (8/18/03) |
|
|
3.84% |
|
Performance data quoted represents past performance which is no guarantee of future results. Returns shown do not reflect the deduction
of taxes that a shareholder would pay on Fund distributions or the redemption of Fund shares. Investment return and principal value will fluctuate so that an investor’s shares, when redeemed, may be worth more or less than their original cost.
Mutual funds are not obligations of or guaranteed by any bank and are not federally insured. Mutual fund performance changes over time and current performance may be lower or higher than what is stated. For current to the most recent month end
performance, visit www.wilmingtonfunds.com or call 1-800-836-2211.
Annual Operating Expense Ratio
|
|
|
|
|
| |
|
|
|
| Before Waivers |
|
|
1.41% |
|
| After Waivers |
|
|
1.04% |
|
The Expense Ratio Before Waivers represents the operating costs borne by the Fund, expressed as a percentage of the Fund’s average
net assets, as shown in the Fees and Expenses table in the Fund’s current prospectus (under “Total Annual Fund Operating Expenses”).
| 1 |
|
Represents a hypothetical investment of $1,000,000 in Class I of the Fund and assumes the reinvestment of all dividends and distributions. |
| 2 |
|
The performance shown for Class I of the Fund and the Russell 1000 Growth Index assumes the reinvestment of all dividends and distributions. It is not possible to invest
directly in an index, and the represented index is unmanaged. |
April 30,
2013 / ANNUAL REPORT
WILMINGTON LARGE-CAP STRATEGY FUND
Management’s Discussion of Fund Performance
For the fiscal year ended April 30, 2013, Wilmington Large-Cap Strategy
Fund (the “Fund”) had a total return of 16.25%* for Class I Shares, versus its benchmark, the Russell 1000 Index**, which had a total return of 17.17%.
The Fund attempts to outperform the Russell 1000 Index by overweighting growth or value companies based on recommendations from
the Wilmington Trust Investment Advisors, Inc. Investment Strategy Team (IST). During the period May 2012 through October 2012, the Fund was positioned to track a custom index of 60% growth and 40% value companies. Over this period, the Russell 1000
Value Index returned 4.7% and the Russell 1000 Growth Index returned -0.9%. The tactical overweight to growth had a -0.6% impact on relative performance.
At the end of the October meeting, the IST recommended removing the overweight to growth companies for domestic large cap
portfolios. The fund was rebalanced to track the Russell 1000 Index. For the period November 2012 to February 2013 the Russell 1000 Index returned 8.9% and the Fund returned 8.7%. The majority of the 0.2% underperformance over the period is
explained by expenses and transaction costs.
At the February IST meeting, the proprietary U.S. Large-cap style model
continued to signal neutral on style. The IST voted to follow the models and recommended maintaining the neutral position. However, the team wanted to increase exposure to mid-cap stocks which the momentum models had been favoring. The IST
recommended overweighting mid-cap companies relative to the Russell 1000 Index. The Russell 1000 Index can be divided into the Russell Top 200 Index of mega-cap stocks and the Russell Midcap Index which represents the 800 mid-cap companies. The
weight of the Russell Midcap Index has been approximately 30% of the Russell 1000 Index. The Fund was rebalanced at the end of February to target the IST recommended benchmark of 65% Russell Top 200 and 35% Russell Midcap. For the period March 2013
to April 2013, the Russell Top 200 Index returned 5.8% and the Russell Midcap Index returned 5.6%. The tactical tilt toward mid cap had no impact on relative performance for the period.
The IST and Investment Research Team are researching additional tactics to improve the risk adjusted return of the Fund.
| |
* |
Performance data quoted represents past performance, which is no guarantee of future results. Investment return and principal value will
fluctuate so that an investor’s shares, when redeemed, may be worth more or less than their original cost. The total return shown assumes the reinvestment of all distributions and does not reflect the deduction of taxes that a shareholder would
pay on fund distributions or the redemption of shares. Mutual fund performance changes over time and current performance may be lower or higher than what is stated. For the most recent month-end performance, please visit www.wilmingtonfunds.com or
call 1-800-836-2211. |
| |
** |
The Russell 1000 Index measures the performance of the large-cap segment of the U.S. equity universe. It is a subset of the Russell 3000 Index and
includes approximately 1,000 of the largest securities based on a combination of their market cap and current index membership. The Index represents approximately 92% of the U.S. market and is constructed to provide a comprehensive and unbiased
barometer for the large-cap segment and is completely reconstituted annually to ensure new and growing equities are reflected. The Russell 3000 Index measures the performance of the largest 3,000 U.S. companies representing approximately 98% of the
investable U.S. equity market. Russell 1000 Growth Index measures the performance of those Russell 1000 companies with higher price-to-book ratios and higher forecasted growth values. Russell 1000 Value Index measures the performance of those
Russell 1000 companies with lower price-to-book ratios and lower forecasted growth values. |
ANNUAL
REPORT / April 30, 2013
WILMINGTON LARGE-CAP STRATEGY FUND – Class I
The graph below illustrates the hypothetical investment of $1,000,0001 in
the Wilmington Large-Cap Strategy Fund (Class I) (the “Fund”) from July 1, 2003 (start of performance) to April 30, 2013, compared to the Russell 1000 Index2 and the S&P
500.2

Average Annual Total Returns for the Year Ended April 30, 2013
|
|
|
|
|
| |
|
|
|
| 1 Year |
|
|
16.25% |
|
| 5 Years |
|
|
3.94% |
|
| Start of Performance (7/01/03) |
|
|
5.92% |
|
Performance data quoted represents past performance which is no guarantee of future results. Returns shown do not reflect the deduction
of taxes that a shareholder would pay on Fund distributions or the redemption of Fund shares. Investment return and principal value will fluctuate so that an investor’s shares, when redeemed, may be worth more or less than their original cost.
Mutual funds are not obligations of or guaranteed by any bank and are not federally insured. Mutual fund performance changes over time and current performance may be lower or higher than what is stated. For current to the most recent month end
performance, visit www.wilmingtonfunds.com or call 1-800-836-2211.
Annual Operating Expense Ratio
|
|
|
|
|
| |
|
|
|
| Before Waivers |
|
|
0.88% |
|
| After Waivers |
|
|
0.25% |
|
The Expense Ratio Before Waivers represents the operating costs borne by the Fund, expressed as a percentage of the Fund’s average
net assets, as shown in the Fees and Expenses table in the Fund’s current prospectus (under “Total Annual Fund Operating Expenses”).
| 1 |
|
Represents a hypothetical investment of $1,000,000 in Class I of the Fund and assumes the reinvestment of all dividends and distributions. |
| 2 |
|
The performance shown for Class I of the Fund, the Russell 1000 Index and the S&P 500 assumes the reinvestment of all dividends and distributions. It is not possible to
invest directly in an index, and the represented index is unmanaged. |
April 30,
2013 / ANNUAL REPORT
WILMINGTON LARGE-CAP VALUE FUND
Management’s Discussion of Fund Performance
For the fiscal year ended April 30, 2013, Wilmington Large-Cap Value Fund
(the “Fund”) had a total return of 10.65%* for Class A Shares and 10.91%* for Class I Shares, versus its benchmark, the Russell 1000 Value Index,** which had a total return of 21.80%.
Over the twelve month period which ended April 30, 2013, the stock market reached a new all time high as measured by the
S&P 500 Index (“S&P 500”). The crossover point was on April 10, 2013 when the S&P 500 rose through the 1576 level that was attained on October 11, 2007. At that time, little did investors know that the Great Recession
was looming, and that the S&P 500 would be more than cut in half to its ultimate low point of 666 on March 6, 2009. Fortunately, since then, the Federal Reserve has implemented repeated rounds of monetary easing with the latest version,
called Quantitative Easing, still going strong. The result has been near zero money market rates and record low interest rates in U.S. Treasury notes and other high quality bonds. This has forced investors to move into riskier asset classes such as
junk bonds and higher yielding equities in the pursuit of yield. Corporations have also been active buyers of their own shares, as borrowing costs fell well below the cost of equity and, in many cases, below the dividend yield itself.
The resulting rise in equity values has served to boost retirement accounts and re-liquefy consumer balance sheets, which in
turn has boosted consumer confidence (at least among higher level consumers). Of course, mortgage rates have also dropped to all time lows and finally begun to stimulate the housing market. Up until this year, “Wall Street” seemed to be
ahead of “Main Street” as employment trends remained sluggish. This too seems to have shifted into positive mode as payroll employment gains have averaged 173,000 over the past twelve months. The unemployment rate is now down to 7.5%, and
a regular feature of the monthly payroll employment report is upward revision to prior month job totals. This is a strong indication that the financially led recovery is finally beginning to benefit mainstream America. That gives us confidence that
the economic recovery is taking on an aura of sustainability that we had not felt previously. Despite record low interest rates, investors had been so disillusioned by the equity market pummeling of 2008 and the subsequent (European-related)
corrections in 2010 and 2011 that money flows to equity mutual funds had remained largely negative.
As growth rates have
moderated, the attractiveness of lower risk, lower duration equities with yield characteristics have been bid up versus their cyclical counterparts. Within the equity market, value may be found with cyclical stocks with low valuations versus
defensive companies with above average dividend yields and higher valuations. If growth rates accelerate at all, a shift towards longer duration cyclical exposure should take place. One of the remaining pieces of the puzzle is business confidence
among small to medium enterprises which is critical for continued hiring and investment for the broad economy. Even here there appears to be good news with a sharp upturn since November that followed many months of decline. It remains to be seen
whether or not we are on the verge of a new secular bull market in equities. The final test will be the durability of equity prices once the Federal Reserve begins pull back on monetary stimulus. If the stock market can withstand the competition
from gradually rising interest rates, both the real economy and the
financial markets can be viewed as re-entering a prolonged period of recovery and prosperity. In our opinion, valuations in the equity market are reasonable enough that, even with a continuation
of only modest mid-single-digit earnings growth, the stock market can continue to rise.
The Fund was managed by two
different portfolio management teams during the fiscal year ended April 30, 2013. The old portfolio management team, with NWQ Investment Management Company LLC, which had managed the Fund for several years was replaced in December 2012 with a
new portfolio management team with Wilmington Trust Investment Advisors, Inc. Unfortunately, the strategies utilized by both portfolio management teams underperformed the Fund’s benchmark, the Russell 1000 Value Index, during the periods they
managed the Fund.
During the period from May 1, 2012 through December 31, 2012, the Fund returned -0.45%
trailing significantly the benchmark which returned 6.84%. Stock selection and, to a lesser extent, sector positioning, contributed to relative underperformance in the Fund. Positioning in the information technology sector was the leading detractor
in the Fund during the period. Information technology was the worst performing sector in the benchmark over the span, and the Fund’s sizeable overweight proved a headwind to relative performance. Stock selection in the sector also hurt
performance, led by underperforming positions in Hewlett-Packard, CA Inc., and Microsoft. The energy sector was the second leading detractor in the period, with holdings reacting to movement in energy prices. Apache Corp., Canadian Natural
Resources, Talisman Energy, Occidental Petroleum, and Noble Energy were all represented on the list of leading detractors for the period. The contribution from the financial sector was mixed, as an overweight to the outperforming sector was
countered by a shortfall in stock selection. Looking at individual contributors, strength in the Fund’s bank holdings, particularly Citigroup and Goldman Sachs, unfortunately was offset by weakness in the Fund’s insurance holdings,
including Metlife and Unum. Stock selection and sector positioning in the utilities sector was a source of positive contribution in the period, as an underweight to the sector, and a strong contribution from NRG energy, combined to benefit relative
performance. Healthcare also contributed, led by strength in the ADR of French pharmaceutical giant Sanofi. Sanofi was the leading individual contributor in the Fund over the period.
For the period January 1, 2013 through April 30, 2013, the Fund returned 11.42% which trailed the benchmark return of
14.01%. The largest underperformance came from technology, financials and health care sectors. Basic materials outperformed during this period. Within technology, the majority of the underperformance came from Apple computer and Qualcomm along with
no position in Hewlett Packard which outperformed during this period. The financial sector underperformance came from the commercial bank industry with underperformance from BB&T and US Bancorp. Relative outperformance in the basic material
sector came mainly from having no weight in the poorly performing metals and mining industry.
ANNUAL
REPORT / April 30, 2013
| |
* |
Performance data quoted represents past performance, which is no guarantee of future results. Investment return and principal value will
fluctuate so that an investor’s shares, when redeemed, may be worth more or less than their original cost. The total return shown assumes the reinvestment of all distributions and does not reflect the deduction of taxes that a shareholder would
pay on fund distributions or the redemption of shares. The total return for Class A Shares was 4.54%, adjusted for the Fund’s maximum sales charge. Mutual fund performance changes over time and current performance may be lower or higher
than what is stated. For the most recent month-end performance, please visit www.wilmingtonfunds.com or call 1-800-836-2211. |
| |
** |
The Russell 1000 Value Index measures the performance of the large-cap value segment of the U.S. equity universe. It includes those Russell 1000
companies with lower price-to-book ratios and lower expected growth values. The Russell 1000 Value Index is constructed to provide a comprehensive and unbiased barometer for the large-cap value segment. The Russell 1000 Value Index is completely
reconstituted annually to ensure new and growing equities are included and that the represented companies continue to reflect value characteristics. |
Quantitative Easing (QE) is government monetary policy occasionally used to increase the money supply by buying government
securities or other securities from the market. Quantitative easing increases the money supply by flooding financial institutions with capital, in an effort to promote increased lending and liquidity.
Duration is a measure of a security’s price sensitivity to changes in interest rates. Securities with longer durations are
more sensitive to changes in interest rates than securities of shorter durations.
Valuation is the process of determining
the current worth of an asset or company. There are many techniques that can be used to determine value; some are subjective and others are objective.
Dividend Yield is a financial ratio that shows how much a company pays out in dividends each year relative to its share price.
In the absence of any capital gains, the dividend yield is the return on investment of a stock.
April 30,
2013 / ANNUAL REPORT
WILMINGTON LARGE-CAP VALUE FUND – Class A
The graph below illustrates the hypothetical investment of $10,0001 in the
Wilmington Large-Cap Value Fund (Class A) (the “Fund”) from April 30, 2003 to April 30, 2013, compared to the Russell 1000 Value Index (“Russell 1000 Value”).2
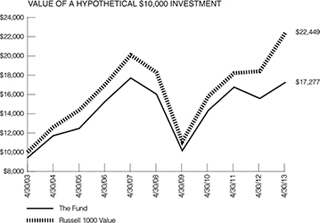
Average Annual Total Returns for the Year Ended April 30, 2013
|
|
|
|
|
| |
|
|
|
| 1 Year |
|
|
4.54% |
|
| 5 Years |
|
|
0.34% |
|
| 10 Years |
|
|
5.62% |
|
Performance data quoted represents past performance which is no guarantee of future results. Returns shown do not reflect the deduction
of taxes that a shareholder would pay on Fund distributions or the redemption of Fund shares. Investment return and principal value will fluctuate so that an investor’s shares, when redeemed, may be worth more or less than their original cost.
Mutual funds are not obligations of or guaranteed by any bank and are not federally insured. Mutual fund performance changes over time and current performance may be lower or higher than what is stated. For current to the most recent month end
performance, visit www.wilmingtonfunds.com or call 1-800-836-2211. Total returns shown include the maximum sales charge of 5.50%.
Annual Operating Expense Ratio
|
|
|
|
|
| |
|
|
|
| Before Waivers |
|
|
1.42% |
|
| After Waivers |
|
|
1.32% |
|
The Expense Ratio Before Waivers represents the operating costs borne by the Fund, expressed as a percentage of the Fund’s average
net assets, as shown in the Fees and Expenses table in the Fund’s current prospectus (under “Total Annual Fund Operating Expenses”).
| 1 |
|
Represents a hypothetical investment of $10,000 in Class A of the Fund after deducting the maximum sales charge of 5.50% ($10,000 investment minus $550 sales charge =
$9,450). The Fund’s performance assumes the reinvestment of all dividends and distributions. |
| 2 |
|
The performance for the Russell 1000 Value Index assumes the reinvestment of all dividends and distributions but does not reflect the deduction of a sales charge required
for the Fund’s performance by Securities and Exchange Commission. It is not possible to invest directly in an index, and the represented index is unmanaged.
|
ANNUAL
REPORT / April 30, 2013
WILMINGTON LARGE-CAP VALUE FUND – Class I
The graph below illustrates the hypothetical investment of $1,000,0001 in
the Wilmington Large-Cap Value Fund (Class I) (the “Fund”) from August 18, 2003 (start of performance) to April 30, 2013, compared to the Russell 1000 Value.2

Average Annual Total Returns for the Year Ended April 30, 2013
|
|
|
|
|
| |
|
|
|
| 1 Year |
|
|
10.91% |
|
| 5 Years |
|
|
1.65% |
|
| Start of Performance (8/18/03) |
|
|
5.45% |
|
Performance data quoted represents past performance which is no guarantee of future results. Returns shown do not reflect the deduction
of taxes that a shareholder would pay on Fund distributions or the redemption of Fund shares. Investment return and principal value will fluctuate so that an investor’s shares, when redeemed, may be worth more or less than their original cost.
Mutual funds are not obligations of or guaranteed by any bank and are not federally insured. Mutual fund performance changes over time and current performance may be lower or higher than what is stated. For current to the most recent month end
performance, visit www.wilmingtonfunds.com or call 1-800-836-2211.
Annual Operating Expense Ratio
|
|
|
|
|
| |
|
|
|
| Before Waivers |
|
|
1.17% |
|
| After Waivers |
|
|
1.04% |
|
The Expense Ratio Before Waivers represents the operating costs borne by the Fund, expressed as a percentage of the Fund’s average
net assets, as shown in the Fees and Expenses table in the Fund’s current prospectus (under “Total Annual Fund Operating Expenses”).
| 1 |
|
Represents a hypothetical investment of $1,000,000 in Class I of the Fund and assumes the reinvestment of all dividends and distributions. |
| 2 |
|
The performance shown for Class I of the Fund and the Russell 1000 Value Index assumes the reinvestment of all dividends and distributions. It is not possible to invest
directly in an index, and the represented index is unmanaged. |
April 30,
2013 / ANNUAL REPORT
WILMINGTON MID-CAP GROWTH FUND
Management’s Discussion of Fund Performance
For the fiscal year ended April 30, 2013, Wilmington Mid-Cap Growth Fund
(the “Fund”) had a total return of 9.55%* for Class A Shares and 9.70%* for Class I Shares, versus its benchmark, the Russell 1000 Mid Cap Growth Index**, which had a total return of 14.42%.
Since the beginning of the U.S. equity market recovery in 2009, there has been a discernible and puzzling rhythm to returns.
Each spring, investors have been confronted with economic data that suggests the recovery is faltering and the stock market pulls back on concerns that corporate earnings have peaked. As each year progressed, the data firmed, investors’
confidence in the outlook for growth recovered, their appetite for equities returned, and the market resumed its upward path.
Since the market lows of 2008 and 2009, we have retained to our benefit a consistent pro-growth tilt, which explains the broad
contours of the Fund’s performance this past year. Broadly speaking, our year divided into two periods: a very disappointing pullback –both absolute and relative to the benchmark – from May through mid-July 2012 and a subsequent
strong recovery – again, both absolute and relative – from mid-July to the end of April 2013. The early period of underperformance accounts for more than the entire benchmark-relative performance deficit for the year and was attributable
primarily to the Fund being more exposed to cyclical stocks and sectors than the benchmark (and the peer group). This worked to our disadvantage as the market became defensive due to concerns regarding the sustainability of global economic growth.
This explains, for example, the bulk of underperformance in our Industrials holdings, which was our weakest sector even though no single stock in the sector had a large impact on overall results.
In July 2012, the pattern reversed; the Fund’s pro-growth positioning worked to our advantage, but the rebound was
insufficient to recover the ground we lost in the early months of the year. The difference was not due to overall positioning; in fact, the impact of sector allocation was only slightly negative. Rather, adverse stock selection explains the gap
between the downturn and the rebound. To some extent, this reflects investors’ pronounced preference for value sectors and high(er) dividend-paying stocks, even within the growth universe and even as the overall market ascends to all-time
highs. Stocks of companies with attractive growth characteristics have not always been rewarded if they cannot promise impatient investors a near-term payoff.
However, it is still true that the Fund’s performance was harmed by several stocks that disappointed investors’
expectations. Whiting Petroleum Corporation, Coach, Inc., ITT Educational Services, Inc., and Adtran, Inc. stand out. (A short-seller attack on Herbalife Ltd. impaired the performance of the stock to the detriment of the Fund.) Unfortunately, the
impact of these, and other, underperforming stocks offset notable successes such as Stratasys Ltd., MAP Pharmaceuticals Inc., Cabot Oil & Gas Corporation, CBS Corporation, and LKQ Corporation.
Our mandate is to construct a portfolio of U.S. midcap companies with superior growth prospects. At the end of a disappointing
year, we remind ourselves that we cannot control the periodic growth
scares that have swept the market. Ultimately, they make for distressing weeks and months, but have had little impact on performance. What does have a durable impact is our ability to identify
companies with superior growth prospects and attractive valuations, and invest in them. A hospitable environment for growth stocks would support our efforts, but we believe a patient, disciplined approach to company and stock analysis to identify
successful growth companies will support our manadate.
| |
* |
Performance data quoted represents past performance, which is no guarantee of future results. Investment return and principal value will
fluctuate so that an investor’s shares, when redeemed, may be worth more or less than their original cost. The total return shown assumes the reinvestment of all distributions and does not reflect the deduction of taxes that a shareholder would
pay on fund distributions or the redemption of shares. The total return for Class A Shares was 3.49%, adjusted for the Fund’s maximum sales charge. Mutual fund performance changes over time and current performance may be lower or higher
than what is stated. For the most recent month-end performance, please visit www.wilmingtonfunds.com or call 1-800-836-2211. |
| |
** |
The Russell Mid Cap Growth Index measures the performance of the mid-cap growth segment of the U.S. equity universe. It includes those Russell Mid
Cap Index companies with higher price-to-book ratios and higher forecasted growth values. The Russell Midcap Growth Index is constructed to provide a comprehensive and unbiased barometer for the mid-cap growth market. The Index is completely
reconstituted annually to ensure larger stocks do not distort the performance and characteristics of the true mid-cap growth market. |
Valuation is the process of determining the current worth of an asset or company. There are many techniques that can be used to
determine value; some are subjective and others are objective.
ANNUAL
REPORT / April 30, 2013
WILMINGTON MID-CAP GROWTH FUND – Class A†
The graph below illustrates the hypothetical investment of $10,0001 in the
Wilmington Mid-Cap Growth Fund (Class A) (the “Fund”) from April 30, 2003 to April 30, 2013, compared to the Russell Mid Cap Growth Index (“Russell Mid Cap Growth”).2
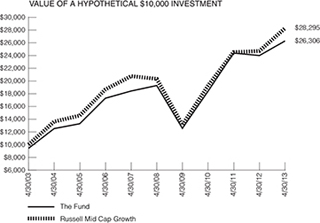
Average Annual Total Returns for the Year Ended April 30, 2013
|
|
|
|
|
| |
|
|
|
| 1 Year |
|
|
3.49% |
|
| 5 Years |
|
|
5.20% |
|
| 10 Years |
|
|
10.16% |
|
Performance data quoted represents past performance which is no guarantee of future results. Returns shown do not reflect the deduction
of taxes that a shareholder would pay on Fund distributions or the redemption of Fund shares. Investment return and principal value will fluctuate so that an investor’s shares, when redeemed, may be worth more or less than their original cost.
Mutual funds are not obligations of or guaranteed by any bank and are not federally insured. Mutual fund performance changes over time and current performance may be lower or higher than what is stated. For current to the most recent month end
performance, visit www.wilmingtonfunds.com or call 1-800-836-2211. Total returns shown include the maximum sales charge of 5.50%.
Annual Operating Expense Ratio
|
|
|
|
|
| |
|
|
|
| Before Waivers |
|
|
1.57% |
|
| After Waivers |
|
|
1.24% |
|
The Expense Ratio Before Waivers represents the operating costs borne by the Fund, expressed as a percentage of the Fund’s average
net assets, as shown in the Fees and Expenses table in the Fund’s current prospectus (under “Total Annual Fund Operating Expenses”).
| 1 |
|
Represents a hypothetical investment of $10,000 in Class A of the Fund after deducting the maximum sales charge of 5.50% ($10,000 investment minus $550 sales charge =
$9,450). The Fund’s performance assumes the reinvestment of all dividends and distributions. |
| 2 |
|
The performance for the Russell Mid Cap Growth Index assumes the reinvestment of all dividends and distributions but does not reflect the deduction of a sales charge
required for the Fund’s performance by Securities and Exchange Commission. It is not possible to invest directly in an index, and the represented index is unmanaged. |
| † |
|
The Wilmington Mid-Cap Growth Fund is the successor to the ARK Mid-Cap Equity Portfolio pursuant to a reorganization which took place on August 22, 2003. The
information presented above, for the periods prior to August 22, 2003, is historical information for the ARK Mid-Cap Equity Portfolio.
|
April 30,
2013 / ANNUAL REPORT
WILMINGTON MID-CAP
GROWTH FUND –
Class I†
The graph below illustrates the hypothetical investment of $1,000,0001 in
the Wilmington Mid-Cap Growth Fund (Class I) (the “Fund”) from April 30, 2003 to April 30, 2013, compared to the Russell Mid Cap Growth.2
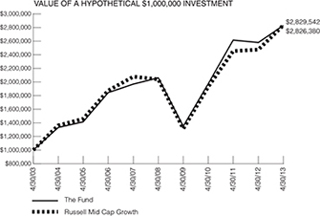
Average Annual Total Returns for the Year Ended April 30, 2013
|
|
|
|
|
| |
|
|
|
| 1 Year |
|
|
9.70% |
|
| 5 Years |
|
|
6.56% |
|
| 10 Years |
|
|
10.95% |
|
Performance data quoted represents past performance which is no guarantee of future results. Returns shown do not reflect the deduction
of taxes that a shareholder would pay on Fund distributions or the redemption of Fund shares. Investment return and principal value will fluctuate so that an investor’s shares, when redeemed, may be worth more or less than their original cost.
Mutual funds are not obligations of or guaranteed by any bank and are not federally insured. Mutual fund performance changes over time and current performance may be lower or higher than what is stated. For current to the most recent month end
performance, visit www.wilmingtonfunds.com or call 1-800- 836-2211.
Annual Operating Expense Ratio
|
|
|
|
|
| |
|
|
|
| Before Waivers |
|
|
1.32% |
|
| After Waivers |
|
|
1.08% |
|
The Expense Ratio Before Waivers represents the operating costs borne by the Fund, expressed as a percentage of the Fund’s average
net assets, as shown in the Fees and Expenses table in the Fund’s current prospectus (under “Total Annual Fund Operating Expenses”).
| 1 |
|
Represents a hypothetical investment of $1,000,000 in Class I of the Fund and assumes the reinvestment of all dividends and distributions. |
| 2 |
|
The performance shown for Class I of the Fund and the Russell Mid Cap Growth assumes the reinvestment of all dividends and distributions. It is not possible to invest
directly in an index, and the represented index is unmanaged. |
| † |
|
The Wilmington Mid-Cap Growth Fund is the successor to the ARK Mid-Cap Equity Portfolio pursuant to a reorganization which took place on August 22, 2003. The
information presented above, for the periods prior to August 22, 2003, is historical information for the ARK Mid-Cap Equity Portfolio.
|
ANNUAL
REPORT / April 30, 2013
WILMINGTON SMALL-CAP GROWTH FUND
Management’s Discussion of Fund Performance
For the fiscal year ended April 30, 2013, Wilmington Small-Cap Growth Fund
(the “Fund”) had a total return of 10.21%* for Class A Shares, and 10.47%* for Class I Shares, versus its benchmark, the Russell 2000 Growth Index,** which had a total return of 15.67%.
Over the twelve month period which ended April 30, 2013, the stock market reached a new all time high as measured by the
S&P 500 Index (“S&P 500”). The crossover point was on April 10, 2013 when the S&P 500 rose through the 1576 level that was attained on October 11, 2007. At that time, little did investors know that the Great Recession
was looming, and that the S&P 500 would be more than cut in half to its ultimate low point of 666 on March 6, 2009. Fortunately, since then, the Federal Reserve has implemented repeated rounds of monetary easing with the latest version,
called Quantitative Easing, still going strong. The result has been near zero money market rates and record low interest rates in U.S. Treasury notes and other high quality bonds. This has forced investors to move into riskier asset classes such as
junk bonds and higher yielding equities in the pursuit of yield. Corporations have also been active buyers of their own shares, as borrowing costs fell well below the cost of equity and, in many cases, below the dividend yield itself.
The resulting rise in equity values has served to boost retirement accounts and re-liquefy consumer balance sheets, which in
turn has boosted consumer confidence (at least among higher level consumers). Of course, mortgage rates have also dropped to all time lows and finally begun to stimulate the housing market. Up until this year, “Wall Street” seemed to be
ahead of “Main Street” as employment trends remained sluggish. This too seems to have shifted into positive mode as payroll employment gains have averaged 173,000 over the past twelve months. The unemployment rate is now down to 7.5%, and
a regular feature of the monthly payroll employment report is upward revision to prior month job totals. This is a strong indication that the financially led recovery is finally beginning to benefit mainstream America. That gives us confidence that
the economic recovery is taking on an aura of sustainability that we had not felt previously. Despite record low interest rates, investors had been so disillusioned by the equity market pummeling of 2008 and the subsequent (European-related)
corrections in 2010 and 2011 that money flows to equity mutual funds had remained largely negative.
As growth rates have
moderated, the attractiveness of lower risk, lower duration equities with yield characteristics have been bid up versus their cyclical counterparts. Within the equity market, value may be found with cyclical stocks with low valuations versus
defensive companies with above average dividend yields and higher valuations. If growth rates accelerate at all, a shift towards longer duration cyclical exposure should take place. One of the remaining pieces of the puzzle is business confidence
among small to medium enterprises which is critical for continued hiring and investment for the broad economy. Even here there appears to be good news with a sharp upturn since November that followed many months of decline. It remains to be seen
whether or not we are on the verge of a new secular bull market in equities. The final test will be the durability of equity prices once the Federal Reserve begins pull back on monetary stimulus. If the stock market can withstand the competition
from gradually rising interest rates, in our opinion both the real economy and the financial markets could be viewed as re-entering a prolonged period of recovery and prosperity. In our opinion,
valuations in the equity market are reasonable enough that, even with a continuation of only modest mid-single-digit earnings growth, the stock market can continue to rise.
The Fund was managed by two different portfolio management teams, each with Wilmington Trust Investment Advisors, Inc., during
the fiscal year ended April 30, 2013. The old portfolio management team which had managed the Fund for several years was replaced with a new portfolio management team in June 2012. The strategy utilized by the old portfolio management team
underperformed the Fund’s benchmark, the Russell 2000 Growth Index, during the period they managed the Fund. The new portfolio management team slightly exceeded the benchmark during the period it managed the Fund.
During the period from May 1, 2012 through June 30, 2012, the Fund returned -7.05% trailing the benchmark which
returned -2.33%. The largest underperformance came from consumer discretionary, health care and industrials while positive performance came from the energy sector. In the discretionary sector, the larger underperformers were Red Robin, Gourmet
Burgers, Arctic Cat, Francesca’s Holdings, Sonic Automotive, Body Central, Penske Automotive, and Orient Express Hotels. Lumber Liquidators was one of the few significant positive performers in the discretionary sector. Within health care, LCA
Vision and Starr Surgical were significant underperformers while an underweighted position in top performer Pharmacyclics and no position in Onyx Pharmaceutical contributed to underperformance that was slightly offset by an outperforming position in
Questor Pharmaceuticals. Within the industrial sector, Triumph Group, Kirby, TrueBlue, United Rentals, Wesco, Owens Corning, and H&E Equipment Services were all significant underperformers which were offset by positive performance from US
Airways and Armstrong World Industries. In the energy sector, positive performance was achieved from underweighted or no weight in several underperforming energy companies such as Cheniere Energy, Energy XXI and Rosetta Resources.
For the period July 1, 2012 through April 30, 2013, the Fund returned 18.86% which slightly outperformed the
benchmark return of 18.44%. The largest outperformance came from the consumer discretionary, technology and financial sectors while the industrial sector posted negative relative performance. Within consumer discretionary, media companies Sinclair
Broadcast and Nexstar Broadcasting led performance along with retailer Steve Madden. Financials were led by capital markets companies Virtus Financials, Alliance Bernstein and Medallion Financial along with REITs Newcastle Investment and Glimcher
Realty Trust. In technology, positive performance came from acquisition target Brightpoint as well as IT services company Maximus and software company Manhattan Associates which were offset by poor performance from Pulse Electronics and Adtran. The
model utilized by the portfolio management team has been favoring market factors like lower valuation, higher growth rates of earnings and positive price momentum during this period.
April 30,
2013 / ANNUAL REPORT
| |
* |
Performance data quoted represents past performance, which is no guarantee of future results. Investment return and principal value will
fluctuate so that an investor’s shares, when redeemed, may be worth more or less than their original cost. The total return shown assumes the reinvestment of all distributions and does not reflect the deduction of taxes that a shareholder would
pay on fund distributions or the redemption of shares. The total return for Class A Shares was 4.13%, adjusted for the Fund’s maximum sales charge. Mutual fund performance changes over time and current performance may be lower or higher
than what is stated. For the most recent month-end performance, please visit www.wilmingtonfunds.com or call 1-800-836-2211. |
| |
** |
The Russell 2000 Growth Index measures the performance of the small-cap growth segment of the U.S. equity universe. It includes those Russell 2000
companies with higher price-to-book ratios and higher forecasted growth values. The Russell 2000 Growth Index is constructed to provide a comprehensive and unbiased barometer for the small-cap growth segment. The Index is completely reconstituted
annually to ensure larger stocks do not distort the performance and characteristics of the true small-cap opportunity set and that the represented companies continue to reflect growth characteristics. |
Quantitative Easing (QE) is government monetary policy occasionally used to increase the money supply by buying government
securities or other securities from the market. Quantitative easing increases the money supply by flooding financial institutions with capital, in an effort to promote increased lending and liquidity.
Duration is a measure of a security’s price sensitivity to changes in interest rates. Securities with longer durations are
more sensitive to changes in interest rates than securities of shorter durations.
Valuation is the process of determining
the current worth of an asset or company. There are many techniques that can be used to determine value; some are subjective and others are objective.
Dividend Yield is a financial ratio that shows how much a company pays out in dividends each year relative to its share price.
In the absence of any capital gains, the dividend yield is the return on investment of a stock.
ANNUAL
REPORT / April 30, 2013
WILMINGTON SMALL-CAP GROWTH FUND – Class A†
The graph below illustrates the hypothetical investment of
$10,0001 in the Wilmington Small-Cap Growth Fund (Class A) (the “Fund”) from April 30, 2003 to April 30, 2013, compared to the Russell 2000 Growth Index (“Russell 2000
Growth”).2
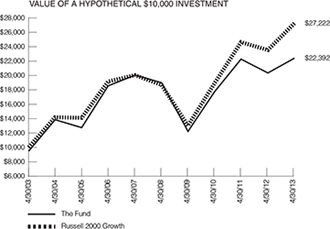
Average Annual Total Returns for the Year Ended April 30, 2013
|
|
|
|
|
| |
|
|
|
| 1 Year |
|
|
4.13% |
|
| 5 Years |
|
|
2.20% |
|
| 10 Years |
|
|
8.40% |
|
Performance data quoted represents past performance which is no guarantee of future results. Returns shown do not reflect the deduction
of taxes that a shareholder would pay on Fund distributions or the redemption of Fund shares. Investment return and principal value will fluctuate so that an investor’s shares, when redeemed, may be worth more or less than their original cost.
Mutual funds are not obligations of or guaranteed by any bank and are not federally insured. Mutual fund performance changes over time and current performance may be lower or higher than what is stated. For current to the most recent month end
performance, visit www.wilmingtonfunds.com or call 1-800-836-2211. Total returns shown include the maximum sales charge of 5.50%.
Annual Operating Expense Ratio
|
|
|
|
|
| |
|
|
|
| Before Waivers |
|
|
1.64% |
|
| After Waivers |
|
|
1.47% |
|
The Expense Ratio Before Waivers represents the operating costs borne by the Fund, expressed as a percentage of the Fund’s average
net assets, as shown in the Fees and Expenses table in the Fund’s current prospectus (under “Total Annual Fund Operating Expenses”).
| 1 |
|
Represents a hypothetical investment of $10,000 in Class A of the Fund after deducting the maximum sales charge of 5.50% ($10,000 investment minus $550 sales charge =
$9,450). The Fund’s performance assumes the reinvestment of all dividends and distributions. |
| 2 |
|
The performance for the Russell 2000 Growth Index assumes the reinvestment of all dividends and distributions but does not reflect the deduction of a sales charge required
for the Fund’s performance by Securities and Exchange Commission. It is not possible to invest directly in an index, and the represented index is unmanaged. |
| † |
|
The Wilmington Small-Cap Growth Fund is the successor to the ARK Small Cap Equity Portfolio pursuant to a reorganization which took place on August 22, 2003. The
information presented above, for the periods prior to August 23, 2003, is historical information for the ARK Small Cap Equity Portfolio.
|
April 30,
2013 / ANNUAL REPORT
WILMINGTON SMALL-CAP GROWTH FUND – Class I†
The graph below illustrates the hypothetical investment of
$1,000,0001 in the Wilmington Small-Cap Growth Fund (Class I) (the “Fund”) from April 30, 2003 to April 30, 2013, compared to the Russell 2000 Growth.2
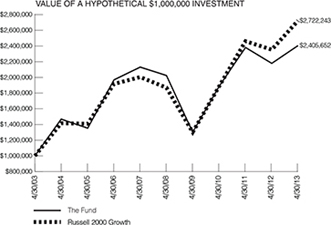
Average Annual Total Returns for the Year Ended April 30, 2013
|
|
|
|
|
| |
|
|
|
| 1 Year |
|
|
10.47% |
|
| 5 Years |
|
|
3.53% |
|
| 10 Years |
|
|
9.18% |
|
Performance data quoted represents past performance which is no guarantee of future results. Returns shown do not reflect the deduction
of taxes that a shareholder would pay on Fund distributions or the redemption of Fund shares. Investment return and principal value will fluctuate so that an investor’s shares, when redeemed, may be worth more or less than their original cost.
Mutual funds are not obligations of or guaranteed by any bank and are not federally insured. Mutual fund performance changes over time and current performance may be lower or higher than what is stated. For current to the most recent month end
performance, visit www.wilmingtonfunds.com or call 1-800-836-2211.
Annual Operating Expense Ratio
|
|
|
|
|
| |
|
|
|
| Before Waivers |
|
|
1.39% |
|
| After Waivers |
|
|
1.25% |
|
The Expense Ratio Before Waivers represents the operating costs borne by the Fund, expressed as a percentage of the Fund’s average
net assets, as shown in the Fees and Expenses table in the Fund’s current prospectus (under “Total Annual Fund Operating Expenses”).
| 1 |
|
Represents a hypothetical investment of $1,000,000 in Class I of the Fund and assumes the reinvestment of all dividends and distributions. |
| 2 |
|
The performance shown for Class I of the Fund and the Russell 2000 Growth Index assumes the reinvestment of all dividends and distributions. It is not possible to invest
directly in an index, and the represented index is unmanaged. |
| † |
|
The Wilmington Small-Cap Growth Fund is the successor to the ARK Small-Cap Equity Portfolio pursuant to a reorganization which took place on August 22, 2003. The
information presented above, for the periods prior to August 23, 2003, is historical information for the ARK Small-Cap Equity Portfolio.
|
ANNUAL
REPORT / April 30, 2013
WILMINGTON SMALL-CAP STRATEGY FUND
Management’s Discussion of Fund Performance
For the fiscal year ended April 30, 2013, Wilmington Small-Cap Strategy
Fund (the “Fund”) had a total return of 18.07%* for Class I Shares, versus its benchmark, the Russell 2000 Index**, which had a total return of 17.69%.
The Fund attempts to outperform the Russell 2000 Index by overweighting growth or value companies based on recommendations from
the Wilmington Trust Investment Advisors, Inc. Investment Strategy Team (IST). During the period May 2012 through October 2012, the IST style recommendation for domestic small-cap equities was to overweight growth companies. The Russell 2000 Value
Index returned 2.8% and the Russell 2000 Growth Index returned -0.7% during this period, so the style tilt had a -0.3% impact on relative performance.
At the October 2012 meeting of the IST, the team voted to remove the style tilt for domestic small-cap portfolios. The Fund was
rebalanced to track to Russell 2000 Index at the end of October. IST advice remained neutral on style tilt through February 2013. During this period, the Fund returned 11.9%, slightly outperforming the Russell 2000 Index return of 11.8%.
The IST voted in February 2013 to target a benchmark of 65% value and 35% growth companies for domestic small-cap equities. The
Fund was rebalanced at the end of February to target the new custom benchmark. The value-overweight remained through the end of April. During March and April, the Russell 2000 Value Index narrowly outperformed the Russell 2000 Growth Index by 0.3%.
The style tilt had essentially no impact on relative return.
At the April IST meeting, the proprietary U.S. small-cap
style model continued to favor value stocks. The IST voted to follow the models and recommended maintaining the overweight to value companies in domestic small cap-equity portfolios. The IST and Investment Research Team are researching additional
tactics to improve the risk adjusted return of the Fund.
| |
* |
Performance data quoted represents past performance, which is no guarantee of future results. Investment return and principal value will
fluctuate so that an investor’s shares, when redeemed, may be worth more or less than their original cost. The total return shown assumes the reinvestment of all distributions and does not reflect the deduction of taxes that a shareholder would
pay on fund distributions or the redemption of shares. Mutual fund performance changes over time and current performance may be lower or higher than what is stated. For the most recent month-end performance, please visit www.wilmingtonfunds.com or
call 1-800-836-2211. |
| |
** |
The Russell 2000 Index measures the performance of the small-cap segment of the U.S. equity universe. It is a subset of the Russell 3000 Index
representing approximately 10% of the total market capitalization of the Index. It includes approximately 2,000 of the smallest securities based on a combination of their market cap and current index membership. The Index is constructed to provide a
comprehensive and unbiased small-cap barometer and is completely reconstituted annually to ensure large stocks do not distort the performance and characteristics of the true small-cap opportunity set. The Russell 3000 Index measures the performance
of the largest 3,000 U.S. companies representing approximately 98% of the investable U.S. equity market. Russell 2000 Growth Index measures the performance of those Russell 2000 Index companies with higher price-to-book ratios and higher forecasted
growth values. Russell 2000 Value Index measures the performance of those Russell 2000 Index companies with lower price-to-book ratios and lower forecasted growth values.
|
April 30,
2013 / ANNUAL REPORT
WILMINGTON SMALL-CAP STRATEGY FUND – Class I
The graph below illustrates the hypothetical investment of $1,000,0001 in
the Wilmington Small-Cap Strategy Fund (Class I) (the “Fund”) from July 1, 2003 (start of performance) to April 30, 2013, compared to the Russell 2000 Index.2

Average Annual Total Returns for the Year Ended April 30, 2013
|
|
|
|
|
| |
|
|
|
| 1 Year |
|
|
18.07% |
|
| 5 Years |
|
|
6.52% |
|
| Start of Performance (7/01/03) |
|
|
7.80% |
|
Performance data quoted represents past performance which is no guarantee of future results. Returns shown do not reflect the deduction
of taxes that a shareholder would pay on Fund distributions or the redemption of Fund shares. Investment return and principal value will fluctuate so that an investor’s shares, when redeemed, may be worth more or less than their original cost.
Mutual funds are not obligations of or guaranteed by any bank and are not federally insured. Mutual fund performance changes over time and current performance may be lower or higher than what is stated. For current to the most recent month end
performance, visit www.wilmingtonfunds.com or call 1-800-836-2211.
Annual Operating Expense Ratio
|
|
|
|
|
| |
|
|
|
| Before Waivers |
|
|
1.39% |
|
| After Waivers |
|
|
0.31% |
|
The Expense Ratio Before Waivers represents the operating costs borne by the Fund, expressed as a percentage of the Fund’s average
net assets, as shown in the Fees and Expenses table in the Fund’s current prospectus (under “Total Annual Fund Operating Expenses”).
| 1 |
|
Represents a hypothetical investment of $1,000,000 in Class I of the Fund and assumes the reinvestment of all dividends and distributions. |
| 2 |
|
The performance shown for Class I of the Fund and the Russell 2000 Index assumes the reinvestment of all dividends and distributions. It is not possible to invest directly
in an index, and the represented index is unmanaged. |
ANNUAL
REPORT / April 30, 2013
SHAREHOLDER EXPENSE EXAMPLE
As a shareholder of the Fund, you incur ongoing costs, including management fees; to the extent
applicable, distribution (12b-1) fees, and/or shareholder services fees; and other Fund expenses. This Example is intended to help you to understand your ongoing costs (in dollars) of investing in the Funds and to compare these costs with the
ongoing costs of investing in other mutual funds. It is based on an investment of $1,000 invested at the beginning of the period and held for the entire period from November 1, 2012 to April 30, 2013.
Actual Expenses
This section of the following table
provides information about actual account values and actual expenses. You may use the information in this section, together with the amount you invested, to estimate the expenses that you incurred over the period. Simply divide your account value by
$1,000 (for example, an $8,600 account value divided by $1,000 = 8.6), then multiply the result by the number in the first section under the heading entitled “Expenses Paid During Period” to estimate the expenses attributable to your
investment during this period.
Hypothetical Example for
Comparison
Purposes
This section of the following table provides information about hypothetical account values and hypothetical expenses based on the
Funds’ actual expense ratios and assumed rates of return of 5% per year before expenses, which are not the Funds’ actual returns. Thus, you should not use the hypothetical account values and expenses to estimate the actual
ending account balance or your expenses for the period. Rather, these figures are required to be provided to enable you to compare the ongoing costs of investing in the Funds with other funds. To do so, compare this 5% hypothetical example with the
5% hypothetical examples that appear in the shareholder reports of the other funds.
Please note that the expenses shown in the table are
meant to highlight your ongoing costs only. Therefore, the Annualized Net Expense Ratio section of the table is useful in comparing ongoing costs only, and will not help you determine the relative total costs of owning different funds.
|
|
|
|
|
|
|
|
|
|
|
|
|
|
|
|
|
|
|
|
|
| |
|
Beginning
Account Value
11/1/12 |
|
Ending
Account Value
4/30/13 |
|
Expenses Paid
During Period1 |
|
Annualized Net
Expense Ratio2 |
| WILMINGTON LARGE-CAP GROWTH FUND |
|
|
|
|
|
|
|
|
|
|
|
|
|
|
|
|
|
|
|
|
| Actual |
|
|
|
|
|
|
|
|
|
|
|
|
|
|
|
|
|
|
|
|
| Class A |
|
|
$ |
1,000.00 |
|
|
|
$ |
1,109.50 |
|
|
|
$ |
7.43 |
|
|
|
|
1.42 |
% |
| Class I |
|
|
$ |
1,000.00 |
|
|
|
$ |
1,113.50 |
|
|
|
$ |
5.45 |
|
|
|
|
1.04 |
% |
| Hypothetical (assuming a 5% return before expense) |
|
|
|
|
|
|
|
|
|
|
|
|
|
|
|
|
|
|
|
|
| Class A |
|
|
$ |
1,000.00 |
|
|
|
$ |
1,017.75 |
|
|
|
$ |
7.10 |
|
|
|
|
1.42 |
% |
| Class I |
|
|
$ |
1,000.00 |
|
|
|
$ |
1,019.64 |
|
|
|
$ |
5.21 |
|
|
|
|
1.04 |
% |
|
|
|
|
|
| WILMINGTON LARGE-CAP STRATEGY FUND |
|
|
|
|
|
|
|
|
|
|
|
|
|
|
|
|
|
|
|
|
| Actual |
|
|
|
|
|
|
|
|
|
|
|
|
|
|
|
|
|
|
|
|
| Class I |
|
|
$ |
1,000.00 |
|
|
|
$ |
1,149.20 |
|
|
|
$ |
1.33 |
|
|
|
|
0.25 |
% |
| Hypothetical (assuming a 5% return before expense) |
|
|
|
|
|
|
|
|
|
|
|
|
|
|
|
|
|
|
|
|
| Class I |
|
|
$ |
1,000.00 |
|
|
|
$ |
1,023.55 |
|
|
|
$ |
1.25 |
|
|
|
|
0.25 |
% |
|
|
|
|
|
| WILMINGTON LARGE-CAP VALUE FUND |
|
|
|
|
|
|
|
|
|
|
|
|
|
|
|
|
|
|
|
|
| Actual |
|
|
|
|
|
|
|
|
|
|
|
|
|
|
|
|
|
|
|
|
| Class A |
|
|
$ |
1,000.00 |
|
|
|
$ |
1,118.90 |
|
|
|
$ |
6.72 |
|
|
|
|
1.28 |
% |
| Class I |
|
|
$ |
1,000.00 |
|
|
|
$ |
1,118.80 |
|
|
|
$ |
5.46 |
|
|
|
|
1.04 |
% |
| Hypothetical (assuming a 5% return before expense) |
|
|
|
|
|
|
|
|
|
|
|
|
|
|
|
|
|
|
|
|
| Class A |
|
|
$ |
1,000.00 |
|
|
|
$ |
1,018.45 |
|
|
|
$ |
6.41 |
|
|
|
|
1.28 |
% |
| Class I |
|
|
$ |
1,000.00 |
|
|
|
$ |
1,019.64 |
|
|
|
$ |
5.21 |
|
|
|
|
1.04 |
% |
|
|
|
|
|
| WILMINGTON MID-CAP GROWTH FUND |
|
|
|
|
|
|
|
|
|
|
|
|
|
|
|
|
|
|
|
|
| Actual |
|
|
|
|
|
|
|
|
|
|
|
|
|
|
|
|
|
|
|
|
| Class A |
|
|
$ |
1,000.00 |
|
|
|
$ |
1,158.70 |
|
|
|
$ |
6.64 |
|
|
|
|
1.24 |
% |
| Class I |
|
|
$ |
1,000.00 |
|
|
|
$ |
1,159.50 |
|
|
|
$ |
5.78 |
|
|
|
|
1.08 |
% |
| Hypothetical (assuming a 5% return before expense) |
|
|
|
|
|
|
|
|
|
|
|
|
|
|
|
|
|
|
|
|
| Class A |
|
|
$ |
1,000.00 |
|
|
|
$ |
1,018.65 |
|
|
|
$ |
6.21 |
|
|
|
|
1.24 |
% |
| Class I |
|
|
$ |
1,000.00 |
|
|
|
$ |
1,019.44 |
|
|
|
$ |
5.41 |
|
|
|
|
1.08 |
% |
April 30,
2013 / ANNUAL REPORT
|
|
|
|
|
|
|
|
|
|
|
|
|
|
|
|
|
|
|
|
|
| |
|
Beginning
Account Value
11/1/12 |
|
Ending
Account Value
4/30/13 |
|
Expenses Paid
During Period1 |
|
Annualized Net
Expense Ratio2 |
| WILMINGTON SMALL-CAP GROWTH FUND |
|
|
|
|
|
|
|
|
|
|
|
|
|
|
|
|
|
|
|
|
| Actual |
|
|
|
|
|
|
|
|
|
|
|
|
|
|
|
|
|
|
|
|
| Class A |
|
|
$ |
1,000.00 |
|
|
|
$ |
1,137.00 |
|
|
|
$ |
7.74 |
|
|
|
|
1.46 |
% |
| Class I |
|
|
$ |
1,000.00 |
|
|
|
$ |
1,138.60 |
|
|
|
$ |
6.63 |
|
|
|
|
1.25 |
% |
| Hypothetical (assuming a 5% return before expense) |
|
|
|
|
|
|
|
|
|
|
|
|
|
|
|
|
|
|
|
|
| Class A |
|
|
$ |
1,000.00 |
|
|
|
$ |
1,017.55 |
|
|
|
$ |
7.30 |
|
|
|
|
1.46 |
% |
| Class I |
|
|
$ |
1,000.00 |
|
|
|
$ |
1,018.60 |
|
|
|
$ |
6.26 |
|
|
|
|
1.25 |
% |
|
|
|
|
|
| WILMINGTON SMALL-CAP STRATEGY FUND |
|
|
|
|
|
|
|
|
|
|
|
|
|
|
|
|
|
|
|
|
| Actual |
|
|
|
|
|
|
|
|
|
|
|
|
|
|
|
|
|
|
|
|
| Class I |
|
|
$ |
1,000.00 |
|
|
|
$ |
1,168.30 |
|
|
|
$ |
1.40 |
|
|
|
|
0.26 |
% |
| Hypothetical (assuming a 5% return before expense) |
|
|
|
|
|
|
|
|
|
|
|
|
|
|
|
|
|
|
|
|
| Class I |
|
|
$ |
1,000.00 |
|
|
|
$ |
1,023.51 |
|
|
|
$ |
1.30 |
|
|
|
|
0.26 |
% |
| (1) |
Expenses are equal to the Funds’ annualized net expense ratios, multiplied by the average account value over the period, multiplied by 181/365 (to reflect the most recent one-half year period). |
| (2) |
Expense ratio does not reflect the indirect expenses of the underlying funds in which it invests. |
ANNUAL
REPORT / April 30, 2013
PORTFOLIO OF INVESTMENTS SUMMARY TABLE
Wilmington Large-Cap Growth Fund
At April 30, 2013,
the Fund’s sector classifications were as follows (unaudited):
|
|
|
|
|
|
| |
|
Percentage of |
| |
|
Total Net Assets |
| Common Stocks |
|
|
|
|
|
| Information Technology |
|
|
|
30.2 |
% |
| Consumer Discretionary |
|
|
|
18.1 |
% |
| Health Care |
|
|
|
15.5 |
% |
| Industrials |
|
|
|
11.7 |
% |
| Consumer Staples |
|
|
|
10.3 |
% |
| Energy |
|
|
|
5.7 |
% |
| Financials |
|
|
|
5.5 |
% |
| Materials |
|
|
|
1.9 |
% |
| Telecommunication Services |
|
|
|
1.1 |
% |
| Cash Equivalents1 |
|
|
|
2.9 |
% |
| Other Assets and Liabilities – Net2 |
|
|
|
(2.9 |
)% |
|
|
|
|
|
|
| TOTAL |
|
|
|
100.0 |
% |
|
|
|
|
|
|
| (1) |
Cash Equivalents include investments in repurchase agreements. |
| (2) |
Assets, other than investments in securities, less liabilities. See Statements of Assets and Liabilities. |
PORTFOLIO OF INVESTMENTS
April 30, 2013
|
|
|
|
|
|
|
|
|
| Description |
|
Number of
Shares |
|
|
Value |
|
| COMMON STOCKS – 100.0% |
|
|
|
|
|
|
|
|
|
|
| CONSUMER DISCRETIONARY – 18.1% |
|
|
|
|
|
| AUTO COMPONENTS – 0.6% |
|
|
|
|
|
|
|
|
| BorgWarner, Inc.* |
|
|
4,800 |
|
|
$ |
375,216 |
|
| DISTRIBUTORS – 0.6% |
|
|
|
|
|
|
|
|
| LKQ Corp.* |
|
|
17,800 |
|
|
|
428,624 |
|
| HOTELS, RESTAURANTS & LEISURE – 0.8% |
|
|
|
|
|
| DineEquity, Inc. |
|
|
3,580 |
|
|
|
255,039 |
|
| Panera Bread Co.* |
|
|
1,580 |
|
|
|
280,023 |
|
|
|
|
|
|
|
$ |
535,062 |
|
| INTERNET & CATALOG RETAIL – 3.0% |
|
|
|
|
|
| Amazon.com, Inc.* |
|
|
6,033 |
|
|
|
1,531,236 |
|
| priceline.com, Inc.* |
|
|
746 |
|
|
|
519,209 |
|
|
|
|
|
|
|
$ |
2,050,445 |
|
| MEDIA – 4.2% |
|
|
|
|
|
|
|
|
| CBS Corp., Non-Voting |
|
|
39,891 |
|
|
|
1,826,210 |
|
| Comcast Corp. |
|
|
18,296 |
|
|
|
755,625 |
|
| Scripps Networks Interactive, Inc. |
|
|
3,780 |
|
|
|
251,672 |
|
|
|
|
|
|
|
$ |
2,833,507 |
|
|
|
|
|
|
|
|
|
|
| Description |
|
Number of
Shares |
|
|
Value |
|
| MULTILINE RETAIL – 2.0% |
|
|
|
|
|
|
|
|
| Nordstrom, Inc. |
|
|
6,300 |
|
|
$ |
356,517 |
|
| Target Corp. |
|
|
14,571 |
|
|
|
1,028,130 |
|
|
|
|
|
|
|
$ |
1,384,647 |
|
| SPECIALTY RETAIL – 2.5% |
|
|
|
|
|
|
|
|
| Bed Bath & Beyond, Inc.* |
|
|
7,459 |
|
|
|
513,179 |
|
| GameStop Corp.# |
|
|
8,700 |
|
|
|
303,630 |
|
| L Brands, Inc. |
|
|
6,750 |
|
|
|
340,268 |
|
| Tile Shop Holdings, Inc.* |
|
|
10,085 |
|
|
|
250,108 |
|
| Vitamin Shoppe, Inc.* |
|
|
5,700 |
|
|
|
280,155 |
|
|
|
|
|
|
|
$ |
1,687,340 |
|
| TEXTILES, APPAREL & LUXURY GOODS – 4.4% |
|
|
|
|
|
| Coach, Inc. |
|
|
5,575 |
|
|
|
328,145 |
|
| Lululemon Athletica, Inc.#,* |
|
|
4,080 |
|
|
|
310,610 |
|
| Michael Kors Holdings Ltd.* |
|
|
10,982 |
|
|
|
625,315 |
|
| NIKE, Inc. |
|
|
20,134 |
|
|
|
1,280,522 |
|
| PVH Corp. |
|
|
4,025 |
|
|
|
464,525 |
|
|
|
|
|
|
|
$ |
3,009,117 |
|
| TOTAL CONSUMER DISCRETIONARY |
|
|
|
|
|
$ |
12,303,958 |
|
April 30,
2013 / ANNUAL REPORT
|
|
|
|
|
| PORTFOLIOS OF INVESTMENTS |
|
|
23 |
|
Wilmington Large-Cap Growth Fund (continued)
|
|
|
|
|
|
|
|
|
| Description
|
|
Number of
Shares |
|
|
Value
|
|
|
|
|
| CONSUMER STAPLES – 10.3% |
|
|
|
|
|
|
|
|
|
|
|
| BEVERAGES – 3.2% |
|
|
|
|
|
|
|
|
| PepsiCo, Inc. |
|
|
26,480 |
|
|
$ |
2,183,806 |
|
|
|
| FOOD & STAPLES RETAILING – 2.8% |
|
|
|
|
|
| Costco Wholesale Corp. |
|
|
10,066 |
|
|
|
1,091,456 |
|
| Whole Foods Market, Inc. |
|
|
9,151 |
|
|
|
808,216 |
|
|
|
|
|
|
|
$ |
1,899,672 |
|
|
|
|
| FOOD PRODUCTS – 0.5% |
|
|
|
|
|
|
|
|
| Green Mountain Coffee Roasters, Inc.#,* |
|
|
5,975 |
|
|
|
342,965 |
|
| HOUSEHOLD PRODUCTS – 0.4% |
|
|
|
|
|
|
|
|
| Church & Dwight Co., Inc. |
|
|
4,650 |
|
|
|
297,089 |
|
|
|
|
| PERSONAL PRODUCTS – 1.2% |
|
|
|
|
|
|
|
|
| Estee Lauder Cos., Inc. |
|
|
8,237 |
|
|
|
571,236 |
|
| Herbalife Ltd.# |
|
|
6,680 |
|
|
|
265,263 |
|
|
|
|
|
|
|
$ |
836,499 |
|
| TOBACCO – 2.2% |
|
|
|
|
|
|
|
|
| Philip Morris International, Inc. |
|
|
15,548 |
|
|
|
1,486,233 |
|
| TOTAL CONSUMER STAPLES |
|
|
|
|
|
$ |
7,046,264 |
|
|
|
|
| ENERGY – 5.7% |
|
|
|
|
|
|
|
|
|
|
| ENERGY EQUIPMENT & SERVICES – 4.3% |
|
|
|
|
|
| Cameron International Corp.* |
|
|
6,025 |
|
|
|
370,839 |
|
| CARBO Ceramics, Inc.# |
|
|
2,500 |
|
|
|
176,625 |
|
| Core Laboratories NV |
|
|
2,035 |
|
|
|
294,627 |
|
| Lufkin Industries, Inc. |
|
|
1,990 |
|
|
|
175,697 |
|
| National Oilwell Varco, Inc. |
|
|
8,237 |
|
|
|
537,217 |
|
| Schlumberger Ltd. |
|
|
18,297 |
|
|
|
1,361,846 |
|
|
|
|
|
|
|
$ |
2,916,851 |
|
|
|
| OIL, GAS & CONSUMABLE FUELS – 1.4% |
|
|
|
|
|
| Cabot Oil & Gas Corp. |
|
|
5,110 |
|
|
|
347,735 |
|
| Noble Energy, Inc. |
|
|
2,670 |
|
|
|
302,484 |
|
| Whiting Petroleum Corp.* |
|
|
7,380 |
|
|
|
328,410 |
|
|
|
|
|
|
|
$ |
978,629 |
|
| TOTAL ENERGY |
|
|
|
|
|
$ |
3,895,480 |
|
|
|
|
| FINANCIALS – 5.5% |
|
|
|
|
|
|
|
|
|
|
|
| CAPITAL MARKETS – 1.0% |
|
|
|
|
|
|
|
|
| Raymond James Financial, Inc. |
|
|
9,680 |
|
|
|
400,946 |
|
| T Rowe Price Group, Inc. |
|
|
3,810 |
|
|
|
276,225 |
|
|
|
|
|
|
|
$ |
677,171 |
|
|
|
|
| COMMERCIAL BANKS – 0.5% |
|
|
|
|
|
|
|
|
| SVB Financial Group* |
|
|
4,625 |
|
|
|
328,884 |
|
|
|
|
| CONSUMER FINANCE – 1.1% |
|
|
|
|
|
|
|
|
| American Express Co. |
|
|
10,979 |
|
|
|
751,073 |
|
|
|
| DIVERSIFIED FINANCIAL SERVICES – 0.4% |
|
|
|
|
|
| IntercontinentalExchange, Inc.* |
|
|
1,875 |
|
|
|
305,494 |
|
|
|
|
|
|
|
|
|
|
| Description
|
|
Number of
Shares |
|
|
Value
|
|
|
|
|
| INSURANCE – 0.5% |
|
|
|
|
|
|
|
|
| Brown & Brown, Inc. |
|
|
10,500 |
|
|
$ |
325,395 |
|
|
|
|
| REAL ESTATE INVESTMENT TRUSTS – 1.1% |
|
|
|
|
|
|
|
|
| American Tower Corp. |
|
|
9,149 |
|
|
|
768,425 |
|
|
|
| REAL ESTATE MANAGEMENT & DEVELOPMENT – 0.9% |
|
|
|
|
|
| CBRE Group, Inc.* |
|
|
14,500 |
|
|
|
351,190 |
|
| Realogy Holdings Corp.* |
|
|
5,100 |
|
|
|
244,800 |
|
|
|
|
|
|
|
$ |
595,990 |
|
| TOTAL FINANCIALS |
|
|
|
|
|
$ |
3,752,432 |
|
|
|
|
| HEALTH CARE – 15.5% |
|
|
|
|
|
|
|
|
|
|
|
| BIOTECHNOLOGY – 6.2% |
|
|
|
|
|
|
|
|
| Biogen Idec, Inc.* |
|
|
4,576 |
|
|
|
1,001,824 |
|
| Celgene Corp.* |
|
|
7,465 |
|
|
|
881,393 |
|
| Cepheid, Inc.* |
|
|
4,826 |
|
|
|
184,015 |
|
| Gilead Sciences, Inc.* |
|
|
35,570 |
|
|
|
1,801,265 |
|
| Regeneron Pharmaceuticals, Inc.* |
|
|
1,800 |
|
|
|
387,252 |
|
|
|
|
|
|
|
$ |
4,255,749 |
|
|
|
| HEALTH CARE EQUIPMENT &
SUPPLIES – 2.4% |
|
|
|
|
|
| Alere, Inc.* |
|
|
12,150 |
|
|
|
312,012 |
|
| Intuitive Surgical, Inc.* |
|
|
682 |
|
|
|
335,742 |
|
| ResMed, Inc.# |
|
|
6,600 |
|
|
|
316,932 |
|
| Stryker Corp. |
|
|
10,435 |
|
|
|
684,327 |
|
|
|
|
|
|
|
$ |
1,649,013 |
|
|
|
| HEALTH CARE PROVIDERS &
SERVICES – 3.7% |
|
|
|
|
|
| Express Scripts Holding Co.* |
|
|
25,882 |
|
|
|
1,536,614 |
|
| UnitedHealth Group, Inc. |
|
|
16,255 |
|
|
|
974,162 |
|
|
|
|
|
|
|
$ |
2,510,776 |
|
|
|
| HEALTH CARE TECHNOLOGY – 0.5% |
|
|
|
|
|
| Cerner Corp.* |
|
|
3,150 |
|
|
|
304,825 |
|
|
|
| LIFE SCIENCES TOOLS & SERVICES – 0.2% |
|
|
|
|
|
| Life Technologies Corp.* |
|
|
2,120 |
|
|
|
156,223 |
|
|
|
|
| PHARMACEUTICALS – 2.5% |
|
|
|
|
|
|
|
|
| Allergan, Inc. |
|
|
2,745 |
|
|
|
311,695 |
|
| Auxilium Pharmaceuticals, Inc.* |
|
|
5,900 |
|
|
|
88,087 |
|
| Bristol-Myers Squibb Co. |
|
|
22,864 |
|
|
|
908,158 |
|
| Perrigo Co. |
|
|
3,415 |
|
|
|
407,785 |
|
|
|
|
|
|
|
$ |
1,715,725 |
|
| TOTAL HEALTH CARE |
|
|
|
|
|
$ |
10,592,311 |
|
|
|
|
| INDUSTRIALS – 11.7% |
|
|
|
|
|
|
|
|
|
|
|
| AEROSPACE & DEFENSE – 4.1% |
|
|
|
|
|
|
|
|
| HEICO Corp. |
|
|
6,557 |
|
|
|
221,758 |
|
| Precision Castparts Corp. |
|
|
3,551 |
|
|
|
679,271 |
|
| United Technologies Corp. |
|
|
21,046 |
|
|
|
1,921,289 |
|
|
|
|
|
|
|
$ |
2,822,318 |
|
ANNUAL
REPORT / April 30, 2013
|
|
|
| 24 |
|
PORTFOLIOS OF INVESTMENTS |
Wilmington Large-Cap Growth Fund (continued)
|
|
|
|
|
|
|
|
|
| Description
|
|
Number of
Shares |
|
|
Value
|
|
|
|
|
| AIR FREIGHT & LOGISTICS – 1.8% |
|
|
|
|
|
|
|
|
| CH Robinson Worldwide, Inc. |
|
|
4,800 |
|
|
$ |
285,072 |
|
| Expeditors International of Washington, Inc. |
|
|
5,750 |
|
|
|
206,598 |
|
| United Parcel Service, Inc. |
|
|
8,235 |
|
|
|
706,892 |
|
|
|
|
|
|
|
$ |
1,198,562 |
|
|
|
| COMMERCIAL SERVICES &
SUPPLIES – 0.4% |
|
|
|
|
|
| Waste Connections, Inc. |
|
|
6,850 |
|
|
|
259,958 |
|
|
|
|
| ELECTRICAL EQUIPMENT – 1.2% |
|
|
|
|
|
|
|
|
| AMETEK, Inc. |
|
|
7,460 |
|
|
|
303,697 |
|
| Babcock & Wilcox Co. |
|
|
6,600 |
|
|
|
179,520 |
|
| Rockwell Automation, Inc. |
|
|
3,750 |
|
|
|
317,925 |
|
|
|
|
|
|
|
$ |
801,142 |
|
|
|
| INDUSTRIAL CONGLOMERATES – 2.0% |
|
|
|
|
|
| Danaher Corp. |
|
|
22,878 |
|
|
|
1,394,185 |
|
|
|
|
| MACHINERY – 1.8% |
|
|
|
|
|
|
|
|
| Cummins, Inc. |
|
|
2,600 |
|
|
|
276,614 |
|
| Graco, Inc. |
|
|
6,150 |
|
|
|
372,260 |
|
| Joy Global, Inc. |
|
|
5,270 |
|
|
|
297,860 |
|
| Pall Corp. |
|
|
3,755 |
|
|
|
250,496 |
|
|
|
|
|
|
|
$ |
1,197,230 |
|
|
|
| TRADING COMPANIES &
DISTRIBUTORS – 0.4% |
|
|
|
|
|
| Fastenal Co. |
|
|
6,200 |
|
|
|
304,110 |
|
| TOTAL INDUSTRIALS |
|
|
|
|
|
$ |
7,977,505 |
|
|
|
| INFORMATION TECHNOLOGY – 30.2% |
|
|
|
|
|
|
|
| COMMUNICATIONS EQUIPMENT – 3.8% |
|
|
|
|
|
| Aruba Networks, Inc.* |
|
|
10,615 |
|
|
|
238,731 |
|
| F5 Networks, Inc.* |
|
|
3,120 |
|
|
|
238,462 |
|
| QUALCOMM, Inc. |
|
|
33,826 |
|
|
|
2,084,358 |
|
|
|
|
|
|
|
$ |
2,561,551 |
|
|
|
| COMPUTERS & PERIPHERALS – 8.5% |
|
|
|
|
|
| Apple, Inc. |
|
|
9,749 |
|
|
|
4,316,370 |
|
| EMC Corp.* |
|
|
54,908 |
|
|
|
1,231,586 |
|
| Stratasys Ltd.#,* |
|
|
3,100 |
|
|
|
257,455 |
|
|
|
|
|
|
|
$ |
5,805,411 |
|
|
|
| ELECTRONIC EQUIPMENT,
INSTRUMENTS & COMPONENTS – 1.0% |
|
|
|
|
|
| FEI Co. |
|
|
3,525 |
|
|
|
225,177 |
|
| IPG Photonics Corp. |
|
|
4,475 |
|
|
|
284,968 |
|
| National Instruments Corp. |
|
|
7,275 |
|
|
|
198,826 |
|
|
|
|
|
|
|
$ |
708,971 |
|
|
|
| INTERNET SOFTWARE &
SERVICES – 2.5% |
|
|
|
|
|
| Google, Inc.* |
|
|
2,100 |
|
|
|
1,731,597 |
|
|
|
|
| IT SERVICES – 5.5% |
|
|
|
|
|
|
|
|
| Global Payments, Inc. |
|
|
5,650 |
|
|
|
262,160 |
|
|
|
|
|
|
|
|
|
|
| Description
|
|
Number of
Shares |
|
|
Value
|
|
| International Business Machines Corp. |
|
|
9,945 |
|
|
$ |
2,014,260 |
|
| Mastercard, Inc. |
|
|
2,466 |
|
|
|
1,363,525 |
|
| Teradata Corp.* |
|
|
2,320 |
|
|
|
118,482 |
|
|
|
|
|
|
|
$ |
3,758,427 |
|
|
|
| SEMICONDUCTORS & SEMICONDUCTOR EQUIPMENT – 1.1% |
|
|
|
|
|
| Altera Corp. |
|
|
10,525 |
|
|
|
336,905 |
|
| Lam Research Corp.* |
|
|
4,950 |
|
|
|
228,789 |
|
| MKS Instruments, Inc. |
|
|
5,610 |
|
|
|
150,741 |
|
|
|
|
|
|
|
$ |
716,435 |
|
|
|
|
| SOFTWARE – 7.8% |
|
|
|
|
|
|
|
|
| ANSYS, Inc.* |
|
|
4,600 |
|
|
|
371,956 |
|
| Autodesk, Inc.* |
|
|
10,500 |
|
|
|
413,490 |
|
| Citrix Systems, Inc.* |
|
|
5,795 |
|
|
|
360,275 |
|
| Microsoft Corp. |
|
|
64,500 |
|
|
|
2,134,950 |
|
| Nuance Communications, Inc.* |
|
|
14,125 |
|
|
|
268,940 |
|
| Oracle Corp. |
|
|
44,842 |
|
|
|
1,469,921 |
|
| Sourcefire, Inc.* |
|
|
5,380 |
|
|
|
256,949 |
|
|
|
|
|
|
|
$ |
5,276,481 |
|
| TOTAL INFORMATION TECHNOLOGY |
|
|
$ |
20,558,873 |
|
|
|
|
| MATERIALS – 1.9% |
|
|
|
|
|
|
|
|
|
|
|
| CHEMICALS – 1.5% |
|
|
|
|
|
|
|
|
| Airgas, Inc. |
|
|
1,880 |
|
|
|
181,702 |
|
| Ashland, Inc. |
|
|
4,790 |
|
|
|
408,156 |
|
| WR Grace & Co.* |
|
|
5,300 |
|
|
|
408,683 |
|
|
|
|
|
|
|
$ |
998,541 |
|
|
|
| CONTAINERS & PACKAGING – 0.4% |
|
|
|
|
|
| Crown Holdings, Inc.* |
|
|
7,300 |
|
|
|
311,564 |
|
| TOTAL MATERIALS |
|
|
|
|
|
$ |
1,310,105 |
|
|
|
| TELECOMMUNICATION SERVICES – 1.1% |
|
|
|
|
|
|
|
| DIVERSIFIED TELECOMMUNICATION
SERVICES – 1.1% |
|
|
|
|
|
| Verizon Communications, Inc. |
|
|
13,510 |
|
|
|
728,324 |
|
TOTAL COMMON STOCKS
(COST $48,663,366) |
|
|
|
|
|
$ |
68,165,252 |
|
TOTAL INVESTMENTS IN SECURITIES – 100.0%
(COST $48,663,366) |
|
|
$ |
68,165,252 |
|
|
|
|
|
|
|
|
|
|
|
|
|
| |
|
Par Value |
|
|
|
|
|
CASH COLLATERAL INVESTED FOR
SECURITIES ON LOAN – 2.9% |
|
|
|
| REPURCHASE AGREEMENTS – 2.9% |
|
|
|
|
|
|
|
|
| Deutsche Bank Securities, Inc., 0.14%, dated 04/30/13, due 05/01/13, repurchase price $947,566, collateralized by U.S. Treasury Securities 0.00% to 10.63%,
maturing 05/15/13 to 05/15/42; total market value of $ 966,514. |
|
$ |
947,562 |
|
|
|
947,562 |
|
April 30,
2013 / ANNUAL REPORT
|
|
|
|
|
| PORTFOLIOS OF INVESTMENTS |
|
|
25 |
|
Wilmington Large-Cap Growth Fund (concluded)
|
|
|
|
|
|
|
|
|
| Description
|
|
Par
Value |
|
|
Value |
|
| Morgan Stanley & Co. LLC, 0.17%, dated 04/30/13, due 05/01/13, repurchase price $1,000,005, collateralized by U.S. Government Securities 2.19% to 5.78%,
maturing 09/01/23 to 03/01/43; total market value of $ 1,020,000. |
|
$ |
1,000,000 |
|
|
$ |
1,000,000 |
|
|
|
|
TOTAL CASH COLLATERAL INVESTED FOR SECURITIES ON LOAN
(COST $1,947,562) |
|
|
|
|
|
$ |
1,947,562 |
|
|
|
|
|
|
|
|
| |
|
|
|
Value |
|
|
|
|
TOTAL INVESTMENTS – 102.9%
(COST $50,610,928) |
|
|
|
$ |
70,112,814 |
|
|
|
|
| COLLATERAL FOR SECURITIES ON LOAN – (2.9%) |
|
|
|
|
(1,947,562 |
) |
|
|
|
| OTHER LIABILITIES LESS ASSETS – 0.0%** |
|
|
|
|
(19,615 |
) |
|
|
|
| TOTAL NET ASSETS – 100.0% |
|
|
|
$ |
68,145,637 |
|
Cost of investments
for Federal income tax purposes is $51,107,297. The net unrealized appreciation/(depreciation) of investments was $19,005,517. This consists of net unrealized appreciation from investment for those securities having an excess of value over cost of
$19,549,909 and net unrealized depreciation from investments for those securities having an excess of cost over value of $544,392.
Various inputs are used in determining the value of the Fund’s investments. These inputs are summarized in the three broad levels
listed below.
Level 1 – quoted prices in active markets for identical securities
Level 2 – other significant observable inputs (including quoted prices for similar securities, interest rates, prepayment speeds,
credit risk, etc.)
Level 3 – significant unobservable inputs (including the Fund’s own assumptions in determining the fair
value of investments)
The following is a summary of the inputs used as of April 30, 2013 in valuing the Fund’s assets
carried at fair value:
|
|
|
|
|
|
|
|
|
|
|
|
|
|
|
|
|
| |
|
Level 1 |
|
|
Level 2 |
|
|
Level 3 |
|
|
Total |
|
| Investments in Securities |
|
|
|
|
|
|
|
|
|
|
|
|
|
|
|
|
| Common Stocks |
|
$ |
68,165,252 |
|
|
$ |
— |
|
|
$ |
— |
|
|
$ |
68,165,252 |
|
| Repurchase Agreements |
|
|
— |
|
|
|
1,947,562 |
|
|
|
— |
|
|
|
1,947,562 |
|
|
|
|
|
|
|
|
|
|
|
|
|
|
|
|
|
|
| Total |
|
$ |
68,165,252 |
|
|
$ |
1,947,562 |
|
|
$ |
— |
|
|
$ |
70,112,814 |
|
|
|
|
|
|
|
|
|
|
|
|
|
|
|
|
|
|
See Notes to Portfolios of Investments
See Notes which are an integral part of the Financial Statements
ANNUAL
REPORT / April 30, 2013
PORTFOLIO OF INVESTMENTS SUMMARY TABLE
Wilmington Large-Cap Strategy Fund
At April 30,
2013, the Fund’s sector classifications were as follows (unaudited):
|
|
|
|
|
|
| |
|
Percentage of
Total Net Assets |
| Common Stocks |
|
|
|
|
|
| Information Technology |
|
|
|
16.8 |
% |
| Financials |
|
|
|
16.7 |
% |
| Consumer Discretionary |
|
|
|
12.9 |
% |
| Health Care |
|
|
|
12.3 |
% |
| Industrials |
|
|
|
10.9 |
% |
| Consumer Staples |
|
|
|
10.0 |
% |
| Energy |
|
|
|
9.6 |
% |
| Materials |
|
|
|
3.9 |
% |
| Utilities |
|
|
|
3.6 |
% |
| Telecommunication Services |
|
|
|
2.7 |
% |
| Investment Company |
|
|
|
0.5 |
% |
| Preferred Stock |
|
|
|
0.0 |
%3 |
| Rights |
|
|
|
0.0 |
%3 |
| Warrants |
|
|
|
0.0 |
%3 |
| Cash Equivalents1 |
|
|
|
2.3 |
% |
| Other Assets and Liabilities – Net2 |
|
|
|
(2.2 |
)% |
|
|
|
|
|
|
| TOTAL |
|
|
|
100.0 |
% |
|
|
|
|
|
|
| (1) |
Cash Equivalents include investments in repurchase agreements. |
| (2) |
Assets, other than investments in securities, less liabilities. See Statements of Assets and Liabilities. |
| (3) |
Represent less than 0.05%. |
PORTFOLIO OF INVESTMENTS
April 30, 2013
|
|
|
|
|
|
|
|
|
| Description
|
|
Number of
Shares |
|
|
Value
|
|
|
|
|
| COMMON STOCKS – 99.4% |
|
|
|
|
|
|
|
|
|
|
| CONSUMER DISCRETIONARY – 12.9% |
|
|
|
|
|
|
|
|
| AUTO COMPONENTS – 0.5% |
|
|
|
|
|
|
|
|
| BorgWarner, Inc.* |
|
|
3,440 |
|
|
$ |
268,905 |
|
| Delphi Automotive PLC |
|
|
9,700 |
|
|
|
448,237 |
|
| Gentex Corp. |
|
|
2,390 |
|
|
|
53,775 |
|
| Goodyear Tire & Rubber Co.* |
|
|
4,660 |
|
|
|
58,227 |
|
| Johnson Controls, Inc. |
|
|
16,730 |
|
|
|
585,717 |
|
| Lear Corp. |
|
|
2,400 |
|
|
|
138,672 |
|
| TRW Automotive Holdings Corp.* |
|
|
2,910 |
|
|
|
174,804 |
|
| Visteon Corp.* |
|
|
1,500 |
|
|
|
88,185 |
|
|
|
|
|
|
|
$ |
1,816,522 |
|
|
|
|
| AUTOMOBILES – 0.5% |
|
|
|
|
|
|
|
|
| Ford Motor Co. |
|
|
79,220 |
|
|
|
1,086,106 |
|
|
|
|
|
|
|
|
|
|
| Description
|
|
Number of
Shares |
|
|
Value
|
|
| General Motors Co.* |
|
|
18,700 |
|
|
$ |
576,708 |
|
| Harley-Davidson, Inc. |
|
|
7,950 |
|
|
|
434,467 |
|
| Tesla Motors, Inc.#, * |
|
|
1,500 |
|
|
|
80,985 |
|
| Thor Industries, Inc. |
|
|
280 |
|
|
|
10,385 |
|
|
|
|
|
|
|
$ |
2,188,651 |
|
|
|
|
| DISTRIBUTORS – 0.2% |
|
|
|
|
|
|
|
|
| Genuine Parts Co. |
|
|
4,960 |
|
|
|
378,597 |
|
| LKQ Corp.* |
|
|
12,480 |
|
|
|
300,518 |
|
|
|
|
|
|
|
$ |
679,115 |
|
|
|
| DIVERSIFIED CONSUMER SERVICES – 0.1% |
|
|
|
|
|
| Apollo Group, Inc.#,* |
|
|
2,487 |
|
|
|
45,686 |
|
| DeVry, Inc. |
|
|
2,020 |
|
|
|
56,580 |
|
| H&R Block, Inc. |
|
|
6,160 |
|
|
|
170,878 |
|
April 30,
2013 / ANNUAL REPORT
|
|
|
|
|
| PORTFOLIOS OF INVESTMENTS |
|
|
27 |
|
Wilmington Large-Cap Strategy Fund (continued)
|
|
|
|
|
|
|
|
|
| Description
|
|
Number of
Shares |
|
|
Value
|
|
| Service Corp. International |
|
|
10,870 |
|
|
$ |
183,486 |
|
| Weight Watchers International, Inc.# |
|
|
1,560 |
|
|
|
65,785 |
|
|
|
|
|
|
|
$ |
522,415 |
|
|
|
| HOTELS, RESTAURANTS & LEISURE – 2.0% |
|
|
|
|
|
| Bally Technologies, Inc.#,* |
|
|
700 |
|
|
|
37,296 |
|
| Brinker International, Inc. |
|
|
4,020 |
|
|
|
156,378 |
|
| Carnival Corp. |
|
|
6,620 |
|
|
|
228,456 |
|
| Chipotle Mexican Grill, Inc.* |
|
|
1,150 |
|
|
|
417,668 |
|
| Choice Hotels International, Inc.# |
|
|
60 |
|
|
|
2,344 |
|
| Darden Restaurants, Inc. |
|
|
2,540 |
|
|
|
131,140 |
|
| Dunkin’ Brands Group, Inc. |
|
|
900 |
|
|
|
34,929 |
|
| International Game Technology |
|
|
7,000 |
|
|
|
118,650 |
|
| Las Vegas Sands Corp. |
|
|
12,120 |
|
|
|
681,750 |
|
| Marriott International, Inc. |
|
|
7,072 |
|
|
|
304,520 |
|
| McDonald’s Corp. |
|
|
23,299 |
|
|
|
2,379,760 |
|
| MGM Resorts International* |
|
|
9,810 |
|
|
|
138,517 |
|
| Panera Bread Co.* |
|
|
845 |
|
|
|
149,759 |
|
| Penn National Gaming, Inc.* |
|
|
2,480 |
|
|
|
145,204 |
|
| Royal Caribbean Cruises Ltd. |
|
|
4,080 |
|
|
|
149,042 |
|
| Starbucks Corp. |
|
|
19,760 |
|
|
|
1,202,198 |
|
| Starwood Hotels & Resorts Worldwide, Inc. |
|
|
4,330 |
|
|
|
279,372 |
|
| Wendy’s Co. |
|
|
1,200 |
|
|
|
6,828 |
|
| Wyndham Worldwide Corp. |
|
|
3,460 |
|
|
|
207,877 |
|
| Wynn Resorts Ltd. |
|
|
2,320 |
|
|
|
318,536 |
|
| Yum! Brands, Inc. |
|
|
12,150 |
|
|
|
827,658 |
|
|
|
|
|
|
|
$ |
7,917,882 |
|
|
|
| HOUSEHOLD DURABLES – 0.5% |
|
|
|
|
|
| DR Horton, Inc. |
|
|
7,070 |
|
|
|
184,386 |
|
| Garmin Ltd.# |
|
|
1,290 |
|
|
|
45,253 |
|
| Harman International Industries, Inc. |
|
|
1,180 |
|
|
|
52,758 |
|
| Jarden Corp.* |
|
|
2,340 |
|
|
|
105,323 |
|
| Leggett & Platt, Inc. |
|
|
3,670 |
|
|
|
118,321 |
|
| Lennar Corp.# |
|
|
5,410 |
|
|
|
223,000 |
|
| Mohawk Industries, Inc.* |
|
|
1,650 |
|
|
|
182,952 |
|
| Newell Rubbermaid, Inc. |
|
|
7,820 |
|
|
|
205,979 |
|
| NVR, Inc.* |
|
|
130 |
|
|
|
133,900 |
|
| PulteGroup, Inc.* |
|
|
10,140 |
|
|
|
212,839 |
|
| Toll Brothers, Inc.* |
|
|
4,050 |
|
|
|
138,956 |
|
| Tupperware Brands Corp. |
|
|
2,700 |
|
|
|
216,810 |
|
| Whirlpool Corp. |
|
|
2,450 |
|
|
|
279,986 |
|
|
|
|
|
|
|
$ |
2,100,463 |
|
|
|
| INTERNET & CATALOG RETAIL – 1.0% |
|
|
|
|
|
| Amazon.com, Inc.* |
|
|
7,830 |
|
|
|
1,987,332 |
|
| Expedia, Inc. |
|
|
3,120 |
|
|
|
174,221 |
|
| Liberty Interactive Corp.* |
|
|
18,350 |
|
|
|
390,672 |
|
| Liberty Ventures* |
|
|
1,223 |
|
|
|
89,854 |
|
| Netflix, Inc.* |
|
|
1,880 |
|
|
|
406,212 |
|
|
|
|
|
|
|
|
|
|
| Description
|
|
Number of
Shares |
|
|
Value
|
|
| priceline.com, Inc.* |
|
|
1,330 |
|
|
$ |
925,667 |
|
| TripAdvisor, Inc.* |
|
|
3,120 |
|
|
|
164,050 |
|
|
|
|
|
|
|
$ |
4,138,008 |
|
|
|
| LEISURE EQUIPMENT & PRODUCTS – 0.2% |
|
|
|
|
|
| Hasbro, Inc.# |
|
|
3,490 |
|
|
|
165,321 |
|
| Mattel, Inc. |
|
|
10,650 |
|
|
|
486,279 |
|
| Polaris Industries, Inc. |
|
|
2,000 |
|
|
|
172,380 |
|
|
|
|
|
|
|
$ |
823,980 |
|
|
|
|
| MEDIA – 3.9% |
|
|
|
|
|
|
|
|
| AMC Networks, Inc.* |
|
|
1,685 |
|
|
|
106,172 |
|
| Cablevision Systems Corp. |
|
|
6,540 |
|
|
|
97,184 |
|
| CBS Corp., Non-Voting |
|
|
16,530 |
|
|
|
756,743 |
|
| Charter Communications, Inc.* |
|
|
1,300 |
|
|
|
130,962 |
|
| Clear Channel Outdoor Holdings, Inc.* |
|
|
500 |
|
|
|
3,615 |
|
| Comcast Corp. |
|
|
62,380 |
|
|
|
2,576,294 |
|
| DIRECTV* |
|
|
12,990 |
|
|
|
734,714 |
|
| Discovery Communications, Inc.* |
|
|
6,500 |
|
|
|
512,330 |
|
| DISH Network Corp. |
|
|
4,680 |
|
|
|
183,409 |
|
| DreamWorks Animation SKG, Inc.#,* |
|
|
2,490 |
|
|
|
48,007 |
|
| Gannett Co., Inc. |
|
|
7,690 |
|
|
|
155,030 |
|
| Interpublic Group of Cos., Inc.# |
|
|
8,720 |
|
|
|
120,685 |
|
| John Wiley & Sons, Inc. |
|
|
2,100 |
|
|
|
80,157 |
|
| Lamar Advertising Co.* |
|
|
2,400 |
|
|
|
112,368 |
|
| Liberty Global, Inc.* |
|
|
7,220 |
|
|
|
522,511 |
|
| Liberty Media Corp.* |
|
|
1,943 |
|
|
|
223,212 |
|
| Madison Square Garden Co.* |
|
|
2,187 |
|
|
|
131,810 |
|
| Morningstar, Inc. |
|
|
1,100 |
|
|
|
72,611 |
|
| News Corp. |
|
|
49,230 |
|
|
|
1,524,653 |
|
| Omnicom Group, Inc.# |
|
|
8,090 |
|
|
|
483,539 |
|
| Regal Entertainment Group# |
|
|
770 |
|
|
|
13,814 |
|
| Scripps Networks Interactive, Inc. |
|
|
2,280 |
|
|
|
151,802 |
|
| Sirius XM Radio, Inc.# |
|
|
123,100 |
|
|
|
400,075 |
|
| Starz - Liberty Capital* |
|
|
2,343 |
|
|
|
54,779 |
|
| Thomson Reuters Corp. |
|
|
5,800 |
|
|
|
194,242 |
|
| Time Warner Cable, Inc. |
|
|
8,524 |
|
|
|
800,318 |
|
| Time Warner, Inc. |
|
|
23,696 |
|
|
|
1,416,547 |
|
| Viacom, Inc. |
|
|
14,020 |
|
|
|
897,140 |
|
| Virgin Media, Inc. |
|
|
6,970 |
|
|
|
339,997 |
|
| Walt Disney Co. |
|
|
40,746 |
|
|
|
2,560,479 |
|
| Washington Post Co. |
|
|
140 |
|
|
|
62,068 |
|
|
|
|
|
|
|
$ |
15,467,267 |
|
|
|
|
| MULTILINE RETAIL – 0.7% |
|
|
|
|
|
|
|
|
| Big Lots, Inc.* |
|
|
1,324 |
|
|
|
48,220 |
|
| Dillard’s, Inc. |
|
|
1,400 |
|
|
|
115,374 |
|
| Dollar General Corp.* |
|
|
3,900 |
|
|
|
203,151 |
|
| Dollar Tree, Inc.* |
|
|
6,562 |
|
|
|
312,089 |
|
| Family Dollar Stores, Inc. |
|
|
2,356 |
|
|
|
144,588 |
|
ANNUAL
REPORT / April 30, 2013
|
|
|
| 28 |
|
PORTFOLIOS OF INVESTMENTS |
Wilmington Large-Cap Strategy Fund (continued)
|
|
|
|
|
|
|
|
|
| Description
|
|
Number of
Shares |
|
|
Value
|
|
| JC Penney Co., Inc.# |
|
|
2,330 |
|
|
$ |
38,259 |
|
| Kohl’s Corp. |
|
|
6,210 |
|
|
|
292,243 |
|
| Macy’s, Inc. |
|
|
9,280 |
|
|
|
413,888 |
|
| Nordstrom, Inc. |
|
|
5,880 |
|
|
|
332,749 |
|
| Sears Canada, Inc.# |
|
|
29 |
|
|
|
272 |
|
| Sears Holdings Corp.#,* |
|
|
70 |
|
|
|
3,594 |
|
| Target Corp. |
|
|
13,560 |
|
|
|
956,794 |
|
|
|
|
|
|
|
$ |
2,861,221 |
|
|
|
|
| SPECIALTY RETAIL – 2.5% |
|
|
|
|
|
|
|
|
| Aaron’s, Inc. |
|
|
4,300 |
|
|
|
123,453 |
|
| Abercrombie & Fitch Co. |
|
|
2,400 |
|
|
|
118,944 |
|
| Advance Auto Parts, Inc. |
|
|
2,150 |
|
|
|
180,342 |
|
| American Eagle Outfitters, Inc. |
|
|
3,150 |
|
|
|
61,267 |
|
| Ascena Retail Group, Inc.* |
|
|
4,500 |
|
|
|
83,250 |
|
| AutoNation, Inc.* |
|
|
580 |
|
|
|
26,396 |
|
| AutoZone, Inc.* |
|
|
560 |
|
|
|
229,090 |
|
| Bed Bath & Beyond, Inc.* |
|
|
6,690 |
|
|
|
460,272 |
|
| Best Buy Co., Inc. |
|
|
5,680 |
|
|
|
147,623 |
|
| CarMax, Inc.* |
|
|
4,300 |
|
|
|
197,972 |
|
| Chico’s FAS, Inc. |
|
|
4,890 |
|
|
|
89,340 |
|
| Dick’s Sporting Goods, Inc. |
|
|
2,300 |
|
|
|
110,630 |
|
| Foot Locker, Inc. |
|
|
4,930 |
|
|
|
171,909 |
|
| GameStop Corp.# |
|
|
5,520 |
|
|
|
192,648 |
|
| Gap, Inc. |
|
|
7,190 |
|
|
|
273,148 |
|
| GNC Holdings, Inc. |
|
|
1,800 |
|
|
|
81,594 |
|
| Guess?, Inc.# |
|
|
1,160 |
|
|
|
32,109 |
|
| Home Depot, Inc. |
|
|
35,640 |
|
|
|
2,614,194 |
|
| L Brands, Inc. |
|
|
8,250 |
|
|
|
415,883 |
|
| Lowe’s Cos., Inc. |
|
|
26,300 |
|
|
|
1,010,446 |
|
| O’Reilly Automotive, Inc.* |
|
|
3,600 |
|
|
|
386,352 |
|
| PetSmart, Inc. |
|
|
3,860 |
|
|
|
263,406 |
|
| Ross Stores, Inc. |
|
|
5,880 |
|
|
|
388,492 |
|
| Signet Jewelers Ltd. |
|
|
1,420 |
|
|
|
97,597 |
|
| Staples, Inc. |
|
|
19,410 |
|
|
|
256,988 |
|
| Tiffany & Co. |
|
|
3,090 |
|
|
|
227,671 |
|
| TJX Cos., Inc. |
|
|
19,240 |
|
|
|
938,335 |
|
| Tractor Supply Co. |
|
|
2,800 |
|
|
|
300,076 |
|
| Ulta Salon Cosmetics & Fragrance, Inc.* |
|
|
1,600 |
|
|
|
140,240 |
|
| Urban Outfitters, Inc.* |
|
|
4,060 |
|
|
|
168,246 |
|
| Williams-Sonoma, Inc. |
|
|
3,640 |
|
|
|
195,395 |
|
|
|
|
|
|
|
$ |
9,983,308 |
|
|
|
| TEXTILES, APPAREL &
LUXURY GOODS – 0.8% |
|
|
|
|
|
| Carter’s, Inc.* |
|
|
1,400 |
|
|
|
91,546 |
|
| Coach, Inc. |
|
|
6,650 |
|
|
|
391,419 |
|
| Deckers Outdoor Corp.#,* |
|
|
400 |
|
|
|
22,048 |
|
| Fossil, Inc.* |
|
|
1,600 |
|
|
|
156,992 |
|
| Hanesbrands, Inc.* |
|
|
3,700 |
|
|
|
185,592 |
|
|
|
|
|
|
|
|
|
|
| Description
|
|
Number of
Shares |
|
|
Value
|
|
| Michael Kors Holdings Ltd.* |
|
|
1,800 |
|
|
$ |
102,492 |
|
| NIKE, Inc. |
|
|
18,120 |
|
|
|
1,152,432 |
|
| PVH Corp. |
|
|
1,580 |
|
|
|
182,348 |
|
| Ralph Lauren Corp. |
|
|
1,900 |
|
|
|
345,002 |
|
| Under Armour, Inc.#,* |
|
|
2,200 |
|
|
|
125,576 |
|
| VF Corp. |
|
|
2,350 |
|
|
|
418,817 |
|
|
|
|
|
|
|
$ |
3,174,264 |
|
| TOTAL CONSUMER DISCRETIONARY |
|
|
|
|
|
$ |
51,673,096 |
|
|
|
|
| CONSUMER STAPLES – 10.0% |
|
|
|
|
|
|
|
|
|
|
|
| BEVERAGES – 2.1% |
|
|
|
|
|
|
|
|
| Beam, Inc. |
|
|
4,760 |
|
|
|
308,020 |
|
| Brown-Forman Corp. |
|
|
5,097 |
|
|
|
359,338 |
|
| Coca-Cola Co. |
|
|
90,882 |
|
|
|
3,847,035 |
|
| Coca-Cola Enterprises, Inc. |
|
|
8,840 |
|
|
|
323,809 |
|
| Constellation Brands, Inc.* |
|
|
4,630 |
|
|
|
228,490 |
|
| Dr Pepper Snapple Group, Inc. |
|
|
3,150 |
|
|
|
153,814 |
|
| Molson Coors Brewing Co. |
|
|
2,550 |
|
|
|
131,580 |
|
| Monster Beverage Corp.* |
|
|
3,668 |
|
|
|
206,875 |
|
| PepsiCo, Inc. |
|
|
35,299 |
|
|
|
2,911,109 |
|
|
|
|
|
|
|
$ |
8,470,070 |
|
|
|
|
| FOOD & STAPLES RETAILING – 2.1% |
|
|
|
|
|
|
|
|
| Costco Wholesale Corp. |
|
|
9,160 |
|
|
|
993,219 |
|
| CVS Caremark Corp. |
|
|
30,800 |
|
|
|
1,791,944 |
|
| Kroger Co. |
|
|
12,336 |
|
|
|
424,112 |
|
| Safeway, Inc. |
|
|
6,550 |
|
|
|
147,506 |
|
| Sysco Corp. |
|
|
13,490 |
|
|
|
470,261 |
|
| Walgreen Co. |
|
|
20,420 |
|
|
|
1,010,994 |
|
| Wal-Mart Stores, Inc. |
|
|
39,333 |
|
|
|
3,056,961 |
|
| Whole Foods Market, Inc. |
|
|
5,570 |
|
|
|
491,942 |
|
|
|
|
|
|
|
$ |
8,386,939 |
|
|
|
|
| FOOD PRODUCTS – 1.9% |
|
|
|
|
|
|
|
|
| Archer-Daniels-Midland Co. |
|
|
16,640 |
|
|
|
564,762 |
|
| Bunge Ltd. |
|
|
3,070 |
|
|
|
221,685 |
|
| Campbell Soup Co. |
|
|
3,656 |
|
|
|
169,675 |
|
| ConAgra Foods, Inc. |
|
|
12,530 |
|
|
|
443,186 |
|
| Dean Foods Co.* |
|
|
3,360 |
|
|
|
64,310 |
|
| Flowers Foods, Inc. |
|
|
6,225 |
|
|
|
205,051 |
|
| General Mills, Inc. |
|
|
16,184 |
|
|
|
815,997 |
|
| Green Mountain Coffee Roasters,
Inc.#,* |
|
|
3,940 |
|
|
|
226,156 |
|
| Hershey Co. |
|
|
4,640 |
|
|
|
413,702 |
|
| Hillshire Brands Co. |
|
|
3,300 |
|
|
|
118,503 |
|
| HJ Heinz Co. |
|
|
8,980 |
|
|
|
650,332 |
|
| Hormel Foods Corp. |
|
|
3,460 |
|
|
|
142,794 |
|
| Ingredion, Inc. |
|
|
2,270 |
|
|
|
163,463 |
|
| JM Smucker Co. |
|
|
2,799 |
|
|
|
288,941 |
|
| Kellogg Co. |
|
|
4,340 |
|
|
|
282,274 |
|
April 30,
2013 / ANNUAL REPORT
|
|
|
|
|
| PORTFOLIOS OF INVESTMENTS |
|
|
29 |
|
Wilmington Large-Cap Strategy Fund (continued)
|
|
|
|
|
|
|
|
|
| Description
|
|
Number of
Shares |
|
|
Value
|
|
| Kraft Foods Group, Inc. |
|
|
11,762 |
|
|
$ |
605,625 |
|
| McCormick & Co., Inc. |
|
|
5,030 |
|
|
|
361,858 |
|
| Mead Johnson Nutrition Co. |
|
|
5,050 |
|
|
|
409,505 |
|
| Mondelez International, Inc. |
|
|
40,587 |
|
|
|
1,276,461 |
|
| Smithfield Foods, Inc.* |
|
|
4,810 |
|
|
|
123,136 |
|
| Tyson Foods, Inc. |
|
|
6,100 |
|
|
|
150,243 |
|
| WhiteWave Foods Co.#,* |
|
|
7,500 |
|
|
|
126,825 |
|
|
|
|
|
|
|
$ |
7,824,484 |
|
|
|
|
| HOUSEHOLD PRODUCTS – 2.0% |
|
|
|
|
|
|
|
|
| Church & Dwight Co., Inc. |
|
|
4,792 |
|
|
|
306,161 |
|
| Clorox Co. |
|
|
2,068 |
|
|
|
178,365 |
|
| Colgate-Palmolive Co. |
|
|
11,588 |
|
|
|
1,383,723 |
|
| Energizer Holdings, Inc. |
|
|
2,290 |
|
|
|
221,191 |
|
| Kimberly-Clark Corp. |
|
|
9,440 |
|
|
|
974,114 |
|
| Procter & Gamble Co. |
|
|
62,506 |
|
|
|
4,798,586 |
|
|
|
|
|
|
|
$ |
7,862,140 |
|
|
|
|
| PERSONAL PRODUCTS – 0.3% |
|
|
|
|
|
|
|
|
| Avon Products, Inc. |
|
|
13,970 |
|
|
|
323,545 |
|
| Estee Lauder Cos., Inc. |
|
|
7,580 |
|
|
|
525,673 |
|
| Herbalife Ltd.# |
|
|
3,960 |
|
|
|
157,252 |
|
| Nu Skin Enterprises, Inc.# |
|
|
1,600 |
|
|
|
81,168 |
|
|
|
|
|
|
|
$ |
1,087,638 |
|
|
|
|
| TOBACCO – 1.6% |
|
|
|
|
|
|
|
|
| Altria Group, Inc. |
|
|
49,250 |
|
|
|
1,798,117 |
|
| Lorillard, Inc. |
|
|
9,820 |
|
|
|
421,180 |
|
| Philip Morris International, Inc. |
|
|
39,760 |
|
|
|
3,800,658 |
|
| Reynolds American, Inc. |
|
|
10,040 |
|
|
|
476,097 |
|
|
|
|
|
|
|
$ |
6,496,052 |
|
| TOTAL CONSUMER STAPLES |
|
|
|
|
|
$ |
40,127,323 |
|
|
|
|
| ENERGY – 9.6% |
|
|
|
|
|
|
|
|
|
|
| ENERGY EQUIPMENT & SERVICES – 1.6% |
|
|
|
|
|
| Atwood Oceanics, Inc.* |
|
|
2,650 |
|
|
|
129,982 |
|
| Baker Hughes, Inc. |
|
|
8,800 |
|
|
|
399,432 |
|
| Cameron International Corp.* |
|
|
7,180 |
|
|
|
441,929 |
|
| CARBO Ceramics, Inc.# |
|
|
700 |
|
|
|
49,455 |
|
| Diamond Offshore Drilling, Inc.# |
|
|
1,440 |
|
|
|
99,504 |
|
| Dresser-Rand Group, Inc.* |
|
|
2,070 |
|
|
|
115,113 |
|
| Era Group, Inc.* |
|
|
660 |
|
|
|
15,081 |
|
| FMC Technologies, Inc.* |
|
|
5,060 |
|
|
|
274,758 |
|
| Halliburton Co. |
|
|
21,630 |
|
|
|
925,115 |
|
| Helmerich & Payne, Inc. |
|
|
3,080 |
|
|
|
180,550 |
|
| McDermott International, Inc.* |
|
|
5,080 |
|
|
|
54,254 |
|
| Nabors Industries Ltd. |
|
|
7,430 |
|
|
|
109,890 |
|
| National Oilwell Varco, Inc. |
|
|
9,655 |
|
|
|
629,699 |
|
| Oceaneering International, Inc. |
|
|
3,480 |
|
|
|
244,192 |
|
| Oil States International, Inc.* |
|
|
1,360 |
|
|
|
121,530 |
|
|
|
|
|
|
|
|
|
|
| Description
|
|
Number of
Shares |
|
|
Value
|
|
| Patterson-UTI Energy, Inc. |
|
|
4,330 |
|
|
$ |
91,320 |
|
| Rowan Cos. PLC* |
|
|
3,240 |
|
|
|
105,397 |
|
| RPC, Inc.# |
|
|
450 |
|
|
|
5,958 |
|
| Schlumberger Ltd. |
|
|
28,584 |
|
|
|
2,127,507 |
|
| SEACOR Holdings, Inc. |
|
|
660 |
|
|
|
47,593 |
|
| Superior Energy Services, Inc.* |
|
|
2,740 |
|
|
|
75,597 |
|
| Tidewater, Inc. |
|
|
1,660 |
|
|
|
87,067 |
|
| Unit Corp.* |
|
|
220 |
|
|
|
9,247 |
|
|
|
|
|
|
|
$ |
6,340,170 |
|
|
|
| OIL, GAS & CONSUMABLE FUELS – 8.0% |
|
|
|
|
|
| Alpha Natural Resources, Inc.* |
|
|
7,134 |
|
|
|
52,934 |
|
| Anadarko Petroleum Corp. |
|
|
11,850 |
|
|
|
1,004,406 |
|
| Apache Corp. |
|
|
9,373 |
|
|
|
692,477 |
|
| Cabot Oil & Gas Corp. |
|
|
6,240 |
|
|
|
424,632 |
|
| Cheniere Energy, Inc.* |
|
|
5,400 |
|
|
|
153,792 |
|
| Chesapeake Energy Corp. |
|
|
17,500 |
|
|
|
341,950 |
|
| Chevron Corp. |
|
|
44,700 |
|
|
|
5,453,847 |
|
| Cimarex Energy Co. |
|
|
2,050 |
|
|
|
150,019 |
|
| Cobalt International Energy, Inc.* |
|
|
3,900 |
|
|
|
108,966 |
|
| Concho Resources, Inc.* |
|
|
3,280 |
|
|
|
282,506 |
|
| ConocoPhillips |
|
|
27,560 |
|
|
|
1,666,002 |
|
| CONSOL Energy, Inc. |
|
|
7,300 |
|
|
|
245,572 |
|
| Continental Resources, Inc.* |
|
|
1,360 |
|
|
|
108,691 |
|
| Denbury Resources, Inc.* |
|
|
9,115 |
|
|
|
163,067 |
|
| Devon Energy Corp. |
|
|
9,400 |
|
|
|
517,564 |
|
| Energen Corp. |
|
|
3,830 |
|
|
|
181,619 |
|
| EOG Resources, Inc. |
|
|
5,800 |
|
|
|
702,728 |
|
| EQT Corp. |
|
|
3,450 |
|
|
|
259,164 |
|
| EXCO Resources, Inc.# |
|
|
2,470 |
|
|
|
17,932 |
|
| Exxon Mobil Corp. |
|
|
105,483 |
|
|
|
9,386,932 |
|
| Hess Corp. |
|
|
7,890 |
|
|
|
569,500 |
|
| HollyFrontier Corp. |
|
|
5,240 |
|
|
|
259,118 |
|
| Kinder Morgan, Inc. |
|
|
10,605 |
|
|
|
414,656 |
|
| Marathon Oil Corp. |
|
|
18,430 |
|
|
|
602,108 |
|
| Marathon Petroleum Corp. |
|
|
9,065 |
|
|
|
710,333 |
|
| Murphy Oil Corp. |
|
|
5,550 |
|
|
|
344,600 |
|
| Newfield Exploration Co.* |
|
|
2,560 |
|
|
|
55,782 |
|
| Noble Energy, Inc. |
|
|
4,360 |
|
|
|
493,944 |
|
| Occidental Petroleum Corp. |
|
|
18,000 |
|
|
|
1,606,680 |
|
| Peabody Energy Corp. |
|
|
9,470 |
|
|
|
189,968 |
|
| Phillips 66 |
|
|
14,730 |
|
|
|
897,794 |
|
| Pioneer Natural Resources Co. |
|
|
3,720 |
|
|
|
454,696 |
|
| Plains Exploration & Production Co.* |
|
|
2,591 |
|
|
|
117,113 |
|
| QEP Resources, Inc. |
|
|
6,500 |
|
|
|
186,615 |
|
| Range Resources Corp. |
|
|
3,750 |
|
|
|
275,700 |
|
| Sandridge Energy, Inc.#,* |
|
|
19,430 |
|
|
|
99,870 |
|
| SM Energy Co. |
|
|
1,570 |
|
|
|
95,770 |
|
ANNUAL
REPORT / April 30, 2013
|
|
|
| 30 |
|
PORTFOLIOS OF INVESTMENTS |
Wilmington Large-Cap Strategy Fund (continued)
|
|
|
|
|
|
|
|
|
| Description
|
|
Number of
Shares |
|
|
Value
|
|
| Southwestern Energy Co.* |
|
|
10,028 |
|
|
$ |
375,248 |
|
| Spectra Energy Corp. |
|
|
13,700 |
|
|
|
431,961 |
|
| Teekay Corp. |
|
|
520 |
|
|
|
18,512 |
|
| Tesoro Corp. |
|
|
4,440 |
|
|
|
237,096 |
|
| Ultra Petroleum Corp.#,* |
|
|
4,800 |
|
|
|
102,720 |
|
| Valero Energy Corp. |
|
|
15,470 |
|
|
|
623,750 |
|
| Whiting Petroleum Corp.* |
|
|
4,100 |
|
|
|
182,450 |
|
| Williams Cos., Inc. |
|
|
15,850 |
|
|
|
604,361 |
|
| World Fuel Services Corp. |
|
|
3,100 |
|
|
|
125,705 |
|
| WPX Energy, Inc.* |
|
|
5,116 |
|
|
|
79,963 |
|
|
|
|
|
|
|
$ |
32,070,813 |
|
| TOTAL ENERGY |
|
|
|
|
|
$ |
38,410,983 |
|
|
|
|
| FINANCIALS – 16.7% |
|
|
|
|
|
|
|
|
|
|
|
| CAPITAL MARKETS – 2.2% |
|
|
|
|
|
|
|
|
| Affiliated Managers Group, Inc.* |
|
|
1,470 |
|
|
|
228,850 |
|
| American Capital Ltd.* |
|
|
11,200 |
|
|
|
169,456 |
|
| Ameriprise Financial, Inc. |
|
|
5,240 |
|
|
|
390,537 |
|
| Ares Capital Corp. |
|
|
7,500 |
|
|
|
136,200 |
|
| Bank of New York Mellon Corp. |
|
|
30,670 |
|
|
|
865,507 |
|
| BlackRock, Inc. |
|
|
3,160 |
|
|
|
842,140 |
|
| Charles Schwab Corp. |
|
|
28,070 |
|
|
|
476,067 |
|
| E*TRADE Financial Corp.* |
|
|
4,900 |
|
|
|
50,421 |
|
| Eaton Vance Corp. |
|
|
4,670 |
|
|
|
186,240 |
|
| Federated Investors, Inc.# |
|
|
470 |
|
|
|
10,791 |
|
| Franklin Resources, Inc. |
|
|
2,780 |
|
|
|
429,955 |
|
| Goldman Sachs Group, Inc. |
|
|
11,590 |
|
|
|
1,692,951 |
|
| Invesco Ltd. |
|
|
8,870 |
|
|
|
281,534 |
|
| Janus Capital Group, Inc.# |
|
|
6,350 |
|
|
|
56,642 |
|
| Lazard Ltd. |
|
|
3,550 |
|
|
|
120,345 |
|
| Legg Mason, Inc. |
|
|
3,910 |
|
|
|
124,573 |
|
| LPL Financial Holdings, Inc. |
|
|
1,100 |
|
|
|
38,016 |
|
| Morgan Stanley |
|
|
35,196 |
|
|
|
779,591 |
|
| Northern Trust Corp. |
|
|
5,680 |
|
|
|
306,266 |
|
| Raymond James Financial, Inc. |
|
|
2,010 |
|
|
|
83,254 |
|
| SEI Investments Co. |
|
|
1,940 |
|
|
|
55,600 |
|
| State Street Corp. |
|
|
12,520 |
|
|
|
732,044 |
|
| T Rowe Price Group, Inc. |
|
|
8,280 |
|
|
|
600,300 |
|
| TD Ameritrade Holding Corp. |
|
|
5,650 |
|
|
|
112,492 |
|
| Waddell & Reed Financial, Inc. |
|
|
2,740 |
|
|
|
117,464 |
|
|
|
|
|
|
|
$ |
8,887,236 |
|
|
|
| COMMERCIAL BANKS – 2.6% |
|
|
|
|
|
| Associated Banc-Corp.# |
|
|
5,285 |
|
|
|
75,417 |
|
| Bank of Hawaii Corp. |
|
|
770 |
|
|
|
36,721 |
|
| BB&T Corp. |
|
|
17,690 |
|
|
|
544,321 |
|
| BOK Financial Corp. |
|
|
320 |
|
|
|
19,997 |
|
| CapitalSource, Inc. |
|
|
4,720 |
|
|
|
42,244 |
|
|
|
|
|
|
|
|
|
|
| Description
|
|
Number of
Shares |
|
|
Value
|
|
| CIT Group, Inc.* |
|
|
6,200 |
|
|
$ |
263,562 |
|
| City National Corp.# |
|
|
940 |
|
|
|
53,796 |
|
| Comerica, Inc. |
|
|
3,630 |
|
|
|
131,587 |
|
| Commerce Bancshares, Inc. |
|
|
487 |
|
|
|
19,534 |
|
| Cullen/Frost Bankers, Inc.# |
|
|
1,440 |
|
|
|
86,990 |
|
| East West Bancorp, Inc. |
|
|
2,500 |
|
|
|
60,825 |
|
| Fifth Third Bancorp |
|
|
19,900 |
|
|
|
338,897 |
|
| First Citizens Bancshares, Inc. |
|
|
50 |
|
|
|
9,321 |
|
| First Horizon National Corp. |
|
|
6,384 |
|
|
|
66,394 |
|
| First Niagara Financial Group, Inc. |
|
|
10,030 |
|
|
|
95,385 |
|
| First Republic Bank |
|
|
1,000 |
|
|
|
37,980 |
|
| Fulton Financial Corp. |
|
|
7,410 |
|
|
|
81,955 |
|
| Huntington Bancshares, Inc. |
|
|
21,541 |
|
|
|
154,449 |
|
| KeyCorp |
|
|
29,870 |
|
|
|
297,804 |
|
| M&T Bank Corp.§ |
|
|
3,410 |
|
|
|
341,682 |
|
| PNC Financial Services Group, Inc. |
|
|
13,160 |
|
|
|
893,301 |
|
| Popular, Inc.* |
|
|
4,400 |
|
|
|
125,356 |
|
| Regions Financial Corp. |
|
|
40,756 |
|
|
|
346,018 |
|
| Signature Bank* |
|
|
1,100 |
|
|
|
78,771 |
|
| SunTrust Banks, Inc. |
|
|
14,880 |
|
|
|
435,240 |
|
| Synovus Financial Corp. |
|
|
15,640 |
|
|
|
42,072 |
|
| TCF Financial Corp. |
|
|
4,310 |
|
|
|
62,711 |
|
| US Bancorp |
|
|
38,620 |
|
|
|
1,285,274 |
|
| Valley National Bancorp# |
|
|
5,622 |
|
|
|
50,542 |
|
| Wells Fargo & Co. |
|
|
105,605 |
|
|
|
4,010,878 |
|
| Zions Bancorporation |
|
|
4,790 |
|
|
|
117,930 |
|
|
|
|
|
|
|
$ |
10,206,954 |
|
|
|
|
| CONSUMER FINANCE – 0.8% |
|
|
|
|
|
|
|
|
| American Express Co. |
|
|
25,260 |
|
|
|
1,728,037 |
|
| Capital One Financial Corp. |
|
|
14,100 |
|
|
|
814,698 |
|
| Discover Financial Services |
|
|
12,480 |
|
|
|
545,875 |
|
| SLM Corp. |
|
|
11,460 |
|
|
|
236,649 |
|
|
|
|
|
|
|
$ |
3,325,259 |
|
|
|
| DIVERSIFIED FINANCIAL SERVICES – 3.2% |
|
|
|
|
|
| Bank of America Corp. |
|
|
250,690 |
|
|
|
3,085,994 |
|
| CBOE Holdings, Inc. |
|
|
500 |
|
|
|
18,765 |
|
| Citigroup, Inc. |
|
|
65,702 |
|
|
|
3,065,655 |
|
| CME Group, Inc. |
|
|
5,600 |
|
|
|
340,816 |
|
| Interactive Brokers Group, Inc. |
|
|
8,800 |
|
|
|
132,528 |
|
| IntercontinentalExchange, Inc.* |
|
|
2,100 |
|
|
|
342,153 |
|
| JPMorgan Chase & Co. |
|
|
86,220 |
|
|
|
4,225,642 |
|
| Leucadia National Corp. |
|
|
7,710 |
|
|
|
238,162 |
|
| McGraw Hill Financial, Inc. |
|
|
7,440 |
|
|
|
402,578 |
|
| Moody’s Corp. |
|
|
5,440 |
|
|
|
331,024 |
|
| MSCI, Inc.* |
|
|
2,520 |
|
|
|
85,932 |
|
April 30,
2013 / ANNUAL REPORT
|
|
|
|
|
| PORTFOLIOS OF INVESTMENTS |
|
|
31 |
|
Wilmington Large-Cap Strategy Fund (continued)
|
|
|
|
|
|
|
|
|
| Description
|
|
Number of
Shares |
|
|
Value
|
|
| NASDAQ OMX Group, Inc. |
|
|
3,830 |
|
|
$ |
112,908 |
|
| NYSE Euronext |
|
|
7,120 |
|
|
|
276,327 |
|
|
|
|
|
|
|
$ |
12,658,484 |
|
|
|
|
| INSURANCE – 4.1% |
|
|
|
|
|
|
|
|
| ACE Ltd. |
|
|
7,700 |
|
|
|
686,378 |
|
| Aflac, Inc. |
|
|
10,450 |
|
|
|
568,898 |
|
| Alleghany Corp.* |
|
|
256 |
|
|
|
100,797 |
|
| Allied World Assurance Co. Holdings AG |
|
|
930 |
|
|
|
84,453 |
|
| Allstate Corp. |
|
|
10,780 |
|
|
|
531,023 |
|
| American Financial Group, Inc. |
|
|
3,800 |
|
|
|
183,426 |
|
| American International Group, Inc.* |
|
|
16,150 |
|
|
|
668,933 |
|
| American National Insurance Co. |
|
|
2,100 |
|
|
|
197,463 |
|
| Aon PLC |
|
|
9,150 |
|
|
|
552,203 |
|
| Arch Capital Group Ltd.* |
|
|
3,540 |
|
|
|
187,832 |
|
| Arthur J Gallagher & Co. |
|
|
3,880 |
|
|
|
164,706 |
|
| Aspen Insurance Holdings, Ltd. |
|
|
190 |
|
|
|
7,256 |
|
| Assurant, Inc. |
|
|
3,530 |
|
|
|
167,816 |
|
| Assured Guaranty Ltd. |
|
|
6,700 |
|
|
|
138,221 |
|
| Axis Capital Holdings Ltd. |
|
|
3,280 |
|
|
|
146,386 |
|
| Berkshire Hathaway, Inc.* |
|
|
41,206 |
|
|
|
4,381,022 |
|
| Brown & Brown, Inc. |
|
|
2,170 |
|
|
|
67,248 |
|
| Chubb Corp. |
|
|
6,650 |
|
|
|
585,665 |
|
| Cincinnati Financial Corp. |
|
|
4,606 |
|
|
|
225,279 |
|
| CNA Financial Corp. |
|
|
1,050 |
|
|
|
35,395 |
|
| Endurance Specialty Holdings Ltd. |
|
|
3,000 |
|
|
|
146,910 |
|
| Erie Indemnity Co. |
|
|
2,170 |
|
|
|
172,667 |
|
| Everest Re Group Ltd. |
|
|
1,770 |
|
|
|
238,932 |
|
| Fidelity National Financial, Inc. |
|
|
6,220 |
|
|
|
167,007 |
|
| Genworth Financial, Inc.* |
|
|
10,160 |
|
|
|
101,905 |
|
| Hanover Insurance Group, Inc. |
|
|
3,600 |
|
|
|
181,548 |
|
| Hartford Financial Services Group, Inc. |
|
|
13,390 |
|
|
|
376,125 |
|
| HCC Insurance Holdings, Inc. |
|
|
3,670 |
|
|
|
156,342 |
|
| Kemper Corp. |
|
|
370 |
|
|
|
11,788 |
|
| Lincoln National Corp. |
|
|
6,070 |
|
|
|
206,441 |
|
| Loews Corp. |
|
|
8,090 |
|
|
|
361,380 |
|
| Markel Corp.#,* |
|
|
180 |
|
|
|
96,525 |
|
| Marsh & McLennan Cos., Inc. |
|
|
14,040 |
|
|
|
533,660 |
|
| MBIA, Inc.#,* |
|
|
1,650 |
|
|
|
15,609 |
|
| Mercury General Corp. |
|
|
370 |
|
|
|
16,913 |
|
| MetLife, Inc. |
|
|
17,401 |
|
|
|
678,465 |
|
| Old Republic International Corp. |
|
|
6,600 |
|
|
|
89,100 |
|
| PartnerRe Ltd. |
|
|
870 |
|
|
|
82,076 |
|
| Principal Financial Group, Inc. |
|
|
4,690 |
|
|
|
169,309 |
|
| ProAssurance Corp. |
|
|
500 |
|
|
|
24,495 |
|
| Progressive Corp. |
|
|
15,080 |
|
|
|
381,373 |
|
| Protective Life Corp. |
|
|
1,130 |
|
|
|
43,008 |
|
| Prudential Financial, Inc. |
|
|
9,430 |
|
|
|
569,761 |
|
|
|
|
|
|
|
|
|
|
| Description
|
|
Number of
Shares |
|
|
Value
|
|
| Reinsurance Group of America, Inc. |
|
|
1,690 |
|
|
$ |
105,710 |
|
| RenaissanceRe Holdings Ltd. |
|
|
1,320 |
|
|
|
123,935 |
|
| StanCorp Financial Group, Inc. |
|
|
2,140 |
|
|
|
92,405 |
|
| Torchmark Corp. |
|
|
2,730 |
|
|
|
169,451 |
|
| Travelers Cos., Inc. |
|
|
9,180 |
|
|
|
784,064 |
|
| Unum Group |
|
|
7,510 |
|
|
|
209,454 |
|
| Validus Holdings Ltd. |
|
|
3,370 |
|
|
|
130,116 |
|
| White Mountains Insurance Group Ltd. |
|
|
160 |
|
|
|
92,530 |
|
| WR Berkley Corp. |
|
|
3,580 |
|
|
|
155,444 |
|
| XL Group PLC |
|
|
6,420 |
|
|
|
199,919 |
|
|
|
|
|
|
|
$ |
16,564,767 |
|
|
|
| REAL ESTATE INVESTMENT TRUSTS – 3.5% |
|
|
|
|
|
| Alexandria Real Estate Equities, Inc. |
|
|
2,640 |
|
|
|
192,113 |
|
| American Capital Agency Corp. |
|
|
9,500 |
|
|
|
316,445 |
|
| American Tower Corp. |
|
|
10,160 |
|
|
|
853,338 |
|
| Annaly Capital Management, Inc. |
|
|
26,450 |
|
|
|
421,613 |
|
| Apartment Investment & Management Co. |
|
|
3,970 |
|
|
|
123,507 |
|
| AvalonBay Communities, Inc. |
|
|
2,622 |
|
|
|
348,831 |
|
| BioMed Realty Trust, Inc. |
|
|
10,100 |
|
|
|
227,351 |
|
| Boston Properties, Inc. |
|
|
4,150 |
|
|
|
454,134 |
|
| Brandywine Realty Trust |
|
|
9,630 |
|
|
|
143,776 |
|
| BRE Properties, Inc. |
|
|
5,400 |
|
|
|
272,592 |
|
| Camden Property Trust |
|
|
1,970 |
|
|
|
142,510 |
|
| CBL & Associates Properties, Inc. |
|
|
5,000 |
|
|
|
120,700 |
|
| Chimera Investment Corp. |
|
|
42,300 |
|
|
|
139,590 |
|
| CommonWealth REIT |
|
|
4,542 |
|
|
|
101,423 |
|
| Corporate Office Properties Trust |
|
|
1,820 |
|
|
|
52,762 |
|
| Corrections Corp. of America |
|
|
3,600 |
|
|
|
130,320 |
|
| DDR Corp. |
|
|
2,800 |
|
|
|
51,352 |
|
| Digital Realty Trust, Inc.# |
|
|
4,660 |
|
|
|
328,623 |
|
| Douglas Emmett, Inc. |
|
|
4,410 |
|
|
|
115,410 |
|
| Duke Realty Corp. |
|
|
6,310 |
|
|
|
111,308 |
|
| Equity Residential |
|
|
7,350 |
|
|
|
426,741 |
|
| Essex Property Trust, Inc. |
|
|
1,050 |
|
|
|
164,902 |
|
| Extra Space Storage, Inc. |
|
|
2,200 |
|
|
|
95,876 |
|
| Federal Realty Investment Trust |
|
|
1,170 |
|
|
|
136,902 |
|
| General Growth Properties, Inc. |
|
|
16,243 |
|
|
|
369,041 |
|
| Hatteras Financial Corp. |
|
|
4,300 |
|
|
|
117,519 |
|
| HCP, Inc. |
|
|
10,670 |
|
|
|
568,711 |
|
| Health Care REIT, Inc. |
|
|
6,220 |
|
|
|
466,313 |
|
| Home Properties, Inc. |
|
|
1,000 |
|
|
|
64,460 |
|
| Hospitality Properties Trust |
|
|
4,950 |
|
|
|
145,580 |
|
| Host Hotels & Resorts, Inc. |
|
|
12,540 |
|
|
|
229,106 |
|
| Kilroy Realty Corp. |
|
|
2,000 |
|
|
|
113,180 |
|
| Kimco Realty Corp. |
|
|
6,880 |
|
|
|
163,606 |
|
| Liberty Property Trust |
|
|
1,340 |
|
|
|
57,607 |
|
| Macerich Co. |
|
|
2,510 |
|
|
|
175,826 |
|
ANNUAL
REPORT / April 30, 2013
|
|
|
| 32 |
|
PORTFOLIOS OF INVESTMENTS |
Wilmington Large-Cap Strategy Fund (continued)
|
|
|
|
|
|
|
|
|
| Description
|
|
Number of
Shares |
|
|
Value
|
|
| Mack-Cali Realty Corp. |
|
|
7,230 |
|
|
$ |
200,777 |
|
| MFA Financial, Inc. |
|
|
13,600 |
|
|
|
126,072 |
|
| Mid-America Apartment Communities, Inc. |
|
|
500 |
|
|
|
34,365 |
|
| National Retail Properties, Inc.# |
|
|
3,600 |
|
|
|
142,848 |
|
| Piedmont Office Realty Trust, Inc. |
|
|
3,300 |
|
|
|
67,716 |
|
| Plum Creek Timber Co., Inc. |
|
|
3,210 |
|
|
|
165,443 |
|
| Post Properties, Inc. |
|
|
3,200 |
|
|
|
158,176 |
|
| Prologis, Inc. |
|
|
9,810 |
|
|
|
411,530 |
|
| Public Storage |
|
|
3,760 |
|
|
|
620,400 |
|
| Rayonier, Inc. |
|
|
3,915 |
|
|
|
232,629 |
|
| Realty Income Corp.# |
|
|
3,910 |
|
|
|
199,293 |
|
| Regency Centers Corp. |
|
|
2,060 |
|
|
|
115,896 |
|
| Senior Housing Properties Trust |
|
|
7,640 |
|
|
|
217,205 |
|
| Simon Property Group, Inc. |
|
|
7,633 |
|
|
|
1,359,208 |
|
| SL Green Realty Corp. |
|
|
1,990 |
|
|
|
180,493 |
|
| Tanger Factory Outlet Centers |
|
|
3,100 |
|
|
|
115,072 |
|
| Taubman Centers, Inc. |
|
|
1,850 |
|
|
|
158,194 |
|
| UDR, Inc. |
|
|
8,480 |
|
|
|
208,438 |
|
| Ventas, Inc. |
|
|
6,866 |
|
|
|
546,740 |
|
| Vornado Realty Trust |
|
|
2,773 |
|
|
|
242,804 |
|
| Weingarten Realty Investors |
|
|
3,560 |
|
|
|
121,289 |
|
| Weyerhaeuser Co. |
|
|
14,010 |
|
|
|
427,445 |
|
|
|
|
|
|
|
$ |
13,995,101 |
|
|
|
| REAL ESTATE MANAGEMENT &
DEVELOPMENT – 0.2% |
|
|
|
|
|
| Alexander & Baldwin, Inc.* |
|
|
260 |
|
|
|
8,856 |
|
| CBRE Group, Inc.* |
|
|
8,910 |
|
|
|
215,800 |
|
| Forest City Enterprises, Inc.* |
|
|
11,400 |
|
|
|
212,838 |
|
| Howard Hughes Corp.* |
|
|
658 |
|
|
|
62,102 |
|
| Jones Lang LaSalle, Inc. |
|
|
1,370 |
|
|
|
135,657 |
|
| St Joe Co.#,* |
|
|
2,820 |
|
|
|
55,187 |
|
|
|
|
|
|
|
$ |
690,440 |
|
|
|
| THRIFTS & MORTGAGE FINANCE – 0.1% |
|
|
|
|
|
| Hudson City Bancorp, Inc. |
|
|
16,032 |
|
|
|
133,226 |
|
| New York Community Bancorp, Inc.# |
|
|
10,240 |
|
|
|
138,752 |
|
| People’s United Financial, Inc. |
|
|
7,600 |
|
|
|
100,016 |
|
| TFS Financial Corp.* |
|
|
250 |
|
|
|
2,718 |
|
| Washington Federal, Inc. |
|
|
270 |
|
|
|
4,636 |
|
|
|
|
|
|
|
$ |
379,348 |
|
| TOTAL FINANCIALS |
|
|
|
|
|
$ |
66,707,589 |
|
|
|
|
| HEALTH CARE – 12.3% |
|
|
|
|
|
|
|
|
|
|
|
| BIOTECHNOLOGY – 2.2% |
|
|
|
|
|
|
|
|
| Alexion Pharmaceuticals, Inc.* |
|
|
5,540 |
|
|
|
542,920 |
|
| Amgen, Inc. |
|
|
18,684 |
|
|
|
1,947,060 |
|
| Ariad Pharmaceuticals, Inc.* |
|
|
3,900 |
|
|
|
69,693 |
|
| Biogen Idec, Inc.* |
|
|
6,400 |
|
|
|
1,401,152 |
|
| BioMarin Pharmaceutical, Inc.* |
|
|
3,000 |
|
|
|
196,800 |
|
|
|
|
|
|
|
|
|
|
| Description
|
|
Number of
Shares |
|
|
Value
|
|
| Celgene Corp.* |
|
|
10,083 |
|
|
$ |
1,190,500 |
|
| Gilead Sciences, Inc.* |
|
|
35,754 |
|
|
|
1,810,583 |
|
| Incyte Corp. Ltd.#,* |
|
|
800 |
|
|
|
17,720 |
|
| Medivation, Inc.* |
|
|
1,800 |
|
|
|
94,878 |
|
| Myriad Genetics, Inc.* |
|
|
2,310 |
|
|
|
64,334 |
|
| Onyx Pharmaceuticals, Inc.* |
|
|
2,500 |
|
|
|
237,000 |
|
| Regeneron Pharmaceuticals, Inc.* |
|
|
2,400 |
|
|
|
516,336 |
|
| United Therapeutics Corp.* |
|
|
1,340 |
|
|
|
89,485 |
|
| Vertex Pharmaceuticals, Inc.* |
|
|
5,983 |
|
|
|
459,614 |
|
|
|
|
|
|
|
$ |
8,638,075 |
|
|
|
| HEALTH CARE EQUIPMENT &
SUPPLIES – 2.2% |
|
|
|
|
|
| Abbott Laboratories |
|
|
34,109 |
|
|
|
1,259,304 |
|
| Alere, Inc.* |
|
|
2,650 |
|
|
|
68,052 |
|
| Baxter International, Inc. |
|
|
12,850 |
|
|
|
897,829 |
|
| Becton Dickinson & Co. |
|
|
6,160 |
|
|
|
580,888 |
|
| Boston Scientific Corp.* |
|
|
42,300 |
|
|
|
316,827 |
|
| CareFusion Corp.* |
|
|
4,900 |
|
|
|
163,856 |
|
| Cooper Cos., Inc. |
|
|
2,050 |
|
|
|
226,320 |
|
| Covidien PLC |
|
|
10,700 |
|
|
|
683,088 |
|
| CR Bard, Inc. |
|
|
2,280 |
|
|
|
226,541 |
|
| DENTSPLY International, Inc. |
|
|
3,670 |
|
|
|
155,424 |
|
| Edwards Lifesciences Corp.* |
|
|
3,286 |
|
|
|
209,614 |
|
| Hill-Rom Holdings, Inc. |
|
|
2,260 |
|
|
|
76,998 |
|
| Hologic, Inc.* |
|
|
8,040 |
|
|
|
163,775 |
|
| IDEXX Laboratories, Inc.#,* |
|
|
1,790 |
|
|
|
157,448 |
|
| Intuitive Surgical, Inc.* |
|
|
1,000 |
|
|
|
492,290 |
|
| Medtronic, Inc. |
|
|
23,960 |
|
|
|
1,118,453 |
|
| ResMed, Inc.# |
|
|
4,620 |
|
|
|
221,852 |
|
| Sirona Dental Systems, Inc.* |
|
|
1,700 |
|
|
|
125,018 |
|
| St Jude Medical, Inc. |
|
|
7,370 |
|
|
|
303,791 |
|
| Stryker Corp. |
|
|
9,400 |
|
|
|
616,452 |
|
| Teleflex, Inc. |
|
|
1,160 |
|
|
|
90,631 |
|
| Thoratec Corp.* |
|
|
100 |
|
|
|
3,620 |
|
| Varian Medical Systems, Inc.* |
|
|
2,750 |
|
|
|
179,135 |
|
| Zimmer Holdings, Inc. |
|
|
3,010 |
|
|
|
230,115 |
|
|
|
|
|
|
|
$ |
8,567,321 |
|
|
|
| HEALTH CARE PROVIDERS &
SERVICES – 2.1% |
|
|
|
|
|
| Aetna, Inc. |
|
|
9,220 |
|
|
|
529,597 |
|
| AmerisourceBergen Corp. |
|
|
8,170 |
|
|
|
442,160 |
|
| Brookdale Senior Living, Inc.* |
|
|
470 |
|
|
|
12,121 |
|
| Cardinal Health, Inc. |
|
|
11,200 |
|
|
|
495,264 |
|
| Catamaran Corp.* |
|
|
5,812 |
|
|
|
335,527 |
|
| Cigna Corp. |
|
|
7,890 |
|
|
|
522,081 |
|
| Community Health Systems, Inc. |
|
|
2,990 |
|
|
|
136,254 |
|
| Coventry Health Care, Inc. |
|
|
3,890 |
|
|
|
192,749 |
|
| DaVita Healthcare Partners, Inc.* |
|
|
2,294 |
|
|
|
272,183 |
|
April 30,
2013 / ANNUAL REPORT
|
|
|
|
|
| PORTFOLIOS OF INVESTMENTS |
|
|
33 |
|
Wilmington Large-Cap Strategy Fund (continued)
|
|
|
|
|
|
|
|
|
| Description
|
|
Number of
Shares |
|
|
Value
|
|
| Express Scripts Holding Co.* |
|
|
17,862 |
|
|
$ |
1,060,467 |
|
| HCA Holdings, Inc. |
|
|
5,500 |
|
|
|
219,395 |
|
| Health Management Associates, Inc.* |
|
|
3,700 |
|
|
|
42,513 |
|
| Health Net, Inc.* |
|
|
1,220 |
|
|
|
35,868 |
|
| Henry Schein, Inc.* |
|
|
3,760 |
|
|
|
339,904 |
|
| Humana, Inc. |
|
|
3,970 |
|
|
|
294,217 |
|
| Laboratory Corp. of America Holdings* |
|
|
3,110 |
|
|
|
290,350 |
|
| LifePoint Hospitals, Inc.* |
|
|
2,330 |
|
|
|
111,840 |
|
| McKesson Corp. |
|
|
6,300 |
|
|
|
666,666 |
|
| MEDNAX, Inc.* |
|
|
1,370 |
|
|
|
121,560 |
|
| Omnicare, Inc. |
|
|
1,959 |
|
|
|
85,745 |
|
| Patterson Cos., Inc. |
|
|
970 |
|
|
|
36,812 |
|
| Quest Diagnostics, Inc. |
|
|
2,850 |
|
|
|
160,541 |
|
| Tenet Healthcare Corp.* |
|
|
2,425 |
|
|
|
109,998 |
|
| UnitedHealth Group, Inc. |
|
|
19,920 |
|
|
|
1,193,806 |
|
| Universal Health Services, Inc. |
|
|
2,580 |
|
|
|
171,802 |
|
| VCA Antech, Inc.* |
|
|
5,570 |
|
|
|
134,237 |
|
| WellPoint, Inc. |
|
|
7,010 |
|
|
|
511,169 |
|
|
|
|
|
|
|
$ |
8,524,826 |
|
|
|
| HEALTH CARE TECHNOLOGY – 0.1% |
|
|
|
|
|
| Allscripts Healthcare Solutions, Inc.* |
|
|
4,700 |
|
|
|
65,048 |
|
| Cerner Corp.* |
|
|
4,820 |
|
|
|
466,431 |
|
|
|
|
|
|
|
$ |
531,479 |
|
|
|
| LIFE SCIENCES TOOLS & SERVICES – 0.7% |
|
|
|
|
|
| Agilent Technologies, Inc. |
|
|
9,890 |
|
|
|
409,842 |
|
| Bio-Rad Laboratories, Inc.* |
|
|
890 |
|
|
|
106,577 |
|
| Charles River Laboratories International, |
|
|
|
|
|
|
|
|
| Inc.* |
|
|
1,920 |
|
|
|
83,501 |
|
| Covance, Inc.* |
|
|
2,340 |
|
|
|
174,470 |
|
| Illumina, Inc.#,* |
|
|
2,600 |
|
|
|
168,194 |
|
| Life Technologies Corp.* |
|
|
4,831 |
|
|
|
355,996 |
|
| Mettler-Toledo International, Inc.* |
|
|
920 |
|
|
|
192,243 |
|
| PerkinElmer, Inc. |
|
|
3,470 |
|
|
|
106,356 |
|
| QIAGEN NV* |
|
|
7,500 |
|
|
|
149,100 |
|
| Thermo Fisher Scientific, Inc. |
|
|
9,120 |
|
|
|
735,802 |
|
| Waters Corp.* |
|
|
2,810 |
|
|
|
259,644 |
|
|
|
|
|
|
|
$ |
2,741,725 |
|
|
|
|
| PHARMACEUTICALS – 5.0% |
|
|
|
|
|
|
|
|
| AbbVie, Inc. |
|
|
31,209 |
|
|
|
1,437,174 |
|
| Actavis, Inc.* |
|
|
3,920 |
|
|
|
414,462 |
|
| Allergan, Inc. |
|
|
7,800 |
|
|
|
885,690 |
|
| Bristol-Myers Squibb Co. |
|
|
38,600 |
|
|
|
1,533,192 |
|
| Eli Lilly & Co. |
|
|
24,090 |
|
|
|
1,334,104 |
|
| Endo Health Solutions, Inc.* |
|
|
3,410 |
|
|
|
124,942 |
|
| Forest Laboratories, Inc.* |
|
|
5,230 |
|
|
|
195,654 |
|
| Hospira, Inc.* |
|
|
2,070 |
|
|
|
68,558 |
|
| Johnson & Johnson |
|
|
61,220 |
|
|
|
5,217,781 |
|
|
|
|
|
|
|
|
|
|
| Description
|
|
Number of
Shares |
|
|
Value
|
|
| Merck & Co., Inc. |
|
|
68,046 |
|
|
$ |
3,198,162 |
|
| Mylan, Inc.* |
|
|
12,130 |
|
|
|
353,104 |
|
| Perrigo Co. |
|
|
1,460 |
|
|
|
174,339 |
|
| Pfizer, Inc. |
|
|
167,007 |
|
|
|
4,854,893 |
|
| Salix Pharmaceuticals Ltd.* |
|
|
1,600 |
|
|
|
83,664 |
|
| Valeant Pharmaceuticals International, Inc.#,* |
|
|
2 |
|
|
|
152 |
|
| Warner Chilcott PLC |
|
|
5,600 |
|
|
|
80,528 |
|
|
|
|
|
|
|
$ |
19,956,399 |
|
| TOTAL HEALTH CARE |
|
|
|
|
|
$ |
48,959,825 |
|
|
|
|
| INDUSTRIALS – 10.9% |
|
|
|
|
|
|
|
|
|
|
|
| AEROSPACE & DEFENSE – 2.2% |
|
|
|
|
|
|
|
|
| Alliant Techsystems, Inc. |
|
|
1,020 |
|
|
|
75,847 |
|
| B/E Aerospace, Inc.* |
|
|
2,900 |
|
|
|
181,946 |
|
| Boeing Co. |
|
|
17,890 |
|
|
|
1,635,325 |
|
| Engility Holdings, Inc.* |
|
|
285 |
|
|
|
6,829 |
|
| Exelis, Inc. |
|
|
5,070 |
|
|
|
56,632 |
|
| General Dynamics Corp. |
|
|
4,710 |
|
|
|
348,352 |
|
| Honeywell International, Inc. |
|
|
18,770 |
|
|
|
1,380,346 |
|
| Huntington Ingalls Industries, Inc. |
|
|
1,645 |
|
|
|
87,020 |
|
| L-3 Communications Holdings, Inc. |
|
|
1,610 |
|
|
|
130,813 |
|
| Lockheed Martin Corp. |
|
|
5,350 |
|
|
|
530,132 |
|
| Northrop Grumman Corp. |
|
|
5,470 |
|
|
|
414,298 |
|
| Precision Castparts Corp. |
|
|
3,590 |
|
|
|
686,731 |
|
| Raytheon Co. |
|
|
7,620 |
|
|
|
467,716 |
|
| Rockwell Collins, Inc. |
|
|
2,870 |
|
|
|
180,580 |
|
| Spirit Aerosystems Holdings, Inc.* |
|
|
1,940 |
|
|
|
38,781 |
|
| Textron, Inc. |
|
|
6,370 |
|
|
|
164,028 |
|
| TransDigm Group, Inc. |
|
|
1,290 |
|
|
|
189,372 |
|
| Triumph Group, Inc. |
|
|
1,500 |
|
|
|
119,850 |
|
| United Technologies Corp. |
|
|
21,860 |
|
|
|
1,995,599 |
|
|
|
|
|
|
|
$ |
8,690,197 |
|
|
|
|
| AIR FREIGHT & LOGISTICS – 0.6% |
|
|
|
|
|
|
|
|
| CH Robinson Worldwide, Inc. |
|
|
4,384 |
|
|
|
260,366 |
|
| Expeditors International of Washington, Inc. |
|
|
4,180 |
|
|
|
150,187 |
|
| FedEx Corp. |
|
|
6,560 |
|
|
|
616,706 |
|
| United Parcel Service, Inc. |
|
|
17,250 |
|
|
|
1,480,740 |
|
| UTi Worldwide, Inc. |
|
|
800 |
|
|
|
11,752 |
|
|
|
|
|
|
|
$ |
2,519,751 |
|
|
|
|
| AIRLINES – 0.3% |
|
|
|
|
|
|
|
|
| Copa Holdings SA |
|
|
720 |
|
|
|
90,418 |
|
| Delta Air Lines, Inc.* |
|
|
27,020 |
|
|
|
463,123 |
|
| Southwest Airlines Co. |
|
|
14,830 |
|
|
|
203,171 |
|
| United Continental Holdings, Inc.* |
|
|
9,933 |
|
|
|
320,836 |
|
|
|
|
|
|
|
$ |
1,077,548 |
|
ANNUAL
REPORT / April 30, 2013
|
|
|
| 34 |
|
PORTFOLIOS OF INVESTMENTS |
Wilmington Large-Cap Strategy Fund (continued)
|
|
|
|
|
|
|
|
|
| Description
|
|
Number of
Shares |
|
|
Value
|
|
|
|
|
| BUILDING PRODUCTS – 0.1% |
|
|
|
|
|
|
|
|
| Armstrong World Industries, Inc.* |
|
|
40 |
|
|
$ |
2,042 |
|
| Fortune Brands Home & Security, Inc.* |
|
|
4,760 |
|
|
|
173,216 |
|
| Lennox International, Inc. |
|
|
1,490 |
|
|
|
92,380 |
|
| Masco Corp. |
|
|
9,130 |
|
|
|
177,487 |
|
| Owens Corning* |
|
|
3,690 |
|
|
|
155,201 |
|
|
|
|
|
|
|
$ |
600,326 |
|
|
|
| COMMERCIAL SERVICES & SUPPLIES – 0.7% |
|
|
|
|
|
| ADT Corp. |
|
|
8,850 |
|
|
|
386,214 |
|
| Avery Dennison Corp. |
|
|
3,210 |
|
|
|
133,054 |
|
| Cintas Corp. |
|
|
3,520 |
|
|
|
157,942 |
|
| Clean Harbors, Inc.* |
|
|
1,300 |
|
|
|
74,061 |
|
| Copart, Inc.* |
|
|
1,880 |
|
|
|
66,270 |
|
| Iron Mountain, Inc. |
|
|
4,134 |
|
|
|
156,513 |
|
| KAR Auction Services, Inc. |
|
|
100 |
|
|
|
2,237 |
|
| Pitney Bowes, Inc.# |
|
|
2,430 |
|
|
|
33,218 |
|
| Republic Services, Inc. |
|
|
8,540 |
|
|
|
291,043 |
|
| RR Donnelley & Sons Co.# |
|
|
11,770 |
|
|
|
144,889 |
|
| Stericycle, Inc.* |
|
|
2,852 |
|
|
|
308,929 |
|
| Tyco International Ltd. |
|
|
16,500 |
|
|
|
529,980 |
|
| Waste Connections, Inc. |
|
|
5,175 |
|
|
|
196,391 |
|
| Waste Management, Inc. |
|
|
9,040 |
|
|
|
370,459 |
|
|
|
|
|
|
|
$ |
2,851,200 |
|
|
|
| CONSTRUCTION & ENGINEERING – 0.3% |
|
|
|
|
|
| AECOM Technology Corp.* |
|
|
1,800 |
|
|
|
52,326 |
|
| Chicago Bridge & Iron Co. NV |
|
|
1,682 |
|
|
|
90,475 |
|
| Fluor Corp. |
|
|
5,270 |
|
|
|
300,285 |
|
| Jacobs Engineering Group, Inc.* |
|
|
3,750 |
|
|
|
189,300 |
|
| KBR, Inc. |
|
|
5,870 |
|
|
|
176,570 |
|
| Quanta Services, Inc.* |
|
|
5,010 |
|
|
|
137,675 |
|
| URS Corp. |
|
|
2,220 |
|
|
|
97,502 |
|
|
|
|
|
|
|
$ |
1,044,133 |
|
|
|
|
| ELECTRICAL EQUIPMENT – 0.8% |
|
|
|
|
|
|
|
|
| AMETEK, Inc. |
|
|
6,780 |
|
|
|
276,014 |
|
| Babcock & Wilcox Co. |
|
|
2,940 |
|
|
|
79,968 |
|
| Eaton Corp. PLC |
|
|
12,428 |
|
|
|
763,203 |
|
| Emerson Electric Co. |
|
|
15,290 |
|
|
|
848,748 |
|
| General Cable Corp.* |
|
|
1,060 |
|
|
|
36,549 |
|
| GrafTech International Ltd.#,* |
|
|
5,400 |
|
|
|
38,772 |
|
| Hubbell, Inc. |
|
|
1,590 |
|
|
|
152,576 |
|
| Polypore International, Inc.#,* |
|
|
1,700 |
|
|
|
71,281 |
|
| Regal-Beloit Corp. |
|
|
600 |
|
|
|
47,172 |
|
| Rockwell Automation, Inc. |
|
|
3,820 |
|
|
|
323,860 |
|
| Roper Industries, Inc. |
|
|
3,210 |
|
|
|
384,077 |
|
|
|
|
|
|
|
$ |
3,022,220 |
|
|
|
|
|
|
|
|
|
|
| Description
|
|
Number of
Shares |
|
|
Value
|
|
|
|
|
| INDUSTRIAL CONGLOMERATES – 2.0% |
|
|
|
|
|
|
|
|
| 3M Co. |
|
|
16,310 |
|
|
$ |
1,707,820 |
|
| Carlisle Cos., Inc. |
|
|
1,890 |
|
|
|
122,604 |
|
| Danaher Corp. |
|
|
15,480 |
|
|
|
943,351 |
|
| General Electric Co. |
|
|
236,720 |
|
|
|
5,276,489 |
|
|
|
|
|
|
|
$ |
8,050,264 |
|
|
|
|
| MACHINERY – 2.2% |
|
|
|
|
|
|
|
|
| AGCO Corp. |
|
|
2,760 |
|
|
|
146,970 |
|
| Caterpillar, Inc. |
|
|
15,100 |
|
|
|
1,278,517 |
|
| CNH Global N.V. |
|
|
100 |
|
|
|
4,113 |
|
| Crane Co. |
|
|
50 |
|
|
|
2,691 |
|
| Cummins, Inc. |
|
|
4,420 |
|
|
|
470,244 |
|
| Deere & Co. |
|
|
10,350 |
|
|
|
924,255 |
|
| Donaldson Co., Inc. |
|
|
4,860 |
|
|
|
176,807 |
|
| Dover Corp. |
|
|
3,860 |
|
|
|
266,263 |
|
| Flowserve Corp. |
|
|
1,140 |
|
|
|
180,257 |
|
| Gardner Denver, Inc. |
|
|
1,030 |
|
|
|
77,343 |
|
| Graco, Inc. |
|
|
2,140 |
|
|
|
129,534 |
|
| Harsco Corp. |
|
|
1,810 |
|
|
|
39,512 |
|
| IDEX Corp. |
|
|
2,120 |
|
|
|
110,304 |
|
| Illinois Tool Works, Inc. |
|
|
11,000 |
|
|
|
710,160 |
|
| Ingersoll-Rand PLC |
|
|
8,500 |
|
|
|
457,300 |
|
| ITT Corp. |
|
|
2,535 |
|
|
|
69,966 |
|
| Joy Global, Inc. |
|
|
3,180 |
|
|
|
179,734 |
|
| Kennametal, Inc. |
|
|
2,650 |
|
|
|
105,974 |
|
| Lincoln Electric Holdings, Inc. |
|
|
2,600 |
|
|
|
137,176 |
|
| Manitowoc Co., Inc. |
|
|
3,910 |
|
|
|
73,352 |
|
| Navistar International Corp.#,* |
|
|
1,680 |
|
|
|
55,642 |
|
| Nordson Corp. |
|
|
2,000 |
|
|
|
138,980 |
|
| Oshkosh Corp.* |
|
|
3,290 |
|
|
|
129,165 |
|
| PACCAR, Inc. |
|
|
10,190 |
|
|
|
507,258 |
|
| Pall Corp. |
|
|
3,170 |
|
|
|
211,471 |
|
| Parker Hannifin Corp. |
|
|
4,500 |
|
|
|
398,565 |
|
| Pentair Ltd. |
|
|
4,766 |
|
|
|
259,032 |
|
| Snap-On, Inc. |
|
|
1,780 |
|
|
|
153,436 |
|
| SPX Corp. |
|
|
1,230 |
|
|
|
91,647 |
|
| Stanley Black & Decker, Inc. |
|
|
3,320 |
|
|
|
248,369 |
|
| Tempur-Pedic International, Inc.* |
|
|
3,000 |
|
|
|
145,500 |
|
| Terex Corp.* |
|
|
2,030 |
|
|
|
58,058 |
|
| Timken Co. |
|
|
2,400 |
|
|
|
126,168 |
|
| Toro Co. |
|
|
3,140 |
|
|
|
141,331 |
|
| Trinity Industries, Inc. |
|
|
1,080 |
|
|
|
45,587 |
|
| Valmont Industries, Inc. |
|
|
1,060 |
|
|
|
154,474 |
|
| WABCO Holdings, Inc.* |
|
|
2,050 |
|
|
|
148,072 |
|
| Wabtec Corp. |
|
|
910 |
|
|
|
95,495 |
|
| Xylem, Inc. |
|
|
1,270 |
|
|
|
35,243 |
|
|
|
|
|
|
|
$ |
8,683,965 |
|
April 30,
2013 / ANNUAL REPORT
|
|
|
|
|
| PORTFOLIOS OF INVESTMENTS |
|
|
35 |
|
Wilmington Large-Cap Strategy Fund (continued)
|
|
|
|
|
|
|
|
|
| Description
|
|
Number of
Shares |
|
|
Value
|
|
| MARINE – 0.0%** |
|
|
|
|
|
|
|
|
| Kirby Corp.* |
|
|
1,500 |
|
|
$ |
112,335 |
|
| Matson, Inc. |
|
|
760 |
|
|
|
17,890 |
|
|
|
|
|
|
|
$ |
130,225 |
|
|
|
| PROFESSIONAL SERVICES – 0.3% |
|
|
|
|
|
| Dun & Bradstreet Corp.# |
|
|
930 |
|
|
|
82,258 |
|
| Equifax, Inc. |
|
|
4,060 |
|
|
|
248,472 |
|
| IHS, Inc.* |
|
|
2,140 |
|
|
|
208,500 |
|
| Manpowergroup, Inc. |
|
|
1,860 |
|
|
|
98,878 |
|
| Nielsen Holdings NV |
|
|
2,100 |
|
|
|
72,702 |
|
| Robert Half International, Inc. |
|
|
4,810 |
|
|
|
157,864 |
|
| Towers Watson & Co. |
|
|
2,800 |
|
|
|
204,176 |
|
| Verisk Analytics, Inc.* |
|
|
4,000 |
|
|
|
245,160 |
|
|
|
|
|
|
|
$ |
1,318,010 |
|
|
|
|
| ROAD & RAIL – 1.0% |
|
|
|
|
|
|
|
|
| Con-way, Inc. |
|
|
1,840 |
|
|
|
62,192 |
|
| CSX Corp. |
|
|
31,200 |
|
|
|
767,208 |
|
| Hertz Global Holdings, Inc.* |
|
|
8,050 |
|
|
|
193,844 |
|
| JB Hunt Transport Services, Inc. |
|
|
2,980 |
|
|
|
211,789 |
|
| Kansas City Southern |
|
|
2,800 |
|
|
|
305,396 |
|
| Landstar System, Inc. |
|
|
1,590 |
|
|
|
86,909 |
|
| Norfolk Southern Corp. |
|
|
6,860 |
|
|
|
531,101 |
|
| Ryder System, Inc. |
|
|
1,640 |
|
|
|
95,235 |
|
| Union Pacific Corp. |
|
|
11,660 |
|
|
|
1,725,214 |
|
|
|
|
|
|
|
$ |
3,978,888 |
|
|
|
| TRADING COMPANIES &
DISTRIBUTORS – 0.4% |
|
|
|
|
|
| Air Lease Corp. |
|
|
4,200 |
|
|
|
115,542 |
|
| Fastenal Co. |
|
|
9,660 |
|
|
|
473,823 |
|
| GATX Corp. |
|
|
2,490 |
|
|
|
126,865 |
|
| MSC Industrial Direct Co., Inc. |
|
|
1,390 |
|
|
|
109,532 |
|
| United Rentals, Inc.* |
|
|
2,600 |
|
|
|
136,786 |
|
| WESCO International, Inc.#,* |
|
|
2,180 |
|
|
|
156,284 |
|
| WW Grainger, Inc. |
|
|
1,510 |
|
|
|
372,170 |
|
|
|
|
|
|
|
$ |
1,491,002 |
|
| TOTAL INDUSTRIALS |
|
|
|
|
|
$ |
43,457,729 |
|
|
|
| INFORMATION TECHNOLOGY – 16.8% |
|
|
|
|
|
|
|
| COMMUNICATIONS EQUIPMENT – 1.5% |
|
|
|
|
|
| Brocade Communications Systems, Inc.* |
|
|
8,790 |
|
|
|
51,158 |
|
| Cisco Systems, Inc. |
|
|
119,320 |
|
|
|
2,496,174 |
|
| EchoStar Corp.* |
|
|
270 |
|
|
|
10,603 |
|
| F5 Networks, Inc.* |
|
|
1,710 |
|
|
|
130,695 |
|
| Harris Corp. |
|
|
1,740 |
|
|
|
80,388 |
|
| JDS Uniphase Corp.* |
|
|
5,850 |
|
|
|
78,975 |
|
| Juniper Networks, Inc.* |
|
|
16,040 |
|
|
|
265,462 |
|
| Motorola Solutions, Inc. |
|
|
7,790 |
|
|
|
445,588 |
|
| Polycom, Inc.* |
|
|
3,200 |
|
|
|
33,600 |
|
|
|
|
|
|
|
|
|
|
| Description
|
|
Number of Shares |
|
|
Value
|
|
| QUALCOMM, Inc. |
|
|
38,900 |
|
|
$ |
2,397,018 |
|
| Riverbed Technology, Inc.* |
|
|
4,200 |
|
|
|
62,412 |
|
|
|
|
|
|
|
$ |
6,052,073 |
|
|
|
| COMPUTERS & PERIPHERALS – 3.3% |
|
|
|
|
|
| Apple, Inc. |
|
|
20,840 |
|
|
|
9,226,910 |
|
| Dell, Inc. |
|
|
37,750 |
|
|
|
505,850 |
|
| Diebold, Inc. |
|
|
973 |
|
|
|
28,499 |
|
| EMC Corp.* |
|
|
52,570 |
|
|
|
1,179,145 |
|
| Fusion-io, Inc.#,* |
|
|
300 |
|
|
|
5,634 |
|
| Hewlett-Packard Co. |
|
|
47,090 |
|
|
|
970,054 |
|
| Lexmark International, Inc.# |
|
|
2,230 |
|
|
|
67,591 |
|
| NCR Corp.* |
|
|
5,320 |
|
|
|
145,076 |
|
| NetApp, Inc.* |
|
|
8,543 |
|
|
|
298,065 |
|
| SanDisk Corp.* |
|
|
6,450 |
|
|
|
338,238 |
|
| Stratasys Ltd.#,* |
|
|
200 |
|
|
|
16,610 |
|
| Western Digital Corp. |
|
|
7,080 |
|
|
|
391,382 |
|
|
|
|
|
|
|
$ |
13,173,054 |
|
|
|
| ELECTRONIC EQUIPMENT,
INSTRUMENTS & COMPONENTS – 0.5% |
|
|
|
|
|
| Amphenol Corp. |
|
|
5,350 |
|
|
|
404,032 |
|
| Arrow Electronics, Inc.* |
|
|
3,540 |
|
|
|
138,874 |
|
| Avnet, Inc.* |
|
|
6,360 |
|
|
|
208,290 |
|
| AVX Corp. |
|
|
200 |
|
|
|
2,262 |
|
| Corning, Inc. |
|
|
35,340 |
|
|
|
512,430 |
|
| Dolby Laboratories, Inc.# |
|
|
1,350 |
|
|
|
44,347 |
|
| FLIR Systems, Inc. |
|
|
3,390 |
|
|
|
82,411 |
|
| Ingram Micro, Inc.* |
|
|
4,200 |
|
|
|
74,802 |
|
| IPG Photonics Corp. |
|
|
100 |
|
|
|
6,368 |
|
| Itron, Inc.* |
|
|
70 |
|
|
|
2,775 |
|
| Jabil Circuit, Inc. |
|
|
5,240 |
|
|
|
93,272 |
|
| Molex, Inc. |
|
|
3,650 |
|
|
|
100,631 |
|
| National Instruments Corp. |
|
|
2,880 |
|
|
|
78,710 |
|
| Tech Data Corp.* |
|
|
1,700 |
|
|
|
79,441 |
|
| Trimble Navigation Ltd.* |
|
|
7,700 |
|
|
|
221,298 |
|
| Vishay Intertechnology, Inc.* |
|
|
2,370 |
|
|
|
33,275 |
|
|
|
|
|
|
|
$ |
2,083,218 |
|
|
|
| INTERNET SOFTWARE &
SERVICES – 2.2% |
|
|
|
|
|
| Akamai Technologies, Inc.* |
|
|
4,850 |
|
|
|
212,963 |
|
| AOL, Inc. |
|
|
2,331 |
|
|
|
90,070 |
|
| eBay, Inc.* |
|
|
25,220 |
|
|
|
1,321,276 |
|
| Equinix, Inc.* |
|
|
1,290 |
|
|
|
276,189 |
|
| Facebook, Inc.* |
|
|
11,200 |
|
|
|
310,912 |
|
| Google, Inc.* |
|
|
5,885 |
|
|
|
4,852,594 |
|
| IAC/InterActiveCorp |
|
|
1,130 |
|
|
|
53,189 |
|
| Linkedin Corp.* |
|
|
2,200 |
|
|
|
422,598 |
|
| Rackspace Hosting, Inc.* |
|
|
2,800 |
|
|
|
134,960 |
|
ANNUAL
REPORT / April 30, 2013
|
|
|
| 36 |
|
PORTFOLIOS OF INVESTMENTS |
Wilmington Large-Cap Strategy Fund (continued)
|
|
|
|
|
|
|
|
|
| Description
|
|
Number of
Shares |
|
|
Value
|
|
| VeriSign, Inc.* |
|
|
3,950 |
|
|
$ |
181,977 |
|
| Yahoo!, Inc.* |
|
|
27,970 |
|
|
|
691,698 |
|
|
|
|
|
|
|
$ |
8,548,426 |
|
|
|
|
| IT SERVICES – 3.6% |
|
|
|
|
|
|
|
|
| Accenture PLC |
|
|
16,100 |
|
|
|
1,311,184 |
|
| Alliance Data Systems Corp.* |
|
|
2,090 |
|
|
|
358,999 |
|
| Amdocs Ltd. |
|
|
2,720 |
|
|
|
97,104 |
|
| Automatic Data Processing, Inc. |
|
|
12,330 |
|
|
|
830,302 |
|
| Broadridge Financial Solutions, Inc. |
|
|
3,630 |
|
|
|
91,403 |
|
| Cognizant Technology Solutions Corp.* |
|
|
7,470 |
|
|
|
484,056 |
|
| Computer Sciences Corp. |
|
|
3,600 |
|
|
|
168,660 |
|
| CoreLogic, Inc.* |
|
|
680 |
|
|
|
18,550 |
|
| DST Systems, Inc. |
|
|
170 |
|
|
|
11,755 |
|
| Fidelity National Information Services, Inc. |
|
|
7,543 |
|
|
|
317,183 |
|
| Fiserv, Inc.* |
|
|
3,830 |
|
|
|
348,951 |
|
| FleetCor Technologies, Inc.* |
|
|
2,100 |
|
|
|
161,490 |
|
| Gartner, Inc.* |
|
|
1,700 |
|
|
|
98,345 |
|
| Genpact Ltd. |
|
|
400 |
|
|
|
7,440 |
|
| Global Payments, Inc. |
|
|
3,250 |
|
|
|
150,800 |
|
| International Business Machines Corp. |
|
|
25,100 |
|
|
|
5,083,754 |
|
| Jack Henry & Associates, Inc. |
|
|
1,900 |
|
|
|
88,160 |
|
| Lender Processing Services, Inc. |
|
|
770 |
|
|
|
21,360 |
|
| Mastercard, Inc. |
|
|
2,580 |
|
|
|
1,426,559 |
|
| NeuStar, Inc.* |
|
|
3,350 |
|
|
|
146,965 |
|
| Paychex, Inc.# |
|
|
9,570 |
|
|
|
348,444 |
|
| SAIC, Inc.# |
|
|
8,800 |
|
|
|
131,472 |
|
| Teradata Corp.* |
|
|
4,070 |
|
|
|
207,855 |
|
| Total System Services, Inc. |
|
|
4,520 |
|
|
|
106,762 |
|
| VeriFone Systems, Inc.* |
|
|
2,600 |
|
|
|
55,848 |
|
| Visa, Inc. |
|
|
12,130 |
|
|
|
2,043,420 |
|
| Western Union Co. |
|
|
19,890 |
|
|
|
294,571 |
|
|
|
|
|
|
|
$ |
14,411,392 |
|
|
|
|
| OFFICE ELECTRONICS – 0.1% |
|
|
|
|
|
|
|
|
| Xerox Corp. |
|
|
33,560 |
|
|
|
287,945 |
|
| Zebra Technologies Corp.* |
|
|
350 |
|
|
|
16,328 |
|
|
|
|
|
|
|
$ |
304,273 |
|
|
|
| SEMICONDUCTORS & SEMICONDUCTOR
EQUIPMENT – 2.1% |
|
|
|
|
|
| Advanced Micro Devices, Inc.#,* |
|
|
12,850 |
|
|
|
36,237 |
|
| Altera Corp. |
|
|
7,030 |
|
|
|
225,030 |
|
| Analog Devices, Inc. |
|
|
8,820 |
|
|
|
387,992 |
|
| Applied Materials, Inc. |
|
|
32,580 |
|
|
|
472,736 |
|
| Atmel Corp.* |
|
|
11,220 |
|
|
|
72,593 |
|
| Avago Technologies Ltd. |
|
|
6,100 |
|
|
|
194,956 |
|
| Broadcom Corp. |
|
|
9,630 |
|
|
|
346,680 |
|
| Cree, Inc.#,* |
|
|
3,430 |
|
|
|
194,035 |
|
| Cypress Semiconductor Corp. |
|
|
5,630 |
|
|
|
56,807 |
|
|
|
|
|
|
|
|
|
|
| Description
|
|
Number of
Shares |
|
|
Value
|
|
| Fairchild Semiconductor International, Inc.* |
|
|
1,810 |
|
|
$ |
23,349 |
|
| Intel Corp. |
|
|
111,670 |
|
|
|
2,674,496 |
|
| KLA-Tencor Corp. |
|
|
3,550 |
|
|
|
192,588 |
|
| Lam Research Corp.* |
|
|
4,680 |
|
|
|
216,310 |
|
| Linear Technology Corp. |
|
|
6,470 |
|
|
|
236,155 |
|
| LSI Corp.* |
|
|
19,800 |
|
|
|
129,492 |
|
| Marvell Technology Group Ltd. |
|
|
11,030 |
|
|
|
118,683 |
|
| Maxim Integrated Products, Inc. |
|
|
11,920 |
|
|
|
368,686 |
|
| Microchip Technology, Inc.# |
|
|
7,240 |
|
|
|
263,681 |
|
| Micron Technology, Inc.* |
|
|
30,770 |
|
|
|
289,853 |
|
| NVIDIA Corp. |
|
|
21,480 |
|
|
|
295,780 |
|
| ON Semiconductor Corp.* |
|
|
10,570 |
|
|
|
83,080 |
|
| PMC - Sierra, Inc.* |
|
|
7,550 |
|
|
|
43,488 |
|
| Silicon Laboratories, Inc.* |
|
|
1,380 |
|
|
|
54,800 |
|
| Skyworks Solutions, Inc.* |
|
|
4,800 |
|
|
|
105,936 |
|
| Teradyne, Inc.* |
|
|
3,450 |
|
|
|
56,718 |
|
| Texas Instruments, Inc. |
|
|
29,750 |
|
|
|
1,077,248 |
|
| Xilinx, Inc. |
|
|
8,200 |
|
|
|
310,862 |
|
|
|
|
|
|
|
$ |
8,528,271 |
|
|
|
|
| SOFTWARE – 3.5% |
|
|
|
|
|
|
|
|
| Activision Blizzard, Inc. |
|
|
8,770 |
|
|
|
131,111 |
|
| Adobe Systems, Inc.* |
|
|
14,080 |
|
|
|
634,726 |
|
| ANSYS, Inc.* |
|
|
2,280 |
|
|
|
184,361 |
|
| Autodesk, Inc.* |
|
|
5,030 |
|
|
|
198,081 |
|
| BMC Software, Inc.* |
|
|
2,550 |
|
|
|
115,974 |
|
| CA, Inc. |
|
|
7,980 |
|
|
|
215,221 |
|
| Cadence Design Systems, Inc.* |
|
|
12,310 |
|
|
|
169,878 |
|
| Citrix Systems, Inc.* |
|
|
5,930 |
|
|
|
368,668 |
|
| Compuware Corp.* |
|
|
1,080 |
|
|
|
12,960 |
|
| Concur Technologies, Inc.#,* |
|
|
1,100 |
|
|
|
80,421 |
|
| Electronic Arts, Inc.* |
|
|
11,160 |
|
|
|
196,528 |
|
| FactSet Research Systems, Inc. |
|
|
1,540 |
|
|
|
144,868 |
|
| Fortinet, Inc.* |
|
|
4,000 |
|
|
|
71,840 |
|
| Informatica Corp.* |
|
|
3,500 |
|
|
|
115,255 |
|
| Intuit, Inc. |
|
|
9,040 |
|
|
|
539,146 |
|
| MICROS Systems, Inc.* |
|
|
3,420 |
|
|
|
145,042 |
|
| Microsoft Corp. |
|
|
166,540 |
|
|
|
5,512,474 |
|
| Netsuite, Inc.#,* |
|
|
1,200 |
|
|
|
105,552 |
|
| Nuance Communications, Inc.#,* |
|
|
7,200 |
|
|
|
137,088 |
|
| Oracle Corp. |
|
|
84,200 |
|
|
|
2,760,076 |
|
| Red Hat, Inc.* |
|
|
6,330 |
|
|
|
303,397 |
|
| Rovi Corp.* |
|
|
1,650 |
|
|
|
38,594 |
|
| Salesforce.Com, Inc.* |
|
|
13,680 |
|
|
|
562,385 |
|
| SolarWinds, Inc.* |
|
|
1,300 |
|
|
|
66,105 |
|
| Solera Holdings, Inc. |
|
|
3,000 |
|
|
|
172,740 |
|
| Symantec Corp.* |
|
|
21,220 |
|
|
|
515,646 |
|
| Synopsys, Inc.* |
|
|
5,700 |
|
|
|
202,749 |
|
April 30,
2013 / ANNUAL REPORT
|
|
|
|
|
| PORTFOLIOS OF INVESTMENTS |
|
|
37 |
|
Wilmington Large-Cap Strategy Fund (continued)
|
|
|
|
|
|
|
|
|
| Description
|
|
Number of
Shares |
|
|
Value
|
|
| TIBCO Software, Inc.* |
|
|
5,000 |
|
|
$ |
97,050 |
|
| VMware, Inc.* |
|
|
2,310 |
|
|
|
162,855 |
|
|
|
|
|
|
|
$ |
13,960,791 |
|
| TOTAL INFORMATION TECHNOLOGY |
|
|
|
|
|
$ |
67,061,498 |
|
|
|
|
| MATERIALS – 3.9% |
|
|
|
|
|
|
|
|
|
|
|
| CHEMICALS – 2.6% |
|
|
|
|
|
|
|
|
| Air Products & Chemicals, Inc. |
|
|
4,370 |
|
|
|
380,015 |
|
| Airgas, Inc. |
|
|
1,960 |
|
|
|
189,434 |
|
| Albemarle Corp. |
|
|
3,080 |
|
|
|
188,650 |
|
| Ashland, Inc. |
|
|
1,840 |
|
|
|
156,786 |
|
| Cabot Corp. |
|
|
2,560 |
|
|
|
96,154 |
|
| Celanese Corp. |
|
|
5,570 |
|
|
|
275,214 |
|
| CF Industries Holdings, Inc. |
|
|
1,623 |
|
|
|
302,706 |
|
| Cytec Industries, Inc. |
|
|
980 |
|
|
|
71,403 |
|
| Dow Chemical Co. |
|
|
28,850 |
|
|
|
978,303 |
|
| Eastman Chemical Co. |
|
|
4,388 |
|
|
|
292,460 |
|
| Ecolab, Inc. |
|
|
8,077 |
|
|
|
683,476 |
|
| EI du Pont de Nemours & Co. |
|
|
23,130 |
|
|
|
1,260,816 |
|
| FMC Corp. |
|
|
3,660 |
|
|
|
222,162 |
|
| Huntsman Corp. |
|
|
7,270 |
|
|
|
137,112 |
|
| International Flavors & Fragrances, Inc. |
|
|
1,600 |
|
|
|
123,504 |
|
| Intrepid Potash, Inc. |
|
|
100 |
|
|
|
1,841 |
|
| Lyondellbasell Industries NV |
|
|
6,600 |
|
|
|
400,620 |
|
| Monsanto Co. |
|
|
12,550 |
|
|
|
1,340,591 |
|
| Mosaic Co. |
|
|
7,750 |
|
|
|
477,323 |
|
| PPG Industries, Inc. |
|
|
3,920 |
|
|
|
576,789 |
|
| Praxair, Inc. |
|
|
7,550 |
|
|
|
862,965 |
|
| Rockwood Holdings, Inc. |
|
|
2,000 |
|
|
|
129,780 |
|
| RPM International, Inc. |
|
|
3,760 |
|
|
|
121,824 |
|
| Scotts Miracle-Gro Co.# |
|
|
1,470 |
|
|
|
66,665 |
|
| Sherwin-Williams Co. |
|
|
2,758 |
|
|
|
505,017 |
|
| Sigma-Aldrich Corp. |
|
|
3,490 |
|
|
|
274,628 |
|
| Valspar Corp. |
|
|
2,720 |
|
|
|
173,590 |
|
| WR Grace & Co.* |
|
|
2,500 |
|
|
|
192,775 |
|
|
|
|
|
|
|
$ |
10,482,603 |
|
|
|
|
| CONSTRUCTION MATERIALS – 0.1% |
|
|
|
|
|
|
|
|
| Martin Marietta Materials, Inc.# |
|
|
1,500 |
|
|
|
151,485 |
|
| Vulcan Materials Co. |
|
|
3,300 |
|
|
|
164,604 |
|
|
|
|
|
|
|
$ |
316,089 |
|
|
|
|
| CONTAINERS & PACKAGING – 0.4% |
|
|
|
|
|
|
|
|
| Aptargroup, Inc. |
|
|
580 |
|
|
|
32,538 |
|
| Ball Corp. |
|
|
7,000 |
|
|
|
308,840 |
|
| Bemis Co., Inc. |
|
|
3,440 |
|
|
|
135,364 |
|
| Crown Holdings, Inc.* |
|
|
4,340 |
|
|
|
185,231 |
|
| Greif, Inc. |
|
|
270 |
|
|
|
13,006 |
|
|
|
|
|
|
|
|
|
|
| Description
|
|
Number of
Shares |
|
|
Value
|
|
| MeadWestvaco Corp. |
|
|
4,680 |
|
|
$ |
161,366 |
|
| Owens-Illinois, Inc.* |
|
|
3,380 |
|
|
|
88,826 |
|
| Packaging Corp. of America |
|
|
2,850 |
|
|
|
135,546 |
|
| Rock-Tenn Co. |
|
|
2,000 |
|
|
|
200,280 |
|
| Sealed Air Corp. |
|
|
3,900 |
|
|
|
86,268 |
|
| Silgan Holdings, Inc. |
|
|
1,900 |
|
|
|
90,953 |
|
| Sonoco Products Co. |
|
|
510 |
|
|
|
17,870 |
|
|
|
|
|
|
|
$ |
1,456,088 |
|
|
|
|
| METALS & MINING – 0.6% |
|
|
|
|
|
|
|
|
| Alcoa, Inc. |
|
|
35,600 |
|
|
|
302,600 |
|
| Allegheny Technologies, Inc. |
|
|
2,650 |
|
|
|
71,497 |
|
| Allied Nevada Gold Corp.* |
|
|
1,600 |
|
|
|
17,120 |
|
| Carpenter Technology Corp. |
|
|
3,080 |
|
|
|
138,477 |
|
| Cliffs Natural Resources, Inc.# |
|
|
2,540 |
|
|
|
54,204 |
|
| Commercial Metals Co. |
|
|
870 |
|
|
|
12,719 |
|
| Compass Minerals International, Inc. |
|
|
900 |
|
|
|
77,886 |
|
| Freeport-McMoRan Copper & Gold, Inc. |
|
|
18,660 |
|
|
|
567,824 |
|
| Molycorp, Inc.#,* |
|
|
1,900 |
|
|
|
11,096 |
|
| Newmont Mining Corp. |
|
|
11,570 |
|
|
|
374,868 |
|
| Nucor Corp. |
|
|
9,150 |
|
|
|
399,123 |
|
| Reliance Steel & Aluminum Co. |
|
|
2,450 |
|
|
|
159,422 |
|
| Royal Gold, Inc. |
|
|
2,400 |
|
|
|
133,392 |
|
| Southern Copper Corp. |
|
|
2,170 |
|
|
|
72,326 |
|
| Steel Dynamics, Inc. |
|
|
5,700 |
|
|
|
85,728 |
|
| United States Steel Corp.# |
|
|
3,620 |
|
|
|
64,436 |
|
| Walter Industries, Inc. |
|
|
1,950 |
|
|
|
34,944 |
|
|
|
|
|
|
|
$ |
2,577,662 |
|
|
|
|
| PAPER & FOREST PRODUCTS – 0.2% |
|
|
|
|
|
|
|
|
| Domtar Corp. |
|
|
1,800 |
|
|
|
125,118 |
|
| International Paper Co. |
|
|
10,540 |
|
|
|
495,169 |
|
|
|
|
|
|
|
$ |
620,287 |
|
| TOTAL MATERIALS |
|
|
|
|
|
$ |
15,452,729 |
|
|
|
| TELECOMMUNICATION SERVICES – 2.7% |
|
|
|
|
|
|
| DIVERSIFIED TELECOMMUNICATION SERVICES – 2.3% |
|
| AT&T, Inc. |
|
|
132,857 |
|
|
|
4,976,823 |
|
| Centurylink, Inc. |
|
|
13,219 |
|
|
|
496,638 |
|
| Frontier Communications Corp.# |
|
|
21,600 |
|
|
|
89,856 |
|
| Level 3 Communications, Inc.* |
|
|
2,028 |
|
|
|
40,824 |
|
| tw telecom, Inc.* |
|
|
4,100 |
|
|
|
111,028 |
|
| Verizon Communications, Inc. |
|
|
64,020 |
|
|
|
3,451,318 |
|
| Windstream Corp.# |
|
|
15,700 |
|
|
|
133,764 |
|
|
|
|
|
|
|
$ |
9,300,251 |
|
|
| WIRELESS TELECOMMUNICATION SERVICES – 0.4% |
|
| Clearwire Corp.* |
|
|
8,700 |
|
|
|
29,232 |
|
| Crown Castle International Corp.* |
|
|
6,940 |
|
|
|
534,380 |
|
| MetroPCS Communications, Inc.* |
|
|
4,930 |
|
|
|
58,371 |
|
ANNUAL
REPORT / April 30, 2013
|
|
|
| 38 |
|
PORTFOLIOS OF INVESTMENTS |
Wilmington Large-Cap Strategy Fund (continued)
|
|
|
|
|
|
|
|
|
| Description
|
|
Number of
Shares |
|
|
Value
|
|
| NII Holdings, Inc.#,* |
|
|
5,590 |
|
|
$ |
48,633 |
|
| SBA Communications Corp.* |
|
|
3,210 |
|
|
|
253,558 |
|
| Sprint Nextel Corp.* |
|
|
91,540 |
|
|
|
645,357 |
|
| Telephone & Data Systems, Inc. |
|
|
2,424 |
|
|
|
54,395 |
|
| United States Cellular Corp.* |
|
|
90 |
|
|
|
3,460 |
|
|
|
|
|
|
|
$ |
1,627,386 |
|
| TOTAL TELECOMMUNICATION SERVICES |
|
|
|
|
|
$ |
10,927,637 |
|
|
|
|
| UTILITIES – 3.6% |
|
|
|
|
|
|
|
|
|
|
|
| ELECTRIC UTILITIES – 1.9% |
|
|
|
|
|
|
|
|
| American Electric Power Co., Inc. |
|
|
10,690 |
|
|
|
549,787 |
|
| Duke Energy Corp. |
|
|
16,695 |
|
|
|
1,255,464 |
|
| Edison International |
|
|
8,620 |
|
|
|
463,756 |
|
| Entergy Corp. |
|
|
4,570 |
|
|
|
325,521 |
|
| Exelon Corp. |
|
|
19,499 |
|
|
|
731,407 |
|
| FirstEnergy Corp. |
|
|
10,326 |
|
|
|
481,192 |
|
| Great Plains Energy, Inc. |
|
|
6,220 |
|
|
|
150,089 |
|
| Hawaiian Electric Industries, Inc. |
|
|
2,710 |
|
|
|
76,693 |
|
| ITC Holdings Corp. |
|
|
1,320 |
|
|
|
121,730 |
|
| NextEra Energy, Inc. |
|
|
8,440 |
|
|
|
692,333 |
|
| Northeast Utilities |
|
|
5,713 |
|
|
|
258,970 |
|
| NV Energy, Inc. |
|
|
5,880 |
|
|
|
127,184 |
|
| OGE Energy Corp. |
|
|
3,110 |
|
|
|
225,257 |
|
| Pepco Holdings, Inc. |
|
|
14,750 |
|
|
|
333,350 |
|
| Pinnacle West Capital Corp. |
|
|
3,200 |
|
|
|
194,880 |
|
| PPL Corp. |
|
|
16,900 |
|
|
|
564,122 |
|
| Southern Co. |
|
|
16,081 |
|
|
|
775,587 |
|
| Westar Energy, Inc. |
|
|
2,960 |
|
|
|
103,482 |
|
| Xcel Energy, Inc. |
|
|
11,770 |
|
|
|
374,168 |
|
|
|
|
|
|
|
$ |
7,804,972 |
|
|
|
|
| GAS UTILITIES – 0.2% |
|
|
|
|
|
|
|
|
| AGL Resources, Inc. |
|
|
3,820 |
|
|
|
167,507 |
|
| Atmos Energy Corp. |
|
|
2,610 |
|
|
|
115,806 |
|
| National Fuel Gas Co. |
|
|
1,410 |
|
|
|
88,435 |
|
| ONEOK, Inc. |
|
|
5,160 |
|
|
|
265,018 |
|
| Questar Corp. |
|
|
6,500 |
|
|
|
165,035 |
|
| UGI Corp. |
|
|
1,890 |
|
|
|
77,452 |
|
|
|
|
|
|
|
$ |
879,253 |
|
|
|
| INDEPENDENT POWER PRODUCERS &
ENERGY TRADERS – 0.2% |
|
|
|
|
|
| AES Corp. |
|
|
19,910 |
|
|
|
275,953 |
|
| Calpine Corp.* |
|
|
8,450 |
|
|
|
183,618 |
|
| NRG Energy, Inc. |
|
|
7,100 |
|
|
|
197,877 |
|
|
|
|
|
|
|
$ |
657,448 |
|
|
|
|
| MULTI-UTILITIES – 1.2% |
|
|
|
|
|
|
|
|
| Alliant Energy Corp. |
|
|
2,000 |
|
|
|
107,020 |
|
|
|
|
|
|
|
|
|
|
| Description
|
|
Number of
Shares |
|
|
Value
|
|
| Ameren Corp. |
|
|
6,450 |
|
|
$ |
233,812 |
|
| CenterPoint Energy, Inc. |
|
|
5,060 |
|
|
|
124,881 |
|
| CMS Energy Corp. |
|
|
7,770 |
|
|
|
232,634 |
|
| Consolidated Edison, Inc. |
|
|
7,340 |
|
|
|
467,191 |
|
| Dominion Resources, Inc. |
|
|
14,370 |
|
|
|
886,342 |
|
| DTE Energy Co. |
|
|
3,900 |
|
|
|
284,232 |
|
| Integrys Energy Group, Inc. |
|
|
1,760 |
|
|
|
108,346 |
|
| MDU Resources Group, Inc. |
|
|
4,280 |
|
|
|
106,786 |
|
| NiSource, Inc. |
|
|
5,400 |
|
|
|
165,942 |
|
| PG&E Corp. |
|
|
11,120 |
|
|
|
538,653 |
|
| Public Service Enterprise Group, Inc. |
|
|
11,000 |
|
|
|
402,710 |
|
| SCANA Corp. |
|
|
740 |
|
|
|
40,108 |
|
| Sempra Energy |
|
|
6,750 |
|
|
|
559,238 |
|
| TECO Energy, Inc. |
|
|
16,930 |
|
|
|
323,871 |
|
| Vectren Corp. |
|
|
1,680 |
|
|
|
63,101 |
|
| Wisconsin Energy Corp. |
|
|
7,340 |
|
|
|
329,860 |
|
|
|
|
|
|
|
$ |
4,974,727 |
|
|
|
|
| WATER UTILITIES – 0.1% |
|
|
|
|
|
|
|
|
| American Water Works Co., Inc. |
|
|
4,390 |
|
|
|
183,853 |
|
| Aqua America, Inc. |
|
|
1,500 |
|
|
|
47,595 |
|
|
|
|
|
|
|
$ |
231,448 |
|
| TOTAL UTILITIES |
|
|
|
|
|
$ |
14,547,848 |
|
TOTAL COMMON STOCKS
(COST $266,878,319) |
|
|
|
|
|
$ |
397,326,257 |
|
| INVESTMENT COMPANY – 0.5% |
|
|
|
|
|
|
|
|
|
|
|
| EQUITY FUND – 0.5% |
|
|
|
|
|
|
|
|
| iShares Russell 1000 Index Fund# |
|
|
22,400 |
|
|
|
1,990,688 |
|
TOTAL INVESTMENT COMPANY
(COST $1,942,314) |
|
|
|
|
|
$ |
1,990,688 |
|
| PREFERRED STOCK – 0.0%** |
|
|
|
|
|
|
|
|
|
|
|
| CONSUMER DISCRETIONARY – 0.0%** |
|
|
|
|
|
|
|
|
|
|
|
| SPECIALTY RETAIL – 0.0%** |
|
|
|
|
|
|
|
|
| Orchard Supply Hardware Stores Corp.* |
|
|
57 |
|
|
|
46 |
|
TOTAL PREFERRED STOCK
(COST $132) |
|
|
|
|
|
$ |
46 |
|
| RIGHTS – 0.0%** |
|
|
|
|
|
|
|
|
| Celgene Corp.* |
|
|
89 |
|
|
|
632 |
|
| Fresenius Kabi Pharmaceuticals Holding, Inc.* |
|
|
132 |
|
|
|
— |
|
TOTAL RIGHTS
(COST $0) |
|
|
|
|
|
$ |
632 |
|
April 30,
2013 / ANNUAL REPORT
|
|
|
|
|
| PORTFOLIOS OF INVESTMENTS |
|
|
39 |
|
Wilmington Large-Cap Strategy Fund (concluded)
|
|
|
|
|
|
|
|
|
| Description
|
|
Number
of Shares |
|
|
Value
|
|
|
|
|
| WARRANTS – 0.0%** |
|
|
|
|
|
|
|
|
| American International Group, Inc. CW21* |
|
|
2,055 |
|
|
$ |
36,373 |
|
| Kinder Morgan, Inc.* |
|
|
16,345 |
|
|
|
91,042 |
|
| TOTAL WARRANTS (COST $48,690) |
|
|
|
|
|
$ |
127,415 |
|
| TOTAL INVESTMENTS IN SECURITIES – 99.9%
(COST $268,869,455) |
|
|
$ |
399,445,038 |
|
|
|
|
|
|
|
|
|
|
| |
|
Par Value |
|
|
|
|
|
| CASH COLLATERAL INVESTED FOR SECURITIES
ON LOAN – 2.3% |
|
|
|
|
| REPURCHASE AGREEMENTS – 2.3% |
|
|
|
|
|
|
|
|
| Deutsche Bank Securities, Inc., 0.17%, dated 04/30/13, due 05/01/13, repurchase price $2,126,100, collateralized by U.S. Government Securities 2.13% to 7.50%,
maturing 12/01/16 to 04/01/48; total market value of $ 2,168,612. |
|
$ |
2,126,090 |
|
|
|
2,126,090 |
|
|
|
|
| HSBC Securities USA, Inc., 0.15%, dated 04/30/13, due 05/01/13, repurchase price $2,126,099, collateralized by U.S. Government Securities 0.00% to 9.38%, maturing
07/15/13 to 03/17/31; total market value of $ 2,168,613. |
|
|
2,126,090 |
|
|
|
2,126,090 |
|
|
|
|
| Merrill Lynch, Pierce, Fenner & Smith, Inc., 0.14%, dated 04/30/13, due 05/01/13, repurchase price $447,576, collateralized by U.S. Treasury Securities
0.25% to 2.75%, maturing 10/15/15 to 08/15/42; total market value of $ 456,526. |
|
|
447,574 |
|
|
|
447,574 |
|
|
|
|
|
|
|
|
|
|
| Description
|
|
Par Value |
|
|
Value
|
|
| Mizuho Securities USA, Inc., 0.20%, dated 04/30/13, due 05/01/13, repurchase price $2,126,102, collateralized by U.S. Government Securities 2.08% to 7. 00%,
maturing 01/01/22 to 04/15/52; total market value of $ 2,168,612. |
|
$ |
2,126,090 |
|
|
$ |
2,126,090 |
|
|
|
|
| RBC Capital Markets LLC, 0.17%, dated 04/30/13, due 05/01/13, repurchase price $2,126,100, collateralized by U.S. Government Securities 1.97% to 4.50%, maturing
08/01/24 to 12/15/44; total market value of $ 2,168,612. |
|
|
2,126,090 |
|
|
|
2,126,090 |
|
| TOTAL CASH COLLATERAL INVESTED FOR SECURITIES ON LOAN
(COST $8,951,934) |
|
|
|
|
|
$ |
8,951,934 |
|
| TOTAL INVESTMENTS – 102.2% (COST
$277,821,389) |
|
|
|
|
|
$ |
408,396,972 |
|
COLLATERAL FOR SECURITIES ON
LOAN – (2.3%) |
|
|
|
|
|
|
(8,951,934 |
) |
| OTHER ASSETS LESS LIABILITIES – 0.1% |
|
|
|
|
|
|
264,566 |
|
| TOTAL NET ASSETS – 100.0% |
|
|
|
|
|
$ |
399,709,604 |
|
Cost of investments
for Federal income tax purposes is $284,358,390. The net unrealized appreciation/(depreciation) of investments was $124,038,582. This consists of net unrealized appreciation from investment for those securities having an excess of value over cost of
$134,134,690 and net unrealized depreciation from investments for those securities having an excess of cost over value of $10,096,108.
Various inputs are used in determining the value of the Fund’s investments. These inputs are summarized in the three broad levels
listed below.
Level 1 – quoted prices in active markets for identical securities
Level 2 – other significant observable inputs (including quoted prices for similar securities, interest rates, prepayment speeds,
credit risk, etc.)
Level 3 – significant unobservable inputs (including the Fund’s own assumptions in determining the fair
value of investments)
The following is a summary of the inputs used as of April 30, 2013 in valuing the Fund’s assets
carried at fair value:
|
|
|
|
|
|
|
|
|
|
|
|
|
|
|
|
|
| |
|
Level 1 |
|
|
Level 2 |
|
|
Level 3 |
|
|
Total |
|
| Investments in Securities |
|
|
|
|
|
|
|
|
|
|
|
|
|
|
|
|
| Common Stocks |
|
$ |
397,326,257 |
|
|
$ |
— |
|
|
$ |
— |
|
|
$ |
397,326,257 |
|
| Investment Company |
|
|
1,990,688 |
|
|
|
— |
|
|
|
— |
|
|
|
1,990,688 |
|
| Preferred Stock |
|
|
46 |
|
|
|
— |
|
|
|
— |
|
|
|
46 |
|
| Rights |
|
|
632 |
|
|
|
— |
|
|
|
— |
|
|
|
632 |
|
| Warrants |
|
|
127,415 |
|
|
|
— |
|
|
|
— |
|
|
|
127,415 |
|
| Repurchase Agreements |
|
|
— |
|
|
|
8,951,934 |
|
|
|
— |
|
|
|
8,951,934 |
|
|
|
|
|
|
|
|
|
|
|
|
|
|
|
|
|
|
| Total |
|
$ |
399,445,038 |
|
|
$ |
8,951,934 |
|
|
$ |
— |
|
|
$ |
408,396,972 |
|
|
|
|
|
|
|
|
|
|
|
|
|
|
|
|
|
|
See Notes to Portfolios of Investments
See Notes which are an integral part of the Financial Statements
ANNUAL
REPORT / April 30, 2013
PORTFOLIO OF INVESTMENTS SUMMARY TABLE
Wilmington Large-Cap Value Fund
At April 30, 2013,
the Fund’s sector classifications were as follows (unaudited):
|
|
|
|
|
|
| |
|
Percentage of
Total Net Assets |
| Common Stocks |
|
|
|
|
|
| Financials |
|
|
|
25.1 |
% |
| Energy |
|
|
|
15.3 |
% |
| Health Care |
|
|
|
13.8 |
% |
| Industrials |
|
|
|
10.5 |
% |
| Consumer Staples |
|
|
|
9.4 |
% |
| Information Technology |
|
|
|
9.2 |
% |
| Consumer Discretionary |
|
|
|
7.7 |
% |
| Utilities |
|
|
|
6.5 |
% |
| Materials |
|
|
|
1.6 |
% |
| Telecommunication Services |
|
|
|
1.3 |
% |
| Other Assets and Liabilities – Net1 |
|
|
|
(0.4 |
)% |
|
|
|
|
|
|
| TOTAL |
|
|
|
100.0 |
% |
|
|
|
|
|
|
| (1) |
Assets, other than investments in securities, less liabilities. See Statements of Assets and Liabilities. |
PORTFOLIO OF
INVESTMENTS
April 30, 2013
|
|
|
|
|
|
|
|
|
| Description
|
|
Number of Shares |
|
|
Value
|
|
| COMMON STOCKS – 100.4% |
|
|
|
|
|
|
|
|
|
|
|
| CONSUMER DISCRETIONARY – 7.7% |
|
|
|
|
|
|
|
|
| MEDIA – 2.9% |
|
|
|
|
|
|
|
|
| Omnicom Group, Inc. |
|
|
60,947 |
|
|
$ |
3,642,802 |
|
| MULTILINE RETAIL – 4.8% |
|
|
|
|
|
|
|
|
| Nordstrom, Inc. |
|
|
51,907 |
|
|
|
2,937,417 |
|
| Target Corp. |
|
|
45,978 |
|
|
|
3,244,208 |
|
|
|
|
|
|
|
$ |
6,181,625 |
|
| TOTAL CONSUMER DISCRETIONARY |
|
|
|
|
|
$ |
9,824,427 |
|
|
|
|
| CONSUMER STAPLES – 9.4% |
|
|
|
|
|
|
|
|
| BEVERAGES – 2.3% |
|
|
|
|
|
|
|
|
| PepsiCo, Inc. |
|
|
35,480 |
|
|
|
2,926,036 |
|
| FOOD & STAPLES RETAILING – 3.5% |
|
|
|
|
|
|
|
|
| Costco Wholesale Corp. |
|
|
14,095 |
|
|
|
1,528,321 |
|
| CVS Caremark Corp. |
|
|
49,769 |
|
|
|
2,895,560 |
|
|
|
|
|
|
|
$ |
4,423,881 |
|
| FOOD PRODUCTS – 1.6% |
|
|
|
|
|
|
|
|
| Mondelez International, Inc. |
|
|
64,633 |
|
|
|
2,032,708 |
|
|
|
|
|
|
|
|
|
|
| Description
|
|
Number of Shares |
|
|
Value
|
|
| TOBACCO – 2.0% |
|
|
|
|
|
|
|
|
| Philip Morris International, Inc. |
|
|
27,502 |
|
|
$ |
2,628,916 |
|
| TOTAL CONSUMER STAPLES |
|
|
|
|
|
$ |
12,011,541 |
|
|
|
|
| ENERGY – 15.3% |
|
|
|
|
|
|
|
|
| ENERGY EQUIPMENT & SERVICES – 3.8% |
|
|
|
|
|
| National Oilwell Varco, Inc. |
|
|
27,703 |
|
|
|
1,806,790 |
|
| Schlumberger Ltd. |
|
|
41,015 |
|
|
|
3,052,746 |
|
|
|
|
|
|
|
$ |
4,859,536 |
|
| OIL, GAS & CONSUMABLE FUELS – 11.5% |
|
|
|
|
|
| Chevron Corp. |
|
|
49,380 |
|
|
|
6,024,854 |
|
| ConocoPhillips |
|
|
62,114 |
|
|
|
3,754,791 |
|
| Exxon Mobil Corp. |
|
|
26,148 |
|
|
|
2,326,911 |
|
| Occidental Petroleum Corp. |
|
|
15,553 |
|
|
|
1,388,261 |
|
| Phillips 66 |
|
|
19,441 |
|
|
|
1,184,929 |
|
|
|
|
|
|
|
$ |
14,679,746 |
|
| TOTAL ENERGY |
|
|
|
|
|
$ |
19,539,282 |
|
|
|
|
| FINANCIALS – 25.1% |
|
|
|
|
|
|
|
|
| CAPITAL MARKETS – 2.0% |
|
|
|
|
|
|
|
|
| T Rowe Price Group, Inc. |
|
|
35,577 |
|
|
|
2,579,333 |
|
| COMMERCIAL BANKS – 9.3% |
|
|
|
|
|
|
|
|
| BB&T Corp. |
|
|
123,352 |
|
|
|
3,795,541 |
|
April 30,
2013 / ANNUAL REPORT
|
|
|
|
|
| PORTFOLIOS OF INVESTMENTS |
|
|
41 |
|
Wilmington Large-Cap Value Fund (continued)
|
|
|
|
|
|
|
|
|
| Description
|
|
Number of
Shares |
|
|
Value
|
|
| PNC Financial Services Group, Inc. |
|
|
42,284 |
|
|
$ |
2,870,238 |
|
| US Bancorp |
|
|
41,013 |
|
|
|
1,364,913 |
|
| Wells Fargo & Co. |
|
|
100,121 |
|
|
|
3,802,596 |
|
|
|
|
|
|
|
$ |
11,833,288 |
|
|
|
| DIVERSIFIED FINANCIAL
SERVICES – 2.8% |
|
|
|
|
|
| JPMorgan Chase & Co. |
|
|
71,530 |
|
|
|
3,505,685 |
|
| INSURANCE – 8.4% |
|
|
|
|
|
|
|
|
| ACE Ltd. |
|
|
38,293 |
|
|
|
3,413,438 |
|
| MetLife, Inc. |
|
|
78,638 |
|
|
|
3,066,096 |
|
| Travelers Cos., Inc. |
|
|
49,769 |
|
|
|
4,250,770 |
|
|
|
|
|
|
|
$ |
10,730,304 |
|
|
|
| REAL ESTATE INVESTMENT
TRUSTS – 2.6% |
|
|
|
|
|
| Simon Property Group, Inc. |
|
|
18,566 |
|
|
|
3,306,048 |
|
| TOTAL FINANCIALS |
|
|
|
|
|
$ |
31,954,658 |
|
|
|
|
| HEALTH CARE – 13.8% |
|
|
|
|
|
|
|
|
|
|
| HEALTH CARE PROVIDERS &
SERVICES – 2.3% |
|
|
|
|
|
| Cardinal Health, Inc. |
|
|
64,852 |
|
|
|
2,867,755 |
|
|
|
|
| PHARMACEUTICALS – 11.5% |
|
|
|
|
|
|
|
|
| Johnson & Johnson |
|
|
54,532 |
|
|
|
4,647,762 |
|
| Merck & Co., Inc. |
|
|
76,014 |
|
|
|
3,572,658 |
|
| Pfizer, Inc. |
|
|
164,664 |
|
|
|
4,786,782 |
|
| Teva Pharmaceutical Industries Ltd. ADR |
|
|
42,964 |
|
|
|
1,645,092 |
|
|
|
|
|
|
|
$ |
14,652,294 |
|
| TOTAL HEALTH CARE |
|
|
|
|
|
$ |
17,520,049 |
|
|
|
|
| INDUSTRIALS – 10.5% |
|
|
|
|
|
|
|
|
|
|
|
| AIR FREIGHT & LOGISTICS – 1.8% |
|
|
|
|
|
|
|
|
| United Parcel Service, Inc. |
|
|
26,926 |
|
|
|
2,311,328 |
|
| ELECTRICAL EQUIPMENT – 1.0% |
|
|
|
|
|
|
|
|
| Emerson Electric Co. |
|
|
23,426 |
|
|
|
1,300,377 |
|
|
|
| INDUSTRIAL CONGLOMERATES – 4.8% |
|
|
|
|
|
| Danaher Corp. |
|
|
40,437 |
|
|
|
2,464,231 |
|
| General Electric Co. |
|
|
160,361 |
|
|
|
3,574,447 |
|
|
|
|
|
|
|
$ |
6,038,678 |
|
| ROAD & RAIL – 1.9% |
|
|
|
|
|
|
|
|
| Union Pacific Corp. |
|
|
16,330 |
|
|
|
2,416,187 |
|
|
|
|
|
|
|
|
|
|
| Description
|
|
Number of
Shares |
|
|
Value
|
|
| TRADING COMPANIES &
DISTRIBUTORS – 1.0% |
|
|
|
|
|
| Fastenal Co. |
|
|
26,537 |
|
|
$ |
1,301,640 |
|
| TOTAL INDUSTRIALS |
|
|
|
|
|
$ |
13,368,210 |
|
|
|
| INFORMATION TECHNOLOGY – 9.2% |
|
|
|
|
|
|
|
| COMMUNICATIONS EQUIPMENT – 3.0% |
|
|
|
|
|
| QUALCOMM, Inc. |
|
|
62,114 |
|
|
|
3,827,465 |
|
|
|
| COMPUTERS & PERIPHERALS – 1.1% |
|
|
|
|
|
| Apple, Inc. |
|
|
3,318 |
|
|
|
1,469,044 |
|
|
|
| SEMICONDUCTORS & SEMICONDUCTOR
EQUIPMENT – 5.1% |
|
|
|
|
|
| Applied Materials, Inc. |
|
|
174,871 |
|
|
|
2,537,378 |
|
| Intel Corp. |
|
|
86,020 |
|
|
|
2,060,179 |
|
| Maxim Integrated Products, Inc. |
|
|
60,850 |
|
|
|
1,882,090 |
|
|
|
|
|
|
|
$ |
6,479,647 |
|
| TOTAL INFORMATION TECHNOLOGY |
|
|
|
|
|
$ |
11,776,156 |
|
|
|
|
| MATERIALS – 1.6% |
|
|
|
|
|
|
|
|
|
|
|
| CHEMICALS – 1.6% |
|
|
|
|
|
|
|
|
| Air Products & Chemicals, Inc. |
|
|
23,615 |
|
|
|
2,053,560 |
|
|
|
| TELECOMMUNICATION SERVICES – 1.3% |
|
|
|
|
|
|
|
|
| WIRELESS TELECOMMUNICATION SERVICES – 1.3% |
|
|
|
|
|
|
|
|
| Vodafone Group PLC ADR |
|
|
55,407 |
|
|
|
1,694,900 |
|
|
|
|
| UTILITIES – 6.5% |
|
|
|
|
|
|
|
|
|
|
| ELECTRIC UTILITIES – 4.7% |
|
|
|
|
|
| PPL Corp. |
|
|
103,037 |
|
|
|
3,439,375 |
|
| Southern Co. |
|
|
52,296 |
|
|
|
2,522,236 |
|
|
|
|
|
|
|
$ |
5,961,611 |
|
|
|
|
| MULTI-UTILITIES – 1.8% |
|
|
|
|
|
|
|
|
| Dominion Resources, Inc. |
|
|
36,549 |
|
|
|
2,254,342 |
|
| TOTAL UTILITIES |
|
|
|
|
|
$ |
8,215,953 |
|
| TOTAL COMMON STOCKS (COST $109,907,274) |
|
|
|
|
|
$ |
127,958,736 |
|
| TOTAL INVESTMENTS – 100.4% (COST
$109,907,274) |
|
|
|
|
|
$ |
127,958,736 |
|
| OTHER LIABILITIES LESS ASSETS – (0.4%) |
|
|
|
(523,846 |
) |
| TOTAL NET ASSETS – 100.0% |
|
|
|
|
|
$ |
127,434,890 |
|
Cost of investments
for Federal income tax purposes is $110,019,148. The net unrealized appreciation/(depreciation) of investments was $17,939,588. This consists of net unrealized appreciation from investment for those securities having an excess of value over cost of
$18,487,715 and net unrealized depreciation from investments for those securities having an excess of cost over value of $548,127.
ANNUAL
REPORT / April 30, 2013
|
|
|
| 42 |
|
PORTFOLIOS OF INVESTMENTS |
Wilmington Large-Cap Value Fund (concluded)
Various inputs are used in determining the value of the Fund’s investments. These
inputs are summarized in the three broad levels listed below.
Level 1 – quoted prices in active markets for identical securities
Level 2 – other significant observable inputs (including quoted prices for similar securities, interest rates, prepayment
speeds, credit risk, etc.)
Level 3 – significant unobservable inputs (including the Fund’s own assumptions in determining
the fair value of investments)
The following is a summary of the inputs used as of April 30, 2013 in valuing the Fund’s
assets carried at fair value:
|
|
|
|
|
|
|
|
|
|
|
|
|
|
|
|
|
| |
|
Level 1 |
|
|
Level 2 |
|
|
Level 3 |
|
|
Total |
|
| Investments in Securities |
|
|
|
|
|
|
|
|
|
|
|
|
|
|
|
|
| Common Stocks |
|
$ |
127,958,736 |
|
|
$ |
— |
|
|
$ |
— |
|
|
$ |
127,958,736 |
|
|
|
|
|
|
|
|
|
|
|
|
|
|
|
|
|
|
| Total |
|
$ |
127,958,736 |
|
|
$ |
— |
|
|
$ |
— |
|
|
$ |
127,958,736 |
|
|
|
|
|
|
|
|
|
|
|
|
|
|
|
|
|
|
See Notes to Portfolios of Investments
See Notes which are an integral part of the Financial Statements
April 30,
2013 / ANNUAL REPORT
PORTFOLIO OF INVESTMENTS SUMMARY TABLE
Wilmington Mid-Cap Growth Fund
At April 30, 2013,
the Fund’s sector classifications were as follows (unaudited):
|
|
|
|
|
|
| |
|
Percentage of |
| |
|
Total Net Assets |
| Common Stocks |
|
|
|
|
|
| Consumer Discretionary |
|
|
|
21.9 |
% |
| Information Technology |
|
|
|
19.2 |
% |
| Industrials |
|
|
|
15.8 |
% |
| Health Care |
|
|
|
12.9 |
% |
| Financials |
|
|
|
10.3 |
% |
| Energy |
|
|
|
9.1 |
% |
| Materials |
|
|
|
6.1 |
% |
| Consumer Staples |
|
|
|
4.2 |
% |
| Cash Equivalents1 |
|
|
|
10.1 |
% |
| Other Assets and Liabilities – Net2 |
|
|
|
(9.6 |
)% |
|
|
|
|
|
|
| TOTAL |
|
|
|
100.0 |
% |
|
|
|
|
|
|
| (1) |
Cash Equivalents include investments in money market mutual fund and repurchase agreements. |
| (2) |
Assets, other than investments in securities, less liabilities. See Statements of Assets and Liabilities. |
PORTFOLIO OF
INVESTMENTS
April 30, 2013
|
|
|
|
|
|
|
|
|
| Description
|
|
Number of
Shares |
|
|
Value
|
|
| COMMON STOCKS – 99.5% |
|
|
|
|
|
|
|
|
|
|
| CONSUMER DISCRETIONARY – 21.9% |
|
|
|
|
|
|
|
|
| AUTO COMPONENTS – 1.8% |
|
|
|
|
|
|
|
|
| BorgWarner, Inc.* |
|
|
67,650 |
|
|
$ |
5,288,200 |
|
|
|
|
| DISTRIBUTORS – 2.0% |
|
|
|
|
|
|
|
|
| LKQ Corp.* |
|
|
248,800 |
|
|
|
5,991,104 |
|
| HOTELS, RESTAURANTS & LEISURE – 2.6% |
|
|
|
|
|
| DineEquity, Inc. |
|
|
51,200 |
|
|
|
3,647,488 |
|
| Panera Bread Co.* |
|
|
23,200 |
|
|
|
4,111,736 |
|
|
|
|
|
|
|
$ |
7,759,224 |
|
|
|
|
| MEDIA – 3.6% |
|
|
|
|
|
|
|
|
| CBS Corp., Non-Voting |
|
|
160,650 |
|
|
|
7,354,557 |
|
| Scripps Networks Interactive, Inc. |
|
|
54,050 |
|
|
|
3,598,649 |
|
|
|
|
|
|
|
$ |
10,953,206 |
|
|
|
|
| MULTILINE RETAIL – 1.6% |
|
|
|
|
|
|
|
|
| Nordstrom, Inc. |
|
|
85,800 |
|
|
|
4,855,422 |
|
|
|
|
| SPECIALTY RETAIL – 5.4% |
|
|
|
|
|
|
|
|
| GameStop Corp.# |
|
|
122,200 |
|
|
|
4,264,780 |
|
| L Brands, Inc. |
|
|
91,750 |
|
|
|
4,625,118 |
|
| Tile Shop Holdings, Inc.* |
|
|
138,900 |
|
|
|
3,444,720 |
|
|
|
|
|
|
|
|
|
|
| Description
|
|
Number of
Shares |
|
|
Value
|
|
| Vitamin Shoppe, Inc.* |
|
|
78,600 |
|
|
$ |
3,863,190 |
|
|
|
|
|
|
|
$ |
16,197,808 |
|
|
|
| TEXTILES, APPAREL & LUXURY
GOODS – 4.9% |
|
|
|
|
|
| Coach, Inc. |
|
|
75,900 |
|
|
|
4,467,474 |
|
| Lululemon Athletica, Inc.#,* |
|
|
53,900 |
|
|
|
4,103,407 |
|
| PVH Corp. |
|
|
54,800 |
|
|
|
6,324,468 |
|
|
|
|
|
|
|
$ |
14,895,349 |
|
| TOTAL CONSUMER DISCRETIONARY |
|
|
|
|
|
$ |
65,940,313 |
|
|
|
| CONSUMER STAPLES – 4.2% |
|
|
|
|
|
|
|
|
| FOOD PRODUCTS – 1.5% |
|
|
|
|
|
|
|
|
| Green Mountain Coffee Roasters, Inc.#,* |
|
|
80,775 |
|
|
|
4,636,485 |
|
|
|
| HOUSEHOLD PRODUCTS – 1.4% |
|
|
|
|
|
| Church & Dwight Co., Inc. |
|
|
65,400 |
|
|
|
4,178,406 |
|
|
|
|
| PERSONAL PRODUCTS – 1.3% |
|
|
|
|
|
|
|
|
| Herbalife Ltd.# |
|
|
95,200 |
|
|
|
3,780,392 |
|
| TOTAL CONSUMER STAPLES |
|
|
|
|
|
$ |
12,595,283 |
|
|
|
|
| ENERGY – 9.1% |
|
|
|
|
|
|
|
|
|
|
| ENERGY EQUIPMENT & SERVICES – 4.6% |
|
|
|
|
|
| Cameron International Corp.* |
|
|
81,750 |
|
|
|
5,031,713 |
|
| CARBO Ceramics, Inc.# |
|
|
34,300 |
|
|
|
2,423,295 |
|
| Core Laboratories NV |
|
|
27,900 |
|
|
|
4,039,362 |
|
ANNUAL
REPORT / April 30, 2013
|
|
|
| 44 |
|
PORTFOLIOS OF INVESTMENTS |
Wilmington Mid-Cap Growth Fund (continued)
|
|
|
|
|
|
|
|
|
| Description
|
|
Number of
Shares |
|
|
Value
|
|
| Lufkin Industries, Inc. |
|
|
27,300 |
|
|
$ |
2,410,317 |
|
|
|
|
|
|
|
$ |
13,904,687 |
|
|
|
| OIL, GAS & CONSUMABLE FUELS – 4.5% |
|
|
|
|
|
| Cabot Oil & Gas Corp. |
|
|
70,900 |
|
|
|
4,824,745 |
|
| Noble Energy, Inc. |
|
|
37,400 |
|
|
|
4,237,046 |
|
| Whiting Petroleum Corp.* |
|
|
99,700 |
|
|
|
4,436,650 |
|
|
|
|
|
|
|
$ |
13,498,441 |
|
| TOTAL ENERGY |
|
|
|
|
|
$ |
27,403,128 |
|
|
|
|
| FINANCIALS – 10.3% |
|
|
|
|
|
|
|
|
|
|
|
| CAPITAL MARKETS – 3.1% |
|
|
|
|
|
|
|
|
| Raymond James Financial, Inc. |
|
|
132,600 |
|
|
|
5,492,292 |
|
| T Rowe Price Group, Inc. |
|
|
52,700 |
|
|
|
3,820,750 |
|
|
|
|
|
|
|
$ |
9,313,042 |
|
|
|
|
| COMMERCIAL BANKS – 1.5% |
|
|
|
|
|
|
|
|
| SVB Financial Group* |
|
|
63,150 |
|
|
|
4,490,597 |
|
|
|
| DIVERSIFIED FINANCIAL
SERVICES – 1.4% |
|
|
|
|
|
| IntercontinentalExchange, Inc.* |
|
|
26,200 |
|
|
|
4,268,766 |
|
|
|
|
| INSURANCE – 1.5% |
|
|
|
|
|
|
|
|
| Brown & Brown, Inc. |
|
|
147,750 |
|
|
|
4,578,772 |
|
|
|
| REAL ESTATE MANAGEMENT &
DEVELOPMENT – 2.8% |
|
|
|
|
|
| CBRE Group, Inc.* |
|
|
200,250 |
|
|
|
4,850,055 |
|
| Realogy Holdings Corp.* |
|
|
71,650 |
|
|
|
3,439,200 |
|
|
|
|
|
|
|
$ |
8,289,255 |
|
| TOTAL FINANCIALS |
|
|
|
|
|
$ |
30,940,432 |
|
|
|
|
| HEALTH CARE – 12.9% |
|
|
|
|
|
|
|
|
|
|
|
| BIOTECHNOLOGY – 2.7% |
|
|
|
|
|
|
|
|
| Cepheid, Inc.* |
|
|
68,500 |
|
|
|
2,611,905 |
|
| Regeneron Pharmaceuticals, Inc.* |
|
|
25,575 |
|
|
|
5,502,206 |
|
|
|
|
|
|
|
$ |
8,114,111 |
|
|
|
| HEALTH CARE EQUIPMENT &
SUPPLIES – 4.5% |
|
|
|
|
|
| Alere, Inc.* |
|
|
167,400 |
|
|
|
4,298,832 |
|
| Intuitive Surgical, Inc.* |
|
|
9,815 |
|
|
|
4,831,826 |
|
| ResMed, Inc.# |
|
|
90,800 |
|
|
|
4,360,216 |
|
|
|
|
|
|
|
$ |
13,490,874 |
|
|
|
| HEALTH CARE PROVIDERS &
SERVICES – 1.4% |
|
|
|
|
|
| Express Scripts Holding Co.* |
|
|
68,400 |
|
|
|
4,060,908 |
|
|
|
| HEALTH CARE TECHNOLOGY – 1.4% |
|
|
|
|
|
| Cerner Corp.* |
|
|
44,475 |
|
|
|
4,303,846 |
|
|
|
| LIFE SCIENCES TOOLS &
SERVICES – 0.7% |
|
|
|
|
|
| Life Technologies Corp.* |
|
|
29,700 |
|
|
|
2,188,593 |
|
|
|
|
| PHARMACEUTICALS – 2.2% |
|
|
|
|
|
|
|
|
| Auxilium Pharmaceuticals, Inc.* |
|
|
82,400 |
|
|
|
1,230,232 |
|
|
|
|
|
|
|
|
|
|
| Description
|
|
Number of
Shares |
|
|
Value
|
|
| Perrigo Co. |
|
|
45,975 |
|
|
$ |
5,489,875 |
|
|
|
|
|
|
|
$ |
6,720,107 |
|
| TOTAL HEALTH CARE |
|
|
|
|
|
$ |
38,878,439 |
|
|
|
|
| INDUSTRIALS – 15.8% |
|
|
|
|
|
|
|
|
|
|
| AEROSPACE & DEFENSE – 2.0% |
|
|
|
|
|
| HEICO Corp. |
|
|
91,675 |
|
|
|
3,100,449 |
|
| Precision Castparts Corp. |
|
|
15,700 |
|
|
|
3,003,253 |
|
|
|
|
|
|
|
$ |
6,103,702 |
|
|
|
| AIR FREIGHT & LOGISTICS – 2.1% |
|
|
|
|
|
| CH Robinson Worldwide, Inc. |
|
|
61,600 |
|
|
|
3,658,424 |
|
| Expeditors International of Washington, Inc. |
|
|
78,100 |
|
|
|
2,806,133 |
|
|
|
|
|
|
|
$ |
6,464,557 |
|
|
|
| COMMERCIAL SERVICES &
SUPPLIES – 1.2% |
|
|
|
|
|
| Waste Connections, Inc. |
|
|
93,700 |
|
|
|
3,555,915 |
|
|
|
|
| ELECTRICAL EQUIPMENT – 3.6% |
|
|
|
|
|
|
|
|
| AMETEK, Inc. |
|
|
99,650 |
|
|
|
4,056,751 |
|
| Babcock & Wilcox Co. |
|
|
89,000 |
|
|
|
2,420,800 |
|
| Rockwell Automation, Inc. |
|
|
50,800 |
|
|
|
4,306,824 |
|
|
|
|
|
|
|
$ |
10,784,375 |
|
|
|
|
| MACHINERY – 5.5% |
|
|
|
|
|
|
|
|
| Cummins, Inc. |
|
|
36,600 |
|
|
|
3,893,874 |
|
| Graco, Inc. |
|
|
82,825 |
|
|
|
5,013,397 |
|
| Joy Global, Inc. |
|
|
71,700 |
|
|
|
4,052,484 |
|
| Pall Corp. |
|
|
54,200 |
|
|
|
3,615,682 |
|
|
|
|
|
|
|
$ |
16,575,437 |
|
|
|
| TRADING COMPANIES &
DISTRIBUTORS – 1.4% |
|
|
|
|
|
| Fastenal Co. |
|
|
84,500 |
|
|
|
4,144,725 |
|
| TOTAL INDUSTRIALS |
|
|
|
|
|
$ |
47,628,711 |
|
|
|
| INFORMATION TECHNOLOGY – 19.2% |
|
|
|
|
|
|
|
| COMMUNICATIONS EQUIPMENT – 2.1% |
|
|
|
|
|
| Aruba Networks, Inc.#,* |
|
|
149,735 |
|
|
|
3,367,540 |
|
| F5 Networks, Inc.* |
|
|
39,700 |
|
|
|
3,034,271 |
|
|
|
|
|
|
|
$ |
6,401,811 |
|
|
|
| COMPUTERS & PERIPHERALS – 1.2% |
|
|
|
|
|
| Stratasys Ltd.#,* |
|
|
42,200 |
|
|
|
3,504,710 |
|
|
|
| ELECTRONIC EQUIPMENT,
INSTRUMENTS & COMPONENTS – 3.2% |
|
|
|
|
|
| FEI Co. |
|
|
48,100 |
|
|
|
3,072,628 |
|
| IPG Photonics Corp. |
|
|
61,300 |
|
|
|
3,903,584 |
|
| National Instruments Corp. |
|
|
99,800 |
|
|
|
2,727,534 |
|
|
|
|
|
|
|
$ |
9,703,746 |
|
|
|
|
| IT SERVICES – 1.8% |
|
|
|
|
|
|
|
|
| Global Payments, Inc. |
|
|
78,200 |
|
|
|
3,628,480 |
|
April 30,
2013 / ANNUAL REPORT
|
|
|
|
|
| PORTFOLIOS OF INVESTMENTS |
|
|
45 |
|
Wilmington Mid-Cap Growth Fund (continued)
|
|
|
|
|
|
|
|
|
| Description
|
|
Number
of
Shares |
|
|
Value
|
|
| Teradata Corp.* |
|
|
35,600 |
|
|
$ |
1,818,092 |
|
|
|
|
|
|
|
$ |
5,446,572 |
|
|
|
| SEMICONDUCTORS & SEMICONDUCTOR EQUIPMENT – 3.3% |
|
|
|
|
|
| Altera Corp. |
|
|
144,375 |
|
|
|
4,621,444 |
|
| Lam Research Corp.* |
|
|
68,400 |
|
|
|
3,161,448 |
|
| MKS Instruments, Inc. |
|
|
77,500 |
|
|
|
2,082,425 |
|
|
|
|
|
|
|
$ |
9,865,317 |
|
|
|
|
| SOFTWARE – 7.6% |
|
|
|
|
|
|
|
|
| ANSYS, Inc.* |
|
|
64,800 |
|
|
|
5,239,728 |
|
| Autodesk, Inc.* |
|
|
144,000 |
|
|
|
5,670,720 |
|
| Citrix Systems, Inc.* |
|
|
79,625 |
|
|
|
4,950,286 |
|
| Nuance Communications, Inc.* |
|
|
193,200 |
|
|
|
3,678,528 |
|
| Sourcefire, Inc.* |
|
|
73,925 |
|
|
|
3,530,658 |
|
|
|
|
|
|
|
$ |
23,069,920 |
|
| TOTAL INFORMATION TECHNOLOGY |
|
|
|
|
|
$ |
57,992,076 |
|
|
|
|
| MATERIALS – 6.1% |
|
|
|
|
|
|
|
|
|
|
|
| CHEMICALS – 4.7% |
|
|
|
|
|
|
|
|
| Airgas, Inc. |
|
|
30,350 |
|
|
|
2,933,327 |
|
| Ashland, Inc. |
|
|
67,900 |
|
|
|
5,785,759 |
|
| WR Grace & Co.* |
|
|
70,400 |
|
|
|
5,428,544 |
|
|
|
|
|
|
|
$ |
14,147,630 |
|
|
|
|
| CONTAINERS & PACKAGING – 1.4% |
|
|
|
|
|
|
|
|
| Crown Holdings, Inc.* |
|
|
101,100 |
|
|
|
4,314,948 |
|
| TOTAL MATERIALS |
|
|
|
|
|
$ |
18,462,578 |
|
TOTAL COMMON STOCKS
(COST $211,925,354) |
|
|
|
|
|
$ |
299,840,960 |
|
|
|
|
| MONEY MARKET FUND – 0.4% |
|
|
|
|
|
|
|
|
| Dreyfus Cash Management Fund, Institutional Shares, 0.05%^ |
|
|
1,180,457 |
|
|
|
1,180,457 |
|
| TOTAL MONEY MARKET FUND (COST $1,180,457) |
|
|
|
|
|
$ |
1,180,457 |
|
TOTAL INVESTMENTS IN SECURITIES – 99.9%
(COST $213,105,811) |
|
|
|
|
|
$ |
301,021,417 |
|
|
|
|
|
|
|
|
|
|
| Description
|
|
Par
Value |
|
|
Value
|
|
|
|
| CASH COLLATERAL INVESTED FOR SECURITIES ON LOAN – 9.7% |
|
|
|
|
|
|
|
| REPURCHASE AGREEMENTS – 9.7% |
|
|
|
|
|
|
|
|
| Deutsche Bank Securities, Inc., 0.17%, dated 04/30/13, due 05/01/13, repurchaseprice $6,914,777, collateralized by U.S. Government Securities 2.13% to 7.50%,
maturing 12/01/16 to 04/01/48; total market value of $ 7,053,039. |
|
$ |
6,914,744 |
|
|
$ |
6,914,744 |
|
|
|
|
| HSBC Securities USA, Inc., 0.15%, dated 04/30/13, due 05/01/13, repurchase price $6,914,773, collateralized by U.S. Government Securities 0.00% to 9.38%, maturing
07/15/13 to 03/17/31; total market value of $ 7,053,043. |
|
|
6,914,744 |
|
|
|
6,914,744 |
|
|
|
|
| Merrill Lynch, Pierce, Fenner & Smith, Inc., 0.14%, dated 04/30/13, due 05/01/13, repurchase price $1,455,670, collateralized by U.S. Treasury Securities
0.25% to 2.75%, maturing 10/15/15 to 08/15/42; total market value of $ 1,484,777. |
|
|
1,455,664 |
|
|
|
1,455,664 |
|
|
|
|
| Mizuho Securities USA, Inc., 0.20%, dated 04/30/13, due 05/01/13, repurchase price $6,914,782, collateralized by U.S. Government Securities 2.08% to 7.00%,
maturing 01/01/22 to 04/15/52; total market value of $ 7,053,039. |
|
|
6,914,744 |
|
|
|
6,914,744 |
|
|
|
|
| RBC Capital Markets LLC, 0.17%, dated 04/30/13, due 05/01/13, repurchase price $6,914,777, collateralized by U.S. Government Securities 1.97% to 4.50%maturing
08/01/24 to 12/15/44; total market value of $ 7,053,039. |
|
|
6,914,744 |
|
|
|
6,914,744 |
|
TOTAL CASH COLLATERAL INVESTED FOR SECURITIES ON LOAN
(COST $29,114,640) |
|
|
|
|
|
$ |
29,114,640 |
|
TOTAL INVESTMENTS – 109.6%
(COST $242,220,451) |
|
|
|
|
|
$ |
330,136,057 |
|
COLLATERAL FOR SECURITIES
ON LOAN – (9.7%) |
|
|
|
(29,114,640 |
) |
| OTHER ASSETS LESS LIABILITIES – 0.1% |
|
|
|
242,620 |
|
| TOTAL NET ASSETS – 100.0% |
|
|
|
|
|
$ |
301,264,037 |
|
Cost of investments
for Federal income tax purposes is $245,900,582. The net unrealized appreciation/(depreciation) of investments was $84,235,475. This consists of net unrealized appreciation from investment for those securities having an excess of value over cost of
$91,123,421 and net unrealized depreciation from investments for those securities having an excess of cost over value of $6,887,946.
ANNUAL
REPORT / April 30, 2013
|
|
|
| 46 |
|
PORTFOLIOS OF INVESTMENTS |
Wilmington Mid-Cap Growth Fund (concluded)
Various inputs are used in determining the value of the Fund’s investments. These
inputs are summarized in the three broad levels listed below.
Level 1 – quoted prices in active markets for identical securities
Level 2 – other significant observable inputs (including quoted prices for similar securities, interest rates, prepayment
speeds, credit risk, etc.)
Level 3 – significant unobservable inputs (including the Fund’s own assumptions in determining
the fair value of investments)
The following is a summary of the inputs used as of April 30, 2013 in valuing the Fund’s
assets carried at fair value:
|
|
|
|
|
|
|
|
|
|
|
|
|
|
|
|
|
| |
|
Level
1 |
|
|
Level 2 |
|
|
Level 3 |
|
|
Total |
|
| Investments in Securities |
|
|
|
|
|
|
|
|
|
|
|
|
|
|
|
|
| Common Stocks |
|
$ |
299,840,960 |
|
|
$ |
— |
|
|
$ |
— |
|
|
$ |
299,840,960 |
|
| Money Market Fund |
|
|
1,180,457 |
|
|
|
— |
|
|
|
— |
|
|
|
1,180,457 |
|
| Repurchase Agreements |
|
|
— |
|
|
|
29,114,640 |
|
|
|
— |
|
|
|
29,114,640 |
|
|
|
|
|
|
|
|
|
|
|
|
|
|
|
|
|
|
| Total |
|
$ |
301,021,417 |
|
|
$ |
29,114,640 |
|
|
$ |
— |
|
|
$ |
330,136,057 |
|
|
|
|
|
|
|
|
|
|
|
|
|
|
|
|
|
|
See Notes to Portfolios of Investments
See Notes which is an integral part of the Financial Statements
April 30,
2013 / ANNUAL REPORT
PORTFOLIO OF INVESTMENTS SUMMARY TABLE
Wilmington Small-Cap Growth Fund
At April 30, 2013,
the Fund’s sector classifications were as follows (unaudited):
|
|
|
|
|
|
| |
|
Percentage of
Total Net Assets |
| Common Stocks |
|
|
|
|
|
| Industrials |
|
|
|
25.2 |
% |
| Health Care |
|
|
|
16.9 |
% |
| Information Technology |
|
|
|
16.7 |
% |
| Consumer Discretionary |
|
|
|
15.8 |
% |
| Financials |
|
|
|
9.0 |
% |
| Materials |
|
|
|
6.7 |
% |
| Consumer Staples |
|
|
|
4.4 |
% |
| Energy |
|
|
|
2.9 |
% |
| Utilities |
|
|
|
0.2 |
% |
| Cash Equivalents1 |
|
|
|
15.1 |
% |
| Other Assets and Liabilities – Net2 |
|
|
|
(12.9 |
)% |
|
|
|
|
|
|
| TOTAL |
|
|
|
100.0 |
% |
|
|
|
|
|
|
| (1) |
Cash Equivalents include investments in money market mutual fund and repurchase agreements. |
| (2) |
Assets, other than investments in securities, less liabilities. See Statements of Assets and Liabilities. |
PORTFOLIO OF
INVESTMENTS
April 30, 2013
|
|
|
|
|
|
|
|
|
| Description
|
|
Number of Shares |
|
|
Value
|
|
|
|
|
| COMMON STOCKS – 97.8% |
|
|
|
|
|
|
|
|
|
|
| CONSUMER DISCRETIONARY – 15.8% |
|
|
|
|
|
|
|
|
| AUTO COMPONENTS – 0.8% |
|
|
|
|
|
|
|
|
| Cooper Tire & Rubber Co. |
|
|
8,500 |
|
|
$ |
211,565 |
|
| Tenneco, Inc.* |
|
|
24,000 |
|
|
|
928,080 |
|
|
|
|
|
|
|
$ |
1,139,645 |
|
|
|
|
| DISTRIBUTORS – 0.3% |
|
|
|
|
|
|
|
|
| Core-Mark Holding Co., Inc. |
|
|
7,130 |
|
|
|
371,045 |
|
|
|
| DIVERSIFIED CONSUMER SERVICES – 0.4% |
|
|
|
|
|
| Steiner Leisure Ltd.* |
|
|
11,400 |
|
|
|
552,102 |
|
|
|
| HOTELS, RESTAURANTS & LEISURE – 2.7% |
|
|
|
|
|
| AFC Enterprises, Inc.* |
|
|
6,210 |
|
|
|
197,975 |
|
| Bally Technologies, Inc.#,* |
|
|
2,690 |
|
|
|
143,323 |
|
| Carrols Restaurant Group, Inc.* |
|
|
27,590 |
|
|
|
131,052 |
|
| Cheesecake Factory, Inc. |
|
|
16,000 |
|
|
|
637,120 |
|
| DineEquity, Inc. |
|
|
2,400 |
|
|
|
170,976 |
|
| Life Time Fitness, Inc.* |
|
|
17,500 |
|
|
|
808,150 |
|
| Premier Exhibitions, Inc.* |
|
|
86,600 |
|
|
|
236,418 |
|
| Six Flags Entertainment Corp. |
|
|
9,100 |
|
|
|
663,117 |
|
| Sonic Corp.* |
|
|
35,050 |
|
|
|
439,177 |
|
|
|
|
|
|
|
|
|
|
| Description
|
|
Number of Shares |
|
|
Value
|
|
| Town Sports International Holdings, Inc. |
|
|
42,400 |
|
|
$ |
426,968 |
|
|
|
|
|
|
|
$ |
3,854,276 |
|
|
|
|
| HOUSEHOLD DURABLES – 2.8% |
|
|
|
|
|
|
|
|
| Libbey, Inc.* |
|
|
132,560 |
|
|
|
2,567,687 |
|
| Meritage Homes Corp.* |
|
|
10,900 |
|
|
|
531,811 |
|
| Ryland Group, Inc.# |
|
|
19,580 |
|
|
|
882,275 |
|
|
|
|
|
|
|
$ |
3,981,773 |
|
|
|
| LEISURE EQUIPMENT & PRODUCTS – 0.6% |
|
|
|
|
|
| Brunswick Corp. |
|
|
6,470 |
|
|
|
204,840 |
|
| LeapFrog Enterprises, Inc.#,* |
|
|
13,780 |
|
|
|
123,193 |
|
| Polaris Industries, Inc. |
|
|
4,890 |
|
|
|
421,469 |
|
| Sturm Ruger & Co., Inc.# |
|
|
720 |
|
|
|
36,914 |
|
|
|
|
|
|
|
$ |
786,416 |
|
|
|
|
| MEDIA – 3.2% |
|
|
|
|
|
|
|
|
| Arbitron, Inc. |
|
|
4,670 |
|
|
|
218,042 |
|
| Belo Corp. |
|
|
81,370 |
|
|
|
872,286 |
|
| Lions Gate Entertainment Corp.* |
|
|
16,600 |
|
|
|
411,846 |
|
| MDC Partners, Inc. |
|
|
32,150 |
|
|
|
549,444 |
|
| National CineMedia, Inc. |
|
|
6,600 |
|
|
|
107,184 |
|
ANNUAL
REPORT / April 30, 2013
|
|
|
| 48 |
|
PORTFOLIOS OF INVESTMENTS |
Wilmington Small-Cap Growth Fund (continued)
|
|
|
|
|
|
|
|
|
| Description
|
|
Number of
Shares |
|
|
Value
|
|
| Nexstar Broadcasting Group, Inc. |
|
|
15,450 |
|
|
$ |
376,208 |
|
| Sinclair Broadcast Group, Inc. |
|
|
58,700 |
|
|
|
1,573,160 |
|
| Valassis Communications, Inc.# |
|
|
18,300 |
|
|
|
469,029 |
|
|
|
|
|
|
|
$ |
4,577,199 |
|
|
|
|
| SPECIALTY RETAIL – 2.8% |
|
|
|
|
|
|
|
|
| Aeropostale, Inc.#,* |
|
|
9,000 |
|
|
|
131,940 |
|
| Cabela’s, Inc.* |
|
|
6,280 |
|
|
|
403,176 |
|
| Hibbett Sports, Inc.* |
|
|
10,000 |
|
|
|
548,500 |
|
| Hot Topic, Inc. |
|
|
5,690 |
|
|
|
79,376 |
|
| Lumber Liquidators Holdings, Inc.#,* |
|
|
6,590 |
|
|
|
540,116 |
|
| Monro Muffler Brake, Inc.# |
|
|
11,700 |
|
|
|
483,912 |
|
| Select Comfort Corp.* |
|
|
7,860 |
|
|
|
166,789 |
|
| Tractor Supply Co. |
|
|
9,800 |
|
|
|
1,050,266 |
|
| Winmark Corp. |
|
|
5,800 |
|
|
|
358,846 |
|
| Zumiez, Inc.* |
|
|
5,130 |
|
|
|
148,616 |
|
|
|
|
|
|
|
$ |
3,911,537 |
|
|
|
| TEXTILES, APPAREL &
LUXURY GOODS – 2.2% |
|
|
|
|
|
| Crocs, Inc.* |
|
|
20,550 |
|
|
|
329,211 |
|
| Deckers Outdoor Corp.#,* |
|
|
540 |
|
|
|
29,765 |
|
| Steven Madden Ltd.* |
|
|
22,080 |
|
|
|
1,073,750 |
|
| Under Armour, Inc.#,* |
|
|
9,130 |
|
|
|
521,140 |
|
| Wolverine World Wide, Inc.# |
|
|
23,190 |
|
|
|
1,107,786 |
|
|
|
|
|
|
|
$ |
3,061,652 |
|
| TOTAL CONSUMER DISCRETIONARY |
|
|
|
|
|
$ |
22,235,645 |
|
|
|
|
| CONSUMER STAPLES – 4.4% |
|
|
|
|
|
|
|
|
|
|
|
| BEVERAGES – 0.2% |
|
|
|
|
|
|
|
|
| National Beverage Corp. |
|
|
20,760 |
|
|
|
305,795 |
|
|
|
| FOOD & STAPLES RETAILING – 1.9% |
|
|
|
|
|
| Andersons, Inc. |
|
|
16,300 |
|
|
|
888,676 |
|
| Nash Finch Co. |
|
|
34,800 |
|
|
|
715,140 |
|
| Pricesmart, Inc.# |
|
|
8,630 |
|
|
|
770,055 |
|
| SUPERVALU, Inc.# |
|
|
49,760 |
|
|
|
290,598 |
|
|
|
|
|
|
|
$ |
2,664,469 |
|
|
|
|
| FOOD PRODUCTS – 1.2% |
|
|
|
|
|
|
|
|
| Darling International, Inc.* |
|
|
24,480 |
|
|
|
453,125 |
|
| Hain Celestial Group, Inc.#,* |
|
|
4,700 |
|
|
|
306,675 |
|
| J&J Snack Foods Corp. |
|
|
4,100 |
|
|
|
307,582 |
|
| Lancaster Colony Corp. |
|
|
4,870 |
|
|
|
384,389 |
|
| Pilgrim’s Pride Corp.* |
|
|
28,000 |
|
|
|
274,120 |
|
|
|
|
|
|
|
$ |
1,725,891 |
|
|
|
|
| HOUSEHOLD PRODUCTS – 0.7% |
|
|
|
|
|
|
|
|
| Spectrum Brands Holdings, Inc. |
|
|
4,910 |
|
|
|
274,960 |
|
| WD-40 Co. |
|
|
11,540 |
|
|
|
622,352 |
|
|
|
|
|
|
|
$ |
897,312 |
|
|
|
|
|
|
|
|
|
|
| Description
|
|
Number of
Shares |
|
|
Value
|
|
|
|
|
| PERSONAL PRODUCTS – 0.4% |
|
|
|
|
|
|
|
|
| Nature’s Sunshine Products, Inc. |
|
|
17,000 |
|
|
$ |
248,710 |
|
| Nu Skin Enterprises, Inc.# |
|
|
730 |
|
|
|
37,033 |
|
| Prestige Brands Holdings, Inc.* |
|
|
10,260 |
|
|
|
276,507 |
|
|
|
|
|
|
|
$ |
562,250 |
|
| TOTAL CONSUMER STAPLES |
|
|
|
|
|
$ |
6,155,717 |
|
|
|
|
| ENERGY – 2.9% |
|
|
|
|
|
|
|
|
|
|
| ENERGY EQUIPMENT & SERVICES – 1.6% |
|
|
|
|
|
| Dril-Quip, Inc.* |
|
|
14,200 |
|
|
|
1,188,682 |
|
| ION Geophysical Corp.* |
|
|
49,160 |
|
|
|
306,758 |
|
| Lufkin Industries, Inc. |
|
|
3,880 |
|
|
|
342,565 |
|
| Mitcham Industries, Inc.* |
|
|
17,260 |
|
|
|
256,311 |
|
| TGC Industries, Inc. |
|
|
24,318 |
|
|
|
215,701 |
|
|
|
|
|
|
|
$ |
2,310,017 |
|
|
|
| OIL, GAS & CONSUMABLE FUELS – 1.3% |
|
|
|
|
|
| Energy XXI Bermuda Ltd. |
|
|
1,440 |
|
|
|
32,746 |
|
| Halcon Resources Corp.#,* |
|
|
18,940 |
|
|
|
123,868 |
|
| Kodiak Oil & Gas Corp.* |
|
|
110,460 |
|
|
|
864,902 |
|
| Oasis Petroleum, Inc.* |
|
|
10,040 |
|
|
|
343,669 |
|
| Sanchez Energy Corp.#,* |
|
|
23,290 |
|
|
|
421,782 |
|
|
|
|
|
|
|
$ |
1,786,967 |
|
| TOTAL ENERGY |
|
|
|
|
|
$ |
4,096,984 |
|
|
|
|
| FINANCIALS – 9.0% |
|
|
|
|
|
|
|
|
|
|
|
| CAPITAL MARKETS – 2.6% |
|
|
|
|
|
|
|
|
| AllianceBernstein Holding LP# |
|
|
27,400 |
|
|
|
649,106 |
|
| HFF, Inc. |
|
|
21,150 |
|
|
|
443,093 |
|
| Lazard Ltd. |
|
|
13,600 |
|
|
|
461,040 |
|
| Medallion Financial Corp. |
|
|
103,250 |
|
|
|
1,542,555 |
|
| Virtus Investment Partners, Inc.* |
|
|
2,800 |
|
|
|
534,800 |
|
|
|
|
|
|
|
$ |
3,630,594 |
|
|
|
|
| COMMERCIAL BANKS – 0.1% |
|
|
|
|
|
|
|
|
| FNB United Corp.#,* |
|
|
19,110 |
|
|
|
143,325 |
|
|
|
|
| CONSUMER FINANCE – 1.0% |
|
|
|
|
|
|
|
|
| First Cash Financial Services, Inc.* |
|
|
22,910 |
|
|
|
1,179,178 |
|
| Portfolio Recovery Associates, Inc.* |
|
|
1,300 |
|
|
|
159,575 |
|
| QC Holdings, Inc. |
|
|
21,167 |
|
|
|
64,348 |
|
|
|
|
|
|
|
$ |
1,403,101 |
|
|
|
|
| INSURANCE – 0.1% |
|
|
|
|
|
|
|
|
| First American Financial Corp. |
|
|
6,150 |
|
|
|
164,635 |
|
| Montpelier Re Holdings Ltd. |
|
|
1,710 |
|
|
|
44,050 |
|
|
|
|
|
|
|
$ |
208,685 |
|
|
|
| REAL ESTATE INVESTMENT TRUSTS – 5.0% |
|
|
|
|
|
| Geo Group, Inc. |
|
|
6,603 |
|
|
|
247,282 |
|
| Glimcher Realty Trust |
|
|
264,800 |
|
|
|
3,320,592 |
|
| Investors Real Estate Trust |
|
|
110,900 |
|
|
|
1,079,057 |
|
April 30,
2013 / ANNUAL REPORT
|
|
|
|
|
| PORTFOLIOS OF INVESTMENTS |
|
|
49 |
|
Wilmington Small-Cap Growth Fund (continued)
|
|
|
|
|
|
|
|
|
| Description
|
|
Number of
Shares |
|
|
Value
|
|
| National Health Investors, Inc. |
|
|
15,300 |
|
|
$ |
1,013,472 |
|
| Newcastle Investment Corp. |
|
|
89,180 |
|
|
|
1,010,409 |
|
| Omega Healthcare Investors, Inc.# |
|
|
9,740 |
|
|
|
320,154 |
|
|
|
|
|
|
|
$ |
6,990,966 |
|
|
|
| REAL ESTATE MANAGEMENT & DEVELOPMENT – 0.2% |
|
|
|
|
|
| Tejon Ranch Co.* |
|
|
9,080 |
|
|
|
264,954 |
|
| TOTAL FINANCIALS |
|
|
|
|
|
$ |
12,641,625 |
|
|
|
|
| HEALTH CARE – 16.9% |
|
|
|
|
|
|
|
|
|
|
|
| BIOTECHNOLOGY – 4.7% |
|
|
|
|
|
|
|
|
| Achillion Pharmaceuticals, Inc.* |
|
|
29,700 |
|
|
|
223,938 |
|
| Aegerion Pharmaceuticals, Inc.#, * |
|
|
13,900 |
|
|
|
584,356 |
|
| Affymax, Inc.#, * |
|
|
15,580 |
|
|
|
14,024 |
|
| Arena Pharmaceuticals, Inc.#, * |
|
|
35,560 |
|
|
|
293,014 |
|
| Array BioPharma, Inc.* |
|
|
48,990 |
|
|
|
291,490 |
|
| Cubist Pharmaceuticals, Inc.* |
|
|
8,250 |
|
|
|
378,840 |
|
| Dendreon Corp.#, * |
|
|
22,040 |
|
|
|
103,808 |
|
| Idenix Pharmaceuticals, Inc.#, * |
|
|
26,200 |
|
|
|
96,940 |
|
| Infinity Pharmaceuticals, Inc.* |
|
|
5,480 |
|
|
|
236,133 |
|
| Keryx Biopharmaceuticals, Inc.#, * |
|
|
40,120 |
|
|
|
326,978 |
|
| Novavax, Inc.#, * |
|
|
102,400 |
|
|
|
240,640 |
|
| OncoGenex Pharmaceutical, Inc.#, * |
|
|
50,000 |
|
|
|
506,500 |
|
| Orexigen Therapeutics, Inc.#, * |
|
|
37,200 |
|
|
|
226,176 |
|
| PDL BioPharma, Inc.# |
|
|
40,250 |
|
|
|
311,535 |
|
| Pharmacyclics, Inc.* |
|
|
13,642 |
|
|
|
1,111,823 |
|
| Raptor Pharmaceutical Corp.#, * |
|
|
20,000 |
|
|
|
138,000 |
|
| Rigel Pharmaceuticals, Inc.* |
|
|
25,080 |
|
|
|
120,133 |
|
| Seattle Genetics, Inc.#, * |
|
|
5,910 |
|
|
|
218,375 |
|
| Spectrum Pharmaceuticals, Inc.# |
|
|
12,610 |
|
|
|
93,440 |
|
| Synageva BioPharma Corp.* |
|
|
2,990 |
|
|
|
154,553 |
|
| Theravance, Inc.#, * |
|
|
22,680 |
|
|
|
765,450 |
|
| United Therapeutics Corp.* |
|
|
700 |
|
|
|
46,746 |
|
| ZIOPHARM Oncology, Inc.#, * |
|
|
56,300 |
|
|
|
94,584 |
|
|
|
|
|
|
|
$ |
6,577,476 |
|
|
|
| HEALTH CARE EQUIPMENT &
SUPPLIES – 5.8% |
|
|
|
|
|
| Abaxis, Inc. |
|
|
9,620 |
|
|
|
410,678 |
|
| ABIOMED, Inc.#, * |
|
|
27,610 |
|
|
|
509,957 |
|
| Align Technology, Inc.* |
|
|
20,200 |
|
|
|
669,024 |
|
| Cantel Medical Corp. |
|
|
7,100 |
|
|
|
224,431 |
|
| Cardiovascular Systems, Inc.* |
|
|
36,300 |
|
|
|
622,908 |
|
| Cynosure, Inc.* |
|
|
23,800 |
|
|
|
615,468 |
|
| Haemonetics Corp.* |
|
|
13,400 |
|
|
|
515,900 |
|
| ICU Medical, Inc.* |
|
|
3,000 |
|
|
|
180,750 |
|
| Neogen Corp.* |
|
|
19,920 |
|
|
|
1,012,534 |
|
| NuVasive, Inc.* |
|
|
7,180 |
|
|
|
150,565 |
|
| OraSure Technologies, Inc.* |
|
|
52,270 |
|
|
|
233,124 |
|
|
|
|
|
|
|
|
|
|
| Description
|
|
Number of
Shares |
|
|
Value
|
|
| RTI Biologics, Inc.* |
|
|
153,000 |
|
|
$ |
608,940 |
|
| Sirona Dental Systems, Inc.* |
|
|
4,000 |
|
|
|
294,160 |
|
| Staar Surgical Co.* |
|
|
9,330 |
|
|
|
65,123 |
|
| STERIS Corp. |
|
|
15,900 |
|
|
|
661,281 |
|
| Utah Medical Products, Inc. |
|
|
14,500 |
|
|
|
642,785 |
|
| West Pharmaceutical Services, Inc. |
|
|
12,530 |
|
|
|
800,166 |
|
|
|
|
|
|
|
$ |
8,217,794 |
|
|
|
| HEALTH CARE PROVIDERS &
SERVICES – 2.6% |
|
|
|
|
|
| Accretive Health, Inc.#, * |
|
|
12,800 |
|
|
|
134,912 |
|
| Centene Corp.* |
|
|
8,290 |
|
|
|
382,998 |
|
| Corvel Corp.* |
|
|
18,400 |
|
|
|
873,448 |
|
| Emeritus Corp.* |
|
|
25,220 |
|
|
|
648,154 |
|
| HealthSouth Corp.* |
|
|
14,410 |
|
|
|
396,275 |
|
| National Research Corp. |
|
|
8,240 |
|
|
|
493,988 |
|
| Providence Service Corp.* |
|
|
16,310 |
|
|
|
285,588 |
|
| Skilled Healthcare Group, Inc.* |
|
|
70,260 |
|
|
|
494,630 |
|
|
|
|
|
|
|
$ |
3,709,993 |
|
|
|
| HEALTH CARE TECHNOLOGY – 0.4% |
|
|
|
|
|
| athenahealth, Inc.#, * |
|
|
1,920 |
|
|
|
184,819 |
|
| Cerner Corp.* |
|
|
2,040 |
|
|
|
197,411 |
|
| HMS Holdings Corp.* |
|
|
7,090 |
|
|
|
178,739 |
|
|
|
|
|
|
|
$ |
560,969 |
|
|
|
| LIFE SCIENCES TOOLS & SERVICES – 0.6% |
|
|
|
|
|
| Furiex Pharmaceuticals, Inc.* |
|
|
5,460 |
|
|
|
185,367 |
|
| Luminex Corp.* |
|
|
4,500 |
|
|
|
74,835 |
|
| PAREXEL International Corp.* |
|
|
13,300 |
|
|
|
544,635 |
|
|
|
|
|
|
|
$ |
804,837 |
|
|
|
|
| PHARMACEUTICALS – 2.8% |
|
|
|
|
|
|
|
|
| Cadence Pharmaceuticals, Inc.#, * |
|
|
47,000 |
|
|
|
332,760 |
|
| Endocyte, Inc.#, * |
|
|
15,570 |
|
|
|
216,267 |
|
| Hi-Tech Pharmacal Co., Inc. |
|
|
21,980 |
|
|
|
726,659 |
|
| Jazz Pharmaceuticals PLC* |
|
|
23,340 |
|
|
|
1,361,889 |
|
| Nektar Therapeutics#, * |
|
|
17,900 |
|
|
|
194,036 |
|
| Questcor Pharmaceuticals, Inc.# |
|
|
2,810 |
|
|
|
86,379 |
|
| Salix Pharmaceuticals Ltd.* |
|
|
10,828 |
|
|
|
566,196 |
|
| Santarus, Inc.* |
|
|
12,140 |
|
|
|
223,012 |
|
| Vivus, Inc.#, * |
|
|
14,740 |
|
|
|
195,895 |
|
|
|
|
|
|
|
$ |
3,903,093 |
|
| TOTAL HEALTH CARE |
|
|
|
|
|
$ |
23,774,162 |
|
|
|
|
| INDUSTRIALS – 25.2% |
|
|
|
|
|
|
|
|
|
|
|
| AEROSPACE & DEFENSE – 1.2% |
|
|
|
|
|
|
|
|
| DigitalGlobe, Inc.* |
|
|
7,190 |
|
|
|
209,876 |
|
| GenCorp., Inc.#, * |
|
|
28,990 |
|
|
|
378,899 |
|
| HEICO Corp. |
|
|
5,100 |
|
|
|
224,451 |
|
ANNUAL
REPORT / April 30, 2013
|
|
|
| 50 |
|
PORTFOLIOS OF INVESTMENTS |
Wilmington Small-Cap Growth Fund (continued)
|
|
|
|
|
|
|
|
|
| Description
|
|
Number of
Shares |
|
|
Value
|
|
| Hexcel Corp.* |
|
|
20,090 |
|
|
$ |
612,745 |
|
| Sypris Solutions, Inc. |
|
|
27,220 |
|
|
|
87,104 |
|
| Teledyne Technologies, Inc.* |
|
|
3,100 |
|
|
|
232,686 |
|
|
|
|
|
|
|
$ |
1,745,761 |
|
|
|
|
| AIR FREIGHT & LOGISTICS – 0.8% |
|
|
|
|
|
|
|
|
| Park-Ohio Holdings Corp.* |
|
|
23,800 |
|
|
|
875,364 |
|
| XPO Logistics, Inc.#,* |
|
|
15,430 |
|
|
|
251,663 |
|
|
|
|
|
|
|
$ |
1,127,027 |
|
|
|
|
| AIRLINES – 1.3% |
|
|
|
|
|
|
|
|
| Hawaiian Holdings, Inc.#,* |
|
|
90,720 |
|
|
|
498,053 |
|
| Republic Airways Holdings, Inc.* |
|
|
61,700 |
|
|
|
690,423 |
|
| US Airways Group, Inc.#,* |
|
|
35,250 |
|
|
|
595,725 |
|
|
|
|
|
|
|
$ |
1,784,201 |
|
|
|
|
| BUILDING PRODUCTS – 1.8% |
|
|
|
|
|
|
|
|
| American Woodmark Corp.* |
|
|
8,800 |
|
|
|
296,120 |
|
| Builders FirstSource, Inc.* |
|
|
51,950 |
|
|
|
321,570 |
|
| Trex Co., Inc.* |
|
|
21,580 |
|
|
|
1,050,514 |
|
| USG Corp.#,* |
|
|
31,930 |
|
|
|
829,861 |
|
|
|
|
|
|
|
$ |
2,498,065 |
|
|
|
| COMMERCIAL SERVICES & SUPPLIES – 2.7% |
|
|
|
|
|
| ACCO Brands Corp.* |
|
|
61,190 |
|
|
|
413,033 |
|
| Healthcare Services Group, Inc. |
|
|
23,600 |
|
|
|
526,044 |
|
| Herman Miller, Inc. |
|
|
800 |
|
|
|
20,072 |
|
| InnerWorkings, Inc.#,* |
|
|
57,770 |
|
|
|
581,744 |
|
| Knoll, Inc. |
|
|
7,000 |
|
|
|
108,920 |
|
| Mobile Mini, Inc.* |
|
|
10,000 |
|
|
|
281,300 |
|
| Standard Parking Corp.* |
|
|
41,650 |
|
|
|
895,059 |
|
| Team, Inc.* |
|
|
25,910 |
|
|
|
1,004,272 |
|
| TRC Cos., Inc.* |
|
|
2,913 |
|
|
|
17,595 |
|
|
|
|
|
|
|
$ |
3,848,039 |
|
|
|
| CONSTRUCTION & ENGINEERING – 5.5% |
|
|
|
|
|
| Aegion Corp.* |
|
|
36,900 |
|
|
|
777,114 |
|
| Ameresco, Inc.* |
|
|
71,380 |
|
|
|
526,071 |
|
| Argan, Inc. |
|
|
59,470 |
|
|
|
1,052,619 |
|
| Comfort Systems USA, Inc. |
|
|
15,600 |
|
|
|
200,148 |
|
| Dycom Industries, Inc.* |
|
|
57,400 |
|
|
|
1,108,968 |
|
| Great Lakes Dredge & Dock Corp. |
|
|
113,340 |
|
|
|
784,313 |
|
| MasTec, Inc.* |
|
|
19,870 |
|
|
|
552,386 |
|
| MYR Group, Inc.* |
|
|
6,490 |
|
|
|
147,972 |
|
| Primoris Services Corp. |
|
|
84,200 |
|
|
|
1,855,768 |
|
| Sterling Construction Co., Inc.* |
|
|
78,509 |
|
|
|
794,511 |
|
|
|
|
|
|
|
$ |
7,799,870 |
|
|
|
|
| ELECTRICAL EQUIPMENT – 1.9% |
|
|
|
|
|
|
|
|
| Acuity Brands, Inc. |
|
|
14,700 |
|
|
|
1,072,512 |
|
| AZZ, Inc. |
|
|
14,460 |
|
|
|
611,513 |
|
| Coleman Cable, Inc. |
|
|
23,887 |
|
|
|
358,305 |
|
|
|
|
|
|
|
|
|
|
| Description
|
|
Number of
Shares |
|
|
Value
|
|
| Encore Wire Corp. |
|
|
19,600 |
|
|
$ |
641,900 |
|
|
|
|
|
|
|
$ |
2,684,230 |
|
|
|
|
| MACHINERY – 1.5% |
|
|
|
|
|
|
|
|
| Blount International, Inc.* |
|
|
9,600 |
|
|
|
133,344 |
|
| CLARCOR, Inc. |
|
|
1,790 |
|
|
|
92,543 |
|
| Commercial Vehicle Group, Inc.* |
|
|
109,160 |
|
|
|
765,212 |
|
| Gorman-Rupp Co. |
|
|
340 |
|
|
|
9,605 |
|
| Meritor, Inc.* |
|
|
27,390 |
|
|
|
158,862 |
|
| Mueller Water Products, Inc. |
|
|
24,910 |
|
|
|
147,467 |
|
| Trimas Corp.* |
|
|
14,700 |
|
|
|
448,350 |
|
| Valmont Industries, Inc. |
|
|
700 |
|
|
|
102,011 |
|
| Wabash National Corp.* |
|
|
28,670 |
|
|
|
270,358 |
|
|
|
|
|
|
|
$ |
2,127,752 |
|
|
|
|
| MARINE – 0.3% |
|
|
|
|
|
|
|
|
| Rand Logistics, Inc.* |
|
|
62,966 |
|
|
|
366,462 |
|
|
|
|
| PROFESSIONAL SERVICES – 3.2% |
|
|
|
|
|
|
|
|
| Acacia Research Corp. |
|
|
18,340 |
|
|
|
436,859 |
|
| Advisory Board Co.* |
|
|
21,100 |
|
|
|
1,037,065 |
|
| Exponent, Inc. |
|
|
20,000 |
|
|
|
1,054,000 |
|
| GP Strategies Corp.* |
|
|
35,280 |
|
|
|
777,924 |
|
| Navigant Consulting, Inc.* |
|
|
45,700 |
|
|
|
563,481 |
|
| On Assignment, Inc.* |
|
|
9,430 |
|
|
|
228,866 |
|
| Resources Connection, Inc. |
|
|
34,050 |
|
|
|
386,808 |
|
|
|
|
|
|
|
$ |
4,485,003 |
|
|
|
|
| ROAD & RAIL – 0.4% |
|
|
|
|
|
|
|
|
| Genesee & Wyoming, Inc.* |
|
|
2,760 |
|
|
|
235,152 |
|
| Swift Transportation Co.* |
|
|
19,810 |
|
|
|
277,736 |
|
|
|
|
|
|
|
$ |
512,888 |
|
|
|
| TRADING COMPANIES &
DISTRIBUTORS – 4.6% |
|
|
|
|
|
| Aceto Corp. |
|
|
50,610 |
|
|
|
526,344 |
|
| Beacon Roofing Supply, Inc.* |
|
|
11,450 |
|
|
|
436,588 |
|
| CAI International, Inc.* |
|
|
11,500 |
|
|
|
293,135 |
|
| DXP Enterprises, Inc.* |
|
|
10,160 |
|
|
|
679,501 |
|
| H&E Equipment Services, Inc. |
|
|
14,630 |
|
|
|
297,867 |
|
| Houston Wire & Cable Co. |
|
|
88,470 |
|
|
|
1,204,961 |
|
| Textainer Group Holdings Ltd. |
|
|
21,890 |
|
|
|
846,486 |
|
| Titan Machinery, Inc.#,* |
|
|
22,330 |
|
|
|
503,765 |
|
| United Rentals, Inc.* |
|
|
15,870 |
|
|
|
834,921 |
|
| Watsco, Inc. |
|
|
10,220 |
|
|
|
862,364 |
|
|
|
|
|
|
|
$ |
6,485,932 |
|
| TOTAL INDUSTRIALS |
|
|
|
|
|
$ |
35,465,230 |
|
|
|
| INFORMATION TECHNOLOGY – 16.7% |
|
|
|
|
|
|
|
| COMMUNICATIONS EQUIPMENT – 1.8% |
|
|
|
|
|
| ARRIS Group, Inc.* |
|
|
30,100 |
|
|
|
496,951 |
|
April 30,
2013 / ANNUAL REPORT
|
|
|
|
|
| PORTFOLIOS OF INVESTMENTS |
|
|
51 |
|
Wilmington Small-Cap Growth Fund (continued)
|
|
|
|
|
|
|
|
|
| Description
|
|
Number of
Shares |
|
|
Value
|
|
| Aruba Networks, Inc.#,* |
|
|
20,000 |
|
|
$ |
449,800 |
|
| Black Box Corp. |
|
|
10,900 |
|
|
|
236,748 |
|
| InterDigital, Inc. |
|
|
7,000 |
|
|
|
310,870 |
|
| Ixia* |
|
|
12,000 |
|
|
|
197,640 |
|
| Loral Space & Communications, Inc. |
|
|
6,900 |
|
|
|
424,488 |
|
| Tessco Technologies, Inc. |
|
|
18,290 |
|
|
|
373,848 |
|
|
|
|
|
|
|
$ |
2,490,345 |
|
|
|
| COMPUTERS & PERIPHERALS – 0.5% |
|
|
|
|
|
| 3D Systems Corp.#,* |
|
|
10,290 |
|
|
|
393,490 |
|
| Cray, Inc.* |
|
|
14,410 |
|
|
|
304,916 |
|
|
|
|
|
|
|
$ |
698,406 |
|
| ELECTRONIC EQUIPMENT, INSTRUMENTS & COMPONENTS – 0.9% |
|
|
|
|
|
| Anixter International, Inc. |
|
|
11,880 |
|
|
|
852,271 |
|
| RealD, Inc.#,* |
|
|
9,900 |
|
|
|
148,203 |
|
| Universal Display Corp.#,* |
|
|
10,040 |
|
|
|
315,658 |
|
|
|
|
|
|
|
$ |
1,316,132 |
|
|
|
| INTERNET SOFTWARE &
SERVICES – 3.4% |
|
|
|
|
|
| CoStar Group, Inc.* |
|
|
5,790 |
|
|
|
627,694 |
|
| Keynote Systems, Inc. |
|
|
18,480 |
|
|
|
207,161 |
|
| LivePerson, Inc.* |
|
|
9,040 |
|
|
|
115,893 |
|
| Market Leader, Inc.* |
|
|
45,260 |
|
|
|
453,505 |
|
| MeetMe, Inc.#,* |
|
|
61,900 |
|
|
|
119,467 |
|
| OpenTable, Inc.#,* |
|
|
4,900 |
|
|
|
271,411 |
|
| Spark Networks, Inc.#,* |
|
|
41,550 |
|
|
|
283,371 |
|
| Stamps.com, Inc.* |
|
|
24,110 |
|
|
|
815,882 |
|
| support.com, Inc.* |
|
|
48,300 |
|
|
|
192,717 |
|
| TechTarget, Inc.* |
|
|
16,700 |
|
|
|
74,148 |
|
| ValueClick, Inc.* |
|
|
41,240 |
|
|
|
1,272,666 |
|
| Web.com Group, Inc.* |
|
|
19,090 |
|
|
|
332,166 |
|
|
|
|
|
|
|
$ |
4,766,081 |
|
|
|
|
| IT SERVICES – 4.8% |
|
|
|
|
|
|
|
|
| Cardtronics, Inc.* |
|
|
37,900 |
|
|
|
1,061,579 |
|
| Computer Task Group, Inc. |
|
|
20,160 |
|
|
|
413,683 |
|
| CSG Systems International, Inc.* |
|
|
3,700 |
|
|
|
79,957 |
|
| Global Cash Access Holdings, Inc.* |
|
|
20,400 |
|
|
|
145,452 |
|
| Hackett Group, Inc. |
|
|
31,780 |
|
|
|
155,086 |
|
| iGATE Corp.* |
|
|
49,970 |
|
|
|
833,999 |
|
| Jack Henry & Associates, Inc. |
|
|
15,000 |
|
|
|
696,000 |
|
| Lender Processing Services, Inc. |
|
|
7,260 |
|
|
|
201,392 |
|
| ManTech International Corp.# |
|
|
6,640 |
|
|
|
177,222 |
|
| MAXIMUS, Inc. |
|
|
16,810 |
|
|
|
1,339,589 |
|
| MoneyGram International, Inc.* |
|
|
47,500 |
|
|
|
784,225 |
|
| TeleTech Holdings, Inc.* |
|
|
9,000 |
|
|
|
191,610 |
|
| Unisys Corp.* |
|
|
28,570 |
|
|
|
546,544 |
|
|
|
|
|
|
|
|
|
|
| Description
|
|
Number of
Shares |
|
|
Value
|
|
| WEX, Inc.* |
|
|
2,270 |
|
|
$ |
172,021 |
|
|
|
|
|
|
|
$ |
6,798,359 |
|
|
|
| SEMICONDUCTORS & SEMICONDUCTOR EQUIPMENT – 0.1% |
|
|
|
|
|
| Microsemi Corp.* |
|
|
5,500 |
|
|
|
114,400 |
|
|
|
|
| SOFTWARE – 5.2% |
|
|
|
|
|
|
|
|
| ACI Worldwide, Inc.* |
|
|
4,400 |
|
|
|
206,844 |
|
| American Software, Inc. |
|
|
11,800 |
|
|
|
98,058 |
|
| ANSYS, Inc.* |
|
|
4,600 |
|
|
|
371,956 |
|
| Aspen Technology, Inc.* |
|
|
6,120 |
|
|
|
186,538 |
|
| Blackbaud, Inc. |
|
|
9,800 |
|
|
|
287,238 |
|
| CommVault Systems, Inc.* |
|
|
2,970 |
|
|
|
218,414 |
|
| Concur Technologies, Inc.#,* |
|
|
6,800 |
|
|
|
497,148 |
|
| Digimarc Corp. |
|
|
5,680 |
|
|
|
124,619 |
|
| Ebix, Inc.# |
|
|
9,200 |
|
|
|
171,212 |
|
| Fair Isaac Corp. |
|
|
3,600 |
|
|
|
167,688 |
|
| Glu Mobile, Inc.#,* |
|
|
28,890 |
|
|
|
88,981 |
|
| Guidance Software, Inc.* |
|
|
35,960 |
|
|
|
378,299 |
|
| Manhattan Associates, Inc.* |
|
|
18,490 |
|
|
|
1,298,183 |
|
| Mentor Graphics Corp. |
|
|
18,200 |
|
|
|
332,332 |
|
| PROS Holdings, Inc.* |
|
|
9,880 |
|
|
|
256,090 |
|
| PTC, Inc.* |
|
|
12,800 |
|
|
|
307,328 |
|
| QLIK Technologies, Inc.* |
|
|
16,770 |
|
|
|
436,188 |
|
| Solera Holdings, Inc. |
|
|
5,500 |
|
|
|
316,690 |
|
| Sourcefire, Inc.* |
|
|
2,880 |
|
|
|
137,549 |
|
| Symantec Corp.* |
|
|
23,900 |
|
|
|
580,770 |
|
| Ultimate Software Group, Inc.* |
|
|
5,270 |
|
|
|
509,029 |
|
| VirnetX Holding Corp.#,* |
|
|
15,880 |
|
|
|
324,270 |
|
|
|
|
|
|
|
$ |
7,295,424 |
|
| TOTAL INFORMATION TECHNOLOGY |
|
|
$ |
23,479,147 |
|
|
|
|
| MATERIALS – 6.7% |
|
|
|
|
|
|
|
|
|
|
|
| CHEMICALS – 4.3% |
|
|
|
|
|
|
|
|
| American Vanguard Corp. |
|
|
5,150 |
|
|
|
148,526 |
|
| Axiall Corp. |
|
|
11,990 |
|
|
|
628,875 |
|
| Hawkins, Inc. |
|
|
18,300 |
|
|
|
680,577 |
|
| HB Fuller Co. |
|
|
22,700 |
|
|
|
860,330 |
|
| KMG Chemicals, Inc. |
|
|
22,700 |
|
|
|
416,772 |
|
| Koppers Holdings, Inc. |
|
|
19,400 |
|
|
|
851,854 |
|
| Landec Corp.* |
|
|
50,590 |
|
|
|
678,412 |
|
| OMNOVA Solutions, Inc.* |
|
|
146,520 |
|
|
|
977,288 |
|
| Quaker Chemical Corp. |
|
|
10,000 |
|
|
|
617,200 |
|
| Zep, Inc. |
|
|
13,790 |
|
|
|
209,608 |
|
|
|
|
|
|
|
$ |
6,069,442 |
|
|
|
| CONSTRUCTION MATERIALS – 1.1% |
|
|
|
|
|
| Eagle Materials, Inc. |
|
|
16,680 |
|
|
|
1,130,070 |
|
| Headwaters, Inc.* |
|
|
37,140 |
|
|
|
403,340 |
|
|
|
|
|
|
|
$ |
1,533,410 |
|
ANNUAL
REPORT / April 30, 2013
|
|
|
| 52 |
|
PORTFOLIOS OF INVESTMENTS |
Wilmington Small-Cap Growth Fund (continued)
|
|
|
|
|
|
|
|
|
| Description
|
|
Number of
Shares |
|
|
Value
|
|
|
|
|
| CONTAINERS & PACKAGING – 0.1% |
|
|
|
|
|
|
|
|
| Myers Industries, Inc. |
|
|
12,980 |
|
|
$ |
192,364 |
|
|
|
|
| METALS & MINING – 0.7% |
|
|
|
|
|
|
|
|
| Haynes International, Inc. |
|
|
7,000 |
|
|
|
340,270 |
|
| Materion Corp. |
|
|
15,090 |
|
|
|
399,734 |
|
| Midway Gold Corp.* |
|
|
102,500 |
|
|
|
96,391 |
|
| Noranda Aluminum Holding Corp. |
|
|
29,980 |
|
|
|
114,224 |
|
|
|
|
|
|
|
$ |
950,619 |
|
|
|
|
| PAPER & FOREST PRODUCTS – 0.5% |
|
|
|
|
|
|
|
|
| Deltic Timber Corp. |
|
|
8,200 |
|
|
|
512,336 |
|
| Neenah Paper, Inc. |
|
|
5,490 |
|
|
|
157,892 |
|
|
|
|
|
|
|
$ |
670,228 |
|
| TOTAL MATERIALS |
|
|
|
|
|
$ |
9,416,063 |
|
|
|
|
| UTILITIES – 0.2% |
|
|
|
|
|
|
|
|
|
|
|
| WATER UTILITIES –0.2% |
|
|
|
|
|
|
|
|
| Cadiz, Inc.#,* |
|
|
7,246 |
|
|
|
42,679 |
|
| Connecticut Water Service, Inc. |
|
|
4,800 |
|
|
|
136,704 |
|
|
|
|
|
|
|
$ |
179,383 |
|
| TOTAL UTILITIES |
|
|
|
|
|
$ |
179,383 |
|
TOTAL COMMON STOCKS
(COST $112,884,185) |
|
|
|
|
|
$ |
137,443,956 |
|
|
|
|
| MONEY MARKET FUND – 2.4% |
|
|
|
|
|
|
|
|
| Dreyfus Cash Management Fund,
Institutional Shares, 0.05%^ |
|
|
3,348,482 |
|
|
|
3,348,482 |
|
TOTAL MONEY MARKET FUND
(COST $3,348,482) |
|
|
|
|
|
$ |
3,348,482 |
|
TOTAL INVESTMENTS IN
SECURITIES – 100.2%
(COST $116,232,667) |
|
|
|
|
|
$ |
140,792,438 |
|
| |
|
Par Value |
|
|
|
|
|
|
|
| CASH COLLATERAL INVESTED FOR SECURITIES ON LOAN – 12.7% |
|
|
|
|
|
|
|
|
|
|
| REPURCHASE AGREEMENTS – 12.7% |
|
|
|
|
|
| Deutsche Bank Securities, Inc., 0.17%,dated 04/30/13, due 05/01/13, repurchase price $4,250,681, collateralized by U.S. Government Securities 2.13% to 7.50%,
maturing 12/01/16 to 04/01/48; total market value of $ 4,335,674. |
|
$ |
4,250,661 |
|
|
|
4,250,661 |
|
|
|
|
|
|
|
|
|
|
| Description |
|
Par Value |
|
|
Value |
|
| HSBC Securities USA, Inc., 0.15%, dated 04/30/13, due 05/01/13, repurchase price $4,250,679, collateralized by U.S. Government Securities 0.00% to 9.38%, maturing
07/15/13 to 03/17/31; total market value of $ 4,335,677. |
|
$ |
4,250,661 |
|
|
$ |
4,250,661 |
|
|
|
|
| Merrill Lynch, Pierce, Fenner & Smith, Inc., 0.14%, dated 04/30/13, due 05/01/13, repurchase price $894,838, collateralized by U.S. Treasury Securities
0.25% to 2.75%, maturing 10/15/15 to 08/15/42; total market value of $ 912,732. |
|
|
894,835 |
|
|
|
894,835 |
|
|
|
|
| Mizuho Securities USA, Inc., 0.20%, dated 04/30/13, due 05/01/13, repurchase price $4,250,685, collateralized by U.S. Government Securities 2.08% to 7.00%,
maturing 01/01/22 to 04/15/52; total market value of $ 4,335,674. |
|
|
4,250,661 |
|
|
|
4,250,661 |
|
|
|
|
| RBC Capital Markets LLC, 0.17%, dated 04/30/13, due 05/01/13, repurchase price $4,250,681, collateralized by U.S. Government Securities 1.97% to 4.50%, maturing
08/01/24 to 12/15/44; total market value of $ 4,335,674. |
|
|
4,250,661 |
|
|
|
4,250,661 |
|
TOTAL CASH COLLATERAL INVESTED FOR SECURITIES ON
LOAN (COST $17,897,479) |
|
|
|
|
|
$ |
17,897,479 |
|
TOTAL INVESTMENTS – 112.9%
(COST $134,130,146) |
|
|
|
|
|
$ |
158,689,917 |
|
| COLLATERAL FOR SECURITIES ON LOAN – (12.7%) |
|
|
|
|
|
|
(17,897,479 |
) |
| OTHER LIABILITIES LESS ASSETS – (0.2%) |
|
|
|
|
|
|
(195,450 |
) |
| TOTAL NET ASSETS – 100.0% |
|
|
|
|
|
$ |
140,596,988 |
|
Cost of investments
for Federal income tax purposes is $134,445,926. The net unrealized appreciation/(depreciation) of investments was $24,243,991. This consists of net unrealized appreciation from investment for those securities having an excess of value over cost of
$27,727,122 and net unrealized depreciation from investments for those securities having an excess of cost over value of $3,483,131.
April 30,
2013 / ANNUAL REPORT
|
|
|
|
|
| PORTFOLIOS OF INVESTMENTS |
|
|
53 |
|
Wilmington Small-Cap Growth Fund (concluded)
Various inputs are used in determining the value of the Fund’s investments. These
inputs are summarized in the three broad levels listed below.
Level 1 – quoted prices in active markets for identical securities
Level 2 – other significant observable inputs (including quoted prices for similar securities, interest rates, prepayment
speeds, credit risk, etc.)
Level 3 – significant unobservable inputs (including the Fund’s own assumptions in determining
the fair value of investments)
The following is a summary of the inputs used as of April 30, 2013 in valuing the Fund’s
assets carried at fair value:
|
|
|
|
|
|
|
|
|
|
|
|
|
|
|
|
|
| |
|
Level
1 |
|
|
Level 2 |
|
|
Level 3 |
|
|
Total |
|
| Investments in Securities |
|
|
|
|
|
|
|
|
|
|
|
|
|
|
|
|
| Common Stocks |
|
$ |
137,443,956 |
|
|
$ |
— |
|
|
$ |
— |
|
|
$ |
137,443,956 |
|
| Money Market Fund |
|
|
3,348,482 |
|
|
|
— |
|
|
|
— |
|
|
|
3,348,482 |
|
| Repurchase Agreements |
|
|
— |
|
|
|
17,897,479 |
|
|
|
— |
|
|
|
17,897,479 |
|
|
|
|
|
|
|
|
|
|
|
|
|
|
|
|
|
|
| Total |
|
$ |
140,792,438 |
|
|
$ |
17,897,479 |
|
|
$ |
— |
|
|
$ |
158,689,917 |
|
|
|
|
|
|
|
|
|
|
|
|
|
|
|
|
|
|
See Notes to Portfolios of Investments
See Notes which are an integral part of the Financial Statements
ANNUAL
REPORT / April 30, 2013
PORTFOLIO OF INVESTMENTS SUMMARY TABLE
Wilmington Small-Cap Strategy Fund
At April 30,
2013, the Fund’s sector classifications were as follows (unaudited):
|
|
|
|
|
|
| Stocks |
|
Percentage of
Total Net Assets |
| Common Stocks |
|
|
|
|
|
| Financials |
|
|
|
27.3 |
% |
| Information Technology |
|
|
|
14.8 |
% |
| Industrials |
|
|
|
14.0 |
% |
| Consumer Discretionary |
|
|
|
13.6 |
% |
| Health Care |
|
|
|
10.3 |
% |
| Energy |
|
|
|
6.0 |
% |
| Materials |
|
|
|
5.1 |
% |
| Utilities |
|
|
|
4.1 |
% |
| Consumer Staples |
|
|
|
3.5 |
% |
| Telecommunication Services |
|
|
|
0.7 |
% |
| Investment Companies |
|
|
|
0.6 |
% |
| Rights |
|
|
|
0.0 |
%3 |
| Warrants |
|
|
|
0.0 |
%3 |
| Cash Equivalents1 |
|
|
|
14.0 |
% |
| Other Assets and Liabilities – Net2 |
|
|
|
(14.0 |
)% |
|
|
|
|
|
|
| TOTAL |
|
|
|
100.0 |
% |
|
|
|
|
|
|
| (1) |
Cash Equivalents include investments in repurchase agreements. |
| (2) |
Assets, other than investments in securities, less liabilities. See Statements of Assets and Liabilities. |
| (3) |
Represent less than 0.05%. |
PORTFOLIO OF INVESTMENTS
April 30, 2013
|
|
|
|
|
|
|
|
|
| Description
|
|
Number of
Shares |
|
|
Value
|
|
|
|
|
| COMMON STOCKS – 99.4% |
|
|
|
|
|
|
|
|
|
|
| CONSUMER DISCRETIONARY – 13.6% |
|
|
|
|
|
|
|
|
| AUTO COMPONENTS – 0.9% |
|
|
|
|
|
|
|
|
| American Axle & Manufacturing Holdings, Inc.* |
|
|
3,645 |
|
|
$ |
48,734 |
|
| Cooper Tire & Rubber Co. |
|
|
2,916 |
|
|
|
72,579 |
|
| Dana Holding Corp.# |
|
|
7,970 |
|
|
|
137,482 |
|
| Dorman Products, Inc. |
|
|
1,072 |
|
|
|
40,457 |
|
| Drew Industries, Inc. |
|
|
1,094 |
|
|
|
39,493 |
|
| Exide Technologies* |
|
|
5,202 |
|
|
|
4,407 |
|
| Federal-Mogul Corp.* |
|
|
1,190 |
|
|
|
8,901 |
|
| Fuel Systems Solutions, Inc.* |
|
|
566 |
|
|
|
8,892 |
|
| Gentherm, Inc.* |
|
|
1,127 |
|
|
|
17,164 |
|
| Modine Manufacturing Co.* |
|
|
2,175 |
|
|
|
19,880 |
|
| Spartan Motors, Inc. |
|
|
2,409 |
|
|
|
12,816 |
|
| Standard Motor Products, Inc. |
|
|
1,350 |
|
|
|
41,364 |
|
| Stoneridge, Inc.* |
|
|
2,798 |
|
|
|
21,181 |
|
|
|
|
|
|
|
|
|
|
| Description
|
|
Number of
Shares |
|
|
Value
|
|
| Superior Industries International, Inc. |
|
|
1,546 |
|
|
$ |
28,385 |
|
| Tenneco, Inc.* |
|
|
2,500 |
|
|
|
96,675 |
|
| Tower International, Inc.* |
|
|
1,220 |
|
|
|
19,630 |
|
|
|
|
|
|
|
$ |
618,040 |
|
|
|
|
| AUTOMOBILES – 0.0%** |
|
|
|
|
|
|
|
|
| Winnebago Industries, Inc.* |
|
|
1,365 |
|
|
|
25,007 |
|
|
|
|
| DISTRIBUTORS – 0.2% |
|
|
|
|
|
|
|
|
| Core-Mark Holding Co., Inc. |
|
|
573 |
|
|
|
29,819 |
|
| Pool Corp. |
|
|
1,955 |
|
|
|
95,834 |
|
| VOXX International Corp.* |
|
|
1,868 |
|
|
|
17,802 |
|
| Weyco Group, Inc. |
|
|
591 |
|
|
|
14,184 |
|
|
|
|
|
|
|
$ |
157,639 |
|
|
|
| DIVERSIFIED CONSUMER SERVICES – 1.0% |
|
|
|
|
|
| American Public Education, Inc.* |
|
|
735 |
|
|
|
24,645 |
|
| Ascent Capital Group, Inc.* |
|
|
900 |
|
|
|
59,841 |
|
| Bridgepoint Education, Inc.#,* |
|
|
900 |
|
|
|
9,702 |
|
April 30,
2013 / ANNUAL REPORT
|
|
|
|
|
| PORTFOLIO OF INVESTMENTS |
|
|
55 |
|
Wilmington Small-Cap Strategy Fund (continued)
|
|
|
|
|
|
|
|
|
| Description
|
|
Number of
Shares |
|
|
Value
|
|
| Bright Horizons Family Solutions, Inc.* |
|
|
420 |
|
|
$ |
13,625 |
|
| Capella Education Co.* |
|
|
425 |
|
|
|
15,053 |
|
| Career Education Corp.* |
|
|
3,120 |
|
|
|
6,833 |
|
| Carriage Services, Inc. |
|
|
740 |
|
|
|
12,943 |
|
| Coinstar, Inc.#,* |
|
|
1,348 |
|
|
|
71,188 |
|
| Corinthian Colleges, Inc.* |
|
|
7,641 |
|
|
|
15,282 |
|
| Education Management Corp.#,* |
|
|
2,850 |
|
|
|
16,159 |
|
| Grand Canyon Education, Inc.* |
|
|
1,914 |
|
|
|
48,941 |
|
| Hillenbrand, Inc. |
|
|
2,480 |
|
|
|
62,322 |
|
| K12, Inc.#,* |
|
|
1,550 |
|
|
|
39,478 |
|
| LifeLock, Inc.* |
|
|
1,050 |
|
|
|
9,450 |
|
| Lincoln Educational Services Corp. |
|
|
1,680 |
|
|
|
9,358 |
|
| Mac-Gray Corp. |
|
|
1,000 |
|
|
|
12,950 |
|
| Matthews International Corp. |
|
|
1,172 |
|
|
|
43,141 |
|
| Regis Corp. |
|
|
3,118 |
|
|
|
58,463 |
|
| Sotheby’s |
|
|
3,402 |
|
|
|
120,703 |
|
| Steiner Leisure Ltd.* |
|
|
605 |
|
|
|
29,300 |
|
| Stewart Enterprises, Inc. |
|
|
3,839 |
|
|
|
34,205 |
|
| Strayer Education, Inc.# |
|
|
400 |
|
|
|
18,944 |
|
| Universal Technical Institute, Inc. |
|
|
901 |
|
|
|
10,695 |
|
|
|
|
|
|
|
$ |
743,221 |
|
|
|
| HOTELS, RESTAURANTS & LEISURE – 3.0% |
|
|
|
|
|
| AFC Enterprises, Inc.* |
|
|
1,045 |
|
|
|
33,315 |
|
| Ameristar Casinos, Inc. |
|
|
1,655 |
|
|
|
43,675 |
|
| Biglari Holdings, Inc.* |
|
|
40 |
|
|
|
15,491 |
|
| BJ’s Restaurants, Inc.* |
|
|
920 |
|
|
|
31,556 |
|
| Bloomin’ Brands, Inc.* |
|
|
580 |
|
|
|
12,615 |
|
| Bob Evans Farms, Inc. |
|
|
1,626 |
|
|
|
70,471 |
|
| Boyd Gaming Corp.#,* |
|
|
5,210 |
|
|
|
62,520 |
|
| Bravo Brio Restaurant Group, Inc.* |
|
|
1,030 |
|
|
|
17,510 |
|
| Buffalo Wild Wings, Inc.* |
|
|
732 |
|
|
|
65,880 |
|
| Caesars Entertainment Corp.#,* |
|
|
1,110 |
|
|
|
17,660 |
|
| Carrols Restaurant Group, Inc.* |
|
|
1,060 |
|
|
|
5,035 |
|
| CEC Entertainment, Inc. |
|
|
928 |
|
|
|
30,967 |
|
| Cheesecake Factory, Inc. |
|
|
2,276 |
|
|
|
90,630 |
|
| Churchill Downs, Inc. |
|
|
582 |
|
|
|
44,500 |
|
| Chuy’s Holdings, Inc.#,* |
|
|
400 |
|
|
|
13,080 |
|
| Cracker Barrel Old Country Store, Inc. |
|
|
732 |
|
|
|
60,566 |
|
| Denny’s Corp.* |
|
|
3,860 |
|
|
|
21,886 |
|
| DineEquity, Inc. |
|
|
682 |
|
|
|
48,586 |
|
| Domino’s Pizza, Inc. |
|
|
2,314 |
|
|
|
127,733 |
|
| Einstein Noah Restaurant Group, Inc. |
|
|
704 |
|
|
|
10,145 |
|
| Fiesta Restaurant Group, Inc.* |
|
|
1,060 |
|
|
|
28,896 |
|
| International Speedway Corp. |
|
|
1,850 |
|
|
|
60,809 |
|
| Interval Leisure Group, Inc. |
|
|
1,500 |
|
|
|
28,590 |
|
| Isle of Capri Casinos, Inc.* |
|
|
321 |
|
|
|
2,459 |
|
| Jack In The Box, Inc.* |
|
|
2,166 |
|
|
|
77,651 |
|
|
|
|
|
|
|
|
|
|
| Description
|
|
Number of
Shares |
|
|
Value
|
|
| Jamba, Inc.* |
|
|
2,990 |
|
|
$ |
7,953 |
|
| Krispy Kreme Doughnuts, Inc.* |
|
|
4,370 |
|
|
|
59,694 |
|
| Life Time Fitness, Inc.* |
|
|
1,847 |
|
|
|
85,294 |
|
| Luby’s, Inc.* |
|
|
1,420 |
|
|
|
9,670 |
|
| Marcus Corp. |
|
|
487 |
|
|
|
6,253 |
|
| Marriott Vacations Worldwide Corp.* |
|
|
1,890 |
|
|
|
85,957 |
|
| Monarch Casino & Resort, Inc.* |
|
|
928 |
|
|
|
11,943 |
|
| Morgans Hotel Group Co.* |
|
|
943 |
|
|
|
5,781 |
|
| Multimedia Games Holding Co., Inc.* |
|
|
1,530 |
|
|
|
37,730 |
|
| Orient-Express Hotels Ltd.* |
|
|
6,310 |
|
|
|
63,731 |
|
| Papa John’s International, Inc.* |
|
|
836 |
|
|
|
52,668 |
|
| Pinnacle Entertainment, Inc.* |
|
|
3,757 |
|
|
|
71,608 |
|
| Red Lion Hotels Corp.* |
|
|
520 |
|
|
|
3,396 |
|
| Red Robin Gourmet Burgers, Inc.* |
|
|
762 |
|
|
|
36,858 |
|
| Ruby Tuesday, Inc.* |
|
|
4,000 |
|
|
|
38,560 |
|
| Ruth’s Hospitality Group, Inc. |
|
|
610 |
|
|
|
6,045 |
|
| Scientific Games Corp.* |
|
|
2,380 |
|
|
|
21,134 |
|
| SHFL Entertainment, Inc.* |
|
|
2,590 |
|
|
|
40,922 |
|
| Six Flags Entertainment Corp. |
|
|
1,590 |
|
|
|
115,863 |
|
| Sonic Corp.* |
|
|
3,415 |
|
|
|
42,790 |
|
| Speedway Motorsports, Inc. |
|
|
1,491 |
|
|
|
26,883 |
|
| Texas Roadhouse, Inc. |
|
|
2,635 |
|
|
|
61,923 |
|
| Town Sports International Holdings, Inc. |
|
|
980 |
|
|
|
9,869 |
|
| Vail Resorts, Inc. |
|
|
1,880 |
|
|
|
113,364 |
|
| WMS Industries, Inc.* |
|
|
3,780 |
|
|
|
95,936 |
|
|
|
|
|
|
|
$ |
2,134,051 |
|
|
|
| HOUSEHOLD DURABLES – 1.3% |
|
|
|
|
|
| American Greetings Corp. |
|
|
2,667 |
|
|
|
49,179 |
|
| Bassett Furniture Industries, Inc. |
|
|
760 |
|
|
|
10,663 |
|
| Beazer Homes USA, Inc.#,* |
|
|
1,468 |
|
|
|
23,723 |
|
| Blyth, Inc.# |
|
|
210 |
|
|
|
3,461 |
|
| Cavco Industries, Inc.* |
|
|
395 |
|
|
|
18,020 |
|
| CSS Industries, Inc. |
|
|
1,088 |
|
|
|
31,182 |
|
| Ethan Allen Interiors, Inc. |
|
|
956 |
|
|
|
27,992 |
|
| Flexsteel Industries, Inc. |
|
|
720 |
|
|
|
14,825 |
|
| Helen of Troy Ltd.* |
|
|
2,133 |
|
|
|
74,399 |
|
| Hooker Furniture Corp. |
|
|
770 |
|
|
|
13,313 |
|
| Hovnanian Enterprises, Inc.#,* |
|
|
6,663 |
|
|
|
36,313 |
|
| iRobot Corp.* |
|
|
1,300 |
|
|
|
37,817 |
|
| KB Home# |
|
|
5,550 |
|
|
|
125,097 |
|
| La-Z-Boy, Inc. |
|
|
2,496 |
|
|
|
45,078 |
|
| Libbey, Inc.* |
|
|
780 |
|
|
|
15,109 |
|
| Lifetime Brands, Inc. |
|
|
120 |
|
|
|
1,620 |
|
| M/I Homes, Inc.* |
|
|
1,414 |
|
|
|
34,784 |
|
| MDC Holdings, Inc. |
|
|
2,370 |
|
|
|
89,112 |
|
| Meritage Homes Corp.* |
|
|
1,822 |
|
|
|
88,895 |
|
ANNUAL
REPORT / April 30, 2013
|
|
|
| 56 |
|
PORTFOLIO OF INVESTMENTS |
Wilmington Small-Cap Strategy Fund (continued)
|
|
|
|
|
|
|
|
|
| Description
|
|
Number of
Shares |
|
|
Value
|
|
| NACCO Industries, Inc. |
|
|
216 |
|
|
$ |
12,532 |
|
| Ryland Group, Inc.# |
|
|
2,291 |
|
|
|
103,232 |
|
| Skullcandy, Inc.#,* |
|
|
760 |
|
|
|
3,906 |
|
| Standard Pacific Corp.#,* |
|
|
7,870 |
|
|
|
71,224 |
|
| TRI Pointe Homes, Inc.#,* |
|
|
740 |
|
|
|
14,060 |
|
| Universal Electronics, Inc.* |
|
|
648 |
|
|
|
14,891 |
|
| Zagg, Inc.#,* |
|
|
880 |
|
|
|
5,958 |
|
|
|
|
|
|
|
$ |
966,385 |
|
|
|
| INTERNET & CATALOG RETAIL – 0.4% |
|
|
|
|
|
| 1-800-Flowers.com, Inc.* |
|
|
572 |
|
|
|
3,392 |
|
| Blue Nile, Inc.#,* |
|
|
662 |
|
|
|
21,601 |
|
| Geeknet, Inc.* |
|
|
300 |
|
|
|
3,924 |
|
| HSN, Inc. |
|
|
1,330 |
|
|
|
69,931 |
|
| Kayak Software Corp.* |
|
|
290 |
|
|
|
11,548 |
|
| Nutrisystem, Inc. |
|
|
1,229 |
|
|
|
9,955 |
|
| Orbitz Worldwide, Inc.#,* |
|
|
2,949 |
|
|
|
17,635 |
|
| Overstock.com, Inc.#,* |
|
|
402 |
|
|
|
8,362 |
|
| PetMed Express, Inc.# |
|
|
947 |
|
|
|
11,838 |
|
| Shutterfly, Inc.* |
|
|
2,092 |
|
|
|
93,157 |
|
| US Auto Parts Network, Inc.* |
|
|
1,920 |
|
|
|
2,400 |
|
| Vitacost.com, Inc.#,* |
|
|
1,410 |
|
|
|
10,970 |
|
|
|
|
|
|
|
$ |
264,713 |
|
|
|
| LEISURE EQUIPMENT & PRODUCTS – 0.4% |
|
|
|
|
|
| Arctic Cat, Inc.#,* |
|
|
760 |
|
|
|
34,192 |
|
| Black Diamond, Inc.#,* |
|
|
940 |
|
|
|
9,212 |
|
| Brunswick Corp. |
|
|
3,511 |
|
|
|
111,158 |
|
| Callaway Golf Co. |
|
|
2,811 |
|
|
|
18,834 |
|
| JAKKS Pacific, Inc.# |
|
|
2,400 |
|
|
|
26,184 |
|
| Johnson Outdoors, Inc.* |
|
|
120 |
|
|
|
2,815 |
|
| LeapFrog Enterprises, Inc.#,* |
|
|
1,727 |
|
|
|
15,439 |
|
| Marine Products Corp. |
|
|
1,100 |
|
|
|
7,953 |
|
| Smith & Wesson Holding Corp.#,* |
|
|
2,887 |
|
|
|
25,348 |
|
| Steinway Musical Instruments, Inc.* |
|
|
588 |
|
|
|
14,665 |
|
| Sturm Ruger & Co., Inc.# |
|
|
680 |
|
|
|
34,864 |
|
|
|
|
|
|
|
$ |
300,664 |
|
|
|
| MEDIA – 1.4% |
|
|
|
|
|
| Arbitron, Inc. |
|
|
1,214 |
|
|
|
56,682 |
|
| Belo Corp. |
|
|
4,120 |
|
|
|
44,166 |
|
| Carmike Cinemas, Inc.* |
|
|
680 |
|
|
|
11,941 |
|
| Central European Media Enterprises Ltd.* |
|
|
3,730 |
|
|
|
13,801 |
|
| Cumulus Media, Inc.#,* |
|
|
3,560 |
|
|
|
11,356 |
|
| Daily Journal Corp.#,* |
|
|
130 |
|
|
|
13,720 |
|
| Digital Domain Media Group, Inc.* |
|
|
1,470 |
|
|
|
25 |
|
| Digital Generation, Inc.#,* |
|
|
1,047 |
|
|
|
7,015 |
|
| Entercom Communications Corp.#,* |
|
|
1,600 |
|
|
|
12,656 |
|
| Entravision Communications Corp. |
|
|
4,740 |
|
|
|
18,296 |
|
| EW Scripps Co.* |
|
|
1,410 |
|
|
|
19,585 |
|
|
|
|
|
|
|
|
|
|
| Description
|
|
Number of
Shares |
|
|
Value
|
|
| Fisher Communications, Inc. |
|
|
497 |
|
|
$ |
20,586 |
|
| Global Sources Ltd.* |
|
|
619 |
|
|
|
4,222 |
|
| Harte-Hanks, Inc. |
|
|
3,546 |
|
|
|
28,120 |
|
| Journal Communications, Inc.* |
|
|
3,160 |
|
|
|
21,520 |
|
| LIN TV Corp.* |
|
|
2,690 |
|
|
|
33,114 |
|
| Lions Gate Entertainment Corp.* |
|
|
3,220 |
|
|
|
79,888 |
|
| Live Nation Entertainment, Inc.* |
|
|
9,176 |
|
|
|
115,893 |
|
| Martha Stewart Living Omnimedia* |
|
|
1,683 |
|
|
|
4,157 |
|
| McClatchy Co.#,* |
|
|
3,460 |
|
|
|
7,993 |
|
| MDC Partners, Inc. |
|
|
980 |
|
|
|
16,748 |
|
| Meredith Corp.# |
|
|
2,460 |
|
|
|
95,497 |
|
| National CineMedia, Inc. |
|
|
2,932 |
|
|
|
47,616 |
|
| New York Times Co.* |
|
|
8,840 |
|
|
|
78,322 |
|
| Nexstar Broadcasting Group, Inc. |
|
|
530 |
|
|
|
12,906 |
|
| Outdoor Channel Holdings, Inc. |
|
|
1,170 |
|
|
|
10,238 |
|
| ReachLocal, Inc.* |
|
|
260 |
|
|
|
4,334 |
|
| Reading International, Inc.* |
|
|
1,510 |
|
|
|
8,788 |
|
| Rentrak Corp.* |
|
|
280 |
|
|
|
6,339 |
|
| Saga Communications, Inc. |
|
|
230 |
|
|
|
10,589 |
|
| Scholastic Corp. |
|
|
1,556 |
|
|
|
42,712 |
|
| Shutterstock, Inc.* |
|
|
320 |
|
|
|
13,344 |
|
| Sinclair Broadcast Group, Inc. |
|
|
3,508 |
|
|
|
94,014 |
|
| Valassis Communications, Inc. |
|
|
1,760 |
|
|
|
45,109 |
|
| World Wrestling Entertainment, Inc. |
|
|
1,017 |
|
|
|
9,336 |
|
|
|
|
|
|
|
$ |
1,020,628 |
|
|
|
| MULTILINE RETAIL – 0.2% |
|
|
|
|
|
| Bon-Ton Stores, Inc. |
|
|
340 |
|
|
|
5,216 |
|
| Fred’s, Inc. |
|
|
2,032 |
|
|
|
28,915 |
|
| Gordmans Stores, Inc.* |
|
|
160 |
|
|
|
1,805 |
|
| Saks, Inc.#,* |
|
|
3,860 |
|
|
|
44,583 |
|
| Tuesday Morning Corp.* |
|
|
3,530 |
|
|
|
28,628 |
|
|
|
|
|
|
|
$ |
109,147 |
|
|
|
| SPECIALTY RETAIL – 3.3% |
|
|
|
|
|
| Aeropostale, Inc.#,* |
|
|
2,910 |
|
|
|
42,661 |
|
| America’s Car-Mart, Inc.* |
|
|
310 |
|
|
|
14,344 |
|
| ANN, Inc.* |
|
|
2,140 |
|
|
|
63,216 |
|
| Asbury Automotive Group, Inc.* |
|
|
1,274 |
|
|
|
51,075 |
|
| Barnes & Noble, Inc.#,* |
|
|
2,170 |
|
|
|
39,342 |
|
| bebe stores, Inc. |
|
|
2,446 |
|
|
|
13,844 |
|
| Big 5 Sporting Goods Corp. |
|
|
1,352 |
|
|
|
22,714 |
|
| Body Central Corp.* |
|
|
510 |
|
|
|
5,192 |
|
| Brown Shoe Co., Inc. |
|
|
2,555 |
|
|
|
43,205 |
|
| Buckle, Inc.# |
|
|
1,175 |
|
|
|
57,046 |
|
| Cabela’s, Inc.* |
|
|
2,014 |
|
|
|
129,299 |
|
| Cato Corp. |
|
|
1,463 |
|
|
|
35,127 |
|
| Childrens Place Retail Stores, Inc.* |
|
|
1,418 |
|
|
|
69,369 |
|
April 30,
2013 / ANNUAL REPORT
|
|
|
|
|
| PORTFOLIO OF INVESTMENTS |
|
|
57 |
|
Wilmington Small-Cap Strategy Fund (continued)
|
|
|
|
|
|
|
|
|
| Description
|
|
Number of
Shares |
|
|
Value
|
|
| Citi Trends, Inc.* |
|
|
936 |
|
|
$ |
11,017 |
|
| Conn’s, Inc.#,* |
|
|
1,086 |
|
|
|
47,035 |
|
| Destination Maternity Corp. |
|
|
930 |
|
|
|
22,087 |
|
| Destination XL Group, Inc.* |
|
|
2,440 |
|
|
|
12,151 |
|
| Express, Inc.* |
|
|
3,310 |
|
|
|
60,275 |
|
| Finish Line, Inc. |
|
|
3,014 |
|
|
|
58,441 |
|
| Five Below, Inc.#,* |
|
|
600 |
|
|
|
21,594 |
|
| Francesca’s Holdings Corp.#,* |
|
|
1,440 |
|
|
|
41,126 |
|
| Genesco, Inc.* |
|
|
1,081 |
|
|
|
66,536 |
|
| Group 1 Automotive, Inc. |
|
|
1,534 |
|
|
|
92,776 |
|
| Haverty Furniture Cos., Inc. |
|
|
1,437 |
|
|
|
34,172 |
|
| hhgregg, Inc.* |
|
|
715 |
|
|
|
9,660 |
|
| Hibbett Sports, Inc.* |
|
|
1,114 |
|
|
|
61,103 |
|
| Hot Topic, Inc. |
|
|
2,501 |
|
|
|
34,889 |
|
| Jos A Bank Clothiers, Inc.#,* |
|
|
1,180 |
|
|
|
51,542 |
|
| Kirkland’s, Inc.* |
|
|
330 |
|
|
|
3,980 |
|
| Lithia Motors, Inc. |
|
|
1,440 |
|
|
|
71,309 |
|
| Lumber Liquidators Holdings, Inc.#,* |
|
|
1,081 |
|
|
|
88,599 |
|
| MarineMax, Inc.* |
|
|
800 |
|
|
|
9,272 |
|
| Mattress Firm Holding Corp.* |
|
|
590 |
|
|
|
22,609 |
|
| Men’s Wearhouse, Inc. |
|
|
2,899 |
|
|
|
97,116 |
|
| Monro Muffler Brake, Inc.# |
|
|
1,322 |
|
|
|
54,678 |
|
| New York & Co., Inc.* |
|
|
2,080 |
|
|
|
9,277 |
|
| Office Depot, Inc.* |
|
|
17,890 |
|
|
|
69,055 |
|
| OfficeMax, Inc. |
|
|
5,340 |
|
|
|
61,463 |
|
| Penske Automotive Group, Inc. |
|
|
2,600 |
|
|
|
80,392 |
|
| Pep Boys-Manny Moe & Jack* |
|
|
2,843 |
|
|
|
32,979 |
|
| Perfumania Holdings, Inc.* |
|
|
2,080 |
|
|
|
12,958 |
|
| Pier 1 Imports, Inc. |
|
|
4,000 |
|
|
|
92,840 |
|
| RadioShack Corp.# |
|
|
8,250 |
|
|
|
26,153 |
|
| Rent-A-Center, Inc. |
|
|
3,754 |
|
|
|
131,127 |
|
| Restoration Hardware Holdings, Inc.#,* |
|
|
290 |
|
|
|
11,296 |
|
| rue21, Inc.* |
|
|
520 |
|
|
|
16,588 |
|
| Select Comfort Corp.* |
|
|
2,420 |
|
|
|
51,352 |
|
| Shoe Carnival, Inc. |
|
|
553 |
|
|
|
11,519 |
|
| Sonic Automotive, Inc. |
|
|
2,918 |
|
|
|
64,167 |
|
| Stage Stores, Inc. |
|
|
2,138 |
|
|
|
59,201 |
|
| Stein Mart, Inc. |
|
|
680 |
|
|
|
5,379 |
|
| Systemax, Inc. |
|
|
272 |
|
|
|
2,492 |
|
| Tilly’s, Inc.* |
|
|
710 |
|
|
|
10,252 |
|
| Vitamin Shoppe, Inc.* |
|
|
1,250 |
|
|
|
61,438 |
|
| West Marine, Inc.* |
|
|
60 |
|
|
|
710 |
|
| Wet Seal, Inc.* |
|
|
5,056 |
|
|
|
16,483 |
|
| Zumiez, Inc.* |
|
|
1,163 |
|
|
|
33,692 |
|
|
|
|
|
|
|
$ |
2,419,214 |
|
|
|
| TEXTILES, APPAREL &
LUXURY GOODS – 1.5% |
|
|
|
|
|
| Cherokee, Inc. |
|
|
150 |
|
|
|
1,954 |
|
|
|
|
|
|
|
|
|
|
| Description
|
|
Number of
Shares |
|
|
Value
|
|
| Columbia Sportswear Co. |
|
|
723 |
|
|
$ |
42,368 |
|
| Crocs, Inc.* |
|
|
3,450 |
|
|
|
55,269 |
|
| Culp, Inc. |
|
|
640 |
|
|
|
10,394 |
|
| Delta Apparel, Inc.* |
|
|
1,210 |
|
|
|
16,190 |
|
| Fifth & Pacific Cos., Inc.* |
|
|
7,870 |
|
|
|
162,279 |
|
| G-III Apparel Group Ltd.* |
|
|
1,137 |
|
|
|
46,230 |
|
| Iconix Brand Group, Inc.* |
|
|
4,845 |
|
|
|
138,809 |
|
| Jones Group, Inc. |
|
|
6,160 |
|
|
|
86,240 |
|
| K-Swiss, Inc.* |
|
|
2,058 |
|
|
|
9,755 |
|
| Maidenform Brands, Inc.* |
|
|
929 |
|
|
|
16,722 |
|
| Movado Group, Inc. |
|
|
1,085 |
|
|
|
32,810 |
|
| Oxford Industries, Inc. |
|
|
640 |
|
|
|
37,843 |
|
| Perry Ellis International, Inc. |
|
|
617 |
|
|
|
10,841 |
|
| PVH Corp. |
|
|
98 |
|
|
|
11,310 |
|
| Quiksilver, Inc.* |
|
|
8,690 |
|
|
|
58,484 |
|
| RG Barry Corp. |
|
|
990 |
|
|
|
13,652 |
|
| Skechers U.S.A., Inc.* |
|
|
2,253 |
|
|
|
46,817 |
|
| Steven Madden Ltd.* |
|
|
1,656 |
|
|
|
80,531 |
|
| True Religion Apparel, Inc. |
|
|
1,377 |
|
|
|
37,262 |
|
| Tumi Holdings, Inc.* |
|
|
1,020 |
|
|
|
23,491 |
|
| Unifi, Inc.* |
|
|
926 |
|
|
|
18,057 |
|
| Vera Bradley, Inc.#,* |
|
|
1,210 |
|
|
|
27,612 |
|
| Wolverine World Wide, Inc.# |
|
|
2,016 |
|
|
|
96,304 |
|
|
|
|
|
|
|
$ |
1,081,224 |
|
| TOTAL CONSUMER DISCRETIONARY |
|
|
|
|
|
$ |
9,839,933 |
|
|
|
|
| CONSUMER STAPLES – 3.5% |
|
|
|
|
|
|
|
|
|
|
| BEVERAGES – 0.1% |
|
|
|
|
|
| Boston Beer Co., Inc.#,* |
|
|
355 |
|
|
|
60,109 |
|
| Central European Distribution Corp.* |
|
|
1,400 |
|
|
|
98 |
|
| Coca-Cola Bottling Co. Consolidated |
|
|
261 |
|
|
|
16,051 |
|
| National Beverage Corp. |
|
|
510 |
|
|
|
7,512 |
|
|
|
|
|
|
|
$ |
83,770 |
|
|
|
| FOOD & STAPLES RETAILING – 1.2% |
|
|
|
|
|
| Andersons, Inc. |
|
|
1,145 |
|
|
|
62,425 |
|
| Arden Group, Inc. |
|
|
53 |
|
|
|
5,242 |
|
| Casey’s General Stores, Inc. |
|
|
1,546 |
|
|
|
89,529 |
|
| Chefs’ Warehouse, Inc.* |
|
|
570 |
|
|
|
10,482 |
|
| Harris Teeter Supermarkets, Inc. |
|
|
2,640 |
|
|
|
110,326 |
|
| Ingles Markets, Inc. |
|
|
1,040 |
|
|
|
22,173 |
|
| Nash Finch Co. |
|
|
1,408 |
|
|
|
28,934 |
|
| Natural Grocers by Vitamin Cottage, Inc.#,* |
|
|
510 |
|
|
|
12,791 |
|
| Pantry, Inc.* |
|
|
2,400 |
|
|
|
35,064 |
|
| Pricesmart, Inc.# |
|
|
806 |
|
|
|
71,919 |
|
| Rite Aid Corp.* |
|
|
42,030 |
|
|
|
111,380 |
|
| Roundy’s, Inc.# |
|
|
2,010 |
|
|
|
14,392 |
|
| Spartan Stores, Inc. |
|
|
1,879 |
|
|
|
31,530 |
|
ANNUAL
REPORT / April 30, 2013
|
|
|
| 58 |
|
PORTFOLIOS OF INVESTMENTS |
Wilmington Small-Cap Strategy Fund (continued)
|
|
|
|
|
|
|
|
|
| Description
|
|
Number of
Shares |
|
|
Value
|
|
| SUPERVALU, Inc.# |
|
|
10,740 |
|
|
$ |
62,722 |
|
| Susser Holdings Corp.* |
|
|
591 |
|
|
|
31,423 |
|
| United Natural Foods, Inc.* |
|
|
1,977 |
|
|
|
98,731 |
|
| Village Super Market, Inc. |
|
|
650 |
|
|
|
22,880 |
|
| Weis Markets, Inc. |
|
|
510 |
|
|
|
21,333 |
|
|
|
|
|
|
|
$ |
843,276 |
|
|
|
|
| FOOD PRODUCTS – 1.5% |
|
|
|
|
|
|
|
|
| Alico, Inc. |
|
|
260 |
|
|
|
10,871 |
|
| Annie’s, Inc.#,* |
|
|
290 |
|
|
|
10,959 |
|
| B&G Foods, Inc. |
|
|
2,206 |
|
|
|
68,077 |
|
| Boulder Brands, Inc.#,* |
|
|
4,199 |
|
|
|
37,833 |
|
| Calavo Growers, Inc.# |
|
|
307 |
|
|
|
8,707 |
|
| Cal-Maine Foods, Inc. |
|
|
642 |
|
|
|
27,401 |
|
| Chiquita Brands International, Inc.#,* |
|
|
2,481 |
|
|
|
21,411 |
|
| Darling International, Inc.* |
|
|
6,237 |
|
|
|
115,447 |
|
| Diamond Foods, Inc.#,* |
|
|
995 |
|
|
|
15,005 |
|
| Dole Food Co., Inc.* |
|
|
2,350 |
|
|
|
25,286 |
|
| Farmer Bros Co.* |
|
|
388 |
|
|
|
5,878 |
|
| Fresh Del Monte Produce, Inc. |
|
|
2,539 |
|
|
|
64,516 |
|
| Griffin Land & Nurseries, Inc. |
|
|
246 |
|
|
|
7,343 |
|
| Hain Celestial Group, Inc.#,* |
|
|
1,533 |
|
|
|
100,028 |
|
| J&J Snack Foods Corp. |
|
|
544 |
|
|
|
40,811 |
|
| John B Sanfilippo & Son, Inc. |
|
|
590 |
|
|
|
12,378 |
|
| Lancaster Colony Corp. |
|
|
812 |
|
|
|
64,091 |
|
| Limoneira Co.# |
|
|
180 |
|
|
|
3,353 |
|
| Omega Protein Corp.* |
|
|
550 |
|
|
|
5,121 |
|
| Pilgrim’s Pride Corp.* |
|
|
3,300 |
|
|
|
32,307 |
|
| Post Holdings, Inc.* |
|
|
1,180 |
|
|
|
51,672 |
|
| Sanderson Farms, Inc. |
|
|
1,061 |
|
|
|
64,997 |
|
| Seaboard Corp. |
|
|
17 |
|
|
|
46,682 |
|
| Seneca Foods Corp.* |
|
|
420 |
|
|
|
13,688 |
|
| Snyders-Lance, Inc. |
|
|
2,101 |
|
|
|
52,903 |
|
| Tootsie Roll Industries, Inc.# |
|
|
1,243 |
|
|
|
38,819 |
|
| TreeHouse Foods, Inc.* |
|
|
1,762 |
|
|
|
112,257 |
|
|
|
|
|
|
|
$ |
1,057,841 |
|
|
|
|
| HOUSEHOLD PRODUCTS – 0.2% |
|
|
|
|
|
|
|
|
| Central Garden and Pet Co.* |
|
|
1,854 |
|
|
|
16,315 |
|
| Harbinger Group, Inc.* |
|
|
2,990 |
|
|
|
27,030 |
|
| Oil-Dri Corp. of America |
|
|
160 |
|
|
|
4,402 |
|
| Orchids Paper Products Co. |
|
|
480 |
|
|
|
11,040 |
|
| Spectrum Brands Holdings, Inc. |
|
|
1,030 |
|
|
|
57,680 |
|
| WD-40 Co. |
|
|
654 |
|
|
|
35,270 |
|
|
|
|
|
|
|
$ |
151,737 |
|
|
|
|
| PERSONAL PRODUCTS – 0.3% |
|
|
|
|
|
|
|
|
| Elizabeth Arden, Inc.* |
|
|
1,137 |
|
|
|
46,560 |
|
| Female Health Co. |
|
|
1,410 |
|
|
|
10,815 |
|
| Inter Parfums, Inc. |
|
|
898 |
|
|
|
26,015 |
|
|
|
|
|
|
|
|
|
|
| Description
|
|
Number of
Shares |
|
|
Value
|
|
| Medifast, Inc.* |
|
|
440 |
|
|
$ |
11,528 |
|
| Nature’s Sunshine Products, Inc. |
|
|
380 |
|
|
|
5,559 |
|
| Nutraceutical International Corp. |
|
|
460 |
|
|
|
8,496 |
|
| Prestige Brands Holdings, Inc.* |
|
|
2,507 |
|
|
|
67,564 |
|
| Revlon, Inc.* |
|
|
780 |
|
|
|
15,093 |
|
| Star Scientific, Inc.#,* |
|
|
4,009 |
|
|
|
4,971 |
|
| Synutra International, Inc.#,* |
|
|
429 |
|
|
|
2,072 |
|
| USANA Health Sciences, Inc.#,* |
|
|
475 |
|
|
|
26,800 |
|
|
|
|
|
|
|
$ |
225,473 |
|
|
|
|
| TOBACCO – 0.2% |
|
|
|
|
|
|
|
|
| Alliance One International, Inc.* |
|
|
8,162 |
|
|
|
30,607 |
|
| Universal Corp.# |
|
|
1,372 |
|
|
|
78,959 |
|
| Vector Group Ltd.# |
|
|
2,867 |
|
|
|
46,761 |
|
|
|
|
|
|
|
$ |
156,327 |
|
| TOTAL CONSUMER STAPLES |
|
|
|
|
|
$ |
2,518,424 |
|
|
|
|
| ENERGY – 6.0% |
|
|
|
|
|
|
|
|
|
|
| ENERGY EQUIPMENT & SERVICES – 2.2% |
|
|
|
|
|
| Basic Energy Services, Inc.#,* |
|
|
2,022 |
|
|
|
27,762 |
|
| Bolt Technology Corp. |
|
|
800 |
|
|
|
12,800 |
|
| Bristow Group, Inc. |
|
|
2,301 |
|
|
|
145,423 |
|
| C&J Energy Services, Inc.#,* |
|
|
2,120 |
|
|
|
41,955 |
|
| Cal Dive International, Inc.* |
|
|
3,789 |
|
|
|
6,328 |
|
| Dawson Geophysical Co.* |
|
|
343 |
|
|
|
10,544 |
|
| Dril-Quip, Inc.* |
|
|
1,578 |
|
|
|
132,094 |
|
| Exterran Holdings, Inc.* |
|
|
4,170 |
|
|
|
110,171 |
|
| Forbes Energy Services Ltd.* |
|
|
3,210 |
|
|
|
12,102 |
|
| Forum Energy Technologies, Inc.#,* |
|
|
800 |
|
|
|
22,248 |
|
| Geospace Technologies Corp.* |
|
|
522 |
|
|
|
44,041 |
|
| Global Geophysical Services, Inc.#,* |
|
|
490 |
|
|
|
1,784 |
|
| Gulf Island Fabrication, Inc. |
|
|
463 |
|
|
|
9,519 |
|
| Gulfmark Offshore, Inc. |
|
|
1,781 |
|
|
|
74,125 |
|
| Heckmann Corp.#,* |
|
|
9,220 |
|
|
|
34,022 |
|
| Helix Energy Solutions Group, Inc.* |
|
|
6,960 |
|
|
|
160,358 |
|
| Hercules Offshore, Inc.* |
|
|
10,340 |
|
|
|
76,206 |
|
| Hornbeck Offshore Services, Inc.* |
|
|
2,128 |
|
|
|
95,590 |
|
| ION Geophysical Corp.* |
|
|
5,947 |
|
|
|
37,109 |
|
| Key Energy Services, Inc.* |
|
|
11,070 |
|
|
|
65,756 |
|
| Lufkin Industries, Inc. |
|
|
1,310 |
|
|
|
115,660 |
|
| Matrix Service Co.* |
|
|
1,613 |
|
|
|
24,243 |
|
| Mitcham Industries, Inc.* |
|
|
240 |
|
|
|
3,564 |
|
| Natural Gas Services Group, Inc.* |
|
|
704 |
|
|
|
14,214 |
|
| Newpark Resources, Inc.* |
|
|
5,522 |
|
|
|
57,981 |
|
| Parker Drilling Co.* |
|
|
8,824 |
|
|
|
36,355 |
|
| PHI, Inc.* |
|
|
935 |
|
|
|
25,965 |
|
| Pioneer Energy Services Corp.* |
|
|
4,488 |
|
|
|
31,640 |
|
| RigNet, Inc.* |
|
|
480 |
|
|
|
11,616 |
|
April 30,
2013 / ANNUAL REPORT
|
|
|
|
|
| PORTFOLIOS OF INVESTMENTS |
|
|
59 |
|
Wilmington Small-Cap Strategy Fund (continued)
|
|
|
|
|
|
|
|
|
| Description
|
|
Number of
Shares |
|
|
Value
|
|
| Tesco Corp.* |
|
|
1,580 |
|
|
$ |
19,276 |
|
| TETRA Technologies, Inc.* |
|
|
5,340 |
|
|
|
48,754 |
|
| TGC Industries, Inc. |
|
|
1,260 |
|
|
|
11,176 |
|
| Vantage Drilling Co.* |
|
|
19,290 |
|
|
|
32,600 |
|
| Willbros Group, Inc.* |
|
|
2,928 |
|
|
|
27,816 |
|
|
|
|
|
|
|
$ |
1,580,797 |
|
|
|
| OIL, GAS & CONSUMABLE FUELS – 3.8% |
|
|
|
|
|
| Abraxas Petroleum Corp.#,* |
|
|
4,480 |
|
|
|
10,035 |
|
| Adams Resources & Energy, Inc. |
|
|
350 |
|
|
|
17,391 |
|
| Alon USA Energy, Inc. |
|
|
624 |
|
|
|
10,358 |
|
| Amyris, Inc.#,* |
|
|
990 |
|
|
|
2,693 |
|
| Apco Oil and Gas International, Inc.#,* |
|
|
480 |
|
|
|
4,853 |
|
| Approach Resources, Inc.#,* |
|
|
1,430 |
|
|
|
33,920 |
|
| Arch Coal, Inc.# |
|
|
14,270 |
|
|
|
69,209 |
|
| ATP Oil & Gas Corp.* |
|
|
2,852 |
|
|
|
399 |
|
| Berry Petroleum Co. |
|
|
2,134 |
|
|
|
102,240 |
|
| Bill Barrett Corp.#,* |
|
|
3,465 |
|
|
|
68,815 |
|
| Bonanza Creek Energy, Inc.* |
|
|
730 |
|
|
|
25,075 |
|
| BPZ Resources, Inc.* |
|
|
4,853 |
|
|
|
10,385 |
|
| Callon Petroleum Co.* |
|
|
1,680 |
|
|
|
6,014 |
|
| Carrizo Oil & Gas, Inc.* |
|
|
2,076 |
|
|
|
50,281 |
|
| Clayton Williams Energy, Inc.* |
|
|
313 |
|
|
|
12,082 |
|
| Clean Energy Fuels Corp.#,* |
|
|
2,379 |
|
|
|
31,379 |
|
| Cloud Peak Energy, Inc.* |
|
|
4,280 |
|
|
|
83,631 |
|
| Comstock Resources, Inc.* |
|
|
3,470 |
|
|
|
54,340 |
|
| Contango Oil & Gas Co. |
|
|
649 |
|
|
|
24,415 |
|
| Crimson Exploration, Inc.* |
|
|
110 |
|
|
|
338 |
|
| Crosstex Energy, Inc. |
|
|
1,773 |
|
|
|
32,641 |
|
| CVR Energy, Inc. |
|
|
746 |
|
|
|
36,755 |
|
| Delek US Holdings, Inc. |
|
|
1,232 |
|
|
|
44,463 |
|
| Diamondback Energy, Inc.#,* |
|
|
470 |
|
|
|
12,342 |
|
| Emerald Oil, Inc.* |
|
|
2,347 |
|
|
|
15,091 |
|
| Endeavour International Corp.#,* |
|
|
1,533 |
|
|
|
4,200 |
|
| Energy XXI Bermuda Ltd. |
|
|
3,620 |
|
|
|
82,319 |
|
| EPL Oil & Gas, Inc.* |
|
|
2,020 |
|
|
|
65,993 |
|
| Evolution Petroleum Corp.* |
|
|
1,160 |
|
|
|
11,530 |
|
| Forest Oil Corp.* |
|
|
6,750 |
|
|
|
28,282 |
|
| Frontline Ltd.#,* |
|
|
2,000 |
|
|
|
3,640 |
|
| FX Energy, Inc.* |
|
|
2,593 |
|
|
|
9,957 |
|
| GasLog Ltd. |
|
|
1,180 |
|
|
|
15,104 |
|
| Gastar Exploration Ltd.* |
|
|
1,490 |
|
|
|
4,172 |
|
| Gevo, Inc.#,* |
|
|
1,380 |
|
|
|
2,546 |
|
| Goodrich Petroleum Corp.#,* |
|
|
1,285 |
|
|
|
16,756 |
|
| Green Plains Renewable Energy, Inc.* |
|
|
1,390 |
|
|
|
17,389 |
|
| Gulfport Energy Corp.* |
|
|
4,470 |
|
|
|
233,289 |
|
| Halcon Resources Corp.#,* |
|
|
5,621 |
|
|
|
36,761 |
|
|
|
|
|
|
|
|
|
|
| Description
|
|
Number of
Shares |
|
|
Value
|
|
| Hallador Energy Co. |
|
|
1,410 |
|
|
$ |
10,096 |
|
| Harvest Natural Resources, Inc.#,* |
|
|
1,209 |
|
|
|
3,966 |
|
| Isramco, Inc.#,* |
|
|
40 |
|
|
|
3,654 |
|
| KiOR, Inc.#,* |
|
|
1,360 |
|
|
|
6,623 |
|
| Knightsbridge Tankers Ltd.# |
|
|
2,663 |
|
|
|
18,242 |
|
| Kodiak Oil & Gas Corp.* |
|
|
10,480 |
|
|
|
82,058 |
|
| Magnum Hunter Resources Corp.#,* |
|
|
8,460 |
|
|
|
23,011 |
|
| Matador Resources Co.* |
|
|
1,590 |
|
|
|
15,693 |
|
| McMoRan Exploration Co.#,* |
|
|
7,058 |
|
|
|
116,810 |
|
| Midstates Petroleum Co., Inc.* |
|
|
1,460 |
|
|
|
8,424 |
|
| Miller Energy Resources, Inc.#,* |
|
|
540 |
|
|
|
2,052 |
|
| Nordic American Tankers Ltd. |
|
|
3,698 |
|
|
|
32,949 |
|
| Northern Oil and Gas, Inc.#,* |
|
|
2,460 |
|
|
|
31,709 |
|
| Oasis Petroleum, Inc.* |
|
|
3,170 |
|
|
|
108,509 |
|
| Panhandle Oil and Gas, Inc. |
|
|
586 |
|
|
|
16,689 |
|
| Patriot Coal Corp.* |
|
|
3,730 |
|
|
|
347 |
|
| PDC Energy, Inc.* |
|
|
1,979 |
|
|
|
85,691 |
|
| Penn Virginia Corp.# |
|
|
3,564 |
|
|
|
14,363 |
|
| PetroQuest Energy, Inc.* |
|
|
3,153 |
|
|
|
13,495 |
|
| Quicksilver Resources, Inc.#,* |
|
|
10,290 |
|
|
|
25,931 |
|
| Renewable Energy Group, Inc.* |
|
|
2,130 |
|
|
|
20,938 |
|
| Resolute Energy Corp.* |
|
|
2,790 |
|
|
|
25,724 |
|
| REX American Resources Corp.* |
|
|
200 |
|
|
|
3,738 |
|
| Rex Energy Corp.* |
|
|
2,195 |
|
|
|
35,274 |
|
| Rosetta Resources, Inc.* |
|
|
2,128 |
|
|
|
91,312 |
|
| Sanchez Energy Corp.#,* |
|
|
460 |
|
|
|
8,331 |
|
| Scorpio Tankers, Inc. |
|
|
7,180 |
|
|
|
62,107 |
|
| SemGroup Corp. |
|
|
2,630 |
|
|
|
136,366 |
|
| Ship Finance International Ltd. |
|
|
3,303 |
|
|
|
54,433 |
|
| Solazyme, Inc.#,* |
|
|
1,820 |
|
|
|
16,562 |
|
| Stone Energy Corp.* |
|
|
3,234 |
|
|
|
63,807 |
|
| Swift Energy Co.* |
|
|
3,336 |
|
|
|
43,168 |
|
| Synergy Resources Corp.* |
|
|
1,650 |
|
|
|
11,138 |
|
| Targa Resources Corp. |
|
|
1,210 |
|
|
|
79,570 |
|
| Teekay Tankers Ltd.# |
|
|
7,768 |
|
|
|
19,653 |
|
| Triangle Petroleum Corp.* |
|
|
1,410 |
|
|
|
7,741 |
|
| Uranerz Energy Corp.#,* |
|
|
1,910 |
|
|
|
1,948 |
|
| Uranium Energy Corp.* |
|
|
3,940 |
|
|
|
6,107 |
|
| Vaalco Energy, Inc.* |
|
|
2,387 |
|
|
|
16,041 |
|
| W&T Offshore, Inc.# |
|
|
2,030 |
|
|
|
23,710 |
|
| Warren Resources, Inc.* |
|
|
2,940 |
|
|
|
7,732 |
|
| Western Refining, Inc.# |
|
|
2,825 |
|
|
|
87,321 |
|
| Westmoreland Coal Co.* |
|
|
140 |
|
|
|
1,690 |
|
|
|
|
|
|
|
$ |
2,735,806 |
|
| TOTAL ENERGY |
|
|
|
|
|
$ |
4,316,603 |
|
ANNUAL
REPORT / April 30, 2013
|
|
|
| 60 |
|
PORTFOLIOS OF INVESTMENTS |
Wilmington Small-Cap Strategy Fund (continued)
|
|
|
|
|
|
|
|
|
| Description
|
|
Number of
Shares |
|
|
Value
|
|
| FINANCIALS – 27.3% |
|
|
|
|
|
|
|
|
|
|
|
| CAPITAL MARKETS – 2.8% |
|
|
|
|
|
|
|
|
| Apollo Investment Corp. |
|
|
13,022 |
|
|
$ |
114,724 |
|
| Arlington Asset Investment Corp. |
|
|
830 |
|
|
|
22,485 |
|
| Artio Global Investors, Inc. |
|
|
2,080 |
|
|
|
5,699 |
|
| BGC Partners, Inc. |
|
|
4,390 |
|
|
|
25,111 |
|
| BlackRock Kelso Capital Corp.# |
|
|
5,740 |
|
|
|
57,113 |
|
| Calamos Asset Management, Inc. |
|
|
1,585 |
|
|
|
17,990 |
|
| Capital Southwest Corp. |
|
|
102 |
|
|
|
12,004 |
|
| CIFC Corp.* |
|
|
1,380 |
|
|
|
10,805 |
|
| Cohen & Steers, Inc.# |
|
|
873 |
|
|
|
34,492 |
|
| Cowen Group, Inc.* |
|
|
5,765 |
|
|
|
14,758 |
|
| Diamond Hill Investment Group, Inc. |
|
|
160 |
|
|
|
12,078 |
|
| Evercore Partners, Inc. |
|
|
1,753 |
|
|
|
66,176 |
|
| FBR & Co.* |
|
|
1,897 |
|
|
|
39,515 |
|
| Fidus Investment Corp. |
|
|
570 |
|
|
|
10,716 |
|
| Fifth Street Finance Corp. |
|
|
6,746 |
|
|
|
74,476 |
|
| Financial Engines, Inc. |
|
|
1,980 |
|
|
|
72,013 |
|
| FXCM, Inc. |
|
|
1,730 |
|
|
|
23,441 |
|
| GAMCO Investors, Inc. |
|
|
202 |
|
|
|
10,605 |
|
| GFI Group, Inc. |
|
|
6,051 |
|
|
|
24,265 |
|
| Gladstone Capital Corp. |
|
|
1,822 |
|
|
|
16,890 |
|
| Gladstone Investment Corp. |
|
|
3,547 |
|
|
|
26,390 |
|
| Golub Capital BDC, Inc.# |
|
|
1,490 |
|
|
|
26,269 |
|
| Greenhill & Co., Inc. |
|
|
1,170 |
|
|
|
54,042 |
|
| GSV Capital Corp.#,* |
|
|
1,170 |
|
|
|
8,997 |
|
| Harris & Harris Group, Inc.* |
|
|
2,760 |
|
|
|
9,108 |
|
| Hercules Technology Growth Capital, Inc. |
|
|
3,617 |
|
|
|
48,106 |
|
| HFF, Inc. |
|
|
1,900 |
|
|
|
39,805 |
|
| Horizon Technology Finance Corp.# |
|
|
850 |
|
|
|
12,486 |
|
| ICG Group, Inc.* |
|
|
1,734 |
|
|
|
20,583 |
|
| INTL. FCStone, Inc.#,* |
|
|
1,696 |
|
|
|
29,036 |
|
| Investment Technology Group, Inc.* |
|
|
3,060 |
|
|
|
33,323 |
|
| JMP Group, Inc. |
|
|
3,030 |
|
|
|
19,574 |
|
| KCAP Financial, Inc.# |
|
|
1,700 |
|
|
|
18,394 |
|
| Knight Capital Group, Inc.* |
|
|
11,042 |
|
|
|
39,089 |
|
| Ladenburg Thalmann Financial Services, Inc.* |
|
|
5,250 |
|
|
|
7,717 |
|
| Main Street Capital Corp. |
|
|
1,745 |
|
|
|
52,455 |
|
| Manning & Napier, Inc. |
|
|
1,080 |
|
|
|
18,911 |
|
| MCG Capital Corp. |
|
|
4,950 |
|
|
|
25,443 |
|
| Medallion Financial Corp. |
|
|
1,311 |
|
|
|
19,586 |
|
| Medley Capital Corp. |
|
|
1,600 |
|
|
|
24,928 |
|
| MVC Capital, Inc. |
|
|
2,454 |
|
|
|
31,877 |
|
| New Mountain Finance Corp. |
|
|
2,020 |
|
|
|
30,785 |
|
| NGP Capital Resources Co. |
|
|
3,107 |
|
|
|
20,693 |
|
| Oppenheimer Holdings, Inc. |
|
|
850 |
|
|
|
15,725 |
|
| PennantPark Investment Corp. |
|
|
5,130 |
|
|
|
60,021 |
|
|
|
|
|
|
|
|
|
|
| Description
|
|
Number of
Shares |
|
|
Value
|
|
| Piper Jaffray Cos.* |
|
|
770 |
|
|
$ |
25,995 |
|
| Prospect Capital Corp. |
|
|
12,909 |
|
|
|
142,386 |
|
| Pzena Investment Management, Inc. |
|
|
715 |
|
|
|
4,533 |
|
| Safeguard Scientifics, Inc.* |
|
|
1,135 |
|
|
|
18,319 |
|
| Solar Capital Ltd. |
|
|
2,810 |
|
|
|
67,243 |
|
| Solar Senior Capital Ltd. |
|
|
790 |
|
|
|
15,144 |
|
| Stifel Financial Corp.* |
|
|
2,976 |
|
|
|
95,887 |
|
| SWS Group, Inc.* |
|
|
1,777 |
|
|
|
10,111 |
|
| TCP Capital Corp. |
|
|
800 |
|
|
|
12,536 |
|
| Teton Advisors, Inc.# |
|
|
10 |
|
|
|
180 |
|
| THL Credit, Inc. |
|
|
800 |
|
|
|
12,304 |
|
| TICC Capital Corp.# |
|
|
3,759 |
|
|
|
38,229 |
|
| Triangle Capital Corp.# |
|
|
1,986 |
|
|
|
55,548 |
|
| Virtus Investment Partners, Inc.* |
|
|
323 |
|
|
|
61,693 |
|
| Walter Investment Management Corp.* |
|
|
2,202 |
|
|
|
73,899 |
|
| Westwood Holdings Group, Inc. |
|
|
460 |
|
|
|
20,102 |
|
| WhiteHorse Finance, Inc.# |
|
|
910 |
|
|
|
14,424 |
|
| WisdomTree Investments, Inc.* |
|
|
2,650 |
|
|
|
30,740 |
|
|
|
|
|
|
|
$ |
2,057,972 |
|
|
|
|
| COMMERCIAL BANKS – 7.4% |
|
|
|
|
|
|
|
|
| 1st Source Corp. |
|
|
1,188 |
|
|
|
27,954 |
|
| 1st United Bancorp, Inc. |
|
|
740 |
|
|
|
4,906 |
|
| American National Bankshares, Inc. |
|
|
490 |
|
|
|
10,648 |
|
| Ameris Bancorp* |
|
|
830 |
|
|
|
11,512 |
|
| Ames National Corp.# |
|
|
11 |
|
|
|
216 |
|
| Arrow Financial Corp.# |
|
|
924 |
|
|
|
22,352 |
|
| Bancfirst Corp. |
|
|
134 |
|
|
|
5,607 |
|
| Banco Latinoamericano de Comercio |
|
|
|
|
|
|
|
|
| Exterior SA |
|
|
2,264 |
|
|
|
51,370 |
|
| Bancorp, Inc.* |
|
|
1,510 |
|
|
|
19,630 |
|
| BancorpSouth, Inc. |
|
|
6,010 |
|
|
|
96,160 |
|
| Bank of Kentucky Financial Corp. |
|
|
370 |
|
|
|
9,701 |
|
| Bank of Marin Bancorp |
|
|
310 |
|
|
|
12,276 |
|
| Bank of the Ozarks, Inc. |
|
|
1,422 |
|
|
|
58,202 |
|
| Banner Corp. |
|
|
1,200 |
|
|
|
39,204 |
|
| Bar Harbor Bankshares |
|
|
400 |
|
|
|
14,400 |
|
| BBCN Bancorp, Inc. |
|
|
4,601 |
|
|
|
59,261 |
|
| Boston Private Financial Holdings, Inc. |
|
|
5,138 |
|
|
|
49,530 |
|
| Bridge Bancorp, Inc. |
|
|
570 |
|
|
|
11,508 |
|
| Bridge Capital Holdings* |
|
|
300 |
|
|
|
4,374 |
|
| Bryn Mawr Bank Corp. |
|
|
475 |
|
|
|
11,034 |
|
| BSB Bancorp, Inc.* |
|
|
1,470 |
|
|
|
20,212 |
|
| C&F Financial Corp. |
|
|
250 |
|
|
|
10,050 |
|
| Camden National Corp. |
|
|
263 |
|
|
|
8,782 |
|
| Capital Bank Financial Corp.* |
|
|
1,280 |
|
|
|
22,874 |
|
| Capital City Bank Group, Inc.* |
|
|
951 |
|
|
|
11,887 |
|
| Cardinal Financial Corp. |
|
|
1,330 |
|
|
|
20,282 |
|
| Cathay General Bancorp |
|
|
4,732 |
|
|
|
93,268 |
|
April 30,
2013 / ANNUAL REPORT
|
|
|
|
|
| PORTFOLIOS OF INVESTMENTS |
|
|
61 |
|
Wilmington Small-Cap Strategy Fund (continued)
|
|
|
|
|
|
|
|
|
| Description
|
|
Number of
Shares |
|
|
Value
|
|
| Center Bancorp, Inc. |
|
|
130 |
|
|
$ |
1,514 |
|
| Centerstate Banks, Inc. |
|
|
2,486 |
|
|
|
20,684 |
|
| Central Pacific Financial Corp.* |
|
|
800 |
|
|
|
13,472 |
|
| Century Bancorp, Inc. |
|
|
410 |
|
|
|
13,932 |
|
| Chemical Financial Corp. |
|
|
1,738 |
|
|
|
43,102 |
|
| Citizens & Northern Corp. |
|
|
831 |
|
|
|
16,088 |
|
| City Holding Co.# |
|
|
762 |
|
|
|
29,093 |
|
| CNB Financial Corp. |
|
|
910 |
|
|
|
14,733 |
|
| CoBiz Financial, Inc. |
|
|
1,980 |
|
|
|
16,949 |
|
| Columbia Banking System, Inc. |
|
|
3,299 |
|
|
|
70,830 |
|
| Community Bank System, Inc. |
|
|
2,904 |
|
|
|
83,171 |
|
| Community Trust Bancorp, Inc. |
|
|
928 |
|
|
|
32,127 |
|
| CVB Financial Corp. |
|
|
5,494 |
|
|
|
59,720 |
|
| Eagle Bancorp, Inc.* |
|
|
1,340 |
|
|
|
30,994 |
|
| Enterprise Bancorp, Inc. |
|
|
60 |
|
|
|
967 |
|
| Enterprise Financial Services Corp. |
|
|
753 |
|
|
|
10,828 |
|
| Farmers National Banc Corp.# |
|
|
2,030 |
|
|
|
13,398 |
|
| Fidelity Southern Corp.* |
|
|
967 |
|
|
|
11,497 |
|
| Financial Institutions, Inc. |
|
|
873 |
|
|
|
16,700 |
|
| First BanCorp#,* |
|
|
6,500 |
|
|
|
38,415 |
|
| First Bancorp |
|
|
1,095 |
|
|
|
14,246 |
|
| First Bancorp, Inc. |
|
|
439 |
|
|
|
7,503 |
|
| First Busey Corp. |
|
|
7,781 |
|
|
|
33,458 |
|
| First California Financial Group, Inc.* |
|
|
1,340 |
|
|
|
10,814 |
|
| First Commonwealth Financial Corp. |
|
|
6,326 |
|
|
|
45,231 |
|
| First Community Bancshares, Inc. |
|
|
1,301 |
|
|
|
20,179 |
|
| First Connecticut Bancorp, Inc. |
|
|
1,340 |
|
|
|
19,886 |
|
| First Financial Bancorp |
|
|
4,075 |
|
|
|
62,633 |
|
| First Financial Bankshares, Inc.# |
|
|
2,081 |
|
|
|
102,822 |
|
| First Financial Corp. |
|
|
935 |
|
|
|
28,882 |
|
| First Interstate Bancsystem, Inc. |
|
|
1,240 |
|
|
|
25,197 |
|
| First Merchants Corp. |
|
|
1,795 |
|
|
|
29,133 |
|
| First Midwest Bancorp, Inc. |
|
|
4,761 |
|
|
|
59,751 |
|
| First of Long Island Corp. |
|
|
220 |
|
|
|
6,646 |
|
| FirstMerit Corp. |
|
|
10,732 |
|
|
|
183,839 |
|
| FNB Corp. |
|
|
8,836 |
|
|
|
100,642 |
|
| FNB United Corp.#,* |
|
|
780 |
|
|
|
5,850 |
|
| German American Bancorp, Inc. |
|
|
400 |
|
|
|
8,528 |
|
| Glacier Bancorp, Inc. |
|
|
4,471 |
|
|
|
82,490 |
|
| Great Southern Bancorp, Inc. |
|
|
490 |
|
|
|
12,921 |
|
| Guaranty Bancorp |
|
|
6,220 |
|
|
|
13,186 |
|
| Hancock Holding Co.# |
|
|
5,178 |
|
|
|
141,204 |
|
| Hanmi Financial Corp.* |
|
|
2,400 |
|
|
|
37,032 |
|
| Heartland Financial USA, Inc. |
|
|
593 |
|
|
|
15,068 |
|
| Heritage Commerce Corp.* |
|
|
2,150 |
|
|
|
14,125 |
|
| Heritage Financial Corp. |
|
|
820 |
|
|
|
11,439 |
|
| Home BancShares, Inc. |
|
|
1,462 |
|
|
|
58,071 |
|
| HomeTrust Bancshares, Inc.* |
|
|
1,540 |
|
|
|
24,563 |
|
|
|
|
|
|
|
|
|
|
| Description
|
|
Number of
Shares |
|
|
Value
|
|
| Horizon Bancorp |
|
|
580 |
|
|
$ |
11,194 |
|
| Hudson Valley Holding Corp. |
|
|
1,112 |
|
|
|
17,103 |
|
| Iberiabank Corp. |
|
|
2,074 |
|
|
|
94,616 |
|
| Independent Bank Corp. |
|
|
1,586 |
|
|
|
49,229 |
|
| International Bancshares Corp. |
|
|
3,902 |
|
|
|
75,699 |
|
| Investors Bancorp, Inc.# |
|
|
1,871 |
|
|
|
37,046 |
|
| Lakeland Bancorp, Inc. |
|
|
1,692 |
|
|
|
16,176 |
|
| Lakeland Financial Corp. |
|
|
1,015 |
|
|
|
27,202 |
|
| MainSource Financial Group, Inc. |
|
|
979 |
|
|
|
12,404 |
|
| MB Financial, Inc. |
|
|
3,415 |
|
|
|
84,555 |
|
| Mercantile Bank Corp. |
|
|
620 |
|
|
|
10,360 |
|
| Merchants Bancshares, Inc. |
|
|
290 |
|
|
|
8,799 |
|
| Metro Bancorp, Inc.* |
|
|
572 |
|
|
|
10,153 |
|
| MetroCorp Bancshares, Inc.* |
|
|
900 |
|
|
|
9,045 |
|
| Middleburg Financial Corp. |
|
|
690 |
|
|
|
12,482 |
|
| MidSouth Bancorp, Inc. |
|
|
820 |
|
|
|
12,882 |
|
| MidWestOne Financial Group, Inc. |
|
|
480 |
|
|
|
11,472 |
|
| National Bank Holdings Corp. |
|
|
1,140 |
|
|
|
20,588 |
|
| National Bankshares, Inc.# |
|
|
200 |
|
|
|
6,550 |
|
| National Penn Bancshares, Inc. |
|
|
8,141 |
|
|
|
79,700 |
|
| NBT Bancorp, Inc. |
|
|
3,180 |
|
|
|
64,395 |
|
| Northrim BanCorp, Inc. |
|
|
580 |
|
|
|
12,632 |
|
| OFG Bancorp |
|
|
3,634 |
|
|
|
58,398 |
|
| Old National Bancorp |
|
|
6,471 |
|
|
|
78,817 |
|
| OmniAmerican Bancorp, Inc.* |
|
|
740 |
|
|
|
18,426 |
|
| Pacific Continental Corp. |
|
|
1,340 |
|
|
|
14,981 |
|
| Pacific Mercantile Bancorp* |
|
|
2,380 |
|
|
|
14,280 |
|
| PacWest Bancorp# |
|
|
1,789 |
|
|
|
49,609 |
|
| Park National Corp. |
|
|
598 |
|
|
|
40,891 |
|
| Park Sterling Corp.* |
|
|
3,640 |
|
|
|
20,857 |
|
| Peapack Gladstone Financial Corp. |
|
|
940 |
|
|
|
13,705 |
|
| Penns Woods Bancorp, Inc.# |
|
|
160 |
|
|
|
6,547 |
|
| Peoples Bancorp, Inc. |
|
|
596 |
|
|
|
12,146 |
|
| Pinnacle Financial Partners, Inc.* |
|
|
2,481 |
|
|
|
60,214 |
|
| Preferred Bank* |
|
|
650 |
|
|
|
10,725 |
|
| PrivateBancorp, Inc. |
|
|
4,250 |
|
|
|
81,515 |
|
| Prosperity Bancshares, Inc. |
|
|
2,995 |
|
|
|
137,590 |
|
| Renasant Corp. |
|
|
1,581 |
|
|
|
36,078 |
|
| Republic Bancorp, Inc. |
|
|
827 |
|
|
|
18,359 |
|
| S&T Bancorp, Inc. |
|
|
2,010 |
|
|
|
37,929 |
|
| Sandy Spring Bancorp, Inc. |
|
|
2,147 |
|
|
|
43,971 |
|
| SCBT Financial Corp.# |
|
|
1,170 |
|
|
|
55,891 |
|
| Sierra Bancorp |
|
|
516 |
|
|
|
6,667 |
|
| Simmons First National Corp. |
|
|
1,426 |
|
|
|
34,966 |
|
| Southside Bancshares, Inc.# |
|
|
1,571 |
|
|
|
33,584 |
|
| Southwest Bancorp, Inc.* |
|
|
1,132 |
|
|
|
14,965 |
|
| State Bank Financial Corp. |
|
|
2,320 |
|
|
|
34,127 |
|
| StellarOne Corp. |
|
|
1,393 |
|
|
|
20,881 |
|
ANNUAL
REPORT / April 30, 2013
|
|
|
| 62 |
|
PORTFOLIOS OF INVESTMENTS |
Wilmington Small-Cap Strategy Fund (continued)
|
|
|
|
|
|
|
|
|
| Description
|
|
Number of
Shares |
|
|
Value
|
|
| Sterling Bancorp |
|
|
1,237 |
|
|
$ |
13,953 |
|
| Sterling Financial Corp. |
|
|
1,230 |
|
|
|
26,814 |
|
| Suffolk Bancorp* |
|
|
854 |
|
|
|
13,357 |
|
| Sun Bancorp, Inc.* |
|
|
1,460 |
|
|
|
4,701 |
|
| Susquehanna Bancshares, Inc. |
|
|
12,682 |
|
|
|
147,999 |
|
| SY Bancorp, Inc. |
|
|
530 |
|
|
|
12,169 |
|
| Taylor Capital Group, Inc.* |
|
|
730 |
|
|
|
10,695 |
|
| Texas Capital Bancshares, Inc.* |
|
|
1,858 |
|
|
|
77,404 |
|
| Tompkins Financial Corp. |
|
|
710 |
|
|
|
29,678 |
|
| TowneBank# |
|
|
1,921 |
|
|
|
27,490 |
|
| Trico Bancshares |
|
|
1,093 |
|
|
|
19,095 |
|
| Trustmark Corp.# |
|
|
4,238 |
|
|
|
104,043 |
|
| UMB Financial Corp. |
|
|
1,994 |
|
|
|
100,378 |
|
| Umpqua Holdings Corp. |
|
|
7,906 |
|
|
|
94,872 |
|
| Union First Market Bankshares Corp. |
|
|
1,079 |
|
|
|
20,404 |
|
| United Bankshares, Inc.# |
|
|
3,124 |
|
|
|
79,068 |
|
| United Community Banks, Inc.* |
|
|
3,214 |
|
|
|
35,193 |
|
| Univest Corp. of Pennsylvania |
|
|
1,793 |
|
|
|
31,431 |
|
| Virginia Commerce Bancorp, Inc.* |
|
|
1,480 |
|
|
|
19,891 |
|
| Washington Banking Co. |
|
|
920 |
|
|
|
12,696 |
|
| Washington Trust Bancorp, Inc. |
|
|
576 |
|
|
|
15,408 |
|
| Webster Financial Corp. |
|
|
5,040 |
|
|
|
117,785 |
|
| WesBanco, Inc. |
|
|
2,016 |
|
|
|
50,460 |
|
| West Bancorporation, Inc. |
|
|
1,097 |
|
|
|
11,826 |
|
| Westamerica Bancorporation# |
|
|
1,303 |
|
|
|
56,537 |
|
| Western Alliance Bancorp* |
|
|
4,821 |
|
|
|
70,917 |
|
| Wilshire Bancorp, Inc.* |
|
|
3,780 |
|
|
|
24,154 |
|
| Wintrust Financial Corp. |
|
|
2,113 |
|
|
|
75,772 |
|
|
|
|
|
|
|
$ |
5,365,344 |
|
|
|
|
| CONSUMER FINANCE – 0.7% |
|
|
|
|
|
|
|
|
| Asta Funding, Inc. |
|
|
1,350 |
|
|
|
12,676 |
|
| Cash America International, Inc.# |
|
|
1,426 |
|
|
|
62,216 |
|
| Credit Acceptance Corp.* |
|
|
298 |
|
|
|
29,898 |
|
| DFC Global Corp.* |
|
|
2,478 |
|
|
|
33,453 |
|
| Encore Capital Group, Inc.#,* |
|
|
985 |
|
|
|
28,063 |
|
| Ezcorp, Inc.* |
|
|
2,169 |
|
|
|
36,656 |
|
| First Cash Financial Services, Inc.* |
|
|
1,149 |
|
|
|
59,139 |
|
| First Marblehead Corp.* |
|
|
5,080 |
|
|
|
6,248 |
|
| Green Dot Corp.#,* |
|
|
1,050 |
|
|
|
16,495 |
|
| Nelnet, Inc. |
|
|
1,302 |
|
|
|
44,268 |
|
| Netspend Holdings, Inc.* |
|
|
1,090 |
|
|
|
17,396 |
|
| Portfolio Recovery Associates, Inc.* |
|
|
709 |
|
|
|
87,030 |
|
| Regional Management Corp.* |
|
|
650 |
|
|
|
14,092 |
|
| World Acceptance Corp.#,* |
|
|
464 |
|
|
|
41,231 |
|
|
|
|
|
|
|
$ |
488,861 |
|
|
|
| DIVERSIFIED FINANCIAL SERVICES – 0.3% |
|
|
|
|
|
| California First National Bancorp |
|
|
150 |
|
|
|
2,388 |
|
|
|
|
|
|
|
|
|
|
| Description
|
|
Number of
Shares |
|
|
Value
|
|
| Gain Capital Holdings, Inc. |
|
|
2,760 |
|
|
$ |
13,607 |
|
| MarketAxess Holdings, Inc. |
|
|
1,547 |
|
|
|
65,469 |
|
| Marlin Business Services Corp. |
|
|
480 |
|
|
|
11,630 |
|
| NewStar Financial, Inc.* |
|
|
924 |
|
|
|
11,042 |
|
| PHH Corp.* |
|
|
3,547 |
|
|
|
74,771 |
|
| PICO Holdings, Inc.* |
|
|
1,180 |
|
|
|
25,606 |
|
| Resource America, Inc. |
|
|
1,290 |
|
|
|
11,894 |
|
|
|
|
|
|
|
$ |
216,407 |
|
|
|
|
| INSURANCE – 3.1% |
|
|
|
|
|
|
|
|
| Alterra Capital Holdings Ltd. |
|
|
5,575 |
|
|
|
181,466 |
|
| American Equity Investment Life Holding Co. |
|
|
4,603 |
|
|
|
70,150 |
|
| American Safety Insurance Holdings Ltd.* |
|
|
877 |
|
|
|
21,118 |
|
| AMERISAFE, Inc. |
|
|
1,082 |
|
|
|
35,338 |
|
| Amtrust Financial Services, Inc.# |
|
|
1,566 |
|
|
|
49,580 |
|
| Argo Group International Holdings Ltd. |
|
|
1,921 |
|
|
|
79,625 |
|
| Baldwin & Lyons, Inc. |
|
|
492 |
|
|
|
11,956 |
|
| Citizens, Inc.#,* |
|
|
1,797 |
|
|
|
11,752 |
|
| CNO Financial Group, Inc. |
|
|
13,580 |
|
|
|
153,726 |
|
| Crawford & Co. |
|
|
1,767 |
|
|
|
13,412 |
|
| Donegal Group, Inc. |
|
|
940 |
|
|
|
13,762 |
|
| Eastern Insurance Holdings, Inc. |
|
|
630 |
|
|
|
11,737 |
|
| eHealth, Inc.* |
|
|
804 |
|
|
|
16,836 |
|
| EMC Insurance Group, Inc. |
|
|
510 |
|
|
|
14,397 |
|
| Employers Holdings, Inc. |
|
|
1,347 |
|
|
|
30,510 |
|
| Enstar Group Ltd.* |
|
|
559 |
|
|
|
71,043 |
|
| FBL Financial Group, Inc. |
|
|
933 |
|
|
|
36,676 |
|
| First American Financial Corp. |
|
|
6,520 |
|
|
|
174,540 |
|
| Global Indemnity PLC* |
|
|
524 |
|
|
|
11,680 |
|
| Greenlight Capital Re Ltd.* |
|
|
2,150 |
|
|
|
52,912 |
|
| Hallmark Financial Services* |
|
|
7 |
|
|
|
63 |
|
| Hilltop Holdings, Inc.* |
|
|
2,131 |
|
|
|
28,534 |
|
| Homeowners Choice, Inc.# |
|
|
430 |
|
|
|
11,412 |
|
| Horace Mann Educators Corp. |
|
|
3,064 |
|
|
|
69,093 |
|
| Independence Holding Co. |
|
|
1,800 |
|
|
|
18,900 |
|
| Infinity Property & Casualty Corp. |
|
|
698 |
|
|
|
39,605 |
|
| Kansas City Life Insurance Co. |
|
|
370 |
|
|
|
13,357 |
|
| Maiden Holdings Ltd. |
|
|
4,002 |
|
|
|
41,341 |
|
| Meadowbrook Insurance Group, Inc. |
|
|
4,025 |
|
|
|
31,314 |
|
| Montpelier Re Holdings Ltd. |
|
|
2,884 |
|
|
|
74,292 |
|
| National Financial Partners Corp.* |
|
|
2,390 |
|
|
|
60,563 |
|
| National Interstate Corp. |
|
|
519 |
|
|
|
15,077 |
|
| National Western Life Insurance Co. |
|
|
165 |
|
|
|
30,132 |
|
| Navigators Group, Inc.* |
|
|
426 |
|
|
|
24,657 |
|
| OneBeacon Insurance Group Ltd. |
|
|
2,090 |
|
|
|
28,403 |
|
| Phoenix Cos., Inc.* |
|
|
811 |
|
|
|
23,608 |
|
| Platinum Underwriters Holdings Ltd. |
|
|
2,220 |
|
|
|
125,985 |
|
April 30,
2013 / ANNUAL REPORT
|
|
|
|
|
| PORTFOLIOS OF INVESTMENTS |
|
|
63 |
|
Wilmington Small-Cap Strategy Fund (continued)
|
|
|
|
|
|
|
|
|
| Description
|
|
Number of
Shares |
|
|
Value
|
|
| Primerica, Inc. |
|
|
2,900 |
|
|
$ |
98,484 |
|
| RLI Corp. |
|
|
1,356 |
|
|
|
97,429 |
|
| Safety Insurance Group, Inc. |
|
|
1,014 |
|
|
|
50,365 |
|
| Selective Insurance Group, Inc. |
|
|
3,803 |
|
|
|
89,104 |
|
| State Auto Financial Corp. |
|
|
638 |
|
|
|
11,088 |
|
| Stewart Information Services Corp. |
|
|
1,499 |
|
|
|
40,578 |
|
| Symetra Financial Corp. |
|
|
5,730 |
|
|
|
78,100 |
|
| Tower Group International Ltd. |
|
|
2,081 |
|
|
|
39,373 |
|
| United Fire Group, Inc. |
|
|
1,365 |
|
|
|
38,165 |
|
| Universal Insurance Holdings, Inc. |
|
|
2,460 |
|
|
|
14,711 |
|
|
|
|
|
|
|
$ |
2,255,949 |
|
|
|
| REAL ESTATE INVESTMENT TRUSTS – 10.5% |
|
|
|
|
|
| Acadia Realty Trust |
|
|
2,135 |
|
|
|
60,954 |
|
| AG Mortgage Investment Trust, Inc.# |
|
|
1,900 |
|
|
|
49,153 |
|
| Agree Realty Corp. |
|
|
979 |
|
|
|
29,439 |
|
| Alexander’s, Inc. |
|
|
96 |
|
|
|
29,567 |
|
| American Assets Trust, Inc. |
|
|
2,330 |
|
|
|
78,661 |
|
| American Capital Mortgage Investment Corp. |
|
|
3,820 |
|
|
|
101,459 |
|
| AmREIT, Inc. |
|
|
830 |
|
|
|
15,778 |
|
| Anworth Mortgage Asset Corp. |
|
|
10,551 |
|
|
|
66,577 |
|
| Apollo Commercial Real Estate Finance, Inc. |
|
|
2,170 |
|
|
|
38,496 |
|
| Apollo Residential Mortgage, Inc. |
|
|
1,990 |
|
|
|
44,297 |
|
| Ares Commercial Real Estate Corp.# |
|
|
1,220 |
|
|
|
20,533 |
|
| ARMOUR Residential REIT, Inc. |
|
|
25,780 |
|
|
|
167,312 |
|
| Ashford Hospitality Trust, Inc. |
|
|
4,350 |
|
|
|
56,028 |
|
| Associated Estates Realty Corp. |
|
|
2,294 |
|
|
|
40,994 |
|
| Campus Crest Communities, Inc. |
|
|
3,960 |
|
|
|
54,094 |
|
| CapLease, Inc. |
|
|
5,851 |
|
|
|
41,074 |
|
| Capstead Mortgage Corp. |
|
|
7,100 |
|
|
|
94,288 |
|
| Cedar Realty Trust, Inc. |
|
|
4,046 |
|
|
|
25,935 |
|
| Chatham Lodging Trust |
|
|
1,140 |
|
|
|
20,873 |
|
| Chesapeake Lodging Trust |
|
|
3,060 |
|
|
|
72,400 |
|
| Colonial Properties Trust |
|
|
5,853 |
|
|
|
135,848 |
|
| Colony Financial, Inc. |
|
|
4,320 |
|
|
|
96,336 |
|
| Coresite Realty Corp. |
|
|
1,190 |
|
|
|
43,054 |
|
| Cousins Properties, Inc. |
|
|
6,347 |
|
|
|
69,309 |
|
| CubeSmart |
|
|
8,804 |
|
|
|
154,686 |
|
| CYS Investments, Inc. |
|
|
11,860 |
|
|
|
147,420 |
|
| DCT Industrial Trust, Inc. |
|
|
16,955 |
|
|
|
132,758 |
|
| DiamondRock Hospitality Co. |
|
|
12,167 |
|
|
|
121,427 |
|
| DuPont Fabros Technology, Inc.# |
|
|
2,975 |
|
|
|
74,791 |
|
| Dynex Capital, Inc. |
|
|
4,520 |
|
|
|
48,590 |
|
| EastGroup Properties, Inc. |
|
|
1,254 |
|
|
|
79,090 |
|
| Education Realty Trust, Inc. |
|
|
6,101 |
|
|
|
67,050 |
|
| EPR Properties |
|
|
3,139 |
|
|
|
177,479 |
|
| Equity One, Inc. |
|
|
3,552 |
|
|
|
90,540 |
|
| Excel Trust, Inc. |
|
|
3,390 |
|
|
|
51,630 |
|
|
|
|
|
|
|
|
|
|
| Description
|
|
Number of
Shares |
|
|
Value
|
|
| FelCor Lodging Trust, Inc.* |
|
|
4,680 |
|
|
$ |
27,986 |
|
| First Industrial Realty Trust, Inc. |
|
|
6,382 |
|
|
|
114,493 |
|
| First Potomac Realty Trust |
|
|
3,384 |
|
|
|
54,144 |
|
| Franklin Street Properties Corp. |
|
|
5,357 |
|
|
|
81,801 |
|
| Geo Group, Inc. |
|
|
4,856 |
|
|
|
181,857 |
|
| Getty Realty Corp.# |
|
|
1,437 |
|
|
|
30,766 |
|
| Gladstone Commercial Corp.# |
|
|
1,150 |
|
|
|
22,011 |
|
| Glimcher Realty Trust |
|
|
5,605 |
|
|
|
70,287 |
|
| Government Properties Income Trust |
|
|
3,150 |
|
|
|
82,057 |
|
| Gramercy Property Trust, Inc.* |
|
|
3,070 |
|
|
|
14,582 |
|
| Healthcare Realty Trust, Inc. |
|
|
6,006 |
|
|
|
180,300 |
|
| Hersha Hospitality Trust |
|
|
10,648 |
|
|
|
63,675 |
|
| Highwoods Properties, Inc. |
|
|
3,335 |
|
|
|
136,835 |
|
| Hudson Pacific Properties, Inc. |
|
|
2,810 |
|
|
|
64,096 |
|
| Inland Real Estate Corp. |
|
|
4,565 |
|
|
|
51,676 |
|
| Invesco Mortgage Capital, Inc. |
|
|
9,240 |
|
|
|
197,736 |
|
| Investors Real Estate Trust |
|
|
6,057 |
|
|
|
58,935 |
|
| iStar Financial, Inc.#,* |
|
|
6,500 |
|
|
|
75,920 |
|
| JAVELIN Mortgage Investment Corp.# |
|
|
740 |
|
|
|
14,904 |
|
| Kite Realty Group Trust |
|
|
4,530 |
|
|
|
29,898 |
|
| LaSalle Hotel Properties |
|
|
5,061 |
|
|
|
131,232 |
|
| Lexington Realty Trust |
|
|
9,881 |
|
|
|
126,576 |
|
| LTC Properties, Inc. |
|
|
1,782 |
|
|
|
82,863 |
|
| Medical Properties Trust, Inc. |
|
|
9,865 |
|
|
|
158,728 |
|
| Mission West Properties Escrow |
|
|
1,655 |
|
|
|
— |
|
| Monmouth Real Estate Investment Corp. |
|
|
1,802 |
|
|
|
19,173 |
|
| National Health Investors, Inc. |
|
|
1,054 |
|
|
|
69,817 |
|
| New York Mortgage Trust, Inc.# |
|
|
4,850 |
|
|
|
34,629 |
|
| NorthStar Realty Finance Corp.# |
|
|
13,180 |
|
|
|
131,405 |
|
| Omega Healthcare Investors, Inc.# |
|
|
4,415 |
|
|
|
145,121 |
|
| One Liberty Properties, Inc. |
|
|
450 |
|
|
|
10,323 |
|
| Parkway Properties, Inc. |
|
|
1,329 |
|
|
|
24,228 |
|
| Pebblebrook Hotel Trust |
|
|
4,060 |
|
|
|
110,270 |
|
| Pennsylvania Real Estate Investment Trust# |
|
|
3,601 |
|
|
|
74,649 |
|
| PennyMac Mortgage Investment Trust |
|
|
4,010 |
|
|
|
101,253 |
|
| Potlatch Corp. |
|
|
2,031 |
|
|
|
96,168 |
|
| PS Business Parks, Inc. |
|
|
899 |
|
|
|
71,740 |
|
| RAIT Financial Trust# |
|
|
5,467 |
|
|
|
46,688 |
|
| Ramco-Gershenson Properties Trust |
|
|
4,064 |
|
|
|
70,998 |
|
| Redwood Trust, Inc. |
|
|
5,339 |
|
|
|
121,836 |
|
| Resource Capital Corp. |
|
|
7,982 |
|
|
|
52,601 |
|
| Retail Opportunity Investments Corp.# |
|
|
3,260 |
|
|
|
48,281 |
|
| RLJ Lodging Trust |
|
|
8,140 |
|
|
|
187,546 |
|
| Rouse Properties, Inc.# |
|
|
1,520 |
|
|
|
28,804 |
|
| Ryman Hospitality Properties# |
|
|
1,542 |
|
|
|
68,557 |
|
| Sabra Health Care REIT, Inc. |
|
|
2,723 |
|
|
|
81,200 |
|
| Saul Centers, Inc. |
|
|
438 |
|
|
|
19,622 |
|
| Select Income REIT |
|
|
1,180 |
|
|
|
33,665 |
|
ANNUAL
REPORT / April 30, 2013
|
|
|
| 64 |
|
PORTFOLIOS OF INVESTMENTS |
Wilmington Small-Cap Strategy Fund (continued)
|
|
|
|
|
|
|
|
|
| Description
|
|
Number of
Shares |
|
|
Value
|
|
| Silver Bay Realty Trust Corp. |
|
|
1,669 |
|
|
$ |
31,845 |
|
| Sovran Self Storage, Inc. |
|
|
1,207 |
|
|
|
82,800 |
|
| Spirit Realty Capital, Inc. |
|
|
1,690 |
|
|
|
36,386 |
|
| STAG Industrial, Inc. |
|
|
2,600 |
|
|
|
57,304 |
|
| Starwood Property Trust, Inc. |
|
|
9,120 |
|
|
|
250,709 |
|
| Strategic Hotels & Resorts, Inc.* |
|
|
7,160 |
|
|
|
57,781 |
|
| Summit Hotel Properties, Inc. |
|
|
4,370 |
|
|
|
43,656 |
|
| Sun Communities, Inc. |
|
|
1,211 |
|
|
|
61,943 |
|
| Sunstone Hotel Investors, Inc.* |
|
|
8,834 |
|
|
|
109,630 |
|
| Terreno Realty Corp. |
|
|
1,530 |
|
|
|
28,795 |
|
| Two Harbors Investment Corp. |
|
|
22,850 |
|
|
|
273,743 |
|
| UMH Properties, Inc. |
|
|
410 |
|
|
|
4,531 |
|
| Universal Health Realty Income Trust |
|
|
597 |
|
|
|
32,077 |
|
| Urstadt Biddle Properties, Inc. |
|
|
1,065 |
|
|
|
23,718 |
|
| Washington Real Estate Investment Trust |
|
|
3,652 |
|
|
|
104,301 |
|
| Western Asset Mortgage Capital Corp.# |
|
|
1,740 |
|
|
|
38,976 |
|
| Whitestone REIT# |
|
|
1,480 |
|
|
|
24,420 |
|
| Winthrop Realty Trust |
|
|
2,820 |
|
|
|
35,842 |
|
|
|
|
|
|
|
$ |
7,598,309 |
|
|
|
| REAL ESTATE MANAGEMENT &
DEVELOPMENT – 0.2% |
|
|
|
|
|
| AV Homes, Inc.* |
|
|
512 |
|
|
|
6,610 |
|
| Consolidated-Tomoka Land Co. |
|
|
290 |
|
|
|
10,791 |
|
| Forestar Group, Inc.* |
|
|
2,258 |
|
|
|
48,637 |
|
| Kennedy-Wilson Holdings, Inc. |
|
|
2,680 |
|
|
|
44,568 |
|
| Tejon Ranch Co.* |
|
|
798 |
|
|
|
23,286 |
|
| Thomas Properties Group, Inc. |
|
|
1,940 |
|
|
|
9,875 |
|
| Zillow, Inc.#,* |
|
|
60 |
|
|
|
3,530 |
|
|
|
|
|
|
|
$ |
147,297 |
|
|
|
| THRIFTS & MORTGAGE FINANCE – 2.3% |
|
|
|
|
|
| Astoria Financial Corp. |
|
|
6,650 |
|
|
|
63,773 |
|
| Bank Mutual Corp. |
|
|
4,791 |
|
|
|
24,817 |
|
| BankFinancial Corp. |
|
|
1,681 |
|
|
|
13,263 |
|
| Beneficial Mutual Bancorp, Inc.* |
|
|
1,250 |
|
|
|
10,687 |
|
| Berkshire Hills Bancorp, Inc. |
|
|
1,821 |
|
|
|
47,091 |
|
| BofI Holding, Inc.* |
|
|
650 |
|
|
|
26,507 |
|
| Brookline Bancorp, Inc. |
|
|
3,558 |
|
|
|
29,887 |
|
| Cape Bancorp, Inc. |
|
|
640 |
|
|
|
5,766 |
|
| Charter Financial Corp.# |
|
|
1,446 |
|
|
|
14,706 |
|
| Clifton Savings Bancorp, Inc. |
|
|
1,090 |
|
|
|
13,091 |
|
| Dime Community Bancshares, Inc. |
|
|
2,823 |
|
|
|
40,284 |
|
| Doral Financial Corp.#,* |
|
|
3,288 |
|
|
|
2,477 |
|
| ESB Financial Corp. |
|
|
1,560 |
|
|
|
21,840 |
|
| ESSA Bancorp, Inc. |
|
|
1,740 |
|
|
|
18,740 |
|
| EverBank Financial Corp.# |
|
|
1,410 |
|
|
|
22,560 |
|
| Federal Agricultural Mortgage Corp. |
|
|
470 |
|
|
|
14,937 |
|
| First Defiance Financial Corp. |
|
|
550 |
|
|
|
12,452 |
|
|
|
|
|
|
|
|
|
|
| Description
|
|
Number of
Shares |
|
|
Value
|
|
| First Financial Holdings, Inc. |
|
|
854 |
|
|
$ |
17,114 |
|
| First Financial Northwest, Inc.* |
|
|
2,580 |
|
|
|
20,898 |
|
| First Pactrust Bancorp, Inc.# |
|
|
500 |
|
|
|
5,680 |
|
| Flushing Financial Corp. |
|
|
2,554 |
|
|
|
38,770 |
|
| Fox Chase Bancorp, Inc. |
|
|
980 |
|
|
|
16,572 |
|
| Franklin Financial Corp. |
|
|
620 |
|
|
|
11,272 |
|
| Heritage Financial Group, Inc. |
|
|
1,120 |
|
|
|
16,565 |
|
| Hingham Institution for Savings |
|
|
230 |
|
|
|
15,642 |
|
| Home Bancorp, Inc.* |
|
|
710 |
|
|
|
12,851 |
|
| Home Federal Bancorp, Inc. |
|
|
653 |
|
|
|
7,954 |
|
| Home Loan Servicing Solutions Ltd. |
|
|
3,460 |
|
|
|
78,369 |
|
| HomeStreet, Inc. |
|
|
390 |
|
|
|
8,385 |
|
| Kearny Financial Corp. |
|
|
19 |
|
|
|
187 |
|
| Meridian Interstate Bancorp, Inc.* |
|
|
220 |
|
|
|
4,024 |
|
| MGIC Investment Corp.#,* |
|
|
20,850 |
|
|
|
112,590 |
|
| Nationstar Mortgage Holdings, Inc.#,* |
|
|
740 |
|
|
|
27,210 |
|
| Northfield Bancorp, Inc. |
|
|
625 |
|
|
|
7,350 |
|
| Northwest Bancshares, Inc. |
|
|
6,188 |
|
|
|
75,803 |
|
| OceanFirst Financial Corp. |
|
|
1,788 |
|
|
|
25,407 |
|
| Ocwen Financial Corp.* |
|
|
6,976 |
|
|
|
255,182 |
|
| Oritani Financial Corp. |
|
|
1,940 |
|
|
|
30,012 |
|
| Peoples Federal Bancshares, Inc. |
|
|
890 |
|
|
|
16,607 |
|
| Provident Financial Holdings, Inc. |
|
|
550 |
|
|
|
8,910 |
|
| Provident Financial Services, Inc. |
|
|
4,265 |
|
|
|
65,382 |
|
| Provident New York Bancorp |
|
|
3,574 |
|
|
|
32,309 |
|
| Radian Group, Inc.# |
|
|
11,556 |
|
|
|
138,094 |
|
| Rockville Financial, Inc. |
|
|
1,562 |
|
|
|
20,306 |
|
| Roma Financial Corp. |
|
|
100 |
|
|
|
1,702 |
|
| SI Financial Group, Inc. |
|
|
1,440 |
|
|
|
16,704 |
|
| Simplicity Bancorp, Inc. |
|
|
670 |
|
|
|
10,050 |
|
| Territorial Bancorp, Inc. |
|
|
730 |
|
|
|
17,067 |
|
| TrustCo Bank Corp. |
|
|
6,890 |
|
|
|
36,930 |
|
| United Financial Bancorp, Inc. |
|
|
2,130 |
|
|
|
31,545 |
|
| ViewPoint Financial Group, Inc. |
|
|
1,741 |
|
|
|
32,417 |
|
| Walker & Dunlop, Inc.* |
|
|
510 |
|
|
|
9,083 |
|
| Westfield Financial, Inc. |
|
|
3,124 |
|
|
|
23,524 |
|
| WSFS Financial Corp. |
|
|
738 |
|
|
|
36,118 |
|
|
|
|
|
|
|
$ |
1,667,463 |
|
| TOTAL FINANCIALS |
|
|
|
|
|
$ |
19,797,602 |
|
|
|
|
| HEALTH CARE – 10.3% |
|
|
|
|
|
|
|
|
|
|
|
| BIOTECHNOLOGY – 3.2% |
|
|
|
|
|
|
|
|
| Achillion Pharmaceuticals, Inc.* |
|
|
2,150 |
|
|
|
16,211 |
|
| Acorda Therapeutics, Inc.* |
|
|
1,733 |
|
|
|
68,575 |
|
| Aegerion Pharmaceuticals, Inc.#,* |
|
|
1,280 |
|
|
|
53,811 |
|
| Affymax, Inc.#,* |
|
|
1,875 |
|
|
|
1,688 |
|
| Alkermes PLC* |
|
|
4,913 |
|
|
|
150,387 |
|
April 30,
2013 / ANNUAL REPORT
|
|
|
|
|
| PORTFOLIOS OF INVESTMENTS |
|
|
65 |
|
Wilmington Small-Cap Strategy Fund (continued)
|
|
|
|
|
|
|
|
|
| Description
|
|
Number of
Shares |
|
|
Value
|
|
| Alnylam Pharmaceuticals, Inc.* |
|
|
1,970 |
|
|
$ |
47,181 |
|
| AMAG Pharmaceuticals, Inc.* |
|
|
1,020 |
|
|
|
22,491 |
|
| Amicus Therapeutics, Inc.#,* |
|
|
90 |
|
|
|
292 |
|
| Anacor Pharmaceuticals, Inc.#,* |
|
|
50 |
|
|
|
335 |
|
| Arena Pharmaceuticals, Inc.#,* |
|
|
9,430 |
|
|
|
77,703 |
|
| Arqule, Inc.* |
|
|
3,040 |
|
|
|
8,968 |
|
| Array BioPharma, Inc.* |
|
|
6,243 |
|
|
|
37,146 |
|
| Astex Pharmaceuticals* |
|
|
6,220 |
|
|
|
42,794 |
|
| AVEO Pharmaceuticals, Inc.#,* |
|
|
1,390 |
|
|
|
7,103 |
|
| BioCryst Pharmaceuticals, Inc.#,* |
|
|
1,130 |
|
|
|
2,271 |
|
| Biospecifics Technologies Corp.* |
|
|
150 |
|
|
|
2,380 |
|
| Biotime, Inc.#,* |
|
|
260 |
|
|
|
941 |
|
| Celldex Therapeutics, Inc.* |
|
|
3,363 |
|
|
|
43,887 |
|
| Cepheid, Inc.* |
|
|
2,607 |
|
|
|
99,405 |
|
| Clovis Oncology, Inc.#,* |
|
|
530 |
|
|
|
19,833 |
|
| Codexis, Inc.* |
|
|
770 |
|
|
|
1,725 |
|
| Coronado Biosciences, Inc.#,* |
|
|
1,460 |
|
|
|
16,425 |
|
| Cubist Pharmaceuticals, Inc.* |
|
|
2,542 |
|
|
|
116,729 |
|
| Curis, Inc.#,* |
|
|
2,950 |
|
|
|
11,062 |
|
| Cytori Therapeutics, Inc.#,* |
|
|
2,187 |
|
|
|
6,145 |
|
| Dendreon Corp.#,* |
|
|
5,560 |
|
|
|
26,188 |
|
| Discovery Laboratories, Inc.* |
|
|
4,290 |
|
|
|
7,250 |
|
| Dyax Corp.* |
|
|
2,921 |
|
|
|
8,033 |
|
| Dynavax Technologies Corp.* |
|
|
6,770 |
|
|
|
15,909 |
|
| Emergent Biosolutions, Inc.* |
|
|
991 |
|
|
|
15,202 |
|
| Enzon Pharmaceuticals, Inc. |
|
|
1,860 |
|
|
|
6,138 |
|
| Exact Sciences Corp.* |
|
|
2,440 |
|
|
|
22,790 |
|
| Exelixis, Inc.#,* |
|
|
8,152 |
|
|
|
42,309 |
|
| Genomic Health, Inc.#,* |
|
|
750 |
|
|
|
22,770 |
|
| Geron Corp.* |
|
|
6,027 |
|
|
|
7,052 |
|
| GTx, Inc.* |
|
|
350 |
|
|
|
1,617 |
|
| Halozyme Therapeutics, Inc.* |
|
|
3,951 |
|
|
|
23,864 |
|
| Idenix Pharmaceuticals, Inc.#,* |
|
|
3,412 |
|
|
|
12,624 |
|
| ImmunoCellular Therapeutics Ltd.* |
|
|
4,650 |
|
|
|
11,718 |
|
| ImmunoGen, Inc.#,* |
|
|
4,218 |
|
|
|
67,572 |
|
| Immunomedics, Inc.* |
|
|
2,800 |
|
|
|
7,168 |
|
| Infinity Pharmaceuticals, Inc.* |
|
|
980 |
|
|
|
42,228 |
|
| InterMune, Inc.#,* |
|
|
3,946 |
|
|
|
36,816 |
|
| Ironwood Pharmaceuticals, Inc.#,* |
|
|
3,380 |
|
|
|
51,410 |
|
| Isis Pharmaceuticals, Inc.* |
|
|
3,582 |
|
|
|
80,201 |
|
| Keryx Biopharmaceuticals, Inc.#,* |
|
|
2,860 |
|
|
|
23,309 |
|
| Lexicon Pharmaceuticals, Inc.* |
|
|
9,060 |
|
|
|
17,939 |
|
| Ligand Pharmaceuticals, Inc.#,* |
|
|
655 |
|
|
|
17,895 |
|
| MannKind Corp.#,* |
|
|
7,307 |
|
|
|
28,863 |
|
| Maxygen, Inc. |
|
|
196 |
|
|
|
470 |
|
| Momenta Pharmaceuticals, Inc.* |
|
|
2,030 |
|
|
|
25,010 |
|
| Neurocrine Biosciences, Inc.* |
|
|
2,837 |
|
|
|
32,739 |
|
| NewLink Genetics Corp.#,* |
|
|
470 |
|
|
|
6,552 |
|
|
|
|
|
|
|
|
|
|
| Description
|
|
Number of
Shares |
|
|
Value
|
|
| Novavax, Inc.#,* |
|
|
5,063 |
|
|
$ |
11,898 |
|
| NPS Pharmaceuticals, Inc.* |
|
|
3,352 |
|
|
|
45,017 |
|
| OncoGenex Pharmaceutical, Inc.#,* |
|
|
1,200 |
|
|
|
12,156 |
|
| Oncothyreon, Inc.#,* |
|
|
2,180 |
|
|
|
5,472 |
|
| Opko Health, Inc.#,* |
|
|
5,020 |
|
|
|
33,433 |
|
| Orexigen Therapeutics, Inc.#,* |
|
|
3,845 |
|
|
|
23,378 |
|
| Osiris Therapeutics, Inc.#,* |
|
|
704 |
|
|
|
7,899 |
|
| PDL BioPharma, Inc.# |
|
|
6,856 |
|
|
|
53,065 |
|
| Pharmacyclics, Inc.* |
|
|
2,070 |
|
|
|
168,705 |
|
| Progenics Pharmaceuticals, Inc.* |
|
|
1,876 |
|
|
|
8,630 |
|
| Raptor Pharmaceutical Corp.#,* |
|
|
3,780 |
|
|
|
26,082 |
|
| Repligen Corp.* |
|
|
1,780 |
|
|
|
15,949 |
|
| Rigel Pharmaceuticals, Inc.* |
|
|
3,171 |
|
|
|
15,189 |
|
| Sangamo Biosciences, Inc.#,* |
|
|
2,305 |
|
|
|
23,465 |
|
| Seattle Genetics, Inc.#,* |
|
|
3,815 |
|
|
|
140,964 |
|
| SIGA Technologies, Inc.#,* |
|
|
1,840 |
|
|
|
6,072 |
|
| Spectrum Pharmaceuticals, Inc.# |
|
|
2,840 |
|
|
|
21,044 |
|
| Sunesis Pharmaceuticals, Inc.#,* |
|
|
610 |
|
|
|
3,434 |
|
| Synageva BioPharma Corp.* |
|
|
450 |
|
|
|
23,261 |
|
| Synergy Pharmaceuticals, Inc.#,* |
|
|
2,310 |
|
|
|
12,128 |
|
| Synta Pharmaceuticals Corp.* |
|
|
2,000 |
|
|
|
20,500 |
|
| Targacept, Inc.* |
|
|
640 |
|
|
|
2,950 |
|
| Theravance, Inc.#,* |
|
|
2,616 |
|
|
|
88,290 |
|
| Threshold Pharmaceuticals, Inc.#,* |
|
|
1,280 |
|
|
|
6,170 |
|
| Trius Therapeutics, Inc.* |
|
|
1,740 |
|
|
|
12,128 |
|
| Vanda Pharmaceuticals, Inc.* |
|
|
4,140 |
|
|
|
20,120 |
|
| Vical, Inc.#,* |
|
|
1,980 |
|
|
|
7,306 |
|
| Xoma Corp.#,* |
|
|
3,250 |
|
|
|
11,375 |
|
| ZIOPHARM Oncology, Inc.#,* |
|
|
2,920 |
|
|
|
4,906 |
|
|
|
|
|
|
|
$ |
2,348,110 |
|
|
|
| HEALTH CARE EQUIPMENT &
SUPPLIES – 2.6% |
|
|
|
|
|
| Abaxis, Inc. |
|
|
1,051 |
|
|
|
44,867 |
|
| ABIOMED, Inc.#,* |
|
|
1,412 |
|
|
|
26,080 |
|
| Accuray, Inc.#,* |
|
|
2,732 |
|
|
|
12,021 |
|
| Align Technology, Inc.* |
|
|
2,941 |
|
|
|
97,406 |
|
| Alphatec Holdings, Inc.* |
|
|
400 |
|
|
|
756 |
|
| Analogic Corp. |
|
|
508 |
|
|
|
40,376 |
|
| AngioDynamics, Inc.* |
|
|
989 |
|
|
|
10,019 |
|
| Antares Pharma, Inc.#,* |
|
|
3,030 |
|
|
|
11,484 |
|
| ArthroCare Corp.* |
|
|
1,340 |
|
|
|
46,431 |
|
| AtriCure, Inc.* |
|
|
750 |
|
|
|
6,255 |
|
| Atrion Corp. |
|
|
90 |
|
|
|
18,035 |
|
| Biolase Technology, Inc.#,* |
|
|
2 |
|
|
|
11 |
|
| Cantel Medical Corp. |
|
|
846 |
|
|
|
26,742 |
|
| Cardiovascular Systems, Inc.* |
|
|
1,160 |
|
|
|
19,906 |
|
| Cerus Corp.#,* |
|
|
2,350 |
|
|
|
12,502 |
|
ANNUAL
REPORT / April 30, 2013
|
|
|
| 66 |
|
PORTFOLIOS OF INVESTMENTS |
Wilmington Small-Cap Strategy Fund (continued)
|
|
|
|
|
|
|
|
|
| Description
|
|
Number of
Shares |
|
|
Value
|
|
| Conceptus, Inc.* |
|
|
1,470 |
|
|
$ |
45,585 |
|
| CONMED Corp. |
|
|
1,873 |
|
|
|
58,681 |
|
| CryoLife, Inc. |
|
|
1,550 |
|
|
|
9,300 |
|
| Cyberonics, Inc.* |
|
|
1,150 |
|
|
|
49,933 |
|
| Cynosure, Inc.* |
|
|
603 |
|
|
|
15,594 |
|
| Derma Sciences, Inc.#,* |
|
|
930 |
|
|
|
11,244 |
|
| DexCom, Inc.* |
|
|
3,063 |
|
|
|
50,264 |
|
| Endologix, Inc.* |
|
|
2,710 |
|
|
|
40,704 |
|
| Exactech, Inc.* |
|
|
622 |
|
|
|
11,507 |
|
| Greatbatch, Inc.* |
|
|
1,511 |
|
|
|
42,217 |
|
| Haemonetics Corp.* |
|
|
2,100 |
|
|
|
80,850 |
|
| Hansen Medical, Inc.* |
|
|
2,673 |
|
|
|
5,239 |
|
| HeartWare International, Inc.#,* |
|
|
650 |
|
|
|
63,180 |
|
| ICU Medical, Inc.* |
|
|
557 |
|
|
|
33,559 |
|
| Insulet Corp.* |
|
|
2,181 |
|
|
|
55,048 |
|
| Integra LifeSciences Holdings Corp.* |
|
|
897 |
|
|
|
31,422 |
|
| Invacare Corp. |
|
|
1,684 |
|
|
|
22,650 |
|
| MAKO Surgical Corp.#,* |
|
|
1,390 |
|
|
|
14,720 |
|
| Masimo Corp. |
|
|
2,411 |
|
|
|
48,365 |
|
| Meridian Bioscience, Inc.# |
|
|
1,494 |
|
|
|
30,313 |
|
| Merit Medical Systems, Inc.* |
|
|
2,560 |
|
|
|
24,755 |
|
| Natus Medical, Inc.* |
|
|
1,193 |
|
|
|
14,924 |
|
| Navidea Biopharmaceuticals, Inc.#,* |
|
|
5,470 |
|
|
|
13,402 |
|
| Neogen Corp.* |
|
|
1,013 |
|
|
|
51,491 |
|
| NuVasive, Inc.* |
|
|
2,200 |
|
|
|
46,134 |
|
| NxStage Medical, Inc.* |
|
|
2,631 |
|
|
|
29,388 |
|
| OraSure Technologies, Inc.* |
|
|
3,017 |
|
|
|
13,456 |
|
| Orthofix International NV* |
|
|
901 |
|
|
|
29,192 |
|
| Palomar Medical Technologies, Inc.* |
|
|
1,323 |
|
|
|
17,927 |
|
| PhotoMedex, Inc.#,* |
|
|
670 |
|
|
|
10,921 |
|
| Quidel Corp.#,* |
|
|
1,297 |
|
|
|
28,949 |
|
| Rochester Medical Corp.* |
|
|
780 |
|
|
|
10,592 |
|
| Rockwell Medical Technologies, Inc.#,* |
|
|
1,370 |
|
|
|
5,809 |
|
| RTI Biologics, Inc.* |
|
|
4,370 |
|
|
|
17,393 |
|
| Solta Medical, Inc.* |
|
|
3,890 |
|
|
|
7,586 |
|
| Spectranetics Corp.* |
|
|
1,838 |
|
|
|
34,279 |
|
| Staar Surgical Co.* |
|
|
1,250 |
|
|
|
8,725 |
|
| STERIS Corp. |
|
|
2,760 |
|
|
|
114,788 |
|
| SurModics, Inc.* |
|
|
700 |
|
|
|
18,515 |
|
| Symmetry Medical, Inc.* |
|
|
2,448 |
|
|
|
29,180 |
|
| Tornier NV* |
|
|
1,090 |
|
|
|
19,827 |
|
| Unilife Corp.#,* |
|
|
3,980 |
|
|
|
7,880 |
|
| Vascular Solutions, Inc.* |
|
|
940 |
|
|
|
14,955 |
|
| Volcano Corp.#,* |
|
|
2,349 |
|
|
|
47,661 |
|
| West Pharmaceutical Services, Inc. |
|
|
1,640 |
|
|
|
104,730 |
|
| Wright Medical Group, Inc.* |
|
|
2,600 |
|
|
|
60,944 |
|
|
|
|
|
|
|
|
|
|
| Description
|
|
Number of
Shares |
|
|
Value
|
|
| Zeltiq Aesthetics, Inc.* |
|
|
40 |
|
|
$ |
175 |
|
|
|
|
|
|
|
$ |
1,876,844 |
|
|
|
| HEALTH CARE PROVIDERS &
SERVICES – 2.3% |
|
|
|
|
|
| Acadia Healthcare Co., Inc.* |
|
|
1,190 |
|
|
|
37,544 |
|
| Accretive Health, Inc.#,* |
|
|
1,700 |
|
|
|
17,918 |
|
| Air Methods Corp. |
|
|
1,633 |
|
|
|
59,751 |
|
| Almost Family, Inc. |
|
|
248 |
|
|
|
4,896 |
|
| Amedisys, Inc.* |
|
|
2,536 |
|
|
|
25,461 |
|
| AMN Healthcare Services, Inc.* |
|
|
1,918 |
|
|
|
26,334 |
|
| Amsurg Corp.* |
|
|
1,610 |
|
|
|
54,032 |
|
| Assisted Living Concepts, Inc.# |
|
|
1,914 |
|
|
|
22,815 |
|
| Bio-Reference Labs, Inc.#,* |
|
|
988 |
|
|
|
25,194 |
|
| BioScrip, Inc.* |
|
|
1,960 |
|
|
|
27,166 |
|
| Capital Senior Living Corp.* |
|
|
1,128 |
|
|
|
27,365 |
|
| Centene Corp.* |
|
|
2,077 |
|
|
|
95,957 |
|
| Chemed Corp. |
|
|
845 |
|
|
|
68,969 |
|
| Chindex International, Inc.* |
|
|
861 |
|
|
|
11,796 |
|
| Corvel Corp.* |
|
|
340 |
|
|
|
16,140 |
|
| Cross Country Healthcare, Inc.* |
|
|
884 |
|
|
|
4,420 |
|
| Emeritus Corp.* |
|
|
1,276 |
|
|
|
32,793 |
|
| Ensign Group, Inc. |
|
|
869 |
|
|
|
30,302 |
|
| ExamWorks Group, Inc.#,* |
|
|
1,950 |
|
|
|
35,295 |
|
| Five Star Quality Care, Inc.* |
|
|
2,940 |
|
|
|
13,906 |
|
| Gentiva Health Services, Inc.* |
|
|
1,367 |
|
|
|
14,340 |
|
| Hanger, Inc.* |
|
|
2,053 |
|
|
|
62,391 |
|
| HealthSouth Corp.* |
|
|
4,174 |
|
|
|
114,785 |
|
| Healthways, Inc.* |
|
|
2,700 |
|
|
|
37,503 |
|
| IPC The Hospitalist Co., Inc.* |
|
|
840 |
|
|
|
38,321 |
|
| Kindred Healthcare, Inc.* |
|
|
4,305 |
|
|
|
45,159 |
|
| Landauer, Inc. |
|
|
356 |
|
|
|
19,890 |
|
| LHC Group, Inc.* |
|
|
547 |
|
|
|
11,881 |
|
| Magellan Health Services, Inc.* |
|
|
1,825 |
|
|
|
93,367 |
|
| Molina Healthcare, Inc.* |
|
|
1,702 |
|
|
|
56,506 |
|
| MWI Veterinary Supply, Inc.* |
|
|
530 |
|
|
|
62,386 |
|
| National Healthcare Corp. |
|
|
700 |
|
|
|
32,501 |
|
| National Research Corp. |
|
|
210 |
|
|
|
12,590 |
|
| Owens & Minor, Inc.# |
|
|
2,906 |
|
|
|
94,648 |
|
| PharMerica Corp.* |
|
|
1,299 |
|
|
|
16,744 |
|
| Providence Service Corp.* |
|
|
510 |
|
|
|
8,930 |
|
| Select Medical Holdings Corp. |
|
|
1,750 |
|
|
|
14,438 |
|
| Skilled Healthcare Group, Inc.* |
|
|
649 |
|
|
|
4,569 |
|
| Team Health Holdings, Inc.* |
|
|
1,130 |
|
|
|
42,126 |
|
| Triple-S Management Corp.* |
|
|
941 |
|
|
|
16,966 |
|
| Universal American Corp. |
|
|
3,043 |
|
|
|
26,018 |
|
| US Physical Therapy, Inc. |
|
|
472 |
|
|
|
11,262 |
|
| Vanguard Health Systems, Inc.* |
|
|
1,470 |
|
|
|
21,506 |
|
April 30,
2013 / ANNUAL REPORT
|
|
|
|
|
| PORTFOLIOS OF INVESTMENTS |
|
|
67 |
|
Wilmington Small-Cap Strategy Fund (continued)
|
|
|
|
|
|
|
|
|
| Description
|
|
Number of
Shares |
|
|
Value
|
|
| WellCare Health Plans, Inc.* |
|
|
2,320 |
|
|
$ |
135,279 |
|
|
|
|
|
|
|
$ |
1,632,160 |
|
|
|
| HEALTH CARE TECHNOLOGY – 0.7% |
|
|
|
|
|
| athenahealth, Inc.#,* |
|
|
1,400 |
|
|
|
134,764 |
|
| Computer Programs & Systems, Inc. |
|
|
573 |
|
|
|
30,060 |
|
| Greenway Medical Technologies#,* |
|
|
740 |
|
|
|
9,968 |
|
| HealthStream, Inc.* |
|
|
720 |
|
|
|
16,531 |
|
| HMS Holdings Corp.* |
|
|
3,477 |
|
|
|
87,655 |
|
| MedAssets, Inc.* |
|
|
3,109 |
|
|
|
58,232 |
|
| Medidata Solutions, Inc.* |
|
|
860 |
|
|
|
57,070 |
|
| Merge Healthcare, Inc.#,* |
|
|
2,830 |
|
|
|
8,830 |
|
| Omnicell, Inc.* |
|
|
2,048 |
|
|
|
36,905 |
|
| Quality Systems, Inc. |
|
|
1,886 |
|
|
|
33,703 |
|
| Vocera Communications, Inc.* |
|
|
380 |
|
|
|
7,524 |
|
|
|
|
|
|
|
$ |
481,242 |
|
|
|
| LIFE SCIENCES TOOLS &
SERVICES – 0.3% |
|
|
|
|
|
| Affymetrix, Inc.* |
|
|
3,504 |
|
|
|
12,755 |
|
| BG Medicine, Inc.#,* |
|
|
280 |
|
|
|
462 |
|
| Cambrex Corp.* |
|
|
1,134 |
|
|
|
14,164 |
|
| Fluidigm Corp.#,* |
|
|
980 |
|
|
|
16,503 |
|
| Furiex Pharmaceuticals, Inc.* |
|
|
370 |
|
|
|
12,561 |
|
| Harvard Bioscience, Inc.* |
|
|
650 |
|
|
|
3,328 |
|
| Luminex Corp.* |
|
|
1,688 |
|
|
|
28,071 |
|
| Pacific Biosciences of California, Inc.* |
|
|
1,380 |
|
|
|
3,533 |
|
| PAREXEL International Corp.* |
|
|
2,399 |
|
|
|
98,239 |
|
| Sequenom, Inc.#,* |
|
|
5,682 |
|
|
|
21,421 |
|
|
|
|
|
|
|
$ |
211,037 |
|
|
|
|
| PHARMACEUTICALS – 1.2% |
|
|
|
|
|
|
|
|
| Acura Pharmaceuticals, Inc.#,* |
|
|
1,700 |
|
|
|
4,165 |
|
| Akorn, Inc.* |
|
|
2,550 |
|
|
|
38,377 |
|
| Ampio Pharmaceuticals, Inc.#,* |
|
|
1,230 |
|
|
|
6,199 |
|
| Auxilium Pharmaceuticals, Inc.* |
|
|
1,611 |
|
|
|
24,052 |
|
| AVANIR Pharmaceuticals, Inc.#,* |
|
|
5,770 |
|
|
|
18,406 |
|
| BioDelivery Sciences International, Inc.#,* |
|
|
2,450 |
|
|
|
13,916 |
|
| Cadence Pharmaceuticals, Inc.#,* |
|
|
2,659 |
|
|
|
18,826 |
|
| Corcept Therapeutics, Inc.* |
|
|
490 |
|
|
|
867 |
|
| Cornerstone Therapeutics, Inc.* |
|
|
20 |
|
|
|
168 |
|
| Cumberland Pharmaceuticals, Inc.* |
|
|
2,910 |
|
|
|
13,619 |
|
| Depomed, Inc.* |
|
|
2,530 |
|
|
|
13,940 |
|
| Endocyte, Inc.* |
|
|
1,160 |
|
|
|
16,112 |
|
| Hi-Tech Pharmacal Co., Inc. |
|
|
570 |
|
|
|
18,844 |
|
| Horizon Pharma, Inc.#,* |
|
|
80 |
|
|
|
192 |
|
| Impax Laboratories, Inc.* |
|
|
2,680 |
|
|
|
46,900 |
|
| Jazz Pharmaceuticals PLC* |
|
|
1,690 |
|
|
|
98,612 |
|
| Lannett Co., Inc.* |
|
|
460 |
|
|
|
5,341 |
|
| Medicines Co.* |
|
|
2,079 |
|
|
|
70,187 |
|
| Nektar Therapeutics#,* |
|
|
5,162 |
|
|
|
55,956 |
|
|
|
|
|
|
|
|
|
|
| Description
|
|
Number of
Shares |
|
|
Value
|
|
| Omeros Corp.#,* |
|
|
1,000 |
|
|
$ |
4,030 |
|
| Optimer Pharmaceuticals, Inc.#,* |
|
|
2,215 |
|
|
|
34,200 |
|
| Pacira Pharmaceuticals, Inc.#,* |
|
|
900 |
|
|
|
25,983 |
|
| Pain Therapeutics, Inc. |
|
|
2,020 |
|
|
|
8,322 |
|
| Pernix Therapeutics Holdings#,* |
|
|
1,740 |
|
|
|
6,647 |
|
| Pozen, Inc.* |
|
|
725 |
|
|
|
3,574 |
|
| Questcor Pharmaceuticals, Inc.# |
|
|
2,109 |
|
|
|
64,831 |
|
| Repros Therapeutics, Inc.#,* |
|
|
620 |
|
|
|
12,611 |
|
| Sagent Pharmaceuticals, Inc.#,* |
|
|
320 |
|
|
|
5,293 |
|
| Santarus, Inc.* |
|
|
2,380 |
|
|
|
43,721 |
|
| Sciclone Pharmaceuticals, Inc.* |
|
|
2,900 |
|
|
|
13,717 |
|
| Sucampo Pharmaceuticals, Inc.* |
|
|
892 |
|
|
|
8,483 |
|
| ViroPharma, Inc.* |
|
|
4,474 |
|
|
|
121,917 |
|
| Vivus, Inc.#,* |
|
|
3,626 |
|
|
|
48,190 |
|
| XenoPort, Inc.* |
|
|
2,584 |
|
|
|
16,047 |
|
| Zogenix, Inc.#,* |
|
|
3,430 |
|
|
|
5,934 |
|
|
|
|
|
|
|
$ |
888,179 |
|
| TOTAL HEALTH CARE |
|
|
|
|
|
$ |
7,437,572 |
|
|
|
|
| INDUSTRIALS – 14.0% |
|
|
|
|
|
|
|
|
|
|
|
| AEROSPACE & DEFENSE – 1.7% |
|
|
|
|
|
|
|
|
| AAR Corp. |
|
|
3,096 |
|
|
|
55,295 |
|
| Aerovironment, Inc.* |
|
|
614 |
|
|
|
11,887 |
|
| American Science & Engineering, Inc. |
|
|
354 |
|
|
|
22,826 |
|
| API Technologies Corp.* |
|
|
3,490 |
|
|
|
9,632 |
|
| Astronics Corp.* |
|
|
510 |
|
|
|
14,178 |
|
| Cubic Corp. |
|
|
628 |
|
|
|
26,985 |
|
| Curtiss-Wright Corp. |
|
|
3,076 |
|
|
|
101,016 |
|
| DigitalGlobe, Inc.* |
|
|
3,057 |
|
|
|
89,234 |
|
| Esterline Technologies Corp.* |
|
|
2,077 |
|
|
|
155,858 |
|
| GenCorp., Inc.#,* |
|
|
2,539 |
|
|
|
33,185 |
|
| HEICO Corp. |
|
|
2,161 |
|
|
|
95,106 |
|
| Hexcel Corp.* |
|
|
3,993 |
|
|
|
121,786 |
|
| KEYW Holding Corp.#,* |
|
|
1,290 |
|
|
|
17,531 |
|
| Kratos Defense & Security Solutions, Inc.* |
|
|
3,161 |
|
|
|
16,089 |
|
| LMI Aerospace, Inc.* |
|
|
657 |
|
|
|
14,053 |
|
| Moog, Inc.* |
|
|
3,176 |
|
|
|
146,763 |
|
| National Presto Industries, Inc. |
|
|
312 |
|
|
|
23,400 |
|
| Orbital Sciences Corp.* |
|
|
3,861 |
|
|
|
69,575 |
|
| SIFCO Industries, Inc. |
|
|
700 |
|
|
|
11,956 |
|
| Sypris Solutions, Inc. |
|
|
3,040 |
|
|
|
9,728 |
|
| Taser International, Inc.* |
|
|
3,071 |
|
|
|
27,056 |
|
| Teledyne Technologies, Inc.* |
|
|
1,984 |
|
|
|
148,919 |
|
|
|
|
|
|
|
$ |
1,222,058 |
|
|
|
|
| AIR FREIGHT & LOGISTICS – 0.3% |
|
|
|
|
|
|
|
|
| Air Transport Services Group, Inc.* |
|
|
3,040 |
|
|
|
17,541 |
|
ANNUAL
REPORT / April 30, 2013
|
|
|
| 68 |
|
PORTFOLIOS OF INVESTMENTS |
Wilmington Small-Cap Strategy Fund (continued)
|
|
|
|
|
|
|
|
|
| Description
|
|
Number of
Shares |
|
|
Value
|
|
| Atlas Air Worldwide Holdings, Inc.* |
|
|
1,494 |
|
|
$ |
55,876 |
|
| Echo Global Logistics, Inc.* |
|
|
470 |
|
|
|
8,154 |
|
| Forward Air Corp. |
|
|
1,171 |
|
|
|
43,198 |
|
| Hub Group, Inc.* |
|
|
1,592 |
|
|
|
58,347 |
|
| Pacer International, Inc.* |
|
|
2,385 |
|
|
|
13,571 |
|
| Park-Ohio Holdings Corp.* |
|
|
320 |
|
|
|
11,770 |
|
| XPO Logistics, Inc.#,* |
|
|
680 |
|
|
|
11,091 |
|
|
|
|
|
|
|
$ |
219,548 |
|
|
|
|
| AIRLINES – 0.8% |
|
|
|
|
|
|
|
|
| Alaska Air Group, Inc.* |
|
|
2,864 |
|
|
|
176,537 |
|
| Allegiant Travel Co. |
|
|
574 |
|
|
|
51,603 |
|
| Hawaiian Holdings, Inc.#,* |
|
|
2,093 |
|
|
|
11,491 |
|
| JetBlue Airways Corp.#,* |
|
|
15,274 |
|
|
|
105,238 |
|
| Republic Airways Holdings, Inc.* |
|
|
3,591 |
|
|
|
40,183 |
|
| SkyWest, Inc. |
|
|
3,653 |
|
|
|
52,274 |
|
| Spirit Airlines, Inc.* |
|
|
1,690 |
|
|
|
45,123 |
|
| US Airways Group, Inc.#,* |
|
|
6,686 |
|
|
|
112,993 |
|
|
|
|
|
|
|
$ |
595,442 |
|
|
|
|
| BUILDING PRODUCTS – 1.0% |
|
|
|
|
|
|
|
|
| AAON, Inc. |
|
|
698 |
|
|
|
19,830 |
|
| American Woodmark Corp.* |
|
|
615 |
|
|
|
20,695 |
|
| AO Smith Corp. |
|
|
2,378 |
|
|
|
179,373 |
|
| Apogee Enterprises, Inc. |
|
|
2,150 |
|
|
|
54,782 |
|
| Builders FirstSource, Inc.* |
|
|
2,810 |
|
|
|
17,394 |
|
| Gibraltar Industries, Inc.* |
|
|
2,030 |
|
|
|
37,961 |
|
| Griffon Corp. |
|
|
2,619 |
|
|
|
26,976 |
|
| Insteel Industries, Inc. |
|
|
900 |
|
|
|
14,922 |
|
| NCI Building Systems, Inc.* |
|
|
1,422 |
|
|
|
24,345 |
|
| Nortek, Inc.* |
|
|
400 |
|
|
|
28,744 |
|
| Quanex Building Products Corp. |
|
|
2,013 |
|
|
|
32,752 |
|
| Simpson Manufacturing Co., Inc. |
|
|
2,431 |
|
|
|
69,867 |
|
| Trex Co., Inc.* |
|
|
669 |
|
|
|
32,567 |
|
| Universal Forest Products, Inc. |
|
|
1,306 |
|
|
|
50,412 |
|
| USG Corp.#,* |
|
|
3,070 |
|
|
|
79,789 |
|
|
|
|
|
|
|
$ |
690,409 |
|
|
|
| COMMERCIAL SERVICES &
SUPPLIES – 2.0% |
|
|
|
|
|
| ABM Industries, Inc. |
|
|
3,109 |
|
|
|
70,108 |
|
| ACCO Brands Corp.* |
|
|
4,900 |
|
|
|
33,075 |
|
| Acorn Energy, Inc.# |
|
|
1,070 |
|
|
|
8,025 |
|
| ARC Document Solutions, Inc.* |
|
|
918 |
|
|
|
2,947 |
|
| AT Cross Co.* |
|
|
1,030 |
|
|
|
12,999 |
|
| Brink’s Co. |
|
|
1,960 |
|
|
|
51,960 |
|
| Casella Waste Systems, Inc.* |
|
|
1,750 |
|
|
|
7,630 |
|
| Cenveo, Inc.#,* |
|
|
593 |
|
|
|
1,210 |
|
| Compx International, Inc. |
|
|
70 |
|
|
|
875 |
|
| Consolidated Graphics, Inc.* |
|
|
502 |
|
|
|
17,906 |
|
| Courier Corp. |
|
|
104 |
|
|
|
1,498 |
|
|
|
|
|
|
|
|
|
|
| Description
|
|
Number of
Shares |
|
|
Value
|
|
| Deluxe Corp. |
|
|
2,415 |
|
|
$ |
92,108 |
|
| EnergySolutions, Inc.* |
|
|
6,471 |
|
|
|
26,725 |
|
| EnerNOC, Inc.* |
|
|
1,694 |
|
|
|
29,679 |
|
| Ennis, Inc. |
|
|
2,059 |
|
|
|
31,647 |
|
| G&K Services, Inc. |
|
|
1,174 |
|
|
|
55,166 |
|
| Healthcare Services Group, Inc. |
|
|
2,905 |
|
|
|
64,752 |
|
| Heritage-Crystal Clean, Inc.#,* |
|
|
550 |
|
|
|
8,552 |
|
| Herman Miller, Inc. |
|
|
2,305 |
|
|
|
57,832 |
|
| HNI Corp. |
|
|
1,923 |
|
|
|
66,209 |
|
| InnerWorkings, Inc.#,* |
|
|
1,580 |
|
|
|
15,911 |
|
| Interface, Inc. |
|
|
2,765 |
|
|
|
46,286 |
|
| Intersections, Inc. |
|
|
80 |
|
|
|
765 |
|
| Kimball International, Inc. |
|
|
2,450 |
|
|
|
22,515 |
|
| Knoll, Inc. |
|
|
2,222 |
|
|
|
34,574 |
|
| McGrath RentCorp |
|
|
1,070 |
|
|
|
33,234 |
|
| Metalico, Inc.* |
|
|
1,003 |
|
|
|
1,494 |
|
| Mine Safety Appliances Co. |
|
|
1,173 |
|
|
|
56,304 |
|
| Mobile Mini, Inc.* |
|
|
2,738 |
|
|
|
77,020 |
|
| Multi-Color Corp. |
|
|
681 |
|
|
|
17,611 |
|
| NL Industries, Inc. |
|
|
42 |
|
|
|
473 |
|
| Performant Financial Corp.* |
|
|
940 |
|
|
|
9,146 |
|
| Quad/Graphics, Inc.# |
|
|
1,850 |
|
|
|
38,665 |
|
| Schawk, Inc. |
|
|
343 |
|
|
|
3,492 |
|
| Standard Parking Corp.* |
|
|
588 |
|
|
|
12,636 |
|
| Steelcase, Inc. |
|
|
4,610 |
|
|
|
58,547 |
|
| Team, Inc.* |
|
|
784 |
|
|
|
30,388 |
|
| Tetra Tech, Inc.* |
|
|
2,984 |
|
|
|
78,449 |
|
| TMS International Corp. |
|
|
1,160 |
|
|
|
16,750 |
|
| TRC Cos., Inc.* |
|
|
320 |
|
|
|
1,933 |
|
| UniFirst Corp. |
|
|
868 |
|
|
|
79,031 |
|
| United Stationers, Inc. |
|
|
2,758 |
|
|
|
89,552 |
|
| US Ecology, Inc. |
|
|
1,024 |
|
|
|
27,853 |
|
| Viad Corp. |
|
|
1,055 |
|
|
|
27,483 |
|
|
|
|
|
|
|
$ |
1,421,015 |
|
|
|
| CONSTRUCTION & ENGINEERING – 0.9% |
|
|
|
|
|
| Aegion Corp.* |
|
|
2,473 |
|
|
|
52,081 |
|
| Ameresco, Inc.* |
|
|
770 |
|
|
|
5,675 |
|
| Argan, Inc. |
|
|
810 |
|
|
|
14,337 |
|
| Comfort Systems USA, Inc. |
|
|
2,191 |
|
|
|
28,111 |
|
| Dycom Industries, Inc.* |
|
|
1,557 |
|
|
|
30,081 |
|
| EMCOR Group, Inc. |
|
|
4,502 |
|
|
|
168,375 |
|
| Furmanite Corp.* |
|
|
2,481 |
|
|
|
15,754 |
|
| Granite Construction, Inc. |
|
|
2,630 |
|
|
|
72,772 |
|
| Great Lakes Dredge & Dock Corp. |
|
|
2,646 |
|
|
|
18,310 |
|
| Layne Christensen Co.* |
|
|
970 |
|
|
|
19,817 |
|
| MasTec, Inc.* |
|
|
2,124 |
|
|
|
59,047 |
|
April 30,
2013 / ANNUAL REPORT
|
|
|
|
|
| PORTFOLIOS OF INVESTMENTS |
|
|
69 |
|
Wilmington Small-Cap Strategy Fund (continued)
|
|
|
|
|
|
|
|
|
| Description
|
|
Number of
Shares |
|
|
Value
|
|
| Michael Baker Corp. |
|
|
490 |
|
|
$ |
11,931 |
|
| MYR Group, Inc.* |
|
|
1,100 |
|
|
|
25,080 |
|
| Northwest Pipe Co.* |
|
|
1,041 |
|
|
|
28,409 |
|
| Orion Marine Group, Inc.* |
|
|
1,648 |
|
|
|
15,096 |
|
| Pike Electric Corp. |
|
|
1,200 |
|
|
|
18,756 |
|
| Primoris Services Corp. |
|
|
1,470 |
|
|
|
32,399 |
|
| Sterling Construction Co., Inc.* |
|
|
1,705 |
|
|
|
17,255 |
|
| Tutor Perini Corp.* |
|
|
2,931 |
|
|
|
48,186 |
|
|
|
|
|
|
|
$ |
681,472 |
|
|
|
|
| ELECTRICAL EQUIPMENT – 1.1% |
|
|
|
|
|
|
|
|
| A123 Systems, Inc.* |
|
|
4,740 |
|
|
|
118 |
|
| Acuity Brands, Inc. |
|
|
1,683 |
|
|
|
122,792 |
|
| American Superconductor Corp.* |
|
|
815 |
|
|
|
2,046 |
|
| AZZ, Inc. |
|
|
1,104 |
|
|
|
46,688 |
|
| Belden, Inc. |
|
|
1,974 |
|
|
|
97,555 |
|
| Brady Corp. |
|
|
3,369 |
|
|
|
114,142 |
|
| Capstone Turbine Corp.* |
|
|
10,750 |
|
|
|
9,461 |
|
| Coleman Cable, Inc. |
|
|
1,220 |
|
|
|
18,300 |
|
| Encore Wire Corp. |
|
|
1,217 |
|
|
|
39,857 |
|
| EnerSys, Inc.* |
|
|
2,427 |
|
|
|
111,254 |
|
| Franklin Electric Co., Inc. |
|
|
1,932 |
|
|
|
62,539 |
|
| FuelCell Energy, Inc.* |
|
|
9,644 |
|
|
|
10,126 |
|
| Generac Holdings, Inc. |
|
|
1,480 |
|
|
|
53,176 |
|
| Global Power Equipment Group, Inc. |
|
|
1,070 |
|
|
|
17,655 |
|
| II-VI, Inc.* |
|
|
2,284 |
|
|
|
35,333 |
|
| LSI Industries, Inc. |
|
|
33 |
|
|
|
232 |
|
| Powell Industries, Inc.* |
|
|
509 |
|
|
|
25,063 |
|
| Preformed Line Products Co. |
|
|
194 |
|
|
|
15,617 |
|
| Thermon Group Holdings, Inc.* |
|
|
900 |
|
|
|
17,640 |
|
| Vicor Corp.* |
|
|
689 |
|
|
|
3,700 |
|
|
|
|
|
|
|
$ |
803,294 |
|
|
|
|
| INDUSTRIAL
CONGLOMERATES – 0.1% |
|
|
|
|
|
|
|
|
| Raven Industries, Inc. |
|
|
1,502 |
|
|
|
50,392 |
|
|
|
|
| MACHINERY – 3.0% |
|
|
|
|
|
|
|
|
| Accuride Corp.* |
|
|
4,430 |
|
|
|
22,770 |
|
| Actuant Corp. |
|
|
4,180 |
|
|
|
130,834 |
|
| Alamo Group, Inc. |
|
|
229 |
|
|
|
9,176 |
|
| Albany International Corp. |
|
|
1,740 |
|
|
|
50,547 |
|
| Altra Holdings, Inc. |
|
|
1,173 |
|
|
|
31,260 |
|
| American Railcar Industries, Inc. |
|
|
559 |
|
|
|
19,962 |
|
| Ampco-Pittsburgh Corp. |
|
|
556 |
|
|
|
10,419 |
|
| Astec Industries, Inc. |
|
|
1,291 |
|
|
|
42,384 |
|
| Barnes Group, Inc. |
|
|
3,515 |
|
|
|
97,612 |
|
| Blount International, Inc.* |
|
|
2,230 |
|
|
|
30,975 |
|
| Briggs & Stratton Corp. |
|
|
3,428 |
|
|
|
77,096 |
|
| Chart Industries, Inc.* |
|
|
1,229 |
|
|
|
104,231 |
|
| CIRCOR International, Inc. |
|
|
1,248 |
|
|
|
59,068 |
|
|
|
|
|
|
|
|
|
|
| Description
|
|
Number of
Shares |
|
|
Value
|
|
| CLARCOR, Inc. |
|
|
2,028 |
|
|
$ |
104,848 |
|
| Columbus McKinnon Corp.* |
|
|
855 |
|
|
|
16,057 |
|
| Commercial Vehicle Group, Inc.* |
|
|
1,480 |
|
|
|
10,375 |
|
| Douglas Dynamics, Inc. |
|
|
1,430 |
|
|
|
20,006 |
|
| Dynamic Materials Corp. |
|
|
675 |
|
|
|
10,719 |
|
| Eastern Co. |
|
|
90 |
|
|
|
1,506 |
|
| Energy Recovery, Inc.#,* |
|
|
2,459 |
|
|
|
9,000 |
|
| EnPro Industries, Inc.* |
|
|
1,097 |
|
|
|
54,060 |
|
| ESCO Technologies, Inc. |
|
|
1,442 |
|
|
|
51,869 |
|
| ExOne Co.#,* |
|
|
420 |
|
|
|
16,128 |
|
| Federal Signal Corp.* |
|
|
3,369 |
|
|
|
26,143 |
|
| Flow International Corp.* |
|
|
1,261 |
|
|
|
4,615 |
|
| FreightCar America, Inc. |
|
|
1,033 |
|
|
|
21,569 |
|
| Gorman-Rupp Co. |
|
|
640 |
|
|
|
18,080 |
|
| Graham Corp. |
|
|
665 |
|
|
|
16,160 |
|
| Greenbrier Cos., Inc.* |
|
|
1,350 |
|
|
|
30,456 |
|
| Hardinge, Inc. |
|
|
900 |
|
|
|
12,150 |
|
| Hurco Cos., Inc.* |
|
|
510 |
|
|
|
13,683 |
|
| Hyster-Yale Materials Handling, Inc. |
|
|
706 |
|
|
|
36,846 |
|
| Hyster-Yale Materials Handling, Inc. Class B |
|
|
216 |
|
|
|
11,273 |
|
| John Bean Technologies Corp. |
|
|
1,320 |
|
|
|
27,377 |
|
| Kadant, Inc. |
|
|
714 |
|
|
|
19,756 |
|
| Kaydon Corp. |
|
|
1,902 |
|
|
|
45,344 |
|
| LB Foster Co. |
|
|
606 |
|
|
|
26,755 |
|
| Lindsay Corp. |
|
|
548 |
|
|
|
42,097 |
|
| Lydall, Inc.* |
|
|
700 |
|
|
|
10,038 |
|
| Meritor, Inc.* |
|
|
7,150 |
|
|
|
41,470 |
|
| Met-Pro Corp. |
|
|
2,180 |
|
|
|
29,212 |
|
| Middleby Corp.* |
|
|
744 |
|
|
|
111,288 |
|
| Miller Industries, Inc. |
|
|
1,500 |
|
|
|
22,665 |
|
| Mueller Industries, Inc. |
|
|
1,156 |
|
|
|
59,858 |
|
| Mueller Water Products, Inc. |
|
|
6,500 |
|
|
|
38,480 |
|
| NN, Inc.* |
|
|
120 |
|
|
|
1,081 |
|
| Omega Flex, Inc. |
|
|
150 |
|
|
|
2,021 |
|
| PMFG, Inc.* |
|
|
1,007 |
|
|
|
5,800 |
|
| Proto Labs, Inc.* |
|
|
220 |
|
|
|
11,238 |
|
| RBC Bearings, Inc.* |
|
|
907 |
|
|
|
43,627 |
|
| Rexnord Corp.#,* |
|
|
1,150 |
|
|
|
20,953 |
|
| Standex International Corp. |
|
|
638 |
|
|
|
33,750 |
|
| Sun Hydraulics Corp. |
|
|
997 |
|
|
|
32,652 |
|
| Tennant Co. |
|
|
781 |
|
|
|
37,347 |
|
| Titan International, Inc.# |
|
|
2,285 |
|
|
|
50,978 |
|
| Trimas Corp.* |
|
|
1,450 |
|
|
|
44,225 |
|
| Twin Disc, Inc.# |
|
|
493 |
|
|
|
10,511 |
|
| Wabash National Corp.* |
|
|
3,140 |
|
|
|
29,610 |
|
| Watts Water Technologies, Inc. |
|
|
1,724 |
|
|
|
81,131 |
|
ANNUAL
REPORT / April 30, 2013
|
|
|
| 70 |
|
PORTFOLIOS OF INVESTMENTS |
Wilmington Small-Cap Strategy Fund (continued)
|
|
|
|
|
|
|
|
|
| Description
|
|
Number of
Shares |
|
|
Value
|
|
| Woodward, Inc. |
|
|
2,781 |
|
|
$ |
100,088 |
|
|
|
|
|
|
|
$ |
2,151,229 |
|
|
|
|
| MARINE – 0.0%** |
|
|
|
|
|
|
|
|
| Genco Shipping & Trading Ltd.#,* |
|
|
5,779 |
|
|
|
9,882 |
|
| International Shipholding Corp. |
|
|
755 |
|
|
|
13,635 |
|
| Rand Logistics, Inc.* |
|
|
2,180 |
|
|
|
12,688 |
|
|
|
|
|
|
|
$ |
36,205 |
|
|
|
|
| PROFESSIONAL SERVICES – 1.2% |
|
|
|
|
|
|
|
|
| Acacia Research Corp. |
|
|
2,050 |
|
|
|
48,831 |
|
| Advisory Board Co.* |
|
|
1,446 |
|
|
|
71,071 |
|
| Barrett Business Services, Inc. |
|
|
220 |
|
|
|
11,647 |
|
| CBIZ, Inc.#,* |
|
|
597 |
|
|
|
3,875 |
|
| CDI Corp. |
|
|
453 |
|
|
|
7,099 |
|
| Corporate Executive Board Co. |
|
|
1,420 |
|
|
|
80,031 |
|
| CRA International, Inc.* |
|
|
717 |
|
|
|
13,221 |
|
| Dolan Co.* |
|
|
1,269 |
|
|
|
2,195 |
|
| Exponent, Inc. |
|
|
677 |
|
|
|
35,678 |
|
| Franklin Covey Co.* |
|
|
350 |
|
|
|
4,928 |
|
| FTI Consulting, Inc.* |
|
|
2,780 |
|
|
|
92,074 |
|
| GP Strategies Corp.* |
|
|
590 |
|
|
|
13,009 |
|
| Heidrick & Struggles International, Inc. |
|
|
1,080 |
|
|
|
14,278 |
|
| Hill International, Inc.* |
|
|
1,739 |
|
|
|
4,782 |
|
| Hudson Global, Inc.* |
|
|
540 |
|
|
|
1,782 |
|
| Huron Consulting Group, Inc.* |
|
|
992 |
|
|
|
41,446 |
|
| ICF International, Inc.* |
|
|
1,057 |
|
|
|
28,655 |
|
| Insperity, Inc. |
|
|
1,081 |
|
|
|
29,868 |
|
| Kelly Services, Inc. |
|
|
2,297 |
|
|
|
39,095 |
|
| Kforce, Inc. |
|
|
1,303 |
|
|
|
19,701 |
|
| Korn/Ferry International* |
|
|
2,924 |
|
|
|
48,392 |
|
| Mistras Group, Inc.* |
|
|
780 |
|
|
|
14,781 |
|
| Navigant Consulting, Inc.* |
|
|
3,692 |
|
|
|
45,522 |
|
| Odyssey Marine Exploration, Inc.#,* |
|
|
3,200 |
|
|
|
9,440 |
|
| On Assignment, Inc.* |
|
|
1,775 |
|
|
|
43,079 |
|
| Pendrell Corp.* |
|
|
13,920 |
|
|
|
23,525 |
|
| Resources Connection, Inc. |
|
|
2,635 |
|
|
|
29,934 |
|
| RPX Corp.* |
|
|
1,140 |
|
|
|
15,287 |
|
| TrueBlue, Inc.* |
|
|
1,611 |
|
|
|
33,380 |
|
| VSE Corp. |
|
|
336 |
|
|
|
10,245 |
|
| WageWorks, Inc.* |
|
|
570 |
|
|
|
14,598 |
|
|
|
|
|
|
|
$ |
851,449 |
|
|
|
|
| ROAD & RAIL – 1.0% |
|
|
|
|
|
|
|
|
| AMERCO |
|
|
582 |
|
|
|
93,527 |
|
| Arkansas Best Corp. |
|
|
1,416 |
|
|
|
14,882 |
|
| Avis Budget Group, Inc.* |
|
|
4,300 |
|
|
|
124,012 |
|
| Celadon Group, Inc. |
|
|
748 |
|
|
|
12,559 |
|
| Genesee & Wyoming, Inc.* |
|
|
1,707 |
|
|
|
145,436 |
|
|
|
|
|
|
|
|
|
|
| Description
|
|
Number of
Shares |
|
|
Value
|
|
| Heartland Express, Inc. |
|
|
1,878 |
|
|
$ |
25,484 |
|
| Knight Transportation, Inc. |
|
|
2,647 |
|
|
|
41,346 |
|
| Marten Transport Ltd. |
|
|
719 |
|
|
|
14,646 |
|
| Old Dominion Freight Line, Inc.* |
|
|
2,880 |
|
|
|
110,880 |
|
| Patriot Transportation Holding, Inc.* |
|
|
250 |
|
|
|
7,238 |
|
| Quality Distribution, Inc.* |
|
|
1,100 |
|
|
|
8,756 |
|
| Roadrunner Transportation Systems, Inc.* |
|
|
700 |
|
|
|
15,757 |
|
| Saia, Inc.* |
|
|
949 |
|
|
|
38,833 |
|
| Swift Transportation Co.* |
|
|
3,710 |
|
|
|
52,014 |
|
| Universal Truckload Services, Inc.* |
|
|
380 |
|
|
|
9,591 |
|
| Werner Enterprises, Inc. |
|
|
1,871 |
|
|
|
42,958 |
|
|
|
|
|
|
|
$ |
757,919 |
|
|
|
|
| TRADING COMPANIES & DISTRIBUTORS – 0.9% |
|
|
|
|
|
|
|
|
| Aceto Corp. |
|
|
1,663 |
|
|
|
17,295 |
|
| Aircastle Ltd. |
|
|
4,555 |
|
|
|
63,588 |
|
| Applied Industrial Technologies, Inc. |
|
|
1,860 |
|
|
|
78,585 |
|
| Beacon Roofing Supply, Inc.* |
|
|
1,874 |
|
|
|
71,456 |
|
| CAI International, Inc.* |
|
|
940 |
|
|
|
23,961 |
|
| DXP Enterprises, Inc.* |
|
|
360 |
|
|
|
24,077 |
|
| H&E Equipment Services, Inc. |
|
|
1,715 |
|
|
|
34,917 |
|
| Houston Wire & Cable Co. |
|
|
1,199 |
|
|
|
16,330 |
|
| Kaman Corp. |
|
|
1,092 |
|
|
|
36,899 |
|
| Rush Enterprises, Inc.* |
|
|
2,190 |
|
|
|
50,129 |
|
| TAL International Group, Inc. |
|
|
1,479 |
|
|
|
61,231 |
|
| Textainer Group Holdings Ltd. |
|
|
794 |
|
|
|
30,704 |
|
| Titan Machinery, Inc.#,* |
|
|
640 |
|
|
|
14,438 |
|
| Watsco, Inc. |
|
|
1,203 |
|
|
|
101,509 |
|
| Willis Lease Finance Corp.* |
|
|
650 |
|
|
|
9,224 |
|
|
|
|
|
|
|
$ |
634,343 |
|
|
|
|
| TRANSPORTATION INFRASTRUCTURE – 0.0%** |
|
|
|
|
|
|
|
|
| Wesco Aircraft Holdings, Inc.#,* |
|
|
1,010 |
|
|
|
16,675 |
|
| TOTAL INDUSTRIALS |
|
|
|
|
|
$ |
10,131,450 |
|
|
|
| INFORMATION TECHNOLOGY –14.8% |
|
|
|
|
|
|
|
| COMMUNICATIONS EQUIPMENT – 1.8% |
|
|
|
|
|
| ADTRAN, Inc.# |
|
|
2,711 |
|
|
|
56,931 |
|
| Anaren, Inc.* |
|
|
1,231 |
|
|
|
28,818 |
|
| ARRIS Group, Inc.* |
|
|
6,611 |
|
|
|
109,148 |
|
| Aruba Networks, Inc.#,* |
|
|
4,465 |
|
|
|
100,418 |
|
| Aviat Networks, Inc.* |
|
|
3,568 |
|
|
|
11,418 |
|
| Bel Fuse, Inc. |
|
|
1,387 |
|
|
|
20,417 |
|
| Black Box Corp. |
|
|
1,078 |
|
|
|
23,414 |
|
| CalAmp Corp.* |
|
|
1,010 |
|
|
|
11,241 |
|
| Calix, Inc.* |
|
|
2,244 |
|
|
|
19,141 |
|
| Ciena Corp.* |
|
|
4,590 |
|
|
|
68,666 |
|
| Comtech Telecommunications Corp. |
|
|
1,219 |
|
|
|
30,000 |
|
April 30,
2013 / ANNUAL REPORT
|
|
|
|
|
| PORTFOLIOS OF INVESTMENTS |
|
|
71 |
|
Wilmington Small-Cap Strategy Fund (continued)
|
|
|
|
|
|
|
|
|
| Description
|
|
Number of
Shares |
|
|
Value
|
|
| Digi International, Inc.* |
|
|
812 |
|
|
$ |
7,405 |
|
| Emulex Corp.* |
|
|
5,980 |
|
|
|
35,880 |
|
| Extreme Networks* |
|
|
3,736 |
|
|
|
12,441 |
|
| Finisar Corp.#,* |
|
|
6,030 |
|
|
|
77,425 |
|
| Globecomm Systems, Inc.* |
|
|
1,116 |
|
|
|
13,671 |
|
| Harmonic, Inc.* |
|
|
8,382 |
|
|
|
47,610 |
|
| Infinera Corp.#,* |
|
|
4,446 |
|
|
|
37,435 |
|
| InterDigital, Inc.# |
|
|
1,728 |
|
|
|
76,740 |
|
| Ixia* |
|
|
1,895 |
|
|
|
31,211 |
|
| KVH Industries, Inc.* |
|
|
690 |
|
|
|
9,115 |
|
| Loral Space & Communications, Inc. |
|
|
501 |
|
|
|
30,822 |
|
| NETGEAR, Inc.* |
|
|
1,587 |
|
|
|
47,277 |
|
| Numerex Corp.* |
|
|
770 |
|
|
|
7,946 |
|
| Oclaro, Inc.* |
|
|
5,420 |
|
|
|
7,371 |
|
| Oplink Communications, Inc.* |
|
|
811 |
|
|
|
13,317 |
|
| Parkervision, Inc.#,* |
|
|
4,400 |
|
|
|
17,556 |
|
| PC-Tel, Inc. |
|
|
1,620 |
|
|
|
10,805 |
|
| Plantronics, Inc. |
|
|
2,336 |
|
|
|
102,364 |
|
| Procera Networks, Inc.* |
|
|
560 |
|
|
|
6,210 |
|
| Ruckus Wireless, Inc.#,* |
|
|
400 |
|
|
|
7,720 |
|
| ShoreTel, Inc.* |
|
|
1,550 |
|
|
|
5,596 |
|
| Sonus Networks, Inc.* |
|
|
13,800 |
|
|
|
28,980 |
|
| Sycamore Networks, Inc. |
|
|
725 |
|
|
|
277 |
|
| Symmetricom, Inc.* |
|
|
3,918 |
|
|
|
20,374 |
|
| Tellabs, Inc. |
|
|
24,990 |
|
|
|
51,729 |
|
| Telular Corp. |
|
|
960 |
|
|
|
12,259 |
|
| Ubiquiti Networks, Inc.# |
|
|
910 |
|
|
|
14,060 |
|
| ViaSat, Inc.#,* |
|
|
1,552 |
|
|
|
75,225 |
|
| Westell Technologies, Inc.* |
|
|
10,030 |
|
|
|
19,659 |
|
|
|
|
|
|
|
$ |
1,308,092 |
|
|
|
|
| COMPUTERS & PERIPHERALS – 0.7% |
|
|
|
|
|
|
|
|
| 3D Systems Corp.#,* |
|
|
2,830 |
|
|
|
108,219 |
|
| Avid Technology, Inc.* |
|
|
1,047 |
|
|
|
6,900 |
|
| Cray, Inc.* |
|
|
1,440 |
|
|
|
30,470 |
|
| Datalink Corp.* |
|
|
1,120 |
|
|
|
12,533 |
|
| Electronics For Imaging, Inc.* |
|
|
3,188 |
|
|
|
85,183 |
|
| Imation Corp.* |
|
|
2,508 |
|
|
|
9,229 |
|
| Immersion Corp.* |
|
|
1,927 |
|
|
|
20,407 |
|
| Intermec, Inc.* |
|
|
3,812 |
|
|
|
37,510 |
|
| Intevac, Inc.* |
|
|
486 |
|
|
|
2,202 |
|
| OCZ Technology Group, Inc.* |
|
|
4,770 |
|
|
|
6,249 |
|
| QLogic Corp.* |
|
|
5,630 |
|
|
|
61,142 |
|
| Quantum Corp.* |
|
|
20,390 |
|
|
|
29,158 |
|
| Silicon Graphics International Corp.#,* |
|
|
2,580 |
|
|
|
33,540 |
|
| STEC, Inc.#,* |
|
|
1,556 |
|
|
|
5,648 |
|
| Super Micro Computer, Inc.* |
|
|
1,228 |
|
|
|
11,813 |
|
|
|
|
|
|
|
|
|
|
| Description
|
|
Number of
Shares |
|
|
Value
|
|
| Synaptics, Inc.* |
|
|
1,523 |
|
|
$ |
62,793 |
|
|
|
|
|
|
|
$ |
522,996 |
|
|
|
| ELECTRONIC EQUIPMENT,
INSTRUMENTS & COMPONENTS – 2.1% |
|
|
|
|
|
| Aeroflex Holding Corp.#,* |
|
|
760 |
|
|
|
5,654 |
|
| Agilysys, Inc.* |
|
|
1,540 |
|
|
|
17,987 |
|
| Anixter International, Inc. |
|
|
1,375 |
|
|
|
98,642 |
|
| Badger Meter, Inc. |
|
|
588 |
|
|
|
25,684 |
|
| Benchmark Electronics, Inc.* |
|
|
3,440 |
|
|
|
61,370 |
|
| Checkpoint Systems, Inc.* |
|
|
2,753 |
|
|
|
31,852 |
|
| Cognex Corp. |
|
|
1,630 |
|
|
|
64,711 |
|
| Coherent, Inc. |
|
|
1,384 |
|
|
|
77,407 |
|
| CTS Corp. |
|
|
2,408 |
|
|
|
25,645 |
|
| Daktronics, Inc. |
|
|
1,458 |
|
|
|
14,565 |
|
| DTS, Inc.* |
|
|
677 |
|
|
|
11,360 |
|
| Echelon Corp.* |
|
|
2,799 |
|
|
|
6,186 |
|
| Electro Rent Corp. |
|
|
784 |
|
|
|
12,991 |
|
| Electro Scientific Industries, Inc. |
|
|
1,343 |
|
|
|
14,478 |
|
| Fabrinet* |
|
|
1,560 |
|
|
|
21,419 |
|
| FARO Technologies, Inc.* |
|
|
743 |
|
|
|
28,821 |
|
| FEI Co. |
|
|
1,602 |
|
|
|
102,336 |
|
| GSI Group, Inc.* |
|
|
2,140 |
|
|
|
18,276 |
|
| Insight Enterprises, Inc.* |
|
|
3,040 |
|
|
|
55,085 |
|
| InvenSense, Inc.#,* |
|
|
1,330 |
|
|
|
12,396 |
|
| Kemet Corp.* |
|
|
3,650 |
|
|
|
22,739 |
|
| Key Tronic Corp.* |
|
|
1,320 |
|
|
|
14,916 |
|
| Littelfuse, Inc. |
|
|
855 |
|
|
|
59,696 |
|
| Maxwell Technologies, Inc.#,* |
|
|
1,618 |
|
|
|
9,870 |
|
| Measurement Specialties, Inc.* |
|
|
791 |
|
|
|
33,831 |
|
| Mercury Computer Systems, Inc.* |
|
|
2,865 |
|
|
|
22,146 |
|
| Mesa Laboratories, Inc. |
|
|
210 |
|
|
|
10,366 |
|
| Methode Electronics, Inc. |
|
|
2,567 |
|
|
|
36,913 |
|
| MTS Systems Corp. |
|
|
750 |
|
|
|
45,712 |
|
| Multi-Fineline Electronix, Inc.* |
|
|
653 |
|
|
|
9,952 |
|
| Neonode, Inc.* |
|
|
30 |
|
|
|
171 |
|
| Newport Corp.* |
|
|
2,512 |
|
|
|
38,057 |
|
| OSI Systems, Inc.* |
|
|
839 |
|
|
|
48,075 |
|
| Park Electrochemical Corp. |
|
|
1,172 |
|
|
|
27,976 |
|
| PC Connection, Inc. |
|
|
319 |
|
|
|
4,925 |
|
| Plexus Corp.* |
|
|
1,598 |
|
|
|
43,098 |
|
| Power-One, Inc.* |
|
|
2,710 |
|
|
|
17,127 |
|
| Radisys Corp.* |
|
|
2,062 |
|
|
|
10,228 |
|
| RealD, Inc.#,* |
|
|
1,640 |
|
|
|
24,551 |
|
| Richardson Electronics Ltd. |
|
|
1,100 |
|
|
|
12,903 |
|
| Rofin-Sinar Technologies, Inc.* |
|
|
1,723 |
|
|
|
42,903 |
|
| Rogers Corp.* |
|
|
662 |
|
|
|
28,228 |
|
| Sanmina Corp.* |
|
|
4,810 |
|
|
|
60,702 |
|
ANNUAL
REPORT / April 30, 2013
|
|
|
| 72 |
|
PORTFOLIOS OF INVESTMENTS |
Wilmington Small-Cap Strategy Fund (continued)
|
|
|
|
|
|
|
|
|
| Description
|
|
Number of
Shares |
|
|
Value
|
|
| ScanSource, Inc.* |
|
|
1,581 |
|
|
$ |
45,802 |
|
| SYNNEX Corp.* |
|
|
1,792 |
|
|
|
62,003 |
|
| TTM Technologies, Inc.* |
|
|
2,289 |
|
|
|
16,549 |
|
| Universal Display Corp.#,* |
|
|
1,407 |
|
|
|
44,236 |
|
| Viasystems Group, Inc.#,* |
|
|
20 |
|
|
|
254 |
|
| Vishay Precision Group, Inc.* |
|
|
480 |
|
|
|
6,878 |
|
| Zygo Corp.* |
|
|
610 |
|
|
|
9,126 |
|
|
|
|
|
|
|
$ |
1,516,798 |
|
|
|
|
| INTERNET SOFTWARE &
SERVICES – 2.0% |
|
|
|
|
|
|
|
|
| Active Network, Inc.#,* |
|
|
1,820 |
|
|
|
9,155 |
|
| Angie’s List, Inc.#,* |
|
|
1,360 |
|
|
|
32,966 |
|
| Bankrate, Inc.* |
|
|
2,760 |
|
|
|
37,205 |
|
| Blucora, Inc.* |
|
|
2,274 |
|
|
|
33,587 |
|
| Carbonite, Inc.* |
|
|
180 |
|
|
|
1,915 |
|
| comScore, Inc.* |
|
|
1,435 |
|
|
|
23,204 |
|
| Constant Contact, Inc.* |
|
|
1,613 |
|
|
|
23,566 |
|
| Cornerstone OnDemand, Inc.* |
|
|
1,170 |
|
|
|
42,448 |
|
| CoStar Group, Inc.* |
|
|
1,122 |
|
|
|
121,636 |
|
| DealerTrack Holdings, Inc.* |
|
|
2,048 |
|
|
|
57,037 |
|
| Demand Media, Inc.* |
|
|
1,480 |
|
|
|
12,817 |
|
| Demandware, Inc.#,* |
|
|
330 |
|
|
|
9,009 |
|
| Dice Holdings, Inc.* |
|
|
2,060 |
|
|
|
17,386 |
|
| Digital River, Inc.* |
|
|
2,061 |
|
|
|
29,843 |
|
| EarthLink, Inc. |
|
|
8,703 |
|
|
|
49,520 |
|
| Envestnet, Inc.* |
|
|
1,290 |
|
|
|
23,504 |
|
| ExactTarget, Inc.* |
|
|
440 |
|
|
|
8,615 |
|
| Internap Network Services Corp.* |
|
|
2,485 |
|
|
|
19,830 |
|
| IntraLinks Holdings, Inc.* |
|
|
1,460 |
|
|
|
8,351 |
|
| j2 Global, Inc.# |
|
|
2,075 |
|
|
|
84,452 |
|
| Keynote Systems, Inc. |
|
|
829 |
|
|
|
9,293 |
|
| Limelight Networks, Inc.* |
|
|
4,342 |
|
|
|
8,380 |
|
| Liquidity Services, Inc.#,* |
|
|
870 |
|
|
|
28,623 |
|
| LivePerson, Inc.* |
|
|
2,440 |
|
|
|
31,281 |
|
| LogMeIn, Inc.* |
|
|
730 |
|
|
|
16,483 |
|
| Marchex, Inc. |
|
|
405 |
|
|
|
1,673 |
|
| Market Leader, Inc.* |
|
|
1,410 |
|
|
|
14,128 |
|
| MeetMe, Inc.#,* |
|
|
2,160 |
|
|
|
4,169 |
|
| Millennial Media, Inc.#,* |
|
|
570 |
|
|
|
3,950 |
|
| Monster Worldwide, Inc.* |
|
|
7,810 |
|
|
|
34,208 |
|
| Move, Inc.* |
|
|
2,550 |
|
|
|
29,096 |
|
| NIC, Inc. |
|
|
2,993 |
|
|
|
50,402 |
|
| OpenTable, Inc.#,* |
|
|
900 |
|
|
|
49,851 |
|
| Perficient, Inc.* |
|
|
1,026 |
|
|
|
10,752 |
|
| QuinStreet, Inc.#,* |
|
|
1,360 |
|
|
|
8,894 |
|
| RealNetworks, Inc.* |
|
|
719 |
|
|
|
5,536 |
|
| Responsys, Inc.* |
|
|
1,950 |
|
|
|
15,152 |
|
|
|
|
|
|
|
|
|
|
| Description
|
|
Number of
Shares |
|
|
Value
|
|
| Saba Software, Inc.* |
|
|
1,010 |
|
|
$ |
9,191 |
|
| SciQuest, Inc.* |
|
|
1,130 |
|
|
|
25,832 |
|
| SPS Commerce, Inc.* |
|
|
530 |
|
|
|
24,979 |
|
| Stamps.com, Inc.* |
|
|
870 |
|
|
|
29,441 |
|
| support.com, Inc.* |
|
|
2,211 |
|
|
|
8,822 |
|
| TechTarget, Inc.* |
|
|
1,335 |
|
|
|
5,927 |
|
| Travelzoo, Inc.* |
|
|
250 |
|
|
|
6,383 |
|
| Trulia, Inc.#,* |
|
|
420 |
|
|
|
12,205 |
|
| United Online, Inc. |
|
|
6,533 |
|
|
|
44,424 |
|
| Unwired Planet, Inc.* |
|
|
5,890 |
|
|
|
11,662 |
|
| ValueClick, Inc.* |
|
|
3,759 |
|
|
|
116,003 |
|
| VistaPrint NV#,* |
|
|
1,400 |
|
|
|
57,120 |
|
| Vocus, Inc.* |
|
|
994 |
|
|
|
8,360 |
|
| Web.com Group, Inc.* |
|
|
1,370 |
|
|
|
23,838 |
|
| WebMD Health Corp.* |
|
|
3,060 |
|
|
|
73,899 |
|
| XO Group, Inc.* |
|
|
2,084 |
|
|
|
23,466 |
|
| Yelp, Inc.* |
|
|
380 |
|
|
|
9,891 |
|
| Zix Corp.* |
|
|
3,220 |
|
|
|
12,107 |
|
|
|
|
|
|
|
$ |
1,471,467 |
|
|
|
|
| IT SERVICES – 1.8% |
|
|
|
|
|
|
|
|
| Acxiom Corp.* |
|
|
5,171 |
|
|
|
102,851 |
|
| CACI International, Inc.* |
|
|
1,433 |
|
|
|
83,816 |
|
| Cardtronics, Inc.* |
|
|
2,020 |
|
|
|
56,580 |
|
| Cass Information Systems, Inc. |
|
|
578 |
|
|
|
24,160 |
|
| CIBER, Inc.* |
|
|
3,842 |
|
|
|
16,367 |
|
| Computer Task Group, Inc. |
|
|
1,060 |
|
|
|
21,751 |
|
| Convergys Corp. |
|
|
6,660 |
|
|
|
113,353 |
|
| CSG Systems International, Inc.* |
|
|
1,330 |
|
|
|
28,741 |
|
| Euronet Worldwide, Inc.* |
|
|
3,406 |
|
|
|
103,985 |
|
| ExlService Holdings, Inc.* |
|
|
1,165 |
|
|
|
38,002 |
|
| Forrester Research, Inc. |
|
|
735 |
|
|
|
26,350 |
|
| Global Cash Access Holdings, Inc.* |
|
|
2,591 |
|
|
|
18,474 |
|
| Hackett Group, Inc. |
|
|
1,523 |
|
|
|
7,432 |
|
| Heartland Payment Systems, Inc. |
|
|
1,559 |
|
|
|
51,276 |
|
| Higher One Holdings, Inc.* |
|
|
950 |
|
|
|
9,367 |
|
| iGATE Corp.* |
|
|
1,778 |
|
|
|
29,675 |
|
| Lionbridge Technologies, Inc.* |
|
|
1,870 |
|
|
|
6,395 |
|
| ManTech International Corp.# |
|
|
1,351 |
|
|
|
36,058 |
|
| MAXIMUS, Inc. |
|
|
1,374 |
|
|
|
109,494 |
|
| ModusLink Global Solutions, Inc.* |
|
|
1,459 |
|
|
|
4,085 |
|
| MoneyGram International, Inc.* |
|
|
737 |
|
|
|
12,168 |
|
| PRGX Global, Inc.* |
|
|
1,750 |
|
|
|
9,783 |
|
| Sapient Corp.* |
|
|
4,770 |
|
|
|
55,714 |
|
| ServiceSource International, Inc.#,* |
|
|
2,110 |
|
|
|
13,504 |
|
| Sykes Enterprises, Inc.* |
|
|
2,282 |
|
|
|
35,120 |
|
| Syntel, Inc. |
|
|
715 |
|
|
|
45,167 |
|
| TeleTech Holdings, Inc.* |
|
|
1,218 |
|
|
|
25,931 |
|
April 30,
2013 / ANNUAL REPORT
|
|
|
|
|
| PORTFOLIOS OF INVESTMENTS |
|
|
73 |
|
Wilmington Small-Cap Strategy Fund (continued)
|
|
|
|
|
|
|
|
|
| Description
|
|
Number of
Shares |
|
|
Value
|
|
| Unisys Corp.* |
|
|
1,631 |
|
|
$ |
31,201 |
|
| Virtusa Corp.* |
|
|
1,109 |
|
|
|
24,631 |
|
| WEX, Inc.* |
|
|
1,546 |
|
|
|
117,156 |
|
|
|
|
|
|
|
$ |
1,258,587 |
|
|
|
| SEMICONDUCTORS & SEMICONDUCTOR
EQUIPMENT – 3.5% |
|
|
|
|
|
| Advanced Energy Industries, Inc.* |
|
|
2,652 |
|
|
|
45,031 |
|
| Alpha & Omega Semiconductor Ltd.* |
|
|
1,770 |
|
|
|
12,816 |
|
| Amkor Technology, Inc.#,* |
|
|
6,054 |
|
|
|
25,608 |
|
| ANADIGICS, Inc.* |
|
|
4,640 |
|
|
|
9,744 |
|
| Applied Micro Circuits Corp.* |
|
|
3,654 |
|
|
|
27,259 |
|
| ATMI, Inc.* |
|
|
1,572 |
|
|
|
34,191 |
|
| Axcelis Technologies, Inc.* |
|
|
1,830 |
|
|
|
2,379 |
|
| AXT, Inc.* |
|
|
1,540 |
|
|
|
4,420 |
|
| Brooks Automation, Inc. |
|
|
4,974 |
|
|
|
48,347 |
|
| Cabot Microelectronics Corp.* |
|
|
1,131 |
|
|
|
37,900 |
|
| Cavium, Inc.* |
|
|
2,084 |
|
|
|
65,542 |
|
| Ceva, Inc.* |
|
|
952 |
|
|
|
14,528 |
|
| Cirrus Logic, Inc.* |
|
|
2,550 |
|
|
|
49,240 |
|
| Cohu, Inc. |
|
|
843 |
|
|
|
8,068 |
|
| Cymer, Inc.* |
|
|
1,766 |
|
|
|
185,006 |
|
| Diodes, Inc.* |
|
|
2,565 |
|
|
|
51,967 |
|
| DSP Group, Inc.* |
|
|
1,625 |
|
|
|
13,114 |
|
| Entegris, Inc.* |
|
|
7,740 |
|
|
|
73,375 |
|
| Entropic Communications, Inc.* |
|
|
3,890 |
|
|
|
16,494 |
|
| Exar Corp.* |
|
|
1,670 |
|
|
|
18,003 |
|
| First Solar, Inc.#,* |
|
|
4,190 |
|
|
|
195,086 |
|
| FormFactor, Inc.* |
|
|
2,571 |
|
|
|
12,726 |
|
| GSI Technology, Inc.* |
|
|
440 |
|
|
|
2,746 |
|
| GT Advanced Technologies, Inc.#,* |
|
|
7,344 |
|
|
|
28,862 |
|
| Hittite Microwave Corp.* |
|
|
1,258 |
|
|
|
70,586 |
|
| Inphi Corp.* |
|
|
1,560 |
|
|
|
14,680 |
|
| Integrated Device Technology, Inc.* |
|
|
9,540 |
|
|
|
67,829 |
|
| Integrated Silicon Solution, Inc.* |
|
|
1,000 |
|
|
|
9,170 |
|
| Intermolecular, Inc.* |
|
|
140 |
|
|
|
1,219 |
|
| International Rectifier Corp.* |
|
|
4,190 |
|
|
|
88,870 |
|
| Intersil Corp. |
|
|
8,690 |
|
|
|
67,434 |
|
| IXYS Corp. |
|
|
1,532 |
|
|
|
13,880 |
|
| Kopin Corp.* |
|
|
3,208 |
|
|
|
10,618 |
|
| Lattice Semiconductor Corp.* |
|
|
8,270 |
|
|
|
38,455 |
|
| LTX-Credence Corp.* |
|
|
2,733 |
|
|
|
16,125 |
|
| MaxLinear, Inc.* |
|
|
1,510 |
|
|
|
9,407 |
|
| MEMC Electronic Materials, Inc.* |
|
|
15,400 |
|
|
|
83,160 |
|
| Micrel, Inc. |
|
|
2,356 |
|
|
|
23,701 |
|
| Microsemi Corp.* |
|
|
3,762 |
|
|
|
78,250 |
|
| Mindspeed Technologies, Inc.#,* |
|
|
920 |
|
|
|
2,107 |
|
| MKS Instruments, Inc. |
|
|
3,449 |
|
|
|
92,675 |
|
|
|
|
|
|
|
|
|
|
| Description
|
|
Number of
Shares |
|
|
Value
|
|
| Monolithic Power Systems, Inc. |
|
|
1,387 |
|
|
$ |
33,454 |
|
| MoSys, Inc.* |
|
|
790 |
|
|
|
3,571 |
|
| Nanometrics, Inc.* |
|
|
1,180 |
|
|
|
16,555 |
|
| NeoPhotonics Corp.* |
|
|
460 |
|
|
|
2,535 |
|
| NVE Corp.* |
|
|
299 |
|
|
|
15,868 |
|
| OmniVision Technologies, Inc.* |
|
|
3,381 |
|
|
|
45,339 |
|
| PDF Solutions, Inc.* |
|
|
810 |
|
|
|
13,859 |
|
| Pericom Semiconductor Corp.* |
|
|
513 |
|
|
|
3,314 |
|
| Photronics, Inc.* |
|
|
5,630 |
|
|
|
44,421 |
|
| PLX Technology, Inc.* |
|
|
2,873 |
|
|
|
13,417 |
|
| Power Integrations, Inc. |
|
|
1,304 |
|
|
|
53,999 |
|
| Rambus, Inc.* |
|
|
6,810 |
|
|
|
47,398 |
|
| RF Micro Devices, Inc.* |
|
|
17,730 |
|
|
|
99,465 |
|
| Rubicon Technology, Inc.#,* |
|
|
702 |
|
|
|
5,202 |
|
| Rudolph Technologies, Inc.* |
|
|
2,417 |
|
|
|
28,206 |
|
| Semtech Corp.* |
|
|
2,730 |
|
|
|
87,551 |
|
| Sigma Designs, Inc.* |
|
|
1,225 |
|
|
|
5,831 |
|
| Silicon Image, Inc.* |
|
|
3,155 |
|
|
|
15,554 |
|
| Spansion, Inc.* |
|
|
3,430 |
|
|
|
44,556 |
|
| STR Holdings, Inc.* |
|
|
750 |
|
|
|
1,688 |
|
| SunPower Corp.#,* |
|
|
2,140 |
|
|
|
29,083 |
|
| Supertex, Inc. |
|
|
670 |
|
|
|
14,124 |
|
| Tessera Technologies, Inc. |
|
|
3,526 |
|
|
|
71,825 |
|
| TriQuint Semiconductor, Inc.* |
|
|
10,995 |
|
|
|
64,211 |
|
| Ultra Clean Holdings* |
|
|
540 |
|
|
|
3,380 |
|
| Ultratech, Inc.* |
|
|
1,211 |
|
|
|
35,688 |
|
| Veeco Instruments, Inc.#,* |
|
|
1,840 |
|
|
|
70,049 |
|
| Volterra Semiconductor Corp.* |
|
|
812 |
|
|
|
10,564 |
|
|
|
|
|
|
|
$ |
2,551,325 |
|
|
|
|
| SOFTWARE – 2.9% |
|
|
|
|
|
|
|
|
| Accelrys, Inc.#,* |
|
|
2,169 |
|
|
|
21,365 |
|
| ACI Worldwide, Inc.* |
|
|
1,664 |
|
|
|
78,225 |
|
| Actuate Corp.* |
|
|
2,873 |
|
|
|
17,640 |
|
| Advent Software, Inc.* |
|
|
1,244 |
|
|
|
36,126 |
|
| American Software, Inc. |
|
|
954 |
|
|
|
7,928 |
|
| Aspen Technology, Inc.* |
|
|
3,860 |
|
|
|
117,653 |
|
| Blackbaud, Inc. |
|
|
1,812 |
|
|
|
53,110 |
|
| Bottomline Technologies, Inc.* |
|
|
1,847 |
|
|
|
48,391 |
|
| BroadSoft, Inc.* |
|
|
1,410 |
|
|
|
36,040 |
|
| Callidus Software, Inc.#,* |
|
|
1,750 |
|
|
|
7,507 |
|
| CommVault Systems, Inc.* |
|
|
1,751 |
|
|
|
128,769 |
|
| Comverse, Inc.* |
|
|
1,013 |
|
|
|
26,875 |
|
| Digimarc Corp. |
|
|
260 |
|
|
|
5,704 |
|
| Ebix, Inc.# |
|
|
1,368 |
|
|
|
25,458 |
|
| Ellie Mae, Inc.* |
|
|
660 |
|
|
|
17,173 |
|
| EPIQ Systems, Inc. |
|
|
1,991 |
|
|
|
27,814 |
|
| ePlus, Inc. |
|
|
210 |
|
|
|
9,551 |
|
ANNUAL
REPORT / April 30, 2013
|
|
|
| 74 |
|
PORTFOLIOS OF INVESTMENTS |
Wilmington Small-Cap Strategy Fund (continued)
|
|
|
|
|
|
|
|
|
| Description
|
|
Number of
Shares |
|
|
Value
|
|
| Fair Isaac Corp. |
|
|
1,434 |
|
|
$ |
66,796 |
|
| FalconStor Software, Inc.* |
|
|
2,261 |
|
|
|
3,731 |
|
| Glu Mobile, Inc.#,* |
|
|
890 |
|
|
|
2,741 |
|
| Guidance Software, Inc.* |
|
|
680 |
|
|
|
7,154 |
|
| Guidewire Software, Inc.* |
|
|
1,000 |
|
|
|
40,080 |
|
| Imperva, Inc.* |
|
|
450 |
|
|
|
17,541 |
|
| Infoblox, Inc.* |
|
|
550 |
|
|
|
12,160 |
|
| Interactive Intelligence Group, Inc.* |
|
|
833 |
|
|
|
34,511 |
|
| Jive Software, Inc.#,* |
|
|
640 |
|
|
|
8,698 |
|
| Manhattan Associates, Inc.* |
|
|
895 |
|
|
|
62,838 |
|
| Mentor Graphics Corp. |
|
|
4,328 |
|
|
|
79,029 |
|
| MicroStrategy, Inc.* |
|
|
319 |
|
|
|
28,771 |
|
| Monotype Imaging Holdings, Inc. |
|
|
1,688 |
|
|
|
39,145 |
|
| Netscout Systems, Inc.* |
|
|
1,461 |
|
|
|
33,325 |
|
| Pegasystems, Inc. |
|
|
709 |
|
|
|
17,945 |
|
| Progress Software Corp.* |
|
|
3,494 |
|
|
|
78,860 |
|
| PROS Holdings, Inc.* |
|
|
846 |
|
|
|
21,928 |
|
| PTC, Inc.* |
|
|
4,777 |
|
|
|
114,696 |
|
| QAD, Inc. |
|
|
607 |
|
|
|
7,333 |
|
| QLIK Technologies, Inc.* |
|
|
3,500 |
|
|
|
91,035 |
|
| RealPage, Inc.#,* |
|
|
1,850 |
|
|
|
37,740 |
|
| Rosetta Stone, Inc.* |
|
|
750 |
|
|
|
12,698 |
|
| Seachange International, Inc.* |
|
|
1,480 |
|
|
|
16,073 |
|
| Sourcefire, Inc.* |
|
|
1,218 |
|
|
|
58,172 |
|
| SS&C Technologies Holdings, Inc.* |
|
|
1,600 |
|
|
|
49,104 |
|
| Synchronoss Technologies, Inc.* |
|
|
1,339 |
|
|
|
37,947 |
|
| Take-Two Interactive Software, Inc.* |
|
|
3,401 |
|
|
|
51,899 |
|
| Tangoe, Inc.#,* |
|
|
1,150 |
|
|
|
14,789 |
|
| TeleNav, Inc.* |
|
|
770 |
|
|
|
4,035 |
|
| TiVo, Inc.* |
|
|
6,420 |
|
|
|
75,242 |
|
| Tyler Technologies, Inc.* |
|
|
1,289 |
|
|
|
81,516 |
|
| Ultimate Software Group, Inc.* |
|
|
1,067 |
|
|
|
103,062 |
|
| VASCO Data Security International, Inc.* |
|
|
955 |
|
|
|
8,127 |
|
| Verint Systems, Inc.* |
|
|
1,887 |
|
|
|
62,346 |
|
| VirnetX Holding Corp.#,* |
|
|
1,760 |
|
|
|
35,939 |
|
| Websense, Inc.* |
|
|
2,161 |
|
|
|
38,552 |
|
|
|
|
|
|
|
$ |
2,120,887 |
|
| TOTAL INFORMATION TECHNOLOGY |
|
|
|
|
|
$ |
10,750,152 |
|
|
|
|
| MATERIALS – 5.1% |
|
|
|
|
|
|
|
|
|
|
|
| CHEMICALS – 2.2% |
|
|
|
|
|
|
|
|
| A Schulman, Inc. |
|
|
2,008 |
|
|
|
52,148 |
|
| ADA-ES, Inc.#,* |
|
|
460 |
|
|
|
12,701 |
|
| American Vanguard Corp. |
|
|
1,094 |
|
|
|
31,551 |
|
| Arabian American Development Co.* |
|
|
1,710 |
|
|
|
13,013 |
|
| Axiall Corp. |
|
|
3,020 |
|
|
|
158,399 |
|
| Balchem Corp. |
|
|
1,170 |
|
|
|
50,708 |
|
| Calgon Carbon Corp.* |
|
|
2,991 |
|
|
|
50,967 |
|
|
|
|
|
|
|
|
|
|
| Description
|
|
Number of
Shares |
|
|
Value
|
|
| Chemtura Corp.* |
|
|
4,760 |
|
|
$ |
101,198 |
|
| Ferro Corp.* |
|
|
5,482 |
|
|
|
38,593 |
|
| Flotek Industries, Inc.* |
|
|
2,060 |
|
|
|
33,042 |
|
| FutureFuel Corp. |
|
|
810 |
|
|
|
9,922 |
|
| GSE Holding, Inc.* |
|
|
1,800 |
|
|
|
13,500 |
|
| Hawkins, Inc. |
|
|
340 |
|
|
|
12,645 |
|
| HB Fuller Co. |
|
|
2,039 |
|
|
|
77,278 |
|
| Innophos Holdings, Inc. |
|
|
995 |
|
|
|
51,053 |
|
| Innospec, Inc. |
|
|
1,430 |
|
|
|
62,934 |
|
| KMG Chemicals, Inc. |
|
|
10 |
|
|
|
184 |
|
| Koppers Holdings, Inc. |
|
|
854 |
|
|
|
37,499 |
|
| Kraton Performance Polymers, Inc.* |
|
|
2,190 |
|
|
|
49,735 |
|
| Landec Corp.* |
|
|
1,937 |
|
|
|
25,975 |
|
| LSB Industries, Inc.* |
|
|
741 |
|
|
|
24,201 |
|
| Minerals Technologies, Inc. |
|
|
2,390 |
|
|
|
97,106 |
|
| Olin Corp. |
|
|
3,705 |
|
|
|
89,550 |
|
| OM Group, Inc.* |
|
|
2,456 |
|
|
|
60,098 |
|
| OMNOVA Solutions, Inc.* |
|
|
2,320 |
|
|
|
15,474 |
|
| PolyOne Corp. |
|
|
4,512 |
|
|
|
101,655 |
|
| Quaker Chemical Corp. |
|
|
632 |
|
|
|
39,007 |
|
| Rentech, Inc. |
|
|
12,750 |
|
|
|
26,393 |
|
| Sensient Technologies Corp. |
|
|
3,412 |
|
|
|
134,262 |
|
| Stepan Co. |
|
|
678 |
|
|
|
38,605 |
|
| Tredegar Corp. |
|
|
1,810 |
|
|
|
53,576 |
|
| Zep, Inc. |
|
|
904 |
|
|
|
13,741 |
|
| Zoltek Cos., Inc.#,* |
|
|
1,847 |
|
|
|
24,399 |
|
|
|
|
|
|
|
$ |
1,601,112 |
|
|
|
|
| CONSTRUCTION MATERIALS – 0.4% |
|
|
|
|
|
|
|
|
| Eagle Materials, Inc. |
|
|
1,930 |
|
|
|
130,757 |
|
| Headwaters, Inc.* |
|
|
3,505 |
|
|
|
38,064 |
|
| Texas Industries, Inc.#,* |
|
|
1,420 |
|
|
|
90,426 |
|
| United States Lime & Minerals, Inc.* |
|
|
246 |
|
|
|
11,360 |
|
|
|
|
|
|
|
$ |
270,607 |
|
|
|
|
| CONTAINERS & PACKAGING – 0.2% |
|
|
|
|
|
|
|
|
| AEP Industries, Inc.* |
|
|
147 |
|
|
|
11,334 |
|
| Berry Plastics Group, Inc.* |
|
|
1,270 |
|
|
|
24,130 |
|
| Boise, Inc. |
|
|
3,180 |
|
|
|
25,408 |
|
| Graphic Packaging Holding Co.* |
|
|
8,710 |
|
|
|
65,499 |
|
| Myers Industries, Inc. |
|
|
1,512 |
|
|
|
22,408 |
|
| UFP Technologies, Inc.* |
|
|
580 |
|
|
|
11,768 |
|
|
|
|
|
|
|
$ |
160,547 |
|
|
|
|
| METALS & MINING – 1.4% |
|
|
|
|
|
|
|
|
| AK Steel Holding Corp.# |
|
|
9,470 |
|
|
|
31,724 |
|
| AM Castle & Co.#,* |
|
|
1,490 |
|
|
|
25,807 |
|
| AMCOL International Corp. |
|
|
1,120 |
|
|
|
34,462 |
|
| Century Aluminum Co.* |
|
|
2,760 |
|
|
|
22,522 |
|
| Coeur d’Alene Mines Corp.* |
|
|
5,090 |
|
|
|
77,572 |
|
April 30,
2013 / ANNUAL REPORT
|
|
|
|
|
| PORTFOLIOS OF INVESTMENTS |
|
|
75 |
|
Wilmington Small-Cap Strategy Fund (continued)
|
|
|
|
|
|
|
|
|
| Description
|
|
Number of
Shares |
|
|
Value
|
|
| General Moly, Inc.* |
|
|
2,460 |
|
|
$ |
4,576 |
|
| Globe Specialty Metals, Inc. |
|
|
3,750 |
|
|
|
48,975 |
|
| Gold Reserve, Inc.* |
|
|
2,870 |
|
|
|
9,184 |
|
| Gold Resource Corp.# |
|
|
930 |
|
|
|
9,523 |
|
| Golden Minerals Co.#,* |
|
|
1,130 |
|
|
|
2,057 |
|
| Golden Star Resources Ltd.* |
|
|
19,700 |
|
|
|
21,276 |
|
| Handy & Harman Ltd.* |
|
|
730 |
|
|
|
11,227 |
|
| Haynes International, Inc. |
|
|
614 |
|
|
|
29,847 |
|
| Hecla Mining Co. |
|
|
16,678 |
|
|
|
56,705 |
|
| Horsehead Holding Corp.* |
|
|
3,898 |
|
|
|
41,709 |
|
| Kaiser Aluminum Corp. |
|
|
1,271 |
|
|
|
80,073 |
|
| Materion Corp. |
|
|
1,252 |
|
|
|
33,165 |
|
| McEwen Mining, Inc.#,* |
|
|
16,230 |
|
|
|
37,816 |
|
| Midway Gold Corp.* |
|
|
9,790 |
|
|
|
9,207 |
|
| Noranda Aluminum Holding Corp. |
|
|
870 |
|
|
|
3,315 |
|
| Olympic Steel, Inc. |
|
|
625 |
|
|
|
12,500 |
|
| Paramount Gold and Silver Corp.#,* |
|
|
4,520 |
|
|
|
7,142 |
|
| Revett Minerals, Inc.#,* |
|
|
2,660 |
|
|
|
3,910 |
|
| RTI International Metals, Inc.* |
|
|
2,292 |
|
|
|
66,514 |
|
| Schnitzer Steel Industries, Inc. |
|
|
1,850 |
|
|
|
45,381 |
|
| Stillwater Mining Co.#,* |
|
|
7,214 |
|
|
|
89,742 |
|
| SunCoke Energy, Inc.* |
|
|
3,430 |
|
|
|
51,896 |
|
| Universal Stainless & Alloy* |
|
|
226 |
|
|
|
7,901 |
|
| US Antimony Corp.#,* |
|
|
4,400 |
|
|
|
6,688 |
|
| US Silica Holdings, Inc.# |
|
|
700 |
|
|
|
14,301 |
|
| Vista Gold Corp.* |
|
|
3,460 |
|
|
|
5,813 |
|
| Worthington Industries, Inc. |
|
|
3,639 |
|
|
|
117,103 |
|
|
|
|
|
|
|
$ |
1,019,633 |
|
|
|
|
| PAPER & FOREST PRODUCTS – 0.9% |
|
|
|
|
|
|
|
|
| Boise Cascade Co.* |
|
|
880 |
|
|
|
28,186 |
|
| Buckeye Technologies, Inc. |
|
|
1,708 |
|
|
|
64,204 |
|
| Clearwater Paper Corp.* |
|
|
1,074 |
|
|
|
49,425 |
|
| Deltic Timber Corp. |
|
|
475 |
|
|
|
29,678 |
|
| KapStone Paper and Packaging Corp. |
|
|
2,450 |
|
|
|
72,471 |
|
| Louisiana-Pacific Corp.* |
|
|
9,526 |
|
|
|
172,611 |
|
| Neenah Paper, Inc. |
|
|
891 |
|
|
|
25,625 |
|
| PH Glatfelter Co. |
|
|
2,563 |
|
|
|
61,512 |
|
| Resolute Forest Products#,* |
|
|
5,910 |
|
|
|
86,463 |
|
| Schweitzer-Mauduit International, Inc. |
|
|
1,598 |
|
|
|
64,383 |
|
| Wausau Paper Corp. |
|
|
1,710 |
|
|
|
17,408 |
|
|
|
|
|
|
|
$ |
671,966 |
|
| TOTAL MATERIALS |
|
|
|
|
|
$ |
3,723,865 |
|
|
|
|
| TELECOMMUNICATION
SERVICES – 0.7% |
|
|
|
|
|
|
|
|
|
|
|
| DIVERSIFIED TELECOMMUNICATION SERVICES – 0.6% |
|
|
|
|
|
|
|
|
| 8x8, Inc.* |
|
|
3,350 |
|
|
|
24,220 |
|
|
|
|
|
|
|
|
|
|
| Description
|
|
Number of
Shares |
|
|
Value
|
|
| Atlantic Tele-Network, Inc. |
|
|
400 |
|
|
$ |
20,308 |
|
| Cbeyond, Inc.* |
|
|
2,039 |
|
|
|
17,902 |
|
| Cincinnati Bell, Inc.* |
|
|
12,380 |
|
|
|
43,578 |
|
| Cogent Communications Group, Inc. |
|
|
2,023 |
|
|
|
57,939 |
|
| Consolidated Communications Holdings, Inc. |
|
|
1,522 |
|
|
|
28,050 |
|
| Fairpoint Communications, Inc.#,* |
|
|
1,780 |
|
|
|
14,489 |
|
| General Communication, Inc.* |
|
|
1,642 |
|
|
|
15,944 |
|
| Hawaiian Telcom Holdco, Inc.* |
|
|
550 |
|
|
|
13,293 |
|
| HickoryTech Corp. |
|
|
790 |
|
|
|
8,121 |
|
| IDT Corp. |
|
|
1,200 |
|
|
|
17,748 |
|
| inContact, Inc.* |
|
|
2,070 |
|
|
|
16,767 |
|
| Iridium Communications, Inc.#,* |
|
|
3,010 |
|
|
|
20,197 |
|
| Lumos Networks Corp. |
|
|
637 |
|
|
|
8,593 |
|
| magicJack VocalTec Ltd.#,* |
|
|
540 |
|
|
|
8,926 |
|
| Neutral Tandem, Inc. |
|
|
1,350 |
|
|
|
4,023 |
|
| ORBCOMM, Inc.* |
|
|
2,560 |
|
|
|
12,109 |
|
| Premiere Global Services, Inc.* |
|
|
2,460 |
|
|
|
27,626 |
|
| Primus Telecommunications Group, Inc. |
|
|
1,110 |
|
|
|
13,953 |
|
| Towerstream Corp.#,* |
|
|
3,390 |
|
|
|
8,136 |
|
| Vonage Holdings Corp.* |
|
|
10,720 |
|
|
|
32,696 |
|
|
|
|
|
|
|
$ |
414,618 |
|
|
|
|
| WIRELESS TELECOMMUNICATION SERVICES – 0.1% |
|
|
|
|
|
|
|
|
| Boingo Wireless, Inc.#,* |
|
|
1,190 |
|
|
|
7,414 |
|
| Leap Wireless International, Inc.#,* |
|
|
4,250 |
|
|
|
24,310 |
|
| NTELOS Holdings Corp. |
|
|
637 |
|
|
|
9,377 |
|
| Shenandoah Telecommunications Co. |
|
|
1,706 |
|
|
|
27,961 |
|
| USA Mobility, Inc. |
|
|
1,488 |
|
|
|
20,192 |
|
|
|
|
|
|
|
$ |
89,254 |
|
| TOTAL TELECOMMUNICATION SERVICES |
|
|
|
|
|
$ |
503,872 |
|
|
|
|
| UTILITIES – 4.1% |
|
|
|
|
|
|
|
|
|
|
|
| ELECTRIC UTILITIES – 1.9% |
|
|
|
|
|
|
|
|
| ALLETE, Inc. |
|
|
2,386 |
|
|
|
122,521 |
|
| Cleco Corp. |
|
|
4,025 |
|
|
|
199,318 |
|
| El Paso Electric Co. |
|
|
2,410 |
|
|
|
90,279 |
|
| Empire District Electric Co. |
|
|
2,926 |
|
|
|
67,503 |
|
| IDACORP, Inc. |
|
|
3,292 |
|
|
|
161,999 |
|
| MGE Energy, Inc. |
|
|
1,369 |
|
|
|
76,459 |
|
| Otter Tail Corp. |
|
|
2,430 |
|
|
|
75,816 |
|
| PNM Resources, Inc. |
|
|
5,007 |
|
|
|
120,218 |
|
| Portland General Electric Co. |
|
|
5,027 |
|
|
|
162,121 |
|
| UIL Holdings Corp. |
|
|
3,396 |
|
|
|
141,409 |
|
| Unitil Corp. |
|
|
1,340 |
|
|
|
40,615 |
|
| UNS Energy Corp. |
|
|
2,565 |
|
|
|
130,712 |
|
|
|
|
|
|
|
$ |
1,388,970 |
|
|
|
|
| GAS UTILITIES – 1.2% |
|
|
|
|
|
|
|
|
| Chesapeake Utilities Corp. |
|
|
570 |
|
|
|
30,415 |
|
ANNUAL
REPORT / April 30, 2013
|
|
|
| 76 |
|
PORTFOLIOS OF INVESTMENTS |
Wilmington Small-Cap Strategy Fund (continued)
|
|
|
|
|
|
|
|
|
| Description
|
|
Number of
Shares |
|
|
Value
|
|
| Delta Natural Gas Co., Inc. |
|
|
330 |
|
|
$ |
7,154 |
|
| Laclede Group, Inc.# |
|
|
1,698 |
|
|
|
79,314 |
|
| New Jersey Resources Corp. |
|
|
2,607 |
|
|
|
123,050 |
|
| Northwest Natural Gas Co. |
|
|
1,888 |
|
|
|
83,959 |
|
| Piedmont Natural Gas Co., Inc. |
|
|
4,824 |
|
|
|
166,090 |
|
| South Jersey Industries, Inc. |
|
|
1,801 |
|
|
|
111,122 |
|
| Southwest Gas Corp. |
|
|
2,948 |
|
|
|
149,375 |
|
| WGL Holdings, Inc. |
|
|
3,600 |
|
|
|
166,392 |
|
|
|
|
|
|
|
$ |
916,871 |
|
|
|
|
| INDEPENDENT POWER PRODUCERS & ENERGY TRADERS – 0.1% |
|
|
|
|
|
|
|
|
| Atlantic Power Corp. |
|
|
7,430 |
|
|
|
34,921 |
|
| Genie Energy Ltd. |
|
|
1,200 |
|
|
|
12,936 |
|
| Ormat Technologies, Inc.# |
|
|
820 |
|
|
|
17,827 |
|
|
|
|
|
|
|
$ |
65,684 |
|
|
|
|
| MULTI-UTILITIES – 0.6% |
|
|
|
|
|
|
|
|
| Avista Corp. |
|
|
3,868 |
|
|
|
108,497 |
|
| Black Hills Corp. |
|
|
3,028 |
|
|
|
141,983 |
|
| CH Energy Group, Inc. |
|
|
1,045 |
|
|
|
67,894 |
|
| NorthWestern Corp. |
|
|
2,259 |
|
|
|
97,182 |
|
|
|
|
|
|
|
$ |
415,556 |
|
|
|
|
| WATER UTILITIES – 0.3% |
|
|
|
|
|
|
|
|
| American States Water Co. |
|
|
1,067 |
|
|
|
59,197 |
|
| Artesian Resources Corp. |
|
|
630 |
|
|
|
14,849 |
|
| Cadiz, Inc.#,* |
|
|
936 |
|
|
|
5,513 |
|
| California Water Service Group |
|
|
2,100 |
|
|
|
42,105 |
|
| Connecticut Water Service, Inc. |
|
|
363 |
|
|
|
10,338 |
|
| Consolidated Water Co. Ltd. |
|
|
907 |
|
|
|
9,043 |
|
| Middlesex Water Co. |
|
|
1,821 |
|
|
|
35,710 |
|
| SJW Corp. |
|
|
388 |
|
|
|
9,840 |
|
| York Water Co. |
|
|
1,140 |
|
|
|
21,375 |
|
|
|
|
|
|
|
$ |
207,970 |
|
| TOTAL UTILITIES |
|
|
|
|
|
$ |
2,995,051 |
|
TOTAL COMMON STOCKS
(COST $51,534,975) |
|
|
|
|
|
$ |
72,014,524 |
|
|
|
|
| INVESTMENT COMPANIES – 0.6% |
|
|
|
|
|
|
|
|
|
|
|
| EQUITY FUNDS – 0.6% |
|
|
|
|
|
|
|
|
| Firsthand Technology Value Fund, Inc.#,* |
|
|
620 |
|
|
|
11,532 |
|
| iShares Russell 2000 Index Fund# |
|
|
4,800 |
|
|
|
451,872 |
|
| TOTAL EQUITY FUNDS |
|
|
|
|
|
$ |
463,404 |
|
TOTAL INVESTMENT COMPANIES
(COST $416,683) |
|
|
|
|
|
$ |
463,404 |
|
|
|
|
|
|
|
|
|
|
| Description
|
|
Number of
Shares |
|
|
Value
|
|
| RIGHTS – 0.0%** |
|
|
|
|
|
|
|
|
| Clinical Data, Inc. |
|
$ |
845 |
|
|
$ |
— |
|
TOTAL RIGHTS
(COST $0) |
|
|
|
|
|
$ |
— |
|
|
|
|
| WARRANTS – 0.0%** |
|
|
|
|
|
|
|
|
| Magnum Hunter Resources Corp.# |
|
|
1,145 |
|
|
|
160 |
|
| Vector Group Ltd. |
|
|
3,960 |
|
|
|
— |
|
TOTAL WARRANTS
(COST $0) |
|
|
|
|
|
$ |
160 |
|
TOTAL INVESTMENTS IN
SECURITIES – 100.0%
(COST $51,951,658) |
|
|
|
|
|
$ |
72,478,088 |
|
|
|
|
|
|
|
|
|
|
| |
|
Par Value |
|
|
|
|
|
CASH COLLATERAL INVESTED FOR
SECURITIES ON LOAN – 14.0% |
|
|
|
|
| REPURCHASE AGREEMENTS – 14.0% |
|
|
|
|
|
|
|
|
|
|
|
| Deutsche Bank Securities, Inc., 0.17%, dated 04/30/13, due 05/01/13, repurchase price $2,413,398, collateralized by U.S. Government Securities 2.13% to 7.50%,
maturing 12/01/16 to 04/01/48; total market value of $ 2,461,655. |
|
$ |
2,413,387 |
|
|
|
2,413,387 |
|
|
|
|
| HSBC Securities USA, Inc., 0.15%, dated 04/30/13, due 05/01/13, repurchase price $2,413,397, collateralized by U.S. Government Securities 0.00% to 9.38%, maturing
07/15/13 to 03/17/31; total market value of $ 2,461,656. |
|
|
2,413,387 |
|
|
|
2,413,387 |
|
|
|
|
| Merrill Lynch, Pierce, Fenner & Smith, Inc., 0.14%, dated 04/30/13, due 05/01/13, repurchase price $508,060, collateralized by U.S. Treasury Securities
0.25% to 2.75%, maturing 10/15/15 to 08/15/42; total market value of $ 518,219. |
|
|
508,058 |
|
|
|
508,058 |
|
|
|
|
| Mizuho Securities USA, Inc., 0.20%, dated 04/30/13, due 05/01/13, repurchase price $2,413,400, collateralized by U.S. Government Securities 2.08% to 7.00%,
maturing 01/01/22 to 04/15/52; total market value of $ 2,461,655. |
|
|
2,413,387 |
|
|
|
2,413,387 |
|
|
|
|
| RBC Capital Markets LLC, 0.17%, dated 04/30/13, due 05/01/13, repurchase price $2,413,398, collateralized by U.S. Government Securities 1.97% to 4.50%, maturing
08/01/24 to 12/15/44; total market value of $ 2,461,655. |
|
|
2,413,387 |
|
|
|
2,413,387 |
|
TOTAL CASH COLLATERAL INVESTED FOR SECURITIES ON LOAN
(COST $10,161,606) |
|
|
|
|
|
$ |
10,161,606 |
|
TOTAL INVESTMENTS – 114.0%
(COST $62,113,264) |
|
|
|
|
|
$ |
82,639,694 |
|
| COLLATERAL FOR SECURITIES ON LOAN – (14.0%) |
|
|
|
|
|
|
(10,161,606 |
) |
OTHER ASSETS LESS
LIABILITIES – 0.0%** |
|
|
|
|
|
|
8,435 |
|
| TOTAL NET ASSETS – 100.0% |
|
|
|
|
|
$ |
72,486,523 |
|
April 30,
2013 / ANNUAL REPORT
|
|
|
|
|
| PORTFOLIOS OF INVESTMENTS |
|
|
77 |
|
Wilmington Small-Cap Strategy Fund (concluded)
Cost of investments for Federal income tax purposes is $63,427,545. The net unrealized
appreciation/(depreciation) of investments was $19,212,149. This consists of net unrealized appreciation from investment for those securities having an excess of value over cost of $21,624,624 and net unrealized depreciation from investments for
those securities having an excess of cost over value of $2,412,475.
Various inputs are used in determining the value of the
Fund’s investments. These inputs are summarized in the three broad levels listed below.
Level 1 – quoted prices in active
markets for identical securities
Level 2 – other significant observable inputs (including quoted prices for similar securities,
interest rates, prepayment speeds, credit risk, etc.)
Level 3 – significant unobservable inputs (including the Fund’s own
assumptions in determining the fair value of investments)
The following is a summary of the inputs used as of April 30, 2013 in
valuing the Fund’s assets carried at fair value:
|
|
|
|
|
|
|
|
|
|
|
|
|
|
|
|
|
| |
|
Level
1 |
|
|
Level 2 |
|
|
Level 3 |
|
|
Total |
|
| Investments in Securities |
|
|
|
|
|
|
|
|
|
|
|
|
|
|
|
|
| Common Stocks |
|
$ |
72,014,524 |
|
|
$ |
— |
|
|
$ |
— |
|
|
$ |
72,014,524 |
|
| Investment Companies |
|
|
463,404 |
|
|
|
— |
|
|
|
— |
|
|
|
463,404 |
|
| Rights |
|
|
— |
|
|
|
— |
|
|
|
— |
|
|
|
— |
|
| Warrants |
|
|
160 |
|
|
|
— |
|
|
|
— |
|
|
|
160 |
|
| Repurchase Agreements |
|
|
— |
|
|
|
10,161,606 |
|
|
|
— |
|
|
|
10,161,606 |
|
|
|
|
|
|
|
|
|
|
|
|
|
|
|
|
|
|
| Total |
|
$ |
72,478,088 |
|
|
$ |
10,161,606 |
|
|
$ |
— |
|
|
$ |
82,639,694 |
|
|
|
|
|
|
|
|
|
|
|
|
|
|
|
|
|
|
See Notes to Portfolios of Investments
See Notes which are an integral part of the Financial Statements
ANNUAL
REPORT / April 30, 2013
NOTES TO PORTFOLIOS OF INVESTMENTS
| § |
Affiliated company. See Note 4 in Notes to Financial Statements. |
| # |
Security, or a portion thereof, is on loan. See Note 2 in Notes to Financial Statements. |
| * |
Non-income producing security. |
| ** |
Represents less than 0.05%. |
The following acronyms are used throughout this report:
ADR – American Depositary Receipt
LLC – Limited Liability Corporation
LP
– Limited Partnership
PLC – Public Limited Company
April 30,
2013 / ANNUAL REPORT
|
|
|
|
|
| STATEMENTS OF ASSETS AND LIABILITIES |
|
|
79 |
|
|
|
|
|
|
|
|
|
|
|
|
|
|
|
|
| April 30, 2013 |
|
|
|
Wilmington
Large-Cap
Growth
Fund |
|
|
Wilmington
Large-Cap
Strategy
Fund |
|
|
Wilmington
Large-Cap
Value
Fund |
|
| ASSETS: |
|
|
|
|
|
|
|
|
|
|
|
|
|
|
| Investments, at identified cost |
|
|
|
$ |
50,610,928 |
|
|
$ |
277,821,389 |
|
|
$ |
109,907,274 |
|
|
|
|
|
|
|
|
|
|
|
|
|
|
|
|
| Investments in securities, at value (Including $1,944,149, $8,764,736 and $0 of securities on loan, respectively) (Note 2) |
|
|
|
|
70,112,814 |
|
|
|
408,396,972 |
(a) |
|
|
127,958,736 |
|
| Cash |
|
|
|
|
172,668 |
|
|
|
44,685 |
|
|
|
— |
|
| Income receivable |
|
|
|
|
28,878 |
|
|
|
356,040 |
|
|
|
52,397 |
|
| Receivable for shares sold |
|
|
|
|
22,662 |
|
|
|
105,000 |
|
|
|
67,990 |
|
| Receivable for investments sold |
|
|
|
|
148,419 |
|
|
|
1,106 |
|
|
|
— |
|
| Other assets |
|
|
|
|
8,099 |
|
|
|
7,865 |
|
|
|
6,207 |
|
|
|
|
|
|
|
|
|
|
|
|
|
|
|
|
| TOTAL ASSETS |
|
|
|
|
70,493,540 |
|
|
|
408,911,668 |
|
|
|
128,085,330 |
|
| |
|
|
|
|
|
|
|
|
|
|
|
|
|
|
| LIABILITIES: |
|
|
|
|
|
|
|
|
|
|
|
|
|
|
| Payable to custodian |
|
|
|
|
— |
|
|
|
— |
|
|
|
440,225 |
|
| Payable for investments purchased |
|
|
|
|
164,902 |
|
|
|
— |
|
|
|
— |
|
| Collateral for securities on loan |
|
|
|
|
1,947,562 |
|
|
|
8,951,934 |
|
|
|
— |
|
| Payable for shares redeemed |
|
|
|
|
70,835 |
|
|
|
96,416 |
|
|
|
60,906 |
|
| Payable for Trustees’ fees |
|
|
|
|
540 |
|
|
|
530 |
|
|
|
498 |
|
| Payable for distribution services fee |
|
|
|
|
4,413 |
|
|
|
6 |
|
|
|
3,971 |
|
| Payable for shareholder services fee |
|
|
|
|
11,906 |
|
|
|
— |
|
|
|
16,640 |
|
| Other accrued expenses |
|
|
|
|
147,745 |
|
|
|
153,178 |
|
|
|
128,200 |
|
|
|
|
|
|
|
|
|
|
|
|
|
|
|
|
| TOTAL LIABILITIES |
|
|
|
|
2,347,903 |
|
|
|
9,202,064 |
|
|
|
650,440 |
|
| |
|
|
|
|
|
|
|
|
|
|
|
|
|
|
| NET ASSETS |
|
|
|
$ |
68,145,637 |
|
|
$ |
399,709,604 |
|
|
$ |
127,434,890 |
|
| |
|
|
|
|
|
|
|
|
|
|
|
|
|
|
| NET ASSETS CONSIST OF: |
|
|
|
|
|
|
|
|
|
|
|
|
|
|
| |
|
|
|
|
|
|
|
|
|
|
|
|
|
|
| Paid-in capital |
|
|
|
$ |
63,910,016 |
|
|
$ |
313,576,506 |
|
|
$ |
119,413,601 |
|
| Undistributed (distributions in excess of) net investment income |
|
|
|
|
341,701 |
|
|
|
502,727 |
|
|
|
— |
|
| Accumulated net realized gain (loss) on investments and foreign currency transactions |
|
|
|
|
(15,607,966 |
) |
|
|
(44,945,212 |
) |
|
|
(10,030,173 |
) |
| Net unrealized appreciation (depreciation) of investments |
|
|
|
|
19,501,886 |
|
|
|
130,575,583 |
|
|
|
18,051,462 |
|
|
|
|
|
|
|
|
|
|
|
|
|
|
|
|
| TOTAL NET ASSETS |
|
|
|
$ |
68,145,637 |
|
|
$ |
399,709,604 |
|
|
$ |
127,434,890 |
|
| |
|
|
|
|
|
|
|
|
|
|
|
|
|
|
| COMPUTATION OF NET ASSET VALUE AND OFFERING PRICE: |
|
|
|
|
|
|
|
|
|
|
|
|
|
|
| Class A |
|
|
|
|
|
|
|
|
|
|
|
|
|
|
| Net Assets |
|
|
|
$ |
17,131,430 |
|
|
$ |
— |
|
|
$ |
5,928,090 |
|
|
|
|
|
|
|
|
|
|
|
|
|
|
|
|
| Shares outstanding (unlimited shares authorized) |
|
|
|
|
2,003,053 |
|
|
|
— |
|
|
|
510,616 |
|
|
|
|
|
|
|
|
|
|
|
|
|
|
|
|
| Net Asset Value per share |
|
|
|
$ |
8.55 |
|
|
$ |
— |
|
|
$ |
11.61 |
|
|
|
|
|
|
|
|
|
|
|
|
|
|
|
|
| Offering price per share* |
|
|
|
$ |
9.05 |
** |
|
$ |
— |
|
|
$ |
12.29 |
** |
|
|
|
|
|
|
|
|
|
|
|
|
|
|
|
| Class I |
|
|
|
|
|
|
|
|
|
|
|
|
|
|
| Net Assets |
|
|
|
$ |
51,014,207 |
|
|
$ |
399,709,604 |
|
|
$ |
121,506,800 |
|
|
|
|
|
|
|
|
|
|
|
|
|
|
|
|
| Shares outstanding (unlimited shares authorized) |
|
|
|
|
5,907,619 |
|
|
|
27,325,009 |
|
|
|
10,425,640 |
|
|
|
|
|
|
|
|
|
|
|
|
|
|
|
|
| Net Asset Value per share |
|
|
|
$ |
8.64 |
|
|
$ |
14.63 |
|
|
$ |
11.65 |
|
|
|
|
|
|
|
|
|
|
|
|
|
|
|
|
| (a) |
Includes $341,682 of investments in affiliated issuers. |
| * |
See “How are Shares Priced?” in the Prospectus. |
| ** |
Computation of offering price per share 100/94.50 of net asset value. |
See Notes which are an integral part
of the Financial Statements
ANNUAL
REPORT / April 30, 2013
|
|
|
| 80 |
|
STATEMENTS OF ASSETS AND LIABILITIES (concluded) |
|
|
|
|
|
|
|
|
|
|
|
|
|
|
|
| April 30, 2013 |
|
|
|
Wilmington
Mid-Cap
Growth
Fund |
|
|
Wilmington
Small-Cap
Growth
Fund |
|
|
Wilmington
Small-Cap
Strategy
Fund |
|
| ASSETS: |
|
|
|
|
|
|
|
|
|
|
|
|
|
|
| Investments, at identified cost |
|
|
|
$ |
242,220,451 |
|
|
$ |
134,130,146 |
|
|
$ |
62,113,264 |
|
|
|
|
|
|
|
|
|
|
|
|
|
|
|
|
| Investments in repurchase agreements, at value |
|
|
|
$ |
29,114,640 |
|
|
$ |
17,897,479 |
|
|
$ |
10,161,606 |
|
| Investments in securities, at value (Including $28,985,432, $17,437,829 and $9,905,197 of securities on loan, respectively) (Note 2) |
|
|
|
|
301,021,417 |
|
|
|
140,792,438 |
|
|
|
72,478,088 |
|
|
|
|
|
|
|
|
|
|
|
|
|
|
|
|
| TOTAL INVESTMENTS IN SECURITIES AND REPURCHASE AGREEMENTS |
|
|
|
|
330,136,057 |
|
|
|
158,689,917 |
|
|
|
82,639,694 |
|
| |
|
|
|
|
|
|
|
|
|
|
|
|
|
|
| Cash |
|
|
|
|
— |
|
|
|
— |
|
|
|
10,120 |
|
| Cash denominated in foreign currencies |
|
|
|
|
— |
|
|
|
— |
|
|
|
209 |
(a) |
| Income receivable |
|
|
|
|
117,065 |
|
|
|
55,756 |
|
|
|
41,501 |
|
| Receivable for shares sold |
|
|
|
|
224,002 |
|
|
|
78,007 |
|
|
|
47,894 |
|
| Receivable for investments sold |
|
|
|
|
1,995,665 |
|
|
|
— |
|
|
|
— |
|
| Other assets |
|
|
|
|
7,322 |
|
|
|
6,055 |
|
|
|
17,682 |
|
|
|
|
|
|
|
|
|
|
|
|
|
|
|
|
| TOTAL ASSETS |
|
|
|
|
332,480,111 |
|
|
|
158,829,735 |
|
|
|
82,757,100 |
|
| |
|
|
|
|
|
|
|
|
|
|
|
|
|
|
| LIABILITIES: |
|
|
|
|
|
|
|
|
|
|
|
|
|
|
| Payable for investments purchased |
|
|
|
|
1,668,214 |
|
|
|
— |
|
|
|
— |
|
| Collateral for securities on loan |
|
|
|
|
29,114,640 |
|
|
|
17,897,479 |
|
|
|
10,161,606 |
|
| Payable for shares redeemed |
|
|
|
|
180,091 |
|
|
|
101,512 |
|
|
|
2,845 |
|
| Payable for Trustees’ fees |
|
|
|
|
450 |
|
|
|
453 |
|
|
|
446 |
|
| Payable for distribution services fee |
|
|
|
|
12,704 |
|
|
|
5,500 |
|
|
|
— |
|
| Payable for shareholder services fee |
|
|
|
|
32,476 |
|
|
|
15,185 |
|
|
|
— |
|
| Other accrued expenses |
|
|
|
|
207,499 |
|
|
|
212,618 |
|
|
|
105,680 |
|
|
|
|
|
|
|
|
|
|
|
|
|
|
|
|
| TOTAL LIABILITIES |
|
|
|
|
31,216,074 |
|
|
|
18,232,747 |
|
|
|
10,270,577 |
|
| |
|
|
|
|
|
|
|
|
|
|
|
|
|
|
| NET ASSETS |
|
|
|
$ |
301,264,037 |
|
|
$ |
140,596,988 |
|
|
$ |
72,486,523 |
|
| |
|
|
|
|
|
|
|
|
|
|
|
|
|
|
| NET ASSETS CONSIST OF: |
|
|
|
|
|
|
|
|
|
|
|
|
|
|
| Paid-in capital |
|
|
|
$ |
229,189,611 |
|
|
$ |
144,951,883 |
|
|
$ |
65,984,419 |
|
| Undistributed (distributions in excess of) net investment income |
|
|
|
|
(272,627 |
) |
|
|
(417,631 |
) |
|
|
83,347 |
|
| Accumulated net realized gain (loss) on investments and foreign currency transactions |
|
|
|
|
(15,568,553 |
) |
|
|
(28,497,035 |
) |
|
|
(14,107,673 |
) |
| Net unrealized appreciation (depreciation) of investments |
|
|
|
|
87,915,606 |
|
|
|
24,559,771 |
|
|
|
20,526,430 |
|
|
|
|
|
|
|
|
|
|
|
|
|
|
|
|
| TOTAL NET ASSETS |
|
|
|
$ |
301,264,037 |
|
|
$ |
140,596,988 |
|
|
$ |
72,486,523 |
|
| |
|
|
|
|
|
|
|
|
|
|
|
|
|
|
| COMPUTATION OF NET ASSET VALUE AND OFFERING PRICE: |
|
|
|
|
|
|
|
|
|
|
|
|
|
|
| Class A |
|
|
|
|
|
|
|
|
|
|
|
|
|
|
| Net Assets |
|
|
|
$ |
56,837,318 |
|
|
$ |
36,269,090 |
|
|
$ |
— |
|
|
|
|
|
|
|
|
|
|
|
|
|
|
|
|
| Shares outstanding (unlimited shares authorized) |
|
|
|
|
3,562,059 |
|
|
|
1,990,719 |
|
|
|
— |
|
|
|
|
|
|
|
|
|
|
|
|
|
|
|
|
| Net Asset Value per share |
|
|
|
$ |
15.96 |
|
|
$ |
18.22 |
|
|
$ |
— |
|
|
|
|
|
|
|
|
|
|
|
|
|
|
|
|
| Offering price per share* |
|
|
|
$ |
16.89 |
** |
|
$ |
19.28 |
** |
|
$ |
— |
|
|
|
|
|
|
|
|
|
|
|
|
|
|
|
|
| Class I |
|
|
|
|
|
|
|
|
|
|
|
|
|
|
| Net Assets |
|
|
|
$ |
244,426,719 |
|
|
$ |
104,327,898 |
|
|
$ |
72,486,523 |
|
|
|
|
|
|
|
|
|
|
|
|
|
|
|
|
| Shares outstanding (unlimited shares authorized) |
|
|
|
|
14,900,669 |
|
|
|
5,534,126 |
|
|
|
5,890,825 |
|
|
|
|
|
|
|
|
|
|
|
|
|
|
|
|
| Net Asset Value per share |
|
|
|
$ |
16.40 |
|
|
$ |
18.85 |
|
|
$ |
12.30 |
|
|
|
|
|
|
|
|
|
|
|
|
|
|
|
|
| (a) |
Cost of cash denominated in foreign currencies was $209. |
| * |
See “How are Shares Priced?” in the Prospectus. |
| ** |
Computation of offering price per share 100/94.50 of net asset value. |
See Notes which are an integral part
of the Financial Statements
April 30,
2013 / ANNUAL REPORT
|
|
|
|
|
| STATEMENTS OF OPERATIONS |
|
|
81 |
|
|
|
|
|
|
|
|
|
|
|
|
|
|
|
|
| Year Ended April 30, 2013 |
|
|
|
Wilmington
Large-Cap Growth
Fund |
|
|
Wilmington
Large-Cap Strategy
Fund |
|
|
Wilmington
Large-Cap Value
Fund |
|
| INVESTMENT INCOME: |
|
|
|
|
|
|
|
|
|
|
|
|
|
|
| Dividends |
|
|
|
$ |
1,232,494 |
(a)(b) |
|
$ |
8,174,328 |
(a)(b) |
|
$ |
3,123,380 |
(a)(b) |
| Securities lending income |
|
|
|
|
26,330 |
|
|
|
75,515 |
|
|
|
28,183 |
|
|
|
|
|
|
|
|
|
|
|
|
|
|
|
|
| TOTAL INVESTMENT INCOME |
|
|
|
|
1,258,824 |
|
|
|
8,249,843 |
|
|
|
3,151,563 |
|
| |
|
|
|
|
|
|
|
|
|
|
|
|
|
|
| EXPENSES: |
|
|
|
|
|
|
|
|
|
|
|
|
|
|
| Investment advisory fee |
|
|
|
|
697,139 |
|
|
|
1,842,921 |
|
|
|
908,568 |
|
| Administrative personnel and services fee |
|
|
|
|
18,836 |
|
|
|
84,538 |
|
|
|
29,779 |
|
| Portfolio accounting, administration and custodian fees |
|
|
|
|
45,133 |
|
|
|
159,170 |
|
|
|
45,920 |
|
| Transfer and dividend disbursing agent fees and expenses |
|
|
|
|
138,008 |
|
|
|
21,542 |
|
|
|
115,148 |
|
| Trustees’ fees |
|
|
|
|
27,904 |
|
|
|
28,334 |
|
|
|
27,812 |
|
| Professional fees |
|
|
|
|
62,181 |
|
|
|
66,531 |
|
|
|
55,843 |
|
| Distribution services fee—Class A |
|
|
|
|
42,488 |
|
|
|
125 |
(c) |
|
|
14,101 |
|
| Shareholder services fee—Class A |
|
|
|
|
42,488 |
|
|
|
125 |
(c) |
|
|
14,101 |
|
| Shareholder services fee—Class I |
|
|
|
|
162,552 |
|
|
|
921,338 |
|
|
|
310,387 |
|
| Share registration costs |
|
|
|
|
29,869 |
|
|
|
38,265 |
|
|
|
24,057 |
|
| Printing and postage |
|
|
|
|
29,712 |
|
|
|
17,925 |
|
|
|
23,858 |
|
| Miscellaneous |
|
|
|
|
14,888 |
|
|
|
48,016 |
|
|
|
15,529 |
|
|
|
|
|
|
|
|
|
|
|
|
|
|
|
|
| TOTAL EXPENSES |
|
|
|
|
1,311,198 |
|
|
|
3,228,830 |
|
|
|
1,585,103 |
|
| |
|
|
|
|
|
|
|
|
|
|
|
|
|
|
| WAIVERS AND REIMBURSEMENTS: |
|
|
|
|
|
|
|
|
|
|
|
|
|
|
| Waiver/reimbursement by investment advisor |
|
|
|
|
(226,864 |
) |
|
|
(1,385,777 |
) |
|
|
(52,100 |
) |
| Waiver of distribution services fee—Class A |
|
|
|
|
(361 |
) |
|
|
— |
(c) |
|
|
(798 |
) |
| Waiver of shareholder services fee—Class A |
|
|
|
|
(17,097 |
) |
|
|
(125 |
)(c) |
|
|
(6,312 |
) |
| Waiver of shareholder services fee—Class I |
|
|
|
|
(149,758 |
) |
|
|
(921,338 |
) |
|
|
(162,286 |
) |
|
|
|
|
|
|
|
|
|
|
|
|
|
|
|
| TOTAL WAIVERS AND REIMBURSEMENTS |
|
|
|
|
(394,080 |
) |
|
|
(2,307,240 |
) |
|
|
(221,496 |
) |
| |
|
|
|
|
|
|
|
|
|
|
|
|
|
|
| Net expenses |
|
|
|
|
917,118 |
|
|
|
921,590 |
|
|
|
1,363,607 |
|
|
|
|
|
|
|
|
|
|
|
|
|
|
|
|
| Net investment income (loss) |
|
|
|
|
341,706 |
|
|
|
7,328,253 |
|
|
|
1,787,956 |
|
|
|
|
|
|
|
|
|
|
|
|
|
|
|
|
| REALIZED AND UNREALIZED GAIN (LOSS) ON INVESTMENTS: |
|
|
|
|
|
|
|
|
|
|
|
|
|
|
| Net realized gain (loss) on investments |
|
|
|
|
4,081,645 |
|
|
|
13,948,281 |
|
|
|
10,280,159 |
|
| Net realized gain (loss) on foreign currency transactions |
|
|
|
|
— |
|
|
|
— |
|
|
|
16 |
|
| Net change in unrealized appreciation (depreciation) of investments |
|
|
|
|
(1,350,720 |
) |
|
|
34,752,819 |
|
|
|
1,036,364 |
|
|
|
|
|
|
|
|
|
|
|
|
|
|
|
|
| Net realized and unrealized gain (loss) on investments |
|
|
|
|
2,730,925 |
|
|
|
48,701,100 |
|
|
|
11,316,539 |
|
|
|
|
|
|
|
|
|
|
|
|
|
|
|
|
| Change in net assets resulting from operations |
|
|
|
$ |
3,072,631 |
|
|
$ |
56,029,353 |
|
|
$ |
13,104,495 |
|
|
|
|
|
|
|
|
|
|
|
|
|
|
|
|
| (a) |
Net of foreign withholding taxes withheld of $569, $7,246 and $116,921. |
| (b) |
Includes $54, $7,868 and $527 received from affiliated issuers. |
| (c) |
On April 13, 2013, Class A of the Large-Cap Strategy Fund was terminated after the conversion to Class I of the Fund. |
See Notes which are an integral part of the Financial Statements
ANNUAL
REPORT / April 30, 2013
|
|
|
| 82 |
|
STATEMENTS OF OPERATIONS (concluded) |
|
|
|
|
|
|
|
|
|
|
|
|
|
|
|
| Year Ended April 30, 2013 |
|
|
|
Wilmington
Mid-Cap Growth
Fund |
|
|
Wilmington
Small-Cap Growth
Fund |
|
|
Wilmington
Small-Cap Strategy
Fund |
|
| INVESTMENT INCOME: |
|
|
|
|
|
|
|
|
|
|
|
|
|
|
| Dividends |
|
|
|
$ |
2,804,156 |
(a)(b) |
|
$ |
1,780,033 |
(a)(b) |
|
$ |
806,722 |
(a) |
| Securities lending income |
|
|
|
|
417,023 |
|
|
|
323,530 |
|
|
|
136,126 |
|
|
|
|
|
|
|
|
|
|
|
|
|
|
|
|
| TOTAL INVESTMENT INCOME |
|
|
|
|
3,221,179 |
|
|
|
2,103,563 |
|
|
|
942,848 |
|
| |
|
|
|
|
|
|
|
|
|
|
|
|
|
|
| EXPENSES: |
|
|
|
|
|
|
|
|
|
|
|
|
|
|
| Investment advisory fee |
|
|
|
|
2,365,865 |
|
|
|
1,221,565 |
|
|
|
277,074 |
|
| Administrative personnel and services fee |
|
|
|
|
63,830 |
|
|
|
32,988 |
|
|
|
11,673 |
|
| Portfolio accounting, administration and custodian fees |
|
|
|
|
108,584 |
|
|
|
67,025 |
|
|
|
75,235 |
|
| Transfer and dividend disbursing agent fees and expenses |
|
|
|
|
205,951 |
|
|
|
238,982 |
|
|
|
23,483 |
|
| Trustees’ fees |
|
|
|
|
28,048 |
|
|
|
28,557 |
|
|
|
30,165 |
|
| Professional fees |
|
|
|
|
76,704 |
|
|
|
60,275 |
|
|
|
70,437 |
|
| Distribution services fee—Class A |
|
|
|
|
137,144 |
|
|
|
88,819 |
|
|
|
— |
|
| Distribution services fee—Class C |
|
|
|
|
— |
|
|
|
1,787 |
(c) |
|
|
— |
|
| Shareholder services fee—Class A |
|
|
|
|
137,144 |
|
|
|
88,819 |
|
|
|
— |
|
| Shareholder services fee—Class C |
|
|
|
|
— |
|
|
|
596 |
(c) |
|
|
— |
|
| Shareholder services fee— Class I |
|
|
|
|
558,697 |
|
|
|
269,869 |
|
|
|
127,359 |
|
| Share registration costs |
|
|
|
|
29,476 |
|
|
|
38,723 |
|
|
|
28,041 |
|
| Printing and postage |
|
|
|
|
33,372 |
|
|
|
30,827 |
|
|
|
13,582 |
|
| Miscellaneous |
|
|
|
|
28,416 |
|
|
|
21,137 |
|
|
|
16,764 |
|
|
|
|
|
|
|
|
|
|
|
|
|
|
|
|
| TOTAL EXPENSES |
|
|
|
|
3,773,231 |
|
|
|
2,189,969 |
|
|
|
673,813 |
|
| |
|
|
|
|
|
|
|
|
|
|
|
|
|
|
| WAIVERS AND REIMBURSEMENTS: |
|
|
|
|
|
|
|
|
|
|
|
|
|
|
| Waiver/reimbursement by investment advisor |
|
|
|
|
(291,638 |
) |
|
|
(112,198 |
) |
|
|
(417,902 |
) |
| Waiver of distribution services fee—Class A |
|
|
|
|
(851 |
) |
|
|
(438 |
) |
|
|
— |
|
| Waiver of distribution services fee—Class C |
|
|
|
|
— |
|
|
|
(986 |
)(c) |
|
|
— |
|
| Waiver of shareholder services fee—Class A |
|
|
|
|
(116,422 |
) |
|
|
(58,862 |
) |
|
|
— |
|
| Waiver of shareholder services fee—Class C |
|
|
|
|
— |
|
|
|
(489 |
)(c) |
|
|
— |
|
| Waiver of shareholder services fee—Class I |
|
|
|
|
(275,839 |
) |
|
|
(145,062 |
) |
|
|
(127,359 |
) |
|
|
|
|
|
|
|
|
|
|
|
|
|
|
|
| TOTAL WAIVERS AND REIMBURSEMENTS |
|
|
|
|
(684,750 |
) |
|
|
(318,035 |
) |
|
|
(545,261 |
) |
| |
|
|
|
|
|
|
|
|
|
|
|
|
|
|
| Net expenses |
|
|
|
|
3,088,481 |
|
|
|
1,871,934 |
|
|
|
128,552 |
|
|
|
|
|
|
|
|
|
|
|
|
|
|
|
|
| Net investment income (loss) |
|
|
|
|
132,698 |
|
|
|
231,629 |
|
|
|
814,296 |
|
|
|
|
|
|
|
|
|
|
|
|
|
|
|
|
| REALIZED AND UNREALIZED GAIN (LOSS) ON INVESTMENTS: |
|
|
|
|
|
|
|
|
|
|
|
|
|
|
| Net realized gain (loss) on investments |
|
|
|
|
7,738,830 |
|
|
|
1,385,443 |
|
|
|
5,895,718 |
|
| Net realized gain (loss) on foreign currency transactions |
|
|
|
|
— |
|
|
|
— |
|
|
|
(22 |
) |
| Net change in unrealized appreciation (depreciation) of investments |
|
|
|
|
18,624,339 |
|
|
|
11,305,096 |
|
|
|
2,022,351 |
|
|
|
|
|
|
|
|
|
|
|
|
|
|
|
|
| Net realized and unrealized gain (loss) on investments |
|
|
|
|
26,363,169 |
|
|
|
12,690,539 |
|
|
|
7,918,047 |
|
|
|
|
|
|
|
|
|
|
|
|
|
|
|
|
| Change in net assets resulting from operations |
|
|
|
$ |
26,495,867 |
|
|
$ |
12,922,168 |
|
|
$ |
8,732,343 |
|
|
|
|
|
|
|
|
|
|
|
|
|
|
|
|
| (a) |
Net of foreign withholding taxes withheld of $6,424, $1,826 and $897. |
| (b) |
Includes $100 and $88 received from affiliated issuers. |
| (c) |
On April 13, 2013, Class C of the Small-Cap Growth Fund was terminated after the conversion to Class A of the Fund. |
See Notes which are an integral part of the Financial Statements
April 30,
2013 / ANNUAL REPORT
|
|
|
|
|
| STATEMENTS OF CHANGES IN NET ASSETS |
|
|
83 |
|
|
|
|
|
|
|
|
|
|
|
|
|
|
|
|
|
|
|
|
|
|
|
|
| |
|
|
|
Wilmington
Large-Cap
Growth
Fund |
|
|
Wilmington
Large-Cap
Strategy
Fund |
|
| |
|
|
|
Year
Ended April 30,
2013 |
|
|
Year
Ended
April 30,
2012 |
|
|
Year
Ended April 30,
2013 |
|
|
Ten Months Ended
April 30,
2012(a) |
|
|
Year Ended
June 30,
2011 |
|
| OPERATIONS: |
|
|
|
|
|
|
|
|
|
|
|
|
|
|
|
|
|
|
|
|
|
|
| Net investment income (loss) |
|
|
|
$ |
341,706 |
|
|
$ |
155,795 |
|
|
$ |
7,328,253 |
|
|
$ |
5,569,382 |
|
|
$ |
6,566,630 |
|
| Net realized gain (loss) on investments |
|
|
|
|
4,081,645 |
|
|
|
13,226,789 |
|
|
|
13,948,281 |
|
|
|
8,077,638 |
|
|
|
2,692,000 |
|
| Net change in unrealized appreciation (depreciation) of investments |
|
|
|
|
(1,350,720 |
) |
|
|
(22,434,916 |
) |
|
|
34,752,819 |
|
|
|
13,862,545 |
|
|
|
78,156,513 |
|
|
|
|
|
|
|
|
|
|
|
|
|
|
|
|
|
|
|
|
|
|
|
|
| Change in net assets resulting from operations |
|
|
|
|
3,072,631 |
|
|
|
(9,052,332 |
) |
|
|
56,029,353 |
|
|
|
27,509,565 |
|
|
|
87,415,143 |
|
|
|
|
|
|
|
|
|
|
|
|
|
|
|
|
|
|
|
|
|
|
|
|
| DISTRIBUTIONS TO SHAREHOLDERS: |
|
|
|
|
|
|
|
|
|
|
|
|
|
|
|
|
|
|
|
|
|
|
| Distributions from net investment income |
|
|
|
|
|
|
|
|
|
|
|
|
|
|
|
|
|
|
|
|
|
|
| Class A |
|
|
|
|
(5,852 |
) |
|
|
— |
|
|
|
(944 |
) |
|
|
(267 |
) |
|
|
(286 |
) |
| Class I |
|
|
|
|
(79,133 |
) |
|
|
(70,815 |
) |
|
|
(7,318,547 |
) |
|
|
(5,372,840 |
) |
|
|
(6,299,693 |
) |
| Distributions from net realized gain on investments |
|
|
|
|
|
|
|
|
|
|
|
|
|
|
|
|
|
|
|
|
|
|
| Class A |
|
|
|
|
(1,579,653 |
) |
|
|
(308,531 |
) |
|
|
— |
|
|
|
— |
|
|
|
— |
|
| Class I |
|
|
|
|
(5,786,413 |
) |
|
|
(1,546,450 |
) |
|
|
— |
|
|
|
— |
|
|
|
— |
|
|
|
|
|
|
|
|
|
|
|
|
|
|
|
|
|
|
|
|
|
|
|
|
| Change in net assets resulting from distributions to shareholders |
|
|
|
|
(7,451,051 |
) |
|
|
(1,925,796 |
) |
|
|
(7,319,491 |
) |
|
|
(5,373,107 |
) |
|
|
(6,299,979 |
) |
|
|
|
|
|
|
|
|
|
|
|
|
|
|
|
|
|
|
|
|
|
|
|
| SHARE TRANSACTIONS: |
|
|
|
|
|
|
|
|
|
|
|
|
|
|
|
|
|
|
|
|
|
|
| Proceeds from sale of shares |
|
|
|
|
|
|
|
|
|
|
|
|
|
|
|
|
|
|
|
|
|
|
| Class A |
|
|
|
|
253,460 |
|
|
|
266,102 |
|
|
|
40,894 |
|
|
|
— |
|
|
|
24,341 |
|
| Class I |
|
|
|
|
10,388,386 |
|
|
|
19,200,047 |
|
|
|
48,465,457 |
|
|
|
65,074,652 |
|
|
|
315,538,826 |
|
| Proceeds from exchange of Class A for
Class I |
|
|
|
|
|
|
|
|
|
|
|
|
|
|
|
|
|
|
|
|
|
|
| Class A |
|
|
|
|
— |
|
|
|
— |
|
|
|
(71,512 |
)(b) |
|
|
— |
|
|
|
— |
|
| Class I |
|
|
|
|
— |
|
|
|
— |
|
|
|
71,512 |
(b) |
|
|
— |
|
|
|
— |
|
| Distributions reinvested |
|
|
|
|
|
|
|
|
|
|
|
|
|
|
|
|
|
|
|
|
|
|
| Class A |
|
|
|
|
1,541,369 |
|
|
|
300,789 |
|
|
|
944 |
|
|
|
267 |
|
|
|
236 |
|
| Class I |
|
|
|
|
5,219,589 |
|
|
|
1,407,752 |
|
|
|
2,465,687 |
|
|
|
1,858,419 |
|
|
|
2,303,175 |
|
| Cost of shares redeemed |
|
|
|
|
|
|
|
|
|
|
|
|
|
|
|
|
|
|
|
|
|
|
| Class A |
|
|
|
|
(2,625,380 |
) |
|
|
(3,122,802 |
) |
|
|
(9,294 |
) |
|
|
(4,333 |
) |
|
|
(2,088 |
) |
| Class I |
|
|
|
|
(39,496,341 |
) |
|
|
(55,868,242 |
) |
|
|
(74,891,786 |
) |
|
|
(143,632,690 |
) |
|
|
(87,589,025 |
) |
|
|
|
|
|
|
|
|
|
|
|
|
|
|
|
|
|
|
|
|
|
|
|
| Change in net assets resulting from share transactions |
|
|
|
|
(24,718,917 |
) |
|
|
(37,816,354 |
) |
|
|
(23,928,098 |
) |
|
|
(76,703,685 |
) |
|
|
230,275,465 |
|
|
|
|
|
|
|
|
|
|
|
|
|
|
|
|
|
|
|
|
|
|
|
|
| Change in net assets |
|
|
|
|
(29,097,337 |
) |
|
|
(48,794,482 |
) |
|
|
24,781,764 |
|
|
|
(54,567,227 |
) |
|
|
311,390,629 |
|
| NET ASSETS: |
|
|
|
|
|
|
|
|
|
|
|
|
|
|
|
|
|
|
|
|
|
|
| Beginning of period |
|
|
|
|
97,242,974 |
|
|
|
146,037,456 |
|
|
|
374,927,840 |
|
|
|
429,495,067 |
|
|
|
118,104,438 |
|
|
|
|
|
|
|
|
|
|
|
|
|
|
|
|
|
|
|
|
|
|
|
|
| End of period |
|
|
|
$ |
68,145,637 |
|
|
$ |
97,242,974 |
|
|
$ |
399,709,604 |
|
|
$ |
374,927,840 |
|
|
$ |
429,495,067 |
|
|
|
|
|
|
|
|
|
|
|
|
|
|
|
|
|
|
|
|
|
|
|
|
| Undistributed (distributions in excess of) net investment income included in net assets at end of period |
|
|
|
$ |
341,701 |
|
|
$ |
84,980 |
|
|
$ |
502,727 |
|
|
$ |
490,455 |
|
|
$ |
305,380 |
|
|
|
|
|
|
|
|
|
|
|
|
|
|
|
|
|
|
|
|
|
|
|
|
| SHARES OF BENEFICIAL INTEREST: |
|
|
|
|
|
|
|
|
|
|
|
|
|
|
|
|
|
|
|
|
|
|
| Shares sold |
|
|
|
|
|
|
|
|
|
|
|
|
|
|
|
|
|
|
|
|
|
|
| Class A |
|
|
|
|
30,523 |
|
|
|
30,904 |
|
|
|
3,295 |
|
|
|
— |
|
|
|
2,320 |
|
| Class I |
|
|
|
|
1,233,597 |
|
|
|
2,296,957 |
|
|
|
3,620,752 |
|
|
|
5,878,354 |
|
|
|
30,273,313 |
|
| Shares exchanged |
|
|
|
|
|
|
|
|
|
|
|
|
|
|
|
|
|
|
|
|
|
|
| Class A |
|
|
|
|
— |
|
|
|
— |
|
|
|
(4,623 |
)(b) |
|
|
— |
|
|
|
— |
|
| Class I |
|
|
|
|
— |
|
|
|
— |
|
|
|
4,623 |
(b) |
|
|
— |
|
|
|
— |
|
| Distributions reinvested |
|
|
|
|
|
|
|
|
|
|
|
|
|
|
|
|
|
|
|
|
|
|
| Class A |
|
|
|
|
197,616 |
|
|
|
37,505 |
|
|
|
71 |
|
|
|
23 |
|
|
|
20 |
|
| Class I |
|
|
|
|
663,275 |
|
|
|
174,874 |
|
|
|
187,578 |
|
|
|
161,249 |
|
|
|
203,829 |
|
| Shares redeemed |
|
|
|
|
|
|
|
|
|
|
|
|
|
|
|
|
|
|
|
|
|
|
| Class A |
|
|
|
|
(315,072 |
) |
|
|
(368,225 |
) |
|
|
(698 |
) |
|
|
(408 |
) |
|
|
(213 |
) |
| Class I |
|
|
|
|
(4,693,783 |
) |
|
|
(6,653,843 |
) |
|
|
(5,690,589 |
) |
|
|
(12,239,104 |
) |
|
|
(7,651,566 |
) |
|
|
|
|
|
|
|
|
|
|
|
|
|
|
|
|
|
|
|
|
|
|
|
| Net change resulting from share transactions |
|
|
|
|
(2,883,844 |
) |
|
|
(4,481,828 |
) |
|
|
(1,879,591 |
) |
|
|
(6,199,886 |
) |
|
|
22,827,703 |
|
|
|
|
|
|
|
|
|
|
|
|
|
|
|
|
|
|
|
|
|
|
|
|
| (a) |
Year end changed from June 30 to April 30. |
| (b) |
On April 13, 2013, Class A of the Large-Cap Strategy Fund was terminated after the conversion to Class I of the Fund. |
See Notes which are an integral part of the Financial Statements
ANNUAL
REPORT / April 30, 2013
|
|
|
| 84 |
|
STATEMENTS OF CHANGES IN NET ASSETS (continued) |
|
|
|
|
|
|
|
|
|
|
|
|
|
|
|
|
|
|
|
| |
|
|
|
Wilmington
Large-Cap Value Fund |
|
|
Wilmington
Mid-Cap Growth Fund |
|
| |
|
|
|
Year
Ended
April 30,
2013 |
|
|
Year
Ended
April 30,
2012 |
|
|
Year
Ended
April 30,
2013 |
|
|
Year
Ended
April 30,
2012 |
|
| OPERATIONS: |
|
|
|
|
|
|
|
|
|
|
|
|
|
|
|
|
|
|
| Net investment income (loss) |
|
|
|
$ |
1,787,956 |
|
|
$ |
1,317,174 |
|
|
$ |
132,698 |
|
|
$ |
(809,168 |
) |
| Net realized gain (loss) on investments |
|
|
|
|
10,280,175 |
|
|
|
4,135,047 |
|
|
|
7,738,830 |
|
|
|
25,609,997 |
|
| Net change in unrealized appreciation (depreciation) of investments |
|
|
|
|
1,036,364 |
|
|
|
(19,012,573 |
) |
|
|
18,624,339 |
|
|
|
(27,883,636 |
) |
|
|
|
|
|
|
|
|
|
|
|
|
|
|
|
|
|
|
|
| Change in net assets resulting from operations |
|
|
|
|
13,104,495 |
|
|
|
(13,560,352 |
) |
|
|
26,495,867 |
|
|
|
(3,082,807 |
) |
|
|
|
|
|
|
|
|
|
|
|
|
|
|
|
|
|
|
|
| DISTRIBUTIONS TO SHAREHOLDERS: |
|
|
|
|
|
|
|
|
|
|
|
|
|
|
|
|
|
|
| Distributions from net investment income |
|
|
|
|
|
|
|
|
|
|
|
|
|
|
|
|
|
|
| Class A |
|
|
|
|
(63,452 |
) |
|
|
(36,426 |
) |
|
|
— |
|
|
|
— |
|
| Class I |
|
|
|
|
(1,735,768 |
) |
|
|
(1,319,431 |
) |
|
|
— |
|
|
|
— |
|
| Distributions from net realized gain on investments |
|
|
|
|
|
|
|
|
|
|
|
|
|
|
|
|
|
|
| Class A |
|
|
|
|
— |
|
|
|
— |
|
|
|
(2,239,956 |
) |
|
|
(2,661,286 |
) |
| Class I |
|
|
|
|
— |
|
|
|
— |
|
|
|
(9,036,430 |
) |
|
|
(7,928,225 |
) |
|
|
|
|
|
|
|
|
|
|
|
|
|
|
|
|
|
|
|
| Change in net assets resulting from distributions to shareholders |
|
|
|
|
(1,799,220 |
) |
|
|
(1,355,857 |
) |
|
|
(11,276,386 |
) |
|
|
(10,589,511 |
) |
|
|
|
|
|
|
|
|
|
|
|
|
|
|
|
|
|
|
|
| SHARE TRANSACTIONS: |
|
|
|
|
|
|
|
|
|
|
|
|
|
|
|
|
|
|
| Proceeds from sale of shares |
|
|
|
|
|
|
|
|
|
|
|
|
|
|
|
|
|
|
| Class A |
|
|
|
|
258,300 |
|
|
|
282,370 |
|
|
|
3,853,332 |
|
|
|
8,152,799 |
|
| Class I |
|
|
|
|
28,166,748 |
|
|
|
42,352,416 |
|
|
|
61,439,480 |
|
|
|
89,824,533 |
|
| Distributions reinvested |
|
|
|
|
|
|
|
|
|
|
|
|
|
|
|
|
|
|
| Class A |
|
|
|
|
61,515 |
|
|
|
35,523 |
|
|
|
2,060,452 |
|
|
|
2,500,128 |
|
| Class I |
|
|
|
|
1,063,341 |
|
|
|
842,966 |
|
|
|
8,109,967 |
|
|
|
7,366,210 |
|
| Cost of shares redeemed |
|
|
|
|
|
|
|
|
|
|
|
|
|
|
|
|
|
|
| Class A |
|
|
|
|
(927,691 |
) |
|
|
(1,015,899 |
) |
|
|
(12,309,078 |
) |
|
|
(9,489,591 |
) |
| Class I |
|
|
|
|
(54,085,694 |
) |
|
|
(68,742,638 |
) |
|
|
(70,635,840 |
) |
|
|
(41,530,266 |
) |
|
|
|
|
|
|
|
|
|
|
|
|
|
|
|
|
|
|
|
| Change in net assets resulting from share transactions |
|
|
|
|
(25,463,481 |
) |
|
|
(26,245,262 |
) |
|
|
(7,481,687 |
) |
|
|
56,823,813 |
|
|
|
|
|
|
|
|
|
|
|
|
|
|
|
|
|
|
|
|
| Change in net assets |
|
|
|
|
(14,158,206 |
) |
|
|
(41,161,471 |
) |
|
|
7,737,794 |
|
|
|
43,151,495 |
|
| NET ASSETS: |
|
|
|
|
|
|
|
|
|
|
|
|
|
|
|
|
|
|
| Beginning of year |
|
|
|
|
141,593,096 |
|
|
|
182,754,567 |
|
|
|
293,526,243 |
|
|
|
250,374,748 |
|
|
|
|
|
|
|
|
|
|
|
|
|
|
|
|
|
|
|
|
| End of year |
|
|
|
$ |
127,434,890 |
|
|
$ |
141,593,096 |
|
|
$ |
301,264,037 |
|
|
$ |
293,526,243 |
|
|
|
|
|
|
|
|
|
|
|
|
|
|
|
|
|
|
|
|
| Undistributed (distributions in excess of) net investment income included in net assets at end of year |
|
|
|
$ |
— |
|
|
$ |
— |
|
|
$ |
(272,627 |
) |
|
$ |
(405,325 |
) |
|
|
|
|
|
|
|
|
|
|
|
|
|
|
|
|
|
|
|
| SHARES OF BENEFICIAL INTEREST: |
|
|
|
|
|
|
|
|
|
|
|
|
|
|
|
|
|
|
| Shares sold |
|
|
|
|
|
|
|
|
|
|
|
|
|
|
|
|
|
|
| Class A |
|
|
|
|
24,650 |
|
|
|
27,134 |
|
|
|
266,791 |
|
|
|
552,347 |
|
| Class I |
|
|
|
|
2,701,379 |
|
|
|
4,216,455 |
|
|
|
4,131,878 |
|
|
|
5,962,713 |
|
| Distributions reinvested |
|
|
|
|
|
|
|
|
|
|
|
|
|
|
|
|
|
|
| Class A |
|
|
|
|
5,812 |
|
|
|
3,484 |
|
|
|
146,339 |
|
|
|
181,037 |
|
| Class I |
|
|
|
|
100,572 |
|
|
|
82,892 |
|
|
|
560,468 |
|
|
|
520,580 |
|
| Shares redeemed |
|
|
|
|
|
|
|
|
|
|
|
|
|
|
|
|
|
|
| Class A |
|
|
|
|
(88,890 |
) |
|
|
(99,446 |
) |
|
|
(839,784 |
) |
|
|
(641,122 |
) |
| Class I |
|
|
|
|
(5,101,040 |
) |
|
|
(6,814,920 |
) |
|
|
(4,725,079 |
) |
|
|
(2,847,066 |
) |
|
|
|
|
|
|
|
|
|
|
|
|
|
|
|
|
|
|
|
| Net change resulting from share transactions |
|
|
|
|
(2,357,517 |
) |
|
|
(2,584,401 |
) |
|
|
(459,387 |
) |
|
|
3,728,489 |
|
|
|
|
|
|
|
|
|
|
|
|
|
|
|
|
|
|
|
|
See Notes which are an integral part of the Financial Statements
April 30,
2013 / ANNUAL REPORT
|
|
|
|
|
| STATEMENTS OF CHANGES IN NET ASSETS (concluded) |
|
|
85 |
|
|
|
|
|
|
|
|
|
|
|
|
|
|
|
|
|
|
|
|
|
|
| |
|
Wilmington
Small-Cap
Growth
Fund |
|
|
Wilmington
Small-Cap
Strategy
Fund |
|
| |
|
Year
Ended
April 30,
2013 |
|
|
Year
Ended
April 30,
2012 |
|
|
Year
Ended
April 30,
2013 |
|
|
Ten Months Ended
April 30,
2012(a) |
|
|
Year
Ended
June 30,
2011 |
|
| OPERATIONS: |
|
|
|
|
|
|
|
|
|
|
|
|
|
|
|
|
|
|
|
|
| Net investment income (loss) |
|
$ |
231,629 |
|
|
$ |
(599,979 |
) |
|
$ |
814,296 |
|
|
$ |
723,480 |
|
|
$ |
1,356,548 |
|
| Net realized gain (loss) on investments |
|
|
1,385,443 |
|
|
|
9,032,820 |
|
|
|
5,895,696 |
|
|
|
(1,998,866 |
) |
|
|
5,092,724 |
|
| Net change in unrealized appreciation (depreciation) of investments |
|
|
11,305,096 |
|
|
|
(25,481,130 |
) |
|
|
2,022,351 |
|
|
|
(11,912,058 |
) |
|
|
27,454,374 |
|
|
|
|
|
|
|
|
|
|
|
|
|
|
|
|
|
|
|
|
|
|
| Change in net assets resulting from operations |
|
|
12,922,168 |
|
|
|
(17,048,289 |
) |
|
|
8,732,343 |
|
|
|
(13,187,444 |
) |
|
|
33,903,646 |
|
|
|
|
|
|
|
|
|
|
|
|
|
|
|
|
|
|
|
|
|
|
| DISTRIBUTIONS TO SHAREHOLDERS: |
|
|
|
|
|
|
|
|
|
|
|
|
|
|
|
|
|
|
|
|
| Distributions from net investment income |
|
|
|
|
|
|
|
|
|
|
|
|
|
|
|
|
|
|
|
|
| Class A |
|
|
(185,121 |
) |
|
|
— |
|
|
|
— |
|
|
|
— |
|
|
|
— |
|
| Class C |
|
|
(1,318 |
) |
|
|
— |
|
|
|
— |
|
|
|
— |
|
|
|
— |
|
| Class I |
|
|
(571,237 |
) |
|
|
— |
|
|
|
(763,725 |
) |
|
|
(884,546 |
) |
|
|
(1,230,775 |
) |
|
|
|
|
|
|
|
|
|
|
|
|
|
|
|
|
|
|
|
|
|
| Change in net assets resulting from distributions to shareholders |
|
|
(757,676 |
) |
|
|
— |
|
|
|
(763,725 |
) |
|
|
(884,546 |
) |
|
|
(1,230,775 |
) |
|
|
|
|
|
|
|
|
|
|
|
|
|
|
|
|
|
|
|
|
|
| SHARE TRANSACTIONS: |
|
|
|
|
|
|
|
|
|
|
|
|
|
|
|
|
|
|
|
|
| Proceeds from sale of shares |
|
|
|
|
|
|
|
|
|
|
|
|
|
|
|
|
|
|
|
|
| Class A |
|
|
591,874 |
|
|
|
1,063,682 |
|
|
|
— |
|
|
|
— |
|
|
|
— |
|
| Class C |
|
|
9,481 |
|
|
|
— |
|
|
|
— |
|
|
|
— |
|
|
|
— |
|
| Class I |
|
|
15,999,615 |
|
|
|
21,997,629 |
|
|
|
26,614,352 |
|
|
|
7,510,526 |
|
|
|
54,102,863 |
|
| Proceeds from exchange of Class C for Class A |
|
|
|
|
|
|
|
|
|
|
|
|
|
|
|
|
|
|
|
|
| Class A |
|
|
299,066 |
(b) |
|
|
— |
|
|
|
— |
|
|
|
— |
|
|
|
— |
|
| Class C |
|
|
(299,066 |
)(b) |
|
|
— |
|
|
|
— |
|
|
|
— |
|
|
|
— |
|
| Distributions reinvested |
|
|
|
|
|
|
|
|
|
|
|
|
|
|
|
|
|
|
|
|
| Class A |
|
|
172,046 |
|
|
|
— |
|
|
|
— |
|
|
|
— |
|
|
|
— |
|
| Class C |
|
|
1,161 |
|
|
|
— |
|
|
|
— |
|
|
|
— |
|
|
|
— |
|
| Class I |
|
|
284,137 |
|
|
|
— |
|
|
|
188,667 |
|
|
|
186,726 |
|
|
|
237,390 |
|
| Cost of shares redeemed |
|
|
|
|
|
|
|
|
|
|
|
|
|
|
|
|
|
|
|
|
| Class A |
|
|
(6,344,652 |
) |
|
|
(6,178,700 |
) |
|
|
— |
|
|
|
— |
|
|
|
— |
|
| Class C |
|
|
(20,041 |
) |
|
|
(51,523 |
) |
|
|
— |
|
|
|
— |
|
|
|
— |
|
| Class I |
|
|
(45,935,744 |
) |
|
|
(32,909,077 |
) |
|
|
(11,259,397 |
) |
|
|
(72,618,596 |
) |
|
|
(58,102,865 |
) |
|
|
|
|
|
|
|
|
|
|
|
|
|
|
|
|
|
|
|
|
|
| Change in net assets resulting from share transactions |
|
|
(35,242,123 |
) |
|
|
(16,077,989 |
) |
|
|
15,543,622 |
|
|
|
(64,921,344 |
) |
|
|
(3,762,612 |
) |
|
|
|
|
|
|
|
|
|
|
|
|
|
|
|
|
|
|
|
|
|
| Change in net assets |
|
|
(23,077,631 |
) |
|
|
(33,126,278 |
) |
|
|
23,512,240 |
|
|
|
(78,993,334 |
) |
|
|
28,910,259 |
|
| NET ASSETS: |
|
|
|
|
|
|
|
|
|
|
|
|
|
|
|
|
|
|
|
|
| Beginning of period |
|
|
163,674,619 |
|
|
|
196,800,897 |
|
|
|
48,974,283 |
|
|
|
127,967,617 |
|
|
|
99,057,358 |
|
|
|
|
|
|
|
|
|
|
|
|
|
|
|
|
|
|
|
|
|
|
| End of period |
|
$ |
140,596,988 |
|
|
$ |
163,674,619 |
|
|
$ |
72,486,523 |
|
|
$ |
48,974,283 |
|
|
$ |
127,967,617 |
|
|
|
|
|
|
|
|
|
|
|
|
|
|
|
|
|
|
|
|
|
|
| Undistributed (distributions in excess of) net investment income included in net assets at end of period |
|
$ |
(417,631 |
) |
|
$ |
— |
|
|
$ |
83,347 |
|
|
$ |
21,273 |
|
|
$ |
205,306 |
|
|
|
|
|
|
|
|
|
|
|
|
|
|
|
|
|
|
|
|
|
|
| SHARES OF BENEFICIAL INTEREST: |
|
|
|
|
|
|
|
|
|
|
|
|
|
|
|
|
|
|
|
|
| Shares sold |
|
|
|
|
|
|
|
|
|
|
|
|
|
|
|
|
|
|
|
|
| Class A |
|
|
36,338 |
|
|
|
67,626 |
|
|
|
— |
|
|
|
— |
|
|
|
— |
|
| Class C |
|
|
545 |
|
|
|
— |
|
|
|
— |
|
|
|
— |
|
|
|
— |
|
| Class I |
|
|
943,603 |
|
|
|
1,378,910 |
|
|
|
2,267,147 |
|
|
|
787,693 |
|
|
|
5,901,118 |
|
| Shares exchanged |
|
|
|
|
|
|
|
|
|
|
|
|
|
|
|
|
|
|
|
|
| Class A |
|
|
15,564 |
(b) |
|
|
— |
|
|
|
— |
|
|
|
— |
|
|
|
— |
|
| Class C |
|
|
(16,152 |
)(b) |
|
|
— |
|
|
|
— |
|
|
|
— |
|
|
|
— |
|
| Distributions reinvested |
|
|
|
|
|
|
|
|
|
|
|
|
|
|
|
|
|
|
|
|
| Class A |
|
|
10,582 |
|
|
|
— |
|
|
|
— |
|
|
|
— |
|
|
|
— |
|
| Class C |
|
|
74 |
|
|
|
— |
|
|
|
— |
|
|
|
— |
|
|
|
— |
|
| Class I |
|
|
16,903 |
|
|
|
— |
|
|
|
17,227 |
|
|
|
19,935 |
|
|
|
24,537 |
|
| Shares redeemed |
|
|
|
|
|
|
|
|
|
|
|
|
|
|
|
|
|
|
|
|
| Class A |
|
|
(384,759 |
) |
|
|
(385,128 |
) |
|
|
— |
|
|
|
— |
|
|
|
— |
|
| Class C |
|
|
(1,387 |
) |
|
|
(3,393 |
) |
|
|
— |
|
|
|
— |
|
|
|
— |
|
| Class I |
|
|
(2,706,593 |
) |
|
|
(2,017,597 |
) |
|
|
(1,019,535 |
) |
|
|
(8,141,855 |
) |
|
|
(6,505,328 |
) |
|
|
|
|
|
|
|
|
|
|
|
|
|
|
|
|
|
|
|
|
|
| Net change resulting from share transactions |
|
|
(2,085,282 |
) |
|
|
(959,582 |
) |
|
|
1,264,839 |
|
|
|
(7,334,227 |
) |
|
|
(579,673 |
) |
|
|
|
|
|
|
|
|
|
|
|
|
|
|
|
|
|
|
|
|
|
| (a) |
Year end changed from June 30 to April 30. |
| (b) |
On April 13, 2013, Class C of the Small-Cap Growth Fund was terminated after the conversion to Class A of the Fund. |
See Notes which are an integral part of the Financial Statements
ANNUAL
REPORT / April 30, 2013
For a share outstanding throughout each year ended April 30, unless otherwise noted:
|
|
|
|
|
|
|
|
|
|
|
|
|
|
|
|
|
|
|
|
|
|
|
|
|
| WILMINGTON LARGE-CAP GROWTH FUND |
|
|
|
|
|
|
|
|
|
|
|
|
|
|
|
|
|
|
|
|
|
|
|
|
|
|
|
|
|
|
|
|
|
|
|
|
|
| CLASS A |
|
|
|
2013 |
|
|
2012 |
|
|
2011 |
|
|
2010 |
|
|
2009 |
|
|
|
| Net Asset Value, Beginning of Year |
|
|
|
|
$8.97 |
|
|
|
$9.54 |
|
|
|
$8.09 |
|
|
|
$5.80 |
|
|
|
$8.75 |
|
|
|
| Income (Loss) From Operations: |
|
|
|
|
|
|
|
|
|
|
|
|
|
|
|
|
|
|
|
|
|
|
|
|
| Net Investment Income (Loss)(a) |
|
|
|
|
0.00 |
(b) |
|
|
(0.02 |
) |
|
|
(0.05 |
) |
|
|
0.00 |
(b) |
|
|
(0.01 |
) |
|
|
| Net Realized and Unrealized Gain (Loss) on Investments |
|
|
|
|
0.40 |
|
|
|
(0.41 |
) |
|
|
1.51 |
|
|
|
2.29 |
|
|
|
(2.93 |
) |
|
|
|
|
|
| Total Income (Loss) From Operations |
|
|
|
|
0.40 |
|
|
|
(0.43 |
) |
|
|
1.46 |
|
|
|
2.29 |
|
|
|
(2.94 |
) |
|
|
|
|
|
| Less Distributions From: |
|
|
|
|
|
|
|
|
|
|
|
|
|
|
|
|
|
|
|
|
|
|
|
|
| Net Investment Income |
|
|
|
|
(0.00 |
)(b) |
|
|
— |
|
|
|
(0.01 |
) |
|
|
(0.00 |
)(b) |
|
|
(0.01 |
) |
|
|
| Net Realized Gains |
|
|
|
|
(0.82 |
) |
|
|
(0.14 |
) |
|
|
— |
|
|
|
— |
|
|
|
— |
|
|
|
|
|
|
| Total Distributions |
|
|
|
|
(0.82 |
) |
|
|
(0.14 |
) |
|
|
(0.01 |
) |
|
|
— |
|
|
|
(0.01 |
) |
|
|
|
|
|
| Net Asset Value, End of Year |
|
|
|
|
$8.55 |
|
|
|
$8.97 |
|
|
|
$9.54 |
|
|
|
$8.09 |
|
|
|
$5.80 |
|
|
|
|
|
|
| Total Return(c) |
|
|
|
|
5.39 |
% |
|
|
(4.36 |
)% |
|
|
18.00 |
% |
|
|
39.52 |
% |
|
|
(33.56 |
)% |
|
|
| Net Assets, End of Year (000’s) |
|
|
|
|
$17,131 |
|
|
|
$18,738 |
|
|
|
$22,790 |
|
|
|
$20,790 |
|
|
|
$15,714 |
|
|
|
| Ratios to Average Net Assets |
|
|
|
|
|
|
|
|
|
|
|
|
|
|
|
|
|
|
|
|
|
|
|
|
| Gross Expense |
|
|
|
|
1.80 |
% |
|
|
1.66 |
% |
|
|
1.66 |
% |
|
|
1.64 |
% |
|
|
1.53 |
% |
|
|
| Net Expenses(d) |
|
|
|
|
1.42 |
% |
|
|
1.42 |
% |
|
|
1.42 |
% |
|
|
1.29 |
% |
|
|
1.23 |
% |
|
|
| Net Investment Income (Loss) |
|
|
|
|
0.04 |
% |
|
|
(0.20 |
)% |
|
|
(0.58 |
)% |
|
|
(0.06 |
)% |
|
|
(0.16 |
)% |
|
|
| Portfolio Turnover Rate |
|
|
|
|
49 |
% |
|
|
83 |
% |
|
|
61 |
% |
|
|
83 |
% |
|
|
138 |
% |
|
|
|
|
|
|
|
|
|
|
|
|
|
|
|
|
|
|
|
|
|
|
|
|
|
|
|
| CLASS I |
|
|
|
2013 |
|
|
2012 |
|
|
2011 |
|
|
2010 |
|
|
2009 |
|
|
|
| Net Asset Value, Beginning of Year |
|
|
|
|
$9.02 |
|
|
|
$9.56 |
|
|
|
$8.09 |
|
|
|
$5.80 |
|
|
|
$8.75 |
|
|
|
| Income (Loss) From Operations: |
|
|
|
|
|
|
|
|
|
|
|
|
|
|
|
|
|
|
|
|
|
|
|
|
| Net Investment Income (Loss)(a) |
|
|
|
|
0.05 |
|
|
|
0.02 |
|
|
|
0.02 |
|
|
|
0.01 |
|
|
|
0.02 |
|
|
|
| Net Realized and Unrealized Gain (Loss) on Investments |
|
|
|
|
0.40 |
|
|
|
(0.41 |
) |
|
|
1.47 |
|
|
|
2.29 |
|
|
|
(2.95 |
) |
|
|
|
|
|
| Total Income (Loss) From Operations |
|
|
|
|
0.45 |
|
|
|
(0.39 |
) |
|
|
1.49 |
|
|
|
2.30 |
|
|
|
(2.93 |
) |
|
|
|
|
|
| Less Distributions From: |
|
|
|
|
|
|
|
|
|
|
|
|
|
|
|
|
|
|
|
|
|
|
|
|
| Net Investment Income |
|
|
|
|
(0.01 |
) |
|
|
(0.01 |
) |
|
|
(0.02 |
) |
|
|
(0.01 |
) |
|
|
(0.02 |
) |
|
|
| Net Realized Gains |
|
|
|
|
(0.82 |
) |
|
|
(0.14 |
) |
|
|
— |
|
|
|
— |
|
|
|
— |
|
|
|
|
|
|
| Total Distributions |
|
|
|
|
(0.83 |
) |
|
|
(0.15 |
) |
|
|
(0.02 |
) |
|
|
(0.01 |
) |
|
|
(0.02 |
) |
|
|
|
|
|
| Net Asset Value, End of Year |
|
|
|
|
$8.64 |
|
|
|
$9.02 |
|
|
|
$9.56 |
|
|
|
$8.09 |
|
|
|
$5.80 |
|
|
|
|
|
|
| Total Return(c) |
|
|
|
|
5.92 |
% |
|
|
(3.96 |
)% |
|
|
18.40 |
% |
|
|
39.72 |
% |
|
|
(33.47 |
)% |
|
|
| Net Assets, End of Year (000’s) |
|
|
|
|
$51,014 |
|
|
|
$78,505 |
|
|
|
$123,247 |
|
|
|
$121,608 |
|
|
|
$92,658 |
|
|
|
| Ratios to Average Net Assets |
|
|
|
|
|
|
|
|
|
|
|
|
|
|
|
|
|
|
|
|
|
|
|
|
| Gross Expense |
|
|
|
|
1.55 |
% |
|
|
1.41 |
% |
|
|
1.41 |
% |
|
|
1.39 |
% |
|
|
1.36 |
% |
|
|
| Net Expenses(d) |
|
|
|
|
1.04 |
% |
|
|
1.03 |
% |
|
|
1.03 |
% |
|
|
1.10 |
% |
|
|
1.13 |
% |
|
|
| Net Investment Income (Loss) |
|
|
|
|
0.52 |
% |
|
|
0.20 |
% |
|
|
0.25 |
% |
|
|
0.14 |
% |
|
|
0.30 |
% |
|
|
| Portfolio Turnover Rate |
|
|
|
|
49 |
% |
|
|
83 |
% |
|
|
61 |
% |
|
|
83 |
% |
|
|
138 |
% |
|
|
| (a) |
Per share numbers have been calculated using the average shares method. |
| (b) |
Represents less than $0.005. |
| (c) |
Based on net asset value, which does not reflect the sales charge or contingent deferred sales charge, if applicable. Total returns for periods of less than one year, if any, are not annualized. |
| (d) |
The investment advisor and other service providers waived or reimbursed a portion of their fees. |
See Notes
which are an integral part of the Financial Statements
April 30,
2013 / ANNUAL REPORT
|
|
|
|
|
| FINANCIAL HIGHLIGHTS (continued) |
|
|
87 |
|
For a share outstanding throughout each period:
|
|
|
|
|
|
|
|
|
|
|
|
|
|
|
|
|
|
|
|
|
|
|
|
|
|
|
|
|
| WILMINGTON LARGE-CAP STRATEGY FUND† |
|
|
|
|
|
|
|
|
|
|
|
|
|
|
|
|
|
|
|
|
|
|
|
|
|
|
|
|
|
|
|
|
|
|
|
|
|
|
| CLASS I |
|
|
|
Year Ended
April 30, 2013 |
|
|
For the Period
July 1,
2011
through April
30,
2012* |
|
|
Year Ended
June 30, 2011 |
|
|
Year Ended
June 30, 2010 |
|
|
Year Ended
June 30, 2009 |
|
|
Year Ended
June 30, 2008 |
|
|
|
| Net Asset Value, Beginning of Period |
|
|
|
|
$12.84 |
|
|
|
$12.13 |
|
|
|
$9.39 |
|
|
|
$8.61 |
|
|
|
$12.28 |
|
|
|
$14.40 |
|
|
|
| Income (Loss) From Operations: |
|
|
|
|
|
|
|
|
|
|
|
|
|
|
|
|
|
|
|
|
|
|
|
|
|
|
|
|
| Net Investment Income (Loss)(a) |
|
|
|
|
0.26 |
|
|
|
0.16 |
|
|
|
0.20 |
|
|
|
0.10 |
|
|
|
0.12 |
|
|
|
0.09 |
|
|
|
| Net Realized and Unrealized Gain (Loss)on Investments |
|
|
|
|
1.79 |
|
|
|
0.71 |
|
|
|
2.72 |
|
|
|
0.79 |
|
|
|
(3.68 |
) |
|
|
(1.57 |
) |
|
|
|
|
|
| Total Income (Loss) From Operations |
|
|
|
|
2.05 |
|
|
|
0.87 |
|
|
|
2.92 |
|
|
|
0.89 |
|
|
|
(3.56 |
) |
|
|
(1.48 |
) |
|
|
|
|
|
| Less Distributions From: |
|
|
|
|
|
|
|
|
|
|
|
|
|
|
|
|
|
|
|
|
|
|
|
|
|
|
|
|
| Net Investment Income |
|
|
|
|
(0.26 |
) |
|
|
(0.16 |
) |
|
|
(0.18 |
) |
|
|
(0.11 |
) |
|
|
(0.11 |
) |
|
|
(0.09 |
) |
|
|
| Net Realized Gains |
|
|
|
|
— |
|
|
|
— |
|
|
|
— |
|
|
|
— |
|
|
|
— |
|
|
|
(0.55 |
) |
|
|
|
|
|
| Total Distributions |
|
|
|
|
(0.26 |
) |
|
|
(0.16 |
) |
|
|
(0.18 |
) |
|
|
(0.11 |
) |
|
|
(0.11 |
) |
|
|
(0.64 |
) |
|
|
|
|
|
| Net Asset Value, End of Period |
|
|
|
|
$14.63 |
|
|
|
$12.84 |
|
|
|
$12.13 |
|
|
|
$9.39 |
|
|
|
$8.61 |
|
|
|
$12.28 |
|
|
|
|
|
|
| Total Return(b) |
|
|
|
|
16.25 |
% |
|
|
7.32 |
% |
|
|
31.24 |
% |
|
|
10.28 |
% |
|
|
(28.94 |
)% |
|
|
(10.75 |
)% |
|
|
| Net Assets, End of Period (000’s) |
|
|
|
|
$399,710 |
|
|
|
$374,903 |
|
|
|
$429,467 |
|
|
|
$118,102 |
|
|
|
$131,692 |
|
|
|
$242,391 |
|
|
|
| Ratios to Average Net Assets |
|
|
|
|
|
|
|
|
|
|
|
|
|
|
|
|
|
|
|
|
|
|
|
|
|
|
|
|
| Gross Expense |
|
|
|
|
0.88 |
% |
|
|
0.74 |
%(c) |
|
|
0.69 |
% |
|
|
1.01 |
% |
|
|
1.18 |
% |
|
|
1.00 |
% |
|
|
| Net Expenses(d) |
|
|
|
|
0.25 |
% |
|
|
0.25 |
%(c) |
|
|
0.25 |
% |
|
|
0.93 |
% |
|
|
1.00 |
% |
|
|
0.93 |
% |
|
|
| Net Investment Income (Loss) |
|
|
|
|
1.99 |
% |
|
|
1.70 |
%(c) |
|
|
1.72 |
% |
|
|
0.99 |
% |
|
|
1.27 |
% |
|
|
0.67 |
% |
|
|
| Portfolio Turnover Rate |
|
|
|
|
24 |
% |
|
|
19 |
% |
|
|
39 |
% |
|
|
160 |
% |
|
|
224 |
% |
|
|
127 |
% |
|
|
| (a) |
Per share numbers have been calculated using the average shares method. |
| (b) |
Based on net asset value, which does not reflect the sales charge or contingent deferred sales charge, if applicable. Total returns for periods of less than one year, if any, are not annualized. |
| (c) |
Annualized for periods less the one year. |
| (d) |
The investment advisor and other service providers waived or reimbursed a portion of their fees. |
| † |
Effective March 9, 2012, the Fund acquired all of the assets and liabilities of the Wilmington Large-Cap Strategy Fund, a series of WT Mutual Fund (the “WT Fund”). The financial highlights for the periods
prior to that date reflect the performance of the WT Fund. |
| * |
Year end changed from June 30 to April 30. |
See Notes which are an integral part of the Financial
Statements
ANNUAL
REPORT / April 30, 2013
|
|
|
| 88 |
|
FINANCIAL HIGHLIGHTS (continued) |
For a share outstanding throughout each year ended April 30, unless otherwise noted:
|
|
|
|
|
|
|
|
|
|
|
|
|
|
|
|
|
|
|
|
|
|
|
|
|
| WILMINGTON LARGE-CAP VALUE FUND |
|
|
|
|
|
|
|
|
|
|
|
|
|
|
|
|
|
|
|
|
|
|
|
|
|
|
|
|
|
|
|
|
|
|
| CLASS A |
|
|
|
2013 |
|
|
2012 |
|
|
2011 |
|
|
2010 |
|
|
2009 |
|
|
|
| Net Asset Value, Beginning of Year |
|
|
|
|
$10.61 |
|
|
|
$11.47 |
|
|
|
$9.85 |
|
|
|
$7.03 |
|
|
|
$11.32 |
|
|
|
| Income (Loss) From Operations: |
|
|
|
|
|
|
|
|
|
|
|
|
|
|
|
|
|
|
|
|
|
|
|
|
| Net Investment Income (Loss)(a) |
|
|
|
|
0.12 |
|
|
|
0.06 |
|
|
|
0.01 |
|
|
|
0.04 |
|
|
|
0.19 |
|
|
|
| Net Realized and Unrealized Gain (Loss) on Investments |
|
|
|
|
1.00 |
|
|
|
(0.86 |
) |
|
|
1.64 |
|
|
|
2.83 |
|
|
|
(4.30 |
) |
|
|
|
|
|
| Total Income (Loss) From Operations |
|
|
|
|
1.12 |
|
|
|
(0.80 |
) |
|
|
1.65 |
|
|
|
2.87 |
|
|
|
(4.11 |
) |
|
|
|
|
|
| Less Distributions From: |
|
|
|
|
|
|
|
|
|
|
|
|
|
|
|
|
|
|
|
|
|
|
|
|
| Net Investment Income |
|
|
|
|
(0.12 |
) |
|
|
(0.06 |
) |
|
|
(0.03 |
) |
|
|
(0.05 |
) |
|
|
(0.15 |
) |
|
|
| Net Realized Gains |
|
|
|
|
— |
|
|
|
— |
|
|
|
— |
|
|
|
— |
|
|
|
(0.03 |
) |
|
|
| Return of Capital |
|
|
|
|
— |
|
|
|
— |
|
|
|
— |
|
|
|
(0.00 |
)(b) |
|
|
— |
|
|
|
|
|
|
| Total Distributions |
|
|
|
|
(0.12 |
) |
|
|
(0.06 |
) |
|
|
(0.03 |
) |
|
|
(0.05 |
) |
|
|
(0.18 |
) |
|
|
|
|
|
| Net Asset Value, End of Year |
|
|
|
|
$11.61 |
|
|
|
$10.61 |
|
|
|
$11.47 |
|
|
|
$9.85 |
|
|
|
$7.03 |
|
|
|
|
|
|
| Total Return(c) |
|
|
|
|
10.65 |
% |
|
|
(6.94 |
)% |
|
|
16.79 |
% |
|
|
41.02 |
% |
|
|
(36.53 |
)% |
|
|
| Net Assets, End of Year (000’s) |
|
|
|
|
$5,928 |
|
|
|
$6,038 |
|
|
|
$7,315 |
|
|
|
$6,606 |
|
|
|
$5,027 |
|
|
|
| Ratios to Average Net Assets |
|
|
|
|
|
|
|
|
|
|
|
|
|
|
|
|
|
|
|
|
|
|
|
|
| Gross Expense |
|
|
|
|
1.46 |
% |
|
|
1.42 |
% |
|
|
1.43 |
% |
|
|
1.42 |
% |
|
|
1.34 |
% |
|
|
| Net Expenses(d) |
|
|
|
|
1.29 |
% |
|
|
1.29 |
% |
|
|
1.31 |
% |
|
|
1.15 |
% |
|
|
0.53 |
% |
|
|
| Net Investment Income (Loss) |
|
|
|
|
1.12 |
% |
|
|
0.56 |
% |
|
|
0.09 |
% |
|
|
0.41 |
% |
|
|
2.30 |
% |
|
|
| Portfolio Turnover Rate |
|
|
|
|
93 |
% |
|
|
37 |
% |
|
|
26 |
% |
|
|
29 |
% |
|
|
34 |
% |
|
|
|
|
|
|
|
|
|
|
|
|
|
|
|
|
|
|
|
|
|
|
|
|
|
|
|
| CLASS I |
|
|
|
2013 |
|
|
2012 |
|
|
2011 |
|
|
2010 |
|
|
2009 |
|
|
|
| Net Asset Value, Beginning of Year |
|
|
|
|
$10.65 |
|
|
|
$11.51 |
|
|
|
$9.88 |
|
|
|
$7.05 |
|
|
|
$11.34 |
|
|
|
| Income (Loss) From Operations: |
|
|
|
|
|
|
|
|
|
|
|
|
|
|
|
|
|
|
|
|
|
|
|
|
| Net Investment Income (Loss)(a) |
|
|
|
|
0.15 |
|
|
|
0.09 |
|
|
|
0.05 |
|
|
|
0.05 |
|
|
|
0.13 |
|
|
|
| Net Realized and Unrealized Gain (Loss) on Investments |
|
|
|
|
1.00 |
|
|
|
(0.86 |
) |
|
|
1.63 |
|
|
|
2.84 |
|
|
|
(4.26 |
) |
|
|
|
|
|
| Total Income (Loss) From Operations |
|
|
|
|
1.15 |
|
|
|
(0.77 |
) |
|
|
1.68 |
|
|
|
2.89 |
|
|
|
(4.13 |
) |
|
|
|
|
|
| Less Distributions From: |
|
|
|
|
|
|
|
|
|
|
|
|
|
|
|
|
|
|
|
|
|
|
|
|
| Net Investment Income |
|
|
|
|
(0.15 |
) |
|
|
(0.09 |
) |
|
|
(0.05 |
) |
|
|
(0.06 |
) |
|
|
(0.13 |
) |
|
|
| Net Realized Gains |
|
|
|
|
— |
|
|
|
— |
|
|
|
— |
|
|
|
— |
|
|
|
(0.03 |
) |
|
|
| Return of Capital |
|
|
|
|
— |
|
|
|
— |
|
|
|
— |
|
|
|
(0.00 |
)(b) |
|
|
— |
|
|
|
|
|
|
| Total Distributions |
|
|
|
|
(0.15 |
) |
|
|
(0.09 |
) |
|
|
(0.05 |
) |
|
|
(0.06 |
) |
|
|
(0.16 |
) |
|
|
|
|
|
| Net Asset Value, End of Year |
|
|
|
|
$11.65 |
|
|
|
$10.65 |
|
|
|
$11.51 |
|
|
|
$9.88 |
|
|
|
$7.05 |
|
|
|
|
|
|
| Total Return(c) |
|
|
|
|
10.91 |
% |
|
|
(6.65 |
)% |
|
|
17.08 |
% |
|
|
41.23 |
% |
|
|
(36.62 |
)% |
|
|
| Net Assets, End of Year (000’s) |
|
|
|
|
$121,507 |
|
|
|
$135,556 |
|
|
|
$175,440 |
|
|
|
$156,442 |
|
|
|
$117,108 |
|
|
|
| Ratios to Average Net Assets |
|
|
|
|
|
|
|
|
|
|
|
|
|
|
|
|
|
|
|
|
|
|
|
|
| Gross Expense |
|
|
|
|
1.21 |
% |
|
|
1.17 |
% |
|
|
1.18 |
% |
|
|
1.17 |
% |
|
|
1.13 |
% |
|
|
| Net Expenses(d) |
|
|
|
|
1.04 |
% |
|
|
1.00 |
% |
|
|
1.02 |
% |
|
|
0.99 |
% |
|
|
0.96 |
% |
|
|
| Net Investment Income |
|
|
|
|
1.39 |
% |
|
|
0.85 |
% |
|
|
0.48 |
% |
|
|
0.57 |
% |
|
|
1.55 |
% |
|
|
| Portfolio Turnover Rate |
|
|
|
|
93 |
% |
|
|
37 |
% |
|
|
26 |
% |
|
|
29 |
% |
|
|
34 |
% |
|
|
| (a) |
Per share numbers have been calculated using the average shares method. |
| (b) |
Represents less than $0.005. |
| (c) |
Based on net asset value, which does not reflect the sales charge or contingent deferred sales charge, if applicable. Total returns for periods of less than one year, if any, are not annualized. |
| (d) |
The investment advisor and other service providers waived or reimbursed a portion of their fees. |
See Notes
which are an integral part of the Financial Statements
April 30,
2013 / ANNUAL REPORT
|
|
|
|
|
| FINANCIAL HIGHLIGHTS (continued) |
|
|
89 |
|
For a share outstanding throughout each year ended April 30, unless otherwise noted:
|
|
|
|
|
|
|
|
|
|
|
|
|
|
|
|
|
|
|
|
|
|
|
|
|
| WILMINGTON MID-CAP GROWTH FUND |
|
|
|
|
|
|
|
|
|
|
|
|
|
|
|
|
|
|
|
|
|
|
|
|
|
|
|
|
|
|
|
|
|
|
|
|
|
| CLASS A |
|
|
|
2013 |
|
|
2012 |
|
|
2011 |
|
|
2010 |
|
|
2009 |
|
|
|
| Net Asset Value, Beginning of Year |
|
|
|
|
$15.21 |
|
|
|
$16.21 |
|
|
|
$12.24 |
|
|
|
$8.37 |
|
|
|
$13.43 |
|
|
|
| Income (Loss) From Operations: |
|
|
|
|
|
|
|
|
|
|
|
|
|
|
|
|
|
|
|
|
|
|
|
|
| Net Investment Income (Loss)(a) |
|
|
|
|
(0.01 |
) |
|
|
(0.07 |
) |
|
|
(0.11 |
) |
|
|
(0.05 |
) |
|
|
(0.01 |
) |
|
|
| Net Realized and Unrealized Gain (Loss) on Investments |
|
|
|
|
1.38 |
|
|
|
(0.25 |
) |
|
|
4.08 |
|
|
|
3.93 |
|
|
|
(4.74 |
) |
|
|
|
|
|
| Total Income (Loss) From Operations |
|
|
|
|
1.37 |
|
|
|
(0.32 |
) |
|
|
3.97 |
|
|
|
3.88 |
|
|
|
(4.75 |
) |
|
|
|
|
|
| Less Distributions From: |
|
|
|
|
|
|
|
|
|
|
|
|
|
|
|
|
|
|
|
|
|
|
|
|
| Net Investment Income |
|
|
|
|
— |
|
|
|
— |
|
|
|
— |
|
|
|
(0.01 |
) |
|
|
— |
|
|
|
| Net Realized Gains |
|
|
|
|
(0.62 |
) |
|
|
(0.68 |
) |
|
|
— |
|
|
|
— |
|
|
|
(0.31 |
) |
|
|
| Return of Capital |
|
|
|
|
— |
|
|
|
— |
|
|
|
— |
|
|
|
(0.00 |
)(b) |
|
|
— |
|
|
|
|
|
|
| Total Distributions |
|
|
|
|
(0.62 |
) |
|
|
(0.68 |
) |
|
|
— |
|
|
|
(0.01 |
) |
|
|
(0.31 |
) |
|
|
|
|
|
| Net Asset Value, End of Year |
|
|
|
|
$15.96 |
|
|
|
$15.21 |
|
|
|
$16.21 |
|
|
|
$12.24 |
|
|
|
$8.37 |
|
|
|
|
|
|
| Total Return(c) |
|
|
|
|
9.55 |
% |
|
|
(1.55 |
)% |
|
|
32.43 |
% |
|
|
46.30 |
% |
|
|
(34.75 |
)% |
|
|
| Net Assets, End of Year (000’s) |
|
|
|
|
$56,837 |
|
|
|
$60,666 |
|
|
|
$63,168 |
|
|
|
$40,438 |
|
|
|
$19,638 |
|
|
|
| Ratios to Average Net Assets |
|
|
|
|
|
|
|
|
|
|
|
|
|
|
|
|
|
|
|
|
|
|
|
|
| Gross Expense |
|
|
|
|
1.56 |
% |
|
|
1.57 |
% |
|
|
1.62 |
% |
|
|
1.62 |
% |
|
|
1.59 |
% |
|
|
| Net Expenses(d) |
|
|
|
|
1.24 |
% |
|
|
1.24 |
% |
|
|
1.24 |
% |
|
|
1.13 |
% |
|
|
1.08 |
% |
|
|
| Net Investment Income (Loss) |
|
|
|
|
(0.08 |
)% |
|
|
(0.47 |
)% |
|
|
(0.85 |
)% |
|
|
(0.51 |
)% |
|
|
(0.10 |
)% |
|
|
| Portfolio Turnover Rate |
|
|
|
|
36 |
% |
|
|
44 |
% |
|
|
34 |
% |
|
|
56 |
% |
|
|
90 |
% |
|
|
|
|
|
|
|
|
|
|
|
|
|
|
|
|
|
|
|
|
|
|
|
|
|
|
|
| CLASS I |
|
|
|
2013 |
|
|
2012 |
|
|
2011 |
|
|
2010 |
|
|
2009 |
|
|
|
| Net Asset Value, Beginning of Year |
|
|
|
|
$15.59 |
|
|
|
$16.57 |
|
|
|
$12.49 |
|
|
|
$8.54 |
|
|
|
$13.66 |
|
|
|
| Income (Loss) From Operations: |
|
|
|
|
|
|
|
|
|
|
|
|
|
|
|
|
|
|
|
|
|
|
|
|
| Net Investment Income (Loss)(a) |
|
|
|
|
0.01 |
|
|
|
(0.04 |
) |
|
|
(0.07 |
) |
|
|
(0.04 |
) |
|
|
0.02 |
|
|
|
| Net Realized and Unrealized Gain (Loss) on Investments |
|
|
|
|
1.42 |
|
|
|
(0.26 |
) |
|
|
4.15 |
|
|
|
4.00 |
|
|
|
(4.83 |
) |
|
|
|
|
|
| Total Income (Loss) From Operations |
|
|
|
|
1.43 |
|
|
|
(0.30 |
) |
|
|
4.08 |
|
|
|
3.96 |
|
|
|
(4.81 |
) |
|
|
|
|
|
| Less Distributions From: |
|
|
|
|
|
|
|
|
|
|
|
|
|
|
|
|
|
|
|
|
|
|
|
|
| Net Investment Income |
|
|
|
|
— |
|
|
|
— |
|
|
|
— |
|
|
|
(0.01 |
) |
|
|
— |
|
|
|
| Net Realized Gains |
|
|
|
|
(0.62 |
) |
|
|
(0.68 |
) |
|
|
— |
|
|
|
— |
|
|
|
(0.31 |
) |
|
|
| Return of Capital |
|
|
|
|
— |
|
|
|
— |
|
|
|
— |
|
|
|
(0.00 |
)(b) |
|
|
— |
|
|
|
|
|
|
| Total Distributions |
|
|
|
|
(0.62 |
) |
|
|
(0.68 |
) |
|
|
— |
|
|
|
(0.01 |
) |
|
|
(0.31 |
) |
|
|
|
|
|
| Net Asset Value, End of Year |
|
|
|
|
$16.40 |
|
|
|
$15.59 |
|
|
|
$16.57 |
|
|
|
$12.49 |
|
|
|
$8.54 |
|
|
|
|
|
|
| Total Return(c) |
|
|
|
|
9.70 |
% |
|
|
(1.40 |
)% |
|
|
32.67 |
% |
|
|
46.37 |
% |
|
|
(34.60 |
)% |
|
|
| Net Assets, End of Year (000’s) |
|
|
|
|
$244,427 |
|
|
|
$232,860 |
|
|
|
$187,207 |
|
|
|
$143,594 |
|
|
|
$95,447 |
|
|
|
| Ratios to Average Net Assets |
|
|
|
|
|
|
|
|
|
|
|
|
|
|
|
|
|
|
|
|
|
|
|
|
| Gross Expense |
|
|
|
|
1.31 |
% |
|
|
1.33 |
% |
|
|
1.37 |
% |
|
|
1.36 |
% |
|
|
1.39 |
% |
|
|
| Net Expenses(d) |
|
|
|
|
1.08 |
% |
|
|
1.06 |
% |
|
|
1.06 |
% |
|
|
0.96 |
% |
|
|
0.94 |
% |
|
|
| Net Investment Income |
|
|
|
|
0.08 |
% |
|
|
(0.30 |
)% |
|
|
(0.54 |
)% |
|
|
(0.33 |
)% |
|
|
0.18 |
% |
|
|
| Portfolio Turnover Rate |
|
|
|
|
36 |
% |
|
|
44 |
% |
|
|
34 |
% |
|
|
56 |
% |
|
|
90 |
% |
|
|
| (a) |
Per share numbers have been calculated using the average shares method. |
| (b) |
Represents less than $0.005. |
| (c) |
Based on net asset value, which does not reflect the sales charge or contingent deferred sales charge, if applicable. Total returns for periods of less than one year, if any, are not annualized. |
| (d) |
The investment advisor and other service providers waived or reimbursed a portion of their fees. |
See Notes
which are an integral part of the Financial Statements
ANNUAL
REPORT / April 30, 2013
|
|
|
| 90 |
|
FINANCIAL HIGHLIGHTS (continued) |
For a share outstanding throughout each year ended April 30, unless otherwise noted:
|
|
|
|
|
|
|
|
|
|
|
|
|
|
|
|
|
|
|
|
|
|
|
|
|
| WILMINGTON SMALL-CAP GROWTH FUND |
|
|
|
|
|
|
|
|
|
|
|
|
|
|
|
|
|
|
|
|
|
|
|
|
|
|
|
|
|
|
|
|
|
|
|
|
|
| CLASS A |
|
|
|
2013 |
|
|
2012 |
|
|
2011 |
|
|
2010 |
|
|
2009 |
|
|
|
| Net Asset Value, Beginning of Year |
|
|
|
|
$16.62 |
|
|
|
$18.20 |
|
|
|
$14.48 |
|
|
|
$9.99 |
|
|
|
$15.53 |
|
|
|
| Income (Loss) From Operations: |
|
|
|
|
|
|
|
|
|
|
|
|
|
|
|
|
|
|
|
|
|
|
|
|
| Net Investment Income (Loss)(a) |
|
|
|
|
(0.00 |
)(b) |
|
|
(0.08 |
) |
|
|
(0.21 |
) |
|
|
(0.12 |
) |
|
|
(0.06 |
) |
|
|
| Net Realized and Unrealized Gain (Loss) on Investments |
|
|
|
|
1.69 |
|
|
|
(1.50 |
) |
|
|
3.93 |
|
|
|
4.61 |
|
|
|
(5.48 |
) |
|
|
|
|
|
| Total Income (Loss) From Operations |
|
|
|
|
1.69 |
|
|
|
(1.58 |
) |
|
|
3.72 |
|
|
|
4.49 |
|
|
|
(5.54 |
) |
|
|
|
|
|
| Less Distributions From: |
|
|
|
|
|
|
|
|
|
|
|
|
|
|
|
|
|
|
|
|
|
|
|
|
| Net Investment Income |
|
|
|
|
(0.09 |
) |
|
|
— |
|
|
|
— |
|
|
|
— |
|
|
|
— |
|
|
|
| Net Realized Gains |
|
|
|
|
— |
|
|
|
— |
|
|
|
— |
|
|
|
— |
|
|
|
— |
|
|
|
|
|
|
| Total Distributions |
|
|
|
|
(0.09 |
) |
|
|
— |
|
|
|
— |
|
|
|
— |
|
|
|
— |
|
|
|
|
|
|
| Net Asset Value, End of Year |
|
|
|
|
$18.22 |
|
|
|
$16.62 |
|
|
|
$18.20 |
|
|
|
$14.48 |
|
|
|
$9.99 |
|
|
|
|
|
|
| Total Return(c) |
|
|
|
|
10.21 |
% |
|
|
(8.68 |
)% |
|
|
25.69 |
% |
|
|
44.94 |
% |
|
|
(35.67 |
)% |
|
|
| Net Assets, End of Year (000’s) |
|
|
|
|
$36,269 |
|
|
|
$38,439 |
|
|
|
$47,884 |
|
|
|
$41,276 |
|
|
|
$29,935 |
|
|
|
| Ratios to Average Net Assets |
|
|
|
|
|
|
|
|
|
|
|
|
|
|
|
|
|
|
|
|
|
|
|
|
| Gross Expense |
|
|
|
|
1.71 |
% |
|
|
1.64 |
% |
|
|
1.67 |
% |
|
|
1.70 |
% |
|
|
1.66 |
% |
|
|
| Net Expenses(d) |
|
|
|
|
1.47 |
% |
|
|
1.44 |
% |
|
|
1.45 |
% |
|
|
1.30 |
% |
|
|
1.26 |
% |
|
|
| Net Investment Income (Loss) |
|
|
|
|
(0.01 |
)% |
|
|
(0.54 |
)% |
|
|
(1.43 |
)% |
|
|
(0.98 |
)% |
|
|
(0.49 |
)% |
|
|
| Portfolio Turnover Rate |
|
|
|
|
142 |
% |
|
|
561 |
% |
|
|
393 |
% |
|
|
635 |
% |
|
|
865 |
% |
|
|
|
|
|
|
|
|
|
|
|
|
|
|
|
|
|
|
|
|
|
|
|
|
|
|
|
| CLASS I |
|
|
|
2013 |
|
|
2012 |
|
|
2011 |
|
|
2010 |
|
|
2009 |
|
|
|
| Net Asset Value, Beginning of Year |
|
|
|
|
$17.16 |
|
|
|
$18.76 |
|
|
|
$14.89 |
|
|
|
$10.26 |
|
|
|
$15.94 |
|
|
|
| Income (Loss) From Operations: |
|
|
|
|
|
|
|
|
|
|
|
|
|
|
|
|
|
|
|
|
|
|
|
|
| Net Investment Income (Loss)(a) |
|
|
|
|
0.04 |
|
|
|
(0.05 |
) |
|
|
(0.12 |
) |
|
|
(0.10 |
) |
|
|
(0.05 |
) |
|
|
| Net Realized and Unrealized Gain (Loss) on Investments |
|
|
|
|
1.75 |
|
|
|
(1.55 |
) |
|
|
3.99 |
|
|
|
4.73 |
|
|
|
(5.63 |
) |
|
|
|
|
|
| Total Income (Loss) From Operations |
|
|
|
|
1.79 |
|
|
|
(1.60 |
) |
|
|
3.87 |
|
|
|
4.63 |
|
|
|
(5.68 |
) |
|
|
|
|
|
| Less Distributions From: |
|
|
|
|
|
|
|
|
|
|
|
|
|
|
|
|
|
|
|
|
|
|
|
|
| Net Investment Income |
|
|
|
|
(0.10 |
) |
|
|
— |
|
|
|
— |
|
|
|
— |
|
|
|
— |
|
|
|
| Net Realized Gains |
|
|
|
|
— |
|
|
|
— |
|
|
|
— |
|
|
|
— |
|
|
|
— |
|
|
|
|
|
|
| Total Distributions |
|
|
|
|
(0.10 |
) |
|
|
— |
|
|
|
— |
|
|
|
— |
|
|
|
— |
|
|
|
|
|
|
| Net Asset Value, End of Year |
|
|
|
|
$18.85 |
|
|
|
$17.16 |
|
|
|
$18.76 |
|
|
|
$14.89 |
|
|
|
$10.26 |
|
|
|
|
|
|
| Total Return(c) |
|
|
|
|
10.47 |
% |
|
|
(8.53 |
)% |
|
|
25.99 |
% |
|
|
45.13 |
% |
|
|
(35.63 |
)% |
|
|
| Net Assets, End of Year (000’s) |
|
|
|
|
$104,328 |
|
|
|
$124,964 |
|
|
|
$148,560 |
|
|
|
$130,502 |
|
|
|
$93,014 |
|
|
|
| Ratios to Average Net Assets |
|
|
|
|
|
|
|
|
|
|
|
|
|
|
|
|
|
|
|
|
|
|
|
|
| Gross Expense |
|
|
|
|
1.46 |
% |
|
|
1.39 |
% |
|
|
1.42 |
% |
|
|
1.45 |
% |
|
|
1.43 |
% |
|
|
| Net Expenses(d) |
|
|
|
|
1.25 |
% |
|
|
1.21 |
% |
|
|
1.24 |
% |
|
|
1.17 |
% |
|
|
1.18 |
% |
|
|
| Net Investment Income (Loss) |
|
|
|
|
0.21 |
% |
|
|
(0.30 |
)% |
|
|
(0.81 |
)% |
|
|
(0.84 |
)% |
|
|
(0.40 |
)% |
|
|
| Portfolio Turnover Rate |
|
|
|
|
142 |
% |
|
|
561 |
% |
|
|
393 |
% |
|
|
635 |
% |
|
|
865 |
% |
|
|
| (a) |
Per share numbers have been calculated using the average shares method. |
| (b) |
Represents less than $0.005. |
| (c) |
Based on net asset value, which does not reflect the sales charge or contingent deferred sales charge, if applicable. Total returns for periods of less than one year, if any, are not annualized. |
| (d) |
The investment advisor and other service providers waived or reimbursed a portion of their fees. |
See Notes
which are an integral part of the Financial Statements
April 30,
2013 / ANNUAL REPORT
|
|
|
|
|
| FINANCIAL HIGHLIGHTS (concluded) |
|
|
91 |
|
For a share outstanding throughout each period:
|
|
|
|
|
|
|
|
|
|
|
|
|
|
|
|
|
|
|
|
|
|
|
|
|
|
|
| WILMINGTON SMALL-CAP STRATEGY FUND† |
|
|
|
|
|
|
|
|
|
|
|
|
|
|
|
|
|
|
|
|
|
|
|
|
|
|
|
|
|
|
|
|
|
|
|
|
|
|
|
| CLASS I |
|
Year Ended
April 30, 2013 |
|
|
For the Period
July 1,
2011
through April
30,
2012* |
|
|
Year Ended
June 30, 2011 |
|
|
Year Ended
June 30, 2010 |
|
|
Year Ended
June 30, 2009 |
|
|
Year Ended
June 30, 2008 |
|
|
|
| Net Asset Value, Beginning of Period |
|
|
$10.59 |
|
|
|
$10.70 |
|
|
|
$7.90 |
|
|
|
$6.57 |
|
|
|
$9.16 |
|
|
|
$14.11 |
|
|
|
| Income (Loss) From Operations: |
|
|
|
|
|
|
|
|
|
|
|
|
|
|
|
|
|
|
|
|
|
|
|
|
|
|
| Net Investment Income (Loss)(a) |
|
|
0.18 |
|
|
|
0.09 |
|
|
|
0.11 |
|
|
|
0.09 |
|
|
|
0.05 |
|
|
|
(0.02 |
) |
|
|
| Net Realized and Unrealized Gain (Loss) on Investments |
|
|
1.70 |
|
|
|
(0.10 |
) |
|
|
2.80 |
|
|
|
1.32 |
|
|
|
(2.60 |
) |
|
|
(2.25 |
) |
|
|
|
|
|
|
| Total Income (Loss) From Operations |
|
|
1.88 |
|
|
|
(0.01 |
) |
|
|
2.91 |
|
|
|
1.41 |
|
|
|
(2.55 |
) |
|
|
(2.27 |
) |
|
|
|
|
|
|
| Less Distributions From: |
|
|
|
|
|
|
|
|
|
|
|
|
|
|
|
|
|
|
|
|
|
|
|
|
|
|
| Net Investment Income |
|
|
(0.17 |
) |
|
|
(0.10 |
) |
|
|
(0.11 |
) |
|
|
(0.08 |
) |
|
|
(0.04 |
) |
|
|
— |
|
|
|
| Net Realized Gains |
|
|
— |
|
|
|
— |
|
|
|
— |
|
|
|
— |
|
|
|
— |
|
|
|
(2.68 |
) |
|
|
|
|
|
|
| Total Distributions |
|
|
(0.17 |
) |
|
|
(0.10 |
) |
|
|
(0.11 |
) |
|
|
(0.08 |
) |
|
|
(0.04 |
) |
|
|
(2.68 |
) |
|
|
|
|
|
|
| Net Asset Value, End of Period |
|
|
$12.30 |
|
|
|
$10.59 |
|
|
|
$10.70 |
|
|
|
$7.90 |
|
|
|
$6.57 |
|
|
|
$9.16 |
|
|
|
|
|
|
|
| Total Return(b) |
|
|
18.07 |
% |
|
|
0.06 |
% |
|
|
36.96 |
% |
|
|
21.47 |
% |
|
|
(27.72 |
)% |
|
|
(18.13 |
)% |
|
|
| Net Assets, End of Period (000’s) |
|
|
$72,487 |
|
|
|
$48,974 |
|
|
|
$127,968 |
|
|
|
$99,057 |
|
|
|
$62,938 |
|
|
|
$31,834 |
|
|
|
| Ratios to Average Net Assets |
|
|
|
|
|
|
|
|
|
|
|
|
|
|
|
|
|
|
|
|
|
|
|
|
|
|
| Gross Expense |
|
|
1.32 |
% |
|
|
1.16 |
%(c) |
|
|
0.96 |
% |
|
|
1.07 |
% |
|
|
1.61 |
% |
|
|
1.92 |
% |
|
|
| Net Expenses(d) |
|
|
0.25 |
% |
|
|
0.25 |
%(c) |
|
|
0.25 |
% |
|
|
0.25 |
% |
|
|
0.75 |
% |
|
|
1.25 |
% |
|
|
| Net Investment Income (Loss) |
|
|
1.60 |
% |
|
|
1.17 |
%(c) |
|
|
1.18 |
% |
|
|
1.14 |
% |
|
|
0.81 |
% |
|
|
(0.15 |
)% |
|
|
| Portfolio Turnover Rate |
|
|
42 |
% |
|
|
10 |
% |
|
|
48 |
% |
|
|
84 |
% |
|
|
205 |
% |
|
|
134 |
% |
|
|
| (a) |
Per share numbers have been calculated using the average shares method. |
| (b) |
Based on net asset value, which does not reflect the sales charge or contingent deferred sales charge, if applicable. Total returns for periods of less than one year, if any, are not annualized. |
| (c) |
Annualized for periods less the one year. |
| (d) |
The investment advisor and other service providers waived or reimbursed a portion of their fees. |
| † |
Effective March 9, 2012, the Fund acquired all of the assets and liabilities of the Wilmington Small-Cap Strategy Fund, a series of WT Mutual Fund (the“WT Fund”). The financial highlights for the periods
prior to that date reflect the performance of the WT Fund. |
| * |
Year end changed from June 30 to April 30. |
See Notes which are an integral part of the Financial
Statements
ANNUAL
REPORT / April 30, 2013
|
|
|
| 92 |
|
NOTES TO FINANCIAL STATEMENTS |
Wilmington Funds
April 30,
2013
Wilmington Funds (the “Trust”) is registered under the
Investment Company Act of 1940, as amended (the “Act”), as an open-end management investment company. The Trust consists of 23 portfolios, 6 of which are presented herein (individually referred to as a “Fund” or collectively as
the “Funds”). The remaining 17 funds are presented in separate reports.
|
|
|
| Fund |
|
Investment Goal |
| Wilmington Large-Cap Growth Fund (“Large-Cap Growth Fund”)(d) |
|
The Fund seeks to provide long-term capital appreciation. |
|
|
| Wilmington Large-Cap Strategy Fund*(“Large-Cap Strategy Fund”)(d) |
|
The Fund’s investment goal is to achieve long-term capital appreciation. |
|
|
| Wilmington Large-Cap Value Fund (“Large-Cap Value Fund”)(d) |
|
The Fund seeks to provide long-term capital appreciation and secondarily, current income. |
|
|
| Wilmington Mid-Cap Growth Fund (“Mid-Cap Growth Fund”)(d) |
|
The Fund seeks to provide long-term capital appreciation. |
|
|
| Wilmington Small-Cap Growth Fund (“Small-Cap Growth Fund”)(d) |
|
The Fund seeks to provide long-term capital appreciation. |
|
|
| Wilmington Small-Cap Strategy Fund*(“Small-Cap Strategy Fund”)(d) |
|
The Fund’s investment goal is to achieve long-term capital appreciation. |
| |
* |
|
Effective March 9, 2012, the Wilmington Large-Cap Strategy Fund and the Wilmington Small-Cap Strategy Fund (collectively the “WT Funds”), each a
series of WT Mutual Fund, were reorganized into the Trust. For financial reporting purposes, the WT Funds’ financial and performance history prior to the reorganization has been carried forward and is reflected in the Funds’ financial
statements and financial highlights. See Note 7 for additional information regarding the reorganization. |
The Trust offers 6 classes of shares: Class A, Service Class, Select Class, Administrative Class, Class I and Institutional
Class. All shares of the Trust have equal rights with respect to voting, except on class-specific matters.
On
April 13, 2013, Class C shares of the Small-Cap Growth Fund were terminated after the conversion to Class A of the Fund. On April 13, 2013, Class A shares of the Large-Cap Strategy Fund were terminated after the conversion to
Class I of the Funds. The assets of each portfolio are segregated and a shareholder’s interest is limited to the portfolio in which shares are held.
| 2. |
|
SUMMARY OF SIGNIFICANT ACCOUNTING POLICIES |
The following is a summary of
significant accounting policies consistently followed by the Funds in the preparation of their financial statements. These policies are in conformity with U.S. generally accepted accounting principles (“GAAP”). The preparation of financial
statements in conformity with GAAP requires management to make estimates and assumptions that affect the amounts of assets, liabilities, expenses and revenues reported in the financial statements. Actual results could differ from those estimated.
Investment Valuation – Fair value of the Funds’ portfolio securities are determined as follows:
| |
• |
|
for equity securities, according to the last sale price or official closing price reported in the market in which they are primarily traded (either
a national securities exchange or the over-the-counter market), if available; |
| |
• |
|
in the absence of recorded sales for equity securities, according to the mean between the last closing bid and asked prices; |
| |
• |
|
investments in open-end regulated investment companies are valued at net asset value (“NAV”); |
| |
• |
|
for all other securities at fair value as determined in accordance with procedures established by and under the general supervision of the Board of
Trustees (“Trustees”). |
Trading in foreign securities may be completed at times which vary from
the closing of the New York Stock Exchange (“NYSE”). In computing its NAV, the Funds value foreign securities using the latest closing price on the primary exchange on which they are traded immediately prior to the closing of the NYSE.
Certain foreign currency exchange rates are generally determined at the latest rate prior to the closing of the NYSE. Foreign securities quoted in foreign currencies are translated into U.S. dollars at current rates. Events that affect these values
and exchange rates may occur between the times at which they are determined and the closing of the NYSE. If such events materially affect the value of portfolio securities, these securities may be valued at their fair value as determined in good
faith by the Trustees, although the actual calculation may be done by others. An event is considered material if there is both an affirmative expectation that the security’s value will change in response to the event and a reasonable basis for
quantifying the resulting change in value.
The Trust follows the authoritative guidance (GAAP) for fair value measurements.
The guidance establishes a framework for measuring fair value and a hierarchy for inputs used in measuring fair value that maximizes the use of observable inputs and minimizes the use of unobservable inputs by requiring that the most observable
inputs be used when available. The guidance establishes three tiers of inputs that may be used to measure fair value. The three tiers of inputs are summarized at the end of each Fund’s Portfolio of Investments. The inputs or methodology used
for valuing securities are not necessarily an indication of the risk associated with investing in those securities.
April 30,
2013 / ANNUAL REPORT
|
|
|
|
|
| NOTES TO FINANCIAL STATEMENTS (continued) |
|
|
93 |
|
The Funds’ policy is to disclose transfers between levels based on
valuations at the beginning of the reporting period. Each portfolio may hold securities which are periodically fair valued in accordance with the Funds’ fair value procedures. This may result in movements between Levels 1, 2 and 3 throughout
the period. As of April 30, 2013, there were no transfers between Levels 1, 2 and 3 assets and liabilities, based on levels assigned to securities at the beginning of the period. Pursuant to the Funds’ fair value procedures noted previously,
equity securities (including exchange traded securities and other open-end regulated investment companies) are generally categorized as Level 1 securities in the fair value hierarchy. Fixed income securities and money market instruments are
generally categorized as Level 2 securities in the fair value hierarchy.
Investments for which there are no such
quotations, or for which quotations do not appear reliable, are valued at fair value as determined in accordance with procedures established by and under the general supervision of the Trustees. These valuations are typically categorized as Level 2
or Level 3 securities in the fair value hierarchy.
Repurchase Agreements – Repurchase agreements are
transactions in which a Fund buys a security from a dealer or bank and agrees to sell the security back at a mutually agreed upon time and price. The repurchase price exceeds the sale price, reflecting the Fund’s return on the transaction. It
is each Fund’s policy to require the counterparty to a repurchase agreement to transfer to the Funds’ custodian or sub-custodian eligible securities or cash with a market value (after transaction costs) at least equal to the repurchase
price to be paid under the repurchase agreement. The eligible securities are transferred to accounts with the custodian or sub-custodian in which the Funds hold a “securities entitlement” and exercise “control” as those terms are
defined in the Uniform Commercial Code. The Funds have established procedures for monitoring the market value of the transferred securities and requiring the transfer of additional eligible securities if necessary to equal at least the repurchase
price. These procedures also allow the counterparty to require securities to be transferred from the account to the extent that their market value exceeds the repurchase price or in exchange for other eligible securities of equivalent market value.
The insolvency of the counterparty or other failure to repurchase the securities may delay the disposition of the
underlying securities or cause the Funds to receive less than the full repurchase price.
Investment Income, Gains and
Losses, Expenses and Distributions – Interest income and expenses are accrued daily. Dividends and distributions to shareholders are recorded on the ex-dividend date. Non-cash dividends included in dividend income, if any, are recorded at
fair value. Foreign dividends are recorded on the ex-dividend date or when the Funds are informed of the ex-dividend date. Investment transactions are accounted for on a trade date basis for financial reporting purposes. Realized gains and losses
from investment transactions are recorded on an identified cost basis.
Expenses of the Trust, which are directly
identifiable to a specific Fund, are applied to that Fund. Expenses which are not identifiable to a specific Fund are allocated in such a manner as deemed equitable, taking into consideration the nature and type of expense.
All Funds offer multiple classes of shares. Investment income, realized and unrealized gains and losses, and certain fund-level
expenses are allocated to each class based on relative daily net assets, except that each class bears certain expenses unique to that class such as distribution and shareholder services fees. Distributions are declared separately for each class. No
class has preferential distribution rights; differences in per share distributions rates are generally due to differences in class specific expenses. Distributions from net realized gains, if any, are declared and paid to shareholders annually.
Distributions from net investment income are declared and as follows:
|
|
|
|
|
| Fund |
|
Dividends
Declared |
|
Dividends
Paid |
| Large-Cap Growth Fund |
|
Annually |
|
Annually |
| Large-Cap Strategy Fund |
|
Quarterly |
|
Quarterly |
| Large-Cap Value Fund |
|
Quarterly |
|
Quarterly |
| Mid-Cap Growth Fund |
|
Annually |
|
Annually |
| Small-Cap Growth Fund |
|
Annually |
|
Annually |
| Small-Cap Strategy Fund |
|
Quarterly |
|
Quarterly |
Federal Taxes – It is the Funds’ policy to comply with the Subchapter M
provision of the Internal Revenue Code of 1986, as amended (the “Code”), and to distribute to shareholders each year substantially all of their income. Accordingly, no provisions for Federal income or excise tax are necessary.
Withholding taxes and where appropriate, deferred withholding taxes, on foreign interest, dividends and capital gains have been
provided for in accordance with the applicable country’s tax rules and rates.
Warrants and Rights –
Certain Funds hold warrants and rights acquired either through a direct purchase, including as part of private placement, or pursuant to corporate actions. Warrants and rights entitle the holder to buy a proportionate amount of common stock at a
specific price and time through the expiration dates. Such warrants and rights are held as long positions by the Funds until exercised, sold or expired. Equity-linked warrants are purchased in order to own local exposure to certain countries in
which the Funds are not locally registered. Warrants and rights are valued at fair value in accordance with the Board of Trustees’ approved fair value procedures.
Lending of Portfolio Securities – The Trust has entered into an agreement with their custodian whereby the custodian
may lend securities owned by the Funds to brokers, dealers and other financial organizations. Any increase or decrease in the fair value of securities loaned and any interest or dividends earned on those securities during the term of the loan would
be for the account of the Fund. In exchange for lending
ANNUAL
REPORT / April 30, 2013
|
|
|
| 94 |
|
NOTES TO FINANCIAL STATEMENTS (continued) |
securities under the terms of the agreement with their custodian, the Funds receive a lender’s fee. Fees earned by the Funds on securities lending are recorded as income. Loans of securities
by the Funds are collateralized by cash, U.S. government securities or money market instruments that are maintained at all times in an amount at least equal to the current market value of the loaned securities plus a margin which varies depending on
the type of securities owned. The custodian establishes and maintains the collateral in a segregated account. The Funds have the right under the lending agreement to recover the securities from the borrower on demand.
Investments purchased with cash collateral are presented on the portfolios of investments under the caption “Cash
Collateral Invested for Securities on Loan.”
As of April 30, 2013, the Funds listed below had securities with the
following values on loan:
|
|
|
|
|
|
|
|
|
|
|
| Fund |
|
Value of
Securities
on Loan |
|
Value of
Collateral |
| Large-Cap Growth Fund |
|
|
|
$ 1,944,149 |
|
|
|
|
$ 1,947,562 |
|
| Large-Cap Strategy Fund |
|
|
|
8,764,736 |
|
|
|
|
8,951,934 |
|
| Mid-Cap Growth Fund |
|
|
|
28,985,432 |
|
|
|
|
29,114,640 |
|
| Small-Cap Growth Fund |
|
|
|
17,437,829 |
|
|
|
|
17,897,479 |
|
| Small-Cap Strategy Fund |
|
|
|
9,905,197 |
|
|
|
|
10,161,606 |
|
The Funds maintain the risk of any loss on the securities on loan as well as the potential loss
on investments purchased with cash collateral received from securities lending.
| 3. |
|
FEDERAL TAX INFORMATION |
The timing and character of income and capital gain
distributions are determined in accordance with income tax regulations, which may differ from GAAP. These differences are due in part to differing treatments for income recognition on expiration of capital loss carryforwards, reclassification of
ordinary loss to short-term gains, REIT dividend reclasses and distributions recognition on income distribution payables.
As of April 30, 2013, there are no uncertain tax positions that would require financial statement recognition,
de-recognition or disclosure. The Funds’ federal tax returns filed for the periods ended 2012, 2011, and 2010, remain subject to examination by the Internal Revenue Service.
For the year ended April 30, 2013, permanent differences identified and reclassified among the components of net assets
were as follows:
|
|
|
|
|
|
|
|
|
|
|
|
|
|
|
|
| Fund |
|
Paid-in
Capital |
|
Increase (Decrease)
Undistributed
(Distributions
in Excess of) Net
Investment Income |
|
Accumulated
Net Realized
Gain (Loss) |
| Large-Cap Strategy
Fund |
|
|
$ |
— |
|
|
|
|
$ 3,510 |
|
|
|
|
$ (3,510 |
) |
| Large-Cap Value Fund |
|
|
|
(19,825 |
) |
|
|
|
11,264 |
|
|
|
|
8,561 |
|
| Small-Cap Growth Fund |
|
|
|
(108,416 |
) |
|
|
|
108,416 |
|
|
|
|
— |
|
| Small-Cap Strategy
Fund |
|
|
|
— |
|
|
|
|
11,503 |
|
|
|
|
(11,503 |
) |
The tax character of distributions for the corresponding years or periods as reported on the
Statements of Changes in Net Assets were as follows:
|
|
|
|
|
|
|
|
|
|
|
|
|
|
|
|
|
|
|
| |
|
2013 |
|
|
2012 |
|
| Fund |
|
Return of
Capital |
|
Ordinary
Income* |
|
|
Long-Term
Capital Gains |
|
|
Ordinary
Income* |
|
|
Long-Term
Capital Gains |
|
| Large-Cap Growth Fund |
|
$— |
|
|
$ 84,985 |
|
|
|
$ 7,366,066 |
|
|
|
$ 70,815 |
|
|
|
$ 1,854,981 |
|
| Large-Cap Value Fund |
|
— |
|
|
1,799,220 |
|
|
|
— |
|
|
|
1,355,857 |
|
|
|
— |
|
| Mid-Cap Growth Fund |
|
— |
|
|
— |
|
|
|
11,276,386 |
|
|
|
— |
|
|
|
10,589,511 |
|
| Small-Cap Growth Fund |
|
— |
|
|
757,676 |
|
|
|
— |
|
|
|
— |
|
|
|
— |
|
|
|
|
|
|
|
|
|
|
|
|
|
|
|
|
|
| Fund |
|
2013
Ordinary
Income* |
|
2012
Ordinary
Income* |
|
2011
Ordinary
Income* |
| Large-Cap Strategy Fund |
|
|
|
$7,319,491 |
|
|
|
|
$5,373,107 |
|
|
|
|
$6,299,979 |
|
| Small-Cap Strategy Fund |
|
|
|
763,725 |
|
|
|
|
884,546 |
|
|
|
|
1,230,775 |
|
| |
* |
For tax purposes, short-term capital gain distributions are considered ordinary income distributions. |
April 30,
2013 / ANNUAL REPORT
|
|
|
|
|
| NOTES TO FINANCIAL STATEMENTS (continued) |
|
|
95 |
|
As of April 30, 2013, the components of distributable earnings on a tax
basis were as follows:
|
|
|
|
|
|
|
|
|
|
|
|
|
|
|
|
|
|
|
|
|
|
|
|
|
|
|
|
|
|
|
| Fund |
|
Undistributed/
Over Distributed
Ordinary Income |
|
Undistributed
Capital Gains |
|
Unrealized
Appreciation |
|
Late Year
Ordinary
Deferrals |
|
Other
Timing
Differences |
|
Capital Loss
Carryforwards
and Deferrals |
| Large-Cap Growth Fund |
|
|
|
$341,701 |
|
|
|
|
$ 110,679 |
|
|
|
|
$ 19,005,517 |
|
|
|
|
$ — |
|
|
|
|
$— |
|
|
|
|
$(15,222,276 |
) |
| Large-Cap Strategy Fund |
|
|
|
497,455 |
|
|
|
|
— |
|
|
|
|
124,038,582 |
|
|
|
|
— |
|
|
|
|
— |
|
|
|
|
(38,402,939 |
) |
| Large-Cap Value Fund |
|
|
|
— |
|
|
|
|
— |
|
|
|
|
17,939,588 |
|
|
|
|
— |
|
|
|
|
— |
|
|
|
|
(9,918,299 |
) |
| Mid-Cap Growth Fund |
|
|
|
— |
|
|
|
|
5,772,003 |
|
|
|
|
84,235,475 |
|
|
|
|
(272,627 |
) |
|
|
|
— |
|
|
|
|
(17,660,425 |
) |
| Small-Cap Growth Fund |
|
|
|
— |
|
|
|
|
— |
|
|
|
|
24,243,991 |
|
|
|
|
(400,871 |
) |
|
|
|
— |
|
|
|
|
(28,198,015 |
) |
| Small-Cap Strategy Fund |
|
|
|
96,848 |
|
|
|
|
— |
|
|
|
|
19,212,149 |
|
|
|
|
— |
|
|
|
|
— |
|
|
|
|
(12,806,893 |
) |
At April 30, 2013, the following Funds had capital loss carryforwards which will reduce
each Fund’s taxable income arising from future net realized gain on investments, if any, to the extent permitted by the Code and thus will reduce the amount of distributions to shareholders which would otherwise be necessary to relieve the Fund
of any liability for federal income tax. Pursuant to the Code, such capital loss carryforwards will expire as follows:
|
|
|
|
|
|
|
|
|
|
|
|
|
|
|
|
|
|
|
|
|
|
|
|
|
|
|
|
|
|
|
| Fund |
|
Capital Loss Available Through |
|
Short-Term
Post-Effective |
|
Long-Term
Post-Effective |
|
Total Capital
Loss |
| |
2016 |
|
2017 |
|
2018 |
|
No Expiration |
|
No Expiration |
|
Carryforwards |
| Large-Cap Growth Fund |
|
|
|
$11,416,707 |
|
|
|
|
$ 3,805,569 |
|
|
|
|
$ — |
|
|
|
|
$ — |
|
|
|
|
$ — |
|
|
|
|
$15,222,276 |
|
| Large-Cap Strategy Fund |
|
|
|
— |
|
|
|
|
— |
|
|
|
|
38,402,939 |
|
|
|
|
— |
|
|
|
|
— |
|
|
|
|
38,402,939 |
|
| Large-Cap Value Fund |
|
|
|
2,000,070 |
|
|
|
|
4,472,572 |
|
|
|
|
1,646,592 |
|
|
|
|
— |
|
|
|
|
— |
|
|
|
|
8,119,234 |
|
| Mid-Cap Growth Fund |
|
|
|
— |
|
|
|
|
16,299,495 |
|
|
|
|
1,360,930 |
|
|
|
|
— |
|
|
|
|
— |
|
|
|
|
17,660,425 |
|
| Small-Cap Growth Fund |
|
|
|
7,293,340 |
|
|
|
|
18,467,238 |
|
|
|
|
1,273,640 |
|
|
|
|
380,282 |
|
|
|
|
382,938 |
|
|
|
|
27,797,438 |
|
| Small-Cap Strategy Fund |
|
|
|
— |
|
|
|
|
12,806,893 |
|
|
|
|
— |
|
|
|
|
— |
|
|
|
|
— |
|
|
|
|
12,806,893 |
|
Under the recently enacted Regulated Investment Company Modernization Act of 2010, the Funds
will be permitted to carry forward capital losses incurred in taxable years beginning after December 22, 2010 for an unlimited period. However, any losses incurred during those future taxable years will be required to be utilized prior to the
losses incurred in pre-enactment taxable years. As a result of this ordering rule, pre-enactment capital loss carryforwards may have an increased likelihood to expire unused. Additionally, post-enactment capital losses that are carried forward will
retain their character as either short-term or long-term capital losses rather than being considered all short-term as under previous law.
As a result of the tax-free transfer of assets described in Note 7 and to the extent unrealized gains and losses that existed at
the time of the reorganization are realized, the capital loss carryforwards may further be limited for up to five years from the date of the reorganization.
The Funds used capital loss carryforwards as follows to offset taxable capital gains realized during the year ended
April 30, 2013:
|
|
|
|
|
|
| Fund |
|
Capital Loss
Carryforwards
Used |
| Large-Cap Growth Fund |
|
|
|
$ 3,805,569 |
|
| Large-Cap Strategy Fund |
|
|
|
13,423,393 |
|
| Large-Cap Value Fund |
|
|
|
8,503,135 |
|
| Mid-Cap Growth Fund |
|
|
|
3,259,899 |
|
| Small-Cap Strategy Fund |
|
|
|
5,508,704 |
|
Under current tax regulations, capital losses on securities transactions realized after
October 31 may be deferred and treated as occurring on the first day of the following fiscal year. Under recently enacted Regulated Investment Company Modernization Act of 2010, the Funds will be permitted to defer taxable ordinary income
losses incurred after December 31 and treat as occurring on the first day of the following fiscal year. Post-October, Post-December and Late Year losses deferred to May 1, 2013 are as follows:
|
|
|
|
|
|
|
|
|
|
|
|
|
|
|
|
| Fund |
|
Ordinary
Post-December
Losses |
|
Short-Term
Post-October/
Late Year
Losses |
|
Long-Term
Post-October/
Late Year
Losses |
| Large-Cap Value Fund |
|
|
|
$ — |
|
|
|
|
$1,799,065 |
|
|
|
|
$ — |
|
| Mid-Cap Growth Fund |
|
|
|
272,627 |
|
|
|
|
— |
|
|
|
|
— |
|
| Small-Cap Growth Fund |
|
|
|
400,871 |
|
|
|
|
— |
|
|
|
|
400,577 |
|
ANNUAL
REPORT / April 30, 2013
|
|
|
| 96 |
|
NOTES TO FINANCIAL STATEMENTS (continued) |
| 4. |
|
ADVISORY FEES, SERVICING FEES, AND OTHER SERVICE PROVIDERS |
Investment
Advisor – Wilmington Funds Management Corporation (“WFMC” or the “Advisor”) serves as the Investment Advisor to each of the Funds. Wilmington Trust Investment Advisors, Inc. (“WTIA”) provides sub-advisory
services to the Funds. WFMC and WTIA are wholly-owned subsidiaries of M&T Bank Corporation. For its services, the Funds pay WFMC an annual investment advisory fee, accrued and paid daily, based on a percentage of each Fund’s average daily
net assets as described below. WFMC, not the Funds, pays WTIA for its services.
|
|
|
|
|
|
| Fund |
|
Advisory Fee
Annual Rate |
| Large-Cap Growth Fund |
|
|
|
0.85 |
% |
| Large-Cap Strategy Fund |
|
|
|
0.50 |
% |
| Large-Cap Value Fund |
|
|
|
0.70 |
% |
| Mid-Cap Growth Fund |
|
|
|
0.85 |
% |
| Small-Cap Growth Fund |
|
|
|
0.85 |
% |
| Small-Cap Strategy Fund |
|
|
|
0.55 |
% |
WFMC had entered into a Sub-Advisory agreement with NWQ Investment Management Company LLC
(“NWQ”) to manage the Large-Cap Value Fund, subject to supervision by the Advisor and the Trustees, and in accordance with the investment goal and restrictions of the Fund. For their service, NWQ received a fee of 0.45%, accrued daily and
paid monthly, based upon the Fund’s average daily net assets that they managed for the Fund, which was paid by the Fund.
Effective December 13, 2012, the sub-advisory agreement with NWQ was terminated and WFMC assumed management of all the
assets of the Large-Cap Value Fund. The advisory fee paid to WFMC was changed from 0.25% to 0.70% of average daily net assets of the Fund effective with the termination of NWQ.
WFMC and the Funds’ distributor and shareholder service providers have contractually agreed to waive their fees and/or
reimburse expenses through August 31, 2013, so that total annual fund operating expenses paid by the Funds (not including the effects of dividends or interest on short positions, acquired fund fees and expenses, taxes, or other extraordinary
expenses expressed as an annualized percentage of average daily net assets), will not exceed the expense limitations set forth below.
|
|
|
|
|
|
|
|
|
|
|
| Fund |
|
Contractual Expense
Limitations |
| |
|
Class A |
|
Class I |
| Large-Cap Growth Fund |
|
|
|
1.42 |
% |
|
|
|
1.04 |
% |
| Large-Cap Strategy Fund |
|
|
|
N/A |
|
|
|
|
0.25 |
% |
| Large-Cap Value Fund |
|
|
|
1.32 |
% |
|
|
|
1.04 |
% |
| Mid-Cap Growth Fund |
|
|
|
1.24 |
% |
|
|
|
1.08 |
% |
| Small-Cap Growth Fund |
|
|
|
1.47 |
% |
|
|
|
1.25 |
% |
| Small-Cap Strategy Fund |
|
|
|
N/A |
|
|
|
|
0.31 |
% |
Administrative Fee – The Bank of New York Mellon (“BNYM”) provides the
Trust with fund administration services. Effective October 1, 2012, WFMC replaced WTIA as Co-Administrator for the Funds. WFMC in its role as co-administrator provides the Funds with certain administrative personnel and services necessary to
operate the Funds. These services were provided for at an aggregate annual fee as specified below.
|
|
|
|
|
|
|
| Administrator |
|
Maximum
Fee |
|
|
Average Aggregate Daily Net
Assets of the Trust |
| WFMC |
|
|
0.033 |
% |
|
on the first $5 billion |
|
|
|
0.020 |
% |
|
on the next $2 billion |
|
|
|
0.016 |
% |
|
on the next $3 billion |
|
|
|
0.015 |
% |
|
on assets in excess of $10 billion |
| BNYM |
|
|
0.0285 |
% |
|
on the first $500 million |
|
|
|
0.0280 |
% |
|
on the next $500 million |
|
|
|
0.0275 |
% |
|
on assets in excess of $1 billion |
WFMC may voluntarily choose to waive any portion of its fee. WFMC can modify or terminate its
voluntary waiver at any time at its sole discretion. For the year ended April 30, 2013, WTIA and WFMC did not waive any administrative personnel and services fee.
April 30,
2013 / ANNUAL REPORT
|
|
|
|
|
| NOTES TO FINANCIAL STATEMENTS (continued) |
|
|
97 |
|
Distribution Services Fee – The Trust has adopted a Distribution
Services Plan (the “Plan”) pursuant to Rule 12b-1 under the Act. The Plan allows the Funds to pay fees to financial intermediaries, which may be paid through ALPS Distributors, Inc. (“ALPS”), the principal distributor, at an
annual rate of up to 0.25% of the average daily net assets of the Funds’ Class A, for the sale, distribution, administration, customer servicing and record keeping of these shares.
The Trust may reduce the maximum amount of distribution services fees it pays from time to time at its sole discretion. In
addition, a financial intermediary (including ALPS, the Advisor or their affiliates), may voluntarily waive or reduce any fees to which they are entitled.
For the year ended April 30, 2013, M&T Securities, Inc. and Manufacturers and Traders Trust Company (together
“M&T”), affiliates of the Advisor, received a portion of the fees paid by the Funds which are listed below:
|
|
|
|
|
|
| Fund |
|
Distribution
Fees |
| Large-Cap Growth Fund |
|
|
|
$35,416 |
|
| Large-Cap Strategy Fund |
|
|
|
65 |
|
| Large-Cap Value Fund |
|
|
|
10,116 |
|
| Mid-Cap Growth Fund |
|
|
|
84,892 |
|
| Small-Cap Growth Fund |
|
|
|
31,010 |
|
| Small-Cap Strategy Fund |
|
|
|
— |
|
Sales Charges – The Class A shares of all the Funds bear front-end sales
charges.
For the year ended April 30, 2013, M&T received the amounts listed below from sales charges on the sale
of Class A shares.
|
|
|
|
|
|
| Fund |
|
Sales Charges
from Class A |
| Large-Cap Growth Fund |
|
|
|
$ 4,111 |
|
| Large-Cap Strategy Fund |
|
|
|
— |
|
| Large-Cap Value Fund |
|
|
|
3,520 |
|
| Mid-Cap Growth Fund |
|
|
|
12,422 |
|
| Small-Cap Growth Fund |
|
|
|
5,041 |
|
| Small-Cap Strategy Fund |
|
|
|
— |
|
Shareholder Services Fee – Pursuant to a Shareholder Services Plan adopted by the
Funds and administered by ALPS, the Funds may pay up to 0.25% of the average daily net assets of each Fund’s Class A and Class I to financial intermediaries (which may include ALPS, the Advisor or their affiliates) for providing
shareholder services and maintaining shareholder accounts. M&T has entered into a Shareholders Services Agreement with ALPS, under which it is entitled to receive up to 0.25% of the average daily net assets of each Fund’s shares for whom
M&T provides shareholder services. The Funds may reduce the maximum amount of shareholder service fees it pays from time to time at its sole discretion. In addition, a financial intermediary (including M&T) may waive or reduce any fees to
which they are entitled.
For the year ended April 30, 2013, M&T received a portion of the fees paid by the
following Funds which are listed below:
|
|
|
|
|
|
| Fund |
|
Shareholder
Services
Fee |
| Large-Cap Growth Fund |
|
|
|
$ 33,408 |
|
| Large-Cap Strategy Fund |
|
|
|
— |
|
| Large-Cap Value Fund |
|
|
|
143,067 |
|
| Mid-Cap Growth Fund |
|
|
|
254,107 |
|
| Small-Cap Growth Fund |
|
|
|
128,408 |
|
| Small-Cap Strategy Fund |
|
|
|
— |
|
Other Service Providers – Foreside Management Services, LLC (“FMS”)
provides a Principal Executive Officer to the Trust. FMS has no role in determining the investment policies or which securities are to be sold or purchased by the Trust or its Funds.
BNYM provides fund accounting and custody services to the Trust.
BNY Mellon Investment Servicing (U.S.) Inc. provides transfer agency services to the Trust.
General – Certain Officers of the Trust are also Officers or employees of the above companies that provide services
to the Funds, and during their terms of office, receive no compensation from the Funds. The Trust’s Statement of Additional Information includes additional information about the Trustees.
Other Affiliated Parties and Transactions – Affiliated holdings are securities and mutual funds which are managed by
the Advisor or an affiliate of the Advisor or which are distributed by an affiliate of the Funds’ distributor. Transactions with affiliated companies during the year ended April 30, 2013 are as follows:
ANNUAL
REPORT / April 30, 2013
|
|
|
| 98 |
|
NOTES TO FINANCIAL STATEMENTS (continued) |
|
|
|
|
|
|
|
|
|
|
|
|
|
|
|
|
|
|
|
|
|
|
|
|
|
|
|
|
|
|
|
|
|
|
|
|
| Affiliated Fund Name |
|
Balance of
Shares Held
4/30/2012 |
|
Purchases/
Additions |
|
Sales/
Reductions |
|
Balance of
Shares Held
4/30/2013 |
|
Value at
4/30/2013 |
|
Dividend
Income |
|
Realized
Gain/Loss |
| Large-Cap Growth Fund: |
|
|
|
|
|
|
|
|
|
|
|
|
|
|
|
|
|
|
|
|
|
|
|
|
|
|
|
|
|
|
|
|
|
|
|
Wilmington Prime Money Market
Fund |
|
|
|
— |
|
|
|
|
2,568,165 |
|
|
|
|
2,568,165 |
|
|
|
|
— |
|
|
|
$ |
— |
|
|
|
$ |
69 |
|
|
|
$ |
— |
|
|
|
|
|
|
|
|
|
|
|
|
|
|
|
|
|
|
|
|
|
|
|
|
|
|
|
|
|
|
|
|
|
|
|
|
|
| Large-Cap Strategy Fund: |
|
|
|
|
|
|
|
|
|
|
|
|
|
|
|
|
|
|
|
|
|
|
|
|
|
|
|
|
|
|
|
|
|
|
|
| M&T Bank Corp. |
|
|
|
2,210 |
|
|
|
|
1,200 |
|
|
|
|
— |
|
|
|
|
3,410 |
|
|
|
|
341,682 |
|
|
|
|
7,868 |
|
|
|
|
— |
|
|
|
|
|
|
|
|
|
|
|
|
|
|
|
|
|
|
|
|
|
|
|
|
|
|
|
|
|
|
|
|
|
|
|
|
|
| Large-Cap Value Fund: |
|
|
|
|
|
|
|
|
|
|
|
|
|
|
|
|
|
|
|
|
|
|
|
|
|
|
|
|
|
|
|
|
|
|
|
Wilmington Prime Money Market
Fund |
|
|
|
1,988,206 |
|
|
|
|
24,596,180 |
|
|
|
|
26,584,386 |
|
|
|
|
— |
|
|
|
|
— |
|
|
|
|
527 |
|
|
|
|
— |
|
|
|
|
|
|
|
|
|
|
|
|
|
|
|
|
|
|
|
|
|
|
|
|
|
|
|
|
|
|
|
|
|
|
|
|
|
| Mid-Cap Growth Fund: |
|
|
|
|
|
|
|
|
|
|
|
|
|
|
|
|
|
|
|
|
|
|
|
|
|
|
|
|
|
|
|
|
|
|
|
Wilmington Prime Money Market
Fund |
|
|
|
3,796,553 |
|
|
|
|
8,311,219 |
|
|
|
|
12,107,772 |
|
|
|
|
— |
|
|
|
|
— |
|
|
|
|
— |
|
|
|
|
— |
|
|
|
|
|
|
|
|
|
|
|
|
|
|
|
|
|
|
|
|
|
|
|
|
|
|
|
|
|
|
|
|
|
|
|
|
|
| Small-Cap Growth Fund: |
|
|
|
|
|
|
|
|
|
|
|
|
|
|
|
|
|
|
|
|
|
|
|
|
|
|
|
|
|
|
|
|
|
|
|
Wilmington Prime Money Market
Fund |
|
|
|
94,563 |
|
|
|
|
11,275,615 |
|
|
|
|
11,370,178 |
|
|
|
|
— |
|
|
|
|
— |
|
|
|
|
88 |
|
|
|
|
— |
|
|
|
|
|
|
|
|
|
|
|
|
|
|
|
|
|
|
|
|
|
|
|
|
|
|
|
|
|
|
|
|
|
|
|
|
|
Certain Funds effect trades for security purchase and sale transactions through brokers that are
affiliates of the Advisor or sub-advisors. Commissions paid on those trades for the year ended April 30, 2013 were as follows:
|
|
|
|
|
|
| Fund |
|
Commissions |
| Large-Cap Growth Fund |
|
|
|
$ 18,404 |
|
| Large-Cap Strategy Fund |
|
|
|
55,372 |
|
| Large-Cap Value Fund |
|
|
|
65,053 |
|
| Mid-Cap Growth Fund |
|
|
|
2,031 |
|
| Small-Cap Growth Fund |
|
|
|
270,065 |
|
| Small-Cap Strategy Fund |
|
|
|
37,946 |
|
| 5. |
|
INVESTMENT TRANSACTIONS |
Purchases and sales of investments, excluding
short-term obligations and U.S. Government Securities, for the year ended April 30, 2013 were as follows:
|
|
|
|
|
|
|
|
|
|
|
| |
|
Investments |
| Fund |
|
Purchases |
|
Sales |
| Large-Cap Growth Fund |
|
|
|
$ 40,094,142 |
|
|
|
|
$ 70,406,787 |
|
| Large-Cap Strategy Fund |
|
|
|
86,980,813 |
|
|
|
|
110,334,602 |
|
| Large-Cap Value Fund |
|
|
|
119,483,110 |
|
|
|
|
141,871,404 |
|
| Mid-Cap Growth Fund |
|
|
|
98,874,371 |
|
|
|
|
115,392,384 |
|
| Small-Cap Growth Fund |
|
|
|
203,839,256 |
|
|
|
|
242,224,995 |
|
| Small-Cap Strategy Fund |
|
|
|
37,901,969 |
|
|
|
|
22,006,243 |
|
The Trust participated in a $20,000,000 unsecured, committed
revolving line of credit (“LOC”) agreement with BNYM. The LOC was made available for extraordinary or emergency purposes, primarily for financing redemption payments. Borrowings are charged interest at a rate of 1.25% per annum over
the greater of the Federal Funds Rate or the overnight LIBOR Rate. The LOC included a commitment fee of 0.12% per annum on the daily unused portion. In addition, an upfront commitment fee of 0.02% was paid to BNYM. The termination date of this
LOC is March 10, 2014. The Funds did not utilize the LOC for the year ended April 30, 2013.
On February 21, 2012 the Board approved an Agreement and
Plan of Reorganization (the “Reorganization”) to transfer all of the assets of Wilmington Large-Cap Strategy Fund and Wilmington Small-Cap Strategy Fund, each a series of WT Mutual Fund, (collectively the “WT Funds”) in exchange
for shares of Large-Cap Strategy Fund and Small-Cap Strategy Funds (each an “Acquiring Fund”), respectively. The Reorganization is believed to be in the best interest of shareholders as combining the series of WT Funds and the Trust onto a
single operating platform will create a larger fund family that will offer a broader range of investment options. Additionally, the Reorganization is believed to present the opportunity to achieve asset growth through combined distribution networks,
to achieve economies of scale, and to operate with greater efficiency and lower overall costs. The shareholders of the WT Funds approved the Reorganization at a meeting on February 21, 2012 and the Reorganization took place on March 9, 2012.
The Reorganization was treated as tax-free reorganization for federal
April 30,
2013 / ANNUAL REPORT
|
|
|
|
|
| NOTES TO FINANCIAL STATEMENTS (continued) |
|
|
99 |
|
income tax purposes and, accordingly, the basis of the assets of each
Acquiring Fund reflected the historical basis of the assets of each respective WT Fund as of the date of the Reorganization. WFMC and its affiliates bore the expenses related to the Reorganization, except for brokerage fees and other transaction
costs associated with the disposition and/or purchase of securities in contemplation of or as a result of the Reorganization.
In exchange for their shares (A Shares and Institutional Shares), shareholders of the WT Funds received an identical number of
shares of the corresponding class (A Shares and I Shares) of the Acquiring Funds, with an aggregate net asset value equal to the aggregate net asset value of their shares immediately prior to the Reorganization. The Acquiring Funds had no operations
prior to March 9, 2012. The WT Funds investment objectives, policies and limitations were identical to those of the Acquiring Funds. Accordingly, for financial reporting purposes, the operating history of the WT Funds prior to the
Reorganization is reflected in the financial statements and financial highlights.
The Funds are subject to claims and suits that arise from
time to time in the ordinary course of business. For example, certain creditors of Tribune Co., which has recently emerged from bankruptcy, have filed actions against former Tribune shareholders, (collectively, the “Lawsuits”) who tendered
their shares when Tribune went private in 2007 as part of a leveraged buyout (“LBO”). These creditor plaintiffs seek the return of all proceeds received by the former Tribune shareholders. The Tribune-related actions are currently pending
in the U.S. District Court for the Southern District of New York in a Multi-District Litigation (“MDL”). There are thousands of defendants in the MDL, including the Large-Cap Strategy Fund and the Mid-Cap Growth Fund. The suits all seek
the same thing: disgorgement of the amounts received by the former Tribune shareholders as part of the LBO, but by different legal theories. Although management currently believes that the resolution of the claims against the Funds, individually or
in the aggregate, will not have a materially adverse impact on the Funds’ financial positions, results of operations, or cash flows, these matters are subject to inherent uncertainties and management’s view of these matters could change in
the future.
Litigation counsel to the Large-Cap Strategy Fund and the Mid-Cap Growth Fund in the Lawsuits does not believe
that it is possible, at this early stage in the proceedings, to predict with any reasonable certainty the probable outcome of the Lawsuits or quantify the ultimate exposure to the Large-Cap Strategy Fund and the Mid-Cap Growth Fund arising from the
Lawsuits. Until the Large-Cap Strategy Fund and the Mid-Cap Growth Fund can do so, no reduction of their net asset values will be made relating to the Lawsuits. However, even if the plaintiffs in the Lawsuits were to obtain the full recovery they
seek, the amount would be less than 0.5% of each of the Large-Cap Strategy Fund and the Mid-Cap Growth Fund’s net asset value at this time. Neither the Large-Cap Strategy Fund nor the Mid-Cap Growth Fund can predict what their size might be at
the time that the cost of the Lawsuits might be quantifiable and thus potentially deducted from their net asset value. Therefore, at this time, those buying or redeeming shares of the Large-Cap Strategy Fund and the Mid-Cap Growth Fund will pay or
receive, as the case may be, a price based on net asset value of the Large-Cap Strategy Fund and the Mid-Cap Growth Fund, with no adjustment relating to the Lawsuits. The attorneys’ fees and costs relating to the Lawsuits will be taken as
expenses by the Large-Cap Strategy Fund and the Mid-Cap Growth Fund as incurred and in a manner similar to any other expense incurred by the Large-Cap Strategy Fund and the Mid-Cap Growth Fund.
| 9. |
|
RECENT ACCOUNTING PRONOUNCEMENT |
In December 2011, the Financial Accounting
Standards Board(“FASB”) issued Accounting Standards Update (“ASU”) No. 2011-11 regarding “Disclosures about Offsetting Assets and Liabilities”. The amendments, which will be effective for annual reporting periods
beginning on or after January 1, 2013 and interim periods within those annual periods, require an entity to disclose information about offsetting and related arrangements for assets and liabilities, financial instruments and derivatives that
are either currently offset in accordance with current requirements or are subject to enforceable master netting arrangements or similar agreements. At this time, management is evaluating the implications of ASU No. 2011-11 and its impact on
the financial statements has not yet been determined.
Management has evaluated events and transactions for
potential recognition or disclosure in the financial statements through the date the financial statements were issued. Management has determined that there are no material events that would require disclosure in the Funds’ financial statements
through this date.
ANNUAL
REPORT / April 30, 2013
|
|
|
| 100 |
|
NOTES TO FINANCIAL STATEMENTS (continued) |
| 11. |
|
FEDERAL TAX INFORMATION (UNAUDITED) |
Complete information regarding the tax
status of distributions will be reported on Forms 1099.
Of the ordinary income (including short-term capital gain)
distributions made by the Funds during the year ended April 30, 2013, the Funds designate the following percentages, or such greater percentages that constitute the maximum amount allowable pursuant to Code Sections Section 243 and
854(b)(2), as qualifying for the corporate dividends received deduction:
|
|
|
|
|
|
| Fund |
|
|
| Large-Cap Growth Fund |
|
|
|
100.00 |
% |
| Large-Cap Strategy Fund |
|
|
|
95.85 |
% |
| Large-Cap Value Fund |
|
|
|
100.00 |
% |
| Small-Cap Growth Fund |
|
|
|
100.00 |
% |
| Small-Cap Strategy Fund |
|
|
|
38.84 |
% |
For the year ended April 30, 2013, the Funds designate the following percentages of the
ordinary income dividends, or such greater percentages that constitute the maximum amount allowable pursuant to Code Sections 1(h)(11) and 854(b)(2), as qualified dividend income which may be subject to a maximum rate of federal income tax of 15%:
|
|
|
|
|
|
| Fund |
|
|
| Large-Cap Growth Fund |
|
|
|
100.00 |
% |
| Large-Cap Strategy Fund |
|
|
|
100.00 |
% |
| Large-Cap Value Fund |
|
|
|
100.00 |
% |
| Samll-Cap Growth Fund |
|
|
|
100.00 |
% |
| Small-Cap Strategy Fund |
|
|
|
41.15 |
% |
If the Funds meet the requirements of Section 853 of the Code, the Funds will pass through
to shareholders credits of foreign taxes paid.
April 30,
2013 / ANNUAL REPORT
REPORT OF INDEPENDENT REGISTERED PUBLIC ACCOUNTING FIRM
TO THE SHAREHOLDERS AND BOARD OF TRUSTEES OF
WILMINGTON
FUNDS
We have audited the accompanying statements of assets and liabilities, including the portfolios of investments, of Wilmington
Large-Cap Growth Fund, Wilmington Large-Cap Strategy Fund, Wilmington Large-Cap Value Fund, Wilmington Mid-Cap Growth Fund, Wilmington Small-Cap Growth Fund and Wilmington Small-Cap Strategy Fund (six of the series constituting the Wilmington Funds)
(the “Funds”) as of April 30, 2013, and the related statements of operations for the year then ended, and the statements of changes in net assets and financial highlights for each of the years or periods indicated therein. These
financial statements and financial highlights are the responsibility of the Funds’ management. Our responsibility is to express an opinion on these financial statements and financial highlights based on our audits.
We conducted our audits in accordance with standards of the Public Company Accounting Oversight Board (United States). Those standards require
that we plan and perform the audit to obtain reasonable assurance about whether the financial statements and financial highlights are free of material misstatement. We were not engaged to perform an audit of the Funds’ internal control over
financial reporting. Our audits included consideration of internal control over financial reporting as a basis for designing audit procedures that are appropriate in the circumstances, but not for the purpose of expressing an opinion on the
effectiveness of the Funds’ internal control over financial reporting. Accordingly, we express no such opinion. An audit also includes examining, on a test basis, evidence supporting the amounts and disclosures in the financial statements and
financial highlights, assessing the accounting principles used and significant estimates made by management, and evaluating the overall financial statement presentation. Our procedures included confirmation of securities owned as of April 30,
2013, by correspondence with the custodian and brokers, or by other appropriate auditing procedures where replies from the brokers were not received. We believe that our audits provide a reasonable basis for our opinion.
In our opinion, the financial statements and financial highlights referred to above present fairly, in all material respects, the financial
position of the Wilmington Large-Cap Growth Fund, Wilmington Large-Cap Strategy Fund, Wilmington Large-Cap Value Fund, Wilmington Mid-Cap Growth Fund, Wilmington Small-Cap Growth Fund and Wilmington Small-Cap Strategy Fund at April 30, 2013,
the results of their operations for the year then ended and the changes in their net assets and their financial highlights for each of the years or periods indicated therein, in conformity with U.S. generally accepted accounting principles.

Philadelphia, Pennsylvania
June 28, 2013
ANNUAL
REPORT / April 30, 2013
|
|
|
| 102 |
|
BOARD OF TRUSTEES AND TRUST OFFICERS |
BOARD OF TRUSTEES AND TRUST OFFICERS
The following tables give information about each Trustee and the senior officers of the Trust. The tables separately list Trustee members who
are “interested persons” of the Fund (i.e., “Interested” Trustees) and those who are not (i.e., “Independent” Trustees). The Trust is comprised of 23 funds. Unless otherwise noted, the business address of each Trustee
and senior officer is 111 South Calvert Street, 26th floor, Baltimore, Maryland 21202. Each Trustee oversees all portfolios of the Trust and serves for an indefinite term. The Trust’s Statement of Additional Information includes additional
information about the Trustees and is available, without charge and upon request, by calling 1-800-836-2211.
INTERESTED TRUSTEES BACKGROUND
|
|
|
|
Name
Address
Birth date
Position With Trust
Date Service
Began |
|
Principal Occupations and Other Directorships Held for Past Five Years
|
|
|
| R. Samuel Fraundorf, CFA, CPA*
Birth date: 4/64 TRUSTEE
Began serving: March 2012 |
|
Principal Occupations: President of WTIA, President of Wilmington Trust Investment Managements
(“WTIM”), Director of Wilmington Funds Management Corporation (formerly known as Rodney Square Management Corporation).
Other Directorships Held: None.
Previous Positions: Chief Operating Officer of WTIM (1/08 to 1/09); Director of Research at WTIM (8/04 to 1/08); Senior Manager and Tax Manager, KPMG Investment
Advisors (1/99 to 8/04). |
|
|
| Robert J. Truesdell*
Birth date: 11/55 TRUSTEE
Began serving: December 2012 |
|
Principal Occupations: Group Vice President and Senior Investment Advisor for Wilmington Trust Wealth
Advisory Services, M&T Bank. Other Directorships Held: None.
Previous Positions: Group Vice President, Managing Director and Chief Investment Officer,
WTIA (6/02-6/12) and WFMC (3/12 to 6/12). |
| * |
|
R. Samuel Fraundorf is “interested” due to positions he holds with WTIA and WTIM. Robert J. Truesdell is “interested” due to the
positions he currently holds with Wilmington Trust Wealth Advisory Services, M&T Bank, the parent of the Funds’ Advisor, and previous positions held with WTIA and WFMC. |
April 30,
2013 / ANNUAL REPORT
|
|
|
|
|
| BOARD OF TRUSTEES AND TRUST OFFICERS |
|
|
103 |
|
INDEPENDENT TRUSTEES BACKGROUND
|
|
|
| Name
Birth
date
Position with Trust
Date Service Began |
|
Principal Occupations and Other Directorships Held for Past Five Years
|
|
|
| Joseph J. Castiglia
Birth date: 7/34 CHAIRMAN AND TRUSTEE
Began serving: February 1988 |
|
Principal Occupations: Private Investor, Consultant and Community Volunteer.
Other Directorships Held: Chairman (3/06 to 3/08), Trustee (3/04 to present) and Treasurer
(3/10 to 3/12), Buffalo Olmstead Parks Conservancy (1/05 to present); Chairman and Trustee, Buffalo Philharmonic Orchestra Foundation (1/06 to 1/12); Vice Chairman and Trustee, Christ the King Seminary (1/05 to present); Director, Dunn Tire
Corporation (1/05 to present); Chairman (5/12 to present), Director (1/08 to present), Read to Succeed Buffalo (1/08 to present); Director, Catholic Medical Partners (7/12 to present); Director, Roycroft Campus Corporation (8/12 to present).
Previous Positions: President, Chief Executive Officer, Vice President,
Treasurer, Controller and Vice Chairman, Pratt & Lambert United (manufacturing of paints, coatings and adhesives) (12/67 to 1/96); Chairman and Director, Catholic Health Systems of Western New York (1/97 to 5/03); Chairman and Director, Blue
Cross Blue Shield of Western and Central New York (health insurance provider) (5/92 to 5/07); Lead Director and Director, Energy East (gas and electric utility); Chairman and Director, Federal Reserve Bank of New York, Buffalo Branch.
|
|
|
| Robert H. Arnold
Birth date: 3/44 TRUSTEE
Began serving: March 2012 |
|
Principal Occupations: Founder and Co-Manager, R.H. Arnold & Co. (financial consulting) (1989 to
present). Other Directorships Held: First Potomac Realty Trust (real estate
investment trust). |
|
|
| William H. Cowie, Jr.
Birth date: 1/31 TRUSTEE
Began serving: September 2003 |
|
Principal Occupations: Retired.
Other Directorships Held: MedStar Community Health (not-for-profit owner and operator of
hospitals) (1972 to present). Previous Positions: Vice Chairman of Signet
Banking Corp. |
|
|
| John S. Cramer
Birth date: 2/42 TRUSTEE
Began serving: December 2000 |
|
Principal Occupations: Senior Consultant, Yaffe & Co. (health care consulting) (2/06 to present).
Other Directorships Held: Director, Chairman of the Executive Committee and
Chairman of the Compensation Committee of ChekMed Corporation (6/03 to present).
Previous Positions: President and Chief Executive Officer Emeriti, Pinnacle Health Systems (non-profit hospital and health care system in Central
Pennsylvania). |
|
|
| Daniel R. Gernatt, Jr.
Birth date: 7/40 TRUSTEE
Began serving: February 1988 |
|
Principal Occupations: CEO, Gernatt Asphalt Products, Inc. (asphalt, sand and gravel products) (1979 to
present). Other Directorships Held: Director, Roswell Park Alliance (2008 to
present); Trustee, Gernatt Family Foundation. |
|
|
| Nicholas A. Giordano
Birth date: 3/43 TRUSTEE
Began serving: March 2012 |
|
Principal Occupations: Consultant, financial services organizations (1997 to present).
Other Directorships Held: Kalmar Pooled Investment Trust; The RBB Fund Inc. (19 portfolios)
(registered investment companies); Independence Blue Cross; IntriCon Corporation (industrial furnaces and ovens).
Previous Positions: Interim President, LaSalle University (1998 to 1999); President and Chief Executive Officer, Philadelphia Stock Exchange (1981 to 1997).
|
ANNUAL
REPORT / April 30, 2013
|
|
|
| 104 |
|
BOARD OF TRUSTEES AND TRUST OFFICERS |
|
|
|
| Name
Birth
date
Position with Trust
Date Service Began |
|
Principal Occupations and Other Directorships Held for Past Five Years
|
|
|
| Richard B. Seidel
Birth date: 4/41 TRUSTEE
Began serving: September 2003 |
|
Principal Occupations: Chairman and Director, Girard Partners, Ltd. (investment advisor) (9/95 to
present); Chairman and Director, Girard Capital (broker-dealer) (3/09 to present).
Other Directorships Held: Director, Tristate Capital Bank (9/07 to present). |
OFFICERS
|
|
|
|
Name
Address
Birth year
Positions with Trust
|
|
Principal Occupations for Past Five Years and Previous Positions
|
|
|
| Samuel Guerrieri
Birth year: 1965 PRESIDENT
Began serving: December 2012 |
|
Principal Occupations: President and Chief Executive Officer, M&T Securities, Senior Vice President, M&T Bank. |
|
|
| Michael D. Daniels
Birth year: 1967 CHIEF OPERATING OFFICER
Began serving: June 2007 |
|
Principal Occupations: Chief Operating Officer, Wilmington Funds and Wilmington Trust Investment
Advisors, Inc., Administrative Vice President, M&T Bank. Previous Positions:
Senior Vice President, MSD&T and MCA (2006 to 2007); Vice President, Calamos Asset Management (2004 to 2006); Vice President, JP Morgan Chase Bank (2002 to 2004).
|
|
|
| Jeffrey M. Seling
Birth year: 1970 VICE PRESIDENT
Began serving: June 2007 |
|
Principal Occupations: Vice President, M&T Bank and Wilmington Trust Investment Advisors, Inc.
Previous Positions: Vice President, MSD&T; Assistant Vice President, Wells
Fargo Bank; Assistant Vice President, JP Morgan Chase Bank. |
|
|
| Hope L. Brown
Birth year: 1973 CHIEF COMPLIANCE OFFICER,
AML COMPLIANCE OFFICER AND ASSISTANT SECRETARY
Began serving: December 2012 |
|
Principal Occupations: Vice President, Wilmington Trust Investment Advisors, Inc.; Chief Compliance
Officer, Wilmington Funds. Previous Positions: Assistant Vice President, Lead
Manager, Risk Management and Divisional Compliance for T. Rowe Price (2005 to 2010); Senior Compliance Officer, Manager of Compliance for RE Investment, Inc., RE Advisers, Inc. and the Homestead Funds (2001 to 2005).
|
|
|
| Eric B. Paul
Birth year: 1974 VICE PRESIDENT
Began serving: June 2008 |
|
Principal Occupations: Administrative Vice President, M&T Bank (2003 to present); Director of Proprietary Products, M&T Bank
since April 2008. |
|
|
| Ralph V. Partlow, III
25 South Charles Street, 22nd floor Baltimore, MD 21201
Birth year: 1957 VICE PRESIDENT
Began serving: June 2010 |
|
Principal Occupation: Administrative Vice President and Deputy General Counsel, M&T Bank (2003 to
present). Previous Positions: Vice President and Senior Counsel, Allfirst Bank
(1995-2003). |
April 30,
2013 / ANNUAL REPORT
|
|
|
|
|
| BOARD OF TRUSTEES AND TRUST OFFICERS |
|
|
105 |
|
|
|
|
|
Name
Address
Birth year
Positions with Trust
|
|
Principal Occupations for Past Five Years and Previous Positions
|
|
|
| Guy Nordahl
101 Barclay Street, 13E New York, NY 10286
Birth year: 1965 CHIEF FINANCIAL OFFICER AND
TREASURER Began serving: September 2007 |
|
Principal Occupations: Vice President, BNY Mellon Asset Servicing (2009 to present).
Previous Positions: Vice President, BNY Mellon Asset Management (2003 to 2009); Vice
President, BNY Mellon Asset Servicing (1999 to 2003). |
|
|
| Lisa R. Grosswirth
101 Barclay Street, 13E New York, NY 10286
Birth year: 1963 SECRETARY
Began serving: September 2007 |
|
Principal Occupations: Vice President, BNY Mellon Asset Servicing (2004 to present).
Previous Positions: Supervisory Paralegal, The Dreyfus Corporation (1998 to
2004). |
|
|
| Richard J. Berthy
Three Canal Plaza, Suite 100 Portland, ME 04101
Birth year: 1958 CHIEF EXECUTIVE OFFICER
Began serving: September 2007 |
|
Principal Occupations: Chief Executive Officer, Foreside Financial Group, LLC (7/12 to present).
Previous Positions: President, Foreside Financial Group, LLC (5/08 to 7/12);
Chief Administrative Officer, Foreside Financial Group, LLC (2005 to 2008); President and Secretary, Bainbridge Capital Management, LLC (6/03 to 6/06); Vice President, Bainbridge Capital Management (8/02 to 5/04).
|
ANNUAL
REPORT / April 30, 2013
Shares of the
Wilmington Funds are not FDIC insured or otherwise protected by the U.S. government, are not deposits or other obligations of, or guaranteed by, Manufacturers and Traders Trust Company, and are subject to investment risks, including possible loss of
the principal amount invested.
VOTING PROXIES ON FUND PORTFOLIO SECURITIES
A description of the policies and procedures that the Funds use to determine how to vote proxies relating to securities held in the
Funds’port-folios is available, without charge and upon request, by calling 1-800-836-2211. A report on how the Funds voted any such proxies during the most recent 12-month period ended June 30 is available through Wilmington Funds’
website. Go to www.wilmingtonfunds.com select “Proxy Voting Record” to access the link. This information is also available from the Edgar database on the SEC’s website at www.sec.gov.
QUARTERLY PORTFOLIO SCHEDULE
The Funds file
with the SEC a complete schedule of their portfolio holdings, as of the close of the first and third quarters of their fiscal year, on Form N-Q. These filings are available on the SEC’s website at www.sec.gov and may be reviewed and copied at
the SEC’s Public Reference Room in Washington DC. (Call 1-800-SEC-0330 for information on the operation of the Public Reference Room.)
Electronic
Delivery
Wilmington Funds encourages you to sign up for electronic delivery of investor materials. By doing so you will receive
information faster, help lower shareholder costs, and reduce the impact to the environment. To enroll in electronic delivery:
| |
1.) |
Go to www.wilmingtonfunds.com and select “Individual Investors” |
| |
2.) |
Click on the link “Sign up for Electronic Delivery” |
| |
3.) |
Login to your account or create new user ID |
| |
4.) |
Select E-Delivery Consent from the available options, and |
| |
5.) |
Complete the information requested, including providing the email address where you would like to receive notification for electronic documents.
|
* If you hold your account through a financial intermediary, please contact your advisor to request electronic
delivery of investor materials.
Householding
In an effort to reduce volume of mail you receive, only one copy of the prospectus, annual/semi-annual report, SAI and proxy statements will be
sent to shareholders who are part of the same family and share the same address.
If you would like to request additional copies of the
prospectus, annual/semi-annual report or SAI, or wish to opt out of householding mailings, please contact Shareholder Services at 1-800-836-2211, or write to Wilmington Funds, P.O. Box 9828, Providence, RI 02940-8025.
April 30,
2013 / ANNUAL REPORT
PRIVACY POLICY AND NOTICE
OF THE FUNDS AND THEIR DISTRIBUTOR
June 8, 2012
The
Wilmington Funds, their distributor and their agents (referred to as “the Funds”, “we” or “us”) recognize that consumers (referred to as “you” or “your”) expect us to protect both your assets and
financial information. We respect your right to privacy and your expectation that all personal information about you or your account will be maintained in a secure manner. We are committed to maintaining the confidentiality, security and integrity
of client and shareholder information. We want you to understand the Funds’ policy that governs the handling of your information, how the Funds gather information, how that information is used and how it is kept secure.
Information The Funds Collect:
The Funds
collect nonpublic personal information about you from the following sources:
| |
• |
We may receive information from you, or from your financial representative, on account applications, other forms or electronically (such as through
the Funds’ website or other electronic trading mechanisms). Examples of this information include your name, address, social security number, assets and income. |
| |
• |
We may receive information from you, or from your financial representative, through transactions with us or others, correspondence and other
communications. Examples of this information include specific investments and your account balances. |
| |
• |
We may obtain other personal information from you in connection with providing you a financial product or service. Examples of this information
include depository, debit or credit account numbers. |
Information Sharing Policy
The Funds may share nonpublic personal information about you, as described above, with financial or non-financial companies or other entities,
including companies that may be affiliated with the Funds and other nonaffiliated third parties, for the following purposes:
| |
• |
We may share information when it is necessary and required to process a transaction or to service a customer relationship. For example, information
may be shared with a company that provides account record keeping services or a company that provides proxy services to shareholders. |
| |
• |
We may share information when it is required or permitted by law. For example, information may be shared in response to a subpoena or to protect you
against fraud or with someone who has established a legal beneficial interest, such as a power of attorney. |
| |
• |
We may disclose some or all of the information described above to companies that perform marketing or other services on our behalf. For example, we
may share information about you with the financial intermediary (bank, investment bank or broker-dealer) through whom you purchased the Funds’ products or services, or with providers of marketing, legal, accounting or other professional
services. The Funds will not, however, disclose a consumer’s account number or similar form of access number or access code for credit card, deposit or transaction accounts to any nonaffiliated third party for use in telemarketing, direct mail
or other marketing purposes. |
Except as described above, the Funds do not share customer information. We will not rent,
sell, trade, or otherwise release or disclose any personal information about you. Any information you provide to us is for the Funds’ use only. If you decide to close your account(s) or become an inactive customer, we will adhere to the privacy
policies and practices as described in this notice.
Information Security:
When the Funds share nonpublic customer information with third parties hired to facilitate the delivery of certain products or services to our
customers, such information is made available for limited purposes and under controlled circumstances designed to protect our customers’pri-vacy. We require third parties to comply with our standards regarding security and confidentiality of
such information. We do not permit them to use that information for their own or any other purposes, or rent, sell, trade or otherwise release or disclose the information to any other party. These requirements are reflected in written agreements
between the Funds and the third party service providers.
The Funds protect your personal information in several ways. We maintain physical,
electronic, and procedural safeguards to guard your nonpublic personal information. In addition, the Funds’ Transfer Agent and Shareholder Servicing Agent have procedures in place for the appropriate disposal of nonpublic personal information
when they are no longer required to maintain the information.
Each of the following sections explains an aspect of the Funds’
commitment to protecting your personal information and respecting your privacy.
Employee Access to Information:
Our Code of Ethics, which applies to all employees, restricts the use of customer information and requires that it be held in the strictest of
confidence. Employee access to customer information is authorized for business purposes only, and the degree of access is based on the sensitivity of the information and on an employee’s or agent’s need to know the information in order to
service a customer’s account or comply with legal requirements.
Visiting The Funds’ Website:
The Funds’ website gathers and maintains statistics about the number of visitors as well as what information is viewed most frequently.
This information is used to improve the content and level of service we provide to our clients and shareholders.
ANNUAL
REPORT / April 30, 2013
| |
• |
Information or data entered into a website will be retained. |
| |
• |
Where registration to a website or re-entering personal information on a website is required, “cookies” are used to improve your online
experience. A cookie is a way for websites to recognize whether or not you have visited the site before. It is a small file that is stored on your computer that identifies you each time you re-visit our site so you don’t have to resubmit
personal information. Cookies provide faster access into the website. |
| |
• |
We may also collect non-personally identifiable Internet Protocol (“IP”) addresses for all other visitors to monitor the number of
visitors to the site. These non-personally identifiable IP addresses are never shared with any third party. |
E-mail:
If you have opted to receive marketing information from the Funds by e-mail, it is our policy to include instructions in all marketing messages
on how to unsubscribe from subsequent e-mail programs. Some products or services from the Funds are intended to be delivered and serviced electronically. E-mail communication may be utilized in such cases. If you participate in an employer-sponsored
retirement plan administered by the Funds, we may, at your employer’s request, send you e-mail on matters pertaining to the retirement plan.
Please do not provide any account or personal information such as social security numbers, account numbers, or account balances within your
e-mail correspondence to us. We cannot use e-mail to execute transaction instructions, provide personal account information, or change account registration. We can, however, use e-mail to provide you with the necessary forms or you may contact
customer service toll-free at 1-800-836-2211.
Surveys/Aggregate Data:
Periodically, the Funds may conduct surveys about financial products and services or review elements of customer information in an effort to
forecast future business needs. The Funds then generate reports that include aggregate data regarding its customers. Aggregate data classifies customer information in various ways but that does not identify individual customers. These reports may
also include information on website traffic patterns and related information. These reports are used for the Funds’ planning, statistical and other corporate purposes. Aggregate data may also be shared with external parties, such as marketing
organizations. However, no information is shared by which any individual customer could be identified.
Changes to Our Privacy Statement:
The effective date of this policy is June 8, 2012. We reserve the right to modify this policy at any time. When it is revised or materially
changed, we will update the effective date. You can determine whether there have been changes since the last time you reviewed by simply checking the effective date.
Notice will be provided to you in advance of any changes that would affect your rights under this policy statement
April 30,
2013 / ANNUAL REPORT
[This Page Intentionally Left Blank]
[This Page Intentionally Left Blank]

|
|
|
|
|
|
|
|
|
Investment Advisor
Wilmington Funds Management Corp.
1100 North Market Street
Wilmington, DE 19890
Sub-Advisor
Wilmington Trust Investment Advisors
111 South Calvert Street 26th Floor
Baltimore, MD 21202
Co-Administrator
Wilmington Funds Management Corp.
1100 North Market Street
Wilmington, DE 19890 |
|
|
|
Co-Administrator, Accountant, and Custodian
The Bank of New York Mellon
101 Barclay Street New
York, NY 10286 Distributor
ALPS Distributors, Inc.
1290 Broadway, Suite 1100
Denver, CO 80203
Transfer Agent and Dividend Disbursing Agent BNY Mellon
Investment Servicing (U.S.) Inc. 301 Bellevue Parkway
Wilmington, DE 19809
Independent Registered Public Accounting Firm Ernst
& Young LLP One Commerce Square
2005 Market Street, Suite 700
Philadelphia, PA 19103 |
|
WT-AR-EQ-0413
Wilmington Funds | 1-800-836-2211 | www.wilmingtonfunds.com
We are pleased to send you this shareholder report for the
Wilmington Funds. This report contains important information about your investments in the funds.
|


Wilmington
Multi-Manager International Fund (“International Fund”)
Wilmington Rock Maple Alternatives Fund
(“Rock Maple Alternatives Fund”)
Wilmington Multi-Manager Real Asset Fund (“Real Asset
Fund”)
Wilmington Strategic Allocation Conservative Fund (“Strategic Allocation Conservative
Fund”)
Wilmington Strategic Allocation Moderate Fund (“Strategic Allocation Moderate Fund”)
Wilmington Strategic Allocation Aggressive Fund (“Strategic Allocation Aggressive Fund”)
CONTENTS
[This Page Intentionally Left Blank]
i
Dear Investor:
I am pleased to present the Annual Report of the Wilmington Funds (“Trust”). This report covers the Trust’s fiscal year,
which is the 12-month reporting period from May 1, 2012 through April 30, 2013. Inside, you will find a discussion of the factors impacting each Fund’s performance during the reporting period, as well as a complete listing of each
Fund’s holdings and financial statements.
The Economy and Financial Markets in Review
Wilmington Funds Management Corporation, the investment advisor to the Trust, and Wilmington Trust Investment Advisors, Inc., the
sub-advisor to the Trust, have provided the following review of the economy, bond markets, and stock markets over the 12-month reporting period.
The Economy
The U.S.
economic expansion continued during the 12 months ended April 30, 2013, though its pace remained tepid. The production of goods and services grew 3.1%, 0.4%, and 2.5% faster than the rate of inflation during the third and fourth quarters of
2012 and the first quarter of 2013, respectively. U.S. consumer spending propelled the gains, though consumers were still cautious amid the long, slow recovery from the Great Recession of 2007–2009. Retail and food sales, for example, amounted
to $4.94 trillion during our fiscal year, up 2.5% in real (inflation-adjusted) terms over the preceding 12-month period. The housing market continued its nascent recovery, and inflation averaged about 1.1%.
Source: Federal Reserve Bank of St. Louis, May 28, 2013
If consumers were feeling somewhat better, business managers remained wary. During the third and fourth quarters of 2012 and the first quarter of 2013, investments in U.S. plants, property, and equipment
expected to last three years or more were made at lower rates than they had been made in the corresponding quarters five years earlier, as the recession was beginning. Employers likewise remained cautious in hiring. The number of U.S. private sector
workers grew in all 12 months of our fiscal year, but the rate of private-sector job growth remained slow. At the end of April, there were still 2.0 million fewer private-sector workers than there had been at the labor market’s January
2008 peak. Much of the blame for soft business enthusiasm was laid at the doorsteps of Congress and the White House. Many business leaders said lawmakers needed to make meaningful changes in U.S. tax and spending policies to shore up the
nation’s finances and to clarify the legal and regulatory environment.
Despite the modest rate of expansion, the U.S.
recovery looked solid in relation to economic conditions in Europe, where a recession appeared to be worsening. Greece appeared likely to remain at least a near-term participant in the continent’s common currency experiment, but Spain, Portugal
and Italy all joined Greece in struggling under heavy sovereign debts. Debate about the possibility of developing common fiscal policies and banking regulations continued, and investors were soothed by the European Central Bank President’s
assurance that the bank would do “whatever it takes to preserve the euro.” In China, growth appeared to slow, though it remained strong in absolute terms. On balance, the global economy appeared to be expanding at a modest rate.
The Bond Markets
The good times rolled on in the U.S. bond market during our fiscal year. The Barclays Capital U.S. Aggregate Bond Index returned 3.68%. The index tracks the overall market for taxable, investment-grade
U.S. bonds and includes U.S. Treasury and agency securities, corporate bonds, and mortgage-backed securities (MBS). The gain was propelled by strong results among corporate issues (+7.49%, according to the Barclays Capital U.S. Credit Bond Index),
into which investors piled as the search for investment opportunities with meaningful yields continued.
The yield of the
10-year U.S. Treasury note, against which many other interest rates are set, declined from 1.91% at the end of April 2012 to a low of 1.43% in late July 2012 before climbing to 1.67% at the end of April 2013. The net 12-month decrease of a quarter
of a percentage point boosted the prices of bonds across the market.
The S&P Municipal Bond Intermediate Index1 returned
4.71%. Demand for shares of municipal bond mutual funds, which account for much of the total demand for municipal bonds, accelerated as fears of widespread municipal bankruptcies dissipated and the rates of U.S. taxation on interest, dividends, and
capital gains were allowed to revert in 2013 to prior, higher levels for higher-income taxpayers. Talk of limiting the federal tax exemption on municipal bond interest income, meanwhile, continued to be just talk.
PRESIDENT’S
MESSAGE / April 30, 2013
ii
For the 12-month reporting period May 1, 2012 through
April 30, 2013, certain Barclays Capital indices performed as follows2:
|
|
|
|
|
|
|
|
|
| Barclays Capital U.S. Aggregate
Bond Index3 |
|
Barclays Capital U.S. Treasury
Bond Index4 |
|
Barclays Capital U.S. Mortgage-
Backed
Securities Index5 |
|
Barclays Capital U.S. Credit
Bond Index6 |
|
Barclays Capital Municipal Bond
Index7 |
| 3.68% |
|
2.56% |
|
1.85% |
|
7.49% |
|
5.19% |
The Stock Markets
Investors heard plenty about the “lost decade” of equity returns when the effects of the financial crisis were in full swing in early 2009. Commercials decrying 401(k) retirement plans as
“201(k)s” promoted “gold 401(k)s” or day trading as solutions; “buy and hold,” it was said, was dead. Fast forward four years and anyone who abandoned equities may be wishing they hadn’t. The “lost
decade” has turned into a pretty normal “found decade,” with a trailing 10-year total return for the S&P 500 Index of 7.88%, annualized. Granted, ten years ago we were emerging from the tech bubble; one must always be leery of the
period selected in drawing conclusions from economic or investment data.
Stocks generally did very well
during the 12 months ended April 30, 2013. Six broad stock market indices, which together offer a rough portrait of the world’s equity securities, returned between +3.97% and +19.39% in U.S. dollars during the fiscal year. The weakest
return came from the MSCI Emerging Markets (Net) Index8 (+3.97%) and the strongest return (+19.39%) was recorded by the MSCI EAFE (Net) Index9 of developed international stock markets. In between were the returns of the Russell Top 200
Index10(+16.30%), which tracks mega-capitalization U.S. stocks, the Russell Midcap Index11
(+19.20%) of mid-cap U.S. stocks, the Russell 2000 Index12 (+17.69%) of small-cap U.S. stocks, and the S&P 500 Index13 (+16.89%), a widely watched gauge consisting mainly of large-cap U.S. stocks.
For the 12-month reporting period May 1, 2012 through April 30, 2013, certain stock market indices performed as follows:
|
|
|
|
|
|
|
| S&P 500
Index13 |
|
Dow Jones
Industrial Average14 |
|
NASDAQ Composite Index15 |
|
MSCI All Country World ex-US (Net)
Index16 |
| 16.89% |
|
15.39% |
|
10.78% |
|
14.15% |
The Trust, with assets of $13.3 billion as of April 30, 2013, gives investors
access to every major asset class and sector. Whether you are looking for a comfortable retirement, to fund a child’s higher education, pursue tax-free income17, stay
ahead of inflation, or keep your cash working, one or more of the Trust’s Funds may provide you with the diversification, flexibility, and professional management you need.
Sincerely,

Sam Guerrieri
President
May 28, 2013
April 30, 2013 /
PRESIDENT’S MESSAGE
iii
For more complete information, please download the Funds’ prospectus
available on www.wilmingtonfunds.com or call 1-800-836-2211 for a copy. You should consider the Funds’ investment objectives, risks, charges, and expenses carefully before you invest. Information about these and other important subjects is in
the Funds’ prospectus, which you should read carefully before investing.
Past performance is no guarantee of
future results. The index performance quoted is for illustrative purposes only and is not representative of any specific investment. Diversification does not ensure a profit nor protect against loss.
An investment in money market funds is neither insured nor guaranteed by the Federal Deposit Insurance Corporation or any other
government agency. Although money market funds seek to preserve the value of your investment at $1.00 per share, it is possible to lose money by investing in these funds.
All investments involve risk, including possible loss of principal. Equity securities are subject to price fluctuation and possible loss of principal. Small- and mid-cap stocks involve greater risks
and volatility than large-cap stocks. International investments are subject to special risks, including currency fluctuations, social, economic, and political uncertainties, which could increase volatility.
High yield, lower-rated securities generally entail greater market, credit and liquidity risks than investment grade securities and
may include higher volatility and higher risk of default.
Stock markets, especially foreign markets, are volatile and
can decline significantly in response to adverse issuer, political, regulatory, market or economic developments. Bond prices are sensitive to change in interest rates, and a rise in interest rates can cause a decline in their price. Real estate is a
cyclical industry that is sensitive to interest rates, economic conditions (both nationally and locally), property tax rates and other factors. Commodity-related securities may be subject to additional risks and broad market price fluctuations. High
yield securities present greater risk of loss than higher quality debt securities and may be subject to greater price volatility. Investments such as mutual funds that focus on alternative strategies are subject to increased risk and loss of
principal and are not suitable for all investors.
Diversification and asset allocation do not assure profit or protect
against loss. Investment markets are volatile and no investment strategy can guarantee that the desired result will be achieved. There is no assurance that any investment strategy will be successful. Any investment in the Fund should be part of an
overall investment program rather than, in itself, a complete program. Because certain Funds invest in underlying mutual funds or other managed strategies, an investor in the Fund will bear the management fees and operating expenses of the
“Underlying Strategies” in which the Fund invests. The total expenses borne by an investor in the Fund will be higher than if the investor invested directly in the Underlying Strategies, and the returns may therefore be lower.
| 1. |
S&P Municipal Bond Intermediate Index is a broad, market value-weighted index that seeks to measure the performance of the U.S. municipal bond market.
|
| 2. |
Bond prices are sensitive to changes in interest rates and a rise in interest rates can cause a decline in their prices. |
| 3. |
Barclays Capital U.S. Aggregate Bond Index is a widely used benchmark index for the domestic investment-grade bond market composed of securities from the Barclays
Capital Government/Corporate Bond Index, Mortgage-Backed Securities Index and Asset-Backed Securities Index. The index typically includes fixed income securities with overall intermediate- to long-term average maturities. The index is unmanaged and
investments cannot be made directly in an index. |
| 4. |
Barclays Capital U.S. Treasury Bond Index is a market capitalization weighted index that includes all publicly issued U.S. Treasury securities that have a remaining
maturity of at least one year, are rated investment-grade, and have $250 million or more of outstanding face value. The index is unmanaged and investments cannot be made directly in an index. |
| 5. |
Barclays Capital U.S. Mortgage-Backed Securities Index is composed of all securities mortgage pools by GNMA, FNMA and the FHLMC, including GNMA graduated Payment
Mortgages. The index is unmanaged and investments cannot be made directly in an index. |
| 6. |
Barclays Capital U.S. Credit Bond Index tracks the performance of domestic investment-grade corporate bonds and is composed of all publicly issued, fixed-rate,
nonconvertible, investment-grade corporate debt. The index is unmanaged and investments cannot be made directly in an index. |
| 7. |
Barclays Capital Municipal Bond Index tracks the performance of the long-term, tax-exempt, investment-grade bond market. To be included in the index, bonds must have an
outstanding par balance of at least $7 million and be issued as part of a transaction of at least $75 million. The index is unmanaged and investments cannot be made directly in an index. |
| 8. |
MSCI Emerging Markets (Net) Index is a free float-adjusted market capitalization index that is designed to measure equity market performance of emerging markets. The
MSCI Emerging Markets Index consists of the following 21 emerging market country indices: Brazil, Chile, China, Colombia, Czech Republic, Egypt, Hungary, India, Indonesia, Korea, Malaysia, Mexico, Morocco, Peru, Philippines, Poland, Russia, South
Africa, Taiwan, Thailand, and Turkey. |
| 9. |
MSCI EAFE (Net) Index is a free float-adjusted market capitalization index that is designed to measure equity market performance of developed markets, excluding the
U.S. & Canada. The index consisted of the following 22 developed market country indices: Australia, Austria, Belgium, Denmark, Finland, France, Germany, Greece, Hong Kong, Ireland, Israel, Italy, Japan, Netherlands, New Zealand, Norway,
Portugal, Singapore, Spain, Sweden, Switzerland and the United Kingdom. |
| 10. |
Russell Top 200 Index measures the performance of the largest cap segment of the U.S. equity universe. The Russell Top 200 is a subset of the Russell 3000 Index. It
includes approximately 200 of the largest securities based on a combination of their market cap and current index membership and represents approximately 68% of the U.S. market. |
| 11. |
Russell Midcap Index measures the performance of the 800 smallest companies in the Russell 1000 Index, which represents approximately 25% of the total market
capitalization of the Russell 1000 Index. |
| 12. |
Russell 2000 Index measures the performance of the 2,000 smallest companies in the Russell 3000 Index, which represents approximately 8% of the total market
capitalization of the Russell 3000 Index. |
PRESIDENT’S
MESSAGE / April 30, 2013
iv
| 13. |
S&P 500 Index is a capitalization-weighted index of 500 stocks designed to measure performance of the broad domestic economy through changes in the aggregate market
value of 500 stocks representing all major industries. The index is unmanaged and investments cannot be made directly in an index. |
| 14. |
Dow Jones Industrial Average (“DJIA”) represents share prices of selected blue chip industrial corporations as well as public utility and transportation
companies. The DJIA indicates daily changes in the average prices of stocks in any of its categories. It also reports total sales for each group of industries. Because it represents the top corporations of America, the DJIA’s average movements
are leading economic indicators for the stock market as a whole. The DJIA is unmanaged and investments cannot be made directly in the DJIA. |
| 15. |
NASDAQ Composite Index measures all NASDAQ domestic and non-U.S. based common stocks listed on the NASDAQ Stock Market. The index is unmanaged and investments cannot be
made directly in an index. |
| 16. |
MSCI All Country World ex-US (Net) Index is a free float-adjusted market capitalization weighted index that is designed to measure the equity market performance of
developed and emerging markets excluding the U.S. market. The index consists of 45 country indices comprising 23 developed and 22 emerging market country indices. |
| 17. |
Income generated by tax-free funds may be subject to the federal alternative minimum tax and state and local taxes. |
April 30, 2013 /
PRESIDENT’S MESSAGE
1
WILMINGTON MULTI-MANAGER INTERNATIONAL FUND
Management’s Discussion of Fund Performance
For the fiscal year ended April 30, 2013, Wilmington Multi-Manager International Fund
(the “Fund”) had a total return of 10.17%* for Class A Shares and 10.22%* for Class I Shares, versus its benchmark, the Morgan Stanley Capital International – All Country World ex-US Index (Net, USD) (“MSCI ACWI
ex-US”)** which had a total return of 14.15%. The appreciation of the U.S. Dollar detracted 4.5%, as the MSCI ACWI ex-US in local currency terms, returned 18.7%. The MSCI ACWI ex-US is a free float-adjusted market capitalization index that
is designed to measure developed and emerging market equity performance, excluding the U.S. On a net-of-fees basis, both tactical asset allocation decisions and overall manager selection had a negative effect on the Fund’s relative returns.
During the period, developed countries outperformed emerging markets. The MSCI World ex-US Index (Net), a proxy for developed
country large/mid-cap equity returns, registered a return of 17.5% in U.S. Dollar (“dollar”) terms and 23.0% in local currency terms. By contrast, the MSCI Emerging Markets (Net) Index returned only 4.0% in dollar terms, against 5.7%
for local currency.
Within developed countries, Japan produced a 22.0% return in dollar terms and 48.8% in Japanese Yen (yen)
terms. The difference, 26.8%, reflected the depreciation of the yen against the dollar. A new Japanese government, under Prime Minister Shinzo Abe, came into power at the end of 2012, pledging monetary expansion. The result has been two-fold: a
sharp depreciation of the yen and a dramatic rise in Japanese stock indexes, as they adjusted upward to reflect expectations for improved Japanese exporter competitiveness and rising corporate earnings.
For the Eurozone in aggregate, the return in dollar terms was 21.2%, as against 21.6% in local currency returns. However, returns varied
across Eurozone markets. Most of Europe has been confronting a recession or near-recession, caused in part by the fiscal austerity policies adopted by Eurozone peripheral countries to contain their sovereign debt loads. High equity returns mainly
reflect expectations for renewed positive economic growth in 2014.
In spite of very high unemployment, especially among
youth, Spain registered a 26.8% return during the year. The government of Mariano Rajoy continued to implement banking sector consolidation and was allowed extra time to reach fiscal targets. The strong net return likely reflects expectations of an
industrial rebound, given that unit labor costs are falling. Already, automobile companies are making plans to locate operations in Spain.
The other major Eurozone peripheral country, Italy, registered a 13.9% return. This lower return is likely due to months of political and economic uncertainty following a partially deadlocked election.
This uncertainty has ended, for the time being, with the formation of a new grand coalition government under Prime Minister Enrico Letta. Both the new Italian government and the existing French government under Francois Hollande are seeking to
soften the austerity regime favored by Germany, seeking to replace it with one that is more pro-growth in policy orientation.
The current French government had reversed, in part, its predecessor’s austerity policies. France produced net returns of 22.5%
during the year. Germany, Europe’s largest economy, registered a 16.4%
return. Like much of the rest of the Eurozone, Germany has been in recession. However, as
with the rest of the Eurozone, the equities markets appear to be looking to 2014 for positive economic growth.
The UK
registered a relatively weak 11.7% return. In some part this was due to weak exports to Europe and continued fiscal constraint by the coalition conservative - liberal democrat government. However, the UK index is influenced by the listing in London
of a number of global metals and oil companies. Weak commodities prices contributed to depressing UK returns.
Within
large-cap developed market space, the value style, represented by the MSCI World ex-US Value Index (Net), returned 19.7% while the growth style, represented by the MSCI World ex-US Growth Index (Net) returned 15.3%. Typically, when a pronounced
global cyclical economic upswing is expected, value would outperform growth significantly. The difference between the value and growth returns suggests that the market expects only a mild economic upswing. The international developed country
small-cap sector, represented by the MSCI World ex-US Small Cap Index (Net), registered a 14.7% return, versus 17.5% for MSCI World ex-US Index, which represents the large/mid-cap sector.
Within emerging markets, there was particularly wide variation among markets. Brazil, Russia, Korea, and South Africa all posted negative
returns in dollar terms: -5.3%, -6.6%, -1.0%, and -3.8%, respectively. Further, China registered a relatively small positive return of 4.1%. Brazil and South Africa suffered from some government policy stumbles. The Russian economy depends on energy
revenues, and oil prices had weakened in 2013. The Korean market is dominated by export manufacturers, which suffered from the improved competitive position of their Japanese exporters. Regarding China, the market was awaiting the newly installed
leadership team’s elaboration of economic and financial policies. Other emerging markets demonstrated far better returns. Indonesia, Mexico, India and Taiwan returned 17.0%, 16.7%, 11.8% and 10.4%, respectively. Turkey, the Philippines and
Thailand posted more spectacular returns of 46.5%, 43.1% and 21.9%, respectively.
Source: MSCI, May 1, 2013
On November 13, 2012, the Fund added Northern Cross LLC (“Northern Cross”) as a new sub-advisor and terminated
the sub-advisory services of Goldman Sachs Asset Management, L.P. and Hansberger Global Investors, Inc. Northern Cross holds an actively managed 70-80 stock portfolio, owning names for the long-term (7-10 years) that have both franchise power and
ability to grow their earnings.
The Fund allocates assets between developed and emerging market countries based on the advice
from Wilmington Trust Investment Advisors’ Investment Strategy Team, which recommended tactical asset allocation at the end of the period of 67% allocation to developed large-cap countries, 0% to developed small-cap countries, and 33%
allocation to emerging markets. In addition, the allocation to developed large-cap markets was 50% value and 50% growth. At the start of the period, the Fund’s assets represented a 73% allocation to developed large-cap countries (42% value/58%
growth), 0% to developed small-cap countries, and 27% allocation to emerging markets. The Fund’s persistent overweight allocation to emerging
|
|
|
|
|
ANNUAL REPORT / April 30, 2013 |
2
markets throughout the period had a negative effect on the Fund’s overall relative
performance as noted previously by the large difference in returns between developed countries and emerging markets.
The Fund
currently has a sub-advisor lineup consisting of the following asset managers: Barings International Investment Limited (“Barings”), Dimensional Fund Advisors LP (“DFA”), LSV Asset Management (“LSV”), Northern Cross,
Parametric Portfolio Associates LLC (“Parametric”), and Wilmington Trust Investment Advisors, Inc. (“WTIA”). WTIA allocates assets of the Fund among the sub-advisors.
The emerging markets portfolio managed by Parametric significantly outperformed the MSCI Emerging Markets Net Index. The main positive
drivers in explaining its relative results were its structural underweight to Brazil, investments in non-benchmark countries such as the United Arab Emirates, Kenya, and Nigeria, and its overweight allocation to Turkey and Mexico. Its underweight
allocations to India, Taiwan, and the Czech Republic had the most meaningful negative influence on relative returns.
The all
country large-cap value portfolio managed by LSV outperformed the MSCI All Country World ex-US Value Index (Net). As its investment style is to maintain a country and sector-neutral bias, most of its positive relative results were based on stock
selection, especially having overweight allocation to stocks that have high earnings yield (earnings-to-market price ratio) and high dividend yield (dividends paid-to-market price ratio).
The developed country large-cap core portfolio managed by Barings trailed the MSCI World ex-US Index (Net). Its relatively poor
performance resulted from a number of factors including having an allocation to emerging market stocks, which trailed in the period, and poor stock selection within Japan. Another explanatory factor was its overweight allocation to gold mining
stocks which were owned resulting from its thesis that the price of gold would remain elevated as a result of global quantitative easing. Instead, the price of gold declined and correspondingly so did the stock price of gold miners. In addition, one
of the miners it owned and later sold, Centamin Egypt, was adversely impacted by political issues in Egypt.
The developed
country large-cap growth portfolio managed by Northern Cross trailed the MSCI World ex-US Growth Index (Net). Most of the relative underperformance can be attributed to its large underweight allocation to Japan, one of the best performing countries
in the period. Positive contributions from underweight positions in Italy, Spain, the United Kingdom, and the Netherlands were offset by losses due to overweight positions in Brazil, Denmark, Malaysia, Sweden, and China. It also experienced weak
stock selection in Hong Kong (overweight position in Cheung Kong Holdings) and Japan (overweight position in Fanuc) while experiencing good stock selection in France (overweight position in L’Oreal).
The developed country large-cap value portfolio managed by DFA significantly underperformed the MSCI World ex-US Value Index (Net). The
portfolio’s relative performance was driven primarily by the specific industries and countries owned as a result of its portfolio construction process. At the sector level, its structural bias to own high book-to-market price stocks resulted in
a larger relative portfolio allocation to materials and energy, the two weakest performing sectors during the period and a corresponding underweight allocation to healthcare, the best performing sector. At the country level, allocation and
differences in individual holdings in Canada, Australia, and Japan also had a negative impact.
| * |
Performance data quoted represents past performance, which is no guarantee of future results. Investment return and principal value will
fluctuate so that an investor’s shares, when redeemed, may be worth more or less than their original cost. The total return shown assumes the reinvestment of all distributions and does not reflect the deduction of taxes that a shareholder would
pay on fund distributions or the redemption of shares. The total return for Class A Shares was 4.12%, adjusted for the Fund’s maximum sales charge. Mutual fund performance changes over time and current performance may be lower or higher
than what is stated. For the most recent month-end performance, please visit www.wilmingtonfunds.com or call 1-800-836-2211. |
| ** |
The MSCI All Country World ex-US Index (Net, USD) (MSCI ACWI ex-US) is a free float-adjusted market capitalization weighted index that is designed
to measure the equity market performance of developed and emerging markets, excluding the United States. The MSCI ACWI ex-US consists of 45 country indices comprising 22 developed and 23 emerging market country indices. The developed market country
indices included are:Australia,Austria, Belgium, Canada, Denmark, Finland, France, Germany, Greece, Hong Kong, Ireland, Italy, Japan, Netherlands, New Zealand, Norway, Portugal, Singapore, Spain, Sweden, Switzerland, and the United Kingdom. The
emerging market country indices included are: Argentina, Brazil, Chile, China, Colombia, Czech Republic, Egypt, Hungary, India, Indonesia, Israel, Korea, Malaysia, Mexico, Morocco, Peru, Philippines, Poland, Russia, South Africa, Taiwan, Thailand,
and Turkey. The index is unmanaged and it is not possible to invest directly in an index. The MSCI EAFE Index (Europe, Australasia, Far East) (Net, USD) is a free float-adjusted market capitalization index that is designed to measure the equity
market performance of developed markets, excluding the US & Canada. The MSCI EAFE Index consisted of the following 22 developed market country indices: Australia, Austria, Belgium, Denmark, Finland, France, Germany, Greece, Hong Kong, Ireland,
Israel, Italy, Japan, Netherlands, New Zealand, Norway, Portugal, Singapore, Spain, Sweden, Switzerland and the United Kingdom. The index is unmanaged and it is not possible to invest directly in an index. |
MSCI Emerging Markets Index (Net, USD) is a free float-adjusted market capitalization index that is designed to measure
equity market performance of emerging markets. The MSCI Emerging Markets Index consists of the following 21 emerging market country indices: Brazil, Chile, China, Colombia, Czech Republic, Egypt, Hungary, India, Indonesia, Korea, Malaysia, Mexico,
Morocco, Peru, Philippines, Poland, Russia, South Africa, Taiwan, Thailand, and Turkey.
MSCI World ex-US
Index (Net, USD) is a free float-adjusted market capitalization weighted index that is designed to measure the equity market performance of developed markets excluding the U.S. market. The MSCI World ex-US Index consists of 23 developed market
country indices: Australia, Austria, Belgium, Canada, Denmark, Finland, France, Germany, Greece, Hong Kong, Ireland, Israel, Italy, Japan, Netherlands, New Zealand, Norway, Portugal, Singapore, Spain, Sweden, Switzerland and the United Kingdom.
MSCI World ex-US Growth and Value Indices (Net, USD) are free float-adjusted market capitalization weighted
indices that are designed to measure the equity market performance of developed markets excluding the U.S. market. MSCI uses a two dimensional framework for style segmentation in which value and growth securities are categorized using a multi-factor
approach, which uses three variables to define the value investment style characteristics and five variables to define the growth investment style characteristics
|
|
|
| April 30, 2013 / ANNUAL REPORT |
|
|
3
including forward looking variables. The objective of the index design is
to divide constituents of the MSCI World ex-US Index into respective value and growth indices, each targeting 50% of the free float adjusted market capitalization of the underlying market index.
The MSCI ACWI ex US Small Cap Index captures small cap representation across 23 of 24 Developed Markets countries
(excluding the US) and 21 Emerging Markets countries. With 4,168 constituents, the index covers approximately 14% of the global equity opportunity set outside of the U.S.
Quantitative Easing (QE) is government monetary policy occasionally used to increase the money supply by buying government securities or other securities from the market. Quantitative Easing increases the
money supply by flooding financial institutions with capital, in an effort to promote increased lending and liquidity.
Earnings Yield (earnings-to-market price ratio) is the earnings per share for the most recent 12-month period divided by the current
market price per share. The earnings yield (which is the inverse of the share price/earnings - P/E ratio) shows the percentage of each dollar invested in the stock that was earned by the company. The earnings yield is used by many investment
managers to determine optimal asset allocations.
Dividend Yield (dividends paid-to-market price ratio) is a financial ratio
that shows how much a company pays out in dividends each year relative to its share price. In the absence of any capital gains, the dividend yield is the return on investment for a stock.
Book-to-Market is a ratio used to find the value of a company by comparing the book value of a firm to its market value. Book value is
calculated by looking at the firm’s historical cost, or accounting value. Market value is determined in the stock market through its market capitalization.
ANNUAL REPORT / April
30, 2013
4
WILMINGTON MULTI-MANAGER INTERNATIONAL FUND – CLASS A†
The graph below illustrates the hypothetical investment of $10,0001 in the Wilmington Multi-Manager International Fund (Class A)
(the “Fund”) from December 19, 2005 (start of performance) to April 30, 2013, compared to the MSCI ACWI ex-US.2
VALUE OF A HYPOTHETICAL $10,000 INVESTMENT
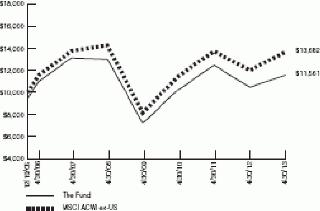
Average Annual Total Returns for the Year Ended April 30, 2013
|
|
|
|
|
|
|
|
|
|
| 1 Year |
|
4.12% |
| 5 Years |
|
-3.46% |
| Start of Performance (12/19/05) |
|
1.99% |
Performance data quoted represents past performance which is no guarantee of future results. Returns shown do not reflect the
deduction of taxes that a shareholder would pay on Fund distributions or the redemption of Fund shares. Investment return and principal value will fluctuate so that an investor’s shares, when redeemed, may be worth more or less than their
original cost. Mutual funds are not obligations of or guaranteed by any bank and are not federally insured. Mutual fund performance changes over time and current performance may be lower or higher than what is stated. For current to the most recent
month end performance, visit www.wilmingtonfunds.com or call 1-800-836-2211. Total returns shown include the maximum sales charge of 5.50%.
Annual
Operating Expense Ratio
|
|
|
|
|
|
|
|
|
|
| Before Waivers |
|
1.87% |
| After Waivers |
|
1.54% |
The Expense Ratio Before Waivers represents the operating costs borne by the Fund, expressed as a percentage of the Fund’s
average net assets, as shown in the Fees and Expenses table in the Fund’s current prospectus (under “Total Annual Fund Operating Expenses”).
| 1 |
Represents a hypothetical investment of $10,000 in Class A of the Fund after deducting the maximum sales charge of 5.50% ($10,000 investment minus $550 sales charge =
$9,450). The Fund’s performance assumes the reinvestment of all dividends and distributions. |
| 2 |
The performance for the MSCI ACWI ex-US assumes the reinvestment of all dividends and distributions but does not reflect the deduction of a sales charge required for the
Fund’s performance by the Securities and Exchange Commission. It is not possible to invest directly in an index and the represented index is unmanaged. |
| † |
The information presented above, for the period prior to March 12, 2012, is historical information for the WT Multi-Manager International Fund. See Reorganization note
within the notes to financial statements. |
April 30, 2013 / ANNUAL REPORT
5
WILMINGTON MULTI-MANAGER INTERNATIONAL FUND – CLASS I†
The graph below illustrates the hypothetical investment of $1,000,0001 in the Wilmington Multi-Manager International Fund (Class
I) (the “Fund”) from April 30, 2003 to April 30, 2013, compared to the Morgan Stanley Capital International All Country World Index ex-US (Net, USD) (“MSCI ACWI ex-US”).2
VALUE OF A HYPOTHETICAL $1,000,000 INVESTMENT
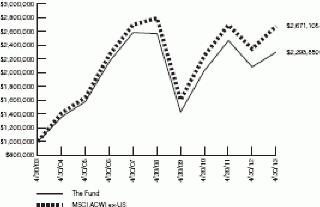
Average Annual Total Returns for the Year
Ended April 30, 2013
|
|
|
|
|
|
|
|
|
|
| 1 Year |
|
10.22%
|
| 5 Years |
|
-2.18%
|
| 10 Years |
|
8.66%
|
Performance data quoted represents past performance which is no guarantee of future results. Returns shown do not reflect the
deduction of taxes that a shareholder would pay on Fund distributions or the redemption of Fund shares. Investment return and principal value will fluctuate so that an investor’s shares, when redeemed, may be worth more or less than their
original cost. Mutual funds are not obligations of or guaranteed by any bank and are not federally insured. Mutual fund performance changes over time and current performance may be lower or higher than what is stated. For current to the most recent
month end performance, visit www.wilmingtonfunds.com or call 1-800-836-2211.
Annual Operating Expense Ratio
|
|
|
|
|
|
|
|
|
|
| Before Waivers |
|
1.62%
|
| After Waivers |
|
1.41% |
The Expense Ratio Before Waivers represents the operating costs borne by the Fund, expressed as a percentage of the Fund’s
average net assets, as shown in the Fees and Expenses table in the Fund’s current prospectus (under “Total Annual Fund Operating Expenses”).
| 1 |
Represents a hypothetical investment of $1,000,000 in Class I of the Fund and assumes the reinvestment of all dividends and distributions. |
| 2 |
The performance for the Fund and the MSCI ACWI ex-US assumes the reinvestment of all dividends and distributions. It is not possible to invest directly in an index and the
represented index is unmanaged. |
| † |
The information presented above, for the period prior to March 12, 2012, is historical information for the WT Multi-Manager International Fund. See Reorganization note
within the notes to financial statements. |
ANNUAL REPORT / April
30, 2013
6
WILMINGTON ROCK MAPLE ALTERNATIVES FUND
Management’s Discussion of Fund Performance
For the fiscal year ended April 30, 2013, Wilmington Rock Maple
Alternatives Fund (the “Fund”) had a total return of 5.56%* for Class A Shares and 5.91%* for Class I Shares, versus its benchmark, the HFRX Global Hedge Fund Index**, which had a total return of 4.02%.
Fund Highlights
The Fund’s performance met objectives relative to the benchmark and the expectations of the portfolio management team. Manager cross correlation was low, and return attribution was well diversified
from both a strategic and geographic standpoint. The Fund’s annualized volatility for the fiscal year was 2.68%, and the realized beta to S&P 500 was 0.13.
Performance by Strategy
All of the long/short equity
managers contributed positively to the Fund’s performance. Our European focused manager, Calypso Capital Management, LP, saw the strongest gains as it had a number of single name wins particularly in the energy/oil services sector. Our dividend
income focused manager, ADAR Investment Management, LLC, generated gains through both income and price appreciation, and rotated out of a number of equities that hit price targets. Our two small- and mid-cap equities focused managers, Madison Street
Partners, LLC and TIG Advisors, LLC, also made positive contributions albeit on higher volatility. The four funded equity managers continue to exhibit low correlation to one another.
Our event driven strategy, accessed through the Arbitrage Fund (an underlying fund), detracted modestly from returns.
Over the year, we became increasingly bearish on the strategy given light merger activity and prevalence of cash deals (which are hedged with a broad equity index short position and as a result are costly in a rising equity environment). As a
result, we reduced the strategy’s allocation during the year.
Our corporate credit strategies
contributed positively to returns. The strategies, one portion being accessed through an allocation to Acuity Capital Management, LLC and the other through an allocation to the Osterweis Strategic Income Fund, remain focused on short-duration higher
credit-quality high yield issuers. As a result of improvements in the debt markets, a high proportion of the underlying bonds were refinanced, which made an important contribution to the Fund’s overall total return.
Options Arbitrage, managed by Parametric Risk Advisers, was a strong performer in calendar year 2012, given that
realized volatility was consistently below implied volatility. Given the historic low levels of both realized and implied volatility we have seen in 2013, calendar year to date the strategy has given back some of its profits.
Global Macro was the Fund’s worst performing strategy and detracted from performance. The manager struggled given
the high correlation in risk assets driven by risk-on/risk-off sentiments. Earlier this year, Evercore Wealth Management, LLC (Evercore) stopped acting as a sub-advisor to the Fund as Evercore decided to exit the separately managed account business.
The strategy exhibited low correlation to our other managers and dampened volatility during calendar year 2012, but reduced overall performance.
Commentary & Outlook
At this point, the portfolio management team has a constructive view on both equity and credit markets. We feel that
much of the sensitivity to macro headlines has abated and it is an increasingly positive environment for security selection and soft-catalyst strategies. We believe that constrained global growth will lead to greater dispersion among individual
equities. This may also result in greater corporate activity which would be a tail wind for our event strategy. We believe that there is room for further advances in corporate credit, despite the strong rally, given the quality of corporate balance
sheets. In a lower-volatility environment with an advancing equity market, we would expect our options arbitrage strategy to have modestly lower returns. We intend to continue to run the portfolio well diversified from an exposure and thematic
standpoint.
| |
* |
Performance data quoted represents past performance, which is no guarantee of future results. Investment return and principal value will
fluctuate so that an investor’s shares, when redeemed, may be worth more or less than their original cost. The total return shown assumes the reinvestment of all distributions and does not reflect the deduction of taxes that a shareholder would
pay on fund distributions or the redemption of shares. The total return for Class A Shares was -0.26%, adjusted for the Fund’s maximum sales charge. Mutual fund performance changes over time and current performance may be lower or higher
than what is stated. For the most recent month-end performance, please visit www.wilmingtonfunds.com or call 1-800-836-2211. |
| |
** |
The HFRX Global Hedge Fund Index is designed to be representative of the overall composition of the hedge fund universe and is composed of active
private funds with assets under management of a least $50 million reporting to Hedge Fund Research, Inc. (HFRX). The performance results reported by HFRX are asset weighted. The index is unmanaged and it is not possible to invest directly in an
index. |
Alpha is a measure of performance on a risk-adjusted basis. The excess
return of the fund relative to the return of the benchmark index is a fund’s alpha.
Chicago Board Options Exchange Volatility Index (VIX)—VIX is designed to measure the
market’s expectation of 30-day volatility implied by at-the-money S&P 500® Index option prices. VIX estimates expected volatility by averaging the weighted
prices of S&P 500® puts and calls over a wide range of strike prices. As such, VIX does not serve as a benchmark for returns, but rather as an indication of
opportunities that may be present in the marketplace when utilizing volatility-based, or volatility management, strategies. There is no established return benchmark for volatility or options strategies. International investing involves special risks
including currency risk, political risks, increased volatility of foreign securities, and differences in auditing and other financial standards.
Valuation is the process of determining the current worth of an asset or company. There are many techniques that can be used to determine value; some are subjective and others are objective.
Correlation is a statistical measure of how two securities move in relation to each other.
April 30, 2013 / ANNUAL REPORT
7
WILMINGTON ROCK MAPLE ALTERNATIVES FUND – CLASS A
The graph below illustrates the hypothetical investment of $10,0001 in the Wilmington Rock Maple Alternatives Fund (Class A) (the “Fund”) from January 12, 2012 (start of performance) to April 30, 2013, compared to the HFRX
Global Hedge Fund Index.2
VALUE OF A HYPOTHETICAL $10,000
INVESTMENT
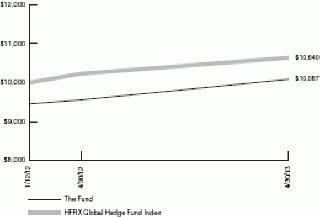
Average Annual Total Returns for the Year
Ended April 30, 2013
|
|
|
|
|
|
|
|
|
|
| 1 Year |
|
-0.26%
|
| 5 Years |
|
N/A
|
| Start of Performance (1/12/12) |
|
0.67%
|
Performance data quoted represents past performance which is no guarantee of future results. Returns shown do not reflect the
deduction of taxes that a shareholder would pay on Fund distributions or the redemption of Fund shares. Investment return and principal value will fluctuate so that an investor’s shares, when redeemed, may be worth more or less than their
original cost. Mutual funds are not obligations of or guaranteed by any bank and are not federally insured. Mutual fund performance changes over time and current performance may be lower or higher than what is stated. For current to the most recent
month end performance, visit www.wilmingtonfunds.com or call 1-800-836-2211. Total returns shown include the maximum sales charge of 5.50%.
Annual
Operating Expense Ratio
|
|
|
|
|
|
|
|
|
|
| Before Waivers |
|
3.90%
|
| After Waivers |
|
2.74%
|
The Expense Ratio Before Waivers represents the operating costs borne by the Fund, expressed as a percentage of the Fund’s
average net assets, as shown in the Fees and Expenses table in the Fund’s current prospectus (under “Total Annual Fund Operating Expenses”).
| 1 |
Represents a hypothetical investment of $10,000 in Class A of the Fund after deducting the maximum sales charge of 5.50% ($10,000 investment minus $550 sales charge =
$9,450). The Fund’s performance assumes the reinvestment of all dividends and distributions. |
| 2 |
The performance for the HFRX Global Hedge Fund Index assumes the reinvestment of all dividends and distributions but does not reflect the deduction of a sales charge required for
the Fund’s performance by the Securities and Exchange Commission. It is not possible to invest directly in an index and the represented index is unmanaged.
|
ANNUAL REPORT / April
30, 2013
8
WILMINGTON ROCK MAPLE ALTERNATIVES FUND – CLASS I
The graph below illustrates the hypothetical investment of $1,000,0001 in the Wilmington Rock Maple Alternatives Fund (Class I) (the “Fund”) from January 12, 2012 (start of performance) to April 30, 2013, compared to the HFRX
Global Hedge Fund Index.2
VALUE OF A HYPOTHETICAL $1,000,000
INVESTMENT
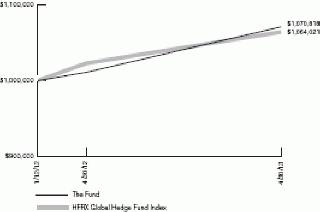
Average Annual Total Returns for the Year
Ended April 30, 2013
|
|
|
|
|
|
|
|
|
|
|
|
| 1 Year |
|
|
|
5.91% |
|
| Start of Performance (1/12/12) |
|
|
|
5.41% |
|
Performance data quoted represents past performance which is no guarantee of future results. Returns shown do not reflect the
deduction of taxes that a shareholder would pay on Fund distributions or the redemption of Fund shares. Investment return and principal value will fluctuate so that an investor’s shares, when redeemed, may be worth more or less than their
original cost. Mutual funds are not obligations of or guaranteed by any bank and are not federally insured. Mutual fund performance changes over time and current performance may be lower or higher than what is stated. For current to the most recent
month end performance, visit www.wilmingtonfunds.com or call 1-800-836-2211.
Annual Operating Expense Ratio
|
|
|
|
|
|
|
|
|
|
|
|
| Before Waivers |
|
|
|
3.65% |
|
| After Waivers |
|
|
|
2.49% |
|
The Expense Ratio Before Waivers represents the operating costs borne by the Fund, expressed as a percentage of the Fund’s
average net assets, as shown in the Fees and Expenses table in the Fund’s current prospectus (under “Total Annual Fund Operating Expenses”).
| 1 |
Represents a hypothetical investment of $1,000,000 in Class I of the Fund and assumes the reinvestment of all dividends and distributions. |
| 2 |
The performance for the Fund and the HFRX Global Hedge Fund Index assumes the reinvestment of all dividends and distributions. It is not possible to invest directly in an index
and the represented index is unmanaged. |
April 30, 2013 / ANNUAL REPORT
9
WILMINGTON MULTI-MANAGER REAL ASSET FUND
Management’s Discussion of Fund Performance
For the fiscal year ended April 30, 2013, Wilmington Multi-Manager Real Asset Fund
(the “Fund”) had a total return of 10.33%* for Class A Shares and 10.58%* for Class I Shares, versus its benchmarks, the Barclays Capital World Government Inflation Linked Bond Index (hedged, USD) (Barclays World GILB Index)** and its
Blended Index which had total returns of 6.71% and 12.24%, respectively. The Blended Index is currently a blend of 50% Barclays World GILB Index, 35% S&P Developed Property Index**, and 15% Dow Jones-UBS Commodity Index (“DJUBSCI”)**.
During this period, the Fund’s managers and investments subtracted value, while tactical asset allocation decisions to underweight global inflation linked bonds (ILBs) and overweight real estate related securities during the last two months of
the fiscal period added value.
The Fund maintained a neutral stance during the year relative to its blended benchmark up
until the end of February 2013 when it shifted to a 10% overweight to real estate and a 10% tactical underweight to global ILBs. In aggregate, the tactical tilts have helped performance relative to the blended benchmark thus far in March and April
of 2013.
The current weightings of 45% real estate related securities, 40% global ILBs and 15% commodities reflect our belief
that a slowly growing economy, low interest rates, available financing and restrained inflation may benefit real estate to a greater extent than ILBs or commodities.
Real yields on ILBs fell during the period as measured by the Barclays World GILB Index due in part to slow economic growth, central bank intervention and limited inflation expectations. They crossed into
negative territory and ended the period at -0.4%, leading global ILBs to a +6.7% gain for the fiscal year. The portfolio of developed-and emerging-market ILBs managed by Pacific Investment Management Company (“PIMCO”) outperformed the
Fund’s ILB benchmark during this time (+9.0% versus +6.7%), benefiting from a structural allocation to emerging market ILBs which rose +8.8% measured by the Barclays Capital Emerging Market GILB (hedged USD) Index** on positive real yields and
higher realized inflation than developed markets. The portfolio of global, developed-market ILBs managed by HSBC Global Asset Management (“HSBC”) underperformed its benchmark during the period (+5.8% versus +6.7% for the Barclays World
GILB Index). HSBC’s portfolio trailed the Barclays World GILB Index primarily due to holding shorter maturity bonds on average, which had a negative impact on performance when real rates declined during the period, pushing up bond prices.
Global real estate securities were up +28.5% during the fiscal year as measured by the S&P Developed Property Index as
real estate markets continued their recovery and the space remained a favorite among investors looking for yield. Performance was driven by non-U.S. markets, principally Asia (+43.8%) followed by Europe (+23.3%) and the U.S. (+19.4%). The
portfolio of global real estate securities managed by EII Capital Management, Inc. (“EII”) returned +22.7% during the period while the portfolio of global real estate securities managed by CBRE Clarion Securities (“CBRE”)
returned +24.4%. Both trailed the index performance of +28.5% primarily due to a focus on higher quality names while the biggest rallies occurred in smaller capitalization Real Estate Investment Trusts (REITs) and those with the highest dividend
yields.
Finally, commodities, the smallest allocation in the Fund, were down -5.3% over the period
as measured by the DJUBSCI. During this time, most underlying commodities suffered declines as investors pulled funds from commodity investments on the back of slow global growth and concerns about further slowing in the emerging market countries
such as China specifically. Declines were led by soft commodities, such as coffee, cocoa, sugar and fruit, (-18.9%) while natural gas was far and away the largest gainer at +34.7%. The PIMCO CommodityPLUS Strategy Fund (the “PIMCO Fund”),
to which the Fund has exposure, outpaced the DJUBSCI, returning -1.5%. The PIMCO Fund invests in derivative securities linked to commodity indices, while the collateral portion of the portfolio is actively managed by investing primarily in domestic
ILBs in an attempt to add incremental returns, along with additional inflation hedging. The PIMCO Fund’s excess return, therefore, is primarily attributable to the collateral portfolio beating the return on T-Bills, which is the implied
collateral return for the DJUBSCI. The Credit Suisse Commodity Return Strategy Fund (the “Credit Suisse Fund”), to which the Fund has exposure, has a similar structure to the PIMCO Fund, but instead of investing the collateral primarily in
domestic ILBs, it invests primarily in enhanced cash securities. During the fiscal year, the Credit Suisse Fund slightly trailed the DJUBSCI (-5.8% versus -5.3%). The Fund also had exposure to the Deutsche Bank Liquid Commodity Index-Optimum Yield
Diversified (“DBLCIOY Diversified”) index** via exposure to the PowerShares DB Commodity Index Tracking Fund. During the period, the DBLCIOY Diversified underperformed the DJUBSCI (-7.3% vs. -5.3%).
| * |
Performance data quoted represents past performance, which is no guarantee of future results. Investment return and principal value will
fluctuate so that an investor’s shares, when redeemed, may be worth more or less than their original cost. The total return shown assumes the reinvestment of all distributions and does not reflect the deduction of taxes that a shareholder would
pay on fund distributions or the redemption of shares. The total return for Class A Shares was 4.27%, adjusted for the Fund’s maximum sales charge. Mutual fund performance changes over time and current performance may be lower or higher
than what is stated. For the most recent month-end performance, please visit www.wilmingtonfunds.com or call 1-800-836-2211. |
| ** |
Barclays World GILB Index measures the performance of the major government inflation-linked bond markets. The index is designed to include only
those markets in which a global government linker fund is likely to invest. |
S&P
Developed Property Index defines and measures the investable universe of publicly traded property companies in developed global markets.
Dow Jones - UBS Commodity Index is designed to be a diversified benchmark for commodities as an asset class, and reflects the returns that are potentially available through an unleveraged investment in
the futures contracts on physical commodities comprising the Index plus the rate of interest that
ANNUAL REPORT / April
30, 2013
10
could be earned on cash collateral invested in specified Treasury Bills.
The Index is currently composed of futures contracts on 20 physical commodities.
Barclays Emerging Market
Government Inflation-Linked Bond Index measures the total return performance of inflation-linked bonds from the major emerging market countries. The index includes government debt, i.e. direct obligations of the state issuer. Quasi-government and
corporate debt is not included in the index.
Deutsche Bank Liquid Commodity Index-Optimum Yield-Diversified
IndexTM reflects the performance of a basket of futures contracts relating to 16 of the most heavily-traded and imported physical commodities. International investing involves special risks including currency risks, increased volatility of foreign
securities, political risks and differences in auditing and other financial standards.
Dividend Yield (dividends
paid-to-market price ratio) is a financial ratio that shows how much a company pays out in dividends each year relative to its share price. In the absence of any capital gains, the dividend yield is the return on investment for a stock.
April 30, 2013 / ANNUAL REPORT
11
WILMINGTON MULTI-MANAGER REAL ASSET FUND – CLASS A
The graph below illustrates the hypothetical investment of $10,0001 in the Wilmington Multi-Manager Real Asset Fund (Class A) (the “Fund”) from December 20, 2005 (start of performance) to April 30, 2013, compared to the
Barclays Capital World Government Inflation-Linked Bond Index
(“BCWGILB”)2 and the Real Asset Blended Index.2,3
VALUE OF A HYPOTHETICAL $10,000 INVESTMENT
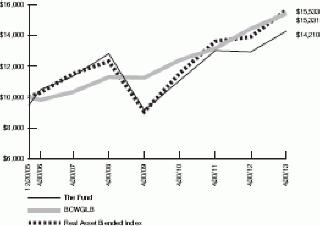
Average Annual Total Returns for the Year
Ended April 30, 2013
|
|
|
|
|
|
|
|
|
|
|
|
| 1 Year |
|
|
|
4.27% |
|
| 5 Years |
|
|
|
1.02% |
|
| Start of Performance (12/20/05) |
|
|
|
4.89% |
|
Performance data quoted represents past performance which is no guarantee of future results. Returns shown do not reflect the
deduction of taxes that a shareholder would pay on Fund distributions or the redemption of Fund shares. Investment return and principal value will fluctuate so that an investor’s shares, when redeemed, may be worth more or less than their
original cost. Mutual funds are not obligations of or guaranteed by any bank and are not federally insured. Mutual fund performance changes over time and current performance may be lower or higher than what is stated. For current to the most recent
month end performance, visit www.wilmingtonfunds.com or call 1-800-836-2211. Total returns shown include the maximum sales charge of 5.50%.
Annual
Operating Expense Ratio
|
|
|
|
|
|
|
|
|
|
|
|
| Before Waivers |
|
|
|
1.61% |
|
| After Waivers |
|
|
|
1.37% |
|
The Expense Ratio Before Waivers represents the operating costs borne by the Fund, expressed as a percentage of the Fund’s
average net assets, as shown in the Fees and Expenses table in the Fund’s current prospectus (under “Total Annual Fund Operating Expenses”).
| 1 |
Represents a hypothetical investment of $10,000 in Class A of the Fund after deducting the maximum sales charge of 5.50% ($10,000 investment minus $550 sales charge =
$9,450). The Fund’s performance assumes the reinvestment of all dividends and distributions. |
| 2 |
The performance for the BCWGILB and the Real Asset Blended Index assumes the reinvestment of all dividends and distributions but does not reflect the deduction of a sales charge
required for the Fund’s performance by the Securities and Exchange Commission. It is not possible to invest directly in an index and the represented index is unmanaged. |
| 3 |
The Real Asset Blended Index is calculated by the investment advisor and represents the weighted return of 50% Barclays Capital U.S. TIPS Index, 30% NAREIT Equity Index and 20%
Dow Jones-UBS Commodity Index Total Return for the period from inception until January 1, 2009 and 50% BCWGILB, 35% S&P Developed Property Index and 15% Dow Jones-UBS Commodity Index for the period since January 1, 2009.
|
ANNUAL REPORT / April
30, 2013
12
WILMINGTON MULTI-MANAGER REAL ASSET FUND – CLASS I
The graph below illustrates the hypothetical investment of $1,000,0001 in the Wilmington Multi-Manager Real Asset Fund (Class I) (the “Fund”) from July 1, 2003 (start of performance) to April 30, 2013, compared to the BCWGILB2 and the Real Asset Blended Index.2,3
VALUE OF A HYPOTHETICAL $1,000,000 INVESTMENT
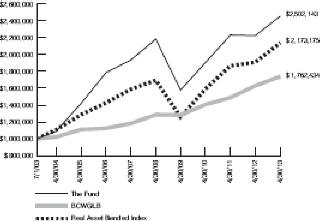
Average Annual Total Returns for the Year
Ended April 30, 2013
|
|
|
|
|
|
|
|
|
|
|
|
| 1 Year |
|
|
|
10.58% |
|
| 5 Years |
|
|
|
2.43% |
|
| Start of Performance (7/01/03) |
|
|
|
9.78% |
|
Performance data quoted represents past performance which is no guarantee of future results. Returns shown do not reflect the
deduction of taxes that a shareholder would pay on Fund distributions or the redemption of Fund shares. Investment return and principal value will fluctuate so that an investor’s shares, when redeemed, may be worth more or less than their
original cost. Mutual funds are not obligations of or guaranteed by any bank and are not federally insured. Mutual fund performance changes over time and current performance may be lower or higher than what is stated. For current to the most recent
month end performance, visit www.wilmingtonfunds.com or call 1-800-836-2211.
Annual Operating Expense Ratio
|
|
|
|
|
|
|
|
|
|
|
|
| Before Waivers |
|
|
|
1.36% |
|
| After Waivers |
|
|
|
1.12% |
|
The Expense Ratio Before Waivers represents the operating costs borne by the Fund, expressed as a percentage of the Fund’s
average net assets, as shown in the Fees and Expenses table in the Fund’s current prospectus (under “Total Annual Fund Operating Expenses”).
| 1 |
Represents a hypothetical investment of $1,000,000 in Class I of the Fund and assumes the reinvestment of all dividends and distributions. |
| 2 |
The performance for the Fund, the BCWGILB and the Real Asset Blended Index assumes the reinvestment of all dividends and distributions. It is not possible to invest directly in
an index and the represented index is unmanaged. |
| 3 |
The Real Asset Blended Index is calculated by the investment advisor and represents the weighted return of 50% Barclays Capital U.S. TIPS Index, 30% NAREIT Equity Index and 20%
Dow Jones-UBS Commodity Index Total Return for the period from inception until January 1, 2009 and 50% BCWGILB, 35% S&P Developed Property Index and 15% Dow Jones-UBS Commodity Index for the period since January 1, 2009.
|
April 30, 2013 / ANNUAL REPORT
13
WILMINGTON STRATEGIC ALLOCATION CONSERVATIVE FUND
Management’s Discussion of Fund Performance
For the fiscal year ended April 30, 2013, Wilmington Strategic Allocation Conservative
Fund (the “Fund”) returned 5.97%* for Class A Shares and 6.13%* for Class I Shares, versus its benchmarks, the Barclays Capital U.S. Aggregate Bond Index** and the Conservative Blended Index**, which returned 3.68% and 5.49%,
respectively.
The Wilmington Strategic Allocation Conservative Fund is managed by first replicating tactical asset allocation
decisions made by Wilmington Trust Investment Advisors, Inc. and then overlaying upon the asset allocation framework, active and passive managers that are closely benchmarked against the tactical asset allocations. The portfolio managers seek to add
value through the combination of tactical asset allocation and manager selection. The primary focus of the portfolio managers is in beating the Conservative Blended Index.
Over the past year, the Class I Shares outperformed the Conservative Blended Index by 0.6%. Over the past 12 months, tactical decisions added about 0.8% above the Fund’s relative performance to the
Conservative Blended Index. Manager performance was able to add about 1.5% over the entire fiscal year. Both manager performance and tactical decisions were able to add value sufficient to overcome the roughly 1.7% in fees charged by the Fund and
the various mutual funds employed by the Fund. During the year, the Fund faced an environment that was marked by systemic risks from Europe and fiscal policy confrontation on the domestic front. This promoted the very volatile “risk
on/risk-off” environment that generated very volatile return patterns. Towards the end of the fiscal year, markets became more manageable and the Fund moved from a tactically defensive posture to a more aggressive position. Tactical decisions
which helped the Fund included an exposure to the U.S. Corporate High Yield market which outperformed the investment grade bond market and an underweight to hedge funds which were unable to beat either equities or domestic investment grade fixed
income. Offsetting this to a degree were allocations to emerging market equities and developed international equities where markets struggled against weaker economic conditions than existed in the United States.
| * |
Performance data quoted represents past performance, which is no guarantee of future results. Investment return and principal value will
fluctuate so that an investor’s shares, when redeemed, may be worth more or less than their original cost. The total return shown assumes the reinvestment of all distributions and does not reflect the deduction of taxes that a shareholder would
pay on fund distributions or the redemption of shares. The total return for Class A Shares was 0.12%, adjusted for the Fund’s maximum sales charge. Mutual fund performance changes over time and current performance may be lower or higher
than what is stated. For the most recent month-end performance, please visit www.wilmingtonfunds.com or call 1-800-836-2211. |
| ** |
The Barclays Capital U.S. Aggregate Bond Index is an index measuring both the capital price changes and income provided by the underlying universe
of securities, comprised of U.S. Treasury obligations, U.S. investment
|
grade corporate debt and mortgage-backed obligations. The Conservative
Blended Index is calculated by the investment advisor and represents the weighted returns for the following indices: 53% Barclays Capital U.S. Aggregate Bond Index; 7.5% HFRX Absolute Index; 7.5% HFRX Global Index; 7.2% Russell 3000 Index; 7%
Barclays Capital Global Aggregate ex-US (unhedged) Index; 5% Barclays Capital World Government Inflation-Linked Bond Index (hedged USD); 4.8% MSCI All Country World ex-US Investable Market Index; 3.5% S&P Global Developed Property Index; 1.5%
Dow Jones-UBS Commodity Index; and 3% Citigroup 3-Month T-Bill Index. The indices are unmanaged and it is not possible to invest directly in an index.
International investing involves special risks including currency risk, political risks, increased volatility of foreign securities, and differences in auditing and other financial standards.
Due to its strategy of investing in other mutual funds, this Fund may incur certain additional expenses and tax results
that would not be present with a direct investment in the underlying funds.
Risk-On/Risk-Off - is an investment setting in
which price behavior responds to, and is driven by, changes in investor risk tolerance. Risk-on/risk-off refers to changes in investment activity in response to global economic patterns. During periods when risk is perceived as low, risk-on/risk-off
theory states that investors tend to engage in higher-risk investments (i.e. stocks and high-yield bonds). When risk is perceived as high, investors have the tendency to gravitate toward lower-risk investments (i.e. cash equivalents and U.S.
Treasury securities).
Investment grade - is a rating that indicates that a municipal or corporate bond has a relatively low
risk of default. Bond rating firms, such as Standard & Poor’s, use different designations consisting of upper- and lower-case letters ’A’ and ’B’ to identify a bond’s credit quality ratings. ’AAA’ and
’AA’ (high credit quality) and ’A’ and ’BBB’ (medium credit quality) are considered investment grade. Credit ratings for bonds below these designations (’BB’, ’B’, ’CCC’, etc) are
considered lower credit quality.
ANNUAL REPORT / April
30, 2013
14
WILMINGTON STRATEGIC
ALLOCATION CONSERVATIVE FUND –CLASS A
The graph below illustrates the hypothetical investment of $10,0001 in the Wilmington Strategic Allocation Conservative Fund
(Class A) (the “Fund”) from December 20, 2005 (start of performance) to April 30, 2013, compared to the Barclays Capital U.S. Aggregate Bond Index (“BCAB”)2 and the Conservative Blended Index.2,3
VALUE OF A HYPOTHETICAL $10,000 INVESTMENT

Average Annual Total Returns for the Year
Ended April 30, 2013
|
|
|
|
|
|
|
|
|
|
|
|
| 1 Year |
|
|
|
0.12% |
|
| 5 Years |
|
|
|
2.18% |
|
| Start of Performance (12/20/05) |
|
|
|
3.48% |
|
Performance data quoted represents past performance which is no guarantee of future results. Returns shown do not reflect the
deduction of taxes that a shareholder would pay on Fund distributions or the redemption of Fund shares. Investment return and principal value will fluctuate so that an investor’s shares, when redeemed, may be worth more or less than their
original cost. Mutual funds are not obligations of or guaranteed by any bank and are not federally insured. Mutual fund performance changes over time and current performance may be lower or higher than what is stated. For current to the most recent
month end performance, visit www.wilmingtonfunds.com or call 1-800-836-2211. Total returns shown include the maximum sales charge of 5.50%.
Annual
Operating Expense Ratio
|
|
|
|
|
|
|
|
|
|
|
|
| Before Waivers |
|
|
|
1.95% |
|
| After Waivers |
|
|
|
1.49% |
|
The Expense Ratio Before Waivers represents the operating costs borne by the Fund, expressed as a percentage of the Fund’s
average net assets, as shown in the Fees and Expenses table in the Fund’s current prospectus (under “Total Annual Fund Operating Expenses”).
| 1 |
Represents a hypothetical investment of $10,000 in Class A of the Fund after deducting the maximum sales charge of 5.50% ($10,000 investment minus $550 sales charge =
$9,450). The Fund’s performance assumes the reinvestment of all dividends and distributions. |
| 2 |
The performance for the Fund, the BCAB and the Conservative Blended Index assumes the reinvestment of all dividends and distributions. It is not possible to invest directly in an
index and the represented index is unmanaged. |
| 3 |
The Conservative Blended Index is calculated by the investment advisor and represents the weighted returns of the following indices: 53% Barclays Capital U.S. Aggregate Bond
Index; 7.5% HFRX Absolute Index; 7.5% HFRX Global Index; 7.2% Russell 3000 Index; 7% Barclays Capital Global Aggregate ex-U.S. (unhedged) Index; 5% Barclays Capital World Government Inflation-Linked Bond Index (hedged USD); 4.8% MSCI All Country
World ex-U.S. Investable Market Index; 3.5% S&P Global Developed Property Index; 1.5% Dow Jones-UBS Commodity Index; and 3% Citigroup 3-Month T-Bill.
|
April 30, 2013 / ANNUAL REPORT
15
WILMINGTON STRATEGIC
ALLOCATION CONSERVATIVE FUND –CLASS I
The graph below illustrates the hypothetical investment of $1,000,0001 in the Wilmington Strategic Allocation Conservative Fund
(Class I) (the “Fund”) from December 20, 2005 (start of performance) to April 30, 2013, compared to the BCAB2 and the Conservative Blended Index.2,3
VALUE OF A HYPOTHETICAL $1,000,000 INVESTMENT
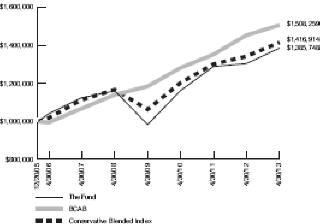
Average Annual Total Returns for the Year
Ended April 30, 2013
|
|
|
|
|
|
|
|
|
|
|
|
| 1 Year |
|
|
|
6.13% |
|
| 5 Years |
|
|
|
3.59% |
|
| Start of Performance (12/20/05) |
|
|
|
4.53% |
|
Performance data quoted represents past performance which is no guarantee of future results. Returns shown do not reflect the
deduction of taxes that a shareholder would pay on Fund distributions or the redemption of Fund shares. Investment return and principal value will fluctuate so that an investor’s shares, when redeemed, may be worth more or less than their
original cost. Mutual funds are not obligations of or guaranteed by any bank and are not federally insured. Mutual fund performance changes over time and current performance may be lower or higher than what is stated. For current to the most recent
month end performance, visit www.wilmingtonfunds.com or call 1-800-836-2211.
Annual Operating Expense Ratio
|
|
|
|
|
|
|
|
|
|
|
|
| Before Waivers |
|
|
|
1.70% |
|
| After Waivers |
|
|
|
1.24% |
|
The Expense Ratio Before Waivers represents the operating costs borne by the Fund, expressed as a percentage of the Fund’s
average net assets, as shown in the Fees and Expenses table in the Fund’s current prospectus (under “Total Annual Fund Operating Expenses”).
| 1 |
Represents a hypothetical investment of $1,000,000 in Class I of the Fund and assumes the reinvestment of all dividends and distributions. |
| 2 |
The performance for the Fund, the BCAB and the Conservative Blended Index assumes the reinvestment of all dividends and distributions. It is not possible to invest directly in an
index and the represented index is unmanaged. |
| 3 |
The Conservative Blended Index is calculated by the investment advisor and represents the weighted returns of the following indices: 53% Barclays Capital U.S. Aggregate Bond
Index; 7.5% HFRX Absolute Index; 7.5% HFRX Global Index; 7.2% Russell 3000 Index; 7% Barclays Capital Global Aggregate ex-U.S. (unhedged) Index; 5% Barclays Capital World Government Inflation-Linked Bond Index (hedged USD); 4.8% MSCI All Country
World ex-U.S. Investable Market Index; 3.5% S&P Global Developed Property Index; 1.5% Dow Jones-UBS Commodity Index; and 3% Citigroup 3-Month T-Bill.
|
ANNUAL REPORT / April
30, 2013
16
WILMINGTON STRATEGIC ALLOCATION MODERATE FUND
Management’s Discussion of Fund Performance
For the fiscal year ended April 30, 2013, Wilmington Strategic Allocation Moderate
Fund (the “Fund”) had a total return of 8.12%* for Class A Shares and 8.29%* for Class I Shares, versus its current benchmarks, the Russell 3000 Index**, Barclays Capital U.S. Aggregate Bond Index**, and the Moderate Blended Index**,
which had total returns of 17.21%, 3.68%, and 9.57%, respectively.
The Wilmington Strategic Allocation Moderate Fund is
managed by first replicating tactical asset allocation decisions made by Wilmington Trust Investment Advisors, Inc. and then overlaying upon the asset allocation framework, active and passive managers that are closely benchmarked against the
tactical asset allocations. The portfolio managers seek to add value through the combination of tactical asset allocation and manager selection. The primary focus of the portfolio managers is in beating the Moderate Blended Index.
Over the past year, the Class I Shares underperformed the Moderate Blended Index by 1.3%. Over the past 12 months tactical decisions
added about 0.6% above the Fund’s relative performance to the Moderate Blended Index. Manager performance was only able to add about 0.1% over the entire fiscal year. While both manager performance and tactical decisions were able to add value,
they were not sufficient to overcome the roughly 1.8% in fees charged by the Fund and the various mutual funds employed by the fund. During the year, the Fund faced an environment that was marked by systemic risks from Europe and fiscal policy
confrontation on the domestic front. This promoted the very volatile “risk on/risk-off” environment that generated very volatile return patterns. Towards the end of the fiscal year, markets became more manageable and the Fund moved from a
tactically defensive posture to a more aggressive position. Tactical decisions which helped the Fund included an exposure to the U.S. Corporate High Yield market which outperformed the investment grade bond market and an underweight to hedge funds
which were unable to beat either equities or domestic investment grade fixed income. Offsetting this to a degree were allocations to emerging market equities and developed international equities where markets struggled against weaker economic
conditions than existed in the United States.
| * |
Performance data quoted represents past performance, which is no guarantee of future results. Investment return and principal value will
fluctuate so that an investor’s shares, when redeemed, may be worth more or less than their original cost. The total return shown assumes the reinvestment of all distributions and does not reflect the deduction of taxes that a shareholder would
pay on fund distributions or the redemption of shares. The total return for Class A Shares was 2.16%, adjusted for the Fund’s maximum sales charge. Mutual fund performance changes over time and current performance may be lower or higher
than what is stated. For the most recent month-end performance, please visit www.wilmingtonfunds.com or call 1-800-836-2211.
|
| ** |
The Russell 3000 Index measures the performance of the largest 3,000 U.S. companies representing approximately 98% of the investable U.S. equity
market. Barclays Capital U.S. Aggregate Bond Index is an index measuring both the capital price changes and income provided by the underlying universe of securities, comprised of U.S. Treasury obligations, U.S. investment grade corporate debt and
mortgage-backed obligations. The Moderate Blended Index is calculated by the investment advisor and represents the weighted returns for the following indices: 27% Russell 3000 Index; 20% Barclays Capital U.S. Aggregate Bond Index; 18% MSCI All
Country World ex-US Investable Market Index; 7.5% HFRX Absolute Index; 7.5% HFRX Global Index; 7% Barclays Capital Global Aggregate ex-US (unhedged)Index; 5% Barclays Capital World Government Inflation-Linked Bond Index (hedged USD); 3.5% S&P
Global Developed Property Index; 1.5% Dow Jones-UBS Commodity Index; and 3% Citigroup 3-Month T-Bill Index. The indices are unmanaged and it is not possible to invest directly in an index. |
International investing involves special risks including currency risk, political risks, increased volatility of
foreign securities, and differences in auditing and other financial standards.
Due to its strategy of
investing in other mutual funds, this Fund may incur certain additional expenses and tax results that would not be present with a direct investment in the underlying funds.
Risk-On/Risk-Off - is an investment setting in which price behavior responds to, and is driven by, changes in investor risk tolerance. Risk-on/risk-off refers to changes in investment activity in response
to global economic patterns. During periods when risk is perceived as low, risk-on/risk-off theory states that investors tend to engage in higher-risk investments (i.e. stocks and high-yield bonds). When risk is perceived as high, investors have the
tendency to gravitate toward lower-risk investments (i.e. cash equivalents and U.S. Treasury securities).
Investment grade -
is a rating that indicates that a municipal or corporate bond has a relatively low risk of default. Bond rating firms, such as Standard & Poor’s, use different designations consisting of upper- and lower-case letters ’A’ and
’B’ to identify a bond’s credit quality ratings. ’AAA’ and ’AA’ (high credit quality) and ’A’ and ’BBB’ (medium credit quality) are considered investment grade. Credit ratings for bonds below
these designations (’BB’, ’B’, ’CCC’, etc) are considered lower credit quality.
April 30, 2013 / ANNUAL REPORT
17
WILMINGTON STRATEGIC ALLOCATION MODERATE FUND – CLASS A
The graph below illustrates the hypothetical investment of $10,0001 in the Wilmington Strategic Allocation Moderate Fund (Class A) (the “Fund”) from April 30, 2003 to April 30, 2013, compared to the Barclays Capital U.S.
Aggregate Bond Index (“BCAB”)2, the Russell 3000 Index2 and the Moderate Blended Index.2,3
VALUE OF A HYPOTHETICAL $10,000 INVESTMENT
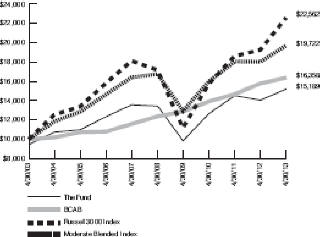
Average Annual Total Returns for the Year
Ended April 30, 2013
|
|
|
|
|
|
|
|
|
|
|
|
| 1 Year |
|
|
|
2.16% |
|
| 5 Years |
|
|
|
1.32% |
|
| 10 Years |
|
|
|
4.27% |
|
Performance data quoted represents past performance which is no guarantee of future results. Returns shown do not reflect the
deduction of taxes that a shareholder would pay on Fund distributions or the redemption of Fund shares. Investment return and principal value will fluctuate so that an investor’s shares, when redeemed, may be worth more or less than their
original cost. Mutual funds are not obligations of or guaranteed by any bank and are not federally insured. Mutual fund performance changes over time and current performance may be lower or higher than what is stated. For current to the most recent
month end performance, visit www.wilmingtonfunds.com or call 1-800-836-2211. Total returns shown include the maximum sales charge of 5.50%.
Annual
Operating Expense Ratio
|
|
|
|
|
|
|
|
|
|
|
|
| Before Waivers |
|
|
|
2.12% |
|
| After Waivers |
|
|
|
1.55% |
|
The Expense Ratio Before Waivers represents the operating costs borne by the Fund, expressed as a percentage of the Fund’s
average net assets, as shown in the Fees and Expenses table in the Fund’s current prospectus (under “Total Annual Fund Operating Expenses”).
| 1 |
Represents a hypothetical investment of $10,000 in Class A of the Fund after deducting the maximum sales charge of 5.50% ($10,000 investment minus $550 sales charge =
$9,450). The Fund’s performance assumes the reinvestment of all dividends and distributions. |
| 2 |
The performance for the BCAB, the Russell 3000 Index and the Moderate Blended Index assumes the reinvestment of all dividends and distributions. It is not possible to invest
directly in an index and the represented index is unmanaged. |
| 3 |
The Moderate Blended Index is calculated by the investment advisor and represents the weighted returns of the following indices: 27% Russell 3000 Index; 20% Barclays Capital U.S.
Aggregate Bond Index; 18% MSCI All Country World ex-US Investable Market Index; 7.5% HFRX Absolute Index; 7.5% HFRX Global Index; 7% Barclays Capital Global Aggregate ex-US (unhedged) Index; 5% Barclays Capital World Government Inflation-Linked Bond
Index (hedged USD); 3.5% S&P Global Developed Property Index; 1.5% Dow Jones-UBS Commodity Index; and 3% Citigroup 3-Month T-Bill.
|
ANNUAL REPORT / April
30, 2013
18
WILMINGTON STRATEGIC ALLOCATION MODERATE FUND – Class I
The graph below illustrates the hypothetical investment of $1,000,0001 in the Wilmington Strategic Allocation Moderate Fund (Class I) (the “Fund”) from June 11, 2010 (start of performance) to April 30, 2013, compared to the BCAB2, the Russell 3000 Index2 and the Moderate Blended Index.2,3
VALUE OF A HYPOTHETICAL $1,000,000 INVESTMENT
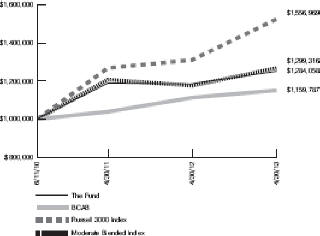
Average Annual Total Returns for the Year
Ended April 30, 2013
|
|
|
|
|
|
|
|
|
|
|
|
| 1 Year |
|
|
|
8.29% |
|
| Start of Performance (6/11/10) |
|
|
|
9.05% |
|
Performance data quoted represents past performance which is no guarantee of future results. Returns shown do not reflect the
deduction of taxes that a shareholder would pay on Fund distributions or the redemption of Fund shares. Investment return and principal value will fluctuate so that an investor’s shares, when redeemed, may be worth more or less than their
original cost. Mutual funds are not obligations of or guaranteed by any bank and are not federally insured. Mutual fund performance changes over time and current performance may be lower or higher than what is stated. For current to the most recent
month end performance, visit www.wilmingtonfunds.com or call 1-800-836-2211.
Annual Operating Expense Ratio
|
|
|
|
|
|
|
|
|
|
|
|
| Before Waivers |
|
|
|
1.87% |
|
| After Waivers |
|
|
|
1.30% |
|
The Expense Ratio Before Waivers represents the operating costs borne by the Fund, expressed as a percentage of the Fund’s
average net assets, as shown in the Fees and Expenses table in the Fund’s current prospectus (under “Total Annual Fund Operating Expenses”).
| 1 |
Represents a hypothetical investment of $1,000,000 in Class I of the Fund and assumes the reinvestment of all dividends and distributions. |
| 2 |
The performance for the BCAB, the Russell 3000 Index and the Moderate Blended Index assumes the reinvestment of all dividends and distributions. It is not possible to invest
directly in an index and the represented index is unmanaged. |
| 3 |
The Moderate Blended Index is calculated by the investment advisor and represents the weighted returns of the following indices: 27% Russell 3000 Index; 20% Barclays Capital U.S.
Aggregate Bond Index; 18% MSCI All Country World ex-US Investable Market Index; 7.5% HFRX Absolute Index; 7.5% HFRX Global Index; 7% Barclays Capital Global Aggregate ex-US (unhedged) Index; 5% Barclays Capital World Government Inflation-Linked Bond
Index (hedged USD); 3.5% S&P Global Developed Property Index; 1.5% Dow Jones-UBS Commodity Index; and 3% Citigroup 3-Month T-Bill.
|
April 30, 2013 / ANNUAL REPORT
19
WILMINGTON STRATEGIC ALLOCATION AGGRESSIVE FUND
Management’s Discussion of Fund Performance
For the fiscal year ended April 30, 2013, Wilmington Strategic Allocation Aggressive
Fund (the “Fund”) had a total return of 12.26%* for Class A Shares and 12.62%* for Class I Shares, versus its benchmarks, the Russell 3000 Index**, MSCI All Country World ex-US Investable Market Index**, and the Aggressive Blended
Index**, which returned 17.21%, 14.18%, and 14.38%, respectively.
The Wilmington Strategic Allocation Aggressive Fund is
managed by first replicating tactical asset allocation decisions made by Wilmington Trust Investment Advisors, Inc. and then overlaying upon the asset allocation framework, active and passive managers that are closely benchmarked against the
tactical asset allocations. The portfolio managers seek to add value through the combination of tactical asset allocation and manager selection. The primary focus of the portfolio managers is in beating the Aggressive Blended Index.
Over the past year, the Class I Shares underperformed the Aggressive Blended Index by 1.8% which was approximately equal to the expenses
charged by the Fund and the various mutual funds employed by the Fund. Over the past 12 months tactical decisions detracted about 0.5% from the Fund’s relative performance to the Aggressive Blended Index with manager performance largely
offsetting the tactical underperformance. During the year, the Fund faced an environment that was marked by systemic risks from Europe and fiscal policy confrontation on the domestic front. This promoted the very volatile “risk
on/risk-off” environment that generated very volatile return patterns. The Fund started the year in a more defensive asset allocation position that included a slight underweight to equities. This hurt performance as the equity markets started
the fiscal year by performing very well. Towards the end of the fiscal year, markets became more manageable and the Fund moved from a tactically defensive posture to a more aggressive position which included overweighting international and emerging
markets. This overweight was helpful during the later part of calendar 2012 but detracted from performance as emerging market economies began to stumble in concert with the evolving recession in Europe.
| * |
Performance data quoted represents past performance, which is no guarantee of future results. Investment
return and principal value will fluctuate so that an investor’s shares, when redeemed, may be worth more or less than their original cost. The total return shown assumes the reinvestment of all distributions and does not reflect the deduction of taxes that a shareholder would pay on fund distributions or the redemption of shares. The total return for Class A Shares was
6.03%, adjusted for the Fund’s maximum sales charge. Mutual fund performance changes over time and current performance may be lower or
higher than what is stated. For the most recent month-end performance, please visit www.wilmingtonfunds.com or call 1-800-836-2211. |
| ** |
The Russell 3000 Index measures the performance of the largest 3,000 U.S. companies representing approximately 98% of the investable U.S. equity
market. MSCI All Country World ex-US Index (ACWI ex-US) is a free float-adjusted market capitalization weighted index that is designed to measure the large-cap and mid-cap equity market performance of developed
|
and emerging markets excluding the U.S. market. The MSCI All Country
World ex-US Investable Market Index (ACWI IMI ex-US) is designed to also include the small-cap equity market performance which is not included in the ACWI ex-US. The ACWI ex-US and ACWI IMI ex-US Indices consisted of 45 country indices comprising 22
developed and 23 emerging market country indices. TheAggressive Blended Index is calculated by the investment advisor and represents the weighted returns for the following indices: 48% Russell 3000 Index; 32% MSCI All Country World ex-US Investable
Market Index; 7% HFRX Global Index; 5% Barclays Capital World Government Inflation-Linked Bond Index (hedged USD); 3.5% S&P Global Developed Property Index; 1.5% Dow Jones-UBS Commodity Index; and 3% Citigroup 3-Month T-Bill Index. The indices
are unmanaged and it is not possible to invest directly in an index.
International investing involves
special risks including currency risk, political risks, increased volatility of foreign securities, and differences in auditing and other financial standards.
Due to its strategy of investing in other mutual funds, this Fund may incur certain additional expenses and tax results
that would not be present with a direct investment in the underlying funds.
Risk-On/Risk-Off - is an investment setting in
which price behavior responds to, and is driven by, changes in investor risk tolerance. Risk-on/risk-off refers to changes in investment activity in response to global economic patterns. During periods when risk is perceived as low, risk-on/risk-off
theory states that investors tend to engage in higher-risk investments (i.e. stocks and high-yield bonds). When risk is perceived as high, investors have the tendency to gravitate toward lower-risk investments (i.e. cash equivalents and U.S.
Treasury securities).
Investment grade - is a rating that indicates that a municipal or corporate bond has a relatively low
risk of default. Bond rating firms, such as Standard & Poor’s, use different designations consisting of upper- and lower-case letters ’A’ and ’B’ to identify a bond’s credit quality ratings. ’AAA’ and
’AA’ (high credit quality) and ’A’ and ’BBB’ (medium credit quality) are considered investment grade. Credit ratings for bonds below these designations (’BB’, ’B’, ’CCC’, etc) are
considered lower credit quality.
|
|
|
|
|
ANNUAL REPORT / April 30, 2013 |
20
WILMINGTON STRATEGIC
ALLOCATION AGGRESSIVE FUND –
CLASS A
The graph below illustrates the hypothetical investment of $10,0001 in the Wilmington Strategic Allocation Aggressive Fund (Class A) (the “Fund”) from December 20, 2005 (start of performance) to April 30, 2013, compared to
the Russell 3000 Index2, the MSCI All Country World ex-US Investable Market Index (“MSCI ACWI ex-US Investable Market Index”)2 and the Aggressive Blended Index.2,3
VALUE OF A HYPOTHETICAL $10,000 INVESTMENT
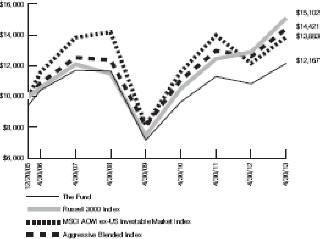
Average Annual Total Returns for the Year
Ended April 30, 2013
|
|
|
| |
|
|
| 1 Year |
|
6.03% |
| 5 Years |
|
-0.31% |
| Start of Performance (12/20/05) |
|
2.70% |
Performance data quoted represents past performance which is no guarantee of future results. Returns shown do not reflect the
deduction of taxes that a shareholder would pay on Fund distributions or the redemption of Fund shares. Investment return and principal value will fluctuate so that an investor’s shares, when redeemed, may be worth more or less than their
original cost. Mutual funds are not obligations of or guaranteed by any bank and are not federally insured. Mutual fund performance changes over time and current performance may be lower or higher than what is stated. For current to the most recent
month end performance, visit www.wilmingtonfunds.com or call 1-800-836-2211. Total returns shown include the maximum sales charge of 5.50%.
Annual
Operating Expense Ratio
|
|
|
|
|
|
|
|
|
|
| Before Waivers |
|
2.10%
|
| After Waivers |
|
1.66% |
The Expense Ratio Before Waivers represents the operating costs borne by the Fund, expressed as a percentage of the Fund’s
average net assets, as shown in the Fees and Expenses table in the Fund’s current prospectus (under “Total Annual Fund Operating Expenses”).
| 1 |
Represents a hypothetical investment of $10,000 in A Shares of the Fund after deducting the maximum sales charge of 5.50% ($10,000 investment minus $550 sales charge = $9,450).
The Fund’s performance assumes the reinvestment of all dividends and distributions. |
| 2 |
The performance for the Russell 3000 Index, the MSCI ACWI ex-US Investable Market Index and the Aggressive Blended Index assumes the reinvestment of all dividends and
distributions. It is not possible to invest directly in an index and the represented index is unmanaged. |
| 3 |
The Aggressive Blended Index is calculated by the investment advisor and represents the weighted returns of the following indices: 48% Russell 3000 Index; 32% MSCI ACWI ex-US
Investable Market Index; 7% HFRX Global Index; 5% Barclays Capital World Government Inflation-Linked Bond Index (hedged USD); 3.5% S&P Global Developed Property Index; 1.5% Dow Jones-UBS Commodity Index; and 3% Citigroup 3-Month T-Bill.
|
April 30, 2013 / ANNUAL REPORT
21
WILMINGTON STRATEGIC
ALLOCATION AGGRESSIVE FUND –CLASS I
The graph below illustrates the hypothetical investment of $1,000,0001 in the Wilmington Strategic Allocation Moderate Fund (I
Shares) (the “Fund”) from December 20, 2005 (start of performance) to April 30, 2013, compared to the Russell 3000 Index2, the MSCI All Country World
ex-US Investable Market Index (“MSCI ACWI ex-US Investable Market Index”)2and the Aggressive Blended Index.2,3
VALUE OF A HYPOTHETICAL $1,000,000
INVESTMENT

Average Annual Total Returns for the Year
Ended April 30, 2013
|
|
|
| |
|
|
| 1 Year |
|
12.62% |
| 5 Years |
|
1.07% |
| Start of Performance (12/20/05) |
|
3.75% |
Performance data quoted represents past performance which is no guarantee of future results. Returns shown do not reflect the
deduction of taxes that a shareholder would pay on Fund distributions or the redemption of Fund shares. Investment return and principal value will fluctuate so that an investor’s shares, when redeemed, may be worth more or less than their
original cost. Mutual funds are not obligations of or guaranteed by any bank and are not federally insured. Mutual fund performance changes over time and current performance may be lower or higher than what is stated. For current to the most recent
month end performance, visit www.wilmingtonfunds.com or call 1-800-836-2211.
Annual Operating Expense Ratio
|
|
|
|
|
|
|
|
|
|
| Before Waivers |
|
1.85%
|
| After Waivers |
|
1.41% |
The Expense Ratio Before Waivers represents the operating costs borne by the Fund, expressed as a percentage of the Fund’s
average net assets, as shown in the Fees and Expenses table in the Fund’s current prospectus (under “Total Annual Fund Operating Expenses”).
| 1 |
Represents a hypothetical investment of $1,000,000 in Class I of the Fund and assumes the reinvestment of all dividends and distributions. |
| 2 |
The performance for the Fund, the Russell 3000 Index, the MSCI ACWI ex-US Investable Market Index and the Aggressive Blended Index assumes the reinvestment of all dividends and
distributions. It is not possible to invest directly in an index and the represented index is unmanaged. |
| 3 |
The Aggressive Blended Index is calculated by the investment advisor and represents the weighted returns of the following indices: 48% Russell 3000 Index; 32% MSCI ACWI ex-US
Investable Market Index; 7% HFRX Global Index; 5% Barclays Capital World Government Inflation-Linked Bond Index (hedged USD); 3.5% S&P Global Developed Property Index; 1.5% Dow Jones-UBS Commodity Index; and 3% Citigroup 3-Month T-Bill.
|
ANNUAL REPORT / April
30, 2013
22
SHAREHOLDER EXPENSE EXAMPLE
As a shareholder of the Fund, you incur
ongoing costs, including management fees; to the extent applicable, distribution (12b-1) fees, and/or shareholder services fees; and other Fund expenses. This Example is intended to help you to understand your ongoing costs (in dollars) of investing
in the Funds and to compare these costs with the ongoing costs of investing in other mutual funds. It is based on an investment of $1,000 invested at the beginning of the period and held for the entire period from November 1, 2012 to
April 30, 2013.
Actual Expenses
This section of the following table provides information about actual account values and
actual expenses. You may use the information in this section, together with the amount you invested, to estimate the expenses that you incurred over the period. Simply divide your account value by $1,000 (for example, an $8,600 account value
divided by $1,000 = 8.6), then multiply the result by the number in the first section under the heading entitled “Expenses Paid During Period” to estimate the expenses attributable to your investment during this period.
Hypothetical Example for
Comparison Purposes
This section of the
following table provides information about hypothetical account values and hypothetical expenses based on the Funds’ actual expense ratios and assumed rates of return of 5% per year before expenses, which is not the Funds’
actual returns. Thus, you should not use the hypothetical account values and expenses to estimate the actual ending account balance or your expenses for the period. Rather, these figures are required to be provided to enable you to compare
the ongoing costs of investing in the Funds with other funds. To do so, compare this 5% hypothetical example with the 5% hypothetical examples that appear in the shareholder reports of the other funds.
Please note that the expenses shown in the table are meant to highlight your
ongoing costs only. Therefore, the Annualized Net Expense Ratio section of the table is useful in comparing ongoing costs only, and will not help you determine the relative total costs of owning different funds.
|
|
|
|
|
|
|
|
|
| |
|
Beginning
Account
Value
11/1/12 |
|
Ending
Account
Value
4/30/13 |
|
Expenses Paid
During Period1 |
|
Annualized Net
Expense Ratio2 |
|
|
|
|
|
| WILMINGTON MULTI-MANAGER INTERNATIONAL FUND |
|
|
|
|
|
|
|
|
|
|
|
|
|
| Actual |
|
|
|
|
|
|
|
|
|
|
|
|
|
| Class A |
|
$1,000.00 |
|
$1,106.00 |
|
$7.68 |
|
1.47% |
|
|
|
|
|
| Class I |
|
$1,000.00 |
|
$1,105.80 |
|
$7.00 |
|
1.34% |
|
|
|
|
|
| Hypothetical (assuming a 5% return before expense) |
|
|
|
|
|
|
|
|
|
|
|
|
|
| Class A |
|
$1,000.00 |
|
$1,017.50 |
|
$7.35 |
|
1.47% |
|
|
|
|
|
| Class I |
|
$1,000.00 |
|
$1,018.15 |
|
$6.71 |
|
1.34% |
|
|
|
|
|
| WILMINGTON ROCK MAPLE ALTERNATIVES FUND |
|
|
|
|
|
|
|
|
|
|
|
|
|
| Actual |
|
|
|
|
|
|
|
|
|
|
|
|
|
| Class A |
|
$1,000.00 |
|
$1,034.00 |
|
$14.22 |
|
2.82% |
|
|
|
|
|
| Class I |
|
$1,000.00 |
|
$1,035.00 |
|
$13.17 |
|
2.61% |
|
|
|
|
|
| Hypothetical (assuming a 5% return before expense) |
|
|
|
|
|
|
|
|
|
|
|
|
|
| Class A |
|
$1,000.00 |
|
$1,010.81 |
|
$14.06 |
|
2.82% |
|
|
|
|
|
| Class I |
|
$1,000.00 |
|
$1,011.85 |
|
$13.02 |
|
2.61% |
|
|
|
|
|
| WILMINGTON MULTI-MANAGER REAL ASSET FUND |
|
|
|
|
|
|
|
|
|
|
|
|
|
| Actual |
|
|
|
|
|
|
|
|
|
|
|
|
|
| Class A |
|
$1,000.00 |
|
$1,070.90 |
|
$6.57 |
|
1.28% |
|
|
|
|
|
| Class I |
|
$1,000.00 |
|
$1,072.00 |
|
$5.29 |
|
1.03% |
|
|
|
|
|
| Hypothetical (assuming a 5% return before expense) |
|
|
|
|
|
|
|
|
|
|
|
|
|
| Class A |
|
$1,000.00 |
|
$1,018.45 |
|
$6.41 |
|
1.28% |
|
|
|
|
|
| Class I |
|
$1,000.00 |
|
$1,019.69 |
|
$5.16 |
|
1.03% |
|
|
|
|
|
| WILMINGTON STRATEGIC ALLOCATION CONSERVATIVE FUND |
|
|
|
|
|
|
|
|
|
|
|
|
|
| Actual |
|
|
|
|
|
|
|
|
|
|
|
|
|
| Class A |
|
$1,000.00 |
|
$1,033.50 |
|
$3.58 |
|
0.71% |
|
|
|
|
|
| Class I |
|
$1,000.00 |
|
$1,034.70 |
|
$2.32 |
|
0.46% |
|
|
|
|
|
| Hypothetical (assuming a 5% return before expense) |
|
|
|
|
|
|
|
|
|
|
|
|
|
| Class A |
|
$1,000.00 |
|
$1,021.27 |
|
$3.56 |
|
0.71% |
|
|
|
|
|
| Class I |
|
$1,000.00 |
|
$1,022.51 |
|
$2.31 |
|
0.46% |
April 30, 2013 / ANNUAL REPORT
23
|
|
|
|
|
|
|
|
|
| |
|
Beginning
Account
Value
11/1/12 |
|
Ending
Account
Value
4/30/13 |
|
Expenses Paid
During Period1 |
|
Annualized Net
Expense Ratio2 |
|
|
|
|
|
| WILMINGTON STRATEGIC ALLOCATION MODERATE FUND |
|
|
|
|
|
|
|
|
|
|
|
|
|
| Actual |
|
|
|
|
|
|
|
|
|
|
|
|
|
| Class A |
|
$1,000.00 |
|
$1,070.90 |
|
$4.31 |
|
0.84% |
|
|
|
|
|
| Class I |
|
$1,000.00 |
|
$1,071.20 |
|
$3.03 |
|
0.59% |
|
|
|
|
|
| Hypothetical (assuming a 5% return before expense) |
|
|
|
|
|
|
|
|
|
|
|
|
|
| Class A |
|
$1,000.00 |
|
$1,020.63 |
|
$4.21 |
|
0.84% |
|
|
|
|
|
| Class I |
|
$1,000.00 |
|
$1,021.87 |
|
$2.96 |
|
0.59% |
|
|
|
|
|
| WILMINGTON STRATEGIC ALLOCATION AGGRESSIVE FUND |
|
|
|
|
|
|
|
|
|
|
|
|
|
| Actual |
|
|
|
|
|
|
|
|
|
|
|
|
|
| Class A |
|
$1,000.00 |
|
$1,114.90 |
|
$4.56 |
|
0.87% |
|
|
|
|
|
| Class I |
|
$1,000.00 |
|
$1,115.90 |
|
$3.25 |
|
0.62% |
|
|
|
|
|
| Hypothetical (assuming a 5% return before expense) |
|
|
|
|
|
|
|
|
|
|
|
|
|
| Class A |
|
$1,000.00 |
|
$1,020.48 |
|
$4.36 |
|
0.87% |
|
|
|
|
|
| Class I |
|
$1,000.00 |
|
$1,021.72 |
|
$3.11 |
|
0.62% |
| (1) |
Expenses are equal to the Funds’ annualized net expense ratios, multiplied by the average account value over the period, multiplied by 181/365 (to reflect the most recent
one-half year period). |
| (2) |
Expense ratio does not reflect the indirect expenses of the underlying funds it invests in. |
ANNUAL REPORT / April
30, 2013
24
PORTFOLIO OF INVESTMENTS SUMMARY TABLE
Wilmington Multi-Manager International Fund
At April 30, 2013, the Fund’s sector classifications and country allocations were as follows
(unaudited):
|
|
|
|
|
| Common Stocks |
|
Percentage of
Total Net Assets |
|
| Financial |
|
|
22.5 |
% |
| Industrials |
|
|
10.9 |
% |
| Consumer, Non-cyclical |
|
|
10.1 |
% |
| Basic Materials |
|
|
9.5 |
% |
| Consumer, Cyclical |
|
|
8.0 |
% |
| Energy |
|
|
7.3 |
% |
| Health Care |
|
|
6.5 |
% |
| Information Technology |
|
|
4.9 |
% |
| Telecommunication Services |
|
|
4.7 |
% |
| Utilities |
|
|
2.1 |
% |
| Investment Companies |
|
|
7.4 |
% |
| Preferred Stocks |
|
|
1.9 |
% |
| Call Warrants |
|
|
1.6 |
% |
| Real Estate Investment Trusts |
|
|
0.6 |
% |
| Certificates |
|
|
0.2 |
% |
| Rights |
|
|
0.0 |
%3 |
| Corporate Bond |
|
|
0.0 |
%3 |
| Cash Equivalents1 |
|
|
2.5 |
% |
| Other Assets and Liabilities – Net2 |
|
|
(0.7 |
)% |
|
|
|
|
|
| TOTAL |
|
|
100.0 |
% |
|
|
|
|
|
| (1) |
Cash Equivalents include investments in a money market fund and repurchase agreements. |
| (2) |
Assets, other than investments in securities, less liabilities. See Statements of Assets and Liabilities. |
| (3) |
Represent less than 0.05%.
|
|
|
|
|
|
| Country Allocation |
|
Percentage of
Total Net Assets |
|
| United Kingdom |
|
|
12.6 |
% |
| Japan |
|
|
11.1 |
% |
| France |
|
|
7.4 |
% |
| Switzerland |
|
|
7.2 |
% |
| Germany |
|
|
5.8 |
% |
| Canada |
|
|
3.3 |
% |
| China |
|
|
3.1 |
% |
| Sweden |
|
|
2.7 |
% |
| Australia |
|
|
2.3 |
% |
| Taiwan |
|
|
2.2 |
% |
| South Korea |
|
|
1.9 |
% |
| Russia |
|
|
1.7 |
% |
| Mexico |
|
|
1.5 |
% |
| South Africa |
|
|
1.5 |
% |
| Malaysia |
|
|
1.3 |
% |
| Netherlands |
|
|
1.3 |
% |
| Belgium |
|
|
1.2 |
% |
| Singapore |
|
|
1.2 |
% |
| Spain |
|
|
1.2 |
% |
| Denmark |
|
|
1.1 |
% |
| Hong Kong |
|
|
1.1 |
% |
| Italy |
|
|
1.0 |
% |
| All other Country less than 1.0% |
|
|
12.8 |
% |
| Investment Companies |
|
|
7.4 |
% |
| Preferred Stocks |
|
|
1.9 |
% |
| Call Warrants |
|
|
1.6 |
% |
| Real Estate Investment Trusts |
|
|
0.6 |
% |
| Certificates |
|
|
0.2 |
% |
| Rights |
|
|
0.0 |
%3 |
| Corporate Bond |
|
|
0.0 |
%3 |
| Cash Equivalents1 |
|
|
2.5 |
% |
| Other Assets and Liabilities – Net2 |
|
|
(0.7 |
)% |
|
|
|
|
|
| TOTAL |
|
|
100.0 |
% |
|
|
|
|
|
PORTFOLIO OF INVESTMENTS
April 30, 2013
|
|
|
|
|
|
|
|
|
| Description |
|
Number
of
Shares |
|
|
Value |
|
|
|
|
| COMMON STOCKS – 86.5% |
|
|
|
|
|
|
|
|
|
|
|
| ARGENTINA – 0.2% |
|
|
|
|
|
|
|
|
|
|
|
| Adecoagro SA* |
|
|
5,500 |
|
|
$ |
41,030 |
|
|
|
|
| Arcos Dorados Holdings, Inc. |
|
|
9,700 |
|
|
|
132,114 |
|
|
|
|
| Banco Macro SA ADR#,* |
|
|
3,500 |
|
|
|
55,790 |
|
|
|
|
|
|
|
|
|
|
| Description |
|
Number
of
Shares |
|
|
Value |
|
|
|
|
| BBVA Banco Frances SA ADR* |
|
|
5,120 |
|
|
$ |
22,989 |
|
|
|
|
| Cresud SACIF y A ADR |
|
|
9,926 |
|
|
|
87,150 |
|
|
|
|
| Grupo Financiero Galicia SA ADR# |
|
|
10,400 |
|
|
|
58,552 |
|
|
|
|
| Mercadolibre, Inc. |
|
|
1,800 |
|
|
|
181,062 |
|
|
|
|
| Petrobras Argentina SA ADR |
|
|
33,036 |
|
|
|
162,537 |
|
|
|
|
| Telecom Argentina SA ADR |
|
|
15,650 |
|
|
|
258,068 |
|
April 30, 2013 / ANNUAL REPORT
PORTFOLIOS OF INVESTMENTS 25
Wilmington Multi-Manager International Fund (continued)
|
|
|
|
|
|
|
|
|
| Description |
|
Number of
Shares
|
|
|
Value |
|
|
|
|
| Transportadora de Gas del Sur SA ADR |
|
|
10,400 |
|
|
$ |
17,680 |
|
|
|
|
|
|
|
|
|
|
|
|
|
| TOTAL ARGENTINA |
|
|
|
|
|
$ |
1,016,972 |
|
|
|
|
| AUSTRALIA – 2.3% |
|
|
|
|
|
|
|
|
|
|
|
| AGL Energy Ltd. |
|
|
4,217 |
|
|
|
69,380 |
|
|
|
|
| ALS Ltd. |
|
|
3,085 |
|
|
|
31,311 |
|
|
|
|
| Alumina Ltd.* |
|
|
31,910 |
|
|
|
31,923 |
|
|
|
|
| Alumina Ltd. ADR* |
|
|
4,000 |
|
|
|
16,000 |
|
|
|
|
| Amcor Ltd. |
|
|
12,817 |
|
|
|
131,412 |
|
|
|
|
| APA Group |
|
|
5,889 |
|
|
|
39,744 |
|
|
|
|
| Arrium Ltd. |
|
|
208,000 |
|
|
|
183,288 |
|
|
|
|
| Asciano Ltd. |
|
|
34,831 |
|
|
|
194,990 |
|
|
|
|
| ASX Ltd. |
|
|
1,019 |
|
|
|
39,731 |
|
|
|
|
| Aurizon Holdings Ltd. |
|
|
14,150 |
|
|
|
60,878 |
|
|
|
|
| Australia & New Zealand Banking Group Ltd. |
|
|
13,852 |
|
|
|
457,234 |
|
|
|
|
| Bank of Queensland Ltd. |
|
|
7,786 |
|
|
|
80,960 |
|
|
|
|
| Bendigo and Adelaide Bank Ltd. |
|
|
50,517 |
|
|
|
579,222 |
|
|
|
|
| BHP Billiton Ltd. |
|
|
12,699 |
|
|
|
430,497 |
|
|
|
|
| BlueScope Steel Ltd.* |
|
|
20,120 |
|
|
|
103,249 |
|
|
|
|
| Boral Ltd. |
|
|
21,033 |
|
|
|
109,024 |
|
|
|
|
| Brambles Ltd. |
|
|
12,481 |
|
|
|
112,828 |
|
|
|
|
| Brickworks Ltd. |
|
|
1,116 |
|
|
|
14,763 |
|
|
|
|
| Challenger Ltd. |
|
|
51,900 |
|
|
|
225,980 |
|
|
|
|
| Coca-Cola Amatil Ltd. |
|
|
1,210 |
|
|
|
18,992 |
|
|
|
|
| Cochlear Ltd. |
|
|
324 |
|
|
|
22,162 |
|
|
|
|
| Commonwealth Bank of Australia |
|
|
6,324 |
|
|
|
481,544 |
|
|
|
|
| Crown Ltd. |
|
|
3,732 |
|
|
|
49,910 |
|
|
|
|
| CSL Ltd. |
|
|
3,804 |
|
|
|
248,289 |
|
|
|
|
| Downer EDI Ltd. |
|
|
63,750 |
|
|
|
324,500 |
|
|
|
|
| Echo Entertainment Group Ltd. |
|
|
18,904 |
|
|
|
70,944 |
|
|
|
|
| Fairfax Media Ltd.# |
|
|
86,793 |
|
|
|
58,486 |
|
|
|
|
| Fortescue Metals Group Ltd. |
|
|
6,140 |
|
|
|
22,279 |
|
|
|
|
| Goodman Fielder Ltd.* |
|
|
163,900 |
|
|
|
131,684 |
|
|
|
|
| GrainCorp Ltd. |
|
|
3,989 |
|
|
|
53,016 |
|
|
|
|
| Harvey Norman Holdings Ltd.# |
|
|
9,633 |
|
|
|
29,960 |
|
|
|
|
| Incitec Pivot Ltd. |
|
|
36,866 |
|
|
|
110,452 |
|
|
|
|
| Insurance Australia Group Ltd. |
|
|
19,936 |
|
|
|
120,286 |
|
|
|
|
| Leighton Holdings Ltd.# |
|
|
3,545 |
|
|
|
73,465 |
|
|
|
|
| Lend Lease Group |
|
|
44,236 |
|
|
|
494,365 |
|
|
|
|
| Macquarie Group Ltd. |
|
|
15,972 |
|
|
|
648,914 |
|
|
|
|
| Metcash Ltd. |
|
|
50,197 |
|
|
|
212,840 |
|
|
|
|
| National Australia Bank Ltd. |
|
|
29,178 |
|
|
|
1,028,460 |
|
|
|
|
| Newcrest Mining Ltd. |
|
|
17,105 |
|
|
|
298,087 |
|
|
|
|
| Orica Ltd. |
|
|
3,980 |
|
|
|
94,281 |
|
|
|
|
| Origin Energy Ltd. |
|
|
31,484 |
|
|
|
402,118 |
|
|
|
|
| OZ Minerals Ltd. |
|
|
21,842 |
|
|
|
97,367 |
|
|
|
|
| Primary Health Care Ltd. |
|
|
11,418 |
|
|
|
62,381 |
|
|
|
|
|
|
|
|
|
|
| Description |
|
Number of
Shares
|
|
|
Value |
|
|
|
|
| Qantas Airways Ltd.* |
|
|
37,254 |
|
|
$ |
73,380 |
|
|
|
|
| QBE Insurance Group Ltd. |
|
|
5,491 |
|
|
|
76,109 |
|
|
|
|
| Ramsay Health Care Ltd. |
|
|
1,156 |
|
|
|
38,338 |
|
|
|
|
| Rio Tinto Ltd. |
|
|
1,027 |
|
|
|
59,410 |
|
|
|
|
| Santos Ltd. |
|
|
27,989 |
|
|
|
358,349 |
|
|
|
|
| Sims Metal Management Ltd. |
|
|
5,437 |
|
|
|
54,449 |
|
|
|
|
| Skilled Group Ltd. |
|
|
69,900 |
|
|
|
206,526 |
|
|
|
|
| Suncorp Group Ltd. |
|
|
32,826 |
|
|
|
441,718 |
|
|
|
|
| TABCORP Holdings Ltd. |
|
|
22,564 |
|
|
|
80,703 |
|
|
|
|
| Tatts Group Ltd. |
|
|
32,697 |
|
|
|
110,843 |
|
|
|
|
| Telstra Corp. Ltd. |
|
|
10,691 |
|
|
|
55,195 |
|
|
|
|
| Toll Holdings Ltd. |
|
|
11,181 |
|
|
|
66,071 |
|
|
|
|
| Transurban Group |
|
|
8,432 |
|
|
|
59,617 |
|
|
|
|
| Treasury Wine Estates Ltd. |
|
|
10,695 |
|
|
|
64,751 |
|
|
|
|
| Wesfarmers Ltd. |
|
|
29,211 |
|
|
|
1,313,374 |
|
|
|
|
| Westpac Banking Corp. |
|
|
11,613 |
|
|
|
406,925 |
|
|
|
|
| Woodside Petroleum Ltd. |
|
|
5,486 |
|
|
|
213,616 |
|
|
|
|
| Woolworths Ltd. |
|
|
8,302 |
|
|
|
313,369 |
|
|
|
|
| WorleyParsons Ltd. |
|
|
919 |
|
|
|
21,694 |
|
|
|
|
|
|
|
|
|
|
|
|
|
| TOTAL AUSTRALIA |
|
|
|
|
|
$ |
12,081,633 |
|
|
|
|
| AUSTRIA – 0.4% |
|
|
|
|
|
|
|
|
|
|
|
| Andritz AG |
|
|
569 |
|
|
|
37,078 |
|
|
|
|
| Erste Group Bank AG* |
|
|
37,508 |
|
|
|
1,175,629 |
|
|
|
|
| OMV AG |
|
|
10,903 |
|
|
|
512,247 |
|
|
|
|
| Raiffeisen International Bank Holding AG# |
|
|
2,579 |
|
|
|
91,007 |
|
|
|
|
| Telekom Austria AG |
|
|
6,978 |
|
|
|
47,841 |
|
|
|
|
| Voestalpine AG |
|
|
4,500 |
|
|
|
140,482 |
|
|
|
|
|
|
|
|
|
|
|
|
|
| TOTAL AUSTRIA |
|
|
|
|
|
$ |
2,004,284 |
|
|
|
|
| BELGIUM – 1.2% |
|
|
|
|
|
|
|
|
|
|
|
| Ageas |
|
|
5,970 |
|
|
|
218,726 |
|
|
|
|
| Anheuser-Busch InBev NV |
|
|
47,329 |
|
|
|
4,503,339 |
|
|
|
|
| Delhaize Group SA |
|
|
6,700 |
|
|
|
420,090 |
|
|
|
|
| Delhaize Group SA ADR |
|
|
2,400 |
|
|
|
150,024 |
|
|
|
|
| KBC Groep NV |
|
|
10,874 |
|
|
|
426,751 |
|
|
|
|
| Mobistar SA |
|
|
1,115 |
|
|
|
26,593 |
|
|
|
|
| Solvay SA |
|
|
2,050 |
|
|
|
300,482 |
|
|
|
|
| Telenet Group Holding NV |
|
|
726 |
|
|
|
39,196 |
|
|
|
|
| UCB SA |
|
|
2,066 |
|
|
|
122,110 |
|
|
|
|
| Umicore SA |
|
|
1,261 |
|
|
|
58,373 |
|
|
|
|
|
|
|
|
|
|
|
|
|
| TOTAL BELGIUM |
|
|
|
|
|
$ |
6,265,684 |
|
|
|
|
| BERMUDA – 0.0%** |
|
|
|
|
|
|
|
|
|
|
|
| Seadrill Ltd. |
|
|
3,421 |
|
|
|
130,931 |
|
|
|
|
| Shangri-La Asia Ltd. |
|
|
2,000 |
|
|
|
3,866 |
|
|
|
|
|
|
|
|
|
|
|
|
|
| TOTAL BERMUDA |
|
|
|
|
|
$ |
134,797 |
|
|
|
|
| BOTSWANA – 0.1% |
|
|
|
|
|
|
|
|
|
|
|
| Barclays Bank of Botswana Ltd. |
|
|
100,300 |
|
|
|
86,264 |
|
ANNUAL REPORT / April
30, 2013
26 PORTFOLIOS OF INVESTMENTS
Wilmington Multi-Manager International Fund (continued)
|
|
|
|
|
|
|
|
|
| Description |
|
Number of
Shares
|
|
|
Value |
|
|
|
|
| Botswana Insurance Holdings Ltd. |
|
|
60,900 |
|
|
$ |
79,132 |
|
|
|
|
| First National Bank of Botswana |
|
|
274,700 |
|
|
|
124,079 |
|
|
|
|
| Sechaba Breweries Ltd. |
|
|
61,203 |
|
|
|
124,590 |
|
|
|
|
| Standard Chartered Bank Botswana Ltd. |
|
|
41,700 |
|
|
|
55,629 |
|
|
|
|
|
|
|
|
|
|
|
|
|
| TOTAL BOTSWANA |
|
|
|
|
|
$ |
469,694 |
|
|
|
|
| BRAZIL – 0.7% |
|
|
|
|
|
|
|
|
|
|
|
| All America Latina Logistica SA |
|
|
11,400 |
|
|
|
57,662 |
|
|
|
|
| Banco Do Brasil SA |
|
|
12,367 |
|
|
|
155,766 |
|
|
|
|
| Banco Santander Brasil SA |
|
|
11,000 |
|
|
|
80,765 |
|
|
|
|
| BM&FBovespa SA |
|
|
21,807 |
|
|
|
151,284 |
|
|
|
|
| BR Malls Participacoes SA |
|
|
5,800 |
|
|
|
68,414 |
|
|
|
|
| BRF - Brasil Foods SA |
|
|
8,856 |
|
|
|
219,724 |
|
|
|
|
| CCR SA |
|
|
20,900 |
|
|
|
204,430 |
|
|
|
|
| Centrais Eletricas Brasileiras SA |
|
|
12,500 |
|
|
|
33,800 |
|
|
|
|
| Cia de Saneamento Basico do Estado de Sao Paulo |
|
|
18,300 |
|
|
|
257,658 |
|
|
|
|
| Cia de Saneamento Basico do Estado de Sao Paulo ADR |
|
|
14,400 |
|
|
|
205,920 |
|
|
|
|
| Cia de Saneamento de Minas Gerais-COPASA |
|
|
10,400 |
|
|
|
239,630 |
|
|
|
|
| Cia Energetica de Minas Gerais |
|
|
2,453 |
|
|
|
30,945 |
|
|
|
|
| Cia Siderurgica Nacional SA |
|
|
10,200 |
|
|
|
40,428 |
|
|
|
|
| Cielo SA |
|
|
8,669 |
|
|
|
228,511 |
|
|
|
|
| Cosan SA Industria e Comercio |
|
|
3,000 |
|
|
|
70,773 |
|
|
|
|
| CPFL Energia SA |
|
|
4,800 |
|
|
|
51,365 |
|
|
|
|
| Cyrela Brazil Realty SA Empreendimentos e Participacoes |
|
|
7,500 |
|
|
|
67,737 |
|
|
|
|
| EDP - Energias do Brasil SA |
|
|
10,300 |
|
|
|
62,858 |
|
|
|
|
| Embraer SA |
|
|
19,600 |
|
|
|
170,848 |
|
|
|
|
| Fibria Celulose SA* |
|
|
2,086 |
|
|
|
22,187 |
|
|
|
|
| Gafisa SA* |
|
|
28,700 |
|
|
|
57,378 |
|
|
|
|
| LLX Logistica SA* |
|
|
13,400 |
|
|
|
13,127 |
|
|
|
|
| Localiza Rent a Car SA |
|
|
4,800 |
|
|
|
85,288 |
|
|
|
|
| Lojas Renner SA |
|
|
2,500 |
|
|
|
94,914 |
|
|
|
|
| Marfrig Alimentos SA* |
|
|
5,050 |
|
|
|
17,214 |
|
|
|
|
| MRV Engenharia e Participacoes SA |
|
|
6,600 |
|
|
|
28,402 |
|
|
|
|
| Natura Cosmeticos SA |
|
|
3,600 |
|
|
|
90,218 |
|
|
|
|
| OGX Petroleo e Gas Participacoes SA* |
|
|
13,400 |
|
|
|
13,529 |
|
|
|
|
| Oi SA |
|
|
9,480 |
|
|
|
27,576 |
|
|
|
|
| PDG Realty SA Empreendimentos e Participacoes |
|
|
37,100 |
|
|
|
41,907 |
|
|
|
|
| Souza Cruz SA |
|
|
5,500 |
|
|
|
84,531 |
|
|
|
|
| Tim Participacoes SA |
|
|
25,006 |
|
|
|
104,486 |
|
|
|
|
| Totvs SA |
|
|
4,400 |
|
|
|
82,733 |
|
|
|
|
| Tractebel Energia SA |
|
|
4,800 |
|
|
|
85,312 |
|
|
|
|
| Ultrapar Participacoes SA |
|
|
4,000 |
|
|
|
106,360 |
|
|
|
|
| Weg SA |
|
|
7,900 |
|
|
|
104,557 |
|
|
|
|
|
|
|
|
|
|
|
|
|
| TOTAL BRAZIL |
|
|
|
|
|
$ |
3,458,237 |
|
|
|
|
|
|
|
|
|
|
| Description |
|
Number of
Shares
|
|
|
Value |
|
|
|
|
| BULGARIA – 0.0%** |
|
|
|
|
|
|
|
|
|
|
|
| Central Cooperative Bank AD* |
|
|
20,482 |
|
|
$ |
12,219 |
|
|
|
|
| Chimimport AD* |
|
|
10,600 |
|
|
|
9,993 |
|
|
|
|
| Doverie Holding AD |
|
|
11,040 |
|
|
|
6,319 |
|
|
|
|
| Olovno Tzinkov Komplex AD* |
|
|
900 |
|
|
|
133 |
|
|
|
|
| Petrol AD* |
|
|
37,250 |
|
|
|
125,412 |
|
|
|
|
| Sopharma AD Sofia |
|
|
14,000 |
|
|
|
24,699 |
|
|
|
|
|
|
|
|
|
|
|
|
|
| TOTAL BULGARIA |
|
|
|
|
|
$ |
178,775 |
|
|
|
|
| CANADA – 3.3% |
|
|
|
|
|
|
|
|
|
|
|
| Agrium, Inc. |
|
|
1,342 |
|
|
|
123,017 |
|
|
|
|
| Alimentation Couche Tard, Inc. |
|
|
1,400 |
|
|
|
85,060 |
|
|
|
|
| Atco Ltd. |
|
|
1,600 |
|
|
|
153,242 |
|
|
|
|
| Athabasca Oil Sands Corp.* |
|
|
3,780 |
|
|
|
27,352 |
|
|
|
|
| AuRico Gold, Inc. |
|
|
95 |
|
|
|
488 |
|
|
|
|
| Bank of Montreal |
|
|
3,900 |
|
|
|
244,619 |
|
|
|
|
| Bank of Nova Scotia |
|
|
7,095 |
|
|
|
409,101 |
|
|
|
|
| Barrick Gold Corp. (067901108) |
|
|
19,441 |
|
|
|
383,182 |
|
|
|
|
| Barrick Gold Corp. (2024644) |
|
|
3,275 |
|
|
|
64,561 |
|
|
|
|
| Baytex Energy Corp. |
|
|
436 |
|
|
|
17,229 |
|
|
|
|
| Bell Aliant, Inc. |
|
|
500 |
|
|
|
13,370 |
|
|
|
|
| Bombardier, Inc. |
|
|
8,100 |
|
|
|
32,160 |
|
|
|
|
| Bonavista Energy Corp. |
|
|
1,621 |
|
|
|
25,664 |
|
|
|
|
| Brookfield Asset Management, Inc. |
|
|
2,553 |
|
|
|
98,552 |
|
|
|
|
| CAE, Inc. |
|
|
1,400 |
|
|
|
15,133 |
|
|
|
|
| Cameco Corp. (13321L108) |
|
|
3,902 |
|
|
|
76,128 |
|
|
|
|
| Cameco Corp. (2166160) |
|
|
1,611 |
|
|
|
31,406 |
|
|
|
|
| Canadian Imperial Bank of Commerce |
|
|
7,000 |
|
|
|
559,819 |
|
|
|
|
| Canadian National Railway Co. |
|
|
2,945 |
|
|
|
288,317 |
|
|
|
|
| Canadian Natural Resources Ltd. |
|
|
|
|
|
|
|
|
| (136385101) |
|
|
21,257 |
|
|
|
623,680 |
|
|
|
|
| Canadian Natural Resources Ltd. (2171573) |
|
|
5,353 |
|
|
|
157,011 |
|
|
|
|
| Canadian Pacific Railway Ltd. |
|
|
133 |
|
|
|
16,576 |
|
|
|
|
| Canadian Tire Corp. Ltd. |
|
|
6,273 |
|
|
|
462,015 |
|
|
|
|
| Canadian Utilities Ltd. |
|
|
698 |
|
|
|
57,450 |
|
|
|
|
| Cenovus Energy, Inc. |
|
|
6,295 |
|
|
|
188,391 |
|
|
|
|
| Crescent Point Energy Corp. |
|
|
100 |
|
|
|
3,820 |
|
|
|
|
| Dorel Industries, Inc. |
|
|
8,700 |
|
|
|
375,651 |
|
|
|
|
| Eldorado Gold Corp. (2307873) |
|
|
2,689 |
|
|
|
21,273 |
|
|
|
|
| Eldorado Gold Corp. (284902103) |
|
|
910 |
|
|
|
7,207 |
|
|
|
|
| Empire Co. Ltd. |
|
|
8,000 |
|
|
|
543,947 |
|
|
|
|
| Enbridge, Inc. |
|
|
5,558 |
|
|
|
264,480 |
|
|
|
|
| Enerplus Corp. |
|
|
1,090 |
|
|
|
15,385 |
|
|
|
|
| Ensign Energy Services, Inc. |
|
|
2,332 |
|
|
|
39,258 |
|
|
|
|
| Fairfax Financial Holdings Ltd. |
|
|
450 |
|
|
|
180,523 |
|
|
|
|
| Finning International, Inc. |
|
|
1,116 |
|
|
|
24,082 |
|
|
|
|
| First Quantum Minerals Ltd. |
|
|
6,297 |
|
|
|
109,945 |
|
|
|
|
| Franco-Nevada Corp. |
|
|
1,300 |
|
|
|
56,596 |
|
April 30, 2013 / ANNUAL REPORT
PORTFOLIOS OF INVESTMENTS 27
Wilmington Multi-Manager International Fund (continued)
|
|
|
|
|
|
|
|
|
| Description |
|
Number of
Shares
|
|
|
Value |
|
|
|
|
| Genworth MI Canada, Inc. |
|
|
1,061 |
|
|
$ |
26,382 |
|
|
|
|
| George Weston Ltd. |
|
|
600 |
|
|
|
46,222 |
|
|
|
|
| Gildan Activewear, Inc. |
|
|
600 |
|
|
|
24,126 |
|
|
|
|
| Goldcorp, Inc. (2676302) |
|
|
6,240 |
|
|
|
184,701 |
|
|
|
|
| Goldcorp, Inc. (380956409) |
|
|
15,542 |
|
|
|
459,732 |
|
|
|
|
| Husky Energy, Inc. |
|
|
7,400 |
|
|
|
213,894 |
|
|
|
|
| IAMGOLD Corp. (2446646) |
|
|
8,028 |
|
|
|
43,110 |
|
|
|
|
| IAMGOLD Corp. (450913108) |
|
|
8,324 |
|
|
|
44,700 |
|
|
|
|
| Imperial Oil Ltd. |
|
|
2,819 |
|
|
|
112,150 |
|
|
|
|
| Industrial Alliance Insurance & Financial Services, Inc. |
|
|
1,794 |
|
|
|
66,279 |
|
|
|
|
| Inmet Mining Corp.†† |
|
|
1,400 |
|
|
|
93,926 |
|
|
|
|
| Intact Financial Corp. |
|
|
1,031 |
|
|
|
62,835 |
|
|
|
|
| Kinross Gold Corp. |
|
|
14,013 |
|
|
|
76,362 |
|
|
|
|
| Laurentian Bank of Canada |
|
|
5,700 |
|
|
|
250,134 |
|
|
|
|
| Loblaw Cos. Ltd. |
|
|
1,818 |
|
|
|
77,145 |
|
|
|
|
| Lundin Mining Corp.* |
|
|
43,600 |
|
|
|
171,379 |
|
|
|
|
| Magna International, Inc. |
|
|
14,420 |
|
|
|
867,390 |
|
|
|
|
| Manulife Financial Corp. |
|
|
45,835 |
|
|
|
677,437 |
|
|
|
|
| Metro, Inc. |
|
|
4,500 |
|
|
|
305,167 |
|
|
|
|
| National Bank of Canada |
|
|
3,400 |
|
|
|
256,995 |
|
|
|
|
| New Gold, Inc.* |
|
|
3,377 |
|
|
|
27,084 |
|
|
|
|
| Onex Corp. |
|
|
500 |
|
|
|
24,939 |
|
|
|
|
| Open Text Corp.* |
|
|
300 |
|
|
|
19,603 |
|
|
|
|
| Pan American Silver Corp. (2669272) |
|
|
600 |
|
|
|
7,891 |
|
|
|
|
| Pan American Silver Corp. (697900108) |
|
|
589 |
|
|
|
7,775 |
|
|
|
|
| Pembina Pipeline Corp. |
|
|
1,266 |
|
|
|
41,557 |
|
|
|
|
| Pengrowth Energy Corp. |
|
|
6,876 |
|
|
|
35,082 |
|
|
|
|
| Penn West Petroleum Ltd. (707887105) |
|
|
3,500 |
|
|
|
32,305 |
|
|
|
|
| Penn West Petroleum Ltd. (B63FY34)# |
|
|
6,303 |
|
|
|
58,184 |
|
|
|
|
| PetroBakken Energy Ltd. |
|
|
3,400 |
|
|
|
29,024 |
|
|
|
|
| Potash Corp. of Saskatchewan, Inc. (2696980) |
|
|
1,813 |
|
|
|
76,303 |
|
|
|
|
| Potash Corp. of Saskatchewan, Inc. (73755L107) |
|
|
40,813 |
|
|
|
1,718,227 |
|
|
|
|
| Power Corp. of Canada |
|
|
1,700 |
|
|
|
45,780 |
|
|
|
|
| Power Financial Corp. |
|
|
3,300 |
|
|
|
97,482 |
|
|
|
|
| Precision Drilling Corp. (74022D308) |
|
|
3,100 |
|
|
|
25,110 |
|
|
|
|
| Precision Drilling Corp. (B5YPLH9) |
|
|
8,400 |
|
|
|
68,120 |
|
|
|
|
| Research In Motion Ltd. (2117265)#,* |
|
|
12,417 |
|
|
|
203,366 |
|
|
|
|
| Research In Motion Ltd. (760975102)# |
|
|
8,604 |
|
|
|
140,159 |
|
|
|
|
| Ritchie Bros Auctioneers, Inc. |
|
|
500 |
|
|
|
10,125 |
|
|
|
|
| Rogers Communications, Inc. |
|
|
1,391 |
|
|
|
68,608 |
|
|
|
|
| Royal Bank of Canada |
|
|
5,300 |
|
|
|
319,752 |
|
|
|
|
| Saputo, Inc. |
|
|
800 |
|
|
|
41,189 |
|
|
|
|
| Shaw Communications, Inc. |
|
|
3,600 |
|
|
|
81,973 |
|
|
|
|
| Sherritt International Corp. |
|
|
44,900 |
|
|
|
209,915 |
|
|
|
|
|
|
|
|
|
|
| Description |
|
Number of
Shares
|
|
|
Value |
|
|
|
|
| Shoppers Drug Mart Corp. |
|
|
1,200 |
|
|
$ |
53,744 |
|
|
|
|
| Silver Wheaton Corp. |
|
|
1,891 |
|
|
|
46,231 |
|
|
|
|
| SNC-Lavalin Group, Inc. |
|
|
800 |
|
|
|
34,527 |
|
|
|
|
| Sun Life Financial, Inc. (2566124) |
|
|
8,575 |
|
|
|
241,899 |
|
|
|
|
| Sun Life Financial, Inc. (866796105) |
|
|
4,901 |
|
|
|
138,159 |
|
|
|
|
| Suncor Energy, Inc. |
|
|
34,396 |
|
|
|
1,072,389 |
|
|
|
|
| Talisman Energy, Inc. (2068299) |
|
|
23,990 |
|
|
|
287,656 |
|
|
|
|
| Talisman Energy, Inc. (87425E103) |
|
|
2,300 |
|
|
|
27,347 |
|
|
|
|
| Teck Resources Ltd. (2879327) |
|
|
4,400 |
|
|
|
117,048 |
|
|
|
|
| Teck Resources Ltd. (878742204) |
|
|
11,509 |
|
|
|
305,794 |
|
|
|
|
| TELUS Corp. |
|
|
2,362 |
|
|
|
84,989 |
|
|
|
|
| Thomson Reuters Corp. |
|
|
8,775 |
|
|
|
293,966 |
|
|
|
|
| Tim Hortons, Inc. |
|
|
800 |
|
|
|
43,341 |
|
|
|
|
| Toronto-Dominion Bank |
|
|
3,305 |
|
|
|
270,941 |
|
|
|
|
| Tourmaline Oil Corp.* |
|
|
1,041 |
|
|
|
41,301 |
|
|
|
|
| TransAlta Corp. |
|
|
8,900 |
|
|
|
130,834 |
|
|
|
|
| TransCanada Corp. |
|
|
1,435 |
|
|
|
71,134 |
|
|
|
|
| Transcontinental, Inc. |
|
|
18,800 |
|
|
|
242,033 |
|
|
|
|
| Uranium One, Inc.* |
|
|
8,600 |
|
|
|
23,902 |
|
|
|
|
| Valeant Pharmaceuticals International, Inc.* |
|
|
2,239 |
|
|
|
170,017 |
|
|
|
|
| Vermilion Energy, Inc. |
|
|
982 |
|
|
|
50,394 |
|
|
|
|
| Yamana Gold, Inc. |
|
|
20,386 |
|
|
|
252,334 |
|
|
|
|
|
|
|
|
|
|
|
|
|
| TOTAL CANADA |
|
|
|
|
|
$ |
17,245,289 |
|
|
|
|
| CAYMAN ISLANDS – 0.1% |
|
|
|
|
|
|
|
|
|
|
|
| Chaowei Power Holdings Ltd. |
|
|
227,000 |
|
|
|
106,770 |
|
|
|
|
| Sands China Ltd. |
|
|
22,000 |
|
|
|
115,384 |
|
|
|
|
| Tianneng Power International Ltd. |
|
|
428,000 |
|
|
|
270,804 |
|
|
|
|
| Veripos, Inc. |
|
|
270 |
|
|
|
918 |
|
|
|
|
| Wynn Macau Ltd.* |
|
|
20,000 |
|
|
|
60,695 |
|
|
|
|
|
|
|
|
|
|
|
|
|
| TOTAL CAYMAN ISLANDS |
|
|
|
|
|
$ |
554,571 |
|
|
|
|
| CHILE – 0.6% |
|
|
|
|
|
|
|
|
|
|
|
| Administradora de Fondos de Pensiones Provida SA |
|
|
14,200 |
|
|
|
98,295 |
|
|
|
|
| AES Gener SA |
|
|
101,000 |
|
|
|
73,345 |
|
|
|
|
| Antarchile SA |
|
|
8,664 |
|
|
|
137,976 |
|
|
|
|
| Banco de Chile |
|
|
1,936,427 |
|
|
|
302,008 |
|
|
|
|
| Banco de Credito e Inversiones |
|
|
1,979 |
|
|
|
142,032 |
|
|
|
|
| Banco Santander Chile |
|
|
876,218 |
|
|
|
58,514 |
|
|
|
|
| Banco Santander Chile ADR |
|
|
4,272 |
|
|
|
113,806 |
|
|
|
|
| Capital SA |
|
|
2,590 |
|
|
|
81,668 |
|
|
|
|
| Cencosud SA |
|
|
41,800 |
|
|
|
236,057 |
|
|
|
|
| Cia Cervecerias Unidas SA ADR |
|
|
3,500 |
|
|
|
120,855 |
|
|
|
|
| Cia General de Electricidad SA |
|
|
7,900 |
|
|
|
47,808 |
|
|
|
|
| Colbun SA |
|
|
322,547 |
|
|
|
99,308 |
|
|
|
|
| Empresa Nacional de Electricidad SA ADR |
|
|
3,400 |
|
|
|
181,254 |
|
|
|
|
| Empresas CMPC SA |
|
|
43,750 |
|
|
|
161,641 |
|
|
|
|
| Empresas COPEC SA |
|
|
17,346 |
|
|
|
248,616 |
|
|
| ANNUAL REPORT / April 30, 2013 |
28 PORTFOLIOS OF INVESTMENTS
Wilmington Multi-Manager International Fund (continued)
|
|
|
|
|
|
|
|
|
| Description |
|
Number of
Shares
|
|
|
Value |
|
|
|
|
| Enersis SA |
|
|
459,155 |
|
|
$ |
173,054 |
|
|
|
|
| ENTEL Chile SA |
|
|
3,669 |
|
|
|
70,739 |
|
|
|
|
| Lan Airlines SA |
|
|
9,926 |
|
|
|
205,073 |
|
|
|
|
| Parque Arauco SA |
|
|
28,900 |
|
|
|
74,737 |
|
|
|
|
| Quinenco SA |
|
|
31,602 |
|
|
|
103,674 |
|
|
|
|
| SACI Falabella |
|
|
30,748 |
|
|
|
351,583 |
|
|
|
|
| Sociedad Matriz SAAM SA |
|
|
373,941 |
|
|
|
42,877 |
|
|
|
|
| Sonda SA |
|
|
39,007 |
|
|
|
135,007 |
|
|
|
|
| Vina Concha y Toro SA ADR |
|
|
1,100 |
|
|
|
43,109 |
|
|
|
|
|
|
|
|
|
|
|
|
|
| TOTAL CHILE |
|
|
|
|
|
$ |
3,303,036 |
|
|
|
|
| CHINA – 3.1% |
|
|
|
|
|
|
|
|
|
|
|
| Agricultural Bank of China Ltd. |
|
|
270,000 |
|
|
|
129,083 |
|
|
|
|
| Aluminum Corp. of China Ltd.#, * |
|
|
142,000 |
|
|
|
53,615 |
|
|
|
|
| Anhui Conch Cement Co. Ltd. |
|
|
28,500 |
|
|
|
103,200 |
|
|
|
|
| Baidu, Inc. ADR* |
|
|
8,850 |
|
|
|
759,772 |
|
|
|
|
| Bank of China Ltd. |
|
|
1,837,000 |
|
|
|
859,302 |
|
|
|
|
| Bank of Communications Co. Ltd.# |
|
|
78,800 |
|
|
|
62,653 |
|
|
|
|
| Beijing Capital International Airport Co. Ltd. |
|
|
90,000 |
|
|
|
62,396 |
|
|
|
|
| Beijing Enterprises Holdings Ltd. |
|
|
11,500 |
|
|
|
86,026 |
|
|
|
|
| Belle International Holdings Ltd. |
|
|
55,000 |
|
|
|
89,728 |
|
|
|
|
| Byd Co. Ltd.#,* |
|
|
42,500 |
|
|
|
151,705 |
|
|
|
|
| Chaoda Modern Agriculture Holdings Ltd.* |
|
|
98,140 |
|
|
|
— |
|
|
|
|
| China Agri-Industries Holdings Ltd. |
|
|
145,000 |
|
|
|
71,191 |
|
|
|
|
| China BlueChemical Ltd. |
|
|
236,000 |
|
|
|
143,848 |
|
|
|
|
| China Citic Bank Corp. Ltd. |
|
|
156,000 |
|
|
|
87,849 |
|
|
|
|
| China Coal Energy Co. Ltd. |
|
|
75,000 |
|
|
|
57,699 |
|
|
|
|
| China Communications Construction Co. Ltd. |
|
|
96,000 |
|
|
|
91,916 |
|
|
|
|
| China Construction Bank Corp. |
|
|
823,810 |
|
|
|
690,034 |
|
|
|
|
| China COSCO Holdings Co. Ltd.* |
|
|
135,500 |
|
|
|
57,272 |
|
|
|
|
| China Eastern Airlines Corp. Ltd.* |
|
|
74,000 |
|
|
|
29,657 |
|
|
|
|
| China Green Holdings Ltd.* |
|
|
45,000 |
|
|
|
6,263 |
|
|
|
|
| China Huiyuan Juice Group Ltd.* |
|
|
29,000 |
|
|
|
13,042 |
|
|
|
|
| China International Marine Containers Group Co. Ltd.* |
|
|
39,000 |
|
|
|
62,318 |
|
|
|
|
| China Life Insurance Co. Ltd. |
|
|
82,000 |
|
|
|
224,016 |
|
|
|
|
| China Mengniu Dairy Co. Ltd. |
|
|
36,000 |
|
|
|
101,364 |
|
|
|
|
| China Merchants Bank Co. Ltd. |
|
|
55,552 |
|
|
|
118,404 |
|
|
|
|
| China Merchants Holdings International Co. Ltd. |
|
|
18,000 |
|
|
|
56,945 |
|
|
|
|
| China Minsheng Banking Corp. Ltd.# |
|
|
89,500 |
|
|
|
114,987 |
|
|
|
|
| China Mobile Ltd. |
|
|
270,500 |
|
|
|
2,961,151 |
|
|
|
|
| China Oilfield Services Ltd. |
|
|
30,000 |
|
|
|
59,148 |
|
|
|
|
| China Overseas Land & Investment Ltd. |
|
|
52,320 |
|
|
|
159,789 |
|
|
|
|
| China Pacific Insurance Group Co. Ltd. |
|
|
135,400 |
|
|
|
486,803 |
|
|
|
|
| China Petroleum & Chemical Corp. |
|
|
594,000 |
|
|
|
649,867 |
|
|
|
|
| China Railway Construction Corp. Ltd. |
|
|
89,400 |
|
|
|
90,205 |
|
|
|
|
|
|
|
|
|
|
| Description |
|
Number of
Shares
|
|
|
Value |
|
|
|
|
| China Resources Enterprise Ltd. |
|
|
26,000 |
|
|
$ |
89,122 |
|
|
|
|
| China Resources Land Ltd. |
|
|
28,000 |
|
|
|
84,792 |
|
|
|
|
| China Resources Power Holdings Co. Ltd. |
|
|
39,600 |
|
|
|
129,616 |
|
|
|
|
| China Shenhua Energy Co. Ltd. |
|
|
52,000 |
|
|
|
183,940 |
|
|
|
|
| China Shipping Development Co. Ltd.# |
|
|
112,000 |
|
|
|
48,061 |
|
|
|
|
| China Southern Airlines Co. Ltd. |
|
|
81,000 |
|
|
|
42,587 |
|
|
|
|
| China Telecom Corp. Ltd. |
|
|
332,000 |
|
|
|
169,419 |
|
|
|
|
| China Unicom Hong Kong Ltd. |
|
|
118,652 |
|
|
|
170,330 |
|
|
|
|
| China Yurun Food Group Ltd.#,* |
|
|
106,000 |
|
|
|
63,107 |
|
|
|
|
| Chongqing Rural Commercial Bank |
|
|
609,000 |
|
|
|
331,177 |
|
|
|
|
| CNOOC Ltd. |
|
|
207,000 |
|
|
|
386,250 |
|
|
|
|
| COSCO Pacific Ltd. |
|
|
38,000 |
|
|
|
50,339 |
|
|
|
|
| Ctrip.com International Ltd. ADR#, * |
|
|
2,800 |
|
|
|
61,544 |
|
|
|
|
| Datang International Power Generation Co. Ltd. |
|
|
132,000 |
|
|
|
58,174 |
|
|
|
|
| Dongfeng Motor Group Co. Ltd. |
|
|
94,000 |
|
|
|
140,028 |
|
|
|
|
| Focus Media Holding Ltd. ADR# |
|
|
3,300 |
|
|
|
89,991 |
|
|
|
|
| Global Bio-Chem Technology Group Co. Ltd. |
|
|
282,000 |
|
|
|
24,348 |
|
|
|
|
| Golden Eagle Retail Group Ltd. |
|
|
53,000 |
|
|
|
93,295 |
|
|
|
|
| Guangzhou Automobile Group Co. Ltd.# |
|
|
64,974 |
|
|
|
53,586 |
|
|
|
|
| Harbin Electric Co. Ltd. |
|
|
24,000 |
|
|
|
18,402 |
|
|
|
|
| Hengan International Group Co. Ltd. |
|
|
13,000 |
|
|
|
134,353 |
|
|
|
|
| Industrial & Commercial Bank of China |
|
|
810,000 |
|
|
|
569,912 |
|
|
|
|
| Inner Mongolia Yitai Coal Co. |
|
|
6,600 |
|
|
|
34,386 |
|
|
|
|
| Intime Department Store Group Co. Ltd. |
|
|
35,000 |
|
|
|
41,494 |
|
|
|
|
| Jiangxi Copper Co. Ltd. |
|
|
20,000 |
|
|
|
38,762 |
|
|
|
|
| Kingboard Chemical Holdings Ltd. |
|
|
113,500 |
|
|
|
308,608 |
|
|
|
|
| Kunlun Energy Co. Ltd. |
|
|
54,000 |
|
|
|
105,632 |
|
|
|
|
| Lenovo Group Ltd. |
|
|
118,000 |
|
|
|
107,810 |
|
|
|
|
| NetEase, Inc. ADR |
|
|
1,600 |
|
|
|
90,224 |
|
|
|
|
| New Oriental Education & Technology Group ADR |
|
|
10,800 |
|
|
|
206,604 |
|
|
|
|
| Nine Dragons Paper Holdings Ltd. |
|
|
93,000 |
|
|
|
80,654 |
|
|
|
|
| Parkson Retail Group Ltd. |
|
|
84,000 |
|
|
|
45,463 |
|
|
|
|
| PetroChina Co. Ltd. |
|
|
1,406,000 |
|
|
|
1,788,267 |
|
|
|
|
| PICC Property & Casualty Co. Ltd. |
|
|
58,000 |
|
|
|
74,442 |
|
|
|
|
| Ping An Insurance Group Co. |
|
|
22,000 |
|
|
|
174,211 |
|
|
|
|
| Shandong Weigao Group Medical Polymer Co. Ltd.# |
|
|
64,000 |
|
|
|
61,442 |
|
|
|
|
| Shanghai Electric Group Co. Ltd. |
|
|
90,000 |
|
|
|
31,546 |
|
|
|
|
| Shanghai Industrial Holdings Ltd. |
|
|
13,000 |
|
|
|
41,211 |
|
|
|
|
| Shanghai Zhenhua Heavy Industries Co. Ltd.* |
|
|
62,400 |
|
|
|
22,402 |
|
|
|
|
| SINA Corp. (2579230)* |
|
|
900 |
|
|
|
50,688 |
|
|
|
|
| SINA Corp. (G81477104)* |
|
|
1,000 |
|
|
|
56,320 |
|
|
|
|
| Sinopec Shanghai Petrochemical Co. Ltd. |
|
|
54,000 |
|
|
|
18,580 |
|
|
|
|
| Sohu.com, Inc.* |
|
|
1,300 |
|
|
|
66,872 |
|
|
|
|
| Tencent Holdings Ltd. |
|
|
13,800 |
|
|
|
473,388 |
|
April 30, 2013 / ANNUAL REPORT
PORTFOLIOS OF INVESTMENTS 29
Wilmington Multi-Manager International Fund (continued)
|
|
|
|
|
|
|
|
|
| Description |
|
Number of
Shares
|
|
|
Value |
|
|
|
|
| Tingyi Cayman Islands Holding Corp. |
|
|
44,000 |
|
|
$ |
121,621 |
|
|
|
|
| Want Want China Holdings Ltd. |
|
|
143,000 |
|
|
|
226,658 |
|
|
|
|
| Wumart Stores, Inc. |
|
|
27,000 |
|
|
|
47,319 |
|
|
|
|
| Yangzijiang Shipbuilding Holdings Ltd. |
|
|
93,000 |
|
|
|
71,730 |
|
|
|
|
| Yantai Changyu Pioneer Wine Co. Ltd. |
|
|
9,100 |
|
|
|
41,500 |
|
|
|
|
| Yanzhou Coal Mining Co. Ltd. |
|
|
40,000 |
|
|
|
41,649 |
|
|
|
|
| Zijin Mining Group Co. Ltd. |
|
|
90,000 |
|
|
|
26,559 |
|
|
|
|
| ZTE Corp.# |
|
|
43,840 |
|
|
|
73,894 |
|
|
|
|
|
|
|
|
|
|
|
|
|
| TOTAL CHINA |
|
|
|
|
|
$ |
16,253,557 |
|
|
|
|
| COLOMBIA – 0.3% |
|
|
|
|
|
|
|
|
|
|
|
| Almacenes Exito SA |
|
|
9,203 |
|
|
|
150,872 |
|
|
|
|
| Banco de Bogota SA |
|
|
2,920 |
|
|
|
100,795 |
|
|
|
|
| Bancolombia SA ADR |
|
|
3,100 |
|
|
|
210,087 |
|
|
|
|
| Cementos Argos SA |
|
|
7,800 |
|
|
|
34,831 |
|
|
|
|
| Corp. Financiera Colombiana SA (B000C92) |
|
|
2,416 |
|
|
|
46,729 |
|
|
|
|
| Corp. Financiera Colombiana SA (B9FR7T6)* |
|
|
64 |
|
|
|
1,175 |
|
|
|
|
| Ecopetrol SA |
|
|
96,190 |
|
|
|
231,372 |
|
|
|
|
| Empresa de Energia de Bogota SA |
|
|
117,410 |
|
|
|
87,812 |
|
|
|
|
| Grupo Argos SA |
|
|
10,800 |
|
|
|
120,244 |
|
|
|
|
| Grupo Aval Acciones y Valores |
|
|
107,700 |
|
|
|
74,649 |
|
|
|
|
| Grupo de Inversiones Suramericana SA |
|
|
5,600 |
|
|
|
118,131 |
|
|
|
|
| Grupo Nutresa SA |
|
|
13,178 |
|
|
|
181,667 |
|
|
|
|
| Grupo Odinsa SA (B06MW70) |
|
|
5,784 |
|
|
|
29,276 |
|
|
|
|
| Grupo Odinsa SA (B50LC56)* |
|
|
289 |
|
|
|
1,463 |
|
|
|
|
| Interconexion Electrica SA ESP |
|
|
25,278 |
|
|
|
116,343 |
|
|
|
|
| Isagen SA ESP |
|
|
46,200 |
|
|
|
64,297 |
|
|
|
|
|
|
|
|
|
|
|
|
|
| TOTAL COLOMBIA |
|
|
|
|
|
$ |
1,569,743 |
|
|
|
|
| CROATIA – 0.1% |
|
|
|
|
|
|
|
|
|
|
|
| Atlantska Plovidba DD* |
|
|
562 |
|
|
|
30,947 |
|
|
|
|
| Ericsson Nikola Tesla |
|
|
200 |
|
|
|
52,416 |
|
|
|
|
| Hrvatski Telekom DD |
|
|
5,250 |
|
|
|
195,360 |
|
|
|
|
| Koncar-Elektroindustrija DD |
|
|
920 |
|
|
|
115,748 |
|
|
|
|
| Petrokemija DD* |
|
|
1,500 |
|
|
|
61,844 |
|
|
|
|
| Podravka DD* |
|
|
1,000 |
|
|
|
47,091 |
|
|
|
|
| Privredna Banka Zagreb DD |
|
|
830 |
|
|
|
74,690 |
|
|
|
|
| Tankerska Plovidba DD* |
|
|
40 |
|
|
|
2,578 |
|
|
|
|
| VIRO Tvornica Secera |
|
|
370 |
|
|
|
40,936 |
|
|
|
|
| Zagrebacka Banka DD |
|
|
3,000 |
|
|
|
18,887 |
|
|
|
|
|
|
|
|
|
|
|
|
|
| TOTAL CROATIA |
|
|
|
|
|
$ |
640,497 |
|
|
|
|
| CZECH REPUBLIC – 0.3% |
|
|
|
|
|
|
|
|
|
|
|
| CEZ AS |
|
|
20,930 |
|
|
|
605,772 |
|
|
|
|
| Komercni Banka AS |
|
|
2,320 |
|
|
|
443,463 |
|
|
|
|
| New World Resources PLC |
|
|
30,670 |
|
|
|
78,997 |
|
|
|
|
| Pegas Nonwovens SA |
|
|
2,900 |
|
|
|
76,768 |
|
|
|
|
| Philip Morris CR AS |
|
|
250 |
|
|
|
142,569 |
|
|
|
|
|
|
|
|
|
|
| Description |
|
Number of
Shares
|
|
|
Value |
|
|
|
|
| Telefonica Czech Republic AS |
|
|
12,532 |
|
|
$ |
181,067 |
|
|
|
|
| Unipetrol AS* |
|
|
21,709 |
|
|
|
190,634 |
|
|
|
|
|
|
|
|
|
|
|
|
|
| TOTAL CZECH REPUBLIC |
|
|
|
|
|
$ |
1,719,270 |
|
|
|
|
| DENMARK – 1.1% |
|
|
|
|
|
|
|
|
|
|
|
| AP Moeller - Maersk A/S Class A |
|
|
36 |
|
|
|
256,148 |
|
|
|
|
| AP Moeller - Maersk A/S Class B |
|
|
10 |
|
|
|
68,361 |
|
|
|
|
| Carlsberg A/S |
|
|
3,041 |
|
|
|
282,285 |
|
|
|
|
| Coloplast A/S |
|
|
685 |
|
|
|
37,268 |
|
|
|
|
| Danske Bank A/S* |
|
|
16,125 |
|
|
|
304,777 |
|
|
|
|
| DSV A/S |
|
|
1,213 |
|
|
|
30,533 |
|
|
|
|
| H Lundbeck A/S |
|
|
9,528 |
|
|
|
190,523 |
|
|
|
|
| Novo-Nordisk A/S |
|
|
25,602 |
|
|
|
4,490,785 |
|
|
|
|
| Novozymes A/S |
|
|
1,740 |
|
|
|
60,089 |
|
|
|
|
| TDC A/S |
|
|
15,338 |
|
|
|
124,414 |
|
|
|
|
| TrygVesta A/S |
|
|
98 |
|
|
|
8,486 |
|
|
|
|
| William Demant Holding A/S* |
|
|
139 |
|
|
|
11,123 |
|
|
|
|
|
|
|
|
|
|
|
|
|
| TOTAL DENMARK |
|
|
|
|
|
$ |
5,864,792 |
|
|
|
|
| EGYPT – 0.3% |
|
|
|
|
|
|
|
|
|
|
|
| Alexandria Mineral Oils Co. |
|
|
4,000 |
|
|
|
39,399 |
|
|
|
|
| Commercial International Bank Egypt SAE |
|
|
60,970 |
|
|
|
268,965 |
|
|
|
|
| Eastern Tobacco |
|
|
6,070 |
|
|
|
85,777 |
|
|
|
|
| Egyptian Financial Group-Hermes Holding* |
|
|
54,250 |
|
|
|
77,844 |
|
|
|
|
| Egyptian International Pharmaceutical Industrial Co. |
|
|
8,690 |
|
|
|
52,484 |
|
|
|
|
| Egyptian Kuwaiti Holding Co. SAE |
|
|
77,173 |
|
|
|
90,292 |
|
|
|
|
| ElSwedy Electric Co. |
|
|
6,134 |
|
|
|
17,329 |
|
|
|
|
| EZZ Steel |
|
|
26,500 |
|
|
|
35,159 |
|
|
|
|
| Juhayna Food Industries |
|
|
95,000 |
|
|
|
113,574 |
|
|
|
|
| Misr Beni Suef Cement Co. |
|
|
8,812 |
|
|
|
57,580 |
|
|
|
|
| National Societe Generale Bank SAE |
|
|
7,245 |
|
|
|
28,994 |
|
|
|
|
| Orascom Construction Industries*,†† |
|
|
9,520 |
|
|
|
320,475 |
|
|
|
|
| Orascom Telecom Holding SAE* |
|
|
324,755 |
|
|
|
218,712 |
|
|
|
|
| Orascom Telecom Media And Technology Holding SAE |
|
|
224,975 |
|
|
|
15,898 |
|
|
|
|
| Sidi Kerir Petrochemicals Co. |
|
|
29,750 |
|
|
|
52,899 |
|
|
|
|
| Talaat Moustafa Group* |
|
|
110,387 |
|
|
|
62,880 |
|
|
|
|
| Telecom Egypt Co. |
|
|
49,980 |
|
|
|
91,033 |
|
|
|
|
|
|
|
|
|
|
|
|
|
| TOTAL EGYPT |
|
|
|
|
|
$ |
1,629,294 |
|
|
|
|
| ESTONIA – 0.1% |
|
|
|
|
|
|
|
|
|
|
|
| AS Merko Ehitus* |
|
|
4,300 |
|
|
|
40,773 |
|
|
|
|
| AS Tallinna Vesi |
|
|
5,400 |
|
|
|
78,227 |
|
|
|
|
| Nordecon AS* |
|
|
12,000 |
|
|
|
18,174 |
|
|
|
|
| Olympic Entertainment Group AS |
|
|
42,630 |
|
|
|
102,178 |
|
|
|
|
| Tallink Group AS* |
|
|
306,420 |
|
|
|
419,682 |
|
|
|
|
| Tallinna Kaubamaja AS |
|
|
11,600 |
|
|
|
87,077 |
|
|
|
|
|
|
|
|
|
|
|
|
|
| TOTAL ESTONIA |
|
|
|
|
|
$ |
746,111 |
|
ANNUAL REPORT / April
30, 2013
30 PORTFOLIOS OF INVESTMENTS
Wilmington Multi-Manager International Fund (continued)
|
|
|
|
|
|
|
|
|
| Description |
|
Number of
Shares
|
|
|
Value |
|
|
|
|
| FINLAND – 0.1% |
|
|
|
|
|
|
|
|
|
|
|
| Fortum OYJ |
|
|
1,621 |
|
|
$ |
30,122 |
|
|
|
|
| Kesko OYJ |
|
|
1,647 |
|
|
|
49,454 |
|
|
|
|
| Kone OYJ |
|
|
1,516 |
|
|
|
133,865 |
|
|
|
|
| Neste Oil OYJ |
|
|
921 |
|
|
|
14,349 |
|
|
|
|
| Nokia OYJ* |
|
|
26,728 |
|
|
|
89,547 |
|
|
|
|
| Nokian Renkaat OYJ |
|
|
1,315 |
|
|
|
57,011 |
|
|
|
|
| Stora Enso OYJ |
|
|
16,771 |
|
|
|
116,507 |
|
|
|
|
| UPM-Kymmene OYJ |
|
|
12,909 |
|
|
|
134,984 |
|
|
|
|
| Wartsila OYJ Abp |
|
|
1,520 |
|
|
|
74,606 |
|
|
|
|
|
|
|
|
|
|
|
|
|
| TOTAL FINLAND |
|
|
|
|
|
$ |
700,445 |
|
|
|
|
| FRANCE – 7.4% |
|
|
|
|
|
|
|
|
|
|
|
| Accor SA |
|
|
36,096 |
|
|
|
1,193,170 |
|
|
|
|
| Air Liquide SA |
|
|
12,586 |
|
|
|
1,593,203 |
|
|
|
|
| Alstom SA |
|
|
845 |
|
|
|
34,676 |
|
|
|
|
| Arkema SA |
|
|
3,000 |
|
|
|
281,064 |
|
|
|
|
| AtoS |
|
|
272 |
|
|
|
18,931 |
|
|
|
|
| AXA SA |
|
|
222,350 |
|
|
|
4,162,492 |
|
|
|
|
| BNP Paribas SA |
|
|
28,403 |
|
|
|
1,582,620 |
|
|
|
|
| Bollore SA |
|
|
165 |
|
|
|
69,535 |
|
|
|
|
| Bouygues SA |
|
|
3,676 |
|
|
|
102,583 |
|
|
|
|
| Bureau Veritas SA |
|
|
382 |
|
|
|
46,811 |
|
|
|
|
| Capital Gemini SA |
|
|
2,308 |
|
|
|
106,155 |
|
|
|
|
| Casino Guichard Perrachon SA |
|
|
1,573 |
|
|
|
170,013 |
|
|
|
|
| Christian Dior SA |
|
|
241 |
|
|
|
42,006 |
|
|
|
|
| Cie de St-Gobain |
|
|
52,678 |
|
|
|
2,112,795 |
|
|
|
|
| Cie Generale de Geophysique - Veritas* |
|
|
2,084 |
|
|
|
45,134 |
|
|
|
|
| Cie Generale de Geophysique - Veritas ADR |
|
|
1,200 |
|
|
|
25,620 |
|
|
|
|
| Cie Generale des Etablissements Michelin |
|
|
808 |
|
|
|
68,240 |
|
|
|
|
| Cie Generale d’Optique Essilor International SA |
|
|
15,249 |
|
|
|
1,715,821 |
|
|
|
|
| Ciments Francais SA |
|
|
373 |
|
|
|
20,381 |
|
|
|
|
| CNP Assurances |
|
|
6,904 |
|
|
|
97,787 |
|
|
|
|
| Credit Agricole SA* |
|
|
47,368 |
|
|
|
433,612 |
|
|
|
|
| Danone |
|
|
33,346 |
|
|
|
2,547,511 |
|
|
|
|
| Dassault Systemes SA |
|
|
446 |
|
|
|
54,390 |
|
|
|
|
| Edenred |
|
|
1,941 |
|
|
|
64,621 |
|
|
|
|
| Electricite de France SA |
|
|
8,034 |
|
|
|
179,550 |
|
|
|
|
| Eutelsat Communications SA |
|
|
577 |
|
|
|
20,832 |
|
|
|
|
| France Telecom SA |
|
|
54,358 |
|
|
|
581,571 |
|
|
|
|
| GDF Suez |
|
|
37,318 |
|
|
|
801,079 |
|
|
|
|
| Gemalto NV |
|
|
596 |
|
|
|
48,695 |
|
|
|
|
| Hermes International |
|
|
4 |
|
|
|
1,349 |
|
|
|
|
| Iliad SA |
|
|
79 |
|
|
|
18,061 |
|
|
|
|
| JCDecaux SA |
|
|
27,107 |
|
|
|
745,029 |
|
|
|
|
| Lafarge SA |
|
|
5,629 |
|
|
|
363,650 |
|
|
|
|
|
|
|
|
|
|
| Description |
|
Number of
Shares
|
|
|
Value |
|
|
|
|
| Lagardere SCA |
|
|
3,846 |
|
|
$ |
142,934 |
|
|
|
|
| Legrand SA |
|
|
19,271 |
|
|
|
898,034 |
|
|
|
|
| L’Oreal SA |
|
|
14,985 |
|
|
|
2,672,052 |
|
|
|
|
| LVMH Moet Hennessy Louis Vuitton SA |
|
|
1,667 |
|
|
|
288,689 |
|
|
|
|
| Metropole Television SA |
|
|
132 |
|
|
|
2,209 |
|
|
|
|
| Natixis |
|
|
49,439 |
|
|
|
216,812 |
|
|
|
|
| Pernod-Ricard SA |
|
|
19,377 |
|
|
|
2,398,744 |
|
|
|
|
| Peugeot SA* |
|
|
6,771 |
|
|
|
54,216 |
|
|
|
|
| PPR |
|
|
249 |
|
|
|
54,779 |
|
|
|
|
| Publicis Groupe SA |
|
|
1,378 |
|
|
|
95,855 |
|
|
|
|
| Renault SA |
|
|
6,646 |
|
|
|
457,928 |
|
|
|
|
| Rexel SA |
|
|
4,038 |
|
|
|
88,834 |
|
|
|
|
| Sa des Ciments Vicat |
|
|
165 |
|
|
|
9,778 |
|
|
|
|
| Safran SA |
|
|
1,839 |
|
|
|
90,312 |
|
|
|
|
| Sanofi-Aventis SA |
|
|
24,682 |
|
|
|
2,705,063 |
|
|
|
|
| Schneider Electric SA |
|
|
36,565 |
|
|
|
2,788,134 |
|
|
|
|
| SCOR SE |
|
|
32,167 |
|
|
|
976,240 |
|
|
|
|
| Societe BIC SA |
|
|
157 |
|
|
|
16,754 |
|
|
|
|
| Societe Generale SA* |
|
|
20,495 |
|
|
|
744,410 |
|
|
|
|
| Sodexo |
|
|
699 |
|
|
|
58,372 |
|
|
|
|
| STMicroelectronics NV |
|
|
16,726 |
|
|
|
145,403 |
|
|
|
|
| Suez Environnement Co. |
|
|
53,595 |
|
|
|
769,696 |
|
|
|
|
| Technip SA |
|
|
714 |
|
|
|
76,635 |
|
|
|
|
| Total SA |
|
|
33,585 |
|
|
|
1,692,674 |
|
|
|
|
| Vallourec SA |
|
|
832 |
|
|
|
39,988 |
|
|
|
|
| Veolia Environnement SA |
|
|
6,814 |
|
|
|
93,910 |
|
|
|
|
| Vinci SA |
|
|
1,080 |
|
|
|
52,000 |
|
|
|
|
| Vivendi SA |
|
|
59,243 |
|
|
|
1,341,946 |
|
|
|
|
| Zodiac Aerospace |
|
|
299 |
|
|
|
37,475 |
|
|
|
|
|
|
|
|
|
|
|
|
|
| TOTAL FRANCE |
|
|
|
|
|
$ |
38,358,863 |
|
|
|
|
| GERMANY – 5.8% |
|
|
|
|
|
|
|
|
|
|
|
| Adidas AG |
|
|
8,858 |
|
|
|
925,078 |
|
|
|
|
| Allianz SE |
|
|
31,557 |
|
|
|
4,656,686 |
|
|
|
|
| BASF SE |
|
|
7,762 |
|
|
|
724,956 |
|
|
|
|
| Bayer AG |
|
|
15,656 |
|
|
|
1,633,372 |
|
|
|
|
| Bayerische Motoren Werke AG |
|
|
7,111 |
|
|
|
656,007 |
|
|
|
|
| Brenntag AG |
|
|
209 |
|
|
|
35,630 |
|
|
|
|
| Celesio AG |
|
|
1,825 |
|
|
|
36,112 |
|
|
|
|
| Commerzbank AG* |
|
|
10,855 |
|
|
|
146,025 |
|
|
|
|
| Continental AG |
|
|
451 |
|
|
|
53,550 |
|
|
|
|
| Daimler AG |
|
|
60,162 |
|
|
|
3,328,865 |
|
|
|
|
| Deutsche Bank AG |
|
|
17,996 |
|
|
|
827,361 |
|
|
|
|
| Deutsche Bank AG Regisetered Shares |
|
|
10,886 |
|
|
|
501,300 |
|
|
|
|
| Deutsche Boerse AG |
|
|
13,015 |
|
|
|
812,441 |
|
|
|
|
| Deutsche Lufthansa AG |
|
|
6,051 |
|
|
|
120,967 |
|
|
|
|
| Deutsche Post AG |
|
|
15,970 |
|
|
|
378,991 |
|
April 30, 2013 / ANNUAL REPORT
PORTFOLIOS OF INVESTMENTS 31
Wilmington Multi-Manager International Fund (continued)
|
|
|
|
|
|
|
|
|
| Description |
|
Number of
Shares
|
|
|
Value |
|
|
|
|
| Deutsche Telekom AG ADR# |
|
|
26,653 |
|
|
$ |
317,171 |
|
|
|
|
| Deutsche Telekom AG |
|
|
26,073 |
|
|
|
308,414 |
|
|
|
|
| E.ON AG |
|
|
46,603 |
|
|
|
844,503 |
|
|
|
|
| Fraport AG Frankfurt Airport Services Worldwide |
|
|
520 |
|
|
|
31,077 |
|
|
|
|
| Freenet AG |
|
|
12,600 |
|
|
|
313,785 |
|
|
|
|
| Fresenius Medical Care AG & Co. KGaA |
|
|
10,738 |
|
|
|
741,010 |
|
|
|
|
| Fresenius SE & Co. KGaA |
|
|
12,220 |
|
|
|
1,532,388 |
|
|
|
|
| GEA Group AG |
|
|
1,277 |
|
|
|
43,196 |
|
|
|
|
| HeidelbergCement AG |
|
|
3,724 |
|
|
|
268,119 |
|
|
|
|
| Henkel AG & Co. KGaA |
|
|
1,303 |
|
|
|
102,015 |
|
|
|
|
| Hochtief AG |
|
|
458 |
|
|
|
31,787 |
|
|
|
|
| Kabel Deutschland Holding AG |
|
|
672 |
|
|
|
63,870 |
|
|
|
|
| Lanxess AG |
|
|
790 |
|
|
|
57,534 |
|
|
|
|
| Linde AG |
|
|
16,714 |
|
|
|
3,160,853 |
|
|
|
|
| Merck KGaA |
|
|
487 |
|
|
|
74,141 |
|
|
|
|
| Metro AG |
|
|
5,610 |
|
|
|
174,913 |
|
|
|
|
| Muenchener Rueckversicherungs AG# |
|
|
8,415 |
|
|
|
1,682,823 |
|
|
|
|
| Rheinmetall AG |
|
|
4,100 |
|
|
|
194,193 |
|
|
|
|
| RWE AG |
|
|
10,674 |
|
|
|
384,252 |
|
|
|
|
| Salzgitter AG |
|
|
1,130 |
|
|
|
44,228 |
|
|
|
|
| SAP AG |
|
|
51,787 |
|
|
|
4,113,197 |
|
|
|
|
| Siemens AG |
|
|
3,113 |
|
|
|
325,104 |
|
|
|
|
| Suedzucker AG |
|
|
389 |
|
|
|
15,681 |
|
|
|
|
| United Internet AG |
|
|
702 |
|
|
|
19,248 |
|
|
|
|
| Volkswagen AG |
|
|
2,985 |
|
|
|
580,230 |
|
|
|
|
|
|
|
|
|
|
|
|
|
| TOTAL GERMANY |
|
|
|
|
|
$ |
30,261,073 |
|
|
|
|
| GHANA – 0.1% |
|
|
|
|
|
|
|
|
|
|
|
| Aluworks Ghana Ltd.* |
|
|
232,000 |
|
|
|
7,050 |
|
|
|
|
| CAL Bank Ltd. |
|
|
498,146 |
|
|
|
158,943 |
|
|
|
|
| Ghana Commercial Bank Ltd. |
|
|
106,696 |
|
|
|
236,682 |
|
|
|
|
| HFC Bank Ghana Ltd. |
|
|
243,750 |
|
|
|
66,662 |
|
|
|
|
| Produce Buying Co. Ltd. |
|
|
162,500 |
|
|
|
13,168 |
|
|
|
|
| Standard Chartered Bank Ghana Ltd. |
|
|
13,200 |
|
|
|
106,429 |
|
|
|
|
|
|
|
|
|
|
|
|
|
| TOTAL GHANA |
|
|
|
|
|
$ |
588,934 |
|
|
|
|
| GREECE – 0.0%** |
|
|
|
|
|
|
|
|
|
|
|
| Hellenic Petroleum SA |
|
|
1,059 |
|
|
|
11,715 |
|
|
|
|
| National Bank of Greece SA* |
|
|
17,182 |
|
|
|
14,369 |
|
|
|
|
|
|
|
|
|
|
|
|
|
| TOTAL GREECE |
|
|
|
|
|
$ |
26,084 |
|
|
|
|
| HONG KONG – 1.1% |
|
|
|
|
|
|
|
|
|
|
|
| AIA Group Ltd. |
|
|
184,000 |
|
|
|
816,840 |
|
|
|
|
| ASM Pacific Technology Ltd. |
|
|
1,100 |
|
|
|
11,340 |
|
|
|
|
| Bank of East Asia Ltd. |
|
|
13,200 |
|
|
|
54,262 |
|
|
|
|
| Cheung Kong Holdings Ltd. |
|
|
149,000 |
|
|
|
2,242,638 |
|
|
|
|
| Cheung Kong Infrastructure Holdings Ltd. |
|
|
3,000 |
|
|
|
21,765 |
|
|
|
|
| Chongqing Machinery and Electric Co. Ltd.* |
|
|
1,156,000 |
|
|
|
153,435 |
|
|
|
|
| CLP Holdings Ltd. |
|
|
9,000 |
|
|
|
79,328 |
|
|
|
|
|
|
|
|
|
|
| Description |
|
Number of
Shares
|
|
|
Value |
|
|
|
|
| Hang Lung Group Ltd. |
|
|
5,000 |
|
|
$ |
29,445 |
|
|
|
|
| Hang Lung Properties Ltd. |
|
|
161,000 |
|
|
|
626,560 |
|
|
|
|
| Henderson Land Development Co. Ltd. |
|
|
18,116 |
|
|
|
131,198 |
|
|
|
|
| HKT Trust / HKT Ltd. |
|
|
346 |
|
|
|
363 |
|
|
|
|
| Hong Kong & China Gas Co. Ltd. |
|
|
48,750 |
|
|
|
146,687 |
|
|
|
|
| Hong Kong Exchanges and Clearing Ltd.# |
|
|
4,200 |
|
|
|
70,684 |
|
|
|
|
| Hongkong & Shanghai Hotels |
|
|
6,000 |
|
|
|
9,758 |
|
|
|
|
| Hopewell Holdings Ltd. |
|
|
10,000 |
|
|
|
38,659 |
|
|
|
|
| Huabao International Holdings Ltd. |
|
|
525,000 |
|
|
|
240,846 |
|
|
|
|
| Hutchison Whampoa Ltd. |
|
|
16,400 |
|
|
|
178,157 |
|
|
|
|
| Hysan Development Co. Ltd. |
|
|
8,000 |
|
|
|
39,638 |
|
|
|
|
| Johnson Electric Holdings Ltd. |
|
|
333,000 |
|
|
|
227,002 |
|
|
|
|
| Kerry Properties Ltd. |
|
|
5,000 |
|
|
|
22,616 |
|
|
|
|
| MTR Corp. Ltd. |
|
|
5,500 |
|
|
|
22,680 |
|
|
|
|
| New World Development Co. Ltd. |
|
|
99,913 |
|
|
|
174,330 |
|
|
|
|
| Orient Overseas International Ltd. |
|
|
2,500 |
|
|
|
14,852 |
|
|
|
|
| Sun Hung Kai Properties Ltd. |
|
|
10,000 |
|
|
|
144,585 |
|
|
|
|
| Wharf Holdings Ltd. |
|
|
19,000 |
|
|
|
169,552 |
|
|
|
|
| Wheelock & Co. Ltd. |
|
|
29,000 |
|
|
|
161,440 |
|
|
|
|
|
|
|
|
|
|
|
|
|
| TOTAL HONG KONG |
|
|
|
|
|
$ |
5,828,660 |
|
|
|
|
| HUNGARY – 0.4% |
|
|
|
|
|
|
|
|
|
|
|
| EGIS Pharmaceuticals PLC |
|
|
3,690 |
|
|
|
291,529 |
|
|
|
|
| Magyar Telekom Telecommunications PLC |
|
|
147,600 |
|
|
|
272,776 |
|
|
|
|
| MOL Hungarian Oil and Gas PLC |
|
|
6,863 |
|
|
|
487,402 |
|
|
|
|
| OTP Bank Nyrt |
|
|
29,050 |
|
|
|
605,379 |
|
|
|
|
| Richter Gedeon Nyrt |
|
|
2,990 |
|
|
|
444,033 |
|
|
|
|
|
|
|
|
|
|
|
|
|
| TOTAL HUNGARY |
|
|
|
|
|
$ |
2,101,119 |
|
|
|
|
| INDIA – 0.5% |
|
|
|
|
|
|
|
|
|
|
|
| GAIL India Ltd. GDR |
|
|
1,770 |
|
|
|
69,862 |
|
|
|
|
| ICICI Bank Ltd. ADR |
|
|
6,300 |
|
|
|
294,966 |
|
|
|
|
| Infosys Ltd. ADR# |
|
|
12,568 |
|
|
|
524,588 |
|
|
|
|
| Reliance Industries Ltd. GDR•,W |
|
|
16,661 |
|
|
|
491,000 |
|
|
|
|
| State Bank of India GDR |
|
|
1,710 |
|
|
|
144,495 |
|
|
|
|
| Tata Motors Ltd. ADR |
|
|
21,790 |
|
|
|
600,097 |
|
|
|
|
| Tata Steel Ltd. GDR |
|
|
38,100 |
|
|
|
217,741 |
|
|
|
|
| Wipro Ltd. ADR |
|
|
15,098 |
|
|
|
120,635 |
|
|
|
|
|
|
|
|
|
|
|
|
|
| TOTAL INDIA |
|
|
|
|
|
$ |
2,463,384 |
|
|
|
|
| INDONESIA – 0.8% |
|
|
|
|
|
|
|
|
|
|
|
| Adaro Energy Tbk PT |
|
|
719,000 |
|
|
|
90,961 |
|
|
|
|
| AKR Corporindo Tbk PT |
|
|
143,500 |
|
|
|
76,012 |
|
|
|
|
| Aneka Tambang Persero Tbk PT |
|
|
190,000 |
|
|
|
26,968 |
|
|
|
|
| Astra International Tbk PT |
|
|
449,500 |
|
|
|
339,812 |
|
|
|
|
| Bank Central Asia Tbk PT |
|
|
333,500 |
|
|
|
368,745 |
|
|
|
|
| Bank Danamon Indonesia Tbk PT |
|
|
81,122 |
|
|
|
53,817 |
|
|
|
|
| Bank Mandiri Persero Tbk PT |
|
|
206,500 |
|
|
|
223,014 |
|
ANNUAL REPORT / April
30, 2013
32 PORTFOLIOS OF INVESTMENTS
Wilmington Multi-Manager International Fund (continued)
|
|
|
|
|
|
|
|
|
| Description |
|
Number of
Shares
|
|
|
Value |
|
|
|
|
| Bank Negara Indonesia Persero Tbk PT |
|
|
272,000 |
|
|
$ |
151,072 |
|
|
|
|
| Bank Rakyat Indonesia Persero Tbk PT |
|
|
231,500 |
|
|
|
223,821 |
|
|
|
|
| Barito Pacific Tbk PT* |
|
|
269,000 |
|
|
|
11,205 |
|
|
|
|
| Bumi Resources Tbk PT |
|
|
1,083,000 |
|
|
|
74,632 |
|
|
|
|
| Charoen Pokphand Indonesia Tbk PT |
|
|
200,000 |
|
|
|
103,883 |
|
|
|
|
| Gudang Garam Tbk PT |
|
|
18,000 |
|
|
|
91,458 |
|
|
|
|
| Indo Tambangraya Megah Tbk PT |
|
|
21,000 |
|
|
|
79,378 |
|
|
|
|
| Indocement Tunggal Prakarsa Tbk PT |
|
|
70,000 |
|
|
|
190,075 |
|
|
|
|
| Indofood Sukses Makmur Tbk PT |
|
|
148,000 |
|
|
|
111,885 |
|
|
|
|
| Indosat Tbk PT |
|
|
70,500 |
|
|
|
43,507 |
|
|
|
|
| Kalbe Farma Tbk PT |
|
|
870,000 |
|
|
|
124,382 |
|
|
|
|
| Lippo Karawaci Tbk PT |
|
|
501,000 |
|
|
|
69,565 |
|
|
|
|
| Perusahaan Gas Negara Persero Tbk PT |
|
|
588,000 |
|
|
|
377,989 |
|
|
|
|
| Semen Gresik Persero Tbk PT |
|
|
129,500 |
|
|
|
245,081 |
|
|
|
|
| Surya Semesta Internusa Tbk PT |
|
|
410,000 |
|
|
|
66,629 |
|
|
|
|
| Tambang Batubara Bukit Asam Persero Tbk PT |
|
|
29,000 |
|
|
|
45,487 |
|
|
|
|
| Telekomunikasi Indonesia Persero Tbk PT |
|
|
334,500 |
|
|
|
402,535 |
|
|
|
|
| Timah Persero Tbk PT |
|
|
416,500 |
|
|
|
60,831 |
|
|
|
|
| Unilever Indonesia Tbk PT |
|
|
49,000 |
|
|
|
132,296 |
|
|
|
|
| United Tractors Tbk PT |
|
|
75,500 |
|
|
|
137,837 |
|
|
|
|
| XL Axiata Tbk PT |
|
|
70,000 |
|
|
|
36,719 |
|
|
|
|
|
|
|
|
|
|
|
|
|
| TOTAL INDONESIA |
|
|
|
|
|
$ |
3,959,596 |
|
|
|
|
| IRELAND – 0.4% |
|
|
|
|
|
|
|
|
|
|
|
| Bank of Ireland |
|
|
100,824 |
|
|
|
22,440 |
|
|
|
|
| CRH PLC |
|
|
85,444 |
|
|
|
1,834,251 |
|
|
|
|
| CRH PLC ADR |
|
|
4,795 |
|
|
|
103,140 |
|
|
|
|
| Elan Corp. PLC |
|
|
3,601 |
|
|
|
41,519 |
|
|
|
|
| James Hardie Industries PLC |
|
|
2,466 |
|
|
|
25,923 |
|
|
|
|
| Kerry Group PLC |
|
|
1,457 |
|
|
|
86,173 |
|
|
|
|
| Permanent TSB Group Holdings PLC* |
|
|
38,000 |
|
|
|
1,752 |
|
|
|
|
| Prothena Corp. PLC* |
|
|
87 |
|
|
|
719 |
|
|
|
|
|
|
|
|
|
|
|
|
|
| TOTAL IRELAND |
|
|
|
|
|
$ |
2,115,917 |
|
|
|
|
| ISRAEL – 0.4% |
|
|
|
|
|
|
|
|
|
|
|
| Bank Hapoalim BM* |
|
|
49,877 |
|
|
|
231,647 |
|
|
|
|
| Bank Leumi Le-Israel BM* |
|
|
55,972 |
|
|
|
198,596 |
|
|
|
|
| Israel Chemicals Ltd. |
|
|
44,670 |
|
|
|
531,305 |
|
|
|
|
| Israel Discount Bank Ltd.* |
|
|
45,421 |
|
|
|
76,183 |
|
|
|
|
| Teva Pharmaceutical Industries Ltd. ADR |
|
|
14,972 |
|
|
|
573,278 |
|
|
|
|
| Teva Pharmaceutical Industries Ltd. |
|
|
10,501 |
|
|
|
410,959 |
|
|
|
|
|
|
|
|
|
|
|
|
|
| TOTAL ISRAEL |
|
|
|
|
|
$ |
2,021,968 |
|
|
|
|
| ITALY – 1.0% |
|
|
|
|
|
|
|
|
|
|
|
| Assicurazioni Generali SpA |
|
|
3,036 |
|
|
|
55,696 |
|
|
|
|
| Atlantia SpA |
|
|
1,615 |
|
|
|
28,862 |
|
|
|
|
| Banca Monte dei Paschi di Siena SpA#,* |
|
|
101,271 |
|
|
|
28,528 |
|
|
|
|
| Banco Popolare SC* |
|
|
12,600 |
|
|
|
18,170 |
|
|
|
|
| Enel SpA |
|
|
131,781 |
|
|
|
509,540 |
|
|
|
|
|
|
|
|
|
|
| Description |
|
Number of
Shares
|
|
|
Value |
|
|
|
|
| ENI SpA |
|
|
32,935 |
|
|
$ |
787,667 |
|
|
|
|
| Exor SpA |
|
|
1,244 |
|
|
|
37,681 |
|
|
|
|
| Fiat Industrial SpA |
|
|
2,965 |
|
|
|
33,464 |
|
|
|
|
| Fiat SpA* |
|
|
17,391 |
|
|
|
104,026 |
|
|
|
|
| Finmeccanica SpA* |
|
|
6,450 |
|
|
|
33,570 |
|
|
|
|
| Intesa Sanpaolo SpA |
|
|
1,215,055 |
|
|
|
2,203,430 |
|
|
|
|
| Luxottica Group SpA |
|
|
672 |
|
|
|
34,984 |
|
|
|
|
| Mediaset SpA |
|
|
13,498 |
|
|
|
34,877 |
|
|
|
|
| Mediobanca SpA |
|
|
2,499 |
|
|
|
15,883 |
|
|
|
|
| Milano Assicurazioni SpA* |
|
|
19,800 |
|
|
|
12,965 |
|
|
|
|
| Pirelli & C SpA |
|
|
1,489 |
|
|
|
15,462 |
|
|
|
|
| Prysmian SpA |
|
|
1,573 |
|
|
|
31,757 |
|
|
|
|
| Saipem SpA |
|
|
1,916 |
|
|
|
54,250 |
|
|
|
|
| Telecom Italia SpA |
|
|
189,456 |
|
|
|
160,306 |
|
|
|
|
| Telecom Italia SpA ADR |
|
|
4,715 |
|
|
|
39,323 |
|
|
|
|
| UniCredit SpA* |
|
|
126,325 |
|
|
|
658,800 |
|
|
|
|
| Unione di Banche Italiane SCPA |
|
|
42,922 |
|
|
|
179,188 |
|
|
|
|
|
|
|
|
|
|
|
|
|
| TOTAL ITALY |
|
|
|
|
|
$ |
5,078,429 |
|
|
|
|
| JAPAN – 11.1% |
|
|
|
|
|
|
|
|
|
|
|
| ABC-Mart, Inc. |
|
|
100 |
|
|
|
3,744 |
|
|
|
|
| Aeon Co. Ltd. |
|
|
11,300 |
|
|
|
159,847 |
|
|
|
|
| Aeon Mall Co. Ltd. |
|
|
400 |
|
|
|
12,864 |
|
|
|
|
| Ajinomoto Co., Inc. |
|
|
6,000 |
|
|
|
82,290 |
|
|
|
|
| Alfresa Holdings Corp. |
|
|
900 |
|
|
|
53,454 |
|
|
|
|
| Amada Co. Ltd. |
|
|
8,000 |
|
|
|
64,010 |
|
|
|
|
| Aoyama Trading Co. Ltd. |
|
|
400 |
|
|
|
11,953 |
|
|
|
|
| Asahi Glass Co. Ltd. |
|
|
32,000 |
|
|
|
250,787 |
|
|
|
|
| Asahi Group Holdings Ltd. |
|
|
3,100 |
|
|
|
77,083 |
|
|
|
|
| Asahi Kasei Corp. |
|
|
19,000 |
|
|
|
127,466 |
|
|
|
|
| Asics Corp. |
|
|
2,000 |
|
|
|
36,047 |
|
|
|
|
| Astellas Pharma, Inc. |
|
|
9,900 |
|
|
|
575,812 |
|
|
|
|
| Autobacs Seven Co. Ltd. |
|
|
1,200 |
|
|
|
20,212 |
|
|
|
|
| Azbil Corp. |
|
|
800 |
|
|
|
17,250 |
|
|
|
|
| Bank of Kyoto Ltd. |
|
|
4,000 |
|
|
|
42,017 |
|
|
|
|
| Bank of Yokohama Ltd. |
|
|
23,000 |
|
|
|
139,672 |
|
|
|
|
| Benesse Holdings, Inc. |
|
|
400 |
|
|
|
17,705 |
|
|
|
|
| Bridgestone Corp. |
|
|
5,300 |
|
|
|
199,800 |
|
|
|
|
| Brother Industries Ltd. |
|
|
18,700 |
|
|
|
213,692 |
|
|
|
|
| Canon Marketing Japan, Inc. |
|
|
1,600 |
|
|
|
23,306 |
|
|
|
|
| Canon, Inc. |
|
|
12,100 |
|
|
|
433,805 |
|
|
|
|
| Casio Computer Co. Ltd. |
|
|
4,200 |
|
|
|
34,768 |
|
|
|
|
| Central Japan Railway Co. |
|
|
500 |
|
|
|
60,266 |
|
|
|
|
| Chiba Bank Ltd. |
|
|
13,000 |
|
|
|
100,816 |
|
|
|
|
| Chiyoda Corp. |
|
|
2,000 |
|
|
|
20,495 |
|
|
|
|
| Chugai Pharmaceutical Co. Ltd. |
|
|
2,700 |
|
|
|
67,220 |
|
|
|
|
| Citizen Holdings Co. Ltd. |
|
|
10,300 |
|
|
|
60,753 |
|
April 30, 2013 / ANNUAL REPORT
PORTFOLIOS OF INVESTMENTS 33
Wilmington Multi-Manager International Fund (continued)
|
|
|
|
|
|
|
|
|
| Description |
|
Number of
Shares
|
|
|
Value |
|
|
|
|
| Coca-Cola West Co. Ltd. |
|
|
1,400 |
|
|
$ |
26,037 |
|
|
|
|
| COMSYS Holdings Corp. |
|
|
3,000 |
|
|
|
39,698 |
|
|
|
|
| Cosmo Oil Co. Ltd. |
|
|
12,000 |
|
|
|
28,558 |
|
|
|
|
| Credit Saison Co. Ltd. |
|
|
1,500 |
|
|
|
43,807 |
|
|
|
|
| Dai Nippon Printing Co. Ltd. |
|
|
12,000 |
|
|
|
117,310 |
|
|
|
|
| Daicel Corp. |
|
|
4,000 |
|
|
|
32,210 |
|
|
|
|
| Daido Steel Co. Ltd. |
|
|
5,000 |
|
|
|
27,184 |
|
|
|
|
| Daihatsu Motor Co. Ltd. |
|
|
2,000 |
|
|
|
39,637 |
|
|
|
|
| Dai-ichi Life Insurance Co. Ltd. |
|
|
26 |
|
|
|
35,739 |
|
|
|
|
| Dainippon Sumitomo Pharma Co. Ltd. |
|
|
1,400 |
|
|
|
25,707 |
|
|
|
|
| Daishi Bank Ltd. |
|
|
6,000 |
|
|
|
23,696 |
|
|
|
|
| Daito Trust Construction Co. Ltd. |
|
|
600 |
|
|
|
58,101 |
|
|
|
|
| Daiwa House Industry Co. Ltd. |
|
|
3,000 |
|
|
|
67,764 |
|
|
|
|
| Denso Corp. |
|
|
17,800 |
|
|
|
797,015 |
|
|
|
|
| Dentsu, Inc. |
|
|
200 |
|
|
|
6,945 |
|
|
|
|
| East Japan Railway Co. |
|
|
9,700 |
|
|
|
817,911 |
|
|
|
|
| Ebara Corp. |
|
|
8,000 |
|
|
|
33,482 |
|
|
|
|
| Eizo Nanao Corp. |
|
|
9,500 |
|
|
|
164,302 |
|
|
|
|
| FamilyMart Co. Ltd. |
|
|
300 |
|
|
|
13,710 |
|
|
|
|
| FANUC Corp. |
|
|
21,600 |
|
|
|
3,257,117 |
|
|
|
|
| Fast Retailing Co. Ltd. |
|
|
600 |
|
|
|
219,726 |
|
|
|
|
| Fuji Media Holdings, Inc. |
|
|
18 |
|
|
|
39,052 |
|
|
|
|
| FUJIFILM Holdings Corp. |
|
|
15,300 |
|
|
|
313,580 |
|
|
|
|
| Fujitsu Ltd. |
|
|
57,000 |
|
|
|
239,145 |
|
|
|
|
| Fukuoka Financial Group, Inc. |
|
|
33,000 |
|
|
|
168,580 |
|
|
|
|
| Geo Holdings Corp. |
|
|
200 |
|
|
|
238,806 |
|
|
|
|
| Glory Ltd. |
|
|
1,200 |
|
|
|
32,977 |
|
|
|
|
| Gree, Inc. |
|
|
900 |
|
|
|
11,531 |
|
|
|
|
| Gunma Bank Ltd. |
|
|
9,000 |
|
|
|
57,147 |
|
|
|
|
| H2O Retailing Corp. |
|
|
2,000 |
|
|
|
22,280 |
|
|
|
|
| Hachijuni Bank Ltd. |
|
|
10,000 |
|
|
|
67,908 |
|
|
|
|
| Hakuhodo DY Holdings, Inc. |
|
|
130 |
|
|
|
10,708 |
|
|
|
|
| Hamamatsu Photonics KK |
|
|
300 |
|
|
|
12,325 |
|
|
|
|
| Hankyu Hanshin Holdings, Inc. |
|
|
25,000 |
|
|
|
161,563 |
|
|
|
|
| Hirose Electric Co. Ltd. |
|
|
300 |
|
|
|
43,084 |
|
|
|
|
| Hiroshima Bank Ltd. |
|
|
4,000 |
|
|
|
21,049 |
|
|
|
|
| Hisamitsu Pharmaceutical Co., Inc. |
|
|
300 |
|
|
|
17,633 |
|
|
|
|
| Hitachi Capital Corp. |
|
|
11,200 |
|
|
|
278,722 |
|
|
|
|
| Hitachi Chemical Co. Ltd. |
|
|
2,200 |
|
|
|
34,416 |
|
|
|
|
| Hitachi High-Technologies Corp. |
|
|
900 |
|
|
|
22,407 |
|
|
|
|
| Hitachi Ltd. |
|
|
9,000 |
|
|
|
57,424 |
|
|
|
|
| Hitachi Metals Ltd. |
|
|
48,000 |
|
|
|
495,830 |
|
|
|
|
| Hitachi Transport System Ltd. |
|
|
1,300 |
|
|
|
20,643 |
|
|
|
|
| Hokkaido Electric Power Co., Inc.* |
|
|
7,300 |
|
|
|
92,481 |
|
|
|
|
| Hokuhoku Financial Group, Inc. |
|
|
29,000 |
|
|
|
67,528 |
|
|
|
|
| Honda Motor Co. Ltd. |
|
|
5,400 |
|
|
|
214,648 |
|
|
|
|
| House Foods Corp. |
|
|
1,600 |
|
|
|
27,869 |
|
|
|
|
| Hoya Corp. |
|
|
1,500 |
|
|
|
29,974 |
|
|
|
|
|
|
|
|
|
|
| Description |
|
Number of
Shares
|
|
|
Value |
|
|
|
|
| Ibiden Co. Ltd. |
|
|
6,300 |
|
|
$ |
110,186 |
|
|
|
|
| Idemitsu Kosan Co. Ltd. |
|
|
100 |
|
|
|
8,442 |
|
|
|
|
| IHI Corp. |
|
|
21,000 |
|
|
|
78,197 |
|
|
|
|
| Inpex Corp. |
|
|
47 |
|
|
|
226,599 |
|
|
|
|
| Isetan Mitsukoshi Holdings Ltd. |
|
|
8,900 |
|
|
|
141,600 |
|
|
|
|
| Isuzu Motors Ltd. |
|
|
119,000 |
|
|
|
792,235 |
|
|
|
|
| Ito En Ltd. |
|
|
100 |
|
|
|
2,405 |
|
|
|
|
| ITOCHU Corp. |
|
|
29,500 |
|
|
|
364,646 |
|
|
|
|
| Iyo Bank Ltd. |
|
|
6,000 |
|
|
|
62,779 |
|
|
|
|
| J Front Retailing Co. Ltd. |
|
|
7,000 |
|
|
|
58,737 |
|
|
|
|
| Japan Airlines Co. Ltd. |
|
|
600 |
|
|
|
30,405 |
|
|
|
|
| Japan Tobacco, Inc. |
|
|
113,200 |
|
|
|
4,279,038 |
|
|
|
|
| JFE Holdings, Inc. |
|
|
13,700 |
|
|
|
296,247 |
|
|
|
|
| JGC Corp. |
|
|
2,000 |
|
|
|
59,189 |
|
|
|
|
| Joyo Bank Ltd. |
|
|
9,000 |
|
|
|
55,208 |
|
|
|
|
| JS Group Corp. |
|
|
3,300 |
|
|
|
74,100 |
|
|
|
|
| JTEKT Corp. |
|
|
2,500 |
|
|
|
25,414 |
|
|
|
|
| Juroku Bank Ltd. |
|
|
3,000 |
|
|
|
12,740 |
|
|
|
|
| JX Holdings, Inc. |
|
|
94,280 |
|
|
|
510,640 |
|
|
|
|
| Kamigumi Co. Ltd. |
|
|
4,000 |
|
|
|
37,421 |
|
|
|
|
| Kaneka Corp. |
|
|
9,000 |
|
|
|
54,101 |
|
|
|
|
| Kansai Electric Power Co., Inc.* |
|
|
10,600 |
|
|
|
129,177 |
|
|
|
|
| Kansai Paint Co. Ltd. |
|
|
2,000 |
|
|
|
25,624 |
|
|
|
|
| KAO Corp. |
|
|
4,100 |
|
|
|
141,735 |
|
|
|
|
| Kawasaki Kisen Kaisha Ltd. |
|
|
21,000 |
|
|
|
46,099 |
|
|
|
|
| KDDI Corp. |
|
|
17,000 |
|
|
|
816,125 |
|
|
|
|
| Keikyu Corp. |
|
|
4,000 |
|
|
|
44,232 |
|
|
|
|
| Keio Corp. |
|
|
5,000 |
|
|
|
42,981 |
|
|
|
|
| Keisei Electric Railway Co. Ltd. |
|
|
1,000 |
|
|
|
10,566 |
|
|
|
|
| Keyence Corp. |
|
|
2,470 |
|
|
|
782,921 |
|
|
|
|
| Kinden Corp. |
|
|
3,000 |
|
|
|
21,850 |
|
|
|
|
| Kintetsu Corp. |
|
|
12,000 |
|
|
|
60,686 |
|
|
|
|
| Kobe Steel Ltd.* |
|
|
14,000 |
|
|
|
18,239 |
|
|
|
|
| Komatsu Ltd. |
|
|
71,400 |
|
|
|
1,947,507 |
|
|
|
|
| Konica Minolta Holdings, Inc. |
|
|
26,500 |
|
|
|
187,296 |
|
|
|
|
| Kubota Corp. |
|
|
10,000 |
|
|
|
143,304 |
|
|
|
|
| Kyocera Corp. |
|
|
10,200 |
|
|
|
1,036,897 |
|
|
|
|
| Kyocera Corp. ADR |
|
|
100 |
|
|
|
10,140 |
|
|
|
|
| Kyowa Exeo Corp. |
|
|
16,100 |
|
|
|
189,761 |
|
|
|
|
| Kyowa Hakko Kirin Co. Ltd. |
|
|
3,000 |
|
|
|
36,775 |
|
|
|
|
| Kyushu Electric Power Co., Inc.* |
|
|
9,100 |
|
|
|
125,553 |
|
|
|
|
| Lawson, Inc. |
|
|
500 |
|
|
|
39,391 |
|
|
|
|
| Makita Corp. |
|
|
400 |
|
|
|
24,332 |
|
|
|
|
| Marubeni Corp. |
|
|
63,000 |
|
|
|
450,439 |
|
|
|
|
| Marui Group Co. Ltd. |
|
|
5,100 |
|
|
|
59,117 |
|
|
|
|
| McDonald’s Holdings Co Japan Ltd. |
|
|
300 |
|
|
|
8,749 |
|
|
|
|
| Medipal Holdings Corp. |
|
|
4,550 |
|
|
|
71,364 |
|
|
|
|
| Ministop Co. Ltd. |
|
|
9,600 |
|
|
|
165,539 |
|
ANNUAL REPORT / April
30, 2013
34 PORTFOLIOS OF INVESTMENTS
Wilmington Multi-Manager International Fund (continued)
|
|
|
|
|
|
|
|
|
| Description |
|
Number of
Shares
|
|
|
Value |
|
|
|
|
| Miraca Holdings, Inc. |
|
|
3,400 |
|
|
$ |
169,503 |
|
|
|
|
| Mitsubishi Chemical Holdings Corp. |
|
|
25,000 |
|
|
|
121,557 |
|
|
|
|
| Mitsubishi Corp. |
|
|
73,600 |
|
|
|
1,319,719 |
|
|
|
|
| Mitsubishi Electric Corp. |
|
|
83,000 |
|
|
|
790,111 |
|
|
|
|
| Mitsubishi Estate Co. Ltd. |
|
|
9,000 |
|
|
|
292,199 |
|
|
|
|
| Mitsubishi Gas Chemical Co., Inc. |
|
|
13,000 |
|
|
|
99,215 |
|
|
|
|
| Mitsubishi Heavy Industries Ltd. |
|
|
21,000 |
|
|
|
144,545 |
|
|
|
|
| Mitsubishi Materials Corp. |
|
|
32,000 |
|
|
|
91,584 |
|
|
|
|
| Mitsubishi UFJ Financial Group, Inc. |
|
|
520,194 |
|
|
|
3,537,864 |
|
|
|
|
| Mitsui & Co. Ltd. |
|
|
46,092 |
|
|
|
632,622 |
|
|
|
|
| Mitsui Chemicals, Inc. |
|
|
18,000 |
|
|
|
41,545 |
|
|
|
|
| Mitsui Fudosan Co. Ltd. |
|
|
6,000 |
|
|
|
203,724 |
|
|
|
|
| Mitsui OSK Lines Ltd. |
|
|
21,000 |
|
|
|
87,244 |
|
|
|
|
| Mizuho Financial Group, Inc. |
|
|
288,100 |
|
|
|
635,395 |
|
|
|
|
| MS&AD Insurance Group Holdings |
|
|
9,700 |
|
|
|
259,602 |
|
|
|
|
| Nabtesco Corp. |
|
|
1,000 |
|
|
|
22,055 |
|
|
|
|
| Nagase & Co. Ltd. |
|
|
3,000 |
|
|
|
38,344 |
|
|
|
|
| NEC Corp. |
|
|
53,000 |
|
|
|
137,549 |
|
|
|
|
| NGK Spark Plug Co. Ltd. |
|
|
3,000 |
|
|
|
50,500 |
|
|
|
|
| Nihon Kohden Corp. |
|
|
4,700 |
|
|
|
180,556 |
|
|
|
|
| Nikon Corp. |
|
|
2,800 |
|
|
|
60,834 |
|
|
|
|
| Nintendo Co. Ltd. |
|
|
200 |
|
|
|
22,157 |
|
|
|
|
| Nippon Electric Glass Co. Ltd. |
|
|
15,000 |
|
|
|
76,320 |
|
|
|
|
| Nippon Express Co. Ltd. |
|
|
20,000 |
|
|
|
104,016 |
|
|
|
|
| Nippon Paper Industries Co. Ltd.* |
|
|
7,400 |
|
|
|
110,220 |
|
|
|
|
| Nippon Shokubai Co. Ltd. |
|
|
1,000 |
|
|
|
9,807 |
|
|
|
|
| Nippon Steel Corp. |
|
|
167,340 |
|
|
|
444,593 |
|
|
|
|
| Nippon Telegraph & Telephone Corp. |
|
|
13,200 |
|
|
|
653,331 |
|
|
|
|
| Nippon Television Network Corp. |
|
|
1,800 |
|
|
|
31,777 |
|
|
|
|
| Nippon Yusen KK |
|
|
41,000 |
|
|
|
106,827 |
|
|
|
|
| Nishi-Nippon City Bank Ltd. |
|
|
44,000 |
|
|
|
146,689 |
|
|
|
|
| Nissan Motor Co. Ltd. |
|
|
5,000 |
|
|
|
52,111 |
|
|
|
|
| Nisshin Seifun Group, Inc. |
|
|
6,500 |
|
|
|
83,879 |
|
|
|
|
| Nisshin Steel Holdings Co. Ltd. |
|
|
10,415 |
|
|
|
87,286 |
|
|
|
|
| Nisshinbo Holdings, Inc. |
|
|
3,000 |
|
|
|
21,757 |
|
|
|
|
| Nitto Denko Corp. |
|
|
900 |
|
|
|
59,086 |
|
|
|
|
| NKSJ Holdings, Inc. |
|
|
4,600 |
|
|
|
116,457 |
|
|
|
|
| NOF Corp. |
|
|
42,000 |
|
|
|
225,758 |
|
|
|
|
| NOK Corp. |
|
|
500 |
|
|
|
7,196 |
|
|
|
|
| Nomura Holdings, Inc. |
|
|
38,900 |
|
|
|
316,435 |
|
|
|
|
| North Pacific Bank Ltd. |
|
|
8,800 |
|
|
|
30,331 |
|
|
|
|
| NTN Corp.* |
|
|
31,000 |
|
|
|
78,863 |
|
|
|
|
| NTT Data Corp. |
|
|
17 |
|
|
|
53,711 |
|
|
|
|
| NTT DoCoMo, Inc. |
|
|
315 |
|
|
|
520,234 |
|
|
|
|
| NTT Urban Development Corp. |
|
|
6 |
|
|
|
8,863 |
|
|
|
|
| Obayashi Corp. |
|
|
15,000 |
|
|
|
92,168 |
|
|
|
|
| Odakyu Electric Railway Co. Ltd. |
|
|
6,000 |
|
|
|
72,196 |
|
|
|
|
| OJI Paper Co. Ltd. |
|
|
39,000 |
|
|
|
138,821 |
|
|
|
|
|
|
|
|
|
|
| Description |
|
Number of
Shares
|
|
|
Value |
|
|
|
|
| Onward Holdings Co. Ltd. |
|
|
2,000 |
|
|
$ |
18,690 |
|
|
|
|
| Oriental Land Co. Ltd. |
|
|
500 |
|
|
|
80,833 |
|
|
|
|
| Otsuka Corp. |
|
|
300 |
|
|
|
30,989 |
|
|
|
|
| Otsuka Holdings Co. Ltd. |
|
|
16,100 |
|
|
|
579,689 |
|
|
|
|
| Panasonic Corp. |
|
|
3,100 |
|
|
|
22,546 |
|
|
|
|
| Rakuten, Inc. |
|
|
71,000 |
|
|
|
756,722 |
|
|
|
|
| Rengo Co. Ltd. |
|
|
7,000 |
|
|
|
33,821 |
|
|
|
|
| Resona Holdings, Inc. |
|
|
21,000 |
|
|
|
112,017 |
|
|
|
|
| Ricoh Co. Ltd. |
|
|
12,000 |
|
|
|
133,682 |
|
|
|
|
| Rinnai Corp. |
|
|
200 |
|
|
|
15,879 |
|
|
|
|
| Rohm Co. Ltd. |
|
|
2,400 |
|
|
|
84,567 |
|
|
|
|
| San-In Godo Bank Ltd. |
|
|
2,000 |
|
|
|
17,028 |
|
|
|
|
| Sankyu, Inc. |
|
|
44,000 |
|
|
|
196,338 |
|
|
|
|
| Santen Pharmaceutical Co. Ltd. |
|
|
400 |
|
|
|
20,024 |
|
|
|
|
| SBI Holdings, Inc. |
|
|
4,210 |
|
|
|
81,449 |
|
|
|
|
| Secom Co. Ltd. |
|
|
1,400 |
|
|
|
78,125 |
|
|
|
|
| Seiko Epson Corp. |
|
|
1,300 |
|
|
|
14,896 |
|
|
|
|
| Sekisui House Ltd. |
|
|
5,000 |
|
|
|
74,935 |
|
|
|
|
| Seven & I Holdings Co. Ltd. |
|
|
1,600 |
|
|
|
61,384 |
|
|
|
|
| Seven Bank Ltd. |
|
|
1,000 |
|
|
|
3,549 |
|
|
|
|
| Shiga Bank Ltd. |
|
|
4,000 |
|
|
|
28,148 |
|
|
|
|
| Shimamura Co. Ltd. |
|
|
100 |
|
|
|
12,628 |
|
|
|
|
| Shimano, Inc. |
|
|
300 |
|
|
|
26,066 |
|
|
|
|
| Shimizu Corp. |
|
|
18,000 |
|
|
|
72,380 |
|
|
|
|
| Shin-Etsu Chemical Co. Ltd. |
|
|
2,900 |
|
|
|
195,148 |
|
|
|
|
| Shionogi & Co. Ltd. |
|
|
21,900 |
|
|
|
538,711 |
|
|
|
|
| Showa Denko KK |
|
|
19,000 |
|
|
|
30,600 |
|
|
|
|
| SMC Corp. |
|
|
9,700 |
|
|
|
1,941,294 |
|
|
|
|
| Softbank Corp. |
|
|
6,100 |
|
|
|
301,918 |
|
|
|
|
| Sojitz Corp. |
|
|
30,900 |
|
|
|
48,497 |
|
|
|
|
| Sony Corp. |
|
|
19,400 |
|
|
|
320,995 |
|
|
|
|
| Sony Financial Holdings, Inc. |
|
|
2,500 |
|
|
|
35,262 |
|
|
|
|
| Sumco Corp. |
|
|
8,300 |
|
|
|
87,100 |
|
|
|
|
| Sumitomo Chemical Co. Ltd. |
|
|
26,000 |
|
|
|
86,947 |
|
|
|
|
| Sumitomo Corp. |
|
|
45,200 |
|
|
|
563,812 |
|
|
|
|
| Sumitomo Electric Industries Ltd. |
|
|
17,700 |
|
|
|
234,947 |
|
|
|
|
| Sumitomo Metal Mining Co. Ltd. |
|
|
13,000 |
|
|
|
180,962 |
|
|
|
|
| Sumitomo Mitsui Financial Group, Inc. |
|
|
21,000 |
|
|
|
991,999 |
|
|
|
|
| Sumitomo Mitsui Trust Holdings, Inc. |
|
|
263,820 |
|
|
|
1,323,362 |
|
|
|
|
| Sumitomo Realty & Development Co. Ltd. |
|
|
3,000 |
|
|
|
141,560 |
|
|
|
|
| Sumitomo Rubber Industries Ltd. |
|
|
2,500 |
|
|
|
46,084 |
|
|
|
|
| Suruga Bank Ltd. |
|
|
1,000 |
|
|
|
17,664 |
|
|
|
|
| Suzuken Co. Ltd. |
|
|
1,700 |
|
|
|
66,092 |
|
|
|
|
| Suzuki Motor Corp. |
|
|
1,400 |
|
|
|
35,874 |
|
|
|
|
| Sysmex Corp. |
|
|
400 |
|
|
|
25,768 |
|
|
|
|
| Taisei Corp. |
|
|
24,000 |
|
|
|
80,012 |
|
|
|
|
| Taisho Pharmaceutical Holdings Co. Ltd. |
|
|
200 |
|
|
|
14,813 |
|
|
|
|
| Takashimaya Co. Ltd. |
|
|
5,000 |
|
|
|
58,983 |
|
April 30, 2013 / ANNUAL REPORT
PORTFOLIOS OF INVESTMENTS 35
Wilmington Multi-Manager International Fund (continued)
|
|
|
|
|
|
|
|
|
| Description |
|
Number
of
Shares |
|
|
Value |
|
|
|
|
| Takeda Pharmaceutical Co. Ltd. |
|
|
20,400 |
|
|
$ |
1,119,557 |
|
|
|
|
| TDK Corp. |
|
|
1,900 |
|
|
|
69,385 |
|
|
|
|
| Teijin Ltd. |
|
|
12,000 |
|
|
|
28,804 |
|
|
|
|
| Tobu Railway Co. Ltd. |
|
|
7,000 |
|
|
|
40,642 |
|
|
|
|
| Toho Co. Ltd. |
|
|
300 |
|
|
|
6,672 |
|
|
|
|
| Tokai Rika Co. Ltd. |
|
|
900 |
|
|
|
18,206 |
|
|
|
|
| Tokio Marine Holdings, Inc. |
|
|
28,100 |
|
|
|
890,691 |
|
|
|
|
| Tokyo Broadcasting System Holdings, Inc. |
|
|
700 |
|
|
|
11,065 |
|
|
|
|
| Tokyo Electric Power Co., Inc.* |
|
|
39,700 |
|
|
|
175,114 |
|
|
|
|
| Tokyo Electron Ltd. |
|
|
6,100 |
|
|
|
312,243 |
|
|
|
|
| Tokyu Corp. |
|
|
12,000 |
|
|
|
95,153 |
|
|
|
|
| Toppan Printing Co. Ltd. |
|
|
14,000 |
|
|
|
106,560 |
|
|
|
|
| Toray Industries, Inc. |
|
|
6,000 |
|
|
|
42,099 |
|
|
|
|
| Toshiba Corp. |
|
|
10,000 |
|
|
|
55,085 |
|
|
|
|
| Tosoh Corp. |
|
|
16,000 |
|
|
|
52,685 |
|
|
|
|
| TOTO Ltd. |
|
|
1,000 |
|
|
|
10,361 |
|
|
|
|
| Toyo Ink SC Holdings Co. Ltd. |
|
|
1,000 |
|
|
|
4,657 |
|
|
|
|
| Toyo Seikan Kaisha Ltd. |
|
|
3,300 |
|
|
|
45,158 |
|
|
|
|
| Toyo Tire & Rubber Co. Ltd. |
|
|
62,000 |
|
|
|
333,262 |
|
|
|
|
| Toyota Motor Corp. |
|
|
85,500 |
|
|
|
4,946,607 |
|
|
|
|
| Toyota Tsusho Corp. |
|
|
1,600 |
|
|
|
44,495 |
|
|
|
|
| Tsumura & Co. |
|
|
300 |
|
|
|
9,771 |
|
|
|
|
| Ube Industries Ltd. |
|
|
15,000 |
|
|
|
30,312 |
|
|
|
|
| Unicharm Corp. |
|
|
800 |
|
|
|
51,700 |
|
|
|
|
| UNY Co. Ltd. |
|
|
6,000 |
|
|
|
42,653 |
|
|
|
|
| Ushio, Inc. |
|
|
2,400 |
|
|
|
24,422 |
|
|
|
|
| Yahoo Japan Corp. |
|
|
77 |
|
|
|
38,506 |
|
|
|
|
| Yakult Honsha Co. Ltd. |
|
|
400 |
|
|
|
17,418 |
|
|
|
|
| Yamada Denki Co. Ltd. |
|
|
2,800 |
|
|
|
134,852 |
|
|
|
|
| Yamaguchi Financial Group, Inc. |
|
|
13,000 |
|
|
|
140,955 |
|
|
|
|
| Yamaha Motor Co. Ltd. |
|
|
3,800 |
|
|
|
52,935 |
|
|
|
|
| Yamato Holdings Co. Ltd. |
|
|
1,100 |
|
|
|
21,180 |
|
|
|
|
| Yamato Kogyo Co. Ltd. |
|
|
700 |
|
|
|
23,086 |
|
|
|
|
| Yamazaki Baking Co. Ltd. |
|
|
3,000 |
|
|
|
39,206 |
|
|
|
|
| Yokogawa Electric Corp. |
|
|
700 |
|
|
|
7,109 |
|
|
|
|
| Yokohama Rubber Co. Ltd. |
|
|
40,100 |
|
|
|
525,699 |
|
|
|
|
|
|
|
|
|
|
|
|
|
| TOTAL JAPAN |
|
|
|
|
|
$ |
57,579,078 |
|
|
|
|
| JORDAN – 0.2% |
|
|
|
|
|
|
|
|
|
|
|
| Arab Bank PLC |
|
|
37,635 |
|
|
|
378,078 |
|
|
|
|
| Arab Potash Co. |
|
|
2,100 |
|
|
|
133,522 |
|
|
|
|
| Bank of Jordan |
|
|
14,070 |
|
|
|
44,332 |
|
|
|
|
| Capital Bank of Jordan* |
|
|
23,325 |
|
|
|
36,582 |
|
|
|
|
| Jordan Petroleum Refinery Co. |
|
|
5,580 |
|
|
|
45,334 |
|
|
|
|
| Jordan Phosphate Mines |
|
|
1,700 |
|
|
|
28,223 |
|
|
|
|
| Jordan Steel |
|
|
5,259 |
|
|
|
11,146 |
|
|
|
|
| Jordan Telecommunications Co. PSC |
|
|
9,750 |
|
|
|
68,742 |
|
|
|
|
| Jordanian Electric Power Co. |
|
|
10,917 |
|
|
|
48,434 |
|
|
|
|
|
|
|
|
|
|
| Description |
|
Number
of
Shares |
|
|
Value |
|
|
|
|
| Middle East Complex for Engineering |
|
|
|
|
|
|
|
|
| Electric and Heavy Industries PLC*,†† |
|
|
60 |
|
|
$ |
9 |
|
|
|
|
| Taameer Jordan Holdings PSC* |
|
|
12,900 |
|
|
|
2,916 |
|
|
|
|
|
|
|
|
|
|
|
|
|
| TOTAL JORDAN |
|
|
|
|
|
$ |
797,318 |
|
|
|
|
| KAZAKHSTAN – 0.1% |
|
|
|
|
|
|
|
|
|
|
|
| Halyk Savings Bank of Kazakhstan JSC GDR |
|
|
25,890 |
|
|
|
188,997 |
|
|
|
|
| Kazakhmys PLC |
|
|
29,656 |
|
|
|
159,528 |
|
|
|
|
| Kazkommertsbank JSC GDR* |
|
|
28,000 |
|
|
|
58,548 |
|
|
|
|
| KazMunaiGas Exploration Production JSC GDR |
|
|
13,000 |
|
|
|
233,350 |
|
|
|
|
|
|
|
|
|
|
|
|
|
| TOTAL KAZAKHSTAN |
|
|
|
|
|
$ |
640,423 |
|
|
|
|
| KENYA – 0.2% |
|
|
|
|
|
|
|
|
|
|
|
| Athi River Mining Ltd. |
|
|
146,000 |
|
|
|
108,890 |
|
|
|
|
| Bamburi Cement Co. Ltd. |
|
|
15,600 |
|
|
|
37,976 |
|
|
|
|
| Barclays Bank of Kenya Ltd. |
|
|
493,600 |
|
|
|
104,257 |
|
|
|
|
| East African Breweries Ltd. |
|
|
56,180 |
|
|
|
204,474 |
|
|
|
|
| Equity Bank Ltd. |
|
|
313,800 |
|
|
|
117,020 |
|
|
|
|
| Kenya Airways Ltd. |
|
|
402,900 |
|
|
|
52,646 |
|
|
|
|
| Kenya Commercial Bank Ltd. |
|
|
244,300 |
|
|
|
122,442 |
|
|
|
|
| Kenya Power & Lighting Ltd. |
|
|
178,087 |
|
|
|
38,890 |
|
|
|
|
| Nation Media Group Ltd. |
|
|
31,944 |
|
|
|
106,734 |
|
|
|
|
| Safaricom Ltd. |
|
|
2,400,100 |
|
|
|
196,190 |
|
|
|
|
| Standard Chartered Bank Kenya Ltd. |
|
|
10,458 |
|
|
|
34,818 |
|
|
|
|
|
|
|
|
|
|
|
|
|
| TOTAL KENYA |
|
|
|
|
|
$ |
1,124,337 |
|
|
|
|
| LATVIA – 0.0%** |
|
|
|
|
|
|
|
|
|
|
|
| Latvian Shipping Co.* |
|
|
36,206 |
|
|
|
15,733 |
|
|
|
|
| LEBANON – 0.1% |
|
|
|
|
|
|
|
|
|
|
|
| Solidere GDR# |
|
|
19,314 |
|
|
|
253,979 |
|
|
|
|
| LITHUANIA – 0.1% |
|
|
|
|
|
|
|
|
|
|
|
| Apranga PVA |
|
|
22,400 |
|
|
|
74,339 |
|
|
|
|
| Invalda PVA* |
|
|
17,284 |
|
|
|
52,581 |
|
|
|
|
| Lesto AB |
|
|
19,018 |
|
|
|
16,706 |
|
|
|
|
| Lietuvos Energijos Gamyba |
|
|
10,949 |
|
|
|
5,638 |
|
|
|
|
| Litgrid AB |
|
|
8,818 |
|
|
|
6,643 |
|
|
|
|
| Panevezio Statybos Trestas |
|
|
16,900 |
|
|
|
24,705 |
|
|
|
|
| Pieno Zvaigzdes |
|
|
10,687 |
|
|
|
29,837 |
|
|
|
|
| Siauliu Bankas |
|
|
61,853 |
|
|
|
21,668 |
|
|
|
|
|
|
|
|
|
|
|
|
|
| TOTAL LITHUANIA |
|
|
|
|
|
$ |
232,117 |
|
|
|
|
| LUXEMBOURG – 0.2% |
|
|
|
|
|
|
|
|
|
|
|
| Millicom International Cellular SA# |
|
|
224 |
|
|
|
18,318 |
|
|
|
|
| SES SA |
|
|
25,659 |
|
|
|
801,200 |
|
|
|
|
|
|
|
|
|
|
|
|
|
| TOTAL LUXEMBOURG |
|
|
|
|
|
$ |
819,518 |
|
|
|
|
| MALAYSIA – 1.3% |
|
|
|
|
|
|
|
|
|
|
|
| AirAsia Bhd |
|
|
53,300 |
|
|
|
51,329 |
|
|
|
|
| Alliance Financial Group Bhd |
|
|
28,800 |
|
|
|
42,218 |
|
|
|
|
| AMMB Holdings Bhd |
|
|
29,800 |
|
|
|
65,624 |
|
ANNUAL REPORT / April
30, 2013
36 PORTFOLIOS OF INVESTMENTS
Wilmington Multi-Manager International Fund (continued)
|
|
|
|
|
|
|
|
|
| Description |
|
Number
of
Shares |
|
|
Value |
|
|
|
|
| Astro Malaysia Holdings Bhd |
|
|
39,600 |
|
|
$ |
38,396 |
|
|
|
|
| Axiata Group Bhd |
|
|
72,200 |
|
|
|
160,655 |
|
|
|
|
| Batu Kawan Bhd |
|
|
12,600 |
|
|
|
75,455 |
|
|
|
|
| Boustead Holdings Bhd |
|
|
29,500 |
|
|
|
49,643 |
|
|
|
|
| British American Tobacco Malaysia Bhd |
|
|
4,100 |
|
|
|
85,329 |
|
|
|
|
| Bumi Armada Bhd |
|
|
53,900 |
|
|
|
70,686 |
|
|
|
|
| CIMB Group Holdings Bhd |
|
|
54,800 |
|
|
|
139,409 |
|
|
|
|
| Dialog Group Bhd |
|
|
85,600 |
|
|
|
66,679 |
|
|
|
|
| DiGi.Com Bhd |
|
|
50,000 |
|
|
|
76,253 |
|
|
|
|
| Felda Global Ventures Holdings Bhd |
|
|
61,400 |
|
|
|
93,235 |
|
|
|
|
| Gamuda Bhd |
|
|
81,100 |
|
|
|
108,489 |
|
|
|
|
| Genting Bhd |
|
|
466,500 |
|
|
|
1,609,942 |
|
|
|
|
| Genting Malaysia Bhd |
|
|
86,300 |
|
|
|
106,652 |
|
|
|
|
| Hong Leong Bank Bhd |
|
|
16,400 |
|
|
|
77,944 |
|
|
|
|
| IHH Healthcare Bhd* |
|
|
79,400 |
|
|
|
97,864 |
|
|
|
|
| IJM Corp. Bhd |
|
|
40,860 |
|
|
|
73,192 |
|
|
|
|
| IOI Corp. Bhd |
|
|
75,280 |
|
|
|
124,456 |
|
|
|
|
| KLCC Property Holdings Bhd†† |
|
|
24,500 |
|
|
|
58,381 |
|
|
|
|
| Kuala Lumpur Kepong Bhd |
|
|
14,900 |
|
|
|
105,586 |
|
|
|
|
| Kulim Malaysia Bhd |
|
|
17,300 |
|
|
|
20,356 |
|
|
|
|
| Lafarge Malayan Cement Bhd |
|
|
16,000 |
|
|
|
52,168 |
|
|
|
|
| Malayan Banking Bhd |
|
|
52,990 |
|
|
|
167,548 |
|
|
|
|
| Malaysian Resources Corp. Bhd |
|
|
83,700 |
|
|
|
38,789 |
|
|
|
|
| Maxis Bhd |
|
|
55,800 |
|
|
|
123,980 |
|
|
|
|
| MMC Corp. Bhd |
|
|
48,400 |
|
|
|
40,565 |
|
|
|
|
| Muhibbah Engineering M Bhd |
|
|
68,300 |
|
|
|
25,142 |
|
|
|
|
| Multi-Purpose Holdings Bhd |
|
|
36,500 |
|
|
|
42,228 |
|
|
|
|
| Petronas Chemicals Group Bhd |
|
|
110,500 |
|
|
|
237,162 |
|
|
|
|
| Petronas Dagangan Bhd |
|
|
14,200 |
|
|
|
110,240 |
|
|
|
|
| Petronas Gas Bhd |
|
|
10,100 |
|
|
|
65,463 |
|
|
|
|
| PPB Group Bhd |
|
|
14,100 |
|
|
|
59,320 |
|
|
|
|
| Public Bank Bhd |
|
|
19,800 |
|
|
|
106,858 |
|
|
|
|
| RHB Capital Bhd |
|
|
18,000 |
|
|
|
50,169 |
|
|
|
|
| Sapurakencana Petroleum Bhd* |
|
|
96,517 |
|
|
|
100,879 |
|
|
|
|
| Sime Darby Bhd |
|
|
504,846 |
|
|
|
1,566,391 |
|
|
|
|
| Ta Ann Holdings Bhd |
|
|
19,008 |
|
|
|
21,804 |
|
|
|
|
| Telekom Malaysia Bhd |
|
|
35,100 |
|
|
|
63,682 |
|
|
|
|
| Tenaga Nasional Bhd |
|
|
168,825 |
|
|
|
435,588 |
|
|
|
|
| UMW Holdings Bhd |
|
|
15,400 |
|
|
|
72,381 |
|
|
|
|
| Wah Seong Corp. Bhd |
|
|
36,247 |
|
|
|
19,419 |
|
|
|
|
| WCT Bhd |
|
|
40,786 |
|
|
|
32,173 |
|
|
|
|
| YTL Corp. Bhd |
|
|
102,176 |
|
|
|
55,076 |
|
|
|
|
| YTL Power International Bhd |
|
|
69,316 |
|
|
|
34,402 |
|
|
|
|
|
|
|
|
|
|
|
|
|
| TOTAL MALAYSIA |
|
|
|
|
|
$ |
6,919,200 |
|
|
|
|
| MAURITIUS – 0.1% |
|
|
|
|
|
|
|
|
|
|
|
| CIM Financial Services Ltd. |
|
|
191,700 |
|
|
|
36,303 |
|
|
|
|
|
|
|
|
|
|
| Description |
|
Number
of
Shares |
|
|
Value |
|
|
|
|
| Lux Island Resorts Ltd.* |
|
|
7,000 |
|
|
$ |
4,227 |
|
|
|
|
| Mauritius Commercial Bank |
|
|
38,600 |
|
|
|
236,200 |
|
|
|
|
| Mauritius Development Invest Trust |
|
|
265,200 |
|
|
|
45,097 |
|
|
|
|
| New Mauritius Hotels Ltd.* |
|
|
18,900 |
|
|
|
43,674 |
|
|
|
|
| Rogers And Co. Ltd. |
|
|
7,100 |
|
|
|
40,988 |
|
|
|
|
| State Bank of Mauritius Ltd. |
|
|
5,580,000 |
|
|
|
185,101 |
|
|
|
|
| Sun Resorts Ltd. |
|
|
24,969 |
|
|
|
22,516 |
|
|
|
|
|
|
|
|
|
|
|
|
|
| TOTAL MAURITIUS |
|
|
|
|
|
$ |
614,106 |
|
|
|
|
| MEXICO – 1.5% |
|
|
|
|
|
|
|
|
|
|
|
| Alfa SAB de CV |
|
|
178,700 |
|
|
|
414,876 |
|
|
|
|
| America Movil SAB de CV |
|
|
1,209,424 |
|
|
|
1,295,851 |
|
|
|
|
| America Movil SAB de CV ADR |
|
|
14,970 |
|
|
|
320,059 |
|
|
|
|
| Arca Continental SAB de CV |
|
|
19,500 |
|
|
|
159,584 |
|
|
|
|
| Cemex SAB de CV* |
|
|
439,054 |
|
|
|
495,379 |
|
|
|
|
| Coca-Cola Femsa SAB de CV |
|
|
8,700 |
|
|
|
140,549 |
|
|
|
|
| Compartamos SAB de CV |
|
|
108,000 |
|
|
|
179,669 |
|
|
|
|
| Corp. Moctezuma SAB de CV |
|
|
20,900 |
|
|
|
65,063 |
|
|
|
|
| Empresas ICA SAB de CV* |
|
|
20,800 |
|
|
|
57,215 |
|
|
|
|
| Fomento Economico Mexicano SAB de CV |
|
|
45,400 |
|
|
|
514,860 |
|
|
|
|
| Grupo Aeroportuario del Centro Norte SAB de CV# |
|
|
17,800 |
|
|
|
68,079 |
|
|
|
|
| Grupo Aeroportuario del Pacifico SAB de CV |
|
|
14,700 |
|
|
|
85,145 |
|
|
|
|
| Grupo Aeroportuario del Sureste SAB de CV |
|
|
2,300 |
|
|
|
28,546 |
|
|
|
|
| Grupo Bimbo SAB de CV# |
|
|
66,200 |
|
|
|
215,627 |
|
|
|
|
| Grupo Carso SAB de CV |
|
|
24,800 |
|
|
|
141,358 |
|
|
|
|
| Grupo Elektra SA de CV |
|
|
1,460 |
|
|
|
63,053 |
|
|
|
|
| Grupo Financiero Banorte SAB de CV |
|
|
120,600 |
|
|
|
908,798 |
|
|
|
|
| Grupo Financiero Inbursa SAB de CV |
|
|
194,100 |
|
|
|
563,007 |
|
|
|
|
| Grupo Mexico SAB de CV |
|
|
119,621 |
|
|
|
429,431 |
|
|
|
|
| Grupo Modelo SAB de CV |
|
|
16,500 |
|
|
|
150,048 |
|
|
|
|
| Grupo Televisa SAB de CV |
|
|
60,600 |
|
|
|
307,135 |
|
|
|
|
| Impulsora del Desarrollo y El Empleo en America Latina SAB de CV* |
|
|
56,900 |
|
|
|
137,912 |
|
|
|
|
| Industrias CH SAB de CV* |
|
|
7,500 |
|
|
|
60,421 |
|
|
|
|
| Industrias Penoles SAB de CV |
|
|
5,130 |
|
|
|
215,449 |
|
|
|
|
| Kimberly-Clark de Mexico SAB de CV |
|
|
42,000 |
|
|
|
147,076 |
|
|
|
|
| Mexichem SAB de CV |
|
|
29,605 |
|
|
|
151,020 |
|
|
|
|
| Minera Frisco SAB de CV* |
|
|
16,600 |
|
|
|
71,036 |
|
|
|
|
| Organizacion Soriana SAB de CV |
|
|
10,800 |
|
|
|
44,473 |
|
|
|
|
| Promotora y Operadora de Infraestructura SAB de CV* |
|
|
13,900 |
|
|
|
124,012 |
|
|
|
|
| TV Azteca SAB de CV |
|
|
38,700 |
|
|
|
28,653 |
|
|
|
|
| Wal-Mart de Mexico SAB de CV |
|
|
129,700 |
|
|
|
411,458 |
|
|
|
|
|
|
|
|
|
|
|
|
|
| TOTAL MEXICO |
|
|
|
|
|
$ |
7,994,842 |
|
|
|
|
| MOROCCO – 0.2% |
|
|
|
|
|
|
|
|
|
|
|
| Attijariwafa Bank |
|
|
4,519 |
|
|
|
178,941 |
|
|
|
|
| Auto Hall |
|
|
3,700 |
|
|
|
26,770 |
|
|
|
|
| Banque Centrale Populaire |
|
|
3,900 |
|
|
|
86,204 |
|
|
| April 30, 2013 / ANNUAL REPORT |
|
PORTFOLIOS OF INVESTMENTS 37
Wilmington Multi-Manager International Fund (continued)
|
|
|
|
|
|
|
|
|
| Description |
|
Number
of
Shares |
|
|
Value |
|
|
|
|
| Banque Marocaine du Commerce et de l’Industrie |
|
|
320 |
|
|
$ |
29,881 |
|
|
|
|
| Banque Marocaine du Commerce Exterieur |
|
|
4,980 |
|
|
|
114,197 |
|
|
|
|
| Cie Generale Immobiliere |
|
|
390 |
|
|
|
25,820 |
|
|
|
|
| Credit Immobilier et Hotelier |
|
|
800 |
|
|
|
21,744 |
|
|
|
|
| Delta Holding SA |
|
|
7,500 |
|
|
|
26,985 |
|
|
|
|
| Douja Promotion Groupe Addoha SA |
|
|
13,520 |
|
|
|
87,958 |
|
|
|
|
| Holcim Maroc SA |
|
|
240 |
|
|
|
42,524 |
|
|
|
|
| Lafarge Ciments |
|
|
785 |
|
|
|
93,716 |
|
|
|
|
| Maroc Telecom SA |
|
|
20,900 |
|
|
|
276,068 |
|
|
|
|
|
|
|
|
|
|
|
|
|
| TOTAL MOROCCO |
|
|
|
|
|
$ |
1,010,808 |
|
|
|
|
| NETHERLANDS – 1.3% |
|
|
|
|
|
|
|
|
|
|
|
| Aegon NV |
|
|
86,274 |
|
|
|
569,343 |
|
|
|
|
| AKZO Nobel NV |
|
|
4,780 |
|
|
|
288,186 |
|
|
|
|
| ArcelorMittal |
|
|
7,792 |
|
|
|
95,352 |
|
|
|
|
| ArcelorMittal, NY Reg. Shares# |
|
|
18,397 |
|
|
|
229,779 |
|
|
|
|
| ASML Holding NV |
|
|
11,843 |
|
|
|
880,431 |
|
|
|
|
| Delta Lloyd NV |
|
|
3,924 |
|
|
|
75,190 |
|
|
|
|
| European Aeronautic Defence and Space Co. NV |
|
|
3,337 |
|
|
|
176,248 |
|
|
|
|
| Fugro NV |
|
|
9,129 |
|
|
|
528,086 |
|
|
|
|
| Heineken NV |
|
|
24,336 |
|
|
|
1,718,483 |
|
|
|
|
| ING Groep NV* |
|
|
135,167 |
|
|
|
1,109,348 |
|
|
|
|
| Koninklijke Ahold NV |
|
|
2,960 |
|
|
|
46,700 |
|
|
|
|
| Koninklijke Boskalis Westminster NV |
|
|
748 |
|
|
|
31,153 |
|
|
|
|
| Koninklijke DSM NV |
|
|
7,751 |
|
|
|
499,462 |
|
|
|
|
| Koninklijke KPN NV# |
|
|
51,812 |
|
|
|
108,015 |
|
|
|
|
| Koninklijke Philips Electronics NV |
|
|
1,678 |
|
|
|
46,340 |
|
|
|
|
| Randstad Holding NV |
|
|
588 |
|
|
|
24,482 |
|
|
|
|
| Unilever NV |
|
|
6,274 |
|
|
|
267,046 |
|
|
|
|
|
|
|
|
|
|
|
|
|
| TOTAL NETHERLANDS |
|
|
|
|
|
$ |
6,693,644 |
|
|
|
|
| NEW ZEALAND – 0.0%** |
|
|
|
|
|
|
|
|
|
|
|
| Auckland International Airport Ltd. |
|
|
15,953 |
|
|
|
42,390 |
|
|
|
|
| Contact Energy Ltd. |
|
|
8,921 |
|
|
|
40,374 |
|
|
|
|
| Fletcher Building Ltd. |
|
|
87 |
|
|
|
659 |
|
|
|
|
| SKYCITY Entertainment Group Ltd. |
|
|
3,557 |
|
|
|
13,598 |
|
|
|
|
|
|
|
|
|
|
|
|
|
| TOTAL NEW ZEALAND |
|
|
|
|
|
$ |
97,021 |
|
|
|
|
| NIGERIA – 0.2% |
|
|
|
|
|
|
|
|
|
|
|
| Africa Prudential Registrars PLC* |
|
|
24,606 |
|
|
|
241 |
|
|
|
|
| Dangote Cement PLC |
|
|
100,100 |
|
|
|
102,634 |
|
|
|
|
| FBN Holdings PLC |
|
|
1,383,642 |
|
|
|
163,322 |
|
|
|
|
| First City Monument Bank PLC* |
|
|
862,500 |
|
|
|
24,565 |
|
|
|
|
| Guaranty Trust Bank PLC |
|
|
576,410 |
|
|
|
94,123 |
|
|
|
|
| Guinness Nigeria PLC |
|
|
19,500 |
|
|
|
32,740 |
|
|
|
|
| Lafarge Cement WAPCO Nigeria PLC |
|
|
155,000 |
|
|
|
75,538 |
|
|
|
|
| Nestle Nigeria PLC |
|
|
17,736 |
|
|
|
99,905 |
|
|
|
|
| Nigerian Breweries PLC |
|
|
92,380 |
|
|
|
96,414 |
|
|
|
|
|
|
|
|
|
|
| Description |
|
Number
of
Shares |
|
|
Value |
|
|
|
|
| Oando PLC* |
|
|
1,420,875 |
|
|
$ |
133,544 |
|
|
|
|
| UAC of Nigeria PLC |
|
|
124,250 |
|
|
|
44,824 |
|
|
|
|
| UBA Capital PLC* |
|
|
98,425 |
|
|
|
716 |
|
|
|
|
| United Bank for Africa PLC* |
|
|
812,013 |
|
|
|
35,410 |
|
|
|
|
| Zenith Bank PLC |
|
|
1,340,475 |
|
|
|
170,953 |
|
|
|
|
|
|
|
|
|
|
|
|
|
| TOTAL NIGERIA |
|
|
|
|
|
$ |
1,074,929 |
|
|
|
|
| NORWAY – 0.5% |
|
|
|
|
|
|
|
|
|
|
|
| AKER Solutions ASA |
|
|
954 |
|
|
|
13,318 |
|
|
|
|
| Cermaq ASA |
|
|
498 |
|
|
|
7,427 |
|
|
|
|
| DNB ASA# |
|
|
9,287 |
|
|
|
151,790 |
|
|
|
|
| Norsk Hydro ASA |
|
|
22,820 |
|
|
|
106,848 |
|
|
|
|
| Orkla ASA |
|
|
8,470 |
|
|
|
76,232 |
|
|
|
|
| Statoil ASA |
|
|
21,673 |
|
|
|
528,811 |
|
|
|
|
| Storebrand ASA* |
|
|
10,389 |
|
|
|
47,202 |
|
|
|
|
| Subsea 7 SA |
|
|
29,633 |
|
|
|
638,241 |
|
|
|
|
| Telenor ASA |
|
|
7,363 |
|
|
|
165,481 |
|
|
|
|
| Yara International ASA |
|
|
21,438 |
|
|
|
1,003,773 |
|
|
|
|
|
|
|
|
|
|
|
|
|
| TOTAL NORWAY |
|
|
|
|
|
$ |
2,739,123 |
|
|
|
|
| OMAN – 0.2% |
|
|
|
|
|
|
|
|
|
|
|
| Bank Dhofar SAOG |
|
|
44,454 |
|
|
|
43,184 |
|
|
|
|
| Bank Sohar |
|
|
237,226 |
|
|
|
113,376 |
|
|
|
|
| BankMuscat SAOG |
|
|
98,380 |
|
|
|
158,175 |
|
|
|
|
| Dhofar International Development & Investment Holding Co. |
|
|
41,800 |
|
|
|
50,703 |
|
|
|
|
| Galfar Engineering & Contracting SAOG |
|
|
34,540 |
|
|
|
32,925 |
|
|
|
|
| HSBC Bank Oman |
|
|
35,846 |
|
|
|
18,901 |
|
|
|
|
| National Bank of Oman SAOG |
|
|
49,374 |
|
|
|
34,498 |
|
|
|
|
| Oman Cement Co. |
|
|
32,940 |
|
|
|
59,035 |
|
|
|
|
| Oman Flour Mills Co. SAOG |
|
|
16,000 |
|
|
|
26,057 |
|
|
|
|
| Oman Oil Marketing Co. |
|
|
13,300 |
|
|
|
72,925 |
|
|
|
|
| Oman Telecommunications Co. SAOG |
|
|
46,300 |
|
|
|
172,573 |
|
|
|
|
| Renaissance Services SAOG* |
|
|
58,892 |
|
|
|
79,389 |
|
|
|
|
|
|
|
|
|
|
|
|
|
| TOTAL OMAN |
|
|
|
|
|
$ |
861,741 |
|
|
|
|
| PAKISTAN – 0.2% |
|
|
|
|
|
|
|
|
|
|
|
| Engro Corp. Ltd. |
|
|
51,752 |
|
|
|
70,591 |
|
|
|
|
| Fauji Fertilizer Co. Ltd. |
|
|
58,780 |
|
|
|
66,733 |
|
|
|
|
| HUB Power Co. |
|
|
214,000 |
|
|
|
117,291 |
|
|
|
|
| Lucky Cement Ltd. |
|
|
48,500 |
|
|
|
85,542 |
|
|
|
|
| MCB Bank Ltd. |
|
|
81,537 |
|
|
|
180,531 |
|
|
|
|
| Millat Tractors Ltd. |
|
|
8,426 |
|
|
|
43,323 |
|
|
|
|
| National Bank Of Pakistan |
|
|
101,752 |
|
|
|
40,695 |
|
|
|
|
| Nishat Mills Ltd. |
|
|
55,450 |
|
|
|
45,660 |
|
|
|
|
| Oil & Gas Development Co. Ltd. |
|
|
74,000 |
|
|
|
153,391 |
|
|
|
|
| Pakistan Oilfields Ltd. |
|
|
9,300 |
|
|
|
44,430 |
|
|
|
|
| Pakistan Petroleum Ltd. |
|
|
45,572 |
|
|
|
83,855 |
|
ANNUAL REPORT / April
30, 2013
38 PORTFOLIOS OF INVESTMENTS
Wilmington Multi-Manager International Fund (continued)
|
|
|
|
|
|
|
|
|
| Description |
|
Number
of
Shares |
|
|
Value |
|
|
|
|
| Pakistan Telecommunication Co. Ltd.* |
|
|
135,000 |
|
|
$ |
24,582 |
|
|
|
|
| United Bank Ltd. |
|
|
53,000 |
|
|
|
48,129 |
|
|
|
|
|
|
|
|
|
|
|
|
|
| TOTAL PAKISTAN |
|
|
|
|
|
$ |
1,004,753 |
|
|
|
|
| PERU – 0.3% |
|
|
|
|
|
|
|
|
|
|
|
| Alicorp SA |
|
|
72,000 |
|
|
|
269,694 |
|
|
|
|
| BBVA Banco Continental SA |
|
|
28,742 |
|
|
|
73,948 |
|
|
|
|
| Cia de Minas Buenaventura SA ADR |
|
|
7,700 |
|
|
|
154,154 |
|
|
|
|
| Cia Minera Milpo SAA |
|
|
34,893 |
|
|
|
22,443 |
|
|
|
|
| Credicorp Ltd. |
|
|
2,500 |
|
|
|
376,475 |
|
|
|
|
| Edegel SAA |
|
|
37,100 |
|
|
|
35,514 |
|
|
|
|
| Ferreyros SA |
|
|
71,981 |
|
|
|
62,367 |
|
|
|
|
| Grana y Montero SA |
|
|
46,300 |
|
|
|
200,581 |
|
|
|
|
| Luz del Sur SAA |
|
|
12,200 |
|
|
|
43,621 |
|
|
|
|
| Minsur SA |
|
|
35,670 |
|
|
|
22,133 |
|
|
|
|
| Sociedad Minera Cerro Verde SAA* |
|
|
1,400 |
|
|
|
32,620 |
|
|
|
|
| Sociedad Minera el Brocal SA |
|
|
4,000 |
|
|
|
37,230 |
|
|
|
|
| Southern Copper Corp. |
|
|
8,259 |
|
|
|
275,272 |
|
|
|
|
| Volcan Cia Minera SAA |
|
|
41,905 |
|
|
|
26,954 |
|
|
|
|
|
|
|
|
|
|
|
|
|
| TOTAL PERU |
|
|
|
|
|
$ |
1,633,006 |
|
|
|
|
| PHILIPPINES – 0.4% |
|
|
|
|
|
|
|
|
|
|
|
| Aboitiz Equity Ventures, Inc. |
|
|
218,500 |
|
|
|
302,587 |
|
|
|
|
| Aboitiz Power Corp. |
|
|
49,300 |
|
|
|
44,677 |
|
|
|
|
| Alliance Global Group, Inc. |
|
|
135,000 |
|
|
|
77,733 |
|
|
|
|
| Ayala Corp. |
|
|
5,620 |
|
|
|
87,522 |
|
|
|
|
| Ayala Land, Inc. |
|
|
178,200 |
|
|
|
140,491 |
|
|
|
|
| Bank of the Philippine Islands |
|
|
50,645 |
|
|
|
126,489 |
|
|
|
|
| BDO Unibank, Inc.* |
|
|
40,562 |
|
|
|
90,368 |
|
|
|
|
| Energy Development Corp. |
|
|
411,750 |
|
|
|
65,124 |
|
|
|
|
| International Container Terminal Services, |
|
|
|
|
|
|
|
|
| Inc. |
|
|
31,900 |
|
|
|
71,302 |
|
|
|
|
| JG Summit Holdings, Inc. |
|
|
92,500 |
|
|
|
106,748 |
|
|
|
|
| Jollibee Foods Corp. |
|
|
47,600 |
|
|
|
148,605 |
|
|
|
|
| Manila Electric Co. |
|
|
10,710 |
|
|
|
97,316 |
|
|
|
|
| Metro Pacific Investments Corp. |
|
|
513,000 |
|
|
|
75,903 |
|
|
|
|
| Metropolitan Bank & Trust |
|
|
27,813 |
|
|
|
84,128 |
|
|
|
|
| Philex Mining Corp. |
|
|
216,150 |
|
|
|
86,649 |
|
|
|
|
| Philippine Long Distance Telephone Co. |
|
|
1,800 |
|
|
|
133,207 |
|
|
|
|
| San Miguel Corp. |
|
|
23,000 |
|
|
|
67,614 |
|
|
|
|
| Semirara Mining Corp. |
|
|
14,190 |
|
|
|
103,426 |
|
|
|
|
| SM Investments Corp. |
|
|
5,010 |
|
|
|
139,370 |
|
|
|
|
| SM Prime Holdings, Inc. |
|
|
200,750 |
|
|
|
97,546 |
|
|
|
|
| Universal Robina Corp. |
|
|
22,900 |
|
|
|
66,152 |
|
|
|
|
|
|
|
|
|
|
|
|
|
| TOTAL PHILIPPINES |
|
|
|
|
|
$ |
2,212,957 |
|
|
|
|
| POLAND – 0.7% |
|
|
|
|
|
|
|
|
|
|
|
| AmRest Holdings SE* |
|
|
2,700 |
|
|
|
69,212 |
|
|
|
|
| Asseco Poland SA |
|
|
7,073 |
|
|
|
95,938 |
|
|
|
|
| Bank Pekao SA |
|
|
5,150 |
|
|
|
246,918 |
|
|
|
|
|
|
|
|
|
|
| Description |
|
Number
of
Shares |
|
|
Value |
|
|
|
|
| Bioton SA* |
|
|
1,701,800 |
|
|
$ |
21,543 |
|
|
|
|
| BRE Bank SA |
|
|
780 |
|
|
|
85,310 |
|
|
|
|
| Budimex SA |
|
|
2,780 |
|
|
|
67,920 |
|
|
|
|
| Cyfrowy Polsat SA* |
|
|
22,930 |
|
|
|
121,332 |
|
|
|
|
| Eurocash SA |
|
|
10,410 |
|
|
|
187,455 |
|
|
|
|
| Get Bank SA* |
|
|
54,005 |
|
|
|
26,833 |
|
|
|
|
| Getin Holding SA |
|
|
18,000 |
|
|
|
12,703 |
|
|
|
|
| Grupa Kety SA |
|
|
450 |
|
|
|
20,080 |
|
|
|
|
| Grupa Lotos SA* |
|
|
2,600 |
|
|
|
31,243 |
|
|
|
|
| ING Bank Slaski SA* |
|
|
2,000 |
|
|
|
57,028 |
|
|
|
|
| Jastrzebska Spolka Weglowa SA |
|
|
2,850 |
|
|
|
75,312 |
|
|
|
|
| Kernel Holding SA* |
|
|
4,220 |
|
|
|
76,525 |
|
|
|
|
| KGHM Polska Miedz SA |
|
|
6,100 |
|
|
|
285,710 |
|
|
|
|
| LPP SA |
|
|
120 |
|
|
|
243,050 |
|
|
|
|
| Lubelski Wegiel Bogdanka SA |
|
|
1,500 |
|
|
|
55,541 |
|
|
|
|
| Netia SA* |
|
|
41,500 |
|
|
|
55,161 |
|
|
|
|
| Orbis SA |
|
|
2,900 |
|
|
|
32,259 |
|
|
|
|
| PGE SA |
|
|
57,280 |
|
|
|
297,471 |
|
|
|
|
| Polimex-Mostostal SA* |
|
|
47,700 |
|
|
|
4,227 |
|
|
|
|
| Polski Koncern Naftowy Orlen SA* |
|
|
11,150 |
|
|
|
172,904 |
|
|
|
|
| Polskie Gornictwo Naftowe i Gazownictwo SA* |
|
|
61,300 |
|
|
|
103,594 |
|
|
|
|
| Powszechna Kasa Oszczednosci Bank Polski SA |
|
|
33,700 |
|
|
|
350,881 |
|
|
|
|
| Powszechny Zaklad Ubezpieczen SA |
|
|
2,660 |
|
|
|
366,609 |
|
|
|
|
| Rovese SA* |
|
|
13,950 |
|
|
|
6,313 |
|
|
|
|
| Synthos SA |
|
|
34,800 |
|
|
|
51,872 |
|
|
|
|
| Tauron Polska Energia SA |
|
|
70,360 |
|
|
|
93,744 |
|
|
|
|
| Telekomunikacja Polska SA |
|
|
55,920 |
|
|
|
124,587 |
|
|
|
|
| TVN SA |
|
|
30,150 |
|
|
|
83,012 |
|
|
|
|
|
|
|
|
|
|
|
|
|
| TOTAL POLAND |
|
|
|
|
|
$ |
3,522,287 |
|
|
|
|
| PORTUGAL – 0.1% |
|
|
|
|
|
|
|
|
|
|
|
| EDP - Energias de Portugal SA |
|
|
28,687 |
|
|
|
98,604 |
|
|
|
|
| EDP Renovaveis SA* |
|
|
10,506 |
|
|
|
54,666 |
|
|
|
|
| Jeronimo Martins SGPS SA# |
|
|
1,290 |
|
|
|
30,724 |
|
|
|
|
| Portugal Telecom SGPS SA# |
|
|
22,539 |
|
|
|
117,574 |
|
|
|
|
|
|
|
|
|
|
|
|
|
| TOTAL PORTUGAL |
|
|
|
|
|
$ |
301,568 |
|
|
|
|
| QATAR – 0.4% |
|
|
|
|
|
|
|
|
|
|
|
| Al Meera Consumer Goods Co. |
|
|
1,000 |
|
|
|
34,881 |
|
|
|
|
| Barwa Real Estate Co. |
|
|
7,607 |
|
|
|
49,203 |
|
|
|
|
| Commercial Bank of Qatar QSC |
|
|
4,508 |
|
|
|
80,480 |
|
|
|
|
| Doha Bank QSC |
|
|
3,322 |
|
|
|
41,241 |
|
|
|
|
| Gulf International Services QSC |
|
|
5,500 |
|
|
|
61,558 |
|
|
|
|
| Industries Qatar QSC |
|
|
10,153 |
|
|
|
479,639 |
|
|
|
|
| Masraf Al Rayan |
|
|
22,240 |
|
|
|
152,404 |
|
|
|
|
| Omani Qatari Telecommunications Co. SAOG |
|
|
14,700 |
|
|
|
18,785 |
|
|
|
|
| Qatar Electricity & Water Co. |
|
|
3,180 |
|
|
|
124,898 |
|
April 30, 2013 / ANNUAL REPORT
PORTFOLIOS OF INVESTMENTS 39
Wilmington Multi-Manager International Fund (continued)
|
|
|
|
|
|
|
|
|
| Description |
|
Number
of
Shares |
|
|
Value |
|
|
|
|
| Qatar Gas Transport Co. Nakilat |
|
|
26,100 |
|
|
$ |
112,546 |
|
|
|
|
| Qatar Islamic Bank |
|
|
3,500 |
|
|
|
66,330 |
|
|
|
|
| Qatar National Bank SAQ |
|
|
9,188 |
|
|
|
340,679 |
|
|
|
|
| Qatar National Cement Co. |
|
|
2,620 |
|
|
|
71,960 |
|
|
|
|
| Qatar Navigation |
|
|
2,703 |
|
|
|
46,251 |
|
|
|
|
| Qatar Telecom Qtel QSC |
|
|
7,232 |
|
|
|
228,427 |
|
|
|
|
|
|
|
|
|
|
|
|
|
| TOTAL QATAR |
|
|
|
|
|
$ |
1,909,282 |
|
|
|
|
| ROMANIA – 0.1% |
|
|
|
|
|
|
|
|
|
|
|
| Antibiotice |
|
|
159,827 |
|
|
|
22,365 |
|
|
|
|
| Banca Transilvania* |
|
|
257,164 |
|
|
|
97,475 |
|
|
|
|
| Biofarm Bucuresti |
|
|
481,487 |
|
|
|
33,732 |
|
|
|
|
| BRD-Groupe Societe Generale |
|
|
85,800 |
|
|
|
202,804 |
|
|
|
|
| OMV Petrom SA |
|
|
1,688,500 |
|
|
|
237,821 |
|
|
|
|
| Transelectrica SA |
|
|
2,450 |
|
|
|
9,264 |
|
|
|
|
|
|
|
|
|
|
|
|
|
| TOTAL ROMANIA |
|
|
|
|
|
$ |
603,461 |
|
|
|
|
| RUSSIA – 1.7% |
|
|
|
|
|
|
|
|
|
|
|
| CTC Media, Inc. |
|
|
17,200 |
|
|
|
214,828 |
|
|
|
|
| Federal Hydrogenerating Co. JSC ADR |
|
|
105,160 |
|
|
|
178,772 |
|
|
|
|
| Gazprom Neft OAO ADR |
|
|
16,800 |
|
|
|
341,544 |
|
|
|
|
| Gazprom OAO ADR |
|
|
110,810 |
|
|
|
880,939 |
|
|
|
|
| Globaltrans Investment PLC GDR |
|
|
12,380 |
|
|
|
175,796 |
|
|
|
|
| LSR Group GDR |
|
|
27,240 |
|
|
|
118,494 |
|
|
|
|
| Lukoil OAO ADR |
|
|
10,310 |
|
|
|
653,654 |
|
|
|
|
| Magnit OJSC GDR |
|
|
8,400 |
|
|
|
428,400 |
|
|
|
|
| Mail.ru Group Ltd. GDR |
|
|
3,190 |
|
|
|
86,130 |
|
|
|
|
| Mechel ADR |
|
|
22,700 |
|
|
|
92,616 |
|
|
|
|
| MMC Norilsk Nickel OJSC ADR |
|
|
14,210 |
|
|
|
216,987 |
|
|
|
|
| MMC Norilsk Nickel OJSC ADR Euronext Shares |
|
|
22,900 |
|
|
|
350,828 |
|
|
|
|
| Mobile Telesystems OJSC ADR |
|
|
58,364 |
|
|
|
1,208,135 |
|
|
|
|
| NovaTek OAO GDR |
|
|
2,100 |
|
|
|
212,520 |
|
|
|
|
| Novolipetsk Steel OJSC GDR |
|
|
2,800 |
|
|
|
46,480 |
|
|
|
|
| Pharmstandard OJSC GDR |
|
|
9,700 |
|
|
|
202,827 |
|
|
|
|
| Rosneft OAO GDR |
|
|
25,500 |
|
|
|
174,292 |
|
|
|
|
| Rostelecom OJSC ADR |
|
|
8,766 |
|
|
|
195,482 |
|
|
|
|
| Sberbank of Russia ADR |
|
|
135,649 |
|
|
|
1,744,446 |
|
|
|
|
| Severstal OAO GDR |
|
|
5,880 |
|
|
|
49,715 |
|
|
|
|
| Sistema JSFC GDR |
|
|
5,500 |
|
|
|
104,885 |
|
|
|
|
| Surgutneftegas OAO ADR |
|
|
18,070 |
|
|
|
154,860 |
|
|
|
|
| Tatneft OAO ADR |
|
|
4,000 |
|
|
|
151,160 |
|
|
|
|
| TMK OAO GDR |
|
|
4,860 |
|
|
|
61,430 |
|
|
|
|
| Uralkali OJSC GDR |
|
|
5,000 |
|
|
|
180,950 |
|
|
|
|
| VimpelCom Ltd. ADR |
|
|
28,400 |
|
|
|
310,980 |
|
|
|
|
| VTB Bank OJSC GDR |
|
|
42,550 |
|
|
|
134,032 |
|
|
|
|
| X5 Retail Group NV GDR* |
|
|
6,100 |
|
|
|
106,994 |
|
|
|
|
| Yandex NV* |
|
|
4,100 |
|
|
|
105,534 |
|
|
|
|
|
|
|
|
|
|
|
|
|
| TOTAL RUSSIA |
|
|
|
|
|
$ |
8,883,710 |
|
|
|
|
|
|
|
|
|
|
| Description |
|
Number
of
Shares |
|
|
Value |
|
|
|
|
| SINGAPORE – 1.2% |
|
|
|
|
|
|
|
|
|
|
|
| CapitaLand Ltd. |
|
|
58,000 |
|
|
$ |
176,114 |
|
|
|
|
| City Developments Ltd. |
|
|
3,000 |
|
|
|
27,426 |
|
|
|
|
| DBS Group Holdings Ltd. |
|
|
145,000 |
|
|
|
1,973,045 |
|
|
|
|
| Global Logistic Properties Ltd. |
|
|
17,000 |
|
|
|
38,094 |
|
|
|
|
| Golden Agri-Resources Ltd. |
|
|
1,697,400 |
|
|
|
730,391 |
|
|
|
|
| Jardine Cycle & Carriage Ltd. |
|
|
1,000 |
|
|
|
39,539 |
|
|
|
|
| Keppel Corp. Ltd. |
|
|
83,900 |
|
|
|
729,536 |
|
|
|
|
| Keppel Land Ltd. |
|
|
9,000 |
|
|
|
29,666 |
|
|
|
|
| Noble Group Ltd. |
|
|
66,000 |
|
|
|
60,283 |
|
|
|
|
| Olam International Ltd. |
|
|
22,000 |
|
|
|
29,918 |
|
|
|
|
| Oversea-Chinese Banking Corp. |
|
|
19,000 |
|
|
|
167,370 |
|
|
|
|
| Overseas Union Enterprise Ltd. |
|
|
8,000 |
|
|
|
20,200 |
|
|
|
|
| SembCorp. Industries Ltd. |
|
|
5,000 |
|
|
|
20,257 |
|
|
|
|
| SembCorp. Marine Ltd.# |
|
|
4,000 |
|
|
|
13,997 |
|
|
|
|
| Singapore Airlines Ltd. |
|
|
14,000 |
|
|
|
126,167 |
|
|
|
|
| Singapore Exchange Ltd. |
|
|
11,000 |
|
|
|
66,802 |
|
|
|
|
| Singapore Land Ltd. |
|
|
2,000 |
|
|
|
14,370 |
|
|
|
|
| Singapore Press Holdings Ltd.# |
|
|
8,000 |
|
|
|
28,968 |
|
|
|
|
| Singapore Technologies Engineering Ltd. |
|
|
20,000 |
|
|
|
71,446 |
|
|
|
|
| Singapore Telecommunications Ltd. |
|
|
55,000 |
|
|
|
175,489 |
|
|
|
|
| STX OSV Holdings Ltd. |
|
|
155,000 |
|
|
|
129,618 |
|
|
|
|
| United Overseas Bank Ltd. |
|
|
85,000 |
|
|
|
1,473,370 |
|
|
|
|
| UOL Group Ltd. |
|
|
12,000 |
|
|
|
69,465 |
|
|
|
|
| Venture Corp. Ltd. |
|
|
5,000 |
|
|
|
33,774 |
|
|
|
|
|
|
|
|
|
|
|
|
|
| TOTAL SINGAPORE |
|
|
|
|
|
$ |
6,245,305 |
|
|
|
|
| SLOVENIA – 0.1% |
|
|
|
|
|
|
|
|
|
|
|
| Gorenje DD |
|
|
2,600 |
|
|
|
14,724 |
|
|
|
|
| Krka DD Novo Mesto |
|
|
4,070 |
|
|
|
266,927 |
|
|
|
|
| Luka Koper* |
|
|
1,120 |
|
|
|
11,652 |
|
|
|
|
| Mercator Poslovni Sistem |
|
|
622 |
|
|
|
92,973 |
|
|
|
|
| Nova Kreditna Banka Maribor DD* |
|
|
11,800 |
|
|
|
10,412 |
|
|
|
|
| Petrol DD Ljubljana |
|
|
210 |
|
|
|
62,945 |
|
|
|
|
| Telekom Slovenije DD |
|
|
1,000 |
|
|
|
123,793 |
|
|
|
|
| Zavarovalnica Triglav DD |
|
|
2,000 |
|
|
|
52,678 |
|
|
|
|
|
|
|
|
|
|
|
|
|
| TOTAL SLOVENIA |
|
|
|
|
|
$ |
636,104 |
|
|
|
|
| SOUTH AFRICA – 1.5% |
|
|
|
|
|
|
|
|
|
|
|
| ABSA Group Ltd. |
|
|
7,500 |
|
|
|
123,438 |
|
|
|
|
| African Bank Investments Ltd.# |
|
|
19,710 |
|
|
|
62,577 |
|
|
|
|
| African Rainbow Minerals Ltd. |
|
|
2,100 |
|
|
|
41,394 |
|
|
|
|
| Anglo American Platinum Ltd.* |
|
|
1,800 |
|
|
|
68,279 |
|
|
|
|
| AngloGold Ashanti Ltd. |
|
|
7,030 |
|
|
|
131,144 |
|
|
|
|
| Aspen Pharmacare Holdings Ltd. |
|
|
7,432 |
|
|
|
161,419 |
|
|
|
|
| Astral Foods Ltd. |
|
|
16,800 |
|
|
|
176,921 |
|
|
|
|
| Aveng Ltd. |
|
|
21,500 |
|
|
|
70,680 |
|
|
|
|
| AVI Ltd. |
|
|
11,200 |
|
|
|
67,398 |
|
ANNUAL REPORT / April
30, 2013
40 PORTFOLIOS OF INVESTMENTS
Wilmington Multi-Manager International Fund (continued)
|
|
|
|
|
|
|
|
|
| Description |
|
Number
of
Shares |
|
|
Value |
|
|
|
|
| Barloworld Ltd. |
|
|
10,400 |
|
|
$ |
108,943 |
|
|
|
|
| Bidvest Group Ltd. |
|
|
13,125 |
|
|
|
341,322 |
|
|
|
|
| Discovery Holdings Ltd. |
|
|
7,999 |
|
|
|
72,863 |
|
|
|
|
| Exxaro Resources Ltd. |
|
|
4,100 |
|
|
|
64,300 |
|
|
|
|
| FirstRand Ltd. |
|
|
64,690 |
|
|
|
224,777 |
|
|
|
|
| Foschini Group Ltd. |
|
|
4,400 |
|
|
|
56,388 |
|
|
|
|
| Gold Fields Ltd. |
|
|
15,890 |
|
|
|
113,099 |
|
|
|
|
| Grindrod Ltd. |
|
|
29,600 |
|
|
|
62,014 |
|
|
|
|
| Harmony Gold Mining Co. Ltd. |
|
|
8,390 |
|
|
|
40,391 |
|
|
|
|
| Impala Platinum Holdings Ltd. |
|
|
10,574 |
|
|
|
144,302 |
|
|
|
|
| Imperial Holdings Ltd. |
|
|
3,900 |
|
|
|
86,358 |
|
|
|
|
| Kumba Iron Ore Ltd. |
|
|
1,490 |
|
|
|
78,586 |
|
|
|
|
| Liberty Holdings Ltd. |
|
|
6,400 |
|
|
|
85,229 |
|
|
|
|
| Life Healthcare Group Holdings Ltd. |
|
|
23,000 |
|
|
|
97,167 |
|
|
|
|
| Massmart Holdings Ltd. |
|
|
3,274 |
|
|
|
67,862 |
|
|
|
|
| MMI Holdings Ltd. |
|
|
22,679 |
|
|
|
57,876 |
|
|
|
|
| Mr Price Group Ltd. |
|
|
4,800 |
|
|
|
68,992 |
|
|
|
|
| MTN Group Ltd. |
|
|
68,060 |
|
|
|
1,227,029 |
|
|
|
|
| Murray & Roberts Holdings Ltd.* |
|
|
26,380 |
|
|
|
64,587 |
|
|
|
|
| Nampak Ltd. |
|
|
15,000 |
|
|
|
55,129 |
|
|
|
|
| Naspers Ltd. |
|
|
7,071 |
|
|
|
473,186 |
|
|
|
|
| Nedbank Group Ltd. |
|
|
14,400 |
|
|
|
305,925 |
|
|
|
|
| Netcare Ltd. |
|
|
31,200 |
|
|
|
70,929 |
|
|
|
|
| Omnia Holdings Ltd. |
|
|
17,400 |
|
|
|
305,787 |
|
|
|
|
| Pick n Pay Stores Ltd. |
|
|
8,300 |
|
|
|
39,310 |
|
|
|
|
| PPC Ltd. |
|
|
10,421 |
|
|
|
38,103 |
|
|
|
|
| Remgro Ltd. |
|
|
9,190 |
|
|
|
185,336 |
|
|
|
|
| Reunert Ltd. |
|
|
12,650 |
|
|
|
109,943 |
|
|
|
|
| RMB Holdings Ltd. |
|
|
22,300 |
|
|
|
98,981 |
|
|
|
|
| RMI Holdings |
|
|
26,900 |
|
|
|
70,296 |
|
|
|
|
| Sanlam Ltd. |
|
|
37,500 |
|
|
|
192,191 |
|
|
|
|
| Sasol Ltd. |
|
|
11,180 |
|
|
|
483,194 |
|
|
|
|
| Shoprite Holdings Ltd. |
|
|
6,320 |
|
|
|
119,794 |
|
|
|
|
| Sibanye Gold Ltd.* |
|
|
15,890 |
|
|
|
15,052 |
|
|
|
|
| Standard Bank Group Ltd. |
|
|
23,140 |
|
|
|
289,073 |
|
|
|
|
| Steinhoff International Holdings Ltd. |
|
|
37,100 |
|
|
|
99,019 |
|
|
|
|
| Telkom SA Ltd.* |
|
|
61,700 |
|
|
|
88,010 |
|
|
|
|
| Tiger Brands Ltd. |
|
|
3,590 |
|
|
|
111,663 |
|
|
|
|
| Truworths International Ltd. |
|
|
10,600 |
|
|
|
105,356 |
|
|
|
|
| Vodacom Group Ltd. |
|
|
13,820 |
|
|
|
162,033 |
|
|
|
|
| Wilson Bayly Holmes-Ovcon Ltd. |
|
|
4,800 |
|
|
|
82,643 |
|
|
|
|
| Woolworths Holdings Ltd. |
|
|
11,980 |
|
|
|
93,373 |
|
|
|
|
|
|
|
|
|
|
|
|
|
| TOTAL SOUTH AFRICA |
|
|
|
|
|
$ |
7,559,661 |
|
|
|
|
| SOUTH KOREA – 1.9% |
|
|
|
|
|
|
|
|
|
|
|
| BS Financial Group, Inc. |
|
|
19,015 |
|
|
|
250,357 |
|
|
|
|
|
|
|
|
|
|
| Description |
|
Number
of
Shares |
|
|
Value |
|
|
|
|
| Cheil Industries, Inc. |
|
|
890 |
|
|
$ |
76,692 |
|
|
|
|
| Daewoo Engineering & Construction Co. |
|
|
|
|
|
|
|
|
| Ltd.* |
|
|
4,364 |
|
|
|
29,957 |
|
|
|
|
| Daewoo International Corp. |
|
|
1,379 |
|
|
|
48,396 |
|
|
|
|
| DGB Financial Group, Inc. |
|
|
12,200 |
|
|
|
170,598 |
|
|
|
|
| Doosan Heavy Industries & Construction Co. Ltd. |
|
|
1,030 |
|
|
|
38,299 |
|
|
|
|
| Doosan Infracore Co. Ltd.* |
|
|
2,200 |
|
|
|
26,069 |
|
|
|
|
| E-Mart Co. Ltd. |
|
|
421 |
|
|
|
82,189 |
|
|
|
|
| GS Holdings |
|
|
1,300 |
|
|
|
64,215 |
|
|
|
|
| Hana Financial Group, Inc. |
|
|
9,609 |
|
|
|
307,125 |
|
|
|
|
| Honam Petrochemical Corp. |
|
|
200 |
|
|
|
29,511 |
|
|
|
|
| Hyosung Corp. |
|
|
1,650 |
|
|
|
83,002 |
|
|
|
|
| Hyundai Department Store Co. Ltd. |
|
|
430 |
|
|
|
62,472 |
|
|
|
|
| Hyundai Glovis Co. Ltd. |
|
|
470 |
|
|
|
78,952 |
|
|
|
|
| Hyundai Heavy Industries Co. Ltd. |
|
|
397 |
|
|
|
72,457 |
|
|
|
|
| Hyundai Marine & Fire Insurance Co. Ltd. |
|
|
5,800 |
|
|
|
163,262 |
|
|
|
|
| Hyundai Merchant Marine Co. Ltd.* |
|
|
1,180 |
|
|
|
10,982 |
|
|
|
|
| Hyundai Mobis |
|
|
663 |
|
|
|
150,504 |
|
|
|
|
| Hyundai Motor Co. |
|
|
1,619 |
|
|
|
293,281 |
|
|
|
|
| Hyundai Securities Co. Ltd. |
|
|
2,330 |
|
|
|
16,185 |
|
|
|
|
| Hyundai Steel Co. |
|
|
1,290 |
|
|
|
89,256 |
|
|
|
|
| Industrial Bank of Korea |
|
|
18,600 |
|
|
|
212,803 |
|
|
|
|
| KB Financial Group, Inc. |
|
|
6,573 |
|
|
|
214,862 |
|
|
|
|
| KCC Corp. |
|
|
120 |
|
|
|
35,631 |
|
|
|
|
| Kia Motors Corp. |
|
|
2,955 |
|
|
|
147,039 |
|
|
|
|
| Korea Electric Power Corp.* |
|
|
6,940 |
|
|
|
199,447 |
|
|
|
|
| Korea Zinc Co. Ltd. |
|
|
200 |
|
|
|
57,296 |
|
|
|
|
| Korean Air Lines Co. Ltd.* |
|
|
800 |
|
|
|
25,642 |
|
|
|
|
| KT Corp. |
|
|
12,631 |
|
|
|
413,464 |
|
|
|
|
| KT&G Corp. |
|
|
2,000 |
|
|
|
144,012 |
|
|
|
|
| LG Chem Ltd. |
|
|
818 |
|
|
|
193,117 |
|
|
|
|
| LG Corp. |
|
|
1,630 |
|
|
|
97,093 |
|
|
|
|
| LG Display Co. Ltd.* |
|
|
2,660 |
|
|
|
72,339 |
|
|
|
|
| LG Electronics, Inc. |
|
|
1,970 |
|
|
|
157,593 |
|
|
|
|
| LG Household & Health Care Ltd. |
|
|
150 |
|
|
|
84,309 |
|
|
|
|
| LG Uplus Corp.* |
|
|
5,860 |
|
|
|
55,338 |
|
|
|
|
| Lotte Shopping Co. Ltd. |
|
|
290 |
|
|
|
108,227 |
|
|
|
|
| Macquarie Korea Infrastructure Fund |
|
|
5,769 |
|
|
|
36,564 |
|
|
|
|
| NHN Corp. |
|
|
580 |
|
|
|
155,888 |
|
|
|
|
| OCI Co. Ltd. |
|
|
270 |
|
|
|
34,691 |
|
|
|
|
| POSCO |
|
|
1,384 |
|
|
|
394,603 |
|
|
|
|
| Samsung C&T Corp. |
|
|
1,650 |
|
|
|
88,396 |
|
|
|
|
| Samsung Card Co. Ltd. |
|
|
1,000 |
|
|
|
38,364 |
|
|
|
|
| Samsung Electro-Mechanics Co. Ltd. |
|
|
970 |
|
|
|
86,757 |
|
|
|
|
| Samsung Electronics Co. Ltd. GDR |
|
|
1,683 |
|
|
|
2,322,855 |
|
|
|
|
| Samsung Fire & Marine Insurance Co. Ltd. |
|
|
830 |
|
|
|
170,703 |
|
|
|
|
| Samsung Heavy Industries Co. Ltd. |
|
|
1,680 |
|
|
|
53,468 |
|
|
| April 30, 2013 / ANNUAL REPORT |
PORTFOLIOS OF INVESTMENTS 41
Wilmington Multi-Manager International Fund (continued)
|
|
|
|
|
|
|
|
|
| Description |
|
Number
of
Shares |
|
|
Value |
|
|
|
|
| Samsung Life Insurance Co. Ltd. |
|
|
1,900 |
|
|
$ |
187,188 |
|
|
|
|
| Samsung Securities Co. Ltd. |
|
|
1,240 |
|
|
|
56,973 |
|
|
|
|
| Shinhan Financial Group Co. Ltd. |
|
|
7,950 |
|
|
|
275,034 |
|
|
|
|
| SK Holdings Co. Ltd. |
|
|
320 |
|
|
|
46,055 |
|
|
|
|
| SK Hynix, Inc.* |
|
|
6,090 |
|
|
|
165,342 |
|
|
|
|
| SK Innovation Co. Ltd. |
|
|
800 |
|
|
|
108,962 |
|
|
|
|
| SK Telecom Co. Ltd. |
|
|
4,030 |
|
|
|
708,076 |
|
|
|
|
| S-Oil Corp. |
|
|
740 |
|
|
|
59,466 |
|
|
|
|
| Woongjin Coway Co. Ltd. |
|
|
1,510 |
|
|
|
76,508 |
|
|
|
|
| Woori Finance Holdings Co. Ltd. |
|
|
8,590 |
|
|
|
92,818 |
|
|
|
|
| Woori Investment & Securities Co. Ltd. |
|
|
6,468 |
|
|
|
66,366 |
|
|
|
|
|
|
|
|
|
|
|
|
|
| TOTAL SOUTH KOREA |
|
|
|
|
|
$ |
9,587,050 |
|
|
|
|
| SPAIN – 1.2% |
|
|
|
|
|
|
|
|
|
|
|
| Acciona SA |
|
|
818 |
|
|
|
53,594 |
|
|
|
|
| ACS Actividades de Construccion y Servicios SA |
|
|
3,179 |
|
|
|
81,743 |
|
|
|
|
| Amadeus IT Holding SA |
|
|
1,985 |
|
|
|
58,596 |
|
|
|
|
| Banco Bilbao Vizcaya Argentaria SA |
|
|
276,704 |
|
|
|
2,685,668 |
|
|
|
|
| Banco Bilbao Vizcaya Argentaria SA Temporary Shares* |
|
|
2,971 |
|
|
|
28,836 |
|
|
|
|
| Banco de Sabadell SA |
|
|
42,250 |
|
|
|
87,857 |
|
|
|
|
| Banco Espanol de Credito SA* |
|
|
3,705 |
|
|
|
17,053 |
|
|
|
|
| Banco Popular Espanol SA |
|
|
164,948 |
|
|
|
128,382 |
|
|
|
|
| Banco Santander SA |
|
|
116,482 |
|
|
|
842,325 |
|
|
|
|
| Banco Santander SA Temporary Shares* |
|
|
788 |
|
|
|
5,698 |
|
|
|
|
| CaixaBank |
|
|
13,118 |
|
|
|
48,562 |
|
|
|
|
| Grifols SA* |
|
|
850 |
|
|
|
34,108 |
|
|
|
|
| Iberdrola SA |
|
|
96,127 |
|
|
|
517,772 |
|
|
|
|
| Inditex SA |
|
|
1,681 |
|
|
|
225,918 |
|
|
|
|
| Mapfre SA |
|
|
23,156 |
|
|
|
84,929 |
|
|
|
|
| Red Electrica Corp. SA |
|
|
1,048 |
|
|
|
55,745 |
|
|
|
|
| Repsol YPF SA |
|
|
27,732 |
|
|
|
650,086 |
|
|
|
|
| Telefonica SA |
|
|
31,553 |
|
|
|
462,908 |
|
|
|
|
|
|
|
|
|
|
|
|
|
| TOTAL SPAIN |
|
|
|
|
|
$ |
6,069,780 |
|
|
|
|
| SWEDEN – 2.7% |
|
|
|
|
|
|
|
|
|
|
|
| Assa Abloy AB# |
|
|
2,996 |
|
|
|
119,312 |
|
|
|
|
| Atlas Copco AB Class A |
|
|
126,499 |
|
|
|
3,329,820 |
|
|
|
|
| Atlas Copco AB Class B |
|
|
3,785 |
|
|
|
89,762 |
|
|
|
|
| Boliden AB |
|
|
30,037 |
|
|
|
475,509 |
|
|
|
|
| CDON Group AB* |
|
|
191 |
|
|
|
890 |
|
|
|
|
| Elekta AB# |
|
|
48,566 |
|
|
|
746,731 |
|
|
|
|
| Getinge AB |
|
|
2,202 |
|
|
|
66,287 |
|
|
|
|
| Hennes & Mauritz AB# |
|
|
3,398 |
|
|
|
120,221 |
|
|
|
|
| Hexagon AB* |
|
|
2,016 |
|
|
|
57,577 |
|
|
|
|
| Holmen AB |
|
|
1,517 |
|
|
|
42,343 |
|
|
|
|
| Investor AB |
|
|
70,423 |
|
|
|
2,075,403 |
|
|
|
|
|
|
|
|
|
|
| Description |
|
Number
of
Shares |
|
|
Value |
|
|
|
|
| Meda AB |
|
|
3,075 |
|
|
$ |
36,723 |
|
|
|
|
| Nordea Bank AB |
|
|
45,392 |
|
|
|
543,845 |
|
|
|
|
| Saab AB |
|
|
13,800 |
|
|
|
302,784 |
|
|
|
|
| Sandvik AB# |
|
|
118,345 |
|
|
|
1,677,195 |
|
|
|
|
| Skandinaviska Enskilda Banken AB |
|
|
25,382 |
|
|
|
260,437 |
|
|
|
|
| SKF AB# |
|
|
4,302 |
|
|
|
100,098 |
|
|
|
|
| SSAB AB Class A |
|
|
12,066 |
|
|
|
87,967 |
|
|
|
|
| SSAB AB Class B |
|
|
1,865 |
|
|
|
11,885 |
|
|
|
|
| Svenska Cellulosa AB |
|
|
8,884 |
|
|
|
230,700 |
|
|
|
|
| Svenska Handelsbanken AB |
|
|
1,133 |
|
|
|
51,466 |
|
|
|
|
| Swedbank AB |
|
|
7,219 |
|
|
|
177,661 |
|
|
|
|
| Swedish Match AB# |
|
|
1,376 |
|
|
|
47,728 |
|
|
|
|
| Telefonaktiebolaget LM Ericsson ADR |
|
|
5,941 |
|
|
|
73,134 |
|
|
|
|
| Telefonaktiebolaget LM Ericsson
Class A |
|
|
1,060 |
|
|
|
12,839 |
|
|
|
|
| Telefonaktiebolaget LM Ericsson
Class B# |
|
|
41,122 |
|
|
|
513,307 |
|
|
|
|
| TeliaSonera AB |
|
|
60,678 |
|
|
|
417,468 |
|
|
|
|
| Trelleborg AB# |
|
|
1,475 |
|
|
|
21,871 |
|
|
|
|
| Volvo AB |
|
|
149,779 |
|
|
|
2,072,994 |
|
|
|
|
|
|
|
|
|
|
|
|
|
| TOTAL SWEDEN |
|
|
|
|
|
$ |
13,763,957 |
|
|
|
|
| SWITZERLAND – 7.2% |
|
|
|
|
|
|
|
|
|
|
|
| ABB Ltd. |
|
|
87,185 |
|
|
|
1,973,806 |
|
|
|
|
| Adecco SA |
|
|
2,344 |
|
|
|
125,368 |
|
|
|
|
| Aryzta AG |
|
|
2,401 |
|
|
|
148,997 |
|
|
|
|
| Baloise Holding AG |
|
|
4,451 |
|
|
|
458,121 |
|
|
|
|
| Barry Callebaut AG |
|
|
34 |
|
|
|
33,203 |
|
|
|
|
| Cie Financiere Richemont SA |
|
|
32,962 |
|
|
|
2,662,343 |
|
|
|
|
| Clariant AG |
|
|
4,675 |
|
|
|
68,380 |
|
|
|
|
| Credit Suisse Group AG |
|
|
72,219 |
|
|
|
2,002,386 |
|
|
|
|
| Geberit AG |
|
|
219 |
|
|
|
53,490 |
|
|
|
|
| Givaudan SA |
|
|
143 |
|
|
|
183,941 |
|
|
|
|
| Glencore International PLC# |
|
|
26,121 |
|
|
|
128,603 |
|
|
|
|
| Helvetia Holding AG |
|
|
600 |
|
|
|
251,506 |
|
|
|
|
| Holcim Ltd. |
|
|
34,306 |
|
|
|
2,673,123 |
|
|
|
|
| Julius Baer Group Ltd. |
|
|
24,007 |
|
|
|
956,355 |
|
|
|
|
| Lonza Group AG |
|
|
551 |
|
|
|
38,371 |
|
|
|
|
| Nestle SA |
|
|
51,777 |
|
|
|
3,697,562 |
|
|
|
|
| Novartis AG |
|
|
55,987 |
|
|
|
4,157,778 |
|
|
|
|
| Pargesa Holding SA |
|
|
785 |
|
|
|
54,709 |
|
|
|
|
| Partners Group Holding AG |
|
|
162 |
|
|
|
41,554 |
|
|
|
|
| Roche Holding AG |
|
|
20,844 |
|
|
|
5,209,879 |
|
|
|
|
| Schindler Holding AG (B11TCY0) |
|
|
380 |
|
|
|
56,971 |
|
|
|
|
| Schindler Holding AG (B11WWH2) |
|
|
125 |
|
|
|
18,297 |
|
|
|
|
| SGS SA |
|
|
43 |
|
|
|
103,916 |
|
|
|
|
| Sika AG |
|
|
13 |
|
|
|
31,388 |
|
|
|
|
| Sonova Holding AG |
|
|
100 |
|
|
|
10,884 |
|
|
|
|
| Sulzer AG |
|
|
391 |
|
|
|
66,695 |
|
|
|
|
| Swatch Group AG |
|
|
464 |
|
|
|
265,735 |
|
ANNUAL REPORT / April
30, 2013
42 PORTFOLIOS OF INVESTMENTS
Wilmington Multi-Manager International Fund (continued)
|
|
|
|
|
|
|
|
|
| Description |
|
Number
of
Shares |
|
|
Value |
|
|
|
|
| Swiss Life Holding AG |
|
|
3,952 |
|
|
$ |
624,805 |
|
|
|
|
| Swiss Re AG |
|
|
14,298 |
|
|
|
1,137,166 |
|
|
|
|
| Syngenta AG |
|
|
7,598 |
|
|
|
3,247,414 |
|
|
|
|
| UBS AG |
|
|
243,139 |
|
|
|
4,340,834 |
|
|
|
|
| Wolseley PLC |
|
|
1,334 |
|
|
|
65,957 |
|
|
|
|
| Zurich Financial Services AG |
|
|
8,702 |
|
|
|
2,429,598 |
|
|
|
|
|
|
|
|
|
|
|
|
|
| TOTAL SWITZERLAND |
|
|
|
|
|
$ |
37,319,135 |
|
|
|
|
| TAIWAN – 2.2% |
|
|
|
|
|
|
|
|
|
|
|
| Acer, Inc.* |
|
|
73,870 |
|
|
|
59,698 |
|
|
|
|
| Advanced Semiconductor Engineering, Inc. |
|
|
90,804 |
|
|
|
78,306 |
|
|
|
|
| Asia Cement Corp. |
|
|
41,350 |
|
|
|
52,472 |
|
|
|
|
| Asustek Computer, Inc. |
|
|
11,700 |
|
|
|
136,180 |
|
|
|
|
| AU Optronics Corp.* |
|
|
147,126 |
|
|
|
67,551 |
|
|
|
|
| Catcher Technology Co. Ltd. |
|
|
9,438 |
|
|
|
47,810 |
|
|
|
|
| Cathay Financial Holding Co. Ltd. |
|
|
130,623 |
|
|
|
175,716 |
|
|
|
|
| Chang Hwa Commercial Bank |
|
|
78,142 |
|
|
|
44,615 |
|
|
|
|
| Cheng Shin Rubber Industry Co. Ltd. |
|
|
59,920 |
|
|
|
202,833 |
|
|
|
|
| Chimei Innolux Corp.* |
|
|
167,877 |
|
|
|
104,952 |
|
|
|
|
| China Airlines Ltd.* |
|
|
87,858 |
|
|
|
33,492 |
|
|
|
|
| China Development Financial Holding Corp.* |
|
|
192,750 |
|
|
|
53,295 |
|
|
|
|
| China Steel Corp. |
|
|
227,405 |
|
|
|
200,343 |
|
|
|
|
| Chinatrust Financial Holding Co. Ltd. |
|
|
223,352 |
|
|
|
135,470 |
|
|
|
|
| Chunghwa Telecom Co. Ltd. |
|
|
102,024 |
|
|
|
324,270 |
|
|
|
|
| Compal Electronics, Inc. |
|
|
278,736 |
|
|
|
180,397 |
|
|
|
|
| Delta Electronics, Inc. |
|
|
22,888 |
|
|
|
109,740 |
|
|
|
|
| D-Link Corp. |
|
|
36,046 |
|
|
|
21,069 |
|
|
|
|
| E.Sun Financial Holding Co. Ltd. |
|
|
120,000 |
|
|
|
72,377 |
|
|
|
|
| Epistar Corp. |
|
|
31,099 |
|
|
|
54,796 |
|
|
|
|
| Far Eastern Department Stores Co. Ltd. |
|
|
92,881 |
|
|
|
82,143 |
|
|
|
|
| Far Eastern New Century Corp. |
|
|
75,290 |
|
|
|
81,000 |
|
|
|
|
| Far EasTone Telecommunications Co. Ltd. |
|
|
57,000 |
|
|
|
138,869 |
|
|
|
|
| First Financial Holding Co. Ltd. |
|
|
149,402 |
|
|
|
91,883 |
|
|
|
|
| Formosa Chemicals & Fibre Corp. |
|
|
74,950 |
|
|
|
175,489 |
|
|
|
|
| Formosa Petrochemical Corp. |
|
|
28,990 |
|
|
|
78,880 |
|
|
|
|
| Formosa Plastics Corp. |
|
|
89,040 |
|
|
|
216,023 |
|
|
|
|
| Foxconn Technology Co. Ltd. |
|
|
19,950 |
|
|
|
52,660 |
|
|
|
|
| Fubon Financial Holding Co. Ltd. |
|
|
124,314 |
|
|
|
177,549 |
|
|
|
|
| Gemtek Technology Corp. |
|
|
1 |
|
|
|
1 |
|
|
|
|
| Giant Manufacturing Co. Ltd. |
|
|
14,000 |
|
|
|
83,966 |
|
|
|
|
| Gigabyte Technology Co. Ltd. |
|
|
252,000 |
|
|
|
239,943 |
|
|
|
|
| Hon Hai Precision Industry Co. Ltd. |
|
|
121,127 |
|
|
|
312,750 |
|
|
|
|
| Hotai Motor Co. Ltd. |
|
|
13,000 |
|
|
|
116,071 |
|
|
|
|
| HTC Corp. |
|
|
9,465 |
|
|
|
96,536 |
|
|
|
|
| Hua Nan Financial Holdings Co. Ltd. |
|
|
166,255 |
|
|
|
96,614 |
|
|
|
|
| King Yuan Electronics Co. Ltd. |
|
|
358,000 |
|
|
|
254,744 |
|
|
|
|
| Largan Precision Co. Ltd. |
|
|
4,000 |
|
|
|
109,244 |
|
|
|
|
| Lien Hwa Industrial Corp. |
|
|
75,104 |
|
|
|
51,788 |
|
|
|
|
|
|
|
|
|
|
| Description |
|
Number
of
Shares |
|
|
Value |
|
|
|
|
| Lite-On Technology Corp. |
|
|
34,061 |
|
|
$ |
61,285 |
|
|
|
|
| MediaTek, Inc. |
|
|
18,082 |
|
|
|
220,572 |
|
|
|
|
| Mega Financial Holding Co. Ltd. |
|
|
201,558 |
|
|
|
155,376 |
|
|
|
|
| Motech Industries, Inc.* |
|
|
13,372 |
|
|
|
13,978 |
|
|
|
|
| Nan Kang Rubber Tire Co. Ltd. |
|
|
70,599 |
|
|
|
83,369 |
|
|
|
|
| Nan Ya Plastics Corp. |
|
|
116,730 |
|
|
|
232,574 |
|
|
|
|
| Novatek Microelectronics Corp. |
|
|
10,145 |
|
|
|
49,501 |
|
|
|
|
| Pegatron Corp.* |
|
|
42,990 |
|
|
|
70,358 |
|
|
|
|
| Pou Chen Corp. |
|
|
96,157 |
|
|
|
113,387 |
|
|
|
|
| President Chain Store Corp. |
|
|
18,496 |
|
|
|
114,065 |
|
|
|
|
| Quanta Computer, Inc. |
|
|
44,571 |
|
|
|
92,126 |
|
|
|
|
| Realtek Semiconductor Corp. |
|
|
35,174 |
|
|
|
101,308 |
|
|
|
|
| Shin Kong Financial Holding Co. Ltd.* |
|
|
223,586 |
|
|
|
70,609 |
|
|
|
|
| Siliconware Precision Industries Co. |
|
|
36,000 |
|
|
|
42,694 |
|
|
|
|
| Sino-American Silicon Products, Inc. |
|
|
13,657 |
|
|
|
18,858 |
|
|
|
|
| SinoPac Financial Holdings Co. Ltd. |
|
|
130,191 |
|
|
|
65,069 |
|
|
|
|
| Synnex Technology International Corp. |
|
|
23,941 |
|
|
|
40,480 |
|
|
|
|
| Tainan Spinning Co. Ltd. |
|
|
113,464 |
|
|
|
55,748 |
|
|
|
|
| Taishin Financial Holding Co. Ltd. |
|
|
98,929 |
|
|
|
42,908 |
|
|
|
|
| Taiwan Cement Corp. |
|
|
62,057 |
|
|
|
82,429 |
|
|
|
|
| Taiwan Cooperative Financial Holding |
|
|
136,777 |
|
|
|
78,557 |
|
|
|
|
| Taiwan Fertilizer Co. Ltd. |
|
|
16,000 |
|
|
|
38,276 |
|
|
|
|
| Taiwan Mobile Co. Ltd. |
|
|
50,874 |
|
|
|
185,313 |
|
|
|
|
| Taiwan Semiconductor Manufacturing Co. Ltd. |
|
|
219,911 |
|
|
|
815,948 |
|
|
|
|
| Taiwan Semiconductor Manufacturing Co. Ltd. ADR |
|
|
153,056 |
|
|
|
2,920,308 |
|
|
|
|
| Tatung Co. Ltd.* |
|
|
245,916 |
|
|
|
62,079 |
|
|
|
|
| TPK Holding Co. Ltd. |
|
|
10,000 |
|
|
|
202,968 |
|
|
|
|
| TSRC Corp. |
|
|
18,700 |
|
|
|
36,941 |
|
|
|
|
| Tung Ho Steel Enterprise Corp. |
|
|
37,476 |
|
|
|
36,572 |
|
|
|
|
| Uni-President Enterprises Corp. |
|
|
135,411 |
|
|
|
266,582 |
|
|
|
|
| United Microelectronics Corp. |
|
|
222,000 |
|
|
|
84,627 |
|
|
|
|
| Vanguard International Semiconductor Corp. |
|
|
256,000 |
|
|
|
278,883 |
|
|
|
|
| Walsin Lihwa Corp.* |
|
|
120,000 |
|
|
|
37,205 |
|
|
|
|
| Wistron Corp. |
|
|
32,020 |
|
|
|
32,495 |
|
|
|
|
| Yuanta Financial Holding Co. Ltd. |
|
|
204,172 |
|
|
|
103,774 |
|
|
|
|
| Yulon Motor Co. Ltd. |
|
|
49,640 |
|
|
|
85,111 |
|
|
|
|
| Zinwell Corp. |
|
|
22,435 |
|
|
|
18,739 |
|
|
|
|
|
|
|
|
|
|
|
|
|
| TOTAL TAIWAN |
|
|
|
|
|
$ |
11,622,607 |
|
|
|
|
| THAILAND – 0.8% |
|
|
|
|
|
|
|
|
|
|
|
| Advanced Info Service PCL |
|
|
37,500 |
|
|
|
344,974 |
|
|
|
|
| Airports of Thailand PCL |
|
|
14,900 |
|
|
|
73,358 |
|
|
|
|
| Bangkok Bank PCL |
|
|
15,200 |
|
|
|
117,560 |
|
|
|
|
| Bangkok Dusit Medical Services PCL |
|
|
8,900 |
|
|
|
51,247 |
|
|
|
|
| Bangkok Expressway PCL |
|
|
24,400 |
|
|
|
33,254 |
|
|
|
|
| Bank of Ayudhya PCL |
|
|
79,700 |
|
|
|
88,933 |
|
|
|
|
| Banpu PCL |
|
|
2,900 |
|
|
|
33,693 |
|
|
| April 30, 2013 / ANNUAL REPORT |
PORTFOLIOS OF INVESTMENTS 43
Wilmington Multi-Manager International Fund (continued)
|
|
|
|
|
|
|
|
|
| Description |
|
Number
of
Shares |
|
|
Value |
|
|
|
|
| BEC World PCL |
|
|
41,700 |
|
|
$ |
95,192 |
|
|
|
|
| Berli Jucker PCL |
|
|
60,600 |
|
|
|
152,274 |
|
|
|
|
| Big C Supercenter PCL |
|
|
12,200 |
|
|
|
96,020 |
|
|
|
|
| Bumrungrad Hospital PCL |
|
|
16,000 |
|
|
|
44,838 |
|
|
|
|
| Central Pattana PCL |
|
|
27,000 |
|
|
|
91,993 |
|
|
|
|
| Charoen Pokphand Foods PCL |
|
|
91,300 |
|
|
|
98,766 |
|
|
|
|
| CP ALL PCL |
|
|
115,100 |
|
|
|
172,552 |
|
|
|
|
| Electricity Generating PCL |
|
|
8,600 |
|
|
|
44,978 |
|
|
|
|
| Glow Energy PCL |
|
|
22,100 |
|
|
|
57,980 |
|
|
|
|
| Hana Microelectronics PCL |
|
|
131,800 |
|
|
|
111,368 |
|
|
|
|
| Indorama Ventures PCL |
|
|
46,100 |
|
|
|
36,911 |
|
|
|
|
| IRPC PCL |
|
|
269,900 |
|
|
|
37,703 |
|
|
|
|
| Kasikornbank PCL |
|
|
28,300 |
|
|
|
208,273 |
|
|
|
|
| Krung Thai Bank PCL |
|
|
472,950 |
|
|
|
399,630 |
|
|
|
|
| PTT Exploration & Production PCL |
|
|
31,209 |
|
|
|
163,754 |
|
|
|
|
| PTT Global Chemical PCL |
|
|
24,800 |
|
|
|
61,683 |
|
|
|
|
| PTT Global Chemical PCL (Foreign) |
|
|
12,681 |
|
|
|
31,540 |
|
|
|
|
| PTT PCL |
|
|
18,700 |
|
|
|
207,707 |
|
|
|
|
| Quality Houses PCL |
|
|
243,291 |
|
|
|
34,981 |
|
|
|
|
| Ratchaburi Electricity Generating Holding PCL |
|
|
19,500 |
|
|
|
39,365 |
|
|
|
|
| Shin Corp. PCL |
|
|
31,900 |
|
|
|
93,744 |
|
|
|
|
| Siam Cement PCL |
|
|
6,500 |
|
|
|
109,404 |
|
|
|
|
| Siam City Cement PCL |
|
|
2,600 |
|
|
|
43,230 |
|
|
|
|
| Siam Commercial Bank PCL |
|
|
33,200 |
|
|
|
210,399 |
|
|
|
|
| Siam Makro PCL |
|
|
3,300 |
|
|
|
84,777 |
|
|
|
|
| Thai Beverage PCL |
|
|
242,369 |
|
|
|
119,049 |
|
|
|
|
| Thai Oil PCL |
|
|
25,600 |
|
|
|
57,567 |
|
|
|
|
| Thai Union Frozen Products PCL |
|
|
20,664 |
|
|
|
39,779 |
|
|
|
|
| Tisco Financial Group PCL |
|
|
59,600 |
|
|
|
111,687 |
|
|
|
|
| TMB Bank PCL |
|
|
1,112,100 |
|
|
|
103,821 |
|
|
|
|
| Total Access Communication PCL |
|
|
28,400 |
|
|
|
113,213 |
|
|
|
|
| True Corp. PCL* |
|
|
317,500 |
|
|
|
91,410 |
|
|
|
|
|
|
|
|
|
|
|
|
|
| TOTAL THAILAND |
|
|
|
|
|
$ |
4,108,607 |
|
|
|
|
| TURKEY – 0.8% |
|
|
|
|
|
|
|
|
|
|
|
| Akbank TAS |
|
|
56,903 |
|
|
|
298,997 |
|
|
|
|
| Akenerji Elektrik Uretim AS* |
|
|
1 |
|
|
|
1 |
|
|
|
|
| Anadolu Efes Biracilik Ve Malt Sanayii AS |
|
|
7,963 |
|
|
|
132,365 |
|
|
|
|
| Arcelik AS |
|
|
13,520 |
|
|
|
105,204 |
|
|
|
|
| BIM Birlesik Magazalar AS |
|
|
4,060 |
|
|
|
208,350 |
|
|
|
|
| Dogan Sirketler Grubu Holding AS* |
|
|
85,907 |
|
|
|
57,982 |
|
|
|
|
| Dogus Otomotiv Servis ve Ticaret AS |
|
|
13,000 |
|
|
|
83,029 |
|
|
|
|
| Enka Insaat ve Sanayi AS |
|
|
41,878 |
|
|
|
129,412 |
|
|
|
|
| Eregli Demir ve Celik Fabrikalari TAS |
|
|
118,156 |
|
|
|
135,111 |
|
|
|
|
| Haci Omer Sabanci Holding AS |
|
|
24,348 |
|
|
|
151,432 |
|
|
|
|
| Kardemir Karabuk Demir Celik Sanayi ve Ticaret AS |
|
|
68,862 |
|
|
|
77,591 |
|
|
|
|
|
|
|
|
|
|
| Description |
|
Number
of
Shares |
|
|
Value |
|
|
|
|
| KOC Holding AS |
|
|
42,128 |
|
|
$ |
254,963 |
|
|
|
|
| Koza Altin Isletmeleri AS |
|
|
2,800 |
|
|
|
55,914 |
|
|
|
|
| Koza Anadolu Metal Madencilik Isletmeleri AS* |
|
|
11,200 |
|
|
|
27,863 |
|
|
|
|
| Petkim Petrokimya Holding AS |
|
|
52,218 |
|
|
|
90,877 |
|
|
|
|
| TAV Havalimanlari Holding AS |
|
|
15,200 |
|
|
|
107,254 |
|
|
|
|
| Tekfen Holding AS |
|
|
18,500 |
|
|
|
71,823 |
|
|
|
|
| Tofas Turk Otomobil Fabrikasi AS |
|
|
14,700 |
|
|
|
102,496 |
|
|
|
|
| Tupras Turkiye Petrol Rafinerileri AS |
|
|
15,836 |
|
|
|
441,668 |
|
|
|
|
| Turk Hava Yollari* |
|
|
31,080 |
|
|
|
129,330 |
|
|
|
|
| Turk Sise ve Cam Fabrikalari AS |
|
|
1 |
|
|
|
2 |
|
|
|
|
| Turk Telekomunikasyon AS |
|
|
25,727 |
|
|
|
121,980 |
|
|
|
|
| Turkcell Iletisim Hizmetleri AS* |
|
|
38,168 |
|
|
|
236,321 |
|
|
|
|
| Turkiye Garanti Bankasi AS |
|
|
66,523 |
|
|
|
367,356 |
|
|
|
|
| Turkiye Halk Bankasi AS |
|
|
8,554 |
|
|
|
93,282 |
|
|
|
|
| Turkiye Is Bankasi |
|
|
47,992 |
|
|
|
185,249 |
|
|
|
|
| Turkiye Sinai Kalkinma Bankasi AS |
|
|
51,563 |
|
|
|
74,205 |
|
|
|
|
| Turkiye Vakiflar Bankasi Tao |
|
|
41,240 |
|
|
|
147,224 |
|
|
|
|
| Ulker Biskuvi Sanayi AS |
|
|
6,181 |
|
|
|
52,923 |
|
|
|
|
| Yapi ve Kredi Bankasi AS |
|
|
28,578 |
|
|
|
88,631 |
|
|
|
|
| Yazicilar Holding AS |
|
|
9,580 |
|
|
|
114,356 |
|
|
|
|
|
|
|
|
|
|
|
|
|
| TOTAL TURKEY |
|
|
|
|
|
$ |
4,143,191 |
|
|
|
|
| UKRAINE – 0.1% |
|
|
|
|
|
|
|
|
|
|
|
| Avangardco Investments Public Ltd. GDR* |
|
|
5,300 |
|
|
|
45,050 |
|
|
|
|
| Ferrexpo PLC |
|
|
59,500 |
|
|
|
164,330 |
|
|
|
|
| MHP SA GDR#, * |
|
|
5,500 |
|
|
|
101,750 |
|
|
|
|
|
|
|
|
|
|
|
|
|
| TOTAL UKRAINE |
|
|
|
|
|
$ |
311,130 |
|
|
|
| UNITED ARAB EMIRATES – 0.4% |
|
|
|
|
|
|
|
|
| Aabar Investments PJSC* |
|
|
83,600 |
|
|
|
— |
|
|
|
|
| Abu Dhabi Commercial Bank PJSC |
|
|
216,270 |
|
|
|
270,853 |
|
|
|
|
| Abu Dhabi National Hotels |
|
|
50,000 |
|
|
|
25,864 |
|
|
|
|
| Air Arabia PJSC |
|
|
501,800 |
|
|
|
133,750 |
|
|
|
|
| Aldar Properties PJSC |
|
|
193,170 |
|
|
|
76,258 |
|
|
|
|
| Arabtec Holding Co. |
|
|
36,093 |
|
|
|
20,832 |
|
|
|
|
| DP World Ltd. |
|
|
33,630 |
|
|
|
515,884 |
|
|
|
|
| Dubai Financial Market* |
|
|
144,800 |
|
|
|
49,279 |
|
|
|
|
| Dubai Islamic Bank PJSC |
|
|
65,548 |
|
|
|
51,396 |
|
|
|
|
| Emaar Properties PJSC |
|
|
289,660 |
|
|
|
442,416 |
|
|
|
|
| First Gulf Bank PJSC |
|
|
46,598 |
|
|
|
189,031 |
|
|
|
|
| National Bank of Abu Dhabi PJSC |
|
|
102,469 |
|
|
|
337,565 |
|
|
|
|
| Union National Bank PJSC |
|
|
128,326 |
|
|
|
153,376 |
|
|
|
|
|
|
|
|
|
|
|
|
|
| TOTAL UNITED ARAB EMIRATES |
|
|
|
|
|
$ |
2,266,504 |
|
|
|
|
| UNITED KINGDOM – 12.6% |
|
|
|
|
|
|
|
|
|
|
|
| 3i Group PLC |
|
|
8,335 |
|
|
|
42,544 |
|
|
|
|
| Aberdeen Asset Management PLC |
|
|
7,766 |
|
|
|
54,128 |
|
|
|
|
| Admiral Group PLC |
|
|
37,325 |
|
|
|
742,708 |
|
ANNUAL REPORT / April
30, 2013
44 PORTFOLIOS OF INVESTMENTS
Wilmington Multi-Manager International Fund (continued)
|
|
|
|
|
|
|
|
|
| Description |
|
Number
of
Shares |
|
|
Value |
|
|
|
|
| Aggreko PLC |
|
|
1,822 |
|
|
$ |
50,434 |
|
|
|
|
| Alent PLC |
|
|
17,900 |
|
|
|
94,314 |
|
|
|
|
| Anglo American PLC |
|
|
57,335 |
|
|
|
1,393,809 |
|
|
|
|
| Antofagasta PLC |
|
|
1,765 |
|
|
|
24,606 |
|
|
|
|
| ARM Holdings PLC |
|
|
11,008 |
|
|
|
170,309 |
|
|
|
|
| Associated British Foods PLC |
|
|
2,442 |
|
|
|
73,400 |
|
|
|
|
| AstraZeneca PLC |
|
|
21,459 |
|
|
|
1,114,166 |
|
|
|
|
| Aviva PLC |
|
|
111,717 |
|
|
|
529,457 |
|
|
|
|
| Babcock International Group PLC |
|
|
2,062 |
|
|
|
34,272 |
|
|
|
|
| BAE Systems PLC |
|
|
90,500 |
|
|
|
527,871 |
|
|
|
|
| Barclays PLC |
|
|
130,146 |
|
|
|
578,285 |
|
|
|
|
| Barclays PLC ADR |
|
|
62,686 |
|
|
|
1,127,094 |
|
|
|
|
| BG Group PLC |
|
|
206,233 |
|
|
|
3,474,217 |
|
|
|
|
| BHP Billiton PLC |
|
|
67,005 |
|
|
|
1,864,113 |
|
|
|
|
| BP PLC |
|
|
198,399 |
|
|
|
1,437,365 |
|
|
|
|
| BP PLC ADR |
|
|
65,962 |
|
|
|
2,875,943 |
|
|
|
|
| British American Tobacco PLC |
|
|
85,849 |
|
|
|
4,755,387 |
|
|
|
|
| BT Group PLC |
|
|
365,610 |
|
|
|
1,568,596 |
|
|
|
|
| Bunzl PLC |
|
|
1,783 |
|
|
|
35,423 |
|
|
|
|
| Burberry Group PLC |
|
|
2,540 |
|
|
|
52,712 |
|
|
|
|
| Carnival PLC ADR |
|
|
2,155 |
|
|
|
77,860 |
|
|
|
|
| Centrica PLC |
|
|
13,843 |
|
|
|
79,776 |
|
|
|
|
| Cobham PLC |
|
|
6,837 |
|
|
|
26,604 |
|
|
|
|
| Compass Group PLC |
|
|
14,382 |
|
|
|
189,222 |
|
|
|
|
| Computacenter PLC |
|
|
25,600 |
|
|
|
178,071 |
|
|
|
|
| Croda International PLC |
|
|
858 |
|
|
|
33,026 |
|
|
|
|
| Dairy Crest Group PLC |
|
|
13,900 |
|
|
|
99,256 |
|
|
|
|
| Diageo PLC |
|
|
114,957 |
|
|
|
3,507,084 |
|
|
|
|
| Eurasian Natural Resources Corp. PLC |
|
|
34,173 |
|
|
|
145,659 |
|
|
|
|
| Evraz PLC* |
|
|
33,672 |
|
|
|
81,071 |
|
|
|
|
| Experian PLC |
|
|
43,920 |
|
|
|
772,286 |
|
|
|
|
| Fresnillo PLC |
|
|
22,873 |
|
|
|
409,303 |
|
|
|
|
| G4S PLC |
|
|
8,277 |
|
|
|
40,217 |
|
|
|
|
| GKN PLC |
|
|
11,542 |
|
|
|
49,268 |
|
|
|
|
| GlaxoSmithKline PLC |
|
|
67,121 |
|
|
|
1,731,276 |
|
|
|
|
| HSBC Holdings PLC |
|
|
78,377 |
|
|
|
856,489 |
|
|
|
|
| HSBC Holdings PLC ADR |
|
|
35,553 |
|
|
|
1,950,438 |
|
|
|
|
| ICAP PLC |
|
|
124,896 |
|
|
|
558,353 |
|
|
|
|
| IMI PLC |
|
|
2,419 |
|
|
|
46,556 |
|
|
|
|
| Imperial Tobacco Group PLC |
|
|
35,736 |
|
|
|
1,276,742 |
|
|
|
|
| InterContinental Hotels Group PLC |
|
|
1,584 |
|
|
|
46,700 |
|
|
|
|
| International Consolidated Airlines Group SA* |
|
|
18,643 |
|
|
|
78,769 |
|
|
|
|
| Intertek Group PLC |
|
|
1,153 |
|
|
|
59,247 |
|
|
|
|
| Investec PLC |
|
|
3,817 |
|
|
|
26,978 |
|
|
|
|
| ITV PLC |
|
|
21,905 |
|
|
|
42,839 |
|
|
|
|
| J Sainsbury PLC |
|
|
76,972 |
|
|
|
455,660 |
|
|
|
|
|
|
|
|
|
|
| Description |
|
Number
of
Shares |
|
|
Value |
|
|
|
|
| Johnson Matthey PLC |
|
|
1,139 |
|
|
$ |
42,887 |
|
|
|
|
| Kingfisher PLC |
|
|
58,123 |
|
|
|
282,684 |
|
|
|
|
| Lloyds Banking Group PLC* |
|
|
2,630,147 |
|
|
|
2,219,672 |
|
|
|
|
| Lloyds Banking Group PLC ADR* |
|
|
114,884 |
|
|
|
394,052 |
|
|
|
|
| London Stock Exchange Group PLC |
|
|
2,311 |
|
|
|
48,139 |
|
|
|
|
| Marston’s PLC |
|
|
92,160 |
|
|
|
207,291 |
|
|
|
|
| Meggitt PLC |
|
|
6,123 |
|
|
|
44,569 |
|
|
|
|
| Mondi PLC |
|
|
19,900 |
|
|
|
263,213 |
|
|
|
|
| National Grid PLC |
|
|
9,006 |
|
|
|
114,644 |
|
|
|
|
| New Melrose PLC |
|
|
9,528 |
|
|
|
36,128 |
|
|
|
|
| Next PLC |
|
|
1,639 |
|
|
|
110,978 |
|
|
|
|
| Old Mutual PLC |
|
|
76,258 |
|
|
|
242,834 |
|
|
|
|
| Pearson PLC |
|
|
69,321 |
|
|
|
1,260,930 |
|
|
|
|
| Petrofac Ltd. |
|
|
2,059 |
|
|
|
43,178 |
|
|
|
|
| Premier Foods PLC* |
|
|
6,700 |
|
|
|
7,597 |
|
|
|
|
| Prudential PLC |
|
|
70,435 |
|
|
|
1,208,983 |
|
|
|
|
| Randgold Resources Ltd. |
|
|
3,946 |
|
|
|
310,154 |
|
|
|
|
| Reckitt Benckiser Group PLC |
|
|
13,536 |
|
|
|
987,388 |
|
|
|
|
| Reed Elsevier PLC |
|
|
3,692 |
|
|
|
43,127 |
|
|
|
|
| Resolution Ltd. |
|
|
201,697 |
|
|
|
826,815 |
|
|
|
|
| Rexam PLC |
|
|
4,216 |
|
|
|
33,825 |
|
|
|
|
| Rio Tinto PLC |
|
|
4,800 |
|
|
|
217,643 |
|
|
|
|
| Rolls-Royce Holdings PLC |
|
|
198,084 |
|
|
|
3,476,939 |
|
|
|
|
| Royal Bank of Scotland Group PLC ADR* |
|
|
21,776 |
|
|
|
208,179 |
|
|
|
|
| Royal Dutch Shell PLC |
|
|
18,711 |
|
|
|
637,099 |
|
|
|
|
| Royal Dutch Shell PLC ADR (780259107) |
|
|
23,933 |
|
|
|
1,670,284 |
|
|
|
|
| Royal Dutch Shell PLC ADR (780259206) |
|
|
2,201 |
|
|
|
149,602 |
|
|
|
|
| Royal Dutch Shell PLC Class A |
|
|
76,587 |
|
|
|
2,605,751 |
|
|
|
|
| Royal Dutch Shell PLC Class B |
|
|
45,158 |
|
|
|
1,580,393 |
|
|
|
|
| SABMiller PLC |
|
|
22,952 |
|
|
|
1,236,606 |
|
|
|
|
| Sage Group PLC |
|
|
11,594 |
|
|
|
60,782 |
|
|
|
|
| Schroders PLC |
|
|
648 |
|
|
|
23,503 |
|
|
|
|
| Severn Trent PLC |
|
|
2,536 |
|
|
|
71,735 |
|
|
|
|
| Shire PLC |
|
|
4,269 |
|
|
|
132,758 |
|
|
|
|
| Smith & Nephew PLC |
|
|
4,929 |
|
|
|
56,237 |
|
|
|
|
| Smiths Group PLC |
|
|
1,864 |
|
|
|
36,193 |
|
|
|
|
| SSE PLC |
|
|
2,269 |
|
|
|
54,877 |
|
|
|
|
| Standard Chartered PLC |
|
|
37,080 |
|
|
|
931,363 |
|
|
|
|
| Tate & Lyle PLC |
|
|
3,682 |
|
|
|
48,301 |
|
|
|
|
| TESCO PLC |
|
|
105,758 |
|
|
|
601,508 |
|
|
|
|
| Travis Perkins PLC |
|
|
3,405 |
|
|
|
75,846 |
|
|
|
|
| Tullow Oil PLC |
|
|
40,659 |
|
|
|
632,208 |
|
|
|
|
| Unilever PLC |
|
|
6,914 |
|
|
|
299,213 |
|
|
|
|
| Vedanta Resources PLC |
|
|
907 |
|
|
|
17,033 |
|
|
|
|
| Vesuvius PLC |
|
|
33,100 |
|
|
|
178,927 |
|
|
|
|
| Vodafone Group PLC |
|
|
385,327 |
|
|
|
1,174,350 |
|
|
|
|
| Vodafone Group PLC ADR |
|
|
34,031 |
|
|
|
1,041,008 |
|
|
|
|
| Weir Group PLC |
|
|
1,346 |
|
|
|
46,081 |
|
|
| April 30, 2013 / ANNUAL REPORT |
PORTFOLIOS OF INVESTMENTS 45
Wilmington Multi-Manager International Fund (continued)
|
|
|
|
|
|
|
|
|
| Description |
|
Number
of
Shares |
|
|
Value |
|
|
|
|
| Whitbread PLC |
|
|
1,014 |
|
|
$ |
40,244 |
|
|
|
|
| WM Morrison Supermarkets PLC |
|
|
167,375 |
|
|
|
759,437 |
|
|
|
|
| WPP PLC |
|
|
75,266 |
|
|
|
1,243,969 |
|
|
|
|
| Xstrata PLC* |
|
|
120,195 |
|
|
|
1,798,902 |
|
|
|
|
|
|
|
|
|
|
|
|
|
| TOTAL UNITED KINGDOM |
|
|
|
|
|
$ |
65,275,962 |
|
|
|
|
| UNITED STATES – 0.4% |
|
|
|
|
|
|
|
|
|
|
|
| Boart Longyear Ltd. |
|
|
48,400 |
|
|
|
47,918 |
|
|
|
|
| Brookfield Property Partners LP* |
|
|
146 |
|
|
|
3,177 |
|
|
|
|
| Freeport-McMoRan Copper & Gold, Inc. |
|
|
64,199 |
|
|
|
1,953,576 |
|
|
|
|
| Transocean Ltd.* |
|
|
654 |
|
|
|
33,661 |
|
|
|
|
|
|
|
|
|
|
|
|
|
| TOTAL UNITED STATES |
|
|
|
|
|
$ |
2,038,332 |
|
|
|
|
|
|
|
|
|
|
|
|
|
| TOTAL COMMON STOCKS
(COST $397,062,102) |
|
|
|
|
|
$ |
449,126,974 |
|
|
|
|
| INVESTMENT COMPANIES – 7.4% |
|
|
|
|
|
|
|
|
|
|
|
| Dragon Capital - Vietnam Enterprise |
|
|
|
|
|
|
|
|
| Investments Ltd.* |
|
|
101,745 |
|
|
|
223,839 |
|
|
|
|
| iShares MSCI Emerging Markets Minimum Volatility Index Fund |
|
|
273,600 |
|
|
|
17,119,152 |
|
|
|
|
| Vanguard FTSE Emerging Markets ETF |
|
|
95,800 |
|
|
|
4,192,208 |
|
|
|
|
| Vanguard MSCI EAFE ETF |
|
|
441,000 |
|
|
|
16,903,530 |
|
|
|
|
|
|
|
|
|
|
|
|
|
| TOTAL INVESTMENT COMPANIES
(COST $35,680,969) |
|
|
|
|
|
$ |
38,438,729 |
|
|
|
|
| PREFERRED STOCKS – 1.9% |
|
|
|
|
|
|
|
|
|
|
|
| BRAZIL – 1.7% |
|
|
|
|
|
|
|
|
|
|
|
| AES Tiete SA |
|
|
3,080 |
|
|
|
31,219 |
|
|
|
|
| Alpargatas SA |
|
|
10,670 |
|
|
|
71,089 |
|
|
|
|
| Banco Bradesco SA |
|
|
147,712 |
|
|
|
2,427,475 |
|
|
|
|
| Banco do Estado do Rio Grande do Sul |
|
|
22,600 |
|
|
|
190,221 |
|
|
|
|
| Banco Industrial e Comercial SA |
|
|
39,700 |
|
|
|
112,110 |
|
|
|
|
| Bradespar SA |
|
|
1,900 |
|
|
|
24,102 |
|
|
|
|
| Braskem SA |
|
|
3,300 |
|
|
|
28,683 |
|
|
|
|
| Centrais Eletricas Brasileiras SA, Series B |
|
|
13,600 |
|
|
|
70,626 |
|
|
|
|
| Cia Brasileira de Distribuicao Grupo Pao de Acucar |
|
|
1,423 |
|
|
|
78,136 |
|
|
|
|
| Cia de Bebidas das Americas |
|
|
11,735 |
|
|
|
490,926 |
|
|
|
|
| Cia Energetica de Minas Gerais |
|
|
12,710 |
|
|
|
161,801 |
|
|
|
|
| Cia Energetica de Sao Paulo |
|
|
40,700 |
|
|
|
430,241 |
|
|
|
|
| Cia Paranaense de Energia |
|
|
15,400 |
|
|
|
273,709 |
|
|
|
|
| Eletropaulo Metropolitana Eletricidade de Sao Paulo SA |
|
|
5,760 |
|
|
|
23,665 |
|
|
|
|
| Gerdau SA |
|
|
9,900 |
|
|
|
77,438 |
|
|
|
|
| Itau Unibanco Holding SA |
|
|
24,900 |
|
|
|
417,665 |
|
|
|
|
| Itau Unibanco Holding SA ADR |
|
|
92,731 |
|
|
|
1,560,663 |
|
|
|
|
| Itausa - Investimentos Itau SA |
|
|
36,816 |
|
|
|
182,171 |
|
|
|
|
| Klabin SA |
|
|
8,600 |
|
|
|
57,555 |
|
|
|
|
| Lojas Americanas SA |
|
|
11,322 |
|
|
|
98,804 |
|
|
|
|
| Marcopolo SA |
|
|
16,900 |
|
|
|
112,427 |
|
|
|
|
|
|
|
|
|
|
| Description |
|
Number
of
Shares |
|
|
Value |
|
|
|
|
| Metalurgica Gerdau SA |
|
|
3,500 |
|
|
$ |
34,829 |
|
|
|
|
| Oi SA |
|
|
17,000 |
|
|
|
41,634 |
|
|
|
|
| Petroleo Brasileiro SA |
|
|
104,759 |
|
|
|
1,045,626 |
|
|
|
|
| Telefonica Brasil SA |
|
|
6,910 |
|
|
|
183,461 |
|
|
|
|
| Usinas Siderurgicas de Minas Gerais SA* |
|
|
4,300 |
|
|
|
21,277 |
|
|
|
|
| Vale SA |
|
|
33,841 |
|
|
|
549,541 |
|
|
|
|
|
|
|
|
|
|
|
|
|
| TOTAL BRAZIL |
|
|
|
|
|
$ |
8,797,094 |
|
|
|
|
| CHILE – 0.1% |
|
|
|
|
|
|
|
|
|
|
|
| Embotelladora Andina SA |
|
|
10,300 |
|
|
|
69,986 |
|
|
|
|
| Sociedad Quimica y Minera de Chile SA |
|
|
3,740 |
|
|
|
185,193 |
|
|
|
|
|
|
|
|
|
|
|
|
|
| TOTAL CHILE |
|
|
|
|
|
$ |
255,179 |
|
|
|
|
| COLOMBIA – 0.0%** |
|
|
|
|
|
|
|
|
|
|
|
| Grupo Argos SA |
|
|
2,418 |
|
|
|
26,683 |
|
|
|
|
| Grupo Aval Acciones y Valores |
|
|
121,300 |
|
|
|
85,072 |
|
|
|
|
|
|
|
|
|
|
|
|
|
| TOTAL COLOMBIA |
|
|
|
|
|
$ |
111,755 |
|
|
|
|
| CROATIA – 0.0%** |
|
|
|
|
|
|
|
|
|
|
|
| Adris Grupa DD |
|
|
579 |
|
|
|
29,801 |
|
|
|
|
| GERMANY – 0.1% |
|
|
|
|
|
|
|
|
|
|
|
| Bayerische Motoren Werke AG |
|
|
1,210 |
|
|
|
84,105 |
|
|
|
|
| Henkel AG & Co. KGaA |
|
|
1,401 |
|
|
|
132,105 |
|
|
|
|
| Porsche Automobil Holding SE |
|
|
1,198 |
|
|
|
93,858 |
|
|
|
|
| ProSiebenSat.1 Media AG |
|
|
1,194 |
|
|
|
45,727 |
|
|
|
|
| RWE AG |
|
|
1,495 |
|
|
|
50,845 |
|
|
|
|
| Volkswagen AG |
|
|
901 |
|
|
|
182,613 |
|
|
|
|
|
|
|
|
|
|
|
|
|
| TOTAL GERMANY |
|
|
|
|
|
$ |
589,253 |
|
|
|
|
| NIGERIA – 0.0%** |
|
|
|
|
|
|
|
|
|
|
|
| Ecobank Transitional, Inc.* |
|
|
7,768 |
|
|
|
— |
|
|
|
|
| PHILIPPINES – 0.0%** |
|
|
|
|
|
|
|
|
|
|
|
| Ayala Land Voting*,†† |
|
|
178,200 |
|
|
|
433 |
|
|
|
|
| RUSSIA – 0.0%** |
|
|
|
|
|
|
|
|
|
|
|
| Surgutneftegas OAO ADR |
|
|
17,100 |
|
|
|
117,990 |
|
|
|
|
| UNITED KINGDOM – 0.0%** |
|
|
|
|
|
|
|
|
|
|
|
| Rolls-Royce Holdings PLC* |
|
|
23,571,996 |
|
|
|
36,615 |
|
|
|
|
|
|
|
|
|
|
|
|
|
| TOTAL PREFERRED STOCKS
(COST $9,198,997) |
|
|
|
|
|
$ |
9,938,120 |
|
|
|
|
| MONEY MARKET FUND – 1.2% |
|
|
|
|
|
|
|
|
|
|
|
| Dreyfus Cash Management Fund, Institutional Shares, 0.05%^ |
|
|
6,331,346 |
|
|
|
6,331,346 |
|
|
|
|
|
|
|
|
|
|
|
|
|
| TOTAL MONEY MARKET FUND
(COST $6,331,346) |
|
|
|
|
|
$ |
6,331,346 |
|
ANNUAL REPORT / April
30, 2013
46 PORTFOLIOS OF INVESTMENTS
Wilmington Multi-Manager International Fund (continued)
|
|
|
|
|
|
|
|
|
| Description |
|
Number
of
Shares |
|
|
Value |
|
|
|
|
| RIGHTS – 0.0%** |
|
|
|
|
|
|
|
|
|
|
|
| BRAZIL – 0.0%** |
|
|
|
|
|
|
|
|
|
|
|
| Cia Brasileira de Distribuicao Grupo Pao de |
|
|
|
|
|
|
|
|
| Acucar, Expire 05/24/2013* |
|
|
1 |
|
|
$ |
3 |
|
|
|
|
| LUXEMBOURG – 0.0%** |
|
|
|
|
|
|
|
|
|
|
|
| HAGL JSC, Expire 05/22/2013* |
|
|
49,507 |
|
|
|
5,957 |
|
|
|
|
| NETHERLANDS – 0.0%** |
|
|
|
|
|
|
|
|
|
|
|
| Koninklijke KPN NV, Expire 05/14/2013#, * |
|
|
40,112 |
|
|
|
53,882 |
|
|
|
|
| POLAND – 0.0%** |
|
|
|
|
|
|
|
|
|
|
|
| Polimex-Mostostal SA, Expire 12/31/2049 at $0.52* |
|
|
47,700 |
|
|
|
— |
|
|
|
|
| SPAIN – 0.0%** |
|
|
|
|
|
|
|
|
|
|
|
| Banco Santander SA, Expire 05/13/2013* |
|
|
4 |
|
|
|
1 |
|
|
|
|
| THAILAND – 0.0%** |
|
|
|
|
|
|
|
|
|
|
|
| Tisco Financial Group PCL, Expire 06/25/2013*,†† |
|
|
5,960 |
|
|
|
6,295 |
|
|
|
|
|
|
|
|
|
|
|
|
|
| TOTAL RIGHTS
(COST $122,016) |
|
|
|
|
|
$ |
66,138 |
|
|
|
|
| CALL WARRANTS – 1.6% |
|
|
|
|
|
|
|
|
|
|
|
| Citigroup Global Markets - |
|
|
|
|
|
|
|
|
|
|
|
| Agility, Expire 3/17/2014 |
|
|
45,000 |
|
|
|
106,125 |
|
|
|
|
| Al-Qurain Petrochemicals Co., Expire 11/2/2013 |
|
|
40,000 |
|
|
|
29,567 |
|
|
|
|
| Boubyan Petrochemicals, Expire 10/4/2013 |
|
|
60,000 |
|
|
|
137,276 |
|
|
|
|
| Boubyan Petrochemicals, Expire 10/4/2013 |
|
|
49,000 |
|
|
|
110,384 |
|
|
|
|
| Commercial Bank of Kuwait, Expire 2/25/2014* |
|
|
29,000 |
|
|
|
71,454 |
|
|
|
|
| Gulf Bank, Expire 10/4/2013 |
|
|
40,000 |
|
|
|
55,614 |
|
|
|
|
| Gulf Cable and Electrical Industries Co., Expire 11/4/2013 |
|
|
20,000 |
|
|
|
73,214 |
|
|
|
|
| Kuwait Finance House, Expire 1/14/2014 |
|
|
53,200 |
|
|
|
149,806 |
|
|
|
|
| Kuwait Food Co., Expire 11/15/2013 |
|
|
9,600 |
|
|
|
64,879 |
|
|
|
|
| Kuwait Real Estate Co., Expire 11/15/2013* |
|
|
120,000 |
|
|
|
29,145 |
|
|
|
|
| Mebanee, Expire 7/27/2014 |
|
|
26,300 |
|
|
|
109,236 |
|
|
|
|
| Mena Holdings, Expire 11/15/2013* |
|
|
35,000 |
|
|
|
— |
|
|
|
|
| Mobile Telecommunications Co., Expire 9/20/2013 |
|
|
110,800 |
|
|
|
292,503 |
|
|
|
|
| National Industries Group Holdings, Expire 1/14/2014* |
|
|
148,000 |
|
|
|
129,194 |
|
|
|
|
| National Investment Co., Expire 10/4/2013 |
|
|
30,000 |
|
|
|
17,951 |
|
|
|
|
| National Real Estate Bank for Development, Expire 11/4/2013 |
|
|
93,600 |
|
|
|
309,694 |
|
|
|
|
| National Real Estate Bank for Development, Expire 3/28/2018* |
|
|
40,000 |
|
|
|
23,654 |
|
|
|
|
| Sultan, Expire 3/11/2014* |
|
|
100,000 |
|
|
|
41,535 |
|
|
|
|
| JPMorgan Chase Bank NA - |
|
|
|
|
|
|
|
|
|
|
|
| FPT Corp., Expire 1/13/2015•,W |
|
|
24,950 |
|
|
|
44,411 |
|
|
|
|
| HAGL JSC, Expire 3/3/2015 |
|
|
49,507 |
|
|
|
53,468 |
|
|
|
|
| Hoa Phat Group JSC, Expire 3/3/2015 |
|
|
34,404 |
|
|
|
45,069 |
|
|
|
|
|
|
|
|
|
|
| Description |
|
Number
of
Shares |
|
|
Value |
|
|
|
|
| Kinh Do Corp., Expire 12/8/2014•,W |
|
|
26,040 |
|
|
$ |
58,590 |
|
|
|
|
| Masan Group Corp., Expire 7/7/2016 |
|
|
27,330 |
|
|
|
142,116 |
|
|
|
|
| PetroVietnam Drilling & Well Services JSC, Expire 12/15/2014•,W |
|
|
32,300 |
|
|
|
61,693 |
|
|
|
|
| PetroVietnam Fertilizer & Chemicals JSC, Expire 12/9/2014•,W |
|
|
24,830 |
|
|
|
49,908 |
|
|
|
|
| Pha Lai Thermal Power JSC, Expire 1/13/2015•,W |
|
|
58,600 |
|
|
|
57,428 |
|
|
|
|
| Saudi Pharmaceutical Industries Ltd., Expire 9/24/2015 |
|
|
2,270 |
|
|
|
26,693 |
|
|
|
|
| Vietnam Joint Stock Commercial Bank for Industry and Trade, Expire 10/27/2016 |
|
|
150,727 |
|
|
|
132,640 |
|
|
|
|
| Vingroup JSC, Expire 12/16/2014•,W |
|
|
51,538 |
|
|
|
152,552 |
|
|
|
|
| Merrill Lynch International & Co. - |
|
|
|
|
|
|
|
|
|
|
|
| ABB Ltd., Expire 6/5/2017 |
|
|
2,560 |
|
|
|
24,775 |
|
|
|
|
| Adani Ports and Special Economic Zone, Expire 12/17/2014 |
|
|
21,000 |
|
|
|
56,559 |
|
|
|
|
| Aditya Birla Nuvo Ltd., Expire 6/11/2015•,W |
|
|
1,600 |
|
|
|
31,149 |
|
|
|
|
| Ambuja Cements Ltd., Expire 6/11/2015•,W |
|
|
17,000 |
|
|
|
58,886 |
|
|
|
|
| Axis Bank Ltd., Expire 3/16/2015•,W |
|
|
5,660 |
|
|
|
156,921 |
|
|
|
|
| Bharat Heavy Electricals Ltd., Expire 8/17/2015 |
|
|
16,020 |
|
|
|
57,337 |
|
|
|
|
| Bharti Airtel Ltd., Expire 2/8/2016 |
|
|
60,726 |
|
|
|
359,419 |
|
|
|
|
| Burgan Bank, Expire 3/30/2016 |
|
|
30,000 |
|
|
|
62,302 |
|
|
|
|
| Cairn India Ltd., Expire 11/14/2016 |
|
|
8,870 |
|
|
|
51,371 |
|
|
|
|
| Cipla Ltd., Expire 9/9/2015 |
|
|
11,100 |
|
|
|
83,536 |
|
|
|
|
| Coal India Ltd., Expire 11/2/2015 |
|
|
14,980 |
|
|
|
88,786 |
|
|
|
|
| Colgate-Palmolive India Ltd., Expire 8/10/2017 |
|
|
2,500 |
|
|
|
68,306 |
|
|
|
|
| Container Corp. of India, Expire 2/2/2015•,W |
|
|
2,500 |
|
|
|
52,224 |
|
|
|
|
| DLF Ltd., Expire 2/1/2016 |
|
|
11,800 |
|
|
|
52,158 |
|
|
|
|
| Dr Reddy’s Laboratories Ltd., Expire 12/17/2015 |
|
|
2,700 |
|
|
|
101,683 |
|
|
|
|
| Essar Oil Ltd., Expire 3/27/2017 |
|
|
44,290 |
|
|
|
62,830 |
|
|
|
|
| Grasim Industries Ltd., Expire 4/18/2016 |
|
|
300 |
|
|
|
16,327 |
|
|
|
|
| HCL Technologies Ltd., Expire 8/17/2015 |
|
|
5,500 |
|
|
|
73,674 |
|
|
|
|
| HDFC Bank Ltd., Expire 5/26/2015•,W |
|
|
22,505 |
|
|
|
285,120 |
|
|
|
|
| Hero Motocorp Ltd., Expire 4/18/2016 |
|
|
2,200 |
|
|
|
67,177 |
|
|
|
|
| Hindustan Unilever Ltd., Expire 12/14/2015 |
|
|
20,000 |
|
|
|
216,804 |
|
|
|
|
| Housing Development Finance Corp., Expire 8/19/2015 |
|
|
26,270 |
|
|
|
413,453 |
|
|
|
|
| Idea Cellular Ltd., Expire 2/14/2017 |
|
|
47,390 |
|
|
|
116,684 |
|
|
|
|
| Indian Oil Corp. Ltd., Expire 7/29/2016 |
|
|
17,400 |
|
|
|
96,734 |
|
|
|
|
| Infrastructure Development Finance Co. Ltd., Expire 7/29/2015 |
|
|
32,000 |
|
|
|
90,880 |
|
|
|
|
| ITC Ltd., Expire 8/4/2015 |
|
|
41,360 |
|
|
|
252,552 |
|
|
|
|
| Jaiprakash Associates Ltd., Expire 6/15/2015•,W |
|
|
50,500 |
|
|
|
70,564 |
|
|
|
|
| Jindal Steel & Power Ltd., Expire 10/8/2015 |
|
|
9,510 |
|
|
|
53,744 |
|
|
|
|
| Kotak Mahindra Bank Ltd., Expire 3/27/2017 |
|
|
7,400 |
|
|
|
97,160 |
|
April 30, 2013 / ANNUAL REPORT
PORTFOLIOS OF INVESTMENTS 47
Wilmington Multi-Manager International Fund (continued)
|
|
|
|
|
|
|
|
|
| Description |
|
Number
of
Shares |
|
|
Value |
|
|
|
|
| Larsen & Toubro Ltd., Expire 5/18/2015•,W |
|
|
1,200 |
|
|
$ |
33,704 |
|
|
|
|
| Larsen & Toubro Ltd., Expire 6/10/2014 |
|
|
3,690 |
|
|
|
103,612 |
|
|
|
|
| Mahindra & Mahindra Ltd., Expire 12/10/2015 |
|
|
7,700 |
|
|
|
132,124 |
|
|
|
|
| Maruti Suzuki India Ltd., Expire 11/30/2015 |
|
|
3,080 |
|
|
|
95,486 |
|
|
|
|
| Nestle India Ltd., Expire 9/17/2015 |
|
|
1,500 |
|
|
|
138,729 |
|
|
|
|
| NTPC Ltd., Expire 10/6/2014•,W |
|
|
54,303 |
|
|
|
158,711 |
|
|
|
|
| Oil & Natural Gas Corp. Ltd., Expire 2/28/2016 |
|
|
38,498 |
|
|
|
233,540 |
|
|
|
|
| Piramal Enterprises Ltd., Expire 1/19/2018 |
|
|
4,505 |
|
|
|
46,932 |
|
|
|
|
| Power Grid Corp. of India Ltd., Expire 3/27/2017 |
|
|
51,990 |
|
|
|
108,316 |
|
|
|
|
| Punj Lloyd Ltd., Expire 3/27/2017 |
|
|
44,190 |
|
|
|
44,146 |
|
|
|
|
| Ranbaxy Laboratories Ltd., Expire 10/26/2015 |
|
|
5,000 |
|
|
|
41,960 |
|
|
|
|
| Reliance Capital Ltd., Expire 8/30/2016 |
|
|
7,700 |
|
|
|
50,450 |
|
|
|
|
| Reliance Communications Ltd., Expire 12/28/2015 |
|
|
30,229 |
|
|
|
54,445 |
|
|
|
|
| Reliance Infrastructure Ltd., Expire 2/11/16 |
|
|
9,200 |
|
|
|
64,086 |
|
|
|
|
| Reliance Power Ltd., Expire 3/27/2017 |
|
|
23,200 |
|
|
|
30,738 |
|
|
|
|
| Sesa Goa Ltd., Expire 12/4/2014 |
|
|
20,500 |
|
|
|
60,428 |
|
|
|
|
| Steel Authority of India Ltd., Expire 3/25/2014•,W |
|
|
32,680 |
|
|
|
37,409 |
|
|
|
|
| Sterlite Industries India Ltd., Expire 6/24/2015 |
|
|
18,000 |
|
|
|
31,986 |
|
|
|
|
| Sun Pharmaceutical Industries Ltd., Expire 2/2/2015•,W |
|
|
12,000 |
|
|
|
211,914 |
|
|
|
|
| Suzlon Energy Ltd., Expire 8/15/2015 |
|
|
163,300 |
|
|
|
44,124 |
|
|
|
|
| Tata Consultancy Services Ltd., Expire 12/14/2015•,W |
|
|
5,840 |
|
|
|
149,473 |
|
|
|
|
| Tata Consultancy Services Ltd., Expire 8/6/2014 |
|
|
5,840 |
|
|
|
149,473 |
|
|
|
|
| Tata Power Co. Ltd., Expire 9/17/2015 |
|
|
51,800 |
|
|
|
91,085 |
|
|
|
|
| Tata Steel Ltd., Expire 12/23/2014•,W |
|
|
4,750 |
|
|
|
26,703 |
|
|
|
|
| Ultratech Cement Ltd., Expire 6/10/2014 |
|
|
3,571 |
|
|
|
126,041 |
|
|
|
|
| Unitech Ltd., Expire 7/7/2015•,W |
|
|
46,200 |
|
|
|
23,118 |
|
|
|
|
| United Spirits Ltd., Expire 1/13/2016 |
|
|
2,200 |
|
|
|
90,376 |
|
|
|
|
| WCT Bhd - |
|
|
|
|
|
|
|
|
|
|
|
| WCT Bhd, Strike Price: 2.25 MYR, Expire 12/06/2017 |
|
|
7,093 |
|
|
|
804 |
|
|
|
|
|
|
|
|
|
|
|
|
|
| TOTAL CALL WARRANTS
(COST $7,924,407) |
|
|
|
|
|
$ |
8,174,827 |
|
|
|
|
| CERTIFICATES – 0.2% |
|
|
|
|
|
|
|
|
|
|
|
| HSBC Bank PLC - |
|
|
|
|
|
|
|
|
|
|
|
| Al Rajhi Bank, Expire 2/16/2015 |
|
|
4,800 |
|
|
|
84,473 |
|
|
|
|
| Alinma Bank, Expire 2/23/2015 |
|
|
10,150 |
|
|
|
35,996 |
|
|
|
|
| Almarai Co. Ltd., Expire 11/24/2014 |
|
|
2,782 |
|
|
|
48,217 |
|
|
|
|
| Arab National Bank, Expire 5/11/2015 |
|
|
7,523 |
|
|
|
55,766 |
|
|
|
|
| Banque Saudi Fransi, Expire 2/23/2015 |
|
|
4,125 |
|
|
|
32,777 |
|
|
|
|
| Etihad Etisalat Co., Expire 12/5/2014 |
|
|
5,170 |
|
|
|
110,285 |
|
|
|
|
| Jarir Marketing Co., Expire 5/4/2015 |
|
|
650 |
|
|
|
30,244 |
|
|
|
|
|
|
|
|
|
|
| Description |
|
Number
of
Shares |
|
|
Value |
|
|
|
|
| National Industrialization Co., Expire 5/4/2015 |
|
|
8,502 |
|
|
$ |
59,169 |
|
|
|
|
| Samba Financial, Expire 2/10/2015 |
|
|
1,750 |
|
|
|
21,232 |
|
|
|
|
| Saudi Arabian Fertilizer Co., Expire 5/11/2015 |
|
|
1,466 |
|
|
|
58,733 |
|
|
|
|
| Saudi Basic Industries Corp., Expire 2/23/2015 |
|
|
3,800 |
|
|
|
91,953 |
|
|
|
|
| Saudi Cement Co., Expire 8/10/2015 |
|
|
1,900 |
|
|
|
50,156 |
|
|
|
|
| Saudi Electricity Co., Expire 3/27/2015 |
|
|
5,670 |
|
|
|
19,579 |
|
|
|
|
| Saudi Industrial Investment Group, Expire 3/27/2015 |
|
|
5,750 |
|
|
|
34,957 |
|
|
|
|
| Saudi Kayan Petrochemical Co., Expire 3/27/2015 |
|
|
5,500 |
|
|
|
16,572 |
|
|
|
|
| Saudi Telecom Co., Expire 5/11/2015 |
|
|
3,600 |
|
|
|
37,341 |
|
|
|
|
| Savola, Expire 2/2/2015 |
|
|
5,800 |
|
|
|
74,079 |
|
|
|
|
|
|
|
|
|
|
|
|
|
| TOTAL CERTIFICATES
(COST $858,382) |
|
|
|
|
|
$ |
861,529 |
|
|
|
| REAL ESTATE INVESTMENT TRUSTS – 0.6% |
|
|
|
|
|
|
|
|
| AUSTRALIA – 0.1% |
|
|
|
|
|
|
|
|
|
|
|
| CFS Retail Property Trust Group |
|
|
9,654 |
|
|
|
22,018 |
|
|
|
|
| Federation Centres |
|
|
15,794 |
|
|
|
42,571 |
|
|
|
|
| Shopping Centres Australasia Property Group* |
|
|
2,111 |
|
|
|
3,545 |
|
|
|
|
| Stockland |
|
|
25,350 |
|
|
|
101,705 |
|
|
|
|
| Westfield Group |
|
|
4,442 |
|
|
|
53,648 |
|
|
|
|
|
|
|
|
|
|
|
|
|
| TOTAL AUSTRALIA |
|
|
|
|
|
$ |
223,487 |
|
|
|
|
| CANADA – 0.0%** |
|
|
|
|
|
|
|
|
|
|
|
| H&R Real Estate Investment Trust |
|
|
1,200 |
|
|
|
29,480 |
|
|
|
|
| FRANCE – 0.5% |
|
|
|
|
|
|
|
|
|
|
|
| Unibail-Rodamco SE |
|
|
10,437 |
|
|
|
2,728,385 |
|
|
|
|
| HONG KONG – 0.0%** |
|
|
|
|
|
|
|
|
|
|
|
| Link REIT |
|
|
17,500 |
|
|
|
99,112 |
|
|
|
|
| NETHERLANDS – 0.0%** |
|
|
|
|
|
|
|
|
|
|
|
| Corio NV |
|
|
1,053 |
|
|
|
48,793 |
|
|
|
|
| NIGERIA – 0.0%** |
|
|
|
|
|
|
|
|
|
|
|
| Afriland Properties PLC* |
|
|
24,606 |
|
|
|
— |
|
|
|
|
| SINGAPORE – 0.0%** |
|
|
|
|
|
|
|
|
|
|
|
| Keppel REIT |
|
|
16,780 |
|
|
|
20,571 |
|
|
|
|
|
|
|
|
|
|
|
|
| TOTAL REAL ESTATE INVESTMENT TRUSTS (COST $2,604,906) |
|
|
$ |
3,149,828 |
|
ANNUAL REPORT / April
30, 2013
48 PORTFOLIOS OF INVESTMENTS
Wilmington Multi-Manager International Fund (continued)
|
|
|
|
|
|
|
|
|
|
|
|
| Description |
|
Par Value |
|
|
Value |
|
|
|
|
| CORPORATE BOND – 0.0%** |
|
|
|
|
|
|
|
|
|
|
|
| FINANCIALS – 0.0%** |
|
|
|
|
|
|
|
|
|
|
|
| BankMuscat SAOG, |
|
|
|
|
|
|
|
|
| 4.50%, 3/20/16 |
|
$ |
14,611 |
|
|
$ |
4,212 |
|
|
|
|
|
|
|
|
|
|
|
|
|
| TOTAL CORPORATE BOND
(COST $4,175) |
|
|
|
|
|
$ |
4,212 |
|
|
|
|
|
|
|
|
|
|
|
|
| TOTAL INVESTMENTS IN SECURITIES – 99.4%
(COST $459,787,300) |
|
|
$ |
516,091,703 |
|
|
| CASH COLLATERAL INVESTED FOR SECURITIES ON LOAN – 1.3% |
|
|
|
| REPURCHASE AGREEMENTS – 1.3% |
|
|
|
|
|
|
|
|
| Deutsche Bank Securities, Inc., 0.17%, dated 04/30/13, due 05/01/13, repurchase price $1,617,827, collateralized by U.S. Government Securities 2.13% to 7.50%,
maturing 12/01/16 to 04/01/48; total market value of $ 1,650,175. |
|
|
1,617,819 |
|
|
|
1,617,819 |
|
|
|
|
| HSBC Securities USA, Inc., 0.15%, dated 04/30/13, due 05/01/13, repurchase price $1,617,826, collateralized by U.S. Government Securities 0.00% to 9.38%,
maturing 07/15/13 to 03/17/31; total market value of $ 1,650,176. |
|
|
1,617,819 |
|
|
|
1,617,819 |
|
|
|
|
| Merrill Lynch, Pierce, Fenner & Smith, Inc., 0.14%, dated 04/30/13, due 05/01/13, repurchase price $340,578, collateralized by U.S. Treasury Securities
0.25% to 2.75%, maturing 10/15/15 to 08/15/42; total market value of $ 347,389. |
|
|
340,577 |
|
|
|
340,577 |
|
|
|
|
|
|
|
|
|
|
|
|
|
| Description |
|
Par Value |
|
|
Value |
|
|
|
|
| Mizuho Securities USA, Inc., 0.20%, dated 04/30/13, due 05/01/13, repurchase price $1,617,828, collateralized by U.S. Government Securities 2.08% to 7.00%,
maturing 01/01/22 to 04/15/52; total market value of $ 1,650,175. |
|
$ |
1,617,819 |
|
|
$ |
1,617,819 |
|
|
|
|
| RBC Capital Markets LLC, 0.17%, dated 04/30/13, due 05/01/13, repurchase price $1,617,827, collateralized by U.S. Government Securities 1.97% to 4.50%, maturing
08/01/24 to 12/15/44; total market value of $ 1,650,175. |
|
|
1,617,819 |
|
|
|
1,617,819 |
|
|
|
|
|
|
|
|
|
|
|
|
| TOTAL CASH COLLATERAL INVESTED FOR SECURITIES ON LOAN |
|
|
|
|
|
| (COST $6,811,853) |
|
|
|
|
|
$ |
6,811,853 |
|
|
|
|
|
|
|
|
|
|
|
|
|
| TOTAL INVESTMENTS – 100.7% |
|
|
|
|
|
|
|
|
| (COST $466,599,153) |
|
|
|
|
|
$ |
522,903,556 |
|
|
|
| COLLATERAL FOR SECURITIES ON
LOAN – (1.3%) |
|
|
|
(6,811,853 |
) |
|
|
| OTHER ASSETS LESS LIABILITIES – 0.6% |
|
|
|
3,097,970 |
|
|
|
|
|
|
|
|
|
|
|
|
| TOTAL NET ASSETS – 100.0% |
|
|
|
$ 519,189,673 |
|
|
|
|
|
|
|
|
|
|
Cost of investments for Federal
income tax purposes is $475,391,042. The net unrealized appreciation/(depreciation) of investments was $47,512,514. This consists of net unrealized appreciation from investment for those securities having an excess of value over cost of $81,555,312
and net unrealized depreciation from investments for those securities having an excess of cost over value of $34,042,798.
Various inputs
are used in determining the value of the Fund’s investments. These inputs are summarized in the three broad levels listed below.
Level 1 – quoted prices in active markets for identical securities
Level 2
– other significant observable inputs (including quoted prices for similar securities, interest rates, prepayment speeds, credit risk, etc.)
Level 3 – significant unobservable inputs (including the Fund’s own assumptions in determining the fair value of investments)
April 30, 2013 / ANNUAL REPORT
PORTFOLIOS OF INVESTMENTS 49
Wilmington Multi-Manager International Fund (continued)
The following is a summary of the inputs used as of April 30, 2013 in valuing the Fund’s
assets carried at fair value:
|
|
|
|
|
|
|
|
|
|
|
|
|
|
|
|
|
|
|
|
|
|
| |
|
Level 1 |
|
|
Level 2 |
|
|
Level 3 |
|
|
Total |
|
| Assets |
|
|
|
|
|
|
|
|
|
|
|
|
|
|
|
|
|
|
|
|
|
| Investments in Securities |
|
|
|
|
|
|
|
|
|
|
|
|
|
|
|
|
|
|
|
|
|
| Common Stocks |
|
$ |
449,126,974 |
|
|
$ |
— |
|
|
$ |
— |
|
|
$ |
449,126,974 |
|
|
|
|
|
|
| Investment Companies |
|
|
38,214,890 |
|
|
|
223,839 |
|
|
|
— |
|
|
|
38,438,729 |
|
|
|
|
|
|
| Preferred Stocks |
|
|
9,901,072 |
|
|
|
37,048 |
|
|
|
— |
(a) |
|
|
9,938,120 |
|
|
|
|
|
|
| Money Market Fund |
|
|
6,331,346 |
|
|
|
— |
|
|
|
— |
|
|
|
6,331,346 |
|
|
|
|
|
|
| Rights |
|
|
53,886 |
|
|
|
12,252 |
|
|
|
— |
|
|
|
66,138 |
|
|
|
|
|
|
| Call Warrants |
|
|
8,174,023 |
|
|
|
804 |
|
|
|
— |
|
|
|
8,174,827 |
|
|
|
|
|
|
| Certificates |
|
|
861,529 |
|
|
|
— |
|
|
|
— |
|
|
|
861,529 |
|
|
|
|
|
|
| Real Estate Investment Trusts |
|
|
3,149,828 |
|
|
|
— |
|
|
|
— |
|
|
|
3,149,828 |
|
|
|
|
|
|
| Corporate Bond |
|
|
— |
|
|
|
4,212 |
|
|
|
— |
|
|
|
4,212 |
|
|
|
|
|
|
| Repurchase Agreements |
|
|
— |
|
|
|
6,811,853 |
|
|
|
— |
|
|
|
6,811,853 |
|
|
|
|
|
|
|
|
|
|
|
|
|
|
|
|
|
|
|
|
|
|
|
| Total Investments |
|
$ |
515,813,548 |
|
|
|
$7,090,008 |
|
|
$ |
— |
|
|
|
$522,903,556 |
|
|
|
|
|
|
|
|
|
|
|
|
|
|
|
|
|
|
|
|
|
|
|
| Other Financial Instruments^ |
|
|
|
|
|
|
|
|
|
|
|
|
|
|
|
|
|
|
|
|
|
| Forward Foreign Currency Contracts |
|
|
— |
|
|
|
212 |
|
|
|
— |
|
|
|
212 |
|
|
|
|
|
|
|
|
|
|
|
|
|
|
|
|
|
|
|
|
|
|
|
| Total Assets |
|
$ |
515,813,548 |
|
|
|
$7,090,220 |
|
|
$ |
— |
|
|
|
$522,903,768 |
|
|
|
|
|
|
|
|
|
|
|
|
|
|
|
|
|
|
|
|
|
|
|
| Liabilities |
|
|
|
|
|
|
|
|
|
|
|
|
|
|
|
|
|
|
|
|
|
| Other Financial Instruments^ |
|
|
|
|
|
|
|
|
|
|
|
|
|
|
|
|
|
|
|
|
|
| Forward Foreign Currency Contracts |
|
$ |
— |
|
|
|
$(5,105) |
|
|
$ |
— |
|
|
|
$(5,105) |
|
|
|
|
|
|
|
|
|
|
|
|
|
|
|
|
|
|
|
|
|
|
|
| Total Liabilities |
|
$ |
— |
|
|
|
$(5,105) |
|
|
$ |
— |
|
|
|
$(5,105) |
|
|
|
|
|
|
|
|
|
|
|
|
|
|
|
|
|
|
(a) At April 30, 2013, the Fund held a security that was valued at $0 and classified as Level 3. Beginning and
ending Level 3 balances were zero and there was no activity during the period.
^Other financial instruments are derivative instruments
not reflected in the value of total investments in securities in the Portfolio of Investments such as forward foreign currency contracts, which are valued at the unrealized appreciation (depreciation) on the instrument.
The following table summarizes the valuation techniques used and unobservable inputs developed to determine the fair value of Level 3 investments:
|
|
|
|
|
|
|
|
|
| |
|
Fair Value at April 30, 2013 |
|
Valuation
Technique
|
|
Unobservable
Input
|
|
Value of Unobservable
Input
|
| Investments in Securities: |
|
|
|
|
|
|
|
|
|
|
|
| Preferred Stocks |
|
$— |
|
Discounted cash flow |
|
Estimated liquidation value |
|
$— |
The significant unobservable input used in the fair value measurement of the Fund’s preferred
stock is estimated liquidation value. Significant increases in estimated liquidation value in isolation would result in a similar significant increase in fair value measurement.
ANNUAL REPORT / April
30, 2013
50 PORTFOLIOS OF INVESTMENTS
Wilmington Multi-Manager International Fund (concluded)
At April 30, 2013, the Wilmington Multi-Manager International Fund had the following
outstanding forward foreign currency contracts, which contractually obligates the Fund to deliver or receive currencies at specified future dates. The open contracts were as follows:
|
|
|
|
|
|
|
|
|
|
|
|
|
|
|
|
|
|
|
|
|
|
|
|
|
|
|
| Settlement Date |
|
Counterparty |
|
|
Contracts to Deliver/Receive |
|
|
Contract Amount |
|
|
Contracts at Value |
|
|
Unrealized
Appreciation
(Depreciation)
|
|
| CONTRACTS PURCHASED |
|
|
|
|
|
|
|
|
|
|
|
|
|
|
|
|
|
|
|
|
| 5/3/2013 |
|
|
Bank of New York |
|
|
|
40,500 Euro |
|
|
$ |
53,286 |
|
|
|
$ 53,336 |
|
|
|
$ 50 |
|
| 5/3/2013 |
|
|
Bank of New York |
|
|
|
22,000 Euro |
|
|
|
28,811 |
|
|
|
28,973 |
|
|
|
162 |
|
| CONTRACTS SOLD |
|
|
|
|
|
|
|
|
|
|
|
|
|
|
|
|
|
|
|
|
| 5/1/2013 |
|
|
Bank of New York |
|
|
|
18,305,769 Japanese Yen |
|
|
|
184,089 |
|
|
|
187,780 |
|
|
|
(3,691) |
|
| 5/1/2013 |
|
|
Bank of New York |
|
|
|
19,245 Pound Sterling |
|
|
|
29,791 |
|
|
|
29,894 |
|
|
|
(103) |
|
| 5/1/2013 |
|
|
Bank of New York |
|
|
|
15,414 Japanese Yen |
|
|
|
155 |
|
|
|
158 |
|
|
|
(3) |
|
| 5/2/2013 |
|
|
Bank of New York |
|
|
|
29,130 Pound Sterling |
|
|
|
45,163 |
|
|
|
45,249 |
|
|
|
(86) |
|
| 5/2/2013 |
|
|
Bank of New York |
|
|
|
11,909 Euro |
|
|
|
15,451 |
|
|
|
15,683 |
|
|
|
(232) |
|
| 5/2/2013 |
|
|
Bank of New York |
|
|
|
10,073 Euro |
|
|
|
13,069 |
|
|
|
13,265 |
|
|
|
(196) |
|
| 5/2/2013 |
|
|
Bank of New York |
|
|
|
4,956 Euro |
|
|
|
6,431 |
|
|
|
6,527 |
|
|
|
(96) |
|
| 5/2/2013 |
|
|
Bank of New York |
|
|
|
610 Euro |
|
|
|
791 |
|
|
|
803 |
|
|
|
(12) |
|
| 5/2/2013 |
|
|
Bank of New York |
|
|
|
172 Euro |
|
|
|
223 |
|
|
|
227 |
|
|
|
(4) |
|
| 5/3/2013 |
|
|
Bank of New York |
|
|
|
33,283 Swiss Franc |
|
|
|
35,370 |
|
|
|
35,796 |
|
|
|
(426) |
|
| 5/3/2013 |
|
|
Bank of New York |
|
|
|
27,000 Pound Sterling |
|
|
|
41,936 |
|
|
|
41,940 |
|
|
|
(4) |
|
| 5/3/2013 |
|
|
Bank of New York |
|
|
|
9,633 Swiss Franc |
|
|
|
10,237 |
|
|
|
10,360 |
|
|
|
(123) |
|
| 5/3/2013 |
|
|
Bank of New York |
|
|
|
4,001 Swiss Franc |
|
|
|
4,252 |
|
|
|
4,304 |
|
|
|
(52) |
|
| 5/3/2013 |
|
|
Bank of New York |
|
|
|
3,882 Euro |
|
|
|
5,070 |
|
|
|
5,112 |
|
|
|
(42) |
|
| 5/3/2013 |
|
|
Bank of New York |
|
|
|
2,552 Swiss Franc |
|
|
|
2,711 |
|
|
|
2,744 |
|
|
|
(33) |
|
| 5/3/2013 |
|
|
Bank of New York |
|
|
|
293 Pound Sterling |
|
|
|
454 |
|
|
|
456 |
|
|
|
(2) |
|
| NET UNREALIZED APPRECIATION |
|
|
|
|
|
|
|
|
|
|
|
|
|
|
|
|
|
|
|
|
| (DEPRECIATION) ON FORWARD FOREIGN |
|
|
|
|
|
|
|
|
|
|
|
|
|
|
|
|
|
|
|
|
| CURRENCY CONTRACTS |
|
|
|
|
|
|
|
|
|
|
|
|
|
|
|
|
|
|
$(4,893) |
|
At April 30, 2013, the Wilmington Multi-Manager International Fund had the following outstanding foreign
exchange contracts:
|
|
|
|
|
|
|
|
|
|
|
|
|
|
|
|
|
|
|
|
|
|
|
|
|
|
|
| Settlement Date |
|
Counterparty |
|
|
Contracts to Deliver/Receive |
|
|
In Exchange For |
|
|
Contracts at Value |
|
|
Unrealized
Appreciation
(Depreciation)
|
|
| CONTRACTS SOLD |
|
|
|
|
|
|
|
|
|
|
|
|
|
|
|
|
|
|
|
|
| 5/1/2013 |
|
|
Bank of New York |
|
|
|
2,008 Canadian Dollar |
|
|
|
$1,978 |
|
|
|
$1,993 |
|
|
|
$(15) |
|
| 5/1/2013 |
|
|
Bank of New York |
|
|
|
495 Canadian Dollar |
|
|
|
488 |
|
|
|
491 |
|
|
|
(3) |
|
| 5/1/2013 |
|
|
Bank of New York |
|
|
|
108 Canadian Dollar |
|
|
|
106 |
|
|
|
107 |
|
|
|
(1) |
|
| 5/1/2013 |
|
|
Bank of New York |
|
|
|
48 Canadian Dollar |
|
|
|
47 |
|
|
|
47 |
|
|
|
— |
|
| 5/1/2013 |
|
|
Bank of New York |
|
|
|
10 Canadian Dollar |
|
|
|
10 |
|
|
|
10 |
|
|
|
— |
|
| 5/1/2013 |
|
|
Bank of New York |
|
|
|
3 Canadian Dollar |
|
|
|
3 |
|
|
|
3 |
|
|
|
— |
|
| 5/2/2013 |
|
|
Bank of New York |
|
|
|
866 Canadian Dollar |
|
|
|
856 |
|
|
|
860 |
|
|
|
(4) |
|
| 5/2/2013 |
|
|
Bank of New York |
|
|
|
125 Canadian Dollar |
|
|
|
123 |
|
|
|
124 |
|
|
|
(1) |
|
| NET UNREALIZED APPRECIATION |
|
|
|
|
|
|
|
|
|
|
|
|
|
|
|
|
|
| (DEPRECIATION) ON FOREIGN EXCHANGE |
|
|
|
|
|
|
|
|
|
|
|
|
|
|
|
|
|
| CONTRACTS |
|
|
|
|
|
|
|
|
|
|
|
|
|
|
|
|
|
|
$(24) |
|
See Notes to Portfolios of Investments
See Notes which are an integral part of the Financial Statements
April 30, 2013 / ANNUAL REPORT
51
PORTFOLIO OF INVESTMENTS SUMMARY TABLE
Wilmington Rock Maple Alternatives Fund
At April 30, 2013, the Fund’s portfolio composition was
as follows (unaudited):
|
|
|
|
|
|
| |
|
Percentage of Total Net Assets |
| Common Stocks |
|
|
|
40.8 |
% |
| Corporate Bonds |
|
|
|
16.2 |
% |
| Investment Companies |
|
|
|
13.0 |
% |
| U.S. Government Obligations |
|
|
|
2.4 |
% |
| Purchased Options |
|
|
|
0.0 |
%3 |
| Cash Equivalents1 |
|
|
|
30.2 |
% |
| Securities Sold Short |
|
|
|
(16.3 |
)% |
| Written Options |
|
|
|
(0.2 |
)% |
| Other Assets and Liabilities – Net2 |
|
|
|
13.9 |
% |
|
|
|
|
|
|
| TOTAL |
|
|
|
100.0 |
% |
|
|
|
|
|
|
| (1) |
Cash Equivalents include investments in a money market fund. |
| (2) |
Assets, other than investments in securities, less liabilities. See Statements of Assets and Liabilities. |
| (3) |
Represent less than 0.05%.
|
PORTFOLIO OF INVESTMENTS
April 30, 2013
|
|
|
|
|
|
|
|
|
| Description |
|
Number of
Shares
|
|
|
Value |
|
|
|
|
| COMMON STOCKS – 40.8% |
|
|
|
|
|
|
|
|
|
|
|
| AEROSPACE & DEFENSE – 1.7% |
|
|
|
|
|
|
|
|
|
|
|
| Chemring Group PLC |
|
|
22,750 |
|
|
$ |
95,803 |
|
|
|
|
| Lockheed Martin Corp.Ö |
|
|
7,063 |
|
|
|
699,873 |
|
|
|
|
|
|
|
|
|
|
|
|
|
| TOTAL AEROSPACE & DEFENSE |
|
|
|
|
|
$ |
795,676 |
|
|
|
|
| BIOTECHNOLOGY – 0.4% |
|
|
|
|
|
|
|
|
|
|
|
| QLT,
Inc.*,Ö |
|
|
25,119 |
|
|
|
201,706 |
|
|
|
| BUILDING PRODUCTS – 0.1% |
|
|
|
|
|
|
|
|
| Masonite Worldwide Holdings, Inc.* |
|
|
620 |
|
|
|
28,830 |
|
|
|
| COMMERCIAL SERVICES & SUPPLIES – 0.5% |
|
|
|
|
|
|
|
|
| ADT Corp.Ö |
|
|
4,940 |
|
|
|
215,582 |
|
|
|
| COMPUTERS & PERIPHERALS – 0.2% |
|
|
|
|
|
|
|
|
| Apple, Inc. |
|
|
238 |
|
|
|
105,374 |
|
|
|
| CONSTRUCTION & ENGINEERING – 0.5% |
|
|
|
|
|
|
|
|
| Primoris Services Corp.Ö |
|
|
11,354 |
|
|
|
250,242 |
|
|
|
| CONTAINERS & PACKAGING – 0.5% |
|
|
|
|
|
|
|
|
| Sealed Air Corp.Ö |
|
|
10,980 |
|
|
|
242,878 |
|
|
|
| DIVERSIFIED CONSUMER SERVICES – 0.8% |
|
|
|
|
|
|
|
|
| JTH Holding,
Inc.*,Ö |
|
|
20,551 |
|
|
|
355,738 |
|
|
|
|
|
|
|
|
|
|
| Description |
|
Number of
Shares
|
|
|
Value |
|
|
|
|
| LifeLock, Inc.* |
|
|
1,945 |
|
|
$ |
17,505 |
|
|
|
|
|
|
|
|
|
|
|
|
|
| TOTAL DIVERSIFIED CONSUMER SERVICES |
|
|
|
|
|
$ |
373,243 |
|
|
|
| DIVERSIFIED FINANCIAL SERVICES – 1.6% |
|
|
|
|
|
|
|
|
| Citigroup, Inc. |
|
|
1,282 |
|
|
|
59,818 |
|
|
|
|
| JPMorgan Chase & Co.Ö |
|
|
13,752 |
|
|
|
673,986 |
|
|
|
|
|
|
|
|
|
|
|
|
|
| TOTAL DIVERSIFIED FINANCIAL SERVICES |
|
|
|
|
|
$ |
733,804 |
|
|
|
| ELECTRONIC EQUIPMENT, INSTRUMENTS & |
|
|
|
|
|
| COMPONENTS – 0.7% |
|
|
|
|
|
|
|
|
|
|
|
| GSI Group,
Inc.*,Ö |
|
|
17,866 |
|
|
|
152,576 |
|
|
|
|
| Rogers Corp.*,Ö |
|
|
4,180 |
|
|
|
178,235 |
|
|
|
|
|
|
|
|
|
|
| TOTAL ELECTRONIC EQUIPMENT, INSTRUMENTS & COMPONENTS |
|
|
|
|
|
$ |
330,811 |
|
|
|
| ENERGY EQUIPMENT & SERVICES – 1.3% |
|
|
|
|
|
|
|
|
| Baker Hughes, Inc. |
|
|
351 |
|
|
|
15,932 |
|
|
|
|
| Petroleum Geo-Services ASA |
|
|
19,746 |
|
|
|
289,008 |
|
|
|
|
| Technip
SAÖ |
|
|
2,795 |
|
|
|
299,991 |
|
|
|
|
|
|
|
|
|
|
|
|
| TOTAL ENERGY EQUIPMENT & SERVICES |
|
|
$ |
604,931 |
|
|
|
|
| FOOD PRODUCTS – 1.6% |
|
|
|
|
|
|
|
|
|
|
|
| Austevoll Seafood ASAÖ |
|
|
45,780 |
|
|
|
302,474 |
|
ANNUAL REPORT / April
30, 2013
52 PORTFOLIOS OF INVESTMENTS
Wilmington Rock Maple Alternatives Fund (continued)
|
|
|
|
|
|
|
|
|
| Description |
|
Number of
Shares
|
|
|
Value |
|
|
|
|
| Marine Harvest ASA*,Ö |
|
|
450,192 |
|
|
$ |
468,421 |
|
|
|
|
|
|
|
|
|
|
|
|
|
| TOTAL FOOD PRODUCTS |
|
|
|
|
|
$ |
770,895 |
|
|
|
| HOTELS, RESTAURANTS & LEISURE – 2.5% |
|
|
|
|
|
|
|
|
| Fiesta Restaurant Group, Inc.*,Ö |
|
|
2,389 |
|
|
|
65,124 |
|
|
|
|
| International Game Technology |
|
|
2,933 |
|
|
|
49,714 |
|
|
|
|
| Las Vegas Sands Corp.Ö |
|
|
6,461 |
|
|
|
363,431 |
|
|
|
|
| Starwood Hotels & Resorts Worldwide, Inc.Ö |
|
|
10,576 |
|
|
|
682,364 |
|
|
|
|
|
|
|
|
|
|
|
|
|
| TOTAL HOTELS, RESTAURANTS & LEISURE |
|
|
|
|
|
$ |
1,160,633 |
|
|
|
| HOUSEHOLD DURABLES – 0.7% |
|
|
|
|
|
|
|
|
| Brookfield Residential Properties, Inc.*,Ö |
|
|
8,420 |
|
|
|
201,154 |
|
|
|
|
| Lennar Corp. |
|
|
1,296 |
|
|
|
53,421 |
|
|
|
|
| PulteGroup, Inc.* |
|
|
1,943 |
|
|
|
40,784 |
|
|
|
|
| Standard Pacific Corp.* |
|
|
5,445 |
|
|
|
49,277 |
|
|
|
|
|
|
|
|
|
|
|
|
|
| TOTAL HOUSEHOLD DURABLES |
|
|
|
|
|
$ |
344,636 |
|
|
|
|
| INSURANCE – 2.0% |
|
|
|
|
|
|
|
|
|
|
|
| American International Group, Inc.* |
|
|
864 |
|
|
|
35,787 |
|
|
|
|
| Berkshire Hathaway, Inc.*,Ö |
|
|
944 |
|
|
|
100,366 |
|
|
|
|
| Delta Lloyd NVÖ |
|
|
17,217 |
|
|
|
329,906 |
|
|
|
|
| XL Group PLCÖ |
|
|
15,666 |
|
|
|
487,839 |
|
|
|
|
|
|
|
|
|
|
|
|
|
| TOTAL INSURANCE |
|
|
|
|
|
$ |
953,898 |
|
|
|
| INTERNET & CATALOG RETAIL – 0.5% |
|
|
|
|
|
|
|
|
| Liberty
Ventures*,Ö
|
|
|
3,065 |
|
|
|
225,186 |
|
|
|
| INTERNET SOFTWARE & SERVICES – 0.8% |
|
|
|
|
|
|
|
|
| IntraLinks Holdings, Inc.*,Ö |
|
|
56,243 |
|
|
|
321,710 |
|
|
|
|
| Yandex NV* |
|
|
2,585 |
|
|
|
66,538 |
|
|
|
|
|
|
|
|
|
|
|
|
|
| TOTAL INTERNET SOFTWARE & SERVICES |
|
|
|
|
|
$ |
388,248 |
|
|
|
|
| IT SERVICES – 2.6% |
|
|
|
|
|
|
|
|
|
|
|
| Blackhawk Network Holdings, Inc.* |
|
|
500 |
|
|
|
11,970 |
|
|
|
|
| InterXion Holding NVÖ |
|
|
21,532 |
|
|
|
538,946 |
|
|
|
|
| Mastercard, Inc.Ö |
|
|
650 |
|
|
|
359,404 |
|
|
|
|
| Vantiv, Inc.* |
|
|
1,393 |
|
|
|
31,384 |
|
|
|
|
| Visa,
Inc.Ö |
|
|
1,718 |
|
|
|
289,414 |
|
|
|
|
|
|
|
|
|
|
|
|
|
| TOTAL IT SERVICES |
|
|
|
|
|
$ |
1,231,118 |
|
|
|
|
| MACHINERY – 0.5% |
|
|
|
|
|
|
|
|
|
|
|
| Luxfer Holdings PLC ADRÖ |
|
|
14,467 |
|
|
|
255,921 |
|
|
|
|
| MEDIA – 5.8% |
|
|
|
|
|
|
|
|
|
|
|
| Antena 3 de Television SAÖ |
|
|
79,890 |
|
|
|
486,076 |
|
|
|
|
| Kabel Deutschland Holding AGÖ |
|
|
6,024 |
|
|
|
572,547 |
|
|
|
|
| Liberty Global, Inc.*,Ö |
|
|
5,575 |
|
|
|
377,149 |
|
|
|
|
| Liberty Media Corp.*,Ö |
|
|
3,100 |
|
|
|
356,128 |
|
|
|
|
| Viacom, Inc. |
|
|
7,230 |
|
|
|
462,648 |
|
|
|
|
| Zon Multimedia Servicos de Telecomunicacoes e Multimedia SGPS SAÖ |
|
|
103,092 |
|
|
|
462,966 |
|
|
|
|
|
|
|
|
|
|
|
|
|
| TOTAL MEDIA |
|
|
|
|
|
$ |
2,717,514 |
|
|
|
|
|
|
|
|
|
|
| Description |
|
Number of
Shares
|
|
|
Value |
|
|
|
|
| METALS & MINING – 1.1% |
|
|
|
|
|
|
|
|
|
|
|
| Barrick Gold Corp.Ö |
|
|
25,898 |
|
|
$ |
510,450 |
|
|
|
|
| MULTILINE RETAIL – 0.7% |
|
|
|
|
|
|
|
|
|
|
|
| Bon-Ton Stores, Inc. |
|
|
1,099 |
|
|
|
16,859 |
|
|
|
|
| Saks, Inc.*,Ö |
|
|
25,959 |
|
|
|
299,826 |
|
|
|
|
|
|
|
|
|
|
|
|
|
| TOTAL MULTILINE RETAIL |
|
|
|
|
|
$ |
316,685 |
|
|
| OIL, GAS & CONSUMABLE FUELS – 4.0% |
|
|
|
|
| Det Norske Oljeselskap ASA*,Ö |
|
|
29,078 |
|
|
|
412,230 |
|
|
|
|
| Lundin Petroleum AB*,Ö |
|
|
16,769 |
|
|
|
401,563 |
|
|
|
|
| Southwestern Energy Co.* |
|
|
12,382 |
|
|
|
463,334 |
|
|
|
|
| Talisman Energy, Inc.Ö |
|
|
41,095 |
|
|
|
488,620 |
|
|
|
|
| Valero Energy Corp. |
|
|
2,690 |
|
|
|
108,461 |
|
|
|
|
|
|
|
|
|
|
|
|
|
| TOTAL OIL, GAS & CONSUMABLE FUELS |
|
|
|
|
|
$ |
1,874,208 |
|
|
|
|
| PHARMACEUTICALS – 0.7% |
|
|
|
|
|
|
|
|
|
|
|
| Pain Therapeutics, Inc. |
|
|
75,722 |
|
|
|
311,975 |
|
|
| REAL ESTATE INVESTMENT TRUSTS – 4.7% |
|
|
|
|
| Apollo Commercial Real Estate Finance,
Inc.Ö |
|
|
36,365 |
|
|
|
645,115 |
|
|
|
|
| Chimera Investment Corp.Ö |
|
|
160,868 |
|
|
|
530,864 |
|
|
|
|
| MFA Financial, Inc.Ö |
|
|
69,220 |
|
|
|
641,669 |
|
|
|
|
| Spirit Realty Capital, Inc.Ö |
|
|
19,100 |
|
|
|
411,223 |
|
|
|
|
|
|
|
|
|
|
|
|
|
| TOTAL REAL ESTATE INVESTMENT TRUSTS |
|
|
|
|
|
$ |
2,228,871 |
|
|
| REAL ESTATE MANAGEMENT & DEVELOPMENT – 0.3% |
|
|
|
|
| Forestar Group, Inc.* |
|
|
2,748 |
|
|
|
59,192 |
|
|
|
|
| Howard Hughes Corp.* |
|
|
638 |
|
|
|
60,214 |
|
|
|
|
|
|
|
|
|
|
|
|
| TOTAL REAL ESTATE MANAGEMENT & DEVELOPMENT |
|
|
$ |
119,406 |
|
|
| SEMICONDUCTORS & SEMICONDUCTOR EQUIPMENT – 0.3% |
|
|
|
|
| EZchip Semiconductor Ltd.* |
|
|
6,636 |
|
|
|
151,367 |
|
|
|
|
| SOFTWARE – 2.2% |
|
|
|
|
|
|
|
|
|
|
|
| Playtech PLCÖ |
|
|
67,039 |
|
|
|
638,348 |
|
|
|
|
| Verint Systems, Inc.*,Ö |
|
|
11,910 |
|
|
|
393,506 |
|
|
|
|
|
|
|
|
|
|
|
|
|
| TOTAL SOFTWARE |
|
|
|
|
|
$ |
1,031,854 |
|
|
|
|
| SPECIALTY RETAIL – 0.6% |
|
|
|
|
|
|
|
|
|
|
|
| L Brands, Inc.* |
|
|
648 |
|
|
|
32,666 |
|
|
|
|
| Wet Seal, Inc.*,Ö |
|
|
73,600 |
|
|
|
239,936 |
|
|
|
|
|
|
|
|
|
|
|
|
|
| TOTAL SPECIALTY RETAIL |
|
|
|
|
|
$ |
272,602 |
|
|
| TEXTILES, APPAREL & LUXURY GOODS – 0.2% |
|
|
|
|
| Fifth & Pacific Cos., Inc.* |
|
|
5,064 |
|
|
|
104,420 |
|
|
|
| THRIFTS & MORTGAGE FINANCE – 0.2% |
|
|
|
|
|
|
|
|
| HomeStreet, Inc.Ö |
|
|
3,875 |
|
|
|
83,310 |
|
|
| TRADING COMPANIES & DISTRIBUTORS – 0.0%** |
|
|
|
|
| United Rentals, Inc.* |
|
|
324 |
|
|
|
17,046 |
|
April 30, 2013 / ANNUAL REPORT
PORTFOLIOS OF INVESTMENTS 53
Wilmington Rock Maple Alternatives Fund (continued)
|
|
|
|
|
|
|
|
|
| Description |
|
Number of
Shares
|
|
|
Value |
|
|
| TRANSPORTATION INFRASTRUCTURE – 0.5% |
|
|
|
|
| Macquarie Infrastructure Co. LLCÖ |
|
|
4,370 |
|
|
$ |
254,684 |
|
|
|
|
|
|
|
|
|
|
|
|
|
| TOTAL COMMON STOCKS
(COST $16,725,595) |
|
|
|
|
|
$ |
19,208,004 |
|
|
|
|
| INVESTMENT COMPANIES – 13.0% |
|
|
|
|
|
|
|
|
|
|
| ALTERNATIVE INVESTMENT FUND – 4.2% |
|
|
|
|
|
|
|
|
| Arbitrage Fund |
|
|
157,241 |
|
|
|
1,996,957 |
|
|
|
|
| EQUITY FUNDS – 8.8% |
|
|
|
|
|
|
|
|
|
|
|
| Professionally Managed Portfolios - The Osterweis Strategic Income Fund |
|
|
345,436 |
|
|
|
4,138,322 |
|
|
|
|
|
|
|
|
|
|
|
|
|
| TOTAL INVESTMENT COMPANIES
(COST $6,068,541) |
|
|
|
|
|
$ |
6,135,279 |
|
| |
|
|
|
|
|
|
|
|
| |
|
Par Value |
|
|
|
|
|
|
|
| CORPORATE BONDS – 16.2% |
|
|
|
|
|
|
|
|
|
|
|
| AGRICULTURE – 1.1% |
|
|
|
|
|
|
|
|
|
|
|
| Alliance One International, Inc., |
|
|
|
|
|
|
|
|
| Sr. Unsecured, 10.00%, 7/15/16 |
|
$ |
500,000 |
|
|
|
533,125 |
|
|
|
| DIVERSIFIED FINANCIAL SERVICES – 0.8% |
|
|
|
|
|
|
|
| Jefferies Finance LLC/JFIN Co-Issuer Corp., |
|
|
|
|
|
| Sr. Unsecured, 7.38%, 4/01/20•,W |
|
|
340,000 |
|
|
|
355,300 |
|
|
|
|
| ENTERTAINMENT – 2.0% |
|
|
|
|
|
|
|
|
|
|
|
| Greektown Superholdings, Inc., |
|
|
|
|
|
|
|
|
| Secured, 13.00%, 7/01/15 |
|
|
450,000 |
|
|
|
486,000 |
|
|
|
|
| Yonkers Racing Corp., |
|
|
|
|
|
|
|
|
| Secured, 11.38%, 7/15/16•,W |
|
|
425,000 |
|
|
|
457,937 |
|
|
|
|
|
|
|
|
|
|
|
|
|
| TOTAL ENTERTAINMENT |
|
|
|
|
|
$ |
943,937 |
|
|
|
| ENVIORNMENTAL CONTROL – 1.1% |
|
|
|
|
|
|
|
|
| ADS Waste Holdings, Inc., |
|
|
|
|
|
|
|
|
| Sr. Unsecured, 8.25%, 10/01/20•,W |
|
|
475,000 |
|
|
|
518,937 |
|
|
|
|
| FOOD – 1.1% |
|
|
|
|
|
|
|
|
|
|
|
| Michael Foods Holding, Inc., |
|
|
|
|
|
|
|
|
| Sr. Unsecured, 8.50%, 7/15/18•,W |
|
|
470,000 |
|
|
|
497,612 |
|
|
|
|
| LODGING – 1.2% |
|
|
|
|
|
|
|
|
|
|
|
| CityCenter Holdings LLC / CityCenter Finance Corp., |
|
|
|
|
|
|
|
|
| Sr. Secured, 7.63%, 1/15/16 |
|
|
500,000 |
|
|
|
541,250 |
|
|
|
| OFFICE/BUSINESS EQUIPMENT – 0.9% |
|
|
|
|
|
|
|
|
| CDW LLC / CDW Finance Corp., |
|
|
|
|
|
|
|
|
| Company Guaranteed, 12.54%, 10/12/17 |
|
|
413,000 |
|
|
|
446,040 |
|
|
|
|
| RETAIL – 4.5% |
|
|
|
|
|
|
|
|
|
|
|
| Burlington Holdings LLC/Burlington Holding Finance Inc., |
|
|
|
|
|
|
|
|
| Sr. Unsecured, 9.00%, 2/15/18•,W |
|
|
500,000 |
|
|
|
521,250 |
|
|
|
|
| Dave & Buster’s, Inc., |
|
|
|
|
|
|
|
|
| Company Guaranteed, 11.00%, 6/01/18 |
|
|
500,000 |
|
|
|
567,500 |
|
|
|
|
| Rite Aid Corp., |
|
|
|
|
|
|
|
|
| Company Guaranteed, 9.50%, 6/15/17 |
|
|
500,000 |
|
|
|
521,250 |
|
|
|
|
|
|
|
|
|
|
| Description |
|
Par Value |
|
|
Value |
|
|
|
|
| Wok Acquisition Corp., |
|
|
|
|
|
|
|
|
| Company Guaranteed, 10.25%, 6/30/20•,W |
|
$ |
475,000 |
|
|
$ |
523,687 |
|
|
|
|
|
|
|
|
|
|
|
|
|
| TOTAL RETAIL |
|
|
|
|
|
$ |
2,133,687 |
|
|
|
|
| SOFTWARE – 1.1% |
|
|
|
|
|
|
|
|
|
|
|
| First Data Corp., |
|
|
|
|
|
|
|
|
| Company Guaranteed, 11.25%, 3/31/16 |
|
|
500,000 |
|
|
|
511,250 |
|
|
|
| TELECOMMUNICATIONS – 2.4% |
|
|
|
|
|
|
|
|
| Intelsat Luxembourg SA, |
|
|
|
|
|
|
|
|
| Company Guaranteed, 11.25%, 2/04/17 |
|
|
348,000 |
|
|
|
371,057 |
|
|
|
|
| Level 3 Financing, Inc., |
|
|
|
|
|
|
|
|
| Company Guaranteed, 10.00%, 2/01/18 |
|
|
500,000 |
|
|
|
553,125 |
|
|
|
|
| Wind Acquisition Finance SA, |
|
|
|
|
|
|
|
|
| Sr. Secured, 7.25%, 2/15/18•,W |
|
|
215,000 |
|
|
|
227,900 |
|
|
|
|
|
|
|
|
|
|
|
|
|
| TOTAL TELECOMMUNICATIONS |
|
|
|
|
|
$ |
1,152,082 |
|
|
|
|
|
|
|
|
|
|
|
|
|
| TOTAL CORPORATE BONDS
(COST $7,481,179) |
|
|
|
|
|
$ |
7,633,220 |
|
|
|
| U.S. GOVERNMENT OBLIGATIONS – 2.4% |
|
|
|
|
|
|
|
|
| U.S. TREASURY BILL – 0.2% |
|
|
|
|
|
|
|
|
|
|
|
| 0.17%, 5/02/13Ö |
|
|
100,000 |
|
|
|
99,999 |
|
|
|
|
| U.S. TREASURY NOTES – 2.2% |
|
|
|
|
|
|
|
|
|
|
|
| 0.25%, 1/31/14Ö |
|
|
750,000 |
|
|
|
750,732 |
|
|
|
|
| 0.25%, 3/31/14Ö |
|
|
250,000 |
|
|
|
250,245 |
|
|
|
|
|
|
|
|
|
|
|
|
|
| TOTAL U.S. TREASURY NOTES |
|
|
|
|
|
$ |
1,000,977 |
|
|
|
|
|
|
|
|
|
|
| TOTAL U.S. GOVERNMENT OBLIGATIONS
(COST $1,100,697) |
|
|
$ |
1,100,976 |
|
| |
|
|
|
|
|
| |
|
Number
of
Shares |
|
|
|
|
|
|
|
| MONEY MARKET FUND – 30.2% |
|
|
|
|
|
|
|
|
|
|
|
| Dreyfus Cash Management Fund, |
|
|
|
|
|
|
|
|
| Institutional Shares, 0.05%^ |
|
|
14,192,620 |
|
|
|
14,192,620 |
|
|
|
|
|
|
|
|
|
|
|
|
|
| TOTAL MONEY MARKET FUND
(COST $14,192,620) |
|
|
|
|
|
$ |
14,192,620 |
|
| |
|
|
|
|
|
|
|
|
| |
|
Contracts |
|
|
|
|
|
|
|
| PURCHASED OPTIONS – 0.0%** |
|
|
|
|
|
|
|
|
|
|
|
| CALL OPTIONS – 0.0%** |
|
|
|
|
|
|
|
|
|
|
|
| Apple, Inc., Strike Price $440.00, Expiring 5/03/2013 |
|
|
1 |
|
|
|
625 |
|
|
|
|
| S&P 500 Index, Strike Price $1,655.00, Expiring 5/03/2013 |
|
|
6 |
|
|
|
1 |
|
|
|
|
| S&P 500 Index, Strike Price $1,660.00, Expiring 5/15/2013 |
|
|
6 |
|
|
|
216 |
|
|
|
|
| S&P 500 Index, Strike Price $1,660.00, Expiring 5/18/2013 |
|
|
6 |
|
|
|
312 |
|
|
|
|
| S&P 500 Index, Strike Price $1,665.00, Expiring 5/01/2013 |
|
|
7 |
|
|
|
— |
|
ANNUAL REPORT / April
30, 2013
54 PORTFOLIOS OF INVESTMENTS
Wilmington Rock Maple Alternatives Fund (continued)
|
|
|
|
|
|
|
|
|
| Description |
|
Contracts |
|
|
Value |
|
|
|
|
| S&P 500 Index, Strike Price $1,670.00, |
|
|
|
|
|
|
|
|
| Expiring 5/06/2013 |
|
|
6 |
|
|
$ |
8 |
|
|
|
|
| S&P 500 Index, Strike Price $1,670.00, |
|
|
|
|
|
|
|
|
| Expiring 5/13/2013 |
|
|
6 |
|
|
|
101 |
|
|
|
|
| S&P 500 Index, Strike Price $1,670.00, |
|
|
|
|
|
|
|
|
| Expiring 5/20/2013 |
|
|
6 |
|
|
|
211 |
|
|
|
|
| S&P 500 Index, Strike Price $1,685.00, |
|
|
|
|
|
|
|
|
| Expiring 5/22/2013 |
|
|
7 |
|
|
|
152 |
|
|
|
|
| S&P 500 Index, Strike Price $1,685.00, |
|
|
|
|
|
|
|
|
| Expiring 5/24/2013 |
|
|
6 |
|
|
|
210 |
|
|
|
|
| S&P 500 Index, Strike Price $1,694.00, |
|
|
|
|
|
|
|
|
| Expiring 5/08/2013 |
|
|
7 |
|
|
|
6 |
|
|
|
|
| S&P 500 Index, Strike Price $1,700.00, |
|
|
|
|
|
|
|
|
| Expiring 5/10/2013 |
|
|
6 |
|
|
|
60 |
|
|
|
|
| S&P 500 Index, Strike Price $1,702.00, |
|
|
|
|
|
|
|
|
| Expiring 5/28/2013 |
|
|
6 |
|
|
|
104 |
|
|
|
|
| Technology Select Sector SPDR, Strike Price $31.00,
Expiring 6/22/2013 |
|
|
55 |
|
|
|
2,585 |
|
|
|
|
|
|
|
|
|
|
|
|
|
| TOTAL CALL OPTIONS |
|
|
|
|
|
$ |
4,591 |
|
|
|
|
| PUT OPTIONS – 0.0%** |
|
|
|
|
|
|
|
|
|
|
|
| Russell 2000 Index, Strike Price $900.00, |
|
|
|
|
|
|
|
|
| Expiring 5/18/2013 |
|
|
7 |
|
|
|
2,065 |
|
|
|
|
| S&P 500 Index, Strike Price $1,390.00, |
|
|
|
|
|
|
|
|
| Expiring 5/15/2013 |
|
|
6 |
|
|
|
117 |
|
|
|
|
| S&P 500 Index, Strike Price $1,395.00, |
|
|
|
|
|
|
|
|
| Expiring 5/03/2013 |
|
|
6 |
|
|
|
— |
|
|
|
|
| S&P 500 Index, Strike Price $1,395.00, |
|
|
|
|
|
|
|
|
| Expiring 5/18/2013 |
|
|
6 |
|
|
|
150 |
|
|
|
|
| S&P 500 Index, Strike Price $1,415.00, |
|
|
|
|
|
|
|
|
| Expiring 5/01/2013 |
|
|
7 |
|
|
|
— |
|
|
|
|
| S&P 500 Index, Strike Price $1,415.00, |
|
|
|
|
|
|
|
|
| Expiring 5/20/2013 |
|
|
6 |
|
|
|
303 |
|
|
|
|
| S&P 500 Index, Strike Price $1,419.00, |
|
|
|
|
|
|
|
|
| Expiring 5/06/2013 |
|
|
6 |
|
|
|
13 |
|
|
|
|
| S&P 500 Index, Strike Price $1,420.00, |
|
|
|
|
|
|
|
|
| Expiring 5/13/2013 |
|
|
6 |
|
|
|
147 |
|
|
|
|
| S&P 500 Index, Strike Price $1,425.00, |
|
|
|
|
|
|
|
|
| Expiring 5/22/2013 |
|
|
7 |
|
|
|
488 |
|
|
|
|
| S&P 500 Index, Strike Price $1,430.00, |
|
|
|
|
|
|
|
|
| Expiring 5/24/2013 |
|
|
6 |
|
|
|
540 |
|
|
|
|
| S&P 500 Index, Strike Price $1,440.00, |
|
|
|
|
|
|
|
|
| Expiring 5/10/2013 |
|
|
6 |
|
|
|
150 |
|
|
|
|
| S&P 500 Index, Strike Price $1,445.00, |
|
|
|
|
|
|
|
|
| Expiring 5/28/2013 |
|
|
6 |
|
|
|
878 |
|
|
|
|
| S&P 500 Index, Strike Price $1,451.00, |
|
|
|
|
|
|
|
|
| Expiring 5/08/2013 |
|
|
7 |
|
|
|
117 |
|
|
|
|
|
|
|
|
|
|
|
|
|
| TOTAL PUT OPTIONS |
|
|
|
|
|
$ |
4,968 |
|
|
|
|
|
|
|
|
|
|
|
|
|
| TOTAL PURCHASED OPTIONS
(COST $19,166) |
|
|
|
|
|
$ |
9,559 |
|
|
|
|
|
|
|
|
|
|
|
|
| TOTAL INVESTMENTS IN SECURITIES – 102.6%
(COST $45,587,798) |
|
|
$ |
48,279,658 |
|
|
|
|
|
|
|
|
|
|
| Description |
|
Number of
Shares
|
|
|
Value |
|
|
|
| SECURITIES SOLD SHORT – (16.3%) |
|
|
|
|
|
|
|
|
| COMMON STOCKS – (0.1%) |
|
|
|
|
|
|
|
|
|
|
| DIVERSIFIED FINANCIAL SERVICES – 0.0%** |
|
|
|
|
|
|
|
|
| CME Group, Inc. |
|
|
(159 |
) |
|
$ |
(9,677 |
) |
|
|
| LEISURE EQUIPMENT & PRODUCTS – 0.0%** |
|
|
|
|
|
|
|
|
| Sturm Ruger & Co, Inc. |
|
|
(432 |
) |
|
|
(22,148 |
) |
|
|
|
| SPECIALTY RETAIL – (0.1%) |
|
|
|
|
|
|
|
|
|
|
|
| Best Buy Co, Inc. |
|
|
(1,188 |
) |
|
|
(30,876 |
) |
|
|
|
|
|
|
|
|
|
|
|
|
| TOTAL COMMON STOCKS |
|
|
|
|
|
$ |
(62,701 |
) |
|
|
| INVESTMENT COMPANIES – (16.2%) |
|
|
|
|
|
|
|
|
| EQUITY FUNDS – (16.2%) |
|
|
|
|
|
|
|
|
|
|
|
| Consumer Discretionary Select Sector SPDR Fund |
|
|
(4,600 |
) |
|
|
(251,206 |
) |
|
|
|
| Consumer Staples Select Sector SPDR Fund |
|
|
(3,100 |
) |
|
|
(126,914 |
) |
|
|
|
| Health Care Select Sector SPDR Fund |
|
|
(4,600 |
) |
|
|
(217,718 |
) |
|
|
|
| Industrial Select Sector SPDR Fund |
|
|
(4,740 |
) |
|
|
(196,473 |
) |
|
|
|
| iShares Core S&P 500 ETF |
|
|
(6,155 |
) |
|
|
(987,016 |
) |
|
|
|
| iShares Dow Jones US Real Estate Index Fund |
|
|
(11,102 |
) |
|
|
(815,553 |
) |
|
|
|
| iShares MSCI United Kingdom Index Fund |
|
|
(17,420 |
) |
|
|
(327,322 |
) |
|
|
|
| iShares Russell 2000 Value Index Fund |
|
|
(2,280 |
) |
|
|
(191,155 |
) |
|
|
|
| Materials Select Sector SPDR Fund |
|
|
(27,884 |
) |
|
|
(1,102,812 |
) |
|
|
|
| ProShares Ultra S&P 500 |
|
|
(1,295 |
) |
|
|
(98,161 |
) |
|
|
|
| SPDR S&P 500 ETF Trust, Series T |
|
|
(4,282 |
) |
|
|
(683,750 |
) |
|
|
|
| Technology Select Sector SPDR Fund |
|
|
(8,810 |
) |
|
|
(271,436 |
) |
|
|
|
| Vanguard FTSE Europe ETF |
|
|
(45,831 |
) |
|
|
(2,353,880 |
) |
|
|
|
|
|
|
|
|
|
|
|
|
| TOTAL EQUITY FUNDS |
|
|
|
|
|
$ |
(7,623,396 |
) |
|
|
|
|
|
|
|
|
|
|
|
|
| TOTAL INVESTMENT COMPANIES |
|
|
|
|
|
$ |
(7,623,396 |
) |
|
|
|
|
|
|
|
|
|
|
|
|
| TOTAL SECURITIES SOLD SHORT |
|
|
|
|
|
|
|
|
| (PROCEEDS $7,091,030) |
|
|
|
|
|
$ |
(7,686,097 |
) |
| |
|
|
|
|
|
|
|
|
| |
|
Contracts |
|
|
|
|
|
|
|
| WRITTEN OPTIONS – (0.2%) |
|
|
|
|
|
|
|
|
|
|
|
| CALL OPTIONS – (0.2%) |
|
|
|
|
|
|
|
|
|
|
|
| S&P 500 Index, Strike Price $1,490.00, |
|
|
|
|
|
|
|
|
| Expiring 5/01/2013 |
|
|
(7 |
) |
|
$ |
— |
|
|
|
|
| S&P 500 Index, Strike Price $1,580.00, |
|
|
|
|
|
|
|
|
| Expiring 5/03/2013 |
|
|
(6 |
) |
|
|
(11,125 |
) |
|
|
|
| S&P 500 Index, Strike Price $1,585.00, |
|
|
|
|
|
|
|
|
| Expiring 5/15/2013 |
|
|
(6 |
) |
|
|
(12,414 |
) |
|
|
|
| S&P 500 Index, Strike Price $1,585.00, |
|
|
|
|
|
|
|
|
| Expiring 5/18/2013 |
|
|
(6 |
) |
|
|
(12,990 |
) |
|
|
|
| S&P 500 Index, Strike Price $1,590.00, |
|
|
|
|
|
|
|
|
| Expiring 5/01/2013 |
|
|
(7 |
) |
|
|
(5,895 |
) |
|
|
|
| S&P 500 Index, Strike Price $1,592.00, |
|
|
|
|
|
|
|
|
| Expiring 5/06/2013 |
|
|
(6 |
) |
|
|
(7,104 |
) |
|
|
|
| S&P 500 Index, Strike Price $1,595.00, |
|
|
|
|
|
|
|
|
| Expiring 5/13/2013 |
|
|
(6 |
) |
|
|
(8,173 |
) |
|
| April 30, 2013 / ANNUAL REPORT |
PORTFOLIOS OF INVESTMENTS 55
Wilmington Rock Maple Alternatives Fund (continued)
|
|
|
|
|
|
|
|
|
| Description |
|
Contracts |
|
|
Value |
|
|
|
|
| S&P 500 Index, Strike Price $ 1,595.00, |
|
|
|
|
|
|
|
|
| Expiring 5/20/2013 |
|
|
(6 |
) |
|
$ |
(9,908 |
) |
|
|
|
| S&P 500 Index, Strike Price $ 1,610.00, |
|
|
|
|
|
|
|
|
| Expiring 5/22/2013 |
|
|
(7 |
) |
|
|
(6,799 |
) |
|
|
|
| S&P 500 Index, Strike Price $ 1,610.00, |
|
|
|
|
|
|
|
|
| Expiring 5/24/2013 |
|
|
(6 |
) |
|
|
(6,180 |
) |
|
|
|
| S&P 500 Index, Strike Price $ 1,615.00, |
|
|
|
|
|
|
|
|
| Expiring 5/08/2013 |
|
|
(7 |
) |
|
|
(1,906 |
) |
|
|
|
| S&P 500 Index, Strike Price $ 1,620.00, |
|
|
|
|
|
|
|
|
| Expiring 5/10/2013 |
|
|
(6 |
) |
|
|
(1,560 |
) |
|
|
|
| S&P 500 Index, Strike Price $ 1,622.00, |
|
|
|
|
|
|
|
|
| Expiring 5/28/2013 |
|
|
(6 |
) |
|
|
(4,280 |
) |
|
|
|
|
|
|
|
|
|
|
|
|
| TOTAL CALL OPTIONS |
|
|
|
|
|
|
$ (88,334) |
|
|
|
|
| PUT OPTIONS – 0.0%** |
|
|
|
|
|
|
|
|
|
|
|
| S&P 500 Index, Strike Price $ 1,465.00, |
|
|
|
|
|
|
|
|
| Expiring 5/13/2013 |
|
|
(6 |
) |
|
|
(392 |
) |
|
|
|
| S&P 500 Index, Strike Price $ 1,470.00, |
|
|
|
|
|
|
|
|
| Expiring 5/03/2013 |
|
|
(6 |
) |
|
|
(1 |
) |
|
|
|
| S&P 500 Index, Strike Price $ 1,470.00, |
|
|
|
|
|
|
|
|
| Expiring 5/18/2013 |
|
|
(6 |
) |
|
|
(510 |
) |
|
|
|
| S&P 500 Index, Strike Price $ 1,490.00, |
|
|
|
|
|
|
|
|
| Expiring 5/20/2013 |
|
|
(6 |
) |
|
|
(1,041 |
) |
|
|
|
| S&P 500 Index, Strike Price $ 1,495.00, |
|
|
|
|
|
|
|
|
| Expiring 5/13/2013 |
|
|
(6 |
) |
|
|
(562 |
) |
|
|
|
|
|
|
|
|
|
| Description |
|
Contracts |
|
|
Value |
|
|
|
|
| S&P 500 Index, Strike Price $1,497.00, |
|
|
|
|
|
|
|
|
| Expiring 5/06/2013 |
|
|
(6 |
) |
|
$ |
(124 |
) |
|
|
|
| S&P 500 Index, Strike Price $1,500.00, |
|
|
|
|
|
|
|
|
| Expiring 5/22/2013 |
|
|
(7 |
) |
|
|
(1,743 |
) |
|
|
|
| S&P 500 Index, Strike Price $1,505.00, |
|
|
|
|
|
|
|
|
| Expiring 5/24/2013 |
|
|
(6 |
) |
|
|
(2,220 |
) |
|
|
|
| S&P 500 Index, Strike Price $1,520.00, |
|
|
|
|
|
|
|
|
| Expiring 5/10/2013 |
|
|
(6 |
) |
|
|
(720 |
) |
|
|
|
| S&P 500 Index, Strike Price $1,525.00, |
|
|
|
|
|
|
|
|
| Expiring 5/28/2013 |
|
|
(6 |
) |
|
|
(3,405 |
) |
|
|
|
| S&P 500 Index, Strike Price $1,530.00, |
|
|
|
|
|
|
|
|
| Expiring 5/08/2013 |
|
|
(7 |
) |
|
|
(752 |
) |
|
|
|
|
|
|
|
|
|
|
|
|
| TOTAL PUT OPTIONS |
|
|
|
|
|
$ |
(11,470 |
) |
|
|
|
|
|
|
|
|
|
|
|
|
| TOTAL WRITTEN OPTIONS |
|
|
|
|
|
|
|
|
| (PREMIUMS RECEIVED $88,244) |
|
|
|
|
|
$ |
(99,804 |
) |
|
|
|
|
|
|
|
|
|
|
|
| TOTAL INVESTMENTS NET OF SECURITIES SOLD SHORT AND WRITTEN OPTIONS – 86.1% |
|
|
|
40,493,757 |
|
|
|
| OTHER ASSETS LESS LIABILITIES – 13.9% |
|
|
|
6,563,547 |
|
|
|
|
|
|
|
|
|
|
|
|
|
| TOTAL NET ASSETS – 100.0% |
|
|
|
|
|
$ |
47,057,304 |
|
|
|
|
|
|
|
|
|
|
Cost of investments for Federal
income tax purposes is $45,889,715. The net unrealized appreciation/(depreciation) of investments was $2,389,943. This consists of net unrealized appreciation from investment for those securities having an excess of value over cost of $3,312,847 and
net unrealized depreciation from investments for those securities having an excess of cost over value of $922,904.
Various inputs are
used in determining the value of the Fund’s investments. These inputs are summarized in the three broad levels listed below.
Level 1 – quoted prices in active markets for identical securities
Level 2
– other significant observable inputs (including quoted prices for similar securities, interest rates, prepayment speeds, credit risk, etc.)
Level 3 – significant unobservable inputs (including the Fund’s own assumptions in determining the fair value of investments)
ANNUAL REPORT / April
30, 2013
56 PORTFOLIOS OF INVESTMENTS
Wilmington Rock Maple Alternatives Fund (continued)
The following is a summary of the inputs used as of April 30, 2013 in valuing the Fund’s
assets carried at fair value:
|
|
|
|
|
|
|
|
|
|
|
|
|
|
|
|
|
|
|
|
|
|
| |
|
Level 1 |
|
|
Level 2 |
|
|
Level 3 |
|
|
Total |
|
|
|
|
|
|
| Assets |
|
|
|
|
|
|
|
|
|
|
|
|
|
|
|
|
|
|
|
|
|
| Investments in Securities |
|
|
|
|
|
|
|
|
|
|
|
|
|
|
|
|
|
|
|
|
|
| Common Stocks |
|
$ |
19,208,004 |
|
|
$ |
— |
|
|
$ |
— |
|
|
$ |
19,208,004 |
|
|
|
|
|
|
| Investment Companies |
|
|
6,135,279 |
|
|
|
— |
|
|
|
— |
|
|
|
6,135,279 |
|
|
|
|
|
|
| Corporate Bonds |
|
|
— |
|
|
|
7,633,220 |
|
|
|
— |
|
|
|
7,633,220 |
|
|
|
|
|
|
| U.S. Government Obligations |
|
|
— |
|
|
|
1,100,976 |
|
|
|
— |
|
|
|
1,100,976 |
|
|
|
|
|
|
| Money Market Fund |
|
|
14,192,620 |
|
|
|
— |
|
|
|
— |
|
|
|
14,192,620 |
|
|
|
|
|
|
| Purchased Options |
|
|
6,697 |
|
|
|
2,862 |
|
|
|
— |
|
|
|
9,559 |
|
|
|
|
|
|
|
|
|
|
|
|
|
|
|
|
|
|
|
|
|
|
|
| Total Investments |
|
$ |
39,542,600 |
|
|
$ |
8,737,058 |
|
|
$ |
— |
|
|
$ |
48,279,658 |
|
|
|
|
|
|
|
|
|
|
|
|
|
|
|
|
|
|
|
|
|
|
|
| Other Financial Instruments^ |
|
|
|
|
|
|
|
|
|
|
|
|
|
|
|
|
|
|
|
|
|
| Forward Foreign Currency Contracts |
|
|
— |
|
|
|
2,577 |
|
|
|
— |
|
|
|
2,577 |
|
|
|
|
|
|
|
|
|
|
|
|
|
|
|
|
|
|
|
|
|
|
|
| Total Assets |
|
$ |
39,542,600 |
|
|
$ |
8,739,635 |
|
|
$ |
— |
|
|
$ |
48,282,235 |
|
|
|
|
|
|
|
|
|
|
|
|
|
|
|
|
|
|
|
|
|
|
|
| Liabilities |
|
|
|
|
|
|
|
|
|
|
|
|
|
|
|
|
|
|
|
|
|
| Other Financial Instruments^ |
|
|
|
|
|
|
|
|
|
|
|
|
|
|
|
|
|
|
|
|
|
| Forward Foreign Currency Contracts |
|
$ |
— |
|
|
$ |
(74,519 |
) |
|
$ |
— |
|
|
$ |
(74,519 |
) |
|
|
|
|
|
| Securities Sold Short |
|
|
(7,686,097 |
) |
|
|
— |
|
|
|
— |
|
|
|
(7,686,097 |
) |
|
|
|
|
|
| Written Options |
|
|
(24,180 |
) |
|
|
(75,624 |
) |
|
|
— |
|
|
|
(99,804 |
) |
|
|
|
|
|
|
|
|
|
|
|
|
|
|
|
|
|
|
|
|
|
|
| Total Liabilities |
|
$ |
(7,710,277 |
) |
|
$ |
(150,143 |
) |
|
$ |
— |
|
|
$ |
(7,860,420 |
) |
|
|
|
|
|
|
|
|
|
|
|
|
|
|
|
|
|
| ^ |
Other financial instruments are derivative instruments not reflected in the value of total investments in securities in the Portfolio of Investments
such as forward foreign currency contracts, which are valued at the unrealized appreciation (depreciation) on the instrument. Securities sold short and written options are reported at their market value at period end. |
At April 30, 2013, the Wilmington Rock Maple Alternatives Fund had the following outstanding forward foreign currency contracts, which
contractually obligates the Fund to deliver or receive currencies at specified future dates. The open contracts were as follows:
|
|
|
|
|
|
|
|
|
|
|
|
|
|
|
|
|
|
|
|
|
|
|
|
|
|
|
| Settlement Date |
|
Counterparty |
|
|
Contracts
to
Deliver/Receive |
|
|
Contract
Amount |
|
|
Contract
at
Value |
|
|
Unrealized
Appreciation
(Depreciation)
|
|
|
|
|
|
|
|
| CONTRACTS PURCHASED |
|
|
|
|
|
|
|
|
|
|
|
|
|
|
|
|
|
|
|
|
| 5/3/2013 |
|
|
Bank of New York |
|
|
|
1,734,589 Norwegian Krone |
|
|
$ |
298,501 |
|
|
$ |
300,804 |
|
|
$ |
2,303 |
|
| 5/31/2013 |
|
|
Bank of New York |
|
|
|
66,000 Pound Sterling |
|
|
|
102,501 |
|
|
|
102,500 |
|
|
|
(1 |
) |
| 5/31/2013 |
|
|
Bank of New York |
|
|
|
58,000 Pound Sterling |
|
|
|
89,801 |
|
|
|
90,075 |
|
|
|
274 |
|
| CONTRACTS SOLD |
|
|
|
|
|
|
|
|
|
|
|
|
|
|
|
|
|
|
|
|
| 5/2/2013 |
|
|
Bank of New York |
|
|
|
62,485 Pound Sterling |
|
|
|
96,759 |
|
|
|
97,062 |
|
|
|
(303 |
) |
| 5/3/2013 |
|
|
Bank of New York |
|
|
|
62,560 Pound Sterling |
|
|
|
97,175 |
|
|
|
97,178 |
|
|
|
(3 |
) |
| 5/31/2013 |
|
|
Bank of New York |
|
|
|
6,700,000 Norwegian Krone |
|
|
|
1,135,921 |
|
|
|
1,160,466 |
|
|
|
(24,545 |
) |
| 5/31/2013 |
|
|
Bank of New York |
|
|
|
2,515,000 Swedish Krona |
|
|
|
379,617 |
|
|
|
387,780 |
|
|
|
(8,163 |
) |
| 5/31/2013 |
|
|
Bank of New York |
|
|
|
1,728,000 Norwegian Krone |
|
|
|
296,932 |
|
|
|
299,296 |
|
|
|
(2,364 |
) |
| 5/31/2013 |
|
|
Bank of New York |
|
|
|
1,631,000 Euro |
|
|
|
2,123,970 |
|
|
|
2,148,386 |
|
|
|
(24,416 |
) |
| 5/31/2013 |
|
|
Bank of New York |
|
|
|
517,000 Pound Sterling |
|
|
|
788,994 |
|
|
|
802,915 |
|
|
|
(13,921 |
) |
| 5/31/2013 |
|
|
Bank of New York |
|
|
|
88,000 Pound Sterling |
|
|
|
135,863 |
|
|
|
136,666 |
|
|
|
(803 |
) |
| NET UNREALIZED APPRECIATION (DEPRECIATION) ON FORWARD FOREIGN CURRENCY CONTRACTS |
|
|
|
|
|
|
|
|
|
|
|
|
|
|
|
|
|
$ |
(71,942 |
) |
See Notes to Portfolios of Investments
See Notes which are an integral part of the Financial Statements
April 30, 2013 / ANNUAL REPORT
57
PORTFOLIO OF INVESTMENTS SUMMARY TABLE
Wilmington Multi-Manager Real Asset Fund
At April 30, 2013, the Fund’s portfolio composition was
as follows (unaudited):
|
|
|
| |
|
Percentage of
Total Net Assets |
| Inflation-Linked & Fixed Income Securities: |
|
|
| Foreign Government Inflation-Linked Securities |
|
21.6% |
|
|
| U.S. Government Inflation-Linked Securities |
|
11.7% |
|
|
| Foreign Government Securities |
|
1.6% |
|
|
| Corporate Bonds |
|
1.0% |
|
|
| Exchange-Traded Funds |
|
1.0% |
|
|
| Corporate Notes |
|
0.7% |
|
|
| U.S. Treasury |
|
0.6% |
|
|
| Asset-Backed Securities |
|
0.1% |
|
|
| Mortgage-Backed Securities |
|
0.1% |
|
|
| Real Estate Related Securities: |
|
|
|
|
| Real Estate Investment Trusts |
|
24.7% |
|
|
| Common Stocks |
|
12.0% |
|
|
| Exchange-Traded Funds |
|
8.0% |
|
|
| Commodity Related Securities: |
|
|
|
|
| Investment Companies |
|
6.2% |
|
|
| Exchange-Traded Funds |
|
4.1% |
|
|
| Structured Note |
|
1.3% |
|
|
| Purchases Options |
|
0.0%3 |
|
|
| Written Options |
|
0.0%3 |
|
|
| Short-Term Investments |
|
|
|
|
| Cash Equivalents1 |
|
4.8% |
|
|
| Other Assets and Liabilities – Net2 |
|
0.5% |
|
|
|
|
|
| TOTAL |
|
100.0% |
|
|
|
| (1) |
Cash Equivalents include investments in money market funds and repurchase agreements. |
| (2) |
Assets, other than investments in securities, less liabilities. See Statements of Assets and Liabilities. |
| (3) |
Represent less than 0.05%.
|
PORTFOLIO OF INVESTMENTS
April 30, 2013
|
|
|
|
|
|
|
|
|
|
|
|
| Description |
|
Par Value |
|
|
Value |
|
|
| INFLATION-LINKED & FIXED INCOME SECURITIES – 38.4% |
|
|
| ASSET-BACKED SECURITIES – 0.1% |
|
|
| DIVERSIFIED FINANCIAL SERVICES – 0.1% |
|
|
|
|
| Venture CDO Ltd., 0.51%, 1/20/22D,•,W |
|
$ |
400,000 |
|
|
$ |
387,565 |
|
|
|
|
|
|
|
|
|
|
|
|
|
| TOTAL ASSET-BACKED SECURITIES (COST $363,174) |
|
|
|
|
|
$ |
387,565 |
|
|
|
|
| CORPORATE BONDS – 1.0% |
|
|
|
|
|
|
|
|
|
|
|
|
|
|
|
|
|
|
|
|
| Description |
|
Par Value |
|
|
Value |
|
|
|
|
| CONSUMER FINANCE – 0.2% |
|
|
|
|
|
|
|
|
|
|
|
| SLM Corp., |
|
|
|
|
|
|
|
|
| Series CPI, Sr. Unsecured, 4.10%, 1/31/14 |
|
$ |
734,000 |
|
|
$ |
733,416 |
|
|
|
|
| FINANCIALS – 0.8% |
|
|
|
|
|
|
|
|
|
|
|
| Banco Santander Brazil SA, |
|
|
|
|
|
|
|
|
| Sr. Unsecured, 2.38%, 3/18/14D,•,W |
|
|
500,000 |
|
|
|
498,917 |
|
ANNUAL REPORT / April
30, 2013
58 PORTFOLIOS OF INVESTMENTS
Wilmington Multi-Manager Real Asset Fund (continued)
|
|
|
|
|
|
|
|
|
|
|
|
| Description |
|
Par Value |
|
|
Value |
|
|
|
|
| Banque PSA Finance SA, |
|
|
|
|
|
|
|
|
| Sr. Unsecured, 4.00%, 7/19/13 |
|
$ |
300,000 |
|
|
$ |
397,247 |
|
|
|
|
| Dexia Credit Local SA, Government Liquid GTD, 1.08%, 9/18/13D |
|
|
600,000 |
|
|
|
792,955 |
|
|
|
|
| Eksportfinans ASA, |
|
|
|
|
|
|
|
|
| Sr. Unsecured, 5.50%, 6/26/17 |
|
|
1,000,000 |
|
|
|
1,045,878 |
|
|
|
|
| Ford Motor Credit Co., LLC, |
|
|
|
|
|
|
|
|
| Sr. Unsecured, 8.00%, 6/01/14 |
|
|
200,000 |
|
|
|
214,609 |
|
|
|
|
| International Lease Finance Corp., |
|
|
|
|
|
|
|
|
| Sr. Secured, 7.13%, 9/01/18•,W |
|
|
100,000 |
|
|
|
119,438 |
|
|
|
|
| Intesa Sanpaolo SpA, |
|
|
|
|
|
|
|
|
| Sr. Unsecured, 3.13%, 1/15/16 |
|
|
100,000 |
|
|
|
99,987 |
|
|
|
|
| MAGI Funding PLC, |
|
|
|
|
|
|
|
|
| 1.31%, 4/11/21 |
|
|
344,475 |
|
|
|
442,240 |
|
|
|
|
|
|
|
|
|
|
|
|
|
| TOTAL FINANCIALS |
|
|
|
|
|
$ |
3,611,271 |
|
|
|
|
|
|
|
|
|
|
|
|
|
| TOTAL CORPORATE BONDS (COST $4,333,500) |
|
|
|
|
|
$ |
4,344,687 |
|
|
|
|
| CORPORATE NOTES – 0.7% |
|
|
|
|
|
|
|
|
|
|
|
| FINANCIALS – 0.7% |
|
|
|
|
|
|
|
|
|
|
|
| JPMorgan Chase & Co., |
|
|
|
|
|
|
|
|
| Notes, 1.06%, 9/30/13D |
|
|
1,500,000 |
|
|
|
1,504,674 |
|
|
|
|
| Metropolitan Life Global Funding I, |
|
|
|
|
|
|
|
|
| Secured, 1.06%, 1/10/14D,•,W |
|
|
1,500,000 |
|
|
|
1,503,677 |
|
|
|
|
|
|
|
|
|
|
|
|
|
| TOTAL FINANCIALS |
|
|
|
|
|
$ |
3,008,351 |
|
|
|
|
|
|
|
|
|
|
|
|
|
| TOTAL CORPORATE NOTES
(COST $3,001,068) |
|
|
|
|
|
$ |
3,008,351 |
|
|
|
| EXCHANGE-TRADED FUNDS – 1.0% |
|
|
|
|
|
|
|
|
| DEBT FUND – 1.0% |
|
|
|
|
|
|
|
|
|
|
|
| iShares Barclays TIPS Bond Fund |
|
|
38,800 |
|
|
|
4,739,420 |
|
|
|
|
|
|
|
|
|
|
|
|
| TOTAL EXCHANGE-TRADED FUNDS (COST $4,535,711) |
|
|
$ |
4,739,420 |
|
|
| FOREIGN GOVERNMENT INFLATION-LINKED
SECURITIES – 21.6% |
|
|
|
|
| DIVERSIFIED – 0.2% |
|
|
|
|
|
|
|
|
|
|
|
| Network Rail Infrastructure Finance PLC, |
|
|
|
|
|
|
|
|
| 1.38%, 11/22/37 |
|
|
389,296 |
GBP |
|
|
822,289 |
|
|
|
|
| GOVERNMENT – 21.4% |
|
|
|
|
|
|
|
|
|
|
|
| Australia Government Bond, |
|
|
|
|
|
|
|
|
|
|
|
| 3.00%, 9/20/25 |
|
|
1,100,000 |
AUD |
|
|
1,603,842 |
|
|
|
|
| 4.00%, 8/20/20 |
|
|
350,000 |
AUD |
|
|
703,492 |
|
|
|
|
| Bonos del Banco Central de Chile en UF, |
|
|
|
|
|
|
|
|
| 3.00%, 3/01/22 |
|
|
229,461,300 |
CLP |
|
|
508,093 |
|
|
|
|
| Brazil Notas do Tesouro Nacional Serie B, |
|
|
|
|
|
|
|
|
| 6.00%, 5/15/17 |
|
|
7,419,000 |
BRL |
|
|
9,277,678 |
|
| 6.00%, 8/15/24 |
|
|
1,640,000 |
BRL |
|
|
2,190,758 |
|
| 6.00%, 5/15/35 |
|
|
300,000 |
BRL |
|
|
421,475 |
|
| 6.00%, 5/15/45 |
|
|
1,508,000 |
BRL |
|
|
2,170,987 |
|
| 6.00%, 8/15/50 |
|
|
600,000 |
BRL |
|
|
870,627 |
|
|
|
|
|
|
|
|
|
|
|
|
|
| Description |
|
Par Value |
|
|
Value |
|
|
|
|
| Bundesrepublik Deutschland Bundesobligation Inflation Linked Bond, |
|
|
|
|
|
|
|
|
| 0.75%, 4/15/18 |
|
$ |
2,450,542 |
EUR |
|
$ |
3,519,411 |
|
|
|
|
| Canadian Government Bond, |
|
|
|
|
|
|
|
|
| 1.50%, 12/01/44 |
|
|
742,707 |
CAD |
|
|
968,405 |
|
|
|
|
| 3.00%, 12/01/36 |
|
|
833,637 |
CAD |
|
|
1,332,661 |
|
|
|
|
| 4.00%, 12/01/31 |
|
|
577,146 |
CAD |
|
|
979,541 |
|
|
|
|
| Denmark I/L Government Bond, 0.10%, 11/15/23 |
|
|
21,523,865 |
DKK |
|
|
3,991,027 |
|
|
|
|
| Deutsche Bundesrepublik Inflation Linked Bond, |
|
|
|
|
|
|
|
|
| 0.10%, 4/15/23 |
|
|
1,070,000 |
EUR |
|
|
1,532,482 |
|
|
|
|
| 1.75%, 4/15/20 |
|
|
852,821 |
EUR |
|
|
1,332,443 |
|
|
|
|
| France Government Bond OAT, |
|
|
|
|
|
|
|
|
|
|
|
| 0.25%, 7/25/18 |
|
|
3,950,000 |
EUR |
|
|
5,643,215 |
|
|
|
|
| 1.00%, 7/25/17 |
|
|
448,680 |
EUR |
|
|
643,289 |
|
|
|
|
| 1.10%, 7/25/22 |
|
|
1,261,326 |
EUR |
|
|
1,851,748 |
|
|
|
|
| 1.30%, 7/25/19 |
|
|
105,560 |
EUR |
|
|
157,498 |
|
|
|
|
| 1.80%, 7/25/40 |
|
|
225,708 |
EUR |
|
|
389,140 |
|
|
|
|
| 2.10%, 7/25/23 |
|
|
228,354 |
EUR |
|
|
369,093 |
|
|
|
|
| 2.25%, 7/25/20 |
|
|
240,486 |
EUR |
|
|
382,295 |
|
|
|
|
| 3.15%, 7/25/32 |
|
|
365,493 |
EUR |
|
|
717,878 |
|
|
|
|
| 3.40%, 7/25/29 |
|
|
123,964 |
EUR |
|
|
246,655 |
|
|
|
|
| French Treasury Note BTAN, |
|
|
|
|
|
|
|
|
| 0.45%, 7/25/16 |
|
|
259,790 |
EUR |
|
|
360,161 |
|
|
|
|
| Japanese Government CPI Linked Bond, |
|
|
|
|
|
|
|
|
| 1.40%, 3/10/18 |
|
|
24,550,000 |
JPY |
|
|
287,914 |
|
|
|
|
| Mexican Udibonos, |
|
|
|
|
|
|
|
|
|
|
|
| 3.50%, 12/14/17 |
|
|
33,212,266 |
MXN |
|
|
3,066,947 |
|
|
|
|
| 4.50%, 12/18/14 |
|
|
12,428,810 |
MXN |
|
|
1,087,067 |
|
|
|
|
| New South Wales Treasury Corp., |
|
|
|
|
|
|
|
|
|
|
|
| 2.75%, 11/20/25 |
|
|
900,000 |
AUD |
|
|
1,250,790 |
|
|
|
|
| 3.75%, 11/20/20 |
|
|
800,000 |
AUD |
|
|
1,087,245 |
|
|
|
|
| New Zealand Index Linked, |
|
|
|
|
|
|
|
|
| 2.02%, 9/20/25 |
|
|
3,100,000 |
NZD |
|
|
2,949,206 |
|
|
|
|
| Poland Government Bond, |
|
|
|
|
|
|
|
|
| 3.00%, 8/24/16 |
|
|
2,325,598 |
PLN |
|
|
785,662 |
|
|
|
|
| Sweden Government Bond, |
|
|
|
|
|
|
|
|
|
|
|
| 4.29%, 12/01/15 |
|
|
11,400,000 |
SEK |
|
|
2,362,496 |
|
|
|
|
| 4.29%, 12/01/28 |
|
|
1,500,000 |
SEK |
|
|
425,452 |
|
|
|
|
| 5.16%, 12/01/20 |
|
|
8,600,000 |
SEK |
|
|
2,224,956 |
|
|
|
|
| Turkey Government Bond, |
|
|
|
|
|
|
|
|
| 9.00%, 5/21/14 |
|
|
1,746,097 |
TRY |
|
|
1,076,245 |
|
|
|
|
| U.K. Gilt Inflation Linked, |
|
|
|
|
|
|
|
|
|
|
|
| 0.13%, 3/22/24 |
|
|
2,552,800 |
GBP |
|
|
4,533,513 |
|
|
|
|
| 0.13%, 3/22/29 |
|
|
938,358 |
GBP |
|
|
1,642,395 |
|
|
|
|
| 0.13%, 3/22/44 |
|
|
4,104,862 |
GBP |
|
|
7,137,934 |
|
|
|
|
| 0.38%, 3/22/62 |
|
|
125,959 |
GBP |
|
|
258,845 |
|
|
|
|
| 0.50%, 3/22/50 |
|
|
475,592 |
GBP |
|
|
948,332 |
|
April 30, 2013 / ANNUAL REPORT
PORTFOLIOS OF INVESTMENTS 59
Wilmington Multi-Manager Real Asset Fund (continued)
|
|
|
|
|
|
|
|
|
|
|
|
| Description |
|
Par Value |
|
|
Value |
|
|
|
|
| 0.63%, 3/22/40 |
|
$ |
342,975GBP |
|
|
$ |
676,398 |
|
|
|
|
| 0.63%, 11/22/42 |
|
|
873,818GBP |
|
|
|
1,758,178 |
|
|
|
|
| 0.75%, 3/22/34 |
|
|
3,197,790GBP |
|
|
|
6,300,610 |
|
|
|
|
| 0.75%, 11/22/47 |
|
|
1,572,688GBP |
|
|
|
3,343,624 |
|
|
|
|
| 1.13%, 11/22/37 |
|
|
183,596GBP |
|
|
|
398,363 |
|
|
|
|
| 1.25%, 11/22/17 |
|
|
255,558GBP |
|
|
|
465,918 |
|
|
|
|
| 1.25%, 11/22/27 |
|
|
1,211,763GBP |
|
|
|
2,486,639 |
|
|
|
|
| 1.25%, 11/22/32 |
|
|
342,012GBP |
|
|
|
730,080 |
|
|
|
|
| 1.25%, 11/22/55 |
|
|
386,379GBP |
|
|
|
1,006,355 |
|
|
|
|
| 1.88%, 11/22/22 |
|
|
300,913GBP |
|
|
|
626,994 |
|
|
|
|
| 2.50%, 3/22/52 |
|
|
713,570GBP |
|
|
|
1,314,591 |
|
|
|
|
| 6.21%, 7/17/24 |
|
|
320,000GBP |
|
|
|
1,777,982 |
|
|
|
|
| 7.23%, 4/16/20 |
|
|
250,000GBP |
|
|
|
1,506,395 |
|
|
|
|
|
|
|
|
|
|
|
|
|
| TOTAL GOVERNMENT |
|
|
|
|
|
$ |
95,681,020 |
|
|
|
|
|
|
|
|
|
|
|
|
| TOTAL FOREIGN GOVERNMENT INFLATION-LINKED SECURITIES
(COST $88,947,621) |
|
|
$ |
96,503,309 |
|
|
| FOREIGN GOVERNMENT SECURITIES – 1.6% |
|
|
|
|
| GOVERNMENT – 1.6% |
|
|
|
|
|
|
|
|
|
|
|
| Australia Government Bond, |
|
|
|
|
|
|
|
|
| 5.50%, 4/20/23 |
|
|
200,000 |
|
|
|
249,953 |
|
|
|
|
| Bundesrepublik Deutschland, |
|
|
|
|
|
|
|
|
| 1.50%, 2/15/23 |
|
|
430,000 |
|
|
|
582,337 |
|
|
|
|
| Mexican Bonos, |
|
|
|
|
|
|
|
|
| 8.50%, 12/13/18 |
|
|
15,154,200 |
|
|
|
1,517,476 |
|
|
|
|
| Mexican Bonos de Proteccion al Ahorro, |
|
|
|
|
|
|
|
|
|
|
|
| 4.32%, 1/30/20 |
|
|
3,900,000 |
|
|
|
318,895 |
|
|
|
|
| 4.49%, 1/04/18 |
|
|
15,500,000 |
|
|
|
1,270,772 |
|
|
|
|
| South Africa Government Bond, |
|
|
|
|
|
|
|
|
| Series R207, Sr. Unsecured, 7.25%, 1/15/20 |
|
|
23,700,000 |
|
|
|
2,832,693 |
|
|
|
|
| Xunta de Galicia, |
|
|
|
|
|
|
|
|
| Sr. Unsub. Notes, |
|
|
|
|
|
|
|
|
|
|
|
| 5.76%, 4/03/17 |
|
|
100,000 |
|
|
|
140,342 |
|
|
|
|
| 6.13%, 4/03/18 |
|
|
100,000 |
|
|
|
142,754 |
|
|
|
|
|
|
|
|
|
|
|
|
|
| TOTAL GOVERNMENT |
|
|
|
|
|
$ |
7,055,222 |
|
|
|
|
|
|
|
|
|
|
|
|
| TOTAL FOREIGN GOVERNMENT SECURITIES
(COST $6,673,679) |
|
|
$ |
7,055,222 |
|
|
|
| MORTGAGE-BACKED SECURITIES – 0.1% |
|
|
|
|
|
|
|
|
| WHOLE LOAN – 0.1% |
|
|
|
|
|
|
|
|
|
|
|
| WAMU Mortgage Pass-Through Certificates, |
|
|
|
|
|
|
|
|
|
|
|
| 2.38%, 11/25/36D |
|
|
463,912 |
|
|
|
371,738 |
|
|
|
|
| 2.65%, 3/25/37D |
|
|
206,347 |
|
|
|
198,199 |
|
|
|
|
|
|
|
|
|
|
|
|
|
| TOTAL WHOLE LOAN |
|
|
|
|
|
$ |
569,937 |
|
|
|
|
|
|
|
|
|
|
|
|
| TOTAL MORTGAGE-BACKED SECURITIES
(COST $490,487) |
|
|
$ |
569,937 |
|
|
| U.S. GOVERNMENT INFLATION-LINKED SECURITIES – 11.7% |
|
|
|
|
|
|
|
|
|
|
|
|
|
| Description |
|
Par Value |
|
|
Value |
|
|
| U.S. TREASURY INFLATION INDEXED BONDS – 6.4% |
|
|
|
|
| U.S. Treasury Inflation Indexed Bond, |
|
|
|
|
|
|
|
|
|
|
|
| 0.13%, 1/15/22 |
|
$ |
9,350,000 |
|
|
$ |
10,442,818 |
|
|
|
|
| 0.63%, 7/15/21 |
|
|
2,000,000 |
|
|
|
2,355,365 |
|
|
|
|
| 0.63%, 2/15/43 |
|
|
3,840,000 |
|
|
|
4,062,637 |
|
|
|
|
| 0.75%, 2/15/42 |
|
|
1,770,000 |
|
|
|
1,976,671 |
|
|
|
|
| 2.00%, 1/15/26 |
|
|
918,000 |
|
|
|
1,410,972 |
|
|
|
|
| 2.13%, 2/15/40 |
|
|
400,000 |
|
|
|
625,930 |
|
|
|
|
| 2.38%, 1/15/25ø |
|
|
2,923,000 |
|
|
|
4,846,322 |
|
|
|
|
| 3.38%, 4/15/32 |
|
|
274,000 |
|
|
|
587,587 |
|
|
|
|
| 3.88%, 4/15/29 |
|
|
1,000,000 |
|
|
|
2,331,271 |
|
|
|
|
|
|
|
|
|
|
|
|
| TOTAL U.S. TREASURY INFLATION INDEXED BONDS |
|
|
$ |
28,639,573 |
|
|
| U.S. TREASURY INFLATION INDEXED NOTES – 5.3% |
|
|
|
|
| U.S. Treasury Inflation Indexed Note, |
|
|
|
|
|
|
|
|
|
|
|
| 0.13%, 4/15/17 |
|
|
2,200,000 |
|
|
|
2,394,599 |
|
|
|
|
| 0.13%, 7/15/22 |
|
|
4,700,000 |
|
|
|
5,181,345 |
|
|
|
|
| 0.13%, 1/15/23 |
|
|
2,700,000 |
|
|
|
2,932,971 |
|
|
|
|
| 1.25%, 4/15/14 |
|
|
40,000 |
|
|
|
44,761 |
|
|
|
|
| 1.25%, 7/15/20 |
|
|
1,700,000 |
|
|
|
2,150,042 |
|
|
|
|
| 1.63%, 1/15/15 |
|
|
400,000 |
|
|
|
510,941 |
|
|
|
|
| 1.63%, 1/15/18 |
|
|
1,900,000 |
|
|
|
2,425,008 |
|
|
|
|
| 1.88%, 7/15/13 |
|
|
2,478,000 |
|
|
|
3,147,572 |
|
|
|
|
| 1.88%, 7/15/15 |
|
|
900,000 |
|
|
|
1,160,946 |
|
|
|
|
| 2.00%, 7/15/14 |
|
|
768,000 |
|
|
|
986,627 |
|
|
|
|
| 2.00%, 1/15/16 |
|
|
8,000 |
|
|
|
10,271 |
|
|
|
|
| 2.13%, 1/15/19 |
|
|
2,010,000 |
|
|
|
2,625,896 |
|
|
|
|
| 2.38%, 1/15/17 |
|
|
200,000 |
|
|
|
264,715 |
|
|
|
|
|
|
|
|
|
|
|
|
| TOTAL U.S. TREASURY INFLATION INDEXED NOTES |
|
|
$ |
23,835,694 |
|
|
|
|
|
|
|
|
|
|
|
|
| TOTAL U.S. GOVERNMENT INFLATION-LINKED SECURITIES
(COST $52,154,553) |
|
|
$ |
52,475,267 |
|
|
|
|
| U.S. TREASURY – 0.6% |
|
|
|
|
|
|
|
|
|
|
|
| U.S. TREASURY BILLS – 0.2% |
|
|
|
|
|
|
|
|
|
|
|
| 0.07%, 10/03/13 |
|
|
11,000 |
|
|
|
10,997 |
|
|
|
|
| 0.09%, 2/06/14 |
|
|
969,000 |
|
|
|
968,319 |
|
|
|
|
| 0.13%, 1/09/14‡,ø |
|
|
109,000 |
|
|
|
108,935 |
|
|
|
|
|
|
|
|
|
|
|
|
|
| TOTAL U.S. TREASURY BILLS |
|
|
|
|
|
$ |
1,088,251 |
|
|
|
| U.S. TREASURY NOTES – 0.4% |
|
|
|
|
|
|
|
|
| 2.00%, 2/15/22 |
|
|
950,000 |
|
|
|
990,575 |
|
|
|
|
| 2.00%, 2/15/23# |
|
|
570,000 |
|
|
|
586,874 |
|
|
|
|
|
|
|
|
|
|
|
|
| TOTAL U.S. TREASURY NOTES |
|
|
$ |
1,577,449 |
|
|
|
|
|
|
|
|
|
|
|
|
|
| TOTAL U.S. TREASURY (COST $2,615,540) |
|
|
|
|
|
$ |
2,665,700 |
|
|
|
|
|
|
|
|
|
|
|
|
| TOTAL INFLATION-LINKED & FIXED INCOME SECURITIES (COST $163,115,333) |
|
|
$ |
171,749,458 |
|
ANNUAL REPORT / April
30, 2013
60 PORTFOLIOS OF INVESTMENTS
Wilmington Multi-Manager Real Asset Fund (continued)
|
|
|
|
|
|
|
|
|
| Description |
|
Number
of
Shares |
|
|
Value |
|
| REAL ESTATE RELATED SECURITIES – 44.7% |
|
|
|
|
| COMMON STOCKS – 12.0% |
|
|
|
|
|
|
|
|
|
|
|
| DEPARTMENT STORES – 0.4% |
|
|
|
|
|
|
|
|
|
|
|
| Lifestyle International Holdings Ltd. |
|
|
835,400 |
|
|
$ |
1,845,165 |
|
|
| DIVERSIFIED REAL ESTATE ACTIVITIES – 6.7% |
|
|
|
|
| CapitaLand Ltd. |
|
|
856,616 |
|
|
|
2,601,074 |
|
|
|
|
| City Developments Ltd. |
|
|
205,000 |
|
|
|
1,874,077 |
|
|
|
|
| Daito Trust Construction Co. Ltd. |
|
|
5,601 |
|
|
|
542,375 |
|
|
|
|
| Daiwa House Industry Co. Ltd. |
|
|
130,700 |
|
|
|
2,952,264 |
|
|
|
|
| Hang Lung Group Ltd. |
|
|
16,900 |
|
|
|
99,525 |
|
|
|
|
| Hang Lung Properties Ltd. |
|
|
510,999 |
|
|
|
1,988,643 |
|
|
|
|
| Kerry Properties Ltd. |
|
|
475,500 |
|
|
|
2,150,738 |
|
|
|
|
| Mitsubishi Estate Co. Ltd. |
|
|
191,510 |
|
|
|
6,217,666 |
|
|
|
|
| Mitsui Fudosan Co. Ltd. |
|
|
175,489 |
|
|
|
5,958,543 |
|
|
|
|
| PSP Swiss Property AG |
|
|
2,925 |
|
|
|
274,474 |
|
|
|
|
| Sumitomo Realty & Development Co. Ltd. |
|
|
42,200 |
|
|
|
1,991,280 |
|
|
|
|
| Sun Hung Kai Properties Ltd. |
|
|
136,267 |
|
|
|
1,970,214 |
|
|
|
|
| Swire Properties Ltd. |
|
|
147,000 |
|
|
|
524,719 |
|
|
|
|
| Wharf Holdings Ltd. |
|
|
76,000 |
|
|
|
678,209 |
|
|
|
|
|
|
|
|
|
|
|
|
| TOTAL DIVERSIFIED REAL ESTATE ACTIVITIES |
|
|
$ |
29,823,801 |
|
|
| HOTELS, RESORTS, & CRUISE LINES – 0.9% |
|
|
|
|
| Melia Hotels International SA |
|
|
134,500 |
|
|
|
996,355 |
|
|
|
|
| Shangri-La Asia Ltd. |
|
|
632,416 |
|
|
|
1,222,430 |
|
|
|
|
| Starwood Hotels & Resorts Worldwide, Inc. |
|
|
25,800 |
|
|
|
1,664,616 |
|
|
|
|
|
|
|
|
|
|
|
|
| TOTAL HOTELS, RESORTS, & CRUISE LINES |
|
|
$ |
3,883,401 |
|
|
|
| REAL ESTATE DEVELOPMENT – 1.4% |
|
|
|
|
|
|
|
|
| Cheung Kong Holdings Ltd. |
|
|
96,634 |
|
|
|
1,454,463 |
|
|
|
|
| China Overseas Land & Investment Ltd. |
|
|
683,500 |
|
|
|
2,087,453 |
|
|
|
|
| China Resources Land Ltd. |
|
|
268,000 |
|
|
|
811,582 |
|
|
|
|
| Guangzhou R&F Properties Co. Ltd. |
|
|
470,000 |
|
|
|
850,344 |
|
|
|
|
| Keppel Land Ltd. |
|
|
37,000 |
|
|
|
121,962 |
|
|
|
|
| Sino Land Co. Ltd. |
|
|
379,982 |
|
|
|
624,804 |
|
|
|
|
| Wing Tai Holdings Ltd. |
|
|
195,975 |
|
|
|
346,858 |
|
|
|
|
|
|
|
|
|
|
|
|
|
| TOTAL REAL ESTATE DEVELOPMENT |
|
|
|
|
|
$ |
6,297,466 |
|
|
| REAL ESTATE OPERATING COMPANIES – 2.6% |
|
|
|
|
| Aeon Mall Co. Ltd. |
|
|
67,000 |
|
|
|
2,154,639 |
|
|
|
|
| Castellum AB |
|
|
104,618 |
|
|
|
1,565,788 |
|
|
|
|
| Central Pattana PCL |
|
|
416,000 |
|
|
|
1,417,377 |
|
|
|
|
| Central Pattana PCL |
|
|
58,000 |
|
|
|
197,615 |
|
|
|
|
| Global Logistic Properties Ltd. |
|
|
431,300 |
|
|
|
966,459 |
|
|
|
|
| GSW Immobilien AG |
|
|
3,502 |
|
|
|
140,526 |
|
|
|
|
| Hongkong Land Holdings Ltd. |
|
|
395,881 |
|
|
|
2,874,096 |
|
|
|
|
| Hufvudstaden AB |
|
|
10,024 |
|
|
|
131,002 |
|
|
|
|
| Hysan Development Co. Ltd. |
|
|
445,617 |
|
|
|
2,207,944 |
|
|
|
|
|
|
|
|
|
|
| Description |
|
Number
of
Shares |
|
|
Value |
|
|
|
|
| Safestore Holdings PLC |
|
|
62,600 |
|
|
$ |
133,218 |
|
|
|
|
| Sonae Sierra Brasil SA |
|
|
4,200 |
|
|
|
57,959 |
|
|
|
|
|
|
|
|
|
|
|
|
| TOTAL REAL ESTATE OPERATING COMPANIES |
|
|
$ |
11,846,623 |
|
|
|
|
|
|
|
|
|
|
|
|
| TOTAL COMMON STOCKS (COST $37,992,876) |
|
|
$ |
53,696,456 |
|
|
|
| EXCHANGE-TRADED FUNDS – 8.0% |
|
|
|
|
|
|
|
|
| EQUITY FUNDS – 8.0% |
|
|
|
|
|
|
|
|
|
|
|
| SPDR Dow Jones International Real Estate ETF |
|
|
451,400 |
|
|
|
20,814,054 |
|
|
|
|
| Vanguard REIT ETF |
|
|
201,300 |
|
|
|
15,153,864 |
|
|
|
|
|
|
|
|
|
|
|
|
|
| TOTAL EQUITY FUNDS |
|
|
|
|
|
$ |
35,967,918 |
|
|
|
|
|
|
|
|
|
|
|
|
| TOTAL EXCHANGE-TRADED FUNDS (COST $29,957,691) |
|
|
$ |
35,967,918 |
|
|
| REAL ESTATE INVESTMENT TRUSTS – 24.7% |
|
|
|
|
| DIVERSIFIED – 3.0% |
|
|
|
|
|
|
|
|
|
|
|
| British Land Co. PLC |
|
|
22,708 |
|
|
|
209,701 |
|
|
|
|
| Dexus Property Group |
|
|
738,514 |
|
|
|
884,287 |
|
|
|
|
| Duke Realty Corp. |
|
|
30,300 |
|
|
|
534,492 |
|
|
|
|
| Fonciere Des Regions |
|
|
2,546 |
|
|
|
202,519 |
|
|
|
|
| GPT Group |
|
|
360,799 |
|
|
|
1,533,564 |
|
|
|
|
| ICADE |
|
|
23,226 |
|
|
|
2,141,125 |
|
|
|
|
| Kenedix Realty Investment Corp. |
|
|
47 |
|
|
|
220,572 |
|
|
|
|
| Land Securities Group PLC |
|
|
156,761 |
|
|
|
2,127,013 |
|
|
|
|
| Liberty Property Trust |
|
|
20,000 |
|
|
|
859,800 |
|
|
|
|
| Mercialys SA |
|
|
2,720 |
|
|
|
60,699 |
|
|
|
|
| Mirvac Group |
|
|
336,375 |
|
|
|
617,234 |
|
|
|
|
| Segro PLC |
|
|
34,100 |
|
|
|
141,110 |
|
|
|
|
| Shaftesbury PLC |
|
|
61,233 |
|
|
|
577,831 |
|
|
|
|
| Stockland |
|
|
462,360 |
|
|
|
1,855,000 |
|
|
|
|
| United Urban Investment Corp. |
|
|
218 |
|
|
|
358,917 |
|
|
|
|
| Vornado Realty Trust |
|
|
9,897 |
|
|
|
866,581 |
|
|
|
|
| Weyerhaeuser Co. |
|
|
10,300 |
|
|
|
314,253 |
|
|
|
|
|
|
|
|
|
|
|
|
|
| TOTAL DIVERSIFIED |
|
|
|
|
|
$ |
13,504,698 |
|
|
| DIVERSIFIED REAL ESTATE ACTIVITIES – 0.6% |
|
|
|
|
| Eurocommercial Properties NV |
|
|
4,627 |
|
|
|
189,021 |
|
|
|
|
| LEG Immobilien AG |
|
|
6,200 |
|
|
|
341,301 |
|
|
|
|
| Lexington Realty Trust |
|
|
20,600 |
|
|
|
263,886 |
|
|
|
|
| Mapletree Greater China Commercial Trust |
|
|
392,000 |
|
|
|
354,859 |
|
|
|
|
| Plum Creek Timber Co., Inc. |
|
|
22,800 |
|
|
|
1,175,112 |
|
|
|
|
| Tokyo Tatemono Co. Ltd. |
|
|
46,600 |
|
|
|
430,698 |
|
|
|
|
|
|
|
|
|
|
|
|
| TOTAL DIVERSIFIED REAL ESTATE ACTIVITIES |
|
|
$ |
2,754,877 |
|
|
|
|
| FINANCIALS – 0.3% |
|
|
|
|
|
|
|
|
|
|
|
| American Tower Corp. |
|
|
2,400 |
|
|
|
201,576 |
|
|
|
|
| Goodman Group |
|
|
138,862 |
|
|
|
750,022 |
|
|
|
|
| Investa Office Fund |
|
|
79,400 |
|
|
|
269,990 |
|
|
|
|
|
|
|
|
|
|
|
|
|
| TOTAL FINANCIALS |
|
|
|
|
|
$ |
1,221,588 |
|
April 30, 2013 / ANNUAL REPORT
PORTFOLIOS OF INVESTMENTS 61
Wilmington Multi-Manager Real Asset Fund (continued)
|
|
|
|
|
|
|
|
|
| Description |
|
Number
of
Shares |
|
|
Value |
|
|
|
|
| INDUSTRIALS – 1.2% |
|
|
|
|
|
|
|
|
|
|
|
| Ascendas Real Estate Investment Trust |
|
|
88,000 |
|
|
$ |
196,476 |
|
|
|
|
| Prologis, Inc. |
|
|
126,621 |
|
|
|
5,311,751 |
|
|
|
|
|
|
|
|
|
|
|
|
|
| TOTAL INDUSTRIALS |
|
|
|
|
|
$ |
5,508,227 |
|
|
|
|
| OFFICE – 4.1% |
|
|
|
|
|
|
|
|
|
|
|
| Alexandria Real Estate Equities, Inc. |
|
|
24,800 |
|
|
|
1,804,696 |
|
|
|
|
| BioMed Realty Trust, Inc. |
|
|
15,100 |
|
|
|
339,901 |
|
|
|
|
| Boston Properties, Inc. |
|
|
35,200 |
|
|
|
3,851,936 |
|
|
|
|
| Brandywine Realty Trust |
|
|
8,800 |
|
|
|
131,384 |
|
|
|
|
| CapitaCommercial Trust |
|
|
543,000 |
|
|
|
753,861 |
|
|
|
|
| CommonWealth REIT |
|
|
8,400 |
|
|
|
187,572 |
|
|
|
|
| Derwent London PLC |
|
|
63,158 |
|
|
|
2,265,279 |
|
|
|
|
| Douglas Emmett, Inc. |
|
|
56,100 |
|
|
|
1,468,137 |
|
|
|
|
| Great Portland Estates PLC |
|
|
243,414 |
|
|
|
2,011,529 |
|
|
|
|
| Highwoods Properties, Inc. |
|
|
9,900 |
|
|
|
406,197 |
|
|
|
|
| Japan Real Estate Investment Corp. |
|
|
81 |
|
|
|
1,085,152 |
|
|
|
|
| Kilroy Realty Corp. |
|
|
40,500 |
|
|
|
2,291,895 |
|
|
|
|
| Nippon Building Fund, Inc. |
|
|
38 |
|
|
|
546,505 |
|
|
|
|
| SL Green Realty Corp. |
|
|
13,400 |
|
|
|
1,215,380 |
|
|
|
|
| Societe Immobiliere de Location pour l’industrie et le Commerce |
|
|
1,630 |
|
|
|
191,930 |
|
|
|
|
|
|
|
|
|
|
| TOTAL OFFICE |
|
|
|
|
|
$ |
18,551,354 |
|
|
|
|
| RESIDENTIAL – 3.3% |
|
|
|
|
|
|
|
|
|
|
|
| Advance Residence Investment Corp. |
|
|
58 |
|
|
|
138,686 |
|
|
|
|
| American Campus Communities, Inc. |
|
|
41,400 |
|
|
|
1,848,096 |
|
|
|
|
| AvalonBay Communities, Inc. |
|
|
6,129 |
|
|
|
815,402 |
|
|
|
|
| Boardwalk Real Estate Investment Trust |
|
|
5,600 |
|
|
|
366,144 |
|
|
|
|
| BRE Properties, Inc. |
|
|
30,200 |
|
|
|
1,524,496 |
|
|
|
|
| Campus Crest Communities, Inc. |
|
|
9,100 |
|
|
|
124,306 |
|
|
|
|
| Equity Residential |
|
|
77,000 |
|
|
|
4,470,620 |
|
|
|
|
| Essex Property Trust, Inc. |
|
|
18,800 |
|
|
|
2,952,540 |
|
|
|
|
| Nippon Accommodations Fund, Inc. |
|
|
25 |
|
|
|
193,620 |
|
|
|
|
| Post Properties, Inc. |
|
|
13,400 |
|
|
|
662,362 |
|
|
|
|
| UDR, Inc. |
|
|
62,219 |
|
|
|
1,529,343 |
|
|
|
|
|
|
|
|
|
|
|
|
|
| TOTAL RESIDENTIAL |
|
|
|
|
|
$ |
14,625,615 |
|
|
|
|
| RETAIL – 8.2% |
|
|
|
|
|
|
|
|
|
|
|
| Calloway Real Estate Investment Trust |
|
|
4,200 |
|
|
|
125,944 |
|
|
|
|
| CapitaMall Trust |
|
|
277,542 |
|
|
|
522,771 |
|
|
|
|
| CBL & Associates Properties, Inc. |
|
|
4,800 |
|
|
|
115,872 |
|
|
|
|
| CFS Retail Property Trust Group |
|
|
305,000 |
|
|
|
695,625 |
|
|
|
|
| DDR Corp. |
|
|
76,010 |
|
|
|
1,394,023 |
|
|
|
|
| Federal Realty Investment Trust |
|
|
17,300 |
|
|
|
2,024,273 |
|
|
|
|
| Federation Centres |
|
|
205,300 |
|
|
|
553,369 |
|
|
|
|
| Frasers Centrepoint Trust |
|
|
36,000 |
|
|
|
65,763 |
|
|
|
|
| General Growth Properties, Inc. |
|
|
60,474 |
|
|
|
1,373,969 |
|
|
|
|
| Hammerson PLC |
|
|
228,985 |
|
|
|
1,847,830 |
|
|
|
|
| Japan Retail Fund Investment Corp. |
|
|
335 |
|
|
|
793,814 |
|
|
|
|
|
|
|
|
|
|
| Description |
|
Number
of
Shares |
|
|
Value |
|
|
|
|
| Kimco Realty Corp. |
|
|
42,100 |
|
|
$ |
1,001,138 |
|
|
|
|
| Klepierre |
|
|
33,732 |
|
|
|
1,430,432 |
|
|
|
|
| Link REIT |
|
|
190,300 |
|
|
|
1,077,774 |
|
|
|
|
| Macerich Co. |
|
|
33,984 |
|
|
|
2,380,579 |
|
|
|
|
| Ramco-Gershenson Properties Trust |
|
|
7,800 |
|
|
|
136,266 |
|
|
|
|
| RioCan Real Estate Investment Trust |
|
|
103,321 |
|
|
|
3,026,456 |
|
|
|
|
| Simon Property Group, Inc. |
|
|
45,569 |
|
|
|
8,114,472 |
|
|
|
|
| Tanger Factory Outlet Centers |
|
|
5,310 |
|
|
|
197,107 |
|
|
|
|
| Taubman Centers, Inc. |
|
|
38,100 |
|
|
|
3,257,931 |
|
|
|
|
| Unibail-Rodamco SE |
|
|
13,274 |
|
|
|
3,470,018 |
|
|
|
|
| Westfield Group |
|
|
116,402 |
|
|
|
1,405,850 |
|
|
|
|
| Westfield Retail Trust |
|
|
420,863 |
|
|
|
1,439,817 |
|
|
|
|
|
|
|
|
|
|
|
|
|
| TOTAL RETAIL |
|
|
|
|
|
$ |
36,451,093 |
|
|
|
|
| SPECIALIZED – 3.9% |
|
|
|
|
|
|
|
|
|
|
|
| HCP, Inc. |
|
|
22,300 |
|
|
|
1,188,590 |
|
|
|
|
| Health Care REIT, Inc. |
|
|
55,300 |
|
|
|
4,145,841 |
|
|
|
|
| Healthcare Trust of America, Inc. |
|
|
7,900 |
|
|
|
98,592 |
|
|
|
|
| Host Hotels & Resorts, Inc. |
|
|
238,514 |
|
|
|
4,357,651 |
|
|
|
|
| LaSalle Hotel Properties |
|
|
29,100 |
|
|
|
754,563 |
|
|
|
|
| Pebblebrook Hotel Trust |
|
|
9,800 |
|
|
|
266,168 |
|
|
|
|
| Public Storage |
|
|
15,000 |
|
|
|
2,475,000 |
|
|
|
|
| Sunstone Hotel Investors, Inc.* |
|
|
19,700 |
|
|
|
244,477 |
|
|
|
|
| Ventas, Inc. |
|
|
48,284 |
|
|
|
3,844,855 |
|
|
|
|
|
|
|
|
|
|
|
|
|
| TOTAL SPECIALIZED |
|
|
|
|
|
$ |
17,375,737 |
|
|
|
|
| SPECIALTY RETAIL – 0.1% |
|
|
|
|
|
|
|
|
|
|
|
| Senior Housing Properties Trust |
|
|
14,200 |
|
|
|
403,706 |
|
|
|
|
|
|
|
|
|
|
|
|
|
| TOTAL REAL ESTATE INVESTMENT TRUSTS (COST $82,510,513) |
|
|
|
|
|
$ |
110,396,895 |
|
|
|
|
|
|
|
|
|
|
|
|
| TOTAL REAL ESTATE RELATED SECURITIES (COST $150,461,080) |
|
|
$ |
200,061,269 |
|
|
|
| COMMODITY RELATED SECURITIES – 11.6% |
|
|
|
|
|
|
|
|
| EXCHANGE-TRADED FUND – 4.1% |
|
|
|
|
|
|
|
|
|
|
|
| COMMODITY FUND – 4.1% |
|
|
|
|
|
|
|
|
|
|
|
| PowerShares DB Commodity Index Tracking Fund* |
|
|
699,500 |
|
|
|
18,375,865 |
|
|
|
|
|
|
|
|
|
|
|
|
|
| TOTAL EXCHANGE-TRADED FUND
(COST $18,704,368) |
|
|
|
|
|
$ |
18,375,865 |
|
|
|
|
| INVESTMENT COMPANIES – 6.2% |
|
|
|
|
|
|
|
|
|
|
|
| COMMODITY FUNDS – 6.2% |
|
|
|
|
|
|
|
|
|
|
|
| Credit Suisse Commodity Return Strategy Fund |
|
|
1,724,196 |
|
|
|
13,276,311 |
|
|
|
|
| PIMCO CommoditiesPLUS Strategy Fund |
|
|
1,350,445 |
|
|
|
14,382,242 |
|
|
|
|
|
|
|
|
|
|
|
|
|
| TOTAL COMMODITY FUNDS |
|
|
|
|
|
$ |
27,658,553 |
|
|
|
|
|
|
|
|
|
|
|
|
|
| TOTAL INVESTMENT COMPANIES
(COST $27,576,944) |
|
|
|
|
|
$ |
27,658,553 |
|
|
|
|
| STRUCTURED NOTE – 1.3% |
|
|
|
|
|
|
|
|
ANNUAL REPORT / April
30, 2013
62 PORTFOLIOS OF INVESTMENTS
Wilmington Multi-Manager Real Asset Fund (continued)
|
|
|
|
|
|
|
|
|
| Description |
|
Number
of
Shares |
|
|
Value |
|
| FINANCIALS –
1.3% |
|
|
|
|
|
|
|
|
| Deutsche Bank AG, London Branch, Structured Note Linked
to Dow Jones-UBS Commodity Index, 0.07%, 06/20/2013‡ |
|
|
6,000,000 |
|
|
$ |
5,925,000 |
|
|
|
|
|
|
|
|
|
|
| TOTAL STRUCTURED
NOTE (COST $6,000,000) |
|
|
$ |
5,925,000 |
|
|
|
|
|
|
|
|
|
|
| TOTAL COMMODITY
RELATED SECURITIES (COST $52,281,312) |
|
|
$ |
51,959,418 |
|
|
|
|
|
|
|
|
|
|
| Description |
|
Contracts |
|
|
Value |
|
| PURCHASED OPTIONS –
0.0%** |
|
|
|
|
|
|
|
|
| CALL OPTIONS –
0.0%** |
|
|
|
|
|
|
|
|
| U.S. Dollar vs. Japanese Yen, Strike Price 0.99%,
Expiring |
|
|
700,000 |
|
|
$ |
15,257 |
|
| U.S. Dollar vs. Japanese Yen, Strike Price 0.99%,
Expiring |
|
|
600,000 |
|
|
|
13,077 |
|
|
|
|
|
|
|
|
|
|
| TOTAL CALL OPTIONS |
|
|
|
|
|
$ |
28,334 |
|
| PUT OPTIONS –
0.0%** |
|
|
|
|
|
|
|
|
| U.S. 30Y Futures, Strike Price 3.88%, Expiring
4/14/2014 |
|
|
600,000 |
|
|
|
5,565 |
|
|
|
|
|
|
|
|
|
|
| TOTAL PURCHASED
OPTIONS (COST $52,295) |
|
|
|
|
|
$ |
33,899 |
|
|
|
|
|
|
|
|
|
|
| |
|
Number
of
Shares |
|
|
|
|
| SHORT-TERM INVESTMENTS – 4.7% |
|
|
|
|
|
| MONEY MARKET FUNDS
– 3.9% |
|
|
|
|
|
| Dreyfus Cash Management Fund, Institutional Shares^ |
|
|
14,872,296 |
|
|
|
14,872,296 |
|
| Wilmington Prime Money Market Fund, Institutional
Shares, 0.02%^,§ |
|
|
2,650,807 |
|
|
|
2,650,807 |
|
|
|
|
|
|
|
|
|
|
| TOTAL MONEY MARKET
FUNDS (COST $17,523,103) |
|
|
$ |
17,523,103 |
|
|
|
|
|
|
|
|
|
|
|
|
|
|
|
|
|
|
|
| |
|
Par Value |
|
|
|
|
| REPURCHASE AGREEMENT – 0.8% |
|
|
|
|
|
| Citigroup Global Markets 0.15%, dated 04/30/13, due
05/01/2013, repurchase price $3,300,014, collateralized by U.S. Treasury Note 0.625%, maturing 05/31/17; total market value of $3,369,561. |
|
$ |
3,300,000 |
|
|
|
3,300,000 |
|
|
|
|
|
|
|
|
|
|
| TOTAL REPURCHASE
AGREEMENT (COST $3,300,000) |
|
|
$ |
3,300,000 |
|
|
|
|
|
|
|
|
|
|
| TOTAL SHORT-TERM
INVESTMENT (COST $20,823,103) |
|
|
$ |
20,823,103 |
|
|
|
|
|
|
|
|
|
|
| Description |
|
Par Value |
|
|
Value |
|
| CASH COLLATERAL
INVESTED FOR SECURITIES ON LOAN – 0.1% |
|
| REPURCHASE AGREEMENT
– 0.1% |
|
|
|
|
|
| RBC Capital Markets LLC, 0.14%, dated 04/30/13, due
05/01/13, repurchase price $601,404, collateralized by U.S. Treasury Securities 0.13% to 3.88%, maturing 07/15/13 to 02/15/43; total market value of $613,432. |
|
$ |
601,402 |
|
|
$ |
601,402 |
|
|
|
|
|
|
|
|
|
|
| TOTAL CASH COLLATERAL
INVESTED FOR SECURITIES ON LOAN
(COST $601,402) |
|
|
$ |
601,402 |
|
|
TOTAL INVESTMENTS IN SECURITIES
BEFORE WRITTEN OPTIONS – 99.5%
(COST $387,334,525) |
|
|
$ |
445,228,549 |
|
|
|
|
|
|
|
|
|
|
| |
|
Contracts |
|
|
Value |
|
| WRITTEN OPTIONS –
0.0%** |
|
|
|
|
|
|
|
|
| CALL OPTIONS –
0.0%** |
|
|
|
|
|
|
|
|
| INF FLOOR USD, Strike Price 216.69%, Expiring
4/07/2020 |
|
|
(260 |
) |
|
|
(4,224 |
) |
| U.S. 10Y Futures, Strike Price 1.80%, Expiring
7/29/2013 |
|
|
(20 |
) |
|
|
(1,174 |
) |
| U.S. 10Y Futures, Strike Price 1.80%, Expiring
7/29/2013 |
|
|
(40 |
) |
|
|
(2,349 |
) |
| U.S. 10Y Futures, Strike Price 1.80%, Expiring
7/29/2013 |
|
|
(70 |
) |
|
|
(4,111 |
) |
| U.S. 10Y Futures, Strike Price 1.80%, Expiring
7/29/2013 |
|
|
(80 |
) |
|
|
(4,698 |
) |
| U.S. 10Y Futures, Strike Price 1.80%, Expiring
7/29/2013 |
|
|
(90 |
) |
|
|
(5,285 |
) |
| U.S. 10Y Futures, Strike Price 2.65%, Expiring
7/29/2013 |
|
|
(60 |
) |
|
|
(3,523 |
) |
| U.S. 3Y Futures, Strike Price 1.60%, Expiring
7/02/2013 |
|
|
(300 |
) |
|
|
(9,181 |
) |
| U.S. 5Y Futures, Strike Price 7.50%, Expiring
9/03/2013 |
|
|
(20 |
) |
|
|
(180 |
) |
| U.S. 5Y Futures, Strike Price 7.50%, Expiring
9/03/2013 |
|
|
(20 |
) |
|
|
(180 |
) |
| U.S. 5Y Futures, Strike Price 7.50%, Expiring
9/13/2013 |
|
|
(130 |
) |
|
|
(1,170 |
) |
| U.S. Dollar vs. Japanese Yen, Strike Price 0.10%, Expiring 9/24/2013 |
|
|
(60 |
) |
|
|
(5,210 |
) |
| U.S. Dollar vs. Japanese Yen, Strike Price 0.10%,
Expiring 9/24/2013 |
|
|
(70 |
) |
|
|
(6,078 |
) |
|
|
|
|
|
|
|
|
|
| TOTAL CALL OPTIONS |
|
|
|
|
|
$ |
(47,363 |
) |
| PUT OPTIONS –
0.0%** |
|
|
|
|
|
|
|
|
| EURO 2Y Futures, Strike Price 1.15%, Expiring
7/24/2013 |
|
|
(40 |
) |
|
|
(2 |
) |
| EURO 2Y Futures, Strike Price 1.15%, Expiring
7/24/2013 |
|
|
(70 |
) |
|
|
(3 |
) |
| EURO 2Y Futures, Strike Price 1.15%, Expiring
7/24/2013 |
|
|
(120 |
) |
|
|
(5 |
) |
April 30, 2013 / ANNUAL REPORT
PORTFOLIOS OF INVESTMENTS 63
Wilmington Multi-Manager Real Asset Fund (continued)
|
|
|
|
|
|
|
|
|
| Description |
|
Contracts |
|
|
Value |
|
| EURO 5Y Futures, Strike Price 1.15%, Expiring
6/03/2013 |
|
|
(20 |
) |
|
$ |
— |
|
| EURO 5Y Futures, Strike Price 1.15%, Expiring
6/03/2013 |
|
|
(80 |
) |
|
|
— |
|
| EURO 5Y Futures, Strike Price 1.70%, Expiring
7/24/2013 |
|
|
(10 |
) |
|
|
(2 |
) |
| EURO 5Y Futures, Strike Price 1.70%, Expiring
7/24/2013 |
|
|
(20 |
) |
|
|
(4 |
) |
| EURO 5Y Futures, Strike Price 1.70%, Expiring
7/24/2013 |
|
|
(30 |
) |
|
|
(6 |
) |
| EURO 5Y Futures, Strike Price 1.70%, Expiring
7/24/2013 |
|
|
(120 |
) |
|
|
(24 |
) |
| U.S. 10Y Futures, Strike Price 2.65%, Expiring
7/29/2013 |
|
|
(20 |
) |
|
|
(92 |
) |
| U.S. 10Y Futures, Strike Price 2.65%, Expiring
7/29/2013 |
|
|
(40 |
) |
|
|
(184 |
) |
| U.S. 10Y Futures, Strike Price 2.65%, Expiring
7/29/2013 |
|
|
(60 |
) |
|
|
(275 |
) |
| U.S. 10Y Futures, Strike Price 2.65%, Expiring
7/29/2013 |
|
|
(70 |
) |
|
|
(321 |
) |
| U.S. 10Y Futures, Strike Price 2.65%, Expiring
7/29/2013 |
|
|
(80 |
) |
|
|
(367 |
) |
| U.S. 10Y Futures, Strike Price 2.65%, Expiring
7/29/2013 |
|
|
(90 |
) |
|
|
(413 |
) |
| U.S. 3Y Futures, Strike Price 1.60%, Expiring
7/02/2013 |
|
|
(300 |
) |
|
|
(4,894 |
) |
| U.S. 5Y Futures, Strike Price 1.25%, Expiring
9/03/2013 |
|
|
(20 |
) |
|
|
(298 |
) |
|
|
|
|
|
|
|
|
|
| Description |
|
Contracts |
|
|
Value |
|
| U.S. 5Y Futures, Strike Price 1.25%, Expiring
9/03/2013 |
|
|
(20 |
) |
|
$ |
(298 |
) |
| U.S. 5Y Futures, Strike Price 1.25%, Expiring
9/03/2013 |
|
|
(130 |
) |
|
|
(1,938 |
) |
| U.S. 5Y Futures, Strike Price 1.40%, Expiring
9/03/2013 |
|
|
(30 |
) |
|
|
(243 |
) |
| U.S. 5Y Futures, Strike Price 2.85%, Expiring
4/14/2014 |
|
|
(270 |
) |
|
|
(2,077 |
) |
| U.S. Dollar vs. Japanese Yen, Strike Price 0.88%,
Expiring |
|
|
(70 |
) |
|
|
(2,338 |
) |
| U.S. Dollar vs. Japanese Yen, Strike Price 0.88%,
Expiring |
|
|
(60 |
) |
|
|
(2,135 |
) |
|
|
|
|
|
|
|
|
|
| TOTAL PUT OPTIONS |
|
|
|
|
|
$ |
(15,919 |
) |
|
|
|
|
|
|
|
|
|
| TOTAL WRITTEN
OPTIONS (PREMIUM RECEIVED $161,326) |
|
|
$ |
(63,282 |
) |
|
|
| TOTAL INVESTMENTS NET OF WRITTEN
OPTIONS – 99.5% |
|
|
|
445,165,267 |
|
| OTHER ASSETS LESS
LIABILITIES – 0.5% |
|
|
|
2,170,651 |
|
|
|
|
|
|
|
|
|
|
| TOTAL NET ASSETS –
100.0% |
|
|
|
|
|
$ |
447,335,918 |
|
|
|
|
|
|
|
|
|
|
Cost of investments for Federal
income tax purposes is $404,611,160. The net unrealized appreciation/(depreciation) of investments was $40,617,389. This consists of net unrealized appreciation from investment for those securities having an excess of value over cost of $43,150,636
and net unrealized depreciation from investments for those securities having an excess of cost over value of $2,533,247.
Various inputs
are used in determining the value of the Fund’s investments. These inputs are summarized in the three broad levels listed below.
|
|
|
|
|
|
|
Level 1 – |
|
quoted prices in active markets for identical securities |
|
|
Level 2 – |
|
other significant observable inputs (including quoted prices for similar securities, interest rates, prepayment speeds, credit risk, etc.) |
|
|
Level 3 – |
|
significant unobservable inputs (including the Fund’s own assumptions in determining the fair value of investments) |
ANNUAL REPORT / April
30, 2013
64 PORTFOLIOS OF INVESTMENTS
Wilmington Multi-Manager Real Asset Fund (continued)
The following is a summary of the inputs used as of April 30, 2013 in valuing the Fund’s assets carried
at fair value:
|
|
|
|
|
|
|
|
|
|
|
|
|
|
|
|
|
| |
|
Level
1 |
|
|
Level
2 |
|
|
Level
3 |
|
|
Total
|
|
| Assets |
|
|
|
|
|
|
|
|
|
|
|
|
|
|
|
|
|
|
|
|
|
| Investments in Securities |
|
|
|
|
|
|
|
|
|
|
|
|
|
|
|
|
|
|
|
|
|
| Inflation-Linked & Fixed Income Securities |
|
|
|
|
|
|
|
|
|
|
|
|
|
|
|
|
|
|
|
|
|
| Asset-Backed Securities |
|
$ |
— |
|
|
$ |
387,565 |
|
|
$ |
— |
|
|
$ |
387,565 |
|
|
|
|
|
|
| Corporate Bonds |
|
|
— |
|
|
|
4,344,687 |
|
|
|
— |
|
|
|
4,344,687 |
|
|
|
|
|
|
| Corporate Notes |
|
|
— |
|
|
|
3,008,351 |
|
|
|
— |
|
|
|
3,008,351 |
|
|
|
|
|
|
| Exchange-Traded Funds |
|
|
4,739,420 |
|
|
|
— |
|
|
|
— |
|
|
|
4,739,420 |
|
|
|
|
|
|
| Foreign Government Inflation-Linked Securities |
|
|
— |
|
|
|
96,503,309 |
|
|
|
— |
|
|
|
96,503,309 |
|
|
|
|
|
|
| Foreign Government Securities |
|
|
— |
|
|
|
7,055,222 |
|
|
|
— |
|
|
|
7,055,222 |
|
|
|
|
|
|
| Mortgage-Backed Securities |
|
|
— |
|
|
|
569,937 |
|
|
|
— |
|
|
|
569,937 |
|
|
|
|
|
|
| U.S. Government Inflation-Linked Securities |
|
|
— |
|
|
|
52,475,267 |
|
|
|
— |
|
|
|
52,475,267 |
|
|
|
|
|
|
| U.S. Treasury |
|
|
— |
|
|
|
2,665,700 |
|
|
|
— |
|
|
|
2,665,700 |
|
|
|
|
|
|
| Real Estate Related Securities |
|
|
|
|
|
|
|
|
|
|
|
|
|
|
|
|
|
|
|
|
|
| Common Stocks |
|
|
53,696,456 |
|
|
|
— |
|
|
|
— |
|
|
|
53,696,456 |
|
|
|
|
|
|
| Exchange-Traded Funds |
|
|
35,967,918 |
|
|
|
— |
|
|
|
— |
|
|
|
35,967,918 |
|
|
|
|
|
|
| Real Estate Investment Trusts |
|
|
110,396,895 |
|
|
|
— |
|
|
|
— |
|
|
|
110,396,895 |
|
|
|
|
|
|
| Commodity Related Securities |
|
|
|
|
|
|
|
|
|
|
|
|
|
|
|
|
|
|
|
|
|
| Exchange-Traded Fund |
|
|
18,375,865 |
|
|
|
— |
|
|
|
— |
|
|
|
18,375,865 |
|
|
|
|
|
|
| Investment Companies |
|
|
27,658,553 |
|
|
|
— |
|
|
|
— |
|
|
|
27,658,553 |
|
|
|
|
|
|
| Structured Note |
|
|
— |
|
|
|
5,925,000 |
|
|
|
— |
|
|
|
5,925,000 |
|
|
|
|
|
|
| Purchased Options |
|
|
— |
|
|
|
33,899 |
|
|
|
— |
|
|
|
33,899 |
|
|
|
|
|
|
| Short-Term Investments |
|
|
|
|
|
|
|
|
|
|
|
|
|
|
|
|
|
|
|
|
|
| Money Market Funds |
|
|
17,523,103 |
|
|
|
— |
|
|
|
— |
|
|
|
17,523,103 |
|
|
|
|
|
|
| Repurchase Agreements |
|
|
— |
|
|
|
3,901,402 |
|
|
|
— |
|
|
|
3,901,402 |
|
|
|
|
|
|
|
|
|
|
|
|
|
|
|
|
|
|
|
|
|
|
|
| Total Investments |
|
|
268,358,210 |
|
|
|
176,870,339 |
|
|
|
— |
|
|
|
445,228,549 |
|
|
|
|
|
|
|
|
|
|
|
|
|
|
|
|
|
|
|
|
|
|
|
| Other Financial Instruments^ |
|
|
|
|
|
|
|
|
|
|
|
|
|
|
|
|
|
|
|
|
|
| Forward Foreign Currency Contracts |
|
|
— |
|
|
|
1,870,423 |
|
|
|
— |
|
|
|
1,870,423 |
|
|
|
|
|
|
| Financial Futures Contracts |
|
|
— |
|
|
|
7,972 |
|
|
|
— |
|
|
|
7,972 |
|
|
|
|
|
|
| Interest Rate Swaps |
|
|
— |
|
|
|
81,107 |
|
|
|
— |
|
|
|
81,107 |
|
|
|
|
|
|
|
|
|
|
|
|
|
|
|
|
|
|
|
|
|
|
|
| Total Assets |
|
$ |
268,358,210 |
|
|
$ |
178,829,841 |
|
|
$ |
— |
|
|
$ |
447,188,051 |
|
|
|
|
|
|
|
|
|
|
|
|
|
|
|
|
|
|
| |
|
|
|
|
|
|
|
|
|
|
|
|
|
|
|
|
|
|
|
|
|
| Liabilities |
|
|
|
|
|
|
|
|
|
|
|
|
|
|
|
|
|
|
|
|
|
| Other Financial Instruments^ |
|
|
|
|
|
|
|
|
|
|
|
|
|
|
|
|
|
|
|
|
|
| Written Options |
|
|
— |
|
|
|
(63,282 |
) |
|
|
— |
|
|
|
(63,282 |
) |
|
|
|
|
|
| Forward Foreign Currency Contracts |
|
|
— |
|
|
|
(2,487,312 |
) |
|
|
— |
|
|
|
(2,487,312 |
) |
|
|
|
|
|
| Financial Futures Contracts |
|
|
— |
|
|
|
(70,196 |
) |
|
|
— |
|
|
|
(70,196 |
) |
|
|
|
|
|
| Interest Rate Swaps |
|
|
— |
|
|
|
(157,658 |
) |
|
|
— |
|
|
|
(157,658 |
) |
|
|
|
|
|
|
|
|
|
|
|
|
|
|
|
|
|
|
|
|
|
|
| Total Liabilities |
|
$ |
— |
|
|
$ |
(2,778,448 |
) |
|
$ |
— |
|
|
$ |
(2,778,448 |
) |
|
|
|
|
|
|
|
|
|
|
|
|
|
|
|
|
|
| ^ |
Other financial instruments are derivative instruments not reflected in the value of total investments in securities in the Portfolio of
Investments. Financial futures contracts, interest rate swaps and forward foreign currency contracts are valued at the unrealized appreciation (depreciation) on the instrument. Written options are reported at their market value at period end.
|
April 30, 2013 / ANNUAL REPORT
PORTFOLIOS OF INVESTMENTS 65
Wilmington Multi-Manager Real Asset Fund (continued)
At April 30, 2013, the Wilmington Multi-Manager Real Asset Fund had the following outstanding
forward foreign currency contracts, which contractually obligates the Fund to deliver or receive currencies at specified future dates. The open contracts were as follows:
|
|
|
|
|
|
|
|
|
|
|
|
|
|
|
|
|
| Settlement Date |
|
Counterparty |
|
Contracts to
Deliver/Receive
|
|
Contract
Amount |
|
|
Contract
at
Value |
|
|
Unrealized
Appreciation
(Depreciation)
|
|
| CONTRACTS PURCHASED |
|
|
|
|
|
|
|
|
|
|
|
|
|
|
| 5/1/2013 |
|
Brown Brothers Harriman |
|
48,167 Pound Sterling |
|
$ |
74,591 |
|
|
$ |
74,820 |
|
|
$ |
229 |
|
| 5/2/2013 |
|
Royal Bank of Scotland |
|
16,116,000 Pound Sterling |
|
|
24,584,958 |
|
|
|
25,033,785 |
|
|
|
448,827 |
|
| 5/2/2013 |
|
Banc of America Securities |
|
7,846,000 Euro |
|
|
10,199,800 |
|
|
|
10,332,793 |
|
|
|
132,993 |
|
| 5/2/2013 |
|
Barclays Bank International |
|
4,640,000 Pound Sterling |
|
|
7,059,667 |
|
|
|
7,207,543 |
|
|
|
147,876 |
|
| 5/2/2013 |
|
Deutsche Bank |
|
820,000 Euro |
|
|
1,073,761 |
|
|
|
1,079,899 |
|
|
|
6,138 |
|
| 5/2/2013 |
|
HSBC Securities, Inc. |
|
720,000 Australian Dollar |
|
|
741,357 |
|
|
|
746,423 |
|
|
|
5,066 |
|
| 5/2/2013 |
|
Credit Suisse |
|
520,000 Australian Dollar |
|
|
534,976 |
|
|
|
539,084 |
|
|
|
4,108 |
|
| 5/2/2013 |
|
BNP Paribas |
|
450,000 Australian Dollar |
|
|
465,444 |
|
|
|
466,515 |
|
|
|
1,071 |
|
| 5/2/2013 |
|
Brown Brothers Harriman |
|
12,652 Pound Sterling |
|
|
19,615 |
|
|
|
19,654 |
|
|
|
39 |
|
| 5/3/2013 |
|
HSBC Securities, Inc. |
|
870,931 Brazilian Real |
|
|
435,096 |
|
|
|
435,147 |
|
|
|
51 |
|
| 5/3/2013 |
|
Banc of America Securities |
|
870,931 Brazilian Real |
|
|
438,425 |
|
|
|
435,147 |
|
|
|
(3,278) |
|
| 5/3/2013 |
|
Brown Brothers Harriman |
|
15,540 Pound Sterling |
|
|
24,152 |
|
|
|
24,139 |
|
|
|
(13) |
|
| 5/8/2013 |
|
Societe General Securities |
|
44,662,077 Japanese Yen |
|
|
483,767 |
|
|
|
458,161 |
|
|
|
(25,606) |
|
| 5/8/2013 |
|
Societe General Securities |
|
2,530,135 Swedish Krona |
|
|
386,678 |
|
|
|
390,318 |
|
|
|
3,640 |
|
| 5/8/2013 |
|
Societe General Securities |
|
1,935,470 Euro |
|
|
2,532,704 |
|
|
|
2,549,052 |
|
|
|
16,348 |
|
| 5/8/2013 |
|
Societe General Securities |
|
1,624,985 Pound Sterling |
|
|
2,461,524 |
|
|
|
2,524,034 |
|
|
|
62,510 |
|
| 5/8/2013 |
|
Societe General Securities |
|
438,973 Euro |
|
|
560,582 |
|
|
|
578,137 |
|
|
|
17,555 |
|
| 5/8/2013 |
|
Societe General Securities |
|
334,914 Canadian Dollar |
|
|
325,354 |
|
|
|
332,371 |
|
|
|
7,017 |
|
| 5/8/2013 |
|
Societe General Securities |
|
219,699 Euro |
|
|
285,324 |
|
|
|
289,348 |
|
|
|
4,024 |
|
| 5/15/2013 |
|
HSBC Securities, Inc. |
|
1,400,000 Swedish Krona |
|
|
215,667 |
|
|
|
215,940 |
|
|
|
273 |
|
| 5/23/2013 |
|
Citigroup Global Markets |
|
350,000 New Zealand Dollar |
|
|
293,701 |
|
|
|
299,490 |
|
|
|
5,789 |
|
| 6/4/2013 |
|
Citigroup Global Markets |
|
1,010,000 Euro |
|
|
1,313,535 |
|
|
|
1,330,430 |
|
|
|
16,895 |
|
| 6/20/2013 |
|
JPMorgan Chase Bank |
|
1,252,000 Canadian Dollar |
|
|
1,229,422 |
|
|
|
1,241,228 |
|
|
|
11,806 |
|
| 6/20/2013 |
|
Citigroup Global Markets |
|
840,000 Canadian Dollar |
|
|
830,075 |
|
|
|
832,772 |
|
|
|
2,697 |
|
| 6/20/2013 |
|
Morgan Stanley & Co., Inc. |
|
830,000 Canadian Dollar |
|
|
814,940 |
|
|
|
822,858 |
|
|
|
7,918 |
|
| 6/20/2013 |
|
WestPac Bank |
|
820,000 Canadian Dollar |
|
|
800,321 |
|
|
|
812,945 |
|
|
|
12,624 |
|
| 6/20/2013 |
|
HSBC Securities, Inc. |
|
630,000 Canadian Dollar |
|
|
619,975 |
|
|
|
624,579 |
|
|
|
4,604 |
|
| 6/20/2013 |
|
Deutsche Bank |
|
620,000 Canadian Dollar |
|
|
608,395 |
|
|
|
614,665 |
|
|
|
6,270 |
|
| 6/27/2013 |
|
Morgan Stanley & Co., Inc. |
|
137,000,000 Mexican Peso |
|
|
10,954,742 |
|
|
|
11,228,086 |
|
|
|
273,344 |
|
| 6/27/2013 |
|
Deutsche Bank |
|
1,547,000 Mexican Peso |
|
|
127,272 |
|
|
|
126,787 |
|
|
|
(485) |
|
| 7/18/2013 |
|
Deutsche Bank |
|
126,100,000 Japanese Yen |
|
|
1,291,259 |
|
|
|
1,294,105 |
|
|
|
2,846 |
|
| CONTRACTS SOLD |
|
|
|
|
|
|
|
|
|
|
|
|
|
|
| 5/2/2013 |
|
HSBC Securities, Inc. |
|
18,616,000 Pound Sterling |
|
|
28,254,620 |
|
|
|
28,917,160 |
|
|
|
(662,540) |
|
| 5/2/2013 |
|
Banc of America Securities |
|
8,386,000 Euro |
|
|
10,799,264 |
|
|
|
11,043,947 |
|
|
|
(244,683) |
|
| 5/2/2013 |
|
Banc of America Securities |
|
5,572,000 Australian Dollar |
|
|
5,706,547 |
|
|
|
5,776,488 |
|
|
|
(69,941) |
|
| 5/2/2013 |
|
Barclays Bank International |
|
1,663,000 Australian Dollar |
|
|
1,734,127 |
|
|
|
1,724,031 |
|
|
|
10,096 |
|
| 5/2/2013 |
|
Royal Bank of Canada |
|
930,000 Pound Sterling |
|
|
1,406,672 |
|
|
|
1,444,615 |
|
|
|
(37,943) |
|
| 5/2/2013 |
|
Deutsche Bank |
|
720,000 Pound Sterling |
|
|
1,103,819 |
|
|
|
1,118,412 |
|
|
|
(14,593) |
|
| 5/2/2013 |
|
WestPac Bank |
|
490,000 Pound Sterling |
|
|
752,418 |
|
|
|
761,141 |
|
|
|
(8,723) |
|
| 5/2/2013 |
|
Deutsche Bank |
|
280,000 Euro |
|
|
366,699 |
|
|
|
368,746 |
|
|
|
(2,047) |
|
| 5/2/2013 |
|
Royal Bank of Scotland |
|
229,000 Australian Dollar |
|
|
238,570 |
|
|
|
237,404 |
|
|
|
1,166 |
|
| 5/2/2013 |
|
Brown Brothers Harriman |
|
8,549 Swiss Franc |
|
|
9,069 |
|
|
|
9,194 |
|
|
|
(125) |
|
| 5/2/2013 |
|
Brown Brothers Harriman |
|
2,651 Euro |
|
|
3,468 |
|
|
|
3,491 |
|
|
|
(23) |
|
| 5/3/2013 |
|
HSBC Securities, Inc. |
|
870,931 Brazilian Real |
|
|
438,425 |
|
|
|
435,147 |
|
|
|
3,278 |
|
| 5/3/2013 |
|
Banc of America Securities |
|
870,931 Brazilian Real |
|
|
435,096 |
|
|
|
435,147 |
|
|
|
(51) |
|
| 5/3/2013 |
|
Brown Brothers Harriman |
|
1,671 Euro |
|
|
2,198 |
|
|
|
2,200 |
|
|
|
(2) |
|
| 5/6/2013 |
|
Bank of New York |
|
128,773 Euro |
|
|
169,340 |
|
|
|
169,595 |
|
|
|
(255) |
|
| 5/8/2013 |
|
Societe General Securities |
|
71,633,250 Japanese Yen |
|
|
761,730 |
|
|
|
734,842 |
|
|
|
26,888 |
|
| 5/8/2013 |
|
UBS Warburg LLC |
|
10,683,690 Euro |
|
|
14,292,459 |
|
|
|
14,070,632 |
|
|
|
221,827 |
|
ANNUAL REPORT / April
30, 2013
66 PORTFOLIOS OF INVESTMENTS
Wilmington Multi-Manager Real Asset Fund (continued)
|
|
|
|
|
|
|
|
|
|
|
|
|
|
|
|
|
| Settlement Date |
|
Counterparty |
|
Contracts to
Deliver/Receive
|
|
Contract
Amount |
|
|
Contract
at
Value |
|
|
Unrealized
Appreciation
(Depreciation)
|
|
| CONTRACTS SOLD (continued) |
|
|
|
|
|
|
|
|
|
|
|
|
| 5/8/2013 |
|
UBS Warburg LLC |
|
8,849,235 Pound Sterling |
|
|
$13,697,501 |
|
|
|
$13,745,217 |
|
|
|
$ (47,716 |
) |
| 5/8/2013 |
|
Societe General Securities |
|
7,804,406 Swedish Krona |
|
|
1,232,002 |
|
|
|
1,203,969 |
|
|
|
28,033 |
|
| 5/8/2013 |
|
UBS Warburg LLC |
|
1,342,717 Canadian Dollar |
|
|
1,330,921 |
|
|
|
1,332,520 |
|
|
|
(1,599 |
) |
| 5/8/2013 |
|
Societe General Securities |
|
675,381 Australian Dollar |
|
|
691,246 |
|
|
|
699,717 |
|
|
|
(8,471 |
) |
| 5/8/2013 |
|
Societe General Securities |
|
652,376 Pound Sterling |
|
|
989,129 |
|
|
|
1,013,314 |
|
|
|
(24,185 |
) |
| 5/8/2013 |
|
Societe General Securities |
|
650,000 Pound Sterling |
|
|
995,830 |
|
|
|
1,009,623 |
|
|
|
(13,793 |
) |
| 5/8/2013 |
|
Societe General Securities |
|
169,773 Pound Sterling |
|
|
254,565 |
|
|
|
263,702 |
|
|
|
(9,137 |
) |
| 5/13/2013 |
|
Deutsche Bank |
|
1,490,109 Polish Zloty |
|
|
484,018 |
|
|
|
471,108 |
|
|
|
12,910 |
|
| 5/13/2013 |
|
Banc of America Securities |
|
1,154,527 Polish Zloty |
|
|
360,000 |
|
|
|
365,012 |
|
|
|
(5,012 |
) |
| 5/15/2013 |
|
Barclays Bank International |
|
30,064,000 Swedish Krona |
|
|
4,705,072 |
|
|
|
4,637,167 |
|
|
|
67,905 |
|
| 5/15/2013 |
|
Barclays Bank International |
|
22,310,000 Danish Krone |
|
|
4,018,100 |
|
|
|
3,941,574 |
|
|
|
76,526 |
|
| 5/15/2013 |
|
Royal Bank of Canada |
|
380,000 Swedish Krona |
|
|
58,271 |
|
|
|
58,612 |
|
|
|
(341 |
) |
| 5/23/2013 |
|
Credit Suisse |
|
2,160,000 New Zealand Dollar |
|
|
1,815,882 |
|
|
|
1,848,283 |
|
|
|
(32,401 |
) |
| 5/23/2013 |
|
WestPac Bank |
|
1,135,000 New Zealand Dollar |
|
|
951,471 |
|
|
|
971,204 |
|
|
|
(19,733 |
) |
| 5/23/2013 |
|
Deutsche Bank |
|
350,000 New Zealand Dollar |
|
|
294,967 |
|
|
|
299,490 |
|
|
|
(4,523 |
) |
| 6/4/2013 |
|
Credit Suisse |
|
29,008,099 Brazilian Real |
|
|
14,640,942 |
|
|
|
14,437,131 |
|
|
|
203,811 |
|
| 6/4/2013 |
|
Royal Bank of Scotland |
|
16,116,000 Pound Sterling |
|
|
24,579,978 |
|
|
|
25,028,019 |
|
|
|
(448,041 |
) |
| 6/4/2013 |
|
Banc of America Securities |
|
7,846,000 Euro |
|
|
10,201,950 |
|
|
|
10,335,198 |
|
|
|
(133,248 |
) |
| 6/4/2013 |
|
Morgan Stanley & Co., Inc. |
|
1,628,930 Brazilian Real |
|
|
819,093 |
|
|
|
810,707 |
|
|
|
8,386 |
|
| 6/5/2013 |
|
Goldman Sachs |
|
240,010,917 Chilean Peso |
|
|
488,522 |
|
|
|
506,952 |
|
|
|
(18,430 |
) |
| 6/13/2013 |
|
Citigroup Global Markets |
|
5,774,000 Australian Dollar |
|
|
5,965,986 |
|
|
|
5,965,610 |
|
|
|
376 |
|
| 6/20/2013 |
|
Royal Bank of Scotland |
|
6,701,000 Canadian Dollar |
|
|
6,508,321 |
|
|
|
6,643,343 |
|
|
|
(135,022 |
) |
| 6/20/2013 |
|
Royal Bank of Canada |
|
620,000 Canadian Dollar |
|
|
608,855 |
|
|
|
614,665 |
|
|
|
(5,810 |
) |
| 6/27/2013 |
|
HSBC Securities, Inc. |
|
207,744,434 Mexican Peso |
|
|
16,540,162 |
|
|
|
17,026,076 |
|
|
|
(485,914 |
) |
| 6/27/2013 |
|
HSBC Securities, Inc. |
|
9,567,414 Mexican Peso |
|
|
789,000 |
|
|
|
784,115 |
|
|
|
4,885 |
|
| 7/18/2013 |
|
WestPac Bank |
|
128,600,000 Japanese Yen |
|
|
1,321,540 |
|
|
|
1,319,762 |
|
|
|
1,778 |
|
| 7/30/2013 |
|
Banc of America Securities |
|
25,233,706 South African Rand |
|
|
2,767,005 |
|
|
|
2,776,633 |
|
|
|
(9,628 |
) |
| 10/9/2013 |
|
Credit Suisse |
|
2,098,798 Turkish Lira |
|
|
1,136,698 |
|
|
|
1,150,698 |
|
|
|
(14,000 |
) |
| NET UNREALIZED APPRECIATION (DEPRECIATION) ON FORWARD FOREIGN CURRENCY CONTRACTS |
|
|
|
|
|
|
|
|
|
|
|
|
|
|
$(616,889 |
) |
April 30, 2013 / ANNUAL REPORT
PORTFOLIOS OF INVESTMENTS 67
Wilmington Multi-Manager Real Asset Fund (concluded)
At April 30, 2013, the Wilmington Multi-Manager Real Asset Fund had the following outstanding
foreign exchange contracts:
|
|
|
|
|
|
|
|
|
|
|
|
|
|
|
|
|
| Settlement Date |
|
Counterparty |
|
Contracts
to
Deliver/Receive |
|
In
Exchange
For |
|
|
Contracts
at
Value |
|
|
Unrealized
Appreciation
(Depreciation)
|
|
| CONTRACTS PURCHASED |
|
|
|
|
|
|
|
|
|
|
|
|
|
|
| 5/2/2013 |
|
Citigroup Global Markets |
|
5,774,000 Australian Dollar |
|
|
$5,984,751 |
|
|
|
$5,985,901 |
|
|
|
$ 1,150 |
|
| CONTRACTS SOLD |
|
|
|
|
|
|
|
|
|
|
|
|
|
|
| 5/1/2013 |
|
BNP Paribas |
|
450,000 Australian Dollar |
|
|
465,480 |
|
|
|
466,515 |
|
|
|
(1,035 |
) |
| NET UNREALIZED APPRECIATION (DEPRECIATION) ON FOREIGN EXCHANGE CONTRACTS |
|
|
|
|
|
|
|
|
|
|
|
|
|
|
$ 115 |
|
At April 30, 2013, the Wilmington Multi-Manager Real Asset Fund had open financial futures contracts as
follows:
|
|
|
|
|
|
|
|
|
|
|
|
|
|
|
|
|
|
|
|
|
| Underlying Contracts to Buy/Sell |
|
Expiration
Date |
|
|
Number
of
Contracts |
|
|
Contract
Amount |
|
|
Contract
at
Value |
|
|
Unrealized
Appreciation
(Depreciation)
|
|
| SHORT POSITIONS: |
|
|
|
|
|
|
|
|
|
|
|
|
|
|
|
|
|
|
|
|
| EURO-BOBL 10 YR FUT |
|
|
June 2013 |
|
|
|
22 |
|
|
|
$3,648,065 |
|
|
|
$3,671,737 |
|
|
|
$(23,672 |
) |
| EURO-BUND 10YR FUT |
|
|
June 2013 |
|
|
|
3 |
|
|
|
566,473 |
|
|
|
579,116 |
|
|
|
(12,643 |
) |
| LONG 10YR GILT FUT |
|
|
June 2013 |
|
|
|
7 |
|
|
|
1,290,645 |
|
|
|
1,304,923 |
|
|
|
(14,278 |
) |
| U.S. 10YR TREASURY NOTE |
|
|
June 2013 |
|
|
|
2 |
|
|
|
263,371 |
|
|
|
266,719 |
|
|
|
(3,348 |
) |
| U.S. 10YR TREASURY NOTE |
|
|
June 2013 |
|
|
|
2 |
|
|
|
264,998 |
|
|
|
266,719 |
|
|
|
(1,721 |
) |
| U.S. LONG TREASURY BOND |
|
|
June 2013 |
|
|
|
33 |
|
|
|
4,904,347 |
|
|
|
4,896,375 |
|
|
|
7,972 |
|
| U.S. ULTRA TREASURY BOND |
|
|
June 2013 |
|
|
|
3 |
|
|
|
478,497 |
|
|
|
493,031 |
|
|
|
(14,534 |
) |
| NET UNREALIZED APPRECIATION (DEPRECIATION) ON FINANCIAL FUTURES CONTRACTS |
|
|
|
|
|
|
|
|
|
|
|
|
|
|
|
|
|
|
$(62,224 |
) |
At April 30, 2013, the Wilmington Multi-Manager Real Asset Fund had open interest rate swap contracts as
follows:
|
|
|
|
|
|
|
|
|
|
|
|
|
|
|
|
|
|
|
|
|
|
|
|
|
|
|
| Counterparty |
|
Termination
Date |
|
|
Notional
Amount |
|
|
Fixed
Rate |
|
|
Floating Rate |
|
Fair Value |
|
|
Upfront
Premium
Paid
(Received) |
|
|
Unrealized
Appreciation
(Depreciation)
|
|
| Banc of America Security# |
|
|
01/02/15 |
|
|
$ |
10,400,000 |
|
|
|
8.16 |
% |
|
Brazilian Interbank Deposit |
|
$ |
3,939 |
|
|
|
$(15,396 |
) |
|
|
$ 19,335 |
|
| Morgan Stanley Capital Services, LLC# |
|
|
01/02/17 |
|
|
|
10,900,000 |
|
|
|
8.22 |
|
|
Brazilian Interbank Deposit |
|
|
(91,112 |
) |
|
|
(521 |
) |
|
|
(90,591 |
) |
| Credit Suisse# |
|
|
01/02/17 |
|
|
|
10,100,000 |
|
|
|
8.94 |
|
|
Brazilian Interbank Deposit |
|
|
36,845 |
|
|
|
(18,018 |
) |
|
|
54,863 |
|
| HSBC Bank USA, NA# |
|
|
01/02/17 |
|
|
|
500,000 |
|
|
|
8.32 |
|
|
Brazilian Interbank Deposit |
|
|
(3,200 |
) |
|
|
431 |
|
|
|
(3,631 |
) |
| Deutsche Bank AG# |
|
|
07/25/16 |
|
|
|
200,000 |
|
|
|
2.00 |
|
|
France CPI EX-Tobacco Household |
|
|
5,826 |
|
|
|
189 |
|
|
|
5,637 |
|
| Banc of America Security# |
|
|
12/11/18 |
|
|
|
600,000 |
|
|
|
3.50 |
|
|
New Zealand OCR |
|
|
1,442 |
|
|
|
170 |
|
|
|
1,272 |
|
| Goldman Sachs Group, Inc.* |
|
|
02/12/17 |
|
|
|
500,000 |
|
|
|
2.42 |
|
|
US Urban Consumers NSA |
|
|
(4,291 |
) |
|
|
— |
|
|
|
(4,291 |
) |
| RBS Securities, Inc.* |
|
|
07/15/17 |
|
|
|
2,400,000 |
|
|
|
2.25 |
|
|
US Urban Consumers NSA |
|
|
(23,225 |
) |
|
|
211 |
|
|
|
(23,436 |
) |
| Citibank NA* |
|
|
07/15/17 |
|
|
|
200,000 |
|
|
|
2.25 |
|
|
US Urban Consumers NSA |
|
|
(1,935 |
) |
|
|
43 |
|
|
|
(1,978 |
) |
| Goldman Sachs Group, Inc.* |
|
|
07/15/22 |
|
|
|
1,600,000 |
|
|
|
2.50 |
|
|
US Urban Consumers NSA |
|
|
1,110 |
|
|
|
29,488 |
|
|
|
(28,378 |
) |
| Citibank NA* |
|
|
07/15/22 |
|
|
|
500,000 |
|
|
|
2.50 |
|
|
US Urban Consumers NSA |
|
|
347 |
|
|
|
3,591 |
|
|
|
(3,244 |
) |
| Deutsche Bank AG* |
|
|
07/15/22 |
|
|
|
400,000 |
|
|
|
2.50 |
|
|
US Urban Consumers NSA |
|
|
3,506 |
|
|
|
5,615 |
|
|
|
(2,109 |
) |
| Net Unrealized Appreciation (Depreciation) on Interest Rate Swap Contracts |
|
|
|
|
|
|
|
|
|
|
|
|
|
|
|
$ |
(70,748 |
) |
|
|
$ 5,803 |
|
|
|
$(76,551 |
) |
# Portfolio pays the floating rate and receives the fixed rate.
* Portfolio pays the fixed rate and receives the floating rate.
See Notes to Portfolios of Investments
See Notes which are an integral
part of the Financial Statements
ANNUAL REPORT / April
30, 2013
68
PORTFOLIO OF INVESTMENTS SUMMARY TABLE
Wilmington Strategic Allocation Conservative Fund
At April 30, 2013, the Fund’s portfolio
composition was as follows (unaudited):
|
|
|
|
|
|
|
| |
|
Percentage of
Total Net Assets |
|
|
|
| Debt Funds |
|
|
72.8 |
% |
|
|
|
|
|
| Equity Funds |
|
|
20.2 |
% |
|
|
|
|
|
| Asset Allocation Fund |
|
|
5.7 |
% |
|
|
|
|
|
| Money Market Fund |
|
|
1.5 |
% |
|
|
|
|
|
| Other Assets and Liabilities – Net1 |
|
|
(0.2 |
)% |
|
|
|
|
|
|
|
|
|
|
|
|
| TOTAL |
|
|
100.0 |
% |
|
|
|
|
|
|
|
|
|
| (1) |
Assets, other than investments in securities, less liabilities. See Statements of Assets and Liabilities.
|
PORTFOLIO OF INVESTMENTS
April 30, 2013
|
|
|
|
|
|
|
|
|
| Description |
|
Number
of
Shares |
|
|
Value |
|
|
|
|
| INVESTMENT COMPANIES – 100.2% |
|
|
|
|
|
|
|
|
|
|
|
| ASSET ALLOCATION FUND – 5.7% |
|
|
|
|
|
|
|
|
|
|
|
| Wilmington Multi-Manager Real Asset Fund, Class I§ |
|
|
175,518 |
|
|
$ |
2,739,830 |
|
|
|
|
| DEBT FUNDS – 72.8% |
|
|
|
|
|
|
|
|
|
|
|
| Dreyfus International Bond Fund, Class I |
|
|
60,753 |
|
|
|
1,047,995 |
|
|
|
|
| Federated Ultrashort Bond Fund, Institutional Shares¤ |
|
|
317,005 |
|
|
|
2,929,126 |
|
|
|
|
| MFS Emerging Markets Debt Fund, Class I |
|
|
151,547 |
|
|
|
2,450,520 |
|
|
|
|
| PIMCO Unconstrained Bond Fund, Institutional Shares |
|
|
180,103 |
|
|
|
2,087,393 |
|
|
|
|
| RidgeWorth Seix Floating Rate High Income Fund, Class I |
|
|
248,251 |
|
|
|
2,256,604 |
|
|
|
|
| Wilmington Intermediate-Term Bond Fund, Class I§ |
|
|
2,276,678 |
|
|
|
24,132,788 |
|
|
|
|
|
|
|
|
|
|
|
|
|
| TOTAL DEBT FUNDS |
|
|
|
|
|
$ |
34,904,426 |
|
|
|
|
| EQUITY FUNDS – 20.2% |
|
|
|
|
|
|
|
|
|
|
|
| Gateway Fund, Class Y |
|
|
51,357 |
|
|
|
1,449,303 |
|
|
|
|
| TIAA-CREF Mid-Cap Value Fund, Retail Shares |
|
|
29,625 |
|
|
|
612,655 |
|
|
|
|
| Wilmington Large-Cap Strategy Fund, Class I§ |
|
|
242,365 |
|
|
|
3,545,798 |
|
|
|
|
| Wilmington Mid-Cap Growth Fund, Class I§ |
|
|
34,388 |
|
|
|
563,962 |
|
|
|
|
| Wilmington Multi-Manager International Fund, Class I§ |
|
|
434,816 |
|
|
|
3,174,153 |
|
|
|
|
| Wilmington Small-Cap Strategy Fund, Class I§ |
|
|
26,932 |
|
|
|
331,531 |
|
|
|
|
|
|
|
|
|
|
|
|
|
| TOTAL EQUITY FUNDS |
|
|
|
|
|
$ |
9,677,402 |
|
|
|
|
|
|
|
|
|
|
| Description |
|
Number
of
Shares |
|
|
Value |
|
|
|
|
| MONEY MARKET FUND – 1.5% |
|
|
|
|
|
|
|
|
|
|
|
| Wilmington Prime Money Market Fund, Institutional Class, 0.02%^,§ |
|
|
710,281 |
|
|
$ |
710,281 |
|
|
|
|
|
|
|
|
|
|
|
|
|
| TOTAL INVESTMENT COMPANIES
(COST $44,189,092) |
|
|
|
|
|
$ |
48,031,939 |
|
|
|
|
|
|
|
|
|
|
|
|
|
| TOTAL INVESTMENTS – 100.2%
(COST $44,189,092) |
|
|
|
|
|
$ |
48,031,939 |
|
|
|
| OTHER LIABILITIES LESS ASSETS – (0.2%) |
|
|
|
(97,914 |
) |
|
|
|
|
|
|
|
|
|
|
|
|
| TOTAL NET ASSETS – 100.0% |
|
|
|
|
|
$ |
47,934,025 |
|
|
|
|
|
|
|
|
|
|
April 30, 2013 / ANNUAL REPORT
PORTFOLIOS OF INVESTMENTS 69
Wilmington Strategic Allocation Conservative Fund (concluded)
Cost of investments for Federal income tax purposes is $44,980,882. The net unrealized
appreciation/(depreciation) of investments was $3,051,057. This consists of net unrealized appreciation from investment for those securities having an excess of value over cost of $3,098,295 and net unrealized depreciation from investments for those
securities having an excess of cost over value of $47,238.
Various inputs are used in determining the value of the Fund’s
investments. These inputs are summarized in the three broad levels listed below.
Level 1 – quoted prices in active
markets for identical securities
Level 2 – other significant observable inputs (including quoted prices for similar
securities, interest rates, prepayment speeds, credit risk, etc.)
Level 3 – significant unobservable inputs
(including the Fund’s own assumptions in determining the fair value of investments)
The following is a summary of the inputs used
as of April 30, 2013 in valuing the Fund’s assets carried at fair value:
|
|
|
|
|
|
|
|
|
|
|
|
|
|
|
|
|
| |
|
Level 1 |
|
|
Level 2 |
|
|
Level 3 |
|
|
Total |
|
|
|
|
|
|
| Investments in Securities |
|
|
|
|
|
|
|
|
|
|
|
|
|
|
|
|
|
|
|
|
|
| Investment Companies |
|
$ |
48,031,939 |
|
|
$ |
— |
|
|
$ |
— |
|
|
$ |
48,031,939 |
|
|
|
|
|
|
|
|
|
|
|
|
|
|
|
|
|
|
|
|
|
|
|
| Total |
|
$ |
48,031,939 |
|
|
$ |
— |
|
|
$ |
— |
|
|
$ |
48,031,939 |
|
|
|
|
|
|
|
|
|
|
|
|
|
|
|
|
|
|
See Notes to Portfolios of Investments
See Notes which are an integral part of the Financial Statements
ANNUAL REPORT / April
30, 2013
70
PORTFOLIO OF INVESTMENTS SUMMARY TABLE
Wilmington Strategic Allocation Moderate Fund
At April 30, 2013, the Fund’s portfolio composition
was as follows (unaudited):
|
|
|
|
|
|
|
| |
|
Percentage of
Total Net Assets |
|
|
|
| Investment Companies: |
|
|
|
|
|
|
|
|
|
| Equity Funds |
|
|
53.2 |
% |
|
|
|
|
|
| Debt Funds |
|
|
20.6 |
% |
|
|
|
|
|
| Asset Allocation Fund |
|
|
5.4 |
% |
|
|
|
|
|
| Money Market Fund |
|
|
1.9 |
% |
|
|
|
|
|
| Corporate Bonds |
|
|
9.1 |
% |
|
|
|
|
|
| Mortgage-Backed Securities |
|
|
5.2 |
% |
|
|
|
|
|
| U.S. Treasury |
|
|
3.9 |
% |
|
|
|
|
|
| Collateralized Mortgage Obligations |
|
|
0.5 |
% |
|
|
|
|
|
| Enhanced Equipment Trust Certificates |
|
|
0.2 |
% |
|
|
|
|
|
| Cash Equivalents1 |
|
|
0.1 |
% |
|
|
|
|
|
| Other Assets and Liabilities – Net2 |
|
|
(0.1 |
)% |
|
|
|
|
|
|
|
|
|
|
|
|
| TOTAL |
|
|
100.0 |
% |
|
|
|
|
|
|
|
|
|
| (1) |
Cash Equivalents include investments in money market funds. |
| (2) |
Assets, other than investments in securities, less liabilities. See Statements of Assets and Liabilities. |
PORTFOLIO OF INVESTMENTS
April 30, 2013
|
|
|
|
|
|
|
|
|
| Description |
|
Number
of
Shares |
|
|
Value |
|
|
|
|
| INVESTMENT COMPANIES – 81.1% |
|
|
|
|
|
|
|
|
|
|
|
| ASSET ALLOCATION FUND – 5.4% |
|
|
|
|
|
|
|
|
|
|
|
| Wilmington Multi-Manager Real Asset Fund, Class I§ |
|
|
221,091 |
|
|
$ |
3,451,237 |
|
|
|
|
| DEBT FUNDS – 20.6% |
|
|
|
|
|
|
|
|
|
|
|
| Dreyfus International Bond Fund, Class I |
|
|
74,343 |
|
|
|
1,282,422 |
|
|
|
|
| Federated Ultrashort Bond Fund¤ |
|
|
279,749 |
|
|
|
2,584,877 |
|
|
|
|
| MFS Emerging Markets Debt Fund, Class I |
|
|
207,446 |
|
|
|
3,354,403 |
|
|
|
|
| PIMCO Unconstrained Bond Fund, Institutional Shares |
|
|
213,203 |
|
|
|
2,471,026 |
|
|
|
|
| RidgeWorth Seix Floating Rate High Income Fund, Class I |
|
|
367,583 |
|
|
|
3,341,333 |
|
|
|
|
|
|
|
|
|
|
|
|
|
| TOTAL DEBT FUNDS |
|
|
|
|
|
$ |
13,034,061 |
|
|
|
|
| EQUITY FUNDS – 53.2% |
|
|
|
|
|
|
|
|
|
|
|
| Gateway Fund, Class Y |
|
|
87,896 |
|
|
|
2,480,415 |
|
|
|
|
| Harbor International Fund, Institutional Shares |
|
|
49,305 |
|
|
|
3,235,857 |
|
|
|
|
| Lazard Emerging Markets Equity Portfolio, Institutional Shares |
|
|
105,247 |
|
|
|
2,055,473 |
|
|
|
|
| LSV Value Equity Fund |
|
|
282,319 |
|
|
|
5,019,624 |
|
|
|
|
| Morgan Stanley Focus Growth Fund, Class I |
|
|
101,048 |
|
|
|
4,383,479 |
|
|
|
|
|
|
|
|
|
|
| Description |
|
Number
of
Shares |
|
|
Value |
|
|
|
|
| TIAA-CREF Mid-Cap Value Fund, Retail Shares |
|
|
108,203 |
|
|
$ |
2,237,630 |
|
|
|
|
| Wilmington Large-Cap Growth Fund, Class I§ |
|
|
211,542 |
|
|
|
1,827,727 |
|
|
|
|
| Wilmington Large-Cap Value Fund, Class I§ |
|
|
122,512 |
|
|
|
1,427,262 |
|
|
|
|
| Wilmington Mid-Cap Growth Fund, Class I§ |
|
|
188,417 |
|
|
|
3,090,043 |
|
|
|
|
| Wilmington Multi-Manager International Fund, Class I§ |
|
|
942,860 |
|
|
|
6,882,878 |
|
|
|
|
| Wilmington Small-Cap Growth Fund, Class I§ |
|
|
56,897 |
|
|
|
1,072,513 |
|
|
|
|
|
|
|
|
|
|
|
|
|
| TOTAL EQUITY FUNDS |
|
|
|
|
|
$ |
33,712,901 |
|
|
|
|
| MONEY MARKET FUND – 1.9% |
|
|
|
|
|
|
|
|
|
|
|
| Wilmington Prime Money Market Fund, Institutional Class, 0.02%^,§ |
|
|
1,223,157 |
|
|
|
1,223,157 |
|
|
|
|
|
|
|
|
|
|
|
|
|
| TOTAL INVESTMENT COMPANIES
(COST $43,662,498)
|
|
|
|
|
|
$ |
51,421,356 |
|
|
|
|
| |
|
Par Value |
|
|
|
|
|
| COLLATERALIZED MORTGAGE OBLIGATIONS – 0.5% |
|
|
| FEDERAL NATIONAL MORTGAGE ASSOCIATION
(FNMA) – 0.3% |
|
|
|
|
| Series 1988-23, Class C, 9.75%, 9/25/18 |
|
$ |
1,979 |
|
|
|
2,261 |
|
April 30, 2013 / ANNUAL REPORT
PORTFOLIOS OF INVESTMENTS 71
Wilmington Strategic Allocation Moderate Fund (continued)
|
|
|
|
|
|
|
|
|
|
|
|
| Description |
|
Par Value |
|
|
Value |
|
|
|
|
| Series 2012-114, Class VM, 3.50%, 10/25/25 |
|
$ |
192,797 |
|
|
|
214,243 |
|
|
|
|
|
|
|
|
|
|
|
|
| TOTAL FEDERAL NATIONAL MORTGAGE ASSOCIATION (FNMA) |
|
|
$ |
216,504 |
|
|
|
|
| WHOLE LOAN – 0.2% |
|
|
|
|
|
|
|
|
|
|
|
| Banc of America Mortgage Securities, Inc., Series 2004-A, Class 2A1, 2.92%, 2/25/34D |
|
|
65,299 |
|
|
|
65,093 |
|
|
|
|
| IndyMac INDA Mortgage Loan Trust, Series 2005-AR1, Class 2A1, 2.90%,
11/25/35D |
|
|
48,849 |
|
|
|
43,204 |
|
|
|
|
|
|
|
|
|
|
|
|
|
| TOTAL WHOLE LOAN |
|
|
|
|
|
$ |
108,297 |
|
|
|
|
|
|
|
|
|
|
|
|
| TOTAL COLLATERALIZED MORTGAGE
OBLIGATIONS (COST $331,009) |
|
|
$ |
324,801 |
|
|
|
|
| CORPORATE BONDS – 9.1% |
|
|
|
|
|
|
|
|
|
|
|
| AEROSPACE & DEFENSE – 0.1% |
|
|
|
|
|
|
|
|
|
|
|
| L-3 Communications Corp., Company Guaranteed, 3.95%, 11/15/16 |
|
|
85,000 |
|
|
|
91,733 |
|
|
|
|
| AGRICULTURE – 0.3% |
|
|
|
|
|
|
|
|
|
|
|
| Archer-Daniels-Midland Co, Sr. Unsecured, 4.02%, 4/16/43 |
|
|
200,000 |
|
|
|
199,555 |
|
|
|
|
| BEVERAGES – 0.3% |
|
|
|
|
|
|
|
|
|
|
|
| Anheuser-Busch Cos. LLC, Company Guaranteed, 5.05%, 10/15/16 |
|
|
130,000 |
|
|
|
148,434 |
|
|
|
|
| Anheuser-Busch InBev Worldwide, Inc., Company Guaranteed, 3.75%, 7/15/42 |
|
|
20,000 |
|
|
|
19,586 |
|
|
|
|
| Diageo Capital PLC, Company Guaranteed, 3.88%, 4/29/43 |
|
|
15,000 |
|
|
|
14,937 |
|
|
|
|
| Dr Pepper Snapple Group, Inc., Company Guaranteed, 2.00%, 1/15/20 |
|
|
10,000 |
|
|
|
9,976 |
|
|
|
|
|
|
|
|
|
|
|
|
|
| TOTAL BEVERAGES |
|
|
|
|
|
$ |
192,933 |
|
|
|
|
| CAPITAL MARKETS – 0.3% |
|
|
|
|
|
|
|
|
|
|
|
| BlackRock, Inc., Sr. Unsecured, 3.38%, 6/01/22 |
|
|
38,000 |
|
|
|
40,786 |
|
|
|
|
| Goldman Sachs Group, Inc., Sr. Unsecured, 3.30%, 5/03/15 |
|
|
100,000 |
|
|
|
104,109 |
|
|
|
|
| Morgan Stanley, Sr. Unsecured, 1.54%, 2/25/16D |
|
|
35,000 |
|
|
|
35,244 |
|
|
|
|
|
|
|
|
|
|
|
|
|
| TOTAL CAPITAL MARKETS |
|
|
|
|
|
$ |
180,139 |
|
|
|
|
| CHEMICALS – 0.1% |
|
|
|
|
|
|
|
|
|
|
|
| Dow Chemical Co., Sr. Unsecured, 3.00%, 11/15/22 |
|
|
70,000 |
|
|
|
70,414 |
|
|
|
|
| COMMERCIAL BANKS – 0.7% |
|
|
|
|
|
|
|
|
|
|
|
| Fifth Third Bancorp, Sr. Unsecured, 6.25%, 5/01/13 |
|
|
100,000 |
|
|
|
100,014 |
|
|
|
|
| KeyCorp,
Sr. Unsecured, MTN, 6.50%, 5/14/13 |
|
|
100,000 |
|
|
|
100,221 |
|
|
|
|
| PNC Funding Corp., Bank Guaranteed, 4.25%, 9/21/15 |
|
|
75,000 |
|
|
|
81,173 |
|
|
|
|
|
|
|
|
|
|
|
|
|
| Description |
|
Par Value |
|
|
Value |
|
|
|
|
| SunTrust Capital III, Limited Guarantee, 0.93%, 3/15/28D |
|
$ |
152,000 |
|
|
$ |
125,224 |
|
|
|
|
| Wells Fargo & Co., Series M, Subordinated, 3.45%, 2/13/23 |
|
|
35,000 |
|
|
|
35,645 |
|
|
|
|
|
|
|
|
|
|
|
|
|
| TOTAL COMMERCIAL BANKS |
|
|
|
|
|
$ |
442,277 |
|
|
|
|
| COMMERCIAL FINANCE – 0.2% |
|
|
|
|
|
|
|
|
|
|
|
| General Electric Capital Corp., Sr. Unsecured, MTN, 2.30%, 4/27/17 |
|
|
130,000 |
|
|
|
135,497 |
|
|
|
|
| COMPUTERS – 0.2% |
|
|
|
|
|
|
|
|
|
|
|
| Apple, Inc.,
Sr. Unsecured, 3.85%, 5/04/43†† |
|
|
35,000 |
|
|
|
34,796 |
|
|
|
|
| Hewlett-Packard Co., Sr. Unsecured, 4.75%, 6/02/14 |
|
|
80,000 |
|
|
|
83,212 |
|
|
|
|
|
|
|
|
|
|
|
|
|
| TOTAL COMPUTERS |
|
|
|
|
|
$ |
118,008 |
|
|
|
|
| CONSUMER FINANCE – 0.5% |
|
|
|
|
|
|
|
|
|
|
|
| American Express Credit Corp., Sr. Unsecured, MTN, 5.13%, 8/25/14 |
|
|
100,000 |
|
|
|
106,071 |
|
|
|
|
| Capital One Financial Corp., Sr. Unsecured, 7.38%, 5/23/14 |
|
|
100,000 |
|
|
|
107,119 |
|
|
|
|
| Capital One Financial Corp., Sr. Unsecured, 2.15%, 3/23/15 |
|
|
130,000 |
|
|
|
132,768 |
|
|
|
|
|
|
|
|
|
|
|
|
|
| TOTAL CONSUMER FINANCE |
|
|
|
|
|
$ |
345,958 |
|
|
| DIVERSIFIED FINANCIAL SERVICES – 1.0% |
|
|
|
|
| Bank of America Corp., Sr. Unsecured, MTN, 2.00%, 1/11/18 |
|
|
50,000 |
|
|
|
50,146 |
|
|
|
|
| Citigroup, Inc., Sr. Unsecured, 6.00%, 8/15/17 |
|
|
200,000 |
|
|
|
234,478 |
|
|
|
|
| FMR LLC,
Sr. Unsecured, 6.45%, 11/15/39•,W |
|
|
100,000 |
|
|
|
126,399 |
|
|
|
|
| JPMorgan Chase & Co., Sr. Unsecured, 3.40%, 6/24/15 |
|
|
100,000 |
|
|
|
105,338 |
|
|
|
|
| JPMorgan Chase & Co., Sr. Unsecured, MTN, 2.05%, 1/24/14 |
|
|
100,000 |
|
|
|
101,245 |
|
|
|
|
| JPMorgan Chase & Co., Subordinated, 3.38%, 5/01/23 |
|
|
20,000 |
|
|
|
19,977 |
|
|
|
|
|
|
|
|
|
|
|
|
| TOTAL DIVERSIFIED FINANCIAL SERVICES |
|
|
$ |
637,583 |
|
|
|
|
| ELECTRIC – 0.1% |
|
|
|
|
|
|
|
|
|
|
|
| UIL Holdings Corp., Sr. Unsecured, 4.63%, 10/01/20 |
|
|
70,000 |
|
|
|
75,868 |
|
|
|
|
| ELECTRONICS – 0.2% |
|
|
|
|
|
|
|
|
|
|
|
| Thermo Fisher Scientific, Inc., Sr. Unsecured, 3.25%, 11/20/14 |
|
|
150,000 |
|
|
|
155,418 |
|
|
| ENVIORNMENTAL CONTROL – 0.1% |
|
|
|
|
| Waste Management, Inc., Company Guaranteed, 2.60%, 9/01/16 |
|
|
60,000 |
|
|
|
62,995 |
|
|
|
|
| FOOD – 0.2% |
|
|
|
|
|
|
|
|
|
|
|
| Kroger Co.,
Company Guaranteed, 3.90%, 10/01/15 |
|
|
100,000 |
|
|
|
107,303 |
|
|
| FOREST PRODUCTS & PAPER – 0.2% |
|
|
|
|
| International Paper Co., Sr. Unsecured, 5.30%, 4/01/15 |
|
|
100,000 |
|
|
|
108,150 |
|
|
| ANNUAL REPORT / April 30, 2013 |
72 PORTFOLIOS OF INVESTMENTS
Wilmington Strategic Allocation Moderate Fund (continued)
|
|
|
|
|
|
|
|
|
|
|
|
| Description |
|
Par Value |
|
|
Value |
|
|
| HEALTH CARE PROVIDERS & SERVICES – 0.0%** |
|
|
|
|
| UnitedHealth Group, Inc., |
|
|
|
|
|
|
|
|
| Sr. Unsecured, 2.75%, 2/15/23 |
|
$ |
25,000 |
|
|
$ |
25,239 |
|
|
|
|
| HOME FURNISHINGS – 0.1% |
|
|
|
|
|
|
|
|
|
|
|
| Whirlpool Corp., |
|
|
|
|
|
|
|
|
| Notes, MTN, 5.15%, 3/01/43 |
|
|
10,000 |
|
|
|
10,553 |
|
|
|
|
| Whirlpool Corp., |
|
|
|
|
|
|
|
|
| Sr. Unsecured, 4.70%, 6/01/22 |
|
|
65,000 |
|
|
|
72,419 |
|
|
|
|
|
|
|
|
|
|
|
|
|
| TOTAL HOME FURNISHINGS |
|
|
|
|
|
$ |
82,972 |
|
|
|
|
| HOUSEHOLD PRODUCTS – 0.1% |
|
|
|
|
|
|
|
|
|
|
|
| Tupperware Brands Corp., |
|
|
|
|
|
|
|
|
| Company Guaranteed, 4.75%, 6/01/21 |
|
|
60,000 |
|
|
|
64,456 |
|
|
|
|
| INSURANCE – 0.3% |
|
|
|
|
|
|
|
|
|
|
|
| Berkshire Hathaway Finance Corp., |
|
|
|
|
|
|
|
|
| Company Guaranteed, 4.40%, 5/15/42 |
|
|
90,000 |
|
|
|
93,876 |
|
|
|
|
| WR Berkley Corp., |
|
|
|
|
|
|
|
|
| Sr. Unsecured, 4.63%, 3/15/22 |
|
|
60,000 |
|
|
|
66,561 |
|
|
|
|
|
|
|
|
|
|
|
|
|
| TOTAL INSURANCE |
|
|
|
|
|
$ |
160,437 |
|
|
|
|
| INTERNET – 0.1% |
|
|
|
|
|
|
|
|
|
|
|
| Symantec Corp., |
|
|
|
|
|
|
|
|
| Sr. Unsecured, 2.75%, 6/15/17 |
|
|
90,000 |
|
|
|
93,397 |
|
|
|
|
| IRON/STEEL – 0.1% |
|
|
|
|
|
|
|
|
|
|
|
| Cliffs Natural Resources, Inc., |
|
|
|
|
|
|
|
|
| Sr. Unsecured, 3.95%, 1/15/18 |
|
|
45,000 |
|
|
|
45,651 |
|
|
|
|
| MEDIA – 0.6% |
|
|
|
|
|
|
|
|
|
|
|
| Comcast Corp., |
|
|
|
|
|
|
|
|
| Company Guaranteed, 4.65%, 7/15/42 |
|
|
60,000 |
|
|
|
66,033 |
|
|
|
|
| COX Communications, Inc., |
|
|
|
|
|
|
|
|
| Sr. Unsecured, 4.50%, 6/30/43•,W |
|
|
100,000 |
|
|
|
100,174 |
|
|
|
|
| DIRECTV Holdings LLC / DIRECTV Financing Co., Inc., |
|
|
|
|
|
|
|
|
| Company Guaranteed, 3.50%, 3/01/16 |
|
|
127,000 |
|
|
|
135,670 |
|
|
|
|
| Viacom, Inc., |
|
|
|
|
|
|
|
|
| Sr. Unsecured, 2.50%, 12/15/16 |
|
|
60,000 |
|
|
|
62,788 |
|
|
|
|
|
|
|
|
|
|
|
|
|
| TOTAL MEDIA |
|
|
|
|
|
$ |
364,665 |
|
|
|
|
| METALS & MINING – 0.1% |
|
|
|
|
|
|
|
|
|
|
|
| Rio Tinto Finance USA Ltd., |
|
|
|
|
|
|
|
|
| Company Guaranteed, 9.00%, 5/01/19 |
|
|
60,000 |
|
|
|
83,118 |
|
|
| MISCELLANEOUS MANUFACTURING – 0.1% |
|
|
|
|
| General Electric Co., |
|
|
|
|
|
|
|
|
| Sr. Unsecured, 4.13%, 10/09/42 |
|
|
35,000 |
|
|
|
37,237 |
|
|
|
|
| OIL & GAS – 0.3% |
|
|
|
|
|
|
|
|
|
|
|
| BP Capital Markets PLC, |
|
|
|
|
|
|
|
|
| Company Guaranteed, 2.50%, 11/06/22 |
|
|
50,000 |
|
|
|
49,924 |
|
|
|
|
| Marathon Oil Corp., |
|
|
|
|
|
|
|
|
| Sr. Unsecured, 2.80%, 11/01/22 |
|
|
45,000 |
|
|
|
45,081 |
|
|
|
|
| Murphy Oil Corp., |
|
|
|
|
|
|
|
|
| Sr. Unsecured, 5.13%, 12/01/42 |
|
|
70,000 |
|
|
|
67,987 |
|
|
|
|
| Transocean, Inc., |
|
|
|
|
|
|
|
|
| Company Guaranteed, 6.50%, 11/15/20 |
|
|
45,000 |
|
|
|
53,452 |
|
|
|
|
|
|
|
|
|
|
|
|
|
| TOTAL OIL & GAS |
|
|
|
|
|
$ |
216,444 |
|
|
|
|
|
|
|
|
|
|
|
|
|
| Description |
|
Par Value |
|
|
Value |
|
|
|
|
| PHARMACEUTICALS – 0.1% |
|
|
|
|
|
|
|
|
|
|
|
| AbbVie, Inc., |
|
|
|
|
|
|
|
|
| Sr. Unsecured, 4.40%, 11/06/42•,W |
|
$ |
20,000 |
|
|
$ |
21,132 |
|
|
|
|
| Zoetis, Inc., |
|
|
|
|
|
|
|
|
| Sr. Unsecured, 4.70%, 2/01/43•,W |
|
|
15,000 |
|
|
|
15,900 |
|
|
|
|
|
|
|
|
|
|
|
|
|
| TOTAL PHARMACEUTICALS |
|
|
|
|
|
$ |
37,032 |
|
|
|
|
| PIPELINES – 0.1% |
|
|
|
|
|
|
|
|
|
|
|
| Energy Transfer Partners LP, |
|
|
|
|
|
|
|
|
| Sr. Unsecured, 3.60%, 2/01/23 |
|
|
35,000 |
|
|
|
35,696 |
|
|
| REAL ESTATE INVESTMENT TRUSTS – 1.8% |
|
|
|
|
| AvalonBay Communities, Inc., |
|
|
|
|
|
|
|
|
| Sr. Unsecured, MTN, 5.70%, 3/15/17 |
|
|
100,000 |
|
|
|
116,315 |
|
|
|
|
| Boston Properties LP, |
|
|
|
|
|
|
|
|
| Sr. Unsecured, 5.88%, 10/15/19 |
|
|
100,000 |
|
|
|
121,956 |
|
|
|
|
| CommonWealth REIT, |
|
|
|
|
|
|
|
|
| Sr. Unsecured, 6.65%, 1/15/18 |
|
|
100,000 |
|
|
|
113,238 |
|
|
|
|
| Digital Realty Trust LP, |
|
|
|
|
|
|
|
|
| Company Guaranteed, 5.88%, 2/01/20 |
|
|
100,000 |
|
|
|
117,442 |
|
|
|
|
| HCP, Inc., |
|
|
|
|
|
|
|
|
| Sr. Unsecured, 5.38%, 2/01/21 |
|
|
100,000 |
|
|
|
118,359 |
|
|
|
|
| Health Care REIT, Inc., |
|
|
|
|
|
|
|
|
| Sr. Unsecured, 4.70%, 9/15/17 |
|
|
100,000 |
|
|
|
113,048 |
|
|
|
|
| Healthcare Realty Trust, Inc., |
|
|
|
|
|
|
|
|
| Sr. Unsecured, 3.75%, 4/15/23 |
|
|
40,000 |
|
|
|
40,838 |
|
|
|
|
| Mack-Cali Realty LP, |
|
|
|
|
|
|
|
|
| Sr. Unsecured, 2.50%, 12/15/17 |
|
|
90,000 |
|
|
|
91,916 |
|
|
|
|
| ProLogis LP, |
|
|
|
|
|
|
|
|
| Company Guaranteed,
6.13%, 12/01/16 |
|
|
60,000 |
|
|
|
69,406 |
|
|
|
|
| Simon Property Group LP, |
|
|
|
|
|
|
|
|
| Sr. Unsecured, 5.65%, 2/01/20 |
|
|
100,000 |
|
|
|
121,732 |
|
|
|
|
| Ventas Realty LP / Ventas Capital Corp., |
|
|
|
|
|
|
|
|
| Company Guaranteed, 2.70%, 4/01/20 |
|
|
105,000 |
|
|
|
106,936 |
|
|
|
|
|
|
|
|
|
|
|
|
| TOTAL REAL ESTATE INVESTMENT TRUSTS |
|
|
$ |
1,131,186 |
|
|
|
|
| RETAIL – 0.5% |
|
|
|
|
|
|
|
|
|
|
|
| CVS Caremark Corp., |
|
|
|
|
|
|
|
|
| Sr. Unsecured, 5.75%, 6/01/17 |
|
|
49,000 |
|
|
|
58,095 |
|
|
|
|
| Home Depot, Inc., |
|
|
|
|
|
|
|
|
| Sr. Unsecured, 5.40%, 3/01/16 |
|
|
105,000 |
|
|
|
118,909 |
|
|
|
|
| Yum! Brands, Inc., |
|
|
|
|
|
|
|
|
| Sr. Unsecured, 5.30%, 9/15/19 |
|
|
100,000 |
|
|
|
117,448 |
|
|
|
|
|
|
|
|
|
|
|
|
|
| TOTAL RETAIL |
|
|
|
|
|
$ |
294,452 |
|
|
|
|
| SEMICONDUCTORS – 0.1% |
|
|
|
|
|
|
|
|
|
|
|
| Intel Corp., |
|
|
|
|
|
|
|
|
| Sr. Unsecured, 2.70%, 12/15/22 |
|
|
35,000 |
|
|
|
35,004 |
|
|
|
|
| SOFTWARE – 0.1% |
|
|
|
|
|
|
|
|
|
|
|
| Oracle Corp., |
|
|
|
|
|
|
|
|
| Sr. Unsecured, 1.20%, 10/15/17 |
|
|
75,000 |
|
|
|
75,604 |
|
|
|
|
| TRANSPORTATION – 0.1% |
|
|
|
|
|
|
|
|
|
|
|
| FedEx Corp., |
|
|
|
|
|
|
|
|
| Company Guaranteed, 3.88%, 8/01/42 |
|
|
30,000 |
|
|
|
29,362 |
|
April 30, 2013 / ANNUAL REPORT
PORTFOLIOS OF INVESTMENTS 73
Wilmington Strategic Allocation Moderate Fund (continued)
|
|
|
|
|
|
|
|
|
|
|
|
| Description |
|
Par Value |
|
|
Value |
|
|
|
|
| Ryder System, Inc., |
|
|
|
|
|
|
|
|
| Sr. Unsecured, MTN, 2.50%, 3/01/18 |
|
$ |
55,000 |
|
|
$ |
56,658 |
|
|
|
|
|
|
|
|
|
|
|
|
|
| TOTAL TRANSPORTATION |
|
|
|
|
|
$ |
86,020 |
|
|
|
|
|
|
|
|
|
|
| TOTAL CORPORATE BONDS
(COST $5,524,561) |
|
|
|
|
|
$ |
5,792,441 |
|
|
| ENHANCED EQUIPMENT TRUST CERTIFICATES – 0.2% |
|
|
|
|
| AIRLINES – 0.2% |
|
|
|
|
|
|
|
|
|
|
|
| Continental Airlines 2009-2, Pass-Through Certificates, 7.25%, 11/10/19 |
|
|
70,126 |
|
|
|
82,442 |
|
|
|
|
| Delta Air Lines, 2009-1, |
|
|
|
|
|
|
|
|
| Series A, Pass-Through Certificates, |
|
|
|
|
|
|
|
|
| 6.82%, 8/10/22 |
|
|
55,046 |
|
|
|
64,197 |
|
|
|
|
|
|
|
|
|
|
|
|
|
| TOTAL AIRLINES |
|
|
|
|
|
$ |
146,639 |
|
|
|
|
|
|
|
|
|
|
|
|
|
| TOTAL ENHANCED EQUIPMENT TRUST CERTIFICATES
(COST $124,932) |
|
|
|
|
|
$ |
146,639 |
|
|
| MORTGAGE-BACKED SECURITIES – 5.2% |
|
|
| FEDERAL HOME LOAN MORTGAGE CORPORATION
(FHLMC) – 2.4% |
|
|
|
|
| Pool A15865, 5.50%, 11/01/33 |
|
|
99,629 |
|
|
|
108,584 |
|
|
|
|
| Pool A19412, 5.00%, 3/01/34 |
|
|
221,233 |
|
|
|
239,252 |
|
|
|
|
| Pool C00478, 8.50%, 9/01/26 |
|
|
3,116 |
|
|
|
3,622 |
|
|
|
|
| Pool C03517, 4.50%, 9/01/40 |
|
|
75,592 |
|
|
|
80,931 |
|
|
|
|
| Pool C04305, 3.00%, 11/01/42 |
|
|
252,160 |
|
|
|
262,935 |
|
|
|
|
| Pool C09020, 3.50%, 11/01/42 |
|
|
270,761 |
|
|
|
288,103 |
|
|
|
|
| Pool G05774, 5.00%, 1/01/40 |
|
|
524,217 |
|
|
|
562,161 |
|
|
|
|
|
|
|
|
|
|
|
|
| TOTAL FEDERAL HOME LOAN MORTGAGE CORPORATION (FHLMC) |
|
|
$ |
1,545,588 |
|
|
| FEDERAL NATIONAL MORTGAGE ASSOCIATION
(FNMA) – 2.6% |
|
|
|
|
| Pool 533246, 7.50%, 4/01/30 |
|
|
32,249 |
|
|
|
35,270 |
|
|
|
|
| Pool 889982, 5.50%, 11/01/38 |
|
|
246,887 |
|
|
|
268,503 |
|
|
|
|
| Pool 932752, 5.00%, 4/01/40 |
|
|
90,018 |
|
|
|
97,372 |
|
|
|
|
| Pool AA7692, 4.50%, 6/01/39 |
|
|
154,132 |
|
|
|
166,131 |
|
|
|
|
| Pool AB3417, 4.00%, 8/01/41 |
|
|
439,099 |
|
|
|
470,653 |
|
|
|
|
| Pool AB4089, 3.00%, 12/01/26 |
|
|
223,670 |
|
|
|
236,460 |
|
|
|
|
| Pool AJ4050, 4.00%, 10/01/41 |
|
|
211,037 |
|
|
|
226,796 |
|
|
|
|
| Pool MA0563, 4.00%, 11/01/30 |
|
|
153,893 |
|
|
|
165,766 |
|
|
|
|
|
|
|
|
|
|
|
|
| TOTAL FEDERAL NATIONAL MORTGAGE ASSOCIATION (FNMA) |
|
|
$ |
1,666,951 |
|
|
| GOVERNMENT NATIONAL MORTGAGE ASSOCIATION
(GNMA) – 0.2% |
|
|
|
|
| Pool 354677, 7.50%, 10/15/23 |
|
|
26,390 |
|
|
|
30,386 |
|
|
|
|
| Pool 354765, 7.00%, 2/15/24 |
|
|
34,606 |
|
|
|
39,751 |
|
|
|
|
| Pool 354827, 7.00%, 5/15/24 |
|
|
34,748 |
|
|
|
39,915 |
|
|
|
|
|
|
|
|
|
|
|
|
| TOTAL GOVERNMENT NATIONAL MORTGAGE ASSOCIATION (GNMA) |
|
|
$ |
110,052 |
|
|
|
|
|
|
|
|
|
|
|
|
|
| TOTAL MORTGAGE-BACKED SECURITIES |
|
|
|
|
|
|
|
|
| (COST $3,230,246) |
|
|
|
|
|
$ |
3,322,591 |
|
|
|
|
|
|
|
|
|
|
|
|
|
| Description |
|
Par Value |
|
|
Value |
|
|
|
|
| U.S. TREASURY – 3.9% |
|
|
|
|
|
|
|
|
|
|
|
| U.S. TREASURY BONDS – 0.7% |
|
|
|
|
|
|
|
|
|
|
|
| 2.75%, 8/15/42 |
|
$ |
35,000 |
|
|
$ |
34,046 |
|
|
|
|
| 4.38%, 5/15/40 |
|
|
290,000 |
|
|
|
378,713 |
|
|
|
|
| 4.75%, 2/15/37 |
|
|
21,000 |
|
|
|
28,694 |
|
|
|
|
|
|
|
|
|
|
|
|
|
| TOTAL U.S. TREASURY BONDS |
|
|
|
|
|
$ |
441,453 |
|
|
| U.S. TREASURY INFLATION INDEXED NOTES – 1.0% |
|
|
|
|
| 1.13%, 1/15/21 |
|
|
480,000 |
|
|
|
598,776 |
|
|
| U.S. TREASURY NOTES – 2.2% |
|
|
|
|
| 0.63%, 9/30/17 |
|
|
40,000 |
|
|
|
40,104 |
|
|
|
|
| 0.88%, 1/31/17 |
|
|
150,000 |
|
|
|
152,412 |
|
|
|
|
| 1.50%, 3/31/19 |
|
|
200,000 |
|
|
|
207,467 |
|
|
|
|
| 1.63%, 11/15/22 |
|
|
96,000 |
|
|
|
95,901 |
|
|
|
|
| 2.00%, 11/15/21 |
|
|
100,000 |
|
|
|
104,583 |
|
|
|
|
| 2.13%, 5/31/15 |
|
|
65,000 |
|
|
|
67,565 |
|
|
|
|
| 3.50%, 5/15/20 |
|
|
200,000 |
|
|
|
232,912 |
|
|
|
|
| 4.00%, 2/15/14 |
|
|
40,000 |
|
|
|
41,227 |
|
|
|
|
| 4.50%, 2/15/16 |
|
|
200,000 |
|
|
|
223,429 |
|
|
|
|
| 4.50%, 5/15/17 |
|
|
200,000 |
|
|
|
232,084 |
|
|
|
|
|
|
|
|
|
|
|
|
|
| TOTAL U.S. TREASURY NOTES |
|
|
|
|
|
$ |
1,397,684 |
|
|
|
|
|
|
|
|
|
|
|
|
|
| TOTAL U.S. TREASURY |
|
|
|
|
|
|
|
|
| (COST $2,159,685) |
|
|
|
|
|
$ |
2,437,913 |
|
| |
|
Number
of
Shares |
|
|
|
|
|
|
| MONEY MARKET FUND – 0.1% |
|
|
|
|
|
|
|
|
| Dreyfus Cash Management Fund, |
|
|
|
|
|
|
|
|
|
|
|
| Institutional Shares, 0.05%^ |
|
|
41,172 |
|
|
|
41,172 |
|
|
|
|
|
|
|
|
|
|
|
|
|
| TOTAL MONEY MARKET FUND |
|
|
|
|
|
|
|
|
| (COST $41,172) |
|
|
|
|
|
$ |
41,172 |
|
|
|
|
|
|
|
|
|
|
|
|
|
| TOTAL INVESTMENTS – 100.1% |
|
|
|
|
|
|
|
|
| (COST $55,074,103) |
|
|
|
|
|
$ |
63,486,913 |
|
|
|
| OTHER LIABILITIES LESS ASSETS – (0.1%) |
|
|
|
(93,565 |
) |
|
|
|
|
|
|
|
|
|
|
|
|
| TOTAL NET ASSETS – 100.0% |
|
|
|
|
|
$ |
63,393,348 |
|
|
|
|
|
|
|
|
|
|
ANNUAL REPORT / April
30, 2013
74 PORTFOLIOS OF INVESTMENTS
Wilmington Strategic Allocation Moderate Fund (concluded)
Cost of investments for Federal income tax purposes is $55,880,879. The net unrealized
appreciation/(depreciation) of investments was $7,606,034. This consists of net unrealized appreciation from investment for those securities having an excess of value over cost of $7,663,408 and net unrealized depreciation from investments for those
securities having an excess of cost over value of $57,374.
Various inputs are used in determining the value of the Fund’s
investments. These inputs are summarized in the three broad levels listed below.
Level 1 – quoted prices in active
markets for identical securities
Level 2 – other significant observable inputs (including quoted prices for similar
securities, interest rates, prepayment speeds, credit risk, etc.)
Level 3 – significant unobservable inputs
(including the Fund’s own assumptions in determining the fair value of investments)
The following is a summary of the inputs used
as of April 30, 2013 in valuing the Fund’s assets carried at fair value:
|
|
|
|
|
|
|
|
|
|
|
|
|
|
|
|
|
| |
|
Level 1 |
|
|
Level 2 |
|
|
Level 3 |
|
|
Total |
|
|
|
|
|
|
| Investments in Securities |
|
|
|
|
|
|
|
|
|
|
|
|
|
|
|
|
|
|
|
|
|
| Investment Companies |
|
$ |
51,421,356 |
|
|
$ |
— |
|
|
$ |
— |
|
|
$ |
51,421,356 |
|
|
|
|
|
|
| Collateralized Mortgage Obligations |
|
|
— |
|
|
|
324,801 |
|
|
|
— |
|
|
|
324,801 |
|
|
|
|
|
|
| Corporate Bonds |
|
|
— |
|
|
|
5,792,441 |
|
|
|
— |
|
|
|
5,792,441 |
|
|
|
|
|
|
| Enhanced Equipment Trust Certificates |
|
|
— |
|
|
|
146,639 |
|
|
|
— |
|
|
|
146,639 |
|
|
|
|
|
|
| Mortgage-Backed Securities |
|
|
— |
|
|
|
3,322,591 |
|
|
|
— |
|
|
|
3,322,591 |
|
|
|
|
|
|
| U.S. Treasury |
|
|
— |
|
|
|
2,437,913 |
|
|
|
— |
|
|
|
2,437,913 |
|
|
|
|
|
|
| Money Market Fund |
|
|
41,172 |
|
|
|
— |
|
|
|
— |
|
|
|
41,172 |
|
|
|
|
|
|
|
|
|
|
|
|
|
|
|
|
|
|
|
|
|
|
|
| Total |
|
$ |
51,462,528 |
|
|
$ |
12,024,385 |
|
|
$ |
— |
|
|
$ |
63,486,913 |
|
|
|
|
|
|
|
|
|
|
|
|
|
|
|
|
|
|
See Notes to Portfolios of Investments
See Notes which are an integral part of the Financial Statements
April 30, 2013 / ANNUAL REPORT
75
PORTFOLIO OF INVESTMENTS SUMMARY TABLE
Wilmington Strategic Allocation Aggressive Fund
At April 30, 2013, the Fund’s portfolio
composition was as follows (unaudited):
|
|
|
|
|
|
|
| |
|
Percentage of
Total Net Assets |
| Equity Funds |
|
|
88.6 |
% |
|
|
| Debt Fund |
|
|
5.1 |
% |
|
|
| Asset Allocation Fund |
|
|
5.0 |
% |
|
|
| Money Market Fund |
|
|
1.7 |
% |
|
|
| Other Assets and Liabilities – Net1 |
|
|
(0.4 |
)% |
|
|
|
|
|
|
|
|
|
| TOTAL |
|
|
100.0 |
% |
|
|
|
|
|
|
|
|
|
| (1) |
Assets, other than investments in securities, less liabilities. See Statements of Assets and Liabilities.
|
PORTFOLIO OF INVESTMENTS
April 30, 2013
|
|
|
|
|
|
|
| Description |
|
Number
of
Shares |
|
|
Value |
|
| INVESTMENT COMPANIES – 100.4% |
|
| ASSET ALLOCATION FUND – 5.0% |
|
|
|
| Wilmington Multi-Manager Real Asset Fund, Class I§ |
|
|
125,870 |
|
|
$ 1,964,829 |
|
|
|
| DEBT FUND – 5.1% |
|
|
|
|
|
|
|
|
|
| RidgeWorth Seix Floating Rate High Income Fund, Class I |
|
|
218,751 |
|
|
1,988,445 |
|
|
|
| EQUITY FUNDS – 88.6% |
|
|
|
|
|
|
|
|
|
| Gateway Fund, Class Y |
|
|
40,352 |
|
|
1,138,738 |
|
|
|
| Lazard Emerging Markets Equity Portfolio, Institutional Shares |
|
|
76,649 |
|
|
1,496,958 |
|
|
|
| LSV Value Equity Fund |
|
|
61,910 |
|
|
1,100,764 |
|
|
|
| Morgan Stanley Focus Growth Fund,
Class I |
|
|
23,820 |
|
|
1,033,333 |
|
|
|
| TIAA-CREF Mid-Cap Value Fund, Retail Shares |
|
|
138,074 |
|
|
2,855,367 |
|
|
|
| Wilmington Large-Cap Strategy Fund,
Class I§ |
|
|
897,089 |
|
|
13,124,405 |
|
|
|
| Wilmington Mid-Cap Growth Fund,
Class I§ |
|
|
169,356 |
|
|
2,777,438 |
|
|
|
|
|
|
|
|
|
| Description |
|
Number
of
Shares |
|
|
Value |
|
|
|
|
| Wilmington Multi-Manager International Fund, Class I§ |
|
|
1,398,685 |
|
|
$ |
10,210,397 |
|
|
|
|
| Wilmington Small-Cap Strategy Fund, Class I§ |
|
|
69,393 |
|
|
|
854,224 |
|
|
|
|
|
|
|
|
|
|
|
|
|
| TOTAL EQUITY FUNDS |
|
|
|
|
|
$ |
34,591,624 |
|
|
|
|
| MONEY MARKET FUND – 1.7% |
|
|
|
|
|
|
|
|
|
|
|
| Wilmington Prime Money Market Fund, Institutional Class,
0.02%^,§ |
|
|
643,033 |
|
|
|
643,033 |
|
|
|
|
|
|
|
|
|
|
|
|
|
| TOTAL INVESTMENT COMPANIES
(COST $28,749,923) |
|
|
|
|
|
$ |
39,187,931 |
|
|
|
|
|
|
|
|
|
|
|
|
|
| TOTAL INVESTMENTS – 100.4%
(COST $28,749,923) |
|
|
|
|
|
$ |
39,187,931 |
|
|
|
| OTHER LIABILITIES LESS ASSETS – (0.4%) |
|
|
|
(156,912 |
) |
|
|
|
|
|
|
|
|
|
|
|
|
| TOTAL NET ASSETS – 100.0% |
|
|
|
|
|
$ |
39,031,019 |
|
|
|
|
|
|
|
|
|
|
Cost of investments for Federal income tax purposes is $35,047,798. The net unrealized appreciation/(depreciation) of
investments was $4,140,133. This consists of net unrealized appreciation from investment for those securities having an excess of value over cost of $4,165,399 and net unrealized depreciation from investments for those securities having an excess of
cost over value of $25,266.
ANNUAL REPORT / April
30, 2013
76 PORTFOLIOS OF INVESTMENTS
Wilmington Strategic Allocation Aggressive Fund (concluded)
Various inputs are used in determining the value of the Fund’s investments. These inputs are
summarized in the three broad levels listed below.
Level 1 – quoted prices in active markets for identical
securities
Level 2 – other significant observable inputs (including quoted prices for similar securities, interest
rates, prepayment speeds, credit risk, etc.)
Level 3 – significant unobservable inputs (including the Fund’s
own assumptions in determining the fair value of investments)
The following is a summary of the inputs used as of April 30, 2013
in valuing the Fund’s assets carried at fair value:
|
|
|
|
|
|
|
|
|
|
|
|
|
|
|
|
|
| |
|
Level 1 |
|
|
Level
2 |
|
|
Level
3 |
|
|
Total |
|
|
|
|
|
|
| Investments in Securities |
|
|
|
|
|
|
|
|
|
|
|
|
|
|
|
|
|
|
|
|
|
| Investment Companies |
|
$ |
39,187,931 |
|
|
$ |
— |
|
|
$ |
— |
|
|
$ |
39,187,931 |
|
|
|
|
|
|
|
|
|
|
|
|
|
|
|
|
|
|
|
|
|
|
|
| Total |
|
$ |
39,187,931 |
|
|
$ |
— |
|
|
$ |
— |
|
|
$ |
39,187,931 |
|
|
|
|
|
|
|
|
|
|
|
|
|
|
|
|
|
|
See Notes to Portfolios of Investments
See Notes which are an integral part of the Financial Statements
April 30, 2013 / ANNUAL REPORT
77
NOTES TO PORTFOLIOS OF INVESTMENTS
| D |
Floating rate note with current rate and stated maturity date shown. |
| ‡ |
Zero coupon security. The rate shown reflects the effective yield at purchase date. |
| W |
Denotes a restricted security, or a portion thereof, that may be resold without restriction to “qualified institutional buyers” as defined in Rule 144A under the
Securities Act of 1933 and that the Fund has determined to be liquid under criteria established by the Fund’s Board of Trustees. At April 30, 2013, these liquid restricted securities were as follows: |
|
|
|
|
|
|
|
|
|
| Fund |
|
Amount |
|
|
Percentage of
Total
Net
Assets |
|
| Multi-Manager International Fund |
|
|
$2,211,478 |
|
|
|
0.4 |
% |
| Rock Maple Alternatives Fund |
|
|
3,102,623 |
|
|
|
6.6 |
% |
| Multi-Manager Real Asset Fund |
|
|
2,509,597 |
|
|
|
0.6 |
% |
| Strategic Allocation Moderate Fund |
|
|
263,605 |
|
|
|
0.4 |
% |
| • |
|
Denotes a restricted security, or a portion thereof, that either (a) cannot be offered for public sale without first being registered, or being able to take
advantage of an exemption from registration, under the Securities Act of 1933, or (b) is subject to a contractual restriction on public sales. At April 30, 2013, these restricted securities were as follows: |
|
|
|
|
|
|
|
|
|
|
|
|
|
|
|
| Security |
|
Acquisition
Date |
|
|
Acquisition
Cost |
|
|
Market
Value |
|
|
Percentage
of Total
Net
Assets |
| Multi-Manager International Fund |
|
|
|
|
|
|
|
|
|
|
|
|
|
|
| Aditya Birla Nuvo Ltd. |
|
|
06/16/2010 |
|
|
|
$26,604 |
|
|
|
$31,149 |
|
|
|
| Ambuja Cements Ltd. |
|
|
11/01/2012 |
|
|
|
64,415 |
|
|
|
58,886 |
|
|
|
| Axis Bank Ltd. |
|
|
03/19/2010 |
|
|
|
70,031 |
|
|
|
76,520 |
|
|
|
| Axis Bank Ltd. |
|
|
01/13/2011 |
|
|
|
29,199 |
|
|
|
27,724 |
|
|
|
| Axis Bank Ltd. |
|
|
03/27/2012 |
|
|
|
43,358 |
|
|
|
52,677 |
|
|
|
| Container Corp. of India |
|
|
02/08/2010 |
|
|
|
29,219 |
|
|
|
22,978 |
|
|
|
| Container Corp. of India |
|
|
01/13/2011 |
|
|
|
38,773 |
|
|
|
29,246 |
|
|
|
| FPT Corp. |
|
|
10/13/2010 |
|
|
|
25,843 |
|
|
|
15,486 |
|
|
|
| FPT Corp. |
|
|
01/13/2011 |
|
|
|
38,488 |
|
|
|
28,925 |
|
|
|
| HDFC Bank Ltd. |
|
|
12/20/2010 |
|
|
|
121,868 |
|
|
|
161,596 |
|
|
|
| HDFC Bank Ltd. |
|
|
01/13/2011 |
|
|
|
54,119 |
|
|
|
69,680 |
|
|
|
| HDFC Bank Ltd. |
|
|
03/27/2012 |
|
|
|
43,653 |
|
|
|
53,844 |
|
|
|
| Jaiprakash Associates Ltd. |
|
|
06/21/2010 |
|
|
|
34,593 |
|
|
|
16,628 |
|
|
|
| Jaiprakash Associates Ltd. |
|
|
01/13/2011 |
|
|
|
36,608 |
|
|
|
23,754 |
|
|
|
| Jaiprakash Associates Ltd. |
|
|
11/01/2012 |
|
|
|
35,223 |
|
|
|
30,182 |
|
|
|
| Kinh Do Corp. |
|
|
10/14/2010 |
|
|
|
60,400 |
|
|
|
58,590 |
|
|
|
| Larsen & Toubro Ltd. |
|
|
11/01/2012 |
|
|
|
36,626 |
|
|
|
33,704 |
|
|
|
| NTPC Ltd. |
|
|
10/12/2009 |
|
|
|
102,375 |
|
|
|
66,266 |
|
|
|
| NTPC Ltd. |
|
|
01/13/2011 |
|
|
|
52,888 |
|
|
|
36,241 |
|
|
|
| NTPC Ltd. |
|
|
03/27/2012 |
|
|
|
63,330 |
|
|
|
56,204 |
|
|
|
| PetroVietnam Drilling and Well Services JSC |
|
|
10/11/2012 |
|
|
|
58,107 |
|
|
|
61,693 |
|
|
|
| Petrovietnam Fertilizer & Chemicals JSC |
|
|
03/27/2012 |
|
|
|
37,753 |
|
|
|
49,908 |
|
|
|
| Pha Lai Thermal Power JSC |
|
|
10/13/2010 |
|
|
|
35,986 |
|
|
|
57,428 |
|
|
|
| Reliance Industries Ltd. GDR |
|
|
07/03/2007 |
|
|
|
303,953 |
|
|
|
210,858 |
|
|
|
| Reliance Industries Ltd. GDR |
|
|
01/13/2011 |
|
|
|
76,929 |
|
|
|
50,099 |
|
|
|
| Reliance Industries Ltd. GDR |
|
|
01/20/2012 |
|
|
|
42,433 |
|
|
|
39,961 |
|
|
|
| Reliance Industries Ltd. GDR |
|
|
03/27/2012 |
|
|
|
82,122 |
|
|
|
83,990 |
|
|
|
| Reliance Industries Ltd. GDR |
|
|
04/02/2012 |
|
|
|
41,493 |
|
|
|
41,258 |
|
|
|
| Reliance Industries Ltd. GDR |
|
|
11/01/2012 |
|
|
|
66,561 |
|
|
|
64,834 |
|
|
|
| Steel Authority of India Ltd. |
|
|
04/16/2009 |
|
|
|
20,302 |
|
|
|
10,417 |
|
|
|
| Steel Authority of India Ltd. |
|
|
03/27/2012 |
|
|
|
44,175 |
|
|
|
26,992 |
|
|
|
| Sun Pharmaceutical Industries Ltd. |
|
|
02/08/2010 |
|
|
|
77,517 |
|
|
|
211,914 |
|
|
|
| Tata Consultancy Services Ltd. |
|
|
08/14/2009 |
|
|
|
62,871 |
|
|
|
149,473 |
|
|
|
| Tata Steel Ltd. |
|
|
09/21/2011 |
|
|
|
45,297 |
|
|
|
26,703 |
|
|
|
ANNUAL REPORT / April
30, 2013
78 NOTES TO PORTFOLIOS OF INVESTMENTS
|
|
|
|
|
|
|
|
|
|
|
|
|
|
|
|
|
| Security |
|
Acquisition
Date
|
|
|
Acquisition
Cost |
|
|
Market Value |
|
|
Percentage
of Total
Net
Assets |
|
| Unitech Ltd |
|
|
07/08/2010 |
|
|
|
$16,170 |
|
|
|
$5,104 |
|
|
|
|
|
| Unitech Ltd |
|
|
01/13/2011 |
|
|
|
47,365 |
|
|
|
18,014 |
|
|
|
|
|
| Vingroup JSC |
|
|
10/13/2010 |
|
|
|
24,321 |
|
|
|
36,459 |
|
|
|
|
|
| Vingroup JSC |
|
|
10/14/2010 |
|
|
|
42,947 |
|
|
|
62,754 |
|
|
|
|
|
| Vingroup JSC |
|
|
11/01/2012 |
|
|
|
51,422 |
|
|
|
53,339 |
|
|
|
|
|
| |
|
|
|
|
|
|
|
|
|
|
$2,211,478 |
|
|
|
0.4% |
|
| Rock Maple Alternatives Fund |
|
|
|
|
|
|
|
|
|
|
|
|
|
|
|
|
| ADS Waste Holdings, Inc. |
|
|
11/14/2012 |
|
|
|
497,563 |
|
|
|
518,937 |
|
|
|
|
|
| Burlington Holdings LLC |
|
|
04/01/2013 |
|
|
|
512,500 |
|
|
|
521,250 |
|
|
|
|
|
| Jefferies Finance LLC |
|
|
04/10/2013 |
|
|
|
348,925 |
|
|
|
355,300 |
|
|
|
|
|
| Michael Foods Holdings, Inc. |
|
|
03/13/2013 |
|
|
|
486,450 |
|
|
|
497,612 |
|
|
|
|
|
| Wind Acquisition Finance SA |
|
|
02/13/2013 |
|
|
|
225,213 |
|
|
|
227,900 |
|
|
|
|
|
| Wok Acquisition Corp. |
|
|
12/06/2012 |
|
|
|
504,688 |
|
|
|
523,687 |
|
|
|
|
|
| Yonkers Racing Corp. |
|
|
11/28/2012 |
|
|
|
456,875 |
|
|
|
457,937 |
|
|
|
|
|
| |
|
|
|
|
|
|
|
|
|
|
$3,102,623 |
|
|
|
6.6% |
|
| Multi-Manager Real Asset Fund |
|
|
|
|
|
|
|
|
|
|
|
|
|
|
|
|
| Banco Santander Brazil SA |
|
|
03/17/2011 |
|
|
|
500,000 |
|
|
|
498,917 |
|
|
|
|
|
| International Lease Finance Corp. |
|
|
08/11/2010 |
|
|
|
100,000 |
|
|
|
119,438 |
|
|
|
|
|
| Metropolitan Life Global Funding I |
|
|
01/05/2011 |
|
|
|
1,500,000 |
|
|
|
1,503,677 |
|
|
|
|
|
| Venture CDO Ltd |
|
|
08/02/2010 |
|
|
|
358,224 |
|
|
|
387,565 |
|
|
|
|
|
| |
|
|
|
|
|
|
|
|
|
|
$2,509,597 |
|
|
|
0.6% |
|
| Strategic Allocation Moderate Fund |
|
|
|
|
|
|
|
|
|
|
|
|
|
|
|
|
| AbbVie, Inc. |
|
|
11/05/2012 |
|
|
|
19,793 |
|
|
|
21,132 |
|
|
|
|
|
| Cox Communications, Inc. |
|
|
04/24/2013 |
|
|
|
99,875 |
|
|
|
100,174 |
|
|
|
|
|
| FMR LLC |
|
|
06/28/2010 |
|
|
|
102,666 |
|
|
|
126,399 |
|
|
|
|
|
| Zoetis, Inc. |
|
|
01/16/2013 |
|
|
|
14,890 |
|
|
|
15,900 |
|
|
|
|
|
| |
|
|
|
|
|
|
|
|
|
|
$263,605 |
|
|
|
0.4% |
|
| § |
Affiliated company. See Note 4 in Notes to Financial Statements. |
| †† |
Security is fair valued in accordance with procedures adopted by the Board of Trustees. See Note 2 in Notes to Financial Statements. At April 30, 2013, the value of these
securities amounted to: |
|
|
|
|
|
|
|
|
|
| Fund |
|
Amount |
|
|
Percentage of
Total
Net
Assets |
|
| Multi-Manager International Fund |
|
|
$479,519 |
|
|
|
0.1% |
|
| Strategic Allocation Moderate Fund |
|
|
34,796 |
|
|
|
0.1% |
|
| ¤ |
While the Fund’s position in this security is long, the investment provides short exposure to the market. |
| # |
Security, or a portion thereof, is on loan. See Note 2 in Notes to Financial Statements. |
| Ö |
All or a portion of this security is segregated as collateral in connection with the fund’s short positions and written options carried by the funds. The total value of all
securities segregated at April 30, 2013 was: |
|
|
|
|
|
|
|
|
|
| Fund |
|
Amount |
|
|
Percentage of
Total
Net
Assets |
|
| Rock Maple Alternatives Fund |
|
|
$13,593,412 |
|
|
|
28.9% |
|
| ø |
All or a portion of this security is segregated as collateral in connection with the fund’s futures positions. The total value of all securities segregated at April 30,
2013 was: |
|
|
|
|
|
|
|
|
|
| Fund |
|
Amount |
|
|
Percentage of
Total
Net
Assets |
|
| Multi-Manager Real Asset Fund |
|
|
$124,147 |
|
|
|
0.0%** |
|
| * |
Non-income producing security. |
| ** |
Represents less than 0.05%. |
April 30, 2013 / ANNUAL REPORT
NOTES TO PORTFOLIOS OF INVESTMENTS 79
The following acronyms are used throughout this report:
|
|
|
| ADR – American Depositary Receipt |
|
LLC – Limited Liability Corporation |
|
|
| CPI – Consumer Price Index |
|
LP – Limited Partnership |
|
|
| EAFE – Europe, Asia, Far East |
|
MSCI – Morgan Stanley Capital International |
|
|
| ETF – Exchange Traded Fund |
|
MTN – Medium Term Note |
|
|
| FHLMC – Federal Home Loan Mortgage Corporation |
|
PCL – Public Company Limited |
|
|
| FNMA – Federal National Mortgage Association |
|
PLC – Public Limited Company |
|
|
| GDR – Global Depositary Receipt |
|
REIT – Real Estate Investment Trust |
|
|
| GNMA – Government National Mortgage Association |
|
SPDR – Standard & Poor’s Depository Receipts |
|
|
| GTD – Guaranteed |
|
TIPS – Treasury Inflation Protected Security |
|
|
|
|
|
| Currency Code |
|
Currency |
|
|
|
|
|
| AUD |
|
Australian Dollar |
|
|
|
|
|
| BRL |
|
Brazilian Real |
|
|
|
|
|
| CAD |
|
Canadian Dollar |
|
|
|
|
|
| CLP |
|
Chilean Peso |
|
|
|
|
|
| DKK |
|
Danish Krone |
|
|
|
|
|
| EUR |
|
Euro |
|
|
|
|
|
| GBP |
|
Pound Sterling |
|
|
|
|
|
| JPY |
|
Japanese Yen |
|
|
|
|
|
| MXN |
|
Mexican Peso |
|
|
|
|
|
| NZD |
|
New Zealand Dollar |
|
|
|
|
|
| PLN |
|
Polish Zloty |
|
|
|
|
|
| SEK |
|
Swedish Krona |
|
|
|
|
|
| TRY |
|
Turkish Lira |
|
|
|
|
|
| ZAR |
|
South African Rand |
|
|
ANNUAL REPORT / April
30, 2013
80 STATEMENTS OF ASSETS AND LIABILITIES
|
|
|
|
|
|
|
|
|
|
|
|
|
|
|
|
|
|
|
| April 30, 2013 |
|
|
|
Wilmington
Multi-Manager
International
Fund |
|
|
|
|
Wilmington
Rock
Maple
Alternatives
Fund |
|
|
|
|
Wilmington
Multi-Manager
Real Asset Fund |
|
| ASSETS: |
|
|
|
|
|
|
|
|
|
|
|
|
|
|
|
|
|
|
| Investments, at identified cost |
|
|
|
$ |
466,599,153 |
|
|
|
|
$ |
45,587,798 |
|
|
|
|
$ |
387,334,525 |
|
|
|
|
|
|
|
|
|
|
|
|
|
|
|
|
|
|
|
|
| Investments in securities, at value (Including $6,567,937, $0 and $586,874 of securities on loan, respectively) (Note 2) |
|
|
|
|
522,903,556 |
|
|
|
|
|
48,279,658 |
|
|
|
|
|
445,228,549 |
(a) |
|
|
|
|
|
|
|
|
|
|
|
|
|
|
|
|
|
|
|
| Cash |
|
|
|
|
552,761 |
|
|
|
|
|
4,089,100 |
|
|
|
|
|
990,483 |
|
| Deposits for securities sold short |
|
|
|
|
— |
|
|
|
|
|
2,365,087 |
|
|
|
|
|
— |
|
| Cash denominated in foreign currencies(b) |
|
|
|
|
1,603,194 |
|
|
|
|
|
61,609 |
|
|
|
|
|
2,037,479 |
|
| Premiums paid for swap agreements |
|
|
|
|
— |
|
|
|
|
|
— |
|
|
|
|
|
39,738 |
|
| Income receivable |
|
|
|
|
2,609,408 |
|
|
|
|
|
199,953 |
|
|
|
|
|
1,315,826 |
|
| Receivable for shares sold |
|
|
|
|
170,957 |
|
|
|
|
|
500,000 |
|
|
|
|
|
612,780 |
|
| Unrealized appreciation on swap agreements |
|
|
|
|
— |
|
|
|
|
|
— |
|
|
|
|
|
81,107 |
|
| Unrealized appreciation on foreign exchange contracts |
|
|
|
|
212 |
|
|
|
|
|
2,577 |
|
|
|
|
|
1,870,423 |
|
| Receivable for investments sold |
|
|
|
|
463,221 |
|
|
|
|
|
1,661,434 |
|
|
|
|
|
9,422,204 |
|
| Other assets |
|
|
|
|
9,125 |
|
|
|
|
|
5,314 |
|
|
|
|
|
8,028 |
|
|
|
|
|
|
|
|
|
|
|
|
|
|
|
|
|
|
|
|
| TOTAL ASSETS |
|
|
|
|
528,312,434 |
|
|
|
|
|
57,164,732 |
|
|
|
|
|
461,606,617 |
|
|
|
|
|
|
|
|
|
|
|
|
|
|
|
|
|
|
|
|
| LIABILITIES: |
|
|
|
|
|
|
|
|
|
|
|
|
|
|
|
|
|
|
| Options written, at value |
|
|
|
|
— |
|
|
|
|
|
99,804 |
(c) |
|
|
|
|
63,282 |
(c) |
| Deferred capital gains tax payable |
|
|
|
|
334,463 |
|
|
|
|
|
— |
|
|
|
|
|
193,510 |
|
| Premiums received for swap agreements |
|
|
|
|
— |
|
|
|
|
|
— |
|
|
|
|
|
33,935 |
|
| Payable for securities sold short |
|
|
|
|
— |
|
|
|
|
|
7,686,097 |
(d) |
|
|
|
|
— |
|
| Payable for investments purchased |
|
|
|
|
873,097 |
|
|
|
|
|
2,099,609 |
|
|
|
|
|
8,765,496 |
|
| Collateral for securities on loan |
|
|
|
|
6,811,853 |
|
|
|
|
|
— |
|
|
|
|
|
601,402 |
|
| Due to broker for swap agreements |
|
|
|
|
— |
|
|
|
|
|
— |
|
|
|
|
|
1,374,000 |
|
| Unrealized depreciation on swap agreements |
|
|
|
|
— |
|
|
|
|
|
— |
|
|
|
|
|
157,658 |
|
| Unrealized depreciation on foreign exchange contracts |
|
|
|
|
5,105 |
|
|
|
|
|
74,519 |
|
|
|
|
|
2,487,312 |
|
| Payable for shares redeemed |
|
|
|
|
138,887 |
|
|
|
|
|
6,912 |
|
|
|
|
|
91,088 |
|
| Payable to sub-advisors |
|
|
|
|
205,850 |
|
|
|
|
|
30,507 |
|
|
|
|
|
122,074 |
|
| Payable for Trustees’ fees |
|
|
|
|
452 |
|
|
|
|
|
257 |
|
|
|
|
|
485 |
|
| Payable for distribution services fee |
|
|
|
|
3,521 |
|
|
|
|
|
477 |
|
|
|
|
|
1,300 |
|
| Payable for shareholder services fee |
|
|
|
|
50,164 |
|
|
|
|
|
— |
|
|
|
|
|
— |
|
| Other accrued expenses |
|
|
|
|
699,369 |
|
|
|
|
|
109,246 |
|
|
|
|
|
379,157 |
|
|
|
|
|
|
|
|
|
|
|
|
|
|
|
|
|
|
|
|
| TOTAL LIABILITIES |
|
|
|
|
9,122,761 |
|
|
|
|
|
10,107,428 |
|
|
|
|
|
14,270,699 |
|
| |
|
|
|
|
|
|
|
|
|
|
|
|
|
|
|
|
|
|
| NET ASSETS |
|
|
|
$ |
519,189,673 |
|
|
|
|
$ |
47,057,304 |
|
|
|
|
$ |
447,335,918 |
|
| |
|
|
|
|
|
|
|
|
|
|
|
|
|
|
|
|
|
|
| NET ASSETS CONSIST OF: |
|
|
|
|
|
|
|
|
|
|
|
|
|
|
|
|
|
|
| Paid-in capital |
|
|
|
$ |
833,282,035 |
|
|
|
|
$ |
45,015,376 |
|
|
|
|
$ |
506,266,223 |
|
| Undistributed (distributions in excess of) net investment income |
|
|
|
|
2,491,830 |
|
|
|
|
|
55,303 |
|
|
|
|
|
(265,630) |
|
| Accumulated net realized gain (loss) on investments and foreign currency transactions |
|
|
|
|
(372,895,749) |
|
|
|
|
|
(25,327) |
|
|
|
|
|
(115,950,007) |
|
| Net unrealized appreciation (depreciation) of investments and foreign currencies |
|
|
|
|
56,311,557 |
|
|
|
|
|
2,011,952 |
|
|
|
|
|
57,285,332 |
|
|
|
|
|
|
|
|
|
|
|
|
|
|
|
|
|
|
|
|
| TOTAL NET ASSETS |
|
|
|
$ |
519,189,673 |
|
|
|
|
$ |
47,057,304 |
|
|
|
|
$ |
447,335,918 |
|
|
|
|
|
|
|
|
|
|
|
|
|
|
|
|
|
|
|
|
| COMPUTATION OF NET ASSET VALUE AND OFFERING PRICE: |
|
|
|
|
|
|
|
|
|
|
|
|
|
|
|
|
|
|
| Class A |
|
|
|
|
|
|
|
|
|
|
|
|
|
|
|
|
|
|
| Net Assets |
|
|
|
$ |
6,300,646 |
|
|
|
|
$ |
2,397,176 |
|
|
|
|
$ |
6,337,000 |
|
|
|
|
|
|
|
|
|
|
|
|
|
|
|
|
|
|
|
|
| Shares outstanding (unlimited shares authorized) |
|
|
|
|
867,128 |
|
|
|
|
|
226,538 |
|
|
|
|
|
407,507 |
|
|
|
|
|
|
|
|
|
|
|
|
|
|
|
|
|
|
|
|
| Net Asset Value per share |
|
|
|
$ |
7.27 |
|
|
|
|
$ |
10.58 |
|
|
|
|
$ |
15.55 |
|
|
|
|
|
|
|
|
|
|
|
|
|
|
|
|
|
|
|
|
| Offering price per share* |
|
|
|
$ |
7.69 |
** |
|
|
|
$ |
11.20 |
** |
|
|
|
$ |
16.46 |
** |
|
|
|
|
|
|
|
|
|
|
|
|
|
|
|
|
|
|
|
| Class I |
|
|
|
|
|
|
|
|
|
|
|
|
|
|
|
|
|
|
| Net Assets |
|
|
|
$ |
512,889,027 |
|
|
|
|
$ |
44,660,128 |
|
|
|
|
$ |
440,998,918 |
|
|
|
|
|
|
|
|
|
|
|
|
|
|
|
|
|
|
|
|
| Shares outstanding (unlimited shares authorized) |
|
|
|
|
70,227,248 |
|
|
|
|
|
4,228,766 |
|
|
|
|
|
28,246,460 |
|
|
|
|
|
|
|
|
|
|
|
|
|
|
|
|
|
|
|
|
| Net Asset Value per share |
|
|
|
$ |
7.30 |
|
|
|
|
$ |
10.56 |
|
|
|
|
$ |
15.61 |
|
|
|
|
|
|
|
|
|
|
|
|
|
|
|
|
|
|
|
|
| (a) |
Includes $2,650,807 of investments in affiliated issuers. |
| (b) |
Cost of cash denominated in foreign currencies was $1,593,271, $60,819 and $1,993,669, respectively. |
| (c) |
Premiums received for options written was $88,244 and $161,326, respectively. |
| (d) |
Proceeds received for securities sold short was $7,091,030. |
| * |
See “What Do Shares Cost?” in the Prospectus. |
| ** |
Computation of offering price per share 100/94.50 of net asset value. |
See Notes which are an integral part of the Financial Statements
April 30, 2013 / ANNUAL REPORT
STATEMENTS OF ASSETS AND LIABILITIES (concluded) 81
|
|
|
|
|
|
|
|
|
|
|
|
|
|
|
|
|
|
|
| April 30, 2013 |
|
|
|
Wilmington
Strategic
Allocation
Conservative Fund |
|
|
|
|
Wilmington
Strategic
Allocation
Moderate Fund |
|
|
|
|
Wilmington
Strategic
Allocation
Aggressive Fund |
|
| ASSETS: |
|
|
|
|
|
|
|
|
|
|
|
|
|
|
|
|
|
|
| Investments, at identified cost |
|
|
|
$ |
44,189,092 |
|
|
|
|
$ |
55,074,103 |
|
|
|
|
$ |
28,749,923 |
|
|
|
|
|
|
|
|
|
|
|
|
|
|
|
|
|
|
|
|
| Investments in securities, at value |
|
|
|
|
48,031,939 |
(a) |
|
|
|
|
63,486,913 |
(a) |
|
|
|
|
39,187,931 |
(a) |
|
|
|
|
|
|
|
|
|
|
|
|
|
|
|
|
|
|
|
| Income receivable |
|
|
|
|
62,218 |
|
|
|
|
|
106,976 |
|
|
|
|
|
6,729 |
|
| Receivable for shares sold |
|
|
|
|
— |
|
|
|
|
|
10,725 |
|
|
|
|
|
95 |
|
| Receivable for investments sold |
|
|
|
|
— |
|
|
|
|
|
157,237 |
|
|
|
|
|
— |
|
| Other assets |
|
|
|
|
5,865 |
|
|
|
|
|
6,650 |
|
|
|
|
|
5,166 |
|
|
|
|
|
|
|
|
|
|
|
|
|
|
|
|
|
|
|
|
| TOTAL ASSETS |
|
|
|
|
48,100,022 |
|
|
|
|
|
63,768,501 |
|
|
|
|
|
39,199,921 |
|
| |
|
|
|
|
|
|
|
|
|
|
|
|
|
|
|
|
|
|
| LIABILITIES: |
|
|
|
|
|
|
|
|
|
|
|
|
|
|
|
|
|
|
| Payable for investments purchased |
|
|
|
|
40,232 |
|
|
|
|
|
200,338 |
|
|
|
|
|
10 |
|
| Payable for shares redeemed |
|
|
|
|
72,466 |
|
|
|
|
|
13,445 |
|
|
|
|
|
110,446 |
|
| Payable for Trustees’ fees |
|
|
|
|
442 |
|
|
|
|
|
541 |
|
|
|
|
|
534 |
|
| Payable for distribution services fee |
|
|
|
|
1,249 |
|
|
|
|
|
24,679 |
|
|
|
|
|
1,068 |
|
| Other accrued expenses |
|
|
|
|
51,608 |
|
|
|
|
|
136,150 |
|
|
|
|
|
56,844 |
|
|
|
|
|
|
|
|
|
|
|
|
|
|
|
|
|
|
|
|
| TOTAL LIABILITIES |
|
|
|
|
165,997 |
|
|
|
|
|
375,153 |
|
|
|
|
|
168,902 |
|
| |
|
|
|
|
|
|
|
|
|
|
|
|
|
|
|
|
|
|
| NET ASSETS |
|
|
|
$ |
47,934,025 |
|
|
|
|
$ |
63,393,348 |
|
|
|
|
$ |
39,031,019 |
|
| |
|
|
|
|
|
|
|
|
|
|
|
|
|
|
|
|
|
|
| NET ASSETS CONSIST OF: |
|
|
|
|
|
|
|
|
|
|
|
|
|
|
|
|
|
|
| Paid-in capital |
|
|
|
$ |
45,480,411 |
|
|
|
|
$ |
69,484,827 |
|
|
|
|
$ |
43,354,505 |
|
| Undistributed (distributions in excess of) net investment income |
|
|
|
|
279,493 |
|
|
|
|
|
84,765 |
|
|
|
|
|
48,599 |
|
| Accumulated net realized gain (loss) on investments |
|
|
|
|
(1,668,726) |
|
|
|
|
|
(14,589,054) |
|
|
|
|
|
(14,810,093) |
|
| Net unrealized appreciation (depreciation) of investments |
|
|
|
|
3,842,847 |
|
|
|
|
|
8,412,810 |
|
|
|
|
|
10,438,008 |
|
|
|
|
|
|
|
|
|
|
|
|
|
|
|
|
|
|
|
|
| TOTAL NET ASSETS |
|
|
|
$ |
47,934,025 |
|
|
|
|
$ |
63,393,348 |
|
|
|
|
$ |
39,031,019 |
|
| |
|
|
|
|
|
|
|
|
|
|
|
|
|
|
|
|
|
|
| COMPUTATION OF NET ASSET VALUE AND OFFERING PRICE: |
|
|
|
|
|
|
|
|
|
|
|
|
|
|
|
|
|
|
| Class A |
|
|
|
|
|
|
|
|
|
|
|
|
|
|
|
|
|
|
| Net Assets |
|
|
|
$ |
6,016,119 |
|
|
|
|
$ |
60,640,298 |
|
|
|
|
$ |
3,204,676 |
|
|
|
|
|
|
|
|
|
|
|
|
|
|
|
|
|
|
|
|
| Shares outstanding (unlimited shares authorized) |
|
|
|
|
545,619 |
|
|
|
|
|
6,151,712 |
|
|
|
|
|
313,845 |
|
|
|
|
|
|
|
|
|
|
|
|
|
|
|
|
|
|
|
|
| Net Asset Value per share |
|
|
|
$ |
11.03 |
|
|
|
|
$ |
9.86 |
|
|
|
|
$ |
10.21 |
|
|
|
|
|
|
|
|
|
|
|
|
|
|
|
|
|
|
|
|
| Offering price per share* |
|
|
|
$ |
11.67 |
** |
|
|
|
$ |
10.43 |
** |
|
|
|
$ |
10.80 |
** |
|
|
|
|
|
|
|
|
|
|
|
|
|
|
|
|
|
|
|
| Class I |
|
|
|
|
|
|
|
|
|
|
|
|
|
|
|
|
|
|
| Net Assets |
|
|
|
$ |
41,917,906 |
|
|
|
|
$ |
2,753,050 |
|
|
|
|
$ |
35,826,343 |
|
|
|
|
|
|
|
|
|
|
|
|
|
|
|
|
|
|
|
|
| Shares outstanding (unlimited shares authorized) |
|
|
|
|
3,794,026 |
|
|
|
|
|
279,647 |
|
|
|
|
|
3,499,460 |
|
|
|
|
|
|
|
|
|
|
|
|
|
|
|
|
|
|
|
|
| Net Asset Value per share |
|
|
|
$ |
11.05 |
|
|
|
|
$ |
9.84 |
|
|
|
|
$ |
10.24 |
|
|
|
|
|
|
|
|
|
|
|
|
|
|
|
|
|
|
|
|
| (a) |
Includes $35,198,343, $18,974,817 and $29,574,326 of investments in affiliated issuers, respectively. |
| * |
See “What Do Shares Cost?” in the Prospectus. |
| ** |
Computation of offering price per share 100/94.50 of net asset value. |
See Notes which are an integral part of the Financial Statements
ANNUAL REPORT / April
30, 2013
82 STATEMENTS OF OPERATIONS
|
|
|
|
|
|
|
|
|
|
|
|
|
|
|
|
|
|
|
|
|
| Year Ended April 30, 2013 |
|
|
|
Wilmington
Multi-Manager
International
Fund |
|
|
|
|
Wilmington
Rock
Maple
Alternatives
Fund |
|
|
|
|
Wilmington
Multi-Manager
Real
Asset
Fund |
|
|
|
| INVESTMENT INCOME: |
|
|
|
|
|
|
|
|
|
|
|
|
|
|
|
|
|
|
|
|
| Dividends |
|
|
|
$ |
12,354,420 |
(a)(b) |
|
|
|
$ |
585,708 |
(a) |
|
|
|
$ |
4,245,050 |
(a)(b) |
|
|
| Interest |
|
|
|
|
— |
|
|
|
|
|
492,551 |
(a) |
|
|
|
|
4,955,678 |
(a) |
|
|
| Securities lending income |
|
|
|
|
144,469 |
|
|
|
|
|
— |
|
|
|
|
|
3,791 |
|
|
|
|
|
|
|
|
|
|
|
|
|
|
|
|
|
|
|
|
|
|
|
|
| TOTAL INVESTMENT INCOME |
|
|
|
|
12,498,889 |
|
|
|
|
|
1,078,259 |
|
|
|
|
|
9,204,519 |
|
|
|
| |
|
|
|
|
|
|
|
|
|
|
|
|
|
|
|
|
|
|
|
|
| EXPENSES: |
|
|
|
|
|
|
|
|
|
|
|
|
|
|
|
|
|
|
|
|
| Investment advisory fee |
|
|
|
|
4,433,243 |
|
|
|
|
|
812,338 |
|
|
|
|
|
3,167,916 |
|
|
|
| Administrative personnel and services fee |
|
|
|
|
101,297 |
|
|
|
|
|
8,377 |
|
|
|
|
|
87,734 |
|
|
|
| Portfolio accounting, administration and custodian fees |
|
|
|
|
724,495 |
|
|
|
|
|
63,814 |
|
|
|
|
|
375,731 |
|
|
|
| Transfer and dividend disbursing agent fees and expenses |
|
|
|
|
140,674 |
|
|
|
|
|
3,228 |
|
|
|
|
|
159,130 |
|
|
|
| Trustees’ fees |
|
|
|
|
28,856 |
|
|
|
|
|
28,247 |
|
|
|
|
|
27,177 |
|
|
|
| Professional fees |
|
|
|
|
144,188 |
|
|
|
|
|
78,492 |
|
|
|
|
|
100,299 |
|
|
|
| Distribution services fee—Class A |
|
|
|
|
15,511 |
|
|
|
|
|
2,641 |
|
|
|
|
|
15,455 |
|
|
|
| Shareholder services fee—Class A |
|
|
|
|
15,511 |
|
|
|
|
|
2,641 |
|
|
|
|
|
15,455 |
|
|
|
| Shareholder services fee— Class I |
|
|
|
|
1,090,186 |
|
|
|
|
|
88,858 |
|
|
|
|
|
941,106 |
|
|
|
| Share registration costs |
|
|
|
|
34,002 |
|
|
|
|
|
25,821 |
|
|
|
|
|
43,982 |
|
|
|
| Printing and postage |
|
|
|
|
41,189 |
|
|
|
|
|
11,430 |
|
|
|
|
|
41,663 |
|
|
|
| Dividend expense on securities sold short |
|
|
|
|
— |
|
|
|
|
|
166,200 |
|
|
|
|
|
— |
|
|
|
| Prime broker interest expense |
|
|
|
|
— |
|
|
|
|
|
80,150 |
|
|
|
|
|
— |
|
|
|
| Interest expense on reverse repurchase agreements |
|
|
|
|
— |
|
|
|
|
|
— |
|
|
|
|
|
4,675 |
|
|
|
| Miscellaneous |
|
|
|
|
40,952 |
|
|
|
|
|
10,370 |
|
|
|
|
|
40,054 |
|
|
|
|
|
|
|
|
|
|
|
|
|
|
|
|
|
|
|
|
|
|
|
|
| TOTAL EXPENSES |
|
|
|
|
6,810,104 |
|
|
|
|
|
1,382,607 |
|
|
|
|
|
5,020,377 |
|
|
|
| |
|
|
|
|
|
|
|
|
|
|
|
|
|
|
|
|
|
|
|
|
| WAIVERS AND REIMBURSEMENTS: |
|
|
|
|
|
|
|
|
|
|
|
|
|
|
|
|
|
|
|
|
| Waiver/reimbursement by investment advisor |
|
|
|
|
(228,596) |
|
|
|
|
|
(317,328) |
|
|
|
|
|
(148,456) |
|
|
|
| Waiver of distribution services fee—Class A |
|
|
|
|
(183) |
|
|
|
|
|
— |
|
|
|
|
|
— |
|
|
|
| Waiver of shareholder services fee—Class A |
|
|
|
|
(15,511) |
|
|
|
|
|
(2,641) |
|
|
|
|
|
(15,455) |
|
|
|
| Waiver of shareholder services fee—Class I |
|
|
|
|
(587,767) |
|
|
|
|
|
(88,858) |
|
|
|
|
|
(941,106) |
|
|
|
|
|
|
|
|
|
|
|
|
|
|
|
|
|
|
|
|
|
|
|
|
| TOTAL WAIVERS AND REIMBURSEMENTS |
|
|
|
|
(832,057) |
|
|
|
|
|
(408,827) |
|
|
|
|
|
(1,105,017) |
|
|
|
| |
|
|
|
|
|
|
|
|
|
|
|
|
|
|
|
|
|
|
|
|
| Net expenses |
|
|
|
|
5,978,047 |
|
|
|
|
|
973,780 |
|
|
|
|
|
3,915,360 |
|
|
|
|
|
|
|
|
|
|
|
|
|
|
|
|
|
|
|
|
|
|
|
|
| Net investment income (loss) |
|
|
|
|
6,520,842 |
|
|
|
|
|
104,479 |
|
|
|
|
|
5,289,159 |
|
|
|
|
|
|
|
|
|
|
|
|
|
|
|
|
|
|
|
|
|
|
|
|
| REALIZED AND UNREALIZED GAIN (LOSS) ON INVESTMENTS: |
|
|
|
|
|
|
|
|
|
|
|
|
|
|
|
|
|
|
|
|
| Net realized gain (loss) on investments |
|
|
|
|
1,632,205 |
|
|
|
|
|
541,885 |
|
|
|
|
|
11,981,487 |
|
|
|
| Net realized gain (loss) of foreign currency transactions |
|
|
|
|
(120,408) |
|
|
|
|
|
65,671 |
|
|
|
|
|
1,379,295 |
|
|
|
| Net realized gain (loss) on futures contracts |
|
|
|
|
(11,960) |
|
|
|
|
|
— |
|
|
|
|
|
(251,317) |
|
|
|
| Net realized gain (loss) on swap agreements |
|
|
|
|
— |
|
|
|
|
|
— |
|
|
|
|
|
184,905 |
|
|
|
| Net realized gain (loss) on options written |
|
|
|
|
— |
|
|
|
|
|
434,046 |
|
|
|
|
|
143,645 |
|
|
|
| Net realized gain (loss) on short sales |
|
|
|
|
— |
|
|
|
|
|
(653,018) |
|
|
|
|
|
(1,153) |
|
|
|
| Net change in unrealized appreciation (depreciation) of investments |
|
|
|
|
39,873,592 |
|
|
|
|
|
1,805,504 |
|
|
|
|
|
21,596,419 |
|
|
|
|
|
|
|
|
|
|
|
|
|
|
|
|
|
|
|
|
|
|
|
|
| Net realized and unrealized gain (loss) on investments |
|
|
|
|
41,373,429 |
|
|
|
|
|
2,194,088 |
|
|
|
|
|
35,033,281 |
|
|
|
|
|
|
|
|
|
|
|
|
|
|
|
|
|
|
|
|
|
|
|
|
| Change in net assets resulting from operations |
|
|
|
$ |
47,894,271 |
|
|
|
|
$ |
2,298,567 |
|
|
|
|
$ |
40,322,440 |
|
|
|
|
|
|
|
|
|
|
|
|
|
|
|
|
|
|
|
|
|
|
|
|
| (a) |
Net of foreign withholding taxes withheld of $1,113,389, $3,885 and $217,870, respectively. |
| (b) |
Includes $406 and $541 received from affiliated issuers, respectively. |
See Notes which are an integral part of the Financial Statements
April 30, 2013 / ANNUAL REPORT
STATEMENTS OF OPERATIONS (concluded) 83
|
|
|
|
|
|
|
|
|
|
|
|
|
|
|
|
|
|
|
|
|
| Year Ended April 30, 2013 |
|
|
|
Wilmington
Strategic
Allocation
Conservative Fund |
|
|
|
|
Wilmington
Strategic
Allocation
Moderate Fund |
|
|
|
|
Wilmington
Strategic
Allocation
Aggressive Fund |
|
|
|
| INVESTMENT INCOME: |
|
|
|
|
|
|
|
|
|
|
|
|
|
|
|
|
|
|
|
|
| Dividends(a) |
|
|
|
$ |
1,202,055 |
|
|
|
|
$ |
1,010,798 |
|
|
|
|
$ |
775,078 |
|
|
|
| Interest |
|
|
|
|
— |
|
|
|
|
|
368,901 |
|
|
|
|
|
— |
|
|
|
| Securities lending income |
|
|
|
|
— |
|
|
|
|
|
21,669 |
|
|
|
|
|
— |
|
|
|
|
|
|
|
|
|
|
|
|
|
|
|
|
|
|
|
|
|
|
|
|
| TOTAL INVESTMENT INCOME |
|
|
|
|
1,202,055 |
|
|
|
|
|
1,401,368 |
|
|
|
|
|
775,078 |
|
|
|
| |
|
|
|
|
|
|
|
|
|
|
|
|
|
|
|
|
|
|
|
|
| EXPENSES: |
|
|
|
|
|
|
|
|
|
|
|
|
|
|
|
|
|
|
|
|
| Investment advisory fee |
|
|
|
|
248,544 |
|
|
|
|
|
319,652 |
|
|
|
|
|
194,396 |
|
|
|
| Administrative personnel and services fee |
|
|
|
|
11,409 |
|
|
|
|
|
14,670 |
|
|
|
|
|
8,920 |
|
|
|
| Portfolio accounting, administration and custodian fees |
|
|
|
|
26,555 |
|
|
|
|
|
25,574 |
|
|
|
|
|
30,874 |
|
|
|
| Transfer and dividend disbursing agent fees and expenses |
|
|
|
|
7,841 |
|
|
|
|
|
104,660 |
|
|
|
|
|
9,604 |
|
|
|
| Trustees’ fees |
|
|
|
|
28,994 |
|
|
|
|
|
28,112 |
|
|
|
|
|
28,986 |
|
|
|
| Professional fees |
|
|
|
|
51,409 |
|
|
|
|
|
56,497 |
|
|
|
|
|
52,081 |
|
|
|
| Distribution services fee—Class A |
|
|
|
|
16,185 |
|
|
|
|
|
152,603 |
|
|
|
|
|
7,531 |
|
|
|
| Shareholder services fee—Class A |
|
|
|
|
16,185 |
|
|
|
|
|
152,603 |
|
|
|
|
|
7,531 |
|
|
|
| Shareholder services fee— Class I |
|
|
|
|
108,087 |
|
|
|
|
|
7,223 |
|
|
|
|
|
89,667 |
|
|
|
| Share registration costs |
|
|
|
|
29,057 |
|
|
|
|
|
17,690 |
|
|
|
|
|
30,214 |
|
|
|
| Printing and postage |
|
|
|
|
5,964 |
|
|
|
|
|
30,028 |
|
|
|
|
|
3,887 |
|
|
|
| Miscellaneous |
|
|
|
|
14,621 |
|
|
|
|
|
13,658 |
|
|
|
|
|
15,767 |
|
|
|
|
|
|
|
|
|
|
|
|
|
|
|
|
|
|
|
|
|
|
|
|
| TOTAL EXPENSES |
|
|
|
|
564,851 |
|
|
|
|
|
922,970 |
|
|
|
|
|
479,458 |
|
|
|
| |
|
|
|
|
|
|
|
|
|
|
|
|
|
|
|
|
|
|
|
|
| WAIVERS AND REIMBURSEMENTS: |
|
|
|
|
|
|
|
|
|
|
|
|
|
|
|
|
|
|
|
|
| Waiver/reimbursement by investment advisor |
|
|
|
|
(191,467) |
|
|
|
|
|
(235,533) |
|
|
|
|
|
(133,678) |
|
|
|
| Waiver of distribution services fee—Class A |
|
|
|
|
— |
|
|
|
|
|
(29) |
|
|
|
|
|
— |
|
|
|
| Waiver of shareholder services fee—Class A |
|
|
|
|
(16,185) |
|
|
|
|
|
(152,603) |
|
|
|
|
|
(7,531) |
|
|
|
| Waiver of shareholder services fee—Class I |
|
|
|
|
(108,087) |
|
|
|
|
|
(7,223) |
|
|
|
|
|
(89,667) |
|
|
|
|
|
|
|
|
|
|
|
|
|
|
|
|
|
|
|
|
|
|
|
|
| TOTAL WAIVERS AND REIMBURSEMENTS |
|
|
|
|
(315,739) |
|
|
|
|
|
(395,388) |
|
|
|
|
|
(230,876) |
|
|
|
| |
|
|
|
|
|
|
|
|
|
|
|
|
|
|
|
|
|
|
|
|
| Net expenses |
|
|
|
|
249,112 |
|
|
|
|
|
527,582 |
|
|
|
|
|
248,582 |
|
|
|
|
|
|
|
|
|
|
|
|
|
|
|
|
|
|
|
|
|
|
|
|
| Net investment income |
|
|
|
|
952,943 |
|
|
|
|
|
873,786 |
|
|
|
|
|
526,496 |
|
|
|
|
|
|
|
|
|
|
|
|
|
|
|
|
|
|
|
|
|
|
|
|
| REALIZED AND UNREALIZED GAIN (LOSS) ON INVESTMENTS: |
|
|
|
|
|
|
|
|
|
|
|
|
|
|
|
|
|
|
|
|
| Net realized gain (loss) on investments |
|
|
|
|
1,236,740 |
|
|
|
|
|
1,217,145 |
|
|
|
|
|
739,351 |
|
|
|
| Net realized gain (loss) from affiliated investment companies |
|
|
|
|
1,288,488 |
|
|
|
|
|
969,255 |
|
|
|
|
|
2,357,380 |
|
|
|
| Realized gain distributions received from investment companies |
|
|
|
|
426,208 |
(b) |
|
|
|
|
451,018 |
(b) |
|
|
|
|
17,555 |
(b) |
|
|
| Net change in unrealized appreciation (depreciation) of investments |
|
|
|
|
(972,404) |
|
|
|
|
|
1,297,464 |
|
|
|
|
|
786,944 |
|
|
|
|
|
|
|
|
|
|
|
|
|
|
|
|
|
|
|
|
|
|
|
|
| Net realized and unrealized gain (loss) on investments |
|
|
|
|
1,979,032 |
|
|
|
|
|
3,934,882 |
|
|
|
|
|
3,901,230 |
|
|
|
|
|
|
|
|
|
|
|
|
|
|
|
|
|
|
|
|
|
|
|
|
| Change in net assets resulting from operations |
|
|
|
$ |
2,931,975 |
|
|
|
|
$ |
4,808,668 |
|
|
|
|
$ |
4,427,726 |
|
|
|
|
|
|
|
|
|
|
|
|
|
|
|
|
|
|
|
|
|
|
|
|
| (a) |
Includes $766,629, $145,704 and $564,525 received from affiliated issuers, respectively. |
| (b) |
Includes $412,964, $334,457 and $0 received from affiliated issuers, respectively. |
See Notes which are an integral part of the Financial Statements
ANNUAL REPORT / April
30, 2013
84 STATEMENTS OF CHANGES IN NET ASSETS
|
|
|
|
|
|
|
|
|
|
|
|
|
|
|
|
|
|
|
|
|
|
|
|
|
|
|
|
|
|
|
|
|
|
|
|
|
| |
|
|
|
Wilmington
Multi-Manager
International
Fund |
|
|
|
|
|
|
Wilmington
Rock
Maple
Alternatives
Fund |
|
|
|
|
|
| |
|
Year Ended April 30,
2013
|
|
|
|
|
Ten Months Ended April 30,
2012(a)
|
|
|
|
|
Year Ended June 30, 2011 |
|
|
|
|
|
|
Year Ended April 30,
2013
|
|
|
|
|
Year Ended April 30,
2012*
|
|
|
|
|
|
| OPERATIONS: |
|
|
|
|
|
|
|
|
|
|
|
|
|
|
|
|
|
|
|
|
|
|
|
|
|
|
|
|
|
|
|
|
|
|
|
|
| Net investment income (loss) |
|
|
|
$ |
6,520,842 |
|
|
|
|
$ |
3,173,418 |
|
|
|
|
$ |
4,518,207 |
|
|
|
|
|
|
$ |
104,479 |
|
|
|
|
$ |
147,748 |
|
|
|
|
|
| Net realized gain (loss) on investments |
|
|
|
|
1,499,837 |
|
|
|
|
|
(10,376,352) |
|
|
|
|
|
23,982,615 |
|
|
|
|
|
|
|
388,584 |
|
|
|
|
|
(104,089) |
|
|
|
|
|
| Net change in unrealized appreciation
(depreciation) of investments |
|
|
|
|
39,873,592 |
|
|
|
|
|
(38,808,023) |
|
|
|
|
|
43,967,692 |
|
|
|
|
|
|
|
1,805,504 |
|
|
|
|
|
206,448 |
|
|
|
|
|
|
|
|
|
|
|
|
|
|
|
|
|
|
|
|
|
|
|
|
|
|
|
|
|
|
|
|
|
|
|
|
|
|
|
|
|
|
| Change in net assets resulting from operations |
|
|
|
|
47,894,271 |
|
|
|
|
|
(46,010,957) |
|
|
|
|
|
72,468,514 |
|
|
|
|
|
|
|
2,298,567 |
|
|
|
|
|
250,107 |
|
|
|
|
|
|
|
|
|
|
|
|
|
|
|
|
|
|
|
|
|
|
|
|
|
|
|
|
|
|
|
|
|
|
|
|
|
|
|
|
|
|
| DISTRIBUTIONS TO SHAREHOLDERS: |
|
|
|
|
|
|
|
|
|
|
|
|
|
|
|
|
|
|
|
|
|
|
|
|
|
|
|
|
|
|
|
|
|
|
|
|
| Distributions from net investment income |
|
|
|
|
|
|
|
|
|
|
|
|
|
|
|
|
|
|
|
|
|
|
|
|
|
|
|
|
|
|
|
|
|
|
|
|
| Class A |
|
|
|
|
(111,214) |
|
|
|
|
|
(1,355) |
|
|
|
|
|
(5,671) |
|
|
|
|
|
|
|
(4,523) |
|
|
|
|
|
— |
|
|
|
|
|
| Class I |
|
|
|
|
(7,211,270) |
|
|
|
|
|
(1,469,295) |
|
|
|
|
|
(4,170,715) |
|
|
|
|
|
|
|
(199,237) |
|
|
|
|
|
(71,149) |
|
|
|
|
|
| Distributions from net realized gain on
investments |
|
|
|
|
|
|
|
|
|
|
|
|
|
|
|
|
|
|
|
|
|
|
|
|
|
|
|
|
|
|
|
|
|
|
|
|
| Class A |
|
|
|
|
— |
|
|
|
|
|
— |
|
|
|
|
|
— |
|
|
|
|
|
|
|
(8,614 |
) |
|
|
|
|
— |
|
|
|
|
|
| Class I |
|
|
|
|
— |
|
|
|
|
|
— |
|
|
|
|
|
— |
|
|
|
|
|
|
|
(223,223 |
) |
|
|
|
|
— |
|
|
|
|
|
|
|
|
|
|
|
|
|
|
|
|
|
|
|
|
|
|
|
|
|
|
|
|
|
|
|
|
|
|
|
|
|
|
|
|
|
|
| Change in net assets resulting from distributions to shareholders |
|
|
|
|
(7,322,484) |
|
|
|
|
|
(1,470,650) |
|
|
|
|
|
(4,176,386) |
|
|
|
|
|
|
|
(435,597) |
|
|
|
|
|
(71,149) |
|
|
|
|
|
|
|
|
|
|
|
|
|
|
|
|
|
|
|
|
|
|
|
|
|
|
|
|
|
|
|
|
|
|
|
|
|
|
|
|
|
|
| SHARE TRANSACTIONS: |
|
|
|
|
|
|
|
|
|
|
|
|
|
|
|
|
|
|
|
|
|
|
|
|
|
|
|
|
|
|
|
|
|
|
|
|
| Proceeds from sale of shares |
|
|
|
|
|
|
|
|
|
|
|
|
|
|
|
|
|
|
|
|
|
|
|
|
|
|
|
|
|
|
|
|
|
|
|
|
| Class A |
|
|
|
|
142,433 |
|
|
|
|
|
156,622 |
|
|
|
|
|
550,709 |
|
|
|
|
|
|
|
2,861,578 |
|
|
|
|
|
121,568 |
|
|
|
|
|
| Class I |
|
|
|
|
166,779,699 |
|
|
|
|
|
43,205,337 |
|
|
|
|
|
132,362,115 |
|
|
|
|
|
|
|
27,403,985 |
|
|
|
|
|
25,140,242 |
|
|
|
|
|
| Proceeds from shares issued in connection with Reorganization (Note 8) |
|
|
|
|
— |
|
|
|
|
|
131,922,273 |
|
|
|
|
|
— |
|
|
|
|
|
|
|
— |
|
|
|
|
|
— |
|
|
|
|
|
| Distributions reinvested |
|
|
|
|
|
|
|
|
|
|
|
|
|
|
|
|
|
|
|
|
|
|
|
|
|
|
|
|
|
|
|
|
|
|
|
|
| Class A |
|
|
|
|
103,845 |
|
|
|
|
|
1,225 |
|
|
|
|
|
5,480 |
|
|
|
|
|
|
|
4,638 |
|
|
|
|
|
— |
|
|
|
|
|
| Class I |
|
|
|
|
3,795,059 |
|
|
|
|
|
636,820 |
|
|
|
|
|
1,806,057 |
|
|
|
|
|
|
|
253,077 |
|
|
|
|
|
1,524 |
|
|
|
|
|
| Cost of shares redeemed |
|
|
|
|
|
|
|
|
|
|
|
|
|
|
|
|
|
|
|
|
|
|
|
|
|
|
|
|
|
|
|
|
|
|
|
|
| Class A |
|
|
|
|
(1,098,408) |
|
|
|
|
|
(359,888) |
|
|
|
|
|
(102,237) |
|
|
|
|
|
|
|
(667,034) |
|
|
|
|
|
— |
|
|
|
|
|
| Class I |
|
|
|
|
(93,477,137) |
|
|
|
|
|
(100,077,373) |
|
|
|
|
|
(77,659,243) |
|
|
|
|
|
|
|
(9,717,858) |
|
|
|
|
|
(386,344) |
|
|
|
|
|
|
|
|
|
|
|
|
|
|
|
|
|
|
|
|
|
|
|
|
|
|
|
|
|
|
|
|
|
|
|
|
|
|
|
|
|
|
| Change in net assets resulting from share transactions |
|
|
|
|
76,245,491 |
|
|
|
|
|
75,485,016 |
|
|
|
|
|
56,962,881 |
|
|
|
|
|
|
|
20,138,386 |
|
|
|
|
|
24,876,990 |
|
|
|
|
|
|
|
|
|
|
|
|
|
|
|
|
|
|
|
|
|
|
|
|
|
|
|
|
|
|
|
|
|
|
|
|
|
|
|
|
|
|
| Change in net assets |
|
|
|
|
116,817,278 |
|
|
|
|
|
28,003,409 |
|
|
|
|
|
125,255,009 |
|
|
|
|
|
|
|
22,001,356 |
|
|
|
|
|
25,055,948 |
|
|
|
|
|
| NET ASSETS: |
|
|
|
|
|
|
|
|
|
|
|
|
|
|
|
|
|
|
|
|
|
|
|
|
|
|
|
|
|
|
|
|
|
|
|
|
| Beginning of period |
|
|
|
|
402,372,395 |
|
|
|
|
|
374,368,986 |
|
|
|
|
|
249,113,977 |
|
|
|
|
|
|
|
25,055,948 |
|
|
|
|
|
— |
|
|
|
|
|
|
|
|
|
|
|
|
|
|
|
|
|
|
|
|
|
|
|
|
|
|
|
|
|
|
|
|
|
|
|
|
|
|
|
|
|
|
| End of period |
|
|
|
$ |
519,189,673 |
|
|
|
|
$ |
402,372,395 |
|
|
|
|
$ |
374,368,986 |
|
|
|
|
|
|
$ |
47,057,304 |
|
|
|
|
$ |
25,055,948 |
|
|
|
|
|
|
|
|
|
|
|
|
|
|
|
|
|
|
|
|
|
|
|
|
|
|
|
|
|
|
|
|
|
|
|
|
|
|
|
|
|
|
| Undistributed (distributions in excess of) net investment income included in net assets at end of period |
|
|
|
$ |
2,491,830 |
|
|
|
|
$ |
3,137,031 |
|
|
|
|
$ |
(225,519) |
|
|
|
|
|
|
$ |
55,303 |
|
|
|
|
$ |
8,784 |
|
|
|
|
|
|
|
|
|
|
|
|
|
|
|
|
|
|
|
|
|
|
|
|
|
|
|
|
|
|
|
|
|
|
|
|
|
|
|
|
|
|
| SHARES OF BENEFICIAL INTEREST: |
|
|
|
|
|
|
|
|
|
|
|
|
|
|
|
|
|
|
|
|
|
|
|
|
|
|
|
|
|
|
|
|
|
|
|
|
| Shares sold |
|
|
|
|
|
|
|
|
|
|
|
|
|
|
|
|
|
|
|
|
|
|
|
|
|
|
|
|
|
|
|
|
|
|
|
|
| Class A |
|
|
|
|
21,733 |
|
|
|
|
|
22,732 |
|
|
|
|
|
73,980 |
|
|
|
|
|
|
|
277,947 |
|
|
|
|
|
11,964 |
|
|
|
|
|
| Class I |
|
|
|
|
24,972,503 |
|
|
|
|
|
6,748,787 |
|
|
|
|
|
17,575,569 |
|
|
|
|
|
|
|
2,674,880 |
|
|
|
|
|
2,512,086 |
|
|
|
|
|
| Shares issued in connection with Reorganization (Note 8) |
|
|
|
|
— |
|
|
|
|
|
19,336,655 |
|
|
|
|
|
— |
|
|
|
|
|
|
|
— |
|
|
|
|
|
— |
|
|
|
|
|
| Distributions reinvested |
|
|
|
|
|
|
|
|
|
|
|
|
|
|
|
|
|
|
|
|
|
|
|
|
|
|
|
|
|
|
|
|
|
|
|
|
| Class A |
|
|
|
|
16,626 |
|
|
|
|
|
189 |
|
|
|
|
|
746 |
|
|
|
|
|
|
|
456 |
|
|
|
|
|
— |
|
|
|
|
|
| Class I |
|
|
|
|
602,343 |
|
|
|
|
|
97,298 |
|
|
|
|
|
245,029 |
|
|
|
|
|
|
|
24,901 |
|
|
|
|
|
150 |
|
|
|
|
|
| Shares redeemed |
|
|
|
|
|
|
|
|
|
|
|
|
|
|
|
|
|
|
|
|
|
|
|
|
|
|
|
|
|
|
|
|
|
|
|
|
| Class A |
|
|
|
|
(165,710) |
|
|
|
|
|
(54,447) |
|
|
|
|
|
(13,770) |
|
|
|
|
|
|
|
(63,829) |
|
|
|
|
|
— |
|
|
|
|
|
| Class I |
|
|
|
|
(13,970,185) |
|
|
|
|
|
(15,391,690) |
|
|
|
|
|
(10,733,877) |
|
|
|
|
|
|
|
(945,109) |
|
|
|
|
|
(38,142) |
|
|
|
|
|
|
|
|
|
|
|
|
|
|
|
|
|
|
|
|
|
|
|
|
|
|
|
|
|
|
|
|
|
|
|
|
|
|
|
|
|
|
| Net change resulting from share transactions |
|
|
|
|
11,477,310 |
|
|
|
|
|
10,759,524 |
|
|
|
|
|
7,147,677 |
|
|
|
|
|
|
|
1,969,246 |
|
|
|
|
|
2,486,058 |
|
|
|
|
|
|
|
|
|
|
|
|
|
|
|
|
|
|
|
|
|
|
|
|
|
|
|
|
|
|
|
|
|
|
|
|
|
|
|
|
|
|
|
|
|
|
|
|
|
|
|
|
|
|
|
|
|
|
|
|
|
|
|
|
|
|
|
|
|
|
|
|
|
|
|
|
|
|
|
| (a) |
Year end changed from June 30 to April 30. |
| * |
Commencement of investment operations January 12, 2012. |
See Notes which are an integral part of the Financial Statements
April 30, 2013 / ANNUAL REPORT
STATEMENTS OF CHANGES IN NET ASSETS (continued) 85
|
|
|
|
|
|
|
|
|
|
|
|
|
|
|
|
|
|
|
|
|
|
|
|
|
|
|
|
|
|
|
|
|
|
|
|
|
|
|
| |
|
|
|
Wilmington
Multi-Manager
Real Asset
Fund |
|
|
|
|
Wilmington
Strategic
Allocation Conservative Fund |
|
|
|
| |
|
|
|
Year Ended April 30,
2013
|
|
|
|
|
Ten Months Ended April 30,
2012(a)
|
|
|
|
|
Year Ended June 30,
2011
|
|
|
|
|
Year Ended
April 30, 2013 |
|
|
|
|
Ten Months
Ended
April
30,
2012(a)
|
|
|
|
|
Year Ended June 30,
2011
|
|
|
|
| OPERATIONS: |
|
|
|
|
|
|
|
|
|
|
|
|
|
|
|
|
|
|
|
|
|
|
|
|
|
|
|
|
|
|
|
|
|
|
|
|
|
|
| Net investment income (loss) |
|
|
|
$ |
5,289,159 |
|
|
|
|
$ |
(1,770,999) |
|
|
|
|
$ |
14,208,111 |
|
|
|
|
$ |
952,943 |
|
|
|
|
$ |
1,016,371 |
|
|
|
|
$ |
1,807,659 |
|
|
|
| Net realized gain (loss) on investments |
|
|
|
|
13,436,862 |
|
|
|
|
|
9,789,834 |
|
|
|
|
|
23,990,074 |
|
|
|
|
|
2,951,436 |
|
|
|
|
|
1,952,265 |
|
|
|
|
|
1,414,599 |
|
|
|
| Net change in unrealized appreciation (depreciation) of investments |
|
|
|
|
21,596,419 |
|
|
|
|
|
(873,799) |
|
|
|
|
|
20,676,164 |
|
|
|
|
|
(972,404) |
|
|
|
|
|
(2,033,581) |
|
|
|
|
|
4,673,730 |
|
|
|
| |
|
|
|
|
|
|
|
|
|
|
|
|
|
|
|
|
|
|
|
|
|
|
|
|
|
|
|
|
|
|
|
|
|
|
|
|
|
|
| Change in net assets resulting from operations |
|
|
|
|
40,322,440 |
|
|
|
|
|
7,145,036 |
|
|
|
|
|
58,874,349 |
|
|
|
|
|
2,931,975 |
|
|
|
|
|
935,055 |
|
|
|
|
|
7,895,988 |
|
|
|
| |
|
|
|
|
|
|
|
|
|
|
|
|
|
|
|
|
|
|
|
|
|
|
|
|
|
|
|
|
|
|
|
|
|
|
|
|
|
|
| DISTRIBUTIONS TO SHAREHOLDERS: |
|
|
|
|
|
|
|
|
|
|
|
|
|
|
|
|
|
|
|
|
|
|
|
|
|
|
|
|
|
|
|
|
|
|
|
|
|
|
| Distributions from net investment income |
|
|
|
|
|
|
|
|
|
|
|
|
|
|
|
|
|
|
|
|
|
|
|
|
|
|
|
|
|
|
|
|
|
|
|
|
|
|
| Class A |
|
|
|
|
(81,145) |
|
|
|
|
|
(5,519) |
|
|
|
|
|
(718,487) |
|
|
|
|
|
(125,121) |
|
|
|
|
|
(144,371) |
|
|
|
|
|
(235,297) |
|
|
|
| Class I |
|
|
|
|
(5,540,020) |
|
|
|
|
|
(240,392) |
|
|
|
|
|
(13,559,782) |
|
|
|
|
|
(935,470) |
|
|
|
|
|
(1,054,442) |
|
|
|
|
|
(1,563,166) |
|
|
|
| |
|
|
|
|
|
|
|
|
|
|
|
|
|
|
|
|
|
|
|
|
|
|
|
|
|
|
|
|
|
|
|
|
|
|
|
|
|
|
| Change in net assets resulting from distributions to shareholders |
|
|
|
|
(5,621,165) |
|
|
|
|
|
(245,911) |
|
|
|
|
|
(14,278,269) |
|
|
|
|
|
(1,060,591) |
|
|
|
|
|
(1,198,813) |
|
|
|
|
|
(1,798,463) |
|
|
|
| |
|
|
|
|
|
|
|
|
|
|
|
|
|
|
|
|
|
|
|
|
|
|
|
|
|
|
|
|
|
|
|
|
|
|
|
|
|
|
| SHARE TRANSACTIONS: |
|
|
|
|
|
|
|
|
|
|
|
|
|
|
|
|
|
|
|
|
|
|
|
|
|
|
|
|
|
|
|
|
|
|
|
|
|
|
| Proceeds from sale of shares |
|
|
|
|
|
|
|
|
|
|
|
|
|
|
|
|
|
|
|
|
|
|
|
|
|
|
|
|
|
|
|
|
|
|
|
|
|
|
| Class A |
|
|
|
|
1,212,737 |
|
|
|
|
|
1,277,305 |
|
|
|
|
|
2,247,464 |
|
|
|
|
|
169,929 |
|
|
|
|
|
89,798 |
|
|
|
|
|
7,194,268 |
|
|
|
| Class I |
|
|
|
|
116,563,420 |
|
|
|
|
|
146,316,832 |
|
|
|
|
|
47,667,501 |
|
|
|
|
|
1,963,989 |
|
|
|
|
|
3,320,115 |
|
|
|
|
|
323,968 |
|
|
|
| Distributions reinvested |
|
|
|
|
|
|
|
|
|
|
|
|
|
|
|
|
|
|
|
|
|
|
|
|
|
|
|
|
|
|
|
|
|
|
|
|
|
|
| Class A |
|
|
|
|
71,152 |
|
|
|
|
|
5,209 |
|
|
|
|
|
680,196 |
|
|
|
|
|
119,486 |
|
|
|
|
|
137,603 |
|
|
|
|
|
221,830 |
|
|
|
| Class I |
|
|
|
|
2,285,729 |
|
|
|
|
|
78,344 |
|
|
|
|
|
4,291,103 |
|
|
|
|
|
865,722 |
|
|
|
|
|
968,602 |
|
|
|
|
|
1,402,127 |
|
|
|
| Cost of shares redeemed |
|
|
|
|
|
|
|
|
|
|
|
|
|
|
|
|
|
|
|
|
|
|
|
|
|
|
|
|
|
|
|
|
|
|
|
|
|
|
| Class A |
|
|
|
|
(2,482,554) |
|
|
|
|
|
(7,934,816) |
|
|
|
|
|
(7,842,454) |
|
|
|
|
|
(1,514,337) |
|
|
|
|
|
(1,205,703) |
|
|
|
|
|
(3,342,991) |
|
|
|
| Class I |
|
|
|
|
(56,703,907) |
|
|
|
|
|
(61,223,719) |
|
|
|
|
|
(125,378,229) |
|
|
|
|
|
(7,844,528) |
|
|
|
|
|
(13,973,081) |
|
|
|
|
|
(11,688,226) |
|
|
|
| |
|
|
|
|
|
|
|
|
|
|
|
|
|
|
|
|
|
|
|
|
|
|
|
|
|
|
|
|
|
|
|
|
|
|
|
|
|
|
| Change in net assets resulting from share transactions |
|
|
|
|
60,946,577 |
|
|
|
|
|
78,519,155 |
|
|
|
|
|
(78,334,419) |
|
|
|
|
|
(6,239,739) |
|
|
|
|
|
(10,662,666) |
|
|
|
|
|
(5,889,024) |
|
|
|
| |
|
|
|
|
|
|
|
|
|
|
|
|
|
|
|
|
|
|
|
|
|
|
|
|
|
|
|
|
|
|
|
|
|
|
|
|
|
|
| Change in net assets |
|
|
|
|
95,647,852 |
|
|
|
|
|
85,418,280 |
|
|
|
|
|
(33,738,339) |
|
|
|
|
|
(4,368,355) |
|
|
|
|
|
(10,926,424) |
|
|
|
|
|
208,501 |
|
|
|
| NET ASSETS: |
|
|
|
|
|
|
|
|
|
|
|
|
|
|
|
|
|
|
|
|
|
|
|
|
|
|
|
|
|
|
|
|
|
|
|
|
|
|
| Beginning of period |
|
|
|
|
351,688,066 |
|
|
|
|
|
266,269,786 |
|
|
|
|
|
300,008,125 |
|
|
|
|
|
52,302,380 |
|
|
|
|
|
63,228,804 |
|
|
|
|
|
63,020,303 |
|
|
|
| |
|
|
|
|
|
|
|
|
|
|
|
|
|
|
|
|
|
|
|
|
|
|
|
|
|
|
|
|
|
|
|
|
|
|
|
|
|
|
| End of period |
|
|
|
$ |
447,335,918 |
|
|
|
|
$ |
351,688,066 |
|
|
|
|
$ |
266,269,786 |
|
|
|
|
$ |
47,934,025 |
|
|
|
|
$ |
52,302,380 |
|
|
|
|
$ |
63,228,804 |
|
|
|
| |
|
|
|
|
|
|
|
|
|
|
|
|
|
|
|
|
|
|
|
|
|
|
|
|
|
|
|
|
|
|
|
|
|
|
|
|
|
|
| Undistributed (distributions in excess of) net investment income included in net assets at end of
period |
|
|
|
$ |
(265,630) |
|
|
|
|
$ |
(3,182,329) |
|
|
|
|
$ |
(5,345,159) |
|
|
|
|
$ |
279,493 |
|
|
|
|
$ |
203,414 |
|
|
|
|
$ |
313,907 |
|
|
|
| |
|
|
|
|
|
|
|
|
|
|
|
|
|
|
|
|
|
|
|
|
|
|
|
|
|
|
|
|
|
|
|
|
|
|
|
|
|
|
| SHARES OF BENEFICIAL INTEREST: |
|
|
|
|
|
|
|
|
|
|
|
|
|
|
|
|
|
|
|
|
|
|
|
|
|
|
|
|
|
|
|
|
|
|
|
|
|
|
| Shares sold |
|
|
|
|
|
|
|
|
|
|
|
|
|
|
|
|
|
|
|
|
|
|
|
|
|
|
|
|
|
|
|
|
|
|
|
|
|
|
| Class A |
|
|
|
|
82,008 |
|
|
|
|
|
93,062 |
|
|
|
|
|
164,706 |
|
|
|
|
|
15,803 |
|
|
|
|
|
8,568 |
|
|
|
|
|
31,671 |
|
|
|
| Class I |
|
|
|
|
7,894,671 |
|
|
|
|
|
10,525,216 |
|
|
|
|
|
3,501,036 |
|
|
|
|
|
183,347 |
|
|
|
|
|
320,755 |
|
|
|
|
|
695,050 |
|
|
|
| Distributions reinvested |
|
|
|
|
|
|
|
|
|
|
|
|
|
|
|
|
|
|
|
|
|
|
|
|
|
|
|
|
|
|
|
|
|
|
|
|
|
|
| Class A |
|
|
|
|
4,913 |
|
|
|
|
|
381 |
|
|
|
|
|
50,838 |
|
|
|
|
|
11,200 |
|
|
|
|
|
13,640 |
|
|
|
|
|
21,512 |
|
|
|
| Class I |
|
|
|
|
157,201 |
|
|
|
|
|
5,727 |
|
|
|
|
|
319,566 |
|
|
|
|
|
80,984 |
|
|
|
|
|
95,789 |
|
|
|
|
|
135,584 |
|
|
|
| Shares redeemed |
|
|
|
|
|
|
|
|
|
|
|
|
|
|
|
|
|
|
|
|
|
|
|
|
|
|
|
|
|
|
|
|
|
|
|
|
|
|
| Class A |
|
|
|
|
(172,209) |
|
|
|
|
|
(584,668) |
|
|
|
|
|
(579,584) |
|
|
|
|
|
(141,142) |
|
|
|
|
|
(117,367) |
|
|
|
|
|
(322,385) |
|
|
|
| Class I |
|
|
|
|
(3,858,115) |
|
|
|
|
|
(4,484,128) |
|
|
|
|
|
(9,233,540) |
|
|
|
|
|
(729,645) |
|
|
|
|
|
(1,357,544) |
|
|
|
|
|
(1,122,201) |
|
|
|
| |
|
|
|
|
|
|
|
|
|
|
|
|
|
|
|
|
|
|
|
|
|
|
|
|
|
|
|
|
|
|
|
|
|
|
|
|
|
|
| Net change resulting from share transactions |
|
|
|
|
4,108,469 |
|
|
|
|
|
5,555,590 |
|
|
|
|
|
(5,776,978) |
|
|
|
|
|
(579,453) |
|
|
|
|
|
(1,036,159) |
|
|
|
|
|
(560,769) |
|
|
|
| |
|
|
|
|
|
|
|
|
|
|
|
|
|
|
|
|
|
|
|
|
|
|
|
|
|
|
|
|
|
|
|
|
|
|
|
|
|
|
| (a) |
Year end changed from June 30 to April 30. |
See Notes which are an integral part of the Financial Statements
ANNUAL REPORT / April
30, 2013
86 STATEMENTS OF CHANGES IN NET ASSETS (concluded)
|
|
|
|
|
|
|
|
|
|
|
|
|
|
|
|
|
|
|
|
|
| |
|
Wilmington
Strategic Allocation
Moderate Fund |
|
|
Wilmington
Strategic
Allocation
Aggressive Fund |
|
| |
|
Year Ended
April 30, 2013 |
|
|
Year Ended
April 30, 2012 |
|
|
Year Ended
April 30, 2013 |
|
|
Ten Months Ended April 30,
2012(a)
|
|
|
Year Ended
June 30,
2011 |
|
| OPERATIONS: |
|
|
|
|
|
|
|
|
|
|
|
|
|
|
|
|
|
|
|
|
| Net investment income (loss) |
|
$ |
873,786 |
|
|
$ |
888,364 |
|
|
$ |
526,496 |
|
|
$ |
377,486 |
|
|
$ |
1,009,987 |
|
| Net realized gain (loss) on investments |
|
|
2,637,418 |
|
|
|
1,004,390 |
|
|
|
3,114,286 |
|
|
|
521,974 |
|
|
|
737,245 |
|
| Net change in unrealized appreciation (depreciation)
of investments |
|
|
1,297,464 |
|
|
|
(4,599,886 |
) |
|
|
786,944 |
|
|
|
(2,521,934 |
) |
|
|
10,603,386 |
|
|
|
|
|
|
|
|
|
|
|
|
|
|
|
|
|
|
|
|
|
|
| Change in net assets resulting from operations |
|
|
4,808,668 |
|
|
|
(2,707,132 |
) |
|
|
4,427,726 |
|
|
|
(1,622,474 |
) |
|
|
12,350,618 |
|
|
|
|
|
|
|
|
|
|
|
|
|
|
|
|
|
|
|
|
|
|
| DISTRIBUTIONS TO SHAREHOLDERS: |
|
|
|
|
|
|
|
|
|
|
|
|
|
|
|
|
|
|
|
|
| Distributions from net investment income |
|
|
|
|
|
|
|
|
|
|
|
|
|
|
|
|
|
|
|
|
| Class A |
|
|
(926,451 |
) |
|
|
(859,662 |
) |
|
|
(35,195 |
) |
|
|
(19,654 |
) |
|
|
(61,960 |
) |
| Class I |
|
|
(49,723 |
) |
|
|
(51,060 |
) |
|
|
(505,334 |
) |
|
|
(320,102 |
) |
|
|
(948,415 |
) |
| Distributions from net realized gain on investments |
|
|
|
|
|
|
|
|
|
|
|
|
|
|
|
|
|
|
|
|
| Class A |
|
|
— |
|
|
|
(87,547 |
) |
|
|
— |
|
|
|
— |
|
|
|
— |
|
| Class I |
|
|
— |
|
|
|
(3,953 |
) |
|
|
— |
|
|
|
— |
|
|
|
— |
|
|
|
|
|
|
|
|
|
|
|
|
|
|
|
|
|
|
|
|
|
|
| Change in net assets resulting from distributions
to shareholders |
|
|
(976,174 |
) |
|
|
(1,002,222 |
) |
|
|
(540,529 |
) |
|
|
(339,756 |
) |
|
|
(1,010,375 |
) |
|
|
|
|
|
|
|
|
|
|
|
|
|
|
|
|
|
|
|
|
|
| SHARE TRANSACTIONS: |
|
|
|
|
|
|
|
|
|
|
|
|
|
|
|
|
|
|
|
|
| Proceeds from sale of shares |
|
|
|
|
|
|
|
|
|
|
|
|
|
|
|
|
|
|
|
|
| Class A |
|
|
2,054,731 |
|
|
|
2,997,639 |
|
|
|
209,528 |
|
|
|
88,736 |
|
|
|
145,629 |
|
| Class I |
|
|
159,948 |
|
|
|
149,012 |
|
|
|
2,700,961 |
|
|
|
5,267,653 |
|
|
|
7,918,850 |
|
| Distributions reinvested |
|
|
|
|
|
|
|
|
|
|
|
|
|
|
|
|
|
|
|
|
| Class A |
|
|
883,415 |
|
|
|
892,049 |
|
|
|
34,161 |
|
|
|
18,277 |
|
|
|
59,889 |
|
| Class I |
|
|
49,723 |
|
|
|
55,013 |
|
|
|
162,920 |
|
|
|
98,282 |
|
|
|
286,957 |
|
| Cost of shares redeemed |
|
|
|
|
|
|
|
|
|
|
|
|
|
|
|
|
|
|
|
|
| Class A |
|
|
(11,243,873 |
) |
|
|
(10,617,664 |
) |
|
|
(433,111 |
) |
|
|
(463,921 |
) |
|
|
(1,343,528 |
) |
| Class I |
|
|
(735,576 |
) |
|
|
(354,196 |
) |
|
|
(9,861,513 |
) |
|
|
(16,104,843 |
) |
|
|
(12,864,588 |
) |
|
|
|
|
|
|
|
|
|
|
|
|
|
|
|
|
|
|
|
|
|
| Change in net assets resulting from share transactions |
|
|
(8,831,632 |
) |
|
|
(6,878,147 |
) |
|
|
(7,187,054 |
) |
|
|
(11,095,816 |
) |
|
|
(5,796,791 |
) |
|
|
|
|
|
|
|
|
|
|
|
|
|
|
|
|
|
|
|
|
|
| Change in net assets |
|
|
(4,999,138 |
) |
|
|
(10,587,501 |
) |
|
|
(3,299,857 |
) |
|
|
(13,058,046 |
) |
|
|
5,543,452 |
|
| NET ASSETS: |
|
|
|
|
|
|
|
|
|
|
|
|
|
|
|
|
|
|
|
|
| Beginning of period |
|
|
68,392,486 |
|
|
|
78,979,987 |
|
|
|
42,330,876 |
|
|
|
55,388,922 |
|
|
|
49,845,470 |
|
|
|
|
|
|
|
|
|
|
|
|
|
|
|
|
|
|
|
|
|
|
| End of period |
|
$ |
63,393,348 |
|
|
$ |
68,392,486 |
|
|
$ |
39,031,019 |
|
|
$ |
42,330,876 |
|
|
$ |
55,388,922 |
|
|
|
|
|
|
|
|
|
|
|
|
|
|
|
|
|
|
|
|
|
|
| Undistributed (distributions in excess of) net investment
income included in net assets at end of period |
|
$ |
84,765 |
|
|
$ |
101,652 |
|
|
$ |
48,599 |
|
|
$ |
62,632 |
|
|
$ |
24,902 |
|
|
|
|
|
|
|
|
|
|
|
|
|
|
|
|
|
|
|
|
|
|
| SHARES OF BENEFICIAL INTEREST: |
|
|
|
|
|
|
|
|
|
|
|
|
|
|
|
|
|
|
|
|
| Shares sold |
|
|
|
|
|
|
|
|
|
|
|
|
|
|
|
|
|
|
|
|
| Class A |
|
|
219,213 |
|
|
|
330,801 |
|
|
|
22,757 |
|
|
|
9,921 |
|
|
|
16,577 |
|
| Class I |
|
|
17,508 |
|
|
|
16,720 |
|
|
|
284,533 |
|
|
|
610,813 |
|
|
|
878,842 |
|
| Distributions reinvested |
|
|
|
|
|
|
|
|
|
|
|
|
|
|
|
|
|
|
|
|
| Class A |
|
|
94,779 |
|
|
|
102,604 |
|
|
|
3,589 |
|
|
|
2,186 |
|
|
|
6,796 |
|
| Class I |
|
|
5,344 |
|
|
|
6,304 |
|
|
|
17,145 |
|
|
|
11,700 |
|
|
|
32,395 |
|
| Shares redeemed |
|
|
|
|
|
|
|
|
|
|
|
|
|
|
|
|
|
|
|
|
| Class A |
|
|
(1,209,721 |
) |
|
|
(1,175,129 |
) |
|
|
(46,813 |
) |
|
|
(53,136 |
) |
|
|
(153,541 |
) |
| Class I |
|
|
(79,089 |
) |
|
|
(40,455 |
) |
|
|
(1,060,103 |
) |
|
|
(1,914,753 |
) |
|
|
(1,495,856 |
) |
|
|
|
|
|
|
|
|
|
|
|
|
|
|
|
|
|
|
|
|
|
| Net change resulting from share transactions |
|
|
(951,966 |
) |
|
|
(759,155 |
) |
|
|
(778,892 |
) |
|
|
(1,333,269 |
) |
|
|
(714,787 |
) |
|
|
|
|
|
|
|
|
|
|
|
|
|
|
|
|
|
|
|
|
|
| (a) |
Year end changed from June 30 to April 30. |
See Notes which are an integral part of the Financial Statements
April 30, 2013 / ANNUAL REPORT
FINANCIAL HIGHLIGHTS 87
For a share outstanding throughout each period.
|
| WILMINGTON MULTI-MANAGER INTERNATIONAL
FUND† |
|
|
|
|
|
|
|
|
|
|
|
|
|
|
|
|
|
|
|
|
|
|
|
|
|
| CLASS A |
|
Year Ended
April
30, 2013 |
|
|
For the Period
July 1, 2011
through April 30,
2012* |
|
|
Year Ended
June 30,
2011 |
|
|
Year Ended
June 30,
2010 |
|
|
Year
Ended
June 30, 2009 |
|
|
Year
Ended
June 30, 2008 |
|
| Net Asset Value, Beginning
of Period |
|
|
$6.72 |
|
|
|
$7.63 |
|
|
|
$5.95 |
|
|
|
$5.36 |
|
|
|
$8.50 |
|
|
|
$11.75 |
|
| Income (Loss) From Operations: |
|
|
|
|
|
|
|
|
|
|
|
|
|
|
|
|
|
|
|
|
|
|
|
|
| Net Investment Income (Loss)(a) |
|
|
0.09 |
|
|
|
0.16 |
|
|
|
0.12 |
|
|
|
0.06 |
|
|
|
0.08 |
|
|
|
0.15 |
|
| Net Realized and Unrealized Gain (Loss) on Investments and Foreign Currency |
|
|
0.57 |
|
|
|
(1.05 |
) |
|
|
1.64 |
|
|
|
0.63 |
|
|
|
(2.92 |
) |
|
|
(1.23 |
) |
|
|
|
|
|
| Total Income (Loss) From Operations |
|
|
0.66 |
|
|
|
(0.89 |
) |
|
|
1.76 |
|
|
|
0.69 |
|
|
|
(2.84 |
) |
|
|
(1.08 |
) |
|
|
|
|
|
| Less Distributions From: |
|
|
|
|
|
|
|
|
|
|
|
|
|
|
|
|
|
|
|
|
|
|
|
|
| Net Investment Income |
|
|
(0.11 |
) |
|
|
(0.02 |
) |
|
|
(0.08 |
) |
|
|
(0.10 |
) |
|
|
(0.10 |
) |
|
|
(0.25 |
) |
| Net Realized Gains |
|
|
— |
|
|
|
— |
|
|
|
— |
|
|
|
— |
|
|
|
(0.20 |
) |
|
|
(1.92 |
) |
| Return of Capital |
|
|
— |
|
|
|
— |
|
|
|
— |
|
|
|
0.00 |
(b) |
|
|
— |
|
|
|
— |
|
|
|
|
|
|
| Total Distributions |
|
|
(0.11 |
) |
|
|
(0.02 |
) |
|
|
(0.08 |
) |
|
|
(0.10 |
) |
|
|
(0.30 |
) |
|
|
(2.17 |
) |
|
|
|
|
|
| Net Asset Value, End of Period |
|
|
$7.27 |
|
|
|
$6.72 |
|
|
|
$7.63 |
|
|
|
$5.95 |
|
|
|
$5.36 |
|
|
|
$8.50 |
|
|
|
|
|
|
| Total Return(c) |
|
|
10.17 |
% |
|
|
(11.65 |
)% |
|
|
29.57 |
% |
|
|
12.74 |
% |
|
|
(32.95 |
)% |
|
|
(10.66 |
)% |
| Net Assets, End of Period (000’s) |
|
|
$6,301 |
|
|
|
$6,682 |
|
|
|
$571 |
|
|
|
$83 |
|
|
|
$80 |
|
|
|
$118 |
|
| Ratios to Average Net Assets |
|
|
|
|
|
|
|
|
|
|
|
|
|
|
|
|
|
|
|
|
|
|
|
|
| Gross Expense |
|
|
1.78 |
% |
|
|
1.62 |
%(d) |
|
|
1.59 |
% |
|
|
1.63 |
% |
|
|
1.72 |
% |
|
|
1.40 |
% |
| Net Expenses(e) |
|
|
1.48 |
% |
|
|
1.42 |
%(d) |
|
|
1.58 |
% |
|
|
1.62 |
% |
|
|
1.65 |
% |
|
|
1.40 |
% |
| Net Investment Income (Loss) |
|
|
1.38 |
% |
|
|
2.77 |
%(d) |
|
|
1.61 |
% |
|
|
0.89 |
% |
|
|
1.53 |
% |
|
|
1.46 |
% |
| Portfolio Turnover Rate |
|
|
72 |
% |
|
|
85 |
% |
|
|
98 |
% |
|
|
107 |
% |
|
|
136 |
% |
|
|
124 |
% |
|
|
|
|
|
|
|
|
|
|
|
|
|
|
|
|
|
|
|
|
|
|
|
|
|
| CLASS I |
|
Year Ended
April 30,
2013 |
|
|
For the Period
July 1, 2011 through April 30,
2012* |
|
|
Year Ended
June 30,
2011 |
|
|
Year Ended
June 30,
2010 |
|
|
Year Ended
June 30,
2009 |
|
|
Year Ended
June 30,
2008 |
|
| Net Asset Value, Beginning
of Period |
|
|
$6.75 |
|
|
|
$7.66 |
|
|
|
$5.97 |
|
|
|
$5.37 |
|
|
|
$8.51 |
|
|
|
$11.76 |
|
| Income (Loss) From Operations: |
|
|
|
|
|
|
|
|
|
|
|
|
|
|
|
|
|
|
|
|
|
|
|
|
| Net Investment Income (Loss)(a) |
|
|
0.10 |
|
|
|
0.06 |
|
|
|
0.10 |
|
|
|
0.07 |
|
|
|
0.10 |
|
|
|
0.18 |
|
| Net Realized and Unrealized Gain (Loss) on Investments and Foreign Currency |
|
|
0.57 |
|
|
|
(0.94 |
) |
|
|
1.67 |
|
|
|
0.64 |
|
|
|
(2.93 |
) |
|
|
(1.24 |
) |
|
|
|
|
|
| Total Income (Loss) From Operations |
|
|
0.67 |
|
|
|
(0.88 |
) |
|
|
1.77 |
|
|
|
0.71 |
|
|
|
(2.83 |
) |
|
|
(1.06 |
) |
|
|
|
|
|
| Less Distributions From: |
|
|
|
|
|
|
|
|
|
|
|
|
|
|
|
|
|
|
|
|
|
|
|
|
| Net Investment Income |
|
|
(0.12 |
) |
|
|
(0.03 |
) |
|
|
(0.08 |
) |
|
|
(0.11 |
) |
|
|
(0.11 |
) |
|
|
(0.27 |
) |
| Net Realized Gains |
|
|
— |
|
|
|
— |
|
|
|
— |
|
|
|
— |
|
|
|
(0.20 |
) |
|
|
(1.92 |
) |
| Return of Capital |
|
|
— |
|
|
|
— |
|
|
|
— |
|
|
|
0.00 |
(b) |
|
|
— |
|
|
|
— |
|
|
|
|
|
|
| Total Distributions |
|
|
(0.12 |
) |
|
|
(0.03 |
) |
|
|
(0.08 |
) |
|
|
(0.11 |
) |
|
|
(0.31 |
) |
|
|
(2.19 |
) |
|
|
|
|
|
| Net Asset Value, End of Period |
|
|
$7.30 |
|
|
|
$6.75 |
|
|
|
$7.66 |
|
|
|
$5.97 |
|
|
|
$5.37 |
|
|
|
$8.51 |
|
|
|
|
|
|
| Total Return(c) |
|
|
10.22 |
% |
|
|
(11.45 |
)% |
|
|
29.78 |
% |
|
|
13.10 |
% |
|
|
(32.82 |
)% |
|
|
(10.49 |
)% |
| Net Assets, End of Period (000’s) |
|
|
$512,889 |
|
|
|
$395,690 |
|
|
|
$373,798 |
|
|
|
$249,031 |
|
|
|
$395,536 |
|
|
|
$1,035,939 |
|
| Ratios to Average Net Assets |
|
|
|
|
|
|
|
|
|
|
|
|
|
|
|
|
|
|
|
|
|
|
|
|
| Gross Expense |
|
|
1.54 |
% |
|
|
1.42 |
%(d) |
|
|
1.43 |
% |
|
|
1.38 |
% |
|
|
1.42 |
% |
|
|
1.16 |
% |
| Net Expenses(e) |
|
|
1.35 |
% |
|
|
1.38 |
%(d) |
|
|
1.41 |
% |
|
|
1.37 |
% |
|
|
1.40 |
% |
|
|
1.15 |
% |
| Net Investment Income (Loss) |
|
|
1.47 |
% |
|
|
1.17 |
%(d) |
|
|
1.38 |
% |
|
|
1.03 |
% |
|
|
1.64 |
% |
|
|
1.75 |
% |
| Portfolio Turnover Rate |
|
|
72 |
% |
|
|
85 |
% |
|
|
98 |
% |
|
|
107 |
% |
|
|
136 |
% |
|
|
124 |
% |
| (a) |
Per share numbers have been calculated using the average shares method. |
| (b) |
Less than $.01 per share. |
| (c) |
Based on net asset value, which does not reflect the sales charge or contingent deferred sales charge, if applicable. Total returns for periods of less than
one year, if any, are not annualized. |
| (d) |
Annualized for periods less the one year. |
| (e) |
The investment advisor and other service providers waived or reimbursed a portion of their fees. |
| † |
Effective March 9, 2012, the Fund acquired all the assets and liabilities of the Wilmington Multi-Manager International Fund, a series of WT Mutual Fund
(the “WT Fund”). The financial highlights for the period prior to this date reflect the performance of the WT Fund. |
| * |
Year end changed from June 30 to April 30. |
See Notes which are an integral part of the Financial Statements
ANNUAL REPORT / April
30, 2013
88 FINANCIAL HIGHLIGHTS (continued)
For a share outstanding throughout each period.
|
| WILMINGTON ROCK MAPLE ALTERNATIVES
FUND |
|
|
|
|
|
|
|
|
|
| CLASS A |
|
Year Ended
April 30,
2013 |
|
|
For the Period
January 12,
2012*
through
April 30,
2012 |
|
| Net Asset Value, Beginning of Period |
|
|
$10.11 |
|
|
|
$10.00 |
|
| Income (Loss) From Operations: |
|
|
|
|
|
|
|
|
| Net Investment Income (Loss)(a) |
|
|
0.00 |
(b) |
|
|
0.03 |
|
| Net Realized and Unrealized Gain (Loss) on Investments and Foreign Currency |
|
|
0.56 |
|
|
|
0.08 |
|
|
|
|
|
|
| Total Income (Loss) From Operations |
|
|
0.56 |
|
|
|
0.11 |
|
|
|
|
|
|
| Less Distributions From: |
|
|
|
|
|
|
|
|
| Net Investment Income |
|
|
(0.03 |
) |
|
|
— |
|
| Net Realized Gains |
|
|
(0.06 |
) |
|
|
— |
|
|
|
|
|
|
| Total Distributions |
|
|
(0.09 |
) |
|
|
— |
|
|
|
|
|
|
| Net Asset Value, End of Period |
|
|
$10.58 |
|
|
|
$10.11 |
|
|
|
|
|
|
| Total Return(c) |
|
|
5.56 |
% |
|
|
1.10 |
% |
| Net Assets, End of Period (000’s) |
|
|
$2,397 |
|
|
|
$121 |
|
| Ratios to Average Net Assets |
|
|
|
|
|
|
|
|
| Gross Expense |
|
|
3.98 |
% |
|
|
4.66 |
%(d) |
| Net Expenses(e)(f) |
|
|
2.84 |
% |
|
|
2.89 |
%(d)(g) |
| Net Investment Income (Loss) |
|
|
0.00 |
%(h) |
|
|
0.88 |
%(d) |
| Portfolio Turnover Rate |
|
|
367 |
% |
|
|
8 |
% |
|
|
|
|
|
|
|
|
|
| CLASS I |
|
Year Ended
April
30, 2013 |
|
|
For the Period
January 12,
2012* through April 30, 2012 |
|
| Net Asset Value, Beginning of Period |
|
|
$10.08 |
|
|
|
$10.00 |
|
| Income (Loss) From Operations: |
|
|
|
|
|
|
|
|
| Net Investment Income (Loss)(a) |
|
|
0.03 |
|
|
|
0.06 |
|
| Net Realized and Unrealized Gain (Loss) on Investments and Foreign Currency |
|
|
0.56 |
|
|
|
0.05 |
|
|
|
|
|
|
| Total Income (Loss) From Operations |
|
|
0.59 |
|
|
|
0.11 |
|
|
|
|
|
|
| Less Distributions From: |
|
|
|
|
|
|
|
|
| Net Investment Income |
|
|
(0.05 |
) |
|
|
(0.03 |
) |
| Net Realized Gains |
|
|
(0.06 |
) |
|
|
— |
|
|
|
|
|
|
| Total Distributions |
|
|
(0.11 |
) |
|
|
(0.03 |
) |
|
|
|
|
|
| Net Asset Value, End of Period |
|
|
$10.56 |
|
|
|
$10.08 |
|
|
|
|
|
|
| Total Return(c) |
|
|
5.91 |
% |
|
|
1.10 |
% |
| Net Assets, End of Period (000’s) |
|
|
$44,660 |
|
|
|
$24,935 |
|
| Ratios to Average Net Assets |
|
|
|
|
|
|
|
|
| Gross Expense |
|
|
3.77 |
% |
|
|
4.33 |
%(d) |
| Net Expenses(e)(f) |
|
|
2.65 |
% |
|
|
2.39 |
%(d)(g) |
| Net Investment Income (Loss) |
|
|
0.29 |
% |
|
|
2.11 |
%(d) |
| Portfolio Turnover Rate |
|
|
367 |
% |
|
|
8 |
% |
| (a) |
Per share numbers have been calculated using the average shares method. |
| (b) |
Represents less than $0.005. |
| (c) |
Based on net asset value, which does not reflect the sales charge or contingent deferred sales charge, if applicable. Total returns for periods of less than
one year, if any, are not annualized. |
| (d) |
Annualized for periods less the one year. |
| (e) |
The investment advisor and other service providers waived or reimbursed a portion of their fees. |
| (f) |
Expense ratio includes dividend and interest expense related to short sales. Excluding such dividend and interest expense, the ratio of expenses to average
net assets for the year and the period presented would be: |
|
|
|
|
|
|
|
| |
|
Class A
|
|
Class I |
|
|
| 2013 |
|
2.24% |
|
1.98% |
|
|
| 2012 |
|
2.48% |
|
1.98% |
|
|
| (g) |
Ratio of expenses to average net assets was increased by 0.41% to include dividend and interest expenses related to short sales. |
| (h) |
Represents less than 0.005%. |
| * |
Commencement of operations. |
See Notes which are an integral part of the Financial Statements
April 30, 2013 / ANNUAL REPORT
FINANCIAL HIGHLIGHTS (continued) 89
For a share outstanding throughout each period.
|
| WILMINGTON MULTI-MANAGER REAL ASSET FUND† |
|
|
|
|
|
|
|
|
|
|
|
|
|
|
|
|
|
|
|
|
|
|
|
|
|
| CLASS A |
|
Year
Ended
April 30, 2013 |
|
|
For the Period
July 1, 2011 through April 30,
2012* |
|
|
Year
Ended
June 30, 2011 |
|
|
Year
Ended
June 30, 2010 |
|
|
Year
Ended
June 30, 2009 |
|
|
Year
Ended
June 30, 2008 |
|
| Net Asset Value, Beginning of
Period |
|
|
$14.28 |
|
|
|
$14.00 |
|
|
|
$12.10 |
|
|
|
$11.60 |
|
|
|
$17.75 |
|
|
|
$15.34 |
|
| Income (Loss) From Operations: |
|
|
|
|
|
|
|
|
|
|
|
|
|
|
|
|
|
|
|
|
|
|
|
|
| Net Investment Income (Loss)(a) |
|
|
0.18 |
|
|
|
(0.21 |
) |
|
|
0.63 |
|
|
|
0.02 |
|
|
|
0.15 |
|
|
|
0.63 |
|
| Net Realized and Unrealized Gain (Loss) on Investments and Foreign Currency |
|
|
1.28 |
|
|
|
0.50 |
|
|
|
1.91 |
|
|
|
0.75 |
|
|
|
(4.89 |
) |
|
|
2.65 |
|
|
|
|
|
|
| Total Income (Loss) From Operations |
|
|
1.46 |
|
|
|
0.29 |
|
|
|
2.54 |
|
|
|
0.77 |
|
|
|
(4.74 |
) |
|
|
3.28 |
|
|
|
|
|
|
| Less Distributions From: |
|
|
|
|
|
|
|
|
|
|
|
|
|
|
|
|
|
|
|
|
|
|
|
|
| Net Investment Income |
|
|
(0.19 |
) |
|
|
(0.01 |
) |
|
|
(0.64 |
) |
|
|
(0.27 |
) |
|
|
(0.59 |
) |
|
|
(0.54 |
) |
| Net Realized Gains |
|
|
— |
|
|
|
— |
|
|
|
— |
|
|
|
— |
|
|
|
(0.82 |
) |
|
|
(0.33 |
) |
|
|
|
|
|
| Total Distributions |
|
|
(0.19 |
) |
|
|
(0.01 |
) |
|
|
(0.64 |
) |
|
|
(0.27 |
) |
|
|
(1.41 |
) |
|
|
(0.87 |
) |
|
|
|
|
|
| Net Asset Value, End of Period |
|
|
$15.55 |
|
|
|
$14.28 |
|
|
|
$14.00 |
|
|
|
$12.10 |
|
|
|
$11.60 |
|
|
|
$17.75 |
|
|
|
|
|
|
| Total Return(b) |
|
|
10.33 |
% |
|
|
2.04 |
% |
|
|
21.45 |
% |
|
|
6.57 |
% |
|
|
(26.78 |
)% |
|
|
22.00 |
% |
| Net Assets, End of Period (000’s) |
|
|
$6,337 |
|
|
|
$7,038 |
|
|
|
$13,773 |
|
|
|
$16,305 |
|
|
|
$20,073 |
|
|
|
$32,637 |
|
| Ratios to Average Net Assets |
|
|
|
|
|
|
|
|
|
|
|
|
|
|
|
|
|
|
|
|
|
|
|
|
| Gross Expense |
|
|
1.55 |
% |
|
|
1.33 |
%(c) |
|
|
1.25 |
% |
|
|
1.20 |
% |
|
|
1.09 |
% |
|
|
0.99 |
% |
| Net Expenses(d) |
|
|
1.27 |
% |
|
|
1.28 |
%(c) |
|
|
1.25 |
% |
|
|
1.19 |
% |
|
|
1.07 |
% |
|
|
0.90 |
% |
| Net Investment Income (Loss) |
|
|
1.13 |
% |
|
|
(1.86 |
)%(c) |
|
|
4.64 |
% |
|
|
0.13 |
% |
|
|
1.15 |
% |
|
|
3.61 |
% |
| Portfolio Turnover Rate |
|
|
131 |
% |
|
|
180 |
% |
|
|
199 |
% |
|
|
156 |
% |
|
|
115 |
% |
|
|
72 |
% |
|
|
|
|
|
|
|
|
|
|
|
|
|
|
|
|
|
|
|
|
|
|
|
|
|
| CLASS I |
|
Year Ended
April 30,
2013 |
|
|
For the Period
July 1, 2011 through April 30,
2012* |
|
|
Year Ended
June 30,
2011 |
|
|
Year Ended
June 30,
2010 |
|
|
Year Ended
June 30,
2009 |
|
|
Year Ended
June 30,
2008 |
|
| Net Asset Value, Beginning of
Period |
|
|
$14.33 |
|
|
|
$14.02 |
|
|
|
$12.11 |
|
|
|
$11.61 |
|
|
|
$17.75 |
|
|
|
$15.33 |
|
| Income (Loss) From Operations: |
|
|
|
|
|
|
|
|
|
|
|
|
|
|
|
|
|
|
|
|
|
|
|
|
| Net Investment Income (Loss)(a) |
|
|
0.20 |
|
|
|
(0.09 |
) |
|
|
0.65 |
|
|
|
0.04 |
|
|
|
0.28 |
|
|
|
0.60 |
|
| Net Realized and Unrealized Gain (Loss) on Investments and Foreign Currency |
|
|
1.30 |
|
|
|
0.41 |
|
|
|
1.94 |
|
|
|
0.75 |
|
|
|
(4.99 |
) |
|
|
2.71 |
|
|
|
|
|
|
| Total Income (Loss) From Operations |
|
|
1.50 |
|
|
|
0.32 |
|
|
|
2.59 |
|
|
|
0.79 |
|
|
|
(4.71 |
) |
|
|
3.31 |
|
|
|
|
|
|
| Less Distributions From: |
|
|
|
|
|
|
|
|
|
|
|
|
|
|
|
|
|
|
|
|
|
|
|
|
| Net Investment Income |
|
|
(0.22 |
) |
|
|
(0.01 |
) |
|
|
(0.68 |
) |
|
|
(0.29 |
) |
|
|
(0.61 |
) |
|
|
(0.56 |
) |
| Net Realized Gains |
|
|
— |
|
|
|
— |
|
|
|
— |
|
|
|
— |
|
|
|
(0.82 |
) |
|
|
(0.33 |
) |
|
|
|
|
|
| Total Distributions |
|
|
(0.22 |
) |
|
|
(0.01 |
) |
|
|
(0.68 |
) |
|
|
(0.29 |
) |
|
|
(1.43 |
) |
|
|
(0.89 |
) |
|
|
|
|
|
| Net Asset Value, End of Period |
|
|
$15.61 |
|
|
|
$14.33 |
|
|
|
$14.02 |
|
|
|
$12.11 |
|
|
|
$11.61 |
|
|
|
$17.75 |
|
|
|
|
|
|
| Total Return(b) |
|
|
10.58 |
% |
|
|
2.31 |
% |
|
|
21.70 |
% |
|
|
6.76 |
% |
|
|
(26.59 |
)% |
|
|
22.27 |
% |
| Net Assets, End of Period (000’s) |
|
|
$440,999 |
|
|
|
$344,650 |
|
|
|
$252,497 |
|
|
|
$283,703 |
|
|
|
$368,263 |
|
|
|
$782,540 |
|
| Ratios to Average Net Assets |
|
|
|
|
|
|
|
|
|
|
|
|
|
|
|
|
|
|
|
|
|
|
|
|
| Gross Expense |
|
|
1.31 |
% |
|
|
1.08 |
%(c) |
|
|
1.00 |
% |
|
|
0.95 |
% |
|
|
0.82 |
% |
|
|
0.65 |
% |
| Net Expenses(d) |
|
|
1.02 |
% |
|
|
1.02 |
%(c) |
|
|
1.00 |
% |
|
|
0.94 |
% |
|
|
0.82 |
% |
|
|
0.65 |
% |
| Net Investment Income (Loss) |
|
|
1.39 |
% |
|
|
(0.74 |
)%(c) |
|
|
4.82 |
% |
|
|
0.33 |
% |
|
|
2.09 |
% |
|
|
3.64 |
% |
| Portfolio Turnover Rate |
|
|
131 |
% |
|
|
180 |
% |
|
|
199 |
% |
|
|
156 |
% |
|
|
115 |
% |
|
|
72 |
% |
| (a) |
Per share numbers have been calculated using the average shares method. |
| (b) |
Based on net asset value, which does not reflect the sales charge or contingent deferred sales charge, if applicable. Total returns for periods of less than
one year, if any, are not annualized. |
| (c) |
Annualized for periods less the one year. |
| (d) |
The investment advisor and other service providers waived or reimbursed a portion of their fees. |
| † |
Effective March 9, 2012, the Fund acquired all of the assets and liabilities of the Wilmington Multi-Manager Real Asset Fund, a series of WT Mutual Fund
(the “WT Fund”). The financial highlights for the periods prior to that date reflect the performance of the WT Fund. |
| * |
Year end changed from June 30 to April 30. |
See Notes which are an integral part of the Financial Statements
ANNUAL REPORT / April
30, 2013
90 FINANCIAL HIGHLIGHTS (continued)
For a share outstanding throughout each period.
|
| WILMINGTON STRATEGIC ALLOCATION CONSERVATIVE FUND† |
|
|
|
|
|
|
|
|
|
|
|
|
|
|
|
|
|
|
|
|
|
|
|
|
|
| CLASS A |
|
Year Ended
April 30,
2013 |
|
|
For the Period
July 1, 2011
through April 30,2012* |
|
|
Year Ended
June 30,
2011 |
|
|
Year Ended
June 30,
2010 |
|
|
Year Ended
June 30,
2009 |
|
|
Year Ended
June 30,
2008 |
|
| Net Asset Value, Beginning of
Period |
|
|
$10.61 |
|
|
|
$10.60 |
|
|
|
$9.66 |
|
|
|
$9.02 |
|
|
|
$10.54 |
|
|
|
$10.80 |
|
| Income (Loss) From Operations: |
|
|
|
|
|
|
|
|
|
|
|
|
|
|
|
|
|
|
|
|
|
|
|
|
| Net Investment Income (Loss)(a) |
|
|
0.18 |
|
|
|
0.17 |
|
|
|
0.26 |
|
|
|
0.26 |
|
|
|
0.28 |
|
|
|
0.28 |
|
| Net Realized and Unrealized Gain (Loss) on Investments |
|
|
0.45 |
|
|
|
0.05 |
|
|
|
0.95 |
|
|
|
0.64 |
|
|
|
(1.41 |
) |
|
|
(0.13 |
) |
|
|
|
|
|
| Total Income (Loss) From
Operations |
|
|
0.63 |
|
|
|
0.22 |
|
|
|
1.21 |
|
|
|
0.90 |
|
|
|
(1.13 |
) |
|
|
0.15 |
|
|
|
|
|
|
| Less Distributions From(b): |
|
|
|
|
|
|
|
|
|
|
|
|
|
|
|
|
|
|
|
|
|
|
|
|
| Net Investment Income |
|
|
(0.21 |
) |
|
|
(0.21 |
) |
|
|
(0.27 |
) |
|
|
(0.26 |
) |
|
|
(0.25 |
) |
|
|
(0.28 |
) |
| Net Realized Gains |
|
|
— |
|
|
|
— |
|
|
|
— |
|
|
|
— |
|
|
|
(0.14 |
) |
|
|
(0.13 |
) |
|
|
|
|
|
| Total Distributions |
|
|
(0.21 |
) |
|
|
(0.21 |
) |
|
|
(0.27 |
) |
|
|
(0.26 |
) |
|
|
(0.39 |
) |
|
|
(0.41 |
) |
|
|
|
|
|
| Net Asset Value, End of Period |
|
|
$11.03 |
|
|
|
$10.61 |
|
|
|
$10.60 |
|
|
|
$9.66 |
|
|
|
$9.02 |
|
|
|
$10.54 |
|
|
|
|
|
|
| Total Return(c) |
|
|
5.97 |
% |
|
|
2.15 |
% |
|
|
12.58 |
% |
|
|
9.98 |
% |
|
|
(10.57 |
)% |
|
|
1.35 |
% |
| Net Assets, End of Period
(000’s) |
|
|
$6,016 |
|
|
|
$7,003 |
|
|
|
$8,003 |
|
|
|
$9,890 |
|
|
|
$3,402 |
|
|
|
$4,777 |
|
| Ratios to Average Net Assets |
|
|
|
|
|
|
|
|
|
|
|
|
|
|
|
|
|
|
|
|
|
|
|
|
| Gross Expense(d) |
|
|
1.35 |
% |
|
|
0.77 |
%(e) |
|
|
0.60 |
% |
|
|
0.64 |
% |
|
|
1.56 |
% |
|
|
1.68 |
% |
| Net Expenses(d)(f) |
|
|
0.72 |
% |
|
|
0.63 |
%(e) |
|
|
0.60 |
% |
|
|
0.64 |
% |
|
|
0.75 |
% |
|
|
0.75 |
% |
| Net Investment Income (Loss) |
|
|
1.71 |
% |
|
|
1.95 |
%(e) |
|
|
2.54 |
% |
|
|
2.65 |
% |
|
|
3.02 |
% |
|
|
2.61 |
% |
| Portfolio Turnover Rate |
|
|
29 |
% |
|
|
37 |
% |
|
|
26 |
% |
|
|
92 |
% |
|
|
31 |
% |
|
|
25 |
% |
|
|
|
|
|
|
|
|
|
|
|
|
|
|
|
|
|
|
|
|
|
|
|
|
|
| CLASS I |
|
Year
Ended
April 30, 2013 |
|
|
For the Period
January 12,
2012 through April 30,
2012* |
|
|
Year
Ended
June 30, 2011 |
|
|
Year
Ended
June 30, 2010 |
|
|
Year
Ended
June 30, 2009 |
|
|
Year
Ended
June 30, 2008 |
|
| Net Asset Value, Beginning of
Period |
|
|
$10.64 |
|
|
|
$10.62 |
|
|
|
$9.67 |
|
|
|
$9.04 |
|
|
|
$10.55 |
|
|
|
$10.81 |
|
| Income (Loss) From Operations: |
|
|
|
|
|
|
|
|
|
|
|
|
|
|
|
|
|
|
|
|
|
|
|
|
| Net Investment Income (Loss)(a) |
|
|
0.21 |
|
|
|
0.19 |
|
|
|
0.29 |
|
|
|
0.29 |
|
|
|
0.31 |
|
|
|
0.31 |
|
| Net Realized and Unrealized Gain (Loss) on Investments |
|
|
0.43 |
|
|
|
0.06 |
|
|
|
0.95 |
|
|
|
0.62 |
|
|
|
(1.41 |
) |
|
|
(0.14 |
) |
|
|
|
|
|
| Total Income (Loss) From
Operations |
|
|
0.64 |
|
|
|
0.25 |
|
|
|
1.24 |
|
|
|
0.91 |
|
|
|
(1.10 |
) |
|
|
0.17 |
|
|
|
|
|
|
| Less Distributions From(b): |
|
|
|
|
|
|
|
|
|
|
|
|
|
|
|
|
|
|
|
|
|
|
|
|
| Net Investment Income |
|
|
(0.23 |
) |
|
|
(0.23 |
) |
|
|
(0.29 |
) |
|
|
(0.28 |
) |
|
|
(0.27 |
) |
|
|
(0.30 |
) |
| Net Realized Gains |
|
|
— |
|
|
|
— |
|
|
|
— |
|
|
|
— |
|
|
|
(0.14 |
) |
|
|
(0.13 |
) |
|
|
|
|
|
| Total Distributions |
|
|
(0.23 |
) |
|
|
(0.23 |
) |
|
|
(0.29 |
) |
|
|
(0.28 |
) |
|
|
(0.41 |
) |
|
|
(0.43 |
) |
|
|
|
|
|
| Net Asset Value, End of Period |
|
|
$11.05 |
|
|
|
$10.64 |
|
|
|
$10.62 |
|
|
|
$9.67 |
|
|
|
$9.04 |
|
|
|
$10.55 |
|
|
|
|
|
|
| Total Return(c) |
|
|
6.13 |
% |
|
|
2.44 |
% |
|
|
12.96 |
% |
|
|
10.12 |
% |
|
|
(10.30 |
)% |
|
|
1.58 |
% |
| Net Assets, End of Period
(000’s) |
|
|
$41,918 |
|
|
|
$45,299 |
|
|
|
$55,226 |
|
|
|
$53,131 |
|
|
|
$13,021 |
|
|
|
$8,058 |
|
| Ratios to Average Net Assets |
|
|
|
|
|
|
|
|
|
|
|
|
|
|
|
|
|
|
|
|
|
|
|
|
| Gross Expense(d) |
|
|
1.10 |
% |
|
|
0.52 |
%(e) |
|
|
0.35 |
% |
|
|
0.39 |
% |
|
|
1.30 |
% |
|
|
1.43 |
% |
| Net Expenses(d)(f) |
|
|
0.47 |
% |
|
|
0.38 |
%(e) |
|
|
0.35 |
% |
|
|
0.39 |
% |
|
|
0.50 |
% |
|
|
0.50 |
% |
| Net Investment Income (Loss) |
|
|
1.95 |
% |
|
|
2.20 |
%(e) |
|
|
2.81 |
% |
|
|
2.91 |
% |
|
|
3.42 |
% |
|
|
2.83 |
% |
| Portfolio Turnover Rate |
|
|
29 |
% |
|
|
37 |
% |
|
|
26 |
% |
|
|
92 |
% |
|
|
31 |
% |
|
|
25 |
% |
| (a) |
Per share numbers have been calculated using the average shares method. |
| (b) |
For financial reporting purposes, certain distributions from net investment income for Federal income tax purposes have been reclassified to distributions
from realized gains. |
| (c) |
Based on net asset value, which does not reflect the sales charge or contingent deferred sales charge, if applicable. Total returns for periods of less than
one year, if any, are not annualized. |
| (d) |
The Fund invests in other underlying funds and indirectly bears its proportionate share of fees and expenses incurred by the underlying funds in which the
Fund is invested. This ratio does not include these indirect fees and expenses. |
| (e) |
Annualized for periods less the one year. |
| (f) |
The investment advisor and other service providers waived or reimbursed a portion of their fees. |
| † |
Effective March 9, 2012, the Fund acquired all of the assets and liabilities of the Wilmington Conservative Asset Allocation Fund, a series of WT Mutual
Fund (the “WT Fund”). The financial highlights for the periods prior to that date reflect the performance of the WT Fund. |
| * |
Year end changed from June 30 to April 30. |
See Notes which are an integral part of the Financial Statements
April 30, 2013 / ANNUAL REPORT
FINANCIAL HIGHLIGHTS (continued) 91
|
|
|
|
|
| For a share outstanding throughout each year ended April 30, unless otherwise noted: |
|
| WILMINGTON STRATEGIC ALLOCATION MODERATE FUND† |
|
|
|
|
|
|
|
|
|
|
|
|
|
|
|
|
|
|
|
|
|
| CLASS A |
|
2013 |
|
|
2012 |
|
|
2011 |
|
|
2010 |
|
|
2009 |
|
| Net Asset Value, Beginning of Period |
|
|
$9.26 |
|
|
|
$9.70 |
|
|
|
$8.62 |
|
|
|
$6.72 |
|
|
|
$10.07 |
|
| Income (Loss) From Operations: |
|
|
|
|
|
|
|
|
|
|
|
|
|
|
|
|
|
|
|
|
| Net Investment Income (Loss)(a) |
|
|
0.13 |
|
|
|
0.11 |
|
|
|
0.10 |
|
|
|
0.04 |
|
|
|
0.10 |
|
| Net Realized and Unrealized Gain (Loss) on Investments |
|
|
0.61 |
|
|
|
(0.42 |
) |
|
|
1.13 |
|
|
|
1.87 |
|
|
|
(2.82 |
) |
|
|
|
|
|
| Total Income (Loss) From Operations |
|
|
0.74 |
|
|
|
(0.31 |
) |
|
|
1.23 |
|
|
|
1.91 |
|
|
|
(2.72 |
) |
|
|
|
|
|
| Less Distributions From: |
|
|
|
|
|
|
|
|
|
|
|
|
|
|
|
|
|
|
|
|
| Net Investment Income |
|
|
(0.14 |
) |
|
|
(0.12 |
) |
|
|
(0.12 |
) |
|
|
(0.01 |
) |
|
|
(0.10 |
) |
| Net Realized Gains |
|
|
— |
|
|
|
(0.01 |
) |
|
|
(0.03 |
) |
|
|
— |
|
|
|
(0.53 |
) |
|
|
|
|
|
| Total Distributions |
|
|
(0.14 |
) |
|
|
(0.13 |
) |
|
|
(0.15 |
) |
|
|
(0.01 |
) |
|
|
(0.63 |
) |
|
|
|
|
|
| Net Asset Value, End of Period |
|
|
$9.86 |
|
|
|
$9.26 |
|
|
|
$9.70 |
|
|
|
$8.62 |
|
|
|
$6.72 |
|
|
|
|
|
|
| Total Return(b) |
|
|
8.12 |
% |
|
|
(3.13 |
)% |
|
|
14.54 |
% |
|
|
28.39 |
% |
|
|
(26.61 |
)% |
| Net Assets, End of Period (000’s) |
|
|
$60,640 |
|
|
|
$65,285 |
|
|
|
$75,554 |
|
|
|
$21,822 |
|
|
|
$21,871 |
|
| Ratios to Average Net Assets |
|
|
|
|
|
|
|
|
|
|
|
|
|
|
|
|
|
|
|
|
| Gross Expense(c) |
|
|
1.45 |
% |
|
|
1.64 |
% |
|
|
1.51 |
% |
|
|
1.39 |
% |
|
|
1.48 |
% |
| Net Expenses(c)(d) |
|
|
0.84 |
% |
|
|
0.79 |
% |
|
|
0.73 |
% |
|
|
0.83 |
% |
|
|
0.86 |
% |
| Net Investment Income (Loss) |
|
|
1.36 |
% |
|
|
1.26 |
% |
|
|
0.97 |
% |
|
|
0.46 |
% |
|
|
1.31 |
% |
| Portfolio Turnover Rate |
|
|
32 |
% |
|
|
41 |
% |
|
|
55 |
% |
|
|
10 |
% |
|
|
42 |
% |
|
|
|
|
|
|
|
|
|
|
|
|
|
|
|
|
|
|
|
|
|
| CLASS I |
|
2013
|
|
|
2012
|
|
|
2011(e)
|
|
|
|
|
|
|
|
| Net Asset Value, Beginning of Period |
|
|
$9.25 |
|
|
|
$9.70 |
|
|
|
$8.08 |
|
|
|
|
|
|
|
|
|
| Income (Loss) From Operations: |
|
|
|
|
|
|
|
|
|
|
|
|
|
|
|
|
|
|
|
|
| Net Investment Income (Loss)(a) |
|
|
0.15 |
|
|
|
0.14 |
|
|
|
0.10 |
|
|
|
|
|
|
|
|
|
| Net Realized and Unrealized Gain (Loss) on Investments |
|
|
0.61 |
|
|
|
(0.43 |
) |
|
|
1.66 |
|
|
|
|
|
|
|
|
|
|
|
|
|
|
|
|
|
|
|
|
|
|
| Total Income (Loss) From Operations |
|
|
0.76 |
|
|
|
(0.29 |
) |
|
|
1.76 |
|
|
|
|
|
|
|
|
|
|
|
|
|
|
|
|
|
|
|
|
|
|
| Less Distributions From: |
|
|
|
|
|
|
|
|
|
|
|
|
|
|
|
|
|
|
|
|
| Net Investment Income |
|
|
(0.17 |
) |
|
|
(0.15 |
) |
|
|
(0.11 |
) |
|
|
|
|
|
|
|
|
| Net Realized Gains |
|
|
— |
|
|
|
(0.01 |
) |
|
|
(0.03 |
) |
|
|
|
|
|
|
|
|
|
|
|
|
|
|
|
|
|
|
|
|
|
| Total Distributions |
|
|
(0.17 |
) |
|
|
(0.16 |
) |
|
|
(0.14 |
) |
|
|
|
|
|
|
|
|
|
|
|
|
|
|
|
|
|
|
|
|
|
| Net Asset Value, End of Period |
|
|
$9.84 |
|
|
|
$9.25 |
|
|
|
$9.70 |
|
|
|
|
|
|
|
|
|
|
|
|
|
|
|
|
|
|
|
|
|
|
| Total Return(b) |
|
|
8.29 |
% |
|
|
(2.87 |
)% |
|
|
22.07 |
% |
|
|
|
|
|
|
|
|
| Net Assets, End of Period (000’s) |
|
|
$2,753 |
|
|
|
$3,108 |
|
|
|
$3,426 |
|
|
|
|
|
|
|
|
|
| Ratios to Average Net Assets |
|
|
|
|
|
|
|
|
|
|
|
|
|
|
|
|
|
|
|
|
| Gross Expense(c) |
|
|
1.20 |
% |
|
|
1.39 |
% |
|
|
1.44 |
%(f) |
|
|
|
|
|
|
|
|
| Net Expenses(c)(d) |
|
|
0.59 |
% |
|
|
0.51 |
% |
|
|
0.67 |
%(f) |
|
|
|
|
|
|
|
|
| Net Investment Income (Loss) |
|
|
1.59 |
% |
|
|
1.53 |
% |
|
|
1.25 |
%(f) |
|
|
|
|
|
|
|
|
| Portfolio Turnover Rate |
|
|
32 |
% |
|
|
41 |
% |
|
|
55 |
%(g) |
|
|
|
|
|
|
|
|
| (a) |
Per share numbers have been calculated using the average shares method. |
| (b) |
Based on net asset value, which does not reflect the sales charge or contingent deferred sales charge, if applicable. Total returns for periods of less than
one year, if any, are not annualized. |
| (c) |
The Fund invests in other underlying funds and indirectly bears its proportionate share of fees and expenses incurred by the underlying funds in which the
Fund is invested. This ratio does not include these indirect fees and expenses. |
| (d) |
The investment advisor and other service providers waived or reimbursed a portion of their fees. |
| (e) |
For the period from June 11, 2010 (commencement of operations) to April 30, 2011. |
| (f) |
Annualized for periods less the one year. |
| (g) |
Reflects portfolio turnover for the Fund for the year ended April 30, 2011. |
| † |
Effective June 11, 2010, shareholders of the former Managed Allocation Fund—Aggressive Growth, Managed Allocation Fund—Moderate Growth, and
Managed Allocation Fund—Conservative Growth became owners of the Strategic Allocation Fund in a plan of reorganization. See Note 8. Additionally, the accounting and performance history of the Managed Allocation Fund—Moderate Growth Fund
was redesignated as that of the Strategic Allocation Fund for A Shares for periods prior to June 14, 2010. |
See Notes
which are an integral part of the Financial Statements
ANNUAL REPORT / April
30, 2013
92 FINANCIAL HIGHLIGHTS (concluded)
For a share outstanding throughout each period.
|
| WILMINGTON STRATEGIC ALLOCATION AGGRESSIVE FUND† |
|
|
|
|
|
|
|
|
|
|
|
|
|
|
|
|
|
|
|
|
|
|
|
|
|
| CLASS A |
|
Year
Ended
April 30, 2013 |
|
|
For the Period
July 1, 2011
through April 30,2012* |
|
|
Year
Ended
June 30, 2011 |
|
|
Year
Ended
June 30, 2010 |
|
|
Year
Ended
June 30, 2009 |
|
|
Year
Ended
June 30, 2008 |
|
| Net Asset Value, Beginning of
Period |
|
|
$9.20 |
|
|
|
$9.33 |
|
|
|
$7.49 |
|
|
|
$6.81 |
|
|
|
$10.92 |
|
|
|
$12.19 |
|
| Income (Loss) From
Operations: |
|
|
|
|
|
|
|
|
|
|
|
|
|
|
|
|
|
|
|
|
|
|
|
|
| Net Investment Income (Loss)(a) |
|
|
0.10 |
|
|
|
0.05 |
|
|
|
0.14 |
|
|
|
0.10 |
|
|
|
0.12 |
|
|
|
0.17 |
|
| Net Realized and Unrealized Gain (Loss) on Investments |
|
|
1.02 |
|
|
|
(0.13 |
) |
|
|
1.85 |
|
|
|
0.68 |
|
|
|
(3.53 |
) |
|
|
(0.78 |
) |
|
|
|
|
|
| Total Income (Loss) From
Operations |
|
|
1.12 |
|
|
|
(0.08 |
) |
|
|
1.99 |
|
|
|
0.78 |
|
|
|
(3.41 |
) |
|
|
(0.61 |
) |
|
|
|
|
|
| Less Distributions From(b): |
|
|
|
|
|
|
|
|
|
|
|
|
|
|
|
|
|
|
|
|
|
|
|
|
| Net Investment Income |
|
|
(0.11 |
) |
|
|
(0.05 |
) |
|
|
(0.15 |
) |
|
|
(0.10 |
) |
|
|
(0.12 |
) |
|
|
(0.17 |
) |
| Net Realized Gains |
|
|
— |
|
|
|
— |
|
|
|
— |
|
|
|
— |
|
|
|
(0.58 |
) |
|
|
(0.49 |
) |
|
|
|
|
|
| Total Distributions |
|
|
(0.11 |
) |
|
|
(0.05 |
) |
|
|
(0.15 |
) |
|
|
(0.10 |
) |
|
|
(0.70 |
) |
|
|
(0.66 |
) |
|
|
|
|
|
| Net Asset Value, End of Period |
|
|
$10.21 |
|
|
|
$9.20 |
|
|
|
$9.33 |
|
|
|
$7.49 |
|
|
|
$6.81 |
|
|
|
$10.92 |
|
|
|
|
|
|
| Total Return(c) |
|
|
12.26 |
% |
|
|
(0.75 |
)% |
|
|
26.66 |
% |
|
|
11.41 |
% |
|
|
(30.79 |
)% |
|
|
(5.37 |
)% |
| Net Assets, End of Period
(000’s) |
|
|
$3,205 |
|
|
|
$3,074 |
|
|
|
$3,502 |
|
|
|
$3,788 |
|
|
|
$3,165 |
|
|
|
$4,737 |
|
| Ratios to Average Net Assets |
|
|
|
|
|
|
|
|
|
|
|
|
|
|
|
|
|
|
|
|
|
|
|
|
| Gross Expense(d) |
|
|
1.46 |
% |
|
|
0.88 |
%(e) |
|
|
0.67 |
% |
|
|
0.58 |
% |
|
|
0.66 |
% |
|
|
0.61 |
% |
| Net Expenses(d)(f) |
|
|
0.87 |
% |
|
|
0.73 |
%(e) |
|
|
0.67 |
% |
|
|
0.58 |
% |
|
|
0.65 |
% |
|
|
0.60 |
% |
| Net Investment Income (Loss) |
|
|
1.10 |
% |
|
|
0.75 |
%(e) |
|
|
1.64 |
% |
|
|
1.23 |
% |
|
|
1.63 |
% |
|
|
1.41 |
% |
| Portfolio Turnover Rate |
|
|
43 |
% |
|
|
17 |
% |
|
|
34 |
% |
|
|
53 |
% |
|
|
59 |
% |
|
|
23 |
% |
|
|
|
|
|
|
|
|
|
|
|
|
|
|
|
|
|
|
|
|
|
|
|
|
|
| CLASS I |
|
Year Ended
April 30,
2013 |
|
|
For the Period
January 12,
2012 through April 30,
2012* |
|
|
Year Ended
June 30,
2011 |
|
|
Year Ended
June 30,
2010 |
|
|
Year Ended
June 30,
2009 |
|
|
Year Ended
June 30,
2008 |
|
| Net Asset Value, Beginning of
Period |
|
|
$9.22 |
|
|
|
$9.35 |
|
|
|
$7.51 |
|
|
|
$6.82 |
|
|
|
$10.93 |
|
|
|
$12.20 |
|
| Income (Loss) From
Operations: |
|
|
|
|
|
|
|
|
|
|
|
|
|
|
|
|
|
|
|
|
|
|
|
|
| Net Investment Income (Loss)(a) |
|
|
0.13 |
|
|
|
0.07 |
|
|
|
0.17 |
|
|
|
0.11 |
|
|
|
0.15 |
|
|
|
0.20 |
|
| Net Realized and Unrealized Gain (Loss) on Investments |
|
|
1.02 |
|
|
|
(0.13 |
) |
|
|
1.84 |
|
|
|
0.70 |
|
|
|
(3.54 |
) |
|
|
(0.78 |
) |
|
|
|
|
|
| Total Income (Loss) From
Operations |
|
|
1.15 |
|
|
|
(0.06 |
) |
|
|
2.01 |
|
|
|
0.81 |
|
|
|
(3.39 |
) |
|
|
(0.58 |
) |
|
|
|
|
|
| Less Distributions From(b): |
|
|
|
|
|
|
|
|
|
|
|
|
|
|
|
|
|
|
|
|
|
|
|
|
| Net Investment Income |
|
|
(0.13 |
) |
|
|
(0.07 |
) |
|
|
(0.17 |
) |
|
|
(0.12 |
) |
|
|
(0.14 |
) |
|
|
(0.20 |
) |
| Net Realized Gains |
|
|
— |
|
|
|
— |
|
|
|
— |
|
|
|
— |
|
|
|
(0.58 |
) |
|
|
(0.49 |
) |
|
|
|
|
|
| Total Distributions |
|
|
(0.13 |
) |
|
|
(0.07 |
) |
|
|
(0.17 |
) |
|
|
(0.12 |
) |
|
|
(0.72 |
) |
|
|
(0.69 |
) |
|
|
|
|
|
| Net Asset Value, End of Period |
|
|
$10.24 |
|
|
|
$9.22 |
|
|
|
$9.35 |
|
|
|
$7.51 |
|
|
|
$6.82 |
|
|
|
$10.93 |
|
|
|
|
|
|
| Total Return(c) |
|
|
12.62 |
% |
|
|
(0.62 |
)% |
|
|
26.91 |
% |
|
|
11.80 |
% |
|
|
(30.63 |
)% |
|
|
(5.14 |
)% |
| Net Assets, End of Period
(000’s) |
|
|
$35,826 |
|
|
|
$39,257 |
|
|
|
$51,887 |
|
|
|
$46,058 |
|
|
|
$51,823 |
|
|
|
$56,985 |
|
| Ratios to Average Net Assets |
|
|
|
|
|
|
|
|
|
|
|
|
|
|
|
|
|
|
|
|
|
|
|
|
| Gross Expense(d) |
|
|
1.21 |
% |
|
|
0.61 |
%(e) |
|
|
0.42 |
% |
|
|
0.33 |
% |
|
|
0.41 |
% |
|
|
0.36 |
% |
| Net Expenses(d)(f) |
|
|
0.62 |
% |
|
|
0.48 |
%(e) |
|
|
0.42 |
% |
|
|
0.33 |
% |
|
|
0.40 |
% |
|
|
0.35 |
% |
| Net Investment Income (Loss) |
|
|
1.38 |
% |
|
|
1.02 |
%(e) |
|
|
1.89 |
% |
|
|
1.41 |
% |
|
|
1.97 |
% |
|
|
1.67 |
% |
| Portfolio Turnover Rate |
|
|
43 |
% |
|
|
17 |
% |
|
|
34 |
% |
|
|
53 |
% |
|
|
59 |
% |
|
|
23 |
% |
| (a) |
Per share numbers have been calculated using the average shares method. |
| (b) |
For financial reporting purposes, certain distributions from net investment income for Federal income tax purposes have been reclassified to distributions
from realized gains. |
| (c) |
Based on net asset value, which does not reflect the sales charge or contingent deferred sales charge, if applicable. Total returns for periods of less than
one year, if any, are not annualized. |
| (d) |
The Fund invests in other underlying funds and indirectly bears its proportionate share of fees and expenses incurred by the underlying funds in which the
Fund is invested. This ratio does not include these indirect fees and expenses. |
| (e) |
Annualized for periods less the one year. |
| (f) |
The investment advisor and other service providers waived or reimbursed a portion of their fees. |
| † |
Effective March 9, 2012, the Fund acquired all of the assets and liabilities of the Wilmington Aggressive Asset Allocation Fund, a series of WT Mutual
Fund (the “WT Fund”). The financial highlights for the periods prior to that date reflect the performance of the WT Fund. |
| * |
Year end changed from June 30 to April 30. |
See Notes which are an integral part of the Financial Statements
April 30, 2013 / ANNUAL REPORT
NOTES TO FINANCIAL STATEMENTS 93
Wilmington Funds
April 30, 2013
Wilmington Funds (the “Trust”), is registered under the Investment Company Act of 1940, as amended (the “Act”), as an
open-end management investment company. The Trust consists of 23 portfolios, 6 of which are presented herein (individually referred to as a “Fund” or collectively as the “Funds”). The remaining 17 funds are presented in separate
reports.
|
|
|
| Fund |
|
Investment Goal |
| Wilmington Multi-Manager International Fund* (“International Fund”)(d) |
|
The Fund seeks to provide long-term capital appreciation primarily through a diversified portfolio of non-U.S. equity securities. |
|
|
| Wilmington Rock Maple Alternatives Fund (“Rock Maple Alternatives Fund”)(d) |
|
The Fund’s investment goal is to achieve long-term growth of capital through consistent returns from investments that have a low correlation to traditional asset
classes. |
|
|
| Wilmington Multi-Manager Real Asset Fund* (“Real Asset Fund”)(d) |
|
The Fund’s investment goal is to achieve long-term preservation of capital with current income. |
|
|
| Wilmington Strategic Allocation Conservative Fund*
(“Strategic Allocation Conservative Fund”)(d) |
|
The Fund’s investment goal is to seek a high level of total return consistent with a conservative level of risk relative to other Wilmington Strategic Allocation
Funds. |
|
|
| Wilmington Strategic Allocation Moderate Fund
(“Strategic Allocation Moderate Fund”)(d) |
|
The Fund’s investment goal is to seek a high level of total return consistent with a moderate level of risk relative to the other Wilmington Strategic Allocation
Funds. |
|
|
| Wilmington Strategic Allocation Aggressive Fund*
(“Strategic Allocation Aggressive Fund”)(d) |
|
The Fund’s investment goal is to seek a high level of total return consistent with an aggressive level of risk relative to other Wilmington Strategic Allocation
Funds. |
(d) Diversified
| |
* |
Effective March 9, 2012, the Wilmington Multi-Manager International Fund, Wilmington Multi-Manager Real Asset Fund, Wilmington Conservative
Asset Allocation Fund and Wilmington Aggressive Asset Allocation Fund (collectively the “WT Funds”), each a series of WT Mutual Fund, were reorganized into the Trust. For financial reporting purposes, the WT Funds’ financial and
performance history prior to the reorganization has been carried forward and is reflected in the Funds’ financial statements and financial highlights. See Note 8 for additional information regarding the reorganization.
|
The Trust offers 6 classes of shares: Class A, Service Class, Select Class, Administrative Class, Class
I and Institutional Class. All shares of the Trust have equal rights with respect to voting, except on class-specific matters.
The assets of each portfolio are segregated and a shareholder’s interest is limited to the portfolio in which shares are held.
| 2. |
SUMMARY OF SIGNIFICANT ACCOUNTING POLICIES |
The following is a summary of significant accounting policies consistently followed by the Funds in the preparation of their financial statements. These policies are in conformity with U.S. generally
accepted accounting principles (“GAAP”). The preparation of financial statements in conformity with GAAP requires management to make estimates and assumptions that affect the amounts of assets, liabilities, expenses and revenues reported
in the financial statements. Actual results could differ from those estimated.
Investment Valuation – Fair value
of the Funds’ portfolio securities are determined as follows:
| |
• |
for equity securities, according to the last sale price or official closing price reported in the market in which they are primarily traded (either a national
securities exchange or the over-the-counter market), if available; |
| |
• |
in the absence of recorded sales for equity securities, according to the mean between the last closing bid and asked prices; |
| |
• |
futures contracts and options are generally valued at market values established by the exchanges on which they are traded at the close of trading on
such exchanges. Options traded in the over-the-counter market are generally valued according to the mean between the last bid and the last asked price for the option as provided by an investment dealer or other financial institution that deals in
the option. The Board of Trustees (“Trustees”) may determine in good faith that another method of valuing such investments is necessary to appraise their fair value; |
| |
• |
forward foreign currency contracts are valued at the mean between the last bid and asked prices; |
| |
• |
investments in open-end regulated investment companies are valued at net asset value (“NAV”); |
| |
• |
for fixed income securities according to prices as furnished by an independent pricing service, except that fixed income securities with remaining
maturities of less than 60 days at the time of purchase are valued at amortized cost; |
| |
• |
price information on listed securities, including underlying Exchange Traded Funds (“ETF’s”) and Exchange Traded Notes
(“ETN’s”), is taken from the exchange where the security is primarily traded; and |
| |
• |
for all other securities at fair value as determined in accordance with procedures established by and under the general supervision of the Trustees.
|
ANNUAL REPORT/
April 30, 2013
94 NOTES TO FINANCIAL STATEMENTS (continued)
Trading in foreign securities may be completed at times which vary from the closing of
the New York Stock Exchange (“NYSE”). In computing its NAV, the Funds value foreign securities using the latest closing price on the primary exchange on which they are traded immediately prior to the closing of the NYSE. Certain foreign
currency exchange rates are generally determined at the latest rate prior to the closing of the NYSE. Foreign securities quoted in foreign currencies are translated into U.S. dollars at current rates. Events that affect these values and exchange
rates may occur between the times at which they are determined and the closing of the NYSE. If such events materially affect the value of portfolio securities, these securities may be valued at their fair value as determined in good faith by the
Trustees, although the actual calculation may be done by others. An event is considered material if there is both an affirmative expectation that the security’s value will change in response to the event and a reasonable basis for quantifying
the resulting change in value.
The Trust follows the authoritative guidance (GAAP) for fair value measurements. The guidance
establishes a framework for measuring fair value and a hierarchy for inputs used in measuring fair value that maximizes the use of observable inputs and minimizes the use of unobservable inputs by requiring that the most observable inputs be used
when available. The guidance establishes three tiers of inputs that may be used to measure fair value. The three tiers of inputs are summarized at the end of each Fund’s Portfolio of Investments. The inputs or methodology used for valuing
securities are not necessarily an indication of the risk associated with investing in those securities.
The Funds’ policy
is to disclose transfers between levels based on valuations at the beginning of the reporting period. Each portfolio may hold securities which are periodically fair valued in accordance with the Funds’ fair value procedures. This may result in
movements between Levels 1, 2 and 3 throughout the period. As of April 30, 2013, there were no transfers between Levels 1, 2 and 3 assets and liabilities, based on levels assigned to securities at the beginning of the period. This does not
include transfers between Level 1 and Level 2 due to the Multi-Manager International Fund utilizing international fair value pricing during the period. Pursuant to the Funds’ fair value procedures noted previously, equity securities (including
exchange traded securities and other open-end regulated investment companies) exchange traded derivatives are generally categorized as Level 1 securities in the fair value hierarchy. Fixed income securities, non-exchange traded derivatives and money
market instruments are generally categorized as Level 2 securities in the fair value hierarchy.
Investments for which there
are no such quotations, or for which quotations do not appear reliable, are valued at fair value as determined in accordance with procedures established by and under the general supervision of the Trustees. These valuations are typically categorized
as Level 2 or Level 3 securities in the fair value hierarchy.
Repurchase Agreements – Repurchase agreements are
transactions in which a Fund buys a security from a dealer or bank and agrees to sell the security back at a mutually agreed upon time and price. The repurchase price exceeds the sale price, reflecting the Fund’s return on the transaction. It
is each Fund’s policy to require the counterparty to a repurchase agreement to transfer to the Funds’ custodian or sub-custodian eligible securities or cash with a market value (after transaction costs) at least equal to the repurchase
price to be paid under the repurchase agreement. The eligible securities are transferred to accounts with the custodian or sub-custodian in which the Funds hold a “securities entitlement” and exercise “control” as those terms are
defined in the Uniform Commercial Code. The Funds have established procedures for monitoring the market value of the transferred securities and requiring the transfer of additional eligible securities if necessary to equal at least the repurchase
price. These procedures also allow the counterparty to require securities to be transferred from the account to the extent that their market value exceeds the repurchase price or in exchange for other eligible securities of equivalent market value.
The insolvency of the counterparty or other failure to repurchase the securities may delay the disposition of the underlying
securities or cause the Funds to receive less than the full repurchase price.
Reverse Repurchase Agreements –
Reverse repurchase agreements are repurchase agreements in which a Fund is the seller (rather than the buyer) of the security, and agrees to repurchase the security at an agreed upon time and price. A reverse repurchase agreement may be viewed as a
type of borrowing by a Fund. Reverse repurchase agreements are subject to credit risks. In addition, reverse repurchase agreements create leverage risks because a Fund must repurchase the underlying security at a higher price, regardless of the
market value of the security at the time of repurchase.
For the year ended April 30, 2013, the Real Asset Fund had reverse repurchase
agreement activity as follows:
|
|
|
|
|
|
|
| Days Outstanding |
|
Average Daily Balance* |
|
Daily Weighted
Average
Interest
Rate* |
|
Interest Rate Range |
| 276 |
|
$2,720,203 |
|
0.23% |
|
0.15%-0.31% |
* Average based on the number of days the Fund had reverse repurchase agreement outstanding.
As of April 30, 2013, the Real Asset Fund had no open reverse repurchase agreement.
Investment Income, Gains and Losses, Expenses and Distributions – Interest income and expenses are accrued daily. Dividends
and distributions to shareholders are recorded on the ex-dividend date. Non-cash dividends included in dividend income, if any, are recorded at fair value. Foreign dividends are recorded on the ex-dividend date or when the Funds are informed of the
ex-dividend date. Investment transactions are accounted for on a trade date basis for financial reporting purposes. Realized gains and losses from investment transactions are recorded on an identified cost basis.
April 30, 2013 / ANNUAL REPORT
NOTES TO FINANCIAL STATEMENTS (continued) 95
Expenses of the Trust, which are directly identifiable to a specific Fund, are applied to that
Fund. Expenses which are not identifiable to a specific Fund are allocated in such a manner as deemed equitable, taking into consideration the nature and type of expense.
All Funds offer multiple classes of shares. Investment income, realized and unrealized gains and losses, and certain fund-level expenses are allocated to each class based on relative daily net assets, except that
each class bears certain expenses unique to that class such as distribution and shareholder services fees. Distributions are declared separately for each class. No class has preferential distribution rights; differences in per share distributions
rates are generally due to differences in class specific expenses. Distributions from net realized gains, if any, are declared and paid to shareholders annually. Distributions from net investment income are declared and paid quarterly.
Premium and Discount Amortization/Accretion and Paydown Gains and Losses – All premiums and discounts on fixed income securities are
amortized/accreted for financial statement purposes. Gains and losses realized on principal payment of mortgage-backed securities (paydown gains and losses) are classified as part of investment income.
Federal Taxes – It is the Funds’ policy to comply with the Subchapter M provision of the Internal Revenue Code of 1986, as amended
(the “Code”), and to distribute to shareholders each year substantially all of their income. Accordingly, no provisions for Federal income or excise tax are necessary.
Withholding taxes and where appropriate, deferred withholding taxes, on foreign interest, dividends and capital gains have been provided for in
accordance with the applicable country’s tax rules and rates.
Warrants and Rights – Certain Funds hold warrants and
rights acquired either through a direct purchase, including as part of private placement, or pursuant to corporate actions. Warrants and rights entitle the holder to buy a proportionate amount of common stock at a specific price and time through the
expiration dates. Such warrants and rights are held as long positions by the Funds until exercised, sold or expired. Equity-linked warrants are purchased in order to own local exposure to certain countries in which the Funds are not locally
registered. Warrants and rights are valued at fair value in accordance with the Trustees’ approved fair value procedures.
Foreign Currency Translation – The accounting records of the Funds are maintained in U.S. dollars. All assets and liabilities
denominated in foreign currencies (“FCs”) are translated into U.S. dollars based on the rates of exchange of such currencies against U.S. dollars on the date of valuation. Purchases and sales of securities, income and expenses are
translated at the rate of exchange quoted on the respective date that such transactions are recorded. The Funds do not isolate that portion of results of operations resulting from changes in foreign exchange rates on investments from fluctuations
arising from changes in the net realized and unrealized gain or loss on investments.
Reported net realized foreign exchange gains or
losses arise from sales of portfolio securities, sales and maturities of short-term securities, sales of FCs, currency gains or losses realized between the trade and settlement dates on securities transactions, the difference between the amounts of
dividends, interest, and foreign withholding taxes recorded on the Funds’ books and the U.S. dollar equivalent of the amounts actually received or paid. Net unrealized foreign exchange gains and losses arise from changes in the value of assets
and liabilities other than investments in securities at period end, resulting from changes in the exchange rate.
Restricted
Securities – Restricted securities are securities that either (a) cannot be offered for public sale without first being registered, or being able to take advantage of an exemption from registration, under the Securities Act of 1933, as
amended, or (b) are subject to contractual restrictions on public sales. In some cases, when a security cannot be offered for public sale without first being registered, the issuer of the restricted security has agreed to register such
securities for resale, at the issuer’s expense, either upon demand by the Funds or in connection with another registered offering of the securities. Many such restricted securities may be resold in the secondary market in transactions exempt
from registration. Restricted securities may be determined to be liquid under criteria established by the Trustees. A Fund will not incur any registration costs upon such resales. The Funds’ restricted securities are valued at the price
provided by dealers in the secondary market or, if no market prices are available, at the fair value as determined in accordance with procedures established by and under the general supervision of the Trustees.
Short Sales – Certain Funds may sell securities short. A short sale is a transaction in which the Fund sells a security it does not own
in anticipation of a decline in market price. To sell a security short, the Fund must borrow the security. The Fund’s obligation to replace the security borrowed and sold short will be fully collateralized at all times by the proceeds from the
short sale retained by the broker and by cash and securities deposited in a segregated account with the Fund’s custodian. If the price of the security sold short increases between the time of the short sale and the time the Fund replaces the
borrowed security, the Fund will realize a loss, and if the price declines during the period, the Fund will realize a gain. Any realized gain will be decreased, and any realized loss increased, by the amount of transaction costs. On ex-dividend
date, dividends on short sales are recorded as an expense to the Funds.
Lending of Portfolio Securities – The Trust has
entered into an agreement with their custodian whereby the custodian may lend securities owned by the Funds to brokers, dealers and other financial organizations. Any increase or decrease in the fair value of securities loaned and any interest or
dividends earned on those securities during the term of the loan would be for the account of the Fund. In exchange for lending securities under the terms of the agreement with their custodian, the Funds receive a lender’s fee. Fees earned by
the Funds on securities lending are recorded as income. Loans of securities by the Funds are collateralized by cash, U.S. government securities or money market instruments that are maintained at all times in an amount at least equal to the current
market value of the loaned securities plus a margin which varies depending on the type of securities owned. The custodian establishes and maintains the collateral in a segregated account. The Funds have the right under the lending agreement to
recover the securities from the borrower on demand.
ANNUAL REPORT / April
30, 2013
96 NOTES TO FINANCIAL STATEMENTS (continued)
Investments purchased with cash collateral are presented on the portfolios of
investments under the caption “Cash Collateral Invested for Securities on Loan.”
As of April 30, 2013, the Funds listed below
had securities with the following values on loan:
|
|
|
|
|
|
|
|
|
| Fund |
|
Value of
Securities
on
Loan |
|
|
Value
of
Collateral |
|
| International Fund |
|
$ |
6,567,937 |
|
|
$ |
6,811,853 |
|
| Real Asset Fund |
|
|
586,874 |
|
|
|
601,402 |
|
The Funds maintain the risk of any loss on the securities on loan as well as the potential loss on
investments purchased with cash collateral received from securities lending.
| 3. |
DERIVATIVE FINANCIAL INSTRUMENTS |
Disclosures about derivative instruments and hedging activities are intended to improve financial reporting for derivative instruments by requiring enhanced disclosures that enables investors to
understand how and why an entity uses derivatives, how derivatives are accounted for, and how derivative instruments affect and entity’s results of operations and financial position.
Options – Certain Funds may either purchase or write options in order to hedge against adverse market movements or
fluctuations in value caused by changes in prevailing interest rates, value of equities or foreign exchange rates, with respect to securities which the Fund currently owns or intends to purchase. A Fund’s principal reason for writing options is
to realize, through receipt of premiums, a greater current return than would be realized on the underlying security alone. When a Fund purchases an option, it pays a premium and an amount equal to that premium is recorded as an asset. When a Fund
writes an option, it receives a premium and an amount equal to that premium is recorded as a liability. The asset or liability is adjusted daily to reflect the current market value of the option. If an option expires unexercised, a Fund realizes a
gain or loss to the extent of the premium received or paid. If an option is exercised, the premium received or paid is recorded as an adjustment to the proceeds from the sale or the cost of the purchase in determining whether a Fund has realized a
gain or loss. The difference between the premium and the amount received or paid on effecting a closing purchase or sale transaction is also treated as a realized gain or loss. Gain or loss on purchased options is included in net realized gain or
loss on investment transactions. Gain or loss on written options is presented separately as net realized gain or loss on options written. A Fund, as writer of options, may have no control over whether the underlying securities may be sold (called)
or purchased (put). As a result, a Fund bears the market risk of an unfavorable change in the price of the security underlying the written option. A Fund, as purchaser of over-the-counter options, bears the risk of the potential inability of the
counterparties to meet the terms of their contracts.
The Rock Maple Alternatives Fund had options written during the year ended April 30,
2013 as follows:
|
|
|
|
|
|
|
|
|
| |
|
Number
of
Contracts |
|
|
Premiums
Received
|
|
| Outstanding options at April 30, 2012 |
|
|
145 |
|
|
$ |
77,560 |
|
| Options purchased |
|
|
— |
|
|
|
— |
|
| Option closed |
|
|
(29) |
|
|
|
(2,984) |
|
| Options written |
|
|
1,786 |
|
|
|
1,081,522 |
|
| Options expired |
|
|
(1,363) |
|
|
|
(823,043) |
|
| Options exercised |
|
|
(389) |
|
|
|
(244,811) |
|
|
|
|
|
|
|
|
|
|
| Options outstanding at April 30, 2013 |
|
|
150 |
|
|
$ |
88,244 |
|
|
|
|
|
|
|
|
|
|
The Real Asset Fund had transactions in options written during the year ended April 30, 2013 as
follows:
|
|
|
|
|
|
|
|
|
| |
|
Number
of
Contracts |
|
|
Premiums
Received
|
|
| Options outstanding at April 30, 2012 |
|
|
2,240 |
|
|
$ |
189,785 |
|
| Options purchased |
|
|
— |
|
|
|
— |
|
| Options closed |
|
|
(683) |
|
|
|
(41,136) |
|
| Options written |
|
|
7,020 |
|
|
|
240,384 |
|
| Options expired |
|
|
(3,915) |
|
|
|
(161,415) |
|
| Options exercised |
|
|
(1,672) |
|
|
|
(66,292) |
|
|
|
|
|
|
|
|
|
|
| Options outstanding at April 30, 2013 |
|
|
2,990 |
|
|
$ |
161,326 |
|
|
|
|
|
|
|
|
|
|
Forward Foreign Currency Contracts – Certain Funds may enter into foreign currency
commitments or foreign currency exchange transactions. The Fund may enter into foreign currency contract transactions to protect assets against adverse changes in foreign currency exchange rates or exchange control regulations. Purchased contracts
are used to acquire exposure to foreign currencies; whereas, contracts to sell are used to hedge the Fund’s securities against currency fluctuations. Risks may arise upon entering into these transactions from the potential
April 30, 2013 / ANNUAL REPORT
NOTES TO FINANCIAL STATEMENTS (continued) 97
inability of counterparties to meet the terms of their commitments and from
unanticipated movements in security prices or foreign exchange rates. The foreign currency transactions are adjusted by the daily exchange rate of the underlying currency and any gains or losses are recorded for financial statement purposes as
unrealized until the settlement date.
Futures Contracts – The Funds may invest in financial futures contracts to
hedge their existing portfolios, manage cash flows, enhance yield and to potentially reduce transaction costs. Upon entering into a futures contract with a broker, the Fund is required to deposit in a segregated account a specified amount of cash or
U.S. government securities. Futures contracts are valued daily and unrealized gains or losses are recorded in a “variation margin” account. Daily, the Fund receives from or pays to the broker a specified amount of cash based upon changes
in the variation margin account. When a contract is closed, the Fund recognizes a realized gain or loss. Futures contracts have market risks, including the risk that the change in the value of the contract may not correlate with the changes in the
value of the underlying securities.
Swap Agreements – Certain Funds may enter into credit default, interest rate,
total return and other forms of swap agreements. A swap agreement is an agreement to exchange the return generated by one instrument for the return generated by another instrument. The swap agreements are valued daily at current market value and any
change in value is included in the net unrealized appreciation or depreciation on investments. Payments received or paid by the Fund are recorded as realized gains or losses upon termination or maturity of the swap. Risk of loss may exceed amounts
recognized on the statements of assets and liabilities. Swap agreements outstanding at period end, if any, are listed on the Portfolio of Investments.
Interest rate swaps – Interest rate swaps represent an agreement between counterparties to exchange cash flows based on the difference between two interest rates, applied to a notional
principal amount for a specified period. The Fund is subject to interest rate risk exposure in the normal course of pursuing its investment objectives. The Fund may use interest rate swaps to either maintain its ability to generate steady cash flow
by receiving a stream of fixed rate payments or to increase exposure to prevailing market rates by receiving floating rate payments using interest rate swap contracts. The Fund’s maximum risk of loss from counterparty credit risk is the
discounted net value of the cash flows to be received from the counterparty over the contract’s remaining life. This risk may be mitigated by having a master netting arrangement between the Fund and the counterparty which may permit the Fund to
offset amounts payable by the Fund to the same counterparty against amounts to be received; and by the receipt of collateral from the counterparty by the Fund, to cover the Fund’s exposure to the counterparty. However, there is no assurance
that such mitigating factors are easily enforceable.
Credit default swap agreements – Credit default swap
agreements involve one party making a stream of payments (referred to as the buyer of protection) to another party (the seller of protection) in exchange for the right to receive a specified return in the event of a default or other credit event for
the referenced entity, obligation or index. As a seller of protection on credit default swap agreements, a Fund will generally receive from the buyer of protection a fixed rate of income throughout the term of the swap provided that there is no
credit event. As the seller, a Fund would effectively add leverage to its portfolio because, in addition to its total net assets, a Fund would be subject to investment exposure on the notional amount of the swap.
If a Fund is a seller of protection and a credit event occurs, as defined under the terms of that particular swap agreement, a Fund will
either (i) pay to the buyer of protection an amount equal to the notional amount of the swap and take delivery of the referenced obligation, other deliverable obligations or underlying securities comprising the referenced index or (ii) pay
a net settlement amount in the form of cash or securities equal to the notional amount of the swap less the recovery value of the referenced obligation or underlying securities comprising the referenced index. If a Fund is a buyer of protection and
a credit event occurs, as defined under the terms of that particular swap agreement, a Fund will either (i) receive from the seller of protection an amount equal to the notional amount of the swap and deliver the referenced obligation, other
deliverable obligations or underlying securities comprising the referenced index or (ii) receive a net settlement amount in the form of cash or securities equal to the notional amount of the swap less the recovery value of the referenced
obligation or underlying securities comprising the referenced index. Recovery values are estimated by market makers considering either industry standard recovery rates or entity specific factors and considerations until a credit event occurs. If a
credit event has occurred, the recovery value is determined by a facilitated auction whereby a minimum number of allowable broker bids, together with a specified valuation method, are used to calculate the settlement value.
Credit default swap agreements on corporate issues, sovereign issues of an emerging country or U.S. municipal issues involve one party
making a stream of payments to another party in exchange for the right to receive a specified return in the event of a default or other credit event. If a credit event occurs and cash settlement is not elected, a variety of other deliverable
obligations may be delivered in lieu of the specific referenced obligation. The ability to deliver other obligations may result in a cheapest-to deliver option (the buyer of protection’s right to choose the deliverable obligation with the
lowest value following a credit event). A Fund may use credit default swaps on corporate issues, sovereign issues of an emerging country or U.S. municipal issues to provide a measure of protection against defaults of the issuers (i.e., to reduce
risk where a Fund owns or has exposure to the referenced obligation) or to take an active long or short position with respect to the likelihood of a particular issuer’s default.
Credit default swap agreements on credit indices involve one party making a stream of payments to another party in exchange for the right
to receive a specified return in the event of a write-down, principal shortfall, interest shortfall or default of all or part of the referenced entities comprising the credit index. A credit index is a basket of credit instruments or exposures
designed to be representative of some part of the credit market as a whole. These indices are made up of reference credits that are judged by a poll of dealers to be the most liquid entities in the credit default swap market based on the sector of
the index. Components of the indices may include, but are not limited to, investment grade securities, high yield securities, asset-backed securities, emerging markets, and/or various credit ratings within each sector. Credit
ANNUAL REPORT / April
30, 2013
98 NOTES TO FINANCIAL STATEMENTS (continued)
indices are traded using credit default swaps with standardized terms including a fixed
spread and standard maturity dates. An index credit default swap references all the names in the index, and if there is a default, the credit event is settled based on that name’s weight in the index. The composition of the indices changes
periodically, usually every six months, and for most indices, each name has an equal weight in the index. A Fund may use credit default swaps on credit indices to hedge a portfolio of credit default swaps or bonds, which is less expensive than it
would be to buy many credit default swaps to achieve a similar effect. Credit default swaps on indices are benchmarks for protecting investors owning bonds against default, and traders use them to speculate on changes in credit quality. Implied
credit spreads, represented in absolute terms, utilized in determining the market value of credit default swap agreements on corporate issues, sovereign issues of an emerging country or U.S. municipal issues as of period end are disclosed in the
footnotes to the Portfolios of Investments and serve as an indicator of the current status of the payment/performance risk and represent the likelihood or risk of default for the credit derivative. The implied credit spread of a particular
referenced entity reflects the cost of buying/ selling protection and may include upfront payments required to be made to enter into the agreement. For credit default swap agreements on credit indices, the quoted market prices and resulting values
serve as the indicator of the current status of the payment/ performance risk. Wider credit spreads represent a deterioration of the referenced entity’s credit soundness and a greater likelihood or risk of default or other credit event
occurring as defined under the terms of the agreement. The maximum potential amount of future payments (undiscounted) that a Fund as a seller of protection could be required to make under a credit default swap agreement would be an amount equal to
the notional amount of the agreement.
As of April 30, 2013, none of the Funds had any open credit default swap
agreements.
The Following is a summary of the location of derivatives on the Funds’ Statements of Assets and Liabilities
as of April 30, 2013.
|
|
|
|
|
| |
|
Location on the Statement of Assets
and Liabilities |
| Derivative Type |
|
Asset Derivatives |
|
Liability Derivatives |
| Interest rate contracts |
|
Investments in securities, at value. |
|
Options written, at value. |
|
|
|
|
|
Net unrealized appreciation on swap agreements. |
|
Net unrealized depreciation on swap agreements. |
|
|
|
| Foreign exchange contracts |
|
Investments in securities, at value. |
|
Net unrealized depreciation on forward foreign currency exchange contracts. |
|
|
Net unrealized appreciation on forward foreign |
|
|
|
currency exchange contracts. |
|
Options written, at value. |
|
|
|
| Equity contracts |
|
Investments in securities, at value. |
|
Options written, at value. |
|
|
|
|
|
|
|
|
|
|
|
|
|
|
|
|
|
|
|
|
|
|
|
|
|
|
|
| |
|
|
|
|
|
|
Asset Derivative Fair
Value |
|
|
| Fund |
|
Total
Value |
|
Equity Contracts |
|
Foreign Exchange Contracts |
|
Interest Rate Contracts |
|
Credit Contracts |
| International Fund |
|
$ |
212 |
|
|
|
|
$ |
— |
|
|
|
|
$ |
212 |
|
|
|
|
$ |
— |
|
|
|
|
$— |
| Rock Maple Alternatives Fund |
|
|
12,136 |
|
|
|
|
|
9,559 |
|
|
|
|
|
2,577 |
|
|
|
|
|
— |
|
|
|
|
— |
| Real Asset Fund |
|
|
1,993,401 |
|
|
|
|
|
— |
|
|
|
|
|
1,898,757 |
|
|
|
|
|
94,644 |
|
|
|
|
— |
|
|
|
|
|
|
|
|
|
|
|
|
|
|
|
|
|
|
|
|
|
|
|
|
|
|
|
| |
|
|
|
|
|
|
Liability Derivative Fair
Value |
|
|
| Fund |
|
Total
Value |
|
Equity Contracts |
|
Foreign
Exchange
Contracts
|
|
Interest
Rate
Contracts |
|
Credit
Contracts |
| International Fund |
|
$ |
5,105 |
|
|
|
|
$ |
— |
|
|
|
|
$ |
5,105 |
|
|
|
|
$ |
— |
|
|
|
|
$— |
| Rock Maple Alternatives Fund |
|
|
174,323 |
|
|
|
|
|
99,804 |
|
|
|
|
|
74,519 |
|
|
|
|
|
— |
|
|
|
|
— |
| Real Asset Fund |
|
|
2,778,448 |
|
|
|
|
|
— |
|
|
|
|
|
2,503,073 |
|
|
|
|
|
275,375 |
|
|
|
|
— |
The effect of derivative instruments on the Statements of Operations for the year ended April 30, 2013 are as
follows:
|
|
|
| Derivative Type |
|
Location on the Statement of
Operations |
| Equity contracts |
|
Net realized gain (loss) on investments, options written and futures contracts Net change in unrealized appreciation (depreciation) on investments |
|
|
| Credit contracts |
|
Net realized gain (loss) on swap agreements |
|
|
Net change in unrealized appreciation (depreciation) on investments |
|
|
| Interest rate contracts |
|
Net realized gain (loss) on investments, swap agreements, options written and futures contracts |
|
|
Net change in unrealized appreciation (depreciation) on investments |
|
|
| Foreign exchange contracts |
|
Net realized gain (loss) on investments, foreign currency transactions and options written |
|
|
Net change in unrealized appreciation (depreciation) on investments |
April 30, 2013 / ANNUAL REPORT
NOTES TO FINANCIAL STATEMENTS (continued) 99
|
|
|
|
|
|
|
|
|
|
|
|
|
|
|
|
|
|
|
|
|
| |
|
Total Realized Gain
(Loss) on Derivatives Recognized in Results from Operations |
|
| Fund |
|
Total |
|
|
Equity Contracts |
|
|
Foreign Exchange Contracts |
|
|
Interest Rate Contracts |
|
|
Credit Contracts |
|
| International Fund |
|
$ |
(1,796) |
|
|
$ |
(11,960) |
|
|
$ |
10,164 |
|
|
$ |
— |
|
|
$ |
— |
|
| Rock Maple Alternatives Fund |
|
|
(194,000) |
|
|
|
(277,791) |
|
|
|
83,791 |
|
|
|
— |
|
|
|
— |
|
| Real Asset Fund |
|
|
91,824 |
|
|
|
— |
|
|
|
47,805 |
|
|
|
16,880 |
|
|
|
27,139 |
|
| |
|
|
|
|
|
|
|
|
|
|
|
|
|
|
|
|
|
|
|
|
| |
|
Change in Unrealized Appreciation
(Depreciation) on Derivatives |
|
| |
|
|
|
|
Recognized in Results from
Operations |
|
| Fund |
|
Total |
|
|
Equity Contracts |
|
|
Foreign Exchange Contracts |
|
|
Interest Rate Contracts |
|
|
Credit
Contracts |
|
| International Fund |
|
$ |
26,546 |
|
|
$ |
27,676 |
|
|
$ |
(1,130) |
|
|
$ |
— |
|
|
$ |
— |
|
| Rock Maple Alternatives Fund |
|
|
8,909 |
|
|
|
66,351 |
|
|
|
(57,442) |
|
|
|
— |
|
|
|
— |
|
| Real Asset Fund |
|
|
(412,264) |
|
|
|
— |
|
|
|
(304,649) |
|
|
|
(95,446) |
|
|
|
(12,169) |
|
The Funds’ derivative financial instruments outstanding as of April 30, 2013, as disclosed in
the Portfolios of Investments, is indicative of the volume of derivative activity for the Funds.
| 4. |
FEDERAL TAX INFORMATION |
The timing and character of income and capital gain distributions are determined in accordance with income tax regulations, which may differ from GAAP. These differences are due in part to differing
treatments for income recognition on expiration of capital loss carryforwards, reclassification of ordinary loss to short-term gains, market discount reclass, partnership adjustments, REIT dividend reclasses, and discount accretion/premium
amortization on debt securities.
As of April 30, 2013, there are no uncertain tax positions that would require financial
statement recognition, de-recognition or disclosure. The Funds’ federal tax returns filed for the periods ended 2012, 2011, and 2010, remain subject to examination by the Internal Revenue Service.
For the year ended April 30, 2013, permanent differences identified and reclassified among the components of net assets were as
follows:
|
|
|
|
|
|
|
|
|
|
|
|
|
| Fund |
|
Paid-in Capital |
|
|
Increase (Decrease) Undistributed
(Distributions
in Excess
of) Net Investment Income |
|
|
Accumulated
Net
Realized Gain (Loss) |
|
| International Fund |
|
$ |
(42,273) |
|
|
$ |
156,441 |
|
|
$ |
(114,168) |
|
| Rock Maple Alternatives Fund |
|
|
— |
|
|
|
145,800 |
|
|
|
(145,800) |
|
| Real Asset Fund |
|
|
(54,223) |
|
|
|
3,248,705 |
|
|
|
(3,194,482) |
|
| Strategic Allocation |
|
|
|
|
|
|
|
|
|
|
|
|
| Conservative Fund |
|
|
— |
|
|
|
183,727 |
|
|
|
(183,727) |
|
| Strategic Allocation Moderate Fund |
|
|
— |
|
|
|
85,501 |
|
|
|
(85,501) |
|
The tax character of distributions for the corresponding years or periods as reported on the Statements
of Changes in Net Assets were as follows:
|
|
|
|
|
|
|
|
|
|
|
|
|
|
|
|
|
|
|
| |
|
2013 |
|
|
2012 |
| Fund |
|
Ordinary
Income* |
|
|
Long-Term
Capital
Gains |
|
|
Ordinary
Income* |
|
|
Long-Term
Capital
Gains |
| Rock Maple Alternatives Fund |
|
|
241,997 |
|
|
|
193,600 |
|
|
|
71,149 |
|
|
|
— |
|
|
|
| Strategic Allocation Moderate Fund |
|
|
976,174 |
|
|
|
— |
|
|
|
910,770 |
|
|
|
91,452 |
|
|
|
|
|
|
|
|
|
|
|
|
|
|
|
|
|
|
|
|
|
|
| Fund |
|
|
|
|
2013
Ordinary
Income*
|
|
|
2012
Ordinary
Income*
|
|
|
2011
Ordinary
Income*
|
| International Fund |
|
|
|
|
|
$ |
7,322,484 |
|
|
$ |
2,509,709 |
|
|
$ |
4,176,386 |
|
|
|
| Real Asset Fund |
|
|
|
|
|
|
5,621,165 |
|
|
|
245,911 |
|
|
|
14,278,269 |
|
|
|
| Strategic Allocation Conservative Fund |
|
|
|
|
|
|
1,060,591 |
|
|
|
1,198,813 |
|
|
|
1,798,463 |
|
|
|
| Strategic Allocation Aggressive Fund |
|
|
|
|
|
|
540,529 |
|
|
|
339,756 |
|
|
|
1,010,375 |
|
|
|
| * |
For tax purposes, short-term capital gain distributions are considered ordinary income distributions. |
ANNUAL REPORT / April
30, 2013
100 NOTES TO FINANCIAL STATEMENTS (continued)
As of April 30, 2013, the components of distributable earnings on a tax basis were
as follows:
|
|
|
|
|
|
|
|
|
|
|
|
|
|
|
|
|
|
|
|
|
| Fund |
|
Undistributed/
(Over
Distributed)
Ordinary Income |
|
|
Undistributed
Long-Term
Capital
Gains |
|
|
Other
Timing
Differences
|
|
|
Unrealized
Appreciation
|
|
|
Capital Loss
Carryforwards
and
Deferrals |
|
| International Fund |
|
|
$4,408,839 |
|
|
$ |
— |
|
|
$ |
4,893 |
|
|
|
$47,519,668 |
|
|
|
$(366,025,762) |
|
| Rock Maple Alternatives Fund |
|
|
11,909 |
|
|
|
676,662 |
|
|
|
94,079 |
|
|
|
1,710,035 |
|
|
|
(450,757) |
|
| Real Asset Fund |
|
|
6,007,834 |
|
|
|
— |
|
|
|
(289,795) |
|
|
|
40,008,697 |
|
|
|
(104,657,041) |
|
| Strategic Allocation Conservative Fund |
|
|
279,493 |
|
|
|
— |
|
|
|
— |
|
|
|
3,051,057 |
|
|
|
(876,936) |
|
| Strategic Allocation Moderate Fund |
|
|
84,765 |
|
|
|
— |
|
|
|
— |
|
|
|
7,606,034 |
|
|
|
(13,782,278) |
|
| Strategic Allocation Aggressive Fund |
|
|
48,599 |
|
|
|
— |
|
|
|
— |
|
|
|
4,140,133 |
|
|
|
(8,512,218) |
|
Under the recently enacted Regulated Investment Company Modernization Act of 2010, the Funds are
permitted to carry forward capital losses incurred in taxable years beginning after December 22, 2010 for an unlimited period. However, any losses incurred during those future taxable years will be required to be utilized prior to the losses
incurred in pre-enactment taxable years. As a result of this ordering rule, pre-enactment capital loss carryforwards may have an increased likelihood to expire unused. Additionally, post-enactment capital losses that are carried forward will retain
their character as either short-term or long-term capital losses rather than being considered all short-term as under previous law.
At April 30, 2013, the following Funds had capital loss carryforwards which will reduce each Fund’s taxable income arising from future net realized gain on investments, if any, to the extent
permitted by the Internal Revenue Code (“Code”) and thus will reduce the amount of distributions to shareholders which would otherwise be necessary to relieve the Fund of any liability for federal income tax. Pursuant to the Code, such
capital loss carryforwards will expire as follows:
|
|
|
|
|
|
|
|
|
|
|
|
|
|
|
|
|
|
|
|
|
|
|
|
|
|
|
|
|
| |
|
|
|
|
Short-Term
|
|
|
Long-Term
|
|
|
Total
Capital |
|
|
|
|
Capital Loss
Available Through |
|
|
Post-Effective
No
Expiration |
|
|
Post-Effective
No
Expiration |
|
|
Loss Carryforwards |
|
| Fund
|
|
2016 |
|
|
2017 |
|
|
2018 |
|
|
2019 |
|
|
|
|
| International Fund |
|
|
$88,749,523 |
|
|
|
$236,603,604 |
|
|
|
$28,105,841 |
|
|
|
$ — |
|
|
|
$10,812,793 |
|
|
|
$1,754,001 |
|
|
|
$366,025,762 |
|
| Real Asset Fund |
|
|
— |
|
|
|
— |
|
|
|
104,657,041 |
|
|
|
— |
|
|
|
— |
|
|
|
— |
|
|
|
104,657,041 |
|
| Strategic Allocation Conservative Fund |
|
|
— |
|
|
|
— |
|
|
|
876,936 |
|
|
|
— |
|
|
|
— |
|
|
|
— |
|
|
|
876,936 |
|
| Strategic Allocation Moderate Fund |
|
|
— |
|
|
|
11,971,259 |
|
|
|
1,811,019 |
|
|
|
— |
|
|
|
— |
|
|
|
— |
|
|
|
13,782,278 |
|
| Strategic Allocation Aggressive Fund |
|
|
— |
|
|
|
— |
|
|
|
883,083 |
|
|
|
7,629,135 |
|
|
|
— |
|
|
|
— |
|
|
|
8,512,218 |
|
As a result of the tax-free transfer of assets described in Note 8 and to the extent unrealized gains and losses that
existed at the time of the reorganization are realized, the capital loss carryforwards may further be limited for up to five years from the date of the reorganization.
The Funds used capital loss carryforwards as follows to offset taxable capital gains realized during the year ended April 30, 2013:
|
|
|
| Fund |
|
Capital
Loss
Carryforwards
Used |
| Real Asset Fund |
|
$7,333,654 |
| Strategic Allocation Conservative Fund |
|
2,568,195 |
| Strategic Allocation Moderate Fund |
|
1,172,622 |
| Strategic Allocation Aggressive Fund |
|
2,709,546 |
Under current tax regulations, capital losses on securities transactions realized after October 31 may be deferred
and treated as occurring on the first day of the following fiscal year. Post-October losses deferred to May 1, 2013 are as follows:
|
|
|
|
|
|
|
| Fund |
|
Short-Term
Post-October/
Late
Year
Capital
Losses |
|
Long-Term
Post-October/
Late
Year
Capital
Losses |
|
Short-Term
Post-October/
Late
Year
Currency
Losses |
| Rock Maple Alternatives Fund |
|
$450,757 |
|
$— |
|
$— |
April 30, 2013 / ANNUAL REPORT
NOTES TO FINANCIAL STATEMENTS (continued) 101
| 5. |
ADVISORY FEES, SERVICING FEES, AND OTHER SERVICE PROVIDERS |
Investment Advisor – Wilmington Funds Management Corporation (“WFMC” or the “Advisor”) serves as the Investment Advisor to each of the Funds. Wilmington Trust Investment
Advisors, Inc. (“WTIA”) provides sub-advisory services to the Funds. WFMC and WTIA are wholly-owned subsidiaries of M&T Bank Corporation. For its services, the Funds pay WFMC an annual investment advisory fee, accrued and paid daily,
based on a percentage of each Fund’s average daily net assets as described below. WFMC, not the Funds, pays WTIA for its services.
The International Fund, Rock Maple Alternatives Fund and Real Asset Fund, utilize a multi-manager strategy, whereby WFMC allocates all or a portion of the Funds’ assets among a number of
sub-advisors. WFMC engages Rock Maple Services, LLC (“Rock Maple”) to assist in the identification and selection of sub-advisors and in the portfolio construction process for the Rock Maple Alternatives Fund. For their services, the Funds
pay Rock Maple and each sub-advisor fees, accrued daily and paid monthly, as described below. Certain sub-advisors have entered into an agreement with WFMC to waive their fees to the extent that the fee calculation determined by taking into account
similarly managed assets in the accounts of clients of WFMC or its affiliates results in a fee that is less than the fee calculation under the sub-advisory agreement.
WFMC and the Funds’ distributor and shareholder service providers have contractually agreed to waive their fees and/or reimburse expenses through August 31, 2013, so that total annual fund
operating expenses paid by the Funds (not including the effects of dividends or interest on short positions, acquired fund fees and expenses, taxes, or other extraordinary expenses expressed as an annualized percentage of average daily net assets),
will not exceed the expense limitations set forth below.
|
|
|
|
|
|
|
|
|
| |
|
Contractual
Expense
Limitations |
|
| Fund |
|
Class A |
|
|
Class I |
|
| Multi-Manager International Fund |
|
|
1.49% |
|
|
|
1.36% |
|
| Rock Maple Fund |
|
|
2.23% |
|
|
|
1.98% |
|
| Multi-Manager Real Asset Fund |
|
|
1.28% |
|
|
|
1.03% |
|
| Strategic Allocation Conservative Fund* |
|
|
0.90% |
|
|
|
0.65% |
|
| Strategic Allocation Moderate Fund |
|
|
0.84% |
|
|
|
0.59% |
|
| Strategic Allocation Aggressive Fund* |
|
|
1.03% |
|
|
|
0.78% |
|
* The advisor has voluntarily agreed to waive fees so that the Fund’s expenses are
below the contractual expense limitations.
Prior to September 1, 2012 the contractual expense limitations for Rock Maple
Fund was 2.48% for Class A and Strategic Allocation Moderate Fund was 1.10% and 0.85% for Class A and Class I, respectively.
|
|
|
|
|
|
|
|
|
| Fund |
|
Gross Fees |
|
Fees
Waived |
|
|
Fee as a % of average net asset of the Fund/ Allocated Net Assets for Sub-advisors |
| International Fund |
|
|
|
|
|
|
|
|
| WFMC |
|
$2,212,008 |
|
|
$(173,570) |
|
|
0.50% |
| Sub-advisors: |
|
|
|
|
|
|
|
|
| Barings International Investment Limited |
|
228,633 |
|
|
— |
|
|
0.45% |
| Goldman Sachs Asset Management, L.P. (terminated 11/13/12) |
|
162,746 |
|
|
(4,825) |
|
|
0.50% |
| Hansberger Global Investors, Inc. (terminated 11/13/12) |
|
107,091 |
|
|
— |
|
|
0.60% |
| LSV Asset Management |
|
202,557 |
|
|
— |
|
|
0.49% |
| Dimensional Fund Advisors LP |
|
261,263 |
|
|
(41,923) |
|
|
0.45% on the first $50 million; |
|
|
|
|
|
|
|
|
0.30% in excess of $50 million |
| Parametric Portfolio Associates, LLC |
|
818,023 |
|
|
— |
|
|
0.80% on the first $100 million; |
| (Emerging Markets Strategy) |
|
|
|
|
|
|
|
0.75% in excess of $100 million |
| Parametric Portfolio Associates, LLC |
|
122,781 |
|
|
(8,278) |
|
|
0.275% on the first $50 million; |
| (Developed Country Index Replication Strategy) |
|
|
|
|
|
|
|
0.20% in excess of $50 million |
| Northern Cross, LLC (since 11/13/12) |
|
318,141 |
|
|
— |
|
|
0.55% on the first $1 billion; |
|
|
|
|
|
|
|
|
0.50% in excess of $1 billion |
| Rock Maple Fund |
|
|
|
|
|
|
|
|
| WFMC |
|
365,997 |
|
|
(317,328) |
|
|
1.00% |
| Rock Maple Services, LLC |
|
146,399 |
|
|
— |
|
|
0.40% |
| Sub-advisors: |
|
|
|
|
|
|
|
|
| Acuity Capital Management, LLC |
|
60,694 |
|
|
— |
|
|
1.00% |
| ADAR Investment Management, LLC |
|
48,435 |
|
|
— |
|
|
1.00% |
| Calypso Capital Management, LP |
|
46,878 |
|
|
— |
|
|
1.00% |
| TIG Advisors, LLC |
|
38,056 |
|
|
— |
|
|
1.00% |
| Whitebox Advisors (terminated 11/23/12) |
|
— |
|
|
— |
|
|
1.00% |
| Madison Street Partners, LLC |
|
42,778 |
|
|
— |
|
|
1.00% |
| Parametric Risk Advisors |
|
46,598 |
|
|
— |
|
|
0.90% |
| Evercore Wealth Management, LLC (terminated 3/1/13) |
|
16,503 |
|
|
— |
|
|
0.75% |
ANNUAL REPORT / April
30, 2013
102 NOTES TO FINANCIAL STATEMENTS (continued)
|
|
|
|
|
|
|
|
|
| Fund |
|
Gross
Fees |
|
Fees
Waived |
|
|
Fee as a % of average net asset of the Fund/ Allocated Net Assets for Sub-advisors |
| Real Asset Fund |
|
|
|
|
|
|
|
|
| WFMC |
|
1,916,151 |
|
|
(133,245) |
|
|
0.50% excluding assets allocated to the inflation-protected debt securities (“TIPS”) strategy or the Enhanced Cash Strategy 0.57% of the first $25 million of assets allocated
to the TIPS strategy; 0.54% of the next $25 million; and 0.52% of assets over $50 million |
|
|
|
|
|
|
|
|
0.58% of assets allocated to the enhanced cash strategy |
| WFMC- Enhanced Cash Strategy |
|
9,679 |
|
|
— |
|
|
For assets allocated to the Enhanced Cash Strategy, an additional fee as follows: 0.08% on the assets allocated to the Enhanced Cash Strategy |
| Sub-advisors: |
|
|
|
|
|
|
|
|
| Pacific Investment Management Company, LLC |
|
353,628 |
|
|
— |
|
|
0.29% |
| E.I.I. Capital Management, Inc. |
|
414,039 |
|
|
(665) |
|
|
0.65% on the first $100 million; |
|
|
|
|
|
|
|
|
0.60% in excess of $100 million |
| CBRE Clarion Securities, LLC |
|
367,281 |
|
|
(14,546) |
|
|
0.65% on the first $50 million; |
|
|
|
|
|
|
|
|
0.55% on the next $50 million; |
|
|
|
|
|
|
|
|
0.45% in excess of $100 million |
| HSBC Global Asset Management (France) |
|
107,138 |
|
|
— |
|
|
0.20% on the first $100 million; |
|
|
|
|
|
|
|
|
0.15% on the next $400 million; |
|
|
|
|
|
|
|
|
0.10% in excess of $500 million |
| Strategic Allocation Conservative Fund |
|
248,544 |
|
|
(191,467) |
|
|
0.50% |
| Strategic Allocation Moderate Fund |
|
319,652 |
|
|
(235,533) |
|
|
0.50% |
| Strategic Allocation Aggressive Fund |
|
194,396 |
|
|
(133,678) |
|
|
0.50% |
Administrative Fee – The Bank of New York Mellon (“BNYM”) provides the Trust with
fund administration services. Effective October 1, 2012, WFMC replaced WTIA as Co-Administrator for the Funds. WFMC in its role as co-administrator provides the Funds with certain administrative personnel and services necessary to operate the
Funds. These services were provided for at an aggregate annual fee as specified below.
|
|
|
|
|
|
|
| Administrator |
|
Maximum
Fee |
|
|
Average Aggregate Daily Net Assets of the Trust |
| WFMC |
|
|
0.033 |
% |
|
on the first $5 billion |
|
|
|
0.020 |
% |
|
on the next $2 billion |
|
|
|
0.016 |
% |
|
on the next $3 billion |
|
|
|
0.015 |
% |
|
on assets in excess of $10 billion |
|
|
|
| BNYM |
|
|
0.0285 |
% |
|
on the first $500 million |
|
|
|
0.0280 |
% |
|
on the next $500 million |
|
|
|
0.0275 |
% |
|
on assets in excess of $1 billion |
WFMC may voluntarily choose to waive any portion of its fee. WFMC can modify or terminate its voluntary
waiver at any time at its sole discretion. For the year ended April 30, 2013, WTIA and WFMC did not waive any administrative personnel and services fee.
Distribution Services Fee – The Trust has adopted a Distribution Services Plan (the “Plan”) pursuant to Rule 12b-1 under the Act. The Plan allows the Funds to pay fees to financial
intermediaries, which may be paid through ALPS Distributors, Inc. (“ALPS”), the principal distributor, at an annual rate of up to 0.25% of the average daily net assets of the Funds’ Class A shares.
The Funds may reduce the maximum amount of distribution services fees it pays from time to time at its sole discretion. In addition, a
financial intermediary (including ALPS, the Advisor or their affiliates), may voluntarily waive or reduce any fees to which they are entitled.
For the year ended April 30, 2013, M&T Securities, Inc. and Manufacturers and Traders Trust Company (together “M&T”), affiliates of the Advisor, received a portion of the fees paid
by the Funds which are listed below:
|
|
|
|
|
| Fund |
|
Distribution
Fees
|
|
| International Fund |
|
$ |
5,652 |
|
| Rock Maple Alternatives Fund |
|
|
3 |
|
| Real Asset Fund |
|
|
118 |
|
| Strategic Allocation Conservative Fund |
|
|
491 |
|
| Strategic Allocation Moderate Fund |
|
|
121,617 |
|
| Strategic Allocation Aggressive Fund |
|
|
463 |
|
Sales Charges – The Class A shares of all the Funds bear front-end sales charges.
April 30, 2013 / ANNUAL REPORT
NOTES TO FINANCIAL STATEMENTS (continued) 103
For the year ended April 30, 2013, M&T received the amounts listed below from
sales charges on the sale of A shares.
|
|
|
|
|
|
| Fund |
|
Sales Charges from
Class
A |
| International Fund |
|
|
$ |
1,337 |
|
| Rock Maple Alternatives Fund |
|
|
|
8,144 |
|
| Real Asset Fund |
|
|
|
210 |
|
| Strategic Allocation Conservative Fund |
|
|
|
5,020 |
|
| Strategic Allocation Moderate Fund |
|
|
|
85,076 |
|
| Strategic Allocation Aggressive Fund |
|
|
|
9,584 |
|
Shareholder Services Fee – Pursuant to a Shareholder Services Plan adopted by the Funds and
administered by ALPS, the Funds may pay up to 0.25% of the average daily net assets of each Fund’s Class A and Class I shares to financial intermediaries (which may include ALPS, the Advisor or their affiliates) for providing shareholder
services and maintaining shareholder accounts. M&T has entered into a Shareholders Services Agreement with ALPS, under which it is entitled to receive up to 0.25% of the average daily net assets of each Fund’s shares for whom M&T
provides shareholder services. The Funds may reduce the maximum amount of shareholder service fees it pays from time to time at its sole discretion. In addition, a financial intermediary (including M&T) may waive or reduce any fees to which they
are entitled.
For the year ended April 30, 2013, M&T received a portion of the fees paid by the following Fund which
is listed below:
|
|
|
|
|
|
| Fund |
|
Shareholder
Services
Fee |
| International Fund |
|
|
|
$243,020 |
|
Other Service Providers – Foreside Management Services, LLC (“FMS”) provides a
Principal Executive Officer to the Trust. FMS has no role in determining the investment policies or which securities are to be sold or purchased by the Trust or its Funds.
BNYM provides fund accounting and custody services to the Trust.
BNY Mellon Investment Servicing
(U.S.) Inc. provides transfer agency services to the Trust.
General – Certain Officers of the Trust are also
Officers or employees of the above companies that provide services to the Funds, and during their terms of office, receive no compensation from the Funds. The Trust’s Statement of Additional Information includes additional information about the
Trustees.
Other Affiliated Parties and Transactions – Affiliated holdings are mutual funds which are managed by
the Advisor or an affiliate of the Advisor or which are distributed by an affiliate of the Funds’ distributor. Transactions with affiliated companies during the year ended April 30, 2013 are as follows:
|
|
|
|
|
|
|
|
|
|
|
|
|
|
|
|
|
|
|
|
|
|
|
|
|
|
|
|
|
| Affiliated Fund Name |
|
Balance of Shares Held
4/30/2012 |
|
|
Purchases/
Additions
|
|
|
Sales/
Reductions
|
|
|
Balance
of
Shares Held
4/30/2013 |
|
|
Value
at
4/30/2013 |
|
|
Dividend
Income(a) |
|
|
Realized
Gain/(Loss)(b) |
|
| Wilmington Multi-Manager |
|
|
|
|
|
|
|
|
|
|
|
|
|
|
|
|
|
|
|
|
|
|
|
|
|
|
|
|
| International Fund |
|
|
|
|
|
|
|
|
|
|
|
|
|
|
|
|
|
|
|
|
|
|
|
|
|
|
|
|
| Wilmington Prime Money Market Fund |
|
|
— |
|
|
|
83,143,180 |
|
|
|
83,143,180 |
|
|
|
— |
|
|
|
$ — |
|
|
|
$406 |
|
|
|
$— |
|
|
|
|
|
|
|
|
|
|
|
|
|
|
|
|
|
|
|
|
|
|
|
|
|
|
|
|
|
|
| Wilmington Multi-Manager Real |
|
|
|
|
|
|
|
|
|
|
|
|
|
|
|
|
|
|
|
|
|
|
|
|
|
|
|
|
| Assets Fund |
|
|
|
|
|
|
|
|
|
|
|
|
|
|
|
|
|
|
|
|
|
|
|
|
|
|
|
|
| Wilmington Prime Money Market Fund |
|
|
1,774,134 |
|
|
|
76,408,843 |
|
|
|
75,532,170 |
|
|
|
2,650,807 |
|
|
|
2,650,807 |
|
|
|
541 |
|
|
|
— |
|
|
|
|
|
|
|
|
|
|
|
|
|
|
|
|
|
|
|
|
|
|
|
|
|
|
|
|
|
|
ANNUAL REPORT / April
30, 2013
104 NOTES TO FINANCIAL STATEMENTS (continued)
|
|
|
|
|
|
|
|
|
|
|
|
|
|
|
|
|
|
|
|
|
|
|
|
|
|
|
|
|
| Affiliated Fund
Name |
|
Balance
of
Shares Held
4/30/2012 |
|
|
Purchases/
Additions
|
|
|
Sales/
Reductions
|
|
|
Balance
of
Shares Held
4/30/2013 |
|
|
Value
at
4/30/2013 |
|
|
Dividend
Income(a) |
|
|
Realized
Gain/(Loss)(b) |
|
| Wilmington Strategic Allocation |
|
|
|
|
|
|
|
|
|
|
|
|
|
|
|
|
|
|
|
|
|
|
|
|
|
|
|
|
| Conservative Fund: |
|
|
|
|
|
|
|
|
|
|
|
|
|
|
|
|
|
|
|
|
|
|
|
|
|
|
|
|
| Wilmington Prime Money Market Fund |
|
|
— |
|
|
|
2,725,482 |
|
|
|
2,015,201 |
|
|
|
710,281 |
|
|
|
710,281 |
|
|
|
61 |
|
|
|
— |
|
| Wilmington Mid-Cap Growth Fund |
|
|
— |
|
|
|
34,388 |
|
|
|
— |
|
|
|
34,388 |
|
|
|
563,962 |
|
|
|
— |
|
|
|
— |
|
| Wilmington Large-Cap Strategy Fund |
|
|
444,836 |
|
|
|
53,477 |
|
|
|
255,948 |
|
|
|
242,365 |
|
|
|
3,545,798 |
|
|
|
89,662 |
|
|
|
870,819 |
|
| Wilmington Small-Cap Strategy Fund |
|
|
36,077 |
|
|
|
442 |
|
|
|
9,588 |
|
|
|
26,932 |
|
|
|
331,531 |
|
|
|
4,812 |
|
|
|
37,061 |
|
| Wilmington Intermediate-Term Bond Fund |
|
|
2,766,407 |
|
|
|
92,575 |
|
|
|
582,303 |
|
|
|
2,276,678 |
|
|
|
24,132,788 |
|
|
|
571,219 |
|
|
|
443,010 |
|
| Wilmington Multi-Manager International Fund |
|
|
515,092 |
|
|
|
161,949 |
|
|
|
242,225 |
|
|
|
434,816 |
|
|
|
3,174,153 |
|
|
|
61,988 |
|
|
|
318,677 |
|
| Wilmington Multi-Manager Real Asset Fund |
|
|
186,604 |
|
|
|
2,674 |
|
|
|
13,760 |
|
|
|
175,518 |
|
|
|
2,739,830 |
|
|
|
38,887 |
|
|
|
31,885 |
|
|
|
|
|
|
|
|
|
|
|
|
|
|
|
|
|
|
|
|
|
|
|
|
|
|
|
|
|
|
| TOTAL |
|
|
|
|
|
|
3,070,987 |
|
|
|
3,119,025 |
|
|
|
|
|
|
|
35,198,343 |
|
|
|
766,629 |
|
|
|
1,701,452 |
|
|
|
|
|
|
|
|
|
|
|
|
|
|
|
|
|
|
|
|
|
|
|
|
|
|
|
|
|
|
| Wilmington Strategic Allocation |
|
|
|
|
|
|
|
|
|
|
|
|
|
|
|
|
|
|
|
|
|
|
|
|
|
|
|
|
| Moderate Fund: |
|
|
|
|
|
|
|
|
|
|
|
|
|
|
|
|
|
|
|
|
|
|
|
|
|
|
|
|
| Wilmington Prime Money Market Fund |
|
|
2,351,958 |
|
|
|
13,079,390 |
|
|
|
14,208,191 |
|
|
|
1,223,157 |
|
|
|
1,223,157 |
|
|
|
341 |
|
|
|
— |
|
| Wilmington Large-Cap Growth Fund |
|
|
394,891 |
|
|
|
— |
|
|
|
183,349 |
|
|
|
211,542 |
|
|
|
1,827,727 |
|
|
|
2,200 |
|
|
|
652,749 |
|
| Wilmington Large-Cap Value Fund |
|
|
226,768 |
|
|
|
— |
|
|
|
104,256 |
|
|
|
122,512 |
|
|
|
1,427,262 |
|
|
|
20,569 |
|
|
|
155,803 |
|
| Wilmington Mid-Cap Growth Fund |
|
|
200,777 |
|
|
|
1,370 |
|
|
|
13,730 |
|
|
|
188,417 |
|
|
|
3,090,043 |
|
|
|
— |
|
|
|
156,483 |
|
| Wilmington Small-Cap Growth Fund |
|
|
110,991 |
|
|
|
— |
|
|
|
54,094 |
|
|
|
56,897 |
|
|
|
1,072,513 |
|
|
|
5,452 |
|
|
|
338,677 |
|
| Wilmington Multi-Manager International Fund |
|
|
623,127 |
|
|
|
319,733 |
|
|
|
— |
|
|
|
942,860 |
|
|
|
6,882,878 |
|
|
|
77,870 |
|
|
|
— |
|
| Wilmington Multi-Manager Real Asset Fund |
|
|
145,148 |
|
|
|
75,943 |
|
|
|
— |
|
|
|
221,091 |
|
|
|
3,451,237 |
|
|
|
39,272 |
|
|
|
— |
|
|
|
|
|
|
|
|
|
|
|
|
|
|
|
|
|
|
|
|
|
|
|
|
|
|
|
|
|
|
| TOTAL |
|
|
|
|
|
|
13,476,436 |
|
|
|
14,563,620 |
|
|
|
|
|
|
|
18,974,817 |
|
|
|
145,704 |
|
|
|
1,303,712 |
|
|
|
|
|
|
|
|
|
|
|
|
|
|
|
|
|
|
|
|
|
|
|
|
|
|
|
|
|
|
| Wilmington Strategic Allocation |
|
|
|
|
|
|
|
|
|
|
|
|
|
|
|
|
|
|
|
|
|
|
|
|
|
|
|
|
| Aggressive Fund: |
|
|
|
|
|
|
|
|
|
|
|
|
|
|
|
|
|
|
|
|
|
|
|
|
|
|
|
|
| Wilmington Prime Money Market Fund |
|
|
— |
|
|
|
4,367,526 |
|
|
|
3,724,492 |
|
|
|
643,033 |
|
|
|
643,033 |
|
|
|
47 |
|
|
|
— |
|
| Wilmington Mid-Cap Growth Fund |
|
|
— |
|
|
|
169,356 |
|
|
|
— |
|
|
|
169,356 |
|
|
|
2,777,438 |
|
|
|
— |
|
|
|
— |
|
| Wilmington Large-Cap Strategy Fund |
|
|
1,530,206 |
|
|
|
23,702 |
|
|
|
656,819 |
|
|
|
897,089 |
|
|
|
13,124,405 |
|
|
|
309,953 |
|
|
|
1,883,923 |
|
| Wilmington Small-Cap Strategy Fund |
|
|
84,858 |
|
|
|
1,144 |
|
|
|
16,610 |
|
|
|
69,393 |
|
|
|
854,224 |
|
|
|
12,469 |
|
|
|
73,158 |
|
| Wilmington Multi-Manager International Fund |
|
|
1,718,189 |
|
|
|
368,409 |
|
|
|
687,913 |
|
|
|
1,398,685 |
|
|
|
10,210,397 |
|
|
|
212,587 |
|
|
|
306,496 |
|
| Wilmington Multi-Manager Real Asset Fund |
|
|
154,862 |
|
|
|
2,028 |
|
|
|
31,020 |
|
|
|
125,870 |
|
|
|
1,964,829 |
|
|
|
29,469 |
|
|
|
93,803 |
|
|
|
|
|
|
|
|
|
|
|
|
|
|
|
|
|
|
|
|
|
|
|
|
|
|
|
|
|
|
| TOTAL |
|
|
|
|
|
|
4,932,165 |
|
|
|
5,116,854 |
|
|
|
|
|
|
|
29,574,326 |
|
|
|
564,525 |
|
|
|
2,357,380 |
|
|
|
|
|
|
|
|
|
|
|
|
|
|
|
|
|
|
|
|
|
|
|
|
|
|
|
|
|
|
| (a) |
Dividend Income may include distributions from net investment income and
return of capital paid by the affliated fund to the Fund. |
| (b) |
Realized Gain/(Loss) includes realized capital gain distributions paid by
the affiliated fund and gain/(loss) received by the Fund for sales of the affiliated fund. |
Certain Funds
effect trades for security purchase and sale transactions through brokers that are affiliates of the Advisor or sub-advisors. Commissions paid on those trades for the year ended April 30, 2013 were as follows:
|
|
|
|
|
|
| Fund |
|
Comissions |
| International Fund |
|
|
$ |
110,095 |
|
| Rock Maple Alternatives Fund |
|
|
|
4,594 |
|
| Real Asset Fund |
|
|
|
12,739 |
|
| Strategic Allocation Conservative Fund |
|
|
|
4,152 |
|
| Strategic Allocation Aggressive Fund |
|
|
|
3,380 |
|
April 30, 2013 / ANNUAL REPORT
NOTES TO FINANCIAL STATEMENTS (continued) 105
| 6. |
INVESTMENT TRANSACTIONS |
Purchases and sales of investments, excluding short-term obligations, U.S. Government Securities and in-kind transactions, for the year ended April 30, 2013 were as follows:
|
|
|
|
|
|
|
|
|
| |
|
Investments |
|
| Fund |
|
Purchases |
|
|
Sales |
|
| International Fund |
|
$ |
401,146,316 |
|
|
$ |
313,084,095 |
|
| Rock Maple Alternatives Fund |
|
|
127,118,989 |
|
|
|
118,328,395 |
|
| Real Asset Fund |
|
|
230,783,206 |
|
|
|
187,230,146 |
|
| Strategic Allocation Conservative Fund |
|
|
14,038,850 |
|
|
|
19,982,720 |
|
| Strategic Allocation Moderate Fund |
|
|
19,356,252 |
|
|
|
24,942,692 |
|
| Strategic Allocation Aggressive Fund |
|
|
16,351,410 |
|
|
|
22,713,482 |
|
Purchases and sales of investments of U.S. Government Securities for the year ended April 30, 2013 were as follows:
|
|
|
|
|
|
|
|
|
|
|
| |
|
U.S. Government
Securities
|
| Fund |
|
Purchases |
|
Sales |
| Real Asset Fund |
|
|
$ |
294,458,004 |
|
|
|
$ |
299,138,078 |
|
| Strategic Allocation Moderate Fund |
|
|
|
509,072 |
|
|
|
|
2,241,731 |
|
The Trust participated in a $20,000,000 unsecured, committed revolving line of credit (“LOC”) agreement with BNYM. The LOC was
made available for extraordinary or emergency purposes, primarily for financing redemption payments. Borrowings are charged interest at a rate of 1.25% per annum over the greater of the Federal Funds Rate or the overnight LIBOR Rate. The LOC
included a commitment fee of 0.12% per annum on the daily unused portion. In addition, an upfront commitment fee of 0.02% was paid to BNYM. The termination date of this LOC is March 10, 2014. The Funds did not utilize the LOC for the year
ended April 30, 2013.
On
February 21, 2012, the Board approved an Agreement and Plan of Reorganization (the “Reorganization”) to transfer all of the assets of Wilmington Multi-Manager International Fund (“WT International Fund”), Wilmington
Multi-Manager Real Asset Fund (“WT Real Asset Fund”), Wilmington Conservative Asset Allocation Fund (“WT Conservative Asset Allocation Fund”) and Wilmington Aggressive Asset Allocation Fund (“WT Aggressive Asset Allocation
Fund”), each a series of WT Mutual Fund (collectively the “WT Funds”), in exchange for shares of the International Fund (“MTB International Fund”), Real Asset Fund, Strategic Allocation Conservative Fund and Strategic
Allocation Aggressive Fund (each an “Acquiring Fund”), respectively. The Reorganization is believed to be in the best interest of shareholders as combining the series of WT Funds and the Trust onto a single operating platform will create a
larger fund family that will offer a broader range of investment options. Additionally, the Reorganization is believed to present the opportunity to achieve asset growth through combined distribution networks, to achieve economies of scale, and to
operate with greater efficiency and lower overall costs. The shareholders of the WT Funds approved the Reorganization at a meeting on February 21, 2012 and the Reorganization took place on March 9, 2012. The Reorganization was treated as
tax-free reorganization for federal income tax purposes and, accordingly, the basis of the assets of each Acquiring Fund reflected the historical basis of the assets of each respective WT Fund as of the date of the Reorganization. WFMC and its
affiliates bore the expenses related to the Reorganization, except for brokerage fees and other transaction costs associated with the disposition and/or purchase of securities in contemplation of or as a result of the Reorganization.
In exchange for their shares (A Shares and Institutional Shares), shareholders of the WT Real Asset Fund, WT Conservative Asset Allocation
Fund and WT Aggressive Asset Allocation Fund received an identical number of shares of the corresponding class (Class A Shares and Class I Shares) of the Real Asset Fund, Strategic Allocation Conservative Fund and Strategic Allocation Aggressive
Fund, respectively, with an aggregate net asset value equal to the aggregate net asset value of their shares immediately prior to the Reorganization. The Real Asset Fund, Strategic Allocation Conservative Fund and Strategic Allocation Aggressive
Fund had no operations prior to March 9, 2012. Each WT Fund’s investment objectives, policies and limitations were similar or identical to those of the respective Acquiring Fund. Accordingly, for financial reporting purposes, the operating
history of the WT Real Asset Fund, WT Aggressive Asset Allocation Fund and WT Aggressive Asset Allocation Fund prior to the Reorganization is reflected in each respective Acquiring Fund’s financial statements and financial highlights.
In connection with the Reorganization, the MTB International Fund revised its investment strategies so that they were
identical to the investment strategies of WT International Fund. Additionally, the portfolio management team, portfolio composition and operating structure of the combined fund more closely resemble that of the WT International Fund. Accordingly,
for financial reporting purposes, the WT International Fund’s operating history prior to the Reorganization is reflected in the International Fund’s financial statements and financial highlights. As such, the financial statements and
financial highlights are presented as if the WT International Fund acquired the MTB International Fund,
ANNUAL REPORT / April
30, 2013
106 NOTES TO FINANCIAL STATEMENTS (continued)
and reflect the issuance of 951,099 A Shares and 18,385,556 I Shares (formerly A Shares
and Institutional Shares) of the WT International Fund, respectively, in exchange for 740,978 A Shares and 14,509,670 I Shares of the MTB International Fund with an aggregate net asset value equal to the aggregate net asset value of such shares in
the MTB International Fund immediately prior to the Reorganization. The following additional information is as of the date of the Reorganization:
|
|
|
|
|
|
|
|
|
|
|
|
MTB
International Fund |
|
|
|
|
|
|
Accumulated Net Realized
Loss on
Investments |
|
Net Unrealized Appreciation
on
Investments |
|
Net Assets |
|
Net Assets of WT
International
Fund |
|
Net Assets of
combined
fund |
| $(61,012,527) |
|
$9,585,986 |
|
$131,922,273 |
|
$283,001,865 |
|
$414,924,138 |
The financial statements of the International Fund reflect the operations of the WT International Fund for
the period prior to the Reorganization and the combined fund for the period subsequent to the Reorganization. Because the combined investment portfolios have been managed as a single integrated portfolio since the Reorganization was completed, it is
not practicable to separate the amounts of revenue and earnings of the International Fund that have been included in the combined fund’s Statement of Operations since the Reorganization was completed. Assuming the Reorganization had been
completed on July 1, 2011, the proforma net investment income , net loss on investments and net decrease in net assets from operations for the fiscal period ended April 30, 2012 would have been $5,019,069, $(153,589,156) and
$(148,570,086), respectively.
9. RECENT ACCOUNTING PRONOUNCEMENT
In December 2011, the Financial Accounting Standards Board (“FASB”) issued Accounting Standards Update (“ASU”) No. 2011-11 regarding “Disclosures about Offsetting Assets and
Liabilities”. The amendments, which will be effective for annual reporting periods beginning on or after January 1, 2013 and interim periods within those annual periods, require an entity to disclose information about offsetting and
related arrangements for assets and liabilities, financial instruments and derivatives that are either currently offset in accordance with current requirements or are subject to enforceable master netting arrangements or similar agreements. At this
time, management is evaluating the implications of ASU No. 2011-11 and its impact on the financial statements has not yet been determined.
Management has evaluated events and transactions for potential recognition or disclosure in the financial statements through the date the
financial statements were issued. Management has determined that there are no material events that would require disclosure in the Funds’ financial statements through this date.
| 11. |
FEDERAL TAX INFORMATION (UNAUDITED) |
Complete information regarding the tax status of distributions will be reported on Forms 1099.
Of the ordinary income (including short-term capital gain) distributions made by the Funds during the year ended April 30, 2013, the Funds designate the following percentages, or such greater
percentages that constitute the maximum amount allowable pursuant to Code Sections Section 243 and 854(b)(2), as qualifying for the corporate dividends received deduction:
|
|
|
|
|
|
| Fund |
|
|
| International Fund |
|
0.00% |
| Rock Maple Alternatives Fund |
|
74.39% |
| Real Asset Fund |
|
11.08% |
| Strategic Allocation Conservative Fund |
|
11.26% |
| Strategic Allocation Moderate Fund |
|
25.35% |
| Strategic Allocation Aggressive Fund |
|
69.08% |
For the year ended April 30, 2013, the Funds designate the following percentages of the ordinary
income dividends, or such greater percentages that constitute the maximum amount allowable pursuant to Code Sections 1(h)(11) and 854(b)(2), as qualified dividend income which may be subject to a maximum rate of federal income tax of 15%:
|
|
|
|
|
| Fund |
|
|
|
| International Fund |
|
|
100.00% |
|
| Rock Maple Alternatives Fund |
|
|
100.00% |
|
| Real Asset Fund |
|
|
28.75% |
|
| Strategic Allocation Conservative Fund |
|
|
18.70% |
|
| Strategic Allocation Moderate Fund |
|
|
42.59% |
|
| Strategic Allocation Aggressive Fund |
|
|
100.00% |
|
If the Funds meet the requirements of Section 853 of the Code, the Funds will pass through to
shareholders credits of foreign taxes paid.
April 30, 2013 / ANNUAL REPORT
107
REPORT OF INDEPENDENT REGISTERED PUBLIC ACCOUNTING FIRM
TO THE SHAREHOLDERS AND BOARD OF TRUSTEES OF
WILMINGTON FUNDS
We have audited the accompanying statements of assets
and liabilities, including the portfolios of investments, of Wilmington Multi-Manager International Fund, Wilmington Rock Maple Alternatives Fund, Wilmington Multi-Manager Real Asset Fund, Wilmington Strategic Allocation Conservative Fund,
Wilmington Strategic Allocation Moderate Fund and Wilmington Strategic Allocation Aggressive Fund (six of the series constituting the Wilmington Funds) (the “Funds”) as of April 30, 2013, and the related statements of operations for
the year then ended, and the statements of changes in net assets and financial highlights for each of years or periods indicated therein. These financial statements and financial highlights are the responsibility of the Funds’ management. Our
responsibility is to express an opinion on these financial statements and financial highlights based on our audits.
We
conducted our audits in accordance with standards of the Public Company Accounting Oversight Board (United States). Those standards require that we plan and perform the audit to obtain reasonable assurance about whether the financial statements and
financial highlights are free of material misstatement. We were not engaged to perform an audit of the Funds’ internal control over financial reporting. Our audits included consideration of internal control over financial reporting as a basis
for designing audit procedures that are appropriate in the circumstances, but not for the purpose of expressing an opinion on the effectiveness of the Funds’ internal control over financial reporting. Accordingly, we express no such opinion. An
audit also includes examining, on a test basis, evidence supporting the amounts and disclosures in the financial statements and financial highlights, assessing the accounting principles used and significant estimates made by management, and
evaluating the overall financial statement presentation. Our procedures included confirmation of securities owned as of April 30, 2013, by correspondence with the custodian and brokers, or by other appropriate auditing procedures where replies
from the brokers were not received. We believe that our audits provide a reasonable basis for our opinion.
In our opinion,
the financial statements and financial highlights referred to above present fairly, in all material respects, the financial position of the Wilmington Multi-Manager International Fund, Wilmington Rock Maple Alternatives Fund, Wilmington
Multi-Manager Real Asset Fund, Wilmington Strategic Allocation Conservative Fund, Wilmington Strategic Allocation Moderate Fund and Wilmington Strategic Allocation Aggressive Fund at April 30, 2013, the results of their operations for the year
then ended, and the changes in their net assets and their financial highlights for each of the years or periods indicated therein, in conformity with U.S. generally accepted accounting principles.

Philadelphia, Pennsylvania
June 28, 2013
ANNUAL REPORT / April
30, 2013
108 BOARD OF TRUSTEES AND TRUST OFFICERS
BOARD OF TRUSTEES AND TRUST OFFICERS
The following tables give information about each Trustee and the senior officers of the Trust. The tables separately list Trustee members
who are “interested persons” of the Fund (i.e., “Interested” Trustees) and those who are not (i.e., “Independent” Trustees). The Trust is comprised of 23 funds. Unless otherwise noted, the business address of each
Trustee and senior officer is 111 South Calvert Street, 26th floor, Baltimore, Maryland 21202. Each Trustee oversees all portfolios of the Trust and serves for an indefinite term. The Trust’s Statement of Additional Information includes
additional information about the Trustees and is available, without charge and upon request, by calling 1-800-836-2211.
INTERESTED TRUSTEES
BACKGROUND
|
|
|
|
|
|
Name
Address
Birth date
Position With
Trust Date Service
Began |
|
Principal Occupations and Other Directorships Held for Past Five
Years |
|
|
|
|
|
| R. Samuel Fraundorf, CFA, CPA* Birth date: 4/64 TRUSTEE Began serving: March 2012 |
|
Principal Occupations: President of WTIA, President of Wilmington Trust Investment Managements (“WTIM”), Director of Wilmington Funds Management
Corporation (formerly known as Rodney Square Management Corporation). |
|
|
|
|
|
|
|
Other Directorships Held: None. |
|
|
|
|
|
| |
|
Previous Positions: Chief Operating Officer of WTIM (1/08 to 1/09); Director of
Research at WTIM (8/04 to 1/08); Senior Manager and Tax Manager, KPMG Investment Advisors (1/99 to 8/04). |
|
|
|
|
|
| Robert J. Truesdell*
Birth date: 11/55 TRUSTEE
Began serving: December 2012 |
|
Principal Occupations: Group Vice President and Senior Investment Advisor for
Wilmington Trust Wealth Advisory Services, M&T Bank. Other Directorships Held: None. Previous Positions: Group Vice President, Managing Director and Chief Investment Officer, WTIA (6/02-6/12) and WFMC (3/12 to 6/12).
|
|
|
| * |
R. Samuel Fraundorf is “interested” due to positions he holds with WTIA and WTIM. Robert J. Truesdell is “interested” due to the
positions he currently holds with Wilmington Trust Wealth Advisory Services, M&T Bank, the parent of the Funds’ Advisor, and previous positions held with WTIA and WFMC. |
April 30, 2013 / ANNUAL REPORT
BOARD OF TRUSTEES AND TRUST OFFICERS 109
INDEPENDENT TRUSTEES BACKGROUND
|
|
|
|
Name
Birth date
Position with
Trust Date Service
Began |
|
Principal Occupations and Other Directorships Held for Past Five
Years |
| Joseph J.
Castiglia |
|
Principal Occupations: Private Investor, Consultant and Community
Volunteer. |
| Birth date: 7/34
CHAIRMAN AND TRUSTEE Began serving: February 1988 |
|
Other Directorships Held: Chairman (3/06 to 3/08), Trustee
(3/04 to present) and Treasurer (3/10 to 3/12), Buffalo Olmstead Parks Conservancy (1/05 to present); Chairman and Trustee, Buffalo Philharmonic Orchestra Foundation (1/06 to 1/12); Vice Chairman and Trustee, Christ the King Seminary (1/05 to
present); Director, Dunn Tire Corporation (1/05 to present); Chairman (5/12 to present), Director (1/08 to present), Read to Succeed Buffalo (1/08 to present); Director, Catholic Medical Partners (7/12 to present); Director, Roycroft Campus
Corporation (8/12 to present). |
|
|
|
|
| |
|
Previous Positions: President, Chief Executive Officer, Vice President, Treasurer, Controller and Vice Chairman, Pratt & Lambert United
(manufacturing of paints, coatings and adhesives) (12/67 to 1/96); Chairman and Director, Catholic Health Systems of Western New York (1/97 to 5/03); Chairman and Director, Blue Cross Blue Shield of Western and Central New York (health insurance
provider) (5/92 to 5/07); Lead Director and Director, Energy East (gas and electric utility); Chairman and Director, Federal Reserve Bank of New York, Buffalo Branch. |
| Robert H. Arnold
Birth date: 3/44 |
|
Principal Occupations: Founder and Co-Manager, R.H. Arnold & Co.
(financial consulting) (1989 to present). |
| TRUSTEE
Began serving: March 2012 |
|
Other Directorships Held:
First Potomac Realty Trust (real estate investment trust). |
| William H. Cowie,
Jr. Birth date: 1/31 |
|
Principal Occupations: Retired. |
| TRUSTEE Began serving: September 2003 |
|
Other Directorships Held: MedStar Community Health (not-for-profit
owner and operator of hospitals) (1972 to present). |
| |
|
Previous Positions: Vice
Chairman of Signet Banking Corp. |
| John S. Cramer
Birth date: 2/42 |
|
Principal Occupations: Senior Consultant, Yaffe & Co. (health care
consulting) (2/06 to present). |
| TRUSTEE Began serving: December 2000 |
|
Other Directorships Held: Director, Chairman of the Executive
Committee and Chairman of the Compensation Committee of ChekMed Corporation (6/03 to present). |
| |
|
Previous Positions: President
and Chief Executive Officer Emeriti, Pinnacle Health Systems (non-profit hospital and health care system in Central Pennsylvania). |
| Daniel R. Gernatt,
Jr. Birth date: 7/40 |
|
Principal Occupations: CEO, Gernatt Asphalt Products, Inc. (asphalt,
sand and gravel products) (1979 to present). |
| TRUSTEE
Began serving: February 1988 |
|
Other Directorships Held:
Director, Roswell Park Alliance (2008 to present); Trustee, Gernatt Family Foundation. |
| Nicholas A.
Giordano Birth date: 3/43 |
|
Principal Occupations: Consultant, financial services organizations
(1997 to present). |
| TRUSTEE Began serving: March 2012 |
|
Other Directorships Held: Kalmar Pooled Investment Trust; The RBB Fund
Inc. (19 portfolios) (registered investment companies); Independence Blue Cross; IntriCon Corporation (industrial furnaces and ovens). |
| |
|
Previous Positions: Interim
President, LaSalle University (1998 to 1999); President and Chief Executive Officer, Philadelphia Stock Exchange (1981 to 1997). |
ANNUAL REPORT / April
30, 2013
110 BOARD OF TRUSTEES AND TRUST OFFICERS
|
|
|
|
Name
Birth date
Position with
Trust Date Service
Began |
|
Principal Occupations and Other Directorships Held for Past Five
Years |
| Richard B. Seidel
Birth date: 4/41 TRUSTEE Began serving: September 2003 |
|
Principal Occupations: Chairman and Director, Girard Partners, Ltd. (investment advisor) (9/95
to present); Chairman and Director, Girard Capital (broker-dealer) (3/09 to present). Other Directorships Held: Director, Tristate Capital Bank (9/07 to present). |
| OFFICERS
|
|
|
|
Name
Address
Birth year
Positions with
Trust |
|
Principal Occupations for Past Five Years and Previous
Positions |
| Samuel Guerrieri Birth year: 1965
PRESIDENT Began serving: December 2012 |
|
Principal Occupations:
President and Chief Executive Officer, M&T Securities, Senior Vice President, M&T Bank. |
| Michael D. Daniels Birth year: 1967
CHIEF OPERATING OFFICER Began serving: June 2007 |
|
Principal
Occupations: Chief Operating Officer, Wilmington Funds and Wilmington Trust Investment Advisors, Inc., Administrative Vice President, M&T Bank.
Previous Positions: Senior Vice President, MSD&T and MCA (2006 to 2007); Vice President, Calamos Asset Management (2004 to 2006); Vice President, JP
Morgan Chase Bank (2002 to 2004). |
| |
| Jeffrey M. Seling Birth year: 1970
VICE PRESIDENT Began serving: June 2007 |
|
Principal Occupations: Vice
President, M&T Bank and Wilmington Trust Investment Advisors, Inc.
Previous Positions: Vice President, MSD&T; Assistant Vice President, Wells Fargo Bank; Assistant Vice President, JP Morgan Chase
Bank. |
| Hope L. Brown Birth year: 1973
CHIEF COMPLIANCE OFFICER, AML
COMPLIANCE OFFICER AND ASSISTANT SECRETARY Began serving: December 2012 |
|
Principal Occupations: Vice
President, Wilmington Trust Investment Advisors, Inc.; Chief Compliance Officer, Wilmington Funds. Previous Positions: Assistant Vice President, Lead Manager, Risk Management and Divisional Compliance for T. Rowe Price (2005 to 2010); Senior Compliance Officer, Manager of Compliance for RE Investment,
Inc., RE Advisers, Inc. and the Homestead Funds (2001 to 2005). |
| Eric B. Paul Birth year: 1974
VICE PRESIDENT Began serving: June 2008 |
|
Principal Occupations:
Administrative Vice President, M&T Bank (2003 to present); Director of Proprietary Products, M&T Bank since April 2008. |
| Ralph V. Partlow,
III 25 South Charles Street, 22nd floor |
|
Principal Occupation: Administrative Vice President and Deputy
General Counsel, M&T Bank (2003 to present). |
| Baltimore, MD 21201 |
|
|
| Birth year: 1957
VICE PRESIDENT Began serving: June 2010 |
|
Previous Positions: Vice President and Senior Counsel, Allfirst Bank (1995-2003). |
April 30, 2013 / ANNUAL REPORT
BOARD OF TRUSTEES AND TRUST OFFICERS 111
|
|
|
|
Name
Address
Birth year
Positions with
Trust |
|
Principal Occupations for Past Five Years and Previous
Positions |
| Guy Nordahl 101 Barclay Street, 13E
New York, NY 10286 Birth year: 1965 CHIEF FINANCIAL OFFICER AND
TREASURER Began serving: September 2007 |
|
Principal Occupations: Vice
President, BNY Mellon Asset Servicing (2009 to present). Previous Positions:
Vice President, BNY Mellon Asset Management (2003 to 2009); Vice President, BNY Mellon Asset Servicing (1999 to 2003). |
| Lisa R. Grosswirth 101 Barclay Street, 13E
New York, NY 10286 Birth year: 1963 SECRETARY
Began serving: September 2007 |
|
Principal Occupations: Vice
President, BNY Mellon Asset Servicing (2004 to present). Previous
Positions: Supervisory Paralegal, The Dreyfus Corporation (1998 to 2004). |
| Richard J. Berthy Three Canal Plaza, Suite 100
Portland, ME 04101 Birth year: 1958 CHIEF EXECUTIVE OFFICER
Began serving: September 2007 |
|
Principal Occupations:
Chief Executive Officer, Foreside Financial Group, LLC (7/12 to present).
Previous Positions: President, Foreside Financial Group, LLC (5/08 to 7/12); Chief Administrative Officer, Foreside Financial Group, LLC (2005 to 2008);
President and Secretary, Bainbridge Capital Management, LLC (6/03 to 6/06); Vice President, Bainbridge Capital Management (8/02 to 5/04). |
ANNUAL REPORT / April
30, 2013
112
Shares of the
Wilmington Funds are not FDIC insured or otherwise protected by the U.S. government, are not deposits or other obligations of, or guaranteed by, Manufacturers and Traders Trust Company, and are subject to investment risks, including possible loss of
the principal amount invested.
VOTING PROXIES ON FUND PORTFOLIO SECURITIES
A description of the policies and procedures that the Funds use to determine how to vote proxies relating to securities held in the
Funds’ portfolios is available, without charge and upon request, by calling 1-800-836-2211. A report on how the Funds voted any such proxies during the most recent 12-month period ended June 30 is available through Wilmington Funds’
website. Go to www.wilmingtonfunds.com select “Proxy Voting Record” to access the link. This information is also available from the Edgar database on the SEC’s website at www.sec.gov.
QUARTERLY PORTFOLIO SCHEDULE
The Funds file with the SEC a complete schedule of their portfolio holdings, as of the close of the first and third quarters of their fiscal year, on Form N-Q. These filings are available on the
SEC’s website at www.sec.gov and may be reviewed and copied at the SEC’s Public Reference Room in Washington DC. (Call 1-800-SEC-0330 for information on the operation of the Public Reference Room.)
Electronic Delivery
Wilmington Funds encourages you to sign up for electronic delivery of investor materials. By doing so you will receive information
faster, help lower shareholder costs, and reduce the impact to the environment. To enroll in electronic delivery:
| |
1.) |
Go to www.wilmingtonfunds.com and select “Individual Investors” |
| |
2.) |
Click on the link “Sign up for Electronic Delivery” |
| |
3.) |
Login to your account or create new user ID |
| |
4.) |
Select E-Delivery Consent from the available options, and |
| |
5.) |
Complete the information requested, including providing the email address where you would like to receive notification for electronic documents.
|
* If you hold your account through a financial intermediary, please contact your advisor to request electronic delivery
of investor materials.
Householding
In an effort to reduce volume of mail you receive, only one copy of the prospectus, annual/semi-annual report, SAI and proxy statements will be sent to shareholders who are part of the same family and
share the same address.
If you would like to request additional copies of the prospectus, annual/semi-annual report or SAI,
or wish to opt out of householding mailings, please contact Shareholder Services at 1-800-836-2211, or write to Wilmington Funds, P.O. Box 9828, Providence, RI 02940-8025.
April 30, 2013 / ANNUAL REPORT
113
PRIVACY POLICY AND NOTICE
OF THE FUNDS AND THEIR DISTRIBUTOR
June 8, 2012
The Wilmington Funds, their distributor and their agents
(referred to as “the Funds”, “we” or “us”) recognize that consumers (referred to as “you” or “your”) expect us to protect both your assets and financial information. We respect your right to privacy
and your expectation that all personal information about you or your account will be maintained in a secure manner. We are committed to maintaining the confidentiality, security and integrity of client and shareholder information. We want you to
understand the Funds’ policy that governs the handling of your information, how the Funds gather information, how that information is used and how it is kept secure.
Information The Funds Collect:
The Funds collect nonpublic personal information about you
from the following sources:
| |
• |
|
We may receive information from you, or from your financial representative, on account applications, other forms or electronically (such as through
the Funds’ website or other electronic trading mechanisms). Examples of this information include your name, address, social security number, assets and income. |
| |
• |
|
We may receive information from you, or from your financial representative, through transactions with us or others, correspondence and other
communications. Examples of this information include specific investments and your account balances. |
| |
• |
|
We may obtain other personal information from you in connection with providing you a financial product or service. Examples of this information
include depository, debit or credit account numbers. |
Information Sharing Policy
The Funds may share nonpublic personal information about you, as described above, with financial or non-financial companies or other
entities, including companies that may be affiliated with the Funds and other nonaffiliated third parties, for the following purposes:
| |
• |
|
We may share information when it is necessary and required to process a transaction or to service a customer relationship. For example, information
may be shared with a company that provides account record keeping services or a company that provides proxy services to shareholders. |
| |
• |
|
We may share information when it is required or permitted by law. For example, information may be shared in response to a subpoena or to protect you
against fraud or with someone who has established a legal beneficial interest, such as a power of attorney. |
| |
• |
|
We may disclose some or all of the information described above to companies that perform marketing or other services on our behalf. For example, we
may share information about you with the financial intermediary (bank, investment bank or broker-dealer) through whom you purchased the Funds’ products or services, or with providers of marketing, legal, accounting or other professional
services. The Funds will not, however, disclose a consumer’s account number or similar form of access number or access code for credit card, deposit or transaction accounts to any nonaffiliated third party for use in telemarketing, direct mail
or other marketing purposes. |
Except as described above, the Funds do not share customer information. We will
not rent, sell, trade, or otherwise release or disclose any personal information about you. Any information you provide to us is for the Funds’ use only. If you decide to close your account(s) or become an inactive customer, we will adhere to
the privacy policies and practices as described in this notice.
Information Security:
When the Funds share nonpublic customer information with third parties hired to facilitate the delivery of certain products or services to
our customers, such information is made available for limited purposes and under controlled circumstances designed to protect our customers’ privacy. We require third parties to comply with our standards regarding security and confidentiality
of such information. We do not permit them to use that information for their own or any other purposes, or rent, sell, trade or otherwise release or disclose the information to any other party. These requirements are reflected in written agreements
between the Funds and the third party service providers.
The Funds protect your personal information in several ways. We
maintain physical, electronic, and procedural safeguards to guard your nonpublic personal information. In addition, the Funds’ Transfer Agent and Shareholder Servicing Agent have procedures in place for the appropriate disposal of nonpublic
personal information when they are no longer required to maintain the information.
Each of the following sections explains an
aspect of the Funds’ commitment to protecting your personal information and respecting your privacy.
Employee Access to Information:
Our Code of Ethics, which applies to all employees, restricts the use of customer information and requires that it be held
in the strictest of confidence. Employee access to customer information is authorized for business purposes only, and the degree of access is based on the sensitivity of the information and on an employee’s or agent’s need to know the
information in order to service a customer’s account or comply with legal requirements.
Visiting The Funds’ Website:
The Funds’ website gathers and maintains statistics about the number of visitors as well as what information is
viewed most frequently. This information is used to improve the content and level of service we provide to our clients and shareholders.
ANNUAL REPORT / April
30, 2013
114
| |
• |
|
Information or data entered into a website will be retained. |
| |
• |
|
Where registration to a website or re-entering personal information on a website is required, “cookies” are used to improve your online
experience. A cookie is a way for websites to recognize whether or not you have visited the site before. It is a small file that is stored on your computer that identifies you each time you re-visit our site so you don’t have to resubmit
personal information. Cookies provide faster access into the website. |
| |
• |
|
We may also collect non-personally identifiable Internet Protocol (“IP”) addresses for all other visitors to monitor the number of
visitors to the site. These non-personally identifiable IP addresses are never shared with any third party. |
E-mail:
If you have opted to receive marketing information from the Funds by e-mail, it is our policy to include instructions in
all marketing messages on how to unsubscribe from subsequent e-mail programs. Some products or services from the Funds are intended to be delivered and serviced electronically. E-mail communication may be utilized in such cases. If you participate
in an employer-sponsored retirement plan administered by the Funds, we may, at your employer’s request, send you e-mail on matters pertaining to the retirement plan.
Please do not provide any account or personal information such as social security numbers, account numbers, or account balances within your e-mail correspondence to us. We cannot use e-mail to execute
transaction instructions, provide personal account information, or change account registration. We can, however, use e-mail to provide you with the necessary forms or you may contact customer service toll-free at 1-800-836-2211.
Surveys/Aggregate Data:
Periodically, the Funds may conduct surveys about financial products and services or review elements of customer information in an effort
to forecast future business needs. The Funds then generate reports that include aggregate data regarding its customers. Aggregate data classifies customer information in various ways but that does not identify individual customers. These reports may
also include information on website traffic patterns and related information. These reports are used for the Funds’ planning, statistical and other corporate purposes. Aggregate data may also be shared with external parties, such as marketing
organizations. However, no information is shared by which any individual customer could be identified.
Changes to Our Privacy Statement:
The effective date of this policy is June 8, 2012. We reserve the right to modify this policy at any time. When it is
revised or materially changed, we will update the effective date. You can determine whether there have been changes since the last time you reviewed by simply checking the effective date.
Notice will be provided to you in advance of any changes that would affect your rights under this policy statement
April 30, 2013 / ANNUAL REPORT

Item 2. Code of Ethics.
| |
(a) |
As of the end of the period covered by this report, the registrant has adopted a code of ethics (the “Section 406 Standards for Investment
Companies - Ethical Standards for Principal Executive and Financial Officers”) that applies to the registrant’s Principal Executive Officer and Principal Financial Officer; the registrant’s Principal Financial Officer also serves as
the Principal Accounting Officer |
| |
(b) |
There have been no amendments to the registrant’s code of ethics that apply to its Principal Executive Officer or Principal Financial Officer.
|
| |
(c) |
There have been no amendments to the Funds’ code of ethics during the reporting period for this Form N-CSR. |
| |
(d) |
The registrant has not granted any waivers, including an implicit waiver, from any provisions of its code of ethics during the reporting period for
this Form N-CSR. |
|
|
|
| (f)(3) |
|
The registrant hereby undertakes to provide any person, without charge, upon request, a copy of the code of ethics. To request a copy of the code of ethics,
contact the registrant at 1-800-836-2211, and ask for a copy of the Section 406 Standards for Investment Companies - Ethical Standards for Principal Executive and Financial Officers. |
Item 3. Audit Committee Financial Expert.
The registrant’s Board has determined that each member of the Board’s Audit Committee is an “audit committee financial expert,” and that each such member is “independent,”
for purposes of this Item. The Audit Committee consists of the following Board members: Nicholas A. Giordano, Joseph J. Castiglia, William H. Cowie, Jr., and John S. Cramer.
Item 4. Principal Accountant Fees and Services.
| |
(a) |
The Audit Fees. The aggregate fees billed for each of the last two fiscal years for professional services rendered by the principal accountant for the audit of
the Registrant’s annual financial statements or services that are normally provided by the accountant in connection with statutory and regulatory filings or engagements were as follows: |
Fiscal year ended 2013 - $494,400
Fiscal year ended 2012 - $605,900
| |
(b) |
Audit-Related Fees. The aggregate fees billed for each of the last two fiscal years for professional services rendered by the principal accountant for
assurance and related services by |
| |
the principal accountant that are reasonably related to the performance of the audit of the Registrant’s financial statements and are not reported above in Item 4(a) were as follows:
|
Fiscal year ended 2013 - $0
Fiscal year ended 2012 - $0
Amount requiring approval of the registrant’s audit committee pursuant to paragraph (c)(7)(ii) of Rule 2-01 of Regulation S-X, $0 and $0 respectively.
| |
(c) |
Tax Fees. The aggregate fees billed for each of the last two fiscal years for professional services rendered by the principal accountant for
tax compliance, tax advice and tax planning were as follows: |
Fiscal year ended 2013 -
$195,325
Fiscal year ended 2012 - $204,390
Amount requiring approval of the registrant’s audit committee pursuant to paragraph (c)(7)(ii) of Rule 2-01 of
Regulation S-X, $195,325 and $204,390 respectively.
| |
(d) |
All Other Fees. The aggregate fees billed in each of the last two fiscal years for products and services provided by the principal accountant, other
than the services reported in paragraphs (a) and (c) of this Item were as follows: |
Fiscal year ended 2013 - $0
Fiscal year ended 2012 - $0
Amount requiring approval of the
registrant’s audit committee pursuant to paragraph (c)(7)(ii) of Rule 2-01 of Regulation S-X, $0 and $0 respectively.
(e)(1) Audit Committee Policies regarding Pre-approval of Services.
The Audit Committee is required to pre-approve audit and non-audit services performed by the independent auditor in
order to assure that the provision of such services do not impair the auditor’s independence. Unless a type of service to be provided by the independent auditor has received general pre-approval, it will require specific pre-approval by the
Audit Committee. Any proposed services exceeding pre-approved cost levels will require specific pre- approval by the Audit Committee.
Certain services have the general pre-approval of the Audit Committee. The term of the general pre-approval is 12 months from the date of pre-approval, unless the Audit Committee specifically provides for
a different period. The Audit Committee will annually review the services that may be provided by the independent auditor without obtaining specific pre-approval from the Audit Committee and may grant general pre-approval for such services. The
Audit Committee will revise the list of general pre-approved services from time to time, based on subsequent determinations. The Audit Committee will not delegate its responsibilities to pre-approve services performed by the independent auditor to
management.
The Audit Committee has delegated pre-approval authority to its Chairman. The Chairman will
report any pre-approval decisions to the Audit Committee at its next scheduled meeting. The Committee will designate another member with such pre-approval authority when the Chairman is unavailable.
AUDIT SERVICES
The annual
Audit services engagement terms and fees will be subject to the specific pre-approval of the Audit Committee. The Audit Committee must approve any changes in terms, conditions and fees resulting from changes in audit scope, registered investment
company (RIC) structure or other matters.
In addition to the annual Audit services engagement specifically approved by the
Audit Committee, the Audit Committee may grant general pre-approval for other Audit Services, which are those services that only the independent auditor reasonably can provide. The Audit Committee has pre-approved certain Audit services, all other
Audit services must be specifically pre-approved by the Audit Committee.
AUDIT-RELATED SERVICES
Audit-related services are assurance and related services that are reasonably related to the performance of the audit or review of the
Company’s financial statements or that are traditionally performed by the independent auditor. The Audit Committee believes that the provision of Audit-related services does not impair the independence of the auditor, and has pre-approved
certain Audit-related services, all other Audit-related services must be specifically pre-approved by the Audit Committee.
TAX SERVICES
The Audit Committee believes that the independent auditor can provide Tax services to the Company such as tax compliance,
tax planning and tax advice without impairing the auditor’s independence. However, the Audit Committee will not permit the retention of the independent auditor in connection with a transaction initially recommended by the independent auditor,
the purpose of which may be tax avoidance and the tax treatment of which may not be supported in the Internal Revenue Code and related regulations. The Audit Committee has pre-approved certain Tax services, all Tax services involving large and
complex transactions must be specifically pre-approved by the Audit Committee.
ALL OTHER SERVICES
With respect to the provision of services other than audit, review or attest services the pre-approval requirement is waived if:
| |
(1) |
The aggregate amount of all such services provided constitutes no more than five percent of the total amount of revenues paid by the registrant, the registrant’s
adviser (not including any sub-adviser whose role is primarily portfolio management and is subcontracted with or overseen by another investment adviser), and any entity controlling, controlled by, or under common control with the investment adviser
that provides ongoing services to the registrant to its accountant during the fiscal year in which the services are provided; |
| |
(2) |
Such services were not recognized by the registrant, the registrant’s adviser (not including any sub-adviser whose role is primarily portfolio management and is
subcontracted with or overseen by another investment adviser), and any entity controlling, controlled by, or under common control with the investment adviser that provides ongoing services to the registrant at the time of the engagement to be
non-audit services; and |
| |
(3) |
Such services are promptly brought to the attention of the Audit Committee of the issuer and approved prior to the completion of the audit by the Audit Committee or by
one or more members of the Audit Committee who are members of the board of directors to whom authority to grant such approvals has been delegated by the Audit Committee. |
The Audit Committee may grant general pre-approval to those permissible non-audit services classified as All Other
services that it believes are routine and recurring services, and would not impair the independence of the auditor.
The SEC’s rules and relevant guidance should be consulted to determine the precise definitions of prohibited non-audit services and the applicability of exceptions to certain of the prohibitions.
PRE-APPROVAL FEE LEVELS
Pre-approval fee levels for all services to be provided by the independent auditor will be established annually by the
Audit Committee. Any proposed services exceeding these levels will require specific pre-approval by the Audit Committee.
PROCEDURES
Requests or applications to provide services that require specific approval by the Audit Committee will be
submitted to the Audit Committee by both the independent auditor and the Principal Accounting Officer and/or Internal Auditor, and must include a joint statement as to whether, in their view, the request or application is consistent with the
SEC’s rules on auditor independence.
|
|
|
| (e)(2) |
|
Percentage of services identified in items 4(b) through 4(d) that were approved by the registrants audit committee pursuant to paragraph (c)(7)(i)(C) of Rule 2-01 of Regulation
S-X: |
4(b)
Fiscal year ended 2013 –0%
Fiscal year ended 2012 - 0%
Percentage of services provided to the registrants investment adviser and any entity controlling, controlled by, or under common control
with the investment adviser that provides ongoing services to the registrant that were approved by the registrants audit committee pursuant to paragraph (c)(7)(i)(C) of Rule 2-01 of Regulation S-X, 0% and 0% respectively.
4(c)
Fiscal
year ended 2013 - 100%
Fiscal year ended 2012 - 100%
Percentage of services provided to the registrants investment adviser and any entity controlling, controlled by, or under common control with the investment adviser that provides ongoing services to the
registrant that were approved by the registrants audit committee pursuant to paragraph (c)(7)(i)(C) of Rule 2-01 of Regulation S-X, 100% and 100% respectively.
4(d)
Fiscal year ended 2013 - 0 %
Fiscal year ended 2012 - 0%
Percentage of services provided to the registrants investment adviser and any entity controlling, controlled by, or under common control with the investment adviser that provides ongoing services to the
registrant that were approved by the registrants audit committee pursuant to paragraph (c)(7)(i)(C) of Rule 2-01 of Regulation S-X, 0% and 0% respectively
| (g) |
Non-Audit Fees billed to the registrant, the registrant’s investment adviser, and certain entities controlling, controlled by or under common control with the
investment adviser that provide ongoing services to the registrant: |
Fiscal year ended 2013 -
$195,325
Fiscal year ended 2012 - $204,390
| (h) |
The registrant’s Audit Committee has considered that the provision of non-audit services that were rendered to the registrant’s adviser
(not including any sub-adviser whose role is primarily portfolio management and is subcontracted with or overseen by another investment adviser), and any entity controlling, controlled by, or under common control with the investment adviser that
provides ongoing services to the registrant that were not pre-approved pursuant to paragraph (c)(7)(ii) of Rule 2-01 of Regulation S-X is compatible with maintaining the principal accountant’s independence. |
Item 5. Audit Committee of Listed registrants.
Not applicable.
Item 6. Investments.
| (a) |
Schedule of Investments in securities of unaffiliated issuers as of the close of the reporting period is included as part of the report to
shareholders filed under Item 1 of this form. |
| Item 7. |
Disclosure of Proxy Voting Policies and Procedures for Closed-End Management Investment Companies. |
Not applicable.
Item 8. Portfolio Managers of Closed-End Management Investment Companies.
Not applicable.
| Item 9. |
Purchases of Equity Securities by Closed-End Management Investment Company and Affiliated Purchasers. |
Not applicable.
Item 10. Submission of Matters to a Vote of Security Holders.
No changes to report.
Item 11. Controls and Procedures.
| |
(a) |
The registrant’s principal executive and principal financial officers, or persons performing similar functions, have concluded that the
registrant’s disclosure controls and procedures (as defined in Rule
30a-3(c) under the Investment Company Act of 1940, as amended (the “1940 Act”) (17 CFR 270.30a-3(c))) are effective, as of a date within 90 days of the filing
date of the report that includes the disclosure required by this paragraph, based on their evaluation of these controls and procedures required by Rule 30a-3(b) under the 1940 Act (17 CFR 270.30a-3(b)) and Rules 13a-15(b) or 15d-15(b) under the
Securities Exchange Act of 1934, as amended (17 CFR 240.13a-15(b) or 240.15d-15(b)). |
| |
(b) |
There were no changes in the registrant’s internal control over financial reporting (as defined in Rule
30a-3(d) under the 1940 Act (17 CFR
270.30a-3(d)) that occurred during the registrant’s second fiscal quarter of the period covered by this report that has materially affected, or is reasonably likely to materially affect, the registrant’s internal control over financial
reporting. |
Item 12. Exhibits.
|
|
|
|
|
|
|
(a)(1) |
|
Not applicable |
|
|
|
|
|
(a)(2) |
|
Certifications pursuant to Rule 30a-2(a) under the 1940 Act and Section 302 of the Sarbanes-Oxley Act of 2002 are attached hereto. |
|
|
|
|
|
(a)(3) |
|
Not applicable. |
|
|
|
|
|
(b) |
|
Certifications pursuant to Rule 30a-2(b) under the 1940 Act and Section 906 of the Sarbanes-Oxley Act of 2002 are attached hereto. |
(12.other) Not applicable.
SIGNATURES
Pursuant to the requirements of the Securities Exchange Act of 1934 and the Investment Company Act of 1940, the registrant has duly caused this report to be signed on its behalf by the undersigned,
thereunto duly authorized.
|
|
|
| (Registrant) |
|
Wilmington
Funds |
|
|
|
|
|
| By (Signature and Title)* |
|
/s/ Richard J.
Berthy |
|
|
|
|
|
|
|
|
|
Richard J. Berthy |
|
|
|
|
(Principal Executive Officer) |
Pursuant to the requirements of the Securities Exchange Act of 1934 and the Investment Company Act of
1940, this report has been signed below by the following persons on behalf of the registrant and in the capacities and on the dates indicated.
|
|
|
| By (Signature and Title)* |
|
/s/ Richard J.
Berthy |
|
|
|
|
|
|
|
|
|
Richard J. Berthy |
|
|
|
|
(Principal Executive Officer) |
|
|
|
|
|
| By (Signature and Title)* |
|
/s/ Guy
Nordahl |
|
|
|
|
|
|
|
|
|
Guy Nordahl |
|
|
|
|
(Principal Financial Officer) |
| * |
Print the name and title of each signing officer under his or her signature. |