Exhibit 99.1

|
NEWS RELEASE FOR ADDITIONAL INFORMATION, PLEASE CONTACT: John M. Perino Vice President, Investor Relations 608-361-7501 |
Page 1
REGAL BELOIT REPORTS THIRD QUARTER 2011 FINANCIAL RESULTS
| • | Record Quarterly Sales of $737 million |
|
| • | Diluted Earnings Per Share of $1.13 |
|
| • | Adjusted Diluted Earnings Per Share of $1.33* |
|
| • | Free Cash Flow of 133% of Net Income* |
October 31, 2011 (Beloit, WI): Regal Beloit Corporation (NYSE: RBC) today reported financial
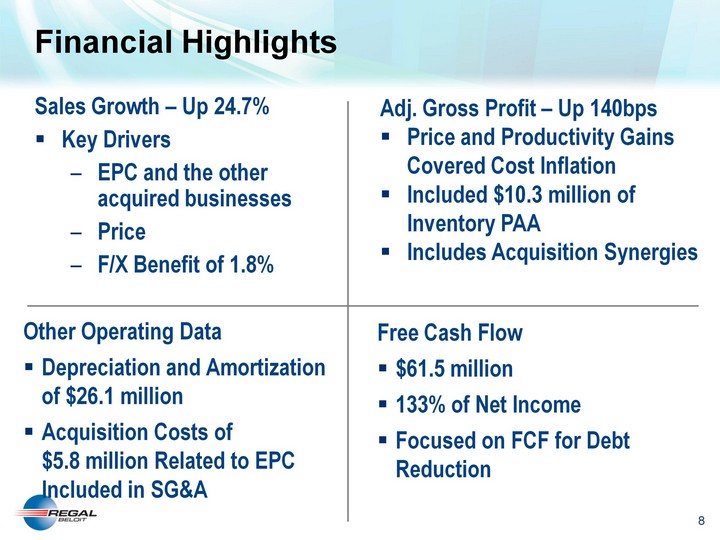
results for the third quarter ended October 1, 2011. Net sales of $736.9 million increased 24.7%
compared to $590.8 million for the third quarter 2010. Diluted earnings per share for the third
quarter 2011 were $1.13 compared to $1.14 for the third quarter 2010. Diluted earnings per share
for the third quarter 2011 included a gain on a business divestiture and purchase accounting
adjustments and transaction costs related to the acquisition of the A.O. Smith Electric Products
Company (EPC), as detailed below:
| Three Months | ||||
| Ended | ||||
| Oct. 1, 2011 | ||||
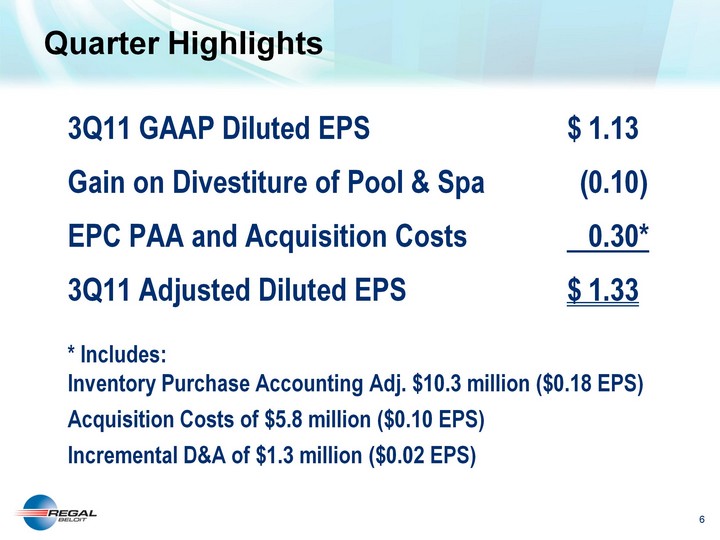
GAAP Diluted Earnings Per Share |
$ | 1.13 | ||
Gain on Divestiture |
(0.10 | ) | ||
EPC Purchase Accounting Adjustments and Acquisition Costs |
0.30 | |||
Adjusted Diluted Earnings Per Share |
$ | 1.33 | ||
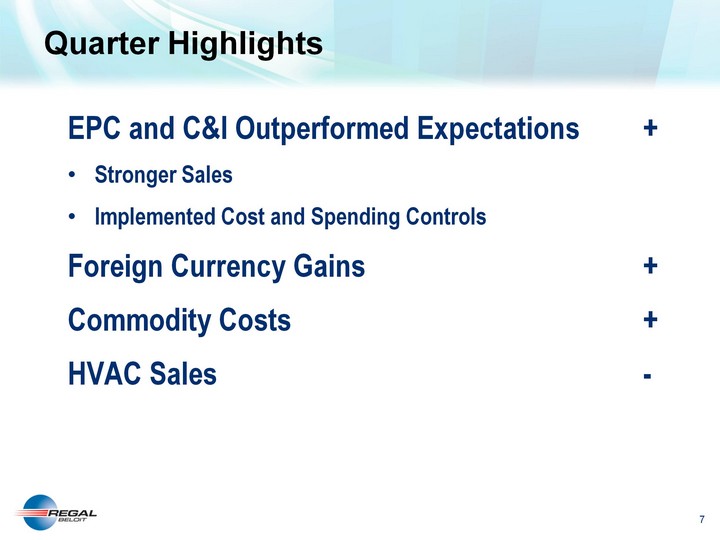
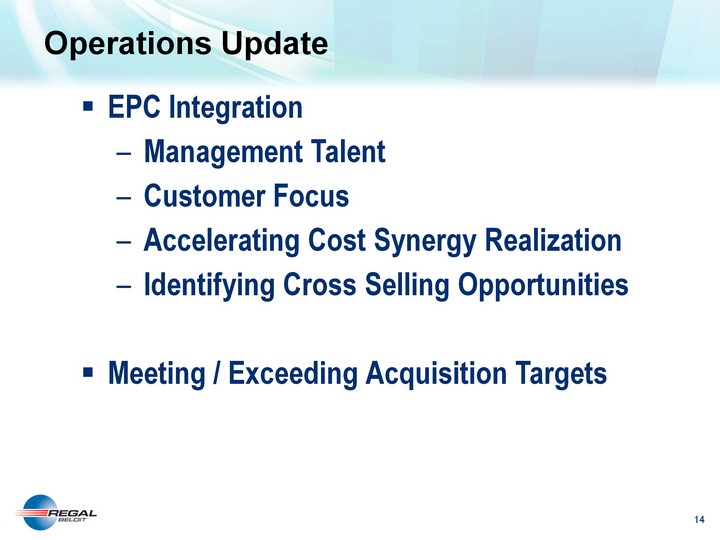
“It was an exciting quarter for Regal Beloit,” commented Mark Gliebe, Chief Executive Officer.
“On top of strong overall performance from our operations, we closed on the acquisition of EPC
which is the largest acquisition in the Company’s history. Our Commercial and Industrial,
Mechanical, International and EPC businesses performed exceptionally well in the quarter offsetting
continued weakness in residential HVAC sales. Additionally, our free cash flow for the quarter
was well in excess of net income. Overall, we were pleased with our performance in the quarter.”
| * | This earnings release includes non-GAAP financial measures. Schedules that reconcile these
non-GAAP financial measures to the most comparable GAAP figures are included with this earnings
release. |
Regal Beloit Corporation
News Release
Page 2 of 9
News Release
Page 2 of 9
NET SALES
| (Dollars in millions) | ||||||||||||||||||||||||
| Three Months Ended | Nine Months Ended | |||||||||||||||||||||||
| Oct. 1, 2011 | Oct. 2, 2010 | % Change | Oct. 1, 2011 | Oct. 2, 2010 | % Change | |||||||||||||||||||
Net Sales |
$ | 736.9 | $ | 590.8 | 24.7 | % | $ | 2,081.3 | $ | 1,682.3 | 23.7 | % | ||||||||||||
Net Sales by Segment: |
||||||||||||||||||||||||
Electrical segment |
$ | 667.5 | $ | 527.8 | 26.5 | % | $ | 1,873.0 | $ | 1,507.8 | 24.2 | % | ||||||||||||
Mechanical segment |
$ | 69.4 | $ | 63.0 | 10.2 | % | $ | 208.3 | $ | 174.5 | 19.4 | % | ||||||||||||
Net sales for the third quarter 2011 increased $146.1 million compared to the third quarter
2010 driven primarily by incremental sales from EPC since August 22, 2011 and the other businesses
acquired within the last twelve months (the “acquired businesses”).
In the Electrical segment, net sales for the third quarter 2011 increased $139.7 million compared
to the third quarter 2010, including $144.5 million of incremental net sales from the acquired
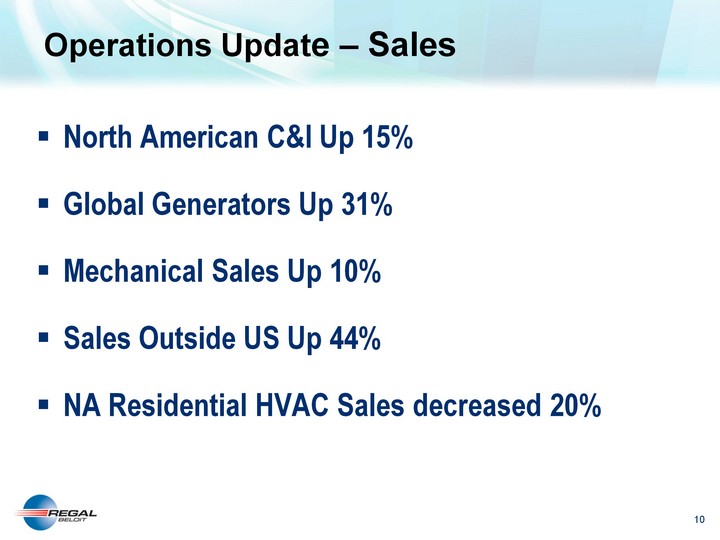
businesses. North American residential HVAC net sales, excluding net sales from the acquired
businesses, decreased 20.3% in the third quarter 2011 compared to the third quarter 2010, due
primarily to reduced federal tax incentives for high efficiency products, the impact of the growth
of R22 systems and continued weakness in the housing market. North American commercial and
industrial net sales, excluding net sales from the acquired businesses, increased 14.8% in the
third quarter 2011 compared to the third quarter 2010, driven primarily by improving economic
conditions, sales of new energy efficient products, pricing initiatives to offset commodity
inflation, and increased sales in the generator business.
In the Mechanical segment, net sales for the third quarter 2011 increased $6.4 million or 10.2%
compared to the third quarter 2010. This increase was driven primarily by improving demand in
later cycle end markets.
Net sales to regions outside of the United States were 35.9% of total net sales for the third
quarter 2011 compared to 31.0% of total net sales for the third quarter 2010. Third quarter 2011
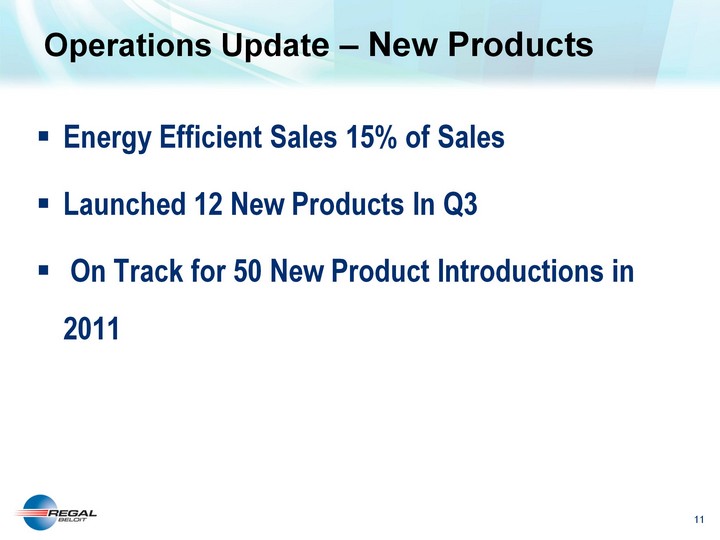
net sales of high efficiency products were 15.4% of total net sales and increased 0.2% compared to
the third quarter 2010. The impact of foreign currency exchange rates increased total net sales by
1.8% for the third quarter 2011 compared to the third quarter 2010.
GROSS PROFIT
| (Dollars in thousands) | ||||||||||||||||
| Three Months Ended | Nine Months Ended | |||||||||||||||
| Oct. 1, 2011 | Oct. 2, 2010 | Oct. 1, 2011 | Oct. 2, 2010 | |||||||||||||
Gross Profit |
$ | 179,626 | $ | 144,664 | $ | 495,106 | $ | 419,083 | ||||||||
As a percentage of net sales |
24.4 | % | 24.5 | % | 23.8 | % | 24.9 | % | ||||||||
Gross Profit |
||||||||||||||||
Electrical segment |
$ | 160,054 | $ | 127,957 | $ | 435,958 | $ | 370,756 | ||||||||
As a percentage of net sales |
24.0 | % | 24.2 | % | 23.3 | % | 24.6 | % | ||||||||
Mechanical segment |
$ | 19,572 | $ | 16,707 | $ | 59,148 | $ | 48,327 | ||||||||
As a percentage of net sales |
28.2 | % | 26.5 | % | 28.4 | % | 27.7 | % | ||||||||
Regal Beloit Corporation
News Release
Page 3 of 9
News Release
Page 3 of 9
Gross profit was $179.6 million, or 24.4% of net sales, for the third quarter 2011 compared to
$144.7 million, or 24.5% of net sales, for the third quarter 2010. Cost of sales for the third
quarter 2011 included expenses of $10.3 million related to EPC purchase accounting adjustments to
inventories. Excluding this expense, adjusted gross profit was $189.9 million, or 25.8% of net
sales, for the third quarter 2011. Gross profit was $495.1 million, or 23.8% of net sales, for the
nine months ended October 1, 2011 compared to $419.1 million, or 24.9% of net sales, for the nine
months ended October 2, 2010. Cost of sales for the nine months ended October 1, 2011 included the
$10.3 million of purchase accounting adjustments and $28.0 million of incremental warranty expenses
accrued in the second quarter 2011. Excluding these expenses, adjusted gross profit was $533.4
million, or 25.6% of net sales, for the nine months ended October 1, 2011.
OPERATING EXPENSES
| (Dollars in thousands) | ||||||||||||||||
| Three Months Ended | Nine Months Ended | |||||||||||||||
| Oct. 1, 2011 | Oct. 2, 2010 | Oct. 1, 2011 | Oct. 2, 2010 | |||||||||||||
Operating Expenses |
$ | 101,482 | $ | 74,781 | $ | 298,033 | $ | 219,636 | ||||||||
As a percentage of net sales |
13.8 | % | 12.7 | % | 14.3 | % | 13.1 | % | ||||||||
Operating Expenses by Segment: |
||||||||||||||||
Electrical segment |
$ | 90,680 | $ | 65,919 | $ | 266,158 | $ | 193,541 | ||||||||
As a percentage of net sales |
13.6 | % | 12.5 | % | 14.2 | % | 12.8 | % | ||||||||
Mechanical segment |
$ | 10,802 | $ | 8,862 | $ | 31,875 | $ | 26,095 | ||||||||
As a percentage of net sales |
15.6 | % | 14.1 | % | 15.3 | % | 15.0 | % | ||||||||
INCOME FROM OPERATIONS
| (Dollars in thousands) | ||||||||||||||||
| Three Months Ended | Nine Months Ended | |||||||||||||||
| Oct. 1, 2011 | Oct. 2, 2010 | Oct. 1, 2011 | Oct. 2, 2010 | |||||||||||||
Income from Operations |
$ | 78,144 | $ | 69,883 | $ | 197,073 | $ | 199,447 | ||||||||
As a percentage of net sales |
10.6 | % | 11.8 | % | 9.5 | % | 11.9 | % | ||||||||
Income from Operations by Segment: |
||||||||||||||||
Electrical segment |
$ | 69,375 | $ | 62,038 | $ | 169,800 | $ | 177,215 | ||||||||
As a percentage of net sales |
10.4 | % | 11.8 | % | 9.1 | % | 11.8 | % | ||||||||
Mechanical segment |
$ | 8,769 | $ | 7,845 | $ | 27,273 | $ | 22,232 | ||||||||
As a percentage of net sales |
12.6 | % | 12.4 | % | 13.1 | % | 12.7 | % | ||||||||
Operating expenses for the third quarter 2011 increased $26.7 million primarily due to $21.9
million related to the acquired businesses, and an incremental $5.6 million of acquisition-related
expenses.
Net interest expense for the third quarter 2011 increased $5.9 million compared to the third
quarter 2010 primarily due to interest on additional borrowings incurred to finance the EPC
acquisition. The effective tax rate for the third quarter 2011 was 30.3%, consistent with the
third quarter 2010.
Net income attributable to Regal Beloit Corporation for the third quarter 2011 was $45.7 million
compared to $44.7 million for the third quarter 2010. Diluted earnings per share for the third
quarter 2011 were $1.13 compared to $1.14 for the third quarter 2010.
Net cash provided by operating activities was $66.7 million for the third quarter 2011 as compared
to $48.9 million for the third quarter 2010. Capital expenditures were $5.9 million for the third
quarter 2011.
Regal Beloit Corporation
News Release
Page 4 of 9
News Release
Page 4 of 9
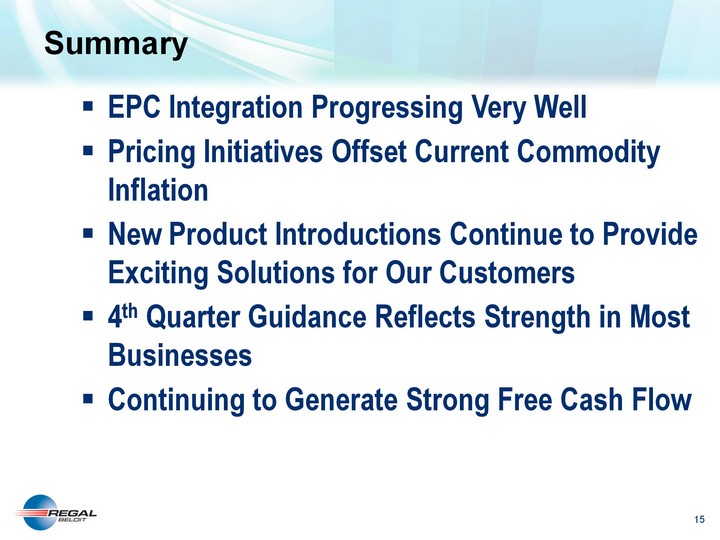
“As we look forward to the fourth quarter,” commented Mr. Gliebe, “we are expecting continued
strength in our C&I, Mechanical and India based businesses. However, we also expect further
weakness in residential HVAC demand and a general slowdown in our China based businesses.
Accordingly, we are projecting fourth quarter adjusted diluted earnings per share of $0.67 to
$0.73, which excludes purchase accounting adjustments related to the acquisition of EPC, which we
anticipate will be approximately $0.25 per share. I am pleased with the performance and progress
we are making in 2011,” added Gliebe. “We enter the fourth quarter with real momentum from the
largest acquisition in the Company’s history. Despite challenges in a few end markets, we continue
to grow the Company, improve our performance and position Regal Beloit for continued success.”
Regal Beloit will hold a conference call pertaining to this news release at 10:00 AM CDT (11:00 AM
EDT) on Tuesday, November 1, 2011. To listen to the call and view the presentation slides via the
internet, please go http://www.regalbeloit.com/ or at:
http://www.videonewswire.com/event.asp?id=83183. Individuals who would like to participate
by phone should dial 866-524-3160, referencing Regal Beloit. International callers should dial
412-317-6760, referencing Regal Beloit.
A telephone replay of the call will be available through February 1, 2012, at 877-344-7529,
conference ID 10005959. International callers should call 412-317-0088 using the same conference
ID. A webcast replay will be available until February 1, 2012, and can be accessed at
http://www.regalbeloit.com/rbceventspresentations.htm or at
http://www.videonewswire.com/event.asp?id=83183.
Regal Beloit Corporation is a leading manufacturer of electric motors, mechanical and electrical
motion controls and power generation products serving markets throughout the world. Regal Beloit
is headquartered in Beloit, Wisconsin, and has manufacturing, sales, and service facilities
throughout the United States, Canada, Mexico, Europe and Asia. Regal Beloit’s common stock is a
component of the S&P Mid Cap 400 Index and the Russell 2000 Index.
Regal Beloit Corporation
News Release
Page 5 of 9
News Release
Page 5 of 9
CAUTIONARY STATEMENT
The following is a cautionary statement made under the Private Securities Litigation Reform Act of
1995: With the exception of historical facts, the statements contained in this press release may be
forward looking statements. Forward-looking statements represent our management’s judgment
regarding future events. In many cases, you can identify forward-looking statements by terminology
such as “may,” “will,” “plan,” “expect,” “anticipate,” “estimate,” “believe,” or “continue” or the
negative of these terms or other similar words. Actual results and events could differ materially
and adversely from those contained in the forward-looking statements due to a number of factors,
including: actions taken by our competitors and our ability to effectively compete in the
increasingly competitive global electric motor, power generation and mechanical motion control
industries; our ability to develop new products based on technological innovation and the
marketplace acceptance of new and existing products; fluctuations in commodity prices and raw
material costs; our dependence on significant customers; issues and costs arising from the
integration of acquired companies and businesses, including the timing and impact of purchase
accounting adjustments; unanticipated costs or expenses we may incur related to product warranty
issues; our dependence on key suppliers and the potential effects of supply disruptions;
infringement of our intellectual property by third parties, challenges to our intellectual
property, and claims of infringement by us of third party technologies; increases in our overall
debt levels as a result of acquisitions or otherwise and our ability to repay principal and
interest on our outstanding debt; product liability and other litigation, or the failure of our
products to perform as anticipated, particularly in high volume applications; economic changes in
global markets where we do business, such as reduced demand for the products we sell, currency
exchange rates, inflation rates, interest rates, recession, foreign government policies and other
external factors that we cannot control; unanticipated liabilities of acquired businesses; cyclical
downturns affecting the global market for capital goods; difficulties associated with managing
foreign operations; and other risks and uncertainties including but not limited to those described
in Item 1A-Risk Factors of the Company’s Annual Report on Form 10-K filed on March 2, 2011 and from
time to time in our reports filed with U.S. Securities and Exchange Commission. All subsequent
written and oral forward-looking statements attributable to us or to persons acting on our behalf
are expressly qualified in their entirety by the applicable cautionary statements. The
forward-looking statements included in this presentation are made only as of their respective
dates, and we undertake no obligation to update these statements to reflect subsequent events or
circumstances.
Regal Beloit Corporation
News Release
Page 6 of 9
News Release
Page 6 of 9
CONDENSED CONSOLIDATED STATEMENTS OF EARNINGS
Unaudited
Dollars in Thousands, Except Dividends Declared and Per Share Data
Dollars in Thousands, Except Dividends Declared and Per Share Data
| Three Months Ended | Nine Months Ended | |||||||||||||||
| Oct. 1, 2011 | Oct. 2, 2010 | Oct. 1, 2011 | Oct. 2, 2010 | |||||||||||||
Net Sales |
$ | 736,885 | $ | 590,801 | $ | 2,081,325 | $ | 1,682,300 | ||||||||
Cost of Sales |
557,259 | 446,137 | 1,586,219 | 1,263,217 | ||||||||||||
Gross Profit |
179,626 | 144,664 | 495,106 | 419,083 | ||||||||||||
Operating Expenses |
101,482 | 74,781 | 298,033 | 219,636 | ||||||||||||
Income From Operations |
78,144 | 69,883 | 197,073 | 199,447 | ||||||||||||
Interest Expense |
10,482 | 4,817 | 20,387 | 14,358 | ||||||||||||
Interest Income |
450 | 645 | 1,186 | 1,800 | ||||||||||||
Income Before Taxes & Noncontrolling Interests |
68,112 | 65,711 | 177,872 | 186,889 | ||||||||||||
Provision For Income Taxes |
20,618 | 19,831 | 53,570 | 58,366 | ||||||||||||
Net Income |
47,494 | 45,880 | 124,302 | 128,523 | ||||||||||||
Less: Net Income Attributable to Noncontrolling Interests, net of tax |
1,823 | 1,226 | 5,464 | 4,387 | ||||||||||||
Net Income Attributable to Regal Beloit Corporation |
$ | 45,671 | $ | 44,654 | $ | 118,838 | $ | 124,136 | ||||||||
Earnings Per Share of Common Stock: |
||||||||||||||||
Basic |
$ | 1.14 | $ | 1.16 | $ | 3.04 | $ | 3.26 | ||||||||
Assuming Dilution |
$ | 1.13 | $ | 1.14 | $ | 3.00 | $ | 3.19 | ||||||||
Cash Dividends Declared |
$ | 0.18 | $ | 0.17 | $ | 0.53 | $ | 0.50 | ||||||||
Weighted Average Number of Shares Outstanding: |
||||||||||||||||
Basic |
39,931,610 | 38,581,166 | 39,075,118 | 38,112,515 | ||||||||||||
Assuming Dilution |
40,421,659 | 39,023,135 | 39,648,485 | 38,875,978 | ||||||||||||
SEGMENT INFORMATION
Unaudited
Dollars in Thousands
Dollars in Thousands
| Mechanical Segment | Electrical Segment | |||||||||||||||
| Three Months Ended | Three Months Ended | |||||||||||||||
| October 1, 2011 | October 2, 2010 | October 1, 2011 | October 2, 2010 | |||||||||||||
Net Sales |
$ | 69,435 | $ | 63,012 | $ | 667,450 | $ | 527,789 | ||||||||
Income from Operations |
8,769 | 7,845 | 69,375 | 62,038 | ||||||||||||
| Mechanical Segment | Electrical Segment | |||||||||||||||
| Nine Months Ended | Nine Months Ended | |||||||||||||||
| October 1, 2011 | October 2, 2010 | October 1, 2011 | October 2, 2010 | |||||||||||||
Net Sales |
$ | 208,271 | $ | 174,476 | $ | 1,873,054 | $ | 1,507,824 | ||||||||
Income from Operations |
27,273 | 22,232 | 169,800 | 177,215 | ||||||||||||
Regal Beloit Corporation
News Release
Page 7 of 9
News Release
Page 7 of 9
CONDENSED CONSOLIDATED BALANCE SHEETS
Dollars in Thousands
| (Unaudited) | ||||||||
| October 1, 2011 | January 1, 2011 | |||||||
ASSETS |
||||||||
Current Assets: |
||||||||
Cash and Investments |
$ | 124,414 | $ | 230,858 | ||||
Trade Receivables, less Allowances of $9,331 in
2011 and $10,637 in 2010 |
498,745 | 331,017 | ||||||
Inventories |
626,857 | 390,587 | ||||||
Prepaid Expenses and Other Current Assets |
140,101 | 135,589 | ||||||
Total Current Assets |
1,390,117 | 1,088,051 | ||||||
Property, Plant, Equipment and Noncurrent Assets |
1,986,061 | 1,361,085 | ||||||
Total Assets |
$ | 3,376,178 | $ | 2,449,136 | ||||
LIABILITIES AND EQUITY |
||||||||
Current Liabilities: |
||||||||
Accounts Payable |
$ | 308,855 | $ | 231,705 | ||||
Other Accrued Expenses |
273,779 | 159,000 | ||||||
Current Maturities of Debt |
13,278 | 8,637 | ||||||
Total Current Liabilities |
595,912 | 399,342 | ||||||
Long-Term Debt |
955,147 | 428,256 | ||||||
Other Noncurrent Liabilities |
267,605 | 224,376 | ||||||
Equity: |
||||||||
Total Regal Beloit Corporation Shareholders’ Equity |
1,517,434 | 1,361,960 | ||||||
Noncontrolling Interests |
40,080 | 35,202 | ||||||
Total Equity |
1,557,514 | 1,397,162 | ||||||
Total Liabilities and Equity |
$ | 3,376,178 | $ | 2,449,136 | ||||
Regal Beloit Corporation
News Release
Page 8 of 9
News Release
Page 8 of 9
CONDENSED CONSOLIDATED STATEMENTS OF CASH FLOW
Unaudited
Dollars in Thousands
Unaudited
Dollars in Thousands
| Three Months Ended | Nine Months Ended | |||||||||||||||
| Oct. 1, | Oct. 2, | Oct. 1, | Oct. 2, | |||||||||||||
| 2011 | 2010 | 2011 | 2010 | |||||||||||||
CASH FLOWS FROM OPERATING ACTIVITIES: |
||||||||||||||||
Net income |
$ | 47,494 | $ | 45,880 | $ | 124,302 | $ | 128,523 | ||||||||
Adjustments to reconcile net income to net cash provided
by operating activities (net of acquisitions): |
||||||||||||||||
Depreciation and amortization |
26,084 | 18,390 | 69,710 | 54,289 | ||||||||||||
Excess tax benefits from stock-based compensation |
(37 | ) | (170 | ) | (1,040 | ) | (1,581 | ) | ||||||||
(Gain) Loss on disposition of assets |
(6,101 | ) | 3,083 | (5,613 | ) | 4,451 | ||||||||||
Stock-based compensation expense |
3,933 | 1,903 | 10,168 | 4,968 | ||||||||||||
Change in assets and liabilities |
(4,683 | ) | (20,226 | ) | (21,261 | ) | (42,063 | ) | ||||||||
Net cash provided by operating activities |
66,690 | 48,860 | 176,266 | 148,587 | ||||||||||||
CASH FLOWS FROM INVESTING ACTIVITIES: |
||||||||||||||||
Additions to property, plant and equipment |
(5,864 | ) | (11,757 | ) | (44,389 | ) | (29,989 | ) | ||||||||
Purchases of investment securities |
— | (125,292 | ) | — | (313,169 | ) | ||||||||||
Sales of investment securities |
— | 105,223 | 55,998 | 236,752 | ||||||||||||
Business acquisitions, net of cash acquired |
(742,809 | ) | (31,395 | ) | (764,862 | ) | (107,258 | ) | ||||||||
Sale of assets |
14,904 | 41 | 15,113 | 108 | ||||||||||||
Net cash used in investing activities |
(733,769 | ) | (63,180 | ) | (738,140 | ) | (213,556 | ) | ||||||||
CASH FLOWS FROM FINANCING ACTIVITIES: |
||||||||||||||||
Repayments of convertible debt |
— | (470 | ) | — | (39,198 | ) | ||||||||||
Net borrowings (repayments) under revolving credit
facility |
— | — | (2,863 | ) | ||||||||||||
Borrowings under revolving credit facility |
200,000 | 200,000 | ||||||||||||||
Repayments under revolving credit facility |
(172,000 | ) | (172,000 | ) | ||||||||||||
Proceeds from short-term borrowings |
938 | — | 21,446 | — | ||||||||||||
Repayments of short-term borrowings |
(1,874 | ) | (406 | ) | (17,264 | ) | (9,139 | ) | ||||||||
Proceeds from long-term borrowings |
500,000 | — | 500,000 | — | ||||||||||||
Payments of long-term debt |
(27 | ) | (35 | ) | (115 | ) | (138 | ) | ||||||||
Dividends paid to shareholders |
(6,962 | ) | (6,556 | ) | (20,092 | ) | (18,534 | ) | ||||||||
Proceeds from the exercise of stock options |
100 | 556 | 1,856 | 3,545 | ||||||||||||
Excess tax benefits from stock-based compensation |
37 | 170 | 1,040 | 1,581 | ||||||||||||
Financing fees paid |
(902 | ) | — | (2,776 | ) | — | ||||||||||
Net cash provided by (used in) financing activities |
519,310 | (6,741 | ) | 512,095 | (64,746 | ) | ||||||||||
EFFECT OF EXCHANGE RATES ON CASH |
(3,165 | ) | 2,639 | (338 | ) | 1,373 | ||||||||||
Net decrease in cash and cash equivalents |
(150,934 | ) | (18,422 | ) | (50,117 | ) | (128,342 | ) | ||||||||
Cash and cash equivalents at beginning of period |
275,348 | 152,502 | 174,531 | 262,422 | ||||||||||||
Cash and cash equivalents at end of period |
$ | 124,414 | $ | 134,080 | $ | 124,414 | $ | 134,080 | ||||||||
Regal Beloit Corporation
News Release
Page 9 of 9
News Release
Page 9 of 9
NON-GAAP MEASURES
Unaudited
Dollars in Thousands, Except Per Share Data
Unaudited
Dollars in Thousands, Except Per Share Data
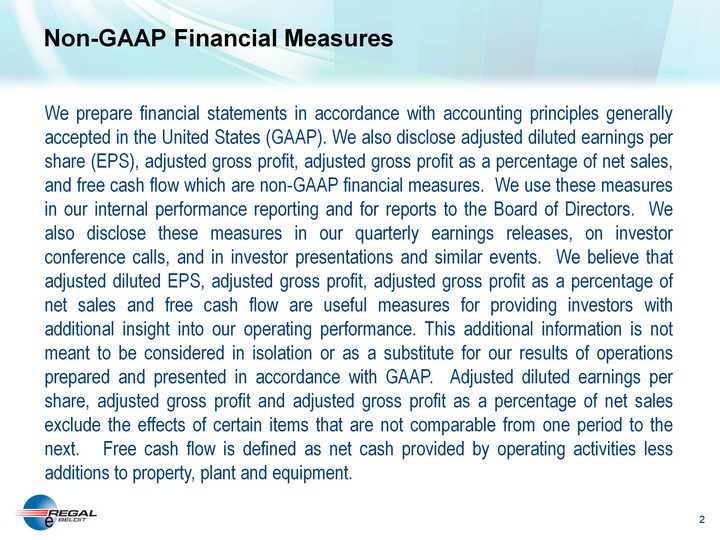
Regal Beloit Corporation prepares financial statements in accordance with accounting
principles generally accepted in the United States (GAAP). Regal Beloit Corporation also discloses
adjusted diluted earnings per share (EPS), adjusted gross profit, adjusted gross profit as a
percentage of net sales and free cash flow, which are non-GAAP financial measures. Management uses
these measures in its internal performance reporting and for reports to the Board of Directors.
Regal Beloit Corporation also discloses these measures in its quarterly earnings releases, on
investor conference calls, and in investor presentations and similar events. Management believes
that adjusted diluted EPS, adjusted gross profit, adjusted gross profit as a percentage of net
sales and free cash flow are useful measures for providing investors with additional insight into
the Company’s operating performance. This additional information is not meant to be considered in
isolation or as a substitute for Regal Beloit Corporation’s results of operations prepared and
presented in accordance with GAAP.
Adjusted diluted earnings per share, adjusted gross profit and adjusted gross profit as a
percentage of net sales exclude the effects of certain items that are not comparable from one
period to the next. Free cash flow is defined as net cash provided by operating activities less
additions to property, plant and equipment.
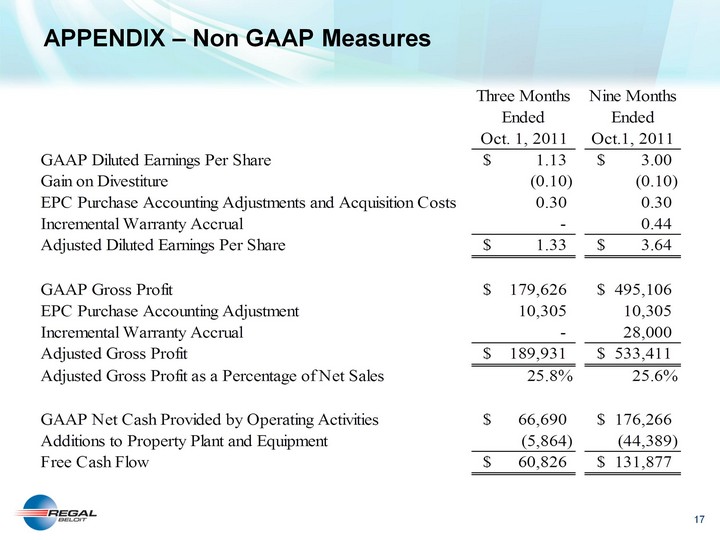
| Three Months | Nine Months | |||||||
| Ended | Ended | |||||||
| Oct. 1, 2011 | Oct. 1, 2011 | |||||||
GAAP Diluted Earnings Per Share |
$ | 1.13 | $ | 3.00 | ||||
Gain on Divestiture |
(0.10 | ) | (0.10 | ) | ||||
EPC Purchase Accounting Adjustments and Acquisition Costs |
0.30 | 0.30 | ||||||
Incremental Warranty Accrual |
— | 0.44 | ||||||
Adjusted Diluted Earnings Per Share |
$ | 1.33 | $ | 3.64 | ||||
GAAP Gross Profit |
$ | 179,626 | $ | 495,106 | ||||
EPC Purchase Accounting Adjustment |
10,305 | 10,305 | ||||||
Incremental Warranty Accrual |
— | 28,000 | ||||||
Adjusted Gross Profit |
$ | 189,931 | $ | 533,411 | ||||
Adjusted Gross Profit as a Percentage of Net Sales |
25.8 | % | 25.6 | % | ||||
GAAP Net Cash Provided by Operating Activities |
$ | 66,690 | $ | 176,266 | ||||
Additions to Property Plant and Equipment |
(5,864 | ) | (44,389 | ) | ||||
Free Cash Flow |
$ | 60,826 | $ | 131,877 | ||||