UNITED STATES
SECURITIES AND EXCHANGE COMMISSION
Washington, D.C. 20549
FORM 10-K
(Mark One)
For the fiscal year ended March 31, 2020
OR
For the transition period from _________ to __________
Commission File Number: 0-21184

(Exact Name of Registrant as Specified in Its Charter)
(State or Other Jurisdiction of Incorporation or Organization) | (IRS Employer Identification No.) | |
(Address of Principal Executive Offices, Including Zip Code)
(480 ) 792-7200
(Registrant's Telephone Number, Including Area Code)
Securities registered pursuant to Section 12(b) of the Act:
Title of Each Class | Trading Symbol | Name of Each Exchange on Which Registered | |
Stock Market LLC | |||
(Nasdaq Global Select Market) | |||
Securities registered pursuant to Section 12(g) of the Act: None
Indicate by check mark if the Registrant is a well-known seasoned issuer, as defined in Rule 405 of the Securities Act. ☒ Yes ☐ No
Indicate by check mark if the Registrant is not required to file reports pursuant to Section 13 or Section 15(d) of the Act. ☐ Yes ☒ No
Indicate by check mark whether the Registrant: (1) has filed all reports required to be filed by Section 13 or 15(d) of the Securities Exchange Act of 1934 during the preceding 12 months (or for such shorter period that the registrant was required to file such reports), and (2) has been subject to such filing requirements for the past 90 days. ☒ Yes ☐ No
Indicate by check mark whether the registrant has submitted electronically every Interactive Data File required to be submitted pursuant to Rule 405 of Regulation S-T (§229.405 of this chapter) during the preceding 12 months (or for such shorter period that the registrant was required to submit such files). ☒ Yes ☐ No
Indicate by check mark whether the registrant is a large accelerated filer, an accelerated filer, a non-accelerated filer, a smaller reporting company, or an emerging growth company. See definitions of "large accelerated filer," "accelerated filer," "smaller reporting company," and "emerging growth company" in Rule 12b-2 of the Exchange Act:
☒ | Accelerated filer | ☐ | Non-accelerated filer | ☐ | Smaller reporting company | ||
Emerging growth company | |||||||
If an emerging growth company, indicate by check mark if the registrant has elected not to use the extended transition period for complying with any new or revised financial accounting standards provided pursuant to Section 13(a) of the Exchange Act. ☐
Indicate by check mark whether the registrant has filed a report on and attestation to its management's assessment of the effectiveness of its internal control over financial reporting under Section 404(b) of the Sarbanes-Oxley Act (15 U.S.C. 7262(b)) by the registered public accounting firm that prepared or issued its audit report. ☒
Indicate by check mark whether the registrant is a shell company (as defined in Rule 12b-2 of the Exchange Act). ☐ Yes ☒ No
Aggregate market value of the voting and non-voting common equity held by non-affiliates as of September 30, 2019 based upon the closing price of the common stock as reported by the NASDAQ Global Market on such date was approximately $21,697,205,962 .
Number of shares of Common Stock, $0.001 par value, outstanding as of May 14, 2020: 245,332,497 shares
Documents Incorporated by Reference | ||
Document | Part of Form 10-K | |
Annual Report on Form 10-K for the fiscal year ended March 31, 2019 | II | |
Proxy Statement for the 2020 Annual Meeting of Stockholders | III | |
MICROCHIP TECHNOLOGY INCORPORATED AND SUBSIDIARIES
FORM 10-K
TABLE OF CONTENTS
Page | ||
PART I | ||
PART II | ||
PART III | ||
PART IV | ||
2
PART I
This Form 10-K contains certain forward-looking statements that involve risks and uncertainties, including statements regarding our strategy and future financial performance and those statements identified under "Item 7 – Management's Discussion and Analysis of Financial Condition and Results of Operations – Note Regarding Forward-looking Statements." Our actual results could differ materially from the results described in these forward-looking statements as a result of certain factors including those set forth under "Item 1A – Risk Factors," beginning below at page 12, and elsewhere in this Form 10-K. Although we believe that the matters reflected in the forward-looking statements are reasonable, we cannot guarantee future results, levels of activity, performance or achievements. You should not place undue reliance on these forward-looking statements. We disclaim any obligation to update information contained in any forward-looking statement. In this Form 10-K, "we," "us," "our," and "Microchip" each refers to Microchip Technology Incorporated and its subsidiaries.
Item 1. Business
We develop, manufacture and sell specialized semiconductor products used by our customers for a wide variety of embedded control applications. Our product portfolio comprises general purpose and specialized 8-bit, 16-bit, and 32-bit microcontrollers, 32-bit microprocessors, field-programmable gate array (FPGA) products, a broad spectrum of high-performance linear, mixed-signal, power management, thermal management, discrete diodes and Metal Oxide Semiconductor Field Effect Transistors (MOSFETS), radio frequency (RF), timing, timing systems, safety, security, wired connectivity and wireless connectivity devices, as well as Serial Electrically Erasable Programmable Read Only Memory (EEPROM), Serial Flash memories, Parallel Flash memories, Serial Electrically Erasable Random Access Memory (EERAM) and Serial Static Random Access Memory (SRAM). We also license Flash-IP solutions that are incorporated in a broad range of products. Our synergistic product portfolio targets thousands of applications worldwide and a strong demand for high-performance designs in the automotive, aerospace, defense, space, communications, computing, consumer and industrial control markets. We comply with several quality systems, including: ISO9001 (2015 version), IATF16949 (2016 version), AS9100 (2016 version), and TL9000.
Microchip Technology Incorporated was incorporated in Delaware in 1989. Our executive offices are located at 2355 West Chandler Boulevard, Chandler, Arizona 85224-6199 and our telephone number is (480) 792-7200.
Our Internet address is www.microchip.com. We post the following filings on our website as soon as reasonably practicable after they are electronically filed with or furnished to the Securities and Exchange Commission:
• | our annual report on Form 10-K |
• | our quarterly reports on Form 10-Q |
• | our current reports on Form 8-K |
• | our proxy statement |
• | any amendments to the above-listed reports filed or furnished pursuant to Sections 13(a) or 15(d) of the Securities Exchange Act of 1934 |
All of our SEC filings on our website are available free of charge. The information on our website is not incorporated into this Form 10-K.
Acquisition of Microsemi
On May 29, 2018, we completed our acquisition of Microsemi Corporation (Microsemi), a publicly traded company headquartered in Aliso Viejo, California. We paid an aggregate of approximately $8.19 billion in cash to the stockholders of Microsemi. The total consideration transferred in the acquisition, including approximately $53.9 million of non-cash consideration for the exchange of certain share-based payment awards of Microsemi for stock awards of Microchip, was approximately $8.24 billion. In addition to the consideration transferred, we recognized in our consolidated financial statements $3.23 billion in liabilities of Microsemi consisting of debt, taxes payable and deferred, pension obligations, restructuring, and contingent and other liabilities of which $2.06 billion of existing debt was paid off. We financed the purchase price using approximately $8.10 billion of borrowings consisting of $3.10 billion of loans under our revolving line of credit (the "Revolving Credit Facility"), $3.00 billion of term loans ("Term Loan Facility") provided under our amended and restated Credit Agreement, and $2.00 billion in newly issued senior secured notes. We incurred $22.0 million in costs related to the acquisition. As a result of the acquisition, Microsemi became a wholly owned subsidiary of Microchip. Microsemi offers a comprehensive portfolio of semiconductor and system solutions for aerospace and defense, communications, data center and industrial markets. Our primary reason for this acquisition was to expand our range of solutions, products and capabilities by extending our served available market.
3
Industry Background
Competitive pressures require original equipment manufacturers (OEM) of a wide variety of products to expand product functionality and provide differentiation while maintaining or reducing cost. To address these requirements, manufacturers often use integrated circuit-based embedded control systems that enable them to:
• | differentiate their products |
• | replace less efficient electromechanical control devices |
• | reduce the number of components in their system |
• | add product functionality |
• | reduce the system level energy consumption |
• | make systems safer to operate |
• | add security to their products |
• | decrease time to market for their products |
• | significantly reduce product cost |
Embedded control systems have been incorporated into thousands of products and subassemblies in a wide variety of applications and markets worldwide, including:
• | actuators |
• | applications needing touch buttons, touch screens and graphical user interfaces |
• | automotive access control |
• | automotive comfort, safety, information and entertainment applications |
• | avionics |
• | building automation |
• | communication infrastructure systems |
• | consumer electronics |
• | defense and military hardware |
• | energy monitoring |
• | handheld tools |
• | industrial automation |
• | large and small home appliances |
• | medical devices |
• | motor controls |
• | portable computers and accessories |
• | power supplies |
• | remote control devices |
• | robotics |
• | routers and video surveillance systems |
• | satellites |
• | security systems |
• | smoke and carbon monoxide detectors |
• | storage and server systems |
• | thermostats |
Embedded control systems typically incorporate a microcontroller as the principal active, and sometimes sole, component. A microcontroller is a self-contained computer-on-a-chip consisting of a central processing unit, often with on-board non-volatile program memory for program storage, random access memory for data storage and various analog and digital input/output peripheral capabilities. In addition to the microcontroller, a complete embedded control system often incorporates application-specific software, various analog, mixed-signal, timing, connectivity, security and non-volatile memory components such as EEPROMs and Flash memory.
The increasing demand for embedded control has made the market for microcontrollers a significant segment of the semiconductor market at $18 billion in calendar year 2019. Microcontrollers are primarily available in 8-bit through 32-bit architectures. 8-bit microcontrollers remain very cost-effective and easy to use for a wide range of high-volume embedded control applications and, as a result, continue to represent a significant portion of the overall microcontroller market. 16-bit and 32-bit microcontrollers provide higher performance and functionality, and are generally found in more complex embedded control applications. FPGAs are programmable integrated circuits that are used to implement complex logic functions and can
4
be re-programmed at any time, allowing for multiple implementations and revisions during or after the end customer system is manufactured. Some versions of FPGAs also include a microcontroller or microprocessor core to provide additional system on chip functionality for compute intensive tasks. The analog and mixed-signal segment of the semiconductor market was $56 billion in calendar year 2019, and this market is fragmented into a large number of sub segments.
Our Products
Our strategic focus is on embedded control solutions, including:
• | general purpose and specialized microcontrollers and microprocessors |
• | wired and wireless connectivity products |
• | development tools and related software |
• | analog, interface, mixed signal, timing, timing systems and security products |
• | discrete diodes and MOSFETS |
• | FPGA products |
• | memory products |
• | technology licensing |
We provide cost-effective embedded control solutions that also offer the advantages of small size, high performance, extreme low power usage, wide voltage range operation, mixed signal integration, and ease of development, thus enabling timely and cost-effective integration of our solutions by our customers in their end products.
Microcontrollers
We offer a broad family of proprietary general purpose microcontroller products marketed under multiple brand names. We believe that our microcontroller product families provide leading function and performance characteristics in the worldwide microcontroller market. With over 3,950 microcontrollers in our product portfolio, we target the 8-bit, 16-bit, and 32-bit microcontroller and 32-bit embedded microprocessor markets. We have shipped more than 27.2 billion microcontrollers to customers worldwide since 1990. We also offer specialized microcontrollers for automotive, industrial, computing, communications, lighting, power supplies, motor control, human machine interface, security, wired connectivity and wireless connectivity applications.
We leverage our circuit design, process technologies, development tools, applications knowledge, and manufacturing experiences to enable our customers to implement various embedded control functions in their end systems with our microcontrollers.
Development Tools
We offer a comprehensive set of low-cost and easy-to-learn application development tools. These tools enable system designers to quickly and easily program our microcontroller products for specific applications and, we believe, they are an important factor for facilitating design wins.
Our family of development tools for our microcontroller products range from entry-level systems, which include an assembler or a compiler and programmer or in-circuit debugging hardware, to fully configured systems that provide in-circuit emulation capability. We also offer a complete suite of compilers, software code configurators and simulators. Customers moving from entry-level designs to those requiring real-time emulation are able to preserve their investment in learning and tools as they migrate to future microcontroller devices in our portfolio.
Many independent companies also develop and market application development tools that support our microcontroller product architectures, including an extensive amount of third-party tool suppliers whose products support our microcontroller architectures.
We believe that familiarity with and adoption of development tools from Microchip as well as third-party development tool partners by an increasing number of product designers will be an important factor in the future selection of our embedded control products. These development tools allow design engineers to develop thousands of application-specific products from our standard microcontrollers.
Analog, Power, Interface, Mixed Signal and Timing Products
5
Our analog, power, interface, mixed signal and timing products consist of several families with over 8,900 power management, linear, mixed-signal, high voltage, thermal management, discrete diodes and MOSFETS, RF, drivers, safety, security, timing, USB, ethernet, wireless and other interface products.
We market and sell our analog, power, interface, mixed signal and timing products into our microcontroller, microprocessor and FPGA customer base, and to customers who use microcontrollers and FPGA products from other suppliers and to customers who use other products that may not fit our traditional microcontroller, FPGA and memory products customer base.
Field-Programmable Gate Array (FPGA) Products
Our FPGA product line was primarily acquired as a part of our acquisition of Microsemi. Our portfolio of non-volatile FPGAs range in densities from 100 to 481,000 logic elements and are recognized for their low power, high security and extended reliability. We market and sell our FPGA products and related solutions into a broad range of applications within the industrial, defense, aviation, space and communications markets.
We offer a comprehensive set of development tools for our FPGA products. These tools enable system designers to visualize, implement, simulate and program complex logic functions in the FPGA. Our development tool suite manages the entire design flow from design entry, simulation, synthesis, through place-and-route, timing, and power analysis. We also provide C/C++ development and debugging environment to support our FPGAs that implement embedded microcontrollers or microprocessor cores.
Licensing, Memory and Other (LMO)
Our LMO product line includes royalties associated with licenses for the use of our SuperFlash and other technologies, sales of our intellectual property, fees for engineering services, memory products, timing systems, manufacturing services (wafer foundry and assembly and test subcontracting), legacy application specific integrated circuits, and products for aerospace applications.
Our technology licensing business generates license fees and royalties associated with technology licenses for the use of our SuperFlash® embedded flash and Smartbits® one time programmable NVM technologies. We also generate fees for engineering services related to these technologies. We license our NVM technologies to foundries, integrated device manufacturers and design partners throughout the world for use in the manufacture of their advanced microcontroller products, gate array, RF, analog and neuromorphic compute products that require embedded non-volatile memory.
Our memory products consist of EEPROMs, Serial Flash memories, Parallel Flash memories, Serial SRAM memories and EERAM. Serial EEPROMs, Serial Flash memories, Serial SRAMs and EERAM have a very low I/O pin requirement, permitting production of very small footprint devices. We sell our memory products primarily into the embedded control
market, complementing our microcontroller offerings.
Manufacturing
Our manufacturing operations include wafer fabrication, wafer probe, assembly and test. The ownership of a substantial portion of our manufacturing resources is an important component of our business strategy, enabling us to maintain a high level of manufacturing control, resulting in us being one of the lowest cost producers in the embedded control industry. By owning wafer fabrication facilities and our assembly and test operations, and by employing statistical techniques (statistical process control, designed experiments and wafer level monitoring), we have been able to achieve and maintain high production yields. Direct control over manufacturing resources allows us to shorten our design and production cycles. This control also allows us to capture a portion of the wafer manufacturing and assembly and testing profit margin. We do outsource a significant portion of our manufacturing requirements to third parties and the amount of our outsourced manufacturing has increased in recent years due to our acquisitions of Microsemi and other companies that outsource all or substantial portions of their manufacturing.
Our manufacturing facilities are located in:
• | United States |
◦ | Chandler, Arizona (wafer probe) |
◦ | Tempe, Arizona (Fab 2) |
◦ | Gresham, Oregon (Fab 4) |
6
◦ | Colorado Springs, Colorado (Fab 5) |
◦ | Garden Grove, California (manufacturing, R&D and administrative) |
◦ | San Jose, California (manufacturing, R&D, and administrative) |
◦ | Simsbury, Connecticut (manufacturing, R&D and administrative) |
◦ | Beverly, Massachusetts (manufacturing) |
◦ | Lawrence, Massachusetts (manufacturing and administrative) |
◦ | Lowell, Massachusetts (wafer fabrication, assembly and test, R&D, warehousing and administrative) |
◦ | Mt. Holly Springs, Pennsylvania (manufacturing, R&D and administrative) |
• | Thailand |
◦ | Chacherngsao (wafer probe, assembly and test) |
• | Philippines |
◦ | Calamba, Laguna (wafer probe and test) |
• | France |
◦ | Nantes, Loire-Atlantique (design, engineering, test, probe, administrative and warehousing) |
• | Ireland |
◦ | Ennis, County Clare (manufacturing) |
• | Germany |
◦ | Neckarbischofsheim, Baden-Württemberg (manufacturing and administrative) |
◦ | Teltow, Brandenburg (wafer fabrication, assembly and test, wafer probe, R&D, warehousing and administrative) |
Wafer Fabrication
Fab 2 currently produces 8-inch wafers and supports various manufacturing process technologies, but predominantly utilizes our 0.5 microns to 1.0 microns processes. During fiscal 2020, we increased Fab 2's capacity to support more advanced technologies by making process improvements, upgrading existing equipment, and adding equipment.
Fab 4 currently produces 8-inch wafers using predominantly 0.13 microns to 0.5 microns manufacturing processes. During fiscal 2020, we increased Fab 4's capacity to support more advanced technologies by making process improvements, upgrading existing equipment, and adding equipment. A significant amount of additional clean room capacity in Fab 4 can be brought on line in the future to support incremental wafer fabrication capacity needs.
Fab 5 is a 6-inch wafer fabrication facility that currently utilizes processes from 0.25 microns to 1.0 microns. During fiscal 2020, we announced our intention to re-purpose Fab 5 to manufacture discrete and specialty products in addition to a lower volume of a diversified set of standard products. In connection with these efforts, we reduced the clean room footprint and transferred certain higher volume products to our 8-inch wafer fabrication facilities in Arizona and Oregon. We anticipate that these actions will result in significant cost savings over the next several years.
We believe the combined capacity of Fab 2, Fab 4, and Fab 5 will provide sufficient capacity to allow us to respond to increases in future demand over the next several years with modest incremental capital expenditures.
As a result of our acquisition of Microsemi, we acquired several smaller wafer fabrication facilities, which utilize older technologies that are appropriate for the discrete products they manufacture. We plan to operate these fabrication facilities with modest investment to keep them operational with the exception of the facility in Bend, Oregon, which discontinued production in March 2019, and the facility in Santa Clara, California, which we plan to close by March 2021.
We continue to transition products to more advanced process technologies to reduce future manufacturing costs. We believe that our ability to successfully transition to more advanced process technologies is important for us to remain competitive.
We augment our internal manufacturing capabilities by outsourcing a significant portion of our wafer production requirements to third-party wafer foundries. As a result of our acquisitions in recent years, we have become more reliant on outside wafer foundries for our wafer fabrication requirements. In fiscal 2020, approximately 61% of our sales came from products that were produced at outside wafer foundries.
Assembly and Test
We perform product assembly and test at various facilities located around the world. During fiscal 2020, we increased capacity at our Thailand and Philippines facilities to support more technologies by making process improvements, upgrading
7
existing equipment, and adding equipment. During fiscal 2020, approximately 45% of our assembly requirements were being performed in our internal facilities and approximately 54% of our test requirements were performed in internal facilities. We use third-party assembly and test contractors for the balance of our assembly and test requirements. Over time, we intend to continue to migrate a portion of the outsourced assembly and test activities to our internal facilities.
General Matters Impacting Our Manufacturing Operations
Due to the high fixed costs inherent in semiconductor manufacturing, consistently high manufacturing yields have significant positive effects on our gross profit and overall operating results. Our continuous focus on manufacturing productivity has allowed us to maintain excellent manufacturing yields at our facilities. Our manufacturing yields are primarily driven by a comprehensive implementation of statistical process control, extensive employee training and effective use of our manufacturing facilities and equipment. Maintenance of manufacturing productivity and yields are important factors in the achievement of our operating results. The manufacture of integrated circuits, particularly non-volatile, erasable complementary metal-oxide semiconductor (CMOS) memory and logic devices, such as those that we produce, are complex processes. These processes are sensitive to a wide variety of factors, including the level of contaminants in the manufacturing environment, impurities in the materials used and the performance of our manufacturing personnel and equipment. As is typical in the semiconductor industry, we have from time to time experienced lower than anticipated manufacturing yields. Our operating results will suffer if we are unable to maintain yields at or above approximately the current levels.
Historically, we have relied on our ability to respond quickly to customer orders as part of our competitive strategy, resulting in customers placing orders with relatively short delivery schedules. In order to respond to such requirements, we have historically maintained a significant work-in-process and finished goods inventory.
The following table summarizes our long-lived assets (consisting of property, plant and equipment and right-of-use assets) by geography at the end of fiscal 2020, fiscal 2019 and fiscal 2018 (in millions).
March 31, | |||||||||||
2020 | 2019 | 2018 | |||||||||
United States | $ | 515.0 | $ | 521.1 | $ | 393.3 | |||||
Thailand | 174.4 | 209.3 | 215.5 | ||||||||
Various other countries | 306.2 | 266.3 | 159.1 | ||||||||
Total long-lived assets(1) | $ | 995.6 | $ | 996.7 | $ | 767.9 | |||||
(1) The amounts presented for March 31, 2020 include right-of-use assets of $119.5 million due to the adoption of Accounting Standards Codification Topic 842, Leases, under the retrospective cumulative effect adjustment transition method. The disclosures are not applicable for the fiscal years ended March 31, 2019 and March 31, 2018 (see Note 11, Leases, for further information).
We have many suppliers of raw materials and subcontractors which provide our various materials and service needs. We generally seek to have multiple sources of supply for our raw materials and services, but, in some cases, we may rely on a single or limited number of suppliers.
Sales and Distribution
General
We market and sell our products worldwide primarily through a network of direct sales personnel and distributors.
Our direct sales force focuses on a wide variety of strategic accounts in three geographical markets: the Americas, Europe and Asia. We currently maintain sales and technical support centers in major metropolitan areas in all three geographic markets. We believe that a strong technical service presence is essential to the continued development of the embedded control market. Many of our client engagement managers, embedded solutions engineers (ESEs), and sales management have technical degrees or backgrounds and have been previously employed in high technology environments. We believe that the technical and business knowledge of our sales force is a key competitive advantage in the sale of our products. The primary mission of our ESE team is to provide technical assistance to customers and to conduct periodic training sessions for the balance of our sales team. ESEs also frequently conduct technical seminars and workshops in major cities around the world or through online webcasts.
8
Our licensing division has dedicated sales, technology, design, product, test and reliability personnel that support the requirements of our licensees.
For information regarding our revenue, results of operations, and total assets for each of our last three fiscal years, refer to our financial statements included in this Form 10-K.
Distribution
Our distributors focus primarily on servicing the product requirements of a broad base of diverse customers. We believe that distributors provide an effective means of reaching this broad and diverse customer base. We believe that customers recognize us for our products and brand name and use distributors as an effective supply channel.
In fiscal 2020, we derived 50% of our net sales through distributors and 50% of our net sales from customers serviced directly by us. In fiscal 2019, we derived 51% of our net sales through distributors and 49% of our net sales from customers serviced directly by us. In fiscal 2018, we derived 54% of our net sales through distributors and 46% of our net sales from customers serviced directly by us. With the exception of Arrow Electronics, our largest distributor, which made up 10% of our net sales in fiscal 2020 and fiscal 2019, no other distributor or end customer accounted for more than 10% of our net sales. In fiscal 2018, no distributor or end customer accounted for more than 10% of our net sales.
We do not have long-term purchase commitments from our distributors and we, or our distributors, may each terminate our relationship with little or no advanced notice. The loss of, or the disruption in the operations of, one or more of our distributors could reduce our future net sales in a given quarter and could result in an increase in inventory returns.
Backlog
As of March 31, 2020, our backlog was approximately $2.42 billion, compared to $2.20 billion as of March 31, 2019. Our backlog includes all purchase orders scheduled for delivery within the subsequent 12 months.
We primarily produce standard products that can be shipped from inventory within a relatively short time after we receive an order. Our business and, to a large extent, that of the entire semiconductor industry, is characterized by short-term orders and shipment schedules. Orders constituting our current backlog are subject to changes in delivery schedules, or to cancellation at the customer's option without significant penalty. Thus, while backlog is useful for scheduling production, backlog as of any particular date may not be a reliable measure of our sales for any future period.
Competition
The semiconductor industry is intensely competitive and has been characterized by price erosion and rapid technological change. We compete with major domestic and international semiconductor companies, some of which have greater market recognition and greater financial, technical, marketing, distribution and other resources than we have with which to pursue engineering, manufacturing, marketing and distribution of their products. We also compete with a number of companies that we believe have copied, cloned, pirated or reverse engineered our proprietary product lines in such countries as China and Taiwan. We are continuing to take actions to vigorously and aggressively defend and protect our intellectual property on a worldwide basis.
We currently compete principally on the basis of the technical innovation and performance of our embedded control products, including the following product characteristics:
• | performance |
• | analog, digital and mixed signal functionality and level of functional integration |
• | field programmability |
• | memory density |
• | low power consumption |
• | extended voltage ranges |
• | reliability |
• | packaging alternatives |
• | completeness of development tool line |
We believe that other important competitive factors in the embedded control market include:
9
• | ease of use |
• | functionality of application development systems |
• | dependable delivery, quality and availability |
• | technical and innovative service and support |
• | time to market |
• | price |
We believe that we compete favorably with other companies on all of these factors, but we may be unable to compete successfully in the future, which could harm our business.
Patents, Licenses and Trademarks
We maintain a portfolio of U.S. and foreign patents, expiring on various dates through 2039. We also have numerous additional U.S. and foreign patent applications pending. We do not expect that the expiration of any particular patent will have a material impact on our business. While our intention is to continue to patent our technology and manufacturing processes, we believe that our continued success depends primarily on the technological skills and innovative capabilities of our personnel and our ability to rapidly commercialize new and enhanced products. As with any operating company, the scope and strength of our intellectual property assets, including our pending and existing patents, trademarks, copyrights, and other intellectual property rights may be insufficient to provide meaningful protection or commercial advantage. Moreover, pursuing violations of intellectual property rights on a worldwide basis is a complex challenge involving multinational patent, trademark, copyright and trade secret laws. Further, the laws of particular foreign countries often fail to protect our intellectual property rights to the same extent as the laws of the U.S.
We have also entered into certain intellectual property licenses and cross-licenses with other companies and those licenses relate to semiconductor products and manufacturing processes. As is typical in the semiconductor industry, we and our customers from time to time receive, and may continue to receive, demand letters from third parties asserting infringement of patent and other intellectual property rights. We diligently investigate all such notices and respond as we believe appropriate. In most cases we believe that we can obtain necessary licenses on commercially reasonable terms, however, we cannot be certain that this would be the case, or that litigation or damages for any past infringement could be avoided. Litigation, which could result in substantial costs and require significant attention from management, may be necessary to enforce our intellectual property rights, or to defend against claimed infringement of the rights of others. The failure to obtain necessary licenses, or the necessity of engaging in defensive litigation, could harm our business.
Environmental Regulation
We must comply with many different federal, state, local and foreign governmental regulations related to the use, storage, discharge and disposal of certain chemicals and gases used in our manufacturing processes. Our facilities have been designed to comply with these regulations and we believe that our activities are conducted in material compliance with such regulations. Any changes in such regulations or in their enforcement could require us to acquire costly equipment or to incur other significant expenses to comply with environmental regulations. Any failure by us to adequately control the storage, use, discharge and disposal of regulated substances could result in significant future liabilities.
Increasing public attention has been focused on the environmental impact of electronic manufacturing operations. While we have not experienced any materially adverse effects on our operations from recently adopted environmental regulations, our business and results of operations could suffer if for any reason we fail to control the storage or use of, or to adequately restrict the discharge or disposal of, hazardous substances under present or future environmental regulations.
Employees
As of March 31, 2020, we had approximately 18,000 employees. We have never had a work stoppage and believe that our employee relations are good.
10
Executive Officers of the Registrant
The following sets forth certain information regarding our executive officers as of April 30, 2020:
Name | Age | Position | ||
Steve Sanghi | 64 | Chief Executive Officer and Chairman of the Board | ||
Ganesh Moorthy | 60 | President and Chief Operating Officer | ||
J. Eric Bjornholt | 49 | Senior Vice President, Chief Financial Officer | ||
Stephen V. Drehobl | 58 | Senior Vice President, MCU8 and MCU16 Business Units | ||
Mitchell R. Little | 68 | Senior Vice President, Worldwide Client Engagement | ||
Richard J. Simoncic | 56 | Senior Vice President, Analog Power and Interface Business Units | ||
Mr. Sanghi has served as Chief Executive Officer since October 1991, and as Chairman of the Board since October 1993. He served as President from August 1990 to February 2016 and has served as a director since August 1990. Mr. Sanghi holds an M.S. degree in Electrical and Computer Engineering from the University of Massachusetts and a B.S. degree in Electronics and Communication from Punjab University. Mr. Sanghi served on the Board of Directors of Myomo, Inc., a publicly traded commercial stage medical robotics company that offers expanded mobility for those suffering from neurological disorders and upper-limb paralysis, from November 2016 through October 2019. Mr. Sanghi served on the board of Mellanox Technologies Ltd., a publicly traded supplier of end-to-end Ethernet and InfiniBand intelligent interconnect solutions and services for servers, storage, and hyper-converged infrastructure, from February 2018 through April 2020.
Mr. Moorthy has served as President since February 2016 and as Chief Operating Officer since June 2009. He also served as Executive Vice President from October 2006 to August 2012 and as a Vice President in various roles since he joined Microchip in 2001. Prior to this time, he served in various executive capacities with other semiconductor companies. Mr. Moorthy holds an M.B.A. in Marketing from National University, a B.S. degree in Electrical Engineering from the University of Washington and a B.S. degree in Physics from the University of Mumbai, India. Mr. Moorthy was elected to the Board of Directors of Rogers Corporation in July 2013 and serves on the Audit Committee of the Board and as the Nominating and Governance Committee Chairperson.
Mr. Bjornholt was promoted to Senior Vice President in 2019 and has served as Vice President of Finance since 2008 and as Chief Financial Officer since January 2009. He has served in various financial management capacities since he joined Microchip in 1995. Mr. Bjornholt holds a Master's degree in Taxation from Arizona State University and a B.S. degree in Accounting from the University of Arizona.
Mr. Drehobl was promoted to Senior Vice President in 2019 and has served as Vice President of the MCU8 business unit and various other divisions and business units since July 2001. He has been employed by Microchip since August 1989 and has served as a Vice President in various roles since February 1997. Mr. Drehobl holds a Bachelor of Technology degree from the University of Dayton.
Mr. Little was promoted to Senior Vice President in 2019 and has served as Vice President of Worldwide Sales since July 2000. He has been employed by Microchip since 1989 and has served as a Vice President in various roles since September 1993. Mr. Little holds a B.S. degree in Engineering Technology from United Electronics Institute.
Mr. Simoncic was promoted to Senior Vice President in 2019 and has served as Vice President, Analog Power and Interface Business Units since September 1999. From October 1995 to September 1999, he served as Vice President in various roles. Since joining Microchip in 1990, Mr. Simoncic held various roles in Design, Device/Yield Engineering and Quality Systems. Mr. Simoncic holds a B.S. degree in Electrical Engineering Technology from DeVry Institute of Technology.
11
Item 1A. Risk Factors
When evaluating Microchip and its business, you should give careful consideration to the factors listed below, in addition to the information provided elsewhere in this Form 10-K and in other documents that we file with the Securities and Exchange Commission.
Our operating results are impacted by global economic conditions and may fluctuate in the future due to a number of factors that could reduce our net sales and profitability.
Our operating results are affected by a wide variety of factors that could reduce our net sales and profitability, many of which are beyond our control. Some of the factors that may affect our operating results include:
• | general economic, industry, public health or political conditions in the U.S. or internationally, including ongoing uncertainty surrounding the COVID-19 virus and its implications; |
• | disruptions in our business, our supply chain or our customers' businesses due to public health concerns (including viral outbreaks such as the COVID-19 virus), cybersecurity incidents, terrorist activity, armed conflict, war, worldwide oil prices and supply, fires, natural disasters or disruptions in the transportation system; |
• | constrained availability from other electronic suppliers impacting our customers' ability to ship their products, which in turn may adversely impact our sales to those customers; |
• | changes in demand or market acceptance of our products and products of our customers, and market fluctuations in the industries into which such products are sold; |
• | the level of order cancellations or push-outs due to the impact of the COVID-19 virus or other factors; |
• | trade restrictions and changes in tariffs, including those impacting business in China, as well as those focused on specific companies; |
• | the mix of inventory we hold and our ability to satisfy orders from our inventory; |
• | our ability to continue to realize the expected benefits of our past or future acquisitions; |
• | our ability to adjust our factory capacity to respond to changes in customer demand; |
• | changes in utilization of our manufacturing capacity and fluctuations in manufacturing yields; |
• | our ability to secure sufficient wafer foundry, assembly and testing capacity; |
• | changes or fluctuations in customer order patterns and seasonality; |
• | changes in tax regulations and policies in the U.S. and other countries in which we do business including the impact of the Tax Cuts and Jobs Act of 2017 (the Act); |
• | new accounting pronouncements or changes in existing accounting standards and practices; |
• | levels of inventories held by our customers; |
• | risk of excess and obsolete inventories; |
• | competitive developments including pricing pressures; |
• | unauthorized copying of our products resulting in pricing pressure and loss of sales; |
• | availability of raw materials, supplies and equipment; |
• | our ability to successfully transition products to more advanced process technologies to reduce manufacturing costs; |
• | the level of orders that are received and can be shipped in a quarter, including the impact of product lead times; |
• | the level of sell-through of our products through distribution; |
• | fluctuations in our mix of product sales; |
• | announcements of other significant acquisitions by us or our competitors; |
• | costs and outcomes of any current or future tax audits or any litigation, investigation or claims involving intellectual property, our Microsemi acquisition, customers or other issues; |
• | fluctuations in commodity or energy prices; and |
• | property damage or other losses, whether or not covered by insurance. |
We believe that period-to-period comparisons of our operating results are not necessarily meaningful and that you should not rely upon any such comparisons as indications of our future performance. In future periods, our operating results may fall below our public guidance or the expectations of public market analysts and investors, which would likely have a negative effect on the price of our common stock. Uncertain global economic and public health conditions, such as the COVID-19 virus, have caused or may cause our operating results to fluctuate significantly and make comparability between periods less meaningful.
Our operating results may be adversely impacted if economic conditions impact the financial viability of our licensees, customers, distributors, or suppliers.
12
We regularly review the financial performance of our licensees, customers, distributors and suppliers. However, any downturn in global economic conditions, as a result of the COVID-19 virus or otherwise, may adversely impact the financial viability of our licensees, customers, distributors or suppliers. The financial failure of a large licensee, customer or distributor, an important supplier, or a group thereof, could have an adverse impact on our operating results and could result in our not being able to collect our accounts receivable balances, higher reserves for doubtful accounts, write-offs for accounts receivable, and higher operating costs as a percentage of net sales.
The future trading price of our common stock could be subject to wide fluctuations in response to a variety of factors.
The market price of our common stock has fluctuated significantly in the recent past and is likely to fluctuate in the future. The future trading price of our common stock could be subject to wide fluctuations in response to a variety of factors, many of which are beyond our control, including, but not limited to:
• | global economic and financial uncertainty due to the COVID-19 virus or other factors; |
• | quarterly variations in our operating results or the operating results of other technology companies; |
• | changes in our financial guidance or our failure to meet such guidance; |
• | changes in analysts' estimates of our financial performance or buy/sell recommendations; |
• | general conditions in the semiconductor industry; |
• | our ability to realize the expected benefits of our completed or future acquisitions; and |
• | actual or anticipated announcements of technical innovations or new products by us or our competitors. |
In addition, the stock market has recently and from time to time in the past experienced significant price and volume fluctuations that have affected the market prices for many companies and that often have been unrelated to the operating performance of such companies. These broad market fluctuations and other factors have harmed and may harm the market price of our common stock. Some or all of the foregoing factors could also cause the market price of our convertible debentures to decline or fluctuate substantially.
We may not fully realize the anticipated benefits of our completed or future acquisitions or divestitures including our acquisition of Microsemi.
We have acquired, and expect in the future to acquire, additional businesses that we believe will complement or augment our existing businesses. In May 2018, we completed our acquisition of Microsemi, which was our largest and most complex acquisition ever, and, in April 2016, we completed our acquisition of Atmel. The integration process for our acquisitions is complex and may be costly and time consuming and include unanticipated issues, expenses and liabilities. We may not be able to successfully or profitably integrate, operate, maintain and manage any newly acquired operations or employees. We may not be able to maintain uniform standards, procedures and policies and we may be unable to realize the expected synergies and cost savings from the integration. There may be increased risk due to integrating financial reporting and internal control systems. We may have difficulty in developing, manufacturing and marketing the products of a newly acquired company, or in growing the business at the rate we anticipate. Following an acquisition, we may not achieve the revenue or net income levels that justify the acquisition. We may suffer loss of key employees, customers and strategic partners of acquired companies and it may be difficult to implement our corporate culture at acquired companies. We have been and may in the future be subject to claims from terminated employees, shareholders of Microchip or the acquired companies and other third parties related to the transaction. In particular, in connection with our Microsemi and Atmel acquisitions, we became involved with third-party claims, litigation, governmental investigations and disputes related to such businesses and transactions. See Note 12 to our consolidated financial statements for information regarding such matters. Acquisitions may also result in charges (such as acquisition-related expenses, write-offs, restructuring charges, or future impairment of goodwill), contingent liabilities, adverse tax consequences, additional share-based compensation expense and other charges that adversely affect our operating results. To fund our acquisition of Microsemi, we used a significant portion of our cash balances and incurred approximately $8.10 billion of additional debt. We may fund future acquisitions of new businesses or strategic alliances by utilizing cash, borrowings under our Revolving Credit Facility, raising debt, issuing shares of our common stock, or other mechanisms.
Further, if we decide to divest assets or a business, we may encounter difficulty in finding or completing divestiture opportunities or alternative exit strategies, which may include site closures, on acceptable terms or in a timely manner. These circumstances could delay the achievement of our strategic objectives or cause us to incur additional expenses with respect to assets or a business that we want to dispose of, or we may dispose of assets or a business at a price or on terms that are less favorable than we had anticipated. Even following a divestiture or other exit strategy, we may be contractually obligated with respect to certain continuing obligations to former employees, customers, vendors, landlords or other third parties. We may also have continuing obligations for pre-existing liabilities related to the former employees, assets or businesses. Such obligations may have a material adverse impact on our results of operations and financial condition.
13
In addition to acquisitions, we have in the past, and expect in the future, to enter into joint development agreements or other business or strategic relationships with other companies. These transactions are subject to a number of risks similar to those we face with our acquisitions including our ability to realize the expected benefits of any such transaction, to successfully market and sell any products resulting from such transactions or to successfully integrate any technology developed through such transactions.
Our financial condition and results of operations could be adversely affected if we do not effectively manage our current or future debt.
As of March 31, 2020, the principal amount of our outstanding indebtedness was $10.59 billion. In connection with our acquisition of Microsemi, we incurred debt consisting of $3.10 billion under our revolving line of credit, $3.00 billion under our term loan facility, and $2.00 billion in senior secured notes. At March 31, 2020, we had $2.39 billion in outstanding borrowings under our revolving line of credit which provides up to $3.57 billion of revolving loan commitments that terminate in 2023. At March 31, 2020, we had $1.72 billion of outstanding borrowings under our term loan facility. In March 2020, we financed the settlement of $615.0 million in principal amount of our 2015 Senior Convertible Debt through borrowings under our bridge loan facility. At March 31, 2020, we had $3.87 billion of outstanding principal related to our convertible debt consisting of $2.77 billion of aggregate principal value issued in 2017 and $1.11 billion of principal value issued in 2015.
As a result of such transactions, we have a substantially greater amount of debt than we had maintained in the past. Our maintenance of substantial levels of debt could adversely affect our ability to take advantage of corporate opportunities and could adversely affect our financial condition and results of operations. We may need or desire to refinance our convertible debt, senior debt, term loan debt or any other future indebtedness and there can be no assurance that we will be able to refinance any of our indebtedness on commercially reasonable terms, if at all.
Servicing our current debt requires a significant amount of cash, we may not have sufficient cash flow from our business to fund future payments and any adverse changes in our credit ratings could increase our borrowing costs and could adversely affect our ability to access the debt markets.
Our ability to make scheduled payments of principal, to pay interest on or to refinance our indebtedness, including our outstanding convertible debt and senior notes, depends on our future performance, which is subject to economic, financial, competitive and other factors including uncertainties related to the COVID-19 virus. Our business may not continue to generate cash flow from operations in the future sufficient to service our debt and to fund capital expenditures, dividend payments, share repurchases or acquisitions. If we are unable to generate such cash flow, we may be required to adopt one or more alternatives, such as selling assets, restructuring debt or obtaining additional equity capital on terms that may be onerous or highly dilutive. Our ability to refinance our indebtedness will depend on the capital markets and our financial condition at such time. Our senior secured notes are rated by certain major credit rating agencies. These credit ratings impact our cost of borrowing and our ability to access the capital markets and are based on our financial performance and certain financial metrics including debt levels. There can be no assurance that we will be able to maintain our current credit ratings. Any downgrade of our credit rating by any of the major credit rating agencies could result in increased borrowing costs and could adversely affect our ability to access the debt markets to refinance our existing debt or finance future debt.
We are dependent on orders that are received and shipped in the same quarter and therefore have limited visibility to future product shipments.
Our net sales in any given quarter depend upon a combination of shipments from backlog and customer orders that are both received and shipped in that same quarter, which we refer to as turns orders. We measure turns orders at the beginning of a quarter based on the orders needed to meet the shipment targets that we set entering the quarter. Historically, we have relied on our ability to respond quickly to customer orders as part of our competitive strategy, resulting in customers placing orders with relatively short delivery schedules. Shorter lead times generally mean that turns orders as a percentage of our business are relatively high in any particular quarter and reduce our backlog visibility on future product shipments. Turns orders correlate to overall semiconductor industry conditions and product lead times. Because turns orders are difficult to predict, especially in times of economic volatility such as those caused by the COVID-19 virus where customers may increase or decrease order levels within the quarter, varying levels of turns orders make it more difficult to forecast net sales. As a significant portion of our products are manufactured at foundries, foundry lead times may affect our ability to satisfy certain turns orders. If we do not achieve a sufficient level of turns orders in a particular quarter relative to our revenue targets, our revenue and operating results will likely suffer.
14
We may lose sales if suppliers of raw materials, components or equipment fail to meet our or our customers' needs or increase costs due to the impact of the COVID-19 virus, increased tariffs or other factors.
Our semiconductor manufacturing operations require raw and processed materials and equipment that must meet exacting standards. We generally have more than one source for these supplies, but there are only a limited number of suppliers capable of delivering various materials and equipment that meet our standards. The materials and equipment necessary for our business could become more difficult to obtain as worldwide use of semiconductors in product applications increases. Additionally, consolidation in our supply chain due to mergers and acquisitions may reduce the number of suppliers or change the relationships that we have with our suppliers. Also, the impact of the COVID-19 virus or the application of trade restrictions or tariffs by the U.S. or other countries may adversely impact the industry supply chain. For example, in 2019, the U.S. government increased tariffs on products that have China as their country of origin and which are imported into the U.S. Likewise, the China government increased tariffs on products that have the U.S. as their country of origin and which are imported into China. We have taken steps to attempt to mitigate the costs of these tariffs on our business. Although these increases in tariffs did not result in significant increases to the operating costs of our business, they did, however, adversely impact demand for our products during fiscal 2020 and fiscal 2019. The additional tariffs imposed on components or equipment that we or our suppliers source from China will increase our costs and could have a material adverse impact on our operating results in the three months ending June 30, 2020 or future periods. We may also incur increases in manufacturing costs in mitigating the impact of tariffs on our operations. This could also impair sourcing flexibility. We have experienced supply shortages from time to time in the past, and on occasion our suppliers have told us they need more time than expected to fill our orders or that they will no longer support certain equipment with updates or spare and replacement parts. In particular, we have recently experienced longer lead times for equipment which we need for capacity expansion at certain of our manufacturing facilities. An interruption of any materials or equipment sources, or the lack of supplier support for a particular piece of equipment, could harm our business.
Our customers may also be adversely affected by these same issues. The materials, components and equipment necessary for their businesses could become more difficult to obtain for various reasons not limited to business interruptions of suppliers, consolidation in their supply chain due to mergers and acquisitions, the impact of the COVID-19 virus or application of trade restrictions or tariffs that impair sourcing flexibility or increase costs. If our customers are not able to produce their products, then their need for our products will decrease. Such interruptions of our customers’ businesses could harm our business.
Intense competition in the markets we serve may lead to pricing pressures, reduced sales of our products or reduced market share.
The semiconductor industry is intensely competitive and has been characterized by price erosion and rapid technological change. We compete with major domestic and international semiconductor companies, many of which have greater market recognition and substantially greater financial, technical, marketing, distribution and other resources than we do. The semiconductor industry has experienced significant merger and acquisition activity and consolidation in recent years which has resulted in several of our competitors becoming much larger in terms of revenue, product offerings and scale. We may be unable to compete successfully in the future, which could harm our business. Our ability to compete successfully depends on a number of factors both within and outside our control, including, but not limited to:
• | the relative impact of the COVID-19 virus on us relative to our competitors; |
• | changes in demand in the markets that we serve and the overall rate of growth or contraction of such markets, including but not limited to the automotive, personal computing and consumer electronics markets; |
• | our ability to obtain adequate foundry and assembly and test capacity and supplies of raw materials and other supplies at acceptable prices; |
• | the quality, performance, reliability, features, ease of use, pricing and diversity of our products; |
• | our success in designing and manufacturing new products including those implementing new technologies; |
• | the rate at which customers incorporate our products into their own applications and the success of such applications; |
• | the rate at which the markets that we serve redesign and change their own products; |
• | our ability to ramp production and increase capacity, as needed, at our wafer fabrication and assembly and test facilities; |
• | product introductions by our competitors; |
• | the number, nature and success of our competitors in a given market; |
• | our ability to protect our products and processes by effective utilization of intellectual property rights; |
• | our ability to remain price competitive against companies that have copied our proprietary product lines, especially in countries where intellectual property rights protection is difficult to achieve and maintain; |
• | our ability to address the needs of our customers; and |
15
• | general market and economic conditions. |
Historically, average selling prices in the semiconductor industry decrease over the life of any particular product. The average selling prices of our microcontroller, FPGA, and proprietary analog, interface, mixed signal and timing products have remained relatively constant, while average selling prices of our memory and non-proprietary analog, interface, mixed signal and timing products have declined over time. The overall average selling price of our products is affected by these trends; however, variations in our product and geographic mix of sales can cause wider fluctuations in our overall average selling price in any given period.
We have experienced, and expect to continue to experience, modest pricing declines in certain of our more mature proprietary product lines, primarily due to competitive conditions. We have been able to moderate average selling price declines in many of our proprietary product lines by continuing to introduce new products with more features and higher prices. However, there can be no assurance that we will be able to do so in the future. We have experienced in the past, and expect to continue to experience in the future, varying degrees of competitive pricing pressures in our memory and non-proprietary analog, interface, mixed signal and timing products. We may be unable to maintain average selling prices for our products as a result of increased pricing pressure in the future, which could adversely impact our operating results.
We are dependent on wafer foundries and other contractors to perform key manufacturing functions for us, and our licensees of our SuperFlash and other technologies also rely on foundries and other contractors.
We rely on outside wafer foundries for a significant portion of our wafer fabrication needs. Specifically, during fiscal 2020 and fiscal 2019, approximately 61% and 57%, respectively, of our net sales came from products that were produced at outside wafer foundries. We also use several contractors located primarily in Asia for a portion of the assembly and testing of our products. Specifically, during fiscal 2020, approximately 55% of our assembly requirements and 46% of our test requirements were performed by third party contractors compared to approximately 62% of our assembly requirements and 51% of our test requirements during fiscal 2019. Our reliance on third party contractors and foundries has increased as a result of our acquisitions including our acquisitions of Microsemi and Atmel. The disruption or termination of any of our contractors could harm our business and operating results.
Our use of third parties somewhat reduces our control over the subcontracted portions of our business. Our future operating results could suffer if any contractor were to experience financial, operational or production difficulties or situations when demand exceeds capacity, or if they were unable to maintain manufacturing yields, assembly and test yields and costs at approximately their current levels due to disruptions from the COVID-19 virus, or if the countries in which such contractors are located were to experience political upheaval or infrastructure disruption. If these third parties are unable or unwilling to timely deliver products or services conforming to our quality standards, we may not be able to qualify additional manufacturing sources for our products in a timely manner on terms favorable to us, or at all. Additionally, these subcontractors could abandon fabrication processes that are important to us, or fail to adopt advanced manufacturing technologies that we desire to control costs. In any such event, we could experience an interruption in production, an increase in manufacturing and production costs or a decline in product reliability, and our business and operating results could be adversely affected. Further, our use of subcontractors increases the risks of potential misappropriation of our intellectual property.
Certain of our SuperFlash and other technology licensees also rely on outside wafer foundries for wafer fabrication services. If our licensees were to experience any disruption in supply from outside wafer foundries, this would reduce the revenue we receive in our technology licensing business and would harm our operating results.
Our operating results will suffer if we ineffectively utilize our manufacturing capacity or fail to maintain manufacturing yields.
The manufacture and assembly of integrated circuits, particularly non-volatile, erasable CMOS memory and logic devices such as those that we produce, are complex processes. These processes are sensitive to a wide variety of factors, including the level of contaminants in the manufacturing environment, impurities in the materials used, the performance of our wafer fabrication and assembly and test personnel and equipment, and other quality issues. As is typical in the semiconductor industry, we have from time to time experienced lower than anticipated manufacturing yields. Our operating results will suffer if we are unable to maintain yields at or above approximately the current levels. This could include delays in the recognition of revenue, loss of revenue or future orders, and customer-imposed penalties for our failure to meet contractual shipment deadlines. Our operating results are also adversely affected when we operate at less than optimal capacity. In fiscal 2020 and fiscal 2019, we operated at below normal capacity levels resulting in unabsorbed capacity charges of $47.2 million and $16.2 million, respectively.
16
Our operating results are impacted by both seasonality and the wide fluctuations of supply and demand in the semiconductor industry.
The semiconductor industry is characterized by seasonality and wide fluctuations of supply and demand. Historically, since a significant portion of our revenue is from consumer markets and international sales, our business tends to generate stronger revenues in the first and second quarters and comparatively weaker revenues in the third and fourth quarters of our fiscal year. Broad fluctuations in our overall business, changes in semiconductor industry and global economic conditions (including the impact of the COVID-19 virus or trade tensions) and our acquisition activity (including our acquisition of Microsemi) have had and can have a more significant impact on our results than seasonality. As a result, in periods when these broad fluctuations, changes in business conditions or acquisitions occur, it is difficult to assess the impact of seasonal factors on our business. The semiconductor industry has also experienced significant economic downturns, characterized by diminished product demand and production over-capacity. We have sought to reduce our exposure to this industry cyclically by selling proprietary products, that cannot be easily or quickly replaced, to a geographically diverse customer base across a broad range of market segments. However, we have experienced substantial period-to-period fluctuations in operating results and expect, in the future, to experience period-to-period fluctuations in operating results due to general industry or economic conditions.
Our business is dependent on distributors to service our end customers.
Sales to distributors accounted for approximately 50% of our net sales in fiscal 2020 and approximately 51% of our net sales in fiscal 2019. We do not have long-term agreements with our distributors, and we and our distributors may each terminate our relationship with little or no advance notice.
Any future adverse conditions in the U.S. or global economies (including the impact of the COVID-19 virus) or in the U.S. or global credit markets could materially impact the operations of our distributors. Any deterioration in the financial condition of our distributors or any disruption in the operations of our distributors could adversely impact the flow of our products to our end customers and adversely impact our results of operation. In addition, during an industry or economic downturn, it is possible there will be an oversupply of products and a decrease in demand for our products from our distributors, which could reduce our net sales in a given period and result in an increase in inventory returns. Violations of the Foreign Corrupt Practices Act, or similar laws, by our distributors or other channel partners could have a material adverse impact on our business.
Our success depends on our ability to introduce new products on a timely basis.
Our future operating results depend on our ability to develop and timely introduce new products that compete effectively on the basis of price and performance and which address customer requirements. The success of our new product introductions depends on various factors, including, but not limited to:
• | effective new product selection; |
• | timely completion and introduction of new product designs; |
• | procurement of licenses for intellectual property rights from third parties under commercially reasonable terms; |
• | timely filing and protection of intellectual property rights for new product designs; |
• | availability of development and support tools and collateral literature that make complex new products easy for engineers to understand and use; and |
• | market acceptance of our customers' end products. |
Because our products are complex, we have experienced delays from time to time in completing new product development. In addition, our new products may not receive or maintain substantial market acceptance. We may be unable to timely design, develop and introduce competitive products, which could adversely impact our future operating results.
Our success also depends upon our ability to develop and implement new design and process technologies. Semiconductor design and process technologies are subject to rapid technological change and require significant R&D expenditures. We and other companies in the industry have, from time to time, experienced difficulties in effecting transitions to advanced process technologies and, consequently, have suffered reduced manufacturing yields or delays in product deliveries. Our future operating results could be adversely affected if any transition to future process technologies is substantially delayed or inefficiently implemented.
17
We continue to be the target of attacks on our data, attempts to breach our security and attempts to introduce malicious software into our IT systems and any interruptions in our IT systems, unauthorized access to our IT systems or improper handling of data, could adversely affect our business.
We rely on the efficient and uninterrupted operation of complex IT systems and networks to operate our business. Any significant disruption to our systems or networks, including, but not limited to, new system implementations, computer viruses, security breaches, facility issues, natural disasters, terrorism, war, telecommunication failures or energy blackouts could have a material adverse impact on our business, operations, sales and operating results. Such disruption could result in a loss of our intellectual property or the release of sensitive competitive information or supplier, customer or employee personal data. Any loss of such information could harm our business or competitive position, result in a loss of customer confidence, and cause us to incur significant costs to remedy the damages caused by any such disruptions or security breaches. Additionally, any failure to properly manage the collection, handling, transfer or disposal of personal data of employees and customers may result in regulatory penalties, enforcement actions, remediation obligations, litigation, fines and other sanctions.
From time to time, we have experienced verifiable attacks on our data, network compromises, attempts to breach our security and attempts to introduce malicious software into our IT systems. For example, in fiscal 2019, we learned of an ongoing compromise of our computer networks by what is believed to be sophisticated hackers. We engaged experienced legal counsel and a leading forensic investigatory firm with experience in such matters. We took various steps to identify malicious activity on our network including a compromise of our network and, in May 2019, we began implementing a containment plan. We routinely evaluate the effectiveness of the containment mechanisms that were implemented and continue to implement additional measures from time to time. We have analyzed and continue to analyze the amount and content of the information that was compromised. We do not believe that this IT system compromise has had a material adverse effect on our business or resulted in any material damage to us. As a result of the IT system compromise, our management, including our chief executive officer and our chief financial officer, concluded that our internal controls related to IT system access were not effective resulting in a material weakness in our internal controls for fiscal 2019. Although this material weakness in our internal controls was remediated in fiscal 2020, there can be no assurance that similar control issues will not be identified in future periods.
Due to the types of products we sell and the significant amount of sales we make to government agencies or customers whose principal sales are to U.S. government agencies, we expect to continue to be the target of attacks on our data, attempts to breach our security, network compromises and attempts to introduce malicious software into our IT systems. Were any future attacks to be successful, we may be unaware of the incident, its magnitude, or its effects until significant harm is done. In recent years, we have regularly implemented improvements to our protective measures which include, but are not limited to, the following: firewalls, endpoint detection and response software, patches, log monitors, event correlation tools, routine backups with offsite retention of storage media, system audits, dual factor identification, data partitioning and routine password modifications. As a result of the material weakness in our internal controls resulting from the IT systems compromise in 2019, we have taken remediation actions and implemented additional controls and we plan to continue to take further actions to attempt to address evolving threats. However, recent system improvements have not been fully effective in preventing attacks on our data and breaches to our security, and there can be no assurance that any future system improvements will be effective in preventing attacks or breaches or limiting the damage from any future cyber attacks or disruptions. Such system improvements have resulted in increased costs to us and any future improvements, attacks or disruptions could result in additional costs related to rebuilding of our internal systems, defending litigation, providing notices to regulatory agencies or other third parties, responding to regulatory actions, or paying damages. Such attacks or disruptions could have a material adverse impact on our business, operations and financial results.
Third-party service providers, such as wafer foundries, assembly and test contractors, distributors, credit card processors and other vendors have access to certain portions of our and our customers' sensitive data. In the event that these service providers do not properly safeguard the data that they hold, security breaches and loss of data could result. Any such loss of data by our third-party service providers could negatively impact our business, operations and financial results, as well as our relationship with our customers.
If we fail to maintain proper and effective internal control and remediate future control deficiencies, our ability to produce accurate and timely financial statements could be impaired, which could harm our operating results, our ability to operate our business and investors' views of us.
As discussed in Item 9A “Controls and Procedures” in our annual report on Form 10-K for fiscal 2019, we identified a material weakness in our internal controls related to accounting for income taxes and we also identified a material weakness in our internal controls related to IT system access. Although such material weaknesses were remediated in fiscal 2020, internal controls are important to accurately reflect our financial position and results of operations in our financial
18
reports and there can be no assurance that similar control issues will not be identified in future periods. If we are unable to remediate any future material weaknesses or significant deficiencies in an appropriate and timely manner, or if we identify additional control deficiencies that individually or together constitute significant deficiencies or material weaknesses, our ability to accurately record, process, and report financial information and consequently, our ability to prepare financial statements within required time periods, could be adversely affected. Failure to maintain effective internal controls could result in violations of applicable securities laws, stock exchange listing requirements, and the covenants under our debt agreements, subject us to litigation and investigations, negatively affect investor confidence in our financial statements, and adversely impact our stock price and ability to access capital markets.
Ensuring that we have adequate internal financial and accounting controls and procedures so that we can produce accurate financial statements on a timely basis is a costly and time-consuming effort that needs to be re-evaluated frequently. Our internal control over financial reporting is a process designed to provide reasonable assurance regarding the reliability of financial reporting and the preparation of financial statements in accordance with United States generally accepted accounting principles. We are required to comply with Section 404 of the Sarbanes-Oxley Act of 2002 which requires an annual management assessment of the effectiveness of our internal control over financial reporting and a report by our independent auditors. In addition to the identified material weaknesses related to accounting for income taxes and to IT system access, which were remediated as of March 31, 2020, we have from time to time identified significant deficiencies related to other matters. If we fail to remediate any future material weaknesses or significant deficiencies or to maintain proper and effective internal control over financial reporting in the future, our ability to produce accurate and timely financial statements could be impaired, which could harm our operating results, harm our ability to operate our business and reduce the trading price of our stock.
Our reported financial results may be adversely affected by new accounting pronouncements or changes in existing accounting standards and practices.
We prepare our financial statements in conformity with accounting principles generally accepted in the U.S. These accounting principles are subject to interpretation or changes by the Financial Accounting Standards Board (FASB) and the SEC. New accounting pronouncements and varying interpretations of accounting standards and practices have occurred in the past and are expected to occur in the future. New accounting pronouncements or a change in the interpretation of existing accounting standards or practices may have a significant effect on our reported financial results and may even affect our reporting of transactions completed before the change is announced or effective.
Business interruptions to our operations or the operations of our key vendors, subcontractors, licensees or customers, whether due to public health concerns (such as the COVID-19 virus), natural disasters, cybersecurity incidents, or other events, could harm our business.
Operations at any of our facilities, at the facilities of any of our wafer fabrication or assembly and test subcontractors, or at any of our significant vendors or customers may be disrupted for reasons beyond our control. These reasons may include public health concerns (including viral outbreaks such as the COVID-19 virus), work stoppages, power loss, insufficient water, cyber attacks, computer network compromises, incidents of terrorism or security risk, political instability, public health issues, telecommunications, transportation or other infrastructure failure, radioactive contamination, fire, earthquake, floods, droughts, volcanic eruptions or other natural disasters. We have taken steps to mitigate the impact of some of these events should they occur; however, we cannot be certain that our actions will be effective to avoid a significant impact on our business in the event of a disaster or other business interruption. For example, recent restrictions on travel have adversely impacted our manufacturing operations in the Philippines and our subcontractors' manufacturing operations in Malaysia and China. Similar challenges have arose for our logistics service providers, which adversely impacted their ability to ship product to our customers.
In particular, recent restrictions on travel have impacted our manufacturing operations in the Philippines and our subcontractors' manufacturing operations in Malaysia and China. Similar challenges have arisen for our logistics service providers, which has impacted their ability to ship product to our customers. The impact of such interruptions on our lead times and ability to fulfill orders was minimal in the fiscal quarter ended March 31, 2020, but we have seen increased impacts since then which we expect to adversely impact our business in the fiscal quarter ended June 30, 2020 and which could continue to adversely impact our business in future periods. In the future, local governments could require us to temporarily reduce production further or cease operations at any of our facilities and we could experience constraints in fulfilling customer orders.
Additionally, operations at our customers and licensees may be disrupted for a number of reasons. We have received a greater number of order cancellations and requests by our customers to reschedule deliveries to future dates. Some customers are requesting order cancellations within our firm order window and are claiming applicability of force majeure clauses.
19
Likewise, if our licensees are unable to manufacture and ship products incorporating our technology, or if there is a decrease in product demand due to a business disruption, our royalty revenue may decline. Such customer and licensee disruptions are expected to adversely impact our business in the fiscal quarter ended June 30, 2020 and we cannot accurately predict whether such disruptions will continue in subsequent periods.
Also, Thailand has experienced periods of severe flooding in recent years. While our facilities in Thailand have continued to operate normally, there can be no assurance that any future flooding in Thailand would not have a material adverse impact on our operations. If operations at any of our facilities, or our subcontractors' facilities are interrupted, we may not be able to shift production to other facilities on a timely basis, and we may need to spend significant amounts to repair or replace our facilities and equipment. If we experienced business interruptions, we would likely experience delays in shipments of products to our customers and alternate sources for production may be unavailable on acceptable terms. This could result in reduced revenues and profits and the cancellation of orders or loss of customers. Although we maintain business interruption insurance, such insurance will likely not be enough to compensate us for any losses that may occur and any losses or damages incurred by us as a result of business interruptions could significantly harm our business.
Our technology licensing business exposes us to various risks.
Our technology licensing business is based on our SuperFlash and other technologies. The success of our licensing business depends on the continued market acceptance of these technologies and on our ability to further develop and enhance such technologies and to introduce new technologies in the future. To be successful, any such technology must be able to be repeatably implemented by licensees, provide satisfactory yield rates, address licensee and customer requirements, and perform competitively. The success of our technology licensing business depends on various other factors, including, but not limited to:
• | proper identification of licensee requirements; |
• | timely development and introduction of new or enhanced technology; |
• | our ability to protect and enforce our intellectual property rights for our licensed technology; |
• | our ability to limit our liability and indemnification obligations to licensees; |
• | availability of sufficient development and support services to assist licensees in their design and manufacture of products integrating our technology; |
• | availability of foundry licensees with sufficient capacity to support OEM production; and |
• | market acceptance of our customers' end products. |
Because our licensed technologies are complex, there may be delays from time to time in developing and enhancing such technologies. There can be no assurance that our existing or any enhanced or new technology will achieve or maintain substantial market acceptance. Our licensees may experience disruptions in production or lower than expected production levels which would adversely affect the revenue that we receive from them. Our technology license agreements generally include an indemnification clause that indemnifies the licensee against liability and damages (including legal defense costs) arising from intellectual property matters. We could be exposed to substantial liability for claims or damages related to intellectual property matters or indemnification claims. Any claim, with or without merit, could result in significant legal fees and require significant attention from our management. Any of the foregoing issues may adversely impact the success of our licensing business and adversely affect our future operating results.
We are exposed to various risks related to legal proceedings, investigations or claims.
We are currently, and in the future may be, involved in legal proceedings, investigations or claims regarding patent infringement, other intellectual property rights, product failures, our Microsemi acquisition, contracts and other matters. As is typical in the semiconductor industry, we receive notifications from third parties from time to time who believe that we owe them indemnification or other obligations related to claims made against us, our direct or indirect customers or our licensees. These legal proceedings and claims, even if meritless, have in the past and could in the future result in substantial costs to us and divert our resources. If we are not able to resolve a claim, settle a matter, obtain necessary licenses on commercially reasonable terms, reengineer our products or processes to avoid infringement, provide a cost-effective remedy, or successfully prosecute or defend our position, we could incur uninsured liability in any of them, be required to take an appropriate charge to operations, be enjoined from selling a material portion of our products or using certain processes, suffer a reduction or elimination in the value of our inventories, and our business, financial condition or results of operations could be harmed.
20
It is also possible that from time to time we may be subject to claims related to the manufacture, performance or use of our products. These claims may be due to injuries, economic damage or environmental exposures related to manufacturing, a product's nonconformance to our specifications or specifications agreed upon with the customer, changes in our manufacturing processes, or unexpected customer system issues due to the integration of our products or insufficient design or testing by our customers. We could incur significant expenses related to such matters, including, but not limited to:
• | costs related to writing off the value of our inventory of nonconforming products; |
• | recalling nonconforming products; |
• | providing support services, product replacements, or modifications to products and the defense of such claims; |
• | diversion of resources from other projects; |
• | lost revenue or a delay in the recognition of revenue due to cancellation of orders or unpaid receivables; |
• | customer imposed fines or penalties for failure to meet contractual requirements; and |
• | a requirement to pay damages or penalties. |
Because the systems into which our products are integrated have a higher cost of goods than the products we sell, the expenses and damages we are asked to pay may be significantly higher than the sales and profits we received from the products involved. While we specifically exclude consequential damages in our standard terms and conditions, certain of our contracts may not exclude such liabilities. Further, our ability to avoid such liabilities may be limited by applicable law. We do have liability insurance which covers certain damages arising out of product defects, but we do not expect that insurance will cover all claims or be of a sufficient amount to fully protect against such claims. Costs or payments we may make in connection with these customer claims may adversely affect the results of our operations.
Further, we sell to customers in industries such as automotive, aerospace, defense, safety, security, and medical, where failure of the systems in which our products are integrated could cause damage to property or persons. We may be subject to claims if our products, or the integration of our products, cause system failures. We will face increased exposure to claims if there are substantial increases in either the volume of our sales into these applications or the frequency of system failures integrating our products.
Failure to adequately protect our intellectual property could result in lost revenue or market opportunities.
Our ability to obtain patents, licenses and other intellectual property rights covering our products and manufacturing processes is important for our success. To that end, we have acquired certain patents and patent licenses and intend to continue to seek patents on our technology and manufacturing processes. The process of seeking patent protection can be long and expensive, and patents may not be issued from currently pending or future applications. In addition, our existing and new patents, trademarks and copyrights that issue may not have sufficient scope or strength to provide meaningful protection or commercial advantage to us. We may be subject to, or may ourselves initiate, interference proceedings in the U.S. Patent and Trademark Office, patent offices of a foreign country or U.S. or foreign courts, which can require significant financial and management resources. In addition, the laws of certain foreign countries do not protect our intellectual property rights to the same extent as the laws of the U.S. Infringement of our intellectual property rights by a third party could result in uncompensated lost market and revenue opportunities for us. Although we continue to vigorously and aggressively defend and protect our intellectual property on a worldwide basis, there can be no assurance that we will be successful in our endeavors.
Regulatory authorities in jurisdictions into or from which we ship our products could levy fines, restrict or delay our ability to export or transfer products, or increase costs associated with the manufacture or transfer of products.
A significant portion of our sales are made through the exporting and importing of products. In addition to local jurisdictions' trade regulations, our U.S.-manufactured products or products based on U.S. technology are subject to U.S. laws and regulations governing international trade, including, but not limited to the Foreign Corrupt Practices Act, Export Administration Regulations, International Traffic in Arms Regulations and trade sanctions against embargoed countries and denied entities administered by the U.S. Department of the Treasury, Office of Foreign Assets Control (OFAC). Licenses or proper license exceptions are required for the shipment of our products to certain countries. A determination by the U.S. or foreign government that we have failed to comply with trade or export regulations or anti-bribery regulations can result in penalties which may include denial of export privileges, fines, civil or criminal penalties, and seizure of products. Such penalties could have a material adverse effect on our business, sales and earnings. Further, a change in these laws and regulations could restrict our ability to transfer product to previously permitted countries, customers, distributors or other third parties. For example, in fiscal 2019, the U.S. Commerce Department banned U.S. companies from selling products or transferring technology to ZTE, a Chinese company, and certain of its subsidiaries. This ban was lifted in July 2018. In fiscal 2020, the U.S. Commerce Department banned U.S. companies from selling products or transferring technology to certain Chinese companies, including Huawei and certain of its subsidiaries. Recent amendments made to the Export Administration
21
Regulation (EAR) pursuant to prohibitions of items with a “military end use” in China, Russia, and Venezuela, 85 Fed. Reg. 23459, and elimination of EAR License Exception CIV, 85 Fed. Reg. 23470, which are effective June 2020, apply to a greater number of our products than previous versions of the regulations. These changes could adversely impact our operational costs due to the administrative impacts of complying with these regulations, and may limit those with whom we conduct business. Any one or more of these sanctions, future sanctions, a change in laws or regulations, or a prohibition on shipment of our products or transfer of our technology to significant customers could have a material adverse effect on our business, financial condition and results of operations.
For certain of our products associated with our Microsemi acquisition, we rely on U.S. export licenses to ship our products to non-U.S. customers. In 2018, there was a federal government shutdown from January 20, 2018 to January 23, 2018 and a second shutdown from December 22, 2018 through January 25, 2019. Due to the U.S. federal government shutdown, the agency that approves these export licenses was temporarily closed. This resulted in a delay in certain shipments that were scheduled to ship within the quarter. Although this delay did not result in a material adverse impact on our revenue in previous quarters, it could have a material adverse impact on our revenue within the quarter of any future government shutdown, and in the following quarter depending on the ability of the governmental agency to expedite processing of licenses delayed during the shutdown. Additionally, certain of our products associated with our Microsemi acquisition ship from jurisdictions that Microchip did not previously ship from. This makes us subject to different jurisdictional export regulations for different products. Although a delay in approval of exports from any single jurisdiction is unlikely to result in a material adverse impact on our revenue in the short term, a denial in approval of exports could over the longer term have a negative effect on our business, financial condition and results of operations.
The U.S. and other countries have levied tariffs and taxes on certain goods and implemented trade restrictions on materials and products. Trade tensions between the U.S. and China escalated in 2018 and 2019, including the U.S. increasing tariffs on Chinese origin goods, and China increasing tariffs on U.S. goods. Some of our products were adversely affected and are continuing to be affected by the increased tariffs. Higher duties on existing tariffs and further rounds of tariffs were announced as recently as September 2019. We have taken steps to mitigate the costs of these tariffs on our business. Although these increases in tariffs did not result in significant increases to the operating costs of our business, they did, however, adversely impact demand for our products during fiscal 2020 and fiscal 2019. The additional tariffs imposed in 2019 on components or equipment that we or our suppliers source from China increased our costs but did not have a material adverse impact on our operating results in fiscal 2020 as we were able to make adjustments in operations and supply to mitigate the effects of these tariffs. Increased tariffs on our customers' products could impact their sales of their products, and increased tariffs on our products in comparison to those of our competitors could each result in lower demand for our products.
Further changes in trade policy, tariffs, additional taxes, restrictions on exports or other trade barriers, may limit our ability to produce products, increase our selling and/or manufacturing costs, decrease margins, reduce the competitiveness of our products, or inhibit our ability to sell products, which could have a material adverse effect on our business, results of operations or financial conditions.
We are highly dependent on foreign sales and operations, which exposes us to foreign political and economic risks including risks from increases in tariffs.
Sales to foreign customers account for a substantial portion of our net sales. During fiscal 2020, approximately 78% of our net sales were made to foreign customers, including 21% in China and 15% in Taiwan. During fiscal 2019, approximately 80% of our net sales were made to foreign customers, including 22% in China and 13% in Taiwan.
A strong position in the Chinese market is a key component of our global growth strategy. The market for integrated circuit products in China is highly competitive, and both international and domestic competitors are aggressively seeking to increase their market share. Increased competition and, economic weakness in the China market has recently made it more difficult for us to achieve our desired sales volumes in China. In particular, the trade relationship between the U.S. and China has worsened, economic conditions in China remain uncertain, and we are unable to predict whether such uncertainty will continue or worsen in future periods. In 2019 the U.S. government increased tariffs on products that have China as their country of origin and which are imported into the U.S. Likewise, the China government increased tariffs on products that have the U.S. as their country of origin and which are imported into China. We have taken steps to mitigate the costs of these tariffs on our business. Although these increases in tariffs did not result in significant increases to the operating costs of our business, they did, however, adversely impact demand for our products during fiscal 2020 and fiscal 2019. The additional tariffs imposed on components or equipment that we or our suppliers source from China did increase our costs but did not have a material adverse impact on our operating results in fiscal 2020 as we were able to make adjustments in operations and supply to mitigate the effects of these tariffs. Additionally, tariffs on our customers' products could impact their sales of such end products,
22
resulting in lower demand for our products. We may also incur increases in manufacturing costs in mitigating the impact of tariffs on our customers.
We purchase a substantial portion of our raw materials and equipment from foreign suppliers. In addition, we own product assembly and testing facilities near Bangkok, Thailand, which has experienced periods of political instability in the past. A large portion of our finished goods inventory is maintained in Thailand. From time to time, Thailand has also experienced periods of severe flooding. There can be no assurance that any future flooding or political instability in Thailand would not have a material adverse impact on our operations. As part of our Atmel acquisition, we acquired a test facility in Calamba, Philippines. We use various foundries and other foreign contractors for a significant portion of our assembly and testing and wafer fabrication requirements.
Our reliance on foreign operations, foreign suppliers, maintenance of substantially all of our finished goods inventory at foreign locations and significant foreign sales exposes us to foreign political and economic risks, including, but not limited to:
• | political, social and economic instability due to the COVID-19 virus or other factors; |
• | trade restrictions and changes in tariffs; |
• | potentially adverse tax consequences; |
• | economic uncertainty in the worldwide markets served by us; |
• | import and export license requirements and restrictions; |
• | changes in rules and laws related to taxes, environmental, health and safety, technical standards and consumer protection in various jurisdictions; |
• | currency fluctuations and foreign exchange regulations; |
• | difficulties in staffing and managing international operations; |
• | employment regulations; |
• | disruptions due to cybersecurity incidents; |
• | disruptions in international transport or delivery; |
• | public health conditions (including viral outbreaks such as the COVID-19 virus); and |
• | difficulties in collecting receivables and longer payment cycles. |
If any of these risks materialize, or are worse than we anticipate, our sales could decrease and our operating results could suffer, we could face an increase in the cost of components, production delays, general business interruptions, delays from difficulties in obtaining export licenses for certain technology, tariffs and other barriers and restrictions, longer payment cycles, increased taxes, restrictions on the repatriation of funds and the burdens of complying with a variety of foreign laws, any of which could ultimately have a material adverse effect on our business.
Further changes in trade policy, tariffs, additional taxes, or restrictions on supplies, equipment, and raw materials including rare earth minerals, may limit our ability to produce products, increase our selling and/or manufacturing costs, decrease margins, reduce the competitiveness of our products, or inhibit our ability to sell products or purchase necessary equipment and supplies, which could have a material adverse effect on our business, results of operations, or financial conditions.
Our contractual relationships with our customers expose us to risks and liabilities.
We do not typically enter into long-term contracts with our non-distributor customers, and therefore we cannot be certain about future order levels from our customers. When we do enter into customer contracts, the contract is generally cancelable at the convenience of the customer. Even though we had approximately 120,000 customers and our ten largest direct customers made up approximately 12% of our total revenue for fiscal 2020 and six of our top ten direct customers are contract manufacturers that perform manufacturing services for many customers, cancellation of customer contracts could have an adverse impact on our revenue and profits.
We have contracts with certain customers that differ from our standard terms of sale. For several of the significant markets that we sell into, such as the automotive and personal computer markets, our current or potential customers may possess significant leverage over us in negotiating the terms and conditions of supply as a result of their market size and position. For example, under certain contracts we may commit to supply specific quantities of products on scheduled delivery dates, or agree to extend our obligations for certain liabilities such as warranties or indemnification for quality issues or claims of intellectual property infringement. If we are unable to supply the customer as required under the contract, the customer may incur additional production costs, lost revenues due to subsequent delays in their own manufacturing schedule, or quality-related issues. We may be liable for the customer's costs, expenses and damages associated with their claims and we may be obligated to defend the customer against claims of intellectual property infringement and pay the associated legal fees. While we try to minimize the number of contracts which contain such provisions, manage the risks underlying such liabilities, and set caps on
23
our liability exposure, sometimes we are not able to do so. In order to win important designs, avoid losing business to competitors, maintain existing business, or be permitted to bid on new business, we have been, and may in the future be, forced to agree to uncapped liability for such items as intellectual property infringement, product failure, or confidentiality. Such provisions expose us to risk of liability far exceeding the purchase price of the products we sell under such contracts, the lifetime revenues we receive from such products, or various forms of potential consequential damages. Further, where we do not have negotiated contracts with our customers, the terms of our customer's orders may govern the transaction and contain terms that are not favorable to us. These significant additional risks could result in a material adverse impact on our results of operations and financial condition.
Reliance on government contracts and sales to governmental agencies could have a material adverse effect on our results of operations.
A significant portion of the sales of Microsemi (which we acquired in May 2018) are from or are derived from government agencies or customers whose principal sales are to U.S. government agencies. Such sales are subject to uncertainties regarding governmental spending levels, spending priorities, regulatory and policy changes. Future sales to U.S. government agencies or their prime customers are also subject to uncertain government appropriations and national defense policies and priorities, including the constraints of the budgetary process, changes in the timing and potential spending priorities and the impact of any past or future government shutdowns, contract terminations or renegotiations, future sequestrations, or the impact of the COVID-19 virus. For example, as a result of the COVID-19 virus, we currently have suspensions and stop work orders in place for some of our subcontracts and we do not know when work on those projects will restart or what additional measures (such as purchasing additional protective gear) we will need to take to be able to again perform work at those sites. Although such actions have not yet had a material adverse impact on our business, there can be no assurance as to the future costs or implications of such actions. Sales to government agencies or customers whose principal sales are to U.S. government agencies are also subject to uncertainties related to monetary, regulatory, tax and trade policies implemented by current or future administrations or by the U.S. Congress.
In the past, Microsemi has experienced delays and reductions in appropriations on programs that included its products. For example, there were federal government shutdowns from January 20, 2018 to January 23, 2018 and from December 22, 2018 through January 25, 2019. Further delays, reductions in or terminations of government contracts or subcontracts, including those caused by any past or future shutdown of the U.S. federal government, could materially and adversely affect our operating results. If the U.S. government fails to complete its annual budget process or to provide for a continuing resolution to fund government operations, another federal government shutdown may occur, during which time we may experience further delays and reductions in appropriations or reductions in or terminations of government contracts or subcontracts, which could materially and adversely affect our operating results. While we generally function as a subcontractor in these type of transactions, further changes in U.S. government procurement regulations and practices, particularly surrounding initiatives to reduce costs or increase compliance obligations (such as the Cybersecurity Maturity Model Certification), may adversely impact the contracting environment and our operating results.
The U.S. government and its contractors may terminate their contracts with Microsemi or us at any time. For example, in 2014, Microsemi had a $75 million contract terminated for convenience by the U.S. government. Uncertainty with respect to government spending and termination of contracts associated with government related projects could have a material adverse impact on the revenue and other benefits we achieve from our Microsemi acquisition. Our business related to U.S. governmental agencies or customers not only requires us to comply with the contract terms, but also with applicable governmental regulations, particularly for our facilities, systems and personnel that service such customers. Maintaining compliance with these regulations, including any audit requirements, requires that we devote significant resources to such matters in terms of training, personnel, information technology and facilities. Any failure to maintain compliance with these requirements may result in fines and penalties and loss of current or future business that may materially and adversely affect our operating results.
We must attract and retain qualified personnel to be successful, and competition for qualified personnel can be intense.
Our success depends upon the efforts and abilities of our senior management, engineering, manufacturing and other personnel. The competition for qualified engineering and management personnel can be intense. We may be unsuccessful in retaining our existing key personnel or in attracting and retaining additional key personnel that we require. The loss of the services of one or more of our key personnel or the inability to add key personnel could harm our business. The loss of, or any inability to attract personnel, even if not key personnel, if experienced in sufficient numbers could harm our business. We have no employment agreements with any member of our senior management team.
24
Fluctuations in foreign currency exchange rates could adversely impact our operating results.
We use forward currency exchange contracts in an attempt to reduce the adverse earnings impact from the effect of exchange rate fluctuations on our non-U.S. dollar net balance sheet exposures. Nevertheless, in periods when the U.S. dollar significantly fluctuates in relation to the non-U.S. currencies in which we transact business, the value of our non-U.S. dollar transactions can have an adverse effect on our results of operations and financial condition. In particular, in periods when a foreign currency significantly declines in value in relation to the U.S. dollar, customers transacting in that foreign currency may find it more difficult to fulfill their previously committed contractual obligations or to undertake new obligations to make payments or purchase products. In periods when the U.S. dollar is significantly declining in relation to the British pound, Euro, Thai baht and Taiwan dollar, the operational costs in our European and Thailand subsidiaries are adversely affected. Although our business has not been materially adversely impacted by recent changes in the value of the U.S. dollar, there can be no assurance as to the future impact that any weakness or strength in the U.S. dollar will have on our business or results of operations.
The occurrence of events for which we are self-insured, or which exceed our insurance limits, may adversely affect our profitability and liquidity.
We have insurance contracts with independent insurance companies related to many different types of risk; however, we self-insure for some potentially significant risks and obligations. In these circumstances, we believe that it is more cost effective for us to self-insure certain risks than to pay the high premium costs. The risks and exposures that we self-insure include, but are not limited to employee health matters, certain property, product defects, cybersecurity matters, employment risks, environmental matters, political risks, and intellectual property matters. Should there be a loss or adverse judgment or other decision in an area for which we are self-insured, then our financial condition, results of operations and liquidity may be adversely affected.
We are subject to stringent environmental and other regulations, which may force us to incur significant expenses.
We must comply with all applicable federal, state, local and foreign governmental regulations related to the use, storage, discharge and disposal of toxic, volatile or otherwise hazardous substances used in our products and manufacturing processes. Our failure to comply, or the failure of entities that we have acquired over time to have complied, with applicable regulations could result in significant fines, liability for clean up, suspension of production, cessation of operations or future liabilities. Such environmental regulations have required us in the past, and could require us in the future, to buy costly equipment or to incur significant expenses to comply with such regulations. Our failure to control the use of, or adequately restrict the discharge of, hazardous substances could impact the health of our employees and others and could impact our ability to operate. Such failure could also restrict our ability to ship certain products to certain countries, require us to modify our operations' logistics, or require us to incur other significant costs and expenses. There is a continuing expansion in environmental laws with a focus on reducing or eliminating hazardous substances and substances of high concern in electronic products and shipping materials. These and other future environmental regulations could require us to reengineer certain of our existing products and may make it more expensive for us to manufacture, sell and ship our products. In addition, the number and complexity of laws focused on the energy efficiency of electronic products and accessories, the recycling of electronic products, and the reduction in the quantity and the recycling of packing materials have expanded significantly. It may be difficult for us to timely comply with these laws and we may not have sufficient quantities of compliant products to meet customers' needs, thereby adversely impacting our sales and profitability. We may also have to write off inventory in the event that we hold unsaleable inventory as a result of changes to regulations or customer requirements. We expect these risks and trends to continue. In addition, we anticipate increased customer requirements to meet voluntary criteria related to the reduction or elimination of substances of high concern in our products, energy efficiency measures, and supplier practices associated with sourcing and manufacturing. These requirements may increase our own costs, as well as those passed on to us by our supply chain.
Customer demands for us to implement business practices that are more stringent than existing legal requirements may reduce our revenue opportunities or cause us to incur higher costs.
Some of our customers and potential customers are requiring that we implement operating practices that are more stringent than what is required by applicable laws with respect to workplace and labor requirements, the type of materials we use in our products, environmental matters or other items. To comply with such requirements, we pass these requirements regarding operating practices on to our suppliers. Our suppliers may in the future refuse to implement these operating practices, or may charge us more for complying with them. If certain of our suppliers refuse to implement the required practices, we may be forced to identify and source from alternate suppliers. The cost to implement such practices may cause us to incur higher costs and reduce our profitability, and if we choose not to implement such practices, such customers may disqualify us as a supplier,
25
resulting in decreased revenue opportunities. Developing, administering, monitoring and auditing these customer-requested practices at our own sites and those in our supply chain will increase our costs and may require that we hire more personnel.
Customer demands and regulations related to conflict-free minerals may force us to incur additional expenses.
Under the Dodd-Frank Wall Street Reform and Consumer Protection Act, in August 2012, the SEC released investigation, disclosure and reporting requirements regarding the use of "conflict" minerals mined from the Democratic Republic of Congo and adjoining countries and which are necessary to the functionality or production of products. We filed a report on Form SD with the SEC regarding such matters on May 31, 2019. Other countries are considering similar regulations. If we cannot certify that our supply chain is free from the risk of irresponsible sourcing, customers may demand that we change the sourcing of minerals and other materials used in the manufacture of our products, even if the costs for compliant minerals and materials significantly increases and availability is limited. If we make changes to materials or suppliers, there will likely be costs associated with qualifying new suppliers and production capacity and quality could be negatively impacted. Our relationships with customers and suppliers may be adversely affected if we are unable to certify that our products are free from the risk of irresponsible sourcing. We have incurred, and expect in the future to incur, additional costs associated with complying with these new disclosure requirements, such as costs related to determining the source of any conflict minerals used in our products. We may also encounter challenges to satisfy those customers who require that all of the components of our products be certified as conflict free in a materially different manner than advocated by the Responsible Minerals Initiative or the Dodd-Frank Wall Street Reform and Consumer Protection Act. If we are not able to meet customer requirements, customers may choose to disqualify us as a supplier and we may have to write off inventory in the event that it cannot be sold.
In addition to concerns over “conflict” minerals mined from the Democratic Republic of Congo, our customers may also begin to require that additional minerals and substances used within our supply chain be evaluated and reported on. As our reporting obligations increase so will the operating costs associated with this obligation. This in turn could have negative effects on our overall operating profits.
The outcome of future examinations of our income tax returns could have an adverse effect on our results of operations.
We are subject to examination of our income tax returns by the IRS and other tax authorities for fiscal 2007 and later. We are subject to certain income tax examinations in foreign jurisdictions for fiscal 2007 and later. We regularly assess the likelihood of adverse outcomes resulting from these examinations to determine the adequacy of our provision for income taxes and have reserved for potential adjustments that may result from the current examinations. There can be no assurance that the final determination of any of these or any future examinations will not have an adverse effect on our effective tax rates, financial position and results of operations.
Exposure to greater than anticipated income tax liabilities, changes in tax rules and regulations (including the Act), changes in the interpretation of tax rules and regulations, or unfavorable assessments from tax audits could affect our effective tax rates, financial condition and results of operations.
We are a U.S.-based multinational company subject to tax in multiple U.S. and foreign tax jurisdictions. Our income tax obligations could be affected by many factors, including but not limited to changes to our corporate operating structure, intercompany arrangements and tax planning strategies.
Our income tax expense is computed based on tax rates at the time of the respective financial period. Our future effective tax rates, financial condition and results from operations could be unfavorably affected by changes in the tax rates in jurisdictions where our income is earned, by changes in the tax rules and regulations or the interpretation of tax rules and regulations in the jurisdictions in which we do business or by changes in the valuation of our deferred tax assets.
Currently, a majority of our revenue is generated from customers located outside the U.S., and a substantial portion of our assets, including employees, are located outside of the U.S. The adoption of the Act significantly changed the taxation of U.S.-based multinational corporations, by, among other things, reducing the U.S. corporate income tax rate, adopting elements of a territorial tax system, assessing a one-time transition tax on earnings of certain foreign subsidiaries that were previously tax deferred, and creating new taxes on certain foreign-sourced earnings. The Act is unclear in some respects and will require interpretations and continued implementation of regulations by the Internal Revenue Service, as well as state tax authorities, and the legislation could be subject to potential amendments and technical corrections, any of which could lessen or increase certain adverse impacts of the legislation. A significant portion of our earnings are earned by our subsidiaries outside the U.S. Changes to the taxation of certain foreign earnings resulting from the Act, along with the state tax impact of these changes and potential future cash distributions, will likely have an adverse effect on our effective tax rate. Furthermore, changes to the
26
taxation of undistributed foreign earnings could change our future intentions regarding reinvestment of such earnings. The foregoing items could have a material adverse effect on our business, cash flow, results of operations or financial conditions.
The Organization for Economic Cooperation and Development has been working on a Base Erosion and Profit Shifting Project, and issued a report in 2015, an interim report in 2018, and is expected to continue to issue guidelines and proposals that may change various aspects of the existing framework under which our tax obligations are determined in many of the countries in which we do business. Similarly, the European Commission and several countries have issued proposals that would change various aspects of the current tax framework under which we are taxed. These proposals include changes to the existing framework to calculate income tax, as well as proposals to change or impose new types of non-income taxes, including taxes based on a percentage of revenue.
In April 2020, we became aware of a withholding tax regulation that could be interpreted to apply to certain of our previous intra-group transactions. We are evaluating whether the interpretation of this regulation could apply to our facts and circumstances, and, upon conclusion of our analysis, we may establish a reserve related to this matter in a subsequent period. An estimate of the impact on the financial statements cannot be made at this time.
Anti-takeover defenses in our charter documents and under Delaware law could discourage takeover attempts, which could also reduce the market price of our common stock.
Our certificate of incorporation and bylaws contain provisions that could delay or prevent a change in control of Microchip. These provisions could also make it difficult for stockholders to elect directors that are not nominated by the current members of our board of directors or take other corporate actions, including effecting changes in our management. These provisions include:
• | the ability of our board of directors to issue shares of preferred stock and to determine the price and other terms of those shares, including preferences and voting rights, without stockholder approval, which could be used to significantly dilute the ownership of a hostile acquiror; |
• | the right of our board of directors to elect a director to fill a vacancy created by the expansion of our board of directors or the resignation, death or removal of a director, which prevents stockholders from being able to fill vacancies on our board of directors; |
• | the requirement that a special meeting of stockholders may be called only by the holders of 50% or more of the combined voting power of all classes of our capital stock, which could delay the ability of our stockholders to force consideration of a proposal or to take action, including the removal of directors; |
• | the ability of our board of directors, by majority vote, to amend the bylaws, which may allow our board of directors to take additional actions to prevent an unsolicited takeover and inhibit the ability of an acquiror to amend the bylaws to facilitate an unsolicited takeover attempt; and |
• | advance notice procedures with which stockholders must comply to nominate candidates to our board of directors or to propose matters to be acted upon at a stockholders' meeting, which may discourage or deter a potential acquiror from conducting a solicitation of proxies to elect the acquiror's own slate of directors or otherwise attempting to obtain control of us. |
In addition, as a Delaware corporation, we are subject to Section 203 of the Delaware General Corporation Law. These provisions may prohibit large stockholders, in particular those owning 15% or more of our outstanding voting stock, from merging or combining with us for a certain period of time. The application of Section 203 also could have the effect of delaying or preventing a change in control of us.
Any of these provisions could, under certain circumstances, depress the market price of our common stock.
As a result of our acquisition activity, our goodwill and intangible assets have increased significantly in recent years and we may in the future incur impairments to goodwill or intangible assets.
When we acquire a business, a substantial portion of the purchase price of the acquisition is allocated to goodwill and other identifiable intangible assets. The amount of the purchase price which is allocated to goodwill is determined by the excess of the purchase price over the net identifiable assets acquired. As of March 31, 2020, we had goodwill of $6.66 billion and net intangible assets of $5.70 billion. In connection with the completion of our acquisition of Microsemi in May 2018, our balance of goodwill and intangible assets increased significantly. We review our indefinite-lived intangible assets, including goodwill, for impairment annually in the fourth fiscal quarter or whenever events or changes in circumstances indicate that the carrying amount of those assets is more likely than not impaired. Factors that may be considered in assessing whether goodwill or intangible assets may be impaired include a decline in our stock price or market capitalization, reduced estimates of future cash
27
flows and slower growth rates in our industry. Our valuation methodology for assessing impairment requires management to make judgments and assumptions based on historical experience and to rely heavily on projections of future operating performance. Because we operate in highly competitive environments, projections of our future operating results and cash flows may vary significantly from our actual results. No goodwill impairment charges were recorded in fiscal 2020 or fiscal 2019. In fiscal 2020, we recognized $2.2 million of intangible asset impairment charges and in fiscal 2019, we recognized $3.1 million of intangible asset impairment charges. If in future periods, we determine that our goodwill or intangible assets are impaired, we will be required to write down these assets which would have a negative effect on our consolidated financial statements.
Our foreign pension plans are unfunded, and any requirement to fund these plans in the future could negatively affect our cash position and operating capital.
In connection with our acquisitions of Microsemi and Atmel, we assumed defined benefit pension plans that cover certain of our French and German employees. Plan benefits are managed in accordance with local statutory requirements. Benefits are based on years of service and employee compensation levels. The projected benefit obligation totaled $70.0 million at March 31, 2020. Most of these plans are unfunded in compliance with local statutory regulations, and we have no immediate intention of funding these plans. Benefits are paid when amounts become due, commencing when participants retire. We expect to pay approximately $1.3 million in fiscal 2021 for benefits earned. Should legislative regulations require complete or partial funding of these plans in the future, it could negatively affect our cash position and operating capital.
From time to time we receive grants from governments, agencies and research organizations. If we are unable to comply with the terms of those grants, we may not be able to receive or recognize grant benefits or we may be required to repay grant benefits previously paid to us and recognize related charges, which would adversely affect our operating results and financial position.
From time to time, we receive economic incentive grants and allowances from European governments, agencies and research organizations targeted at increasing employment at specific locations. The subsidy grant agreements typically contain economic incentive, headcount, capital and research and development expenditures and other covenants that must be met to receive and retain grant benefits, and these programs can be subjected to periodic review by the relevant governments. Noncompliance by us with the conditions of the grants could result in our forfeiture of all or a portion of any future amounts to be received, as well as the repayment of all or a portion of amounts received to date.
Conversion of our debentures will dilute the ownership interest of our existing stockholders.
The conversion of some or all of our outstanding debentures will dilute the ownership interest of existing stockholders to the extent we deliver common stock upon conversion of the debentures. Upon conversion, we may satisfy our conversion obligation by delivering cash, shares of common stock or any combination, at our option. If upon conversion we elect to deliver cash for the lesser of the conversion value and principal amount of the debentures, we would pay the holder the cash value of the applicable number of shares of our common stock. Upon conversion, we intend to satisfy the lesser of the principal amount or the conversion value of the debentures in cash. If the conversion value of a debenture exceeds the principal amount of the debenture, we may also elect to deliver cash in lieu of common stock for the conversion value in excess of the one thousand dollars principal amount (i.e., the conversion spread). There would be no adjustment to the numerator in the net income per common share computation for the cash settled portion of the debentures as that portion of the debt instrument will always be settled in cash. The conversion spread will be included in the denominator for the computation of diluted net income per common share. Any sales in the public market of any common stock issuable upon conversion of our debentures could adversely affect prevailing market prices of our common stock. In addition, the existence of the debentures may encourage short selling by market participants because the conversion of the debentures could be used to satisfy short positions, or anticipated conversion of the debentures into shares of our common stock could depress the price of our common stock.
Climate change regulations and sustained adverse climate change pose regulatory and physical risks that could harm our results of operations or affect the way we conduct business.
Climate change regulations at the federal, state or local level or in international jurisdictions could require us to limit emissions, change our manufacturing processes, obtain substitute materials which may cost more or be less available, increase our investment in control technology for greenhouse gas emissions, fund offset projects or undertake other costly activities. These regulations could significantly increase our costs and restrict our manufacturing operations by virtue of requirements for new equipment. New permits may be required for our current operations, or expansions thereof. Failure to timely receive permits could result in fines, suspension of production, or cessation of operations at one or more facilities. In addition, restrictions on carbon dioxide or other greenhouse gas emissions could result in significant costs such as higher energy costs,
28
and utility companies passing down carbon taxes, emission cap and trade programs and renewable portfolio standards. The cost of complying, or of failing to comply, with these and other climate change and emissions regulations could have an adverse effect on our operating results.
Further, any sustained adverse change in climate could have a direct adverse economic impact on us, such as water and power shortages, and higher costs of water or energy to control the temperature of our facilities. Certain of our operations are located in arid or tropical regions, such as Arizona, Thailand, and the Philippines. Some environmental experts predict that these regions may become vulnerable to storms, severe floods and droughts due to climate change. While we maintain business recovery plans that are intended to allow us to recover from natural disasters or other events that can interrupt our business, we cannot be certain that our plans will protect us from all such disasters or events.
Item 1B. Unresolved Staff Comments
None.
29
Item 2. Properties
At March 31, 2020, we owned and used the facilities described below:
Location | Approximate Total Sq. Ft. | Uses | ||
Gresham, Oregon | 826,500 | Wafer Fabrication (Fab 4); R&D Center; Administrative Offices; and Warehousing | ||
Chandler, Arizona | 687,000 | Executive and Administrative Offices; Wafer Probe; R&D Center; Sales and Marketing; and Computer and Service Functions | ||
Chacherngsao, Thailand | 489,000 | Assembly and Test; Wafer Probe; Sample Center; Warehousing; and Administrative Offices | ||
Colorado Springs, Colorado | 480,000 | Manufacturing, Test, Research and Development, Computer and Service Functions, Design and Engineering | ||
Calamba, Philippines | 460,000 | Wafer Probe, Test, Warehousing and Administrative Offices | ||
Tempe, Arizona | 457,000 | Wafer Fabrication (Fab 2); R&D Center; Administrative Offices; and Warehousing | ||
Bangalore, India | 294,000 | Design and Development; Sales and Marketing Support, and Administrative Offices | ||
Chacherngsao, Thailand | 215,000 | Assembly and Test; Warehousing; and Administrative Offices | ||
Chennai, India | 187,000 | Design and Development | ||
Rousset, France | 170,000 | Design, Engineering, Test and Administrative | ||
Lawrence, Massachusetts | 160,000 | Manufacturing and Administrative offices | ||
Mount Holly Springs, Pennsylvania | 100,000 | Manufacturing, R&D and Administrative offices | ||
Garden Grove, California | 98,100 | Manufacturing, R&D and Administrative offices | ||
San Jose, California | 98,000 | Design, Engineering, and Administrative | ||
Neckarbischofsheim, Germany | 80,000 | Manufacturing and Administrative offices | ||
Nantes, France | 77,000 | Design, Engineering, Test and Probe, Administrative and Warehousing | ||
San Jose, California | 71,000 | Design, Engineering, and Administrative | ||
San Jose, California | 57,000 | Design, Engineering, and Administrative | ||
Beverly, Massachusetts | 52,103 | Manufacturing | ||
Heilbronn, Germany | 46,000 | Design, Engineering and Administrative | ||
Karlsruhe, Germany | 43,000 | Design, Engineering and Administrative | ||
Ennis County, Ireland | 40,000 | Manufacturing | ||
Simsbury, Connecticut | 32,500 | Manufacturing, R&D and Administrative offices | ||
Shanghai, China | 21,000 | Research and Development; Marketing Support, and Administrative Offices | ||
Hsinchu, Taiwan | 15,000 | Design, Engineering and Administrative | ||
In addition to the facilities we own, we lease several research and development facilities and sales offices in North America, Europe and Asia.
30
We currently believe that our existing facilities are suitable and will be adequate to meet our requirements for at least the next 12 months.
See page 46 for a discussion of the capacity utilization of our manufacturing facilities.
Item 3. Legal Proceedings
Refer to Note 12 to our consolidated financial statements for information regarding legal proceedings.
Item 4. Mine Safety Disclosures
Not applicable.
31
PART II
Item 5. Market for Registrant's Common Equity, Related Stockholder Matters and Issuer Purchases of Equity Securities
Our common stock is traded on the NASDAQ Global Market under the symbol "MCHP."
Stock Price Performance Graph
The following graph and table show a comparison of the five-year cumulative total stockholder return, calculated on a dividend reinvestment basis, for Microchip Technology Incorporated, the Standard & Poor's (S&P) 500 Stock Index, and the Philadelphia Semiconductor Index.
Comparison of 5 year Cumulative Total Return*
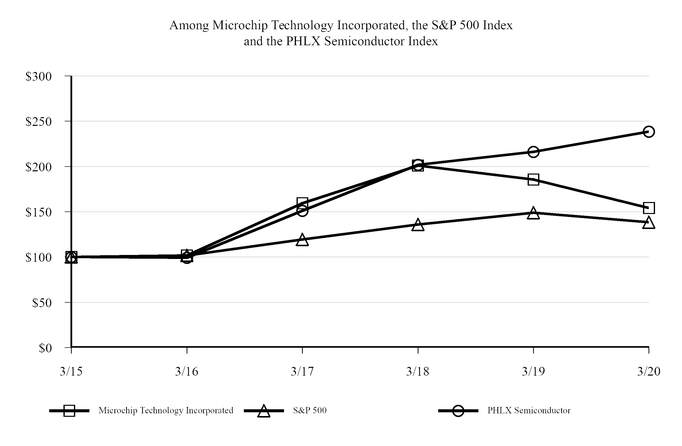
*$100 invested on March 31, 2015 in stock or index, including reinvestment of dividends
Fiscal year ending March 31.
Copyright © 2020 Standard & Poor's, a division of S&P Global. All rights reserved.
Cumulative Total Return | ||||||||||||
March 2015 | March 2016 | March 2017 | March 2018 | March 2019 | March 2020 | |||||||
Microchip Technology Incorporated | 100.00 | 101.73 | 159.48 | 200.89 | 185.62 | 154.16 | ||||||
S&P 500 Stock Index | 100.00 | 101.78 | 119.26 | 135.95 | 148.86 | 138.47 | ||||||
Philadelphia Semiconductor Index | 100.00 | 99.27 | 151.06 | 201.80 | 216.14 | 238.58 | ||||||
Data acquired by Research Data Group, Inc. (www.researchdatagroup.com)
On May 14, 2020, there were approximately 568 holders of record of our common stock. This figure does not reflect beneficial ownership of shares held in nominee names.
32
For a description of our dividend policies, see Part II, Item 7, "Management's Discussion and Analysis of Financial Condition and Results of Operations - Liquidity and Capital Resources," included herein.
Refer to "Item 12 - Security Ownership Of Certain Beneficial Owners And Management And Related Stockholder Matters," at page 56 below, for the information required by Item 201(d) of Regulation S-K with respect to securities authorized for issuance under our equity compensation plans at March 31, 2020.
Issuer Purchases of Equity Securities
From time to time, our Board of Directors has authorized the repurchase of shares of our common stock in the open market or in privately negotiated transactions. Most recently, in January 2016, our Board of Directors authorized an increase in the then existing share repurchase program to 15.0 million shares of common stock. There were no repurchases of common stock during fiscal 2020. There is no expiration date associated with this repurchase program.
33
Item 6. Selected Financial Data
You should read the following selected consolidated financial data for the five-year period ended March 31, 2020 in conjunction with our consolidated financial statements and notes thereto and "Management's Discussion and Analysis of Financial Condition and Results of Operations" included in Items 7 and 8 of this Form 10-K. Our consolidated statements of income data for each of the years in the three-year period ended March 31, 2020, and the balance sheet data as of March 31, 2020 and 2019, are derived from our audited consolidated financial statements, included in Item 8 of this Form 10-K. The statement of income data for the years ended March 31, 2017 and 2016 and balance sheet data as of March 31, 2018, 2017 and 2016 have been derived from our audited consolidated financial statements not included herein (in the tables below all amounts are in millions, except per share data).
Year ended March 31, | |||||||||||||||||||
2020 | 2019(1) | 2018 | 2017(1) | 2016 | |||||||||||||||
Consolidated Statements of Income data: | |||||||||||||||||||
Net sales | $ | 5,274.2 | $ | 5,349.5 | $ | 3,980.8 | $ | 3,407.8 | $ | 2,173.3 | |||||||||
Special charges and other, net (2) | $ | 46.7 | $ | 33.7 | $ | 17.5 | $ | 98.6 | $ | 4.0 | |||||||||
Loss on settlement of debt (3) | $ | (5.4 | ) | $ | (12.6 | ) | $ | (16.0 | ) | $ | (43.9 | ) | $ | — | |||||
Net income from continuing operations | $ | 570.6 | $ | 355.9 | $ | 255.4 | $ | 170.6 | $ | 323.9 | |||||||||
Basic net income per common share from continuing operations | $ | 2.39 | $ | 1.51 | $ | 1.10 | $ | 0.79 | $ | 1.59 | |||||||||
Diluted net income per common share from continuing operations | $ | 2.23 | $ | 1.42 | $ | 1.03 | $ | 0.73 | $ | 1.49 | |||||||||
Dividends declared per common share | $ | 1.465 | $ | 1.457 | $ | 1.449 | $ | 1.441 | $ | 1.433 | |||||||||
Consolidated Balance Sheets data: | |||||||||||||||||||
Total assets | $ | 17,426.1 | $ | 18,350.0 | $ | 8,257.2 | $ | 7,686.9 | $ | 5,537.9 | |||||||||
Net long-term debt and capital lease obligations, less current maturities (3) | $ | 8,882.1 | $ | 8,956.0 | $ | 1,769.1 | $ | 2,912.1 | $ | 2,465.8 | |||||||||
Stockholders' equity | $ | 5,585.5 | $ | 5,287.5 | $ | 3,279.8 | $ | 3,270.7 | $ | 2,150.9 | |||||||||
(1) | Refer to Note 2 to our consolidated financial statements for a discussion of our acquisition of Microsemi during fiscal 2019. During fiscal 2017, we completed our acquisition of Atmel. |
(2) Refer to Note 5 to our consolidated financial statements for a discussion of the special charges and other, net.
(3) Refer to Note 7, Debt, for further discussion.
34
Item 7. Management's Discussion and Analysis of Financial Condition and Results of Operations
Note Regarding Forward-looking Statements
This report, including "Item 1 – Business," "Item 1A – Risk Factors," and "Item 7 – Management's Discussion and Analysis of Financial Condition and Results of Operations," contains certain forward-looking statements that involve risks and uncertainties, including statements regarding our strategy, financial performance and revenue sources. We use words such as "anticipate," "believe," "plan," "expect," "future," "continue," "intend" and similar expressions to identify forward-looking statements. Our actual results could differ materially from the results anticipated in these forward-looking statements as a result of certain factors including those set forth under "Risk Factors," beginning at page 12 and elsewhere in this Form 10-K. Although we believe that the expectations reflected in the forward-looking statements are reasonable, we cannot guarantee future results, levels of activity, performance or achievements. You should not place undue reliance on these forward-looking statements. We disclaim any obligation to update information contained in any forward-looking statement. These forward-looking statements include, without limitation, statements regarding the following:
• | The impact of disruptions to our manufacturing and the distribution of our products, including disruptions due to the COVID-19 virus and related government responses; |
• | That we have seen increased impacts since then which we expect to adversely impact our business in the fiscal quarter ended June 30, 2020; |
• | That local governments could require us to temporarily reduce production further or cease operations at any of our facilities and we could experience constraints in fulfilling customer orders; |
• | Our belief that our actions to combat the spread of the COVID-19 virus will help preserve the health of our team members, customers, suppliers, visitors to our facilities, people with whom we conduct business and our communities, and allow us to safely continue operations; |
• | Our inability to predict how the COVID-19 virus outbreak, and actions taken by others in response to it, will affect our business; |
• | The effects that uncertain global economic conditions and fluctuations in the global credit and equity markets may have on our financial condition and results of operations; |
• | The effects and amount of competitive pricing pressure on our product lines and modest pricing declines in certain of our more mature proprietary product lines; |
• | Our ability to moderate future average selling price declines; |
• | The effect of product mix, capacity utilization, yields, fixed cost absorption, competition and economic conditions on gross margin; |
• | The amount of, and changes in, demand for our products and those of our customers; |
• | The impact of trade restrictions and changes in tariffs, including those impacting China; |
• | Our expectation that in the future we will acquire additional businesses that we believe will complement our existing businesses; |
• | Our expectation that in the future we will enter into joint development agreements or other business or strategic relationships with other companies; |
• | The level of orders that will be received and shipped within a quarter, including the impact of our product lead times; |
• | Our expectation that our June 2020 days of inventory levels will be down 6 days to up 8 days compared to the March 2020 levels. Our belief that our existing level of inventory will allow us to maintain competitive lead times and provide strong delivery performance to our customers; |
• | The effect that distributor and customer inventory holding patterns will have on us; |
• | Our belief that customers recognize our products and brand name and use distributors as an effective supply channel; |
• | Anticipating increased customer requirements to meet voluntary criteria related to the reduction or elimination of substances in our products; |
• | Our belief that our direct sales personnel combined with our distributors provide an effective means of reaching our customer base; |
• | The accuracy of our estimates of the useful life and values of our property, assets and other liabilities; |
• | Our ability to increase the proprietary portion of our analog, interface, mixed signal and timing product lines and the effect of such an increase; |
• | Our belief that our processes afford us both cost-effective designs in existing and derivative products and greater functionality in new product designs; |
• | The impact of any supply disruption we may experience; |
• | Our ability to effectively utilize our facilities at appropriate capacity levels and anticipated costs; |
35
• | That we adjust capacity utilization to respond to actual and anticipated business and industry-related conditions; |
• | That manufacturing costs will be reduced by transition to advanced process technologies; |
• | Our ability to maintain manufacturing yields; |
• | Continuing our investments in new and enhanced products; |
• | The cost effectiveness of using our own assembly and test operations; |
• | Our plans for operation of our fabrication facilities, including our plan to close our facility in Santa Clara, California; |
• | The cost savings from re-purposing Fab 5 for the manufacture of discrete and specialty products in addition to a lower volume of a diversified set of standard products and transferring the manufacture of certain higher volume products to other facilities; |
• | Our anticipated level of capital expenditures; |
• | Continuation and amount of quarterly cash dividends; |
• | The sufficiency of our existing sources of liquidity to finance anticipated capital expenditures and otherwise meet our anticipated cash requirements, and the effects that our contractual obligations are expected to have on them; |
• | The impact of seasonality on our business; |
• | Our belief that our IT system compromise has not had a material adverse effect on our business or resulted in any material damage to us; |
• | Our expectation that we will continue to be the target of attacks on our data, attempts to breach our security and attempts to introduce malicious software into our IT systems; |
• | The accuracy of our estimates used in valuing employee equity awards; |
• | That the resolution of legal actions will not have a material effect on our business, and the accuracy of our assessment of the probability of loss and range of potential loss; |
• | The recoverability of our deferred tax assets; |
• | The adequacy of our tax reserves to offset any potential tax liabilities, having the appropriate support for our income tax positions and the accuracy of our estimated tax rate; |
• | Our belief that the expiration of any tax holidays will not have a material impact on our financial statements or effective tax rate; |
• | The impact of our intra-group asset transfers, and the geographical dispersion of our earnings and losses on our effective tax rate; |
• | Our belief that the estimates used in preparing our consolidated financial statements are reasonable; |
• | Our actions to vigorously and aggressively defend and protect our intellectual property on a worldwide basis; |
• | Our ability to obtain patents and intellectual property licenses and minimize the effects of litigation; |
• | The level of risk we are exposed to for product liability claims or indemnification claims; |
• | The effect of fluctuations in market interest rates on our income and/or cash flows; |
• | The effect of fluctuations in currency rates; |
• | That we could increase our borrowings or seek additional equity or debt financing to maintain or expand our facilities, or to fund cash dividends, share repurchases, acquisitions or other corporate activities, and that the timing and amount of such financing requirements will depend on a number of factors; |
• | Our intention to satisfy the lesser of the principal amount or the conversion value of our debentures in cash; |
• | Our intention to invest substantially all of our foreign subsidiary earnings, as well as our capital in our foreign subsidiaries, indefinitely outside of the U.S. in those jurisdictions in which we would incur significant, additional costs upon repatriation of such amounts. |
• | Changes to the taxation of undistributed foreign earnings could change our future intentions regarding reinvestment of such earnings; |
• | Our belief that the effect the new tax laws will have on low-taxed income of foreign subsidiaries will have the most significant, adverse impact; and |
• | Our ability to collect accounts receivable. |
Our actual results could differ materially from the results anticipated in these forward-looking statements as a result of certain factors including those set forth in "Item 1A – Risk Factors," and elsewhere in this Form 10-K. Although we believe that the expectations reflected in our forward-looking statements are reasonable, we cannot guarantee future results, levels of activity, performance or achievements. You should not place undue reliance on these forward-looking statements. We disclaim any obligation to update the information contained in any forward-looking statement.
36
Introduction
The following discussion should be read in conjunction with the consolidated financial statements and the related notes that appear elsewhere in this document, as well as with other sections of this Annual Report on Form 10-K, including "Item 1 – Business;" "Item 6 – Selected Financial Data;" and "Item 8 – Financial Statements and Supplementary Data."
We begin our Management's Discussion and Analysis of Financial Condition and Results of Operations (MD&A) with a summary of our overall business strategy to give the reader an overview of the goals of our business and the overall direction of our business and products. This is followed by a discussion of the Critical Accounting Policies and Estimates that we believe are important to understanding the assumptions and judgments incorporated in our reported financial results. We then discuss our results of operations for fiscal 2020 compared to fiscal 2019. The changes in our fiscal 2019 results of operations compared to fiscal 2018 were primarily due to our acquisition of Microsemi Corporation, which closed on May 29, 2018. After discussing our results of operations for fiscal 2020 compared to fiscal 2019, we provide an analysis of changes in our balance sheet and cash flows, and discuss our financial commitments in sections titled "Liquidity and Capital Resources," "Contractual Obligations" and "Off-Balance Sheet Arrangements". Our liquidity and capital resources section generally discusses fiscal 2020 compared to fiscal 2019. For our discussion of our fiscal 2019 results in comparison to fiscal 2018 for both our results of operations and our liquidity and capital resources sections, refer to “Item 7. Management’s Discussion and Analysis of Financial Condition and Results of Operations” in our Annual Report on Form 10-K for the fiscal year ended March 31, 2019 filed with the SEC on May 30, 2019, which is incorporated by reference herein.
COVID-19 Developments
The ongoing COVID-19 pandemic has resulted in a global reduction in economic activity by adversely affecting production, creating supply chain and market disruption, and adversely impacting businesses and individuals. The severity and duration of the economic impact is currently unknown and will depend on many factors, such as the effectiveness of containment efforts. We regularly monitor new information regarding the severity of the COVID-19 virus and the ability to contain, treat, or prevent it.
Demand for our products has increased in the areas of our business that support the stay-at-home economy, such as products used in medical devices, datacenter, communications infrastructure, computers, printers, monitors and contact free consumer and industrial products. However, demand has decreased in other areas such as automotive, broad based industrial, consumer and home appliances, and aerospace. We have seen a greater number of order cancellations and requests to reschedule deliveries to future dates. Some customers are requesting order cancellation within our firm order window and are claiming applicability of force majeure clauses. While we have a diverse customer base operating in diverse industries, the extent of the impact of the COVID-19 virus on demand for our products depends on unpredictable future developments.
At this time, our global manufacturing sites are operational, though certain of them are operating at reduced utilization levels. This may be due to local restrictions related to the COVID-19 virus, such as our Philippine manufacturing sites, or a decrease in demand for products manufactured at a particular site. Additionally, travel restrictions have impacted our subcontractors' manufacturing operations in Malaysia and China, and similar challenges have arisen for our logistics service providers, which has impacted their ability to ship product to our customers. The impact to our lead times and ability to fulfill orders was minimal in the fiscal quarter ended March 31, 2020 but we have seen increased impacts since then which we expect to adversely impact our business in the fiscal quarter ended June 30, 2020 and which could continue to adversely impact our business in future periods. In the future, local governments could require us to temporarily reduce production further or cease operations at any of our facilities and we could experience constraints in fulfilling customer orders.
In response to the early indications of the COVID-19 pandemic, we took proactive measures to safeguard the health of our employees, contractors, customers, suppliers, visitors to our facilities, other business partners, and our communities. We strategically implemented plans intended to ensure business continuity in the event severe outbreaks or government requirements were to impact our operations. We are committed to the health and safety of our employees, contractors, customers, suppliers, visitors to our facilities, other business partners, and communities. We are following governmental policies and CDC recommendations designed to slow the spread of the COVID-19 virus.
Our efforts to combat the COVID-19 virus include the following:
• | We require social distancing, and have established distancing protocols at our facilities. We currently prohibit visitors, have suspended business travel, have suspended attendance at conferences and other gatherings, and require team members to work from home to the extent possible. Where work from home is not possible, all on-site team members are requested to take their temperatures before arriving to work, stay home if they do not feel |
37
well, stay home if they have been exposed to someone with the COVID-19 virus or its symptoms, maintain a safe distance from others, wash their hands frequently, and wear a mask if they choose. We clean high touch surfaces daily.
• | In partnership with our suppliers, we have evaluated our supply chain to identify gaps or weak points. In order to ensure continuity, in some cases, we have qualified alternative suppliers and increased our inventory of raw materials. |
• | We have added assembly and test capacity to provide redundant manufacturing capability through our network of subcontractors. |
• | We have implemented measures to help prepare for an economic downturn, such as implementing employee salary cuts, limiting hiring, reducing business travel costs, reducing discretionary spending, and limiting capital expenditures. |
• | We are working with government authorities in the areas where we have a significant footprint. We continue to update ourselves on government requirements, relevant regulations, industry standards, and best practices to help safeguard our team members across the globe. |
We believe these actions are important and will help preserve the health of our team members, customers, suppliers, visitors to our facilities, people with whom we conduct business and our communities, and allow us to safely continue operations. However, we cannot predict how these actions, or the actions taken by government entities, suppliers, or customers in response to the COVID-19 virus outbreak will impact our business, revenues, or results of operations.
Acquisition of Microsemi
On May 29, 2018, we completed our acquisition of Microsemi Corporation, a publicly traded company headquartered in Aliso Viejo, California. We paid an aggregate of approximately $8.19 billion in cash to the stockholders of Microsemi. The total consideration transferred in the acquisition, including approximately $53.9 million of non-cash consideration for the exchange of certain share-based payment awards of Microsemi for stock awards of Microchip, was approximately $8.24 billion. In addition to the consideration transferred, we recognized in our consolidated financial statements $3.23 billion in liabilities of Microsemi consisting of debt, taxes payable and deferred, pension obligations, restructuring, and contingent and other liabilities of which $2.06 billion of existing debt was paid off. We financed the purchase price using approximately $8.10 billion of borrowings consisting of $3.10 billion of loans under our revolving line of credit (the "Revolving Credit Facility"), $3.00 billion of term loans ("Term Loan Facility") provided under our amended and restated Credit Agreement, and $2.00 billion in newly issued senior secured notes. We incurred $22.0 million in costs related to the acquisition. As a result of the acquisition, Microsemi became a wholly owned subsidiary of Microchip. Microsemi offers a comprehensive portfolio of semiconductor and system solutions for aerospace and defense, communications, data center and industrial markets. Our primary reason for this acquisition was to expand our range of solutions, products and capabilities by extending our served available market.
For further details, see the discussion in Note 2 of our consolidated financial statements included in this report.
Strategy
Our goal is to be a worldwide leader in providing specialized semiconductor products for a wide variety of embedded control applications. Our strategic focus is on embedded control solutions, including general purpose and specialized 8-bit, 16-bit, and 32-bit microcontrollers, microprocessors, field-programmable gate array (FPGA) products, a broad spectrum of high-performance linear, mixed-signal, power management, thermal management, discrete diodes and MOSFETS, radio frequency (RF), timing, timing systems, safety, security, wired connectivity and wireless connectivity devices, as well as Serial Electrically Erasable Programmable Read Only Memory (EEPROM), Serial Flash memories, Parallel Flash memories, Serial Electrically Erasable Random Access Memory (EERAM) and Serial Static Random Access Memory (SRAM). We also license Flash-IP solutions that are incorporated in a broad range of products. We provide highly cost-effective embedded control solutions that also offer the advantages of small size, high performance, extreme low power usage, wide voltage range operation, mixed signal integration and ease of development, thus enabling timely and cost-effective integration of our solutions by our customers in their end products. We license our SuperFlash technology and other technologies to wafer foundries, integrated device manufacturers and design partners throughout the world for use in the manufacture of advanced microcontroller products, gate array, RF and analog products that require embedded non-volatile memory.
38
We sell our products to a broad base of domestic and international customers across a variety of industries. The principal markets that we serve include consumer, automotive, industrial, aerospace, office communication, and computing. Our business is subject to fluctuations based on economic conditions within these markets.
Our manufacturing operations include wafer fabrication, wafer probe and assembly and test. The ownership of a substantial portion of our manufacturing resources is an important component of our business strategy, enabling us to maintain a high level of manufacturing control resulting in us being one of the lowest cost producers in the embedded control industry. By owning wafer fabrication facilities and assembly and test operations, and by employing statistical process control techniques, we have been able to achieve and maintain high production yields. Direct control over manufacturing resources allows us to shorten our design and production cycles. This control also allows us to capture a portion of the wafer manufacturing and the assembly and test profit margin. We do outsource a significant portion of our manufacturing requirements to third parties. Our acquisition of Microsemi significantly increased the amount of our outsourced manufacturing requirements.
We employ proprietary design and manufacturing processes in developing our embedded control products. We believe our processes afford us both cost-effective designs in existing and derivative products and greater functionality in new product designs. While many of our competitors develop and optimize separate processes for their logic and memory product lines, we use a common process technology for both microcontroller and non-volatile memory products. This allows us to more fully leverage our process research and development costs and to deliver new products to market more rapidly. Our engineers utilize advanced computer-aided design tools and software to perform circuit design, simulation and layout, and our in-house photomask and wafer fabrication facilities enable us to rapidly verify design techniques by processing test wafers quickly and efficiently.
We are committed to continuing our investment in new and enhanced products, including development systems, and in our design and manufacturing process technologies. We believe these investments are significant factors in maintaining our competitive position. Our current research and development activities focus on the design of new microcontrollers, digital signal controllers, memory, analog and mixed-signal products, FPGAs, timing systems, Flash-IP, development systems, software and application-specific software libraries. We are also developing new design and process technologies to achieve further cost reductions and performance improvements in our products.
We market and sell our products worldwide primarily through a network of direct sales personnel and distributors. Our distributors focus primarily on servicing the product and technical support requirements of a broad base of diverse customers. We believe that our direct sales personnel combined with our distributors provide an effective means of reaching this broad and diverse customer base. Our direct sales force focuses primarily on major strategic accounts in three geographical markets: the Americas, Europe and Asia. We currently maintain sales and support centers in major metropolitan areas in North America, Europe and Asia. We believe that a strong technical service presence is essential to the continued development of the embedded control market. Many of our client engagement managers (CEMs), embedded solutions engineers (ESEs), and sales management personnel have technical degrees and have been previously employed in an engineering environment. We believe that the technical and business knowledge of our sales force is a key competitive advantage in the sale of our products. The primary mission of our ESE team is to provide technical assistance to strategic accounts and to conduct periodic training sessions for CEMs and distributor sales teams. ESEs also frequently conduct technical seminars for our customers in major cities around the world or through online webcasts, and work closely with our distributors to provide technical assistance and end-user support.
See "Our operating results are impacted by both seasonality and the wide fluctuation of supply and demand in the semiconductor industry," on page 17 for discussion of the impact of seasonality on our business.
Critical Accounting Policies and Estimates
General
Our discussion and analysis of our financial condition and results of operations is based upon our consolidated financial statements, which have been prepared in accordance with accounting principles generally accepted in the U.S. We review the accounting policies we use in reporting our financial results on a regular basis. The preparation of these financial statements requires us to make estimates and judgments that affect the reported amounts of assets, liabilities, revenues and expenses and related disclosure of contingent liabilities. On an ongoing basis, we evaluate our estimates, including those related to revenue recognition, business combinations, share-based compensation, inventories, income taxes, senior and junior subordinated convertible debt and contingencies. We base our estimates on historical experience and on various other assumptions that are believed to be reasonable under the circumstances, the results of which form the basis for making judgments about the carrying
39
value of assets and liabilities that are not readily apparent from other sources. Our results may differ from these estimates due to actual outcomes being different from those on which we based our assumptions. We review these estimates and judgments on an ongoing basis. We believe the following critical accounting policies affect our more significant judgments and estimates used in the preparation of our consolidated financial statements.
Revenue Recognition
On April 1, 2018, we adopted Accounting Standards Codification Topic 606, Revenue from Contracts with Customers (ASC 606) and all related amendments. We generate revenue primarily from sales of our semiconductor products to distributors and non-distributor customers (direct customers) and, to a lesser extent, from royalties paid by licensees of our intellectual property. We apply the following five-step approach to determine the timing and amount of revenue recognition: (1) identify the contract with the customer, (2) identify performance obligations in the contract, (3) determine the transaction price, (4) allocate the transaction price to the performance obligations in the contract, and (5) recognize revenue when the performance obligation is satisfied.
Sales to our distributors are governed by a distributor agreement, a purchase order, and an order acknowledgment. Sales to distributors do not meet the definition of a contract, as defined by ASC 606, until the distributor has sent in a purchase order, we have acknowledged the order, we have deemed the collectability of the consideration to be probable, and legally enforceable rights and obligations have been created; this generally occurs 30 days prior to the estimated ship date. As is customary in the semiconductor industry, we offer price concessions and stock rotation rights to many of our distributors. As these are forms of variable consideration, we estimate the amount of consideration to which we will be entitled using recent historical data and applying the expected value method. Usually, there is only a single performance obligation in the contract, and therefore the entire transaction price is allocated to the single performance obligation. After the transaction price has been allocated, we recognize revenue when the performance obligation is satisfied. Substantially all of the revenue generated from contracts with distributors is recognized at the time risk and title of the inventory transfers to the distributor.
Sales to our direct customers are generally governed by a purchase order and an order acknowledgment. Sales to direct customers usually do not meet the definition of a contract, as defined by ASC 606, until shipment of the product occurs. Generally, the transaction price associated with contracts with direct customers is set at the standalone selling price and is not variable. Usually, there is only a single performance obligation in the contract, and therefore the entire transaction price is allocated to the single performance obligation. After the transaction price has been allocated, we recognize revenue when the performance obligation is satisfied. Substantially all of the revenue generated from contracts with direct customers is recognized at the time risk and title of the inventory transfers to the customer.
Revenue generated from our licensees is governed by licensing agreements. Our primary performance obligation related to these agreements is to provide the licensee the right to use the intellectual property. The final transaction price is determined by multiplying the usage of the license by the royalty, which is fixed in the licensing agreement. Revenue is recognized as usage of the license occurs.
Business Combinations
All of our business combinations are accounted for at fair value under the acquisition method of accounting. Under the acquisition method of accounting, (i) acquisition-related costs, except for those costs incurred to issue debt or equity securities, will be expensed in the period incurred; (ii) non-controlling interests will be valued at fair value at the acquisition date; (iii) in-process research and development will be recorded at fair value as an intangible asset at the acquisition date and amortized once the technology reaches technological feasibility; (iv) restructuring costs associated with a business combination will be expensed subsequent to the acquisition date; and (v) changes in deferred tax asset valuation allowances and income tax uncertainties after the acquisition date will be recognized through income tax expense. The measurement of the fair value of assets acquired and liabilities assumed requires significant judgment. The valuation of intangible assets, in particular, requires that we use valuation techniques such as the income approach. The income approach includes the use of a discounted cash flow model, which includes discounted cash flow scenarios and requires the following significant estimates: revenue, expenses, capital spending and other costs, and discount rates based on the respective risks of the cash flows. Under the acquisition method of accounting, the aggregate amount of consideration we pay for a company is allocated to net tangible assets and intangible assets based on their estimated fair values as of the acquisition date. The excess of the purchase price over the value of the net tangible assets and intangible assets is recorded to goodwill. On an annual basis, we test goodwill for impairment and through March 31, 2020, we have never recorded an impairment charge against our goodwill balance.
40
Share-based Compensation
We measure at fair value and recognize compensation expense for all share-based payment awards, including grants of employee stock options, restricted stock units (RSUs) and employee stock purchase rights, to be recognized in our financial statements based on their respective grant date fair values. We utilize RSUs as our primary equity incentive compensation instrument for employees. Share-based compensation cost is measured on the grant date based on the fair market value of our common stock discounted for expected future dividends and is recognized as expense on a straight-line basis over the requisite service periods. Total share-based compensation expense recognized during the fiscal 2020 was $170.2 million, of which $149.3 million was reflected in operating expenses and $20.9 million was reflected in cost of sales. Total share-based compensation included in our inventory balance was $14.4 million at March 31, 2020.
If there are any modifications or cancellations of the underlying unvested securities, we may be required to accelerate, increase or cancel any remaining unearned share-based compensation expense. Future share-based compensation expense and unearned share-based compensation will increase to the extent that we grant additional equity awards to employees or we assume unvested equity awards in connection with acquisitions.
Inventories
Inventories are valued at the lower of cost or net realizable value using the first-in, first-out method. We write down our inventory for estimated obsolescence or unmarketable inventory in an amount equal to the difference between the cost of inventory and the estimated net realizable value based upon assumptions about future demand and market conditions. If actual market conditions are less favorable than those we projected, additional inventory write-downs may be required. Inventory impairment charges establish a new cost basis for inventory and charges are not subsequently reversed to income even if circumstances later suggest that increased carrying amounts are recoverable. In estimating our inventory obsolescence, we primarily evaluate estimates of demand over a 12-month period and record impairment charges for inventory on hand in excess of the estimated 12-month demand. Estimates for projected 12-month demand are generally based on the average shipments of the prior three-month period, which are then annualized to adjust for any potential seasonality in our business. The estimated 12-month demand is compared to our most recently developed sales forecast to further reconcile the 12-month demand estimate. Management reviews and adjusts the estimates as appropriate based on specific situations. For example, demand can be adjusted up for new products for which historic sales are not representative of future demand. Alternatively, demand can be adjusted down to the extent any existing products are being replaced or discontinued.
In periods where our production levels are substantially below our normal operating capacity, the reduced production levels of our manufacturing facilities are charged directly to cost of sales. As a result of production being below normal operating levels in our wafer fabrication facilities, approximately $47.2 million and $16.2 million was charged to cost of sales in fiscal 2020 and fiscal 2019, respectively.
Income Taxes
As part of the process of preparing our consolidated financial statements, we are required to estimate our income taxes in each of the jurisdictions in which we operate. This process involves estimating our actual current tax exposure together with assessing temporary differences resulting from differing treatment of items for tax and accounting purposes. These differences result in deferred tax assets and liabilities, which are included within our consolidated balance sheets. We must then assess the likelihood that our deferred tax assets will be recovered from future taxable income within the relevant jurisdiction and to the extent we believe that recovery is not likely, we must establish a valuation allowance. We provided valuation allowances for certain of our deferred tax assets, where it is more likely than not that some portion, or all of such assets, will not be realized.
Various taxing authorities in the U.S. and other countries in which we do business scrutinize the tax structures employed by businesses. Companies of our size and complexity are regularly audited by the taxing authorities in the jurisdictions in which they conduct significant operations. We are currently being audited by the tax authorities in the U.S. and in various foreign jurisdictions. At this time, we do not know what the outcome of these audits will be. We record benefits for uncertain tax positions based on an assessment of whether it is more likely than not that the tax positions will be sustained based on their technical merits under currently enacted law. If this threshold is not met, no tax benefit of the uncertain tax position is recognized. If the threshold is met, we recognize the largest amount of the tax benefit that is more than 50% likely to be realized upon ultimate settlement.
The accounting model as defined in Accounting Standards Codification Topic 740, Income Taxes (ASC 740) related to the valuation of uncertain tax positions requires us to presume that the tax position will be examined by the relevant taxing authority that has full knowledge of all relevant information and that each tax position will be evaluated without consideration
41
of the possibility of offset or aggregation with other positions. The recognition requirement for the liability exists even if we believe the possibility of examination by a taxing authority or discovery of the related risk matters is remote or where we have a long history of the taxing authority not performing an exam or overlooking an issue. We will record an adjustment to a previously recorded position if new information or facts related to the position are identified in a subsequent period. All adjustments to the positions are recorded through the income statement. Generally, adjustments will be recorded in periods subsequent to the initial recognition if the taxing authority has completed an audit of the period that results in the position being effectively settled or if the statute of limitation expires. Due to the inherent uncertainty in the estimation process and in consideration of the criteria of the accounting model, amounts recognized in the financial statements in periods subsequent to the initial recognition may significantly differ from the estimated exposure of the position under the accounting model.
Senior and Junior Subordinated Convertible Debt
We separately account for the liability and equity components of our senior and junior subordinated convertible debt in a manner that reflects our nonconvertible debt (unsecured debt) borrowing rate. This results in a bifurcation of a component of the debt, classification of that component in equity and the accretion of the resulting discount on the debt to be recognized as part of interest expense in our consolidated statements of income. Lastly, we include the dilutive effect of the shares of our common stock issuable upon conversion of the outstanding senior and junior subordinated convertible debt in our diluted income per share calculation regardless of whether the market price triggers or other contingent conversion features have been met. We apply the treasury stock method as we have the intent and have adopted an accounting policy to settle the principal amount of the senior and junior subordinated convertible debentures in cash. This method results in incremental dilutive shares when the average fair value of our common stock for a reporting period exceeds the conversion prices per share and adjusts as dividends are recorded in the future.
Contingencies
In the ordinary course of our business, we are exposed to various liabilities as a result of contracts, product liability, customer claims, governmental investigations and other matters. Additionally, we are involved in a limited number of legal actions, both as plaintiff and defendant. Consequently, we could incur uninsured liability in any of those actions. We also periodically receive notifications from various third parties alleging infringement of patents or other intellectual property rights, or from customers requesting reimbursement for various costs. With respect to pending legal actions to which we are a party and other claims, although the outcomes are generally not determinable, we believe that the ultimate resolution of these matters will not have a material adverse effect on our financial position, cash flows or results of operations. Litigation, governmental investigations and disputes relating to the semiconductor industry are not uncommon, and we are, from time to time, subject to such litigation, governmental investigations and disputes. As a result, no assurances can be given with respect to the extent or outcome of any such litigation, governmental investigations or disputes in the future.
We accrue for claims and contingencies when losses become probable and reasonably estimable. As of the end of each applicable reporting period, we review each of our matters and, where it is probable that a liability has been or will be incurred, we accrue for all probable and reasonably estimable losses. Where we can reasonably estimate a range of losses we may incur regarding such a matter, we record an accrual for the amount within the range that constitutes our best estimate. If we can reasonably estimate a range but no amount within the range appears to be a better estimate than any other, we use the amount that is the low end of such range. Contingencies of an acquired company that exist as of the date of the acquisition are measured at fair value if determinable, which generally is based on a probability weighted model. If fair value is not determinable, contingencies of an acquired company are recognized when they become probable and reasonably estimable.
Results of Operations
The following table sets forth certain operational data as a percentage of net sales for fiscal 2020 and fiscal 2019:
42
Year Ended March 31, | |||||
2020 | 2019 | ||||
Net sales | 100.0 | % | 100.0 | % | |
Cost of sales | 38.5 | 45.2 | |||
Gross profit | 61.5 | 54.8 | |||
Research and development | 16.6 | 15.4 | |||
Selling, general and administrative | 12.8 | 12.8 | |||
Amortization of acquired intangible assets | 18.9 | 12.6 | |||
Special charges and other, net | 0.9 | 0.6 | |||
Operating income | 12.3 | % | 13.4 | % | |
Net Sales
We operate in two industry segments and engage primarily in the design, development, manufacture and sale of semiconductor products as well as the licensing of our SuperFlash and other technologies. We sell our products to distributors and original equipment manufacturers, referred to as OEMs, in a broad range of markets, perform ongoing credit evaluations of our customers and generally require no collateral. In certain circumstances, a customer's financial condition may require collateral, and, in such cases, the collateral would be typically provided by letters of credit.
The following table summarizes our net sales for fiscal 2020 and fiscal 2019 (dollars in millions):
Year Ended March 31, | ||||||||||
2020 | 2019 | % Change | ||||||||
Net sales | $ | 5,274.2 | $ | 5,349.5 | (1.4 | )% | ||||
The decrease in net sales in fiscal 2020 compared to fiscal 2019 was primarily due to adverse demand fluctuations in the markets we serve, which were negatively impacted by general economic conditions, trade restrictions, adverse changes in tariffs, and the impact of the COVID-19 virus. These adverse conditions did not affect each of the markets we serve equally. For instance, in fiscal 2020 compared to fiscal 2019, we experienced relatively weaker demand for our products that are used in the consumer, automotive, and industrial markets, and relatively stronger demand for our products that are used in the computing, communication, and aerospace and defense markets. These adverse conditions negatively affected consolidated net sales by approximately 5% in fiscal 2020 compared to the same period in fiscal 2019 and such impact was partially offset by the timing of our acquisition of Microsemi as fiscal 2020 included twelve months of Microsemi net sales compared to ten months of Microsemi net sales in fiscal 2019. The timing of our acquisition of Microsemi accounted for an increase of approximately 4% in our net sales in fiscal 2020 compared to fiscal 2019.
We sell a large number of products to a large and diverse customer base and there was not any single product or customer that accounted for a material portion of the change. The overall average selling price of our products is affected by pricing declines over the life of individual products; however, variations in our product and geographic mix of sales can cause wider fluctuations in our overall average selling price in any given period. The overall average selling price of our products did not change significantly during fiscal 2020 compared to fiscal 2019.
Key factors impacting the amount of net sales during fiscal 2020 and fiscal 2019 include:
• | global economic conditions in the markets we serve; |
• | semiconductor industry conditions; |
• | trade restrictions and adverse changes in tariffs; |
• | our acquisition of Microsemi, which closed on May 29, 2018; |
• | our new product offerings that have increased our served available market; |
• | customers' increasing needs for the flexibility offered by our programmable solutions; |
• | inventory holding patterns of our customers, including distributors; and |
• | increasing semiconductor content in our customers' products. |
Net sales by product line for fiscal 2020 and 2019 were as follows (dollars in millions):
43
Year Ended March 31, | |||||||||||||
2020 | % | 2019 | % | ||||||||||
Microcontrollers | $ | 2,817.9 | 53.4 | $ | 2,921.9 | 54.6 | |||||||
Analog, interface, mixed signal and timing products | 1,511.1 | 28.7 | 1,530.7 | 28.6 | |||||||||
Field-programmable gate array products | 373.5 | 7.1 | 303.8 | 5.7 | |||||||||
Licensing, memory and other | 571.7 | 10.8 | 593.1 | 11.1 | |||||||||
Total net sales | $ | 5,274.2 | 100.0 | % | $ | 5,349.5 | 100.0 | % | |||||
Microcontrollers
Our microcontroller product line represents the largest component of our total net sales. Microcontrollers and associated application development systems accounted for approximately 53.4% and 54.6% of our net sales in fiscal 2020 and 2019, respectively.
Net sales of our microcontroller products decreased approximately 3.6% in fiscal 2020 compared to fiscal 2019. The decrease in net sales was due primarily to adverse demand fluctuations in the markets we serve, partially offset by our acquisition of Microsemi.
Historically, average selling prices in the semiconductor industry decrease over the life of any particular product. The overall average selling prices of our microcontroller products have remained relatively constant over time due to the proprietary nature of these products. We have experienced, and expect to continue to experience, moderate pricing pressure in certain microcontroller product lines, primarily due to competitive conditions. We have in the past been able to, and expect in the future to be able to, moderate average selling price declines in our microcontroller product lines by introducing new products with more features and higher prices. We may be unable to maintain average selling prices for our microcontroller products as a result of increased pricing pressure in the future, which would adversely affect our operating results. The average selling price of our microcontroller products is affected by these trends; however, variations in our product and geographic mix of sales can cause wider fluctuations in the average selling price of our microcontroller products in any given period.
Analog, Interface, Mixed Signal and Timing Products
Sales of our analog, interface, mixed signal and timing products accounted for approximately 28.7% and 28.6% of our net sales in fiscal 2020 and 2019, respectively.
Net sales of our analog, interface, mixed signal and timing products decreased approximately 1.3% in fiscal 2020 compared to fiscal 2019. The decrease in net sales was due primarily to adverse demand fluctuations in the markets we serve, partially offset by our acquisition of Microsemi.
Analog, interface, mixed signal and timing products can be proprietary or non-proprietary in nature. Currently, we consider a majority of our analog, interface, mixed signal and timing products to be proprietary in nature, where prices are relatively stable, similar to the pricing stability experienced in our microcontroller products. The non-proprietary portion of our analog, interface, mixed signal and timing business will experience price fluctuations, driven primarily by the current supply and demand for those products. We may be unable to maintain the average selling prices of our analog, interface, mixed signal and timing products as a result of increased pricing pressure in the future, which would adversely affect our operating results. We anticipate the proprietary portion of our analog, interface, mixed signal and timing products will increase over time.
Field-Programmable Gate Array (FPGA) Products
Our FPGA product line was primarily acquired as part of our acquisition of Microsemi on May 29, 2018. Sales of our FPGA products accounted for approximately 7.1% and 5.7% of our net sales in fiscal 2020 and 2019, respectively.
Net sales of our FPGA products increased approximately 22.9% in fiscal 2020 compared to fiscal 2019. The increase in net sales was due primarily to our acquisition of Microsemi.
FPGA product pricing has historically been relatively stable because they are proprietary products with significant design in complexity and are frequently designed into long-lived end applications.
Licensing, Memory and Other
44
Licensing, memory and other (LMO) includes royalties associated with licenses for the use of our SuperFlash and other technologies, sales of our intellectual property, fees for engineering services, memory products, timing systems, manufacturing services (wafer foundry and assembly and test subcontracting), legacy application specific integrated circuits, and products for aerospace applications. Revenue from these services and products accounted for approximately 10.8% and 11.1% of our net sales in fiscal 2020 and fiscal 2019, respectively.
Net sales related to these services and products decreased approximately 3.6% in fiscal 2020 compared to fiscal 2019. LMO net sales can fluctuate over time based on general economic and semiconductor industry conditions as well as changes in demand for our licenses, engineering services, memory products, and manufacturing services (wafer foundry and assembly and test subcontracting).
Distribution
Distributors accounted for approximately 50% and 51% our net sales in fiscal 2020 and 2019, respectively. With the exception of Arrow Electronics, our largest distributor, which made up 10% of our net sales in fiscal 2020 and fiscal 2019, no other distributor or end customer accounted for more than 10% of our net sales. Our distributors focus primarily on servicing the product requirements of a broad base of diverse customers. We believe that distributors provide an effective means of reaching this broad and diverse customer base. We believe that customers recognize Microchip for its products and brand name and use distributors as an effective supply channel.
Generally, we do not have long-term agreements with our distributors and we, or our distributors, may terminate our relationships with each other with little or no advance notice. The loss of, or the disruption in the operations of, one or more of our distributors could reduce our future net sales in a given quarter and could result in an increase in inventory returns.
At March 31, 2020, our distributors maintained 29 days of inventory of our products compared to 35 days at March 31, 2019. Over the past ten fiscal years, the days of inventory maintained by our distributors have fluctuated between approximately 27 days and 47 days.
Sales by Geography
Sales by geography for fiscal 2020 and fiscal 2019 were as follows (dollars in millions):
Year Ended March 31, | |||||||||||
2020 | % | 2019 | % | ||||||||
Americas | $ | 1,365.0 | 25.9 | $ | 1,353.6 | 25.3 | |||||
Europe | 1,163.1 | 22.1 | 1,225.2 | 22.9 | |||||||
Asia | 2,746.1 | 52.0 | 2,770.7 | 51.8 | |||||||
Total net sales | $ | 5,274.2 | 100.0% | $ | 5,349.5 | 100.0% | |||||
Americas sales include sales to customers in the U.S., Canada, Central America and South America. Sales to foreign customers accounted for approximately 78% and 80% of our net sales in fiscal 2020 and fiscal 2019, respectively. Substantially all of our foreign sales are U.S. dollar denominated. Sales to customers in Asia as a percentage of total sales have generally increased over time due to many of our customers transitioning their manufacturing operations to Asia and growth in demand from the emerging Asian market. Sales to customers in the Americas increased as a percentage of total sales in fiscal 2020 compared to fiscal 2019 due to our acquisition of Microsemi, which had more concentration in the aerospace and defense industry in the Americas. Our sales force in the Americas and Europe supports a significant portion of the design activity for products which are ultimately shipped to Asia.
Gross Profit
Our gross profit was $3.24 billion and $2.93 billion in fiscal 2020 and fiscal 2019, respectively. Gross profit as a percentage of sales was 61.5% and 54.8% in fiscal 2020 and fiscal 2019, respectively.
The most significant factors affecting our gross profit percentage in fiscal 2020 and fiscal 2019 were:
45
• | charges of approximately $365.7 million in fiscal 2019 related to the recognition of acquired inventory at fair value as a result of our acquisitions which increased the value of our acquired inventory and subsequently increased our cost of sales and reduced our gross margins when the related revenue was recognized; |
• | for fiscal 2020 and 2019, inventory write-downs being higher than the gross margin impact of sales of inventory that was previously written down; |
• | unabsorbed capacity charges due to operating at below normal capacity in fiscal 2020 and fiscal 2019; and |
• | fluctuations in the product mix of our net sales. |
Other factors that impacted our gross profit percentage in fiscal 2020 and fiscal 2019 include:
• | continual cost reductions in wafer fabrication and assembly and test manufacturing, such as new manufacturing technologies and more efficient manufacturing techniques; and |
• | economic market conditions. |
We adjust our wafer fabrication and assembly and test capacity utilization as required to respond to actual and anticipated business and industry-related conditions. When production levels are below normal capacity, which we measure as a percentage of the capacity of the installed equipment, we charge cost of sales for the unabsorbed capacity. During fiscal 2020, we operated at below normal capacity levels due to lower demand for our products primarily related to general economic conditions and uncertainty from the COVID-19 virus resulting in unabsorbed capacity charges of $47.2 million compared to unabsorbed capacity charges of $16.2 million in fiscal 2019.
The process technologies utilized in our wafer fabrication facilities impact our gross margins. Our wafer fabrication facility located in Tempe, Arizona (Fab 2) currently utilizes various manufacturing process technologies, but predominantly utilizes our 0.5 micron to 1.0 micron processes. Our wafer fabrication facility located in Gresham, Oregon (Fab 4) predominantly utilizes our 0.13 micron to 0.5 micron processes. We continue to transition products to more advanced process technologies to reduce future manufacturing costs. All of our production in Fab 2 and Fab 4 has been on 8-inch wafers during fiscal 2020 and fiscal 2019. We consider normal capacity at Fab 2 and Fab 4 to be 90% to 95%. Our wafer fabrication facility in Colorado Springs, Colorado (Fab 5) currently utilizes processes between 0.25 micron and 1.0 micron that run on 6-inch wafers. We consider normal capacity at Fab 5 to be 70% to 75%.
Our overall inventory levels were $685.7 million at March 31, 2020, compared to $711.7 million at March 31, 2019. We maintained 122 days of inventory on our balance sheet at March 31, 2020 compared to 128 days of inventory at March 31, 2019. We expect our days of inventory levels in the June 2020 quarter to be down 6 days to up 8 days compared to the March 2020 levels. We believe our existing level of inventory will allow us to maintain competitive lead times and provide strong delivery performance to our customers.
We anticipate that our gross margins will fluctuate over time, driven primarily by capacity utilization levels, the overall product mix of microcontroller, analog, interface, mixed signal and timing products, FPGA products, memory products and technology licensing revenue and the percentage of net sales of each of these products in a particular quarter, as well as manufacturing yields, fixed cost absorption, and competitive and economic conditions in the markets we serve.
During fiscal 2020, we announced our intention to re-purpose Fab 5 to manufacture discrete and specialty products in addition to a lower volume of a diversified set of standard products. In connection with these efforts, we reduced the clean room footprint and transferred certain higher volume products from Fab 5 to our 8-inch wafer fabrication facilities in Arizona and Oregon. We anticipate that these actions will result in significant cost savings over the next several years. In fiscal 2020, we incurred $18.0 million in costs associated with these actions, which have been recorded within the special charges and other, net line item in our statements of income. We expect to incur less than $10.0 million within the next year for the remaining associated costs of these restructuring activities.
We operate assembly and test facilities in Thailand, the Philippines, and other locations throughout the world. During fiscal 2020, approximately 45% of our assembly requirements were performed in our internal assembly facilities, compared to approximately 38% during fiscal 2019. During fiscal 2020, approximately 54% of our test requirements were performed in our internal test facilities, compared to approximately 49% during fiscal 2019. The increases in the percentage of assembly and test operations that were performed internally in fiscal 2020 compared to fiscal 2019 are primarily due to our investments in assembly and test equipment, which increased our internal capacity capabilities, and also due to adverse demand fluctuations in the markets we serve, which reduced our demand for external assembly and test operations. Third-party contractors located primarily in Asia perform the balance of our assembly and test operations. The percentage of our assembly and test operations that are performed internally fluctuates over time based on supply and demand conditions in the semiconductor industry, our internal capacity capabilities and our acquisition activities. We believe that the assembly and test operations performed at our
46
internal facilities provide us with significant cost savings compared to contractor assembly and test costs, as well as increased control over these portions of the manufacturing process. We plan to continue to transition certain outsourced assembly and test capacity to our internal facilities.
We rely on outside wafer foundries for a significant portion of our wafer fabrication requirements. During fiscal 2020, approximately 61% of our net sales came from products that were produced at outside wafer foundries compared to approximately 57% during fiscal 2019. The increase was primarily due to our acquisition of Microsemi, for which the majority of its wafer fabrication requirements are outsourced. The timing of the acquisition, which occurred on May 29, 2018, also contributed to the increase as fiscal 2020 included twelve months of Microsemi activity compared to ten months in fiscal 2019.
Our use of third parties involves some reduction in our level of control over the portions of our business that we subcontract. While we review the quality, delivery and cost performance of our third-party contractors, our future operating results could suffer if any third-party contractor is unable to maintain manufacturing yields, assembly and test yields and costs at approximately their current levels.
Research and Development (R&D)
R&D expenses for fiscal 2020 were $877.8 million, or 16.6% of net sales, compared to $826.3 million, or 15.4% of net sales, for fiscal 2019. We are committed to investing in new and enhanced products, including development systems software, and in our design and manufacturing process technologies. We believe these investments are significant factors in maintaining our competitive position. R&D costs are expensed as incurred. Assets purchased to support our ongoing research and development activities are capitalized when related to products which have achieved technological feasibility or that have alternative future uses and are amortized over their expected useful lives. R&D expenses include labor, depreciation, masks, prototype wafers, and expenses for the development of process technologies, new packages, and software to support new products and design environments.
R&D expenses increased $51.5 million, or 6.2%, for fiscal 2020 compared to fiscal 2019. The primary reason for the increase in R&D expenses in fiscal 2020 compared to fiscal 2019 was additional costs from our acquisition of Microsemi.
R&D expenses fluctuate over time, primarily due to revenue and operating expense investment levels.
Selling, General and Administrative
Selling, general and administrative expenses for fiscal 2020 were $676.6 million, or 12.8% of net sales, compared to $682.9 million, or 12.8% of net sales, for fiscal 2019. Our goal is to continue to be more efficient with our operating expenses. Selling, general and administrative expenses include salary expenses related to field sales, marketing and administrative personnel, advertising and promotional expenditures and legal expenses. Selling, general and administrative expenses also include costs related to our direct sales force, CEMs and ESEs who work in sales offices worldwide to stimulate demand by assisting customers in the selection and use of our products.
Selling, general and administrative expenses decreased $6.3 million, or 0.9%, for fiscal 2020 compared to fiscal 2019. The primary reasons for the decrease in selling, general and administrative expenses were reductions in personnel and associated costs in connection with synergies realized from our Microsemi acquisition, partially offset by remediation costs related to the network compromise discussed in Item 9A of this Form 10-K.
Selling, general and administrative expenses fluctuate over time, primarily due to revenue and operating expense investment levels.
Amortization of Acquired Intangible Assets
Amortization of acquired intangible assets in fiscal 2020 was $993.9 million compared to $674.1 million in fiscal 2019. The primary reason for the increase in acquired intangible asset amortization was our acquisition of Microsemi.
Special Charges and Other, Net
During fiscal 2020, we incurred special charges and other, net of $46.7 million comprised primarily of restructuring charges of $31.0 million and legal contingencies of $15.7 million. During fiscal 2019, we incurred special charges and other, net of $33.7 million comprised primarily of restructuring charges of $63.9 million, offset by the release of $30.2 million in legal contingencies. Restructuring expenses incurred during fiscal 2020 include $18.0 million related to the restructuring of our
47
wafer fabrication operations. Other restructuring expenses incurred during fiscal 2020 and fiscal 2019 were related to our most recent business acquisitions, and resulted from workforce, property and other operating expense rationalizations as well as combining product roadmaps and manufacturing operations.
Other Income (Expense)
Interest income in fiscal 2020 was $2.8 million compared to $8.1 million in fiscal 2019. The primary reason for the decrease in interest income in fiscal 2020 compared to fiscal 2019 was lower invested cash balances as we used a significant portion of our cash to help finance the purchase price of our acquisition of Microsemi and we have continued to pay down our debt.
Interest expense in fiscal 2020 was $497.3 million compared to $502.9 million in fiscal 2019. The primary reason for the decrease in interest expense in fiscal 2020 compared to fiscal 2019 relates to the cumulative pay down of debt.
Loss on settlement of debt in fiscal 2020 was $5.4 million compared to $12.6 million in fiscal 2019. In fiscal 2020, we recognized losses of $2.0 million primarily related to the voluntary prepayment of a portion of the outstanding balance on our Term Loan Facility and $3.4 million related to the settlement of $615.0 million in principal of our 2015 Senior Convertible Debt. In fiscal 2019, the losses primarily related to the voluntary prepayment of a portion of the outstanding balance on our Term Loan Facility.
Other income, net, in fiscal 2020 was $3.2 million compared to other loss, net of $2.2 million in fiscal 2019. The primary reason for the change in other income during fiscal 2020 compared to fiscal 2019 related to foreign currency exchange rate fluctuations.
Provision for Income Taxes
We account for incomes taxes in accordance with ASC 740. Our provision or benefit for income taxes is attributable to U.S. federal, state, and foreign income taxes. A comparison of our effective tax rates for the fiscal years ended March 31, 2020 and March 31, 2019 is not meaningful due to the amount of pre-tax income, and income tax benefits recorded during the period.
Our effective tax rate in fiscal 2020 includes a $40.8 million tax benefit received from current year generated R&D credits, which reduced our effective tax rate by 27.2%. Our effective tax rate in fiscal 2020 includes a $11.1 million tax benefit for share-based compensation deductions, which reduced our effective tax rate by 7.4%. Our effective tax rate in fiscal 2020 includes a $28.5 million tax benefit related to audit closures and expirations of the statute of limitations on various tax reserves, which reduced our effective tax rate by 19.0%. Our effective tax rate in fiscal 2020 includes $54.7 million tax expense for global intangible low-taxed income (“GILTI”) and foreign-derived intangible income ("FDII"), net of credits, which increased our effective tax rate by 36.4%. Our effective tax rate for fiscal 2020 includes a $334.8 million tax benefit related to intra-group transfers of certain intellectual property rights, which reduced our effective tax rate by 222.9%. The tax benefit for the intra-group asset transfers was primarily made up of $78.0 million recorded as a deferred tax asset which represents the book and tax basis difference on the transferred assets measured based on the new applicable statutory tax rate, as well as, the reversal of the pre-existing deferred tax liability of $259.9 million, which represents the book and tax basis difference on the transferred assets measured based on applicable statutory tax rate prior to the transfer. We expect to be able to realize the future tax benefit of the deferred tax assets resulting from the intra-group asset transfers. It is not uncommon for taxing authorities of different countries to have conflicting views, for instance, with respect to, among other things, the manner in which the arm’s length standard is applied with respect to the valuation of intellectual property rights. The taxing authorities of jurisdictions in which we operate may challenge our methodologies for valuing the intellectual property rights transferred, which could increase our future effective income tax rate and harm future results of operations.
Our effective tax rate in fiscal 2019 includes a $27.5 million tax benefit received from current year generated R&D credits, which reduced our effective tax rate by 13.4%. Our effective tax rate in fiscal 2019 includes a $13.3 million tax benefit for share-based compensation deductions, which reduced our effective tax rate by 6.5%. Our effective tax rate in fiscal 2019 includes a $75.1 million tax benefit related to audit closures and expirations of the statute of limitations on various tax reserves, which reduced our effective tax rate by 36.7%. Our effective tax rate in fiscal 2019 includes $95.4 million tax expense for GILTI, which increased our effective tax rate by 46.7%. Our effective tax rate in fiscal 2019 includes a $90.6 million tax benefit for business realignment, which reduced our effective tax rate by 44.3%.
Our effective tax rate in fiscal 2018 includes $644.7 million of tax expense estimated on a provisional basis, calculated under SAB 118, related to the one-time transition tax on certain foreign earnings, $136.7 million of tax benefit estimated on a provisional basis related to the revaluation of our deferred tax assets and liabilities to the newly enacted U.S. statutory tax rate
48
of 21.0%, and $20.5 million of tax benefit estimated on a provisional basis related to the release of valuation allowances against our foreign tax credit carryforwards. These three adjustments increased (reduced) our effective tax rate by 87.4%, (18.5%), and (2.8%), respectively. Our effective tax rate in fiscal 2018 also includes a $17.0 million tax benefit received from current year generated R&D credits, which reduced our effective tax rate by 2.3%. Our effective tax rate in fiscal 2018 also includes a $27.2 million tax benefit for share-based compensation deductions, which reduced our effective tax rate by 3.7%. Our effective tax rate in fiscal 2018 also includes a $11.3 million benefit related to audit closures and expirations of the statute of limitations on various tax reserves, which reduced our effective tax rate by 1.5%.
We are subject to taxation in many jurisdictions in which we have operations. The effective tax rates that we pay in these jurisdictions vary widely, but they are generally lower than our combined U.S. federal and state effective tax rate. Our domestic statutory tax rate for the fiscal year ended March 31, 2020 was approximately 22% and our domestic statutory tax rate for the fiscal year ended March 31, 2019 was approximately 22%. Our non-U.S. blended statutory tax rates for the fiscal years ended March 31, 2020 and March 31, 2019 were much lower than this amount. The difference in rates applicable in foreign jurisdictions results from a number of factors, including lower statutory rates, tax holidays, financing arrangements and other factors. Our effective tax rate has been, and will continue to be impacted by the geographical dispersion of our earnings and losses.
Our foreign tax rate differential benefit primarily relates to our operations and assets in Thailand, Malta and Ireland. Our Thailand manufacturing operations are currently subject to numerous tax holidays granted to us based on our investment in property, plant and equipment in Thailand. Our tax holiday periods in Thailand expire at various times in the future; however, we actively seek to obtain new tax holidays, otherwise we will be subject to tax at the statutory tax rate of 20%. We do not expect the future expiration of any of our tax holiday periods in Thailand to have a material impact on our effective tax rate. Microsemi was previously granted a tax holiday in Malaysia, which expired in December 2019. The remaining material components of foreign income taxed at a rate lower than the U.S. are earnings accrued in Ireland at a 12.5% statutory tax rate and earnings accrued in Malta at a 0% to 5% tax rate.
Various taxing authorities in the U.S. and other countries in which we do business are increasing their scrutiny of the tax structures employed by businesses. Companies of our size and complexity are regularly audited by the taxing authorities in the jurisdictions in which they conduct significant operations. For U.S. federal, and in general for U.S. state tax returns, our fiscal 2007 and later tax returns remain effectively open for examination by the taxing authorities. We are currently being audited by the tax authorities in the United States and in various foreign jurisdictions. At this time, we do not know what the outcome of these audits will be. We record benefits for uncertain tax positions based on an assessment of whether it is more likely than not that the tax positions will be sustained based on their technical merits under currently enacted law. If this threshold is not met, no tax benefit of the uncertain tax position is recognized. If the threshold is met, we recognize the largest amount of the tax benefit that is more than 50% likely to be realized upon ultimate settlement.
On July 27, 2015, in Altera Corp. v. Commissioner, the U.S. Tax Court issued an opinion related to the treatment of stock-based compensation expense in an intercompany cost-sharing arrangement. In the July 2015 ruling, the Tax Court concluded that the sharing of the cost of employee stock compensation in a company’s cost-sharing arrangement was invalid under the U.S. Administrative Procedures Act. In June 2019, a panel of the Ninth Circuit of the U.S. Court of Appeals reversed this decision. In July 2019, Altera petitioned U.S. Court of Appeals for the Ninth Circuit to hold an en banc rehearing of the case. In November 2019, the en banc rehearing petition was denied, and Altera has asked the Supreme Court for a judicial review. Due to the uncertainty surrounding the status of the current regulations and questions related to the scope of potential benefits, we have not recorded any adjustments as of March 31, 2020. We will continue to monitor ongoing developments and potential impacts to our financial statements.
49
Liquidity and Capital Resources
We had $403.0 million in cash, cash equivalents and short-term investments at March 31, 2020, a decrease of $27.9 million from the March 31, 2019 balance.
Net cash provided by operating activities was $1.54 billion for fiscal 2020 compared to $1.67 billion for fiscal 2019. The decrease in net cash provided by operating activities in fiscal 2020 compared to fiscal 2019 was primarily due to lower net sales partially offset by increased operating cash flows resulting from synergies realized from our process efficiencies and restructuring activities related to our acquisition of Microsemi as well as working capital management.
Net cash used in investing activities was $133.2 million for fiscal 2020 compared to $6.81 billion for fiscal 2019. Fiscal 2020 investing cash flows primarily related to capital purchases and investments in other assets. Fiscal 2019 investing cash flows included net cash and cash equivalents used to finance our acquisition of Microsemi of $7.85 billion net of $340.0 million of cash and cash equivalents acquired, offset by net cash inflows of $1.29 billion due to the sale and maturity of available-for-sale debt securities to fund our acquisition of Microsemi, and capital expenditures of $228.9 million.
Our level of capital expenditures varies from time to time as a result of actual and anticipated business conditions. Capital expenditures were $67.6 million and $228.9 million in fiscal 2020 and fiscal 2019, respectively. Capital expenditures were primarily for the expansion of production capacity, the addition of research and development equipment and new office buildings. We currently intend to spend between $50 million and $70 million during the next twelve months to invest in equipment and facilities. We believe that the capital expenditures anticipated to be incurred over the next twelve months will be sufficient to maintain and operate our internal manufacturing operations, support the production capabilities for new products and technologies, as well as to selectively bring in-house some of the assembly and test operations that are currently outsourced. We expect to finance our capital expenditures through our existing cash balances and cash flows from operations.
Net cash used in financing activities was $1.44 billion for fiscal 2020 compared to net cash provided by financing activities of $4.66 billion for fiscal 2019. The cash flows provided by financing activities during fiscal 2019 were favorably impacted by the net proceeds from amounts borrowed to fund our acquisition of Microsemi. Significant transactions affecting our net financing cash flows include:
• | In fiscal 2020, gross proceeds of $615.0 million from term loans made under the Bridge Loan Facility used to settle $615.0 million in principal of our 2015 Senior Convertible debt, and $878.0 million and $188.0 million of cash used to pay down borrowings under our Revolving Credit Facility and our Term Loan Facility, respectively, |
• | In fiscal 2019, proceeds of $3.0 billion from term loans made under the Term Loan Facility, net proceeds of $3.27 billion from borrowings under our Revolving Credit Facility, net proceeds of $1.99 billion from the issuance of our Senior Secured Notes, $2.06 billion of cash used to repay Microsemi's existing debt, and $1.09 billion of cash used to pay down the principal of our Term Loan Facility, and |
• | In fiscal 2020 and fiscal 2019, we paid cash dividends to our stockholders of $350.1 million and $344.4 million, respectively. |
On May 29, 2018, we completed the acquisition of Microsemi Corporation, a publicly traded company headquartered in Aliso Viejo, California. We paid an aggregate of approximately $8.19 billion in cash to the stockholders of Microsemi. The total consideration transferred in the acquisition, including approximately $53.9 million of non-cash consideration for the exchange of certain share-based payment awards of Microsemi for stock awards for our common stock, was approximately $8.24 billion. In addition to the consideration transferred, we recognized $3.23 billion in liabilities in our consolidated financial statements of Microsemi consisting of debt, taxes payable and deferred, pension obligations, restructuring, and contingent and other liabilities of which $2.06 billion of existing debt was paid off. We financed the purchase price using approximately $8.10 billion of borrowings consisting of $3.10 billion of loans under our Revolving Credit Facility, $3.00 billion under the Term Loan Facility, and $2.00 billion in newly issued senior secured notes. We incurred $22.0 million in acquisition costs related to the acquisition. During fiscal 2020, we voluntarily prepaid $188.0 million of principal under the Term Loan Facility. During fiscal 2019, we voluntarily prepaid $1.09 billion of principal under the Term Loan Facility, of which $500.0 million was from funds borrowed under our Revolving Credit Facility. At March 31, 2020, we had $1.72 billion of outstanding borrowings under our Term Loan Facility compared to $1.91 billion at March 31, 2019.
In March 2020 and September 2019, we amended our credit agreement dated May 29, 2018, to, among other things, reduce the margin added to the interest rate on revolving loans under the Credit Agreement and amend certain negative covenants, including covenants that restrict our and our subsidiaries’ ability to, among other things, incur subsidiary indebtedness, grant
50
liens and enter into certain restrictive agreements. The amendments also allow us the option to factor receivables and certain related assets. The amendments lowered the Revolving Credit Facility thereunder to $3.57 billion from $3.60 billion.
The Credit Agreement provides for a revolving loan facility in an aggregate principal amount of approximately $3.57 billion, with a $250.0 million foreign currency sublimit, a $50.0 million letter of credit sublimit and a $25.0 million swingline loan sublimit. The Credit Agreement also provides for the Term Loan Facility. The Revolving Credit Facility consists of $3.57 billion of revolving loan commitments (the "2023 Revolving Loans") that terminate on May 18, 2023 (the "2023 Maturity Date"). The 2023 Revolving Loans bear interest, at our option, at the base rate plus a spread of 0.00% to 0.75% or an adjusted LIBOR rate plus a spread of 1.00% to 1.75%, in each case, with such spread being determined based on the consolidated senior leverage ratio for the preceding four fiscal quarter period. At March 31, 2020, we had $2.39 billion of outstanding borrowings under the Revolving Credit Facility compared to $3.27 billion at March 31, 2019. See Note 7 of the notes to our consolidated financial statements for more information regarding our Credit Agreement.
The enactment of the Act in 2017 imposed a tax on all previously untaxed earnings of non-U.S. subsidiaries of U.S. corporations. Due to this change, the jurisdiction in which our cash is at any given point in time no longer has a significant impact on our liquidity. Future distributions of a significant portion of our non-U.S. assets to the U.S. will no longer be subject to U.S. federal taxation. We intend to invest substantially all of our foreign subsidiary earnings, as well as our capital in our foreign subsidiaries, indefinitely outside of the U.S. in those jurisdictions in which we would incur significant, additional costs upon repatriation of such amounts.
We enter into derivative transactions from time to time in an attempt to reduce our exposure to currency rate fluctuations. Although none of the countries in which we conduct significant foreign operations has had a highly inflationary economy in the last five years, there is no assurance that inflation rates or fluctuations in foreign currency rates in countries where we conduct operations will not adversely affect our operating results in the future. At March 31, 2020, we had no foreign currency forward contracts outstanding.
There were no repurchases of common stock during fiscal 2020, 2019 and 2018. As of March 31, 2020, we held approximately 13.1 million shares as treasury shares.
On October 28, 2002, we announced that our Board of Directors had approved and instituted a quarterly cash dividend on our common stock. To date, our cumulative dividend payments have totaled approximately $4.2 billion. Cash dividends paid per share were $1.465, $1.457 and $1.449 during fiscal 2020, 2019 and 2018, respectively. Total dividend payments amounted to $350.1 million, $344.4 million and $337.5 million during fiscal 2020, 2019 and 2018, respectively. A quarterly dividend of $0.3675 per share was declared on May 7, 2020 and will be paid on June 4, 2020 to stockholders of record as of May 21, 2020. We expect the aggregate cash dividend for June 2020 to be approximately $90.3 million. Our Board is free to change our dividend practices at any time and to increase or decrease the dividend paid, or not to pay a dividend on our common stock on the basis of our results of operations, financial condition, cash requirements and future prospects, and other factors deemed relevant by our Board. Our current intent is to provide for ongoing quarterly cash dividends depending upon market conditions, our results of operations, and potential changes in tax laws.
We believe that our existing sources of liquidity combined with cash generated from operations and borrowings under our Revolving Credit Facility will be sufficient to meet our currently anticipated cash requirements for at least the next 12 months. However, the semiconductor industry is capital intensive. In order to remain competitive, we must constantly evaluate the need to make significant investments in capital equipment for both production and research and development. We may increase our borrowings under our Revolving Credit Facility or seek additional equity or debt financing from time to time to maintain or expand our wafer fabrication and product assembly and test facilities, for cash dividends, for share repurchases or for acquisitions or other purposes. The timing and amount of any such financing requirements will depend on a number of factors, including our level of dividend payments, changes in tax laws and regulations regarding the repatriation of offshore cash (including the impact of the Act), demand for our products, changes in industry conditions, product mix, competitive factors and our ability to identify suitable acquisition candidates. We may from time to time seek to refinance certain of our outstanding notes or convertible debt through issuances of new notes or convertible debt or through exchange transactions. Such issuances or exchanges, if any, will depend on prevailing market conditions, our ability to negotiate acceptable terms, our liquidity position and other factors. There can be no assurance that any financing will be available on acceptable terms due to unfavorable market conditions resulting from the COVID-19 virus or other factors, and any additional equity financing would result in incremental ownership dilution to our existing stockholders.
51
Contractual Obligations
The following table summarizes our significant contractual obligations at March 31, 2020, and the effect such obligations are expected to have on our liquidity and cash flows in future periods (in millions):
Payments Due by Period | |||||||||||||||||||
Total | Less than 1 year | 1 – 3 years | 3 – 5 years | More than 5 years | |||||||||||||||
Operating lease obligations | $ | 153.2 | $ | 49.2 | $ | 64.7 | $ | 20.4 | $ | 18.9 | |||||||||
Capital purchase obligations (1) | 20.4 | 20.4 | — | — | — | ||||||||||||||
Other purchase obligations and commitments (2) | 137.4 | 135.2 | 1.9 | 0.3 | — | ||||||||||||||
Revolving Credit Facility (3) | 2,551.3 | 52.7 | 103.2 | 2,395.4 | — | ||||||||||||||
Term Loan Facility (4) | 1,938.9 | 42.4 | 83.1 | 83.1 | 1,730.3 | ||||||||||||||
Bridge Loan Facility (5) | 628.8 | 628.8 | — | — | — | ||||||||||||||
2023 and 2021 Senior Notes | 2,210.6 | 82.6 | 1,106.3 | 1,021.7 | — | ||||||||||||||
2017 Senior Convertible Debt (6) | 2,305.5 | 33.6 | 67.3 | 67.3 | 2,137.3 | ||||||||||||||
2015 Senior Convertible Debt (7) | 1,200.2 | 18.0 | 36.1 | 1,146.1 | — | ||||||||||||||
2017 Junior Convertible Debt (8) | 948.5 | 15.4 | 30.9 | 30.9 | 871.3 | ||||||||||||||
Pension obligations (9) | 22.1 | 1.3 | 3.3 | 4.6 | 12.9 | ||||||||||||||
Transition tax obligation (10) | 243.8 | 23.2 | 46.4 | 101.6 | 72.6 | ||||||||||||||
Total contractual obligations (11) | $ | 12,360.7 | $ | 1,102.8 | $ | 1,543.2 | $ | 4,871.4 | $ | 4,843.3 | |||||||||
(1) | Capital purchase obligations represent commitments for construction or purchases of property, plant and equipment. These obligations were not recorded as liabilities on our balance sheet as of March 31, 2020, as we have not yet received the related goods or taken title to the property. |
(2) | Other purchase obligations and commitments include payments due under various types of licenses and outstanding purchase commitments with our wafer foundries. |
(3) | For purposes of this table, we have assumed that the principal of our 2023 revolving loans outstanding at March 31, 2020 will be paid on May 18, 2023, which is the maturity date of such borrowings. |
(4) | The Term Loan Facility matures on May 29, 2025. |
(5) | The Bridge Loan Facility matures on March 26, 2021. |
(6) | For purposes of this table, we have assumed that the principal of our 2017 Senior Convertible Debt will be paid on February 15, 2027, which is the maturity date of such debt. |
(7) | For purposes of this table, we have assumed that the principal of our 2015 Senior Convertible Debt will be paid on February 15, 2025, which is the maturity date of such debt. |
(8) | For purposes of this table, we have assumed that the principal of our 2017 Junior Convertible Debt will be paid on February 15, 2037, which is the maturity date of such debt. |
(9) | For purposes of this table, pension obligations due in more than 5 years represent the expected pension payments from 2026 through 2030. It excludes pension obligations subsequent to 2030. |
(10) | During fiscal 2018, we recognized a provisionary one-time transition tax on accumulated unrepatriated foreign earnings, estimated at $644.7 million, as a result of the Act. As of December 31, 2018, with the conclusion of the measurement period in accordance with SAB 118, we increased this amount by $13.1 million to $657.8 million, of which we expect cash payments of approximately $290.3 million after offsets by the utilization of various tax attribute carryforwards in the U.S. This tax is payable over a period of eight years, with 8% of the transition tax payable each year for fiscal 2019 through fiscal 2023, and 15%, 20%, and 25%, respectively, payable during fiscal 2024, 2025, and 2026. |
(11) | The contractual obligations do not include amounts related to uncertain tax positions because reasonable estimates cannot be made. |
Purchase orders or contracts for the purchase of raw materials and other goods and services, with the exception of commitments to our wafer foundries, are not included in the table above. We are not able to determine the aggregate amount of such purchase orders that represent contractual obligations, as purchase orders may represent authorizations to purchase
52
rather than binding agreements. For the purpose of this table, contractual obligations for the purchase of goods or services are defined as agreements that are enforceable and legally binding on us and that specify all significant terms, including: fixed or minimum quantities to be purchased; fixed, minimum or variable price provisions; and the approximate timing of the transaction. Our purchase orders are based on our current manufacturing needs and are fulfilled by our vendors with short time horizons. We do not have significant agreements for the purchase of raw materials or other goods specifying minimum quantities or set prices that exceed our expected requirements for three months. We also enter into contracts for outsourced services; however, the obligations under these contracts were not significant and the contracts generally contain clauses allowing for cancellation without significant penalty.
The expected timing of payment of the obligations discussed above is estimated based on current information. Timing of payments and actual amounts paid may be different depending on the time of receipt of goods or services or changes to agreed-upon amounts for some obligations.
Off-Balance Sheet Arrangements (Including Guarantees)
As of March 31, 2020, we are not involved in any off-balance sheet arrangements, as defined in Item 303(a)(4)(ii) of SEC Regulation S-K with the exception of standby letters of credit or other guarantee instruments to certain parties as required for certain transactions initiated by us or our subsidiaries. We have not recorded any liability in connection with these guarantee arrangements. Based on historical experience and information currently available, we believe we will not be required to make any payments under these guarantee arrangements. Prior to fiscal 2020, we did not record any liability in connection with various operating leases for buildings and equipment entered into in the ordinary course of business. We recorded the associated lease obligations as a liability when we adopted the provisions of the Accounting Standard Update 2016-02-Leases, which was effective April 1, 2019. Refer to Note 1 and Note 11 to our consolidated financial statements for additional information regarding the adoption of this accounting standard.
Recently Issued Accounting Pronouncements
Refer to Note 1 to our consolidated financial statements regarding recently issued accounting pronouncements.
Item 7A. Quantitative and Qualitative Disclosures About Market Risk
As of March 31, 2020, our long-term debt totaled $10.59 billion. We have no interest rate exposure to rate changes on our fixed rate debt, which totaled $5.86 billion as of March 31, 2020. We do have interest rate exposure with respect to the $4.73 billion balance of our variable interest rate debt outstanding as of March 31, 2020. A 50 basis point increase in interest rates would impact our expected annual interest expense for the next 12 months by approximately $23.6 million.
Item 8. Financial Statements and Supplementary Data
The consolidated financial statements listed in the index appearing under Item 15(a)(1) hereof are filed as part of this Form 10-K. See also Index to Financial Statements below.
Item 9. Changes in and Disagreements with Accountants on Accounting and Financial Disclosure
None.
Item 9A. Controls and Procedures
Evaluation of Disclosure Controls and Procedures
As of the end of the period covered by this Annual Report on Form 10-K, as required by paragraph (b) of Rule 13a-15 or Rule 15d-15 under the Securities Exchange Act of 1934, as amended (the "Exchange Act"), we evaluated under the supervision of our Chief Executive Officer and our Chief Financial Officer, the effectiveness of our disclosure controls and procedures (as defined in Rules 13a-15(e) or 15d-15(e) of the Exchange Act. Based on this evaluation, our Chief Executive Officer and our Chief Financial Officer have concluded that our disclosure controls and procedures were effective to ensure that information we are required to disclose in reports that we file or submit under the Exchange Act (i) is recorded, processed, summarized and reported within the time periods specified in Securities and Exchange Commission rules and forms, and (ii) is accumulated and communicated to our management, including our Chief Executive Officer and our Chief Financial Officer, as appropriate to allow timely decisions regarding required disclosure. Our disclosure controls and procedures are designed to provide reasonable assurance that such information is accumulated and communicated to our management. Our disclosure controls and
53
procedures include components of our internal control over financial reporting. Management's assessment of the effectiveness of our internal control over financial reporting is expressed at the level of reasonable assurance because a control system, no matter how well designed and operated, can provide only reasonable, but not absolute, assurance that the control system's objectives will be met.
Management Report on Internal Control Over Financial Reporting
Our management, including our principal executive officer and our principal financial officer, is responsible for establishing and maintaining adequate internal control over financial reporting to provide reasonable assurance regarding the reliability of our financial reporting and the preparation of financial statements for external purposes in accordance with generally accepted accounting principles. Internal control over financial reporting includes those policies and procedures that (i) pertain to the maintenance of records that in reasonable detail accurately and fairly reflect the transactions and dispositions of the assets of the company; (ii) provide reasonable assurance that transactions are recorded as necessary to permit preparation of financial statements in accordance with generally accepted accounting principles, and that receipts and expenditures of the company are being made only in accordance with authorizations of management and directors of the company; and (iii) provide reasonable assurance regarding prevention or timely detection of unauthorized acquisition, use or disposition of our assets that could have a material effect on our financial statements.
Management assessed our internal control over financial reporting as of March 31, 2020, the end of our fiscal year. Management based its assessment on criteria established in Internal Control – Integrated Framework (2013 framework) issued by the Committee of Sponsoring Organizations of the Treadway Commission. Management's assessment included an evaluation of such elements as the design and operating effectiveness of key financial reporting controls, process documentation, accounting policies, and our overall control environment. This assessment is supported by testing and monitoring performed by our finance organization.
Based on our assessment, management has concluded that our internal control over financial reporting was effective as of the end of the fiscal year to provide reasonable assurance regarding the reliability of financial reporting and the preparation of financial statements for external reporting purposes in accordance with generally accepted accounting principles. We reviewed the results of management's assessment with the Audit Committee of our Board of Directors.
Ernst & Young LLP, an independent registered public accounting firm, who audited our consolidated financial statements included in this Form 10-K has issued an attestation report on our internal control over financial reporting as of March 31, 2020, which is included on page F-5.
Changes in Internal Control over Financial Reporting
As previously described in Part II, Item 9A of our Annual Report on Form 10-K for the fiscal year ended March 31, 2019, we identified a material weakness in our internal controls related to accounting for income taxes and we also identified a material weakness in our internal controls related to IT system access. Both of these material weaknesses were remediated as of March 31, 2020. During the three months ended March 31, 2020, we transitioned certain of Microsemi's processes to our internal control processes and we expect to transition more of such processes throughout the remainder of calendar year 2020. Other than with respect to the remediation efforts and our transition of Microsemi to our systems and control environment as described above, during the three months ended March 31, 2020, there was no change in our internal control over financial reporting identified in connection with the evaluation required by paragraph (d) of Rule 13a-15 or Rule 15d-15 that has materially affected, or is reasonably likely to materially affect, our internal control over financial reporting.
54
Item 9B. Other Information
J. Eric Bjornholt, our Senior Vice President, Chief Financial Officer, Mitch Little, our Senior Vice President, Worldwide Client Engagement, Steve Drehobl, our Senior Vice President, MCU8 and MCU16 Business Units, and Rich Simoncic, our Senior Vice President, Analog Power and Interface Business Units, have entered into trading plans as contemplated by Rule 10b-5-1 under the Exchange Act and periodic sales of our common stock have occurred and are expected to occur under such plans.
The foregoing disclosure is being made on a voluntary basis and not pursuant to any specific requirement under Form 10‑K, Form 8‑K or otherwise.
55
PART III
Item 10. Directors, Executive Officers and Corporate Governance
Information on the members of our Board of Directors is incorporated herein by reference to our proxy statement for our 2020 annual meeting of stockholders under the captions "The Board of Directors," and "Proposal One – Election of Directors."
Information on the composition of our audit committee and the members of our audit committee, including information on our audit committee financial experts, is incorporated by reference to our proxy statement for our 2020 annual meeting of stockholders under the caption "The Board of Directors – Committees of the Board of Directors – Audit Committee."
Information on our executive officers is provided in Item 1, Part I of this Form 10-K under the caption "Executive Officers of the Registrant" at page 11, above.
Information with respect to our code of ethics that applies to our directors, executive officers (including our principal executive officer and our principal financial and accounting officer) and employees is incorporated by reference to our proxy statement for our 2020 annual meeting of stockholders under the caption "Code of Business Conduct and Ethics." A copy of our Code of Business Conduct and Ethics is available on our website at the Investor Relations section under Mission Statement/Corporate Governance on www.microchip.com.
Information regarding material changes, if any, to procedures by which security holders may recommend nominees to our Board of Directors is incorporated by reference to our proxy statement for the 2020 annual meeting of stockholders under the caption "Requirements, Including Deadlines, for Receipt of Stockholder Proposals for the 2020 Annual Meeting of Stockholders; Discretionary Authority to Vote on Stockholder Proposals."
Item 11. Executive Compensation
Information with respect to executive compensation is incorporated herein by reference to the information under the caption "Executive Compensation" in our proxy statement for our 2020 annual meeting of stockholders.
Information with respect to director compensation is incorporated herein by reference to the information under the caption "The Board of Directors – Director Compensation" in our proxy statement for our 2020 annual meeting of stockholders.
Information with respect to compensation committee interlocks and insider participation in compensation decisions is incorporated herein by reference to the information under the caption "The Board of Directors – Compensation Committee Interlocks and Insider Participation" in our proxy statement for our 2020 annual meeting of stockholders.
Our Board compensation committee report on executive compensation is incorporated herein by reference to the information under the caption "Executive Compensation – Compensation Committee Report on Executive Compensation" in our proxy statement for our 2020 annual meeting of stockholders.
Item 12. Security Ownership of Certain Beneficial Owners and Management and Related Stockholder Matters
Information with respect to securities authorized for issuance under our equity compensation plans is incorporated herein by reference to the information under the caption "Executive Compensation – Equity Compensation Plan Information" in our proxy statement for our 2020 annual meeting of stockholders.
Information with respect to security ownership of certain beneficial owners, members of our Board of Directors and management is incorporated herein by reference to the information under the caption "Security Ownership of Principal Stockholders, Directors and Executive Officers" in our proxy statement for our 2020 annual meeting of stockholders.
56
Item 13. Certain Relationships and Related Transactions, and Director Independence
The information required by this Item pursuant to Item 404 of Regulation S-K is incorporated by reference to the information under the caption "Certain Transactions" contained in our proxy statement for our 2020 annual meeting of stockholders.
The information required by this Item pursuant to Item 407(a) of Regulation S-K regarding the independence of our directors is incorporated by reference to the information under the caption "Meetings of the Board of Directors" contained in our proxy statement for our 2020 annual meeting of stockholders.
Item 14. Principal Accountant Fees and Services
The information required by this Item related to principal accountant fees and services as well as related pre-approval policies is incorporated by reference to the information under the caption "Independent Registered Public Accounting Firm" contained in our proxy statement for our 2020 annual meeting of stockholders.
57
PART IV
Item 15. Exhibits and Financial Statement Schedules
(a) The following documents are filed as part of this Form 10-K:
Page No. | ||
(1) | Financial Statements: | |
Report of Independent Registered Public Accounting Firm | ||
Report of Independent Registered Public Accounting Firm on Internal Control Over Financial Reporting | ||
Consolidated Balance Sheets as of March 31, 2020 and 2019 | ||
Consolidated Statements of Income for each of the three years in the period ended March 31, 2020 | ||
Consolidated Statements of Comprehensive Income for each of the three years in the period ended March 31, 2020 | ||
Consolidated Statements of Cash Flows for each of the three years in the period ended March 31, 2020 | ||
Consolidated Statements of Changes in Equity for each of the three years in the period ended March 31, 2020 | ||
Notes to Consolidated Financial Statements | ||
(2) | Financial Statement Schedules | None |
(3) | The Exhibits filed with this Form 10-K or incorporated herein by reference are set forth in the Exhibit Index beginning on page 60 hereof, which Exhibit Index is incorporated herein by this reference. | |
(b) See Item 15(a)(3) above.
(c) See "Index to Financial Statements" included under Item 8 to this Form 10-K.
58
Item 16. Form 10-K Summary
Not applicable.
59
EXHIBIT INDEX
Incorporated by Reference | ||||||||||||
Exhibit Number | Exhibit Description | Form | File Number | Exhibit | Filing Date | Included Herewith | ||||||
2.2 | 8-K | 000-21184 | 2.1 | 3/2/2018 | ||||||||
3.1 | 10-Q | 000-21184 | 3.1 | 11/12/2002 | ||||||||
3.2 | 8-K | 000-21184 | 3.1 | 5/24/2019 | ||||||||
4.1 | 8-K | 000-21184 | 4.1 | 2/11/2015 | ||||||||
4.2 | 8-K | 000-21184 | 4.1 | 2/15/2017 | ||||||||
4.3 | 8-K | 000-21184 | 4.3 | 2/15/2017 | ||||||||
4.4** | X | |||||||||||
10.1 | 8-K | 000-21184 | 10.1 | 11/13/2017 | ||||||||
10.2 | 8-K | 000-21184 | 10.1 | 9/1/2017 | ||||||||
10.3 | 10-K | 000-21184 | 10.1 | 5/27/2015 | ||||||||
10.4 | 8-K | 000-21184 | 10.1 | 5/18/2018 | ||||||||
10.5 | 8-K | 000-21184 | 10.1 | 10/1/2019 | ||||||||
10.6 | 8-K | 000-21184 | 10.1 | 3/24/2020 | ||||||||
60
EXHIBIT INDEX
Incorporated by Reference | ||||||||||||
Exhibit Number | Exhibit Description | Form | File Number | Exhibit | Filing Date | Included Herewith | ||||||
10.7 | 8-K | 000-21184 | 10.2 | 2/8/2017 | ||||||||
10.8 | 8-K | 000-21184 | 10.2 | 3/27/2020 | ||||||||
10.9 | 8-K | 000-21184 | 10.1 | 3/27/2020 | ||||||||
10.10 | 8-K | 000-21184 | 10.3 | 3/27/2020 | ||||||||
10.11 | 8-K | 000-21184 | 10.1 | 3/2/2018 | ||||||||
10.12 | Form of Indemnification Agreement between Registrant and its directors and certain of its officers [Paper filing not on SEC website.] | S-1 | 33-57960 | 10.1 | 2/5/1993 | |||||||
10.13 | S-8 | 333-183074 | 4.8 | 8/3/2012 | ||||||||
10.14* | 8-K | 000-21184 | 10.1 | 5/24/2019 | ||||||||
10.15* | 10-Q | 000-21184 | 10.1 | 2/4/2020 | ||||||||
10.16* | S-8 | 333-192273 | 10.2 | 11/12/2013 | ||||||||
10.17* | S-8 | 333-192273 | 10.3 | 11/12/2013 | ||||||||
10.18* | S-8 | 333-119939 | 4.5 | 10/25/2004 | ||||||||
10.19* | 10-K | 000-21184 | 10.6 | 5/31/2006 | ||||||||
10.20* | 10-Q | 000-21184 | 10.3 | 11/7/2007 | ||||||||
10.21* | 10-Q | 000-21184 | 10.4 | 11/7/2007 | ||||||||
10.22* | 8-K | 000-21184 | 10.1 | 9/27/2010 | ||||||||
61
EXHIBIT INDEX
Incorporated by Reference | ||||||||||||
Exhibit Number | Exhibit Description | Form | File Number | Exhibit | Filing Date | Included Herewith | ||||||
10.23* | 10-K | 000-21184 | 10.17 | 5/30/2019 | ||||||||
10.24* | 10-K | 000-21184 | 10.18 | 5/30/2019 | ||||||||
10.25* | 10-K | 000-21184 | 10.19 | 5/30/2019 | ||||||||
10.26* | 10-K | 000-21184 | 10.20 | 5/30/2019 | ||||||||
10.27* | 8-K | 000-21184 | 10.1 | 1/7/2020 | ||||||||
10.28* | 10-K | 000-21184 | 10.21 | 5/30/2019 | ||||||||
10.29* | 10-K | 000-21184 | 10.22 | 5/30/2019 | ||||||||
10.30* | 8-K | 000-21184 | 10.1 | 8/18/2016 | ||||||||
10.31* | 8-K | 000-21184 | 10.3 | 8/24/2006 | ||||||||
10.32* | 10-K | 000-21184 | 10.21 | 5/30/2013 | ||||||||
10.33* | S-8 | 333-101696 | 4.1.1 | 12/6/2002 | ||||||||
10.34* | S-8 | 333-101696 | 4.1.3 | 12/6/2002 | ||||||||
10.35* | S-8 | 333-101696 | 4.1.4 | 12/6/2002 | ||||||||
10.36* | 10-K | 000-21184 | 10.28 | 6/5/2003 | ||||||||
10.37* | 10-Q | 000-21184 | 10.1 | 2/9/2006 | ||||||||
10.38* | 10-K | 000-21184 | 10.28 | 5/24/2016 | ||||||||
10.39* | 8-K | 000-21184 | 10.1 | 12/18/2008 | ||||||||
10.40* | 8-K | 000-21184 | 10.2 | 12/18/2008 | ||||||||
10.41 | 10-Q | 000-21184 | 10.1 | 2/13/1998 | ||||||||
10.42 | 10-K | 000-21184 | 10.14 | 5/15/2001 | ||||||||
10.43 | 10-Q | 000-21184 | 10.2 | 2/13/1998 | ||||||||
62
EXHIBIT INDEX
Incorporated by Reference | ||||||||||||
Exhibit Number | Exhibit Description | Form | File Number | Exhibit | Filing Date | Included Herewith | ||||||
21.1** | X | |||||||||||
23.1** | X | |||||||||||
24.1** | X | |||||||||||
31.1** | X | |||||||||||
31.2** | X | |||||||||||
32** | X | |||||||||||
101.INS | XBRL Instance Document - the instance document does not appear in the Interactive File because its XBRL tags are embedded within the Inline XBRL document | X | ||||||||||
101.SCH | XBRL Taxonomy Extension Schema Document | X | ||||||||||
101.CAL | Taxonomy Extension Calculation Linkbase Document | X | ||||||||||
101.DEF | XBRL Taxonomy Extension Definition Linkbase Document | X | ||||||||||
101.LAB | XBRL Taxonomy Extension Label Linkbase Document | X | ||||||||||
101.PRE | XBRL Taxonomy Presentation Linkbase Document | X | ||||||||||
104 | Cover Page Interactive Data File - the cover page XBRL tags are embedded within the Inline XBRL document. | X | ||||||||||
*Compensation plans or arrangements in which directors or executive officers are eligible to participate | ||||||||||||
** Furnished herewith | ||||||||||||
63
Signatures
Pursuant to the requirements of Section 13 or 15(d) of the Securities Exchange Act of 1934, the registrant has duly caused this report to be signed on its behalf by the undersigned, thereunto duly authorized.
MICROCHIP TECHNOLOGY INCORPORATED | |
(Registrant) | |
May 21, 2020 | By: /s/ Steve Sanghi |
Steve Sanghi | |
Chief Executive Officer and Chairman of the Board | |
64
Power of Attorney
KNOW ALL PERSONS BY THESE PRESENTS, that the undersigned officer or director of Microchip Technology Incorporated, a Delaware corporation (the "Company"), does hereby constitute and appoint each of STEVE SANGHI and J. ERIC BJORNHOLT, with full power to each of them to act alone, as the true and lawful attorneys and agents of the undersigned, with full power of substitution and resubstitution to each of said attorneys to execute, file or deliver any and all instruments and to do any and all acts and things which said attorneys and agents, or any of them, deem advisable to enable the Company to comply with the Securities Exchange Act of 1934, as amended, and any requirements of the Securities and Exchange Commission in respect thereto relating to this annual report on Form 10-K, including specifically, but without limitation of the general authority hereby granted, the power and authority to sign such person's name individually and on behalf of the Company as an officer or director (as indicated below opposite such person's signature) to the Company's annual report on Form 10-K or any amendments or supplements thereto; and each of the undersigned does hereby fully ratify and confirm all that said attorneys and agents or any of them, shall do or cause to be done by virtue hereof. This Power of Attorney revokes any and all previous powers of attorney granted by any of the undersigned which such power would have entitled said attorneys and agents, or any of them, to sign such person's name, individually or on behalf of the Company, to any Form 10-K.
IN WITNESS WHEREOF, each of the undersigned has executed the foregoing power of attorney on this 21st day of May, 2020.
Pursuant to the requirements of the Securities Exchange Act of 1934, this report has been signed below by the following persons on behalf of the registrant and in the capacities and on the dates indicated.
Name and Signature | Title | Date | |||
/s/ Steve Sanghi | Chief Executive Officer and Chairman of the Board | May 21, 2020 | |||
Steve Sanghi | (Principal Executive Officer) | ||||
/s/ Matthew W. Chapman | Director | May 21, 2020 | |||
Matthew W. Chapman | |||||
/s/ L.B. Day | Director | May 21, 2020 | |||
L.B. Day | |||||
/s/ Esther L. Johnson | Director | May 21, 2020 | |||
Esther L. Johnson | |||||
/s/ Wade F. Meyercord | Director | May 21, 2020 | |||
Wade F. Meyercord | |||||
/s/ J. Eric Bjornholt | Senior Vice President and Chief Financial Officer | May 21, 2020 | |||
J. Eric Bjornholt | (Principal Financial and Accounting Officer) | ||||
65
Annual Report on Form 10-K
Item 8, Item 15(a)(1) and (2), (b) and (c)
_________________________________
INDEX TO FINANCIAL STATEMENTS
CONSOLIDATED FINANCIAL STATEMENTS
EXHIBITS
_________________________________
YEAR ENDED MARCH 31, 2020
MICROCHIP TECHNOLOGY INCORPORATED
AND SUBSIDIARIES
CHANDLER, ARIZONA
MICROCHIP TECHNOLOGY INCORPORATED AND SUBSIDIARIES
Index to Consolidated Financial Statements
Page Number | |
Report of Independent Registered Public Accounting Firm | |
Report of Independent Registered Public Accounting Firm on Internal Control Over Financial Reporting | |
Consolidated Balance Sheets as of March 31, 2020 and 2019 | |
Consolidated Statements of Income for each of the three years in the period ended March 31, 2020 | |
Consolidated Statements of Comprehensive Income for each of the three years in the period ended March 31, 2020 | |
Consolidated Statements of Cash Flows for each of the three years in the period ended March 31, 2020 | |
Consolidated Statements of Changes in Equity for each of the three years in the period ended March 31, 2020 | |
Notes to Consolidated Financial Statements | |
i
Report of Independent Registered Public Accounting Firm
To the Shareholders and the Board of Directors of Microchip Technology Incorporated
Opinion on the Financial Statements
We have audited the accompanying consolidated balance sheets of Microchip Technology Incorporated (the Company) as of March 31, 2020 and 2019, the related consolidated statements of income, comprehensive income, changes in equity and cash flows for each of the three years in the period ended March 31, 2020, and the related notes (collectively referred to as the “consolidated financial statements”). In our opinion, the consolidated financial statements present fairly, in all material respects, the financial position of the Company at March 31, 2020 and 2019, and the results of its operations and its cash flows for each of the three years in the period ended March 31, 2020, in conformity with U.S. generally accepted accounting principles.
We also have audited, in accordance with the standards of the Public Company Accounting Oversight Board (United States) (PCAOB), the Company's internal control over financial reporting as of March 31, 2020, based on criteria established in Internal Control-Integrated Framework issued by the Committee of Sponsoring Organizations of the Treadway Commission (2013 framework), and our report dated May 21, 2020 expressed an unqualified opinion thereon.
Basis for Opinion
These financial statements are the responsibility of the Company's management. Our responsibility is to express an opinion on the Company’s financial statements based on our audits. We are a public accounting firm registered with the PCAOB and are required to be independent with respect to the Company in accordance with the U.S. federal securities laws and the applicable rules and regulations of the Securities and Exchange Commission and the PCAOB.
We conducted our audits in accordance with the standards of the PCAOB. Those standards require that we plan and perform the audit to obtain reasonable assurance about whether the financial statements are free of material misstatement, whether due to error or fraud. Our audits included performing procedures to assess the risks of material misstatement of the financial statements, whether due to error or fraud, and performing procedures that respond to those risks. Such procedures included examining, on a test basis, evidence regarding the amounts and disclosures in the financial statements. Our audits also included evaluating the accounting principles used and significant estimates made by management, as well as evaluating the overall presentation of the financial statements. We believe that our audits provide a reasonable basis for our opinion.
Critical Audit Matters
The critical audit matters communicated below are matters arising from the current period audit of the financial statements that were communicated or required to be communicated to the audit committee and that: (1) relate to accounts or disclosures that are material to the financial statements and (2) involved our especially challenging, subjective or complex judgments. The communication of critical audit matters does not alter in any way our opinion on the consolidated financial statements, taken as a whole, and we are not, by communicating the critical audit matters below, providing separate opinions on the critical audit matters or on the accounts or disclosures to which they relate.
F-1
Inventory Valuation
Description of the Matter | The Company's inventories totaled $685.7 million as of March 31, 2020. As explained in Note 1 to the consolidated financial statements, the Company assesses the valuation of inventory each reporting period based on the lower of cost or net realizable value. The Company primarily reserves for obsolete and unmarketable inventory based on inventory on hand in excess of 12-month forecast demand. Estimated 12-month forecast demand is generally determined based on annualized sales using the prior three-month period. The Company uses the most recently developed sales forecast to refine the estimated demand to adjust for circumstances in which historical sales are not expected to be representative of future demand including new products with little or no historical demand, products being replaced or discontinued for which demand is expected to decrease, or other customer specific or economic factors. Auditing management's estimates for obsolete or unmarketable inventory involved subjective auditor judgment because the assumptions used to make the estimate require judgments about future market and economic conditions outside the Company's control. In particular, the adjustments to the obsolete or unmarketable inventory estimates are sensitive to significant assumptions impacting forecast demand, including changes in economic and market conditions such as the impacts of COVID-19. | |
How We Addressed the Matter in Our Audit | We obtained an understanding, evaluated the design, and tested the operating effectiveness of internal controls over the Company's obsolete or unmarketable inventory estimation process, including management's assessment of the assumptions and data underlying the obsolete or unmarketable inventory reserves. Our substantive audit procedures included, among others, evaluating the significant assumptions stated above and the accuracy and completeness of the underlying data used in management's obsolete or unmarketable inventory assessment. We compared on-hand inventories to demand forecasts, assessed the reasonableness of management’s demand forecasts through testing historical sales quantities, and evaluated adjustments to demand forecasts for specific product considerations, such as specific customer demand. We also assessed the historical accuracy of management's estimates and the related assumptions by performing a retrospective review on the accuracy of prior period demand forecast estimates. | |
F-2
Estimating Variable Consideration for Distributor Sales
Description of the Matter | The Company's sales arrangements provide certain distributors with price concessions and product return rights, which results in variable consideration. During the year ended March 31, 2020, approximately $2,626.9 million of the Company's total $5,274.2 million in net sales represents sales to distributors, which has been adjusted for estimates of the price concessions and product return rights that are expected to be claimed. As explained in Note 1 to the consolidated financial statements, the Company estimates the amount of consideration to which it will be entitled using recent historical data and applying the expected value method. The Company records a reduction of the original sale amount for the estimated variable consideration resulting from price concessions and product returns. At March 31, 2020, such reserves totaled $353.0 million. Auditing management's estimates of variable consideration resulting from price concessions and product returns under the distributor contracts involved subjective auditor judgment because the estimates rely on a number of factors that are forward-looking and could be affected by future economic and market conditions including the impacts of COVID-19. The estimated concession and return rates are generally made using recent, observable experience from the prior quarter. The recent experience is evaluated to determine whether adjustments to the concession rates are needed for changing market or economic conditions. For example, estimated variable consideration resulting from price concessions and product returns included in the transaction price reflects management's evaluation of contractual terms, historical experience and assumptions about future economic conditions. Changes in those assumptions can have a material effect on the amount of variable consideration recognized. | |
How We Addressed the Matter in Our Audit | We obtained an understanding, evaluated the design, and tested the operating effectiveness of internal controls over the Company's process to calculate the variable consideration resulting from price concessions and product returns, including management's assessment of the price concession and return rate assumptions and data underlying the estimate. Our substantive audit procedures included, among others, evaluating the significant assumptions and the accuracy and completeness of the underlying data used in management's estimate. This included comparing management’s accrual for future price concessions at a disaggregated level to historical results and testing value of the inventory held by distributors at the end of the period through a combination of inspection of source documentation for transactions executed during the period and confirmations with the distributors. We confirmed contractual terms and conditions directly with a selection of distributor customers. We evaluated whether recent return and concession experience from the prior quarter is a reasonable approximation for expected future concessions in consideration of the current market conditions. In addition, we assessed the historical accuracy of management's estimates for variable consideration resulting from price concessions and product returns and the related assumptions by performing a retrospective review on the accuracy of prior period estimates. | |
F-3
Unrecognized Tax Benefits
Description of the Matter | As more fully described in Note 13 to the consolidated financial statements, the Company operates in a number of tax jurisdictions and its income tax returns are subject to examination by tax authorities in those jurisdictions that may challenge any tax position on these returns. Because the matters challenged by authorities are typically complex and subject to interpretation, their ultimate outcome is uncertain. The Company uses significant judgment in (1) determining whether a tax position’s technical merits are more-likely-then-not to be sustained, and (2) measuring the amount of tax benefit that qualifies for recognition. As of March 31, 2020, the Company recognized accrued liabilities for unrecognized tax benefits associated with various tax positions totaling $757.3 million. Auditing the recognition and measurement of the Company's tax transactions (in particular, intra-group intellectual property right transfers) and positions was challenging because the conclusions regarding the recognition and measurement of the tax positions is complex and highly subjective judgments are made by management to evaluate the technical merits of each position, which are based on interpretations of complex tax laws as well as administrative and legal rulings. In certain cases, the Company’s conclusions involved valuation methodologies and subjective assumptions such as revenue growth rates, measures of profitability, terminal rates, and discount rates. | |
How We Addressed the Matter in Our Audit | We evaluated the design and tested the operating effectiveness of internal controls over the Company’s process to assess the technical merits and measurement of unrecognized tax benefits. For example, we tested management’s review of the inputs into intellectual property valuations and management’s assessment of other third-party information used in the evaluation of the completeness and measurement of unrecognized tax benefits. Our audit procedures included, among others, evaluating the assumptions the Company used to develop its tax positions and related unrecognized income tax benefit amounts by jurisdiction and testing the completeness and accuracy of the underlying data used by the Company to calculate its uncertain tax positions. We involved our tax professionals to assist us with obtaining an understanding of the Company’s tax structure, assessing the Company’s compliance with tax laws, related developments in administrative rulings and court cases, identifying tax law changes in jurisdictions that may impact the Company’s unrecognized tax benefits and assessing the technical merits of the Company’s tax positions. This included assessing the Company’s correspondence with the relevant tax authorities and evaluating income tax opinions or other third-party advice obtained by the Company. We also used our knowledge of, and experience with, the application of international and local income tax laws to evaluate the Company’s accounting for its tax positions. For certain material tax positions related to intra-group transactions, we assessed the assumptions and pricing methods used in setting arm’s length prices and the documentation to support the pricing, and used our tax and valuation professionals to assist in testing certain significant assumptions and pricing methods. We have also evaluated the Company’s income tax disclosures included in Note 13 in relation to these matters. | |
/s/ Ernst & Young LLP
We have served as the Company’s auditor since 2001.
Phoenix, Arizona
May 21, 2020
F-4
Report of Independent Registered Public Accounting Firm
To the Shareholders and the Board of Directors of Microchip Technology Incorporated
Opinion on Internal Control Over Financial Reporting
We have audited Microchip Technology Incorporated’s internal control over financial reporting as of March 31, 2020, based on criteria established in Internal Control-Integrated Framework issued by the Committee of Sponsoring Organizations of the Treadway Commission (2013 framework) (the COSO criteria). In our opinion, Microchip Technology Incorporated (the Company) maintained, in all material respects, effective internal control over financial reporting as of March 31, 2020, based on the COSO criteria.
We also have audited, in accordance with the standards of the Public Company Accounting Oversight Board (United States) (PCAOB), the consolidated balance sheets of the Company as of March 31, 2020 and 2019, the related consolidated statements of income, comprehensive income, changes in equity and cash flows for each of the three years in the period ended March 31, 2020, and the related notes and our report dated May 21, 2020 expressed an unqualified opinion thereon.
Basis for Opinion
The Company’s management is responsible for maintaining effective internal control over financial reporting and for its assessment of the effectiveness of internal control over financial reporting included in the accompanying Management Report on Internal Control over Financial Reporting. Our responsibility is to express an opinion on the Company’s internal control over financial reporting based on our audit. We are a public accounting firm registered with the PCAOB and are required to be independent with respect to the Company in accordance with the U.S. federal securities laws and the applicable rules and regulations of the Securities and Exchange Commission and the PCAOB.
We conducted our audit in accordance with the standards of the PCAOB. Those standards require that we plan and perform the audit to obtain reasonable assurance about whether effective internal control over financial reporting was maintained in all material respects.
Our audit included obtaining an understanding of internal control over financial reporting, assessing the risk that a material weakness exists, testing and evaluating the design and operating effectiveness of internal control based on the assessed risk, and performing such other procedures as we considered necessary in the circumstances. We believe that our audit provides a reasonable basis for our opinion.
Definition and Limitations of Internal Control Over Financial Reporting
A company’s internal control over financial reporting is a process designed to provide reasonable assurance regarding the reliability of financial reporting and the preparation of financial statements for external purposes in accordance with generally accepted accounting principles. A company’s internal control over financial reporting includes those policies and procedures that (1) pertain to the maintenance of records that, in reasonable detail, accurately and fairly reflect the transactions and dispositions of the assets of the company; (2) provide reasonable assurance that transactions are recorded as necessary to permit preparation of financial statements in accordance with generally accepted accounting principles, and that receipts and expenditures of the company are being made only in accordance with authorizations of management and directors of the company; and (3) provide reasonable assurance regarding prevention or timely detection of unauthorized acquisition, use, or disposition of the company’s assets that could have a material effect on the financial statements.
Because of its inherent limitations, internal control over financial reporting may not prevent or detect misstatements. Also, projections of any evaluation of effectiveness to future periods are subject to the risk that controls may become inadequate because of changes in conditions, or that the degree of compliance with the policies or procedures may deteriorate.
/s/ Ernst & Young LLP
Phoenix, Arizona
May 21, 2020
F-5
Item 1. Financial Statements
MICROCHIP TECHNOLOGY INCORPORATED AND SUBSIDIARIES
CONSOLIDATED BALANCE SHEETS
(in millions, except share and per share amounts)
ASSETS | |||||||
March 31, | |||||||
2020 | 2019 | ||||||
Cash and cash equivalents | $ | $ | |||||
Short-term investments | |||||||
Accounts receivable, net | |||||||
Inventories | |||||||
Other current assets | |||||||
Total current assets | |||||||
Property, plant and equipment, net | |||||||
Goodwill | |||||||
Intangible assets, net | |||||||
Long-term deferred tax assets | |||||||
Other assets | |||||||
Total assets | $ | $ | |||||
LIABILITIES AND STOCKHOLDERS' EQUITY | |||||||
Accounts payable | $ | $ | |||||
Accrued liabilities | |||||||
Current portion of long-term debt | |||||||
Total current liabilities | |||||||
Long-term debt | |||||||
Long-term income tax payable | |||||||
Long-term deferred tax liability | |||||||
Other long-term liabilities | |||||||
Stockholders' equity: | |||||||
Preferred stock, $0.001 par value; authorized 5,000,000 shares; no shares issued or outstanding | |||||||
Common stock, $0.001 par value; authorized 450,000,000 shares; 258,391,231 shares issued and 245,325,643 shares outstanding at March 31, 2020; 253,232,909 shares issued and 237,589,501 shares outstanding at March 31, 2019 | |||||||
Additional paid-in capital | |||||||
Common stock held in treasury: 13,065,588 shares at March 31, 2020; 15,643,408 shares at March 31, 2019 | ( | ) | ( | ) | |||
Accumulated other comprehensive loss | ( | ) | ( | ) | |||
Retained earnings | |||||||
Total stockholders' equity | |||||||
Total liabilities and stockholders' equity | $ | $ | |||||
See accompanying notes to consolidated financial statements
F-6
MICROCHIP TECHNOLOGY INCORPORATED AND SUBSIDIARIES
CONSOLIDATED STATEMENTS OF INCOME
(in millions, except per share amounts)
Year ended March 31, | |||||||||||
2020 | 2019 | 2018 | |||||||||
Net sales | $ | $ | $ | ||||||||
Cost of sales (1) | |||||||||||
Gross profit | |||||||||||
Research and development (1) | |||||||||||
Selling, general and administrative (1) | |||||||||||
Amortization of acquired intangible assets | |||||||||||
Special charges and other, net (1) | |||||||||||
Operating expenses | |||||||||||
Operating income | |||||||||||
Losses on equity method investments | ( | ) | ( | ) | |||||||
Other income (expense): | |||||||||||
Interest income | |||||||||||
Interest expense | ( | ) | ( | ) | ( | ) | |||||
Loss on settlement of debt | ( | ) | ( | ) | ( | ) | |||||
Other income (loss), net | ( | ) | ( | ) | |||||||
Income before income taxes | |||||||||||
Income tax (benefit) provision | ( | ) | ( | ) | |||||||
Net income | $ | $ | $ | ||||||||
Basic net income per common share | $ | $ | $ | ||||||||
Diluted net income per common share | $ | $ | $ | ||||||||
Dividends declared per common share | $ | $ | $ | ||||||||
Basic common shares outstanding | |||||||||||
Diluted common shares outstanding | |||||||||||
(1) Includes share-based compensation expense as follows: | |||||||||||
Cost of sales | $ | $ | $ | ||||||||
Research and development | $ | $ | $ | ||||||||
Selling, general and administrative | $ | $ | $ | ||||||||
Special charges and other, net | $ | $ | $ | ||||||||
See accompanying notes to consolidated financial statements
F-7
MICROCHIP TECHNOLOGY INCORPORATED AND SUBSIDIARIES
CONSOLIDATED STATEMENTS OF COMPREHENSIVE INCOME
CONSOLIDATED STATEMENTS OF COMPREHENSIVE INCOME
(in millions)
Year Ended March 31, | |||||||||||
2020 | 2019 | 2018 | |||||||||
Net income | $ | $ | $ | ||||||||
Components of other comprehensive income (loss): | |||||||||||
Available-for-sale securities: | |||||||||||
Unrealized holding losses, net of tax effect | ( | ) | ( | ) | |||||||
Reclassification of realized transactions, net of tax effect | |||||||||||
Defined benefit plans: | |||||||||||
Actuarial gains (losses) related to defined benefit pension plans, net of tax (provision) benefit | ( | ) | |||||||||
Reclassification of realized transactions, net of tax effect | |||||||||||
Change in net foreign currency translation adjustment | ( | ) | ( | ) | |||||||
Other comprehensive income (loss), net of tax effect | ( | ) | ( | ) | |||||||
Comprehensive income | $ | $ | $ | ||||||||
See accompanying notes to consolidated financial statements
F-8
MICROCHIP TECHNOLOGY INCORPORATED AND SUBSIDIARIES
CONSOLIDATED STATEMENTS OF CASH FLOWS
(in millions)
Year ended March 31, | |||||||||||
2020 | 2019 | 2018 | |||||||||
Cash flows from operating activities: | |||||||||||
Net income | $ | $ | $ | ||||||||
Adjustments to reconcile net income to net cash provided by operating activities: | |||||||||||
Depreciation and amortization | |||||||||||
Deferred income taxes | ( | ) | ( | ) | |||||||
Share-based compensation expense related to equity incentive plans | |||||||||||
Loss on settlement of debt | |||||||||||
Amortization of debt discount | |||||||||||
Amortization of debt issuance costs | |||||||||||
Losses on equity method investments | |||||||||||
Gains on sale of assets | ( | ) | ( | ) | |||||||
Losses on write-down of fixed assets | |||||||||||
Impairment of intangible assets | |||||||||||
Gains on marketable equity securities | ( | ) | |||||||||
Impairment of available-for-sale investments | |||||||||||
Amortization of premium on available-for-sale investments | ( | ) | |||||||||
Changes in operating assets and liabilities, excluding impact of acquisitions: | |||||||||||
(Increase) decrease in accounts receivable | ( | ) | ( | ) | |||||||
Decrease (increase) in inventories | ( | ) | |||||||||
Increase in deferred income on shipments to distributors | |||||||||||
Increase (decrease) in accounts payable and accrued liabilities | ( | ) | ( | ) | |||||||
Change in other assets and liabilities | ( | ) | ( | ) | |||||||
Change in income tax payable | ( | ) | ( | ) | |||||||
Net cash provided by operating activities | |||||||||||
Cash flows from investing activities: | |||||||||||
Purchases of available-for-sale investments | ( | ) | ( | ) | ( | ) | |||||
Maturities of available-for-sale investments | |||||||||||
Sales of available-for-sale investments and marketable equity securities | |||||||||||
Acquisition of Microsemi, net of cash acquired | ( | ) | |||||||||
Investments in other assets | ( | ) | ( | ) | ( | ) | |||||
Proceeds from sale of assets | |||||||||||
Capital expenditures | ( | ) | ( | ) | ( | ) | |||||
Net cash used in investing activities | ( | ) | ( | ) | ( | ) | |||||
Cash flows from financing activities: | |||||||||||
Payments on settlement of convertible debt | ( | ) | ( | ) | |||||||
Proceeds from borrowings on bridge loan facility | |||||||||||
Proceeds from issuance of 2023 and 2021 Senior Notes | |||||||||||
Proceeds from borrowings on term loan facility | |||||||||||
Repayments of term loan facility | ( | ) | ( | ) | |||||||
Proceeds from borrowings on revolving loan under credit facility | |||||||||||
Repayments of revolving loan under credit facility | ( | ) | ( | ) | ( | ) | |||||
Repayment of debt assumed in Microsemi acquisition | ( | ) | |||||||||
Deferred financing costs | ( | ) | ( | ) | ( | ) | |||||
Payment of cash dividends | ( | ) | ( | ) | ( | ) | |||||
Proceeds from sale of common stock | |||||||||||
Tax payments related to shares withheld for vested restricted stock units | ( | ) | ( | ) | ( | ) | |||||
Capital lease payments | ( | ) | ( | ) | ( | ) | |||||
F-9
Year ended March 31, | |||||||||||
2020 | 2019 | 2018 | |||||||||
Net cash (used in) provided by financing activities | ( | ) | ( | ) | |||||||
Net decrease in cash and cash equivalents | ( | ) | ( | ) | ( | ) | |||||
Cash and cash equivalents, and restricted cash at beginning of period | |||||||||||
Cash and cash equivalents, and restricted cash at end of period | $ | $ | $ | ||||||||
Supplemental disclosure of cash flow information | |||||||||||
Restricted cash | $ | $ | $ | ||||||||
Non-cash activities: | |||||||||||
Right-of-use assets obtained in exchange of lease liabilities (1) | $ | ||||||||||
Cash paid for: | |||||||||||
Interest | $ | $ | $ | ||||||||
Income taxes | $ | $ | $ | ||||||||
Operating lease payments in operating cash flows (1) | $ | ||||||||||
(1) During the fiscal year ended March 31, 2020, the Company adopted Accounting Standards Codification Topic 842, Leases, using the retrospective cumulative effect adjustment transition method. The disclosures are not applicable for the fiscal years ended March 31, 2019 or 2018.
See accompanying notes to consolidated financial statements
F-10
MICROCHIP TECHNOLOGY INCORPORATED AND SUBSIDIARIES
CONSOLIDATED STATEMENTS OF CHANGES IN EQUITY
(in millions)
Common Stock and Additional Paid-in-Capital | Common Stock Held in Treasury | Accumulated Other Comprehensive Loss | Retained Earnings | Total Equity | ||||||||||||||||||||||
Shares | Amount | Shares | Amount | |||||||||||||||||||||||
Balance at March 31, 2017 | $ | $ | ( | ) | $ | ( | ) | $ | $ | |||||||||||||||||
Net income | — | — | — | — | — | |||||||||||||||||||||
Other comprehensive loss | — | — | — | — | ( | ) | — | ( | ) | |||||||||||||||||
Proceeds from sales of common stock through employee equity incentive plans | — | — | — | — | ||||||||||||||||||||||
Restricted stock unit and stock appreciation right withholdings | ( | ) | ( | ) | — | — | — | — | ( | ) | ||||||||||||||||
Treasury stock used for new issuances | ( | ) | ( | ) | ( | ) | — | — | — | |||||||||||||||||
Share-based compensation | — | — | — | — | — | |||||||||||||||||||||
Shares issued to settle convertible debt | — | — | — | — | ||||||||||||||||||||||
Settlement of convertible debt | — | ( | ) | — | — | — | — | ( | ) | |||||||||||||||||
Exchange of convertible debt | — | — | — | — | — | |||||||||||||||||||||
Cash dividend | — | — | — | — | — | ( | ) | ( | ) | |||||||||||||||||
Balance at March 31, 2018 | $ | $ | ( | ) | $ | ( | ) | $ | $ | |||||||||||||||||
Net income | — | — | — | — | — | |||||||||||||||||||||
Other comprehensive loss | — | — | — | — | ( | ) | — | ( | ) | |||||||||||||||||
Adoption of ASU 2016-01, cumulative adjustment | — | — | — | — | ( | ) | ||||||||||||||||||||
Adoption of ASC 606, cumulative adjustment | — | — | — | — | — | |||||||||||||||||||||
Adoption of ASU 2016-16, cumulative adjustment | — | — | — | — | — | |||||||||||||||||||||
Non-cash consideration, exchange of employee stock awards - Microsemi acquisition | — | — | — | — | — | |||||||||||||||||||||
Proceeds from sales of common stock through employee equity incentive plans | — | — | — | — | ||||||||||||||||||||||
Restricted stock unit and stock appreciation right withholdings | ( | ) | ( | ) | — | — | — | — | ( | ) | ||||||||||||||||
Treasury stock used for new issuances | ( | ) | ( | ) | ( | ) | — | — | — | |||||||||||||||||
Share-based compensation | — | — | — | — | — | |||||||||||||||||||||
Cash dividend | — | — | — | — | — | ( | ) | ( | ) | |||||||||||||||||
Balance at March 31, 2019 | $ | $ | ( | ) | $ | ( | ) | $ | $ | |||||||||||||||||
Net Income | — | — | — | — | — | |||||||||||||||||||||
Other comprehensive income | — | — | — | — | — | |||||||||||||||||||||
Adoption of ASU 2018-02, cumulative adjustment | — | — | — | — | ( | ) | ||||||||||||||||||||
Proceeds from sales of common stock through employee equity incentive plans | — | — | — | — | ||||||||||||||||||||||
F-11
Common Stock and Additional Paid-in-Capital | Common Stock Held in Treasury | Accumulated Other Comprehensive Loss | Retained Earnings | Total Equity | ||||||||||||||||||||||
Shares | Amount | Shares | Amount | |||||||||||||||||||||||
Restricted stock unit and stock appreciation right withholdings | ( | ) | ( | ) | — | — | — | — | ( | ) | ||||||||||||||||
Treasury stock used for new issuances | ( | ) | ( | ) | ( | ) | — | — | — | |||||||||||||||||
Shares issued to settle convertible debt | — | — | — | — | ||||||||||||||||||||||
Settlement of convertible debt | — | ( | ) | — | — | — | — | ( | ) | |||||||||||||||||
Share-based compensation | — | — | — | — | — | |||||||||||||||||||||
Cash dividend | — | — | — | — | — | ( | ) | ( | ) | |||||||||||||||||
Balance at March 31, 2020 | $ | $ | ( | ) | $ | ( | ) | $ | $ | |||||||||||||||||
See accompanying notes to consolidated financial statements
F-12
MICROCHIP TECHNOLOGY INCORPORATED AND SUBSIDIARIES
Notes to Consolidated Financial Statements
Note 1. Significant Accounting Policies
Nature of Business
Microchip Technology Incorporated ("Microchip" or the "Company") develops, manufactures and sells specialized semiconductor products used by its customers for a wide variety of embedded control applications. The Company provides cost-effective embedded control solutions that also offer the advantages of small size, high performance, extreme low power usage, wide voltage range operation, mixed signal integration, and ease of development, thus enabling timely and cost-effective integration of the Company's solutions by its customers in their end products.
The Company's strategic focus is on embedded control solutions, including:
• | general purpose and specialized microcontrollers and microprocessors |
•wired and wireless connectivity products
•development tools and related software
•field-programmable gate array (FPGA) products
•analog, interface, mixed signal, timing, timing systems and security products
•discrete diodes and Metal Oxide Semiconductor Field Effect Transistors (MOSFETS)
•memory products
•technology licensing
Principles of Consolidation
The Company prepares its consolidated financial statements in accordance with generally accepted accounting principles in the United States of America (US GAAP). The consolidated financial statements include the accounts of Microchip and its majority-owned and controlled subsidiaries. All significant intercompany accounts and transactions have been eliminated in consolidation. All dollar amounts in the financial statements and tables in these notes, except per share amounts, are stated in millions of U.S. dollars unless otherwise noted. As further discussed in Note 2, on May 29, 2018, the Company completed its acquisition of Microsemi Corporation (Microsemi) and the Company's financial results include Microsemi's results beginning as of such acquisition date.
Revenue Recognition
On April 1, 2018, the Company adopted Accounting Standards Codification Topic 606, Revenue from Contracts with Customers (ASC 606) and all related amendments. The Company generates revenue primarily from sales of semiconductor products to distributors and non-distributor customers (direct customers) and, to a lesser extent, from royalties paid by licensees of intellectual property. The Company applies the following five-step approach to determine the timing and amount of revenue recognition: (1) identify the contract with the customer, (2) identify performance obligations in the contract, (3) determine the transaction price, (4) allocate the transaction price to the performance obligations in the contract, and (5) recognize revenue when the performance obligation is satisfied.
Sales to distributors are governed by a distributor agreement, a purchase order, and an order acknowledgment. Sales to distributors do not meet the definition of a contract, as defined by ASC 606, until the distributor has sent in a purchase order, the Company has acknowledged the order, the Company has deemed the collectability of the consideration to be probable, and legally enforceable rights and obligations have been created; this generally occurs 30 days prior to the estimated ship date. As is customary in the semiconductor industry, the Company offers price concessions and stock rotation rights to many of its distributors. As these are forms of variable consideration, the Company estimates the amount of consideration to which they will be entitled using recent historical data and applying the expected value method. Usually, there is only a single performance obligation in the contract, and therefore the entire transaction price is allocated to the single performance obligation. After the transaction price has been allocated, the Company recognizes revenue when the performance obligation is satisfied. Substantially all of the revenue generated from contracts with distributors is recognized at the time risk and title of the inventory transfers to the distributor.
Sales to direct customers are generally governed by a purchase order and an order acknowledgment. Sales to direct customers usually do not meet the definition of a contract, as defined by ASC 606, until shipment of the product occurs. Generally, the transaction price associated with contracts with direct customers is set at the standalone selling price and is not
F-13
variable. Usually, there is only a single performance obligation in the contract, and therefore the entire transaction price is allocated to the single performance obligation. After the transaction price has been allocated, the Company recognizes revenue when the performance obligation is satisfied. Substantially all of the revenue generated from contracts with direct customers is recognized at the time risk and title of the inventory transfers to the customer.
Revenue generated from licensees is governed by licensing agreements. The Company's primary performance obligation related to these agreements is to provide the licensee the right to use the intellectual property. The final transaction price is determined by multiplying the usage of the license by the royalty, which is fixed in the licensing agreement. Revenue is recognized as usage of the license occurs.
Revenue Recognition (prior to the adoption of ASC 606)
Prior to the adoption of ASC 606 on April 1, 2018, the Company recognized revenue when the earnings process was complete, as evidenced by an agreement with the customer, transfer of title had occurred, the pricing was fixed or determinable and collectability was reasonably assured. The Company recognized revenue from product sales to original equipment manufacturers (OEMs) upon shipment and recorded reserves for estimated customer returns.
Distributors worldwide generally had broad price protection and product return rights which prevented the sales pricing from being fixed or determinable at the time of the Company's shipment to the distributors. Therefore, revenue recognition was deferred until the pricing uncertainty was resolved, which generally occurred when the distributor sold the product to their customer. At the time of shipment to these distributors, the Company recorded a trade receivable for the selling price as there was a legally enforceable right to payment, relieved inventory for the carrying value of goods shipped since legal title had passed to the distributor, and recorded the gross margin in deferred income on shipments to distributors on its consolidated balance sheets.
Deferred income on shipments to distributors effectively represented gross margin on the sale to the distributor at the initial shipment date; however, the amount of gross margin recognized by the Company in future periods was less than the deferred margin as a result of credits granted to distributors on specifically identified products and customers to allow the distributors to earn a competitive gross margin on the sale of the Company's products to their end customers and price protection concessions related to market pricing conditions.
The Company sold the majority of the items in its product catalog to its distributors worldwide at a uniform list price. However, distributors resold the Company's products to end customers at a broad range of individually negotiated price points. The majority of the Company's distributors' resales required a reduction from the original list price paid. Often, under these circumstances, the Company remitted back to the distributor a portion of their original purchase price after the resale transaction was completed in the form of a credit against the distributors' outstanding accounts receivable balance. The credits were on a per unit basis and were not given to the distributor until they provided information regarding the sale to their end customer. The price reductions varied significantly based on the customer, product, quantity ordered, geographic location and other factors and discounts to a price less than the Company's cost have historically been rare. The effect of granting these credits established the net selling price from the Company to its distributors for the product and resulted in the net revenue recognized by the Company when the product was sold by the distributors to their end customers. Thus, a portion of the "deferred income on shipments to distributors" balance represented the amount of distributors' original purchase price that was
to be credited back to the distributors in the future. The Company did not reduce deferred income on shipments to distributors or accounts receivable by anticipated future price concessions; rather, price concessions were recorded against deferred income on shipments to distributors when incurred, which was generally at the time the distributor sold the product.
The Company reduced product pricing through price protection based on market conditions, competitive considerations and other factors. Price protection was granted to distributors on the inventory they have on hand at the date the price protection was offered. When the Company reduced the price of its products, it allowed the distributor to claim a credit against its outstanding accounts receivable balances based on the new price of the inventory it had on hand as of the date of the price reduction. There was no immediate revenue impact from the price protection, as it was reflected as a reduction of the deferred income on shipments to distributors' balance.
Products returned by distributors and subsequently scrapped have historically been immaterial to the Company's consolidated results of operations. The Company routinely evaluated the risk of impairment of the deferred cost of sales component of the deferred income on shipments to distributors' account. Because of the historically immaterial amounts of inventory that have been scrapped, and historically rare instances where discounts given to a distributor resulted in a price less than the Company's cost, the Company believed the deferred costs have a low risk of material impairment.
F-14
Shipping charges billed to customers were included in net sales, and the related shipping costs were included in cost of sales. The Company collected and remitted certain sales-related taxes on a portion of its sales of inventory and reported such amounts under the net method in its consolidated statements of income.
For licenses or other technology arrangements without an upgrade period, non-royalty revenue from the license was recognized upon delivery of the technology if the fee was fixed or determinable and collection of the fee was reasonably assured. Royalties were recognized when reported to the Company, which generally coincided with the receipt of payment. In certain limited circumstances, the Company entered into license and other arrangements for technologies that the Company was continuing to enhance and refine or under which it was obligated to provide unspecified enhancements. Under these arrangements, non-royalty revenue is recognized over the lesser of (1) the estimated period that the Company has historically enhanced and developed refinements to the specific technology, typically one to three years (the "upgrade period"), and (2) the remaining portion of the upgrade period after the date of delivery of all specified technology and documentation, provided that the fee is fixed or determinable and collection of the fee is reasonably assured. Royalties received during the upgrade period were recognized as revenue based on an amortization calculation of the elapsed portion of the upgrade period compared to the entire estimated upgrade period. Royalties received after the upgrade period has elapsed were recognized when reported to the Company, which generally coincided with the receipt of payment.
Product Warranty
Advertising Costs
Research and Development
Research and development costs are expensed as incurred. Assets purchased to support the Company's ongoing research and development activities are capitalized when related to products which have achieved technological feasibility or that have alternative future uses and are amortized over their estimated useful lives. Renewals or extensions of these assets are expensed as incurred. Research and development expenses include expenditures for labor, share-based payments, depreciation, masks, prototype wafers, and expenses for development of process technologies, new packages, and software to support new products and design environments.
Restructuring Charges
Restructuring charges are included within special charges and other, net in the consolidated statements of income and are primarily comprised of employee separation costs, asset impairments, contract exit costs and costs of facility consolidation and closure, including the related gains or losses associated with the sale of owned facilities. Employee separation costs includes one-time termination benefits that are recognized as a liability at estimated fair value, at the time of communication to employees, unless future service is required, in which case the costs are recognized ratably over the future service period. Ongoing termination benefits are recognized as a liability at estimated fair value when the amount of such benefits are probable and reasonably estimable. Contract exit costs includes contract termination fees and right-of-use asset impairments recognized on the cease-use date of leased facilities. A liability for contract termination fees is recognized in the period in which the Company terminates the contract.
Foreign Currency Translation
Substantially all of the Company's foreign subsidiaries are considered to be extensions of the U.S. company and any translation gains and losses related to these subsidiaries are included in other income (expense) in the consolidated statements of income. As the U.S. dollar is utilized as the functional currency, gains and losses resulting from foreign currency transactions (transactions denominated in a currency other than the subsidiaries' functional currency) are also included in
F-15
income. For fiscal 2020 and 2019, certain foreign subsidiaries acquired as part of the Company's acquisition activities had the local currency as the functional currency. For subsidiaries acquired as part of the Company's acquisition of Microsemi, the U.S. dollar is expected to become the functional currency for such entities once integrated into the Company's legal structure and intercompany agreements are executed.
Income Taxes
As part of the process of preparing its consolidated financial statements, the Company is required to estimate its income taxes in each of the jurisdictions in which it operates. This process involves estimating its actual current tax exposure together with assessing temporary differences resulting from differing treatment of items for tax and accounting purposes. These differences result in deferred tax assets and liabilities, which are included within the Company's consolidated balance sheets. The Company must then assess the likelihood that its deferred tax assets will be recovered from future taxable income within the relevant jurisdiction and to the extent the Company believes that recovery is not likely, it must establish a valuation allowance. The Company provided valuation allowances for certain of its deferred tax assets where it is more likely than not that some portion, or all of such assets, will not be realized.
Various taxing authorities in the U.S. and other countries in which the Company does business scrutinize the tax structures employed by businesses. Companies of a similar size and complexity as the Company are regularly audited by the taxing authorities in the jurisdictions in which they conduct significant operations. During the year ended March 31, 2020, various foreign jurisdictions finalized their audits. The close of these audits did not have an adverse impact on the financial statements. The Company is currently being audited by the tax authorities in the United States and various foreign jurisdictions. At this time, the Company does not know what the outcome of these audits will be. The Company records benefits for uncertain tax positions based on an assessment of whether it is more likely than not that the tax positions will be sustained based on their technical merits under currently enacted law. If this threshold is not met, no tax benefit of the uncertain tax position is recognized. If the threshold is met, the Company recognizes the largest amount of the tax benefit that is more than 50% likely to be realized upon ultimate settlement.
The accounting model as defined in Accounting Standards Codification Topic 740, Income Taxes (ASC 740) related to the valuation of uncertain tax positions requires the Company to presume that the tax position will be examined by the relevant taxing authority that has full knowledge of all relevant information and that each tax position will be evaluated without consideration of the possibility of offset or aggregation with other positions. The recognition requirement for the liability exists even if the Company believes the possibility of examination by a taxing authority or discovery of the related risk matters is remote or where it has a long history of the taxing authority not performing an exam or overlooking an issue. The Company will record an adjustment to a previously recorded position if new information or facts related to the position are identified in a subsequent period. All adjustments to the positions are recorded through the income statement. Generally, adjustments will be recorded in periods subsequent to the initial recognition if the taxing authority has completed an audit of the period or if the statute of limitation expires. Due to the inherent uncertainty in the estimation process and in consideration of the criteria of the accounting model, amounts recognized in the financial statements in periods subsequent to the initial recognition may significantly differ from the estimated exposure of the position under the accounting model.
On December 22, 2017, the Tax Cuts and Jobs Act of 2017 (the Act) was enacted into law. The Act provides for numerous significant tax law changes and modifications including the reduction of the U.S. federal corporate income tax rate from 35.0% to 21.0%, the requirement for companies to pay a one-time transition tax on earnings of certain foreign subsidiaries that were previously tax deferred and the creation of new taxes on certain foreign-sourced earnings. As a fiscal year-end taxpayer, certain provisions of the Act began to impact the Company in the third quarter of fiscal 2018, while other provisions became effective for the Company in fiscal 2019.
In addition to the impacts of tax reform on fiscal 2018, the Act established new tax laws that were effective for fiscal 2019, including, but not limited to, (1) a new provision designed to tax low-taxed income of foreign subsidiaries (“GILTI”), which allows for the possibility of using foreign tax credits ("FTCs") and a deduction of up to 50% to offset the income tax liability (subject to some limitations); (2) limitations on the deductibility of certain executive compensation; (3) limitations on the deductibility of interest expense; and (4) limitations on the use of FTCs to reduce the U.S. income tax liability. While each of these provisions is expected to continue to have an impact on the Company's tax expense for future periods, the increase in tax expense for GILTI is the most significant.
The FASB allows taxpayers to make an accounting policy election of either (1) treating taxes due on GILTI inclusions as a current-period expense when incurred or (2) recognizing deferred taxes for temporary basis differences that are expected to reverse as GILTI in future years. The Company has made a policy choice to include taxes due on the future GILTI inclusion in taxable income when incurred.
F-16
Cash and Cash Equivalents
All highly liquid investments, including marketable securities with an original maturity to the Company of three months or less when acquired are considered to be cash equivalents.
Derivative Instruments
Derivative instruments are required to be recorded at fair value as either assets or liabilities in the Company's consolidated balance sheet. The Company's accounting policies for derivative instruments depends on whether the instrument has been designated and qualifies as part of a hedging relationship and further, on the type of hedging relationship.
The Company does not apply hedge accounting to foreign currency forward contracts. Gains and losses associated with currency rate changes on forward contracts are recorded currently in income. These gains and losses have been immaterial to the Company's financial statements.
The Company is exposed to fluctuations in prices for energy that it consumes, particularly electricity and natural gas. The Company also enters into variable-priced contracts for some purchases of electricity and natural gas, on an index basis. The Company seeks, or may seek, to partially mitigate these exposures through fixed-price contracts. These contracts meet the characteristics of derivative instruments, but generally qualify for the “normal purchases or normal sales” exception under authoritative guidance and require no mark-to-market adjustment.
Allowance for Doubtful Accounts
Inventories
Inventories are valued at the lower of cost or net realizable value using the first-in, first-out method. The Company writes down its inventory for estimated obsolescence or unmarketable inventory in an amount equal to the difference between the cost of inventory and the estimated net realizable value based upon assumptions about future demand and market conditions. If actual market conditions are less favorable than those projected by the Company, additional inventory write-downs may be required. Inventory impairment charges establish a new cost basis for inventory and charges are not subsequently reversed to income even if circumstances later suggest that increased carrying amounts are recoverable. In estimating reserves for obsolescence, the Company primarily evaluates estimates of demand over a 12-month period and provides reserves for inventory on hand in excess of the estimated 12-month demand. Estimates for projected 12-month demand are generally based on the average shipments of the prior three-month period, which are then annualized to adjust for any potential seasonality in the Company's business. The estimated 12-month demand is compared to the Company's most recently developed sales forecast to further reconcile the 12-month demand estimate. Management reviews and adjusts the estimates as appropriate based on specific situations. For example, demand can be adjusted up for new products for which historic sales are not representative of future demand. Alternatively, demand can be adjusted down to the extent any existing products are being replaced or discontinued.
In periods where the Company's production levels are substantially below normal operating capacity, unabsorbed overhead production costs associated with the reduced production levels of the Company's manufacturing facilities are charged directly to cost of sales.
F-17
Property, Plant and Equipment
Property, plant and equipment are stated at cost. Major renewals and improvements are capitalized, while maintenance and repairs are expensed when incurred. The Company's property and equipment accounting policies incorporate estimates, assumptions and judgments relative to the useful lives of its property and equipment. Depreciation is provided for assets placed in service on a straight-line basis over the estimated useful lives of the relative assets, which range from 10 to 40 years for buildings and building improvements and 5 to 7 years for machinery and equipment. The Company evaluates the carrying value of its property and equipment when events or changes in circumstances indicate that the carrying value of such assets may be impaired. Asset impairment evaluations are, by nature, highly subjective.
Leases
The Company determines if an arrangement is a lease at its inception. Operating lease arrangements are comprised primarily of real estate and equipment agreements for which the right-of-use (“ROU”) assets are included in other assets and the corresponding lease liabilities, depending on their maturity, are included in accrued expenses and other current liabilities or other long-term liabilities in the condensed consolidated balance sheets.
Operating lease ROU assets and liabilities are recognized at commencement date based on the present value of lease payments over the lease term. Operating lease ROU assets also include any initial direct costs and prepayments less lease incentives. Lease terms may include options to extend or terminate the lease when it is reasonably certain that the Company will exercise such options.
As the Company's leases generally do not provide an implicit rate, the Company uses its collateralized incremental borrowing rate based on the information available at the lease commencement date, including lease term, in determining the present value of lease payments. Lease expense for these leases is recognized on a straight-line basis over the lease term. The Company accounts for the lease and non-lease components as a single lease component.
Senior and Junior Subordinated Convertible Debt
The Company separately accounts for the liability and equity components of its senior and junior subordinated convertible debt in a manner that reflects its nonconvertible debt (unsecured debt) borrowing rate. This results in a bifurcation of a component of the debt, classification of that component in equity and the accretion of the resulting discount on the debt to be recognized as part of interest expense in its consolidated statements of income. Lastly, the Company includes the dilutive effect of the shares of its common stock issuable upon conversion of the outstanding senior and junior subordinated convertible debt in its diluted income per share calculation regardless of whether the market price triggers or other contingent conversion features have been met. The Company applies the treasury stock method as it has the intent and ability to settle the principal amounts of the senior and junior subordinated convertible debentures in cash. This method results in incremental dilutive shares when the average market value of the Company's common stock for a reporting period exceeds the conversion prices per share and adjust as dividends are recorded in the future.
Upon a de-recognition event such as a settlement or conversion, the Company estimates the fair value of the liability component and compares that to the carrying amount in order to calculate the appropriate amount of gain or loss. The remaining amounts paid or issued (in the case of non cash consideration in the form of shares of common stock) are recognized as a reduction of additional paid-in-capital. The fair value of the liability component is estimated using the current comparable borrowing rate for an otherwise identical non-convertible debt instrument.
Defined Benefit Pension Plans
The Company maintains defined benefit pension plans, covering certain of its foreign employees. For financial reporting purposes, net periodic pension costs and pension obligations are determined based upon a number of actuarial assumptions, including discount rates for plan obligations, and assumed rates of compensation increases for employees participating in plans. These assumptions are based upon management's judgment and consultation with actuaries, considering all known trends and uncertainties.
Contingencies
In the ordinary course of business, the Company is exposed to various liabilities as a result of contracts, product liability, customer claims and other matters. Additionally, the Company is involved in a limited number of legal actions, both as plaintiff and defendant. Consequently, the Company could incur uninsured liability in any of those actions. The Company also
F-18
periodically receives notifications from various third parties alleging infringement of patents or other intellectual property rights, or from customers requesting reimbursement for various costs. With respect to pending legal actions to which the Company is a party and other claims, although the outcomes are generally not determinable, the Company believes that the ultimate resolution of these matters will not have a material adverse effect on its financial position, cash flows or results of operations. Litigation and disputes relating to the semiconductor industry are not uncommon, and the Company is, from time to time, subject to such litigation and disputes. As a result, no assurances can be given with respect to the extent or outcome of any such litigation or disputes in the future.
The Company accrues for claims and contingencies when losses become probable and reasonably estimable. As of the end of each applicable reporting period, the Company reviews each of its matters and, where it is probable that a liability has been or will be incurred, it accrues for all probable and reasonably estimable losses. Where the Company can reasonably estimate a range of losses it may incur regarding such a matter, it records an accrual for the amount within the range that constitutes its best estimate. If the Company can reasonably estimate a range but no amount within the range appears to be a better estimate than any other, it uses the amount that is the low end of such range.
Business Combinations
All of the Company's business combinations are accounted for at fair value under the acquisition method of accounting. Under the acquisition method of accounting, (i) acquisition-related costs, except for those costs incurred to issue debt or equity securities, will be expensed in the period incurred; (ii) non-controlling interests will be valued at fair value at the acquisition date; (iii) in-process research and development will be recorded at fair value as an intangible asset at the acquisition date and amortized once the technology reaches technological feasibility; (iv) restructuring costs associated with a business combination will be expensed subsequent to the acquisition date; and (v) changes in deferred tax asset valuation allowances and income tax uncertainties after the acquisition date will be recognized through income tax expense. The aggregate amount of consideration paid by the Company is allocated to net tangible assets and intangible assets based on their estimated fair values as of the acquisition date. The excess of the purchase price over the value of the net tangible assets and intangible assets is recorded to goodwill. The measurement of fair value of assets acquired and liabilities assumed requires significant judgment. The valuation of intangible assets, in particular, requires that the Company use valuation techniques such as the income approach. The income approach includes the use of a discounted cash flow model, which includes discounted cash flow scenarios and requires the following significant estimates: revenue, expenses, capital spending and other costs, and discount rates based on the respective risks of the cash flows.
Goodwill and Other Intangible Assets
The Company's intangible assets include goodwill and other intangible assets. Goodwill is recorded when the purchase price paid for an acquisition exceeds the estimated fair value of the net identified tangible and intangible assets acquired. Other intangible assets include existing technologies, core and developed technology, in-process research and development, trademarks and trade names, distribution rights and customer-related intangibles. In-process research and development is capitalized until such time as the related projects are completed or abandoned at which time the capitalized amounts will begin to be amortized or written off. Indefinite-lived intangible assets consist of goodwill and in-process research and development intangible assets that have not yet been placed in service. All other intangible assets are definite-lived intangible assets, including in-process research and development assets that have been placed in service, and are amortized over their respective estimated lives, ranging from 1 to 15 years.
The Company is required to perform an impairment review of indefinite-lived intangible assets, including goodwill annually, and more frequently under certain circumstances. Indefinite-lived intangible assets are subjected to this annual impairment test during the fourth quarter of the Company's fiscal year. The Company engages primarily in the development, manufacture and sale of semiconductor products as well as technology licensing. As a result, the Company concluded there are two reporting units, semiconductor products and technology licensing. Under the qualitative indefinite-lived intangible asset impairment assessment standard, management evaluates whether it is more likely than not that the indefinite-lived intangible assets are impaired. If it is determined that it is more likely than not, the Company proceeds with the next step of the impairment test, which compares the fair value of the reporting unit or indefinite-lived intangible asset to its carrying value. If the Company determines through the impairment process that the indefinite-lived intangible asset has been impaired, the Company will record the impairment charge in its results of operation. Through March 31, 2020, the Company has not had impaired goodwill. In the event that facts and circumstances indicate definite-lived intangible assets may be impaired, the Company evaluates the recoverability and estimated useful lives of such assets. If such indicators are present, recoverability is evaluated based on whether the sum of the estimated undiscounted cash flows attributable to the asset (group) in question is less than their carrying value. If less, the Company measures the fair value of the asset (group) and recognizes an impairment loss if the carrying amount of the assets exceeds their respective fair values.
F-19
Impairment of Long-Lived Assets
The Company assesses whether indicators of impairment of long-lived assets are present. If such indicators are present, the Company determines whether the sum of the estimated undiscounted cash flows attributable to the assets in question is less than their carrying value. If less, the Company recognizes an impairment loss based on the excess of the carrying amount of the assets over their respective fair values. Fair value is determined by discounted future cash flows, appraisals or other methods. If the assets determined to be impaired are to be held and used, the Company recognizes an impairment loss through a charge to operating results to the extent the present value of anticipated net cash flows attributable to the asset are less than the asset's carrying value. The Company would depreciate the remaining value over the remaining estimated useful life of the asset.
Share-Based Compensation
The Company has equity incentive plans under which non-qualified stock options and restricted stock units (RSUs) have been granted to employees and non-employee members of the Board of Directors. The Company uses RSUs as its primary equity incentive compensation instrument for employees. The Company also has employee stock purchase plans for eligible employees. Share-based compensation cost is measured on the grant date based on the fair market value of the Company’s common stock discounted for expected future dividends and is recognized as expense on a straight-line basis over the requisite service periods.
If there are any modifications or cancellations of the underlying unvested securities, the Company may be required to accelerate or increase any remaining unearned share-based compensation expense. Future share-based compensation expense and unearned share-based compensation will increase to the extent that the Company grants additional equity awards to employees or it assumes unvested equity awards in connection with acquisitions.
Concentrations of Credit Risk
Financial instruments that potentially subject the Company to concentrations of credit risk consist primarily of investments in debt securities and trade receivables. Investments in debt securities with original maturities of greater than six months consist primarily of AAA and AA rated financial instruments and counterparties. The Company's investments are primarily in direct obligations of the U.S. government or its agencies, corporate bonds, and municipal bonds.
Concentrations of credit risk with respect to accounts receivable are generally not significant due to the diversity of the Company's customers and geographic sales areas. The Company sells its products primarily to OEMs and distributors in the Americas, Europe and Asia. The Company performs ongoing credit evaluations of its customers' financial condition and, as deemed necessary, may require collateral, primarily letters of credit.
Distributor advances in the consolidated balance sheets, totaled $149.6 million and $170.7 million at March 31, 2020 and March 31, 2019, respectively. On sales to distributors, the Company's payment terms generally require the distributor to settle amounts owed to the Company for an amount in excess of their ultimate cost. The Company's sales price to its distributors may be higher than the amount that the distributors will ultimately owe the Company because distributors often negotiate price reductions after purchasing the products from the Company and such reductions are often significant. It is the Company's practice to apply these negotiated price discounts to future purchases, requiring the distributor to settle receivable balances, on a current basis, generally within 30 days, for amounts originally invoiced. This practice has an adverse impact on the working capital of the Company's distributors. As such, the Company has entered into agreements with certain distributors whereby it advances cash to the distributors to reduce the distributors' working capital requirements. These advances are reconciled at least on a quarterly basis and are estimated based on the amount of ending inventory as reported by the distributor multiplied by a negotiated percentage. Such advances have no impact on revenue recognition or the Company's consolidated statements of income. The terms of these advances are set forth in binding legal agreements and are unsecured, bear no interest on unsettled balances and are due upon demand. The agreements governing these advances can be canceled by the Company at any time.
Use of Estimates
The Company has made a number of estimates and assumptions relating to the reporting of assets, liabilities, revenues and expenses and the disclosure of contingent assets and liabilities to prepare its consolidated financial statements in conformity with U.S. Generally Accepted Accounting Principles. Actual results could differ from those estimates.
Business Segments
F-20
Operating segments are components of an enterprise about which separate financial information is regularly reviewed by the chief operating decision makers ("CODMs") to assess the performance of the component and make decisions about the resources to be allocated to the component. The Company's Chairman and Chief Executive Officer and the Company's President and Chief Operating Officer have been identified as the CODMs as they jointly manage the Company's worldwide consolidated enterprise. Based on the Company's structure and manner in which the Company is managed and decisions are made, the Company's business is made up of two operating segments, semiconductor products and technology licensing.
In the semiconductor products segment, the Company designs, develops, manufactures and markets microcontrollers, development tools and analog, interface, mixed-signal, timing, wired and wireless connectivity devices, and memory products. Under the leadership of the CODMs, the Company is structured and organized around standardized roles and responsibilities based on product groups and functional activities. The Company's product groups are responsible for product research, design and development. The Company's functional activities include sales, marketing, manufacturing, information technology, human resources, legal and finance.
The Company's product groups have similar products, production processes, types of customers and methods for distribution. In addition, the tools and technologies used in the design and manufacture of the Company's products are shared among the various product groups. The Company's product group leaders, under the direction of the CODMs, define the product roadmaps and team with sales personnel to achieve design wins and revenue and other performance targets. Product group leaders also interact with manufacturing and operational personnel who are responsible for the production, prioritization and planning of the Company's manufacturing capabilities to help ensure the efficiency of the Company's operations and fulfillment of customer requirements. This centralized structure supports a global operating strategy in which the CODMs assess performance and allocate resources based on the Company's consolidated results.
Recently Adopted Accounting Pronouncements
On April 1, 2019, the Company adopted Accounting Standards Codification Topic 842, Leases (ASC 842). This standard requires lessees to recognize a lease liability and a right-of-use asset on the balance sheet and aligns many of the underlying principles of the new lessor model with those in ASC 606. ASC 842 is effective for annual periods, and interim periods within those annual periods, beginning after December 15, 2018, with early adoption permitted. The Company adopted ASC 842 using the retrospective cumulative effect adjustment transition method by recording right-of-use assets of $124.6 million, accrued lease liabilities of $39.4 million and other long-term liabilities of $97.9 million. Under this method, periods prior to fiscal 2020 remain unchanged. The Company applied the package of practical expedients to leases that commenced before the effective date whereby the Company elected to not reassess the following: (i) whether any expired or existing contracts contain leases; (ii) the lease classification for any expired or existing leases; and (iii) initial direct costs for any existing leases. See Note 11 for further information and disclosures related to the adoption of this standard.
In February 2018, the FASB issued ASU 2018-02, Income Statement - Reporting Comprehensive Income (Topic 220): Reclassification of Certain Tax Effects from Accumulated Other Comprehensive Income. This guidance provides an option to reclassify from accumulated other comprehensive income to retained earnings the stranded tax effects resulting from the Act. This ASU is effective for all entities for fiscal years beginning after December 15, 2018, and interim periods within those fiscal years. The Company adopted the standard and elected to reclassify the income tax effects of the Act from accumulated other comprehensive income to retained earnings effective April 1, 2019. The cumulative impact of adoption resulted in an immaterial change to retained earnings.
Recently Issued Accounting Pronouncements Not Yet Adopted
In March 2020, the FASB issued ASU 2020-04-Reference Rate Reform (Topic 848): Facilitation of the Effects of Reference Rate Reform on Financial Reporting, which provides optional expedients and exceptions to US GAAP for applying guidance on contract modifications and hedge accounting to ease the financial reporting burdens of the expected market transition from the London Interbank Offered Rate (LIBOR) and other interbank offered rates to alternative reference rates. The guidance is effective upon issuance through December 31, 2022. The Company is currently evaluating the impact the adoption of this standard will have on its consolidated financial statements.
In December 2019, the FASB issued ASU 2019-12-Income Taxes (Topic 740): Simplifying the Accounting for Income Taxes. This guidance enhances and simplifies various aspects of the income tax accounting standard ASC 740, including requirements related to hybrid tax regimes, the tax basis step-up in goodwill obtained in a transaction that is not a business combination, separate financial statements of entities not subject to tax, the intraperiod tax allocation exception to the incremental approach, ownership changes in investments, interim-period accounting for enacted changes in tax law, and the
F-21
year-to-date loss limitation in interim-period tax accounting. The amendments are effective for public business entities for fiscal years beginning after December 15, 2020, including interim periods therein. Early adoption of the standard is permitted, including adoption in interim or annual periods for which financial statements have not yet been issued. The Company is currently evaluating the impact the adoption of this standard will have on its consolidated financial statements.
In January 2017, the FASB issued ASU 2017-04-Intangibles - Goodwill and Other (Topic 350): Simplifying the Test for Goodwill Impairment, which simplifies the accounting for goodwill impairment. The guidance removes Step 2 of the goodwill impairment test, which requires a hypothetical purchase price allocation. A goodwill impairment will now be the amount by which a reporting unit's carrying value exceeds its fair value, not to exceed the carrying amount of goodwill. The amendment is effective for annual periods and interim periods within those annual periods, beginning after December 15, 2019, and early adoption is permitted. The Company does not expect this standard to have an impact on its consolidated financial statements.
In June 2016, the FASB issued ASU 2016-13-Financial Instruments - Credit Losses: Measurement of Credit Losses on Financial Instruments. This standard requires entities to use a current lifetime expected credit loss methodology to measure impairments of certain financial assets. Using this methodology will result in earlier recognition of losses than under the current incurred loss approach, which required waiting to recognize a loss until it is probable of having been incurred. The amendments in ASU 2016-13 broaden the information that an entity must consider in developing its expected credit loss estimate for assets measured either collectively or individually and can include forecasted information. There are other provisions within the standard affecting how impairments of other financial assets may be recorded and presented, as well as expanded disclosures. ASU 2016-13 is effective for interim and annual periods beginning after December 15, 2019, and permits early adoption, but not before December 15, 2018. The standard is to be applied using a modified retrospective approach. The Company is currently evaluating the impact the adoption of this standard will have on its consolidated financial statements.
Note 2. Business Acquisitions
Acquisition of Microsemi
On May 29, 2018, the Company completed its acquisition of Microsemi Corporation, a publicly traded company headquartered in Aliso Viejo, California. The Company paid an aggregate of approximately $8.19 billion in cash to the stockholders of Microsemi. The total consideration transferred in the acquisition, including approximately $53.9 million of non-cash consideration for the exchange of certain share-based payment awards of Microsemi for stock awards of the Company, was approximately $8.24 billion. In addition to the consideration transferred, the Company recognized in its consolidated financial statements $3.23 billion in liabilities of Microsemi consisting of debt, taxes payable and deferred, restructuring, and contingent and other liabilities of which $2.06 billion of existing debt was paid off. The Company financed the purchase price using approximately $8.10 billion of borrowings consisting of $3.10 billion under its amended and restated revolving line of credit (the "Revolving Credit Facility"), $3.00 billion of term loans ("Term Loan Facility") provided under the Company's amended and restated credit agreement (the "Credit Agreement"), and $2.00 billion in newly issued senior secured notes. The Company incurred $22.0 million in acquisition costs related to the acquisition. As a result of the acquisition, Microsemi became a wholly owned subsidiary of the Company. Microsemi offers a comprehensive portfolio of semiconductor and system solutions for aerospace and defense, communications, data center and industrial markets. The Company's primary reason for this acquisition was to expand the Company's range of solutions, products and capabilities by extending its served available market.
The acquisition was accounted for under the acquisition method of accounting, with the Company identified as the acquirer, and the operating results of Microsemi have been included in the Company's consolidated financial statements as of the closing date of the acquisition. Under the acquisition method of accounting, the aggregate amount of consideration paid by the Company was allocated to Microsemi's net tangible assets and intangible assets based on their estimated fair values as of May 29, 2018. The excess of the purchase price over the value of the net tangible assets and intangible assets was recorded to goodwill. The factors contributing to the recognition of goodwill were based upon the Company's conclusion that there are strategic and synergistic benefits that are expected to be realized from the acquisition. The goodwill has been allocated to the Company's semiconductor products reporting segment. None of the goodwill related to the Microsemi acquisition is deductible for tax purposes. The Company retained independent third-party appraisers to assist management in its valuation of the acquired assets and liabilities.
F-22
The table below represents the allocation of the purchase price to the net assets acquired based on their estimated fair values, as well as the associated estimated useful lives of the acquired intangible assets (in millions).
Assets acquired | |||
Cash and cash equivalents | $ | ||
Accounts receivable | |||
Inventories | |||
Other current assets | |||
Property, plant and equipment | |||
Goodwill | |||
Purchased intangible assets | |||
Long-term deferred tax assets | |||
Other assets | |||
Total assets acquired | |||
Liabilities assumed | |||
Accounts payable | ( | ) | |
Other current liabilities | ( | ) | |
Long-term debt | ( | ) | |
Deferred tax liabilities | ( | ) | |
Long-term income tax payable | ( | ) | |
Other long-term liabilities | ( | ) | |
Total liabilities assumed | ( | ) | |
Purchase price allocated | $ | ||
Purchased Intangible Assets | Weighted Average | ||||
Useful Life | May 29, 2018 | ||||
(in years) | (in millions) | ||||
Core and developed technology | $ | ||||
In-process research and development | — | ||||
Customer-related | |||||
Backlog | |||||
Other | |||||
Total purchased intangible assets | $ | ||||
Purchased intangible assets include core and developed technology, in-process research and development, customer-related intangibles, acquisition-date backlog and other intangible assets.
The estimated fair values of the core and developed technology and in-process research and development were determined based on the present value of the expected cash flows to be generated by the respective existing technology or future technology. The core and developed technology intangible assets are being amortized in a manner based on the expected cash flows used in the initial determination of fair value.
In-process research and development is capitalized until such time as the related projects are completed or abandoned at which time the capitalized amounts will begin to be amortized or written off.
Customer-related intangible assets consist of Microsemi's contractual relationships and customer loyalty related to its distributor and end-customer relationships. The fair values of the customer-related intangibles were determined using the distributor method, a form of the income approach based on distributor margin and expected attrition and revenue growth for Microsemi's existing customers as of the acquisition date. Customer relationships are being amortized in a manner based on the estimated cash flows associated with the existing customers and anticipated retention rates.
F-23
Backlog relates to the value of orders not yet shipped by Microsemi at the acquisition date, and the fair values were determined based on the estimated profit associated with those orders. Backlog related assets have a one year useful life and are being amortized on a straight-line basis over that period.
The total weighted average amortization period of intangible assets acquired as a result of the Microsemi transaction is 13 years. Amortization expense associated with acquired intangible assets is not deductible for tax purposes. Thus, approximately $856.7 million was established as a net deferred tax liability for the future amortization of the intangible assets.
Note 3. Net Sales
The following table represents the Company's net sales by product line (in millions):
Year Ended March 31, | |||||||
2020 | 2019 | ||||||
Microcontrollers | $ | $ | |||||
Analog, interface, mixed signal and timing products | |||||||
Field-programmable gate array products | |||||||
Licensing, memory and other | |||||||
Total net sales | $ | $ | |||||
The product lines listed above are included entirely in the Company's semiconductor product segment with the exception of the licensing, memory and other product line, which includes products from both the semiconductor product and technology licensing segments.
The following table represents the Company's net sales by contract type (in millions):
Year Ended March 31, | |||||||
2020 | 2019 | ||||||
Distributors | $ | $ | |||||
Direct customers | |||||||
Licensees | |||||||
Total net sales | $ | $ | |||||
Distributors are customers that buy products with the intention of reselling them. Distributors generally have a distributor agreement with the Company to govern the terms of the relationship. Direct customers are non-distributor customers, which generally do not have a master sales agreement with the Company. The Company's direct customers primarily consist of OEMs and, to a lesser extent, contract manufacturers. Licensees are customers of the Company's technology licensing segment, which include purchasers of intellectual property and customers that have licensing agreements to use the Company's SuperFlash® embedded flash and Smartbits® one time programmable NVM technologies. All of the contract types listed in the table above are included in the Company's semiconductor product segment with the exception of licensees, which is the technology licensing segment.
Substantially all of the Company's net sales are recognized from contracts with customers.
Semiconductor Product Segment
For contracts related to the purchase of semiconductor products, the Company satisfies its performance obligation when control of the ordered product transfers to the customer. The timing of the transfer of control depends on the agreed upon shipping terms with the customer, but generally occurs upon shipment, which is when physical possession of the product has been transferred and legal title of the product transfers to the customer. Payment is generally due within 30 days of the ship date. Payment is generally collected after the Company satisfies its performance obligation, therefore contract liabilities are uncommon. Also, the Company usually does not record contract assets because the Company has an unconditional right to payment upon satisfaction of the performance obligation, and therefore, a receivable is more commonly recorded than a contract asset. Refer to Note 10 for the opening and closing balances of the Company's receivables. As contracts with
F-24
customers generally have an expected duration of one year or less, the balance of open performance obligations as of period end that will be recognized as revenue subsequent to March 31, 2021 is immaterial.
Generally, there is only a single performance obligation in the Company's contracts with customers for semiconductor products; as such, the entire transaction price is allocated to the single performance obligation and allocation of the transaction price to individual performance obligations is not necessary. The consideration received from customers is fixed, with the exception of consideration from certain distributors. Certain of the Company's distributors are granted price concessions and return rights, which result in variable consideration. The amount of revenue recognized for sales to these certain distributors is adjusted for estimates of the price concessions and return rights that are expected to be claimed. These estimates are based on the recent history of price concessions and stock rotations.
Technology Licensing Segment
The technology licensing segment includes sales and licensing of the Company's intellectual property. For contracts related to the sale of the Company's intellectual property, the Company satisfies its performance obligation and recognizes revenue when control of the intellectual property transfers to the customer. For contracts related to the licensing of the Company's technology, the Company satisfies its performance obligation and recognizes revenue as usage of the license occurs. The transaction price is fixed by the license agreement. Payment is collected after the Company satisfies its performance obligation, and therefore no contract liabilities are recorded. The Company does not record contract assets due to the fact that the Company has an unconditional right to payment upon satisfaction of the performance obligation, and therefore, the Company recognizes a receivable instead of a contract asset. Refer to Note 10 for the opening and closing balances of the Company's receivables.
Note 4. Geographic and Segment Information
The Company's reportable segments are semiconductor products and technology licensing. The Company does not allocate operating expenses, interest income, interest expense, other income or expense, or provision for or benefit from income taxes to these segments for internal reporting purposes, as the Company does not believe that allocating these expenses is beneficial in evaluating segment performance. Additionally, the Company does not allocate assets to segments for internal reporting purposes as it does not manage its segments by such metrics.
The following table represents net sales and gross profit for each segment (in millions):
Years ended March 31, | |||||||||||||||||||||||
2020 | 2019 | 2018 | |||||||||||||||||||||
Net Sales | Gross Profit | Net Sales | Gross Profit | Net Sales | Gross Profit | ||||||||||||||||||
Semiconductor products | $ | $ | $ | $ | $ | $ | |||||||||||||||||
Technology licensing | |||||||||||||||||||||||
Total | $ | $ | $ | $ | $ | $ | |||||||||||||||||
The Company sells its products to distributors and OEMs in a broad range of market segments, performs on-going credit evaluations of its customers and, as deemed necessary, may require collateral, primarily letters of credit. The Company's operations outside the U.S. consist of product assembly and final test facilities in Thailand, and sales and support centers and design centers in certain foreign countries. Domestic operations are responsible for the design, development and wafer fabrication of products, as well as the coordination of production planning and shipping to meet worldwide customer commitments. The Company's Thailand assembly and test facility is reimbursed in relation to value added with respect to assembly and test operations and other functions performed, and certain foreign sales offices receive compensation for sales within their territory. Accordingly, for financial statement purposes, it is not meaningful to segregate sales or operating profits for the assembly and test and foreign sales office operations. Identifiable long-lived assets (consisting of property, plant and equipment net of accumulated amortization and ROU assets) by geographic area are as follows (in millions):
F-25
March 31, | |||||||
2020 | 2019 | ||||||
United States | $ | $ | |||||
Thailand | |||||||
Various other countries | |||||||
Total long-lived assets (1) | $ | $ | |||||
(1) The amounts presented for March 31, 2020 include ROU assets of $119.5 million due to the adoption of ASC 842, Leases, under the retrospective cumulative effect adjustment transition method. The disclosures are not applicable for the fiscal year ended March 31, 2019 (see Note 11, Leases, for further information).
Sales to unaffiliated customers located outside the U.S., primarily in Asia and Europe, aggregated approximately 78 %, 80 % and 85 % of consolidated net sales for fiscal 2020, fiscal 2019 and fiscal 2018, respectively. Sales to customers in Europe represented approximately 22 %, 23 % and 24 % of consolidated net sales for fiscal 2020, fiscal 2019 and fiscal 2018, respectively. Sales to customers in Asia represented approximately 52 % of consolidated net sales for each of fiscal 2020 and 2019 and approximately 58 % of consolidated net sales during fiscal 2018. Within Asia, sales into China represented approximately 21 %, 22 % and 30 % of consolidated net sales for fiscal 2020, 2019 and 2018, respectively. Sales into Taiwan represented approximately 15 %, 13 % and 11 % of consolidated net sales for fiscal 2020, 2019 and 2018, respectively. Sales into any other individual foreign country did not exceed 10% of the Company's net sales for any of the three years presented.
Note 5. Special Charges and Other, Net
The following table summarizes activity included in the "special charges and other, net" caption on the Company's consolidated statements of income (in millions):
Year Ended March 31, | |||||||||||
2020 | 2019 | 2018 | |||||||||
Restructuring | |||||||||||
Employee separation costs | $ | $ | $ | ||||||||
Gain on sale of assets | ( | ) | ( | ) | |||||||
Impairment charges | |||||||||||
Contract exit costs | ( | ) | |||||||||
Other | ( | ) | |||||||||
Legal contingencies | ( | ) | |||||||||
Non-restructuring contract exit costs and other | |||||||||||
Total | $ | $ | $ | ||||||||
The Company continuously evaluates its existing operations in an attempt to identify and realize cost savings opportunities and operational efficiencies. This same approach is applied to businesses that are acquired by the Company and often the operating models of acquired companies are not as efficient as the Company's operating model which enables the Company to realize significant savings and efficiencies. As a result, following an acquisition, the Company will from time to time incur restructuring expenses; however, the Company is often not able to estimate the timing or amount of such costs in advance of the period in which they occur. The primary reason for this is that the Company regularly reviews and evaluates each position, contract and expense against the Company's strategic objectives, long-term operating targets and other operational priorities. Decisions related to restructuring activities are made on a "rolling basis" during the course of the integration of an acquisition whereby department managers, executives and other leaders work together to evaluate each of these expenses and make recommendations. As a result of this approach, at the time of an acquisition, the Company is not able to estimate the future amount of expected employee separation or exit costs that it will incur in connection with its restructuring activities.
F-26
During the fiscal year ended March 31, 2020, the Company incurred costs of $18.0 million associated with restructuring certain of its wafer fabrication operations primarily consisting of $8.2 million in contract exit costs, $6.6 million in other relocation costs and $2.5 million in asset impairment charges. The Company estimates that it will incur less than $10.0 million within the next year for the remaining associated costs of these restructuring activities. The Company's other restructuring expenses during the fiscal year ended March 31, 2020 and March 31, 2019 were primarily related to the Company's most recent business acquisitions, and resulted from workforce, property and other operating expense rationalizations as well as combining product roadmaps and manufacturing operations. These expenses were for employee separation costs and intangible asset impairment charges. The impairment charges in the fiscal year ended March 31, 2019 were primarily recognized as a result of writing off intangible assets purchased from Microsemi prior to the close of the acquisition and other intangible assets that were impaired as a result of changes in the combined product roadmaps after the acquisition that affected the use and life of the assets. Additional costs will be incurred in the future as additional synergies or operational efficiencies are identified in connection with the Microsemi transaction or other previous acquisitions. The Company is not able to estimate the amount of other such future expenses at this time.
During the fiscal year ended March 31, 2020, the Company incurred $15.7 million of net charges related to legal settlements, for which the majority of the cash settlement occurred early in the fiscal year ended March 31, 2021.
During the fiscal year ended March 31, 2018, the Company incurred expenses including non-restructuring contract exit costs of $19.5 million for fees associated with transitioning from the public utility provider in Oregon to a lower cost direct access provider. The fee is paid monthly and will depend on the amount of actual energy consumed by the Company's wafer fabrication facility in Oregon over the subsequent five-year period. In connection with the transition to a direct access provider, the Company signed a ten-year supply agreement to purchase monthly amounts of energy that are less than the current average usage and priced on a per mega watt hour published index rate in effect at those future dates. Also during the fiscal year ended March 31, 2018, the Company incurred $1.2 million of employee separation costs in connection with the acquisition of Atmel and completed the sale of an asset it acquired as part of its acquisition of Micrel for proceeds of $10.0 million resulting in a gain of $4.4 million.
All of the Company's restructuring activities occurred in its semiconductor products segment. The Company incurred $111.6 million in costs since the start of the fiscal year ended March 31, 2017 in connection with employee separation activities, of which $6.0 million, $65.3 million and $1.2 million were incurred during the fiscal years ended March 31, 2020, 2019 and 2018, respectively. The Company could incur future expenses as additional synergies or operational efficiencies are identified. Beyond what is already accrued, the Company is not able to estimate future expenses, if any, to be incurred in employee separation costs. The Company has incurred $53.5 million in costs in connection with contract exit activities since the start of the fiscal year ended March 31, 2017 which includes expense of $13.4 million and $0.7 million for the fiscal years ended March 31, 2020 and March 31, 2018, respectively, compared to income of $4.7 million for the fiscal year ended March 31, 2019.
F-27
The following is a roll forward of accrued restructuring and other exit cost charges for the fiscal years ended March 31, 2020 and March 31, 2019 (in millions):
Restructuring | Non-Restructuring | ||||||||||||||
Employee Separation Costs | Exit Costs | Exit Costs | Total | ||||||||||||
Balance at March 31, 2018 | $ | $ | $ | $ | |||||||||||
Additions due to Microsemi acquisition | |||||||||||||||
Charges | ( | ) | |||||||||||||
Payments | ( | ) | ( | ) | ( | ) | ( | ) | |||||||
Non-cash - Other | |||||||||||||||
Changes in foreign exchange rates | ( | ) | ( | ) | |||||||||||
Balance at March 31, 2019 | $ | $ | $ | $ | |||||||||||
Charges | |||||||||||||||
Payments | ( | ) | ( | ) | ( | ) | ( | ) | |||||||
Non-cash - Other | ( | ) | ( | ) | ( | ) | |||||||||
Effect of adoption of ASC 842 | ( | ) | ( | ) | |||||||||||
Balance at March 31, 2020 | $ | $ | $ | $ | |||||||||||
Current | $ | ||||||||||||||
Non-current | |||||||||||||||
Total | $ | ||||||||||||||
Note 6. Net Income Per Common Share
The following table sets forth the computation of basic and diluted net income per common share (in millions, except per share amounts):
Year Ended March 31, | |||||||||||
2020 | 2019 | 2018 | |||||||||
Net income | $ | $ | $ | ||||||||
Basic weighted average common shares outstanding | |||||||||||
Dilutive effect of stock options and RSUs | |||||||||||
Dilutive effect of 2007 Junior Convertible Debt | |||||||||||
Dilutive effect of 2015 Senior Convertible Debt | |||||||||||
Dilutive effect of 2017 Senior Convertible Debt | |||||||||||
Dilutive effect of 2017 Junior Convertible Debt | |||||||||||
Diluted weighted average common shares outstanding | |||||||||||
Basic net income per common share | $ | $ | $ | ||||||||
Diluted net income per common share | $ | $ | $ | ||||||||
The Company computed basic net income per common share based on the weighted average number of common shares outstanding during the period. The Company computed diluted net income per common share based on the weighted average number of common shares outstanding plus potentially dilutive common shares outstanding during the period.
Potentially dilutive common shares from employee equity incentive plans are determined by applying the treasury stock method to the assumed exercise of outstanding stock options and the assumed vesting of outstanding RSUs. Weighted average common shares exclude the effect of option shares which are not dilutive. There were no anti-dilutive option shares for each of the fiscal years ended March 31, 2020, 2019 and 2018.
F-28
Diluted weighted average common shares outstanding for fiscal 2020, 2019 and 2018 includes 13.7 million shares, 9.9 million shares and 10.3 million shares, respectively, issuable upon the exchange of the Company's 2015 Senior Convertible Debt. Diluted weighted average common shares outstanding for fiscal 2020 includes 0.1 million shares issuable upon the exchange of each of the Company's 2017 Senior Convertible Debt and the 2017 Junior Convertible Debt. There were no shares issuable upon the exchange of the Company's 2017 Senior Convertible Debt or the Company's 2017 Junior Convertible Debt for fiscal 2019 and fiscal 2018. Diluted weighted average common shares outstanding for fiscal 2018 includes 1.3 million shares, issuable upon the exchange of the Company's 2007 Junior Convertible Debt, which was fully settled as of December 31, 2017. The convertible debt has no impact on diluted net income per common share unless the average price of the Company's common stock exceeds the conversion price because the Company intends to settle the principal amount of the debentures in cash upon conversion. Prior to conversion, the Company will include, in the diluted net income per common share calculation, the effect of the additional shares that may be issued when the Company's common stock price exceeds the conversion price using the treasury stock method. The following is the weighted average conversion price per share used in calculating the dilutive effect (see Note 7 Debt for details on the convertible debt):
Year Ended March 31, | |||||||||||
2020 | 2019 | 2018 | |||||||||
2007 Junior Convertible Debt (1) | $ | ||||||||||
2015 Senior Convertible Debt | $ | $ | $ | ||||||||
2017 Senior Convertible Debt | $ | $ | $ | ||||||||
2017 Junior Convertible Debt | $ | $ | $ | ||||||||
(1)No longer outstanding as of December 31, 2017.
Note 7. Debt
Debt obligations included in the consolidated balance sheets consisted of the following (in millions):
Coupon Interest Rate | Effective Interest Rate | Fair Value of Liability Component at Issuance (1) | March 31, | ||||||||||
2020 | 2019 | ||||||||||||
Senior Secured Indebtedness | |||||||||||||
Revolving Credit Facility | $ | $ | |||||||||||
Term Loan Facility | |||||||||||||
Bridge Loan Facility | |||||||||||||
2023 Notes, maturing June 1, 2023 ("2023 Notes") | |||||||||||||
2021 Notes, maturing June 1, 2021 ("2021 Notes") | |||||||||||||
Total Senior Secured Indebtedness | |||||||||||||
Senior Subordinated Convertible Debt - Principal Outstanding | |||||||||||||
2017 Senior Convertible Debt, maturing February 15, 2027 ("2017 Senior Convertible Debt") | $ | $ | $ | ||||||||||
2015 Senior Convertible Debt, maturing February 15, 2025 ("2015 Senior Convertible Debt") | $ | ||||||||||||
Junior Subordinated Convertible Debt - Principal Outstanding | |||||||||||||
2017 Junior Convertible Debt, maturing February 15, 2037 ("2017 Junior Convertible Debt") | $ | ||||||||||||
Total Convertible Debt | |||||||||||||
Gross long-term debt including current maturities | |||||||||||||
Less: Debt discount (2) | ( | ) | ( | ) | |||||||||
Less: Debt issuance costs (3) | ( | ) | ( | ) | |||||||||
Net long-term debt including current maturities | |||||||||||||
Less: Current maturities (4) | ( | ) | ( | ) | |||||||||
Net long-term debt | $ | $ | |||||||||||
F-29
(1) As each of the convertible debt instruments may be settled in cash upon conversion, for accounting purposes, they were bifurcated into a liability component and an equity component, which are both initially recorded at fair value. The amount allocated to the equity component is the difference between the principal value of the instrument and the fair value of the liability component at issuance. The resulting debt discount is being amortized to interest expense at the respective effective interest rate over the contractual term of the debt.
(2) The unamortized discount consists of the following (in millions):
March 31, | |||||||
2020 | 2019 | ||||||
Bridge Loan Facility | $ | ( | ) | $ | |||
2023 Notes | ( | ) | ( | ) | |||
2021 Notes | ( | ) | ( | ) | |||
2017 Senior Convertible Debt | ( | ) | ( | ) | |||
2015 Senior Convertible Debt | ( | ) | ( | ) | |||
2017 Junior Convertible Debt | ( | ) | ( | ) | |||
Total unamortized discount | $ | ( | ) | $ | ( | ) | |
(3) Debt issuance costs consist of the following (in millions):
March 31, | |||||||
2020 | 2019 | ||||||
Revolving Credit Facility | $ | ( | ) | $ | ( | ) | |
Term Loan Facility | ( | ) | ( | ) | |||
Bridge Loan Facility | ( | ) | |||||
2023 Notes | ( | ) | ( | ) | |||
2021 Notes | ( | ) | ( | ) | |||
2017 Senior Convertible Debt | ( | ) | ( | ) | |||
2015 Senior Convertible Debt | ( | ) | ( | ) | |||
2017 Junior Convertible Debt | ( | ) | ( | ) | |||
Total debt issuance costs | $ | ( | ) | $ | ( | ) | |
(4) As of March 31, 2020, current maturities include the Bridge Loan Facility. As of March 31, 2019, current maturities consists of the liability component of the 2015 Senior Convertible Debt, as the debentures were convertible.
Expected maturities relating to the Company’s debt obligations as of March 31, 2020 are as follows (in millions):
Fiscal year ending March 31, | Expected Maturities | |||
2021 | $ | |||
2022 | ||||
2023 | ||||
2024 | ||||
2025 | ||||
Thereafter | ||||
Total | $ | |||
Ranking of Convertible Debt - The Senior Subordinated Convertible Debt and Junior Subordinated Convertible Debt (collectively, the Convertible Debt) are unsecured obligations which are subordinated in right of payment to the amounts outstanding under the Company's Credit Facility, the Bridge Loan Facility and Senior Secured Notes (as defined below). The Junior Subordinated Convertible Debt is expressly subordinated in right of payment to any existing and future senior debt of the Company (including the Credit Facility, the Bridge Loan Facility, the Senior Secured Notes, and the Senior Subordinated Convertible Debt) and is structurally subordinated in right of payment to the liabilities of the Company's subsidiaries. The Senior Subordinated Convertible Debt is subordinated to the Credit Facility, the Bridge Loan Facility and the Senior Secured Notes; ranks senior to the Company's indebtedness that is expressly subordinated in right of payment to it, including the Junior Subordinated Convertible Debt; ranks equal in right of payment to any of the Company's unsubordinated indebtedness that does not provide that it is senior to the Senior Subordinated Convertible Debt; ranks junior in right of payment to any of the
F-30
Company's secured, unsubordinated indebtedness to the extent of the value of the assets securing such indebtedness; and is structurally subordinated to all indebtedness and other liabilities of the Company's subsidiaries.
Summary of Conversion Features - Each series of Convertible Debt is convertible, subject to certain conditions, into cash, shares of the Company's common stock or a combination thereof, at the Company's election, at specified Conversion Rates (see table below), adjusted for certain events including the declaration of cash dividends. Except during the three-month period immediately preceding the maturity date of the applicable series of Convertible Debt, each series of Convertible Debt is convertible only upon the occurrence of (1) such time as the closing price of the Company's common stock exceeds the Conversion Price (see table below) by 130 % for 20 days (whether or not consecutive) during a period of 30 consecutive trading days ending on the last trading day of the immediately preceding fiscal quarter or (2) during the 5 business day period after any 10 consecutive trading day period, or the measurement period, in which the trading price per $1,000 principal amount of notes for each trading day of the measurement period was less than 98 % of the product of the last reported sale price of the Company's common stock and the conversion rate on each such trading day or (3) upon the occurrence of certain corporate events specified in the indenture of such series of Convertible Debt. In addition, for each series, if at the time of conversion the applicable price of the Company's common stock exceeds the applicable Conversion Price at such time, the applicable Conversion Rate will be increased by up to an additional maximum incremental shares rate, as determined pursuant to a formula specified in the indenture for the applicable series of Convertible Debt, and as adjusted for cash dividends paid since the issuance of such series of Convertible Debt. However, in no event will the applicable Conversion Rate exceed the applicable Maximum Conversion Rate specified in the indenture for the applicable series of Convertible Debt (see table below).
The following table sets forth the applicable Conversion Rates adjusted for dividends declared since issuance of such series of Convertible Debt and the applicable Incremental Share Factors and Maximum Conversion Rates as adjusted for dividends paid since the applicable issuance date:
Dividend adjusted rates as of March 31, 2020 | ||||||||||||
Conversion Rate | Approximate Conversion Price | Incremental Share Factor | Maximum Conversion Rate | |||||||||
2017 Senior Convertible Debt (1) | $ | |||||||||||
2015 Senior Convertible Debt (1) | $ | |||||||||||
2017 Junior Convertible Debt (1) | $ | |||||||||||
(1) As of March 31, 2020, the 2017 Senior Convertible Debt, the 2015 Senior Convertible Debt and the 2017 Junior Convertible Debt were not convertible. As of March 31, 2020, the 2015 Senior Convertible Debt had a value if converted above par of $175.7 million.
The Company may not redeem any series of Convertible Debt prior to the relevant maturity date and no sinking fund is provided for any series of Convertible Debt. Upon the occurrence of a fundamental change as defined in the applicable indenture of such series of Convertible Debt, holders of such series may require the Company to purchase all or a portion of their Convertible Debt for cash at a price equal to 100 % of the principal amount plus any accrued and unpaid interest.
Interest expense consists of the following (in millions):
Year Ended March 31, | |||||||||||
2020 | 2019 | 2018 | |||||||||
Debt issuance amortization | $ | $ | $ | ||||||||
Debt discount amortization | |||||||||||
Interest expense | |||||||||||
Total interest expense on Senior Secured Indebtedness | |||||||||||
Debt issuance amortization | |||||||||||
Debt discount amortization | |||||||||||
Coupon interest expense | |||||||||||
Total interest expense on Convertible Debt | |||||||||||
Other interest expense | |||||||||||
Total interest expense | $ | $ | $ | ||||||||
F-31
The remaining period over which the unamortized debt discount will be recognized as non-cash interest expense is 6.9 years, 4.9 years, and 16.9 years for the 2017 Senior Convertible Debt, 2015 Senior Convertible Debt and 2017 Junior Convertible Debt, respectively.
In March 2020, the Company settled, in privately negotiated transactions that are accounted for as induced conversions, $615.0 million aggregate principal amount of its 2015 Senior Convertible Debt for $615.0 million in cash and 5.2 million shares of the Company's common stock valued at $351.8 million for total consideration of $966.8 million, of which $460.4 million was allocated to the fair value of the liability component and $461.1 million was allocated to the reacquisition of the equity component. The consideration was allocated to the liability and equity components using the equivalent rate that reflected the borrowing rate for a similar non-convertible debt instrument prior to the exchange, resulting in a net loss on inducement and settlement of debt of $3.4 million. In addition, the Company also entered into a 364 -Day Senior Secured Bridge Agreement (as further explained below) in an aggregate principal amount of $615.0 million, the proceeds of which was used to finance substantially all of the cash portion of its 2015 Senior Convertible Debt exchange transaction. Following the settlement transaction, $1.11 billion in aggregate principal amount of the Company's 2015 Senior Convertible Debt remained outstanding as of March 31, 2020.
In November 2017, the Company called for redemption $14.6 million in principal value of the remaining outstanding 2007 Junior Subordinated Convertible Debt (2007 Junior Convertible Debt) with an effective redemption date of December 15, 2017 for which substantially all holders submitted requests to convert. Prior to the call, conversion requests were received in both the second and third quarters of fiscal 2018. Total conversions for fiscal 2018 were for a principal amount of $32.5 million for which the Company settled the principal amount in cash and issued 0.5 million shares of its common stock in respect of the conversion value in excess of the principal amount for the conversions occurring prior to the redemption notice and $41.0 million in cash for the conversion value in excess of the principal amount for the conversion requests received after the notice of redemption. A loss on total conversions was recorded for $2.2 million.
In June 2017, the Company exchanged, in privately negotiated transactions, $111.3 million aggregate principal amount of its 2007 Junior Convertible Debt for (i) $111.3 million principal amount of 2017 Junior Convertible Debt with a market value of $119.3 million plus (ii) the issuance of 3.2 million shares of the Company's common stock with a value of $254.6 million, of which $56.3 million was allocated to the fair value of the liability and $321.1 million was allocated to the reacquisition of the equity component for total consideration of $374.0 million. The transaction resulted in a loss on settlement of the 2007 Junior Convertible Debt of approximately $13.8 million, which represented the difference between the fair value of the liability component at time of repurchase and the sum of the carrying values of the debt component and any unamortized debt issuance costs. The debt discount on the new 2017 Junior Convertible Debt was the difference between the par value and the fair value of the debt resulting in a debt discount of $55.1 million which will be amortized to interest expense using the effective interest method over the term of the debt.
In February 2017, the Company issued the 2017 Senior Convertible Debt and 2017 Junior Convertible Debt for net proceeds of $2.04 billion and $567.7 million, respectively. In connection with the issuance of these instruments, the Company incurred issuance costs of $33.7 million, of which $17.8 million and $3.4 million was recorded as convertible debt issuance costs related to the 2017 Senior Convertible Debt and 2017 Junior Convertible Debt, respectively, and will be amortized using the effective interest method over the term of the debt. The balance of $12.5 million in fees was recorded to equity. Interest on both instruments is payable semi-annually on February 15 and August 15 of each year.
In February 2015, the Company issued the 2015 Senior Convertible Debt for net proceeds of approximately $1.69 billion. In connection with the issuance, the Company incurred issuance costs of $30.3 million, of which $20.4 million was recorded as debt issuance costs and will be amortized using the effective interest method over the term of the debt. The balance of $9.9 million was recorded to equity.
The Company utilized the proceeds from the issuances of the 2017 Senior Convertible Debt, 2017 Junior Convertible Debt, and 2015 Senior Convertible Debt to reduce amounts borrowed under its Credit Facility and to settle a portion of the 2007 Junior Convertible Debt in privately negotiated transactions. In February 2017 and February 2015, the Company settled $431.3 million and $575.0 million, respectively, in aggregate principal of its 2007 Junior Convertible Debt. The February 2015 repurchase consisted solely of cash. In February 2017, the Company used cash of $431.3 million and an aggregate of 12.0 million in shares of the Company's common stock valued at $862.7 million for total consideration of $1.29 billion to repurchase $431.3 million of the 2007 Junior Convertible Debt, of which $188.0 million was allocated to the liability component and $1.11 billion was allocated to the equity component. In addition, in February 2017, there was an inducement fee of $5.0 million which was recorded in the consolidated statements of income in loss on settlement of debt. The consideration transferred in February 2015 was $1.13 billion, of which $238.3 million was allocated to the liability component and $896.3 million was allocated to the equity component. In the case of both settlements of the 2007 Junior Convertible Debt, the consideration was
F-32
allocated to the liability and equity components using the equivalent rate that reflected the borrowing rate for a similar non-convertible debt prior to the retirement. The transactions resulted in a loss on settlement of debt of approximately $43.9 million and $50.6 million in fiscal 2017 and fiscal 2015, respectively, which represented, in each case, the difference between the fair value of the liability component at time of repurchase and the sum of the carrying values of the debt component and any unamortized debt issuance costs.
Senior Secured Notes
In May 2018, the Company issued $1.00 billion aggregate principal amount of 3.922 % Senior Secured Notes due 2021 (the “2021 Notes”) and $1.00 billion aggregate principal amount of 4.333 % Senior Secured Notes due 2023 (the “2023 Notes”, and together with the 2021 Notes, the "Senior Secured Notes") to qualified institutional buyers in a Rule 144A offering. In connection with the issuance of these instruments, the Company incurred issuance costs of $24.4 million and recorded a debt discount of $10.5 million for fees deducted from the proceeds, which will both be amortized using the effective interest method over the term of the debt. The 2021 Notes mature on June 1, 2021 and the 2023 Notes mature on June 1, 2023. Interest on the 2021 Notes accrues at a rate of 3.922 % per annum, payable semi-annually in arrears on June 1 and December 1 of each year. Interest on the 2023 Notes accrues at a rate of 4.333 % per annum, payable semi-annually in arrears on June 1 and December 1 of each year.
The Company may, at its option, redeem some or all of the 2021 Notes prior to June 1, 2021 at a price equal to the greater of (a) 100 % of the principal amount of the 2021 Notes redeemed or (b) the sum of the present value of all remaining scheduled payments of principal and interest (discounted in accordance with the indenture for the 2021 Notes) that would have been due on the redeemed 2021 Notes, in each case, plus accrued and unpaid interest to, but excluding, the redemption date. The Company may, at its option, redeem some or all of the 2023 Notes, (i) if prior to May 1, 2023 (one month prior to the maturity date of the 2023 Notes), at a price equal to the greater of (a) 100 % of the principal amount of the 2023 Notes redeemed or (b) the sum of the present value of all remaining scheduled payments of principal and interest (discounted in accordance with the indenture for the 2023 Notes) that would have been due on the redeemed 2023 Notes, in each case, plus accrued and unpaid interest to, but excluding, the redemption date, and (ii) if on or after May 1, 2023 (one month prior to maturity of the 2023 Notes), at a redemption price equal to 100 % of the principal amount of the notes redeemed, plus accrued and unpaid interest to, but excluding, the redemption date.
If the Company experiences a specified change of control triggering event, the Company must offer to repurchase the Notes at a price equal to 101 % of the principal amount of the Notes repurchased, plus accrued and unpaid interest, if any, to, but excluding, the repurchase date.
The Notes are guaranteed by certain of the Company's subsidiaries (each such guarantee, a “Note Guarantee”) that have also guaranteed the obligations under the Company's Credit Facility and under the Term Loan Facility (the Term Loan Facility together with the Credit Facility, the “Senior Credit Facilities”) that was entered into in connection with the financing of the Microsemi acquisition.
The Notes and the Note Guarantees are secured, on a pari passu first lien basis with the Senior Credit Facilities, by substantially all of the tangible and intangible assets (other than certain excluded assets) of the Company and the guarantors that secure obligations under the Senior Credit Facilities, in each case subject to certain thresholds, exceptions and permitted liens, as set forth in the indenture for the Senior Secured Notes and the Security Agreement, dated May 29, 2018, by and among the Company, the subsidiary guarantors party thereto and the Collateral Agent (the "Security Agreement").
Credit Facility
In March 2020 and September 2019, the Company amended the Company's Credit Agreement to, among other things, amend certain negative covenants, including covenants that restrict the Company and its subsidiaries’ ability to, among other things, incur subsidiary indebtedness, grant liens and enter into certain restrictive agreements. The amendments provide the Company the ability to finance a Convertible Notes repurchase not to exceed $1.0 billion with secured debt, and the ability to factor receivables and certain related assets as further explained below. In addition, the amendments reduce the margin added to the interest rate on revolving loans under the Credit Agreement to 0.0 % to 0.75 % for base rate loans and 1.0 % to 1.75 % for the LIBOR rate loans, in each case determined based on the Company's senior leverage ratio. The amendments reduced the commitments for the Revolving Credit Facility thereunder to $3.57 billion from $3.60 billion. In connection with the fiscal 2020 amendments of the Credit Agreement, the Company incurred issuance costs of $3.9 million, which will be amortized using the effective interest method over the remaining term of the debt.
F-33
The Credit Agreement provides for a revolving loan facility in an aggregate principal amount of approximately $3.57 billion, with a $250.0 million foreign currency sublimit, a $50.0 million letter of credit sublimit and a $25.0 million swingline loan sublimit. The Credit Agreement consists of approximately $3.57 billion of revolving loan commitments that terminate on May 18, 2023 (the "2023 Maturity Date"). The $244.3 million of revolving loan commitments that would have terminated on February 4, 2020 were canceled in the fiscal year ended March 31, 2019. The Revolving Loans bear interest, at the Company’s option, at the base rate plus a spread of 0.00 % to 0.75 % or an adjusted LIBOR rate (based on one, two, three or six-month interest periods) plus a spread of 1.00 % to 1.75 %, in each case with such spread being determined based on the consolidated senior leverage ratio for the preceding four fiscal quarter period.
The Credit Agreement permits the Company to effect a refinancing or replacement of the initial Term Loans or payoff of other indebtedness and may not have a maturity date that is prior to the maturity date of the Term Loans or Revolving Commitments being refinanced. The Credit Agreement allows the Company the sale, transfer or assignment of securitization assets in connection with qualified factoring transactions to the borrower or any subsidiary in an aggregate face amount that does not exceed an outstanding amount of $600 million at any time. The Credit Agreement permits the Company to add one or more incremental term loan facilities (in addition to the loans under the Term Loan Facility) and/or increase the commitments under the Revolving Credit Facility from time to time, subject, in each case, to the receipt of additional commitments from existing and/or new lenders and pro forma compliance with a consolidated senior leverage ratio set forth in the Credit Agreement.
The Company's obligations under the Credit Agreement are guaranteed by certain of its subsidiaries meeting materiality thresholds set forth in the Credit Agreement. To secure the Company's obligations under the Credit Agreement and the subsidiary guarantors’ obligations under the guarantees, the Company and each of the subsidiary guarantors has granted a security interest in substantially all of its assets subject to certain exceptions and limitations.
In May 2018, the Company borrowed $3.0 billion aggregate principal amount of loans under the Term Loan Facility ("Term Loans"). In connection with such borrowings, the Company incurred issuance costs of $34.7 million which will be amortized using the effective interest method over the term of the debt. The Credit Agreement provides for quarterly amortization payments of the Term Loans on the last business day of each March, June, September and December, commencing with the last business day of the first full fiscal quarter to occur after the Microsemi acquisition effective date of May 29, 2018, equal to 0.25 % of the aggregate original principal amount of the Term Loans. In addition, the Credit Agreement requires mandatory prepayments of the Term Loans from the incurrence of debt not otherwise permitted to be incurred under the Credit Agreement, certain asset sales and certain excess cash flow. Mandatory prepayments with excess cash flow (as defined in the Credit Agreement) are required to be made beginning with the Company’s fiscal year ending March 31, 2020 in an amount equal to 50 %, 25 % or 0 % of the excess cash flow for such fiscal year, depending on the Company’s senior leverage ratio. The Company may prepay the Term Loans at any time without premium or penalty. Term Loans repaid or prepaid may not be reborrowed. The Company voluntarily prepaid $188.0 million of principal under the Term Loan Facility in fiscal 2020, which resulted in a loss on settlement of debt of approximately $1.9 million consisting of unamortized financing fees. During fiscal 2019, the Company voluntarily prepaid $1.09 billion of principal under the Term Loan Facility of which $500.0 million was from funds borrowed under its Revolving Credit Facility, and such transactions resulted in a loss on settlement of debt of approximately $11.5 million consisting of unamortized financing fees.
Interest is due and payable in arrears quarterly for loans bearing interest at the base rate and at the end of an interest period (or at each three-month interval in the case of loans with interest periods greater than three months) in the case of loans bearing interest at the adjusted LIBOR rate. Principal, together with all accrued and unpaid interest, is due and payable on the 2023 Maturity Date in the case of revolving loans under the Credit Agreement and May 29, 2025 in the case of the Term Loans. The Company pays a quarterly commitment fee on the available but unused portion of the Revolving Credit Facility which is calculated on the average daily available balance during the period. The Company may prepay the loans and terminate the commitments, in whole or in part, at any time without premium or penalty, subject to certain conditions including minimum amounts in the case of commitment reductions and reimbursement of certain costs in the case of prepayments of LIBOR loans.
The Credit Agreement contains customary affirmative and negative covenants, including covenants that limit or restrict the Company and its subsidiaries' ability to, among other things, incur subsidiary indebtedness, grant liens, merge or consolidate, dispose of assets, make investments, make acquisitions, enter into certain transactions with affiliates, pay dividends or make distributions, repurchase stock, enter into restrictive agreements and enter into sale and leaseback transactions, in each case subject to customary exceptions for a credit facility of this size and type. The Company is also required to maintain compliance with a senior leverage ratio, a total leverage ratio and an interest coverage ratio, all measured quarterly and calculated on a consolidated basis. The maximum Total Leverage Ratio (capitalized terms not otherwise defined in this Form 10-K have the meaning of the defined terms in the applicable agreements), measured quarterly, cannot exceed (a) 6.00 to 1.00 for any such period ended on or after the Second Amendment Effective Date of March 21, 2020 to (but excluding) the first anniversary of
F-34
the Second Amendment Effective Date, (b) 5.75 to 1.00 for any such period ended on or after the first anniversary of the Second Amendment Effective Date to (but excluding) the second anniversary of the Second Amendment Effective Date to (but excluding) the second anniversary or the Second Amendment Effective Date and (c) 5.25 to 1.00 for any such period ended on or after the second anniversary of the Second Amendment Effective Date. The total leverage ratio is calculated as Consolidated Total Indebtedness, excluding the Junior Convertible Debt up to a $700 million maximum, to Consolidated EBIDTA for a period of four consecutive quarters. The Credit Agreement also requires that the Senior Leverage Ratio, measured quarterly, not exceed (a) 4.75 to 1.00 for any such period ended on or after the Second Amendment Effective Date to (but excluding) the first anniversary of the Second Amendment Effective Date, (b) 4.25 to 1.00 for any such period ended on or after the first anniversary of the Second Amendment Effective Date to (but excluding) the second anniversary of the Second Amendment Effective Date and (c) 3.75 to 1.00 for any such period ended on or after the second anniversary of the Second Amendment Effective Date. The senior leverage ratio is calculated as Consolidated Senior Indebtedness to Consolidated EBIDTA for four consecutive quarters. The Company is also required to comply with a Minimum Interest Coverage Ratio of at least 3.25 to 1.00 for any period ended on or after the Microsemi Acquisition Closing Date, measured quarterly. At March 31, 2020, the Company was in compliance with these financial covenants.
The Credit Agreement includes customary events of default that include, among other things, non-payment defaults, inaccuracy of representations and warranties, covenant defaults, cross default to material indebtedness, bankruptcy and insolvency defaults, material judgment defaults, ERISA defaults and a change of control default. The occurrence of an event of default could result in the acceleration of the obligations under the Credit Agreement. Under certain circumstances, a default interest rate will apply on all obligations during the existence of an event of default under the Revolving Credit Facility at a per annum rate equal to 2.00 % above the applicable interest rate for any overdue principal and 2.00 % above the rate applicable for base rate loans for any other overdue amounts.
Bridge Facility
On March 27, 2020, the Company entered into 364-Day Senior Secured Bridge Agreement (the "Bridge Credit Agreement") for an aggregate principal amount of $615.0 million to finance the cash portion of its 2015 Convertible Debt exchange transaction. The Bridge Credit Agreement provides for a term loan facility (the "Bridge Loan Facility"), which bears interest at the base rate plus a spread of 0.75 %, or an adjusted LIBOR rate (based on one, two, three or six-month interest periods) plus a spread of 1.75 %, in each case, increasing by 0.50 % on the date that is 90 days following the closing date and by an additional 0.50 % at the end of each 90-day period thereafter. If the Company has not repaid 50 % of the aggregate principal amount of the Term Loans borrowed at closing (the “Reference Amount”) by June 20, 2020, the Company must pay the lenders a fee equal to 0.50 % of the Reference Amount. The Company must also pay a fee equal to 0.50 % of the aggregate principal amount of the Term Loans held by the lenders on each of September 20, 2020, and December 20, 2020. The Bridge Loan Facility matures 364 days after closing, at which time all outstanding principal and accrued and unpaid interest become due and payable. In connection with such borrowings, the Company incurred issuance costs of $6.2 million, which will be amortized using the effective interest method over the term of the debt.
The Company's obligations under the Bridge Credit Agreement are guaranteed by certain of its subsidiaries meeting materiality thresholds set forth in the Bridge Credit Agreement. To secure the Company's obligations under the Bridge Credit Agreement and the subsidiary guarantors’ obligations under the guarantees, the Company and each of the subsidiary guarantors has granted a security interest in substantially all of its assets subject to certain exceptions and limitations.
The Bridge Credit Agreement contains customary affirmative and negative covenants, including covenants that limit or restrict the Company’s and its subsidiaries’ ability to, among other things, incur subsidiary indebtedness, grant liens, merge or consolidate, dispose of assets, make investments, make acquisitions, enter into certain transactions with affiliates, pay dividends or make distributions, repurchase stock, enter into restrictive agreements and enter into sale and leaseback transactions, in each case subject to customary exceptions for a credit facility of this size and type. The Bridge Credit Agreement also requires the Company to maintain compliance with (a) a consolidated Total Leverage Ratio of not greater than 6.00 to 1.00 for any four fiscal quarter period ended on or after the effective date of March 27, 2020 to, but excluding, the first anniversary of the effective date; (b) a consolidated Senior Leverage Ratio of not greater than 4.75 to 1.00 for any four fiscal quarter period ended on or after the effective date to, but excluding the first anniversary of the effective date; and (c) a consolidated Interest Coverage Ratio of not less than 3.25 to 1.00 for any four fiscal quarter period, each determined in accordance with the terms of the Bridge Credit Agreement. The total leverage ratio is calculated as Consolidated Total Indebtedness, excluding the Junior Convertible Debt up to a $700 million maximum, to Consolidated EBIDTA for a period of four consecutive quarters. The senior leverage ratio is calculated as Consolidated Senior Indebtedness to Consolidated EBIDTA for four consecutive quarters. At March 31, 2020, the Company was in compliance with these financial covenants.
F-35
The Bridge Credit Agreement includes customary events of default that include, among other things, non-payment defaults, inaccuracy of representations and warranties, covenant defaults, cross default to material indebtedness, bankruptcy and insolvency defaults, material judgment defaults, ERISA defaults and a change of control default. The occurrence of an event of default could result in the acceleration of the obligations under the Bridge Credit Agreement. Under certain circumstances, a default interest rate will apply on all obligations during the existence of an event of default under the Bridge Credit Agreement at a per annum rate equal to 2.00 % above the applicable interest rate for any overdue principal and 2.00 % above the rate applicable for base rate loans for any other overdue amounts.
Note 8. Fair Value of Financial Instruments
Accounting rules for fair value clarify that fair value is an exit price, representing the amount that would be received to sell an asset or paid to transfer a liability in an orderly transaction between market participants. As such, fair value is a market-based measurement that should be determined based on assumptions that market participants would use in pricing an asset or liability. As a basis for considering such assumptions, the Company utilizes a three-tier fair value hierarchy, which prioritizes the inputs used in measuring fair value as follows:
Level 1- | Observable inputs such as quoted prices in active markets; |
Level 2- | Inputs, other than the quoted prices in active markets, that are observable either directly or indirectly; and |
Level 3- | Unobservable inputs in which there is little or no market data, which require the reporting entity to develop its own assumptions. |
The carrying amount of cash equivalents approximates fair value because their maturity is less than three months. Management believes the carrying amount of the equity and cost-method investments materially approximated fair value at March 31, 2020 based upon unobservable inputs. The fair values of these investments have been determined as Level 3 fair value measurements. The carrying amount of accounts receivable, accounts payable and accrued liabilities approximates fair value due to the short-term maturity of the amounts and are considered Level 2 in the fair value hierarchy.
The fair values of the Company's revolving credit facility, term loan facility and bridge loan facility are estimated using discounted cash flow analyses, based on the Company's current incremental borrowing rates for similar types of borrowing arrangements. Based on the borrowing rates currently available to the Company for bank loans with similar terms and average maturities, the fair value of the Company's revolving credit facility, term loan facility and bridge loan facility at March 31, 2020 approximated the carrying value excluding debt discounts and debt issuance costs and are considered Level 2 in the fair value hierarchy. The Company measures the fair value of its senior and junior subordinated convertible debt and senior secured notes for disclosure purposes. These fair values are based on observable market prices for this debt, which is traded in less active markets and are therefore classified as a Level 2 fair value measurement.
The following table shows the carrying amounts and fair values of the Company's debt obligations as of March 31, 2020 and March 31, 2019 (in millions).
March 31, | |||||||||||||||
2020 | 2019 | ||||||||||||||
Carrying Amount (1) | Fair Value | Carrying Amount (1) | Fair Value | ||||||||||||
Revolving Credit Facility | $ | $ | $ | $ | |||||||||||
Term Loan Facility | $ | $ | $ | $ | |||||||||||
Bridge Loan Facility | $ | $ | $ | $ | |||||||||||
2023 Senior Secured Notes | $ | $ | $ | $ | |||||||||||
2021 Senior Secured Notes | $ | $ | $ | $ | |||||||||||
2017 Senior Convertible Debt | $ | $ | $ | $ | |||||||||||
2015 Senior Convertible Debt | $ | $ | $ | $ | |||||||||||
2017 Junior Convertible Debt | $ | $ | $ | $ | |||||||||||
(1) The carrying amounts presented are net of debt discounts and debt issuance costs (see Note 7 Debt for further information).
F-36
Note 9. Intangible Assets and Goodwill
Intangible assets consist of the following (in millions):
March 31, 2020 | |||||||||||
Gross Amount | Accumulated Amortization | Net Amount | |||||||||
Core and developed technology | $ | $ | ( | ) | $ | ||||||
Customer-related | ( | ) | |||||||||
In-process research and development | — | ||||||||||
Distribution rights and other | ( | ) | |||||||||
Total | $ | $ | ( | ) | $ | ||||||
March 31, 2019 | |||||||||||
Gross Amount | Accumulated Amortization | Net Amount | |||||||||
Core and developed technology | $ | $ | ( | ) | $ | ||||||
Customer-related | ( | ) | |||||||||
In-process research and development | — | ||||||||||
Distribution rights and other | ( | ) | |||||||||
Total | $ | $ | ( | ) | $ | ||||||
The following is an expected amortization schedule for the intangible assets for fiscal 2021 through fiscal 2025, absent any future acquisitions or impairment charges (in millions):
Fiscal Year Ending March 31, | Projected Amortization Expense | |||
2021 | $ | |||
2022 | $ | |||
2023 | $ | |||
2024 | $ | |||
2025 | $ | |||
The Company amortizes intangible assets over their expected useful lives, which range between 1 and 15 years. Amortization expense attributed to intangible assets are assigned to cost of sales and operating expenses as follows (in millions):
Year Ended March 31, | |||||||||||
2020 | 2019 | 2018 | |||||||||
Amortization expense charged to cost of sales | $ | $ | $ | ||||||||
Amortization expense charged to operating expense | |||||||||||
Total amortization expense | $ | $ | $ | ||||||||
The Company recognized impairment charges of $2.2 million, $3.1 million and $0.5 million in fiscal 2020, 2019 and 2018, respectively. The impairment charges of $3.1 million in fiscal 2019 were recognized as a result of writing off intangible assets purchased from Microsemi prior to the close of the acquisition and as a result of the changes in the combined product roadmaps after the acquisition of Microsemi that affected the use and life of these assets.
F-37
Goodwill activity for fiscal 2020 and fiscal 2019 was as follows (amounts in millions):
Semiconductor Products Reporting Unit | Technology Licensing Reporting Unit | ||||||
Balance at March 31, 2018 | $ | $ | |||||
Additions due to the acquisition of Microsemi | |||||||
Balance at March 31, 2019 | $ | $ | |||||
Additions | |||||||
Balance at March 31, 2020 | $ | $ | |||||
At March 31, 2020, the Company applied a qualitative goodwill impairment test to its two reporting units, concluding it was not more likely than not that goodwill was impaired. Through March 31, 2020, the Company has never recorded an impairment charge against its goodwill balance.
Note 10. Other Financial Statement Details
Accounts Receivable
Accounts receivable consists of the following (in millions):
March 31, | |||||||
2020 | 2019 | ||||||
Trade accounts receivable | $ | $ | |||||
Other | |||||||
Total accounts receivable, gross | |||||||
Less allowance for doubtful accounts | |||||||
Total accounts receivable, net | $ | $ | |||||
Inventories
The components of inventories consist of the following (in millions):
March 31, | |||||||
2020 | 2019 | ||||||
Raw materials | $ | $ | |||||
Work in process | |||||||
Finished goods | |||||||
Total inventories | $ | $ | |||||
Inventories are valued at the lower of cost and net realizable value using the first-in, first-out method. Inventory impairment charges establish a new cost basis for inventory and charges are not subsequently reversed to income even if circumstances later suggest that increased carrying amounts are recoverable.
F-38
Property, Plant and Equipment
Property, plant and equipment consists of the following (in millions):
March 31, | |||||||
2020 | 2019 | ||||||
Land | $ | $ | |||||
Building and building improvements | |||||||
Machinery and equipment | |||||||
Projects in process | |||||||
Total property, plant and equipment, gross | |||||||
Less accumulated depreciation and amortization | |||||||
Total property, plant and equipment, net | $ | $ | |||||
Depreciation expense attributed to property, plant and equipment was $168.9 million, $180.6 million and $123.7 million for the fiscal years ending March 31, 2020, 2019 and 2018, respectively.
Accrued Liabilities
Accrued liabilities consists of the following (in millions):
March 31, | |||||||
2020 | 2019 | ||||||
Accrued compensation and benefits | $ | $ | |||||
Income taxes payable | |||||||
Sales related reserves | |||||||
Current portion of lease liabilities | — | ||||||
Accrued expenses and other liabilities | |||||||
Total accrued liabilities | $ | $ | |||||
Note 11. Leases
Effective April 1, 2019, the Company adopted the new lease accounting standard using the modified retrospective approach. The Company elected the package of practical expedients permitted under the transition guidance with the new standard, which among other things, allows the Company to carry forward historical lease classification. The Company elected to apply the short-term measurement and recognition exemption in which ROU assets and lease liabilities are not recognized for short-term leases. Adoption of this standard resulted in recording of net operating lease ROU assets and corresponding operating lease liabilities of $124.6 million and $137.3 million, respectively. The net ROU asset includes the effect of reclassifying a portion of facilities-related restructuring reserves as an offset in accordance with the transition guidance. The standard did not materially affect the consolidated statements of income and had no impact on the condensed consolidated statements of cash flows.
The Company determines if an arrangement is a lease at its inception. Operating lease ROU assets and liabilities are recognized at commencement date based on the present value of lease payments over the lease term. Operating lease ROU assets also include any initial direct costs and prepayments less lease incentives. Lease terms may include options to extend or terminate the lease when it is reasonably certain that the Company will exercise such options. As the Company's leases generally do not provide an implicit rate, the Company uses its collateralized incremental borrowing rate based on the information available at the lease commencement date, including lease term, in determining the present value of lease payments. Lease expense for these leases is recognized on a straight-line basis over the lease term.
Operating lease arrangements are comprised primarily of real estate and equipment agreements for which the ROU assets are included in other assets and the corresponding lease liabilities, depending on their maturity, are included in accrued liabilities or other long-term liabilities in the consolidated balance sheets. There are certain immaterial finance leases recorded in the consolidated balance sheets. The Company has elected to account for the lease and non-lease components as a single lease component.
F-39
The details of the Company's total lease expense are as follows (in millions):
Year Ended March 31, | |||
2020 | |||
Operating lease expense | $ | ||
Variable lease expense | |||
Short-term lease expense | |||
Total lease expense | $ | ||
The Company's leases are included as a component of the following balance sheet lines (in millions):
March 31, | |||
2020 | |||
Other assets: | |||
Right-of-use assets | $ | ||
Total lease assets | $ | ||
Accrued liabilities: | |||
Current portion of lease liabilities | $ | ||
Other long-term liabilities: | |||
Non-current portion of lease liabilities | |||
Total lease liabilities | $ | ||
As of March 31, 2020, there are additional operating lease commitments of approximately $9.0 million that have not yet commenced. The following table presents the maturities of lease liabilities as of March 31, 2020 (in millions):
Fiscal year ending March 31, | Operating Leases | ||
2021 | $ | ||
2022 | |||
2023 | |||
2024 | |||
2025 | |||
Thereafter | |||
Total lease payments | $ | ||
Less: Imputed lease interests | |||
Total lease liabilities | $ | ||
The following table represents future minimum lease obligations under non-cancelable operating leases as of March 31, 2019 (in millions):
Fiscal year ending March 31, | Operating Leases | ||
2020 | $ | ||
2021 | |||
2022 | |||
2023 | |||
2024 | |||
Thereafter | |||
Total | $ | ||
F-40
The Company's weighted-average remaining lease-term and weighted-average discount rate are as follows:
As of March 31, 2020 | ||
Weighted average remaining lease-term | ||
Weighted average discount rate | % | |
Note 12. Commitments and Contingencies
Purchase Obligations
The Company has agreements for the purchase of property, plant and equipment and other goods and services including outstanding purchase commitments with the Company's wafer foundries. Commitments for construction or purchases of property, plant and equipment totaled $20.4 million as of March 31, 2020, all of which will be due within the next year. Other purchase obligations and commitments totaled approximately $135.2 million, which includes outstanding purchase commitments with the Company's wafer foundries and other suppliers, for delivery in fiscal 2021.
Indemnification Contingencies
The Company's technology license agreements generally include an indemnification clause that indemnifies the licensee against liability and damages (including legal defense costs) arising from any claims of patent, copyright, trademark or trade secret infringement by the Company's proprietary technology. The terms of these indemnification provisions approximate the terms of the outgoing technology license agreements, which are typically perpetual unless terminated by either party for breach. The possible amount of future payments the Company could be required to make based on agreements that specify indemnification limits, if such indemnifications were required on all of these agreements, is approximately $168.1 million. There are some licensing agreements in place that do not specify indemnification limits. As of March 31, 2020, the Company had not recorded any liabilities related to these indemnification obligations and the Company believes that any amounts that it may be required to pay under these agreements in the future will not have a material adverse effect on its financial position, cash flows or results of operations.
Legal Matters
In the ordinary course of the Company's business, it is exposed to various liabilities as a result of contracts, product liability, customer claims, governmental investigations and other matters. Additionally, the Company is involved in a limited number of legal actions, both as plaintiff and defendant. Consequently, the Company could incur uninsured liability in any of those actions. The Company also periodically receives notifications from various third parties alleging infringement of patents or other intellectual property rights, or from customers requesting reimbursement for various costs. With respect to pending legal actions to which the Company is a party and other claims, although the outcomes are generally not determinable, the Company believes that the ultimate resolution of these matters will not have a material adverse effect on its financial position, cash flows or results of operations. Litigation, governmental investigations and disputes relating to the semiconductor industry are not uncommon, and the Company is, from time to time, subject to such litigation, governmental investigations and disputes. As a result, no assurances can be given with respect to the extent or outcome of any such litigation, governmental investigations or disputes in the future.
In connection with its acquisition of Microsemi, which closed on May 29, 2018, the Company became involved with the following legal matters:
Federal Shareholder Class Action Litigation. Beginning on September 14, 2018, the Company and certain of its officers were named in two putative shareholder class action lawsuits filed in the United States District Court for the District of Arizona, captioned Jackson v. Microchip Technology Inc., et al., Case No. 2:18-cv-02914-JJT and Maknissian v. Microchip Technology Inc., et al., Case No. 2:18-cv-02924-JJT. On November 13, 2018, the Maknissian complaint was voluntarily dismissed. The Jackson complaint is allegedly brought on behalf of a putative class of purchasers of Microchip common stock between March 2, 2018 and August 9, 2018. The complaint asserts claims for alleged violations of the federal securities laws and generally alleges that the defendants issued materially false and misleading statements and failed to disclose material adverse facts about the Company’s business, operations, and prospects during the putative class period. The complaint seeks, among other things, compensatory damages and attorneys’ fees and costs on behalf of the putative class. On December 11, 2018, the Court issued an order appointing the lead plaintiff. An amended complaint was filed on February 22, 2019.
F-41
Defendants filed a motion to dismiss the amended complaint on April 1, 2019, which motion was granted in part and denied in part on March 11, 2020. Defendants filed their answer on April 24, 2020.
Federal Derivative Litigation. On December 17, 2018, a shareholder derivative lawsuit was filed against certain of the Company’s officers and directors in the United States District Court for the District of Arizona, captioned Kistenmacher v. Sanghi, et al., Case No. 18-cv-04720. The Company was named as a nominal defendant. The complaint generally alleged that defendants breached their fiduciary duties by, among other things, making or causing the Company to make false and misleading statements and omissions regarding the Microsemi acquisition, the Company’s business, operations, and prospects, and a purported failure to maintain internal controls. The complaint further alleged that certain defendants engaged in insider trading. The complaint asserted causes of action for alleged violations of Section 14(a) of the Securities Exchange Act, breach of fiduciary duties, and unjust enrichment and sought unspecified monetary damages, corporate governance reforms, restitution, and attorneys’ fees and costs. Defendants filed motions to dismiss on July 23, 2019. On September 13, 2019, the court granted the parties' stipulation of voluntary dismissal dismissing the case without prejudice.
State Derivative Litigation. On January 22, 2019, a shareholder derivative lawsuit was filed against certain of the Company’s officers and directors in the Superior Court of Arizona for Maricopa County, captioned Reid v. Sanghi, et al., Case No. CV2019-002389. The Company is named as a nominal defendant. The complaint generally alleges that defendants breached their fiduciary duties by, among other things, purportedly failing to conduct adequate due diligence regarding Microsemi prior to its acquisition, misrepresenting the Company’s business prospects and health, and engaging in improper practices, and further alleges that certain defendants engaged in insider trading. The complaint asserts causes of action for breach of fiduciary duty, waste, and unjust enrichment and seeks unspecified monetary damages, corporate governance reforms, equitable and/or injunctive relief, restitution, and attorneys’ fees and costs. This case was stayed on May 23, 2019 to allow the Federal Derivative Litigation to address certain overlapping issues. Following the dismissal of the Federal Derivative Litigation, on October 1, 2019, the court granted the parties' joint request for a temporary stay. On January 30, 2020, the court lifted the temporary stay. An amended complaint was filed on February 28, 2020. Defendants filed their motions to dismiss the amended complaint on April 24, 2020.
Peterson, et al. v. Sanghi, et al. On October 9, 2018, four former officers of Microsemi Corporation filed a lawsuit in the Superior Court of California in Orange County against the Company, Steve Sanghi, Eric Bjornholt, Ganesh Moorthy and Mitch Little asserting claims for slander per se, libel per se, trade libel, and violations of California Business and Professions Code Section 17200 ("UCL"). Among other things, the plaintiffs in this matter allege that statements the Microchip executives made about excess shipments of products by Microsemi into the distribution channel were defamatory and that Microchip executives, including Mr. Sanghi, made false statements about Microsemi's shipments of products into the distribution channel, about certain Microsemi business practices and about the relative strength of the financial results of Microchip and Microsemi for the June 2018 quarter. On November 8, 2018, defendants removed the action to the United States District Court for the Central District of California, Case No. 18-cv-02000-JLS. Defendants moved to dismiss, and, following the Court's ruling, Plaintiffs filed an amended complaint that dropped the trade libel and UCL claims. The plaintiffs are seeking compensatory damages in excess of $100 million, punitive damages in excess of $300 million, as well as injunctive relief, and attorneys' fees and costs. In March 2020, the parties settled this matter, and the matter was later dismissed with prejudice.
Governmental Investigations. The Department of Justice and the Securities and Exchange Commission are investigating matters relating to the Company's acquisition of Microsemi. The Company believes that the investigations relate to distribution channel issues and business practices at Microsemi and the allegations made by the plaintiffs in the Peterson v. Sanghi lawsuit described above.
As a result of its acquisition of Atmel, which closed April 4, 2016, the Company became involved with the following legal matters:
Continental Claim ICC Arbitration. On December 29, 2016, Continental Automotive GmbH ("Continental") filed a Request for Arbitration with the ICC, naming as respondents the Company's subsidiaries Atmel Corporation, Atmel SARL, Atmel Global Sales Ltd., and Atmel Automotive GmbH (collectively, "Atmel"). The Request alleges that a quality issue affecting Continental airbag control units in certain recalled vehicles stems from allegedly defective Atmel application specific integrated circuits ("ASICs"). Continental seeks to recover from Atmel all related costs and damages incurred as a result of the vehicle manufacturers’ airbag control unit-related recalls, currently alleged to be $203 million. The Company's Atmel subsidiaries intend to defend this action vigorously.
Southern District of New York Action by LFoundry Rousset ("LFR") and LFR Employees. On March 4, 2014, LFR and Jean-Yves Guerrini, individually and on behalf of a putative class of LFR employees, filed an action in the United States District Court for the Southern District of New York (the "District Court") against the Company's Atmel subsidiary, French
F-42
subsidiary, Atmel Rousset S.A.S. ("Atmel Rousset"), and LFoundry GmbH ("LF"), LFR's German parent. The case purports to relate to Atmel Rousset's June 2010 sale of its wafer manufacturing facility in Rousset, France to LF, and LFR's subsequent insolvency, and later liquidation, more than three years later. The District Court dismissed the case on August 21, 2015, and the United States Court of Appeals for the Second Circuit affirmed the dismissal on June 27, 2016. On July 25, 2016, the plaintiffs filed a notice of appeal from the District Court's June 27, 2016 denial of their motion for relief from the dismissal judgment. On May 19, 2017, the United States Court of Appeals for the Second Circuit affirmed the June 27, 2016 order dismissing the case.
Individual Labor Actions by former LFR Employees. In June 2010, Atmel Rousset sold its wafer manufacturing business in Rousset, France to LFoundry GmbH ("LF"), the German parent of LFoundry Rousset ("LFR"). LFR then leased the Atmel Rousset facility to conduct the manufacture of wafers. More than three years later, LFR became insolvent and later liquidated. In the wake of LFR's insolvency and liquidation, over 500 former employees of LFR filed individual labor actions against Atmel Rousset in a French labor court, and in 2019 a French labor court dismissed all of the employees’ claims against Atmel Rousset. Plaintiffs have filed appeals requesting reconsideration of the earlier dismissals. Furthermore, these same claims have been filed by this same group of employees in a regional court in France against Microchip Technology Incorporated and Atmel Corporation. The Company, and the other defendant entities, believe that each of these actions is entirely devoid of merit, and, further, that any assertion by any of the Claimants of a co-employment relationship with any of these entities is based substantially on the same specious arguments that the Paris Commercial Court summarily rejected in 2014 in related proceedings. The defendant entities therefore intend to defend vigorously against each of these claims. Additionally, complaints have been filed in a regional court in France on behalf of the same group of employees against Microchip Technology Rousset, Atmel Switzerland Sarl, Atmel Corporation and Microchip Technology Incorporated alleging that the sale of the Atmel Rousset production unit to LF was fraudulent and should be voided. These claims are specious and the defendant entities therefore intend to defend vigorously against these claims.
The Company accrues for claims and contingencies when losses become probable and reasonably estimable. As of the end of each applicable reporting period, the Company reviews each of its matters and, where it is probable that a liability has been or will be incurred, the Company accrues for all probable and reasonably estimable losses. Where the Company can reasonably estimate a range of losses it may incur regarding such a matter, the Company records an accrual for the amount within the range that constitutes its best estimate. If the Company can reasonably estimate a range but no amount within the range appears to be a better estimate than any other, the Company uses the amount that is the low end of such range. As of March 31, 2020, the Company's estimate of the aggregate potential liability that is possible but not probable is approximately $100 million in excess of amounts accrued.
As reported in the Company's Annual Report on Form 10-K for the fiscal year ended March 31, 2019, the Company learned of an ongoing compromise of its computer networks by what is believed to be sophisticated hackers. The Company engaged experienced legal counsel and a leading forensic investigatory firm with experience in such matters. The Company took steps to identify malicious activity on its network including a compromise of its network and, in May 2019, the Company began implementing a containment plan. The Company routinely evaluates the effectiveness of the containment mechanisms that were implemented and continues to implement additional measures from time to time. The Company has analyzed the amount and content of the information that was compromised. The Company does not believe that this IT system compromise has had a material adverse effect on its business or resulted in any material damage to it.
F-43
Note 13. Income Taxes
The income tax provision consists of the following (amounts in millions):
Year Ended March 31, | |||||||||||
2020 | 2019 | 2018 | |||||||||
Pretax (loss) income: | |||||||||||
U.S. | $ | ( | ) | $ | ( | ) | $ | ( | ) | ||
Foreign | |||||||||||
$ | $ | $ | |||||||||
Current (benefit) expense: | |||||||||||
U.S. Federal | $ | $ | ( | ) | $ | ||||||
State | ( | ) | |||||||||
Foreign | |||||||||||
Total current (benefit) expense | $ | $ | ( | ) | $ | ||||||
Deferred expense (benefit): | |||||||||||
U.S. Federal | $ | ( | ) | $ | $ | ||||||
State | ( | ) | |||||||||
Foreign | ( | ) | ( | ) | ( | ) | |||||
Total deferred (benefit) expense | ( | ) | ( | ) | |||||||
Total Income tax (benefit) provision | $ | ( | ) | $ | ( | ) | $ | ||||
On December 22, 2017, the Act was enacted into law. The Act provides for numerous significant tax law changes and modifications including the reduction of the U.S. federal corporate income tax rate from 35.0% to 21.0%, the requirement for companies to pay a one-time transition tax on earnings of certain foreign subsidiaries that were previously tax deferred and the creation of new taxes on certain foreign-sourced earnings.
The Company intends to invest substantially all of its foreign subsidiary earnings, as well as its capital in its foreign subsidiaries, indefinitely outside of the U.S. in those jurisdictions in which the Company would incur significant, additional costs upon repatriation of such amounts. It is not practical to estimate the additional tax that would be incurred, if any, if the permanently reinvested earnings were repatriated.
F-44
The provision for income taxes differs from the amount computed by applying the statutory federal tax rate to income before income taxes. The sources and tax effects of the differences in the total income tax provision are as follows (amounts in millions):
Year Ended March 31, | |||||||||||
2020 | 2019 | 2018 | |||||||||
Computed expected income tax provision | $ | $ | $ | ||||||||
State income taxes, net of federal benefit | ( | ) | ( | ) | ( | ) | |||||
Foreign income taxed at lower than the federal rate | ( | ) | ( | ) | ( | ) | |||||
Impact of the Act - one-time transition tax, net of foreign tax credits | |||||||||||
Impact of the Act - deferred tax effects, net of valuation allowance | ( | ) | |||||||||
GILTI and foreign-derived intangible income ("FDII"), net of credits | |||||||||||
Business realignment of intellectual property rights | ( | ) | ( | ) | |||||||
Increases related to current year tax positions | |||||||||||
Decreases related to prior year tax positions (1) | ( | ) | ( | ) | ( | ) | |||||
Share-based compensation | ( | ) | ( | ) | ( | ) | |||||
Research and development tax credits | ( | ) | ( | ) | ( | ) | |||||
Intercompany prepaid tax asset amortization | |||||||||||
Foreign exchange | ( | ) | ( | ) | |||||||
Other | ( | ) | ( | ) | |||||||
Change in valuation allowance | ( | ) | ( | ) | ( | ) | |||||
Total income tax provision (benefit) | $ | ( | ) | $ | ( | ) | $ | ||||
(1) The release of prior year tax positions during fiscal 2020 increased the basic and diluted net income per common share by $0.12 and $0.11 , respectively. The release of prior year tax positions during fiscal 2019 increased the basic and diluted net income per common share by $0.32 and $0.30 , respectively. The release of prior year tax positions during fiscal 2018 increased the basic and diluted net income per common share by $0.05 .
The foreign tax rate differential benefit primarily relates to the Company's operations in Thailand, Malta and Ireland. The Company's Thailand manufacturing operations are currently subject to numerous tax holidays granted to the Company based on its investment in property, plant and equipment in Thailand. The Company's tax holiday periods in Thailand expire between fiscal 2022 and 2026, however, the Company actively seeks to obtain new tax holidays. The Company does not expect the future expiration of any of its tax holiday periods in Thailand to have a material impact on its effective tax rate. Microsemi was previously granted a tax holiday in Malaysia, which expired in December 2019. The aggregate dollar benefit derived from these tax holidays approximated $11.4 million and $6.2 million in fiscal 2020 and fiscal 2018, respectively, compared to aggregate dollar expense derived from these tax holidays of approximately $0.1 million in fiscal 2019. The impact of the tax holidays during fiscal 2020 increased the basic and diluted net income per common share by $0.05 and $0.04 , respectively. The impact of the tax holidays during fiscal 2018 increased the basic and diluted net income per common share by $0.03 and $0.02 , respectively. There was no such impact of the tax holidays on the basic and diluted net income per common share during fiscal 2019.
The Company's effective tax rate for fiscal 2020 includes a $334.8 million tax benefit related to intra-group transfers of certain intellectual property rights, which reduced its effective tax rate by 222.9 %. The tax benefit for the intra-group asset transfers was primarily made up of $78.0 million recorded as a deferred tax asset which represents the book and tax basis difference on the transferred assets measured based on the new applicable statutory tax rate, as well as, the reversal of the pre-existing deferred tax liability of $259.9 million, which represents the book and tax basis difference on the transferred assets measured based on applicable statutory tax rate prior to the transfer. The Company expects to be able to realize the future tax benefit of the deferred tax assets resulting from the intra-group asset transfers. It is not uncommon for taxing authorities of different countries to have conflicting views, for instance, with respect to, among other things, the manner in which the arm’s length standard is applied with respect to the valuation of intellectual property rights. The taxing authorities of jurisdictions in which the Company operates may challenge its methodologies for valuing the intellectual property rights transferred, which could increase the Company's future effective income tax rate and harm future results of operations.
F-45
The tax effects of temporary differences that give rise to significant portions of the Company's deferred tax assets and deferred tax liabilities are as follows (amounts in millions):
March 31, | |||||||
2020 | 2019 | ||||||
Deferred tax assets: | |||||||
Inventory valuation | $ | $ | |||||
Net operating loss carryforward | |||||||
Capital loss carryforward | |||||||
Share-based compensation | |||||||
Income tax credits | |||||||
Property, plant and equipment | |||||||
Accrued expenses and other | |||||||
Intangible assets | |||||||
Lease liabilities | — | ||||||
Other | |||||||
Gross deferred tax assets | |||||||
Valuation allowances | ( | ) | ( | ) | |||
Deferred tax assets, net of valuation allowances | |||||||
Deferred tax liabilities: | |||||||
Convertible debt | ( | ) | ( | ) | |||
Intangible assets | ( | ) | ( | ) | |||
ROU assets | ( | ) | — | ||||
Other | ( | ) | |||||
Deferred tax liabilities | ( | ) | ( | ) | |||
Net deferred tax asset | $ | $ | |||||
Reported as: | |||||||
Non-current deferred tax assets | $ | $ | |||||
Non-current deferred tax liability | ( | ) | ( | ) | |||
Net deferred tax asset | $ | $ | |||||
In assessing whether it is more likely than not that deferred tax assets will be realized, the Company considers all available evidence, both positive and negative, including its recent cumulative earnings experience and expectations of future available taxable income of the appropriate character by taxing jurisdiction, tax attribute carryback and carryforward periods available for tax reporting purposes, and prudent and feasible tax planning strategies.
A summary of additions and deductions related to the valuation allowance for deferred tax asset accounts for the years ended March 31, 2020, 2019 and 2018 follows (amounts in millions):
Balance at Beginning of Year | Additions Charged to Costs and Expenses | Additions Charged to Other Accounts | Deductions | Balance at End of Year | |||||||||||||||
Valuation allowance for deferred tax assets: | |||||||||||||||||||
Fiscal 2020 | $ | $ | $ | $ | ( | ) | $ | ||||||||||||
Fiscal 2019 | $ | $ | $ | $ | ( | ) | $ | ||||||||||||
Fiscal 2018 | $ | $ | $ | $ | ( | ) | $ | ||||||||||||
The Company had federal, state and foreign NOL carryforwards with an estimated tax effect of $74.8 million available at March 31, 2020. The federal, state and foreign NOL carryforwards expire at various times between fiscal 2021 and fiscal 2040, of which a portion of the NOL carryforwards do not expire. The Company had state tax credits of $168.2 million available at March 31, 2020. These state tax credits expire at various times between fiscal 2021 and fiscal 2040. The Company had capital loss carryforwards with an estimated tax effect of $9.4 million available at March 31, 2020. These capital loss carryforwards
F-46
begin to expire in fiscal 2021. The Company had foreign tax credits of $4.1 million available at March 31, 2020. These foreign tax credits begin to expire in fiscal 2022. The Company had credits for increasing research activity in the amount of $104.1 million available at March 31, 2020. These credits begin to expire in fiscal 2021. The Company had U.S. prior year minimum tax credits in the amount of $9.2 million available at March 31, 2020. The Company had refundable tax credits in foreign jurisdictions of $45.1 million available at March 31, 2020. The Company had withholding tax credits in foreign jurisdictions of $20.4 million available at March 31, 2020. These credits expire at various times between fiscal 2022 and fiscal 2024.
The Company recognizes interest and penalties related to unrecognized tax benefits through income tax expense. The Company is subject to income taxes in the U.S. and numerous foreign jurisdictions. The Company files U.S. federal, U.S. state, and foreign income tax returns. For U.S. federal, and in general for U.S. state tax returns, the fiscal 2007 and later tax years remain effectively open for examination by tax authorities. For foreign tax returns, the Company is generally no longer subject to income tax examinations for years prior to fiscal 2007.
Significant judgment is required in evaluating the Company's uncertain tax positions and determining its provision for income taxes. Although the Company believes that it has appropriately reserved for its uncertain tax positions, no assurance can be given that the final tax outcome of these matters will not be different than expectations. The Company will adjust these reserves in light of changing facts and circumstances, such as the closing of a tax audit, the refinement of an estimate, the closing of a statutory audit period or changes in applicable tax law. To the extent that the final tax outcome of these matters is different than the amounts recorded, such differences would impact the provision for income taxes in the period in which such determination is made. The provision for income taxes includes the impact of reserve provisions and changes to the reserves that are considered appropriate, as well as related net interest.
The Company recognizes liabilities for anticipated tax audit issues in the U.S. and other domestic and international tax jurisdictions based on its estimate of whether, and the extent to which, the tax positions are more likely than not to be sustained based on the technical merits. The Company believes that it has appropriate support for the income tax positions taken and to be taken on its tax returns and that its accruals for tax liabilities are adequate for all open years based on an assessment of many factors including past experience and interpretations of tax laws applied to the facts of each matter.
The Company believes it maintains appropriate reserves to offset any potential income tax liabilities that may arise upon final resolution of matters for open tax years. If such reserve amounts ultimately prove to be unnecessary, the resulting reversal of such reserves could result in tax benefits being recorded in the period the reserves are no longer deemed necessary. If such amounts prove to be less than an ultimate assessment, a future charge to expense would be recorded in the period in which the assessment is determined.
The following table summarizes the activity related to the Company's gross unrecognized tax benefits from April 1, 2017 to March 31, 2020 (amounts in millions):
Year Ended March 31, | |||||||||||
2020 | 2019 | 2018 | |||||||||
Beginning balance | $ | $ | $ | ||||||||
Increases related to acquisitions | |||||||||||
Decreases related to settlements with tax authorities | ( | ) | ( | ) | ( | ) | |||||
Decreases related to statute of limitation expirations | ( | ) | ( | ) | ( | ) | |||||
Increases related to current year tax positions | |||||||||||
Increases (decreases) related to prior year tax positions | ( | ) | ( | ) | |||||||
Ending balance | $ | $ | $ | ||||||||
As of March 31, 2020 and March 31, 2019, the Company had accrued interest and penalties related to tax contingencies of $74.6 million and $88.1 million, respectively. Previously accrued interest and penalties that were released during the years ended March 31, 2020 and March 31, 2019 were $13.5 million and $37.5 million, respectively. Interest and penalties charged to operations during the year ended March 31, 2018 were $5.4 million.
The Company is currently under income tax examination in various tax jurisdictions in which it operates. The years under examination range from fiscal 2007 through fiscal 2019. In some jurisdictions, the Company has received tax assessments in excess of established reserves. The Company is contesting these tax assessments, and will continue to do so, including
F-47
pursuing all available remedies such as appeals and litigation, if necessary. During fiscal 2020, additional assessments were received for these issues and the Company’s position remains unchanged.
The total amount of gross unrecognized tax benefits was $757.3 million and $763.4 million as of March 31, 2020 and March 31, 2019, respectively, of which $654.0 million and $664.4 million is estimated to impact the Company's effective tax rate, if recognized. The Company estimates that it is reasonably possible unrecognized tax benefits as of March 31, 2020 could decrease by approximately $10.0 million in the next 12 months. Positions that may be resolved include various U.S. and non-U.S. matters.
In April 2020, the Company became aware of a withholding tax regulation that could be interpreted to apply to certain of its previous intra-group transactions. The Company is evaluating whether the interpretation of this regulation could apply to its facts and circumstances, and, upon conclusion of its analysis, the Company may establish a reserve related to this matter in a subsequent period. An estimate of the impact on the financial statements cannot be made at this time.
On July 27, 2015, in Altera Corp. v. Commissioner, the U.S. Tax Court issued an opinion related to the treatment of stock-based compensation expense in an intercompany cost-sharing arrangement. In the July 2015 ruling, the Tax Court concluded that the sharing of the cost of employee stock compensation in a company’s cost-sharing arrangement was invalid under the U.S. Administrative Procedures Act. In June 2019, a panel of the Ninth Circuit of the U.S. Court of Appeals reversed this decision. In July 2019, Altera petitioned U.S. Court of Appeals for the Ninth Circuit to hold an en banc rehearing of the case. In November 2019, the en banc rehearing petition was denied, and Altera has asked the Supreme Court for a judicial review. Due to the uncertainty surrounding the status of the current regulations and questions related to the scope of potential benefits, the Company has not recorded any adjustments as of March 31, 2020. The Company will continue to monitor ongoing developments and potential impacts to its financial statements.
Note 14. Employee Benefit Plans
Defined Benefit Plans
The Company has defined benefit pension plans that cover certain French and German employees. Most of these defined pension plans, which were acquired in the Atmel and Microsemi acquisitions, are unfunded. Plan benefits are provided in accordance with local statutory requirements. Benefits are based on years of service and employee compensation levels. Pension liabilities and charges are based upon various assumptions, updated annually, including discount rates, future salary increases, employee turnover, and mortality rates. The Company’s French pension plan provides for termination benefits paid to covered French employees only at retirement, and consists of approximately one to five months of salary. The Company's German pension plan provides for defined benefit payouts for covered German employees following retirement.
The aggregate net pension expense relating to these two plans is as follows (in millions):
Year Ended March 31, | |||||||||||
2020 | 2019 | 2018 | |||||||||
Service costs | $ | $ | $ | ||||||||
Interest costs | |||||||||||
Amortization of actuarial loss | |||||||||||
Net pension period cost | $ | $ | $ | ||||||||
Interest costs and amortization of actuarial losses are recorded in the other income (loss), net line item in the statements of income.
F-48
The change in projected benefit obligation and the accumulated benefit obligation, were as follows (in millions):
Year Ended March 31, | |||||||
2020 | 2019 | ||||||
Projected benefit obligation at the beginning of the year | $ | $ | |||||
Additions due to acquisition of Microsemi | |||||||
Service cost | |||||||
Interest cost | |||||||
Actuarial losses | ( | ) | |||||
Benefits paid | ( | ) | ( | ) | |||
Foreign currency exchange rate changes | ( | ) | ( | ) | |||
Projected benefit obligation at the end of the year | $ | $ | |||||
Accumulated benefit obligation at the end of the year | $ | $ | |||||
Weighted average assumptions | |||||||
Discount rate | % | % | |||||
Rate of compensation increase | % | % | |||||
The Company's pension liability represents the present value of estimated future benefits to be paid. The discount rate is based on the quarterly average yield for Euros treasuries with a duration of 30 years, plus a supplement for corporate bonds (Euros, AA rating). Net actuarial losses, which are included in accumulated other comprehensive loss in the Company's consolidated balance sheets, will be recognized as a component of net periodic cost over the average remaining service period.
As the defined benefit plans are unfunded, the liability recognized on the Company's consolidated balance sheet as of March 31, 2020 was $70.0 million of which $1.3 million is included in accrued liabilities and $68.7 million is included in other long-term liabilities. The liability recognized on the Company's consolidated balance sheet as of March 31, 2019 was $72.7 million of which $1.3 million is included in accrued liabilities and $71.4 million is included in other long-term liabilities.
Future estimated expected benefit payments for fiscal year 2021 through 2030 are as follows (in millions):
Fiscal Year Ending March 31, | Expected Benefit Payments | ||
2021 | $ | ||
2022 | |||
2023 | |||
2024 | |||
2025 | |||
2026 through 2030 | |||
Total | $ | ||
The Company's net periodic pension cost for fiscal 2021 is expected to be approximately $2.8 million.
Defined Contribution Plans
The Company maintains a contributory profit-sharing plan for its domestic employees meeting certain eligibility and service requirements. The plan qualifies under Section 401(k) of the Internal Revenue Code of 1986, as amended, and allows employees to contribute up to 60 % of their base salary, subject to maximum annual limitations prescribed by the IRS. The Company has a discretionary matching contribution program. All matches are provided on a quarterly basis and require the participant to be an active employee at the end of the applicable quarter. During fiscal 2020, 2019 and 2018, the Company's matching contributions to the plan totaled $5.3 million, $8.6 million and $8.8 million, respectively.
F-49
Effective January 1, 1997, the Company adopted a non-qualified deferred compensation arrangement. This plan is unfunded and is maintained primarily for the purpose of providing deferred compensation for a select group of highly compensated employees as defined in ERISA Sections 201, 301 and 401. There are no Company matching contributions made under this plan.
The Company has management incentive compensation plans which provide for bonus payments, based on a percentage of base salary, from an incentive pool created from operating profits of the Company, at the discretion of the Board of Directors. During fiscal 2020, 2019 and 2018, $28.3 million, $18.7 million and $48.1 million were charged against operations for these plans, respectively.
The Company also has a plan that, at the discretion of the Board of Directors, provides a cash bonus to all employees of the Company based on the operating profits of the Company. During fiscal 2020, 2019 and 2018, $23.8 million, $16.4 million and $36.3 million, respectively, were charged against operations for this plan.
Note 15. Share-Based Compensation
Share-Based Compensation Expense
The following table presents the details of the Company's share-based compensation expense (in millions):
Year Ended March 31, | |||||||||||
2020 | 2019 | 2018 | |||||||||
Cost of sales (1) | $ | $ | $ | ||||||||
Research and development | |||||||||||
Selling, general and administrative | |||||||||||
Special charges and other, net | |||||||||||
Pre-tax effect of share-based compensation | |||||||||||
Income tax benefit | |||||||||||
Net income effect of share-based compensation | $ | $ | $ | ||||||||
Microsemi Acquisition-related Equity Awards
In connection with its acquisition of Microsemi on May 29, 2018, the Company assumed certain restricted stock units (RSUs), stock appreciation rights (SARs), and stock options granted by Microsemi. The assumed awards were measured at the acquisition date based on the estimated fair value, which was a total of $175.4 million. A portion of that fair value, $53.9 million, which represented the pre-acquisition vested service provided by employees to Microsemi, was included in the total consideration transferred as part of the acquisition. As of the acquisition date, the remaining portion of the fair value of those awards was $121.5 million, representing post-acquisition share-based compensation expense that will be recognized as these employees provide service over the remaining vesting periods.
Combined Incentive Plan Information
The Company has granted RSUs and stock options to employees and non-employee members of the Board of Directors under the Company’s 2004 Equity Incentive Plan (the 2004 plan). The Company uses RSUs as its primary equity incentive compensation instrument for employees. Under the 2004 plan, 32,194,859 shares of common stock have been authorized for issuance and 8,640,662 shares of common stock remain available for future grants as of March 31, 2020.
F-50
Restricted Stock Units
RSU share activity under the 2004 Plan is set forth below:
Number of Shares | Weighted Average Grant Date Fair Value | |||||
Nonvested shares at March 31, 2017 | $ | |||||
Granted | $ | |||||
Forfeited | ( | ) | $ | |||
Vested | ( | ) | $ | |||
Nonvested shares at March 31, 2018 | $ | |||||
Granted | $ | |||||
Assumed upon acquisition | $ | |||||
Forfeited | ( | ) | $ | |||
Vested | ( | ) | $ | |||
Nonvested shares at March 31, 2019 | $ | |||||
Granted | $ | |||||
Forfeited | ( | ) | $ | |||
Vested | ( | ) | $ | |||
Nonvested shares at March 31, 2020 | $ | |||||
The total intrinsic value of RSUs which vested during the fiscal years ended March 31, 2020, 2019 and 2018 was $223.9 million, $229.3 million and $146.0 million, respectively. The aggregate intrinsic value of RSUs outstanding at March 31, 2020 was $389.3 million, calculated based on the closing price of the Company's common stock of $67.80 per share on March 31, 2020. The amount of unearned share-based compensation currently estimated to be expensed in the remainder of fiscal 2021 through fiscal 2025 related to unvested share-based payment awards at March 31, 2020 is $263.2 million. The weighted average period over which the unearned share-based compensation is expected to be recognized is approximately 2.03 years.
Stock Options and Stock Appreciation Rights
Stock option and stock appreciation right (SAR) activity under the Company's stock incentive plans in the three years ended March 31, 2020 is set forth below:
Number of Shares | Weighted Average Exercise Price per Share | |||||
Outstanding at March 31, 2017 | $ | |||||
Exercised | ( | ) | $ | |||
Forfeited or expired | ( | ) | $ | |||
Outstanding at March 31, 2018 | $ | |||||
Assumed upon acquisition | $ | |||||
Exercised | ( | ) | $ | |||
Forfeited or expired | ( | ) | $ | |||
Outstanding at March 31, 2019 | $ | |||||
Exercised | ( | ) | $ | |||
Forfeited or expired | ( | ) | $ | |||
Outstanding at March 31, 2020 | $ | |||||
The total intrinsic value of options and SARs exercised during the fiscal years ended March 31, 2020, 2019 and 2018 was $8.4 million, $8.3 million and $7.4 million, respectively. This intrinsic value represents the difference between the fair market value of the Company's common stock on the date of exercise and the exercise price of each equity award.
F-51
The aggregate intrinsic value of options and SARs outstanding and exercisable at March 31, 2020 was $10.1 million. The aggregate intrinsic values were calculated based on the closing price of the Company's common stock of $67.80 per share on March 31, 2020. As of March 31, 2020, the weighted average remaining contractual term for options and SARs outstanding and exercisable was 2.66 years.
As of March 31, 2020 and March 31, 2019, the number of option and SAR shares exercisable was 149,010 and 278,591 , respectively, and the weighted average exercise price per share was $31.59 and $30.03 , respectively.
There were no stock options granted in the fiscal years ended March 31, 2020, 2019 and 2018.
Employee Stock Purchase Plan
The Company’s 2001 Employee Stock Purchase Plan and the 1994 International Employee Stock Purchase Plan (collectively referred to as the “employee stock purchase plans”) allows eligible employees to purchase shares of the Company's common stock at 85 % of the value of its common stock on specific dates. Since the inception of the employee stock purchase plans, 16,289,436 shares of common stock have been authorized for issuance and 6,347,253 shares remain available for future purchases as of March 31, 2020.
Employees purchased 787,284 shares of common stock in the fiscal year ended March 31, 2020 for a purchase price of $55.6 million under the employee stock purchase plans compared to 549,796 shares of common stock for a purchase price of $39.6 million in the fiscal year ended March 31, 2019 and 828,015 shares of common stock for a purchase price of $38.2 million in the fiscal year ended March 31, 2018. As of March 31, 2020, unrecognized share-based compensation costs related to the employee stock plans totaled $5.8 million, which will be recognized over a period of approximately five months .
Note 16. Stock Repurchase Activity
In January 2016, the Company's Board of Directors authorized an increase to the existing share repurchase program to 15.0 million shares of common stock. There were no repurchases of common stock during the fiscal years ended March 31, 2020, 2019 and 2018, respectively. There is no expiration date associated with this repurchase program. As of March 31, 2020, approximately 13.1 million shares remained as treasury shares with the balance of the shares being used to fund share issuance requirements under the Company's equity incentive plans.
Note 17. Accumulated Other Comprehensive Loss
The following tables present the changes in the components of accumulated other comprehensive loss for the years ended March 31, 2020 and March 31, 2019:
Unrealized Holding Gains (Losses) Available-for-sale Securities | Minimum Pension Liability | Foreign Currency | Total | ||||||||||||
Balance at March 31, 2019 | $ | $ | ( | ) | $ | ( | ) | $ | ( | ) | |||||
Impact of change in accounting principle | ( | ) | ( | ) | ( | ) | |||||||||
Opening Balance as of April 1, 2019 | $ | $ | ( | ) | $ | ( | ) | $ | ( | ) | |||||
Other comprehensive income (loss) before reclassifications | ( | ) | ( | ) | |||||||||||
Amounts reclassified from accumulated other comprehensive income (loss) | |||||||||||||||
Net other comprehensive income (loss) | ( | ) | |||||||||||||
Balance at March 31, 2020 | $ | $ | ( | ) | $ | ( | ) | $ | ( | ) | |||||
F-52
Unrealized Holding Gains (Losses) Available-for-sale Securities | Minimum Pension Liability | Foreign Currency | Total | ||||||||||||
Balance at March 31, 2018 | $ | $ | ( | ) | $ | ( | ) | $ | ( | ) | |||||
Impact of change in accounting principle | ( | ) | ( | ) | |||||||||||
Opening Balance as of April 1, 2018 | $ | $ | ( | ) | $ | ( | ) | $ | ( | ) | |||||
Other comprehensive (loss) income before reclassifications | ( | ) | ( | ) | ( | ) | |||||||||
Amounts reclassified from accumulated other comprehensive income | |||||||||||||||
Net other comprehensive income (loss) | ( | ) | ( | ) | |||||||||||
Balance at March 31, 2019 | $ | $ | ( | ) | $ | ( | ) | $ | ( | ) | |||||
The table below details where reclassifications of realized transactions out of accumulated other comprehensive loss are recorded on the consolidated statements of income (amounts in millions):
Year ended March 31, | |||||||||||||
Description of AOCI Component | 2020 | 2019 | 2018 | Related Statement of Income Line | |||||||||
Unrealized losses on available-for-sale securities | $ | $ | ( | ) | $ | ( | ) | Other income, net | |||||
Amortization of actuarial loss | ( | ) | ( | ) | ( | ) | Other income, net | ||||||
Reclassification of realized transactions, net of taxes | $ | ( | ) | $ | ( | ) | $ | ( | ) | Net Income | |||
Note 18. Quarterly Results (Unaudited)
The following table presents the Company's selected unaudited quarterly operating results for the eight quarters ended March 31, 2020. The Company believes that all adjustments of a normal recurring nature have been made to present fairly the related quarterly results (in millions, except per share amounts). Amounts may not add to the total due to rounding:
Fiscal 2020 | First Quarter | Second Quarter | Third Quarter | Fourth Quarter | Total | |||||||||||||||
Net sales | $ | $ | $ | $ | $ | |||||||||||||||
Gross profit | $ | $ | $ | $ | $ | |||||||||||||||
Operating income | $ | $ | $ | $ | $ | |||||||||||||||
Net income | $ | $ | $ | $ | $ | |||||||||||||||
Diluted net income per common share | $ | $ | $ | $ | $ | |||||||||||||||
Fiscal 2019 | First Quarter | Second Quarter | Third Quarter | Fourth Quarter | Total | |||||||||||||||
Net sales | $ | $ | $ | $ | $ | |||||||||||||||
Gross profit | $ | $ | $ | $ | $ | |||||||||||||||
Operating income | $ | $ | $ | $ | $ | |||||||||||||||
Net income | $ | $ | $ | $ | $ | |||||||||||||||
Diluted net income per common share | $ | $ | $ | $ | $ | |||||||||||||||
Refer to Note 13, Income Taxes, for an explanation of the $334.8 million tax benefit related to the intra-group transfers of certain intellectual property rights, the majority of which was recognized in the third quarter of fiscal 2020. Refer to Note 5, Special Charges and Other, Net, for an explanation of the special charges included in operating income in fiscal 2020 and fiscal 2019. Refer to Note 7, Debt, for an explanation of the loss on settlement of debt of $1.9 million and $3.4 million during the
F-53
Note 19. Dividends
On October 28, 2002, the Company announced that its Board of Directors had approved and instituted a quarterly cash dividend on its common stock. The Company has continued to pay quarterly dividends and has increased the amount of such dividends on a regular basis. Cash dividends paid per share were $1.465 , $1.457 and $1.449 during fiscal 2020, 2019 and 2018, respectively. Total dividend payments amounted to $350.1 million, $344.4 million and $337.5 million during fiscal 2020, 2019 and 2018, respectively.
F-54